Engineering & Construction - Credit Suisse | PLUS
105
Engineering & Construction FY’17 Outlook & Q4’16 Earnings Preview January 31, 2017 Team Contacts Jamie L. Cook, CFA +212-538-6098 [email protected] Jamie Anderson +212-538-3418 [email protected] Themis Davis [email protected] +212-538-8443 DISCLOSURE APPENDIX AT THE BACK OF THIS REPORT CONTAINS IMPORTANT DISCLOSURES, ANALYST CERTIFICATIONS, LEGAL ENTITY DISCLOSURE AND THE STATUS OF NON-US ANALYSTS. US Disclosure: Credit Suisse does and seeks to do business with companies covered in its research reports. As a result, investors should be aware that the Firm may have a conflict of interest that could affect the objectivity of this report. Investors should consider this report as only a single factor in making their investment decision.
-
Upload
khangminh22 -
Category
Documents
-
view
2 -
download
0
Transcript of Engineering & Construction - Credit Suisse | PLUS
Engineering & Construction FY’17 Outlook & Q4’16 Earnings Preview
January 31, 2017
Team Contacts
Jamie L. Cook, CFA
+212-538-6098
Jamie Anderson
+212-538-3418
Themis Davis
+212-538-8443
DISCLOSURE APPENDIX AT THE BACK OF THIS REPORT CONTAINS IMPORTANT DISCLOSURES, ANALYST CERTIFICATIONS, LEGAL ENTITY DISCLOSURE AND THE STATUS OF NON-US ANALYSTS. US Disclosure: Credit Suisse does and seeks to do business with companies covered in its research reports. As a result, investors should be aware that the Firm may have a conflict of interest that could affect the objectivity of this report. Investors should consider this report as only a single factor in making their investment decision.
US Engineering & Construction
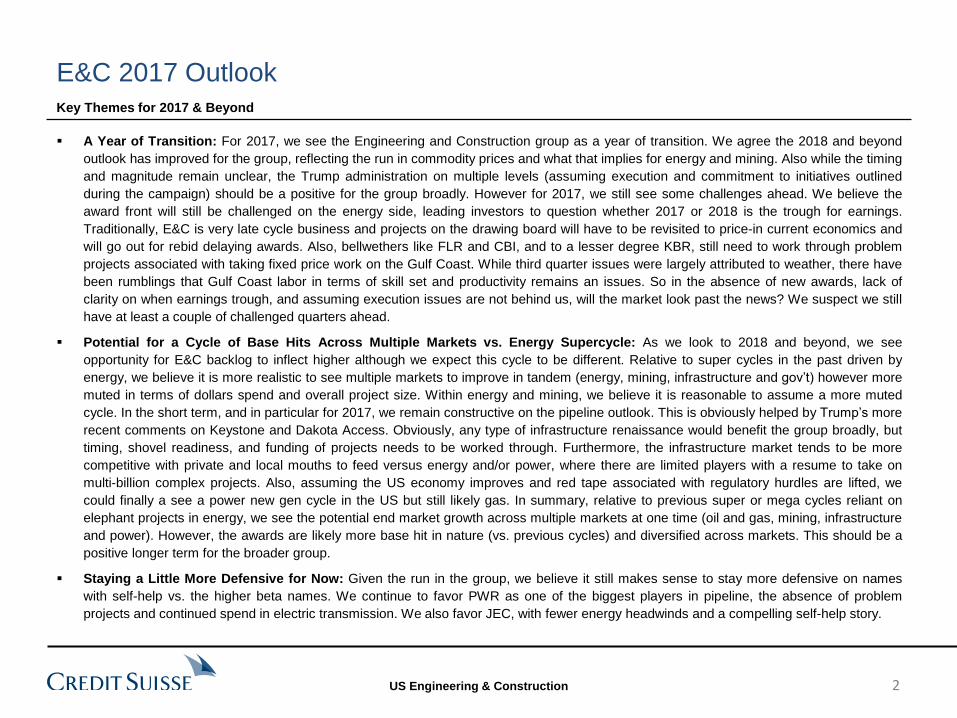
A Year of Transition: For 2017, we see the Engineering and Construction group as a year of transition. We agree the 2018 and beyond
outlook has improved for the group, reflecting the run in commodity prices and what that implies for energy and mining. Also while the timing
and magnitude remain unclear, the Trump administration on multiple levels (assuming execution and commitment to initiatives outlined
during the campaign) should be a positive for the group broadly. However for 2017, we still see some challenges ahead. We believe the
award front will still be challenged on the energy side, leading investors to question whether 2017 or 2018 is the trough for earnings.
Traditionally, E&C is very late cycle business and projects on the drawing board will have to be revisited to price-in current economics and
will go out for rebid delaying awards. Also, bellwethers like FLR and CBI, and to a lesser degree KBR, still need to work through problem
projects associated with taking fixed price work on the Gulf Coast. While third quarter issues were largely attributed to weather, there have
been rumblings that Gulf Coast labor in terms of skill set and productivity remains an issues. So in the absence of new awards, lack of
clarity on when earnings trough, and assuming execution issues are not behind us, will the market look past the news? We suspect we still
have at least a couple of challenged quarters ahead.
Potential for a Cycle of Base Hits Across Multiple Markets vs. Energy Supercycle: As we look to 2018 and beyond, we see
opportunity for E&C backlog to inflect higher although we expect this cycle to be different. Relative to super cycles in the past driven by
energy, we believe it is more realistic to see multiple markets to improve in tandem (energy, mining, infrastructure and gov’t) however more
muted in terms of dollars spend and overall project size. Within energy and mining, we believe it is reasonable to assume a more muted
cycle. In the short term, and in particular for 2017, we remain constructive on the pipeline outlook. This is obviously helped by Trump’s more
recent comments on Keystone and Dakota Access. Obviously, any type of infrastructure renaissance would benefit the group broadly, but
timing, shovel readiness, and funding of projects needs to be worked through. Furthermore, the infrastructure market tends to be more
competitive with private and local mouths to feed versus energy and/or power, where there are limited players with a resume to take on
multi-billion complex projects. Also, assuming the US economy improves and red tape associated with regulatory hurdles are lifted, we
could finally a see a power new gen cycle in the US but still likely gas. In summary, relative to previous super or mega cycles reliant on
elephant projects in energy, we see the potential end market growth across multiple markets at one time (oil and gas, mining, infrastructure
and power). However, the awards are likely more base hit in nature (vs. previous cycles) and diversified across markets. This should be a
positive longer term for the broader group.
Staying a Little More Defensive for Now: Given the run in the group, we believe it still makes sense to stay more defensive on names
with self-help vs. the higher beta names. We continue to favor PWR as one of the biggest players in pipeline, the absence of problem
projects and continued spend in electric transmission. We also favor JEC, with fewer energy headwinds and a compelling self-help story.
Key Themes for 2017 & Beyond
E&C 2017 Outlook
2
US Engineering & Construction
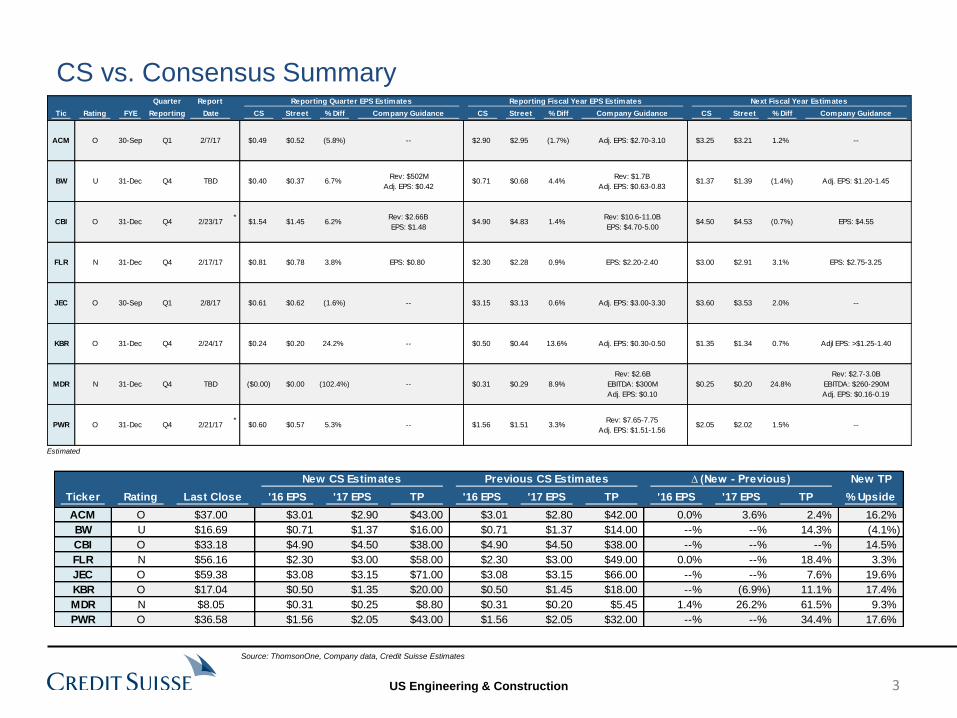
CS vs. Consensus Summary
3
Source: ThomsonOne, Company data, Credit Suisse Estimates
Quarter Report Reporting Quarter EPS Estimates Reporting Fiscal Year EPS Estimates Next Fiscal Year Estimates
Tic Rating FYE Reporting Date CS Street % Diff Company Guidance CS Street % Diff Company Guidance CS Street % Diff Company Guidance
ACM O 30-Sep Q1 2/7/17 $0.49 $0.52 (5.8%) -- $2.90 $2.95 (1.7%) Adj. EPS: $2.70-3.10 $3.25 $3.21 1.2% --
BW U 31-Dec Q4 TBD $0.40 $0.37 6.7%Rev: $502M
Adj. EPS: $0.42 $0.71 $0.68 4.4%
Rev: $1.7B
Adj. EPS: $0.63-0.83 $1.37 $1.39 (1.4%) Adj. EPS: $1.20-1.45
CBI O 31-Dec Q4 2/23/17*
$1.54 $1.45 6.2%Rev: $2.66B
EPS: $1.48 $4.90 $4.83 1.4%
Rev: $10.6-11.0B
EPS: $4.70-5.00 $4.50 $4.53 (0.7%) EPS: $4.55
FLR N 31-Dec Q4 2/17/17 $0.81 $0.78 3.8% EPS: $0.80 $2.30 $2.28 0.9% EPS: $2.20-2.40 $3.00 $2.91 3.1% EPS: $2.75-3.25
JEC O 30-Sep Q1 2/8/17 $0.61 $0.62 (1.6%) -- $3.15 $3.13 0.6% Adj. EPS: $3.00-3.30 $3.60 $3.53 2.0% --
KBR O 31-Dec Q4 2/24/17 $0.24 $0.20 24.2% -- $0.50 $0.44 13.6% Adj. EPS: $0.30-0.50 $1.35 $1.34 0.7% Adjl EPS: >$1.25-1.40
MDR N 31-Dec Q4 TBD ($0.00) $0.00 (102.4%) -- $0.31 $0.29 8.9%
Rev: $2.6B
EBITDA: $300M
Adj. EPS: $0.10
$0.25 $0.20 24.8%
Rev: $2.7-3.0B
EBITDA: $260-290M
Adj. EPS: $0.16-0.19
PWR O 31-Dec Q4 2/21/17*
$0.60 $0.57 5.3% -- $1.56 $1.51 3.3%Rev: $7.65-7.75
Adj. EPS: $1.51-1.56 $2.05 $2.02 1.5% --
* Estimated
New CS Estimates Previous CS Estimates ∆ (New - Previous) New TP
Ticker Rating Last Close '16 EPS '17 EPS TP '16 EPS '17 EPS TP '16 EPS '17 EPS TP % Upside
ACM O $37.00 $3.01 $2.90 $43.00 $3.01 $2.80 $42.00 0.0% 3.6% 2.4% 16.2%
BW U $16.69 $0.71 $1.37 $16.00 $0.71 $1.37 $14.00 --% --% 14.3% (4.1%)
CBI O $33.18 $4.90 $4.50 $38.00 $4.90 $4.50 $38.00 --% --% --% 14.5%
FLR N $56.16 $2.30 $3.00 $58.00 $2.30 $3.00 $49.00 0.0% --% 18.4% 3.3%
JEC O $59.38 $3.08 $3.15 $71.00 $3.08 $3.15 $66.00 --% --% 7.6% 19.6%
KBR O $17.04 $0.50 $1.35 $20.00 $0.50 $1.45 $18.00 --% (6.9%) 11.1% 17.4%
MDR N $8.05 $0.31 $0.25 $8.80 $0.31 $0.20 $5.45 1.4% 26.2% 61.5% 9.3%
PWR O $36.58 $1.56 $2.05 $43.00 $1.56 $2.05 $32.00 --% --% 34.4% 17.6%

US Engineering & Construction
Infrastructure
4
US Engineering & Construction
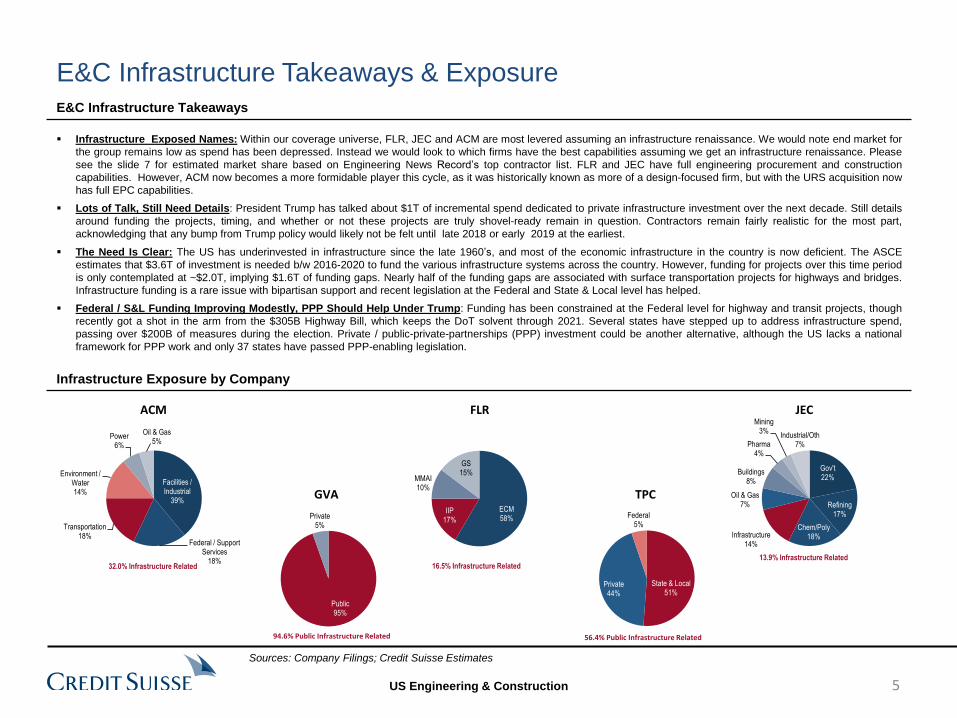
Infrastructure Exposed Names: Within our coverage universe, FLR, JEC and ACM are most levered assuming an infrastructure renaissance. We would note end market for
the group remains low as spend has been depressed. Instead we would look to which firms have the best capabilities assuming we get an infrastructure renaissance. Please
see the slide 7 for estimated market share based on Engineering News Record’s top contractor list. FLR and JEC have full engineering procurement and construction
capabilities. However, ACM now becomes a more formidable player this cycle, as it was historically known as more of a design-focused firm, but with the URS acquisition now
has full EPC capabilities.
Lots of Talk, Still Need Details: President Trump has talked about $1T of incremental spend dedicated to private infrastructure investment over the next decade. Still details
around funding the projects, timing, and whether or not these projects are truly shovel-ready remain in question. Contractors remain fairly realistic for the most part,
acknowledging that any bump from Trump policy would likely not be felt until late 2018 or early 2019 at the earliest.
The Need Is Clear: The US has underinvested in infrastructure since the late 1960’s, and most of the economic infrastructure in the country is now deficient. The ASCE
estimates that $3.6T of investment is needed b/w 2016-2020 to fund the various infrastructure systems across the country. However, funding for projects over this time period
is only contemplated at ~$2.0T, implying $1.6T of funding gaps. Nearly half of the funding gaps are associated with surface transportation projects for highways and bridges.
Infrastructure funding is a rare issue with bipartisan support and recent legislation at the Federal and State & Local level has helped.
Federal / S&L Funding Improving Modestly, PPP Should Help Under Trump: Funding has been constrained at the Federal level for highway and transit projects, though
recently got a shot in the arm from the $305B Highway Bill, which keeps the DoT solvent through 2021. Several states have stepped up to address infrastructure spend,
passing over $200B of measures during the election. Private / public-private-partnerships (PPP) investment could be another alternative, although the US lacks a national
framework for PPP work and only 37 states have passed PPP-enabling legislation.
E&C Infrastructure Takeaways
Infrastructure Exposure by Company
E&C Infrastructure Takeaways & Exposure
Facilities / Industrial
39%
Federal / Support Services
18%
Transportation18%
Environment / Water14%
Power6%
Oil & Gas5%
32.0% Infrastructure Related
Gov't22%
Refining17%
Chem/Poly18%Infrastructure
14%
Oil & Gas7%
Buildings8%
Pharma4%
Mining3%
Industrial/Oth7%
13.9% Infrastructure Related
ECM58%
IIP17%
MMAI10%
GS15%
16.5% Infrastructure Related
State & Local51%
Private44%
Federal5%
56.4% Public Infrastructure Related
Public95%
Private5%
94.6% Public Infrastructure Related
ACM FLR
GVA
JEC
TPC
Sources: Company Filings; Credit Suisse Estimates
5

US Engineering & Construction
Engineering News Record (ENR) publishes an annual “Top 400” contractors list,
where it details contractor performance in the U.S. by selected end markets. We
highlight relevant contractors by infrastructure end market in the following tables.
Transportation includes airports, bridges, roads, canals, locks, dredging, marine
facilities, piers, railroads, tunnels, etc.. Publically traded E&C companies with
favorable transportation exposure include TPC, GVA, FLR, and ACM.
General Building includes commercial buildings, offices, stores, educational
facilities, government buildings, hospitals, medical facilities, hotels, apartments,
housing, etc.. Publically traded E&C companies with favorable general building
exposure include TPC and ACM.
Sewer & Water includes dams, reservoirs, transmission pipelines, distribution
mains, irrigation canals, desalination and potability treatment plants, pumping
stations, etc., as well as sanitary and storm sewers, treatment plants, pumping
plants, incinerators, industrial waste facilities, etc. Publically traded E&C
companies with favorable general building exposure include ACM and GVA.
Selected Infrastructure E&C Contractors by End Market Summary by End Market
Top 25 General Building Firms
Top 25 Transportation Focused Firms
Top 25 Water, Sewer, & Wastewater Firms
Sales
Rank Firm Total Transport % Total
1 BECHTEL 23,372.0 4,440.7 19.0%
2 KIEWIT CORP. 8,718.8 2,790.0 32.0%
3 THE WALSH GROUP 4,950.6 2,722.8 55.0%
4 TUTOR PERINI CORP. 5,661.9 2,208.1 39.0%
5 SKANSKA 6,797.9 2,107.3 31.0%
6 GRANITE CONSTRUCTION INC. 2,371.0 1,636.0 69.0%
7 LANE INDUSTRIES INC. 1,354.9 1,246.5 92.0%
8 FLATIRON CONSTRUCTION CORP. 1,283.4 1,155.1 90.0%
9 COLAS USA 1,248.0 1,148.2 92.0%
10 FERROVIAL US CONSTRUCTION CORP. 1,140.0 1,140.0 100.0%
11 CLARK GROUP 4,100.0 1,107.0 27.0%
12 FLUOR CORP. 14,295.1 857.7 6.0%
13 BALFOUR BEATTY US 4,730.1 804.1 17.0%
14 OHL USA INC. 1,409.3 803.3 57.0%
15 AMES CONSTRUCTION INC. 1,068.0 779.6 73.0%
16 RAILWORKS CORP. 687.0 687.0 100.0%
17 GREAT LAKES DREDGE & DOCK 856.9 685.5 80.0%
18 HENSEL PHELPS 3,103.0 651.6 21.0%
19 AUSTIN INDUSTRIES 1,668.3 650.6 39.0%
20 HERZOG FAMILY OF COS. 628.8 628.8 100.0%
21 ALLAN MYERS INC. 629.8 554.2 88.0%
22 WEEKS MARINE INC. 732.9 542.3 74.0%
23 THE TURNER CORP. 10,566.6 528.3 5.0%
24 LAS VEGAS PAVING CORP. 510.0 510.0 100.0%
25 AECOM 7,011.7 490.8 7.0%
Sales
Rank Firm Total
Sewer &
Waste % Total
1 THE WALSH GROUP 4,950.6 792.1 16.0%
2 GARNEY HOLDING CO. 610.7 610.7 100.0%
3 KIEWIT CORP. 8,718.8 610.3 7.0%
4 LAYNE CHRISTENSEN CO. 683.5 587.8 86.0%
5 MWH GLOBAL 491.2 412.6 84.0%
6 AEGION CORP. 973.0 398.9 41.0%
7 SOUTHLAND/RENDA/JBROS 568.0 363.5 64.0%
8 PCL CONSTRUCTION ENTERPRISES 6,785.0 339.3 5.0%
9 CDM SMITH 437.9 267.1 61.0%
10 PC CONSTRUCTION CO. 500.7 250.4 50.0%
11 LYLES CONSTRUCTION GROUP 266.8 234.8 88.0%
12 AECOM 7,011.7 210.4 3.0%
13 KOKOSING INC. 1,049.8 210.0 20.0%
14 SKANSKA 6,797.9 203.9 3.0%
15 GRANITE CONSTRUCTION INC. 2,371.0 189.7 8.0%
16 OHL USA INC. 1,409.3 183.2 13.0%
17 BLACK & VEATCH 1,473.8 176.9 12.0%
18 ALBERICI-FLINTCO 2,100.4 168.0 8.0%
19 BARNARD CONSTRUCTION CO. INC. 511.4 163.6 32.0%
20 RICE LAKE CONSTRUCTION GROUP 218.7 159.7 73.0%
21 WHARTON-SMITH INC. 222.3 140.0 63.0%
22 BOWEN ENGINEERING CORP. 221.7 139.7 63.0%
23 C. OVERAA & CO. 249.9 122.5 49.0%
24 J. FLETCHER CREAMER & SON INC. 482.1 120.5 25.0%
25 BOH BROS. CONSTRUCTION CO. LLC 288.6 115.4 40.0%
Sales
Rank Firm Total
General
Building % Total
1 THE TURNER CORP. 10,566.6 8,664.6 82.0%
2 THE WHITING-TURNER CONTRACTING 5,721.8 4,005.3 70.0%
3 PCL CONSTRUCTION ENTERPRISES 6,785.0 3,867.5 57.0%
4 BALFOUR BEATTY US 4,730.1 3,831.4 81.0%
5 GILBANE BUILDING CO. 4,480.1 3,808.1 85.0%
6 TUTOR PERINI CORP. 5,661.9 3,453.8 61.0%
7 SKANSKA 6,797.9 3,331.0 49.0%
8 AECOM 7,011.7 3,295.5 47.0%
9 STRUCTURE TONE 3,865.6 3,208.4 83.0%
10 CLARK GROUP 4,100.0 2,870.0 70.0%
11 LENDLEASE 3,067.3 2,852.6 93.0%
12 SUFFOLK CONSTRUCTION CO. 2,502.0 2,502.0 100.0%
13 MORTENSON CONSTRUCTION 3,670.7 2,312.5 63.0%
14 SWINERTON INC. 2,934.0 2,200.5 75.0%
15 JE DUNN CONSTRUCTION 2,810.4 2,164.0 77.0%
16 DPR CONSTRUCTION 3,086.0 2,098.5 68.0%
17 MCCARTHY HOLDINGS INC. 2,821.0 2,031.1 72.0%
18 BRASFIELD & GORRIE LLC 2,297.7 1,999.0 87.0%
19 HENSEL PHELPS 3,103.0 1,954.9 63.0%
20 DAVID E. HARVEY BUILDERS 1,991.0 1,791.9 90.0%
21 THE WALSH GROUP 4,950.6 1,386.2 28.0%
22 HOLDER CONSTRUCTION CO. 2,113.0 1,352.3 64.0%
23 CHINA CONSTRUCTION AMERICA/PLAZA CONSTR. 1,430.0 1,258.4 88.0%
24 RYAN COS. US INC. 1,283.0 1,257.3 98.0%
25 CLAYCO INC. 1,350.0 1,242.0 92.0%
Sources: Engineering News Record
6
US Engineering & Construction
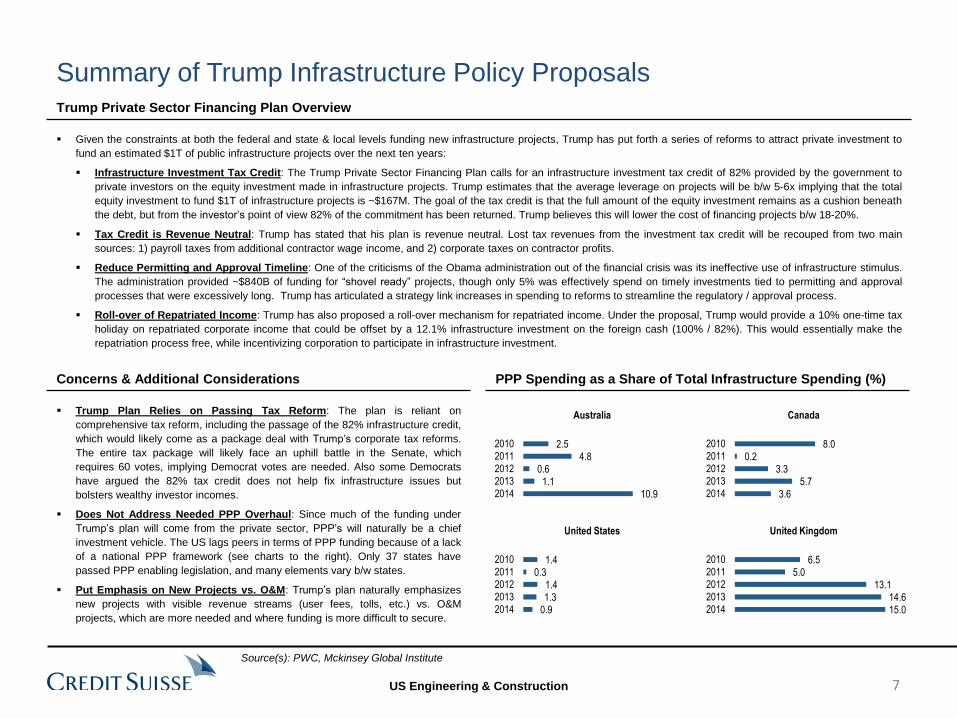
10.9 1.1
0.6 4.8
2.5
20142013201220112010
Australia
3.6 5.7
3.3 0.2
8.0
20142013201220112010
Canada
0.9 1.3 1.4
0.3 1.4
20142013201220112010
United States
15.0 14.6
13.1 5.0
6.5
20142013201220112010
United Kingdom
Summary of Trump Infrastructure Policy Proposals
Trump Plan Relies on Passing Tax Reform: The plan is reliant on
comprehensive tax reform, including the passage of the 82% infrastructure credit,
which would likely come as a package deal with Trump’s corporate tax reforms.
The entire tax package will likely face an uphill battle in the Senate, which
requires 60 votes, implying Democrat votes are needed. Also some Democrats
have argued the 82% tax credit does not help fix infrastructure issues but
bolsters wealthy investor incomes.
Does Not Address Needed PPP Overhaul: Since much of the funding under
Trump’s plan will come from the private sector, PPP’s will naturally be a chief
investment vehicle. The US lags peers in terms of PPP funding because of a lack
of a national PPP framework (see charts to the right). Only 37 states have
passed PPP enabling legislation, and many elements vary b/w states.
Put Emphasis on New Projects vs. O&M: Trump’s plan naturally emphasizes
new projects with visible revenue streams (user fees, tolls, etc.) vs. O&M
projects, which are more needed and where funding is more difficult to secure.
Concerns & Additional Considerations PPP Spending as a Share of Total Infrastructure Spending (%)
Given the constraints at both the federal and state & local levels funding new infrastructure projects, Trump has put forth a series of reforms to attract private investment to
fund an estimated $1T of public infrastructure projects over the next ten years:
Infrastructure Investment Tax Credit: The Trump Private Sector Financing Plan calls for an infrastructure investment tax credit of 82% provided by the government to
private investors on the equity investment made in infrastructure projects. Trump estimates that the average leverage on projects will be b/w 5-6x implying that the total
equity investment to fund $1T of infrastructure projects is ~$167M. The goal of the tax credit is that the full amount of the equity investment remains as a cushion beneath
the debt, but from the investor’s point of view 82% of the commitment has been returned. Trump believes this will lower the cost of financing projects b/w 18-20%.
Tax Credit is Revenue Neutral: Trump has stated that his plan is revenue neutral. Lost tax revenues from the investment tax credit will be recouped from two main
sources: 1) payroll taxes from additional contractor wage income, and 2) corporate taxes on contractor profits.
Reduce Permitting and Approval Timeline: One of the criticisms of the Obama administration out of the financial crisis was its ineffective use of infrastructure stimulus.
The administration provided ~$840B of funding for “shovel ready” projects, though only 5% was effectively spend on timely investments tied to permitting and approval
processes that were excessively long. Trump has articulated a strategy link increases in spending to reforms to streamline the regulatory / approval process.
Roll-over of Repatriated Income: Trump has also proposed a roll-over mechanism for repatriated income. Under the proposal, Trump would provide a 10% one-time tax
holiday on repatriated corporate income that could be offset by a 12.1% infrastructure investment on the foreign cash (100% / 82%). This would essentially make the
repatriation process free, while incentivizing corporation to participate in infrastructure investment.
Trump Private Sector Financing Plan Overview
7
Source(s): PWC, Mckinsey Global Institute
US Engineering & Construction
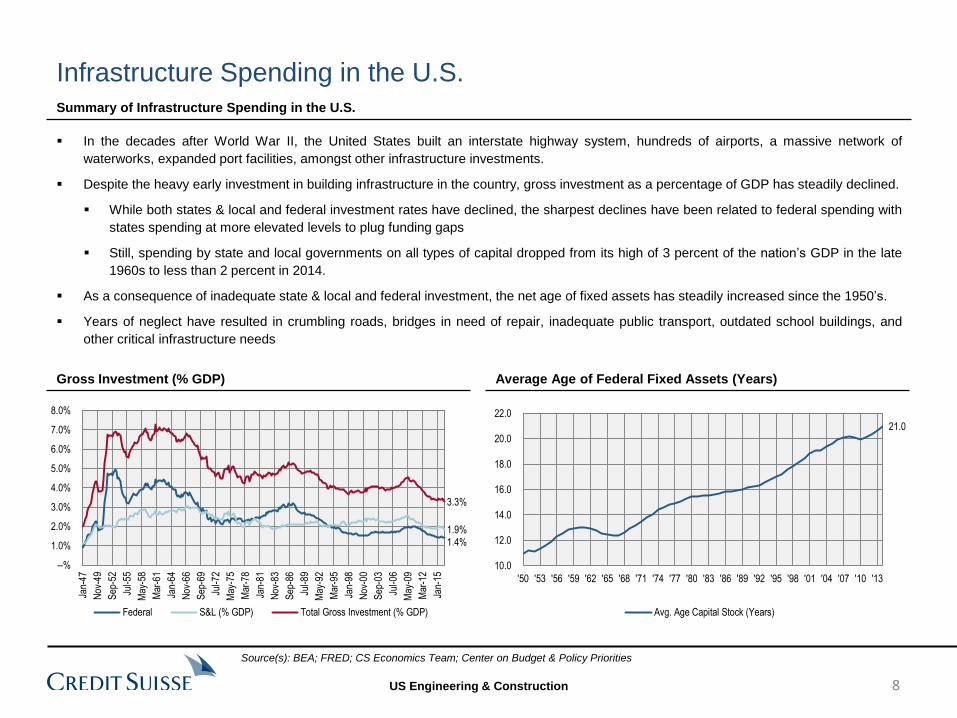
Infrastructure Spending in the U.S.
Gross Investment (% GDP) Average Age of Federal Fixed Assets (Years)
In the decades after World War II, the United States built an interstate highway system, hundreds of airports, a massive network of
waterworks, expanded port facilities, amongst other infrastructure investments.
Despite the heavy early investment in building infrastructure in the country, gross investment as a percentage of GDP has steadily declined.
While both states & local and federal investment rates have declined, the sharpest declines have been related to federal spending with
states spending at more elevated levels to plug funding gaps
Still, spending by state and local governments on all types of capital dropped from its high of 3 percent of the nation’s GDP in the late
1960s to less than 2 percent in 2014.
As a consequence of inadequate state & local and federal investment, the net age of fixed assets has steadily increased since the 1950’s.
Years of neglect have resulted in crumbling roads, bridges in need of repair, inadequate public transport, outdated school buildings, and
other critical infrastructure needs
Summary of Infrastructure Spending in the U.S.
1.4% 1.9%
3.3%
--%
1.0%
2.0%
3.0%
4.0%
5.0%
6.0%
7.0%
8.0%
Jan-
47
Nov
-49
Sep
-52
Jul-5
5
May
-58
Mar
-61
Jan-
64
Nov
-66
Sep
-69
Jul-7
2
May
-75
Mar
-78
Jan-
81
Nov
-83
Sep
-86
Jul-8
9
May
-92
Mar
-95
Jan-
98
Nov
-00
Sep
-03
Jul-0
6
May
-09
Mar
-12
Jan-
15
Federal S&L (% GDP) Total Gross Investment (% GDP)
21.0
10.0
12.0
14.0
16.0
18.0
20.0
22.0
'50 '53 '56 '59 '62 '65 '68 '71 '74 '77 '80 '83 '86 '89 '92 '95 '98 '01 '04 '07 '10 '13
Avg. Age Capital Stock (Years)
Source(s): BEA; FRED; CS Economics Team; Center on Budget & Policy Priorities
8
US Engineering & Construction
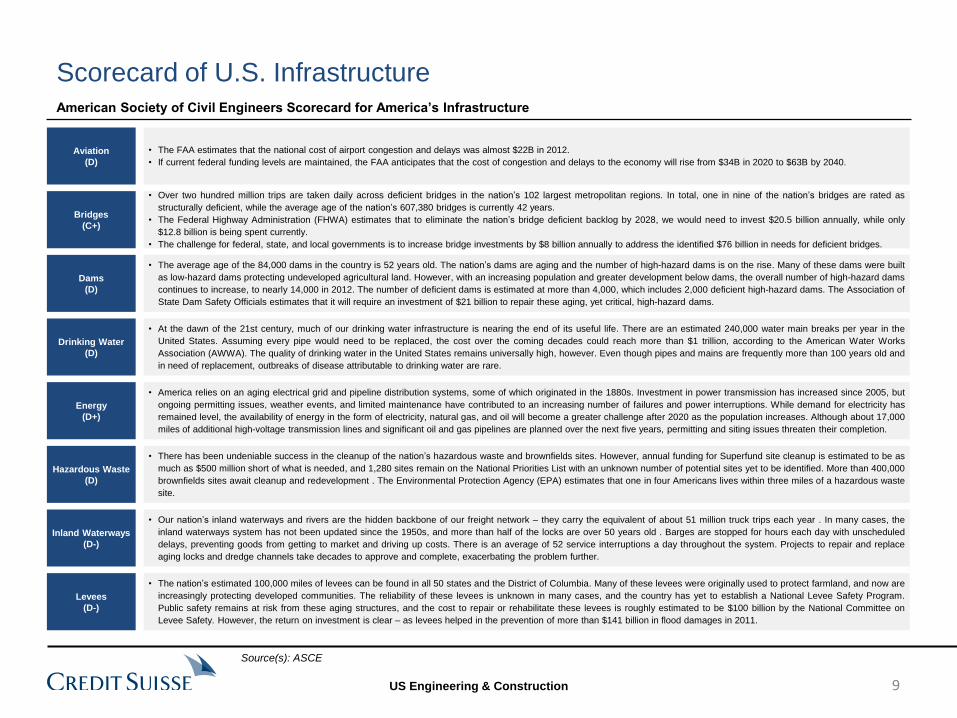
American Society of Civil Engineers Scorecard for America’s Infrastructure
Scorecard of U.S. Infrastructure
Aviation
(D)
• The FAA estimates that the national cost of airport congestion and delays was almost $22B in 2012.
• If current federal funding levels are maintained, the FAA anticipates that the cost of congestion and delays to the economy will rise from $34B in 2020 to $63B by 2040.
Bridges
(C+)
• Over two hundred million trips are taken daily across deficient bridges in the nation’s 102 largest metropolitan regions. In total, one in nine of the nation’s bridges are rated as
structurally deficient, while the average age of the nation’s 607,380 bridges is currently 42 years.
• The Federal Highway Administration (FHWA) estimates that to eliminate the nation’s bridge deficient backlog by 2028, we would need to invest $20.5 billion annually, while only
$12.8 billion is being spent currently.
• The challenge for federal, state, and local governments is to increase bridge investments by $8 billion annually to address the identified $76 billion in needs for deficient bridges.
Dams
(D)
• The average age of the 84,000 dams in the country is 52 years old. The nation’s dams are aging and the number of high-hazard dams is on the rise. Many of these dams were built
as low-hazard dams protecting undeveloped agricultural land. However, with an increasing population and greater development below dams, the overall number of high-hazard dams
continues to increase, to nearly 14,000 in 2012. The number of deficient dams is estimated at more than 4,000, which includes 2,000 deficient high-hazard dams. The Association of
State Dam Safety Officials estimates that it will require an investment of $21 billion to repair these aging, yet critical, high-hazard dams.
Drinking Water
(D)
• At the dawn of the 21st century, much of our drinking water infrastructure is nearing the end of its useful life. There are an estimated 240,000 water main breaks per year in the
United States. Assuming every pipe would need to be replaced, the cost over the coming decades could reach more than $1 trillion, according to the American Water Works
Association (AWWA). The quality of drinking water in the United States remains universally high, however. Even though pipes and mains are frequently more than 100 years old and
in need of replacement, outbreaks of disease attributable to drinking water are rare.
Energy
(D+)
• America relies on an aging electrical grid and pipeline distribution systems, some of which originated in the 1880s. Investment in power transmission has increased since 2005, but
ongoing permitting issues, weather events, and limited maintenance have contributed to an increasing number of failures and power interruptions. While demand for electricity has
remained level, the availability of energy in the form of electricity, natural gas, and oil will become a greater challenge after 2020 as the population increases. Although about 17,000
miles of additional high-voltage transmission lines and significant oil and gas pipelines are planned over the next five years, permitting and siting issues threaten their completion.
Hazardous Waste
(D)
• There has been undeniable success in the cleanup of the nation’s hazardous waste and brownfields sites. However, annual funding for Superfund site cleanup is estimated to be as
much as $500 million short of what is needed, and 1,280 sites remain on the National Priorities List with an unknown number of potential sites yet to be identified. More than 400,000
brownfields sites await cleanup and redevelopment . The Environmental Protection Agency (EPA) estimates that one in four Americans lives within three miles of a hazardous waste
site.
Inland Waterways
(D-)
• Our nation’s inland waterways and rivers are the hidden backbone of our freight network – they carry the equivalent of about 51 million truck trips each year . In many cases, the
inland waterways system has not been updated since the 1950s, and more than half of the locks are over 50 years old . Barges are stopped for hours each day with unscheduled
delays, preventing goods from getting to market and driving up costs. There is an average of 52 service interruptions a day throughout the system. Projects to repair and replace
aging locks and dredge channels take decades to approve and complete, exacerbating the problem further.
Levees
(D-)
• The nation’s estimated 100,000 miles of levees can be found in all 50 states and the District of Columbia. Many of these levees were originally used to protect farmland, and now are
increasingly protecting developed communities. The reliability of these levees is unknown in many cases, and the country has yet to establish a National Levee Safety Program.
Public safety remains at risk from these aging structures, and the cost to repair or rehabilitate these levees is roughly estimated to be $100 billion by the National Committee on
Levee Safety. However, the return on investment is clear – as levees helped in the prevention of more than $141 billion in flood damages in 2011.
9
Source(s): ASCE

US Engineering & Construction
American Society of Civil Engineers Scorecard for America’s Infrastructure (Continued)
Scorecard of U.S. Infrastructure
Ports
(C)
• The U.S. Army Corps of Engineers estimates that more than 95% (by volume) of overseas trade produced or consumed by the United States moves through our ports. To sustain
and serve a growing economy and compete internationally, our nation’s ports need to be maintained, modernized, and expanded. While port authorities and their private sector
partners have planned over $46 billion in capital improvements from now until 2016, federal funding has declined for navigable waterways and landside freight connections needed to
move goods to and from the ports.
Parks & Recreation
(C-)
• The popularity of parks and outdoor recreation areas in the United States continues to grow, with over 140 million Americans making use of these facilities a part of their daily lives.
These activities contribute $646 billion to the nation’s economy, supporting 6.1 million jobs. Yet states and localities struggle to provide these benefits for parks amid flat and
declining budgets, reporting an estimated $18.5 billion in unmet needs in 2011. The federal government is also facing a serious challenge as well since the National Park Service
estimates its maintenance backlog at approximately $11 billion.
Rail
(C+)
• Railroads are experiencing a competitive resurgence as both an energy-efficient freight transportation option and a viable city-to-city passenger service. In 2012, Amtrak recorded its
highest year of ridership with 31.2 million passengers, almost doubling ridership since 2000, with growth anticipated to continue. Both freight and passenger rail have been investing
heavily in their tracks, bridges, and tunnels as well as adding new capacity for freight and passengers. In 2010 alone, freight railroads renewed the rails on more than 3,100 miles of
railroad track, equivalent to going coast to coast. Since 2009, capital investment from both freight and passenger railroads has exceeded $75 billion, actually increasing investment
during the recession when materials prices were lower and trains ran less frequently.
Roads
(D)
• Forty-two percent of America’s major urban highways remain congested, costing the economy an estimated $101 billion in wasted time and fuel annually. While the conditions have
improved in the near term, and Federal, state, and local capital investments increased to $91 billion annually, that level of investment is insufficient and still projected to result in a
decline in conditions and performance in the long term. Currently, the Federal Highway Administration estimates that $170 billion in capital investment would be needed on an annual
basis to significantly improve conditions and performance.
Schools
(D)
• Almost half of America’s public school buildings were built to educate the baby boomers – a generation that is now retiring from the workforce. Public school enrollment is projected
to gradually increase through 2019, yet state and local school construction funding continues to decline. National spending on school construction has diminished to approximately
$10 billion in 2012, about half the level spent prior to the recession, while the condition of school facilities continues to be a significant concern for communities. Experts now estimate
the investment needed to modernize and maintain our nation’s school facilities is at least $270 billion or more. However, due to the absence of national data on school facilities for
more than a decade, a complete picture of the condition of our nation’s schools remains mostly unknown.
Solid Waste
(B-)
• In 2010, Americans generated 250 million tons of trash. Of that, 85 million tons were recycled or composted. This represents a 34% recycling rate, more than double the 14.5% in
1980. Per capita generation rates of waste have been steady over the past 20 years and have even begun to show signs of decline in the past several years.
Transit
(D)
• America’s public transit infrastructure plays a vital role in our economy, connecting millions of people with jobs, medical facilities, schools, shopping, and recreation, and it is critical to
the one-third of Americans who do not drive cars. Unlike many U.S. infrastructure systems, the transit system is not comprehensive, as 45% of American households lack any
access to transit, and millions more have inadequate service levels. Americans who do have access have increased their ridership 9.1% in the past decade, and that trend is
expected to continue. Although investment in transit has also increased, deficient and deteriorating transit systems cost the U.S. economy $90 billion in 2010, as many transit
agencies are struggling to maintain aging and obsolete fleets and facilities amid an economic downturn that has reduced their funding, forcing service cuts and fare increases.
Wastewater
(D)
• Capital investment needs for the nation’s wastewater and stormwater systems are estimated to total $298 billion over the next twenty years. Pipes represent the largest capital need,
comprising three quarters of total needs. Fixing and expanding the pipes will address sanitary sewer overflows, combined sewer overflows, and other pipe-related issues. In recent
years, capital needs for the treatment plants comprise about 15%-20% of total needs, but will likely increase due to new regulatory requirements. Stormwater needs, while growing,
are still small compared with sanitary pipes and treatment plants. Since 2007, the federal government has required cities to invest more than $15 billion in new pipes, plants, and
equipment to eliminate combined sewer overflows.
10
Source(s): ASCE
US Engineering & Construction
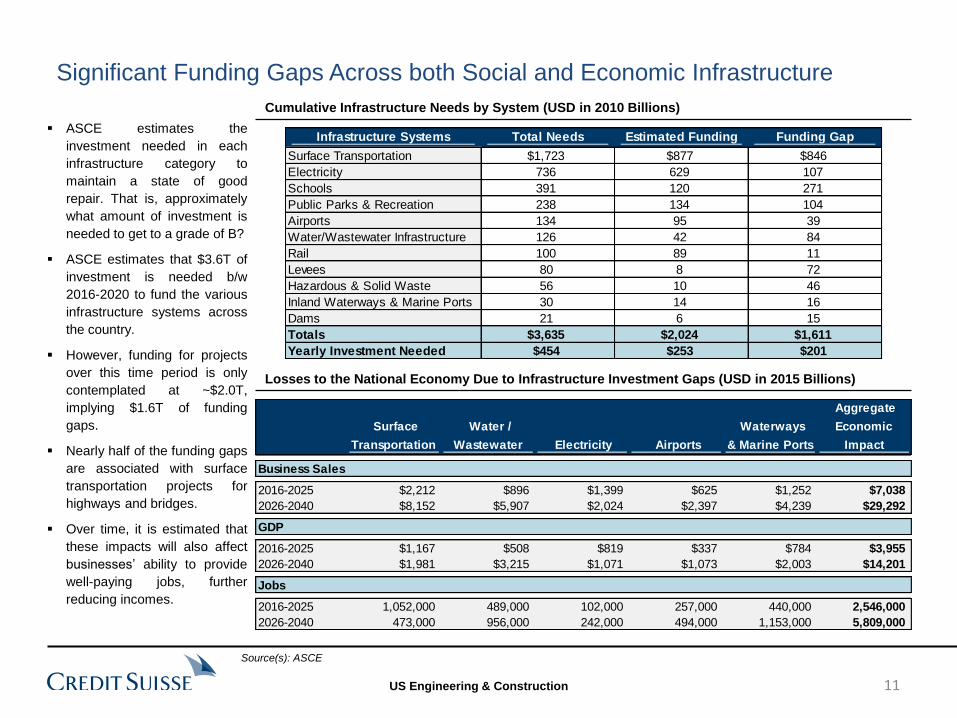
Infrastructure Systems Total Needs Estimated Funding Funding Gap
Surface Transportation $1,723 $877 $846
Electricity 736 629 107
Schools 391 120 271
Public Parks & Recreation 238 134 104
Airports 134 95 39
Water/Wastewater Infrastructure 126 42 84
Rail 100 89 11
Levees 80 8 72
Hazardous & Solid Waste 56 10 46
Inland Waterways & Marine Ports 30 14 16
Dams 21 6 15
Totals $3,635 $2,024 $1,611
Yearly Investment Needed $454 $253 $201
Cumulative Infrastructure Needs by System (USD in 2010 Billions)
Losses to the National Economy Due to Infrastructure Investment Gaps (USD in 2015 Billions)
ASCE estimates the
investment needed in each
infrastructure category to
maintain a state of good
repair. That is, approximately
what amount of investment is
needed to get to a grade of B?
ASCE estimates that $3.6T of
investment is needed b/w
2016-2020 to fund the various
infrastructure systems across
the country.
However, funding for projects
over this time period is only
contemplated at ~$2.0T,
implying $1.6T of funding
gaps.
Nearly half of the funding gaps
are associated with surface
transportation projects for
highways and bridges.
Over time, it is estimated that
these impacts will also affect
businesses’ ability to provide
well-paying jobs, further
reducing incomes.
Significant Funding Gaps Across both Social and Economic Infrastructure
Surface
Transportation
Water /
Wastewater Electricity Airports
Waterways
& Marine Ports
Aggregate
Economic
Impact
Business Sales
2016-2025 $2,212 $896 $1,399 $625 $1,252 $7,038
2026-2040 $8,152 $5,907 $2,024 $2,397 $4,239 $29,292
GDP
2016-2025 $1,167 $508 $819 $337 $784 $3,955
2026-2040 $1,981 $3,215 $1,071 $1,073 $2,003 $14,201
Jobs
2016-2025 1,052,000 489,000 102,000 257,000 440,000 2,546,000
2026-2040 473,000 956,000 242,000 494,000 1,153,000 5,809,000
11
Source(s): ASCE
US Engineering & Construction
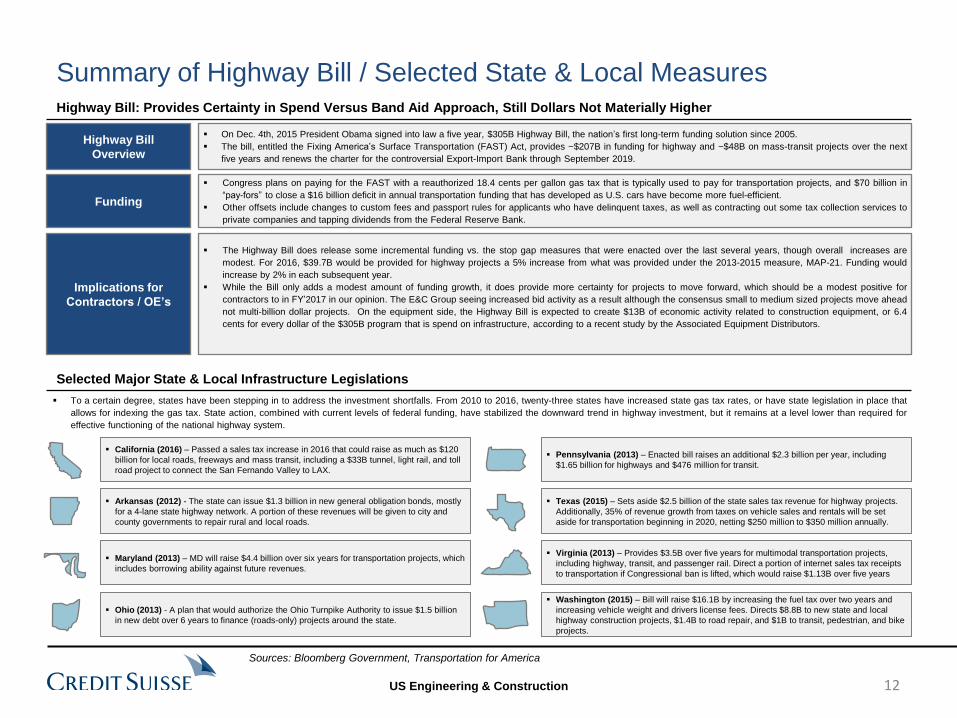
Highway Bill
Overview
On Dec. 4th, 2015 President Obama signed into law a five year, $305B Highway Bill, the nation’s first long-term funding solution since 2005.
The bill, entitled the Fixing America’s Surface Transportation (FAST) Act, provides ~$207B in funding for highway and ~$48B on mass-transit projects over the next
five years and renews the charter for the controversial Export-Import Bank through September 2019.
Funding
Congress plans on paying for the FAST with a reauthorized 18.4 cents per gallon gas tax that is typically used to pay for transportation projects, and $70 billion in
“pay-fors” to close a $16 billion deficit in annual transportation funding that has developed as U.S. cars have become more fuel-efficient.
Other offsets include changes to custom fees and passport rules for applicants who have delinquent taxes, as well as contracting out some tax collection services to
private companies and tapping dividends from the Federal Reserve Bank.
Implications for
Contractors / OE’s
The Highway Bill does release some incremental funding vs. the stop gap measures that were enacted over the last several years, though overall increases are
modest. For 2016, $39.7B would be provided for highway projects a 5% increase from what was provided under the 2013-2015 measure, MAP-21. Funding would
increase by 2% in each subsequent year.
While the Bill only adds a modest amount of funding growth, it does provide more certainty for projects to move forward, which should be a modest positive for
contractors to in FY’2017 in our opinion. The E&C Group seeing increased bid activity as a result although the consensus small to medium sized projects move ahead
not multi-billion dollar projects. On the equipment side, the Highway Bill is expected to create $13B of economic activity related to construction equipment, or 6.4
cents for every dollar of the $305B program that is spend on infrastructure, according to a recent study by the Associated Equipment Distributors.
Summary of Highway Bill / Selected State & Local Measures Highway Bill: Provides Certainty in Spend Versus Band Aid Approach, Still Dollars Not Materially Higher
Selected Major State & Local Infrastructure Legislations
California (2016) – Passed a sales tax increase in 2016 that could raise as much as $120
billion for local roads, freeways and mass transit, including a $33B tunnel, light rail, and toll
road project to connect the San Fernando Valley to LAX.
Pennsylvania (2013) – Enacted bill raises an additional $2.3 billion per year, including
$1.65 billion for highways and $476 million for transit.
Arkansas (2012) - The state can issue $1.3 billion in new general obligation bonds, mostly
for a 4-lane state highway network. A portion of these revenues will be given to city and
county governments to repair rural and local roads.
Texas (2015) – Sets aside $2.5 billion of the state sales tax revenue for highway projects.
Additionally, 35% of revenue growth from taxes on vehicle sales and rentals will be set
aside for transportation beginning in 2020, netting $250 million to $350 million annually.
Maryland (2013) – MD will raise $4.4 billion over six years for transportation projects, which
includes borrowing ability against future revenues.
Virginia (2013) – Provides $3.5B over five years for multimodal transportation projects,
including highway, transit, and passenger rail. Direct a portion of internet sales tax receipts
to transportation if Congressional ban is lifted, which would raise $1.13B over five years
Ohio (2013) - A plan that would authorize the Ohio Turnpike Authority to issue $1.5 billion
in new debt over 6 years to finance (roads-only) projects around the state.
Washington (2015) – Bill will raise $16.1B by increasing the fuel tax over two years and
increasing vehicle weight and drivers license fees. Directs $8.8B to new state and local
highway construction projects, $1.4B to road repair, and $1B to transit, pedestrian, and bike
projects.
Sources: Bloomberg Government, Transportation for America
To a certain degree, states have been stepping in to address the investment shortfalls. From 2010 to 2016, twenty-three states have increased state gas tax rates, or have state legislation in place that
allows for indexing the gas tax. State action, combined with current levels of federal funding, have stabilized the downward trend in highway investment, but it remains at a level lower than required for
effective functioning of the national highway system.
12
US Engineering & Construction
Oil & Gas
13
US Engineering & Construction
Oil & Gas Takeaways & Exposure
E&C Oil & Gas Exposure CS Energy Team WTI Forecast
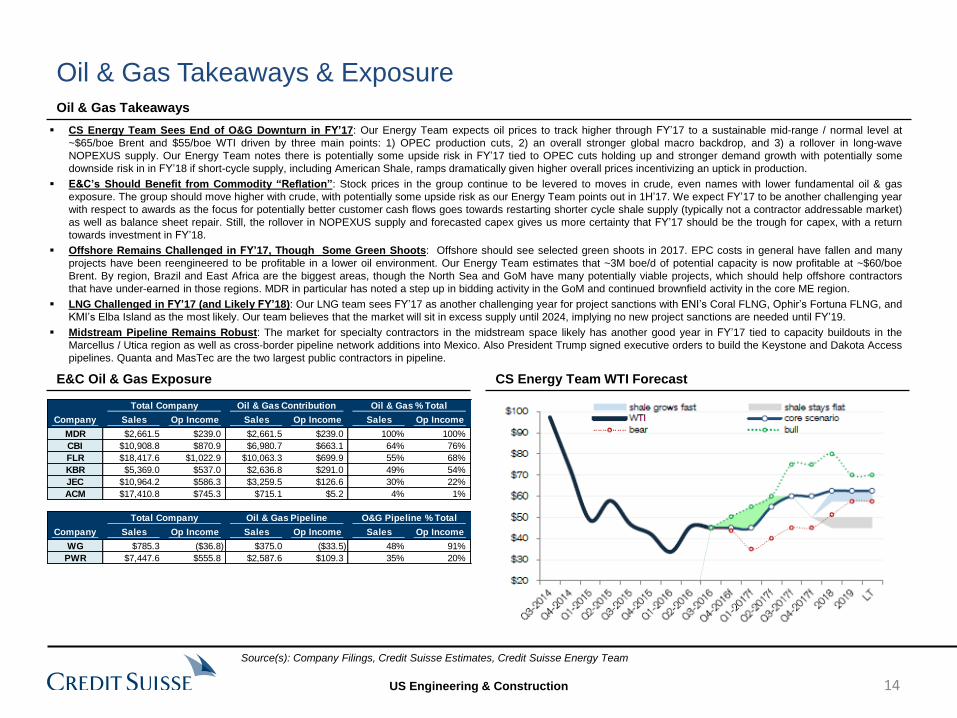
CS Energy Team Sees End of O&G Downturn in FY’17: Our Energy Team expects oil prices to track higher through FY’17 to a sustainable mid-range / normal level at
~$65/boe Brent and $55/boe WTI driven by three main points: 1) OPEC production cuts, 2) an overall stronger global macro backdrop, and 3) a rollover in long-wave
NOPEXUS supply. Our Energy Team notes there is potentially some upside risk in FY’17 tied to OPEC cuts holding up and stronger demand growth with potentially some
downside risk in in FY’18 if short-cycle supply, including American Shale, ramps dramatically given higher overall prices incentivizing an uptick in production.
E&C’s Should Benefit from Commodity “Reflation”: Stock prices in the group continue to be levered to moves in crude, even names with lower fundamental oil & gas
exposure. The group should move higher with crude, with potentially some upside risk as our Energy Team points out in 1H’17. We expect FY’17 to be another challenging year
with respect to awards as the focus for potentially better customer cash flows goes towards restarting shorter cycle shale supply (typically not a contractor addressable market)
as well as balance sheet repair. Still, the rollover in NOPEXUS supply and forecasted capex gives us more certainty that FY’17 should be the trough for capex, with a return
towards investment in FY’18.
Offshore Remains Challenged in FY’17, Though Some Green Shoots: Offshore should see selected green shoots in 2017. EPC costs in general have fallen and many
projects have been reengineered to be profitable in a lower oil environment. Our Energy Team estimates that ~3M boe/d of potential capacity is now profitable at ~$60/boe
Brent. By region, Brazil and East Africa are the biggest areas, though the North Sea and GoM have many potentially viable projects, which should help offshore contractors
that have under-earned in those regions. MDR in particular has noted a step up in bidding activity in the GoM and continued brownfield activity in the core ME region.
LNG Challenged in FY’17 (and Likely FY’18): Our LNG team sees FY’17 as another challenging year for project sanctions with ENI’s Coral FLNG, Ophir’s Fortuna FLNG, and
KMI’s Elba Island as the most likely. Our team believes that the market will sit in excess supply until 2024, implying no new project sanctions are needed until FY’19.
Midstream Pipeline Remains Robust: The market for specialty contractors in the midstream space likely has another good year in FY’17 tied to capacity buildouts in the
Marcellus / Utica region as well as cross-border pipeline network additions into Mexico. Also President Trump signed executive orders to build the Keystone and Dakota Access
pipelines. Quanta and MasTec are the two largest public contractors in pipeline.
Oil & Gas Takeaways
Total Company Oil & Gas Contribution Oil & Gas % Total
Company Sales Op Income Sales Op Income Sales Op Income
MDR $2,661.5 $239.0 $2,661.5 $239.0 100% 100%
CBI $10,908.8 $870.9 $6,980.7 $663.1 64% 76%
FLR $18,417.6 $1,022.9 $10,063.3 $699.9 55% 68%
KBR $5,369.0 $537.0 $2,636.8 $291.0 49% 54%
JEC $10,964.2 $586.3 $3,259.5 $126.6 30% 22%
ACM $17,410.8 $745.3 $715.1 $5.2 4% 1%
Total Company Oil & Gas Pipeline O&G Pipeline % Total
Company Sales Op Income Sales Op Income Sales Op Income
WG $785.3 ($36.8) $375.0 ($33.5) 48% 91%
PWR $7,447.6 $555.8 $2,587.6 $109.3 35% 20%
14
Source(s): Company Filings, Credit Suisse Estimates, Credit Suisse Energy Team
US Engineering & Construction
$0.00
$20.00
$40.00
$60.00
$80.00
$100.00
$120.00
$140.00
$0
$1,000
$2,000
$3,000
$4,000
$5,000
$6,000
$7,000
$8,000
$9,000
$10,000
Q1'
01
Q1'
02
Q1'
03
Q1'
04
Q1'
05
Q1'
06
Q1'
07
Q1'
08
Q1'
09
Q1'
10
Q1'
11
Q1'
12
Q1'
13
Q1'
14
Q1'
15
Q1'
16
Orders Avg Brent
7 Q's for Orders to Recover
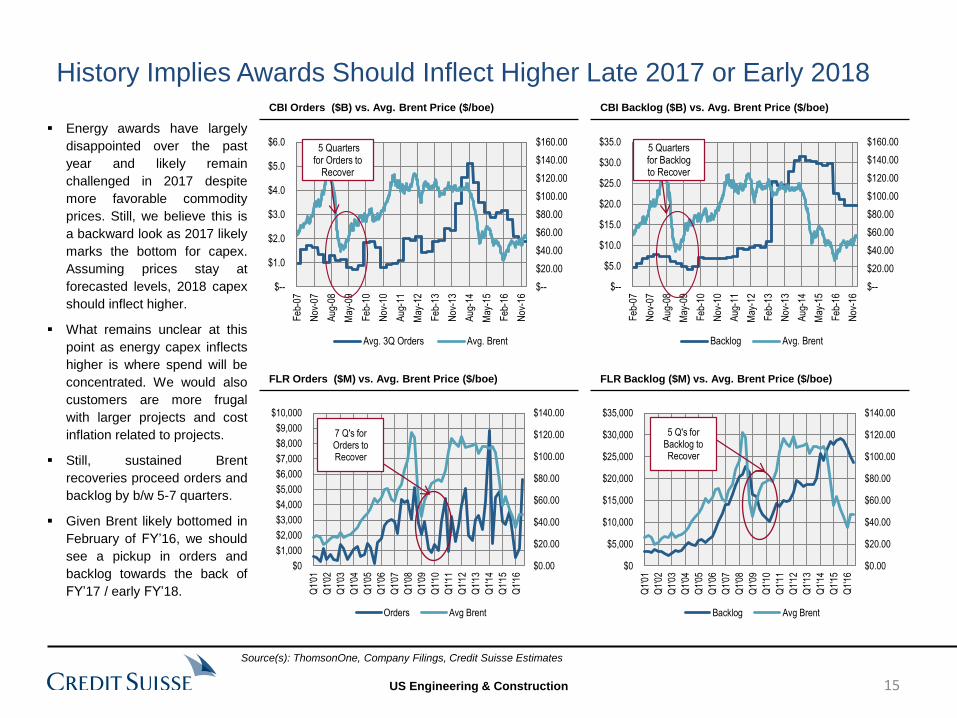
History Implies Awards Should Inflect Higher Late 2017 or Early 2018 CBI Orders ($B) vs. Avg. Brent Price ($/boe)
FLR Orders ($M) vs. Avg. Brent Price ($/boe)
CBI Backlog ($B) vs. Avg. Brent Price ($/boe)
FLR Backlog ($M) vs. Avg. Brent Price ($/boe)
Energy awards have largely
disappointed over the past
year and likely remain
challenged in 2017 despite
more favorable commodity
prices. Still, we believe this is
a backward look as 2017 likely
marks the bottom for capex.
Assuming prices stay at
forecasted levels, 2018 capex
should inflect higher.
What remains unclear at this
point as energy capex inflects
higher is where spend will be
concentrated. We would also
customers are more frugal
with larger projects and cost
inflation related to projects.
Still, sustained Brent
recoveries proceed orders and
backlog by b/w 5-7 quarters.
Given Brent likely bottomed in
February of FY’16, we should
see a pickup in orders and
backlog towards the back of
FY’17 / early FY’18.
$0.00
$20.00
$40.00
$60.00
$80.00
$100.00
$120.00
$140.00
$0
$5,000
$10,000
$15,000
$20,000
$25,000
$30,000
$35,000
Q1'
01
Q1'
02
Q1'
03
Q1'
04
Q1'
05
Q1'
06
Q1'
07
Q1'
08
Q1'
09
Q1'
10
Q1'
11
Q1'
12
Q1'
13
Q1'
14
Q1'
15
Q1'
16
Backlog Avg Brent
5 Q's for Backlog to Recover
$--
$20.00
$40.00
$60.00
$80.00
$100.00
$120.00
$140.00
$160.00
$--
$1.0
$2.0
$3.0
$4.0
$5.0
$6.0
Feb
-07
Nov
-07
Aug
-08
May
-09
Feb
-10
Nov
-10
Aug
-11
May
-12
Feb
-13
Nov
-13
Aug
-14
May
-15
Feb
-16
Nov
-16
Avg. 3Q Orders Avg. Brent
5 Quarters for Orders to
Recover
$--
$20.00
$40.00
$60.00
$80.00
$100.00
$120.00
$140.00
$160.00
$--
$5.0
$10.0
$15.0
$20.0
$25.0
$30.0
$35.0
Feb
-07
Nov
-07
Aug
-08
May
-09
Feb
-10
Nov
-10
Aug
-11
May
-12
Feb
-13
Nov
-13
Aug
-14
May
-15
Feb
-16
Nov
-16
Backlog Avg. Brent
5 Quarters for Backlog to Recover
15
Source(s): ThomsonOne, Company Filings, Credit Suisse Estimates

US Engineering & Construction
In their December Report, our Energy Team expects oil prices to track higher
through FY’17 to a sustainable mid-range / normal level at ~$65/boe Brent and
$55/boe WTI from three drivers:
OPEC Production Cuts: In November, OPEC agreed to reduce by a nominal 1.2
Mb/d to a 32.5 Mb/d group total, with non-OPEC producers also contributing 600
kb/d. The move likely tips the market into a supply deficit for much of the year,
implying inventory draws and supporting prices.
Strong Global Demand: Our Economics Team continues to note that global IP is
strengthening, with generally positive PMI's and broad talk of fiscal stimulus. CS
forecasts Global GDP growth to be 3.0% in 2017 from 2.5% in 2016, with Global
PMI new orders at a 19-month high, consistent with ~3% GDP growth.
NOPEXUS Supply Rollover: NOPEXUS production had already rolled over given
declines in places like China and Mexico. Without new project sanctions,
NOPEXUS volumes would start to decline meaningfully from 2018 onward. It is
this decline, together with demand growth, that creates the space for new
investments across the industry.
CS Energy Team Sees Three Drivers to “Energy Renaissance” in 2017 Closer to the End of the Downturn
Stronger Macro Backdrop
CS Oil Supply and Demand Post OPEC Cuts
Rollover of NOPEXUS Supply Creates 2018 Investment Window
16
Source(s): Company Filings, Credit Suisse Estimates, Credit Suisse Energy Team
US Engineering & Construction
Integrated Oils Historical & Projected Capex (USD in Billions)
Independents Historical & Projected Capex (USD in Billions)
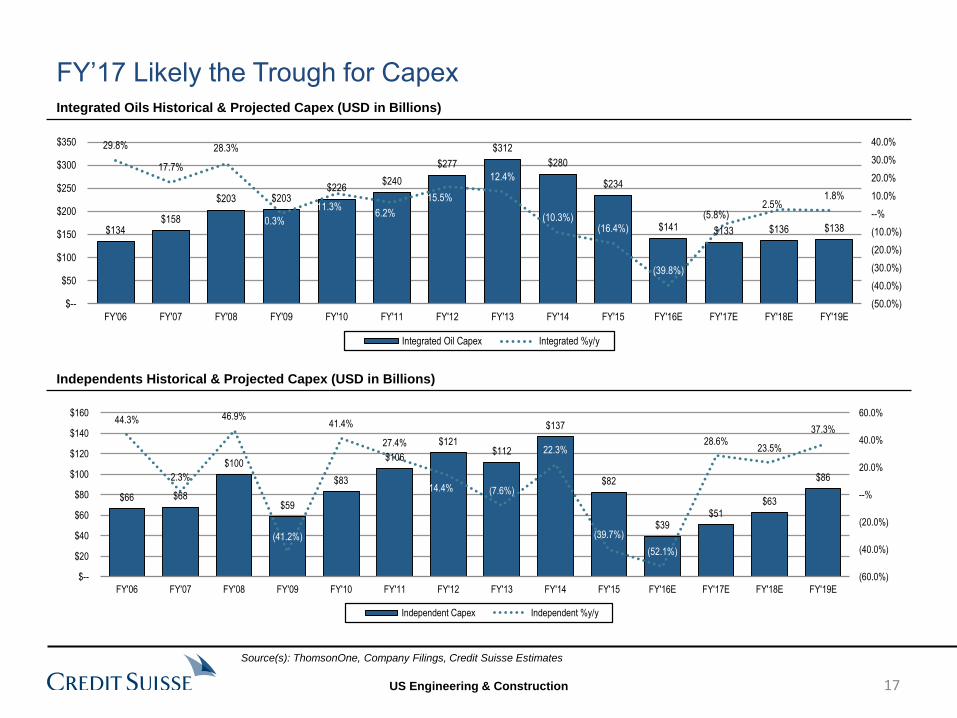
FY’17 Likely the Trough for Capex
$134 $158
$203 $203 $226
$240
$277
$312
$280
$234
$141 $133 $136 $138
29.8%
17.7%
28.3%
0.3%
11.3% 6.2%
15.5%
12.4%
(10.3%)(16.4%)
(39.8%)
(5.8%)2.5%
1.8%
(50.0%)
(40.0%)
(30.0%)
(20.0%)
(10.0%)
--%
10.0%
20.0%
30.0%
40.0%
$--
$50
$100
$150
$200
$250
$300
$350
FY'06 FY'07 FY'08 FY'09 FY'10 FY'11 FY'12 FY'13 FY'14 FY'15 FY'16E FY'17E FY'18E FY'19E
Integrated Oil Capex Integrated %y/y
$66 $68
$100
$59
$83
$106
$121 $112
$137
$82
$39 $51
$63
$86
44.3%
2.3%
46.9%
(41.2%)
41.4%
27.4%
14.4% (7.6%)
22.3%
(39.7%)
(52.1%)
28.6% 23.5%
37.3%
(60.0%)
(40.0%)
(20.0%)
--%
20.0%
40.0%
60.0%
$--
$20
$40
$60
$80
$100
$120
$140
$160
FY'06 FY'07 FY'08 FY'09 FY'10 FY'11 FY'12 FY'13 FY'14 FY'15 FY'16E FY'17E FY'18E FY'19E
Independent Capex Independent %y/y
17
Source(s): ThomsonOne, Company Filings, Credit Suisse Estimates
US Engineering & Construction
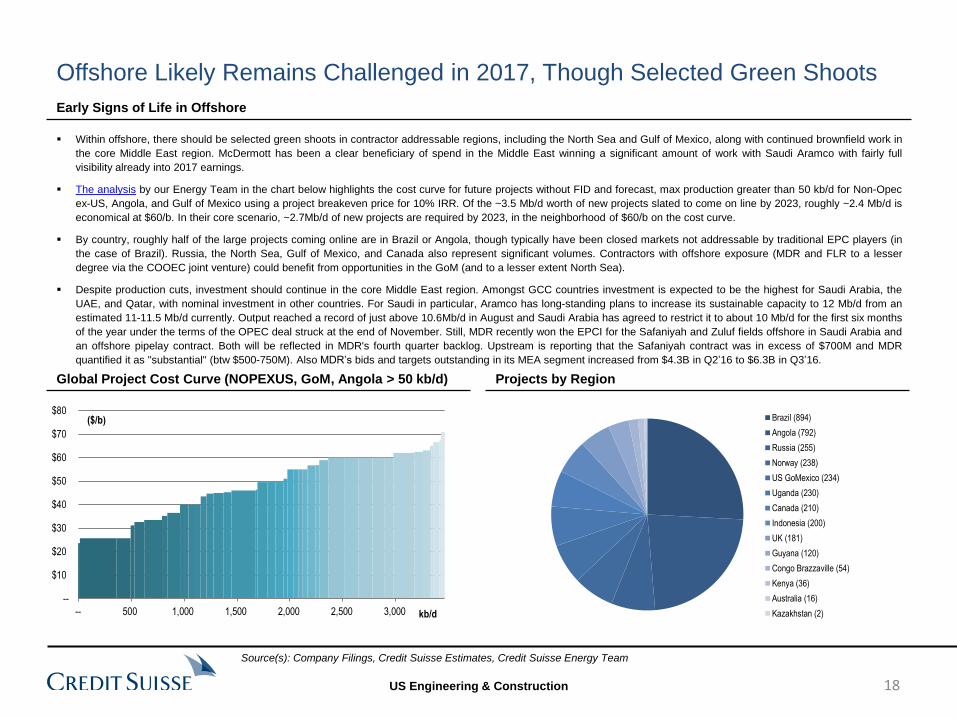
Offshore Likely Remains Challenged in 2017, Though Selected Green Shoots
Global Project Cost Curve (NOPEXUS, GoM, Angola > 50 kb/d) Projects by Region
Within offshore, there should be selected green shoots in contractor addressable regions, including the North Sea and Gulf of Mexico, along with continued brownfield work in
the core Middle East region. McDermott has been a clear beneficiary of spend in the Middle East winning a significant amount of work with Saudi Aramco with fairly full
visibility already into 2017 earnings.
The analysis by our Energy Team in the chart below highlights the cost curve for future projects without FID and forecast, max production greater than 50 kb/d for Non-Opec
ex-US, Angola, and Gulf of Mexico using a project breakeven price for 10% IRR. Of the ~3.5 Mb/d worth of new projects slated to come on line by 2023, roughly ~2.4 Mb/d is
economical at $60/b. In their core scenario, ~2.7Mb/d of new projects are required by 2023, in the neighborhood of $60/b on the cost curve.
By country, roughly half of the large projects coming online are in Brazil or Angola, though typically have been closed markets not addressable by traditional EPC players (in
the case of Brazil). Russia, the North Sea, Gulf of Mexico, and Canada also represent significant volumes. Contractors with offshore exposure (MDR and FLR to a lesser
degree via the COOEC joint venture) could benefit from opportunities in the GoM (and to a lesser extent North Sea).
Despite production cuts, investment should continue in the core Middle East region. Amongst GCC countries investment is expected to be the highest for Saudi Arabia, the
UAE, and Qatar, with nominal investment in other countries. For Saudi in particular, Aramco has long-standing plans to increase its sustainable capacity to 12 Mb/d from an
estimated 11-11.5 Mb/d currently. Output reached a record of just above 10.6Mb/d in August and Saudi Arabia has agreed to restrict it to about 10 Mb/d for the first six months
of the year under the terms of the OPEC deal struck at the end of November. Still, MDR recently won the EPCI for the Safaniyah and Zuluf fields offshore in Saudi Arabia and
an offshore pipelay contract. Both will be reflected in MDR's fourth quarter backlog. Upstream is reporting that the Safaniyah contract was in excess of $700M and MDR
quantified it as "substantial" (btw $500-750M). Also MDR’s bids and targets outstanding in its MEA segment increased from $4.3B in Q2’16 to $6.3B in Q3’16.
Early Signs of Life in Offshore
Brazil (894)
Angola (792)
Russia (255)
Norway (238)
US GoMexico (234)
Uganda (230)
Canada (210)
Indonesia (200)
UK (181)
Guyana (120)
Congo Brazzaville (54)
Kenya (36)
Australia (16)
Kazakhstan (2)
--
$10
$20
$30
$40
$50
$60
$70
$80
-- 500 1,000 1,500 2,000 2,500 3,000
($/b)
kb/d
18
Source(s): Company Filings, Credit Suisse Estimates, Credit Suisse Energy Team
US Engineering & Construction
CS LNG Team Project Tracker
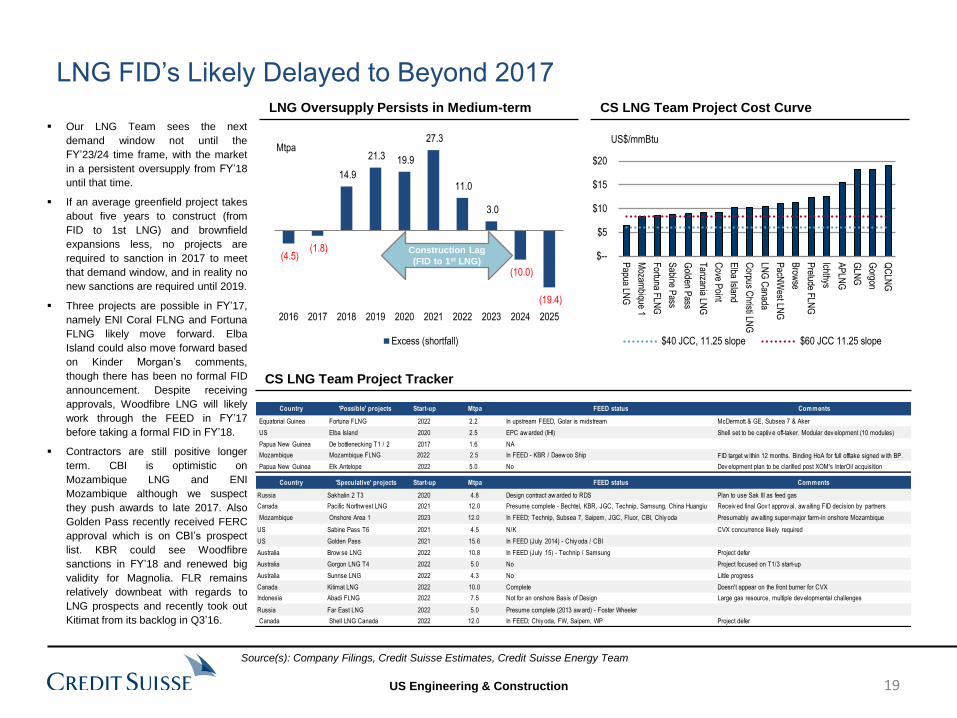
Our LNG Team sees the next
demand window not until the
FY’23/24 time frame, with the market
in a persistent oversupply from FY’18
until that time.
If an average greenfield project takes
about five years to construct (from
FID to 1st LNG) and brownfield
expansions less, no projects are
required to sanction in 2017 to meet
that demand window, and in reality no
new sanctions are required until 2019.
Three projects are possible in FY’17,
namely ENI Coral FLNG and Fortuna
FLNG likely move forward. Elba
Island could also move forward based
on Kinder Morgan’s comments,
though there has been no formal FID
announcement. Despite receiving
approvals, Woodfibre LNG will likely
work through the FEED in FY’17
before taking a formal FID in FY’18.
Contractors are still positive longer
term. CBI is optimistic on
Mozambique LNG and ENI
Mozambique although we suspect
they push awards to late 2017. Also
Golden Pass recently received FERC
approval which is on CBI’s prospect
list. KBR could see Woodfibre
sanctions in FY’18 and renewed big
validity for Magnolia. FLR remains
relatively downbeat with regards to
LNG prospects and recently took out
Kitimat from its backlog in Q3’16.
LNG Oversupply Persists in Medium-term CS LNG Team Project Cost Curve
LNG FID’s Likely Delayed to Beyond 2017
$--
$5
$10
$15
$20
Papua LN
G
Mozam
bique 1
Fortuna F
LNG
Sabine P
ass
Golden P
ass
Tanzania LN
G
Cove P
oint
Elba Island
Corpus C
hristi LNG
LNG
Canada
PacN
West LN
G
Brow
se
Prelude F
LNG
Ichthys
AP
LNG
GLN
G
Gorgon
QC
LNG
$40 JCC, 11.25 slope $60 JCC 11.25 slope
US$/mmBtu
(4.5)(1.8)
14.9
21.3 19.9
27.3
11.0
3.0
(10.0)
(19.4)
2016 2017 2018 2019 2020 2021 2022 2023 2024 2025
Excess (shortfall)
Mtpa
Country 'Possible' projects Start-up Mtpa FEED status Comments
Equatorial Guinea Fortuna FLNG 2022 2.2 In upstream FEED, Golar is midstream McDermott & GE, Subsea 7 & Aker
US Elba Island 2020 2.5 EPC aw arded (IHI) Shell set to be captiv e off-taker. Modular dev elopment (10 modules)
Papua New Guinea De bottlenecking T1 / 2 2017 1.6 NA
Mozambique Mozambique FLNG 2022 2.5 In FEED - KBR / Daew oo Ship FID target w ithin 12 months. Binding HoA for full offtake signed w ith BP.
Papua New Guinea Elk Antelope 2022 5.0 No Dev elopment plan to be clarified post XOM's InterOil acquisition
Country 'Speculative' projects Start-up Mtpa FEED status Comments
Russia Sakhalin 2 T3 2020 4.8 Design contract aw arded to RDS Plan to use Sak III as feed gas
Canada Pacific Northw est LNG 2021 12.0 Presume complete - Bechtel, KBR, JGC, Technip, Samsung, China Huangiu Receiv ed final Gov t approv al, aw aiting FID decision by partners
Mozambique Onshore Area 1 2023 12.0 In FEED; Technip, Subsea 7, Saipem, JGC, Fluor, CBI, Chiy oda Presumably aw aiting super-major farm-in onshore Mozambique
US Sabine Pass T6 2021 4.5 N/K CVX concurrence likely required
US Golden Pass 2021 15.6 In FEED (July 2014) - Chiy oda / CBI
Australia Brow se LNG 2022 10.8 In FEED (July 15) - Technip / Samsung Project defer
Australia Gorgon LNG T4 2022 5.0 No Project focused on T1/3 start-up
Australia Sunrise LNG 2022 4.3 No Little progress
Canada Kitimat LNG 2022 10.0 Complete Doesn't appear on the front burner for CVX
Indonesia Abadi FLNG 2022 7.5 Not for an onshore Basis of Design Large gas resource, multiple dev elopmental challenges
Russia Far East LNG 2022 5.0 Presume complete (2013 aw ard) - Foster Wheeler
Canada Shell LNG Canada 2022 12.0 In FEED; Chiy oda, FW, Saipem, WP Project defer
Construction Lag
(FID to 1st LNG)
19
Source(s): Company Filings, Credit Suisse Estimates, Credit Suisse Energy Team
US Engineering & Construction
Midstream Overview-Pipeline Opportunities Remain Robust Natural Gas Capacity out of Ohio / Utica
U.S. Capacity Into Mexico (Bcf/d)
Planned Pipelines in the Utica Region
New U.S. – Mexico Natural Gas Pipelines
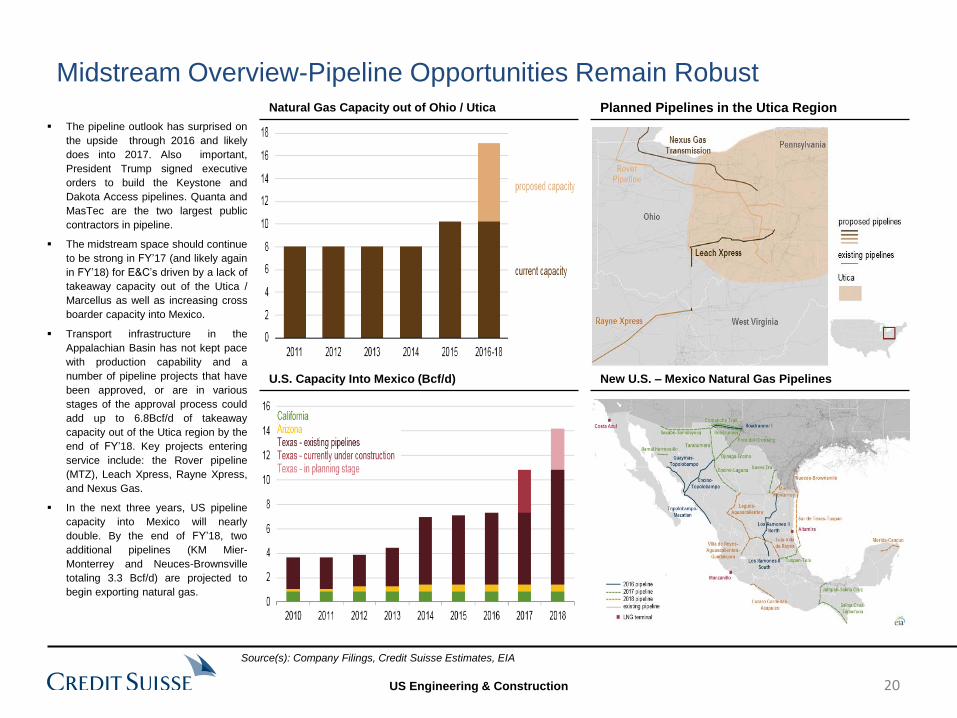
The pipeline outlook has surprised on
the upside through 2016 and likely
does into 2017. Also important,
President Trump signed executive
orders to build the Keystone and
Dakota Access pipelines. Quanta and
MasTec are the two largest public
contractors in pipeline.
The midstream space should continue
to be strong in FY’17 (and likely again
in FY’18) for E&C’s driven by a lack of
takeaway capacity out of the Utica /
Marcellus as well as increasing cross
boarder capacity into Mexico.
Transport infrastructure in the
Appalachian Basin has not kept pace
with production capability and a
number of pipeline projects that have
been approved, or are in various
stages of the approval process could
add up to 6.8Bcf/d of takeaway
capacity out of the Utica region by the
end of FY’18. Key projects entering
service include: the Rover pipeline
(MTZ), Leach Xpress, Rayne Xpress,
and Nexus Gas.
In the next three years, US pipeline
capacity into Mexico will nearly
double. By the end of FY’18, two
additional pipelines (KM Mier-
Monterrey and Neuces-Brownsville
totaling 3.3 Bcf/d) are projected to
begin exporting natural gas.
20
Source(s): Company Filings, Credit Suisse Estimates, EIA
US Engineering & Construction
Government Services
21

US Engineering & Construction
Government Takeaways
E&C Government Exposure
Government Outlook
Sources: Company filings, Credit Suisse Estimates
*KBR Operating Income is actually Gross Profit & Equity in Earnings and shows annualized pro forma figures to include the Wyle and HTSI acquisitions
Defense Under Trump Calls for Prior Peak Spending: Trump made soaring promises to rebuild the U.S. military and increase defense-related spending during his four-year
term, with an emphasis on increased naval vessel and air force combat aircraft procurement, boosting troop counts across all service branches, missile defense hardening,
and developing offensive and defense cybersecurity capabilities. Early indications suggest that Trump wants to restore DoD spending to levels requested in the FY’12 Budget
(so called “Gates Budget”). Successful implementation of the Gates budget would reverse years of anemic growth mandated under the Budget Control Act of 2011 (BCA),
likely growing topline DoD base budget funding to $649B in FY’17 from the $551B requested as part of the FY’17 President’s Budget and mandated by the BCA, or up ~18%.
Trump Plan Prioritizes People, Should Create More E&C Addressable Work: In addition to an ambitious naval shipbuilding plan and combat aircraft increases, Trump’s
defense policy calls for a ramp-up in service men and women across all branches of the military. Over his four year term, Trump wants to increase the number of active duty
Army forces from 460 thousand from the FY’17 request to 540 thousand, or 17%, to meet global readiness levels; increase the number of active duty Navy forces from 323
thousand from the FY’17 request to 380 thousand, or 17%; and increase the number of active duty USMC forces from 182 thousand from the FY’17 request to 200 thousand,
or 10%, to fully staff 36 battalions. Trump also wants to increase the number of combat aircraft, which will likely increase the number of required pilots and support personnel.
The additional headcount across the DoD will result in more demand for O&M and base support / facilities management services for E&C contractors. Additionally, new
Defense Secretary, Ret. Gen. Mattis, is viewed as more interventionist and will likely look to pursue a more “boots-on-the-ground” approach in the fight against ISIS in the ME,
increasing the E&C requirements for OCONUS base support services.
Repealing BCA Will Be a Major Policy Hurdle: Key to successful implementation of Trump’s plan will be the successful repeal of the BCA, which will likely face opposition
from Democrats (as funding will likely come from cuts / offsets to entitlement spending) as well as Tea Party / Deficit Hawk Republicans.
Total Company Gov't Contribution Gov't % Total
Company Sales Op Income Sales Op Income Sales Op Income
KBR $5,369.0 $537.0 $2,225.0 $207.0 41% 39%
JEC $10,964.2 $586.3 $2,657.4 $203.8 24% 35%
ACM $17,410.8 $745.3 $3,253.7 $306.2 19% 41%
FLR $18,417.6 $1,022.9 $2,672.7 $86.7 15% 8%
CBI $10,908.8 $870.9 $1,582.0 $48.8 15% 6%
22
US Engineering & Construction
Key DoD Considerations
Trump has been a proponent of the
FY’12 Budget request (so-called Gates
Budget), which calls for topline DoD
spending of $671B vs. $583B in the
most recent budget proposal, or 18%
more funding
Will look to repeal the Budget Control
Act shortly after taking office to meet
funding goals
Priorities include bolstering the service
levels across all branches, increasing
the deployable US Naval fleet,
increasing the amount of USAF combat
aircraft, bolstering missile defense, and
hardening cybersecurity (including more
use of offensive cyber capabilities)
Key Army Considerations
Increase the number of active duty Army
forces from 460 thousand from the
FY’17 request to 540 thousand, or 17%,
to meet global readiness levels – has
Congressional and service support for
this expansion
Plan estimated to cost b/w $35-50B over
the first four years and could add ~15
thousand soldiers per year based off
historical accession rates
Will submit plan to combat ISIS
immediately after taking office – given
Defense Secretary pick Ret. Gen Mattis
will possibly be more internationalist in
the Middle East, requiring more “boots-
on-the-ground”
Key Navy Considerations
Increase the number of active duty Navy
forces from 323 thousand from the
FY’17 request to 380 thousand, or 17%,
to meet readiness objectives
Increase the naval fleet from 274 today
to 350-355 vessels over the next 30
years – this compares to the existing
long-term shipbuilding plan of 308
vessels
Would require $15B of procurement over
the next four years to buy 6 littoral
combat ships, two amphibious ships,
and one attack sub – would contract an
additional $60B in procurement beyond
the four year term
Key USMC Considerations
Increase the number of active duty
USMC forces from 182 thousand from
the FY’17 request to 200 thousand, or
10%, to fully staff 36 battalions
Plan would require $12B over the next
four years
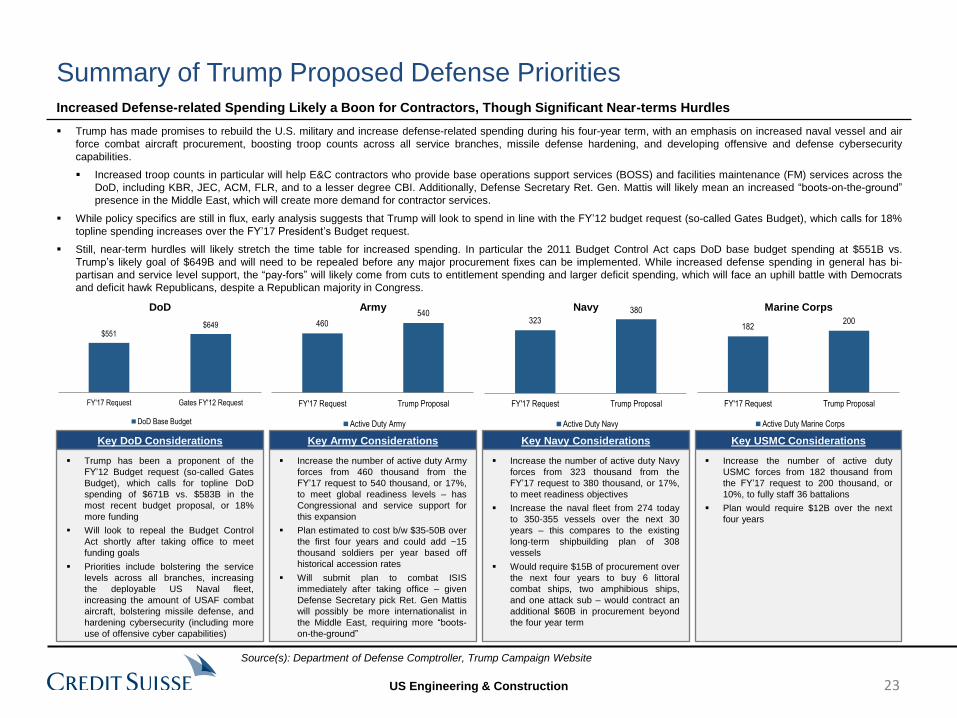
Trump has made promises to rebuild the U.S. military and increase defense-related spending during his four-year term, with an emphasis on increased naval vessel and air
force combat aircraft procurement, boosting troop counts across all service branches, missile defense hardening, and developing offensive and defense cybersecurity
capabilities.
Increased troop counts in particular will help E&C contractors who provide base operations support services (BOSS) and facilities maintenance (FM) services across the
DoD, including KBR, JEC, ACM, FLR, and to a lesser degree CBI. Additionally, Defense Secretary Ret. Gen. Mattis will likely mean an increased “boots-on-the-ground”
presence in the Middle East, which will create more demand for contractor services.
While policy specifics are still in flux, early analysis suggests that Trump will look to spend in line with the FY’12 budget request (so-called Gates Budget), which calls for 18%
topline spending increases over the FY’17 President’s Budget request.
Still, near-term hurdles will likely stretch the time table for increased spending. In particular the 2011 Budget Control Act caps DoD base budget spending at $551B vs.
Trump’s likely goal of $649B and will need to be repealed before any major procurement fixes can be implemented. While increased defense spending in general has bi-
partisan and service level support, the “pay-fors” will likely come from cuts to entitlement spending and larger deficit spending, which will face an uphill battle with Democrats
and deficit hawk Republicans, despite a Republican majority in Congress.
Increased Defense-related Spending Likely a Boon for Contractors, Though Significant Near-terms Hurdles
Summary of Trump Proposed Defense Priorities
$551 $649
FY'17 Request Gates FY'12 Request
DoD Base Budget
DoD
460540
FY'17 Request Trump Proposal
Active Duty Army
Army
323380
FY'17 Request Trump Proposal
Active Duty Navy
Navy
182200
FY'17 Request Trump Proposal
Active Duty Marine Corps
Marine Corps
23
Source(s): Department of Defense Comptroller, Trump Campaign Website
US Engineering & Construction
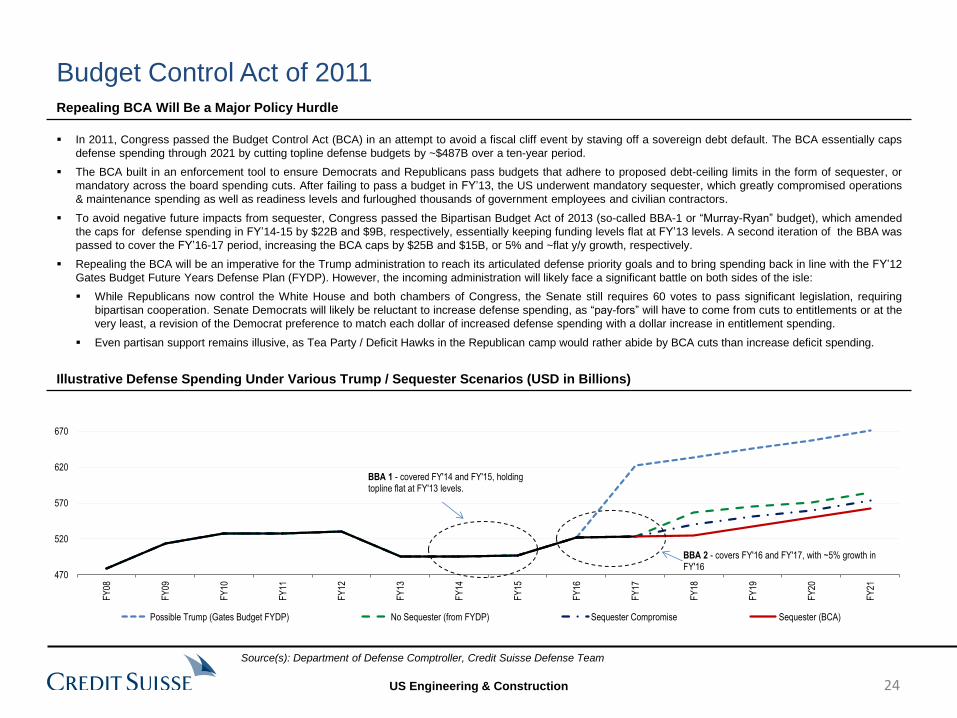
In 2011, Congress passed the Budget Control Act (BCA) in an attempt to avoid a fiscal cliff event by staving off a sovereign debt default. The BCA essentially caps
defense spending through 2021 by cutting topline defense budgets by ~$487B over a ten-year period.
The BCA built in an enforcement tool to ensure Democrats and Republicans pass budgets that adhere to proposed debt-ceiling limits in the form of sequester, or
mandatory across the board spending cuts. After failing to pass a budget in FY’13, the US underwent mandatory sequester, which greatly compromised operations
& maintenance spending as well as readiness levels and furloughed thousands of government employees and civilian contractors.
To avoid negative future impacts from sequester, Congress passed the Bipartisan Budget Act of 2013 (so-called BBA-1 or “Murray-Ryan” budget), which amended
the caps for defense spending in FY’14-15 by $22B and $9B, respectively, essentially keeping funding levels flat at FY’13 levels. A second iteration of the BBA was
passed to cover the FY’16-17 period, increasing the BCA caps by $25B and $15B, or 5% and ~flat y/y growth, respectively.
Repealing the BCA will be an imperative for the Trump administration to reach its articulated defense priority goals and to bring spending back in line with the FY’12
Gates Budget Future Years Defense Plan (FYDP). However, the incoming administration will likely face a significant battle on both sides of the isle:
While Republicans now control the White House and both chambers of Congress, the Senate still requires 60 votes to pass significant legislation, requiring
bipartisan cooperation. Senate Democrats will likely be reluctant to increase defense spending, as “pay-fors” will have to come from cuts to entitlements or at the
very least, a revision of the Democrat preference to match each dollar of increased defense spending with a dollar increase in entitlement spending.
Even partisan support remains illusive, as Tea Party / Deficit Hawks in the Republican camp would rather abide by BCA cuts than increase deficit spending.
Repealing BCA Will Be a Major Policy Hurdle
Illustrative Defense Spending Under Various Trump / Sequester Scenarios (USD in Billions)
Budget Control Act of 2011
470
520
570
620
670
FY
08
FY
09
FY
10
FY
11
FY
12
FY
13
FY
14
FY
15
FY
16
FY
17
FY
18
FY
19
FY
20
FY
21
Possible Trump (Gates Budget FYDP) No Sequester (from FYDP) Sequester Compromise Sequester (BCA)
BBA 1 - covered FY'14 and FY'15, holding topline flat at FY'13 levels.
BBA 2 - covers FY'16 and FY'17, with ~5% growth in FY'16
24
Source(s): Department of Defense Comptroller, Credit Suisse Defense Team
US Engineering & Construction
Trump Army Implications FY’17 U.S. Army President Budget and FYDP (FY’17 Constant USD in Billions)
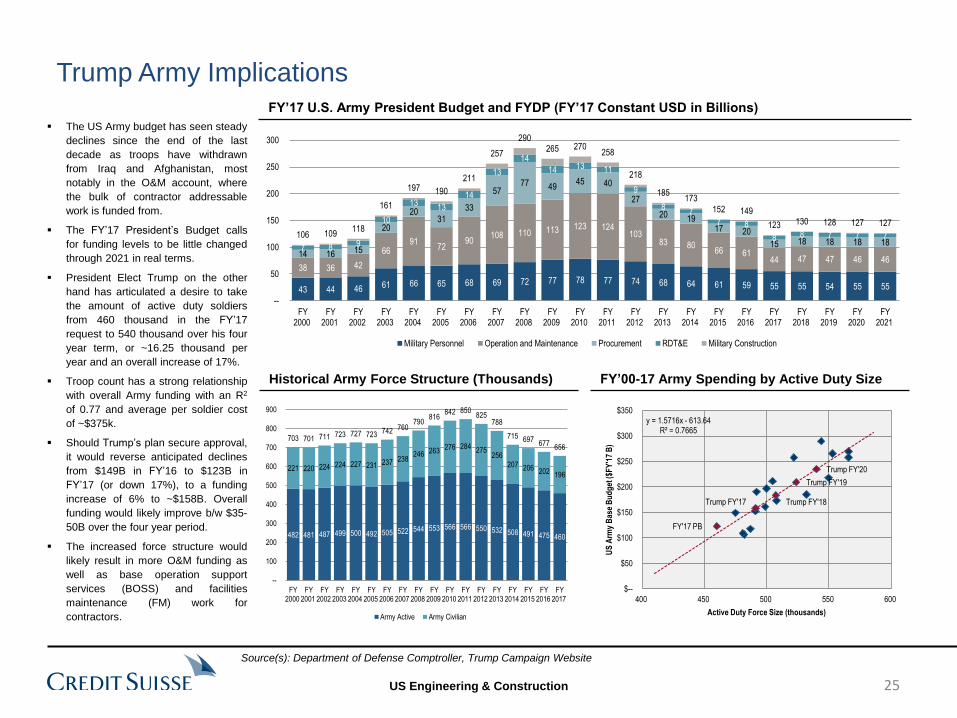
The US Army budget has seen steady
declines since the end of the last
decade as troops have withdrawn
from Iraq and Afghanistan, most
notably in the O&M account, where
the bulk of contractor addressable
work is funded from.
The FY’17 President’s Budget calls
for funding levels to be little changed
through 2021 in real terms.
President Elect Trump on the other
hand has articulated a desire to take
the amount of active duty soldiers
from 460 thousand in the FY’17
request to 540 thousand over his four
year term, or ~16.25 thousand per
year and an overall increase of 17%.
Troop count has a strong relationship
with overall Army funding with an R2
of 0.77 and average per soldier cost
of ~$375k.
Should Trump’s plan secure approval,
it would reverse anticipated declines
from $149B in FY’16 to $123B in
FY’17 (or down 17%), to a funding
increase of 6% to ~$158B. Overall
funding would likely improve b/w $35-
50B over the four year period.
The increased force structure would
likely result in more O&M funding as
well as base operation support
services (BOSS) and facilities
maintenance (FM) work for
contractors.
Historical Army Force Structure (Thousands) FY’00-17 Army Spending by Active Duty Size
43 44 46 61 66 65 68 69 72 77 78 77 74 68 64 61 59 55 55 54 55 55
38 36 42
66 91
72 90
108 110 113 123 124 103
83 80 66 61
44 47 47 46 46 14 16 15
20
20 31
33
57 77 49
45 40
27
20 19 17 20
15 18 18 18 18 7 8 9
10
13 13
14
13
14
14 13 11
9
8 7
7 8
8 8 7 7 7 106 109 118
161
197 190
211
257
290 265 270
258
218
185 173
152 149
123 130 128 127 127
--
50
100
150
200
250
300
FY2000
FY2001
FY2002
FY2003
FY2004
FY2005
FY2006
FY2007
FY2008
FY2009
FY2010
FY2011
FY2012
FY2013
FY2014
FY2015
FY2016
FY2017
FY2018
FY2019
FY2020
FY2021
Military Personnel Operation and Maintenance Procurement RDT&E Military Construction
FY'17 PB
Trump FY'17 Trump FY'18
Trump FY'19
Trump FY'20
y = 1.5716x - 613.64R² = 0.7665
$--
$50
$100
$150
$200
$250
$300
$350
400 450 500 550 600U
S A
rmy
Bas
e B
ud
get
($F
Y'1
7 B
)Active Duty Force Size (thousands)
482 481 487 499 500 492 505 522 544 553 566 566 550 532 508 491 475 460
221 220 224 224 227 231 237 238 246 263 276 284
275 256
207 206 202 196
703 701 711 723 727 723 742 760 790
816 842 850
825 788
715 697 677
656
--
100
200
300
400
500
600
700
800
900
FY2000
FY2001
FY2002
FY2003
FY2004
FY2005
FY2006
FY2007
FY2008
FY2009
FY2010
FY2011
FY2012
FY2013
FY2014
FY2015
FY2016
FY2017
Army Active Army Civilian
25
Source(s): Department of Defense Comptroller, Trump Campaign Website

US Engineering & Construction
Electric Power
26
US Engineering & Construction
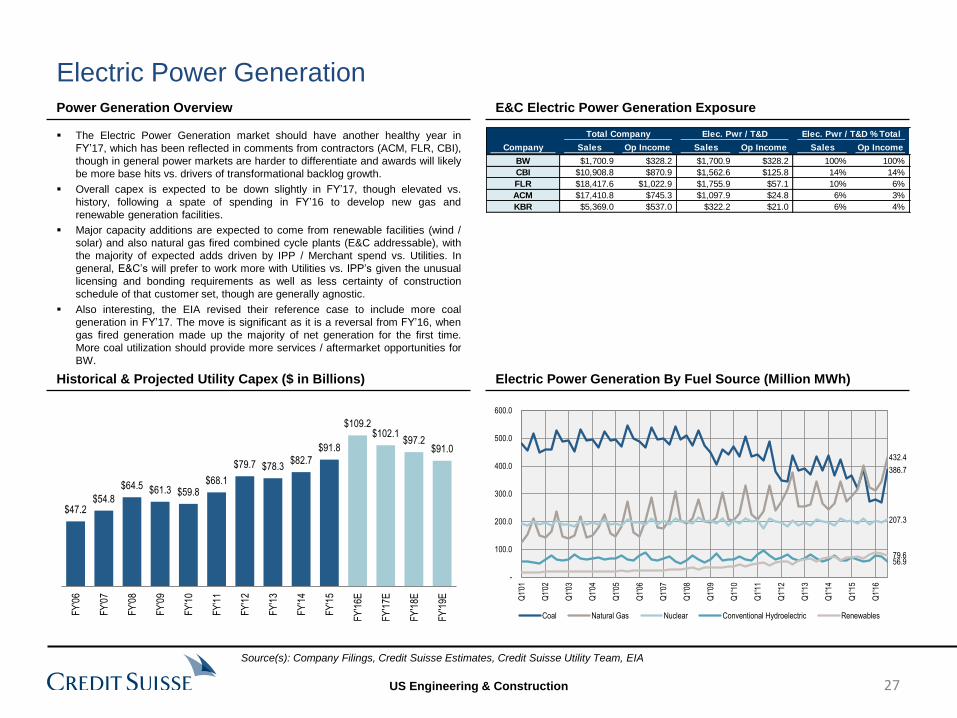
The Electric Power Generation market should have another healthy year in
FY’17, which has been reflected in comments from contractors (ACM, FLR, CBI),
though in general power markets are harder to differentiate and awards will likely
be more base hits vs. drivers of transformational backlog growth.
Overall capex is expected to be down slightly in FY’17, though elevated vs.
history, following a spate of spending in FY’16 to develop new gas and
renewable generation facilities.
Major capacity additions are expected to come from renewable facilities (wind /
solar) and also natural gas fired combined cycle plants (E&C addressable), with
the majority of expected adds driven by IPP / Merchant spend vs. Utilities. In
general, E&C’s will prefer to work more with Utilities vs. IPP’s given the unusual
licensing and bonding requirements as well as less certainty of construction
schedule of that customer set, though are generally agnostic.
Also interesting, the EIA revised their reference case to include more coal
generation in FY’17. The move is significant as it is a reversal from FY’16, when
gas fired generation made up the majority of net generation for the first time.
More coal utilization should provide more services / aftermarket opportunities for
BW.
Electric Power Generation Power Generation Overview
Historical & Projected Utility Capex ($ in Billions)
E&C Electric Power Generation Exposure
Electric Power Generation By Fuel Source (Million MWh)
Total Company Elec. Pwr / T&D Elec. Pwr / T&D % Total
Company Sales Op Income Sales Op Income Sales Op Income
BW $1,700.9 $328.2 $1,700.9 $328.2 100% 100%
CBI $10,908.8 $870.9 $1,562.6 $125.8 14% 14%
FLR $18,417.6 $1,022.9 $1,755.9 $57.1 10% 6%
ACM $17,410.8 $745.3 $1,097.9 $24.8 6% 3%
KBR $5,369.0 $537.0 $322.2 $21.0 6% 4%
386.7
432.4
207.3
56.9 79.6
-
100.0
200.0
300.0
400.0
500.0
600.0
Q1'
01
Q1'
02
Q1'
03
Q1'
04
Q1'
05
Q1'
06
Q1'
07
Q1'
08
Q1'
09
Q1'
10
Q1'
11
Q1'
12
Q1'
13
Q1'
14
Q1'
15
Q1'
16
Coal Natural Gas Nuclear Conventional Hydroelectric Renewables
$47.2 $54.8
$64.5 $61.3 $59.8 $68.1
$79.7 $78.3 $82.7
$91.8
$109.2 $102.1
$97.2 $91.0
FY
'06
FY
'07
FY
'08
FY
'09
FY
'10
FY
'11
FY
'12
FY
'13
FY
'14
FY
'15
FY
'16E
FY
'17E
FY
'18E
FY
'19E
27
Source(s): Company Filings, Credit Suisse Estimates, Credit Suisse Utility Team, EIA
US Engineering & Construction
Electric Power Generation Electric Power Consumption
Annual Capacity Additions by Fuel Source (GW)
Electric Power Generation by Fuel Source
Annual Retirements by Fuel Source (GW)
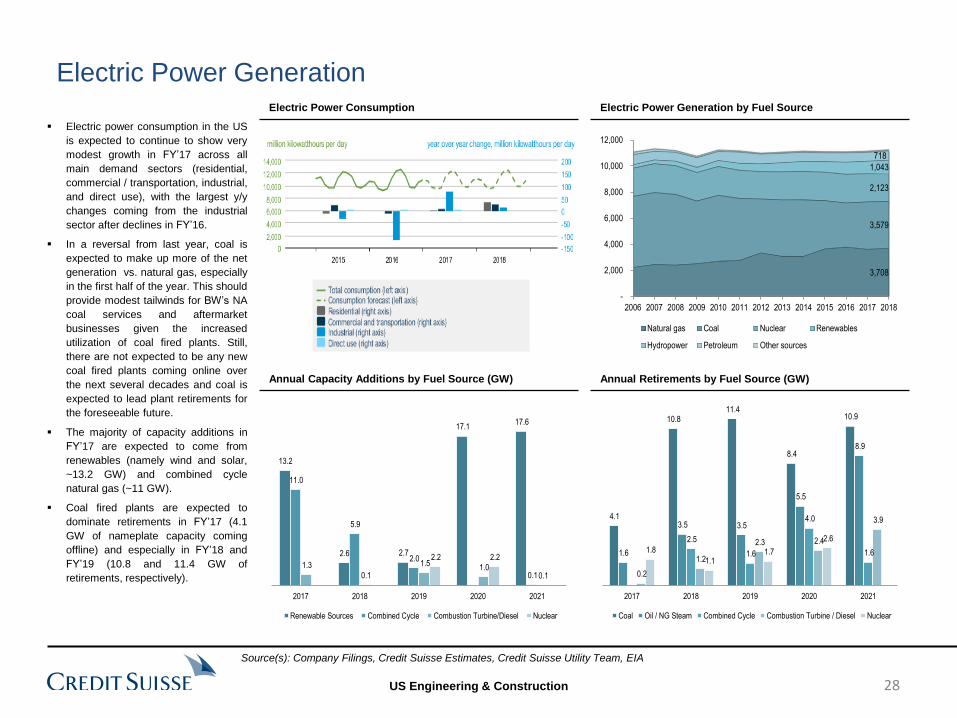
Electric power consumption in the US
is expected to continue to show very
modest growth in FY’17 across all
main demand sectors (residential,
commercial / transportation, industrial,
and direct use), with the largest y/y
changes coming from the industrial
sector after declines in FY’16.
In a reversal from last year, coal is
expected to make up more of the net
generation vs. natural gas, especially
in the first half of the year. This should
provide modest tailwinds for BW’s NA
coal services and aftermarket
businesses given the increased
utilization of coal fired plants. Still,
there are not expected to be any new
coal fired plants coming online over
the next several decades and coal is
expected to lead plant retirements for
the foreseeable future.
The majority of capacity additions in
FY’17 are expected to come from
renewables (namely wind and solar,
~13.2 GW) and combined cycle
natural gas (~11 GW).
Coal fired plants are expected to
dominate retirements in FY’17 (4.1
GW of nameplate capacity coming
offline) and especially in FY’18 and
FY’19 (10.8 and 11.4 GW of
retirements, respectively).
3,708
3,579
2,123
1,043
718
-
2,000
4,000
6,000
8,000
10,000
12,000
2006 2007 2008 2009 2010 2011 2012 2013 2014 2015 2016 2017 2018
Natural gas Coal Nuclear Renewables
Hydropower Petroleum Other sources
13.2
2.6 2.7
17.1 17.6
11.0
5.9
2.0
0.1
1.3
0.1
1.5 1.0
0.1
2.2 2.2
2017 2018 2019 2020 2021
Renewable Sources Combined Cycle Combustion Turbine/Diesel Nuclear
4.1
10.8 11.4
8.4
10.9
1.6
3.5 3.5
5.5
8.9
2.5
1.6
4.0
1.6
0.2
1.2
2.3 2.4
3.9
1.8
1.1 1.7
2.6
2017 2018 2019 2020 2021
Coal Oil / NG Steam Combined Cycle Combustion Turbine / Diesel Nuclear
28
Source(s): Company Filings, Credit Suisse Estimates, Credit Suisse Utility Team, EIA
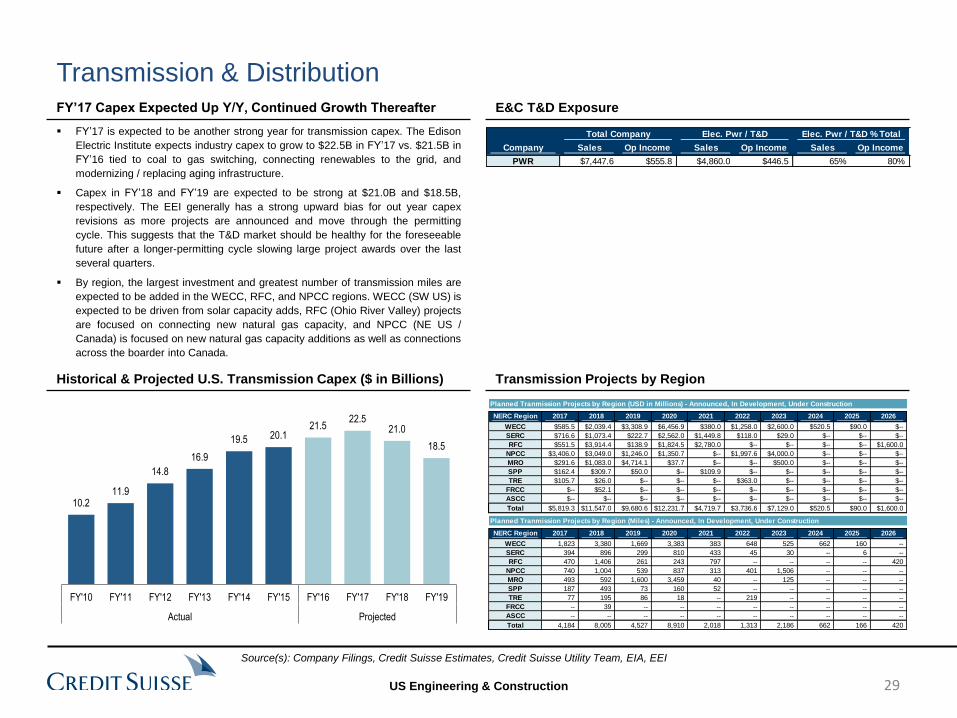
US Engineering & Construction
FY’17 is expected to be another strong year for transmission capex. The Edison
Electric Institute expects industry capex to grow to $22.5B in FY’17 vs. $21.5B in
FY’16 tied to coal to gas switching, connecting renewables to the grid, and
modernizing / replacing aging infrastructure.
Capex in FY’18 and FY’19 are expected to be strong at $21.0B and $18.5B,
respectively. The EEI generally has a strong upward bias for out year capex
revisions as more projects are announced and move through the permitting
cycle. This suggests that the T&D market should be healthy for the foreseeable
future after a longer-permitting cycle slowing large project awards over the last
several quarters.
By region, the largest investment and greatest number of transmission miles are
expected to be added in the WECC, RFC, and NPCC regions. WECC (SW US) is
expected to be driven from solar capacity adds, RFC (Ohio River Valley) projects
are focused on connecting new natural gas capacity, and NPCC (NE US /
Canada) is focused on new natural gas capacity additions as well as connections
across the boarder into Canada.
Transmission & Distribution FY’17 Capex Expected Up Y/Y, Continued Growth Thereafter
10.2 11.9
14.8
16.9
19.5 20.1 21.5
22.5 21.0
18.5
FY'10 FY'11 FY'12 FY'13 FY'14 FY'15 FY'16 FY'17 FY'18 FY'19
Actual Projected
Historical & Projected U.S. Transmission Capex ($ in Billions)
E&C T&D Exposure
Transmission Projects by Region
Planned Tranmission Projects by Region (USD in Millions) - Announced, In Development, Under Construction
NERC Region 2017 2018 2019 2020 2021 2022 2023 2024 2025 2026
WECC $585.5 $2,039.4 $3,308.9 $6,456.9 $380.0 $1,258.0 $2,600.0 $520.5 $90.0 $--
SERC $716.6 $1,073.4 $222.7 $2,562.0 $1,449.8 $118.0 $29.0 $-- $-- $--
RFC $551.5 $3,914.4 $138.9 $1,824.5 $2,780.0 $-- $-- $-- $-- $1,600.0
NPCC $3,406.0 $3,049.0 $1,246.0 $1,350.7 $-- $1,997.6 $4,000.0 $-- $-- $--
MRO $291.6 $1,083.0 $4,714.1 $37.7 $-- $-- $500.0 $-- $-- $--
SPP $162.4 $309.7 $50.0 $-- $109.9 $-- $-- $-- $-- $--
TRE $105.7 $26.0 $-- $-- $-- $363.0 $-- $-- $-- $--
FRCC $-- $52.1 $-- $-- $-- $-- $-- $-- $-- $--
ASCC $-- $-- $-- $-- $-- $-- $-- $-- $-- $--
Total $5,819.3 $11,547.0 $9,680.6 $12,231.7 $4,719.7 $3,736.6 $7,129.0 $520.5 $90.0 $1,600.0
Planned Tranmission Projects by Region (Miles) - Announced, In Development, Under Construction
NERC Region 2017 2018 2019 2020 2021 2022 2023 2024 2025 2026
WECC 1,823 3,380 1,669 3,383 383 648 525 662 160 --
SERC 394 896 299 810 433 45 30 -- 6 --
RFC 470 1,406 261 243 797 -- -- -- -- 420
NPCC 740 1,004 539 837 313 401 1,506 -- -- --
MRO 493 592 1,600 3,459 40 -- 125 -- -- --
SPP 187 493 73 160 52 -- -- -- -- --
TRE 77 195 86 18 -- 219 -- -- -- --
FRCC -- 39 -- -- -- -- -- -- -- --
ASCC -- -- -- -- -- -- -- -- -- --
Total 4,184 8,005 4,527 8,910 2,018 1,313 2,186 662 166 420
Total Company Elec. Pwr / T&D Elec. Pwr / T&D % Total
Company Sales Op Income Sales Op Income Sales Op Income
PWR $7,447.6 $555.8 $4,860.0 $446.5 65% 80%
29
Source(s): Company Filings, Credit Suisse Estimates, Credit Suisse Utility Team, EIA, EEI
US Engineering & Construction
Metals & Mining
30
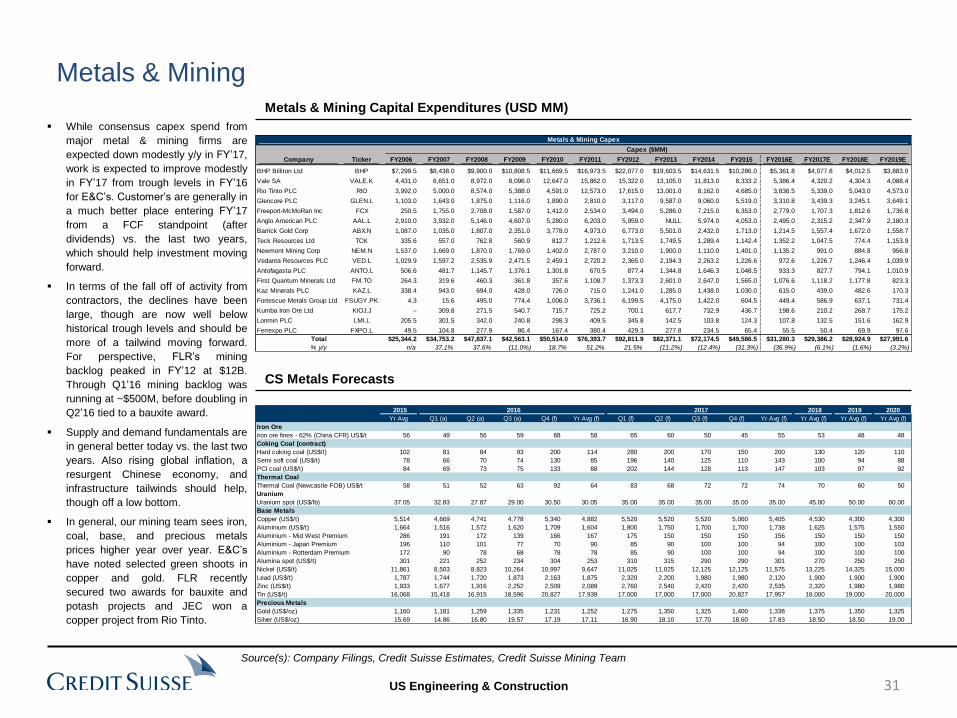
US Engineering & Construction
Metals & Mining Capital Expenditures (USD MM)
CS Metals Forecasts
While consensus capex spend from
major metal & mining firms are
expected down modestly y/y in FY’17,
work is expected to improve modestly
in FY’17 from trough levels in FY’16
for E&C’s. Customer’s are generally in
a much better place entering FY’17
from a FCF standpoint (after
dividends) vs. the last two years,
which should help investment moving
forward.
In terms of the fall off of activity from
contractors, the declines have been
large, though are now well below
historical trough levels and should be
more of a tailwind moving forward.
For perspective, FLR’s mining
backlog peaked in FY’12 at $12B.
Through Q1’16 mining backlog was
running at ~$500M, before doubling in
Q2’16 tied to a bauxite award.
Supply and demand fundamentals are
in general better today vs. the last two
years. Also rising global inflation, a
resurgent Chinese economy, and
infrastructure tailwinds should help,
though off a low bottom.
In general, our mining team sees iron,
coal, base, and precious metals
prices higher year over year. E&C’s
have noted selected green shoots in
copper and gold. FLR recently
secured two awards for bauxite and
potash projects and JEC won a
copper project from Rio Tinto.
Metals & Mining
Metals & Mining Capex
Capex ($MM)
Company Ticker FY2006 FY2007 FY2008 FY2009 FY2010 FY2011 FY2012 FY2013 FY2014 FY2015 FY2016E FY2017E FY2018E FY2019E
BHP Billiton Ltd BHP $7,299.5 $8,438.0 $9,900.0 $10,808.5 $11,669.5 $16,973.5 $22,077.0 $19,603.5 $14,631.5 $10,286.0 $5,361.8 $4,077.8 $4,012.5 $3,883.0
Vale SA VALE.K 4,431.0 6,651.0 8,972.0 8,096.0 12,647.0 15,862.0 15,322.0 13,105.0 11,813.0 8,333.2 5,386.4 4,320.2 4,304.3 4,088.4
Rio Tinto PLC RIO 3,992.0 5,000.0 8,574.0 5,388.0 4,591.0 12,573.0 17,615.0 13,001.0 8,162.0 4,685.0 3,836.5 5,339.0 5,043.0 4,573.0
Glencore PLC GLEN.L 1,103.0 1,643.0 1,875.0 1,116.0 1,890.0 2,810.0 3,117.0 9,587.0 9,060.0 5,519.0 3,310.8 3,439.3 3,245.1 3,649.1
Freeport-McMoRan Inc FCX 250.5 1,755.0 2,708.0 1,587.0 1,412.0 2,534.0 3,494.0 5,286.0 7,215.0 6,353.0 2,779.0 1,707.3 1,812.6 1,736.8
Anglo American PLC AAL.L 2,910.0 3,932.0 5,146.0 4,607.0 5,280.0 6,203.0 5,959.0 NULL 5,974.0 4,053.0 2,495.0 2,315.2 2,347.9 2,180.3
Barrick Gold Corp ABX.N 1,087.0 1,035.0 1,807.0 2,351.0 3,778.0 4,973.0 6,773.0 5,501.0 2,432.0 1,713.0 1,214.5 1,557.4 1,672.0 1,558.7
Teck Resources Ltd TCK 335.6 557.0 762.8 560.9 812.7 1,212.6 1,713.5 1,749.5 1,289.4 1,142.4 1,352.2 1,047.5 774.4 1,153.9
Newmont Mining Corp NEM.N 1,537.0 1,669.0 1,870.0 1,769.0 1,402.0 2,787.0 3,210.0 1,900.0 1,110.0 1,401.0 1,135.2 991.0 884.8 956.8
Vedanta Resources PLC VED.L 1,029.9 1,597.2 2,535.9 2,471.5 2,459.1 2,720.2 2,365.0 2,194.3 2,263.2 1,226.6 972.6 1,226.7 1,246.4 1,039.9
Antofagasta PLC ANTO.L 506.6 481.7 1,145.7 1,376.1 1,301.8 670.5 877.4 1,344.8 1,646.3 1,048.5 933.3 827.7 794.1 1,010.9
First Quantum Minerals Ltd FM.TO 264.3 319.6 460.3 361.8 357.6 1,108.7 1,373.3 2,601.0 2,647.0 1,565.0 1,076.6 1,118.2 1,177.8 823.3
Kaz Minerals PLC KAZ.L 338.4 943.0 694.0 428.0 726.0 715.0 1,241.0 1,285.0 1,438.0 1,030.0 615.0 439.0 482.6 170.3
Fortescue Metals Group Ltd FSUGY.PK 4.3 15.6 495.0 774.4 1,006.0 3,736.1 6,199.5 4,175.0 1,422.0 604.5 449.4 586.9 637.1 731.4
Kumba Iron Ore Ltd KIOJ.J -- 309.8 271.5 540.7 715.7 725.2 700.1 617.7 732.9 436.7 198.6 210.2 268.7 175.2
Lonmin PLC LMI.L 205.5 301.5 342.0 240.8 298.3 409.5 345.8 142.5 103.8 124.3 107.8 132.5 151.6 162.9
Ferrexpo PLC FXPO.L 49.5 104.8 277.9 86.4 167.4 380.4 429.3 277.8 234.5 65.4 55.5 50.4 69.9 97.6
Total $25,344.2 $34,753.2 $47,837.1 $42,563.1 $50,514.0 $76,393.7 $92,811.9 $82,371.1 $72,174.5 $49,586.5 $31,280.3 $29,386.2 $28,924.9 $27,991.6
% y/y n/a 37.1% 37.6% (11.0%) 18.7% 51.2% 21.5% (11.2%) (12.4%) (31.3%) (36.9%) (6.1%) (1.6%) (3.2%)
2015 2016 2017 2018 2019 2020
Yr Avg Q1 (a) Q2 (a) Q3 (a) Q4 (f) Yr Avg (f) Q1 (f) Q2 (f) Q3 (f) Q4 (f) Yr Avg (f) Yr Avg (f) Yr Avg (f) Yr Avg (f)
Iron Ore
Iron ore fines - 62% (China CFR) US$/t 56 49 56 59 68 58 65 60 50 45 55 53 48 48
Coking Coal (contract)
Hard coking coal (US$/t) 102 81 84 93 200 114 280 200 170 150 200 130 120 110
Semi soft coal (US$/t) 78 66 70 74 130 85 196 140 125 110 143 100 94 88
PCI coal (US$/t) 84 69 73 75 133 88 202 144 128 113 147 103 97 92
Thermal Coal
Thermal Coal (Newcastle FOB) US$/t 58 51 52 63 92 64 83 68 72 72 74 70 60 50
Uranium
Uranium spot (US$/lb) 37.05 32.83 27.87 29.00 30.50 30.05 35.00 35.00 35.00 35.00 35.00 45.00 50.00 60.00
Base Metals
Copper (US$/t) 5,514 4,669 4,741 4,778 5,340 4,882 5,520 5,520 5,520 5,060 5,405 4,530 4,300 4,300
Aluminium (US$/t) 1,664 1,516 1,572 1,620 1,709 1,604 1,800 1,750 1,700 1,700 1,738 1,625 1,575 1,550
Aluminium - Mid West Premium 286 191 172 139 166 167 175 150 150 150 156 150 150 150
Aluminium - Japan Premium 196 110 101 77 70 90 85 90 100 100 94 100 100 103
Aluminium - Rotterdam Premium 172 90 78 68 78 78 85 90 100 100 94 100 100 100
Alumina spot (US$/t) 301 221 252 234 304 253 310 315 290 290 301 270 250 250
Nickel (US$/t) 11,861 8,503 8,823 10,264 10,997 9,647 11,025 11,025 12,125 12,125 11,575 13,225 14,325 15,000
Lead (US$/t) 1,787 1,744 1,720 1,873 2,163 1,875 2,320 2,200 1,980 1,980 2,120 1,900 1,900 1,900
Zinc (US$/t) 1,933 1,677 1,916 2,252 2,509 2,089 2,760 2,540 2,420 2,420 2,535 2,320 1,980 1,980
Tin (US$/t) 16,068 15,418 16,915 18,596 20,827 17,939 17,000 17,000 17,000 20,827 17,957 18,000 19,000 20,000
Precious Metals
Gold (US$/oz) 1,160 1,181 1,259 1,335 1,231 1,252 1,275 1,350 1,325 1,400 1,338 1,375 1,350 1,325
Silver (US$/oz) 15.69 14.86 16.80 19.57 17.19 17.11 16.90 18.10 17.70 18.60 17.83 18.50 18.50 19.00
31
Source(s): Company Filings, Credit Suisse Estimates, Credit Suisse Mining Team
US Engineering & Construction
U.S. Election Implications
32

US Engineering & Construction
Trump proposed significant changes to the Internal Revenue Code on the campaign trail. Still, it remains to be seen what pre-election positions on tax reform translate into
proposed legislation, a difficult task previous Presidents have not always been able to fulfill. For example, George H.W. Bush at the 1988 Republican National Convention
famously pledged “read my lips: no new taxes,” only to agree to several tax increases in a budget compromise two years later. Still, Trump should benefit from a unified
Republican Congress. We detail several important proposed changes for E&C’s below:
Lower the corporate income tax rate from 35% to 15%: The benefits here are obvious for companies with a higher mix of US jurisdictional pre-tax income. Net winners
under this rule would include PWR and BW given their more US centric income mix. To a lesser extent ACM and CBI would benefit because of the relatively higher mix of US
pre-tax income, though lose some degree of tax leverage given their debt levels and consequent impacts to the interest tax shield. Moreover, these two companies pay some
of the lower tax-rates in the space already. JEC is also a relative winner.
Allow repatriation of corporate profits held offshore at a one-time tax rate of 10%: While several E&C’s have significant international cash holdings, this item in general is
probably less relevant for the sector. This is because of the risk profile of E&C companies in general requires them to carry relatively higher cash balances and most E&C’s
also typically sit in net debt positions. Moreover, when E&C’s do significant JV work, those agreements typically “restrict” cash, meaning that less cash is available for
repatriation vs. what is reported on the balance sheet. Still, two companies under our coverage could likely repatriate some overseas earnings, namely KBR and FLR.
Eliminate most business tax credits and “special interest” tax outlays, except for the R&D credit: In general, these proposed reforms do not impact our E&C coverage
universe, as most companies do not claim exceptional business tax credits outside of the R&D credit (e.g., FLR, JEC, ACM). One notable exception could potentially be the
elimination of the carried interest provision, which could negatively impact future realized profits for ACM Capital.
Entitle manufacturers to expense capital investment and lose the deductibility of corporate interest expense: This item is not as relevant for E&C’s.
Summary of Trump Tax and Repatriation Financial Impacts
Summary of Trump Tax and Repatriation Financial Impacts
LTM % US Effective Tax Rate (Consensus) Effective Tax Rate (Trump) Consensus EPS EPS (Trump)
Company Ticker Pre-tax FY'17 FY'18 FY'19 FY'17 FY'18 FY'19 FY'17 FY'18 FY'19 FY'17 FY'18 FY'19
AECOM ACM 74.0% 19.7% 23.7% 24.7% 4.1% 4.7% 5.4% $2.95 $3.21 $3.64 $3.52 $4.01 $4.57
Babcock & Wilcox Enterprises BW 68.0% 32.0% 31.3% --% 18.0% 18.0% --% $1.39 $1.55 $-- $1.67 $1.85 $--
Chicago Bridge & Iron Company CBI 65.0% 25.1% 24.5% --% 11.4% 11.5% --% $4.53 $4.65 $-- $5.35 $5.46 $--
Fluor Corporation FLR 43.4% 33.2% 33.1% --% 24.8% 24.9% --% $2.91 $3.22 $-- $3.28 $3.62 $--
Jacobs Engineering Group JEC 59.1% 30.4% 30.3% 32.0% 18.6% 18.6% 18.6% $3.13 $3.53 $3.80 $3.66 $4.12 $4.55
KBR KBR 43.0% 26.5% 26.9% --% 18.3% 18.2% --% $1.34 $1.40 $-- $1.49 $1.57 $--
McDermott International MDR 1.1% 42.3% 38.7% 36.0% 42.3% 49.6% 47.0% $0.20 $0.30 $0.40 $0.20 $0.24 $0.33
Quanta Services PWR 80.0% 38.9% 37.7% --% 22.5% 22.4% --% $2.02 $2.27 $-- $2.57 $2.83 $--
% EPS Impact Cash
Company Ticker FY'17 FY'18 FY'19 Market Cap Total Restricted % Restrict. Int'l % Int'l Repatriated % Repat. % MC Rpt.
AECOM ACM 19.4% 24.9% 25.6% $5,875.3 $692.1 $103.5 15.0% $-- --% $-- --% --%
Babcock & Wilcox Enterprises BW 20.6% 19.2% --% 841.3 93.9 28.9 30.7% 64.1 68.2% 57.7 61.4% 6.9%
Chicago Bridge & Iron Company CBI 18.2% 17.3% --% 3,387.9 615.0 406.2 66.1% 215.0 35.0% 65.7 10.7% 1.9%
Fluor Corporation FLR 12.5% 12.3% --% 7,885.7 1,911.2 506.1 26.5% 931.0 48.7% 616.0 32.2% 7.8%
Jacobs Engineering Group JEC 16.9% 16.7% 19.7% 7,293.3 655.7 -- --% 506.5 77.2% 455.9 69.5% 6.3%
KBR KBR 11.1% 11.8% --% 2,488.1 569.0 52.0 9.1% 369.0 64.9% 289.8 50.9% 11.6%
McDermott International MDR 0.0% (17.7%) (17.3%) 1,945.2 600.1 99.6 16.6% 92.0 15.3% 69.1 11.5% 3.5%
Quanta Services PWR 26.9% 24.5% --% 5,549.1 117.4 9.4 8.0% 108.0 92.0% 96.9 82.6% 1.7%
33
Source(s): Company Filings, Credit Suisse Estimates
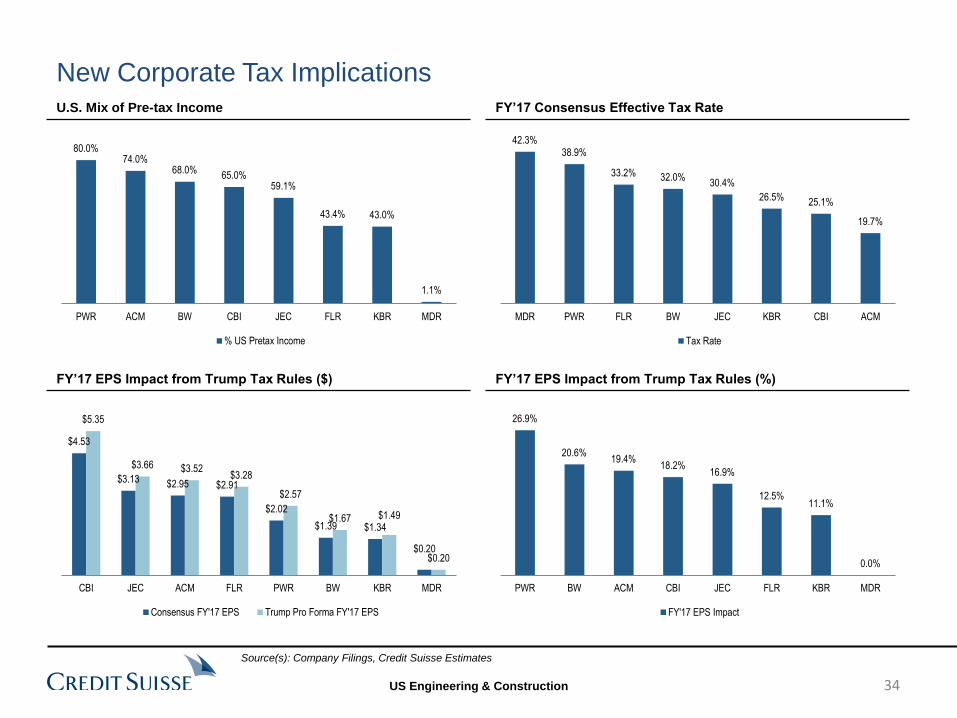
US Engineering & Construction
New Corporate Tax Implications U.S. Mix of Pre-tax Income
FY’17 EPS Impact from Trump Tax Rules ($)
FY’17 Consensus Effective Tax Rate
FY’17 EPS Impact from Trump Tax Rules (%)
80.0% 74.0%
68.0% 65.0%
59.1%
43.4% 43.0%
1.1%
PWR ACM BW CBI JEC FLR KBR MDR
% US Pretax Income
42.3% 38.9%
33.2% 32.0% 30.4%
26.5% 25.1%
19.7%
MDR PWR FLR BW JEC KBR CBI ACM
Tax Rate
26.9%
20.6% 19.4%
18.2% 16.9%
12.5% 11.1%
0.0%
PWR BW ACM CBI JEC FLR KBR MDR
FY'17 EPS Impact
$4.53
$3.13 $2.95 $2.91
$2.02
$1.39 $1.34
$0.20
$5.35
$3.66 $3.52 $3.28
$2.57
$1.67 $1.49
$0.20
CBI JEC ACM FLR PWR BW KBR MDR
Consensus FY'17 EPS Trump Pro Forma FY'17 EPS
34
Source(s): Company Filings, Credit Suisse Estimates
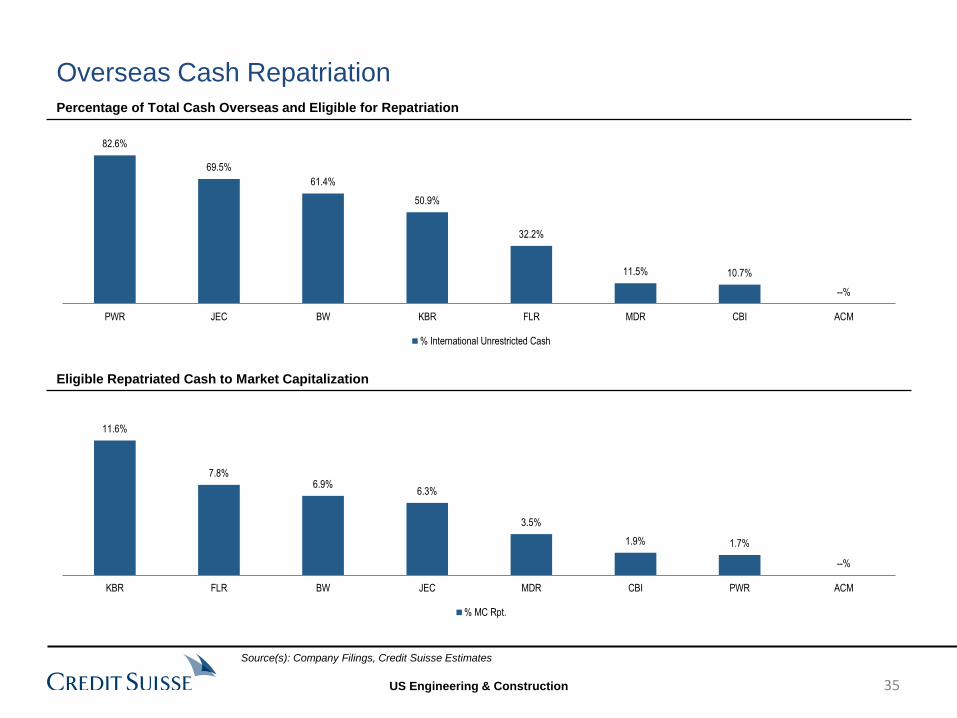
US Engineering & Construction
Percentage of Total Cash Overseas and Eligible for Repatriation
Eligible Repatriated Cash to Market Capitalization
Overseas Cash Repatriation
82.6%
69.5%
61.4%
50.9%
32.2%
11.5% 10.7%
--%
PWR JEC BW KBR FLR MDR CBI ACM
% International Unrestricted Cash
11.6%
7.8% 6.9%
6.3%
3.5%
1.9% 1.7%
--%
KBR FLR BW JEC MDR CBI PWR ACM
% MC Rpt.
35
Source(s): Company Filings, Credit Suisse Estimates

US Engineering & Construction
Labor
36
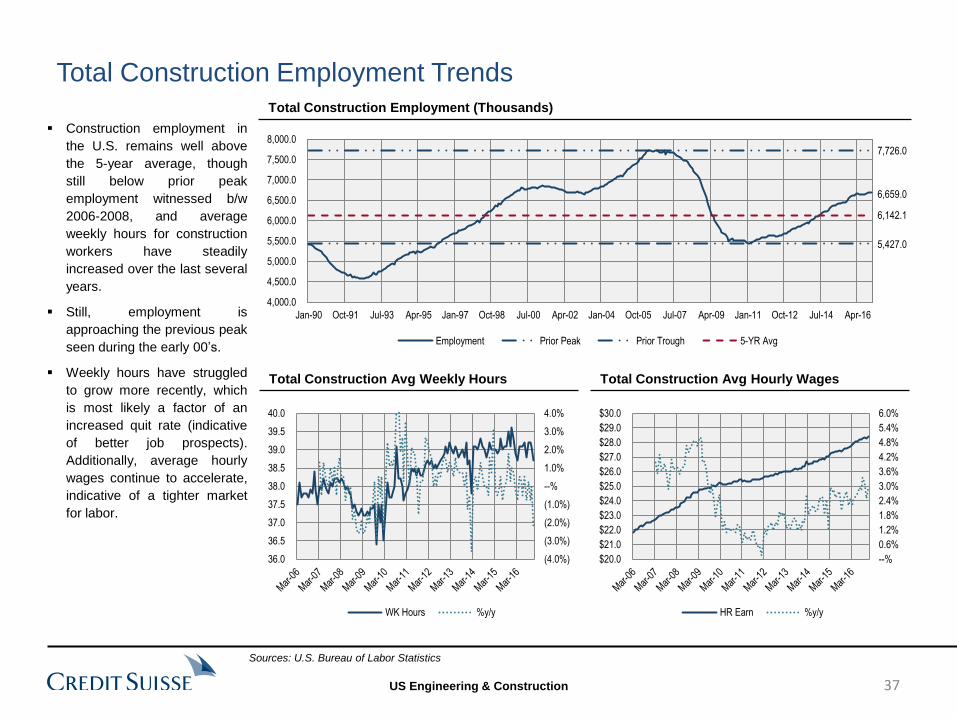
US Engineering & Construction
Total Construction Employment Trends Total Construction Employment (Thousands)
Construction employment in
the U.S. remains well above
the 5-year average, though
still below prior peak
employment witnessed b/w
2006-2008, and average
weekly hours for construction
workers have steadily
increased over the last several
years.
Still, employment is
approaching the previous peak
seen during the early 00’s.
Weekly hours have struggled
to grow more recently, which
is most likely a factor of an
increased quit rate (indicative
of better job prospects).
Additionally, average hourly
wages continue to accelerate,
indicative of a tighter market
for labor.
Total Construction Avg Weekly Hours Total Construction Avg Hourly Wages
Sources: U.S. Bureau of Labor Statistics
6,659.0
7,726.0
5,427.0
6,142.1
4,000.0
4,500.0
5,000.0
5,500.0
6,000.0
6,500.0
7,000.0
7,500.0
8,000.0
Jan-90 Oct-91 Jul-93 Apr-95 Jan-97 Oct-98 Jul-00 Apr-02 Jan-04 Oct-05 Jul-07 Apr-09 Jan-11 Oct-12 Jul-14 Apr-16
Employment Prior Peak Prior Trough 5-YR Avg
(4.0%)
(3.0%)
(2.0%)
(1.0%)
--%
1.0%
2.0%
3.0%
4.0%
36.0
36.5
37.0
37.5
38.0
38.5
39.0
39.5
40.0
WK Hours %y/y
--%
0.6%
1.2%
1.8%
2.4%
3.0%
3.6%
4.2%
4.8%
5.4%
6.0%
$20.0
$21.0
$22.0
$23.0
$24.0
$25.0
$26.0
$27.0
$28.0
$29.0
$30.0
HR Earn %y/y
37

US Engineering & Construction
Specialty Contractor Construction Employment Trends Specialty Contractor Employment
Trends in the specialty
contractor space are similar to
similar to the overall
construction labor market.
Employment continues to
trend well above the historical
5-year average, and while
below prior peak employment
during the ’06-07 time frame,
has recently surpassed peak
employment in the ’00-01.
Weekly hours growth has
moderated suggesting we are
getting closer to full
employment and average
hourly earnings growth
continues at a healthy pace,
both indicative of a tighter
labor market.
Specialty Contractor Avg Weekly Hours Specialty Contractor Avg Hourly Earnings
Sources: U.S. Bureau of Labor Statistics
(4.0%)
(3.0%)
(2.0%)
(1.0%)
--%
1.0%
2.0%
3.0%
4.0%
36.0
36.5
37.0
37.5
38.0
38.5
39.0
39.5
WK Hours %y/y
--%
0.6%
1.2%
1.8%
2.4%
3.0%
3.6%
4.2%
4.8%
5.4%
6.0%
$20.0
$21.0
$22.0
$23.0
$24.0
$25.0
$26.0
$27.0
$28.0
$29.0
$30.0
HR Earn %y/y
4,244.7
4,931.3
3,404.8
3,884.5
2,500.0
3,000.0
3,500.0
4,000.0
4,500.0
5,000.0
5,500.0
Jan-90 Oct-91 Jul-93 Apr-95 Jan-97 Oct-98 Jul-00 Apr-02 Jan-04 Oct-05 Jul-07 Apr-09 Jan-11 Oct-12 Jul-14 Apr-16
Employment Prior Peak Prior Trough 5-YR Avg
38
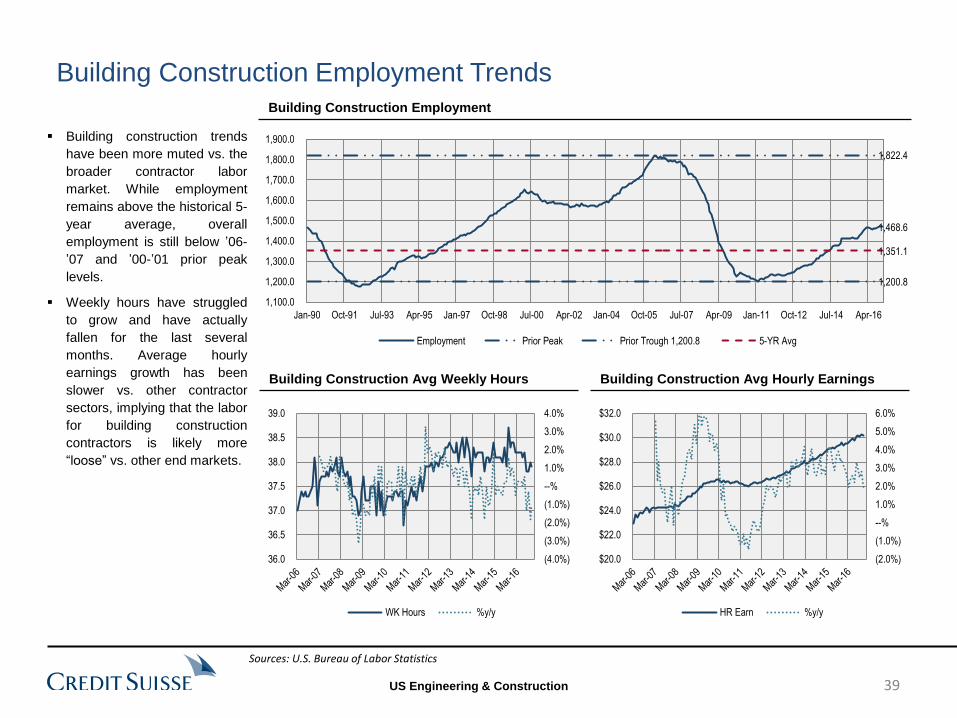
US Engineering & Construction
Building Construction Employment Trends Building Construction Employment
Building construction trends
have been more muted vs. the
broader contractor labor
market. While employment
remains above the historical 5-
year average, overall
employment is still below ’06-
’07 and ’00-’01 prior peak
levels.
Weekly hours have struggled
to grow and have actually
fallen for the last several
months. Average hourly
earnings growth has been
slower vs. other contractor
sectors, implying that the labor
for building construction
contractors is likely more
“loose” vs. other end markets.
Building Construction Avg Weekly Hours Building Construction Avg Hourly Earnings
Sources: U.S. Bureau of Labor Statistics
1,468.6
1,822.4
1,200.8
1,351.1
1,100.0
1,200.0
1,300.0
1,400.0
1,500.0
1,600.0
1,700.0
1,800.0
1,900.0
Jan-90 Oct-91 Jul-93 Apr-95 Jan-97 Oct-98 Jul-00 Apr-02 Jan-04 Oct-05 Jul-07 Apr-09 Jan-11 Oct-12 Jul-14 Apr-16
Employment Prior Peak Prior Trough 1,200.8 5-YR Avg
(4.0%)
(3.0%)
(2.0%)
(1.0%)
--%
1.0%
2.0%
3.0%
4.0%
36.0
36.5
37.0
37.5
38.0
38.5
39.0
WK Hours %y/y
(2.0%)
(1.0%)
--%
1.0%
2.0%
3.0%
4.0%
5.0%
6.0%
$20.0
$22.0
$24.0
$26.0
$28.0
$30.0
$32.0
HR Earn %y/y
39
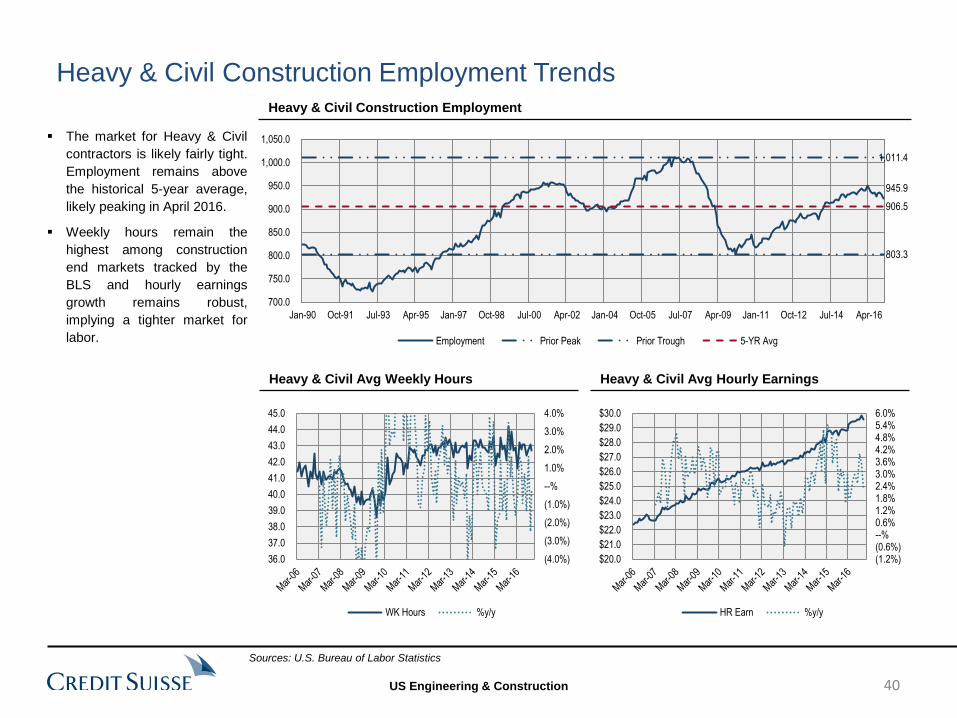
US Engineering & Construction
Heavy & Civil Construction Employment Trends Heavy & Civil Construction Employment
The market for Heavy & Civil
contractors is likely fairly tight.
Employment remains above
the historical 5-year average,
likely peaking in April 2016.
Weekly hours remain the
highest among construction
end markets tracked by the
BLS and hourly earnings
growth remains robust,
implying a tighter market for
labor.
Heavy & Civil Avg Weekly Hours Heavy & Civil Avg Hourly Earnings
Sources: U.S. Bureau of Labor Statistics
945.9
1,011.4
803.3
906.5
700.0
750.0
800.0
850.0
900.0
950.0
1,000.0
1,050.0
Jan-90 Oct-91 Jul-93 Apr-95 Jan-97 Oct-98 Jul-00 Apr-02 Jan-04 Oct-05 Jul-07 Apr-09 Jan-11 Oct-12 Jul-14 Apr-16
Employment Prior Peak Prior Trough 5-YR Avg
(4.0%)
(3.0%)
(2.0%)
(1.0%)
--%
1.0%
2.0%
3.0%
4.0%
36.0
37.0
38.0
39.0
40.0
41.0
42.0
43.0
44.0
45.0
WK Hours %y/y
(1.2%)(0.6%)--%0.6%1.2%1.8%2.4%3.0%3.6%4.2%4.8%5.4%6.0%
$20.0
$21.0
$22.0
$23.0
$24.0
$25.0
$26.0
$27.0
$28.0
$29.0
$30.0
HR Earn %y/y
40
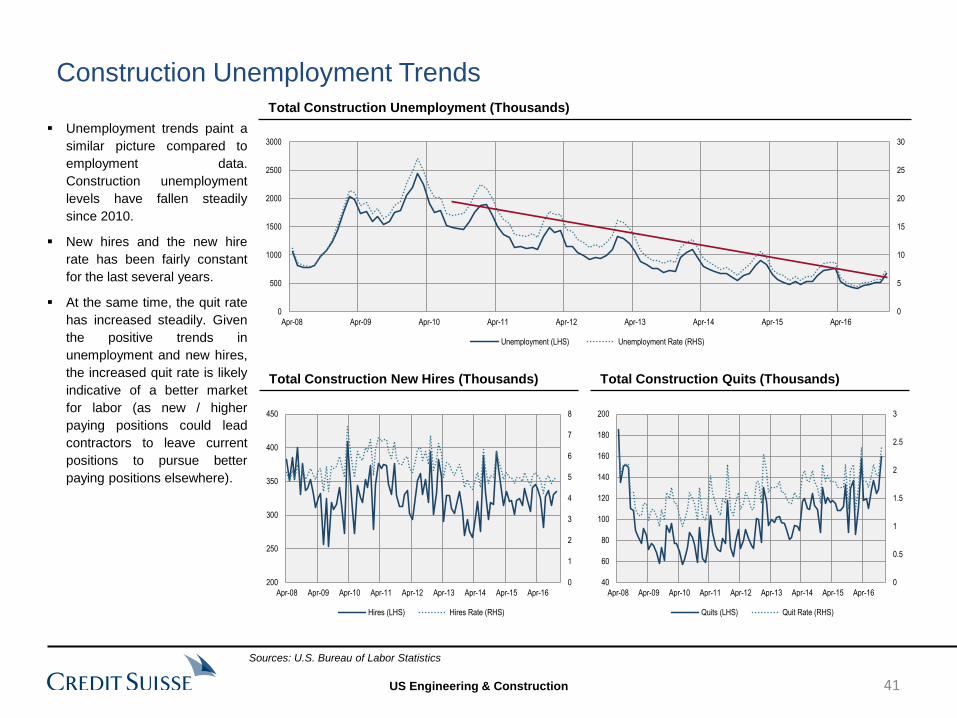
US Engineering & Construction
Construction Unemployment Trends Total Construction Unemployment (Thousands)
Unemployment trends paint a
similar picture compared to
employment data.
Construction unemployment
levels have fallen steadily
since 2010.
New hires and the new hire
rate has been fairly constant
for the last several years.
At the same time, the quit rate
has increased steadily. Given
the positive trends in
unemployment and new hires,
the increased quit rate is likely
indicative of a better market
for labor (as new / higher
paying positions could lead
contractors to leave current
positions to pursue better
paying positions elsewhere).
Total Construction New Hires (Thousands) Total Construction Quits (Thousands)
Sources: U.S. Bureau of Labor Statistics
0
5
10
15
20
25
30
0
500
1000
1500
2000
2500
3000
Apr-08 Apr-09 Apr-10 Apr-11 Apr-12 Apr-13 Apr-14 Apr-15 Apr-16
Unemployment (LHS) Unemployment Rate (RHS)
0
1
2
3
4
5
6
7
8
200
250
300
350
400
450
Apr-08 Apr-09 Apr-10 Apr-11 Apr-12 Apr-13 Apr-14 Apr-15 Apr-16
Hires (LHS) Hires Rate (RHS)
0
0.5
1
1.5
2
2.5
3
40
60
80
100
120
140
160
180
200
Apr-08 Apr-09 Apr-10 Apr-11 Apr-12 Apr-13 Apr-14 Apr-15 Apr-16
Quits (LHS) Quit Rate (RHS)
41
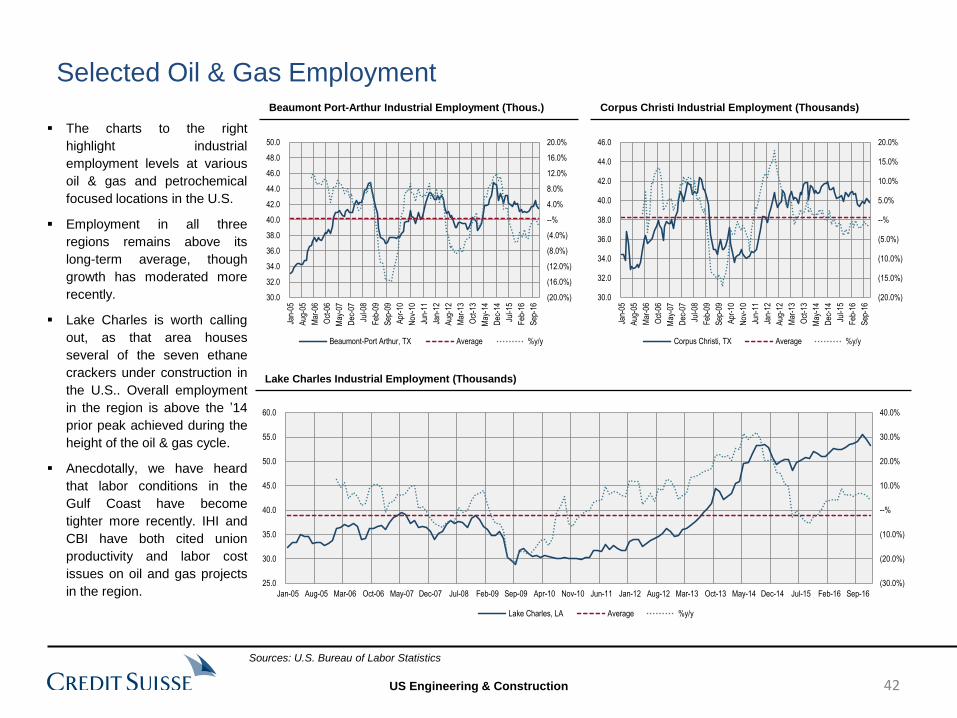
US Engineering & Construction
Selected Oil & Gas Employment
Lake Charles Industrial Employment (Thousands)
The charts to the right
highlight industrial
employment levels at various
oil & gas and petrochemical
focused locations in the U.S.
Employment in all three
regions remains above its
long-term average, though
growth has moderated more
recently.
Lake Charles is worth calling
out, as that area houses
several of the seven ethane
crackers under construction in
the U.S.. Overall employment
in the region is above the ’14
prior peak achieved during the
height of the oil & gas cycle.
Anecdotally, we have heard
that labor conditions in the
Gulf Coast have become
tighter more recently. IHI and
CBI have both cited union
productivity and labor cost
issues on oil and gas projects
in the region.
Beaumont Port-Arthur Industrial Employment (Thous.) Corpus Christi Industrial Employment (Thousands)
Sources: U.S. Bureau of Labor Statistics
(20.0%)
(16.0%)
(12.0%)
(8.0%)
(4.0%)
--%
4.0%
8.0%
12.0%
16.0%
20.0%
30.0
32.0
34.0
36.0
38.0
40.0
42.0
44.0
46.0
48.0
50.0
Jan-
05
Aug
-05
Mar
-06
Oct
-06
May
-07
Dec
-07
Jul-0
8
Feb
-09
Sep
-09
Apr
-10
Nov
-10
Jun-
11
Jan-
12
Aug
-12
Mar
-13
Oct
-13
May
-14
Dec
-14
Jul-1
5
Feb
-16
Sep
-16
Beaumont-Port Arthur, TX Average %y/y
(20.0%)
(15.0%)
(10.0%)
(5.0%)
--%
5.0%
10.0%
15.0%
20.0%
30.0
32.0
34.0
36.0
38.0
40.0
42.0
44.0
46.0
Jan-
05
Aug
-05
Mar
-06
Oct
-06
May
-07
Dec
-07
Jul-0
8
Feb
-09
Sep
-09
Apr
-10
Nov
-10
Jun-
11
Jan-
12
Aug
-12
Mar
-13
Oct
-13
May
-14
Dec
-14
Jul-1
5
Feb
-16
Sep
-16
Corpus Christi, TX Average %y/y
(30.0%)
(20.0%)
(10.0%)
--%
10.0%
20.0%
30.0%
40.0%
25.0
30.0
35.0
40.0
45.0
50.0
55.0
60.0
Jan-05 Aug-05 Mar-06 Oct-06 May-07 Dec-07 Jul-08 Feb-09 Sep-09 Apr-10 Nov-10 Jun-11 Jan-12 Aug-12 Mar-13 Oct-13 May-14 Dec-14 Jul-15 Feb-16 Sep-16
Lake Charles, LA Average %y/y
42
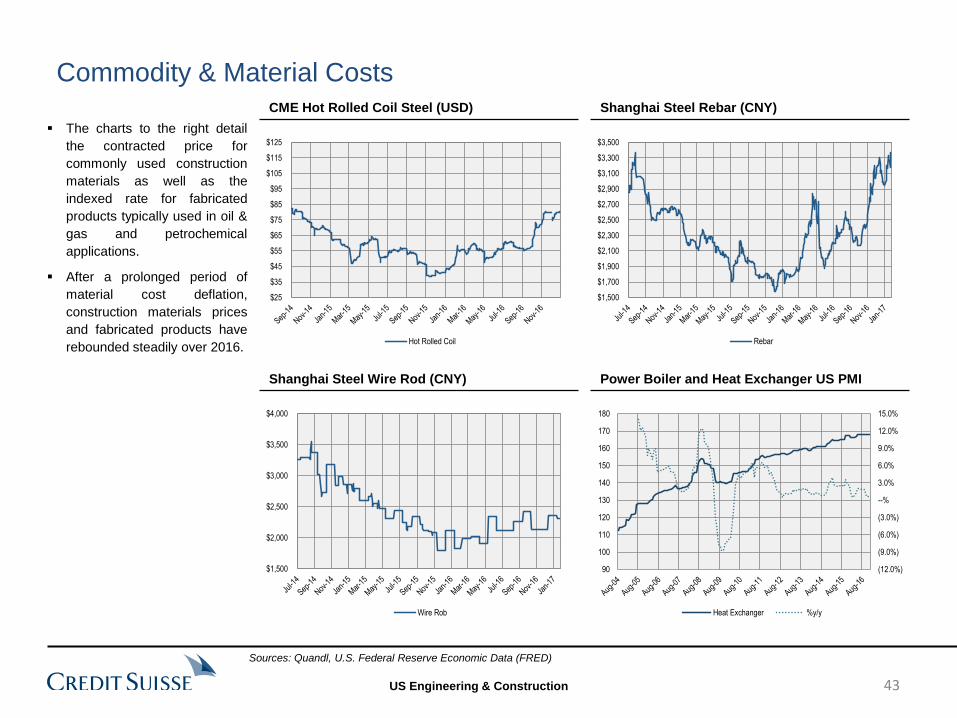
US Engineering & Construction
Commodity & Material Costs CME Hot Rolled Coil Steel (USD)
Shanghai Steel Wire Rod (CNY)
Shanghai Steel Rebar (CNY)
Power Boiler and Heat Exchanger US PMI
The charts to the right detail
the contracted price for
commonly used construction
materials as well as the
indexed rate for fabricated
products typically used in oil &
gas and petrochemical
applications.
After a prolonged period of
material cost deflation,
construction materials prices
and fabricated products have
rebounded steadily over 2016.
Sources: Quandl, U.S. Federal Reserve Economic Data (FRED)
43
$25
$35
$45
$55
$65
$75
$85
$95
$105
$115
$125
Hot Rolled Coil
$1,500
$1,700
$1,900
$2,100
$2,300
$2,500
$2,700
$2,900
$3,100
$3,300
$3,500
Rebar
$1,500
$2,000
$2,500
$3,000
$3,500
$4,000
Wire Rob
(12.0%)
(9.0%)
(6.0%)
(3.0%)
--%
3.0%
6.0%
9.0%
12.0%
15.0%
90
100
110
120
130
140
150
160
170
180
Heat Exchanger %y/y

US Engineering & Construction
Earnings Preview
44
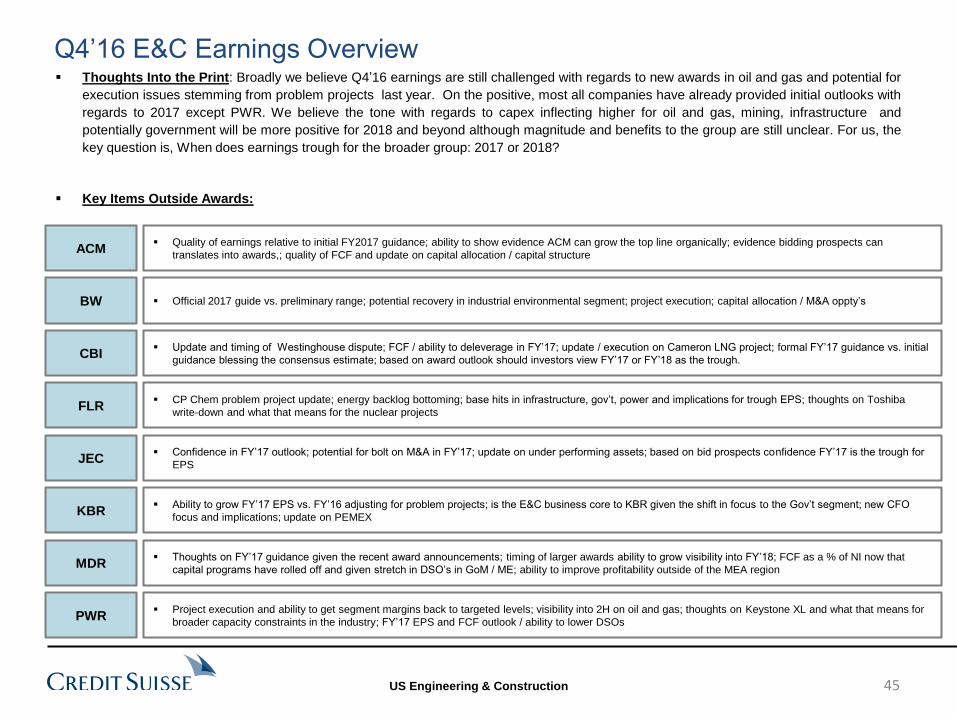
US Engineering & Construction
Q4’16 E&C Earnings Overview Thoughts Into the Print: Broadly we believe Q4’16 earnings are still challenged with regards to new awards in oil and gas and potential for
execution issues stemming from problem projects last year. On the positive, most all companies have already provided initial outlooks with
regards to 2017 except PWR. We believe the tone with regards to capex inflecting higher for oil and gas, mining, infrastructure and
potentially government will be more positive for 2018 and beyond although magnitude and benefits to the group are still unclear. For us, the
key question is, When does earnings trough for the broader group: 2017 or 2018?
Key Items Outside Awards:
ACM Quality of earnings relative to initial FY2017 guidance; ability to show evidence ACM can grow the top line organically; evidence bidding prospects can
translates into awards,; quality of FCF and update on capital allocation / capital structure
BW Official 2017 guide vs. preliminary range; potential recovery in industrial environmental segment; project execution; capital allocation / M&A oppty’s
CBI Update and timing of Westinghouse dispute; FCF / ability to deleverage in FY’17; update / execution on Cameron LNG project; formal FY’17 guidance vs. initial
guidance blessing the consensus estimate; based on award outlook should investors view FY’17 or FY’18 as the trough.
FLR CP Chem problem project update; energy backlog bottoming; base hits in infrastructure, gov’t, power and implications for trough EPS; thoughts on Toshiba
write-down and what that means for the nuclear projects
JEC Confidence in FY’17 outlook; potential for bolt on M&A in FY’17; update on under performing assets; based on bid prospects confidence FY’17 is the trough for
EPS
KBR Ability to grow FY’17 EPS vs. FY’16 adjusting for problem projects; is the E&C business core to KBR given the shift in focus to the Gov’t segment; new CFO
focus and implications; update on PEMEX
MDR Thoughts on FY’17 guidance given the recent award announcements; timing of larger awards ability to grow visibility into FY’18; FCF as a % of NI now that
capital programs have rolled off and given stretch in DSO’s in GoM / ME; ability to improve profitability outside of the MEA region
PWR Project execution and ability to get segment margins back to targeted levels; visibility into 2H on oil and gas; thoughts on Keystone XL and what that means for
broader capacity constraints in the industry; FY’17 EPS and FCF outlook / ability to lower DSOs
45
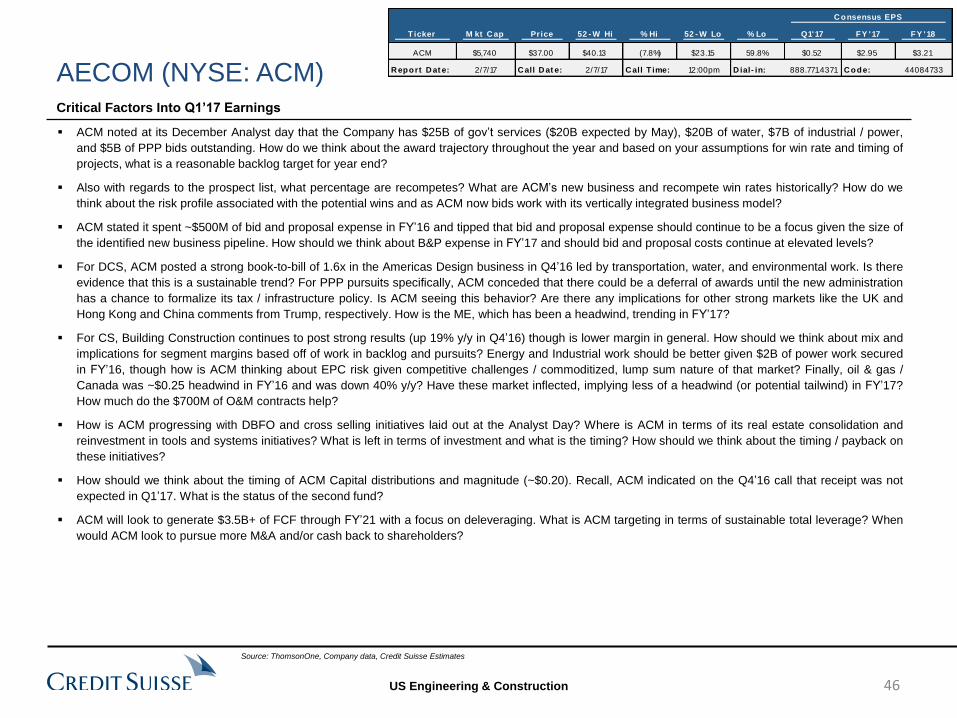
US Engineering & Construction
C onsensus EPS
Ticker M kt C ap Price 52 - W Hi % Hi 52 - W Lo % Lo Q1'17 FY '17 FY '18
ACM $5,740 $37.00 $40.13 (7.8%) $23.15 59.8% $0.52 $2.95 $3.21
R eport D at e: 2/7/17 C all D at e: 2/7/17 C all T ime: 12:00pm D ial- in: 888.771.4371 C ode: 44084733
ACM noted at its December Analyst day that the Company has $25B of gov’t services ($20B expected by May), $20B of water, $7B of industrial / power,
and $5B of PPP bids outstanding. How do we think about the award trajectory throughout the year and based on your assumptions for win rate and timing of
projects, what is a reasonable backlog target for year end?
Also with regards to the prospect list, what percentage are recompetes? What are ACM’s new business and recompete win rates historically? How do we
think about the risk profile associated with the potential wins and as ACM now bids work with its vertically integrated business model?
ACM stated it spent ~$500M of bid and proposal expense in FY’16 and tipped that bid and proposal expense should continue to be a focus given the size of
the identified new business pipeline. How should we think about B&P expense in FY’17 and should bid and proposal costs continue at elevated levels?
For DCS, ACM posted a strong book-to-bill of 1.6x in the Americas Design business in Q4’16 led by transportation, water, and environmental work. Is there
evidence that this is a sustainable trend? For PPP pursuits specifically, ACM conceded that there could be a deferral of awards until the new administration
has a chance to formalize its tax / infrastructure policy. Is ACM seeing this behavior? Are there any implications for other strong markets like the UK and
Hong Kong and China comments from Trump, respectively. How is the ME, which has been a headwind, trending in FY’17?
For CS, Building Construction continues to post strong results (up 19% y/y in Q4’16) though is lower margin in general. How should we think about mix and
implications for segment margins based off of work in backlog and pursuits? Energy and Industrial work should be better given $2B of power work secured
in FY’16, though how is ACM thinking about EPC risk given competitive challenges / commoditized, lump sum nature of that market? Finally, oil & gas /
Canada was ~$0.25 headwind in FY’16 and was down 40% y/y? Have these market inflected, implying less of a headwind (or potential tailwind) in FY’17?
How much do the $700M of O&M contracts help?
How is ACM progressing with DBFO and cross selling initiatives laid out at the Analyst Day? Where is ACM in terms of its real estate consolidation and
reinvestment in tools and systems initiatives? What is left in terms of investment and what is the timing? How should we think about the timing / payback on
these initiatives?
How should we think about the timing of ACM Capital distributions and magnitude (~$0.20). Recall, ACM indicated on the Q4’16 call that receipt was not
expected in Q1’17. What is the status of the second fund?
ACM will look to generate $3.5B+ of FCF through FY’21 with a focus on deleveraging. What is ACM targeting in terms of sustainable total leverage? When
would ACM look to pursue more M&A and/or cash back to shareholders?
Critical Factors Into Q1’17 Earnings
AECOM (NYSE: ACM)
Source: ThomsonOne, Company data, Credit Suisse Estimates
46
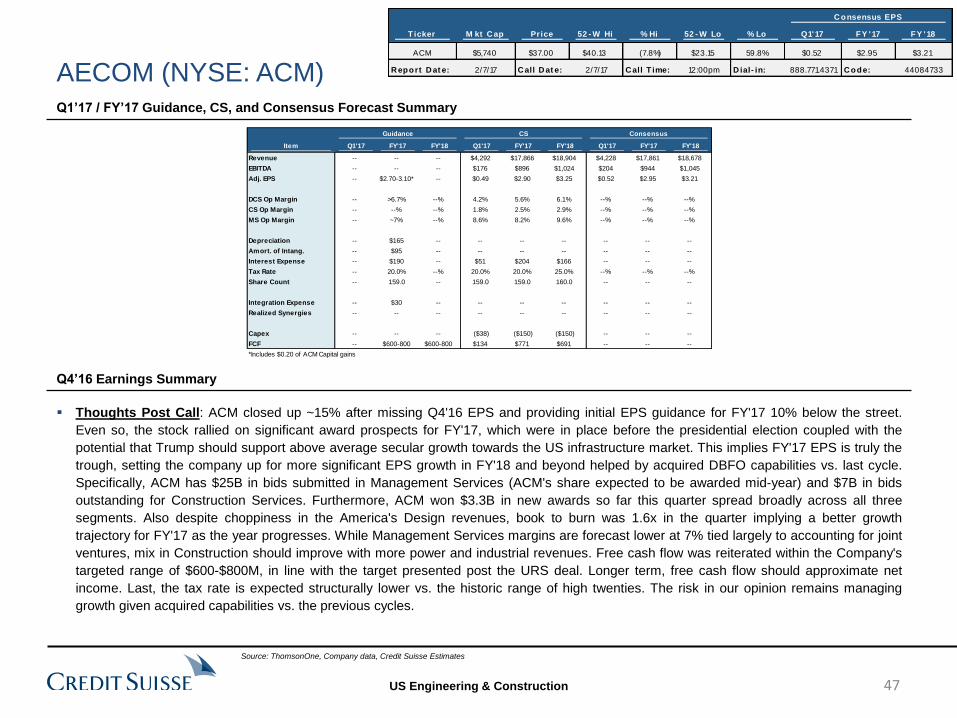
US Engineering & Construction
Q1’17 / FY’17 Guidance, CS, and Consensus Forecast Summary
Q4’16 Earnings Summary
AECOM (NYSE: ACM)
Thoughts Post Call: ACM closed up ~15% after missing Q4'16 EPS and providing initial EPS guidance for FY'17 10% below the street.
Even so, the stock rallied on significant award prospects for FY'17, which were in place before the presidential election coupled with the
potential that Trump should support above average secular growth towards the US infrastructure market. This implies FY'17 EPS is truly the
trough, setting the company up for more significant EPS growth in FY'18 and beyond helped by acquired DBFO capabilities vs. last cycle.
Specifically, ACM has $25B in bids submitted in Management Services (ACM's share expected to be awarded mid-year) and $7B in bids
outstanding for Construction Services. Furthermore, ACM won $3.3B in new awards so far this quarter spread broadly across all three
segments. Also despite choppiness in the America's Design revenues, book to burn was 1.6x in the quarter implying a better growth
trajectory for FY'17 as the year progresses. While Management Services margins are forecast lower at 7% tied largely to accounting for joint
ventures, mix in Construction should improve with more power and industrial revenues. Free cash flow was reiterated within the Company's
targeted range of $600-$800M, in line with the target presented post the URS deal. Longer term, free cash flow should approximate net
income. Last, the tax rate is expected structurally lower vs. the historic range of high twenties. The risk in our opinion remains managing
growth given acquired capabilities vs. the previous cycles.
Source: ThomsonOne, Company data, Credit Suisse Estimates
Guidance CS Consensus
Item Q1'17 FY'17 FY'18 Q1'17 FY'17 FY'18 Q1'17 FY'17 FY'18
Revenue -- -- -- $4,292 $17,866 $18,904 $4,228 $17,861 $18,678
EBITDA -- -- -- $176 $896 $1,024 $204 $944 $1,045
Adj. EPS -- $2.70-3.10* -- $0.49 $2.90 $3.25 $0.52 $2.95 $3.21
DCS Op Margin -- >6.7% --% 4.2% 5.6% 6.1% --% --% --%
CS Op Margin -- --% --% 1.8% 2.5% 2.9% --% --% --%
MS Op Margin -- ~7% --% 8.6% 8.2% 9.6% --% --% --%
Depreciation -- $165 -- -- -- -- -- -- --
Amort. of Intang. -- $95 -- -- -- -- -- -- --
Interest Expense -- $190 -- $51 $204 $166 -- -- --
Tax Rate -- 20.0% --% 20.0% 20.0% 25.0% --% --% --%
Share Count -- 159.0 -- 159.0 159.0 160.0 -- -- --
Integration Expense -- $30 -- -- -- -- -- -- --
Realized Synergies -- -- -- -- -- -- -- -- --
Capex -- -- -- ($38) ($150) ($150) -- -- --
FCF -- $600-800 $600-800 $134 $771 $691 -- -- --
*Includes $0.20 of ACM Capital gains
47
C onsensus EPS
Ticker M kt C ap Price 52 - W Hi % Hi 52 - W Lo % Lo Q1'17 FY '17 FY '18
ACM $5,740 $37.00 $40.13 (7.8%) $23.15 59.8% $0.52 $2.95 $3.21
R eport D at e: 2/7/17 C all D at e: 2/7/17 C all T ime: 12:00pm D ial- in: 888.771.4371 C ode: 44084733
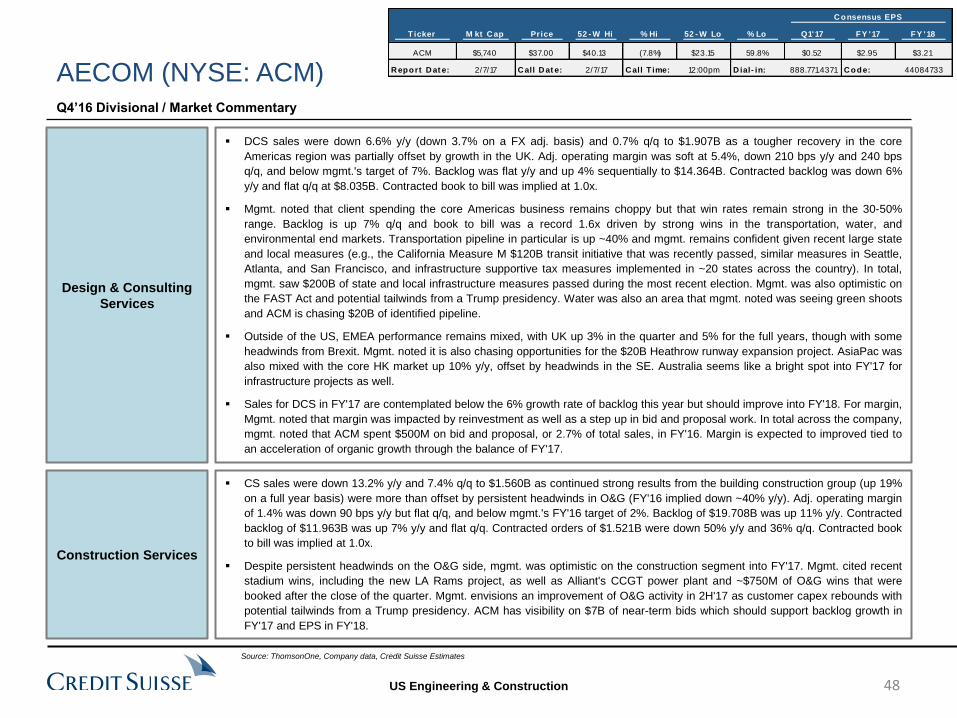
US Engineering & Construction
Design & Consulting
Services
DCS sales were down 6.6% y/y (down 3.7% on a FX adj. basis) and 0.7% q/q to $1.907B as a tougher recovery in the core
Americas region was partially offset by growth in the UK. Adj. operating margin was soft at 5.4%, down 210 bps y/y and 240 bps
q/q, and below mgmt.'s target of 7%. Backlog was flat y/y and up 4% sequentially to $14.364B. Contracted backlog was down 6%
y/y and flat q/q at $8.035B. Contracted book to bill was implied at 1.0x.
Mgmt. noted that client spending the core Americas business remains choppy but that win rates remain strong in the 30-50%
range. Backlog is up 7% q/q and book to bill was a record 1.6x driven by strong wins in the transportation, water, and
environmental end markets. Transportation pipeline in particular is up ~40% and mgmt. remains confident given recent large state
and local measures (e.g., the California Measure M $120B transit initiative that was recently passed, similar measures in Seattle,
Atlanta, and San Francisco, and infrastructure supportive tax measures implemented in ~20 states across the country). In total,
mgmt. saw $200B of state and local infrastructure measures passed during the most recent election. Mgmt. was also optimistic on
the FAST Act and potential tailwinds from a Trump presidency. Water was also an area that mgmt. noted was seeing green shoots
and ACM is chasing $20B of identified pipeline.
Outside of the US, EMEA performance remains mixed, with UK up 3% in the quarter and 5% for the full years, though with some
headwinds from Brexit. Mgmt. noted it is also chasing opportunities for the $20B Heathrow runway expansion project. AsiaPac was
also mixed with the core HK market up 10% y/y, offset by headwinds in the SE. Australia seems like a bright spot into FY'17 for
infrastructure projects as well.
Sales for DCS in FY'17 are contemplated below the 6% growth rate of backlog this year but should improve into FY'18. For margin,
Mgmt. noted that margin was impacted by reinvestment as well as a step up in bid and proposal work. In total across the company,
mgmt. noted that ACM spent $500M on bid and proposal, or 2.7% of total sales, in FY'16. Margin is expected to improved tied to
an acceleration of organic growth through the balance of FY'17.
Q4’16 Divisional / Market Commentary
AECOM (NYSE: ACM)
48
Source: ThomsonOne, Company data, Credit Suisse Estimates
Construction Services
CS sales were down 13.2% y/y and 7.4% q/q to $1.560B as continued strong results from the building construction group (up 19%
on a full year basis) were more than offset by persistent headwinds in O&G (FY'16 implied down ~40% y/y). Adj. operating margin
of 1.4% was down 90 bps y/y but flat q/q, and below mgmt.'s FY'16 target of 2%. Backlog of $19.708B was up 11% y/y. Contracted
backlog of $11.963B was up 7% y/y and flat q/q. Contracted orders of $1.521B were down 50% y/y and 36% q/q. Contracted book
to bill was implied at 1.0x.
Despite persistent headwinds on the O&G side, mgmt. was optimistic on the construction segment into FY'17. Mgmt. cited recent
stadium wins, including the new LA Rams project, as well as Alliant's CCGT power plant and ~$750M of O&G wins that were
booked after the close of the quarter. Mgmt. envisions an improvement of O&G activity in 2H'17 as customer capex rebounds with
potential tailwinds from a Trump presidency. ACM has visibility on $7B of near-term bids which should support backlog growth in
FY'17 and EPS in FY'18.
C onsensus EPS
Ticker M kt C ap Price 52 - W Hi % Hi 52 - W Lo % Lo Q1'17 FY '17 FY '18
ACM $5,740 $37.00 $40.13 (7.8%) $23.15 59.8% $0.52 $2.95 $3.21
R eport D at e: 2/7/17 C all D at e: 2/7/17 C all T ime: 12:00pm D ial- in: 888.771.4371 C ode: 44084733
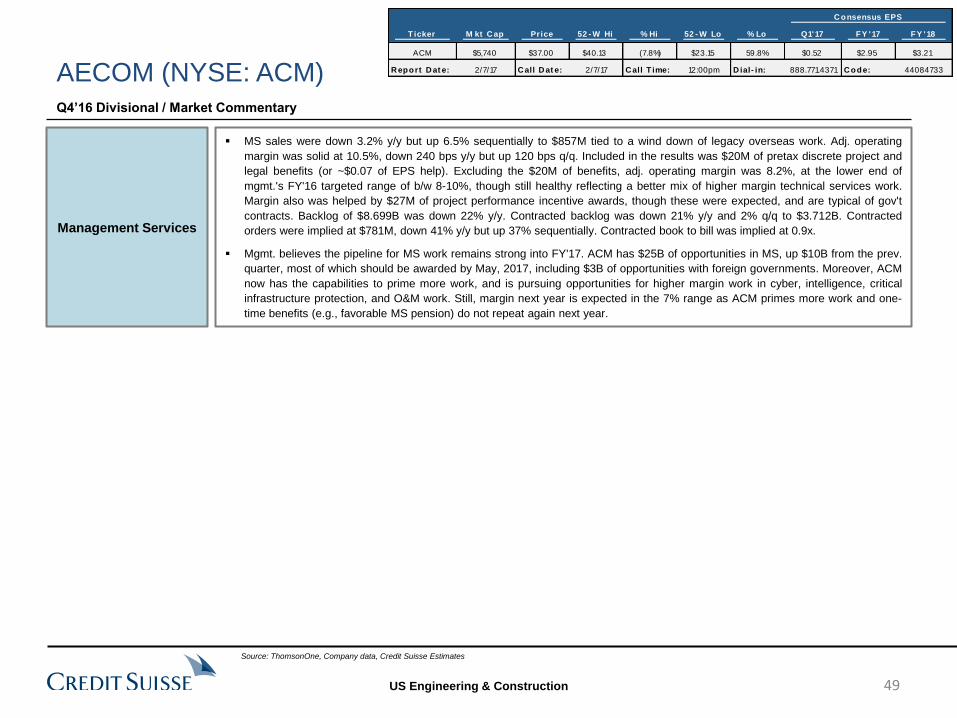
US Engineering & Construction
Management Services
MS sales were down 3.2% y/y but up 6.5% sequentially to $857M tied to a wind down of legacy overseas work. Adj. operating
margin was solid at 10.5%, down 240 bps y/y but up 120 bps q/q. Included in the results was $20M of pretax discrete project and
legal benefits (or ~$0.07 of EPS help). Excluding the $20M of benefits, adj. operating margin was 8.2%, at the lower end of
mgmt.'s FY'16 targeted range of b/w 8-10%, though still healthy reflecting a better mix of higher margin technical services work.
Margin also was helped by $27M of project performance incentive awards, though these were expected, and are typical of gov't
contracts. Backlog of $8.699B was down 22% y/y. Contracted backlog was down 21% y/y and 2% q/q to $3.712B. Contracted
orders were implied at $781M, down 41% y/y but up 37% sequentially. Contracted book to bill was implied at 0.9x.
Mgmt. believes the pipeline for MS work remains strong into FY'17. ACM has $25B of opportunities in MS, up $10B from the prev.
quarter, most of which should be awarded by May, 2017, including $3B of opportunities with foreign governments. Moreover, ACM
now has the capabilities to prime more work, and is pursuing opportunities for higher margin work in cyber, intelligence, critical
infrastructure protection, and O&M work. Still, margin next year is expected in the 7% range as ACM primes more work and one-
time benefits (e.g., favorable MS pension) do not repeat again next year.
Q4’16 Divisional / Market Commentary
AECOM (NYSE: ACM)
Source: ThomsonOne, Company data, Credit Suisse Estimates
49
C onsensus EPS
Ticker M kt C ap Price 52 - W Hi % Hi 52 - W Lo % Lo Q1'17 FY '17 FY '18
ACM $5,740 $37.00 $40.13 (7.8%) $23.15 59.8% $0.52 $2.95 $3.21
R eport D at e: 2/7/17 C all D at e: 2/7/17 C all T ime: 12:00pm D ial- in: 888.771.4371 C ode: 44084733
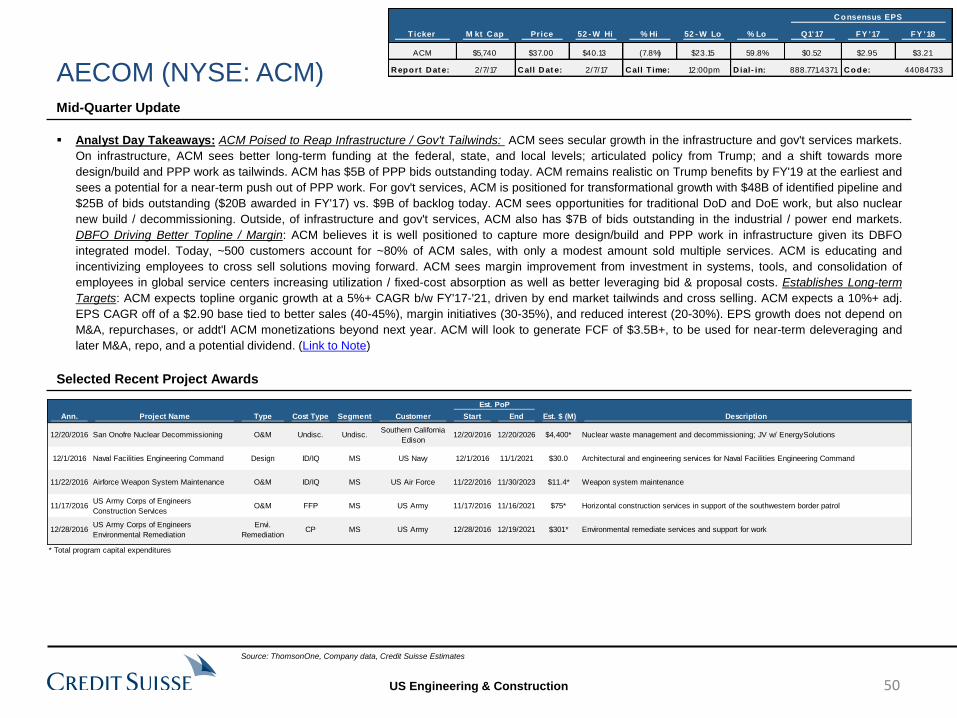
US Engineering & Construction
Analyst Day Takeaways: ACM Poised to Reap Infrastructure / Gov't Tailwinds: ACM sees secular growth in the infrastructure and gov't services markets.
On infrastructure, ACM sees better long-term funding at the federal, state, and local levels; articulated policy from Trump; and a shift towards more
design/build and PPP work as tailwinds. ACM has $5B of PPP bids outstanding today. ACM remains realistic on Trump benefits by FY'19 at the earliest and
sees a potential for a near-term push out of PPP work. For gov't services, ACM is positioned for transformational growth with $48B of identified pipeline and
$25B of bids outstanding ($20B awarded in FY'17) vs. $9B of backlog today. ACM sees opportunities for traditional DoD and DoE work, but also nuclear
new build / decommissioning. Outside, of infrastructure and gov't services, ACM also has $7B of bids outstanding in the industrial / power end markets.
DBFO Driving Better Topline / Margin: ACM believes it is well positioned to capture more design/build and PPP work in infrastructure given its DBFO
integrated model. Today, ~500 customers account for ~80% of ACM sales, with only a modest amount sold multiple services. ACM is educating and
incentivizing employees to cross sell solutions moving forward. ACM sees margin improvement from investment in systems, tools, and consolidation of
employees in global service centers increasing utilization / fixed-cost absorption as well as better leveraging bid & proposal costs. Establishes Long-term
Targets: ACM expects topline organic growth at a 5%+ CAGR b/w FY'17-'21, driven by end market tailwinds and cross selling. ACM expects a 10%+ adj.
EPS CAGR off of a $2.90 base tied to better sales (40-45%), margin initiatives (30-35%), and reduced interest (20-30%). EPS growth does not depend on
M&A, repurchases, or addt'l ACM monetizations beyond next year. ACM will look to generate FCF of $3.5B+, to be used for near-term deleveraging and
later M&A, repo, and a potential dividend. (Link to Note)
Mid-Quarter Update
Selected Recent Project Awards
AECOM (NYSE: ACM)
Source: ThomsonOne, Company data, Credit Suisse Estimates
Est. PoP
Ann. Project Name Type Cost Type Segment Customer Start End Est. $ (M) Description
12/20/2016 San Onofre Nuclear Decommissioning O&M Undisc. Undisc.Southern California
Edison12/20/2016 12/20/2026 $4,400* Nuclear waste management and decommissioning; JV w/ EnergySolutions
12/1/2016 Naval Facilities Engineering Command Design ID/IQ MS US Navy 12/1/2016 11/1/2021 $30.0 Architectural and engineering services for Naval Facilities Engineering Command
11/22/2016 Airforce Weapon System Maintenance O&M ID/IQ MS US Air Force 11/22/2016 11/30/2023 $11.4* Weapon system maintenance
11/17/2016US Army Corps of Engineers
Construction ServicesO&M FFP MS US Army 11/17/2016 11/16/2021 $75* Horizontal construction services in support of the southwestern border patrol
12/28/2016US Army Corps of Engineers
Environmental Remediation
Envi.
RemediationCP MS US Army 12/28/2016 12/19/2021 $301* Environmental remediate services and support for work
* Total program capital expenditures
50
C onsensus EPS
Ticker M kt C ap Price 52 - W Hi % Hi 52 - W Lo % Lo Q1'17 FY '17 FY '18
ACM $5,740 $37.00 $40.13 (7.8%) $23.15 59.8% $0.52 $2.95 $3.21
R eport D at e: 2/7/17 C all D at e: 2/7/17 C all T ime: 12:00pm D ial- in: 888.771.4371 C ode: 44084733
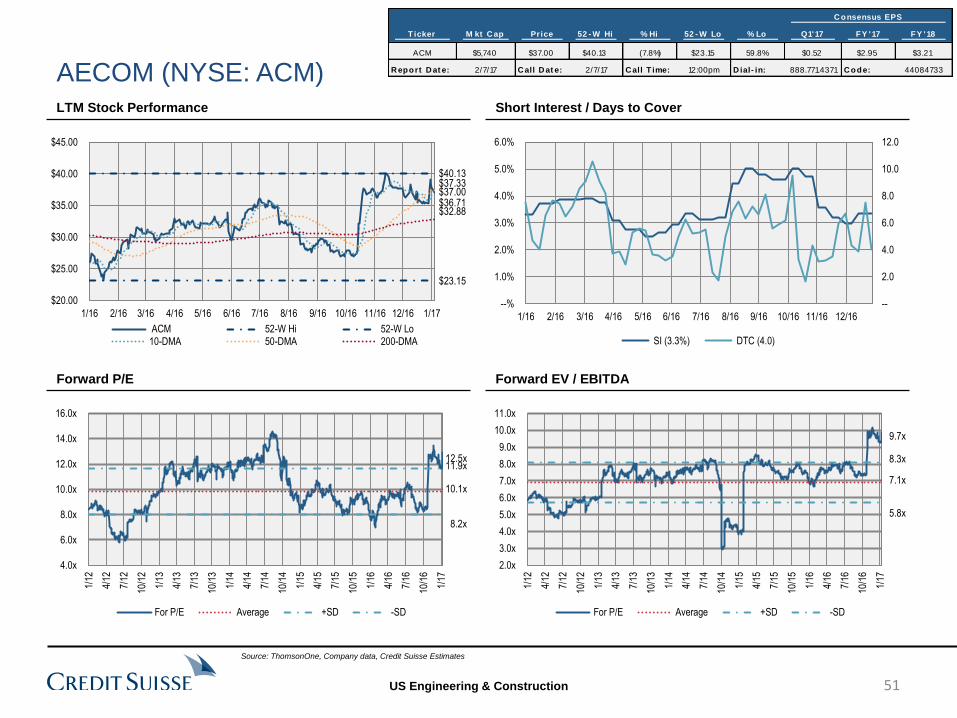
US Engineering & Construction
AECOM (NYSE: ACM) LTM Stock Performance
Forward P/E
Short Interest / Days to Cover
Forward EV / EBITDA
Source: ThomsonOne, Company data, Credit Suisse Estimates
--
2.0
4.0
6.0
8.0
10.0
12.0
--%
1.0%
2.0%
3.0%
4.0%
5.0%
6.0%
1/16 2/16 3/16 4/16 5/16 6/16 7/16 8/16 9/16 10/16 11/16 12/16
SI (3.3%) DTC (4.0)
12.5x
10.1x
11.9x
8.2x
4.0x
6.0x
8.0x
10.0x
12.0x
14.0x
16.0x
1/12
4/12
7/12
10/1
2
1/13
4/13
7/13
10/1
3
1/14
4/14
7/14
10/1
4
1/15
4/15
7/15
10/1
5
1/16
4/16
7/16
10/1
6
1/17
For P/E Average +SD -SD
9.7x
7.1x
8.3x
5.8x
2.0x
3.0x
4.0x
5.0x
6.0x
7.0x
8.0x
9.0x
10.0x
11.0x
1/12
4/12
7/12
10/1
2
1/13
4/13
7/13
10/1
3
1/14
4/14
7/14
10/1
4
1/15
4/15
7/15
10/1
5
1/16
4/16
7/16
10/1
6
1/17
For P/E Average +SD -SD
51
$37.00
$40.13
$23.15
$36.71
$37.33
$32.88
$20.00
$25.00
$30.00
$35.00
$40.00
$45.00
1/16 2/16 3/16 4/16 5/16 6/16 7/16 8/16 9/16 10/16 11/16 12/16 1/17
ACM 52-W Hi 52-W Lo
10-DMA 50-DMA 200-DMA
C onsensus EPS
Ticker M kt C ap Price 52 - W Hi % Hi 52 - W Lo % Lo Q1'17 FY '17 FY '18
ACM $5,740 $37.00 $40.13 (7.8%) $23.15 59.8% $0.52 $2.95 $3.21
R eport D at e: 2/7/17 C all D at e: 2/7/17 C all T ime: 12:00pm D ial- in: 888.771.4371 C ode: 44084733
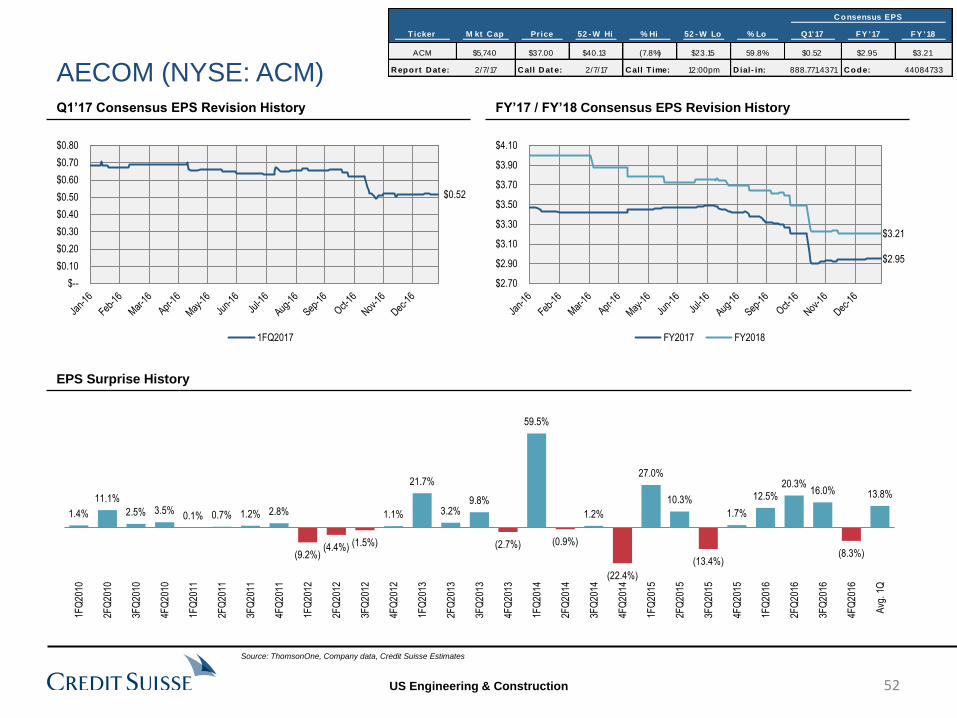
US Engineering & Construction
AECOM (NYSE: ACM) Q1’17 Consensus EPS Revision History FY’17 / FY’18 Consensus EPS Revision History
EPS Surprise History
Source: ThomsonOne, Company data, Credit Suisse Estimates
$0.52
$--
$0.10
$0.20
$0.30
$0.40
$0.50
$0.60
$0.70
$0.80
1FQ2017
$2.95
$3.21
$2.70
$2.90
$3.10
$3.30
$3.50
$3.70
$3.90
$4.10
FY2017 FY2018
13.8%
(8.3%)
16.0% 20.3%
12.5%
1.7%
(13.4%)
10.3%
27.0%
(22.4%)
1.2%
(0.9%)
59.5%
(2.7%)
9.8% 3.2%
21.7%
1.1%
(1.5%)(4.4%)(9.2%)
2.8% 1.2% 0.7% 0.1% 3.5% 2.5%
11.1%
1.4%
Avg
. 1Q
4FQ
2016
3FQ
2016
2FQ
2016
1FQ
2016
4FQ
2015
3FQ
2015
2FQ
2015
1FQ
2015
4FQ
2014
3FQ
2014
2FQ
2014
1FQ
2014
4FQ
2013
3FQ
2013
2FQ
2013
1FQ
2013
4FQ
2012
3FQ
2012
2FQ
2012
1FQ
2012
4FQ
2011
3FQ
2011
2FQ
2011
1FQ
2011
4FQ
2010
3FQ
2010
2FQ
2010
1FQ
2010
52
C onsensus EPS
Ticker M kt C ap Price 52 - W Hi % Hi 52 - W Lo % Lo Q1'17 FY '17 FY '18
ACM $5,740 $37.00 $40.13 (7.8%) $23.15 59.8% $0.52 $2.95 $3.21
R eport D at e: 2/7/17 C all D at e: 2/7/17 C all T ime: 12:00pm D ial- in: 888.771.4371 C ode: 44084733
US Engineering & Construction
C onsensus EPS
Ticker M kt C ap Price 52 - W Hi % Hi 52 - W Lo % Lo Q4 '16 FY '17 FY '18
BW $813 $16.69 $23.66 (29.5%) $13.25 26.0% $0.37 $1.39 $1.55
R eport D at e: TBD C all D at e: TBD C all T ime: TBD D ial- in: TBD C ode: TBD
On the Q2’16 call, mgmt. cited $300M of potential awards that but had not been signed yet. Mgmt. indicated that securing all $300M before the EoY FY’16
could provide some upside though ~$100M was needed to hit the low end of the $1.25-1.45+ (now b/w $1.25-1.45) FY’17 guide. BW has not announced
any sizeable EPC awards, which would suggest the bottom end of the range is more difficult. Is this still the right way to think about $300M of larger
awards?
What are your assumptions for the Industrial Environmental business in FY 2017? Are you seeing any green shoots by a particular region or geography?
How is BW progressing against $3.3B bid pipeline? What is the expected timing of awards and when they need to hit to help FY’17 (mgmt. indicated no later
than early Q1’17)?
What is the status of the problem renewable project? Recall, BW took an additional $14M charge last quarter (though offset by positive $15M insurance
claim) after taking a $29.9M in Q2’16. Mgmt. indicated the project should be complete in early FY’17 (through Q3’16 piping was 83% and electrical was 78%
done and is currently a zero gross margin project).
The EIA and contractors reported higher utilization of coal fired power plants at the end of the year tied a step up in natural gas prices. Moreover, the EIA
now expects coal to account for more net generation in FY’17 vs. natural gas, a reversal from FY’16. Given the positive trends in coal fired generation, is
BW seeing any improvement in Q4’16 / early FY’17 in its services / aftermarket business?
Is BW seeing a pick up in the Canadian oil sands business? Should the Canadian business be less of a headwind (or potentially a tailwind) in FY’17?
How does BW view a Trump Presidency? Have customer conversations changed at all post-election? Given the change in articulated regulatory tone, what
is the status of the Clean Power Plan, which is currently under review in the DC 2nd Circuit Court? When BW talks about coal retirement forecast in terms of
baseload nameplate capacity does that assume the CPP goes through or not? In the EIA AEO17 reference case the CPP has a dramatic step up impact on
coal retirements.
Will BW provide more color on the UniversalAET acquisition, specifically what are the targeted revenue synergies and timing as well as implications for
FY’17 EPS and normalized EPS contribution thereafter?
In terms of capital allocation, how is BW thinking about the timing of the $100M repurchase authorization? What is the expected timing of longer-term
leverage target of 2x? What does BW contemplate in terms of additional acquisitions and timing of M&A?
Critical Factors Into Q4’16 Earnings
Babcock & Wilcox (NYSE: BW)
Source: ThomsonOne, Company data, Credit Suisse Estimates
53

US Engineering & Construction
Q4’16 / FY’16 Guidance
Thoughts Post Call: BW's stock closed down 10% after missing Q3'16 but reiterating FY2016 EPS of $0.63-$0.83 on reduced revenues of
$1.7B. The miss in the quarter was lighter revenues, largely driven by continued weakness in the coal market. Margins were solid considering
the environment. The Q4'16 guide implies a wide range but BW cited some improvement in aftermarket parts business towards the end of Q3
and into Q4 which could help. Awards were light in the quarter however the bid pipeline did increase $400M to $3.3B with half driven by SPIG.
BW remains optimistic with regards to growing EPS in 2017 and reiterated confidence that it will be within the original 2016 range of $1.20-
1.45. BW also looks to further supplement growth via acquisitions with opportunities to close deals between now and the end of 2017 to
diversify away from coal. While we agree with the strategic direction BW mgmt. is shifting the company towards, we continue to be concerned
about the company's ability to weather coal, in particular after the decline in sales this quarter coupled with our more cautious view on industrial
businesses into 2017.
Q3’16 Earnings Summary
Babcock & Wilcox (NYSE: BW)
Source: ThomsonOne, Company data, Credit Suisse Estimates
Guidance CS Consensus
Item Q4'16 FY'16 FY'17 Q4'16 FY'16 FY'17 Q4'16 FY'16 FY'17
Revenue $502 $1,700 -- $500 $1,699 $1,615 $483 $1,681 $1,771
EBITDA -- -- -- $37 $90 $132 $40 $91 $133
Adj. EPS $0.42 $0.63-0.83 $1.20-1.45 $0.40 $0.71 $1.37 $0.37 $0.68 $1.39
SPIG Sales $50 $100 -- -- -- -- -- -- --
Power Sales -- ~$1,050 -- $262 $1,019 $866 -- -- --
Renewable Sales -- $400 -- $121 $415 $431 -- -- --
Industrial Sales -- ~$250 -- $118 $265 $318 -- -- --
Power Gross Margin --% --% low 20% 21.0% 22.2% 20.0% --% --% --%
Renew Gross Margin --% low 20%* 17-18% 16.0% 8.2% 16.5% --% --% --%
Indust. Gross Margin --% --% 20-21% 18.5% 20.7% 19.0% --% --% --%
SG&A -- -- $260 $60 $242 $262 -- -- --
Amortization -- -- $15.5 -- -- -- -- -- --
SPIG EPS Contribution -- -- ~$0.12-0.13 -- -- -- -- -- --
Tax Rate --% 33-35%* Low 30% 34.0% (31.8%) 32.0% --% --% --%
Repurchases -- -- -- -- -- -- -- -- --
Restructuring $7.5 $55-60 $19 -- -- -- -- -- --
FCF Conversion --% <75-100% 75-100% --% --% --% --% --% --%
*Normalized for project charges
54
C onsensus EPS
Ticker M kt C ap Price 52 - W Hi % Hi 52 - W Lo % Lo Q4 '16 FY '17 FY '18
BW $813 $16.69 $23.66 (29.5%) $13.25 26.0% $0.37 $1.39 $1.55
R eport D at e: TBD C all D at e: TBD C all T ime: TBD D ial- in: TBD C ode: TBD

US Engineering & Construction
Q3’16 Divisional / Market Commentary
Babcock & Wilcox (NYSE: BW)
Power
Power sales were down 2.7% y/y and down 12% q/q to $288M. Sales were adversely impacted by the longer-term shift from coal-
power generation to natural gas and renewables in the US as well as other short-term issues such as the mild winter earlier this
year and reduced activity in the Canadian Oil Sands. Despite the top line being relatively light, profitability held up nicely at 23.3%
down only 80bps sequentially. BW continues to see slowness in the power markets. Still, BW saw the aftermarket parts business
picking up significantly in Q3 and very early in Q4, which could be attributed to the warmer weather and the utilities having to invest
in their units because they ran them more. Despite the uncertainty in the market, BW was also able to increase bid and proposal
activity. Also on the positive, mgmt. is starting to see positive effects from the restructuring that support profitability.
Renewables
Renewables sales were up 43% y/y and up 45% q/q to $124M due to higher activity levels in the segment. Gross margin was 15%,
down 510bps y/y weighed down by the European renewable profit. The challenged project had a net benefit of $1 million for the
quarter. Lower-than-expected labor productivity caused the project time line to slip, resulting in a $14-million increase in the
estimated cost to complete the project. However, this was offset by a probable project-related insurance recovery of $15 million.
Mgmt. expects key project milestones to be completed in early 2017 for the problem project (with the spend rate expected to be
significantly lower by Dec-Jan relative to today). The two major systems where BW continues to do work are piping an electrical
(piping was 39% complete in July and is 83% complete today while electrical was 40% complete in mid-July and is 78Z% complete
today).
Source: ThomsonOne, Company data, Credit Suisse Estimates
Industrial
Industrial sales were up 97% y/y to $76.8M. Sales almost doubled due to the acquisition of B&W SPIG which contributed $38.3
million. SPIG revenues were below the expected average quarterly run rate of ~$50M due to project timing and a slower period in
late summer but mgmt. expects SPIG revenues to be in line with expectations in Q4 and continue at a similar run rate in 2017
given the current backlog that SPIG has. Worth noting that SPIG was down 11% in Q3 and is down 22% YTD. SPIG contributed
gross profits of $4.2M though intangible amortization of $7.1M was not included in the segment results. MEGTEC revenues were
flat y/y while implied margins of 27% were solid. Industrial margins of 19.0% were light reflecting timing on SPIG profits and on
tougher comparisons last year of 27.3%. Mgmt. believes that the industrial segment has opportunities for revenues growth and that
margins could be maintained, if not improved, as volumes improve.
55
C onsensus EPS
Ticker M kt C ap Price 52 - W Hi % Hi 52 - W Lo % Lo Q4 '16 FY '17 FY '18
BW $813 $16.69 $23.66 (29.5%) $13.25 26.0% $0.37 $1.39 $1.55
R eport D at e: TBD C all D at e: TBD C all T ime: TBD D ial- in: TBD C ode: TBD
US Engineering & Construction
BW Acquires UniversalAET: Deal Takeaways: BW announced it has acquired Universal Acoustic & Emission Technologies (“UniversalAET”), a
Wisconsin-based provider of custom-engineered acoustic, emission, and filtration solutions to the natural gas power generation, mid-stream natural gas
pipeline, locomotive, and general industrial end markets, for an effective enterprise value of $55M. The Company has a topline of ~$80M, EBITDA margins
in the ~8% range, and employs ~460 people, mainly in the US and Mexico. Typical projects for UniversalAET are in the ~$150k range, but up into the
millions range, and are generally shorter duration. BW has an existing relationship with UniversalAET, and is partnering with the firm on a current project.
The business will be included in the Industrial operating segment alongside MEGTEC and SPIG. The deal makes sense in our view and is consistent with
BW’s strategy to acquire an engineered solution with a solid aftermarket as a bolt-on to the MEGTEC platform. The deal is also attractive as another toehold
into the natural gas end markets, helping BW further diversify away from NA coal. Deal Metrics: BW acquired UniversalAET at an enterprise value of
~$55M (subject to customary adjustments). The Company is expected to contribute $80M for the full year and has EBITDA margins in the ~8% range. This
implies an EV / Sales and EV / EBITDA multiple of 0.7x and 8.6x, respectively. BW anticipates realizing b/w $2.5-3M of cost synergies by FY’18, implying an
adj. EV / EBITDA multiple of closer to ~6x, and sees scope for revenue synergies longer-term. The Company has an annual depreciation expense in the
~$2.5M range. BW will fund the acquisition by drawing on the existing revolver, which maintains an interest rate in the ~4% range. The deal is expected to
be slightly accretive in FY’17. (Link to Note)
B&W Announces Executive Appointments: Jimmy B. Morgan has been named Senior Vice President, Renewable. He will be responsible for B&W’s
renewable energy business, including the company’s Denmark-based subsidiary, Babcock & Wilcox Vølund A/S. With more than 25 years of experience in
the global energy industry, he has served in a number of senior leadership roles and has considerable large project management, operations and
construction experience. In his new position, he will oversee completion of our key renewable project in the European Union. This project remains on track
for commissioning in the first quarter of 2017, with piping currently 95 percent complete and electrical 85 percent complete. D. Paul Scavuzzo has been
named Senior Vice President and Chief Commercial Officer. In his new role, Mr. Scavuzzo will provide increased oversight and leadership as we continue to
expand the company’s global supply chain management initiatives and optimize our global facility utilization. He will continue to oversee the company’s joint
venture operations in China and India. James J. Muckley has been named Senior Vice President, Operations. He will lead the company’s global project
management, quality, and environmental, health, safety & security functions. He also will oversee the company’s global manufacturing operations and
Babcock & Wilcox Construction Co., Inc. (Link to Press Release)
Mid-Quarter Update
Babcock & Wilcox (NYSE: BW)
Source: ThomsonOne, Company data, Credit Suisse Estimates
56
C onsensus EPS
Ticker M kt C ap Price 52 - W Hi % Hi 52 - W Lo % Lo Q4 '16 FY '17 FY '18
BW $813 $16.69 $23.66 (29.5%) $13.25 26.0% $0.37 $1.39 $1.55
R eport D at e: TBD C all D at e: TBD C all T ime: TBD D ial- in: TBD C ode: TBD

US Engineering & Construction
Selected Recent Project Awards
Babcock & Wilcox (NYSE: BW)
Source: ThomsonOne, Company data, Credit Suisse Estimates
Est. PoP
Ann. Project Name Type Cost Type Segment Customer Start End Est. $ (M) Description
1/6/2017 Ontario Steel Mill Boiler Replacement EPCI Undisc. PowerArcelorMittal
Dofasco1/6/2017 8/31/2018 Undisc. Boiler delivery by late FY'17, installation by August FY'18
12/21/2016 Boden Sweden Waste to Energy Plant Design / EPC Undisc. Renewable Bodens Energi AB 12/21/2016 4/30/2019 $35.0 Design, supply and construct a waste-to-energy boiler
11/29/2016Shenzhen Energy Environmental
Engineering Waste Power BoilerDesign Undisc. Renewable Shenzhen Energy 11/29/2016 6/31/19 $40.0 Design of waste to energy boiler for largest waste power plant in China
57
C onsensus EPS
Ticker M kt C ap Price 52 - W Hi % Hi 52 - W Lo % Lo Q4 '16 FY '17 FY '18
BW $813 $16.69 $23.66 (29.5%) $13.25 26.0% $0.37 $1.39 $1.55
R eport D at e: TBD C all D at e: TBD C all T ime: TBD D ial- in: TBD C ode: TBD
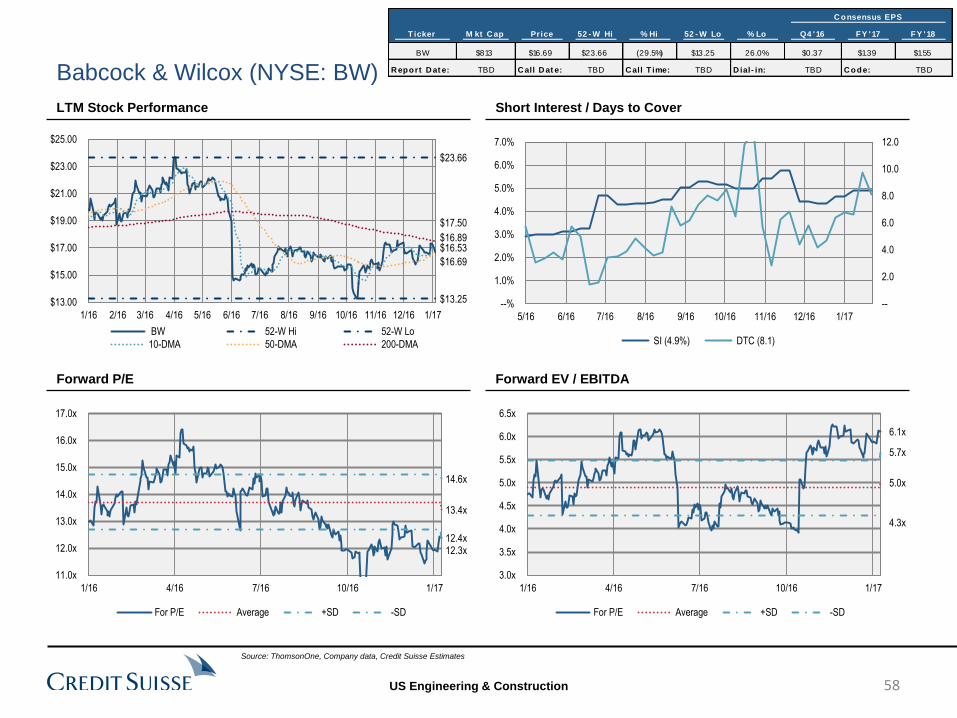
US Engineering & Construction
Babcock & Wilcox (NYSE: BW)
LTM Stock Performance
Forward P/E
Short Interest / Days to Cover
Forward EV / EBITDA
Source: ThomsonOne, Company data, Credit Suisse Estimates
--
2.0
4.0
6.0
8.0
10.0
12.0
--%
1.0%
2.0%
3.0%
4.0%
5.0%
6.0%
7.0%
5/16 6/16 7/16 8/16 9/16 10/16 11/16 12/16 1/17
SI (4.9%) DTC (8.1)
12.4x
13.4x
14.6x
12.3x
11.0x
12.0x
13.0x
14.0x
15.0x
16.0x
17.0x
1/16 4/16 7/16 10/16 1/17
For P/E Average +SD -SD
6.1x
5.0x
5.7x
4.3x
3.0x
3.5x
4.0x
4.5x
5.0x
5.5x
6.0x
6.5x
1/16 4/16 7/16 10/16 1/17
For P/E Average +SD -SD
58
$16.69
$23.66
$13.25
$16.89 $16.53
$17.50
$13.00
$15.00
$17.00
$19.00
$21.00
$23.00
$25.00
1/16 2/16 3/16 4/16 5/16 6/16 7/16 8/16 9/16 10/16 11/16 12/16 1/17
BW 52-W Hi 52-W Lo
10-DMA 50-DMA 200-DMA
C onsensus EPS
Ticker M kt C ap Price 52 - W Hi % Hi 52 - W Lo % Lo Q4 '16 FY '17 FY '18
BW $813 $16.69 $23.66 (29.5%) $13.25 26.0% $0.37 $1.39 $1.55
R eport D at e: TBD C all D at e: TBD C all T ime: TBD D ial- in: TBD C ode: TBD
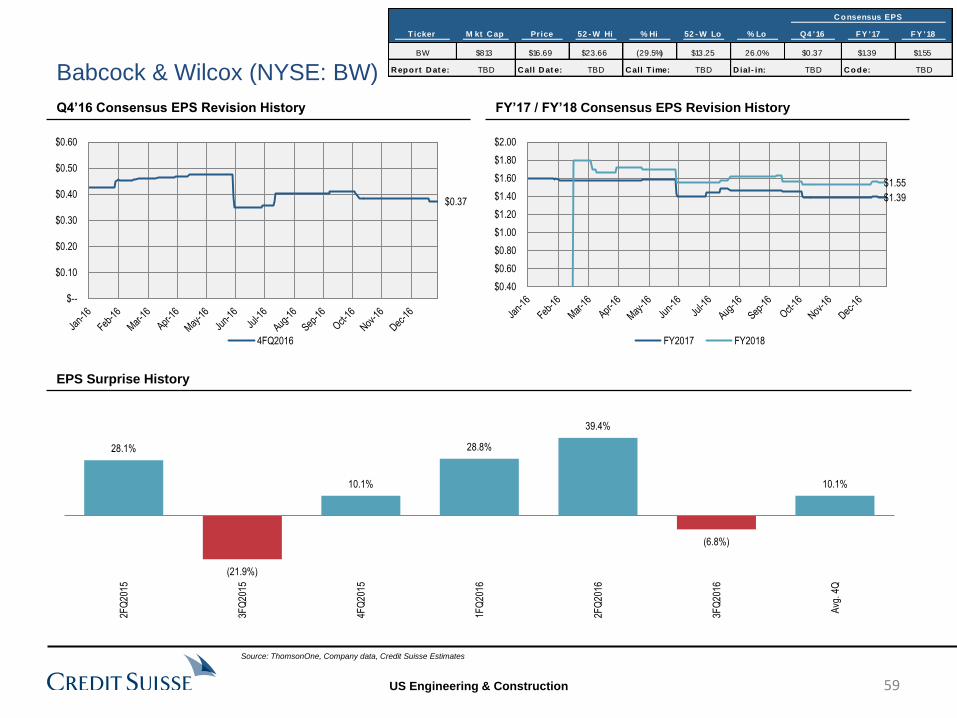
US Engineering & Construction
Babcock & Wilcox (NYSE: BW)
Q4’16 Consensus EPS Revision History FY’17 / FY’18 Consensus EPS Revision History
EPS Surprise History
Source: ThomsonOne, Company data, Credit Suisse Estimates
$0.37
$--
$0.10
$0.20
$0.30
$0.40
$0.50
$0.60
4FQ2016
$1.39
$1.55
$0.40
$0.60
$0.80
$1.00
$1.20
$1.40
$1.60
$1.80
$2.00
FY2017 FY2018
10.1%
(6.8%)
39.4%
28.8%
10.1%
(21.9%)
28.1%
Avg
. 4Q
3FQ
2016
2FQ
2016
1FQ
2016
4FQ
2015
3FQ
2015
2FQ
2015
59
C onsensus EPS
Ticker M kt C ap Price 52 - W Hi % Hi 52 - W Lo % Lo Q4 '16 FY '17 FY '18
BW $813 $16.69 $23.66 (29.5%) $13.25 26.0% $0.37 $1.39 $1.55
R eport D at e: TBD C all D at e: TBD C all T ime: TBD D ial- in: TBD C ode: TBD
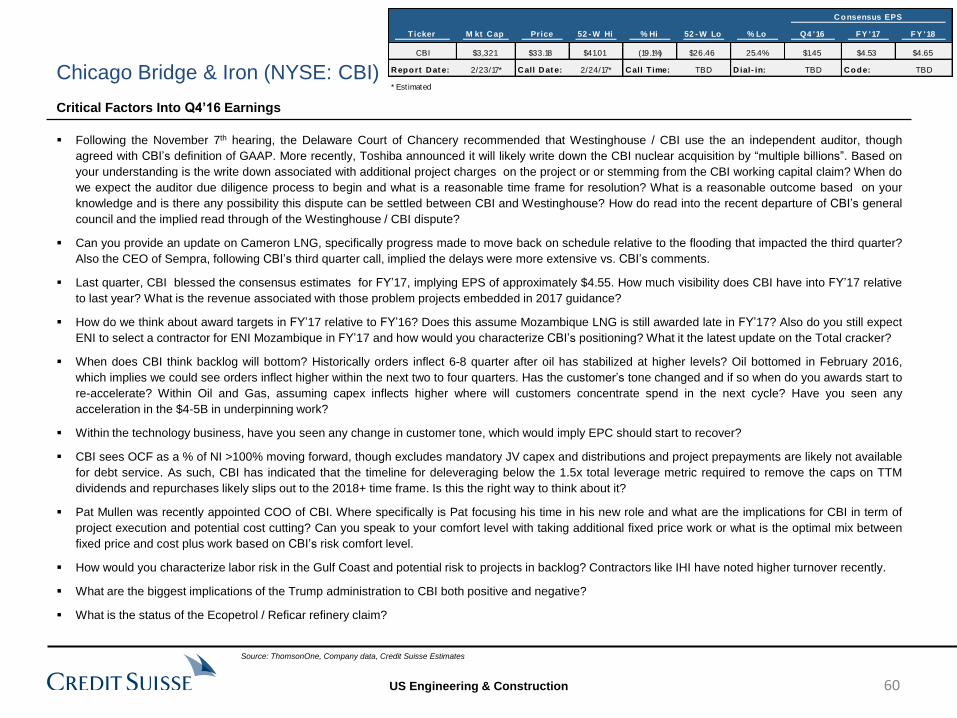
US Engineering & Construction
C onsensus EPS
Ticker M kt C ap Price 52 - W Hi % Hi 52 - W Lo % Lo Q4 '16 FY '17 FY '18
CBI $3,321 $33.18 $41.01 (19.1%) $26.46 25.4% $1.45 $4.53 $4.65
R eport D at e: 2/23/17* C all D at e: 2/24/17* C all T ime: TBD D ial- in: TBD C ode: TBD
* Estimated
Following the November 7th hearing, the Delaware Court of Chancery recommended that Westinghouse / CBI use the an independent auditor, though
agreed with CBI’s definition of GAAP. More recently, Toshiba announced it will likely write down the CBI nuclear acquisition by “multiple billions”. Based on
your understanding is the write down associated with additional project charges on the project or or stemming from the CBI working capital claim? When do
we expect the auditor due diligence process to begin and what is a reasonable time frame for resolution? What is a reasonable outcome based on your
knowledge and is there any possibility this dispute can be settled between CBI and Westinghouse? How do read into the recent departure of CBI’s general
council and the implied read through of the Westinghouse / CBI dispute?
Can you provide an update on Cameron LNG, specifically progress made to move back on schedule relative to the flooding that impacted the third quarter?
Also the CEO of Sempra, following CBI’s third quarter call, implied the delays were more extensive vs. CBI’s comments.
Last quarter, CBI blessed the consensus estimates for FY’17, implying EPS of approximately $4.55. How much visibility does CBI have into FY’17 relative
to last year? What is the revenue associated with those problem projects embedded in 2017 guidance?
How do we think about award targets in FY’17 relative to FY’16? Does this assume Mozambique LNG is still awarded late in FY’17? Also do you still expect
ENI to select a contractor for ENI Mozambique in FY’17 and how would you characterize CBI’s positioning? What it the latest update on the Total cracker?
When does CBI think backlog will bottom? Historically orders inflect 6-8 quarter after oil has stabilized at higher levels? Oil bottomed in February 2016,
which implies we could see orders inflect higher within the next two to four quarters. Has the customer’s tone changed and if so when do you awards start to
re-accelerate? Within Oil and Gas, assuming capex inflects higher where will customers concentrate spend in the next cycle? Have you seen any
acceleration in the $4-5B in underpinning work?
Within the technology business, have you seen any change in customer tone, which would imply EPC should start to recover?
CBI sees OCF as a % of NI >100% moving forward, though excludes mandatory JV capex and distributions and project prepayments are likely not available
for debt service. As such, CBI has indicated that the timeline for deleveraging below the 1.5x total leverage metric required to remove the caps on TTM
dividends and repurchases likely slips out to the 2018+ time frame. Is this the right way to think about it?
Pat Mullen was recently appointed COO of CBI. Where specifically is Pat focusing his time in his new role and what are the implications for CBI in term of
project execution and potential cost cutting? Can you speak to your comfort level with taking additional fixed price work or what is the optimal mix between
fixed price and cost plus work based on CBI’s risk comfort level.
How would you characterize labor risk in the Gulf Coast and potential risk to projects in backlog? Contractors like IHI have noted higher turnover recently.
What are the biggest implications of the Trump administration to CBI both positive and negative?
What is the status of the Ecopetrol / Reficar refinery claim?
Critical Factors Into Q4’16 Earnings
Chicago Bridge & Iron (NYSE: CBI)
Source: ThomsonOne, Company data, Credit Suisse Estimates
60

US Engineering & Construction
Q4’16 / FY’16 Guidance
Thoughts Post Call: CBI reported Q3'16 EPS of $1.20; however, results were helped by ~$0.10 from tax. On the positive, the tax rate is
structurally lower going forward and expected to be 24-25% in 2017. Results were noisy and included $104M in costs overruns associated with
two projects (one complete, one 75% complete) offset by $112M in benefits from two projects associated with significant changes in
profitability within in E&C segment. More important, CBI continues to generate strong OCF at $176M and is on track to deliver $650M in OCF
for the year. Also, CBI reiterated guidance for FY'16 and endorsed the consensus estimates for FY'17 of $4.55. Furthermore, CBI believes
OCF as a % of net income will continue to be at least 100% providing confidence to the deleveraging story. Looking ahead, CBI remains bullish
with regards to longer-term growth oppty's still targeting $8-10B in awards with large LNG elephants expected in in the latter part of FY'17. The
outlook remains encouraging and OCF continues to be strong. The next catalyst for the name is related to Westinghouse. Mgmt. believes there
should be resolution fairly soon, which has been a significant overhang on the name.
Q3’16 Earnings Summary
Chicago Bridge & Iron (NYSE: CBI)
61
Source: ThomsonOne, Company data, Credit Suisse Estimates
Guidance CS Consensus
Item Q4'16 FY'16 FY'17 Q4'16 FY'16 FY'17 Q4'16 FY'16 FY'17
Awards -- $8.0-10.0B*** -- -- -- -- -- -- --
Revenue $2,660 $10.6-11.0B -- $2,691 $10,830 $9,972 $2,717 $10,875 $10,305
EBITDA -- -- -- $234 $951 $912 $231 $950 $891
Adj. EPS $1.48 $4.70-5.00 $4.55 $1.54 $4.90 $4.50 $1.45 $4.83 $4.53
E&C Op Margin --% ~7.5% 6-8%* 7.0% 7.2% 7.4% --% --% --%
FS Op Margin --% 10-13%* 10-13%* 10.5% 10.4% 10.5% --% --% --%
Tech Op Margin --% 25-30%* 25-30%* 30.0% 33.6% 35.0% --% --% --%
CS Op Margin --% 3-6%* 3-6%* 2.8% 2.7% 3.0% --% --% --%
SG&A % Sales --% 3.2-3.3% 3%* 3.2% 3.2% 3.0% --% --% --%
Tax Rate --% 18-19% 24-25% 25.0% 19.1% 24.5% --% --% --%
Tax Benefit $0.35** $0.35** -- -- -- -- -- -- --
Capex -- $100† -- $62 $100 $145 -- -- --
Operating Cash Flow -- $650 -- $191 $686 $388 -- -- --
OCF Conversion --% ~100%+ ~100%+ 122.1% 134.8% 86.1% --% --% --%
* LT targets from FY'14 / FY'15 Analyst Days
** CBI expects to receive a $0.35 tax benefit in Q4'16, w hich is included in the adj. EPS guide
*** Low er end is more likely
† Capex split b/w Clariant / Net Pow er
C onsensus EPS
Ticker M kt C ap Price 52 - W Hi % Hi 52 - W Lo % Lo Q4 '16 FY '17 FY '18
CBI $3,321 $33.18 $41.01 (19.1%) $26.46 25.4% $1.45 $4.53 $4.65
R eport D at e: 2/23/17* C all D at e: 2/24/17* C all T ime: TBD D ial- in: TBD C ode: TBD
* Estimated
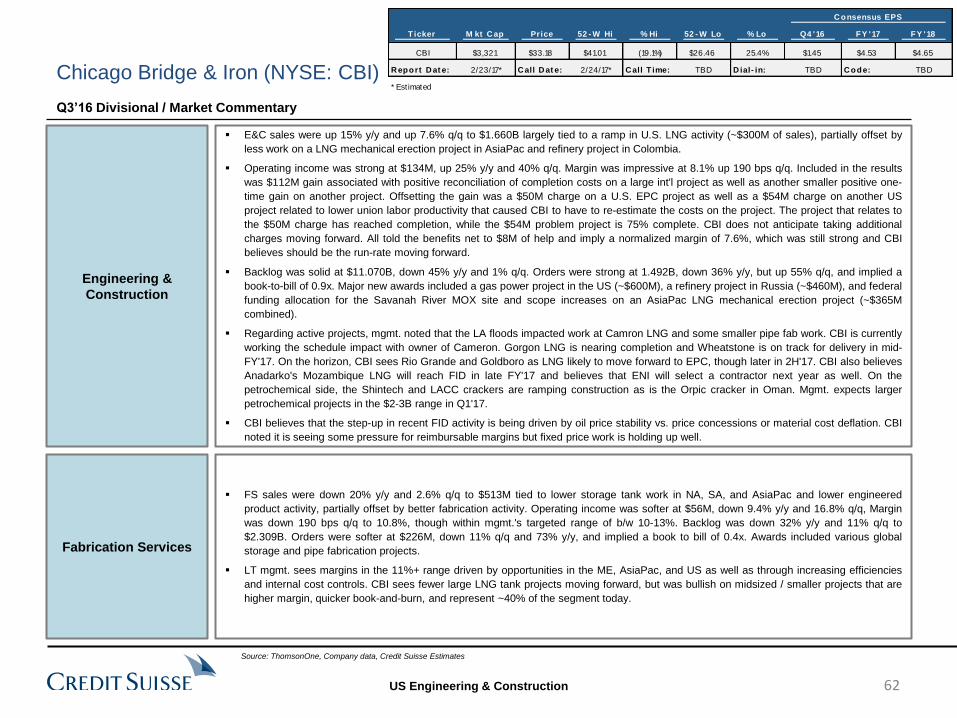
US Engineering & Construction
Engineering &
Construction
E&C sales were up 15% y/y and up 7.6% q/q to $1.660B largely tied to a ramp in U.S. LNG activity (~$300M of sales), partially offset by
less work on a LNG mechanical erection project in AsiaPac and refinery project in Colombia.
Operating income was strong at $134M, up 25% y/y and 40% q/q. Margin was impressive at 8.1% up 190 bps q/q. Included in the results
was $112M gain associated with positive reconciliation of completion costs on a large int'l project as well as another smaller positive one-
time gain on another project. Offsetting the gain was a $50M charge on a U.S. EPC project as well as a $54M charge on another US
project related to lower union labor productivity that caused CBI to have to re-estimate the costs on the project. The project that relates to
the $50M charge has reached completion, while the $54M problem project is 75% complete. CBI does not anticipate taking additional
charges moving forward. All told the benefits net to $8M of help and imply a normalized margin of 7.6%, which was still strong and CBI
believes should be the run-rate moving forward.
Backlog was solid at $11.070B, down 45% y/y and 1% q/q. Orders were strong at 1.492B, down 36% y/y, but up 55% q/q, and implied a
book-to-bill of 0.9x. Major new awards included a gas power project in the US (~$600M), a refinery project in Russia (~$460M), and federal
funding allocation for the Savanah River MOX site and scope increases on an AsiaPac LNG mechanical erection project (~$365M
combined).
Regarding active projects, mgmt. noted that the LA floods impacted work at Camron LNG and some smaller pipe fab work. CBI is currently
working the schedule impact with owner of Cameron. Gorgon LNG is nearing completion and Wheatstone is on track for delivery in mid-
FY'17. On the horizon, CBI sees Rio Grande and Goldboro as LNG likely to move forward to EPC, though later in 2H'17. CBI also believes
Anadarko's Mozambique LNG will reach FID in late FY'17 and believes that ENI will select a contractor next year as well. On the
petrochemical side, the Shintech and LACC crackers are ramping construction as is the Orpic cracker in Oman. Mgmt. expects larger
petrochemical projects in the $2-3B range in Q1'17.
CBI believes that the step-up in recent FID activity is being driven by oil price stability vs. price concessions or material cost deflation. CBI
noted it is seeing some pressure for reimbursable margins but fixed price work is holding up well.
Fabrication Services
FS sales were down 20% y/y and 2.6% q/q to $513M tied to lower storage tank work in NA, SA, and AsiaPac and lower engineered
product activity, partially offset by better fabrication activity. Operating income was softer at $56M, down 9.4% y/y and 16.8% q/q, Margin
was down 190 bps q/q to 10.8%, though within mgmt.'s targeted range of b/w 10-13%. Backlog was down 32% y/y and 11% q/q to
$2.309B. Orders were softer at $226M, down 11% q/q and 73% y/y, and implied a book to bill of 0.4x. Awards included various global
storage and pipe fabrication projects.
LT mgmt. sees margins in the 11%+ range driven by opportunities in the ME, AsiaPac, and US as well as through increasing efficiencies
and internal cost controls. CBI sees fewer large LNG tank projects moving forward, but was bullish on midsized / smaller projects that are
higher margin, quicker book-and-burn, and represent ~40% of the segment today.
Q3’16 Divisional / Market Commentary
Chicago Bridge & Iron (NYSE: CBI)
Source: ThomsonOne, Company data, Credit Suisse Estimates
62
C onsensus EPS
Ticker M kt C ap Price 52 - W Hi % Hi 52 - W Lo % Lo Q4 '16 FY '17 FY '18
CBI $3,321 $33.18 $41.01 (19.1%) $26.46 25.4% $1.45 $4.53 $4.65
R eport D at e: 2/23/17* C all D at e: 2/24/17* C all T ime: TBD D ial- in: TBD C ode: TBD
* Estimated
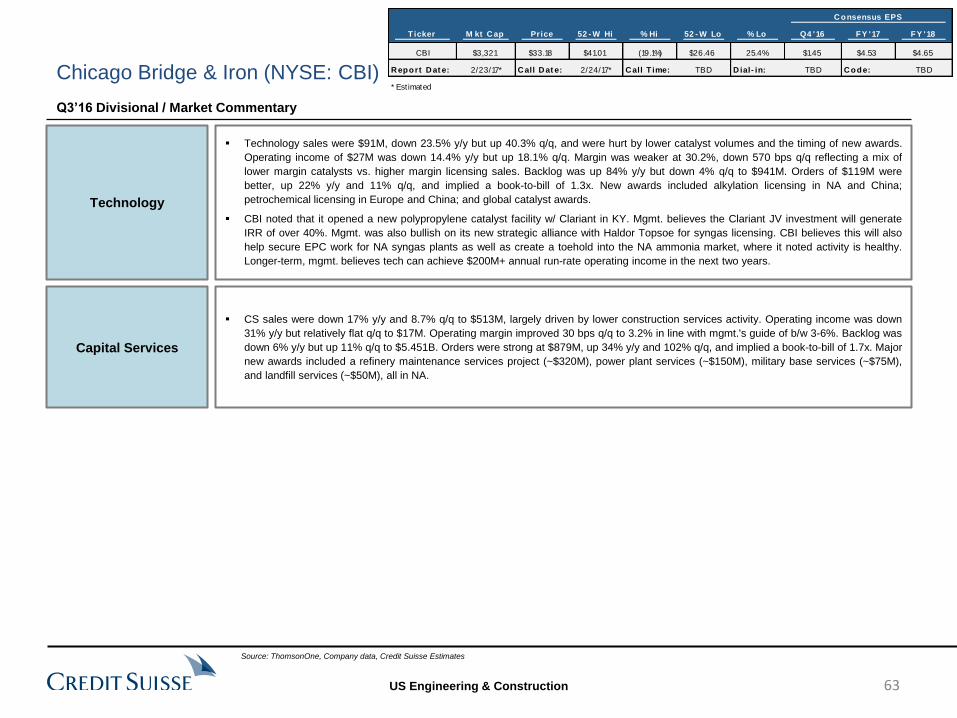
US Engineering & Construction
Technology
Technology sales were $91M, down 23.5% y/y but up 40.3% q/q, and were hurt by lower catalyst volumes and the timing of new awards.
Operating income of $27M was down 14.4% y/y but up 18.1% q/q. Margin was weaker at 30.2%, down 570 bps q/q reflecting a mix of
lower margin catalysts vs. higher margin licensing sales. Backlog was up 84% y/y but down 4% q/q to $941M. Orders of $119M were
better, up 22% y/y and 11% q/q, and implied a book-to-bill of 1.3x. New awards included alkylation licensing in NA and China;
petrochemical licensing in Europe and China; and global catalyst awards.
CBI noted that it opened a new polypropylene catalyst facility w/ Clariant in KY. Mgmt. believes the Clariant JV investment will generate
IRR of over 40%. Mgmt. was also bullish on its new strategic alliance with Haldor Topsoe for syngas licensing. CBI believes this will also
help secure EPC work for NA syngas plants as well as create a toehold into the NA ammonia market, where it noted activity is healthy.
Longer-term, mgmt. believes tech can achieve $200M+ annual run-rate operating income in the next two years.
Capital Services
CS sales were down 17% y/y and 8.7% q/q to $513M, largely driven by lower construction services activity. Operating income was down
31% y/y but relatively flat q/q to $17M. Operating margin improved 30 bps q/q to 3.2% in line with mgmt.'s guide of b/w 3-6%. Backlog was
down 6% y/y but up 11% q/q to $5.451B. Orders were strong at $879M, up 34% y/y and 102% q/q, and implied a book-to-bill of 1.7x. Major
new awards included a refinery maintenance services project (~$320M), power plant services (~$150M), military base services (~$75M),
and landfill services (~$50M), all in NA.
Q3’16 Divisional / Market Commentary
Chicago Bridge & Iron (NYSE: CBI)
Source: ThomsonOne, Company data, Credit Suisse Estimates
63
C onsensus EPS
Ticker M kt C ap Price 52 - W Hi % Hi 52 - W Lo % Lo Q4 '16 FY '17 FY '18
CBI $3,321 $33.18 $41.01 (19.1%) $26.46 25.4% $1.45 $4.53 $4.65
R eport D at e: 2/23/17* C all D at e: 2/24/17* C all T ime: TBD D ial- in: TBD C ode: TBD
* Estimated
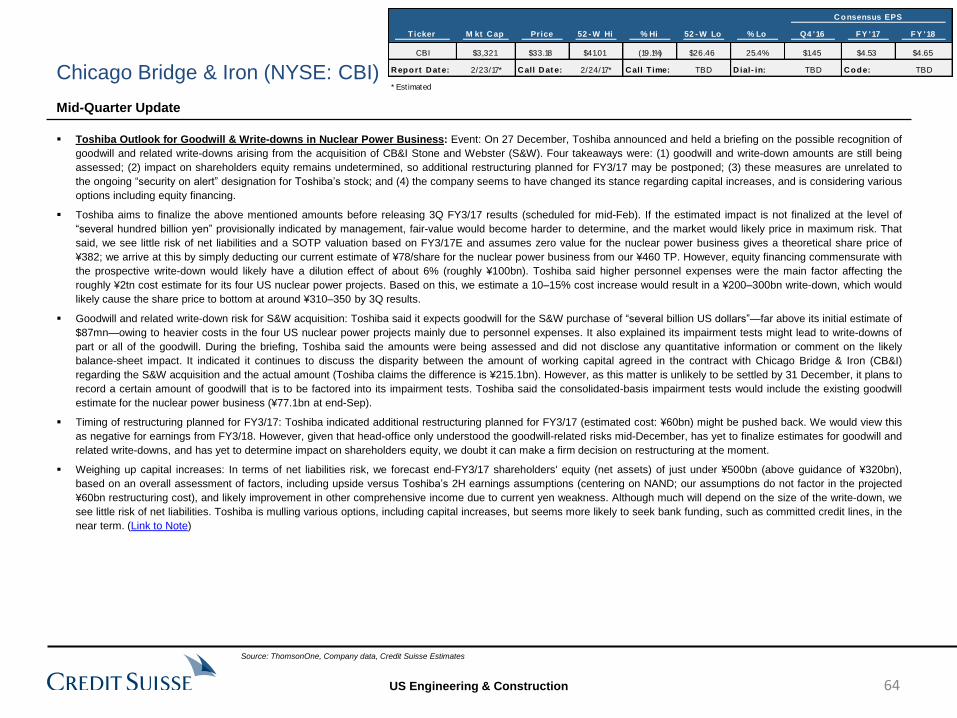
US Engineering & Construction
Toshiba Outlook for Goodwill & Write-downs in Nuclear Power Business: Event: On 27 December, Toshiba announced and held a briefing on the possible recognition of
goodwill and related write-downs arising from the acquisition of CB&I Stone and Webster (S&W). Four takeaways were: (1) goodwill and write-down amounts are still being
assessed; (2) impact on shareholders equity remains undetermined, so additional restructuring planned for FY3/17 may be postponed; (3) these measures are unrelated to
the ongoing “security on alert” designation for Toshiba’s stock; and (4) the company seems to have changed its stance regarding capital increases, and is considering various
options including equity financing.
Toshiba aims to finalize the above mentioned amounts before releasing 3Q FY3/17 results (scheduled for mid-Feb). If the estimated impact is not finalized at the level of
“several hundred billion yen” provisionally indicated by management, fair-value would become harder to determine, and the market would likely price in maximum risk. That
said, we see little risk of net liabilities and a SOTP valuation based on FY3/17E and assumes zero value for the nuclear power business gives a theoretical share price of
¥382; we arrive at this by simply deducting our current estimate of ¥78/share for the nuclear power business from our ¥460 TP. However, equity financing commensurate with
the prospective write-down would likely have a dilution effect of about 6% (roughly ¥100bn). Toshiba said higher personnel expenses were the main factor affecting the
roughly ¥2tn cost estimate for its four US nuclear power projects. Based on this, we estimate a 10–15% cost increase would result in a ¥200–300bn write-down, which would
likely cause the share price to bottom at around ¥310–350 by 3Q results.
Goodwill and related write-down risk for S&W acquisition: Toshiba said it expects goodwill for the S&W purchase of “several billion US dollars”—far above its initial estimate of
$87mn—owing to heavier costs in the four US nuclear power projects mainly due to personnel expenses. It also explained its impairment tests might lead to write-downs of
part or all of the goodwill. During the briefing, Toshiba said the amounts were being assessed and did not disclose any quantitative information or comment on the likely
balance-sheet impact. It indicated it continues to discuss the disparity between the amount of working capital agreed in the contract with Chicago Bridge & Iron (CB&I)
regarding the S&W acquisition and the actual amount (Toshiba claims the difference is ¥215.1bn). However, as this matter is unlikely to be settled by 31 December, it plans to
record a certain amount of goodwill that is to be factored into its impairment tests. Toshiba said the consolidated-basis impairment tests would include the existing goodwill
estimate for the nuclear power business (¥77.1bn at end-Sep).
Timing of restructuring planned for FY3/17: Toshiba indicated additional restructuring planned for FY3/17 (estimated cost: ¥60bn) might be pushed back. We would view this
as negative for earnings from FY3/18. However, given that head-office only understood the goodwill-related risks mid-December, has yet to finalize estimates for goodwill and
related write-downs, and has yet to determine impact on shareholders equity, we doubt it can make a firm decision on restructuring at the moment.
Weighing up capital increases: In terms of net liabilities risk, we forecast end-FY3/17 shareholders' equity (net assets) of just under ¥500bn (above guidance of ¥320bn),
based on an overall assessment of factors, including upside versus Toshiba’s 2H earnings assumptions (centering on NAND; our assumptions do not factor in the projected
¥60bn restructuring cost), and likely improvement in other comprehensive income due to current yen weakness. Although much will depend on the size of the write-down, we
see little risk of net liabilities. Toshiba is mulling various options, including capital increases, but seems more likely to seek bank funding, such as committed credit lines, in the
near term. (Link to Note)
Mid-Quarter Update
Chicago Bridge & Iron (NYSE: CBI)
Source: ThomsonOne, Company data, Credit Suisse Estimates
64
C onsensus EPS
Ticker M kt C ap Price 52 - W Hi % Hi 52 - W Lo % Lo Q4 '16 FY '17 FY '18
CBI $3,321 $33.18 $41.01 (19.1%) $26.46 25.4% $1.45 $4.53 $4.65
R eport D at e: 2/23/17* C all D at e: 2/24/17* C all T ime: TBD D ial- in: TBD C ode: TBD
* Estimated
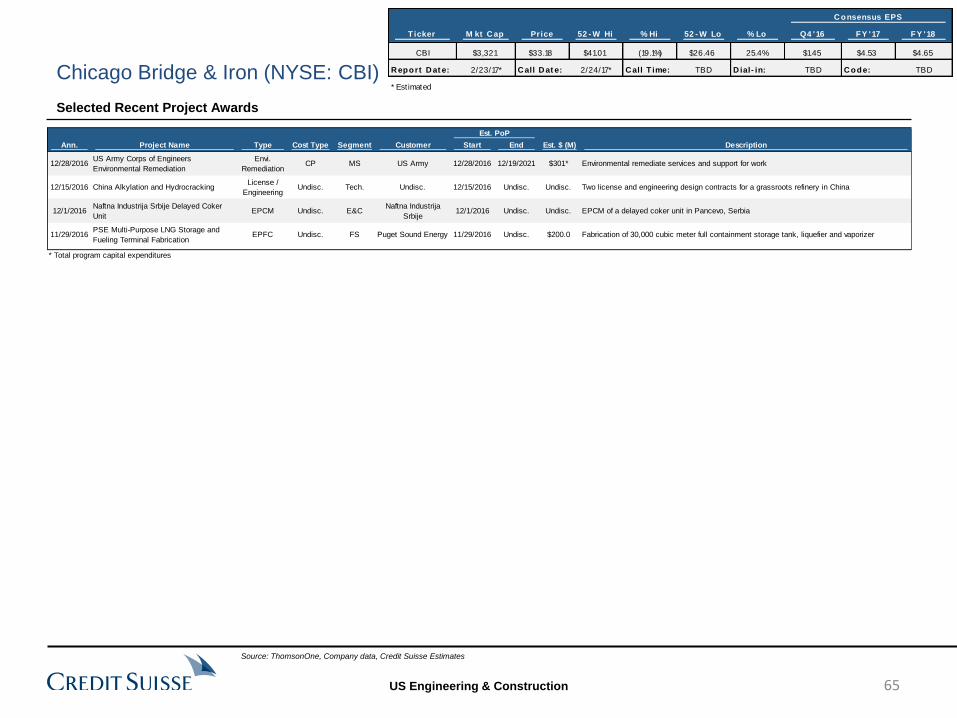
US Engineering & Construction
Selected Recent Project Awards
Chicago Bridge & Iron (NYSE: CBI)
Source: ThomsonOne, Company data, Credit Suisse Estimates
Est. PoP
Ann. Project Name Type Cost Type Segment Customer Start End Est. $ (M) Description
12/28/2016US Army Corps of Engineers
Environmental Remediation
Envi.
RemediationCP MS US Army 12/28/2016 12/19/2021 $301* Environmental remediate services and support for work
12/15/2016 China Alkylation and HydrocrackingLicense /
EngineeringUndisc. Tech. Undisc. 12/15/2016 Undisc. Undisc. Two license and engineering design contracts for a grassroots refinery in China
12/1/2016Naftna Industrija Srbije Delayed Coker
UnitEPCM Undisc. E&C
Naftna Industrija
Srbije12/1/2016 Undisc. Undisc. EPCM of a delayed coker unit in Pancevo, Serbia
11/29/2016PSE Multi-Purpose LNG Storage and
Fueling Terminal FabricationEPFC Undisc. FS Puget Sound Energy 11/29/2016 Undisc. $200.0 Fabrication of 30,000 cubic meter full containment storage tank, liquefier and vaporizer
* Total program capital expenditures
65
C onsensus EPS
Ticker M kt C ap Price 52 - W Hi % Hi 52 - W Lo % Lo Q4 '16 FY '17 FY '18
CBI $3,321 $33.18 $41.01 (19.1%) $26.46 25.4% $1.45 $4.53 $4.65
R eport D at e: 2/23/17* C all D at e: 2/24/17* C all T ime: TBD D ial- in: TBD C ode: TBD
* Estimated
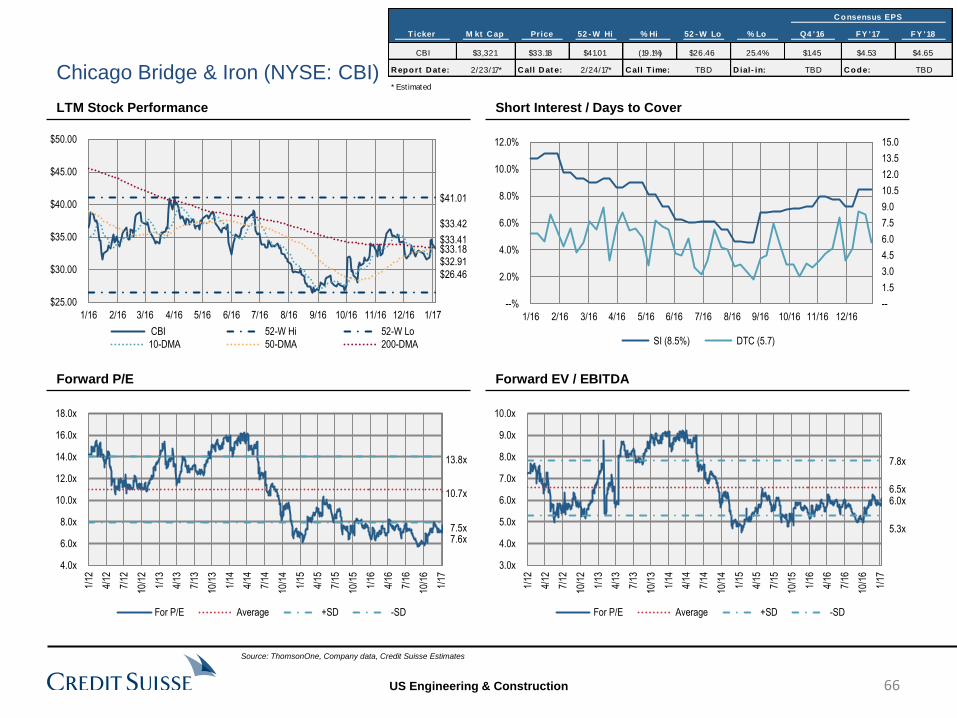
US Engineering & Construction
Chicago Bridge & Iron (NYSE: CBI)
LTM Stock Performance
Forward P/E
Short Interest / Days to Cover
Forward EV / EBITDA
Source: ThomsonOne, Company data, Credit Suisse Estimates
--
1.5
3.0
4.5
6.0
7.5
9.0
10.5
12.0
13.5
15.0
--%
2.0%
4.0%
6.0%
8.0%
10.0%
12.0%
1/16 2/16 3/16 4/16 5/16 6/16 7/16 8/16 9/16 10/16 11/16 12/16
SI (8.5%) DTC (5.7)
7.5x
10.7x
13.8x
7.6x
4.0x
6.0x
8.0x
10.0x
12.0x
14.0x
16.0x
18.0x
1/12
4/12
7/12
10/1
2
1/13
4/13
7/13
10/1
3
1/14
4/14
7/14
10/1
4
1/15
4/15
7/15
10/1
5
1/16
4/16
7/16
10/1
6
1/17
For P/E Average +SD -SD
6.0x 6.5x
7.8x
5.3x
3.0x
4.0x
5.0x
6.0x
7.0x
8.0x
9.0x
10.0x
1/12
4/12
7/12
10/1
2
1/13
4/13
7/13
10/1
3
1/14
4/14
7/14
10/1
4
1/15
4/15
7/15
10/1
5
1/16
4/16
7/16
10/1
6
1/17
For P/E Average +SD -SD
66
$33.18
$41.01
$26.46
$32.91
$33.41
$33.42
$25.00
$30.00
$35.00
$40.00
$45.00
$50.00
1/16 2/16 3/16 4/16 5/16 6/16 7/16 8/16 9/16 10/16 11/16 12/16 1/17
CBI 52-W Hi 52-W Lo
10-DMA 50-DMA 200-DMA
C onsensus EPS
Ticker M kt C ap Price 52 - W Hi % Hi 52 - W Lo % Lo Q4 '16 FY '17 FY '18
CBI $3,321 $33.18 $41.01 (19.1%) $26.46 25.4% $1.45 $4.53 $4.65
R eport D at e: 2/23/17* C all D at e: 2/24/17* C all T ime: TBD D ial- in: TBD C ode: TBD
* Estimated
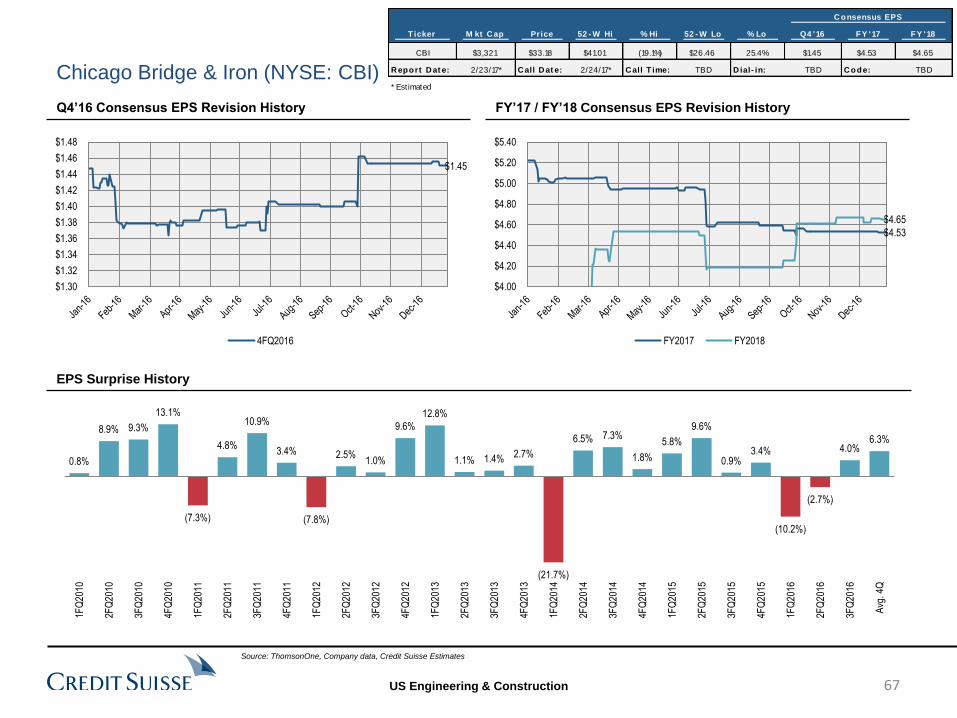
US Engineering & Construction
Chicago Bridge & Iron (NYSE: CBI)
Q4’16 Consensus EPS Revision History FY’17 / FY’18 Consensus EPS Revision History
EPS Surprise History
Source: ThomsonOne, Company data, Credit Suisse Estimates
$1.45
$1.30
$1.32
$1.34
$1.36
$1.38
$1.40
$1.42
$1.44
$1.46
$1.48
4FQ2016
$4.53
$4.65
$4.00
$4.20
$4.40
$4.60
$4.80
$5.00
$5.20
$5.40
FY2017 FY2018
6.3% 4.0%
(2.7%)
(10.2%)
3.4% 0.9%
9.6%
5.8%
1.8%
7.3% 6.5%
(21.7%)
2.7% 1.4% 1.1%
12.8%
9.6%
1.0% 2.5%
(7.8%)
3.4%
10.9%
4.8%
(7.3%)
13.1%
9.3% 8.9%
0.8%
Avg
. 4Q
3FQ
2016
2FQ
2016
1FQ
2016
4FQ
2015
3FQ
2015
2FQ
2015
1FQ
2015
4FQ
2014
3FQ
2014
2FQ
2014
1FQ
2014
4FQ
2013
3FQ
2013
2FQ
2013
1FQ
2013
4FQ
2012
3FQ
2012
2FQ
2012
1FQ
2012
4FQ
2011
3FQ
2011
2FQ
2011
1FQ
2011
4FQ
2010
3FQ
2010
2FQ
2010
1FQ
2010
67
C onsensus EPS
Ticker M kt C ap Price 52 - W Hi % Hi 52 - W Lo % Lo Q4 '16 FY '17 FY '18
CBI $3,321 $33.18 $41.01 (19.1%) $26.46 25.4% $1.45 $4.53 $4.65
R eport D at e: 2/23/17* C all D at e: 2/24/17* C all T ime: TBD D ial- in: TBD C ode: TBD
* Estimated

US Engineering & Construction
C onsensus EPS
Ticker M kt C ap Price 52 - W Hi % Hi 52 - W Lo % Lo Q4 '16 FY '17 FY '18
FLR $7,820 $56.16 $57.14 (1.7%) $41.74 34.5% $0.78 $2.91 $3.22
R eport D at e: 2/17/17 C all D at e: 2/17/17 C all T ime: 9:00am D ial- in: 888.297.0357 C ode: 2189098
What are the potential risks and upside to the FY’17 outlook and how do we think about margin targets by segment? Are there any additional cost cutting
measures FLR is undertaking embedded in FY’17 guidance? What is the revenue associated with the problem projects embedded in FY’17 guidance?
How do we think about FCF relative to net income in FY’17? Is FLR seeing any customers delay payments? Where are PEMEX receivables vs
expectations?
What is the expected contribution from Stork with regards to FY’17 EPS and has business stabilized at all since deteriorating after the deal closed? What is
a reasonable time frame to think about revenue synergies?
Update on the COOEC joint venture? Is FLR on track to pay the remaining $78M in September, 2017 and when can we expect new awards for the JV?
During the third quarter, FLR noted the competitive environment had taken a turn for the worse. Specifically, customers were expecting lower EPC prices
and that there was increased levels of irrational bid and fee pricing. Has this persisted or is there more optimism given higher commodity prices or view the
economy should improve? How has this impacted FLR’s win rate and are there any projects FLR expected to win and lost that could impact FY’17
guidance?
What is the status of the CP Chem fixed price problem project? Recall, FLR took a $241M pre-tax charge in Q3’16. As of Q3’16 the project was 60%
complete and expected to be completed in October 2017.
When does FLR think its Energy backlog bottoms? Historically orders inflect 6-8 quarter after oil has stabilized at higher levels? Oil bottomed in February
2016, which implies we could see orders inflect higher within the next two to four quarters. Is that reasonable and do you thinking mining or energy recovers
first? Given more constructive outlook for offshore, when does FLR see benefits from COOEC joint venture.
Assuming a deferral of awards, what levers can FLR pull in terms of restructuring to preserve profitability? What would be the required spend and what is
the timing for repayment?
How do you think about potential implications of the Trump administration on FLR’s business outlook?
Is there any potential risk to FLR on the Southern and SCANA nuclear projects? Recall, Toshiba has indicated it will write down its nuclear assets acquired
from CBI by “several billion” though it is unclear at this point if the write down is from the working capital claim vs. additional cost overruns on the projects.
Toshiba is looking to either raise external capital or sell its semi business to cover the loss. Assuming the Toshiba news relates to new additional costs on
the nuclear projects is there risk the projects are cancelled or that payments to FLR are delayed?
FLR has been fairly successful winning work on the infrastructure front? Can you speak to the profitability and risk profile associated with those jobs?
The street is modeling FY’17 as the trough for EPS. Is there enough in the way of petrochem / crackers, refining projects, and industrial / power awards to
build backlog in FY’17 and support EPS in FY’18, or is FY’18 more likely the trough? Assuming energy spend comes back, where do you customers
spending money across the broader upstream and downstream landscape?
Critical Factors Into Q4’16 Earnings
Fluor Corporation (NYSE: FLR)
Source: ThomsonOne, Company data, Credit Suisse Estimates
68
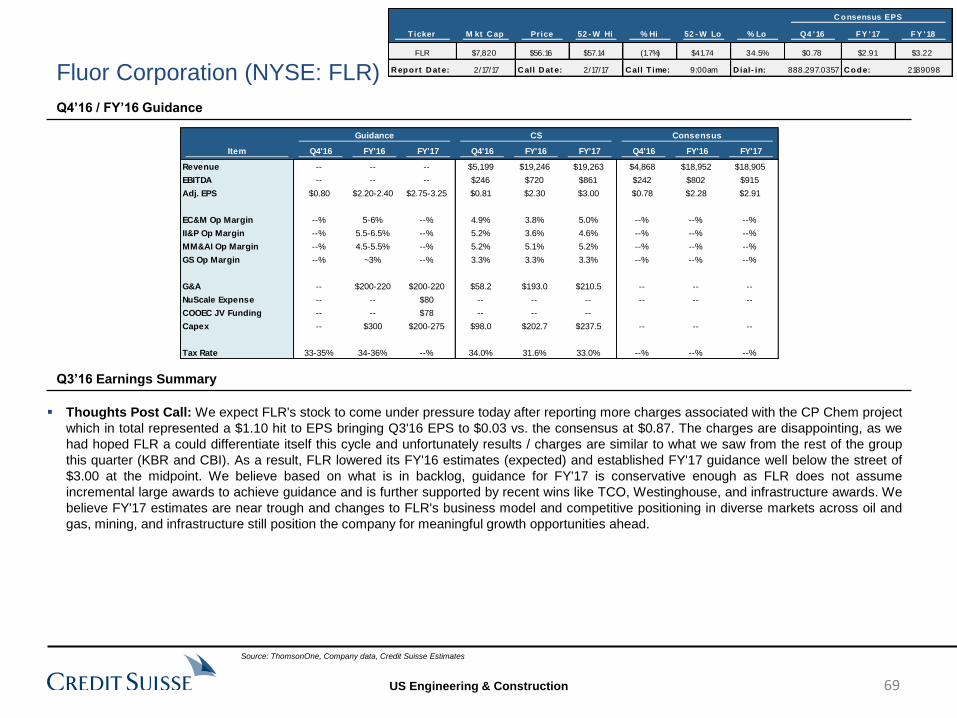
US Engineering & Construction
Q4’16 / FY’16 Guidance
Thoughts Post Call: We expect FLR's stock to come under pressure today after reporting more charges associated with the CP Chem project
which in total represented a $1.10 hit to EPS bringing Q3'16 EPS to $0.03 vs. the consensus at $0.87. The charges are disappointing, as we
had hoped FLR a could differentiate itself this cycle and unfortunately results / charges are similar to what we saw from the rest of the group
this quarter (KBR and CBI). As a result, FLR lowered its FY'16 estimates (expected) and established FY'17 guidance well below the street of
$3.00 at the midpoint. We believe based on what is in backlog, guidance for FY'17 is conservative enough as FLR does not assume
incremental large awards to achieve guidance and is further supported by recent wins like TCO, Westinghouse, and infrastructure awards. We
believe FY'17 estimates are near trough and changes to FLR's business model and competitive positioning in diverse markets across oil and
gas, mining, and infrastructure still position the company for meaningful growth opportunities ahead.
Q3’16 Earnings Summary
Fluor Corporation (NYSE: FLR)
Source: ThomsonOne, Company data, Credit Suisse Estimates
Guidance CS Consensus
Item Q4'16 FY'16 FY'17 Q4'16 FY'16 FY'17 Q4'16 FY'16 FY'17
Revenue -- -- -- $5,199 $19,246 $19,263 $4,868 $18,952 $18,905
EBITDA -- -- -- $246 $720 $861 $242 $802 $915
Adj. EPS $0.80 $2.20-2.40 $2.75-3.25 $0.81 $2.30 $3.00 $0.78 $2.28 $2.91
EC&M Op Margin --% 5-6% --% 4.9% 3.8% 5.0% --% --% --%
II&P Op Margin --% 5.5-6.5% --% 5.2% 3.6% 4.6% --% --% --%
MM&AI Op Margin --% 4.5-5.5% --% 5.2% 5.1% 5.2% --% --% --%
GS Op Margin --% ~3% --% 3.3% 3.3% 3.3% --% --% --%
G&A -- $200-220 $200-220 $58.2 $193.0 $210.5 -- -- --
NuScale Expense -- -- $80 -- -- -- -- -- --
COOEC JV Funding -- -- $78 -- -- --
Capex -- $300 $200-275 $98.0 $202.7 $237.5 -- -- --
Tax Rate 33-35% 34-36% --% 34.0% 31.6% 33.0% --% --% --%
69
C onsensus EPS
Ticker M kt C ap Price 52 - W Hi % Hi 52 - W Lo % Lo Q4 '16 FY '17 FY '18
FLR $7,820 $56.16 $57.14 (1.7%) $41.74 34.5% $0.78 $2.91 $3.22
R eport D at e: 2/17/17 C all D at e: 2/17/17 C all T ime: 9:00am D ial- in: 888.297.0357 C ode: 2189098
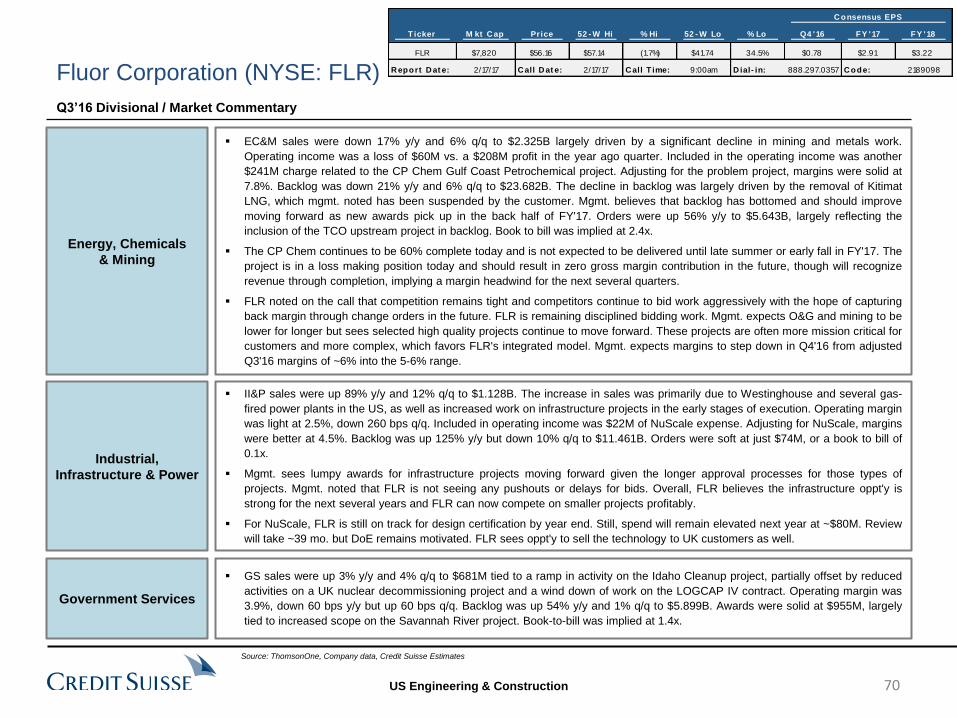
US Engineering & Construction
Q3’16 Divisional / Market Commentary
Fluor Corporation (NYSE: FLR)
Energy, Chemicals
& Mining
EC&M sales were down 17% y/y and 6% q/q to $2.325B largely driven by a significant decline in mining and metals work.
Operating income was a loss of $60M vs. a $208M profit in the year ago quarter. Included in the operating income was another
$241M charge related to the CP Chem Gulf Coast Petrochemical project. Adjusting for the problem project, margins were solid at
7.8%. Backlog was down 21% y/y and 6% q/q to $23.682B. The decline in backlog was largely driven by the removal of Kitimat
LNG, which mgmt. noted has been suspended by the customer. Mgmt. believes that backlog has bottomed and should improve
moving forward as new awards pick up in the back half of FY'17. Orders were up 56% y/y to $5.643B, largely reflecting the
inclusion of the TCO upstream project in backlog. Book to bill was implied at 2.4x.
The CP Chem continues to be 60% complete today and is not expected to be delivered until late summer or early fall in FY'17. The
project is in a loss making position today and should result in zero gross margin contribution in the future, though will recognize
revenue through completion, implying a margin headwind for the next several quarters.
FLR noted on the call that competition remains tight and competitors continue to bid work aggressively with the hope of capturing
back margin through change orders in the future. FLR is remaining disciplined bidding work. Mgmt. expects O&G and mining to be
lower for longer but sees selected high quality projects continue to move forward. These projects are often more mission critical for
customers and more complex, which favors FLR's integrated model. Mgmt. expects margins to step down in Q4'16 from adjusted
Q3'16 margins of ~6% into the 5-6% range.
Industrial,
Infrastructure & Power
II&P sales were up 89% y/y and 12% q/q to $1.128B. The increase in sales was primarily due to Westinghouse and several gas-
fired power plants in the US, as well as increased work on infrastructure projects in the early stages of execution. Operating margin
was light at 2.5%, down 260 bps q/q. Included in operating income was $22M of NuScale expense. Adjusting for NuScale, margins
were better at 4.5%. Backlog was up 125% y/y but down 10% q/q to $11.461B. Orders were soft at just $74M, or a book to bill of
0.1x.
Mgmt. sees lumpy awards for infrastructure projects moving forward given the longer approval processes for those types of
projects. Mgmt. noted that FLR is not seeing any pushouts or delays for bids. Overall, FLR believes the infrastructure oppt'y is
strong for the next several years and FLR can now compete on smaller projects profitably.
For NuScale, FLR is still on track for design certification by year end. Still, spend will remain elevated next year at ~$80M. Review
will take ~39 mo. but DoE remains motivated. FLR sees oppt'y to sell the technology to UK customers as well.
Source: ThomsonOne, Company data, Credit Suisse Estimates
Government Services
GS sales were up 3% y/y and 4% q/q to $681M tied to a ramp in activity on the Idaho Cleanup project, partially offset by reduced
activities on a UK nuclear decommissioning project and a wind down of work on the LOGCAP IV contract. Operating margin was
3.9%, down 60 bps y/y but up 60 bps q/q. Backlog was up 54% y/y and 1% q/q to $5.899B. Awards were solid at $955M, largely
tied to increased scope on the Savannah River project. Book-to-bill was implied at 1.4x.
70
C onsensus EPS
Ticker M kt C ap Price 52 - W Hi % Hi 52 - W Lo % Lo Q4 '16 FY '17 FY '18
FLR $7,820 $56.16 $57.14 (1.7%) $41.74 34.5% $0.78 $2.91 $3.22
R eport D at e: 2/17/17 C all D at e: 2/17/17 C all T ime: 9:00am D ial- in: 888.297.0357 C ode: 2189098
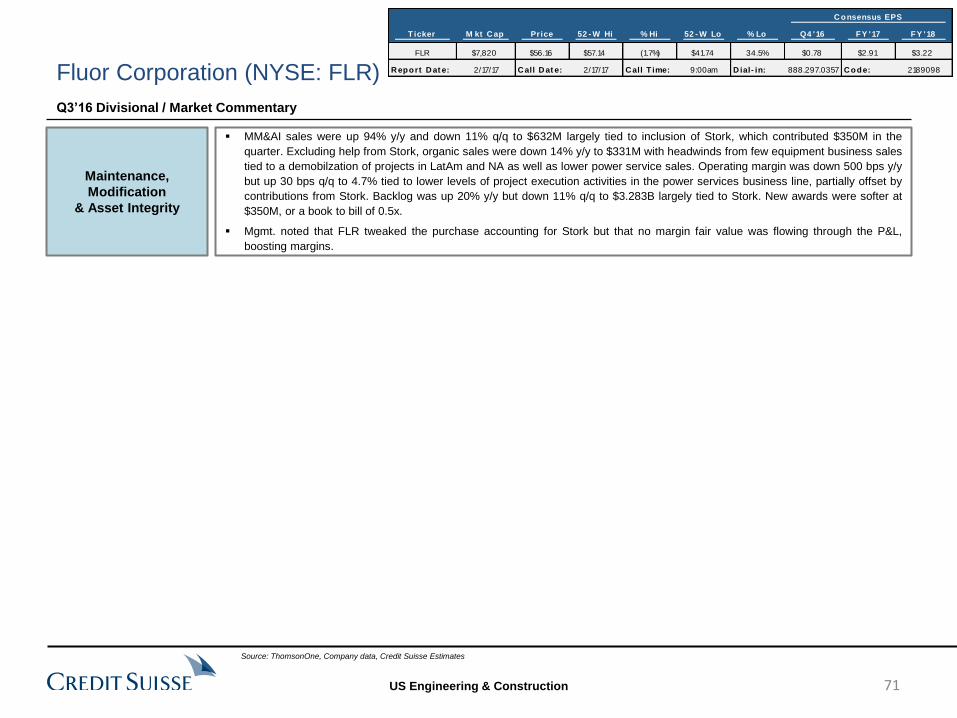
US Engineering & Construction
Q3’16 Divisional / Market Commentary
Fluor Corporation (NYSE: FLR)
Maintenance,
Modification
& Asset Integrity
MM&AI sales were up 94% y/y and down 11% q/q to $632M largely tied to inclusion of Stork, which contributed $350M in the
quarter. Excluding help from Stork, organic sales were down 14% y/y to $331M with headwinds from few equipment business sales
tied to a demobilzation of projects in LatAm and NA as well as lower power service sales. Operating margin was down 500 bps y/y
but up 30 bps q/q to 4.7% tied to lower levels of project execution activities in the power services business line, partially offset by
contributions from Stork. Backlog was up 20% y/y but down 11% q/q to $3.283B largely tied to Stork. New awards were softer at
$350M, or a book to bill of 0.5x.
Mgmt. noted that FLR tweaked the purchase accounting for Stork but that no margin fair value was flowing through the P&L,
boosting margins.
Source: ThomsonOne, Company data, Credit Suisse Estimates
71
C onsensus EPS
Ticker M kt C ap Price 52 - W Hi % Hi 52 - W Lo % Lo Q4 '16 FY '17 FY '18
FLR $7,820 $56.16 $57.14 (1.7%) $41.74 34.5% $0.78 $2.91 $3.22
R eport D at e: 2/17/17 C all D at e: 2/17/17 C all T ime: 9:00am D ial- in: 888.297.0357 C ode: 2189098
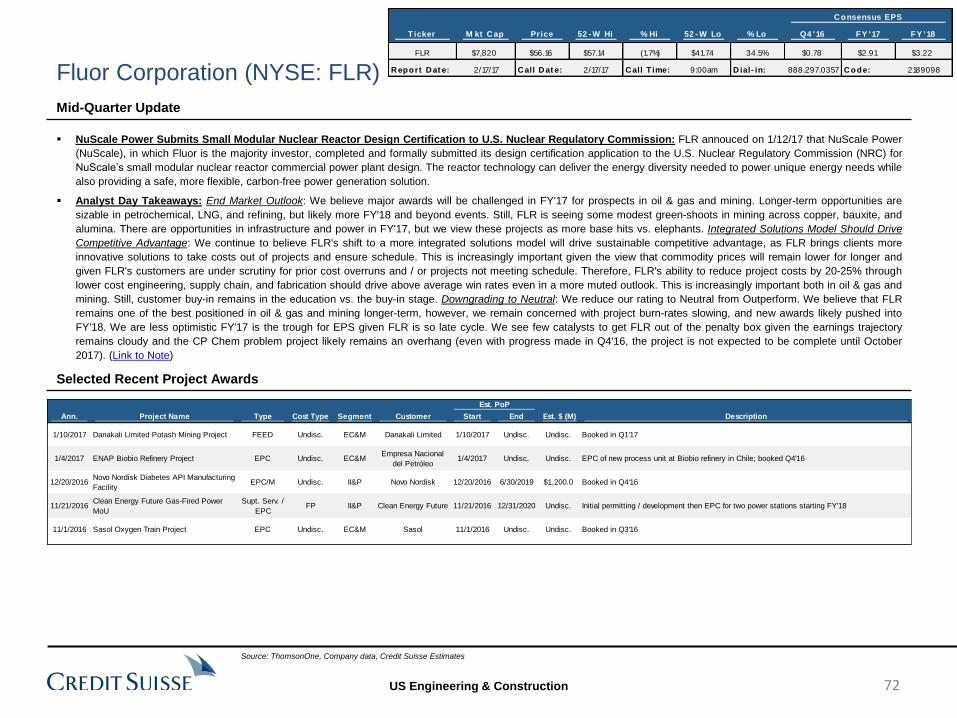
US Engineering & Construction
NuScale Power Submits Small Modular Nuclear Reactor Design Certification to U.S. Nuclear Regulatory Commission: FLR annouced on 1/12/17 that NuScale Power
(NuScale), in which Fluor is the majority investor, completed and formally submitted its design certification application to the U.S. Nuclear Regulatory Commission (NRC) for
NuScale’s small modular nuclear reactor commercial power plant design. The reactor technology can deliver the energy diversity needed to power unique energy needs while
also providing a safe, more flexible, carbon-free power generation solution.
Analyst Day Takeaways: End Market Outlook: We believe major awards will be challenged in FY'17 for prospects in oil & gas and mining. Longer-term opportunities are
sizable in petrochemical, LNG, and refining, but likely more FY'18 and beyond events. Still, FLR is seeing some modest green-shoots in mining across copper, bauxite, and
alumina. There are opportunities in infrastructure and power in FY'17, but we view these projects as more base hits vs. elephants. Integrated Solutions Model Should Drive
Competitive Advantage: We continue to believe FLR's shift to a more integrated solutions model will drive sustainable competitive advantage, as FLR brings clients more
innovative solutions to take costs out of projects and ensure schedule. This is increasingly important given the view that commodity prices will remain lower for longer and
given FLR's customers are under scrutiny for prior cost overruns and / or projects not meeting schedule. Therefore, FLR's ability to reduce project costs by 20-25% through
lower cost engineering, supply chain, and fabrication should drive above average win rates even in a more muted outlook. This is increasingly important both in oil & gas and
mining. Still, customer buy-in remains in the education vs. the buy-in stage. Downgrading to Neutral: We reduce our rating to Neutral from Outperform. We believe that FLR
remains one of the best positioned in oil & gas and mining longer-term, however, we remain concerned with project burn-rates slowing, and new awards likely pushed into
FY'18. We are less optimistic FY'17 is the trough for EPS given FLR is so late cycle. We see few catalysts to get FLR out of the penalty box given the earnings trajectory
remains cloudy and the CP Chem problem project likely remains an overhang (even with progress made in Q4'16, the project is not expected to be complete until October
2017). (Link to Note)
Mid-Quarter Update
Selected Recent Project Awards
Fluor Corporation (NYSE: FLR)
Source: ThomsonOne, Company data, Credit Suisse Estimates
Est. PoP
Ann. Project Name Type Cost Type Segment Customer Start End Est. $ (M) Description
1/10/2017 Danakali Limited Potash Mining Project FEED Undisc. EC&M Danakali Limited 1/10/2017 Undisc. Undisc. Booked in Q1'17
1/4/2017 ENAP Biobio Refinery Project EPC Undisc. EC&MEmpresa Nacional
del Petróleo1/4/2017 Undisc. Undisc. EPC of new process unit at Biobio refinery in Chile; booked Q4'16
12/20/2016Novo Nordisk Diabetes API Manufacturing
FacilityEPC/M Undisc. II&P Novo Nordisk 12/20/2016 6/30/2019 $1,200.0 Booked in Q4'16
11/21/2016Clean Energy Future Gas-Fired Power
MoU
Supt. Serv. /
EPCFP II&P Clean Energy Future 11/21/2016 12/31/2020 Undisc. Initial permitting / development then EPC for two power stations starting FY'18
11/1/2016 Sasol Oxygen Train Project EPC Undisc. EC&M Sasol 11/1/2016 Undisc. Undisc. Booked in Q3'16
72
C onsensus EPS
Ticker M kt C ap Price 52 - W Hi % Hi 52 - W Lo % Lo Q4 '16 FY '17 FY '18
FLR $7,820 $56.16 $57.14 (1.7%) $41.74 34.5% $0.78 $2.91 $3.22
R eport D at e: 2/17/17 C all D at e: 2/17/17 C all T ime: 9:00am D ial- in: 888.297.0357 C ode: 2189098

US Engineering & Construction
Fluor Corporation (NYSE: FLR)
LTM Stock Performance
Forward P/E
Short Interest / Days to Cover
Forward EV / EBITDA
Source: ThomsonOne, Company data, Credit Suisse Estimates
3.0
4.0
5.0
6.0
7.0
8.0
9.0
--%
1.0%
2.0%
3.0%
4.0%
5.0%
6.0%
7.0%
1/16 2/16 3/16 4/16 5/16 6/16 7/16 8/16 9/16 10/16 11/16 12/16
SI (3.6%) DTC (3.1)
19.5x
14.4x
16.4x
12.3x
8.0x
10.0x
12.0x
14.0x
16.0x
18.0x
20.0x
22.0x
1/12
4/12
7/12
10/1
2
1/13
4/13
7/13
10/1
3
1/14
4/14
7/14
10/1
4
1/15
4/15
7/15
10/1
5
1/16
4/16
7/16
10/1
6
1/17
For P/E Average +SD -SD
8.5x
6.2x
7.2x
5.3x
3.0x
4.0x
5.0x
6.0x
7.0x
8.0x
9.0x
1/12
4/12
7/12
10/1
2
1/13
4/13
7/13
10/1
3
1/14
4/14
7/14
10/1
4
1/15
4/15
7/15
10/1
5
1/16
4/16
7/16
10/1
6
1/17
For P/E Average +SD -SD
73
$56.16
$57.14
$41.74
$54.48 $53.91
$52.03
$35.00
$40.00
$45.00
$50.00
$55.00
$60.00
1/16 2/16 3/16 4/16 5/16 6/16 7/16 8/16 9/16 10/16 11/16 12/16 1/17
FLR 52-W Hi 52-W Lo
10-DMA 50-DMA 200-DMA
C onsensus EPS
Ticker M kt C ap Price 52 - W Hi % Hi 52 - W Lo % Lo Q4 '16 FY '17 FY '18
FLR $7,820 $56.16 $57.14 (1.7%) $41.74 34.5% $0.78 $2.91 $3.22
R eport D at e: 2/17/17 C all D at e: 2/17/17 C all T ime: 9:00am D ial- in: 888.297.0357 C ode: 2189098
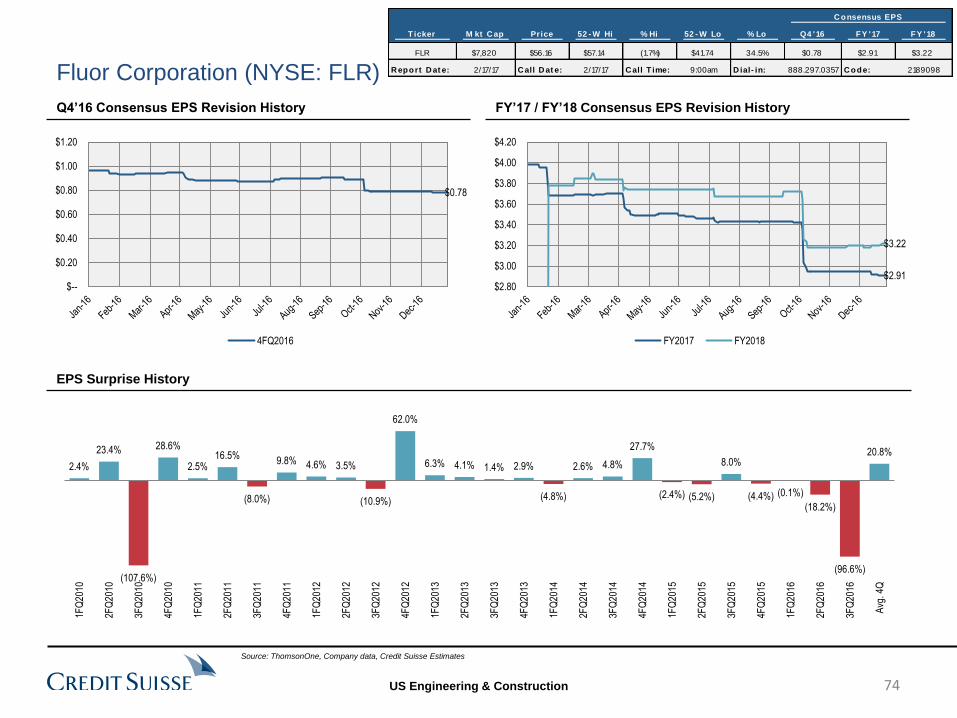
US Engineering & Construction
Fluor Corporation (NYSE: FLR)
Q4’16 Consensus EPS Revision History FY’17 / FY’18 Consensus EPS Revision History
EPS Surprise History
Source: ThomsonOne, Company data, Credit Suisse Estimates
$0.78
$--
$0.20
$0.40
$0.60
$0.80
$1.00
$1.20
4FQ2016
$2.91
$3.22
$2.80
$3.00
$3.20
$3.40
$3.60
$3.80
$4.00
$4.20
FY2017 FY2018
20.8%
(96.6%)
(18.2%)
(0.1%)(4.4%)
8.0%
(5.2%)(2.4%)
27.7%
4.8% 2.6%
(4.8%)
2.9% 1.4% 4.1% 6.3%
62.0%
(10.9%)
3.5% 4.6% 9.8%
(8.0%)
16.5% 2.5%
28.6%
(107.6%)
23.4%
2.4%
Avg
. 4Q
3FQ
2016
2FQ
2016
1FQ
2016
4FQ
2015
3FQ
2015
2FQ
2015
1FQ
2015
4FQ
2014
3FQ
2014
2FQ
2014
1FQ
2014
4FQ
2013
3FQ
2013
2FQ
2013
1FQ
2013
4FQ
2012
3FQ
2012
2FQ
2012
1FQ
2012
4FQ
2011
3FQ
2011
2FQ
2011
1FQ
2011
4FQ
2010
3FQ
2010
2FQ
2010
1FQ
2010
74
C onsensus EPS
Ticker M kt C ap Price 52 - W Hi % Hi 52 - W Lo % Lo Q4 '16 FY '17 FY '18
FLR $7,820 $56.16 $57.14 (1.7%) $41.74 34.5% $0.78 $2.91 $3.22
R eport D at e: 2/17/17 C all D at e: 2/17/17 C all T ime: 9:00am D ial- in: 888.297.0357 C ode: 2189098
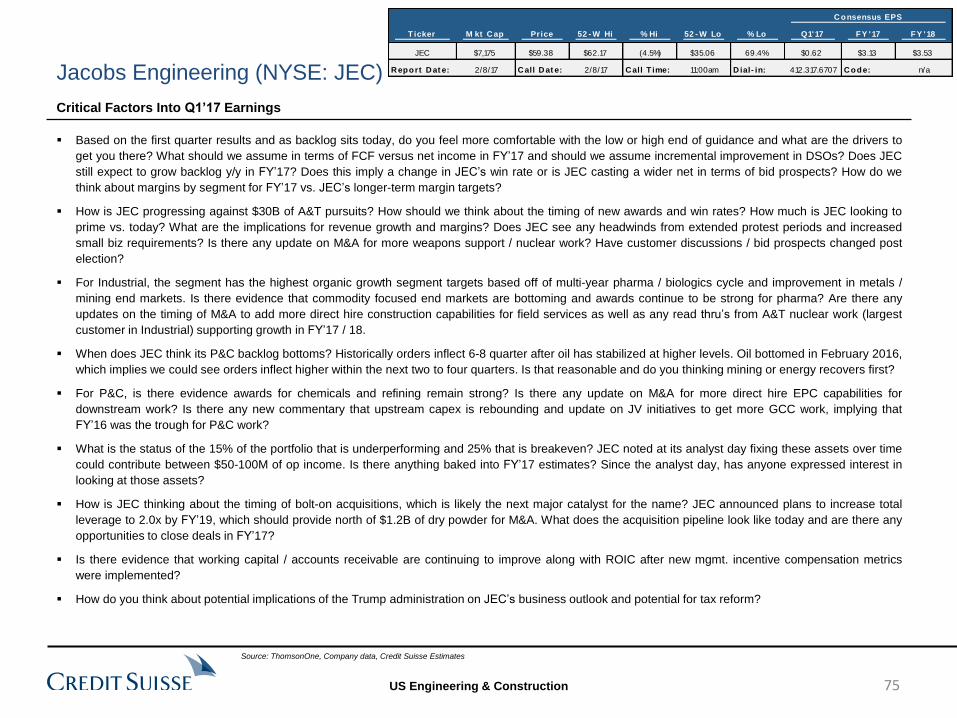
US Engineering & Construction
C onsensus EPS
Ticker M kt C ap Price 52 - W Hi % Hi 52 - W Lo % Lo Q1'17 FY '17 FY '18
JEC $7,175 $59.38 $62.17 (4.5%) $35.06 69.4% $0.62 $3.13 $3.53
R eport D at e: 2/8/17 C all D at e: 2/8/17 C all T ime: 11:00am D ial- in: 412.317.6707 C ode: n/a
Based on the first quarter results and as backlog sits today, do you feel more comfortable with the low or high end of guidance and what are the drivers to
get you there? What should we assume in terms of FCF versus net income in FY’17 and should we assume incremental improvement in DSOs? Does JEC
still expect to grow backlog y/y in FY’17? Does this imply a change in JEC’s win rate or is JEC casting a wider net in terms of bid prospects? How do we
think about margins by segment for FY’17 vs. JEC’s longer-term margin targets?
How is JEC progressing against $30B of A&T pursuits? How should we think about the timing of new awards and win rates? How much is JEC looking to
prime vs. today? What are the implications for revenue growth and margins? Does JEC see any headwinds from extended protest periods and increased
small biz requirements? Is there any update on M&A for more weapons support / nuclear work? Have customer discussions / bid prospects changed post
election?
For Industrial, the segment has the highest organic growth segment targets based off of multi-year pharma / biologics cycle and improvement in metals /
mining end markets. Is there evidence that commodity focused end markets are bottoming and awards continue to be strong for pharma? Are there any
updates on the timing of M&A to add more direct hire construction capabilities for field services as well as any read thru’s from A&T nuclear work (largest
customer in Industrial) supporting growth in FY’17 / 18.
When does JEC think its P&C backlog bottoms? Historically orders inflect 6-8 quarter after oil has stabilized at higher levels. Oil bottomed in February 2016,
which implies we could see orders inflect higher within the next two to four quarters. Is that reasonable and do you thinking mining or energy recovers first?
For P&C, is there evidence awards for chemicals and refining remain strong? Is there any update on M&A for more direct hire EPC capabilities for
downstream work? Is there any new commentary that upstream capex is rebounding and update on JV initiatives to get more GCC work, implying that
FY’16 was the trough for P&C work?
What is the status of the 15% of the portfolio that is underperforming and 25% that is breakeven? JEC noted at its analyst day fixing these assets over time
could contribute between $50-100M of op income. Is there anything baked into FY’17 estimates? Since the analyst day, has anyone expressed interest in
looking at those assets?
How is JEC thinking about the timing of bolt-on acquisitions, which is likely the next major catalyst for the name? JEC announced plans to increase total
leverage to 2.0x by FY’19, which should provide north of $1.2B of dry powder for M&A. What does the acquisition pipeline look like today and are there any
opportunities to close deals in FY’17?
Is there evidence that working capital / accounts receivable are continuing to improve along with ROIC after new mgmt. incentive compensation metrics
were implemented?
How do you think about potential implications of the Trump administration on JEC’s business outlook and potential for tax reform?
Critical Factors Into Q1’17 Earnings
Jacobs Engineering (NYSE: JEC)
Source: ThomsonOne, Company data, Credit Suisse Estimates
75

US Engineering & Construction
Q1’17 / FY’17 Guidance
Thoughts Post Call: JEC's stock closed up ~3% after a fairly in line quarter and providing FY'17 outlook 2.5% below the Street. Still, JEC
bracketed consensus at the high end, which is typical of mgmt. On the positive, JEC continues to execute well against its broader restructuring
efforts, which is resulting in y/y margin improvement both at the segment level and G&A despite tougher markets. Additionally FCF conversion
for FY'16 was fairly impressive at $612M for the year driven largely by DSOs, which are down seven days vs. FY'15. With a good portion of the
restructuring in place, JEC is now focused on profitable growth and is targeting to grow backlog y/y despite the tough market conditions as a
result of a renewed focus leveraging synergies across the Company.
Q4’16 Earnings Summary
Jacobs Engineering (NYSE: JEC)
Source: ThomsonOne, Company data, Credit Suisse Estimates
Guidance CS Consensus
Item Q1'17 FY'17 FY'18 Q1'17 FY'17 FY'18 Q1'17 FY'17 FY'18
Revenue -- -- -- $2,566 $10,706 $11,067 $2,646 $10,902 $11,364
EBITDA -- -- -- $160 $712 $746 $138 $671 $723
Adj. EPS -- $3.00-3.30 -- $0.61 $3.15 $3.60 $0.62 $3.13 $3.53
A&T Op Margin --% --% --% 7.3% 7.8% 7.8% --% --% --%
B&I Op Margin --% --% --% 7.3% 7.7% 7.8% --% --% --%
Industrial Op Margin --% --% --% 3.8% 4.2% 4.4% --% --% --%
P&C Op Margin --% --% --% 3.9% 4.4% 4.6% --% --% --%
Tax --% Low 30% --% 30.5% 30.5% 30.5% --% --% --%
Restructuring Expense -- $54 -- $13.8 $55.2 -- -- -- --
Restructuring Savings -- $260-270 -- -- -- -- -- -- --
Non-allocated Corporate -- $60 -- $14.1 $58.9 $60.9 -- -- --
76
C onsensus EPS
Ticker M kt C ap Price 52 - W Hi % Hi 52 - W Lo % Lo Q1'17 FY '17 FY '18
JEC $7,175 $59.38 $62.17 (4.5%) $35.06 69.4% $0.62 $3.13 $3.53
R eport D at e: 2/8/17 C all D at e: 2/8/17 C all T ime: 11:00am D ial- in: 412.317.6707 C ode: n/a
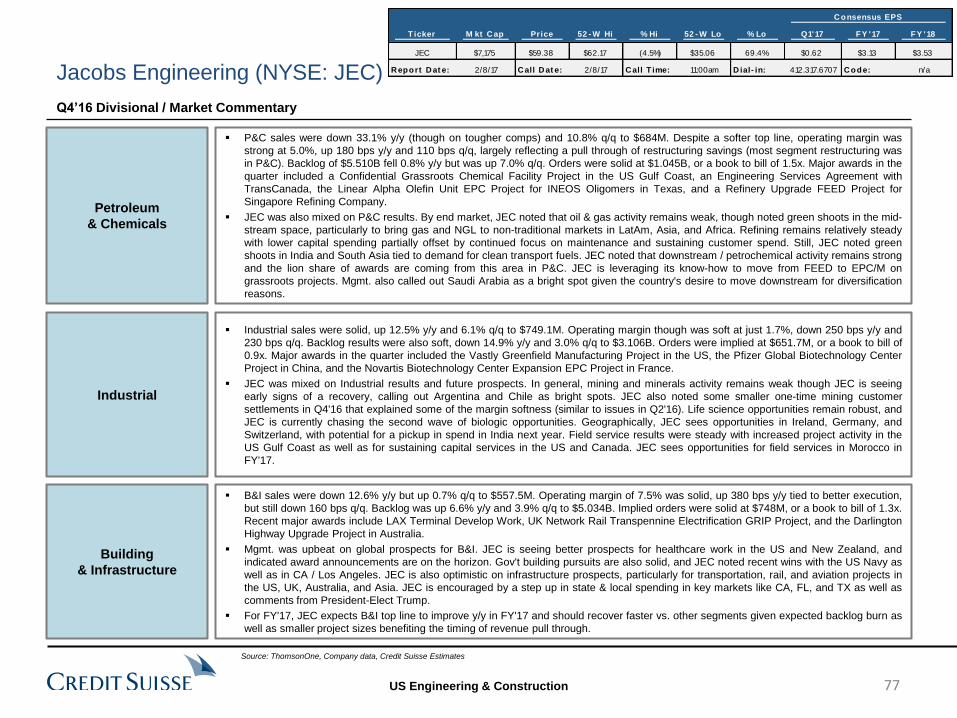
US Engineering & Construction
Q4’16 Divisional / Market Commentary
Jacobs Engineering (NYSE: JEC)
Petroleum
& Chemicals
P&C sales were down 33.1% y/y (though on tougher comps) and 10.8% q/q to $684M. Despite a softer top line, operating margin was
strong at 5.0%, up 180 bps y/y and 110 bps q/q, largely reflecting a pull through of restructuring savings (most segment restructuring was
in P&C). Backlog of $5.510B fell 0.8% y/y but was up 7.0% q/q. Orders were solid at $1.045B, or a book to bill of 1.5x. Major awards in the
quarter included a Confidential Grassroots Chemical Facility Project in the US Gulf Coast, an Engineering Services Agreement with
TransCanada, the Linear Alpha Olefin Unit EPC Project for INEOS Oligomers in Texas, and a Refinery Upgrade FEED Project for
Singapore Refining Company.
JEC was also mixed on P&C results. By end market, JEC noted that oil & gas activity remains weak, though noted green shoots in the mid-
stream space, particularly to bring gas and NGL to non-traditional markets in LatAm, Asia, and Africa. Refining remains relatively steady
with lower capital spending partially offset by continued focus on maintenance and sustaining customer spend. Still, JEC noted green
shoots in India and South Asia tied to demand for clean transport fuels. JEC noted that downstream / petrochemical activity remains strong
and the lion share of awards are coming from this area in P&C. JEC is leveraging its know-how to move from FEED to EPC/M on
grassroots projects. Mgmt. also called out Saudi Arabia as a bright spot given the country's desire to move downstream for diversification
reasons.
Industrial
Industrial sales were solid, up 12.5% y/y and 6.1% q/q to $749.1M. Operating margin though was soft at just 1.7%, down 250 bps y/y and
230 bps q/q. Backlog results were also soft, down 14.9% y/y and 3.0% q/q to $3.106B. Orders were implied at $651.7M, or a book to bill of
0.9x. Major awards in the quarter included the Vastly Greenfield Manufacturing Project in the US, the Pfizer Global Biotechnology Center
Project in China, and the Novartis Biotechnology Center Expansion EPC Project in France.
JEC was mixed on Industrial results and future prospects. In general, mining and minerals activity remains weak though JEC is seeing
early signs of a recovery, calling out Argentina and Chile as bright spots. JEC also noted some smaller one-time mining customer
settlements in Q4'16 that explained some of the margin softness (similar to issues in Q2'16). Life science opportunities remain robust, and
JEC is currently chasing the second wave of biologic opportunities. Geographically, JEC sees opportunities in Ireland, Germany, and
Switzerland, with potential for a pickup in spend in India next year. Field service results were steady with increased project activity in the
US Gulf Coast as well as for sustaining capital services in the US and Canada. JEC sees opportunities for field services in Morocco in
FY'17.
Source: ThomsonOne, Company data, Credit Suisse Estimates
Building
& Infrastructure
B&I sales were down 12.6% y/y but up 0.7% q/q to $557.5M. Operating margin of 7.5% was solid, up 380 bps y/y tied to better execution,
but still down 160 bps q/q. Backlog was up 6.6% y/y and 3.9% q/q to $5.034B. Implied orders were solid at $748M, or a book to bill of 1.3x.
Recent major awards include LAX Terminal Develop Work, UK Network Rail Transpennine Electrification GRIP Project, and the Darlington
Highway Upgrade Project in Australia.
Mgmt. was upbeat on global prospects for B&I. JEC is seeing better prospects for healthcare work in the US and New Zealand, and
indicated award announcements are on the horizon. Gov't building pursuits are also solid, and JEC noted recent wins with the US Navy as
well as in CA / Los Angeles. JEC is also optimistic on infrastructure prospects, particularly for transportation, rail, and aviation projects in
the US, UK, Australia, and Asia. JEC is encouraged by a step up in state & local spending in key markets like CA, FL, and TX as well as
comments from President-Elect Trump.
For FY'17, JEC expects B&I top line to improve y/y in FY'17 and should recover faster vs. other segments given expected backlog burn as
well as smaller project sizes benefiting the timing of revenue pull through.
77
C onsensus EPS
Ticker M kt C ap Price 52 - W Hi % Hi 52 - W Lo % Lo Q1'17 FY '17 FY '18
JEC $7,175 $59.38 $62.17 (4.5%) $35.06 69.4% $0.62 $3.13 $3.53
R eport D at e: 2/8/17 C all D at e: 2/8/17 C all T ime: 11:00am D ial- in: 412.317.6707 C ode: n/a
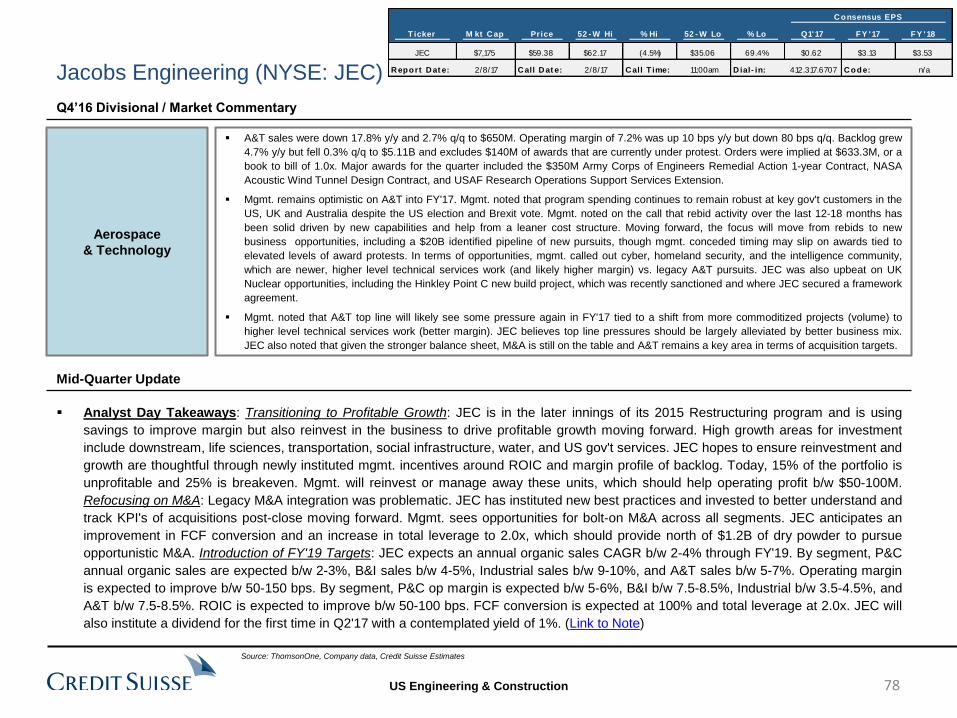
US Engineering & Construction
Aerospace
& Technology
A&T sales were down 17.8% y/y and 2.7% q/q to $650M. Operating margin of 7.2% was up 10 bps y/y but down 80 bps q/q. Backlog grew
4.7% y/y but fell 0.3% q/q to $5.11B and excludes $140M of awards that are currently under protest. Orders were implied at $633.3M, or a
book to bill of 1.0x. Major awards for the quarter included the $350M Army Corps of Engineers Remedial Action 1-year Contract, NASA
Acoustic Wind Tunnel Design Contract, and USAF Research Operations Support Services Extension.
Mgmt. remains optimistic on A&T into FY'17. Mgmt. noted that program spending continues to remain robust at key gov't customers in the
US, UK and Australia despite the US election and Brexit vote. Mgmt. noted on the call that rebid activity over the last 12-18 months has
been solid driven by new capabilities and help from a leaner cost structure. Moving forward, the focus will move from rebids to new
business opportunities, including a $20B identified pipeline of new pursuits, though mgmt. conceded timing may slip on awards tied to
elevated levels of award protests. In terms of opportunities, mgmt. called out cyber, homeland security, and the intelligence community,
which are newer, higher level technical services work (and likely higher margin) vs. legacy A&T pursuits. JEC was also upbeat on UK
Nuclear opportunities, including the Hinkley Point C new build project, which was recently sanctioned and where JEC secured a framework
agreement.
Mgmt. noted that A&T top line will likely see some pressure again in FY'17 tied to a shift from more commoditized projects (volume) to
higher level technical services work (better margin). JEC believes top line pressures should be largely alleviated by better business mix.
JEC also noted that given the stronger balance sheet, M&A is still on the table and A&T remains a key area in terms of acquisition targets.
Q4’16 Divisional / Market Commentary
Analyst Day Takeaways: Transitioning to Profitable Growth: JEC is in the later innings of its 2015 Restructuring program and is using
savings to improve margin but also reinvest in the business to drive profitable growth moving forward. High growth areas for investment
include downstream, life sciences, transportation, social infrastructure, water, and US gov't services. JEC hopes to ensure reinvestment and
growth are thoughtful through newly instituted mgmt. incentives around ROIC and margin profile of backlog. Today, 15% of the portfolio is
unprofitable and 25% is breakeven. Mgmt. will reinvest or manage away these units, which should help operating profit b/w $50-100M.
Refocusing on M&A: Legacy M&A integration was problematic. JEC has instituted new best practices and invested to better understand and
track KPI's of acquisitions post-close moving forward. Mgmt. sees opportunities for bolt-on M&A across all segments. JEC anticipates an
improvement in FCF conversion and an increase in total leverage to 2.0x, which should provide north of $1.2B of dry powder to pursue
opportunistic M&A. Introduction of FY'19 Targets: JEC expects an annual organic sales CAGR b/w 2-4% through FY'19. By segment, P&C
annual organic sales are expected b/w 2-3%, B&I sales b/w 4-5%, Industrial sales b/w 9-10%, and A&T sales b/w 5-7%. Operating margin
is expected to improve b/w 50-150 bps. By segment, P&C op margin is expected b/w 5-6%, B&I b/w 7.5-8.5%, Industrial b/w 3.5-4.5%, and
A&T b/w 7.5-8.5%. ROIC is expected to improve b/w 50-100 bps. FCF conversion is expected at 100% and total leverage at 2.0x. JEC will
also institute a dividend for the first time in Q2'17 with a contemplated yield of 1%. (Link to Note)
Mid-Quarter Update
Jacobs Engineering (NYSE: JEC)
Source: ThomsonOne, Company data, Credit Suisse Estimates
78
C onsensus EPS
Ticker M kt C ap Price 52 - W Hi % Hi 52 - W Lo % Lo Q1'17 FY '17 FY '18
JEC $7,175 $59.38 $62.17 (4.5%) $35.06 69.4% $0.62 $3.13 $3.53
R eport D at e: 2/8/17 C all D at e: 2/8/17 C all T ime: 11:00am D ial- in: 412.317.6707 C ode: n/a
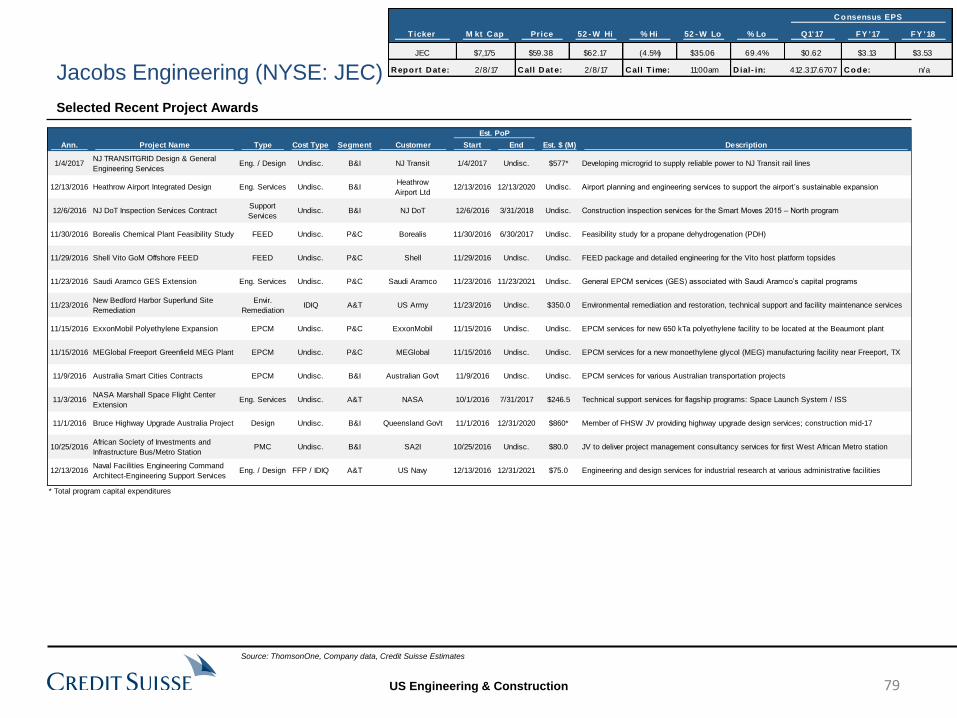
US Engineering & Construction
Selected Recent Project Awards
Jacobs Engineering (NYSE: JEC)
Source: ThomsonOne, Company data, Credit Suisse Estimates
Est. PoP
Ann. Project Name Type Cost Type Segment Customer Start End Est. $ (M) Description
1/4/2017NJ TRANSITGRID Design & General
Engineering ServicesEng. / Design Undisc. B&I NJ Transit 1/4/2017 Undisc. $577* Developing microgrid to supply reliable power to NJ Transit rail lines
12/13/2016 Heathrow Airport Integrated Design Eng. Services Undisc. B&IHeathrow
Airport Ltd12/13/2016 12/13/2020 Undisc. Airport planning and engineering services to support the airport’s sustainable expansion
12/6/2016 NJ DoT Inspection Services ContractSupport
ServicesUndisc. B&I NJ DoT 12/6/2016 3/31/2018 Undisc. Construction inspection services for the Smart Moves 2015 – North program
11/30/2016 Borealis Chemical Plant Feasibility Study FEED Undisc. P&C Borealis 11/30/2016 6/30/2017 Undisc. Feasibility study for a propane dehydrogenation (PDH)
11/29/2016 Shell Vito GoM Offshore FEED FEED Undisc. P&C Shell 11/29/2016 Undisc. Undisc. FEED package and detailed engineering for the Vito host platform topsides
11/23/2016 Saudi Aramco GES Extension Eng. Services Undisc. P&C Saudi Aramco 11/23/2016 11/23/2021 Undisc. General EPCM services (GES) associated with Saudi Aramco’s capital programs
11/23/2016New Bedford Harbor Superfund Site
Remediation
Envir.
RemediationIDIQ A&T US Army 11/23/2016 Undisc. $350.0 Environmental remediation and restoration, technical support and facility maintenance services
11/15/2016 ExxonMobil Polyethylene Expansion EPCM Undisc. P&C ExxonMobil 11/15/2016 Undisc. Undisc. EPCM services for new 650 kTa polyethylene facility to be located at the Beaumont plant
11/15/2016 MEGlobal Freeport Greenfield MEG Plant EPCM Undisc. P&C MEGlobal 11/15/2016 Undisc. Undisc. EPCM services for a new monoethylene glycol (MEG) manufacturing facility near Freeport, TX
11/9/2016 Australia Smart Cities Contracts EPCM Undisc. B&I Australian Gov't 11/9/2016 Undisc. Undisc. EPCM services for various Australian transportation projects
11/3/2016NASA Marshall Space Flight Center
ExtensionEng. Services Undisc. A&T NASA 10/1/2016 7/31/2017 $246.5 Technical support services for flagship programs: Space Launch System / ISS
11/1/2016 Bruce Highway Upgrade Australia Project Design Undisc. B&I Queensland Gov't 11/1/2016 12/31/2020 $860* Member of FHSW JV providing highway upgrade design services; construction mid-17
10/25/2016African Society of Investments and
Infrastructure Bus/Metro StationPMC Undisc. B&I SA2I 10/25/2016 Undisc. $80.0 JV to deliver project management consultancy services for first West African Metro station
12/13/2016Naval Facilities Engineering Command
Architect-Engineering Support ServicesEng. / Design FFP / IDIQ A&T US Navy 12/13/2016 12/31/2021 $75.0 Engineering and design services for industrial research at various administrative facilities
* Total program capital expenditures
79
C onsensus EPS
Ticker M kt C ap Price 52 - W Hi % Hi 52 - W Lo % Lo Q1'17 FY '17 FY '18
JEC $7,175 $59.38 $62.17 (4.5%) $35.06 69.4% $0.62 $3.13 $3.53
R eport D at e: 2/8/17 C all D at e: 2/8/17 C all T ime: 11:00am D ial- in: 412.317.6707 C ode: n/a

US Engineering & Construction
Jacobs Engineering (NYSE: JEC)
LTM Stock Performance
Forward P/E
Short Interest / Days to Cover
Forward EV / EBITDA
Source: ThomsonOne, Company data, Credit Suisse Estimates
--
1.5
3.0
4.5
6.0
7.5
9.0
--%
0.5%
1.0%
1.5%
2.0%
2.5%
3.0%
3.5%
4.0%
1/16 2/16 3/16 4/16 5/16 6/16 7/16 8/16 9/16 10/16 11/16 12/16
SI (2.7%) DTC (3.4)
18.6x
14.1x
15.9x
12.3x
10.0x
11.0x
12.0x
13.0x
14.0x
15.0x
16.0x
17.0x
18.0x
19.0x
20.0x
1/12
4/12
7/12
10/1
2
1/13
4/13
7/13
10/1
3
1/14
4/14
7/14
10/1
4
1/15
4/15
7/15
10/1
5
1/16
4/16
7/16
10/1
6
1/17
For P/E Average +SD -SD
10.3x
7.6x
8.6x
6.5x
4.0x
5.0x
6.0x
7.0x
8.0x
9.0x
10.0x
11.0x
1/12
4/12
7/12
10/1
2
1/13
4/13
7/13
10/1
3
1/14
4/14
7/14
10/1
4
1/15
4/15
7/15
10/1
5
1/16
4/16
7/16
10/1
6
1/17
For P/E Average +SD -SD
80
$59.38
$62.17
$35.06
$59.01 $59.24
$53.00
$30.00
$35.00
$40.00
$45.00
$50.00
$55.00
$60.00
$65.00
1/16 2/16 3/16 4/16 5/16 6/16 7/16 8/16 9/16 10/16 11/16 12/16 1/17
JEC 52-W Hi 52-W Lo
10-DMA 50-DMA 200-DMA
C onsensus EPS
Ticker M kt C ap Price 52 - W Hi % Hi 52 - W Lo % Lo Q1'17 FY '17 FY '18
JEC $7,175 $59.38 $62.17 (4.5%) $35.06 69.4% $0.62 $3.13 $3.53
R eport D at e: 2/8/17 C all D at e: 2/8/17 C all T ime: 11:00am D ial- in: 412.317.6707 C ode: n/a
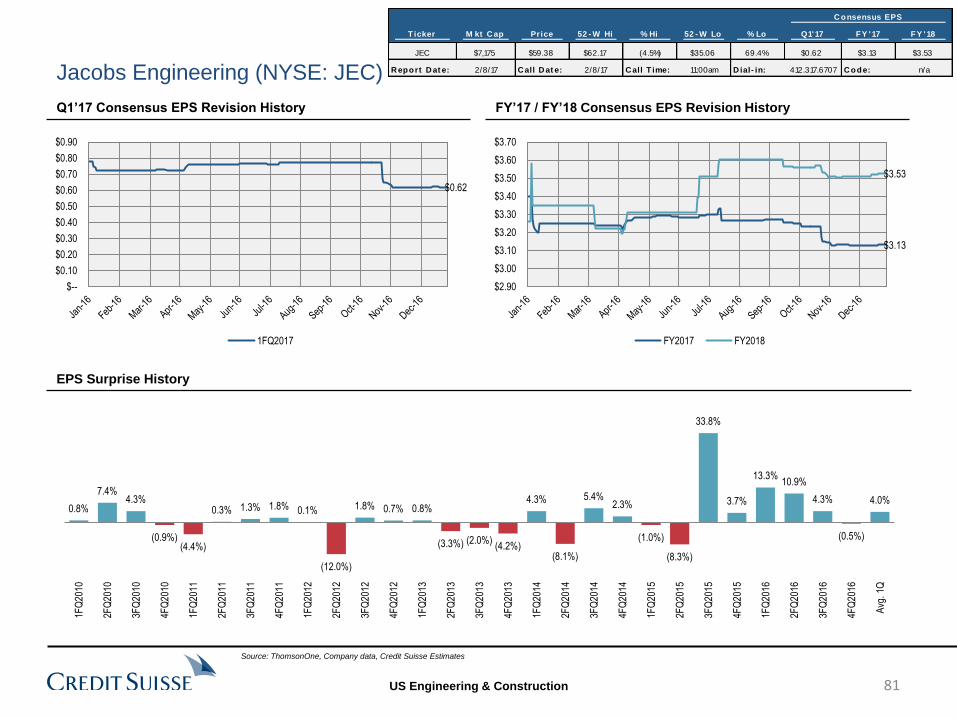
US Engineering & Construction
Jacobs Engineering (NYSE: JEC)
Q1’17 Consensus EPS Revision History FY’17 / FY’18 Consensus EPS Revision History
81
EPS Surprise History
Source: ThomsonOne, Company data, Credit Suisse Estimates
$0.62
$--
$0.10
$0.20
$0.30
$0.40
$0.50
$0.60
$0.70
$0.80
$0.90
1FQ2017
$3.13
$3.53
$2.90
$3.00
$3.10
$3.20
$3.30
$3.40
$3.50
$3.60
$3.70
FY2017 FY2018
4.0%
(0.5%)
4.3%
10.9% 13.3%
3.7%
33.8%
(8.3%)
(1.0%)
2.3% 5.4%
(8.1%)
4.3%
(4.2%)(2.0%)(3.3%)
0.8% 0.7% 1.8%
(12.0%)
0.1% 1.8% 1.3% 0.3%
(4.4%)(0.9%)
4.3% 7.4%
0.8%
Avg
. 1Q
4FQ
2016
3FQ
2016
2FQ
2016
1FQ
2016
4FQ
2015
3FQ
2015
2FQ
2015
1FQ
2015
4FQ
2014
3FQ
2014
2FQ
2014
1FQ
2014
4FQ
2013
3FQ
2013
2FQ
2013
1FQ
2013
4FQ
2012
3FQ
2012
2FQ
2012
1FQ
2012
4FQ
2011
3FQ
2011
2FQ
2011
1FQ
2011
4FQ
2010
3FQ
2010
2FQ
2010
1FQ
2010
C onsensus EPS
Ticker M kt C ap Price 52 - W Hi % Hi 52 - W Lo % Lo Q1'17 FY '17 FY '18
JEC $7,175 $59.38 $62.17 (4.5%) $35.06 69.4% $0.62 $3.13 $3.53
R eport D at e: 2/8/17 C all D at e: 2/8/17 C all T ime: 11:00am D ial- in: 412.317.6707 C ode: n/a
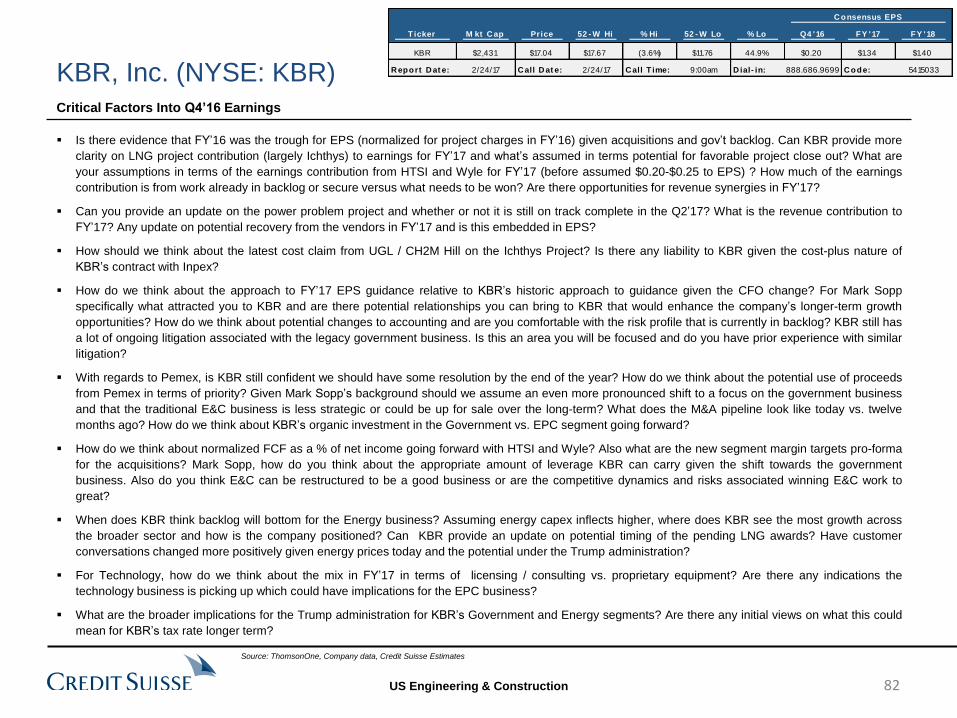
US Engineering & Construction
C onsensus EPS
Ticker M kt C ap Price 52 - W Hi % Hi 52 - W Lo % Lo Q4 '16 FY '17 FY '18
KBR $2,431 $17.04 $17.67 (3.6%) $11.76 44.9% $0.20 $1.34 $1.40
R eport D at e: 2/24/17 C all D at e: 2/24/17 C all T ime: 9:00am D ial- in: 888.686.9699 C ode: 5415033
Is there evidence that FY’16 was the trough for EPS (normalized for project charges in FY’16) given acquisitions and gov’t backlog. Can KBR provide more
clarity on LNG project contribution (largely Ichthys) to earnings for FY’17 and what’s assumed in terms potential for favorable project close out? What are
your assumptions in terms of the earnings contribution from HTSI and Wyle for FY’17 (before assumed $0.20-$0.25 to EPS) ? How much of the earnings
contribution is from work already in backlog or secure versus what needs to be won? Are there opportunities for revenue synergies in FY’17?
Can you provide an update on the power problem project and whether or not it is still on track complete in the Q2’17? What is the revenue contribution to
FY’17? Any update on potential recovery from the vendors in FY’17 and is this embedded in EPS?
How should we think about the latest cost claim from UGL / CH2M Hill on the Ichthys Project? Is there any liability to KBR given the cost-plus nature of
KBR’s contract with Inpex?
How do we think about the approach to FY’17 EPS guidance relative to KBR’s historic approach to guidance given the CFO change? For Mark Sopp
specifically what attracted you to KBR and are there potential relationships you can bring to KBR that would enhance the company’s longer-term growth
opportunities? How do we think about potential changes to accounting and are you comfortable with the risk profile that is currently in backlog? KBR still has
a lot of ongoing litigation associated with the legacy government business. Is this an area you will be focused and do you have prior experience with similar
litigation?
With regards to Pemex, is KBR still confident we should have some resolution by the end of the year? How do we think about the potential use of proceeds
from Pemex in terms of priority? Given Mark Sopp’s background should we assume an even more pronounced shift to a focus on the government business
and that the traditional E&C business is less strategic or could be up for sale over the long-term? What does the M&A pipeline look like today vs. twelve
months ago? How do we think about KBR’s organic investment in the Government vs. EPC segment going forward?
How do we think about normalized FCF as a % of net income going forward with HTSI and Wyle? Also what are the new segment margin targets pro-forma
for the acquisitions? Mark Sopp, how do you think about the appropriate amount of leverage KBR can carry given the shift towards the government
business. Also do you think E&C can be restructured to be a good business or are the competitive dynamics and risks associated winning E&C work to
great?
When does KBR think backlog will bottom for the Energy business? Assuming energy capex inflects higher, where does KBR see the most growth across
the broader sector and how is the company positioned? Can KBR provide an update on potential timing of the pending LNG awards? Have customer
conversations changed more positively given energy prices today and the potential under the Trump administration?
For Technology, how do we think about the mix in FY’17 in terms of licensing / consulting vs. proprietary equipment? Are there any indications the
technology business is picking up which could have implications for the EPC business?
What are the broader implications for the Trump administration for KBR’s Government and Energy segments? Are there any initial views on what this could
mean for KBR’s tax rate longer term?
Critical Factors Into Q4’16 Earnings
KBR, Inc. (NYSE: KBR)
Source: ThomsonOne, Company data, Credit Suisse Estimates
82
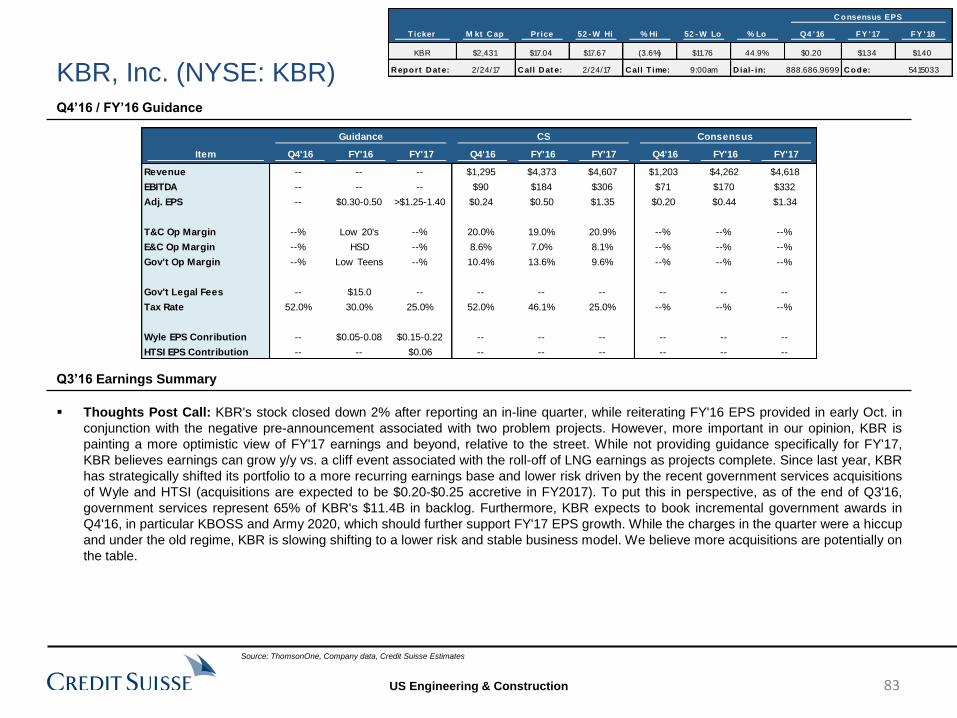
US Engineering & Construction
Q4’16 / FY’16 Guidance
Thoughts Post Call: KBR's stock closed down 2% after reporting an in-line quarter, while reiterating FY'16 EPS provided in early Oct. in
conjunction with the negative pre-announcement associated with two problem projects. However, more important in our opinion, KBR is
painting a more optimistic view of FY'17 earnings and beyond, relative to the street. While not providing guidance specifically for FY'17,
KBR believes earnings can grow y/y vs. a cliff event associated with the roll-off of LNG earnings as projects complete. Since last year, KBR
has strategically shifted its portfolio to a more recurring earnings base and lower risk driven by the recent government services acquisitions
of Wyle and HTSI (acquisitions are expected to be $0.20-$0.25 accretive in FY2017). To put this in perspective, as of the end of Q3'16,
government services represent 65% of KBR's $11.4B in backlog. Furthermore, KBR expects to book incremental government awards in
Q4'16, in particular KBOSS and Army 2020, which should further support FY'17 EPS growth. While the charges in the quarter were a hiccup
and under the old regime, KBR is slowing shifting to a lower risk and stable business model. We believe more acquisitions are potentially on
the table.
Q3’16 Earnings Summary
KBR, Inc. (NYSE: KBR)
Source: ThomsonOne, Company data, Credit Suisse Estimates
Guidance CS Consensus
Item Q4'16 FY'16 FY'17 Q4'16 FY'16 FY'17 Q4'16 FY'16 FY'17
Revenue -- -- -- $1,295 $4,373 $4,607 $1,203 $4,262 $4,618
EBITDA -- -- -- $90 $184 $306 $71 $170 $332
Adj. EPS -- $0.30-0.50 >$1.25-1.40 $0.24 $0.50 $1.35 $0.20 $0.44 $1.34
T&C Op Margin --% Low 20's --% 20.0% 19.0% 20.9% --% --% --%
E&C Op Margin --% HSD --% 8.6% 7.0% 8.1% --% --% --%
Gov't Op Margin --% Low Teens --% 10.4% 13.6% 9.6% --% --% --%
Gov't Legal Fees -- $15.0 -- -- -- -- -- -- --
Tax Rate 52.0% 30.0% 25.0% 52.0% 46.1% 25.0% --% --% --%
Wyle EPS Conribution -- $0.05-0.08 $0.15-0.22 -- -- -- -- -- --
HTSI EPS Contribution -- -- $0.06 -- -- -- -- -- --
83
C onsensus EPS
Ticker M kt C ap Price 52 - W Hi % Hi 52 - W Lo % Lo Q4 '16 FY '17 FY '18
KBR $2,431 $17.04 $17.67 (3.6%) $11.76 44.9% $0.20 $1.34 $1.40
R eport D at e: 2/24/17 C all D at e: 2/24/17 C all T ime: 9:00am D ial- in: 888.686.9699 C ode: 5415033
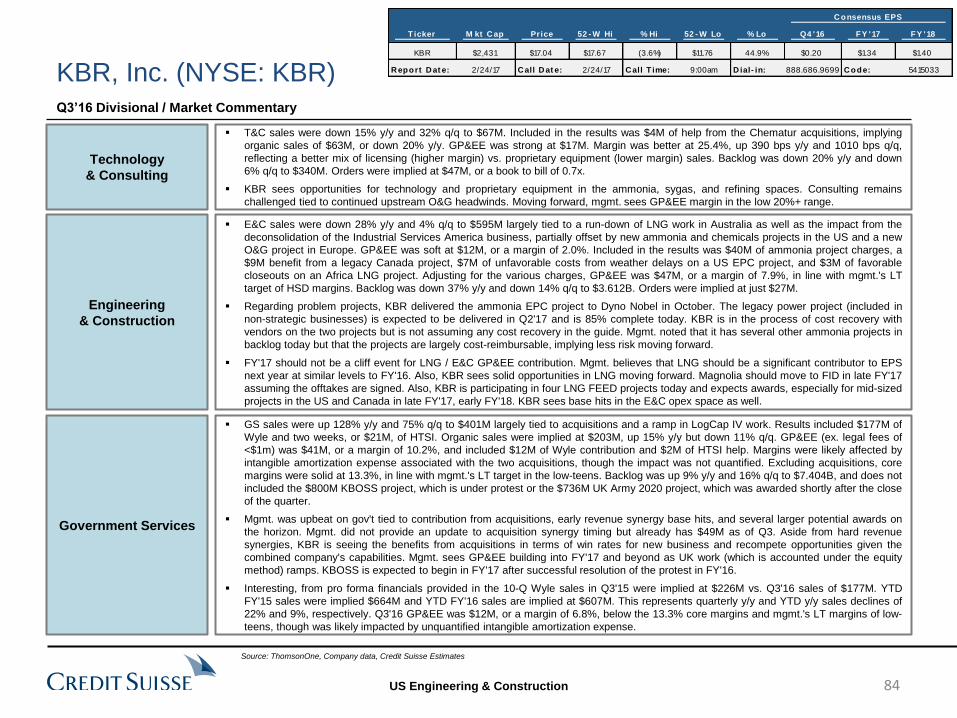
US Engineering & Construction
Q3’16 Divisional / Market Commentary
KBR, Inc. (NYSE: KBR)
Technology
& Consulting
T&C sales were down 15% y/y and 32% q/q to $67M. Included in the results was $4M of help from the Chematur acquisitions, implying
organic sales of $63M, or down 20% y/y. GP&EE was strong at $17M. Margin was better at 25.4%, up 390 bps y/y and 1010 bps q/q,
reflecting a better mix of licensing (higher margin) vs. proprietary equipment (lower margin) sales. Backlog was down 20% y/y and down
6% q/q to $340M. Orders were implied at $47M, or a book to bill of 0.7x.
KBR sees opportunities for technology and proprietary equipment in the ammonia, sygas, and refining spaces. Consulting remains
challenged tied to continued upstream O&G headwinds. Moving forward, mgmt. sees GP&EE margin in the low 20%+ range.
Engineering
& Construction
E&C sales were down 28% y/y and 4% q/q to $595M largely tied to a run-down of LNG work in Australia as well as the impact from the
deconsolidation of the Industrial Services America business, partially offset by new ammonia and chemicals projects in the US and a new
O&G project in Europe. GP&EE was soft at $12M, or a margin of 2.0%. Included in the results was $40M of ammonia project charges, a
$9M benefit from a legacy Canada project, $7M of unfavorable costs from weather delays on a US EPC project, and $3M of favorable
closeouts on an Africa LNG project. Adjusting for the various charges, GP&EE was $47M, or a margin of 7.9%, in line with mgmt.'s LT
target of HSD margins. Backlog was down 37% y/y and down 14% q/q to $3.612B. Orders were implied at just $27M.
Regarding problem projects, KBR delivered the ammonia EPC project to Dyno Nobel in October. The legacy power project (included in
non-strategic businesses) is expected to be delivered in Q2'17 and is 85% complete today. KBR is in the process of cost recovery with
vendors on the two projects but is not assuming any cost recovery in the guide. Mgmt. noted that it has several other ammonia projects in
backlog today but that the projects are largely cost-reimbursable, implying less risk moving forward.
FY'17 should not be a cliff event for LNG / E&C GP&EE contribution. Mgmt. believes that LNG should be a significant contributor to EPS
next year at similar levels to FY'16. Also, KBR sees solid opportunities in LNG moving forward. Magnolia should move to FID in late FY'17
assuming the offtakes are signed. Also, KBR is participating in four LNG FEED projects today and expects awards, especially for mid-sized
projects in the US and Canada in late FY'17, early FY'18. KBR sees base hits in the E&C opex space as well.
Source: ThomsonOne, Company data, Credit Suisse Estimates
Government Services
GS sales were up 128% y/y and 75% q/q to $401M largely tied to acquisitions and a ramp in LogCap IV work. Results included $177M of
Wyle and two weeks, or $21M, of HTSI. Organic sales were implied at $203M, up 15% y/y but down 11% q/q. GP&EE (ex. legal fees of
<$1m) was $41M, or a margin of 10.2%, and included $12M of Wyle contribution and $2M of HTSI help. Margins were likely affected by
intangible amortization expense associated with the two acquisitions, though the impact was not quantified. Excluding acquisitions, core
margins were solid at 13.3%, in line with mgmt.'s LT target in the low-teens. Backlog was up 9% y/y and 16% q/q to $7.404B, and does not
included the $800M KBOSS project, which is under protest or the $736M UK Army 2020 project, which was awarded shortly after the close
of the quarter.
Mgmt. was upbeat on gov't tied to contribution from acquisitions, early revenue synergy base hits, and several larger potential awards on
the horizon. Mgmt. did not provide an update to acquisition synergy timing but already has $49M as of Q3. Aside from hard revenue
synergies, KBR is seeing the benefits from acquisitions in terms of win rates for new business and recompete opportunities given the
combined company's capabilities. Mgmt. sees GP&EE building into FY'17 and beyond as UK work (which is accounted under the equity
method) ramps. KBOSS is expected to begin in FY'17 after successful resolution of the protest in FY'16.
Interesting, from pro forma financials provided in the 10-Q Wyle sales in Q3'15 were implied at $226M vs. Q3'16 sales of $177M. YTD
FY'15 sales were implied $664M and YTD FY'16 sales are implied at $607M. This represents quarterly y/y and YTD y/y sales declines of
22% and 9%, respectively. Q3'16 GP&EE was $12M, or a margin of 6.8%, below the 13.3% core margins and mgmt.'s LT margins of low-
teens, though was likely impacted by unquantified intangible amortization expense.
84
C onsensus EPS
Ticker M kt C ap Price 52 - W Hi % Hi 52 - W Lo % Lo Q4 '16 FY '17 FY '18
KBR $2,431 $17.04 $17.67 (3.6%) $11.76 44.9% $0.20 $1.34 $1.40
R eport D at e: 2/24/17 C all D at e: 2/24/17 C all T ime: 9:00am D ial- in: 888.686.9699 C ode: 5415033
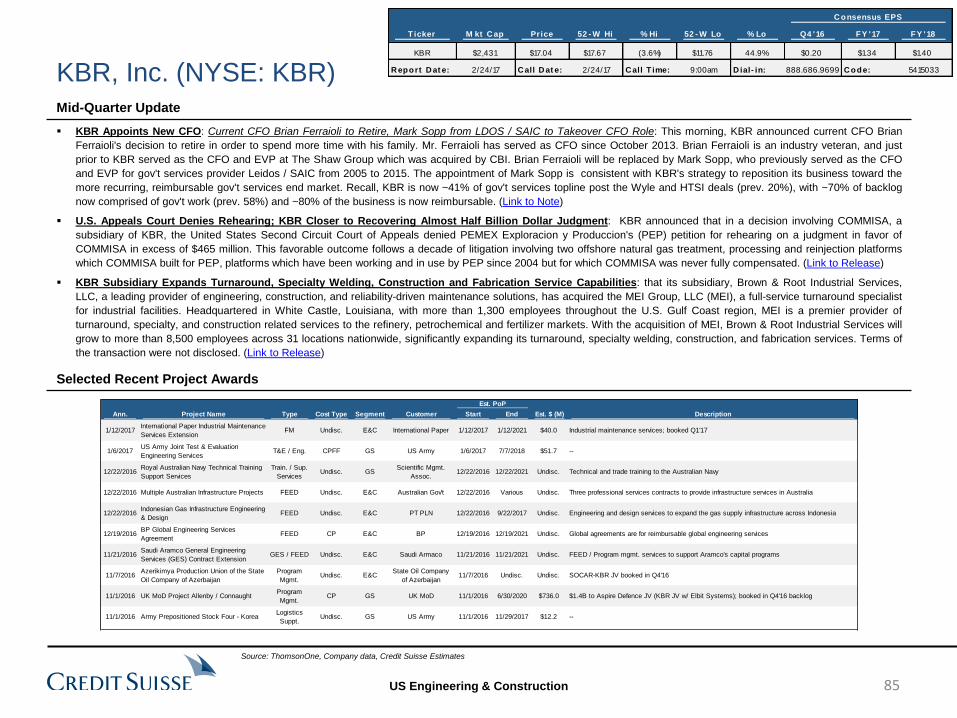
US Engineering & Construction
KBR Appoints New CFO: Current CFO Brian Ferraioli to Retire, Mark Sopp from LDOS / SAIC to Takeover CFO Role: This morning, KBR announced current CFO Brian
Ferraioli's decision to retire in order to spend more time with his family. Mr. Ferraioli has served as CFO since October 2013. Brian Ferraioli is an industry veteran, and just
prior to KBR served as the CFO and EVP at The Shaw Group which was acquired by CBI. Brian Ferraioli will be replaced by Mark Sopp, who previously served as the CFO
and EVP for gov't services provider Leidos / SAIC from 2005 to 2015. The appointment of Mark Sopp is consistent with KBR's strategy to reposition its business toward the
more recurring, reimbursable gov't services end market. Recall, KBR is now ~41% of gov't services topline post the Wyle and HTSI deals (prev. 20%), with ~70% of backlog
now comprised of gov't work (prev. 58%) and ~80% of the business is now reimbursable. (Link to Note)
U.S. Appeals Court Denies Rehearing; KBR Closer to Recovering Almost Half Billion Dollar Judgment: KBR announced that in a decision involving COMMISA, a
subsidiary of KBR, the United States Second Circuit Court of Appeals denied PEMEX Exploracion y Produccion's (PEP) petition for rehearing on a judgment in favor of
COMMISA in excess of $465 million. This favorable outcome follows a decade of litigation involving two offshore natural gas treatment, processing and reinjection platforms
which COMMISA built for PEP, platforms which have been working and in use by PEP since 2004 but for which COMMISA was never fully compensated. (Link to Release)
KBR Subsidiary Expands Turnaround, Specialty Welding, Construction and Fabrication Service Capabilities: that its subsidiary, Brown & Root Industrial Services,
LLC, a leading provider of engineering, construction, and reliability-driven maintenance solutions, has acquired the MEI Group, LLC (MEI), a full-service turnaround specialist
for industrial facilities. Headquartered in White Castle, Louisiana, with more than 1,300 employees throughout the U.S. Gulf Coast region, MEI is a premier provider of
turnaround, specialty, and construction related services to the refinery, petrochemical and fertilizer markets. With the acquisition of MEI, Brown & Root Industrial Services will
grow to more than 8,500 employees across 31 locations nationwide, significantly expanding its turnaround, specialty welding, construction, and fabrication services. Terms of
the transaction were not disclosed. (Link to Release)
Mid-Quarter Update
Selected Recent Project Awards
KBR, Inc. (NYSE: KBR)
Source: ThomsonOne, Company data, Credit Suisse Estimates
Est. PoP
Ann. Project Name Type Cost Type Segment Customer Start End Est. $ (M) Description
1/12/2017International Paper Industrial Maintenance
Services ExtensionFM Undisc. E&C International Paper 1/12/2017 1/12/2021 $40.0 Industrial maintenance services; booked Q1'17
1/6/2017US Army Joint Test & Evaluation
Engineering ServicesT&E / Eng. CPFF GS US Army 1/6/2017 7/7/2018 $51.7 --
12/22/2016Royal Australian Navy Technical Training
Support Services
Train. / Sup.
ServicesUndisc. GS
Scientific Mgmt.
Assoc.12/22/2016 12/22/2021 Undisc. Technical and trade training to the Australian Navy
12/22/2016 Multiple Australian Infrastructure Projects FEED Undisc. E&C Australian Gov't 12/22/2016 Various Undisc. Three professional services contracts to provide infrastructure services in Australia
12/22/2016Indonesian Gas Infrastructure Engineering
& DesignFEED Undisc. E&C PT PLN 12/22/2016 9/22/2017 Undisc. Engineering and design services to expand the gas supply infrastructure across Indonesia
12/19/2016BP Global Engineering Services
AgreementFEED CP E&C BP 12/19/2016 12/19/2021 Undisc. Global agreements are for reimbursable global engineering services
11/21/2016Saudi Aramco General Engineering
Services (GES) Contract ExtensionGES / FEED Undisc. E&C Saudi Armaco 11/21/2016 11/21/2021 Undisc. FEED / Program mgmt. services to support Aramco's capital programs
11/7/2016Azerikimya Production Union of the State
Oil Company of Azerbaijan
Program
Mgmt.Undisc. E&C
State Oil Company
of Azerbaijan11/7/2016 Undisc. Undisc. SOCAR-KBR JV booked in Q4'16
11/1/2016 UK MoD Project Allenby / ConnaughtProgram
Mgmt.CP GS UK MoD 11/1/2016 6/30/2020 $736.0 $1.4B to Aspire Defence JV (KBR JV w/ Elbit Systems); booked in Q4'16 backlog
11/1/2016 Army Prepositioned Stock Four - KoreaLogistics
Suppt.Undisc. GS US Army 11/1/2016 11/29/2017 $12.2 --
85
C onsensus EPS
Ticker M kt C ap Price 52 - W Hi % Hi 52 - W Lo % Lo Q4 '16 FY '17 FY '18
KBR $2,431 $17.04 $17.67 (3.6%) $11.76 44.9% $0.20 $1.34 $1.40
R eport D at e: 2/24/17 C all D at e: 2/24/17 C all T ime: 9:00am D ial- in: 888.686.9699 C ode: 5415033

US Engineering & Construction
KBR, Inc. (NYSE: KBR) LTM Stock Performance
Forward P/E
Short Interest / Days to Cover
Forward EV / EBITDA
Source: ThomsonOne, Company data, Credit Suisse Estimates
--
0.5
1.0
1.5
2.0
2.5
3.0
3.5
4.0
4.5
5.0
--%
0.5%
1.0%
1.5%
2.0%
2.5%
3.0%
3.5%
4.0%
4.5%
5.0%
1/16 2/16 3/16 4/16 5/16 6/16 7/16 8/16 9/16 10/16 11/16 12/16
SI (1.9%) DTC (1.8)
13.0x 12.5x
15.0x
10.0x
6.0x
8.0x
10.0x
12.0x
14.0x
16.0x
18.0x
20.0x
22.0x
24.0x
1/12
4/12
7/12
10/1
2
1/13
4/13
7/13
10/1
3
1/14
4/14
7/14
10/1
4
1/15
4/15
7/15
10/1
5
1/16
4/16
7/16
10/1
6
1/17
For P/E Average +SD -SD
7.8x
5.2x
6.1x
4.2x
2.0x
3.0x
4.0x
5.0x
6.0x
7.0x
8.0x
9.0x
1/12
4/12
7/12
10/1
2
1/13
4/13
7/13
10/1
3
1/14
4/14
7/14
10/1
4
1/15
4/15
7/15
10/1
5
1/16
4/16
7/16
10/1
6
1/17
For P/E Average +SD -SD
86
$17.04
$17.67
$11.76
$16.95 $17.01
$15.23
$10.00
$11.00
$12.00
$13.00
$14.00
$15.00
$16.00
$17.00
$18.00
$19.00
1/16 2/16 3/16 4/16 5/16 6/16 7/16 8/16 9/16 10/16 11/16 12/16 1/17
KBR 52-W Hi 52-W Lo
10-DMA 50-DMA 200-DMA
C onsensus EPS
Ticker M kt C ap Price 52 - W Hi % Hi 52 - W Lo % Lo Q4 '16 FY '17 FY '18
KBR $2,431 $17.04 $17.67 (3.6%) $11.76 44.9% $0.20 $1.34 $1.40
R eport D at e: 2/24/17 C all D at e: 2/24/17 C all T ime: 9:00am D ial- in: 888.686.9699 C ode: 5415033
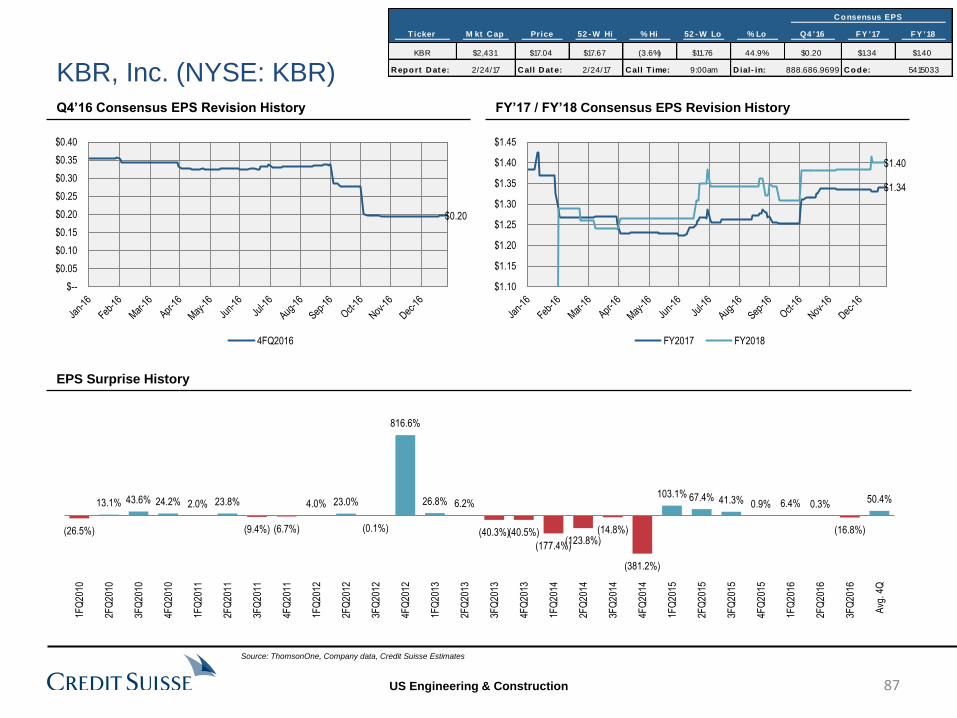
US Engineering & Construction
KBR, Inc. (NYSE: KBR) Q4’16 Consensus EPS Revision History FY’17 / FY’18 Consensus EPS Revision History
EPS Surprise History
Source: ThomsonOne, Company data, Credit Suisse Estimates
$0.20
$--
$0.05
$0.10
$0.15
$0.20
$0.25
$0.30
$0.35
$0.40
4FQ2016
$1.34
$1.40
$1.10
$1.15
$1.20
$1.25
$1.30
$1.35
$1.40
$1.45
FY2017 FY2018
50.4%
(16.8%)
0.3% 6.4% 0.9% 41.3% 67.4% 103.1%
(381.2%)
(14.8%)(123.8%)
(177.4%)
(40.5%)(40.3%)
6.2% 26.8%
816.6%
(0.1%)
23.0% 4.0%
(6.7%)(9.4%)
23.8% 2.0% 24.2% 43.6% 13.1%
(26.5%)
Avg
. 4Q
3FQ
2016
2FQ
2016
1FQ
2016
4FQ
2015
3FQ
2015
2FQ
2015
1FQ
2015
4FQ
2014
3FQ
2014
2FQ
2014
1FQ
2014
4FQ
2013
3FQ
2013
2FQ
2013
1FQ
2013
4FQ
2012
3FQ
2012
2FQ
2012
1FQ
2012
4FQ
2011
3FQ
2011
2FQ
2011
1FQ
2011
4FQ
2010
3FQ
2010
2FQ
2010
1FQ
2010
87
C onsensus EPS
Ticker M kt C ap Price 52 - W Hi % Hi 52 - W Lo % Lo Q4 '16 FY '17 FY '18
KBR $2,431 $17.04 $17.67 (3.6%) $11.76 44.9% $0.20 $1.34 $1.40
R eport D at e: 2/24/17 C all D at e: 2/24/17 C all T ime: 9:00am D ial- in: 888.686.9699 C ode: 5415033
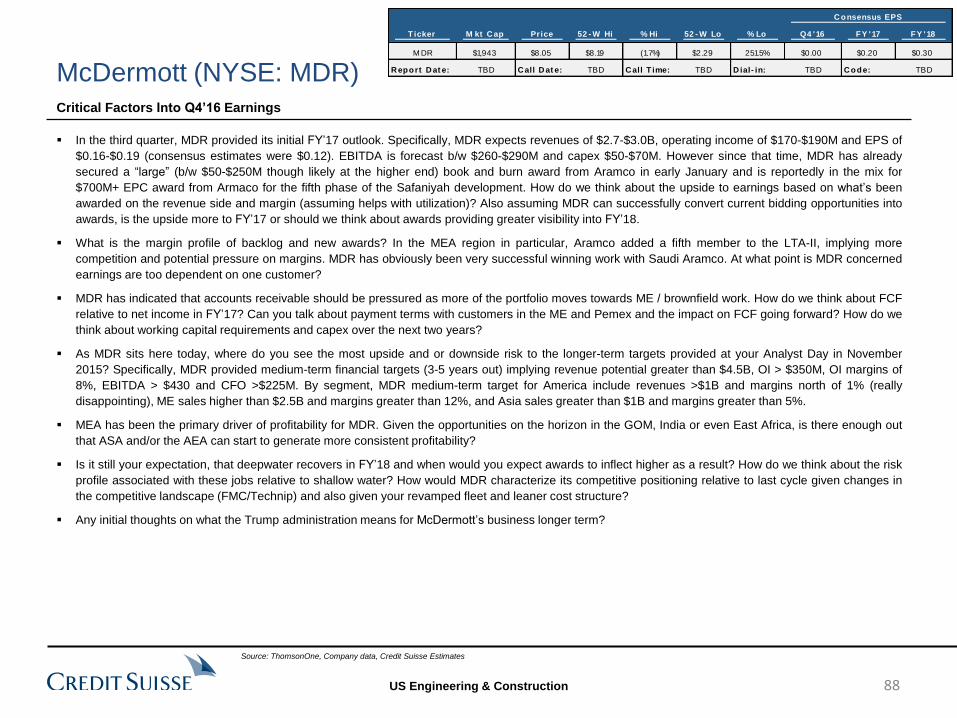
US Engineering & Construction
C onsensus EPS
Ticker M kt C ap Price 52 - W Hi % Hi 52 - W Lo % Lo Q4 '16 FY '17 FY '18
M DR $1,943 $8.05 $8.19 (1.7%) $2.29 251.5% $0.00 $0.20 $0.30
R eport D at e: TBD C all D at e: TBD C all T ime: TBD D ial- in: TBD C ode: TBD
In the third quarter, MDR provided its initial FY’17 outlook. Specifically, MDR expects revenues of $2.7-$3.0B, operating income of $170-$190M and EPS of
$0.16-$0.19 (consensus estimates were $0.12). EBITDA is forecast b/w $260-$290M and capex $50-$70M. However since that time, MDR has already
secured a “large” (b/w $50-$250M though likely at the higher end) book and burn award from Aramco in early January and is reportedly in the mix for
$700M+ EPC award from Armaco for the fifth phase of the Safaniyah development. How do we think about the upside to earnings based on what’s been
awarded on the revenue side and margin (assuming helps with utilization)? Also assuming MDR can successfully convert current bidding opportunities into
awards, is the upside more to FY’17 or should we think about awards providing greater visibility into FY’18.
What is the margin profile of backlog and new awards? In the MEA region in particular, Aramco added a fifth member to the LTA-II, implying more
competition and potential pressure on margins. MDR has obviously been very successful winning work with Saudi Aramco. At what point is MDR concerned
earnings are too dependent on one customer?
MDR has indicated that accounts receivable should be pressured as more of the portfolio moves towards ME / brownfield work. How do we think about FCF
relative to net income in FY’17? Can you talk about payment terms with customers in the ME and Pemex and the impact on FCF going forward? How do we
think about working capital requirements and capex over the next two years?
As MDR sits here today, where do you see the most upside and or downside risk to the longer-term targets provided at your Analyst Day in November
2015? Specifically, MDR provided medium-term financial targets (3-5 years out) implying revenue potential greater than $4.5B, OI > $350M, OI margins of
8%, EBITDA > $430 and CFO >$225M. By segment, MDR medium-term target for America include revenues >$1B and margins north of 1% (really
disappointing), ME sales higher than $2.5B and margins greater than 12%, and Asia sales greater than $1B and margins greater than 5%.
MEA has been the primary driver of profitability for MDR. Given the opportunities on the horizon in the GOM, India or even East Africa, is there enough out
that ASA and/or the AEA can start to generate more consistent profitability?
Is it still your expectation, that deepwater recovers in FY’18 and when would you expect awards to inflect higher as a result? How do we think about the risk
profile associated with these jobs relative to shallow water? How would MDR characterize its competitive positioning relative to last cycle given changes in
the competitive landscape (FMC/Technip) and also given your revamped fleet and leaner cost structure?
Any initial thoughts on what the Trump administration means for McDermott’s business longer term?
Critical Factors Into Q4’16 Earnings
McDermott (NYSE: MDR)
Source: ThomsonOne, Company data, Credit Suisse Estimates
88
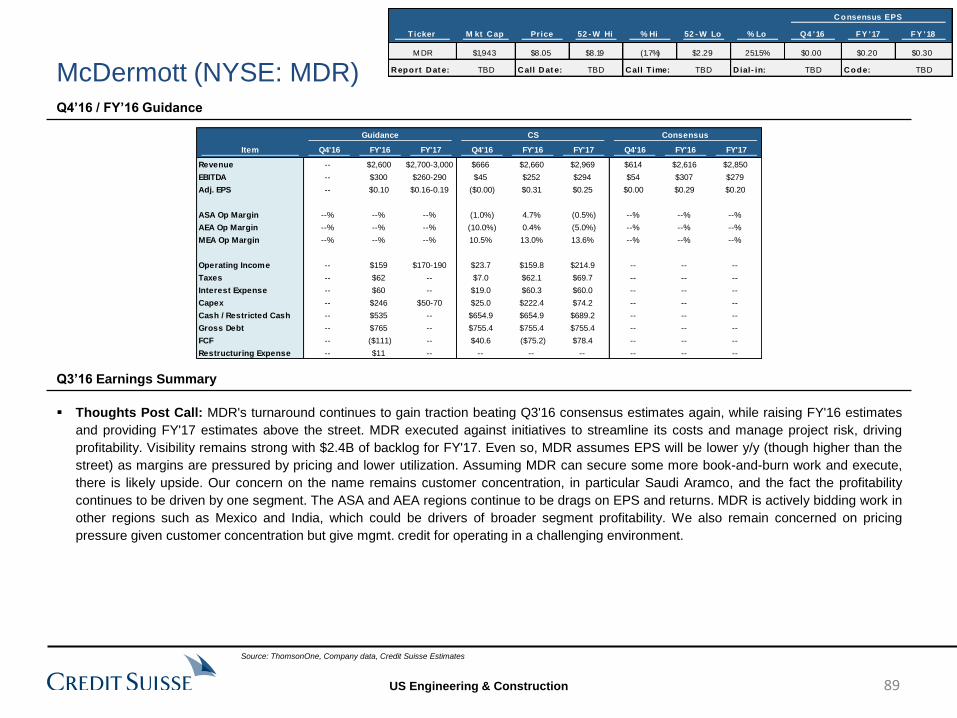
US Engineering & Construction
Q4’16 / FY’16 Guidance
Thoughts Post Call: MDR's turnaround continues to gain traction beating Q3'16 consensus estimates again, while raising FY'16 estimates
and providing FY'17 estimates above the street. MDR executed against initiatives to streamline its costs and manage project risk, driving
profitability. Visibility remains strong with $2.4B of backlog for FY'17. Even so, MDR assumes EPS will be lower y/y (though higher than the
street) as margins are pressured by pricing and lower utilization. Assuming MDR can secure some more book-and-burn work and execute,
there is likely upside. Our concern on the name remains customer concentration, in particular Saudi Aramco, and the fact the profitability
continues to be driven by one segment. The ASA and AEA regions continue to be drags on EPS and returns. MDR is actively bidding work in
other regions such as Mexico and India, which could be drivers of broader segment profitability. We also remain concerned on pricing
pressure given customer concentration but give mgmt. credit for operating in a challenging environment.
Q3’16 Earnings Summary
McDermott (NYSE: MDR)
Source: ThomsonOne, Company data, Credit Suisse Estimates
Guidance CS Consensus
Item Q4'16 FY'16 FY'17 Q4'16 FY'16 FY'17 Q4'16 FY'16 FY'17
Revenue -- $2,600 $2,700-3,000 $666 $2,660 $2,969 $614 $2,616 $2,850
EBITDA -- $300 $260-290 $45 $252 $294 $54 $307 $279
Adj. EPS -- $0.10 $0.16-0.19 ($0.00) $0.31 $0.25 $0.00 $0.29 $0.20
ASA Op Margin --% --% --% (1.0%) 4.7% (0.5%) --% --% --%
AEA Op Margin --% --% --% (10.0%) 0.4% (5.0%) --% --% --%
MEA Op Margin --% --% --% 10.5% 13.0% 13.6% --% --% --%
Operating Income -- $159 $170-190 $23.7 $159.8 $214.9 -- -- --
Taxes -- $62 -- $7.0 $62.1 $69.7 -- -- --
Interest Expense -- $60 -- $19.0 $60.3 $60.0 -- -- --
Capex -- $246 $50-70 $25.0 $222.4 $74.2 -- -- --
Cash / Restricted Cash -- $535 -- $654.9 $654.9 $689.2 -- -- --
Gross Debt -- $765 -- $755.4 $755.4 $755.4 -- -- --
FCF -- ($111) -- $40.6 ($75.2) $78.4 -- -- --
Restructuring Expense -- $11 -- -- -- -- -- -- --
89
C onsensus EPS
Ticker M kt C ap Price 52 - W Hi % Hi 52 - W Lo % Lo Q4 '16 FY '17 FY '18
M DR $1,943 $8.05 $8.19 (1.7%) $2.29 251.5% $0.00 $0.20 $0.30
R eport D at e: TBD C all D at e: TBD C all T ime: TBD D ial- in: TBD C ode: TBD
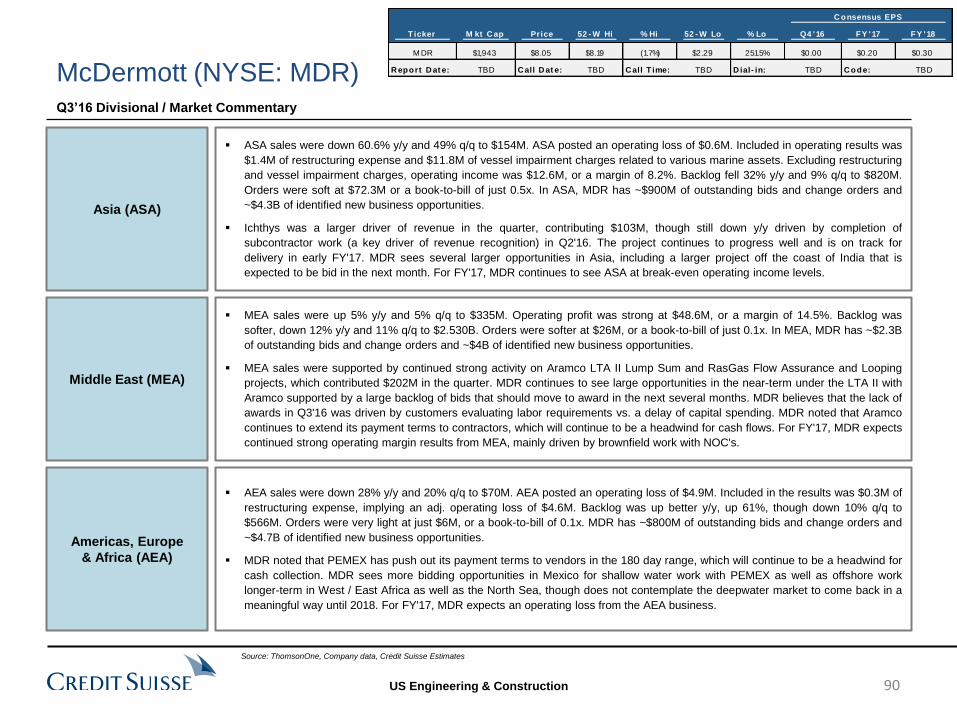
US Engineering & Construction
Q3’16 Divisional / Market Commentary
McDermott (NYSE: MDR)
Asia (ASA)
ASA sales were down 60.6% y/y and 49% q/q to $154M. ASA posted an operating loss of $0.6M. Included in operating results was
$1.4M of restructuring expense and $11.8M of vessel impairment charges related to various marine assets. Excluding restructuring
and vessel impairment charges, operating income was $12.6M, or a margin of 8.2%. Backlog fell 32% y/y and 9% q/q to $820M.
Orders were soft at $72.3M or a book-to-bill of just 0.5x. In ASA, MDR has ~$900M of outstanding bids and change orders and
~$4.3B of identified new business opportunities.
Ichthys was a larger driver of revenue in the quarter, contributing $103M, though still down y/y driven by completion of
subcontractor work (a key driver of revenue recognition) in Q2'16. The project continues to progress well and is on track for
delivery in early FY'17. MDR sees several larger opportunities in Asia, including a larger project off the coast of India that is
expected to be bid in the next month. For FY'17, MDR continues to see ASA at break-even operating income levels.
Middle East (MEA)
MEA sales were up 5% y/y and 5% q/q to $335M. Operating profit was strong at $48.6M, or a margin of 14.5%. Backlog was
softer, down 12% y/y and 11% q/q to $2.530B. Orders were softer at $26M, or a book-to-bill of just 0.1x. In MEA, MDR has ~$2.3B
of outstanding bids and change orders and ~$4B of identified new business opportunities.
MEA sales were supported by continued strong activity on Aramco LTA II Lump Sum and RasGas Flow Assurance and Looping
projects, which contributed $202M in the quarter. MDR continues to see large opportunities in the near-term under the LTA II with
Aramco supported by a large backlog of bids that should move to award in the next several months. MDR believes that the lack of
awards in Q3'16 was driven by customers evaluating labor requirements vs. a delay of capital spending. MDR noted that Aramco
continues to extend its payment terms to contractors, which will continue to be a headwind for cash flows. For FY'17, MDR expects
continued strong operating margin results from MEA, mainly driven by brownfield work with NOC's.
Americas, Europe
& Africa (AEA)
AEA sales were down 28% y/y and 20% q/q to $70M. AEA posted an operating loss of $4.9M. Included in the results was $0.3M of
restructuring expense, implying an adj. operating loss of $4.6M. Backlog was up better y/y, up 61%, though down 10% q/q to
$566M. Orders were very light at just $6M, or a book-to-bill of 0.1x. MDR has ~$800M of outstanding bids and change orders and
~$4.7B of identified new business opportunities.
MDR noted that PEMEX has push out its payment terms to vendors in the 180 day range, which will continue to be a headwind for
cash collection. MDR sees more bidding opportunities in Mexico for shallow water work with PEMEX as well as offshore work
longer-term in West / East Africa as well as the North Sea, though does not contemplate the deepwater market to come back in a
meaningful way until 2018. For FY'17, MDR expects an operating loss from the AEA business.
Source: ThomsonOne, Company data, Credit Suisse Estimates
90
C onsensus EPS
Ticker M kt C ap Price 52 - W Hi % Hi 52 - W Lo % Lo Q4 '16 FY '17 FY '18
M DR $1,943 $8.05 $8.19 (1.7%) $2.29 251.5% $0.00 $0.20 $0.30
R eport D at e: TBD C all D at e: TBD C all T ime: TBD D ial- in: TBD C ode: TBD
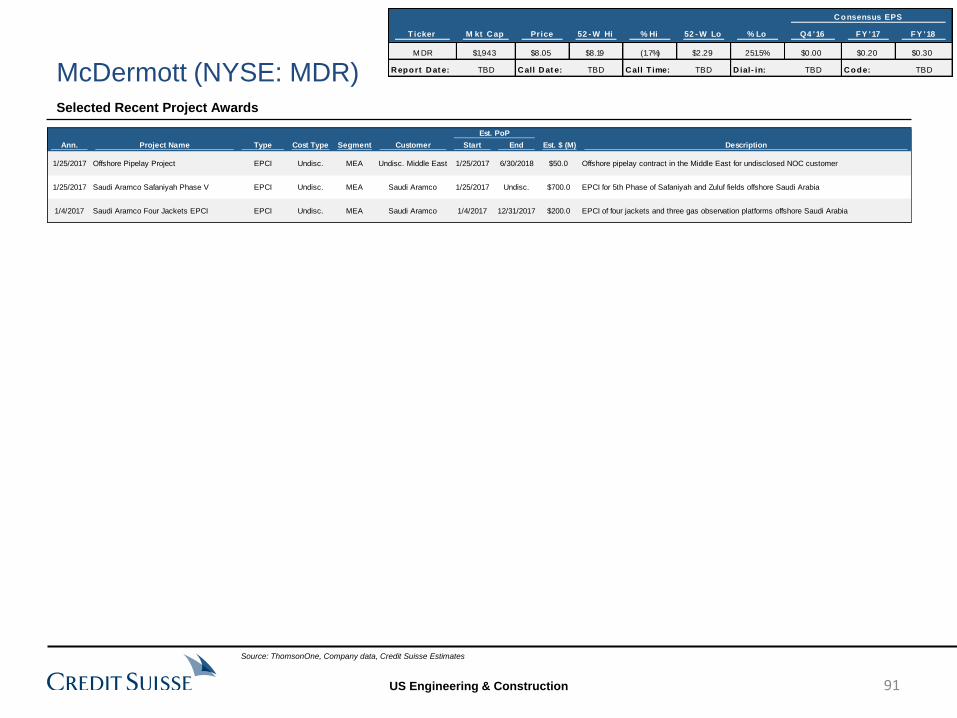
US Engineering & Construction
Selected Recent Project Awards
McDermott (NYSE: MDR)
Source: ThomsonOne, Company data, Credit Suisse Estimates
Est. PoP
Ann. Project Name Type Cost Type Segment Customer Start End Est. $ (M) Description
1/25/2017 Offshore Pipelay Project EPCI Undisc. MEA Undisc. Middle East 1/25/2017 6/30/2018 $50.0 Offshore pipelay contract in the Middle East for undisclosed NOC customer
1/25/2017 Saudi Aramco Safaniyah Phase V EPCI Undisc. MEA Saudi Aramco 1/25/2017 Undisc. $700.0 EPCI for 5th Phase of Safaniyah and Zuluf fields offshore Saudi Arabia
1/4/2017 Saudi Aramco Four Jackets EPCI EPCI Undisc. MEA Saudi Aramco 1/4/2017 12/31/2017 $200.0 EPCI of four jackets and three gas observation platforms offshore Saudi Arabia
91
C onsensus EPS
Ticker M kt C ap Price 52 - W Hi % Hi 52 - W Lo % Lo Q4 '16 FY '17 FY '18
M DR $1,943 $8.05 $8.19 (1.7%) $2.29 251.5% $0.00 $0.20 $0.30
R eport D at e: TBD C all D at e: TBD C all T ime: TBD D ial- in: TBD C ode: TBD
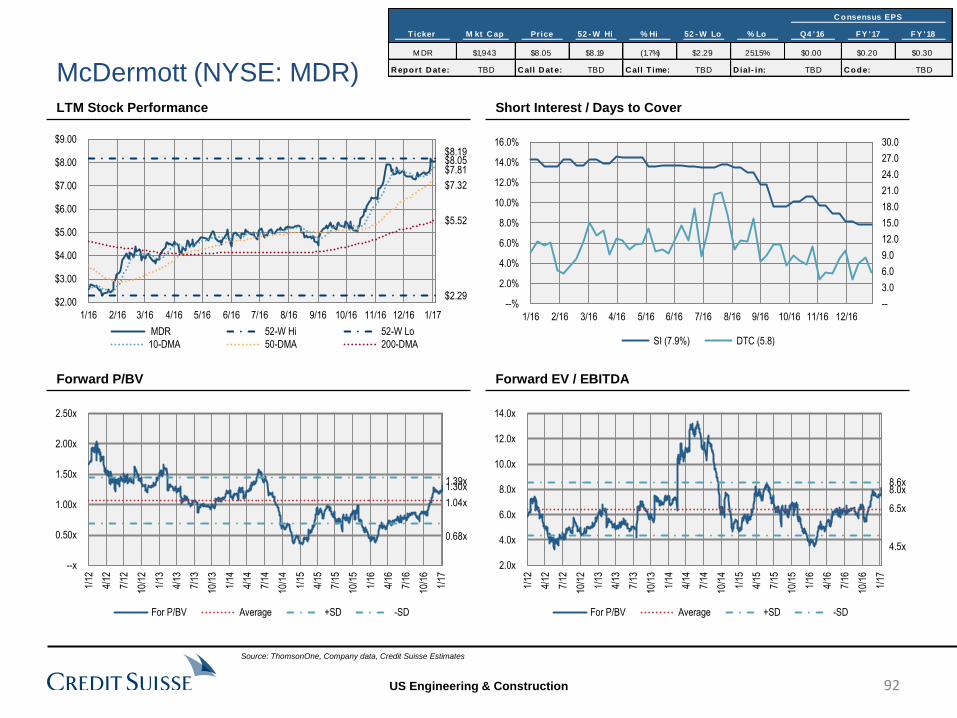
US Engineering & Construction
McDermott (NYSE: MDR) LTM Stock Performance
Forward P/BV
Short Interest / Days to Cover
Forward EV / EBITDA
Source: ThomsonOne, Company data, Credit Suisse Estimates
--
3.0
6.0
9.0
12.0
15.0
18.0
21.0
24.0
27.0
30.0
--%
2.0%
4.0%
6.0%
8.0%
10.0%
12.0%
14.0%
16.0%
1/16 2/16 3/16 4/16 5/16 6/16 7/16 8/16 9/16 10/16 11/16 12/16
SI (7.9%) DTC (5.8)
1.30x
1.04x
1.39x
0.68x
--x
0.50x
1.00x
1.50x
2.00x
2.50x
1/12
4/12
7/12
10/1
2
1/13
4/13
7/13
10/1
3
1/14
4/14
7/14
10/1
4
1/15
4/15
7/15
10/1
5
1/16
4/16
7/16
10/1
6
1/17
For P/BV Average +SD -SD
8.0x
6.5x
8.6x
4.5x
2.0x
4.0x
6.0x
8.0x
10.0x
12.0x
14.0x
1/12
4/12
7/12
10/1
2
1/13
4/13
7/13
10/1
3
1/14
4/14
7/14
10/1
4
1/15
4/15
7/15
10/1
5
1/16
4/16
7/16
10/1
6
1/17
For P/BV Average +SD -SD
92
$8.05 $8.19
$2.29
$7.81
$7.32
$5.52
$2.00
$3.00
$4.00
$5.00
$6.00
$7.00
$8.00
$9.00
1/16 2/16 3/16 4/16 5/16 6/16 7/16 8/16 9/16 10/16 11/16 12/16 1/17
MDR 52-W Hi 52-W Lo
10-DMA 50-DMA 200-DMA
C onsensus EPS
Ticker M kt C ap Price 52 - W Hi % Hi 52 - W Lo % Lo Q4 '16 FY '17 FY '18
M DR $1,943 $8.05 $8.19 (1.7%) $2.29 251.5% $0.00 $0.20 $0.30
R eport D at e: TBD C all D at e: TBD C all T ime: TBD D ial- in: TBD C ode: TBD

US Engineering & Construction
McDermott (NYSE: MDR) Q4’16 Consensus EPS Revision History FY’17 / FY’18 Consensus EPS Revision History
EPS Surprise History
Source: ThomsonOne, Company data, Credit Suisse Estimates
$0.20
$0.30
($0.05)
$--
$0.05
$0.10
$0.15
$0.20
$0.25
$0.30
$0.35
FY2017 FY2018
$0.00
($0.09)
($0.08)
($0.07)
($0.06)
($0.05)
($0.04)
($0.03)
($0.02)
($0.01)
$--
$0.01
4FQ2016
(121.8%)(232.1%)
330.1%
970.0%
(153.8%)(274.0%)(274.2%)(74.7%)(149.2%)
26.5%
(71.3%)
82.1%
(782.4%)
719.7%
(1,875.1%)
(38.0%)(25.9%)(12.6%)
1.4% 67.4%
(78.5%)(31.1%)(15.1%)
2.7%
(34.3%)
57.2%
(18.6%)(27.1%)
Avg
. 4Q
3FQ
2016
2FQ
2016
1FQ
2016
4FQ
2015
3FQ
2015
2FQ
2015
1FQ
2015
4FQ
2014
3FQ
2014
2FQ
2014
1FQ
2014
4FQ
2013
3FQ
2013
2FQ
2013
1FQ
2013
4FQ
2012
3FQ
2012
2FQ
2012
1FQ
2012
4FQ
2011
3FQ
2011
2FQ
2011
1FQ
2011
4FQ
2010
3FQ
2010
2FQ
2010
1FQ
2010
93
C onsensus EPS
Ticker M kt C ap Price 52 - W Hi % Hi 52 - W Lo % Lo Q4 '16 FY '17 FY '18
M DR $1,943 $8.05 $8.19 (1.7%) $2.29 251.5% $0.00 $0.20 $0.30
R eport D at e: TBD C all D at e: TBD C all T ime: TBD D ial- in: TBD C ode: TBD
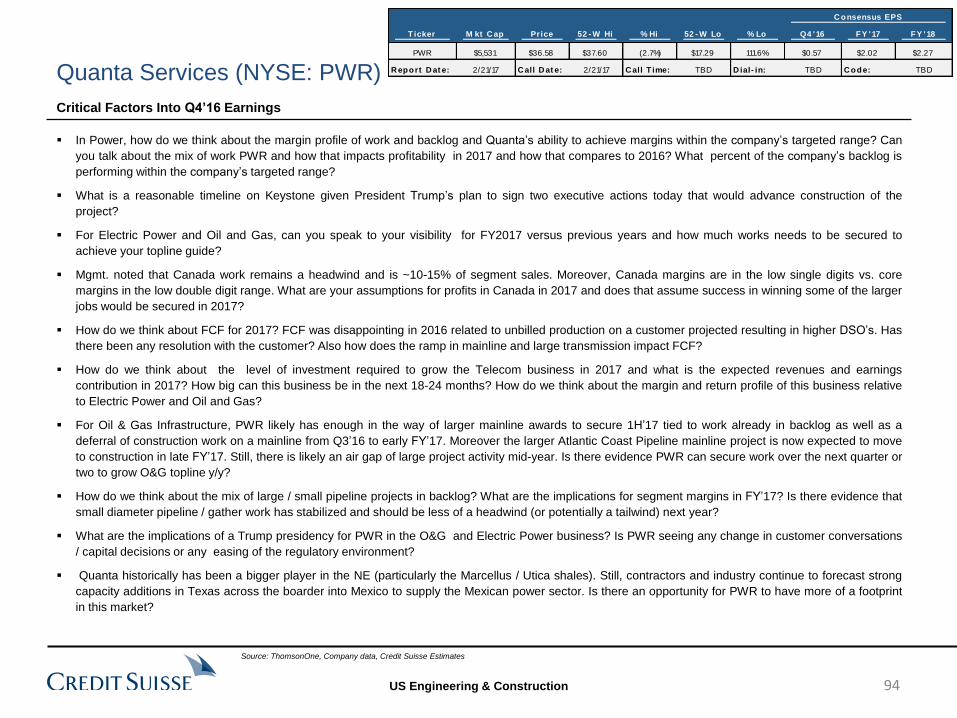
US Engineering & Construction
C onsensus EPS
Ticker M kt C ap Price 52 - W Hi % Hi 52 - W Lo % Lo Q4 '16 FY '17 FY '18
PWR $5,531 $36.58 $37.60 (2.7%) $17.29 111.6% $0.57 $2.02 $2.27
R eport D at e: 2/21/17 C all D at e: 2/21/17 C all T ime: TBD D ial- in: TBD C ode: TBD
In Power, how do we think about the margin profile of work and backlog and Quanta’s ability to achieve margins within the company’s targeted range? Can
you talk about the mix of work PWR and how that impacts profitability in 2017 and how that compares to 2016? What percent of the company’s backlog is
performing within the company’s targeted range?
What is a reasonable timeline on Keystone given President Trump’s plan to sign two executive actions today that would advance construction of the
project?
For Electric Power and Oil and Gas, can you speak to your visibility for FY2017 versus previous years and how much works needs to be secured to
achieve your topline guide?
Mgmt. noted that Canada work remains a headwind and is ~10-15% of segment sales. Moreover, Canada margins are in the low single digits vs. core
margins in the low double digit range. What are your assumptions for profits in Canada in 2017 and does that assume success in winning some of the larger
jobs would be secured in 2017?
How do we think about FCF for 2017? FCF was disappointing in 2016 related to unbilled production on a customer projected resulting in higher DSO’s. Has
there been any resolution with the customer? Also how does the ramp in mainline and large transmission impact FCF?
How do we think about the level of investment required to grow the Telecom business in 2017 and what is the expected revenues and earnings
contribution in 2017? How big can this business be in the next 18-24 months? How do we think about the margin and return profile of this business relative
to Electric Power and Oil and Gas?
For Oil & Gas Infrastructure, PWR likely has enough in the way of larger mainline awards to secure 1H’17 tied to work already in backlog as well as a
deferral of construction work on a mainline from Q3’16 to early FY’17. Moreover the larger Atlantic Coast Pipeline mainline project is now expected to move
to construction in late FY’17. Still, there is likely an air gap of large project activity mid-year. Is there evidence PWR can secure work over the next quarter or
two to grow O&G topline y/y?
How do we think about the mix of large / small pipeline projects in backlog? What are the implications for segment margins in FY’17? Is there evidence that
small diameter pipeline / gather work has stabilized and should be less of a headwind (or potentially a tailwind) next year?
What are the implications of a Trump presidency for PWR in the O&G and Electric Power business? Is PWR seeing any change in customer conversations
/ capital decisions or any easing of the regulatory environment?
Quanta historically has been a bigger player in the NE (particularly the Marcellus / Utica shales). Still, contractors and industry continue to forecast strong
capacity additions in Texas across the boarder into Mexico to supply the Mexican power sector. Is there an opportunity for PWR to have more of a footprint
in this market?
Critical Factors Into Q4’16 Earnings
Quanta Services (NYSE: PWR)
Source: ThomsonOne, Company data, Credit Suisse Estimates
94
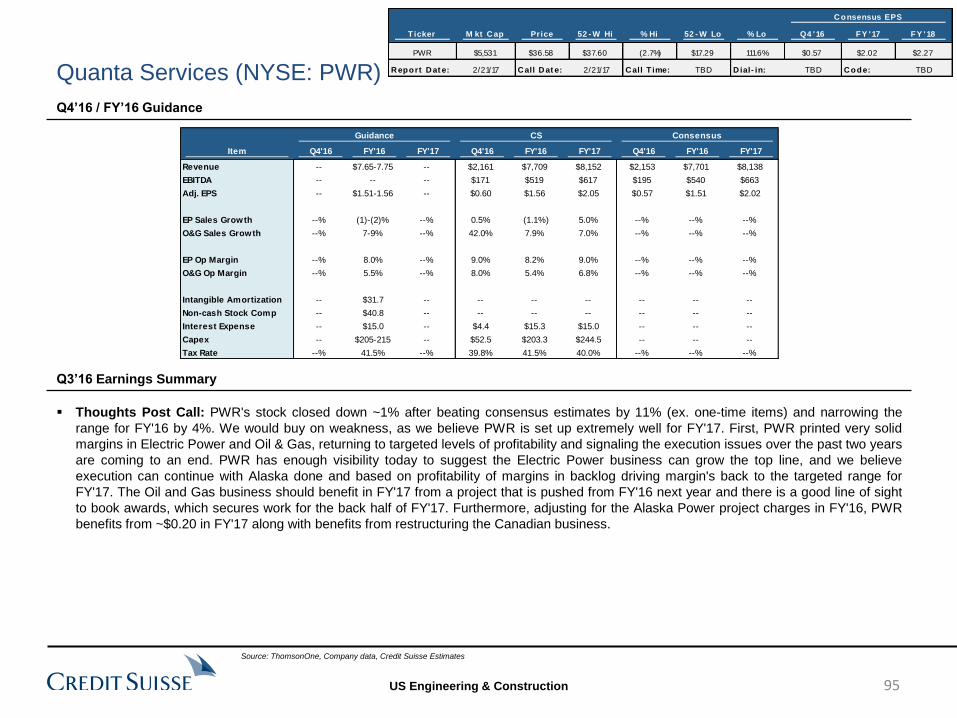
US Engineering & Construction
Q4’16 / FY’16 Guidance
Thoughts Post Call: PWR's stock closed down ~1% after beating consensus estimates by 11% (ex. one-time items) and narrowing the
range for FY'16 by 4%. We would buy on weakness, as we believe PWR is set up extremely well for FY'17. First, PWR printed very solid
margins in Electric Power and Oil & Gas, returning to targeted levels of profitability and signaling the execution issues over the past two years
are coming to an end. PWR has enough visibility today to suggest the Electric Power business can grow the top line, and we believe
execution can continue with Alaska done and based on profitability of margins in backlog driving margin's back to the targeted range for
FY'17. The Oil and Gas business should benefit in FY'17 from a project that is pushed from FY'16 next year and there is a good line of sight
to book awards, which secures work for the back half of FY'17. Furthermore, adjusting for the Alaska Power project charges in FY'16, PWR
benefits from ~$0.20 in FY'17 along with benefits from restructuring the Canadian business.
Q3’16 Earnings Summary
Quanta Services (NYSE: PWR)
Source: ThomsonOne, Company data, Credit Suisse Estimates
Guidance CS Consensus
Item Q4'16 FY'16 FY'17 Q4'16 FY'16 FY'17 Q4'16 FY'16 FY'17
Revenue -- $7.65-7.75 -- $2,161 $7,709 $8,152 $2,153 $7,701 $8,138
EBITDA -- -- -- $171 $519 $617 $195 $540 $663
Adj. EPS -- $1.51-1.56 -- $0.60 $1.56 $2.05 $0.57 $1.51 $2.02
EP Sales Growth --% (1)-(2)% --% 0.5% (1.1%) 5.0% --% --% --%
O&G Sales Growth --% 7-9% --% 42.0% 7.9% 7.0% --% --% --%
EP Op Margin --% 8.0% --% 9.0% 8.2% 9.0% --% --% --%
O&G Op Margin --% 5.5% --% 8.0% 5.4% 6.8% --% --% --%
Intangible Amortization -- $31.7 -- -- -- -- -- -- --
Non-cash Stock Comp -- $40.8 -- -- -- -- -- -- --
Interest Expense -- $15.0 -- $4.4 $15.3 $15.0 -- -- --
Capex -- $205-215 -- $52.5 $203.3 $244.5 -- -- --
Tax Rate --% 41.5% --% 39.8% 41.5% 40.0% --% --% --%
95
C onsensus EPS
Ticker M kt C ap Price 52 - W Hi % Hi 52 - W Lo % Lo Q4 '16 FY '17 FY '18
PWR $5,531 $36.58 $37.60 (2.7%) $17.29 111.6% $0.57 $2.02 $2.27
R eport D at e: 2/21/17 C all D at e: 2/21/17 C all T ime: TBD D ial- in: TBD C ode: TBD

US Engineering & Construction
Q3’16 Divisional / Market Commentary
Quanta Services (NYSE: PWR)
Electric Transmission
EP sales were up 3.3% y/y to $1.222B largely driven by $25M of acquired company revenues. Operating margins were solid at 9.7%, up
320 bps y/y and 310 bps q/q, and included $3M of additional charges on the Alaska problem project. Adj. for the project charge, margins
were 10%, in line with mgmt.'s LT target of b/w 9-12%. EP backlog was up 5% y/y and 3% q/q to $6.520B. Twelve month backlog was
down 1% y/y but up 3% q/q to $3.363B. Orders were implied at $1.395B, or a book to bill of 1.1x.
Mgmt. noted that the Alaska problem project is now complete. PWR is in the early stages of seeking cost recovery with the client. Mgmt.
noted that the company has not recognized any cost recovery to date and potential recoveries are not contemplated in the guide (though
seem unlikely based off of comments on the call).
Mgmt. believes that the core large transmission business is healthy. PWR is executing three large projects today with several more moving
to construction in FY'17. Core margins are trending in the double digit range. Still, mgmt. noted that Canada operations remain a headwind
along with competition on small transmission projects. Mgmt. noted that Canada margins are trending in the lower single digit range and
that consolidated Canada sales are b/w 10-15% of overall topline. PWR is offsetting these headwinds by better controlling its costs to align
with current demand levels as well as better managing utilization rates as small transmission work transitions. Mgmt. was optimistic on
several large Canadian projects (namely Ft. McMurray and Labrador Island) moving to construction next year and boosting margins.
Work in the quarter was helped by storm relief work related to Hurricane Matthew. PWR expects more storm relief work in Q4'16, though
benefits will be offset by a deferral of O&G projects into FY'17.
For Q4'16, PWR expects EP sales to be flat y/y, or ~$1.292B as normal seasonality is offset by higher levels of storm work. This implies
FY'16 sales of $4.860B, or down 1.3% y/y, consistent with mgmt.'s guide of EP sales down 1-2%. FY'16 operating margins are
contemplated in the low 8% range (unchanged from the Q2 guide). This implies Q4'16 margins in the 8-9% range, consistent with mgmt.'s
informal guide on the call that margins should temper from below 10% levels realized in Q3'16.
Source: ThomsonOne, Company data, Credit Suisse Estimates
96
C onsensus EPS
Ticker M kt C ap Price 52 - W Hi % Hi 52 - W Lo % Lo Q4 '16 FY '17 FY '18
PWR $5,531 $36.58 $37.60 (2.7%) $17.29 111.6% $0.57 $2.02 $2.27
R eport D at e: 2/21/17 C all D at e: 2/21/17 C all T ime: TBD D ial- in: TBD C ode: TBD
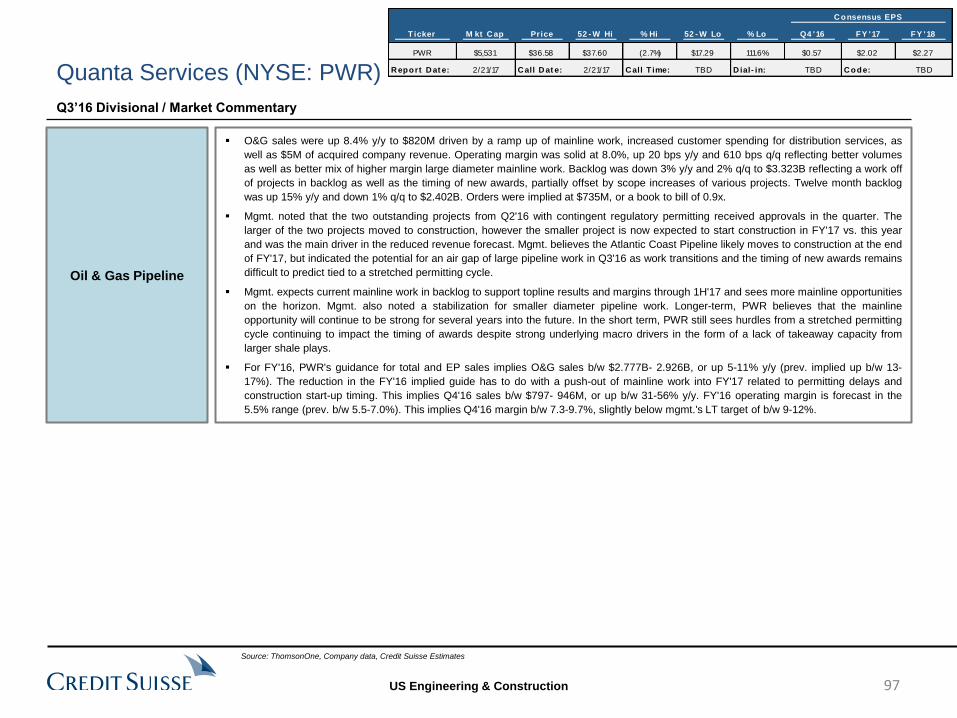
US Engineering & Construction
Q3’16 Divisional / Market Commentary
Quanta Services (NYSE: PWR)
Source: ThomsonOne, Company data, Credit Suisse Estimates
Oil & Gas Pipeline
O&G sales were up 8.4% y/y to $820M driven by a ramp up of mainline work, increased customer spending for distribution services, as
well as $5M of acquired company revenue. Operating margin was solid at 8.0%, up 20 bps y/y and 610 bps q/q reflecting better volumes
as well as better mix of higher margin large diameter mainline work. Backlog was down 3% y/y and 2% q/q to $3.323B reflecting a work off
of projects in backlog as well as the timing of new awards, partially offset by scope increases of various projects. Twelve month backlog
was up 15% y/y and down 1% q/q to $2.402B. Orders were implied at $735M, or a book to bill of 0.9x.
Mgmt. noted that the two outstanding projects from Q2'16 with contingent regulatory permitting received approvals in the quarter. The
larger of the two projects moved to construction, however the smaller project is now expected to start construction in FY'17 vs. this year
and was the main driver in the reduced revenue forecast. Mgmt. believes the Atlantic Coast Pipeline likely moves to construction at the end
of FY'17, but indicated the potential for an air gap of large pipeline work in Q3'16 as work transitions and the timing of new awards remains
difficult to predict tied to a stretched permitting cycle.
Mgmt. expects current mainline work in backlog to support topline results and margins through 1H'17 and sees more mainline opportunities
on the horizon. Mgmt. also noted a stabilization for smaller diameter pipeline work. Longer-term, PWR believes that the mainline
opportunity will continue to be strong for several years into the future. In the short term, PWR still sees hurdles from a stretched permitting
cycle continuing to impact the timing of awards despite strong underlying macro drivers in the form of a lack of takeaway capacity from
larger shale plays.
For FY'16, PWR's guidance for total and EP sales implies O&G sales b/w $2.777B- 2.926B, or up 5-11% y/y (prev. implied up b/w 13-
17%). The reduction in the FY'16 implied guide has to do with a push-out of mainline work into FY'17 related to permitting delays and
construction start-up timing. This implies Q4'16 sales b/w $797- 946M, or up b/w 31-56% y/y. FY'16 operating margin is forecast in the
5.5% range (prev. b/w 5.5-7.0%). This implies Q4'16 margin b/w 7.3-9.7%, slightly below mgmt.'s LT target of b/w 9-12%.
97
C onsensus EPS
Ticker M kt C ap Price 52 - W Hi % Hi 52 - W Lo % Lo Q4 '16 FY '17 FY '18
PWR $5,531 $36.58 $37.60 (2.7%) $17.29 111.6% $0.57 $2.02 $2.27
R eport D at e: 2/21/17 C all D at e: 2/21/17 C all T ime: TBD D ial- in: TBD C ode: TBD
US Engineering & Construction
Selected Recent Project Awards
Quanta Services (NYSE: PWR)
Source: ThomsonOne, Company data, Credit Suisse Estimates
PWR did not report any awards during the quarter.
98
C onsensus EPS
Ticker M kt C ap Price 52 - W Hi % Hi 52 - W Lo % Lo Q4 '16 FY '17 FY '18
PWR $5,531 $36.58 $37.60 (2.7%) $17.29 111.6% $0.57 $2.02 $2.27
R eport D at e: 2/21/17 C all D at e: 2/21/17 C all T ime: TBD D ial- in: TBD C ode: TBD
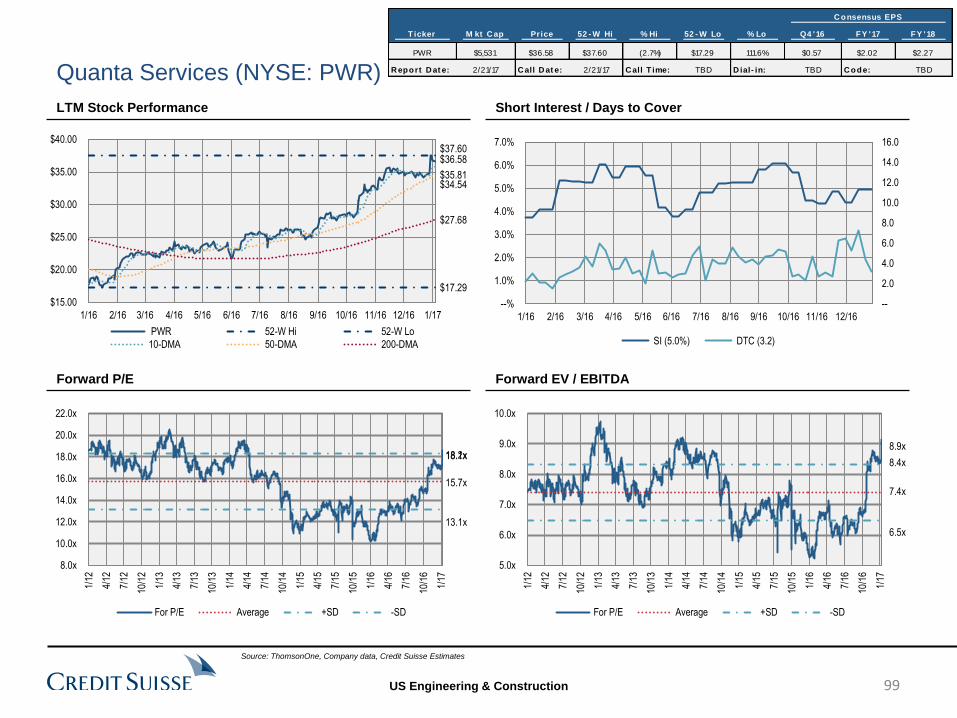
US Engineering & Construction
Quanta Services (NYSE: PWR)
LTM Stock Performance
Forward P/E
Short Interest / Days to Cover
Forward EV / EBITDA
Source: ThomsonOne, Company data, Credit Suisse Estimates
--
2.0
4.0
6.0
8.0
10.0
12.0
14.0
16.0
--%
1.0%
2.0%
3.0%
4.0%
5.0%
6.0%
7.0%
1/16 2/16 3/16 4/16 5/16 6/16 7/16 8/16 9/16 10/16 11/16 12/16
SI (5.0%) DTC (3.2)
18.1x
15.7x
18.2x
13.1x
8.0x
10.0x
12.0x
14.0x
16.0x
18.0x
20.0x
22.0x
1/12
4/12
7/12
10/1
2
1/13
4/13
7/13
10/1
3
1/14
4/14
7/14
10/1
4
1/15
4/15
7/15
10/1
5
1/16
4/16
7/16
10/1
6
1/17
For P/E Average +SD -SD
8.9x
7.4x
8.4x
6.5x
5.0x
6.0x
7.0x
8.0x
9.0x
10.0x
1/12
4/12
7/12
10/1
2
1/13
4/13
7/13
10/1
3
1/14
4/14
7/14
10/1
4
1/15
4/15
7/15
10/1
5
1/16
4/16
7/16
10/1
6
1/17
For P/E Average +SD -SD
99
$36.58 $37.60
$17.29
$35.81 $34.54
$27.68
$15.00
$20.00
$25.00
$30.00
$35.00
$40.00
1/16 2/16 3/16 4/16 5/16 6/16 7/16 8/16 9/16 10/16 11/16 12/16 1/17
PWR 52-W Hi 52-W Lo
10-DMA 50-DMA 200-DMA
C onsensus EPS
Ticker M kt C ap Price 52 - W Hi % Hi 52 - W Lo % Lo Q4 '16 FY '17 FY '18
PWR $5,531 $36.58 $37.60 (2.7%) $17.29 111.6% $0.57 $2.02 $2.27
R eport D at e: 2/21/17 C all D at e: 2/21/17 C all T ime: TBD D ial- in: TBD C ode: TBD
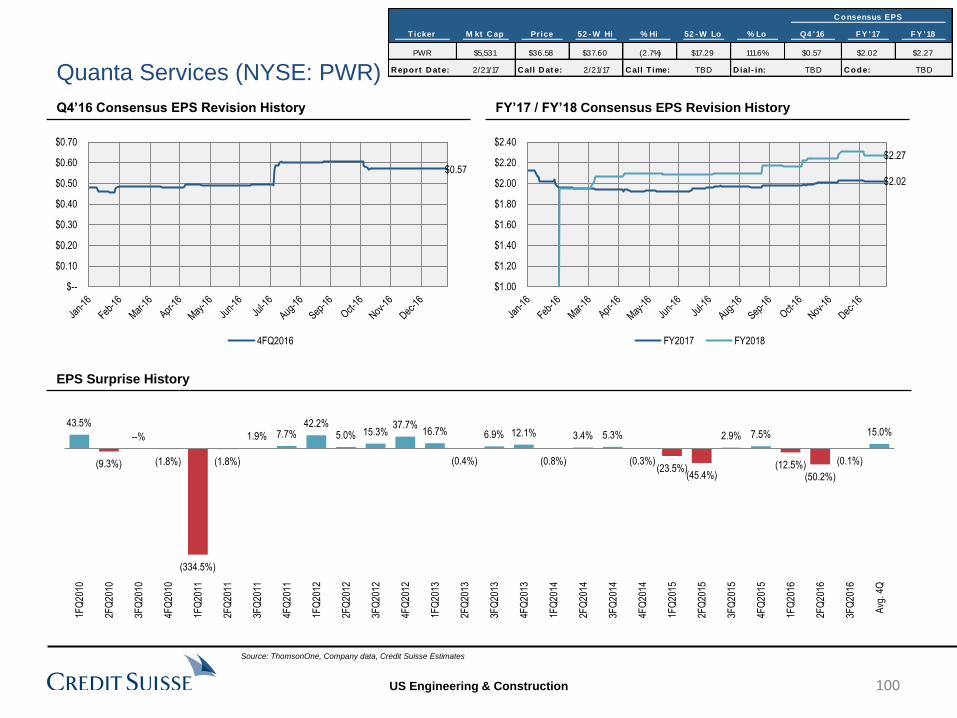
US Engineering & Construction
Quanta Services (NYSE: PWR)
Q4’16 Consensus EPS Revision History FY’17 / FY’18 Consensus EPS Revision History
EPS Surprise History
Source: ThomsonOne, Company data, Credit Suisse Estimates
$0.57
$--
$0.10
$0.20
$0.30
$0.40
$0.50
$0.60
$0.70
4FQ2016
$2.02
$2.27
$1.00
$1.20
$1.40
$1.60
$1.80
$2.00
$2.20
$2.40
FY2017 FY2018
15.0%
(0.1%)
(50.2%)(12.5%)
7.5% 2.9%
(45.4%)(23.5%)
(0.3%)
5.3% 3.4%
(0.8%)
12.1% 6.9%
(0.4%)
16.7% 37.7%
15.3% 5.0% 42.2%
7.7% 1.9%
(1.8%)
(334.5%)
(1.8%)
--%
(9.3%)
43.5%
Avg
. 4Q
3FQ
2016
2FQ
2016
1FQ
2016
4FQ
2015
3FQ
2015
2FQ
2015
1FQ
2015
4FQ
2014
3FQ
2014
2FQ
2014
1FQ
2014
4FQ
2013
3FQ
2013
2FQ
2013
1FQ
2013
4FQ
2012
3FQ
2012
2FQ
2012
1FQ
2012
4FQ
2011
3FQ
2011
2FQ
2011
1FQ
2011
4FQ
2010
3FQ
2010
2FQ
2010
1FQ
2010
100
C onsensus EPS
Ticker M kt C ap Price 52 - W Hi % Hi 52 - W Lo % Lo Q4 '16 FY '17 FY '18
PWR $5,531 $36.58 $37.60 (2.7%) $17.29 111.6% $0.57 $2.02 $2.27
R eport D at e: 2/21/17 C all D at e: 2/21/17 C all T ime: TBD D ial- in: TBD C ode: TBD

US Engineering & Construction
Disclosures
101
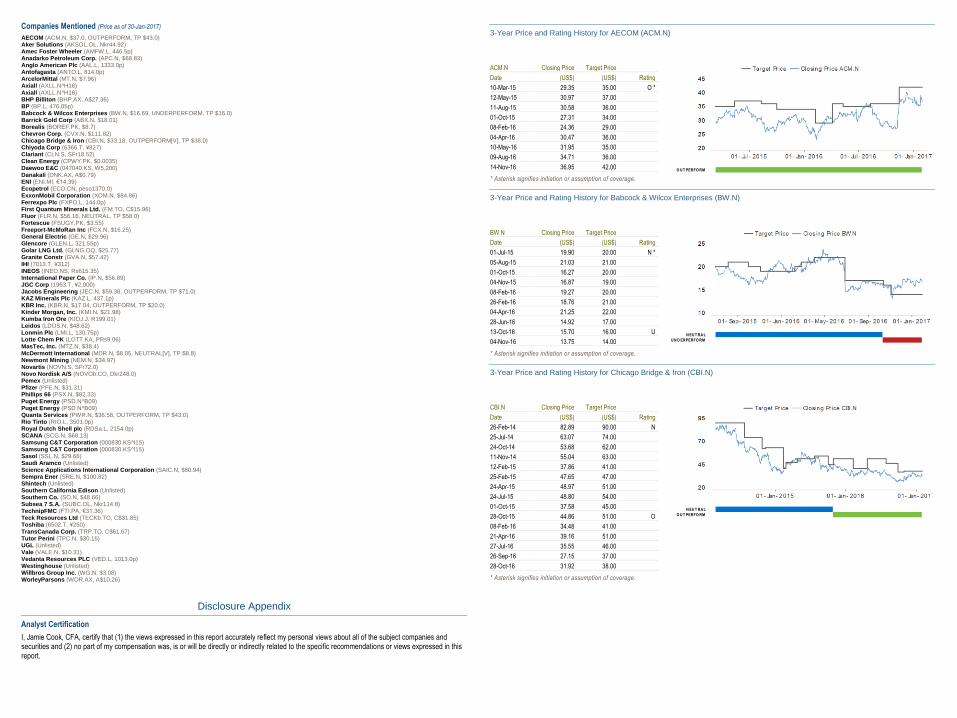
Companies Mentioned (Price as of 30-Jan-2017)
AECOM (ACM.N, $37.0, OUTPERFORM, TP $43.0) Aker Solutions (AKSOL.OL, Nkr44.92) Amec Foster Wheeler (AMFW.L, 446.5p) Anadarko Petroleum Corp. (APC.N, $68.83) Anglo American Plc (AAL.L, 1333.0p) Antofagasta (ANTO.L, 814.0p) ArcelorMittal (MT.N, $7.96) Axiall (AXLL.N^H16) Axiall (AXLL.N^H16) BHP Billiton (BHP.AX, A$27.36) BP (BP.L, 476.05p) Babcock & Wilcox Enterprises (BW.N, $16.69, UNDERPERFORM, TP $16.0) Barrick Gold Corp (ABX.N, $18.01) Borealis (BOREF.PK, $8.7) Chevron Corp. (CVX.N, $111.82) Chicago Bridge & Iron (CBI.N, $33.18, OUTPERFORM[V], TP $38.0) Chiyoda Corp (6366.T, ¥827) Clariant (CLN.S, SFr18.52) Clean Energy (CPWY.PK, $0.0035) Daewoo E&C (047040.KS, W5,200) Danakali (DNK.AX, A$0.79) ENI (ENI.MI, €14.39) Ecopetrol (ECO.CN, peso1370.0) ExxonMobil Corporation (XOM.N, $84.86) Ferrexpo Plc (FXPO.L, 144.0p) First Quantum Minerals Ltd. (FM.TO, C$15.96) Fluor (FLR.N, $56.16, NEUTRAL, TP $58.0) Fortescue (FSUGY.PK, $3.55) Freeport-McMoRan Inc (FCX.N, $16.25) General Electric (GE.N, $29.96) Glencore (GLEN.L, 321.55p) Golar LNG Ltd. (GLNG.OQ, $25.77) Granite Constr (GVA.N, $57.42) IHI (7013.T, ¥312) INEOS (INEO.NS, Rs615.35) International Paper Co. (IP.N, $56.89) JGC Corp (1963.T, ¥2,000) Jacobs Engineering (JEC.N, $59.38, OUTPERFORM, TP $71.0) KAZ Minerals Plc (KAZ.L, 437.1p) KBR Inc. (KBR.N, $17.04, OUTPERFORM, TP $20.0) Kinder Morgan, Inc. (KMI.N, $21.98) Kumba Iron Ore (KIOJ.J, R199.01) Leidos (LDOS.N, $48.62) Lonmin Plc (LMI.L, 130.75p) Lotte Chem PK (LOTT.KA, PRs9.06) MasTec, Inc. (MTZ.N, $38.4) McDermott International (MDR.N, $8.05, NEUTRAL[V], TP $8.8) Newmont Mining (NEM.N, $34.97) Novartis (NOVN.S, SFr72.0) Novo Nordisk A/S (NOVOb.CO, Dkr248.0) Pemex (Unlisted) Pfizer (PFE.N, $31.31) Phillips 66 (PSX.N, $82.33) Puget Energy (PSD.N^B09) Puget Energy (PSD.N^B09) Quanta Services (PWR.N, $36.58, OUTPERFORM, TP $43.0) Rio Tinto (RIO.L, 3501.0p) Royal Dutch Shell plc (RDSa.L, 2154.0p) SCANA (SCG.N, $68.13) Samsung C&T Corporation (000830.KS^I15) Samsung C&T Corporation (000830.KS^I15) Sasol (SSL.N, $29.66) Saudi Aramco (Unlisted) Science Applications International Corporation (SAIC.N, $80.94) Sempra Ener (SRE.N, $100.82) Shintech (Unlisted) Southern California Edison (Unlisted) Southern Co. (SO.N, $48.66) Subsea 7 S.A. (SUBC.OL, Nkr114.8) TechnipFMC (FTI.PA, €31.36) Teck Resources Ltd (TECKb.TO, C$31.85) Toshiba (6502.T, ¥250) TransCanada Corp. (TRP.TO, C$61.67) Tutor Perini (TPC.N, $30.15) UGL (Unlisted) Vale (VALE.N, $10.31) Vedanta Resources PLC (VED.L, 1013.0p) Westinghouse (Unlisted) Willbros Group Inc. (WG.N, $3.08) WorleyParsons (WOR.AX, A$10.26)
Disclosure Appendix
Analyst Certification
I, Jamie Cook, CFA, certify that (1) the views expressed in this report accurately reflect my personal views about all of the subject companies and securities and (2) no part of my compensation was, is or will be directly or indirectly related to the specific recommendations or views expressed in this report.
3-Year Price and Rating History for AECOM (ACM.N)
ACM.N Closing Price Target Price
Date (US$) (US$) Rating
10-Mar-15 29.35 35.00 O *
12-May-15 30.97 37.00
11-Aug-15 30.58 36.00
01-Oct-15 27.31 34.00
08-Feb-16 24.36 29.00
04-Apr-16 30.47 36.00
10-May-16 31.95 35.00
09-Aug-16 34.71 36.00
14-Nov-16 36.95 42.00
* Asterisk signifies initiation or assumption of coverage.
O U T PERFO RM
3-Year Price and Rating History for Babcock & Wilcox Enterprises (BW.N)
BW.N Closing Price Target Price
Date (US$) (US$) Rating
01-Jul-15 19.90 20.00 N *
05-Aug-15 21.03 21.00
01-Oct-15 16.27 20.00
04-Nov-15 16.87 19.00
08-Feb-16 19.27 20.00
26-Feb-16 18.76 21.00
04-Apr-16 21.25 22.00
28-Jun-16 14.92 17.00
13-Oct-16 15.70 16.00 U
04-Nov-16 13.75 14.00
* Asterisk signifies initiation or assumption of coverage.
N EU T RA L
U N D ERPERFO RM
3-Year Price and Rating History for Chicago Bridge & Iron (CBI.N)
CBI.N Closing Price Target Price
Date (US$) (US$) Rating
26-Feb-14 82.89 90.00 N
25-Jul-14 63.07 74.00
24-Oct-14 53.68 62.00
11-Nov-14 55.04 63.00
12-Feb-15 37.86 41.00
25-Feb-15 47.65 47.00
24-Apr-15 48.97 51.00
24-Jul-15 48.80 54.00
01-Oct-15 37.58 45.00
28-Oct-15 44.86 51.00 O
08-Feb-16 34.48 41.00
21-Apr-16 39.16 51.00
27-Jul-16 35.55 46.00
26-Sep-16 27.15 37.00
28-Oct-16 31.92 38.00
* Asterisk signifies initiation or assumption of coverage.
N EU T RA L
O U T PERFO RM

3-Year Price and Rating History for Fluor (FLR.N)
FLR.N Closing Price Target Price
Date (US$) (US$) Rating
18-Feb-14 80.13 98.00 O
01-May-14 75.54 96.00
31-Jul-14 72.87 93.00
15-Oct-14 61.65 77.00
12-Feb-15 56.36 66.00
18-Feb-15 59.09 68.00
30-Apr-15 60.14 71.00
30-Jul-15 50.90 61.00
01-Oct-15 41.46 50.00
29-Oct-15 46.55 57.00
08-Feb-16 42.78 50.00
19-Feb-16 45.38 52.00
04-Apr-16 52.59 61.00
05-May-16 54.68 62.00
04-Aug-16 52.94 59.00
04-Nov-16 44.80 53.00
08-Nov-16 44.58 49.00 N
* Asterisk signifies initiation or assumption of coverage.
O U T PERFO RM
N EU T RA L
3-Year Price and Rating History for Jacobs Engineering (JEC.N)
JEC.N Closing Price Target Price
Date (US$) (US$) Rating
30-Apr-14 57.70 68.00 O
29-Jul-14 52.37 64.00
18-Nov-14 47.70 61.00
29-Jan-15 38.75 45.00
12-Feb-15 42.56 47.00
28-Apr-15 44.00 49.00
28-Jul-15 41.69 51.00
01-Oct-15 36.76 44.00
23-Nov-15 43.54 49.00
03-Feb-16 37.35 43.00
04-Apr-16 43.04 51.00
05-May-16 46.59 53.00
09-Aug-16 55.57 60.00
22-Nov-16 59.32 66.00
* Asterisk signifies initiation or assumption of coverage.
O U T PERFO RM
3-Year Price and Rating History for KBR Inc. (KBR.N)
KBR.N Closing Price Target Price
Date (US$) (US$) Rating
28-Feb-14 27.62 34.00 O
19-Jun-14 24.46 30.00
31-Jul-14 20.66 29.00
04-Nov-14 18.60 26.00
12-Feb-15 17.98 21.00
02-Mar-15 16.13 20.00
29-Apr-15 17.06 21.00
04-Aug-15 18.39 23.00
01-Oct-15 16.67 22.00
02-Nov-15 18.98 23.00
08-Feb-16 12.26 16.00
26-Feb-16 14.16 17.00
01-May-16 15.56 18.00
* Asterisk signifies initiation or assumption of coverage.
O U T PERFO RM
3-Year Price and Rating History for McDermott International (MDR.N)
MDR.N Closing Price Target Price
Date (US$) (US$) Rating
03-Mar-14 8.11 10.00 O
08-May-14 6.73 9.00
06-Nov-14 3.82 5.50
12-Feb-15 2.65 3.50
11-May-15 5.08 6.50
18-Nov-15 4.97 5.80
08-Feb-16 2.52 3.50
04-Apr-16 3.79 4.04 N
10-May-16 4.45 4.41
26-Jul-16 4.99 5.45
* Asterisk signifies initiation or assumption of coverage.
O U T PERFO RM
N EU T RA L
3-Year Price and Rating History for Quanta Services (PWR.N)
PWR.N Closing Price Target Price
Date (US$) (US$) Rating
20-Feb-14 34.54 40.00 O
12-Feb-15 28.86 34.00
30-Apr-15 28.91 35.00
05-Aug-15 23.11 28.00
16-Oct-15 18.74 25.00
06-Nov-15 20.85 26.00
08-Feb-16 17.65 23.00
25-Feb-16 19.92 24.00
04-Apr-16 22.16 26.00
03-Nov-16 28.31 32.00
* Asterisk signifies initiation or assumption of coverage.
O U T PERFO RM
The analyst(s) responsible for preparing this research report received Compensation that is based upon various factors including Credit Suisse's total revenues, a portion of which are generated by Credit Suisse's investment banking activities
As of December 10, 2012 Analysts’ stock rating are defined as follows:
Outperform (O) : The stock’s total return is expected to outperform the relevant benchmark* over the next 12 months.
Neutral (N) : The stock’s total return is expected to be in line with the relevant benchmark* over the next 12 months.
Underperform (U) : The stock’s total return is expected to underperform the relevant benchmark* over the next 12 months.
*Relevant benchmark by region: As of 10th December 2012, Japanese ratings are based on a stock’s total return relative to the analyst's coverage universe which consists of all companies covered by the analyst within the relevant sector, with Outperforms representing the most attractiv e, Neutrals the less attractive, and Underperforms the least attractive investment opportunities. As of 2nd October 2012, U.S. and Canadian as well as European ratings are based on a stock’s t otal return relative to the analyst's coverage universe which consists of all companies covered by the analyst within the relevant sector, with Outperforms representing the most attractive, Neutrals the less attractive, and Underperforms the least attractive investment opportunities. For Latin American and non-Japan Asia stocks, ratings are based on a stock’s total return relative to the average total return of the relevant country or regional benchmark; prior to 2nd October 2012 U.S. and Canadian ratings were based on (1) a stock’s absolute total return potential to its current share price and (2) the relative attractiveness of a stock’s total return potential within an analyst’s coverage universe. For Australian and New Zealand stocks, the expected total return (ETR) calculation includes 12 -month rolling dividend yield. An Outperform rating is assigned where an ETR is greater than or equal to 7.5%; Underperform where an ETR less than or equal to 5%. A Neutral may be assigned where the ETR is between -5% and 15%. The overlapping rating range allows analysts to assign a rating that puts ETR in the context of associated risks. Prior to 18 May 2015, ETR ranges for Outperform and Underperform ratings did not overlap with Neutral thresholds between 15% and 7.5%, which was in operation from 7 July 2011.
Restricted (R) : In certain circumstances, Credit Suisse policy and/or applicable law and regulations preclude certain types of communications, including an investment recommendation, during the course of Credit Suisse's engagement in an investment banking transaction and in certain other circumstances.
Not Rated (NR) : Credit Suisse Equity Research does not have an investment rating or view on the stock or any other securities related to the company at this time.
Not Covered (NC) : Credit Suisse Equity Research does not provide ongoing coverage of the company or offer an investment rating or investment view on the equity security of the company or related products.
Volatility Indicator [V] : A stock is defined as volatile if the stock price has moved up or down by 20% or more in a month in at least 8 of the past 24 months or the analyst expects significant volatility going forward.
Analysts’ sector weightings are distinct from analysts’ stock ratings and are based on the analyst’s expectations for the fundamentals and/or valuation of the sector* relative to the group’s historic fundamentals and/or valuation:
Overweight : The analyst’s expectation for the sector’s fundamentals and/or valuation is favorable over the next 12 months.
Market Weight : The analyst’s expectation for the sector’s fundamentals and/or valuation is neutral over the next 12 months.
Underweight : The analyst’s expectation for the sector’s fundamentals and/or valuation is cautious over the next 12 months.
Credit Suisse's distribution of stock ratings (and banking clients) is:
Global Ratings Distribution
Rating Versus universe (%) Of which banking clients (%)
Outperform/Buy* 44% (64% banking clients)
Neutral/Hold* 38% (60% banking clients)
Underperform/Sell* 15% (54% banking clients)
Restricted 3%
*For purposes of the NYSE and NASD ratings distribution disclosure requirements, our stock ratings of Outperfo rm, Neutral, and Underperform most closely correspond to Buy, Hold, and Sell, respectively; however, the meanings are not the same, as our stock ratings are determined on a relati ve basis. (Please refer to definitions above.) An investor's decision to buy or sell a security should be based on investment objectives, current holdings, and other individual factors.
Important Global Disclosures
Credit Suisse’s research reports are made available to clients through our proprietary research portal on CS PLUS. Credit Suisse research products may also be made available through third-party vendors or alternate electronic means as a convenience. Certain research products are only made available through CS PLUS. The services provided by Credit Suisse’s analysts to clients may depend on a specific client’s preferences regarding the frequency and manner of receiving communications, the client’s risk profile and investment, the size and scope of the overall client relationship with the Firm, as well as legal and regulatory constraints. To access all of Credit Suisse’s research that you are entitled to receive in the most timely manner, please contact your sales representative or go to https://plus.credit-suisse.com .
Credit Suisse’s policy is to update research reports as it deems appropriate, based on developments with the subject company, the sector or the market that may have a material impact on the research views or opinions stated herein.
Credit Suisse's policy is only to publish investment research that is impartial, independent, clear, fair and not misleading. For more detail please refer to Credit Suisse's Policies for Managing Conflicts of Interest in connection with Investment Research: https://www.credit-suisse.com/sites/disclaimers-ib/en/managing-conflicts.html .
Credit Suisse does not provide any tax advice. Any statement herein regarding any US federal tax is not intended or written to be used, and cannot be used, by any taxpayer for the purposes of avoiding any penalties.
Target Price and Rating Valuation Methodology and Risks: (12 months) for AECOM (ACM.N)
Method: Our $43 TP is based on a multiple of 8.0x our 2019 EBITDA estimate, discounted back. We see upside to the additional addressable work around the globe following the successful integration of URS as well as continued cost savings related to the acquisition. Our Outperform rating is merited based on relative upside we see for ACM relative to the group.
Risk: Risks to our Outperform rating and $43 TP include the fact that ACM derives a significant portion of their revenues from federal, state and local governments. Budget cuts or a reduction in spending among governments at any of these levels could negatively impact proposed and existing projects. Given the recent correction in oil prices, there is significant risk that demand is weaker than expected relative to assumptions when ACM acquired URS. Furthermore, a deterioration in the global non-residential construction market (which continue to perform at near-peak levels) could create additional downside for ACM.
Target Price and Rating Valuation Methodology and Risks: (12 months) for Babcock & Wilcox Enterprises (BW.N)
Method: Our $16 target price is based off a 14x earnings multiple on 2019 adjusted EPS, discounted back. Our Underperform rating for BW is merited based on the fact that we anticipate performance below the group.
Risk: Risks to our Underperform rating and our $16 target price are better than expected coal fired retirements, success with international and renewable projects more than offsetting declines in the traditional US coal business, and transformative M&A.
Target Price and Rating Valuation Methodology and Risks: (12 months) for Chicago Bridge & Iron (CBI.N)
Method: Using a EV/EBITDA multiple of 5.0x our FY19 EBITDA estimate (ex. the nuclear projects) discounted back yields a target price of $38 for Chicago Bridge & Iron. Our Outperform rating is merited based on relative upside we see for CBI relative to the group.
Risk: Risks to our Outperform rating and CBI's $38 target price include the company's exposure to risks associated with cost overruns on existing projects and success in winning new work, the health of the end markets, specifically oil and gas and water, and whether the company can find and integrate acquisitions effectively.
Target Price and Rating Valuation Methodology and Risks: (12 months) for Fluor (FLR.N)
Method: Our $58 target price for FLR is based on a price-to-earnings multiple of 18x our 2019 EPS estimate, discounted back. Our Neutral rating is based on the relative in line performance we see for FLR vs. the rest of the group.
Risk: Risks to our $58 target price and Neutral rating for FLR are the general health of endmarkets served, the company's success in winning new contracts, the company's execution on existing contracts, the company's ability to retain existing contracts, and acquisition risk.
Target Price and Rating Valuation Methodology and Risks: (12 months) for Jacobs Engineering (JEC.N)
Method: Our price target of $71 for JEC is based on 18.5x our estimated calendar 2019 EPS, discounted back. This multiple is a slight premium to the peer group as Jacobs is considered one of the most consistent E&Cs from an execution standpoint. Our Outperform rating is merited based on relative upside we see for JEC relative to the group.
Risk: Risks to our Outperform rating and our $71 price target for JEC are the general health of endmarkets served, the company's success in winning new contracts, and the company's execution on contracts.
Target Price and Rating Valuation Methodology and Risks: (12 months) for KBR Inc. (KBR.N)
Method: Our price target of $20 for KBR is 15x our 2019 EPS (earnings per share), discounted back. Our Outperform rating is merited based on relative upside we see for KBR relative to the group.
Risk: Risks to our Outperform rating and $20 target price for KBR are project cost overruns, material price escalation, loss of significant contracts provided by the U.S. Department of Defense and the U.K. Ministry of Defence, expiration of the lock-up period, a decline in crude oil or natural gas prices, and unfavorable fixed price contract terms.
Target Price and Rating Valuation Methodology and Risks: (12 months) for McDermott International (MDR.N)
Method: Our $8.80 TP on MDR assumes 6.5x our 2019 EBITDA estimate, less net debt, discounted back. Our Neutral rating is merited based on in-line performance we see for MDR relative to the group.
Risk: Risks to our Neutral rating and our $8.80 target price for MDR are the general health of endmarkets served, the company's success in winning new contracts, the company's execution on existing contracts, the company's ability to retain existing contracts, labor shortage risk, and customer concentration.
Target Price and Rating Valuation Methodology and Risks: (12 months) for Quanta Services (PWR.N)
Method: We use a 17.5x multiple on our 2019 EPS, discounted back, resulting in a $43 target price. Our Outperform rating is merited based on relative upside we see for PWR relative to the group.
Risk: Risks to our Outperform rating and $43 target price for PWR are improving health of the electric utilities; regulatory delays; catalyst needed for spending on overhaul of U.S. power grid; and integration risk from previous acquisitions.
Please refer to the firm's disclosure website at https://rave.credit-suisse.com/disclosures for the definitions of abbreviations typically used in the target price method and risk sections.
See the Companies Mentioned section for full company names
The subject company (ACM.N, BW.N, CBI.N, FLR.N, KBR.N, JEC.N, PWR.N, MTZ.N, KMI.N, WG.N, GE.N, SUBC.OL, AKSOL.OL, RDSa.L, BP.L, FTI.PA, GLNG.OQ, CVX.N, BHP.AX, VALE.N, RIO.L, GLEN.L, AAL.L, ABX.N, TECKb.TO, NEM.N, VED.L, ANTO.L, FM.TO, KAZ.L, KIOJ.J, FXPO.L, 6502.T, MT.N, ENI.MI, APC.N, CLN.S, PSX.N, NOVOb.CO, TRP.TO, PFE.N, NOVN.S, XOM.N, LDOS.N, SAIC.N, IP.N) currently is, or was during the 12-month period preceding the date of distribution of this report, a client of Credit Suisse.
Credit Suisse provided investment banking services to the subject company (KMI.N, GE.N, RDSa.L, BP.L, BHP.AX, VALE.N, RIO.L, GLEN.L, AAL.L, NEM.N, VED.L, KIOJ.J, FXPO.L, ENI.MI, APC.N, PSX.N, TRP.TO, PFE.N, NOVN.S, XOM.N) within the past 12 months.
Credit Suisse provided non-investment banking services to the subject company (GE.N, XOM.N) within the past 12 months
Credit Suisse has managed or co-managed a public offering of securities for the subject company (GE.N, BP.L, GLEN.L, APC.N, PSX.N, TRP.TO, PFE.N, XOM.N) within the past 12 months.
Credit Suisse has received investment banking related compensation from the subject company (KMI.N, GE.N, RDSa.L, BP.L, BHP.AX, VALE.N, RIO.L, GLEN.L, AAL.L, NEM.N, VED.L, KIOJ.J, FXPO.L, ENI.MI, APC.N, PSX.N, TRP.TO, PFE.N, NOVN.S, XOM.N) within the past 12 months
Credit Suisse expects to receive or intends to seek investment banking related compensation from the subject company (ACM.N, BW.N, CBI.N, FLR.N, KBR.N, MDR.N, JEC.N, PWR.N, MTZ.N, KMI.N, WG.N, 7013.T, GE.N, AKSOL.OL, RDSa.L, BP.L, FTI.PA, GLNG.OQ, CVX.N, BHP.AX, VALE.N, RIO.L, GLEN.L, AAL.L, ABX.N, TECKb.TO, NEM.N, VED.L, ANTO.L, FM.TO, KAZ.L, KIOJ.J, FXPO.L, 6502.T, MT.N, ENI.MI, APC.N, CLN.S, PSX.N, SO.N, NOVOb.CO, TRP.TO, PFE.N, NOVN.S, XOM.N, LDOS.N, SAIC.N, IP.N) within the next 3 months.
Credit Suisse has received compensation for products and services other than investment banking services from the subject company (GE.N, XOM.N) within the past 12 months
As of the date of this report, Credit Suisse makes a market in the following subject companies (KMI.N, NEM.N).
Please visit https://credit-suisse.com/in/researchdisclosure for additional disclosures mandated vide Securities And Exchange Board of India (Research Analysts) Regulations, 2014
Credit Suisse may have interest in (INEO.NS)
As of the end of the preceding month, Credit Suisse beneficially own 1% or more of a class of common equity securities of (SUBC.OL, AMFW.L, KAZ.L, FXPO.L).
As of the end of the preceding month, Credit Suisse beneficially own between 1-3% of a class of common equity securities of (CLN.S, NOVN.S).
Credit Suisse beneficially holds >0.5% long position of the total issued share capital of the subject company (NEM.N, KAZ.L, FXPO.L).
Credit Suisse beneficially holds >0.5% short position of the total issued share capital of the subject company (MDR.N).
Credit Suisse has a material conflict of interest with the subject company (GE.N) . Credit Suisse is acting as financial advisor to General Electric Company (GE) in connection with the announced proposed acquisition of certain assets from Alstom S.A. Credit Suisse is acting as exclusive financial advisors to Capital One Financial in relation to their potential acquisition of General Electric's U.S. Healthcare Finance Unit. Credit Suisse is acting as a financial advisor to General Electric Co. (GE) in relation to their potential sale of GE Capital’s Commercial Distribution Finance, North American Vendor Finance and Corporate Finance platforms to Wells Fargo & Co. (WFC). Credit Suisse is acting as as financial advisor General Electric Co. (GE) in relation to their potential sale of GE Capital, Transportation Finance business in the U.S. and Canada to BMO Financial Group (BMO).
Credit Suisse has a material conflict of interest with the subject company (CVX.N) . Credit Suisse is engaged as the Sole Financial Advisor and Joint Financier to the Consortium (consists of AC Energy, Star Energy Group Holdings Pte. Ltd., Star Energy Geothermal Pte. Ltd., and Electricity Generating Public Company Ltd.) for the purchase of Chevron’s geothermal operations in Indonesia and the Philippines.
Credit Suisse has a material conflict of interest with the subject company (VALE.N) . The analyst Ivano Westin has a relationship with a natural person who may provide remunerated services to one or more of the companies covered in this report.
Credit Suisse has a material conflict of interest with the subject company (AAL.L) . Credit Suisse is acting as financial adviser to Anglo American Platinum Limited in relation to the proposed disposal of its Rustenburg operations.
Credit Suisse has a material conflict of interest with the subject company (NEM.N) . ‘Noreen Doyle, an employee of Credit Suisse, is a Non-Executive Director of Newmont Mining Corporation.’
Credit Suisse has a material conflict of interest with the subject company (XOM.N) . Kofi Adjepong-Boateng, a Senior Advisor of Credit Suisse, is a Senior Advisor to Exxon Mobile (XOM).
Credit Suisse has a material conflict of interest with the subject company (LDOS.N) . Credit Suisse has a material conflict of interest with the subject company (SAI). As of the date of this report, an analyst involved in the preparation of this report has the following material conflict of interest with the subject company (SAI). An analyst or a member of the analyst's household has a long position in the common stock of SAIC (SAI).
As of the date of this report, an analyst involved in the preparation of this report has the following material conflict of interest with the subject company (FXPO.L). Credit Suisse Securities (Europe) Limited is acting as Dealer Manager to Ferrexpo on the announced exchange offer for its outstanding US$500,000,000 7.875% notes due 2016
As of the date of this report, an analyst involved in the preparation of this report has the following material conflict of interest with the subject company (PFE.N). As of the date of this report, an analyst involved in the preparation of this report, Vamil Divan, has following material conflicts of interest with the subject company. The analyst or a member of the analyst's household has a long position in the common stock Pfizer (PFE.N). A member of the analyst's household is an employee of Pfizer (PFE.N).
For other important disclosures concerning companies featured in this report, including price charts, please visit the website at https://rave.credit-suisse.com/disclosures or call +1 (877) 291-2683.
For date and time of production, dissemination and history of recommendation for the subject company(ies) featured in this report, disseminated within the past 12 months, please refer to the link: https://rave.credit-suisse.com/disclosures/view/report?i=264333&v=4b1gikr9u8xh7saf4pqgax8t8 .
Important Regional Disclosures
Singapore recipients should contact Credit Suisse AG, Singapore Branch for any matters arising from this research report.
The analyst(s) involved in the preparation of this report may participate in events hosted by the subject company, including site visits. Credit Suisse does not accept or permit analysts to accept payment or reimbursement for travel expenses associated with these events.
Restrictions on certain Canadian securities are indicated by the following abbreviations: NVS--Non-Voting shares; RVS--Restricted Voting Shares; SVS--Subordinate Voting Shares.
Individuals receiving this report from a Canadian investment dealer that is not affiliated with Credit Suisse should be advised that this report may not contain regulatory disclosures the non-affiliated Canadian investment dealer would be required to make if this were its own report.
For Credit Suisse Securities (Canada), Inc.'s policies and procedures regarding the dissemination of equity research, please visit https://www.credit-suisse.com/sites/disclaimers-ib/en/canada-research-policy.html.
The following disclosed European company/ies have estimates that comply with IFRS: (RDSa.L, BP.L, AAL.L, VED.L, ANTO.L, KAZ.L, MT.N, ENI.MI, CLN.S, XOM.N).
Credit Suisse has acted as lead manager or syndicate member in a public offering of securities for the subject company (PWR.N, KMI.N, GE.N, RDSa.L, BP.L, GLEN.L, AAL.L, FM.TO, FXPO.L, MT.N, APC.N, CLN.S, PSX.N, TRP.TO, PFE.N, NOVN.S, XOM.N) within the past 3 years.
Principal is not guaranteed in the case of equities because equity prices are variable.
Commission is the commission rate or the amount agreed with a customer when setting up an account or at any time after that.
This research report is authored by:
Credit Suisse Securities (USA) LLC ....................................................................................... Jamie Cook, CFA ; Jamie Anderson ; Themis Davris
For Credit Suisse disclosure information on other companies mentioned in this report, please visit the website at https://rave.credit-suisse.com/disclosures or call +1 (877) 291-2683.
This report is produced by subsidiaries and affiliates of Credit Suisse operating under its Global Markets Division. For more information on our structure, please use the following link: https://www.credit-suisse.com/who-we-are This report may contain material that is not directed to, or intended for distribution to or use by, any person or entity who is a citizen or resident of or located in any locality, state, country or other jurisdiction where such distribution, publication, availability or use would be contrary to law or regulation or which would subject Credit Suisse or its affiliates ("CS") to any registration or licensing requirement within such jurisdiction. All material presented in this report, unless specifically indicated otherwise, is under copyright to CS. None of the material, nor its content, nor any copy of it, may be altered in any way, transmitted to, copied or distributed to any other party, without the prior express written permission of CS. All trademarks, service marks and logos used in this report are trademarks or service marks or registered trademarks or service marks of CS or its affiliates.The information, tools and material presented in this report are provided to you for information purposes only and are not to be used or considered as an offer or the solicitation of an offer to sell or to buy or subscribe for securities or other financial instruments. CS may not have taken any steps to ensure that the securities referred to in this report are suitable for any particular investor. CS will not treat recipients of this report as its customers by virtue of their receiving this report. The investments and services contained or referred to in this report may not be suitable for you and it is recommended that you consult an independent investment advisor if you are in doubt about such investments or investment services. Nothing in this report constitutes investment, legal, accounting or tax advice, or a representation that any investment or strategy is suitable or appropriate to your individual circumstances, or otherwise constitutes a personal recommendation to you. CS does not advise on the tax consequences of investments and you are advised to contact an independent tax adviser. Please note in particular that the bases and levels of taxation may change. Information and opinions presented in this report have been obtained or derived from sources believed by CS to be reliable, but CS makes no representation as to their accuracy or completeness. CS accepts no liability for loss arising from the use of the material presented in this report, except that this exclusion of liability does not apply to the extent that such liability arises under specific statutes or regulations applicable to CS. This report is not to be relied upon in substitution for the exercise of independent judgment. CS may have issued, and may in the future issue, other communications that are inconsistent with, and reach different conclusions from, the information presented in this report. Those communications reflect the different assumptions, views and analytical methods of the analysts who prepared them and CS is under no obligation to ensure that such other communications are brought to the attention of any recipient of this report. Some investments referred to in this report will be offered solely by a single entity and in the case of some investments solely by CS, or an associate of CS or CS may be the only market maker in such investments. Past performance should not be taken as an indication or guarantee of future performance, and no representation or warranty, express or implied, is made regarding future performance. Information, opinions and estimates contained in this report reflect a judgment at its original date of publication by CS and are subject to change without notice. The price, value of and income from any of the securities or financial instruments mentioned in this report can fall as well as rise. The value of securities and financial instruments is subject to exchange rate fluctuation that may have a positive or adverse effect on the price or income of such securities or financial instruments. Investors in securities such as ADR's, the values of which are influenced by currency volatility, effectively assume this risk. Structured securities are complex instruments, typically involve a high degree of risk and are intended for sale only to sophisticated investors who are capable of understanding and assuming the risks involved. The market value of any structured security may be affected by changes in economic, financial and political factors (including, but not limited to, spot and forward interest and exchange rates), time to maturity, market conditions and volatility, and the credit quality of any issuer or reference issuer. Any investor interested in purchasing a structured product should conduct their own investigation and analysis of the product and consult with their own professional advisers as to the risks involved in making such a purchase. Some investments discussed in this report may have a high level of volatility. High volatility investments may experience sudden and large falls in their value causing losses when that investment is realised. Those losses may equal your original investment. Indeed, in the case of some investments the potential losses may exceed the amount of initial investment and, in such circumstances, you may be required to pay more money to support those losses. Income yields from investments may fluctuate and, in consequence, initial capital paid to make the investment may be used as part of that income yield. Some investments may not be readily realisable and it may be difficult to sell or realise those investments, similarly it may prove difficult for you to obtain reliable information about the value, or risks, to which such an investment is exposed. This report may provide the addresses of, or contain hyperlinks to, websites. Except to the extent to which the report refers to website material of CS, CS has not reviewed any such site and takes no responsibility for the content contained therein. Such address or hyperlink (including addresses or hyperlinks to CS's own website material) is provided solely for your convenience and information and the content of any such website does not in any way form part of this document. Accessing such website or following such link through this report or CS's website shall be at your own risk.
This report is issued and distributed in European Union (except Switzerland): by Credit Suisse Securities (Europe) Limited, One Cabot Square, London E14 4QJ, England, which is authorised by the Prudential Regulation Authority and regulated by the Financial Conduct Authority and the Prudential Regulation Authority. Germany: Credit Suisse Securities (Europe) Limited Niederlassung Frankfurt am Main regulated by the Bundesanstalt fuer Finanzdienstleistungsaufsicht ("BaFin"). United States and Canada: Credit Suisse Securities (USA) LLC; Switzerland: Credit Suisse AG; Brazil: Banco de Investimentos Credit Suisse (Brasil) S.A or its affiliates; Mexico: Banco Credit Suisse (México), S.A. (transactions related to the securities mentioned in this report will only be effected in compliance with applicable regulation); Japan: by Credit Suisse Securities (Japan) Limited, Financial Instruments Firm, Director-General of Kanto Local Finance Bureau ( Kinsho) No. 66, a member of Japan Securities Dealers Association, The Financial Futures Association of Japan, Japan Investment Advisers Association, Type II Financial Instruments Firms Association; Hong Kong: Credit Suisse (Hong Kong) Limited; Australia: Credit Suisse Equities (Australia) Limited; Thailand: Credit Suisse Securities (Thailand) Limited, regulated by the Office of the Securities and Exchange Commission, Thailand, having registered address at 990 Abdulrahim Place, 27th Floor, Unit 2701, Rama IV Road, Silom, Bangrak, Bangkok10500, Thailand, Tel. +66 2614 6000; Malaysia: Credit Suisse Securities (Malaysia) Sdn Bhd; Singapore: Credit Suisse AG, Singapore Branch; India: Credit Suisse Securities (India) Private Limited (CIN no.U67120MH1996PTC104392) regulated by the Securities and Exchange Board of India as Research Analyst (registration no. INH 000001030) and as Stock Broker (registration no. INB230970637; INF230970637; INB010970631; INF010970631), having registered address at 9th
Floor, Ceejay House, Dr.A.B. Road, Worli, Mumbai - 18, India, T- +91-22 6777 3777; South Korea: Credit Suisse Securities (Europe) Limited, Seoul Branch; Taiwan: Credit Suisse AG Taipei Securities Branch; Indonesia: PT Credit Suisse Securities Indonesia; Philippines:Credit Suisse Securities (Philippines ) Inc., and elsewhere in the world by the relevant authorised affiliate of the above. Additional Regional Disclaimers Hong Kong: Credit Suisse (Hong Kong) Limited ("CSHK") is licensed and regulated by the Securities and Futures Commission of Hong Kong under the laws of Hong Kong, which differ from Australian laws. CSHKL does not hold an Australian financial services licence (AFSL) and is exempt from the requirement to hold an AFSL under the Corporations Act 2001 (the Act) under Class Order 03/1103 published by the ASIC in respect of financial services provided to Australian wholesale clients (within the meaning of section 761G of the Act). Research on Taiwanese securities produced by Credit Suisse AG, Taipei Securities Branch has been prepared by a registered Senior Business Person. Australia (to the extent services are offered in Australia): Credit Suisse Securities (Europe) Limited (“CSSEL”) and Credit Suisse International (“CSI”) are authorised by the Prudential Regulation Authority and regulated by the Financial Conduct Authority (“FCA”) and the Prudential Regulation Authority under UK laws, which differ from Australian Laws. CSSEL and CSI do not hold an Australian Financial Services Licence (“AFSL”) and are exempt from the requirement to hold an AFSL under the Corporations Act (Cth) 2001 (“Corporations Act”) under Class Order 03/1099 published by the Australian Securities and Investments Commission (“ASIC”), in respect of the financial services provided to Australian wholesale clients (within the meaning of section 761G of the Corporations Act). This material is not for distribution to retail clients and is directed exclusively at Credit Suisse's professional clients and eligible counterparties as defined by the FCA, and wholesale clients as defined under section 761G of the Corporations Act. Credit Suisse (Hong Kong) Limited (“CSHK”) is licensed and regulated by the Securities and Futures Commission of Hong Kong under the laws of Hong Kong, which differ from Australian laws. CSHKL does not hold an AFSL and is exempt from the requirement to hold an AFSL under the Corporations Act under Class Order 03/1103 published by the ASIC in respect of financial services provided to Australian wholesale clients (within the meaning of section 761G of the Corporations Act). Credit Suisse Securities (USA) LLC (CSSU) and Credit Suisse Asset Management LLC (CSAM LLC) are licensed and regulated by the Securities Exchange Commission of the United States under the laws of the United States, which differ from Australian laws. CSSU and CSAM LLC do not hold an AFSL and is exempt from the requirement to hold an AFSL under the Corporations Act under Class Order 03/1100 published by the ASIC in respect of financial services provided to Australian wholesale clients (within the meaning of section 761G of the Corporations Act). Malaysia: Research provided to residents of Malaysia is authorised by the Head of Research for Credit Suisse Securities (Malaysia) Sdn Bhd, to whom they should direct any queries on +603 2723 2020. Singapore: This report has been prepared and issued for distribution in Singapore to institutional investors, accredited investors and expert investors (each as defined under the Financial Advisers Regulations) only, and is also distributed by Credit Suisse AG, Singapore Branch to overseas investors (as defined under the Financial Advisers Regulations). Credit Suisse AG, Singapore Branch may distribute reports produced by its foreign entities or affiliates pursuant to an arrangement under Regulation 32C of the Financial Advisers Regulations. Singapore recipients should contact Credit Suisse AG, Singapore Branch at +65-6212-2000 for matters arising from, or in connection with, this report. By virtue of your status as an institutional investor, accredited investor, expert investor or overseas investor, Credit Suisse AG, Singapore Branch is exempted from complying with certain compliance requirements under the Financial Advisers Act, Chapter 110 of Singapore (the “FAA”), the Financial Advisers Regulations and the relevant Notices and Guidelines issued thereunder, in respect of any financial advisory service which Credit Suisse AG, Singapore Branch may provide to you. UAE: This information is being distributed by Credit Suisse AG (DIFC Branch), duly licensed and regulated by the Dubai Financial Services Authority (“DFSA”). Related financial services or products are only made available to Professional Clients or Market Counterparties, as defined by the DFSA, and are not intended for any other persons. Credit Suisse AG (DIFC Branch) is located on Level 9 East, The Gate Building, DIFC, Dubai, United Arab Emirates. EU: This report has been produced by subsidiaries and affiliates of Credit Suisse operating under its Global Markets Division This research may not conform to Canadian disclosure requirements. In jurisdictions where CS is not already registered or licensed to trade in securities, transactions will only be effected in accordance with applicable securities legislation, which will vary from jurisdiction to jurisdiction and may require that the trade be made in accordance with applicable exemptions from registration or licensing requirements. Non-US customers wishing to effect a transaction should contact a CS entity in their local jurisdiction unless governing law permits otherwise. US customers wishing to effect a transaction should do so only by contacting a representative at Credit Suisse Securities (USA) LLC in the US. Please note that this research was originally prepared and issued by CS for distribution to their market professional and institutional investor customers. Recipients who are not market professional or institutional investor customers of CS should seek the advice of their independent financial advisor prior to taking any investment decision based on this report or for any necessary explanation of its contents. This research may relate to investments or services of a person outside of the UK or to other matters which are not authorised by the Prudential Regulation Authority and regulated by the Financial Conduct Authority and the Prudential Regulation Authority or in respect of which the protections of the Prudential Regulation Authority and Financial Conduct Authority for private customers and/or the UK compensation scheme may not be available, and further details as to where this may be the case are available upon request in respect of this report. CS may provide various services to US municipal entities or obligated persons ("municipalities"), including suggesting individual transactions or trades and entering into such transactions. Any services CS provides to municipalities are not viewed as "advice" within the meaning of Section 975 of the Dodd-Frank Wall Street Reform and Consumer Protection Act. CS is providing any such services and related information solely on an arm's length basis and not as an advisor or fiduciary to the municipality. In connection with the provision of the any such services, there is no agreement, direct or indirect, between any municipality (including the officials,management, employees or agents thereof) and CS for CS to provide advice to the municipality. Municipalities should consult with their financial, accounting and legal advisors regarding any such services provided by CS. In addition, CS is not acting for direct or indirect compensation to solicit the municipality on behalf of an unaffiliated broker, dealer, municipal securities dealer, municipal advisor, or investment adviser for the purpose of obtaining or retaining an engagement by the municipality for or in connection with Municipal Financial Products, the issuance of municipal securities, or of an investment adviser to provide investment advisory services to or on behalf of the municipality. If this report is being distributed by a financial institution other than Credit Suisse AG, or its affiliates, that financial institution is solely responsible for distribution. Clients of that institution should contact that institution to effect a transaction in the securities mentioned in this report or require further information. This report does not constitute investment advice by Credit Suisse to the clients of the distributing financial institution, and neither Credit Suisse AG, its affiliates, and their respective officers, directors and employees accept any liability whatsoever for any direct or consequential loss arising from their use of this report or its content. Principal is not guaranteed. Commission is the commission rate or the amount agreed with a customer when setting up an account or at any time after that. Copyright © 2017 CREDIT SUISSE AG and/or its affiliates. All rights reserved.
Investment principal on bonds can be eroded depending on sale price or market price. In addition, there are bonds on which investment principal can be eroded due to changes in redemption amounts. Care is required when investing in such instruments.
When you purchase non-listed Japanese fixed income securities (Japanese government bonds, Japanese municipal bonds, Japanese government guaranteed bonds, Japanese corporate bonds) from CS as a seller, you will be requested to pay the purchase price only