Credit Suisse Global Steel & Mining Conference - Klöckner ...
Upload
khangminh22Category
view
2download
0
DISCLOSURE APPENDIX CONTAINS ANALYST CERTIFICATIONS AND THE STATUS OF NON-US ANALYSTS. FOR OTHER IMPORTANT DISCLOSURES, visit www.credit-suisse.com/ researchdisclosures or call +1 (877) 291-2683. U.S. Disclosure: Credit Suisse does and seeks to do business with companies covered in its research reports. As a result, investors should be aware that the Firm may have a conflict of interest that could affect the objectivity of this report. Investors should consider this report as only a single factor in making their investment decision.
22 November 2011 Asia Pacific/Taiwan
Equity Research Strategy
Taiwan Market Strategy STRATEGY
Earnings stabilisation and upcycle in 2012 Figure 1: Market trough 3 months ahead of FY2 earnings with 78% correlation
-
2,000
4,000
6,000
8,000
10,000
12,000
Jan-
00
Dec
-00
Dec
-01
Dec
-02
Dec
-03
Nov
-04
Nov
-05
Nov
-06
Nov
-07
Oct-0
8
Oct-0
9
Oct-1
0
Oct-1
1
-
5
10
15
20
25
30
35
TWSE (LHS) EPS FY2(Index) (NT$)
Source: TEJ, Datastream, Bloomberg, Credit Suisse Research
■ Expect earnings stabilisation in 1Q 2012. After nine consecutive months of consensus earnings cuts, we expect to see earnings stabilisation in 1Q12. This is based on our finding that in the last 20 years, the average duration of each cycle is ten months with a range of 4.5-14.5 months. By end-1Q12, Taiwan will have completed 14 months of cuts, though the pace of rebound may be moderate. YTD the earnings cut is 32% for 2011 and 27% for 2012.
■ Rotating into tech. We adjust our model portfolio to reflect our view of a sector rotation back to tech with many factors that drove rotation from tech to non-tech reversing. Most notably, tech has led this earnings cut cycle (-42% versus -21% non-tech) and is trading at a discount to non-tech despite better profit growth seen in 2012. Both QFII and ITC are relatively underweight tech, which accounted for 78% of QFII net selling YTD.
■ Elections a risk, not a catalyst. The 14 January 2012 election is expected to be a much closer race; latest polls suggest the KMT has a small lead that is within the margin of error. There is also the legislative election where KMT could see weaker control (65% now) or neither KMT nor DPP will control 50%. Hence, investors should stay cautious into the election, especially for non-tech (airline, tourism, banks and asset plays) that is perceived to benefit from cross strait ties if KMT wins both the Presidential and Legislative Yuan.
■ Stock picks. In an environment of low rate and low growth, stocks that can provide consistent good dividend yields with some growth should outperform the market. Hence, we screen our coverage universe of 95 stocks using the criteria of (1) 5%+ dividend yield; (2) positive earnings growth; (3) net cash and; (4) positive FCF. Using these criteria to choose a basket of stocks has outperformed the market every year in the last nine years. For 2012, we highlight eight stocks: HTC, Novatek, Asustek, TSMC, MStar, E Ink, Taiwan Cement and FET. Our top sell are PCSC, China Airlines and China Steel.
Research Analysts
Chung Hsu, CFA 8862 2715 6362
Randy Abrams, CFA 886 2 2715 6366
Michelle Chou, CFA 886 2 2715 6363
Josette Chang 886 2 2715 6367
Taiwan Research Analyst Team
Randy Abrams (Head of Taiwan Research) (Regional Semiconductors)
Chate Benchvitvilai
(Telecoms)
Pauline Chen (Hardware Components)
Darryl Cheng (LED, Solar, Networking)
Chung Hsu (Financials)
Sam Lee (Transportation)
Jerry Su
(TFT LCD)
Christiaan Tuntono (Economics)
Thompson Wu (Tech hardware)
Sidney Yeh (Basic Materials, Property, Consumer, Chemicals)
Research Assistants Josette Chang
Kevin Chen Jimmy Huang
David Liao Michelle Chou
Grace LI

22 November 2011
Taiwan Market Strategy 2
Focus charts and tables Figure 2: Valuation matrix for the eight top high-yield picks in Taiwan Price EPS (NT$) P/E (x) P/B (x) ROE (%) Earnings growth (%)
Ticker Company (NT$) Rating 2011E 2012E 2011E 2012E 2011E 2012E 2011E 2012E 2011E 2012E
2330.TW TSMC 74.2 O 5.1 5.6 14.4 13.2 3.1 2.8 22.2% 22.0% -17.5% 8.9%
2498.TW HTC 660.0 O 76.8 78.4 8.6 8.4 5.4 4.3 73.3% 56.4% 66.7% 2.1%
4904.TW Far EasTone 56.9 O 2.6 3.1 21.7 18.1 2.6 2.5 11.9% 14.1% -3.3% 19.6%
2357.TW Asustek 202.5 O 22.1 25.5 9.2 7.9 1.3 1.1 14.5% 15.5% -16.0% 15.4%
1101.TW Taiwan Cement 33.0 O 2.5 3.2 13.0 10.4 1.3 1.2 9.8% 11.8% 17.1% 24.9%
3697.TW MStar 170.5 O 11.9 14.9 14.3 11.5 2.8 2.5 19.8% 22.9% -11.2% 24.9%
8069.TWO E Ink 59.2 O 6.7 7.0 8.9 8.4 2.5 2.2 28.9% 28.2% 74.8% 5.4%
3034.TW Novatek Micro 77.1 O 6.4 7.6 12.1 10.1 2.1 1.9 17.4% 19.8% -16.9% 19.0%
Note: O = Outperform. Source: Company data, Credit Suisse estimates
Figure 3: CS 2012E (FY2) earnings revision YTD Figure 4: Market usually peaks and troughs three months
ahead of FY2 earnings with 78% correlation
1% 1% 1% 0%
0%-2%
-7%
-12%-13%
-21%
-27%-30%
-25%
-20%
-15%
-10%
-5%
0%
5%
Jan-11 Feb-11 Mar-11 Apr-11 May-11 Jun-11 Jul-11 Aug-11 Sep-11 Oct-11 Nov-11
CS estimates 2012E earning rev ision YTD
Non-recession earning revision average :-16%
-
2,000
4,000
6,000
8,000
10,000
12,000
Jan-
00
Dec
-00
Dec
-01
Dec
-02
Dec
-03
Nov
-04
Nov
-05
Nov
-06
Nov
-07
Oct
-08
Oct
-09
Oct
-10
Oct
-11
-
5
10
15
20
25
30
35
TWSE (LHS) EPS FY2(Index) (NT$)
Source: Credit Suisse estimates Source: Datastream, Reuters, Credit Suisse Research
Figure 5: Summary table earnings revisions and growth expectation (market, tech and non-tech) CS estimates Consensus estimates Valuation (2012E)
Earnings revision YTD Earnings growth Earnings revision YTD Earnings growth P/B P/E ROE
2011E 2012E 2011E 2012E 2011E 2012E 2011E 2012E (x) (x)
CS coverage all
All sectors -32% -27% -22% 22% -32% -26% -22% 25% 1.61 13.7 12.1%
Total tech -42% -27% -35% 53% -52% -38% -42% 53% 1.63 12.3 13.8%
Total non-tech -21% -27% -8% 0% -9% -10% -2% 7% 1.60 15.2 10.7%
Excluding DRAM, TFT and transportation sectors
All sectors -16% -18% -6% 8% -12% -12% -4% 12% 1.69 12.9 13.6%
Total tech -20% -16% -14% 17% -23% -19% -16% 18% 1.76 11.0 16.9%
Total non-tech -12% -21% 3% -2% 1% -2% 11% 5% 1.64 15.2 11.0%
Source: Bloomberg, Reuters, Credit Suisse estimates
Figure 6: Comparison between Taiwan model portfolio and CS Taiwan coverage P/E (x) P/B (x) ROE (%) Earnings growth (%) Dividend yield (%) Beta
2011E 2012E 2011E 2012E 2011E 2012E 2011E 2012E 2011E 2012E
Taiwan model portfolio 11.6 11.0 2.2 2.0 20.1% 18.8% 14.7% 6.3% 4.8% 4.8% 0.9 CS Taiwan coverage 16.8 13.7 1.7 1.6 10.3% 12.1% -21.7% 22.4% 4.3% 4.2% 1.1
Source: Company data, Bloomberg, Credit Suisse estimates

22 November 2011
Taiwan Market Strategy 3
Earnings stabilisation and upcycle in 2012 The Taiwan market peaked on 28 January 2011 (TAIEX: 9,145) and spent most of 2011 digesting the negative news flow from Europe, the US and even China’s slowdown. In fact, corporate guidance turned cautious earlier in the year and led to consensus earnings cuts of 32%/26% YTD for 2011/2012, respectively. As a result, the TAIEX declined 19% YTD.
Expect earnings stabilisation in 1Q 2012 Yet, we believe after nine consecutive months of consensus earnings cuts, this earnings cut cycle is in its final stage and likely to see stabilisation in 1Q 2012. This is based on our finding that in the last 20 years (and eight cut cycles), the average duration of each cut cycle is about ten months with a range of 4.5-14.5 months. By end-1Q 2012, consensus earnings estimate for the Taiwan market will have completed 14 months of cuts. This also coincides with our economist’s view for quarterly GDP growth to bottom in 1Q12 (+2.5% YoY), though the pace of rebound may be moderate. So far, earnings revisions for the market have reached 32% and are likely to finish at 35-40% by 1Q 2012, which is roughly at par with the average cut of 41% in the previous cycles (including crisis and recessions) but notably higher than the average of 25% for non-recessionary cut cycles.
Rotating out of non-tech into tech We adjust our Taiwan model portfolio to OVERWEIGHT tech (from a slight Underweight) as we believe there will be a sector rotation back to tech with many of the factors that drove rotation from tech to non-tech during May-2010 to Oct-2011 reversing. Notably, tech has led this earnings cut cycle (-42% versus -21%) and is trading at a discount to non-tech (12.3x versus 15.2x P/E) despite better earnings growth (53% vs 0%) in 2012. Both QFII and ITC’s portfolio weighting in tech are one standard deviation below historical average and 78% of QFII net selling YTD is in tech. We have an index target of 8,500.
Elections are a near-term risk, not catalyst The elections on 14 January 2012 are widely expected to be a close race, especially with the People First Party (PFP)’s James Soong running a separate campaign that will split some pan-blue’s support. The experience in 2006’s Taipei city mayor election (James Soong contested but only got 4% of the vote) may provide some hope that pan-blue support may consolidate again but it is too early to tell and it may not happen,. While much of the focus is on the presidential election, the legislative election is also critical as KMT could end up with much less control (versus 65% now) or neither KMT nor DPP may control 50% of the Legislative Yuan. Hence, we believe investors will likely stay cautious as the election is perceived to be more a risk than a catalyst. The concern over a potential KMT loss could facilitate sector rotation out of non-tech as we approach year-end.
Choosing a basket of yield stocks for next year The Taiwan market is one of the highest dividend yield markets (4.3%) in the region and is even more attractive given that interest rates are expected to stay low (sub-1.5%) through 2012. This, together with our view of moderate growth in 2012, suggests that stocks that can provide consistent good dividend with some growth will outperform the market.
Thus, we screen our coverage universe of 95 stocks using the criteria of: (1) at least 5% dividend yield; (2) positive earnings growth into the following fiscal year; (3) net cash on balance sheet; (4) positive free cash flow and; (5) market cap of US$1 bn+. Such a basket of yield stocks has outperformed the market every year since 2003 (nine years). For 2012, we shortlist eight stocks: HTC, Novatek, Asustek, TSMC, MStar, E Ink, Taiwan Cement and FET. Our top sell are PCSC, China Airline and China Steel.
Expect earnings stabilisation in 1Q 2012 with earnings cuts being 14 months into the cycle
Prefer tech over non-tech on cheaper valuation, better growth and underowned by institutions
The elections will, at best, maintain status quo and the latest poll rankings are too close to suggest if KMT has a lead
Quality yield stocks have beat the market every year in the last nine years
Top picks for 2012: HTC, Novatek, Asustek, TSMC, MStar, E Ink, Taiwan Cement and FET
22 November 2011
Taiwan Market Strategy 4
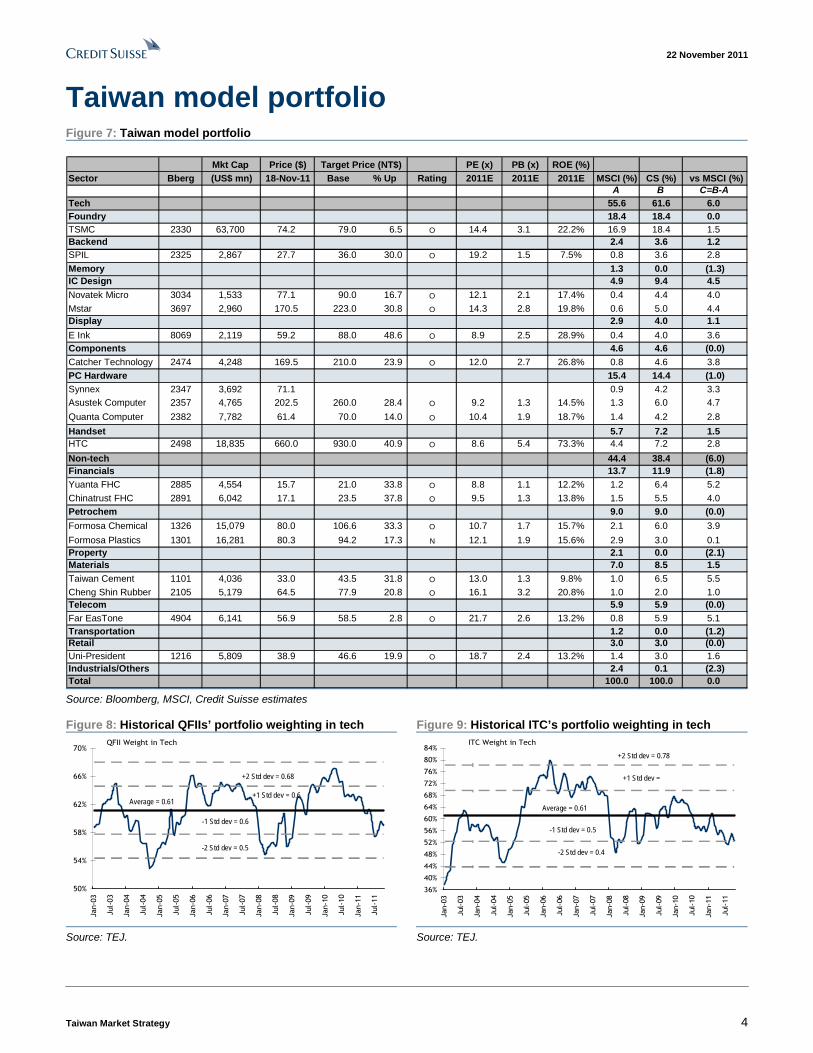
Taiwan model portfolio Figure 7: Taiwan model portfolio
Mkt Cap Price ($) PE (x) PB (x) ROE (%)
Sector Bberg (US$ mn) 18-Nov-11 Base % Up Rating 2011E 2011E 2011E MSCI (%) CS (%) vs MSCI (%)A B C=B-A
Tech 55.6 61.6 6.0Foundry 18.4 18.4 0.0TSMC 2330 63,700 74.2 79.0 6.5 O 14.4 3.1 22.2% 16.9 18.4 1.5Backend 2.4 3.6 1.2SPIL 2325 2,867 27.7 36.0 30.0 O 19.2 1.5 7.5% 0.8 3.6 2.8
Memory 1.3 0.0 (1.3)IC Design 4.9 9.4 4.5Novatek Micro 3034 1,533 77.1 90.0 16.7 O 12.1 2.1 17.4% 0.4 4.4 4.0
Mstar 3697 2,960 170.5 223.0 30.8 O 14.3 2.8 19.8% 0.6 5.0 4.4Display 2.9 4.0 1.1
E Ink 8069 2,119 59.2 88.0 48.6 O 8.9 2.5 28.9% 0.4 4.0 3.6Components 4.6 4.6 (0.0)Catcher Technology 2474 4,248 169.5 210.0 23.9 O 12.0 2.7 26.8% 0.8 4.6 3.8PC Hardware 15.4 14.4 (1.0)Synnex 2347 3,692 71.1 0.9 4.2 3.3Asustek Computer 2357 4,765 202.5 260.0 28.4 O 9.2 1.3 14.5% 1.3 6.0 4.7
Quanta Computer 2382 7,782 61.4 70.0 14.0 O 10.4 1.9 18.7% 1.4 4.2 2.8
Handset 5.7 7.2 1.5HTC 2498 18,835 660.0 930.0 40.9 O 8.6 5.4 73.3% 4.4 7.2 2.8
Non-tech 44.4 38.4 (6.0)Financials 13.7 11.9 (1.8)Yuanta FHC 2885 4,554 15.7 21.0 33.8 O 8.8 1.1 12.2% 1.2 6.4 5.2
Chinatrust FHC 2891 6,042 17.1 23.5 37.8 O 9.5 1.3 13.8% 1.5 5.5 4.0Petrochem 9.0 9.0 (0.0)
Formosa Chemical 1326 15,079 80.0 106.6 33.3 O 10.7 1.7 15.7% 2.1 6.0 3.9
Formosa Plastics 1301 16,281 80.3 94.2 17.3 N 12.1 1.9 15.6% 2.9 3.0 0.1Property 2.1 0.0 (2.1)Materials 7.0 8.5 1.5Taiwan Cement 1101 4,036 33.0 43.5 31.8 O 13.0 1.3 9.8% 1.0 6.5 5.5Cheng Shin Rubber 2105 5,179 64.5 77.9 20.8 O 16.1 3.2 20.8% 1.0 2.0 1.0Telecom 5.9 5.9 (0.0)Far EasTone 4904 6,141 56.9 58.5 2.8 O 21.7 2.6 13.2% 0.8 5.9 5.1Transportation 1.2 0.0 (1.2)Retail 3.0 3.0 (0.0)Uni-President 1216 5,809 38.9 46.6 19.9 O 18.7 2.4 13.2% 1.4 3.0 1.6Industrials/Others 2.4 0.1 (2.3)Total 100.0 100.0 0.0
Target Price (NT$)
Source: Bloomberg, MSCI, Credit Suisse estimates
Figure 8: Historical QFIIs’ portfolio weighting in tech Figure 9: Historical ITC’s portfolio weighting in tech
50%
54%
58%
62%
66%
70%
Jan-
03
Jul-
03
Jan-
04
Jul-
04
Jan-
05
Jul-
05
Jan-
06
Jul-
06
Jan-
07
Jul-
07
Jan-
08
Jul-
08
Jan-
09
Jul-
09
Jan-
10
Jul-
10
Jan-
11
Jul-
11
QFII Weight in Tech
+2 Std dev = 0.68
+1 Std dev = 0.6Average = 0.61
-1 Std dev = 0.6
-2 Std dev = 0.5
36%
40%
44%
48%
52%
56%
60%
64%
68%
72%
76%
80%
84%
Jan-
03
Jul-
03
Jan-
04
Jul-
04
Jan-
05
Jul-
05
Jan-
06
Jul-
06
Jan-
07
Jul-
07
Jan-
08
Jul-
08
Jan-
09
Jul-
09
Jan-
10
Jul-
10
Jan-
11
Jul-
11
ITC Weight in Tech
+2 Std dev = 0.78
+1 Std dev = 0.7
Average = 0.61
-1 Std dev = 0.5
-2 Std dev = 0.4
Source: TEJ. Source: TEJ.

22 November 2011
Taiwan Market Strategy 5
Earnings stabilisation in 1Q 2012 After nine consecutive months of consensus earnings cuts, we believe the earning revision cycle for the Taiwan market is in its final stage and likely to see stabilisation in 1Q 2012. This is based on our finding that in the last 20 years (and eight cut cycles), the average duration of each cut cycle is about ten months with a range 4.5-14.5 months (Figure 12). By end of 1Q 2012, consensus earnings estimates for the Taiwan market would have completed a 14-month cut cycle. This also coincides with our economist’s view for quarterly GDP growth to bottom in 1Q12 (+2.5% YoY), though the pace of rebound may be moderate. So far, earnings revisions for the market have reached 32% and are likely to finish at 35-40% by 1Q 2012, which is roughly at par with the average cut of 41% in the previous cycle (include crisis and recessions) but notably higher than the average of 25% in non-recessionary cut cycles.
Figure 10:CS 2011E (FY1) earnings cut (-32%) YTD Figure 11: CS 2012E (FY2) earnings cut (-27%) YTD
0% 1%
-1% -2% -4%-6%
-14%
-21% -21%
-27%
-32%-35%
-30%
-25%
-20%
-15%
-10%
-5%
0%
5%
Jan-11 Feb-11 Mar-11 Apr-11 May-11 Jun-11 Jul-11 Aug-11 Sep-11 Oct-11 Nov-11
CS estimates 2011E profit revision since the beginning of the year
Non-recession earning revision average :-25%
1% 1% 1% 0%
0%-2%
-7%
-12%-13%
-21%
-27%-30%
-25%
-20%
-15%
-10%
-5%
0%
5%
Jan-11 Feb-11 Mar-11 Apr-11 May-11 Jun-11 Jul-11 Aug-11 Sep-11 Oct-11 Nov-11
CS estimates 2012E earning rev ision YTD
Non-recession earning revision average :-16%
Source: Credit Suisse estimates Source: Credit Suisse estimates
Figure 12: There were eight meaningful earnings cut cycle in Taiwan since 1990
Source: Bloomberg, Credit Suisse estimates
Market typically troughs three months before consensus earnings While we believe earnings revisions could last into 1Q next year, the market usually troughs three months ahead of consensus with a 70% correlation (Figure 13). This implies that unless this current earnings cut cycle sets a new record for the longest duration in Taiwan’s history, the equity market may have already discounted the bulk of negative earnings expectations. In fact, the final months of earnings cuts usually have little impact on share prices and we believe earnings revisions for the next few months could continue to skew to non-tech sectors that have historically lagged in earnings cut cycles. Year-to-date, tech has seen 52% of consensus cuts (or -23% ex-TFT and DRAM) while non-tech has seen 9% cuts of which most came in 4Q and concentrated on the transportation and steel sectors.
Expect earning stabilisation in 1Q12 with the earnings cut cycle reaching 14 months
Historically, the market troughs three months ahead of earnings, which has seen the largest cut in 3Q11

22 November 2011
Taiwan Market Strategy 6
Figure 13: Market usually peaks and troughs three
months ahead of FY1 earnings with 70% correlation
Figure 14: Market usually peaks and troughs three
months ahead of FY2 earnings with 78% correlation
-
2,000
4,000
6,000
8,000
10,000
12,000
Jan-
00
Dec
-00
Dec
-01
Dec
-02
Dec
-03
Nov
-04
Nov
-05
Nov
-06
Nov
-07
Oct
-08
Oct
-09
Oct
-10
Oct
-11
-
5
10
15
20
25
30
TWSE (LHS) EPS FY1(Index ) (NT$)
-
2,000
4,000
6,000
8,000
10,000
12,000
Jan-
00
Dec
-00
Dec
-01
Dec
-02
Dec
-03
Nov
-04
Nov
-05
Nov
-06
Nov
-07
Oct
-08
Oct
-09
Oct
-10
Oct
-11
-
5
10
15
20
25
30
35
TWSE (LHS) EPS FY2(Index) (NT$)
Source: TEJ, Datastream, Bloomberg, Credit Suisse research Source: TEJ, Datastream, Bloomberg, Credit Suisse research
Tech has led the cycle but non-tech is catching up We have learned from the previous (eight) cycles that earnings revisions usually start in upstream tech and are followed by downstream tech. Non-tech (including financials) has historically lagged and only starts to see more significant cuts at the latter part of the cycle.
We find a similar trend this time as well with upstream tech’s 24% earnings cut YTD (ex-TFT and DRAM) largely done in early 3Q11 while non-tech’s 21% earnings cut was only done in the past month (Figure 15). We note that consensus has only cut non-tech earnings by 9% YTD, which suggests there are likely more consensus cuts on the way.
Figure 15: CS estimates revision YTD by sector (2011) Figure 16: CS estimates revision YTD by sector (2012)
-24%
-15%
-21%
-30%
-25%
-20%
-15%
-10%
-5%
0%
5%
Jan-
11
Feb-
11
Mar
-11
Apr-
11
May
-11
Jun-
11
Jul-1
1
Aug-
11
Sep-
11
Oct
-11
Nov
-11
Total Upstream tech (ex. TFT, DRAM) Total Downstream Tech AverageNon tech (incl financial)
bulk of tech cut tookplace in early 3Q
non-tech cutcatch up in 4Q
-21%
-11%
-27%-30%
-25%
-20%
-15%
-10%
-5%
0%
5%
10%
15%
Jan-
11
Feb-
11
Mar
-11
Apr-
11
May
-11
Jun-
11
Jul-1
1
Aug-
11
Sep-
11
Oct
-11
Nov
-11
Total Upstream tech (ex. TFT, DRAM) Total Downstream Tech AverageNon tech (incl financial)
bulk of tech cut tookplace in early 3Q
non-tech cutcatch up in 4Q
Source: Credit Suisse estimates Source: Credit Suisse estimates
Figure 17: Consensus revision changes YTD by sector
(2011)
Figure 18: Consensus revision changes YTD by sector
(2012)
-24%
-9%
-22%
-30%
-25%
-20%
-15%
-10%
-5%
0%
5%
10%
Jan-
11
Feb-
11
Mar
-11
Apr-
11
May
-11
Jun-
11
Jul-1
1
Aug-
11
Sep-
11
Oct
-11
Nov
-11
Total Upstream tech (ex. TFT, DRAM) Total non techTotal Downstream Tech Average
Consensus estimates
-21%
-17%
-10%
-25%
-20%
-15%
-10%
-5%
0%
5%
10%
Jan-
11
Feb-
11
Mar
-11
Apr-
11
May
-11
Jun-
11
Jul-1
1
Aug-
11
Sep-
11
Oct
-11
Nov
-11
Total Upstream tech (ex. TFT, DRAM) Total Downstream Tech AverageNon tech (incl financial)
Source: Reuters, Credit Suisse research Source: Reuters, Credit Suisse research
Tech has led earnings cuts this time with non-tech just starting to see bigger cuts

22 November 2011
Taiwan Market Strategy 7
Figure 19: Earnings revisions YTD by sub-sector 2011 Figure 20: Earnings revisions YTD by sub-sector 2012
-29 -27 -27-21 -17 -12 -9 -7
-2
- -
21 23
-286 -100 -91 -67
-38
-60
-40
-20
-
20
40
TFT
LCD
Sola
r
Tran
spor
tatio
n
LED
IC d
esig
n
Stee
l
Com
pone
nts
Petro
chem
icals
PC/N
B
Foun
dry
Back
end
Con
sum
er
Dev
elop
ers
Fina
ncia
ls
Mem
ory
Mem
ory
Han
dset
Cem
ent
(% ) 2011E CS earnings revision YTD
-33 -32 -29 -25 -21-14 -13 -10
- - 4
2329
-39-50
-73-77-120-60
-40
-20
-
20
40
TFT
LCD
Tran
spor
tatio
n
Sola
r
LED
IC d
esig
n
Petro
chem
icals
Com
pone
nts
Dev
elop
ers
Stee
l
Fina
ncia
ls
Foun
dry
PC/N
B
Back
end
Mem
ory
Mem
ory
Con
sum
er
Han
dset
Cem
ent(%)
2012E CS earnings revision YTD
Source: Credit Suisse estimates Source: Credit Suisse estimates
Moderate growth expectation for 2012 We acknowledge that while earnings estimates are likely to stabilise in 1Q 2012, the pace of earnings rebound may be moderate for next year without a meaningful recovery in the European and US economies. Based on CS estimates, we are currently expecting a 22% profit decline for 2011 followed by a 22% profit rebound in 2012, partly due to a lower base in 2011. Yet, this earnings growth is heavily skewed by the DRAM, TFT and transportation sectors; if we strip these out, we are looking at a more moderate 6% profit decline this year and then an 8% profit rebound in 2012.
Within Taiwan, the tech sector has again demonstrated higher cyclicality with 35% profit decline in 2011 (-14% ex-DRAM and TFT) but will post a 53% rebound next year (+17% ex-DRAM and TFT). Non-tech is expected to deliver 8% profit decline this year (+3% ex-transportation) but 0% growth in 2012 (-2% ex-transportation).
Figure 21: Summary table earnings revisions and growth expectation (market, tech and non-tech) CS estimates Consensus estimates Valuation (2012E)
Earnings revision YTD Earnings growth Earnings revision YTD Earnings growth P/B P/E ROE
2011E 2012E 2011E 2012E 2011E 2012E 2011E 2012E (x) (x)
CS coverage all
All sectors -32% -27% -22% 22% -32% -26% -22% 25% 1.61 13.7 12.1%
Total tech -42% -27% -35% 53% -52% -38% -42% 53% 1.63 12.3 13.8%
Total non-tech -21% -27% -8% 0% -9% -10% -2% 7% 1.60 15.2 10.7%
Excluding DRAM, TFT and transportation sectors
All sectors -16% -18% -6% 8% -12% -12% -4% 12% 1.69 12.9 13.6%
Total tech -20% -16% -14% 17% -23% -19% -16% 18% 1.76 11.0 16.9%
Total non-tech -12% -21% 3% -2% 1% -2% 11% 5% 1.64 15.2 11.0%
Source: TEJ, Credit Suisse estimates
Figure 22: CS earnings estimates for Taiwan, tech and
non-tech
Figure 23: CS earnings estimates for Taiwan, tech and
non-tech, ex-DRAM, TFT and transportation
-35%
-8%
-22%
53%
0%
22%
-40%
-20%
0%
20%
40%
60%
Total Tech average Total Non-Tech average Total Taiwan average
2011E 2012E
-14%
3%
-6%
17%
-2%
8%
-20%
-15%
-10%
-5%
0%
5%
10%
15%
20%
Total Tech ex. DRAM andTFT
Total Non-Tech ex.Transportation
CS coverage ex. DRAM, TFTand Transportation
2011E 2012E
Source: Credit Suisse estimates Source: Credit Suisse estimates

22 November 2011
Taiwan Market Strategy 8
Rotating out of non-tech into tech If we look at both QFII and local ITC’s portfolio allocation, there has been 18 months of sector rotation from tech into non-tech during May-2010 to Oct-2011. During this period, the USD has depreciated (negative for tech earnings) and most tech sub-sectors have seen significant earnings cuts that resulted in a negative earnings growth for 2011 versus a modest positive growth for non-tech. Yet, we believe most of these trends are reversing going into 2012 and will sustain a sector rotation back to tech. Both QFII and ITC’s portfolio weightings in tech are currently one standard deviation below their historical average (Figures 24 and 25) and this will provide tailwinds when fundamentals turn. Tech also accounted for 78% of QFII net selling YTD.
Figure 24: Historical QFIIs’ portfolio weighting in tech Figure 25: Historical ITC’s portfolio weighting in tech
50%
54%
58%
62%
66%
70%
Jan-
03
Jul-
03
Jan-
04
Jul-
04
Jan-
05
Jul-
05
Jan-
06
Jul-
06
Jan-
07
Jul-
07
Jan-
08
Jul-
08
Jan-
09
Jul-
09
Jan-
10
Jul-
10
Jan-
11
Jul-
11
QFII Weight in Tech
+2 Std dev = 0.68
+1 Std dev = 0.6Average = 0.61
-1 Std dev = 0.6
-2 Std dev = 0.5
36%
40%
44%
48%
52%
56%
60%
64%
68%
72%
76%
80%
84%
Jan-
03
Jul-
03
Jan-
04
Jul-
04
Jan-
05
Jul-
05
Jan-
06
Jul-
06
Jan-
07
Jul-
07
Jan-
08
Jul-
08
Jan-
09
Jul-
09
Jan-
10
Jul-
10
Jan-
11
Jul-
11
ITC Weight in Tech
+2 Std dev = 0.78
+1 Std dev = 0.7
Average = 0.61
-1 Std dev = 0.5
-2 Std dev = 0.4
Source: TEJ. Source: TEJ.
Tech will show better earnings growth in 2012… Based on consensus estimates in 2011, non-tech has a better earnings profile of -2% profit decline (or +11% ex-transportation). This is attributed to a larger earnings cut for tech till end-3Q11 while non-tech only started to see larger earnings cuts in recent weeks, which should last into early 2012. In 2012, we expect this trend to reverse with tech’s earnings cuts stabilising ahead of non-tech (includes financials) and given tech’s early cycle nature, it is likely to see earlier positive earnings revisions than non-tech. Currently, we estimate an earnings growth of 17% for tech (ex-DRAM and TFT) for 2012 but a 2% decline for non-tech (ex-transportation).
Figure 26: Tech (ex-DRAM/TFT) forward earnings growth Figure 27: Non-tech forward earnings growth
-40%
-20%
0%
20%
40%
60%
80%
Jan-
03
Jan-
04
Jan-
05
Jan-
06
Jan-
07
Jan-
08
Jan-
09
Jan-
10
Jan-
11
Average = 0.16
+1 Std dev = 0.4
-1 Std dev = -0.1
+2 Std dev = 0.65
-2 Std dev = -0.3
Taiwan Tech Forward YoY EPS growth (%)
9.8%
-130%
-80%
-30%
20%
70%
120%
170%
220%
Jan-
03
Jan-
04
Jan-
05
Jan-
06
Jan-
07
Jan-
08
Jan-
09
Jan-
10
Jan-
11
Average = 0.20
+1 Std dev = 0.7
-1 Std dev = -0.3
+2 Std dev = 1.13
-2 Std dev = -0.7
Taiwan Non-Tech Forward YoY EPS growth (%)
-0.1%
Source: TEJ, Credit Suisse estimates Source: TEJ, Credit Suisse estimates

22 November 2011
Taiwan Market Strategy 9
Figure 28: Earnings growth/valuation summary table CS estimates Consensus estimates Valuation (2012E)
Earnings Earnings Earnings Earnings
revisions YTD growth revisions YTD growth P/B P/E ROE
2011E 2012E 2011E 2012E 2011E 2012E 2011E 2012E (x) (x)
CS coverage all
All sector -32% -27% -22% 22% -32% -26% -22% 25% 1.61 13.7 12.1%
Total tech -42% -27% -35% 53% -52% -38% -42% 53% 1.63 12.3 13.8%
Total non-tech -21% -27% -8% 0% -9% -10% -2% 7% 1.60 15.2 10.7%
Excluding DRAM, TFT and transportation sectors
All sector -16% -18% -6% 8% -12% -12% -4% 12% 1.69 12.9 13.6%
Total tech -20% -16% -14% 17% -23% -19% -16% 18% 1.76 11.0 16.9%
Total non-tech -12% -21% 3% -2% 1% -2% 11% 5% 1.64 15.2 11.0%
Breakdown by sector
Foundry -17% -14% -23% 8% -15% -11% -22% 9% 2.27 13.5 17.4%
Packaging & testing -12% -10% -21% 11% -23% -23% -17% 12% 1.51 11.7 13.4%
Memory 0% 0% n.m n.m 353% -471% -106% 40% 0.74 13.8 5.9%
IC design -38% -39% -36% 21% -40% -38% -40% 24% 2.38 14.6 16.9%
TFT LCD -286% -120% n.m n.m -236% -130% -1174% 67% 0.84 n.m -2.7%
Upstream tech -72% -42% -69% 165% -83% -59% -79% 189% 1.73 16.5 10.7%
Components -27% -32% -10% 10% -31% -33% -11% 12% 1.50 11.0 14.2%
PC / NB -21% -13% -14% 27% -31% -22% -22% 34% 1.26 9.3 14.5%
Handset 21% 23% 63% 3% 26% 22% 67% 8% 4.07 8.7 51.8%
Downstream tech -15% -11% -2% 19% -22% -17% -7% 24% 1.52 9.4 17.2%
Financials -2% -21% 59% -9% 13% -4% 53% -3% 0.95 12.5 8.0%
Petrochemicals -27% -33% -18% -4% -2% 7% 1% 14% 2.19 16.9 13.1%
Developers -7% -29% 1% -22% -10% -25% 9% -10% 1.46 13.0 11.3%
Cement 23% 29% 26% 17% 27% 17% 22% 8% 1.18 9.6 12.6%
Steel -29% -25% -34% 15% -22% -28% -27% 12% 1.43 14.4 10.2%
Transportation -91% -77% -90% 183% -91% -76% -92% 189% 0.99 16.8 6.0%
Consumer -9% 4% -6% 21% -5% -6% -1% 11% 3.12 15.7 20.8%
Telecom 0% 0% -2% 8% -1% 2% 0% 6% 2.62 17.1 15.5%
Non-tech -21% -27% -8% 0% -9% -10% -2% 7% 1.60 15.2 10.7%
Source: Company data, Credit Suisse estimates
…and is trading at cheaper valuations… If we exclude DRAM and TFT, we estimate tech is trading at 11.0x FY12E P/E while non-tech is trading at 15.2x against a 17% and 0% profit growth for 2012, respectively.
Figure 29: Historical tech vs non-tech’s P/E gap Figure 30: Historical tech vs non-tech’s P/B gap
(25.0)
(20.0)
(15.0)
(10.0)
(5.0)
0.0
5.0
10.0
15.0
20.0
25.0
30.0
Jan-
00
Dec
-00
Oct
-01
Sep-
02
Jul-03
Jun-
04
May
-05
Mar
-06
Feb-
07
Dec
-07
Nov
-08
Oct
-09
Sep-
10
Jul-11
Average = 2.47
+1 Std dev = 9.0
-1 Std dev = -4.0
+2 Std dev = 15.46
-2 Std dev = -10.5
Tech vs. Non Tech PE Gap (x)
(1.0)
0.0
1.0
2.0
3.0
4.0
5.0
Jan-
00
Dec
-00
Oct
-01
Sep-
02
Jul-03
Jun-
04
May
-05
Mar
-06
Feb-
07
Dec
-07
Nov
-08
Oct
-09
Sep-
10
Jul-11
Average = 1.11
+1 Std dev = 2.0
-1 Std dev = 0.3
+2 Std dev = 2.83
-2 Std dev = -0.6
Tech vs. Non Tech PB Gap (x)
Source: TEJ, Credit Suisse estimates Source: TEJ, Credit Suisse estimates

22 November 2011
Taiwan Market Strategy 10
…and 78% of QFII net selling YTD is in tech Year-to-date, QFIIs have net sold US$9 bn worth of Taiwanese stocks and 78% of this net selling was in the tech sector (Figure 31). Within tech, PC/NB saw the largest net selling of US$3.6 bn and this sub-sector alone accounted for 40% of QFII total net selling in Taiwan. Within tech, TFT and handsets were the two other sub-sectors that saw the largest selling.
Within non-tech, steel and property were the largest net sold sectors YTD while banks have actually seen small net buying YTD due to a stronger start at the beginning of the year.
Figure 31: YTD QFIIs net selling by sub-sector (US$ mn) Jan-11 Feb-11 Mar-11 Apr-11 May-11 Jun-11 Jul-11 Aug-11 Sep-11 Oct-11 Nov-11 YTD 2011
Upstream tech 158 -1,095 -1,158 474 282 -584 -631 -1,055 549 703 171 -2,186 Foundry 252 -770 -483 442 487 -33 31 -380 232 655 451 882 IC design -22 -228 -120 -53 -107 -113 -395 29 407 3 -175 -774 Backend 403 122 -101 33 78 -219 -172 -343 -25 68 -24 -180 Memory 58 -38 -43 7 -37 -29 -14 -47 -20 2 -30 -190 TFT -493 -215 -420 89 -112 -168 -42 -288 -17 -18 -31 -1,718 Solar -40 34 10 -44 -28 -21 -39 -26 -27 -7 -20 -207 Downstream tech 1,061 -929 -990 885 -367 -799 -719 -2,348 -1,410 714 -35 -4,937 Handset 286 260 237 -18 -503 -193 -424 -552 -569 144 -286 -1,618 Component 376 -268 -132 623 15 -173 533 -511 -467 55 -36 15 PC/NB/MB/EMS 279 -992 -1,082 97 111 -405 -784 -1,319 -336 551 246 -3,634 Networking 9 -22 -17 10 -3 -1 13 13 2 -3 2 3 LED 110 92 4 173 13 -26 -57 22 -40 -33 40 297 Financial 1,231 -459 238 394 -203 318 40 -1,171 -797 -146 -393 -949 Bank 679 -91 247 382 -88 76 81 -586 -269 -74 -225 131 Insurance 371 -221 -2 117 -58 227 -80 -389 -468 -121 -163 -786 Brokerage 181 -146 -6 -105 -57 15 39 -196 -60 48 -5 -294 Materials 24 -424 186 528 -63 95 -671 -917 -354 232 -173 -1,536 Cement -7 -92 88 211 -12 33 -25 -121 -83 57 -36 13 Steel 0 -139 49 59 -157 -102 -816 -495 -195 11 -102 -1,885 Other material 31 -192 49 258 106 163 170 -301 -76 164 -35 337 Petrochem 904 466 505 679 -146 280 45 -621 -517 103 -165 1,533 Property -42 -198 -127 74 -34 -120 -104 -359 -111 -17 17 -1,021 Retail -24 -80 28 72 30 81 110 -124 -80 39 -72 -19 Others 17 -5 55 71 42 -8 7 -39 -16 29 2 155 Telecom -72 -339 -105 109 -77 -151 -256 109 232 -25 57 -518 Transportation 110 -202 -133 -54 14 -18 -29 -70 7 100 -27 -300 Total 3,411 -3,078 -1,436 3,251 -472 -849 -2,188 -6,512 -2,472 1,785 -603 -9,161
Source: TEJ, Credit Suisse Research

22 November 2011
Taiwan Market Strategy 11
Elections are a near-term risk, not a catalyst The elections on 14 January 2012 are widely expected to be a much closer race, especially with People First Party (PFP)’s James Soong running a separate campaign that will split some pan-blue support and further narrow the gap between the incumbent Kuomintang (KMT) and Democratic Progressive Party (DPP). The experience in 2006’s Taipei city mayor election (James Soong also contested there but only got only 4% of the vote versus 7% in the poll) may provide some hope that pan-blue supporters may consolidate again but it is too early to tell and it may not happen, for various reasons.
Figure 32: 2006’s Taipei city mayor election Figure 33: 2006’s Taipei city mayor election poll
Taipei municipal elections, 2006
DPP41%
KMT54%
Others1%
James Soong 4%
Before Election Poll (TVBS)
James Soong 7%
Others20%
KMT52%
DPP21%
Source: Central Election Commission Source: TVBS poll
Figure 34: 2012 presidential candidate preference (TVBS) Figure 35: 2012 presidential candidate preference (ERA)
2012 Presidential Candidate Preference (TVBS)
0
10
20
30
40
50
60
Jan-
11
Feb-
11
Mar
-11
Apr-1
1
May
-11
Jun-
11
Jul-1
1
Aug-
11
Sep-
11
Oct
-11
Ying-jeou Ma Ing-wen Tsai James Soong
2012 Presidential Candidate Preference (ERA)
05
1015202530354045
Jun-
11
Jul-1
1
Aug-
11
Sep-
11
Ying-jeou Ma Ing-wen Tsai James Soong
Source: TVBS poll Source: ERA
Figure 36: 2012 presidential candidate poll (United Daily) Figure 37: 2012 presidential candidate poll (Liberty Time)
2012 Presidential Candidate Preference (United Daily)
05
101520253035404550
Mar
-11
Apr-1
1
May
-11
Jun-
11
Jul-1
1
Aug-
11
Sep-
11
Oct
-11
Nov
-11
Ying-jeou Ma Ing-wen Tsai James Soong
2012 Presidential Candidate Preference (Liberty Times)
05
10152025303540
Jul-1
1
Aug-
11
Sep-
11
Oct
-11
Ying-jeou Ma Ing-wen Tsai James Soong
Source: United Daily poll Source: Liberty Times

22 November 2011
Taiwan Market Strategy 12
Do not forget about the legislative election While most of the focus will be on the presidential election, the outcome of the legislative election will also dictate Taiwan’s political landscape over the next four years. We still believe that the outcome of the presidential election is firmer (i.e., a 0.1% win is still a win) while the legislative election is less direct. Currently, KMT holds 65% of total seats (was 75% at the beginning of 2008) but there is risk that KMT could end up with much less control or that neither KMT nor DPP will end up controlling 50% of the Legislative Yuan, which makes it more difficult for President Ma to push through more a controversial agenda even if re-elected for the second term. Hence, we believe investors will likely stay cautious into the election as it is perceived to be more of a risk than a catalyst. This concern over a potential KMT loss could facilitate sector rotation out of non-tech as we head into year-end.
Figure 38: KMT currently has 65% control in the
Legislative Yuan (down from 75%)
Figure 39: xFuture Expects less KMT control on the
upcoming Legislative Yuan election
Legislative Yuan Party Breakdown
Kuomintang65%
Democratic Progressive
Party30%
Non-Partisan 5%
xFuture Expectation of Legislative Yuan Election
Kuomintang54%
Democratic Progressive
Party42%
Non-Partisan 4%
Source: Central Election Commission Source: The Exchange of Future Events
The outcome is, at best, status quo As we noted in our previous Taiwan Market Strategy report (Reading the cycles…, published on 29 August), unlike in the 2004 and 2008 elections where the market hoped for a change (i.e., the hope that at least the political gridlock of one party controlling the presidency and the other controlling the legislature would be removed), in this election the hope is for no change. It almost appears that the best outcome for the election would be maintaining status quo, or a neutral. In our view, the worst outcome would be if one party ends up controlling the presidency and the other the Legislative Yuan, as this would take Taiwan back to the political gridlock seen between 2000 and 2008.
Figure 40: The political landscape in Taiwan 2000-2004 2004-2008 2008-2012 2012-2016 President Chen Shui-Bian (DPP) Chen Shui-Bian (DPP) Ma Ying-Jeou (KMT) ??
Legislative Yuan
KMT 30.7% 35.6% 64.6% ??
PFP 20.4% 15.1% 8.0% ??
DPP 44.4% 44.9% 23.9% ??
Others 4.4% 4.4% 3.5% ??
Source: Central Election Commission
What makes investors more uneasy is that, historically, pre-election polls usually end up favouring KMT candidates as there tend to be more “undecided” voters who end up voting for the DPP candidate. If we look at the last three presidential elections (Figure 41), the KMT candidate’s actual votes were less than what pre-election polls indicated, if we re-base the poll only to those expressed a view. Conversely, DPP’s actual votes have consistently been higher than pre-election polls. We believe this phenomenon may be

22 November 2011
Taiwan Market Strategy 13
attributed to the way polls are carried out in Taiwan. However, this track record does suggest that the current close race between KMT and DPP could end up being a slight advantage for the DPP.
Figure 41: Historical presidential election results versus pre-election poll Election Date KMT Candidate DPP Candidate PFP Candidate
2000 18-Mar-00 Lien Chan Chen Shui-Bian James Soong
Outcome 23.1% 39.3% 36.8%
Pre-Poll 27.0% 37.8% 35.1%
2004 20-Mar-04 Lien Chan Chen Shui-Bian n.a.
Outcome 49.9% 50.1% n.a.
Pre-Poll 54.5% 45.5% n.a.
2008 22-Mar-08 Ma Ying-Jeou Frank Hsieh n.a.
Outcome 58.5% 41.6% n.a.
Pre-Poll 64.6% 35.4% n.a.
Note: Pre-poll data were re-based by number of people who expressed their political inclination toward the
election. In the 2000 pre-poll, 74% of those interviewed expressed an opinion, in the 2004 pre-poll, 77% did
and in the 2008 pre-poll, 82% of those interviewed expressed an opinion.
Source: Central Election Commission, TVBS poll, United Daily poll
While sentiment about the election can have a material impact on the equity market in the near term, it has affected non-tech to a much greater degree than tech in the past. This is mainly because non-tech sectors (i.e., airlines, tourism and asset plays) are perceived to be the major beneficiaries if KMT wins and Taiwan enters into an expedited economic (but not necessarily political) cooperation or integration with China. We believe that even if a DPP candidate is elected president, Taiwan will continue to develop its economic ties with China but at a much moderate pace compared to that under a KMT government.
Figure 42: Selective sector performance pre and post
2000 presidential election
Figure 43: Selective sector performance pre and post
2004 presidential election 2000 Presidential Election (DPP Victory)
80
85
90
95
100
105
110
115
Feb-00 Mar-00 Apr-00
Index price
Electronics, 2000 Developer, 2000 Transportation, 2000 Tourism, 2000
DPP won the presidentaiol election. Developer/Transportation/Tourism stocks were sold off.
2004 Presidential Election (DPP Victory)
80
85
90
95
100
105
110
115
120
Feb-04 Mar-04 Apr-04
Index price
Electronics, 2004 Developer, 2004 Transportation, 2004 Tourism, 2004
Poll suggested KMT would win.
DPP won the election and Developer/Transportation/Tourismstocks were sold off.
Source: Central Election Commission Source: United Daily poll
Market supported ahead of election? It is widely believed (especially among domestic investors) that the market will see some form of government support (either through policy stimulus or real intervention) ahead of the elections in the hope of fostering positive market sentiment. In the last four presidential elections we have seen that the Taiwan market outperformed regional markets by almost 8% three months ahead of the election, though we feel this has become almost self-fulfilling as we estimate government related funds account for less than 5% of Taiwan’s total market cap. In other words, the so-called election rally is really driven by stronger retail confidence that leads to higher market participation and turnover.
However, if retail investors fear that the election outcome is too uncertain and could turn out to be negative, then it would be very difficult for the government to foster an election rally. If we look at fund flow in the last six months, it seems to suggest there could be

22 November 2011
Taiwan Market Strategy 14
some level of government support already in place to prevent a bigger market decline year-to-date. The amount of QFII (20-30% of market) net selling in the last six months is significant and equivalent to 61% of total QFII selling during the financial crisis back in late 2008-2009. At the same time, retail’s (50-60% of market) long margin is also at one of the lowest levels in history (ex-crisis). Hence, one of the key buyers in the market is likely the government or its affiliates (we have seen consistent net buying by local ITC, which gets part of its mandate from the government’s pension funds).
Figure 44: QFII net sold NT$341 bn since May Figure 45: ITC net bought NT$13.6 bn since August
-300
-200
-100
0
100
200
300
Jan-01 Jan-02 Jan-03 Jan-04 Jan-05 Jan-06 Jan-07 Jan-08 Jan-09 Jan-10 Jan-11
(NT$ bn)
QFII net sold NT$341bnsince May
QFII net sold NT$531bnin financial crisis
QFII
-40
-20
0
20
40
60
80
100
Jan-01 Jan-02 Jan-03 Jan-04 Jan-05 Jan-06 Jan-07 Jan-08 Jan-09 Jan-10 Jan-11
ITC(NT$ bn)
ITC net bought NT$13.6bnsince August
Source: TEJ, Credit Suisse research Source: TEJ, Credit Suisse research
Figure 46: Retail’s long margin balance is near the low of
its historical range (ex-previous crisis)
Figure 47: The implied TAIEX (calculated based on retail
long margin) is noticeably lower than the actual
-
100
200
300
400
500
600
700
Jan-
97
Oct
-97
Aug-
98
Jun-
99
Apr-
00
Jan-
01
Nov
-01
Sep-
02
Jul-0
3
Apr-
04
Feb-
05
Dec
-05
Oct
-06
Aug-
07
May
-08
Mar
-09
Jan-
10
Nov
-10
Sep-
11
Long Balance Average(NT$ bn)
Current margin balance nearrecession level
-
2,000
4,000
6,000
8,000
10,000
12,000
Jan-
95
Jan-
96
Jan-
97
Jan-
98
Jan-
99
Jan-
00
Jan-
01
Jan-
02
Jan-
03
Jan-
04
Jan-
05
Jan-
06
Jan-
07
Jan-
08
Jan-
09
Jan-
10
Jan-
11
TAIEX (RHS) Margin implied TAIEX (Index)
Techbubble
Asian financialcrisis
Globalfinancial crisis
Source: TEJ, Credit Suisse research Source: TEJ, Credit Suisse research

22 November 2011
Taiwan Market Strategy 15
Figure 48: Major cross strait policies and regulatory changes Effective time Cross-strait development Details
Jun-08 to Jun-11 Direct flights Jun-08: Agreement reached on 13 June 2008 to begin charter flights on weekends starting 4
July 2008. A total of 18 flights per weekend (Friday to Monday) were allowed. According to
the agreement, anyone with legal traveling documents, regardless of nationality, was allowed
to travel on these charter flights.
Jun-11: In November 2008, flights became daily instead of only for the weekends. 108
weekly flights were established and planes no longer had to travel through Hong Kong
airspace, cutting travel times by two-thirds in some cases (flying from Taipei to Shanghai).
Aug-09: In April 2009, a new agreement was reached to allow cross-strait flights to become
regularly scheduled instead of chartered. The cap on flights was also raised to 270 per week,
effective 31 August 2009.
May-10: On 22 May 2010, another 100 weekly flights were permitted (370 flights in
total), effective 14 June 2010, and added Shanghai Hongqiao International Airport and
Shijiazhuang Airport to the list of allowed destinations.
Jun-11: Increased direct flights to 558 per week (from 370). In addition, Taiwan was to kick
off a trial programme on 28 June to allow individual tourists from three mainland Chinese
cities—namely Shanghai, Beijing and Xiamen—to visit the island.
Jul-08 to Jun-11 Chinese tourists Jul-08: Under the agreement reached on 13 June 2008, Taiwan was opened to 3,000
Mainland tourists per day.
May-10: Both sides have agreed to ramp up efforts to boost cross-straits tourism by opening
tourism offices in each other’s regions with 5,000 tourists a day.
Jun-11: Taiwan to start a trial programme on 28 June to allow individual tourists from three
mainland Chinese cities (Shanghai, Beijing and Xiamen) to visit the island (up to 500
individuals per day). Currently, there are 1.6 mn mainland tourists a year and the
government targets reaching 2 mn-plus with individual tourists.
Aug-08 Loosening outbound
investment restrictions
Investment threshold up to 60% NAV. MNC subsidiaries will be exempt from any
investment limits. SMEs will have two options in terms of mainland Chinese investment cap.
First is the maximum investment cap of NT$80 mn, and the other is 60% of their company net
worth. As for large-sized enterprises, they will be allowed to invest 60% of their net worth or
their group combined net worth in China, up from the existing maximum percentage of 40%.
Nov-09 Financial MOU China/Taiwan have signed three MOUs on banking, insurance, and securities. The MOUs,
took effect in Jan-10, establish the financial supervisory framework and opening discussions
on financial market access for both sides.
Jan-10 Loosening inbound
investment restrictions Under the financial MOU agreement reached on 16 November 2009, Taiwan allows up to 5%
direct investment from China and another 5% through QDII with an aggregate amount of no
more than US$500 mn. Separate approval is required from MOEA for investments over 10%.
Jun-10 ECFA The two sides signed the cross-straits Economic Cooperation Framework Agreement (ECFA),
in which: (1) China will cut tariff on 539 items while Taiwan will cut tariff on 267 items (2011-
2013) and; (2) Taiwan banks can do RMB business with Taiwanese corporates in China one
year after branch upgrade (vs two years under CEPA and three years under WTO).
20-Dec-2010 to
1H12
Cross-Strait Agreement on
Investment Protection
Dec-10: China/Taiwan reached consensus on the "Cross-Strait Agreement on Investment
Protection". Both sides agreed to establish a contact platform and dispute settlement
mechanism featuring a transparent investment process and full communication.
Feb-11: Taiwan hoped within six months to first create cross-straits investment protection
accord and dispute resolution mechanisms within one year to complete negotiations on tax
cuts for the panel and automobile sectors.
Scheduled to be signed in the 8th round cross-strait talks.
Source: Commercial Times, MoEA, SEF

22 November 2011
Taiwan Market Strategy 16
Choosing a basket of yield stocks for next year The Taiwan market is one of the highest dividend yield markets (4.3%) in the region and this is even more attractive give that the interest rate is expected to stay extremely low (sub-1.5%) through 2012. This, together with our view of moderate growth for 2012, suggests that stocks that can provide consistent good dividends with some growth should outperform the market.
Therefore, we screened our coverage universe of 95 stocks using the criteria of: (1) at least 5% dividend yield for next year; (2) positive earnings growth into the following fiscal year so once can expect dividend to grow; (3) net cash on balance sheet; (4) positive free cash flow and; (5) market cap of US$1 bn-plus. Using these criteria to choose a basket of yield stocks each year, has outperformed the market every year in the past nine years (2003-YTD 2011, Figure 51). For 2012, we highlight a list of eight stocks: HTC, Novatek, Asustek, TSMC, MStar, E Ink, Taiwan Cement and FET.
Figure 49: Valuation matrix for the eight top high yield picks in Taiwan Price EPS (NT$) P/E (x) P/B (x) ROE (%) Earnings growth (%)
Ticker Company (NT$) Rating 2011E 2012E 2011E 2012E 2011E 2012E 2011E 2012E 2011E 2012E
2330.TW TSMC 74.2 O 5.1 5.6 14.4 13.2 3.1 2.8 22.2% 22.0% -17.5% 8.9%
2498.TW HTC 660.0 O 76.8 78.4 8.6 8.4 5.4 4.3 73.3% 56.4% 66.7% 2.1%
4904.TW Far EasTone 56.9 O 2.6 3.1 21.7 18.1 2.6 2.5 11.9% 14.1% -3.3% 19.6%
2357.TW Asustek 202.5 O 22.1 25.5 9.2 7.9 1.3 1.1 14.5% 15.5% -16.0% 15.4%
1101.TW Taiwan Cement 33.0 O 2.5 3.2 13.0 10.4 1.3 1.2 9.8% 11.8% 17.1% 24.9%
3697.TW MStar 170.5 O 11.9 14.9 14.3 11.5 2.8 2.5 19.8% 22.9% -11.2% 24.9%
8069.TWO E Ink 59.2 O 6.7 7.0 8.9 8.4 2.5 2.2 28.9% 28.2% 74.8% 5.4%
3034.TW Novatek Micro 77.1 O 6.4 7.6 12.1 10.1 2.1 1.9 17.4% 19.8% -16.9% 19.0%
Source: Company data, Credit Suisse estimates
Figure 50: Taiwan’s high dividend yield is even more
attractive with ten-year bond yield falling
Figure 51: The high yield basket has outperformed the
market in 2003-2011
Taiwan dividend yield vs. 10-yr bond rate
0.00
0.50
1.00
1.50
2.00
2.50
3.00
3.50
4.00
Feb-
06
Jun-
06
Oct
-06
Feb-
07
Jun-
07
Oct
-07
Feb-
08
Jun-
08
Oct
-08
Feb-
09
Jun-
09
Oct
-09
Feb-
10
Jun-
10
Oct
-10
Feb-
11
Jun-
11
%
Taiwan dividend yield vs. 10-yr bond rate
Basket relative performance
33%
2%14%
25%
3%
36%
4%
86%
28%
0%
20%
40%
60%
80%
100%
2003 2004 2005 2006 2007 2008 2009 2010 2011
Basket relative performance
Hitosical average outperformance of 26%
Source: TEJ, Credit Suisse estimates * Relative performance is based on simple average of the basket
against TAIEX.
Source: Bloomberg, Credit Suisse estimates

22 November 2011
Taiwan Market Strategy 17
Figure 52: Historical dividend high yield basket
2012 CompanyTarget price
(NT$)Rating Div Yld (%)
Net debt (cash) to equity (%)
Free cash flow yield
(%)
Earning growth (%)
P/B (x) P/E (x) ROE (%)
8069.TWO E Ink 88.0 O 9.5% -12.2% 10.7% 5.5% 2.2 8.4 28.2%3034.TW Novatek Micro 90.0 O 7.3% -39.7% 8.1% 19.1% 1.9 10.1 19.8%2498.TW HTC 930.0 O 7.1% -89.0% 10.8% 2.1% 4.3 8.4 56.4%1101.TW Taiwan Cement 43.5 O 6.7% -6.0% 7.6% 24.9% 1.2 10.4 11.8%3697.TW Mstar 223.0 O 6.5% -75.6% 8.6% 24.8% 2.5 11.5 22.9%2330.TW TSMC 79.0 O 5.4% -17.2% 4.7% 8.9% 2.8 13.2 22.0%2357.TW Asustek Computer 260.0 O 5.1% -50.7% 13.4% 20.4% 1.1 7.9 15.5%4904.TW Far East Tone 58.5 O 5.0% -17.8% 6.9% 19.6% 2.5 18.1 15.4%
2011 CompanyTarget price
(NT$)Rating Div Yld (%)
Net debt (cash) to equity (%)
Free cash flow yield
(%)
Earning growth (%)
P/B (x) P/E (x) ROE (%)
8069.TWO E Ink 88.0 O 8.3% -6.3% 15.0% 78.8% 2.5 8.9 28.9%2015.TW Feng Hsin 54.8 N 5.7% -26.5% 12.7% 12.4% 1.9 12.2 16.3%1101.TW Taiwan Cement 43.5 O 5.4% -3.9% 7.4% 17.1% 1.2 12.9 9.8%2498.TW HTC 930.0 O 5.4% -91.9% 9.2% 67.4% 7.0 11.2 73.3%
2010 CompanyTarget price
(NT$)Rating Div Yld (%)
Net debt (cash) to equity (%)
Free cash flow yield
(%)
Earning growth (%)
P/B (x) P/E (x) ROE (%)
2498.TW HTC 930.0 O 11.1% -100.8% 14.7% 74.9% 3.8 7.2 56.3%2412.TW ChungHwa Telecom 100.0 N 11.1% -24.8% 7.2% 8.8% 1.9 14.7 12.9%1326.TW Formosa Chemical 106.6 O 10.8% -4.5% 12.7% 60.6% 1.5 8.4 18.8%1301.TW Formosa Plastics 94.2 N 10.1% -12.7% 11.4% 65.4% 1.6 9.0 18.7%5371.TWO Coretronic Corp 26.0 N 7.5% -48.5% 16.3% 32.0% 1.6 9.5 18.0%1101.TW Taiwan Cement 43.5 O 6.0% -2.3% 8.0% 8.2% 1.3 15.4 9.2%2357.TW Asustek Computer 260.0 O 5.9% -39.0% 9.0% 32.1% 1.4 9.0 11.8%2324.TW Compal Electronics 26.0 N 5.4% -20.3% 8.7% 21.2% 1.6 8.1 20.4%
2009 CompanyTarget price
(NT$)Rating Div Yld (%)
Net debt (cash) to equity (%)
Free cash flow yield
(%)
Earning growth (%)
P/B (x) P/E (x) ROE (%)
2382.TW Quanta Computer 70.0 O 10.4% -32.4% 12.6% 10.3% 1.1 5.6 21.6%1301.TW Formosa Plastics 94.2 N 9.8% -1.5% 11.3% 39.7% 1.1 9.1 13.6%2881.TW Fubon FHC 36.0 N 9.0% -- -- 83.3% 0.8 9.0 11.3%2885.TW Yuanta FHC 21.0 O 6.1% -- -- 340.5% 0.9 16.4 6.5%
2008 CompanyTarget price
(NT$)Rating Div Yld (%)
Net debt (cash) to equity (%)
Free cash flow yield
(%)
Earning growth (%)
P/B (x) P/E (x) ROE (%)
2382.TW Quanta Computer 70.0 O 7.9% -54.0% 21.2% -12.6% 1.7 7.9 21.6%2498.TW HTC 930.0 O 6.7% -105.6% 9.5% -1.0% 5.7 12.1 49.0%4904.TW Far East Tone 58.5 O 5.8% -9.1% 9.8% -12.6% 2.2 15.7 14.6%2412.TW ChungHwa Telecom 100.0 N 5.6% -25.3% 7.9% -6.7% 1.8 14.8 11.7%
2007 CompanyTarget price
(NT$)Rating Div Yld (%)
Net debt (cash) to equity (%)
Free cash flow yield
(%)
Earning growth (%)
P/B (x) P/E (x) ROE (%)
1301.TW Formosa Plastics 94.2 N 13.3% -7.4% 10.9% 54.8% 1.2 6.0 21.6%2002.TW China Steel Corp. 31.1 N 12.1% -0.8% 10.9% 30.9% 1.5 6.5 24.1%2498.TW HTC 930.0 O 10.3% -100.4% 13.4% 14.6% 5.1 9.8 58.5%2325.TW SPIL 36.0 O 9.1% -26.3% 8.3% 31.2% 2.2 8.6 26.5%2324.TW Compal Electronics 26.0 N 8.6% -59.8% 13.2% 56.4% 1.2 7.8 16.8%2892.TW First FHC 20.0 N 8.0% -- -- 17.7% 1.2 11.4 12.2%2412.TW ChungHwa Telecom 100.0 N 6.7% -23.9% 9.9% 14.7% 1.6 12.8 12.1%2382.TW Quanta Computer 70.0 O 6.3% -22.8% 8.4% 42.9% 2.2 10.4 22.8%1722.TW Taiwan Fertilizer 104.1 O 5.5% -26.2% 4.0% 3.6% 1.2 16.2 7.4% Note: O = Outperform; N = Neutral.
* We exclude earnings growth criteria for 2008 given most companies faced earnings decline on YoY basis in that year.
Source: TEJ, Credit Suisse estimates

22 November 2011
Taiwan Market Strategy 18
CS Taiwan model portfolio adjustment We adjust our Taiwan model portfolio to OVERWEIGHT tech (from a slight underweight) as we believe there will be a sector rotation back to tech with many of the factors that drove rotation from tech to non-tech during May-2010 to Oct-2011 reversing. Most notably, tech has led this earnings cut cycle (-42% versus -21%) and is trading at a discount to non-tech (12.3x versus 15.2x P/E) despite better earnings growth in 2012 (53% versus 0%, or 17% versus -2% ex-DRAM, TFT and transportation sectors). Both the QFII and local ITC’s portfolio weighting in tech are one standard deviation below their historical average and 78% of total QFII net selling of US$9 bn YTD is in tech. Hence, there will be tailwinds for the sector rotation when it kicks off.
We have funded our Overweight in tech by lowering our weighting in financials (from 1% Overweight to 1.8% UNDERWEIGHT), property (from Neutral to 2.1% UNDERWEIGHT) and transportation (from 1.6% Overweight to 1.2% UNDERWEIGHT).
Figure 53: Taiwan model portfolio Mkt Cap Price ($) PE (x) PB (x) ROE (%)
Sector Bberg (US$ mn) 18-Nov-11 Base % Up Rating 2011E 2011E 2011E MSCI (%) CS (%) vs MSCI (%)A B C=B-A
Tech 55.6 61.6 6.0Foundry 18.4 18.4 0.0TSMC 2330 63,700 74.2 79.0 6.5 O 14.4 3.1 22.2% 16.9 18.4 1.5Backend 2.4 3.6 1.2SPIL 2325 2,867 27.7 36.0 30.0 O 19.2 1.5 7.5% 0.8 3.6 2.8
Memory 1.3 0.0 (1.3)IC Design 4.9 9.4 4.5Novatek Micro 3034 1,533 77.1 90.0 16.7 O 12.1 2.1 17.4% 0.4 4.4 4.0
Mstar 3697 2,960 170.5 223.0 30.8 O 14.3 2.8 19.8% 0.6 5.0 4.4Display 2.9 4.0 1.1
E Ink 8069 2,119 59.2 88.0 48.6 O 8.9 2.5 28.9% 0.4 4.0 3.6Components 4.6 4.6 (0.0)Catcher Technology 2474 4,248 169.5 210.0 23.9 O 12.0 2.7 26.8% 0.8 4.6 3.8PC Hardware 15.4 14.4 (1.0)Synnex 2347 3,692 71.1 0.9 4.2 3.3Asustek Computer 2357 4,765 202.5 260.0 28.4 O 9.2 1.3 14.5% 1.3 6.0 4.7
Quanta Computer 2382 7,782 61.4 70.0 14.0 O 10.4 1.9 18.7% 1.4 4.2 2.8
Handset 5.7 7.2 1.5HTC 2498 18,835 660.0 930.0 40.9 O 8.6 5.4 73.3% 4.4 7.2 2.8
Non-tech 44.4 38.4 (6.0)Financials 13.7 11.9 (1.8)Yuanta FHC 2885 4,554 15.7 21.0 33.8 O 8.8 1.1 12.2% 1.2 6.4 5.2
Chinatrust FHC 2891 6,042 17.1 23.5 37.8 O 9.5 1.3 13.8% 1.5 5.5 4.0Petrochem 9.0 9.0 (0.0)
Formosa Chemical 1326 15,079 80.0 106.6 33.3 O 10.7 1.7 15.7% 2.1 6.0 3.9
Formosa Plastics 1301 16,281 80.3 94.2 17.3 N 12.1 1.9 15.6% 2.9 3.0 0.1Property 2.1 0.0 (2.1)Materials 7.0 8.5 1.5Taiwan Cement 1101 4,036 33.0 43.5 31.8 O 13.0 1.3 9.8% 1.0 6.5 5.5Cheng Shin Rubber 2105 5,179 64.5 77.9 20.8 O 16.1 3.2 20.8% 1.0 2.0 1.0Telecom 5.9 5.9 (0.0)Far EasTone 4904 6,141 56.9 58.5 2.8 O 21.7 2.6 13.2% 0.8 5.9 5.1Transportation 1.2 0.0 (1.2)Retail 3.0 3.0 (0.0)Uni-President 1216 5,809 38.9 46.6 19.9 O 18.7 2.4 13.2% 1.4 3.0 1.6Industrials/Others 2.4 0.1 (2.3)Total 100.0 100.0 0.0
Target Price (NT$)
Note: O = Outperform.
Source: Company data, Credit Suisse estimates

22 November 2011
Taiwan Market Strategy 19
Figure 54: Comparison between Taiwan model portfolio and CS Taiwan coverage P/E (x) P/B (x) ROE (%) Earnings growth (%) Dividend yield (%) Beta
2011E 2012E 2011E 2012E 2011E 2012E 2011E 2012E 2011E 2012E
Taiwan model portfolio 11.6 11.0 2.2 2.0 20.1% 18.8% 14.7% 6.3% 4.8% 4.8% 0.9 CS Taiwan coverage 16.8 13.7 1.7 1.6 10.3% 12.1% -21.7% 22.4% 4.3% 4.2% 1.1
Source: Company data, Bloomberg, Credit Suisse estimates
Maintain index target of 8,500 We have year-end 2012 index target of 8,500 (18% implied upside), which is based on 1.8x forward P/B, or the mid-point of Taiwan’s historical P/B range. Our current estimate of 12.1% ROE for 2012 is higher than its historical average of 11%, though it should be roughly at par if we also take into account 5-10% further earnings revision into 1Q 2012.
Figure 55: P/E of Taiwan market Figure 56: P/B of Taiwan market
0.0
5.0
10.0
15.0
20.0
25.0
30.0
35.0
40.0
Jan-01 Jan-02 Jan-03 Jan-04 Jan-05 Jan-06 Jan-07 Jan-08 Jan-09 Jan-10 Jan-11
3,000
4,000
5,000
6,000
7,000
8,000
9,000
10,000
Average = 17.33
+1 Std dev = 23.2
-1 Std dev = 11.5
+2 Std dev = 29.10
-2 Std dev = 5.6
Market PE (x)Current Forward PE @ 14.4 x
1.0
1.5
2.0
2.5
3.0
Jan-01 Jan-02 Jan-03 Jan-04 Jan-05 Jan-06 Jan-07 Jan-08 Jan-09 Jan-10 Jan-11
Average = 1.80
+1 Std dev = 2.1
-1 Std dev = 1.5
+2 Std dev = 2.43
-2 Std dev = 1.2
Market PB (x)Current Forward PB @ 1.7 x
Source: Company data, Credit Suisse estimates Source: Company data, Credit Suisse estimates

22 November 2011
Taiwan Market Strategy 20
Taiwan valuation summary Figure 57: Credit Suisse P/B vs ROE analysis—
(upstream tech)
Figure 58: Credit Suisse P/B vs ROE analysis—
(downstream tech)
TSMC
UMCVanguard
ASE
PowertechSPIL
InoteraNanya Tech
Elan
MediaTek
Mstar
Novatek
Pixart
RealtekWPG
AUO
Coretronic
GiantplusCMI
E InkTPK
Wintek Young Fast
0.5x
1.0x
1.5x
2.0x
2.5x
3.0x
3.5x
4.0x
5.0% 7.5% 10.0% 12.5% 15.0% 17.5% 20.0% 22.5% 25.0%Return on Equity (% EPS / BV)
Price
/ B
ook
Valu
e (P
/ BV
)
Inex pensiv e
Ex pensiv e
P P E - = - / -
E BV BV
GEM TEKD-Link
CyberTAN
Silitech
Largan
HTC
Wistron
Quanta
Pegatron
Hon Hai
Foxcon
Compal
Catcher
AustekAcer
I-Chiun
Everlight
Epistar
Unimicron
Tripot
Topoint
Nan Ya PCB
Kinsus
Delta
Chicony
0.5x
1.0x
1.5x
2.0x
2.5x
3.0x
3.5x
4.0x
5.0% 7.5% 10.0% 12.5% 15.0% 17.5% 20.0% 22.5% 25.0%Return on Equity (% EPS / BV)
Price
/ B
ook
Valu
e (P
/ BV
)
Inex pensiv e
Ex pensiv e
P P E - = - / -
E BV BV
Source: TEJ, Credit Suisse estimates Source: TEJ, Credit Suisse estimates
Figure 59: Credit Suisse P/B vs ROE analysis—
(financials)
Figure 60: Credit Suisse P/B vs ROE analysis—
(non-tech)
Yuanta Mega
Hua Nan
FirstCHB
Taishin
Ta ChongSinoPac
E. Sun
Chinatrust
Shin Kong
Fubon
Cathay
0.8x
1.0x
1.2x
1.4x
1.6x
1.8x
2.0x
6.0% 8.0% 10.0% 12.0% 14.0% 16.0%Return on Equity (% EPS / BV)
Pric
e /
Boo
k Va
lue
(P /
BV)
Inexpensive
Expensive
P P E - = - / -
E BV BV
Cheng Shin Rubber
Uni-President
President Chain Store
Yang Ming M arine Wan Hai Lines
U-M ing Marine
Sincere Navigation
Evergreen Marine
EVA AirChina Airlines
Feng Hsin
Tung Ho Steel
China Steel
Asia Cement
Taiwan Cement
Sinyi Realty
Taiwan FertilizerFar Eastern Textiles
Chong Hong
FargloryHuaku
Hung Poo
Prince Housing
Nan Ya Plastics
Formosa Plastics
Formosa Petrochemical
Formosa Chemical
0.5x
1.0x
1.5x
2.0x
2.5x
3.0x
3.5x
4.0x
5.0% 7.5% 10.0% 12.5% 15.0% 17.5% 20.0% 22.5% 25.0%Return on Equity (% EPS / BV)
Pric
e /
Boo
k Va
lue
(P /
BV)
Inexpensive
Expensive
P P E - = - / -
E BV BV
Source: TEJ, Credit Suisse estimates Source: TEJ, Credit Suisse estimates

22 N
ovem
ber 2011
Taiw
an M
arket Strateg
y 21
Figure 61: Credit Suisse Taiwan coverage universe key valuation matrix 12-mth EPS Earnings P/E P/B ROAE Div Mkt cap Price 12-mth Invst. return (NT$) Growth (%) (x) (x) (%) yield (%) Analyst Company US$ mn 18-Nov target rating (%) 2011 2012 2011 2012 2011 2012 2011 2012 2011 2012 2011 2012
2330.TW TSMC 63,700 74.2 79.0 O 10.5 5.15 5.60 -17.5 8.9 14.4 13.2 3.1 2.8 22.2 22.0 4.0 4.0 Randy Abrams 2303.TW UMC 5,249 12.6 12.6 N 3.0 0.80 0.78 -57.9 -1.4 15.7 16.2 0.8 0.8 4.7 4.7 0.0 3.4 Randy Abrams 5347.TWO Vanguard 618 11.2 12.0 N 10.4 0.38 0.47 -67.5 24.2 29.3 23.7 0.9 0.9 3.1 3.8 5.4 2.4 Randy Abrams Foundry 69,567 -23.1 8.2 14.6 13.5 2.4 2.3 17.1 17.4 3.7 4.0 2311.TW ASE 6,131 27.6 34.0 O 25.7 2.10 2.40 -23.9 14.0 13.1 11.5 1.8 1.6 14.8 14.9 2.4 2.3 Randy Abrams 6239.TW Powertech 1,849 70.0 88.0 O 30.6 8.19 8.01 -14.4 -2.2 8.5 8.7 1.6 1.4 18.8 17.0 5.7 4.7 Randy Abrams 2325.TW SPIL 2,867 27.7 36.0 O 34.8 1.45 1.75 -19.8 20.7 19.2 15.8 1.5 1.4 7.5 9.1 5.8 4.7 Randy Abrams Backend 10,846 -20.9 11.0 13.0 11.7 1.6 1.5 13.0 13.4 3.8 3.3 3474.TW Inotera 665 4.4 17.0 N 290.8 -1.98 0.51 n.m n.m n.m 8.5 0.5 0.4 -18.9 5.3 0.0 0.0 MS Hwang 2408.TW Nanya Tech 357 2.7 10.0 U 274.5 -5.20 0.33 n.m n.m n.m 8.1 0.9 0.5 -95.0 7.7 0.0 0.0 MS Hwang Memory 1,022 n.m n.m n.m 13.8 0.9 0.7 -42.7 5.9 0.0 0.0 2458.TW Elan 402 29.2 25.0 U -11.5 1.12 0.98 -33.4 -12.5 25.9 29.6 1.9 1.9 7.6 6.5 2.7 2.6 Jimmy Huang 2454.TW MediaTek 11,237 308.0 306.0 U 2.8 13.06 15.30 -53.5 21.9 23.6 20.1 3.3 3.2 13.3 16.3 6.4 3.1 Randy Abrams 3034.TW Novatek 1,533 77.1 90.0 U 23.1 6.39 7.61 -16.3 19.1 12.1 10.1 2.1 1.9 17.4 19.8 6.4 7.3 Jerry Su 3227.TWO Pixart 344 80.1 78.0 N 1.2 2.96 4.32 -52.6 47.6 27.0 18.5 1.7 1.7 6.2 9.0 4.0 4.0 Jimmy Huang 2379.TW Realtek 775 48.5 50.0 U 3.2 3.42 3.85 -1.3 12.6 14.2 12.6 1.5 1.4 10.0 11.4 0.0 0.0 Randy Abrams 3702.TW WPG 1,672 32.8 44.0 O 39.1 3.38 4.00 7.9 18.3 9.7 8.2 1.5 1.3 15.6 17.2 0.0 5.7 Randy Abrams IC design 18,923 -35.5 20.9 17.6 14.6 2.5 2.4 14.3 16.9 5.3 3.9 2409.TW AUO 4,020 13.8 16.0 O 16.7 -6.00 -1.40 n.m n.m n.m n.m 0.5 0.6 -20.8 -5.6 0.0 0.0 Jerry Su 5371.TWO Coretronic 590 24.6 26.0 N 12.2 2.07 2.99 -57.6 44.7 11.9 8.2 1.1 1.0 8.1 12.5 5.5 7.9 Jerry Su 8105.TW Giantplus 144 9.9 11.0 N 11.6 -1.22 -0.71 n.m n.m n.m n.m 0.5 0.6 -6.5 -4.0 0.0 0.0 Jimmy Huang 3481.TW CMI 3,165 13.3 13.0 N -1.9 -8.16 -4.29 n.m n.m n.m n.m 0.5 0.6 -26.1 -17.1 0.0 0.0 Jerry Su 8069.TWO E Ink 2,119 59.2 88.0 O 56.8 6.67 7.02 78.8 5.5 8.9 8.4 2.5 2.2 28.9 28.2 8.3 9.5 Jerry Su 3673.TW TPK 3,703 442.0 800.0 O 82.5 51.58 57.09 174.3 20.4 8.6 7.7 2.8 2.1 46.9 33.3 1.7 4.2 Jerry Su 2384.TW Wintek 1,078 20.3 18.0 U -10.7 0.22 1.50 -83.6 634.4 93.0 13.5 0.9 0.8 1.0 6.3 0.5 0.6 Jerry Su 3622.TW Young Fast 398 79.9 84.0 N 9.1 4.84 8.00 -72.8 65.7 16.5 10.0 1.1 1.0 6.7 10.9 4.2 4.8 Jerry Su TFT LCD 15,217 n.m n.m n.m n.m 0.8 0.8 -14.7 -2.7 1.9 2.8 3514.TW Gintech 320 28.6 36.0 N 29.7 -1.05 2.70 n.m n.m n.m 10.6 0.7 0.7 -2.2 6.7 0.0 4.1 Darryl Cheng 6244.TWO Motech 723 50.0 49.0 U 0.0 -2.28 2.30 n.m n.m n.m 21.8 1.2 1.1 -4.8 5.4 0.0 2.3 Darryl Cheng 5483.TWO Sino-American 585 42.4 48.0 N 17.4 3.14 3.29 -62.7 9.4 13.5 12.9 1.0 1.0 7.2 7.7 4.0 4.2 Darryl Cheng Solar 1,628 n.m n.m n.m 14.6 1.0 0.9 0.0 6.6 1.5 3.4 2385.TW Chicony 1,033 48.4 58.0 N 28.1 6.96 6.06 22.9 -12.9 6.9 8.0 1.6 1.5 25.7 19.1 9.2 8.0 Pauline Chen 2308.TW Delta 5,618 70.6 60.0 U -9.6 4.66 5.18 -28.9 11.2 15.1 13.6 1.8 1.8 12.5 13.2 5.1 5.5 Pauline Chen 3189.TW Kinsus 1,448 98.0 110.0 N 16.3 6.67 8.43 21.2 26.5 14.7 11.6 1.8 1.6 12.7 14.6 4.1 4.1 Pauline Chen 8046.TW Nan Ya PCB 1,623 75.6 100.0 N 33.4 5.74 7.75 81.0 35.5 13.2 9.8 1.4 1.2 10.9 13.4 0.9 1.2 Pauline Chen 8021.TW Topoint 101 20.3 26.0 N 32.5 2.06 2.40 14.3 16.1 9.8 8.4 0.8 0.8 9.0 9.4 4.1 4.1 Pauline Chen 3044.TW Tripod 1,381 79.3 90.0 N 17.5 7.99 7.95 -17.3 -0.5 9.9 10.0 1.9 1.7 19.9 17.8 4.0 4.0 Pauline Chen 3037.TW Unimicron 1,800 35.3 43.0 N 27.6 3.69 3.95 -20.3 7.2 9.6 8.9 1.2 1.1 13.0 14.0 7.4 5.6 Pauline Chen Components 13,003 -10.5 9.9 12.1 11.0 1.6 1.5 13.8 14.2 5.0 4.9

22 N
ovem
ber 2011
Taiw
an M
arket Strateg
y 22
Figure 61: Credit Suisse Taiwan coverage universe key valuation matrix (continued) 12-mth EPS Earnings P/E P/B ROAE Div Mkt cap Price 12-mth Invst. return (NT$) Growth (%) (x) (x) (%) yield (%) Analyst Company US$ mn 18-Nov target rating (%) 2011 2012 2011 2012 2011 2012 2011 2012 2011 2012 2011 2012
2448.TW Epistar 1,635 58.1 65.0 N 15.8 1.48 3.79 -78.1 157.3 39.3 15.3 1.2 1.1 2.9 7.7 1.6 4.2 Darryl Cheng 2393.TW Everlight 716 51.6 54.0 N 9.9 3.40 4.31 -38.3 26.8 15.2 12.0 1.6 1.5 10.4 12.9 4.3 5.4 Darryl Cheng 2486.TW I-Chiun 100 14.6 51.0 O 268.5 4.22 4.74 24.1 12.4 3.5 3.1 0.6 0.6 18.3 19.1 20.4 19.1 Darryl Cheng LED 2,451 -59.4 69.6 20.8 12.2 1.2 1.2 5.7 9.8 3.2 5.2 2353.TW Acer Inc. 2,959 34.2 26.0 U -22.7 -2.73 2.15 n.m n.m n.m 15.9 1.2 1.1 -8.3 7.0 10.9 n.a. Thompson Wu 2357.TW Asustek 4,765 202.5 260.0 O 28.4 22.10 25.50 -3.3 20.4 9.2 7.9 1.3 1.1 14.5 15.5 6.1 5.1 Thompson Wu 2474.TW Catcher 4,248 169.5 210.0 O 26.6 14.11 16.18 144.9 14.7 12.0 10.5 2.7 2.3 26.8 23.6 2.4 2.7 Pauline Chen 2324.TW Compal 4,123 28.8 26.0 N -4.9 3.19 3.54 -40.8 11.1 9.0 8.1 1.1 1.0 11.7 12.5 7.5 4.4 Thompson Wu 2354.TW Foxconn Tech 3,852 99.5 89.5 N -2.2 6.50 7.25 8.8 11.6 15.3 13.7 1.9 1.7 13.3 13.3 1.3 8.7 Thompson Wu 2317.TW Hon Hai 28,094 80.1 102.7 N 30.9 7.92 9.24 9.4 16.7 10.1 8.7 1.5 1.3 15.9 16.4 2.3 2.7 Thompson Wu 4938.TW Pegatron 2,303 31.0 30.0 N -2.5 -0.36 1.70 n.m n.m n.m 18.2 0.8 0.7 -0.9 4.1 4.7 n.a. Thompson Wu 2382.TW Quanta 7,782 61.4 70.0 O 19.0 5.90 6.35 21.6 7.6 10.4 9.7 1.9 1.6 18.7 18.0 6.6 4.8 Thompson Wu 3231.TW Wistron 2,435 36.5 46.0 O 31.8 4.35 5.10 -27.0 20.3 8.4 7.2 1.2 1.1 14.8 16.2 8.5 5.5 Thompson Wu PC / NB 60,559 -13.5 27.0 11.8 9.3 1.4 1.3 12.5 14.5 3.7 3.1 2498.TW HTC 18,835 660.0 930.0 O 48.0 76.78 78.42 67.4 2.1 8.6 8.4 5.4 4.3 73.3 56.4 7.0 7.1 Pauline Chen 3008.TW Largan 2,542 572.0 700.0 N 26.2 42.06 49.30 39.5 17.2 13.6 11.6 4.2 3.4 32.4 32.3 3.3 3.9 Pauline Chen 3311.TW Silitech 501 82.7 84.0 N 9.0 7.74 8.08 -3.5 4.4 10.7 10.2 2.7 2.6 24.8 25.9 7.4 7.4 Pauline Chen Handset 21,878 62.6 3.3 9.0 8.7 5.1 4.1 64.6 51.8 6.6 6.8 3062.TW CyberTAN 356 32.9 39.0 O 24.2 1.95 3.11 72.6 59.1 16.9 10.6 2.0 1.8 12.5 18.1 3.7 6.0 Darryl Cheng 2332.TW D-Link 478 22.3 31.0 O 46.2 1.72 2.58 -9.0 50.2 13.0 8.7 1.1 1.0 7.9 11.9 5.0 7.5 Darryl Cheng 4906.TW Gemtek 257 25.3 27.0 N 11.2 0.29 1.83 -77.6 532.8 87.0 13.8 0.9 0.9 2.3 6.6 0.7 4.7 Darryl Cheng Networking 1,092 -7.7 76.8 17.9 10.1 1.2 1.1 6.8 11.4 3.6 6.3 2882.TW Cathay FHC 10,730 31.4 36.5 N 17.3 1.53 1.73 243.5 13.1 20.6 18.2 1.7 1.5 7.7 8.8 1.0 1.1 Chung Hsu 2881.TW Fubon FHC 9,207 31.2 36.0 N 19.6 4.35 3.14 91.7 -25.9 7.2 9.9 1.1 1.1 16.4 11.0 3.8 4.0 Chung Hsu 2888.TW Shin Kong 2,421 8.7 8.8 N 1.4 0.86 0.89 184.7 3.2 10.1 9.8 0.8 0.8 8.3 8.2 0.0 0.0 Chung Hsu 2891.TW Chinatrust 6,031 17.1 23.5 O 41.5 1.79 1.69 46.1 -5.3 9.5 10.1 1.3 1.2 13.8 12.0 3.9 3.7 Chung Hsu 2884.TW E.Sun FHC 2,024 13.7 19.0 O 41.3 0.93 1.49 -3.9 80.7 14.7 9.2 1.0 0.9 6.2 9.9 1.4 2.2 Chung Hsu 2887.TW Taishin 2,408 11.6 16.5 O 44.9 1.40 1.29 40.7 -7.6 8.3 9.0 1.0 0.9 12.0 10.2 2.0 2.8 Chung Hsu 2890.TW Sinopac 2,108 8.8 9.5 N 11.7 0.61 0.72 -16.0 21.9 14.3 12.2 0.7 0.7 4.9 5.7 2.7 3.3 Chung Hsu 2801.TW CHB 3,804 17.0 19.0 N 13.9 1.50 1.19 24.2 -16.9 11.3 14.2 1.0 1.0 9.8 7.0 2.5 2.1 Chung Hsu 2892.TW First FHC 4,372 17.6 20.0 N 15.9 1.25 1.23 25.9 6.7 14.0 14.2 1.0 1.0 7.5 7.0 2.0 2.0 Chung Hsu 2880.TW Hua Nan FHC 4,559 17.2 16.0 U -5.2 1.17 0.98 43.0 -7.1 14.6 17.4 1.3 1.2 8.4 7.3 1.7 1.4 Chung Hsu 2886.TW Mega FHC 7,332 19.7 21.0 N 11.9 1.60 1.62 18.3 2.1 12.3 12.2 1.1 1.0 8.7 8.6 5.3 5.3 Chung Hsu 2885.TW Yuanta FHC 4,549 15.7 21.0 O 36.8 1.78 0.93 84.8 -45.7 8.8 16.9 1.1 1.0 12.2 6.2 4.0 3.0 Chung Hsu Financials 60,158 58.8 -8.7 11.4 12.5 1.0 1.0 9.3 8.0 2.8 2.8 1326.TW FCFC 15,079 80.0 106.6 O 40.9 7.50 7.18 -9.7 -4.2 10.7 11.1 1.7 1.7 15.7 14.9 8.0 7.6 Sidney Yeh 6505.TW FPCC 29,597 93.8 75.8 U -16.1 3.15 3.24 -26.7 3.0 29.8 28.9 3.8 3.7 12.5 12.9 3.0 3.1 Sidney Yeh 1301.TW FPC 16,281 80.3 94.2 N 23.1 6.62 5.72 -11.1 -13.6 12.1 14.0 1.9 1.9 15.6 13.4 6.6 5.7 Sidney Yeh 1303.TW Nan Ya Plastic 15,892 61.1 64.4 N 10.8 3.85 3.89 -26.3 1.1 15.9 15.7 1.7 1.7 10.8 11.0 5.4 5.4 Sidney Yeh Petrochemical 76,849 -17.9 -4.2 16.2 16.9 2.2 2.2 13.6 13.1 5.2 5.0

22 N
ovem
ber 2011
Taiw
an M
arket Strateg
y 23
Figure 61: Credit Suisse Taiwan coverage universe key valuation matrix (continued) 12-mth EPS Earnings P/E P/B ROAE Div
Mkt cap Price 12-mth Invst. return (NT$) Growth (%) (x) (x) (%) yield (%) Analyst
Company US$ mn 18-Nov target rating (%) 2011 2012 2011 2012 2011 2012 2011 2012 2011 2012 2011 2012
2511.TW Prince Housing 646 18.2 25.8 N 48.1 2.38 2.13 21.1 -10.4 7.6 8.5 1.3 1.3 18.6 15.2 6.5 5.9 Sidney Yeh
2536.TW Hung Poo 250 23.8 36.7 O 62.2 2.23 3.41 -28.1 52.9 10.7 7.0 0.8 0.7 7.7 11.0 3.8 8.6 Sidney Yeh
2548.TW Huaku 607 67.8 95.4 O 52.4 11.14 11.40 3.3 2.3 6.1 5.9 1.5 1.4 27.0 25.1 11.5 11.8 Sidney Yeh
5522.TW Farglory 1,293 51.1 57.8 N 19.2 8.36 5.98 -3.6 -28.5 6.1 8.5 1.4 1.3 24.1 16.1 8.2 5.9 Sidney Yeh
5534.TW Chong Hong 521 64.4 66.0 N 10.0 8.21 7.30 -24.8 -11.1 7.8 8.8 1.8 1.7 24.0 20.1 8.3 7.4 Sidney Yeh 1402.TW FENC 5,415 33.5 39.3 O 21.9 2.97 1.91 13.1 -35.7 11.3 17.6 1.6 1.6 14.4 9.1 6.6 4.3 Sidney Yeh Developers 12,309 1.3 -21.7 10.2 13.0 1.5 1.5 15.0 11.3 6.3 5.1 1101.TW Taiwan Cement 4,036 33.0 43.5 O 38.4 2.55 3.18 17.1 24.9 13.0 10.4 1.3 1.2 9.8 11.8 5.4 6.7 Sidney Yeh 1102.TW Asia Cement 3,309 31.9 47.5 O 56.9 3.32 3.64 35.5 9.6 9.6 8.8 1.2 1.1 12.9 13.4 7.3 8.0 Sidney Yeh Cement 7,345 26.1 16.9 11.2 9.6 1.2 1.2 11.2 12.6 6.3 7.3 2002.TW China Steel 13,100 28.0 31.1 N 14.5 1.53 1.87 -42.1 21.9 18.3 15.0 1.5 1.4 8.3 9.9 3.0 3.7 Sidney Yeh 2006.TW Tung Ho Steel 858 26.6 35.9 N 42.8 2.77 2.49 114.7 -10.1 9.6 10.7 1.2 1.2 12.8 11.1 8.4 7.5 David Liao 2015.TW Feng Hsin 967 50.2 54.8 N 14.9 4.56 4.07 12.4 -10.7 11.0 12.3 1.7 1.7 16.3 13.9 6.4 5.7 David Liao Steel 14,926 -34.2 15.5 16.6 14.4 1.5 1.4 9.0 10.2 3.5 4.0 2610.TW China Airlines 2,055 13.4 12.0 U -9.1 0.24 0.82 -89.7 239.9 56.5 16.4 1.3 1.2 2.2 7.3 0.4 1.5 Sam Lee 2618.TW EVA Air 1,997 18.5 16.0 U -11.5 0.86 1.30 -76.7 51.3 21.5 14.2 1.4 1.3 6.7 9.6 1.4 2.1 Sam Lee 2603.TW Evergreen Mar. 1,695 15.2 18.7 O 25.6 0.23 1.13 -83.5 53.2 65.0 13.4 0.8 0.7 1.2 5.5 1.5 2.2 Sam Lee 2605.TW Sincere 499 26.5 31.3 N 24.8 3.12 3.59 -22.2 15.2 8.5 7.4 1.0 0.9 11.8 12.9 7.5 6.6 Hung Bin Toh 2606.TW U-Ming Marine 1,199 42.2 38.0 U -3.3 2.90 3.31 -62.7 14.3 14.5 12.7 1.3 1.2 8.6 9.8 3.6 7.1 Hung Bin Toh 2615.TW Wan Hai Lines 1,021 13.9 19.5 O 44.2 0.31 0.87 -84.8 223.4 45.1 15.9 0.9 0.9 2.1 5.8 0.0 4.5 Sam Lee 2609.TW Yang Ming Mar. 1,074 11.5 10.7 N -7.0 -2.35 -0.85 n.m n.m n.m n.m 0.9 0.9 -15.2 -6.1 0.0 0.0 Sam Lee Transportatn 9,540 -90.5 182.6 47.4 16.8 1.0 1.0 2.2 6.0 1.5 2.9 2912.TW President Chain 5,561 161.5 138.8 U -10.7 6.15 6.50 11.7 5.7 26.2 24.8 7.9 7.6 30.9 31.2 3.2 3.4 Sidney Yeh 1216.TW Uni-President 5,801 38.9 46.6 O 23.6 2.07 2.43 -13.8 17.3 18.7 16.0 2.4 2.3 13.2 14.7 3.2 3.8 Sidney Yeh 2105.TW Cheng Shin 5,179 64.5 77.9 O 24.2 4.01 5.67 -4.2 41.3 16.1 11.4 3.2 2.6 20.8 25.2 2.5 3.5 Sidney Yeh Consumer 16,529 -4.7 23.6 19.4 15.7 3.4 3.1 18.4 20.8 3.0 3.6 2412.TW CHT 26,981 102.0 100.0 N 3.4 5.99 6.22 -2.3 3.7 17.0 16.4 2.3 2.2 13.0 13.7 5.2 5.4 C. Benchavitvilai 3045.TW Taiwan Mobile 9,155 96.0 90.6 N 0.0 4.86 6.06 0.6 17.2 19.8 15.8 4.4 4.0 17.1 20.1 5.9 5.7 C. Benchavitvilai
4904.TW FET 6,141 56.9 58.5 O 7.7 2.62 3.14 -3.3 19.6 21.7 18.1 2.6 2.5 13.2 15.4 4.2 5.0 C. Benchavitvilai
Telecom 42,278 -1.9 8.4 18.5 17.1 2.7 2.6 14.2 15.5 5.1 5.2 Upstream tech average 117,669 -69.4 165.1 43.9 16.5 1.8 1.7 4.1 10.7 3.7 3.6 Downstream tech average 98,816 -1.9 19.3 11.2 9.4 1.7 1.5 15.8 17.2 4.8 4.5 Total tech average 216,485 -35.2 53.3 18.8 12.3 1.8 1.6 9.4 13.8 4.2 4.0 Total non-tech average 246,939 -8.0 0.4 15.3 15.2 1.7 1.6 11.1 10.7 4.3 4.4 Total Taiwan average 463,423 -21.7 22.4 16.8 13.7 1.7 1.6 10.3 12.1 4.3 4.2
Note: O = Outperform; N = Neutral; U = Underperform. Source: Company data, Credit Suisse estimates

22 November 2011
Taiwan Market Strategy 24
Taiwan macro research Analyst: Christiaan Tuntono
Growth slows under weak global growth conditions We expect Taiwan’s growth momentum to remain slow throughout 2012 amidst a sluggish global growth environment
Our US and EU economic teams expect the developed world’s economy to remain weak in the coming year. For the US, 2012 GDP growth is expected to be at 2.2%, with the Fed staying on hold on the Fed fund target rate. EU is expected to enter into a recession, with its GDP likely to contract 0.5% in 2012. For China, we expect growth to moderate further to 8.2% in 2012. Despite some measured easing launched by the government, we do not think the economy will rebound from its moderating growth path. In our view, a sluggish developed market economy is a genuine concern for Taiwan’s exports in 2012, though the negative impact is expected to be cushioned by a slower but still resilient Chinese economy.
Figure 62: Global, US, EU and China macroeconomic forecasts 2011E 2012E Annual avg.
1Q 2Q 3Q 4Q 1Q 2Q 3Q 4Q 10 11E 12E 13E
Global Real GDP (YoY) 4.5 3.9 3.8 3.3 3.2 3.4 3.5 3.9 5.1 3.7 3.5 4.1
IP (YoY) 6.6 4.9 5.2 4.6 4.0 4.3 4.2 5.2 9.6 5.3 4.4 ...
Inflation (YoY) 4.5 4.9 5.0 4.7 4.0 3.7 3.7 3.6 3.5 4.7 3.7 3.6
US Real GDP (YoY) 2.2 1.6 1.6 1.6 2.0 2.3 2.2 2.2 3.0 1.8 2.2 2.0
Inflation (YoY) 2.2 3.3 3.8 3.5 2.6 1.7 1.5 1.6 1.6 3.2 1.8 1.7
Policy rate* 0-.25 0-.25 0-.25 0-.25 0-.25 0-.25 0-.25 0-.25 0-.25 0-.25 0-.25 0-.25
Euro Area Real GDP (YoY) 2.4 1.6 1.4 0.5 -0.7 -0.8 -0.8 0.2 1.8 1.5 -0.5 1.7
Inflation (YoY) 2.5 2.8 2.7 3.1 2.5 1.9 1.9 1.5 1.6 2.8 1.9 1.6
Policy rate* 1.00 1.25 1.50 1.00 0.75 0.75 0.75 0.75 ... ... ... ...
China Real GDP (YoY) 9.7 9.5 9.1 8.0 8.0 8.1 8.3 8.5 10.4 8.6 8.2 8.2
Inflation (YoY) 5.1 5.7 6.2 4.9 3.8 4.5 4.6 4.6 3.3 5.4 4.4 4.5
* End of period.
Source: Credit Suisse estimates
Without a boost from exports, we do not think Taiwan’s economy will rebound in 2012 Taiwan’s export growth and GDP growth are highly correlated, estimated at around 0.95 by Robert Prior-Wandesforde in Asia Contagion: How worried should we be? (published on 1 September). The fact that the forward looking manufacturing PMI is still on a down trend (to 43.7 in October) suggests that economic activity is likely to stay sluggish in the quarters to come. We currently expect Taiwan’s GDP growth to be at 4.3% in 2011, and moderate further to 3.5% in 2012. On a quarter-on-quarter seasonally adjusted basis, growth is expected to remain sluggish or even flattish in the near term, although the risk of a sequential contraction cannot be ruled out. Growth may improve in 2H 2012, but it remains contingent upon an improvement in the developed world’s condition, which is still uncertain.

22 November 2011
Taiwan Market Strategy 25
Figure 63: Summary of Taiwan’s macroeconomic forecasts (% YoY) Forecast Consensus
2008 2009 2010 2011F 2012F 2011F 2012F
GDP 0.7 -1.9 10.9 4.3 3.5 4.5 3.8
Private consumption -0.9 1.1 3.7 3.2 2.9 3.3 3.0
Government consumption 0.8 3.9 1.8 1.0 0.0
Fixed asset investment -12.4 -11.0 23.7 3.0 3.0 1.7 2.6
Exports of goods & services 0.9 -8.7 25.6 7.1 4.5
Imports of goods & services -3.7 -12.8 28.2 5.7 3.0
GDP drivers:
Domestic demand contribution -2.1 -3.2 8.5 2.4 1.8
Net trade contribution 2.8 1.2 2.4 1.9 1.6
Current account balance (NT$ bn) 25.1 25.1 42.6 34.4 30.8
CPI inflation 3.5 -0.9 1.0 1.9 2.2 1.6 1.8
Source: Directorate-General for Budget, Accounting and Statistics, Credit Suisse
We rate Taiwan the most vulnerable economy in NJA in the event of a US and EU demand shock
In our view, a deteriorating global growth environment will increase the negative pressure on Taiwan’s export sectors. This stems from the high ratio of Taiwan’s exports to GDP (75%), high exposure of the export mix to the cyclical technology sector (34% of exports), and limited exposure to a less cyclical and more geographically diversified machinery sector (10% of exports) to leverage on the resilience of emerging markets’ demand. This is a reason why Taiwan’s export performance is more volatile than its regional peers, like Korea.
Figure 64: Weaker US and EU imports … Figure 65: … slows Taiwan’s GDP growth
-30
-20
-10
0
10
20
30
1996
1997
199
8
1999
2000
2001
2002
2003
2004
2005
2006
2007
2008
2009
2010
201
1
2012
-50
-40
-30
-20
-10
0
10
20
30
40
50
US imports (%yoy)EU imports (%yoy)Taiwan merchandise exports (%yoy, RHS)
Forecast
-10
-5
0
5
10
15
1996
1997
1998
1999
2000
2001
2002
2003
2004
2005
2006
2007
2008
2009
2010
2011
2012
-40
-30
-20
-10
0
10
20
30
40
50
Taiwan real GDP (%yoy)
Taiwan merchandise exports (%yoy, RHS)Forecast
Source: DGBAS, CEIC, Credit Suisse estimates Source: MoF, CEIC, Credit Suisse estimates
The slowdown of export orders flows in recent months has given a preview on upcoming export flows and industrial production for Taiwan. In October, export orders only rose 4.38% YoY in USD terms, which has improved from the prior month but remained weak in our view. On an official seasonally adjusted basis, October orders was up 2.44% MoM (sa), but only after a 1.25% MoM (sa) and 4% MoM (sa) contraction in September and August. Geographically, orders from China/Hong Kong (Taiwan’s largest export destination) and the US still recorded positive year-on-year growth, but orders from Europe and Japan contracted, down 0.8% YoY and 14.9% YoY, respectively. Product-wise, orders for information and communication equipments (25% of export orders) was up by about 7% YoY, but orders for electronic products (another 25% of export) rose only by 1% YoY. Outlook for November’s export orders is weak, with 35.3% of those surveyed expecting further decline from October. We do not rule out the opportunity to see Taiwan’s

22 November 2011
Taiwan Market Strategy 26
export order to slow again, in reflection of the deteriorating demand from the developed and China markets.
Figure 66: Export orders and production are slowing Figure 67: Domestic demand faces pressure to slow
further
-40
-30
-20
-10
0
10
20
30
40
50
60
1999 2001 2003 2005 2007 2009 2011
Export orders (% yoy)
Industrial production (% yoy)
-40
-30
-20
-10
0
10
20
30
40
Mar
-04
Sep
-04
Mar
-05
Sep
-05
Mar
-06
Sep
-06
Mar
-07
Sep
-07
Mar
-08
Sep
-08
Mar
-09
Sep
-09
Mar
-10
Sep
-10
Mar
-11
Sep
-11
Taiwan: Real GDP (% yoy)Private consumption (% yoy)Fixed asset investments (% yoy)
Source: MoEA, CEIC, Credit Suisse Source: GDBAS, CEIC, Credit Suisse
As an export-led economy, Taiwan’s domestic demand is likely to face greater pressure to slow
Private consumption remained resilient, up 2.7% YoY in 3Q11 thanks to still positive employment conditions (unemployment rate at 4.3%). Retail trade rose 6.7% YoY in September, largely unchanged from the single digit year-on-year growth seen over the past 12 months. However, fixed asset investments contracted 13.5% YoY in 3Q, dragged by the slowdown of facility investments from manufacturers. In the semiconductor sector, for example, expectation of weaker orders and excess capacity have prompted a pull back in investments. According to our equity analyst, Randy Abrams, Taiwan Semiconductor Manufacturing Corporation may limit its capital expenditure spending in 2012 to the amount it spent in 2011 1 , and we think this may reflect the plan of other tech manufacturers as well. That said, we expect gross fixed capital formation to remain moderate in 2012, and imports for capital goods for facility investments and intermediate goods for export manufacturing are likely to be slow as well.
The presidential election is a swing factor Watch out for the presidential and Legislative Yuan elections on 14 January 2012
In our view, the outcome of the elections remains uncertain at this point, and a surprising result may cast uncertainty over Taiwan’s politics and cross-strait relationship. The latest public survey conducted by TVBS suggests that the difference in the level of support between the incumbent President Ma Ying-Jeou and DPP Chairperson Tsai Ing-Wen was very close at 39% and 38%, respectively. The 1pp difference is within the margin of error for the survey, suggesting that neither candidate has a definite upper hand against the other at this juncture. Moreover, the emergence of People First Party’s Chairman James Soong as the third candidate may also complicate the outcome of this election. In our view, this election may cast uncertainty on the future of the cross-straits relationship, which was essential to the liberalisation of the three links: the signing of Economic Cooperation Framework Agreement (ECFA), opening up of Chinese tourist visits to Taiwan, and other rapprochements with Mainland China implemented since Ma took office in 2008. Besides a sluggish global economy, we believe this election is the second most important
1 Taiwan Semiconductor Manufacturing—3Q11 results: Outlook/margins stay on track, published 27 October 2011.

22 November 2011
Taiwan Market Strategy 27
development to watch which can materially influence Taiwan’s economy in 2012 and beyond.
Figure 68: The outcome of the January 2012 presidential election remains uncertain Percentage of survey respondents (%)
42
9
14
3943
3840404242
4039 38 39
353332343235 34 35
33 3335 38
9
131215
131415141716
0
5
10
15
20
25
30
35
40
45
50
15-Aug 22-Aug 29-Aug 05-Sep 12-Sep 19-Sep 26-Sep 03-Oct 10-Oct 17-Oct 24-Oct 31-Oct 07-Nov
Ma & Wu Tsai & Su Soong & Lin Undecided
Question: If the presidential election due to be held in January 2012 is held tomorrow, who would you vote
for?
Source: TVBS, Credit Suisse
Policy rate on hold, TWD strength capped We expect the CBC to continue the pause in its policy rate normalisation process, while chances of seeing a rate cut have increased
The Central Bank of Republic of China (CBC) made the decision to pause on 29 September, leaving the rediscount rate unchanged at 1.875%. In its policy statement, the CBC turned more pessimistic on global growth, saying that global economic and financial uncertainties have increased. The CBC also believed that the pressures for imported inflation have eased as global crude oil and commodity prices have declined, and reckons that inflation expectations have abated in the domestic economy. Given that the current pressure on the economy stems from a sluggish external demand environment, and that private consumption remains resilient so far, we believe the CBC is still biased towards a pause in the upcoming December monetary policy meeting, postponing (but not reversing) the policy rate normalisation process for now. While muted inflation so far gives the CBC the flexibility to cut, we do not think a 12.5 bp reduction in the rediscount rate would materially stimulate facility investments or consumption, which have been dragged down by a weakened external demand situation. This judgement may change, however, if we see a much sharper pace of growth deceleration in the future or there is an unexpected financial shock from Europe which would negatively impact Taiwan’s economy, demanding a supportive monetary policy response from the central bank.

22 November 2011
Taiwan Market Strategy 28
Figure 69: We expect the CBC to stay on pause, though
chances for a rate cut have increased
Figure 70: We expect TWD to hover around similar level
towards end-2011 and 2012
0
1
2
3
4
5
6
2002 2004 2006 2008 2010 2012
Taiwan rediscount rate (%)
Taiwan overnight rate (%)
US Federal Funds rate (%)
Projection
28
29
30
31
32
33
34
35
36
2006 2007 2008 2009 2010 2011
USDTWD
TWDstrength
Source: CBC, Credit Suisse Source: CEIC, Credit Suisse
With exports expected to weaken, we think the CBC’s forex policy will be to prevent excessive strengthening of the TWD
Although we remain bearish on the fundamentals of the USD, uncertainty in the European sovereign debt situation has periodically triggered massive risk reduction across the global financial markets and rapid capital outflows from Asia, Taiwan included. That said, we do not exclude the chance of seeing the USD/TWD rising above 30 if concerns over Europe set in, but the pair may fall back to around their current level when the concern recedes, in our view. Assuming that the European situation stabilises, we expect to see the USD/TWD settle at around 29.2 towards end-2011, and stay flat in 2012. The TWD appreciating much further against the USD is unlikely, in our opinion, unless there is an improvement in the developed world which triggers a rebound in Taiwan exports and another round of capital inflows into Asia.

22 November 2011
Taiwan Market Strategy 29
Outlook for Taiwan sub-sectors Back-end Sector research analysts: Randy Abrams, Kevin Chen
Demand: Bottoming out in 1Q12, driven by smartphones We expect the back-end demand drivers to be led by communications, an end market that has expanded from 30% of sales in 2002 to 50% in 2011 driven by rising wireless penetration, and more recently, more silicon in tablets and smartphones. Our bottom-up analysis of component drivers projects mobile applications would still grow 15% YoY in 2012, favouring ASE with its high exposure in mobile, and SPIL, which we believe is gaining market share after lagging in the past.
The overall back-end sector should see a bottoming out in demand in 1Q12 driven by the confluence of limited new capacity, constraints from the Thai floods, end of inventory depletion and low season for tech builds. We expect a moderate recovery in 2Q12 driven by wireless but extending into PCs in 2H12 for Windows 8 and cheaper Ultrabooks.
Figure 71: Back-end sales driven by communications Figure 72: Back-end should see a cyclical rebound in
2012
01,0002,0003,0004,0005,0006,0007,000
8,000
2010 2011E 2012E 2013E 2014E
US$mn
0%
10%
20%
30%
40%
50%
60%
70%
YoY Growth (%)
Tablets Smartphones Feature phonesNotebooks Netbooks YoY smartphones/tabletsYoY Growth Mobile
$0
$500
$1,000
$1,500
$2,000
$2,500
$3,000
$3,500
1Q
99
3Q
99
1Q00
3Q00
1Q
01
3Q
01
1Q02
3Q
02
1Q
03
3Q
03
1Q04
3Q
04
1Q
05
3Q05
1Q0
63
Q0
61
Q0
73Q
071
Q0
83
Q0
81
Q09
3Q09
1Q
10
3Q
10
1Q11
3Q
11
1Q
12
E3
Q12
E
US$ mn
-60%-40%-20%0%20%40%60%80%100%
YoY Growth
ASE SPIL Amkor Stats YoY Growth
Source: Company data, Credit Suisse estimates Source: Company data, Credit Suisse estimates
Supply: Capex getting more conservative Back-end capacity additions continue to come down from 2010’s peak spending. Industry equipment orders have collapsed by 60% since 2010 to US$150 mn, below the 2004-06 trough levels implying limited new capacity. The approach of a trough in equipment bookings historically has been a positive catalyst for the backend stocks by keeping capacity tight.
We believe many IDMs are moving to becoming asset light and expect more outsourcing in 2012, particularly as back-end suppliers are investing in lower cost copper and higher throughput packaging. Capex-to-sales for the sector is falling back to 15-16%, in line with the 2005-08 levels when the group rerated for having “capex discipline”.
Back-end should see a cyclical bottom in 1Q12 followed by moderate growth from communications in 1H12 and PC applications in 2H12
Capex coming down sharply through 2H11, setting up for tighter capacity by mid-2012
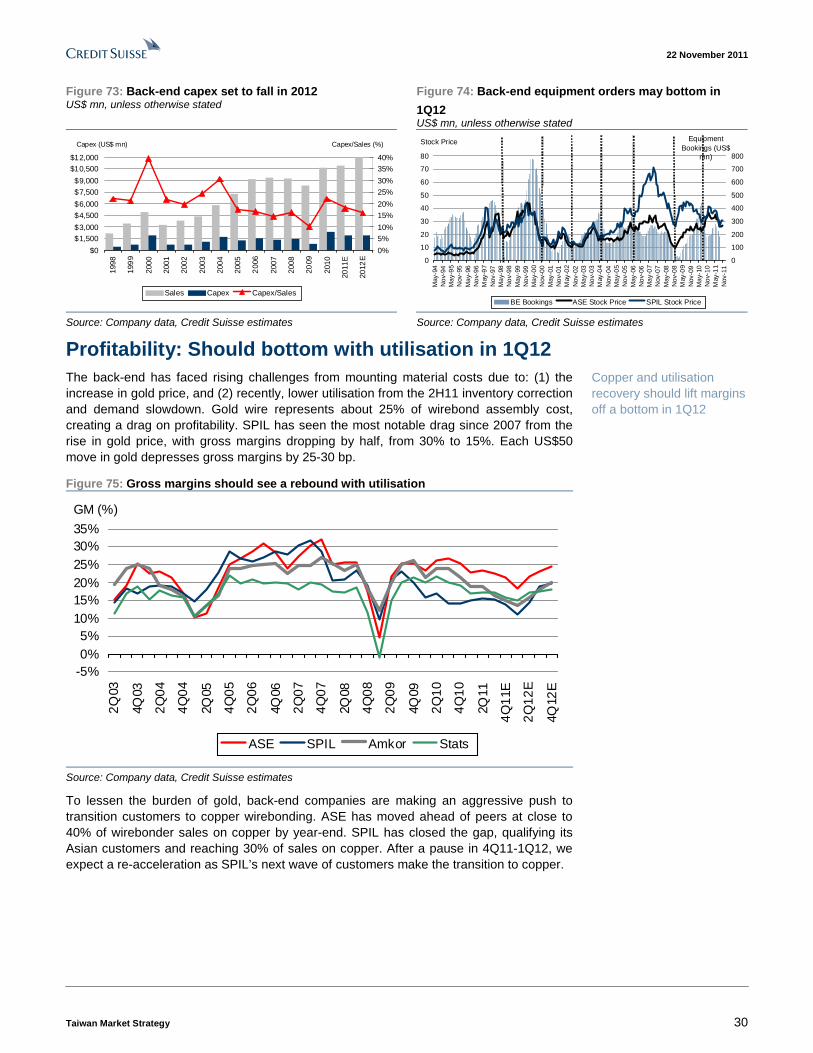
22 November 2011
Taiwan Market Strategy 30
Figure 73: Back-end capex set to fall in 2012 US$ mn, unless otherwise stated
Figure 74: Back-end equipment orders may bottom in
1Q12 US$ mn, unless otherwise stated
$0
$1,500$3,000
$4,500
$6,000
$7,500
$9,000
$10,500$12,000
1998
199
9
2000
2001
2002
2003
2004
2005
200
6
2007
2008
2009
2010
2011
E
2012
E
Capex (US$ mn)
0%
5%10%
15%
20%
25%
30%
35%40%
Capex/Sales (%)
Sales Capex Capex/Sales
0
10
20
30
40
50
60
70
80
May
-94
No
v-94
Ma
y-9
5N
ov-9
5M
ay-
96N
ov-
96
May
-97
Nov
-97
Ma
y-98
No
v-9
8M
ay-9
9N
ov-
99M
ay-
00
Nov
-00
May
-01
No
v-01
May
-02
Nov
-02
Ma
y-03
No
v-0
3M
ay-0
4N
ov-0
4M
ay-
05
No
v-0
5M
ay-0
6N
ov-
06M
ay-
07
Nov
-07
May
-08
No
v-0
8M
ay-0
9N
ov-0
9M
ay-
10N
ov-
10
May
-11
Nov
-11
Stock Price
0
100
200
300
400
500
600
700
800
EquipmentBookings (US$
mn)
BE Bookings ASE Stock Price SPIL Stock Price Source: Company data, Credit Suisse estimates Source: Company data, Credit Suisse estimates
Profitability: Should bottom with utilisation in 1Q12 The back-end has faced rising challenges from mounting material costs due to: (1) the increase in gold price, and (2) recently, lower utilisation from the 2H11 inventory correction and demand slowdown. Gold wire represents about 25% of wirebond assembly cost, creating a drag on profitability. SPIL has seen the most notable drag since 2007 from the rise in gold price, with gross margins dropping by half, from 30% to 15%. Each US$50 move in gold depresses gross margins by 25-30 bp.
Figure 75: Gross margins should see a rebound with utilisation
-5%0%5%
10%15%20%25%30%35%
2Q
03
4Q03
2Q
04
4Q
04
2Q05
4Q
05
2Q
06
4Q06
2Q
07
4Q
07
2Q08
4Q
08
2Q
09
4Q09
2Q
10
4Q
10
2Q11
4Q
11E
2Q
12
E
4Q12
E
GM (%)
ASE SPIL Amkor Stats
Source: Company data, Credit Suisse estimates
To lessen the burden of gold, back-end companies are making an aggressive push to transition customers to copper wirebonding. ASE has moved ahead of peers at close to 40% of wirebonder sales on copper by year-end. SPIL has closed the gap, qualifying its Asian customers and reaching 30% of sales on copper. After a pause in 4Q11-1Q12, we expect a re-acceleration as SPIL’s next wave of customers make the transition to copper.
Copper and utilisation recovery should lift margins off a bottom in 1Q12

22 November 2011
Taiwan Market Strategy 31
Figure 76: TWD and gold are significant swing factors Figure 77: Copper migration improves back-end costs
1,000
1,100
1,200
1,300
1,400
1,500
1,600
1,700
1,800
1,900
2,000
Jan-
10
May
-10
Sep
-10
Jan-
11
May
-11
Sep
-11
Gold
28
29
30
31
32
33
Jan-
10
Apr
-10
Jul-1
0
Oct
-10
Jan-
11
Apr
-11
Jul-1
1
Oct
-11
USD/TWD
0
1,000
2,000
3,000
4,000
5,000
6,000
7,000
8,000
9,000
10,000
3Q094Q091Q102Q103Q104Q101Q112Q113Q114Q111Q122Q123Q124Q12
ASE wirebonders
0
10
20
30
40
50
60
70
80
90
100
Utilization and Copper %
Copper capable bonders Gold only bondersCopper bonders (%) Assembly on copper (%)Uti lization (%)
Source: Company data, Credit Suisse estimates Source: Company data, Credit Suisse estimates
Stocks: ASE and SPIL in the cyclical sweet spot We upgraded ASE and SPIL after the capitulation in August as the stocks had priced in the decline in utilisation from slower demand and inventory cuts and rising gold costs. Back-end stocks normally trough early in inventory adjustments, factoring in that lower supply growth and inventory depletion could help drive a bottoming out in utilisation. Beyond cyclical factors, we like structural drivers for the companies, including their ability to cut costs from the switch to copper, revenue drivers from high growth communications applications, continued lift from outsourcing and inherent capex control due to short equipment lead times.
Figure 78: ASE trading at a discount on a P/B basis Figure 79: SPIL still trading below mid-cycle levels ASE Historical PB Band
0.8x
1.6x
2.2x
3x
0
10
20
30
40
50
60
Sep
/99
Mar
/00
Sep
/00
Mar
/01
Sep
/01
Mar
/02
Sep
/02
Mar
/03
Sep
/03
Mar
/04
Sep
/04
Mar
/05
Sep
/05
Mar
/06
Sep
/06
Mar
/07
Sep
/07
Ma
r/08
Sep
/08
Ma
r/09
Sep
/09
Ma
r/10
Sep
/10
Ma
r/11
Sep
/11
Mar
/12
Sep
/12
NT$
SPIL Historical PB Band
1.2x
2x
2.5x
3.2x
5
20
35
50
65
Jan/
96
Oct
/96
Jul/9
7A
pr/
98Ja
n/99
Oct
/99
Jul/0
0
Ap
r/01
Jan
/02
Oct
/02
Jul/0
3A
pr/
04Ja
n/0
5O
ct/0
5
Jul/0
6
Ap
r/07
Jan
/08
Oct
/08
Jul/0
9
Apr
/10
Jan
/11
Oct
/11
NT$
Source: Company data, Credit Suisse estimates Source: Company data, Credit Suisse estimates
Key risk: Macro and spiralling gold costs The back-end is highly sensitive to the macro environment and has seen a mild recovery off August lows as real demand has not fallen as far as stock market sentiment. A bigger leg down in demand triggered by Europe would drive a rapid round of cuts in the supply chain and huge short-term earnings risk. At the same time, a panic and flight to gold over currencies would also have the added effect of pressuring the back-end companies’ cost structures just as demand was deteriorating.
Maintain ASE and SPIL as our back-end picks
Overcapacity on gold bonders is a key risk

22 November 2011
Taiwan Market Strategy 32
Foundry Sector research analysts: Randy Abrams, Kevin Chen
Demand: Moderate demand drivers Foundries should see a moderate recovery off a utilisation bottom in 1Q12, with demand recovering as inventory depletion runs its course and from new smartphone and tablet builds. CS tech hardware demand forecasts remain moderate overall, with bottom-up weighted tech unit demand decelerating from +8% YoY to +7% YoY. We factor foundry shipments to also rise to just the mid single-digit level. We should see outgrowth at TSMC again as it commands the lion’s share of 28nm designs for application processors, graphics and PLDs and is passing on higher capital intensity with firmer pricing.
Figure 80: Demand drivers for foundries showing moderate growth into 2012 in millions unless otherwise stated
Weights End market (units) 2003 2004 2005 2006 2007 2008 2009 2010 2011E 2012E 2013E
30.0% PC, server and tablet units (m) 164.0 183.4 211.6 231.0 264.1 292.2 308.4 367.9 409.4 464.5 545.5YoY growth 11% 12% 15% 9% 14% 11% 6% 19% 11% 13% 17%
25.0% Handset units (m) 521.0 682.1 820.6 1,000.1 1,209.1 1,303.9 1,374.6 1,589.0 1,742.3 1,809.4 1,899.3YoY growth 22% 31% 20% 22% 21% 8% 5% 16% 10% 4% 5%
20.0% US Consumer Growth ($bn-CEA) 113.5 120.6 137.3 156.5 169.1 181.5 169.8 180.0 186.4 192.0 199.7YoY growth 0% 6% 14% 14% 8% 7% -6% 6% 4% 3% 4%
10.0% Telecom Carrier Capex (bn) 116.8 158.1 178.8 215.4 238.1 252.3 238.0 231.1 246.6 259.0 271.9YoY growth 3% 35% 13% 20% 11% 6% -6% -3% 7% 5% 5%
7.5% Global auto production (m) 60.6 64.5 66.5 69.2 73.3 70.5 61.0 72.0 75.9 78.9 82.9YoY growth 3% 6% 3% 4% 6% -4% -13% 18% 5% 4% 5%
7.5% Global Ind. Production (indexed) 787.0 838.4 881.0 942.0 1,004.0 1,034.1 992.8 1,042.4 1,073.7 1,105.9 1,161.2YoY growth 4% 7% 5% 7% 7% 3% -4% 5% 3% 3% 5%Weighted Growth (YoY) 9.6% 17.0% 14.4% 13.9% 13.1% 7.2% -0.2% 12.3% 7.8% 6.6% 8.5%CS Semi Revenues ($bn) 166.4 213.0 227.5 247.7 255.6 248.6 226.3 300.8 312.8 322.2 338.3YoY Growth 3.9% 28.0% 6.8% 8.9% 3.2% -2.8% -9.0% 32.9% 4.0% 3.0% 5.0%
Source: Company data, Credit Suisse estimates
Fabless outgrowth + IDM outsourcing drive growth Foundries continue to be driven both by fabless customers outgrowing the semiconductor industry and by IDMs outsourcing a greater share of their production. Based on 2002-2011E growth, our survey of 29 IDMs shows a modest 2% CAGR versus 13% CAGR for 59 fabless companies—the engine for foundries now at 80% of sales.
Figure 81: Fabless consistently outgrowing IDMs through the cycle 2000 2001 2002 2003 2004 2005 2006 2007 2008 2009 2010 2011 CAGR '02-11E
IDMs $78,872 $58,001 $56,837 $63,319 $70,978 $69,970 $78,764 $77,367 $67,192 $59,460 $63,420 $67,503 2% YoY IDM -26% -2% 11% 12% -1% 13% -2% -13% -12% 7% 6%Fabless $36,874 $30,455 $33,300 $40,207 $49,219 $57,238 $68,528 $77,709 $81,501 $78,887 $95,094 $102,581 13% YoY Fabless -17% 9% 21% 22% 16% 20% 13% 5% -3% 21% 8%Fabless Outgrowth 9% 11% 9% 10% 18% 7% 15% 18% 8% 14% 1% 11% Source: Factset, Credit Suisse estimates
Fabless outsource all of their production and have outgrown IDMs in every year throughout the cycle as shown in Figure 81 above. Supplementing this growth, IDMs are finally stepping up to higher outsourcing levels after years of promises. IDM outsourcing rebounded from 13% of production back in 2009 to 23% in 2011 (Figure 83), above the 19% level reached in 2008. Japan is still a small contribution for foundries in terms of outsourcing, and has grown outsourcing from 1% to 3%.
Tech unit demand at +7% YoY in 2012, down from +8% YoY in 2011
IDMs rebounded their outsourcing mix from 13% in 2009 to 23% in 2010

22 November 2011
Taiwan Market Strategy 33
Figure 82: Foundries benefit from fabless growing faster Figure 83: IDM outsourcing reached new levels in 2010
$0
$20,000
$40,000
$60,000
$80,000
$100,000
$120,000
$140,000
$160,000
2000 2001 2002 2003 2004 2005 2006 2007 2008 2009 2010 2011 2012 2013 2014 2015
Revenue ($ mn)
-30%
-20%
-10%
0%
10%
20%
30%Y/Y Growth
IDMs Fabless YoY IDM YoY Fabless
0
5,000
10,000
15,000
20,000
25,000
30,000
2000 2001 2002 2003 2004 2005 2006 2007 2008 2009 2010 2011 2012
US$mnproduction
0%
5%
10%
15%
20%
25%
30%
35%
40%%
IDM production TAM Foundry IDM sales IDM mix outsourced % of TSMC Source: Company data, Credit Suisse estimates Source: Company data, Credit Suisse estimates
We see significant headroom for foundries to continue penetrating its addressable market. Foundry share now stands under 30% of IC production and 45% of IC production excluding memory, processors and discretes. Processors have the potential to grow with AMD’s fusion cores and Arm processors for tablets supplied by NVIDIA, Marvell, TI and Qualcomm.
Figure 84: Foundries growing into its addressable market Figure 85: Foundry still outgrowing the chip industry
0
5,000
10,000
15,000
20,000
25,000
30,000
2Q90
4Q90
2Q91
4Q91
2Q92
4Q92
2Q93
4Q93
2Q94
4Q94
2Q95
4Q95
2Q96
4Q96
2Q97
4Q97
2Q98
4Q98
2Q99
4Q99
2Q00
4Q00
2Q01
4Q01
2Q02
4Q02
2Q03
4Q03
2Q04
4Q04
2Q05
4Q05
2Q06
4Q06
2Q07
4Q07
2Q08
4Q08
2Q09
4Q09
2Q10
4Q10
2Q11
4Q11
Quarterly IC Production (70% of COGS) ($m)
-10%
0%
10%
20%
30%
40%
50%
60%
% outsourced
IC Production (70% of COGS) IC Production (Ex memory, MPU, discretes)
Foundry % of IC Prod Foundries % of IC Prod (ex Memory, MPU, Discretes)
0.0
1.0
2.0
3.0
4.0
5.0
6.0
7.0
8.0
1Q98 1Q99 1Q00 1Q01 1Q02 1Q03 1Q04 1Q05 1Q06 1Q07 1Q08 1Q09 1Q10 1Q11
Indexed Sales to 1Q97
Foundry Back-end IC Revenue
Source: Company data, Credit Suisse estimates Source: Company data, Credit Suisse estimates
With foundry penetration having headroom to grow further (note TI, Infineon, STM, Freescale, Atmel, IDTI, and Cypress all pushing more fabless at the leading edge), we believe foundries’ 13% CAGR from 2002-11, above the 11% for IC units and 9% for IC revenue, can continue.
Figure 86: Foundry outpacing logic, IC unit growth and IC revenue 1998 2002 2003 2004 2005 2006 2007 2008 2009 2010 2011 98-11 CAGR 02-11 CAGR
Back-end (mn) 5,683 8,400 10,500 13,500 15,200 17,200 17,936 17,573 14,898 20,206 21,322 11% 11%Foundry (mn) 3,104 8,915 11,621 16,464 16,605 19,746 19,979 20,711 17,745 26,303 27,456 18% 13%Logic (mn) 16,947 43,178 43,997 46,535 42,066 52,580 65,000 42,770 47,658 56,580 73,787 12% 6%IC Units (mn) 58,716 78,556 90,290 105,187 116,349 137,363 151,100 155,292 144,632 186,367 193,624 10% 11%IC Revenue (mn) 109,071 120,523 139,965 178,772 192,798 209,510 217,810 208,656 190,342 249,845 260,113 7% 9% Source: Company data, TEJ, Credit Suisse estimates
Semiconductor inventory starting to come down Our inventory analysis following 3Q11 results shows total tech inventory was up 1.2 days to 45 days, slightly above the 2003-11 average of 42 days and the seasonal 0.9 day depletion in 3Q. We are not alarmed by high inventory heading into the 4Q peak demand season, as a seasonal four-day depletion returns the chain slightly below normal. Order cuts to upstream component makers should help. Our bottom-up analysis of foundry and back-end’s 4Q11 USD sales is down 7% QoQ, lagging chip companies’ guidance (down 3.5% QoQ) and below sub-seasonal CS demand forecasts for +11% growth in 4Q.
We see significant headroom for foundries to continue penetrating its addressable market

22 November 2011
Taiwan Market Strategy 34
Figure 87: Semiconductor inventory starting to drop Figure 88: Slow upstream in 2H helps inventory deplete
Total Tech: 45
Semis: 74
Supply Chain: 3830
40
50
60
70
80
90
1Q '
953Q
'95
1Q '
963Q
'96
1Q '9
73Q
'97
1Q '9
83Q
'98
1Q '9
93Q
'99
1Q '0
03Q
'00
1Q '
013Q
'01
1Q '
023Q
'02
1Q '0
33Q
'03
1Q '0
43Q
'04
1Q '0
53Q
'05
1Q '
063Q
'06
1Q '0
73Q
'07
1Q '0
83Q
'08
1Q '0
93Q
'09
1Q '1
03Q
'10
1Q '1
13Q
'11
Total Tech Semis Supply Chain
Inventory days
Asian Upstream 1Q11 2Q11 3Q11E 4Q11ETotal upstream sales (US$) $7,276 $7,612 $7,382 $6,870 QoQ -3.4% 4.6% -3.0% -6.9%
Semi Customers 1Q11 2Q11E 3Q11E 4Q11EFabless/IDM Customers $23,470 $24,219 $23,856 $23,021 QoQ 1.7% 3.2% -1.5% -3.5%
Downstream units 1Q11 2Q11E 3Q11E 4Q11EHandsets/PCs/TVs/Tablets 552.0 559.6 589.7 654.7 QoQ -10.9% 1.4% 5.4% 11.0%
Source: Company data, Credit Suisse estimates Source: Company data, Credit Suisse estimates
Semiconductor inventory down, with fabless the leanest Inventory decreased the most at fabless, which outsources 100% to foundries. Fabless inventory dollars dropped 3% and days fell by a week to 58 days. Combined fabless and IDMs also fared better with inventory days down three to 79, better than total semi days (flat at 82).
The Taiwan tech chain decreased by two days overall, more than the normal one day decline though it remains ten days above the 2005-11 average. Inventory is getting leanest across semis, with foundries dropping six days for wafer bank and fabless down seven days. For downstream tech, PC brands and distribution were bright spots, with ODMs needing to cut. Ex-Quanta, which had a big shipment right after quarter-end, ODM days would be down two days and total Taiwan inventory down three days.
Supply: Capex coming down from peak 2011 levels While the official 2012 capex guidance will not be out until January, we see a conservative tone for the top four foundries and recently cut US$1 bn capex for 2012E across TSMC, UMC, SMIC and GlobalFoundries—from -18% YoY to -24% YoY. We reduce our estimate for TSMC capex from US$6.0 bn to US$5.5 bn as the company will only spend on its 28nm ramp-up with a limited need to add to existing nodes.
We estimate lower capex will slow capacity growth from +16% YoY in 2011 to +12% YoY in 2012 and on a sequential basis slow additions down to 2-3% per quarter. The lower spending could help TSMC recover utilisation to 95% by 2H11 and the other foundries to 85-90%.
Figure 89: Foundry capex could grow from US$11.3 bn in 2010 to US$14.0 bn in 2011E US$ in millions, unless otherwise stated
US$mn Metric 2000 2001 2002 2003 2004 2005 2006 2007 2008 2009 2010 2011E 2012E Totals ShareSales 5,227 3,959 5,062 6,349 8,050 8,320 9,981 10,146 10,477 9,300 13,193 13,413 14,404 103,634 61%
TSMC Capex 2,493 2,138 1,712 1,171 2,395 2,316 2,476 2,642 1,862 2,761 5,879 7,300 5,500 34,303 52%Capex/Sales 48% 54% 34% 18% 30% 28% 25% 26% 18% 30% 45% 54% 38% 33%Sales 3,305 2,028 2,120 2,669 3,689 2,855 3,274 3,358 2,910 2,787 3,787 3,310 3,188 31,825 19%
UMC Capex 2,409 1,183 877 396 1,525 584 981 884 359 554 1,911 1,800 1,250 10,244 15%Capex/Sales 73% 58% 41% 15% 41% 20% 30% 26% 12% 20% 50% 54% 39% 32%Sales 50 366 975 1,171 1,465 1,550 1,354 1,070 1,555 1,313 1,388 12,207 7%
SMIC Capex 485 486 487 488 1,838 903 911 860 665 200 775 800 350 7,790 12%Capex/Sales 968% 133% 189% 77% 62% 55% 49% 19% 50% 61% 25% 64%Sales 1,134 463 452 551 932 1,033 1,415 1,355 1,661 1,400 3,900 4,095 4,505 20,847 12%
GF Capex 964 490 420 221 686 628 554 758 576 500 2,700 4,080 3,500 14,204 21%Capex/Sales 85% 106% 93% 40% 74% 61% 39% 56% 35% 36% 69% 100% 78% 68%Sales 9,666 6,449 7,684 9,935 13,646 13,379 16,135 16,408 16,401 14,557 22,435 22,131 23,485 168,513 100%
Total Capex 6,350 4,297 3,496 2,276 6,445 4,432 4,923 5,144 3,463 4,014 11,264 13,980 10,600 66,541 100%Capex/Sales 66% 67% 45% 23% 47% 33% 31% 31% 21% 28% 50% 63% 45% 39%
Source: Company data, Credit Suisse estimates
Foundries are taking on more of the burden of industry capex, increasing from 8-10% in 2000-08 to near 20% in 2010-12. At the same time, IDM capex-to-sales has remained below 10% of sales, down from 30% during the tech bubble and 15-20% during the 2003-07 period when most IDMs shifted to asset light models.

22 November 2011
Taiwan Market Strategy 35
Figure 90: Foundry capex significantly ramping Figure 91: IDM capex dropping off with shift to asset light
0
4,000
8,000
12,000
16,000
20,000
24,000
28,000
2000 2002 2004 2006 2008 2010 2012
Capex (US$mn)
0%10%
20%
30%40%
50%
60%70%
80%
Capex / Sales (%)
Foundries revenue Foundries capex
Capex/revenue Foundries % of WW Capex
010,00020,00030,00040,00050,00060,00070,00080,00090,000
100,000
2000 2002 2004 2006 2008 2010 2012
Capex(US$mn)
0%
5%
10%
15%
20%
25%
30%
Capex / Sales(%)
IDM revenue IDMs capex Capex/revenue
Source: Company data, Credit Suisse estimates Source: Company data, Credit Suisse estimates
Taken together with logic capex spending, combined foundry and logic capex is still at 18% capex-to-sales. Foundries have grown from 32% of semiconductor logic capex in 2000 to 84% in 2010 through the expansion of the fabless business model and rising IDM outsourcing. These mitigating factors of more outsourcing and higher capital intensity should help utilisation rebound from 1Q12.
Figure 92: Logic + foundry capex still relatively low Figure 93: Foundry utilisation should bottom in 1Q12
05,000
10,00015,00020,000
25,00030,000
35,00040,000
2000 2002 2004 2006 2008 2010 2012
Capex (US$mn)
0.0%5.0%
10.0%15.0%20.0%
25.0%30.0%
35.0%40.0%
Capex / Sales (%)
Logic capex Foundry capex (all foundries)Logic + Foundry capex/sales
0
1,000
2,000
3,000
4,000
5,000
6,000
7,000
8,0001Q
954Q
953Q
962Q
971Q
984Q
983Q
992Q
001Q
014Q
013Q
022Q
031Q
044Q
043Q
052Q
061Q
074Q
073Q
082Q
091Q
104Q
103Q
112Q
12
3040506070
8090100110
Foundry Shipments (Top 5) Foundry Capacity (Top 5)Utilization (%)
Foundry Capacity (K WPQ) Industry Utilization (%)
Source: Company data, Credit Suisse estimates Source: Company data, Credit Suisse estimates
Higher capital intensity dampening adds relative to the high capex We believe higher capital intensity at 40nm and below is dampening capacity additions relative to history. We estimate US$44 mn per 1,000 8” wafer per month capacity additions, almost double the 2004-08 average. While higher intensity is negative for returns by itself, TSMC has been successful in keeping wafer pricing firm to offset the higher investment required.
Figure 94: Factoring in higher capital intensity in our 2009-11 estimates In US$ mn, unless otherwise stated. WPM Incr. in thousand wafers.
Year Total Capex Maint New Capacity $ Year WPM Incr. Capex/WPM US$ Capex/WPM2004 74,457 14,796 59,661 2004 68 1,097 $33.72005 71,572 15,240 56,331 2005 115 624 $19.22006 78,335 15,698 62,637 2006 101 779 $24.02007 84,002 16,168 67,834 2007 121 694 $21.32008 59,223 16,654 42,569 2008 71 829 $25.5
2004-2008 367,589 78,556 $289,033 2004-2008 476 773 $23.82009 87,785 17,153 70,632 2009 24 3,723 $114.62010 186,944 17,668 169,276 2010 183 1,022 $31.92011 208,661 18,198 190,463 2011 87 2,389 $82.42012 181,800 18,744 163,056 2012 150 1,213 $41.82013 183,600 19,306 164,294 2013 161 1,142 $39.4
2009-2013 848,790 91,068 $757,722 2009-2013 604 1,404 $43.5 Source: Company data, Credit Suisse estimates
Higher capital intensity is keeping new additions contained

22 November 2011
Taiwan Market Strategy 36
Due to the higher intensity, we project 10% YoY capacity growth in 2012, down from 16% in 2011. The HoH capacity growth is still far below the average incremental foundry capacity add between 2000 and 2007. A combination of slower supply growth and restocking should allow utilisation to grow tighter by mid-year.
Figure 95: Capacity additions lower in 2012 Figure 96: Capital intensity rising per addition
-20%
-10%
0%
10%
20%
30%
1H00 1H01 1H02 1H03 1H04 1H05 1H06 1H07 1H08 1H09 1H10 1H11 1H12
HoH Capacity Growth
-
200
400
600
800
1,000
1,200
1,400
1Q95
4Q95
3Q96
2Q97
1Q98
4Q98
3Q99
2Q00
1Q01
4Q01
3Q02
2Q03
1Q04
4Q04
3Q05
2Q06
1Q07
4Q07
3Q08
2Q09
1Q10
4Q10
TSMC Quarterly Capex (US$)
0
10
20
30
40
50
60
70
80
90
100
TSMC US$ Capex per 1,000 8" WPM Added
US$ Capex 3 Quarter Rolling Average Capex per WPM
Linear (3 Quarter Rolling Average Capex per WPM)
Source: Company data, Credit Suisse estimates Source: Company data, Credit Suisse estimates
Profitability: Most of the pool still going to TSMC The profitability for foundries continues to move to TSMC as it has a critical mass of leading edge customers and wafer pricing premium to earn a solid ROE through the cycle. We believe ROE will keep above the company’s target of 20%, with UMC staying mildly profitable through the cycle and SMIC remaining loss making.
Figure 97: ROE—TSMC still has significant leadership Figure 98: TSMC—most of the industry operating profit
0%
5%10%
15%
20%
25%
30%
1997
1998
1999
200
0
200
2
200
3
2004
2005
2006
2007
2008
2009
2010
E
2011
E
2012
E
ROE %
TSMC UMC SMIC
0%
20%
40%
60%
80%
100%
1Q00 4Q00 3Q01 3Q02 2Q03 1Q04 4Q04 3Q05 2Q06 1Q07 4Q07 3Q08 2Q09 1Q10 4Q10 3Q11
Foundry % of Industry Operating Profit
TSMC UMC Chartered SMIC
Source: Company data, Credit Suisse estimates Source: Company data, Credit Suisse estimates
Valuation supportive: TSMC remains our top pick Our NT$79 target price for TSMC suggests modest upside (14x 2012E), following the recent rally; so we prefer back-end for more upside in a utilisation rebound.
Figure 99: TSMC trading at the low end of its P/B range Figure 100: UMC now trading at a discount to book value
1.9x
2.4x
3.9x
0
10
20
30
40
50
60
70
80
90
100
Sep-94 Sep-96 Sep-98 Sep-00 Sep-02 Sep-04 Sep-06 Sep-08 Sep-10
(NT$)
UMC PB Bands
0.5x0.8x1.1x
1.5x
0
10
20
30
40
50
60
Jan/96 Jan/98 Jan/00 Jan/02 Jan/04 Jan/06 Jan/08 Jan/10
(NT$)
Source: Company data, Credit Suisse estimates Source: Company data, Credit Suisse estimates
Capacity growth should slow to 10% in 2012
TSMC will likely keep its wide gap and sizeable share of the profit pool
TSMC remains our top pick, UMC reasonable on P/B

22 November 2011
Taiwan Market Strategy 37
TSMC is still supported by its solid dividends yield, strong balance sheet and lower capex, which should help its free cash flow rebound to a 6% yield in 2012. UMC could see a mild rebound back to book value as profitability rebounds post the current correction. We would need to see the company recover some share in graphics and baseband to drive a further rerating.
Risk: Competition closes the gap Samsung is an exception for the foundries on capital spending. We estimate their logic capex at US$6.3 bn in 2012, ahead of our TSMC estimate of US$5.5 bn. A sizeable proportion of spending is related to Samsung keeping the Apple business through 2012 and taking into account Apple’s volume growth and step-up in die size from 55 mm to 122 mm from its A4 to A5 generation. Samsung also needs to spend aggressively ahead of acquiring customers this time as both Xilinx and TI have migrated back to TSMC and UMC, respectively, after their attempts at Samsung. For 2012, we expect TSMC’s market share and pricing to remain intact, although we would monitor Samsung’s success for impact in 2013. GlobalFoundries is another threat but has struggled to balance the demands from AMD, trying to keep pace with Intel while trying to build a foundry business against TSMC. We believe GlobalFoundries has slowed its expansion due to slow progress acquiring new customers and may only pace TSMC’s capacity additions.
Figure 101: GlobalFoundries has set out aggressive plans in millions, unless otherwise stated TSMC capacity (8" Eq.) 4Q09 4Q10 4Q11 4Q12 4Q13 4Q14200mm 507,063 513,813 511,146 578,483 578,483 578,483300mm 364,500 540,750 630,750 713,250 828,000 927,360Total 871,563 1,054,563 1,141,896 1,291,733 1,406,483 1,505,843 YoY Growth 21% 8% 13% 9% 7%
Global Foundries capacity 4Q09 4Q10 4Q11 4Q12 4Q13 4Q14Fab 1 Module 1 25,000 20,000 20,000 20,000 20,000 20,000Fab 1 Module 2 3,000 20,000 33,000 40,000 40,000 40,000New York - Fab 2 0 10,000 21,000 40,000Abu Dhabi (Unannounced) 0 0Chartered 12" 40,000 40,000 50,000 50,000 60,000 60,000Chartered 200mm (12" eq.) 68,000 78,222 80,000 94,222 94,222 94,222Total Ex AMD MPU (8" eq.) 243,000 300,560 352,429 418,527 461,334 499,329 YoY Growth 24% 17% 19% 10% 8%Percent of TSMC 4Q09 4Q10 4Q11 4Q12 4Q13 4Q14GF 300mm % of TSMC 300mm 48% 41% 43% 45% 44% 44%GF Total % of TSMC total 28% 29% 31% 32% 33% 33%
Source: Company data, Credit Suisse estimates
Foundry market share tends to shift slowly The foundry business tends to be sticky as customers have some resistance to qualifying production at new fabs. At the most advanced nodes, individual chips are also more cost prohibitive to design in multiple foundries. A look at historical market share trends (whether by technology node or by application) shows relatively stable market share. TSMC has sustained 80% market share in computing, 60% in communications and 35% market share in consumer—levels that have remained relatively unchanged over the past decade.
Figure 102: TSMC maintains 80% share in computing, 60% in communications and 35% in consumer Revenue by Computer Applications
0%
20%
40%
60%
80%
100%
1Q00 2Q01 3Q02 4Q03 1Q05 2Q06 3Q07 4Q08 1Q10 2Q11
TSMC UMC Chartered SMIC
Revenue by Com munication Applications
0%
20%
40%
60%
80%
100%
1Q00 2Q01 3Q02 4Q03 1Q05 2Q06 3Q07 4Q08 1Q10 2Q11
TSMC UMC Chartered SMIC
Revenue by Consumer Applications
0%
20%
40%
60%
80%
100%
1Q00 2Q01 3Q02 4Q03 1Q05 2Q06 3Q07 4Q08 1Q10 2QTSMC UMC Chartered SMIC
Source: Company data, Credit Suisse estimates
Samsung’s aggressive capex is a potential risk, though impact may not be felt until 2013
Market share in the foundry sector has some stickiness

22 November 2011
Taiwan Market Strategy 38
IC design Sector research analysts: Randy Abrams, Kevin Chen
Demand drivers: Smartphones to drive the space Demand drivers in IC design are unique to individual companies, driven by each company’s ability to penetrate its chips into new and existing market segments and manage price erosion by competitively introducing new features and reducing cost on mature features. Taiwan has emerged as an IC design centre due to strong support from local foundries/back-end and ITRI (Industrial Technology Research Institute of Taiwan), good proximity to downstream 3C manufacturers in Greater China, and significant focus on local support, rapid feature integration and rapid cost reductions on its chips. In recent years, Taiwan’s advantage has narrowed as many overseas fabless houses have consolidated into larger and more formidable competitors capable of rapid new-feature evolution and integration while matching Taiwan’s ability to lower cost through effective cost reduction. In some high volume segments (consumer, wireless connectivity), China fabless companies have begun to emerge as an even lower cost alternative.
Emerging market smartphones: Key focus in 2012 The Asian IC design space will be dominated by the maturing feature phone space and the emerging low cost smartphone space as Mediatek, MStar, Spreadtrum, and RDA’s sales are dominated by this space and distributor WPG will see increasing contribution within the space. Asian chipset suppliers have been steadily gaining industry share in feature phones but we believe that will start to peak out over 70% share in 2012. The combination of Mediatek competing with smaller players MStar, Spreadtrum and Coolsand in a space with less room for innovation could mean pricing continues to offset units.
The new opportunity will be smartphones, where Mediatek, Spreadtrum and MStar will all be moving to 1 GHz chipsets in 1H12 and toward dual core chipsets in 2H12 to compete with the market leader, Qualcomm. The higher processing power, RF challenges and connectivity drive a 4-6x content add on smartphones from this transition.
Figure 103: Asian vendors could repeat their penetration
gains in smartphones
Figure 104: Significant smartphones ramp in 2012 for
Asian chipsets
0
50
100
150
200
250
3Q11
/1Q
05
1Q12
/3Q
05
3Q12
/1Q
06
1Q13
/3Q
06
3Q13
/1Q
07
1Q
14/3
Q07
3Q14
/1Q
08
1Q15
/3Q
08
3Q15
/1Q
09
1Q16
/3Q
09
3Q
16/1
Q10
1Q17
/3Q
10
3Q17
/1Q
11
1Q18
/3Q
11
0%
10%
20%
30%
40%
50%
60%
70%
Asian Feature phone units Asian Smartphone unitsFF Asian share (%) Smartphone Asian share (%)
Qtrly shipments (mn) Asian share (mn)
-
200
400
600
800
1,000
2005
2006
2007
2008
2009
2010
2011
E
2012
E
2013
E
2014
E
2015
E
0%
20%
40%
60%
80%
100%
Asian chipsets (Mstar/MTK/SPRD) Smart phones Asian share (%)
Chipset units (mn) Asian share (%)
Source: Company data, Credit Suisse estimates Source: Company data, Credit Suisse estimates
We have factored in Asian suppliers gaining some traction, particularly in the open channel with Chinese carriers looking for lower cost smartphone alternatives. MediaTek has already captured notable wins at Lenovo, TCL, G-Five and several replica brands including “HDC” and “GooApple”. We factor units from the Asian suppliers growing from 12 mn in 2011 to 64 mn in 2012, representing 10% of the smartphone market in 2012. We expect MStar and Spreadtrum to sample their smartphone chipsets in 1Q12 and also be in volume production by 2Q12.
IC design demand drivers are company specific
2012 will be driven by growth in emerging market smartphones and Asian vendors’ ability to take market share

22 November 2011
Taiwan Market Strategy 39
Figure 105: Mediatek designs with the MT6573 chipset Light i80 TCL A919 / OT918 Lenovo A60 Shanzhai HTC HD2 HDC Sensation Star x12i
ImageTechnology GSM-EDGE WCDMA WCDMA WCDMA WCDMA WCDMAHSDPA No Yes Yes Yes Yes YesBand Quadband Quadband Quadband Quadband Quadband QuadbandOperating System Android OS, v2.3 Android OS, v2.3 Android OS, v2.3 Android OS, v2.3 Android OS, v2.3 Android OS, v2.3Pixels 320x480 320x480 320x480 320x480 480x800 480x800Connectivity FM+BT+WLAN FM+BT+WLAN FM+BT+WLAN FM+BT+WLAN FM+BT+WLAN FM+BT+WLANCamera 5 MP 5 MP 3.2 MP 8 MP 5 MP 5 MPProcessor 650 MHz 650 MHz 650 MHz 650 MHz 650 MHz 650 MHzDisplay 3.5" HVGA 3.2" QVGA 3.5" HVGA 4.3" WVGA 4" WVGA 4.1" Source: Company data, Mobile Uncle, China Carts.
DTV a more stable demand driver DTV is the second-most important end-market for IC design in Taiwan, with MStar and Mediatek dominating in DTV controller ICs; Novatek and Himax in driver ICs; and Realtek having chips for TVs, monitors and smart TVs.
The DTV space continues to see new content adds that support blended pricing. TV controller pricing ranges from US$6 to US$14-15 per chip, with average pricing still in the US$7-8 range. The current trends involve adding 3DTV, which often requires a higher MHz processor (up to 1GHz), timing controller integration, addition of connectivity and shift to higher speed frame rate conversion (120/240 Hz refresh rates).
Figure 106: Digital TV ICs continue to add in new functionalities 2007 2008 2009 2010 2011 2012 2013 2014 2015
Tuner
Wireless networking
Wired networking
Bigger CPU up to 1GHz
3DTV
TCON Integration
Frame rate conversion/MPEG 4
MPEG-4 Integrated
MPEG-2 Integrated
Source: Display Search
Based on our estimate for 110 mn unit shipments in 2010, we believe MStar commanded 60% of the DTV market. In 2011, we estimate the company will ship 120-125 mn units, maintaining its market share. The chipset landscape has consolidated as smaller stand-alone suppliers (Genesis, Pixelworks, Silicon Optix, Sunplus, Trident, Zoran) have struggled to maintain development costs and competitive cost structures with larger or Asian-based fabless companies closer to the OEMs.
DTV controllers are incremental functionality to hold up pricing

22 November 2011
Taiwan Market Strategy 40
We now believe Mediatek and MStar together are approaching 80% market share, allowing the landscape to grow into a more mature and stable phase. MStar generates about 40-45% of its TV sales from Korean brands (Samsung and LG) and about 35-40% from Chinese brands (Hisense, Skyworth, TCL, Konka, Changhong) and growing share in Japanese brands, including Sony and Toshiba.
Key risks Maturing growth IC design presents the challenge of forcing companies to find new content and new end-markets to replace commoditising end-markets where slower unit growth gets drowned out by pricing pressure. MediaTek is battling that challenge in 2.5G feature phones, where market growth is slowing and getting pressured by more competition.
Figure 107: MTK has high share in slowing feature
phones
Figure 108: Feature phone pricing remains under
pressure
0
25
50
75
100
125
150
175
200
225
250
2Q05
3Q05
4Q05
1Q0
6
2Q0
63
Q0
6
4Q
06
1Q
07
2Q07
3Q07
4Q07
1Q08
2Q08
3Q0
84
Q0
8
1Q
09
2Q
09
3Q09
4Q09
1Q10
2Q10
3Q10
4Q1
01
Q1
1
2Q
11
3Q
11
4Q
11E
Market units (mn)
-25%
0%
25%
50%
75%
100%
125%
150%
175%
200%YoY growth (%)
Mediatek Spreadtrum Mstar Market YoY Mediatek YoY
0
20
40
60
80
100
120
140
160
2Q05
3Q05
4Q
05
1Q
06
2Q0
6
3Q0
6
4Q06
1Q07
2Q07
3Q07
4Q
07
1Q
08
2Q
08
3Q0
8
4Q08
1Q09
2Q09
3Q09
4Q09
1Q
10
2Q
10
3Q
10
4Q10
1Q11
2Q11
3Q11
4Q11
E
Baseband units
0.0
2.0
4.0
6.0
8.0
10.0
12.0
14.0Baseband ASPs
(US$)
Mediatek Units Spreadtrum Units Mediatek ASPs Spreadtrum ASPs
Source: IDC, 2009 April Source: IDC, 2009 April
Realtek is also witnessing a slowdown in its growth as more than two-thirds of its products go into the maturing PC. Realtek generated 66% of sales from PC products, an end-market growing units at +10% YoY in 2011-12E but offset by price erosion. The company has achieved 70-80% share in audio codecs and 10/100 Ethernet but is seeing competition from Asian and overseas competitors, which has kept its market share in WLAN, Ethernet, and LCD monitor controllers capped at 25-30%. The product lines also face risk from lower content in the iPad and slowing gains from Taiwan ODM outsourcing.
The connected and smart TV adoption offers Realtek the greatest opportunity for a new product cycle. Realtek has multiple chips it can supply into this market, including its Ethernet controller, WLAN chipset, digital media processor, and peripheral ICs (webcam, USB card reader).
Valuation and key ideas Our top picks in the space are MStar, Spreadtrum and RDA, which we believe have greater upside from share gains into the open channel and better product mix:
■ MStar combines a stable, profitable and market leading display business with upside growth drivers from handsets and set-top which can drive double-digit sales growth in 2012-13. MStar is trading at 12x our 2012E EPS, a discount to peers at 15x and Mediatek at 21x. Our target price of NT$223 is based on in-line 15x multiple with its peers.
■ Spreadtrum is still gaining share at 25% unit share of emerging market platforms, is leveraged to TD-SCDMA growth with close to 50% share, and is just emerging with smartphones for EDGE and TD-SCDMA in 4Q11 and WCDMA in 2H12. We have a target price of US$39, representing 13x our 2012E EPS of NT$3.00, in line with its peer group which also includes NASDAQ-listed RF suppliers.
MStar has about 60% market share in DTV controller ICs
Feature phones may offset some of the initial gains for Mediatek in smartphones
Realtek is seeing a growth slowdown due to its high exposure to the maturing PC segment
Top picks are MStar, Spreadtrum and RDA for its upside in gaining unit share and mix in handsets. Mediatek still has too high a base of feature phone exposure and too high a valuation

22 November 2011
Taiwan Market Strategy 41
■ WPG maintains its long-term potential to consolidate distribution, grow its communications presence and should benefit once the supply chain completes its de-stocking process. We maintain a target price of NT$44, representing 11x 2012E EPS.
■ RDA is an emerging Chinese fabless supplying RF and connectivity into emerging market platforms, growing share from its low cost structure and focus on optimising integration and die size of its chips. The company will move to higher value in 2012 with a 3:1 and 4:1 connectivity chip, WCDMA PA, and LTE transceiver.
On the flip side, we have a more balanced view on Mediatek relative to some of the street bulls. The stock is trading at 23x 2011E EPS and 20x 2012E EPS, a scenario that requires +3% YoY feature phone growth to 550 mn units and ramp of smartphones from 10 mn to 45 mn units (22% of the global sub-US$200 smartphone market). While expensive, we believe the stock could stay at high multiples off 2012E earnings as long as the smartphone ramp shows promise due to few Taiwan pure plays on low-cost smartphones and good earnings growth off a low 2011E.

22 November 2011
Taiwan Market Strategy 42
TFT LCD Sector research analysts: Jerry Su, Jimmy Huang
Worst is already behind, 2Q12 likely the inflection point on profitability The street is concerned that Taiwan TFT could become the next DRAM and require a government bailout if it continues to incur losses. Due to an industry-wide new fab push-out, utilisation cut, diversification of end-market and applications, Taiwan TFT could avoid ‘DRAMification’ even if the economic slowdown continues, in our view.
Our current global TFT supply and demand model suggests 2Q12 is likely to be a cyclical inflection point, a further delay from the previous projection of some time in 1H11. For the Taiwan TFT LCD sector, although there is no immediate catalyst under the current macro environment, we believe certain macro concerns have already been priced in. We expect the potential upside to come from: (1) panel prices at cash cost; (2) industry-wide utilisation rate cut; (3) capex investment cuts even by Tier 1 panel makers; and (4) signs of stabilisation in inventory and panel prices, especially from China.
Figure 109: Forecast of supply-demand and sufficiency… Figure 110: …versus longer-term historical perspective
0
5,000
10,000
15,000
20,000
25,000
30,000
35,000
40,000
1Q09
2Q09
3Q09
4Q09
1Q10
2Q10
3Q10
4Q10
1Q11
2Q11
3Q11
4Q11
1Q12
2Q12
3Q12
4Q12
0
1
2
3
4
5
6
7
Supply (LHS) Demand (LHS) Sufficiency
('000 sq m) (%)
0
5,000
10,000
15,000
20,000
25,000
30,000
35,000
40,000
1Q06
2Q06
3Q06
4Q06
1Q07
2Q07
3Q07
4Q07
1Q08
2Q08
3Q08
4Q08
1Q09
2Q09
3Q09
4Q09
1Q10
2Q10
3Q10
4Q10
1Q11
2Q11
3Q11
4Q11
1Q12
2Q12
3Q12
4Q12
-2
0
2
4
6
8
10
12
14
Supply (LHS) Demand (LHS) Sufficiency
(%)('000 sq m)
Source: Company data, DisplaySearch, Credit Suisse estimates Source: Company data, DisplaySearch, Credit Suisse estimates
Figure 111: TFT LCD capex and capex-to-sales ratio Figure 112: TV panel prices have stabilised
0
10
20
30
40
50
60
70
80
90
100
2001
2002
2003
2004
2005
2006
2007
2008
2009
2010
2011
E
2012
E
0
10
20
30
40
50
60
Capex (LHS) Sales (LHS) Capex-to-sales (RHS)
(%)(US$ bn)
-20%
-15%
-10%
-5%
0%
5%
10%
15%
Jan-08 Jun-08 Nov-08 Apr-09 Sep-09 Feb-10 Jul-10 Dec-10 May-11 Oct-11
42" TV 32" TV
Source: Company data, Credit Suisse estimates Source: Company data, DisplaySearch, Credit Suisse estimates
2012: China remains an opportunity China has been an important demand driver for Taiwan panel makers since 4Q08 as Korean panel makers outsourced fewer panels to Taiwan amid the 2008-09 financial crisis. The push by the China government on rural subsidy and old-for-new subsidy also boosted China LCD TV demand for the CRT TV replacement cycle. According to CVIA (China Video Industry Association), China has a total of 400 mn CRT TVs for replacement. China is also the largest TV production base globally (~60% for export) with 118 mn units

22 November 2011
Taiwan Market Strategy 43
manufactured in 2010. Its LCD TV production has surged since 2005 and surpassed CRT TV in 2009 with 72% mix in 2010. Its LCD TV export mix also increased from 44% in 2007 to 77% in 2010.
Taiwanese panel makers were early movers in working with Chinese local brands, including Hisense, Skyworth, TCL, Konka, Changhong and Haier, since 2007. CMI and AUO have maintained their position as the top two panel suppliers for local brands in 1H11 due to CMI’s open-cell business model and AUO’s JV with local TV brands (Changhong, TCL and Haier). We expect Chinese domestic TV brands to continue to outperform foreign TV brands in 2012 with ~80% market share, which will benefit AUO and CMI.
Figure 113: Global LCD TV shipments—
China is growing fast
Figure 114: CMI, AUO maintain position as
top two panel suppliers among local
brands in 2Q11
10% 8% 9% 12% 7%
31% 28% 26% 20%19%
31%28%
23% 20%18%
6%9%
7%8%
8%
11% 13%20% 20%
21%
0%10%20%30%40%50%60%70%80%90%
100%
2007 2008 2009 2010 2011E
Japan North AmericaWestern Europe Eastern EuropeChina Asia PacificLatin America Middle East and Africa
CMI30%
AUO24%
LGD23%
Samsung
19%
Others4%
Source: DisplaySearch, Credit Suisse estimates Source: AVC
Figure 115: China TV export mix—LCD TV
becomes the mainstream
Figure 116: China LCD TV—local brands gaining share since Beijing Olympics
China TV export mix
49%40%
25% 21%
44% 53%71% 77%
0%
10%
20%
30%
40%
50%
60%
70%
80%
90%
100%
2007 2008 2009 2010
CRT LCD Plasma Others
0.0%
10.0%
20.0%
30.0%
40.0%
50.0%
60.0%
70.0%
80.0%
90.0%
100.0%
Jan-
08
May
-08
Sep-
08
Jan-
09
May
-09
Sep-
09
Jan-
10
May
-10
Sep-
10
Jan-
11
May
-11
Sep-
11Local Foreign
Source: AVC Source: AVC
Beneficiary of Japanese TV outsourcing We have noted a continued Japan TV outsourcing trend, for both TV panel and OEMs. On the panel side, Japanese brands tend to focus on higher value-add products (LTPS/IPS panel for tablets/smartphones) and will likely increase the panel outsourcing ratio. We think both AUO and CMI will become the major beneficiaries with a mid-single digit percent extra top-line contribution in 2012, especially from Sharp and Panasonic. On the TV OEM side in Taiwan, DisplaySearch thinks Compal and TPV might benefit in 2012 while Wistron will likely become the new OEM partner for Vizio (Unlisted). Based on DisplaySearch data, TPV should maintain its leading position with exposure to various global TV makers, while Chinese brands still produce in-house.
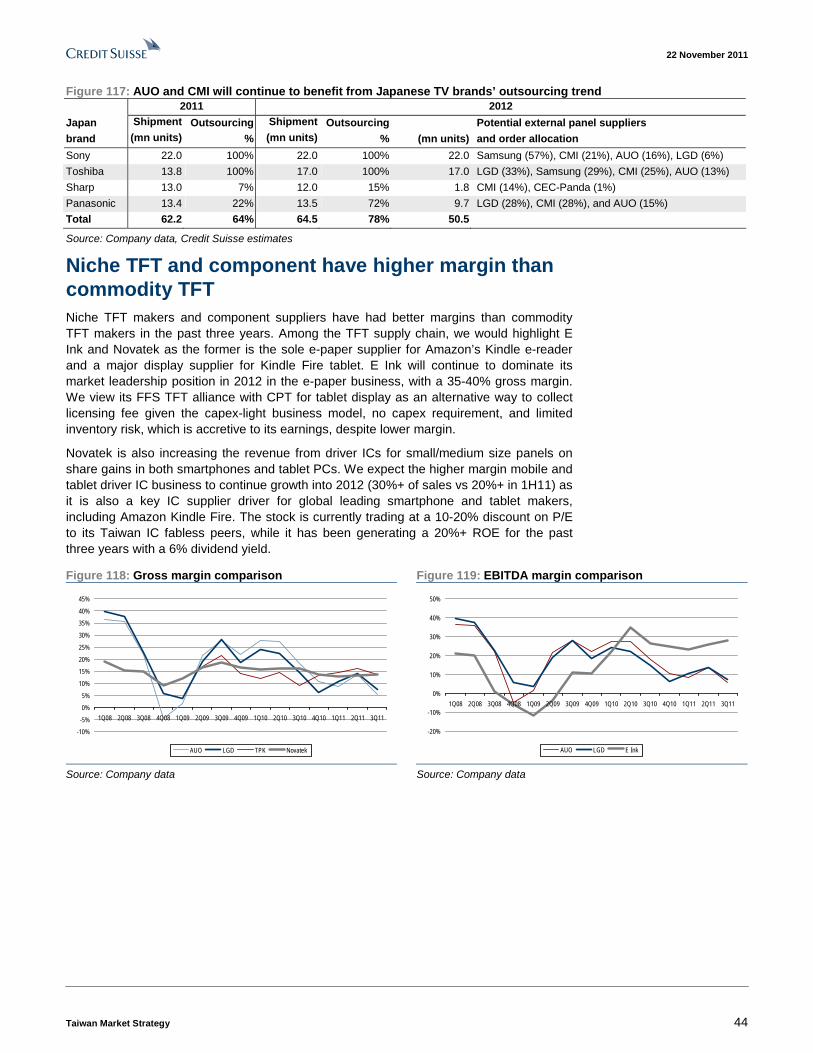
22 November 2011
Taiwan Market Strategy 44
Figure 117: AUO and CMI will continue to benefit from Japanese TV brands’ outsourcing trend 2011 2012
Japan Shipment Outsourcing Shipment Outsourcing Potential external panel suppliers
brand (mn units) % (mn units) % (mn units) and order allocation
Sony 22.0 100% 22.0 100% 22.0 Samsung (57%), CMI (21%), AUO (16%), LGD (6%)
Toshiba 13.8 100% 17.0 100% 17.0 LGD (33%), Samsung (29%), CMI (25%), AUO (13%)
Sharp 13.0 7% 12.0 15% 1.8 CMI (14%), CEC-Panda (1%)
Panasonic 13.4 22% 13.5 72% 9.7 LGD (28%), CMI (28%), and AUO (15%)
Total 62.2 64% 64.5 78% 50.5
Source: Company data, Credit Suisse estimates
Niche TFT and component have higher margin than commodity TFT Niche TFT makers and component suppliers have had better margins than commodity TFT makers in the past three years. Among the TFT supply chain, we would highlight E Ink and Novatek as the former is the sole e-paper supplier for Amazon’s Kindle e-reader and a major display supplier for Kindle Fire tablet. E Ink will continue to dominate its market leadership position in 2012 in the e-paper business, with a 35-40% gross margin. We view its FFS TFT alliance with CPT for tablet display as an alternative way to collect licensing fee given the capex-light business model, no capex requirement, and limited inventory risk, which is accretive to its earnings, despite lower margin.
Novatek is also increasing the revenue from driver ICs for small/medium size panels on share gains in both smartphones and tablet PCs. We expect the higher margin mobile and tablet driver IC business to continue growth into 2012 (30%+ of sales vs 20%+ in 1H11) as it is also a key IC supplier driver for global leading smartphone and tablet makers, including Amazon Kindle Fire. The stock is currently trading at a 10-20% discount on P/E to its Taiwan IC fabless peers, while it has been generating a 20%+ ROE for the past three years with a 6% dividend yield.
Figure 118: Gross margin comparison Figure 119: EBITDA margin comparison
-10%
-5%
0%
5%
10%
15%
20%
25%
30%
35%
40%
45%
1Q08 2Q08 3Q08 4Q08 1Q09 2Q09 3Q09 4Q09 1Q10 2Q10 3Q10 4Q10 1Q11 2Q11 3Q11
AUO LGD TPK Novatek
-20%
-10%
0%
10%
20%
30%
40%
50%
1Q08 2Q08 3Q08 4Q08 1Q09 2Q09 3Q09 4Q09 1Q10 2Q10 3Q10 4Q10 1Q11 2Q11 3Q11
AUO LGD E Ink
Source: Company data Source: Company data

22 November 2011
Taiwan Market Strategy 45
Figure 120: Global e-reader shipment forecast Figure 121: E-reader touch panel penetration increasing
-
10
20
30
40
50
2007 2008 2009 2010 2011E 2012E
mn units
0
100
200
300
400
500
US$
E-reader shipment E-reader price (RHS)
0
10
20
30
40
50
60
2007 2008 2009 2010 2011E 2012E 2013E
mn
units
0%10%20%30%40%50%60%70%
e-reader shipment Touch panel penetration (RHS)
Source: isuppli, Digitimes, Credit Suisse estimates Source: DisplaySearch, Credit Suisse estimates
Top picks: AUO, E Ink, Novatek On the panel maker side, AUO and CMI’s performance gap has widened in this cycle. Both companies have made comparable investments since their inception, but AUO has generated 1.5x the operating cash flow versus CMI since inception and 1.3x after CMI’s three-in-one merger. We maintain our cautious stance on CMI despite it having the largest market share among Chinese TV brands, given its weaker balance sheet and cash flow. We are also concerned about Hon Hai Group’s intention to build new touch panel factories in Chongqing and Brazil. We believe CMI will be derated if it loses Apple’s touch panel business or is required to split the orders with Hon Hai.
On the niche TFT and component side, we also believe Novatek’s gross margin could improve longer term on the back of lower-cost gold alloy bumps (gold, copper and nickel for 50% less gold usage) developed by Chipbond, as well as lower COGS on industry-wide overcapacity and migration to 12” fab. We are also bullish on 2011 and 2012 e-reader shipments and believe E Ink will continue to dominate the e-paper device (EPD) market, given its superior technology and new e-readers to be launched in 4Q11 with new features. E Ink will also benefit from the Amazon tablet by providing FFS TFT panels through its 74%-owned Korean subsidiary, Hydis, as well as new design-wins from other tablet and smartphone brands for 2012 growth. We currently have an OUTPERFORM rating on AUO, Novatek, and E Ink.
Figure 122: AUO one-year forward P/B chart (x) Figure 123: CMI one-year forward P/B chart (x)
0
10
20
30
40
50
60
70
80
Sep-
00
Sep-
01
Sep-
02
Sep-
03
Sep-
04
Sep-
05
Sep-
06
Sep-
07
Sep-
08
Sep-
09
Sep-
10
Sep-
11
NT$
Stock Price 0.4x 0.6x 0.8x 1.0x 2.0x
0
20
40
60
80
100
120
140
160
180
Oct
-06
Feb-
07
Jun-
07
Oct
-07
Feb-
08
Jun-
08
Oct
-08
Feb-
09
Jun-
09
Oct
-09
Feb-
10
Jun-
10
Oct
-10
Feb-
11
Jun-
11
Oct
-11
NT$
Stock Price 0.4x 1.0x 2.0x 3.0x 4.0x Source: Company data, Credit Suisse estimates Source: Company data, Credit Suisse estimates

22 November 2011
Taiwan Market Strategy 46
Figure 124: Novatek one-year forward P/E chart (x) Figure 125: E Ink one-year forward P/E chart (x)
0
50
100
150
200
250
Apr-0
1
Apr-0
2
Apr-0
3
Apr-0
4
Apr-0
5
Apr-0
6
Apr-0
7
Apr-0
8
Apr-0
9
Apr-1
0
Apr-1
1
NT$
Stock Price 4x 8x 10x 12x 16x
0
20
40
60
80
100
120
140
160
Apr-0
4
Jan-
05
Oct
-05
Jul-0
6
Apr-0
7
Jan-
08
Oct
-08
Jul-0
9
Apr-1
0
Jan-
11
Oct
-11
NT$
Stock Price 5x 10x 12x 15x 20x Source: isuppli, Digitimes, Credit Suisse estimates Source: DisplaySearch, Credit Suisse estimates
Key risk: China’s local panel makers are still ramping up new fabs despite oversupply Chinese local panel makers, BOE, CEC-Panda and CSOT, started mass production of their new fabs in 2011 despite the oversupply environment, adding more pressure to TV and monitor panel pricing. However, we believe the risk of Chinese fab oversupply in 2012 should be more muted as Samsung, LGD and AUO have all delayed their next-generation fab construction plans in China, given industry-wide oversupply and demand weakness.
Nevertheless, Chinese local panel makers will still represent 10-11% of global capacity in 2012 on an unadjusted basis. Despite Chinese local panel makers having limited production experience and facing lower yields (below 50% now given poor clean-room conditions), they could still be a potential threat to Taiwanese and Korean panel makers if they decide to dump the panels in the market at cash cost.
Figure 126: Global panel makers’ China fab progress Company Progress
BOE Beijing Gen 8.5 starts mass production in 4Q11 with 30,000 substrates/month input. Targets for 90,000/month input by end-2012. Hefei Gen 6 fab started mass production in 4Q10 and reached 90,000 substrates/month input in May 2011. Targeting for 100,000/month by end-2011.
CSOT Gen 8.5 starts mass production in 4Q11 with 10,000 substrates/month input. Targeting for 120,000/month input by end-2012.
CEC-Panda Gen 6 started mass production in 2Q11, current input of 60,000 substrates/month. Targeting for 80,000/month input by December 2011.
AUO Postponed Gen 8.5 fab construction plan.
Samsung Building Gen 7.5 fab shell but plans to upgrade to Gen 8.5 fab.
LGD Postponed Gen 8.5 fab construction and is reviewing its China fab plan.
Source: Company data, Credit Suisse
Figure 127: Unadjusted area capacity
mix—China below 11% in 2012
Figure 128: Unadjusted area capacity for
Gen 6+—China still small Unadjusted area capacity
3% 4% 7% 11%12% 13% 12% 14%14%
13%
41% 42%48% 45%
45% 44%
45% 43%37% 37% 34% 32%
0%
10%
20%
30%
40%
50%
60%
70%
80%
90%
100%
2007 2008 2009 2010 2011 2012
China Japan Korea Taiwan Others
Unadjusted area capacity (Gen 6+)
4% 10%12% 15% 12% 16%16%
14%
54% 52% 57% 52%50%
49%
35% 33% 30% 32% 30% 27%
0%
10%
20%
30%
40%
50%
60%
70%
80%
90%
100%
2007 2008 2009 2010 2011 2012
China Japan Korea Taiwan Others
Source: Company data, Credit Suisse estimates Source: Company data, Credit Suisse estimates
Chinese local panel makers are still ramping up new fabs but face an issue of lower yields

22 November 2011
Taiwan Market Strategy 47
Touch panel Sector research analysts: Jerry Su, Jimmy Huang
Opportunities in touch: 31% CAGR in 2010-15E We see long-term secular growth for the touch panel industry on increasing demand from mobile handsets, tablet PCs, as well as emerging niche applications for gaming devices, AIO (all-in-one) PCs and notebooks. We forecast touch panel industry revenue will grow from US$7 bn in 2010 to US$18 bn in 2012E and to reach US$27 bn by 2015E—a 31% CAGR.
Figure 129: Touch panel industry
revenue—a 31% CAGR over 2010-15E
Figure 130: 2011E touch panel revenue
mix by application—mobile leads
-
5
10
15
20
25
30
2010 2011E 2012E 2013E 2014E 2015E
US$
bn
31% CAGR
Mobile Phone, 52%
Tablet, 17%
Game Device, 12%
PMP, 3%
Factory, 1%
Retail POS, 1%
POI, 1%
Notebook / Netbook, 2%
Others, 11%
Source: DisplaySearch, Credit Suisse estimates Source: DisplaySearch, Credit Suisse estimates
Mobiles still the biggest growth driver but tablet PCs growing fast
Mobile handsets are likely to remain the core growth driver for the industry from 2011-15 on increasing mobile handset shipments and touch proliferation. For 2012, we forecast mobile handset touch panels to account for 54% of total touch panel revenue, on a 61% touch penetration rate (versus 51% in 2011) and a total of 1.82 bn handset unit shipments, based on the CS global handset shipment model.
Figure 131: Smartphone shipments and
share gains
Figure 132: Touch penetration is rising for
both smartphones and feature phones
-
500
1,000
1,500
2,000
2,500
2008 2009 2010 2011E 2012E 2013E 2014E 2015E
mn unitsSmart Phone Feature Phone
13%11% 18%26%
34%40%
42%44%
Touch Penetration
55%60%
66%
78%85%
91% 92%
12%23% 24%
41%48%
54% 58% 62%
90%
0%10%20%30%40%50%60%70%80%90%
100%
2008 2009 2010 2011E 2012E 2013E 2014E 2015ESmart Phone Feature Phone
Source: Credit Suisse estimates Source: DisplaySearch, Credit Suisse estimates
On the other hand, tablet PCs are expected to continue their growth path in 2012 on the new iPad3, 7”/10” Kindle Fire, and more mature Android-based tablets. We forecast 2012 tablet PCs to account for ~20% of touch panel revenue on 100 mn unit shipments with 100% touch penetration as older people adopt tablets given their ease of use and mobility. Based on the CS global hardware team’s forecast, we estimate Apple will account for ~60% of total tablet shipments.
The touch panel market to continue growing, mainly driven by mobile phones and tablets
Touch panel industry revenue driven by mobile phones and tablet PCs

22 November 2011
Taiwan Market Strategy 48
Figure 133: Touch panel revenue growth driven by mobile phones and tablets Revenue (US$ mn) Revenue CAGR
2010 2012E 2015E 2010 2012E 2015E 2015E 2010-2015Mobile Phone 47% 54% 51% 32% 61% 75% 13,913 33%Tablet 9% 19% 25% 100% 100% 100% 6,991 60%Game Device 7% 10% 7% 55% 72% 80% 1,916 29%Monitor / AIOPC 1% 2% 4% 1% 4% 12% 1,154 77%Notebook / Netbook 6% 2% 3% 5% 5% 8% 734 13%
Education Training 3% 1% 1% 50% 65% 80% 354 12%PMP 6% 2% 1% 80% 84% 84% 317 -6%DCS / Camcorder 1% 1% 1% 9% 12% 20% 240 21%PND 4% 1% 1% 71% 90% 100% 228 -3%POI 2% 1% 1% 80% 88% 93% 141 0%Others 13% 6% 5% 3% 3% 3% 1,495 15%Total 100% 100% 100% 24% 41% 53% 27,484 31%
Revenue Mix Penetration
Source: DisplaySearch, Credit Suisse estimates
In terms of units, mobile phones are still expected to be the largest shipments with about a 70% share from 2011-15E. In terms of area shipments, we believe tablet PCs will consume the largest number of touch panels by 2013, given their larger size (~10” versus ~4”) and rapid growth of Apple, as well as non-Apple, brands such as the new Android and Windows 8 operating system launches.
Figure 134: Touch panel shipment and area growth driven by tablets and mobile phones Shipment CAGR Area CAGR
2010 2012E 2015E 2010 2012E 2015E 2010-2015 2010-2015Tablet 2% 7% 12% 8% 24% 35% 76% 78%Mobile Phone 68% 73% 70% 27% 31% 24% 26% 28%Monitor / AIOPC 0% 0% 1% 3% 6% 11% 71% 74%Education Training 0% 0% 0% 15% 10% 9% 20% 18%Notebook / Netbook 1% 1% 1% 11% 6% 6% 13% 15%Car TV 2% 1% 2% 4% 3% 3% 20% 20%Factory 2% 1% 1% 6% 3% 2% 5% 5%PND 7% 4% 2% 5% 3% 2% 3% 3%Game Device 4% 5% 5% 2% 2% 1% 27% 23%Retail POS 1% 0% 0% 4% 2% 1% 4% 7%POI 0% 0% 0% 5% 2% 1% 3% 4%Others 12% 7% 6% 10% 6% 5% 8% 22%Total 100% 100% 100% 100% 100% 100% 25% 32%
Area MixShipment Mix
Source: DisplaySearch, Credit Suisse estimates
Supply and demand Our analysis shows glass-based capacitive touch sensor area supply to be about 90% greater than demand over 2011-13 given aggressive capacity expansion from existing touch panel makers (TPK, Wintek, HannsTouch, Laibo, etc.) and the conversion from colour filter or legacy TFT fabs to touch sensor manufacturing (Cando, CPT, HannStar, AUO, among others). TPK should have less impact on sensor oversupply given its outsourcing strategy, while Wintek will suffer from lower utilisation and price erosion, in our view.
Figure 135: Glass-based capacitive touch
sensor area supply-demand—oversupply
Figure 136: Glass-based capacitive touch
panel supply versus demand for mobile
phones—looks more balanced
Glass based capacitive touch sensor supply vs. demand
-
1,000
2,000
3,000
4,000
5,000
6,000
7,000
8,000
9,000
2010 2011E 2012E 2013E
K sq
uare
met
er
100%
120%
140%
160%
180%
200%
220%
240%
260%
Total Area Demand Total Area SupplyArea Supply vs. Demand (RHS)
Sensor yield: 90%
-
50
100
150
200
250
300
350
400
450
2010 2011E 2012E 2013E
mn units
100%
110%
120%
130%
140%
150%
Demand Supply Supply/Demand (RHS)
Lamination yield: 85%Full lamination mix: 50%
Source: Company data, Credit Suisse estimates Source: DisplaySearch, Credit Suisse estimates
Glass sensor is oversupplied in terms of area shipments

22 November 2011
Taiwan Market Strategy 49
Nevertheless, we believe lamination continues to be the most critical process for glass-based capacitive touch panel assembly, given that both the cover and sensor glass are rigid and can break easily. As such, the increasing demand for full lamination of smartphones (mainly from Apple) and the ongoing yield issue for Tier 2 suppliers have balanced out the supply-demand profile beyond 2012. For tablet PCs, we think glass-based capacitive touch panels remain the mainstream technology for both Apple and non-Apple tablets in 2012.
Film-based capacitive solutions could gain share from glass solutions in non-Apple markets in 2012 after the process matures and evolves into thinner and lighter designs for tablet PCs. Meanwhile, glass-based capacitive has remained the mainstream touch technology for tablets in 2011, as Apple leads among other tablet makers with a 70%-plus market share. We expect this trend to continue in 1H12, as non-Apple tablet brands wait for the new Windows 8 operating system to be launched in mid-2012. We also believe that film-based capacitive touch will gain share among non-Apple tablets after more tablet product launches and yield improvements.
Figure 137: Glass-based capacitive touch sensor maker capacity forecast K Substrates/mth Gen X mm Y mm Area sqm 2009 2010 2011E 2012E 2013ETPK 2.5 400 500 0.20 180 180 180 180 180 TPK 3 550 650 0.36 - 40 75 75 75
TPK 3 550 650 0.36 - - 75 75 75 TPK 4.5 730 920 0.67 - - 50 70 100 Wintek 1 300 350 0.11 78 78 78 78 78
Wintek 2 320 400 0.13 80 80 80 80 80 Wintek 2.5 370 470 0.17 231 231 231 231 231 Wintek 3 550 650 0.36 - 145 145 145 145
Wintek 3 550 650 0.36 - 200 300 300 300 Wintek 3 550 650 0.36 - - - 30 60 Hanns Touch 5 1200 1300 1.56 45 60 60 60 60
Hanns Touch 5 1200 1300 1.56 - - - 55 80 Cando 3.5 620 750 0.47 50 50 50 50 50 Cando 4.5 730 920 0.67 - 20 80 80 80
Cando 4.5 730 920 0.67 - - 10 90 100 AUO 4 680 880 0.60 - - 30 30 30 AUO 4.5 730 920 0.67 - - 20 20 20
AUO 5 1100 1300 1.43 - - 30 30 30 CMI 2.5 400 500 0.20 - 75 80 80 80 CMI 4.5 730 920 0.67 - 41 45 45 45 CMI 4.5 730 920 0.67 - - 70 70 70
CPT 4.5 730 920 0.67 - 30 30 35 35 CPT 6 1500 1850 2.78 - 10 10 15 30 Compal 4.5 730 920 0.67 - 75 75 75
Giantplus 3.5 620 750 0.47 - 10 25 30 40 Laibo 2.5 400 500 0.20 80 160 200 200 Aimcore 2.5 400 500 0.20 80 100 150 200 200 Source: DisplaySearch, Credit Suisse estimates
Potential threat from in-cell and on-cell In-cell touch: Too early for mainstream applications
Panel makers including AUO, CMI, CPT, Samsung, Sharp, Sony, and TMD (Not listed), among others, have all been trying to develop photo sensing, charge sensing (capacitive) or voltage sensing (resistive) in-cell touch technology since 2008, but none has started mass production given low yields. We believe in-cell technologies still face lower production yields, ambient light interruptions (for photo sensing), higher electrical noise,
Supply-demand looks more balanced for mobile phones but there seems to be oversupply for tablet PCs
Film-based touch panels could gain share from non-Apple camp
In-cell not yet to replace current G/G touch technology

22 November 2011
Taiwan Market Strategy 50
light loss caused by smaller aperture ratios, the inability to work with cover glass, and lack of secondary source issues.
Therefore, we think in-cell touch is unlikely to replace or compete with current touch panel technologies in the near term, including single glass solutions or glass/film, as in-cell touch still requires a cover glass (a total of three glass sets, two from TFT), while single glass or glass/film can meet the trend to reduce overall thickness and has a much better yield.
On-cell touch for TFT: Yield is still the issue
On-cell touch places touch sensors on top of colour filters rather than within pixels. It can also eliminate one layer of glass and reduce the overall thickness of display and touch panel, providing lower costs (if yield is good) and improved clarity. As it requires five additional masks on the flip side of the colour filter to create a touch sensor, its yield is still a significant concern (assuming a 95% yield for each mask leads to a 77% final yield just for producing a sensor versus the current 90% plus overall yield from TPK). Similar to in-cell touch, on-cell touch also requires a cover glass on the top to prevent damaging the TFT display. We think on-cell touch is also not likely to gain more market share over current touch panel technologies, especially after single glass solution or glass/film becomes mature.
Top picks: TPK Among the various touch panel players, we favour TPK in Taiwan for its technology leadership, strong pricing power from better yield and productivity, and prudent capex on sensor outsourcing business model. TPK enjoys a price premium over its peers on differentiated technology, better productivity and yield. The acquisition of a 19.9% stake in Cando in 2Q11 should help it further increase its competitiveness through this vertical integration and bring in more discipline to the industry on sensor pricing. We hold a conservative view on Wintek given it is more aggressive on lowering ASP to win allocations and has recently been losing market share to TPK and CMI for iPhone 4S, iPad 2 and Amazon Kindle Fire products. We believe Wintek will face a tougher challenge from the new entrant CMI and market leader TPK in the Apple supply chain, as well as will need to compete with film capacitive makers, such as Young Fast and J Touch.
Risks 1. Weaker-than-expected mobile phone and tablet PC demand. Mobile phones and tablet PCs are the two key growth drivers for the touch panel industry. A slowdown in the global economy and weaker-than-expected demand for mobile phones and tablet PCs could seriously harm touch industry growth.
2. ASP erosion continues on competition and overcapacity. Despite touch panel being a highly customised product, price competition still exists among touch panel makers. For the Apple tablet touch supply chain, ASP declined from US$65-70 in early 2010 to US$60 by end-2010, and further to US$45–50 in 3Q11. The industry will face more ASP competition (with new entrants in the supply chain) and overcapacity risk. Although most new entrants suffer from lower yield and have smaller scale than TPK, Wintek and Young Fast, they will remain a potential threat, until weaker players exit the market or industry consolidation occurs.
3. New technology threat. Capacitive touch is currently the mainstream touch technology for mobile phones and tablet PCs. Panel makers are trying to build touch sensors within the display (in-cell or on-cell), which could be a threat to existing touch panel makers, given such technology will mean lower total cost (touch plus display), thinner design, lighter weight and improved clarity. However, key concerns for in-cell or on-cell technologies are lower yield, lower sensitivity given higher noise, higher cost and lack of secondary sources.
On-cell touch also lower on yield
TPK is our top pick and we are cautious on Wintek.

22 November 2011
Taiwan Market Strategy 51
Solar energy: Sector research analyst: Darryl Cheng
Demand: Decelerating growth on weak macro economy 2010 was a stellar year for the solar industry, with global solar PV installation growing 175% YoY to 20.5 GWp, in part helped by Italy’s generous subsidy programme. However, the surge in shipments into Italy in late 2010 has also encouraged over inventories in the supply chain, thus increasing demand volatility in 1H11. As a result, the top five Taiwan solar cell makers’ shipments peaked in January 2011 and declined gradually in the following two months. April marked a weak opening for 2Q11, with shipments for the quarter ending up 28% below those in 1Q11. 3Q11 shipments recovered by rising 31% QoQ after inventory levels had reduced in the supply chain, while demand weakened again in 4Q11 hit by the unstable macro economy.
Figure 138: Top five Taiwan solar cell makers’ shipments versus reference ASP
0
100
200
300
400
Jan-10 Apr-10 Jul-10 Oct-10 Jan-11 Apr-11 Jul-11 Oct-110.0
0.5
1.0
1.5
2.0
TW top-5 cell makers' shipment (MWp, LHS) Reference ASP (US$/Wp, RHS)
(MWp) (US$/Wp)
Source: Company data, Credit Suisse estimates
CS solar energy research team currently forecasts 2011-12E global solar PV installations at 22.7 GWp and 24.6 GWp, representing 11% and 8% YoY growth, respectively, a significant slowdown from the 175% YoY growth seen in 2010. The US, Japan, China and India are expected to grow from relatively low bases, while Germany and Italy (which in aggregate accounted for 67% and 51% of global solar PV installation in 2010-11E), are expected to continue declining, partly offsetting the higher installations in the above-mentioned growing markets. European countries have been the most aggressive in encouraging solar PV installation since the early 2000s, while the unstable macro economy in the region will likely lead to negative demand growth in 2012, in our view.
Figure 139: CS global solar PV installation forecast
1.5 1.7 2.85.9 7.4
24.622.7
20.5
18
61
112
25
175
11 80.0
7.5
15.0
22.5
30.0
2005 2006 2007 2008 2009 2010 2011E 2012E
0
50
100
150
200
Global solar PV demand (GWp, LHS) YoY (%, RHS)
(GWp) (%)
Source: Credit Suisse estimates

22 November 2011
Taiwan Market Strategy 52
Figure 140: CS global solar PV installation forecast by region (GWp) 2005 2006 2007 2008 2009 2010 2011E 2012E
Germany 0.8 1.0 1.3 1.9 3.8 7.7 6.0 5.5
Spain 0.0 0.1 0.6 2.5 0.1 0.4 0.8 0.3
Italy 0.0 0.0 0.1 0.2 0.6 6.0 5.5 4.3
Czech Republic 0.0 0.0 0.0 0.1 0.4 1.4 0.1 0.1
US 0.1 0.1 0.2 0.4 0.5 0.9 2.5 3.4
Japan 0.3 0.3 0.2 0.2 0.5 1.0 1.3 2.3
China 0.0 0.0 0.0 0.0 0.2 0.5 2.0 4.0
India 0.0 0.0 0.0 0.1 0.0 0.1 0.8 1.2
Others 0.0 0.0 0.0 0.6 1.3 2.4 3.8 3.6
Global solar PV demand (GWp) 1.5 1.7 2.8 5.9 7.4 20.5 22.7 24.6
YoY growth (%) 18 61 112 25 175 11 8
Source: Credit Suisse estimates
Supply: Oversupply concerns turn true Encouraged by the rapid growth of the solar energy market in the past, Asian solar energy companies have been aggressively adding new capacities since the mid-2000s. This has gradually become a major concern post the financial crisis in 2008-09, as demand for solar PV was still mainly driven by government subsidies, which can vary dramatically when the political and economic environment changes. Luckily for the industry, in 2010, Italy’s generous subsidy programme stimulated solar PV installation in the country, thus helping to digest the increased output by Asian solar energy companies, and to push oversupply out for another year. In the meantime, Asian solar energy companies were adding even more capacity in 2H10-1H11 due to the strong demand from Italy, and most of them were seriously hurt in 2Q-3Q11 when the over-inventories in the supply chain finally hit the industry.
In Taiwan, the top five Taiwan solar cell makers’ aggregate capacity grew 106% in 2010 to 4 GWp/year, followed by 56% YoY growth in 2011 to 5.6 GWp/year. In the beginning of the year, they were initially targeting to expand to 6.1 GWp/year by end-2011, while most of them scaled down their capacity expansion plans post mid-2011 after seeing how demand had shrunk in 2Q11. The CS solar energy research team currently forecasts the capacity of the top 20 solar cell makers at nearly 30 GWp/year by end-2011, well above the estimated 24.6 GWp global solar PV installations in 2012. If we were to further include second-tier solar cell makers’ capacity, global solar cell capacity could be as high as 40-50 GWp/year. In fact, solar cell is not the only sub-sector facing overcapacity. The output of polysilicon, the raw material for production of solar wafer/cell, is also expected to far exceed demand in 2012. In our estimation, 2012 polysilicon output (assuming all of it is converted to solar cells), will be enough for production of 34 GWp solar PV systems. Overall, we believe oversupply will continue to hit solar energy companies’ operations in 2012.
Amid the oversupply, we expect more consolidations and shakeouts in 2012. The solar energy industry is quite fragmented with hundreds of smaller players especially in the mid-stream solar cell/module production. We also expect larger enterprises to penetrate the industry, and they should be better positioned to dominate the market in the future with their ample group resources and better economies of scale.

22 November 2011
Taiwan Market Strategy 53
Figure 141: Taiwan top five solar cell makers' capacity
0.1 0.4 0.71.4
1.9
4.0
5.6
231
7286
39
106
42
0
2
4
6
8
2005 2006 2007 2008 2009 2010 20110
60
120
180
240
TW top-5 solar cell capacity (GWp, LHS) YoY growth (%, RHS)
(%)
Source: Company data, Credit Suisse estimates
Profitability: Structural issues need to be resolved The solar energy industry went through a downturn in 1H09 after Spain closed its subsidy programme, and Taiwan solar cell makers’ aggregate gross margins dipped below breakeven level in 2Q09 (the lowest being -15% ) from 15%-plus in 2Q08. In 2Q11, they were seeing déjà vu, with decreased shipments and free-falling product ASP, which also led to significant inventory write-offs. While 3Q11 profitability improved from the trough in 2Q11, we are still cautious about profitability in 2012, as we believe there are also structural issues in the solar PV cost structure.
Figure 142: Solar cell makers’ profitability
-15
0
15
30
45
1Q08 1Q09 1Q10 1Q11
-30
-15
0
15
30
Net sales (NT$ bn, LHS) Net income (NT$ bn, LHS) GM (%, RHS) OpM (%, RHS)
(NT$ bn) (%)
Source: Company data, Credit Suisse estimates
The cost of polysilicon was the dominant factor in the solar PV price in the past. Polysilicon capacity expansion takes longer (usually more than a year) to set up than other sub-sectors in the solar PV supply chain, and therefore polysilicon supply has been the bottleneck for the solar energy industry in the past upcycles. As such, spot polysilicon prices have been volatile and the decisive factor for solar wafer/cell makers’ profitability. In the beginning of 2011, the spot polysilicon price was still well above US$100/kg, and it began to drop after 2Q11 to its current low of US$25-30/kg.
We believe solar wafer/cell makers’ profitability in 2012 will still be at risk for two reasons:
■ Most solar energy companies still have contract supplies, and given that contract prices are well above spot prices this will continue to cap their profitability unless they can renegotiate better terms.
■ Even after polysilicon prices have dropped to US$25/kg, there is only about US$0.1 profit for solar wafer/cell/module makers to share, assuming solar module prices can be held at the current about US$1/Wp.

22 November 2011
Taiwan Market Strategy 54
Overall, we think double-digit gross margin for solar wafer/cell makers is unlikely to come back, at least in the coming few quarters. Their profitability will depend on their ability to reduce processing costs in the future.
Figure 143: Cost structure Polysilicon cost (US$/kg) 25 30 35 40 45 50 75 Assumption
Polysilicon cost (US$/Wp) 0.15 0.18 0.21 0.24 0.27 0.30 0.45 COGS GM
Wafer price (US$/6"-multi) 1.60 1.72 1.83 1.95 2.07 2.19 2.79 (US$/Wp) (%)
Wafer price (US$/Wp) 0.40 0.43 0.46 0.49 0.52 0.55 0.70 0.25 0.0
Cell price (US$/Wp) 0.60 0.63 0.66 0.69 0.72 0.75 0.90 0.20 0.0
Module price (US$/Wp) 0.90 0.93 0.96 0.99 1.02 1.05 1.20 0.30 0.0
Source: Credit Suisse estimates
Stock picks: Still cautious on solar energy as a whole We turned cautious on the overall solar energy sector in March 2011, at first due to over-inventories in the supply chain and later on due to industry overcapacity. In Taiwan, we currently have a NEUTRAL rating for Gintech and SAS, and an UNDERPERFORM for Motech due to a recent stock price rally and therefore relatively stretched valuation. On the fundamentals front, we actually prefer Motech to standalone solar cell makers in Taiwan. The downcycle for the solar energy industry is expected to last longer than expectation from current visibility. In such a scenario, Motech will have a better chance to survive the industry downturn due to support from TSMC, which is a 20% shareholder of Motech. However, given the weak outlook for the solar energy industry into 2012, we recommend reducing exposure to solar energy stocks for now.
Risks Upside risks to our cautious view for the solar energy industry may come from outside of the industry, such as changes in government policy or the economic environment in major solar PV market such as Europe. China and the US have been viewed as the two markets with the greatest growth potential. However, both governments did not roll out subsidy programmes powerful enough to encourage country-wide solar PV installation. Given the rapidly-falling solar PV system price, governments over the world may reconsider launching more subsidy programmes to encourage solar PV installation and therefore to stimulate employment. In addition, the current solar PV system has reached grid-parity in some long-daylight regions, which may also encourage solar PV installation even without government subsidies. In either case, demand for solar PV systems could increase, partially, easing the oversupply situation for the industry.
Tech Hardware Sector Research Analyst: Thompson Wu
Demand: A year for product cycles The PC hardware sector exits 2011 with acute fear over hard disk drive (HDDs) constraints stemming from the tragic Thailand floods. Nearly 50% of global HDDs are manufactured in Thailand and constraints of HDDs could lead to severe repercussions for the PC supply chain. Our research suggests HDDs production will under-ship PC demand in 4Q11. However, we believe it is manageable due to prepared/channel inventory. Nevertheless, the consumption of said inventories and timing of when production resumes, suggests HDDs constraints could extend into 1Q12 before alleviating through the remainder of the year. In addition to these constraints, a Windows 8 operating system (OS) release in 3Q/4Q12 suggests demand in the first half of 2012 will be worse than seasonal.

22 November 2011
Taiwan Market Strategy 55
Figure 144: CS forecasts PC shipments expands to 364 mn in 2012E (464 mn including
tablets) YoY PC shipment % change
5.5%
19.3%
11.3%
13.5%
17.4%
5.5%
2.1% 1.8%
8.2%
13.7%
0.0%
5.0%
10.0%
15.0%
20.0%
25.0%
2009 2010 2011E 2012E 2013E
PC growth includ ing tablets PC growth excluding table ts
Source: Gartner Quarterly PC Statistics, Worldwide, Credit Suisse estimates
Despite our concerns on supply in the first half of 2012, there are several favourable demand drivers. Overall, we believe 2012 is a year for product cycles including: (1) Android 4.0 tablets; (2) a new PC category delivering thin, light and high performance computing called ultrabooks; and (3) the launch of Windows 8 OS. Buffeting these product cycles, in our view, will be a continuing corporate refresh cycle and further emerging market PC penetration, and we would highlight the following as our key conclusions:
■ Android 4.0 tablets. We believe Android 4.0 is an important OS release to expand the tablet market outside of Apple iPad. The key achievement of Android 4.0 (codenamed Ice Cream Sandwich, or “ICS”) is the OS combines both Android 2.x (Gingerbread) designed for smartphones, and Android 3.x (Honeycomb) design for tablets, into a unified platform. The unification of separate OS’ for distinct mobile products, in our view will unify the application developer community as now applications can be operable across several Android-based products. Given the size of the Android smartphone install base – we estimate 250 million by year-end 2011 – creates a significant opportunity to spur tablet demand, in our view.
We believe Asustek will be a key beneficiary of Android 4.0 OS. In November 2011, Asustek launched its second generation 10.1” Transformer Prime tablet. Priced at US$499 and available by Christmas, Prime is the first tablet to run Android 4.0 and also the first tablet to run NVIDIA’s quad-core Tegra 3 ARM CPU. We forecast 11%/12% revenue and EPS accretion on 4.0 mn units in 2012E, from 1.75 mn in 2011E. Overall, we believe with an established product – Transformer Prime – and a respected consumer brand, we expect Asustek to lead the Android 4.0 product cycle through next year. Please see our Asian daily titled “Transformer Prime(d) for Christmas as Asustek leads another product cycle” published on 14 November 2011 for further details.
Credit Suisse forecasts traditional PC shipments to increase 2.1%/1.8% YoY in 2012/2013E (11.3%/13.5% including tablets), from 2.1% YoY in 2011E (11.3% including tablets)
We believe a 250 million Android smartphone installed base provides a large opportunity for Android tablets to leverage
Key product cycles in 2012 include: (1) Android 4.0 tablets; (2) ultrabooks; (3) Windows 8 OS launch
Asustek is best positioned for Android 4.0 amongst Asian Pc Brands given strong momentum in tablet and a compelling tablet product – Transformer Prime

22 November 2011
Taiwan Market Strategy 56
Figure 145: Credit Suisse tablet forecasts: 2010-15 Shipment in 000’s 2010 2011E 2012E 2013E 2014E 2015E
iPad 15 39 55 76 104 140
Non-iPad market 2 12 55 75 109 149
Tablet shipments 17 51 110 151 213 289
% Share
iPad 88.2% 76.5% 50.5% 50.3% 48.8% 48.4%
Non-iPad market 11.8% 23.5% 49.5% 49.7% 51.2% 51.6%
Tablet shipments 100.0% 100.0% 100.0% 100.0% 100.0% 100.0%
Source: Credit Suisse estimates
■ Ultrabooks. We believe the ultrabook notebook PC is a meaningful step forward in delivering a super thin and light PC with nearly all day computing power at around for around US$1,000. In June 2011 at Computex, Intel launched ultrabooks in coordination with its second generation Sandy Bridge CPUs. To bolster demand, Intel set a goal that 40% of consumer PC shipments in 2012 to be ultrabooks. This target set the PC industry in a frenzy given the high selling price of ultrabooks. Asian PC brands Asustek, Lenovo, and Acer have worked hard to deliver products by Holiday 2011. Overall, we believe it is important for PC brands to establish their ultrabook offering quickly and garner consumer awareness and for demand to meaningfully pull through with the launch of Windows 8 OS in the second half of the year.
Initial ultrabook models launched by Asian PC brands suggest average selling prices (ASPs) of US$800-1,200. Prices vary by CPU speeds (Intel Sandy Bridge Core i3/5/7), storage technology (flash, or hybrid HDD) and capacity (i.e., GB), and casing solution (aluminium uni body or magnesium/aluminium alloy). In our research, we discovered consumer notebooks priced at $800 and above made up 9.0% of global PCs shipped in 2010; 27% of consumer notebooks, or 32 million units. By next year, we expect to see ultrabook ASPs decline as underlying technology becomes cheaper to manufacture. If ultrabook ASPs reach the US$599-799 price band, we could see the total addressable market (or “TAM”) expand by 48 mn shipments.
Figure 146: US$799 and above consumer notebooks represented 9% of global PCs in
2010 % of PC shipments
13.8% 13.8%
10.1% 9.1%
0%
10%
20%
30%
40%
50%
60%
2007 2008 2009 2010
0%
2%
4%
6%
8%
10%
12%
14%
16%
$0-$299 $300-$499
$500-$799 $800-$999
>$1,000 $800 and above of global PCs
Source: Gartner Quarterly PC Statistics, Worldwide
Consumer notebooks priced at US$800 and above make up 9% of global PC shipments; $599-799 make up another 14%

22 November 2011
Taiwan Market Strategy 57
We believe Asustek is best positioned to leverage the ultrabook product cycle. Nearly 58% of its PC shipments in 2010 were consumer notebooks. Drilling in, 11% of its annual notebook PC volumes were priced between US$800-999 and US$1,000-1,200, equating to roughly 2.2 million PCs. By comparison, Lenovo derived 6.0% of its annual volumes in said consumer notebook price-bands and 4% for Acer. Hence, Asustek is most exposed to the ultrabook price-bands. To complement Asustek’s position, we believe Asustek’s ZENBOOK ultrabook, launched in October 2011, has become the industry’s benchmark for Ultrabook and most competitive with the MacBook Air. Overall, we forecast Asustek to ship 2.5 mn ultrabooks in 2012, driving sales and earnings accretion of 7.5%/12.5%.
■ Windows 8 OS launch. In prior Microsoft Windows OS releases, consumer PC demand was preceded by a slowdown. Post launch, consumer demand yields several quarters of outperformance. The last Windows OS launch was July 2009 and consumer PC demand accelerated for a few quarters before macroeconomic concerns forced a slowdown. We expect Windows 8 will spur a similar consumer PC demand cycle. In fact, we believe Windows 8 has greater potential to spur demand as the OS unifies touch-capabilities with traditional pointer-based user interfaces onto one OS platform, which can then be shared across several products (i.e. tablet and PC). Overall, we expect Windows 8 to launch in 3Q/4Q12, which will complement the ultrabook product cycle to drive a resumption of consumer PC demand in the second half of the year.
Figure 147: Windows 7 drove a consumer refresh cycle through early 2010 YoY PC shipment % change
-10.0%
0.0%
10.0%
20.0%
30.0%
40.0%
50.0%
1Q08 2Q08 3Q08 4Q08 1Q09 2Q09 3Q09 4Q09 1Q10 2Q10 3Q10 4Q10 1Q11 2Q11
Windows 7 release to OEMs in July 2009
Source: Gartner Quarterly PC Statistics, Worldwide
Corporate refresh to drive 9%/8% YoY PC unit growth in 2012/2013E
We believe we are in the middle stage of a Windows 7 led corporate refresh that began in late 2010. We saw signs of the refresh in the first half of 2011 and until macroeconomic concerns softened government and financial services spending in 3Q11. As a result, Credit Suisse lowered its global PC forecasts in October 2011. Nevertheless, we believe macro concerns put a pause on the corporate PC refresh, rather than signalling a completion. Hence, Credit Suisse forecasts corporate PC shipment (excluding tablets) to accelerate in 2012 to 9.1%, from 2.7% in 2011 (versus 3.7% growth YTD). Dell’s October quarter-end earnings call affirmed our view citing the Windows 7 refresh cycle was 40% complete.
Asustek is best positioned to leverage the ultrabook product cycle with exposure in the high value consumer notebook segment
We expect Windows 8 to launch in 3Q/4Q12

22 November 2011
Taiwan Market Strategy 58
Figure 148: Corporate refresh to pause in 2H11 but should resume into 2012-13 YoY Commercial PC (ex-tablets) shipment % change
11%
3%
9%8%
0.0%
2.0%
4.0%
6.0%
8.0%
10.0%
12.0%
2010 2011E 2012E 2012E
Macro driven pause in 2H11;
refresh to resume in 2012-13
Source: Gartner, Quarterly PC Statistics, Worldwide, Credit Suisse estimates
Emerging market PC penetration to rise to 55%-plus of global volumes by 2015
Credit Suisse expects emerging market units can rise to 55%-plus of global volumes by 2015, increasing 18.4% compounded over the next five years and accelerating from 18.0% compounded growth over the last five years. Improving affordability of PCs and relatively low PC penetration and increasing household broadband connection are the primary factors that drive this view.
Figure 149: Emerging Markets to represent nearly 55% of total volume long term PC shipments in millions 2008 2009 2010 2011E 2012E 2015E 05-10 CAGR 10-15E CAGR
Developed market 164 170 200 217 268 316 7.9% 9.6%
Emerging market 129 139 169 201 234 393 18.0% 18.4%
Total shipments 292 308 368 418 502 709 11.7% 14.0%
% developed market share 56.0% 55.0% 54.0% 51.9% 53.4% 44.5%
% emerging market share 44.0% 45.0% 46.0% 48.1% 46.6% 55.5%
Source: Gartner Quarterly PC Statistics, Worldwide, Credit Suisse estimates.
China became the largest PC market in 2011 and we expect China to remain a key driver of the emerging market PC market growth in the long term. Credit Suisse forecasts China PC shipments will expand to 100.4 mn units by 2015, from 67.8 mn in 2010.
We prefer Lenovo to leverage a Windows 7 corporate refresh cycle
China became the largest PC market in 2011 and will continue to be a key driver of emerging market PC penetration

22 November 2011
Taiwan Market Strategy 59
Figure 150: Credit Suisse expects China PC shipments to rise to 100 mn by 2015E ‘000s China PC shipments
0
20,000
40,000
60,000
80,000
100,000
120,000
2010 2011E 2012E 2013E 2014E 2015E
Source: Gartner Quarterly PC Statistics, Worldwide, Credit Suisse estimates
We believe Asia PC brands are positioned to benefit from increasing emerging markets PC demand due to their unique competitive positioning strengthened by local distribution, brand recognition and product portfolio. Evidenced over the last ten quarters, Asian PC brands have outperformed the overall market and US OEMs, reaching 37% emerging market share, with Lenovo leading in growth. By expanding distribution and evolving their product portfolio, we expect Asia PC Brands to continue to outperform the market. Of the three Asian PC brands, we believe Lenovo’s exposure and market share in emerging markets offer long-term growth opportunities, followed by Asustek and Acer.
Figure 151: Asian PC brands have outpaced the market in emerging PC markets since
1Q09 YoY PC shipment % change
-20%
-10%
0%
10%
20%
30%
40%
50%
60%
70%
80%
1Q09 2Q09 3Q09 4Q09 1Q10 2Q10 3Q10 4Q10 1Q11
Emerging markets Asian PC Brands U.S. OEMs
Source: Gartner Quarterly PC Statistics, Worldwide.
Note: Asian PC Brands includes Acer, Asus and Lenovo; U.S. OEMs includes HP, Dell and Lenovo.
Asia PC brands are positioned to benefit from increasing emerging markets given their distribution and brand advantages

22 November 2011
Taiwan Market Strategy 60
Supply: ODMs still under pressure but manageable The Asian ODM/EMS industry will face both cyclical and structural pressures in 2012. We highlight four key concerns including: (1) supply chain disruption from the Thailand floods; (3) EMS competition against ODMs; (3) rising labour costs and raw material prices; and (4) overall allocation of resources for new products/technologies. These pressures will continue to test the manufacturing prowess of ODM/EMS vendor. However, we believe counter measures have been taken to navigate these risks and we draw the following conclusions:
■ Thailand floods are a key risk for HDD supply: Nearly 50% of global HDD production is manufactured in Thailand. As a result, leading HDD vendors WD and Seagate have been forced to halt operations, or at the very least reallocate resources to access damages. Fears of HDD constraints and the impact on PC supply emerged. Overall, we believe December and March months have the greatest likelihood for HDD supply to fall short of PC demand. While it is prudent to be wary of HDD constraints, we believe both hard drive vendors and PC OEMs will be able to mitigate the impact on PC supply as the sector evidenced before (i.e. Japan earthquake). Further, the nature of HDDs allows OEMs to prioritize the needs of their customers (i.e. fulfilling a PC orders to a consumer electronic device order). One unavoidable risk is increasing HDD prices, which will be a headwind for OEM margins.
■ Subdued EMS competition. Entering 2011, a key risk to notebook ODMs was increasing competition by EMC companies. Hon Hai made a big move in the space by undercutting the competition. However, it was unable to deliver the same quality execution as ODMs. After speaking with ODMs, we believe PC OEM(s) intend to rotate back to their ODM partners in 2012. This suggests request for quotes (RFQs) in 2012 was less competitive and provides a tailwind for ODM margins and perhaps the tempo of notebook orders will return to historical patterns. Also, the exit by Flextronics in the notebook ODM business this year helps alleviate pricing competition. Overall, despite Hon Hai’s inability to execute in the notebook ODM business for several years now, we believe the company still posses a significant threat, albeit subdued in 2012, given its scale and cost advantages through vertical integration.
■ Rising costs but moving inland: The ODM/EMS industry is continuously under pressure to reduce material and labour costs for their customers. This is a structural pressure. Hence, ODMs operating margins have fallen to 1.6% in 2011E, from 5.4% in 2000. We expect this type of pressure to persist into 2012. However, we expect ODM diversification into LCD TV and servers can expand margin in time. Also, the move to inland China by ODMs should alleviate cost pressure, although the primary cost savings is from tax incentives. While ODMs are in the early stages of these actions, counter measures have been taken and will require time for benefits to emerge. Above all, the ODM/EMS industry will need to continue to manage their business by aligning to their customer needs and efficiently adopt new technologies, which if executed delivers higher manufacturing utilization.
■ Diversified resource allocation required: When tablets launched in 2010, fears emerged that the notebook ODM business would be cannibalised. Indeed the impact of the tablets on PC demand was felt, but notebook ODMs have shown their agility by moving into this product class by signing on customers and fulfilling orders. Now, new fears emerge regarding heighted resources and the allocation of these resources across several product categories. For example, ODM/EMS companies now need to develop ARM and Android technologies and capabilities, alongside Windows and Intel. Overall, we believe these investments are necessary for the future survival of the ODM sector and expect returns on investment begin to emerge in 2012.
We expect supply pressure due to: (1) HDD supply, (2) subdued EMS competition, (3) rising cost from the move to inland China, and (4) resource allocation

22 November 2011
Taiwan Market Strategy 61
Profitability: ODM margins to recovery We believe the Asia PC brands will encounter several obstacles in driving margin expansion in 2012 including: (1) R&D required for several new product classes including ultrabook, Android 4.0 devices, ARM-based PCs, and other mobile devices; (2) expanding distribution and marketing into new segments of the PC market; and (3) rising component costs (i.e., HDDs). Overall, we believe Acer should experience the most significant recovery after a disastrous year in 2011. We believe Asustek can defend its new operating margin level of 5% as investments in Android 4.0 tablets and ultrabooks has a greater possibility of success, in our view. We expect Lenovo will continue to enjoy operating leverage as it extends its global PC share outside of China and momentum in smartphones (a higher margin business) to drive margin expansion. Overall, Asian PC brands have the opportunity to expand margin from the product cycles we mentioned. Some of the names offer higher margins, hence execution will be critical to watch.
ODMs operating margins eroded through 2011 as end-demand slowed in the face of increasing investments. We expect ODM operating margins to recover in 2012 due: (1) reduced competition from Hon Hai; (2) continuing demand from corporate channels (i.e., PC and storage); (3) Windows 8 launch which can help defend PC ASP erosion; and (4) increasing utilisation in both notebook and non-notebook segments (i.e., LCD TVs and tablets). Importantly, we do not expect rising HDD prices from supply constraints to impact ODMs as purchasing is done by PC OEMs. The key risks to our view include (1) FX volatility; (2) fluctuations in component pricing; and (3) rising costs from the move by ODMs to inland China. However, this may be offset by tax benefits in the long term.
Figure 152: NB ODM/EMS shipment in 2010-12E mn shipments 2010 2011E 2012E YoY
Quanta 52.1 56.9 61.1 7%
Compal 48.1 39.2 45.0 15%
Wistron 27.5 30.7 35.5 16%
Pegatron 15.4 15.7 18.0 14%
Total 143.1 142.5 159.6 12%
Source: Company data, Credit Suisse estimates
Stocks: Lenovo, Asustek, Quanta, and Wistron We prefer names leveraged to the key product cycles including Android 4.0 tablets, ultrabooks, Windows 8 launch, a corporate refresh, emerging market PC penetration. Names that we believe best capture this view include: (1) Lenovo; (2) Asustek; (3) Quanta; and (4) Wistron. We rate each of these names OUTPERFORM and we would highlight the following as the key conclusions:
■ Lenovo is our preferred name in Asian PC brands for a stronger underlying PC business. In addition, Lenovo’s mobile Internet and digital home (MIDH) strategy is gaining traction by way of exposure to low-to mid-range smartphones in China. Overall, we expect share gains in emerging markets outside of China and in mature markets to drive scale and deliver operating margin expansion to 2.7% in fiscal 2013E (March 2013 FYE), from 1.9% in fiscal 2012E (March 2012 FYE). Trading at 10.3x times our calendar 2012E EPS (8.3x excluding cash) estimate, we reiterate our OUTPERFORM rating.
■ Asustek is our preferred name to leverage Android 4.0 tablet and ultrabook product cycle. In addition, we believe Asustek’s fundamental PC business remains well positioned to benefit from emerging market PC penetration and a Windows 8 consumer upgrade cycle. Overall, we believe the market’s expectation on Android 4.0 tablets and ultrabooks is low and with Asustek product leadership in both – Transformer Prime tablet and ZENBOOK ultrabook – can lead to upside surprise. Trading at 7.9x times our calendar 2012 EPS estimate and offering a dividend yield of 5.1%, we reiterate our OUTPERFORM rating.
Asian PC Brands will face heighted margin pressures due to new product innovation so company to company execution remains critical to watch
We expect ODM operating margins to recover in 2012
We prefer names with exposure to corporate PC, emerging market PCs, and the key 2012 product cycles including Ultrabooks, Android 4.0 tablets and Windows 8.
OUTPERFORM rated Lenovo, Asustek, Quanta and Wistron are our key names in 2012

22 November 2011
Taiwan Market Strategy 62
■ Quanta is our preferred name in the ODM space for a stronger notebook PC business and for its growth levers in tablets and servers. In addition, Quanta is firmly positioned in ultrabook through Apple’s MacBook Air and in tablets by way of its ties with Amazon. Lastly, its cloud computing business and specifically the direct sale of servers offers both sales and profitability expansion. Overall, we expect non-notebook sales to generate 31% of revenues in 2012E, from 28% in 2011E. Trading at 9.7x times our calendar 2012 EPS estimate and offering a dividend yield of 4.8%, we reiterate our OUTPERFORM rating.
■ Wistron diversification strategy will re-emerge as key revenue and margin driver in 2012. Wistron fell out of love from the market in 2011 as its diversification strategy in LCD TVs stumbled due to slowing end demand. Accordingly, its shares reset and have declined 38% YTD, while 2012 consensus earnings have been cut by 40%. Overall, we believe 3Q11 marks the bottom of the cycle and expect operating margins to improve to 2.0% in 2012E, from 1.8% in 2011E from increasing utilisation in all its key product segments, namely LCD TVs. Trading at 7.2x times our 2012 EPS estimate and offering a dividend yield of 5.5%, we reiterate our OUTPERFORM rating.
Figure 153: Valuation table for Asia Hardware PE (x) PB (x) EPS growth
Code TP Rating 2011E 2012E 2011E 2012E 2011E 2012E
Acer 2353 TT 26.0 UP n.m 15.9 1.2 1.1 NA NA Asustek 2357 TT 260.0 OP 9.2 7.9 1.3 1.1 -3.3% 20.4% Lenovo 0992.HK 6.3 OP 14.5 10.3 2.7 2.1 67.6% 42.3% Quanta 2382 TT 70.0 OP 10.4 9.7 1.9 1.6 21.6% 7.6% Compal 2324 TT 26.0 N 9.0 8.1 1.1 1.0 -40.8% 11.1% Wistron 3231 TT 46.0 OP 8.4 7.2 1.2 1.1 -27.0% 20.3%
Pegatron 4938 TT 30.0 N n.m. 18.2 0.8 0.7 NA NA
Source: Company data, Credit Suisse estimates
Note: Lenovo’s target price in HKD and % change based on fiscal year-end March
Key risks: HDD supply, labour cost, and Windows 8 We highlight three key risks for PC brands and ODMs including: (1) potential HDD supply constraints into 1Q/2Q12 arising from the Thailand floods; (2) rising labour costs and fears of labour shortages from the move to inland China; and (3) potential delays with Windows 8 launch and the push out of a consumer refresh cycle.
■ HDD supply: The devastating floods in Thailand that began in October 2011 have disrupted HDD manufacturing and related PC supply chain. Notably, nearly 50% of global HDD supply is manufactured in Thailand and as a result, fears of HDD constraints emerged. Our conversations with our companies and industry researchers suggest the HDD industry output will be 115-120 mn in 4Q11, compared to an estimate TAM of 160-175 mn. Overall, if production remains offline longer, or the impact on HDD supply is offline longer than expected, PC supply may suffer from prolonged constraints.
■ Labour costs: The ability of an ODM to manage their labour resources and component procurement to peak and slow demand cycles of their customers can materially impact sales and profitability. We expect several risks could affect a ODMs ability to manage their labour resources including: (1) seasonal factors that affect labour supply; (2) labour shortages in the inland.
Chinese New Year, which occurs in 1Q of each year, generally results in labour shortages for ODM/EMS companies as labourers retire home to spend the holiday with their families. As a result, an ODM’s ability to manage its labour requirement during this holiday period could materially affect its sales momentum and profitability. Nevertheless, this is not a new holiday and we believe ODM/EMS companies have
Key risks for the Asia Hardware sector include (1) potential HDD constraints; (2) rising labour costs; and (3) delays of Window 8

22 November 2011
Taiwan Market Strategy 63
learnt to manage their business accordingly. However, a new issue is emerging and that has to do with labourers returning to work post holidays.
Indeed, many of these labourers come from inland China and travel to coastal China cities in pursuit of higher incomes. However, OEM/ODM/EMS companies are moving to inland China for tax benefits and cheap labour. Chongching and Chengdu have emerged as the two major inland cities that are becoming the future of China notebook manufacturing. Ironically, these new cities are closer to the homes of labourers. For now, the industry is still in transition and will continue to move inland through 2013 in our view. We will need to closely monitor labour cost and the availability of qualified labourers in inland and coastal China.
■ Windows 8. We believe a delay of Microsoft’s Windows 8 OS will be a key risk for PC brands and ODMs. Based on reports from Microsoft and corroborated by our conversations with industry researchers, Windows 8 ready devices (PCs and tablets) will be available by 3Q/4Q12. Interestingly, our conversation with ODMs suggests delivery of said products is likely to be in 4Q12/1Q13. Hence, the gap between the expectations of Microsoft and PC brands versus what ODMs expect to deliver creates risk on what the market embeds in valuation of the respective companies. Our global PC forecasts factor in a 2H12 Windows 8 launch.

22 November 2011
Taiwan Market Strategy 64
Components Sector research analysts: Pauline Chen, Josette Chang
Positive product cycle versus pricing pressure Following an estimated 30% YoY rebound in global PCB production value in 2010, we expect the global PCB market to see slower growth. at an estimated 5-10% YoY in 2011. This will be due to deteriorating consumer demand from 2Q11, which will trigger higher-than-expected pricing pressure, overshadowing the positive product cycle such as smartphones and tablets. The outlook is expected to remain gloomy with an estimated growth of 4-5% YoY, below an estimated CAGR of 6-7% in 2010-2015E, given no sign of macro environment improvement, and continuously heavy pricing pressure off lower utilisation rates. By product, we still expect HDI, advanced IC substrates (like FC-CSP) and FPCB to deliver stronger growth, thanks to the positive product cycle of thinner/lighter devices like smartphones, tablet PCs, and ultrabooks. By region, Asian (especially Chinese) PCB makers should continue to expand market share, due to their cost advantage and fast delivery times, though the increasing environmental concerns in China may be an overhang.
Figure 154: Global PCB production value (YoY growth) Figure 155: Positive product cycle continues
0
10
20
30
40
50
60
70
2003 2004 2005 2006 2007E 2008 2009 2010 2011E 2012E
-20%
-10%
0%
10%
20%
30%
40%
WW PCB production value (LHS) YoY growht (RHS)(US$bn)
Source: Company data, Prismark, Credit Suisse estimates Source: Company data.
Figure 156: End-market revenue growth of PC and handsets—slower growth outlook Weights End market (sales) 2003 2004 2005 2006 2007 2008 2009 2010 2011E 2012E 2013E
30.0% PC, server and tablet revenue (bn) 192.9 200.1 201.2 203.9 233.2 242.4 219.0 248.5 246.4 249.7 269.3YoY growth 11% 4% 1% 1% 14% 4% -10% 13% -1% 1% 8%
25.0% Handset revenue (bn) 99.3 118.5 129.6 150.8 168.5 184.3 205.0 258.5 264.2 252.7 245.8YoY growth 22% 19% 9% 16% 12% 9% 11% 26% 2% -4% -3%
20.0% US Consumer Growth ($bn - CEA) 113.5 120.6 137.3 156.5 169.1 181.5 169.8 180.0 186.4 192.0 199.7YoY growth 0% 6% 14% 14% 8% 7% -6% 6% 4% 3% 4%
10.0% Telecom Carrier Capex (bn) 116.8 158.1 178.8 215.4 238.1 252.3 238.0 231.1 246.6 259.0 271.9YoY growth 3% 35% 13% 20% 11% 6% -6% -3% 7% 5% 5%
7.5% Global auto production (m) 60.6 64.5 66.5 69.2 73.3 70.5 61.0 72.0 75.9 78.9 82.9YoY growth 3% 6% 3% 4% 6% -4% -13% 18% 5% 4% 5%
7.5% Global Ind. Production (indexed) 787.0 838.4 881.0 942.0 1,004.0 1,034.1 992.8 1,042.4 1,073.7 1,105.9 1,161.2YoY growth 4% 7% 5% 7% 7% 3% -4% 5% 3% 3% 5%Weighted Growth (YoY) 9.6% 11.7% 7.2% 10.1% 10.8% 5.5% -3.3% 13.2% 2.3% 0.9% 3.7%CS Semi Revenues ($bn) 166.4 213.0 227.5 247.7 255.6 248.6 226.3 300.8 312.8 322.2 338.3YoY Growth 3.9% 28.0% 6.8% 8.9% 3.2% -2.8% -9.0% 32.9% 4.0% 3.0% 5.0%
Source: Company data, Credit Suisse estimates.
Decelerating supply growth On the supply side, we remain positive on the industry consolidation story, which should lead to supply growth decelerating and Asian makers’ gaining market share. For conventional PCB (MLB, multi-layer boards), we expect continuous deceleration in supply growth, given the increasing difficulty in (1) expanding capacity in China (due to

22 November 2011
Taiwan Market Strategy 65
regulatory controls and environmental concerns) and (2) maintaining profitability in the current sluggish demand environment. This should lead to more industry consolidation in our view. On the other hand, the supply growth of HDI (high density interconnection) should remain strong, in our opinion. We expect most players to upgrade and/or expand their capacity in HDI, given strong market growth outlook (from thinner/lighter devices). However, this may trigger larger price wars in the low-end (1+n+1) HDI space. Net-net, we expect companies with better cost structure (like Tripod), or with technology leadership (like Kinsus/Unimicron) to continue gaining share in 2012.
Figure 157: Taiwan PCBs’ MLB capacity growth is
decelerating
Figure 158: Taiwan PCBs’ HDI capacity growth remains
strong
0
5,000
10,000
15,000
20,000
25,000
30,000
35,000
4Q06 4Q07 4Q08 4Q09 4Q10 4Q11E0%
5%
10%
15%
20%
25%
MLB capacity (LHS) YoY growth (RHS)(k sft/mth)
0
2,000
4,000
6,000
8,000
10,000
4Q06 4Q07 4Q08 4Q09 4Q10 4Q11E0%
10%
20%
30%
40%
50%
HDI capacity (LHS) YoY growth (RHS)(k sft/mth)
Source: Company data, Credit Suisse estimates Source: Company data, Credit Suisse estimates
Figure 159: Recent M&A in the PCB space Time Buyer Acquisition target Holdings Amount Rationale
Jun-08 TPT (8213.TW) T-Mac Techvest PCB (5480.TWO) 48% NT$450 mn TFT
Mar-09 Unimicron (3037.TW) Phoenix Precision Technology 100% Share swap at 0.7x P/B Substrates
Sep-09 SEMCO (009150.KS) J-Three (3099.TWO)'s Kung-Shan plant 95% Rmb$136.5 mn HDI, China
Sep-09 Unimicron (3037.TW) Ruwel (GR) 35% €$3 mn Auto
Nov-09 NGK Spark (5334) n.m. n.m. n.m. Out of Intel business
Nov-09 DDi (US) Coretec (Canada) 97% C$25.2 mn (cash & stock) Military/aerospace/FPCB
Nov-09 TTM (TTMI) Meadville (3313.HK) 100% US$521 mn (cash & stock) China, HDI
Jan-10 Kinsus (3189.TW) Piotek (unlisted, Pegatron subsidiary) 51% US$120 mn HDI, China
Jan-10 Unimicron (3037.TW) Maruwa (JP) 40% ¥490 mn FPCB
Feb-10 Viasystems (US) Merix (US) 100% Share swap aerospace/defence
Mar-10 HBI (5469.TW) GBM (6191.TW) 41% NT$4.744 bn NB
Mar-10 Tripod (3044.TW) Victory Circuit (6101.TWO) – Taiwan 53% NT$420 mn DRAM
Mar-10 GCE (2368.TW) Victory Circuit (6101.TWO) - China 100% Rmb$126 mn HDI, China
Apr-10 TPT (8213.TW) Xiangfeng Zhongshan (Not listed) 95% US$38.5 mn TFT, China
Jun-10 APCB (6108.TW) APCB Electronics (Thailand) 100% US$6.765 mn Auto
Aug-10 Best Friend (5321.TW)
Hong Yuan (Not listed)–China Hangzhou
100% NT$560 mn China
Aug-10 TPT (8213.TW) Yeuhwan (3276.TW) 38% NT$281 mn FPCB
Oct-10 Unimicron (3037.TW) Maruwa (JP) n.a. ¥230 mn FPCB
Feb-11 Tripod (3044.TW) HighBoard (unlisted) 100% Rmb$199.8 mn TFT
Aug-11 APCB (6108.TW) APCB Electronics (Thailand) 100% Bt200 mn Auto (capital injection)
Oct-11 Unimicron (3037.TW) Clover Electronics (JP) 75% ¥3.1 bn HDI, Japan
Source: Company data, Credit Suisse estimates
Profitability: Pricing, copper, gold, and labour costs Profitability is a function of pricing, commodity prices (copper and gold in particular), labour costs, and currency movements. For 2012, we expect the volatile/uncertain demand environment to likely trigger bigger pricing pressure, given PCB companies’ intention to

22 November 2011
Taiwan Market Strategy 66
maintain stable utilisation rates. This, together with the continuous rise in labour costs, may overshadow the benefit from stabilising copper/gold prices, and PCB companies’ own productivity gains. Our analysis suggests that a 10% increase in both copper and gold prices is estimated to erode a PCB maker’s gross margin by 150-200 bp. Most PCB companies use a natural hedge and build an RMB asset position to hedge the currency risks. The TWD/USD exchange rate has been stabilising at NT$30/USD level (versus the peak of NT$28.5/USD level back in May).
Figure 160: Copper/gold prices a risk to margins Figure 161: NTD (against USD) appreciation is another
risk
0
2,000
4,000
6,000
8,000
10,000
12,000
Jan-07 Jul-07 Jan-08 Jul-08 Jan-09 Jul-09 Jan-10 Jul-10 Jan-11 Jul-110
350
700
1,050
1,400
1,750
2,100Copper (LHS) Gold (RHS)(US$/oz) (US$/oz)
28
29
30
31
32
33
Jan 10 Jun 10 Nov 10 Apr 11 Sep 11
(NT$/US$)
Source: TEJ Source: Bloomberg
Stocks: Take a break for now We have a MARKET WEIGHT stance on the Taiwan PCB sector, with a NEUTRAL rating on Unimicron, Tripod, Kinsus and NYPCB respectively, as we expect heavier pricing pressure to outweigh the benefit from a positive product cycle and deceleration in supply growth (for conventional PCB only). While we believe Kinsus is well-positioned to benefit from the smartphone growth opportunity in 2012, we remain concerned about its capability to turn around its PCB subsidiary, Piotek, a company with relatively smaller scale and high customer concentration risk in the sluggish demand environment. We expect Unimicron’s shares to see support at 1x 2011 BVPS, or NT$33, with upside catalysts from HDI and its share gains in advanced substrates. Tripod’s shares could still trade sideways, given its higher exposure in DRAM, TFT and HDD, and before the ramp in new business (such as low-cost smartphones and auto). For NYPCB, we think its slower-than-expected margin recovery may dampen its market share gain story.
Key risks: Currency and a shorter lead time Asian currency appreciation, especially from the renminbi and NT dollar, is difficult to hedge and will hurt PCB profitability the most. Theoretically, every 1% appreciation in the TWD against the USD might lead to a 10-15 bp gross margin erosion for Taiwan PCBs, and every 1% RMB appreciation against the USD might lead to 15-25 bp gross margin erosion. Most PCB companies use a natural hedge and build RMB asset positions to hedge their currency risks. Another key risk is a shorter lead time, which might lead to lower revenue visibility and higher volatility in utilisation rates and profitability. This might also trigger bigger pricing competition when utilisation rates are lower in the near term, and industry consolidation in the long term.
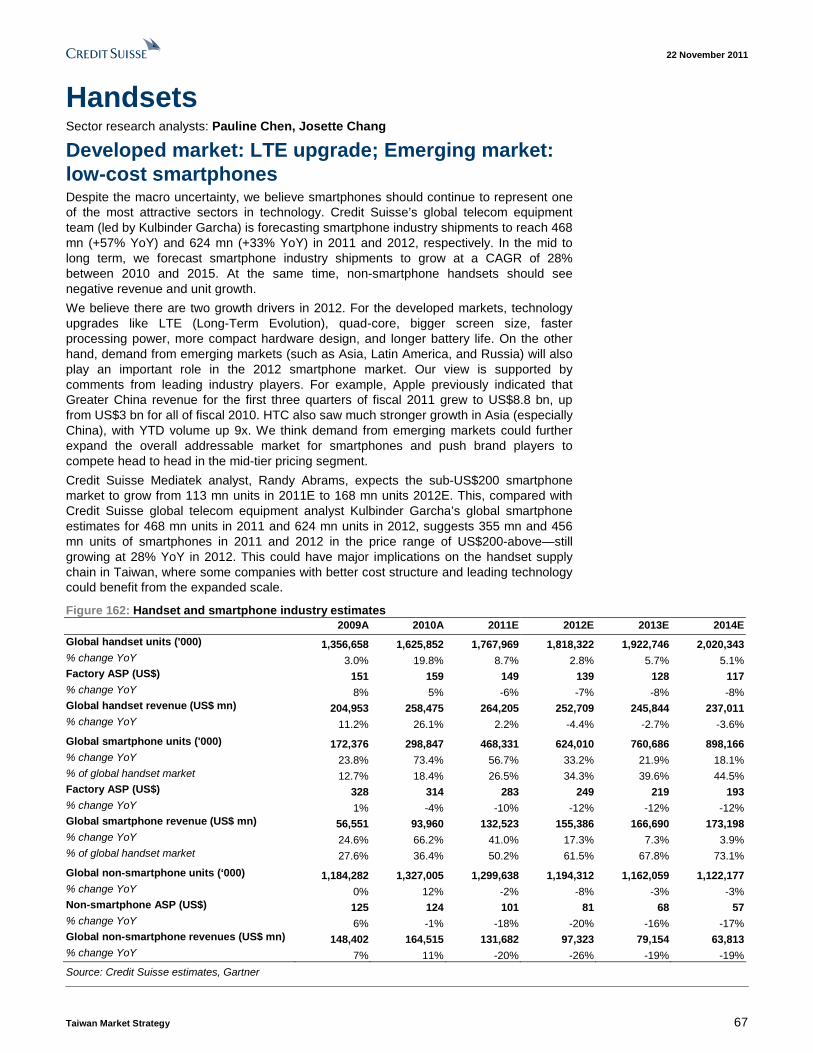
22 November 2011
Taiwan Market Strategy 67
Handsets Sector research analysts: Pauline Chen, Josette Chang
Developed market: LTE upgrade; Emerging market: low-cost smartphones Despite the macro uncertainty, we believe smartphones should continue to represent one of the most attractive sectors in technology. Credit Suisse’s global telecom equipment team (led by Kulbinder Garcha) is forecasting smartphone industry shipments to reach 468 mn (+57% YoY) and 624 mn (+33% YoY) in 2011 and 2012, respectively. In the mid to long term, we forecast smartphone industry shipments to grow at a CAGR of 28% between 2010 and 2015. At the same time, non-smartphone handsets should see negative revenue and unit growth.
We believe there are two growth drivers in 2012. For the developed markets, technology upgrades like LTE (Long-Term Evolution), quad-core, bigger screen size, faster processing power, more compact hardware design, and longer battery life. On the other hand, demand from emerging markets (such as Asia, Latin America, and Russia) will also play an important role in the 2012 smartphone market. Our view is supported by comments from leading industry players. For example, Apple previously indicated that Greater China revenue for the first three quarters of fiscal 2011 grew to US$8.8 bn, up from US$3 bn for all of fiscal 2010. HTC also saw much stronger growth in Asia (especially China), with YTD volume up 9x. We think demand from emerging markets could further expand the overall addressable market for smartphones and push brand players to compete head to head in the mid-tier pricing segment.
Credit Suisse Mediatek analyst, Randy Abrams, expects the sub-US$200 smartphone market to grow from 113 mn units in 2011E to 168 mn units 2012E. This, compared with Credit Suisse global telecom equipment analyst Kulbinder Garcha’s global smartphone estimates for 468 mn units in 2011 and 624 mn units in 2012, suggests 355 mn and 456 mn units of smartphones in 2011 and 2012 in the price range of US$200-above—still growing at 28% YoY in 2012. This could have major implications on the handset supply chain in Taiwan, where some companies with better cost structure and leading technology could benefit from the expanded scale.
Figure 162: Handset and smartphone industry estimates 2009A 2010A 2011E 2012E 2013E 2014E
Global handset units ('000) 1,356,658 1,625,852 1,767,969 1,818,322 1,922,746 2,020,343 % change YoY 3.0% 19.8% 8.7% 2.8% 5.7% 5.1% Factory ASP (US$) 151 159 149 139 128 117 % change YoY 8% 5% -6% -7% -8% -8% Global handset revenue (US$ mn) 204,953 258,475 264,205 252,709 245,844 237,011 % change YoY 11.2% 26.1% 2.2% -4.4% -2.7% -3.6% Global smartphone units ('000) 172,376 298,847 468,331 624,010 760,686 898,166 % change YoY 23.8% 73.4% 56.7% 33.2% 21.9% 18.1% % of global handset market 12.7% 18.4% 26.5% 34.3% 39.6% 44.5% Factory ASP (US$) 328 314 283 249 219 193 % change YoY 1% -4% -10% -12% -12% -12% Global smartphone revenue (US$ mn) 56,551 93,960 132,523 155,386 166,690 173,198 % change YoY 24.6% 66.2% 41.0% 17.3% 7.3% 3.9% % of global handset market 27.6% 36.4% 50.2% 61.5% 67.8% 73.1% Global non-smartphone units (‘000) 1,184,282 1,327,005 1,299,638 1,194,312 1,162,059 1,122,177 % change YoY 0% 12% -2% -8% -3% -3% Non-smartphone ASP (US$) 125 124 101 81 68 57 % change YoY 6% -1% -18% -20% -16% -17% Global non-smartphone revenues (US$ mn) 148,402 164,515 131,682 97,323 79,154 63,813 % change YoY 7% 11% -20% -26% -19% -19%
Source: Credit Suisse estimates, Gartner
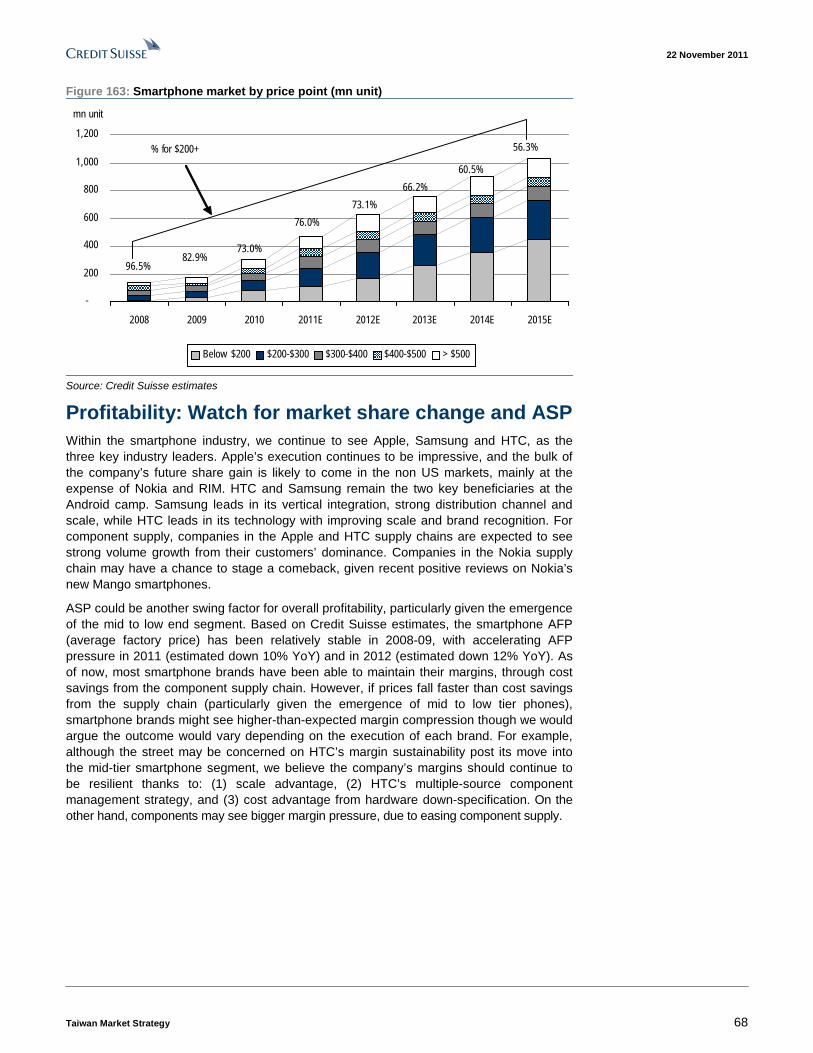
22 November 2011
Taiwan Market Strategy 68
Figure 163: Smartphone market by price point (mn unit)
-
200
400
600
800
1,000
1,200
2008 2009 2010 2011E 2012E 2013E 2014E 2015E
mn unit
Below $200 $200-$300 $300-$400 $400-$500 > $500
% for $200+
82.9%73.0%
76.0%
73.1%
66.2%
60.5%
56.3%
96.5%
Source: Credit Suisse estimates
Profitability: Watch for market share change and ASP Within the smartphone industry, we continue to see Apple, Samsung and HTC, as the three key industry leaders. Apple’s execution continues to be impressive, and the bulk of the company’s future share gain is likely to come in the non US markets, mainly at the expense of Nokia and RIM. HTC and Samsung remain the two key beneficiaries at the Android camp. Samsung leads in its vertical integration, strong distribution channel and scale, while HTC leads in its technology with improving scale and brand recognition. For component supply, companies in the Apple and HTC supply chains are expected to see strong volume growth from their customers’ dominance. Companies in the Nokia supply chain may have a chance to stage a comeback, given recent positive reviews on Nokia’s new Mango smartphones.
ASP could be another swing factor for overall profitability, particularly given the emergence of the mid to low end segment. Based on Credit Suisse estimates, the smartphone AFP (average factory price) has been relatively stable in 2008-09, with accelerating AFP pressure in 2011 (estimated down 10% YoY) and in 2012 (estimated down 12% YoY). As of now, most smartphone brands have been able to maintain their margins, through cost savings from the component supply chain. However, if prices fall faster than cost savings from the supply chain (particularly given the emergence of mid to low tier phones), smartphone brands might see higher-than-expected margin compression though we would argue the outcome would vary depending on the execution of each brand. For example, although the street may be concerned on HTC’s margin sustainability post its move into the mid-tier smartphone segment, we believe the company’s margins should continue to be resilient thanks to: (1) scale advantage, (2) HTC’s multiple-source component management strategy, and (3) cost advantage from hardware down-specification. On the other hand, components may see bigger margin pressure, due to easing component supply.

22 November 2011
Taiwan Market Strategy 69
Figure 164: Smartphone brand market share (2011E) Figure 165: Smartphone ASP trend
Nokia
17%
Research in
Motion
11%
Others
14%
Sony Ericsson
4%
Motorola
4%Palm
0%
Samsung
18%
Apple
17%
HTC
10%
LG
5%
0
50
100
150
200
250
300
350
400
2009A 2010A 2011E 2012E 2013E 2014E 2015E
(US$)
-14%
-12%
-10%
-8%
-6%
-4%
-2%
0%
2%
Smartphone ov erall ASP % change YoY, RHS
(%)
Source: Credit Suisse estimates Source: Credit Suisse estimates
Stocks: HTC We prefer brand to components in the handset space. Our top pick is HTC due to its growing brand recognition, improving cost structure (which should lead to a more resilient margin trend) and improving product pipeline. We expect the company to maintain its share in the global smartphone market (10-11% global share in 2011-12E). Our view is supported by: (1) the growing market size for the US$200-above smartphone market (total units up by +28% YoY in 2012E); (2) HTC’s leadership in the high-end LTE (together with major US operators’ aggressive push); (3) the company’s growing presence in the mid-tier segment (especially in emerging markets such as China); and (4) its improving product pipeline. We believe the street’s common concerns on market share loss and sharp margin erosion are overdone and already in the price. Post the 20% share price correction YTD, HTC is trading at a close-to-trough valuation of 9x FY11E P/E, with 7%-plus cash dividend yield. Valuation is not demanding for a solid smartphone brand in the growing smartphone market. We maintain our OUTPERFORM rating on HTC.
In the component space, we believe Largan (rated NEUTRAL) is also well positioned to capture the growing trend, but its risk-reward is less attractive at 14x FY11 P/E with concerns on the muted near-term outlook and prolonged megapixel migration (8 MP to remain mainstream in 2012). Although we are impressed by Silitech’s (rated NEUTRAL) better-than-expected margin expansion, mainly driven by the strength in its metal casing business, we think this may still be insufficient to offset the weakness in its core keypad business (pricing pressure and slower unit growth). We believe Silitech’s valuation at 11x FY11 P/E looks fair for 5-10% EPS CAGR over 2004-13E.
Key risks: Demand and competition The biggest risk is end-market demand, which may postpone consumer purchases of electronic devices, or trigger more aggressive price competition. The ongoing legal dispute in the smartphone space may also dampen key players’ profitability.
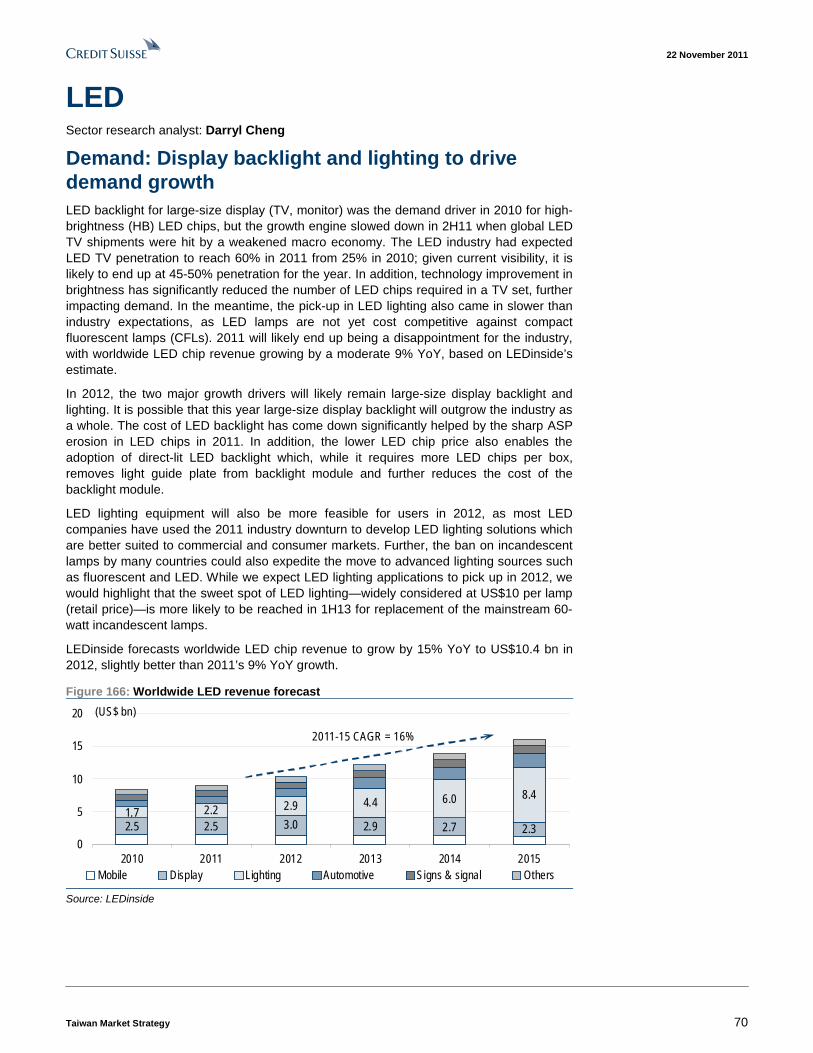
22 November 2011
Taiwan Market Strategy 70
LED Sector research analyst: Darryl Cheng
Demand: Display backlight and lighting to drive demand growth LED backlight for large-size display (TV, monitor) was the demand driver in 2010 for high-brightness (HB) LED chips, but the growth engine slowed down in 2H11 when global LED TV shipments were hit by a weakened macro economy. The LED industry had expected LED TV penetration to reach 60% in 2011 from 25% in 2010; given current visibility, it is likely to end up at 45-50% penetration for the year. In addition, technology improvement in brightness has significantly reduced the number of LED chips required in a TV set, further impacting demand. In the meantime, the pick-up in LED lighting also came in slower than industry expectations, as LED lamps are not yet cost competitive against compact fluorescent lamps (CFLs). 2011 will likely end up being a disappointment for the industry, with worldwide LED chip revenue growing by a moderate 9% YoY, based on LEDinside’s estimate.
In 2012, the two major growth drivers will likely remain large-size display backlight and lighting. It is possible that this year large-size display backlight will outgrow the industry as a whole. The cost of LED backlight has come down significantly helped by the sharp ASP erosion in LED chips in 2011. In addition, the lower LED chip price also enables the adoption of direct-lit LED backlight which, while it requires more LED chips per box, removes light guide plate from backlight module and further reduces the cost of the backlight module.
LED lighting equipment will also be more feasible for users in 2012, as most LED companies have used the 2011 industry downturn to develop LED lighting solutions which are better suited to commercial and consumer markets. Further, the ban on incandescent lamps by many countries could also expedite the move to advanced lighting sources such as fluorescent and LED. While we expect LED lighting applications to pick up in 2012, we would highlight that the sweet spot of LED lighting—widely considered at US$10 per lamp (retail price)—is more likely to be reached in 1H13 for replacement of the mainstream 60-watt incandescent lamps.
LEDinside forecasts worldwide LED chip revenue to grow by 15% YoY to US$10.4 bn in 2012, slightly better than 2011’s 9% YoY growth.
Figure 166: Worldwide LED revenue forecast
2.5 2.5 3.0 2.9 2.7 2.31.7 2.2 2.9 4.4 6.0 8.4
0
5
10
15
20
2010 2011 2012 2013 2014 2015Mobile Display Lighting Automotive Signs & signal Others
(US$ bn)
2011-15 CAGR = 16%
Source: LEDinside

22 November 2011
Taiwan Market Strategy 71
Figure 167: Display backlight and lighting will outgrow the industry in 2012
1
17
-3 -5-16
29 29
5436 41
915 17 14 16
-60
-30
0
30
60
2010 2011 2012 2013 2014 2015
Display Lighting Total
(%)
Source: LEDinside
Supply: Decelerating MOCVD installation in 2012 Supply has been a potential issue for the LED industry. The recent expansion cycle began in 2009, led by Taiwanese and Korean companies. In 2010, Chinese companies joined in, installing even more MOCVD reactors in 2011 when Taiwanese and Korean had slowed their expansion. MOCVD reactor installation peaked in 2010 at about 700 units, with Asian companies (Taiwan/Korea/China) accounting for 80%-plus of the installations. Global MOCVD reactor installation slowed slightly in 2011, as much of the capacity expansion planned in the beginning of the year was withdrawn or scaled down when the companies suffered low capacity utilisation and sharp ASP erosion.
Figure 168: MOCVD reactor installation peaked in 2010-11
0
200
400
600
800
2008 2009 2010 2011 2012 2013 2014 2015Taiwan Korea China ROW
(Units)
Source: LEDinside
The increased MOCVD epitaxy capacity since 2009 has led to oversupply in 2011 and continued to drive ASP decline. Based on the CS LED research team’s forecast, LED epitaxial wafer supply will continue to outgrow demand in 2012, thus further worsening the supply-demand situation. Sapphire wafer, the raw material for production of LED epitaxial wafer, used to be the bottleneck back in 2H10 when lots of new MOCVD reactors launched production. After upstream sapphire suppliers’ expanded their sapphire ingot capacity in 2011, this is no longer an issue. In fact, the aggressive expansion of sapphire suppliers has also caused steep sapphire wafer ASP erosion, from US$30-plus per 2” wafer in the beginning of 2011 to below US$10 per wafer in 4Q11. Going forward, we believe oversupply will remain a major issue for the LED industry. Industry consolidation is likely to be an ongoing theme for the industry in 2012.

22 November 2011
Taiwan Market Strategy 72
Figure 169: LED epitaxial wafer supply and demand forecast
7 8 1117
26
40
4 613
24
43
65
0
20
40
60
80
2007 2008 2009 2010 2011E 2012EDemand Supply
(mn pcs)
Source: Credit Suisse estimates
Profitability: Hurt by continuous ASP erosion Taiwan LED upstream chip makers’ profitability was weak during the financial crisis in early 2009 with aggregate gross margin dipping to the breakeven level at about 1%. However, helped by the introduction of large-size display applications, their aggregate profitability picked up significantly from 2Q09 led by Epistar. Their aggregate gross margin plateaued thereafter until 4Q10, when the newly-added MOCVD epitaxy capacities began production and raised raw sapphire wafer cost. LED chip ASP began to fall into 2011 due to oversupply, and has remained under great cost pressure throughout the year. In 2H11, only the leading LED upstream companies (such as Epistar) were still able to remain profitable on their core business.
Taiwan LED downstream chip packagers’ profitability was less volatile compared to upstream, as chip packaging is less capital intensive. However, this is also a disadvantage for LED downstream because the lower capital requirement also implies lower entry barriers. In addition, it is also more difficult for LED downstream chip packagers to differentiate by technology due to the higher degree of standardisation of the production process. As such, Taiwan LED downstream chip packagers were more aggressive in penetrating end applications, and the majority of them are aiming at LED lighting. In the longer term, we believe the intensified competition in LED downstream chip packaging will continue to reduce the players’ profitability.
Figure 170: Taiwan LED upstream companies’ profitability
-4
0
4
8
12
1Q08 1Q09 1Q10 1Q11
-50
-25
0
25
50
Net sales (NT$ bn, LHS) Net income (NT$ bn, LHS) GM (%, RHS) OpM (%, RHS)
(NT$ bn) (%)
Source: Company data

22 November 2011
Taiwan Market Strategy 73
Figure 171: Taiwan LED downstream companies’ profitability
0
3
6
9
12
1Q08 1Q09 1Q10 1Q110
10
20
30
40
Net sales (NT$ bn, LHS) Net income (NT$ bn, LHS) GM (%, RHS) OpM (%, RHS)
(NT$ bn) (%)
Source: Company data
Stock pick: Epistar for an upcycle, Everlight as a defensive play We currently have a NEUTRAL rating for both Epistar (upstream) and Everlight (downstream). In the near term, we do not see strong stock performance catalysts for either due to a seasonally weak 4Q-1Q. Large-size display backlight has become a battlefield, and the expected 17% YoY growth in LED chip revenue is unlikely to balance the increased capacity in recent years. LED lighting could be a positive sentiment for stock performance, though the large-scale deployment is more likely to come in 2013 when LED lightbulb becomes more cost competitive. Of the Taiwan LED stocks we cover, we believe Epistar is a better pick in the industry upcycle as its leading technology will involve the company in more advanced projects, thus generating better profits. However, Everlight would be a better defensive play in an industry downcycle as it will have better downside protection due to its less capital-intensive nature.
Risks: Over-expectation on lighting The LED sector has performed in early November driven by expectations that the Chinese government’s new policy to ban the usage of incandescent lamps will stimulate demand for LED lighting equipment. In our view, compact fluorescent lamps (CFLs) are an easier alternative to incandescent lamps. LED lamps are more environmentally friendly as they do not contain toxic material such as mercury. However, we are of the opinion that the market has over-expectations about the pick-up in LED lighting in 2012. We believe the sweet spot for LED lighting will likely come in 2013. Before that, in our opinion, the moderate growth in the LED market will likely not justify a strong rerating for the sector.

22 November 2011
Taiwan Market Strategy 74
Financials Sector research analysts: Chung Hsu, Michelle Chou
Diminished expectations We believe most banks will struggle to achieve profit growth next year due to a moderate top-line growth, normalising (higher) credit cost and weaker capital market earnings. Only a few banks within our coverage would manage to see profit growth next year, though the magnitude is relatively small if we exclude extra provisions taken during 2011. For our coverage universe, we estimate an aggregate profit decline of 3.5% next year.
A moderate top-line growth With a weaker macro and a more cautious outlook by banks, we expect banks to deliver a moderate top-line growth next year. GDP growth is expected to slow and our economist expects 3.5% growth for next year, compared with 4.3% for 2011. This is largely driven by a slowdown in exports which will affect corporate loan demand. Foreign currency loan (FC) is likely the only segment that will still see strong demand partly due to tightening in China, though most banks’ high LDR in FC means limited upside momentum into next year. For corporate loans, we expect 5–7% growth versus 11–12% for this year.
Figure 172: GDP growth to slow but likely to bottom in
1Q12
Figure 173: Export growth to stay moderate in 2012
6.2
5.0
3.7
2.5 2.52.9
3.8
4.6
0
1
2
3
4
5
6
7
1Q11 2Q11 3Q11F 4Q11F 1Q12F 2Q12F 3Q12F 4Q12F
GDP
(%)
11.4
4.9 5.3
6.55.8
6.9 7.0 6.8
0
2
4
6
8
10
12
1Q11 2Q11 3Q11F 4Q11F 1Q12F 2Q12F 3Q12F 4Q12F
Ex port grow th
(%)
Source: CEIC, Credit Suisse estimates Source: CEIC, Credit Suisse estimates
Mortgages comprise the second largest loan segment in Taiwan (accounting for 32% of total system loans) and there is risk that it will become an even bigger drag to the overall system loan growth next year. We have seen property transaction volume shrink significantly (-25% YoY in 3Q11), and it is likely to stay weak given a weaker property price outlook for next year, which could lead to lower transaction value as well. We believe there is risk to see a mortgage decline next year (-2%), compared with moderate growth of 1–3% in the last four years. The only positive is a potential slight pick-up in loan spread, as competition is lowered (some banks face real estate lending cap under Banking Law 72-2) and there are fewer new loans that are typically priced at teaser (lower) rates initially.
Lastly, unsecured lending that has seen strong recovery off a low base since early 2010 will likely face a pause on the back of a more difficult employment backdrop, especially with more incidences of unpaid leaves. While we still hold the view that unsecured lending in Taiwan is still at a low base (as a percentage of GDP), compared with most other Asian markets (Figure 176), it is unlikely to yield significant contribution to bank loans in 2012.

22 November 2011
Taiwan Market Strategy 75
Figure 174: Historical loan growth by loan segment Loans to
Total private Corporate Consumer Non- Credit Cash Auto Other Foreign
YoY % loans sector loans loans Mortgage mortgage card card loans consumer currency Gov't
Sep-11 7.9% 8.3% 12.7% 1.5% 1.3% 2.8% -15.1% -20.5% 22.7% 7.8% 26.8% 3.6% Dec-10 6.8% 7.3% 11.0% 2.0% 2.7% -1.5% -13.4% -19.9% 8.5% 2.9% 28.8% 0.9% Dec-09 1.1% -0.3% -0.2% -0.6% 1.0% -8.4% -12.8% -25.6% -15.3% -4.3% -1.5% 19.1% Dec-08 2.6% 3.5% 7.2% -1.4% 0.7% -10.6% -10.2% -29.8% -28.8% -5.6% 7.3% -8.0%
Dec-07 2.7% 4.5% 7.0% 1.5% 6.2% -14.9% -17.5% -29.0% -25.2% -9.5% -4.2% -14.5%
Dec-06 2.5% 4.1% 7.7% 0.0% 9.8% -23.8% -31.1% -41.1% -14.3% -16.9% 1.5% -10.6%
Source: CEIC, Credit Suisse Research
Figure 175: Taiwan system loan mix Figure 176: Unsecured lending as % of GDP for Asia
SME
21%
Corporate
loans
41%
Mortgages
32%
Unsecured
consumer
lending
6%
21.9
17.1
13.8 13.5 13.3
8.5
2.3
-
5
10
15
20
25
US Hong
Kong
Singapore Japan Korea Taiw an China
(%) Consumer loan as % og GDP
Note: Data as of 9M11
Source: CEIC, Credit Suisse research,
Source: CEIC, Credit Suisse research
Potential for some spread and NIM improvement next year?
It is disappointing that Taiwan banks saw only a modest NIM improvement in the last 12 months’ rate hike cycle. In fact, banks within our coverage only saw an average loan spread increase of 3–8 bp, with 4 bp of NIM expansion to 1.22%. Without a rate hike cycle till 2H12, there would be no more tailwind from policy rate adjustment. However, we believe there is room to see both spread and NIM improvement next year on the back of:
1) Better loan yield on foreign currency loans, as liquidity on foreign currency is very tight, and most banks’ loan-to-deposit ratios are already at their upper limit plus banks are charging a bit more risk premium with a weaker macro outlook. In fact, we expect improvement on the foreign currency loan spread to become even more pronounced in the coming quarters.
2) Slight improvement on pricing discipline with the new requirement for at least 1% loan coverage for all banks. This new requirement is not just forcing banks to increase their buffer against unexpected NPL shock, but also forcing them to take 1% credit cost immediately on incremental new loans (not necessary if to replace old loans). We note that competition will not go away immediately, but there should be less incentive for banks to compete for loans with yield of less than 2%—average new lending rate was only 1.60% in September 2011. In fact, we believe one of the reasons for a slower loan growth guidance is the lower profit on new loans based on the current lending rate and the requirement to make 1% reserve immediately.

22 November 2011
Taiwan Market Strategy 76
Figure 177: OBU and overseas branch loan as % of total
loans
Figure 178: FC loan spread versus blended loan spread
for each bank under coverage
27
16 1512 11 11 11
9 87 7 5 5
-
5
10
15
20
25
30
Meg
a
Chi
natru
st
Sino
Pac
Ta C
hong
Firs
t
Fubo
n
Cat
hay
Tais
hin
Cha
ng H
wa
Hua
Na
E. S
un
Yuan
ta
Shin
Kon
g
OBU+ov erseas branches loanas % of total loan
(%)
-
0.5
1.0
1.5
2.0
2.5
3.0
3.5
Chi
natru
st
Shi
n Ko
ng
Meg
a
E. S
un
Firs
t
Sino
Pac
Hua
Nan
CH
B
Fubo
n
Tais
hin
NTD spread FX spread
(%)
Note: Data as of June 2011
Source: CBC Credit Suisse research,
Source: CBC Credit Suisse research
Figure 179: Historical quarterly loan spread Figure 180: Expect moderate NIM expansion in 2012
0
1
2
3
4
5
6
7
8
9
1Q00 1Q01 1Q02 1Q03 1Q04 1Q05 1Q06 1Q07 1Q08 1Q09 1Q10 1Q11
0.0
0.5
1.0
1.5
2.0
2.5
3.0
3.5
4.0
4.5
Spread (RHS) Loan rate Deposit rate
(%) (%)
0.0
0.5
1.0
1.5
2.0
2.5
3.0
2005A 2006A 2007A 2008A 2009A 2010A 2011E 2012E 2013E
NIM
Source: CEIC, Credit Suisse research Source: TEJ, Company data, Credit Suisse estimates
Banks with low LDR could see some NIM improvement next year
We do note that banks with lower LDR could see faster NIM improvement even with a very modest loan spread widening next year—especially those that have been actively reducing mortgage (and other real estate loans) to comply with Banking Law 72-2, which stipulates total real estate related lending cannot exceed 30% of total deposit and financial bills. E. Sun Bank, for example, had one of the lowest LDR of just 67% in 3Q11 and its total real estate related loans is reduced to about 28% of total deposit and financial bills. This will enable E. Sun Bank to control time deposit growth (or even decline), while it shifts its excess deposit from Central Bank’s NCD (yield 85–90 bp) to loans (yield 250–300 bp) and gain on extra interest income without incurring extra funding cost.

22 November 2011
Taiwan Market Strategy 77
Figure 181: LDR by banks Figure 182: FX LDR by banks
9289
8682 81 81 80 79 79 77 75
68 68
50
60
70
80
90
100
Meg
a
CH
B
Firs
t
Hua
Nan
Shi
n Ko
ng
Fubo
n
Tais
hin
Yuan
ta
Chi
natru
st
Ta C
hong
Sino
Pac
Cat
hay
E. S
un
LDR
(%)
95 9492 90
86
75 74
6863
50
60
70
80
90
100
CH
B
Sino
Pac
Meg
a
Shi
n Ko
ng
Firs
t
Fubo
n
Chi
natru
st
E. S
un
Hua
Nan
FX LDR
(%)
Note: Data as of 9M11
Source: CBC, Company data, Credit Suisse research
Source: Company data, Credit Suisse estimates
A tougher year for fee income
Fee income is a growing part of banks’ total operating income and has seen a CAGR of 12% over the last 10 years. For the sector, we estimate 25% of operating income is derived from fee income, with Chinatrust’s largest fee income contribution of 44%.
We believe 2012 is likely to be a tough year for fee income growth, as we estimate 20% of total fee income is derived from capital market related fees (i.e. mutual fund sales) that will likely see a 20–30% decline at least for the early part of next year. The likely offsetting factor is the pick-up in bancassurance, with Nan Shan Life looking to turn very aggressive on bancassurance. However, we do believe the impact could vary on banks due to the difference in product strategy as well as base effect. Taking both into account, we estimate sector fee income growth of 1.3%, compared with our previous expectation of 11%
Figure 183: Fee income breakdown Net fee breakdown Chinatrust Taishin Shin Kong Cathay Ta Chong Mega E. Sun Fubon SinoPac First Hua Na Yuanta
Wealth management 44% 48% 33% 42% 42% 25% 36% 73% 40% 44% 45% 60% Credit card 32% 19% 34% 38% 15% 4% 35% 9% 16% 6% 5% 11% Loan related 24% 19% 15% 17% 41% 34% 29% 18% 16% 17% 10% 21% Others 0% 14% 18% 3% 2% 37% 0% 0% 27% 33% 38% 7% Total net fee (NT$ mn) 14,449 5,478 1,749 6,090 2,247 4,792 4,339 6,114 2,555 3,718 3,755 957
Note: Chinatrust ex lottery fee income, others fee income are mainly forex-related fee income; data as of 9M11
Source: Company data, Credit Suisse estimates

22 November 2011
Taiwan Market Strategy 78
Figure 184: Mutual fund fee as percentage of total fee Figure 185: Bancassuarance fee as percentage of total fee
3430 30
2724 24
22 20 20 1916
5
0
10
20
30
40
Fubo
n
Hua
Na
Firs
t
Yuan
ta
E. S
un
Sino
Pac
Tais
hin
Chi
natru
st
Cat
hay
Ta C
hong
Shin
Kon
g
Meg
a
Mutual fund fee as % of total fee
(%)
35
24 2220
17 17 17 1712
107 7
0
10
20
30
40
Fubo
n
Yuan
ta
Chi
natru
st
Tais
hin
Cat
hay
Shin
Kon
g
Sino
Pac
Ta C
hong
E. S
un
Hua
Na
Meg
a
Firs
t
Bancasurrance fee as % of total fee
(%)
Note: data as of 9M11
Source: Company data, Credit Suisse estimates
Note: Data as of 9M11
Source: Company data, Credit Suisse estimates
Credit cost increase could be faster than expected We believe the new requirement for at least 1% loan coverage will add more trigger points for banks to take loan loss provisions. Hence, lead banks are likely to take loan loss provision faster going forward, in addition to the need for meeting the requirement by year-end.
First, for every 1% loan growth going forward, there is an immediate 1 bp of provisioning needed, regardless of what happens to the NPL condition. This can have a noticeable impact on the sector’s profitability when margin is as low as it is now and with a credit cost of just 14–25 bp for 2011–12. At the current level of profitability, we estimate every 1 bp increase in net credit cost would have 0.6–2.2% net profit impact (Figure 188).
Another reason is that loan loss provisioning on the existing loan portfolio is no longer just on new NPL formation, it is also on the pace of write-offs, as most banks will only maintain a loan coverage ratio of just above 1% (the minimum required). This means banks would need to replenish loan loss reserve after any meaningful loan charge-offs, even if there is no new NPL influx during the period.
For example, if all the banks raise reserve-to-loan ratio to above 1% by the year end, for every 10 bp charge off of total loan, a bank will need to raise loan loss reserve by NT$0.3–1.3 bn in order to continue to stay compliant on the 1% loan coverage requirement. This will have 1–8% profit impact on each bank. The consequence, in our view, is a faster normalisation of credit cost for banks. This can be offset only if banks can raise lending rates by 10–15 bp.
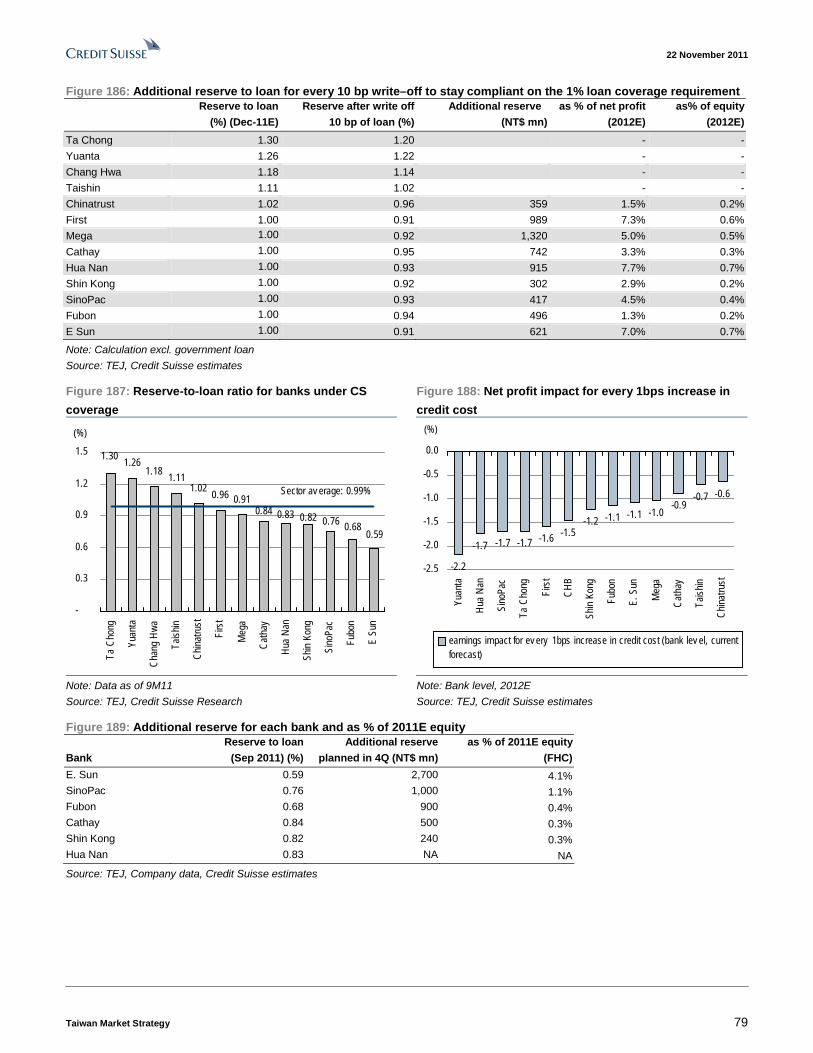
22 November 2011
Taiwan Market Strategy 79
Figure 186: Additional reserve to loan for every 10 bp write–off to stay compliant on the 1% loan coverage requirement Reserve to loan Reserve after write off Additional reserve as % of net profit as% of equity
(%) (Dec-11E) 10 bp of loan (%) (NT$ mn) (2012E) (2012E)
Ta Chong 1.30 1.20 - -
Yuanta 1.26 1.22 - -
Chang Hwa 1.18 1.14 - -
Taishin 1.11 1.02 - -
Chinatrust 1.02 0.96 359 1.5% 0.2%
First 1.00 0.91 989 7.3% 0.6%
Mega 1.00 0.92 1,320 5.0% 0.5%
Cathay 1.00 0.95 742 3.3% 0.3%
Hua Nan 1.00 0.93 915 7.7% 0.7%
Shin Kong 1.00 0.92 302 2.9% 0.2%
SinoPac 1.00 0.93 417 4.5% 0.4%
Fubon 1.00 0.94 496 1.3% 0.2%
E Sun 1.00 0.91 621 7.0% 0.7%
Note: Calculation excl. government loan
Source: TEJ, Credit Suisse estimates
Figure 187: Reserve-to-loan ratio for banks under CS
coverage
Figure 188: Net profit impact for every 1bps increase in
credit cost
1.261.18
1.111.02
0.96 0.91
0.760.820.830.84
1.30
0.680.59
-
0.3
0.6
0.9
1.2
1.5
Ta C
hong
Yuan
ta
Cha
ng H
wa
Tais
hin
Chi
natru
st
Firs
t
Meg
a
Cat
hay
Hua
Nan
Shin
Kon
g
Sino
Pac
Fubo
n
E Su
n
Sector av erage: 0.99%
(%)
-2.2
-1.7 -1.7 -1.7 -1.6 -1.5-1.2 -1.1 -1.1 -1.0
-0.9-0.7 -0.6
-2.5
-2.0
-1.5
-1.0
-0.5
0.0Yu
anta
Hua
Nan
Sino
Pac
Ta C
hong
Firs
t
CH
B
Shin
Kon
g
Fubo
n
E. S
un
Meg
a
Cat
hay
Tais
hin
Chi
natru
st
earnings impact for ev ery 1bps increase in credit cost (bank lev el, currentforecast)
(%)
Note: Data as of 9M11
Source: TEJ, Credit Suisse Research
Note: Bank level, 2012E
Source: TEJ, Credit Suisse estimates
Figure 189: Additional reserve for each bank and as % of 2011E equity Reserve to loan Additional reserve as % of 2011E equity
Bank (Sep 2011) (%) planned in 4Q (NT$ mn) (FHC)
E. Sun 0.59 2,700 4.1% SinoPac 0.76 1,000 1.1% Fubon 0.68 900 0.4% Cathay 0.84 500 0.3% Shin Kong 0.82 240 0.3% Hua Nan 0.83 NA NA
Source: TEJ, Company data, Credit Suisse estimates

22 November 2011
Taiwan Market Strategy 80
Figure 190: FSC has been progressively asking banks to raise their coverage ratio
Source: FSC, Economic Daily New, Commercial Times, Credit Suisse research
Sector preference
Within the financial sector, we like brokers the most in the near term (till year-end), given the better risk reward profile, and also like some banks that appear to be oversold as our lowered earnings (mostly on capital market related earnings) still imply a good discount to fair value. We maintain our negative view on insurers due to weak performance in the last 12 months and a large QFII net selling as interest rate is expected to stay low and ongoing concern over Europe debt problem will cap the stock’s performance.
Figure 191: Credit Suisse top pick table Price (NT$) CS Target Upside 2012 12E P/E 12E P/B 12E ROE
Company rating price (%) EPS (NT$) (x) (x) (%)
Chinatrust FHC 17.05 O 23.5 37.8 1.7 10.1 1.17 12.0
E. Sun FHC 13.65 O 19.0 39.2 1.5 9.2 0.87 9.9
Yuanta FHC 15.70 O 21.0 33.8 0.9 16.9 1.05 6.2
Taishin FHC 11.60 O 16.5 42.2 1.3 9.0 0.88 10.2
Note: O = Outperform. Source: Company data, Credit Suisse estimates
Brokers: Best risk-reward in the near term We believe brokers have the best upside and risk reward in the near-term (till year-end), with valuation at the low end of the historical range (Figure 195), and suggest the market already discounted for a weak equity market to persist. Hence, there is good downside support unless we see further exacerbation of the Europe debt problem, as the corporate earnings cycle is likely to reverse with an uptrend as we discussed in earlier section.
Brokers have the most simple business model driven by market turnover and retail’s long margin lending; there is no credit cost involved or asset quality issues, and they have no overseas investments and so are not exposed to potential losses. They have mostly kept small prop trading positions, so most of them rarely see losses. They also have the least leveraged balance sheet of 2–3x of asset quality, compared with 10–15x for banks and 17–46x for insurers. Yuanta is our top pick in the sector.

22 November 2011
Taiwan Market Strategy 81
Figure 192: Brokers have shown strong outperformance
against TAIEX three month priors to presidential elections
Figure 193: TWSE relative performance three months
ahead of presidential election
27
44
55
9 10 12
3
12
35
-
10
20
30
40
50
60
2000 election 2004 election 2008 election
Brokerage sector TWSE Banking sector
absolute performance 3 months ahead
(%)
96%
98%
100%
102%
104%
106%
108%
110%
-86 -81 -76 -71 -66 -61 -56 -51 -46 -41 -36 -31 -26 -21 -16 -11 -6 -1
TWSE relativ e performance to Asia Pacific ex . Japan
(%)
Note: Aggregate of top six brokers—Yuanta, KGI, Capital, President,
Polaris and MasterLink
Source: Company data, Credit Suisse estimates
Note: Average of the past four presidential elections; from 86 days
prior to election to the day before.
Source: TEJ, Credit Suisse research
Figure 194: Yuanta’s P/B band Figure 195: Valuation at the low end of normal cycle, most
near book value
0.4
0.7
1.0
1.3
1.6
1.9
2.2
Nov-03 Nov-04 Nov-05 Nov-06 Nov-07 Nov-08 Nov-09 Nov-10 Nov-11
Yuanta 1-y r forw ard P/B Av erage +1d -1d +2d -2d
(x) y = 0.0014x0.7465
R2 = 0.6224
0.4
0.6
0.8
1.0
1.2
1.4
1.6
1.8
2.0
2,000 3,000 4,000 5,000 6,000 7,000 8,000 9,000 10,000 11,000
TAIEX
Broker P/B
Bull market, brokerage sector P/B tents to be outlier
Bull mark
Bear marke
Normal market
Source: Company data, Credit Suisse estimates Source: Company data, Credit Suisse estimates
Banks: No profit growth but some are oversold It is difficult to turn very positive on the sector next year, given the issues that we are likely to face. While we do expect the sector to post a small profit decline, there are a few stocks that appear to be oversold amid the global financial share sell-down. Based on our current estimates, we estimate the sector is trading at 12x and 0.9x of next year’s P/E and P/B, respectively. Valuation is now trading at one standard deviation below historical average, or near the low end of the range (ex financial crisis). Chinatrust and E. Sun are our top picks in the sector.

22 November 2011
Taiwan Market Strategy 82
Figure 196: P/B trading at one SD below historical
average
Figure 197: QFII weighting in Taiwan banks slightly below
historical average
0.4
0.8
1.2
1.6
2.0
Nov-99 Nov-01 Nov-03 Nov-05 Nov-07 Nov-09 Nov-11
1-yr forward P/B Average +1d -1d +2d
(x)
Tech bubble Global financial crisis
2%
4%
6%
8%
10%
Jan 03 Jan 05 Jan 07 Jan 09 Jan 11
Bank Av erage +1 std
-1 std +2 std -2 std
(%)
+1 std
+2 std
-2 std
-1 std
Source: TEJ, Credit Suisse estimates Source: TEJ, Credit Suisse research
Insurers: Upside capped on rate and debt concerns While insurers have seen the largest QFII selling in the last 12 months, and valuations for most are near historical lows, we still see the most complications for them to outperform the market in 2012. Interest rate is expected to stay low through 2012 and this will continue to erode their fixed income investment’s recurring yield, as new investments (and those reinvested) will be made at lower rates than their current portfolio yield. Concerns over Europe (or even the US) debts will continue to linger, and earnings volatility from forex hedging will only increase as they continue to raise overseas positions. In fact, we increasingly believe most insurers face difficulties in growing their shareholders’ equity (through retained earnings) in pace with their asset growth; this leads to a steady increase in balance sheet leverage over time, which puts them in a more vulnerable position in each downcycle.
Figure 198: Leverage of insurers now versus 2008 Figure 199: Valuation of insurers
43.8
52.5
14.1
46.3
34.3
15.7
-
10
20
30
40
50
60
Cathay Life Shin Kong Life Fubon Life
2008 9M11
(x )
-
0.5
1.0
1.5
2.0
2.5
3.0
3.5
Sep 04 Jun 06 Mar 08 Nov 09 Aug 11
0.0
0.5
1.0
1.5
2.0
2.5
3.0
3.5
Fw d P/EV (x ) 10 y r bond y ield - RHS
Rediscount rate forecast - RHS
P/EV (x ) (%)
Av g. sector P/EV: 1.7x
Note: Data of life insurance unit
Source: TEJ, Credit Suisse research
Source: TEJ, Credit Suisse estimates

22 November 2011
Taiwan Market Strategy 83
Top picks Yuanta FHC: We believe brokers have the best risk reward in the near term (till year-end), and Yuanta is our top pick; it has exhibited strong seasonality with 4Q outperformance in 12 out of the last 14 years. The stock has historically done well, ahead of elections and is actually one of the best proxies for an election trade. At the current valuation of 1x FY11E P/B (1.1x adjusted P/B), there should be good downside support, especially when there is little expectation for an election rally. The company has historically maintained little proprietary trading position and no overseas investments, and hence, it rarely posts losses. We reiterate our OUTPERFORM rating and target price of NT$21.
Chinatrust FHC: Chinatrust has the highest PPOP/Asset and this provides the bank the best capacity to absorb any potential negative NPL shocks. In addition, Chinatrust will continue to benefit from consumer NPL recovery, and it has better capital adequacy (Tier-1 ratio of 10.9% as of Sep-11) to support growth. Following the recent global financial share sell-down, the stock is trading at 10x and 1.2x FY12E P/E and P/B, respectively, near the low end of the historical range. We reiterate our OUTPERFORM rating with a target price of NT$23.5.
Figure 200: Chinatrust Bank—key assumptions Year-ended 31 Dec 2009A 2010A 2011E 2012E 2013E
Loan growth -1.5% 8.3% 9.1% 5.5% 9.7% Fee income growth 8.7% 11.9% 4.0% 1.0% 5.0% Net interest margin (NIM) 1.44% 1.55% 1.58% 1.63% 1.73% Loan to deposit ratio (LDR) 71% 75% 77% 77% 81% Cost to income ratio (CIR) 66% 64% 59% 60% 57% NPL ratio 1.45% 0.58% 0.87% 0.88% 0.87% Coverage ratio 103% 220% 176% 189% 192% Provision to average loans (bps) 134 19 11 17 31 Tier 1 ratio 9.1% 10.9% 12.0% 11.7% 11.4% Capital adequacy ratio (CAR) 12.6% 14.6% 14.6% 14.2% 13.7%
Source: Company data, Credit Suisse estimates
E. Sun FHC: E. Sun provides the best top-line upside, especially on the bank’s more aggressive credit card consumption market share gain, as well as bancassurance build-up. After the NT$7.5 bn capital raising in Sep-11, E. Sun will have sufficient capital to continue to outgrow its peers over the next two-three years. This will drive a stronger top-line momentum, especially with the bank’s low loan-to-deposit ratio of just 67%. Hence, we estimate the bank will demonstrate a 12% PPOP growth in 2012, nearly double the sector average of 6.7%. The stock is trading at below sector average, mainly due to the provision concern, which is already well flagged, in our view. We maintain our OUTPERFORM rating and target price of NT$19.
Figure 201: E. Sun Bank—key assumptions Year-ended 31 Dec 2009A 2010A 2011E 2012E 2013E
Loan growth 3.3% 8.8% 11.0% 6.5% 10.0% Fee income growth 17% 43% 25% 12% 13% Net interest margin (NIM) 1.08% 1.23% 1.22% 1.27% 1.39% Loan to deposit ratio (LDR) 70% 66% 69% 72% 78% Cost to income ratio (CIR) 66% 56% 54% 52% 49% NPL ratio 0.67% 0.39% 0.26% 0.34% 0.45% NPL coverage ratio 93% 154% 387% 306% 243% Provision to average loans (bp) 44 48 79 39 49 Tier 1 ratio 8.3% 8.6% 9.1% 9.2% 9.1% Capital adequacy ratio (CAR) 11.0% 11.5% 11.9% 11.8% 11.4%
Source: Company data, Credit Suisse estimates

22 November 2011
Taiwan Market Strategy 84
Taishin FHC: We expect Taishin to continue to see core profit improvement along with consumer NPL recoveries that would keep net credit cost low (or negative). The stock’s valuation looks inexpensive, as the market still has not yet fully accounted for the bank’s benefit from consumer recoveries, and the substantial amount of interest expense and preferred dividend savings starting to come through in 2012 when the bank pays back debt using its idle cash on hand. We reiterate our OUTPERFORM rating and target price of NT$16.5.
Figure 202: Taishin Bank—key assumptions Year-ended 31 Dec 2009A 2010A 2011E 2012E 2013E
Loan growth -4.1% 7.0% 10.1% 3.6% 7.4% Fee income growth -7.1% 16.5% 10.0% 2.0% 8.0% Net interest margin (NIM) 1.38% 1.53% 1.45% 1.50% 1.63% Loan to deposit ratio (LDR) 76% 75% 77% 76% 76% Cost to income ratio (CIR) 69% 59% 59% 58% 56% NPL ratio 0.59% 0.34% 0.20% 0.31% 0.39% NPL coverage ratio 236% 327% 510% 344% 261% Provision to average loans (bps) 35 -42 -28 3 11 Tier 1 ratio 8.9% 9.3% 8.9% 8.7% 8.7% Capital adequacy ratio (CAR) 13.0% 13.6% 12.5% 11.8% 11.3%
Source: Company data, Credit Suisse estimates
Figure 203: P/PPOP less PPOP/asset valuation (2012E) Figure 204: P/B by sector (2012E)
-0.54
-0.37 -0.33
0.03 0.05
0.18 0.21 0.22
0.51
-0.6
-0.4
-0.2
0
0.2
0.4
0.6
Chi
natru
st
E. S
un
Tais
hin
Meg
a
Ta C
hong
Sino
Pac
Firs
t
Hua
Nan
CH
B
Discount
Premi
um
1.1 1.1 1.1 1.11.0 1.0 1.0 1.0 1.0
0.90.8
0.7 0.7
0.4
0.6
0.8
1.0
1.2
1.4
Chi
natru
st
Shin
Kon
g
Yuan
ta
Hua
Nan
Fubo
n
Meg
a
E. S
un
CH
B
Firs
t
Tais
hin
Cat
hay
Ta C
hong
Sino
Pac
P/B (x )
Av erage:1.0x
Note: P/PPOP less PPOP/Asset valuation = (company P/PPOP /
sector P/PPOP ) - (company PPOP/Asset/ sector PPOP/Asset)
Bank only PPOP, Taishin’s PPOP and asset include 0.225% of CHB
Source: TEJ, Credit Suisse estimates
Source: TEJ, Credit Suisse estimates

22 November 2011
Taiwan Market Strategy 85
Cement Sector research analysts: Sidney Yeh, David Liao, Grace Li
China operations: Fundamentals remain intact Entering 2012, we remain positive on Taiwan cement players’operation in China thanks to tight supply despite demand deceleration. As of now, we do not see any change in China government’s attitude in directing cement demand-supply to become healthier. In fact, despite being a key enterprise, Taiwan Cement admitted that obtaining a new cement construction licence for their Qujiang (Guangdong) plant has been difficult. As such, we believe limited supply addition and continued phase-out of vertical kilns should be the key driver to support cement prices next year. Moreover, we believe that the practice of cutting supply during the low season to hold up cement ASP could be carried into next year, which would translate into stable margins.
Figure 205: Guangdong’s demand-supply—margin to
sustain on tight supply
Figure 206: Guangxi—shrinking demand-supply gap to
improve unit profit
0
20
40
60
80
100
120
140
160
2008 2009 2010 2011E 2012ETotal capacity Total demand
(mn tons)
0
20
40
60
80
100
120
2008 2009 2010 2011E 2012E
Total capacity Total demand
(m n tons)
Source: Digital Cement, Credit Suisse estimates Source: Digital Cement, Credit Suisse estimates
On the demand side, demand disruption from public infrastructure projects (social housing and railway construction) have concerned the entire industry since September. We believe the impact will be limited as we see Premier Wen has reiterated the target of 10 mn units of social housing to be achieved by end-2011 and China has resumed financing to the Ministry of Railways. Although the short-term pressure has eased, we conservatively assume demand growth to slow down in the next 12 months amid macro uncertainty (from 15% YoY in 2011 0-3% in 2012).
All in all, we believe demand-supply dynamics in Taiwan Cement and Asia Cements’ major territories should largely remain intact in the next 12 months as tight supply drives the market. Among the various provinces, we are especially positive on Guangdong. Even if we conservatively assume no demand growth in 2012, we estimate unit profit to go up from Rmb99/t to Rmb101/t on little supply addition.
Domestic cement market to see a “golden” five years on anti-dumping tax In 2011, we identified the implementation of anti-dumping tax for cement imported from China as the most significant event in changing the domestic industry’s demand-supply dynamics. In late May, the Taiwan government imposed a temporary anti-dumping tax on cement and clinker imported from China in view of the long-standing unfair competition. The five-year tax scheme was finalised on 19 October with a formal tax charge of 91.58%.

22 November 2011
Taiwan Market Strategy 86
Figure 207: Taiwan’s domestic cement consumption
Domestic cement consumption
0
2,000
4,000
6,000
8,000
10,000
12,000
14,000
16,000
18,000
2001 2002 2003 2004 2005 2006 2007 2008 2009 2010 2011E 2012E 2013E
(K tons)
-20%
-15%
-10%
-5%
0%
5%
10%
15%
20%
Cement & Clinker consumption (K Tons) Domestic Consumption (yoy grow th)
Source: TEJ, Credit Suisse estimates
Figure 208: Cement imports (into Taiwan) are decreasing Figure 209: Taiwan’s domestic cement ASP
0
500
1,000
1,500
2,000
2,500
3,000
2001
2002
2003
2004
2005
2006
2007
2008
2009
2010
2011
E
2012
E
Cement import
(K tons)
1,0001,200
1,4001,600
1,8002,0002,200
2,4002,600
2,8003,000
1Q0
03Q
00
1Q0
13Q
01
1Q0
23Q
02
1Q0
33Q
03
1Q0
43Q
04
1Q0
53Q
05
1Q0
63Q
06
1Q0
73Q
07
1Q0
83Q
08
1Q0
93Q
09
1Q1
03Q
10
1Q1
13Q
11
1Q
12
E3
Q1
2E
1Q
13
E3
Q1
3E
(NT$/ton)
Domestic cement ASP
Domestic ASP to rebound in view of anti-dumping tax
Source: Bureau of Foreign Trade, Credit Suisse estimates Source: TEJ, Credit Suisse estimates
After factoring in the anti-dumping tax, the cost of imported cement surged to NT$3,095/t, exceeding local spot price. As imports become unviable, the threat of cement imported from China is now largely alleviated. We expect domestic cement producers to enjoy a sweet spot under the shield of the anti-dumping tax for the next five years. Indeed, cement ASP has increased by NT$200/t to NT$2,300/t. Besides, both TCC and ACC indicated that shipments have risen since its implementation. Even the previous weakest link (export sales) has now turned more positive, driven by more favourable price quotes for next year. Despite a conservative domestic cement consumption forecast in 2012 (11% fall on weaker infrastructure spending), we expect TCC and ACC to grow their domestic cement sales by 15-20% with improved profitability.
Top pick: Taiwan Cement Despite our overall optimistic tone for the cement sector in 2012, we prefer TCC to ACC given its multiple earnings drivers.
We expect consolidated profit growth of 25% in 2012
We believe TCC’s China profit growth should continue, on large volume growth via M&A this year and its relatively strong market focus. On a consolidated basis, we believe earnings from Taiwan should increase with: (1) Hoping Power entering a sweet spot and (2) mild profit growth from its cement operations in Taiwan on the newly introduced anti-dumping tax.
Although TCC’s cement profits are under pressure in eastern China, given the weaker demand outlook, we anticipate blended unit profit in China to see only a mild decrease given TCC’s focus in the south (Guangdong and Guangxi), where the demand-supply

22 November 2011
Taiwan Market Strategy 87
situation looks relatively favourable. We still expect profit contribution from China to increase by 13% in 2012 on 30% volume growth.
Hoping Power enters a sweet spot
With respect to Taiwan operations, while demand could be lukewarm, we believe the anti-dumping tax will boost local cement ASP and, in turn, unit profit in 2012 and beyond. As for the chemical arm, the macro uncertainty and credit tightening have depressed downstream demand. Management expects flattish earnings in 4Q11. 2012 outlook is not clear now as demand is largely subject to the macro environment in a global market. For Hoping Power, management also expects profit to recover starting 4Q11 as the surge in coal costs is coming to a halt with more strength to be reflected in 2012 (higher power tariff and lower coal cost).
Figure 210: Aggressive capacity expansion by TCC Figure 211: Hoping Power’s net income forecast
18 18 18 18 18
5 5 5 5 5
24 28 28 28
4 7 7
0
10
20
30
40
50
60
2009 2010 2011E 2012E 2013E
(mn tons)
Greenfield M &A 2009 M &A 2010 M &A 2011
0
1,000
2,000
3,000
4,000
5,000
6,000
7,000
8,000
9,000
2006 2007 2008 2009 2010 2011E 2012E-40%
-20%
0%
20%
40%
60%
80%
Hoping Power net income yoy- coal cost yoy- coal index(ASP)
(NT$mn) (%)
Source: Company data, Credit Suisse estimates Source: Bloomberg, Credit Suisse estimates
Figure 212: TCC’s income summary Y/e 31 Dec (NT$ mn) 2009 2010 2011E 2012E 2013E
Cement, Taiwan 842 107 390 1,127 1,388
Cement, China (347) 1,574 4,345 4,915 5,074
Hoping Power 4,988 2,984 1,400 2,335 2,316
Hoping Port 955 931 1,024 1,075 1,129
TPCC 228 1,732 1,732 1,559 1,559
Others 758 703 510 731 809
Consolidated net income 7,425 8,031 9,402 11,742 12,275
Source: Company data, Credit Suisse estimates
Figure 213: Valuation matrix of cement sector Rating Target Price Current Price Upside Pot. PE (x) PB (x) ROAE (%) Net Debt/Equity (%) Dividend Yield (%)
Ticker NT$/share NT$/share (%) 10A 11E 12E 10A 11E 12E 10A 11E 12E 10A 11E 12E 10A 11E 12ECement 14.1 11.3 9.6 1.3 1.2 1.2 9.6% 11.3% 12.6% 29.0% 29.1% 28.2% 6.0% 6.3% 7.4%Taiwan Cement 1101.TW OUTPERFORM 43.5 33.0 31.8% 15.2 13.0 10.4 1.3 1.3 1.2 9.2% 9.8% 11.8% net cash net cash net cash 6.1% 5.4% 6.7%Asia Cement 1102.TW OUTPERFORM 47.5 31.9 49.0% 13.0 9.6 8.8 1.3 1.2 1.1 10.0% 12.9% 13.4% 29.0% 29.1% 28.2% 5.8% 7.3% 8.0%China PeersAnhui Conch 0914.HK NEUTRAL 28.0 24.4 15.0% 20.9 10.6 11.0 3.7 2.8 2.4 19.6% 30.4% 23.5% 32.7% 23.0% 17.2% 0.8% 1.9% 1.9%China Natl Bldg 3323.HK UNDERPERFORM 9.0 9.4 -4.5% 14.2 7.1 9.7 2.5 2.0 1.7 21.0% 31.7% 18.6% 183.3% 165.3% 162.4% 1.0% 1.4% 1.0%China Shanshui 0691.HK NEUTRAL 8.5 5.8 47.6% 16.5 6.2 7.0 2.8 2.1 1.6 18.1% 38.5% 25.9% 78.1% 86.6% 75.1% 2.5% 1.6% 1.4%
November 18, 2011 Source: Company data, Credit Suisse estimates

22 November 2011
Taiwan Market Strategy 88
Petrochemicals Sector research analysts: Sidney Yeh, David Liao, Grace Li
Demand bottoming out, but recovery still slow We have seen very weak chemical volumes since the summer as demand was hit by: (1) slow procurement in China due to the credit tightening, (2) power cuts that slowed down clients’ production in China and (3) concerns about US/European demand on the Euro debt risk. Chemical prices and margin also fell with the drop in volumes during this period. However, we believe this is the bottom, given: (1) the stabilising oil and upstream prices, (2) light industry inventory and (3) a likely soft landing of China’s economy.
Figure 214: Stabilising oil price since August, post the
panic
Figure 215: More ethylene production suspension in 4Q11
should help improve demand-supply
600
800
1,000
1,200
1,400
1,600
1,800
Jan-
10
Feb
-10
Mar
-10
Apr
-10
May
-10
Jun-
10
Jul-1
0
Aug
-10
Sep
-10
Oct
-10
Nov
-10
Dec
-10
Jan-
11
Feb
-11
Mar
-11
Apr
-11
May
-11
Jun-
11
Jul-1
1
Aug
-11
Sep
-11
Oct
-11
Nov
-11
(US$/ton)
70
80
90
100
110
120
130
(US$/barrel)
Crude Oil (RHS) Naphtha (LHS) Ethylene (LHS) Propylene (LHS)
0
100
200
300
400
500
600
700
Jan-
11
Feb
-11
Mar
-11
Apr
-11
May
-11
Jun-
11
Jul-1
1
Aug
-11
Sep
-11
Oct
-11
Nov
-11
Dec
-11
(K tons)
0%2%
4%6%
8%10%
12%14%
16%18%
Asian Ethylene Capacity Lost (LHS) Asian Ethylene Percentage Lost (RHS)
Source: CEIC, Bloomberg Source: CMAI, Credit Suisse estimates
We highlighted in our last sector report that further credit tightening in China is unlikely, as the Chinese government is now trying to strike a balance between ‘economy growth’ and ‘inflation control’. China inflation seems to be under control as the headline CPI has fallen from over 6.0% in the summer to 5.5% in October. With the deteriorating global macro outlook since August, China government has been easing credit policy gradually.
Figure 216: Chinese loan growth decelerated on credit tightening
20
25
30
35
40
45
50
55
60
Jan
-08
Ma
r-0
8
May
-08
Jul-
08
Se
p-0
8
Nov
-08
Jan-
09
Ma
r-0
9
Ma
y-0
9
Jul-
09
Sep
-09
No
v-0
9
Jan
-10
Mar
-10
Ma
y-1
0
Jul-
10
Se
p-1
0
No
v-1
0
Jan-
11
Ma
r-1
1
May
-11
Jul-
11
Se
p-1
1
(RMB$ tn)
10%
15%
20%
25%
30%
35%
40%
Loan Amount Loan Amount (YoY)
20
25
30
35
40
45
50
55
60
Jan
-08
Ma
r-0
8
May
-08
Jul-
08
Se
p-0
8
Nov
-08
Jan-
09
Ma
r-0
9
Ma
y-0
9
Jul-
09
Sep
-09
No
v-0
9
Jan
-10
Mar
-10
Ma
y-1
0
Jul-
10
Se
p-1
0
No
v-1
0
Jan-
11
Ma
r-1
1
May
-11
Jul-
11
Se
p-1
1
(RMB$ tn)
10%
15%
20%
25%
30%
35%
40%
Loan Amount Loan Amount (YoY)
Source: CEIC
The tight monetary liquidity has led to operational difficulties (even bankruptcy) for most SMEs in China; it is one of the most unfavourable factors responsible for the sharp demand decline for chemical since 2Q11. Lack of working capital led to more production being suspended and corporate losses for Chinese chemical-related companies in the summer. Per the new policy from the central government, local banks are now required to
Some chemical downstream clients are seeing easing of SME loans in China

22 November 2011
Taiwan Market Strategy 89
increase the loan rate to SMEs to prevent further manufacturing deterioration in Eastern China. Although China bank loan growth continued to slow in October, we believe the new credit policy will likely accelerate the pace incrementally. Our checks with Taiwanese textile companies suggest there are some early signs of production recovery in Eastern China post the new monetary policy, though the recovery pace is still very slow.
Figure 217: New Chinese policy on SMEs released in October to support SME demand Key new measures on small enterprise(SME) loans
(1) SME loan growth from financial institutions shall not be less than the average loan growth
(2) Relax institutional entry barrier for commercial banks with larger outstanding loans and a higher SME customer base. In the meantime, allow those banks to build city branches and a franchisee network (3) Allow commercial banks to use the same risk weighting as retail loans to calculate the risk of SME loans under Rmb5 mn per customer to reduce risk-weighted assets. Appropriately raise NPL tolerance for SME loans (4) Exempt stamp duty on SME loan agreement for three years
Source: State Council of China
Growing US ethylene capacity could be a long-term threat for Asian producers Global ethylene is estimated to grow by 5.5%/4.5% in 2012/2013, with US ethane-based capacity the main contributor (as opposed to naphtha-based capacity for Asia). US new capacity is driven by the technology improvements for drilling shale gas. Given the cost advantage (over naphtha-based), US ethylene capacity will continue to be a threat for Asian crackers; ethylene derivatives (PE, PVC, EG etc) should also be affected, as the US producers enjoy raw material cost advantage over Asian chemical companies. However, US producers’ competitiveness is partially dampened by the long haul transportation to the Asian market; therefore, the real threat comes from: (1) cost gap between oil and gas and (2) Asian producer’s risk appetite (price volatility during shipment delivery). The competition is dynamic, but we believe aromatic products could see less exposure to the US competition, in the long run.
Figure 218: Fast growth of ethane-based ethylene in the
next few years
Figure 219: Middle East and North America ethylene
producers more cost competitive than Asian producers
0
20
40
60
80
100
120
140
160
2006 2007 2008 2009 2010 2011E 2012E 2013E 2014E 2015E
(mn tons)
-10%
-5%
0%
5%
10%
15%
Ethane Naphtha Others Ethane (YoY) Naphtha (YoY)
Source: CMAI Source: CMAI
Run rates of naphtha- based ethylene production in Asia has been affecting by cheaper ethylene imports

22 November 2011
Taiwan Market Strategy 90
Figure 220: Shale gas drill technology improvement (from
vertical, to more economical vertical + horizontal drill)
Figure 221: Major sites of shale gas supplies in the US
Source: EIA Source: EIA
Figure 222: Ethane-based ethylene derivatives are cost competitive (saving US$150-410/ton on PVC and PE products)
Refinery CrackingConversionrate : 0.30
Conversionrate : 1.02
Cost Saving ("Naptha" minus"Ethane" based processes)
Crude Oil Naphtha EthyleneVinyl Chloride
Monomer (VCM)Polyvinyl chloride
(PVC)US$150-200/ton
Ethylene Dichloride(EDC )
Conversion rate :0.70
Conversionrate : 0.93-1.03
Shale Gas EthaneCracking
Polyethylene (PE) US$280-410/ton
Source: Company data, Credit Suisse estimates
Better demand-supply for PX/EG For 2012, we expect refinery margin to move down slightly, as new capacity addition (2.0m b/d) outgrows demand growth (1.0-1.2m B/d). As for crackers, ethylene should see more supply addition than propylene and butadiene.
For various products, we expect overall demand growth to range 5–10% for 2012. Among high upstream products, we believe propylene and butadiene will see healthy price and margin given the more balanced supply. However, we think ethylene profits could be under higher pressure on more supply addition (as discussed above).
Among mid-stream products, auto-related products (such as ABS and synthetic rubber) could see better demand growth, as growth in emerging markets such as China and India remains healthy. Though China car sales growth slowed to 4% YoY in 9M11 (from 36% YoY in 9M10), our auto analyst projects relatively healthy growth of 10–11% YoY for 2012. In addition, the resilient demand for replacement segment should also boost demand for auto components. ABS margin got hit in 2H11 due to: (1) weak new car sales and (2) rocketing butadiene cost in 3Q11. We believe these two unfavourable factors will gradually subside into 2012 and expect mild recovery in profits, though profits seen in 2010 are unlikely to repeat in 2012 given the new capacity built in China.
Figure 223: ABS’ major feedstock costs have fallen fast Figure 224: ABS’ margin spread at the inflection point
500
1,000
1,500
2,000
2,500
3,000
3,500
4,000
4,500
Jan-
10
Feb
-10
Mar
-10
Apr
-10
May
-10
Jun-
10
Jul-1
0
Aug
-10
Sep
-10
Oct
-10
Nov
-10
Dec
-10
Jan-
11
Feb
-11
Mar
-11
Apr
-11
May
-11
Jun-
11
Jul-1
1
Aug
-11
Sep
-11
Oct
-11
Nov
-11
(US$/ton)
Styrene Monomer(SM) Price Butadiene price ABS price Acrylonitrile(AN) Price
(1,000)
(500)
0
500
1,000
1,500
2,000
2,500
Jan-
07M
ar-0
7M
ay-0
7Ju
l-07
Sep
-07
Nov
-07
Jan-
08M
ar-0
8M
ay-0
8Ju
l-08
Sep
-08
Nov
-08
Jan-
09M
ar-0
9M
ay-0
9Ju
l-09
Sep
-09
Nov
-09
Jan-
10M
ar-1
0M
ay-1
0Ju
l-10
Sep
-10
Nov
-10
Jan-
11M
ar-1
1M
ay-1
1Ju
l-11
Sep
-11
Nov
-11
(US$/ton)
ABS Spread ABS price
Source: CEIC, Bloomberg, TEJ Source: CEIC, Bloomberg, TEJ
ABS margin is at the inflection point on easing feedstock costs and rising emerging market demands

22 November 2011
Taiwan Market Strategy 91
The polyester food chain could see stable demand of 5–6% with the stabilisation of textile need (little downside for cotton price from here) and growth of plastic bottle. However, we believe profitability in this food chain will significantly depend on 2012 supply dynamics, as we expect more supply addition in downstream polyester and mid-stream PTA but very light supply growth for upstream PX and midstream EG. Thus, we estimate a decent margin spread for PX/EG, but a downward trend for polyester and PTA.
Figure 225: Global PX utilisation should move higher Figure 226: Light EG supply addition in 2012
83.5%85.8%
93.9%
86.8%86.5%
86.6%
86.8%86.9%
83.5%
84.2%
81.4%79.7%
05,000
10,00015,00020,000
25,00030,00035,000
40,00045,000
2003
2004
2005
2006
2007
2008
2009
2010
2011
E
2012
E
2013
E
2014
E
('000 tons)
70%
75%
80%
85%
90%
95%
Supply Demand Utilisation Rates
0
2
4
6
8
10
12
2007 2008 2009 2010 2011E 2012E 2013E 2014E 2015E 2016
(mn tons)
Net Addition Supply
Source: FENC Source: CMAI
Figure 227: Global PTA utilisation should soften (on aggressive Chinese supply additions)
Figure 228: Polyester utilisation to soften into 2012-13
0
10,000
20,000
30,000
40,000
50,000
60,000
70,000
2003
2004
2005
2006
2007
2008
2009
2010
E
2011
E
2012
E
2013
E
2014
E
('000 tons)
70%
75%
80%
85%
90%
95%
100%
Supply Demand Utilization Rate
70.5%74.4%
80.6%
05
101520253035404550
2009 2010 2011E 2012E 2013E
(mn tons)
60%
65%
70%
75%
80%
85%
90%
Supply Demand Utilization Rate
Source: FENC, ICIS Source: ICIS
Figure 229: Formosa Group—key product summary Company Outlook Product as
% of salesMain Usages Consumer Electronic Industrial Property Others
Formosa Petrochemical (6505 TT)Refinery Segment Stable 62% Gasoline, diesel and naphthaEthylene Weak 11% Polyethylene (PE), Ethylene Oxide (EO) and EDC Propylene Improve 11% Polypropylene(PP), Acrylonitrile (AN) and PhenolButadiene Good 5% Synthetic rubber (for tires) and ABS resins (for electronic casing, car component)Formosa Plastics (1301 TT) 48% 9% 13% 7% 10% 10%Polyvinylchloride (PVC) Weak 17% Building Materials, Packaging and Consumer Products 3% 30% 10% 40% 17%High Density Polyethylene (HDPE) Weak 10% Film/Sheet, Injection Molding, Blow Molding, Consumer Products and Pipes 30% 25% 15% 10% 20%Low Density Polyethylene (LDPE) Flattish 5% Film/ Sheet, Extrusion Coating, Consumer Products and Injection Molding 20% 20% 32% 3% 25%Polypropylene(PP) Weak 10% Film/ Sheet, Injection Molding and Fibre 25% 20% 10% 15% 30%Acrylonitrile(AN) Improve 6% Acrylic Fibre, Carbon Fibre, ABS resin (for casing) and MMA (for LED TV's light guide) 30% 40% 20% 0% 10%Nan Ya Plastics (1303 TT) 41% 41% 0% 0% 0% 0%Ethylene Glycol (EG) Good 26% Polyester Fiber (POY) and PET resin 100% 0% 0% 0% 0%Polyester Fiber (POY) Flattish 16% Textile 100% 0% 0% 0% 0%Formosa Chemical & Fibre (1326 TT) 54% 44% 11% 2% 3% 4%Benzene/Tolune/Xylene (BTX) Improve 10% Styrene Monomer(SM)/Caprolactam (CPL)/Purified Terephthalic Acid(PTA) 70% 10% 10% 0% 10%Purified Terephthalic Acid(PTA) Weak 23% Polyester Fiber (POY) and PET resin 100% 0% 0% 0% 0%Styrene Monomer(SM) Improve 8% Polystyrene (PS), Synthetic rubber (for tires) and ABS resin (for casing) 45% 13% 9% 18% 15%Phenol Good 8% Bisphenol A (BPA) and Nylon 60% 40% 0% 0% 0%Polystyrene(PS) Flattish 4% Packaging, Expandable PS (EPS) and Electrical Appliances 70% 10% 0% 20% 0%Polycarbonate(PC) Flattish 4% Electrical products, Automotive and Optical products 15% 60% 0% 0% 25%ABS Resin Improve 7% Electrical Products, Consumer Products and Injection Molding 20% 50% 10% 10% 10% Source: Company data, Credit Suisse estimates
Better upper stream margin (PX/EG) for the textile chain into 2012

22 November 2011
Taiwan Market Strategy 92
FCFC remains our top pick We believe DRAM link (Nanya Tech) will likely remain an overhang for the Formosa Group in view of the downward trend and the exit barrier for this tough industry. The drag is not only for P&L but also for cash flows (equity injection and affiliate loans). Given that it has the largest exposure to DRAM link, Nan Ya Plastic has the most earnings uncertainty in the group. pr lower volumes and margin spread, we cut our EPS forecasts for the four Formosa companies by 20–41% respectively in our latest report published in November. Our EPS revision is also prompted by the widening losses (forecast) at the DRAM arm. In light of earning revisions, we downgraded Nan Ya Plastic from Outperform to NEUTRAL (TP NT$64.40 from NT$84.80) given the reduced upside potential.
Figure 230: Formosa Group’s holdings of Nanya Tech after the private funding in
November FPC Nan Ya Plastics FCFC FPCC
Old holding (%) 5.5% 33.5% 5.6% 5.5%
New holding (%) 16.1% 38.2% 16.1% 16.1%
Source: Company data
We maintain NEUTRAL on Formosa Plastics (TP NT$94.20) and UNDERPERFORM (TP NT$75.80) on Formosa Petrochemical (FPCC). We continue to prefer Formosa Chemical & Fibre (FCFC) as our top pick (TP NT$106.60) given its strong balance sheet, high yield and aromatic products exposure.
Figure 231: Valuation matrix of Formosa Group Rating Target Price Current Price Upside Pot. PE (x) PB (x) ROAE (%) Net Debt/Equity (%) Dividend Yield (%)
Ticker NT$/share NT$/share (%) 10A 11E 12E 10A 11E 12E 10A 11E 12E 10A 11E 12E 10A 11E 12EPetrochemical 13.5 17.1 17.5 2.2 2.3 2.2 17.5% 13.6% 13.1% 32.9% 28.7% 23.1% 7.4% 5.7% 5.5%Formosa Petrochemical 6505.TW UNDERPERFORM 75.8 93.8 -19.2% 21.8 29.8 28.9 3.7 3.8 3.7 17.2% 12.5% 12.9% 55.9% 60.3% 43.5% 4.2% 3.0% 3.1%Formosa Plastics 1301.TW NEUTRAL 94.2 80.3 17.3% 10.8 12.1 14.0 1.9 1.9 1.9 18.7% 15.6% 13.4% net cash net cash net cash 8.5% 6.6% 5.7%Nan Ya Plastics 1303.TW NEUTRAL 64.4 61.1 5.4% 11.7 15.9 15.7 1.7 1.7 1.7 15.4% 10.8% 11.0% 10.0% 21.4% 25.7% 7.7% 5.4% 5.4%Formosa Chemical & Fibre 1326.TW OUTPERFORM 106.6 80.0 33.3% 9.6 10.7 11.1 1.7 1.7 1.7 18.8% 15.7% 14.9% net cash 4.3% 0.1% 9.4% 8.0% 7.6%
November 18, 2011 Source: Company data, Credit Suisse estimates

22 November 2011
Taiwan Market Strategy 93
Consumer Sector research analysts: Sidney Yeh, David Liao, Grace Li
Macro slowdown likely to harm consumption power Economic data points to a deceleration in domestic growth
On 28 June, the deregulation on arrival of individual Chinese tourists was made official. With 500 wealthy individual tourists arriving from Beijing, Shanghai and Xiamen, the deregulation sparked hopes of more consumer spending and a possible prosperous outlook for the CVS, department store and hotel segments. However, the impact turned out to be overstated as data suggested that on average only 91 daily individual visitors arrived between the official launch and end-September.
Figure 232: Number of Chinese visitors declining in 2H11 Figure 233: Individual Chinese tourists amounted to less
than 100/day on average
0
1,000
2,000
3,000
4,000
5,000
6,000
Jul-0
8
Se
p-08
Nov
-08
Jan
-09
Ma
r-09
May
-09
Jul-0
9S
ep-
09
Nov
-09
Jan
-10
Ma
r-10
May
-10
Jul-1
0S
ep-
10
Nov
-10
Jan
-11
Ma
r-11
May
-11
Jul-1
1S
ep-1
1(Visitor/day)
0%5%10%15%20%25%30%35%40%45%50%
Chinese Tourists China%/Total
Average tourists per month
-50
50
150
250
350
450
550
Jun-11 Jul-11 Aug-11 Sep-11
(visitors)
# of individual tourists
Daily quota of 500 tourists
Huge gap between target andactuall daily visitors
Source: Tourism Bureau Source: Tourism Bureau
While the market saw GDP recovery in 1H11, since August, the euro debt woes have cast a shadow on the global growth outlook. According to the latest survey by Taiwan Economic Development, the consumer confidence index (CCI) dropped 1.54 points to 84.04 points in October, a new low in seven months. Moreover, among the six sub-indicators, the index for economic outlook marks the largest dip—down 4.45 points this month. This survey is line with the recent economic data release of sluggish export orders and industrial production. We believe this data reflects the deteriorating global as well as domestic growth environment. Our economist further estimated that the weak momentum could even lead to sequential contraction in GDP growth in 4Q11
Figure 234: Consumer confidence trends down Figure 235: Export orders and industrial production
weakened further in September
40
50
60
70
80
90
100
Jan-
05A
pr-0
5Ju
l-05
Oct
-05
Jan-
06A
pr-0
6Ju
l-06
Oct
-06
Jan-
07A
pr-0
7Ju
l-07
Oct
-07
Jan-
08A
pr-0
8Ju
l-08
Oct
-08
Jan-
09A
pr-0
9Ju
l-09
Oct
-09
Jan-
10A
pr-1
0Ju
l-10
Oct
-10
Jan-
11A
pr-1
1Ju
l-11
Oct
-11
Taiwan Consumer Confidence Index CCI on economic outlook for next half year
-40
-30
-20
-10
0
10
20
30
40
50
60
1980 1982 1984 1986 1988 1990 1992 1994 1996 1998 2000 2002 2005 2007 2009 2011
Export orders (% yoy) Industrial production (% yoy)
Source: TEJ Source: MOEA, Credit Suisse research
Consumer confidence index fell sequentially in October, reflecting a worsening macro environment

22 November 2011
Taiwan Market Strategy 94
Consumer sector likely not immune to the downturn
From a top-down perspective, we believe the consumer sector is highly correlated to economic growth rate. Statistics show that Taiwan CVS/department store sales posted resilient growth in 2H10, up 9–11% YoY, on strong GDP recovery. However, as more evidence suggests that an economic deceleration is under way, we believe the consumer sector should not be immune amid a macro slowdown. Besides, we believe the growth momentum cannot be sustained due to its high base in 2010.
Figure 236: Declining GDP growth could be a leading indicator of CVS sales
-10%
-5%
0%
5%
10%
15%
20%
1Q05
3Q05
1Q06
3Q06
1Q07
3Q07
1Q08
3Q08
1Q09
3Q09
1Q10
3Q10
1Q11
3Q11
YOY growth of GDP YOY growth of CVS quarterly salesYOY growth of Department Store quarterly sales
Source: TEJ, Credit Suisse estimates
For the department store sector, we noticed a slowdown in 3Q11, mainly attributed to low seasonality. But we believe the sector will not reflect the worsening macro outlook into 4Q11 given the anniversary promotion, which accounts for roughly 35% of annual sales. Besides, the introduction of garment brands Uniqlo and Zara attracted market’s attention and brought massive business traffic. However, with more store openings scheduled, we believe contribution to each department store could be diluted.
Aggregate CVS sales grew 10% YoY in September. However, this is attributed to the inclusion of tobacco tax. Starting 1 September, CVS operators are required to incorporate tobacco charges into their sales base. Stripping out the extraordinary contribution, sales growth would be sluggish. PCSC’s weakening same-store-sales (SSS) momentum could give us more hints. Based on the company’s guidance, SSS declined to 4–5% in 3Q11, compared with 7% in 1H11 and a record-high 15% in 2010. We anticipate a gloomier growth outlook in 4Q11 as CVS enters the low season.
Figure 237: President Chain Store and Family Mart—YoY monthly sales growth
0
2
4
6
8
10
12
Jan-
10F
eb-
10
Ma
r-10
Ap
r-10
May
-10
Jun-
10Ju
l-10
Aug
-10
Sep
-10
Oct
-10
Nov
-10
De
c-1
0Ja
n-1
1
Feb
-11
Mar
-11
Apr
-11
May
-11
Jun
-11
Jul-1
1A
ug-
11
Sep
-11
Oct
-11
(NT$bn)
-5%
0%
5%
10%
15%
20%
25%
Family Mart PCSC Family Mart (YoY) PCSC (YoY)
Source: Company data

22 November 2011
Taiwan Market Strategy 95
F&B names to enjoy easing raw material costs Lower PET costs into 2012E
Packaging material (PET) accounts for an estimated 25% of Uni-P total cost. PET resin prices started to fall in 1H11 due to the rapid drop in upstream chemical (from ethylene/PX to EG/PTA and then to polyester). One key driver of the price correction was softening of the very upstream feedstock—crude oil. Concerns about Euro debt woes and stagnant US growth led to the expectation of weak oil demand and thus falling oil prices from August to October. However, with seasonal demand for energy and stable demand from emerging markets, China and India, oil prices have started stabilising into November.
Figure 238: Stabilising oil prices post the panic since
August
Figure 239: PET resin price softening from the peak in
1H11
600
800
1,000
1,200
1,400
1,600
1,800
Jan-
10
Feb
-10
Mar
-10
Apr
-10
May
-10
Jun-
10
Jul-1
0
Aug
-10
Sep
-10
Oct
-10
Nov
-10
Dec
-10
Jan-
11
Feb
-11
Mar
-11
Apr
-11
May
-11
Jun-
11
Jul-1
1
Aug
-11
Sep
-11
Oct
-11
Nov
-11
(US$/ton)
70
80
90
100
110
120
130
(US$/barrel)
Crude Oil (RHS) Naphtha (LHS) Ethylene (LHS) Propylene (LHS)
600800
1,0001,2001,4001,6001,8002,0002,2002,4002,600
Jan-
07
Apr
-07
Jul-0
7
Oct
-07
Jan
-08
Apr
-08
Jul-0
8
Oct
-08
Jan-
09
Apr
-09
Jul-0
9
Oct
-09
Jan-
10
Apr
-10
Jul-1
0
Oct
-10
Jan
-11
Apr
-11
Jul-1
1
Oct
-11
(US$/ton)
PET PSF POY
Source: CEIC, Bloomberg, TEJ Source: FENC, CMAI
Into 2012, we anticipate a correction in PET resin prices as new capacity growth in polyester would be faster than demand growth. According to ICIS, there will be 6 mn tonnes of new capacity for polyester (which is either for textile application or for PET bottle) in Asia in 2012, which will push down industry utilisation and likely lead to lower polyester resin prices. Into regional details, Chinese and Taiwan PET utilisation is expected to fall in 2012/2013 on regional PET capacity addition based on CMAI’s latest research. Therefore, we expect the price risk on PET to be more on the downside.
Figure 240: Falling PET utilisation in China Figure 241: Falling PET utilisation in Taiwan
China PET D/S and operation rate
800
900
1,000
1,100
1,200
1,300
1,400
1,500
1,600
1Q11
2Q11
3Q11
4Q11
E
1Q12
E
2Q12
E
3Q12
E
4Q12
E
1Q13
E
2Q13
E
3Q13
E
4Q13
E
('000 tons)
60%
65%
70%
75%
80%
85%
Supply Demand Utilization Rate
Taiwan PET D/S and operation rate
100
150
200
250
300
350
1Q11
2Q11
3Q11
4Q11
E
1Q12
E
2Q12
E
3Q12
E
4Q12
E
1Q13
E
2Q13
E
3Q13
E
4Q13
E
('000 tons)
0%
10%
20%
30%
40%
50%
60%
70%
80%
Supply Demand Utilization Rate
Source: CMAI Source: CMAI
Soft commodity prices also trending down
Palm oil prices hit a period high of RM3,906/t in 1Q11, and were range-bound during 2Q-3Q11 but gradually trended down from the peak. The current price at RM2,986/t implies a 24% decrease YTD. Given two to three months of inventory digestion, we believe the material cost alleviation will filter more into the P&L in the next two quarters. For 2012, we expect the favourable trend to continue given (1) Malaysian palm oil inventories have built up significantly, and (2) the potential unwind of speculative demand for corn and soy could dampen their prices and drag palm oil prices lower. According to our regional team, palm oil prices are expected to be RM2,500/t in 2012, or a 15% decrease compared to the 2011 level.
PET prices peaked in 1Q11
PET is expected to trend down into 2012 on supply addition
Our regional team anticipates palm oil costs to drop 15% YoY in 2012

22 November 2011
Taiwan Market Strategy 96
Figure 242: Palm oil prices are anticipated to peak out in
2011 …
Figure 243: …as are sugar prices
-
500
1,000
1,500
2,000
2,500
3,000
3,500
2001
2002
2003
2004
2005
2006
2007
2008
2009
2010
201
1E
201
2E
201
3E
(MYR/ton)
Crude Palm Oil Price
0.0
5.0
10.0
15.0
20.0
25.0
30.0
35.0
200
1
200
2
20
03
20
04
200
5
200
6
200
7
200
8
200
9
201
0
201
1E
20
12E
20
13E
(US$cents/lb)
World Sugar Price
Source: CEIC, Credit Suisse estimates Source: Bloomberg, Credit Suisse estimates
In response to the global supply deficit over the past three years, sugar prices have increased by around 45% from an average of US$15cents/lb in 2008-09 to US$22cents/lb in 2010-11. Despite their still hovering at a high level of US$31cents/lb into 4Q11, we believe it is unlikely for sugar prices to gain further support in 2012. According to the International Sugar Organisation (ISO), global sugar prices are forecasted to be in surplus for the next 12 months, primarily led by growing production in Southeast Asia and India. All in all, our regional team anticipates sugar prices to come off to US$25cents/lb in 2012, implying a significant 19% YoY decrease. The only divergence trend is for sugar prices in China which we believe is more due to tighter demand/supply. While we look for cost declines in PET, palm oil and sugar in Taiwan, we believe the upside risk is very likely for sugar prices in China in 2012.
Top pick: Uni-President and Cheng Shin Rubber We like Uni-President given (1) a favourable margin outlook on the raw material cost alleviation, and (2) early signs of the success of China market share focus strategy. In the Taiwan context, we suggest investors switching from PCSC to Uni-P given (1) stronger growth momentum in Uni-P into 2012, (2) a much cheaper valuation, and (3) upside for QFII holding.
Amid a weak macro outlook, we believe CSR should be a very defensive pick given its business nature: (1) taps into replacement demand for auto/motor/bike tyres; (2) beneficiary of softening raw material prices; and (3) volume growth on new capacity addition in 2012.
Figure 244: Valuation matrix of consumer sector Rating Target Price Current Price Upside Pot. PE (x) PB (x) ROAE (%) Net Debt/Equity (%) Dividend Yield (%)
Ticker NT$/share NT$/share (%) 10A 11E 12E 10A 11E 12E 10A 11E 12E 10A 11E 12E 10A 11E 12EConsumer 19.1 20.4 17.4 4.6 4.5 4.2 23.3% 21.6% 23.7% 48.8% 53.8% 37.2% 3.2% 3.0% 3.6%President Chain Store 2912.TW UNDERPERFORM 138.8 161.5 -14.1% 29.3 26.2 24.8 8.3 7.9 7.6 29.3% 30.9% 31.2% net cash net cash net cash 3.0% 3.2% 3.4%Uni President Enterprises 1216.TW OUTPERFORM 46.6 38.9 19.9% 15.2 18.7 16.0 2.4 2.4 2.3 16.3% 13.2% 14.7% 34.4% 37.1% 30.4% 3.6% 3.2% 3.8%Cheng Shin Rubber 2105.TW OUTPERFORM 77.9 64.5 20.8% 12.8 16.1 11.4 3.0 3.2 2.6 24.4% 20.8% 25.2% 63.1% 70.5% 44.0% 3.1% 2.5% 3.5%
November 18, 2011 Source: Company data, Credit Suisse estimates
Global sugar prices are likely to fall on supply surplus in 2011/12 but China sugar prices may pose a divergence

22 November 2011
Taiwan Market Strategy 97
Property Sector research analysts: Sidney Yeh, David Liao, Grace Li
Mild price decline in 2012, but luxury should hold up Despite resilient pricing, residential property transaction volumes have fallen 10–15% YTD on weaker market sentiment. The government’s unfavourable proposals pushed away speculative buyers, while the increasingly uncertain outlook for the macro and capital markets have led to replacement/upgrade buyers remaining on the sidelines for better bargaining opportunities. We expect property price to drop 0–10% in 2012 on the sharp fall in transaction volumes. However, we do not expect a sharp fall in property prices in 2013 given disciplined supply from both primary and secondary markets. A low interest rate environment implies sellers’ opportunity cost to ‘wait’ (for better sentiment) is low. As for developers, decent balance sheets and cash flows (thanks to locked-in cash from sold projects) imply aggressive price cuts are unlikely in the next twelve months. We continue to believe that the luxury segment will fare better given its tighter supply and affluent customer base, while there is more pressure in non-prime areas.
Figure 245: Property prices generally track GDP trend Figure 246: Low rate environment supports property price
-10%
-5%
0%
5%
10%
15%
1Q93
4Q93
3Q94
2Q95
1Q96
4Q96
3Q97
2Q98
1Q99
4Q99
3Q00
2Q01
1Q02
4Q02
3Q03
2Q04
1Q05
4Q05
3Q06
2Q07
1Q08
4Q08
3Q09
2Q10
1Q11
4Q11
50
60
70
80
90
100
110
120
130
GDP grow th rate Property ASP Index- Primary (Taipei City)
Property ASP Index- Primary (Xinbei City)
0
1
2
3
4
5
Jan-
00
Jan-
01
Jan-
02
Jan-
03
Jan-
04
Jan-
05
Jan-
06
Jan-
07
Jan-
08
Jan-
09
Jan-
10
Jan-
11
Jan-
12
Rediscount rate CS estimates(%)
Source: TEJ Source: CEIC, Credit Suisse estimates
Figure 247: Monetary liquidity remains strong (M1B) Figure 248: Tight supply in Taipei City (primary segment)
50
60
70
80
90
100
110
120
130
1Q00
4Q00
3Q01
2Q02
1Q03
4Q03
3Q04
2Q05
1Q06
4Q06
3Q07
2Q08
1Q09
4Q09
3Q10
2Q11
2,000
4,000
6,000
8,000
10,000
12,000
14,000
(NT$bn)
M1b (RHS) Property ASP Index- Primary (Taipei City)Property ASP Index- Primary (Xinbei City)
New launched houses in Taipei City
0
2,000
4,000
6,000
8,000
10,000
12,000
14,000
16,000
18,000
2003
2004
2005
2006
2007
2008
2009
2010
2011
E
2012
E
(Units)
Source: Cathay RED, TEJ, Company data Source: : Housing Weekly, Company data, Credit Suisse estimates
Decent cash flows, balance sheet; low solvency risk With equity market volatility and large fall in transactions, the market is worried about the developers’ earnings outlook as well as the potential credit problem, which is reminiscent of the 2008 financial crisis. The pre-sales scheme is a very favourable business model for Taiwan’s developers in terms of creating cash flows. We continue to expect low credit risk for developers on relatively healthy balance sheets (gearing has come off since 3Q08) and good cash flows (thanks to projects sold in 2009/10). Light assets and an increasingly popular JV business model should also help ease developers’ land bank and gearing risk.
We expect ASP to fall 0–10% YoY in 2012
Developers opting for lighter asset models (urban renewal or JV)

22 November 2011
Taiwan Market Strategy 98
Figure 249: Developers’ gearing ratio much higher in 2008 Figure 250: Lower net debt to equity suggests lower
bankruptcy risk
0%
20%
40%
60%
80%
100%
120%
140%
160%
180%
200%
Prince Hung Poo Radium Huaku Farglory Chong Hong
4Q08
0%
20%
40%
60%
80%
100%
120%
140%
Prince Hung Poo Radium Huaku Farglory Chong Hong
3Q11 2012E
Source: Company data, TEJ Source: Company data, TEJ, Credit Suisse estimates
Even under a worst-case scenario (assuming no new units are sold in the next 12 months), developers may generally remain in very good shape and be far from facing any solvency problems. We expect a low default risk from contract buyers as it is not justified (unless property prices correct by more than 30% in 2012). Among the companies we cover, asset plays have the least credit issue, while developers such as Huaku and Hung Poo also seem to have very good protection from locked-in profits. However, Prince appears to have higher gearing due to its larger exposure to commercial property and given the slower turnover for its residential projects outside Taipei City.
Figure 251: Renewal and joint development as a % of total
NAV
Figure 252: Developer funding cost is low
Renewal and JV formats as % in NAV
0%
10%
20%
30%
40%
50%
60%
70%
Prince Hung Poo Radium Huaku Farglory Chong Hong
1.5
2.0
2.5
3.0
3.5
4.0
Jan-
03A
pr-0
3Ju
l-03
Oct
-03
Jan-
04A
pr-0
4Ju
l-04
Oct
-04
Jan-
05A
pr-0
5Ju
l-05
Oct
-05
Jan-
06A
pr-0
6Ju
l-06
Oct
-06
Jan-
07A
pr-0
7Ju
l-07
Oct
-07
Jan-
08A
pr-0
8Ju
l-08
Oct
-08
Jan-
09A
pr-0
9Ju
l-09
Oct
-09
Jan-
10A
pr-1
0Ju
l-10
Oct
-10
Jan-
11A
pr-1
1
(%)
Mortgage Loan Rate Corporate loan rate
Source: TEJ, Company data, Credit Suisse estimates Source: Central Bank
Taiwan Fertilizer is our top pick Property names are still trading at a 22–58% discount to NAV, which is not far from the trough valuations seen during the financial crisis in 2008/09. While we see no catalyst in the next one quarter, we believe the risk-reward profile looks decent from a mid- to long-term perspective. With healthier balance sheets, we expect the generous payouts to continue into 2012.
Among all Taiwan property names under CS coverage, Taiwan Fertilizer (TF) is our top pick. We believe TF is one of the few companies that could post earnings growth into 2012 given:(1) a well supported urea price and profits from Jubail and (2) booking of its second residential project sold in 2010. We like Huaku for its high-end exposure, more luxury projects to be launched in the next two years and healthy cash flow proved under stress test, which can be attributed to its diverse land acquisition strategy (more JV format). Valuation for Hung Poo (approached its trough in 2008) and Radium (deep discount to NAV with generous dividend yields) look attractive. Finally, we are cautious on Sinyi Realty on (1) very light secondary market transaction, (2) more sales mixtures leaning to
Huaku and Hung Poo have good protection on locked-in profits

22 November 2011
Taiwan Market Strategy 99
lower margin products, (3) extending break-even time of new stores and (4) policy change risks. We retain our NEUTRAL rating unchanged.
Figure 253: Taiwan property names trading at a premium
(in a reference to discount to NAV) to Chinese peers since
2008
Figure 254: We are close to the valuation trough (vs 2008–
09 financial crisis)
-80%
-60%
-40%
-20%
0%
20%
40%
3Q07
4Q07
1Q08
2Q08
3Q08
4Q08
1Q09
2Q09
Jul-0
9A
ug-0
9S
ep-0
9O
ct-0
9N
ov-0
9D
ec-0
9Ja
n-10
Feb
-10
Mar
-10
Apr
-10
May
-10
Jun-
10Ju
l-10
Aug
-10
Sep
-10
Oct
-10
Nov
-10
Dec
-10
Jan-
11F
eb-1
1M
ar-1
1A
pr-1
1M
ay-1
1Ju
n-11
Jul-1
1A
ug-1
1S
ep-1
1O
ct-1
1N
ov-1
1
Taiwanese Developer Avg. Taiwanese Asset Play Avg.Chinese Property Play Avg.
Avg dic. to NAV of asset plays and developers
-100%
-80%
-60%
-40%
-20%
0%
20%
40%
60%
80%
100%
Prince H&D Hung Poo Radium Huaku Farglory ChongHong
FENC Taiw iFertilizer
Current Peak Trough Average
Source: TEJ, Company data, Credit Suisse estimates Source: TEJ, Company data, Credit Suisse estimates
Figure 255: Property names’ valuation comparison Name Ticker Rating NAV NAV NAV Target Current Upside Discount PE PB ROE Dividend Yield
Bull Base Bear Price Price Potential to NAV 2010 2011E 2012E 2010 2011E 2012E 2010 2011E 2012E 2010A 2011E 2012E(NT$/shr.) (NT$/shr.) (NT$/shr.) (NT$/shr.) (NT$/shr.) (%) (%) (X) (X) (X) (X) (X) (X) (%) (%) (%) (%) (%) (%)
DevelopersPrince 2511.TW N 41.7 36.9 34.3 25.8 18.2 42.1% -50.7% 8.5 7.6 8.5 1.4 1.3 1.3 16.4 17.6 14.7 5.0 6.5 5.9Hung Poo 2536.TW O 60.9 56.5 45.7 36.7 23.8 54.3% -57.9% 6.9 10.7 7.0 0.8 0.8 0.7 10.9 7.5 10.6 4.2 3.8 8.6Radium 2547.TW O 62.0 55.8 49.5 37.4 25.6 45.9% -54.1% 4.0 5.7 11.6 1.0 1.0 1.0 25.9 17.7 8.7 9.4 8.8 7.8Huaku 2548.TW O 127.2 112.2 90.2 95.4 67.8 40.7% -39.6% 6.0 6.1 5.9 1.7 1.5 1.4 27.9 25.4 24.2 9.1 11.5 11.8Farglory 5522.TW N 77.3 72.2 45.3 57.8 51.1 13.1% -29.3% 5.4 6.1 8.5 1.4 1.4 1.3 26.0 23.1 15.8 11.7 8.2 5.9Chong Hong 5534.TW N 84.4 82.5 59.4 66.0 64.4 2.5% -21.9% 5.8 7.8 8.8 1.9 1.8 1.7 32.9 23.2 19.6 9.6 8.3 7.4Asset playFENC 1402.TW O 42.8 39.3 37.5 39.3 33.5 17.3% -14.7% 12.4 11.3 17.6 1.6 1.6 1.6 13.0 14.0 9.2 6.0 6.6 4.3Taiwan Fertilizer 1722.TW O 144.8 130.1 115.5 104.1 75.8 37.3% -41.7% 43.1 25.0 20.2 1.5 1.5 1.4 3.5 5.9 7.1 2.9 2.8 3.5Property agencySinyi Realty 9940.TW N n.a 36.1 38.6 -6.4% n.a 7.1 11.9 10.1 2.1 2.5 2.3 29.6 17.7 16.3 7.8 4.2 5.011/18/2011 Source: Company data, Credit Suisse estimates
Note: O=Outperform; N=Neutral. Base case: 0-10% YoY ASP decrease in 2012. Bear case: 20-30% YoY ASP decrease in 2012; Bull case: 15-
25% YoY ASP growth in 2012
Source: Company data, Credit Suisse estimates

22 November 2011
Taiwan Market Strategy 100
Steel sector Sector research analysts: Sidney Yeh, David Liao, Grace Li
Downside risk on earnings forecast and dividends Based on fundamentals, the 4Q11E demand/profit outlook looks weak. In late October, China Steel (CSC) released its pricing for December shipments, which is down 0.17% from October-November. Among the various products, the company has left the prices of most products unchanged but cut electrical sheet price by NT$1,122/ton or 4.5% from the October-November pricing. We notice that the pricing has turned out to be weaker than management’s previous guidance of “definitely upward trend for December” back in late August when they released October-November pricing. Generally speaking, 2H11 pricing has been consistently below original targets, which is due to weak end-market demand.
Figure 256: Steel prices were flattish which imply sluggish demand October and November 2011 December 2011 Changes Change US$/ton US$/ton (%) NT$/t
Plates 838 838 0.0% 0
Bars/wire rods 937 937 0.0% 0
Hot-rolled sheets/coils 693 693 0.0% 0
Cold-rolled sheets/coils 752 752 0.0% 0
Electro galvanized sheets 833 796 -4.5% -1,122
Electrical sheets 860 860 0.0% 0
Hot-dip galvanized sheets 805 805 0.0% 0
Source: Company data, Credit Suisse estimates
Inventory piping up in the region We believe pricing is unlikely to improve any time soon given the deteriorating macro environment (thus weaker consumption and less capex by industrial companies) as well as the increased steel inventory in the region. We found that steel inventory has been moving up since June with reference to inventory statistics of Shanghai/Guangzhou’s HRC and CRC inventories. Across major production countries in Asia, Japan, and Korea steel makers’ inventories are also enhancing. The lower level of inventory in 1Q11 resulted in a stronger price growth of steel in 2Q11. Given the trend reversal on higher steel inventories of upper stream suppliers, we believe the price pressure will remain for a while.
Figure 257: Chinese steel inventories are staying high (in
a reference to Shanghai’s statistics)
Figure 258: Chinese steel inventories are staying high (in
a reference to Guangzhou’s statistics)
0
200
400
600
800
1,000
1,200
1,400
1,600
1,800
2,000
Jul-0
6S
ep-0
6N
ov-0
6Ja
n-07
Mar
-07
May
-07
Jul-0
7S
ep-0
7N
ov-0
7Ja
n-08
Mar
-08
May
-08
Jul-0
8S
ep-0
8N
ov-0
8Ja
n-09
Mar
-09
May
-09
Jul-0
9S
ep-0
9N
ov-0
9Ja
n-10
Mar
-10
May
-10
Jul-1
0S
ep-1
0N
ov-1
0Ja
n-11
Mar
-11
May
-11
Jul-1
1S
ep-1
1
('000 tons)
0
100
200
300
400
500
600
('000 tons)
HRC inventory (Shanghai, LHS) CRC inventory (Shanghai, RHS)
0
200
400
600
800
1,000
1,200
1,400
Jul-0
6S
ep-0
6N
ov-0
6Ja
n-07
Mar
-07
May
-07
Jul-0
7S
ep-0
7N
ov-0
7Ja
n-08
Mar
-08
May
-08
Jul-0
8S
ep-0
8N
ov-0
8Ja
n-09
Mar
-09
May
-09
Jul-0
9S
ep-0
9N
ov-0
9Ja
n-10
Mar
-10
May
-10
Jul-1
0S
ep-1
0N
ov-1
0Ja
n-11
Mar
-11
May
-11
Jul-1
1S
ep-1
1
('000 tons)
0
100
200
300
400
500
600
700
('000 tons)
HRC inventory (Guangzou, LHS) CRC inventory (Guangzou, RHS)
Source: Bloomberg Source: Bloomberg
Market held high expectation on steel prices year to date…
Capex delay of industrial companies and weak consumption led to enhancing inventories …
…therefore, demand will be weak for a while…

22 November 2011
Taiwan Market Strategy 101
Figure 259: Regional HRC inventories are also enhancing
HRC Inventories: Shanghai, Japan and Korea
1,0001,1001,2001,3001,4001,5001,6001,7001,8001,9002,000
Jan-
10
Feb
-10
Mar
-10
Apr
-10
May
-10
Jun-
10
Jul-1
0
Aug
-10
Sep
-10
Oct
-10
Nov
-10
Dec
-10
Jan-
11
Feb
-11
Mar
-11
Apr
-11
May
-11
Jun-
11
Jul-1
1
Aug
-11
Sep
-11
('000 tons)
050100150200250300350400450500
('000 tons)
Chinese Shanghai HRC Inv. (LHS) Japanese HRC Inv. (LHS)Korean HRC Inv. (RHS)
Source: Bloomberg, Company data, Credit Suisse estimates
Raw material cost is falling; so will ASP With regard to steel supplies, within the past two years, steel production recovered at a fast pace in Asian markets. Chinese crude steel production rose by 30-40% and resulted in tightening demand for raw materials. China recently released its 3Q11 GDP growth rate and the 3Q11 GDP has slowed down to around 9.1% (versus 9.5% in prior quarter). Our economics team believes the moderation may sustain for sequential quarters and that Chinese GDP might slip towards 7.5% or even lower in annualised QoQ terms for the next few quarters. However, the macro slowdown should have more impact on demand while posting less impact on steel supply. Therefore, the oversupply dynamics in China is expected to lead to stronger competition in price and slim margins for steel producers, in our view.
Figure 260: Chinese crude steel production ramped up significantly in the past two years
Steel production in China, Japan and Korea
3,0003,5004,0004,5005,0005,5006,0006,5007,0007,500
Jan-
09F
eb-0
9M
ar-0
9A
pr-0
9M
ay-0
9Ju
n-09
Jul-0
9A
ug-0
9S
ep-0
9O
ct-0
9N
ov-0
9D
ec-0
9Ja
n-10
Feb
-10
Mar
-10
Apr
-10
May
-10
Jun-
10Ju
l-10
Aug
-10
Sep
-10
Oct
-10
Nov
-10
Dec
-10
Jan-
11F
eb-1
1M
ar-1
1A
pr-1
1M
ay-1
1Ju
n-11
Jul-1
1A
ug-1
1S
ep-1
1
('000 tons)
40,000
45,000
50,000
55,000
60,000
65,000('000 tons)
Japanese Oridnary Steel Prod. (LHS) Korean Crude Steel Prod. (LHS)Chinese Crude Steel Prod. (RHS)
Source: CEIC, Bloomberg, Company data, Credit Suisse estimates
Market dynamic looks unhealthy given oversupply in China and slowdown of macro environment

22 November 2011
Taiwan Market Strategy 102
Emerging risk of inventory write-down Iron ore prices fell in a very dramatic pattern. The price crashed from US$171/tonne in September to US$120/tonne in early November, showing a 30% slump, and moderate rebound to US$145/tonne in mid November. Scrap price, a major feedstock for long steel makers, also saw a very weak trend since October. On the flip side, falling feedstock cost should save costs. On the other side, this should bring in higher risks on write-down of procured raw materials and in-process products.
In a reference to China Steel’s profits in 4Q08 and 1Q09, the company reported a write-off of around NT$17 bn and NT$4 bn, respectively. Tung Ho and Feng Hsin reported NT$1.1 bn and NT$2.9 bn in write-offs, respectively, at the same period. In our opinion, the write-off is subjective and will be the major swing factor for steel producer’s profits in the next two quarters as inventories (including the shipping cargo) are subject to the combined opinions between auditors and China Steel’s management. Together with unsettled spot prices, the write-off amount (if any) is hard to conclude now. However, with unclear demand outlook which is unlikely to support feedstock and steel prices, we believe the risks are more on the downside.
Figure 261: Case study on China Steel: subjective write-off and write-back caused strong
earnings volatility in 2008-09 NT$ mn 4Q08 1Q09 2Q09 3Q09
Procurement losses (profits) 5,902 753 (1,863) (1,244)
Impairment losses (profits) 11,096 3,305 (4,290) (9,921)
Write-off total 16,998 4,058 (6,153) (11,165)
Operating profits (10,971) (8,872) (2,398) 7,993
Net income (15,451) (7,176) 725 10,367
EPS (1.23) (0.57) 0.06 0.79
Source: Company data, Credit Suisse estimates
On the positive side regarding cost saving, the benefit is expected to be more vivid after one quarter, in our view, as China Steel still needs to digest higher cost raw material. In tandem with falling iron ore prices, we expect the demand in November and December to carry on the weak sentiment as steel traders might adopt a wait- and- see attitude before seeing more signals regarding feedstock bottoming. It is reasonable for traders to reload after China Steel’s price revisions in 1Q12E with the low cost put option holding on hand thanks to CSC’s retrospective pricing scheme. Limited incentives on building up inventories, higher regional steel inventories and unclear order visibility do not support promising spread growth, in our opinion.
Figure 262: Iron ore prices fell by 15-30% in a month
echoing very weak steel demand
Figure 263: Coking coal price was relative flattish within
the past few months
50
70
90
110
130
150
170
190
210
Jan-
09
Mar
-09
May
-09
Jul-0
9
Sep
-09
Nov
-09
Jan-
10
Mar
-10
May
-10
Jul-1
0
Sep
-10
Nov
-10
Jan-
11
Mar
-11
May
-11
Jul-1
1
Sep
-11
Nov
-11
(US$/ton)
Chinese import Iron Ore Price (62% Fe)
130
150
170
190
210
230
250
270
290
310
Jan-
09
Mar
-09
May
-09
Jul-0
9
Sep
-09
Nov
-09
Jan-
10
Mar
-10
May
-10
Jul-1
0
Sep
-10
Nov
-10
Jan-
11
Mar
-11
May
-11
Jul-1
1
Sep
-11
(US$/ton)
Mccloskey/Xinhua China Coking Coal Price
Source: Bloomberg, Credit Suisse estimates Source: Bloomberg, Credit Suisse estimates
Fast fall on feedstock price is a “good” or “bad” news to steel makers?
We lean to negative side on emerging write off risks…
Cost saving will not benefit China Steel soon

22 November 2011
Taiwan Market Strategy 103
January/February prices are likely to dip… rebates should hurt December profits In tandem with feedstock price corrections, we expect the steel price to be unlikely held. According to management, the price is expected to be announced by late November (24 Nov). If any steel price correction is due to softening feedstock prices, the retrospective pricing scheme would result in steel price decline in December and weak demand in November, in our view. Based on weak feedstock prices, the emerging pressure on price revision should double hit profit (ASP/shipment cut and write-off risks) of China Steel in our view.
Figure 264: HRC and CRC prices have been softening from this summer
300
400
500
600
700
800
900
Jan-
08
Mar
-08
May
-08
Jul-0
8
Sep
-08
Nov
-08
Jan-
09
Mar
-09
May
-09
Jul-0
9
Sep
-09
Nov
-09
Jan-
10
Mar
-10
May
-10
Jul-1
0
Sep
-10
Nov
-10
Jan-
11
Mar
-11
May
-11
Jul-1
1
Sep
-11
Nov
-11
Jan-
12
Mar
-12
(US$/ ton)
Hot-rolled Sheets/Coils Price Cold-rolled Sheets/Coils Price
Source: Company data, TEJ, Credit Suisse estimates
Still cautious on steel sector Given the weak bargaining power of China Steel over downstream clients, emerging write-off risks and yet-to-alleviate industrial steel inventories, we hold our cautious stance on China Steel (CSC) unchanged. As for long steel makers, inventory write-off risk is also not yet alleviated given ample scrap supplies (major feedstock for long steel makers) and lukewarm downstream demand. Into 2012, while the drop of public infrastructure spending is well known by investors, private demand is also sluggish due to delay of project launches of property developers (50% or plus projects faced delay in launching in 2H11) and lower capex plans of enterprises. Together with near-term earnings uncertainties and a weak demand outlook for 2012E, we retain our cautious view on long steel makers.
Figure 265: Valuation matrix of Taiwan steel sector Rating Target Price Current Price Upside Pot. PE (x) PB (x) ROAE (%) Net Debt/Equity (%) Dividend Yield (%)
Ticker NT$/share NT$/share (%) 10A 11E 12E 10A 11E 12E 10A 11E 12E 10A 11E 12E 10A 11E 12ESteel 14.3 12.9 12.7 1.5 1.5 1.4 12.2% 12.5% 11.6% 43.6% 43.2% 44.9% 5.8% 5.9% 5.6%China Steel 2002.TW NEUTRAL 31.1 28.0 10.9% 10.1 18.3 15.0 1.4 1.5 1.4 14.8% 8.3% 9.9% 27.0% 39.1% 42.4% 7.1% 3.0% 3.7%Tung Ho 2006.TW NEUTRAL 35.9 26.6 35.2% 20.6 9.6 10.7 1.3 1.2 1.2 6.3% 12.8% 11.1% 60.2% 47.3% 47.5% 4.5% 8.4% 7.5%Feng Hsin 2015.TW NEUTRAL 54.8 50.2 9.2% 12.4 11.0 12.3 1.8 1.7 1.7 15.7% 16.3% 13.9% net cash net cash net cash 5.7% 6.4% 5.7%
November 18, 2011 Source: Company data, Credit Suisse estimates
We are seeing more price cut pressure on CSC’s Jan/Feb prices
…don’t forget the price revision also affects its Dec price…

22 November 2011
Taiwan Market Strategy 104
Telecoms Sector research analyst: Chate Benchavitvilai
Demand and supply: Smartphones and data usage Smartphone and mobile data growth momentum set to continue
For mobile, we expect growth momentum in Taiwan’s smartphone penetration and mobile data usage to continue into FY12E, driven both by demand (consumers want handset upgrades, data usage) and supply (operators seek data revenue to replace declining voice revenues, continue to lock-in potential smartphone users).
We expect smartphone penetration in Taiwan to continue to increase steadily by around 1% of postpaid subscriber per month to 32% of postpaid subscribers by end-2012E, from 20% as of Y/E11E. Note that smartphone and tablets accounted for 45–67% of total new devices sold by the big three operators (CHT, TWM and FET) in 3Q11, compared with 25–30% reported in FY10.
In FY12, we expect medium-end smartphones to play an increasingly important role in driving smartphone growth and data usage as it helps address the affordability barrier and reduce handset subsidy pressure on operators. But we do not expect to see a significant acceleration in terms of smartphone subscriber growth, as we expect operators to continue to balance between smartphone growth (handset subsidies are recorded upfront) and bottom line growth to preserve dividend flow.
Figure 266: Taiwan SWD subscribers and penetration Figure 267: The big three’s mobile data revenue
0.50 1.03 2.134.86
7.9610.68
12.9214.72
2% 5%9%
20%
32%
41%
49%54%
0
2
4
6
8
10
12
14
16
2008 2009 2010 2011E 2012E 2013E 2014E 2015E
0%
10%
20%
30%
40%
50%
60%
Estimated "Activ e" SWD (mn) Penetration of Postpaid base
Penetration of Total base
Smartphone
"acceleration" phase
168.3141.9 138.2 134.6 131.2 127.8
19.7 23.1 28.6 40.6 69.5 78.9 85.1
154.3
158.9
56.2
34%
40%38%
16%
10%13%
22%29%
0
50
100
150
200
250
2008 2009 2010 2011E 2012E 2013E 2014E 2015E
0%
5%
10%
15%
20%
25%
30%
35%
40%
45%
Voice rev enue Data rev enue Data rev enue as %
SWD: Smart wireless devices
Source: Company data, Credit Suisse estimates
Source: Company data, Credit Suisse estimates
We forecast the big three mobile operators in Taiwan will be able to deliver 38.4% YoY growth in mobile data revenue in FY12E, slightly lower than the 41.9% we expect for FY11E due to the higher revenue base. We expect mobile data revenue to account for 28.9% of overall mobile service revenue, up from 22.3% in FY11E. We expect this growth to be enough to deliver 6.5% YoY growth in overall mobile service revenue despite our forecast for a 2.6% YoY decline in mobile voice revenue into FY12E.
We expect mobile competition, particularly in the smartphone space, to remain benign. We had argued in our August 2011 report, Inflection Point, that competition in the smartphone space has moved beyond price to the entire ecosystem (network, distribution, customer management, content, etc.). Therefore, it is more difficult for smaller operators to compete, at least in the near term.

22 November 2011
Taiwan Market Strategy 105
Fixed broadband competition could intensify further
On the fixed line side, we expect competition on the fixed broadband access to continue into FY12E as cable operators (including TWM) continue to try to gain market share away from CHT. CHT’s key strategy is to attract new subscribers while retaining its existing subscribers using a combination of higher speed and lower price in order to upgrade subscribers from ADSL to FTTx technology. CHT reduced its broadband tariff at the end of June 2011, particularly for FTTx 20 Mbps and 50 Mbps services. This tariff reduction resulted in a 4.9% QoQ and 6.0% YoY decline in CHT’s blended broadband ARPU to NT$742 in 3Q11.
CHT management suggested that: (1) the negative impact of such tariff cuts on revenue could remain in the near term, but that ARPU should improve from 4Q11E; (2) ARPU should go back to the previous level when 50 Mbps or higher subscriber base reaches scale next year (600,000 from 343,000 currently); and (3) this migration will benefit the internet VAS business in the longer term. However, we expect price pressure to continue in the medium to longer term as cable broadband penetration (e.g., 26.6% penetration of TWM’s cable TV subscribers, 13.4% YoY subscriber base growth) remains relatively low, while it could take time for Internet VAS revenue contribution to grow (currently 12.4% of CHT’s internet revenue). CHT management expects Internet VAS revenue to grow quickly following the migration to higher-speed FTTx and contribute more significant revenues and profitability to the company.
Figure 268: Taiwan fixed broadband subscribers (mn)—
FTTx, cable broadband making progress
Figure 269: CHT’s and TWM’s broadband ARPU (NT$/mth)
3.22.6 2.4 2.3 2.2 2.2
1.11.5 2.0 2.0 2.1 2.2
0.6 0.80.9 1.0 1.0 1.0
16%17% 18% 18% 18%
13%
0
1
2
3
4
5
6
Dec-08 Dec-09 Dec-10 Mar-11 Jun-11 Sep-11
0%
2%
4%
6%
8%
10%
12%
14%
16%
18%
20%
ADSL FTTx Cable Cable as % of total
790 786 792 789 790 789
762781 782 783 777 779
751734 741
503 504 505 506 507 514 514 518 516 515 519 522 524 527 531
450
500
550
600
650
700
750
800
850
Jul 1
0
Sep
10
Nov
10
Jan
11
Mar
11
May
11
Jul 1
1
Sep
11
CHT Broadband ARPU (NT$) TWM Broadband ARPU (NT$)
Source: Company data, Credit Suisse estimates Source: Company data, Credit Suisse estimates
CHT’s MOD/IPTV service gaining traction, could continue to grow
CHT’s MOD/IPTV subscriber base crossed 1 mn in November 2011 (~12% household penetration, ~22% of CHT’s broadband lines), up 22.9% from 814,000 subscribers as of end-December 2010, while ARPU has been relatively stable YoY at NT$133 per month in 3Q11 (lower than headline price of NT$359/month due to revenue sharing with content providers).
While revenue contribution from the service remained low at ~NT$369 mn in 3Q11 (~0.7% of group revenue) and the business is yet to break even, CHT management reiterated its positive view on the business. It expects to: (1) invest further in content to enhance competitiveness (e.g., acquisition of Olympic 2012 broadcasting rights, increase HD channels to 43 from 21 as at June 2011) and (2) launch a new platform that would allow content access though multiple devices (e.g. smartphones and tablets). CHT targets 1.5 mn MOD/IPTV subscribers by Y/E12E.

22 November 2011
Taiwan Market Strategy 106
While TWM stated that it has not seen any impact from CHT’s MOD/IPTV service, partly due to CHT’s lack of very popular content (such as local dramas), we believe CHT’s growing content variety, subscriber scale and its plan to integrate its content offerings onto multiple access devices might start to put some competitive pressure on cable operators into FY12E, especially if CHT decides to push more aggressively on content.
Profitability: Expect stable mobile EBITDA margin We expect EBITDA margin for all the big three mobile operators to stabilise or improve slightly into FY12E. We note that this is a significant improvement after several years of EBITDA margin decline for the big three operators. Key factors driving FY12E margins are: (1) smartphone subscriber and mobile data revenue growth, and (2) smaller regulatory-related impact, particular from the change in F2M pricing rights in FY11E.
While we expect mobile voice revenue to decline YoY (competition, regulatory driven), mobile data revenue and smartphone subscriber scale are now large enough for operating leverage to be in favour of the big three operators in Taiwan. The impact from the change in F2M pricing rights should be smaller for both TWM and FET (~NT$100–150 mn decline, compared to NT$700–900 mn in FY11E), while CHT should also begin to benefit from the change due to lower transition fee paid to mobile operators YoY.
Figure 270: CHT, TWM and FET mobile EBITDA margin on service revenues
61.4%57.9%
54.0%51.0%
45.1% 45.1%46.9%46.0% 45.2% 44.9%
41.1%37.5% 38.1% 39.4%
46.2% 45.3% 43.7%
39.6%36.6% 36.6% 38.1%
20%
25%
30%
35%
40%
45%
50%
55%
60%
65%
2007 2008 2009 2010 2011E 2012E 2013E
CHT - Mobile EBITDA margin TWM - Mobile EBITDA margin FET - Mobile EBITDA margin
Source: Company data, Credit Suisse estimates
On a consolidated basis, we expect TWM’s EBITDA margin to decline YoY to 31.3% from 33.0% in FY11E due to the consolidation of low-margin MOMO business. We expect both FET and TWM to be able to deliver 8.0% YoY growth in core consolidated EBITDA (11.3% YoY growth for TWM if MOMO is included), while CHT should also be able to deliver EBITDA growth, but slower at 2.4% YoY due to its less exposure to mobile.
Stocks: Go for higher mobile exposure Overall, we maintain our positive view on smartphone opportunity in Taiwan, and with headwinds from adverse regulatory changes, particularly the shift in F2M pricing rights becoming less severe into FY12E, the favourable operating leverage should allow mobile operators to deliver strong profitability growth into FY12E.
While CHT remains the market leader within the mobile space with 33% revenue market share and the lowest churn rate (high customer loyalty), we note that mobile only contributes 37.4% of its FY11E group’s consolidated EBITDA. In our view, CHT will continue to face challenges on its fixed line (e.g., broadband competition, MOD/IPTV
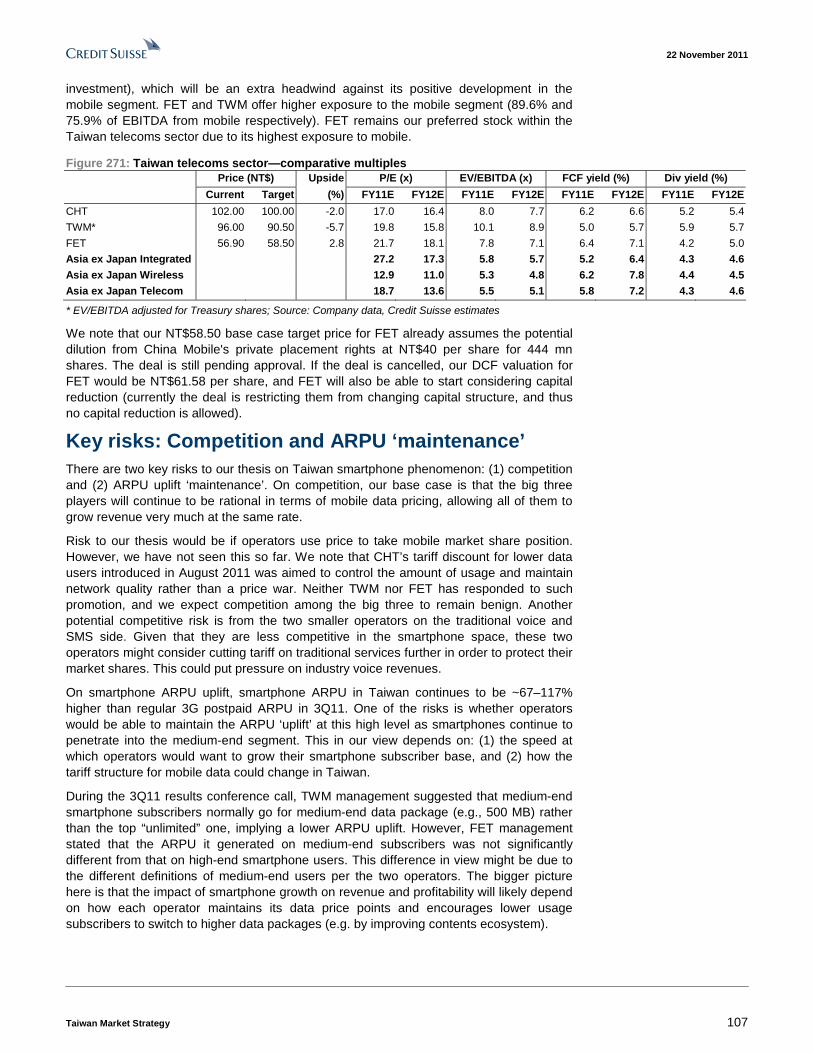
22 November 2011
Taiwan Market Strategy 107
investment), which will be an extra headwind against its positive development in the mobile segment. FET and TWM offer higher exposure to the mobile segment (89.6% and 75.9% of EBITDA from mobile respectively). FET remains our preferred stock within the Taiwan telecoms sector due to its highest exposure to mobile.
Figure 271: Taiwan telecoms sector—comparative multiples Price (NT$) Upside P/E (x) EV/EBITDA (x) FCF yield (%) Div yield (%)
Current Target (%) FY11E FY12E FY11E FY12E FY11E FY12E FY11E FY12E
CHT 102.00 100.00 -2.0 17.0 16.4 8.0 7.7 6.2 6.6 5.2 5.4
TWM* 96.00 90.50 -5.7 19.8 15.8 10.1 8.9 5.0 5.7 5.9 5.7
FET 56.90 58.50 2.8 21.7 18.1 7.8 7.1 6.4 7.1 4.2 5.0
Asia ex Japan Integrated 27.2 17.3 5.8 5.7 5.2 6.4 4.3 4.6
Asia ex Japan Wireless 12.9 11.0 5.3 4.8 6.2 7.8 4.4 4.5
Asia ex Japan Telecom 18.7 13.6 5.5 5.1 5.8 7.2 4.3 4.6
* EV/EBITDA adjusted for Treasury shares; Source: Company data, Credit Suisse estimates
We note that our NT$58.50 base case target price for FET already assumes the potential dilution from China Mobile's private placement rights at NT$40 per share for 444 mn shares. The deal is still pending approval. If the deal is cancelled, our DCF valuation for FET would be NT$61.58 per share, and FET will also be able to start considering capital reduction (currently the deal is restricting them from changing capital structure, and thus no capital reduction is allowed).
Key risks: Competition and ARPU ‘maintenance’ There are two key risks to our thesis on Taiwan smartphone phenomenon: (1) competition and (2) ARPU uplift ‘maintenance’. On competition, our base case is that the big three players will continue to be rational in terms of mobile data pricing, allowing all of them to grow revenue very much at the same rate.
Risk to our thesis would be if operators use price to take mobile market share position. However, we have not seen this so far. We note that CHT’s tariff discount for lower data users introduced in August 2011 was aimed to control the amount of usage and maintain network quality rather than a price war. Neither TWM nor FET has responded to such promotion, and we expect competition among the big three to remain benign. Another potential competitive risk is from the two smaller operators on the traditional voice and SMS side. Given that they are less competitive in the smartphone space, these two operators might consider cutting tariff on traditional services further in order to protect their market shares. This could put pressure on industry voice revenues.
On smartphone ARPU uplift, smartphone ARPU in Taiwan continues to be ~67–117% higher than regular 3G postpaid ARPU in 3Q11. One of the risks is whether operators would be able to maintain the ARPU ‘uplift’ at this high level as smartphones continue to penetrate into the medium-end segment. This in our view depends on: (1) the speed at which operators would want to grow their smartphone subscriber base, and (2) how the tariff structure for mobile data could change in Taiwan.
During the 3Q11 results conference call, TWM management suggested that medium-end smartphone subscribers normally go for medium-end data package (e.g., 500 MB) rather than the top “unlimited” one, implying a lower ARPU uplift. However, FET management stated that the ARPU it generated on medium-end subscribers was not significantly different from that on high-end smartphone users. This difference in view might be due to the different definitions of medium-end users per the two operators. The bigger picture here is that the impact of smartphone growth on revenue and profitability will likely depend on how each operator maintains its data price points and encourages lower usage subscribers to switch to higher data packages (e.g. by improving contents ecosystem).

22 November 2011
Taiwan Market Strategy 108
Transportation: Sector research analysts: Sam Lee, Toh Hung Bin
2012E will continue to be challenging 2011 is challenging for the transportation sector, and we think the operating environment in 2012E will continue to be tough, due to weak global economic growth and high fuel prices. We have our OUTPERFORM rating only on Evergreen and Wan Hai Lines in the container shipping sector, on low P/B valuations, although their profitability outlook is not so encouraging. We are cautious on Taiwanese airlines and bulk shipping names due to their expensive valuations and/or industry oversupply. We maintain our UNDERPERFORM ratings on U-Ming, EVA and China Airlines.
Container shipping: A cost-push rate recovery? We do not think the industry demand-supply balance is favouring shipowners, which means that the rate environment will unlikely be positive in the medium term. US ISM index data comes as a relief, but does not suggest a recovery in Asian exports yet, in our view. Our 2012 global trade demand assumption of 6.4% is below historical average of 8–9%. On the supply side, we estimate 7.9% and 8.9% capacity growth in 2012 and 2013. In other words, supply growth should accelerate in the near term. Thus, we conclude that 2012E supply-demand should deteriorate marginally.
However, our detailed analysis suggests that the current freight rate does not cover cash cost, or even fuel/charter expenses on various trades, especially in the ‘bread-and-butter’ Transpacific and Asia/Europe trades. We think this is unsustainable and idling fleet will have to go up, which should stabilise freight rate. Thus, we expect companies’ blended rates to decline 6% in 2011, but recover marginally by 3% p.a. on average in 2012–13.
Expectations already low on low P/B multiples Given the low P/B multiples, we believe market expectation is already quite low. Evergreen is leveraged to the cycle given its leadership position in Asia, and its forward P/B of 0.7x is more than one standard deviation below the historical average. We believe demand and rate in the Intra-Asia market will continue to outperform the long-haul demand and rate, and WHL had 56% revenue exposure to the former in 1H11. Yang Ming is expensive on 0.9x P/B compared to EMC. WHL’s forward P/B of 10.9x is higher than its peers, but justified by its superior performance and lower risk profile. On an absolute basis, its P/B is almost two standard deviations below historical average of 1.3x.
Figure 272: Fleet idling vs Asia/Europe cash margins Figure 273: EMC’s 12m fwd P/B 1SD below long-term avg
-600
-400
-200
0
200
400
600
800
1,000
1,200
1,400
Aug 09 Dec 09 Apr 10 Aug 10 Dec 10 Apr 11 Aug 11 Dec 11
0%
2%
4%
6%
8%
10%
12%
AE spot rate - Op cost Idle lfeet % total Inv erted RHS)
US$/TEU Idle% |(inv erted)
??
0.4
0.6
0.8
1.0
1.2
1.4
1.6
1.8
2.0
Dec 93 Dec 96 Dec 99 Dec 02 Dec 05 Dec 08 Dec 11
Target price of NT$18.70(x )
Source: Shanghai Shipping Exchange, Clarkson, company data,
Credit Suisse estimates Source: Company data, Credit Suisse estimates
2012E should continue to be challenging. We prefer those with low valuations which share prices will be more defensive
Demand-supply unfavourable, but current rate is below cash cost; we think the number of idle fleet will rise, stabilising freight rates in 2012E
Evergreen’s P/B is way below the historical average; WHL’s P/B is more than 1 SD below the historical average

22 November 2011
Taiwan Market Strategy 109
Bulk shipping: BDI to normalise from 2013? While drybulk vessel fleet growth peaked in February 2011, vessel supply growth remains huge with the fleet still growing at more than 14% YoY in October. Looking at the order book delivery schedule, we expect strong deliveries in the next four quarters, similar to the past seven quarters of ~20 mn DWT per quarter. We expect weak demand growth in 2012. Our China steel analyst, Trina Chen, forecasts steel production to grow only 2.5% YoY in 2012E; this mainly reflects the weaker steel demand from the property sector and weaker FAI as government tightening measures should lead to launch of fewer new projects. Overall, we expect drybulk demand to grow 3.8% YoY in 2012E, driven mainly by major bulk growth of 4.0% and minor bulk growth of 3.4%. In our view, the current Europe crisis, a slowing Chinese economy and a lacklustre US economy are likely to offset the positive demand growth from the Japan earthquake reconstruction, which will result in further downside risk to demand.
With expected supply of 12% versus bulk shipping demand of 3.8%, oversupply is likely to remain a problem in 2012, even three years after the global financial crisis. We also do not expect a repeat of 2009/10, when global drybulk demand surged on quantitative easing and stimulus, with the global economy and China slowing down. We expect the BDI to remain low and largely flattish into 2012 due to vessel oversupply. Compared to 2011, we believe the average BDI is likely to trend higher at around 1,500 on slower vessel supply growth. We believe the sector is likely to see a balanced demand-supply scenario in 2013, at the earliest, as supply growth slows to 8.6%.
Figure 274: Credit Suisse BDI forecasts 2011E 2012E 2013E
BDI 1,350 1,500 2,500
Source: Credit Suisse estimates
NEUTRAL on Sincere, UNDERPERFORM on U-Ming With over 75% of earnings locked in on five-year time charter contracts, we expect Sincere to remain profitable on higher earnings visibility. Our target price of NT$31.30 is based on 1.0x 12M forward P/B. U-Ming has the most expensive valuations in the sector, despite weaker profitability, and with around 50% spot market freight rate exposure, we maintain our UNDERPERFORM rating with a target price of NT$38, based on 1.1x 12M forward P/B, the mid-point of historical average and 1SD below.
Figure 275: Scheduled deliveries for coming quarters still
high despite potentially weaker demand
Figure 276: Demand-supply improving marginally, but
oversupply likely to remain for the next two years
0
5
10
15
20
25
30
35
40
1Q09 3Q09 1Q10 3Q10 1Q11 3Q11 1Q12 3Q12
Capesize Panamax Handy max Handy size
(mn tons) Forecast
-4
-2
0
2
4
6
8
10
12
14
16
1990 1992 1994 1996 1998 2000 2002 2004 2006 2008 2010 2012E
Demand grow th Supply grow th
(%) Forecast
Source: Clarksons, Credit Suisse estimates Source: Clarksons, ABARE-BRS, Credit Suisse estimates
Drybulk shipping demand to grow only 3.8%, but supply at 12% in 2012E
BDI to remain low and largely flattish into 2012E on industry oversupply
Sincere is more defensive with high earnings visibility. U-Ming has the highest P/B multiple in the sector despite weaker profitability

22 November 2011
Taiwan Market Strategy 110
Airlines: Earnings risks on the horizon Like their regional peers, Taiwanese carriers managed to report decent YoY passenger growth in 3Q11. CS economists expect economic growth to moderate, but they do not expect a recession for 2012E. We expect global and Asia 2012E passenger demand to grow 5% and 7%, respectively. Positives risks include recovery in demand on the Taiwan-Japan routes, possible increase in cross-strait flights and wavier of US visa restrictions.
However, we are also seeing some potential negatives. First, cargo demand remained weak with most carriers reporting 5-16% YoY decline. Yields have also been falling at double-digits (-7% YoY in October for EVA). EVA and China Airlines (CAL) are exposed to this, deriving 35–36% revenue from cargo in the first nine months of the year. Worse still, cargo demand usually leads passenger demand by about six months, which could imply a weaker operating environment for the passenger business going into 2012E.
Second, high fuel price remains a concern, and Taiwanese carriers have low fuel hedging ratios (less than 15%). Third, we expect competition to rise within the region. While capacity increase is moderate for Taiwan carriers, Far East Asia, the Middle East and global airlines will all see accelerated gross capacity growth into 2012–13E. By aggregating total seat capacity to be delivered up to 2014E, we estimate that Asian and global carriers will increase their seats at an 8% CAGR in 2010-13E, and ME carriers will expand even faster at 11%.
Fourth, the potential cut in airfares on cross-strait flights due to political pressure can offset the benefits of adding more flights to China. Fifth, Taiwanese airlines have been key beneficiaries of the closer economic ties with China. A DPP presidential victory in January 2012 could mean a slowdown, or even a halt, in the economy opening up further to China, which is a negative for EVA and CAL.
Valuation expensive compared to regional peers EVA and CAL are trading at 1.2x and 1.3x forward P/B, respectively, which are among the most expensive valuations among Asian airlines, considering the projected FY12E RoAE of 7–9%. Its peers such as Cathay Pacific and Air China, which generate similar or higher RoAE, are trading at only 0.8-1.0x P/B. We note that in 2002 and 2004, EVA’s P/B hovered around 0.9-1.0x when it generated an RoE of 8%. CAL’s P/B averaged only 0.7x when its average RoE was around 6% from 1998 to 2005. We believe the market’s expectations on these two companies are too high; thus, we rate them UNDERPERFORM.
Figure 277: EVA’s monthly cargo revenue falling YoY
(-17% YoY in October)
Figure 278: EVA/CAL’s FY12E P/B high considering our
projected FY12E RoAEs
1,000
1,500
2,000
2,500
3,000
3,500
4,000
4,500
Jan Feb Mar Apr May Jun Jul Aug Sep Oct Nov Dec
2006 2007 2009 2010 2011
Cargo rev enue (NT$mn)
AirAsia
CX
China Air
EVA AirMAS
SIA
Qantas
Air China
CEA
CSA
TGR
THAI
y = 0.029x + 0.7454
R2 = 0.1791
0.4
0.6
0.8
1.0
1.2
1.4
1.6
1.8
2.0
2.2
5 10 15 20 25
FY2012E RoAE (%)
FY12E P/B (x )
Source: Company data, Credit Suisse estimates Source: Company data, Credit Suisse estimates
Passenger demand still growing
EVA and CAL exposed to the airfreight business, which has been doing worse than the passenger business
Other issues: High fuel price, rising competition, potential cut in ticket prices on cross-strait flights and political risks
EVA and CAL have among the highest P/Bs in the region

22 November 2011
Taiwan Market Strategy 111
Companies Mentioned (Price as of 18 Nov 11) Acer Group (2353.TW, NT$34.20, UNDERPERFORM, TP NT$26.00) Advanced Micro Devices, Inc. (AMD, $5.47, NEUTRAL [V], TP $7.00) Advanced Semicon. Engr. (2311.TW, NT$27.55, OUTPERFORM, TP NT$34.00) AimCore (3615.TW, NT$89.8, NOT RATED) Amazon.com Inc. (AMZN, $197.14, NEUTRAL, TP $200.00) Anhui Conch Cement Co. Ltd. (0914.HK, HK$24.35, NEUTRAL [V], TP HK$28.00) Apcb (6108.TW, NT$19.35, NOT RATED) Apple Inc. (AAPL, $374.94, OUTPERFORM, TP $500.00)LG Corp (003550.KS, W58,500) Asia Cement (1102.TW, NT$31.85, OUTPERFORM, TP NT$47.45) Asustek (2357.TW, NT$202.50, OUTPERFORM, TP NT$260.00) Atmel Corporation (ATML, $9.11, NOT RATED) AU Optronics (2409.TW, NT$13.75, OUTPERFORM, TP NT$16.00) B.F. (5321.TW, NT$2.55, NOT RATED) Broadcom Corp. (BRCM, $32.77, OUTPERFORM, TP $45.00) Cando (8056.TW, NT$7.22, NOT RATED) Catcher Technology (2474.TW, NT$169.50, OUTPERFORM, TP NT$210.00) Cathay Financial Holding (2882.TW, NT$31.40, NEUTRAL, TP NT$36.50) Chang Hwa Commercial Bank (2801.TW, NT$17.00, NEUTRAL, TP NT$19.00) Cheng Shin Rubber (2105.TW, NT$64.50, OUTPERFORM, TP NT$77.92) Chicony (2385.TW, NT$48.35, NEUTRAL, TP NT$58.00) Chimei Innolux Corporation (3481.TW, NT$13.25, NEUTRAL, TP NT$13.00) China Airlines (2610.TW, NT$13.40, UNDERPERFORM, TP NT$12.00) China National Building Material Co (3323.HK, HK$9.42, UNDERPERFORM [V], TP HK$9.00) China Shanshui Cement Group Ltd. (0691.HK, HK$5.76, NEUTRAL [V], TP HK$8.50) China Steel (2002.TW, NT$28.00, NEUTRAL, TP NT$31.05) Chinatrust Financial Holding (2891.TW, NT$17.05, OUTPERFORM, TP NT$23.50) Chong Hong Construction Co., Ltd (5534.TW, NT$64.40, NEUTRAL, TP NT$66.00) Chunghwa Picture (2475.TW, NT$1.68, NOT RATED) ChungHwa Telecom (2412.TW, NT$102.00, NEUTRAL, TP NT$100.00) Compal Electronics (2324.TW, NT$28.80, NEUTRAL, TP NT$26.00) Coretronic Corp (5371.TWO, NT$24.60, NEUTRAL, TP NT$26.00) CyberTAN Technology Inc. (3062.TW, NT$32.90, OUTPERFORM, TP NT$39.00) Cypress Semiconductor Corp. (CY, $18.75, NEUTRAL, TP $24.00) Delta Electronics (2308.TW, NT$70.60, UNDERPERFORM, TP NT$60.00) D-Link (2332.TW, NT$22.30, OUTPERFORM, TP NT$31.00) E Ink Holdings Inc (8069.TWO, NT$59.20, OUTPERFORM [V], TP NT$88.00) E.Sun Financial Holding Co. (2884.TW, NT$13.65, OUTPERFORM, TP NT$19.00) Elan Microelectronics Corp (2458.TW, NT$29.15, UNDERPERFORM, TP NT$25.00) Epistar Corporation (2448.TW, NT$58.10, NEUTRAL, TP NT$65.00) EVA Air (2618.TW, NT$18.50, UNDERPERFORM [V], TP NT$16.00) Evergreen Marine (2603.TW, NT$15.15, OUTPERFORM, TP NT$18.70) Everlight Electronics Co Ltd (2393.TW, NT$51.60, NEUTRAL, TP NT$54.00) Family Mart. (5903.TWO, NT$133, NOT RATED) Far Eastern New Century Corporation (1402.TW, NT$33.50, OUTPERFORM, TP NT$39.30) Far EasTone Telecom (4904.TW, NT$56.90, OUTPERFORM, TP NT$58.50) Farglory Land Development Co Ltd (5522.TW, NT$51.10, NEUTRAL, TP NT$57.80) Feng Hsin Iron & Steel Co Ltd (2015.TW, NT$50.20, NEUTRAL, TP NT$54.80) First Financial Holding Co Ltd (2892.TW, NT$17.55, NEUTRAL, TP NT$20.00) Flextronics (FLEX, $5.80, NOT RATED) Formosa Chemical & Fibre (1326.TW, NT$80.00, OUTPERFORM, TP NT$106.60) Formosa Petrochemical (6505.TW, NT$93.80, UNDERPERFORM, TP NT$75.80) Formosa Plastics (1301.TW, NT$80.30, NEUTRAL, TP NT$94.20) Foxconn Technology Corp (2354.TW, NT$99.50, NEUTRAL [V], TP NT$89.52) Freescale Semiconductor Inc. (FSL, $12.75, RESTRICTED) Fubon Financial Holding (2881.TW, NT$31.15, NEUTRAL, TP NT$36.00) Gemtek Technology Co Ltd (4906.TW, NT$25.25, NEUTRAL, TP NT$27.00) Genesis Microchip (GNSS, $8.64, NOT RATED) Giantplus Technology (8105.TW, NT$9.86, NEUTRAL [V], TP NT$11.00) Gintech Energy Corporation (3514.TW, NT$28.55, NEUTRAL [V], TP NT$36.00) Global Brands (6191.TW, NT$13.7, NOT RATED) Gold Circuit (2368.TW, NT$8.17, NOT RATED) HannStar Board (5469.TW, NT$12.75, NOT RATED) Hannstar Display Corp (6116.TW, NT$1.82, NOT RATED) Himax Technologies Inc (HIMX.OQ, $1.06, NOT RATED)

22 November 2011
Taiwan Market Strategy 112
Hisense Electric Company Ltd (600060.SS, Rmb12.22, NOT RATED) Hon Hai Precision (2317.TW, NT$80.10, NEUTRAL, TP NT$102.73) HTC Corp (2498.TW, NT$660.00, OUTPERFORM [V], TP NT$930.00) Hua Nan Financial Holding (2880.TW, NT$17.15, UNDERPERFORM, TP NT$16.00) Huaku Development Co Ltd (2548.TW, NT$67.80, OUTPERFORM, TP NT$95.40) Hung Poo Real Estate Development Co., Ltd (2536.TW, NT$23.80, OUTPERFORM, TP NT$36.70) I-Chiun (2486.TW, NT$14.60, OUTPERFORM, TP NT$51.00) Idion Technology (IDIJ.J, R3.59, NOT RATED) Infineon Technologies (IFXGn.DE, Eu 5.91, NOT RATED) Inotera Memories Inc. (3474.TW, NT$4.35, NEUTRAL [V], TP NT$17.00) Intel Corp. (INTC, $24.29, OUTPERFORM, TP $32.00) J Touch (3584.TW, NT$48.5, NOT RATED) Kinsus Interconnect Tech (3189.TW, NT$98.00, NEUTRAL [V], TP NT$110.00) Konka Group Co Ltd (000016.SZ, Rmb4.00, NOT RATED) Largan Precision (3008.TW, NT$572.00, NEUTRAL, TP NT$700.00) Lenovo Group Ltd (0992.HK, HK$5.18, OUTPERFORM, TP HK$6.30) LG Corp (003550.KS, W58,500, NOT RATED) Marvell Technology Group Ltd. (MRVL, $14.65, OUTPERFORM, TP $22.00) MediaTek Inc. (2454.TW, NT$308.00, UNDERPERFORM, TP NT$306.00) Mega Financial Holding Co Ltd (2886.TW, NT$19.70, NEUTRAL, TP NT$21.00) Motech Industries (6244.TWO, NT$50.00, UNDERPERFORM [V], TP NT$49.00) Motorola Inc. (MOT, $39.77, NOT RATED) Mstar Semiconductor (3697.TW, NT$170.50, OUTPERFORM [V], TP NT$223.00) Nan Ya Plastics (1303.TW, NT$61.10, NEUTRAL, TP NT$64.40) Nan Ya Printed Circuit Board (8046.TW, NT$75.60, NEUTRAL, TP NT$100.00) Nanya Technology (2408.TW, NT$2.67, UNDERPERFORM [V], TP NT$10.00) NGK Spark Plug (5334, ¥960, NEUTRAL, TP ¥1,000, MARKET WEIGHT) Nokia (NOK1V.HE, Eu 4.82, UNDERPERFORM, TP Eu 4.00) Novatek Microelectronics Corp Ltd (3034.TW, NT$77.10, OUTPERFORM, TP NT$90.00) Nvidia Corporation (NVDA, $13.93, NOT RATED) Palm Inc. (PALM, $5.69, NOT RATED) Panasonic Corporation (6752, ¥686, OUTPERFORM, TP ¥950, MARKET WEIGHT) Pegatron (4938.TW, NT$30.95, NEUTRAL, TP NT$30.00) Pixart Imaging Inc (3227.TWO, NT$80.10, NEUTRAL, TP NT$78.00) Pixelworks, Inc. (PXLW, $2.26, NOT RATED) Powertech Technology (6239.TW, NT$70.00, OUTPERFORM, TP NT$88.00) President Chain Store (2912.TW, NT$161.50, UNDERPERFORM, TP NT$138.80) Prince Housing & Development (2511.TW, NT$18.15, NEUTRAL [V], TP NT$25.80) Qingdao Haier Company Ltd (600690.SS, Rmb9.25, NOT RATED) QUALCOMM Inc. (QCOM, $55.67, OUTPERFORM, TP $70.00) Quanta Computer (2382.TW, NT$61.40, OUTPERFORM, TP NT$70.00) Radium (2547.TW, NT$25.60, OUTPERFORM, TP NT$37.40) RDA Microelectronics (RDA.OQ, $11.89, OUTPERFORM, TP $17.00) Realtek Semiconductor (2379.TW, NT$48.45, UNDERPERFORM, TP NT$50.00) Research In Motion Limited (RIMM, $18.19, NEUTRAL [V], TP $30.00) Samsung Electro-Mechanics (009150.KS, W77,000, NEUTRAL, TP W95,000) Samsung Electronics (005930.KS, W963,000, OUTPERFORM, TP W1,100,000) Semiconductor Manufacturing Int'l Corp (ADR) (SMI.N, $2.45, NOT RATED) Sharp Corp. (6753, ¥752, NOT RATED, MARKET WEIGHT) Shin Kong Financial Holding (2888.TW, NT$8.68, NEUTRAL, TP NT$8.80) Silicon Graphics (SGID, $.02, NOT RATED) Siliconware Precision (2325.TW, NT$27.70, OUTPERFORM, TP NT$36.00) Silitech Technology Corp (3311.TW, NT$82.70, NEUTRAL, TP NT$84.00) Sincere Navigation (2605.TW, NT$26.50, NEUTRAL, TP NT$31.30) Sino-American Silicon Products (5483.TWO, NT$42.40, NEUTRAL [V], TP NT$48.00) Sinopac Holdings (2890.TW, NT$8.76, NEUTRAL, TP NT$9.50) Sinyi Realty Co (9940.TW, NT$38.55, NEUTRAL, TP NT$36.10) Skyworth Digital (0751.HK, HK$3.99, OUTPERFORM [V], TP HK$7.00) Sony (6758, ¥1,303, RESTRICTED, MARKET WEIGHT) Spreadtrum Communication (SPRD.OQ, $27.78, OUTPERFORM [V], TP $39.00) STMicroelectronics (STM, $6.70, NOT RATED) Sunplus Technology (2401.TW, NT$11.55, NOT RATED) Synnex (2347.TW, NT$71.90, NOT RATED) Ta Chong Bank Ltd (2847.TW, NT$8.48, NEUTRAL, TP NT$9.50) Taishin Financial Holding (2887.TW, NT$11.60, OUTPERFORM, TP NT$16.50)

22 November 2011
Taiwan Market Strategy 113
Taiwan Cement (1101.TW, NT$33.00, OUTPERFORM, TP NT$43.50) Taiwan Fertilizer Co Ltd (1722.TW, NT$75.80, OUTPERFORM, TP NT$104.10) Taiwan Mobile (3045.TW, NT$96.00, NEUTRAL, TP NT$90.55) Taiwan Semiconductor Manufacturing (2330.TW, NT$74.20, OUTPERFORM, TP NT$79.00) TCL Multimedia Technology Holdings Ltd (1070.HK, HK$2.45, NEUTRAL [V], TP HK$2.55) Texas Instruments Inc. (TXN, $30.05, OUTPERFORM, TP $40.00) TMT (5480.TWO, NT$9.85, NOT RATED) Topoint Technology Co Ltd (8021.TW, NT$20.25, NEUTRAL, TP NT$26.00) Toshiba (6502, ¥319, RESTRICTED, MARKET WEIGHT) TPCC (4725.TW, NT$77.30, NOT RATED) TPK Holdings (3673.TW, NT$442.00, OUTPERFORM, TP NT$800.00) TPT (8213.TW, NT$23.25, NOT RATED) Trident Microsystems Inc. (TRID, $.25, NOT RATED) Tripod Technology (3044.TW, NT$79.30, NEUTRAL [V], TP NT$90.00) Tung Ho Steel Enterprise Corp (2006.TW, NT$26.55, NEUTRAL, TP NT$35.90) U-Ming Marine Transport Corp (2606.TW, NT$42.20, UNDERPERFORM, TP NT$38.00) Unimicron Technology Corp (3037.TW, NT$35.30, NEUTRAL, TP NT$43.00) Uni-President Enterprises (1216.TW, NT$38.85, OUTPERFORM, TP NT$46.60) United Microelectronics (2303.TW, NT$12.60, NEUTRAL, TP NT$12.60) Vanguard International Semiconductor (5347.TWO, NT$11.15, NEUTRAL, TP NT$12.00) Victory Circuit (6101.TWO, NT$17.4, NOT RATED) Wan Hai Lines (2615.TW, NT$13.90, OUTPERFORM, TP NT$19.50) Wintek Corp (2384.TW, NT$20.25, UNDERPERFORM [V], TP NT$18.00) Wistron (3231.TW, NT$36.50, OUTPERFORM, TP NT$46.00) Xilinx (XLNX, $31.23, NEUTRAL, TP $35.00) WPG Holdings Ltd (3702.TW, NT$32.80, OUTPERFORM, TP NT$44.00) Yang Ming Marine Transport (2609.TW, NT$11.50, NEUTRAL, TP NT$10.70) Young Fast Optoelectronics (3622.TW, NT$79.90, NEUTRAL, TP NT$84.00) Yuanta Financial Holding Co Ltd (2885.TW, NT$15.70, OUTPERFORM, TP NT$21.00) Zoran Corp (ZRAN, $8.10, NOT RATED)
Disclosure Appendix Important Global Disclosures Chung Hsu, CFA, Randy Abrams, CFA, Michelle Chou, CFA & Josette Chang each certify, with respect to the companies or securities that he or she analyzes, that (1) the views expressed in this report accurately reflect his or her personal views about all of the subject companies and securities and (2) no part of his or her compensation was, is or will be directly or indirectly related to the specific recommendations or views expressed in this report. The analyst(s) responsible for preparing this research report received compensation that is based upon various factors including Credit Suisse's total revenues, a portion of which are generated by Credit Suisse's investment banking activities. Analysts’ stock ratings are defined as follows: Outperform (O): The stock’s total return is expected to outperform the relevant benchmark* by at least 10-15% (or more, depending on perceived risk) over the next 12 months. Neutral (N): The stock’s total return is expected to be in line with the relevant benchmark* (range of ±10-15%) over the next 12 months. Underperform (U): The stock’s total return is expected to underperform the relevant benchmark* by 10-15% or more over the next 12 months. *Relevant benchmark by region: As of 29th May 2009, Australia, New Zealand, U.S. and Canadian ratings are based on (1) a stock’s absolute total return potential to its current share price and (2) the relative attractiveness of a stock’s total return potential within an analyst’s coverage universe**, with Outperforms representing the most attractive, Neutrals the less attractive, and Underperforms the least attractive investment opportunities. Some U.S. and Canadian ratings may fall outside the absolute total return ranges defined above, depending on market conditions and industry factors. For Latin American, Japanese, and non-Japan Asia stocks, ratings are based on a stock’s total return relative to the average total return of the relevant country or regional benchmark; for European stocks, ratings are based on a stock’s total return relative to the analyst's coverage universe**. For Australian and New Zealand stocks, 12-month rolling yield is incorporated in the absolute total return calculation and a 15% and a 7.5% threshold replace the 10-15% level in the Outperform and Underperform stock rating definitions, respectively. The 15% and 7.5% thresholds replace the +10-15% and -10-15% levels in the Neutral stock rating definition, respectively. **An analyst's coverage universe consists of all companies covered by the analyst within the relevant sector. Restricted (R): In certain circumstances, Credit Suisse policy and/or applicable law and regulations preclude certain types of communications, including an investment recommendation, during the course of Credit Suisse's engagement in an investment banking transaction and in certain other circumstances. Volatility Indicator [V]: A stock is defined as volatile if the stock price has moved up or down by 20% or more in a month in at least 8 of the past 24 months or the analyst expects significant volatility going forward.

22 November 2011
Taiwan Market Strategy 114
Analysts’ coverage universe weightings are distinct from analysts’ stock ratings and are based on the expected performance of an analyst’s coverage universe* versus the relevant broad market benchmark**: Overweight: Industry expected to outperform the relevant broad market benchmark over the next 12 months. Market Weight: Industry expected to perform in-line with the relevant broad market benchmark over the next 12 months. Underweight: Industry expected to underperform the relevant broad market benchmark over the next 12 months. *An analyst’s coverage universe consists of all companies covered by the analyst within the relevant sector. **The broad market benchmark is based on the expected return of the local market index (e.g., the S&P 500 in the U.S.) over the next 12 months. Credit Suisse’s distribution of stock ratings (and banking clients) is:
Global Ratings Distribution Outperform/Buy* 49% (61% banking clients) Neutral/Hold* 39% (57% banking clients) Underperform/Sell* 10% (51% banking clients) Restricted 2%
*For purposes of the NYSE and NASD ratings distribution disclosure requirements, our stock ratings of Outperform, Neutral, and Underperform most closely correspond to Buy, Hold, and Sell, respectively; however, the meanings are not the same, as our stock ratings are determined on a relative basis. (Please refer to definitions above.) An investor's decision to buy or sell a security should be based on investment objectives, current holdings, and other individual factors.
Credit Suisse’s policy is to update research reports as it deems appropriate, based on developments with the subject company, the sector or the market that may have a material impact on the research views or opinions stated herein.
Credit Suisse's policy is only to publish investment research that is impartial, independent, clear, fair and not misleading. For more detail please refer to Credit Suisse's Policies for Managing Conflicts of Interest in connection with Investment Research: http://www.csfb.com/research-and-analytics/disclaimer/managing_conflicts_disclaimer.html
Credit Suisse does not provide any tax advice. Any statement herein regarding any US federal tax is not intended or written to be used, and cannot be used, by any taxpayer for the purposes of avoiding any penalties. Important Regional Disclosures Singapore recipients should contact a Singapore financial adviser for any matters arising from this research report.
Restrictions on certain Canadian securities are indicated by the following abbreviations: NVS--Non-Voting shares; RVS--Restricted Voting Shares; SVS--Subordinate Voting Shares. Individuals receiving this report from a Canadian investment dealer that is not affiliated with Credit Suisse should be advised that this report may not contain regulatory disclosures the non-affiliated Canadian investment dealer would be required to make if this were its own report. For Credit Suisse Securities (Canada), Inc.'s policies and procedures regarding the dissemination of equity research, please visit http://www.csfb.com/legal_terms/canada_research_policy.shtml.
As of the date of this report, Credit Suisse acts as a market maker or liquidity provider in the equities securities that are the subject of this report.
Principal is not guaranteed in the case of equities because equity prices are variable. Commission is the commission rate or the amount agreed with a customer when setting up an account or at anytime after that. Taiwanese Disclosures: Reports written by Taiwan-based analysts on non-Taiwan listed companies are not considered recommendations to buy or sell securities under Taiwan Stock Exchange Operational Regulations Governing Securities Firms Recommending Trades in Securities to Customers.
To the extent this is a report authored in whole or in part by a non-U.S. analyst and is made available in the U.S., the following are important disclosures regarding any non-U.S. analyst contributors: The non-U.S. research analysts listed below (if any) are not registered/qualified as research analysts with FINRA. The non-U.S. research analysts listed below may not be associated persons of CSSU and therefore may not be subject to the NASD Rule 2711 and NYSE Rule 472 restrictions on communications with a subject company, public appearances and trading securities held by a research analyst account. • Chung Hsu, CFA, non-U.S. analyst, is a research analyst employed by Credit Suisse AG, Taipei Securities Branch. • Randy Abrams, CFA, non-U.S. analyst, is a research analyst employed by Credit Suisse AG, Taipei Securities Branch. • Michelle Chou, CFA, non-U.S. analyst, is a research analyst employed by Credit Suisse AG, Taipei Securities Branch. • Josette Chang, non-U.S. analyst, is a research analyst employed by Credit Suisse AG, Taipei Securities Branch. For Credit Suisse disclosure information on other companies mentioned in this report, please visit the website at www.credit-suisse.com/researchdisclosures or call +1 (877) 291-2683. Disclaimers continue on next page.

22 November 2011 Asia Pacific/Taiwan
Equity Research
TW0080.doc
This report is not directed to, or intended for distribution to or use by, any person or entity who is a citizen or resident of or located in any locality, state, country or other jurisdiction where such distribution, publication, availability or use would be contrary to law or regulation or which would subject Credit Suisse AG, the Swiss bank, or its subsidiaries or its affiliates (“CS”) to any registration or licensing requirement within such jurisdiction. All material presented in this report, unless specifically indicated otherwise, is under copyright to CS. None of the material, nor its content, nor any copy of it, may be altered in any way, transmitted to, copied or distributed to any other party, without the prior express written permission of CS. All trademarks, service marks and logos used in this report are trademarks or service marks or registered trademarks or service marks of CS or its affiliates. The information, tools and material presented in this report are provided to you for information purposes only and are not to be used or considered as an offer or the solicitation of an offer to sell or to buy or subscribe for securities or other financial instruments. CS may not have taken any steps to ensure that the securities referred to in this report are suitable for any particular investor. CS will not treat recipients as its customers by virtue of their receiving the report. The investments or services contained or referred to in this report may not be suitable for you and it is recommended that you consult an independent investment advisor if you are in doubt about such investments or investment services. Nothing in this report constitutes investment, legal, accounting or tax advice or a representation that any investment or strategy is suitable or appropriate to your individual circumstances or otherwise constitutes a personal recommendation to you. CS does not offer advice on the tax consequences of investment and you are advised to contact an independent tax adviser. Please note in particular that the bases and levels of taxation may change. CS believes the information and opinions in the Disclosure Appendix of this report are accurate and complete. Information and opinions presented in the other sections of the report were obtained or derived from sources CS believes are reliable, but CS makes no representations as to their accuracy or completeness. Additional information is available upon request. CS accepts no liability for loss arising from the use of the material presented in this report, except that this exclusion of liability does not apply to the extent that liability arises under specific statutes or regulations applicable to CS. This report is not to be relied upon in substitution for the exercise of independent judgment. CS may have issued, and may in the future issue, a trading call regarding this security. Trading calls are short term trading opportunities based on market events and catalysts, while stock ratings reflect investment recommendations based on expected total return over a 12-month period as defined in the disclosure section. Because trading calls and stock ratings reflect different assumptions and analytical methods, trading calls may differ directionally from the stock rating. In addition, CS may have issued, and may in the future issue, other reports that are inconsistent with, and reach different conclusions from, the information presented in this report. Those reports reflect the different assumptions, views and analytical methods of the analysts who prepared them and CS is under no obligation to ensure that such other reports are brought to the attention of any recipient of this report. CS is involved in many businesses that relate to companies mentioned in this report. These businesses include specialized trading, risk arbitrage, market making, and other proprietary trading. Past performance should not be taken as an indication or guarantee of future performance, and no representation or warranty, express or implied, is made regarding future performance. Information, opinions and estimates contained in this report reflect a judgement at its original date of publication by CS and are subject to change without notice. The price, value of and income from any of the securities or financial instruments mentioned in this report can fall as well as rise. The value of securities and financial instruments is subject to exchange rate fluctuation that may have a positive or adverse effect on the price or income of such securities or financial instruments. Investors in securities such as ADR’s, the values of which are influenced by currency volatility, effectively assume this risk. Structured securities are complex instruments, typically involve a high degree of risk and are intended for sale only to sophisticated investors who are capable of understanding and assuming the risks involved. The market value of any structured security may be affected by changes in economic, financial and political factors (including, but not limited to, spot and forward interest and exchange rates), time to maturity, market conditions and volatility, and the credit quality of any issuer or reference issuer. Any investor interested in purchasing a structured product should conduct their own investigation and analysis of the product and consult with their own professional advisers as to the risks involved in making such a purchase. Some investments discussed in this report have a high level of volatility. High volatility investments may experience sudden and large falls in their value causing losses when that investment is realised. Those losses may equal your original investment. Indeed, in the case of some investments the potential losses may exceed the amount of initial investment, in such circumstances you may be required to pay more money to support those losses. Income yields from investments may fluctuate and, in consequence, initial capital paid to make the investment may be used as part of that income yield. Some investments may not be readily realisable and it may be difficult to sell or realise those investments, similarly it may prove difficult for you to obtain reliable information about the value, or risks, to which such an investment is exposed. This report may provide the addresses of, or contain hyperlinks to, websites. Except to the extent to which the report refers to website material of CS, CS has not reviewed the linked site and takes no responsibility for the content contained therein. Such address or hyperlink (including addresses or hyperlinks to CS’s own website material) is provided solely for your convenience and information and the content of the linked site does not in any way form part of this document. Accessing such website or following such link through this report or CS’s website shall be at your own risk. This report is issued and distributed in Europe (except Switzerland) by Credit Suisse Securities (Europe) Limited, One Cabot Square, London E14 4QJ, England, which is regulated in the United Kingdom by The Financial Services Authority (“FSA”). This report is being distributed in Germany by Credit Suisse Securities (Europe) Limited Niederlassung Frankfurt am Main regulated by the Bundesanstalt fuer Finanzdienstleistungsaufsicht ("BaFin"). This report is being distributed in the United States by Credit Suisse Securities (USA) LLC ; in Switzerland by Credit Suisse AG; in Canada by Credit Suisse Securities (Canada), Inc.; in Brazil by Banco de Investimentos Credit Suisse (Brasil) S.A. or its affiliates; in Mexico by Banco Credit Suisse (México), S.A. (transactions related to the securities mentioned in this report will only be effected in compliance with applicable regulation); in Japan by Credit Suisse Securities (Japan) Limited, Financial Instrument Firm, Director-General of Kanto Local Finance Bureau (Kinsho) No. 66, a member of Japan Securities Dealers Association, The Financial Futures Association of Japan, Japan Securities Investment Advisers Association, Type II Financial Instruments Firms Association; elsewhere in Asia/Pacific by whichever of the following is the appropriately authorised entity in the relevant jurisdiction: Credit Suisse (Hong Kong) Limited, Credit Suisse Equities (Australia) Limited , Credit Suisse Securities (Thailand) Limited, Credit Suisse Securities (Malaysia) Sdn Bhd, Credit Suisse AG, Singapore Branch, Credit Suisse Securities (India) Private Limited regulated by the Securities and Exchange Board of India (registration Nos. INB230970637; INF230970637; INB010970631; INF010970631), having registered address at 9th Floor, Ceejay House,Dr.A.B. Road, Worli, Mumbai - 18, India, T- +91-22 6777 3777, Credit Suisse Securities (Europe) Limited, Seoul Branch, Credit Suisse AG, Taipei Securities Branch, PT Credit Suisse Securities Indonesia, Credit Suisse Securities (Philippines ) Inc., and elsewhere in the world by the relevant authorised affiliate of the above. Research on Taiwanese securities produced by Credit Suisse AG, Taipei Securities Branch has been prepared by a registered Senior Business Person. Research provided to residents of Malaysia is authorised by the Head of Research for Credit Suisse Securities (Malaysia) Sdn. Bhd., to whom they should direct any queries on +603 2723 2020. In jurisdictions where CS is not already registered or licensed to trade in securities, transactions will only be effected in accordance with applicable securities legislation, which will vary from jurisdiction to jurisdiction and may require that the trade be made in accordance with applicable exemptions from registration or licensing requirements. Non-U.S. customers wishing to effect a transaction should contact a CS entity in their local jurisdiction unless governing law permits otherwise. U.S. customers wishing to effect a transaction should do so only by contacting a representative at Credit Suisse Securities (USA) LLC in the U.S. Please note that this report was originally prepared and issued by CS for distribution to their market professional and institutional investor customers. Recipients who are not market professional or institutional investor customers of CS should seek the advice of their independent financial advisor prior to taking any investment decision based on this report or for any necessary explanation of its contents. This research may relate to investments or services of a person outside of the UK or to other matters which are not regulated by the FSA or in respect of which the protections of the FSA for private customers and/or the UK compensation scheme may not be available, and further details as to where this may be the case are available upon request in respect of this report. Any Nielsen Media Research material contained in this report represents Nielsen Media Research's estimates and does not represent facts. NMR has neither reviewed nor approved this report and/or any of the statements made herein. If this report is being distributed by a financial institution other than Credit Suisse AG, or its affiliates, that financial institution is solely responsible for distribution. Clients of that institution should contact that institution to effect a transaction in the securities mentioned in this report or require further information. This report does not constitute investment advice by Credit Suisse to the clients of the distributing financial institution, and neither Credit Suisse AG, its affiliates, and their respective officers, directors and employees accept any liability whatsoever for any direct or consequential loss arising from their use of this report or its content. Copyright 2011 CREDIT SUISSE AG and/or its affiliates. All rights reserved.
CREDIT SUISSE (Hong Kong) Limited Asia/Pacific: +852 2101-6000
Copyright © 2022 FDOKUMEN