Crompton Greaves - Credit Suisse
27
DISCLOSURE APPENDIX CONTAINS ANALYST CERTIFICATIONS AND THE STATUS OF NON-US ANALYSTS. U.S. Disclosure: Credit Suisse does and seeks to do business with companies covered in its research reports. As a result, investors should be aware that the Firm may have a conflict of interest that could affect the objectivity of this report. Investors should consider this report as only a single factor in making their investment decision. CREDIT SUISSE SECURITIES RESEARCH & ANALYTICS BEYOND INFORMATION ® Client-Driven Solutions, Insights, and Access 13 June 2012 Asia Pacific/India Equity Research Engineering & Construction Crompton Greaves (CROM.BO / CRG IN) INITIATION Losing steam We initiate coverage on Crompton Greaves with an Underperform rating and price target of Rs92, implying a potential downside of 23%. View: We believe that the power generation capex has peaked, as lack of clarity on fuel supply is expected to delay 125-GW capacity addition. This should impact domestic power T&D capex, which represents 25% of sales. We expect a moderate 15-20% growth in overseas T&D orders (42% of sales) from FY12-15, given our expectation of continued weakness in T&D capex in Europe and the US and global over-capacity issues. While Crompton’s diversification into new products & geographies for industrial & consumer (13/19% of sales) business segments is positive, we believe these initiatives would take time to drive meaningful growth. We believe that the company’s guidance of 450bps margin expansion over FY12-15 is aggressive and expect the margin to expand by only 171bps, mostly led by the overseas power business and impacted by the domestic power business. Falling realisations led by the expectation of a sharp decline in domestic order flows from FY14 (PGCIL ordering to peak in FY13) and the inability to meet the top-end of its FY13 margin guidance, are key negative catalysts. Valuation: Our key concerns are Crompton’s (a) decelerating EPS CAGR of 19% over FY13-15 (versus FY13 EPS growth at 44% on low base of FY12), (b) subdued RoE of 14-16% (vs >30% in past), led by lower margins & continued capex impacting asset turns, (c) working capital pressures and (d) unrelated diversification into power generation/distribution business. Given Crompton’s disappointing earnings for four consequtive quarters, we believe investors would turn positive on the stock only on visibility of it meeting its 3- year margin guidance, which is aggressive. Key upside risks: Power/coal sector reforms in India and improvement in global macro conditions. Share price performance 40 90 140 0 100 200 300 400 Jun-10 Oct-10 Feb-11 Jun-11 Oct-11 Feb-12 Price (LHS) Rebased Rel (RHS) The price relative chart measures performance against the BSE SENSEX IDX which closed at 16862.8 on 12/06/12 On 12/06/12 the spot exchange rate was Rs56.04/US$1 Performance Over 1M 3M 12M Absolute (%) 1.8 -18.6 -55.7 Relative (%) -1.7 -12.7 -48.1 Financial and valuation metrics Year 3/12A 3/13E 3/14E 3/15E Revenue (Rs mn) 112,485.8 127,457.7 141,289.9 153,173.7 EBITDA (Rs mn) 8,036.4 10,135.8 11,848.5 13,569.5 EBIT (Rs mn) 5,436.8 7,450.2 8,890.5 10,528.4 Net profit (Rs mn) 3,735.9 5,392.3 6,576.9 7,638.0 EPS (CS adj.) (Rs) 5.82 8.41 10.25 11.91 Change from previous EPS (%) n.a. Consensus EPS (Rs) n.a. 8.9 11.0 13.2 EPS growth (%) -59.7 44.3 22.0 16.1 P/E (x) 20.5 14.2 11.6 10.0 Dividend yield (%) 1.2 1.4 1.5 1.6 EV/EBITDA (x) 9.7 7.5 6.1 4.9 P/B (x) 2.1 1.9 1.7 1.5 ROE (%) 10.9 14.1 15.4 15.7 Net debt/equity (%) 4.3 net cash net cash net cash Source: Company data, Thomson Reuters, Credit Suisse estimates. Rating UNDERPERFORM* Price (12 Jun 12, Rs) 119.30 Target price (Rs) 92.00¹ Upside/downside (%) -22.9 Mkt cap (Rs mn) 76,530 (US$ 1,366) Enterprise value (Rs mn) 75,894 Number of shares (mn) 641.49 Free float (%) 60.0 52-week price range 274.2 - 106.1 *Stock ratings are relative to the relevant country benchmark. ¹Target price is for 12 months. Research Analysts Amish Shah, CFA 91 22 6777 3743 [email protected] Abhishek Bansal 91 22 6777 3968 [email protected]
-
Upload
khangminh22 -
Category
Documents
-
view
4 -
download
0
Transcript of Crompton Greaves - Credit Suisse

DISCLOSURE APPENDIX CONTAINS ANALYST CERTIFICATIONS AND THE STATUS OF NON-US ANALYSTS. U.S. Disclosure: Credit Suisse does and seeks to do business with companies covered in its research reports. As a result, investors should be aware that the Firm may have a conflict of interest that could affect the objectivity of this report. Investors should consider this report as only a single factor in making their investment decision.
CREDIT SUISSE SECURITIES RESEARCH & ANALYTICS BEYOND INFORMATION®
Client-Driven Solutions, Insights, and Access
13 June 2012 Asia Pacific/India Equity Research
Engineering & Construction
Crompton Greaves (CROM.BO / CRG IN)
INITIATION
Losing steam ■ We initiate coverage on Crompton Greaves with an Underperform rating
and price target of Rs92, implying a potential downside of 23%.
■ View: We believe that the power generation capex has peaked, as lack of clarity on fuel supply is expected to delay 125-GW capacity addition. This should impact domestic power T&D capex, which represents 25% of sales. We expect a moderate 15-20% growth in overseas T&D orders (42% of sales) from FY12-15, given our expectation of continued weakness in T&D capex in Europe and the US and global over-capacity issues. While Crompton’s diversification into new products & geographies for industrial & consumer (13/19% of sales) business segments is positive, we believe these initiatives would take time to drive meaningful growth. We believe that the company’s guidance of 450bps margin expansion over FY12-15 is aggressive and expect the margin to expand by only 171bps, mostly led by the overseas power business and impacted by the domestic power business.
■ Falling realisations led by the expectation of a sharp decline in domestic order flows from FY14 (PGCIL ordering to peak in FY13) and the inability to meet the top-end of its FY13 margin guidance, are key negative catalysts.
■ Valuation: Our key concerns are Crompton’s (a) decelerating EPS CAGR of 19% over FY13-15 (versus FY13 EPS growth at 44% on low base of FY12), (b) subdued RoE of 14-16% (vs >30% in past), led by lower margins & continued capex impacting asset turns, (c) working capital pressures and (d) unrelated diversification into power generation/distribution business. Given Crompton’s disappointing earnings for four consequtive quarters, we believe investors would turn positive on the stock only on visibility of it meeting its 3-year margin guidance, which is aggressive. Key upside risks: Power/coal sector reforms in India and improvement in global macro conditions.
Share price performance
40
90
140
0100200300400
Jun-10 Oct-10 Feb-11 Jun-11 Oct-11 Feb-12
Price (LHS) Rebased Rel (RHS)
The price relative chart measures performance against the BSE SENSEX IDX which closed at 16862.8 on 12/06/12 On 12/06/12 the spot exchange rate was Rs56.04/US$1
Performance Over 1M 3M 12M Absolute (%) 1.8 -18.6 -55.7 Relative (%) -1.7 -12.7 -48.1
Financial and valuation metrics
Year 3/12A 3/13E 3/14E 3/15E Revenue (Rs mn) 112,485.8 127,457.7 141,289.9 153,173.7 EBITDA (Rs mn) 8,036.4 10,135.8 11,848.5 13,569.5 EBIT (Rs mn) 5,436.8 7,450.2 8,890.5 10,528.4 Net profit (Rs mn) 3,735.9 5,392.3 6,576.9 7,638.0 EPS (CS adj.) (Rs) 5.82 8.41 10.25 11.91 Change from previous EPS (%) n.a. Consensus EPS (Rs) n.a. 8.9 11.0 13.2 EPS growth (%) -59.7 44.3 22.0 16.1 P/E (x) 20.5 14.2 11.6 10.0 Dividend yield (%) 1.2 1.4 1.5 1.6 EV/EBITDA (x) 9.7 7.5 6.1 4.9 P/B (x) 2.1 1.9 1.7 1.5 ROE (%) 10.9 14.1 15.4 15.7 Net debt/equity (%) 4.3 net cash net cash net cash
Source: Company data, Thomson Reuters, Credit Suisse estimates.
Rating UNDERPERFORM* Price (12 Jun 12, Rs) 119.30 Target price (Rs) 92.00¹ Upside/downside (%) -22.9 Mkt cap (Rs mn) 76,530 (US$ 1,366) Enterprise value (Rs mn) 75,894 Number of shares (mn) 641.49 Free float (%) 60.0 52-week price range 274.2 - 106.1 *Stock ratings are relative to the relevant country benchmark. ¹Target price is for 12 months.
Research Analysts
Amish Shah, CFA 91 22 6777 3743
Abhishek Bansal 91 22 6777 3968

13 June 2012
Crompton Greaves
(CROM.BO / CRG IN) 2
Focus charts Figure 1:Expect 125GW power generation capacity to be
delayed pending fuel supply clarity…
Figure 2: …implies power generation capex has peaked
and could impact T&D capex…
-
2 5
5 0
7 5
1 0 0
1 2 5
L in k a g e c o a l I m p o r t e d c o a l G a s P r o je c t s o nh o l d
T o t a l d e la y e dc a p a c i t y
G W
P r o je c t s u n d e r c o n s t r u c t io n
-
200
400
600
800
1,000
1,200
1,400
FY07
FY08
FY09
FY10
FY11
FY12
FY13
E
FY14
E
FY15
E
FY16
E
FY17
E
Power generation capex (Rs bn)
Source: Ministry of Power, Credit Suisse estimates Source: Ministry of Power, Credit Suisse estimates
Figure 3: …even discarding our concern, planned T&D
capex in XIIth & XIIIth plans offer tepid growth
Figure 4: We believe PGCIL capex has peaked
20%
25%
30%
35%
40%
45%
50%
55%
-
1,500
3,000
4,500
6,000
IX Plan X Plan XI Plan XII Plan (E) XII Plan (E)
T&D T&D as % of total
(Rs bn)
30
60
90
120
150
180
210
240
270
FY09 FY10 FY11 FY12 FY13 FY14 FY15
PGCIL ordering (Rs bn)
Assuming most of remaining Rs330bnorders to be placed in FY13
Limited ordering in FY15 as XIII Plan ordering would commence only from FY16
Source: PGCIL, Credit Suisse estimates Source: PGCIL, Credit Suisse estimates
Figure 5: Foreign players have picked up 30-40% share… Figure 6: …while Crompton’s share has halved
0%
10%
20%
30%
40%
50%
60%
FY09 FY10 FY11 FY12
Mkt share of Chinese/Koreans in PGCIL orders for transformers & reactors
15%
20%
25%
30%
35%
40%
FY09 FY10 FY11 FY12
Crompton's market share in transformers & reactors
Source: PGCIL, Credit Suisse estimates Source: PGCIL, Company data, Credit Suisse estimates
Figure 7: Expect jump in FY13 EPS on low base, but FY13-
15 earnings growth trajectory to decelerate
Figure 8: Expect RoE to remain subdued on relatively low
margins & capex continuing to impactasset turnover
-80%
-60%
-40%
-20%
0%
20%
40%
60%
4
6
8
10
12
14
16
FY08 FY09 FY10 FY11 FY12 FY13E FY14E FY15E
Consolidated EPS (Rs/ share) YoY growth (%)
5%
10%
15%
20%
25%
30%
35%
40%
FY07 FY08 FY09 FY10 FY11 FY12 FY13E FY14E FY15E
RoE (%)
Source: Company data, Credit Suisse estimates Source: Company data, Credit Suisse estimates

13 June 2012
Crompton Greaves
(CROM.BO / CRG IN) 3
Losing steam Declining order visibility across businesses We expect 125-GW of power generation capacity to be delayed led by lack of clarity on fuel supply. This implies that power generation capex has peaked and should impact the T&D capex, albeit with a lag. Contrary to the general perception, about 88% of transmission capex is linked to generation capex, despite India’s under-investment in T&D infrastructure in the past. Even after discarding these concerns, we see muted growth in planned T&D capex during the XIIth (FY12-17) and the XIIIth (FY17-22) Plans over the XIth Plan (FY07-12).
PGCIL has already ordered 67% of its Rs1 tn investments planned during the XIIth Plan. Given that ordering for most of its balance Rs330 bn is expected to be completed in FY13 and ordering for the XIIIth Plan is unlikely to start before FY16, we expect PGCIL ordering to peak in FY13. On the other hand, SEBs’ transmission capex is expected to decline by 15% in the XIIth Plan, IPPs’ transmission capex would be impacted by a slowdown in their power generation capex and the build-own-operate model is yet to pick up meaningfully.
Overall, we expect its domestic power systems’ (25% of sales) order flows to grow by 20% in FY13, but decline by 15-25% during FY15/16. We expect a moderate 15-20% growth in overseas power systems (constituting 42% of sales) order flows over FY12-15 as we expect continued weakness in T&D capex in Europe & the US and global over-capacity issues.
We reckon that Crompton has been diversifying into new geographies, products and business segments, for its industrial (13% of sales) as well as consumer businesses (19% of sales). However, we believe these initiatives would take time to drive meaningful growth. We expect growth in industrial order inflows to remain muted at 10% over FY12-15 and expect consumer segment sales to grow at 13% CAGR over FY12-15.
Pricing pressures are intensifying The transformer industry is witnessing intense competition with the entry of foreign as well as new domestic players. Domestic-only capacity utilisation is at 65-75%. During FY09-12, Chinese & Korean players captured 30-40% share in PGCIL transformer & reactor orders, while Crompton’s share has halved to 19%. TBEA (Chinese player) is planning to set up a domestic capacity. We are surprised with Crompton’s 50K MVA capacity addition plan.
On the pricing front, realisations for its key product (765KV 500MVA transformer) have fallen by 55% since September 2008. Overall, transformer & reactor realisations for Crompton seems to have fallen by 25-40% over FY09-12. However, as per our discussions with industry experts, pricing has now stabilised or is marginally improving.
We expect domestic power margin to improve by 70bps in FY13 but fall by 100bps over FY13-15 on peaking order flows. We expect a sharp 323 bps increase in overseas power margin over FY12-15 from its lows of 1.7% in FY12. We believe Crompton would achieve an increase of 171bps in its consolidated margin over FY12-15 (guidance of 450bps).
Initiate with Underperform, 23% potential downside We initiate coverage on Crompton Greaves with an Underperform rating and target price of Rs92. Decelerating EPS growth of 19% over FY13-15 (versus FY13 EPS growth of 44% on a low base of FY12), subdued RoE at 14-16% (vs >30% in past) led by relatively lower margins & and capex continuing to impact asset turnover, working capital pressures and unrelated diversifications into power generation & distribution business are our concerns.
Given that Crompton has disappointed on earnings for four consequtive quarters, we believe that investors would turn positive only on visibility of it meeting its 3-year margin guidance, which seems aggressive. However, for FY13, we expect Crompton to meet its sales and order inflow growth guidance and the lower end of its margin guidance. Power sector reforms in India and improvement in global macro conditions are key positive risks.
Power generation capex appears to have peaked, which should impact T&D capex, although with a lag
PGCIL/T&D capex likely to peak by FY13; expect Crompton’s domestic power systems inflows to decline 15-25% during FY15/16
Transformer industry seeing intense competition with entry of foreign and new domestic players
Against 450bps margin improvement guidance over FY12-15, expect Crompton to achieve 171bps
Key concerns: decelerating earnings growth, subdued RoE led by relatively lower margins & high capex, working capital pressures & unrelated diversifications

13 June 2012
Crompton Greaves
(CROM.BO / CRG IN) 4
Financial summary Figure 9: Crompton - Financial summary (consolidated) (Rs mn) FY10 FY11 FY12 FY13E FY14E FY15E
Net sales 91,409 100,051 112,486 127,458 141,290 153,174
Total operating expenses 78,639 86,613 104,449 117,322 129,441 139,604
EBITDA 12,770 13,438 8,036 10,136 11,848 13,570
EBITDA margin (%) 14.0% 13.4% 7.1% 8.0% 8.4% 8.9%
Depreciation 1,551 1,936 2,600 2,686 2,958 3,041
EBIT 11,219 11,502 5,437 7,450 8,890 10,528
Interest 428 201 463 583 620 658
Other income 1,100 990 524 732 636 871
Tax 3,650 3,100 1,821 2,275 2,403 3,182
Tax rate (%) 30.7% 25.2% 33.1% 29.9% 27.0% 29.6%
Minority interest/ Asssociates 57 84 47 55 61 66
Recurring PAT 8,247 9,268 3,736 5,392 6,577 7,638
Exceptionals 352 (381) - - - -
Reported PAT 8,599 8,887 3,736 5,392 6,577 7,638
Share capital 1,283 1,283 1,283 1,283 1,283 1,283
Reserves and surplus 23,760 31,464 34,826 38,931 44,145 50,325
Networth 25,043 32,747 36,109 40,214 45,428 51,608
Loan funds 5,010 4,703 11,555 11,555 13,055 13,055
Minority interest 43 157 157 150 144 137
Total liabilities 30,095 37,607 47,821 51,919 58,627 64,800
Net fixed assets 13,760 19,417 16,693 20,008 22,550 23,508
Investments 5,536 6,747 7,864 7,864 7,864 7,864
Goodwill - - 5,882 5,882 5,882 5,882
Deferred tax asset (net) (49) (160) 513 513 513 513
Net current assets 10,849 11,604 16,869 17,653 21,818 27,032
Total assets 30,095 37,607 47,821 51,919 58,627 64,800
Cash Flow from Operations 10,229 6,860 2,383 9,491 10,009 11,321
Cash Flow from Investing Activities (5,037) (9,185) (6,875) (6,000) (5,500) (4,000)
Cash Flow from Financing Activities (4,160) (1,379) 6,484 (1,287) 137 (1,459)
Increase/ (Decrease) in Cash 1,032 (3,704) 1,992 2,203 4,646 5,863
Closing cash and cash equivalents 6,688 2,984 4,976 7,179 11,825 17,688
Net Debt /Equity (x) (0.2) (0.1) 0.0 (0.0) (0.1) (0.2)
EPS (Rs) 12.9 14.4 5.8 8.4 10.3 11.9
DPS (Rs) 1.3 1.3 1.4 1.7 1.8 1.9
BPS (Rs) 39 51 56 63 71 80
P/E (x) 9.3 8.3 20.5 14.2 11.6 10.0
Yield (%) 1.1% 1.1% 1.2% 1.4% 1.5% 1.6%
P/BV (x) 3.1 2.3 2.1 1.9 1.7 1.5
EV/EBITDA (x) 5.6 5.5 9.7 7.5 6.1 4.9
EV/Sales (x) 0.8 0.7 0.7 0.6 0.5 0.4
EPS Growth % 47.3% 12.4% -59.7% 44.3% 22.0% 16.1%
RoCE (%) 29.6% 27.4% 8.7% 10.8% 11.9% 12.4%
RoE (%) 38.0% 32.1% 10.9% 14.1% 15.4% 15.7%
Source: Company data, Credit Suisse estimates

13 Ju
ne 2012
Cro
mp
ton
Greaves
(CR
OM
.BO
/ CR
G IN
) 5
Relative valuation summary Figure 10: India capital goods relative valuation Company Price Shares Mkt Cap PER (x) P/BV (x) EPS growth (%) Div. yield (%) RoE (%)
(Rs) o/s (mn) (US$ mn) FY12 FY13E FY14E FY12 FY13E FY14E FY13E FY14E FY12 FY13E FY12 FY13E FY14E
Larsen & Toubro * 1,316 613 14,463 18 17 15 3.1 2.8 2.5 8% 12% 1.2% 1.5% 17 17 16
Punj Lloyd 48 332 286 14 14 9 0.5 0.5 0.5 5% 50% 0.3% 0.5% (2) 3 5
BGR Energy Systems 294 72 380 9 10 9 1.9 1.6 1.3 -4% 13% 3.4% 2.5% 22 17 17
Bharat Heavy Electricals * 219 2,448 9,632 8 9 10 2.1 1.8 1.6 -12% -10% 2.9% 2.5% 27 20 16
Thermax 461 119 986 14 15 14 4.2 2.9 2.6 -10% 6% 2.0% 1.8% 32 21 19
Cummins India * 422 277 2,100 22 20 17 5.7 5.3 4.8 10% 19% 2.6% 3.0% 26 27 29
Greaves Cotton 69 244 303 9 10 9 2.7 2.2 2.0 -15% 13% 2.2% 2.7% 29 24 23
Kirloskar Oil Engines 152 146 396 12 12 11 2.5 1.8 1.6 -7% 17% 2.6% 0.9% 22 16 16
Blue Star 162 90 262 9 21 11 2.9 3.4 2.8 -56% 83% 4.3% 3.0% 31 18 27
Voltas * 107 331 636 10 12 12 2.4 2.1 1.8 -18% 4% 1.5% 1.7% 24 17 16
ABB India 765 212 2,908 n.a. 46 35 6.4 5.7 5.0 89% 34% 0.4% 0.4% 7 13 15
Alstom T&D India 181 239 776 23 23 18 4.3 4.3 4.0 0% 25% 1.0% 0.9% 29 17 18
Crompton Greaves * 119 641 1,374 21 14 12 2.1 1.9 1.7 44% 22% 1.2% 1.4% 10 13 14
Emco 27 65 32 n.a 9 n.a. 0.3 0.3 n.a. n.m n.a. 0.7% 0.7% (10) 4 n.a.
Siemens 683 340 4,171 27 29 24 6.1 5.3 4.6 -6% 19% 0.9% 0.9% 24 20 21
Voltamp Transformers 480 10 87 15 12 12 1.2 1.1 1.1 22% 3% 1.9% 1.3% 9 9 9
Jyoti Structures 41 82 60 4 4 3 0.5 0.5 0.5 -5% 23% 2.7% 3.0% 15 13 15
Kalpataru Power Transmission 81 153 223 7 6 5 0.7 0.6 0.5 15% 11% 1.9% 2.2% 11 11 12
KEC International India 52 257 238 6 6 5 1.2 1.1 0.9 1% 15% 2.3% 2.4% 20 18 18
Shriram EPC 57 44 45 6 6 9 0.4 0.3 0.3 1% -35% 2.1% 2.1% 7 6 n.a.
Suzlon Energy 18 1,777 568 n.a. 9 6 0.6 0.5 0.4 n.m 53% 0.0% 0.3% (8) 5 8
Elecon Engineering 55 93 92 8 6 6 1.1 1.0 0.9 42% -4% 3.3% 3.5% 14 16 15
McNally Bharat Engineering 88 31 49 4 4 3 0.8 0.7 0.6 7% 15% 2.3% 1.4% 22 16 16
BEML 384 42 287 28 17 n.a. 0.7 0.7 n.a. n.m n.a. 2.6% 2.6% 3 4 n.a.
Havells India 553 125 1,237 19 15 13 7.2 5.2 3.9 24% 16% 0.5% 1.0% 46 39 34
Titagarh Wagons 306 20 110 7 7 7 1.0 0.9 0.8 0% 5% 2.6% 2.6% 14 14 13
Average 13 14 11 2.4 2.1 2.0 6% 17% 1.9% 1.8% 17 15 17
Prices as on 12 June 2012. * CS estimates, rest are consensus estimates.
Source: Company data, Bloomberg, Credit Suisse estimates

13 June 2012
Crompton Greaves
(CROM.BO / CRG IN) 6
Declining order visibility across businesses We expect 125-GW of power generation capacity to be delayed led by lack of fuel supply clarity. This implies that power generation capex has peaked and should impact the T&D capex, albeit with a lag. Contrary to general perception, about 88% of transmission capex is linked to generation capex, despite India’s under-investment in T&D infrastructure in the past. Even after discarding these concerns, we see muted growth in planned T&D capex during the XIIth (FY12-17) and the XIIIth (FY17-22) Plans over the XIth Plan (FY07-12).
PGCIL has already ordered 67% of its Rs1 tn investments planned during the XIIth Plan. Given that ordering for most of its balance of Rs330 bn is expected to be completed in FY13 and ordering for the XIIIth Plan is unlikely to start before FY16, we expect PGCIL ordering to peak in FY13. On the other hand, SEBs’ transmission capex is expected to decline by 15% in the XIIth Plan, IPPs’ transmission capex would be impacted by a slowdown in their power generation capex and the build-own-operate model is yet to pick up meaningfully.
Overall, we expect its domestic power systems’ (25% of sales) order flows to grow by 20% in FY13, but decline by 15-25% during FY15/16. We expect a moderate 15-20% growth in overseas power systems (42% of sales) order flows over FY12-15 as we expect continued weakness in T&D capex in Europe & the US and global over-capacity issues.
We reckon that Crompton has been diversifying into new geographies, products and business segments, for its industrial (13% of sales) as well as consumer businesses (19% of sales). However, we believe these initiatives would take time to drive meaningful growth. We expect growth in industrial order inflows to remain muted at 10% over FY12-15 and expect consumer segment sales to grow at 13% CAGR over FY12-15.
Figure 11: Snapshot of Crompton’s key business segments Segment % of FY12 consol.
revenues Key issues / growth outlook
Domestic Power 25% PGCIL / T&D ordering is close to its peak; order inflows to grow by 20% in FY13 but decline by 15-25% during FY14-15
International Power 42% T&D capex in Europe/ US to remain weak led by global over-capacity issues; expect moderate 15-20% growth in inflows over FY12-15
Industrials 13% Diversifying into new segments & geographies, however new initiatives would take time to drive meaningful growth; expect 5% inflow growth in FY13 and 10-15% over FY14-15
Consumer 19% Leader in fans segment, however, high competition and & weak macro to limit growth prospects; expect 13% revenue CAGR over FY12-15
Source: Company data, Credit Suisse estimates
Expect India T&D capex to mirror generation capex As highlighted in our detailed India utilities sector report, “Coal deficit issue really resolved?”, dated 13 March, 2012, we argue that of the 122GW linkage coal-based capacity currently under construction, we expect only 60-GW projects to be allocated coal. In order to be eligible to get coal allocation, the developer would have to meet the following three criteria (a) having a LoA, (b) project commissioning till Mar 2015 and (c) power sales tied up through long-term PPAs.
This implies that 62GW of back-ended capacity under construction, which was expected to commission during FY15-17, would now be delayed as these projects are unlikely to be allocated coal at least till Mar 2017. This trend has already started to play out with NTPC recently guiding to add only 14GW capacity over FY12-17 vs over 23GW earlier. Similarly, the Ministry of Power has advised IPPs to go slow/defer gas-based capacity addition plans, given poor visibility of gas supplies at least till FY16.
Power generation capex appears to have peaked, which should impact T&D capex, although with a lag
PGCIL/T&D capex likely to peak by FY13; expect Crompton’s domestic power systems inflows to decline 15-25% during FY15/16
Out of 122GW capacity under construction, only 60GW to be allocated coal
Overall 125GW capacity adds likely to be delayed; slowing generation capex would impact T&D capex

13 June 2012
Crompton Greaves
(CROM.BO / CRG IN) 7
Figure 12: Extract from Ministry of Power urging gas based power developers to go slow on capacity adds until FY16
Source: Ministry of Power
Besides, developers have now put on hold 54GW projects that are still seeking regulatory approvals. Overall, we estimate about 125GW capacity adds likely to be delayed or put on hold pending fuel supply clarity.
Figure 13: 62GW under construction linkage coal projects
likely to be delayed given no coal allocation till Mar 2017...
Figure 14: …overall we expect about 125GW capacity to
be delayed or put on hold pending fuel supply clarity
40
60
80
100
120
140
160
180
200
Upto
FY09
FY10 FY11 FY12 FY13 FY14 FY15 FY16 FY17Targetted
till FY17
Capacity to be delayed
Capacity adds over FY09-17 capped at 60GW
75
GW
196
-
25
50
75
100
125
Linkage coal Imported coal Gas Projects onhold
Total delayedcapacity
GW
Projects under construction
Source: Ministry of Power, Company data, Credit Suisse estimates Source: Ministry of Power, Company data, Credit Suisse estimates
For an optimum T&D infrastructure, T&D capex should be equal to the generation capex. Though we reckon that India has historically under-invested in T&D infrastructure, the mix of generation vs T&D capex now appears reasonable. Despite that, we see limited growth in planned T&D capex during the XIIth and the XIIIth Plans in comparison to the XIth Plan.
However, as explained above, we expect power generation capex to slow down materially, which should impact T&D capex spends.

13 June 2012
Crompton Greaves
(CROM.BO / CRG IN) 8
Figure 15: XIIth & XIIIth Plans to see tepid T&D capex
growth despite optimum mix of T&D vs generation capex..
Figure 16: …and is at a risk of slowdown led by expected
slowdown in generation capex
20%
25%
30%
35%
40%
45%
50%
55%
-
1,500
3,000
4,500
6,000
IX Plan X Plan XI Plan XII Plan (E) XII Plan (E)
T&D T&D as % of total
(Rs bn)
-
200
400
600
800
1,000
1,200
1,400
FY07
FY08
FY09
FY10
FY11
FY12
FY13
E
FY14
E
FY15
E
FY16
E
FY17
E
Power generation capex (Rs bn)
Source: PGCIL, Credit Suisse estimates Source: Ministry of Power, Credit Suisse estimates
Typically, T&D capex follows generation capex with a lag as it takes less than two years to execute a T&D project as against the four years it takes to implement a coal-based power generation project. An analysis of PGCIL’s XIIth Plan capex highlights that most of its transmission capex is aimed at meeting the evacuation requirements of generation projects, while the share of grid strengthening capex is relatively small, implying a high risk of slippages in capex as generation capex slows down.
Figure 17: PGCIL’s XIIth Plan capex is mainly linked to generation capex
For central govt. generation projects
22%
For UMPPs generation projects
14%
For Private sector genertion projects
52%
Grid strengthening12%
Source: PGCIL, Credit Suisse
We believe PGCIL/T&D ordering is close to its peak Of the Rs1,000 bn that PGCIL plans to spend during the XIIth Plan, it has already awarded orders worth Rs670 bn. During FY12 itself, it has awarded orders worth Rs250 bn (up 39% YoY). Powergrid plans to order the remaining Rs330bn projects over FY13-14, indicating decline in order flow growth during FY13/14 over FY12 (assuming evenly spreadout orders over FY13/14), or orders peaking by FY13 (assuming most of the Rs330bn would be ordered in FY13 – the most likely scenario, in our view). This is even after assuming that our concerns about a slowdown in T&D capex are ill-founded.
Typically, T&D capex follows generation capex with a lag

13 June 2012
Crompton Greaves
(CROM.BO / CRG IN) 9
As highlighted earlier, T&D spends during the XIIIth Plan are likely to offer no growth as compared to the XIIth Plan. Also, when compared to the peak ordering of PGCIL during FY12/13, the industry would observe a decline in ordering activity from PGCIL. Besides, PGCIL’s XIIIth Plan ordering is unlikely to start before FY16, implying significant dip in order flows during FY15.
An analysis of T&D capex plans from SEBs suggests a) decline in intra-state transmission spends in XIIth Plan, b) growth from intra-state transmission spends would materialise only from FY16/17 c) limited growth from distribution capex in the XIIth and XIIIth Plans and d) intense competition in the distribution segment compared to transmission segment.
Figure 18: PGCIL ordering has peaked Figure 19: SEB’s XIIth Plan T&D spends suggests limited
growth and is highly competitive
30
60
90
120
150
180
210
240
270
FY09 FY10 FY11 FY12 FY13 FY14 FY15
PGCIL ordering (Rs bn)
Assuming most of remaining Rs330bnorders to be placed in FY13
Limited ordering in FY15 as XIII Plan ordering would commence only from FY16
-
500
1,000
1,500
2,000
2,500
3,000
3,500
XI Plan XII Plan (E) XIII Plan (E)
Intra-State transmission (Rs bn) Distribution (Rs bn)
Source: PGCIL, Credit Suisse estimates Source: PGCIL, Credit Suisse estimates
We believe transmission capex from IPPs would certainly be impacted by a slowdown in generation capex, while transmission capex spends through the build-own-operate model is yet to pick up meaningfully.
Expect moderate power system order flow growth from overseas Crompton derives about 50-60% of its power systems orders from overseas markets. However, the visibility of growth in T&D orders from international geographies is weak currently, led by excess global capacity prompting high competition and weak capex on account of financial stress in Europe and strife in the Middle East.
However, the management is optimistic on revival of growth from international markets driven by (a) offshore wind orders from EMEA (expected 20GW implementation), (b) revival of orders from renewable segment in US (expected 20GW implementation) also driving growth for distribution transformers, (c) ageing or old grid structure in the US, and (d) bouyancy in the oil and gas sector expected to drive growth for Crompton’s power and industrial business segments.
We expect Crompton’s domestic power systems order inflows to grow by 20% in FY13, but decline by 15% and 25% respecitively during FY15 and FY16. However, we expect growth in the overseas order inflows to continue over FY12-15 at 15-20%.
PGCIL ordering to decline materially in FY14-15; XIII Plan ordering unlikely to start before FY16
Global over-capacity, financial stress in Europe and unrest in Middle East impacting global T&D ordering

13 June 2012
Crompton Greaves
(CROM.BO / CRG IN) 10
Figure 20: Expect domestic power system order inflows
to peak in FY13…
Figure 21: …but we expect growth in international power
systems order inflows to continue
20,000
22,500
25,000
27,500
30,000
32,500
35,000
37,500
40,000
FY11 FY12 FY13E FY14E FY15E
Power systems order inflows - domestic (Rs mn)
40,000
50,000
60,000
70,000
80,000
90,000
FY11 FY12 FY13E FY14E FY15E
Power systems order inflows - international (Rs mn)
Source: Company data, Credit Suisse estimates Source: Company data, Credit Suisse estimates
New intiatives in industrial segment would take time to drive meaningful growth Crompton’s industrial business was predominantly driven by motors and alternators business segments until recently. It also entered into the drives business with its acquisition of Sweden-based Emotron (specialising in design, engineering & manufacturing of high-end drive solutions) in May 2011 for €57.8 mn. Crompton now plans to ramp up its drives business (2% of consolidated revenues currently) with the commencement of drives production from India (expected from October 2012) and packaging it with the sale of its motors.
These products have application in varied industries. However, industrial capex has been weak and we do not expect any substantial pick-up in the industrial capex cycle at least over the next few quarters due to (a) over-capacity in industries such as metals, cement etc., (b) lack of gas supply visibility impacting fertiliser capex, (c) lack of new gas discoveries impacting hydrocarbons capex and (d) overall industrial capex being impacted by expectations of continued high interest rates and liquidity stress in the near term.
In order to boost its industrial segment growth, Crompton is diversifying in new business segment and geogrpahies:
■ In India, it has received initial orders from Indian Railways and is aiming to win orders from metro rail projects
■ Diversifing into international geographies, especially in the Eastern Europe
■ Adding capacity to manufacture synchronous generators in Hungary which has high demand in the Eastern Europe.
■ Start of drives manufacturing in India expected from Oct 2012.
Crompton has met with some success in the industrial segment from foreign goegraphies. So far, it has won a 6.7MW HT motors order from a German cement manufacturer, a 2.5MW HT motor & 6.6KV drives order from a steel plant in Central Asia and a 4MW motors order for a nuclear plant in Russia. Crompton believes its industrial products have better pricing and higher acceptability in the international markets, and would allow it to earn better margins, given its low-cost structure.
Expect inflow growth from industrials to remain muted at 5% and improve to 10-15% over FY14-15

13 June 2012
Crompton Greaves
(CROM.BO / CRG IN) 11
However, we believe that its new initiatives would take time to drive meaningful growth. Overall, we expect order inflow growth from industrial segment to remain muted at 5% and improve to 10-15 over FY14-15.
Figure 22: Expect muted order inflow growth from
industrial segment near-term, to pick up from FY14-15…
Figure 23: …consumer segment growth would also take
time to pick-up
15,000
17,000
19,000
21,000
23,000
25,000
FY11 FY12 FY13E FY14E FY15E
Industrial order inflows (Rs mn)
15,000
17,500
20,000
22,500
25,000
27,500
30,000
32,500
FY11 FY12 FY13E FY14E FY15E
Consumer business sales (Rs mn)
Source: Company data, Credit Suisse estimates Source: Company data, Credit Suisse estimates
Consumer business would take time to pick up
Crompton is one of the leaders in the fans business in India. It recently introduced a new premium range of fans and sold about 972k fans in FY12, gaining 24% market share. It plans to introduce new products in the consumer segment including kitchen appliances, coolers, geysers, solar fans, etc. Besides, the company is in the process of improving its already strong distribution reach in India of 4,000 distributors and 240,000 retailers (plans to scale up to 400,000 during FY13).
However, we believe that growth in this segment would take time to pick up and is likely to be impacted by high competitive intensity in the segment. Besides, the slowdown in real estate sector on account of high mortgage rates would continue to impact growth in this sector over the next few quarters. We expect Crompton’s consumer business sales to grow at 13% CAGR over FY12-15.
High competition, slowdown in real estate sector impacting consumer segment growth

13 June 2012
Crompton Greaves
(CROM.BO / CRG IN) 12
Pricing pressures are intensifying The transformer industry is witnessing intense competition with the entry of foreign as well as new domestic players. Domestic-only capacity utilisation is at 65-75%. During FY09-12, Chinese & Korean players captured 30-40% share in PGCIL transformer & reactor orders, while Crompton’s share has halved to 19%. TBEA (Chinese player) is planning to set up a domestic capacity. We are surprised with Crompton’s 50K MVA capacity addition plan.
On the pricing front, realisations for its key product (765KV 500MVA transformer) have fallen by 55% since September 2008. Overall, transformer & reactor realisations for Crompton seems to have fallen by 25-40% over FY09-12. However, as per our discussions with industry experts, pricing has now stabilised or is marginally improving.
We expect domestic power margin to improve by 70bps in FY13 but fall by 100bps over FY13-15 on peaking order flows. We expect a sharp 323 bps increase in overseas power margin over FY12-15 from its lows of 1.7% in FY12. We believe Crompton would achieve an increase of 171bps in its consolidated margin over FY12-15 (guidance of 450bps).
Intense competition, over-capacity in T&D segment Competition in the transformer industry has intensified over time with the entry of new domestic as well as foreign players as can be seen from the table below.
Figure 24: Competition in the transformer space has intensified over time Transformers Reactors
Company 132KV 220KV 400KV 765KV 400KV 765KV
Crompton Yes Yes Yes Since FY09. Earlier through JV
with Toshiba
Yes In JV with ZTR since FY10
BHEL Yes Yes Yes Since FY12 Yes Since FY12
Bharat Bijlee Yes Yes x x x x
Alstom India (Areva earlier) Yes Yes Yes Since FY09 Since FY09 Yes
IMP Power Yes Yes x x x x
TELK Yes Yes Yes x x x
TRIL Since FY07 Since FY07 Since FY07 Since FY12 x x
EMCO Since FY07 Since FY07 Since FY07 x x x
ABB India Since FY07 Since FY07 Since FY07 Since FY09. Earlier through
ABB parent
Since FY09 Yes
Indotech Since FY08 Since FY08 Since FY08 x x x
ECE Yes Yes x x x x
Kanohar Since FY09 Since FY09 Yes x x x
Siemens India Since FY09 Since FY09 Since FY09 Since FY09 Since FY09 Yes
Vijai Electricals Since FY09 Since FY09 Since FY09 Yes Yes x
Voltamp Yes Yes x x x x
Victory Transformers Yes Yes x x x x
Hyosung (Korea)* x x Since FY11 Since FY09 x Since FY10 TBEA (China)* x x Since FY11 Since FY11 x Since FY10 ZTR (Ukraine)* x x x Yes x Since FY10 Baoding (China)* x x x Since FY10 x Since FY11 Hyundai (Korea)* x x x Since FY10 x x Xian (China)* x x x x x Since FY11
* These players do have manufacturing capabilities in lower KV segments as well, however, orders wins in India restricted to 400-765KV so far.
Source: Company data, Credit Suisse
Along with the entry of Chinese & Korean competitors such as Hyosung, Hyundai, TBEA, Baoding, Xian etc., domestic players like Vijai Electricals, TRIL & BHEL have now developed capabilities to manufacture 765KV/1200KV transformers. As per the IEEMA, total imports of 765 KV transformers & reactors in FY12 went up to Rs12.3 bn.
Transformer industry seeing intense competition with entry of foreign and new domestic players
Against 450bps margin improvement guidance over FY12-15, expect Crompton to achieve 171bps

13 June 2012
Crompton Greaves
(CROM.BO / CRG IN) 13
As can be seen from the charts below, Chinese & Korean players have captured 30-40% market share in PGCIL’s transformer & reactor orders, while the share of Crompton has halved during FY09-12.
Figure 25: Chinese & Koreans have picked up major share
of PGCIL’s transformer & reactor orders…
Figure 26: …while Crompton’s market share has halved
over FY09-12
0%
10%
20%
30%
40%
50%
60%
FY09 FY10 FY11 FY12
Mkt share of Chinese/Koreans in PGCIL orders for transformers & reactors
15%
20%
25%
30%
35%
40%
FY09 FY10 FY11 FY12
Crompton's market share in transformers & reactors
Source: PGCIL, Credit Suisse Source: PGCIL, Company data, Credit Suisse
Currently, even after excluding competition from Chinese and Korean players, power transformer industry has a huge domestic manufacturing over-capacity. As per industry estimates, currently the transformer industry capacity utilisation is at 65-75%. We expect this situation to deteriorate from FY14, given our expectation of peaking of orders in FY13. However, in that context, we note that Crompton is currently in the process of increasing its installed capacity in India by 50,000MVA.
Besides, some foreign players are also planning to set up manufacturing capacities in India. As per media reports, TBEA plans to set up transformer manufacturing capacity in Gujarat at a capex of Rs2.5 bn.
Transformer prices have touched new lows Due to high competitive intensity and low capacity utilisation, transformer pricing has become very aggressive. As per the data presented by the management, prices for the 765KV 500MVA transformers have fallen by over 65% from September 2008 to December 2010. From the lows of December 2010, the prices seem to have recovered by about 30% by January 2012 and since then have mostly remained flat. However, from the September 2008 levels, current prices seem to be lower by over 55%.
Our calculations suggests that during FY09-12, Crompton’s transformers and reactors realisations have fallen between 25-40%. However, as per our discussions with industry experts, pricing has now remained flat or is marginally improving.
We, thus, expect domestic power business margins to improve by 70bps during FY13. However, we expect the domestic power business margins to fall by 100bps during FY13-15 as order inflows are likely to deteriorate after peaking in FY13. However, we expect overseas margins to improve by 323bps over FY12-15 from its lows of 1.7% in FY12 to 5% by FY15.
765KV 500MVA transformer current prices lower by 55% from Sep-08 levels

13 June 2012
Crompton Greaves
(CROM.BO / CRG IN) 14
Figure 27: 765KV 500MVA transformer pricing have fallen
~55% during FY09-FY12
Figure 28: Crompton’s transformers & reactors
realisations between 25-40%
0
50
100
150
200
250
300
Sept
-08
Dec-
08
Jul-0
9
Aug-
09
Dec-
10
Jan-
11
May
-11
Aug-
11
Nov-
11
Jan-
12
Feb-
12500MVA 765KV transformers (Rs mn)
0%
5%
10%
15%
20%
25%
30%
FY09 FY10 FY11 FY12
MVA volume growth YoY (%)
Power systems sales growth YoY (%)
Source: Company data, Credit Suisse Source: Company data, Credit Suisse
Localisation norms do not help contain margin erosion In CY10, for high-voltage transformers & reactor tenders, Powergrid relaxed its criteria that mandated to source at least 50% transformers (versus 66% earlier) from a manufacturing facility whose transformers have been operating for at least two years. Crompton was one of the few domestic manufacturers meeting these guidelines.
Since CY11, Powergrid introduced certain domestic manufacturing clauses which requires a bidder to have a subsidiary or a JV in India, to qualify bidding for its transformer & reactor tenders.
It was expected that Crompton would be able to benefit from new qualification requirement by gaining market share until foreign players (especially Chinese & Korean competitors), managed to set up JVs/subsidiaries in India. However, foreign competition has remained high despite the localisation norms, impacting margins.
Fixed price industrial & overseas power orders pose margin risk Power orders received from PGCIL as well as from SEBs have price variation clauses, while most of orders received from international geographies are fixed priced contracts. Similarly, given Crompton’s industrial orders have short delivery cycles (about 3 months), it does not get a price variation clause in these contracts. Industrial and overseas power orders thus exposes Crompton to margin risk.
CRGO steel used for the core of transformer and copper used for winding are the key commodities required for its transformers business. As a strategy, Crompton takes a forward hedge for copper and covers it when they receive an order to mitigate margin pressures. However, there are a very few CRGO producers globally and, hence, its price and availability is a key concern for margins.
Strategic plan for margin expansion is aggressive Crompton has devised a three year strategic plan to increase its consolidated EBITDA margin by 450bps. The plan is dependent on four drivers as below:
Industrial and overseas power orders exposes Crompton to margin risk

13 June 2012
Crompton Greaves
(CROM.BO / CRG IN) 15
■ Improved offering: Crompton aims to move to high value-added product offerings such as the 1200KV transformers, CVT & surge arrestors, in line with the market requirements and manufacture energy efficient motors for global markets. It also plans to offer engineering services to utilities and enter new geographies such as the Middle East and Brazil. It expects 150bps EBITDA margin improvement to be contributed from these initiatives.
■ Sourcing: Crompton plans to increase its material sourcing from low cost countries. It has already established its sourcing office in Shanghai in July 2011. Crompton expects 150bps EBITDA margin improvement from its global sourcing initiatives.
■ Manufacturing footprint: Crompton plans to consolidate its manufacturing operations in Europe for optimum utilisation at each of the factories. Crompton also plans to augment capacity by over 50,000 MVA in India. It expects to improve its EBITDA margin by 100bps through these initiatives.
■ Cost efficiencies: Crompton plans to continue its efforts to optimise costs through the implementation of Six Sigma at its worldwide operations and expects these efforts to help improve its EBITDA margin by 50bps.
Figure 29: Segment-wise margin outlook for Crompton Segment % of FY12 consol.
EBITDA Key issues / margin outlook
Domestic Power 35% Pricing pressures intensifying, key product realisation down 55% since Sep-08; expect margin to improve by 70bps in FY13 but fall by 100bps over FY13-15 on peaking order flows
International Power 10% EBITDA margin deteriorated to 1.7% in FY12; expect margins to improve by 323bps over FY12-15
Industrials 25% Mostly fixed priced orders, thus risks margins; expect 210bps margin improvement over FY12-15 led by pick-up in industrial growth and penetration in high margin foreign markets
Consumer 30% Margins to marginally improve (55bps) over FY12-15
Source: Company data, Credit Suisse estimates
Expect 171bps margin improvement over FY12-15
We believe the management guidance for 450bps margin improvement is aggressive. We expect 171bps improvement in consolidated margin for the company over FY12-15. We expect most of the margin improvement to be driven by its international subsidiaires (contributes over 42-46% of sales), followed by industrial (14-15% of sales) and consumer (18-20% of sales) business segments.
Figure 30: Crompton – Consolidated sales mix Figure 31: Margin improvement to be mainly driven by
international subsidiaries
-
20
40
60
80
100
120
140
160
FY09 FY10 FY11 FY12 FY13E FY14E FY15E
Power systems Consumer Products Industrial Systems International subs
6%
7%
8%
9%
10%
11%
12%
13%
14%
0%
2%
4%
6%
8%
10%
12%
14%
16%
18%
FY11 FY12 FY13E FY14E FY15E
Power systems Consumer Products
Industrial Systems International subs
Consol. EBITDA margin
Source: Company data, Credit Suisse estimates Source: Company data, Credit Suisse estimates
Against 450bps margin improvement guidance over FY12-15, expect Crompton to achieve 171bps

13 June 2012
Crompton Greaves
(CROM.BO / CRG IN) 16
Initiate with Underperform, 23% potential downside We initiate coverage on Crompton Greaves with an Underperform rating and target price of Rs92. Decelerating EPS growth of 19% over FY13-15 (versus FY13 EPS growth of 44% on a low base of FY12), subdued RoE at 14-16% (vs >30% in past) led by relatively lower margins & and capex continuing to impact asset turnover, working capital pressures and unrelated diversifications into power generation & distribution business are our concerns.
Given that Crompton has disappointed on earnings for four consequtive quarters, we believe that investors would turn positive only on visibility of it meeting its 3-year margin guidance, which seems aggressive. However, for FY13, we expect Crompton to meet its sales and order inflow growth guidance and the lower end of its margin guidance.
Power sector reforms in India and improvement in global macro conditions are key positive risks.
Expect earnings trajectory to decelerate Crompton’s earnings growth declined by 60% YoY during FY12. Given expected pick-up in power sector order flows as well as margins both from the domestic as well as the international market, we expect FY13 earnings growth to rebound to 44% in FY13. However, we do not see this as a continuing trend for the company, going forward.
During FY13-15, we expect industrial and consumer business diversification to improve sales growth as well as margins. We also expect a significant 193bps margin improvement in its international power segment. However, with peaking domestic power sector order flows in FY13, we expect sales growth and margins for this segment to deteriorate. Overall, we expect the earnings growth to slow to 19% over FY13-15.
This is despite our assumption of a significant improvement in working capital cycle for its domestic business & marginal improvement in its international business led by improvement in pick-up of deliveries by clients & increasing share of industrial business. However, its move towards undertaking EPC jobs (versus only products & services) in 765KV segment should inflate working capital.
We have also assumed the continuaton of tax benefits in India on R&D spends (entitled to a tax rebate for 2x the R&D capex) over FY13-14, resulting in standalone business tax rate at 27%. International subsidiaries are, however, subject to 11-39% tax rates depending on their locations and benefits from carry forward of losses. We expect a tax rate of 26% for its international business.
Key concerns: decelerating earnings growth, subdued RoE led by relatively lower margins & high capex, working capital pressures & unrelated diversifications

13 June 2012
Crompton Greaves
(CROM.BO / CRG IN) 17
Figure 32: Expect a jump in FY13 EPS on low base, FY13-
15 EPS growth trajectory to decelerate
Figure 33: Expect improvement in working capital cycle
-80%
-60%
-40%
-20%
0%
20%
40%
60%
4
6
8
10
12
14
16
FY08 FY09 FY10 FY11 FY12 FY13E FY14E FY15E
Consolidated EPS (Rs/ share) YoY growth (%)
-
4
8
12
16
20
24
28
32
36
FY09 FY10 FY11 FY12 FY13E FY14E FY15E
Working capital net of cash (Standalone)
Working capital net of cash (International subs)
Source: Company data, Credit Suisse estimates Source: Company data, Credit Suisse estimates
Guidance for FY13 seems achievable; medium-term margin guidance is aggressive Crompton has guided for FY13 order inflow growth of 15%, sales growth of 12-14% and consolidated EBITDA margin improvement of 8-9% (vs 7.1% in FY12). We expect Crompton to meet the lower end of its margin guidance for FY13 and achieve its guidance for order inflow and sales growth.
We estimate 14.7% order inflow growth in FY13 for Crompton, mainly led by domestic as well as international power sector orders, though we expect muted growth in the industrial segment. We expect consolidated sales to increase by 13.3% (close to the high-end of its guidance) mainly led by 17% order book growth in FY12 and strong FY13 order inflows.
We expect FY13 margins to improve by 81bps to 8%, mainly led by a sharp 130bps YoY improvement in international subsidiaries’ margins and 70bps YoY improvement in margins for domestic power business due to increased ordering activity combined with stable to marginally increasing transfomer pricing.
We note that during FY12, while Crompton achieved its sales growth guidance and exceeded its order inflow growth guidance, it missed its EBITDA margin guidance.
Figure 34: Crompton – Guidance summary FY12 FY13
Guidance Actual Guidance CSe
Order inflow growth (%) 12.0 14.8 15.0 14.7
Sales growth (%) 10-12 12.4 12-14 13.3
Margin (%) 8-10 7.1 8-9 8.0
Source: Company data, Credit Suisse estimates
RoE to remain low on lower asset turnover & margins Though we expect improvement in Crompton’s RoE from its low of 11% observed in FY12 to about 16% by FY15 mainly led by our expectation of improving margins, compared to its history of over 30% RoE since FY05, we expect Crompton’s RoE to remain low led by relatively lower margins and asset turnover.
Expect 14.7% inflow growth, 13.3% revenue growth and 8% margins in FY13
13 June 2012
Crompton Greaves
(CROM.BO / CRG IN) 18
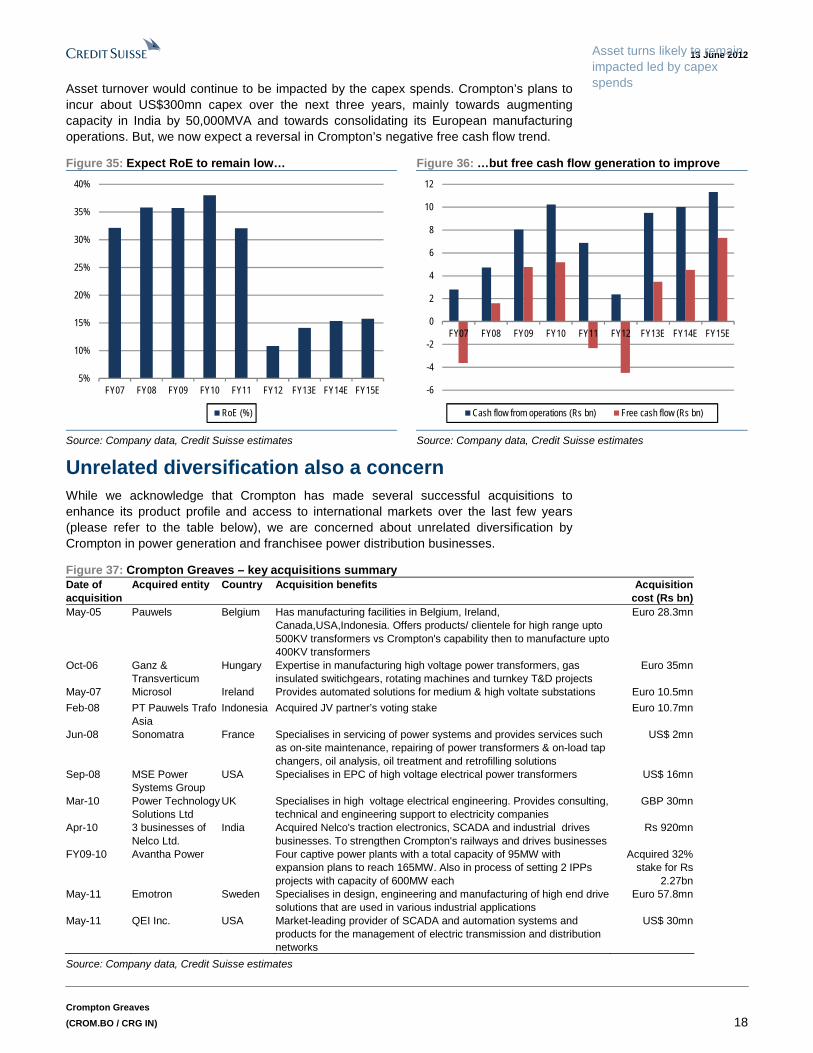
Asset turnover would continue to be impacted by the capex spends. Crompton’s plans to incur about US$300mn capex over the next three years, mainly towards augmenting capacity in India by 50,000MVA and towards consolidating its European manufacturing operations. But, we now expect a reversal in Crompton’s negative free cash flow trend.
Figure 35: Expect RoE to remain low… Figure 36: …but free cash flow generation to improve
5%
10%
15%
20%
25%
30%
35%
40%
FY07 FY08 FY09 FY10 FY11 FY12 FY13E FY14E FY15E
RoE (%)
-6
-4
-2
0
2
4
6
8
10
12
FY07 FY08 FY09 FY10 FY11 FY12 FY13E FY14E FY15E
Cash flow from operations (Rs bn) Free cash flow (Rs bn)
Source: Company data, Credit Suisse estimates Source: Company data, Credit Suisse estimates
Unrelated diversification also a concern While we acknowledge that Crompton has made several successful acquisitions to enhance its product profile and access to international markets over the last few years (please refer to the table below), we are concerned about unrelated diversification by Crompton in power generation and franchisee power distribution businesses.
Figure 37: Crompton Greaves – key acquisitions summary Date of acquisition
Acquired entity Country Acquisition benefits Acquisition cost (Rs bn)
May-05 Pauwels Belgium Has manufacturing facilities in Belgium, Ireland, Canada,USA,Indonesia. Offers products/ clientele for high range upto 500KV transformers vs Crompton's capability then to manufacture upto 400KV transformers
Euro 28.3mn
Oct-06 Ganz & Transverticum
Hungary Expertise in manufacturing high voltage power transformers, gas insulated switichgears, rotating machines and turnkey T&D projects
Euro 35mn
May-07 Microsol Ireland Provides automated solutions for medium & high voltate substations Euro 10.5mn
Feb-08 PT Pauwels Trafo Asia
Indonesia Acquired JV partner’s voting stake Euro 10.7mn
Jun-08 Sonomatra France Specialises in servicing of power systems and provides services such as on-site maintenance, repairing of power transformers & on-load tap changers, oil analysis, oil treatment and retrofilling solutions
US$ 2mn
Sep-08 MSE Power Systems Group
USA Specialises in EPC of high voltage electrical power transformers US$ 16mn
Mar-10 Power Technology Solutions Ltd
UK Specialises in high voltage electrical engineering. Provides consulting, technical and engineering support to electricity companies
GBP 30mn
Apr-10 3 businesses of Nelco Ltd.
India Acquired Nelco's traction electronics, SCADA and industrial drives businesses. To strengthen Crompton's railways and drives businesses
Rs 920mn
FY09-10 Avantha Power Four captive power plants with a total capacity of 95MW with expansion plans to reach 165MW. Also in process of setting 2 IPPs projects with capacity of 600MW each
Acquired 32% stake for Rs
2.27bn May-11 Emotron Sweden Specialises in design, engineering and manufacturing of high end drive
solutions that are used in various industrial applications Euro 57.8mn
May-11 QEI Inc. USA Market-leading provider of SCADA and automation systems and products for the management of electric transmission and distribution networks
US$ 30mn
Source: Company data, Credit Suisse estimates
Asset turns likely to remain impacted led by capex spends
13 June 2012
Crompton Greaves
(CROM.BO / CRG IN) 19
Crompton plans to diversify into power generation business through its investments in its Avantha Group company. Avantha Power operates four captive power plants totaling 95MW, with plans to increase the capacity at these projects to 165MW. Besides, it also plans to set up IPP projects of 1.2GW each in Korba (Chattisgarh) and Jhabua (MP). Crompton had earlier also acquired a 59% stake in Malanpur captive power plant, which it sold in FY10 to the Avantha group company.
Crompton has has earlier tried to venture into power distribution franchisee business. It was selected as the lowest bidder for the Nagpur power distribution franchisee. However, it later withdrew from this bid. In FY11, it again participated and won the power distribution franchisee license for 10 years at Jalgaon, Maharashtra.
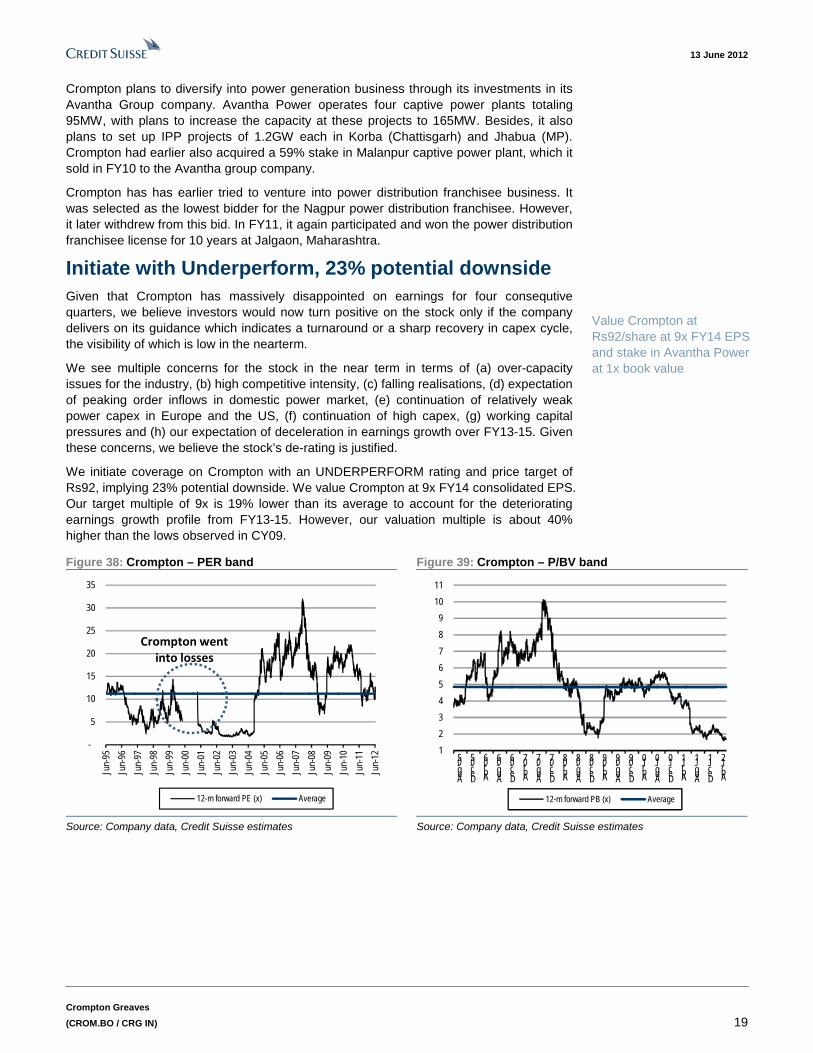
Initiate with Underperform, 23% potential downside Given that Crompton has massively disappointed on earnings for four consequtive quarters, we believe investors would now turn positive on the stock only if the company delivers on its guidance which indicates a turnaround or a sharp recovery in capex cycle, the visibility of which is low in the nearterm.
We see multiple concerns for the stock in the near term in terms of (a) over-capacity issues for the industry, (b) high competitive intensity, (c) falling realisations, (d) expectation of peaking order inflows in domestic power market, (e) continuation of relatively weak power capex in Europe and the US, (f) continuation of high capex, (g) working capital pressures and (h) our expectation of deceleration in earnings growth over FY13-15. Given these concerns, we believe the stock’s de-rating is justified.
We initiate coverage on Crompton with an UNDERPERFORM rating and price target of Rs92, implying 23% potential downside. We value Crompton at 9x FY14 consolidated EPS. Our target multiple of 9x is 19% lower than its average to account for the deteriorating earnings growth profile from FY13-15. However, our valuation multiple is about 40% higher than the lows observed in CY09.
Figure 38: Crompton – PER band Figure 39: Crompton – P/BV band
-
5
10
15
20
25
30
35
Jun-
95
Jun-
96
Jun-
97
Jun-
98
Jun-
99
Jun-
00
Jun-
01
Jun-
02
Jun-
03
Jun-
04
Jun-
05
Jun-
06
Jun-
07
Jun-
08
Jun-
09
Jun-
10
Jun-
11
Jun-
12
12-m forward PE (x) Average
Crompton went into losses
1
2
3
4
5
6
7
8
9
10
11
Aug-05
Dec-05
Apr-06
Aug-06
Dec-06
Apr-07
Aug-07
Dec-07
Apr-08
Aug-08
Dec-08
Apr-09
Aug-09
Dec-09
Apr-10
Aug-10
Dec-10
Apr-11
Aug-11
Dec-11
Apr-12
12-m forward PB (x) Average
Source: Company data, Credit Suisse estimates Source: Company data, Credit Suisse estimates
Value Crompton at Rs92/share at 9x FY14 EPS and stake in Avantha Power at 1x book value

13 June 2012
Crompton Greaves
(CROM.BO / CRG IN) 20
Financial snapshot – Standalone Figure 40: Crompton – Profit and Loss statement summary (Standalone Financials) (Rs mn) FY10 FY11 FY12 FY13E FY14E FY15E
Net sales 52,840 59,514 64,854 73,611 79,709 82,794
Total operating expenses 44,262 50,190 57,647 65,114 70,503 72,727
EBITDA 8,578 9,324 7,207 8,497 9,206 10,067
EBITDA margin (%) 16.2% 15.7% 11.1% 11.5% 11.5% 12.2%
Depreciation 519 809 907 925 1,071 1,143
EBIT 8,059 8,516 6,300 7,572 8,135 8,925
EBIT margin (%) 15.3% 14.3% 9.7% 10.3% 10.2% 10.8%
Interest 200 41 37 10 10 10
Other income 844 795 504 678 600 824
PBT 8,703 9,269 6,767 8,240 8,724 9,739
Tax 2,933 2,327 1,718 2,225 2,355 2,922
Tax rate (%) 33.7% 25.1% 25.4% 27.0% 27.0% 30.0%
Recurring PAT 5,770 6,943 5,049 6,015 6,369 6,817
Exceptionals 403 - - - - -
Reported PAT 6,173 6,943 5,049 6,015 6,369 6,817
Source: Company data, Credit Suisse estimates
Figure 41: Crompton - Balance Sheet summary (standalone financials) (Rs mn) FY10 FY11 FY12 FY13E FY14E FY15E
Share capital 1,283 1,283 1,283 1,283 1,283 1,283
Reserves and surplus 16,364 21,758 25,726 30,454 35,459 40,817
Networth 17,647 23,041 27,009 31,737 36,742 42,100
Loan funds 268 134 104 104 104 104
Deferred tax liability 834 735 432 432 432 432
Total liabilities 18,749 23,910 27,545 32,273 37,279 42,637
Gross block 11,714 16,042 14,474 17,974 20,974 22,974
Less: Depreciation 6,376 7,288 8,195 9,120 10,191 11,333
Net block 5,338 8,754 6,279 8,854 10,783 11,640
CWIP 330 476 476 476 476 476
Net fixed assets 5,668 9,230 6,755 9,330 11,259 12,116
Investments 6,881 7,816 10,525 10,525 10,525 10,525
Inventory 3,035 4,057 4,496 4,840 5,233 5,383
Debtors 12,128 15,102 17,356 17,412 17,763 17,316
Cash and bank 5,485 1,509 3,211 6,242 10,927 16,229
Loans and advances 1,554 3,182 3,362 3,816 4,132 4,292
Total current assets 22,202 23,850 28,425 32,310 38,055 43,220
Current liabilities 14,466 15,293 16,657 18,078 20,597 21,185
Provisions 1,536 1,693 1,503 1,814 1,964 2,040
Total current liabilities 16,002 16,986 18,160 19,892 22,561 23,224
Net current assets 6,200 6,864 10,265 12,418 15,495 19,995
Misc. expenditure written off - - - - - -
Total assets 18,749 23,910 27,545 32,273 37,279 42,637
Source: Company data, Credit Suisse estimates

13 June 2012
Crompton Greaves
(CROM.BO / CRG IN) 21
Figure 42: Crompton – Cash flow statement summary (standalone financials) (Rs mn) FY10 FY11 FY12 FY13E FY14E FY15E
PBT 8,703 9,269 6,767 8,240 8,724 9,739
Tax Paid (2,933) (2,327) (1,718) (2,225) (2,355) (2,922)
Change in net DTL 195 (99) (303) - - -
Add: Depreciation 519 809 907 925 1,071 1,143
Change in Working Capital 263 (4,640) (1,700) 879 1,608 801
Cash Flow from Operations 6,747 3,013 3,953 7,819 9,048 8,761
Extrordinary Income/ (Expenses) 403 - - - - -
Capex (951) (4,370) 1,568 (3,500) (3,000) (2,000)
Change in Investments (4,225) (936) (2,709) - - -
Cash Flow from Investing (4,773) (5,306) (1,141) (3,500) (3,000) (2,000)
Change in Debt (269) (134) (30) - - -
Change in Share capital 550 - - - - -
Change in Reserves (414) 93 - - - -
Dividend and Dividend Tax (1,080) (1,642) (1,081) (1,287) (1,363) (1,459)
Cash Flow from Financing (1,213) (1,683) (1,111) (1,287) (1,363) (1,459)
Increase/ (Decrease) in Cash 760 (3,976) 1,702 3,031 4,685 5,302
Opening cash and cash equivalents 4,725 5,485 1,509 3,211 6,242 10,927
Closing cash and cash equivalents 5,485 1,509 3,211 6,242 10,927 16,229
Source: Company data, Credit Suisse estimates
Figure 43: Crompton – Key ratios and valuation summary (standalone financials) FY10 FY11 FY12 FY13E FY14E FY15E
Share Price (Rs) 119 119 119 119 119 119
Shares Outstanding (mn) 642 642 642 642 642 642
Market Cap (Rs mn) 76,531 76,531 76,531 76,531 76,531 76,531
Net Debt (Rs mn) (8,216) (5,402) (8,116) (11,147) (15,832) (21,134)
EV (Rs mn) 68,315 71,129 68,415 65,383 60,699 55,397
Net Debt /Equity (x) (0.5) (0.2) (0.3) (0.4) (0.4) (0.5)
Gross Debt/ Equity (x) 0.0 0.0 0.0 0.0 0.0 0.0
EPS (Rs) 9 11 8 9 10 11
CEPS (Rs) 10 12 9 11 12 12
DPS (Rs) 1 2 1 2 2 2
BPS (Rs) 28 36 42 49 57 66
P/E (x) 13.3 11.0 15.2 12.7 12.0 11.2
P/CEPS (x) 12.2 9.9 12.9 11.0 10.3 9.6
Yield (%) 1.2% 1.8% 1.2% 1.4% 1.5% 1.6%
P/BV (x) 4.3 3.3 2.8 2.4 2.1 1.8
EV/EBITDA (x) 8.0 7.6 9.5 7.7 6.6 5.5
EV/Sales (x) 1.3 1.2 1.1 0.9 0.8 0.7
EPS Growth % -17.0% 20.3% -27.3% 19.1% 5.9% 7.0%
RoCE (%) 35.7% 32.5% 19.6% 20.1% 18.3% 17.1%
RoE (%) 38.4% 34.1% 20.2% 20.5% 18.6% 17.3%
EBITDA Margin (%) 16.2% 15.7% 11.1% 11.5% 11.5% 12.2%
EBIT Margin (%) 15.3% 14.3% 9.7% 10.3% 10.2% 10.8%
PBT Margin (%) 16.5% 15.6% 10.4% 11.2% 10.9% 11.8%
PAT Margin (%) 10.9% 11.7% 7.8% 8.2% 8.0% 8.2%
Source: Company data, Credit Suisse estimates

13 June 2012
Crompton Greaves
(CROM.BO / CRG IN) 22
Financial snapshot – Consolidated Figure 44: Crompton – Profit and Loss statement summary (consolidated financials) (Rs mn) FY10 FY11 FY12 FY13E FY14E FY15E
Net sales 91,409 100,051 112,486 127,458 141,290 153,174
Total operating expenses 78,639 86,613 104,449 117,322 129,441 139,604
EBITDA 12,770 13,438 8,036 10,136 11,848 13,570
EBITDA margin (%) 14.0% 13.4% 7.1% 8.0% 8.4% 8.9%
Depreciation 1,551 1,936 2,600 2,686 2,958 3,041
EBIT 11,219 11,502 5,437 7,450 8,890 10,528
EBIT margin (%) 12.3% 11.5% 4.8% 5.8% 6.3% 6.9%
Interest 428 201 463 583 620 658
Other income 1,100 990 524 732 636 871
PBT 11,891 12,291 5,497 7,600 8,906 10,742
Tax 3,650 3,100 1,821 2,275 2,403 3,182
Tax rate (%) 30.7% 25.2% 33.1% 29.9% 27.0% 29.6%
Minority interest/ Asssociates 57 84 47 55 61 66
Recurring PAT 8,247 9,268 3,736 5,392 6,577 7,638
Exceptionals 352 (381) - - - -
Reported PAT 8,599 8,887 3,736 5,392 6,577 7,638
Source: Company data, Credit Suisse estimates
Figure 45: Crompton - Balance Sheet summary (Consolidated financials) (Rs mn) FY10 FY11 FY12 FY13E FY14E FY15E
Share capital 1,283 1,283 1,283 1,283 1,283 1,283
Reserves and surplus 23,760 31,464 34,826 38,931 44,145 50,325
Networth 25,043 32,747 36,109 40,214 45,428 51,608
Loan funds 5,010 4,703 11,555 11,555 13,055 13,055
Minority interest 43 157 157 150 144 137
Total liabilities 30,095 37,607 47,821 51,919 58,627 64,800
Gross block 29,858 37,804 37,681 43,681 49,181 53,181
Less: Depreciation 17,234 19,490 22,090 24,775 27,733 30,774
Net block 12,623 18,314 15,591 18,905 21,447 22,406
CWIP 1,137 1,102 1,102 1,102 1,102 1,102
Net fixed assets 13,760 19,417 16,693 20,008 22,550 23,508
Investments 5,536 6,747 7,864 7,864 7,864 7,864
Goodwill - - 5,882 5,882 5,882 5,882
Deferred tax asset (net) (49) (160) 513 513 513 513
Inventory 10,194 11,893 12,233 13,595 15,402 16,767
Debtors 21,463 25,427 31,433 31,205 33,790 35,248
Cash and bank 6,688 2,984 4,976 7,179 11,825 17,688
Loans and advances 2,674 5,192 6,703 6,508 7,211 7,811
Total current assets 41,018 45,496 55,344 58,487 68,229 77,514
Current liabilities 26,567 29,595 34,688 36,258 41,286 44,830
Provisions 3,603 4,298 3,787 4,577 5,124 5,652
Total current liabilities 30,170 33,892 38,475 40,835 46,410 50,482
Net current assets 10,849 11,604 16,869 17,653 21,818 27,032
Misc. expenditure written off - - - - - -
Total assets 30,095 37,607 47,821 51,919 58,627 64,800
Source: Company data, Credit Suisse estimates

13 June 2012
Crompton Greaves
(CROM.BO / CRG IN) 23
Figure 46: Crompton – Cash flow statement summary (Consolidated Financials) (Rs mn) FY10 FY11 FY12 FY13E FY14E FY15E
Recurring PAT (pre-minority) 8,272 9,272 3,729 5,386 6,570 7,631
Change in net DTL 531 111 (673) - - -
Add: Depreciation 1,551 1,936 2,600 2,686 2,958 3,041
Change in Working Capital (125) (4,459) (3,273) 1,419 480 649
Cash Flow from Operations 10,229 6,860 2,383 9,491 10,009 11,321
Extrordinary Income/ (Expenses) 352 (381) (5,882) - - -
Capex (1,526) (7,593) 124 (6,000) (5,500) (4,000)
Change in Investments (3,864) (1,211) (1,117) - - -
Cash Flow from Investing (5,037) (9,185) (6,875) (6,000) (5,500) (4,000)
Change in Debt (2,173) (306) 6,852 - 1,500 -
Change in Share capital 550 - - - - -
Change in Reserves / Minority (1,591) (126) 713 - - -
Dividend and Dividend Tax (946) (946) (1,081) (1,287) (1,363) (1,459)
Cash Flow from Financing (4,160) (1,379) 6,484 (1,287) 137 (1,459)
Increase/ (Decrease) in Cash 1,032 (3,704) 1,992 2,203 4,646 5,863
Opening cash and cash equivalents 5,656 6,688 2,984 4,976 7,179 11,825
Closing cash and cash equivalents 6,688 2,984 4,976 7,179 11,825 17,688
Source: Company data, Credit Suisse estimates
Figure 47: Crompton – key ratios and valuation summary (Consolidated Financials) FY10 FY11 FY12 FY13E FY14E FY15E
Share Price (Rs) 119 119 119 119 119 119
Shares Outstanding (mn) 642 642 642 642 642 642
Market Cap (Rs mn) 76,531 76,531 76,531 76,531 76,531 76,531
Net Debt (Rs mn) (4,678) (2,308) 1,568 (636) (3,782) (9,644)
EV (Rs mn) 71,853 74,223 78,098 75,895 72,749 66,887
Net Debt /Equity (x) (0.2) (0.1) 0.0 (0.0) (0.1) (0.2)
Gross Debt/ Equity (x) 0.2 0.1 0.3 0.3 0.3 0.3
EPS (Rs) 12.9 14.4 5.8 8.4 10.3 11.9
CEPS (Rs) 15.3 17.5 9.9 12.6 14.9 16.6
DPS (Rs) 1.3 1.3 1.4 1.7 1.8 1.9
BPS (Rs) 39 51 56 63 71 80
P/E (x) 9.3 8.3 20.5 14.2 11.6 10.0
P/CEPS (x) 7.8 6.8 12.1 9.5 8.0 7.2
Yield (%) 1.1% 1.1% 1.2% 1.4% 1.5% 1.6%
P/BV (x) 3.1 2.3 2.1 1.9 1.7 1.5
EV/EBITDA (x) 5.6 5.5 9.7 7.5 6.1 4.9
EV/Sales (x) 0.8 0.7 0.7 0.6 0.5 0.4
EPS Growth % 47.3% 12.4% -59.7% 44.3% 22.0% 16.1%
RoCE (%) 29.6% 27.4% 8.7% 10.8% 11.9% 12.4%
RoE (%) 38.0% 32.1% 10.9% 14.1% 15.4% 15.7%
EBITDA Margin (%) 14.0% 13.4% 7.1% 8.0% 8.4% 8.9%
EBIT Margin (%) 12.3% 11.5% 4.8% 5.8% 6.3% 6.9%
PBT Margin (%) 13.0% 12.3% 4.9% 6.0% 6.3% 7.0%
PAT Margin (%) 9.0% 9.3% 3.3% 4.2% 4.7% 5.0%
Source: Company data, Credit Suisse estimates

13 June 2012
Crompton Greaves
(CROM.BO / CRG IN) 24
Companies Mentioned (Price as of 12 Jun 12) ABB Ltd. (ABB.BO, Rs 771.40) BEML Ltd (BEML.BO, Rs 384.45) BGR Energy (BGRE.BO, Rs 293.95) Bharat Heavy Electricals (BHEL.BO, Rs 219.35, UNDERPERFORM, TP Rs 182.00) Blue Star Limited (BLUS.BO, Rs 161.35) Crompton Greaves (CROM.BO, Rs 119.30, UNDERPERFORM [V], TP Rs 92.00) Cummins India (CUMM.BO, Rs 422.95, OUTPERFORM, TP Rs 506.00) Havells India Ltd. (HVEL.BO, Rs 551.85) Jyoti Structures Ltd (JYTS.BO, Rs 40.60) KEC International Ltd (KECL.BO, Rs 51.80) Larsen & Toubro (LART.BO, Rs 1,315.50, NEUTRAL, TP Rs 1,091.00) Mahindra & Mahindra (MAHM.BO, Rs 695.30, OUTPERFORM, TP Rs 820.00) Maruti Suzuki India Ltd (MRTI.BO, Rs 1,146.30, OUTPERFORM, TP Rs 1,422.00) Powergrid (PGCIL) (PGRD.BO, Rs 108, NOT RATED) Punj Lloyd Ltd (PUJL.BO, Rs 48.00) Siemens India (SIEM.BO, Rs 683.45) Suzlon Energy Ltd (SUZL.BO, Rs 17.75) Tata Steel Ltd (TISC.BO, Rs 412.60, NEUTRAL, TP Rs 340.00) TBEA Co Ltd (600089.SS, Rmb 7.38, UNDERPERFORM, TP Rmb 7.90) Thermax (THMX.BO, Rs 459.10) Voltas Ltd (VOLT.BO, Rs 107.15, UNDERPERFORM, TP Rs 83.00)
Disclosure Appendix
Important Global Disclosures Amish Shah, CFA & Abhishek Bansal each certify, with respect to the companies or securities that he or she analyzes, that (1) the views expressed in this report accurately reflect his or her personal views about all of the subject companies and securities and (2) no part of his or her compensation was, is or will be directly or indirectly related to the specific recommendations or views expressed in this report.
See the Companies Mentioned section for full company names. 3-Year Price, Target Price and Rating Change History Chart for CROM.BO CROM.BO Closing
Price Target
Price
Initiation/ Date (Rs) (Rs) Rating Assumption 6-Nov-09 219.515 274.275 O X 19-Feb-10 230.315 306.367 16-Mar-10 245.15 306.37 24-May-10 233.1 306.78 21-Jul-10 282.5 309.843 26-Oct-10 325.45 310 12-Jan-11 291.8 354.292 1-Apr-11 272.9 337.762 24-May-11 251 337.8 21-Jul-11 181.3 217 27-Oct-11 139.35 NC
274
306306 307 310 310
354338 338
217
6-Nov-09NC
O
106
156
206
256
306
356
13-Ju
n-09
13-A
ug-09
13-O
ct-09
13-D
ec-09
13-Feb-10
13-Apr-1
0
13-Ju
n-10
13-Aug-1
0
13-O
ct-10
13-D
ec-10
13-Feb
-11
13-Apr-1
1
13-Ju
n-11
13-Aug-1
1
13-O
ct-11
13-D
ec-11
13-Feb
-12
13-A
pr-12
Closing Price Target Price Initiation/Assumption Rating
Rs
O=Outperform; N=Neutral; U=Underperform; R=Restricted; NR=Not Rated; NC=Not Covered
The analyst(s) responsible for preparing this research report received compensation that is based upon various factors including Credit Suisse's total revenues, a portion of which are generated by Credit Suisse's investment banking activities. Analysts’ stock ratings are defined as follows: Outperform (O): The stock’s total return is expected to outperform the relevant benchmark* by at least 10-15% (or more, depending on perceived risk) over the next 12 months. Neutral (N): The stock’s total return is expected to be in line with the relevant benchmark* (range of ±10-15%) over the next 12 months. Underperform (U): The stock’s total return is expected to underperform the relevant benchmark* by 10-15% or more over the next 12 months. *Relevant benchmark by region: As of 29th May 2009, Australia, New Zealand, U.S. and Canadian ratings are based on (1) a stock’s absolute total return potential to its current share price and (2) the relative attractiveness of a stock’s total return potential within an analyst’s coverage universe**, with Outperforms representing the most attractive, Neutrals the less attractive, and Underperforms the least attractive investment opportunities. Some U.S. and Canadian ratings may fall outside the absolute total return ranges defined above, depending on market conditions and industry factors. For Latin American, Japanese, and non-Japan Asia stocks, ratings are based on a stock’s total return relative to the average total return of

13 June 2012
Crompton Greaves
(CROM.BO / CRG IN) 25
the relevant country or regional benchmark; for European stocks, ratings are based on a stock’s total return relative to the analyst's coverage universe**. For Australian and New Zealand stocks, 12-month rolling yield is incorporated in the absolute total return calculation and a 15% and a 7.5% threshold replace the 10-15% level in the Outperform and Underperform stock rating definitions, respectively. The 15% and 7.5% thresholds replace the +10-15% and -10-15% levels in the Neutral stock rating definition, respectively. **An analyst's coverage universe consists of all companies covered by the analyst within the relevant sector. Restricted (R): In certain circumstances, Credit Suisse policy and/or applicable law and regulations preclude certain types of communications, including an investment recommendation, during the course of Credit Suisse's engagement in an investment banking transaction and in certain other circumstances. Volatility Indicator [V]: A stock is defined as volatile if the stock price has moved up or down by 20% or more in a month in at least 8 of the past 24 months or the analyst expects significant volatility going forward.
Analysts’ coverage universe weightings are distinct from analysts’ stock ratings and are based on the expected performance of an analyst’s coverage universe* versus the relevant broad market benchmark**: Overweight: Industry expected to outperform the relevant broad market benchmark over the next 12 months. Market Weight: Industry expected to perform in-line with the relevant broad market benchmark over the next 12 months. Underweight: Industry expected to underperform the relevant broad market benchmark over the next 12 months. *An analyst’s coverage universe consists of all companies covered by the analyst within the relevant sector. **The broad market benchmark is based on the expected return of the local market index (e.g., the S&P 500 in the U.S.) over the next 12 months. Credit Suisse’s distribution of stock ratings (and banking clients) is:
Global Ratings Distribution Outperform/Buy* 47% (60% banking clients) Neutral/Hold* 41% (56% banking clients) Underperform/Sell* 9% (51% banking clients) Restricted 2%
*For purposes of the NYSE and NASD ratings distribution disclosure requirements, our stock ratings of Outperform, Neutral, and Underperform most closely correspond to Buy, Hold, and Sell, respectively; however, the meanings are not the same, as our stock ratings are determined on a relative basis. (Please refer to definitions above.) An investor's decision to buy or sell a security should be based on investment objectives, current holdings, and other individual factors.
Credit Suisse’s policy is to update research reports as it deems appropriate, based on developments with the subject company, the sector or the market that may have a material impact on the research views or opinions stated herein.
Credit Suisse's policy is only to publish investment research that is impartial, independent, clear, fair and not misleading. For more detail please refer to Credit Suisse's Policies for Managing Conflicts of Interest in connection with Investment Research: http://www.csfb.com/research-and-analytics/disclaimer/managing_conflicts_disclaimer.html
Credit Suisse does not provide any tax advice. Any statement herein regarding any US federal tax is not intended or written to be used, and cannot be used, by any taxpayer for the purposes of avoiding any penalties.
See the Companies Mentioned section for full company names. Price Target: (12 months) for (CROM.BO) Method: We value Crompton Greaves at Rs92/share based on 9x FY14 consolidated EPS. Our target multiple of 9x is 19% lower than its average to account for the deteriorating earnings growth profile from FY13-15. However, our valuation multiple is about 40% higher than the lows observed in CY09. Risks: Key upside risks to our Rs92 target price for Crompton Greaves include power sector reforms and improvement in global macro environment. Please refer to the firm's disclosure website at www.credit-suisse.com/researchdisclosures for the definitions of abbreviations typically used in the target price method and risk sections.
See the Companies Mentioned section for full company names. The subject company (CROM.BO) currently is, or was during the 12-month period preceding the date of distribution of this report, a client of Credit Suisse. Credit Suisse provided investment banking services to the subject company (CROM.BO) within the past 12 months. Credit Suisse expects to receive or intends to seek investment banking related compensation from the subject company (CROM.BO) within the next 3 months. Important Regional Disclosures Singapore recipients should contact a Singapore financial adviser for any matters arising from this research report.
The analyst(s) involved in the preparation of this report have not visited the material operations of the subject company (CROM.BO) within the past 12 months.
Restrictions on certain Canadian securities are indicated by the following abbreviations: NVS--Non-Voting shares; RVS--Restricted Voting Shares; SVS--Subordinate Voting Shares. Individuals receiving this report from a Canadian investment dealer that is not affiliated with Credit Suisse should be advised that this report may not contain regulatory disclosures the non-affiliated Canadian investment dealer would be required to make if this were its own report. For Credit Suisse Securities (Canada), Inc.'s policies and procedures regarding the dissemination of equity research, please visit http://www.csfb.com/legal_terms/canada_research_policy.shtml.

13 June 2012
Crompton Greaves
(CROM.BO / CRG IN) 26
As of the date of this report, Credit Suisse acts as a market maker or liquidity provider in the equities securities that are the subject of this report.
Principal is not guaranteed in the case of equities because equity prices are variable. Commission is the commission rate or the amount agreed with a customer when setting up an account or at anytime after that. Taiwanese Disclosures: This research report is for reference only. Investors should carefully consider their own investment risk. Investment results are the responsibility of the individual investor. Reports may not be reprinted without permission of CS. Reports written by Taiwan-based analysts on non-Taiwan listed companies are not considered recommendations to buy or sell securities under Taiwan Stock Exchange Operational Regulations Governing Securities Firms Recommending Trades in Securities to Customers. To the extent this is a report authored in whole or in part by a non-U.S. analyst and is made available in the U.S., the following are important disclosures regarding any non-U.S. analyst contributors: The non-U.S. research analysts listed below (if any) are not registered/qualified as research analysts with FINRA. The non-U.S. research analysts listed below may not be associated persons of CSSU and therefore may not be subject to the NASD Rule 2711 and NYSE Rule 472 restrictions on communications with a subject company, public appearances and trading securities held by a research analyst account. • Amish Shah, CFA, non-U.S. analyst, is a research analyst employed by Credit Suisse Securities (India) Private Limited. • Abhishek Bansal, non-U.S. analyst, is a research analyst employed by Credit Suisse Securities (India) Private Limited. For Credit Suisse disclosure information on other companies mentioned in this report, please visit the website at www.credit-suisse.com/researchdisclosures or call +1 (877) 291-2683. Disclaimers continue on next page.

13 June 2012 Asia Pacific/India Equity Research
CN0067.doc
This report is not directed to, or intended for distribution to or use by, any person or entity who is a citizen or resident of or located in any locality, state, country or other jurisdiction where such distribution, publication, availability or use would be contrary to law or regulation or which would subject Credit Suisse AG, the Swiss bank, or its subsidiaries or its affiliates (“CS”) to any registration or licensing requirement within such jurisdiction. All material presented in this report, unless specifically indicated otherwise, is under copyright to CS. None of the material, nor its content, nor any copy of it, may be altered in any way, transmitted to, copied or distributed to any other party, without the prior express written permission of CS. All trademarks, service marks and logos used in this report are trademarks or service marks or registered trademarks or service marks of CS or its affiliates. The information, tools and material presented in this report are provided to you for information purposes only and are not to be used or considered as an offer or the solicitation of an offer to sell or to buy or subscribe for securities or other financial instruments. CS may not have taken any steps to ensure that the securities referred to in this report are suitable for any particular investor. CS will not treat recipients as its customers by virtue of their receiving the report. The investments or services contained or referred to in this report may not be suitable for you and it is recommended that you consult an independent investment advisor if you are in doubt about such investments or investment services. Nothing in this report constitutes investment, legal, accounting or tax advice or a representation that any investment or strategy is suitable or appropriate to your individual circumstances or otherwise constitutes a personal recommendation to you. CS does not offer advice on the tax consequences of investment and you are advised to contact an independent tax adviser. Please note in particular that the bases and levels of taxation may change. CS believes the information and opinions in the Disclosure Appendix of this report are accurate and complete. Information and opinions presented in the other sections of the report were obtained or derived from sources CS believes are reliable, but CS makes no representations as to their accuracy or completeness. Additional information is available upon request. CS accepts no liability for loss arising from the use of the material presented in this report, except that this exclusion of liability does not apply to the extent that liability arises under specific statutes or regulations applicable to CS. This report is not to be relied upon in substitution for the exercise of independent judgment. CS may have issued, and may in the future issue, a trading call regarding this security. Trading calls are short term trading opportunities based on market events and catalysts, while stock ratings reflect investment recommendations based on expected total return over a 12-month period as defined in the disclosure section. Because trading calls and stock ratings reflect different assumptions and analytical methods, trading calls may differ directionally from the stock rating. In addition, CS may have issued, and may in the future issue, other reports that are inconsistent with, and reach different conclusions from, the information presented in this report. Those reports reflect the different assumptions, views and analytical methods of the analysts who prepared them and CS is under no obligation to ensure that such other reports are brought to the attention of any recipient of this report. CS is involved in many businesses that relate to companies mentioned in this report. These businesses include specialized trading, risk arbitrage, market making, and other proprietary trading. Past performance should not be taken as an indication or guarantee of future performance, and no representation or warranty, express or implied, is made regarding future performance. Information, opinions and estimates contained in this report reflect a judgement at its original date of publication by CS and are subject to change without notice. The price, value of and income from any of the securities or financial instruments mentioned in this report can fall as well as rise. The value of securities and financial instruments is subject to exchange rate fluctuation that may have a positive or adverse effect on the price or income of such securities or financial instruments. Investors in securities such as ADR’s, the values of which are influenced by currency volatility, effectively assume this risk. Structured securities are complex instruments, typically involve a high degree of risk and are intended for sale only to sophisticated investors who are capable of understanding and assuming the risks involved. The market value of any structured security may be affected by changes in economic, financial and political factors (including, but not limited to, spot and forward interest and exchange rates), time to maturity, market conditions and volatility, and the credit quality of any issuer or reference issuer. Any investor interested in purchasing a structured product should conduct their own investigation and analysis of the product and consult with their own professional advisers as to the risks involved in making such a purchase. Some investments discussed in this report have a high level of volatility. High volatility investments may experience sudden and large falls in their value causing losses when that investment is realised. Those losses may equal your original investment. Indeed, in the case of some investments the potential losses may exceed the amount of initial investment, in such circumstances you may be required to pay more money to support those losses. Income yields from investments may fluctuate and, in consequence, initial capital paid to make the investment may be used as part of that income yield. Some investments may not be readily realisable and it may be difficult to sell or realise those investments, similarly it may prove difficult for you to obtain reliable information about the value, or risks, to which such an investment is exposed. This report may provide the addresses of, or contain hyperlinks to, websites. Except to the extent to which the report refers to website material of CS, CS has not reviewed the linked site and takes no responsibility for the content contained therein. Such address or hyperlink (including addresses or hyperlinks to CS’s own website material) is provided solely for your convenience and information and the content of the linked site does not in any way form part of this document. Accessing such website or following such link through this report or CS’s website shall be at your own risk. This report is issued and distributed in Europe (except Switzerland) by Credit Suisse Securities (Europe) Limited, One Cabot Square, London E14 4QJ, England, which is regulated in the United Kingdom by The Financial Services Authority (“FSA”). This report is being distributed in Germany by Credit Suisse Securities (Europe) Limited Niederlassung Frankfurt am Main regulated by the Bundesanstalt fuer Finanzdienstleistungsaufsicht ("BaFin"). This report is being distributed in the United States by Credit Suisse Securities (USA) LLC ; in Switzerland by Credit Suisse AG; in Canada by Credit Suisse Securities (Canada), Inc.; in Brazil by Banco de Investimentos Credit Suisse (Brasil) S.A. or its affiliates; in Mexico by Banco Credit Suisse (México), S.A. (transactions related to the securities mentioned in this report will only be effected in compliance with applicable regulation); in Japan by Credit Suisse Securities (Japan) Limited, Financial Instrument Firm, Director-General of Kanto Local Finance Bureau (Kinsho) No. 66, a member of Japan Securities Dealers Association, The Financial Futures Association of Japan, Japan Securities Investment Advisers Association, Type II Financial Instruments Firms Association; elsewhere in Asia/Pacific by whichever of the following is the appropriately authorised entity in the relevant jurisdiction: Credit Suisse (Hong Kong) Limited, Credit Suisse Equities (Australia) Limited , Credit Suisse Securities (Thailand) Limited, Credit Suisse Securities (Malaysia) Sdn Bhd, Credit Suisse AG, Singapore Branch, Credit Suisse Securities (India) Private Limited regulated by the Securities and Exchange Board of India (registration Nos. INB230970637; INF230970637; INB010970631; INF010970631), having registered address at 9th Floor, Ceejay House,Dr.A.B. Road, Worli, Mumbai - 18, India, T- +91-22 6777 3777, Credit Suisse Securities (Europe) Limited, Seoul Branch, Credit Suisse AG, Taipei Securities Branch, PT Credit Suisse Securities Indonesia, Credit Suisse Securities (Philippines ) Inc., and elsewhere in the world by the relevant authorised affiliate of the above. Research on Taiwanese securities produced by Credit Suisse AG, Taipei Securities Branch has been prepared by a registered Senior Business Person. Research provided to residents of Malaysia is authorised by the Head of Research for Credit Suisse Securities (Malaysia) Sdn. Bhd., to whom they should direct any queries on +603 2723 2020. In jurisdictions where CS is not already registered or licensed to trade in securities, transactions will only be effected in accordance with applicable securities legislation, which will vary from jurisdiction to jurisdiction and may require that the trade be made in accordance with applicable exemptions from registration or licensing requirements. Non-U.S. customers wishing to effect a transaction should contact a CS entity in their local jurisdiction unless governing law permits otherwise. U.S. customers wishing to effect a transaction should do so only by contacting a representative at Credit Suisse Securities (USA) LLC in the U.S. Please note that this report was originally prepared and issued by CS for distribution to their market professional and institutional investor customers. Recipients who are not market professional or institutional investor customers of CS should seek the advice of their independent financial advisor prior to taking any investment decision based on this report or for any necessary explanation of its contents. This research may relate to investments or services of a person outside of the UK or to other matters which are not regulated by the FSA or in respect of which the protections of the FSA for private customers and/or the UK compensation scheme may not be available, and further details as to where this may be the case are available upon request in respect of this report. Any Nielsen Media Research material contained in this report represents Nielsen Media Research's estimates and does not represent facts. NMR has neither reviewed nor approved this report and/or any of the statements made herein. If this report is being distributed by a financial institution other than Credit Suisse AG, or its affiliates, that financial institution is solely responsible for distribution. Clients of that institution should contact that institution to effect a transaction in the securities mentioned in this report or require further information. This report does not constitute investment advice by Credit Suisse to the clients of the distributing financial institution, and neither Credit Suisse AG, its affiliates, and their respective officers, directors and employees accept any liability whatsoever for any direct or consequential loss arising from their use of this report or its content. Copyright 2012 CREDIT SUISSE AG and/or its affiliates. All rights reserved.