Amtek Engineering - Credit Suisse
33
DISCLOSURE APPENDIX CONTAINS ANALYST CERTIFICATIONS AND THE STATUS OF NON-US ANALYSTS. U.S. Disclosure: Credit Suisse does and seeks to do business with companies covered in its research reports. As a result, investors should be aware that the Firm may have a conflict of interest that could affect the objectivity of this report. Investors should consider this report as only a single factor in making their investment decision. 11 January 2011 Asia Pacific/Singapore Equity Research Electronic Equipment & Instruments Amtek Engineering (AMEL.SI / AMTK SP) INITIATION Aggregation and beyond Initiate coverage with OUTPERFORM: We initiate coverage of Amtek Engineering with an OUTPERFORM rating and a target price of S$1.75. New and improved: Amtek was incorporated in 1970 as a metal stamping specialist, subsequently listed on the Stock Exchange of Singapore in 1987, and then taken private via a consortium buyout in August 2007. Post- acquisition, various operational and strategic changes implemented by Amtek’s current management expanded its capabilities to include manufacturing complex mechanical modules, progressive cold forging, 3D forming processes and offering end-to-end precision engineering solutions. Diversified growth profile: With global manufacturing outsourcing intact, Amtek’s growth will be driven by demand from its 100-plus strong customer base, across diversified industry sectors. Against the backdrop of a muted September quarter for personal computer sales, Amtek achieved 11% YoY revenue and 147% YoY core earnings growth. We forecast core EPS to rise at 46% CAGR from FY10 to FY12. Target price of S$1.75 implies 36% upside: Amtek is set to deliver the strongest earnings growth profile and highest ROE amongst its listed precision engineering services peer group. We peg our target price at 11x P/E, in line with Singapore-listed Venture Corporation, a conservative position we believe given the strong EPS CAGR. With 36% upside, we initiate with OUTPERFORM. Risks: We believe that risks of a potential slowdown in global manufacturing outsourcing is low. Other risks for Amtek are loss of market share by its key customers, raw material cost inflation to the extent that any increase in costs cannot be passed on to customers and limited order book visibility. Share price performance 0 1 2 3 4 Dec-10 80 100 120 140 Price (LHS) Rebased Rel (RHS) The price relative chart measures performance against the SINGAPORE STRAITS TIMES(NEW) index which closed at 3229.27 on 10/01/11 On 10/01/11 the spot exchange rate was S$1.3/US$1 Performance Over 1M 3M 12M Absolute (%) 32.3 — — Relative (%) 30.5 — — Financial and valuation metrics Year 6/10A 6/11E 6/12E 6/13E Revenue (US$ mn) 638.0 714.4 771.6 826.7 EBITDA (US$ mn) 83.2 108.3 124.4 136.7 EBIT (US$ mn) 60.2 84.2 99.0 112.4 Net income (US$ mn) 21.7 59.7 74.4 85.9 EPS (CS adj.) (US$) 0.11 0.14 0.16 Change from previous EPS (%) n.a. Consensus EPS (US$) n.a. — — — EPS growth (%) n.a. 175.0 24.5 15.5 P/E (x) — 9.0 7.3 6.3 Dividend yield (%) 2.0 5.5 6.9 8.0 P/B (x) — 3.2 2.5 2.0 ROE 22.6 43.1 38.5 35.8 Net debt/equity (%) 90.5 20.7 net cash net cash Source: Company data, Thomson Reuters, Credit Suisse estimates. Rating OUTPERFORM* [V] Price (10 Jan 11, S$) 1.29 Target price (S$) 1.75¹ Chg to TP (%) 35.7 Market cap. (S$ mn) 700.74 (US$ 539.95) Enterprise value (US$ mn) 579.01 Number of shares (mn) 543.21 Free float (%) — 52-week price range 1.29 - 0.96 *Stock ratings are relative to the relevant country benchmark. ¹Target price is for 12 months. [V] = Stock considered volatile (see Disclosure Appendix). Research Analysts Su Tye Chua 65 6212 3014 [email protected] Christopher Chang 65 6212 3024 [email protected]
-
Upload
khangminh22 -
Category
Documents
-
view
2 -
download
0
Transcript of Amtek Engineering - Credit Suisse

DISCLOSURE APPENDIX CONTAINS ANALYST CERTIFICATIONS AND THE STATUS OF NON-US ANALYSTS. U.S. Disclosure: Credit Suisse does and seeks to do business with companies covered in its research reports. As a result, investors should be aware that the Firm may have a conflict of interest that could affect the objectivity of this report. Investors should consider this report as only a single factor in making their investment decision.
11 January 2011 Asia Pacific/Singapore
Equity Research Electronic Equipment & Instruments
Amtek Engineering (AMEL.SI / AMTK SP)
INITIATION
Aggregation and beyond ■ Initiate coverage with OUTPERFORM: We initiate coverage of Amtek
Engineering with an OUTPERFORM rating and a target price of S$1.75.
■ New and improved: Amtek was incorporated in 1970 as a metal stamping specialist, subsequently listed on the Stock Exchange of Singapore in 1987, and then taken private via a consortium buyout in August 2007. Post-acquisition, various operational and strategic changes implemented by Amtek’s current management expanded its capabilities to include manufacturing complex mechanical modules, progressive cold forging, 3D forming processes and offering end-to-end precision engineering solutions.
■ Diversified growth profile: With global manufacturing outsourcing intact, Amtek’s growth will be driven by demand from its 100-plus strong customer base, across diversified industry sectors. Against the backdrop of a muted September quarter for personal computer sales, Amtek achieved 11% YoY revenue and 147% YoY core earnings growth. We forecast core EPS to rise at 46% CAGR from FY10 to FY12.
■ Target price of S$1.75 implies 36% upside: Amtek is set to deliver the strongest earnings growth profile and highest ROE amongst its listed precision engineering services peer group. We peg our target price at 11x P/E, in line with Singapore-listed Venture Corporation, a conservative position we believe given the strong EPS CAGR. With 36% upside, we initiate with OUTPERFORM.
■ Risks: We believe that risks of a potential slowdown in global manufacturing outsourcing is low. Other risks for Amtek are loss of market share by its key customers, raw material cost inflation to the extent that any increase in costs cannot be passed on to customers and limited order book visibility.
Share price performance
01234
Dec-10
80
100
120
140Price (LHS) Rebased Rel (RHS)
The price relative chart measures performance against the SINGAPORE STRAITS TIMES(NEW) index which closed at 3229.27 on 10/01/11 On 10/01/11 the spot exchange rate was S$1.3/US$1
Performance Over 1M 3M 12M Absolute (%) 32.3 — — Relative (%) 30.5 — —
Financial and valuation metrics
Year 6/10A 6/11E 6/12E 6/13E Revenue (US$ mn) 638.0 714.4 771.6 826.7 EBITDA (US$ mn) 83.2 108.3 124.4 136.7 EBIT (US$ mn) 60.2 84.2 99.0 112.4 Net income (US$ mn) 21.7 59.7 74.4 85.9 EPS (CS adj.) (US$) 0.11 0.14 0.16 Change from previous EPS (%) n.a. Consensus EPS (US$) n.a. — — — EPS growth (%) n.a. 175.0 24.5 15.5 P/E (x) — 9.0 7.3 6.3 Dividend yield (%) 2.0 5.5 6.9 8.0 P/B (x) — 3.2 2.5 2.0 ROE 22.6 43.1 38.5 35.8 Net debt/equity (%) 90.5 20.7 net cash net cash
Source: Company data, Thomson Reuters, Credit Suisse estimates.
Rating OUTPERFORM* [V] Price (10 Jan 11, S$) 1.29 Target price (S$) 1.75¹ Chg to TP (%) 35.7 Market cap. (S$ mn) 700.74 (US$ 539.95) Enterprise value (US$ mn) 579.01 Number of shares (mn) 543.21 Free float (%) — 52-week price range 1.29 - 0.96 *Stock ratings are relative to the relevant country benchmark. ¹Target price is for 12 months. [V] = Stock considered volatile (see Disclosure Appendix).
Research Analysts
Su Tye Chua 65 6212 3014
Christopher Chang 65 6212 3024

11 January 2011
Amtek Engineering
(AMEL.SI / AMTK SP) 2
Focus charts
Figure 1: Revenue contribution Figure 2: % revenue contribution – 2003-2012E
12.1
31.8
46.9
64.4
0
10
20
30
40
50
60
70
Top customer Top 3 customers Top 5 customers Top 10 customers
(%)
24.0 28.0 19.0 29.0 24.7 25.8 27.7 26.0 25.6
25.030.0
37.0 27.023.3 19.8 15.7 12.4 11.5
18.019.0 17.0 19.0
18.1 17.7 19.9 24.4 26.7
21.013.0 11.0 12.0
6.7 6.4 6.7 6.9 7.1
11.0 8.07.0 7.0
7.2 7.4 9.3 8.2 7.6
9.0 6.0
8.8 9.4 12.4 14.6 14.611.4 13.6 8.3 7.4 6.9
1.0 2.0
FY03 FY04 FY05 FY06 FY08 FY09 FY10 FY11E FY12E
OthersAutomotiv eElectrical and Electronics ComponentsImaging and PrintingMass StorageConsumer ElectronicsCasings and Enclosures
Amtek w as taken priv ate in 2007(%)
Source: Company data Source: Company data
Figure 3: Fixed asset turnover Figure 4: Revenue breakdown comparison
1.6x 1.7x
5.3x
4.7x
5.3x
5.8x
6.7x
7.4x
FY05 FY06 FY07 FY08 FY09 FY10 FY11E FY12E FY13E
(x )
Am
tek
take
n pr
ivat
e
20
71 75 6648
87
4028
16
1232
17
798
29 25 3420 13
43
0
20
40
60
80
100
Amtek Seksun Unisteel MMI Cheung
Woh
Eng Tek Notion
VTEC
Mass Storage Casings and EnclosuresConsumer Electronics Automotiv eImaging & Printing Electrical and ElectronicsOthers
(%)
Source: Company data, Credit Suisse estimates Source: Company data, Credit Suisse estimates
Figure 5: Net profit comparison (YoY change) Figure 6: ROE versus earnings growth
13.0
6.2
-22.6
8.1
13.2
51.8
JCYH* Notion VTEC Amtek
CY3Q09 CY3Q10
(143.5%)(37.7%) 112.9%
0.0
5.0
10.0
15.0
20.0
25.0
30.0
35.0
40.0
45.0
Amtek Precision Eng. Serv ices EMS
0.0
5.0
10.0
15.0
20.0
25.0
30.0
35.0
40.0
45.0
50.0
ROE Average earnings grow th - RHS
(%)(%)
Source: Bloomberg, company data, Credit Suisse estimates Source: Bloomberg, company data, Credit Suisse estimates

11 January 2011
Amtek Engineering
(AMEL.SI / AMTK SP) 3
Aggregation and beyond New and improved Amtek was incorporated in 1970 as a metal stamping specialist, subsequently listed on the Stock Exchange of Singapore in 1987, and then taken private through a consortium buyout in August 2007. Post-acquisition, various operational and strategic changes implemented by Amtek’s current management have expanded its capabilities to include manufacturing complex mechanical modules, progressive cold forging, 3D forming processes and offering end-to-end precision engineering solutions and also serving the following industry sectors: casings and enclosures, mass storage, consumer electronics, automotive, electrical and electronic components and imaging and printing.
Diversified growth profile With global manufacturing outsourcing intact, we forecast growth for Amtek being driven by demand from its 100-plus strong customer base, which is diversified across six core industry sectors: casings and enclosures, mass storage, consumer electronics, automotive, electrical and electronic components, and imaging and printing. Against the backdrop of a muted September quarter for personal computer sales, Amtek achieved 11% YoY revenue and 147% YoY core earnings growth. Going forward, consensus estimates are projecting an average 10.5% YoY sales growth in 2011 for Amtek’s top customers, which lends support to our 12% YoY revenue growth estimates for Amtek. We forecast core earnings to rise at 46% CAGR from FY10 to FY12. Further ahead, we believe that Amtek’s competencies in precision engineering should gain traction amongst existing and potential customers and increasingly seek to outsource complex manufacturing parts, which could provide upside to earnings.
Target price of S$1.75 implies 36% upside We derive our target price of S$1.75 based on 11x P/E, in line with the much larger Singapore-listed Venture Corp, even as Amtek commands superior margins, and a stronger earnings profile. Going forward, we believe that strong earnings delivery, coupled with increasing investor awareness, should help Amtek trade up to the P/E valuation of its precision engineering services peer group. We believe our valuation is conservative, as given the strong EPS growth profile for Amtek, our valuation would still imply 9x P/E on CY12 earnings. This is the three-year historical average P/E multiple that Amtek traded prior to its privatisation in 2007, which does not factor in the benefits from the restructuring and rationalisation of its operations going forward. With 36% upside, we initiate coverage with OUTPERFORM.
Risks We believe that the risk of a potential slowdown in global manufacturing outsourcing is low. Other key risks for Amtek are loss of market share by its key customers, raw material cost inflation to the extent that any increase in costs cannot be passed on to customers and limited order book visibility.
Amtek is today a precision engineering specialist with a diversified customer base
We forecast 46% core earnings CAGR from FY10 to FY12
We benchmarked Amtek against precision engineering services, Asian EMS companies, and Singapore-listed Venture
11 January 2011
Amtek Engineering
(AMEL.SI / AMTK SP) 4
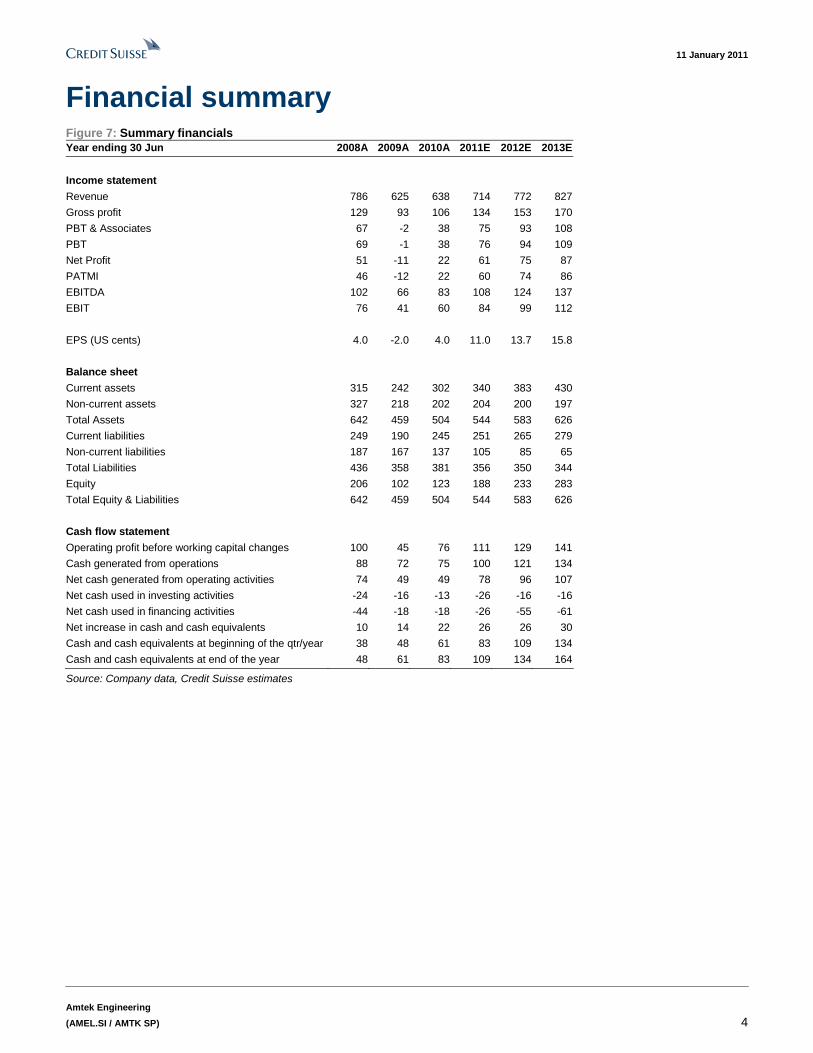
Financial summary Figure 7: Summary financials Year ending 30 Jun 2008A 2009A 2010A 2011E 2012E 2013E
Income statement
Revenue 786 625 638 714 772 827
Gross profit 129 93 106 134 153 170
PBT & Associates 67 -2 38 75 93 108
PBT 69 -1 38 76 94 109
Net Profit 51 -11 22 61 75 87
PATMI 46 -12 22 60 74 86
EBITDA 102 66 83 108 124 137
EBIT 76 41 60 84 99 112
EPS (US cents) 4.0 -2.0 4.0 11.0 13.7 15.8
Balance sheet
Current assets 315 242 302 340 383 430
Non-current assets 327 218 202 204 200 197
Total Assets 642 459 504 544 583 626
Current liabilities 249 190 245 251 265 279
Non-current liabilities 187 167 137 105 85 65
Total Liabilities 436 358 381 356 350 344
Equity 206 102 123 188 233 283
Total Equity & Liabilities 642 459 504 544 583 626
Cash flow statement
Operating profit before working capital changes 100 45 76 111 129 141
Cash generated from operations 88 72 75 100 121 134
Net cash generated from operating activities 74 49 49 78 96 107
Net cash used in investing activities -24 -16 -13 -26 -16 -16
Net cash used in financing activities -44 -18 -18 -26 -55 -61
Net increase in cash and cash equivalents 10 14 22 26 26 30
Cash and cash equivalents at beginning of the qtr/year 38 48 61 83 109 134
Cash and cash equivalents at end of the year 48 61 83 109 134 164
Source: Company data, Credit Suisse estimates
11 January 2011
Amtek Engineering
(AMEL.SI / AMTK SP) 5
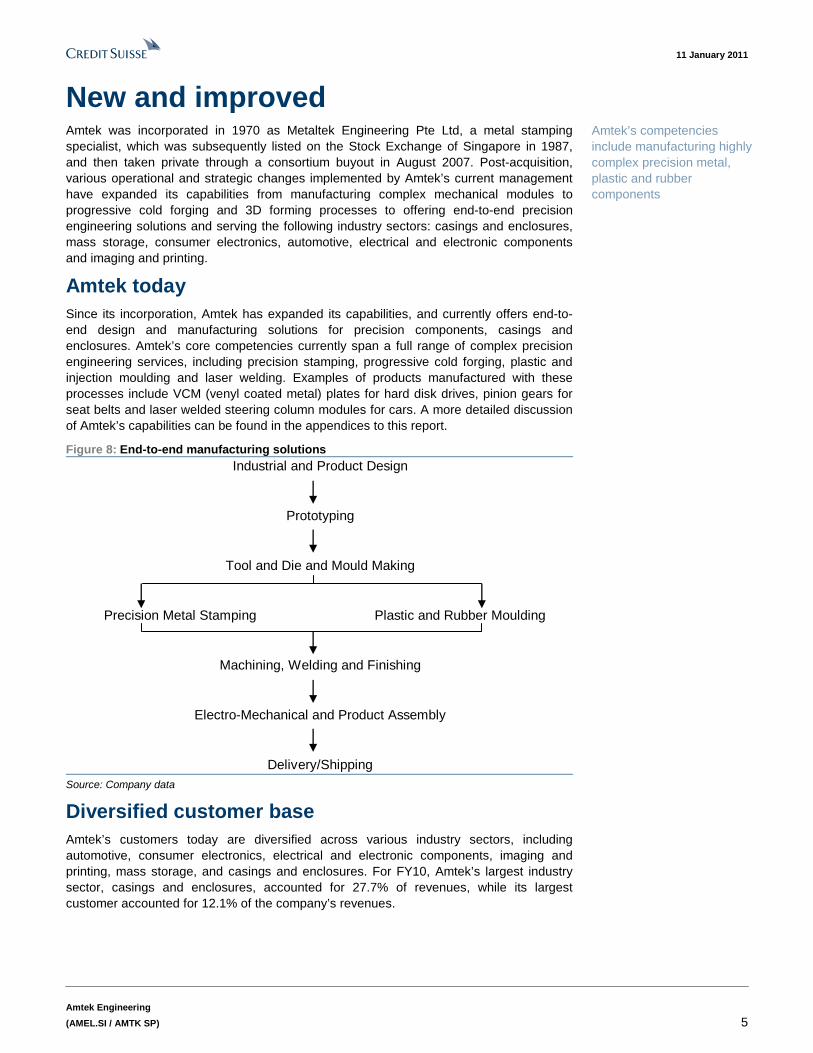
New and improved Amtek was incorporated in 1970 as Metaltek Engineering Pte Ltd, a metal stamping specialist, which was subsequently listed on the Stock Exchange of Singapore in 1987, and then taken private through a consortium buyout in August 2007. Post-acquisition, various operational and strategic changes implemented by Amtek’s current management have expanded its capabilities from manufacturing complex mechanical modules to progressive cold forging and 3D forming processes to offering end-to-end precision engineering solutions and serving the following industry sectors: casings and enclosures, mass storage, consumer electronics, automotive, electrical and electronic components and imaging and printing.
Amtek today Since its incorporation, Amtek has expanded its capabilities, and currently offers end-to-end design and manufacturing solutions for precision components, casings and enclosures. Amtek’s core competencies currently span a full range of complex precision engineering services, including precision stamping, progressive cold forging, plastic and injection moulding and laser welding. Examples of products manufactured with these processes include VCM (venyl coated metal) plates for hard disk drives, pinion gears for seat belts and laser welded steering column modules for cars. A more detailed discussion of Amtek’s capabilities can be found in the appendices to this report.
Figure 8: End-to-end manufacturing solutions Industrial and Product Design
Prototyping
Tool and Die and Mould Making
Precision Metal Stamping Plastic and Rubber Moulding
Machining, Welding and Finishing
Electro-Mechanical and Product Assembly
Delivery/Shipping Source: Company data
Diversified customer base Amtek’s customers today are diversified across various industry sectors, including automotive, consumer electronics, electrical and electronic components, imaging and printing, mass storage, and casings and enclosures. For FY10, Amtek’s largest industry sector, casings and enclosures, accounted for 27.7% of revenues, while its largest customer accounted for 12.1% of the company’s revenues.
Amtek’s competencies include manufacturing highly complex precision metal, plastic and rubber components

11 January 2011
Amtek Engineering
(AMEL.SI / AMTK SP) 6
Figure 9: Segments and products % 2010 Sample
Segment revenue Key products products
Casings and enclosures 27.7 Casings and enclosures, primarily for servers and networking equipment
Mass storage 19.9 Motor hubs, VCM plates and disk
clamps
Consumer electronics 15.7 Components and assemblies for home
appliances, white goods and set top boxes
Automotive 12.4 Seats, seatbelts, sunroof components,
steering column jackets, component for infotainment products, air bag canisters and door locks
Electrical & electronic components
9.3 Contact and circuit breaker components, copper housings for meters and tuner assemblies
Imaging and printing 6.7 Stamping parts for copiers, laser and
ink-jet printers, high-speed line printer cabinets and digital camera casings
Others 8.3 Telecommunications, personal
healthcare and medical equipment
Source: Company data
In addition, Amtek boasts long-term relationships with several multinational companies. Indeed, five of Amtek’s top 30 customers in FY10 have relationships that span more than three decades. Amtek today counts bluechip names such as Autoliv, Canon, Dell, Faurecia, Hitachi, Hewlett-Packard, Juniper, Konica Minolta, Legrand, Philips, Schneider, Shin-Etsu, Sony and ThyssenKrupp among its customers, serving them across multiple locations, including its principal facilities in China, Southeast Asia and Europe.
In FY10, the casings and enclosures segment accounted for 27.7% of Amtek’s revenue

11 January 2011
Amtek Engineering
(AMEL.SI / AMTK SP) 7
Figure 10: Revenue contribution
12.1
31.8
46.9
64.4
0
10
20
30
40
50
60
70
Top customer Top 3 customers Top 5 customers Top 10 customers
(%)
Source: Company data
Figure 11: Breakdown of top 30 customers by length of relationship
5-30 years, 21
> 30 years, 5
< 5 years, 4
Source: Company data
What has changed? Figure 12: Value chain evolution
Simple Single Metal Stampings
Progressive Stampings Plastic Moldings
Cross Selling Modular Assembly Product Assembly
Business initatives post acquisition
Source: Company data, Credit Suisse estimates
There is little distinction between the pre-restructured and restructured Amtek based on historical financial metrics. Amtek’s performance, which was strong in FY08 – with revenue and EBITDA jumping 20% YoY and 46% YoY, respectively – was affected by the global crisis in FY09-10. A comparison of Amtek’s operational profile and financials from FY96 to FY06 (the period prior to its privatisation) and then for the period FY08 to FY10,
Amtek’s top 10 customers account for more than 64% of their revenue

11 January 2011
Amtek Engineering
(AMEL.SI / AMTK SP) 8
shows that there was no significant change in terms of the revenue contribution from each its primary industry sectors.
Figure 13: % revenue contribution – FY03-12E
24.0 28.019.0
29.0 24.7 25.8 27.7 26.0 25.6
25.030.0
37.027.0
23.3 19.8 15.7 12.4 11.5
18.019.0 17.0 19.0
18.1 17.7 19.9 24.4 26.7
21.013.0
11.0 12.0
6.7 6.4 6.7 6.9 7.1
11.0 8.07.0 7.0
7.2 7.4 9.3 8.2 7.6
9.0 6.0
8.8 9.4 12.4 14.6 14.611.4 13.6 8.3 7.4 6.9
1.0 2.0
FY03 FY04 FY05 FY06 FY08 FY09 FY10 FY11E FY12E
Casings and Enclosures Consumer ElectronicsMass Storage Imaging and PrintingElectrical and Electronics Components Automotiv eOthers
Amtek w as taken priv ate in 2007(%)
Source: Bloomberg, Company Annual Report 2003-2006, Credit Suisse estimates
Amtek has grown revenues at 16% CAGR in the two decades through to FY10, and earnings at 9% CAGR during the same period. But on all accounts, Amtek has been profitable every year since FY90, and with some of its customer relationships dating more than three decades, we believe that revenues from these customers have grown in line with those of Amtek’s own.
Figure 14: Revenue, EBIT margin and PBT margin
0
100
200
300
400
500
600
700
800
900
FY90 FY92 FY94 FY96 FY98 FY00 FY02 FY04 FY06 FY08 FY10
-2
0
2
4
6
8
10
12
14
16
Rev enue EBIT margin (RHS) PBT margin (RHS)
(US$m) (%)
Note: Amtek only reported for first three quarters for FY07, 4Q07 projected using average of first three
quarters Source: Bloomberg, company data, company Annual Report 1996-2006, Credit Suisse estimates
However, what is perhaps evident post-restructuring is the strong improvement in working capital management. Amtek’s cash conversion cycle has shortened from 43 days in FY08 to 15 days in FY10. Amtek’s fixed asset turns have also improved, reflecting the rationalisation initiatives by its new management team post-privatisation.

11 January 2011
Amtek Engineering
(AMEL.SI / AMTK SP) 9
Figure 15: Amtek's cash conversion cycle Figure 16: Working capital comparison
22.2
34.831.0
17.019.7
34.1
2.3
-11.7-5.9
46.9
56.3
43.0
32.0
15.0 14.0
-20
-10
0
10
20
30
40
50
60
FY97 FY99 FY01 FY03 FY05 FY07 FY09 1Q11
(day s)
-20
0
20
40
60
80
100
120
140
160
FY00 FY01 FY02 FY03 FY04 FY05 FY06 FY07 FY08 FY09 FY10
Catcher Ev a Hi-P JCY Int Amtek
(day s)
Source: Company data, Credit Suisse estimates Source: Company data, Credit Suisse estimates
Figure 17: Fixed asset turnover
1.6x 1.7x
5.3x
4.7x
5.3x
5.8x
6.7x
7.4x
FY05 FY06 FY07 FY08 FY09 FY10 FY11E FY12E FY13E
(x )
Am
tek
take
n pr
ivat
e
Source: Company data, Credit Suisse estimates
Strong management team Amtek’s current management team is led by CEO Daniel Yeong and CFO Sheila Ng. Their previous stints at GES International, where Daniel Yeong served as its chief executive officer and managing director from 1996 to 2007, and Sheila Ng as its chief financial officer from 2000 to 2007, saw the company deliver 25% CAGR in operating profit from 1996 to 2006, just prior to its acquisition by Venture. Given their execution track record at GES International, we would thus credit them with likely spearheading some of the key operational, strategic and organisational changes at Amtek since its privatisation in August 2007. We believe that these changes – which specifically include (amongst others) an expansion of Amtek’s capabilities, a focus on cross-selling services, streamlining of operations, as well as aligning its facilities and capital investments into identifiable Asian markets and industry sectors – should in aggregate continue to support margin improvement and forward earnings growth.

11 January 2011
Amtek Engineering
(AMEL.SI / AMTK SP) 10
Diversified growth profile With global manufacturing outsourcing intact, we see growth for Amtek going forward being driven by demand from its 100-plus strong customer base, which is diversified across six core industry sectors: casings and enclosures, mass storage, consumer electronics, automotive, electrical and electronic components and imaging and printing. Against the backdrop of a muted September quarter for personal computer sales, Amtek achieved 11% YoY revenue and 147% YoY core earnings growth. Consensus estimates project an average 10.5% YoY sales growth in 2010-11 for Amtek’s top customers, which lends support to our 12% YoY revenue growth estimates for Amtek for FYJun11. We forecast core earnings to rise at 46% CAGR from FY10 to FY12. Our forecasts, which are customer-led, should see Amtek outpace the growth projections for most of its product segments, as further ahead, we believe that Amtek’s competencies in precision engineering, should gain traction amongst existing and potential customers, increasingly seeking to outsource complex manufacturing parts, which could provide an upside to earnings.
Optimistic customer sales outlook We are optimistic on the sales outlook for many of Amtek’s top customers going into 2011 and 2012. Consensus estimates forecast an average of 14.0% YoY and 6.9% YoY sales growth for many of Amtek’s top customers in 2011 and 2012, respectively, or an average of 10.5% YoY for FYJun11. We believe this should support a strong 2011 earnings outlook for Amtek.
Figure 18: Sales growth forecast for top customers (% YoY change) Customer 2009 2010E 2011E 2012E
Autoliv -22.9 42.8 8.4 7.2 Canon -23.5 16.1 5.4 3.7 Dell -15.0 15.4 5.7 3.3 Faurecia -22.2 40.5 5.5 5.4 Hitachi -9.9 0.0 3.4 3.2 HP -0.9 9.4 5.7 n.a. Juniper -9.2 23.5 17.5 17.6 Konica Minolta -14.3 -4.5 3.2 3.1 Legrand -15.5 7.8 6.0 5.6 Philips -12.2 12.6 3.4 n.a. Schneider -14.1 22.3 10.9 6.8 Shin Etsu -22.9 2.6 8.5 5.3 Sony -8.8 -0.3 2.6 1.6 ThyssenKrupp -18.4 7.7 11.2 6.5 Average -15.0 14.0 6.9 5.8
Source: Bloomberg
Key drivers In terms of industry sectors for Amtek, we expect casings and enclosures to rise at 8.5% CAGR from FY10 to FY12, driven by increased orders from its largest server and networking equipment customers. Our estimates are supported by global server unit shipment volumes, which are expected to grow at a 9.5% CAGR from 2009 to 2012, according to Gartner. This growth will be augmented by the enterprise server industry segment, with the inclusion of enterprise networking equipment, which Gartner expects to grow at 8.9% during the same time. We expect stronger contribution from the non-Japan Asia (NJA) region, which is forecast to grow at 11.7% from 2009 to 2012. Both Hewlett-Packard and Dell reported strong double-digit unit server sales growth during their recent quarterly interims, largely on the back of demand recovery and, more importantly, they
Global manufacturing outsourcing will continue to drive growth for Amtek
11 January 2011
Amtek Engineering
(AMEL.SI / AMTK SP) 11
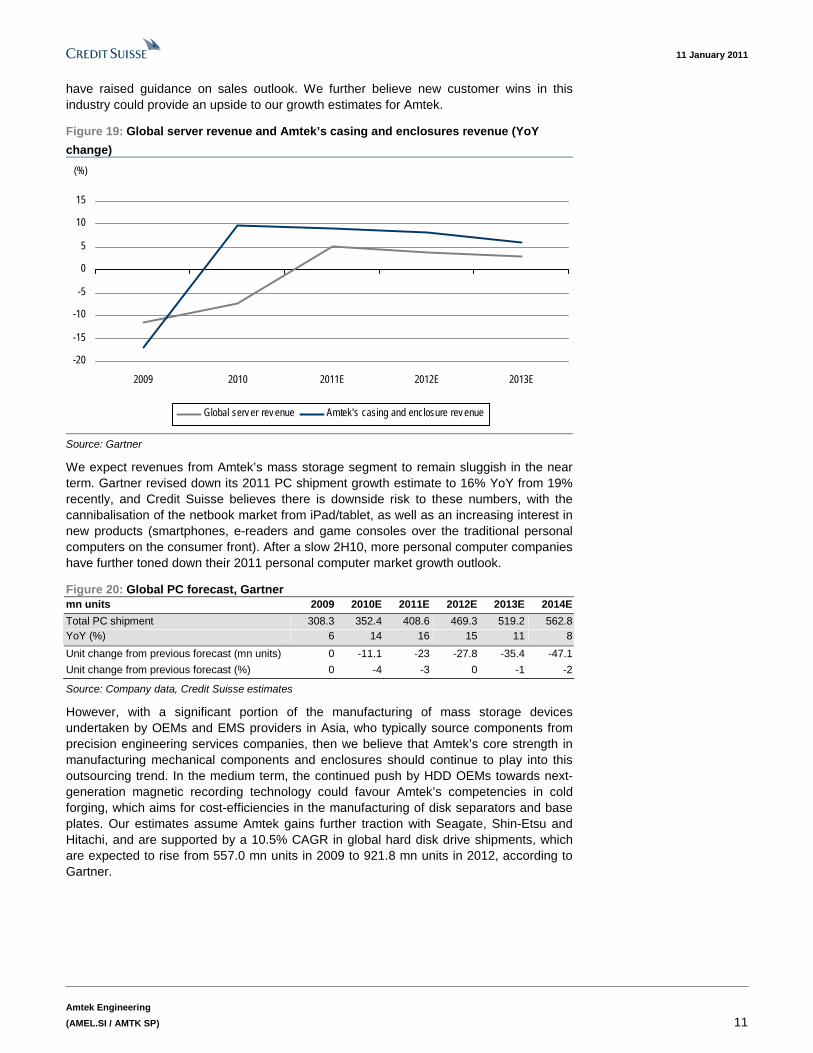
have raised guidance on sales outlook. We further believe new customer wins in this industry could provide an upside to our growth estimates for Amtek.
Figure 19: Global server revenue and Amtek’s casing and enclosures revenue (YoY
change)
-20
-15
-10
-5
0
5
10
15
2009 2010 2011E 2012E 2013E
Global serv er rev enue Amtek's casing and enclosure rev enue
(%)
Source: Gartner
We expect revenues from Amtek’s mass storage segment to remain sluggish in the near term. Gartner revised down its 2011 PC shipment growth estimate to 16% YoY from 19% recently, and Credit Suisse believes there is downside risk to these numbers, with the cannibalisation of the netbook market from iPad/tablet, as well as an increasing interest in new products (smartphones, e-readers and game consoles over the traditional personal computers on the consumer front). After a slow 2H10, more personal computer companies have further toned down their 2011 personal computer market growth outlook.
Figure 20: Global PC forecast, Gartner mn units 2009 2010E 2011E 2012E 2013E 2014E
Total PC shipment 308.3 352.4 408.6 469.3 519.2 562.8 YoY (%) 6 14 16 15 11 8
Unit change from previous forecast (mn units) 0 -11.1 -23 -27.8 -35.4 -47.1
Unit change from previous forecast (%) 0 -4 -3 0 -1 -2
Source: Company data, Credit Suisse estimates
However, with a significant portion of the manufacturing of mass storage devices undertaken by OEMs and EMS providers in Asia, who typically source components from precision engineering services companies, then we believe that Amtek’s core strength in manufacturing mechanical components and enclosures should continue to play into this outsourcing trend. In the medium term, the continued push by HDD OEMs towards next-generation magnetic recording technology could favour Amtek’s competencies in cold forging, which aims for cost-efficiencies in the manufacturing of disk separators and base plates. Our estimates assume Amtek gains further traction with Seagate, Shin-Etsu and Hitachi, and are supported by a 10.5% CAGR in global hard disk drive shipments, which are expected to rise from 557.0 mn units in 2009 to 921.8 mn units in 2012, according to Gartner.

11 January 2011
Amtek Engineering
(AMEL.SI / AMTK SP) 12
Figure 21: Global HDD unit shipment and Amtek’s mass storage revenue
-30
-20
-10
0
10
20
30
40
50
2009 2010 2011E 2012E 2013E
HDD shipment v olume Amtek Mass Storage rev enue
(%)
Source: Gartner
We expect Amtek’s largest consumer electronics (CE) segment customer, Philips (primarily household appliances), to continue to drive order book growth in the near term. Longer term, we believe that Philips’s strategic push to expand from its consumer lifestyle base, into the fast-growing healthcare segment, should offer further growth opportunities for Amtek. We model in a 5% CAGR from 2009 to 2012, to trend in line with the broader and fragmented consumer electronics market projected by Gartner.
Global automotive production is expected to jump from 59.2 mn units in 2009 to 78.6 mn units in 2012, or a 9.9% CAGR, according to IHS Global Insight. The global automotive supply chain includes OEMs that outsource part of their manufacturing to Tier 1 suppliers such as Autoliv, Delphi, Faurecia, Magna, Robert Bosch and Visteon. These suppliers further outsource certain activities to other suppliers, who typically must go through a stringent qualification process for each component manufactured.
Figure 22: Amtek auto sales growth versus industry production growth (%)
-20
-10
0
10
20
30
40
FY08 FY09 FY10 FY11E FY12E
Industry Grow th Amtek Segment Grow th
(%)
Source: IHS Global Insights
This shift in production capacity towards China, coupled with the safety thresholds for automotive equipment, with rigorous testing supporting the production process, would require fewer and more competent suppliers and thus favour suppliers with a more

11 January 2011
Amtek Engineering
(AMEL.SI / AMTK SP) 13
comprehensive range of technical capabilities, a strong Asian footprint and relationships with Tier 1 suppliers. We estimate that Amtek’s automotive industry sector revenues could jump 37% YoY in FY11, driven primarily by increased orders from Autoliv and Faurecia. We believe that new customer wins should drive management’s target for the segment to generate 18% of revenues in three years, from its current 12%.
Figure 23: China vehicle unit production Figure 24: Regional vehicle production 2009-12 CAGR
13.8
15.5
17.3
19.4
2009A 2010E 2011E 2012E
(units - m)
09-12 CAGR: 12.1%
2.6
3.64.3
12.1
US Japan Western Europe China
(%)
Source: Business Monitor International Source: Business Monitor International
The imaging and printing market for Amtek is broad, and includes digital cameras, printers as well as photocopiers and office automation equipment, and is expected to grow at a 3.8% CAGR from 2009 to 2012 according to Gartner. Canon recently revised up its SLR model camera sales volume target from 4.8 mn units to 5.5 mn units, as sales volume of 1.55 mn during the June 2010 quarter surprised on the upside. The strong performance was also led by an increase in laser printer demand, a trend which was also highlighted by Hewlett-Packard, and reflects an overall improvement in corporate spend. Hence, we forecast revenues from Amtek’s printing and imaging industry sector to jump 19% YoY in FY11.
Figure 25: Printer unit shipments and Amtek printer and imaging revenue (YoY change)
-10
0
10
20
30
FY09 FY10 FY11E FY12E
Shipment Grow th Amtek Grow th
(%)
Source: Gartner
Forecasts We forecast revenues to rise 12% YoY to US$739.2 mn in FY11 and gross margins to improve from 16.6% in FY10 to 18.9% in FY11, driven primarily by a more favourable product mix. We expect the higher-margin mass storage industry sector to lead Amtek’s growth and generate 26.7% of its revenues by FY12, from 19.9% in FY10. Likewise, we expect contribution from the automotive industry sector to rise from 12.4% in FY10 to
We forecast margin improvement of 2.3% in FY11

11 January 2011
Amtek Engineering
(AMEL.SI / AMTK SP) 14
14.6% by FY12. We see lower interest costs boosting core earnings by 76% YoY in FY11E, and expect these to rise at 46% from FY10E to FY12E.
Figure 26: Revenue forecasts (YoY change) Year-end June FY09A FY10A FY11E FY12E
Revenue growth (%) -20.6 2.1 12.0 8.0
Casings and enclosures -17.1 9.6 8.9 8.1
Mass storage -22.2 14.7 23.1 10.6
Consumer electronics -32.4 -19.0 -8.4 2.1
Automotive -14.9 34.9 36.5 10.2
Electrical and electronic components -18.0 28.1 2.5 5.0
Imaging and printing -24.1 8.4 18.9 12.4
Other -5.1 -37.1 2.5 5.0
Source: Company data, Credit Suisse estimates
Figure 27: Quarterly forecasts Year-end June, US$ mn FY10 1Q11 2Q11E 3Q11E 4Q11E FY11E 1Q12E 2Q12E 3Q12E 4Q12E FY12E
Revenue 638.0 166.4 182.5 174.2 191.8 714.4 179.2 197.1 188.2 207.1 771.6
Gross profit 106.1 29.9 34.2 32.6 35.9 133.8 35.4 39.0 37.2 41.0 152.6
Operating profit 60.2 16.3 22.9 20.5 23.7 84.2 23.0 25.3 24.2 26.6 99.0
Net profit 21.7 12.5 16.5 14.6 17.2 59.7 17.1 19.0 18.1 20.1 74.4
Gross margin (%) 16.6 18.0 18.7 18.7 18.7 18.7 19.8 19.8 19.8 19.8 19.8
Operating margin (%) 9.4 9.8 12.5 11.8 12.4 11.8 12.8 12.8 12.8 12.8 12.8
Net margin (%) 3.4 7.5 9.0 8.4 9.0 8.4 9.5 9.6 9.6 9.7 9.6
Source: Company data, Credit Suisse estimates
1Q11 results strong Amtek reported 1Q11 results with revenues at US$166.4 mn, up 11% YoY with core net profit jumping 147% YoY to US$12.6 mn.
Figure 28: 1Q11 segmental revenue growth comparison
41.8
29.3
23.7
16.8
11.0 9.3
17.7
41.7
26.9 25.520.8
17.313.7
20.6
Casings &
Enclosures
Mass Storage Consumer
Electronics
Automotiv e Electrical &
Electronic
Components
Imaging &
Printing
Others
1QFY10 1QFY11
(US$m)
(0.2%)(8.2%)
7.6%23.8%
57.3% 47.3%16.4%
Source: Credit Suisse estimates
Growth was broad-based and led by electrical and electronics components up 57% YoY (with Schneider starting to adopt Amtek’s cold forge processes for its traditional die-cast operations), automotive up 24% YoY (Autoliv has recently upgraded Amtek’s supplier status to a global level), and imaging and printing up 46% YoY (ramp-up of Vietnam operations for Canon’s product lines), which cushioned weaker IT related revenues – mass storage fell 8% YoY, while casings and enclosures remained flat.

11 January 2011
Amtek Engineering
(AMEL.SI / AMTK SP) 15
We believe that Amtek’s strong results were driven by a more diversified earnings base versus its other precision engineering services peers. JCY International, for instance, saw earnings decline 144% YoY, given its focus on the HDD segment, where unit volumes fell 2% YoY during the September quarter.
Figure 29: Revenue breakdown comparison
20
71 7566
48
87
40
28
16
1232
17
798
29 2534
20 13
43
0
10
20
30
40
50
60
70
80
90
100
Amtek Seksun Unisteel MMI Cheung Woh Eng Tek Notion VTEC
Mass Storage Casings and Enclosures Consumer Electronics Automotiv e
Imaging & Printing Electrical and Electronics Others
(%)
Source: Company data, Credit Suisse estimates
Figure 30: Global HDD unit shipment growth
400,000.0
500,000.0
600,000.0
700,000.0
800,000.0
900,000.0
1Q09 2Q09 3Q09 4Q09 1Q10 2Q10 3Q10
-5
0
5
10
15
20
25
30
35
40
45
HDD sales estimates (K) YoY growth
(units) (%)
Source: Company data, Credit Suisse estimates

11 January 2011
Amtek Engineering
(AMEL.SI / AMTK SP) 16
Figure 31: Net profit comparison (YoY change)
13.0
6.2
-22.6
8.1
13.2
51.8
JCYH* Notion VTEC Amtek
CY3Q09 CY3Q10
(143.5%)(37.7%) 112.9%
Source: Company data, Credit Suisse estimates
Amtek utilised US$25 mn of its US$200 mn November 2010 IPO proceeds to partially repay a term loan. This was followed by a US$15 mn scheduled repayment on 30 November 2010. Pro-forma gearing would be 48%, versus 77% at end-September 2010.
Figure 32: Amtek 1Q results versus FY estimates YoY FY11E % of
(S$ mn) 1Q11 1Q10 (%) (old) YTD FY11E
Revenue 166.4 149.7 11.1 739.2 166.4 22.5
Casings and enclosures 41.4 41.4 -0.1 192.3 41.4 21.5
Mass storage 26.9 29.7 -9.5 180.7 26.9 14.9
Consumer electronics 25.5 23.5 8.4 91.8 25.5 27.8
Automotive 20.8 18.6 12.1 108.0 20.8 19.3
Electric and electronics 17.3 13.9 24.6 60.6 17.3 28.5
Imaging and printing 13.7 10.1 35.6 51.2 13.7 26.8
Other 20.6 12.5 64.9 54.6 20.6 37.8
Gross profit 29.9 24.9 20.2 139.5 29.9 21.5
PBT and associates 16.3 8.8 84.0 76.6 16.3 21.2
PBT 16.3 9.0 80.6 77.6 16.3 21.0
Net profit 13.2 5.2 152.4 62.1 13.2 21.3
PATMI 12.5 5.1 146.2 61.1 12.5 20.5
Core net profit 12.6 5.1 147.0 61.5 12.6 20.4
Gross margin (%) 18.0 16.6 18.9 18.0
PBT margin (%) 9.8 6.0 10.5 9.8
PATMI margin (%) 7.5 3.4 8.3 7.5
Source: Company data, Credit Suisse estimates
11 January 2011
Amtek Engineering
(AMEL.SI / AMTK SP) 17
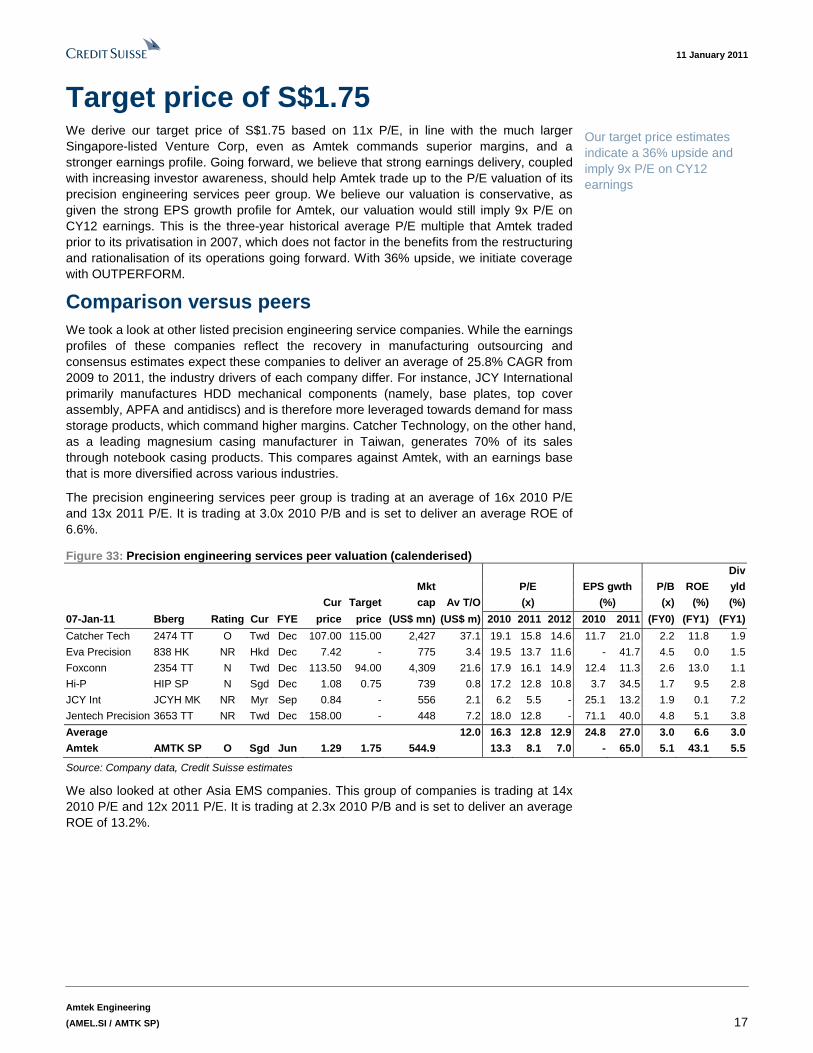
Target price of S$1.75 We derive our target price of S$1.75 based on 11x P/E, in line with the much larger Singapore-listed Venture Corp, even as Amtek commands superior margins, and a stronger earnings profile. Going forward, we believe that strong earnings delivery, coupled with increasing investor awareness, should help Amtek trade up to the P/E valuation of its precision engineering services peer group. We believe our valuation is conservative, as given the strong EPS growth profile for Amtek, our valuation would still imply 9x P/E on CY12 earnings. This is the three-year historical average P/E multiple that Amtek traded prior to its privatisation in 2007, which does not factor in the benefits from the restructuring and rationalisation of its operations going forward. With 36% upside, we initiate coverage with OUTPERFORM.
Comparison versus peers We took a look at other listed precision engineering service companies. While the earnings profiles of these companies reflect the recovery in manufacturing outsourcing and consensus estimates expect these companies to deliver an average of 25.8% CAGR from 2009 to 2011, the industry drivers of each company differ. For instance, JCY International primarily manufactures HDD mechanical components (namely, base plates, top cover assembly, APFA and antidiscs) and is therefore more leveraged towards demand for mass storage products, which command higher margins. Catcher Technology, on the other hand, as a leading magnesium casing manufacturer in Taiwan, generates 70% of its sales through notebook casing products. This compares against Amtek, with an earnings base that is more diversified across various industries.
The precision engineering services peer group is trading at an average of 16x 2010 P/E and 13x 2011 P/E. It is trading at 3.0x 2010 P/B and is set to deliver an average ROE of 6.6%.
Figure 33: Precision engineering services peer valuation (calenderised) Div
Mkt P/E EPS gwth P/B ROE yld
Cur Target cap Av T/O (x) (%) (x) (%) (%)
07-Jan-11 Bberg Rating Cur FYE price price (US$ mn) (US$ m) 2010 2011 2012 2010 2011 (FY0) (FY1) (FY1)
Catcher Tech 2474 TT O Twd Dec 107.00 115.00 2,427 37.1 19.1 15.8 14.6 11.7 21.0 2.2 11.8 1.9
Eva Precision 838 HK NR Hkd Dec 7.42 - 775 3.4 19.5 13.7 11.6 - 41.7 4.5 0.0 1.5
Foxconn 2354 TT N Twd Dec 113.50 94.00 4,309 21.6 17.9 16.1 14.9 12.4 11.3 2.6 13.0 1.1
Hi-P HIP SP N Sgd Dec 1.08 0.75 739 0.8 17.2 12.8 10.8 3.7 34.5 1.7 9.5 2.8
JCY Int JCYH MK NR Myr Sep 0.84 - 556 2.1 6.2 5.5 - 25.1 13.2 1.9 0.1 7.2
Jentech Precision 3653 TT NR Twd Dec 158.00 - 448 7.2 18.0 12.8 - 71.1 40.0 4.8 5.1 3.8
Average 12.0 16.3 12.8 12.9 24.8 27.0 3.0 6.6 3.0
Amtek AMTK SP O Sgd Jun 1.29 1.75 544.9 13.3 8.1 7.0 - 65.0 5.1 43.1 5.5
Source: Company data, Credit Suisse estimates
We also looked at other Asia EMS companies. This group of companies is trading at 14x 2010 P/E and 12x 2011 P/E. It is trading at 2.3x 2010 P/B and is set to deliver an average ROE of 13.2%.
Our target price estimates indicate a 36% upside and imply 9x P/E on CY12 earnings

11 January 2011
Amtek Engineering
(AMEL.SI / AMTK SP) 18
Figure 34: Asia EMS peer valuation (calenderised) Div
Mkt EPS P/B ROE yld
Current Target cap Av T/O P/E (x) gwth (%) (x) (%) (%)
07-Jan-11 Bberg Rating Cur FYE price price (US$ mn) (US$ m) 2010 2011 2012 2010 2011 (FY0) (FY1) (FY1)
BYD Electronic 285 HK N Hkd Dec 4.44 4.80 1,287 2.2 10.0 8.9 8.4 11.2 12.2 1.3 12.6 1.6
Delta Electronic 2308 TT O Twd Dec 136.00 140.00 11,088 18.7 20.0 17.6 14.9 30.5 13.6 4.8 23.6 3.4
Hon Hai 2317 TT N Twd Dec 114.00 113.00 37,571 90.5 14.3 13.1 11.2 0.8 9.4 2.5 16.3 1.6
Lite-on 2301 TT NR Twd Dec 39.25 - 3,059 5.0 10.8 9.7 10.3 14.4 11.2 1.4 3.2 6.6
Venture VMS SP O Sgd Dec 9.50 10.75 2,011 2.6 13.6 11.4 10.0 33.4 19.7 1.4 10.2 5.3
Average 23.8 13.7 12.1 11.0 18.1 13.2 2.3 13.2 3.7
Amtek AMTK SP O Sgd Jun 1.29 1.75 544.9 13.3 8.1 7.0 - 65.0 5.1 43.1 5.5
Source: Company data, Credit Suisse estimates
Within the Asia EMS peer group, Venture stands out, primarily because of its long listed history in Singapore. Operationally, however, both Amtek and Venture are quite distinct. Amtek’s capabilities are mechanical, while Venture’s services are electronics-based. Amtek’s margins, perhaps, reflect the higher value-add in mechanical products, which require a higher customisation threshold.
Figure 35: EBIT margin comparison
0
3
6
9
12
15
FY04 FY05 FY06 FY07 FY08 FY09 FY10 FY11E FY12E
Amtek Venture
(%)
Source: Company data, Credit Suisse estimates
Venture’s forward P/E valuation multiple has ranged from 8x to 23x over the last five years. At current levels, Venture is trading at 11x P/E, at one standard deviation below its five-year mean. In the past year, however, Venture’s valuation has stayed relatively stable at 10x to 12x P/E. We believe this P/E multiple range offers another overlay to assess our fair value for Amtek.

11 January 2011
Amtek Engineering
(AMEL.SI / AMTK SP) 19
Figure 36: Venture forward P/E
5.0
7.0
9.0
11.0
13.0
15.0
17.0
19.0
21.0
23.0
25.0
Nov -04 Nov -05 Nov -06 Nov -07 Nov -08 Nov -09
+1 Std dev = 18.9
Av erage = 15.0
+2 Std dev = 22.7
-1 Std dev = 11.2
-2 Std dev = 7.4
(x )
Source: Company data, Credit Suisse estimates
We also compared Amtek’s earnings growth profile and ROE against the precision engineering services peer group and the Asia EMS companies. Here, Amtek stands out with the strongest earnings CAGR and highest ROE.
Figure 37: ROE comparison (2010-12) Figure 38: Earnings growth comparison (2010-12)
39.0
9.612.3
0
5
10
15
20
25
30
35
40
45
Amtek Precision Eng. Serv ices EMS
46.0
25.8
15.6
0
5
10
15
20
25
30
35
40
45
50
Amtek Precision Eng. Serv ices EMS
Source: Bloomberg, Databridge, Credit Suisse estimates Source: Bloomberg, Databridge, Credit Suisse estimates
After considering these valuation methodologies, we derive our fair value for Amtek at S$1.75, based on 11x CY11 P/E. This is a similar multiple for Venture. We believe that while it is reasonable to compare Amtek against its other precision engineering peers, the lack of other listed companies within the Singapore context suggest that investors could likely focus on Venture’s performance instead.
Indeed, when we consider Venture’s historical share price performance, we see stronger correlation with the Singapore market at 0.94, compared to its correlation with its other global EMS peers.

11 January 2011
Amtek Engineering
(AMEL.SI / AMTK SP) 20
Figure 39: Three-year historical share price correlation Venture Celestica Sanmina Jabil STI
Venture 1.00 0.70 0.65 0.76 0.94
Celestica 0.70 1.00 0.79 0.82 -
Sanmina 0.65 0.79 1.00 0.84 -
Jabil 0.76 0.82 0.84 1.00 -
STI 0.94 - - - 1.00
Source: Company data, Credit Suisse estimates
Given the strong EPS growth profile for Amtek, our valuation would imply 9x P/E on CY12 earnings. This is the three-year historical average P/E multiple that Amtek traded at prior to its privatisation in 2007, which does not factor in the benefits from the restructuring and rationalisation of its operations going forward. Thus the end-2011 fair value of S$1.75 appears conservative. With a 36% upside, we initiate coverage with OUTPERFORM.

11 January 2011
Amtek Engineering
(AMEL.SI / AMTK SP) 21
Investment risks Slowdown in global manufacturing A recovery in global manufacturing after the 2009 financial crisis has supported Amtek’s growth. Credit Suisse economists, Neal Soss and Henry Mo, believe that the slowdown scare of mid-2010 has passed as the sum of purchasing managers’ reports from around the world continued their recovery in the month of December, with the United States and Europe playing their parts in the aggregate movement. They note that while the headline manufacturing ISM did not do an enormous amount in December, the bigger rise in the new orders component suggests there is more to come. Credit Suisse is forecasting global GDP growth of 4.6% in 2010 and 4.3% in 2011. In Asia, growth outside the region’s two largest economies, China and Japan, remained resilient in the face of the government engineered slowdown in China and the loss of growth momentum in Japan. Our economists have recently revised up their 2010 real GDP growth forecast for the region to the highest level since 2004.
Loss of market share by customers While the sales outlook for Amtek’s key customers has been fairly robust, their various industries remain competitive. We believe that consensus and Credit Suisse estimates on the revenue projections may not fully reflect the potential market earnings dilution due to competition and ASP erosion, which could result in loss of market share for customers in each of their product segments. However, we do believe that any adverse impact of this risk factor is mitigated by Amtek’s diversified customer base.
Raw material cost Raw material costs constitute the largest expense for Amtek. Fluctuations in the price of steel, aluminium and copper inputs could impact profitability. Amtek mitigates this risk by incorporating material costs directly into its pricing model, so that the cost at which services are provided reflects the cost of the materials purchased in connection with such services. Amtek aims not to assume any commodity pricing risk or to take a position in relation to the price of the materials used. Therefore, the price of its products are adjusted to reflect any changes in material prices or materials are purchased ‘back-to-back’ at the time Amtek enters into an obligation with its customers and incorporates such prices into the price of its services.
Low order book visibility Amtek’s customers do not commit to purchases under long-term contracts. Indeed, most of its customers do not commit to firm production schedules for more than one quarter in advance. This is a structural norm for the manufacturing sector, and we should not be significantly surprised if a reduction of lead times in customer orders is witnessed going forward. Additionally, Amtek’s customers may vary production quantities or delay production for a number of reasons with little lead time or advance notice. Therefore, with Amtek relying on and planning capital investments and production and inventory levels based on its advance orders and commitments or forecasts from customers, the variation in volume and timing of sales make it difficult to schedule production and optimise utilisation of manufacturing capacity.

11 January 2011
Amtek Engineering
(AMEL.SI / AMTK SP) 22
Financials Figure 40: Income statement Year end 30 Jun 2008A 2009A 2010A 2011E 2012E 2013E
Revenue 786 625 638 714 772 827
Cost of sales -657 -532 -532 -581 -619 -657
Gross profit 129 93 106 134 153 170
Other operating income 6 3 3 4 4 5
SG&A -59 -55 -49 -54 -58 -62
Foreign exchange gain/(loss) 4 -5 -3 0 0 0
Loss on classification 0 0 -4 0 0 0
Finance income 1 1 1 1 1 1
Finance costs -11 -13 -10 -8 -7 -6
Other items -3 -26 -7 -2 0 0
PBT and associates 67 -2 38 75 93 108
Share of results of associates 1 2 1 1 1 1
PBT 69 -1 38 76 94 109
Tax -17 -11 -16 -15 -19 -22
Net profit 51 -11 22 61 75 87
Non-controlling interests -5 -1 -1 -1 -1 -1
PATMI 46 -12 22 60 74 86
Number of shares (m) 543 543 543
EBITDA 102 66 83 108 124 137
EBIT 76 41 60 84 99 112
Source: Company data, Credit Suisse estimates

11 January 2011
Amtek Engineering
(AMEL.SI / AMTK SP) 23
Figure 41: Balance sheet Year end 30 Jun 2008A 2009A 2010A 2011E 2012E 2013E
Inventories 88 48 49 60 64 68
Trade receivables 157 116 145 158 170 182
Other current assets 18 15 25 13 14 14
Cash and bank balances 51 63 83 109 136 166
Total current assets 315 242 302 340 383 430
Property, plant and equipment 149 134 121 127 121 117
Amounts due from holding company 141 53 53 53 53 53
Other non-current assets 38 32 29 25 26 27
Total non-current assets 327 218 202 204 200 197
Total assets 642 459 504 544 583 626
Trade payables 130 88 123 137 146 155
Other payables and accrued expenses 58 42 45 50 55 60
Amounts due to bankers 51 51 64 51 51 51
Other current liabilities 9 10 12 13 13 13
Total current liabilities 249 190 245 251 265 279
Amounts due to bankers 180 160 130 98 78 58
Other non-current liabilities 7 7 7 7 7 7
Total non-current liabilities 187 167 137 105 85 65
Total liabilities 436 358 381 356 350 344
Share capital 36 36 36 36 36 36
Other reserves 25 24 26 31 31 31
Revenue reserve 127 25 44 104 148 197
Shareholders' equity 189 85 106 171 215 264
Minority interests 18 17 16 17 18 18
Total equity 206 102 123 188 233 283
Total equity and liabilities 642 459 504 544 583 626
Source: Company data, Credit Suisse estimates

11 January 2011
Amtek Engineering
(AMEL.SI / AMTK SP) 24
Figure 42: Cash flow statement Year end 30 Jun 2008A 2009A 2010A 2011E 2012E 2013E
PBT 69 -1 38 76 94 109
Depreciation of PP&E 26 25 23 24 25 24
Finance cost 11 13 10 8 7 6
Finance income -1 -1 -1 -1 -1 -1
(Gain)/loss on disposal of PP&E -4 1 -2 0 0 0
Other operating cash flow 0 7 7 3 3 3
Operating profit before working capital changes 100 45 76 111 129 141
(Increase)/decrease in inventories -18 40 -2 -11 -4 -4
(Increase)/decrease in receivables and prepaid expenses -23 44 -41 -12 -13 -12
Decrease in amounts due from associates 0 0 0 0 0 0
(Decrease)/increase in payables and accrued expenses 29 -56 42 13 9 9
Cash generated from operations 88 72 75 100 121 134
Finance income received 1 1 1 1 1 1
Finance cost paid -5 -13 -10 -8 -7 -6
Income tax paid -11 -12 -17 -15 -19 -22
Net cash generated from operating activities 74 49 49 78 96 107
Purchases of property, plant and equipment -29 -17 -16 -30 -20 -20
Proceeds from disposal of property, plant and equipment 11 2 5 6 6 6
Acquisition of non-controlling interests -7 -3 -3 -3 -3 -3
Other investing cash flow 2 1 1 1 1 1
Net cash used in investing activities -24 -16 -13 -26 -16 -16
Repayment of borrowings 0 -18 -16 -16 -16 -16
Dividends paid on ordinary shares -1 -88 0 0 -30 -37
Other financing cash flow -37 88 -2 -2 -2 -2
Finance cost paid -6 0 0 -8 -7 -6
Net cash used in financing activities -44 -18 -18 -26 -55 -61
Net effect of exchange rate changes 4 -1 3 0 0 0
Net increase in cash and cash equivalents 10 14 22 26 26 30
Cash at beginning of the qtr/year 38 48 61 83 109 134
Cash at end of the year 48 61 83 109 134 164
Source: Company data, Credit Suisse estimates

11 January 2011
Amtek Engineering
(AMEL.SI / AMTK SP) 25
Appendix Brief history The company commenced operations in 1970 as Metaltek Engineering Pte Ltd, and was incorporated in Singapore under the Companies Act of Singapore as Amtek Engineering Pte Ltd on 22 October 1980. The company was listed on the Second Board (SESDAQ) of the Stock Exchange of Singapore on 12 August 1987 as Amtek Engineering Ltd and subsequently upgraded to the Main Board of the SES (now SGX-ST) on 5 November 1990. In 2007, a consortium, including affiliates of Standard Chartered Private Equity Limited, Metcomp Group Holdings and the company’s current management purchased 50.74% of the company that they did not already own in a mandatory cash takeover offer through an acquisition vehicle. Post acquisition, Amtek’s current management was put in place and it implemented a number of operational, strategic and organisational changes. Daniel Yeong Bou Wai and Sheila Ng Won Lein were appointed the company’s CEO and CFO, respectively, and the company was subsequently de-listed from the SGX-ST on 31 August 2007 upon completion of the acquisition.
Figure 43: Corporate milestones
1970 1980 1987 1990 2007 2010
Oct 22, 1980Incorporated in Singapore as Amtek Engineering Pte Ltd
1970Founded as Metaltek Engineering Pte Ltd
Aug 12, 1987Company is listed on SESDAQ
Nov 5, 1990Upgraded to listing on Mainboard of SES (now SGX-ST)
Aug 31, 2007Amtek taken private by consortium consisting of Metcomp Group Holdings, Standard Chartered Private Equity Limited and current management
Source: Company data
New team, new initiatives Expanding Amtek’s capabilities
From offering primarily metal stamping services, Amtek expanded its capabilities into end-to-end solutions by increasingly offering industrial design services at the initial development stages of its customers’ product. Amtek also improved on its competencies – integrating plastic and rubber parts into metal components and manufacturing complex mechanical modules. Conceptually, we thus believe this should also be viewed not so much as a development of more advanced mechanical capabilities, but as helping to unlock the potential of each of Amtek’s existing core units and then aggregating their standalone capabilities into a reference point for its diversified customer base.
Focusing on cross-selling services
Amtek has increasingly focused on cross-selling additional services to existing clients, thus aiming to further entrench these relationships and to position its skill-sets as integral to its customers’ manufacturing supply chains.
Streamlining activities to offer one-stop manufacturing solutions
Organisational changes were implemented and reporting structures were streamlined to integrate Amtek’s key functions and remove any informational silos within the organisation. In FY08, Amtek acquired the non-controlling interests in two subsidiaries in the precision

11 January 2011
Amtek Engineering
(AMEL.SI / AMTK SP) 26
engineering segment, which were held by two management shareholders. This was to remove conflicts of interest as well as facilitate the reorganisation of its reporting structure to a matrix organisation, which allows for clearer accountabilities, communication lines and coordination between its global facilities and offices. Amtek’s customers will now also have a single point of contact for multiple services and solutions.
Increasing presence in growing Asian markets and industry sectors
Amtek aligned its focus, service offering and manufacturing footprint in Asia. Thus, a new manufacturing facility in Vietnam was added in FY09. Further expansion is planned for its facility in Shanghai. Amtek’s revenues from its facilities in Asia grew from 78.6% in FY08 to 88.7% in FY10. Consequently, Amtek also increased its focus on industry sectors that present attractive growth prospects. Hence, for example, Amtek has grown the automotive industry sector contribution from 8.8% of revenues in FY08 to 12.4% of revenues in FY10.
Optimising manufacturing footprint
Since FY09, Amtek consolidated and rationalised its manufacturing footprint by closing three facilities in Poland, Hungary and Zhongshan, China, that were either dependent on a single customer or a single segment. The consolidation of its manufacturing footprint is expected to continue with the proposed closure of its Jakarta plant as well as the potential sale of its plant in Tuas, Singapore.
Enhancing operational and financial flexibility and discipline
A deliberate shift to a greater portion of contract labour versus permanent labour (from 64.4% of total employees being contract employees as of 30 June 2008 to 73.8% as of 30 June 2010) has allowed Amtek to improve its operational flexibility. Amtek also moved towards a compensation structure emphasising variable compensation for executives across the organisation.
Manufacturing facilities Figure 44: Global manufacturing facilities
Note (1): The Thailand plant is an associate company.
Source: Company data

11 January 2011
Amtek Engineering
(AMEL.SI / AMTK SP) 27
Amtek’s capabilities Figure 45: Manufacturing processes Process Description Key benefits Products
Precision progressive cold forge stamping
Allows for customisation of metal parts by subjecting raw metal strips through a series of high deformation cold forging processes. In cold forging, material is squeezed into a die at room temperature with the final product assuming the shape of the die.
Intricate 3-D net-shaped parts can be produced as an alternative to die-casting, sintering and metal injection moulding. Cold forged products have uniform grain flow and hence a higher degree of structural integrity and superior strength. The process eliminates or reduces secondary machining processes and in turn saves costs.
Horizontal and vertical cold forming
The forming of metal billets through horizontal and vertical motions
Besides eliminating or reducing the need for secondary processes, cold forging also prevents wastage of raw material and lowers manufacturing costs. Such products also have better structural integrity.
Progressive stamping
Customised metal parts are created by advancing a coiled strip metal in tandem with press stroke through specially designed dies.
Considered the most efficient process known for its speed, quality and consistency. A flexible stamping process that can run fully automated for both small and large parts.
Multi-slide forming Metal coils and strips are fed into a series of
mechanisms to create three-dimensional parts. Three-dimensional shapes can be created in a shorter number of steps, the process is faster and more efficient. The set-up also allows for the integration of other ancillary labour-saving processes.
Laser welding A high energy beam is focused on the work
piece surface, and is converted to thermal energy, thus causing the surface to melt. Heat spreads to the rest of the work piece through surface conductance
Work pieces are welded purely using light energy. The process is non-contact and allows for deep and narrow welds, as well as mending smaller and thinner components.
Plastic and rubber integration
The manufacturing of precision plastic, rubber components and moulds and the integration of these plastic and rubber parts with metal components to manufacture complex mechanical modules.
Source: Company data, Credit Suisse estimates

11 January 2011
Amtek Engineering
(AMEL.SI / AMTK SP) 28
Major customers Figure 46: Key customers % of FY10
Company Industry sector Products revenue
U.S. computer products company Casings and enclosures Enterprise servers 12.1
U.S. computer products company Casings and enclosures Enterprise servers, print cartridges 10.8
Diversified European health and consumer products company
Consumer electronics Personal and garment care products, home appliances, LCD TVs
8.9
Diversified European energy management company
Electrical and electronic components Circuit breakers and electrical products 8.4
US hard disk drive manufacturing company Mass storage Hard disk drives and mass storage devices 6.7
Japanese hard disk drive manufacturing company
Mass storage VCMs for hard disk drives 5.8
Japanese printer, copier, camera equipment company
Imaging and printing Printers, copiers, digital cameras 4.3
US network products company Casings and enclosures Network products (including routers, switches and hubs)
3.0
Diversified Japanese industrial, consumer and IT products company
Mass storage Mass storage devices (optical pickup for DVD drives), display devices
2.6
European automotive products company Automotive Automotive interiors (including seats) 1.8
Source: Company data, Credit Suisse estimates
11 January 2011
Amtek Engineering
(AMEL.SI / AMTK SP) 29
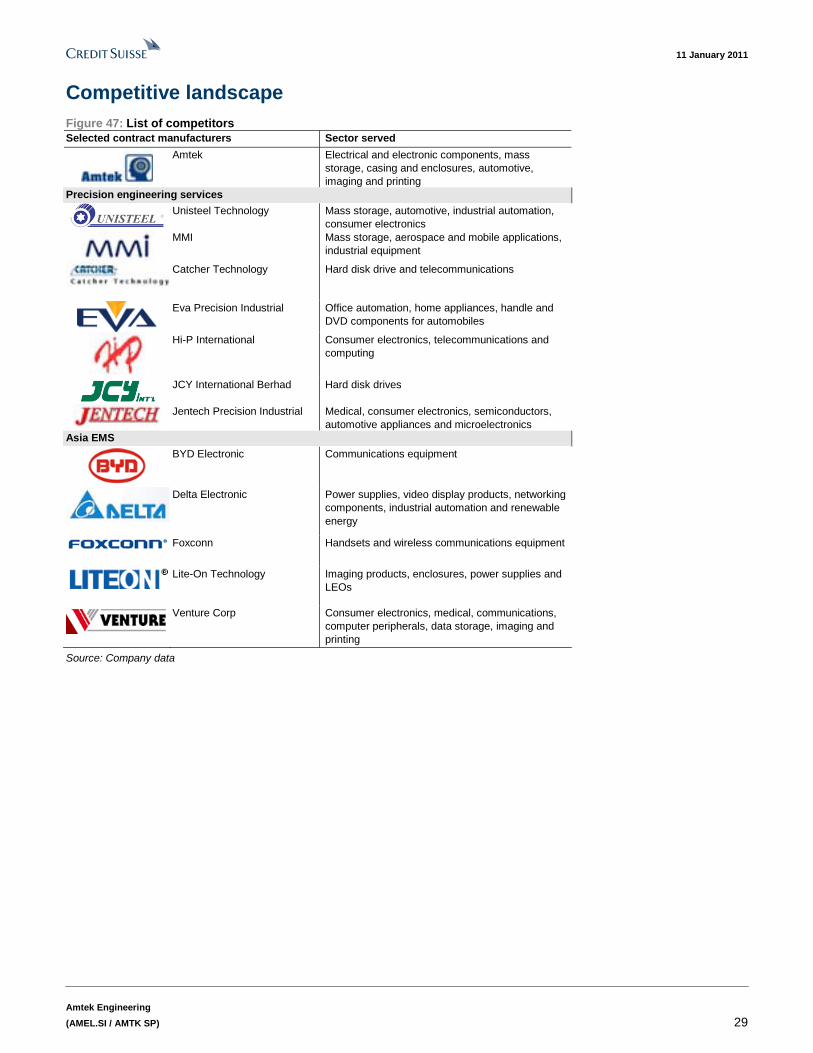
Competitive landscape Figure 47: List of competitors Selected contract manufacturers Sector served
Amtek Electrical and electronic components, mass storage, casing and enclosures, automotive, imaging and printing
Precision engineering services
Unisteel Technology Mass storage, automotive, industrial automation,
consumer electronics
MMI Mass storage, aerospace and mobile applications, industrial equipment
Catcher Technology Hard disk drive and telecommunications
Eva Precision Industrial Office automation, home appliances, handle and DVD components for automobiles
Hi-P International Consumer electronics, telecommunications and computing
JCY International Berhad Hard disk drives
Jentech Precision Industrial Medical, consumer electronics, semiconductors,
automotive appliances and microelectronics Asia EMS
BYD Electronic Communications equipment
Delta Electronic Power supplies, video display products, networking components, industrial automation and renewable energy
Foxconn Handsets and wireless communications equipment
Lite-On Technology Imaging products, enclosures, power supplies and LEOs
Venture Corp Consumer electronics, medical, communications, computer peripherals, data storage, imaging and printing
Source: Company data

11 January 2011
Amtek Engineering
(AMEL.SI / AMTK SP) 30
Companies Mentioned (Price as of 10 Jan 11) Amtek Engineering Ltd. (AMEL.SI, S$1.29, TP S$1.75) Autoliv Inc (ALV.N, $81.49, UNDERPERFORM [V], TP $60.00, MARKET WEIGHT) BYD Electronic International Co Ltd. (0285.HK, HK$3.92, NEUTRAL, TP HK$4.80) Canon (7751, ¥4,310, NEUTRAL, TP ¥3,700, MARKET WEIGHT) Catcher Technology (2474.TW, NT$109.50, OUTPERFORM, TP NT$120.00) Dell Inc. (DELL, $13.77) Delta Electronics (2308.TW, NT$139.50, NEUTRAL, TP NT$140.00) Eva Precision (0838.HK, HK$7.20) Faurecia (EPED.PA, Eu20.98) Foxconn International Holdings (2038.HK, HK$5.41) Hewlett-Packard (HPQ.N, $44.86) Hi-P International (HIPI.SI, S$1.04, NEUTRAL [V], TP S$.75) Hitachi (6501, ¥411, NEUTRAL [V], TP ¥330, MARKET WEIGHT) Hon Hai Precision (2317.TW, NT$117.00, NEUTRAL, TP NT$113.00) JCY International (JCYI.KL, RM0.84) Juniper Networks (JNPR, $37.08, NEUTRAL, TP $30.00) Konica Minolta Holdings (4902, ¥850, NEUTRAL, TP ¥850, MARKET WEIGHT) Legrand SA (LEGD.PA, Eu30.89, UNDERPERFORM, TP Eu25.00, MARKET WEIGHT) Lite-On Technology Corp (2301.TW, NT$40.10) Notion VTEC (NVTE.KL, RM2.15) Philips (PHG.AS, Eu22.84, OUTPERFORM, TP Eu31.50, MARKET WEIGHT) Schneider (SCHN.PA, Eu114.35, OUTPERFORM, TP Eu140.00, MARKET WEIGHT) Shin-Etsu Chemical (4063, ¥4,430, NEUTRAL, TP ¥4,300, MARKET WEIGHT) Sony (6758, ¥2,960, OUTPERFORM, TP ¥3,600, MARKET WEIGHT) ThyssenKrupp (TKAG.DE, Eu30.67) Venture Corporation (VENM.SI, S$9.35, OUTPERFORM, TP S$10.75)
Disclosure Appendix Important Global Disclosures I, Su Tye Chua, certify that (1) the views expressed in this report accurately reflect my personal views about all of the subject companies and securities and (2) no part of my compensation was, is or will be directly or indirectly related to the specific recommendations or views expressed in this report.
See the Companies Mentioned section for full company names. 3-Year Price, Target Price and Rating Change History Chart for AMEL.SI AMEL.SI Closing
Price Target
Price
Initiation/ Date (S$) (S$) Rating Assumption
0
0.2
0.4
0.6
0.8
1
1.2
12-Ja
n-08
12-M
ar-08
12-M
ay-08
12-Ju
l-08
12-Sep
-08
12-N
ov-08
12-Ja
n-09
12-M
ar-09
12-M
ay-09
12-Ju
l-09
12-Sep
-09
12-N
ov-09
12-Jan
-10
12-M
ar-10
12-M
ay-10
12-Jul-
10
12-S
ep-10
12-N
ov-10
Closing Price Target Price Initiation/Assumption Rat ing
S$
O=Outperform; N=Neutral; U=Underperform; R=Rest ricted; NR=Not Rated; NC=Not Covered
The analyst(s) responsible for preparing this research report received compensation that is based upon various factors including Credit Suisse's total revenues, a portion of which are generated by Credit Suisse's investment banking activities. Analysts’ stock ratings are defined as follows: Outperform (O): The stock’s total return is expected to outperform the relevant benchmark* by at least 10-15% (or more, depending on perceived risk) over the next 12 months. Neutral (N): The stock’s total return is expected to be in line with the relevant benchmark* (range of ±10-15%) over the next 12 months. Underperform (U): The stock’s total return is expected to underperform the relevant benchmark* by 10-15% or more over the next 12 months. *Relevant benchmark by region: As of 29th May 2009, Australia, New Zealand, U.S. and Canadian ratings are based on (1) a stock’s absolute total return potential to its current share price and (2) the relative attractiveness of a stock’s total return potential within an analyst’s coverage universe**, with Outperforms representing the most attractive, Neutrals the less attractive, and Underperforms the least attractive investment opportunities.

11 January 2011
Amtek Engineering
(AMEL.SI / AMTK SP) 31
Some U.S. and Canadian ratings may fall outside the absolute total return ranges defined above, depending on market conditions and industry factors. For Latin American, Japanese, and non-Japan Asia stocks, ratings are based on a stock’s total return relative to the average total return of the relevant country or regional benchmark; for European stocks, ratings are based on a stock’s total return relative to the analyst's coverage universe**. For Australian and New Zealand stocks a 22% and a 12% threshold replace the 10-15% level in the Outperform and Underperform stock rating definitions, respectively, subject to analysts’ perceived risk. The 22% and 12% thresholds replace the +10-15% and -10-15% levels in the Neutral stock rating definition, respectively, subject to analysts’ perceived risk. **An analyst's coverage universe consists of all companies covered by the analyst within the relevant sector. Restricted (R): In certain circumstances, Credit Suisse policy and/or applicable law and regulations preclude certain types of communications, including an investment recommendation, during the course of Credit Suisse's engagement in an investment banking transaction and in certain other circumstances. Volatility Indicator [V]: A stock is defined as volatile if the stock price has moved up or down by 20% or more in a month in at least 8 of the past 24 months or the analyst expects significant volatility going forward.
Analysts’ coverage universe weightings are distinct from analysts’ stock ratings and are based on the expected performance of an analyst’s coverage universe* versus the relevant broad market benchmark**: Overweight: Industry expected to outperform the relevant broad market benchmark over the next 12 months. Market Weight: Industry expected to perform in-line with the relevant broad market benchmark over the next 12 months. Underweight: Industry expected to underperform the relevant broad market benchmark over the next 12 months. *An analyst’s coverage universe consists of all companies covered by the analyst within the relevant sector. **The broad market benchmark is based on the expected return of the local market index (e.g., the S&P 500 in the U.S.) over the next 12 months. Credit Suisse’s distribution of stock ratings (and banking clients) is:
Global Ratings Distribution Outperform/Buy* 46% (61% banking clients) Neutral/Hold* 42% (60% banking clients) Underperform/Sell* 11% (53% banking clients) Restricted 2%
*For purposes of the NYSE and NASD ratings distribution disclosure requirements, our stock ratings of Outperform, Neutral, and Underperform most closely correspond to Buy, Hold, and Sell, respectively; however, the meanings are not the same, as our stock ratings are determined on a relative basis. (Please refer to definitions above.) An investor's decision to buy or sell a security should be based on investment objectives, current holdings, and other individual factors.
Credit Suisse’s policy is to update research reports as it deems appropriate, based on developments with the subject company, the sector or the market that may have a material impact on the research views or opinions stated herein.
Credit Suisse's policy is only to publish investment research that is impartial, independent, clear, fair and not misleading. For more detail please refer to Credit Suisse's Policies for Managing Conflicts of Interest in connection with Investment Research: http://www.csfb.com/research-and-analytics/disclaimer/managing_conflicts_disclaimer.html
Credit Suisse does not provide any tax advice. Any statement herein regarding any US federal tax is not intended or written to be used, and cannot be used, by any taxpayer for the purposes of avoiding any penalties.
See the Companies Mentioned section for full company names. Price Target: (12 months) for (AMEL.SIXXX) Method: Our target price estimate of S$1.75 is derived using 11x P/E, in line with Singapore-listed Venture Corporation, a conservative position we believe given the strong EPS CAGR. Risks: Risk to our target price of S$1.75 include 1) a potential slowdown in global manufacturing outsourcing, 2) loss of market share by its key customers, 3) raw material cost inflation to the extent that any increase in costs cannot be passed on to customers and 4) limited order book visibility Please refer to the firm's disclosure website at www.credit-suisse.com/researchdisclosures for the definitions of abbreviations typically used in the target price method and risk sections.
See the Companies Mentioned section for full company names. The subject company (AMEL.SI) currently is, or was during the 12-month period preceding the date of distribution of this report, a client of Credit Suisse. Credit Suisse provided investment banking services to the subject company (AMEL.SI) within the past 12 months. Credit Suisse has managed or co-managed a public offering of securities for the subject company (AMEL.SI) within the past 12 months. Credit Suisse has received investment banking related compensation from the subject company (AMEL.SI) within the past 12 months. Credit Suisse expects to receive or intends to seek investment banking related compensation from the subject company (AMEL.SI) within the next 3 months. Important Regional Disclosures Singapore recipients should contact a Singapore financial adviser for any matters arising from this research report.
The analyst(s) involved in the preparation of this report have not visited the material operations of the subject company (AMEL.SI) within the past 12 months.
Restrictions on certain Canadian securities are indicated by the following abbreviations: NVS--Non-Voting shares; RVS--Restricted Voting Shares; SVS--Subordinate Voting Shares.

11 January 2011
Amtek Engineering
(AMEL.SI / AMTK SP) 32
Individuals receiving this report from a Canadian investment dealer that is not affiliated with Credit Suisse should be advised that this report may not contain regulatory disclosures the non-affiliated Canadian investment dealer would be required to make if this were its own report. For Credit Suisse Securities (Canada), Inc.'s policies and procedures regarding the dissemination of equity research, please visit http://www.csfb.com/legal_terms/canada_research_policy.shtml.
The following disclosed European company/ies have estimates that comply with IFRS: ALV.N, EPED.PA, LEGD.PA, PHG.AS, SCHN.PA.
As of the date of this report, Credit Suisse acts as a market maker or liquidity provider in the equities securities that are the subject of this report.
Principal is not guaranteed in the case of equities because equity prices are variable. Commission is the commission rate or the amount agreed with a customer when setting up an account or at anytime after that.
To the extent this is a report authored in whole or in part by a non-U.S. analyst and is made available in the U.S., the following are important disclosures regarding any non-U.S. analyst contributors: The non-U.S. research analysts listed below (if any) are not registered/qualified as research analysts with FINRA. The non-U.S. research analysts listed below may not be associated persons of CSSU and therefore may not be subject to the NASD Rule 2711 and NYSE Rule 472 restrictions on communications with a subject company, public appearances and trading securities held by a research analyst account. • Su Tye Chua, non-U.S. analyst, is a research analyst employed by Credit Suisse AG, Singapore Branch. • Christopher Chang, non-U.S. analyst, is a research analyst employed by Credit Suisse AG, Singapore Branch. Important MSCI Disclosures The MSCI sourced information is the exclusive property of Morgan Stanley Capital International Inc. (MSCI). Without prior written permission of MSCI, this information and any other MSCI intellectual property may not be reproduced, re-disseminated or used to create any financial products, including any indices. This information is provided on an “as is” basis. The user assumes the entire risk of any use made of this information. MSCI, its affiliates and any third party involved in, or related to, computing or compiling the information hereby expressly disclaim all warranties of originality, accuracy, completeness, merchantability or fitness for a particular purpose with respect to any of this information. Without limiting any of the foregoing, in no event shall MSCI, any of its affiliates or any third party involved in, or related to, computing or compiling the information have any liability for any damages of any kind. MSCI, Morgan Stanley Capital International and the MSCI indexes are services marks of MSCI and its affiliates.
The Global Industry Classification Standard (GICS) was developed by and is the exclusive property of Morgan Stanley Capital International Inc. and Standard & Poor’s. GICS is a service mark of MSCI and S&P and has been licensed for use by Credit Suisse. For Credit Suisse disclosure information on other companies mentioned in this report, please visit the website at www.credit-suisse.com/researchdisclosures or call +1 (877) 291-2683. Disclaimers continue on next page.

11 January 2011 Asia Pacific/Singapore
Equity Research
TC1478.doc
This report is not directed to, or intended for distribution to or use by, any person or entity who is a citizen or resident of or located in any locality, state, country or other jurisdiction where such distribution, publication, availability or use would be contrary to law or regulation or which would subject Credit Suisse AG, the Swiss bank, or its subsidiaries or its affiliates (“CS”) to any registration or licensing requirement within such jurisdiction. All material presented in this report, unless specifically indicated otherwise, is under copyright to CS. None of the material, nor its content, nor any copy of it, may be altered in any way, transmitted to, copied or distributed to any other party, without the prior express written permission of CS. All trademarks, service marks and logos used in this report are trademarks or service marks or registered trademarks or service marks of CS or its affiliates. The information, tools and material presented in this report are provided to you for information purposes only and are not to be used or considered as an offer or the solicitation of an offer to sell or to buy or subscribe for securities or other financial instruments. CS may not have taken any steps to ensure that the securities referred to in this report are suitable for any particular investor. CS will not treat recipients as its customers by virtue of their receiving the report. The investments or services contained or referred to in this report may not be suitable for you and it is recommended that you consult an independent investment advisor if you are in doubt about such investments or investment services. Nothing in this report constitutes investment, legal, accounting or tax advice or a representation that any investment or strategy is suitable or appropriate to your individual circumstances or otherwise constitutes a personal recommendation to you. CS does not offer advice on the tax consequences of investment and you are advised to contact an independent tax adviser. Please note in particular that the bases and levels of taxation may change. CS believes the information and opinions in the Disclosure Appendix of this report are accurate and complete. Information and opinions presented in the other sections of the report were obtained or derived from sources CS believes are reliable, but CS makes no representations as to their accuracy or completeness. Additional information is available upon request. CS accepts no liability for loss arising from the use of the material presented in this report, except that this exclusion of liability does not apply to the extent that liability arises under specific statutes or regulations applicable to CS. This report is not to be relied upon in substitution for the exercise of independent judgment. CS may have issued, and may in the future issue, a trading call regarding this security. Trading calls are short term trading opportunities based on market events and catalysts, while stock ratings reflect investment recommendations based on expected total return over a 12-month period as defined in the disclosure section. Because trading calls and stock ratings reflect different assumptions and analytical methods, trading calls may differ directionally from the stock rating. In addition, CS may have issued, and may in the future issue, other reports that are inconsistent with, and reach different conclusions from, the information presented in this report. Those reports reflect the different assumptions, views and analytical methods of the analysts who prepared them and CS is under no obligation to ensure that such other reports are brought to the attention of any recipient of this report. CS is involved in many businesses that relate to companies mentioned in this report. These businesses include specialized trading, risk arbitrage, market making, and other proprietary trading. Past performance should not be taken as an indication or guarantee of future performance, and no representation or warranty, express or implied, is made regarding future performance. Information, opinions and estimates contained in this report reflect a judgement at its original date of publication by CS and are subject to change without notice. The price, value of and income from any of the securities or financial instruments mentioned in this report can fall as well as rise. The value of securities and financial instruments is subject to exchange rate fluctuation that may have a positive or adverse effect on the price or income of such securities or financial instruments. Investors in securities such as ADR’s, the values of which are influenced by currency volatility, effectively assume this risk. Structured securities are complex instruments, typically involve a high degree of risk and are intended for sale only to sophisticated investors who are capable of understanding and assuming the risks involved. The market value of any structured security may be affected by changes in economic, financial and political factors (including, but not limited to, spot and forward interest and exchange rates), time to maturity, market conditions and volatility, and the credit quality of any issuer or reference issuer. Any investor interested in purchasing a structured product should conduct their own investigation and analysis of the product and consult with their own professional advisers as to the risks involved in making such a purchase. Some investments discussed in this report have a high level of volatility. High volatility investments may experience sudden and large falls in their value causing losses when that investment is realised. Those losses may equal your original investment. Indeed, in the case of some investments the potential losses may exceed the amount of initial investment, in such circumstances you may be required to pay more money to support those losses. Income yields from investments may fluctuate and, in consequence, initial capital paid to make the investment may be used as part of that income yield. Some investments may not be readily realisable and it may be difficult to sell or realise those investments, similarly it may prove difficult for you to obtain reliable information about the value, or risks, to which such an investment is exposed. This report may provide the addresses of, or contain hyperlinks to, websites. Except to the extent to which the report refers to website material of CS, CS has not reviewed the linked site and takes no responsibility for the content contained therein. Such address or hyperlink (including addresses or hyperlinks to CS’s own website material) is provided solely for your convenience and information and the content of the linked site does not in any way form part of this document. Accessing such website or following such link through this report or CS’s website shall be at your own risk. This report is issued and distributed in Europe (except Switzerland) by Credit Suisse Securities (Europe) Limited, One Cabot Square, London E14 4QJ, England, which is regulated in the United Kingdom by The Financial Services Authority (“FSA”). This report is being distributed in Germany by Credit Suisse Securities (Europe) Limited Niederlassung Frankfurt am Main regulated by the Bundesanstalt fuer Finanzdienstleistungsaufsicht ("BaFin"). This report is being distributed in the United States by Credit Suisse Securities (USA) LLC ; in Switzerland by Credit Suisse AG; in Canada by Credit Suisse Securities (Canada), Inc.; in Brazil by Banco de Investimentos Credit Suisse (Brasil) S.A. or its affiliates; in Mexico by Banco Credit Suisse (México), S.A. (transactions related to the securities mentioned in this report will only be effected in compliance with applicable regulation); in Japan by Credit Suisse Securities (Japan) Limited, Financial Instrument Firm, Director-General of Kanto Local Finance Bureau (Kinsho) No. 66, a member of Japan Securities Dealers Association, The Financial Futures Association of Japan, Japan Securities Investment Advisers Association; elsewhere in Asia/Pacific by whichever of the following is the appropriately authorised entity in the relevant jurisdiction: Credit Suisse (Hong Kong) Limited, Credit Suisse Equities (Australia) Limited , Credit Suisse Securities (Thailand) Limited, Credit Suisse Securities (Malaysia) Sdn Bhd, Credit Suisse AG, Singapore Branch, Credit Suisse Securities (India) Private Limited, Credit Suisse Securities (Europe) Limited, Seoul Branch, Credit Suisse AG, Taipei Securities Branch, PT Credit Suisse Securities Indonesia, and elsewhere in the world by the relevant authorised affiliate of the above. Research on Taiwanese securities produced by Credit Suisse AG, Taipei Securities Branch has been prepared by a registered Senior Business Person. Research provided to residents of Malaysia is authorised by the Head of Research for Credit Suisse Securities (Malaysia) Sdn. Bhd., to whom they should direct any queries on +603 2723 2020. In jurisdictions where CS is not already registered or licensed to trade in securities, transactions will only be effected in accordance with applicable securities legislation, which will vary from jurisdiction to jurisdiction and may require that the trade be made in accordance with applicable exemptions from registration or licensing requirements. Non-U.S. customers wishing to effect a transaction should contact a CS entity in their local jurisdiction unless governing law permits otherwise. U.S. customers wishing to effect a transaction should do so only by contacting a representative at Credit Suisse Securities (USA) LLC in the U.S. Please note that this report was originally prepared and issued by CS for distribution to their market professional and institutional investor customers. Recipients who are not market professional or institutional investor customers of CS should seek the advice of their independent financial advisor prior to taking any investment decision based on this report or for any necessary explanation of its contents. This research may relate to investments or services of a person outside of the UK or to other matters which are not regulated by the FSA or in respect of which the protections of the FSA for private customers and/or the UK compensation scheme may not be available, and further details as to where this may be the case are available upon request in respect of this report. Any Nielsen Media Research material contained in this report represents Nielsen Media Research's estimates and does not represent facts. NMR has neither reviewed nor approved this report and/or any of the statements made herein. If this report is being distributed by a financial institution other than Credit Suisse AG, or its affiliates, that financial institution is solely responsible for distribution. Clients of that institution should contact that institution to effect a transaction in the securities mentioned in this report or require further information. This report does not constitute investment advice by Credit Suisse to the clients of the distributing financial institution, and neither Credit Suisse AG, its affiliates, and their respective officers, directors and employees accept any liability whatsoever for any direct or consequential loss arising from their use of this report or its content. Copyright 2011 CREDIT SUISSE AG and/or its affiliates. All rights reserved.
CREDIT SUISSE (Hong Kong) Limited Asia/Pacific: +852 2101-6000