Olympus (7733 / 7733 JP) - Credit Suisse | PLUS
44
DISCLOSURE APPENDIX AT THE BACK OF THIS REPORT CONTAINS IMPORTANT DISCLOSURES, ANALYST CERTIFICATIONS, LEGAL ENTITY DISCLOSURE AND THE STATUS OF NON-US ANALYSTS. US Disclosure: Credit Suisse does and seeks to do business with companies covered in its research reports. As a result, investors should be aware that the Firm may have a conflict of interest that could affect the objectivity of this report. Investors should consider this report as only a single factor in making their investment decision. CREDIT SUISSE SECURITIES RESEARCH & ANALYTICS BEYOND INFORMATION ® Client-Driven Solutions, Insights, and Access 06 September 2016 Asia Pacific/Japan Equity Research Imaging Technology (Precision (Japan)) / MARKET WEIGHT Olympus (7733 / 7733 JP) INITIATION Opportunity to buy in as medium-term investment ■ Initiate coverage: We initiate coverage of Olympus with an OUTPERFORM rating and a ¥4,100 target price (potential return 22%). We see risk that Olympus may miss FY3/17 guidance due to yen appreciation and protracted business negotiations, and think it lacks share-price catalysts over the near term. However, we think the current share price offers an opportunity to buy in as a medium-term investment, given the potential for growth by the medical business. ■ Product line-up that provides significant benefits for both patients and doctors: Olympus’ mainstay gastrointestinal endoscope, surgical endoscope systems, and endotherapy devices have significant growth potential, as they are a good fit with the current healthcare trends of early diagnosis and minimally invasive therapies. We expect steady growth in the gastrointestinal endoscope segment, as Olympus dominates in terms of market share and technical skills. In the surgical and endotherapy device segments, we expect Olympus to grow its market share as it has a strong sales force and a unique line-up of products that reduce the burden on both patient and doctor. Sales stagnated in both endoscope and surgery fields in 1Q, particularly in the US, as business negotiations dragged on, but we think this may only be a transient trend. We expect Olympus to return to growth as more patients undergo gastroscopic procedures, in line with the trends of demographic aging and early diagnosis, and with the introduction of ultra-high definition (4K) surgical endoscopy systems. ■ Risks/catalysts: Risks include an economic slowdown, yen appreciation, and price competition with rival companies. The market could re-evaluate Olympus if 2Q results show a recovery in endoscope and surgerical sales in the US after these segments stagnated in 1Q. ■ Valuation: We base our valuation on EV/EBITDA to allow global comparisons and to reflect investment in expansion of manufacturing sites to grow the medical business. We apply an EV/EBITDA of 11x, the average multiple since FY3/14 after the company announced a capital tie-up with Sony (6758) and had resolved the loss-concealed issue. Share price performance 80 90 100 110 120 2000 3000 4000 5000 6000 Sep-14 Jan-15 May-15 Sep-15 Jan-16 May-16 Price (LHS) Rebased Rel (RHS) The price relative chart measures performance against the TOPIX which closed at 1343.85 on 23/08/16 On 23/08/16 the spot exchange rate was ¥103.47/US$1 Performance over 1M 3M 12M Absolute (%) 5.1 -24.2 -17.7 Relative (%) 0.1 -24.5 -10.7 Financial and valuation metrics Year 3/16A 3/17E 3/18E 3/19E Sales (¥ bn) 804.6 753.0 805.3 843.7 Operating profit (¥ bn) 104.5 72.4 87.2 97.0 Recurring profit (¥ bn) 70.8 58.5 73.2 83.0 Net income (¥ bn) 62.6 49.4 54.9 58.1 EPS (¥) 182.9 144.5 160.5 169.8 Change from previous EPS (%) n.a. IBES Consensus EPS (¥) n.a. 161.4 180.8 194.6 EPS growth (%) n.m. -21.0 11.1 5.8 P/E (x) 23.9 23.4 21.0 19.9 Dividend yield (%) 0.4 0.8 1.0 1.2 EV/EBITDA(x) 10.5 9.6 8.1 7.2 P/B (x) 3.9 2.7 2.5 2.3 ROE(%) 16.9 12.2 12.3 11.9 Net debt/equity (%) 32.4 14.1 6.1 net cash Source: Company data, Thomson Reuters, IFIS, Credit Suisse estimates. Rating OUTPERFORM* Price (05 Sep 16, ¥) 3,375 Target price (¥) 4,100¹ Chg to TP (%) 21.5 Market cap. (¥ bn) 1,155.08 (US$ 11.16) Enterprise value (¥ bn) 1,214.99 Number of shares (mn) 342.25 Free float (%) 70.0 52-week price range 4,945 - 3,195 *Stock ratings are relative to the coverage universe in each analyst's or each team's respective sector. ¹Target price is for 12 months. Research Analysts Mika Nishimura 81 3 4550 7369 [email protected]
-
Upload
khangminh22 -
Category
Documents
-
view
2 -
download
0
Transcript of Olympus (7733 / 7733 JP) - Credit Suisse | PLUS

DISCLOSURE APPENDIX AT THE BACK OF THIS REPORT CONTAINS IMPORTANT DISCLOSURES, ANALYST CERTIFICATIONS, LEGAL ENTITY DISCLOSURE AND THE STATUS OF NON-US ANALYSTS. US Disclosure: Credit
Suisse does and seeks to do business with companies covered in its research reports. As a result, investors should be aware that the Firm may have a conflict of interest that could affect the objectivity of this report. Investors should consider this report as only a single factor in making their investment decision.
CREDIT SUISSE SECURITIES RESEARCH & ANALYTICS BEYOND INFORMATION®
Client-Driven Solutions, Insights, and Access
06 September 2016
Asia Pacific/Japan
Equity Research
Imaging Technology (Precision (Japan)) / MARKET WEIGHT
Olympus (7733 / 7733 JP) INITIATION
Opportunity to buy in as medium-term investment ■ Initiate coverage: We initiate coverage of Olympus with an OUTPERFORM
rating and a ¥4,100 target price (potential return 22%). We see risk that Olympus
may miss FY3/17 guidance due to yen appreciation and protracted business
negotiations, and think it lacks share-price catalysts over the near term. However,
we think the current share price offers an opportunity to buy in as a medium-term
investment, given the potential for growth by the medical business.
■ Product line-up that provides significant benefits for both patients and
doctors: Olympus’ mainstay gastrointestinal endoscope, surgical endoscope
systems, and endotherapy devices have significant growth potential, as they are
a good fit with the current healthcare trends of early diagnosis and minimally
invasive therapies. We expect steady growth in the gastrointestinal endoscope
segment, as Olympus dominates in terms of market share and technical skills. In
the surgical and endotherapy device segments, we expect Olympus to grow its
market share as it has a strong sales force and a unique line-up of products that
reduce the burden on both patient and doctor. Sales stagnated in both
endoscope and surgery fields in 1Q, particularly in the US, as business
negotiations dragged on, but we think this may only be a transient trend. We
expect Olympus to return to growth as more patients undergo gastroscopic
procedures, in line with the trends of demographic aging and early diagnosis,
and with the introduction of ultra-high definition (4K) surgical endoscopy systems.
■ Risks/catalysts: Risks include an economic slowdown, yen appreciation, and
price competition with rival companies. The market could re-evaluate Olympus if
2Q results show a recovery in endoscope and surgerical sales in the US after
these segments stagnated in 1Q.
■ Valuation: We base our valuation on EV/EBITDA to allow global comparisons
and to reflect investment in expansion of manufacturing sites to grow the medical
business. We apply an EV/EBITDA of 11x, the average multiple since FY3/14
after the company announced a capital tie-up with Sony (6758) and had resolved
the loss-concealed issue.
Share price performance
80
90
100
110
120
2000
3000
4000
5000
6000
Sep-14 Jan-15 May-15 Sep-15 Jan-16 May-16
Price (LHS) Rebased Rel (RHS)
The price relative chart measures performance against the
TOPIX which closed at 1343.85 on 23/08/16
On 23/08/16 the spot exchange rate was ¥103.47/US$1
Performance over 1M 3M 12M Absolute (%) 5.1 -24.2 -17.7 Relative (%) 0.1 -24.5 -10.7
Financial and valuation metrics
Year 3/16A 3/17E 3/18E 3/19E Sales (¥ bn) 804.6 753.0 805.3 843.7 Operating profit (¥ bn) 104.5 72.4 87.2 97.0 Recurring profit (¥ bn) 70.8 58.5 73.2 83.0 Net income (¥ bn) 62.6 49.4 54.9 58.1 EPS (¥) 182.9 144.5 160.5 169.8 Change from previous EPS (%) n.a. IBES Consensus EPS (¥) n.a. 161.4 180.8 194.6 EPS growth (%) n.m. -21.0 11.1 5.8 P/E (x) 23.9 23.4 21.0 19.9 Dividend yield (%) 0.4 0.8 1.0 1.2 EV/EBITDA(x) 10.5 9.6 8.1 7.2 P/B (x) 3.9 2.7 2.5 2.3 ROE(%) 16.9 12.2 12.3 11.9 Net debt/equity (%) 32.4 14.1 6.1 net cash
Source: Company data, Thomson Reuters, IFIS, Credit Suisse estimates.
Rating OUTPERFORM* Price (05 Sep 16, ¥) 3,375 Target price (¥) 4,100¹ Chg to TP (%) 21.5 Market cap. (¥ bn) 1,155.08 (US$ 11.16) Enterprise value (¥ bn) 1,214.99 Number of shares (mn) 342.25 Free float (%) 70.0 52-week price range 4,945 - 3,195
*Stock ratings are relative to the coverage universe in each
analyst's or each team's respective sector.
¹Target price is for 12 months.
Research Analysts
Mika Nishimura
81 3 4550 7369

06 September 2016
Olympus (7733 / 7733 JP) 2
Table of contents Key charts 3 1. Rating and valuation 4
Initiate at OUTPERFORM with ¥4,100 target price 4 Expect steady growth by endoscopes, higher market share for surgical and
endotherapy devices 5 Current valuation lower than sector peers 5 Risks, catalysts 7
2. Business structure 9 Medical business generates nearly all of the profits 9
3. Focus on early diagnosis and minimally invasive treatment in medical 11 Products contribute to improve patients’ quality of life 11 Help curb medical expenditure, reduce burden on health workers 12
4. Gastrointestinal endoscopes basis for growth 13 Commanding market share, continuous technical innovation should ensure stable
growth 13 Demand for scopes and services growing in line with increase in testing volume 14 Current generation of endoscopes in fourth year of five-to-seven year product cycle 15 North American endoscope sales down YoY in 1Q FY3/17, but protracted decline
unlikely 16 5. Expanding product lineup, promoting development of surgical techniques 18
Wider application of endoscopic surgery expands demand for instruments 18 Steady sales expansion, growth likely to continue 21
6. Expecting share gains in surgery driven by unique products 23 Building up business via M&A activity, gaining share 23 Endoscopic surgery growing, eligible for insurance 23 Expecting steady growth in energy devices excluding special factors 24 4K surgical endoscopy systems: inquiries strong 25 First-quarter earnings off to slow start, but growth expectations unchanged 25
7. Significant growth potential for medical segment in emerging markets 28 Expansion in emerging markets likely to continue 28
8. Earnings outlook 30 Expecting return to profit growth from FY3/18 30 Beefing up production structure to meet medium-term plan 31 Shareholder returns 32
9. Company history 38 Gastroscopy history of more than 60 years 38 Upgrading compliance and governance systems 39

06 September 2016
Olympus (7733 / 7733 JP) 3
Key charts Figure 1: Olympus EV/EBITDA: Our ¥4,100 target price on
FY3/18E EV/EBITDA of 11x
Figure 2: EV/EBITDA of peers: Growing disparity with
sector peer average
6
8
10
12
14
16
18
20
3/9
13
/92
3/9
33
/94
3/9
53
/96
3/9
73
/98
3/9
93
/00
3/0
13
/02
3/0
33
/04
3/0
53
/06
3/0
73
/08
3/0
93
/10
3/1
13
/12
3/1
33
/14
3/1
53
/16
3/1
7E
3/1
8E
3/1
9E
(X)
11X
2 x
4 x
6 x
8 x
10 x
12 x
14 x
16 x
1/2
007
7/2
007
1/2
008
7/2
008
1/2
009
7/2
009
1/2
010
7/2
010
1/2
011
7/2
011
1/2
012
7/2
012
1/2
013
7/2
013
1/2
014
7/2
014
1/2
015
7/2
015
1/2
016
7/2
016
Johnson & Johnson StrykerMedtronic Boston ScientificOlympus AVERAGE
Source: Thomson Reuters, Credit Suisse estimates Source: Thomson Reuters
Figure 3: Medical business sales forecast: Expecting
return to sales growth from FY3/18
Figure 4: Medical business OP forecast: Maintaining a
high margin
-15%
-10%
-5%
0%
5%
10%
15%
20%
25%
30%
0
100
200
300
400
500
600
700
3/0
2
3/0
3
3/0
4
3/0
5
3/0
6
3/0
7
3/0
8
3/0
9
3/1
0
3/1
1
3/1
2
3/1
3
3/1
4
3/1
5
3/1
6
3/1
7E
3/1
8E
3/1
9E
((JP
Y b
n)
Endotherapy
Surgical
Endoscopes
YoY
Surgical + Endoscopes
0%
5%
10%
15%
20%
25%
30%
0
20
40
60
80
100
120
140
1603/0
8
3/0
9
3/1
0
3/1
1
3/1
2
3/1
3
3/1
4
3/1
5
3/1
6
3/1
7E
3/1
8E
3/1
9E
(JP
Y b
n)
OP OPM
Source: Company data, Credit Suisse estimates Source: Company data, Credit Suisse estimates,
Figure 5: Medical sales YoY growth by region: Slowdown
in 1Q only temporary; Olympus still has growth potential
Figure 6: Healthcare expenditure per capita: Growth
potential in China and Asia market
-15%
-10%
-5%
0%
5%
10%
15%
20%
25%
30%
35%
Q1 Q2 Q3 Q4 Q1 Q2 Q3 Q4 Q1 Q2 Q3 Q4 Q1
FY13 FY14 FY15 FY16
North America
Europe
Asia/Oceania
0
50
100
150
200
250
300
350
400
450
1995
1996
1997
1998
1999
2000
2001
2002
2003
2004
2005
2006
2007
2008
2009
2010
2011
2012
2013
2014
(US
$)
China
Asia (excluding Japan and China)
Source: Company data, Credit Suisse Source: World Bank, Credit Suisse

06 September 2016
Olympus (7733 / 7733 JP) 4
1. Rating and valuation Initiate at OUTPERFORM with ¥4,100 target price
Near-term catalysts lacking, but opportunity to buy in as medium-term investment
We initiate coverage of Olympus with an OUTPERFORM rating and a ¥4,100 target price
(potential return 22%).
We see risk that Olympus may miss its FY3/17 guidance, due to the negative effects of
yen appreciation and protracted business negotiations. We believe the 1Q results could
depress the consensus forecast and think Olympus lacks share-price catalysts over the
near term. However, we think the current share price offers an opportunity to buy in as a
medium-term investment, given the potential for growth in the medical business.
Figure 7: Olympus (7733) – Earnings summary
DPS P/E
¥3,375 ¥bn YoY (%) ¥bn YoY (%) ¥bn YoY (%) ¥bn YoY (%) ¥ YoY (%) ¥ (x)
Consolidated FY
Mar-15 A 764.7 7.2% 91.0 23.9% 8.9 -45.6% -8.7 NM -25.5 NM 10.0 NM
Mar-16 A 804.6 5.2% 104.5 14.8% 70.8 692.5% 62.6 NM 182.9 NM 17.0 23.9
Mar-17 CS E (new) 753.0 -6.4% 72.4 -30.6% 58.5 -17.4% 49.4 -21.0% 144.5 -21.0% 28.0 23.4
CoE 775.0 -3.7% 77.0 -26.3% 67.0 -5.4% 57.0 -8.9% 166.6 -8.9% 28.0 20.3
IBES E 767.2 -4.6% 78.5 -24.9% 68.8 -2.8% 55.7 -10.9% 161.4 -11.8% 28.3 20.9
Mar-18 CS E (new) 805.3 6.9% 87.2 20.4% 73.2 25.2% 54.9 11.1% 160.5 11.1% 35.0 21.0
IBES E 796.5 3.8% 92.6 18.0% 83.7 21.6% 62.0 11.2% 180.8 12.0% 33.7 18.7
Mar-19 CS E (new) 843.7 4.8% 97.0 11.2% 83.0 13.4% 58.1 5.8% 169.8 5.8% 40.0 19.9
IBES E 832.0 4.5% 102.2 10.3% 93.0 11.1% 66.3 6.9% 194.6 7.6% 41.8 17.3
Consolidated Half Year
Mar-16 1H A 395.8 11.5% 50.1 30.3% 39.5 41.3% 35.8 60.4% 104.6 60.4% 0.0
2H A 408.8 -0.2% 54.4 3.5% 31.3 NM 26.8 NM 78.3 NM 17.0
Mar-17 1H CS E (new) 357.0 -9.8% 26.6 -46.8% 19.6 -50.2% 18.4 -48.7% 53.7 -48.7% 0.0
CoE 366.0 -7.5% 29.0 -42.1% 25.0 -36.7% 20.0 -44.1% 58.4 -44.1% 0.0
2H CS E (new) 396.1 0.1% 45.8 -8.5% 38.8 -1.6% 31.1 -13.2% 90.8 -13.2% 28.0
CoE 409.0 0.0% 48.0 -11.7% 42.0 34.0% 37.0 38.1% 108.1 38.1% 28.0
Consolidated Quarter
Mar-16 Q1 A 187.6 12.3% 17.2 14.0% 14.3 27.8% 16.7 105.6%
Q2 A 208.2 10.7% 32.9 40.8% 25.2 50.2% 19.1 34.4%
Q3 A 196.8 0.9% 23.6 -0.2% 6.9 -46.5% 7.0 -26.6%
Q4 A 212.0 -1.2% 30.8 6.6% 24.5 NM 19.7 NM
Mar-17 Q1 A 168.4 -10.2% 10.8 -37.0% 7.3 -48.5% 8.5 -49.0%
Q2 CS E (new) 188.5 -9.5% 15.8 -51.9% 12.3 -51.1% 9.9 -48.3%
EPS05-Sep-16 Sales Operating profit Recurring profit Net profit
Source: Company data, I/B/E/S, Credit Suisse estimates
Our ¥4,100 target price is
based on FY3/18E
EV/EBITDA of 11x

06 September 2016
Olympus (7733 / 7733 JP) 5
Expect steady growth by endoscopes, higher market
share for surgical and endotherapy devices
Product portfolio consistent with current medical trends of early diagnosis,
minimally invasive therapies
Endoscopic techniques allow early diagnosis and treatment and improve patient
prognoses (allowing longer survival rates). Endoscopic and gastroscopic treatments
reduce the physical burden on the patient and allow an earlier return to work and other
social activities. Olympus has a product line-up that helps improve patient QOL at every
phase, from diagnosis to treatment.
High barriers to entry in gastroscopy market; potential for higher market share in
endosurgical and therapeutic device segments
Over the past few decades, Olympus has built up close lines of communication with
hospitals and physicians, which has allowed the company to develop various
groundbreaking technologies for gastroscopic systems and build high barriers to entry to
keep out the competition.
In the endosurgery and therapeutic device segments, Olympus has bolstered its sales
force, hiring more sales staff in the largest market in the US. Olympus can differentiate
itself from the competition through its superior line-up of endosurgery products that help to
reduce the burden on the physician; we think the company could grow its market share
further. The Olympus product portfolio includes 3D and 4K endosurgery systems that
make observations easier during surgery and a dual-energy instrument (Thunderbeat) that
combines devices for dissection and vessel sealing in a single unit. We expect Olympus to
benefit from an expanded line-up of therapeutic devices and the development of
technologies that draw on the company’s strengths.
Medical segment slowdown in 1Q only temporary; Olympus still has growth
potential over the medium term
Both the endoscopes and surgical segments stagnated in the US in 1Q, generating market
concerns over structural problems. Olympus attributes the slowdown to slightly protracted
negotiations over capital products and explained that sales have been pushed back into
2Q or beyond. We agree that the slowdown is probably temporary. We expect Olympus to
return to a growth trajectory as more patients undergo gastroscopic procedures, in line
with the trends of demographic aging and early diagnosis, and with the launch of 4K
surgical endoscopy systems.
Current valuation lower than sector peers
Base our ¥4,100 target price on EV/EBITDA of 11x to our FY3/18 estimates
We base our valuation on EV/EBITDA to allow global comparisons and to reflect
investment in expansion of manufacturing sites in order to grow the medical business. We
apply to our FY3/18 estimates an EV/EBITDA of 11x, the average multiple since FY3/14
after the company announced a capital tie-up with Sony and had resolved the loss-
concealed losses issue. The share price has fallen below a multiple of 10x, approaching
the bottom of the range for the past three years; we think it could recover to the average
for the past three years given the ongoing growth by the medical business.
Product lineup that helps
improve patient QOL
High barriers to entry to
keep out the competition by
various groundbreaking
technologies development
Olympus to return to a
growth trajectory as more
patients undergo
gastroscopic procedures
and the launch of 4K
surgical endoscopy
systems.
EV/EBITDA of 11x is the
average multiple since
FY3/14

06 September 2016
Olympus (7733 / 7733 JP) 6
Figure 8: Olympus (7733) – EV/EBITDA
6
8
10
12
14
16
18
20
3/9
1
3/9
2
3/9
3
3/9
4
3/9
5
3/9
6
3/9
7
3/9
8
3/9
9
3/0
0
3/0
1
3/0
2
3/0
3
3/0
4
3/0
5
3/0
6
3/0
7
3/0
8
3/0
9
3/1
0
3/1
1
3/1
2
3/1
3
3/1
4
3/1
5
3/1
6
3/1
7E
3/1
8E
3/1
9E
(X)
11X
Source: Thomson Reuters, Credit Suisse estimates
Figure 9: Olympus (7733) – P/E Figure 10: Olympus (7733) – P/B
0
10
20
30
40
50
60
70
80
90
100
3/9
13/9
23/9
33/9
43/9
53/9
63/9
73/9
83/9
93/0
03/0
13/0
23/0
33/0
43/0
53/0
63/0
73/0
83/0
93/1
03/1
13/1
23/1
33/1
43/1
53/1
63/1
7E
3/1
8E
3/1
9E
(X)
0.0
1.0
2.0
3.0
4.0
5.0
6.0
7.0
8.0
9.0
10.0
3/9
13/9
23/9
33/9
43/9
53/9
63/9
73/9
83/9
93/0
03/0
13/0
23/0
33/0
43/0
53/0
63/0
73/0
83/0
93/1
03/1
13/1
23/1
33/1
43/1
53/1
63/1
7E
3/1
8E
3/1
9E
(X)
Source: Thomson Reuters, Credit Suisse estimates Source: Thomson Reuters, Credit Suisse estimates
Growing disparity with sector peer average
The difference between the Olympus P/E and the average multiple at other medical device
and equipment makers engaged in endoscopic devices is currently greater than at any
other time over the past ten years. Olympus still dominates the gastroscopy market,
however, and we think this gap will almost certainly narrow as Olympus moves its
unprofitable digital still camera business to the breakeven point. The average P/E for
sector peers is 13x.
The average P/E for sector
peers is 13x

06 September 2016
Olympus (7733 / 7733 JP) 7
Figure 11: EV/EBITDA of peers: Growing disparity with sector peer average
2 x
4 x
6 x
8 x
10 x
12 x
14 x
16 x1/2
007
6/2
007
11/2
007
4/2
008
9/2
008
2/2
009
7/2
009
12/2
009
5/2
010
10/2
010
3/2
011
8/2
011
1/2
012
6/2
012
11/2
012
4/2
013
9/2
013
2/2
014
7/2
014
12/2
014
5/2
015
10/2
015
3/2
016
8/2
016
Johnson &Johnson
Stryker
Medtronic
BostonScientific
Olympus
AVERAGE
Source: Thomson Reuters
Figure 12: Valuations vs. medical device peers
NAME FY15 FY16E FY17E FY18E FY15 FY16E FY17E FY18E FY15 FY16E FY17E FY18E
JOHNSON & JOHNSON 12.5 12.3 11.6 11.3 18.4 17.7 16.7 15.9 4.0 4.1 4.1 4.1
STRYKER CORP 19.1 13.9 12.5 11.7 30.0 19.9 18.0 16.6 5.1 4.3 4.3 4.3
MEDTRONIC PLC 16.0 14.3 13.2 12.1 31.4 18.8 17.1 - 2.1 2.2 2.2 2.2
BOSTON SCIENTIFIC CORP 65.9 16.2 14.7 13.1 - 21.6 18.9 16.7 3.8 4.2 4.2 4.2
OLYMPUS CORP 11.0 10.1 8.9 8.1 24.4 21.3 19.1 17.5 4.0 2.7 2.7 2.7
PER PBREV/EBITDA
Source: Bloomberg
Risks, catalysts
Risks include an economic slowdown, yen appreciation, and competition; catalysts
could include 2Q results
Full-year OP is depressed ¥1.1bn for every ¥1 appreciation versus the dollar and ¥700mn
for every ¥1 appreciation versus the euro. Olympus assumes ¥105/$ and ¥115/€ from 2Q
FY3/17, compared with our estimates of ¥103/$ and ¥114/€.
Investors should watch for signs of an economic slowdown that could further draw out
business negotiations as hospitals work to cut spending. We expect Olympus to secure
orders for a certain level of renewal demand through increased use of the value per
procedure (VPP) system.
The high barriers to entry in the endoscope market mean competition is unlikely to heat up
in this segment. Olympus aims to increase its share of the surgical and endotherapy
device segments, so we think investors need to keep monitoring for any changes in share
due to price competition by rivals.
We see few events capable of catalyzing the share price over the near term, but the
market could re-evaluate Olympus if the 2Q results show a recovery in endoscope and
surgical sales in the US, after these segments stagnated in 1Q.
The market could re-
evaluate Olympus if 2Q
results show a recovery in
endoscope and surgical
sales in the US

06 September 2016
Olympus (7733 / 7733 JP) 8
Figure 13: Olympus share price, OP trend and major history
0
500
1,000
1,500
2,000
2,500
3,000
3,500
4,000
4,500
5,000
0
20
40
60
80
100
120
140
198
0/0
4
198
1/0
4
198
2/0
4
198
3/0
4
198
4/0
4
198
5/0
4
198
6/0
4
198
7/0
4
198
8/0
3
198
9/0
3
199
0/0
3
199
1/0
3
199
2/0
3
199
3/0
3
199
4/0
3
199
5/0
3
199
6/0
3
199
7/0
3
199
8/0
3
199
9/0
3
200
0/0
3
200
1/0
3
200
2/0
3
200
3/0
3
200
4/0
3
200
5/0
3
200
6/0
3
200
7/0
3
200
8/0
3
200
9/0
3
201
0/0
3
201
1/0
3
201
2/0
3
201
3/0
3
201
4/0
3
201
5/0
3
201
6/0
3
OP (LHS)
Share price (RHS)
2001Olympus enters into a
comprehensive alliance agreement with Terumo
in the medical equipment field
2005Olympus and Terumo to
strengthen their business partnership
2008Acquisition of the
Gyrus Group
2009Olympus agrees to divest its analyzer
business to Beckman Coulte
2011Transfer inkjet printer
business to Riso Kagaku
2012Hiroyuki Sasa is
appointed to President
2012Forms a business and capital alliance
with Sony
2013Sony Olympus Medical
Solutions is established
2011The concealment
of losses is revealed
(JP
Yb
n)
(JP
Y)
Source: Company data, Thomson Reuters, Credit Suisse

06 September 2016
Olympus (7733 / 7733 JP) 9
2. Business structure Medical business generates nearly all profit
Medical business focuses on gastroscopes, surgical endoscopes and
attachments/devices; scientific solutions segment profits are stable
The medical business, which centers on gastroscopes, surgical endoscopes and
attachments/devices, accounts for 76% of total company sales. The scientific solutions
segment, comprising mainly microscopes (the company’s original business), accounts for
13% of total company sales, while the imaging solutions segment (mainly digital still
cameras) accounts for 10% (all figures based on FY3/16).
The mainstay medical business generates nearly all of the company’s profits. Excluding
corporate/eliminations, the medical business had a high OPM of 23% in FY3/16
(company-wide OPM of 13%).
The scientific solutions segment handles biological microscopes for research institutes and
universities, industrial videoscopes, industrial microscopes and other such products. With
high market share for each of these products, the segment generates stable earnings.
However, demand is dependent on public sector/government capex trends, so sales are
vulnerable to macro environment swings.
Imaging solutions: stabilizing earnings through restructuring amid shrinking DSC
market
In the imaging solutions segment, nearly 90% of sales come from DSCs, and more than
75% of this comes from mirrorless SLR cameras and interchangeable lens. Hurt by DSC
market contraction, the segment has been unprofitable since FY3/11. However, losses are
narrowing as the company scales back on low-margin compact cameras, cuts costs, and
otherwise restructures the business. We expect a wider loss in FY3/17 due to the recent
earthquakes in Kumamoto, but we believe earnings will improve to around breakeven on
an adjusted basis.
Figure 14: Sales breakdown by segments in FY3/16 Figure 15: OP breakdown by segments in FY3/16
Endoscopes43%
Surgical24%
Endotherapy9%
Life Science5%
Industrials7%
Digital Cameras
9%
Others(imaging)
1%
Others2%
FY16/3 Sales JPY 804.6 bn
Medical 76%
ScientificSoluations 13%
Imaging 10%
Medic
al
Scie
ntific
So
lutions
Imagin
g
Oth
ers
Elim
ina
tions
-60
-40
-20
0
20
40
60
80
100
120
140
160
FY16/3 OP JPY 104.5 bn
(¥bn)
Note: Company does not disclose life science and industrial sub
segments from FY3/17.
Source: Company data, Credit Suisse
Source: Company data, Credit Suisse
The medical business
accounts for 76% of total
company sales
DSC OP is closely to around
breakeven without the
impact of Kumamoto
earthquake

06 September 2016
Olympus (7733 / 7733 JP) 10
Figure 16: Business domain and major products
Gastrointestinal EndoscopesEndoscope systems (videoscopes, video processors, light sources, liquid crystal display(LCD) panels);
Peripheral equipment (image recording device, endoscope cleaning systems, sterilization systems), etc.
Surgical Devices Surgical video endoscopy systems, peripheral devices for endoscope surgery, electrosurgical knives, etc.
Endotherapy Devices
Endoscopic devices for all disciplines of endoscopy (approximately 1,000 different devices for various
diagnostic and treatment procedures, including biopsy forceps, high-frequency polypectomy snares,
grasping forceps, stone retrieval and lithotriptor baskets, hemostasis accessories, etc.)
Life Science
Upright microscopes and polarizing microscopes, inverted microscopes, laser confocal microscopes,
box-type fluorescence macromicroscopes, microscope digital cameras, imaging software, bio-imaging
systems, virtual slide systems
Industrial
Metallurgical microscopes, semiconductor inspection microscope, laser microscopes, measuring
microscopes, microscopic 3D measurement systems, industrial videoscopes, industrial fiberscopes,
industrial rigid scopes, ultrasonic flaw detectors, eddy current flaw detectors, phased array flaw detectors,
X-ray diffraction analyszers, peripheral equipment
Dital CamerasMirrorless interchangeable-lens cameras, compact digital cameras, digital camera-related products,
digital camera lens barrels, optical components
Others IC recorders, binoculars
Medical
Business
Scientific
Solutions
Business
Imaging
Business
Source: Company data, Credit Suisse

06 September 2016
Olympus (7733 / 7733 JP) 11
3. Focus on early diagnosis and minimally invasive treatment in medical Products improve patient quality of life
Core products are gastrointestinal endoscopes, endotherapy, surgical endoscopes,
energy devices
Olympus' core medical segment comprises endoscopes, surgical and endotherapy. The
endoscope segment includes systems and scopes for gastrointestinal endoscopy, while
the surgical segment includes surgical endoscope systems and surgical energy devices.
Endotherapy refers to those used in endoscopic treatment, by being attached to
gastrointestinal endoscopes.
In global share, Olympus has around 70% of the gastrointestinal endoscope system
market, around 20% of the endotherapy market, 20–25% of the surgical endoscope
system market, and 18–20% of the surgical energy devices market (all values are
company estimates; as of FY3/16). Its share of the gastrointestinal endoscope system
market is the largest by far and underpins growth in the medical business.
Figure 17: Medical business sales Figure 18: Medical business sales YoY
-15%
-10%
-5%
0%
5%
10%
15%
20%
25%
30%
0
100
200
300
400
500
600
700
3/0
2
3/0
3
3/0
4
3/0
5
3/0
6
3/0
7
3/0
8
3/0
9
3/1
0
3/1
1
3/1
2
3/1
3
3/1
4
3/1
5
3/1
6
3/1
7E
3/1
8E
3/1
9E
((JP
Y b
n)
Endotherapy
Surgical
Endoscopes
YoY
Surgical + Endoscopes
-15%
-10%
-5%
0%
5%
10%
15%
20%
25%
30%3/0
2
3/0
3
3/0
4
3/0
5
3/0
6
3/0
7
3/0
8
3/0
9
3/1
0
3/1
1
3/1
2
3/1
3
3/1
4
3/1
5
3/1
6
Endoscopes
Surgical
Endotherapy
YoY
Source: Company data, Credit Suisse Source: Company data, Credit Suisse
Products span range from early diagnostics to minimal invasive treatment
Endoscopic examination enables early diagnosis and treatment, which improves patients'
prognosis and helps to improve survival rates. Treating patients with endoscopes and
laparoscopes reduces the physical burden on patients and enables a quick return to
normal life. Olympus' strength lies in its range of products that help improve patients'
quality of life from diagnosis to treatment.
In global share, Olympus
has around 70% of the
gastrointestinal endoscope
system market
06 September 2016
Olympus (7733 / 7733 JP) 12
Help curb medical expenditure, reduce burden on
health workers
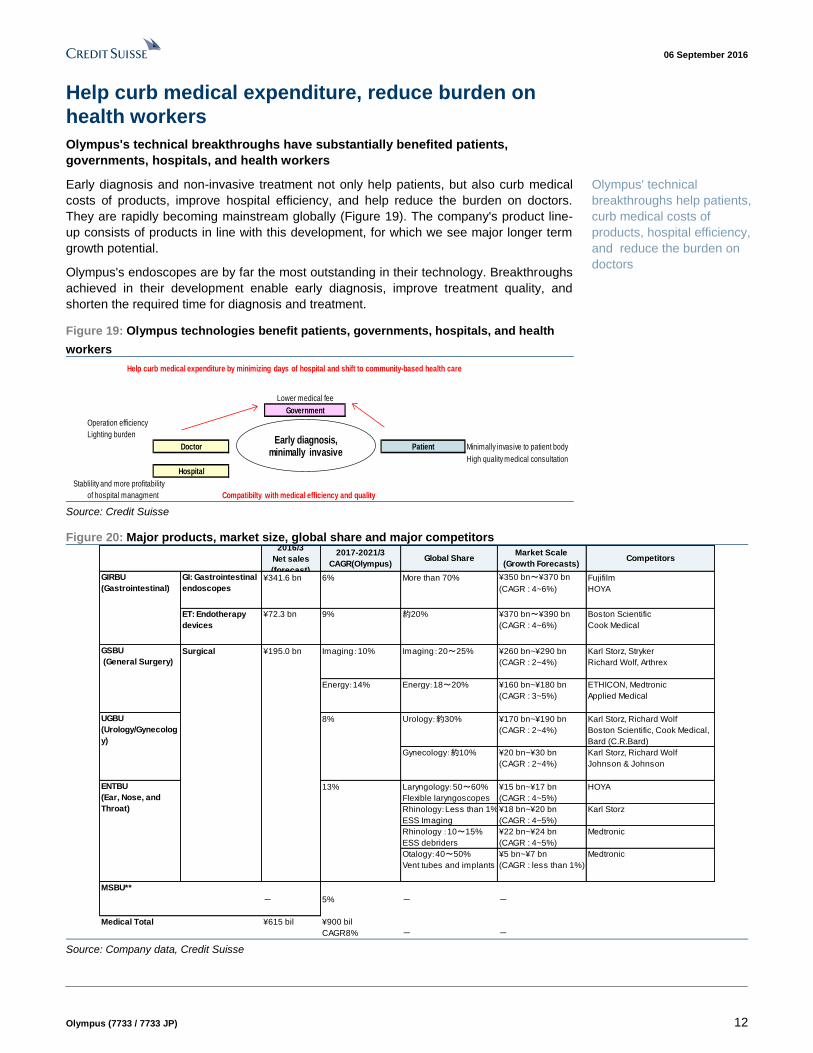
Olympus's technical breakthroughs have substantially benefited patients,
governments, hospitals, and health workers
Early diagnosis and non-invasive treatment not only help patients, but also curb medical
costs of products, improve hospital efficiency, and help reduce the burden on doctors.
They are rapidly becoming mainstream globally (Figure 19). The company's product line-
up consists of products in line with this development, for which we see major longer term
growth potential.
Olympus's endoscopes are by far the most outstanding in their technology. Breakthroughs
achieved in their development enable early diagnosis, improve treatment quality, and
shorten the required time for diagnosis and treatment.
Figure 19: Olympus technologies benefit patients, governments, hospitals, and health
workers
Lower medical fee
Government
Operation efficiency
Lighting burden
Doctor Patient Minimally invasive to patient body
High quality medical consultation
Hospital
Stablility and more profitability
of hospital managment
Early diagnosis,minimally invasive
Compatibilty with medical efficiency and quality
Help curb medical expenditure by minimizing days of hospital and shift to community-based health care
Source: Credit Suisse
Figure 20: Major products, market size, global share and major competitors 2016/3
Net sales
(forecast)
2017-2021/3
CAGR(Olympus)Global Share
Market Scale
(Growth Forecasts)Competitors
¥341.6 bn 6% More than 70% ¥350 bn〜¥370 bn Fujifilm
(CAGR : 4~6%) HOYA
¥72.3 bn 9% 約20% ¥370 bn〜¥390 bn Boston Scientific
(CAGR : 4~6%) Cook Medical
Surgical ¥195.0 bn Imaging:10% Imaging:20〜25% ¥260 bn~¥290 bn Karl Storz, Stryker
(CAGR : 2~4%) Richard Wolf, Arthrex
Energy:14% Energy:18〜20% ¥160 bn~¥180 bn ETHICON, Medtronic
(CAGR : 3~5%) Applied Medical
8% Urology:約30% ¥170 bn~¥190 bn Karl Storz, Richard Wolf
(CAGR : 2~4%) Boston Scientific, Cook Medical,
Bard (C.R.Bard)
Gynecology:約10% ¥20 bn~¥30 bn Karl Storz, Richard Wolf
(CAGR : 2~4%) Johnson & Johnson
13% Laryngology:50〜60% ¥15 bn~¥17 bn HOYA
Flexible laryngoscopes (CAGR : 4~5%)
Rhinology:Less than 1%¥18 bn~¥20 bn Karl Storz
ESS Imaging (CAGR : 4~5%)
Rhinology :10〜15% ¥22 bn~¥24 bn Medtronic
ESS debriders (CAGR : 4~5%)
Otalogy:40〜50% ¥5 bn~¥7 bn Medtronic
Vent tubes and implants (CAGR : less than 1%)
MSBU**
(Medical Service) - 5% - -
Medical Total ¥615 bil ¥900 bil
CAGR8% - -
GI: Gastrointestinal
endoscopes
GIRBU
(Gastrointestinal)
GSBU
(General Surgery)
UGBU
(Urology/Gynecolog
y)
ENTBU
(Ear, Nose, and
Throat)
ET: Endotherapy
devices
Source: Company data, Credit Suisse
Olympus' technical
breakthroughs help patients,
curb medical costs of
products, hospital efficiency,
and reduce the burden on
doctors

06 September 2016
Olympus (7733 / 7733 JP) 13
4. Gastrointestinal endoscopes basis for growth Commanding market share, continuous technical
innovation should ensure stable growth
Forecast steady growth for gastrointestinal endoscopes, as stock-type business
with income stream
The gastrointestinal (GI) endoscope business forms part of Olympus’ gastrointestinal and
respiratory business unit. It has a stock-type business model, focusing on sales of GI
endoscopy systems while also generating recurring revenues from replacement scopes as
well as maintenance and other services.
In general, GI endoscopy systems comprise the main body (which displays the image),
peripheral equipment, and two scopes (for the upper and lower GI tract). As scopes must
be sterilized after each procedure, it is usually necessary to have spares on hand, in
addition to which scopes need replacing after two or three years due to wear and tear.
Services include system maintenance, scope repair, maintenance of scope cleaning and
disinfection equipment, and replenishment of cleaning and disinfection agents. Olympus
fosters strong relationships with hospitals, resulting in steady flow of contract renewals
Close communication with hospitals contributes to technological advances,
resulting in high barriers to entry
Over several decades now, Olympus has maintained close communication with hospitals
and medical professionals, giving rise to constant innovation in its GI endoscopy systems.
Olympus invented a technology known as narrow band imaging (NBI). NBI provides
enhanced imaging of the capillaries and mucosal patterns on the mucosal surface layers
using two narrow-band wavelengths (characteristic changes when a tumor is growing
include an increase in the number of fine capillaries and a complex texture on the mucosal
surface, and the use of NBI technology makes tumor tissue stand out). By combining NBI
with magnification endoscopy, it is possible to detect small lesions that otherwise would
have been overlooked using standard endoscopy. Technological advances of this kind
have created high barriers to entry.
Also involved in respiratory endoscopy, endoscopic ultrasonography, and capsule
endoscopy, albeit on small scale
Respiratory endoscopy is used in diagnosing, biopsying, and treating bronchial conditions.
Endoscopic ultrasonography is used to determine the depth of lesion penetration into the
submucosal layer, and for closer examination of the pancreas, bile duct and other deep
organs that are difficult to view directly with standard endoscopy. Capsule endoscopy is
used to diagnose problems in the small intestine. It combines low-power consumption
imaging with wireless transmission technology, whereby images from the camera inside
the capsule are sent wirelessly to an antenna unit attached to the patient's body, and
recorded by a receiver. Olympus intends to use cross-selling to boost sales of both GI
endoscopes and these other types of endoscope.
Generating recurring
revenues from replacement
scopes as well as
maintenance and other
services
Olympus invented a
technology known as narrow
band imaging (NBI)
Olympus intends to use
cross-selling to boost sales
of both GI endoscopes and
these other types of
endoscope
06 September 2016
Olympus (7733 / 7733 JP) 14
Demand for scopes and services growing in line with
increase in testing volume
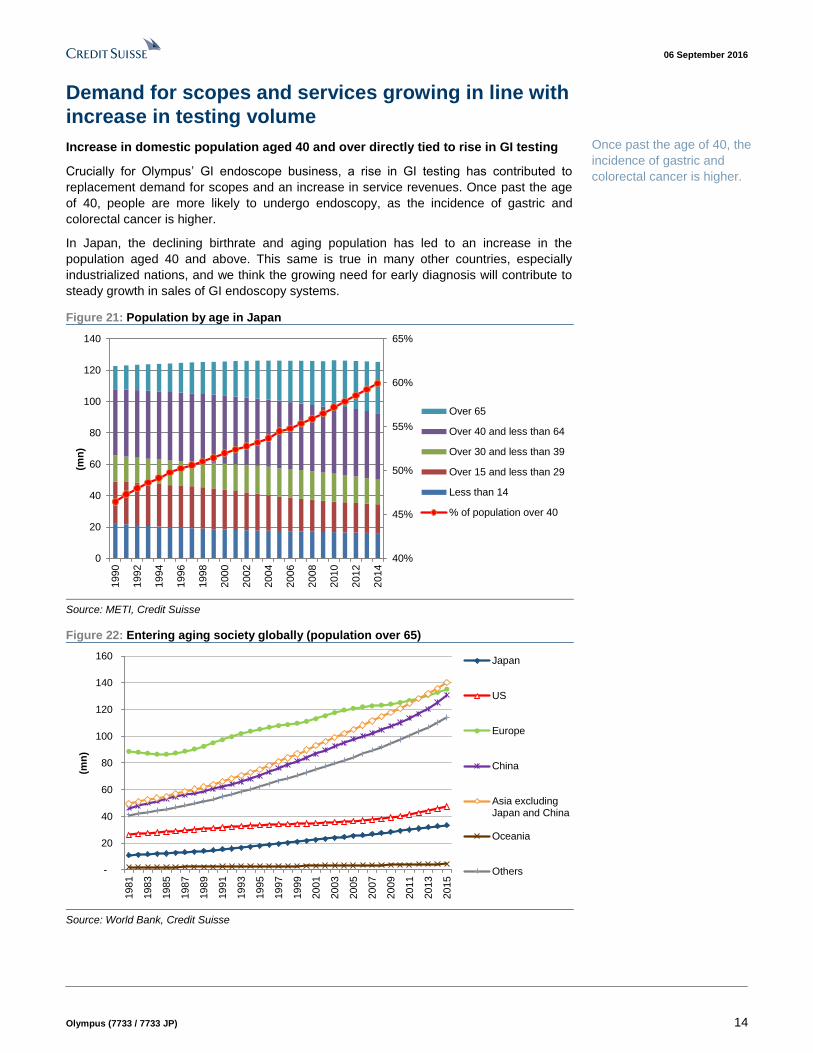
Increase in domestic population aged 40 and over directly tied to rise in GI testing
Crucially for Olympus’ GI endoscope business, a rise in GI testing has contributed to
replacement demand for scopes and an increase in service revenues. Once past the age
of 40, people are more likely to undergo endoscopy, as the incidence of gastric and
colorectal cancer is higher.
In Japan, the declining birthrate and aging population has led to an increase in the
population aged 40 and above. This same is true in many other countries, especially
industrialized nations, and we think the growing need for early diagnosis will contribute to
steady growth in sales of GI endoscopy systems.
Figure 21: Population by age in Japan
40%
45%
50%
55%
60%
65%
0
20
40
60
80
100
120
140
1990
1992
1994
1996
1998
2000
2002
2004
2006
2008
2010
2012
2014
(mn
)
Over 65
Over 40 and less than 64
Over 30 and less than 39
Over 15 and less than 29
Less than 14
% of population over 40
Source: METI, Credit Suisse
Figure 22: Entering aging society globally (population over 65)
-
20
40
60
80
100
120
140
160
1981
1983
1985
1987
1989
1991
1993
1995
1997
1999
2001
2003
2005
2007
2009
2011
2013
2015
(mn
)
Japan
US
Europe
China
Asia excludingJapan and China
Oceania
Others
Source: World Bank, Credit Suisse
Once past the age of 40, the
incidence of gastric and
colorectal cancer is higher.

06 September 2016
Olympus (7733 / 7733 JP) 15
Current generation of endoscopes in fourth year of
five-to-seven year product cycle
Product cycle is around five to seven years; 2018–19 launch likely for next-
generation of GI endoscopes
The new product cycle for GI endoscopes is around five to seven years; the current
generation, comprising the EVIS EXERA III (for the US and European markets) and EVIS
LUCERA ELITE (for the domestic market), came out in 2012. In comparison with the
previous generation launched in 2006, these products feature a dual focus function that
allows physicians to switch from normal-focus mode to near-focus mode with a single
button. It seems 40–45% in case of the US and Europe (50–55% in Japan as of 1Q
FY3/17) of customers have upgraded from the previous generation to the current
generation. Olympus has said the next generation should be out in the latter half of the
five-year period FY3/17–21, based on which we think a launch is likely around 2018–19.
Figure 23: Production cycle of gastrointestinal endoscopes
Name of product Main features
1985 EVIS-1
1990 EVIS100/200
2000 EVIS EXERA (Available in Europe)
2002 EVIS LUCERA The w orld's f irst hi-vision endoscope
2006 EVIS EXERA II NBI (Narrow Band Imaging)
2006 EVIS LUCERA SPECTRUM NBI (Narrow Band Imaging)
2012 EVIS EXERA III (Available in Europe)
2012 EVIS LUCERA ELITE (Available in Japan)
2014 Endoscope with x80 (approx.) Optical Magnification
Advanced NBI and dual focus function, etc.
Source: Company data, Credit Suisse
Accelerating replacements via VPP /CPP system
Under the VPP or value-per-procedure system, the usage contract includes warranty and
maintenance costs in a single package, and charges are made on a per-use basis,
allowing for efficient endoscopic examinations under a payment plan matched to
procedure volume. Generally, endoscopic systems are replaced in about year five (with an
option to acquire the system for its residual value in the final year). In US, this system is
expanded with the name CPP (cost-per procedure system). As VPP and CPP operate
through finance companies, there is no impact on Olympus' balance sheet.
The VPP system enhances operational efficiency by keeping initial investment costs down
and making equipment costs variable. Also, because the hospitals are not purchasing the
equipment, they can turn it in for an upgrade at the end of the VPP term (under normal
arrangements, maintenance costs start to rise from around five years in).
From Olympus’ perspective, the VPP system ensures that equipment is replaced more
often, and because it gives Olympus an accurate picture of procedure volume the system
also helps to further enhance relationships with hospitals, enabling the company to float
suggestions concerning replacement timing and so forth.
In the US, around 40% of GI endoscope sales are under the CPP system, while in Japan
the weighting is about 10-20% (under the VPP system).
It seems 40-45% in case of
US and Europe of
customers have upgraded
from the previous
generation to the current
generation
In the US, around 40% of GI
endoscope sales are under
the CPP system, while in
Japan the weighting is about
10–20%under the VPP
system.

06 September 2016
Olympus (7733 / 7733 JP) 16
North American endoscope sales down YoY in 1Q
FY3/17, but protracted decline unlikely
No change to scenario of continued growth in scope demand over medium term
In 1Q FY3/17, total endoscope sales fell 7% YoY with a 3% YoY increase in Japan and
9% fall overseas. On a local currency basis, total overseas sales were up 3% YoY with a
5% YoY increase in Europe and 32% in Asia/Oceania. In North America, though, sales
dropped 8% YoY. As sales in North American hitherto had been solid, there has been
concern among investors that the decline may be structural in nature.
According to management, though, the fall in sales was primarily due to prolongation of
business negotiations, with those sales now likely to be booked in 2Q or later. As quarterly
growth rates can vary significantly, we also believe that the problem is not structural, and
we look for growth to resume from 2H.
As structural issues that could conceivably arise, we identify among others a loss of
market share (customers switching to rival manufacturers’ equipment), and a decline in the
number of patients. At present, though, the number of patients is actually increasing, in
tandem with the aging population and trend toward early diagnosis. As a general trend, we
think demand will continue to expand.
Figure 24: Domestic and overseas endoscope sales trend (Yen base)
-30%
-20%
-10%
0%
10%
20%
30%
40%
50%
0
10
20
30
40
50
60
70
80
90
100
Q1
Q2
Q3
Q4
Q1
Q2
Q3
Q4
Q1
Q2
Q3
Q4
Q1
Q2
Q3
Q4
Q1
Q2
Q3
Q4
Q1
Q2
Q3
Q4
Q1
Q2
Q3
Q4
Q1
Q2
Q3
Q4
Q1
FY08 FY09 FY10 FY11 FY12 FY13 FY14 FY15 FY16
((JP
Y b
n)
Overseas Domestic
Domestic YoY Overseas YoY
Source: Company data, Credit Suisse
Figure 25: Domestic and overseas endoscope sales trend
(Local currency base)
Figure 26: Endoscope sales growth by region (Local
currency base)
-30%
-20%
-10%
0%
10%
20%
30%
40%
50%
Q1 Q2 Q3 Q4 Q1 Q2 Q3 Q4 Q1 Q2 Q3 Q4 Q1
FY13 FY14 FY15 FY16
Japan
Overseas
-20%
-10%
0%
10%
20%
30%
40%
50%
Q1 Q2 Q3 Q4 Q1 Q2 Q3 Q4 Q1 Q2 Q3 Q4 Q1
FY13 FY14 FY15 FY16
North America
Europe
Asia/Oceania
Source: Company data, Credit Suisse Source: Company data, Credit Suisse
The fall in sales was
primarily due to prolongation
of business negotiations, we
look for growth to resume
from 2H

06 September 2016
Olympus (7733 / 7733 JP) 17
New product effect has waned, but CPP system should ensure ongoing
contributions from contract renewals in US
As we are now in FY3/17, four years have passed since the current generation of
endoscopes were rolled out; at this stage of the product cycle, one might assume the new
product effect has now waned. In previous cycles, sales growth has been strongest in the
fiscal year of launch and in the subsequent fiscal year, tending to narrow thereafter (the
sharp decline in FY3/09 can be attributed in large part to the global financial crisis, and the
fall in FY3/10 to the effects of yen appreciation; Figure 27 is yen-based).
However, we think the increasing weighting of CPP contracts in the US should mitigate
against sales slowing with the new product effect lower. Users who signed up when
purchasing the previous (2012) generation of endoscopes will soon be coming up for
contract renewal. From an efficiency standpoint, we think few users will opt to buy the
equipment at residual value. Thus in 2H FY3/17 and FY3/18 we expect replacement
demand to emerge among CPP-contract users in the US.
While we think yen appreciation inevitably will erode yen-based overseas sales in FY3/17,
from FY3/18 we expect growth at least on a par with the 5% or so pace we forecast for the
global medical equipment market, with sales also increasing steadily in Japan.
Figure 27:Domestic and overseas sales forecast of endoscope
-15%
-10%
-5%
0%
5%
10%
15%
20%
25%
30%
35%
0
50
100
150
200
250
300
350
400
450
500
3/0
2
3/0
3
3/0
4
3/0
5
3/0
6
3/0
7
3/0
8
3/0
9
3/1
0
3/1
1
3/1
2
3/1
3
3/1
4
3/1
5
3/1
6
((JP
Y b
n)
Overseas Domestic
Overseas YoY Domestic YoY
EVIS LUCERA
(02/11-)
EVIS EXERA IIEVIS LUCERA SPECTRUM (06/6-)
EVIS EXERA III (12/4-Overseas)EVIS LUCERA ELITE (12/11-Domestic)
Source: Company data, Credit Suisse
In 2H FY3/17 and FY3/18
we expect replacement
demand to emerge among
CPP contract users in the
US.
06 September 2016
Olympus (7733 / 7733 JP) 18
5. Expanding product lineup, promoting development of surgical techniques Wider application of endoscopic surgery expands
demand for instruments
Difference between endoscopic treatment and surgery using endoscopes;
endoscopic treatment is less invasive
Endoscopic surgery is usually an internal procedure performed by a physician by inserting
an endoscope into the patient’s mouth or anus to remove a lesion or other abnormality.
External endoscopic surgery requires only a few small holes be made in the skin of the
abdomen or chest, a less invasive technique that is increasingly replacing the more
invasive laparotomy and thoracotomy procedures. Endoscopic procedures do not require
making large external incisions, which helps to speed up post-surgery recoveries. Various
types of endoscopic instruments are used in procedures ranging from diagnostic biopsies
to lesion resections, as shown in Figures 28–29. The type of instruments used depends on
the location of the lesion, its size and the surgical technique.
Expansion of insurance coverage for and types of lesions removable by endoscopic
surgery
The development of endoscopic instruments and physicians’ improving procedural skills
are making it possible to use endoscopic surgery in a wider range of gastrointestinal tract
procedures, including the resection of larger lesions than previously possible.
Typical endoscopic surgeries for stomach cancer and colorectal cancer include
endoscopic mucosal resections (EMR) and endoscopic submucosal dissections (ESD). In
recent years, ESD is increasingly being used to entirely remove larger lesions in one
procedure. Insurance coverage for ESD procedures was first approved for treatment of
early-stage stomach cancer in 2006 and has since been expanded to include early-stage
esophageal cancer in 2008 and early-stage colorectal cancer and colorectal adenoma in
2012.
ESD is basically used to remove early-stage lesions, which seldom spread to lymph nodes,
with an invasion depth of less than 2cm (i.e., when the cancer has not spread beyond the
submucosal superficial layer). However, technological progress and the examination of
various cases have in recent years expanded the application of endoscopic surgery to
lesions with an invasion depth of more than 2cm (under the condition that lymph node
metastasis is unlikely).
Expanding share of endotherapy device sales, promoting development of surgical
techniques
Whereas Olympus has devoted resources to the development of endoscopic systems and
endoscopes, the main suppliers of endotherapy devices have been medical equipment
makers up until now. The US’s Boston Scientific is the world’s No. 1 supplier of
endoscopic instruments, with an overwhelming global market share of 50–60%. Olympus
and Cook Medical, another US company, are tied for second, with shares of about 20%.
Olympus began developing endotherapy devices years ago and continues to strengthen
its product lineup.
Today’s endotherapy devices can basically be grouped into three categories: (1) ERCP
instruments, (2) hemostatic devices, and (3) EMR/ESD instruments.
Endoscopic procedures do
not require making large
external incisions, which
helps to speed up post-
surgery recoveries
ESD is increasingly being
used to entirely remove
larger lesions in one
procedure
Olympus has around 20%
global share and continues
to strengthen its product
lineup.

06 September 2016
Olympus (7733 / 7733 JP) 19
ERCP involves the insertion of an instrument from the duodenum into the bile duct and is
used to treat biliary tract dysfunction and narrowing of the bile ducts, as well as to remove
gallstones. The procedure requires the use of various instruments, such as an insertion
assist device (guidewire), a knife (papillotome) for making an incision of the papilla (the
opening to the duodenum’s bile duct), and gallstone recovery equipment (basket).
Olympus plans to strengthen its lineup of devices used in ERCP.
Olympus’ hemostatic devices include clips, and its devices for EMR and ESD procedures
include knives and hemostatic forceps. Thanks to its strength in its gastrointestinal
endoscopic systems, Olympus has grabbed a large share of the market for EMR/ESD
devices, and the company is cooperating with physicians to develop surgical techniques
that will expand the use of ESD to the resection of more deeply invasive lesions.
Figure 28: Area of endotherapy usage
E nd o sco p e (exclud ing end o therap y) :Vid eo sco p es、end o sco p e cleaning system s
B iopsy
P olypectom y
H ot biopsy
EM R
ES D
ER C P
ES T
EB D etc.
S urg ery
Endotherapy
Observing・Imaging Display・ Diagnois
Treatment・
Hemostasis
Irrigation・
Disinfection
EndoscopicSurgery (Laparoscopic
surgery)
Laparotomy
Insertion
Source: Company data, Credit Suisse
Figure 29: Main endoscopic procedures used in internal medicine
PolypectomyThe polyp is grasped with forceps and removed by radiofrequency ablation; mostly
used for small polyps <5mm
Hot biopsyA snare is advanced from the tip of the endoscope to around the polyp root and
the polyp is removed by cauterization
EMR (Endoscopic Mucosal
Resection)Endoscopic mucosal resection
A needle is advanced from the endoscope tip and physiological saline is injected
into the submucosa under the polyp -> the physiological saline lifts the
submucosa off the muscle layer and the polyp forms a bleb -> the polyp bleb is
encircled by a snare and removed by radiofrequency ablation, as with
ESD (Endoscopic Submucosal
Dissection)
Endoscopic submucosal
dissection
For early stage gastric cancer or colorectal cancer, physiological saline is
injected between the normal tissue and the diseased tissue to inflate the site and
the lesion is removed using a snare
ERCP (Endoscopic Retrograde
Cholangio Pancreatography)
Endoscopic retrograde cholangio
pancreatographyEndoscopy to test the pancreas and bile duct
EST (Endoscopic
Sphincterotomy)Endoscopic sphincterotomy
Endoscopic method to sever the sphincter muscle at the point where bile enters
the duodenum; used to eliminate gallstones and bile
EBD (Endoscopic Biliary
Drainage)Endoscopic biliary drainage
Therapeutic method that involves the placement of a biliary stent (narrow tube) in
the bile duct using an endoscope to facilitate the flow of bile into the duodenum in
patients with biliary stenosis and poor bile flow. Endoscopic naso-biliary drainage
(ENBD) is performed to drain the bile externally, via a tube that leads externally
via the nasal passage.
Source: Company data, Credit Suisse

06 September 2016
Olympus (7733 / 7733 JP) 20
Figure 30: EMR and ESD EM R (Endoscopic M ucosal Resection) ESD (Endoscopic Subm ucosal D issection)
Lesion
Mucosa
Submucosa
Proper muscular layer
Snare
1. Injection of physiological 2. Invert the snare and encircle
Local
Physiological
3. Electrocautery 4. Retrieve the excised tissue
1. MarkingEndoscope is passed into the stomach to mark out the area surrounding the lesion that is to be excised
Canser
2. Local injectionAgent is injected into the submucosa to inflate the area
4. Separate the submucosaCarefully cut away the lesion little by little using the specialized knife
3. DissectionFollow the marking with the knife to cut the mucosa around the lesion
5. Complete excisionCut completely through using the knife, or complete tissue removal using the snare
6. Hemostasis After removal, treat to stop bleeding on the stomach surface; retrieve the excised lesion to send for pathology testing
7.Pathological testingTissue examination by microscope to examine whether cured completely or not.
Source: Company website

06 September 2016
Olympus (7733 / 7733 JP) 21
Steady sales expansion, growth likely to continue
Successful efforts to strengthen sales system and product lineup
Over the past two years, Olympus' sales of endoscopic systems and devices have been
expanding at a stronger pace than sales of the global No.1 supplier, Boston Scientific. We
think this strong growth reflects Olympus’ efforts to strengthen its sales structure,
especially in the US and Europe, and the broadening of its product lineup. Olympus has
also enjoyed strong sales in product categories where it has particular competitive
advantages, such as its devices used in ESD procedures. In the future, we expect growing
sales of these devices, many of which must be disposed of after use and have high profit
margins, to help improve the overall profitability of Olympus’ medical business. Excluding
the forex impact, we think sales growth is likely to be around the high single digit to 10%
range.
Figure 31: Domestic and overseas endotherapy sales trend (Yen base)
-10%
-5%
0%
5%
10%
15%
20%
25%
30%
35%
40%
45%
0
2
4
6
8
10
12
14
16
18
20
22
Q1
Q2
Q3
Q4
Q1
Q2
Q3
Q4
Q1
Q2
Q3
Q4
Q1
Q2
Q3
Q4
Q1
Q2
Q3
Q4
Q1
Q2
Q3
Q4
Q1
FY10 FY11 FY12 FY13 FY14 FY15 FY16
((JP
Y b
n)
Overseas
Domestic
Overseas YoY
Domestic YoY
Source: Company data, Credit Suisse
Figure 32: Sales of endotherapy comparison 1 Figure 33: Sales of endotherapy comparison 2
-5%
0%
5%
10%
15%
20%
25%
30%
Q1 2
011
Q2 2
011
Q3 2
011
Q4 2
011
Q1 2
012
Q2 2
012
Q3 2
012
Q4 2
012
Q1 2
013
Q2 2
013
Q3 2
013
Q4 2
013
Q1 2
014
Q2 2
014
Q3 2
014
Q4 2
014
Q1 2
015
Q2 2
015
Q3 2
015
Q4 2
015
Q1 2
016
Q2 2
016
Boston Scientific Endoscopy
Olympus Endotherapy total, yen base
-5%
0%
5%
10%
15%
20%
Q1 2
011
Q2 2
011
Q3 2
011
Q4 2
011
Q1 2
012
Q2 2
012
Q3 2
012
Q4 2
012
Q1 2
013
Q2 2
013
Q3 2
013
Q4 2
013
Q1 2
014
Q2 2
014
Q3 2
014
Q4 2
014
Q1 2
015
Q2 2
015
Q3 2
015
Q4 2
015
Q1 2
016
Q2 2
016
Boston Scientific Endoscopy
Olympus domestic yen base
Olympus oversease local currency base
Source: Company data, Credit Suisse Source: Company data, Credit Suisse
Growing sales of these
devices help improve the
overall profitability of
Olympus’ medical business

06 September 2016
Olympus (7733 / 7733 JP) 22
Figure 34: Domestic and overseas endotherapy sales
trend (Local currency base)
Figure 35: Endotherapy sales growth by region (Local
currency base)
-2%
0%
2%
4%
6%
8%
10%
12%
14%
16%
Q1 Q2 Q3 Q4 Q1 Q2 Q3 Q4 Q1 Q2 Q3 Q4 Q1
FY13 FY14 FY15 FY16
Japan
Overseas
-10%
-5%
0%
5%
10%
15%
20%
25%
30%
35%
Q1 Q2 Q3 Q4 Q1 Q2 Q3 Q4 Q1 Q2 Q3 Q4 Q1
FY13 FY14 FY15 FY16
North America
Europe
Asia/Oceania
Source: Company data, Credit Suisse Source: Company data, Credit Suisse
Figure 36: Domestic and overseas sales forecast of endotherapy
-10%
-5%
0%
5%
10%
15%
20%
25%
30%
35%
0
10
20
30
40
50
60
70
80
90
100
3/1
0
3/1
1
3/1
2
3/1
3
3/1
4
3/1
5
3/1
6
3/1
7E
3/1
8E
3/1
9E
(JP
Y b
n)
Overseas
Domestic
Overseas YoY
Domestic YoY
Source: Company data, Credit Suisse estimates

06 September 2016
Olympus (7733 / 7733 JP) 23
6. Expecting share gains in surgery driven by unique products Building up business via M&A activity, gaining share
Building business via M&A activity, implementing strategic investment for long-
term growth
Olympus made a full-fledged entry into surgical endoscopes with the acquisition of
German rigid endoscope maker Winter & Ibe in 1979. In 2008, the company acquired UK
medical equipment maker Gyrus Group, and expanded its business to include energy
equipment such as high-frequency equipment used in minimally invasive treatment. Over
the past few years, the company has made strategic investments aimed at long-term
growth while focusing on strengthening its sales structure in North America and China.
Three units: surgical business, urology & gynecology business, and ENT business
The company's main products in the surgical field include surgical endoscope systems,
videoscopes, rigid endoscopes, forceps, and energy devices. We estimate that the general
surgical business accounts for around 50% of sales at the surgical unit, urology and
gynecology business for around 40%, and ENT for around 10%.
The surgical business unit has main categories with the company's mainstays being in
surgical imaging (surgical endoscope systems, surgical videoscopes) and energy products
(electronic and ultrasonic scalpels to make incisions and stop bleeding).
At the urology and gynecology business unit, the company has major shares of the flexible
ureteroscope and cystoscope markets.
At the ENT business unit, the company has a solid share of the market for flexible
endoscopes used in the ENT field (ear, nose, and throat) and substantial shares of the
markets for eardrum tubes and auditory ossicle implants. However, these markets are
modest in size.
Strengths lie in unique products that help reduce physicians' burden or enable
advanced treatment
The company's strength in surgical imaging is the technology it has accumulated through
the making of gastrointestinal endoscopes. As products that differentiate Olympus from its
rivals, 3D videoscopes enable 3D examination and 4K surgical endoscope systems make
it easy to examine patients during surgery. At the energy business, the company's
Thunderbeat system (a single device that can make incisions and stop bleeding) is a
product with no direct competitor. These unique products shorten the time to perform
surgical procedures and reduce stress, thus easing the burden on doctors.
Endoscopic surgery growing, eligible for insurance
Endoscopic surgery increasing due to growing demand for minimally-invasive
In Japan, endoscopic surgery was first covered by insurance in 1992, for cholecystectomy
(surgical removal of the gall bladder). In 1994, coverage widened to include hernia repair,
pneumonectomy (removal of a lung or part of a lung), and gynecological surgical
procedures. In 1995, gastrectomy was covered, and in 1996, coverage was extended to
splenectomy and liver resection. Coverage has been expanded to more difficult operative
procedures under the recently revised medical fee scheme in Japan (2016).
The expansion in insurance coverage has driven growth in the number of endoscopic
procedures performed (Figure 37). Given the expansion in minimally invasive treatment to
date, we think this trend will continue.
In 2008, the company
acquired UK medical
equipment maker Gyrus
Group
The general surgical
business accounts for 50%
of sales at the surgical unit,
urology and gynecology
business for 40%, and ENT
for 10%
3D videoscopes enable 3D
examination and 4K surgical
endoscope systems make it
easy to examine patients
during surgery
Insurance coverage
currently includes 16
gastrointestinal procedures

06 September 2016
Olympus (7733 / 7733 JP) 24
Figure 37: Number of endoscopic surgeries in Japan
0
20,000
40,000
60,000
80,000
100,000
120,000
140,000
160,000
180,000
200,000
1990
1991
1992
1993
1994
1995
1996
1997
1998
1999
2000
2001
2002
2003
2004
2005
2006
2007
2008
2009
2010
2011
2012
2013
(Num
ber
of surg
erie
s)
Plastic surgery
Orthopedic surgery
Urology surgery
Obstetrics andgynecology surgeryThyroid surgery
Mastopathy surgery
Respiratory surgery
Pediatric surgery
Obesity surgery
Abdominal surgery
Source: Japan Society for Endoscopic Surgery data
Figure 38:Propolution of type of endoscopic surgery in Japan
Abdominal surgery, 46%
Obesity surgery, 0%
Pediatric surgery, 3%
Respiratory surgery, 12%
Mastopathy surgery, 0%
Thyroid surgery, 0%
Obstetrics and gynecology surgery,
30%
Urology surgery, 7%
Orthopedic surgery, 1%
Plastic surgery, 0%
Source: Japan Society for Endoscopic Surgery data
Expecting steady growth in energy devices
excluding special factors
Firm sales for Thunderbeat, whose unique technology makes surgery more efficient
Thunderbeat, a fully integrated energy device, is a unique Olympus product that can
simultaneously generate bipolar high-frequency current energy (with its outstanding blood
vessel sealing and hemostatic performance) and ultrasonic vibration energy (with its
outstanding structure sectioning and detachment performance). Previously two
instruments with the respective functionalities had to be used. Integrating them in one
device enables rapid sectioning and stable hemostasis operations. As it also means there
is little changing of devices during surgery, less time is needed to carry out procedures,
and the burden on doctors and patients is reduced.
Sales of Thunderbeat, which was launched in 2012, have been firm. We understand sales
of energy devices have grown by 150% over the past three years (we estimate energy
devices generate around 15% of sales in the surgical field).
Thunderbeat was launched in 2016 for abdominal surgery. Via technology accumulated
through endoscopic surgery, the products helps shorten surgery time and make
We understand sales of
energy devices have grown
by 150% over the past three
years owing to firm sales of
Thunderbeat

06 September 2016
Olympus (7733 / 7733 JP) 25
laparotomy (abdominal surgery) procedures more efficient. The company has also
developed equipment to expand the range of application of endoscopic surgery. Taking
stomach cancer as an example, endoscopic surgery is employed in only around 30% of
surgical operations. We think development of equipment for the remaining 70% will lead to
long-term growth.
FDA alert concerning PK technology devices still affecting maternity field, but
should ease up
Gyrus Group, which Olympus acquired in 2008, is engaged in PK technology devices. In
April 2014, the US Food and Drug Administration (FDA) issued an alert about the use of
energy devices (power morcellators) in endoscopic surgery (laparoscopic surgery) in
gynecology. Power morcellators are medical devices used to remove the uterus
(hysterectomy) or uterine fibroids (myomectomy). The FDA said laparoscopic power
morcellation poses a risk of spreading unsuspected cancerous tissue, notably uterine
sarcomas, beyond the uterus. Demand for energy devices in gynecology subsequently
declined, hitting Olympus's sales in FY3/16 by several billion yen. We think the impact
lingered into 1Q FY3/17, although the YoY decline was less severe. The company has
submitted an application to the FDA regarding a new model that can remove tumors
without morcellation and is awaiting approval.
4K surgical endoscopy systems: inquiries strong
Differentiated products leverage strengths of Olympus and Sony
In September 2012, Olympus and Sony announced an operating alliance and in April 2013,
they launched a joint venture company (51% owned by Sony) called Sony Olympus
Medical Solutions. The first products jointly developed by the three companies (Sony,
Olympus, and Sony Olympus Medical Solutions) are 4K surgical endoscopy systems.
These 4K surgical endoscopy systems have three notable characteristics: (1) high
resolution (4K video from input to output), (2) a wide color gamut (high color
reproducibility), and (3) magnification (owing to the use of a large monitor). The recently
unveiled systems leverage Olympus’s optics technology (e.g., lenses) and medical-
segment expertise, Sony’s imaging technology (e.g., imaging sensors) and 4K video
technology (e.g., monitors and recorders). Utilizing these two companies technologies,
Sony Olympus Medical Solutions was tasked with basic system development and overall
optimization. Olympus will be in charge of sales.
Inquiries from hospitals regarding these 4K surgical endoscopy systems have been strong,
and business negotiations currently under way regarding their adoption are coming at an
increasingly brisk rate. This is because these systems increase visibility and improve
identification of microstructures such as blood vessels during endoscopic surgery, greatly
reducing the burden on the doctor during the procedure. The new systems are evidently
30–40% more expensive than conventional systems, but we expect sales to grow because
of the aforementioned features. Because of the time to close sales agreements, these
systems did not contribute meaningfully to sales until 1Q FY3/17. However, we think the
boost to earnings from the introduction of new products will accelerate from 2H FY3/17
into FY3/18.
First-quarter earnings off to slow start, but growth
expectations unchanged
First-quarter sales weakness due to protracted negotiations, likely temporary
In 1Q, sales were firm in Europe and robust in Asia & Oceania, but decreased in Japan
and the US. This was largely attributable to protracted sales negotiations regarding
surgical endoscopy systems. Another factor was the ongoing stagnation in PK technology
devices (which in the domestic market began in 2H FY3/15). However, the robustness of
orders leads us to believe the negative growth seen in 1Q is only temporary.
The company has submitted
an application to the FDA
regarding a new model
We think the boost to
earnings from the
introduction of new products
will accelerate from 2H
FY3/17 into FY3/18.
Sales in Japan and US are
weak but orders are solid

06 September 2016
Olympus (7733 / 7733 JP) 26
Figure 39: Surgical sales (yen base)
-30%
-20%
-10%
0%
10%
20%
30%
40%
50%
60%
70%
80%
0
10
20
30
40
50
60Q
1
Q2
Q3
Q4
Q1
Q2
Q3
Q4
Q1
Q2
Q3
Q4
Q1
Q2
Q3
Q4
Q1
Q2
Q3
Q4
Q1
Q2
Q3
Q4
Q1
FY10 FY11 FY12 FY13 FY14 FY15 FY16
((JP
Y b
n)
Overseas Domestic
Domestic YoY Overseas YoY
Source: Company data, Credit Suisse
Figure 40: Domestic and Overseas surgical sales growth
(local currency base)
Figure 41: Surgical sales growth by region (local currency
base)
-20%
-10%
0%
10%
20%
30%
40%
Q1 Q2 Q3 Q4 Q1 Q2 Q3 Q4 Q1 Q2 Q3 Q4 Q1
FY13 FY14 FY15 FY16
Japan
Overseas
-20%
-10%
0%
10%
20%
30%
40%
50%
Q1 Q2 Q3 Q4 Q1 Q2 Q3 Q4 Q1 Q2 Q3 Q4 Q1
FY13 FY14 FY15 FY16
North America
Europe
Asia/Oceania
Source: Company data, Credit Suisse Source: Company data, Credit Suisse
Current generation of surgical endoscopy systems in fifth year, but growth still
possible through shift to high added-value products
The VISERA ELITE, a conventional surgical endoscopy system, debuted in July 2011, so
FY3/17 is its fifth year on the market. However, within the conventional-product cycle
Olympus has introduced high added-value products, including 3D surgical endoscopy
systems in 2013 and 4K surgical endoscopy systems in 2015.
Moreover, in North America where a large market size for medical devices, over the past
several years the company has strengthened its sales system and augmented its sales
team dedicated to serving group purchasing organizations (GPOs) and integrated delivery
networks (IDNs).
In FY3/15–16, Olympus’s earnings in the surgical field remained on a par with or greater
than that of competitors Stryker and Medtronic, which we attribute to the company
strengthening its sales system and launching new products. We expect progress in closing
sales of 4K surgical endoscopy systems, so we think Olympus’ medical-related earnings
will return to a growth trajectory sometime from 2H FY3/17 into FY3/18.
Company has strengthened
its sales system over the
past several years

06 September 2016
Olympus (7733 / 7733 JP) 27
Figure 42: Product cycle of surgical endoscopy system
Name of product
2002 VISERA
2006 VISERA Pro
2011 VISERA ELITE
2013 3D Laparoscopy System Launched 3D
2015 Surgical endoscope system with 4K resolutionDeveloped by Sony Olympus Medical Solutions
Source: Company data, Credit Suisse
Figure 43: Surgical sales comparison 1 Figure 44: Surgical sales comparison 1
-30%
-20%
-10%
0%
10%
20%
30%
40%
50%
60%
70%
80%
Q1 2
011
Q2 2
011
Q3 2
011
Q4 2
011
Q1 2
012
Q2 2
012
Q3 2
012
Q4 2
012
Q1 2
013
Q2 2
013
Q3 2
013
Q4 2
013
Q1 2
014
Q2 2
014
Q3 2
014
Q4 2
014
Q1 2
015
Q2 2
015
Q3 2
015
Q4 2
015
Q1 2
016
Q2 2
016
Medtronic Surgical Technologies
Stryker Endoscopy
Olympus domestic
Olympus oversease
-15%
-10%
-5%
0%
5%
10%
15%
20%
25%
30%
35%
40%
Q1 2
011
Q2 2
011
Q3 2
011
Q4 2
011
Q1 2
012
Q2 2
012
Q3 2
012
Q4 2
012
Q1 2
013
Q2 2
013
Q3 2
013
Q4 2
013
Q1 2
014
Q2 2
014
Q3 2
014
Q4 2
014
Q1 2
015
Q2 2
015
Q3 2
015
Q4 2
015
Q1 2
016
Q2 2
016
Medtronic Surgical Technologies
Stryker Endoscopy
Olympus Surgical total, yen base Source: Company data, Credit Suisse Source: Company data, Credit Suisse
Figure 45: Domestic and overseas surgical segment sales forecast
-10%
-5%
0%
5%
10%
15%
20%
25%
30%
0
50
100
150
200
250
3/1
0
3/1
1
3/1
2
3/1
3
3/1
4
3/1
5
3/1
6
3/1
7E
3/1
8E
3/1
9E
((JP
Y b
n)
OverseasDomesticOverseas YoYDomestic YoY
Source: Company data, Credit Suisse estimates

06 September 2016
Olympus (7733 / 7733 JP) 28
7. Significant growth potential for medical segment in emerging markets Expansion in emerging markets likely to continue
Major growth potential in China, Asia
For the medical segment overall, overseas markets are driving growth, and growth is
particularly strong in emerging markets in the Asia & Oceania region. Amid increased
medical spending and population growth in emerging countries (a reflection of GDP
growth), we see substantial growth potential for medical devices. At the same time, as the
populations of these countries age, we foresee increased demand for early diagnosis and
minimally invasive treatment.
In China, the economic slowdown has caused the growth of per-capita medical spending
to flatten. However, this growth is still lower than in developed countries, and as medical
treatment in China increases in sophistication, we think growth will continue over the
medium term. We also expect medium-term growth in those parts of Asia other than China
and Japan. Per-capita medical spending in such areas is now at the same level it was in
China in 2006–07, when it began increasing, and we think its growth could accelerate.
Endoscopy education critical; training, after-sales service systems being
strengthened
Olympus has established three training bases in China (Shanghai, Beijing, and
Guangzhou), where it is providing endoscopy training.
As part of a METI project aimed at international expansion of Japanese medical devices
and services, in September 2014 Olympus (in collaboration with the Japan
Gastroenterological Endoscopy Society) established an Advanced Endoscopy Training
Center at Cipto Mangunkusumo Hospital in Jakarta, Indonesia. We expect this endoscopy
training to lead to an expansion of sales channels for endoscopes over the medium term.
Figure 46: Medical segment sales by region Figure 47: Medical segment sales YoY by overseas region
(local currency base)
0
100
200
300
400
500
600
700
3/09 3/10 3/11 3/12 3/13 3/14 3/15 3/16
(JP
Y b
n)
Others
Asia/Oceania
Europe
North America
Domestic
-15%
-10%
-5%
0%
5%
10%
15%
20%
25%
30%
35%
Q1 Q2 Q3 Q4 Q1 Q2 Q3 Q4 Q1 Q2 Q3 Q4 Q1
FY13 FY14 FY15 FY16
North America
Europe
Asia/Oceania
Source: Company data, Credit Suisse Source: Company data, Credit Suisse
Increased demand for early
diagnosis and minimally
invasive treatment even in
developing countries
We expect this endoscopy
training to lead to an
expansion of sales channels
for endoscopes over the
medium term

06 September 2016
Olympus (7733 / 7733 JP) 29
Figure 48: Global medical device market size
Medical Device market
North America USD 158bn
Japan USD 26bn
China USD17.8bn
Asia excluding Japan and China
USD 21.8bnEastern/Central
Europe USD 14.2bn
Middle East/Africa USD 8.7bn
Western EuropeUSD77.2bn
0%
2%
4%
6%
8%
10%
12%
14%
0 500 1,000 1,500 2,000 2,500 3,000 3,500 4,000 4,500 5,000
Medic
al D
evic
e m
ark
et
CA
GR
(2010-
2015)
Health expenditure per capita(US$)
Source: Epicom, Credit Suisse
Figure 49: Health expenditure per capita Figure 50: Health expenditure per capita in China and
Asia
0
1,000
2,000
3,000
4,000
5,000
6,000
7,000
8,000
9,000
10,000
1995
1996
1997
1998
1999
2000
2001
2002
2003
2004
2005
2006
2007
2008
2009
2010
2011
2012
2013
2014
(US
$)
JapanUSEuropeChinaAsia excluding Japan and ChinaOceaniaOthersWorld
0
50
100
150
200
250
300
350
400
450
1995
1996
1997
1998
1999
2000
2001
2002
2003
2004
2005
2006
2007
2008
2009
2010
2011
2012
2013
2014
(US
$)
China
Asia (excluding Japan andChina)
Source: Espicom, Credit Suisse Source: Espicom, Credit Suisse

06 September 2016
Olympus (7733 / 7733 JP) 30
8. Earnings outlook Expecting return to profit growth from FY3/18
Weak start in 1Q FY3/17; expecting guidance miss due in part to stronger yen
Sales fell by 10% YoY, and profits by 37% in 1Q, due to sluggish medical business in the
US resulting from the stronger yen and protracted business negotiations. The company cut
OP guidance from ¥90bn to ¥77bn, due to changes in its forex assumptions (from
¥108/$ and ¥120/€ to ¥105/$ and ¥115/€ from 2Q), the Kumamoto earthquake (¥4bn
impact), and deterioration in the market environment at the scientific solutions segment
(¥1bn impact).
The company maintained its assumptions for the medical business, but the protraction of
business negotiations might have a lingering impact in 2Q, and we expect a slight
guidance miss in FY3/17. The company’s revised forex assumptions are slightly different
from ours (¥103/$, ¥114/€), and we expect the company to miss full-year OP guidance
(¥72.4bn, −31% YoY). However, we expect fundamentals at the medical business to
improve heading into 2H due in part to new products such as 4K surgical endoscopes.
Should revert to profit growth driven by medical business from FY3/18; should also
breakeven in DSCs
In FY3/18, the adverse impact of the stronger yen should ease, while in medical business,
new 4K surgical endoscopes should make a full contribution in the surgical segment, and
we look for growth in demand for replacement VPP / CPP contracts in gastrointestinal
endoscopes. We expect the company to get back on a YoY profit growth track from
FY3/18 due to share gains in the surgical and the endotherapy device segments as well as
stable growth in gastrointestinal endoscopes.
We forecast OP of ¥87.2bn (+20% YoY) in FY3/18 and ¥97.0bn (+11%) in FY3/19.
IFRS adoption from FY3/18 should add roughly ¥10bn to OP
The company books amortization of Gyrus goodwill of around ¥10bn per year. Application
of IFRS should add this amount to profits. Our forecasts are based on Japanese
accounting principles. The profit boost will be due to a change in accounting standards
and underlying profit will not change. However, we think adoption of IFRS will be a plus for
Olympus' valuation.
Figure 51: Medical segment sales forecast Figure 52: Medical segment OP forecast
-15%
-10%
-5%
0%
5%
10%
15%
20%
25%
30%
0
100
200
300
400
500
600
700
3/0
2
3/0
3
3/0
4
3/0
5
3/0
6
3/0
7
3/0
8
3/0
9
3/1
0
3/1
1
3/1
2
3/1
3
3/1
4
3/1
5
3/1
6
3/1
7E
3/1
8E
3/1
9E
((JP
Y b
n)
Endotherapy
Surgical
Endoscopes
YoY
0%
5%
10%
15%
20%
25%
30%
0
20
40
60
80
100
120
140
160
3/0
2
3/0
3
3/0
4
3/0
5
3/0
6
3/0
7
3/0
8
3/0
9
3/1
0
3/1
1
3/1
2
3/1
3
(JP
Y b
n)
OP OPM
Source: Company data, Credit Suisse estimates Source: Company data, Credit Suisse estimates
The protraction of business
negotiations might have a
lingering impact in 2Q but
we expect fundamentals to
improve heading into 2H
We expect share gains in
the surgical and the
endotherapy device
segments as well as stable
growth in gastrointestinal
endoscopes

06 September 2016
Olympus (7733 / 7733 JP) 31
Figure 53: Sales forecast by segment Figure 54: OP forecast by segment
-8%
-6%
-4%
-2%
0%
2%
4%
6%
8%
0
200
400
600
800
1000
FY13 FY14 FY15 FY16E FY17E FY18E
Medical ScientificSolutions
Imaging Others
YoY (%)
(JP
Ybn)
-40%
-20%
0%
20%
40%
60%
80%
100%
120%
-80
-40
0
40
80
120
160
200
240
FY13 FY14 FY15 FY16E FY17E FY18E
Medical ScientificSolutions
Imaging Others
Eliminations YoY (%)
(JP
Ybn)
Source: Company data, Credit Suisse estimates Source: Company data, Credit Suisse estimates
Beefing up production structure to meet medium-
term plan
FY3/21 guidance calls for OP of ¥170bn (¥180bn under IFRS), 15% ROE
Figure 57 shows details of the company's 16CSP medium-term plan, unveiled in March
2016. The key points of the company's strategy are further strengthening its product line-
up, a shift to a business model based on the number of medical cases, optimization of
global bases, long-term investment including expansion of sales in emerging markets, and
cost cutting.
With regard to its production bases, the company has already strengthened its three
domestic bases where it makes products including endoscope systems and scopes.
Overseas, in single-use therapeutic devices, the company plans to build a production
structure for local production and local consumption, and we expect production efficiency
to increase.
Figure 55: Major production site in medical business
Production site Place Major products
Japan
Aizu Olympus Co., Ltd Aizu Wakamatsu, Fukushima Manufacture of medical and industrial endoscopes
Shirakawa Olympus Co., Ltd. Nishi Shirakawa, Fukushima Endoscope systems (video processors, light sources, ultrasound, capsule);
Aomori Olympus Co., Ltd. Kuroishi, Aomori Manufacture of medical endoscope related products
Hinode Plant Nishi Tama, Tokyo Prototype
Asia
Long Thanh Vietnam Endoscope devices and related products
US (Gyrus ACMI)
Maple glove/Brooklyn Park N.America
Memphis N.America
Norwalk N.America
Europe (Olympus Surgical Technologies Europa (OSTE))
Southend-on-Sea/Cardiff England
Hamburg Germany
Berlin Germany
Přerov Czech Republic
Surgery measures device for scirrhous mirror, urinary organ / gynecology
/ otolaryngology
surgical rigid endoscope, equipment, energy device
Source: Company data, Credit Suisse
The key points of the
company's strategy are
further strengthening its
product line-up, a shift to a
business model based on
the number of medical
cases, etc

06 September 2016
Olympus (7733 / 7733 JP) 32
Shareholder returns
Aiming for total return ratio to 30% in mid term plan
In terms of dividend policy, Olympus is prioritizing allocating funds to growth investment in
the Medical Business and the remainder for shareholders returns. The company's FY3/17
DPS plan is ¥28 and a 17% payout ratio to the company's EPS plan but it aims to rise the
total return ratio to 30% in its mid-term plan.
Figure 56: Dividend trends
0%
5%
10%
15%
20%
25%
30%
35%
40%
45%
50%
0
5
10
15
20
25
30
35
40
45
3/9
6
3/9
7
3/9
8
3/9
9
3/0
0
3/0
1
3/0
2
3/0
3
3/0
4
3/0
5
3/0
6
3/0
7
3/0
8
3/0
9
3/1
0
3/1
1
3/1
2
3/1
3
3/1
4
3/1
5
3/1
6
3/1
7 C
oE
Dividend per share(Annual)
Payout ratio
(¥)
Source: Company data, Credit Suisse estimates

06 September 2016
Olympus (7733 / 7733 JP) 33
Figure 57: Medium-term plan to FY3/21
FY3/12 FY3/13 FY3/14 FY3/15 FY3/16 FY3/17 FY3/17 FY3/21 FY3/17-3/21
Old E CoE CoE CAGR
Manegement Goals
ROE -62% 8% 6% -3% 17% 約15% 9.9% 15%
OPM 4% 5% 10% 12% 13% 約12% 15%
EBITDA ※1 (JPY bn) 80.4 78.7 119.8 141.6 154.2 約150.0 130.5 240.0 10%
Equity ratio 5% 16% 32% 33% 38% 約39% 50%
Targets
Net sales (JPY bn) 848.5 743.9 713.3 764.7 804.6 816.0 775.0 1,100.0 (IFRS) 6%
OP (JPY bn) 35.5 35.1 73.4 91 104.5 100.0 77.0 170.0 180 11%
NP (JPY bn) -49 8 13.6 -8.7 62.6 56.0 57.0 110.0 120 15%
Total assets (JPY bn) 966.5 960.2 1,027.5 1,081.6 1,000.6
Total net assets (JPY bn) 48.0 151.9 331.3 357.3 384.3
Equity (JPY bn) 44.8 148.6 329.5 355.5 382.8
NP per share (yen) -184.0 29.0 41.0 -26.0 183.0 163.0 166.6 320.0
Total equity per share 168.0 493.0 963.0 1,039.0
Cash dividends per share - - - 10.0 17.0 17.0 28.0
Consolidated total return ration - - - - 9% 10% 30%
Net income marging -6% 1% 2% -1% 8% 7% 7% 11%
Total assets turnover 0.9 0.8 0.7 0.7 0.8 0.9
Financial leverage 21.6 6.5 3.1 3.0 2.6 2.0
R&D 61.4 63.4 66.8 74.1 814.0 80.0 85.0 430-480bn
in 5 years total
Capex 38.0 28.1 37.8 47.7 64.4 69.0 70.0 300-350bn
in 5 years total
Depreciation 33.8 33.9 36.9 41.2 39.9 43.0 45.0
Amortization of goodwill 11.1 9.7 9.5 9.4 9.9 9.2 8.5
FCF -4.8 58.7 52.1 27.2 -4.3 over 250 in 5 years total
Forex (average in FY)
Yen / U.S. dollar 79 83 100 110 120 120 106 115
Yen / Euro 109 107 134 139 133 133 117 130
Sales and Op by business segment
Sales
Medical 349.2 394.7 492.3 558.3 608.9 615.0 598.0 900.0 8%
Scientific 92.4 85.5 98.5 103.9 101.6 106.0 96.0 130.0 4%
Imaging 128.6 107.6 96.1 79.4 78.3 80.0 62.0 55.0 -7%
Information 229.4 114.2 - - - - - -
Others 48.9 41.7 26.4 23.0 15.8 15.0 19.0 15.0 0%
Elimination - - - - - - - -
Total 848.5 743.9 713.3 764.7 804.6 816.0 775.0 1,100.0 6%
Operating profit
Medical 68.2 87.1 112.7 124.9 140.2 137.0 120.0 235.0 10%
Scientific 5.4 3.5 4.9 6.8 8.5 8.0 4.0 13.0 10%
Imaging -10.8 -23.1 -9.2 -11.7 -2.1 0.0 -4.0 2.0 -
Information 5.3 1.7 - - - - - -
Others -8.0 -4.9 -5.4 -1.0 -5.8 -12.0 -6.0 -
Elimination -24.6 -29.3 -29.7 -28.1 -36.4 -33.0 -37.0
Total 35.5 35.1 73.4 91.0 104.5 100.0 77.0 180.0 11%
Operating profit margin
Medical 20% 22% 23% 22% 23% 22% 20% 22%
Scientific 6% 4% 5% 7% 8% 8% 4% 8%
Imaging - - - - - 0% - 0%
Information 2% 2% - - - - -
Others - - - - - - -
Elimination - - - - -
Total 4% 5% 10% 12% 13% 12% 10% 15%
60.0
-70.0
Source: Company data, Credit Suisse estimates

06 September 2016
Olympus (7733 / 7733 JP) 34
Figure 58: Olympus (7733) – Consolidated segment sales/OP (half- and full-yearly, ¥bn)
FY17E FY18E
1H 2H FY 1H 2H FYE FYE FYE 1H 2H FYE
Sales breakdown
Medical 297.9 311.0 608.9 277.9 305.7 583.6 622.1 660.2 283.0 315.0 598.0
YoY 16% 3% 9% -7% -2% -4% 7% 6% -5% 1% -2%
Endoscopes 167.1 174.5 341.6 155.1 168.4 323.6 340.1 356.5 154.8 171.6 326.4
YoY 18% 2% 9% -7% -3% -5% 5% 5% -7% -2% -4%
Surgical 95.2 99.8 195.0 87.6 99.8 187.4 203.3 217.9 92.3 105.7 198.0
YoY 14% 3% 8% -8% 0% -4% 8% 7% -3% 6% 2%
Endotherapy 35.6 36.7 72.3 35.2 37.4 72.6 78.7 85.8 35.9 37.7 73.6
YoY 14% 8% 11% -1% 2% 0% 8% 9% 1% 3% 2%
Scientific Solutions 48.5 53.1 101.6 42.2 50.4 92.6 93.2 94.0 44.0 52.0 96.0
YoY 4% -7% -2% -13% -5% -9% 1% 1% -9% -2% -6%
Life science 19.5 23.9 43.4 - - - - - - - -
YoY 0% -5% -3% - - - - - - - -
Industrials 29.0 29.3 58.2 - - - - - - - -
YoY 6% -9% -2% - - - - - - - -
Imaging 41.5 36.8 78.3 29.3 33.0 62.4 75.9 75.5 30.0 32.0 62.0
YoY 10% -12% -1% -29% -10% -20% 22% -1% -28% -13% -21%
Digital Cameras 36.4 32.5 68.9 25.5 29.1 54.6 52.6 51.4 26.9 29.4 56.3
YoY 11% -11% -1% -30% -10% -21% -4% -2% -26% -9% -18%
Others 5.1 4.3 9.4 3.8 3.9 7.7 23.4 24.1 3.1 2.6 5.7
YoY 4% -18% -8% -26% -8% -18% 203% 3% -39% -40% -40%
Others 7.9 7.9 15.8 7.5 7.0 14.5 14.0 14.0 9.0 10.0 19.0
YoY -43% -14% -32% -5% -11% -8% -3% 0% 14% 27% 21%
Sales total 395.8 408.8 804.6 357.0 396.1 753.0 805.3 843.7 366.0 409.0 775.0
YoY 11% 0% 5% -10% -3% -6% 7% 5% -8% 0% -4%
OP breakdown
Medical 67.9 72.3 140.2 49.7 65.4 115.1 125.3 135.4 59.0 68.0 120.0
YoY 24% 3% 12% -27% -10% -18% 9% 8% -13% -6% -14%
OPM 23% 23% 23% 18% 21% 20% 20% 21% 20% 21% 20%
Scientific Solutions 3.3 5.2 8.5 0.0 3.5 3.5 4.4 4.7 1.0 5.0 4.0
YoY 165% -8% 24% -99% -33% -59% 25% 7% -70% -3% -53%
OPM 7% 10% 8% 0% 7% 4% 5% 5% 2% 9% 4%
Imaging 0.0 -2.1 -2.1 -2.2 -1.6 -3.8 0.8 0.3 -2.0 2.0 -4.0
YoY - - - - - - - -66% - - -
OPM 0% -6% -3% -8% -5% -6% 1% 0% -6% 5% -6%
Others -3.3 -2.5 -5.8 -2.4 -3.0 -5.4 -6.0 -6.0 -3.0 -3.0 -6.0
YoY - - - - - - - - - - -
OPM -41% -32% -37% -32% -43% -37% -43% -43% -33% -27% -32%
Corporate/Eliminations -17.9 -18.5 -36.4 -18.5 -18.5 -37.0 -37.3 -37.3 -18.0 -19.0 -37.0
OP 50.1 54.4 104.5 26.6 45.8 72.4 87.2 97.0 29.0 48.0 77.0
YoY 30% 4% 15% -47% -16% -31% 20% 11% -42% -12% -26%
OPM 13% 13% 13% 7% 12% 10% 11% 12% 8% 12% 10%
FY15 FY16E
Actual CS E
FY16E
Company E
Source: Company data, Credit Suisse estimates

06 September 2016
Olympus (7733 / 7733 JP) 35
Figure 59: Olympus (7733) – Consolidated segment sales/OP (quarterly, ¥bn)
Q1 Q2 Q3 Q4 Q1 Q2 Q3 Q4 Q1 Q2E
Sales breakdown
Medical 120.9 135.9 141.3 160.2 139.4 158.5 147.3 163.7 130.0 147.9
YoY 12% 11% 16% 14% 15% 17% 4% 2% -7% -7%
Endoscopes 67.8 74.2 78.2 93.0 77.4 89.7 81.3 93.3 72.1 83.0
YoY 14% 9% 17% 17% 14% 21% 4% 0% -7% -7%
Surgical 38.0 45.5 46.1 50.3 44.7 50.5 47.6 52.2 40.7 46.9
YoY 9% 16% 17% 10% 18% 11% 3% 4% -9% -7%
Endotherapy 15.1 16.2 17.1 16.9 17.3 18.3 18.5 18.3 17.1 18.0
YoY 11% 10% 13% 10% 14% 13% 8% 8% -1% -2%
Scientific Solutions 21.1 25.6 26.1 31.1 22.7 25.7 25.1 28.1 18.4 23.8
YoY 6% 7% 11% 1% 8% 0% -4% -10% -19% -7%
Life science 8.7 10.7 10.7 14.3 9.0 10.5 10.4 13.5 - -
YoY 3% 1% 2% -6% 3% -2% -3% -6% - -
Industrials 12.4 14.9 15.4 16.8 13.7 15.2 14.7 14.6 - -
YoY 8% 11% 17% 6% 11% 2% -4% -13% - -
Imaging 18.6 19.1 22.9 18.8 21.5 20.0 20.5 16.3 16.0 13.3
YoY -26% -14% -18% -11% 16% 5% -11% -14% -26% -34%
Digital Cameras 16.1 16.6 20.1 16.4 19.0 17.4 18.1 14.3 14.6 10.9
YoY -26% -14% -19% -9% 18% 5% -10% -13% -23% -37%
Others 2.4 2.5 2.8 2.4 2.5 2.6 2.3 2.0 1.4 2.3
YoY -25% -14% -11% -23% 4% 3% -17% -20% -43% -9%
Others 6.5 7.4 4.6 4.5 3.9 4.0 3.9 4.0 4.0 3.5
YoY 1% 13% -30% -34% -40% -46% -16% -12% 2% -12%
Sales total 167.0 188.0 195.0 214.7 187.6 208.2 196.8 212.0 168.4 188.5
YoY 5% 8% 8% 8% 12% 11% 1% -1% -10% -9%
OP breakdown
Medical 24.2 30.4 29.4 40.9 25.0 42.8 30.8 41.6 22.4 27.3
YoY 31% -1% 0% 20% 3% 41% 5% 2% -10% -36%
OPM 20% 22% 21% 25% 18% 27% 21% 25% 17% 18%
Scientific Solutions -0.3 1.5 2.3 3.3 0.8 2.6 2.2 2.9 -1.4 1.4
YoY - -1% 53% 14% - 68% -3% -11% - -44%
OPM -1% 6% 9% 10% 3% 10% 9% 10% -8% 6%
Imaging -1.9 -1.8 -1.2 -6.8 1.1 -1.1 0.1 -2.2 -0.2 -2.0
YoY - - - - - - - 0 0 0
OPM -10% -9% -5% -36% 5% -5% 0% -13% -1% -15%
Others 0.0 -0.2 -0.3 -0.6 -1.4 -1.9 -1.6 -1.0 -0.9 -1.5
YoY - - - - - - - 0 - 0
OPM 1% -2% -6% -12% -35% -47% -40% -24% -23% -43%
Corporate/Eliminations -7.0 -6.6 -6.6 -7.9 -8.3 -9.5 -7.9 -10.6 -9.1 -9.4
OP 15.1 23.4 23.6 28.9 17.2 32.9 23.6 30.8 10.8 15.8
YoY 84% 15% 11% 23% 14% 41% 0% 7% -37% -52%
OPM 9% 12% 12% 13% 9% 16% 12% 15% 6% 8%
FY14 FY15 FY16
Source: Company data, Credit Suisse estimates

06 September 2016
Olympus (7733 / 7733 JP) 36
Figure 60: Olympus (7733) – Consolidated income statement (half- and full-yearly, ¥bn)
FY17E FY18E
1H 2H FY 1H 2H FYE FYE FYE 1H 2H FYE
Sales 395.8 408.8 804.6 357.0 396.1 753.0 805.3 843.7 366.0 409.0 775.0
YoY 11% 0% 5% -10% -3% -6% 7% 5% -8% 0% -4%
Cost of sales 133.0 136.3 269.3 127.3 136.4 263.7 283.2 291.1
Gross profit 262.8 272.5 535.2 229.6 259.7 489.3 522.1 552.6
SG & A 212.7 218.1 430.8 203.0 213.9 416.9 434.8 455.6
OP 50.1 54.4 104.5 26.6 45.8 72.4 87.2 97.0 29.0 48.0 77.0
YoY 30% 4% 15% -47% -16% -31% 20% 11% -42% -12% -26%
% of sales 13% 13% 13% 7% 12% 10% 11% 12% 8% 12% 10%
Non-operating profit 3.0 2.5 5.5 3.0 3.0 6.0 6.0 6.0
Non-operating loss 9.6 9.5 19.1 8.0 8.0 16.0 16.0 16.0
Recurring profit 43.5 47.4 90.9 21.6 40.8 62.5 77.2 87.0 25.0 42.0 67.0
YoY 47% 10% 25% -50% -14% -31% 24% 13% -43% -11% -26%
Extraordinary profits 0.0 2.4 2.4 0.0 0.0 0.0 0.0 0.0
Extraordinary lss 4.0 18.4 22.5 2.0 2.0 4.0 4.0 4.0
Pre-tax profit 39.5 31.3 70.8 19.7 38.8 58.5 73.2 83.0
Total taxes 3.6 4.5 8.1 1.2 7.8 9.0 18.3 24.9
Minority shareholders' profit/loss 0.0 0.0 0.1 0.0 0.0 0.0 0.0 0.0
Net proft 35.8 26.8 62.6 18.4 31.1 49.4 54.9 58.1 20.0 37.0 57.0
60% - - -49% 16% -21% 11% 6%
¥/$ 120 104 103 103 106
¥/Euro 133 116 114 114 117
R&D 81.4 84.8 86.0 87.0 85.0
Capex 64.4 70.0 66.8 66.8 70.0
Depreciation 39.9 44.9 48.9 52.9 45.0
EPS 182.9 144.5 160.5 169.8 166.6
BPS 1,118.5 1,235.0 1,360.5 1,490.3
Company E
FY16E
CS E
FY15 FY16E
Actual
Source: Company data, Credit Suisse estimates
Figure 61: Olympus (7733) – Consolidated income statement (quarterly, ¥bn)
Q1 Q2 Q3 Q4 Q1 Q2 Q3 Q4 Q1 Q2E
Sales 167.0 188.0 195.0 214.7 187.6 208.2 196.8 212.0 168.4 188.5
YoY 5% 8% 8% 8% 12% 11% 1% -1% -10% -9%
Cost of sales 60.6 69.0 70.0 75.2 65.8 67.2 65.7 70.6 56.4 70.9
Gross profit 106.4 119.0 125.0 139.4 121.7 141.0 131.0 141.4 112.0 117.6
SG & A 91.3 95.6 101.4 110.5 104.6 108.1 107.4 110.6 101.2 101.8
OP 15.1 23.4 23.6 28.9 17.2 32.9 23.6 30.8 10.8 15.8
YoY 84% 15% 11% 23% 14% 41% 0% 7% -37% -52%
% of sales 9% 12% 12% 13% 9% 16% 12% 15% 6% 8%
Non-operating profit 1.1 1.4 1.7 1.5 2.8 0.2 1.3 1.2 1.5 1.5
Non-operating loss 5.0 6.3 6.8 5.8 3.3 6.3 3.7 5.8 4.0 4.0
Recurring profit 11.2 18.5 18.5 24.6 16.7 26.8 21.2 26.2 8.3 13.3
YoY 365% 27% 8% 46% 50% 45% 14% 7% -50% -50%
Extraordinary profits 0.0 0.0 0.0 0.0 0.0 0.0 2.2 0.2 0.0 0.0
Extraordinary lss 0.0 1.7 5.7 56.4 2.4 1.6 16.6 1.9 1.0 1.0
Pre-tax profit 11.2 16.8 12.8 -31.8 14.3 25.2 6.9 24.5 7.3 12.3
Total taxes 3.0 2.6 3.4 8.8 -2.5 6.1 -0.2 4.7 -1.2 2.5
Minority shareholders' profit/loss 0.0 0.0 -0.2 0.0 0.0 0.0 0.0 0.0 0.0 0.0
Net proft 8.1 14.2 9.6 -40.7 16.7 19.1 7.0 19.7 8.5 9.9
YoY - - -30% - 106% 34% -27% - -49% -48%
FY14 FY15 FY16
Source: Company data, Credit Suisse estimates

06 September 2016
Olympus (7733 / 7733 JP) 37
Figure 62: Olympus (7733) – Balance sheet and cash flows FY14 FY15 FY16E FY17E FY18E
<Balance Sheet>
Current assets 577.5 520.7 585.5 616.4 658.1
Cash and cash equivalents 209.9 166.6 230.1 261.5 293.9
Notes and accounts receivable 148.1 140.7 131.7 134.2 140.6
Inventories 107.4 111.6 109.2 106.2 109.2
Allowance for doubtful accounts -4.3 -6.6 -5.5 -5.5 -5.5
Others 116.4 108.5 120.0 120.0 120.0
Noncurrent assets 504.0 479.9 492.2 520.2 524.1
Property, plant and equipment, net 150.1 166.1 191.1 209.0 223.0
Total intangible assets 180.6 150.8 141.1 131.1 121.1
Total investments and other assets 173.2 163.1 160.0 180.0 180.0
Total assets 1,081.6 1,000.6 1,077.7 1,136.6 1,182.2
Current liabilities 374.8 266.6 314.6 317.5 318.7
Notes and accounts payable 39.2 40.6 39.6 42.5 43.7
Short-term borrowings 101.1 26.7 35.0 35.0 35.0
Current maturities of bonds 0.0 30.0 0.0 0.0 0.0
Income taxes payable 12.6 9.1 10.0 10.0 10.0
Others 221.9 160.3 230.0 230.0 230.0
Non-current liabilities 349.5 349.7 339.0 352.0 352.0
Long-term bonds, less current maturities 55.0 25.0 25.0 25.0 25.0
Long-term borrowings, less currentmaturities 198.3 239.5 230.0 230.0 230.0
Net defined benefit liability 38.4 38.6 39.0 39.0 39.0
Others 57.8 46.6 45.0 58.0 58.0
Total liabilities 724.3 616.3 653.6 669.5 670.7
Non controling interests 1.5 1.5 1.5 1.5 1.5
Total net assets 357.3 384.3 424.1 467.1 511.5
Total shareholders’ equity 355.7 382.8 422.6 465.6 510.0
Total liabilities and net assets 1,081.6 1,000.6 1,077.7 1,136.6 1,182.2
Cash flows
Cash flows from operating activities: 66.8 48.6 107.7 110.2 105.8
Consolidated net income -8.7 62.6 49.4 54.9 58.1
Depreciation and amortization 41.2 39.9 44.9 48.9 52.9
Cash flows from investing activities -39.6 -52.9 -67.0 -63.8 -63.8
Purchases of fixed assets -47.7 -64.4 -70.0 -66.8 -66.8
Free cashflow 27.2 -4.3 40.7 46.4 42.0
Cash flows from financing activities: -70.2 -33.9 -7.7 -9.0 -10.7
Dividends paid -3.4 -5.8 -9.6 -12.0 -13.7 Source: Company data, Credit Suisse estimates

06 September 2016
Olympus (7733 / 7733 JP) 38
9. Company history Gastroscopy history of more than 60 years
Starting from microscopes to commercialize the world’s first gastro camera, the
forerunner of endoscopes
Olympus was founded in 1919 as a manufacturer of microscopes, using its experience in
this field to subsequently expand into cameras and medical equipment. Olympus
commercialized the world’s first gastro camera, the forerunner of the endoscope, in 1952.
For more than 60 years, the company has led the way in gastroscope development.
Actively pursuing alliances and acquisitions in the medical field
Aiming to bolster its medical product lineup, Olympus has been active in M&A deals and
forging alliances with other companies. In the scientific field, the company has acquired
overseas manufacturers and expanded its lineup of various devices that contribute to
minimally invasive treatment.
In Japan, Olympus forged a business alliance with medical device maker Terumo in 2001,
followed by a capital tie-up in 2005. Currently, Terumo owns 5.58mn shares of Olympus
stock (1.6% equity stake), while Olympus owns 9.43mn shares of Terumo stock (2.5%
stake). The companies are conducting joint development/sales of endoscope guidewires
and biomaterials.
In guidewires, both firms are conducting R&D aimed at quality improvement. On the sales
side, the companies are cooperating in the gastroenterology and urology fields in the US
market. In biomaterials, the companies have established Olympus Terumo Biomaterial as
a JV (Olympus: 66.6% stake) to develop and sell products including collagen and artificial
bone in the regenerative medicine field.
Figure 63: Medical related acquisitions
Year Acquired company Production, technology
1979 Winter & IbeGmbH Germany Rigid medical endoscope
1987 KeyMed Ltd England Medical, imaging process device
2004 Celon AG Germany Bipolar device
2008 Gyrus pic. England Energy device
2010 Spiration Inc. US Pulmonary treatment device
2011 Spirus Medical. Inc US Supplemental device for inserting endoscope Source: Company data, Credit Suisse
Olympus was founded in
1919
Company has acquired
overseas manufacturers and
expanded its lineup of
various devices that
contribute to minimally
invasive treatment

06 September 2016
Olympus (7733 / 7733 JP) 39
Figure 64: Corporate history
1919Olympus is founded as Takachiho Seisakusho with a view to achieving domestic production of microscopes and other
optical devices.
1936The company achieves its cherished goal of expansion into the camera business with the development of the Zuiko
photographic lenses and launched.
1942 Takachiho Seisakusho is renamed Takachiho Optical Industries.
1949 The company is renamed Olympus Optical Co., Ltd.
The company is listed in Tokyo Stock Exchange
Olympus Optical develops the world's first practical gastrocamera.
1952 The GT-I gastrocamera is launched.
1963 A plant is opened in Ishikawa, Hachioji City, Tokyo. (Now Ishikawa R&D center)
1964 The GTF fiber gastroscope is launched.
1968 Olympus Optical expands into the industrial endoscope field.
Olympus Corporation of America is established as a sales subsidiary for microscopes, measuring equipment and
medical equipment in the United States.
1970 Olympus enters the clinicall analyzer market with the development of the ACA-III automatic biochemical analysis system.
1975 Olympus moves into the rigid medical endoscope field.
1980 Tokyo headquarter was moved to Nishi shinjyuku Tokyo
1988 The Utsugi Technology Research Institute is opened in Kuboyama, Hachioji City, Tokyo.
1997 Olympus moves into bone replacement material business
2001 Olympus enters into a comprehensive alliance agreement with Terumo Corporation in the medical equipment field.
2003 The company is renamed Olympus Corporation.
2004The Imaging and Medical businesses are spun off to create Olympus Imaging Corporation and Olympus Medical Systems
Corporation.
2005 Olympus acquired Boneceram, a hydroxyapatite bone replacement material, from Sumitomo Pharmaceuticals Co., Ltd
Olympus and Terumo to Strengthen their Business Partnership for the development of new minimally invasive technology
2008 Acquisition of the Gyrus Group PLC to strengthen the surgical area of the Medical Business
2009 Olympus agrees to divest its analyzer business to Beckman Coulter, Inc. of the United States. (Jul. 2009)
2011 Transfer inkjet printer business to Riso Kagaku
The concealment of losses is revealed, and a third-party committee is formed in November to investigate the situation.
2012 Hiroyuki Sasa is appointed President.
Olympus forms a business and capital alliance with Sony. (Sep.)
2013 Sony Olympus Medical Solutions Inc. is established. (Apr.)
A repair service center is established in Ina City, Nagano Prefecture to strengthen endoscope repair services and
equipment management in Japan. (Dec.)
2015Olympus uses a matrix organizational structure that maximizes the use of corporate resources by interconnecting
businesses and functions in a balanced and efficient manner. (Apr.) Source: Company data, Credit Suisse
Upgrading compliance and governance systems
Learning from the 2011 concealed losses issue, management has created
frameworks for greater management transparency
In 2011, Olympus discovered that past losses on investment securities and other assets
had been concealed (acquisition funds and other monies had been used to eliminate or
otherwise conceal losses on investment securities and other assets). This resulted in a
loss of confidence by the stock market and the filing of lawsuits by numerous shareholders.
This led to an upgrade of the compliance and governance systems from the current
management framework started in 2012. In addition to the appointment of outside
directors to the 10-member board of directors, the current governance framework includes
an independent auditing committee, a nominating committee and a compensation
committee. Also, as part of the upgrade to internal control systems, the company
established a compliance committee that is chaired by an outside director. The company
has also improved/expanded its disclosure in recent years, indicating an increased
commitment to internal governance.
In 2015, Olympus paid a fine of approximately ¥73.0bn (+¥1.3bn in interest) based on the
findings of the US Justice Department that the company had violated (in cases from 2006–
11) the nation’s Anti-Kickback Statute, False Claims Act, and the Foreign Corrupt
Practices Act.
Regarding lawsuits concerning the hiding of losses in 2011, total unreserved litigation
costs are estimated at ¥39.3bn. However, when the matter is finally resolved, we think the
actual cost is likely to be smaller than this figure.
Increasing commitment to
internal governance in the
company

06 S
ep
tem
ber 2
01
6
Oly
mp
us (7
733 / 7
733
JP
) 4
0
Figure 65: Main products
Endoscopes Surgical devices and systems
4K Surgical Endocopy System4K Camera Head Ultra Telescope
EndoTherapy devices
Video Endoscopy System
OER series
AxeonEVIS EXERAⅢEVIS LUCERA ELITE
ITknife nano
EndoscopeReprocessor
Single-useHigh-frequncy Knife
Guidewire
Surgical Imaging Platform
VISERA ELITE
SurgicalVideoscope
ENDOEYE FLEX 3D
THUNDERBEAT
Integrated Surgical Device with Advanced Bipolar and Ultrasonic Energy
Uretero-Reno Videoscope
URF-V2
Multidebrider
DIEGO ELITE
Source: Company data, Credit Suisse estimates
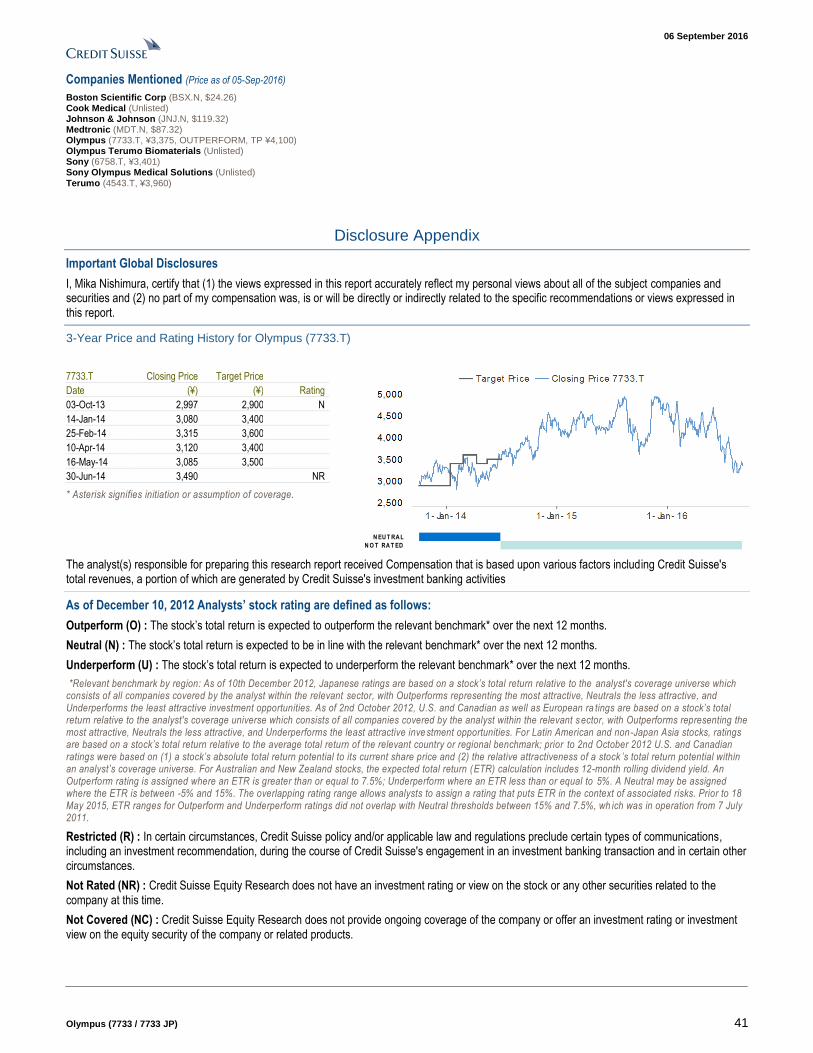
06 September 2016
Olympus (7733 / 7733 JP) 41
Companies Mentioned (Price as of 05-Sep-2016)
Boston Scientific Corp (BSX.N, $24.26) Cook Medical (Unlisted) Johnson & Johnson (JNJ.N, $119.32) Medtronic (MDT.N, $87.32) Olympus (7733.T, ¥3,375, OUTPERFORM, TP ¥4,100) Olympus Terumo Biomaterials (Unlisted) Sony (6758.T, ¥3,401) Sony Olympus Medical Solutions (Unlisted) Terumo (4543.T, ¥3,960)
Disclosure Appendix
Important Global Disclosures
I, Mika Nishimura, certify that (1) the views expressed in this report accurately reflect my personal views about all of the subject companies and securities and (2) no part of my compensation was, is or will be directly or indirectly related to the specific recommendations or views expressed in this report.
3-Year Price and Rating History for Olympus (7733.T)
7733.T Closing Price Target Price
Date (¥) (¥) Rating
03-Oct-13 2,997 2,900 N
14-Jan-14 3,080 3,400
25-Feb-14 3,315 3,600
10-Apr-14 3,120 3,400
16-May-14 3,085 3,500
30-Jun-14 3,490 NR
* Asterisk signifies initiation or assumption of coverage.
N EU T RA L
N O T RA T ED
The analyst(s) responsible for preparing this research report received Compensation that is based upon various factors including Credit Suisse's total revenues, a portion of which are generated by Credit Suisse's investment banking activities
As of December 10, 2012 Analysts’ stock rating are defined as follows:
Outperform (O) : The stock’s total return is expected to outperform the relevant benchmark* over the next 12 months.
Neutral (N) : The stock’s total return is expected to be in line with the relevant benchmark* over the next 12 months.
Underperform (U) : The stock’s total return is expected to underperform the relevant benchmark* over the next 12 months.
*Relevant benchmark by region: As of 10th December 2012, Japanese ratings are based on a stock’s total return relative to the analyst's coverage universe which consists of all companies covered by the analyst within the relevant sector, with Outperforms representing the most attractive, Neutrals the less attractive, and Underperforms the least attractive investment opportunities. As of 2nd October 2012, U.S. and Canadian as well as European ra tings are based on a stock’s total return relative to the analyst's coverage universe which consists of all companies covered by the analyst within the relevant sector, with Outperforms representing the most attractive, Neutrals the less attractive, and Underperforms the least attractive investment opportunities. For Latin American and non-Japan Asia stocks, ratings are based on a stock’s total return relative to the average total return of the relevant country or regional benchmark; prior to 2nd October 2012 U.S. and Canadian ratings were based on (1) a stock’s absolute total return potential to its current share price and (2) the relative attractiveness of a stock ’s total return potential within an analyst’s coverage universe. For Australian and New Zealand stocks, the expected total return (ETR) calculation includes 12-month rolling dividend yield. An Outperform rating is assigned where an ETR is greater than or equal to 7.5%; Underperform where an ETR less than or equal to 5%. A Neutral may be assigned where the ETR is between -5% and 15%. The overlapping rating range allows analysts to assign a rating that puts ETR in the context of associated risks. Prior to 18 May 2015, ETR ranges for Outperform and Underperform ratings did not overlap with Neutral thresholds between 15% and 7.5%, wh ich was in operation from 7 July 2011.
Restricted (R) : In certain circumstances, Credit Suisse policy and/or applicable law and regulations preclude certain types of communications, including an investment recommendation, during the course of Credit Suisse's engagement in an investment banking transaction and in certain other circumstances.
Not Rated (NR) : Credit Suisse Equity Research does not have an investment rating or view on the stock or any other securities related to the company at this time.
Not Covered (NC) : Credit Suisse Equity Research does not provide ongoing coverage of the company or offer an investment rating or investment view on the equity security of the company or related products.

06 September 2016
Olympus (7733 / 7733 JP) 42
Volatility Indicator [V] : A stock is defined as volatile if the stock price has moved up or down by 20% or more in a month in at least 8 of the past 24 months or the analyst expects significant volatility going forward.
Analysts’ sector weightings are distinct from analysts’ stock ratings and are based on the analyst’s expectations for the fundamentals and/or valuation of the sector* relative to the group’s historic fundamentals and/or valuation:
Overweight : The analyst’s expectation for the sector’s fundamentals and/or valuation is favorable over the next 12 months.
Market Weight : The analyst’s expectation for the sector’s fundamentals and/or valuation is neutral over the next 12 months.
Underweight : The analyst’s expectation for the sector’s fundamentals and/or valuation is cautious over the next 12 months.
*An analyst’s coverage sector consists of all companies covered by the analyst within the relevant sector. An analyst may cover multiple sectors.
Credit Suisse's distribution of stock ratings (and banking clients) is:
Global Ratings Distribution
Rating Versus universe (%) Of which banking clients (%)
Outperform/Buy* 55% (52% banking clients)
Neutral/Hold* 28% (25% banking clients)
Underperform/Sell* 17% (53% banking clients)
Restricted 0%
*For purposes of the NYSE and NASD ratings distribution disclosure requirements, our stock ratings of Outperform, Neutral, and Underperform most closely correspond to Buy, Hold, and Sell, respectively; however, the meanings are not the same, as our stock ratings are determined on a relative basis. (Please refer to definitions above.) An investor's decision to buy or sell a security should be based on investment objectives, current holdings, and other individual factors.
Credit Suisse’s policy is to update research reports as it deems appropriate, based on developments with the subject company, the sector or the market that may have a material impact on the research views or opinions stated herein.
Credit Suisse's policy is only to publish investment research that is impartial, independent, clear, fair and not misleading. For more detail please refer to Credit Suisse's Policies for Managing Conflicts of Interest in connection with Investment Research: http://www.csfb.com/research-and-analytics/disclaimer/managing_conflicts_disclaimer.html
Credit Suisse does not provide any tax advice. Any statement herein regarding any US federal tax is not intended or written to be used, and cannot be used, by any taxpayer for the purposes of avoiding any penalties.
Target Price and Rating Valuation Methodology and Risks: (12 months) for Olympus (7733.T)
Method: We base our ¥4,100 target price for Olympus on EV/EBITDA to allow global comparisons and to reflect investment in expansion of manufacturing sites in order to grow the medical business. We apply an EV/EBITDA of 11x, the average multiple since FY3/14 after the company announced a capital tie-up with Sony and had resolved the loss-concealed issue.We think that the potential for growth in the medical business given commanding market share in gastrointestinal endoscopes and increasing share in surgical endoscope and endotherapy device. Our OUTPERFORM rating is based on a comparison of the company's 12-month potential total return versus our coverage universe.
Risk: Risks to our ¥4,100 target price and OUTPERFORM rating for Olympus include an economic slowdown, yen appreciation, and price competition with rivals.
Please refer to the firm's disclosure website at https://rave.credit-suisse.com/disclosures for the definitions of abbreviations typically used in the target price method and risk sections.
See the Companies Mentioned section for full company names
Credit Suisse expects to receive or intends to seek investment banking related compensation from the subject company (7733.T) within the next 3 months.
For a history of recommendations for the subject company(ies) featured in this report, disseminated within the past 12 months, please refer to https://rave.credit-suisse.com/disclosures/view/report?i=245655&v=td5q0dy3zpxshei4lco7eppy .
Important Regional Disclosures
Singapore recipients should contact Credit Suisse AG, Singapore Branch for any matters arising from this research report.
The analyst(s) involved in the preparation of this report may participate in events hosted by the subject company, including site visits. Credit Suisse does not accept or permit analysts to accept payment or reimbursement for travel expenses associated with these events.
Restrictions on certain Canadian securities are indicated by the following abbreviations: NVS--Non-Voting shares; RVS--Restricted Voting Shares; SVS--Subordinate Voting Shares.

06 September 2016
Olympus (7733 / 7733 JP) 43
Individuals receiving this report from a Canadian investment dealer that is not affiliated with Credit Suisse should be advised that this report may not contain regulatory disclosures the non-affiliated Canadian investment dealer would be required to make if this were its own report.
For Credit Suisse Securities (Canada), Inc.'s policies and procedures regarding the dissemination of equity research, please visit https://www.credit-suisse.com/sites/disclaimers-ib/en/canada-research-policy.html.
Principal is not guaranteed in the case of equities because equity prices are variable.
Commission is the commission rate or the amount agreed with a customer when setting up an account or at any time after that.
This research report is authored by:
Credit Suisse Securities (Japan) Limited ......................................................................................................................................... Mika Nishimura
To the extent this is a report authored in whole or in part by a non-U.S. analyst and is made available in the U.S., the following are important disclosures regarding any non-U.S. analyst contributors: The non-U.S. research analysts listed below (if any) are not registered/qualified as research analysts with FINRA. The non-U.S. research analysts listed below may not be associated persons of CSSU and therefore may not be subject to the NASD Rule 2711 and NYSE Rule 472 restrictions on communications with a subject company, public appearances and trading securities held by a research analyst account.
Credit Suisse Securities (Japan) Limited ......................................................................................................................................... Mika Nishimura
For Credit Suisse disclosure information on other companies mentioned in this report, please visit the website at https://rave.credit-suisse.com/disclosures or call +1 (877) 291-2683.

06 September 2016
Olympus (7733 / 7733 JP) 44
This report is produced by subsidiaries and affiliates of Credit Suisse operating under its Global Markets Division. For more information on our structure, please use the following link: https://www.credit-suisse.com/who-we-are This report may contain material that is not directed to, or intended for distribution to or use by, any person or entity who is a citizen or resident of or located in any locality, state, country or other jurisdiction where such distribution, publication, availability or use would be contrary to law or regulation or which would subject Credit Suisse or its affiliates ("CS") to any registration or licensing requirement within such jurisdiction. All material presented in this report, unless specifically indicated otherwise, is under copyright to CS. None of the material, nor its content, nor any copy of it, may be altered in any way, transmitted to, copied or distributed to any other party, without the prior express written permission of CS. All trademarks, service marks and logos used in this report are trademarks or service marks or registered trademarks or service marks of CS or its affiliates.The information, tools and material presented in this report are provided to you for information purposes only and are not to be used or considered as an offer or the solicitation of an offer to sell or to buy or subscribe for securities or other financial instruments. CS may not have taken any steps to ensure that the securities referred to in this report are suitable for any particular investor. CS will not treat recipients of this report as its customers by virtue of their receiving this report. The investments and services contained or referred to in this report may not be suitable for you and it is recommended that you consult an independent investment advisor if you are in doubt about such investments or investment services. Nothing in this report constitutes investment, legal, accounting or tax advice, or a representation that any investment or strategy is suitable or appropriate to your individual circumstances, or otherwise constitutes a personal recommendation to you. CS does not advise on the tax consequences of investments and you are advised to contact an independent tax adviser. Please note in particular that the bases and levels of taxation may change. Information and opinions presented in this report have been obtained or derived from sources believed by CS to be reliable, but CS makes no representation as to their accuracy or completeness. CS accepts no liability for loss arising from the use of the material presented in this report, except that this exclusion of liability does not apply to the extent that such liability arises under specific statutes or regulations applicable to CS. This report is not to be relied upon in substitution for the exercise of independent judgment. CS may have issued, and may in the future issue, other communications that are inconsistent with, and reach different conclusions from, the information presented in this report. Those communications reflect the different assumptions, views and analytical methods of the analysts who prepared them and CS is under no obligation to ensure that such other communications are brought to the attention of any recipient of this report. Some investments referred to in this report will be offered solely by a single entity and in the case of some investments solely by CS, or an associate of CS or CS may be the only market maker in such investments. Past performance should not be taken as an indication or guarantee of future performance, and no representation or warranty, express or implied, is made regarding future performance. Information, opinions and estimates contained in this report reflect a judgment at its original date of publication by CS and are subject to change without notice. The price, value of and income from any of the securities or financial instruments mentioned in this report can fall as well as rise. The value of securities and financial instruments is subject to exchange rate fluctuation that may have a positive or adverse effect on the price or income of such securities or financial instruments. Investors in securities such as ADR's, the values of which are influenced by currency volatility, effectively assume this risk. Structured securities are complex instruments, typically involve a high degree of risk and are intended for sale only to sophisticated investors who are capable of understanding and assuming the risks involved. The market value of any structured security may be affected by changes in economic, financial and political factors (including, but not limited to, spot and forward interest and exchange rates), time to maturity, market conditions and volatility, and the credit quality of any issuer or reference issuer. Any investor interested in purchasing a structured product should conduct their own investigation and analysis of the product and consult with their own professional advisers as to the risks involved in making such a purchase. Some investments discussed in this report may have a high level of volatility. High volatility investments may experience sudden and large falls in their value causing losses when that investment is realised. Those losses may equal your original investment. Indeed, in the case of some investments the potential losses may exceed the amount of initial investment and, in such circumstances, you may be required to pay more money to support those losses. Income yields from investments may fluctuate and, in consequence, initial capital paid to make the investment may be used as part of that income yield. Some investments may not be readily realisable and it may be difficult to sell or realise those investments, similarly it may prove difficult for you to obtain reliable information about the value, or risks, to which such an investment is exposed. This report may provide the addresses of, or contain hyperlinks to, websites. Except to the extent to which the report refers to website material of CS, CS has not reviewed any such site and takes no responsibility for the content contained therein. Such address or hyperlink (including addresses or hyperlinks to CS's own website material) is provided solely for your convenience and information and the content of any such website does not in any way form part of this document. Accessing such website or following such link through this report or CS's website shall be at your own risk.
This report is issued and distributed in European Union (except Switzerland): by Credit Suisse Securities (Europe) Limited, One Cabot Square, London E14 4QJ, England, which is authorised by the Prudential Regulation Authority and regulated by the Financial Conduct Authority and the Prudential Regulation Authority. Germany: Credit Suisse Securities (Europe) Limited Niederlassung Frankfurt am Main regulated by the Bundesanstalt fuer Finanzdienstleistungsaufsicht ("BaFin"). United States and Canada: Credit Suisse Securities (USA) LLC; Switzerland: Credit Suisse AG; Brazil: Banco de Investimentos Credit Suisse (Brasil) S.A or its affiliates; Mexico: Banco Credit Suisse (México), S.A. (transactions related to the securities mentioned in this report will only be effected in compliance with applicable regulation); Japan: by Credit Suisse Securities (Japan) Limited, Financial Instruments Firm, Director-General of Kanto Local Finance Bureau ( Kinsho) No. 66, a member of Japan Securities Dealers Association, The Financial Futures Association of Japan, Japan Investment Advisers Association, Type II Financial Instruments Firms Association; Hong Kong: Credit Suisse (Hong Kong) Limited; Australia: Credit Suisse Equities (Australia) Limited; Thailand: Credit Suisse Securities (Thailand) Limited, regulated by the Office of the Securities and Exchange Commission, Thailand, having registered address at 990 Abdulrahim Place, 27th Floor, Unit 2701, Rama IV Road, Silom, Bangrak, Bangkok10500, Thailand, Tel. +66 2614 6000; Malaysia: Credit Suisse Securities (Malaysia) Sdn Bhd, Credit Suisse AG, Singapore Branch; India: Credit Suisse Securities (India) Private Limited (CIN no.U67120MH1996PTC104392) regulated by the Securities and Exchange Board of India as Research Analyst (registration no. INH 000001030) and as Stock Broker (registration no. INB230970637; INF230970637; INB010970631; INF010970631), having registered address at 9th Floor, Ceejay House, Dr.A.B. Road, Worli, Mumbai - 18, India, T- +91-22 6777 3777; South Korea: Credit Suisse Securities (Europe) Limited, Seoul Branch; Taiwan: Credit Suisse AG Taipei Securities Branch; Indonesia: PT Credit Suisse Securities Indonesia; Philippines: Credit Suisse Securities (Philippines ) Inc., and elsewhere in the world by the relevant authorised affiliate of the above. Additional Regional Disclaimers Hong Kong: Credit Suisse (Hong Kong) Limited ("CSHK") is licensed and regulated by the Securities and Futures Commission of Hong Kong under the laws of Hong Kong, which differ from Australian laws. CSHKL does not hold an Australian financial services licence (AFSL) and is exempt from the requirement to hold an AFSL under the Corporations Act 2001 (the Act) under Class Order 03/1103 published by the ASIC in respect of financial services provided to Australian wholesale clients (within the meaning of section 761G of the Act). Research on Taiwanese securities produced by Credit Suisse AG, Taipei Securities Branch has been prepared by a registered Senior Business Person. Malaysia: Research provided to residents of Malaysia is authorised by the Head of Research for Credit Suisse Securities (Malaysia) Sdn Bhd, to whom they should direct any queries on +603 2723 2020. Singapore: This report has been prepared and issued for distribution in Singapore to institutional investors, accredited investors and expert investors (each as defined under the Financial Advisers Regulations) only, and is also distributed by Credit Suisse AG, Singapore branch to overseas investors (as defined under the Financial Advisers Regulations). By virtue of your status as an institutional investor, accredited investor, expert investor or overseas investor, Credit Suisse AG, Singapore branch is exempted from complying with certain compliance requirements under the Financial Advisers Act, Chapter 110 of Singapore (the "FAA"), the Financial Advisers Regulations and the relevant Notices and Guidelines issued thereunder, in respect of any financial advisory service which Credit Suisse AG, Singapore branch may provide to you. UAE: This information is being distributed by Credit Suisse AG (DIFC Branch), duly licensed and regulated by the Dubai Financial Services Authority (“DFSA”). Related financial services or products are only made available to Professional Clients or Market Counterparties, as defined by the DFSA, and are not intended for any other persons. Credit Suisse AG (DIFC Branch) is located on Level 9 East, The Gate Building, DIFC, Dubai, United Arab Emirates. EU: This report has been produced by subsidiaries and affiliates of Credit Suisse operating under its Global Markets Division This research may not conform to Canadian disclosure requirements. In jurisdictions where CS is not already registered or licensed to trade in securities, transactions will only be effected in accordance with applicable securities legislation, which will vary from jurisdiction to jurisdiction and may require that the trade be made in accordance with applicable exemptions from registration or licensing requirements. Non-US customers wishing to effect a transaction should contact a CS entity in their local jurisdiction unless governing law permits otherwise. US customers wishing to effect a transaction should do so only by contacting a representative at Credit Suisse Securities (USA) LLC in the US. Please note that this research was originally prepared and issued by CS for distribution to their market professional and institutional investor customers. Recipients who are not market professional or institutional investor customers of CS should seek the advice of their independent financial advisor prior to taking any investment decision based on this report or for any necessary explanation of its contents. This research may relate to investments or services of a person outside of the UK or to other matters which are not authorised by the Prudential Regulation Authority and regulated by the Financial Conduct Authority and the Prudential Regulation Authority or in respect of which the protections of the Prudential Regulation Authority and Financial Conduct Authority for private customers and/or the UK compensation scheme may not be available, and further details as to where this may be the case are available upon request in respect of this report. CS may provide various services to US municipal entities or obligated persons ("municipalities"), including suggesting individual transactions or trades and entering into such transactions. Any services CS provides to municipalities are not viewed as "advice" within the meaning of Section 975 of the Dodd-Frank Wall Street Reform and Consumer Protection Act. CS is providing any such services and related information solely on an arm's length basis and not as an advisor or fiduciary to the municipality. In connection with the provision of the any such services, there is no agreement, direct or indirect, between any municipality (including the officials,management, employees or agents thereof) and CS for CS to provide advice to the municipality. Municipalities should consult with their financial, accounting and legal advisors regarding any such services provided by CS. In addition, CS is not acting for direct or indirect compensation to solicit the municipality on behalf of an unaffiliated broker, dealer, municipal securities dealer, municipal advisor, or investment adviser for the purpose of obtaining or retaining an engagement by the municipality for or in connection with Municipal Financial Products, the issuance of municipal securities, or of an investment adviser to provide investment advisory services to or on behalf of the municipality. If this report is being distributed by a financial institution other than Credit Suisse AG, or its affiliates, that financial institution is solely responsible for distribution. Clients of that institution should contact that institution to effect a transaction in the securities mentioned in this report or require further information. This report does not constitute investment advice by Credit Suisse to the clients of the distributing financial institution, and neither Credit Suisse AG, its affiliates, and their respective officers, directors and employees accept any liability whatsoever for any direct or consequential loss arising from their use of this report or its content. Principal is not guaranteed. Commission is the commission rate or the amount agreed with a customer when setting up an account or at any time after that. Copyright © 2016 CREDIT SUISSE AG and/or its affiliates. All rights reserved.
Investment principal on bonds can be eroded depending on sale price or market price. In addition, there are bonds on which investment principal can be eroded due to changes in redemption amounts. Care is required when investing in such instruments.
When you purchase non-listed Japanese fixed income securities (Japanese government bonds, Japanese municipal bonds, Japanese government guaranteed bonds, Japanese corporate bonds) from CS as a seller, you will be requested to pay the purchase price only.
7733_090616_Olympus_E.doc