Cadila Healthcare - Credit Suisse
26
DISCLOSURE APPENDIX CONTAINS ANALYST CERTIFICATIONS AND THE STATUS OF NON-US ANALYSTS. U.S. Disclosure: Credit Suisse does and seeks to do business with companies covered in its research reports. As a result, investors should be aware that the Firm may have a conflict of interest that could affect the objectivity of this report. Investors should consider this report as only a single factor in making their investment decision. CREDIT SUISSE SECURITIES RESEARCH & ANALYTICS BEYOND INFORMATION™ Client-Driven Solutions, Insights, and Access 17 July 2012 Asia Pacific/India Equity Research Specialty Pharmaceuticals Cadila Healthcare (CADI.BO / CDH IN) INITIATION Shifting gears Initiate coverage with OUTPERFORM. We initiate coverage on Cadila Healthcare with an OUTPERFORM rating and a target price of Rs970 with 21.4% upside. Cadila is a mid-sized firm with presence across the US, Europe and emerging markets, and has sales >US$1 bn. 30% EBITDA CAGR in the US with a higher mix of low competition products. Cadila’s portfolio mix in the US is shifting towards low competition products with expected launches of nasal sprays, injectable and controlled- substances this year. Upside from Transdermal should start to roll out from FY15. Cadila has demonstrated strong execution in the US despite having a commodity portfolio thus far, and we expect a 30% EBITDA CAGR in the US over the next three years. High capex requirement during this phase should be funded by steady cash flows from India and joint ventures. Cadila is ranked among the top five firms in Indian pharma market and we expect mid-teens growth for the Indian franchise. Warning letter clearance should drive a re-rating. New approvals for the US were blocked till now due to a warning letter for Moraiya facility, which was resolved on 17 July 2012. The clearance of the facility should kick-start approvals of low-competition products and should drive a re-rating. All ingredients in place to trade at a par with large-cap peers. Cadila has a higher earnings CAGR (21%) vs. large-cap peers, and we expect RoCE to improve from 16% in FY12 to 21% in FY15, despite high capex during this phase. Cadila is moving up the value-chain with the launch of difficult-to- formulate products and its strong execution record provides multi-year growth visibility. Therefore, our target price of Rs970 is based on 20x FY14E EPS, in line with valuations of large-cap peers. Share price performance 80 100 120 140 160 600 700 800 900 1000 Jul-10 Nov-10 Mar-11 Jul-11 Nov-11 Mar-12 Price (LHS) Rebased Rel (RHS) The price relative chart measures performance against the BSE SENSEX IDX which closed at 17115.25 on 16/07/12 On 16/07/12 the spot exchange rate was Rs55.14/US$1 Performance Over 1M 3M 12M Absolute (%) 10.5 11.5 -16.9 Relative (%) 9.5 13.1 -9.3 Financial and valuation metrics Year 3/12A 3/13E 3/14E 3/15E Revenue (Rs mn) 50,899.7 60,456.4 71,622.1 82,637.6 EBITDA (Rs mn) 9,105.2 11,891.0 14,212.6 16,487.4 EBIT (Rs mn) 7,526.4 10,123.2 12,398.4 14,466.9 Net profit (Rs mn) 6,525.9 8,111.6 9,929.1 11,731.0 EPS (CS adj.) (Rs) 31.86 39.61 48.48 57.28 Change from previous EPS (%) n.a. Consensus EPS (Rs) n.a. 39.8 48.6 53.9 EPS growth (%) -8.2 24.3 22.4 18.1 P/E (x) 25.1 20.2 16.5 13.9 Dividend yield (%) 0.9 1.0 1.2 1.4 EV/EBITDA (x) 20.0 15.4 12.9 10.9 P/B (x) 6.3 5.1 4.1 3.4 ROE (%) 27.5 28.1 27.8 26.7 Net debt/equity (%) 68.4 59.3 47.3 31.5 Source: Company data, Thomson Reuters, Credit Suisse estimates. Rating OUTPERFORM* Price (16 Jul 12, Rs) 798.75 Target price (Rs) 970.00¹ Upside/downside (%) 21.4 Mkt cap (Rs mn) 163,543 (US$ 2,966) Enterprise value (Rs mn) 183,231 Number of shares (mn) 204.75 Free float (%) 25.2 52-week price range 960.8 - 632.4 ADTO - 6M (US$ mn) 1.4 *Stock ratings are relative to the relevant country benchmark. ¹Target price is for 12 months. Research Analysts Anubhav Aggarwal 9122 6777 3808 [email protected] Chunky Shah 91 22 6777 3872 [email protected]
-
Upload
khangminh22 -
Category
Documents
-
view
0 -
download
0
Transcript of Cadila Healthcare - Credit Suisse

DISCLOSURE APPENDIX CONTAINS ANALYST CERTIFICATIONS AND THE STATUS OF NON-US ANALYSTS. U.S. Disclosure: Credit Suisse does and seeks to do business with companies covered in its research reports. As a result, investors should be aware that the Firm may have a conflict of interest that could affect the objectivity of this report. Investors should consider this report as only a single factor in making their investment decision.
CREDIT SUISSE SECURITIES RESEARCH & ANALYTICS BEYOND INFORMATION™ Client-Driven Solutions, Insights, and Access
17 July 2012 Asia Pacific/India Equity Research
Specialty Pharmaceuticals
Cadila Healthcare (CADI.BO / CDH IN)
INITIATION
Shifting gears ■ Initiate coverage with OUTPERFORM. We initiate coverage on Cadila
Healthcare with an OUTPERFORM rating and a target price of Rs970 with 21.4% upside. Cadila is a mid-sized firm with presence across the US, Europe and emerging markets, and has sales >US$1 bn.
■ 30% EBITDA CAGR in the US with a higher mix of low competition products. Cadila’s portfolio mix in the US is shifting towards low competition products with expected launches of nasal sprays, injectable and controlled-substances this year. Upside from Transdermal should start to roll out from FY15. Cadila has demonstrated strong execution in the US despite having a commodity portfolio thus far, and we expect a 30% EBITDA CAGR in the US over the next three years. High capex requirement during this phase should be funded by steady cash flows from India and joint ventures. Cadila is ranked among the top five firms in Indian pharma market and we expect mid-teens growth for the Indian franchise.
■ Warning letter clearance should drive a re-rating. New approvals for the US were blocked till now due to a warning letter for Moraiya facility, which was resolved on 17 July 2012. The clearance of the facility should kick-start approvals of low-competition products and should drive a re-rating.
■ All ingredients in place to trade at a par with large-cap peers. Cadila has a higher earnings CAGR (21%) vs. large-cap peers, and we expect RoCE to improve from 16% in FY12 to 21% in FY15, despite high capex during this phase. Cadila is moving up the value-chain with the launch of difficult-to-formulate products and its strong execution record provides multi-year growth visibility. Therefore, our target price of Rs970 is based on 20x FY14E EPS, in line with valuations of large-cap peers.
Share price performance
80100120140160
600700800900
1000
Jul-10 Nov-10 Mar-11 Jul-11 Nov-11 Mar-12
Price (LHS) Rebased Rel (RHS)
The price relative chart measures performance against the BSE SENSEX IDX which closed at 17115.25 on 16/07/12 On 16/07/12 the spot exchange rate was Rs55.14/US$1
Performance Over 1M 3M 12M Absolute (%) 10.5 11.5 -16.9 Relative (%) 9.5 13.1 -9.3
Financial and valuation metrics
Year 3/12A 3/13E 3/14E 3/15E Revenue (Rs mn) 50,899.7 60,456.4 71,622.1 82,637.6 EBITDA (Rs mn) 9,105.2 11,891.0 14,212.6 16,487.4 EBIT (Rs mn) 7,526.4 10,123.2 12,398.4 14,466.9 Net profit (Rs mn) 6,525.9 8,111.6 9,929.1 11,731.0 EPS (CS adj.) (Rs) 31.86 39.61 48.48 57.28 Change from previous EPS (%) n.a. Consensus EPS (Rs) n.a. 39.8 48.6 53.9 EPS growth (%) -8.2 24.3 22.4 18.1 P/E (x) 25.1 20.2 16.5 13.9 Dividend yield (%) 0.9 1.0 1.2 1.4 EV/EBITDA (x) 20.0 15.4 12.9 10.9 P/B (x) 6.3 5.1 4.1 3.4 ROE (%) 27.5 28.1 27.8 26.7 Net debt/equity (%) 68.4 59.3 47.3 31.5
Source: Company data, Thomson Reuters, Credit Suisse estimates.
Rating OUTPERFORM* Price (16 Jul 12, Rs) 798.75 Target price (Rs) 970.00¹ Upside/downside (%) 21.4 Mkt cap (Rs mn) 163,543 (US$ 2,966) Enterprise value (Rs mn) 183,231 Number of shares (mn) 204.75 Free float (%) 25.2 52-week price range 960.8 - 632.4 ADTO - 6M (US$ mn) 1.4 *Stock ratings are relative to the relevant country benchmark. ¹Target price is for 12 months.
Research Analysts
Anubhav Aggarwal 9122 6777 3808
Chunky Shah 91 22 6777 3872
17 July 2012
Cadila Healthcare
(CADI.BO / CDH IN) 2
Focus Charts Figure 1: Cadila’s sales-split with increasing mix in the US Figure 2: Cadila’s complex-generics filings in the US
0%10%20%30%40%50%60%70%80%90%
100%
2005 2008 2012 $3bn targetUS EU India EMs JVs API
Sales = $US 250mn $US 450mn $US 1,000mn $US 3,000mn
0
2
4
68
10
12
14
1618
20
Injectables Nasal +Pulmonary
ControlledSubstances*
Transdermals Dermatology
Cadila's complex generics ANDAs filed till Mar-12
Source: Company data, Credit Suisse estimates Source: Company data, Credit Suisse
Figure 3: Cadila’s India portfolio to grow at 15% CAGR as
60% sales come from molecules with mkt growth <15%
Figure 4: Sales mix in Cardiac and Anti-infectives for
Cadila is inferior vs. Indian Pharma Market
0% 20% 40% 60% 80% 100%
IPM *
Cadila
Sun
Glenmark
Mankind
Lupin
Cipla
Ranbaxy
Reddy's
IPCA
Addressable mkt growth <5% 5%< Growth <15% 15%< Growth <30% Growth >30%
Sales split by growth of addressable market
0% 10% 20% 30% 40% 50% 60% 70% 80% 90% 100%
Cardiac IPMCardiac Cadila
Gastro IPMGastro Cadila
Anti-Infective IPMAnti-Infective Cadila
Gynae IPMGynae Cadila
Pain IPMPain Cadila
Respiratory* IPMRespiratory* Cadila
Derma IPMDerma Cadila
Addressable mkt growth <5% 5%< Growth <15% 15%< Growth <30% Growth >30%
Sales split by growth of addressable market
Sales split =
* Indian Pharma Market. Source: AIOCD-AWACS, Credit Suisse = largest brand of Cadila in the therapy. Source: AIOCD-AWACS
Figure 5: CS estimates of ramp-up in Cadila’s US pipeline Figure 6: Cadila has higher EPS CAGR than large peers
50
100
150
200
250
300
350
400
450
FY10 FY11 FY12 FY13 FY14 FY15
Existing sales Nesher Tentative approvals Litigations Probable DMFs
US$mn
US$260mn
US$295mn
US$355mn
US$420mn
US$212mn
US$142mn
10%
12%
14%
16%
18%
20%
22%
24%
10% 15% 20% 25% 30%
ROCE
2 yr
EPS
CAG
R
Cipla (19.1x PE)
Glenmark (16.9x PE)
Torrent (13x PE)
Cadila (18.9x PE)
Lupin(20.6x PE)
Sun (23.1x PE)
Source: Company data, Credit Suisse estimates Note: Bubble size =FY12 sales. Source: Company data, CS estimates

17 July 2012
Cadila Healthcare
(CADI.BO / CDH IN) 3
Shifting gears US generics—the next growth-driver Cadila’s US$3 bn sales target for FY16 suggests the direction of business mix going forward, with US generics as the next growth-driver (US = 33% of US$3 bn sales vs. 24% in FY12). In our view, Cadila cannot achieve the US$3 bn target by FY16 (requiring a 30% sales CAGR) organically, and we do not expect Cadila to make significant acquisitions as well since: (1) past acquisitions were aimed at obtaining new skill sets rather than scale and (2) low FCF and high leverage limit Cadila from going in for large acquisitions. Focus on new technologies provides multi-year growth visibility, with upside from Nasal sprays and Injectable starting from FY13-14, Transdermal and Vaccines unfolding from FY15 followed by Respiratory and Biosimilars in the developed markets.
Portfolio mix shifting to complex generics Cadila was a late entrant to the US generics market but has demonstrated strong execution with more than 15% market share on >40% of its portfolio. The portfolio mix is now shifting towards low competition products with expected launches of Nasal sprays and Injectable in FY13-14 (as a warning letter for Moraiya facility is now resolved) and the launch of first controlled-substance this year from Nesher. Cadila is the only Indian company working on the US$4 bn Transdermal market (40% already off-patent) and Cadila has already filed for two products and has five more under development. Upside from Transdermal should start to roll out from FY15 (as filings were done in 2012). We expect US EBITDA CAGR of 30% over FY12-15 as strong sales growth is accompanied by margin expansion due to a better product mix, warning letter resolution and Nesher turning EBITDA positive (as it launches one new product every six months).
Steady funding support from India and JVs Cadila’s high capex over the next three years should be funded by internal cashflows with strong support from India and high profitability of its joint ventures. In our view, Cadila’s India portfolio should see a 15% CAGR as it has high exposure to slower-growing molecules with 60% sales derived from molecules with market growth <15%. However, Cadila has shown strong capability of gaining market share across therapies and could surprise positively. The launch of vaccines from FY15 onwards should add another 90 bp to India growth for every 1% incremental market share growth. The recent acquisition of Biochem was complementary to minimal portfolio overlap and we expect lower margin of Biochem to be offset by higher sales force productivity for Cadila (18% sales force addition CAGR over the past three years against 14% sales growth). Joint ventures with Nycomed and Hospira have been important funding sources for Cadila, and we expect near-term growth to be driven by supply of remaining three products to Hospira for the US, and medium-term growth through expansion of Hospira JV for additional products.
All ingredients in place to trade at large-cap multiple We initiate coverage on Cadila with an OUTPERFORM rating and a target price of Rs970 (20x FY14 EPS) with 21.4% upside. Cadila should have a higher earnings CAGR over the next three years (21%) compared with large-cap peers, and we expect RoCE to improve from 16% in FY12 to 21% in FY15 despite high capex during this phase. The recent de-rating was driven by a warning letter from the US FDA and a slowdown in the consumer business. We expect both to reverse now; sales growth for the consumer business rebounding in FY13 and the clearance of warning letter kick-starts approvals of low-competition products. Cadila is moving up the value-chain with the launch of difficult-to-formulate products, and its strong execution record provides multi-year growth visibility. Therefore, our target price of Rs970 is based on 20x FY14E EPS, in line with valuations of large-cap peers.
Focus on new technologies provides multi-year growth visibility for Cadila
We do not expect Cadila to make large acquisitions to attain the US$3 bn sales target by FY16
Nasal and Injectable upside is expected in FY13-14, Transdermal in FY15 and Respiratory and Biosimilars, thereafter
Cadila India should grow at 15% CAGR as 60% of Cadila sales come from molecules with market growth <15%
Launch of vaccines from FY15 should add another 90 bp to India growth for every 1% incremental market share growth
Cadila will have higher earnings CAGR over the next three years (21%) vs. large peers and RoCE should improve from 16% in FY12 to 21% in FY15

17 July 2012
Cadila Healthcare
(CADI.BO / CDH IN) 4
Sector valuation table Figure 7: Global valuation table for generic companies 16-July-2012 Mcap Rating Target Sales
(US$ mn) EBITDA
margin (%) EPS growth
(%) PE (x) PB (x) RoE (%) EV/EBITDA Year
ending (US$
mn) price
(local ccy)
T T+1 T T+1 T T+1 T T+1 T T+1 T T+1 T T+1
India
Sun Pharma 12,158 O 650 1,868 2,083 39 37 21 14 25.1 22.0 4.5 3.8 18 17 16.2 14.9 Mar
Dr. Reddy's 5,341 N 1670 2,390 2,670 23 22 27 12 19.0 17.4 4.0 3.3 21 19 11.1 9.9 Mar
Lupin 4,841 O 580 1,702 1,954 20 19 15 17 23.3 19.8 5.5 4.5 24 23 15.8 14.1 Mar
Cipla 5,091 O 360 1,750 1,988 25 25 27 14 18.7 16.4 3.0 2.6 16 16 13.4 11.5 Mar
Ranbaxy 3,968 U 390 2,412 2,299 18 15 53 31 26.0 19.9 4.9 4.0 19 20 16.1 12.2 Dec
GSK Pharma 3,304 U 1870 554 626 33 33 14 13 25.1 22.2 7.6 7.0 30 31 17.1 14.9 Dec
Cadila 3,091 O 778 1,260 1,351 20 20 24 22 20.2 16.5 5.1 4.1 25 25 15.4 12.9 Mar
Glenmark 1,977 O 375 1,001 1,112 20 19 27 16 17.9 14.6 3.5 2.9 20 20 15.9 13.0 Mar
Torrent 1,036 O 745 563 650 17 18 16 20 13.6 11.3 3.7 2.9 27 26 10.1 8.2 Mar
US
Teva 38,787 O 53 20,694 21,539 32 32 9 8 7.6 7.0 1.5 1.3 19 18 7.2 6.5 Dec
Mylan 9,469 O 28 6,898 7,245 27 28 23 10 8.9 8.1 2.3 2.0 25 25 7.7 7.3 Dec
Watson 9,828 O 98 5,574 6,931 24 24 22 23 13.3 10.7 2.4 2.1 18 19 7.9 6.6 Dec
Hospira 5,582 4,018 4,237 17 19 -29 25 16.0 12.7 1.7 1.5 11 12 9.9 8.0 Dec
Impax 1,374 640 702 32 30 94 13 11.5 10.3 1.8 1.6 16 16 5.0 6.2 Dec
Europe
Gedeon Richter 2,923 1,353 1,423 25 25 -3 6 14.1 13.1 1.3 1.2 9 9 7.9 7.5 Dec
Stada 1,845 2,351 2,509 19 20 4 12 9.7 8.7 1.5 1.4 16 16 7.2 6.6 Dec
Hikma 2,064 1,102 1,228 20 21 17 27 18.4 14.4 2.3 2.1 12 15 10.6 9.1 Dec
South Africa
Aspen 6,911 U 116 1,927 2,198 29 30 6 21 20.2 16.6 3.5 3.0 17 18 13.7 11.2 Jun
Adcock 1,284 U 50 576 639 24 25 3 11 13.1 11.9 2.9 2.6 22 22 8.6 7.7 Sep
Cipla Medpro 422 O 8.15 269 298 26 26 19 15 10.3 8.9 1.5 1.4 15 15 7.2 6.3 Dec
T = current year (FY13 for companies with Mar as year-end). Source: Bloomberg consensus, CS estimates for Indian companies
Figure 8: Embedded sales growth and margin assumptions in our target price of Rs970 Implied DCF assumptions
% split of Target price
Sales growth NOPAT margin Asset turnover ROIC
Last 5 years 0% 19% 14.8% 2.4x 18.7%
Next 3 years (FY15) 1% 17% 15.6% 2.1x 18.6%
Yr 4-10 (FY22) 10% 17% 15.6% 2.2x 20.9%
Yr 11-20 (FY32) 32% 15% 15.6% 2.2x 22.0%
Terminal Value 56% 4% 8.1% 2.0x 10.4%
Source: Company data, Credit Suisse estimates
Figure 9: Profitability and return for Cadila ex-JVs and ex-Wellness 2008 2009 2010 2011
EBITDA Margin
Cadila Consolidated 18% 19% 20% 20%
Wellness 11% 22% 25% 25%
JVs 85% 77% 55% 60%
Ex-JV and Ex-Wellness 16% 17% 18% 17%
ROCE
Cadila Consolidated 14.9% 17.1% 19.6% 21.2%
Wellness 164.6% 39.3% 64.7% 57.3%
JVs 81.7% 85.3% 61.4% 59.9%
Ex-JV and Ex-Wellness 10.0% 14.1% 15.7% 16.2%
Source: Company data, Credit Suisse estimates

17 July 2012
Cadila Healthcare
(CADI.BO / CDH IN) 5
US generics—the next growth-driver Cadila’s US$3 bn sales by FY16 target suggests direction of business mix going forward, with the US generics as the next growth-driver (US = 33% of US$3 bn sales vs. 24% in FY12). In our view, Cadila cannot achieve the US$3 bn target by FY16 (requiring 30% sales CAGR) organically, and we do not expect Cadila to make significant acquisitions as well since: (1) past acquisitions were aimed at obtaining new skill sets rather than scale and (2) low FCF and high leverage limit Cadila from making large acquisitions. Focus on new technologies provide multi-year growth visibility with upside from Nasal sprays and Injectable starting from FY13-FY14, Transdermal and Vaccines unfolding from FY15 followed by Respiratory and Biosimilars in the developed markets.
Sales mix more diversified now with the US as the next growth-driver Cadila has diversified its sales mix significantly from being a domestic market focused company in 2005 to exports accounting for half of FY12 sales (Figure 10). This was helped by several small acquisitions across the US, Europe and the emerging markets (Figure 13). The company now has an aspirational sales target of US$3 bn by FY16 which we believe is difficult to achieve in terms of timing, but the target sales mix does highlight that the next growth-driver for Cadila is primarily the US generic market.
Figure 10: Cadila is much more diversified now with increasing contribution of the US
0%
10%
20%
30%
40%
50%
60%
70%
80%
90%
100%
2005 2008 2012 $3bn target
US EU India EMs JVs API
Sales = $US 250mn $US 450mn $US 1,000mn $US 3,000mn
Source: Company data, Credit Suisse estimates
Don’t expect significant acquisitions for US$3 bn target Achieving US$3 bn sales target by FY16 requires steep organic sales CAGR of 30% over the next four years, which, in our view, is difficult, and therefore, we believe that the target may be shifted by one or two years. The warning letter with regard to the US facility over the past one year has also made the target more difficult to achieve by FY16. We do not expect Cadila to go after large acquisitions to achieve the target despite Cadila making many acquisitions in the past. Our analysis of the previous acquisitions suggest that almost all of them were aimed at acquiring new skill sets rather than acquiring scale.
Focus on new technologies provides multi-year growth visibility for Cadila
We do not expect Cadila to make large acquisitions to attain the US$3 bn sales target by FY16
Cadila’s US$3 bn sales target suggests US generics as the next growth-driver
Cadila is not expected to make significant acquisitions as (1) past acquisitions were aimed at obtaining new skill sets rather than scale and (2) low FCF and high leverage limit Cadila from making large acquisitions

17 July 2012
Cadila Healthcare
(CADI.BO / CDH IN) 6
The largest acquisitions for Cadila were the last two, namely, Nesher Pharma in the US acquired for US$60 mn (enabling Cadila to enter controlled-substance market in the US) and Biochem for approx US$110-120 mn (enabling Cadila to expand presence in the Anti-infective market). Though Biochem’s acquisition provides Cadila with scale in the Anti-Infective market in India, our analysis of Biochem’s India portfolio suggests less than 5% sales overlap between Cadila’s Anti-infective sales and Biochem’s portfolio, and therefore, we believe even Biochem’s acquisition was not for scale.
Additionally, current high leverage and high capex for the next two years do not give Cadila much flexibility to go for large acquisitions for the next two years (Figure 11). As a result, we expect Cadila to only grow at 17% CAGR over the next three years vs. 30% CAGR implied by the US$3 bn sales target.
Figure 11: High leverage and low FCF limit Cadila from making large acquisitions
-130%
-100%
-70%
-40%
-10%
20%
50%
80%
110%
-10,000
-8,000
-6,000
-4,000
-2,000
0
2,000
4,000
6,000
8,000
2004 2005 2006 2007 2008 2009 2010 2011 2012F 2013F 2014F 2015F
FCF Net Debt /Equity
Rs mn
Source: Company data, Credit Suisse estimates
Focus on new technologies provide multi-year growth visibility Cadila’s capex has been high in recent years and is expected to remain high for at least the next two years. asCadila is simultaneously working on several new technologies where upfront investment is high but returns are only back-ended. However, this provides multi-year growth visibility for Cadila. Upside from Transdermal in the US and Vaccines in India should start from FY15 while the upside from Nasals and Injectable should start from FY13-FY14. Cadila has already launched five biosimilars in India, but upside from regulated markets is only expected from FY17 onwards.
Figure 12: Focus markets and focus technologies for Cadila in future S. No. 15 focus markets % of FY12 sales Technology focus
1 India 49% Transdermal
2 US 24% Biosimilars
3 France 5% Vaccines
4 Spain 1% Injectable
5 Brazil 5% Inhalable
6 Mexico 0% Dermatology
7 Japan 1% New Chemical Entities
8-15 Eight markets of Asia Pacific + Africa (SriLanka, Philippines, Myanmar, Vietnam, South Arica, Uganda, Sudan and Algeria)
4%
Source: Company data
Upside from Nasal and Injectable is expected in FY13-14, Transdermal in FY15 and Respiratory and Biosimilars, thereafter

17 July 2012
Cadila Healthcare
(CADI.BO / CDH IN) 7
In terms of market focus, Cadila seeks to concentrate on 15 markets going forward (Figure 12). What is conspicuous from the market selection is the absence of Russia which is one of the most profitable markets globally. In our view, increasingly stringent regulations in Russia has resulted in Cadila not focussing on the country (Cadila was earlier present in Russia but shutdown operations). Nonetheless, the timing of Cadila in the Mexico market is perfect as the Mexico regulator has recently taken a series of steps to reduce approval timelines and eliminate requirement of setting up plant on Mexico soil. Cadila has already made 14 filings thus far in Mexico and expects to start commercial operations from 2013.
Figure 13: Past acquisitions of Cadila have been focussed on skill acquisitions than scale Year Target Country Rationale of acquisition
Acquisitions in India
1995 Indo Pharmaceutical Works India First acquisition by the group
2000 Recon healthcare India Boosted Cadila presence in Southern India market
2001 German Remedies India Enabled Cadila to gain leadership in women’s health, breathing-related ailments and cancer
2001 Aten brand India Cadila got Atenolol—a popular brand used for the treatment of high blood pressure and heart disease
2006 Carnation Nutra-analogue Foods India Acquired Nutralite brand which is part of Zydus Wellness today
2007 Liva Healthcare India Cadila entered Dermatology market (Liva also had presence in Respiratory)
2007 Sarabhai Zydus Animal Health India Cadila acquired the remaining 50% stake in its animal healthcare JV
2011 Bayer JV India Strengthened presence of Cadila in Gynaecology segment
2011 Biochem India Enabled Cadila to expand presence in Anti-infective market in India
USA
2002 Banyan Chemicals USA Gujarat-based company having US FDA approval for API plant
2005 Partnership with Mallinckrodt USA To expand presence in the US generics market and market product under label "Zypharma"
2008 Zydus Pharmaceuticals USA USA Cadila acquired the remaining 30% stake in Zydus Pharmaceuticals
2011 Nesher Pharmaceuticals USA Provided entry into controlled substance market in US and enhanced skill set in Extended Release technology
Europe
2003 Alpharma France France Entry into the French market
2008 Laboratorios Combix SL Spain Had a portfolio covering 17 molecules
2008 Etna Biotech SRL from Crucell NV Italy Provided Cadila with Vaccine technology platform
2011 Bremer Pharma GmbH from ICICI Bank
Germany Expands Animal healthcare business internationally—Bremer has distributor network in more than 50 countries
Japan
2007 Nippon Universal Pharma Japan Provided entry to Japanese generics market
Emerging Markets
2007 Nikkho Do Brasil Ltda. Brazil Provided Cadila an entry into Brazil branded generics market
2008 Majority stake in Simayla Pharma South Africa Manufactures pharmaceuticals in South Africa
2009 Simayla Pharmaceuticals South Africa Cadila acquired remaining 30% minority stake of Simayla Pharmaceuticals
Source: Company data, Credit Suisse estimates
Russia is not one of the focus market for Cadila !

17 July 2012
Cadila Healthcare
(CADI.BO / CDH IN) 8
Portfolio mix shifting to complex generics Cadila was a late entrant to the US generics but has demonstrated strong execution with more than 15% market share on >40% of its portfolio. The portfolio mix is now shifting towards low-competition products with expected launch of Nasal sprays and Injectable in FY13-14 (as warning letter for Moraiya facility is now resolved) and launch of first controlled-substance this year from Nesher. Cadila is the only Indian company working on the US$4 bn Transdermal market (40% already off-patent) and Cadila has already filed for two products and has five more under development. Upside from Transdermal should start to roll-out from FY15 (as filings were done in 2012). We expect US EBITDA CAGR of 30% over FY12-15 as strong sales growth is accompanied by margin expansion due to better product mix, warning letter resolution and Nesher turning EBITDA positive (as it launches one new product every six months).
Strong execution despite commodity portfolio Cadila was a late entrant to the US generics market and launched its first five products in 2006. Cadila followed a dual structure initially, with part of the product-basket launched through a marketing and distribution alliance with Mallinckrodt under the label “Zypharma”, and the rest marketed by Cadila itself under the label “Zygenerics”. Given the success under its own label, Cadila terminated its alliance with Mallinckrodt a year prior to its end-time. In our view, the current portfolio is a commodity portfolio with oral solids, but Cadila has demonstrated strong execution and has been able to get more than 15% market share on more than 40% of its total launches thus far (Figure 14). FY12 US sales for Cadila was US$260 mn.
Figure 14: Cadila has >15% volume market share on >40% of total US launches so far 2006 2007 2008 2009 2010 2011 2012
Total products in US 8 13 18 27 35 40 43
Cadila's volume mkt share Cadila's US portfolio split
0-5% 6 7 5 11 14 12 10 5-10% 1 3 8 6 6 8 11 10-15% 0 2 2 5 1 6 4 15-20% 0 0 1 2 4 4 5 > 20% 1 1 2 3 10 10 13
Source: IMS Health, Credit Suisse
Figure 15: >50% of Cadila’s US sales is from products having >15% value market share 2007 2008 2009 2010 2011 2012
Cadila's sales (US$ mn) 32 64 87 142 212 260
Cadila's value mkt share Cadila's US sales split
0-5% 27% 1% 11% 13% 2% 4%
5-10% 35% 55% 32% 21% 22% 37%
10-15% 31% 15% 27% 1% 28% 5%
15-20% 0% 6% 18% 14% 7% 8%
> 20% 7% 23% 12% 51% 41% 46%
Source: IMS Health, Credit Suisse
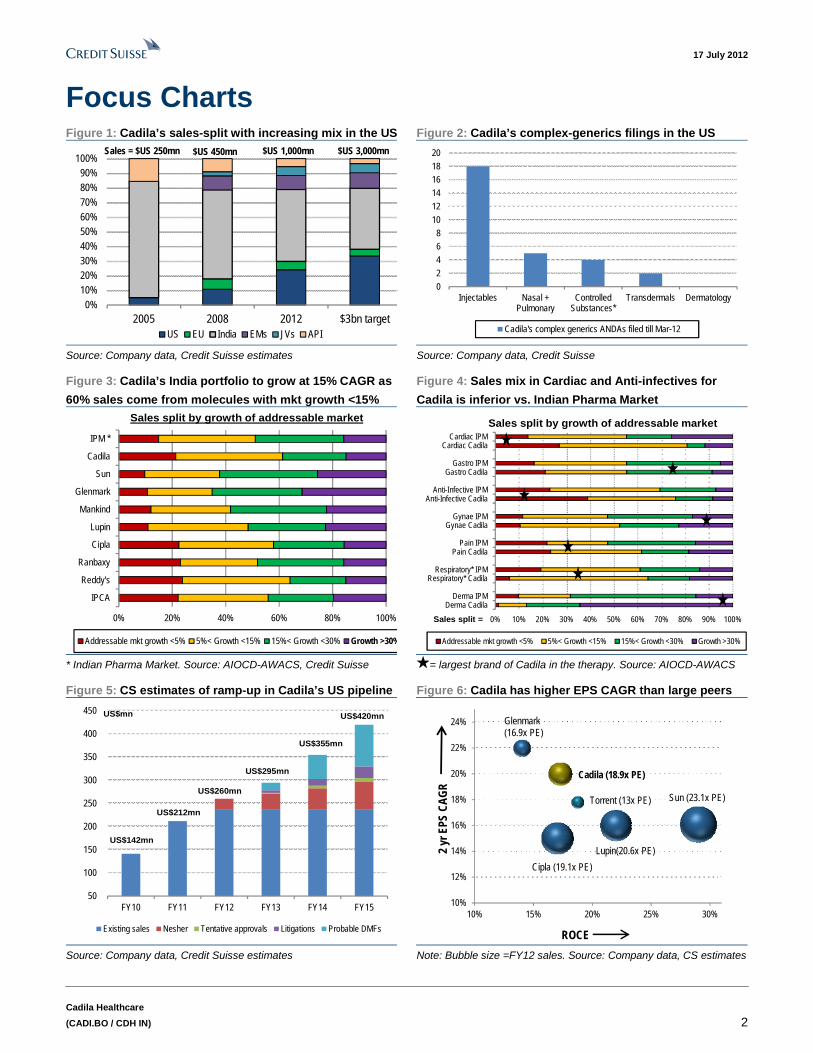
Portfolio mix changing towards complex generics After being successful in oral solids, Cadila shifted its filing trend towards complex generics and started filing ANDAs for Injectable and Nasals in 2009. Shift towards complex generics help reduce pricing pressure as competition is limited due to high entry barriers in complex generics (Figure 16). Currently, Cadila has 18 ANDA filings in Injectable and five Nasal filings. Additionally, Cadila is working on seven Transdermal filings, out of which, two were filed in FY12 (we believe, Clonidine and Diclofenac Epolamine). Nesher acquisition allows Cadila to launch controlled substances in the US
Nasal and Injectable upside is expected in FY13-14, Transdermal in FY15 and Respiratory and Biosimilars, thereafter
Cadila achieved >15% market share on more than 40% of its US portfolio
Nasal and Injectable upside is expected in FY13-14, Controlled substance in late FY13, and Transdermal from FY15 onwards
17 July 2012
Cadila Healthcare
(CADI.BO / CDH IN) 9
(Cadila plans to launch its first controlled substance in late FY13) and Cadila is yet to start filing for Derma applications in the US. We expect that upside from Injectable and Nasal filings should be available from FY13-14, while Transdermal upside will only start from FY15 (as filings were done in FY12). Overall, we are excited by the portfolio mix shifting towards complex generics for Cadila.
Figure 16: Higher complexity = higher entry barriers Figure 17: Cadila’s complex generics ANDA filings
0
2
4
6
8
10
12
14
16
18
20
Injectables Nasal +Pulmonary
ControlledSubstances*
Transdermals Dermatology
Cadila's complex generics ANDAs filed till Mar-12
Source: Mylan Feb-12 Investor day presentation *Nesher’s ANDA. Source: Company data, Credit Suisse
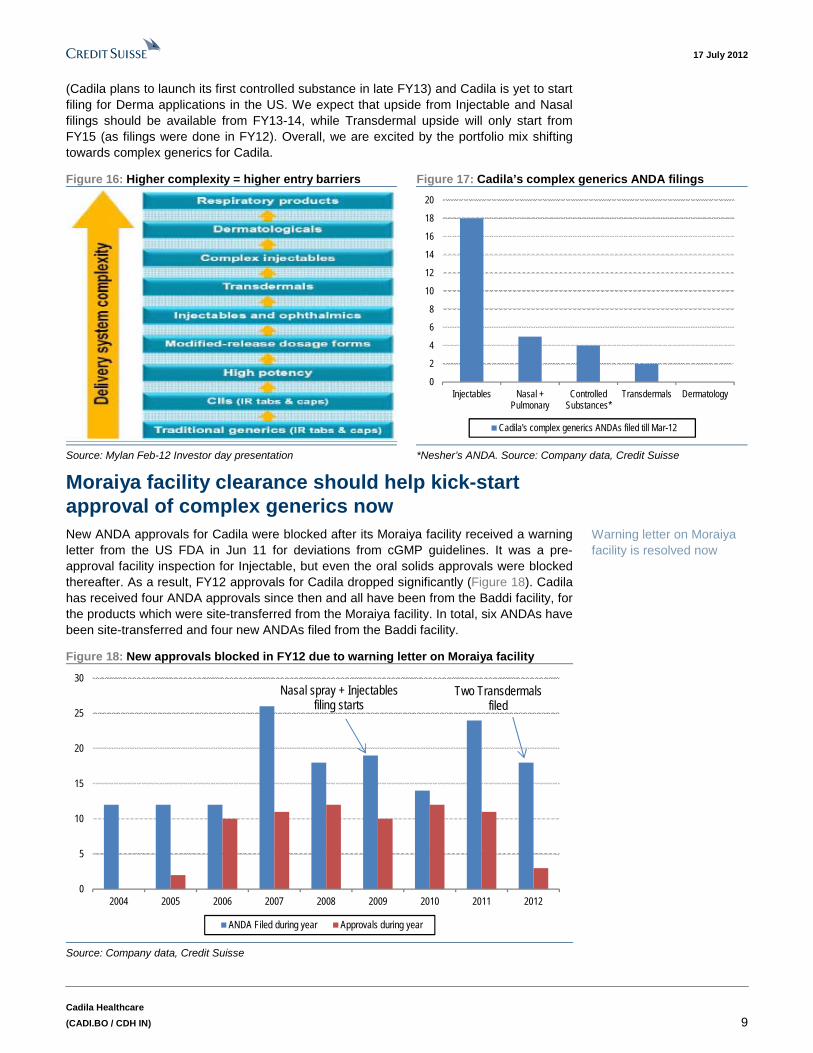
Moraiya facility clearance should help kick-start approval of complex generics now New ANDA approvals for Cadila were blocked after its Moraiya facility received a warning letter from the US FDA in Jun 11 for deviations from cGMP guidelines. It was a pre-approval facility inspection for Injectable, but even the oral solids approvals were blocked thereafter. As a result, FY12 approvals for Cadila dropped significantly (Figure 18). Cadila has received four ANDA approvals since then and all have been from the Baddi facility, for the products which were site-transferred from the Moraiya facility. In total, six ANDAs have been site-transferred and four new ANDAs filed from the Baddi facility.
Figure 18: New approvals blocked in FY12 due to warning letter on Moraiya facility
0
5
10
15
20
25
30
2004 2005 2006 2007 2008 2009 2010 2011 2012
ANDA Filed during year Approvals during year
Two Transdermals filed
Nasal spray + Injectables filing starts
Source: Company data, Credit Suisse
Warning letter on Moraiya facility is resolved now

17 July 2012
Cadila Healthcare
(CADI.BO / CDH IN) 10
Our reading of the warning letter suggests that the issues were primarily related to environmental monitoring of aseptic areas and appropriate training of microbiologists. The issues are more procedural in nature and could be addressed over time. Moraiya facility was re-inspected by US FDA in Feb 12 and the warning letter was resolved on 17 July 2012. Cadila already has tentative approvals on six products where the patent has expired, and the warning letter clearance should result in immediate launch of six-seven products.
Transdermal have high filing cost and few competitors In our view, Cadila is the only one among Indian companies working on Transdermals. Transdermal have high entry barrier as: (1) they require a dedicated facility and (2) per ANDA filing cost is much higher than plain-vanilla generics. In addition to bio-equivalency test required for plain generics, Transdermal also require Adhesion study (so that the patch properly sticks to the skin) and Skin Irritation and Sensitisation study. Number of subjects in these studies are higher than plain generics. Also, for the US market, skin studies need to be conducted on US patients. As a result, ANDA filing cost for even the simpler Transdermal is high (more than US$3-4 mn).
Figure 19: Transdermal in US—US$4 bn market
(LTM May 12)
Figure 20: Split of patented Transdermal market
(US$2.4 bn)
On-Patent60%
Off-Patent40%
Lidoderm50%
Exelon18%
Vivelle-DOT10%
Flector7%
Ortho EVRA
5%
Daytrana4%
Others6%
Source: IMS health, Credit Suisse Source: IMS health, Credit Suisse
Transdermal on the whole is a US$4 bn market in the US with 40% already genericised (Figure 19). Lidoderm is the largest product among the on-patented products whereas Fentanyl patch is the largest one among the genericised products (even after generisation, Fentanyl patch is a US$1 bn molecule). Among the generic companies, Mylan and Watson together control 55% of the generic market (Figure 22). Cadila has filed for two patches so far. We believe Cadila has filed for Clonidine patch (US$227 mn) and Flector patch (US$177 mn with patent expiry in Apr-2014) as these are the two compounds for which Cadila has already filed the DMF. Cadila further has five more Transdermal patches under development though it has not filed DMFs for them as yet.
Transdermal has high entry barrier as they also require Adhesion study and Skin Irritation and Sensitisation study, leading to much higher filing cost.
40% of US$4 bn Transdermal market is already off-patent
Cadila has filed for two patches so far (Clonidine and Flector) and has five under development

17 July 2012
Cadila Healthcare
(CADI.BO / CDH IN) 11
Figure 21: Split of generic Transdermal market
(US$1.6 bn)
Figure 22: Player-wise split of generic Transdermal
Fentanyl62%
Clonidine14%
Estradiol6%
Andoderm5%
Nicotine4%
Nitroglycerin3%
Others6%
Mylan37%
Innovators23%
Watson18%
Teva6%
Actavis4%
Sandoz2% Other
generics10%
Source: IMS Health, Credit Suisse Source: IMS Health, Credit Suisse
Nasal spray should start contributing in FY13-14 Cadila has filed for five Nasal applications so far in the US. Cadila started filing for Nasals in 2009 and therefore, upside from Nasal should be realised in 2013-2014 post clearance of Moraiya facility. In DMFs, Cadila has currently filed for Azelastine and has also settled the litigation with the innovator. Therefore, Azelastine (brand name Astelin, US$112 mn) could be the first nasal launch for Cadila (Apotex and Wallace have already been launched and Cobalt has settled, but not launched as yet), in our view.
Figure 23: Nasal in US—US$3 bn market (LTM May 12) Figure 24: Split of patented Nasal market (US$1.7 bn)
On-Patent56%
Off-Patent44%
Nasonex*60%
Veramyst9%
Astepro6%
Patanase6%
Omnaris5%
Flumist5%
Rhinocort4%
Nascobal2%
Fortical2%
Source: IMS health, Credit Suisse *Apotex won non-infringement case in Jun 12. Source: IMS health,
Credit Suisse
Nasal is a US$3 bn market in the US with generic market at US$1.3 bn (Figure 23). Nasonex is the largest branded product with market size of US$1 bn (Apotex won a non-infringement case against Merck in Jun 12), while Fluticasone is the largest generic product with size of more than US$550 mn. Roxane (Fluticasone) and Apotex (Fluticasone and Azelastine) are the two largest players controlling more than 40% of the genericised market (Figure 26).
Cadila started filing for Nasals in 2009 and thus should launch Nasals in FY13-14
44% of US$3 bn Nasals market is already off-patent
Azelastine nasal spray is one of the filed product for Cadila

17 July 2012
Cadila Healthcare
(CADI.BO / CDH IN) 12
Figure 25: Split of generic Nasal market (US$1.3 bn) Figure 26: Player-wise split of generic Nasal market
44%
13%11%
5% 4% 4% 3% 2% 2% 2% 2%
10%
0%
5%
10%
15%
20%
25%
30%
35%
40%
45%
50%Fl
utic
ason
e Pr
op
Tria
mcin
olon
e Ac
tn
Azel
astin
e
Sum
atrip
tan
Desm
opre
ssin
Salm
on C
alci
toni
n
Afrin
Dih
ydro
ergo
tam
ine
Flun
isol
ide
Cya
noco
bala
min
Calc
itoni
n
Oth
ers
Roxane27%
Innovators18%
Apotex15%
HIT10%
Bausch5%
Sandoz4%
Teva4%
Others17%
Source: IMS Health, Credit Suisse Source: IMS Health, Credit Suisse
Upside from complex generics to start in late FY13 Cadila acquired eight ANDAs during Nesher acquisition, out of which it plans to launch six. One is already launched and three-four are controlled substances from which the first launch is expected in late FY13 (Nesher’s facility is currently under consent decree and Cadila management expects to launch two products every year). Our estimates assume Nesher sales increases from US$30 mn currently to US$60 mn over the next three years. Nesher is marginally EBITDA-negative now, despite strong sales from Potassium Chloride, due to expenses related to consent decree. As the facility clears consent decree, Nesher’s EBITDA margins should improve materially.
Figure 27: CS estimates of ramp-up of Cadila’s US pipeline
150
200
250
300
350
400
450
FY12 FY13 FY14 FY15
Existing sales Nesher Tentative approvals Litigations Probable DMFs
US$mn
US$260mn
US$295mn
US$355mn
US$420mn
Source: Company data, Credit Suisse estimates
Our US sales expects upside from two patch launches in FY15 (under probable DMFs) but factor in only Azelastine nasal spray launch for Cadila (though Cadila has already filed for five nasals). Moraiya facility inspection was mainly for Injectable filings and these could surprise our estimates positively. Some significant products that we have factored in our estimates include Metoprolol Succinate launch in late FY13 or early FY14, Azelastine nasal spray launch, Clonidine patch in FY15, Flector patch in FY15, Niacin in FY15 and Lansaprazole and Gemcitabine launch in FY14.
Nesher is currently EBITDA-negative due to high expenses related to consent decree.
First controlled substance launch is expected in late FY13
We expect 30% EBITDA CAGR for the US over the next three years

17 July 2012
Cadila Healthcare
(CADI.BO / CDH IN) 13
Steady funding support from India and JVs Cadila’s high capex over the next three years should be funded by internal cashflows with strong support from India and high profitability of its JVs. In our view, Cadila’s India portfolio should grow 15% CAGR as it has high exposure to slower growing molecules with 60% sales derived from molecules with market growth <15%. However, Cadila has shown strong ability to gain market share across therapies and could surprise us positively. Launch of vaccines from FY15 onwards should further add 90 bp to India growth for every 1% incremental market share growth. Recent acquisition of Biochem was highly complementary with minimal portfolio overlap and we expect lower margin of Biochem to be offset by higher sales force productivity for Cadila (18% sales force addition CAGR over the past three years against 14% sales growth). JVs with Nycomed and Hospira have been important funding sources for Cadila, and we expect near-term growth to be driven by supply of remaining three products to Hospira for the US, and medium-term growth through expansion of Hospira JV for additional products.
Cadila’s India sales growth has underperformed IPM Cadila is currently ranked sixth in Indian Pharma market but has underperformed the India Pharma market growth over the past decade. Cadila has an Acute-dominated India portfolio accounting for 77% of India sales (Figure 34). Our analysis of the portfolio at the molecule-level suggests that 60% of Cadila’s sales comes from molecules where the market is growing less than 15% (Figure 29). This explains why Cadila has been underperforming industry average growth.
Figure 28: Cadila’s India sales growth has underperformed industry for the past 5 yrs
0%
2%
4%
6%
8%
10%
12%
14%
16%
18%
20%
0
5,000
10,000
15,000
20,000
25,000
2003 2004 2005 2006 2007 2008 2009 2010 2011 2012
Domestic Formulations (Rs mn, LHS) India growth Y-o-Y % (RHS)
Source: Company data, Credit Suisse
In fact, positioning of Cadila’s portfolio at the molecule-level has not improved much in the last the three years, where exposure to both, slow-growing molecules and the fastest-growing molecules, have increased, keeping overall growth for the India portfolio at similar levels (Figure 30).
India should grow at 15% CAGR as 60% of Cadila sales come from molecules with market growth <15%
Launch of vaccines from FY15 should further add 90 bp to India growth for every 1% incremental market share growth
Cadila has an Acute-dominated portfolio in India and has underperformed industry average growth over the past decade
Cadila’s portfolio positioning has not improved in the last three years

17 July 2012
Cadila Healthcare
(CADI.BO / CDH IN) 14
Figure 29: 60% of Cadila sales come from molecules
growing <15% = difficult for Cadila to grow >IPM
Figure 30: Cadila’s India portfolio has not improved much
in the last three years
0% 20% 40% 60% 80% 100%
IPM *
Cadila
Sun
Glenmark
Mankind
Lupin
Cipla
Ranbaxy
Reddy's
IPCA
Addressable mkt growth <5% 5%< Growth <15% 15%< Growth <30% Growth >30%
Sales split by growth of addressable market
0% 20% 40% 60% 80% 100%
IPM*
CadilaFY12
CadilaFY11
CadilaFY10
Addressable mkt growth <5% 5%< Growth <15% 15%< Growth <30% Growth >30%
Sales split by growth of addressable market - Cadila
Sales split
Source: AIOCD-AWACS, Credit Suisse Source: AIOCD-AWACS, Credit Suisse
Cadila has inferior mix in Cardiac and Anti-infectives A closer look at Cadila’s portfolio in Figure 31 suggests that Cadila’s sales mix in Cardiac and Anti-infective is inferior compared with the Indian Pharma market. This explains why Cadila has a higher exposure to slower growing molecules. We have also mapped the largest brand of Cadila in each of its therapy which shows that largest selling brand in Anti-infectives and Cardiac is growing less than 5% (largest brand in each therapy shown as “Star” in Figure 31). Cadila’s positioning in the high-growing Derma segment is strong, but it gets only 3% sales from the segment.
Figure 31: Cadila’s sales mix in Cardiac and Anti-infectives is inferior vs. IPM
0% 10% 20% 30% 40% 50% 60% 70% 80% 90% 100%
Cardiac IPMCardiac Cadila
Gastro IPMGastro Cadila
Anti-Infective IPMAnti-Infective Cadila
Gynae IPMGynae Cadila
Pain IPMPain Cadila
Respiratory* IPMRespiratory* Cadila
Derma IPMDerma Cadila
Addressable mkt growth <5% 5%< Growth <15% 15%< Growth <30% Growth >30%
Sales split by growth of addressable marketSales split by growth of addressable market
Sales split =
*Respiratory Acute , = Positioning of largest brand of Cadila in a therapy. Source: AIOCD-AWACS
Largest brand of Cadila in Anti-infectives and Cardiac is growing less than 5% (denoted by Star in Figure 31)

17 July 2012
Cadila Healthcare
(CADI.BO / CDH IN) 15
Figure 32: Largest brand of Cadila in each therapeutic area Product name Therapy Market growth % of India sales Launch date
Atenol Cardiac 3% 4% May-02
Pantoprazole Gastro 25% 3% Jun-01
Ampicillin + Cloxacillin Anti-Infectives -1% 2% Jan-88
Mifepristone + Misoprostol Gynae 106% 2% Jan-06
Etoricoxib Pain 8% 1% Mar-02
Theophylline + Etophylline Respiratory Acute 9% 3% Jul-02
Hydroquinone Combination Derma 44% 1% Mar-01
Formoteral + Budesonide Respiratory Chronic 29% 1% Feb-02
Source: AIOCD-AWACS, Credit Suisse
Biochem’s portfolio was complementary to Cadila but inferior in terms of growth mix Cadila acquired Biochem in Dec 11 for about US$110-120 mn. Biochem is primarily an Anti-Infective player with ~80% revenues contributed by Anti-Infective segment. After this acquisition, Anti-Infectives proportion in India sales for Cadila has increased from 7% to 16% (Biochem’s Anti-Infective sales were 1.6x Cadila’s Anti-Infective sales). Our analysis suggest that Biochem’s Anti-infective portfolio is highly complementary to Cadila with less than 5% sales overlap. However, we are not excited by Biochem’s growth mix at the molecule level with 90% sales coming from molecules growing at <15%. Unless Biochem gains market share, default growth for Biochem should not be more than 12-13%. Cadila’s management expects to realise cost synergies of Rs250 mn primarily through efficient material procurement. Additional current sales force productivity for Biochem is low at Rs2.9 mn per sales rep and has scope for improvement.
Figure 33: Biochem’s AI* portfolio was inferior to Cadila’s Figure 34: Therapy-split of Cadila’s India sales
0% 20% 40% 60% 80% 100%
AI* IPM
AI* Cadila +Biochem
AI* Cadila
AI* Biochem
Addressable mkt growth <5% 5%< Growth <15% 15%< Growth <30% Growth >30%
Sales split by growth of addressable market
Sales split
Cardiac17%
Gastro16%
Anti-Infectives16%
Gynae12%
Pain7%
Respiratory Acute6%
Vitamin4%
Derma3%
Respiratory Chronic
3%
Others16%
Anti-Infective before Biochem acquisition was
7% of India sales
*AI = Anti-Infectives. Source: AIOCD-AWACS, Credit Suisse Source: AIOCD-AWACS, Credit Suisse
Good execution track-record—bottleneck is portfolio positioning Our analysis of Cadila’s execution in India suggests that Cadila had shown good execution thus far. Cadila has gained market share in most of the therapies over the past two years (Figure 35). Even the market share loss in Cardiac and Anti-Infectives was not due to market share loss in individual molecules, but was more driven by lower proportion of faster growing molecules in the two therapies (Figure 31). In terms of prescription growth, Cadila’s prescriptions have grown at 3% CAGR vs. 5% for the Indian Pharma market (Figure 37) due to prescription share loss from general practitioners.
Biochem is the largest acquisition of Cadila with highly complementary portfolio in Ant-infectives.
We do not like Biochem’s molecule-level presence with 90% sales coming from molecules growing at <15%
Cadila has gained market share across therapies and the bottleneck is the positioning of portfolio with higher exposure to slower growing molecules

17 July 2012
Cadila Healthcare
(CADI.BO / CDH IN) 16
Figure 35: Cadila has gained mkt share in the last 2 yrs Figure 36: Sales force productivity has declined in the last
three years
(60)
(40)
(20)
-
20
40
60
80
100
120
140
Pain
Cardiac
Anti-infectivesRespiratory -
Acute
Vitamin
Overall
bps
Gastro
Derma
Gynae
Respiratory -Chronic
3.0
3.2
3.4
3.6
3.8
4.0
4.2
4.4
4.6
4.8
1,500
2,000
2,500
3,000
3,500
4,000
4,500
5,000
5,500
FY07 FY08 FY09 FY10 FY11 FY12
Medical reps Rs mn/ rep (RHS)
Source: AIOCD-AWACS, Credit Suisse Source: Company data, Credit Suisse
In the last three years, Cadila has increased its sales force by 18% CAGR but India sales have grown only 14% CAGR resulting in sales force productivity declining 14% (Figure 36). Sales force productivity should increase now, given sales growth should exceed field force addition.
Figure 37: Prescription growth for Cadila and Biochem have been lower than Indian Pharma market Prescription 2012 Doctor coverage 2012 Prescription 3 yr CAGR
Cadila Biochem IPM Cadila Biochem IPM Cadila Biochem IPM
General Practitioners 32% 46% 39% 39% 49% 38% -1% 3% 4%
Consulting Physician 14% 9% 9% 11% 8% 7% 3% 5% 5%
Gynaecologist 9% 6% 8% 11% 9% 9% 12% 7% 4%
Orthopaedic 8% 2% 4% 5% 2% 4% 6% 2% 6%
Dentist 7% 9% 9% 6% 5% 12% 7% -6% 7%
Gen.Surgeon 5% 5% 4% 5% 5% 4% -1% -11% 4%
Cardiologist 5% 2% 2% 4% 3% 2% 2% 1% 5%
Gastroenterologist 4% 2% 1% 2% 1% 1% 10% 40% 10%
Chest TB Specialist 3% 1% 2% 2% 1% 2% 15% -14% 8%
Nephrologist Urologist 2% 0% 1% 2% 0% 1% 8% -17% 7%
Diabetologist 2% 1% 1% 2% 1% 1% 18% 13% 10%
ENT 2% 4% 3% 2% 3% 3% -1% 5% 5%
Neurologist 2% 1% 1% 2% 1% 2% -2% 18% 11%
Paediatrician 2% 9% 8% 3% 8% 6% -5% -13% 5%
Dermatologist 1% 1% 2% 2% 2% 2% 15% -9% 7%
Psychiatrist 1% 0% 1% 1% 0% 1% 4% -10% 7%
Oncologist 1% 1% 0% 1% 1% 1% 16% -10% 4%
Ophthalmologist 0% 1% 4% 1% 1% 4% -2% 15% 4% Total 100% 100% 100% 100% 100% 100% 3% 0% 5%
Source: IMS Health, Credit Suisse
In the last three years, sales force increased by 18% CAGR but sales growth was only 14%

17 July 2012
Cadila Healthcare
(CADI.BO / CDH IN) 17
How much can Vaccines add to future growth? Among new technologies, Vaccines is one area that Cadila is working on, with India as the focus market. Etna Biotech acquisition in 2008 provided Cadila with a Vaccine technology platform. Cadila has already launched an indigenously developed and manufactured H1N1 vaccine and has a dedicated Vaccine Centre in Ahmedabad. Vaccine market in India is about Rs12 bn currently (IMS) and growing at more than 20%. We have not factored in upside from Vaccine launches in India, but we estimate that every incremental 1% market share gain in Vaccines should add 90 bp to India growth for Cadila.
JVs—high margins and provide strong funding support Cadila currently has three joint ventures (JVs)—with Nycomed, Hospira and Bayer, where only the latter is focussed on the Indian market. These JVs have been highly profitable for Cadila in the past (Pantoprazole API supply to Nycomed, and Taxotere supply to Hospira) and now, the JVs are servicing multi-products which provide stability to JV-revenues as well (Nycomed JV is supplying seven products and Hospira JV is supplying six products in Europe and three in the US). Near-term growth for the JV will be driven by supply of additional three products to Hospira in the US as Hospira launches them. For the medium-term growth, we assume that scope for Hospira JV will be expanded to additional products (the management has indicated that they are working on expanding the scope for Hospira JV for additional products).
In our estimates, both India and the JVs put together, accounted for >70% of consolidated EBITDA (ex-Wellness) for Cadila in FY12 and in our view, provides strong funding support for the group’s aspirational sales target of US$3 bn by FY16.
Figure 38: JVs accounted for 8% of FY12 sales but 19% of
FY12 EBITDA
Figure 39: India + JVs account for >70% of EBITDA
(Ex-Zydus Wellness)
0%
10%
20%
30%
40%
50%
60%
70%
80%
90%
-
500
1,000
1,500
2,000
2,500
3,000
3,500
4,000
4,500
5,000
FY08 FY09 FY10 FY11 FY12
JV sales (Rs mn) EBITDA margin (RHS)
0%
10%
20%
30%
40%
50%
60%
70%
80%
90%
100%
FY08 FY09 FY10 FY11 FY12
India JVs Others (Ex-Wellness)
Source: Company data, Credit Suisse estimates Source: Company data, Credit Suisse estimates
Every incremental 1% market share gain in Vaccines should add 90 bp to India growth for Cadila
India + JVs together account for 60% of consolidated cashflows
Near-term growth of Hospira JV to be driven by supply of remaining three products to the US, and medium-term growth through expansion of Hospira JV to additional products.

17 July 2012
Cadila Healthcare
(CADI.BO / CDH IN) 18
All ingredients in place, to trade at large-cap multiple We initiate coverage on Cadila with an OUTPERFORM rating and target price of Rs970 (20x FY14 EPS). Cadila should have higher earnings CAGR over the next three years (21%) compared with large-cap peers, and we expect RoCE to improve from 16% in FY12 to 21% in FY15 despite high capex during this phase. Recent de-rating was driven by warning letter from US FDA and slowdown in growth of the consumer business. We expect both to reverse now; sales growth for consumer business rebounding in FY13 and resolution of warning letter kick-starts approvals of low-competition products. Cadila is moving up the value-chain with launch of difficult-to-formulate products, and its strong execution record provides multi-year growth visibility. Therefore, our target price of Rs970 is based on 20x FY14 EPS, in line with valuation of large-cap peers.
Cadila has higher earnings CAGR but lower RoCE than peers Cadila trades at lower multiple than peers despite having higher earnings CAGR as current RoCE is lower and the improvement is dependent on margin expansion from low competition products. We expect the multiple gap to reduce as Cadila starts getting approvals for low competition products and demonstrates its ability to take market share on these products.
Figure 40: Cadila has higher earnings CAGR but lower RoCE than peers
Torrent (13x PE)
Sun (23.1x PE)
Glenmark (16.9x PE)
Lupin (20.6x PE)
Cipla (19.1x PE)
Cadila (18.9x PE)
10%
12%
14%
16%
18%
20%
22%
24%
10% 15% 20% 25% 30% 35%
ROCE
2 yr
EP
S C
AG
R
Note: Bubble size indicates FY12 sales. Source: Company data, Credit Suisse estimates
Cadila’s RoCE has been impacted by higher capex for new technologies (where the upside is more back-ended), acquisition of Nesher and Biochem in FY12 and reduction in JV profitability due to higher competition in Taxotere. We expect improvement in RoCE as new approvals start in the US but a significant improvement is limited by high capex.
Figure 41: RoCE improvement limited by high capex for the next two years Dupont (RoCE) 2006 2007 2008 2009 2010 2011 2012 2013F 2014F 2015F
EBIT margin 12% 13% 13% 16% 16% 16% 15% 17% 17% 18% Asset turns (Sales/ gross block) 1.8x 1.9x 2.0x 2.2x 2.3x 2.5x 2.3x 2.0x 1.9x 1.9x Gross Block/ capital employed 0.6x 0.6x 0.6x 0.5x 0.5x 0.5x 0.5x 0.5x 0.6x 0.6x RoCE 14% 16% 15% 17% 20% 21% 16% 18% 20% 21%
Source: Company data, Credit Suisse estimates
Cadila has higher earnings CAGR over the next three years (21%) vs. large peers and RoCE should improve from 16% in FY12 to 21% in FY15
Cadila’s RoCE is impacted by higher capex for new technologies, acquisition of Nesher and Biochem and reduction in JV profitability

17 July 2012
Cadila Healthcare
(CADI.BO / CDH IN) 19
We also attempt to split profitability and the return-ratio for Cadila, excluding JVs and Zydus Wellness (where Cadila owns 72% stake). Our calculations suggests material improvement in both, EBITDA margins and RoCE, for the stub in the past five years. We expect both the metrics to further improve as the US facility has got warning letter clearance.
Figure 42: Profitability and returns for Cadila ex-JVs and ex-Wellness 2008 2009 2010 2011
EBITDA margin
Cadila consolidated 18% 19% 20% 20%
Wellness 11% 22% 25% 25%
JVs 85% 77% 55% 60%
Ex-JV and ex-Wellness 16% 17% 18% 17%
RoCE
Cadila consolidated 14.9% 17.1% 19.6% 21.2%
Wellness 164.6% 39.3% 64.7% 57.3%
JVs 81.7% 85.3% 61.4% 59.9%
Ex-JV and ex-Wellness 10.0% 14.1% 15.7% 16.2%
Source: Company data, Credit Suisse estimates
Initiate with an OUTPERFORM, target price Rs970 The previous re-rating for Cadila was driven by strong execution in the US market (Figure 43) and the recent de-rating was due to lack of new approvals in the US and growth of Zydus Wellness slowing down (Figure 44). With clearance of the US facility, we expect Cadila’s stock to re-rate to 20x one-year forward PE.
Figure 43: Cadila’s one year forward PE multiple Figure 44: Zydus Wellness PE and Cadila ex-Wellness PE
-
5
10
15
20
25
Sep-03 Sep-05 Sep-07 Sep-09 Sep-11
US business ramp-up
Sector de-rating during Global Financial Crisis
Warning Letter for US facility
0x
5x
10x
15x
20x
25x
30x
35x
40x
Jan-11 Apr-11 Jul-11 Oct-11 Jan-12 Apr-12 Jul-12
Zydus Wellness P/E Cadila Ex Welness P/E
Revenue growth decline in Sugar Free and EverYuth
Warning Letter for US facility
Source: Datastream, Credit Suisse Source: Datastream, Bloomberg
Also, the growth of Zydus Wellness should now rebound as the company has again increased promotional activities around EverYuth and Sugar free (Wellness controls 90% of the market). We therefore expect growth to rebound to 15% CAGR in the next three years, but do not expect a significant higher growth unless Zydus Wellness introduces a completely new product (near-term focus is on promoting line-extensions of the existing products launched in the recent past Figure 45).
Both, margin and RoCE of ex-JV and ex-Wellness Cadila has improved over the past four years
Clearance of warning letter and growth rebound for Zydus wellness should lead to re-rating of Cadila
We expect 15% sales CAGR for Zydus Wellness

17 July 2012
Cadila Healthcare
(CADI.BO / CDH IN) 20
Figure 45: Recent launches were more focused on line-extensions Product Launch date Category
Acti Life FY12 (Nationwide launch) Nutritional milk additive for adults
Sugar Free Natura Sweet Drops FY11 Used in beverages
Sugar Free TeaLite Q1FY11 Iced tea
Sugar Free Mint Q2FY11 Mint
Purify Q1FY11 Hand Sanitizers
Nutralite eggless mayonnaise Q2FY11 Low fat mayonnaise
Sugar Free Herbvia FY11 Herbal sweetener
EverYuth Menz FY10 Skincare range for men
Source: Company data, Credit Suisse
We initiate on Cadila with an OUTPERFORM rating and target price of Rs970, based on 20x FY14 EPS, in line with industry average large-cap multiple. As we have discussed above, there are several limited competition opportunities in the US pipeline and we expect Cadila’s growth to sustain in the US for many years.
What growth assumptions does our target price reflect on DCF?
Our target price of Rs970 on DCF implies sales growth of 17% for the next ten years and 15% thereafter (Figure 46) with margin remaining same as the exit year of Mar 12 (assuming that lower margins in JVs going forward will be compensated by margin expansion from the scale-up in the US). Our Terminal growth assumptions include Cadila growing below India’s GDP growth rate and ROIC equaling cost of capital (WACC = 10.5%). More than half of the target price is contributed by Terminal value as Cadila is in a high capex phase currently, while the benefits are more back-ended.
Figure 46: Embedded sales growth and margin assumptions in our target price of Rs970 Implied DCF assumptions
% split of target price
Sales growth NOPAT margin Asset turnover ROIC
Last 5 years 0% 19% 14.8% 2.4x 18.7%
Next 3 years (FY15) 1% 17% 15.6% 2.1x 18.6%
Yr 4-10 (FY22) 10% 17% 15.6% 2.2x 20.9%
Yr 11-20 (FY32) 32% 15% 15.6% 2.2x 22.0%
Terminal value 56% 4% 8.1% 2.0x 10.4%
Source: Company data, Credit Suisse estimates
Figure 47: Sensitivity table for sales growth and margin in FY15-FY22 Yr 4-10 NOPAT Margin
13.5% 14.5% 15.5% 16.5% 17.5%
13% 652 724 797 869 942
15% 710 791 871 952 1,033
17% 787 878 970 1,061 1,153
19% 845 945 1,044 1,144 1,244 Sal
es
Gro
wth
21% 923 1,034 1,144 1,255 1,365
Source: Credit Suisse estimates
Figure 48: Sensitivity table for sales growth and margin in FY22-FY32 Yr 11-20 NOPAT Margin
13.5% 14.5% 15.5% 16.5% 17.5%
13% 794 852 911 966 1,023 15% 841 904 970 1,031 1,095 17% 903 975 1,049 1,118 1,190 19% 951 1,029 1,110 1,185 1,264 S
ales
G
row
th
21% 1,016 1,103 1,192 1,276 1,363
Source: Credit Suisse estimates
Our target price on DCF implies sales growth of 18% for the next ten years and 15% thereafter, with flat margins

17 July 2012
Cadila Healthcare
(CADI.BO / CDH IN) 21
Risks ■ 45% of India portfolio is exposed to pharma pricing policy. The jury is still out on
the form of pricing policy in India, where the Ministry of Health wants to impose a ceiling on drug prices in India. What is currently debated is whether the form of price control should be based on market-based pricing or on cost-based pricing. The drugs covered under pharma pricing policy are the medicines covered in the National Essential List of Medicines (NLEM 2011). 45% of Cadila’s portfolio in India is exposed to NLEM and may be impacted when the final form of pharma pricing policy is announced. In our view, unless government adopts cost-plus methodology, the impact should be moderate and should not lead to de-rating of the sector.
Figure 49: Cadila’s product level exposure to pharma pricing policy Product Therapy % of India sales
Atenolol Cardiac 3.8%
Atorvastatin Cardiac 3.4%
Pantoprazole Gastro Intestinal 3.2%
Artesunate Anti Malarials 3.1%
Mifepristone + Misoprostol Gynaecological 2.7%
Omeprazole Gastro Intestinal 2.4%
Norethisterone Gynaecological 2.0%
Dexamethasone Hormones 2.0%
Amlodipine Cardiac 2.0%
Bisacodyl Gastro Intestinal 1.9%
Source: AIOCD-AWACS, Credit Suisse estimates
■ Delay in approval of low competition products. Our estimates assume Cadila launching Nasal spray and Injectable products in the US in 2HFY13 and Nesher launching one more product in FY13. However, delay in consent decree procedures at Nesher or delay in approvals of low competition products impact our estimates adversely.
■ Hospira JV not expanded for additional products. Joint ventures have been an important source of funding for Cadila so far, and we have assumed that Hospira JV may be expanded for additional products (beyond supplying six products for Europe and six for the US). Therefore, we have assumed 15% sales CAGR for Hospira JV over the next three years.

17 July 2012
Cadila Healthcare
(CADI.BO / CDH IN) 22
Financial Summary Figure 50: Income statement Year-end 31 Mar (Rs mn) 2010 2011 2012 2013F 2014F 2015F
Revenues 35,741 44,647 50,900 60,456 71,622 82,638
EBITDA 6,959 8,607 9,105 11,891 14,213 16,487
Depreciation 1,339 1,269 1,579 1,768 1,814 2,021
EBIT 5,620 7,338 7,526 10,123 12,398 14,467
Non-operating income 465 1,087 416 434 542 930
Profit Before Tax 6,085 8,425 7,942 10,557 12,940 15,397
Income Tax 741 1,064 1,130 2,111 2,588 3,079
Net Profit 5,051 7,110 6,526 8,112 9,929 11,731
EPS (Rs.) 25 35 32 40 48 57
Source: Company data, Credit Suisse estimates
Figure 51: Balance sheet Year-end 31 Mar (Rs mn) 2010 2011 2012 2013F 2014F 2015F
Cash and cash equivalents 2,507 2,952 4,697 3,263 3,492 7,005
Receivables 4,668 7,652 8,863 10,527 12,471 14,390
Inventory 7,504 8,119 10,905 12,952 15,345 17,705
Other current assets 3,120 4,106 5,798 6,886 8,158 9,413
Total current assets 17,799 22,829 30,263 33,629 39,466 48,512
Net fixed assets 19,326 22,636 33,318 38,016 42,701 45,681
Total assets 37,332 45,672 63,792 71,851 82,374 94,400
Short Term Debt 2,466 2,653 9,728 5,521 5,521 5,521
Payables 6,196 8,306 9,064 10,766 12,755 14,716
Other Current Liabilities 2,489 2,827 2,739 2,587 3,142 3,690
Total Current Liabilities 11,151 13,786 21,531 18,875 21,418 23,928
Long Term debt 8,465 8,375 13,223 17,430 17,430 17,430
Other Liabilities 1,141 1,127 2,367 2,367 2,367 2,367
Total Liabilities 20,757 23,288 37,121 38,672 41,214 43,725
Share Capital 682 1,024 1,024 1,024 1,024 1,024
Share Premium 12,807 13,735 13,096 13,096 13,096 13,096
Retained earnings 2,796 6,956 11,647 17,821 25,378 34,306
Others 290 669 904 1,239 1,662 2,248
Total Equity 16,575 22,384 26,671 33,180 41,160 50,675
Source: Company data, Credit Suisse estimates
Figure 52: Cash flow statement Year-end 31 Mar (Rs.mn) 2010 2011 2012 2013F 2014F 2015F
Net profit 5,051 7,110 6,526 8,112 9,929 11,731
Depreciation & Amortization 1,339 1,269 1,579 1,768 1,814 2,021
Change in Working Capital (238) (2,137) (5,019) (3,249) (3,066) (3,022)
Operating Cash Flow 6,152 6,242 3,086 6,630 8,678 10,729
Change in Fixed Assets (3,483) (4,579) (12,261) (6,465) (6,500) (5,000)
Change in Investments 42 0 (5) 5 0 0
Total Investment Cash Flow (3,441) (4,579) (12,266) (6,461) (6,500) (5,000)
Change in Gross Debt (2,108) 83 13,163 0 0 0
Change in Equity 455 (49) (639) 0 (0) 0
Minority Interests 164 277 235 334 423 586
Dividend paid (1,237) (1,529) (1,835) (1,938) (2,372) (2,803)
Total Financing Cash Flow (2,726) (1,218) 10,925 (1,603) (1,949) (2,216)
Total Cash Flow (15) 445 1,745 (1,434) 229 3,513
Source: Company data, Credit Suisse estimates

17 July 2012
Cadila Healthcare
(CADI.BO / CDH IN) 23
Companies Mentioned (Price as of 16 Jul 12) Adcock Ingram Holdings Ltd (AIPJ.J, R60.2, UNDERPERFORM, TP R61) Aspen Pharmacare Holdings Ltd (APNJ.J, R129.55, UNDERPERFORM, TP R116) Bayer (BAYGn.DE, Eu57.57, OUTPERFORM, TP Eu60.00) Cadila Healthcare Ltd (CADI.BO, Rs798.75, OUTPERFORM, TP Rs970) Cipla Limited (CIPL.BO, Rs332.75, OUTPERFORM, TP Rs360.00) Cipla Medpro South Africa Ltd (CMPJ.J, R7.75, OUTPERFORM, TP R8.15) Dr. Reddy's Laboratories Limited (REDY.BO, Rs1,675.50, NEUTRAL, TP Rs1,670.00) Gedeon Richter (GDRB.BU, HUF36,855.00) Glaxo Smithkline Pharmaceuticals (GLAX.BO, Rs2,054.45, UNDERPERFORM, TP Rs1,870.00) GlaxoSmithKline plc (GSK.L, 1452 p, NEUTRAL, TP 1,430.00 p) Glenmark Pharmaceuticals (GLEN.BO, Rs381.00, OUTPERFORM, TP Rs430.00) Hikma (HIK.L, 670 p) Hi-Tech Pharma (HITK.O, $32.59) Hospira Inc (HSP, $33.80) Impax Laboratories, Inc. (IPXL, $20.51) IPCA Labs (IPCA.BO, Rs378.25) Lupin Ltd (LUPN.BO, Rs571.00, OUTPERFORM, TP Rs580.00) Mylan Inc. (MYL, $22.10, OUTPERFORM, TP $28.00) Ranbaxy Laboratories Limited (RANB.BO, Rs493.35, UNDERPERFORM, TP Rs390.00) Stada Arzneimittel (STAGn.DE, Eu25.40) Sun Pharmaceuticals Industries Limited (SUN.BO, Rs621.00, OUTPERFORM, TP Rs650.00) Teva Pharmaceutical Industries (TEVA, $41.14, OUTPERFORM, TP $53.00) Torrent Pharmaceuticals (TORP.BO, Rs647.90, OUTPERFORM, TP Rs745.00) Watson Pharmaceuticals (WPI, $77.14, OUTPERFORM, TP $98.00) Zydus Wellness (ZYDS.BO, Rs447.61)
Disclosure Appendix Important Global Disclosures Anubhav Aggarwal & Chunky Shah each certify, with respect to the companies or securities that he or she analyzes, that (1) the views expressed in this report accurately reflect his or her personal views about all of the subject companies and securities and (2) no part of his or her compensation was, is or will be directly or indirectly related to the specific recommendations or views expressed in this report.
See the Companies Mentioned section for full company names. 3-Year Price, Target Price and Rating Change History Chart for CADI.BO CADI.BO Closing
Price Target
Price
Initiation/ Date (Rs) (Rs) Rating Assumption
0
100
200
300
400
500
600
700
800
900
Closing Price Target Price Initiation/Assumption Rating
Rs
O=Outperform; N=Neutral; U=Underperform; R=Restricted; NR=Not Rated; NC=Not Covered
The analyst(s) responsible for preparing this research report received compensation that is based upon various factors including Credit Suisse's total revenues, a portion of which are generated by Credit Suisse's investment banking activities. Analysts’ stock ratings are defined as follows: Outperform (O): The stock’s total return is expected to outperform the relevant benchmark* by at least 10-15% (or more, depending on perceived risk) over the next 12 months. Neutral (N): The stock’s total return is expected to be in line with the relevant benchmark* (range of ±10-15%) over the next 12 months. Underperform (U): The stock’s total return is expected to underperform the relevant benchmark* by 10-15% or more over the next 12 months. *Relevant benchmark by region: As of 29th May 2009, Australia, New Zealand, U.S. and Canadian ratings are based on (1) a stock’s absolute total return potential to its current share price and (2) the relative attractiveness of a stock’s total return potential within an analyst’s coverage universe**, with Outperforms representing the most attractive, Neutrals the less attractive, and Underperforms the least attractive investment opportunities. Some U.S. and Canadian ratings may fall outside the absolute total return ranges defined above, depending on market conditions and industry

17 July 2012
Cadila Healthcare
(CADI.BO / CDH IN) 24
factors. For Latin American, Japanese, and non-Japan Asia stocks, ratings are based on a stock’s total return relative to the average total return of the relevant country or regional benchmark; for European stocks, ratings are based on a stock’s total return relative to the analyst's coverage universe**. For Australian and New Zealand stocks, 12-month rolling yield is incorporated in the absolute total return calculation and a 15% and a 7.5% threshold replace the 10-15% level in the Outperform and Underperform stock rating definitions, respectively. The 15% and 7.5% thresholds replace the +10-15% and -10-15% levels in the Neutral stock rating definition, respectively. **An analyst's coverage universe consists of all companies covered by the analyst within the relevant sector. Restricted (R): In certain circumstances, Credit Suisse policy and/or applicable law and regulations preclude certain types of communications, including an investment recommendation, during the course of Credit Suisse's engagement in an investment banking transaction and in certain other circumstances. Volatility Indicator [V]: A stock is defined as volatile if the stock price has moved up or down by 20% or more in a month in at least 8 of the past 24 months or the analyst expects significant volatility going forward.
Analysts’ coverage universe weightings are distinct from analysts’ stock ratings and are based on the expected performance of an analyst’s coverage universe* versus the relevant broad market benchmark**: Overweight: Industry expected to outperform the relevant broad market benchmark over the next 12 months. Market Weight: Industry expected to perform in-line with the relevant broad market benchmark over the next 12 months. Underweight: Industry expected to underperform the relevant broad market benchmark over the next 12 months. *An analyst’s coverage universe consists of all companies covered by the analyst within the relevant sector. **The broad market benchmark is based on the expected return of the local market index (e.g., the S&P 500 in the U.S.) over the next 12 months. Credit Suisse’s distribution of stock ratings (and banking clients) is:
Global Ratings Distribution Outperform/Buy* 47% (59% banking clients) Neutral/Hold* 41% (55% banking clients) Underperform/Sell* 10% (50% banking clients) Restricted 2%
*For purposes of the NYSE and NASD ratings distribution disclosure requirements, our stock ratings of Outperform, Neutral, and Underperform most closely correspond to Buy, Hold, and Sell, respectively; however, the meanings are not the same, as our stock ratings are determined on a relative basis. (Please refer to definitions above.) An investor's decision to buy or sell a security should be based on investment objectives, current holdings, and other individual factors.
Credit Suisse’s policy is to update research reports as it deems appropriate, based on developments with the subject company, the sector or the market that may have a material impact on the research views or opinions stated herein.
Credit Suisse's policy is only to publish investment research that is impartial, independent, clear, fair and not misleading. For more detail please refer to Credit Suisse's Policies for Managing Conflicts of Interest in connection with Investment Research: http://www.csfb.com/research-and-analytics/disclaimer/managing_conflicts_disclaimer.html
Credit Suisse does not provide any tax advice. Any statement herein regarding any US federal tax is not intended or written to be used, and cannot be used, by any taxpayer for the purposes of avoiding any penalties.
See the Companies Mentioned section for full company names. Price Target: (12 months) for (CADI.BO) Method: Our target price of Rs 970 is based on 20x financial year 2014 earnings. Our target multiple of 20x for Cadila is same as industry average multiple we use for large cap peers. Risks: Downside risks to our target price of Rs 970 include (1) Delay in approval of low competition products: Our estimates assume Cadila getting clearance of Nasal spray and Injectable products starting second half of Financial year 2013 and Nesher launching one more product in FY13. However delay in Consent Decree procedures at Nesher or approval delays impacts our estimates adversely (2) 45% of India portfolio is exposed to pharma pricing policy: We have not factored in any impact from probable Pharma pricing policy in India where 45% of Cadila's India portfolio is exposed to Essential drug list in India. (3) Hospira JV not expanded for additional products: Joint Ventures have been an important source of funding for Cadila so far and we have assumed that Hospira JV may be expanded for additional products (beyond supplying six products for Europe and six for the US) and therefore we have assumed 15% sales CAGR for Hospira JV over the next three years. Please refer to the firm's disclosure website at www.credit-suisse.com/researchdisclosures for the definitions of abbreviations typically used in the target price method and risk sections.
Important Regional Disclosures Singapore recipients should contact a Singapore financial adviser for any matters arising from this research report.
The analyst(s) involved in the preparation of this report have not visited the material operations of the subject company (CADI.BO) within the past 12 months.
Restrictions on certain Canadian securities are indicated by the following abbreviations: NVS--Non-Voting shares; RVS--Restricted Voting Shares; SVS--Subordinate Voting Shares. Individuals receiving this report from a Canadian investment dealer that is not affiliated with Credit Suisse should be advised that this report may not contain regulatory disclosures the non-affiliated Canadian investment dealer would be required to make if this were its own report. For Credit Suisse Securities (Canada), Inc.'s policies and procedures regarding the dissemination of equity research, please visit http://www.csfb.com/legal_terms/canada_research_policy.shtml.

17 July 2012
Cadila Healthcare
(CADI.BO / CDH IN) 25
The following disclosed European company/ies have estimates that comply with IFRS: GDRB.BU, HIK.L, STAGn.DE.
As of the date of this report, Credit Suisse acts as a market maker or liquidity provider in the equities securities that are the subject of this report.
Principal is not guaranteed in the case of equities because equity prices are variable. Commission is the commission rate or the amount agreed with a customer when setting up an account or at anytime after that. Taiwanese Disclosures: This research report is for reference only. Investors should carefully consider their own investment risk. Investment results are the responsibility of the individual investor. Reports may not be reprinted without permission of CS. Reports written by Taiwan-based analysts on non-Taiwan listed companies are not considered recommendations to buy or sell securities under Taiwan Stock Exchange Operational Regulations Governing Securities Firms Recommending Trades in Securities to Customers. To the extent this is a report authored in whole or in part by a non-U.S. analyst and is made available in the U.S., the following are important disclosures regarding any non-U.S. analyst contributors: The non-U.S. research analysts listed below (if any) are not registered/qualified as research analysts with FINRA. The non-U.S. research analysts listed below may not be associated persons of CSSU and therefore may not be subject to the NASD Rule 2711 and NYSE Rule 472 restrictions on communications with a subject company, public appearances and trading securities held by a research analyst account. • Anubhav Aggarwal, non-U.S. analyst, is a research analyst employed by Credit Suisse Securities (India) Private Limited. • Chunky Shah, non-U.S. analyst, is a research analyst employed by Credit Suisse Securities (India) Private Limited. For Credit Suisse disclosure information on other companies mentioned in this report, please visit the website at www.credit-suisse.com/researchdisclosures or call +1 (877) 291-2683. Disclaimers continue on next page.

17 July 2012 Asia Pacific/India Equity Research
HC0057.doc
This report is not directed to, or intended for distribution to or use by, any person or entity who is a citizen or resident of or located in any locality, state, country or other jurisdiction where such distribution, publication, availability or use would be contrary to law or regulation or which would subject Credit Suisse AG, the Swiss bank, or its subsidiaries or its affiliates (“CS”) to any registration or licensing requirement within such jurisdiction. All material presented in this report, unless specifically indicated otherwise, is under copyright to CS. None of the material, nor its content, nor any copy of it, may be altered in any way, transmitted to, copied or distributed to any other party, without the prior express written permission of CS. All trademarks, service marks and logos used in this report are trademarks or service marks or registered trademarks or service marks of CS or its affiliates. The information, tools and material presented in this report are provided to you for information purposes only and are not to be used or considered as an offer or the solicitation of an offer to sell or to buy or subscribe for securities or other financial instruments. CS may not have taken any steps to ensure that the securities referred to in this report are suitable for any particular investor. CS will not treat recipients as its customers by virtue of their receiving the report. The investments or services contained or referred to in this report may not be suitable for you and it is recommended that you consult an independent investment advisor if you are in doubt about such investments or investment services. Nothing in this report constitutes investment, legal, accounting or tax advice or a representation that any investment or strategy is suitable or appropriate to your individual circumstances or otherwise constitutes a personal recommendation to you. CS does not offer advice on the tax consequences of investment and you are advised to contact an independent tax adviser. Please note in particular that the bases and levels of taxation may change. CS believes the information and opinions in the Disclosure Appendix of this report are accurate and complete. Information and opinions presented in the other sections of the report were obtained or derived from sources CS believes are reliable, but CS makes no representations as to their accuracy or completeness. Additional information is available upon request. CS accepts no liability for loss arising from the use of the material presented in this report, except that this exclusion of liability does not apply to the extent that liability arises under specific statutes or regulations applicable to CS. This report is not to be relied upon in substitution for the exercise of independent judgment. CS may have issued, and may in the future issue, a trading call regarding this security. Trading calls are short term trading opportunities based on market events and catalysts, while stock ratings reflect investment recommendations based on expected total return over a 12-month period as defined in the disclosure section. Because trading calls and stock ratings reflect different assumptions and analytical methods, trading calls may differ directionally from the stock rating. In addition, CS may have issued, and may in the future issue, other reports that are inconsistent with, and reach different conclusions from, the information presented in this report. Those reports reflect the different assumptions, views and analytical methods of the analysts who prepared them and CS is under no obligation to ensure that such other reports are brought to the attention of any recipient of this report. CS is involved in many businesses that relate to companies mentioned in this report. These businesses include specialized trading, risk arbitrage, market making, and other proprietary trading. Past performance should not be taken as an indication or guarantee of future performance, and no representation or warranty, express or implied, is made regarding future performance. Information, opinions and estimates contained in this report reflect a judgement at its original date of publication by CS and are subject to change without notice. The price, value of and income from any of the securities or financial instruments mentioned in this report can fall as well as rise. The value of securities and financial instruments is subject to exchange rate fluctuation that may have a positive or adverse effect on the price or income of such securities or financial instruments. Investors in securities such as ADR’s, the values of which are influenced by currency volatility, effectively assume this risk. Structured securities are complex instruments, typically involve a high degree of risk and are intended for sale only to sophisticated investors who are capable of understanding and assuming the risks involved. The market value of any structured security may be affected by changes in economic, financial and political factors (including, but not limited to, spot and forward interest and exchange rates), time to maturity, market conditions and volatility, and the credit quality of any issuer or reference issuer. Any investor interested in purchasing a structured product should conduct their own investigation and analysis of the product and consult with their own professional advisers as to the risks involved in making such a purchase. Some investments discussed in this report have a high level of volatility. High volatility investments may experience sudden and large falls in their value causing losses when that investment is realised. Those losses may equal your original investment. Indeed, in the case of some investments the potential losses may exceed the amount of initial investment, in such circumstances you may be required to pay more money to support those losses. Income yields from investments may fluctuate and, in consequence, initial capital paid to make the investment may be used as part of that income yield. Some investments may not be readily realisable and it may be difficult to sell or realise those investments, similarly it may prove difficult for you to obtain reliable information about the value, or risks, to which such an investment is exposed. This report may provide the addresses of, or contain hyperlinks to, websites. Except to the extent to which the report refers to website material of CS, CS has not reviewed the linked site and takes no responsibility for the content contained therein. Such address or hyperlink (including addresses or hyperlinks to CS’s own website material) is provided solely for your convenience and information and the content of the linked site does not in any way form part of this document. Accessing such website or following such link through this report or CS’s website shall be at your own risk. This report is issued and distributed in Europe (except Switzerland) by Credit Suisse Securities (Europe) Limited, One Cabot Square, London E14 4QJ, England, which is regulated in the United Kingdom by The Financial Services Authority (“FSA”). This report is being distributed in Germany by Credit Suisse Securities (Europe) Limited Niederlassung Frankfurt am Main regulated by the Bundesanstalt fuer Finanzdienstleistungsaufsicht ("BaFin"). This report is being distributed in the United States by Credit Suisse Securities (USA) LLC ; in Switzerland by Credit Suisse AG; in Canada by Credit Suisse Securities (Canada), Inc.; in Brazil by Banco de Investimentos Credit Suisse (Brasil) S.A. or its affiliates; in Mexico by Banco Credit Suisse (México), S.A. (transactions related to the securities mentioned in this report will only be effected in compliance with applicable regulation); in Japan by Credit Suisse Securities (Japan) Limited, Financial Instrument Firm, Director-General of Kanto Local Finance Bureau (Kinsho) No. 66, a member of Japan Securities Dealers Association, The Financial Futures Association of Japan, Japan Securities Investment Advisers Association, Type II Financial Instruments Firms Association; elsewhere in Asia/Pacific by whichever of the following is the appropriately authorised entity in the relevant jurisdiction: Credit Suisse (Hong Kong) Limited, Credit Suisse Equities (Australia) Limited , Credit Suisse Securities (Thailand) Limited, Credit Suisse Securities (Malaysia) Sdn Bhd, Credit Suisse AG, Singapore Branch, Credit Suisse Securities (India) Private Limited regulated by the Securities and Exchange Board of India (registration Nos. INB230970637; INF230970637; INB010970631; INF010970631), having registered address at 9th Floor, Ceejay House,Dr.A.B. Road, Worli, Mumbai - 18, India, T- +91-22 6777 3777, Credit Suisse Securities (Europe) Limited, Seoul Branch, Credit Suisse AG, Taipei Securities Branch, PT Credit Suisse Securities Indonesia, Credit Suisse Securities (Philippines ) Inc., and elsewhere in the world by the relevant authorised affiliate of the above. Research on Taiwanese securities produced by Credit Suisse AG, Taipei Securities Branch has been prepared by a registered Senior Business Person. Research provided to residents of Malaysia is authorised by the Head of Research for Credit Suisse Securities (Malaysia) Sdn. Bhd., to whom they should direct any queries on +603 2723 2020. In jurisdictions where CS is not already registered or licensed to trade in securities, transactions will only be effected in accordance with applicable securities legislation, which will vary from jurisdiction to jurisdiction and may require that the trade be made in accordance with applicable exemptions from registration or licensing requirements. Non-U.S. customers wishing to effect a transaction should contact a CS entity in their local jurisdiction unless governing law permits otherwise. U.S. customers wishing to effect a transaction should do so only by contacting a representative at Credit Suisse Securities (USA) LLC in the U.S. Please note that this report was originally prepared and issued by CS for distribution to their market professional and institutional investor customers. Recipients who are not market professional or institutional investor customers of CS should seek the advice of their independent financial advisor prior to taking any investment decision based on this report or for any necessary explanation of its contents. This research may relate to investments or services of a person outside of the UK or to other matters which are not regulated by the FSA or in respect of which the protections of the FSA for private customers and/or the UK compensation scheme may not be available, and further details as to where this may be the case are available upon request in respect of this report. Any Nielsen Media Research material contained in this report represents Nielsen Media Research's estimates and does not represent facts. NMR has neither reviewed nor approved this report and/or any of the statements made herein. If this report is being distributed by a financial institution other than Credit Suisse AG, or its affiliates, that financial institution is solely responsible for distribution. Clients of that institution should contact that institution to effect a transaction in the securities mentioned in this report or require further information. This report does not constitute investment advice by Credit Suisse to the clients of the distributing financial institution, and neither Credit Suisse AG, its affiliates, and their respective officers, directors and employees accept any liability whatsoever for any direct or consequential loss arising from their use of this report or its content. Copyright 2012 CREDIT SUISSE AG and/or its affiliates. All rights reserved.