Domino's Pizza Inc. (DPZ) - Credit Suisse | PLUS
57
DISCLOSURE APPENDIX AT THE BACK OF THIS REPORT CONTAINS IMPORTANT DISCLOSURES, ANALYST CERTIFICATIONS, LEGAL ENTITY DISCLOSURE AND THE STATUS OF NON-US ANALYSTS. US Disclosure: Credit Suisse does and seeks to do business with companies covered in its research reports. As a result, investors should be aware that the Firm may have a conflict of interest that could affect the objectivity of this report. Investors should consider this report as only a single factor in making their investment decision. 25 June 2019 Americas/United States Equity Research Restaurants Domino’s Pizza Inc. (DPZ) Rating OUTPERFORM Price (21-Jun-19, US$) 280.33 Target price (US$) 320.00 52-week price range (US$) 300.67 - 234.35 Market cap(US$ m) 11,523 Enterprise value (US$ m) 14,963 Target price is for 12 months. Research Analysts Lauren Silberman 212 325 2720 [email protected] INITIATION Time to Get A Piece of This Pie; Initiate Outperform ■ We initiate coverage of Domino’s (DPZ) with an Outperform rating and $320 target price. DPZ is one of the best growth stories in restaurants, with ~10% revenue growth, margin expansion and benefits from repurchases driving an EPS CAGR of ~15% over the next four years. We believe concerns regarding the impact of third-party delivery could be overdone as the honeymoon phase wears off and carryout could offset pressure, with outperformance against SSS estimates as upside. Confidence in ~7% global unit growth is driven by global brand strength, domestic whitespace opportunities in a fragmented category and international master franchise agreements. ■ US SSS Outperformance: DPZ should maintain SSS momentum and share gains as one of the few companies with contribution from positive traffic, the only company with a frequency-based loyalty program, consistent value messaging, favorable franchisee relations (avg franchisee ~$975K EBITDA) and an industry-leading digital ecosystem supporting best-in-class execution. We estimate US SSS of 5.5% in 2019, with expectations for sequential improvement throughout the year against easing compares and reduced competitive headwinds from 1Q (Points for Pies, QSR chains delivery campaigns). Longer term, we model US SSS of ~5%. ■ Third-Party Delivery as NT Pressure, But Not LT Issue: An increasing number of cross-branded campaigns with national QSR chains, competition for delivery drivers and aggressive promos represent incremental competitive pressure NT. LT, pizza’s stable 10-yr ~$10BN delivery market share should largely hold, with pizza a cuisine that travels well and offers great value. Positioning as a delivery company could be a net positive for DPZ as delivery demand increases, while increased focus on carryout can drive incremental sales and help offset competitive pressures (~2/3 delivery, 1/3 carryout split). ■ Valuation: Our $320 target price is based on ~20.5x our NTM EBITDA in 12 months, implying ~28x our NTM EPS in 12 months (30x avg), in-line with current multiples. Key risks: competition, consumer spending, interest rates. Share price performance On 21-Jun-2019 the S&P 500 INDEX closed at 2950.46 Daily Jun22, 2018 - Jun21, 2019, 06/22/18 = US$292.39 Quarterly EPS Q1 Q2 Q3 Q4 2018A 2.00 1.84 1.95 2.62 2019E 2.20 2.08 2.11 3.07 2020E 2.44 2.43 2.46 3.79 Financial and valuation metrics Year 12/18A 12/19E 12/20E 12/21E EPS (CS adj.) (US$) 8.42 9.44 11.10 12.66 Prev. EPS (US$) - - - - P/E rel. (%) 186.3 172.0 162.6 156.3 Revenue (US$ m) 3,432.9 3,686.0 4,042.2 4,386.1 EBITDA (US$ m) 625.9 694.5 783.2 847.1 OCFPS (US$) 9.10 10.54 12.69 14.52 P/OCF (x) 27.5 26.6 22.1 19.3 EV/EBITDA (current) 24.0 21.6 19.2 17.7 Net debt (US$ m) 3,506 3,440 3,540 3,588 ROIC (%) 103.56 113.41 115.03 117.77 Number of shares (m) 41.10 IC (current, US$ m) 466.22 BV/share (Next Qtr., US$) -72.8 Dividend (current, US$) 2.60 Net debt (Next Qtr., US$ m) 3,400.6 Net debt/tot eq (Next Qtr.,%) -114.3 Source: Company data, Refinitiv, Credit Suisse estimates
-
Upload
khangminh22 -
Category
Documents
-
view
0 -
download
0
Transcript of Domino's Pizza Inc. (DPZ) - Credit Suisse | PLUS

DISCLOSURE APPENDIX AT THE BACK OF THIS REPORT CONTAINS IMPORTANT DISCLOSURES, ANALYST CERTIFICATIONS, LEGAL ENTITY DISCLOSURE AND THE STATUS OF NON-US ANALYSTS. US Disclosure: Credit Suisse does and seeks to do business with companies covered in its research reports. As a result, investors should be aware that the Firm may have a conflict of interest that could affect the objectivity of this report. Investors should consider this report as only a single factor in making their investment decision.
25 June 2019 Americas/United States
Equity Research
Restaurants
Domino’s Pizza Inc. (DPZ)
Rating OUTPERFORM Price (21-Jun-19, US$) 280.33 Target price (US$) 320.00 52-week price range (US$) 300.67 - 234.35 Market cap(US$ m) 11,523 Enterprise value (US$ m) 14,963 Target price is for 12 months.
Research Analysts
Lauren Silberman
212 325 2720
INITIATION
Time to Get A Piece of This Pie; Initiate
Outperform
■ We initiate coverage of Domino’s (DPZ) with an Outperform rating and $320 target price. DPZ is one of the best growth stories in restaurants, with ~10% revenue growth, margin expansion and benefits from repurchases driving an EPS CAGR of ~15% over the next four years. We believe concerns regarding the impact of third-party delivery could be overdone as the honeymoon phase wears off and carryout could offset pressure, with outperformance against SSS estimates as upside. Confidence in ~7% global unit growth is driven by global brand strength, domestic whitespace opportunities in a fragmented category and international master franchise agreements.
■ US SSS Outperformance: DPZ should maintain SSS momentum and share
gains as one of the few companies with contribution from positive traffic, the only company with a frequency-based loyalty program, consistent value messaging, favorable franchisee relations (avg franchisee ~$975K EBITDA) and an industry-leading digital ecosystem supporting best-in-class execution. We estimate US SSS of 5.5% in 2019, with expectations for sequential improvement throughout the year against easing compares and reduced competitive headwinds from 1Q (Points for Pies, QSR chains delivery campaigns). Longer term, we model US SSS of ~5%.
■ Third-Party Delivery as NT Pressure, But Not LT Issue: An increasing number of cross-branded campaigns with national QSR chains, competition for delivery drivers and aggressive promos represent incremental competitive pressure NT. LT, pizza’s stable 10-yr ~$10BN delivery market share should largely hold, with pizza a cuisine that travels well and offers great value. Positioning as a delivery company could be a net positive for DPZ as delivery demand increases, while increased focus on carryout can drive incremental sales and help offset competitive pressures (~2/3 delivery, 1/3 carryout split).
■ Valuation: Our $320 target price is based on ~20.5x our NTM EBITDA in 12
months, implying ~28x our NTM EPS in 12 months (30x avg), in-line with current multiples. Key risks: competition, consumer spending, interest rates.
Share price performance
On 21-Jun-2019 the S&P 500 INDEX closed at 2950.46
Daily Jun22, 2018 - Jun21, 2019, 06/22/18 = US$292.39
Quarterly EPS Q1 Q2 Q3 Q4 2018A 2.00 1.84 1.95 2.62 2019E 2.20 2.08 2.11 3.07 2020E 2.44 2.43 2.46 3.79
Financial and valuation metrics
Year 12/18A 12/19E 12/20E 12/21E EPS (CS adj.) (US$) 8.42 9.44 11.10 12.66 Prev. EPS (US$) - - - - P/E rel. (%) 186.3 172.0 162.6 156.3 Revenue (US$ m) 3,432.9 3,686.0 4,042.2 4,386.1 EBITDA (US$ m) 625.9 694.5 783.2 847.1 OCFPS (US$) 9.10 10.54 12.69 14.52 P/OCF (x) 27.5 26.6 22.1 19.3 EV/EBITDA (current) 24.0 21.6 19.2 17.7 Net debt (US$ m) 3,506 3,440 3,540 3,588 ROIC (%) 103.56 113.41 115.03 117.77
Number of shares (m) 41.10 IC (current, US$ m) 466.22 BV/share (Next Qtr., US$) -72.8 Dividend (current, US$) 2.60 Net debt (Next Qtr., US$ m) 3,400.6 Net debt/tot eq (Next Qtr.,%) -114.3 Source: Company data, Refinitiv, Credit Suisse estimates

25 June 2019
Domino’s Pizza Inc. (DPZ) 2
Domino’s Pizza Inc. (DPZ)
Price (21 Jun 2019): US$280.33; Rating: OUTPERFORM; Target Price: 320.00; Analyst: Lauren Silberman
Income Statement 12/18A 12/19E 12/20E 12/21E
Revenue (US$ m) 3,432.9 3,686.0 4,042.2 4,386.1 EBITDA (US$ m) 626 695 783 847 Depr. & amort. (54) (59) (65) (70) EBIT (US$) 572 635 718 777 Net interest exp (140) (149) (156) (157) PBT (US$) 433 487 562 619 Income taxes (68) (92) (112) (124) Profit after tax 365 395 450 496 Net profit (US$) 365 395 450 496 Other NPAT adjustments 0 0 0 0
Cash Flow 12/18A 12/19E 12/20E 12/21E
Cash flow from operations 394 440 514 568 CAPEX (120) (112) (100) (90) Free cashflow to the firm 274 328 414 478 Cash flow from investments (88) (71) (100) (90) Net share issue(/repurchase) (581) (223) (392) (391) Dividends paid (92) (105) (122) (136) Changes in Net Cash/Debt (388) 66 (100) (49)
Balance Sheet (US$) 12/18A 12/19E 12/20E 12/21E
Cash & cash equivalents 25 17 82 98 Account receivables 190 193 212 230 Other current assets 305 268 268 268 Total fixed assets 233 241 276 296 Investment securities - - - - Total assets 1,124 1,095 1,214 1,268 Total current liabilities 412 396 404 414 Shareholder equity (3,040) (2,986) (3,040) (3,061) Total liabilities and equity 1,124 1,095 1,214 1,268 Net debt 3,506 3,440 3,540 3,588
Per share 12/18A 12/19E 12/20E 12/21E
No. of shares (wtd avg) 43 42 41 39 CS adj. EPS 8.42 9.44 11.10 12.66 Prev. EPS (US$) Dividend (US$) 2.20 2.60 3.12 3.59 Free cash flow per share 6.33 7.85 10.22 12.22
Earnings 12/18A 12/19E 12/20E 12/21E
Sales growth (%) 23.1 7.4 9.7 8.5 EBIT growth (%) 9.7 11.0 13.1 8.1 Net profit growth (%) 29.5 8.1 14.0 10.2 EPS growth (%) 42.4 12.1 17.6 14.1 EBITDA margin (%) 18.2 18.8 19.4 19.3 EBIT margin (%) 16.7 17.2 17.8 17.7 Pretax margin (%) 12.6 13.2 13.9 14.1 Net margin (%) 10.6 10.7 11.1 11.3
Valuation 12/18A 12/19E 12/20E 12/21E
EV/EBITDA (x) 24.0 21.6 19.2 17.7 P/E (x) 33.3 29.7 25.3 22.1
Returns 12/18A 12/19E 12/20E 12/21E
ROIC (%) 103.6 113.4 115.0 117.8
Gearing 12/18A 12/19E 12/20E 12/21E
Net debt/equity (%) (115.3) (115.2) (116.4) (117.2)
Quarterly EPS Q1 Q2 Q3 Q4 2018A 2.00 1.84 1.95 2.62 2019E 2.20 2.08 2.11 3.07 2020E 2.44 2.43 2.46 3.79
Company Background
Domino's Pizza is the one of the world's largest pizza companies, with nearly 15,000 locations in more than 85 markets.
Blue/Grey Sky Scenario
Our Blue Sky Scenario (US$) 385.00
Our $385 one-year valuation in a blue sky scenario is based on an EV/EBITDA of ~22.5x our blue sky FY20 EBITDA. Our blue sky FY20 EBITDA is based on: 1) domestic SSS of 8%; 2) domestic unit growth of ~6%; and 3) operating margins of ~19%.
Our Grey Sky Scenario (US$) 235.00
Our $235 one-year valuation in a grey sky scenario is based on an EV/EBITDA of ~18x our grey sky FY20 EBITDA. Our grey sky FY20 EBITDA is based on: 1) domestic SSS of 3.5%; 2) domestic unit growth of ~4.5%; and 3) operating margins of ~16.5%.
Share price performance
On 21-Jun-2019 the S&P 500 INDEX closed at 2950.46
Daily Jun22, 2018 - Jun21, 2019, 06/22/18 = US$292.39
Source: Company data, Refinitiv, Credit Suisse estimates

25 June 2019
Domino’s Pizza Inc. (DPZ) 3
Executive Summary We initiate coverage of Domino’s Pizza (DPZ) with an Outperform rating and $320 target
price. DPZ is one of the best growth stories in restaurants, with ~10% revenue growth,
margin expansion and benefits from repurchases supporting EPS growth of ~15% over the
next four years.
Please refer to our views summarizing the Restaurants industry: US Restaurants Phone
To Table: Digitizing Restaurants.
■ DPZ Well Positioned for Global SSS Outperformance: DPZ has exhibited industry-
leading and consistent global SSS, with domestic SSS averaging ~9% and
international SSS averaging ~5.5% over the last five years. DPZ has consistently met
or exceeded its long-term SSS targets, currently 3-6% globally. While increasing
competitive pressure from third-party delivery companies has pressured SSS more
recently, we believe DPZ’s long-term strategy around value, digital and delivery well
positions the company for market share gains.
For 2019, we estimate domestic SSS of 5.5%, with expectations for sequential
improvement throughout the year as compares ease. We model domestic SSS of 5%
post 2019, toward the higher end of DPZ’s long-term SSS target of 3-6%. Our
confidence in ongoing SSS outperformance and market share gains comes from: 1)
historical precedent, with 32 consecutive quarters of positive US SSS averaging ~7.5%
since 2010 comprised of healthy traffic gains and average check increases; 2)
fragmented pizza market, with opportunities to gain share from independents, regional
chains and large chains; and 3) execution against sales initiatives, including ongoing
evolution of its digital platform, compelling and consistent value offers and benefits
from a greater focus on carryout.
We model international SSS of 3.1% in 2019, including sequential improvement
throughout the year as compares ease. Long term, we model international SSS of
~3.5%, toward the lower end of DPZ’s long-term SSS target of 3-6%, in-line with slower
growth over the last two years.
■ Delivery Concerns Could Be Overdone: Third-party delivery is likely to represent
incremental pressure near term, driven by: 1) increasing demand and supply from
third-party delivery providers fueling higher awareness; 2) aggressive
promotions/discounts; 3) QSR chains offering delivery; 4) cross-branded campaigns
between aggregators and large QSR chains; and 5) competition for delivery drivers.
Long term, we believe the pizza delivery market will largely maintain its delivery market
share, which has been ~$10BN for a decade. We view Domino’s as best positioned to
continue to gain share within the segment given the strength of its digital ecosystem
and long-term strategic approach. We expect Domino’s loyalty program and superior
execution in delivery will allow the company to maintain a competitive advantage even
against increasing competition.
■ Global Growth Opportunity Strong: We believe DPZ can reach 25,000 units by
2025, with contribution from accelerating domestic growth and continued robust
international development. The 25,000 unit growth target implies global growth of ~7%
over the next several years, including ~4.5% domestic unit growth and ~8%
international unit growth. We model global unit growth of ~7% through 2022, including
domestic unit growth of ~5% and international unit growth of ~8%. This compares to a
5-yr global growth CAGR of 7.9%, including 3.3% domestically and 11.2%
internationally.
Our confidence in development expectations comes from: 1) global brand strength,
fundamentals and operating momentum; 2) domestic whitespace opportunities with
fortressing strategy in existing markets; and 3) international development opportunities,
with increased visibility from master franchise agreements.

25 June 2019
Domino’s Pizza Inc. (DPZ) 4
■ Earnings Estimates: We expect top-line growth of ~9% over the next few years to
enable margin leverage for operating profit growth of ~10.5%. Together with accretion
from share repurchases, we model EPS growth of ~15% long term. For 2019, we
model EPS growth of ~12%, including dilution from the refranchising of company-
operated stores in New York. We also note 2020 includes a 53rd
week.
■ Valuation: Our $320 target price is based on ~20.5x our NTM EBITDA in 12 months,
implying a P/E multiple of ~28x our NTM EPS in 12 months. Our ~20.5x EV/EBITDA
multiple is in-line with DPZ’s current multiple and a premium to its 3-year average
multiple of ~19x. Our implied P/E multiple of ~28x is in-line with DPZ’s current trading
multiple and below its three-year average P/E multiple of ~30x.
■ Key risks include: 1) competition from pizza peers, other QSR chains and delivery
aggregators; 2) consumer spending; and 3) interest rates, as DPZ is highly levered at
~6x debt/EBITDA.

25 June 2019
Domino’s Pizza Inc. (DPZ) 5
Key Charts
Figure 1: DPZ has demonstrated system sales
growth of ~11% over the last five years, consistently
beating at least the lower end of long-term
guidance, with expectations to maintain 8-12%
growth over the next 3-5 years.
Figure 2: Execution against digital initiatives,
delivery and consistent value should support
ongoing SSS outperformance, even against
increased competitive pressures from delivery and
fortressing growth strategy.
Source: Company data, Credit Suisse estimates Source: Company data, Credit Suisse estimates
Figure 3: Following several years of international
SSS at the high-end of DPZ’s LT range, we model
international SSS toward the low-end of guidance
and in-line with slower growth over the last two
years.
Figure 4: We model global unit growth of 6.9% over
the next four years, relative to 7.9% growth over the
last five years and DPZ’s target of 6-8% growth over
the next three to five years.
Source: Company data, Credit Suisse estimates Source: Company data, Credit Suisse estimates
0%
2%
4%
6%
8%
10%
12%
14%
20
11
20
12
20
13
20
14
20
15
20
16
20
17
20
18
20
19E
20
20E
20
21E
20
22E
Sys
tem
Sale
s G
row
th
Domestic International DPZ LT Target
0.0%
2.0%
4.0%
6.0%
8.0%
10.0%
12.0%
14.0%
20
10
20
11
20
12
20
13
20
14
20
15
20
16
20
17
20
18
20
19E
20
20E
20
21E
20
22E
Dom
est
ic S
SS
Domestic SSS DPZ Target
0.0%
1.0%
2.0%
3.0%
4.0%
5.0%
6.0%
7.0%
8.0%
9.0%
20
10
20
11
20
12
20
13
20
14
20
15
20
16
20
17
20
18
20
19E
20
20E
20
21E
20
22E
Inte
rnatio
nal S
SS
International SSS DPZ Target
0.0%
2.0%
4.0%
6.0%
8.0%
10.0%
12.0%
20
13
20
14
20
15
20
16
20
17
20
18
20
19E
20
20E
20
21E
20
22E
Glo
bal U
nit
Gro
wth
Domestic International DPZ LT Target (6-8%)

25 June 2019
Domino’s Pizza Inc. (DPZ) 6
Figure 5: Delivery aggregators are growing at a
faster rate than pizza companies, highlighting
increasing competition.
Figure 6: Domino’s is currently trading at ~20.5x
EBITDA and we expect the company will maintain
its valuation premium to peers.
Source: Sensor Tower, Credit Suisse estimates
Note: Pizza Apps include Pizza Hut, Papa John’s, Hungry Howie’s, Domino’s, MyCicis, Little Caesars, Blaze, Papa Murphy’s, PizzaRev, Pieology and Marco’s. Delivery Apps include Grubhub, Seamless, Delviery.com, Postmates, DoorDash, Caviar and Uber Eats.
Source: FactSet, Credit Suisse estimates
0%
10%
20%
30%
40%
50%
60%
70%
80%
90%
Jan-1
2
Jun-1
2
Nov-
12
Apr-
13
Sep-1
3
Feb-1
4
Jul-1
4
Dec-
14
May-
15
Oct
-15
Mar-
16
Aug-1
6
Jan-1
7
Jun-1
7
Nov-
17
Apr-
18
Sep-1
8
Feb-1
9
Dig
ital A
pp D
ow
nlo
ad S
hare
Pizza Apps Delivery Apps
12.0x
14.0x
16.0x
18.0x
20.0x
22.0x
24.0x
Jun-1
6
Aug-1
6
Oct
-16
Dec-
16
Feb-1
7
Apr-
17
Jun-1
7
Aug-1
7
Oct
-17
Dec-
17
Feb-1
8
Apr-
18
Jun-1
8
Aug-1
8
Oct
-18
Dec-
18
Feb-1
9
Apr-
19
Jun-1
9
EV
/EB
ITD
A
NTM EV/EBITDA 3-yr Avg +1 Std Dev -1 Std Dev

25 June 2019
Domino’s Pizza Inc. (DPZ) 7
What is DPZ’s SSS outlook? Credit Suisse View
DPZ has exhibited industry-leading and consistent global SSS over the last ten years.
Domestic SSS have averaged ~9% over the last 20 quarters and international SSS have
averaged ~5.5%. While increasing competitive pressure from third-party delivery
companies has pressured SSS more recently, we believe Domino’s remains well
positioned for outperformance globally.
For 2019, we estimate domestic SSS of 5.5%, with expectations for sequential
improvement throughout the year as compares ease. Long term, we model domestic SSS
of 5%, toward the higher end of DPZ’s long-term SSS target of 3-6%. Our confidence in
ongoing SSS outperformance and market share gains comes from: 1) historical precedent,
with 32 consecutive quarters of positive US SSS averaging ~7.5% since 2010 and ~9%
over the last five years comprised of healthy traffic gains and average check increases; 2)
fragmented pizza market, with opportunities to gain share from independents, regional
chains and large chains; and 3) execution against sales initiatives, including ongoing
evolution of its digital platform, compelling and consistent value offers and benefits from a
greater focus on carryout.
We model international SSS of 3.1% in 2019, including sequential improvement
throughout the year as compares ease. Long term, we model international SSS of ~3.5%,
toward the lower end of DPZ’s long-term SSS target of 3-6%, in-line with slower growth
over the last two years.
Consensus Expectations
Consensus Metrix estimates domestic SSS of 4.7% in 2019 and ~4.2% longer term. For
international SSS, consensus models 2.8% in 2019 and ~3.4% longer term.
Brand strength supports continued share gains in
the US
Domino’s has demonstrated 32 consecutive quarters of positive US SSS averaging ~7.5%
since 2010 and ~9% over the last five years comprised of healthy traffic gains and
average check increases. Ongoing execution against key sales drivers should continue to
support outperformance relative to peers and capture market share in the fragmented
pizza category.
We model sequential improvement in SSS throughout 2019 as compares ease. We
believe accelerating digital download growth in 1Q19 (~40% vs ~17% in 4Q18) could be a
leading indicator for accelerating SSS growth in 2Q19 (driven by DPZ’s expanded Piece of
the Pie Rewards program). We also expect the impact of Chipotle’s free delivery bowl
promotion in early January and Taco Bell’s co-branded marketing campaign with Grubhub
offering free delivery in February/March were both incremental pressures in 1Q19.
Chipotle and Taco Bell are two of the strongest competitors in the QSR/fast casual space
currently, and we believe advertising around delivery could have had an incremental
impact. We do note a large marketing campaign by McDonald’s would also represent a
more significant competitive pressure point and is likely to come at some point in 2019.
We model domestic SSS of ~5.5% in 2019, which assumes consistent 2-yr SSS trends
through the year, relative to consensus expectations of ~4.7%. Long term, we model 5%
SSS, at the high end of DPZ’s long-term target of 3-6% and relative to consensus’ ~4%.
We model domestic SSS of ~5-5.5% over
the next few years, relative to DPZ’s long-
term target of 3-6%

25 June 2019
Domino’s Pizza Inc. (DPZ) 8
Figure 7: Domino’s is facing easing compares
throughout 2019, noting 2018 represents the easiest
compares over the last three years.
Figure 8: We expect SSS to accelerate throughout
2019 against easier compares.
Source: Company data, Credit Suisse Source: Company data, Consensus Metrix, Credit Suisse estimates
Figure 9: Domino’s has demonstrated SSS strength
in the US since 2010, with average SSS of 7.4%.
Figure 10: We model domestic SSS of 5.5% in 2019
& 5% long-term, relative to consensus expectations
of ~4.7% in 2019 & ~4-4.5% long term.
Source: Company data, Credit Suisse Source: Company data, Consensus Metrix, Credit Suisse estimates
Consistent and impressive SSS offer confidence in long-term share gains
US SSS have averaged ~7.5% since 2010, supporting ~500bps of pizza segment market
share gains. Despite a challenging restaurant industry backdrop and heightened
competitive environment, Domino’s has maintained its long-term strategy to grow market
share profitability with compelling value and innovation through the evolution of its digital
platform and delivery infrastructure.
Over the last several years, DPZ has raised its long-term SSS outlook, currently guided for
3-6%. While the market has gotten accustomed to DPZ outperforming targets, SSS within
the targeted 3-6% range is still well above peers and demonstrates enviable market share
gains. DPZ has consistently met or exceeded targets, adding to our confidence in the
outlook.
2.0%
4.0%
6.0%
8.0%
10.0%
12.0%
14.0%
1Q
16
2Q
16
3Q
16
4Q
16
1Q
17
2Q
17
3Q
17
4Q
17
1Q
18
2Q
18
3Q
18
4Q
18
Dom
est
ic S
SS
2.0%
2.5%
3.0%
3.5%
4.0%
4.5%
5.0%
5.5%
6.0%
6.5%
7.0%
1Q
19
2Q
19
E
3Q
19
E
4Q
19
E
1Q
20
E
Dom
est
ic S
SS
CSe
Consensus
0%
5%
10%
15%
20%
25%
0%
2%
4%
6%
8%
10%
12%
14%
20
10
20
11
20
12
20
13
20
14
20
15
20
16
20
17
20
18
2-y
r D
om
est
ic S
SS
1-y
r D
om
est
ic S
SS
1-yr Domestic SSS 2-yr Domestic SSS
0.0%
1.0%
2.0%
3.0%
4.0%
5.0%
6.0%
7.0%
2019E 2020E 2021E 2022E
Dom
est
ic S
SS
CSe Consensus DPZ Target
Domestic SSS Target +3-6%
US SSS have averaged
~7.5% since 2010, generating ~500bps of
US pizza segment market share gains

25 June 2019
Domino’s Pizza Inc. (DPZ) 9
Figure 11: Domestic SSS have averaged ~7.5%
since 2010, reflecting consistently impressive
performance on a 1-yr and 2-yr basis.
Figure 12: Domino’s has largely outperformed long-
term outlooks set by management, which have
increased over time.
Source: Company data, Credit Suisse Source: Company data, Credit Suisse
Fragmented industry sets an attractive backdrop
The pizza segment is the most fragmented in restaurants, with the five largest chains making
up 45% of segment sales. For comparison, the five largest burger chains comprise nearly
80% of burger sales and the five largest Mexican restaurant chains make up ~70% of sales.
In every other category outside of pizza, the segment leaders maintain at least 30% of the
market share, and on average, comprise ~45% of their respective segment sales.
Figure 13: Pizza is the most fragmented segment in
restaurants, with the top five largest chains making
up less than 50% of category sales.
Figure 14: Across all segments except pizza, the
market leader makes up 30%+ of the category’s
sales.
Source: Technomic, Credit Suisse estimates Source: Technomic, Credit Suisse estimates
Domino’s is the market share leader, with 15%+ of segment sales, representing an
increase of ~560bps over the last ten years. Small chains and independents have lost
~140bps of market share over the same period, while Pizza Hut and other large pizza
chains have together lost ~10% of the segment’s sales. We believe large chains are better
positioned to gain market share over time as the segment consolidates. Structurally higher
cost structures, a shift toward margin-dilutive delivery channels and technological
investment requirements are likely headwinds for the smaller companies.
Domino’s has exhibited average domestic system sales growth of ~12% per year over the
last five years, nearly triple the rate of the US pizza segment’s ~4% average growth. Many
of the larger and regional chains have donated share, highlighting opportunities to capture
share from both larger players as well as regionals/local pizza shops. Domino’s has
indicated a US market share target of at least 25%, consistent with other market share
leaders, driven by a combination of SSS and unit growth.
-10%
-5%
0%
5%
10%
15%
20%
25%
-6%
-4%
-2%
0%
2%
4%
6%
8%
10%
12%
14%
19
97
19
98
19
99
20
00
20
01
20
02
20
03
20
04
20
05
20
06
20
07
20
08
20
09
20
10
20
11
20
12
20
13
20
14
20
15
20
16
20
17
20
18
2-y
r D
om
est
ic S
SS
1-y
r D
om
est
ic S
SS
1-yr SSS 2-yr SSS
0.0%
2.0%
4.0%
6.0%
8.0%
10.0%
12.0%
14.0%
2010 2011 2012 2013 2014 2015 2016 2017 2018
Dom
est
ic S
SS
Domestic SSS DPZ Target
45% 14% 40%
0% 20% 40% 60% 80% 100%
Burgers
Chicken
Coffee
Bakery Café
Mexican
Sandwich
Frozen Desserts
Asian/Noodle
Pizza
Sales Composition by Segment
Sales Other Large Chains Small Chains & Independents
15%
0% 20% 40% 60% 80%
Burgers
Chicken
Coffee
Bakery Café
Mexican
Sandwich
Frozen Desserts
Asian/Noodle
Pizza
Market Leader by Sales
The pizza segment is the most fragmented in
restaurants, with the five largest pizza
chains making up just 45% of sales

25 June 2019
Domino’s Pizza Inc. (DPZ) 10
Figure 15: Small chain, independents and more
regionalized brands have lost ~700bps of market
share since 2009.
Figure 16: Large chains have represented the
majority of segment sales contribution, though
more recently, share losses from larger pizza
players have weighed on segment growth.
Source: Technomic, Credit Suisse estimates Source: Technomic, Credit Suisse estimates
Best-in-class digital ecosystem as a meaningful
growth driver
Domino’s maintains an industry-leading digital platform, which has supported
outperformance relative to pizza peers and the overall industry. The company uses digital
development to lead its innovation strategy and maintain a competitive advantage. For the
first time, Domino’s added “online ordering” as a reason customers purchase from
Domino’s in its 2018 Franchise Disclosure Document (FDD).
Digital represents ~65% of Domino’s sales, with the pizza segment overall generating the
highest levels of digital utilization across the industry. Domino’s digital ecosystem and
compelling loyalty program have supported robust sales growth and a meaningful
outperformance gap relative to peers. While there are increasing concerns that digital
ecosystems will become table stakes as more restaurants invest in technology and service
providers make it more affordable for smaller companies, we still believe DPZ’s proprietary
infrastructure and integrated operations will help the company sustain a competitive
advantage. Domino’s has the potential to transition to an unprecedented nearly 100%
digital ordering business, and we expect the company to continue to evolve to be at the
forefront of innovation.
We expect Domino’s to continue to evolve its digital ecosystem through both consumer
facing and back of house technology. Domino’s already offers a voice ordering channel,
and though not widely used, can potentially be leveraged for phone orders, unlocking
capacity. Phone orders represent ~25% of the business, so greater digital conversion
should meaningfully drive benefits for restaurant operations and profitability. With every
order guaranteed to be answered in any language and automatically offer add-
ons/suggested sell, the digital technology could actually improve the customer experience.
In addition, we expect utilization of in-store technology such as kiosks makes it possible to
generate labor savings and help in the transition to an increasingly digital company.
0%
10%
20%
30%
40%
50%
60%
70%
80%
90%
100%
20
09
20
10
20
11
20
12
20
13
20
14
20
15
20
16
20
17
20
18
Mar
ket
Shar
e
Papa Murphy's
Papa John's
Little Caesars
Pizza Hut
Domino's
Other Large Pizza
Chains
Small Chains &
Independents
0.0%
1.0%
2.0%
3.0%
4.0%
5.0%
6.0%
7.0%
2012 2013 2014 2015 2016 2017 2018
Sal
es
Gro
wth
YO
Y %
Large Pizza Chains Small Pizza Chains & Independents
Digital makes up ~65% of sales, with an
opportunity to reach an unprecedented nearly
~100% of sales over time

25 June 2019
Domino’s Pizza Inc. (DPZ) 11
Figure 17: The pizza segment leads the industry in
digital sales mix, with the top three largest pizza
players generating at least 50% of their sales
through digital channels.
Figure 18: More than 65% of sales come from digital
channels, with expectations to approach nearly
100% long term.
Source: Company data, Credit Suisse estimates Source: Company data, Credit Suisse estimates
High digital utilization and a large scale loyalty program offer Domino’s a significant
advantage to analyze, segment and target customers through personalized marketing
efforts and suggestive sell. Domino’s is one of the most aggressive in the industry with
suggestive selling, offering add-ons and upselling at nearly every step of the ordering
process. We expect this has been supportive of average check increases and should
continue to offer a benefit.
Figure 19: Domino’s uses suggestive sell at multiple times during the online
ordering process, likely a factor driving its healthy average mix.
Source: Domino’s Digital App
Mobile:
50%+
Mobile:
~75%
Mobile:
~75%
~65%
~50%+
~60%+
Domino's Pizza Hut Papa John's
Digital Sales Mix
0%
10%
20%
30%
40%
50%
60%
70%
80%
90%
100%
2010 2011 2012 2013 2014 2015 2016 2017 2018 Future
Dig
ital S
ales
Mix
Domino’s app suggests add-ons at each stage
of the ordering process, likely a
meaningful factor driving its average
check growth

25 June 2019
Domino’s Pizza Inc. (DPZ) 12
Figure 20: For comparison, Pizza Hut offers an “Extras” page for add-ons and
Papa John’s features popular add-ons at the top of its checkout screen.
Source: Pizza Hut Digital App, Papa John’s Digital App
Domino’s is arguably a pizza company, technology company and marketing company. The
Domino’s AnyWare platform provides a suite of ordering options, from Facebook
messenger to Amazon Alexa. We largely view the AnyWare platform as a marketing tool
to maintain relevancy and generate new news, with limited sales mix likely generated from
a tweet or Facebook message. The Hotspots program allows customers to order delivery
from nontraditional sites, though we expect minimal sales mix from the channel.
Figure 21: Domino’s offers a suite of fun and
innovative ordering platforms.
Figure 22: Domino’s offers 200K Delivery HotSpots
in the US, expanding delivery available to
nontraditional sites, though utilization is limited.
Source: Company data, Credit Suisse Source: Company data, Credit Suisse
2017 Slack
2016 Google Home
2016 Facebook Messenger
2016 Zero Clicks
2016 Apple Watch
2016 Amazon Alexa
2015 Text
2015 Tweet
2015 Pebble & Android Wear smartwatches
2015 Samsung Smart TV
2014 Voice
2014 Ford Sync AppLink
AnyWare Platform
Pizza Hut and Papa John’s both use
suggestive sell though separate from the
overall ordering process

25 June 2019
Domino’s Pizza Inc. (DPZ) 13
Both Pizza Hut and Papa John’s have increased investments to accelerate digital
development. Pizza Hut is playing a catch-up game to Domino’s, launching its Delivery
Tracker in early 2017, nearly a decade after Domino’s, and digital enhancements were
largely rolled out at once. Papa John’s similarly introduced its Papa Track in March 2017,
and has expanded into additional order channels, including Amazon Alexa, Apple and
Google Pay, evolved its loyalty program and expanded into a delivery partnership with
DoorDash. While pizza peers are beginning to offer similar headline features, we believe
Domino’s will maintain a competitive advantage given its holistic integration.
“Piece of the Pie” Loyalty Program
Domino’s “Piece of the Pie” loyalty program launched in late 2015 and is already one of
the largest in the industry, with ~20MM active users (ordered within last 6 months). The
ease of sign up and integration of the Pizza Profile make it a compelling and frictionless
process.
The loyalty program has consistently contributed meaningfully to SSS growth, with its
simplicity, ease of use and ease for customers to understand the value as sources of
strength. The frequency-based loyalty program rewards consumers 10 points for every
order, and consumers can redeem a free pizza once they reach 60 points. Benefits from
data analytics will likely accelerate over time given the large scale of its program.
Domino’s has created an integrated digital ecosystem built off of simplicity, consistency
and value that should continue to be a meaningful contributor to SSS going forward.
Figure 23: Domino’s frequency-based loyalty
program requires minimum spend of $60, which is
compelling relative to pizza peers.
Figure 24: We believe Domino’s loyalty program has
supported high levels of digital download share,
with Domino’s ~35% download share outpacing its
pizza market share (~15% overall and 26% among
large pizza chains).
Source: Company data, Credit Suisse estimates Source: Sensor Tower, Credit Suisse estimates
Domino’s recently launched a 12-week (February to April 2019) campaign through its
loyalty program by rewarding customers for eating any pizza, a creative attempt to acquire
new customers onto to the platform and capture more customer data. To earn points,
customers use the app to upload a picture of their pizzas, and can earn up to 60 total
points, the redemption value of a free pizza, over the promotional period.
Importantly, Domino’s used the program as an opportunity to inquire about competitors
and customers’ experiences. The company also inquired about other loyalty program
memberships to assess competitive overlap. Questions ranged from where customers
ordered the pizza from, how the pizzas were ordered, the quality of the pizza, the type of
pizza ordered (i.e., crust, sauce, cheese, meat) and reward program membership.
$60
$60
$75
$75
$100
$100
$100
$120
Domino's
Hungry Howie's Pizza
Pizza Hut
Papa John's
Marco's
PizzaRev
Pieology
Blaze Pizza
Spend Required For Reward
0%
10%
20%
30%
40%
50%
60%
70%
80%
90%
100%
1Q
14
2Q
14
3Q
14
4Q
14
1Q
15
2Q
15
3Q
15
4Q
15
1Q
16
2Q
16
3Q
16
4Q
16
1Q
17
2Q
17
3Q
17
4Q
17
1Q
18
2Q
18
3Q
18
4Q
18
1Q
19
%D
ow
nlo
ad S
hare Other Large Chains
Papa Murphy's
Little Caesars
Papa John's
Pizza Hut
Domino's
Domino’s frequency-based loyalty program
has meaningfully contributed to SSS
since it launched in late 2015

25 June 2019
Domino’s Pizza Inc. (DPZ) 14
Figure 25: Domino’s Points for Pies Promotion (February to April 2019)
Source: Domino’s App
Consistent value messaging
Execution against value has supported strength, through consistent permanent value
platforms, including a $5.99 Mix & Match deal, $7.99 carryout deal and $19.99 combo
meal deal. Domino’s has maintained its $5.99 deal for nearly a decade, with options
spanning the entire menu, encouraging trial, flexibility and limiting menu fatigue. The $5.99
Mix & Match deal requires the purchase of at least two items, setting a floor for minimum
tickets and supporting margins. Beyond the $5.99 deal, Domino’s has maintained a
permanent $7.99 large three topping carryout deal, which has helped drive growth in that
part of the business, as well as other periodic promos and deals.
Domino’s value strategy is based on consistency. Domino’s sends customers emails daily,
featuring its $5.99 Mix & Match deal in every single communication, and often includes its
$7.99 carryout and $19.99 combo in the majority of its communications. Additionally, its
homepage also features the three national value offers, communicating a consistent
message across channels and across time. For comparison, Pizza Hut also features its $5
Lineup and $7.99 online national price points on its website, though email marketing is
lacking (though has picked up in recent weeks). Papa John’s has relatively inconsistent
value messaging across different platforms.
Execution against consistent value
messaging has supported share gains

25 June 2019
Domino’s Pizza Inc. (DPZ) 15
Figure 26: Domino’s prominently features its three
value deals on its website.
Figure 27: Domino’s maintains a consistent
message by offering the same deal through its
email marketing (and selectively through text).
Source: Domino’s website Source: Domino’s Email – 5/9/19
Menu innovation is limited
Domino’s does not use menu innovation as a driver of growth. The company rarely
introduces new items to the menu. It appears the company’s strategy is to use value deals
as a consistent message, digital innovation as an opportunity to generate new news and
limits operational complexity to optimize operations..
In August 2016, Domino’s rolled out salads nationwide, which are available on the $5.99
meal deal and can help eliminate the veto vote, though unlikely a high volume category.
Bread twists were introduced in mid-2017, a complementary add-on with potential for
suggested sell and supportive of higher average tickets.
Increased focus on driving carryout business
As the rest of the restaurant industry shifts into the food delivery channel, Domino’s has
increased its focus on the carryout side of its business, which represents approximately
1/3 of sales. Domino’s has indicated carryout sales are largely incremental and supportive
of its fortressing strategy as consumers are less willing to travel long distances to pick up a
pizza. We believe this strategy allows the company to remain defensive as delivery
expands into different segments, and also offers added flexibility on value, as carryout
orders eliminate the cost of delivery. Further, in a tight labor market, particularly with
delivery drivers, carryout can help unlock some capacity and drive additional sales.
Carryout represents ~1/3 of Domino’s US sales mix, highlighting opportunity for further
growth. As other restaurants push the delivery message, we believe Domino’s could gain
further share in the carryout segment.
New menu innovation does not appear to be a
meaningful part of the strategy
Carryout sales can help offset increasing
competitive pressure in the delivery segment and unlock capacity

25 June 2019
Domino’s Pizza Inc. (DPZ) 16
Figure 28: Pizza delivery sales have remained
largely stable, while carryout has increased over the
last several years.
Figure 29: Carryout represents ~1/3 of sales for
Domino’s, with opportunities for further share gains
closer to competitors.
Source: Company data, Credit Suisse estimates Source: Company data, Restaurant Research Journal, Credit Suisse estimates
International market strong, but some slowdown
raises concerns
Domino’s has demonstrated 101 consecutive quarters of positive international SSS
averaging ~6% over the last ten years, largely driven by traffic growth. Growth has slowed
more recently, with 1Q19’s 1.8% SSS the lowest comp over the last decade. 2-yr SSS
trends have also decelerated, with 2018 2-yr trends down ~300bps to ~6.9%, relative to
~9.7% in 2017 and ~14.1% in 2016. 2017 and 2018 were the lowest international SSS
over the last 20 years.
We model international SSS of 3.1% in 2019 and ~3.5% longer term, near the low end of
DPZ’s long-term guidance of 3-6%. Our go-forward estimates are below historical
averages given ongoing expectations for an elevated drag from new store cannibalization
given DPZ’s fortressing strategy, more recently lower SSS and the potential impact of
increasing global delivery competition. Consensus models international SSS of 2.8% in
2019 and ~3.5% over the next few years, relatively in-line with the last two years.
Figure 30: International SSS have averaged ~6%,
though have decelerated more recently.
Figure 31: We expect international SSS of ~3.1% in
2019 and ~3.5% over the next several years, in-line
with consensus expectations and DPZ guidance.
Source: Company data, Credit Suisse estimates Source: Company data, Consensus Metrix, Credit Suisse estimates
$0MM
$5MM
$10MM
$15MM
$20MM
$25MM
$30MM
20
02
20
03
20
04
20
05
20
06
20
07
20
08
20
09
20
10
20
11
20
12
20
13
20
14
20
15
20
16
20
17
20
18
US
QS
R P
izza
Segm
ent
Sal
es
Delivery Carryout0%
10%
20%
30%
40%
50%
60%
70%
80%
90%
100%
Domino's Pizza Hut Papa John's Little Caesars
Sal
es
Mix
%
Dine-in
Carryout
Delivery
4%
6%
8%
10%
12%
14%
16%
2%
3%
4%
5%
6%
7%
8%
9%
20
08
20
09
20
10
20
11
20
12
20
13
20
14
20
15
20
16
20
17
20
18
2-y
r In
tern
atio
nal S
SS
1-y
r In
tern
atio
nal S
SS
1-yr International SSS 2-yr International SSS
0.0%
1.0%
2.0%
3.0%
4.0%
5.0%
6.0%
7.0%
2019E 2020E 2021E 2022E
Inte
rnat
ional
SS
S
CSe Consensus DPZ Target
International SSS Target +3-6%
We model international SSS of 3.1% in 2019
and ~3.5% LT, near the low end of DPZ’s 3-6%
target

25 June 2019
Domino’s Pizza Inc. (DPZ) 17
New store cannibalization pressuring international SSS
The proliferation of new store growth in existing markets is one factor weighing on
international SSS trends, with territory splits now making up the majority of unit growth in
certain markets.
In the United Kingdom, splits have had a ~200-300bps drag on SSS on the region’s SSS.
Going forward, the majority of new store openings are expected to be splits, which will
continue to pressure SSS. While sales appear to recover over time and the company
benefits from overall market share gains, near-term organic SSS growth will remain
pressured. With the UK one of DPZ’s largest international markets representing ~11% of
international stores, we expect international SSS to see a drag from this strategy.
Figure 32: The majority of new unit growth is
expected to come in the form of splits.
Figure 33: Increased unit growth and greater splits
have weighed on SSS.
Source: Company data, Credit Suisse estimates
Note: 2018 unit growth estimates reflect Domino’s Pizza Group (DOM) guidance for 2/3 split unit composition.
Source: Company data, Credit Suisse estimates
India represents ~12% of international units. SSS performance improved in 2018, though
unit growth has notably decelerated over the last two years. Recently, India’s master
franchisee, Jubliant Foodworks (JUBI), has indicated intent to incorporate the fortressing
strategy in certain areas through some store splits (which the market has done before).
Given the market’s relatively large store base and lower unit growth, the splits should not
have a material impact on the region’s SSS, though could add some pressure relative to
more recent quarters with modest unit growth. JUBI indicated new opens should not affect
SSS by more than 200-300bps, noting existing stores affected by splits return to the same
level within one year.
Figure 34: SSS have been somewhat volatile, with
2018 performance the strongest in several years.
Figure 35: Unit growth in the region has
decelerated, likely alleviating SSS pressure on the
base.
Source: Company data, Credit Suisse estimates
Note: SSS above reflect calendar quarters. Jubilant Foodworks (JUBI) FY end March 31.
Source: Company data, Credit Suisse estimates
Note: Unit growth reflects calendar years.
0.0%
2.0%
4.0%
6.0%
8.0%
10.0%
12.0%
0
10
20
30
40
50
60
70
80
90
100
2014 2015 2016 2017 2018
UK
New
Unit
Gro
wth
YO
Y %
UK
New
Unit
Opens
Splits Non-Split Unit Growth YOY %
-3.5pp
-2.5pp
-1.5pp
-0.5pp
0.5pp
1.5pp
2.5pp
3.5pp
0.0%
2.0%
4.0%
6.0%
8.0%
10.0%
12.0%
14.0%
16.0%
2013 2014 2015 2016 2017 2018
SS
S D
rag f
rom
Split
s
UK
SS
S
UK SSS excl splits UK SSS incl splits SSS drag from splits
-5.0%
0.0%
5.0%
10.0%
15.0%
20.0%
25.0%
2013 2014 2015 2016 2017 2018
India
SS
S
0.0%
5.0%
10.0%
15.0%
20.0%
25.0%
400
500
600
700
800
900
1,000
1,100
1,200
1,300
2013 2014 2015 2016 2017 2018
Unit
Gro
wth
YO
Y %
India
Units
Units Unit Growth YOY%

25 June 2019
Domino’s Pizza Inc. (DPZ) 18
Increasing penetration of global delivery aggregators
The proliferation of delivery aggregators has been a common theme across geographies
given the potential impact on the pizza segment and DPZ’s digital and delivery strength. In
the US, Domino’s has largely strayed away from delivery aggregators and does not
appear to have plans to add presence on a national scale (though franchisees may
choose to be on a third-party platform). Internationally, master franchisees appear to be
more open to at least testing partnerships with third-party providers as they grow in scale
and customer demand continues to shift toward delivery.
India tested delivery through third-party partners, though has since pulled back and
decided to control the end-to-end experience. The master franchisee, JUBI, has noted the
growth in third-party delivery driven by fundamental consumer changes (greater demand
for convenience, increasing number of women in workforce, more traffic/congestion) and
discounting. The company is working with aggregators from a platform presence
perspective, though not to complete the actual delivery.
The master franchisee, DOM, views delivery aggregators as a potential gateway to
acquire new customers. The company has been on an aggregator platform in Switzerland
for several years and in Norway and Iceland there is minimal if any aggregator presence.
In the UK, DOM recently ran a 20-store trial through Just Eat, indicating overall profit per
order was actually higher than a direct order, with nearly 40% of customers new to
Domino’s. The UK is extending the trial to more than 100 stores in 2019, highlighting
aggregators tend to appeal more to younger cohorts and can be a potential customer
acquisition channel.
DMP in Australia has also indicated it is partnering with aggregators across different
markets, viewing the platforms as a customer acquisition tool and a search engine. Given
lower discounts offered on these platforms, the orders are still profitable transactions.
DMP has also highlighted customers tend to be incremental and are different customers
not specifically entrenched to a brand or cuisine.
ALSEA has also called out the rise of third-party delivery apps pressuring Domino’s
delivery sales in Spain in particular.

25 June 2019
Domino’s Pizza Inc. (DPZ) 19
Will third-party delivery eat into Domino’s US market share? Credit Suisse View
No, we don’t expect the expansion of third-party delivery to meaningfully eat into Domino’s
US market share, though it is likely to represent incremental pressure for the foreseeable
future, driven by: 1) increasing demand and supply from third-party delivery providers
fueling higher awareness; 2) aggressive promotions/discounts; 3) QSR chains offering
delivery; 4) cross-branded campaigns between aggregators and large QSR chains; and 5)
competition for delivery drivers. Long term, we believe the pizza delivery market will
largely maintain its delivery market share, and view Domino’s as best positioned to
continue to gain share within the segment given the strength of its digital ecosystem and
long-term strategic approach. We expect Domino’s loyalty program and superior execution
in delivery will allow the company to maintain a competitive advantage even against
increasing competitive pressure in the delivery channel.
In 1Q19, Domino’s reported its lowest domestic comp in 21 quarters (3.9% in 1Q19 vs 8.7%
avg over 21 qtrs), identifying aggressive promotional activity by delivery aggregators as a
pressure point. While Domino’s has historically indicated limited impact from aggregators, we
believe the 2019 inflection reflects: 1) partnerships and cross-marketing campaigns between
delivery aggregators and QSR chains, and 2) increased advertising by aggregators with
greater access to capital as they grow, particularly at times when the convenience of delivery is
more in demand. We believe the greatest delivery share risk is at the late night daypart, during
at-home events (i.e., major sporting events, elections, etc.) and with inclement weather.
Despite increasing competition, we believe the pizza segment will largely maintain its
delivery market share despite increasing competitive threats given: 1) customers largely
choose the pizza cuisine, limiting the potential share shift; 2) customers prefer individual
brand platforms over third-party aggregators; 3) pizza is a cuisine that maintains its
integrity and travels well; 4) pizza delivers attractive value to the customer based on the
amount of food; and 5) restaurant operators and delivery aggregators still have significant
challenges ahead to improve economics for all parties involved, ensure operational
execution, develop a better system to share data and to limit the customer shift to third-
party platforms. We do believe regional and local chains are facing greater risk given the
aforementioned challenges, as delivery becomes an expectation.
Consensus Expectations
We believe consensus is pricing in pressure from the increasing growth of delivery
aggregators, with domestic SSS estimates of ~4-4.5% over the next several years below
DPZ’s average ~9% over the last five years and lower than prior estimates (albeit in part
related to decelerating comps in recent quarters, also a function of increased competitive
pressure). A significant number of questions in recent quarters have been focused on the
impending impact of third-party delivery, and expectations for delivery market share
growth among other QSR chains to be sourced from the pizza segment.
Domino’s delivery infrastructure is a competitive
advantage…
Domino’s is the number one delivery player in the number one delivery category, uniquely
positioned relative to every other restaurant concept. While many large QSR competitors
have recently partnered with third-party providers, challenges remain, and likely
exacerbate over time as incrementality and the benefit of “newness” declines. Delivery is a
core competency for Domino’s, which we believe has been a meaningful driver of its
success. In contrast, even other pizza chains have failed to execute delivery at the same
level as Domino’s, and we’re unconvinced third-party aggregators will be able to approach

25 June 2019
Domino’s Pizza Inc. (DPZ) 20
Domino’s execution levels any time soon. That said, a flexible work schedule and
potentially higher pay could be a meaningful headwind in attracting delivery drivers for
Domino’s regardless of its proprietary delivery infrastructure.
■ Overall experience – Domino’s has full control of the customer experience, from initial
order to customer delivery. In contrast, restaurants on third-party platforms hand off
control to the third-party provider completing the last mile, though ultimately are
responsible for the end experiences. While customers currently appear more accepting
of lower quality delivery orders in exchange for convenience, we’re not sure they will be
as forgiving longer term.
■ Quality control – Restaurants have limited control over the quality of the food once it
is handed off to a third party. As third-party delivery drivers seek to maximize their
order count, the quality of the food could be secondary (i.e., could wait around for
multiple orders from restaurants before delivering). In contrast, Domino’s has strict
standards regarding food quality and maintains control over the “chain of custody.”
Based on discussions with franchisees from pizza competitors, the quality of the food
delivered by third-party aggregators has been an issue.
■ Economics – Delivery is expensive for all stakeholders, including delivery drivers,
restaurants and customers. Aggressive promotions and discounting have helped drive
customer demand for delivery, though third-party aggregators and restaurants have
borne much of that customer acquisition cost. Over time, we expect costs to largely
shift to customers in the form of inflated delivery menu prices, delivery fees and service
fees. While delivery demand seems relatively inelastic right now, we don’t view that as
sustainable on a larger scale. Additionally, pizza arguably offers one of the best value
propositions for customers, and as newness and aggressive discounting dissipates, we
think the value of pizza will help sustain the segment’s delivery market share.
■ Data – Third-party aggregators own the data transacted through their platforms, giving
minimal information to restaurants about their own customers, while also having
powerful and diversified data. In contrast, customer transactions through restaurants’
own branded platforms captures proprietary data that can be used to better market and
segment customers. Access to data from digital platforms has been a key driver of
success from industry-leading share gainers over the last several years, including
Domino’s, Starbucks and Panera. New up-and-coming restaurant chains are also
leaning into their digital strategies.
■ Customer Shift – Delivery through aggregator platforms alone creates risk that
customers will shift onto the platforms, get introduced to competitors and choose to
start at the platform in the future rather than consider the restaurant from the start.
We do believe presence on a platform could be beneficial should it be incremental to
the business and attract new customers, particularly as third-party aggregators
expand and acquire new customers. Domino’s digital ecosystem is a core tenet of its
success, and risk of customer shift could be high relative to restaurants with nascent
and small digital platforms.
…but not ruling out presence on delivery platforms
Domino’s has been very clear about its unwillingness to allow a third-party to complete the
last-mile of delivery given concerns around the quality of the food and experience.
Franchisees in select markets have signed up with aggregators, which could help offset
some risk of delivery share shift to platforms, while offering an opportunity to enter the
consideration sets of customers.
We do not expect Domino’s to partner with a third-party aggregator of any kind at a
national level, though we do believe franchisees have the decision to partner with
platforms for order aggregation.

25 June 2019
Domino’s Pizza Inc. (DPZ) 21
Domino’s has indicated company-operated delivery is the lower cost option relative to
outsourcing to third-party providers given scale. However, we expect if Domino’s followed
the strategy implemented by many QSR chains and inflated delivery menu prices on
aggregator platforms to cover commission costs and/or do not offer traditional promotions,
the economics could be compelling. However, we also recognize the added potential cost
of poor execution from third parties.
There is some level of overlap between digital Domino’s users and third-party platforms,
suggesting there could be some cannibalization from presence on platforms, but such is
limited. ~10-15% of Domino’s digital users also use the four largest third-party platforms
(Grubhub, DoorDash, Uber Eats, Postmates). Customers using these platforms could
choose to transact through third parties rather than Domino’s directly, which would be a
negative, though it seems to be relatively limited in scope, for now. On the other side, ~15-
20% of customers using third-party platforms also transact through Domino’s digitally. This
suggests Domino’s could access the ~80-85% of customers on these platforms not currently
transacting through Domino’s. This could represent an opportunity to attract new customers,
as well as reduce the impact of the growing popularity of third-party aggregators.
Figure 36: ~10-15% of Domino’s digital users also
use the four largest third-party platforms.
Figure 37: ~15-20% of third-party delivery
customers also transact with Domino’s digitally,
highlighting an opportunity for Domino’s to reach
seemingly incremental 80-85% of third-party
delivery customers.
Source: comScore, Credit Suisse estimates Source: comScore, Credit Suisse estimates
Competition for delivery stomach share is growing
Demand and supply from third-party delivery providers is growing
The exponential growth of third-party delivery providers undoubtedly represents a
competitive threat to the pizza segment, which has largely faced minimal competition in
the delivery channel to-date. Third-party delivery providers have meaningfully expanded
geographic coverage and the number of restaurants on their platforms. Many QSRs have
stepped up their investments and are increasingly engaging with third-party partners,
fueling growth in the delivery channel. Further, these third-party platforms help level the
playing field for smaller companies to engage with consumers on a large scale.
Industry conferences, articles, research and discussions have focused on the delivery
channel as the industry navigates through dynamic changes. This is transforming delivery
into a “need-to-have” channel, and third-party delivery is the fastest way to “turn on”
delivery, driving the growth of the aggregators.
Based on our analysis of digital app downloads over time, third-party delivery platforms
are meaningfully growing download share relative to pizza companies. Over the past
several years, growth in third-party platform downloads have outpaced that of traditional
pizza companies. While this is in part due to the relative newness of these platforms,
such highlights increasing demand for delivery. For reference, Domino’s has ~20MM+
0%
5%
10%
15%
20%
25%
Pizza Hut Papa
John's
GrubHub DoorDash Uber Eats Postmates
Pizza Peers Delivery
% D
om
ino's
Use
rs
Cro
ss V
isiti
ng
0%
5%
10%
15%
20%
25%
30%
Pizza Hut Papa
John's
GrubHub DoorDash Uber Eats Postmates
Pizza Peers Delivery
% P
izza
Peers
/Deliv
ery
Use
rs
Cro
ss V
isiti
ng

25 June 2019
Domino’s Pizza Inc. (DPZ) 22
active users on its digital platform. Grubhub has already amassed 19MM+ active users
as of the end of 1Q19 alone, and together with other aggregators, would meaningfully
top Domino’s users.
Figure 38: Delivery app providers are now growing
digital downloads at a faster rate than the pizza
players.
Figure 39: There is notable overlap among top
digital aggregators, highlighting competition in the
restaurant space overall as well as among delivery
providers.
Note: Read starting from left. Example: 34% of Uber Eats users also visit Grubhub. 19% of Grubhub digital users also use Uber Eats.
Source: SensorTower, Credit Suisse estimates
Note: Pizza Apps include Pizza Hut, Papa John’s, Hungry Howie’s, Domino’s, MyCicis, Little Caesars, Blaze, Papa Murphy’s, PizzaRev, Pieology and Marco’s. Delivery Apps include Grubhub, Seamless, Delviery.com, Postmates, DoorDash, Caviar and Uber Eats.
Source: comScore, Credit Suisse estimates
Figure 40: Based on Google search volumes by metro areas, Domino’s has lost relative volume share
compared to the largest delivery aggregators, highlighting the increasing competitive threat from these
players (we use Grubhub and DoorDash as proxies).
Source: Google Trends, Credit Suisse estimates
Aggressive promos and discounts have recently driven more compelling value proposition
Increasing advertising by the largest third-party delivery aggregator, Grubhub, the launch
of DoorDash’s first TV campaign in January and co-marketing campaigns between QSR
chains and third-party providers suggest increasing competition for share of voice in
delivery. Grubhub spent $170MM in advertising in 2018, a ~60% increase from 2017,
which does not even include free promotions it might offer with select partners (i.e., Taco
Bell). Many other platforms also fund free delivery periodically for select chains to drive
trial as part of the partnership.
0%
10%
20%
30%
40%
50%
60%
70%
80%
90%
Jan-1
2
Jun-1
2
Nov-
12
Apr-
13
Sep-1
3
Feb-1
4
Jul-1
4
Dec-
14
May-
15
Oct
-15
Mar-
16
Aug-1
6
Jan-1
7
Jun-1
7
Nov-
17
Apr-
18
Sep-1
8
Feb-1
9
Dig
ital A
pp D
ow
nlo
ad S
hare
Pizza Apps Delivery Apps
Uber Eats Grubhub DoorDash Postmates
Uber Eats 34% 35% 19%
Grubhub 19% 27% 12%
DoorDash 22% 30% 15%
Postmates 23% 27% 30%
Cross App Usage
2013 2014 2015
2016 2017 2018
25 June 2019
Domino’s Pizza Inc. (DPZ) 23
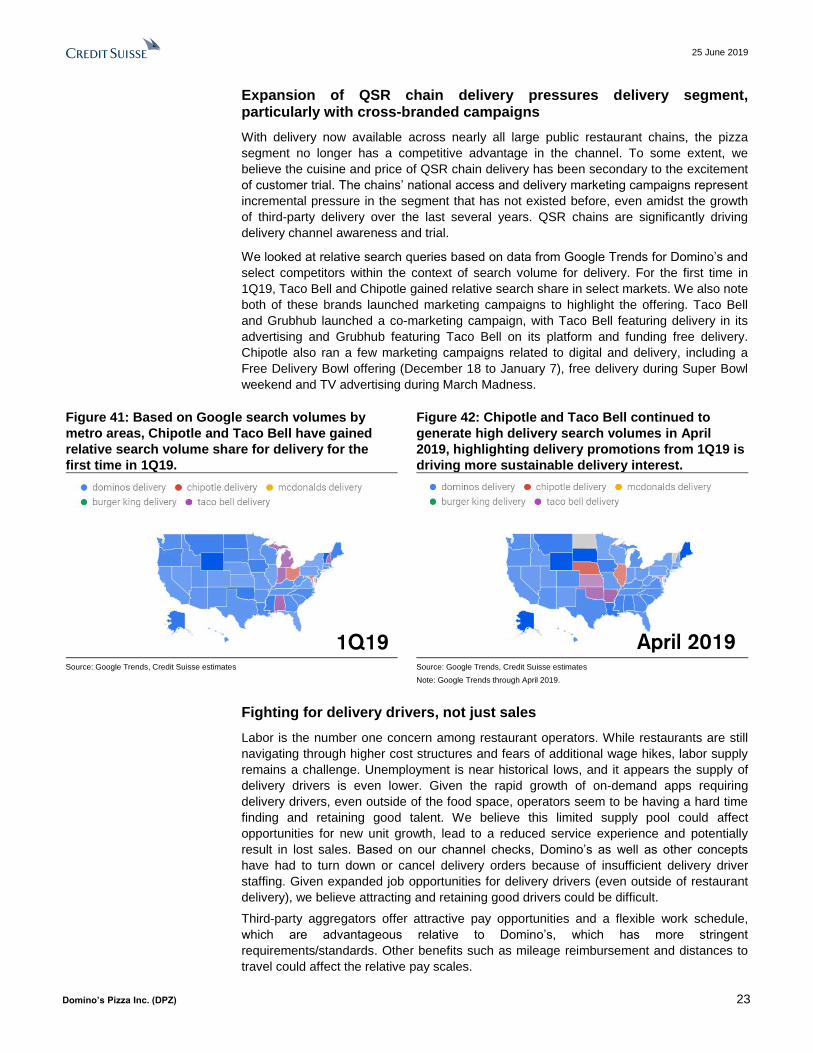
Expansion of QSR chain delivery pressures delivery segment, particularly with cross-branded campaigns
With delivery now available across nearly all large public restaurant chains, the pizza
segment no longer has a competitive advantage in the channel. To some extent, we
believe the cuisine and price of QSR chain delivery has been secondary to the excitement
of customer trial. The chains’ national access and delivery marketing campaigns represent
incremental pressure in the segment that has not existed before, even amidst the growth
of third-party delivery over the last several years. QSR chains are significantly driving
delivery channel awareness and trial.
We looked at relative search queries based on data from Google Trends for Domino’s and
select competitors within the context of search volume for delivery. For the first time in
1Q19, Taco Bell and Chipotle gained relative search share in select markets. We also note
both of these brands launched marketing campaigns to highlight the offering. Taco Bell
and Grubhub launched a co-marketing campaign, with Taco Bell featuring delivery in its
advertising and Grubhub featuring Taco Bell on its platform and funding free delivery.
Chipotle also ran a few marketing campaigns related to digital and delivery, including a
Free Delivery Bowl offering (December 18 to January 7), free delivery during Super Bowl
weekend and TV advertising during March Madness.
Figure 41: Based on Google search volumes by
metro areas, Chipotle and Taco Bell have gained
relative search volume share for delivery for the
first time in 1Q19.
Figure 42: Chipotle and Taco Bell continued to
generate high delivery search volumes in April
2019, highlighting delivery promotions from 1Q19 is
driving more sustainable delivery interest.
Source: Google Trends, Credit Suisse estimates Source: Google Trends, Credit Suisse estimates
Note: Google Trends through April 2019.
Fighting for delivery drivers, not just sales
Labor is the number one concern among restaurant operators. While restaurants are still
navigating through higher cost structures and fears of additional wage hikes, labor supply
remains a challenge. Unemployment is near historical lows, and it appears the supply of
delivery drivers is even lower. Given the rapid growth of on-demand apps requiring
delivery drivers, even outside of the food space, operators seem to be having a hard time
finding and retaining good talent. We believe this limited supply pool could affect
opportunities for new unit growth, lead to a reduced service experience and potentially
result in lost sales. Based on our channel checks, Domino’s as well as other concepts
have had to turn down or cancel delivery orders because of insufficient delivery driver
staffing. Given expanded job opportunities for delivery drivers (even outside of restaurant
delivery), we believe attracting and retaining good drivers could be difficult.
Third-party aggregators offer attractive pay opportunities and a flexible work schedule,
which are advantageous relative to Domino’s, which has more stringent
requirements/standards. Other benefits such as mileage reimbursement and distances to
travel could affect the relative pay scales.
1Q19 April 2019

25 June 2019
Domino’s Pizza Inc. (DPZ) 24
The shift toward aggregators over time
Increasing awareness, geographic coverage and restaurant partnerships are indicative of
the growing demand and supply of delivery aggregators, with share expected to increase
over time. Based on our survey of consumers in March 2019, delivery aggregators are
gaining favor among consumers as a preferred choice for delivery. On average, ~14% of
consumers indicated third-party platforms were their preferred ordering methods, up from
10% in July 2018. Across all age groups and neighborhoods, less consumers indicated
their preferred ordering method was calling the restaurant directly, suggesting digital could
improve the overall customer experience.
~50% of consumers indicated ordering directly through the restaurant website/app was
their favorite ordering method, an increase of ~7% from July 2018 and now the most
preferred ordering method. More than 60% of consumers age 18-29 selected ordering
through restaurant website/app as their preferred method (+13% March 2019 from July
2018), which we believe is in part due to the offering of loyalty/rewards programs, which
seems to be the most important and intent-driving factor relative to other cohorts.
While we do believe third-party aggregators will grab a greater market share over time, the
overall customer experience from branded websites/apps is superior to the platforms and
is a competitive advantage, for now. Domino’s remains well positioned given its digital
ecosystem and compelling loyalty program, and expect the company to defend its share
even in an environment of growing penetration from delivery aggregators.
Figure 43: On average ~14% consumers indicated
third-party platforms as the preferred delivery
method, with some range across cohorts.
Figure 44: Consumers across age groups are
shifting to digital channels, with the greatest
change in delivery aggregator preference among
those ages 30-44, and the greatest move toward
branded websites/apps among those ages 18-29.
Source: Survey data, Credit Suisse estimates Source: Survey data, Credit Suisse estimates
12%22%
12% 8%
0%
10%
20%
30%
40%
50%
60%
70%
80%
90%
100%
18-29 30-44 45-60 60+
Age
% R
esp
ondents
What is/would be your preferred method to order delivery?
Call the restaurant Restaurant website/mobile app Third-party aggregator
-15%
-10%
-5%
0%
5%
10%
15%
18-29 30-44 45-60 60+
Chan
ge M
arch
201
9 v
s Ju
ne 2
01
8
Call the restaurant Restaurant website/mobile app Third-party aggregator

25 June 2019
Domino’s Pizza Inc. (DPZ) 25
Figure 45: Consumers in urban markets tend to
prefer third-party aggregators, though this is in part
due to the availability and magnitude of restaurants
relative to suburban/rural neighborhoods.
Figure 46: Consumers are increasingly shifting
toward digital channels to order delivery across
neighborhoods.
Source: Survey data, Credit Suisse estimates Source: Survey data, Credit Suisse estimates
Pizza segment should be able to hold onto its
delivery market share long term
Despite increasing competition, we believe the pizza segment will largely maintain its
delivery market share long term despite increasing competitive threats given: 1) customers
largely choose the pizza cuisine, limiting the potential share shift; 2) customers prefer
individual brand platforms over third-party aggregators; 3) pizza is a cuisine that maintains
its integrity and travels well; 4) pizza delivers attractive value to the customer based on the
amount of food; and 5) restaurant operators and delivery aggregators still have significant
challenges ahead to improve economics for all parties involved, ensure operational
execution, develop a better system to share data and to limit the customer shift to third-
party platforms. We do believe regional and local chains are facing greater risk given the
aforementioned challenges, as delivery becomes an expectation.
Consumers largely choose to order pizza
Pizza is a top of mind choice for consumers that choose to order delivery given the
segment’s delivery association. Pizza tends to travel well relative to other cuisines, and we
believe many households specifically select pizza as a cuisine, and do not simply choose
to order delivery. Based on our survey of 1,000+ consumers in March 2019, pizza remains
the top cuisine for ordering delivery, with ~65% of consumers indicating they would most
likely order pizza for delivery. Additionally, nearly 65% of consumers first choose the type
of food they want and then choose where delivery is available. This compares to ~35% of
consumers that first decide they want delivery and then select the type of food. We believe
this highlights that pizza is often selected as the cuisine of choice and can be a different
occasion, not necessarily directly competing for delivery share among different cuisines.
19% 14%5%
0%
10%
20%
30%
40%
50%
60%
70%
80%
90%
100%
Urban Suburban Rural
Neighborhood
% R
esp
ondents
What is/would be your preferred method to order delivery?
Call the restaurant Restaurant website/mobile app Third-party aggregator
-15%
-10%
-5%
0%
5%
10%
Urban Suburban Rural
Chan
ge M
arch
201
9 v
s Ju
ne 2
01
8
Call the restaurant Restaurant website/mobile app Third-party aggregator

25 June 2019
Domino’s Pizza Inc. (DPZ) 26
Figure 47: Based on our consumer survey, pizza is
the top cuisine chosen to order for delivery.
Figure 48: Consumers tend to first select the
cuisine they want to order, and then choose where
delivery is available.
Source: Survey data, Credit Suisse estimates Source: Survey data, Credit Suisse estimates
However, we expect at a certain frequency level, the availability of other cuisines for delivery
could eat into pizza delivery market share. Notably, the availability of other delivery
options appears to have a more meaningful impact on 1) more frequent delivery
consumers, and 2) younger cohorts. We expect a greater impact at certain times where
the pizza cuisine has otherwise enjoyed a competitive advantage and restaurants have
experienced lost sales, such as inclement weather and large at-home events.
On average, ~25% of consumers indicated the number of times they order pizza has
changed given the availability of other restaurant delivery options. Among consumers that
order pizza delivery at least 3-4 times per month, ~30% indicated the availability of other
cuisines has affected their pizza delivery. Nearly 50% of consumers that order delivery at
least 5 times per month indicated optionality has affected their pizza delivery consumption.
While we believe pizza delivery could be a separate occasion and consumers explicitly
choose pizza, pizza delivery market share could be at risk in part among frequent delivery
consumers that are likely using the delivery channel more for convenience.
Age tends to influence the impact of other delivery options as well, with ~35% of
consumers ages 18-29 indicating the availability of other delivery options are affecting
their pizza delivery orders. This is likely due in part to higher delivery order frequencies
among younger consumers.
Figure 49: Availability of alternative delivery options
has a more significant impact on higher frequency
delivery consumers. Nearly 50% of consumers that
order pizza delivery at least 5 times per month have
changed their frequency as a result of other options.
Figure 50: ~35% of consumers have changed their
pizza delivery order consumption as a result of
other delivery options, relative to ~25% on average.
Source: Survey data, Credit Suisse estimates Source: Survey data, Credit Suisse estimates
0%
10%
20%
30%
40%
50%
60%
70%
Pizza
Chin
ese
Mexi
can
Burg
ers
/
Sandw
ich
Italia
n
Oth
er
Asi
an
(Thai,
Sush
i)
Sala
d/
Soup
% R
resp
ondents
What cuisines would you most likely order for delivery?
66%
34%
First choose what type of food you
want (i.e. pizza) and then choose
where delivery is available
First decide that you want food
delivered to you, and then select the
type of food
% Respondents
When ordering delivery, do you:
0%10%20%30%40%50%60%70%80%90%
100%
Average Never 1-2 times per
month
3-4 times per
month
5 or more
times per
month
Pizza Delivery Frequency
% R
esp
ondents
Has the # of times you order pizza each week/month
changed with the availability of other delivery options?
Yes No
0%10%20%30%40%50%60%70%80%90%
100%
Average 18-29 30-44 45-60 60+
Age
% R
esp
ondents
Has the # of times you order pizza each week/month
changed with the availability of other delivery options?
Yes No

25 June 2019
Domino’s Pizza Inc. (DPZ) 27
Brand platforms still preferred over aggregators
Despite the strong growth among third-party delivery providers, consumers still show a
preference to order delivery directly from the restaurant. ~85% of consumers in our survey
indicated they prefer to order delivery directly from a restaurant website/app or by calling
the restaurant, with just 15% that prefer online aggregators.
There appears to be a relationship between the frequency of delivery orders and
consumers’ preferences toward third-party aggregators. Among consumers who never use
delivery, only ~6% would choose to order from third-party platforms. As the frequency of
delivery increases, consumers’ affinity toward delivery aggregators tends to increase,
likely suggesting consumers become less sensitive to the cuisine or restaurant, and more
inclined to order delivery for the convenience. Among consumers who order delivery 5+
times per month, a notable 36% of respondents prefer to order from third-party platforms.
Looking at consumers who order pizza delivery specifically, a similar ~85% of consumers
prefer to order from the restaurant directly, which is largely consistent irrespective of pizza
delivery order frequency. Among consumers who order pizza delivery at least 5 times per
month, 22% indicated their preferred channel is third-party aggregators, compared to 36%
among users who order other cuisines for delivery at least 5 times per month. The pizza
chains’ early lead in the digital evolution, secured mindshare in consumers’ consideration
sets, and established real estate on consumers’ phones could support greater defense
against the rise of third-party aggregators.
Figure 51: More frequent delivery consumers tend
to have a greater affinity toward third-party
aggregators.
Figure 52: Pizza delivery consumers tend to prefer
to order from the restaurants directly, with a
consistent 14% indicating a preference for
aggregators.
Source: Survey data, Credit Suisse estimates Source: Survey data, Credit Suisse estimates
Pizza travels well, though not all cuisines may maintain the same quality
While customers appear relatively forgiving of the quality of food in favor of convenience
currently, we don’t believe customers are willing to lower the bar across the board for
delivery long term. One of the reasons pizza has been a top cuisine choice for delivery is
the ability to maintain the integrity of the product from restaurant to the customer. The
pizza box packaging is a good conduit for movement (including the little table in the middle
of the pizza), pizza can stay hot for a relatively long period of time and pizza can be
reheated well. In contrast, other cuisines do not travel as well, are not prepared in the
proper packaging and cannot be reheated successfully.
14% 6% 13% 22%36%
0%10%20%30%40%50%60%70%80%90%
100%
Average Never 1-2 times per
month
3-4 times per
month
5 or more times
per month
Frequency among ALL Delivery Users
% R
esp
ondents
What is/would be your preferred method to order ANY delivery?
Call the restaurant Restaurant website/mobile app Third-party aggregator
14% 12% 14% 15% 22%
0%10%20%30%40%50%60%70%80%90%
100%
Average Never 1-2 times per
month
3-4 times per
month
5 or more times
per month
Frequency among PIZZA Delivery Users
% R
esp
ondents
What is/would be your preferred method to order PIZZA delivery?
Call the restaurant Restaurant website/mobile app Third-party aggregator

25 June 2019
Domino’s Pizza Inc. (DPZ) 28
Figure 53: Fries do not hold up as well as other
delivery products, often coming soggy at high wait
times.
Figure 54: Traditional packaging may not be
sufficient for delivery, requiring companies to take a
long-term view and investment in the channel
(though some are less willing).
Source: Credit Suisse (Delivery May 2019 in NYC) Source: Credit Suisse (Delivery May 2019 in NYC)
Delivered pizza has an attractive value proposition
Despite what appears to be seemingly inelastic demand for delivery currently, it is unclear
how sustainable the current delivery model will be long term. To improve delivery
economics, many QSR chains are inflating delivery menu prices or adding service fees to
offset margin dilution. Additionally, many of the chains do not offer their national value
promotions through delivery channels. As a result of higher delivery prices, lower
promotional take rates through delivery and benefits of suggestive sell (and to some extent
group orders), delivery transactions tend to be 1.5-2x the size of an in-store order. Pizza
arguably offers the most attractive delivered value, in part due to pizza chain restaurants’
value promotions, which are largely non-existent for other cuisines through delivery.
Delivery challenges must be addressed as volumes increase
Challenges with delivery include: 1) incremental delivery costs weigh on already thin
margins; 2) operational execution for restaurants and third-party delivery is still a work-in-
progress (i.e., integration efforts, layout, etc.); 3) data is not being shared as freely as
restaurants would like; and 4) there is risk customers will shift to aggregator platforms as
restaurants market the ease and availability of these offerings through partnerships.
While restaurants are inflating delivery prices and adding service fees, aggregator platforms
are adding delivery fees and customers are still responsible for tips. The combination of
these fees could make the order total ~50%+ higher. Shifting costs to customers seems to
be working right now, but we’re not convinced this is a sustainable model.
Restaurants are still working to optimize operations through integration efforts, delivery
sales forecasting and staffing needs and layout improvements as their digital channels
grow. Third-party delivery providers are also still working through challenges of increasing
demand and fulfilling orders as efficiently as possible.
As we’ve previously highlighted, limited data sharing from delivery providers to restaurants
is a major negative in the partnerships.
Long-term benefits from third-party partnerships are still unknown. Grubhub recently
indicated its co-marketing campaign with Taco Bell in 1Q19 attracted many new diners.
Importantly, Grubhub indicated some new diners are reordering from Taco Bell, with the
majority trying other restaurants on the platform. This highlights our key concern that these

25 June 2019
Domino’s Pizza Inc. (DPZ) 29
partnerships are shifting customers to become platform customers and introducing them to
new competitors. Should Taco Bell decide to integrate delivery in its app, we think it will
have a difficult time reattracting the customers to use its own branded platform given the
ease of use of Grubhub’s ecosystem.
In our view, best practice for restaurants starting to offer delivery is to integrate the
channel directly with their digital apps/websites and have third-party partners fulfill the
order. This should allow restaurant chains to improve economics through a lower
commission structure, capture customer data and limit customer shifting. Presence on
aggregator platforms could also unlock opportunities for incremental orders.

25 June 2019
Domino’s Pizza Inc. (DPZ) 30
Can DPZ reach 25,000 units by 2025? Credit Suisse View
Yes, we believe DPZ can reach 25,000 units by 2025, with contribution from accelerating
domestic growth and ongoing strength internationally. The 25,000 unit growth target
implies global growth of ~7% over the next four years (7.9% 5-yr CAGR), including ~4.5%
domestic unit growth (3.3% 5-yr CAGR) and ~8% international unit growth (11.2% 5-yr
CAGR). We model global unit growth of ~7% through 2022, including domestic unit growth
of ~5% and international unit growth of ~8%. Assuming DPZ maintains our average unit
growth estimates through 2025, the company would achieve ~25,000 global units.
Our confidence in accelerating DPZ global unit growth to ~25,000 units comes from: 1)
global brand strength, fundamentals and operating momentum; 2) domestic whitespace
opportunities with fortressing strategy in existing markets; and 3) international
development opportunities, with increased visibility from master franchise agreements.
Consensus Expectations
Consensus models global unit growth of ~7% through 2022, including ~4.5-5% domestic
unit growth and ~8% in international markets. Applying consensus’ four-year forward
CAGR through 2025 implies DPZ global units of 25,000+, suggesting consensus also buys
into DPZ’s unit growth targets.
DPZ maintains robust global unit growth opportunity
DPZ has exhibited global net unit growth of 7.3% over the last five years, including 3.3% in
the US and 11.2% internationally. Increasing contribution from domestic development
similar to recent levels and continued robust international expansion should support
growth of ~7% over the next few years. Our estimates are relatively in-line with consensus
and at the midpoint of DPZ’s long-term net unit growth target of 6-8%.
DPZ has consistently met or exceeded its long-term unit growth targets over the last
several years, giving us added confidence in the targeted 25,000 units by 2025. Further,
the implied 6.7% unit growth CAGR over the next seven years to reach 25,000 units is a
step down from the 7.3% unit growth CAGR over the last seven years, with DPZ
maintaining 7%+ unit growth over the last four years.
Figure 55: DPZ has maintained global unit growth of
7.3% over the last seven years and 7.9% over the
last five years.
Figure 56: International growth is expected to
contribute to the majority of our estimated ~7%
global growth.
Source: Company data, Credit Suisse estimates Source: Company data, Consensus Metrix, Credit Suisse estimates
5.3%6.2%
6.8%7.7%
10.2%
7.6%7.1%
0.0%
2.0%
4.0%
6.0%
8.0%
10.0%
12.0%
2012 2013 2014 2015 2016 2017 2018
Glo
bal U
nit
Gro
wth
Domestic International
0.0%
1.0%
2.0%
3.0%
4.0%
5.0%
6.0%
7.0%
8.0%
2019E 2020E 2021E 2022E
Glo
bal U
nit
Gro
wth
CSe Domestic Consensus Domestic DPZ Domestic
CSe Int'l Consensus Int'l DPZ Int'l
DPZ has grown at a 7.9% unit CAGR over
the last 5 years, including 3.3% in the
US and 11.2% internationally

25 June 2019
Domino’s Pizza Inc. (DPZ) 31
Figure 57: DPZ has consistently met or exceeded its
long-term unit growth targets, giving us added
confidence in the company’s ability to meet its long-
term targets.
Figure 58: We model global net unit growth of ~7%
over the next few years, at the midpoint of DPZ’s
guidance of 6-8%, and in-line with consensus.
Source: Company data, Credit Suisse estimates Source: Company data, Consensus Metrix, Credit Suisse estimates
Domestic Unit Growth
DPZ has demonstrated domestic net unit growth of 3.3% over the last five years, with
acceleration each year since 2012. We estimate domestic net unit growth of 4.7% through
2022, above consensus’ 4.4% and somewhat above DPZ’s implied unit growth of ~4.5%
to reach a targeted ~8,000 units by 2025.
Our confidence in above average domestic unit growth of 4.7% over the next several
years comes from: 1) strong fundamentals and operating momentum; 2) favorable
franchisee relationships and more optimal franchisee base; 3) robust whitespace
opportunities in a fragmented category; and 4) fortressing strategy providing increased
visibility into development pipeline.
Figure 59: DPZ has demonstrated domestic net unit
growth of 3.3% over the last five years, with
acceleration each year behind strong fundamentals,
favorable franchise relationships and whitespace
opportunities.
Figure 60: We model domestic net unit growth of
4.7% over the next few years, slightly above
consensus expectations of 4.4% and DPZ’s implied
domestic target of 4.5%.
Source: Company data, Credit Suisse estimates Source: Company data, Consensus Metrix, Credit Suisse estimates
0.0%
2.0%
4.0%
6.0%
8.0%
10.0%
12.0%
2010 2011 2012 2013 2014 2015 2016 2017 2018
Glo
bal
Unit
Gro
wth
Actual DPZ Target
0.0%
1.0%
2.0%
3.0%
4.0%
5.0%
6.0%
7.0%
8.0%
9.0%
2019E 2020E 2021E 2022E
Glo
bal U
nit
Gro
wth
CSe Consensus DPZ Target (6-8%)
0.0%
1.0%
2.0%
3.0%
4.0%
5.0%
6.0%
2014 2015 2016 2017 2018
Dom
est
ic U
nit
Gro
wth
2.0%
2.5%
3.0%
3.5%
4.0%
4.5%
5.0%
5.5%
2019E 2020E 2021E 2022E
Dom
est
ic U
nit
Gro
wth
CSe Consensus DPZ Implied Target
We model domestic unit growth of 4.7%
through 2022, above 3.3% over the last five
years

25 June 2019
Domino’s Pizza Inc. (DPZ) 32
Figure 61: DPZ has indicated a domestic unit
growth potential of ~8,000 units by 2025. Based on
our estimates through 2022, such would imply a
step down to ~4.2% through 2025.
Figure 62: We expect domestic unit development to
represent ~25% of global growth over the next
several years, relative to ~15-20% over the prior few.
Source: Company data, Credit Suisse estimates Source: Company data, Credit Suisse estimates
Strong fundamentals and operating momentum
Since 2010, DPZ has delivered average domestic SSS of ~7.5%, primarily through
increased traffic, well outpacing industry peers and driving strong franchisee economics.
Domino’s should continue to maintain industry-leading SSS through traffic gains and
healthy ticket.
Average franchisee EBITDA in 2018 was ~$141K per store, representing growth of ~230%
since 2009 and a ~2-3 year payback period. At an enterprise level, the average franchisee
owns ~7 stores, generating ~$975K of EBITDA in 2018. Further, DPZ franchisees appear
to have the highest cash-on-cash returns among QSR peers, supporting confidence in
franchisee appetite for growth.
Digital innovation also benefits franchisees and operations. DPZ is currently testing its
voice technology, DOM, for phone calls, digital kiosks for in-store orders, as well as an in-
store voice recognition inventory app, allowing crew members to automatically update
inventory. These investments could help offset rising labor pressures, driving attractive
returns and potentially additional franchisee appetite for growth.
Figure 63: Franchisee EBITDA has grown to $141K
per store in 2018, up ~230% since 2009’s ~$60K.
Figure 64: At an aggregate level, the average
franchisee operates 7 stores and is generating
enterprise-wide EBITDA of ~$975K in 2018, up from
an average of 4 stores and ~$235K in 2009.
Source: Company data, Credit Suisse estimates Source: Company data, Credit Suisse estimates
4,000
4,500
5,000
5,500
6,000
6,500
7,000
7,500
8,000
8,500
20
13
20
14
20
15
20
16
20
17
20
18
20
19E
20
20E
20
21E
20
22E
20
25E
Dom
est
ic U
nits
Implies ~4% unit growth CAGR from
2022-2025
0.0%
2.0%
4.0%
6.0%
8.0%
10.0%
12.0%
20
13
20
14
20
15
20
16
20
17
20
18
20
19E
20
20E
20
21E
20
22E
Glo
bal
Unit
Gro
wth
Domestic International DPZ LT Target (6-8%)
$20
$40
$60
$80
$100
$120
$140
$160
20
09
20
10
20
11
20
12
20
13
20
14
20
15
20
16
20
17
20
18
Fra
nch
isee E
BIT
DA
per
Sto
re (
$00
0s)
$100
$200
$300
$400
$500
$600
$700
$800
$900
$1,000
20
08
20
09
20
10
20
11
20
12
20
13
20
14
20
15
20
16
20
17
20
18
EB
ITD
A p
er
Fra
nch
isee (
$00
0s)

25 June 2019
Domino’s Pizza Inc. (DPZ) 33
Figure 65: Domino’s has the best cash-on-cash
returns (excludes rent and G&A) among QSR peers,
supportive of franchisee appetite for growth.
Figure 66: US system orders have doubled over the
past decade. US Franchisee EBITDA has tripled
over the same period.
Source: Restaurant Research Journal, Credit Suisse estimates Source: Company data, Credit Suisse estimates
Favorable franchisee relationships
DPZ has a unique franchisee base, with ~90% of franchise owners that have started within
the restaurant and a vast majority solely dedicated to operating Domino’s restaurants. We
believe this strategy creates a franchisee base with an operator mindset, though could
constrain growth. The base has become more consolidated over the last several years,
with the average franchisee operating ~7 stores, compared to an average of ~4 stores ten
years ago. We believe some consolidation is a prudent strategy, with multi-unit operators
likely better capitalized, can leverage best practices across its base and benefit from
economies of scale. Franchisee EBITDA of ~$141K per store in 2018 and ~$975K on an
aggregate basis per franchisee suggests healthy financials, which should generate an
appetite for unit growth.
DPZ has now largely completed its five-year rollout of the updated reimage program, with
more than 90% of the US system on the Pizza Theater image. This should also unlock
incremental capital for franchisees to invest in new units.
Figure 67: DPZ has consolidated over the last
decade, with the average franchisee operating ~7
stores, up from ~4 stores in 2009.
Figure 68: Multi-unit operators can benefit from the
sharing of best practices and economies of scale
across its system. 262 franchisees operate one
restaurant, down from 372 in 2013.
Source: Company data, Credit Suisse estimates Source: Company data, Credit Suisse estimates
0%
10%
20%
30%
40%
50%
60%
70%
Dom
ino's
Pap
a Jo
hn's
McD
onal
d's
Pizza
Hut
Litt
le C
aesa
rs
Dunkin
Donuts
Tac
o B
ell
Jack
in t
he B
ox
Popeye
s
Culv
er'
s
Sonic
Boja
ngle
s'
Burg
er
Kin
g
Zax
by'
s
Car
l's J
r.
Arb
y's
Wendy'
s
KF
C
Har
dee's
Churc
h's
Dai
ry Q
ueen
Cash
-on-C
ash
Retu
rn
(Exc
l. R
ent
& G
&A
)
140MM
$223MM
310MM
$707MM
US System Orders US Franchise EBITDA
2008 2017
3.0
3.5
4.0
4.5
5.0
5.5
6.0
6.5
7.0
7.5
20
09
20
10
20
11
20
12
20
13
20
14
20
15
20
16
20
17
20
18
Ave
rage #
of
Sto
res
per
Fra
nch
isee
200
220
240
260
280
300
320
340
360
380
400
2013 2014 2015 2016 2017 2018
# F
ranch
isees
Opera
ting 1
Sto
reThe average franchisee operates ~7 stores and
earned ~$975K in EBITDA in 2018

25 June 2019
Domino’s Pizza Inc. (DPZ) 34
DPZ’s integrated supply chain and profit sharing arrangement helps to strengthen
franchisee relationships by providing aligned strategies, enhancing transparency and
further incentivizing franchisees to operate efficiently and effectively. Based on the profit
sharing arrangement, franchisees earn 50% of their regional supply chain’s profits.
Domino’s operates 19 regional supply chain centers across the US, which provide food,
supplies and equipment to nearly the entire US system.
Based on DPZ’s outlook for the US business, the company is expanding supply chain
capacity by building new supply chain centers in the US, including the recently opened
and largest supply chain center in Edison, NJ. DPZ is also accelerating investments to
support two additional centers which are projected to open in early 2020 in South Carolina
and Texas. These investments signal management confidence in the growth of the US
business and the capacity requirements needed to support growth across the existing
base and new units.
Whitespace opportunity in a fragmented category
The pizza segment has exhibited unit growth of ~1% over the last five years, with large
chains outpacing growth among small chains & independents. With the exception of the
Asian/Noodle segment, pizza is the only other segment with small chains & independents
making up more than 50% of the category’s ~62K units. Pizza is also the only segment
with the market share leader representing less than 10% of the segment’s units (Note:
Pizza Hut represents 12% of the segment’s units, but is no longer the segment leader on
overall sales market share). DPZ represents ~10% of the segment’s units, compared to
~30% for burgers, ~38% for coffee and ~15% for Asian/Noodle. We do believe there is a
fundamental difference between pizza and other cuisine categories given relatively lower
barriers to entry with pizza, but still see opportunities for segment share gains, especially
given heightened structural costs.
Segment consolidation appears to be in some part driven by the level of competitive
pricing in the industry, as highlighted by the significant concentration in the burger
segment. We believe DPZ is particularly well positioned on value, with its $5.99 per item
national deal that has run for nearly a decade, as well as the pulsing of additional promos.
Given an environment that is more price sensitive, an increased focus on price point deals
from competitors and consumer access to unlimited information, we view DPZ as a net
beneficiary of increased price competition in the pizza segment.
Figure 69: The top five pizza chains make up just
~35% of the segment’s units, with small chains &
independents comprising ~50% of units.
Figure 70: The pizza segment is the most
consolidated among restaurant categories (with the
exception of Asian/Noodle), while also one of the
largest by units.
Source: Technomic, Credit Suisse estimates Source: Technomic, Credit Suisse estimates
0%
10%
20%
30%
40%
50%
60%
70%
80%
90%
100%
2013 2014 2015 2016 2017 2018
Unit
Com
posi
tion
Small Chains &
Independents
Other Large
Chains
Papa Murphy's
Papa John's
Little Caesars
Pizza Hut
Domino's
36% 13% 51%
0% 20% 40% 60% 80% 100%
Burgers
Chicken
Bakery Café
Coffee
Sandwich
Frozen Desserts
Mexican
Pizza
Asian/Noodle
Unit Composition by Segment
Top 5 Chains Other Large Chains Small Chains & Independents
DPZ’s integrated supply chain and profit
sharing arrangement help strengthen
franchisee relations and align incentives

25 June 2019
Domino’s Pizza Inc. (DPZ) 35
Opportunity to gain share from small chains & independents
Pizza’s large and fragmented market well positions DPZ to continue to take share from
smaller chains & independents. Structurally higher costs and challenges in navigating high
investment, emerging disruptors such as digital and delivery create an uncertain future for
regional players. Additionally, we expect some incremental segment consolidation as
independent pizza operators age, and younger generations may not want to take over the
business given an increasingly difficult restaurant industry backdrop. Over the last several
years, top competitors have gained share in both delivery and carryout. The top three
largest competitors now represent more than 56% of the QSR pizza segment delivery
sales, up ~10% in share since 2010 and ~300bps since 2013. The top four largest
competitors comprise 48% of the QSR pizza segment carryout sales, up ~700bps in share
over the last five years.
Figure 71: Large chains have consistently outpaced
unit growth among small chains & independents…
Figure 72: …supporting market share gains among
the top competitors in both delivery and carryout.
Source: Technomic, Credit Suisse estimates Source: Company data, Credit Suisse estimates
Opportunity for share gains among larger competitors
While DPZ has historically targeted share gains among regional chains & independents,
the company has also identified opportunities to take share from larger chains. In the
aggregate, larger chains represent the greatest competitive threat to DPZ given their
system sizes. Within a one-mile radius, ~34% of DPZ’s store base competes with Pizza
Hut, ~26% of its base competes with Little Caesars and ~25% with Papa John’s.
As Domino’s develops units through its fortressing strategy, we expect geographic overlap
could increase as Domino’s seeks to capture greater market share in its existing markets.
~34% of Domino’s store base competes with a Pizza Hut within a one-mile radius, while
~72% compete with Domino’s within a three-mile radius. Assuming Domino’s puts units
within that three-mile territory, the number of Domino’s facing competition with Pizza Hut
within a shorter distance will increase.
41%
42%
43%
44%
45%
46%
47%
48%
49%
50%
-1.5%
-1.0%
-0.5%
0.0%
0.5%
1.0%
1.5%
2.0%
2013 2014 2015 2016 2017 2018
Larg
e C
hain
s as
% o
f S
egm
ent
Unit
Gro
wth
YO
Y %
Top 500 Chains Small Chains & Independents Large Chains as % of Segment
46%
51%
53%
53%
55%
58%
56%
56%
56%
41%
41%
42%
47%
48%
48%
2010
2011
2012
2013
2014
2015
2016
2017
2018
2013
2014
2015
2016
2017
2018
Top 3
as
% o
f Q
SR
Pizza
Deliv
ery
Top 4
as
% o
f Q
SR
Pizza
Carr
yout
Top 3 pizza competitors have >55%
of the QSR pizza segment delivery sales,
up ~10% since 2010
~34% of Domino’s store bases competes with Pizza Hut within 1
mile and ~72% of the base within 3 miles

25 June 2019
Domino’s Pizza Inc. (DPZ) 36
Figure 73: Domino’s store base faces the most
competition from mature pizza peers given their
relative system sizes. ~34% of DPZ’s base faces
competition from Pizza Hut and ~25% from Papa
John’s within a 1 mile radius.
Figure 74: Domino’s places relatively significant
competitive pressure on select pizza peers, with
~30-40% of the largest pizza competitors facing
pressure from Domino’s within a 1 mile radius.
Source: Thinknum, Credit Suisse estimates Source: Thinknum, Credit Suisse estimates
Fortressing strategy provides increased visibility into domestic growth
DPZ has indicated opportunities to grow in underpenetrated markets, as well as fill-in
existing markets. As part of its fortressing strategy, DPZ is splitting its delivery areas into
smaller addressable markets. This is an offensive move to gain market share as well as a
defensive move to capture market share before a competitor moves in.
Benefits of fortressing include: 1) incremental carryout sales (primarily all carryout sales
are incremental in new split stores); 2) improved service through faster delivery times (per
Domino’s: the closer a delivery customer is to a store, the higher the frequency and
increased spend over time); 3) increased enterprise sales and profits for franchisees, with
most splits within one franchisee’s territory (in general, franchisee cannibalizing own
sales); 4) increased profitability with reduced delivery trade area (shorter distance) and
increased carryout sales (better margins); and 5) defends against competition and
aggregators, especially as Domino’s competes for delivery drivers (assumption is that
delivery drivers can earn more tips per hour with shorter delivery drives).
Fortressing should better position Domino’s long term, though is likely to pressure SSS
near term. In 2018, fortressing represented a ~1-1.5% SSS drag, which we expect to
continue over the next several years. This includes some benefit from split stores comping
over time, but we assume the initial negative impact well offsets the gains.
Based on our geospatial analysis, ~2% of Domino’s store base faces competition from
another Domino’s restaurant within a one-mile radius. We expect there is notable
opportunity for Domino’s to expand through splits in these trade areas, with store overlap
likely to increase over time as a result.
7%
7%
10%
13%
14%
19%
25%
26%
34%
24%
9%
24%
61%
61%
72%
17%
18%
30%
73%
73%
82%
Blaze
MOD
Papa Murphy's
Papa John's
Little Caesars
Pizza Hut
% DPZ Base Facing Competition From Select Peers
0.25 Miles 0.5 Miles 1 Mile 3 Miles 5 Miles
8%
7%
12%
12%
11%
9%
16%
16%
22%
25%
20%
17%
40%
34%
39%
46%
38%
31%
95%
94%
86%
90%
83%
64%
99%
99%
91%
95%
90%
69%
Blaze
MOD
Papa Murphy's
Papa John's
Little Caesars
Pizza Hut
% Select Peers' Bases Facing Competition From DPZ
0.25 Miles 0.5 Miles 1 Mile 3 Miles 5 Miles
Domino’s fortressing strategy is likely to be a
1-1.5% drag on SSS going forward

25 June 2019
Domino’s Pizza Inc. (DPZ) 37
Figure 75: ~2% of Domino’s store base faces
competition from another Domino’s within a 1 mile
radius.
Figure 76: Domino’s same-store overlap is relatively
in-line with peers.
Source: Thinknum, Credit Suisse estimates Source: Thinknum, Credit Suisse estimates
Fortressing – Not a New Concept for Domino’s
Domino’s has implemented its fortressing strategy internationally and in select US markets
for several years. Given expectations for increased domestic expansion over the next
several years, there has been increased interest on the impact of fortressing, which will
likely lead to greater SSS pressure near term. 2018 generated the highest absolute unit
growth in at least a decade, and with the majority in split territories, weighed on SSS by
~1-1.5%. Going forward, unit growth will primarily be split units, and we expect a similar
impact on SSS near term. Long-term, examples from other markets highlight meaningful
share gains within markets as a result of the fortressing strategy.
■ Exeter, UK – Domino’s split the territory in Exeter, UK in both 2014 and 2015, which
now has a total of three stores. Over the last five years, Domino’s increased total
retail sales in the market by more than 100%, and the average sales per store has
continued to increase post splits. Average weekly sales have increased by ~14.5%
from 2015 to 2018.
■ Nottingham, UK – Domino’s split the territory in Nottingham, UK, starting with six
stores, and adding four additional stores in 2013 and 2014. Total market sales in the
region have increased ~80% since 2013. Average sales per unit have increased each
year in the mid to high-single digits, with average weekly sales increasing by ~22.5%
from 2015 to 2018.
0%
0%
0%
2%
35%
65%
0.1 Miles
0.25 Miles
0.5 Miles
1 Mile
3 Miles
5 Miles
% Domino's Base Facing Competition From Another Domino's
~2% of Domino's store base faces
competition from another Domino's
within a 1 mile radius
14%
11%
41%
9%
22%
42%
28%
37%
53%
35%
34%
52%
62%
63%
63%
63%
65%
MOD Pizza
Papa Murphy's
Pizza Hut
Papa John's
Little Caesars
Blaze Pizza
Domino's
% Base Facing Competition From Same Brand
0.25 Miles 0.5 Miles 1 Mile 3 Miles 5 Miles

25 June 2019
Domino’s Pizza Inc. (DPZ) 38
Figure 77: In Exeter, UK, Domino’s more than
doubled the market’s total retail sales through
splits, and the average sales per store has
continued to increase.
Figure 78: In Nottingham, UK, Domino’s increased
its store count to 10 units (opened 4 in 2013 and
2014), up ~80% in total market sales since 2013.
Source: Company data, Credit Suisse estimates
Note: Represents average sales per store post splits (calculated as total sales in period/number of stores in period).
Source: Company data, Credit Suisse estimates
■ Las Vegas, NV – Domino’s split a company-operated Las Vegas territory by adding a
fourth store, which reduced the trade area in each of its other three stores. One year
later, average annual sales per store increased ~$42K, average carryout sales per
store increased ~$82K and average EBITDA per store increased nearly ~$17K.
■ Roanoke, VA – One year after the opening of a second store, total sales increased
$500K per year and EBITDA increased $130K per year.
Figure 79: Incremental carryout sales in Las Vegas
appear to offset the drag from loss of delivery sales
due to smaller trade areas.
Figure 80: The split store in Roanoke, VA generated
increased average market sales of $500K and
EBITDA of $130K. On a per store level, on average,
sales decreased, but EBITDA increased,
highlighting the benefits of smaller delivery trade
areas and a greater carryout mix.
Source: Company data, Credit Suisse estimates Source: Company data, Credit Suisse estimates
£2.4MM
£5.0MM
£0.0MM
£1.0MM
£2.0MM
£3.0MM
£4.0MM
£5.0MM
£6.0MM
2013 2014 2015 2016 2017 2018
Tota
l Reta
il S
ales
-E
xete
r, U
K Split in 2014 & 2015
£5.0MM
£6.0MM
£7.0MM
£8.0MM
£9.0MM
£10.0MM
£11.0MM
£12.0MM
2013 2014 2015 2016 2017 2018
Tota
l Reta
il S
ales
-N
ottin
gham
, U
K
Total of 10 units - opened 4 in
2013 & 2014
$0K
$200K
$400K
$600K
$800K
$1,000K
$1,200K
$1,400K
Pre-Split Post-Split
Avg
Sale
s/S
tore
-Las
Vegas,
NV
Delivery Sales Carryout Sales
Avg Sales/Store:
+$42,120
Avg Carryout
Sales/Store:
+$81,640
Avg EBITDA/Store:
+$16,654
$1.1MM
$1.6MM
$110K
$240K
Sales Store 1
Pre-Split
Sales Post Split EBITDA Store
1 Pre-Split
EBITDA Post
Split
Ave
rage S
ale
s &
EB
ITD
A -
Roanoke,
VA
+$130K
+$500K

25 June 2019
Domino’s Pizza Inc. (DPZ) 39
International unit growth opportunity is strong
DPZ’s international segment has grown at an 11.2% growth CAGR over the last five years,
representing ~85% of DPZ system unit growth. We expect international to continue to drive the
majority of system unit growth going forward, and model an ~8.1% international unit CAGR
over the next several years, comprising ~75% of DPZ system growth. This is relatively in-line
with consensus expectations and DPZ’s implied ~8% per year to reach ~17,000 international
units by 2025. Our confidence in robust unit growth in international markets comes from:
1) strong fundamentals and operating momentum; 2) global whitespace opportunities; and
3) master franchise partnerships with mandated development schedules.
Figure 81: DPZ has exhibited international net unit
growth of 11.2% over the last five years.
Figure 82: We model international unit growth of
8.1% over the next few years, relatively in-line with
consensus and DPZ’s implied target.
Source: Company data, Credit Suisse estimates Source: Company data, Consensus Metrix, Credit Suisse estimates
Note: DPZ’s implied target is based on 7-yr unit growth CAGR to reach 17K international units by 2025.
Figure 83: Domino’s has identified the potential for 6,500+ units in its largest
and fastest growing international markets, including 3,000+ in its top 15
international markets (excl. India & Brazil) and 3,500+ units in Brazil, Russia,
India and China.
Source: Company data, Credit Suisse estimates
*Note: (1) India & Brazil are two of DPZ’s top 15 international markets, but growth opportunities are included in BRIC target growth of 3,500+ units. (2) DPZ has previously indicated a 500 unit market potential in Brazil. At the 2019 DPZ Investor Day, DPZ highlighted the opportunity for at least 1,000 units in Brazil (as well as Russia and China).
Strong fundamentals and operating momentum
101 consecutive quarters of positive international SSS averaging ~6% since 2010 highlight
strong fundamentals in international markets and a solid business case for future growth.
On average, international stores are generating payback periods of about three years, with
the majority of large markets experiencing improving or consistent paybacks.
5.0%
6.0%
7.0%
8.0%
9.0%
10.0%
11.0%
12.0%
13.0%
14.0%
15.0%
16.0%
2014 2015 2016 2017 2018
Inte
rnatio
nal U
nit
Gro
wth
6.0%
6.5%
7.0%
7.5%
8.0%
8.5%
9.0%
9.5%
2019E 2020E 2021E 2022E
Inte
rnatio
nal U
nit
Gro
wth
CSe Consensus DPZ Implied Target
Developed Emerging BRIC
UK/Ireland 1,675 Mexico 1,025 Brazil* 1,000+
Australia/New Zealand 1,200 Turkey 900 Russia 1,000+
France 1,000 Saudi Arabia 450 India* 1,800
Germany 1,000 Malaysia 450 China 1,000+
Kapan 1,000 India* 1,800
Canada 700 Brazil* 1,000+
South Korea 500
Netherlands 400
Spain 350
Total Developed 7,825 Total Emerging 5,625 Total BRIC 4,800
Current Developed ~4,700 Current Emerging ~1,800 Current BRIC ~1,800
Top International Markets (excl. BRIC) Growth Opportunity: 3,000+ BRIC Opportunity 3,500+
We model international growth of 8.1% over the
next 4 years following an 11.2% unit CAGR over the last 5 years

25 June 2019
Domino’s Pizza Inc. (DPZ) 40
Global whitespace opportunities for pizza
Pizza represents a ~$150BN global market, with international comprising ~$100BN and
expected to grow ~4% annually. Carryout and delivery are growing at a faster rate than
dine-in, well positioning Domino’s as a carryout/delivery focused brand. Domino’s
maintains the #1 or #2 pizza delivery market positions in all of its top 15 markets, which
comprise ~75% of international units.
Going forward, Domino’s expects to reach ~17,000 international units by 2025, with the
majority of growth coming from DPZ’s top 15 international markets and markets of Brazil,
Russia, India and China (BRIC). DPZ has indicated an opportunity for 3,000+ more units
in its top 15 international markets excluding the BRIC countries, representing growth of
~50% over the next several years. DPZ has targeted 3,500+ more units across the BRIC
regions, tripling the number of units in these countries.
Figure 84: The global pizza market is expected to
grow at ~4% per year over the next several years.
Figure 85: Chains are expected to drive the majority
of sales growth in domestic markets and about half
of the growth in international markets.
Source: Euromonitor, Credit Suisse estimates Source: Euromonitor, Credit Suisse estimates
Figure 86: DPZ has highlighted an opportunity for
6,500+ units in its largest and fastest growing
markets, including 3,000+ in the top 15 international
markets excl. BRIC and BRIC store growth
opportunity of 3,500+ units by 2025.
Figure 87: Based on our estimates, Domino’s
expects to gain a greater share of the market’s units
in nearly every country with targeted unit growth,
implying the company expects to grow at a faster
rate than the industry.
Source: Company data, Credit Suisse estimates
Note: Brazil and India are among DPZ’s top 15 markets, though growth targets are included in the BRIC store growth opportunity of 3,500+ units by 2025.
Source: Company data, Euromonitor, Credit Suisse estimates
Note: (1) Potential share of international markets is based on DPZ’s stated potential in the region over the estimated unit count in each market by 2025. (2) Potential unit count in each market in 2025 is based on Euromonitor’s 2022 unit count estimate in each market multiplied by Euromonitor’s average unit growth estimate from 2020 to 2022.
0.0%
1.0%
2.0%
3.0%
4.0%
5.0%
6.0%
7.0%
2016 2017 2018 2019 2020 2021 2022
Glo
bal
Pizza
Sal
es
Gro
wth
YO
Y %
0.0%
1.0%
2.0%
3.0%
4.0%
5.0%
6.0%
7.0%
Chain
/Independent
Gro
wth
Contr
ibutio
n
US Chains US Independents International Chains International Independents
0200400600800
1,0001,2001,4001,6001,8002,000
UK
/Ire
land
Aust
ralia
/New
Zeal.
Fra
nce
Germ
any
Japan
Canada
South
Kore
a
Neth
erlands
Spain
Mexi
co
Turk
ey
Saudi A
rabia
Mala
ysia
Bra
zil
Russ
ia
India
Chin
a
Developed Markets Emerging
Markets
BRIC Markets
Unit
Count
Current Potential
0%
10%
20%
30%
40%
50%
UK
/Ire
land
Aust
ralia
/New
Zeal
.
Fra
nce
Germ
any
Japan
Canad
a
South
Kore
a
Neth
erla
nds
Spai
n
Mexi
co
Turk
ey
Sau
di A
rabia
Mal
ays
ia
Bra
zil
Russ
ia
Chin
a
India
Developed Markets Emerging
Markets
BRIC Markets
DP
Z a
s %
of
Units
Current Potential

25 June 2019
Domino’s Pizza Inc. (DPZ) 41
Master franchise partnerships
DPZ is one of the more unique franchised business concepts, with ~65% of its
international units held by five public master franchisees including: Domino’s Pizza
Enterprises Ltd. (DMP), Domino’s Pizza Group PLC (DOM), Jubilant FoodWorks Ltd.
(JUBI), Alsea SAB de CV (ALSEA) and DP Eurasia (DPEU). In addition, Dash Brands, the
master franchisee in China, has indicated interest in going public over the next couple of
years. DPZ’s public international franchises are well capitalized operators and have been
strong partners for the brand.
Select international markets have deployed strategies to purchase existing restaurant
concepts and convert them to Domino’s restaurants, providing for expedited increases in
unit counts. Over the last several years, international master franchisees have converted
restaurants in select markets, including Germany, France and South Africa. We expect
markets will continue to strategically purchase existing concepts going forward, though
such will likely get more challenging as competitors are smaller and the geographical
overlap with existing Domino’s stores may make the deal less complementary.
As part of the agreements, master franchisees have set development schedules, giving
increased confidence in the visibility of the international growth pipeline. Master franchisees
pay lower royalty rates, making returns more attractive, with an added incentive through a
royalty fee rate reduction if the master franchisee meets development targets.
Domino’s Pizza Group (DOM.GB)
Domino’s Pizza Group is master franchisee in the markets of the UK, Ireland, Switzerland
and Liechtenstein, holds a controlling stake in the holders of the master franchise
agreements in Iceland, Norway and Sweden, and associate investments in Germany and
Luxembourg. DOM’s current development agreement is for 350 new stores over a 10-year
period, with a minimum of 1,346 stores by 2026 (from 1,261 at the end of 2018).
Domino’s Pizza Enterprises (DMP.AX/DMP AU)
DMP includes the regions of Australia/New Zealand, Europe and Japan. DMP has a target
to reach 4,900 total stores by FY25-FY28 (raised from 4,650 by FY25) from 2,454 at the
end of FY1H19 (CY18).
Australia/New Zealand
Australia/New Zealand comprise 830 units, with expectations for strong organic new store
openings in FY19, following two calendar years of ~50 net new opens. System sales have
grown nearly 15% per year, including average SSS of ~10%. Domino’s has indicated
market potential for 1,200 total stores, highlighting a still strong runway for growth.
Germany
Germany has 320 stores currently, with an expected market potential of 1,000 stores. In
early 2018, DMP completed the acquisition of the largest independent pizza chain in
Germany, Hallo Pizza, in a JV transaction. A total of 126 stores were converted to
Domino’s restaurants, with conversions completed at a faster rate than expected and at
higher volumes.
France
France is one of the largest European markets with ~400 stores currently and a targeted
potential for 1,000. The region has underperformed expectations, but is working to
address challenges with new management in place.
Five public master franchisees comprise
~65% of DPZ’s international units

25 June 2019
Domino’s Pizza Inc. (DPZ) 42
Netherlands
Netherlands has ~270 units, with expectations to reach 400 long-term. The region appears
to be performing well, including double-digit SSS in 2018. Going forward, expectations
include expansion through splitting territories. With 90% of FY18’s 45 new stores opened
with existing franchisees/managers, confidence in unit growth is high, though likely to
weigh on strong SSS.
Luxembourg
DMP recently acquired the Master Franchise Agreement for Luxembourg, completing the
Benelux region (Netherlands, Belgium, Luxembourg), with the first store in Luxembourg
expected to open in 2019.
Japan
Japan has 550 stores as of FY1H19 (CY18), including organic growth of nearly 100 stores
over the last 2.5 years and a long-term target of 1,000 stores.
Dash Brands
Dash Brands is the master franchisee in China, with ~200 units across mainland China,
Hong Kong and Macau. The company has targeted growth to ~1,000 stores by 2025,
representing a ~25% growth CAGR over the next seven years, relative to ~30% over the
last few years, albeit a smaller base. Sub-franchising opportunities represent upside to
current growth targets.

25 June 2019
Domino’s Pizza Inc. (DPZ) 43
What is DPZ’s earnings growth outlook? Credit Suisse View
We model DPZ EPS growth of ~15% over the next four years, with ~9% revenue growth
(SSS 4.2%, global unit growth ~7%) enabling slight margin expansion for operating profit
growth of ~10.5%, and accretion from share repurchases (~3-4% of EPS growth). In 2019,
we model EPS growth of ~12%,
Upside to expectations exists should Domino’s be able to generate company restaurant
margin expansion following ~300bps of degradation since 2015. We model ~30bps of
contraction in 2019 and relatively stable company margins going forward. We estimate
every ~100bps of company margin expansion is ~1% to EPS. Margin improvement from
the supply chain could also generate upside – we model ~50bps of improvement in 2019
and relatively flat supply chain margins going forward.
Consensus Expectations
Consensus models DPZ EPS growth of ~14% over the next four years, including revenue
growth of 8.8%, ~90bps of operating margin expansion from 2018 for operating profit
growth of ~10% and share repurchases representing ~3% of market cap per year. For
2019, consensus estimates EPS growth of ~12%.
Figure 88: EPS has grown at a ~28% EPS CAGR
over the last five years.
Figure 89: We model EPS growth of 15% over the
next four years, slightly above consensus’ 14%.
Source: Company data, Credit Suisse estimates Source: Company data, Consensus Metrix, Credit Suisse estimates
0%
5%
10%
15%
20%
25%
30%
35%
40%
45%
$0.00
$1.00
$2.00
$3.00
$4.00
$5.00
$6.00
$7.00
$8.00
$9.00
2013 2014 2015 2016 2017 2018
EP
S G
row
th
EP
S
EPS EPS Growth
0%
2%
4%
6%
8%
10%
12%
14%
16%
18%
20%
2019E 2020E 2021E 2022E
EP
S G
row
th
CSe Consensus
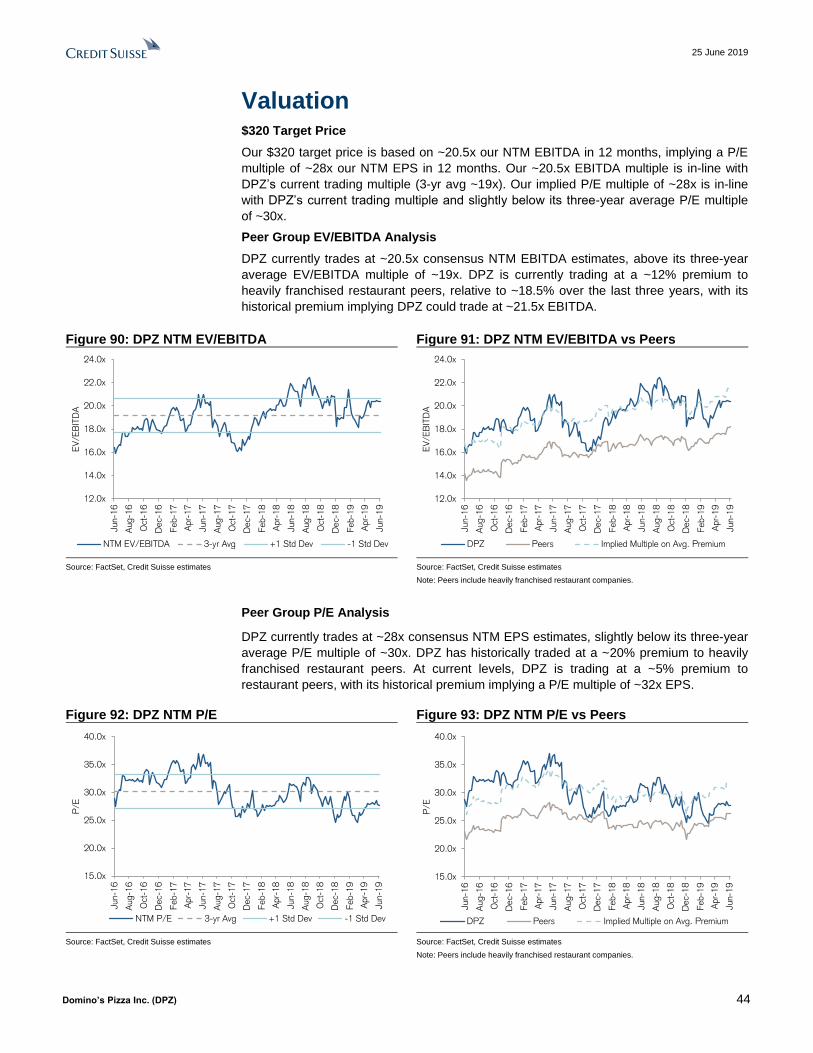
25 June 2019
Domino’s Pizza Inc. (DPZ) 44
Valuation $320 Target Price
Our $320 target price is based on ~20.5x our NTM EBITDA in 12 months, implying a P/E
multiple of ~28x our NTM EPS in 12 months. Our ~20.5x EBITDA multiple is in-line with
DPZ’s current trading multiple (3-yr avg ~19x). Our implied P/E multiple of ~28x is in-line
with DPZ’s current trading multiple and slightly below its three-year average P/E multiple
of ~30x.
Peer Group EV/EBITDA Analysis
DPZ currently trades at ~20.5x consensus NTM EBITDA estimates, above its three-year
average EV/EBITDA multiple of ~19x. DPZ is currently trading at a ~12% premium to
heavily franchised restaurant peers, relative to ~18.5% over the last three years, with its
historical premium implying DPZ could trade at ~21.5x EBITDA.
Figure 90: DPZ NTM EV/EBITDA Figure 91: DPZ NTM EV/EBITDA vs Peers
Source: FactSet, Credit Suisse estimates Source: FactSet, Credit Suisse estimates
Note: Peers include heavily franchised restaurant companies.
Peer Group P/E Analysis
DPZ currently trades at ~28x consensus NTM EPS estimates, slightly below its three-year
average P/E multiple of ~30x. DPZ has historically traded at a ~20% premium to heavily
franchised restaurant peers. At current levels, DPZ is trading at a ~5% premium to
restaurant peers, with its historical premium implying a P/E multiple of ~32x EPS.
Figure 92: DPZ NTM P/E Figure 93: DPZ NTM P/E vs Peers
Source: FactSet, Credit Suisse estimates Source: FactSet, Credit Suisse estimates
Note: Peers include heavily franchised restaurant companies.
12.0x
14.0x
16.0x
18.0x
20.0x
22.0x
24.0x
Jun-1
6
Aug-1
6
Oct
-16
Dec-
16
Feb-1
7
Apr-
17
Jun-1
7
Aug-1
7
Oct
-17
Dec-
17
Feb-1
8
Apr-
18
Jun-1
8
Aug-1
8
Oct
-18
Dec-
18
Feb-1
9
Apr-
19
Jun-1
9
EV
/EB
ITD
A
NTM EV/EBITDA 3-yr Avg +1 Std Dev -1 Std Dev
12.0x
14.0x
16.0x
18.0x
20.0x
22.0x
24.0x
Jun-1
6
Aug-1
6
Oct
-16
Dec-
16
Feb-1
7
Apr-
17
Jun-1
7
Aug-1
7
Oct
-17
Dec-
17
Feb-1
8
Apr-
18
Jun-1
8
Aug-1
8
Oct
-18
Dec-
18
Feb-1
9
Apr-
19
Jun-1
9
EV
/EB
ITD
A
DPZ Peers Implied Multiple on Avg. Premium
15.0x
20.0x
25.0x
30.0x
35.0x
40.0x
Jun-1
6
Aug-1
6
Oct
-16
Dec-
16
Feb-1
7
Apr-
17
Jun-1
7
Aug-1
7
Oct
-17
Dec-
17
Feb-1
8
Apr-
18
Jun-1
8
Aug-1
8
Oct
-18
Dec-
18
Feb-1
9
Apr-
19
Jun-1
9
P/E
NTM P/E 3-yr Avg +1 Std Dev -1 Std Dev
15.0x
20.0x
25.0x
30.0x
35.0x
40.0x
Jun-1
6
Aug-1
6
Oct
-16
Dec-
16
Feb-1
7
Apr-
17
Jun-1
7
Aug-1
7
Oct
-17
Dec-
17
Feb-1
8
Apr-
18
Jun-1
8
Aug-1
8
Oct
-18
Dec-
18
Feb-1
9
Apr-
19
Jun-1
9
P/E
DPZ Peers Implied Multiple on Avg. Premium

25 June 2019
Domino’s Pizza Inc. (DPZ) 45
Figure 94: DPZ’s above-average system sales and EBITDA growth outlook
support its premium valuation.
Source: Company data, FactSet, Consensus Metrix
Note: (1) FCF, system sales and EBITDA growth calculated based on 3-yr forward CAGR using consensus estimates. (2) % Franchised/ Licensed reflects 2018 franchise mix. (3) Averages exclude SHAK.
Scenario Analysis
Blue Sky: $385 One-Year Valuation
Our $385 one-year valuation in a blue sky scenario is based on an EV/EBITDA of ~22.5x
our blue sky FY20 EBITDA. Our blue sky FY20 EBITDA is based on: 1) domestic SSS of
8%; 2) domestic unit growth of ~6%; and 3) operating margins of ~19%.
Grey Sky: $235 One-Year Valuation
Our $235 one-year valuation in a grey sky scenario is based on an EV/EBITDA of ~18x
our grey sky FY20 EBITDA. Our grey sky FY20 EBITDA is based on: 1) domestic SSS of
3.5%; 2) domestic unit growth of ~4.5%; and 3) operating margins of ~16.5%.
NTM
EV/EBITDANTM P/E
System Sales
Growth% Unit Growth EBITDA Growth
% Franchised/
Licensed
SHAK 28.2x 113.8x 22.2% 22.8% 17.5% 40%
CMG 25.6x 53.0x 11.0% 5.9% 22.6% 0%
DPZ 20.4x 29.0x 9.7% 6.8% 10.5% 98%
YUM 20.1x 28.3x 6.8% 4.1% 7.3% 98%
DNKN 18.3x 26.4x 3.5% 1.5% 5.0% 100%
MCD 18.0x 24.8x 5.0% 2.1% 4.4% 93%
QSR 17.5x 25.5x 6.5% 5.4% 5.8% 100%
SBUX 17.4x 29.0x 7.1% 6.9% 7.5% 48%
PZZA 15.7x 36.8x 1.3% 2.8% 3.1% 88%
WEN 15.0x 30.3x 3.3% 1.9% 5.3% 95%
JACK 12.1x 19.1x 2.3% 0.9% 2.6% 94%
Average 18.0x 30.2x 5.7% 3.8% 7.4% 81.3%

25 June 2019
Domino’s Pizza Inc. (DPZ) 46
Investment Risks
■ Competition: Domino’s faces competition from large pizza chains, regional pizza
chains, QSR competitors and third-party delivery aggregators. Increasing competitive
pressure could weigh on market gains globally.
■ Inflation: Inflation in store-level input costs (labor, cheese, etc.) could weigh on store
level profitability and margin compression.
■ Store Growth: Domino’s growth strategy relies in part on opening new US and
international stores. DPZ could face difficulty executing its strategy if it is unable to find
quality site locations, secure leases with acceptable terms, obtain government permits
or approvals and find qualified employees. DPZ’s ability to increase revenues and
operating income could be adversely affected if they are unable to add a significant
number of new stores.
■ Supply Chain Center Disruption: Domino’s operates 19 regional dough
manufacturing and supply chain centers, one crust manufacturing center and one
vegetable processing center in the US and five dough manufacturing and food supply
chain centers in Canada. Domino’s services all company-owned and US franchise
stores. Any prolonged disruption in the operations of these facilities could adversely
affect its business and operating results.
■ International Exposure: ~6.5% of DPZ’s total revenue in 2018 was derived from its
international franchise segment. A hypothetical 10% adverse change in the FX rates in
DPZ’s international markets would likely have a ~$20MM negative impact on
international royalties. Each 10% change in FX in DPZ’s international markets affects
EPS by ~5%.
■ Economic Exposure: DPZ’s financial condition and operations are affected by
economic conditions outside of its control. DPZ could experience reduced product
demand, longer payment cycles, slow adoption of new technologies and increased price
competition if there is an economic downturn or deterioration in economic conditions.
■ Cybersecurity: DPZ collects and stores personal information about its customers,
employees and franchisees as a result of accepting electronic forms of payment and
the nature of its business operations. DPZ’s business, reputation and results of
operations could be adversely affected if confidential customer, employee or franchisee
information is compromised.
■ Food-borne Illness: In the past, reports of food-borne illness or tampering have
injured the reputations of the companies involved. DPZ’s sales, profits, and reputation
could be adversely affected if it is linked to reported cases of food-borne illness or
other food safety incidents.
■ Interest Rates: DPZ is highly levered, with ~6x debt/EBITDA. ~90% of debt is fixed,
though an increase in rates could raise concerns around future refinancing.

25 June 2019
Domino’s Pizza Inc. (DPZ) 47
Financials
Figure 95: DPZ Income Statement
Source: Company data, Credit Suisse estimates
Domino's (DPZ) Fiscal Yr Fiscal Yr 2018 Fiscal Yr 2019 Fiscal Yr 2020 Fiscal Yr Fiscal Yr Fiscal Yr
($ in millions) 2016 2017 1Q18 2Q18 3Q18 4Q18 2018 1Q19 2Q19E 3Q19E 4Q19E 2019E 1Q20E 2Q20E 3Q20E 4Q20E 2020E 2021E 2022E
2016 2017 Mar-18 Jun-18 Sep-18 Dec-18 2018 Mar-19 Jun-19 Sep-19 Dec-19 2019E Mar-20 Jun-20 Sep-20 Jan-21 2020E 2021E 2022E
Income Statement
Revenues
Domestic Company-owned stores $439.0 $490.8 $121.2 $118.8 $118.5 $156.3 $514.8 $123.5 $115.0 $109.3 $147.2 $495.0 $118.0 $114.8 $116.5 $166.4 $515.6 $540.0 $577.4
YOY % 10.6% 11.8% 6.7% 5.7% 5.0% 2.8% 4.9% 1.9% -3.2% -7.8% -5.8% -3.8% -4.4% -0.2% 6.5% 13.0% 4.2% 4.7% 6.9%
Domestic franchise royalties and fees $312.3 $351.4 $89.5 $87.4 $89.4 $125.2 $391.5 $96.7 $97.1 $98.8 $136.3 $428.9 $107.5 $106.5 $107.9 $157.8 $479.7 $513.4 $560.1
YOY % 14.5% 12.5% 12.0% 6.1% 11.4% 15.0% 11.4% 8.1% 11.1% 10.5% 8.9% 9.6% 11.1% 9.7% 9.2% 15.8% 11.8% 7.0% 9.1%
Supply chain $1,544.3 $1,739.0 $440.1 $440.9 $445.1 $617.2 $1,943.3 $472.1 $485.0 $489.6 $678.9 $2,125.7 $519.3 $533.5 $538.6 $746.8 $2,338.2 $2,572.1 $2,829.3
YOY % 11.7% 12.6% 13.3% 13.0% 10.7% 10.6% 11.7% 7.3% 10.0% 10.0% 10.0% 9.4% 10.0% 10.0% 10.0% 10.0% 10.0% 10.0% 10.0%
International franchise royalties and fees $177.0 $206.7 $52.4 $51.3 $50.4 $70.6 $224.7 $54.6 $55.7 $56.5 $80.1 $246.9 $59.5 $60.9 $62.1 $93.6 $276.1 $298.5 $327.9
YOY % 8.2% 16.8% 24.2% 17.5% 4.3% -2.6% 8.7% 4.1% 8.5% 12.1% 13.5% 9.9% 9.1% 9.4% 9.8% 16.9% 11.8% 8.1% 9.9%
Domestic franchise advertising $0.0 $0.0 $82.2 $80.9 $82.5 $112.9 $358.5 $89.1 $88.1 $89.3 $122.9 $389.5 $97.1 $96.0 $97.3 $142.2 $432.6 $462.3 $503.8
YOY % 8.4% 8.9% 8.2% 8.9% 8.6% 8.9% 9.0% 9.0% 15.6% 11.1% 6.9% 9.0%
Total Revenues $2,472.6 $2,788.0 $785.4 $779.4 $786.0 $1,082.1 $3,432.9 $836.0 $841.0 $843.5 $1,165.5 $3,686.0 $901.4 $911.7 $922.3 $1,306.8 $4,042.2 $4,386.1 $4,798.5
YOY % 11.6% 12.8% 25.8% 24.0% 22.1% 21.4% 23.1% 6.4% 7.9% 7.3% 7.7% 7.4% 7.8% 8.4% 9.3% 12.1% 9.7% 8.5% 9.4%
Costs of sales:
Domestic Company-owned stores $331.9 $377.7 $93.0 $92.0 $93.0 $120.1 $398.2 $95.5 $89.4 $86.1 $113.3 $384.4 $91.1 $89.2 $92.0 $128.4 $400.7 $420.2 $449.4
YOY % 12.5% 13.8% 6.7% 3.3% 7.1% 4.8% 5.4% 2.7% -2.8% -7.4% -5.7% -3.5% -4.6% -0.2% 6.8% 13.3% 4.2% 4.9% 6.9%
% of Domestic Company-owned stores revenues 75.6% 76.9% 76.8% 77.4% 78.5% 76.9% 77.3% 77.4% 77.7% 78.8% 77.0% 77.6% 77.2% 77.7% 79.0% 77.2% 77.7% 77.8% 77.8%
Restaurant Margin 24.4% 23.1% 23.2% 22.6% 21.5% 23.1% 22.7% 22.6% 22.3% 21.2% 23.0% 22.4% 22.8% 22.3% 21.0% 22.8% 22.3% 22.2% 22.2%
Margin Chg. YOY -127bps -135bps 1bps 177bps -156bps -144bps -40bps -62bps -30bps -30bps -10bps -30bps 15bps 0bps -20bps -20bps -7bps -11bps 0bps
Supply Chain $1,373.1 $1,544.3 $392.5 $393.8 $397.7 $548.0 $1,732.0 $418.1 $430.8 $435.0 $600.8 $1,884.7 $459.4 $473.3 $478.0 $660.1 $2,070.9 $2,278.0 $2,505.8
YOY % 11.4% 12.5% 14.3% 13.6% 11.0% 10.5% 12.2% 6.5% 9.4% 9.4% 9.6% 8.8% 9.9% 9.9% 9.9% 9.9% 9.9% 10.0% 10.0%
% of Supply chain revenues 88.9% 88.8% 89.2% 89.3% 89.3% 88.8% 89.1% 88.6% 88.8% 88.8% 88.5% 88.7% 88.5% 88.7% 88.7% 88.4% 88.6% 88.6% 88.6%
Supply Chain Margin 11.1% 11.2% 10.8% 10.7% 10.7% 11.2% 10.9% 11.4% 11.2% 11.2% 11.5% 11.3% 11.5% 11.3% 11.3% 11.6% 11.4% 11.4% 11.4%
Margin Chg. YOY 21bps 11bps -85bps -44bps -24bps 6bps -33bps 62bps 50bps 50bps 30bps 46bps 10bps 10bps 10bps 10bps 10bps 0bps 0bps
Total costs of sales $1,704.9 $1,922.0 $485.5 $485.8 $490.7 $668.2 $2,130.2 $513.7 $520.2 $521.1 $714.1 $2,269.1 $550.6 $562.6 $569.9 $788.5 $2,471.6 $2,698.2 $2,955.2
YOY % 11.6% 12.7% 12.8% 11.5% 10.2% 9.4% 10.8% 5.8% 7.1% 6.2% 6.9% 6.5% 7.2% 8.1% 9.4% 10.4% 8.9% 9.2% 9.5%
General & administrative expenses $313.6 $344.1 $84.2 $86.0 $80.4 $121.4 $371.9 $89.7 $89.4 $89.2 $123.8 $392.0 $94.4 $94.6 $95.2 $135.5 $419.8 $449.0 $484.0
YOY % 13.3% 9.7% 8.2% 7.5% -0.5% 15.0% 8.1% 6.5% 4.0% 11.0% 1.9% 5.4% 5.3% 5.9% 6.8% 9.5% 7.1% 6.9% 7.8%
% of Total Revenue 12.7% 12.3% 10.7% 11.0% 10.2% 11.2% 10.8% 10.7% 10.6% 10.6% 10.6% 10.6% 10.5% 10.4% 10.3% 10.4% 10.4% 10.2% 10.1%
Margin Chg. YOY 20bps -34bps -174bps -169bps -232bps -63bps -151bps 1bps -40bps 35bps -60bps -20bps -25bps -25bps -25bps -25bps -25bps -15bps -15bps
Domestic franchise advertising $82.2 $80.9 $82.5 $112.9 $358.5 $89.1 $88.1 $89.3 $122.9 $389.5 $97.1 $96.0 $97.3 $142.2 $432.6 $462.3 $503.8
% of Domestic System Sales 5.4% 5.4% 5.5% 5.5% 5.4% 5.4% 5.4% 5.4% 5.4% 5.4% 5.4% 5.4% 5.4% 5.4% 5.4% 5.4% 5.4%
Total operating costs $2,018.6 $2,266.1 $651.9 $652.7 $653.53 $902.5 $2,860.6 $692.5 $697.7 $699.6 $960.8 $3,050.6 $742.0 $753.2 $762.5 $1,066.2 $3,324.0 $3,609.5 $3,942.9
Operating Income $454.0 $521.9 $133.48 $126.68 $132.44 $179.64 $572.23 $143.5 $143.2 $143.9 $204.7 $635.3 $159.3 $158.5 $159.8 $240.6 $718.3 $776.7 $855.6
YOY % 10.2% 14.9% 15.0% 12.2% 12.5% 2.5% 9.7% 7.5% 13.1% 8.7% 13.9% 11.0% 11.0% 10.6% 11.1% 17.6% 13.1% 8.1% 10.2%
Operating Margin 18.4% 18.7% 17.0% 16.3% 16.9% 16.6% 16.7% 17.2% 17.0% 17.1% 17.6% 17.2% 17.7% 17.4% 17.3% 18.4% 17.8% 17.7% 17.8%
Margin Chg. YOY -22bps 36bps -159bps -170bps -144bps -306bps -205bps 17bps 78bps 21bps 96bps 57bps 51bps 35bps 27bps 85bps 53bps -6bps 12bps
Interest income $0.7 $1.5 $0.5 $1.2 $0.8 $0.9 $3.3 $0.7 $0.4 $0.4 $0.4 $1.9 $0.4 $0.4 $0.4 $0.4 $1.6 $1.6 $1.6
Interest expense ($110.1) ($116.8) ($30.3) ($32.8) ($34.0) ($46.0) ($143.0) ($35.1) ($34.8) ($34.7) ($46.1) ($150.6) ($34.5) ($35.4) ($36.3) ($51.3) ($157.6) ($158.9) ($161.5)
Interest expense, net ($109.4) ($115.3) ($29.8) ($31.6) ($33.2) ($45.1) ($139.7) ($34.4) ($34.4) ($34.3) ($45.7) ($148.7) ($34.1) ($35.0) ($35.9) ($50.9) ($156.0) ($157.3) ($159.9)
Pretax Income $344.7 $406.6 $103.7 $95.0 $99.3 $134.6 $432.5 $109.1 $108.9 $109.6 $158.9 $486.6 $125.2 $123.5 $123.9 $189.7 $562.3 $619.4 $695.7
Pre-Tax Margin 13.9% 14.6% 13.2% 12.2% 12.6% 12.4% 12.6% 13.1% 12.9% 13.0% 13.6% 13.2% 13.9% 13.5% 13.4% 14.5% 13.9% 14.1% 14.5%
Income tax expense $130.0 $124.7 $14.8 $14.7 $15.2 $22.9 $67.58 $16.5 $21.8 $21.9 $31.8 $92.0 $25.0 $24.7 $24.8 $37.9 $112.5 $123.9 $139.1
Tax Rate 37.7% 30.7% 14.3% 15.4% 15.3% 17.0% 15.6% 15.1% 20.0% 20.0% 20.0% 18.9% 20.0% 20.0% 20.0% 20.0% 20.0% 20.0% 20.0%
Net Income $214.7 $281.9 $88.83 $80.38 $84.1 $111.64 $364.9 $92.7 $87.1 $87.7 $127.1 $394.6 $100.2 $98.8 $99.1 $151.7 $449.8 $495.5 $556.5
Net Income Margin 8.7% 10.1% 11.3% 10.3% 10.7% 10.3% 10.6% 11.1% 10.4% 10.4% 10.9% 10.7% 11.1% 10.8% 10.7% 11.6% 11.1% 11.3% 11.6%
Adj EPS $4.30 $5.91 $2.00 $1.84 $1.95 $2.62 $8.42 $2.20 $2.08 $2.11 $3.07 $9.44 $2.44 $2.43 $2.46 $3.79 $11.10 $12.66 $14.73
YOY % 18.6% 37.5% 59.3% 39.6% 54.3% 25.2% 42.4% 9.7% 12.6% 7.8% 17.2% 12.1% 11.2% 16.9% 16.7% 23.5% 17.6% 14.1% 16.3%
Weighted Average Basic Shares 48.6 46.0 42.8 42.0 41.6 41.0 41.9 40.9 40.6 40.3 40.1 40.5 39.7 39.4 39.0 38.7 39.2 37.8 36.4
YOY % -9.6% -5.5% -10.5% -12.4% -9.7% -2.4% -8.9% -4.6% -3.4% -3.0% -2.2% -3.3% -2.8% -3.0% -3.3% -3.5% -3.2% -3.5% -3.6%
Weighted Average Diluted Shares 49.9 47.7 44.4 43.6 43.1 42.6 43.3 42.2 41.9 41.7 41.4 41.8 41.0 40.7 40.3 40.0 40.5 39.1 37.8
YOY % -10.1% -4.5% -10.7% -12.4% -9.7% -4.5% -9.1% -4.9% -3.8% -3.3% -2.8% -3.5% -2.7% -2.9% -3.2% -3.4% -3.1% -3.4% -3.5%
Cash Dividends per Share $1.52 $1.84 $0.55 $0.55 $0.55 $0.55 $2.20 $0.65 $0.65 $0.65 $0.65 $2.60 $0.78 $0.78 $0.78 $0.78 $3.12 $3.59 $4.13
YOY % 22.6% 21.1% 19.6% 19.6% 19.6% 19.6% 19.6% 18.2% 18.2% 18.2% 18.2% 18.2% 20.0% 20.0% 20.0% 20.0% 20.0% 15.0% 15.0%
Payout Ratio 35.3% 31.1% 27.5% 29.8% 28.2% 21.0% 26.1% 29.6% 31.3% 30.9% 21.2% 27.5% 32.0% 32.1% 31.7% 20.6% 28.1% 28.3% 28.0%
Operating Income $454.0 $521.9 $133.5 $126.7 $132.4 $179.6 $572.2 $143.5 $143.2 $143.9 $204.7 $635.3 $159.3 $158.5 $159.8 $240.6 $718.3 $776.7 $855.6
Depreciation & Amortization $38.1 $44.4 $11.1 $12.2 $12.5 $17.9 $53.7 $13.8 $13.2 $13.5 $18.7 $59.2 $14.9 $14.3 $14.7 $21.0 $64.9 $70.4 $77.0
EBITDA $492.2 $566.2 $144.5 $138.9 $144.9 $197.5 $625.9 $157.3 $156.4 $157.4 $223.4 $694.5 $174.2 $172.8 $174.6 $261.6 $783.2 $847.1 $932.6
YOY % 10.7% 15.0% 15.1% 12.8% 13.2% 4.2% 10.5% 8.8% 12.6% 8.6% 13.1% 11.0% 10.7% 10.5% 10.9% 17.1% 12.8% 8.2% 10.1%
EBITDA Margin 19.9% 20.3% 18.4% 17.8% 18.4% 18.3% 18.2% 18.8% 18.6% 18.7% 19.2% 18.8% 19.3% 19.0% 18.9% 20.0% 19.4% 19.3% 19.4%
Margin Chg. YOY -15bps 40bps -171bps -177bps -145bps -301bps -208bps 41bps 78bps 22bps 91bps 61bps 51bps 35bps 27bps 85bps 53bps -6bps 12bps

25 June 2019
Domino’s Pizza Inc. (DPZ) 48
Figure 96: DPZ Balance Sheet
Source: Company data, Credit Suisse estimates
Domino's (DPZ) Fiscal Yr Fiscal Yr 2018 Fiscal Yr 2019 Fiscal Yr 2020 Fiscal Yr Fiscal Yr Fiscal Yr
($ in millions) 2016 2017 1Q18 2Q18 3Q18 4Q18 2018 1Q19 2Q19E 3Q19E 4Q19E 2019E 1Q20E 2Q20E 3Q20E 4Q20E 2020E 2021E 2022E
2016 2017 Mar-18 Jun-18 Sep-18 Dec-18 2018 Mar-19 Jun-19 Sep-19 Dec-19 2019E Mar-20 Jun-20 Sep-20 Jan-21 2020E 2021E 2022E
Balance Sheet
Cash and cash equivalents $42.8 $35.8 $44.6 $157.8 $84.6 $25.4 $25.4 $83.1 $85.2 $52.0 $17.2 $17.2 $14.1 $157.6 $118.2 $82.2 $82.2 $98.4 $214.1
Restricted cash and cash equivalents $126.5 $191.8 $145.2 $145.0 $168.2 $167.0 $167.0 $150.1 $150.1 $150.1 $150.1 $150.1 $150.1 $150.1 $150.1 $150.1 $150.1 $150.1 $150.1
Accounts receivable, net $150.4 $173.7 $174.4 $182.8 $170.2 $190.1 $190.1 $194.1 $204.3 $196.1 $193.4 $193.4 $206.8 $220.2 $212.4 $212.1 $212.1 $230.2 $251.8
Inventories $40.2 $40.0 $41.2 $40.2 $41.4 $46.0 $46.0 $45.7 $45.7 $45.7 $45.7 $45.7 $45.7 $45.7 $45.7 $45.7 $45.7 $45.7 $45.7
Deferred income taxes $0.0 $0.0 $0.0 $0.0 $0.0 $0.0 $0.0 $0.0 $0.0 $0.0 $0.0 $0.0 $0.0 $0.0 $0.0 $0.0 $0.0 $0.0 $0.0
Prepaid expenses and other $17.6 $18.4 $18.7 $33.4 $22.4 $25.7 $25.7 $19.5 $19.5 $19.5 $19.5 $19.5 $19.5 $19.5 $19.5 $19.5 $19.5 $19.5 $19.5
Advertising fund assets, restricted $118.4 $120.2 $112.3 $123.8 $118.8 $112.7 $112.7 $98.1 $98.1 $98.1 $98.1 $98.1 $98.1 $98.1 $98.1 $98.1 $98.1 $98.1 $98.1
Total Current Assets $495.9 $579.8 $536.4 $682.9 $605.6 $566.9 $566.9 $590.5 $602.8 $561.5 $524.0 $524.0 $534.3 $691.2 $644.0 $607.7 $607.7 $642.0 $779.3
Gross PP&E $359.5 $406.9 $412.8 $425.6 $454.2 $485.2 $485.2 $488.1 $476.8 $511.8 $546.8 $546.8 $571.8 $596.8 $621.8 $646.8 $646.8 $736.8 $826.8
Accumulated depreciation and amortization ($221.0) ($237.3) ($243.2) ($248.4) ($247.2) ($252.2) ($252.2) ($260.3) ($273.5) ($286.9) ($305.6) ($305.6) ($320.5) ($334.8) ($349.6) ($370.6) ($370.6) ($441.0) ($518.0)
Net PP&E $138.5 $169.6 $169.5 $177.2 $207.0 $233.0 $233.0 $227.9 $203.4 $224.9 $241.2 $241.2 $251.3 $262.0 $272.3 $276.3 $276.3 $295.8 $308.8
Investments in marketable securities, restricted $7.3 $8.1 $0.0 $0.0 $0.0 $8.7 $8.7 $0.0 $0.0 $0.0 $0.0 $0.0 $0.0 $0.0 $0.0 $0.0 $0.0 $0.0 $0.0
Notes receivable $0.0 $0.0 $0.0 $0.0 $0.0 $0.0 $0.0 $0.0 $0.0 $0.0 $0.0 $0.0 $0.0 $0.0 $0.0 $0.0 $0.0 $0.0 $0.0
Deferred financing costs $0.0 $0.0 $0.0 $0.0 $0.0 $0.0 $0.0 $0.0 $0.0 $0.0 $0.0 $0.0 $0.0 $0.0 $0.0 $0.0 $0.0 $0.0 $0.0
Goodwill $16.1 $15.4 $15.4 $15.4 $14.9 $14.9 $14.9 $14.9 $14.9 $14.9 $14.9 $14.9 $14.9 $14.9 $14.9 $14.9 $14.9 $14.9 $14.9
Capitalized software, net $40.3 $52.8 $56.0 $58.9 $59.8 $63.8 $63.8 $66.2 $66.2 $66.2 $66.2 $66.2 $66.2 $66.2 $66.2 $66.2 $66.2 $66.2 $66.2
Other assets $9.4 $8.3 $16.9 $17.1 $21.8 $12.5 $12.5 $22.7 $22.7 $22.7 $22.7 $22.7 $22.7 $22.7 $22.7 $22.7 $22.7 $22.7 $22.7
Operating lease right-of-use assets $218.9 $218.9 $222.0 $222.0 $222.0 $222.0 $222.0 $222.0 $222.0 $222.0 $222.0 $222.0 $222.0 $222.0
Deferred income taxes $8.9 $2.8 $4.1 $3.2 $2.9 $5.5 $5.5 $4.1 $4.1 $4.1 $4.1 $4.1 $4.1 $4.1 $4.1 $4.1 $4.1 $4.1 $4.1
Total Assets $716.3 $836.8 $798.3 $954.6 $912.1 $1,124.3 $1,124.3 $1,148.3 $1,136.1 $1,116.3 $1,095.0 $1,095.0 $1,115.5 $1,283.0 $1,246.1 $1,213.9 $1,213.9 $1,267.7 $1,417.9
Current portion of long-term debt $38.9 $32.3 $32.3 $35.6 $35.8 $35.9 $35.9 $35.9 $35.9 $35.9 $35.9 $35.9 $35.9 $35.9 $35.9 $35.9 $35.9 $35.9 $35.9
Accounts payable $111.5 $106.9 $89.0 $79.4 $87.5 $92.5 $92.5 $84.9 $91.1 $89.5 $95.9 $95.9 $94.8 $97.5 $96.5 $104.5 $104.5 $114.0 $124.9
Accrued compensation $42.1 $37.4 $0.0 $0.0 $0.0 $41.0 $41.0 $0.0 $0.0 $0.0 $0.0 $0.0 $0.0 $0.0 $0.0 $0.0 $0.0 $0.0 $0.0
Accrued interest $18.8 $22.1 $0.0 $0.0 $0.0 $26.0 $26.0 $0.0 $0.0 $0.0 $0.0 $0.0 $0.0 $0.0 $0.0 $0.0 $0.0 $0.0 $0.0
Insurance reserves $16.7 $20.8 $21.5 $21.3 $21.9 $22.2 $22.2 $22.0 $22.0 $22.0 $22.0 $22.0 $22.0 $22.0 $22.0 $22.0 $22.0 $22.0 $22.0
Dividends Payable $0.0 $0.0 $24.0 $23.6 $23.3 $0.0 $0.0 $27.2 $26.4 $26.2 $0.0 $0.0 $31.0 $30.7 $30.4 $0.0 $0.0 $0.0 $0.0
Advertising fund liabilities $118.4 $120.2 $105.8 $117.4 $112.2 $107.2 $107.2 $93.0 $93.0 $93.0 $93.0 $93.0 $93.0 $93.0 $93.0 $93.0 $93.0 $93.0 $93.0
Legal reserves $0.0 $0.0 $0.0 $0.0 $0.0 $0.0 $0.0 $0.0 $0.0 $0.0 $0.0 $0.0 $0.0 $0.0 $0.0 $0.0 $0.0 $0.0 $0.0
Other accrued liabilities $57.3 $58.6 $112.1 $100.2 $95.7 $54.9 $54.9 $117.2 $117.2 $117.2 $117.2 $117.2 $117.2 $117.2 $117.2 $117.2 $117.2 $117.2 $117.2
Operating lease liabilities $32.0 $32.0 $31.8 $31.8 $31.8 $31.8 $31.8 $31.8 $31.8 $31.8 $31.8 $31.8 $31.8 $31.8
Total Current Liabilities $403.7 $398.3 $384.8 $377.4 $376.4 $411.6 $411.6 $412.0 $417.4 $415.7 $395.9 $395.9 $425.7 $428.2 $426.9 $404.4 $404.4 $414.0 $424.9
Long-term debt, less current portion $2,149.0 $3,121.5 $3,117.2 $3,437.0 $3,437.6 $3,495.7 $3,495.7 $3,447.8 $3,439.0 $3,430.2 $3,421.4 $3,421.4 $3,412.6 $3,603.8 $3,594.9 $3,586.1 $3,586.1 $3,650.9 $3,762.9
Insurance reserves $27.1 $30.6 $31.4 $33.2 $34.0 $31.1 $31.1 $32.6 $32.6 $32.6 $32.6 $32.6 $32.6 $32.6 $32.6 $32.6 $32.6 $32.6 $32.6
Deferred income taxes, net. $0.0 $0.0 $0.0 $0.0 $0.0 $0.0 $0.0 $0.0 $0.0 $0.0 $0.0 $0.0 $0.0 $0.0 $0.0 $0.0 $0.0 $0.0 $0.0
Other accrued liabilities $19.6 $21.8 $35.8 $36.2 $37.8 $31.1 $31.1 $32.5 $32.5 $32.5 $32.5 $32.5 $32.5 $32.5 $32.5 $32.5 $32.5 $32.5 $32.5
Operating lease liabilities $194.7 $194.7 $198.5 $198.5 $198.5 $198.5 $198.5 $198.5 $198.5 $198.5 $198.5 $198.5 $198.5 $198.5
Total Liabilities $2,599.4 $3,572.1 $3,569.2 $3,883.8 $3,885.9 $4,164.2 $4,164.2 $4,123.4 $4,120.0 $4,109.5 $4,080.9 $4,080.9 $4,101.9 $4,295.6 $4,285.5 $4,254.2 $4,254.2 $4,328.5 $4,451.4
Common stock $0.5 $0.4 $0.4 $0.4 $0.4 $0.4 $0.4 $0.4 $0.4 $0.4 $0.4 $0.4 $0.4 $0.4 $0.4 $0.4 $0.4 $0.4 $0.4
Additional paid in capital $1.0 $5.7 $0.1 $0.7 $1.9 $0.6 $0.6 $5.5 $7.5 $9.5 $11.5 $11.5 $13.5 $15.6 $17.7 $19.8 $19.8 $28.5 $37.6
Retained deficit ($1,881.5) ($2,739.4) ($2,768.6) ($2,926.9) ($2,972.6) ($3,036.5) ($3,036.5) ($2,976.8) ($2,987.7) ($2,998.9) ($2,993.5) ($2,993.5) ($2,996.1) ($3,024.4) ($3,053.3) ($3,056.3) ($3,056.3) ($3,085.5) ($3,067.3)
Accumulated other comprehensive loss ($3.1) ($2.0) ($2.8) ($3.4) ($3.5) ($4.4) ($4.4) ($4.2) ($4.2) ($4.2) ($4.2) ($4.2) ($4.2) ($4.2) ($4.2) ($4.2) ($4.2) ($4.2) ($4.2)
Shareholders' Equity ($1,883.1) ($2,735.4) ($2,770.9) ($2,929.2) ($2,973.8) ($3,039.9) ($3,039.9) ($2,975.2) ($2,984.0) ($2,993.2) ($2,985.9) ($2,985.9) ($2,986.4) ($3,012.6) ($3,039.4) ($3,040.3) ($3,040.3) ($3,060.8) ($3,033.4)
Total Liabilities & Shareholders' Equity $716.3 $836.8 $798.3 $954.6 $912.1 $1,124.3 $1,124.3 $1,148.3 $1,136.1 $1,116.3 $1,095.0 $1,095.0 $1,115.5 $1,283.0 $1,246.1 $1,213.9 $1,213.9 $1,267.7 $1,417.9
check - - - - - - - - - - - - - - - - - - -
Balance Sheet Analysis 2016 2017 1Q18 2Q18 3Q18 4Q18 2018 1Q19 2Q19E 3Q19E 4Q19E 2019E 1Q20E 2Q20E 3Q20E 4Q20E 2020E 2021E 2022E
Debt Analysis
Long-term debt, less current portion $2,149.0 $3,121.5 $3,117.2 $3,437.0 $3,437.6 $3,495.7 $3,495.7 $3,447.8 $3,439.0 $3,430.2 $3,421.4 $3,421.4 $3,412.6 $3,603.8 $3,594.9 $3,586.1 $3,586.1 $3,650.9 $3,762.9
Current portion of long-term debt $38.9 $32.3 $32.3 $35.6 $35.8 $35.9 $35.9 $35.9 $35.9 $35.9 $35.9 $35.9 $35.9 $35.9 $35.9 $35.9 $35.9 $35.9 $35.9
Total Debt $2,187.9 $3,153.8 $3,149.5 $3,472.6 $3,473.5 $3,531.6 $3,531.6 $3,483.7 $3,474.9 $3,466.1 $3,457.3 $3,457.3 $3,448.5 $3,639.7 $3,630.9 $3,622.0 $3,622.0 $3,686.8 $3,798.8
Cash and cash equivalents $42.8 $35.8 $44.6 $157.8 $84.6 $25.4 $25.4 $83.1 $85.2 $52.0 $17.2 $17.2 $14.1 $157.6 $118.2 $82.2 $82.2 $98.4 $214.1
Net Debt $2,145.1 $3,118.0 $3,104.9 $3,314.8 $3,388.9 $3,506.1 $3,506.1 $3,400.6 $3,389.7 $3,414.1 $3,440.1 $3,440.1 $3,434.4 $3,482.1 $3,512.6 $3,539.8 $3,539.8 $3,588.4 $3,584.7
Average Debt $2,214.3 $2,670.8 $3,151.7 $3,311.0 $3,473.0 $3,502.5 $3,342.7 $3,507.7 $3,479.3 $3,470.5 $3,461.7 $3,494.4 $3,452.9 $3,544.1 $3,635.3 $3,626.4 $3,539.7 $3,654.4 $3,742.8
TTM EBITDA $492.2 $566.2 $585.2 $601.0 $617.9 $625.9 $625.9 $638.6 $656.2 $668.7 $694.5 $694.5 $711.4 $727.8 $744.9 $783.2 $783.2 $847.1 $932.6
NTM EBITDA $566.2 $625.9 $638.6 $656.2 $668.7 $694.5 $694.5 $711.4 $727.8 $744.9 $783.2 $783.2 $800.5 $818.4 $836.4 $847.1 $847.1
Total Debt/TTM EBITDA 4.4x 5.6x 5.4x 5.8x 5.6x 5.6x 5.6x 5.5x 5.3x 5.2x 5.0x 5.0x 4.8x 5.0x 4.9x 4.6x 4.6x 4.4x 4.1x
Net Debt/TTM EBITDA 4.4x 5.5x 5.3x 5.5x 5.5x 5.6x 5.6x 5.3x 5.2x 5.1x 5.0x 5.0x 4.8x 4.8x 4.7x 4.5x 4.5x 4.2x 3.8x

25 June 2019
Domino’s Pizza Inc. (DPZ) 49
Figure 97: DPZ Statement of Cash Flows
Source: Company data, Credit Suisse estimates
Domino's (DPZ) Fiscal Yr Fiscal Yr 2018 Fiscal Yr 2019 Fiscal Yr 2020 Fiscal Yr Fiscal Yr Fiscal Yr
($ in millions) 2016 2017 1Q18 2Q18 3Q18 4Q18 2018 1Q19 2Q19E 3Q19E 4Q19E 2019E 1Q20E 2Q20E 3Q20E 4Q20E 2020E 2021E 2022E
2016 2017 Mar-18 Jun-18 Sep-18 Dec-18 2018 Mar-19 Jun-19 Sep-19 Dec-19 2019E Mar-20 Jun-20 Sep-20 Jan-21 2020E 2021E 2022E
Cash Flow Statement
Operating Cash Flows
Net income $214.7 $277.9 $88.8 $77.4 $84.1 $111.6 $362.0 $92.7 $87.1 $87.7 $127.1 $394.6 $100.2 $98.8 $99.1 $151.7 $449.8 $495.5 $556.5
Depreciation and amortization $38.1 $44.4 $11.1 $12.2 $12.5 $17.9 $53.7 $13.8 $13.2 $13.5 $18.7 $59.2 $14.9 $14.3 $14.7 $21.0 $64.9 $70.4 $77.0
D&A as a % of Revenue 1.5% 1.6% 1.4% 1.6% 1.6% 1.6% 1.6% 1.6% 1.6% 1.6% 1.6% 1.6% 1.6% 1.6% 1.6% 1.6% 1.6% 1.6% 1.6%
Gain/losses on sale/disposal of assets $0.9 ($3.1) $0.4 $0.2 ($5.7) $0.5 ($4.7) $0.1 $0.0 $0.0 $0.0 $0.1 $0.0 $0.0 $0.0 $0.0 $0.0 $0.0 $0.0
Benefit for losses on accounts and notes receivable ($0.2) ($0.3) $0.0 $0.0 $0.0 $0.9 $0.9 $0.0 $0.0 $0.0 $0.0 $0.0 $0.0 $0.0 $0.0 $0.0 $0.0 $0.0 $0.0
Provision (benefit) for deferred income taxes ($3.1) $6.2 $0.6 $0.9 $0.3 ($2.6) ($0.9) $1.5 $0.0 $0.0 $0.0 $1.5 $0.0 $0.0 $0.0 $0.0 $0.0 $0.0 $0.0
Amortization of debt issuance costs $6.4 $11.0 $1.2 $4.3 $1.1 $1.5 $8.0 $1.1 $1.0 $1.0 $1.0 $4.1 $1.1 $1.0 $1.0 $1.0 $4.1 $4.1 $4.1
Non-cash compensation expense $18.6 $20.7 $6.1 $5.4 $4.2 $7.1 $22.8 $4.6 $5.6 $4.4 $7.5 $22.2 $4.8 $5.9 $4.6 $7.9 $23.3 $24.4 $25.7
Excess tax benefits from equity-based compensation ($48.1) ($27.2) ($8.4) ($6.9) ($7.4) ($1.1) ($23.8) ($8.7) ($3.0) ($3.0) ($3.0) ($17.7) ($8.7) ($3.0) ($3.0) ($3.0) ($17.7) ($17.7) ($17.7)
Other $0.0 $0.0 ($0.1) $0.2 $0.2 ($0.4) $0.0 $0.1 $0.0 $0.0 $0.0 $0.1 $0.0 $0.0 $0.0 $0.0 $0.0 $0.0 $0.0
Changes in operating assets and liabilities $60.0 $9.6 ($15.4) ($34.8) $24.6 $7.1 ($18.4) $2.0 ($4.8) $6.4 ($17.1) ($13.6) $16.5 ($10.9) $6.6 ($22.3) ($10.1) ($8.5) ($10.8)
Accounts receivable ($18.7) ($22.6) ($18.2) ($10.2) $8.1 $2.7 ($13.4) ($13.4) $7.8 $0.2
Inventories, prepaid expenses, and other ($2.9) $1.5 ($12.5) $0.0 $0.0 $0.0 $0.0 $0.0 $0.0 $0.0
Accounts payable and accrued liabilities $78.9 $22.3 $10.0 $5.4 ($1.7) ($19.8) $29.9 $2.5 ($1.3) ($22.5)
Insurance reserves $2.8 $8.4 $2.2 $0.0 $0.0 $0.0 $0.0 $0.0 $0.0 $0.0
Changes in advertising fund assets and liabilties, restricted $0.0 ($0.5) $12.1 ($6.1) ($10.9) ($5.4) ($10.2) $0.0 $0.0 $0.0 ($10.2) $0.0 $0.0 $0.0 $0.0 $0.0 $0.0 $0.0
Net Operating Cash Flows $287.3 $339.0 $83.7 $71.0 $107.8 $131.7 $394.2 $97.0 $99.2 $110.0 $134.2 $440.4 $128.8 $106.1 $123.1 $156.3 $514.3 $568.4 $634.9
Year-to-date $83.7 $154.7 $262.5 $394.2 $97.0 $196.2 $306.2 $440.4 $128.8 $234.9 $358.0 $514.3
Investing Cash Flows
Capital expenditures ($58.6) ($90.0) ($13.6) ($23.6) ($27.8) ($54.8) ($119.9) ($12.2) ($30.0) ($35.0) ($35.0) ($112.2) ($25.0) ($25.0) ($25.0) ($25.0) ($100.0) ($90.0) ($90.0)
Proceeds from sale of assets $4.9 $6.8 $0.0 $0.3 $7.9 $0.2 $8.4 $0.0 $41.3 $0.0 $0.0 $41.3 $0.0 $0.0 $0.0 $0.0 $0.0 $0.0 $0.0
Changes in restricted cash $54.4 ($65.3) $0.0 $0.0 $0.0 $0.0 $0.0 $0.0 $0.0 $0.0 $0.0 $0.0 $0.0 $0.0 $0.0 $0.0 $0.0 $0.0 $0.0
Maturities of advertising fund investments, restricted $0.0 $4.0 $25.0 $15.0 $50.0 $94.0 $0.0 $0.0 $0.0 $0.0 $0.0 $0.0 $0.0 $0.0 $0.0 $0.0 $0.0 $0.0
Purchases of advertising fund investments, restricted $0.0 $0.0 ($35.2) ($15.0) ($20.0) ($70.2) $0.0 $0.0 $0.0 $0.0 $0.0 $0.0 $0.0 $0.0 $0.0 $0.0 $0.0 $0.0
Other ($1.7) ($0.6) ($0.5) ($0.2) ($1.7) $1.8 ($0.6) $0.3 $0.0 $0.0 $0.0 $0.3 $0.0 $0.0 $0.0 $0.0 $0.0 $0.0 $0.0
Net Investing Cash Flows ($0.8) ($149.0) ($10.1) ($33.6) ($21.6) ($22.9) ($88.3) ($12.0) $11.3 ($35.0) ($35.0) ($70.7) ($25.0) ($25.0) ($25.0) ($25.0) ($100.0) ($90.0) ($90.0)
Year-to-date ($10.1) ($43.8) ($65.4) ($88.3) ($12.0) ($0.7) ($35.7) ($70.7) ($25.0) ($50.0) ($75.0) ($100.0)
Financing Cash Flows
Proceeds from issuance of long-term debt $63.0 $1,900.0 $0.0 $905.0 $0.0 $65.0 $970.0 $0.0 $0.0 $0.0 $0.0 $0.0 $0.0 $200.0 $0.0 $0.0 $200.0 $100.0 $1,000.0
Repayments of long-term debt and capital lease obligations ($122.3) ($928.2) ($8.1) ($578.1) ($8.9) ($9.0) ($604.1) ($49.0) ($8.8) ($8.8) ($8.8) ($75.4) ($8.8) ($8.8) ($8.8) ($8.8) ($35.3) ($35.3) ($888.0)
Proceeds from issuance of common stock $0.0 $0.0 $0.0 $0.0 $0.0 $0.0 $0.0 $0.0 $0.0 $0.0 $0.0 $0.0 $0.0 $0.0 $0.0 $0.0 $0.0 $0.0 $0.0
Proceeds from exercises of stock options $15.2 $6.1 $3.7 $1.5 $3.8 $0.9 $9.8 $4.5 $2.0 $2.0 $2.0 $10.5 $2.0 $2.1 $2.1 $2.1 $8.3 $8.7 $9.2
Excess tax benefit from equity-based compensation $48.1 $0.0 $0.0 $0.0 $0.0 $0.0 $0.0 $0.0 $0.0 $0.0 $0.0 $0.0 $0.0 $0.0 $0.0 $0.0 $0.0 $0.0 $0.0
Purchases of common stock ($300.3) ($1,064.3) ($101.1) ($219.0) ($109.1) ($162.0) ($591.2) ($8.1) ($75.0) ($75.0) ($75.0) ($233.1) ($100.0) ($100.0) ($100.0) ($100.0) ($400.0) ($400.0) ($400.0)
Tax payments for restricted stock upon vesting ($5.6) ($9.4) ($2.3) ($0.0) ($4.5) ($0.1) ($7.0) ($2.5) $0.0 $0.0 $0.0 ($2.5) $0.0 $0.0 $0.0 $0.0 $0.0 $0.0 $0.0
Payments of common stock dividends and equivalents ($73.9) ($84.3) ($0.1) ($23.5) ($23.2) ($45.4) ($92.2) ($0.1) ($26.6) ($26.4) ($52.3) ($105.3) $0.0 ($31.0) ($30.7) ($60.6) ($122.3) ($135.6) ($150.4)
Cash paid for financing costs $0.0 ($16.8) $0.0 ($8.2) $0.0 $0.0 ($8.2) $0.0 $0.0 $0.0 $0.0 $0.0 $0.0 $0.0 $0.0 $0.0 $0.0 $0.0 $0.0
Other $0.0 ($0.2) $0.0 $0.0 $0.0 $0.0 $0.0 $0.0 $0.0 $0.0 $0.0 $0.0 $0.0 $0.0 $0.0 $0.0 $0.0 $0.0 $0.0
Net Financing Cash Flows ($375.8) ($197.1) ($107.8) $77.8 ($142.0) ($150.7) ($322.8) ($55.1) ($108.4) ($108.2) ($134.1) ($405.8) ($106.8) $62.3 ($137.4) ($167.3) ($349.2) ($462.2) ($429.2)
Effect of exchange rates ($1.3) $0.1 $0.0 ($0.2) ($0.1) ($0.3) ($0.5) $0.1 $0.0 $0.0 $0.0 $0.1 $0.0 $0.0 $0.0 $0.0 $0.0 $0.0 $0.0
Year-to-date ($107.8) ($30.1) ($172.1) ($322.8) ($55.1) ($163.5) ($271.7) ($405.8) ($106.8) ($44.5) ($181.9) ($349.2)
Change in cash and equivalents incl restricted cash ($90.6) ($7.0) ($34.2) $115.0 ($55.9) ($42.3) ($17.4) $30.0 $2.1 ($33.2) ($34.9) ($35.9) ($3.0) $143.4 ($39.3) ($36.0) $65.1 $16.2 $115.7
Cash at beginning of period $133.4 $42.8 $35.8 $44.6 $157.8 $84.6 $35.8 $25.4 $83.1 $85.2 $52.0 $25.4 $17.2 $14.1 $157.6 $118.2 $17.2 $82.2 $98.4
Less: change in restricted cash ($43.1) $1.8 $17.3 $16.9 ($7.1) ($27.6) $0.0 $0.0 $0.0 ($27.6) $0.0 $0.0 $0.0 $0.0 $0.0 $0.0 $0.0
Cash at end of period $42.8 $35.8 $44.6 $157.8 $84.6 $25.4 $25.4 $83.1 $85.2 $52.0 $17.2 $17.2 $14.1 $157.6 $118.2 $82.2 $82.2 $98.4 $214.1
Restricted cash $126.5 $191.8 $145.2 $145.0 $168.2 $167.0 $167.0 $150.1 $150.1 $150.1 $150.1 $150.1 $150.1 $150.1 $150.1 $150.1 $150.1 $150.1 $150.1
Cash & cash equivalents included in advertising fund assets, restricted $25.1 $27.3 $30.8 $32.8 $26.9 $45.0 $45.0 $34.3 $34.3 $34.3 $34.3 $34.3 $34.3 $34.3 $34.3 $34.3 $34.3 $34.3 $34.3
Change in restricted cash ($49.2) $67.5 ($43.1) $1.8 $17.3 $16.9 ($7.1) ($27.6) $0.0 $0.0 $0.0 ($27.6) $0.0 $0.0 $0.0 $0.0 $0.0 $0.0 $0.0
Change in cash and cash equivalents excl restricted cash ($41.4) ($74.5) $8.8 $113.2 ($73.2) ($59.2) ($10.3) $57.7 $2.1 ($33.2) ($34.9) ($8.3) ($3.0) $143.4 ($39.3) ($36.0) $65.1 $16.2 $115.7
Cash on Balance Sheet $42.8 $35.8 $44.6 $157.8 $84.6 $25.4 $25.4 $83.1 $85.2 $52.0 $17.2 $17.2 $14.1 $157.6 $118.2 $82.2 $82.2 $98.4 $214.1
Difference (0) - - - - 0 0 - - - - (0) - - - - - 0.0 -
Free Cash Flow 2016 2017 1Q18 2Q18 3Q18 4Q18 2018 1Q19 2Q19E 3Q19E 4Q19E 2019E 1Q20E 2Q20E 3Q20E 4Q20E 2020E 2021E 2022E
Operating Cash Flow $287 $339 $84 $71 $108 $132 $394 $97 $99 $110 $134 $440 $129 $106 $123 $156 $514 $568 $635
Less: Capex ($59) ($90) ($14) ($24) ($28) ($55) ($120) ($12) ($30) ($35) ($35) ($112) ($25) ($25) ($25) ($25) ($100) ($90) ($90)
Free Cash Flow $229 $249 $70 $47 $80 $77 $274 $85 $69 $75 $99 $328 $104 $81 $98 $131 $414 $478 $545
FCF/Share $4.58 $5.22 $1.58 $1.09 $1.86 $1.80 $6.33 $2.01 $1.65 $1.80 $2.40 $7.85 $2.53 $1.99 $2.43 $3.28 $10.22 $12.22 $14.42

25 June 2019
Domino’s Pizza Inc. (DPZ) 50
Credit Suisse HOLT® Analysis
DPZ’s current price implies expectations of 4.2% sales growth. DPZ’s valuation is more
sensitive to top-line growth, with every 100bps adding ~$47 per share, and every 100bps
of EBITDA margin adding ~$19 per share.
Figure 98: HOLT Market Implied Scenario
Source: Credit Suisse HOLT®
-200 bps -100 bps 0 bps +100 bps +200 bps
Assumptions and Methodology-
-
-
Source: Credit Suisse HOLT®. CFROI and HOLT are trademarks or registered trademarks of Credit Suisse Group AG or its affiliates in the United States and other countries.
Sales growth: 2019-2025 based on CS Research; then solved for the
sales CAGR required to get to the current price
After the 10-year explicit forecast, the HOLT methodology calculates
the terminal value by fading returns on capital and growth towards cost
of capital and GDP growth respectively
For this analysis, we have made two adjustments consistently across
our coverage: first, we are using the US Country discount rate
(3.83%) for all companies and second, we have adjusted the final fade
rate from 10% to 5% to account for the sector's longer sustainability
of returns on capital
EBITDA margins: 2019-2029 based on CS Research, then assumed
constant
+200 bps 23.8% $231 $271 $318 $373 $437
> 10%
downside
Within
10%
> 10%
upside
DPZ's valuat ion is more sensit ive to top line growth with every
100bps increment adding ~47 per share vs. ~$19 per share
added for 100bps incremental margins growth
$390
+100 bps 22.8% $216 $255 $299 $352 $413
0 bps 21.8% $202 $238 $281 $331
$342
-100 bps 20.8% $187 $222 $262 $310 $366
19.8% $172 $205 $244 $289
HO
LT m
ark
et
imp
lie
d s
ce
nari
o
DOMINO'S PIZZA INC (DPZ)
Illustrative "What's Priced In" AssumptionsValuation Sensitivity Analysis
at Current Share Price of $281
Long-Term Sales growth
2.2% 3.2% 4.2% 5.2% 6.2%
Lo
ng
-Te
rm E
BIT
DA
Marg
in
-200 bps
21.1 21.8 21.8
0
5
10
15
20
25
30
2008 2010 2012 2014 2016 2018 2020 2022 2024 2026 2028 2030
Historical margins Forecast Historical median
EBITDA Margin (%)
2019-2029 based on CS Research, then assumed constant
CS Research
7.2 7.4 4.2
(10)
(5)
0
5
10
15
20
2008 2010 2012 2014 2016 2018 2020 2022 2024 2026 2028 2030
Historical sales growth Market implied Historical median
Sales Growth (%)
2019-2025 based on CS Research, then solved long term sales growth
required to get to current priceCS Research
41.7 40.1 40.0
0
5
10
15
20
25
30
35
40
45
2008 2010 2012 2014 2016 2018 2020 2022 2024 2026 2028 2030
Historical CFROI Forecast CFROI Discount rate Historical median
CFROI (%)
2.4 1.8 1.8
(10)
(5)
0
5
10
15
20
2008 2010 2012 2014 2016 2018 2020 2022 2024 2026 2028 2030
Historical asset growth rate Forecast asset growth
Asset Growth (%)
2.0 2.0 2.0
0.0
0.5
1.0
1.5
2.0
2.5
2008 2010 2012 2014 2016 2018 2020 2022 2024 2026 2028 2030
Historical asset turns Forecast Historical median
Asset Turns (x): Sales/ Invested Capital

25 June 2019
Domino’s Pizza Inc. (DPZ) 51
Company Overview Domino’s Pizza (DPZ) is the largest pizza company in the world based on global retail
sales, serving pizza, sandwiches, pasta, chicken, desserts and beverages. Domino’s was
founded in 1960, with roots in pizza delivery, with a significant amount of sales also
coming from carryout (2/3 delivery and 1/3 carryout). Domino’s is currently headquartered
in Ann Arbor, Michigan.
Domino’s operates ~16,000 restaurants in over 85 markets around the world as of the end
of 2018, including 390 company-operated stores in the US, 5,486 domestic franchise
stores and 10,038 international stores. There are 793 US franchisees as of the end of
2018, with the average franchisee operating ~7 Domino’s stores and generating EBITDA
of ~$141K per store. DPZ is ~98% franchised and operates in three reportable segments
including: 1) US Stores; 2) Supply Chain; and 3) International Franchise. In 2018, DPZ
generated ~$3.4BN in total revenue (~$3.1BN excluding franchise advertising
contributions). System sales were ~$13.5BN in 2018, including ~$6.6BN in the US and
~$7BN internationally.
Figure 99: DPZ Unit Composition Figure 100: DPZ Revenue Composition
Source: Company data, Credit Suisse estimates Source: Company data, Credit Suisse estimates
Note: 2018 revenue excludes US franchise advertising contributions.
Figure 101: DPZ System Sales Figure 102: Average # Stores Per Franchisee
Source: Company data, Credit Suisse estimates Source: Company data, Credit Suisse estimates
0
2,000
4,000
6,000
8,000
10,000
12,000
14,000
16,000
18,000
20
09
20
10
20
11
20
12
20
13
20
14
20
15
20
16
20
17
20
18
Unit
Com
posi
tion
US Company US Franchise International Franchise
$0
$500
$1,000
$1,500
$2,000
$2,500
$3,000
$3,500
20
09
20
10
20
11
20
12
20
13
20
14
20
15
20
16
20
17
20
18
Reve
nue C
om
posi
tion (
$M
M)
US Company US Franchise International Franchise Supply Chain
$0
$2,000
$4,000
$6,000
$8,000
$10,000
$12,000
$14,000
$16,000
20
09
20
10
20
11
20
12
20
13
20
14
20
15
20
16
20
17
20
18
Sys
tem
Sal
es
($M
M)
Domestic International
3.0
3.5
4.0
4.5
5.0
5.5
6.0
6.5
7.0
7.5
20
09
20
10
20
11
20
12
20
13
20
14
20
15
20
16
20
17
20
18
Ave
rage #
of
Sto
res
per
Fra
nch
isee

25 June 2019
Domino’s Pizza Inc. (DPZ) 52
Supply Chain
Domino’s operates 19 regional dough manufacturing and food supply chain centers, one
thin crust manufacturing center, one vegetable processing center and one center providing
equipment and supplies in the US. The company also operates five dough manufacturing
and food supply chain centers in Canada. In 2018, Domino’s made ~2.5 deliveries per
store per week. Domino’s is in a profit-sharing arrangement with US and Canadian stores
that purchase all their food from supply chain centers, which generally offer franchisees
50% of their supply chain centers' profits.
Cheese is the largest food cost (~20-25%) and Domino’s purchases the US pizza cheese
from a single supplier (Leprino Foods). Prices charged to US franchisees for cheese is
based on the Chicago Mercantile Exchange cheddar block price, plus a supply chain
markup. As cheese prices fluctuate, actual supply chain dollar margins remain unchanged,
though revenues and margin percentages similarly fluctuate. Domino’s has a multi-year
agreement with Coca-Cola in the US as the company’s exclusive beverage supplier. The
majority of meat toppings in the US also come from a single supplier (Tyson).
Properties
DPZ owns five supply chain center buildings and two store buildings the company leases
to US franchisees, with all other company-owned stores, US supply chain centers and
international supply chain centers under leases.
Fiscal Year End/Reporting Period
DPZ’s fiscal year ends on the Sunday closest to December 31. Each of DPZ’s first three
fiscal quarters consists of 12 weeks with the fourth fiscal quarter consisting of 16 or 17
weeks. FY20 is the next fiscal year with 53 weeks in the reporting period.

25 June 2019
Domino’s Pizza Inc. (DPZ) 53
Management & Board of Directors
Figure 103: Management & Board Directors
Source: Company data
Management Profile
Executive Position Years at DPZ
Richard E. Allison, Jr. Chief Executive Officer 8
Jeffrey D. Lawrence EVP, Chief Financial Officer 19
Stuart A. Levy EVP, Supply Chain Services Joined Jan 2019
Kevin S. Morris EVP, General Counsel & Corporate Secretary 2
Joseph H. Jordan EVP, International 7
J. Kevin Vasconi EVP, Chief Information Officer 7
Russell J. Weiner Chief Operating Officer & President of the Americas 10
Scott R. Hinshaw EVP, Franchise Operations & Development 33
Thomas B. Curtis EVP, Team USA 34
Timothy P. McIntyre EVP, Communications, Legislative Affairs & Investor Relations 34
Mangement Compensation
Executive Position SalaryStock & Option
Awards
Non-Equity
Incentive & OtherTotal
Richard E. Allison, Jr. CEO $744,711 $6,726,382 $1,631,323 $9,102,416
J. Patrick Doyle Former President & CEO $551,923 $2,606,295 $1,486,203 $4,644,421
Jeffrey D. Lawrence EVP, CFO $500,000 $587,179 $596,689 $1,683,868
Russell J. Weiner COO & President of the Americas $679,557 $4,613,899 $1,064,661 $6,358,117
Joseph H. Jordan EVP, International $425,000 $520,195 $867,171 $1,812,366
J. Kevin Vasconi EVP, CIO $510,000 $613,424 $618,272 $1,741,696
Management Compensation Metrics
CEO Richard E. Allison
Tenure as CEO Since Jul 2018
Total Compensation ~$9.1MM
Annual Incentive Plan Metric
Adjusted Total Segment Income
Long-term Incentive Metrics Vesting Period
Performance Shares 4-yrs
Adjusted Total Segment Income
Stock options 4-yrs
Retention Equity Shares 4-yrs
Board of Directors
Director Joined Board
David A. Brandon Chairman of the Board; former CEO of Domino's Pizza & Toys “R” Us 1999
Andrew B. Balson Managing Partner of Cove Hill Partners; former CEO of Match Beyond 1999
Diana F. Cantor Partner at Alternative Investment Management & Vice Chairman at Virginia Retirement System 2005
James A. Goldman Senior Advisor at Eurazeo; former President, CEO & Director at Godiva Chocolatier 2010
Richard L. Federico Former Non-Executive Chairman, CEO & Co-CEO of P.F. Chang’s 2011
C. Andrew Ballard CEO & Co-founder of Wiser Solutions; Chairman of Datacor; Vice Chairman of Zignal Labs 2015
Richard E. Allison Chief Executive Officer of Domino's Pizza 2018
Corie S. Barry Senior EVP & Chief Financial and Strategic Transformation Officer of Best Buy 2018
Patricia E. Lopez CEO & Director of High Ridge Brands; former SVP at Estée Lauder 2018
Experience
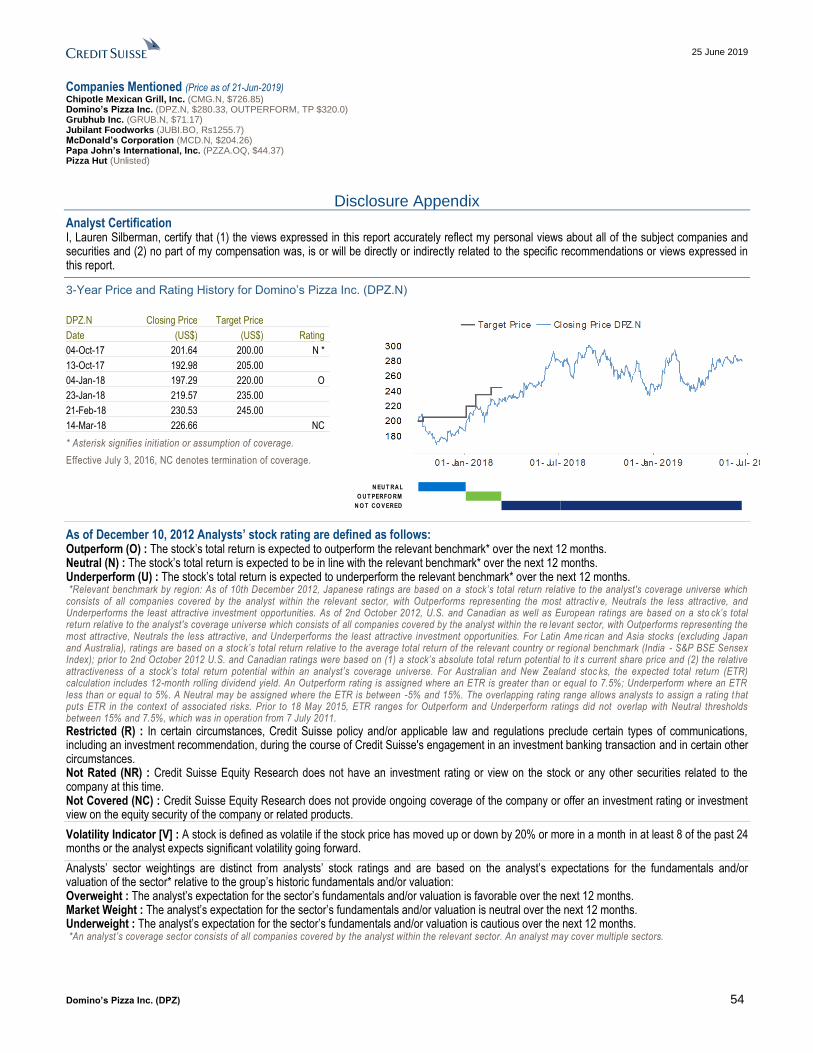
25 June 2019
Domino’s Pizza Inc. (DPZ) 54
Companies Mentioned (Price as of 21-Jun-2019) Chipotle Mexican Grill, Inc. (CMG.N, $726.85) Domino’s Pizza Inc. (DPZ.N, $280.33, OUTPERFORM, TP $320.0) Grubhub Inc. (GRUB.N, $71.17) Jubilant Foodworks (JUBI.BO, Rs1255.7) McDonald’s Corporation (MCD.N, $204.26) Papa John’s International, Inc. (PZZA.OQ, $44.37) Pizza Hut (Unlisted)
Disclosure Appendix
Analyst Certification I, Lauren Silberman, certify that (1) the views expressed in this report accurately reflect my personal views about all of the subject companies and securities and (2) no part of my compensation was, is or will be directly or indirectly related to the specific recommendations or views expressed in this report.
3-Year Price and Rating History for Domino’s Pizza Inc. (DPZ.N)
DPZ.N Closing Price Target Price
Date (US$) (US$) Rating
04-Oct-17 201.64 200.00 N *
13-Oct-17 192.98 205.00
04-Jan-18 197.29 220.00 O
23-Jan-18 219.57 235.00
21-Feb-18 230.53 245.00
14-Mar-18 226.66 NC
* Asterisk signifies initiation or assumption of coverage.
Effective July 3, 2016, NC denotes termination of coverage.
As of December 10, 2012 Analysts’ stock rating are defined as follows: Outperform (O) : The stock’s total return is expected to outperform the relevant benchmark* over the next 12 months. Neutral (N) : The stock’s total return is expected to be in line with the relevant benchmark* over the next 12 months. Underperform (U) : The stock’s total return is expected to underperform the relevant benchmark* over the next 12 months. *Relevant benchmark by region: As of 10th December 2012, Japanese ratings are based on a stock’s total return relative to the analyst's coverage universe which consists of all companies covered by the analyst within the relevant sector, with Outperforms representing the most attractiv e, Neutrals the less attractive, and Underperforms the least attractive investment opportunities. As of 2nd October 2012, U.S. and Canadian as well as European ratings are based on a sto ck’s total return relative to the analyst's coverage universe which consists of all companies covered by the analyst within the re levant sector, with Outperforms representing the most attractive, Neutrals the less attractive, and Underperforms the least attractive investment opportunities. For Latin Ame rican and Asia stocks (excluding Japan and Australia), ratings are based on a stock’s total return relative to the average total return of the relevant country or regional benchmark (India - S&P BSE Sensex Index); prior to 2nd October 2012 U.S. and Canadian ratings were based on (1) a stock’s absolute total return potential to it s current share price and (2) the relative attractiveness of a stock’s total return potential within an analyst’s coverage universe. For Australian and New Zealand stoc ks, the expected total return (ETR) calculation includes 12-month rolling dividend yield. An Outperform rating is assigned where an ETR is greater than or equal to 7.5%; Underperform where an ETR less than or equal to 5%. A Neutral may be assigned where the ETR is between -5% and 15%. The overlapping rating range allows analysts to assign a rating that puts ETR in the context of associated risks. Prior to 18 May 2015, ETR ranges for Outperform and Underperform ratings did not overlap with Neutral thresholds between 15% and 7.5%, which was in operation from 7 July 2011. Restricted (R) : In certain circumstances, Credit Suisse policy and/or applicable law and regulations preclude certain types of communications, including an investment recommendation, during the course of Credit Suisse's engagement in an investment banking transaction and in certain other circumstances. Not Rated (NR) : Credit Suisse Equity Research does not have an investment rating or view on the stock or any other securities related to the company at this time. Not Covered (NC) : Credit Suisse Equity Research does not provide ongoing coverage of the company or offer an investment rating or investment view on the equity security of the company or related products.
Volatility Indicator [V] : A stock is defined as volatile if the stock price has moved up or down by 20% or more in a month in at least 8 of the past 24 months or the analyst expects significant volatility going forward.
Analysts’ sector weightings are distinct from analysts’ stock ratings and are based on the analyst’s expectations for the fundamentals and/or valuation of the sector* relative to the group’s historic fundamentals and/or valuation: Overweight : The analyst’s expectation for the sector’s fundamentals and/or valuation is favorable over the next 12 months. Market Weight : The analyst’s expectation for the sector’s fundamentals and/or valuation is neutral over the next 12 months. Underweight : The analyst’s expectation for the sector’s fundamentals and/or valuation is cautious over the next 12 months. *An analyst’s coverage sector consists of all companies covered by the analyst within the relevant sector. An analyst may cover multiple sectors.
N EU T RA L
O U T PERFO RM
N O T CO V ERED

25 June 2019
Domino’s Pizza Inc. (DPZ) 55
Credit Suisse's distribution of stock ratings (and banking clients) is:
Global Ratings Distribution
Rating Versus universe (%) Of which banking clients (%) Outperform/Buy* 46% (32% banking clients) Neutral/Hold* 39% (27% banking clients) Underperform/Sell* 13% (22% banking clients)
Restricted 2% *For purposes of the NYSE and FINRA ratings distribution disclosure requirements, our stock ratings of Outperform, Neutral, and Underperform most closely correspond to Buy, Hold, and Sell, respectively; however, the meanings are not the same, as our stock ratings are determined on a relative basis. (Please refer to definitions above.) An investor's decision to buy or sell a security should be based on investment objectives, current holdings, and other individual factors.
Important Global Disclosures Credit Suisse’s research reports are made available to clients through our proprietary research portal on CS PLUS. Credit Suisse research products may also be made available through third-party vendors or alternate electronic means as a convenience. Certain research products are only made available through CS PLUS. The services provided by Credit Suisse’s analysts to clients may depend on a specific client’s preferences regarding the frequency and manner of receiving communications, the client’s risk profile and investment, the size and scope of the overall client relationship with the Firm, as well as legal and regulatory constraints. To access all of Credit Suisse’s research that you are entitled to receive in the most timely manner, please contact your sales representative or go to https://plus.credit-suisse.com . Credit Suisse’s policy is to update research reports as it deems appropriate, based on developments with the subject company, the sector or the market that may have a material impact on the research views or opinions stated herein. Credit Suisse's policy is only to publish investment research that is impartial, independent, clear, fair and not misleading. For more detail please refer to Credit Suisse's Policies for Managing Conflicts of Interest in connection with Investment Research: https://www.credit-suisse.com/sites/disclaimers-ib/en/managing-conflicts.html . Any information relating to the tax status of financial instruments discussed herein is not intended to provide tax advice or to be used by anyone to provide tax advice. Investors are urged to seek tax advice based on their particular circumstances from an independent tax professional. Credit Suisse has decided not to enter into business relationships with companies that Credit Suisse has determined to be involved in the development, manufacture, or acquisition of anti-personnel mines and cluster munitions. For Credit Suisse's position on the issue, please see https://www.credit-suisse.com/media/assets/corporate/docs/about-us/responsibility/banking/policy-summaries-en.pdf . The analyst(s) responsible for preparing this research report received compensation that is based upon various factors including Credit Suisse's total revenues, a portion of which are generated by Credit Suisse's investment banking activities
Target Price and Rating Valuation Methodology and Risks: (12 months) for Domino’s Pizza Inc. (DPZ.N)
Method: Our $320 target price and Outperform rating is based on ~20.5x our NTM EBITDA in 12 months, implying a P/E multiple of ~28x our NTM EPS in 12 months. Our ~20.5x EBITDA multiple is in-line with DPZ’s current trading multiple (3-year avg ~19x). Our implied P/E multiple of ~28x is in-line with DPZ’s current trading multiple and slightly below its three-year average P/E multiple of ~30x.
Risk: Key risks to our $320 target price and Outperform rating include: competition and economic factors. Increasing competitive pressure could weigh on market gains globally. DPZ could experience reduced product demand, longer payment cycles, slow adoption of new technologies and increased price competition if there is an economic downturn or deterioration in economic conditions.
Please refer to the firm's disclosure website at https://rave.credit-suisse.com/disclosures/view/selectArchive for the definitions of abbreviations typically used in the target price method and risk sections.
See the Companies Mentioned section for full company names Credit Suisse expects to receive or intends to seek investment banking related compensation from the subject company (DPZ.N) within the next 3 months. Credit Suisse or a member of the Credit Suisse Group is a market maker or liquidity provider in the securities of the following subject issuer(s): DPZ.N
For date and time of production, dissemination and history of recommendation for the subject company(ies) featured in this report, disseminated within the past 12 months, please refer to the link: https://rave.credit-suisse.com/disclosures/view/report?i=437127&v=2woh88f4ce9b1f3k3plxy3072 .
Important Regional Disclosures Singapore recipients should contact Credit Suisse AG, Singapore Branch for any matters arising from this research report. The analyst(s) involved in the preparation of this report may participate in events hosted by the subject company, including site visits. Credit Suisse does not accept or permit analysts to accept payment or reimbursement for travel expenses associated with these events. For Credit Suisse Securities (Canada), Inc.'s policies and procedures regarding the dissemination of equity research, please visit https://www.credit-suisse.com/sites/disclaimers-ib/en/canada-research-policy.html. Investors should note that income from such securities and other financial instruments, if any, may fluctuate and that price or value of such securities and instruments may rise or fall and, in some cases, investors may lose their entire principal investment. This research report is authored by: Credit Suisse Securities (USA) LLC ................................................................................................................................................ Lauren Silberman

25 June 2019
Domino’s Pizza Inc. (DPZ) 56
Important Credit Suisse HOLT Disclosures The HOLT methodology does not assign ratings or a target price to a security. It is an analytical tool that involves use of a set of proprietary quantitative algorithms and warranted value calculations, collectively called the HOLT valuation model, that are consistently applied to all the companies included in its database. Third-party data (including consensus earnings estimates) are systematically translated into a number of default variables and incorporated into the algorithms available in the HOLT valuation model. The source financial statement, pricing, and earnings data provided by outside data vendors are subject to quality control and may also be adjusted to more closely measure the underlying economics of firm performance. These adjustments provide consistency when analyzing a single company across time, or analyzing multiple companies across industries or national borders. The default scenario that is produced by the HOLT valuation model establishes a warranted price for a security, and as the third-party data are updated, the warranted price may also change. The default variables may also be adjusted to produce alternative warranted prices, any of which could occur. The warranted price is an algorithmic output applied systematically across all companies based on historical levels and volatility of returns. Additional information about the HOLT methodology is available on request. CFROI, CFROE, HOLT, HOLT Lens, HOLTfolio, "Clarity is Confidence" and "Powered by HOLT" are trademarks or registered trademarks of Credit Suisse Group AG or its affiliates in the United States and other countries. HOLT is a corporate performance and valuation advisory service of Credit Suisse. © 2019 Credit Suisse Group AG and its subsidiaries and affiliates. All rights reserved.
Important disclosures regarding companies that are the subject of this report are available by calling +1 (877) 291-2683. The same important disclosures, with the exception of valuation methodology and risk discussions, are also available on Credit Suisse’s disclosure website at https://rave.credit-suisse.com/disclosures . For valuation methodology and risks associated with any recommendation, price target, or rating referenced in this report, please refer to the disclosures section of the most recent report regarding the subject company.

25 June 2019
Domino’s Pizza Inc. (DPZ) 57
This report is produced by subsidiaries and affiliates of Credit Suisse operating under its Global Markets Division. For more information on our structure, please use the following link: https://www.credit-suisse.com/who-we-are This report may contain material that is not directed to, or intended for distribution to or use by, any person or entity who is a citizen or resident of or located in any locality, state, country or other jurisdiction where such distribution, publication, availability or use would be contrary to law or regulation or which would subject Credit Suisse or its affiliates ("CS") to any registration or licensing requirement within such jurisdiction. All material presented in this report, unless specifically indicated otherwise, is under copyright to CS. None of the material, nor its content, nor any copy of it, may be altered in any way, transmitted to, copied or distributed to any other party, without the prior express written permission of CS. All trademarks, service marks and logos used in this report are trademarks or service marks or registered trademarks or service marks of CS or its affiliates.The information, tools and material presented in this report are provided to you for information purposes only and are not to be used or considered as an offer or the solicitation of an offer to sell or to buy or subscribe for securities or other financial instruments. CS may not have taken any steps to ensure that the securities referred to in this report are suitable for any particular investor. CS will not treat recipients of this report as its customers by virtue of their receiving this report. The investments and services contained or referred to in this report may not be suitable for you and it is recommended that you consult an independent investment advisor if you are in doubt about such investments or investment services. Nothing in this report constitutes investment, legal, accounting or tax advice, or a representation that any investment or strategy is suitable or appropriate to your individual circumstances, or otherwise constitutes a personal recommendation to you. Please note in particular that the bases and levels of taxation may change. Information and opinions presented in this report have been obtained or derived from sources believed by CS to be reliable, but CS makes no representation as to their accuracy or completeness. CS accepts no liability for loss arising from the use of the material presented in this report, except that this exclusion of liability does not apply to the extent that such liability arises under specific statutes or regulations applicable to CS. This report is not to be relied upon in substitution for the exercise of independent judgment. CS may have issued, and may in the future issue, other communications that are inconsistent with, and reach different conclusions from, the information presented in this report. Those communications reflect the different assumptions, views and analytical methods of the analysts who prepared them and CS is under no obligation to ensure that such other communications are brought to the attention of any recipient of this report. Some investments referred to in this report will be offered solely by a single entity and in the case of some investments solely by CS, or an associate of CS or CS may be the only market maker in such investments. Past performance should not be taken as an indication or guarantee of future performance, and no representation or warranty, express or implied, is made regarding future performance. Information, opinions and estimates contained in this report reflect a judgment at its original date of publication by CS and are subject to change without notice. The price, value of and income from any of the securities or financial instruments mentioned in this report can fall as well as rise. The value of securities and financial instruments is subject to exchange rate fluctuation that may have a positive or adverse effect on the price or income of such securities or financial instruments. Investors in securities such as ADR's, the values of which are influenced by currency volatility, effectively assume this risk. Structured securities are complex instruments, typically involve a high degree of risk and are intended for sale only to sophisticated investors who are capable of understanding and assuming the risks involved. The market value of any structured security may be affected by changes in economic, financial and political factors (including, but not limited to, spot and forward interest and exchange rates), time to maturity, market conditions and volatility, and the credit quality of any issuer or reference issuer. Any investor interested in purchasing a structured product should conduct their own investigation and analysis of the product and consult with their own professional advisers as to the risks involved in making such a purchase. Some investments discussed in this report may have a high level of volatility. High volatility investments may experience sudden and large falls in their value causing losses when that investment is realised. Those losses may equal your original investment. Indeed, in the case of some investments the potential losses may exceed the amount of initial investment and, in such circumstances, you may be required to pay more money to support those losses. Income yields from investments may fluctuate and, in consequence, initial capital paid to make the investment may be used as part of that income yield. Some investments may not be readily realisable and it may be difficult to sell or realise those investments, similarly it may prove difficult for you to obtain reliable information about the value, or risks, to which such an investment is exposed. This report may provide the addresses of, or contain hyperlinks to, websites. Except to the extent to which the report refers to website material of CS, CS has not reviewed any such site and takes no responsibility for the content contained therein. Such address or hyperlink (including addresses or hyperlinks to CS's own website material) is provided solely for your convenience and information and the content of any such website does not in any way form part of this document. Accessing such website or following such link through this report or CS's website shall be at your own risk.
This report is issued and distributed in European Union (except Switzerland): by Credit Suisse Securities (Europe) Limited, One Cabot Square, London E14 4QJ, England, which is authorised by the Prudential Regulation Authority and regulated by the Financial Conduct Authority and the Prudential Regulation Authority. Germany: Credit Suisse (Deutschland) Aktiengesellschaft regulated by the Bundesanstalt fuer Finanzdienstleistungsaufsicht ("BaFin"). United States and Canada: Credit Suisse Securities (USA) LLC; Switzerland: Credit Suisse AG; Brazil: Banco de Investimentos Credit Suisse (Brasil) S.A or its affiliates; Mexico: Banco Credit Suisse (México), S.A., Institución de Banca Múltiple, Grupo Financiero Credit Suisse (México) and Casa de Bolsa Credit Suisse (México), S.A. de C.V., Grupo Financiero Credit Suisse (México) ("Credit Suisse Mexico"). This document has been prepared for information purposes only and is exclusively distributed in Mexico to Institutional Investors. Credit Suisse Mexico is not responsible for any onward distribution of this report to non-institutional investors by any third party. The authors of this report have not received payment or compensation from any entity or company other than from the relevant Credit Suisse Group company employing them; Japan: by Credit Suisse Securities (Japan) Limited, Financial Instruments Firm, Director-General of Kanto Local Finance Bureau ( Kinsho) No. 66, a member of Japan Securities Dealers Association, The Financial Futures Association of Japan, Japan Investment Advisers Association, Type II Financial Instruments Firms Association; Hong Kong: Credit Suisse (Hong Kong) Limited; Australia: Credit Suisse Equities (Australia) Limited; Thailand: Credit Suisse Securities (Thailand) Limited, regulated by the Office of the Securities and Exchange Commission, Thailand, having registered address at 990 Abdulrahim Place, 27th Floor, Unit 2701, Rama IV Road, Silom, Bangrak, Bangkok10500, Thailand, Tel. +66 2614 6000; Malaysia: Credit Suisse Securities (Malaysia) Sdn Bhd; Singapore: Credit Suisse AG, Singapore Branch; India: Credit Suisse Securities (India) Private Limited (CIN no.U67120MH1996PTC104392) regulated by the Securities and Exchange Board of India as Research Analyst (registration no. INH 000001030) and as Stock Broker (registration no. INZ000248233), having registered address at 9th Floor, Ceejay House, Dr.A.B. Road, Worli, Mumbai - 18, India, T- +91-22 6777 3777; South Korea: Credit Suisse Securities (Europe) Limited, Seoul Branch; Taiwan: Credit Suisse AG Taipei
Securities Branch; Indonesia: PT Credit Suisse Sekuritas Indonesia; Philippines:Credit Suisse Securities (Philippines ) Inc., and elsewhere in the world by the relevant authorised affiliate of the above. Additional Regional Disclaimers Australia: Credit Suisse Securities (Europe) Limited ("CSSEL") and Credit Suisse International ("CSI") are authorised by the Prudential Regulation Authority and regulated by the Financial Conduct Authority ("FCA") and the Prudential Regulation Authority under UK laws, which differ from Australian Laws. CSSEL and CSI do not hold an Australian Financial Services Licence ("AFSL") and are exempt from the requirement to hold an AFSL under the Corporations Act (Cth) 2001 ("Corporations Act") in respect of the financial services provided to Australian wholesale clients (within the meaning of section 761G of the Corporations Act) (hereinafter referred to as “Financial Services”). This material is not for distribution to retail clients and is directed exclusively at Credit Suisse's professional clients and eligible counterparties as defined by the FCA, and wholesale clients as defined under section 761G of the Corporations Act. Credit Suisse (Hong Kong) Limited ("CSHK") is licensed and regulated by the Securities and Futures Commission of Hong Kong under the laws of Hong Kong, which differ from Australian laws. CSHKL does not hold an AFSL and is exempt from the requirement to hold an AFSL under the Corporations Act in respect of providing Financial Services. Investment banking services in the United States are provided by Credit Suisse Securities (USA) LLC, an affiliate of Credit Suisse Group. CSSU is regulated by the United States Securities and Exchange Commission under United States laws, which differ from Australian laws. CSSU does not hold an AFSL and is exempt from the requirement to hold an AFSL under the Corporations Act in respect of providing Financial Services. Credit Suisse Asset Management LLC (CSAM) is authorised by the Securities and Exchange Commission under US laws, which differ from Australian laws. CSAM does not hold an AFSL and is exempt from the requirement to hold an AFSL under the Corporations Act in respect of providing Financial Services. This material is provided solely to Institutional Accounts (as defined in the FINRA rules) who are Eligible Contract Participants (as defined in the US Commodity Exchange Act). Credit Suisse Equities (Australia) Limited (ABN 35 068 232 708) ("CSEAL") is an AFSL holder in Australia (AFSL 237237). Malaysia: Research provided to residents of Malaysia is authorised by the Head of Research for Credit Suisse Securities (Malaysia) Sdn Bhd, to whom they should direct any queries on +603 2723 2020. Singapore: This report has been prepared and issued for distribution in Singapore to institutional investors, accredited investors and expert investors (each as defined under the Financial Advisers Regulations) only, and is also distributed by Credit Suisse AG, Singapore Branch to overseas investors (as defined under the Financial Advisers Regulations). Credit Suisse AG, Singapore Branch may distribute reports produced by its foreign entities or affiliates pursuant to an arrangement under Regulation 32C of the Financial Advisers Regulations. Singapore recipients should contact Credit Suisse AG, Singapore Branch at +65-6212-2000 for matters arising from, or in connection with, this report. By virtue of your status as an institutional investor, accredited investor, expert investor or overseas investor, Credit Suisse AG, Singapore Branch is exempted from complying with certain compliance requirements under the Financial Advisers Act, Chapter 110 of Singapore (the “FAA”), the Financial Advisers Regulations and the relevant Notices and Guidelines issued thereunder, in respect of any financial advisory service which Credit Suisse AG, Singapore Branch may provide to you. EU: This report has been produced by subsidiaries and affiliates of Credit Suisse operating under its Global Markets Division In jurisdictions where CS is not already registered or licensed to trade in securities, transactions will only be effected in accordance with applicable securities legislation, which will vary from jurisdiction to jurisdiction and may require that the trade be made in accordance with applicable exemptions from registration or licensing requirements. This material is issued and distributed in the U.S. by CSSU, a member of NYSE, FINRA, SIPC and the NFA, and CSSU accepts responsibility for its contents. Clients should contact analysts and execute transactions through a Credit Suisse subsidiary or affiliate in their home jurisdiction unless governing law permits otherwise. Please note that this research was originally prepared and issued by CS for distribution to their market professional and institutional investor customers. Recipients who are not market professional or institutional investor customers of CS should seek the advice of their independent financial advisor prior to taking any investment decision based on this report or for any necessary explanation of its contents. CS may provide various services to US municipal entities or obligated persons ("municipalities"), including suggesting individual transactions or trades and entering into such transactions. Any services CS provides to municipalities are not viewed as "advice" within the meaning of Section 975 of the Dodd-Frank Wall Street Reform and Consumer Protection Act. CS is providing any such services and related information solely on an arm's length basis and not as an advisor or fiduciary to the municipality. In connection with the provision of the any such services, there is no agreement, direct or indirect, between any municipality (including the officials,management, employees or agents thereof) and CS for CS to provide advice to the municipality. Municipalities should consult with their financial, accounting and legal advisors regarding any such services provided by CS. In addition, CS is not acting for direct or indirect compensation to solicit the municipality on behalf of an unaffiliated broker, dealer, municipal securities dealer, municipal advisor, or investment adviser for the purpose of obtaining or retaining an engagement by the municipality for or in connection with Municipal Financial Products, the issuance of municipal securities, or of an investment adviser to provide investment advisory services to or on behalf of the municipality. If this report is being distributed by a financial institution other than Credit Suisse AG, or its affiliates, that financial institution is solely responsible for distribution. Clients of that institution should contact that institution to effect a transaction in the securities mentioned in this report or require further information. This report does not constitute investment advice by Credit Suisse to the clients of the distributing financial institution, and neither Credit Suisse AG, its affiliates, and their respective officers, directors and employees accept any liability whatsoever for any direct or consequential loss arising from their use of this report or its content. No information or communication provided herein or otherwise is intended to be, or should be construed as, a recommendation within the meaning of the US Department of Labor’s final regulation defining "investment advice" for purposes of the Employee Retirement Income Security Act of 1974, as amended and Section 4975 of the Internal Revenue Code of 1986, as amended, and the information provided herein is intended to be general information, and should not be construed as, providing investment advice (impartial or otherwise). Copyright © 2019 CREDIT SUISSE AG and/or its affiliates. All rights reserved. When you purchase non-listed Japanese fixed income securities (Japanese government bonds, Japanese municipal bonds, Japanese government guaranteed bonds, Japanese corporate bonds) from CS as a seller, you will be requested to pay the purchase price only.