Nintendo (7974) - Credit Suisse | PLUS
37
DISCLOSURE APPENDIX AT THE BACK OF THIS REPORT CONTAINS IMPORTANT DISCLOSURES, ANALYST CERTIFICATIONS, LEGAL ENTITY DISCLOSURE AND THE STATUS OF NON-US ANALYSTS. US Disclosure: Credit Suisse does and seeks to do business with companies covered in its research reports. As a result, investors should be aware that the Firm may have a conflict of interest that could affect the objectivity of this report. Investors should consider this report as only a single factor in making their investment decision. 15 September 2017 Asia Pacific/Japan Equity Research Entertainment Software (Video Game (Japan)) Nintendo (7974) UPGRADE RATING Rating (from NEUTRAL) OUTPERFORM [V] Price (14 Sep 17, ¥) 37,670 Target price (¥) (from 40,000) 55,000 Change to TP (%) 46 Market cap (¥ bn) 4,523 (US$ 40.9) Enterprise value (¥ bn) 3,776 Number of shares (mn) 120.1 Free float (%) 70.0 52-week price range 39,320–22,520 Target price is for 12 months. [V] = Stock Considered Volatile (see Disclosure Appendix) Research Analysts Keiichi Yoneshima 81 3 4550 9740 [email protected] Hanako Takahashi 81 3 4550 7366 [email protected] Upgrading to OUTPERFORM: Multi-Switch homes to drive high earnings peak ■ Action: We raise our forecasts and lift our target price for Nintendo from ¥40,000 to ¥55,000 (potential return 46%). We also upgrade Nintendo from Neutral to OUTPERFORM. We now forecast Switch sales of 130mn (previously 70mn) units through FY3/22. ■ Including multi-Switch households into demand outlook: We had previously expected the Switch to sell like a traditional console, but now expect it to sell more like a handheld, due to three main reasons: (1) a Famitsu survey released in June indicating that many users are already using the Switch like a handheld (see Figure 1), (2) the comparatively low price, and (3) prospects for a long-tail sales cycle driven by minor changes. We now forecast Switch sales peaking at 31mn units in FY3/20–21 (previously 15mn in FY3/19). ■ Catalysts/risks: Potential upside catalysts include a 2Q earnings report accompanied by upwardly revised guidance and unveiling of a major third- party software title at the Tokyo Game Show (21–24 September). Downside risks include disappointing Switch sales and yen appreciation. ■ Valuation: We set our ¥55,000 target price using a the sum-of-the-parts (SOTP) method, using game consoles, smart devices, and cash. We value the game hardware business at an ex-cash P/E of 18x (previously 20x) to reflect that we now expect Switch sales to peak in FY3/20–21 instead of FY3/19. Share price performance Price (LHS) Rebased Rel (RHS) Jan - 1 6 Ju l- 1 6 Jan - 1 7 Ju l- 1 7 10,000 20,000 30,000 40,000 The price relative chart measures performance against the TOPIX which closed at 1,632.13 on 14-Sep-2017 On 14-Sep-2017 the spot exchange rate was ¥110.46/US$1 Performance 1M 3M 12M Absolute (%) 2.8 4.5 46.3 Relative (%) 1.8 2.3 22.1 Financial and valuation metrics Year 3/17A 3/18E 3/19E 3/20E Sales (¥ bn) 489.1 831.4 1,196.4 1,599.1 Operating profit (¥ bn) 29.4 80.4 258.1 470.1 Recurring profit (¥ bn) 50.4 106.3 284.0 496.0 Net income (¥ bn) 102.6 69.1 184.6 322.4 EPS (¥) 853.9 575.1 1,536.5 2,683.6 IBES Consensus EPS (¥) n.a. 856.0 1,409.0 1,877.9 EPS growth (%) 521.4 (32.6) 167.2 74.7 P/E (x) 30.3 65.5 24.5 14.0 Dividend yield (%) 1.7 0.8 2.0 3.6 EV/EBITDA (x) 65.6 42.6 13.9 7.4 P/B (x) 2.9 4.1 3.9 3.5 ROE(%) 8.5 5.4 13.8 22.0 Net debt/equity (%) Net cash Net cash Net cash Net cash Source: Company data, Thomson Reuters, Credit Suisse estimates
-
Upload
khangminh22 -
Category
Documents
-
view
1 -
download
0
Transcript of Nintendo (7974) - Credit Suisse | PLUS

DISCLOSURE APPENDIX AT THE BACK OF THIS REPORT CONTAINS IMPORTANT DISCLOSURES, ANALYST CERTIFICATIONS, LEGAL ENTITY DISCLOSURE AND THE STATUS OF NON-US ANALYSTS. US Disclosure: Credit Suisse does and seeks to do business with companies covered in its research reports. As a result, investors should be aware that the Firm may have a conflict of interest that could affect the objectivity of this report. Investors should consider this report as only a single factor in making their investment decision.
15 September 2017Asia Pacific/JapanEquity Research
Entertainment Software (Video Game (Japan))
Nintendo (7974)
UPGRADE RATING Rating (from NEUTRAL) OUTPERFORM [V]Price (14 Sep 17, ¥) 37,670Target price (¥) (from 40,000) 55,000Change to TP (%) 46Market cap (¥ bn) 4,523 (US$ 40.9)Enterprise value (¥ bn) 3,776Number of shares (mn) 120.1Free float (%) 70.052-week price range 39,320–22,520Target price is for 12 months.[V] = Stock Considered Volatile (see Disclosure Appendix)
Research AnalystsKeiichi Yoneshima
81 3 4550 [email protected]
Hanako Takahashi81 3 4550 7366
Upgrading to OUTPERFORM: Multi-Switch homes to drive high earnings peak■ Action: We raise our forecasts and lift our target price for Nintendo from
¥40,000 to ¥55,000 (potential return 46%). We also upgrade Nintendo from Neutral to OUTPERFORM. We now forecast Switch sales of 130mn (previously 70mn) units through FY3/22.
■ Including multi-Switch households into demand outlook: We had previously expected the Switch to sell like a traditional console, but now expect it to sell more like a handheld, due to three main reasons: (1) a Famitsu survey released in June indicating that many users are already using the Switch like a handheld (see Figure 1), (2) the comparatively low price, and (3) prospects for a long-tail sales cycle driven by minor changes. We now forecast Switch sales peaking at 31mn units in FY3/20–21 (previously 15mn in FY3/19).
■ Catalysts/risks: Potential upside catalysts include a 2Q earnings report accompanied by upwardly revised guidance and unveiling of a major third-party software title at the Tokyo Game Show (21–24 September). Downside risks include disappointing Switch sales and yen appreciation.
■ Valuation: We set our ¥55,000 target price using a the sum-of-the-parts (SOTP) method, using game consoles, smart devices, and cash. We value the game hardware business at an ex-cash P/E of 18x (previously 20x) to reflect that we now expect Switch sales to peak in FY3/20–21 instead of FY3/19.
Share price performancePr ice (LH S) Reb ased Re l (RH S)
Jan - 1 6 Ju l - 1 6 Jan - 1 7 Ju l - 1 71 0 ,0 0 0
2 0 ,0 0 0
3 0 ,0 0 0
4 0 ,0 0 0
The price relative chart measures performance against the TOPIX which closed at 1,632.13 on 14-Sep-2017On 14-Sep-2017 the spot exchange rate was ¥110.46/US$1
Performance 1M 3M 12MAbsolute (%) 2.8 4.5 46.3Relative (%) 1.8 2.3 22.1
Financial and valuation metricsYear 3/17A 3/18E 3/19E 3/20ESales (¥ bn) 489.1 831.4 1,196.4 1,599.1Operating profit (¥ bn) 29.4 80.4 258.1 470.1Recurring profit (¥ bn) 50.4 106.3 284.0 496.0Net income (¥ bn) 102.6 69.1 184.6 322.4EPS (¥) 853.9 575.1 1,536.5 2,683.6IBES Consensus EPS (¥) n.a. 856.0 1,409.0 1,877.9EPS growth (%) 521.4 (32.6) 167.2 74.7P/E (x) 30.3 65.5 24.5 14.0Dividend yield (%) 1.7 0.8 2.0 3.6EV/EBITDA (x) 65.6 42.6 13.9 7.4P/B (x) 2.9 4.1 3.9 3.5ROE(%) 8.5 5.4 13.8 22.0Net debt/equity (%) Net cash Net cash Net cash Net cash
Source: Company data, Thomson Reuters, Credit Suisse estimates
15 September 2017
Nintendo (7974) 2
Nintendo (7974)Price (14 Sep 2017): ¥37,670 (upside: 46%); Rating: (from NEUTRAL) OUTPERFORM [V]; Target Price: (from ¥40,000) ¥55,000; Analyst: Keiichi YoneshimaIncome statement (¥ bn) 3/17A 3/18E 3/19E 3/20ESales 489.1 831.4 1,196.4 1,599.1EBITDA 37.7 88.8 266.5 478.5Operating profit 29.4 80.4 258.1 470.1Recurring profit 50.4 106.3 284.0 496.0Extraordinary gain & loss 64.4 0.0 0.0 0.0Profit before tax 114.7 106.3 284.0 496.0Net income 102.6 69.1 184.6 322.4Cash flow (¥ bn) 3/17A 3/18E 3/19E 3/20EOperating cash flow 19.1 121.9 186.0 320.3Depreciation & Amortization 8.4 8.4 8.4 8.4Investing cash flow 69.5 24.6 (15.2) (15.2)Capex (9.9) (15.2) (15.2) (15.2)Free cash flow 88.6 146.5 170.8 305.1Financing cash flow (14.4) (29.1) (92.3) (161.2)Issuance (retirement) of stock (0.0) 0.0 0.0 0.0Dividends paid (14.4) (34.5) (92.3) (161.2)Net change in cash 74.2 117.4 78.5 143.9Balance sheet (¥ bn) 3/17A 3/18E 3/19E 3/20ECash & cash equivalents 662.8 780.1 858.6 1,002.5Current receivable 106.1 91.1 131.1 175.2Inventories 39.1 83.4 114.2 145.6Other current assets 332.8 330.4 330.4 330.4Current assets 1,140.7 1,285.0 1,434.3 1,653.7Property, plant & equipment 128.7 138.4 148.1 157.8Investments - - - -Intangibles 12.8 12.8 12.8 12.8Other non-current assets 186.7 186.8 186.8 186.8Total assets 1,469.0 1,623.0 1,782.0 2,011.1Payables 104.2 180.8 247.5 315.4Short term debt 0.0 0.0 0.0 0.0Other current liabilities 79.9 117.4 117.4 117.4Current liabilities 184.1 298.1 364.8 432.7Long term debt 33.9 33.9 33.9 33.9Other non-current liabilities 0.0 0.0 0.0 0.0Total liabilities 218.0 332.0 398.7 466.6Shareholders' equity 1,250.8 1,290.8 1,383.1 1,544.3Minority interests 0.1 0.1 0.1 0.1
Key ratios 3/17A 3/18E 3/19E 3/20EGrowth (%)Sales (3.0) 70.0 43.9 33.7Operating profit (10.7) 173.8 221.0 82.1EPS 521.4 (32.6) 167.2 74.7Margins (%)Gross margin 40.7 39.0 41.9 44.6EBITDA margin 7.7 10.7 22.3 29.9OP margin 6.0 9.7 21.6 29.4DuPont analysisROE (%) 8.5 5.4 13.8 22.0Net profit margin (%) 21.0 8.3 15.4 20.2Sales/Assets 0.3 0.5 0.7 0.8Assets/Equity 1.2 1.3 1.3 1.3Credit ratios (%)Equity ratio 85.2 79.5 77.6 76.8Net D/E ratio Net cash Net cash Net cash Net cashPer share data (¥)Number of shares (mn) 120.1 120.1 120.1 120.1EPS 853.9 575.1 1536.5 2683.6BPS 8829.3 9111.5 9763.0 10900.8DPS 430.0 287.6 768.2 1341.8Dividend payout ratio (%) 50.4 50.0 50.0 50.0Valuation (x) 3/17A 3/18E 3/19E 3/20EP/E 30.3 65.5 24.5 14.0P/B 2.9 4.1 3.9 3.5EV/EBITDA 65.6 42.6 13.9 7.4Dividend yield (%) 1.7 0.8 2.0 3.6FCF yield (%) 0.3 2.4 3.8 6.7
Source: Company data, Thomson Reuters, Credit Suisse estimates
15 September 2017
Nintendo (7974) 3
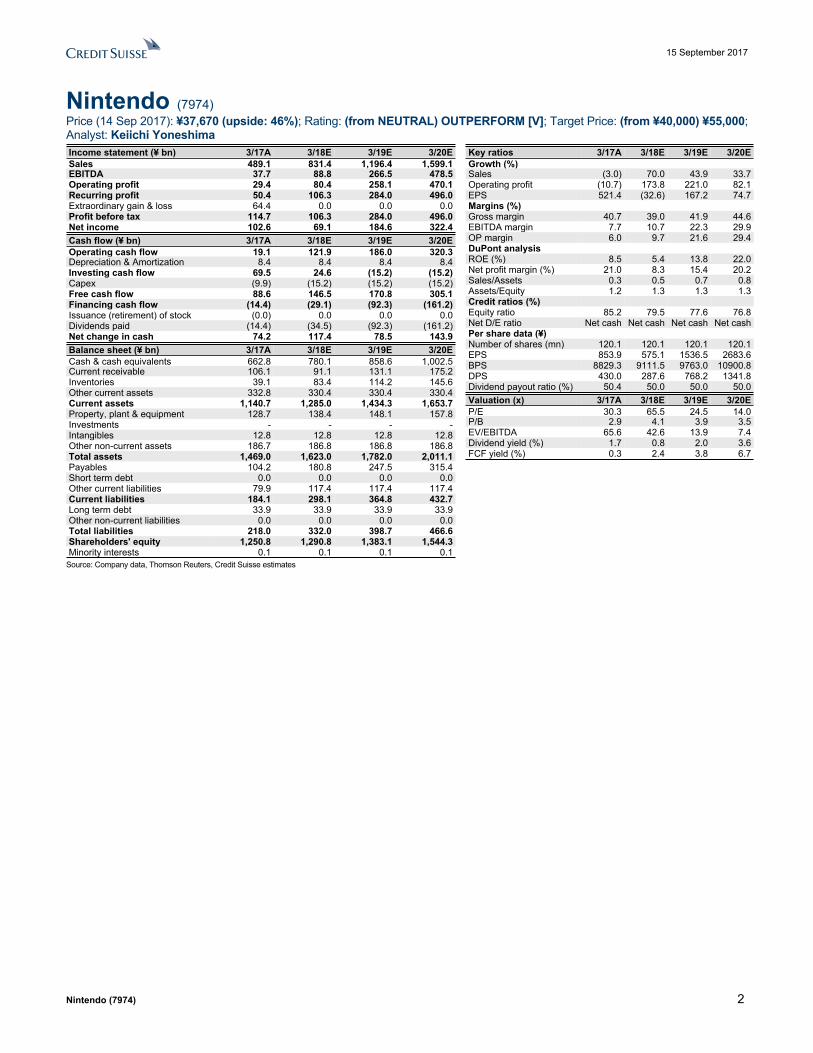
Table of contentsUpgrading to OUTPERFORM: Multi-Switch homes to drive high earnings peak 1
Executive summary 4
Upgrading to OUTPERFORM with ¥55,000 TP .......................................................4
Three reasons why Switch will be more like a handheld..........................................4
Valuation ..................................................................................................................7
Upgrading to OUTPERFORM, raising TP to ¥55,000 9
Forecasting Switch sales through FY3/22 at 130mn units, revised from 70mn .......9
Incorporating multi-Switch households into our sales forecast ................................9
Game hardware is relatively inexpensive per CPI data .........................................12
Switch poised for similar uptake as the DS series 14
3DS+NDS constitute a broader “DS series”...........................................................14
Revising attach rate outlook...................................................................................17
Expecting production capacity to rise to 2.5mn units/month; peak FY capacity of
30mn units within reach .........................................................................................18
Prospects for long-tail sales driven by minor changes 19
Switch color variations suggests scope for device personalization........................19
Previous minor changes.........................................................................................21
Minor changes in handheld and stationary consoles differ by an order of magnitude
...............................................................................................................................22
Near-term catalyst: upward revision at 2Q (Jul–Sep) results 23
Profits concentrated in Oct–Dec; expecting lift to full-year guidance if 1H progress
is around 50% ........................................................................................................23
Forecasts for non-Switch products 25
2DS likely to become the core handheld................................................................25
Modest revision to smartphone app forecasts .......................................................25
Valuation: raising value of game console business from ¥2.7tn to ¥4.7tn 26
Focusing on the Switch; smartphone apps also look promising in the long term...26
Earnings forecasts 30
Revising Switch earnings peak from FY3/19 to FY3/20–21; raising peak sales ‒
15mn to 31mn units................................................................................................30
15 September 2017
Nintendo (7974) 4
Executive summaryUpgrading to OUTPERFORM with ¥55,000 TPChanges from our previous report: Now reflecting realization of upside scenario■ 1) We raise our earnings forecasts after lifting our cumulative sales forecast for the
Switch through FY3/22 from 70mn units to 130mn units.
■ 2) We raise our target price from ¥40,000 to ¥55,000. We push back our expected earnings peak from FY3/19 to FY3/20–21 and, given the time value factor, lower our target P/E for the game console business from 20x to 18x.
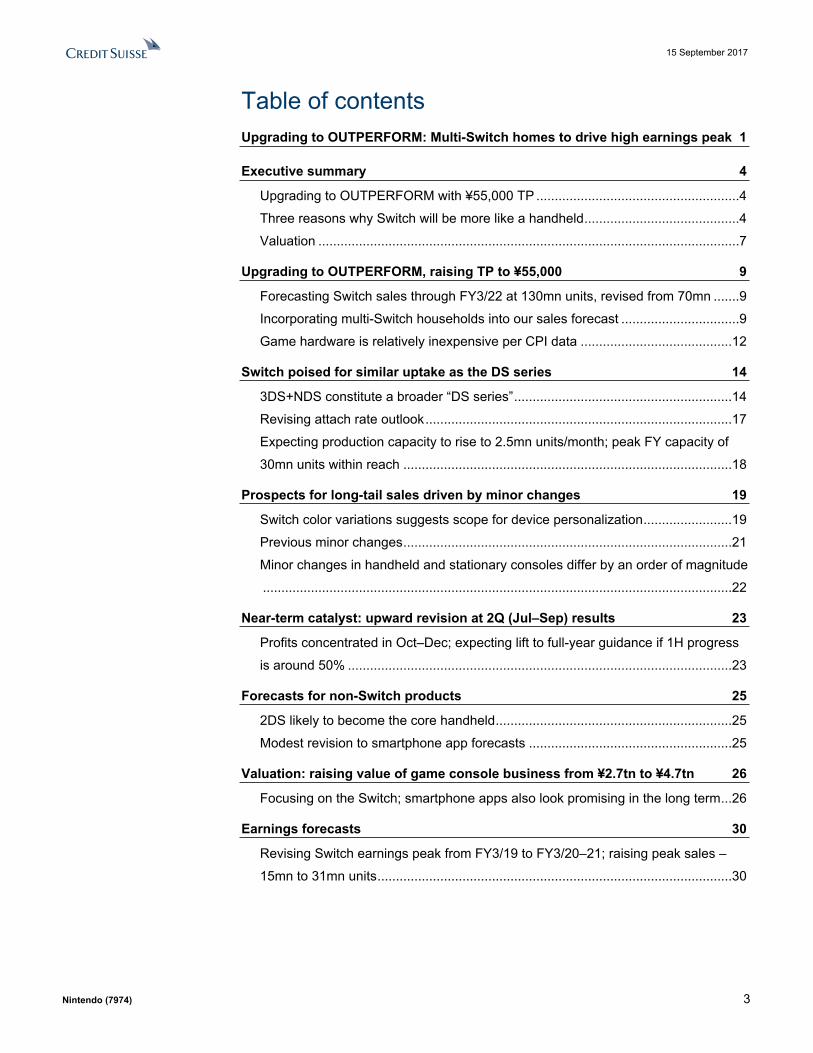
Raising Switch sales forecast through FY3/22 from 70mn to 130mn units to reflect a handheld-like sales cycleAs Nintendo’s Switch is a unique game platform for use as either a console or handheld, there was initially some uncertainty over whether its sales cycle would more closely resemble that of a console or handheld. Although the Switch is currently categorized as more of a console, we expect it to sell like a handheld. Many users are in fact using the Switch as a portable according to a Famitsu survey of users (Figure 1). We previously projected a sales peak at about three years after launch (i.e., in FY3/19) on the assumption of a console-like sales cycle. Now that the Switch looks more likely to sell like a handheld, we update our sales forecast to reflect a longer sales cycle. We now expect the Switch to achieve peak sales about five years after launch (i.e., around FY3/20–21) like a typical handheld game device. We also raise our peak-year sales forecast from 25mn to 31mn units.
We expect Switch sales to rival combined NDS/3DS salesAssuming the Switch sells like a handheld, we could use the Nintendo DS, or NDS, (sales of 150mn units), or Nintendo 3DS (80mn units) as benchmarks for forecasting sales. In retrospect, however, the NDS and 3DS were ultimately similar to each other and, in our opinion, more aptly grouped together as a single broadly defined DS series. Our updated Switch sales forecast assumes that Switch sales will exhibit an arc similar to this broader DS series.
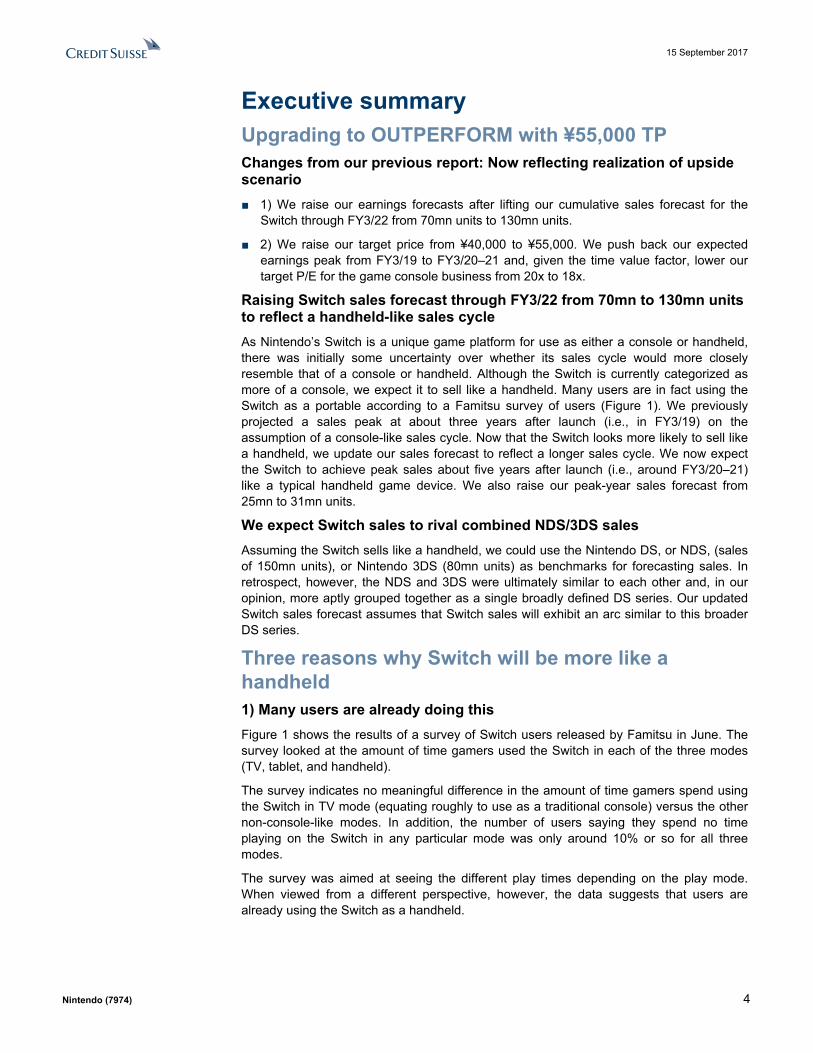
Three reasons why Switch will be more like a handheld1) Many users are already doing thisFigure 1 shows the results of a survey of Switch users released by Famitsu in June. The survey looked at the amount of time gamers used the Switch in each of the three modes (TV, tablet, and handheld).
The survey indicates no meaningful difference in the amount of time gamers spend using the Switch in TV mode (equating roughly to use as a traditional console) versus the other non-console-like modes. In addition, the number of users saying they spend no time playing on the Switch in any particular mode was only around 10% or so for all three modes.
The survey was aimed at seeing the different play times depending on the play mode. When viewed from a different perspective, however, the data suggests that users are already using the Switch as a handheld.
15 September 2017
Nintendo (7974) 5
Figure 1: Switch reportedly often used in tabletop/handheld modes
Figure 2: We expect Switch sales cycle to resemble NDS & 3DS
0%5%
10%15%20%25%30%35%40%
Time spending
TV mode
Tabletop mode
Handheld mode
05
1015202530354045
Year
1
Year
2
Year
3
Year
4
Year
5
Year
6
(mn
units
)
Switch (New- CSE) Switch (Old- CSE)
NDS+3DS Wii
Source: Famitsu, Credit Suisse Source: Company data, Credit Suisse estimates
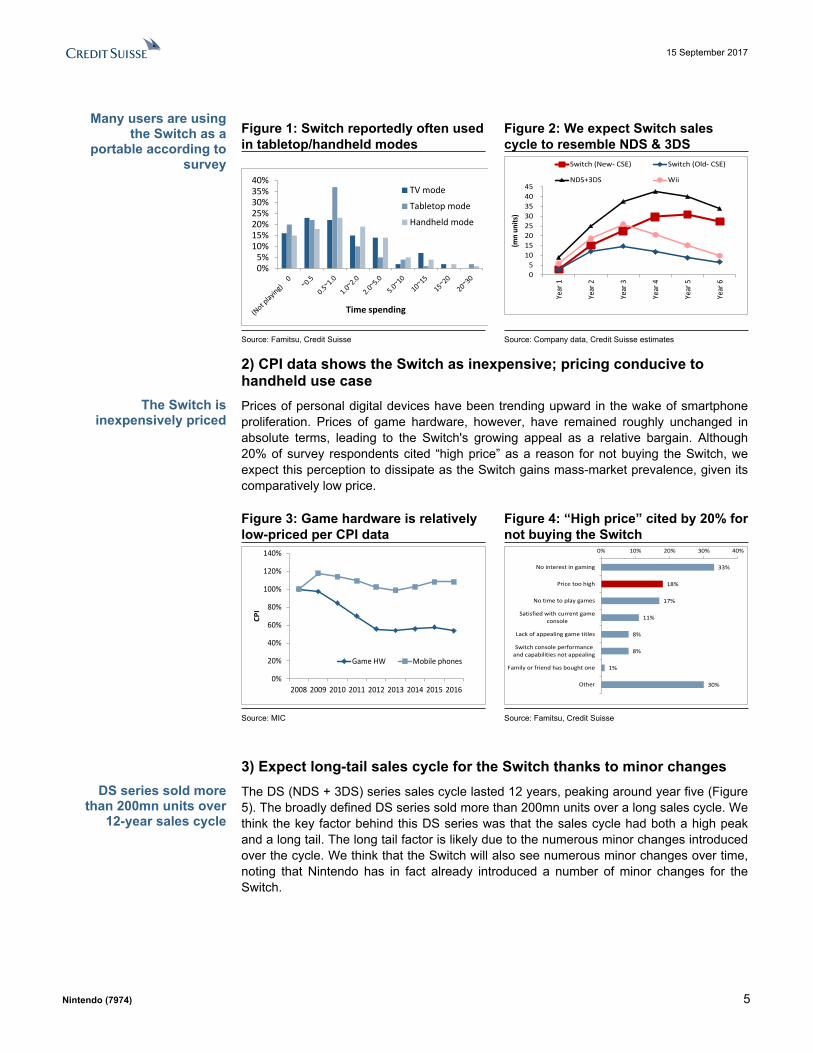
2) CPI data shows the Switch as inexpensive; pricing conducive to handheld use casePrices of personal digital devices have been trending upward in the wake of smartphone proliferation. Prices of game hardware, however, have remained roughly unchanged in absolute terms, leading to the Switch's growing appeal as a relative bargain. Although 20% of survey respondents cited “high price” as a reason for not buying the Switch, we expect this perception to dissipate as the Switch gains mass-market prevalence, given its comparatively low price.
Figure 3: Game hardware is relatively low-priced per CPI data
Figure 4: “High price” cited by 20% for not buying the Switch
0%
20%
40%
60%
80%
100%
120%
140%
2008 2009 2010 2011 2012 2013 2014 2015 2016
CPI
Game HW Mobile phones
33%
18%
17%
11%
8%
8%
1%
30%
0% 10% 20% 30% 40%
No interest in gaming
Price too high
No time to play games
Satisfied with current gameconsole
Lack of appealing game titles
Switch console performanceand capabilities not appealing
Family or friend has bought one
Other
Source: MIC Source: Famitsu, Credit Suisse
3) Expect long-tail sales cycle for the Switch thanks to minor changesThe DS (NDS + 3DS) series sales cycle lasted 12 years, peaking around year five (Figure 5). The broadly defined DS series sold more than 200mn units over a long sales cycle. We think the key factor behind this DS series was that the sales cycle had both a high peak and a long tail. The long tail factor is likely due to the numerous minor changes introduced over the cycle. We think that the Switch will also see numerous minor changes over time, noting that Nintendo has in fact already introduced a number of minor changes for the Switch.
Many users are using the Switch as a
portable according to survey
The Switch is inexpensively priced
DS series sold more than 200mn units over
12-year sales cycle

15 September 2017
Nintendo (7974) 6
Figure 5: DS series had very long-tailed sales cycle
Figure 6: Total market penetration of game hardware
05
101520253035
FY3/
05
FY3/
06
FY3/
07
FY3/
08
FY3/
09
FY3/
10
FY3/
11
FY3/
12
FY3/
13
FY3/
14
FY3/
15
FY3/
16
FY3/
17
(mn
units
)
3DS
NDS12 years
DSi
DS LiteDS i LL
102
14
128 120
81
154
78
201232
0
50
100
150
200
250
Wii
Wii-
U
Switc
h(C
S E)
Gam
e Bo
y
GBA
ND
S
3DS
GB+
GBA
ND
S+3D
S
Console Console?Portable?
Portable CS definition
(mn
units
)
as of end-FY3/22
Source: Company data, Credit Suisse estimates Source: Company data, Credit Suisse estimates
In traditional handhelds, the NDS (150mn units) and 3DS (80mn units) could be viewed as appropriate benchmarks. Looking back over the history of the NDS and 3DS, however, we see the two series as ending up being quite similar. As a result, we include both handhelds in our broad definition of the DS series. We further expect that Switch sales will generally follow those of the broadly defined DS (NDS+3DS) series.
We conservatively assume a lower Switch attach rate than for consoles Game consoles generally tend to have higher attach rates than their handheld counterparts. The Switch, however, is a cross between a console and handheld. We assume the Switch will have a relatively low attach rate, on par with handheld game hardware. Our forecasts therefore have upside potential if the Switch proves to have a higher attach rate more in line with that of a console.
Figure 7: Handheld game devices tend to have lower attach rates than consoles
Figure 8: Switch could benefit from high console-like attach rate and handhelds’ greater mass-market appeal
0 x
2 x
4 x
6 x
8 x
10 x
Year
1
Year
2
Year
3
Year
4
Year
5
NDS
3DS
Wii
Wii-U
Low High
Smaller Conventionalhome console
BiggerConventional
handheldconsole
Positivescenario for
Switch
Attach rate
Inst
all b
ase
Source: Company data, Credit Suisse estimates Source: Company data, Credit Suisse estimates
Combined NDS/3DS series achieved
mass-market success with penetration over
200mn units
Broad definition of DS series includes
NDS+3DS; expect Switch to follow broad
DS series cycle
Handheld game devices tend to have
lower attach rates than consoles
15 September 2017
Nintendo (7974) 7
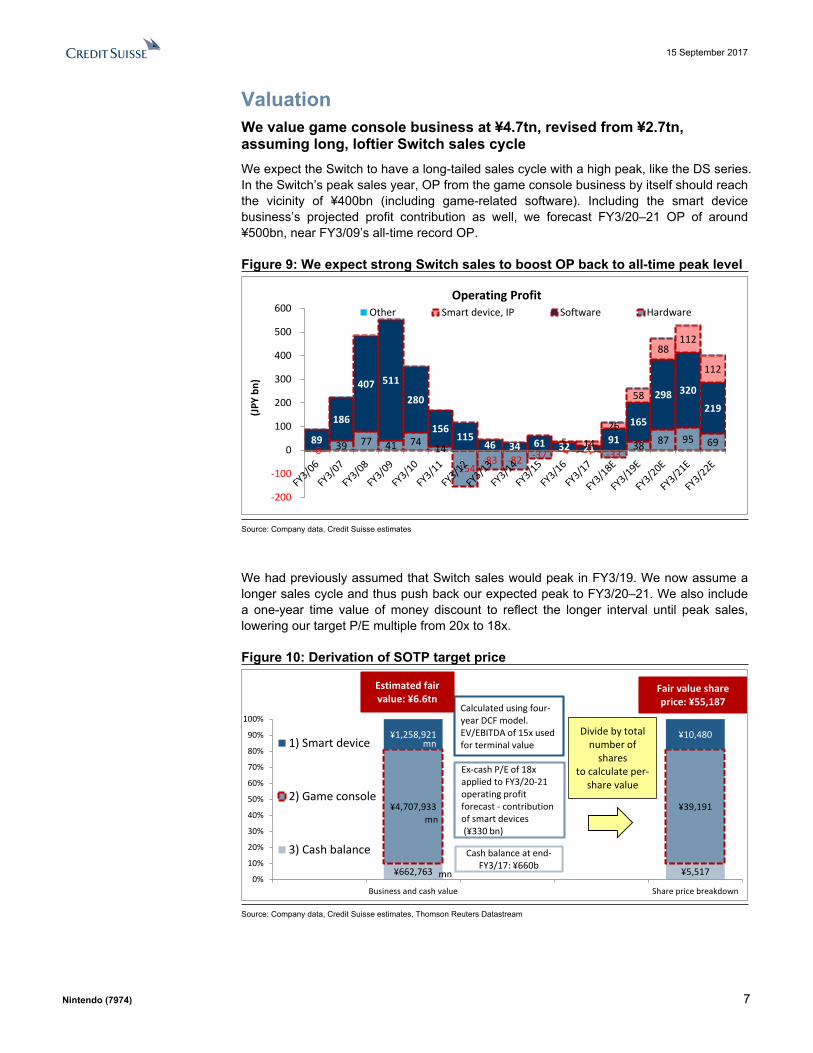
Valuation We value game console business at ¥4.7tn, revised from ¥2.7tn, assuming long, loftier Switch sales cycleWe expect the Switch to have a long-tailed sales cycle with a high peak, like the DS series. In the Switch’s peak sales year, OP from the game console business by itself should reach the vicinity of ¥400bn (including game-related software). Including the smart device business’s projected profit contribution as well, we forecast FY3/20–21 OP of around ¥500bn, near FY3/09’s all-time record OP.
Figure 9: We expect strong Switch sales to boost OP back to all-time peak level
-0 39 77 41 74 14
-154 -83 -82 -37 -4 -7 -33
38 87 95 69 89
186
407 511
280
156 115
46 34 61 32 21 91
165
298 320
219
5 14
26
58
88 112
112
-200
-100
0
100
200
300
400
500
600
(JPY
bn)
Operating ProfitOther Smart device, IP Software Hardware
Source: Company data, Credit Suisse estimates
We had previously assumed that Switch sales would peak in FY3/19. We now assume a longer sales cycle and thus push back our expected peak to FY3/20–21. We also include a one-year time value of money discount to reflect the longer interval until peak sales, lowering our target P/E multiple from 20x to 18x.
Figure 10: Derivation of SOTP target price
¥662,763 ¥5,517
¥4,707,933 ¥39,191
¥1,258,921 ¥10,480
0%
10%
20%
30%
40%
50%
60%
70%
80%
90%
100%
Business and cash value Share price breakdown
1) Smart device
2) Game console
3) Cash balance Cash balance at end-FY3/17: ¥660b
mn
mn
Ex-cash P/E of 18x applied to FY3/20-21operating profit forecast - contribution of smart devices(¥330 bn)
Calculated using four-year DCF model.EV/EBITDA of 15x used for terminal valuemn
Divide by total number of
sharesto calculate per-
share value
Estimated fair value: ¥6.6tn
Fair value share price: ¥55,187
Source: Company data, Credit Suisse estimates, Thomson Reuters Datastream
15 September 2017
Nintendo (7974) 8
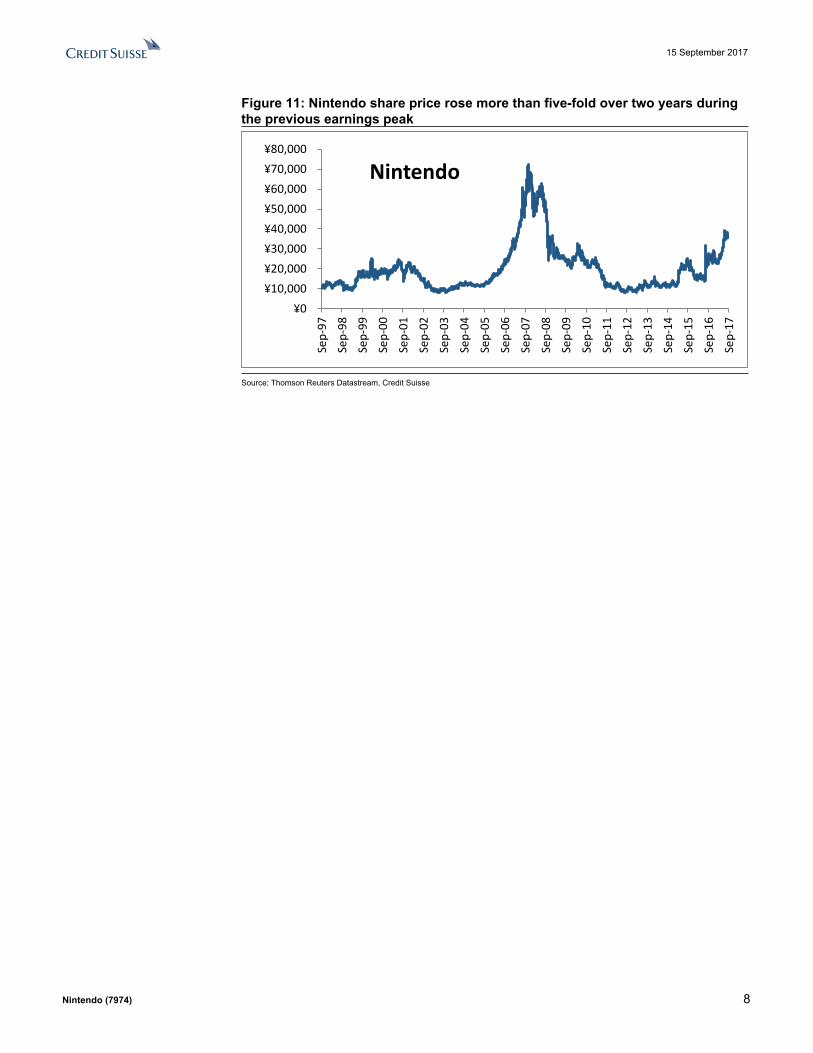
Figure 11: Nintendo share price rose more than five-fold over two years during the previous earnings peak
¥0¥10,000¥20,000¥30,000¥40,000¥50,000¥60,000¥70,000¥80,000
Sep-
97
Sep-
98
Sep-
99
Sep-
00
Sep-
01
Sep-
02
Sep-
03
Sep-
04
Sep-
05
Sep-
06
Sep-
07
Sep-
08
Sep-
09
Sep-
10
Sep-
11
Sep-
12
Sep-
13
Sep-
14
Sep-
15
Sep-
16
Sep-
17
Nintendo
Source: Thomson Reuters Datastream, Credit Suisse
15 September 2017
Nintendo (7974) 9
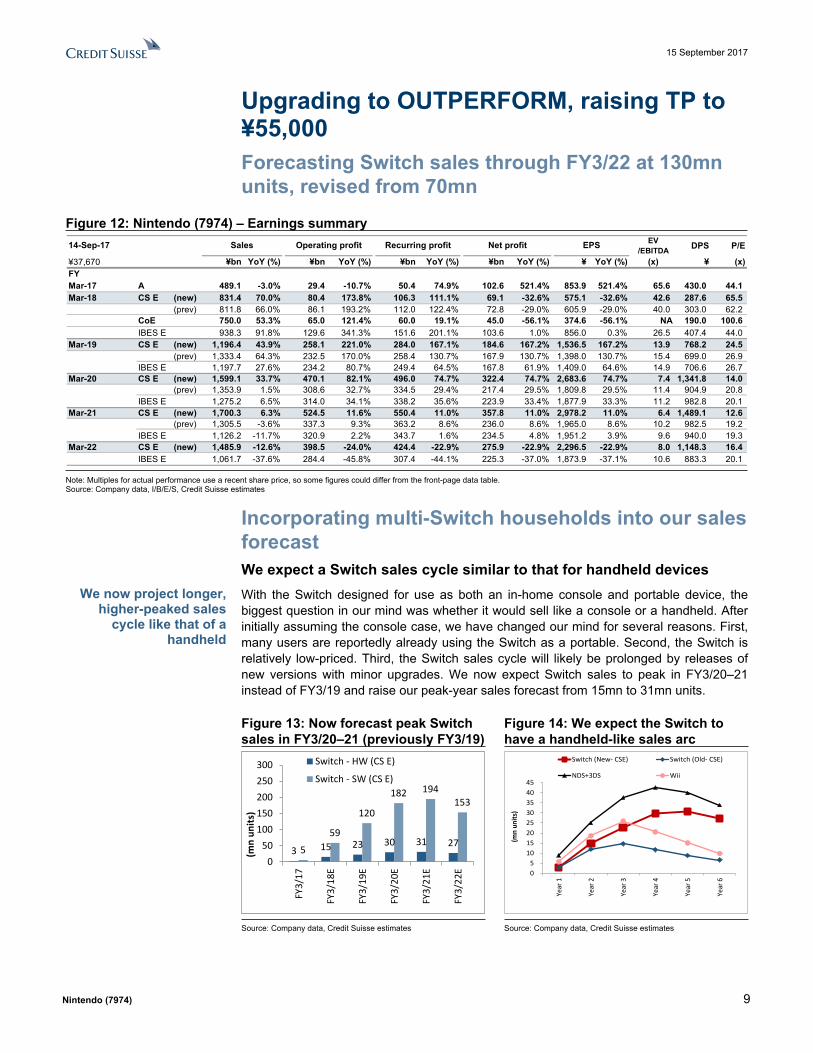
Upgrading to OUTPERFORM, raising TP to ¥55,000Forecasting Switch sales through FY3/22 at 130mn units, revised from 70mn
Figure 12: Nintendo (7974) – Earnings summary EV
/EBITDA DPS P/E
¥37,670 ¥bn YoY (%) ¥bn YoY (%) ¥bn YoY (%) ¥bn YoY (%) ¥ YoY (%) (x) ¥ (x)FYMar-17 A 489.1 -3.0% 29.4 -10.7% 50.4 74.9% 102.6 521.4% 853.9 521.4% 65.6 430.0 44.1Mar-18 CS E (new) 831.4 70.0% 80.4 173.8% 106.3 111.1% 69.1 -32.6% 575.1 -32.6% 42.6 287.6 65.5
(prev) 811.8 66.0% 86.1 193.2% 112.0 122.4% 72.8 -29.0% 605.9 -29.0% 40.0 303.0 62.2CoE 750.0 53.3% 65.0 121.4% 60.0 19.1% 45.0 -56.1% 374.6 -56.1% NA 190.0 100.6IBES E 938.3 91.8% 129.6 341.3% 151.6 201.1% 103.6 1.0% 856.0 0.3% 26.5 407.4 44.0
Mar-19 CS E (new) 1,196.4 43.9% 258.1 221.0% 284.0 167.1% 184.6 167.2% 1,536.5 167.2% 13.9 768.2 24.5(prev) 1,333.4 64.3% 232.5 170.0% 258.4 130.7% 167.9 130.7% 1,398.0 130.7% 15.4 699.0 26.9
IBES E 1,197.7 27.6% 234.2 80.7% 249.4 64.5% 167.8 61.9% 1,409.0 64.6% 14.9 706.6 26.7Mar-20 CS E (new) 1,599.1 33.7% 470.1 82.1% 496.0 74.7% 322.4 74.7% 2,683.6 74.7% 7.4 1,341.8 14.0
(prev) 1,353.9 1.5% 308.6 32.7% 334.5 29.4% 217.4 29.5% 1,809.8 29.5% 11.4 904.9 20.8IBES E 1,275.2 6.5% 314.0 34.1% 338.2 35.6% 223.9 33.4% 1,877.9 33.3% 11.2 982.8 20.1
Mar-21 CS E (new) 1,700.3 6.3% 524.5 11.6% 550.4 11.0% 357.8 11.0% 2,978.2 11.0% 6.4 1,489.1 12.6(prev) 1,305.5 -3.6% 337.3 9.3% 363.2 8.6% 236.0 8.6% 1,965.0 8.6% 10.2 982.5 19.2
IBES E 1,126.2 -11.7% 320.9 2.2% 343.7 1.6% 234.5 4.8% 1,951.2 3.9% 9.6 940.0 19.3Mar-22 CS E (new) 1,485.9 -12.6% 398.5 -24.0% 424.4 -22.9% 275.9 -22.9% 2,296.5 -22.9% 8.0 1,148.3 16.4
IBES E 1,061.7 -37.6% 284.4 -45.8% 307.4 -44.1% 225.3 -37.0% 1,873.9 -37.1% 10.6 883.3 20.1
EPS14-Sep-17 Sales Operating profit Recurring profit Net profit
Note: Multiples for actual performance use a recent share price, so some figures could differ from the front-page data table. Source: Company data, I/B/E/S, Credit Suisse estimates
Incorporating multi-Switch households into our sales forecastWe expect a Switch sales cycle similar to that for handheld devicesWith the Switch designed for use as both an in-home console and portable device, the biggest question in our mind was whether it would sell like a console or a handheld. After initially assuming the console case, we have changed our mind for several reasons. First, many users are reportedly already using the Switch as a portable. Second, the Switch is relatively low-priced. Third, the Switch sales cycle will likely be prolonged by releases of new versions with minor upgrades. We now expect Switch sales to peak in FY3/20–21 instead of FY3/19 and raise our peak-year sales forecast from 15mn to 31mn units.
Figure 13: Now forecast peak Switch sales in FY3/20–21 (previously FY3/19)
Figure 14: We expect the Switch to have a handheld-like sales arc
3 15 23 30 31 275
59
120
182 194153
050
100150200250300
FY3/
17
FY3/
18E
FY3/
19E
FY3/
20E
FY3/
21E
FY3/
22E
(mn
units
)
Switch - HW (CS E)
Switch - SW (CS E)
05
1015202530354045
Year
1
Year
2
Year
3
Year
4
Year
5
Year
6
(mn
units
)
Switch (New- CSE) Switch (Old- CSE)
NDS+3DS Wii
Source: Company data, Credit Suisse estimates Source: Company data, Credit Suisse estimates
We now project longer, higher-peaked sales
cycle like that of a handheld

15 September 2017
Nintendo (7974) 10
Figure 15: Game hardware’s cumulative sales (historical)
Figure 16: DS (NDS+3DS) and Gameboy series both sold over 200mn units
GB, 65 GBA, 82
NDS, 154
3DS, 78
N64, 27 NGC, 22
Wii, 102
Wii U, 14
Switch (CSE), 128
020406080
100120140160180
FY19
97FY
1999
FY20
01FY
2003
FY20
05FY
2007
FY20
09FY
2011
FY20
13FY
2015
FY20
17E
FY20
19E
FY20
21E
(mn
units
) 102
14
128 120
81
154
78
201232
0
50
100
150
200
250
Wii
Wii-
U
Switc
h(C
S E)
Gam
e Bo
y
GBA
ND
S
3DS
GB+
GBA
ND
S+3D
S
Console Console?Portable?
Portable CS definition
(mn
unit
s)
as of end-FY3/22
Source: Company data, Credit Suisse estimates Source: Company data, Credit Suisse estimates
We look for a lofty earnings peak coinciding with peak Switch sales in FY3/20–21Assuming that Switch sales peak in line with our forecast, we expect OP from the game console business by itself to reach ¥400bn (including game software). Meanwhile, the smart device business should contribute additional profits. Although we do not expect hardware unit sales to match their FY3/09 all-time high (Figure 19), we believe consolidated OP should peak above ¥500bn like in FY3/09.
Figure 17: Game hardware’s cumulative sales (historical)
Figure 18: DS (NDS+3DS) and Gameboy series both sold over 200mn units
268 257 519 677
851 877 793 230 206
266
409
577 604 473
6 24
49
113
173 221
221
0200400600800
1,0001,2001,4001,6001,800
FY3/16 FY3/17 FY3/18E FY3/19E FY3/20E FY3/21E FY3/22E
(JPY
bn)
Sales
Other
Smart device, IP
Software
Hardware
-4 -7 -33 38 87 95 69 32 21
91
165
298 320
219
5 14
26
58
88 112
112
-100
0
100
200
300
400
500
600
FY3/16 FY3/17 FY3/18E FY3/19E FY3/20E FY3/21E FY3/22E
(JPY
bn)
Operating ProfitOther
Smartdevice, IPSoftware
Hardware
Source: Company data, Credit Suisse estimates Source: Company data, Credit Suisse estimates
Figure 19: Hardware unit-sales and OP
-100,000
0
100,000
200,000
300,000
400,000
500,000
600,000
-10,000
0
10,000
20,000
30,000
40,000
50,000
60,000
FY3/
90FY
3/91
FY3/
92FY
3/93
FY3/
94FY
3/95
FY3/
96FY
3/97
FY3/
98FY
3/99
FY3/
00FY
3/01
FY3/
02FY
3/03
FY3/
04FY
3/05
FY3/
06FY
3/07
FY3/
08FY
3/09
FY3/
10FY
3/11
FY3/
12FY
3/13
FY3/
14FY
3/15
FY3/
16FY
3/17
FY3/
18E
FY3/
19E
FY3/
20E
FY3/
21E
FY3/
22E
3DS NDSGB total SwitchWii-U WiiGC N64SFC FCOP total (RHS)
('000 units) (JPY mn)
Source: Company data, Credit Suisse estimates
15 September 2017
Nintendo (7974) 11
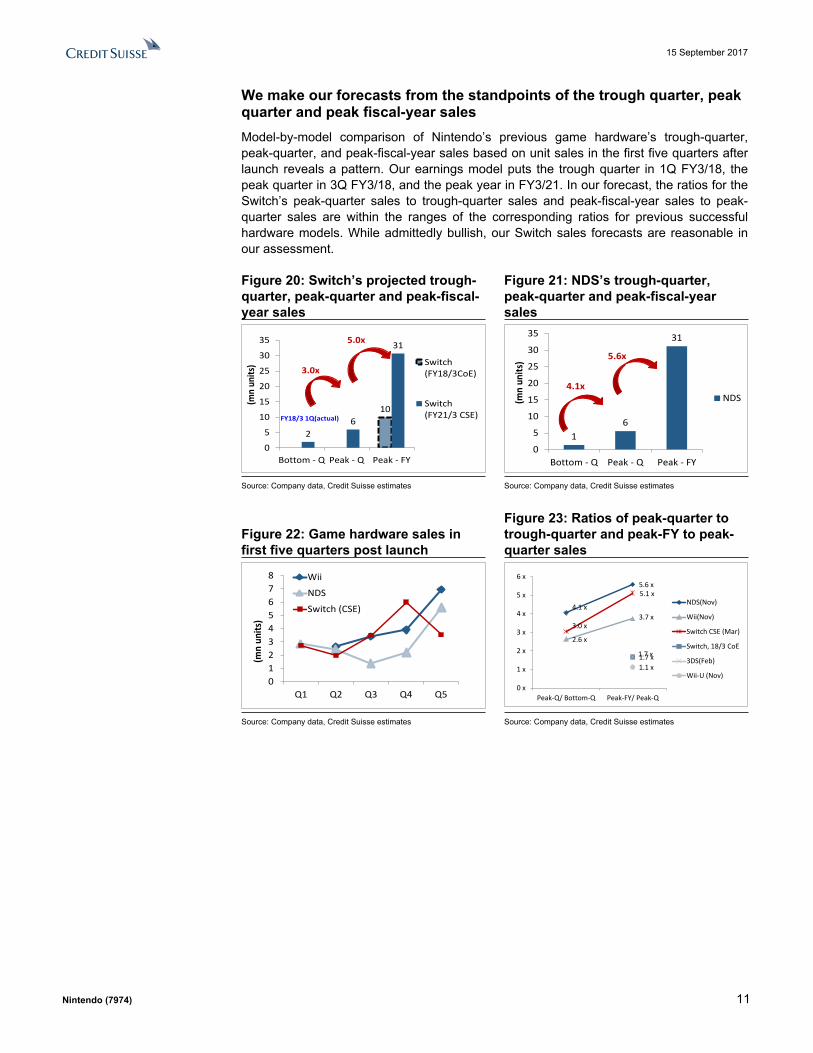
We make our forecasts from the standpoints of the trough quarter, peak quarter and peak fiscal-year salesModel-by-model comparison of Nintendo’s previous game hardware’s trough-quarter, peak-quarter, and peak-fiscal-year sales based on unit sales in the first five quarters after launch reveals a pattern. Our earnings model puts the trough quarter in 1Q FY3/18, the peak quarter in 3Q FY3/18, and the peak year in FY3/21. In our forecast, the ratios for the Switch’s peak-quarter sales to trough-quarter sales and peak-fiscal-year sales to peak-quarter sales are within the ranges of the corresponding ratios for previous successful hardware models. While admittedly bullish, our Switch sales forecasts are reasonable in our assessment.
Figure 20: Switch’s projected trough-quarter, peak-quarter and peak-fiscal-year sales
Figure 21: NDS’s trough-quarter, peak-quarter and peak-fiscal-year sales
10
26
31
0
5
10
15
20
25
30
35
Bottom - Q Peak - Q Peak - FY
(mn
units
) Switch(FY18/3CoE)
Switch(FY21/3 CSE)
3.0x
5.0x
FY18/3 1Q(actual)
16
31
0
5
10
15
20
25
30
35
Bottom - Q Peak - Q Peak - FY
(mn
units
)
NDS4.1x
5.6x
Source: Company data, Credit Suisse estimates Source: Company data, Credit Suisse estimates
Figure 22: Game hardware sales in first five quarters post launch
Figure 23: Ratios of peak-quarter to trough-quarter and peak-FY to peak-quarter sales
012345678
Q1 Q2 Q3 Q4 Q5
(mn
units
)
Wii
NDS
Switch (CSE) 4.1 x
5.6 x
2.6 x
3.7 x3.0 x
5.1 x
1.7 x1.7 x1.1 x
0 x
1 x
2 x
3 x
4 x
5 x
6 x
Peak-Q/ Bottom-Q Peak-FY/ Peak-Q
NDS(Nov)
Wii(Nov)
Switch CSE (Mar)
Switch, 18/3 CoE
3DS(Feb)
Wii-U (Nov)
Source: Company data, Credit Suisse estimates Source: Company data, Credit Suisse estimates
15 September 2017
Nintendo (7974) 12
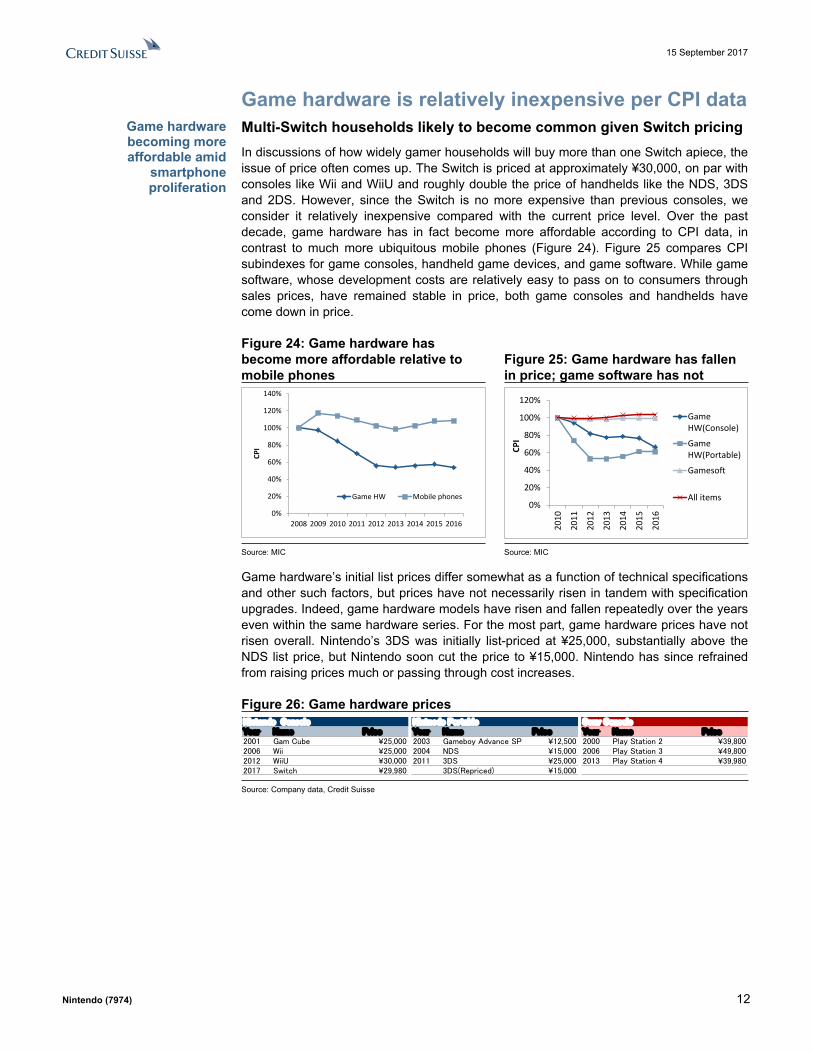
Game hardware is relatively inexpensive per CPI dataMulti-Switch households likely to become common given Switch pricingIn discussions of how widely gamer households will buy more than one Switch apiece, the issue of price often comes up. The Switch is priced at approximately ¥30,000, on par with consoles like Wii and WiiU and roughly double the price of handhelds like the NDS, 3DS and 2DS. However, since the Switch is no more expensive than previous consoles, we consider it relatively inexpensive compared with the current price level. Over the past decade, game hardware has in fact become more affordable according to CPI data, in contrast to much more ubiquitous mobile phones (Figure 24). Figure 25 compares CPI subindexes for game consoles, handheld game devices, and game software. While game software, whose development costs are relatively easy to pass on to consumers through sales prices, have remained stable in price, both game consoles and handhelds have come down in price.
Figure 24: Game hardware has become more affordable relative to mobile phones
Figure 25: Game hardware has fallen in price; game software has not
0%
20%
40%
60%
80%
100%
120%
140%
2008 2009 2010 2011 2012 2013 2014 2015 2016
CPI
Game HW Mobile phones0%
20%
40%
60%
80%
100%
120%
2010
2011
2012
2013
2014
2015
2016
CPI
GameHW(Console)
GameHW(Portable)
Gamesoft
All items
Source: MIC Source: MIC
Game hardware’s initial list prices differ somewhat as a function of technical specifications and other such factors, but prices have not necessarily risen in tandem with specification upgrades. Indeed, game hardware models have risen and fallen repeatedly over the years even within the same hardware series. For the most part, game hardware prices have not risen overall. Nintendo’s 3DS was initially list-priced at ¥25,000, substantially above the NDS list price, but Nintendo soon cut the price to ¥15,000. Nintendo has since refrained from raising prices much or passing through cost increases.
Figure 26: Game hardware pricesNintendo ConsoleYear Name Price Year Name Price Year Name Price2001 Gam Cube ¥25,000 2003 Gameboy Advance SP ¥12,500 2000 Play Station 2 ¥39,8002006 Wii ¥25,000 2004 NDS ¥15,000 2006 Play Station 3 ¥49,8002012 WiiU ¥30,000 2011 3DS ¥25,000 2013 Play Station 4 ¥39,9802017 Switch ¥29,980 3DS(Repriced) ¥15,000
Nintnedo Portable Sony Console
Source: Company data, Credit Suisse
Game hardware becoming more affordable amid
smartphone proliferation
15 September 2017
Nintendo (7974) 13
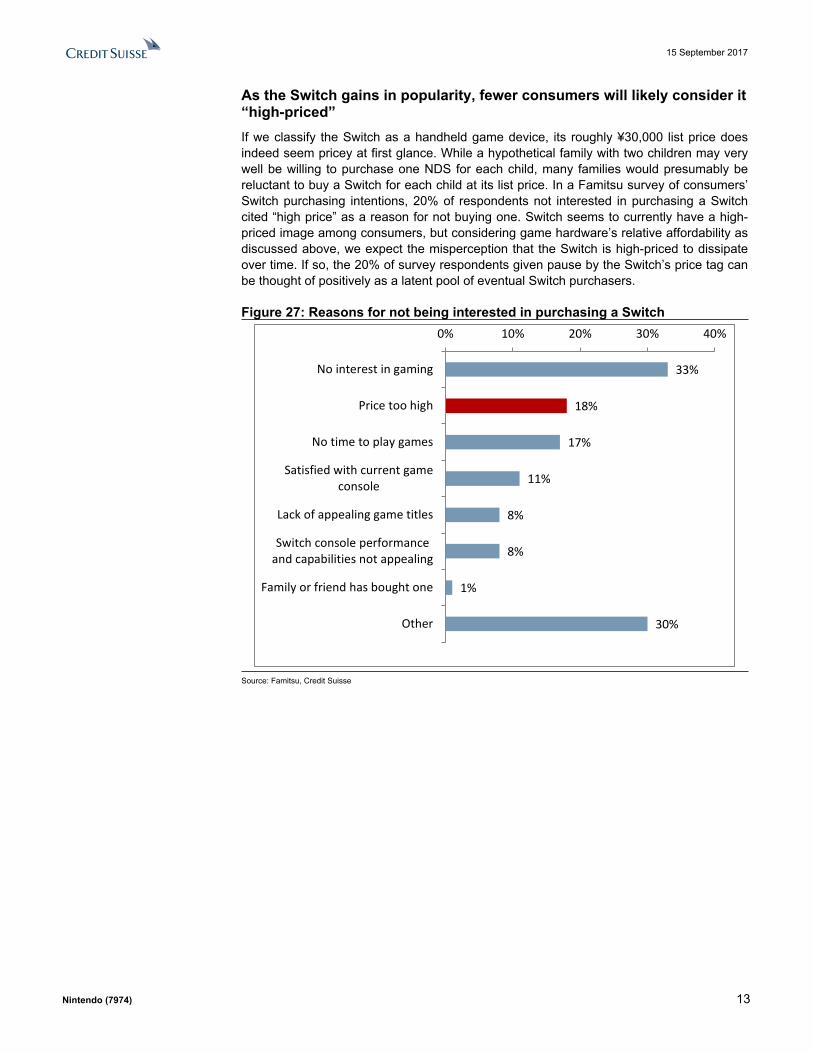
As the Switch gains in popularity, fewer consumers will likely consider it “high-priced” If we classify the Switch as a handheld game device, its roughly ¥30,000 list price does indeed seem pricey at first glance. While a hypothetical family with two children may very well be willing to purchase one NDS for each child, many families would presumably be reluctant to buy a Switch for each child at its list price. In a Famitsu survey of consumers’ Switch purchasing intentions, 20% of respondents not interested in purchasing a Switch cited “high price” as a reason for not buying one. Switch seems to currently have a high-priced image among consumers, but considering game hardware’s relative affordability as discussed above, we expect the misperception that the Switch is high-priced to dissipate over time. If so, the 20% of survey respondents given pause by the Switch’s price tag can be thought of positively as a latent pool of eventual Switch purchasers.
Figure 27: Reasons for not being interested in purchasing a Switch
33%
18%
17%
11%
8%
8%
1%
30%
0% 10% 20% 30% 40%
No interest in gaming
Price too high
No time to play games
Satisfied with current gameconsole
Lack of appealing game titles
Switch console performanceand capabilities not appealing
Family or friend has bought one
Other
Source: Famitsu, Credit Suisse

15 September 2017
Nintendo (7974) 14
Switch poised for similar uptake as the DS series3DS+NDS constitute a broader “DS series” A broader view of the Gameboy and DS seriesNintendo’s post-Gameboy handheld game console sales volume (Figure 28) looks to have repeatedly undergone ups and downs in relatively short sales cycles. However, the sales curve is somewhat more gentle if we adopt the broader view of Gameboy and Gameboy Advance (GB+GBA) constituting the GB series and NDS+3DS constituting the DS series (Figure 29). The sharp sales dip followed by a rebound mid-cycle of the GB series was apparently due to the introduction of the slimmer Gameboy Pocket (GB Pocket) in July 1996 (Figure 30).
Figure 28: High sales volatility if the game consoles are viewed separately…
Figure 29:…but ups and downs are smoother for the broader GB and DS series
05
101520253035
FY3/
90FY
3/92
FY3/
94FY
3/96
FY3/
98FY
3/00
FY3/
02FY
3/04
FY3/
06FY
3/08
FY3/
10FY
3/12
FY3/
14FY
3/16
FY3/
18E
FY3/
20E
FY3/
22E
(mn
units
)
Game Boy GBA NDS 3DS
05
101520253035
FY3/
90FY
3/92
FY3/
94FY
3/96
FY3/
98FY
3/00
FY3/
02FY
3/04
FY3/
06FY
3/08
FY3/
10FY
3/12
FY3/
14FY
3/16
FY3/
18E
FY3/
20E
(mn
units
)
GB+GBA NDS+3DS
Source: Company data, Credit Suisse estimates Source: Company data, Credit Suisse estimates
Sales for the broader GB and DS series have proven to be long-tailed. Restricting the former to consoles released after Gameboy Pocket, we note the two broader series’ sales cycles lasted around 12 years, gradually heading for a peak-out after registering stable sales (Figures 30-31).
Figure 30: GB and GBA sales trends Figure 31: NDS and 3DS sales trends
0
5
10
15
20
25
(mn
units
)
GAMEBOY ADVANCE
Game BoyGameboy
PocketRelease
12 years
05
101520253035
FY3/
05
FY3/
06
FY3/
07
FY3/
08
FY3/
09
FY3/
10
FY3/
11
FY3/
12
FY3/
13
FY3/
14
FY3/
15
FY3/
16
FY3/
17
(mn
units
)
3DS
NDS12 years
DSi
DS LiteDS i LL
Source: Company data, Credit Suisse estimates Source: Company data, Credit Suisse estimates
15 September 2017
Nintendo (7974) 15
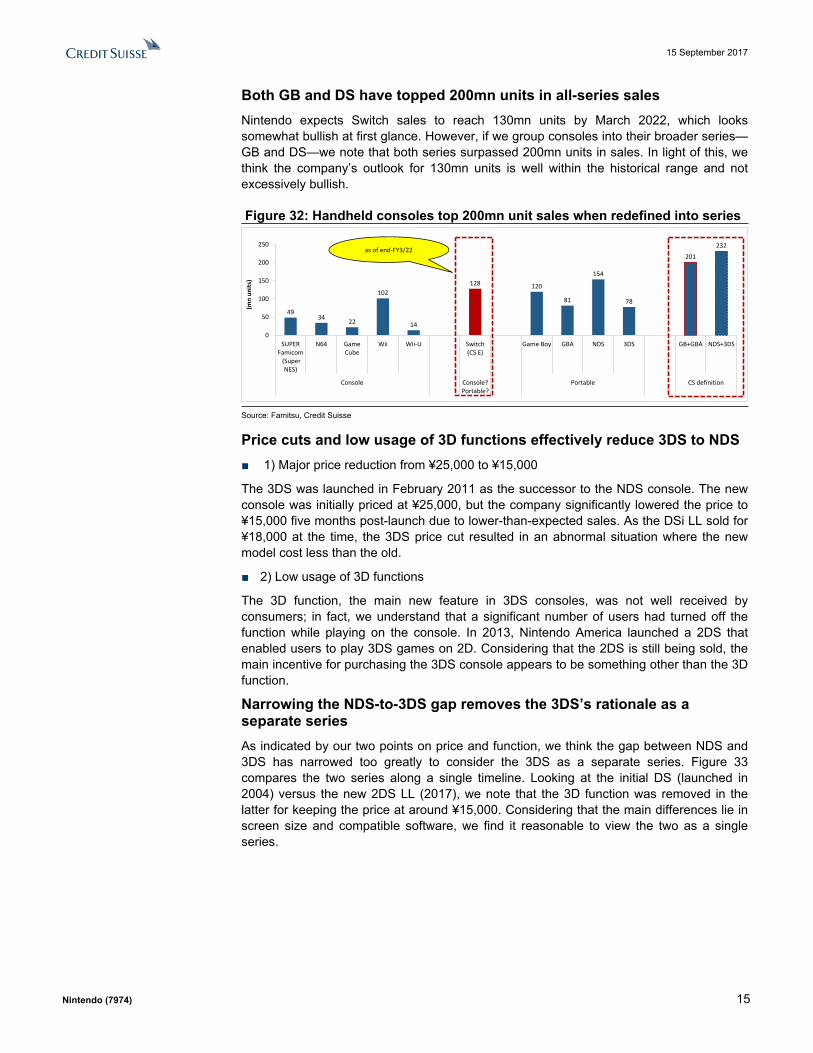
Both GB and DS have topped 200mn units in all-series salesNintendo expects Switch sales to reach 130mn units by March 2022, which looks somewhat bullish at first glance. However, if we group consoles into their broader series—GB and DS—we note that both series surpassed 200mn units in sales. In light of this, we think the company’s outlook for 130mn units is well within the historical range and not excessively bullish.
Figure 32: Handheld consoles top 200mn unit sales when redefined into series
4934
22
102
14
128 120
81
154
78
201
232
0
50
100
150
200
250
SUPERFamicom (Super
NES)
N64 GameCube
Wii Wii-U Switch(CS E)
Game Boy GBA NDS 3DS GB+GBA NDS+3DS
Console Console?Portable?
Portable CS definition
(mn
units
)as of end-FY3/22
Source: Famitsu, Credit Suisse
Price cuts and low usage of 3D functions effectively reduce 3DS to NDS■ 1) Major price reduction from ¥25,000 to ¥15,000
The 3DS was launched in February 2011 as the successor to the NDS console. The new console was initially priced at ¥25,000, but the company significantly lowered the price to ¥15,000 five months post-launch due to lower-than-expected sales. As the DSi LL sold for ¥18,000 at the time, the 3DS price cut resulted in an abnormal situation where the new model cost less than the old.
■ 2) Low usage of 3D functions
The 3D function, the main new feature in 3DS consoles, was not well received by consumers; in fact, we understand that a significant number of users had turned off the function while playing on the console. In 2013, Nintendo America launched a 2DS that enabled users to play 3DS games on 2D. Considering that the 2DS is still being sold, the main incentive for purchasing the 3DS console appears to be something other than the 3D function.
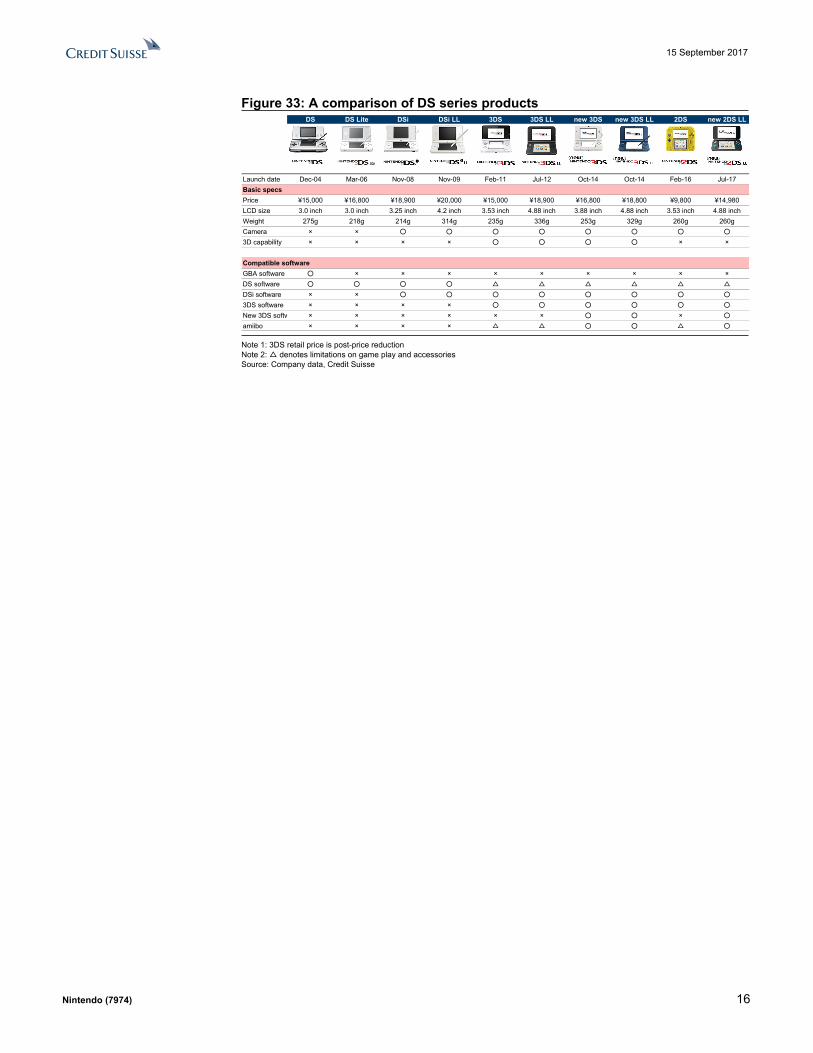
Narrowing the NDS-to-3DS gap removes the 3DS’s rationale as a separate seriesAs indicated by our two points on price and function, we think the gap between NDS and 3DS has narrowed too greatly to consider the 3DS as a separate series. Figure 33 compares the two series along a single timeline. Looking at the initial DS (launched in 2004) versus the new 2DS LL (2017), we note that the 3D function was removed in the latter for keeping the price at around ¥15,000. Considering that the main differences lie in screen size and compatible software, we find it reasonable to view the two as a single series.
15 September 2017
Nintendo (7974) 16
Figure 33: A comparison of DS series products DS DS Lite DSi DSi LL 3DS 3DS LL new 3DS new 3DS LL 2DS new 2DS LL
Launch date Dec-04 Mar-06 Nov-08 Nov-09 Feb-11 Jul-12 Oct-14 Oct-14 Feb-16 Jul-17Basic specs Price ¥15,000 ¥16,800 ¥18,900 ¥20,000 ¥15,000 ¥18,900 ¥16,800 ¥18,800 ¥9,800 ¥14,980LCD size 3.0 inch 3.0 inch 3.25 inch 4.2 inch 3.53 inch 4.88 inch 3.88 inch 4.88 inch 3.53 inch 4.88 inchWeight 275g 218g 214g 314g 235g 336g 253g 329g 260g 260gCamera × × ○ ○ ○ ○ ○ ○ ○ ○
3D capability × × × × ○ ○ ○ ○ × ×
Compatible softwareGBA software ○ × × × × × × × × ×DS software ○ ○ ○ ○ △ △ △ △ △ △
DSi software × × ○ ○ ○ ○ ○ ○ ○ ○
3DS software × × × × ○ ○ ○ ○ ○ ○
New 3DS software × × × × × × ○ ○ × ○
amiibo × × × × △ △ ○ ○ △ ○
Note 1: 3DS retail price is post-price reduction Note 2: △ denotes limitations on game play and accessoriesSource: Company data, Credit Suisse
15 September 2017
Nintendo (7974) 17
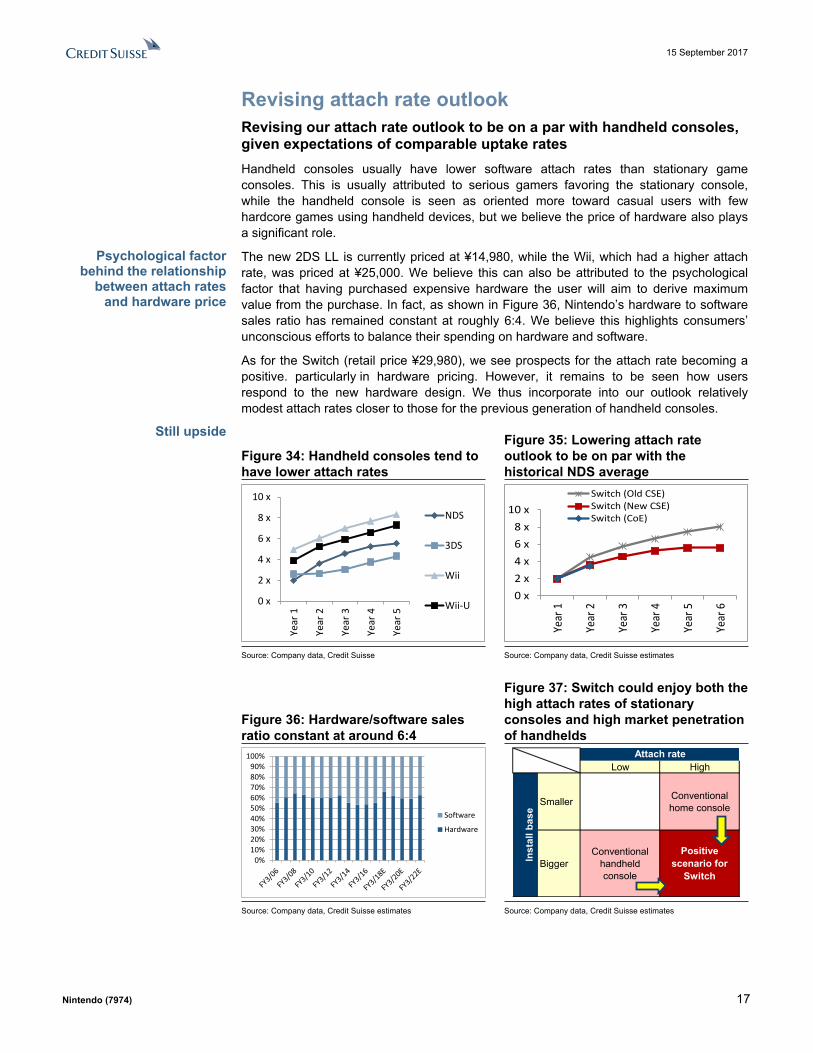
Revising attach rate outlookRevising our attach rate outlook to be on a par with handheld consoles, given expectations of comparable uptake ratesHandheld consoles usually have lower software attach rates than stationary game consoles. This is usually attributed to serious gamers favoring the stationary console, while the handheld console is seen as oriented more toward casual users with few hardcore games using handheld devices, but we believe the price of hardware also plays a significant role.
The new 2DS LL is currently priced at ¥14,980, while the Wii, which had a higher attach rate, was priced at ¥25,000. We believe this can also be attributed to the psychological factor that having purchased expensive hardware the user will aim to derive maximum value from the purchase. In fact, as shown in Figure 36, Nintendo’s hardware to software sales ratio has remained constant at roughly 6:4. We believe this highlights consumers’ unconscious efforts to balance their spending on hardware and software.
As for the Switch (retail price ¥29,980), we see prospects for the attach rate becoming a positive. particularly in hardware pricing. However, it remains to be seen how users respond to the new hardware design. We thus incorporate into our outlook relatively modest attach rates closer to those for the previous generation of handheld consoles.
Figure 34: Handheld consoles tend to have lower attach rates
Figure 35: Lowering attach rate outlook to be on par with the historical NDS average
0 x
2 x
4 x
6 x
8 x
10 x
Year
1
Year
2
Year
3
Year
4
Year
5
NDS
3DS
Wii
Wii-U0 x2 x4 x6 x8 x
10 x
Year
1
Year
2
Year
3
Year
4
Year
5
Year
6
Switch (Old CSE)Switch (New CSE)Switch (CoE)
Source: Company data, Credit Suisse Source: Company data, Credit Suisse estimates
Figure 36: Hardware/software sales ratio constant at around 6:4
Figure 37: Switch could enjoy both the high attach rates of stationary consoles and high market penetration of handhelds
0%10%20%30%40%50%60%70%80%90%
100%
Software
Hardware
Low High
Smaller Conventionalhome console
BiggerConventional
handheldconsole
Positivescenario for
Switch
Attach rate
Inst
all b
ase
Source: Company data, Credit Suisse estimates Source: Company data, Credit Suisse estimates
Psychological factor behind the relationship
between attach rates and hardware price
Still upside
15 September 2017
Nintendo (7974) 18
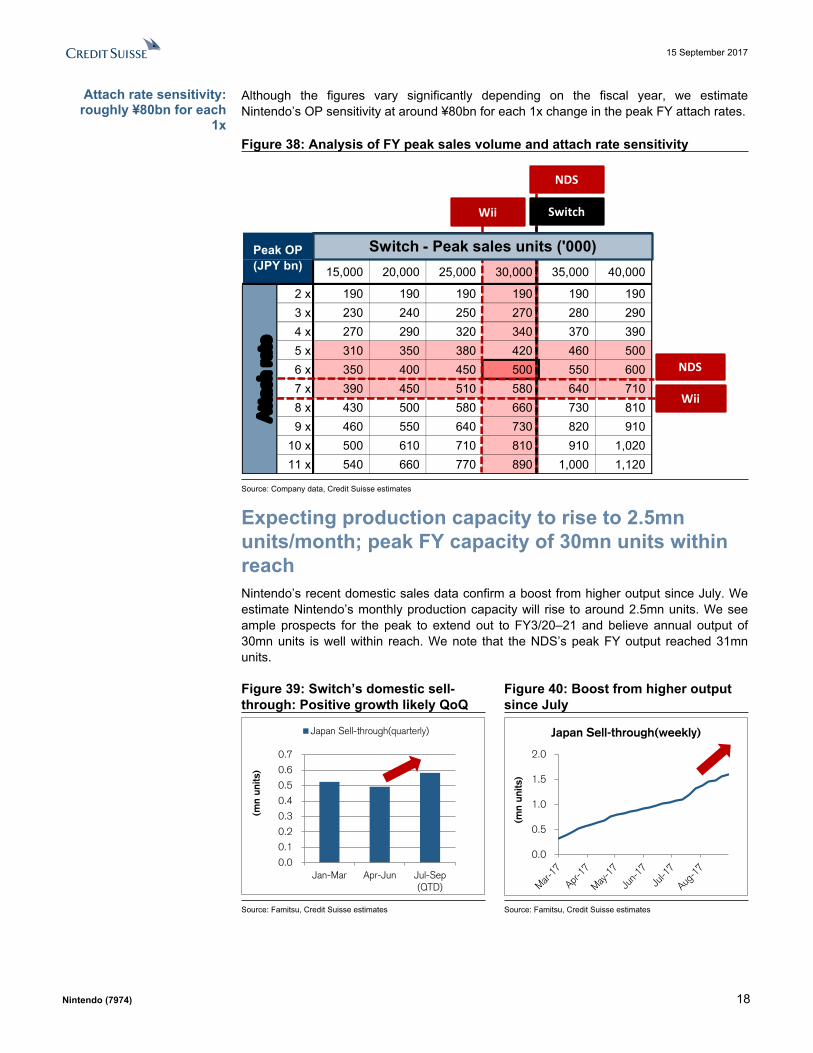
Although the figures vary significantly depending on the fiscal year, we estimate Nintendo’s OP sensitivity at around ¥80bn for each 1x change in the peak FY attach rates.
Figure 38: Analysis of FY peak sales volume and attach rate sensitivity
15,000 20,000 25,000 30,000 35,000 40,000
2 x 190 190 190 190 190 1903 x 230 240 250 270 280 2904 x 270 290 320 340 370 3905 x 310 350 380 420 460 5006 x 350 400 450 500 550 6007 x 390 450 510 580 640 7108 x 430 500 580 660 730 8109 x 460 550 640 730 820 910
10 x 500 610 710 810 910 1,02011 x 540 660 770 890 1,000 1,120
Peak OP(JPY bn)
Switch - Peak sales units ('000)A
ttac
h r
ate
Wii
Wii
NDS
Switch
NDS
Switch - Peak sales units ('000)
Source: Company data, Credit Suisse estimates
Expecting production capacity to rise to 2.5mn units/month; peak FY capacity of 30mn units within reachNintendo’s recent domestic sales data confirm a boost from higher output since July. We estimate Nintendo’s monthly production capacity will rise to around 2.5mn units. We see ample prospects for the peak to extend out to FY3/20–21 and believe annual output of 30mn units is well within reach. We note that the NDS’s peak FY output reached 31mn units.
Figure 39: Switch’s domestic sell-through: Positive growth likely QoQ
Figure 40: Boost from higher output since July
0.0
0.1
0.2
0.3
0.4
0.5
0.6
0.7
Jan-Mar Apr-Jun Jul-Sep(QTD)
(mn
units
)
Japan Sell-through(quarterly)
0.0
0.5
1.0
1.5
2.0
(mn
units
)
Japan Sell-through(weekly)
Source: Famitsu, Credit Suisse estimates Source: Famitsu, Credit Suisse estimates
Attach rate sensitivity: roughly ¥80bn for each
1x
15 September 2017
Nintendo (7974) 19
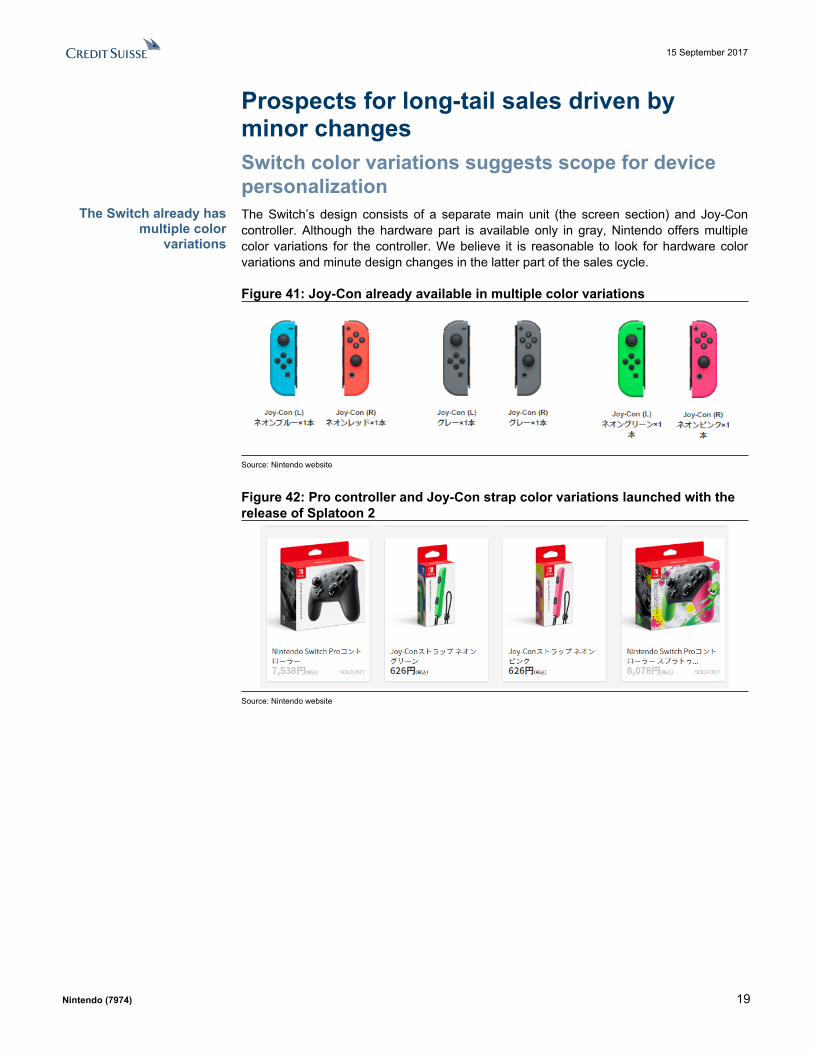
Prospects for long-tail sales driven by minor changesSwitch color variations suggests scope for device personalizationThe Switch’s design consists of a separate main unit (the screen section) and Joy-Con controller. Although the hardware part is available only in gray, Nintendo offers multiple color variations for the controller. We believe it is reasonable to look for hardware color variations and minute design changes in the latter part of the sales cycle.
Figure 41: Joy-Con already available in multiple color variations
Source: Nintendo website
Figure 42: Pro controller and Joy-Con strap color variations launched with the release of Splatoon 2
Source: Nintendo website
The Switch already has multiple color
variations
15 September 2017
Nintendo (7974) 20
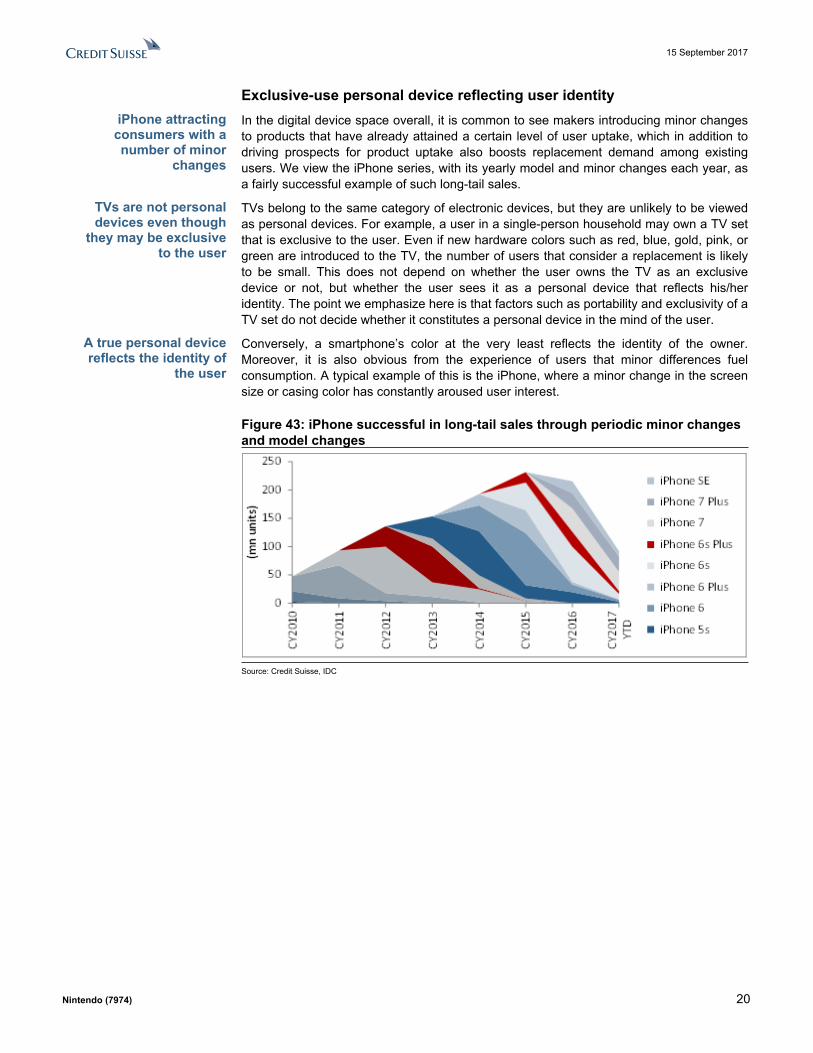
Exclusive-use personal device reflecting user identityIn the digital device space overall, it is common to see makers introducing minor changes to products that have already attained a certain level of user uptake, which in addition to driving prospects for product uptake also boosts replacement demand among existing users. We view the iPhone series, with its yearly model and minor changes each year, as a fairly successful example of such long-tail sales.
TVs belong to the same category of electronic devices, but they are unlikely to be viewed as personal devices. For example, a user in a single-person household may own a TV set that is exclusive to the user. Even if new hardware colors such as red, blue, gold, pink, or green are introduced to the TV, the number of users that consider a replacement is likely to be small. This does not depend on whether the user owns the TV as an exclusive device or not, but whether the user sees it as a personal device that reflects his/her identity. The point we emphasize here is that factors such as portability and exclusivity of a TV set do not decide whether it constitutes a personal device in the mind of the user.
Conversely, a smartphone’s color at the very least reflects the identity of the owner. Moreover, it is also obvious from the experience of users that minor differences fuel consumption. A typical example of this is the iPhone, where a minor change in the screen size or casing color has constantly aroused user interest.
Figure 43: iPhone successful in long-tail sales through periodic minor changes and model changes
Source: Credit Suisse, IDC
iPhone attracting consumers with a number of minor
changes
TVs are not personal devices even though
they may be exclusive to the user
A true personal device reflects the identity of
the user
15 September 2017
Nintendo (7974) 21
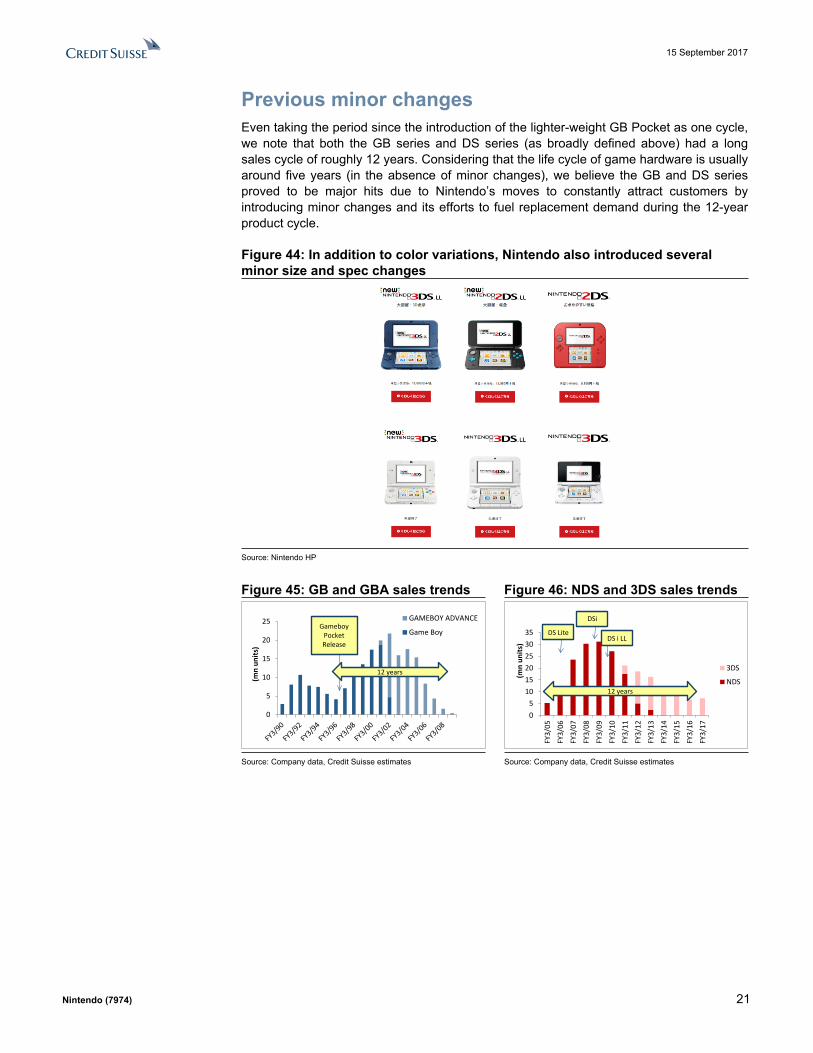
Previous minor changesEven taking the period since the introduction of the lighter-weight GB Pocket as one cycle, we note that both the GB series and DS series (as broadly defined above) had a long sales cycle of roughly 12 years. Considering that the life cycle of game hardware is usually around five years (in the absence of minor changes), we believe the GB and DS series proved to be major hits due to Nintendo’s moves to constantly attract customers by introducing minor changes and its efforts to fuel replacement demand during the 12-year product cycle.
Figure 44: In addition to color variations, Nintendo also introduced several minor size and spec changes
Source: Nintendo HP
Figure 45: GB and GBA sales trends Figure 46: NDS and 3DS sales trends
0
5
10
15
20
25
(mn
units
)
GAMEBOY ADVANCE
Game BoyGameboy
PocketRelease
12 years
05
101520253035
FY3/
05
FY3/
06
FY3/
07
FY3/
08
FY3/
09
FY3/
10
FY3/
11
FY3/
12
FY3/
13
FY3/
14
FY3/
15
FY3/
16
FY3/
17
(mn
units
)
3DS
NDS12 years
DSi
DS LiteDS i LL
Source: Company data, Credit Suisse estimates Source: Company data, Credit Suisse estimates
15 September 2017
Nintendo (7974) 22
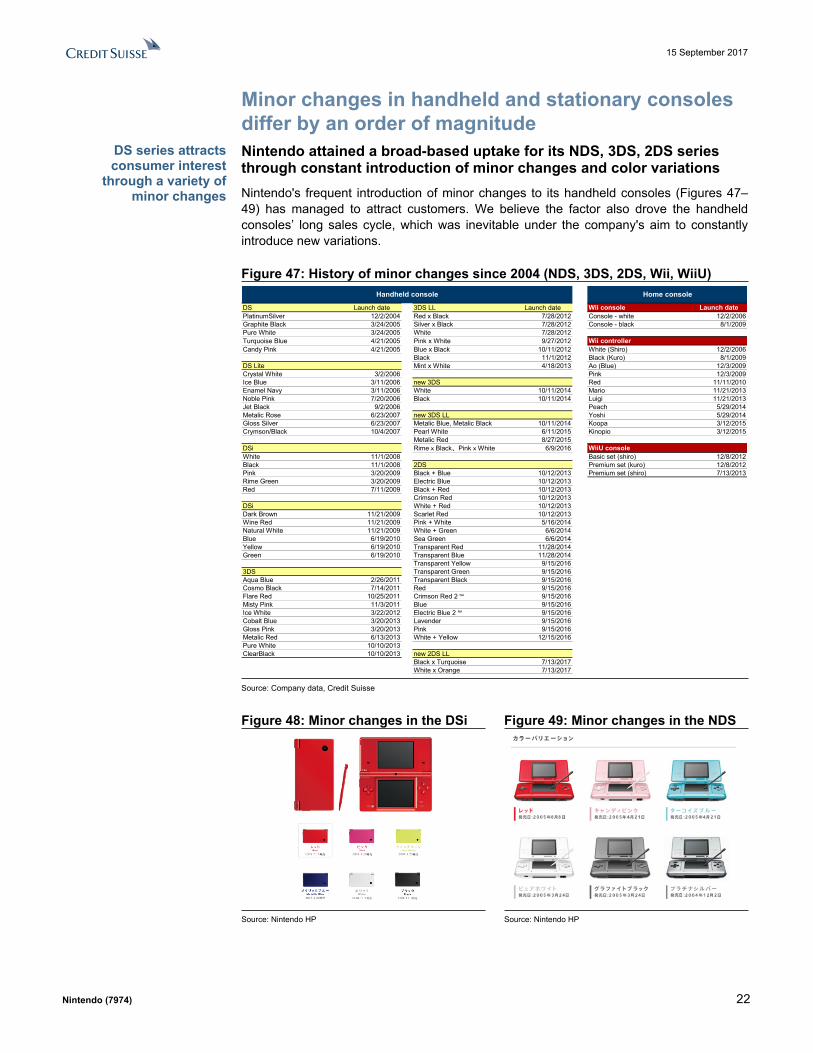
Minor changes in handheld and stationary consoles differ by an order of magnitudeNintendo attained a broad-based uptake for its NDS, 3DS, 2DS series through constant introduction of minor changes and color variationsNintendo's frequent introduction of minor changes to its handheld consoles (Figures 47–49) has managed to attract customers. We believe the factor also drove the handheld consoles’ long sales cycle, which was inevitable under the company's aim to constantly introduce new variations.
Figure 47: History of minor changes since 2004 (NDS, 3DS, 2DS, Wii, WiiU)
DS Launch date 3DS LL Launch date Wii console Launch datePlatinumSilver 12/2/2004 Red x Black 7/28/2012 Console - white 12/2/2006Graphite Black 3/24/2005 Silver x Black 7/28/2012 Console - black 8/1/2009Pure White 3/24/2005 White 7/28/2012Turquoise Blue 4/21/2005 Pink x White 9/27/2012 Wii controller Candy Pink 4/21/2005 Blue x Black 10/11/2012 White (Shiro) 12/2/2006
Black 11/1/2012 Black (Kuro) 8/1/2009DS Lite Mint x White 4/18/2013 Ao (Blue) 12/3/2009Crystal White 3/2/2006 Pink 12/3/2009Ice Blue 3/11/2006 new 3DS Red 11/11/2010Enamel Navy 3/11/2006 White 10/11/2014 Mario 11/21/2013Noble Pink 7/20/2006 Black 10/11/2014 Luigi 11/21/2013Jet Black 9/2/2006 Peach 5/29/2014Metalic Rose 6/23/2007 new 3DS LL Yoshi 5/29/2014Gloss Silver 6/23/2007 Metalic Blue, Metalic Black 10/11/2014 Koopa 3/12/2015Crymson/Black 10/4/2007 Pearl White 6/11/2015 Kinopio 3/12/2015
Metalic Red 8/27/2015DSi RimexBlack、PinkxWhite 6/9/2016 WiiU consoleWhite 11/1/2008 Basic set (shiro) 12/8/2012Black 11/1/2008 2DS Premium set (kuro) 12/8/2012Pink 3/20/2009 Black + Blue 10/12/2013 Premium set (shiro) 7/13/2013Rime Green 3/20/2009 Electric Blue 10/12/2013Red 7/11/2009 Black + Red 10/12/2013
Crimson Red 10/12/2013DSi White + Red 10/12/2013Dark Brown 11/21/2009 Scarlet Red 10/12/2013Wine Red 11/21/2009 Pink + White 5/16/2014Natural White 11/21/2009 White + Green 6/6/2014Blue 6/19/2010 Sea Green 6/6/2014Yellow 6/19/2010 Transparent Red 11/28/2014Green 6/19/2010 Transparent Blue 11/28/2014
Transparent Yellow 9/15/20163DS Transparent Green 9/15/2016Aqua Blue 2/26/2011 Transparent Black 9/15/2016Cosmo Black 7/14/2011 Red 9/15/2016Flare Red 10/25/2011 Crimson Red 2 NA 9/15/2016Misty Pink 11/3/2011 Blue 9/15/2016Ice White 3/22/2012 Electric Blue 2 NA 9/15/2016Cobalt Blue 3/20/2013 Lavender 9/15/2016Gloss Pink 3/20/2013 Pink 9/15/2016Metalic Red 6/13/2013 White + Yellow 12/15/2016Pure White 10/10/2013ClearBlack 10/10/2013 new 2DS LL
Black x Turquoise 7/13/2017White x Orange 7/13/2017
Handheld console Home console
Source: Company data, Credit Suisse
Figure 48: Minor changes in the DSi Figure 49: Minor changes in the NDS
Source: Nintendo HP Source: Nintendo HP
DS series attracts consumer interest
through a variety of minor changes
15 September 2017
Nintendo (7974) 23
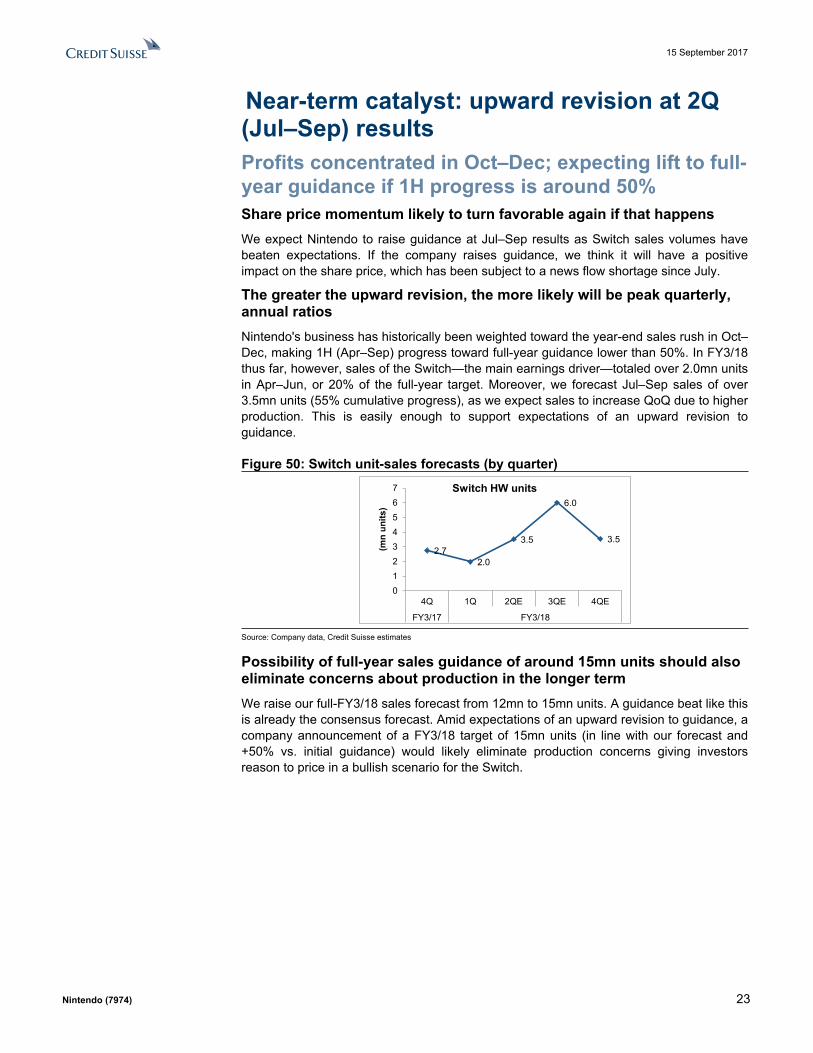
Near-term catalyst: upward revision at 2Q (Jul–Sep) resultsProfits concentrated in Oct–Dec; expecting lift to full-year guidance if 1H progress is around 50%Share price momentum likely to turn favorable again if that happensWe expect Nintendo to raise guidance at Jul–Sep results as Switch sales volumes have beaten expectations. If the company raises guidance, we think it will have a positive impact on the share price, which has been subject to a news flow shortage since July.
The greater the upward revision, the more likely will be peak quarterly, annual ratiosNintendo's business has historically been weighted toward the year-end sales rush in Oct–Dec, making 1H (Apr–Sep) progress toward full-year guidance lower than 50%. In FY3/18 thus far, however, sales of the Switch—the main earnings driver—totaled over 2.0mn units in Apr–Jun, or 20% of the full-year target. Moreover, we forecast Jul–Sep sales of over 3.5mn units (55% cumulative progress), as we expect sales to increase QoQ due to higher production. This is easily enough to support expectations of an upward revision to guidance.
Figure 50: Switch unit-sales forecasts (by quarter)
2.7 2.0
3.5
6.0
3.5
01234567
4Q 1Q 2QE 3QE 4QE
FY3/17 FY3/18
(mn
units
)
Switch HW units
Source: Company data, Credit Suisse estimates
Possibility of full-year sales guidance of around 15mn units should also eliminate concerns about production in the longer termWe raise our full-FY3/18 sales forecast from 12mn to 15mn units. A guidance beat like this is already the consensus forecast. Amid expectations of an upward revision to guidance, a company announcement of a FY3/18 target of 15mn units (in line with our forecast and +50% vs. initial guidance) would likely eliminate production concerns giving investors reason to price in a bullish scenario for the Switch.
15 September 2017
Nintendo (7974) 24
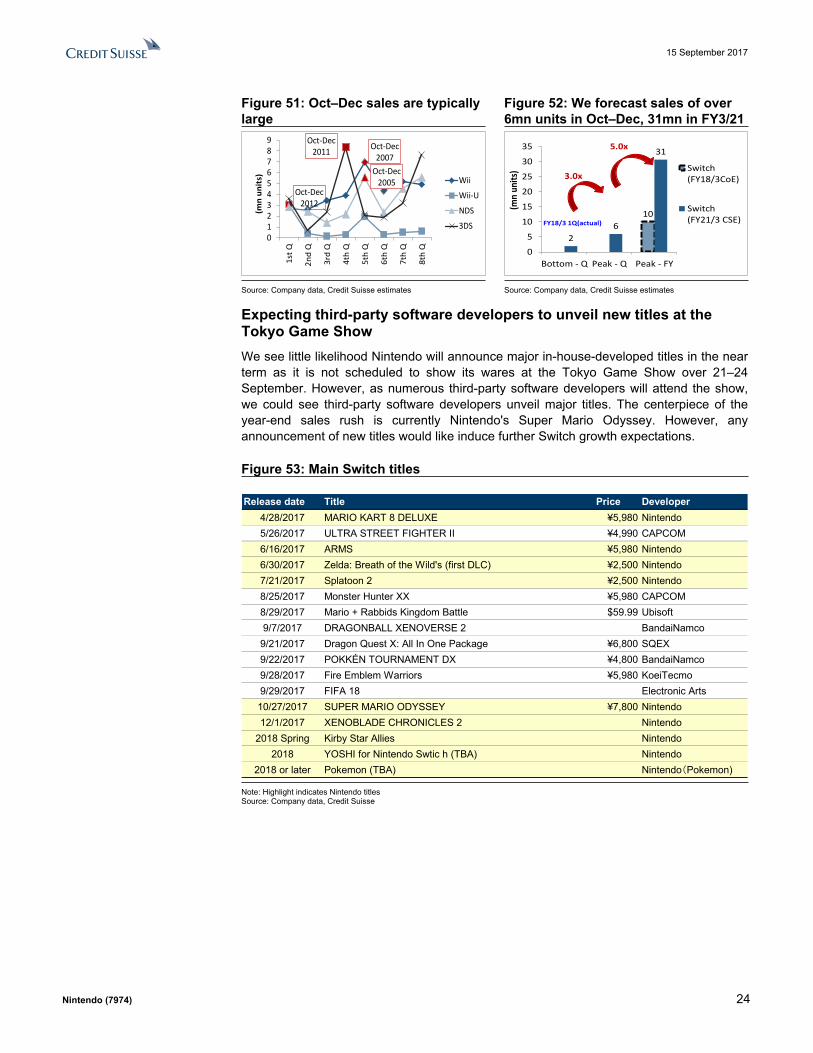
Figure 51: Oct–Dec sales are typically large
Figure 52: We forecast sales of over 6mn units in Oct–Dec, 31mn in FY3/21
Oct-Dec 2007
Oct-Dec 2012
Oct-Dec 2005
Oct-Dec 2011
0123456789
1st Q
2nd
Q
3rd
Q
4th
Q
5th
Q
6th
Q
7th
Q
8th
Q
(mn
unit
s) Wii
Wii-U
NDS
3DS10
26
31
0
5
10
15
20
25
30
35
Bottom - Q Peak - Q Peak - FY
(mn
units
) Switch(FY18/3CoE)
Switch(FY21/3 CSE)
3.0x
5.0x
FY18/3 1Q(actual)
Source: Company data, Credit Suisse estimates Source: Company data, Credit Suisse estimates
Expecting third-party software developers to unveil new titles at the Tokyo Game ShowWe see little likelihood Nintendo will announce major in-house-developed titles in the near term as it is not scheduled to show its wares at the Tokyo Game Show over 21–24 September. However, as numerous third-party software developers will attend the show, we could see third-party software developers unveil major titles. The centerpiece of the year-end sales rush is currently Nintendo's Super Mario Odyssey. However, any announcement of new titles would like induce further Switch growth expectations.
Figure 53: Main Switch titles
Release date Title Price Developer4/28/2017 MARIO KART 8 DELUXE ¥5,980 Nintendo5/26/2017 ULTRA STREET FIGHTER II ¥4,990 CAPCOM6/16/2017 ARMS ¥5,980 Nintendo6/30/2017 Zelda: Breath of the Wild's (first DLC) ¥2,500 Nintendo7/21/2017 Splatoon 2 ¥2,500 Nintendo8/25/2017 Monster Hunter XX ¥5,980 CAPCOM8/29/2017 Mario + Rabbids Kingdom Battle $59.99 Ubisoft9/7/2017 DRAGONBALL XENOVERSE 2 BandaiNamco
9/21/2017 Dragon Quest X: All In One Package ¥6,800 SQEX9/22/2017 POKKÉN TOURNAMENT DX ¥4,800 BandaiNamco9/28/2017 Fire Emblem Warriors ¥5,980 KoeiTecmo9/29/2017 FIFA 18 Electronic Arts10/27/2017 SUPER MARIO ODYSSEY ¥7,800 Nintendo12/1/2017 XENOBLADE CHRONICLES 2 Nintendo
2018 Spring Kirby Star Allies Nintendo2018 YOSHI for Nintendo Swtic h (TBA) Nintendo
2018 or later Pokemon (TBA) Nintendo(Pokemon)
Note: Highlight indicates Nintendo titles Source: Company data, Credit Suisse

15 September 2017
Nintendo (7974) 25
Forecasts for non-Switch products2DS likely to become the core handheldStepped cut in expected price of handhelds from ¥15,000 to ¥9,000, envisaging shift from 3DS to 2DSNintendo's current handheld is the 3DS series. The 2DS series is currently included within the 3DS numbers released by the company, but we believe this series will effectively become the company's core handheld product from next year. Our expectation for a strategic move from the 3DS to the 2DS is grounded on (1) substantial 3DS market penetration at around 70mn units at end-FY3/17, (2) 3DS users who prefer high-end products replacing their existing units with the Switch, and (3) 3DS users who prefer low-end devices replacing their current handhelds with the 2DS.
Figure 54: 3DS (including 2DS) average unit price
Figure 55: 3DS (including 2DS) sales volume
¥0
¥2,000
¥4,000
¥6,000
¥8,000
¥10,000
¥12,000
¥14,000
¥16,000
FY3/17 FY3/18E FY3/19E FY3/20E
ASP (3DS, 2DS)
0
2
4
6
8
10
12
14
16
(mn
units
)
3DS
Source: Company data, Credit Suisse estimates Source: Company data, Credit Suisse estimates
Modest revision to smartphone app forecastsAnimal Crossing appears to be getting off to a slow start. The company has scaled down its take-off expectations to “slow.”
Figure 56: Nintendo lowers its smartphone app sales forecasts
Figure 57: Smart device business forecasts
050
100150200250300
(JPY
bn)
New
Old
1 19
44
108
168
216 216
0 9 21 53
83 107 107
0
50
100
150
200
250
(JPY
bn)
Smart device Sales
Smart device OP
Source: Company data, Credit Suisse estimates Source: Company data, Credit Suisse estimates
15 September 2017
Nintendo (7974) 26
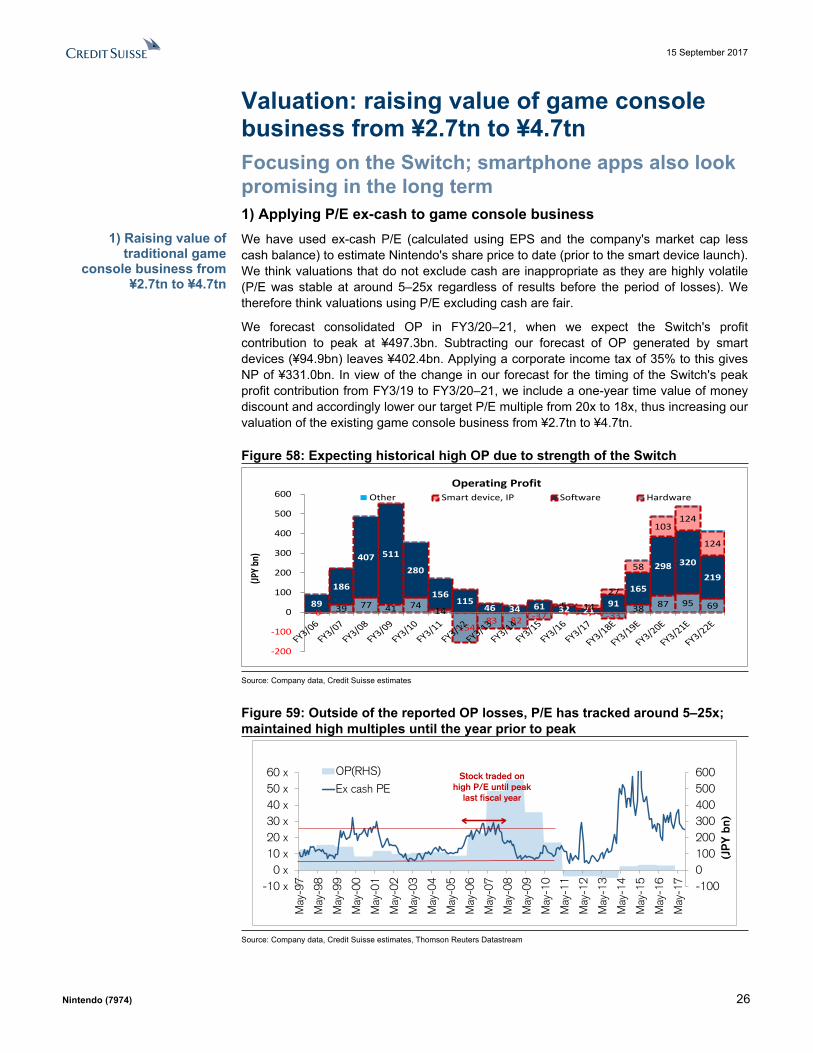
Valuation: raising value of game console business from ¥2.7tn to ¥4.7tnFocusing on the Switch; smartphone apps also look promising in the long term1) Applying P/E ex-cash to game console businessWe have used ex-cash P/E (calculated using EPS and the company's market cap less cash balance) to estimate Nintendo's share price to date (prior to the smart device launch). We think valuations that do not exclude cash are inappropriate as they are highly volatile (P/E was stable at around 5–25x regardless of results before the period of losses). We therefore think valuations using P/E excluding cash are fair.
We forecast consolidated OP in FY3/20–21, when we expect the Switch's profit contribution to peak at ¥497.3bn. Subtracting our forecast of OP generated by smart devices (¥94.9bn) leaves ¥402.4bn. Applying a corporate income tax of 35% to this gives NP of ¥331.0bn. In view of the change in our forecast for the timing of the Switch's peak profit contribution from FY3/19 to FY3/20–21, we include a one-year time value of money discount and accordingly lower our target P/E multiple from 20x to 18x, thus increasing our valuation of the existing game console business from ¥2.7tn to ¥4.7tn.
Figure 58: Expecting historical high OP due to strength of the Switch
-0 39 77 41 74 14
-154 -83 -82 -37 -4 -7 -33
38 87 95 69 89
186
407 511
280
156 115
46 34 61 32 21 91
165
298 320
219
5 14
27
58
103 124
124
-200
-100
0
100
200
300
400
500
600
(JPY b
n)
Operating ProfitOther Smart device, IP Software Hardware
Source: Company data, Credit Suisse estimates
Figure 59: Outside of the reported OP losses, P/E has tracked around 5–25x; maintained high multiples until the year prior to peak
-1000100200300400500600
-10 x0 x
10 x20 x30 x40 x50 x60 x
May
-97
May
-98
May
-99
May
-00
May
-01
May
-02
May
-03
May
-04
May
-05
May
-06
May
-07
May
-08
May
-09
May
-10
May
-11
May
-12
May
-13
May
-14
May
-15
May
-16
May
-17
(JP
Y b
n)
OP(RHS)
Ex cash PEStock traded on
high P/E until peak last fiscal year
Source: Company data, Credit Suisse estimates, Thomson Reuters Datastream
1) Raising value of traditional game
console business from ¥2.7tn to ¥4.7tn

15 September 2017
Nintendo (7974) 27
2) Using DCF to value smart devices businessWe use discounted cash flow to value Nintendo's smart device business as we see it as a growth business that generates stable cash and uses a different business model than the existing game console business.
Under this DCF approach, we apply a market risk premium of 6.65% and a risk-free rate of 0.1%. Based on actual figures, we set a WACC of 8.28%, with debt at zero and beta of 1.23 (past five years, adjusted). We forecast earnings though FY3/21, while for business valuations from FY3/22 we continue to apply a P/E of 15.0x—the average of the three major global handheld game companies (Nintendo, Tencent, and Netease)—to our FY3/21 EBITDA forecasts for the company's smart devices business. Based on the above, we estimate the value of the smart devices business at ¥1.259tn (previously ¥1,461tn).
Figure 60: We estimate the value of the smart devices business at ¥1,259tn DCF Analysis 1.74
(JPY mn)Assumptions FCF estimates# of shares 120,129,323 3/18E 3/19E 3/20E 3/21E 3/22ENet debt (17/3A) (662,763) OP (Smart device business) 20,905 52,905 82,905 106,905 106,905Exit EV/EBITDA Multiple 15.0x Tax rate 35% 35% 35% 35% 35%
EBIAT 13,588 34,388 53,888 69,488 69,488WACC Calculation Depreciation & Amortization - - - - -Risk free rate 0.10% Other non-cash cost - - - - -Beta (5year, adjusted) 1.23 EBITDA 20,905 52,905 82,905 106,905 106,905Mkt. Risk Premium 6.65% Net working capital - - - - -Cost of Equity 8.28% CAPEX - - - - -Interest rate 1.00% FCF 13,588 34,388 53,888 69,488 69,488After-tax cost of debt 0.65% Year 1.00 2.00 3.00 4.00 5.00D/E ratio 0.0x Discount rate 0.92 0.85 0.79 0.73 0.67WACC 8.28% Present Value 12,549 29,331 42,448 50,551 46,685
(a) Present Value Current - 3/22E 181,564
(b) Terminal Value 1,077,357
(c) Enterprise Value (a) + (b) 1,258,921
(d) Net Debt (3/17A Smart device only) -
(e) Market Value (Smart device only) (c) - (d) 1,258,921
Source: Company data, Credit Suisse estimates
Figure 61: EV/EBITDA: Global smart devices and game stocks
17.8 x16.1 x
21.0 x
6.3 x
11.2 x12.0 x
15.2 x
0 x
5 x
10 x
15 x
20 x
25 x
30 x
35 x
EV/E
BITD
A
Activision Blizzard ELECTRONIC ARTS TENCENT HOLDINGS
APPLE ALPHABET 'A' NETEASE
Nintendo
Source: Company data, Credit Suisse estimates, Thomson Reuters Datastream
2) Valuing smart device business at ¥1.259tn
15 September 2017
Nintendo (7974) 28
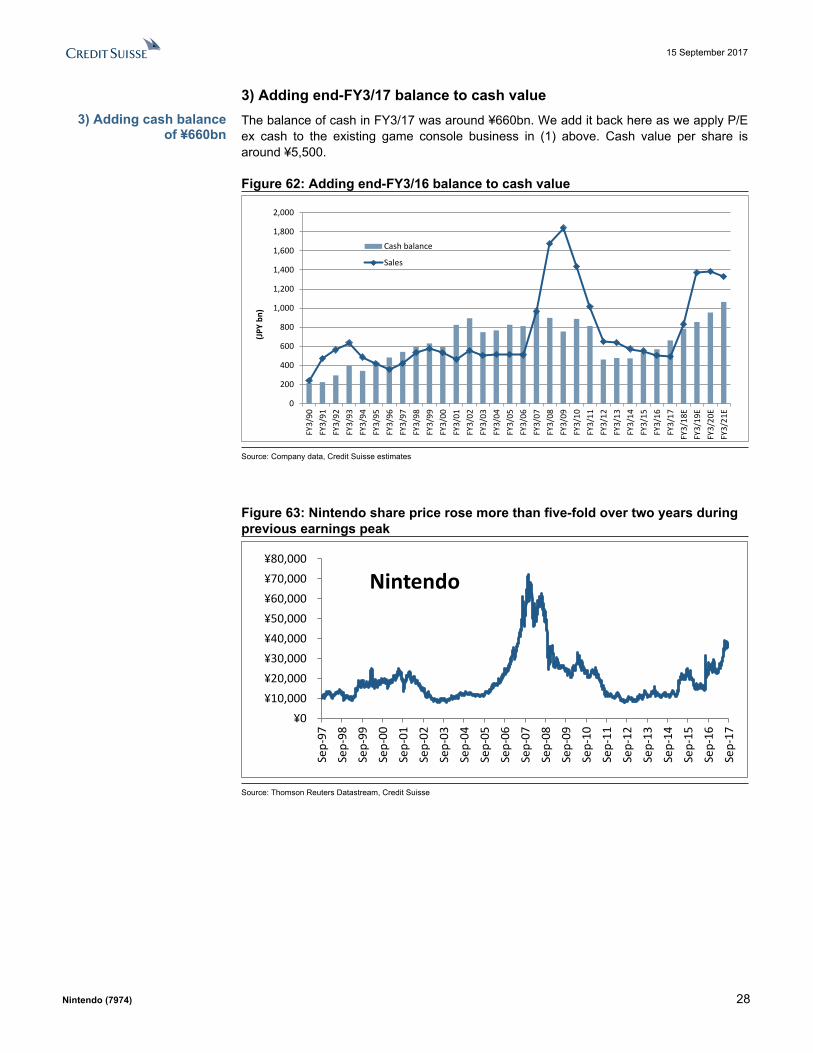
3) Adding end-FY3/17 balance to cash valueThe balance of cash in FY3/17 was around ¥660bn. We add it back here as we apply P/E ex cash to the existing game console business in (1) above. Cash value per share is around ¥5,500.
Figure 62: Adding end-FY3/16 balance to cash value
0
200
400
600
800
1,000
1,200
1,400
1,600
1,800
2,000
FY3/
90FY
3/91
FY3/
92FY
3/93
FY3/
94FY
3/95
FY3/
96FY
3/97
FY3/
98FY
3/99
FY3/
00FY
3/01
FY3/
02FY
3/03
FY3/
04FY
3/05
FY3/
06FY
3/07
FY3/
08FY
3/09
FY3/
10FY
3/11
FY3/
12FY
3/13
FY3/
14FY
3/15
FY3/
16FY
3/17
FY3/
18E
FY3/
19E
FY3/
20E
FY3/
21E
(JPY
bn)
Cash balance
Sales
Source: Company data, Credit Suisse estimates
Figure 63: Nintendo share price rose more than five-fold over two years during previous earnings peak
¥0¥10,000¥20,000¥30,000¥40,000¥50,000¥60,000¥70,000¥80,000
Sep-
97
Sep-
98
Sep-
99
Sep-
00
Sep-
01
Sep-
02
Sep-
03
Sep-
04
Sep-
05
Sep-
06
Sep-
07
Sep-
08
Sep-
09
Sep-
10
Sep-
11
Sep-
12
Sep-
13
Sep-
14
Sep-
15
Sep-
16
Sep-
17
Nintendo
Source: Thomson Reuters Datastream, Credit Suisse
3) Adding cash balance of ¥660bn
15 September 2017
Nintendo (7974) 29
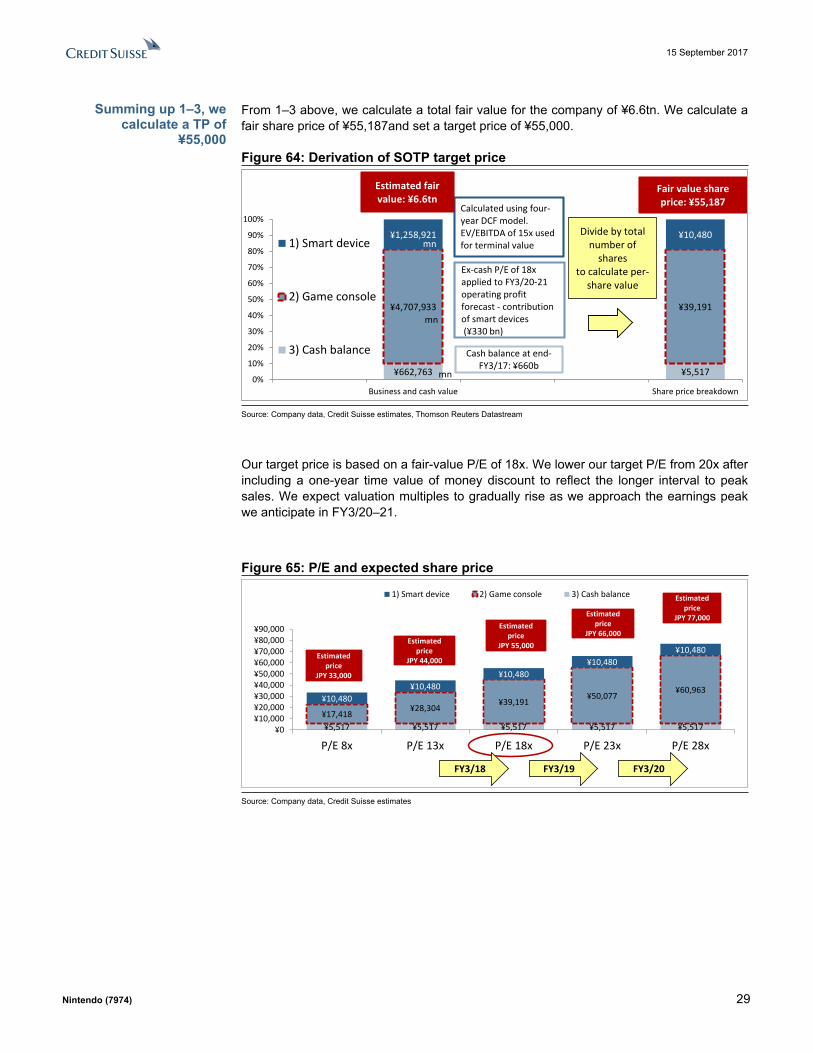
From 1–3 above, we calculate a total fair value for the company of ¥6.6tn. We calculate a fair share price of ¥55,187and set a target price of ¥55,000.
Figure 64: Derivation of SOTP target price
¥662,763 ¥5,517
¥4,707,933 ¥39,191
¥1,258,921 ¥10,480
0%
10%
20%
30%
40%
50%
60%
70%
80%
90%
100%
Business and cash value Share price breakdown
1) Smart device
2) Game console
3) Cash balance Cash balance at end-FY3/17: ¥660b
mn
mn
Ex-cash P/E of 18x applied to FY3/20-21operating profit forecast - contribution of smart devices(¥330 bn)
Calculated using four-year DCF model.EV/EBITDA of 15x used for terminal valuemn
Divide by total number of
sharesto calculate per-
share value
Estimated fair value: ¥6.6tn
Fair value share price: ¥55,187
Source: Company data, Credit Suisse estimates, Thomson Reuters Datastream
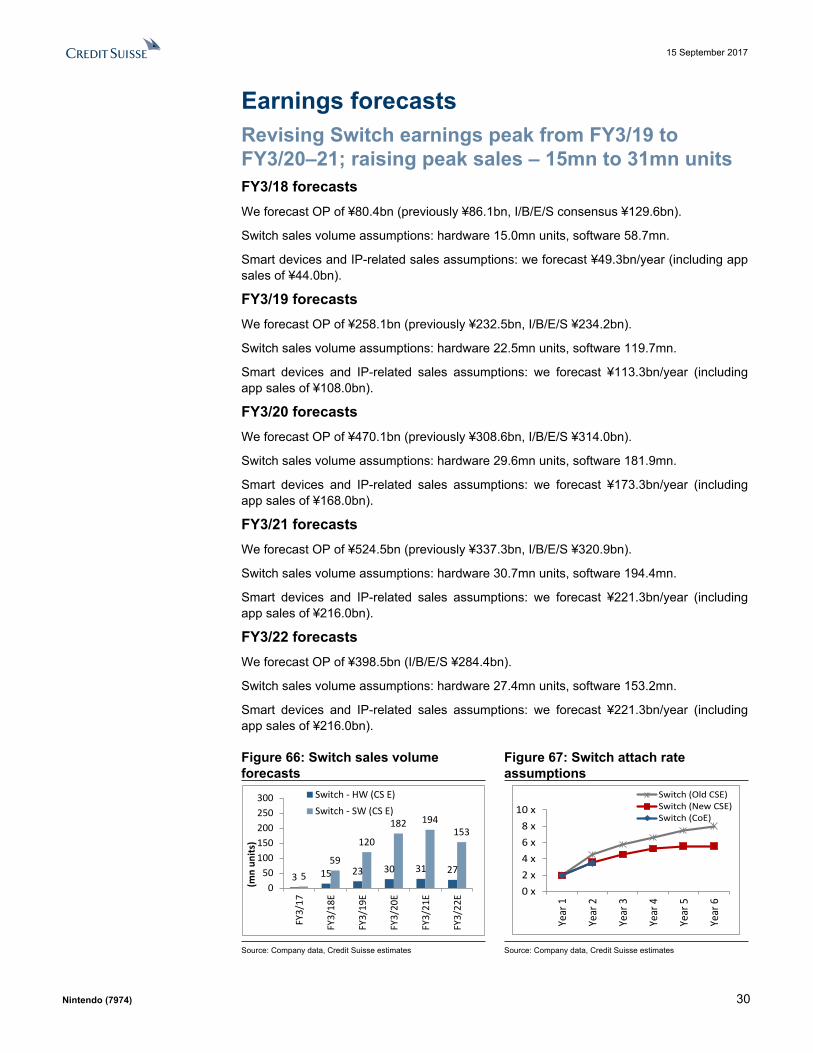
Our target price is based on a fair-value P/E of 18x. We lower our target P/E from 20x after including a one-year time value of money discount to reflect the longer interval to peak sales. We expect valuation multiples to gradually rise as we approach the earnings peak we anticipate in FY3/20–21.
Figure 65: P/E and expected share price
¥5,517 ¥5,517 ¥5,517 ¥5,517 ¥5,517¥17,418
¥28,304¥39,191
¥50,077¥60,963
¥10,480¥10,480
¥10,480¥10,480
¥10,480
¥0¥10,000¥20,000¥30,000¥40,000¥50,000¥60,000¥70,000¥80,000¥90,000
P/E 8x P/E 13x P/E 18x P/E 23x P/E 28x
1) Smart device 2) Game console 3) Cash balance Estimated price
JPY 77,000Estimated price
JPY 66,000Estimated
price JPY 55,000
Estimated price
JPY 33,000
Estimated price
JPY 44,000
FY3/18 FY3/19 FY3/20
Source: Company data, Credit Suisse estimates
Summing up 1–3, we calculate a TP of
¥55,000
15 September 2017
Nintendo (7974) 30
Earnings forecastsRevising Switch earnings peak from FY3/19 to FY3/20–21; raising peak sales ‒ 15mn to 31mn unitsFY3/18 forecasts We forecast OP of ¥80.4bn (previously ¥86.1bn, I/B/E/S consensus ¥129.6bn).
Switch sales volume assumptions: hardware 15.0mn units, software 58.7mn.
Smart devices and IP-related sales assumptions: we forecast ¥49.3bn/year (including app sales of ¥44.0bn).
FY3/19 forecasts We forecast OP of ¥258.1bn (previously ¥232.5bn, I/B/E/S ¥234.2bn).
Switch sales volume assumptions: hardware 22.5mn units, software 119.7mn.
Smart devices and IP-related sales assumptions: we forecast ¥113.3bn/year (including app sales of ¥108.0bn).
FY3/20 forecasts We forecast OP of ¥470.1bn (previously ¥308.6bn, I/B/E/S ¥314.0bn).
Switch sales volume assumptions: hardware 29.6mn units, software 181.9mn.
Smart devices and IP-related sales assumptions: we forecast ¥173.3bn/year (including app sales of ¥168.0bn).
FY3/21 forecasts We forecast OP of ¥524.5bn (previously ¥337.3bn, I/B/E/S ¥320.9bn).
Switch sales volume assumptions: hardware 30.7mn units, software 194.4mn.
Smart devices and IP-related sales assumptions: we forecast ¥221.3bn/year (including app sales of ¥216.0bn).
FY3/22 forecasts We forecast OP of ¥398.5bn (I/B/E/S ¥284.4bn).
Switch sales volume assumptions: hardware 27.4mn units, software 153.2mn.
Smart devices and IP-related sales assumptions: we forecast ¥221.3bn/year (including app sales of ¥216.0bn).
Figure 66: Switch sales volume forecasts
Figure 67: Switch attach rate assumptions
3 15 23 30 31 27559
120
182 194153
050
100150200250300
FY3/
17
FY3/
18E
FY3/
19E
FY3/
20E
FY3/
21E
FY3/
22E
(mn
units
)
Switch - HW (CS E)Switch - SW (CS E)
0 x2 x4 x6 x8 x
10 x
Year
1
Year
2
Year
3
Year
4
Year
5
Year
6
Switch (Old CSE)Switch (New CSE)Switch (CoE)
Source: Company data, Credit Suisse estimates Source: Company data, Credit Suisse estimates
15 September 2017
Nintendo (7974) 31
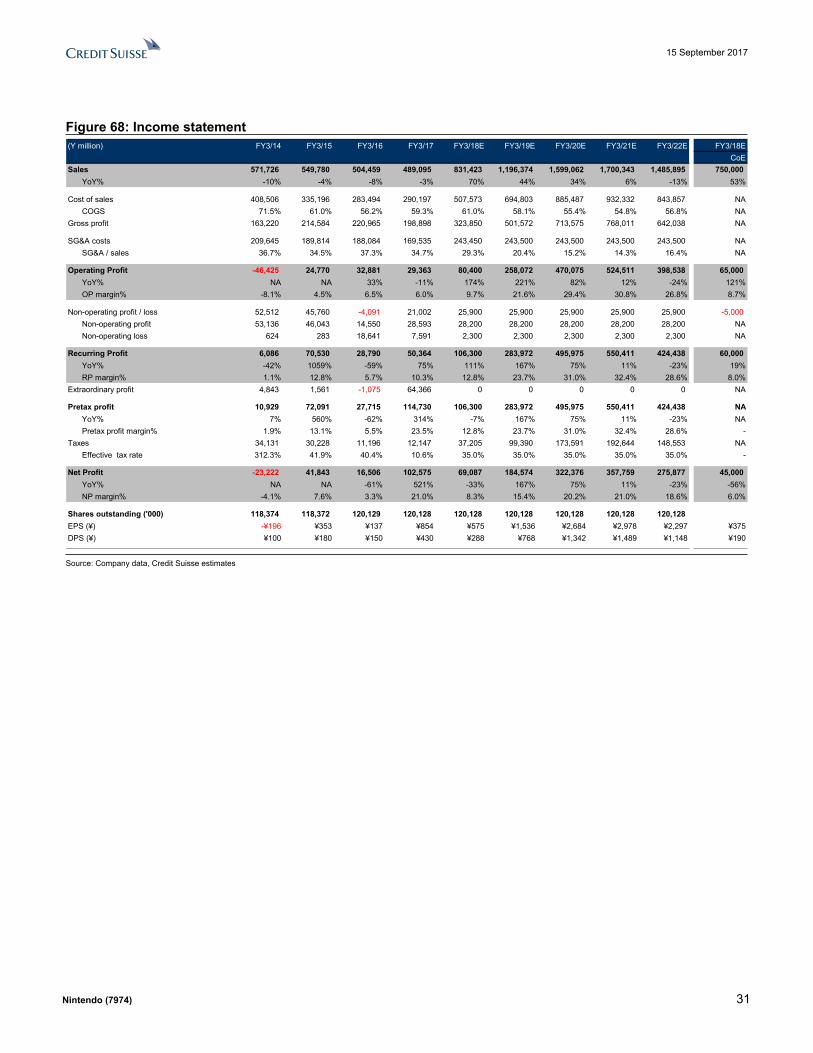
Figure 68: Income statement(Y million) FY3/14 FY3/15 FY3/16 FY3/17 FY3/18E FY3/19E FY3/20E FY3/21E FY3/22E FY3/18E
CoESales 571,726 549,780 504,459 489,095 831,423 1,196,374 1,599,062 1,700,343 1,485,895 750,000
YoY% -10% -4% -8% -3% 70% 44% 34% 6% -13% 53%
Cost of sales 408,506 335,196 283,494 290,197 507,573 694,803 885,487 932,332 843,857 NACOGS 71.5% 61.0% 56.2% 59.3% 61.0% 58.1% 55.4% 54.8% 56.8% NA
Gross profit 163,220 214,584 220,965 198,898 323,850 501,572 713,575 768,011 642,038 NA
SG&A costs 209,645 189,814 188,084 169,535 243,450 243,500 243,500 243,500 243,500 NASG&A / sales 36.7% 34.5% 37.3% 34.7% 29.3% 20.4% 15.2% 14.3% 16.4% NA
Operating Profit -46,425 24,770 32,881 29,363 80,400 258,072 470,075 524,511 398,538 65,000YoY% NA NA 33% -11% 174% 221% 82% 12% -24% 121%OP margin% -8.1% 4.5% 6.5% 6.0% 9.7% 21.6% 29.4% 30.8% 26.8% 8.7%
Non-operating profit / loss 52,512 45,760 -4,091 21,002 25,900 25,900 25,900 25,900 25,900 -5,000 Non-operating profit 53,136 46,043 14,550 28,593 28,200 28,200 28,200 28,200 28,200 NANon-operating loss 624 283 18,641 7,591 2,300 2,300 2,300 2,300 2,300 NA
Recurring Profit 6,086 70,530 28,790 50,364 106,300 283,972 495,975 550,411 424,438 60,000YoY% -42% 1059% -59% 75% 111% 167% 75% 11% -23% 19%RP margin% 1.1% 12.8% 5.7% 10.3% 12.8% 23.7% 31.0% 32.4% 28.6% 8.0%
Extraordinary profit 4,843 1,561 -1,075 64,366 0 0 0 0 0 NA
Pretax profit 10,929 72,091 27,715 114,730 106,300 283,972 495,975 550,411 424,438 NAYoY% 7% 560% -62% 314% -7% 167% 75% 11% -23% NAPretax profit margin% 1.9% 13.1% 5.5% 23.5% 12.8% 23.7% 31.0% 32.4% 28.6% -
Taxes 34,131 30,228 11,196 12,147 37,205 99,390 173,591 192,644 148,553 NAEffective tax rate 312.3% 41.9% 40.4% 10.6% 35.0% 35.0% 35.0% 35.0% 35.0% -
Net Profit -23,222 41,843 16,506 102,575 69,087 184,574 322,376 357,759 275,877 45,000YoY% NA NA -61% 521% -33% 167% 75% 11% -23% -56%NP margin% -4.1% 7.6% 3.3% 21.0% 8.3% 15.4% 20.2% 21.0% 18.6% 6.0%
Shares outstanding ('000) 118,374 118,372 120,129 120,128 120,128 120,128 120,128 120,128 120,128EPS (¥) -¥196 ¥353 ¥137 ¥854 ¥575 ¥1,536 ¥2,684 ¥2,978 ¥2,297 ¥375DPS (¥) ¥100 ¥180 ¥150 ¥430 ¥288 ¥768 ¥1,342 ¥1,489 ¥1,148 ¥190
Source: Company data, Credit Suisse estimates
15 September 2017
Nintendo (7974) 32
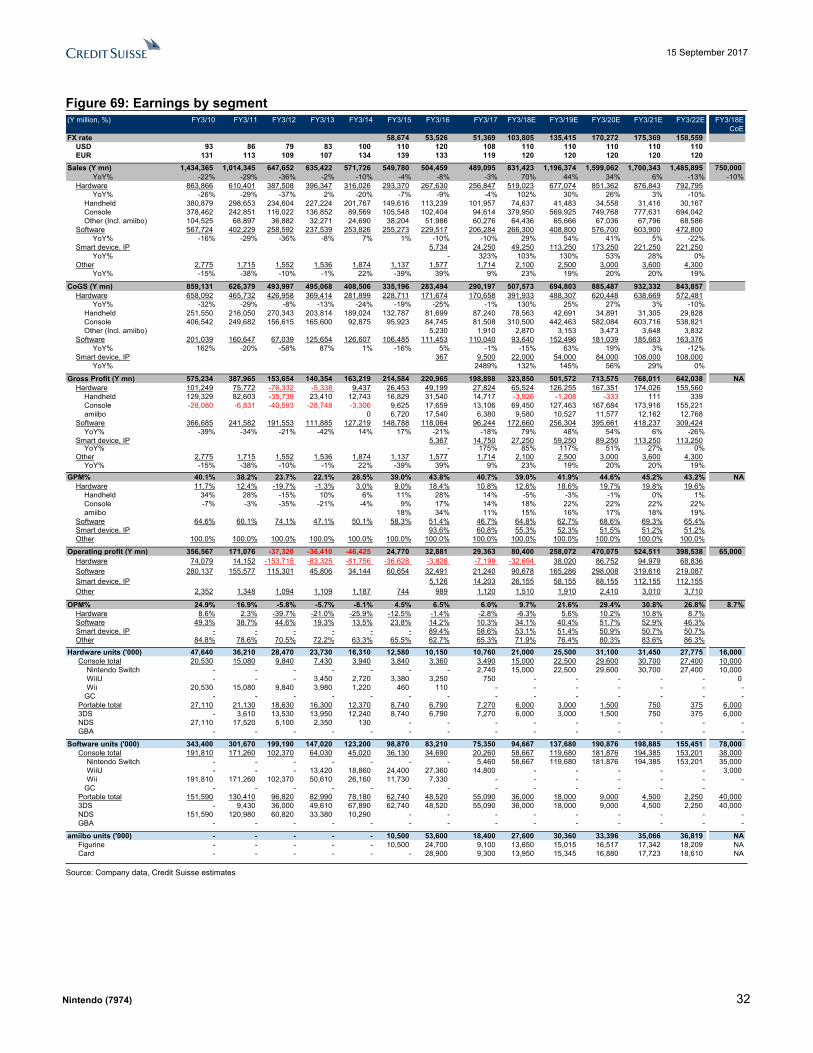
Figure 69: Earnings by segment(Y million, %) FY3/10 FY3/11 FY3/12 FY3/13 FY3/14 FY3/15 FY3/16 FY3/17 FY3/18E FY3/19E FY3/20E FY3/21E FY3/22E FY3/18E
CoEFX rate 58,674 53,526 51,369 103,805 135,415 170,272 175,369 158,559
USD 93 86 79 83 100 110 120 108 110 110 110 110 110EUR 131 113 109 107 134 139 133 119 120 120 120 120 120
Sales (Y mn) 1,434,365 1,014,345 647,652 635,422 571,726 549,780 504,459 489,095 831,423 1,196,374 1,599,062 1,700,343 1,485,895 750,000YoY% -22% -29% -36% -2% -10% -4% -8% -3% 70% 44% 34% 6% -13% -10%
Hardware 863,866 610,401 387,508 396,347 316,026 293,370 267,630 256,847 519,023 677,074 851,362 876,843 792,795YoY% -26% -29% -37% 2% -20% -7% -9% -4% 102% 30% 26% 3% -10%
Handheld 380,879 298,653 234,604 227,224 201,767 149,616 113,239 101,957 74,637 41,483 34,558 31,416 30,167Console 378,462 242,851 116,022 136,852 89,569 105,548 102,404 94,614 379,950 569,925 749,768 777,631 694,042Other (Incl. amiibo) 104,525 68,897 36,882 32,271 24,690 38,204 51,986 60,276 64,436 65,666 67,036 67,796 68,586
Software 567,724 402,229 258,592 237,539 253,826 255,273 229,517 206,284 266,300 408,800 576,700 603,900 472,800YoY% -16% -29% -36% -8% 7% 1% -10% -10% 29% 54% 41% 5% -22%
Smart device, IP 5,734 24,250 49,250 113,250 173,250 221,250 221,250YoY% - 323% 103% 130% 53% 28% 0%
Other 2,775 1,715 1,552 1,536 1,874 1,137 1,577 1,714 2,100 2,500 3,000 3,600 4,300YoY% -15% -38% -10% -1% 22% -39% 39% 9% 23% 19% 20% 20% 19%
CoGS (Y mn) 859,131 626,379 493,997 495,068 408,506 335,196 283,494 290,197 507,573 694,803 885,487 932,332 843,857Hardware 658,092 465,732 426,958 369,414 281,899 228,711 171,674 170,658 391,933 488,307 620,448 638,669 572,481
YoY% -32% -29% -8% -13% -24% -19% -25% -1% 130% 25% 27% 3% -10%Handheld 251,550 216,050 270,343 203,814 189,024 132,787 81,699 87,240 78,563 42,691 34,891 31,305 29,828Console 406,542 249,682 156,615 165,600 92,875 95,923 84,745 81,508 310,500 442,463 582,084 603,716 538,821Other (Incl. amiibo) 5,230 1,910 2,870 3,153 3,473 3,648 3,832
Software 201,039 160,647 67,039 125,654 126,607 106,485 111,453 110,040 93,640 152,496 181,039 185,663 163,376YoY% 162% -20% -58% 87% 1% -16% 5% -1% -15% 63% 19% 3% -12%
Smart device, IP 367 9,500 22,000 54,000 84,000 108,000 108,000YoY% 2489% 132% 145% 56% 29% 0%
Gross Profit (Y mn) 575,234 387,965 153,654 140,354 163,219 214,584 220,965 198,898 323,850 501,572 713,575 768,011 642,038 NAHardware 101,249 75,772 -76,332 -5,338 9,437 26,453 49,199 27,824 65,524 126,255 167,351 174,026 155,560
Handheld 129,329 82,603 -35,739 23,410 12,743 16,829 31,540 14,717 -3,926 -1,208 -333 111 339Console -28,080 -6,831 -40,593 -28,748 -3,306 9,625 17,659 13,106 69,450 127,463 167,684 173,916 155,221amiibo 0 6,720 17,540 6,380 9,580 10,527 11,577 12,162 12,768
Software 366,685 241,582 191,553 111,885 127,219 148,788 118,064 96,244 172,660 256,304 395,661 418,237 309,424YoY% -39% -34% -21% -42% 14% 17% -21% -18% 79% 48% 54% 6% -26%
Smart device, IP 5,367 14,750 27,250 59,250 89,250 113,250 113,250YoY% - 175% 85% 117% 51% 27% 0%
Other 2,775 1,715 1,552 1,536 1,874 1,137 1,577 1,714 2,100 2,500 3,000 3,600 4,300YoY% -15% -38% -10% -1% 22% -39% 39% 9% 23% 19% 20% 20% 19%
GPM% 40.1% 38.2% 23.7% 22.1% 28.5% 39.0% 43.8% 40.7% 39.0% 41.9% 44.6% 45.2% 43.2% NAHardware 11.7% 12.4% -19.7% -1.3% 3.0% 9.0% 18.4% 10.8% 12.6% 18.6% 19.7% 19.8% 19.6%
Handheld 34% 28% -15% 10% 6% 11% 28% 14% -5% -3% -1% 0% 1%Console -7% -3% -35% -21% -4% 9% 17% 14% 18% 22% 22% 22% 22%amiibo 18% 34% 11% 15% 16% 17% 18% 19%
Software 64.6% 60.1% 74.1% 47.1% 50.1% 58.3% 51.4% 46.7% 64.8% 62.7% 68.6% 69.3% 65.4%Smart device, IP 93.6% 60.8% 55.3% 52.3% 51.5% 51.2% 51.2%Other 100.0% 100.0% 100.0% 100.0% 100.0% 100.0% 100.0% 100.0% 100.0% 100.0% 100.0% 100.0% 100.0%
Operating profit (Y mn) 356,567 171,076 -37,320 -36,410 -46,425 24,770 32,881 29,363 80,400 258,072 470,075 524,511 398,538 65,000Hardware 74,079 14,152 -153,715 -83,325 -81,756 -36,628 -3,828 -7,199 -32,694 38,020 86,752 94,979 68,836Software 280,137 155,577 115,301 45,806 34,144 60,654 32,491 21,240 90,678 165,286 298,008 319,616 219,087Smart device, IP 5,126 14,203 26,155 58,155 88,155 112,155 112,155Other 2,352 1,348 1,094 1,109 1,187 744 989 1,120 1,510 1,910 2,410 3,010 3,710
OPM% 24.9% 16.9% -5.8% -5.7% -8.1% 4.5% 6.5% 6.0% 9.7% 21.6% 29.4% 30.8% 26.8% 8.7%Hardware 8.6% 2.3% -39.7% -21.0% -25.9% -12.5% -1.4% -2.8% -6.3% 5.6% 10.2% 10.8% 8.7%Software 49.3% 38.7% 44.6% 19.3% 13.5% 23.8% 14.2% 10.3% 34.1% 40.4% 51.7% 52.9% 46.3%Smart device, IP - - - - - - 89.4% 58.6% 53.1% 51.4% 50.9% 50.7% 50.7%Other 84.8% 78.6% 70.5% 72.2% 63.3% 65.5% 62.7% 65.3% 71.9% 76.4% 80.3% 83.6% 86.3%
Hardware units ('000) 47,640 36,210 28,470 23,730 16,310 12,580 10,150 10,760 21,000 25,500 31,100 31,450 27,775 16,000Console total 20,530 15,080 9,840 7,430 3,940 3,840 3,360 3,490 15,000 22,500 29,600 30,700 27,400 10,000
Nintendo Switch - - - - - - - 2,740 15,000 22,500 29,600 30,700 27,400 10,000WiiU - - - 3,450 2,720 3,380 3,250 750 - - - - - 0Wii 20,530 15,080 9,840 3,980 1,220 460 110 - - - - - - -
GC - - - - - - - - - - - - - -Portable total 27,110 21,130 18,630 16,300 12,370 8,740 6,790 7,270 6,000 3,000 1,500 750 375 6,0003DS - 3,610 13,530 13,950 12,240 8,740 6,790 7,270 6,000 3,000 1,500 750 375 6,000NDS 27,110 17,520 5,100 2,350 130 - - - - - - - - -GBA - - - - - - - - - - - - - -
Software units ('000) 343,400 301,670 199,190 147,020 123,200 98,870 83,210 75,350 94,667 137,680 190,876 198,885 155,451 78,000Console total 191,810 171,260 102,370 64,030 45,020 36,130 34,690 20,260 58,667 119,680 181,876 194,385 153,201 38,000
Nintendo Switch - - - - - - - 5,460 58,667 119,680 181,876 194,385 153,201 35,000WiiU - - - 13,420 18,860 24,400 27,360 14,800 - - - - - 3,000Wii 191,810 171,260 102,370 50,610 26,160 11,730 7,330 - - - - - - -
GC - - - - - - - - - - - - -Portable total 151,590 130,410 96,820 82,990 78,180 62,740 48,520 55,090 36,000 18,000 9,000 4,500 2,250 40,0003DS - 9,430 36,000 49,610 67,890 62,740 48,520 55,090 36,000 18,000 9,000 4,500 2,250 40,000NDS 151,590 120,980 60,820 33,380 10,290 - - - - - - - - -GBA - - - - - - - - - - - - - -
amiibo units ('000) - - - - - 10,500 53,600 18,400 27,600 30,360 33,396 35,066 36,819 NAFigurine - - - - - 10,500 24,700 9,100 13,650 15,015 16,517 17,342 18,209 NACard - - - - - - 28,900 9,300 13,950 15,345 16,880 17,723 18,610 NA
Source: Company data, Credit Suisse estimates
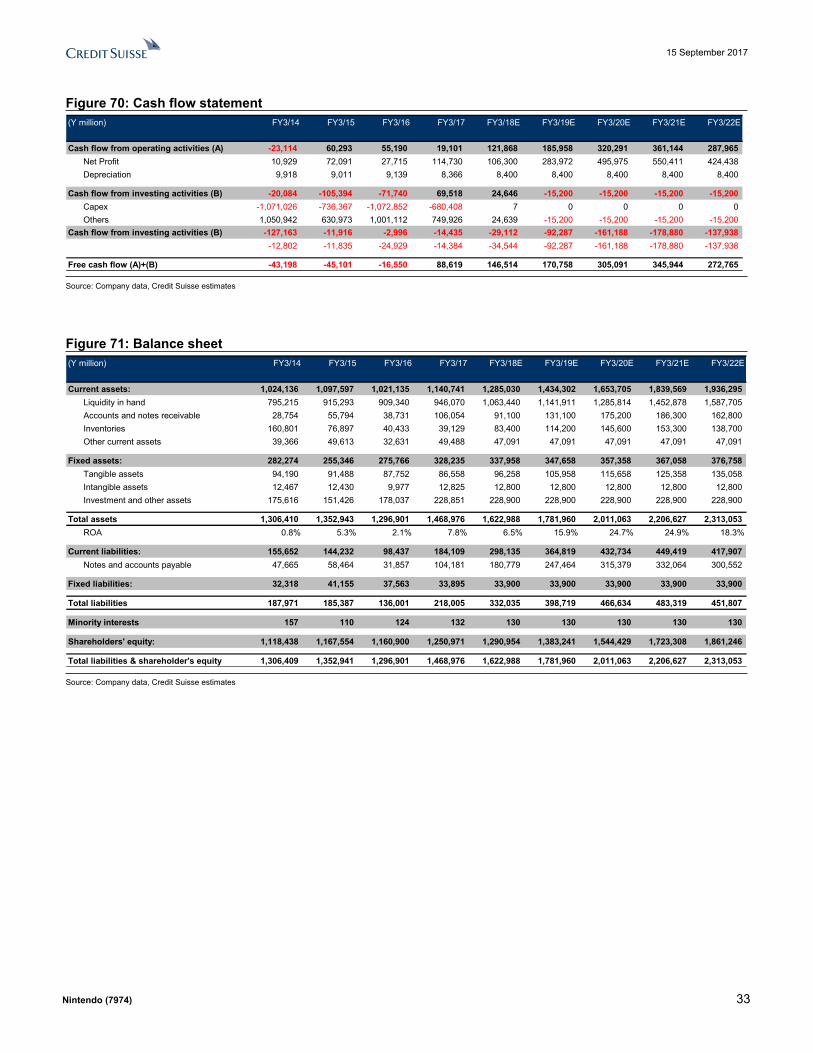
15 September 2017
Nintendo (7974) 33
Figure 70: Cash flow statement(Y million) FY3/14 FY3/15 FY3/16 FY3/17 FY3/18E FY3/19E FY3/20E FY3/21E FY3/22E
Cash flow from operating activities (A) -23,114 60,293 55,190 19,101 121,868 185,958 320,291 361,144 287,965Net Profit 10,929 72,091 27,715 114,730 106,300 283,972 495,975 550,411 424,438Depreciation 9,918 9,011 9,139 8,366 8,400 8,400 8,400 8,400 8,400
Cash flow from investing activities (B) -20,084 -105,394 -71,740 69,518 24,646 -15,200 -15,200 -15,200 -15,200 Capex -1,071,026 -736,367 -1,072,852 -680,408 7 0 0 0 0Others 1,050,942 630,973 1,001,112 749,926 24,639 -15,200 -15,200 -15,200 -15,200
Cash flow from investing activities (B) -127,163 -11,916 -2,996 -14,435 -29,112 -92,287 -161,188 -178,880 -137,938 -12,802 -11,835 -24,929 -14,384 -34,544 -92,287 -161,188 -178,880 -137,938
Free cash flow (A)+(B) -43,198 -45,101 -16,550 88,619 146,514 170,758 305,091 345,944 272,765
Source: Company data, Credit Suisse estimates
Figure 71: Balance sheet(Y million) FY3/14 FY3/15 FY3/16 FY3/17 FY3/18E FY3/19E FY3/20E FY3/21E FY3/22E
Current assets: 1,024,136 1,097,597 1,021,135 1,140,741 1,285,030 1,434,302 1,653,705 1,839,569 1,936,295Liquidity in hand 795,215 915,293 909,340 946,070 1,063,440 1,141,911 1,285,814 1,452,878 1,587,705Accounts and notes receivable 28,754 55,794 38,731 106,054 91,100 131,100 175,200 186,300 162,800Inventories 160,801 76,897 40,433 39,129 83,400 114,200 145,600 153,300 138,700Other current assets 39,366 49,613 32,631 49,488 47,091 47,091 47,091 47,091 47,091
Fixed assets: 282,274 255,346 275,766 328,235 337,958 347,658 357,358 367,058 376,758Tangible assets 94,190 91,488 87,752 86,558 96,258 105,958 115,658 125,358 135,058Intangible assets 12,467 12,430 9,977 12,825 12,800 12,800 12,800 12,800 12,800Investment and other assets 175,616 151,426 178,037 228,851 228,900 228,900 228,900 228,900 228,900
Total assets 1,306,410 1,352,943 1,296,901 1,468,976 1,622,988 1,781,960 2,011,063 2,206,627 2,313,053ROA 0.8% 5.3% 2.1% 7.8% 6.5% 15.9% 24.7% 24.9% 18.3%
Current liabilities: 155,652 144,232 98,437 184,109 298,135 364,819 432,734 449,419 417,907Notes and accounts payable 47,665 58,464 31,857 104,181 180,779 247,464 315,379 332,064 300,552
Fixed liabilities: 32,318 41,155 37,563 33,895 33,900 33,900 33,900 33,900 33,900
Total liabilities 187,971 185,387 136,001 218,005 332,035 398,719 466,634 483,319 451,807
Minority interests 157 110 124 132 130 130 130 130 130
Shareholders' equity: 1,118,438 1,167,554 1,160,900 1,250,971 1,290,954 1,383,241 1,544,429 1,723,308 1,861,246
Total liabilities & shareholder's equity 1,306,409 1,352,941 1,296,901 1,468,976 1,622,988 1,781,960 2,011,063 2,206,627 2,313,053
Source: Company data, Credit Suisse estimates
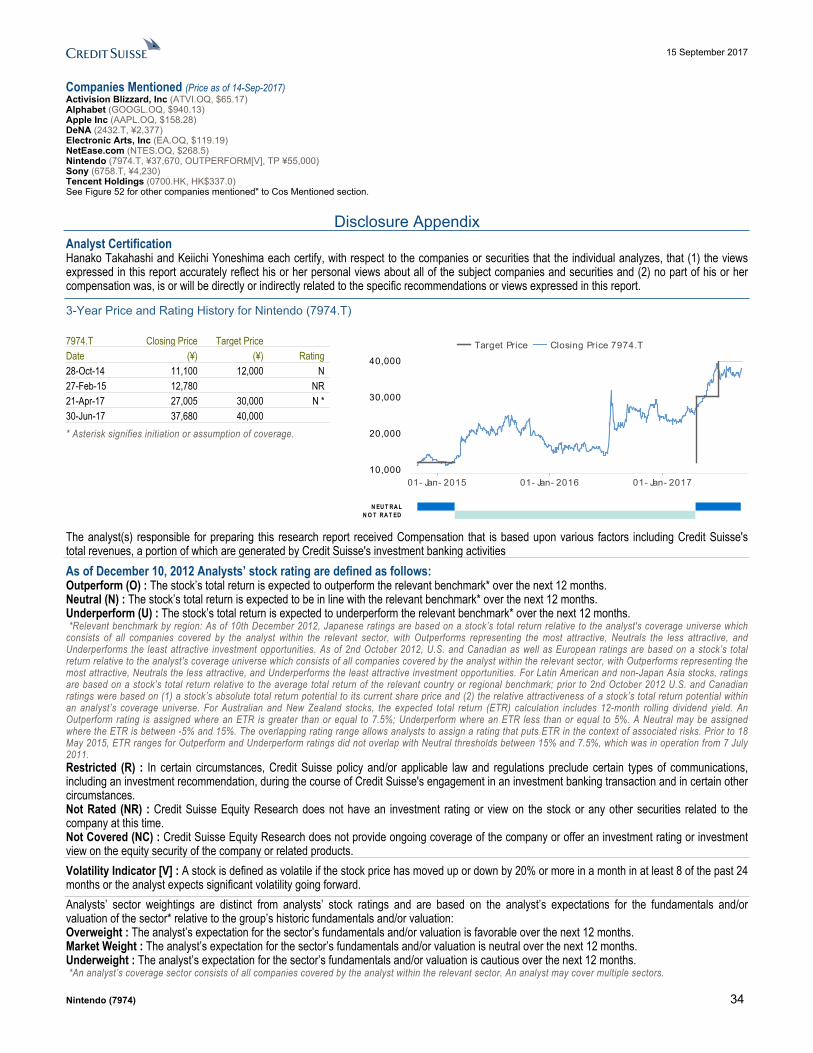
15 September 2017
Nintendo (7974) 34
Companies Mentioned (Price as of 14-Sep-2017)Activision Blizzard, Inc (ATVI.OQ, $65.17)Alphabet (GOOGL.OQ, $940.13)Apple Inc (AAPL.OQ, $158.28)DeNA (2432.T, ¥2,377)Electronic Arts, Inc (EA.OQ, $119.19)NetEase.com (NTES.OQ, $268.5)Nintendo (7974.T, ¥37,670, OUTPERFORM[V], TP ¥55,000)Sony (6758.T, ¥4,230)Tencent Holdings (0700.HK, HK$337.0)See Figure 52 for other companies mentioned" to Cos Mentioned section.
Disclosure AppendixAnalyst Certification Hanako Takahashi and Keiichi Yoneshima each certify, with respect to the companies or securities that the individual analyzes, that (1) the views expressed in this report accurately reflect his or her personal views about all of the subject companies and securities and (2) no part of his or her compensation was, is or will be directly or indirectly related to the specific recommendations or views expressed in this report.
3-Year Price and Rating History for Nintendo (7974.T)
7974.T Closing Price Target Price Date (¥) (¥) Rating 28-Oct-14 11,100 12,000 N 27-Feb-15 12,780 NR 21-Apr-17 27,005 30,000 N * 30-Jun-17 37,680 40,000 * Asterisk signifies initiation or assumption of coverage.
Target Price Closing Price 7974.T
01- Jan- 2015 01- Jan- 2016 01- Jan- 201710,000
20,000
30,000
40,000
N EU T RA LN O T RA T ED
The analyst(s) responsible for preparing this research report received Compensation that is based upon various factors including Credit Suisse's total revenues, a portion of which are generated by Credit Suisse's investment banking activitiesAs of December 10, 2012 Analysts’ stock rating are defined as follows:Outperform (O) : The stock’s total return is expected to outperform the relevant benchmark* over the next 12 months.Neutral (N) : The stock’s total return is expected to be in line with the relevant benchmark* over the next 12 months.Underperform (U) : The stock’s total return is expected to underperform the relevant benchmark* over the next 12 months. *Relevant benchmark by region: As of 10th December 2012, Japanese ratings are based on a stock’s total return relative to the analyst's coverage universe which consists of all companies covered by the analyst within the relevant sector, with Outperforms representing the most attractive, Neutrals the less attractive, and Underperforms the least attractive investment opportunities. As of 2nd October 2012, U.S. and Canadian as well as European ratings are based on a stock’s total return relative to the analyst's coverage universe which consists of all companies covered by the analyst within the relevant sector, with Outperforms representing the most attractive, Neutrals the less attractive, and Underperforms the least attractive investment opportunities. For Latin American and non-Japan Asia stocks, ratings are based on a stock’s total return relative to the average total return of the relevant country or regional benchmark; prior to 2nd October 2012 U.S. and Canadian ratings were based on (1) a stock’s absolute total return potential to its current share price and (2) the relative attractiveness of a stock’s total return potential within an analyst’s coverage universe. For Australian and New Zealand stocks, the expected total return (ETR) calculation includes 12-month rolling dividend yield. An Outperform rating is assigned where an ETR is greater than or equal to 7.5%; Underperform where an ETR less than or equal to 5%. A Neutral may be assigned where the ETR is between -5% and 15%. The overlapping rating range allows analysts to assign a rating that puts ETR in the context of associated risks. Prior to 18 May 2015, ETR ranges for Outperform and Underperform ratings did not overlap with Neutral thresholds between 15% and 7.5%, which was in operation from 7 July 2011.Restricted (R) : In certain circumstances, Credit Suisse policy and/or applicable law and regulations preclude certain types of communications, including an investment recommendation, during the course of Credit Suisse's engagement in an investment banking transaction and in certain other circumstances.Not Rated (NR) : Credit Suisse Equity Research does not have an investment rating or view on the stock or any other securities related to the company at this time.Not Covered (NC) : Credit Suisse Equity Research does not provide ongoing coverage of the company or offer an investment rating or investment view on the equity security of the company or related products.Volatility Indicator [V] : A stock is defined as volatile if the stock price has moved up or down by 20% or more in a month in at least 8 of the past 24 months or the analyst expects significant volatility going forward.Analysts’ sector weightings are distinct from analysts’ stock ratings and are based on the analyst’s expectations for the fundamentals and/or valuation of the sector* relative to the group’s historic fundamentals and/or valuation:Overweight : The analyst’s expectation for the sector’s fundamentals and/or valuation is favorable over the next 12 months.Market Weight : The analyst’s expectation for the sector’s fundamentals and/or valuation is neutral over the next 12 months.Underweight : The analyst’s expectation for the sector’s fundamentals and/or valuation is cautious over the next 12 months. *An analyst’s coverage sector consists of all companies covered by the analyst within the relevant sector. An analyst may cover multiple sectors.
15 September 2017
Nintendo (7974) 35
Credit Suisse's distribution of stock ratings (and banking clients) is:
Global Ratings DistributionRating Versus universe (%) Of which banking clients (%)Outperform/Buy* 44% (64% banking clients)Neutral/Hold* 40% (59% banking clients)Underperform/Sell* 14% (53% banking clients)Restricted 2%*For purposes of the NYSE and FINRA ratings distribution disclosure requirements, our stock ratings of Outperform, Neutral, and Underperform most closely correspond to Buy, Hold, and Sell, respectively; however, the meanings are not the same, as our stock ratings are determined on a relative basis. (Please refer to definitions above.) An investor's decision to buy or sell a security should be based on investment objectives, current holdings, and other individual factors.
Important Global Disclosures Credit Suisse’s research reports are made available to clients through our proprietary research portal on CS PLUS. Credit Suisse research products may also be made available through third-party vendors or alternate electronic means as a convenience. Certain research products are only made available through CS PLUS. The services provided by Credit Suisse’s analysts to clients may depend on a specific client’s preferences regarding the frequency and manner of receiving communications, the client’s risk profile and investment, the size and scope of the overall client relationship with the Firm, as well as legal and regulatory constraints. To access all of Credit Suisse’s research that you are entitled to receive in the most timely manner, please contact your sales representative or go to https://plus.credit-suisse.com . Credit Suisse’s policy is to update research reports as it deems appropriate, based on developments with the subject company, the sector or the market that may have a material impact on the research views or opinions stated herein.Credit Suisse's policy is only to publish investment research that is impartial, independent, clear, fair and not misleading. For more detail please refer to Credit Suisse's Policies for Managing Conflicts of Interest in connection with Investment Research: https://www.credit-suisse.com/sites/disclaimers-ib/en/managing-conflicts.html . Credit Suisse does not provide any tax advice. Any statement herein regarding any US federal tax is not intended or written to be used, and cannot be used, by any taxpayer for the purposes of avoiding any penalties.Credit Suisse has decided not to enter into business relationships with companies that Credit Suisse has determined to be involved in the development, manufacture, or acquisition of anti-personnel mines and cluster munitions. For Credit Suisse's position on the issue, please see https://www.credit-suisse.com/media/assets/corporate/docs/about-us/responsibility/banking/policy-summaries-en.pdf .
Target Price and RatingValuation Methodology and Risks: (12 months) for Nintendo (7974.T)
Method: Our ¥55,000 target price is derived from a sum-of-the-parts model: (1) we use a DCF model for the smart device app business, (2) an ex-cash P/E of 18x for the game console business, and (3) cash on hand as of end-FY3/17. Our DCF model's key inputs include ERP of 6.65% and RFR of 0.1%. We also assume a debt/equity ratio of zero, beta of 1.23 (five-year adjusted average) and WACC of 8.28%. We expect Switch sales will significantly beat market expectations and thus forecast strong sales and profit growth. Our OUTPERFORM rating reflects our outlook for total returns over the next 12 months relative to the rest of our sector coverage.
Risk: Downside risks to our ¥55,000 target price and OUTPERFORM rating include Switch sales volumes and attach rate coming in lower than we expected, delays in launching new apps, and rapid yen appreciation
Please refer to the firm's disclosure website at https://rave.credit-suisse.com/disclosures/view/selectArchive for the definitions of abbreviations typically used in the target price method and risk sections. See the Companies Mentioned section for full company names Credit Suisse currently has, or had within the past 12 months, the following as investment banking client(s): ATVI.OQ, 0700.HK, NTES.OQ, GOOGL.OQ, 6758.TCredit Suisse provided investment banking services to the subject company (ATVI.OQ, GOOGL.OQ) within the past 12 months.Credit Suisse currently has, or had within the past 12 months, the following issuer(s) as client(s), and the services provided were non-investment-banking, securities-related: GOOGL.OQ, 6758.TWithin the past 12 months, Credit Suisse has received compensation for investment banking services from the following issuer(s): ATVI.OQ, GOOGL.OQCredit Suisse expects to receive or intends to seek investment banking related compensation from the subject company (ATVI.OQ, 2432.T, 0700.HK, NTES.OQ, GOOGL.OQ, 6758.T) within the next 3 months.Within the last 12 months, Credit Suisse has received compensation for non-investment banking services or products from the following issuer(s): GOOGL.OQ, 6758.TAs of the date of this report, Credit Suisse makes a market in the following subject companies (0700.HK).A member of the Credit Suisse Group is party to an agreement with, or may have provided services set out in sections A and B of Annex I of Directive 2014/65/EU of the European Parliament and Council ("MiFID Services") to, the subject issuer (7974.T, ATVI.OQ, 2432.T, 0700.HK, NTES.OQ, GOOGL.OQ) within the past 12 months.As of the end of the preceding month, Credit Suisse beneficially own 1% or more of a class of common equity securities of (0700.HK).
15 September 2017
Nintendo (7974) 36
For other important disclosures concerning companies featured in this report, including price charts, please visit the website at https://rave.credit-suisse.com/disclosures or call +1 (877) 291-2683. For date and time of production, dissemination and history of recommendation for the subject company(ies) featured in this report, disseminated within the past 12 months, please refer to the link: https://rave.credit-suisse.com/disclosures/view/report?i=320196&v=4wm0lyzmrvfooax7c9snzftlw . Important Regional Disclosures Singapore recipients should contact Credit Suisse AG, Singapore Branch for any matters arising from this research report.The analyst(s) involved in the preparation of this report may participate in events hosted by the subject company, including site visits. Credit Suisse does not accept or permit analysts to accept payment or reimbursement for travel expenses associated with these events.Restrictions on certain Canadian securities are indicated by the following abbreviations: NVS--Non-Voting shares; RVS--Restricted Voting Shares; SVS--Subordinate Voting Shares.Individuals receiving this report from a Canadian investment dealer that is not affiliated with Credit Suisse should be advised that this report may not contain regulatory disclosures the non-affiliated Canadian investment dealer would be required to make if this were its own report.For Credit Suisse Securities (Canada), Inc.'s policies and procedures regarding the dissemination of equity research, please visit https://www.credit-suisse.com/sites/disclaimers-ib/en/canada-research-policy.html.Credit Suisse has acted as lead manager or syndicate member in a public offering of securities for the subject company (0700.HK, GOOGL.OQ) within the past 3 years.Principal is not guaranteed in the case of equities because equity prices are variable.Commission is the commission rate or the amount agreed with a customer when setting up an account or at any time after that.This research report is authored by:Credit Suisse Securities (Japan) Limited ...................................................................................................Hanako Takahashi ; Keiichi YoneshimaTo the extent this is a report authored in whole or in part by a non-U.S. analyst and is made available in the U.S., the following are important disclosures regarding any non-U.S. analyst contributors: The non-U.S. research analysts listed below (if any) are not registered/qualified as research analysts with FINRA. The non-U.S. research analysts listed below may not be associated persons of CSSU and therefore may not be subject to the FINRA 2241 and NYSE Rule 472 restrictions on communications with a subject company, public appearances and trading securities held by a research analyst account.Credit Suisse Securities (Japan) Limited ...................................................................................................Hanako Takahashi ; Keiichi YoneshimaImportant disclosures regarding companies or other issuers that are the subject of this report are available on Credit Suisse’s disclosure website at https://rave.credit-suisse.com/disclosures or by calling +1 (877) 291-2683.
15 September 2017
Nintendo (7974) 37
This report is produced by subsidiaries and affiliates of Credit Suisse operating under its Global Markets Division. For more information on our structure, please use the following link: https://www.credit-suisse.com/who-we-are This report may contain material that is not directed to, or intended for distribution to or use by, any person or entity who is a citizen or resident of or located in any locality, state, country or other jurisdiction where such distribution, publication, availability or use would be contrary to law or regulation or which would subject Credit Suisse or its affiliates ("CS") to any registration or licensing requirement within such jurisdiction. All material presented in this report, unless specifically indicated otherwise, is under copyright to CS. None of the material, nor its content, nor any copy of it, may be altered in any way, transmitted to, copied or distributed to any other party, without the prior express written permission of CS. All trademarks, service marks and logos used in this report are trademarks or service marks or registered trademarks or service marks of CS or its affiliates.The information, tools and material presented in this report are provided to you for information purposes only and are not to be used or considered as an offer or the solicitation of an offer to sell or to buy or subscribe for securities or other financial instruments. CS may not have taken any steps to ensure that the securities referred to in this report are suitable for any particular investor. CS will not treat recipients of this report as its customers by virtue of their receiving this report. The investments and services contained or referred to in this report may not be suitable for you and it is recommended that you consult an independent investment advisor if you are in doubt about such investments or investment services. Nothing in this report constitutes investment, legal, accounting or tax advice, or a representation that any investment or strategy is suitable or appropriate to your individual circumstances, or otherwise constitutes a personal recommendation to you. CS does not advise on the tax consequences of investments and you are advised to contact an independent tax adviser. Please note in particular that the bases and levels of taxation may change. Information and opinions presented in this report have been obtained or derived from sources believed by CS to be reliable, but CS makes no representation as to their accuracy or completeness. CS accepts no liability for loss arising from the use of the material presented in this report, except that this exclusion of liability does not apply to the extent that such liability arises under specific statutes or regulations applicable to CS. This report is not to be relied upon in substitution for the exercise of independent judgment. CS may have issued, and may in the future issue, other communications that are inconsistent with, and reach different conclusions from, the information presented in this report. Those communications reflect the different assumptions, views and analytical methods of the analysts who prepared them and CS is under no obligation to ensure that such other communications are brought to the attention of any recipient of this report. Some investments referred to in this report will be offered solely by a single entity and in the case of some investments solely by CS, or an associate of CS or CS may be the only market maker in such investments. Past performance should not be taken as an indication or guarantee of future performance, and no representation or warranty, express or implied, is made regarding future performance. Information, opinions and estimates contained in this report reflect a judgment at its original date of publication by CS and are subject to change without notice. The price, value of and income from any of the securities or financial instruments mentioned in this report can fall as well as rise. The value of securities and financial instruments is subject to exchange rate fluctuation that may have a positive or adverse effect on the price or income of such securities or financial instruments. Investors in securities such as ADR's, the values of which are influenced by currency volatility, effectively assume this risk. Structured securities are complex instruments, typically involve a high degree of risk and are intended for sale only to sophisticated investors who are capable of understanding and assuming the risks involved. The market value of any structured security may be affected by changes in economic, financial and political factors (including, but not limited to, spot and forward interest and exchange rates), time to maturity, market conditions and volatility, and the credit quality of any issuer or reference issuer. Any investor interested in purchasing a structured product should conduct their own investigation and analysis of the product and consult with their own professional advisers as to the risks involved in making such a purchase. Some investments discussed in this report may have a high level of volatility. High volatility investments may experience sudden and large falls in their value causing losses when that investment is realised. Those losses may equal your original investment. Indeed, in the case of some investments the potential losses may exceed the amount of initial investment and, in such circumstances, you may be required to pay more money to support those losses. Income yields from investments may fluctuate and, in consequence, initial capital paid to make the investment may be used as part of that income yield. Some investments may not be readily realisable and it may be difficult to sell or realise those investments, similarly it may prove difficult for you to obtain reliable information about the value, or risks, to which such an investment is exposed. This report may provide the addresses of, or contain hyperlinks to, websites. Except to the extent to which the report refers to website material of CS, CS has not reviewed any such site and takes no responsibility for the content contained therein. Such address or hyperlink (including addresses or hyperlinks to CS's own website material) is provided solely for your convenience and information and the content of any such website does not in any way form part of this document. Accessing such website or following such link through this report or CS's website shall be at your own risk.
This report is issued and distributed in European Union (except Switzerland): by Credit Suisse Securities (Europe) Limited, One Cabot Square, London E14 4QJ, England, which is authorised by the Prudential Regulation Authority and regulated by the Financial Conduct Authority and the Prudential Regulation Authority. Germany: Credit Suisse Securities (Europe) Limited Niederlassung Frankfurt am Main regulated by the Bundesanstalt fuer Finanzdienstleistungsaufsicht ("BaFin"). United States and Canada: Credit Suisse Securities (USA) LLC; Switzerland: Credit Suisse AG; Brazil: Banco de Investimentos Credit Suisse (Brasil) S.A or its affiliates; Mexico: Banco Credit Suisse (México), S.A. (transactions related to the securities mentioned in this report will only be effected in compliance with applicable regulation); Japan: by Credit Suisse Securities (Japan) Limited, Financial Instruments Firm, Director-General of Kanto Local Finance Bureau ( Kinsho) No. 66, a member of Japan Securities Dealers Association, The Financial Futures Association of Japan, Japan Investment Advisers Association, Type II Financial Instruments Firms Association; Hong Kong: Credit Suisse (Hong Kong) Limited; Australia: Credit Suisse Equities (Australia) Limited; Thailand: Credit Suisse Securities (Thailand) Limited, regulated by the Office of the Securities and Exchange Commission, Thailand, having registered address at 990 Abdulrahim Place, 27th Floor, Unit 2701, Rama IV Road, Silom, Bangrak, Bangkok10500, Thailand, Tel. +66 2614 6000; Malaysia: Credit Suisse Securities (Malaysia) Sdn Bhd; Singapore: Credit Suisse AG, Singapore Branch; India: Credit Suisse Securities (India) Private Limited (CIN no.U67120MH1996PTC104392) regulated by the Securities and Exchange Board of India as Research Analyst (registration no. INH 000001030) and as Stock Broker (registration no. INB230970637; INF230970637; INB010970631; INF010970631), having registered address at 9th Floor, Ceejay House, Dr.A.B. Road, Worli, Mumbai - 18, India, T- +91-22 6777 3777; South Korea: Credit Suisse Securities (Europe) Limited, Seoul Branch; Taiwan: Credit Suisse AG Taipei Securities Branch; Indonesia: PT Credit Suisse Sekuritas Indonesia; Philippines:Credit Suisse Securities (Philippines ) Inc., and elsewhere in the world by the relevant authorised affiliate of the above.Additional Regional DisclaimersHong Kong: Credit Suisse (Hong Kong) Limited ("CSHK") is licensed and regulated by the Securities and Futures Commission of Hong Kong under the laws of Hong Kong, which differ from Australian laws. CSHKL does not hold an Australian financial services licence (AFSL) and is exempt from the requirement to hold an AFSL under the Corporations Act 2001 (the Act) under Class Order 03/1103 published by the ASIC in respect of financial services provided to Australian wholesale clients (within the meaning of section 761G of the Act). Research on Taiwanese securities produced by Credit Suisse AG, Taipei Securities Branch has been prepared by a registered Senior Business Person. Australia (to the extent services are offered in Australia): Credit Suisse Securities (Europe) Limited (“CSSEL”) and Credit Suisse International (“CSI”) are authorised by the Prudential Regulation Authority and regulated by the Financial Conduct Authority (“FCA”) and the Prudential Regulation Authority under UK laws, which differ from Australian Laws. CSSEL and CSI do not hold an Australian Financial Services Licence (“AFSL”) and are exempt from the requirement to hold an AFSL under the Corporations Act (Cth) 2001 (“Corporations Act”) under Class Order 03/1099 published by the Australian Securities and Investments Commission (“ASIC”), in respect of the financial services provided to Australian wholesale clients (within the meaning of section 761G of the Corporations Act). This material is not for distribution to retail clients and is directed exclusively at Credit Suisse's professional clients and eligible counterparties as defined by the FCA, and wholesale clients as defined under section 761G of the Corporations Act. Credit Suisse (Hong Kong) Limited (“CSHK”) is licensed and regulated by the Securities and Futures Commission of Hong Kong under the laws of Hong Kong, which differ from Australian laws. CSHKL does not hold an AFSL and is exempt from the requirement to hold an AFSL under the Corporations Act under Class Order 03/1103 published by the ASIC in respect of financial services provided to Australian wholesale clients (within the meaning of section 761G of the Corporations Act). Credit Suisse Securities (USA) LLC (CSSU) and Credit Suisse Asset Management LLC (CSAM LLC) are licensed and regulated by the Securities Exchange Commission of the United States under the laws of the United States, which differ from Australian laws. CSSU and CSAM LLC do not hold an AFSL and is exempt from the requirement to hold an AFSL under the Corporations Act under Class Order 03/1100 published by the ASIC in respect of financial services provided to Australian wholesale clients (within the meaning of section 761G of the Corporations Act). Malaysia: Research provided to residents of Malaysia is authorised by the Head of Research for Credit Suisse Securities (Malaysia) Sdn Bhd, to whom they should direct any queries on +603 2723 2020. Singapore: This report has been prepared and issued for distribution in Singapore to institutional investors, accredited investors and expert investors (each as defined under the Financial Advisers Regulations) only, and is also distributed by Credit Suisse AG, Singapore Branch to overseas investors (as defined under the Financial Advisers Regulations). Credit Suisse AG, Singapore Branch may distribute reports produced by its foreign entities or affiliates pursuant to an arrangement under Regulation 32C of the Financial Advisers Regulations. Singapore recipients should contact Credit Suisse AG, Singapore Branch at +65-6212-2000 for matters arising from, or in connection with, this report. By virtue of your status as an institutional investor, accredited investor, expert investor or overseas investor, Credit Suisse AG, Singapore Branch is exempted from complying with certain compliance requirements under the Financial Advisers Act, Chapter 110 of Singapore (the “FAA”), the Financial Advisers Regulations and the relevant Notices and Guidelines issued thereunder, in respect of any financial advisory service which Credit Suisse AG, Singapore Branch may provide to you. UAE: This information is being distributed by Credit Suisse AG (DIFC Branch), duly licensed and regulated by the Dubai Financial Services Authority (“DFSA”). Related financial services or products are only made available to Professional Clients or Market Counterparties, as defined by the DFSA, and are not intended for any other persons. Credit Suisse AG (DIFC Branch) is located on Level 9 East, The Gate Building, DIFC, Dubai, United Arab Emirates. EU: This report has been produced by subsidiaries and affiliates of Credit Suisse operating under its Global Markets Division In jurisdictions where CS is not already registered or licensed to trade in securities, transactions will only be effected in accordance with applicable securities legislation, which will vary from jurisdiction to jurisdiction and may require that the trade be made in accordance with applicable exemptions from registration or licensing requirements. Non-US customers wishing to effect a transaction should contact a CS entity in their local jurisdiction unless governing law permits otherwise. US customers wishing to effect a transaction should do so only by contacting a representative at Credit Suisse Securities (USA) LLC in the US. Please note that this research was originally prepared and issued by CS for distribution to their market professional and institutional investor customers. Recipients who are not market professional or institutional investor customers of CS should seek the advice of their independent financial advisor prior to taking any investment decision based on this report or for any necessary explanation of its contents. This research may relate to investments or services of a person outside of the UK or to other matters which are not authorised by the Prudential Regulation Authority and regulated by the Financial Conduct Authority and the Prudential Regulation Authority or in respect of which the protections of the Prudential Regulation Authority and Financial Conduct Authority for private customers and/or the UK compensation scheme may not be available, and further details as to where this may be the case are available upon request in respect of this report. CS may provide various services to US municipal entities or obligated persons ("municipalities"), including suggesting individual transactions or trades and entering into such transactions. Any services CS provides to municipalities are not viewed as "advice" within the meaning of Section 975 of the Dodd-Frank Wall Street Reform and Consumer Protection Act. CS is providing any such services and related information solely on an arm's length basis and not as an advisor or fiduciary to the municipality. In connection with the provision of the any such services, there is no agreement, direct or indirect, between any municipality (including the officials,management, employees or agents thereof) and CS for CS to provide advice to the municipality. Municipalities should consult with their financial, accounting and legal advisors regarding any such services provided by CS. In addition, CS is not acting for direct or indirect compensation to solicit the municipality on behalf of an unaffiliated broker, dealer, municipal securities dealer, municipal advisor, or investment adviser for the purpose of obtaining or retaining an engagement by the municipality for or in connection with Municipal Financial Products, the issuance of municipal securities, or of an investment adviser to provide investment advisory services to or on behalf of the municipality. If this report is being distributed by a financial institution other than Credit Suisse AG, or its affiliates, that financial institution is solely responsible for distribution. Clients of that institution should contact that institution to effect a transaction in the securities mentioned in this report or require further information. This report does not constitute investment advice by Credit Suisse to the clients of the distributing financial institution, and neither Credit Suisse AG, its affiliates, and their respective officers, directors and employees accept any liability whatsoever for any direct or consequential loss arising from their use of this report or its content. Principal is not guaranteed. Commission is the commission rate or the amount agreed with a customer when setting up an account or at any time after that. Copyright © 2017 CREDIT SUISSE AG and/or its affiliates. All rights reserved. Investment principal on bonds can be eroded depending on sale price or market price. In addition, there are bonds on which investment principal can be eroded due to changes in redemption amounts. Care is required when investing in such instruments. When you purchase non-listed Japanese fixed income securities (Japanese government bonds, Japanese municipal bonds, Japanese government guaranteed bonds, Japanese corporate bonds) from CS as a seller, you will be requested to pay the purchase price only.