Cisco Systems Inc. (CSCO) - Credit Suisse | PLUS
121
DISCLOSURE APPENDIX CONTAINS IMPORTANT DISCLOSURES, ANALYST CERTIFICATIONS, INFORMATION ON TRADE ALERTS, ANALYST MODEL PORTFOLIOS AND THE STATUS OF NON-U.S ANALYSTS. US Disclosure: Credit Suisse does and seeks to do business with companies covered in its research reports. As a result, investors should be aware that the Firm may have a conflict of interest that could affect the objectivity of this report. Investors should consider this report as only a single factor in making their investment decision. CREDIT SUISSE SECURITIES RESEARCH & ANALYTICS BEYOND INFORMATION ® Client-Driven Solutions, Insights, and Access 18 September 2013 Americas/United States Equity Research Networking Equipment Cisco Systems Inc. (CSCO) INITIATION Software Defined Disruption ■ Initiate with Underperform—Now for the Hard Part: Over the past year, Cisco has seen the benefits of improving execution, gross margin stability, and increased capital redeployment, all of which are to be applauded. However, the impact on the networking market from Software Defined Networking (SDN) architectures should be very real and accelerate over time, leading to further margin compression. We initiate with an Underperform rating and a target price of $21. ■ SDN to Threaten the Most Profitable Part of the Stack: Currently, on the hardware side, networking stands as one of the least competitive and highest margin industries in the IT stack. SDN, by allowing software to be separate from the physical infrastructure, will allow competition at multiple points in the network, which was not previously possible. While the impact will take time, the threat will be very real, shrinking gross profit dollars for the industry. Irrespective of whether Cisco executes well in SDN environments, the company is in a vulnerable position amidst this transition. ■ Margins to Continue Their Long-Term Trend Downward: Based on five factors, we estimate that gross margins will decrease to ~60% and operating margins to 26% over the long term, with limited growth in organic operating income. We note the following: (1) our proprietary segmentation analysis shows gross margins by business line; within that UCS is materially dilutive at ~30% GMs; (2) while software and services can offset some of the headwinds, gaps in Cisco's IT stack mean that success in wider IT environments cannot be guaranteed; (3) SDN has the potential to shrink gross profit dollars available to vendors by as much as 70%; (4) Huawei will have an effect on the service provider market and internationally; and (5) the opex base is quite lean and further optimization will likely prove challenging. ■ Valuation—Target Price of $21: While we do not see significant downside risk on Cisco, we also do not see significant upside potential. Our TP of $21 is a blended average of P/E, DCF, and Credit Suisse HOLT ® valuation. Share price performance 16 21 26 Sep-12 Dec-12 Mar-13 Jun-13 Sep-13 Daily Sep 17, 2012 - Sep 17, 2013, 9/17/12 = US$19.16 Price Indexed S&P 500 INDEX On 09/17/13 the S&P 500 INDEX closed at 1704.76 Quarterly EPS Q1 Q2 Q3 Q4 2012A 0.43 0.47 0.48 0.47 2013A 0.48 0.51 0.51 0.52 2014E 0.51 0.51 0.53 0.55 Financial and valuation metrics Year 07/12A 07/13A 07/14E 07/15E EPS - (Excl. ESO) (US$) 1.85 2.02 2.10 2.13 EPS (CS adj.) (US$) 1.85 2.02 2.10 2.13 Prev. EPS (CS adj.) (US$) — — — — P/E (CS adj., x) 13.1 12.0 11.6 11.4 P/E rel. (CS adj., %) — 73.7 75.4 82.4 Revenue (US$ m) 46,061.0 48,607.0 50,822.9 53,655.8 EBITDA (US$ m) 15,338.0 16,033.0 16,289.8 16,322.9 Net debt (US$ m) 6,529 8,286 2,833 -2,316 OCFPS (US$) 2.13 2.40 2.47 2.47 P/OCF (x) 7.5 10.6 9.9 9.9 Number of shares (m) 5,361.55 Price/sales(x) 2.62 BV/share (Next Qtr., US$) — P/BVPS (x) 2.2 Net debt (Next Qtr., US$ m) — Dividend (current, US$) — Dividend yield (%) — Source: Company data, Credit Suisse estimates. Rating UNDERPERFORM* Price (17 Sep 13, US$) 24.37 Target price (US$) 21.00¹ 52-week price range 26.37 - 16.82 Market cap. (US$ m) 130,660.97 *Stock ratings are relative to the coverage universe in each analyst's or each team's respective sector. ¹Target price is for 12 months. Research Analysts Kulbinder Garcha 212 325 4795 [email protected] Andrew Ruben 212 325 4798 [email protected] Vlad Rom 212 325 5442 [email protected] Matthew Cabral 212 538 6260 [email protected] Talal Khan, CFA 212 325 8603 [email protected] Ray Bao 212 325 1227 [email protected]
-
Upload
khangminh22 -
Category
Documents
-
view
1 -
download
0
Transcript of Cisco Systems Inc. (CSCO) - Credit Suisse | PLUS

DISCLOSURE APPENDIX CONTAINS IMPORTANT DISCLOSURES, ANALYST CERTIFICATIONS, INFORMATION ON TRADE ALERTS, ANALYST MODEL PORTFOLIOS AND THE STATUS OF NON-U.S ANALYSTS. US Disclosure: Credit Suisse does and seeks to do business with companies covered in its research reports. As a result, investors should be aware that the Firm may have a conflict of interest that could affect the objectivity of this report. Investors should consider this report as only a single factor in making their investment decision.
CREDIT SUISSE SECURITIES RESEARCH & ANALYTICS BEYOND INFORMATION®
Client-Driven Solutions, Insights, and Access
18 September 2013
Americas/United States
Equity Research
Networking Equipment
Cisco Systems Inc. (CSCO) INITIATION
Software Defined Disruption ■ Initiate with Underperform—Now for the Hard Part: Over the past year,
Cisco has seen the benefits of improving execution, gross margin stability, and increased capital redeployment, all of which are to be applauded. However, the impact on the networking market from Software Defined Networking (SDN) architectures should be very real and accelerate over time, leading to further margin compression. We initiate with an Underperform rating and a target price of $21.
■ SDN to Threaten the Most Profitable Part of the Stack: Currently, on the hardware side, networking stands as one of the least competitive and highest margin industries in the IT stack. SDN, by allowing software to be separate from the physical infrastructure, will allow competition at multiple points in the network, which was not previously possible. While the impact will take time, the threat will be very real, shrinking gross profit dollars for the industry. Irrespective of whether Cisco executes well in SDN environments, the company is in a vulnerable position amidst this transition.
■ Margins to Continue Their Long-Term Trend Downward: Based on five factors, we estimate that gross margins will decrease to ~60% and operating margins to 26% over the long term, with limited growth in organic operating income. We note the following: (1) our proprietary segmentation analysis shows gross margins by business line; within that UCS is materially dilutive at ~30% GMs; (2) while software and services can offset some of the headwinds, gaps in Cisco's IT stack mean that success in wider IT environments cannot be guaranteed; (3) SDN has the potential to shrink gross profit dollars available to vendors by as much as 70%; (4) Huawei will have an effect on the service provider market and internationally; and (5) the opex base is quite lean and further optimization will likely prove challenging.
■ Valuation—Target Price of $21: While we do not see significant downside risk on Cisco, we also do not see significant upside potential. Our TP of $21 is a blended average of P/E, DCF, and Credit Suisse HOLT
® valuation.
Share price performance
16
21
26
Sep-12 Dec-12 Mar-13 Jun-13 Sep-13
Daily Sep 17, 2012 - Sep 17, 2013, 9/17/12 = US$19.16
Price Indexed S&P 500 INDEX
On 09/17/13 the S&P 500 INDEX closed at 1704.76
Quarterly EPS Q1 Q2 Q3 Q4 2012A 0.43 0.47 0.48 0.47 2013A 0.48 0.51 0.51 0.52 2014E 0.51 0.51 0.53 0.55
Financial and valuation metrics
Year 07/12A 07/13A 07/14E 07/15E EPS - (Excl. ESO) (US$) 1.85 2.02 2.10 2.13 EPS (CS adj.) (US$) 1.85 2.02 2.10 2.13 Prev. EPS (CS adj.) (US$) — — — — P/E (CS adj., x) 13.1 12.0 11.6 11.4 P/E rel. (CS adj., %) — 73.7 75.4 82.4 Revenue (US$ m) 46,061.0 48,607.0 50,822.9 53,655.8 EBITDA (US$ m) 15,338.0 16,033.0 16,289.8 16,322.9 Net debt (US$ m) 6,529 8,286 2,833 -2,316 OCFPS (US$) 2.13 2.40 2.47 2.47 P/OCF (x) 7.5 10.6 9.9 9.9
Number of shares (m) 5,361.55 Price/sales(x) 2.62 BV/share (Next Qtr., US$) — P/BVPS (x) 2.2 Net debt (Next Qtr., US$ m) — Dividend (current, US$) — Dividend yield (%) —
Source: Company data, Credit Suisse estimates.
Rating UNDERPERFORM* Price (17 Sep 13, US$) 24.37 Target price (US$) 21.00¹ 52-week price range 26.37 - 16.82 Market cap. (US$ m) 130,660.97
*Stock ratings are relative to the coverage universe in each
analyst's or each team's respective sector.
¹Target price is for 12 months.
Research Analysts
Kulbinder Garcha
212 325 4795
Andrew Ruben
212 325 4798
Vlad Rom
212 325 5442
Matthew Cabral
212 538 6260
Talal Khan, CFA
212 325 8603
Ray Bao
212 325 1227

18 September 2013
Cisco Systems Inc. (CSCO) 2
Table of Contents Proprietary Profits: How Long? 3 Networking to See Moderate Growth 5
A Nexus of Forces at Play for Networking 5 Carrier—Capex Moderate Growth 9 Enterprise Switching and Routing: +3.5% CAGR 17 Service Provider Switching & Routing: +5.5% CAGR 21
Scorecard—Cisco wins 26 What Makes a Networking Vendor Successful? 30
Wireless LAN—Secular Growth 33 Competitive Dynamics—Cisco Dominates 35
SDN—Reorienting Networking 39 SDN—Gradual but real adoption 42 Software Disrupting Networking 45
Networking—Is It So Special? SDN May Change That 46 Hardware and Software Decouple—Lessons from Sun 49 SDN Drives a Major Headwind on Profit Dollars 52 Mean Reversion on Margins 55
UCS—Gaining Share in Servers 57 x86 Server Outlook—Pockets of Strength 58 x86 Server Market—Positioning Critical 60 Cisco Gaining Share with UCS 63
Aiming for the IT Stack 68 Chasing TAM Expansion Is the Norm 68
IT Strategies in Evolution 72 The Industry Says…Cisco, IBM, and MSFT 73
Major Headwinds on Margins 76 Segmentation Analysis—UCS Dilutive 79 Building Software and Services Some Challenges 80 Mean Reversion on Margins 84 SDN Drives a Major Headwind on Profit Dollars 85 ASIC Strategy a Differentiator in an SDN World? 89 Huawei a Threat Not to Be Underestimated 90 Cost Management Has Been Strong of Late 94
Portfolio Refresh Helping Share 97 Switching Portfolio Refresh 97
Capital Distributions Could Move Higher 100 Could Cisco Do More? 100
Valuation—FV of $21 Per Share 104 Risks: Where Could We Be Wrong? 110 Management Team 113 Financial Statements 114

18 September 2013
Cisco Systems Inc. (CSCO) 3
Proprietary Profits: How Long? If there has been one constant in networking over the past 15 years, it has been Cisco.
Through multiple waves of technologies and competitors, Cisco has been able to
out-execute its rivals. At the same time, the company, along with Juniper, has benefited
from a highly vertically integrated structure in networking, where hardware, software, and
services are bundled. Combining this with the perceived value of networking within the IT
space and its impact on other areas has shown that network administrators are loathed to
disrupt it too rapidly. All these factors have led to an oligopolistic industry structure, where
vendors have been able to extract margins that resemble more of a monopoly. One
example of this is the gross margins in switching, which are estimated at 65-70%, notably
higher than other IT hardware categories such as servers and storage.
Exhibit 1: Cisco Summary Income Statement in US millions, unless otherwise stated
Revenue by segment FY12 FY13 FY14E FY15E FY16E
Switching 14,531 14,741 15,239 15,734 16,049
Routing 8,425 8,230 8,522 9,136 9,501
SP Video 3,858 4,852 4,836 4,806 4,857
DC 1,298 2,073 2,516 2,893 3,182
Wireless 1,669 2,166 2,708 3,077 3,385
Security 1,344 1,347 1,374 1,429 1,472
Collaboration 4,182 3,956 3,963 4,083 4,207
Other 1,019 664 398 359 323
Services 9,735 10,578 11,267 12,139 12,989
Revenue 46,061 48,607 50,823 53,656 55,965
yoy 6.6% 5.5% 4.6% 5.6% 4.3%
Consensus 50,944 53,895 57,639
Gross Profit 28,763 30,400 31,563 32,867 33,700
Gross Margin (%) 62.4% 62.5% 62.1% 61.3% 60.2%
Operating Income 12,736 13,682 14,431 14,654 14,727
Operating Margin (%) 27.7% 28.1% 28.4% 27.3% 26.3%
Net Income 10,017 10,866 11,485 11,714 11,815
Share Count 5,405 5,369 5,462 5,502 5,542
EPS ($) 1.85 2.02 2.10 2.13 2.13
yoy 14.4% 9.2% 3.9% 1.3% 0.1%
Consensus 2.11 2.29 2.49
Source: Factset, Company data, Credit Suisse estimates.
Simply put, we believe that the gradual onset of Software Defined Networking (SDN) will
radically change networking economics, driving a more competitive structure and
sustaining the long-term downward trend on gross margins. This implies that, while Cisco's
operating margin shrinks over time, EPS can remain flat driven by capital distribution.
Given this, we initiate coverage on Cisco with an Underperform rating and target price of
$21.
SDN—Some real drivers. The onset of SDN is driven by a very real and genuine
phenomena, which mainly includes changing and rapidly growing datacenter traffic and
the need for more flexible and automated application-specific networks. At its basic level,
the onset and uptake of SDN means that, while previous networking architectures
consisted of bundled hardware and software, these can now be separated effectively into
multiple planes, with functionality being increasingly abstracted away from hardware to
enable aggregation and management, functionality, and automation. To be clear, we
believe that the shift will be gradual, as our survey shows most enterprises currently are in
the proof-of-concept stage, with initial deployments over 18 months away, and production

18 September 2013
Cisco Systems Inc. (CSCO) 4
in scale to be a 2-5 years away. However, this new way of operating will bring with it new
competition at multiple levels, including at the hardware/data plane, the controller,
applications, and orchestration levels. The end result, in our view, is a much more
competitive structure for the networking markets, and consequently, lower margins.
Margins—Downward pressure. We reviewed the outlook for margins through five different
approaches, and the bias to profitability remains to the downside. As shown in Exhibit 104,
we project 26% long-term operating margins, given several factors:
Segmentation analysis—Negative UCS mix shift against the software and services upsell.
Our proprietary segmentation analysis for Cisco’s gross margins by business segment
reveals several major conclusions. First, and not surprisingly, UCS is materially gross
margin dilutive; we believe margins are around 30%, half of corporate levels, given that
growth will increasingly come from gaining share and, given the company's server
exposure, higher scale seems unlikely. Second, approximately 44% of incremental gross
profit dollars that Cisco targets in the medium-term come from the ability to sell additional
services. This strategy centers around both creating software-based solutions and
upselling incremental software functionality, which may prove difficult, especially given the
historically bundled nature of networking spend. Third, we forecast that there will be a
disruption to networking gross margins over time from SDN, which will result in profit
compression.
SDN could make networking look more like other areas of IT spend. Over a five-year view,
we believe SDN will alter the dynamics of the networking market, whereby at its most
basic level, hardware, software, and services may be delivered in a far less integrated
manner. Although it remains to be seen how the traditional networking vendors adapt to
this change, based on our analysis, we believe that SDN will present a major change and
headwind to gross profit dollars. Indeed, the networking industry structure in the longer
term could more closely resemble the server or storage industry which are more
competitive, with gross margins between 15 and 30 percentage points lower. We
compared the cost and total cost of ownership, ex-labor, running costs, etc. for a basic
Cisco datacenter switch (Nexus 3064) to an alternative in an SDN world (Cumulus Linux
software and top-of-line rack bare metal switch). We demonstrate that the Cumulus option
is some 70% cheaper per year, and as a result, gross profits of hardware and software are
a combined 74% lower. In other words, even if Cisco were to embrace SDN, the gross
profit dollars available would significantly shrink. While this is simplistic in many ways, it
highlights the headwinds facing the traditional margin structure of Cisco and something
that the software and services upsell may not easily offset. To be clear, we do not assume
such drastic declines in gross margins, but equally we do believe the pressure over time is
downwards.
Cost management has been solid but in danger of perennial restructuring. Cisco has been
continuously focused on managing its operating costs, highlighted by the recent 4,000
employee workforce rebalancing. Given these efforts, we assume a long-term opex to
sales ratio of 34% is sustainable. We would also note that on a revenue-per-head basis,
compared with other major IT companies, Cisco looks lean.
In traditional networking, Cisco should continue to dominate. In the traditional enterprise
networking, especially in switching, Cisco’s strategy is by far the most robust. Cisco has
continued to out execute its rivals consistently in the networking over time. Our scorecard
also shows that customers have long favored Cisco, with the company ranked first on our
overall scorecard, including number one positions on six metrics, such as roadmap,
salesforce, service offering, and IT portfolio. This level of dominance, though, is arguably
already reflected in its market share. Equally interestingly, on the most important metrics
of price and performance and reliability, Cisco is essentially on par with Juniper and
Huawei. This suggests Cisco’s incumbency, rather than technology, is the key
differentiator for the company. The real concern, as we discuss in detail, is that SDN
threatens the very structure of the industry in which Cisco operates.

18 September 2013
Cisco Systems Inc. (CSCO) 5
Networking to See Moderate Growth Within the context of a cyclical spending recovery, our bottom-up model suggests that the
networking industry, in aggregate, will grow at a rate of 4.2% per year. Given the different
purchasing patterns and products, we segment the market into enterprise and service
provider, and within each of these, look at three distinct product lines: Switching, Routing,
and WLAN. In aggregate, these three markets have an addressable opportunity of some
$53bn in the long term. Within this market we several important growth drivers:
A nexus of forces at play. Fundamentally, both service provider and enterprise networks
have a significant number of forces to drive revenue growth over time. These include: (1)
smartphone and tablet driven data traffic; (2) growth of internet based video; (3) elastic
cloud computing and business analytics; and (4 aggregate trends in carrier capex. We do
believe that through cycle these will produce a networking segment (defined as enterprise
and service provider switching and routing) growth rate of 4.2% per year, modestly higher
that aggregate IT. We note that IDC expects IT spending growth of approximately 5% per
annum going forward; however, as detailed in our May 30, 2013 report, titled "IT
Hardware: "Un"clouding Storage – EMC Shines," we expect this to be significantly less
given the compression effects of cloud.
Enterprise Ethernet switching, multiple mix changes. In 2012, the enterprise switching
market amounted to $19.8 billion in sales and has grown at a rate of 3% per annum over
the past five years, something which we believe will continue in the long term. Within this
we see 10GbE adoption driving both port and revenue growth, stimulated by Intel's Xeon
server chip release code-named "Romley" as well as server virtualization. Among Layer 2,
Layer 3, and chassis, we see 10GbE port adoption to rise to 25% in 2017, up from 6%
currently and only 0.3% five years ago. Additionally, we see Layer 3 switches continuing to
gain wallet share at the expense of Layer 2. We believe the added intelligence of Layer 3
switches removes the need for the manual configuration historically required within
enterprise networks, which is especially important in virtualized infrastructures, as L3
switches are able to abstract away a myriad of VLANs. Finally, we see chassis switches
under macro and secular pressure.
Service provider routing. In examining trends within the service provider (SP) market, we
begin by focusing on routers that accounted $11.3 billion out of $14.2 billion in total service
provider spend in 2012. In revenue terms, the market has shown significant growth over
the past five years, expanding at a pace of 7.9% per annum, which is far faster than
growth on the enterprise side. Within this segment, we see core routers losing wallet share
within spend, as spending within the core of the network tends to be a function of capacity,
and recently service providers have been trying to prolong spend within the area as long
as possible. We see edge routing as the primary source of growth, rising 6.3% in the long
term. The tailwind to edge routing spend has been the tremendous growth in smartphones
and the resulting growth in mobile data consumption. We believe a key driver here will be
LTE that enables both voice and data to travel across IP networks, leading to converged
IP solutions across service providers' networks.
A Nexus of Forces at Play for Networking
We see several fundamental drivers at play for the networking market, as the major
secular trends of social, mobile, cloud, and big data analytics place considerable strains
on today’s networking infrastructure. These forces are playing out on both the carrier side
and enterprise side, essentially creating what Gartner describes as a nexus of forces. This
suggests that there remains healthy underlying growth ultimately driven by IP traffic growth
Global IP traffic growing at the rate of 23%. The Cisco Visual Networking Index highlights
that growth of aggregate IP traffic in the long term should be at a rate of 23% per year,
rising to 120 EB in 2017. Of this traffic, 68% will still reside on the fixed internet, whereas
23% will be on managed IP networks, and finally 9% will be driven from mobile data.

18 September 2013
Cisco Systems Inc. (CSCO) 6
Exhibit 2: Global IP Traffic Distribution... Exhibit 3: ...A Skew Towards Consumer Use
0
20,000
40,000
60,000
80,000
100,000
120,000
140,000
2012 2013 2014 2015 2016 2017Fixed Internet Managed IP Mobile data
0
20,000
40,000
60,000
80,000
100,000
120,000
140,000
2012 2013 2014 2015 2016 2017Consumer Business
Source: Cisco Visual Networking Index. Source: Cisco Visual Networking Index.
Smartphone and tablet adoption will be key. Long-term (2012-17) mobile data is expected
to grow at a CAGR of some 66%. Of this segment, 72% of this traffic will come from
smartphones with a further 13% from tablets. Here, the driver is not only the impact of user
growth of the installed base, but also the impact of the multiplier effect. For example,
compared with a non-smartphone user, a typical smartphone user may use 50 times as
much traffic, whereas a tablet user may use 120 times as much. (See Exhibit 5.)
Exhibit 4: Smartphones Lead Traffic Growth Exabytes per month
Exhibit 5: Summary of Per Device Usage Growth in MB per Month
0.0
2.0
4.0
6.0
8.0
10.0
12.0
2012 2013E 2014E 2015E 2016E 2017E
Exab
yte
s p
er
mo
nth
Smartphones Tablets Other Portables Laptops M2M Non-Smartphones
Device Type 2012
2012*
Multiple2017
2017*
Multiple
Non-Smartphones 7 1.0x 31 1.0x
M2M Module 64 9.4x 330 10.6x
Smartphone 342 50.3x 2,660 85.8x
4G Smartphone 1,302 191.5x 5,114 165.0x
Tablet 820 120.6x 5,387 173.8x
Laptop 2,503 368.1x 5,731 184.9x
* Multiple of non-smartphone device usage Source: Cisco Visual Networking Index. Source: Cisco Visual Networking Index.
Video highlights. It is expected that by 2017 consumer internet video traffic will be 69% of
all consumer internet traffic, up from 57% in 2012. If one were to include video exchanged
through P2P sharing, VoD, and TV, the range would be 80-90% of all global consumer
traffic by 2017. Within this, internet video to TV is expected to increase 5 times by 2017
and VoD traffic in 2017 is expected to be equivalent to 6bn DVDs per month. By 2017 65%
of all Internet video traffic is expected to cross content delivery networks in 2017, up from
53% in 2012.

18 September 2013
Cisco Systems Inc. (CSCO) 7
Exhibit 6: Internet Video Growing to ~70% of All Consumer Internet Traffic by 2017
0%
10%
20%
30%
40%
50%
60%
70%
80%
90%
100%
2012 2013 2014 2015 2016 2017
Internet video Web, Email and Data File Sharing Online Gaming
Source: Cisco Visual Networking Index.
Networking lifecycle. Like all IT hardware, appliances have an essential useful life. Several
factors determine the useful life of an asset including replacement costs, ongoing
operating costs, industry innovation, and vendor support. Based on Gartner data,
highlighted in Exhibit 7, the useful life for edge LAN switching is the longest at seven to ten
years, with core switching and routing coming in at a useful life of five to seven years.
Datacenter networking has a modestly lower useful life of four to seven years, which
makes sense given more disruptive changes.
Exhibit 7: Core Switching and Routing Product Life Is Somewhat Longer Than
Datacenter Networking Product
-
2.0
4.0
6.0
8.0
10.0
12.0
Useful Life Depreciation
Source: Gartner.
This corresponds with our own survey work that suggests that the average installed base
of enterprise switching equipment is 3.5 years. (See Exhibit 8.) As the age of the installed
base continues to move toward the useful life, in a normalized environment, we would
expect to see a replacement cycle across both switching and routing spend. However, it is
important to keep in mind that across the various end markets within IT hardware

18 September 2013
Cisco Systems Inc. (CSCO) 8
(Servers, Storage, PCs, Printers, etc.), organizations are choosing to run their existing
equipment longer, which prolongs the upgrade cycle.
Exhibit 8: On Average, the Installed Base of Ethernet Switches Is ~3.5 Years
Respondents asked the average life of an Ethernet switch
2.5
2.7
2.9
3.1
3.3
3.5
3.7
3.9
0%
5%
10%
15%
20%
25%
30%
35%
40%
45%
50%
Less than 1year
1-2 years 3-5 years 5-7 years 7-9 years 10 years ormore
Year
s
Perc
en
tage
of
resp
on
den
ts
Source: Credit Suisse Networking Survey August 2013.
Credit Suisse CIO Survey supportive of networking growth into 2014. Our proprietary
survey of 40 enterprise CIOs suggests that overall IT spending growth in 2014 will likely
mirror that of 2013. (See Exhibit 9).
Exhibit 9: IT Spending Growth in 2014 to Equal 2013
Respondents asked for y/y growth rates for IT spending
1.71% 1.78%
0.0%
1.0%
2.0%
3.0%
4.0%
5.0%
2013 (vs. 2012) 2014 (vs. 2013)
YoY
gro
wth
in IT
sp
end
Source: Credit Suisse IT Spending Survey August 2013.
While not the highest priority item within enterprise budgets, networking spend continues
to stand out relative to other hardware markets and falls roughly in the middle of overall
priorities. (See Exhibit 10 and Exhibit 11.)

18 September 2013
Cisco Systems Inc. (CSCO) 9
Exhibit 10: Networking in the Middle of Priorities… % of respondents ranking IT segments as top spending areas
Exhibit 11: …as Reflected in Growth Expectations 2013 annual revenue growth for IT spending by category
0%
5%
10%
15%
20%
25%
30%
35%
40%
45%
-1.5%
-1.0%
-0.5%
0.0%
0.5%
1.0%
1.5%
2.0%
2.5%
Printing PC Server Services Software Networking Storage Security Overall IT MobileDevices and
Services
YoY
IT s
pen
d g
row
th f
or
20
13
Source: Credit Suisse CIO Survey August 2013. Source: Credit Suisse CIO Survey August 2013.
Carrier—Capex Moderate Growth
With 38% of the networking market coming from the service provider market, capital
expenditure trends and fundamentals remain important to the outlook for switching and
routing. Following our detailed analysis of wireless capex, for which we have updated our
proprietary model (which tracks spend at over 100 leading carriers globally), we see
accelerating growth ahead driven by a recovery with Western Europe, continued high
levels of spending in the United States, and a strong roll out in China for LTE.
Europe Weak Capex Trends So Far, Are Things about to Change?
Vodafone has been gradually increasing its capex investments in Europe recently.
Vodafone has been maintaining flat capex spend for its European operations similar to its
group level trend over the past two to three years. However, in its FY13 (ending March
2013), it is worth noting that although group capex was roughly flat, its capex spend in
Europe actually grew 7% yoy, mainly driven by investments in Germany and the UK.
Figure 12: Vodafone Capex Spend in Europe Has Already Seen Some Pick Up in Early 2013 in GBP millions, unless otherwise stated; Vodafone financial year ending March
Vodafone capex (£ mn) H1 10/11 H2 10/11 H1 11/12 H2 11/12 H1 12/13 H2 12/13 FY 09/10 FY 10/11 FY 11/12 FY 12/13
Vodafone Germany 342 482 410 470 445 628 766 824 880 1,073
% change yoy 3% 11% 20% -2% 9% 34% 8% 7% 22%
Vodafone UK 178 338 219 356 231 370 494 516 575 601
% change yoy 26% -4% 23% 5% 5% 4% 4% 11% 5%
Vodafone Italy 260 330 269 352 239 328 610 590 621 567
% change yoy -13% 6% 3% 7% -11% -7% -3% 5% -9%
Vodafone Spain 220 297 147 282 152 225 543 517 429 377
% change yoy 29% -20% -33% -5% 3% -20% -5% -17% -12%
Vodafone Other Europe 521 709 497 595 417 823 1,282 1,230 1,092 1,240
% change yoy 11% -13% -5% -16% -16% 38% -4% -11% 14%
Total Vodafone Europe 1,521 2,156 1,542 2,055 1,484 2,374 3,695 3,677 3,597 3,858
% change yoy 8% -6% 1% -5% -4% 16% 0% -2% 7%
Source: Company data, Credit Suisse research
But now Vodafone is looking to break the vicious circle with £6bn investment over three
years? At the time of the Verizon deal (September 2013), Vodafone also unveiled its plan
to increase investments significantly over the next three years to enhance network quality
and drive service leadership. As a reminder, Vodafone has maintained capex at around
£6.3bn over the past couple of years, but under its new Project Spring, the carrier plans to
invest £6bnof incremental investment over the next three years with the majority of spend
directed towards capex. This would imply a capex increase of slightly over 30% yoy from
the current level. In fact, as per Vodafone, it plans to spend 45-50% of the £6bn on the

18 September 2013
Cisco Systems Inc. (CSCO) 10
mobile network, with an additional 20-25% likely spent in the area of NGN, VDSL, and
selective fiber rollouts.
Figure 13: 65-75% of Incremental Investment under Vodafone's Project Spring Will Be Directed Towards Networks
Source: Vodafone.
"Capex arms race is better than a subsidy race" as per Vodafone CEO. While it is still
early days to see how other carriers in Europe react to this aggressive stance from
Vodafone in terms of increasing investment to improve upon the quality of the network, we
would note that this is the first time in years that we have seen some real intent from a
European carrier to focus on network quality as a form of creating differentiation among
the consumer base. Judging by comments from the CEO of Vodafone, it seems that this
shift in strategy from the company may eventually force other bigger players in Europe
(such as DT, Telefonica, and France Telecom) to follow suit, which could then lead to a
situation similar to that which we saw in the United States over the past two to three years.
"I don't know what a capex arms race is. If that's the case then it's better than a
subsidy race because it requires real long-term orientation. It requires taking
money out of some commercial costs, which could be good because at the end of the
day it's a positive for the industry if everybody focuses on quality and investment as
opposed to promotion and short-term. I don't think it will happen. I think some other
competitors, the ones with bigger shoulders, will follow and I think in the end it
will help the industry structure." – Vittorio Colao, CEO of Vodafone Group
(September 3, 2013)
Vodafone represents ~25% of Western European capex. What if others follow with capex
upgrades? We estimate Vodafone represents around 25% of overall wireless capex in
Western Europe. Given Vodafone has decided to increase its capex from £6.3bn to
around £8.3bn per annum over the next three years (implies around 30% increase), we
believe this may put pressure on other operators in the region to follow suit. On the other
hand, our European Telecoms team (Justin Funnell) notes that some of the challenger
operators in Europe continue to struggle owing to declining revenues and a lack of share
gains, for example Yoigo in Spain, Wind in Italy, Everything Everywhere and 3 in the UK,
and may lack the financial resources to increase capex investments. However, we believe
this decision from Vodafone is at least likely to put pressure on bigger operators in Europe
(Deutsche Telekom, Telefonica, and France Telecom) to respond by increasing
investments to improve network quality.

18 September 2013
Cisco Systems Inc. (CSCO) 11
Figure 14: Can the Capex to Sales Ratio in W. Europe Rise Similar to the United States?
13.3%12.4%
14.2%14.8%
16.2%
18.3%
10.0% 9.6% 9.9%
11.3%12.4% 12.1%
0%
5%
10%
15%
20%
2008 2009 2010 2011 2012 1H13
Wir
ele
ss
-C
ap
ex t
o S
erv
ice
Re
ve
nu
e (
%)
US W Europe
Source: Company data, Credit Suisse research, EU Telecoms Research team (Justin Funnell).
Capex to sales significantly behind in WE when compared with the United States. Capex
trends within Europe have been lackluster over the past few years with most carriers
looking to maintain flat investment levels. Further, with service revenues having been
under pressure, the capex to sales ratio has seen a slight improvement in spite of flat
capex. When comparing this with the United States, what is striking is that service
revenues have grown at around 5% pa, but wireless capex has grown significantly faster
resulting in the capex to sales ratio rising from nearly 12.5% in 2009 to slightly over 18% in
1H13. When comparing this with Western Europe, we see that the capex to sales ratio has
only picked up from around 10% in 2009 to 12% in 1H13.
United States to Continue to See High Levels of Capex Activity
What is worth noting is that wireless capex in the United States has seen strong growth
over the past few years. In fact, based on our estimates, we believe that wireless capex is
likely to have grown from $20bn in 2009 to around $34bn in 2013 (CAGR of 15%) driven
by a move from carriers to improve the quality of their networks in order to drive
differentiation and roll out of 4G/LTE networks. (See Exhibit 15.) Looking at guidance from
carriers, we believe that wireless capex spend may remain flat in 2014. We would equally
note that it is already running at a high level of slightly over $34bn per annum. In addition,
we believe there may be risks to the upside to 2014 guidance as carriers continue to look
for ways to differentiate by improving the quality of their 4G networks.
Exhibit 15: Wireless Capex in the United States Likely to Grow to $34bn in 2013, and Remain at There for 2014 in US$ millions, unless otherwise stated
Wireless Capex (US$ mn) Q112 Q212 Q312 Q412 Q113 Q213 2009 2010 2011 2012 2013E 2014E
Verizon 1,885 2,048 2,133 2,791 1,992 2,278 7,152 8,438 8,973 8,857 9,675 9,650
AT&T 2,324 2,345 2,709 3,422 2,500 3,450 6,066 9,171 9,759 10,800 12,750 13,000
Sprint 710 1,012 1,376 1,786 1,706 1,728 1,161 1,444 2,416 4,884 7,425 7,475
T-Mobile US 747 539 717 898 1,230 1,111 3,687 2,819 2,729 2,901 4,300 4,100
Leap 146 119 106 63 26 23 680 399 442 434 150 200
MetroPCS 144 182 262 258 832 790 890 846
Total (US$ mn) 5,956 6,245 7,303 9,217 7,454 8,590 19,578 23,061 25,208 28,722 34,300 34,425
% change yoy -2% -8% 21% 46% 25% 38% 0% 18% 9% 14% 19% 0%
Source: Company data, Credit Suisse estimates.
Wireless capex to sales ratio also rose by around 4pp in the past three years. One of the
factors that has helped this continued increase in capex investment across all U.S. carriers
18 September 2013
Cisco Systems Inc. (CSCO) 12
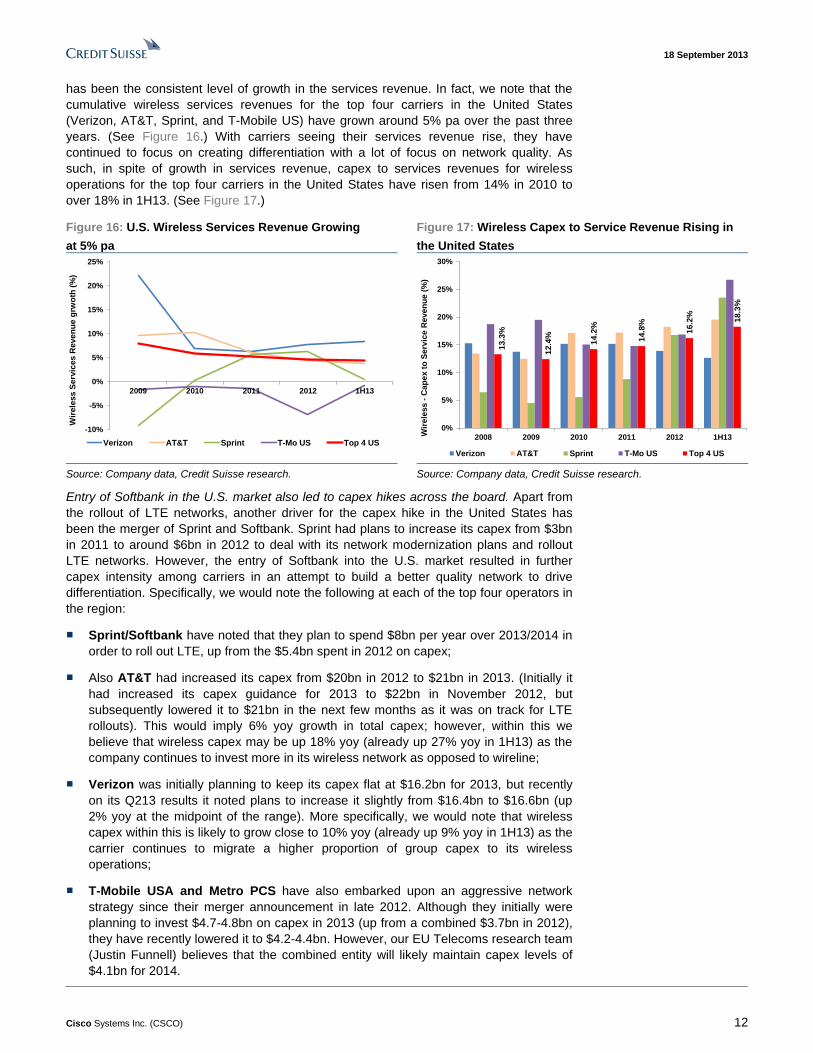
has been the consistent level of growth in the services revenue. In fact, we note that the
cumulative wireless services revenues for the top four carriers in the United States
(Verizon, AT&T, Sprint, and T-Mobile US) have grown around 5% pa over the past three
years. (See Figure 16.) With carriers seeing their services revenue rise, they have
continued to focus on creating differentiation with a lot of focus on network quality. As
such, in spite of growth in services revenue, capex to services revenues for wireless
operations for the top four carriers in the United States have risen from 14% in 2010 to
over 18% in 1H13. (See Figure 17.)
Figure 16: U.S. Wireless Services Revenue Growing
at 5% pa
Figure 17: Wireless Capex to Service Revenue Rising in
the United States
-10%
-5%
0%
5%
10%
15%
20%
25%
2009 2010 2011 2012 1H13
Wir
ele
ss
Serv
ices
Reve
nu
e g
rwo
th (
%)
Verizon AT&T Sprint T-Mo US Top 4 US
13.3
%
12.4
%
14.2
%
14.8
%
16.2
%
18.3
%
0%
5%
10%
15%
20%
25%
30%
2008 2009 2010 2011 2012 1H13Wir
ele
ss
-C
ap
ex t
o S
erv
ice R
eve
nu
e (
%)
Verizon AT&T Sprint T-Mo US Top 4 US
Source: Company data, Credit Suisse research. Source: Company data, Credit Suisse research.
Entry of Softbank in the U.S. market also led to capex hikes across the board. Apart from
the rollout of LTE networks, another driver for the capex hike in the United States has
been the merger of Sprint and Softbank. Sprint had plans to increase its capex from $3bn
in 2011 to around $6bn in 2012 to deal with its network modernization plans and rollout
LTE networks. However, the entry of Softbank into the U.S. market resulted in further
capex intensity among carriers in an attempt to build a better quality network to drive
differentiation. Specifically, we would note the following at each of the top four operators in
the region:
■ Sprint/Softbank have noted that they plan to spend $8bn per year over 2013/2014 in
order to roll out LTE, up from the $5.4bn spent in 2012 on capex;
■ Also AT&T had increased its capex from $20bn in 2012 to $21bn in 2013. (Initially it
had increased its capex guidance for 2013 to $22bn in November 2012, but
subsequently lowered it to $21bn in the next few months as it was on track for LTE
rollouts). This would imply 6% yoy growth in total capex; however, within this we
believe that wireless capex may be up 18% yoy (already up 27% yoy in 1H13) as the
company continues to invest more in its wireless network as opposed to wireline;
■ Verizon was initially planning to keep its capex flat at $16.2bn for 2013, but recently
on its Q213 results it noted plans to increase it slightly from $16.4bn to $16.6bn (up
2% yoy at the midpoint of the range). More specifically, we would note that wireless
capex within this is likely to grow close to 10% yoy (already up 9% yoy in 1H13) as the
carrier continues to migrate a higher proportion of group capex to its wireless
operations;
■ T-Mobile USA and Metro PCS have also embarked upon an aggressive network
strategy since their merger announcement in late 2012. Although they initially were
planning to invest $4.7-4.8bn on capex in 2013 (up from a combined $3.7bn in 2012),
they have recently lowered it to $4.2-4.4bn. However, our EU Telecoms research team
(Justin Funnell) believes that the combined entity will likely maintain capex levels of
$4.1bn for 2014.
18 September 2013
Cisco Systems Inc. (CSCO) 13
LATAM to Pick Up as LTE Networks Are Beginning to Be Deployed
With deadlines in place for a rollout of LTE networks in Brazil, we believe all four operators
in the country—Vivo, Claro, TIM, and Oi—will likely step up their efforts to deploy LTE
networks across a number of cities over the next 12-24 months. In fact, as per the
coverage plans, it is expected that operators are likely to extend LTE coverage to all cities
with more than 500,000 population by May 2014. (See Exhibit 18.)
Exhibit 18: 4G Coverage Plans in Brazil Suggest Significant Activity in the Next 12
Months
Deadline Coverage Plans
Apr 2013 All cities hosting the Confederations Cup 2013
Dec 2013 All cities hosting and co-hosting the World Cup 2014
May 2014 All capitals and cities having more than 500K inhabitants
Dec 2015 All cities having more than 200K inhabitants
Dec 2016 All cities having more than 100K inhabitants
Dec 2017 All cities having between 30K and 100K inhabitants
Source: Teleco Brazil, Credit Suisse research.
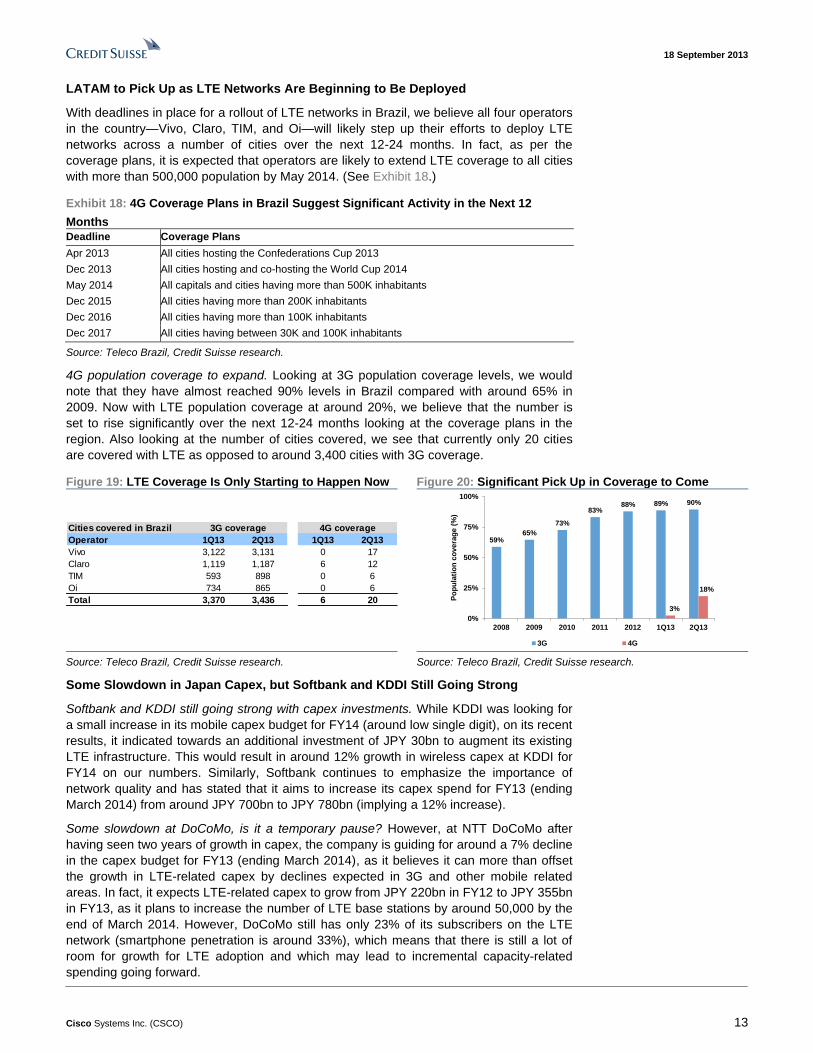
4G population coverage to expand. Looking at 3G population coverage levels, we would
note that they have almost reached 90% levels in Brazil compared with around 65% in
2009. Now with LTE population coverage at around 20%, we believe that the number is
set to rise significantly over the next 12-24 months looking at the coverage plans in the
region. Also looking at the number of cities covered, we see that currently only 20 cities
are covered with LTE as opposed to around 3,400 cities with 3G coverage.
Figure 19: LTE Coverage Is Only Starting to Happen Now Figure 20: Significant Pick Up in Coverage to Come
Cities covered in Brazil
Operator 1Q13 2Q13 1Q13 2Q13
Vivo 3,122 3,131 0 17
Claro 1,119 1,187 6 12
TIM 593 898 0 6
Oi 734 865 0 6
Total 3,370 3,436 6 20
3G coverage 4G coverage
59%65%
73%
83%88% 89% 90%
3%
18%
0%
25%
50%
75%
100%
2008 2009 2010 2011 2012 1Q13 2Q13
Po
pu
lati
on
co
vera
ge (
%)
3G 4G Source: Teleco Brazil, Credit Suisse research. Source: Teleco Brazil, Credit Suisse research.
Some Slowdown in Japan Capex, but Softbank and KDDI Still Going Strong
Softbank and KDDI still going strong with capex investments. While KDDI was looking for
a small increase in its mobile capex budget for FY14 (around low single digit), on its recent
results, it indicated towards an additional investment of JPY 30bn to augment its existing
LTE infrastructure. This would result in around 12% growth in wireless capex at KDDI for
FY14 on our numbers. Similarly, Softbank continues to emphasize the importance of
network quality and has stated that it aims to increase its capex spend for FY13 (ending
March 2014) from around JPY 700bn to JPY 780bn (implying a 12% increase).
Some slowdown at DoCoMo, is it a temporary pause? However, at NTT DoCoMo after
having seen two years of growth in capex, the company is guiding for around a 7% decline
in the capex budget for FY13 (ending March 2014), as it believes it can more than offset
the growth in LTE-related capex by declines expected in 3G and other mobile related
areas. In fact, it expects LTE-related capex to grow from JPY 220bn in FY12 to JPY 355bn
in FY13, as it plans to increase the number of LTE base stations by around 50,000 by the
end of March 2014. However, DoCoMo still has only 23% of its subscribers on the LTE
network (smartphone penetration is around 33%), which means that there is still a lot of
room for growth for LTE adoption and which may lead to incremental capacity-related
spending going forward.

18 September 2013
Cisco Systems Inc. (CSCO) 14
Figure 21: Japan Capex to Continue to Grow Mid-Single Digit in Spite of Expected Slowdown at DoCoMo
Wireless Capex (JPY bn) Mar
2011
Jun
2011
Sep
2011
Dec
2011
Mar
2012
Jun
2012
Sep
2012
Dec
2012
Mar
2013
Jun
2012
Mar
2011
Mar
2012
Mar
2013
Mar
2014E
NTT DoCoMo 200 137 175 190 225 177 184 180 213 146 668 727 754 700
Softbank 170 101 120 115 180 106 152 190 250 181 421 516 698 780
KDDI 96 49 64 79 112 68 83 85 103 69 339 304 338 380
Total 466 287 360 384 517 352 419 454 565 395 1,428 1,547 1,790 1,860
% change 11% 9% 3% 11% 23% 16% 18% 9% 12% 8% 16% 4%
Source: Company data, Credit Suisse estimates.
Capex Spend to Pick Up in Korea after Weak 1H13 Post Spectrum Auctions
Wireless capex spend in Korea has grown from KRW 2.9tn in 2010 to KRW 5.9tn in 2012
due to increased levels of investment on existing 3G capacity and preparing for the rollout
of LTE services. In addition, within total capex we also saw a significant shift towards
wireless operations, especially at KT Corp and LG U+. However, with the impending
spectrum auctions during Q313, capex spend in Korea took a significant pause in 1H13. In
fact, total capex spend in 1H13 in Korea was down 34% yoy but more importantly
wireless-related capex was down 46% yoy.
Figure 22: Korean Capex under Pressure in 1H due to Spectrum Auctions, Expect Strong Pick Up in 2H13
Wireless Capex (KRW bn) Q111 Q211 Q311 Q411 Q112 Q212 Q312 Q412 Q113 Q213 2010 2011 2012 2013E
SK Telecom 243 472 419 708 424 555 708 867 322 223 1,390 1,842 2,554 1,600
KT Corp 363 457 394 393 661 560 262 622 247 182 1,086 1,608 2,105 1,600
LG U+ 44 93 285 424 275 309 292 322 265 256 401 846 1,198 1,100
Total 650 1,022 1,098 1,525 1,360 1,424 1,262 1,811 834 661 2,876 4,296 5,857 4,300
% change 204% 70% 51% 14% 109% 39% 15% 19% -39% -54% 49% 36% -27%
Source: Company data, Credit Suisse estimates.
However, guidance suggests 65% of FY capex to be spent in 2H13. The spectrum auction
results in Korea were determined in the last week of August, and our Korea Telecom
analyst (Taewon Kim) views these results to be a positive for the overall telecom sector in
Korea, given reasonable levels of cost involved in spectrum purchase. While overall
wireless capex for 2013 will be down around 25% yoy given the weak spend in 1H, we still
expect a material uptick in capex spend in 2H13. In fact, we estimate that carriers have
only spent 35% of their FY capex in 1H; we believe that 2H capex spend could be around
KRW 2.8tn (up around 88% hoh).
Figure 23: LTE Penetration in Korea Now Stands at over 40%; But Still Lots to Go
7%
13%
22%
29
%
36%
42%
0%
10%
20%
30%
40%
50%
60%
Q112 Q212 Q312 Q412 Q113 Q213
LT
E p
en
etr
ati
on
(%
)
SK Telecom KT Corp LG U+ Korea Market
Source: Company data, Credit Suisse research.

18 September 2013
Cisco Systems Inc. (CSCO) 15
LTE penetration continues to rise. Korea has been one of the most advanced markets
when it comes to LTE rollouts and levels of consumer adoption. While Korea has already
seen strong LTE penetration over the past few quarters (with 42% of mobile subscribers
now on LTE networks as opposed to only 13% a year ago, as we show in Figure 23);
however, we would note that it still stands at less than 45%. This in our view could result in
continued levels of investment from Korean operators as they prepare to deal with a
growing level of LTE subscribers on their network along with rising usage patterns.
China Pushing on LTE
At its recent 1H results, China Mobile (CM) reiterated its full-year capex plans of
Rmb190bn for 2013, up from Rmb127bn in 2012. Note these numbers do not include
TD-SCDMA (3G) related capex as, it is done at the parent company level, but does
include TD-LTE related capex, which is being planned at the listed company level. If we
were to include around Rmb20bn of TD-SCDMA related capex in our numbers for both
2012 and 2013, we estimate that the total capex at China Mobile may be around
Rmb210bn, up from close to Rmb150bn in 2012.
Exhibit 24: CM Has Retained Rmb190bn of Capex
Guidance Breakdown of capex at listed company and parent company levels
Exhibit 25: Significant Capex Budget for 2H due to LTE Breakdown of listed company capex at China Mobile (1H/2H)
136.3 129.4 124.3 128.5 127.4
190.2
30.0 40.023.0 21.0 20.7
22.0
166.3 169.4
147.3 149.5 148.1
212.2
0
50
100
150
200
250
2008 2009 2010 2011 2012 2013E
Cap
ex
at
Ch
ina
Mo
bile
(R
mb
bn
)
TD-SCDMA GSM, TD-LTE and Others
6671
6367
62 63 6267
59
69
57
133
0
20
40
60
80
100
120
140
1H
08
2H
08
1H
09
2H
09
1H
10
2H
10
1H
11
2H
11
1H
12
2H
12
1H
13
2H
13EC
hin
a M
ob
ile
lis
tco
ca
pex
1H
/2H
(R
mb
bn
)
Source: Company data, Credit Suisse estimates. Source: Company data, Credit Suisse research estimates
This planned increase in capex is mainly driven by aggressive TD-LTE network
deployment plans at China Mobile given weak subscriber uptake of its TD-SCDMA (3G)
services, as opposed to other players in the market such as China Telecom and China
Unicom.
Figure 26: Increase in Mobile Comm Capex Due to LTE Planned breakdown of capex by area of spend
Figure 27: TD-LTE Related Capex of Rmb41.5bn for 2013 Breakdown of capex for 2013 in detail
54.773.2
56.1
79.9
28.6
23.135.7
59.0
124.3 128.5 127.4
190.2
0
20
40
60
80
100
120
140
160
180
200
2010 2011 2012 2013E
Ca
pe
x a
t C
hin
a M
ob
ile
lis
tco
(R
mb
bn
)
Others
Buildings &Infrastructure
SupportSystems
BusinessDevelopment
Transmission
MobileCommunicationNetworks
44%57%
44% 42%
23%
18%
28% 31%
13%6%
6% 6%
7% 6% 8% 6%
9% 9% 11% 13%4% 4% 3% 2%
0%
10%
20%
30%
40%
50%
60%
70%
80%
90%
100%
2010 2011 2012 2013E
Others Buildings & Infrastructure
Support Systems Business Development
Transmission Mobile Communication Networks
TD-LTE52%
GSM + WLAN + Core48%
Source: Company data, Credit Suisse research estimates Source: Company data, Credit Suisse research estimates
1H spending has been weak, so pick-up expected in 2H. Out of the Rmb190bn of FY
capex guidance from China Mobile at the listed company level, it has only spent Rmb57bn
18 September 2013
Cisco Systems Inc. (CSCO) 16
in 1H13, which implies around Rmb133bn to be spent in 2H13. This is surprisingly high in
our view, given the company has not spent this level of capex in any six-month period over
the past five years. So the question remains whether the company will spend all of the
Rmb41.5bn on TD-LTE in 2H13, or some of that spending may potentially get pushed in to
2014 as we see these networks being rolled out.
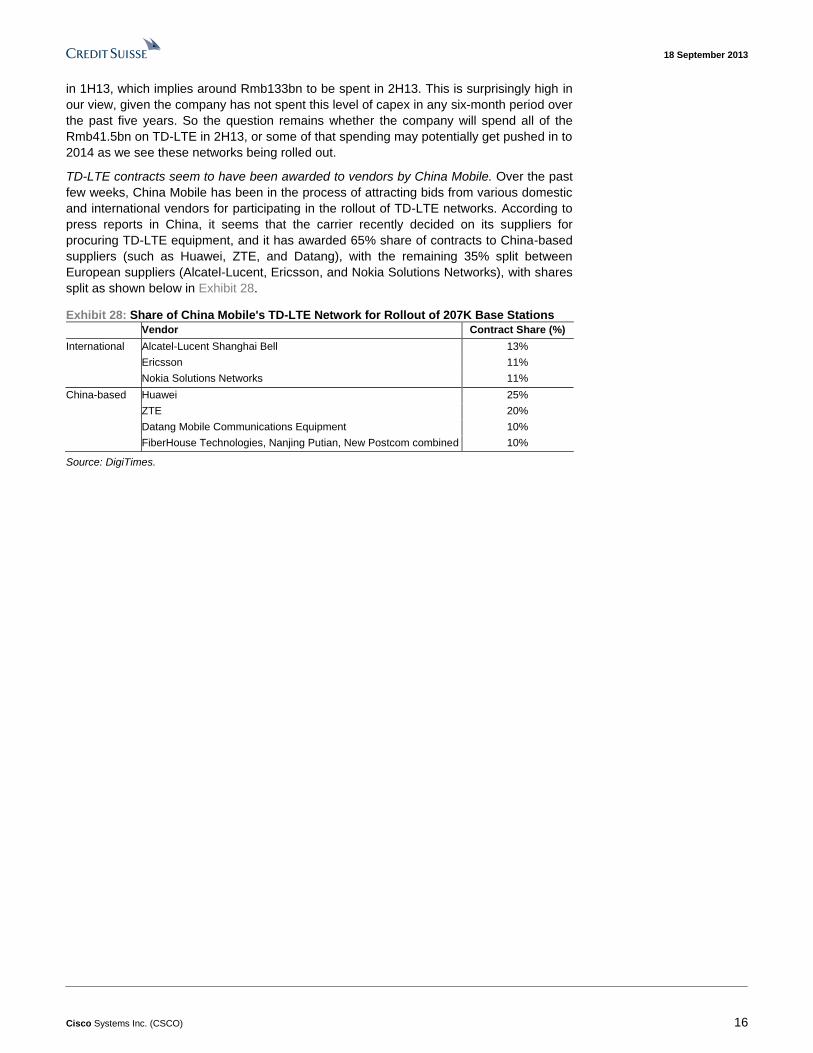
TD-LTE contracts seem to have been awarded to vendors by China Mobile. Over the past
few weeks, China Mobile has been in the process of attracting bids from various domestic
and international vendors for participating in the rollout of TD-LTE networks. According to
press reports in China, it seems that the carrier recently decided on its suppliers for
procuring TD-LTE equipment, and it has awarded 65% share of contracts to China-based
suppliers (such as Huawei, ZTE, and Datang), with the remaining 35% split between
European suppliers (Alcatel-Lucent, Ericsson, and Nokia Solutions Networks), with shares
split as shown below in Exhibit 28.
Exhibit 28: Share of China Mobile's TD-LTE Network for Rollout of 207K Base Stations
Vendor Contract Share (%)
International Alcatel-Lucent Shanghai Bell 13%
Ericsson 11%
Nokia Solutions Networks 11%
China-based Huawei 25%
ZTE 20%
Datang Mobile Communications Equipment 10%
FiberHouse Technologies, Nanjing Putian, New Postcom combined 10%
Source: DigiTimes.

18 September 2013
Cisco Systems Inc. (CSCO) 17
Enterprise Switching and Routing: +3.5% CAGR
Enterprise Ethernet Switching
Diving into specific segments of networking spend, we begin by exploring the enterprise
Ethernet switch market. In 2012, in aggregate, the market was $19.8 billion and has grown
at a rate of 3.0% per annum over the past five years. Within this, shifts are underway that
have important implications for the trajectory of the industry going forward, including
broader adoption of 10GbE ports and the preference for Layer 3 over Layer 2 switches.
10GbE adoption drives both port and revenue growth. While 10 gigabit Ethernet ports
have been available for nearly ten years, Intel's Xeon server chip release code-named
"Romley" paved the way for rampant adoption as it standardized 10GbE
"LAN-on-Motherboard" across both blade and rack-mounted servers. Further, server
virtualization is a secular driver of 10GbE adoption as increased utilization of the physical
compute hardware results in higher data traffic. While many enterprises continue to
operate with a mix of legacy and modern technologies, replacement cycles coupled with
new datacenter build-outs should continue to drive adoption within the enterprise switching
market. Further, while use cases for 10GbE outside the datacenter are somewhat nascent
now, increasing use of end-user video and voice over traditional enterprise networks
should over time drive adoption within campus environments as well. As seen in Exhibit 29,
Exhibit 30, and Exhibit 31, we expect 10GbE adoption to rise to 25% in 2017, up from 6%
now and only 0.3% five years ago.
Exhibit 29: 10GbE Non-Existent in 2007 Exhibit 30: 6% of the Market Now Exhibit 31: Growing to 25% in 2017
Enterprise switch ports by port speed. Note: excludes web-managed and un-managed ports
40GbE+, 0.0%
10GbE, 0.3%
1GbE and below,
99.7%
40GbE+, 0.1%
10GbE, 6.4%
1GbE and below,
93.6%
40GbE+,
0.6%
10GbE,
24.6%
1GbE and
below,
74.8%
Source: Infonetics. Source: Infonetics. Source: Infonetics, Credit Suisse estimates
Layer 3 switches to continue gaining wallet share at the expense of Layer 2. Another
growing trend within datacenters has been an increasing use of Layer 3 (L3) switches,
often at the expense of Layer 2 (L2) switches. The added intelligence of Layer 3 switches
removes a lot of the manual configuration historically required within enterprise networks,
which is especially important within virtualized infrastructures, as L3 switches are able to
abstract away distinct, proliferating, and difficult-to-manage VLANs. Legacy datacenter
networks were built with a three-tier model with L2 switches at the top of the server rack,
the end of the server row, and then at the aggregation layer before connecting to a router.
However, in many cases the added functionality of Layer 3 switches removes the need for
one of the tiers, whether through the use of fabric extenders or otherwise. Looking forward,
we expect these growth trajectories to continue as the modest incremental cost (only 5%
for a 10GbE port) of Layer 3 switches is offset by the ease of management and ability to
utilize less hardware. Outside of datacenter environments, we expect Layer 2 switches to
continue to prevail and port growth to be a function of device growth, although it is
18 September 2013
Cisco Systems Inc. (CSCO) 18
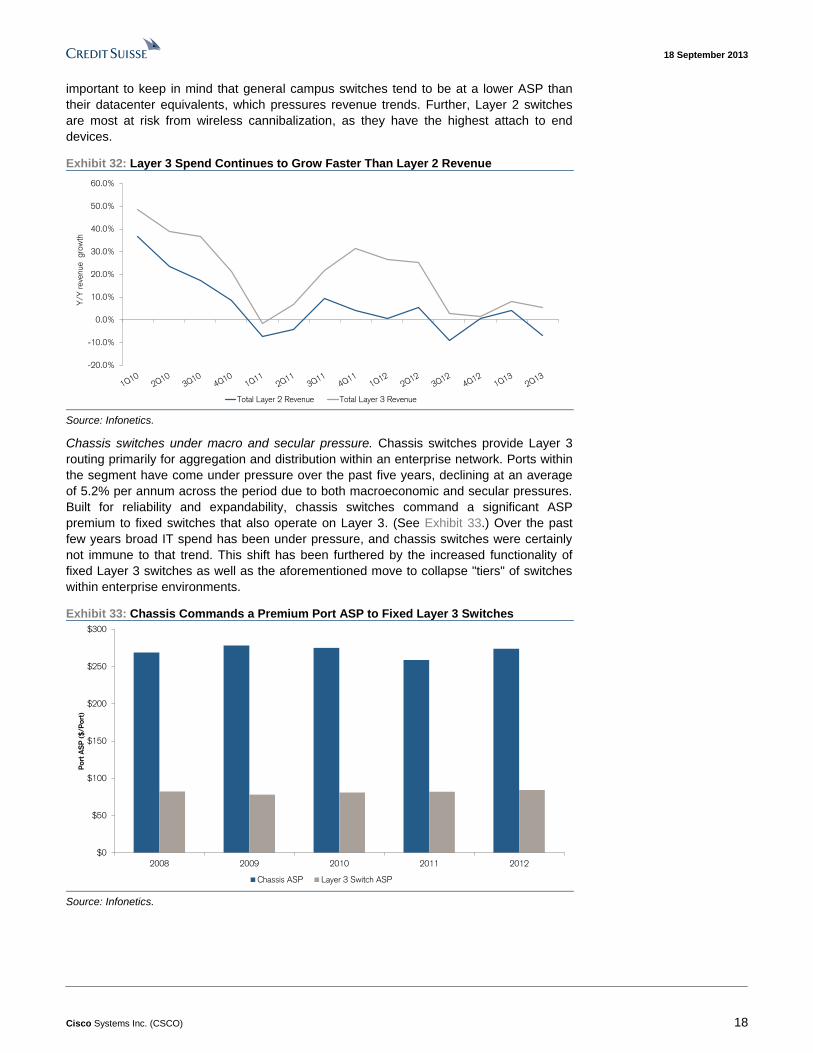
important to keep in mind that general campus switches tend to be at a lower ASP than
their datacenter equivalents, which pressures revenue trends. Further, Layer 2 switches
are most at risk from wireless cannibalization, as they have the highest attach to end
devices.
Exhibit 32: Layer 3 Spend Continues to Grow Faster Than Layer 2 Revenue
-20.0%
-10.0%
0.0%
10.0%
20.0%
30.0%
40.0%
50.0%
60.0%
Y/Y
reve
nue gro
wth
Total Layer 2 Revenue Total Layer 3 Revenue
Source: Infonetics.
Chassis switches under macro and secular pressure. Chassis switches provide Layer 3
routing primarily for aggregation and distribution within an enterprise network. Ports within
the segment have come under pressure over the past five years, declining at an average
of 5.2% per annum across the period due to both macroeconomic and secular pressures.
Built for reliability and expandability, chassis switches command a significant ASP
premium to fixed switches that also operate on Layer 3. (See Exhibit 33.) Over the past
few years broad IT spend has been under pressure, and chassis switches were certainly
not immune to that trend. This shift has been furthered by the increased functionality of
fixed Layer 3 switches as well as the aforementioned move to collapse "tiers" of switches
within enterprise environments.
Exhibit 33: Chassis Commands a Premium Port ASP to Fixed Layer 3 Switches
$0
$50
$100
$150
$200
$250
$300
2008 2009 2010 2011 2012
Po
rt A
SP
($
/P
ort
)
Chassis ASP Layer 3 Switch ASP
Source: Infonetics.

18 September 2013
Cisco Systems Inc. (CSCO) 19
Enterprise Routing
We turn now to the enterprise routing market, which is far smaller than the switching
market at $3.5 billion in 2012. In modeling this segment, we look at the market across
high-end (listed unit ASP >$30,000), midrange (between $5,000 and $30,000), branch
(between $490 and $5,000), and low-end / SOHO (<$490). WAN bandwidth consumption
continues to be a driver of the enterprise routing market, as seen in a November 2012
Infonetics survey, in which North American respondents expect their bandwidth needs to
grow 30% annually. We expect an improving macroeconomic environment to provide a
tailwind into 2014. However, we expect more modest revenue growth of 3.2% in the long
term out of the enterprise routing market.
Exhibit 34: We Expected Low-Single-Digit Revenue Growth in Enterprise Routing
0
200
400
600
800
1,000
1,200
1Q
07
2Q
07
3Q
07
4Q
07
1Q
08
2Q
08
3Q
08
4Q
08
1Q
09
2Q
09
3Q
09
4Q
09
1Q
10
2Q
10
3Q
10
4Q
10
1Q
11
2Q
11
3Q
11
4Q
11
1Q
12
2Q
12
3Q
12
4Q
12
1Q
13
2Q
13
Quar
terly
reve
nue (
US
D m
n)
High-end Mid-Range Branch Office Low-end / SOHO
Source: Infonetics.
Total Enterprise Switching and Routing
In modeling aggregate enterprise spend for switching and routing, we combine the secular
trends with indications from our survey work on how industry participants view the overall
spending environment. Specifically, we model both switches and routers by ports and
ASPs ($/port) by port speed across the various sub-segments identified in Exhibit 42. We
expect total enterprise spend on switching and routing to grow at a 3.4% CAGR in the long
term, with port growth of 4.8% offset by 1.3% declines in $/port.
With respect to the overall demand environment, in our survey of 40 enterprise CIOs we
posed the question of "Why are you investing in Networking?" and found that nearly 50%
of respondents view increased business demand as the most important factor. (See
Exhibit 35.) Indeed, such a response indicates to us that the overall economic backdrop is
improving, which will likely propel networking spend into 2014.

18 September 2013
Cisco Systems Inc. (CSCO) 20
Exhibit 35: Credit Suisse CIO Survey: Why Are You Investing in Networking? % of responses identified as "Most Important"
Increased business demand, 47.2%
Cost savings (OpEx), 22.2%
Application performance, 22.2%
Remain competitive, 5.6%
Regulation, 2.8%
Maintenance, 0.0%Drive new revenues,
0.0%
Source: Credit Suisse CIO Survey August 2013.
Factoring in the aforementioned secular trends at play within the enterprise market
including 10GbE adoption and a preference for fixed Layer 3 switches over Layer 2 and
chassis switches, we expect the market to grow at a CAGR of 3.4% in the long term.
Interestingly, while we expect port growth to slow versus the previous five years to 4.8%
per annum from 5.7% previously, the ASP uplift due to the shift toward 10GbE will offset
the decline and drive a modest reacceleration in the near term in revenue growth.
Exhibit 36: Enterprise Switching and Routing Revenue to Grow at a 3.4% CAGR in the Long Term US$ in millions, unless otherwise stated
Enterprise ($mn) 2010 2011 2012 2013E 2014E 2015E 2016E 2017E '07 - '12 '12 - '17E
Unmanaged / Web managed 726.6 772.8 790.3 856.8 902.8 937.1 963.6 981.4 5.3% 4.4%
Total Layer 2 2,736.5 2,748.4 2,726.0 2,642.5 2,565.4 2,536.4 2,517.0 2,511.5 -12.4% -1.6%
Total Layer 3 7,702.0 8,843.8 9,961.8 10,892.6 11,407.3 11,961.1 12,446.7 12,898.0 20.4% 5.3%
Total Chassis 7,487.4 6,500.0 6,291.7 6,075.8 6,321.8 6,526.5 6,788.0 7,051.6 -2.8% 2.3%
Total Switching $18,652.5 $18,865.0 $19,769.8 $20,467.7 $21,197.4 $21,961.2 $22,715.3 $23,442.5 3.0% 3.5%
y/y % Change 30.4% 1.1% 4.8% 3.5% 3.6% 3.6% 3.4% 3.2%
Total 1GbE & Below 14,243.4 13,057.2 12,677.7 12,003.3 11,168.0 10,318.8 9,484.4 8,694.3 -4.1% -7.3%
Total 10GbE 4,409.1 5,786.1 6,865.4 7,814.7 9,118.4 10,607.4 12,071.4 13,491.7 36.9% 14.5%
Total 40GbE & 100GbE - 21.7 226.7 649.8 910.9 1,035.1 1,159.4 1,256.5 NA 40.8%
High-end 482.8 580.9 566.0 604.6 618.9 636.4 655.8 675.7 -2.2% 3.6%
Mid-Range 1,290.0 1,232.6 1,122.4 1,182.3 1,232.0 1,266.7 1,290.2 1,314.0 -7.8% 3.2%
Branch Office 1,565.3 1,529.7 1,492.9 1,537.5 1,538.3 1,549.9 1,619.6 1,692.5 -4.4% 2.5%
Low-end / SOHO 133.6 273.8 327.5 338.0 356.5 373.5 395.3 422.7 19.6% 5.2%
Total Routing $3,471.7 $3,617.0 $3,508.8 $3,662.3 $3,745.6 $3,826.6 $3,960.9 $4,105.0 -4.1% 3.2%
y/y % Change 13.0% 4.2% -3.0% 4.4% 2.3% 2.2% 3.5% 3.6%
Total Enterprise $22,124.2 $22,482.0 $23,278.6 $24,130.1 $24,943.0 $25,787.8 $26,676.2 $27,547.5 1.7% 3.4%
y/y % Change 27.3% 1.6% 3.5% 3.7% 3.4% 3.4% 3.4% 3.3%
Source: Infonetics, Credit Suisse estimates.

18 September 2013
Cisco Systems Inc. (CSCO) 21
Service Provider Switching & Routing: +5.5% CAGR
Service Provider Routing
In examining trends within the service provider (SP) market, we begin by focusing on
routers which totaled $11.3 billion in 2012 out of $14.2 billion in total service provider
spend. In revenue terms, the market has shown significant growth over the past five years,
expanding at a pace of 7.9% per annum, which is far faster than growth on the enterprise
side. Digging one layer deeper, there are significant divergences between the growth
within core (0.8% 2007-2012 CAGR) and edge (10.7% 2007-2012 CAGR) routers, as
service providers continue to focus on adding capacity and intelligence to the edge of their
networks at the expense of the core.
Exhibit 37: The Hierarchy of Service Provider Network Design
Edge - the boundary between the service-
provider’s premises and the customer’s
location. The concentration point where large
numbers of customer connections will be
terminated.
Aggregation - a concentration point where
data from multiple Edge locations will be
funneled. Functionally another tier of the “Edge.”
Core - the heart of the network. The major
switching locations that form the center of the
network, where data from multiple
Aggregation sites will be funneled
This is typically where one sees the
highest volume of data present in the
network.
Source: Juniper Networks, Credit Suisse research.
Core routers losing wallet share within spend. Core routers are robust, high-speed routers
built for reliability that sit in the center of a service provider's network. These routers are
critical to a network's operations and carriers pay quite a premium for that reliability as a
result. Indeed, in 2012 the average unit price of a core router was $129,000, although only
slightly more than 20,000 were sold. In aggregate, the core routing market totaled $2.7bn
in 2012 and has come under pressure, as it grew only 0.8% per annum over the past five
years and declined 10.3% y/y in 2012. Deployments tend to be 'lumpy' with large
fluctuations depending on individual service provider rollouts. (See Exhibit 38.)
Spending within the core of the network tends to be a function of capacity, and recently
service providers have been trying to prolong spend within the area as long as possible.
Indeed, recent commentary from Juniper indicates that core networks continue to be run
'hotter' i.e., closer to their capacity with an expectation of a coming upgrade cycle. On the
2Q13 conference call, Juniper CEO Kevin Johnson noted that "[Juniper] has seen the core
of the network in our analysis has been running hotter and hotter, and we're just now
starting to see the signs that investment will, in addition to being on the edge, will start to
kick in for the core and we expect to see that start to unfold later this year." We expect a

18 September 2013
Cisco Systems Inc. (CSCO) 22
cyclical uptick over the coming quarters; however, we do not see a structural shift back to
the core on a long-term basis. We model 3.5% growth through 2017 with a significant
deceleration beyond 2014.
Exhibit 38: Core Router Revenue Can be Lumpy from Quarter to Quarter y/y % change in core router revenue
-30.0%
-20.0%
-10.0%
0.0%
10.0%
20.0%
30.0%
40.0%
50.0%
1Q
08
2Q
08
3Q
08
4Q
08
1Q
09
2Q
09
3Q
09
4Q
09
1Q
10
2Q
10
3Q
10
4Q
10
1Q
11
2Q
11
3Q
11
4Q
11
1Q
12
2Q
12
3Q
12
4Q
12
1Q
13
2Q
13
Source: Company data, Infonetics
Increased focus on investment at the edge likely to continue. While core investment has
been stagnant in the aggregate over the past five years, edge routing has seen substantial
growth over the same period, rising 10.7% on average per year in revenue terms. In 2012,
the market totaled $8.6bn amid secular tailwinds of added capacity and services within
service provider networks. One such example of expanded services is the "triple play"
offerings (i.e., cable, phone, and internet) of many traditional voice or cable service
providers, as they look to drive additional ARPU from their installed base and as a result
are forced to add capacity to the edge of their networks. Additionally, overall bandwidth
consumption per subscriber driven by, for example, internet video coupled with broad
subscriber growth, has resulted in increased demand for edge routing capabilities.
A second secular tailwind to edge routing spend has been the tremendous growth in
smartphones and the resulting growth in mobile data consumption. Indeed, within North
America, smartphone penetration (defined as smartphones as a percentage of mobile
shipments) rose from 4.0% in 2006 to 49.5% in 2012, driving massive amounts of mobile
data. Globally, penetration stood at only 4.2% in 2006. Further, the move toward LTE from
2G/3G technologies within mobile networks is causing a renewed focus on a converged IP
network driving an upgrade cycle across service provider networks. Historically, 2G/3G
technologies parsed between voice and data transmissions, sending the former over
legacy circuit-switched networks while routing the data packets across IP networks.
However, LTE enables both voice and data to travel across IP networks, leading to
converged IP solutions across service providers' networks. As seen in Exhibit 39, we
expect tremendous growth in LTE smartphone units through 2017 driving a continued
focus on edge routers.

18 September 2013
Cisco Systems Inc. (CSCO) 23
Exhibit 39: LTE to See Tremendous Growth over the Next Five Years on Our Estimates Number of LTE devices sold in millions
7
86
219
298
460
604
789
0%
5%
10%
15%
20%
25%
30%
35%
40%
0
100
200
300
400
500
600
700
800
900
2011 2012E 2013E 2014E 2015E 2016E 2017E
Asia Pacific North America Western Europe Africa
CEE Latin America Middle East % of the handset market
Source: Company data, Credit Suisse estimates.
Combining these factors, we continue to expect edge routers to outperform core within the
service provider space. We forecast 6.3% long-term revenue growth within the edge
routing market.
Service Provider Switching
In contrast to the enterprise market, the switching market is dwarfed by the routing market
within service provider spend. In 2012 the market totaled $2.9bn and has grown at an
average annual rate of 6.0% over the past five years, although last year spend was down
11.0%. As switches are primarily deployed at the edge of networks, we expect the same
secular drivers of edge routing discussed above to propel carrier switches, as we model a
5.1% growth rate in the long term.
Exhibit 40: Total Service Provider Switching and Routing to Grow 5.5% Per Year Long Term US$ in millions, unless otherwise stated
Service Provider 2010 2011 2012 2013E 2014E 2015E 2016E 2017E '07 - '12 '12 - '17E
Core 2,838.8 2,975.0 2,668.8 2,840.1 3,058.4 3,089.3 3,126.3 3,163.8 0.8% 3.5%
Edge 7,683.1 8,544.0 8,639.6 9,118.8 9,957.7 10,575.1 11,183.2 11,725.6 10.7% 6.3%
Total Routing $10,521.9 $11,519.0 $11,308.4 $11,958.9 $13,016.1 $13,664.4 $14,309.5 $14,889.4 7.9% 5.7%
y/y % Change 17.2% 9.5% -1.8% 5.8% 8.8% 5.0% 4.7% 4.1%
Total Switching $3,176.1 $3,257.3 $2,900.8 $2,897.3 $3,110.8 $3,323.0 $3,517.0 $3,722.4 6.0% 5.1%
y/y % Change 57.7% 2.6% -10.9% -0.1% 7.4% 6.8% 5.8% 5.8%
Total Service Provider $13,698.0 $14,776.3 $14,209.3 $14,856.2 $16,126.9 $16,987.3 $17,826.5 $18,611.8 7.5% 5.5%
y/y % Change 24.6% 7.9% -3.8% 4.6% 8.6% 5.3% 4.9% 4.4%
Source: Company data, Credit Suisse estimates.

1
8 S
ep
tem
ber 2
013
Cis
co
Sy
ste
ms In
c. (C
SC
O)
24
Exhibit 41: Aggregate Networking: 4.2% LT Growth Driven by Edge Routers and 10GbE Adoption in Enterprise Switching
Enterprise Switching Revenue ($mn) 2010 2011 2012 2013E 2014E 2015E 2016E 2017E '07 - '12 '12 - '17E
Unmanaged / Web managed $726.6 $772.8 $790.3 $856.8 $902.8 $937.1 $963.6 $981.4 5.3% 4.4%
Total Layer 2 $2,736.5 $2,748.4 $2,726.0 $2,642.5 $2,565.4 $2,536.4 $2,517.0 $2,511.5 -12.4% -1.6%
Total Layer 3 $7,702.0 $8,843.8 $9,961.8 $10,892.6 $11,407.3 $11,961.1 $12,446.7 $12,898.0 20.4% 5.3%
Total Chassis $7,487.4 $6,500.0 $6,291.7 $6,075.8 $6,321.8 $6,526.5 $6,788.0 $7,051.6 -2.8% 2.3%
Total 1GbE & Below 14,243.4 13,057.2 12,677.7 12,003.3 11,168.0 10,318.8 9,484.4 8,694.3 -4.1% -7.3%
Total 10GbE 4,409.1 5,786.1 6,865.4 7,814.7 9,118.4 10,607.4 12,071.4 13,491.7 36.9% 14.5%
Total 40GbE & 100GbE - 21.7 226.7 649.8 910.9 1,035.1 1,159.4 1,256.5 NA 40.8%
Total Enterprise Switching $18,652.5 $18,865.0 $19,769.8 $20,467.7 $21,197.4 $21,961.2 $22,715.3 $23,442.5 3.0% 3.5%
y/y % Change 30.4% 1.1% 4.8% 3.5% 3.6% 3.6% 3.4% 3.2%
Carrier Ethernet Switching Revenue ($mn) 2010 2011 2012 2013E 2014E 2015E 2016E 2017E '07 - '12 '12 - '17E
Total Carrier Ethernet Switching $3,176.1 $3,257.3 $2,900.8 $2,897.3 $3,110.8 $3,323.0 $3,517.0 $3,722.4 6.0% 5.1%
y/y % Change 57.7% 2.6% -10.9% -0.1% 7.4% 6.8% 5.8% 5.8%
Enterprise Routing Revenue ($mn) 2010 2011 2012 2013E 2014E 2015E 2016E 2017E '07 - '12 '12 - '17E
High-end 482.8 580.9 566.0 604.6 618.9 636.4 655.8 675.7 -2.2% 3.6%
Mid-Range 1,290.0 1,232.6 1,122.4 1,182.3 1,232.0 1,266.7 1,290.2 1,314.0 -7.8% 3.2%
Branch Office 1,565.3 1,529.7 1,492.9 1,537.5 1,538.3 1,549.9 1,619.6 1,692.5 -4.4% 2.5%
Low-end / SOHO 133.6 273.8 327.5 338.0 356.5 373.5 395.3 422.7 19.6% 5.2%
Total Enterprise Routing $3,471.7 $3,617.0 $3,508.8 $3,662.3 $3,745.6 $3,826.6 $3,960.9 $4,105.0 -4.1% 3.2%
y/y % Change 13.0% 4.2% -3.0% 4.4% 2.3% 2.2% 3.5% 3.6%
Service Provider Routing Revenue ($mn) 2010 2011 2012 2013E 2014E 2015E 2016E 2017E '07 - '12 '12 - '17E
Core 2,838.8 2,975.0 2,668.8 2,840.1 3,058.4 3,089.3 3,126.3 3,163.8 0.8% 3.5%
Edge 7,683.1 8,544.0 8,639.6 9,118.8 9,957.7 10,575.1 11,183.2 11,725.6 10.7% 6.3%
Total Service Provider Routing $10,521.9 $11,519.0 $11,308.4 $11,958.9 $13,016.1 $13,664.4 $14,309.5 $14,889.4 7.9% 5.7%
y/y % Change 17.2% 9.5% -1.8% 5.8% 8.8% 5.0% 4.7% 4.1%
Total Enterprise vs. Service Provider ($mn) 2010 2011 2012 2013E 2014E 2015E 2016E 2017E '07 - '12 '12 - '17E
Total Enterprise 22,124.2 22,482.0 23,278.6 24,130.1 24,943.0 25,787.8 26,676.2 27,547.5 1.7% 3.4%
Total Service Provider 13,698.0 14,776.3 14,209.3 14,856.2 16,126.9 16,987.3 17,826.5 18,611.8 7.5% 5.5%
Total Revenue $35,822.2 $37,258.2 $37,487.9 $38,986.3 $41,069.9 $42,775.1 $44,502.7 $46,159.3 3.7% 4.2%
y/y % Change 26.3% 4.0% 0.6% 4.0% 5.3% 4.2% 4.0% 3.7%
1) Expect 4.2% LT revenue growth in aggregate Ethernet Switching & Routing. Looking at combined Ethernet Switching and Routing, we expect the market to grow at
4.2% per annum over the next 5 years. Looking one layer underneath those forecasts, we expect modestly faster growth out of service providers offset by modestly slower
growth out of enterprises in a challenging environment for IT budgets.
2) Enterprise switching driven by 10GbE adoption. Our forecast calls for 3.5% growth in enterprise switches, driven by 10GbE adoption which we expect to rise to 25% of
Layer 2, Layer 3, and Chassis port shipments in 2017, up from 6.4% in 2012. Overall we expect 10GbE revenue to grow at a 14.5% annualized rate long term.
3) Growth at the edge to propel SP routing. Looking at the Service Provider market, edge routers exhibited strong growth over the past 5 years while core routers have
remained relatively constant. While the growth rates out of the edge are likely to slow going forward, we continue to see a more intelligent edge as a secular tailwind to growth
within the SP routing space.
Source: Infonetics, Credit Suisse estimates.

1
8 S
ep
tem
ber 2
013
Cis
co
Sy
ste
ms In
c. (C
SC
O)
25
Exhibit 42: Aggregate Networking: 10GbE Adoption to Offset Broad Pricing Pressure Modestly as Ports Expected to Grow 5.0% Per Annum
1) Ports expected to grow at 5.0% LT. We expect total ports for routing and switching to grow at a 5.0% CAGR LT driven by 13.4% growth in routing.
Within routing we forecast service provider ports to grow at 17.7% through 2017, growing to 61% of total routing ports, up from 50% in 2012.
2) Offset by $3 ASP decline at 0.8% CAGR. We forecast aggregate ASPs for ports to decline $3, or 0.8% per annum, through 2017, driven by a 10.3%
decline in service provider routing.
3) …Resulting in 4.2% aggregate revenue growth. We forecast total industry revenue to grow at 4.2% LT driven mainly by 5.7% growth in SP routing.
Revenue ($mn) 2010 2011 2012 2013E 2014E 2015E 2016E 2017E '07 - '12 '12 - '17E
Total Enterprise Switching 18,652.5 18,865.0 19,769.8 20,467.7 21,197.4 21,961.2 22,715.3 23,442.5 3.0% 3.5%
Total Carrier Ethernet Switching 3,176.1 3,257.3 2,900.8 2,897.3 3,110.8 3,323.0 3,517.0 3,722.4 6.0% 5.1%
Total Switching $21,828.6 $22,122.2 $22,670.7 $23,365.1 $24,308.2 $25,284.2 $26,232.3 $27,164.9 3.3% 3.7%
Total Enterprise Routing 3,471.7 3,617.0 3,508.8 3,662.3 3,745.6 3,826.6 3,960.9 4,105.0 -4.1% 3.2%
Total Service Provider Routing 10,521.9 11,519.0 11,308.4 11,958.9 13,016.1 13,664.4 14,309.5 14,889.4 7.9% 5.7%
Total Routing $13,993.6 $15,136.0 $14,817.2 $15,621.2 $16,761.7 $17,490.9 $18,270.4 $18,994.3 4.2% 5.1%
Total Enterprise 22,124.2 22,482.0 23,278.6 24,130.1 24,943.0 25,787.8 26,676.2 27,547.5 1.7% 3.4%Total Service Provider 13,698.0 14,776.3 14,209.3 14,856.2 16,126.9 16,987.3 17,826.5 18,611.8 7.5% 5.5%
Total Revenue $35,822.2 $37,258.2 $37,487.9 $38,986.3 $41,069.9 $42,775.1 $44,502.7 $46,159.3 3.7% 4.2%
y/y % Change 26.3% 4.0% 0.6% 4.0% 5.3% 4.2% 4.0% 3.7%
Ports ('000) 2010 2011 2012 2013E 2014E 2015E 2016E 2017E '07 - '12 '12 - '17E
Total Enterprise Switching 369,160.7 417,763.2 425,520.0 455,341.7 477,832.0 499,127.5 518,667.4 536,804.2 5.9% 4.8%
Total Service Provider Switching 5,892.9 6,302.9 6,371.0 6,693.0 7,333.7 7,993.7 8,633.2 9,323.9 9.7% 7.9%
Total Switching 375,053.7 424,066.1 431,891.1 462,034.7 485,165.7 507,121.2 527,300.6 546,128.1 5.9% 4.8%
Total Enterprise Routing 4,764.6 4,667.5 5,147.3 5,613.1 6,025.4 6,470.8 7,041.7 7,665.5 -4.1% 8.3%
Total Service Provider Routing 4,051.4 4,973.4 5,212.6 6,167.0 7,413.0 8,700.1 10,166.3 11,790.1 31.0% 17.7%
Total Routing Ports 8,816.0 9,640.9 10,359.9 11,780.1 13,438.4 15,170.8 17,208.0 19,455.6 6.1% 13.4%
Total Enterprise 373,925.3 422,430.7 430,667.3 460,954.8 483,857.4 505,598.3 525,709.0 544,469.7 5.7% 4.8%
Total Service Provider 9,944.3 11,276.3 11,583.7 12,860.0 14,746.7 16,693.8 18,799.5 21,114.0 16.7% 12.8%Total Ports 383,869.6 433,707.0 442,251.0 473,814.8 498,604.1 522,292.1 544,508.5 565,583.6 5.9% 5.0%
y/y % Change 25.0% 13.0% 2.0% 7.1% 5.2% 4.8% 4.3% 3.9%
ASP ($ / Port) 2010 2011 2012 2013E 2014E 2015E 2016E 2017E '07 - '12 '12 - '17E
Total Enterprise Switching 50.5 45.2 46.5 45.0 44.4 44.0 43.8 43.7 -2.7% -1.2%
Total Service Provider Switching 539.0 516.8 455.3 432.9 424.2 415.7 407.4 399.2 -3.4% -2.6%
Total Switching 58.2 52.2 52.5 50.6 50.1 49.9 49.7 49.7 -2.5% -1.1%
Total Enterprise Routing 728.6 774.9 681.7 652.5 621.6 591.4 562.5 535.5 0.0% -4.7%
Total Service Provider Routing 2,597.1 2,316.1 2,169.4 1,939.2 1,755.8 1,570.6 1,407.5 1,262.9 -17.7% -10.3%
Total Routing 1,587.3 1,570.0 1,430.2 1,326.1 1,247.3 1,152.9 1,061.7 976.3 -1.8% -7.4%
Total Enterprise 59.2 53.2 54.1 52.3 51.6 51.0 50.7 50.6 -3.8% -1.3%
Total Service Provider 1,377.5 1,310.4 1,226.7 1,155.2 1,093.6 1,017.6 948.2 881.5 -7.9% -6.4%
Total $ / Port 93.3 85.9 84.8 82.3 82.4 81.9 81.7 81.6 -2.1% -0.8%
y/y % Change 1.0% -7.9% -1.3% -2.9% 0.1% -0.6% -0.2% -0.1%
Source: Infonetics, Credit Suisse estimates.

18 September 2013
Cisco Systems Inc. (CSCO) 26
Scorecard—Cisco wins What makes a successful networking player? This in itself is not a straightforward question
to answer; after all, what has been interesting is that over a prolonged period of time,
Cisco’s market share in revenue terms in the broader switching and routing market has
remained relatively stable, despite several waves of competition. (See Exhibit 69.) This
suggests that barriers to entry have, up until now, remained relatively high compared with
other areas of technology.
An additional problem for the average investor is that while presentations from most
networking companies tend to have the same promise of superior performance and
innovative technology, it is often hard to decipher what really matters. As such, we have
developed a proprietary scorecard to evaluate key networking vendors across eight
metrics that we think are important for success. We evaluate vendors across many areas,
including exposure to the faster growth segments within networking (edge routing, 10Gb
Ethernet), and including the feedback from networking administrators that reflects
customers' views. We arrive at several main conclusions.
Status quo holds for now but SDN will ensure the industry is not static. Given our
conclusions, we believe that this will shape the ability of companies such as Cisco to build
upon their already dominant position and impact fundamentals over 18+ month period.
The issue and complicating factor for networking is the disruption is not necessarily from
established vendors such as Cisco, Juniper, or Huawei, but rather on how the networking
industry could be disrupted by the uptake of SDN.
Cisco seems robust in today’s world. Cisco has continued to out execute its rivals
consistently in the networking space over time. Our scorecard shows that customers have
long favored Cisco, with the company ranked first on our overall scorecard. Cisco scored
the number one positions on six metrics such as roadmap, salesforce, service offering,
and IT portfolio. These rankings, along with its recent product refreshes, should help Cisco
maintain its share in the near term. This level of dominance, though, is arguably already
reflected in its market share. Equally interestingly, on the most important metric of
price/performance/reliability, Cisco is essentially on par with Juniper and Huawei. This
suggests Cisco’s incumbency rather than technology is the key differentiator for the
company. The real concern as we have discussed in much of this note is that SDN
threatens the very structure of the industry in which Cisco operates.
Exhibit 43: Cisco, HP, and Juniper Expected to Be the Most Disrupted On a scale of 1-5 (1=not vulnerable, 5=very vulnerable) which of the following vendors do you think is the most vulnerable to SDN?
0%
5%
10%
15%
20%
25%
30%
35%
40%
45%
50%
NEC Brocade Dell AlcatelLucent
Ericsson Fujitsu ZTE Huawei Juniper HewlettPackard
Cisco
Perc
enta
ge o
f R
esp
on
den
ts
Source: Credit Suisse IT Survey, August 2013.

18 September 2013
Cisco Systems Inc. (CSCO) 27
Juniper fading gradually? With a 14% share in routing, Juniper has been a clear and
established number two player. Juniper ranks second overall on the scorecard and ranks
highly on its roadmap. However, it is interesting that the company is perceived to be only
narrowly ahead of some of its peers, especially in the routing market. For example on the
key metric of price and performance it is actually ranked lower than Huawei. It is also
disconcerting that over time its market share in its core segment of routing has been
slipping with Alcatel Lucent and Huawei simultaneously gaining in edge routing.
Huawei is a worth disruptor. Interestingly, Huawei scores well, coming in third, despite
having a very small share currently in switching and an emerging position in routing. While
the company comes first in the category of price, technology, and performance levels,
which is itself not surprising, it scores poorly on installed base. Over time we believe its
market share will build further in networking even if we see limited traction in the United
States. We believe that on a global basis, it can gain in almost all segments.
Alcatel Lucent—Moving from the edge to the core. Despite Alcatel Lucent’s troubles as a
company in recent years, one area where execution has been robust has been in the
routing market. On our scorecard the company ranks seven, partly due to the company’s
historic strength in service provider routing, where we do believe the company has the
potential to continue gaining in the routing market. More specifically, we believe early
traction for its new core router is encouraging. Adoption of its SDN strategy from Nuage
Networks should be helped by Alcatel's large service provider install base. Additionally, it
could continue to take share in edge routing.
HP shows lots of promise, but questioning potential. HP ranks fifth on our scorecard,
despite having the number two position in switching. The company scores well on overall
IT portfolio and services offering, but trails on roadmap and management performance.
With an 11% share, we do believe that HP has the potential to gain share in this market,
given its strategic status as a core enterprise player. However, we are concerned by the
stagnation in market share over the past two years in traditional enterprise networking.
That said, we believe its early development of an SDN strategy creates optionality.

1
8 S
ep
tem
ber 2
013
Cis
co
Sy
ste
ms In
c. (C
SC
O)
28
Exhibit 44: Credit Suisse Networking Vendor Scorecard—Cisco Is Well Ahead of Peers across Metrics and on Switching and Routing Market Share
Note: All scores are based on a scale of 1 to 10, with 10 being the best, and 1 being the worst score Source: Credit Suisse Survey
Vendor scores and commentary:
1) Cisco (8.0/10 – Rank #1). Cisco has the unquestionably highest rank in 6 of the 7 key metrics on our scorecard (Roadmap, Salesforce, Services offering, IT Portfolio,
Installed base and SDN strategy) giving it an overall score of 8.0/10 on the scorecard in addition to #1 market share in both switching and routing. Interestingly Cisco
ranks behind Huawei and ties with Juniper on the key metric of Price/Technology Performance/Reliability.
2) Juniper (7.1/10 – Rank #2). Juniper ranks second in several key metrics on our scorecard (Roadmap, Price/Technology Performance/Reliability, Services offering and
Installed base) giving it an overall score of 7.1/10 on the scorecard in addition to #2 market share in both switching and routing.
3) Huawei (6.6/10 – Rank #3). Huawei ranks third overall on our scorecard largely because of its #1 rank on Price/Technology Performance/Reliability. Not surprisingly
Huawei has a mediocre score with regard to its Services offering and IT Portfolio giving it an overall score of 6.6/10 on the scorecard. While Huawei has low share in the
Enterprise switching and routing businesses, we believe it could be a disruptive force in international markets.
4) HP (6.4/10 – Rank #5). HP ranks fifth overall on our scorecard and has strong scores on the IT Portfolio, Salesforce/Distribution and Services Offering metrics. It is also
worth noting that HP has a 10.4% share in the switching market, second only to Cisco giving it an overall weighted score of 6.4/10.
5) Alcatel (5.7/10 – Rank #7). Alcatel Lucent rank seventh (5.7/10) on our scorecard which isn’t surprising given the company does not have an enterprise focus within
their networking business. However having introduced new Edge and Core routing products recently as well as having a defined SDN strategy through Nuage, we believe
this will result in share gains over time.
Cisco Juniper Huawei Brocade HP Dell Alcatel Fujitsu NEC ZTE Ericsson Weight
Weighted Rank 1 2 3 4 5 6 7 8 9 10 11
Weighted Score 8.0 7.1 6.6 6.6 6.4 6.4 5.7 5.5 5.3 5.1 5.1
Switching Market Share 61.4% 2.2% 1.1% 1.4% 10.4% 1.2% 1.5% 0.5% 0.4% 3.4% 0.0%
Switching Market Share Rank 1 4 8 6 2 7 5 9 10 3 11
Enterprise Switching Market Share 64.7% 2.6% 0.0% 1.5% 11.9% 1.4% 1.2% 0.0% 0.0% 0.0% 0.0%
Service Provider Switching Market Share 38.9% 0.0% 8.9% 0.7% 0.0% 0.0% 3.3% 4.1% 2.9% 26.3% 0.3%
Routing Market Share 45.2% 14.0% 13.8% 1.2% 1.5% 0.0% 13.5% 0.8% 1.2% 1.4% 2.1%
Routing Market Share Rank 1 2 3 8 6 11 4 10 8 7 5
Enterprise Routing Market Share 71.5% 5.4% 1.4% 0.0% 6.1% 0.0% 0.7% 0.0% 1.1% 0.0% 0.0%
Service Provider Routing Market Share 37.0% 16.7% 17.7% 1.6% 0.0% 0.0% 17.5% 1.1% 1.2% 1.8% 2.7%
Price/Technology Performance/Reliability 7.3 7.3 7.8 6.7 6.8 6.6 6.0 6.2 5.8 6.0 6.0 45%
Roadmap (historical/futures) 9.3 7.8 6.2 7.2 5.9 6.4 5.4 5.1 5.0 4.0 5.0 25%
Installed base 9.2 6.9 5.3 6.6 6.2 6.3 4.9 4.2 5.0 4.9 5.3 10%
SDN Strategy 6.0 5.0 5.0 5.0 5.0 4.0 5.5 5.3 4.0 4.0 0.0 8%
IT Porfolio (storage/servers etc. integration) 7.8 6.3 5.3 5.5 6.9 6.8 5.5 4.7 5.6 5.3 5.3 5%
Services offering (Maintenance/Support) 8.5 7.0 5.6 6.9 7.0 6.4 5.8 4.4 5.0 4.9 5.0 5%
Salesforce/Distribution 7.6 6.2 5.3 6.1 6.4 6.6 5.2 4.4 4.6 4.7 4.8 3%
Source: Credit Suisse IT and Networking Surveys, August 2013.

1
8 S
ep
tem
ber 2
013
Cis
co
Sy
ste
ms In
c. (C
SC
O)
29
Exhibit 45: Industry Share Breakdown—Cisco Dominant Across Both Switching and Routing Although Competition Emerging from Huawei
Switching and Routing Industry Share Breakdown 1) Cisco – dominant across networking. Cisco is well placed
on the enterprise switching side with 65% share overall and
67% share in the 10GbE segment; however the company
has 49% share in the 40GbE & 100GbE segment. Although
this remains small we would expect Cisco's footprint in the
space to grow. On the SP routing side Cisco’ share in the
faster growing Edge market has declined to 31% from
~50% in 2007, although the business has rebounded since
the lows of 2011.
2) Juniper – focused on SP routing. Juniper has sustained
~15% share on the Edge routing side since 2007. We
expect to see continuing competition from Huawei, Cisco
and Alcatel Lucent, and other potential headwinds for share
in the LT. In Core routing Juniper's share has declined from
~30% in 2007 to ~24% in 2012. However this business is
only expected to grow 3.5% through 2017.
3) Huawei – could be a disruptive force. Huawei has rapidly
increased share in its Service provider routing business over
the past few years growing from 5% in 2007 to 17% by
2012. The scale, size and R&D dynamics for Huawei show
that the company cannot be underestimated. The company
has a share of 20% in the Edge market as compared to 6%
in 2007, and this segment is expected to grow at a 6.3% clip
through 2017.
4) ALU – #2 player in Edge. Alcatel Lucent's share in Edge
routing has steadily increased from ~18% in 2008 to ~22%
in 2012. Alcatel has also recently launched a family of XRS
Core routers which could be accretive to its 1% share in
Core service provider routing.
5) HP – shares plateauing. Following the acquisition of 3COM
HP’s share grew from mid-single digit share to ~11% which
the company has largely been able to maintain. In the
absence of any major product refreshes or acquisitions we
believe HP's Enterprise switching share is likely to stay static
going forward.
2012 Market Share Cisco Juniper HP Alcatel Huawei Market (mlns) CAGR '12-'17
Switching
Unmanaged / Web managed 11.0% 0.0% 18.7% 0.0% 0.0% 790 4.4%
Total Layer 2 58.2% 0.0% 22.8% 0.4% 0.0% 2,726 -1.6%
Total Layer 3 64.7% 4.2% 9.3% 1.6% 0.0% 9,962 5.3%
Total Chassis 74.4% 1.4% 10.5% 1.0% 0.0% 6,292 2.3%
Total 1GbE & Below 64.1% 2.7% 12.1% 1.4% 0.0% 12,678 -7.3%
Total 10GbE 66.5% 2.4% 11.8% 0.8% 0.0% 6,865 14.5%
Total 40GbE & 100GbE 49.1% 4.0% 3.5% 1.1% 0.0% 227 40.8%
Enterprise Switching 64.7% 2.6% 11.9% 1.2% 0.0% 19,770 3.5%
SP Ethernet Switching 38.9% 0.0% 0.0% 3.3% 8.8% 2,901 5.1%
Total Switching 61.4% 2.2% 10.4% 1.5% 1.1% 22,671 3.7%
Routing
High-end 47.0% 26.2% 15.9% 4.1% 0.0% 566 3.6%
Mid-Range 82.4% 2.3% 5.1% 0.0% 2.4% 1,122 3.2%
Branch Office 78.6% 0.9% 3.0% 0.0% 1.0% 1,493 2.5%
Low-end / SOHO 44.0% 0.0% 7.1% 0.0% 2.0% 328 5.2%
Total Enterprise Routing 71.5% 5.4% 6.1% 0.7% 1.4% 3,509 3.2%
Core 57.0% 24.3% 0.0% 0.6% 10.4% 2,669 3.5%
Edge 30.8% 14.3% 0.0% 22.7% 20.0% 8,640 6.3%
SP Routing 37.0% 16.7% 0.0% 17.5% 17.7% 11,308 5.7%
Total Routing 45.2% 14.0% 1.5% 13.5% 13.8%
Total Enterprise 65.8% 3.0% 11.0% 1.1% 0.2% 23,279 3.4%
Total Service Provider 37.4% 13.3% 0.0% 14.6% 15.9% 14,209 5.5%
Total Networking Spend 55.0% 6.9% 6.8% 6.2% 6.2% 37,488 4.2%
Source: Infonetics, Credit Suisse estimates.

18 September 2013
Cisco Systems Inc. (CSCO) 30
What Makes a Networking Vendor Successful?
We score each of the key vendors across these seven metrics and use the aggregate
scores for each vendor to develop a ranking of vendor positioning. As shown in Exhibit 46,
these categories include key characteristics such as technological performance, product
roadmap, services offering, datacenter portfolio, and replacement costs. In the networking
world, price, performance, and reliability are valued above all.
Exhibit 46: Networking Vendors Price/ Performance/ Reliability High on the Lost Question: What makes a competitive networking vendor? Please rank in order
0%
10%
20%
30%
40%
50%
60%
70%
80%
90%
100%
Per
cen
tage
of
resp
on
den
ts
Source: Credit Suisse Networking Survey, August 2013.
Most importantly, our scores are based upon the Credit Suisse Networking survey of 40
major buyers. Thus, we are able to see which vendors may be vulnerable to share loss
and which may be able to capture value. We arrive at seven main conclusions.
Cisco to remain dominant in the traditional networking world. Cisco has continued to out
execute its rivals consistently in the networking world over time, commanding 61% share
in switching and 45% share in the routing market at the end of 2012. While we have
concerns about how the industry will ultimately evolve given the onset of SDN, we do
believe that in the traditional market, the company will retain a very strong position and
possibly enhance share over time.
Cisco ranks very strongly across the Credit Suisse scorecard. From a buyer's perspective,
Cisco's lead remains strong, as the company ranked first in six of seven metrics. This level
of dominance, though, is arguably already reflected in its market share. Equally
interestingly, on the most important metrics of price and performance and reliability, Cisco
is essentially on par with Juniper and Huawei. This suggests Cisco’s incumbency rather
than technology is the key differentiator for the company.
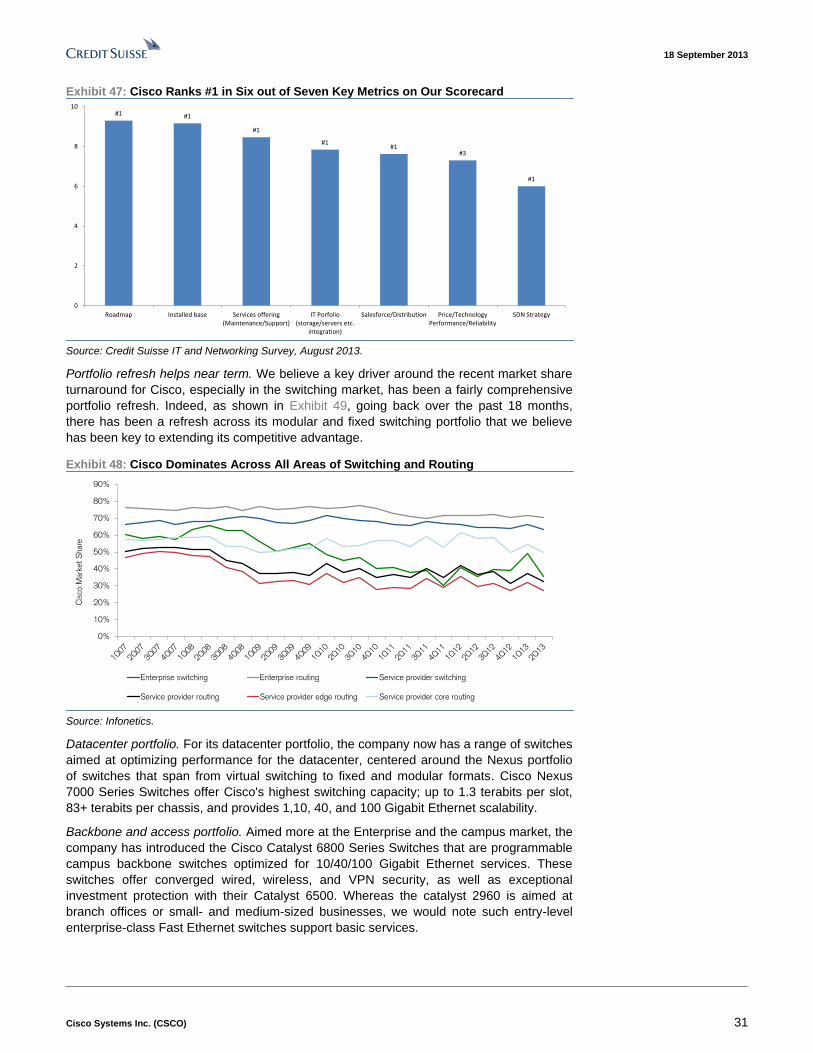
18 September 2013
Cisco Systems Inc. (CSCO) 31
Exhibit 47: Cisco Ranks #1 in Six out of Seven Key Metrics on Our Scorecard
#1 #1
#1
#1#1
#3
#1
0
2
4
6
8
10
Roadmap Installed base Services offering(Maintenance/Support)
IT Porfolio(storage/servers etc.
integration)
Salesforce/Distribution Price/TechnologyPerformance/Reliability
SDN Strategy
Source: Credit Suisse IT and Networking Survey, August 2013.
Portfolio refresh helps near term. We believe a key driver around the recent market share
turnaround for Cisco, especially in the switching market, has been a fairly comprehensive
portfolio refresh. Indeed, as shown in Exhibit 49, going back over the past 18 months,
there has been a refresh across its modular and fixed switching portfolio that we believe
has been key to extending its competitive advantage.
Exhibit 48: Cisco Dominates Across All Areas of Switching and Routing
0%
10%
20%
30%
40%
50%
60%
70%
80%
90%
Cis
co M
ark
et S
hare
Enterprise switching Enterprise routing Service provider switching
Service provider routing Service provider edge routing Service provider core routing
Source: Infonetics.
Datacenter portfolio. For its datacenter portfolio, the company now has a range of switches
aimed at optimizing performance for the datacenter, centered around the Nexus portfolio
of switches that span from virtual switching to fixed and modular formats. Cisco Nexus
7000 Series Switches offer Cisco's highest switching capacity; up to 1.3 terabits per slot,
83+ terabits per chassis, and provides 1,10, 40, and 100 Gigabit Ethernet scalability.
Backbone and access portfolio. Aimed more at the Enterprise and the campus market, the
company has introduced the Cisco Catalyst 6800 Series Switches that are programmable
campus backbone switches optimized for 10/40/100 Gigabit Ethernet services. These
switches offer converged wired, wireless, and VPN security, as well as exceptional
investment protection with their Catalyst 6500. Whereas the catalyst 2960 is aimed at
branch offices or small- and medium-sized businesses, we would note such entry-level
enterprise-class Fast Ethernet switches support basic services.

18 September 2013
Cisco Systems Inc. (CSCO) 32
Exhibit 49: Cisco Has Refreshed the Switching Portfolio Meaningfully of Late
2012 2013
UCS Central
September
Cisco Catalyst
3850
January
MDS 9710 Multilayer Director,
UCS, and NVIDIA GPU
May
Cisco Catalyst
6800
June
Nexus 7700
June
Nexus 3548
November
Nexus 6001, 6004
and 1000V
February
Cisco Catalyst
2960-X
June
Supervisor 8E for
Cisco Catalyst 4500-E
June
Source: Company data.
Forward looking at the Insieme spin in for SDN. Cisco’s initial response to the
opportunity/risk presented by SDN appears to be in the form of Insieme Networks, a
captive private company started by three former key Cisco enterprise switching executives
that Cisco has the right to acquire or “spin-in” for $750 million. While initial product strategy
and details remain forthcoming, we believe Cisco has essentially outsourced to Insieme
the development of its SDN response. We believe the reason for this is to avoid the
standard innovators dilemma, as the focus of Insieme will be to become Cisco’s next next-
generation switching platform, with a focus on 100Gbps Ethernet datacenter switching that
goes beyond traditional enterprise switching to add SDN and storage to Cisco’s Unified
Computing System converged datacenter architecture. We believe the strategy here
shows management's flexibility and realistic assessment that, in order to create an
industry leading SDN platform, it needs to be kept separate from the rest of the company.
While there is always a risk that this remains an expensive decision, we believe this
approach was successful with Nuova Systems, which brought to Cisco the Nexus product
family. We believe one potential negative on Insieme could be that it will continue to use
custom Cisco ASICs, and as a result, a network administrator will still need to purchase a
bundled solution from Cisco.
Dominant in the traditional world. Given the low growth prospects of about 4% in the
longer term within the Networking sector, we believe operating performance of individual
vendors will depend on having the right exposure across key segments within switching
and routing. Cisco's share in the Enterprise switching market peaked at ~70% in 2010,
and has fallen to about 65% in recent years. Overall, we believe Cisco is well positioned
on the enterprise switching side with 65% share overall and 67% share in the faster
growing 10GbE segments. However, the company only has 60% share in the 40GbE and
100GbE segment. Although this remains a nascent market, we would expect Cisco's
footprint in the space to grow over time.
On the service provider routing front, Cisco has lost share from over 50% in 2007-08 to
~37% today. While the company has largely maintained share in the Core business with
~50% share, this segment is only expected to grow ~3.5% through 2017. Additionally, we
highlight that Cisco has a smaller share within the faster growing edge routing market with
about 30% share, which has fallen from ~50% share in 2007, although the business has
rebounded slightly since the lows of 2011. Cisco's edge routing share could fall further
given that the edge routing business has comparatively lower barriers to entry compared
to the core, and as a result, will likely see increased competition from Huawei, Juniper,
and Alcatel Lucent.

18 September 2013
Cisco Systems Inc. (CSCO) 33
Wireless LAN—Secular Growth As a result of technological improvement, the WLAN market has been one of the fastest
growth markets within the networking sector. Based on Infonetics data, we think the
current WLAN market is $3.9 billion and is expected to grow at a five year CAGR of 12%,
reaching $6.7 billion by 2017. On a regional basis, we think emerging markets in Asia
Pacific and CALA will outgrow the overall market. North America will still maintain more
than half of the total market, as we expect to see the adoption of 802.11ac starting first in
developed markets in 2014.
Figure 50: WLAN Is a $4 Billion Market Growing at 12% CAGR 2013-17 in millions, unless otherwise stated
-10.0%
-5.0%
0.0%
5.0%
10.0%
15.0%
20.0%
25.0%
30.0%
0
1,000
2,000
3,000
4,000
5,000
6,000
7,000
8,000
2009 2010 2011 2012 2013E 2014E 2015E 2016E 2017E
Total sales yoy growth
13-17 CAGR:11.9%
Source: Infonetics, Credit Suisse estimates.
We believe in aggregate this growth is driven by several factors
BYOD—The main driver of Wireless LAN adoption. Based on Gartner, we estimate that
there could be over 500 million Wi-Fi enabled devices (mostly tablets and phones) brought
onto enterprise networks by 2015, driven by the quick adoption of the BYOD trend (bring
your own device). With an increasing amount of people using smartphones and tablets,
there is strong demand for having these devices connected to the Internet at the
workplace. To address this demand, IT managers have to build out networks that have
capacity to allocate bandwidth efficiently, offer secure corporate IT access, and enforce
corporate compliance policy. The BYOD adoption trend has created a major opportunity
for the WLAN market. To expand wireless coverage, enterprises need to install more
wireless access points for employees and guests. As the deployment of wireless APs
continues, IT administrators need a centralized platform, managed by a WLAN controller,
to manage the whole network.
Figure 51: Emerging Markets Outgrows the Overall Market In US$ millions, unless otherwise stated
Revenue by Region 2011 2012 2013E 2014E 2015E 2016E 2017E 13-17 CAGR
North America 1,550.9 1,983.8 2,181.7 2,431.9 2,788.6 3,116.7 3,411.8 11.8%
EMEA 858.0 1,061.1 1,186.4 1,246.3 1,420.1 1,635.6 1,812.7 11.2%
Asia Pacific 596.1 715.9 763.1 816.5 945.7 1,106.3 1,235.0 12.8%
CALA 110.4 129.0 135.5 149.0 186.8 214.4 238.4 15.2%
Total sales 3,115.3 3,889.8 4,266.7 4,643.7 5,341.1 6,073.0 6,698.0 11.9%
Source: Infonetics, Credit Suisse estimates.

18 September 2013
Cisco Systems Inc. (CSCO) 34
Figure 52: More Employees at Credit Suisse Are
Connecting Their Personal Phones to Work
Figure 53: What Percentage of Your Mobile Workforce Will
Have Tablets?
0
5,000
10,000
15,000
20,000
25,000
30,000
MAY11
JULY11
SEP11
NOV11
JAN12
MAR12
MAY12
JUL12
SEP12
NOV12
JAN13
MAR13
MAY13
JUL13
SEP13
NOV13
BlackBerry MyMobile
0%
5%
10%
15%
20%
25%
30%
35%
40%
Currently 1 year from now 2 years from now 5 years from nowSurvey CS Forecast
Source: Company data, Credit Suisse research. Source: Company data, Credit Suisse estimates.
Rising data speeds. The quality of the WLAN experience has improved as wireless speeds
rise. In 2009, the 802.11n standard was added to 802.11, which significantly improved
network throughput. It can operate in both 2.4Ghz and 5Ghz bands and support MIMO
(multiple-input, multiple-output). The maximum data transfer speed can reach 600Mbit/s.
Now the industry is moving towards 802.11ac, a standard which will provide throughput in
the 5GHz band. The maximum speed of 802.11ac can achieve is 6,900Mbit/s. (See Figure
55.)
Modernization of infrastructure. The networking functionalities for which enterprises
historically depended on a wired infrastructure can be increasingly performed through
wireless networking. As a direct result, enterprises are seeing the value of being able to
forego Ethernet cables and connect wirelessly, especially with mobile devices proliferating
in the enterprise. Additionally, with its high-bandwidth capabilities, WLAN can increasingly
improve the experience with multimedia applications.
Exhibit 54: Infonetics Expects 6 Million Wifi Public Hotspots by 2015 in millions, unless otherwise stated
0.0
1.0
2.0
3.0
4.0
5.0
6.0
2009 2010 2011 2012 2013 2014 2015
Pu
bli
c h
ots
po
ts (
mil
l.)
Source: Infonetics.
Business/vertical-specific functionalities. The obvious use case has been that many
enterprises find it beneficial to offer WiFi access to their end users and guests and visitors.
However, we are now seeing an increasing majority of enterprise WLAN being deployed
for business-critical applications, such as managing inventory in a warehouse, accessing
medical records while on the move, or accepting payments in a retail store. Enterprises

18 September 2013
Cisco Systems Inc. (CSCO) 35
are finding that wireless networking allows them to run their businesses more effectively.
For example, customers of enterprises such as hotels and restaurants choose these
businesses based on the availability of wireless Internet for business and pleasure.
A Brief Review of WLAN Industry—Driven by Ever Faster Speeds
A wireless local area network links multiple devices by connecting them to the internet
through access points within the network. Initially, the WLAN hardware deployment cost
was very high and thus was only used as an alternative to cabled LAN in rural places
where it was challenging to deploy cable. By the end of late 1990s, industry standards
were set up mainly based on various versions of IEEE 802.11. In 2009, the 802.11n
standard was added to 802.11, which significantly improved network throughput. It can
operate in both 2.4Ghz and 5Ghz bands and support MIMO (multiple-input,
multiple-output). The maximum data transfer speed can reach 600Mbit/s. Now the industry
is moving towards 802.11ac, a standard which will provide throughput in the 5GHz band.
The maximum speed of 802.11ac can achieve 6,900Mbit/s. (See Figure 55.)
Figure 55: The Evolution of WLAN Standards
Source: Cisco.
Competitive Dynamics—Cisco Dominates
Given the superior growth characteristics of the Enterprise Grade WLAN market, it is not
surprising that it remains highly competitive. We believe that several important attributes
are necessary to succeed in this market.

18 September 2013
Cisco Systems Inc. (CSCO) 36
Figure 56: Ubiquiti Has 1% Market Share of WLAN Market
Cisco, 51%
Other, 20%
Aruba, 11%
HP, 6%
Ruckus, 5%
Motorola, 5%
Meru, 2%
Ubiquiti, 1%
Source: Company data, Credit Suisse research.
Global scale, consistency, and support. At the enterprise level, distribution remains
paramount. Indeed WLAN vendors that can serve and are easily accessible to
multinational and global enterprises across geographies will attract clients that want to
deploy consistent IT infrastructures worldwide with consistent customer service to service
them across their infrastructure. In this respect, Cisco’s installed base will inherently be at
an advantage, which will take some time for smaller vendors to overcome.
Wired infrastructure integration capabilities. Not to state the obvious but wireless LAN
cannot exist without a wired infrastructure. However, there are variations in how WLAN
infrastructures interact with the wired network. Good WLAN vendors will use
standards-based integration technology to promote good integration without major
modifications to either the wired or wireless infrastructure. Of course, incumbents in the
wired networking segment have the opportunity to integrate the management platforms as
well. The scoring criterion most heavily influenced by "wired infrastructure integration
capabilities" is "integration capabilities/future integration strategy."
Exhibit 57: Aruba Partners Very Effectively for the WLAN Market
Wired Switches Wireless Aps VPN Managed UnManaged Endpoint
Aruba Aruba Aruba Windows iPhone/ipad NAP,NAC
Cisco Meru Cisco Mac Android A/V,A/S
HP Meraki Juniper Linux Printers Firewall
Enterasys Cisco SonicWall VoIP Phones Discovery
Extreme Enterasys F5 Medical Devices Patch
Juniper Motorola Check Point MFG. Devices Management
Foundry Xirrus and More Security Vulnerability &
(Brocade) and More Equipment Port Scans
and More (cameras, etc.)
Source: Company data, Credit Suisse research.
Partnerships. WLAN is one part of networking and IT infrastructure, and IT departments
and networking configurations will need to evolve and work with all vendors over time.
These vendors will display knowledge of networking needs in their sales, presales,
engineering, and marketing efforts and be able to provide effective first-level support. In
addition to the networking component, a successful channel partner will have experience
and proficiency with RF infrastructures. Additionally, players need a breadth of ecosystem
and integration, as Aruba has done. (See Exhibit 57). This is especially important for

18 September 2013
Cisco Systems Inc. (CSCO) 37
vendors targeting specific verticals. Similarly, a smart vendor strategy can enter into
strategic interoperability and sales and distribution partnerships with ubiquitous technology
providers to increase penetration and brand value.
Application development platform with the ability to add network intelligence services.
Owing to vertical- or business-specific needs, clients may be interested in network
applications that a WLAN vendor may not offer. To help solve this issue, the vendor may
be able to add third-party solutions that allow a given vendor to add incremental
functionality without having to develop it internally.
Controller-less or cloud-based Wi-Fi. In place of deploying a Wi-Fi network with a physical
controller and access points on premise, a new architecture has emerged that is
essentially a cloud-based WiFi solution, which leverages the cloud to create an
environment with a virtual, cloud-based controller, as opposed to having a physical box on
premise. Indeed Cisco’s acquisition of Meraki can be seen in this light.
Cisco to Dominate, Aruba a Worthy Disruptor
Cisco dominating WLAN. We believe Cisco will maintain its strong position in the WLAN
market, as enterprises with large budget dollars prefer to go with end-to-end hardware and
services support from a few concentrated vendors. Given this dynamic, we believe Cisco
is poised to benefit. With its key advantage of a large installed base in the enterprise
switch and router markets, Cisco is able to cross sell its WLAN routers. After the
acquisition of Meraki, Cisco is capable of hosting a network controller on the company’s
own servers and lets customers access the centralized management platform in the cloud.
Exhibit 58: Cisco Has Dominated the Market but Aruba Has Grown
41.6%47.4% 46.3% 49.7% 49.1% 50.6%
5.7%6.4% 8.6%
8.9% 10.2% 11.0%
0%
10%
20%
30%
40%
50%
60%
70%
80%
90%
100%
2007 2008 2009 2010 2011 2012
Rev
enu
e S
har
e
Cisco Aruba Alcatel-Lucent D-Link HP Juniper Meru Motorola Other Ruckus
Source: Infonetics.
Aruba a strong number 2. Aruba is the number two player in the WLAN space with 11%
market share. While the company is a pure WLAN player and lacks the ability to bundle
sales with other enterprise products, it has managed to gain share since 2007. Aruba has
strong software solutions integrated with hardware products, especially on security and
network management. We believe this offers product differentiation and the newly
launched ClearPass system will give the company more leverage in catching the BYOD
opportunity. Aruba has been focusing on selling managed services deployments to service
providers rather than competing directly in the service provider Wi-Fi market.
HP a distant third place. HP is the third largest player with market share of 5.6%. The
company entered into the WLAN market through the acquisitions of Colubris and 3Com.

18 September 2013
Cisco Systems Inc. (CSCO) 38
Similar to Cisco, the company has a large installed base of enterprise products and is
aiming to integrate its wired and wireless product solutions within the networking space.
MSI losing share. Motorola Solutions has market share of 4.7% and has been struggling
and losing share in this market. The company mainly targets the retail vertical and
considers WLAN as part of its overall suite of enterprise products rather than an
independent product. As a result of the verticals, it targets growing much slower and,
having misexecuted the transition from a product-only sale to a managed services,
Motorola Solutions saw its market share drop to 4.7% from 6.4% in 2011.
Ruckus rising share. Ruckus is a newly emerging player in the WLAN market with about
5% market share. The company mainly targets small- and medium-sized businesses and
has about two-thirds of revenue coming from the segment. Ruckus competes directly with
Ubiquiti on this space and is also considered a low-cost vendor.
Ubiquiti trying to disrupt another market. Ubiquiti’s product portfolio mainly targets the
low-end of WLAN market, where customers tend to be small businesses and are more
price sensitive. While Ubiquiti just launched its WLAN product Unifi at the end of 2011, we
think the product is getting very good traction and by the end of 2012 Ubiquiti obtained
about 1% revenue share and 4% units share according to Gartner. Given Ubiquiti’s
disruptive pricing structure, we think the company will continue its momentum and keep
gaining share in the WLAN market. However, at the same time, we also want to point out
that a large part of the WLAN market is for large enterprises and it would be difficult for
Ubiquiti to penetrate this market. The Unifi portfolio is a scalable platform targeting the
Wireless LAN market. The platform consists of hardware that is easy to deploy indoor, and
unlike other enterprise Wi-Fi systems that use hardware switch, Unifi is deployed with a
virtual controller that allows for remote management from any PC within the network.
Similar to its other products, Ubiquiti is very aggressive on pricing, making the product
significantly cheaper than alternative products from industry peers. The main competitors
are Ruckus Wireless and Aruba.
Figure 59: UniFi Portfolio
UniFi AP UniFi AP-LR UniFi AP-PRO UniFi AP-AC
2.4GHz Speed 330 Mbps 300 Mbps 450 Mbps 450 Mbps
5GHz Speed 300 Mbps 1300 Mbps
Range 122m (400ft) 183m (600ft) 122m (400ft) 122m (400ft)
Wi-Fi Standards 802.11 b/g/n 802.11 b/g/n 802.11 a/b/g/n 802.11 a/b/g/n/ac
Price $73 $85 $225 $308 Source: Company data, Credit Suisse research.

18 September 2013
Cisco Systems Inc. (CSCO) 39
SDN—Reorienting Networking Catalyzed by hyperscale adoption, VMware’s acquisition of Nicira, and the promise of
lower opex/capex and choice, SDN or Software-defined Networking, has become the
latest industry buzzword, with management presentations striving to address this topic
meaningfully and numerous roadmaps rolled out. Indeed, there are host of technology
start-ups striving to address this area. At the heart of the move towards SDN, is the
explosion of networking endpoints and the desire for more efficient management. With
this, the changing nature of datacenter traffic requires more flexible networking and is a
departure from the infrastructures of the past 20 years. Consequently, legacy networking
architectures, in which hardware and software were bundled for a static, siloed solution,
are being displaced by systems that can effectively separate hardware and multiple planes
of management. Our analysis of SDN arrives at three important conclusions.
SDN—There are real drivers for its demand. At its most basic definition, SDN involves the
separation of hardware and software, rather than a traditional bundled networking sale.
The reason for this is not disruption to the industry structure for its own sake, but it is to
actually solve underlying challenges facing datacenter deployments. The ever increasing
demand on datacenters from changing traffic and the need for analyzing data, means than
there is a need to create dynamic infrastructure layers that perform the task needed, as
opposed to static traditionally engineered systems. As a result, by divorcing the software
control layer from the hardware, software defined networks can separate away from
individual hardware devices and manage systems at an overarching level.
Three segments for SDN adoption. The adoption in SDN will vary by segment and
anecdotal evidence suggests that this is occurring. From our perspective, we see three
segments, hyperscale datacenter vendors such as Google, Amazon, and Facebook,
carriers such as AT&T, BT, and Verizon, and traditional enterprises.
■ Traditional enterprise. The key benefit here is the ability to create an ease of
management and move towards a virtualized datacenter. We are seeing several
enterprises, mainly financial institutions such as Goldman Sachs and Credit Suisse,
initially test SDN. In such cases, typically, the deployments are more in greenfield
deployments. Outside this narrow vertical, adoption seems to be stem from the devops
movement and agile application development, where more dynamic systems are
favored. This aside, for the broader enterprise market, adoption will likely take time
and anecdotal evidence points to some adoption in the latter half of 2014 and 2015.
■ Carriers. Carriers are looking to embrace SDN and network function virtualization to
extend new services, improve efficiency, and lower capex. As part of this effort, 20
leading carriers formed the Network Functions Virtualization (NFV) working group to
promote a standards-based approach to SDN and NFV, with the goal of leveraging
volume and standardized x86 and switches to extend services on premise and in
branch offices. While the deployment of NFV-type functionality in appliance format has
long been a thorn in the side of carriers, NFV maturity portends a more prolonged
cycle of technology adoption.
■ Hyperscale datacenter. Hyperscale customers have adopted the technology first, with
Amazon and Google adopting versions of OpenFlow technology. Outside of this,
Facebook and the Open Compute are working to develop a specification for an open
networking switch. This design will be agnostic to the software running on it and
consequently, further SDN efforts on separating hardware and software. The Open
Networking and Open Daylight Foundations are involved in the effort along with
Broadcom, Intel, Vmware, and privately-held Cumulus Networks. Outside of the
massive hyperscale datacenters, SaaS vendors are adopting the technology to
streamline their datacenters and improve opex.

18 September 2013
Cisco Systems Inc. (CSCO) 40
Strategies from all segments emerge. Given the rise of SDN over the long term, it is not
surprising that many vendors see this disruption as an opportunity. Traditional networking
companies such as Cisco and Juniper are developing and pushing their own strategies to
enhance their software and services profiles. Meanwhile, IT and telecom equipment
companies such as HP and Huawei are less concerned around their legacy installed base
and see SDN as an avenue for disrupting the market and capturing share. Software
companies such as VMware see the opportunity to absorb functionality and new emerging
companies such as Big Switch, Plexxi, Cumulus, PLUMgrid, and Embrane have stated
that they believe they can gain from added functionality and flexibility to the network. What
is clear is the move to SDN has already resulted in strategies around it being formed.
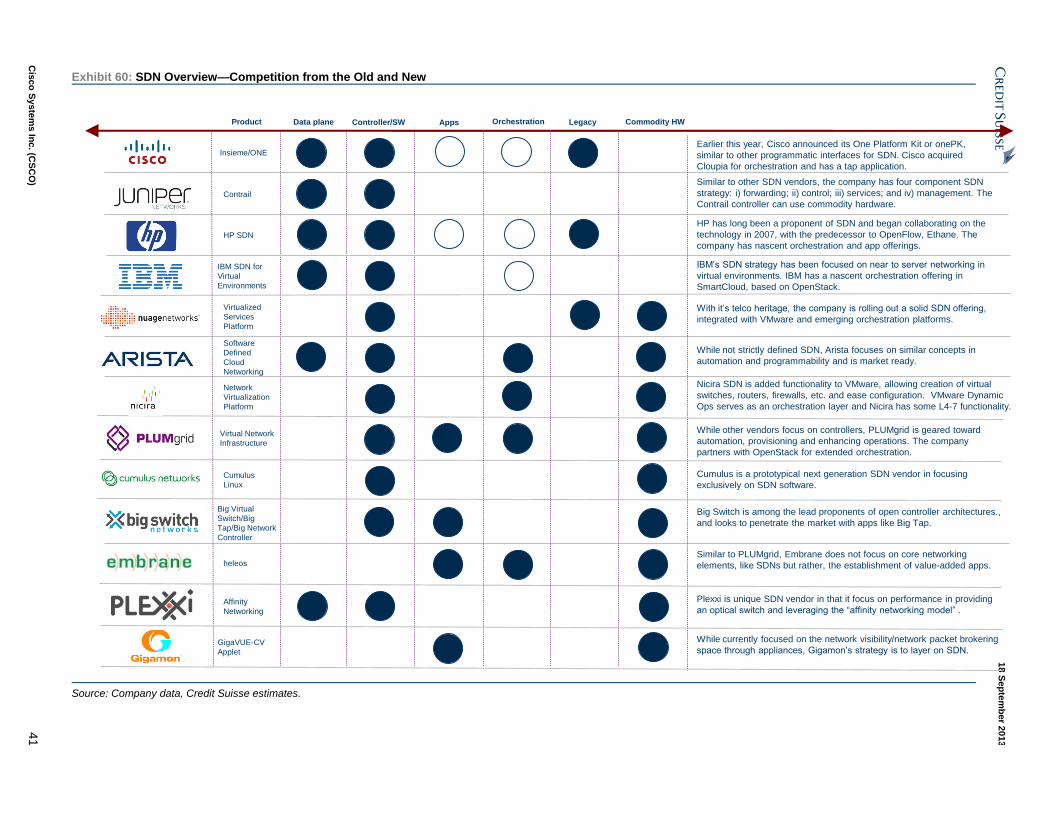
1
8 S
ep
tem
ber 2
013
Cis
co
Sy
ste
ms In
c. (C
SC
O)
41
Exhibit 60: SDN Overview—Competition from the Old and New
Data plane Controller/SW Apps
Earlier this year, Cisco announced its One Platform Kit or onePK,
similar to other programmatic interfaces for SDN. Cisco acquired
Cloupia for orchestration and has a tap application.
Similar to other SDN vendors, the company has four component SDN
strategy: i) forwarding; ii) control; iii) services; and iv) management. The
Contrail controller can use commodity hardware.
IBM’s SDN strategy has been focused on near to server networking in
virtual environments. IBM has a nascent orchestration offering in
SmartCloud, based on OpenStack.
With it’s telco heritage, the company is rolling out a solid SDN offering,
integrated with VMware and emerging orchestration platforms.
Nicira SDN is added functionality to VMware, allowing creation of virtual
switches, routers, firewalls, etc. and ease configuration. VMware Dynamic
Ops serves as an orchestration layer and Nicira has some L4-7 functionality.
While other vendors focus on controllers, PLUMgrid is geared toward
automation, provisioning and enhancing operations. The company
partners with OpenStack for extended orchestration.
Cumulus is a prototypical next generation SDN vendor in focusing
exclusively on SDN software.
Plexxi is unique SDN vendor in that it focus on performance in providing
an optical switch and leveraging the “affinity networking model” .
Orchestration
HP has long been a proponent of SDN and began collaborating on the
technology in 2007, with the predecessor to OpenFlow, Ethane. The
company has nascent orchestration and app offerings.
While not strictly defined SDN, Arista focuses on similar concepts in
automation and programmability and is market ready.
Similar to PLUMgrid, Embrane does not focus on core networking
elements, like SDNs but rather, the establishment of value-added apps.
While currently focused on the network visibility/network packet brokering
space through appliances, Gigamon’s strategy is to layer on SDN.
Big Switch is among the lead proponents of open controller architectures.,
and looks to penetrate the market with apps like Big Tap.
Legacy Commodity HWProduct
Insieme/ONE
Contrail
HP SDN
IBM SDN for
Virtual
Environments
Virtualized
Services
Platform
Software
Defined
Cloud
Networking
Network
Virtualization
Platform
Virtual Network
Infrastructure
Cumulus
Linux
Big Virtual
Switch/Big
Tap/Big Network
Controller
heleos
Affinity
Networking
GigaVUE-CV
Applet
Source: Company data, Credit Suisse estimates.

18 September 2013
Cisco Systems Inc. (CSCO) 42
SDN—Gradual but real adoption The danger of analyzing the impact of something like the onset of SDN that has the
potential to be so disruptive to the industry structure, revenues, and margins of the
networking market, is that it can simply be overhyped. Indeed, the best example of this is
the opportunity discussed and hoped for with the mobile internet. While various
technologies such as WAP, club Nokia, and GPRS arrived in the late 1990s, it took until
arguably the entrance of the iPhone and mass coverage of 3G networks for the actual
potential to be unleashed. While we firmly believe the SDN threat is real, it may take
multiple years for this to have an impact. The risk this creates is that if indeed, as Gartner
notes, the technology is two to five years away or perhaps longer, it allows time for
incumbents to reposition. In order to arrive at a pulse of what the actual industry believes,
we recently, as part of the Credit Suisse Networking survey, aimed to get a sense of the
adoption dynamic and arrived at four main conclusions.
Exhibit 61: The Networking Hype Cycle SDN at Its Peak
Source: Gartner.
Awareness building, mainly in a PoC stage. In Exhibit 62, we note that 35% of
respondents either have or are currently evaluating SDN use cases currently. Looked at
alternatively, as shown in Exhibit 63, 64% of respondents are in proof-of-concept or pilot
stage.

18 September 2013
Cisco Systems Inc. (CSCO) 43
Exhibit 62: SDN Being Slowly Evaluated
Have you evaluated or you evaluating SDN?
Exhibit 63: SDN Still at a POC Stage
At what stage are you with respect to SDN deployments?
Yes35%
No65%
PoC50%
I don't plan to14%
Deploy in Develop/Test
21%
Pilot14%
Source: Credit Suisse survey. Source: Credit Suisse survey.
Deployments start in 18 months. Some 79% of respondents expect to deploy SDN within
24 months. Even with this adoption, spending on SDN services will only account for 13%
of spending.
Exhibit 64: SDN Deployed 16 Months Out
When do you expect to deploy SDN?
Exhibit 65: SDN Will Be 13% of Spend Three Years Out
What percent of your spend will be SDN based in 3 years?
-1
4
9
14
19
24
0%
5%
10%
15%
20%
25%
30%
CurrentlyDeployed
Next 6Months
Next 7-12Months
Next 13-18Months
Next 19-24Months
Over 24Months
NotApplicable
Mon
ths
Perc
enta
ge o
f res
pond
ents
11.5%
13.3%
0.0%
2.0%
4.0%
6.0%
8.0%
10.0%
12.0%
14.0%
1 Year 3 Years
Source: Credit Suisse survey. Source: Credit Suisse survey.
Seen as disruptor from a wary industry. Perhaps the best reflection on the outlook from
SDN is that while it is seen as a disruptor to the market, we believe that there is a mixed
view on how SDN will impact networking spend over the next 3 years.
Mixed views on SDN adoption's effect on spend. Some 43% of respondents expect the
adoption of SDN to cause their overall networking spend to go down (will save them
money) and 36% to go up (will not save them money).
Exhibit 66: Adoption of SDN on Networking Spend
Adoption of SDN will cause overall networking spend to:
Spending will increase, 36%
Spending will decrease, 43%
Spending will not change, 21%
Source: Credit Suisse survey.

18 September 2013
Cisco Systems Inc. (CSCO) 44
We have included what we believe are some interesting quotes from respondents:
“SDN will have the impact on computing networking as virtualization was to
servers. It will centralize much of the networking control, thus reducing the overall cost. It
will usher in a major change in the way "IT" network is performed and it will add new
dimensions to other innovative changes in IT, such as Cloud.”
“I believe it is a generational shift in networking, albeit still in its infancy. There really
is no SDN market today, due to the general immaturity and lack of adoption of the
products. In 2-3 years I expect to see winners and losers emerge. My guess today is HP
as a winner and Cisco as a loser. Juniper may win, or at least break even, although even
they could have serious issues. The best of the startups today will likely get acquired by
today's major vendors.”
“This is a generational shift in networking. The market will have to mature for
widespread adoption. The disruption in network support organizations will be similar to the
disruption in development organizations when object oriented programming was first
introduced.”
“SDN will and is revolutionizing present thinking about network architecture. As we
integrate boots on the ground (sales, marketing, etc.) with production, SDN plays an
increasingly important role in satisfying the need for an elastic cloud architecture and on
demand network availability.”
“There is still more hype than content. The infrastructure aspect of networking is/was
intensive. The short answer to cloud it, just means the intensity has shifted, not gone
away. Newcomers will and have front ended traditional providers, much like the cellular
networking experienced 12 years ago. This will happen with SDN. With that said, the
marketing or buzz & hype IS a forerunner to the provisional technology shift. It will happen
after a settle out in the market occurs and the actual infrastructure shifts happen.
Customer interaction has to be smooth and transparent and that has yet to happen.
Basically, there has to be a shift from a capex/high opex mentality to a consumerization
mentality for it to really be a common and available tool."
“Too early to call. But history of this type of technology suggests companies should wait
for it to mature before jumping too quickly. Maybe as long as 3-4 years.”
“Once a standard has been fully identified I think this will be an open market for new
vendors to compete.”
“Big Switch, Extreme Networks, Cisco, Juniper will all be big players. SDN seems to
be getting more traction than previously expected, so no, I don't think it is [overly hyped].”
"Will wait to see if it gets traction in the enterprise before committing major funds to it."
"Arista seems to be a vendor that could make an impact in the SDN arena."
“I'm looking towards Cisco to play catch-up with some of the smaller players that have
entered the market. It's still early and not sure if it's more hype than reality. If the benefits
are true it could shake up the field if Cisco doesn't acknowledge and enter the race as
stated earlier.”
“1) SDN is for large datacenters and clouds. 2) SDN will evolve from "dumb" hardware
"smart" software concept to automation and adding services without changing hardware
concept. 3) I believe PlumGrid's approach is the most perspective approach.”
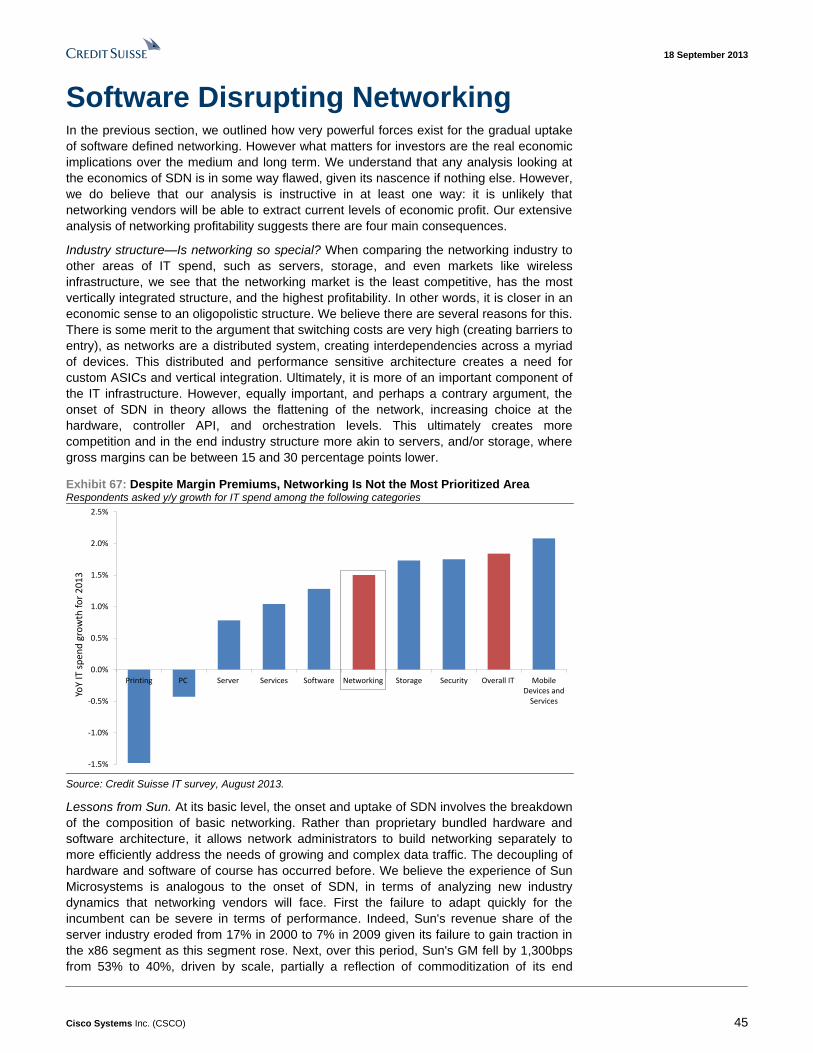
18 September 2013
Cisco Systems Inc. (CSCO) 45
Software Disrupting Networking In the previous section, we outlined how very powerful forces exist for the gradual uptake
of software defined networking. However what matters for investors are the real economic
implications over the medium and long term. We understand that any analysis looking at
the economics of SDN is in some way flawed, given its nascence if nothing else. However,
we do believe that our analysis is instructive in at least one way: it is unlikely that
networking vendors will be able to extract current levels of economic profit. Our extensive
analysis of networking profitability suggests there are four main consequences.
Industry structure—Is networking so special? When comparing the networking industry to
other areas of IT spend, such as servers, storage, and even markets like wireless
infrastructure, we see that the networking market is the least competitive, has the most
vertically integrated structure, and the highest profitability. In other words, it is closer in an
economic sense to an oligopolistic structure. We believe there are several reasons for this.
There is some merit to the argument that switching costs are very high (creating barriers to
entry), as networks are a distributed system, creating interdependencies across a myriad
of devices. This distributed and performance sensitive architecture creates a need for
custom ASICs and vertical integration. Ultimately, it is more of an important component of
the IT infrastructure. However, equally important, and perhaps a contrary argument, the
onset of SDN in theory allows the flattening of the network, increasing choice at the
hardware, controller API, and orchestration levels. This ultimately creates more
competition and in the end industry structure more akin to servers, and/or storage, where
gross margins can be between 15 and 30 percentage points lower.
Exhibit 67: Despite Margin Premiums, Networking Is Not the Most Prioritized Area Respondents asked y/y growth for IT spend among the following categories
-1.5%
-1.0%
-0.5%
0.0%
0.5%
1.0%
1.5%
2.0%
2.5%
Printing PC Server Services Software Networking Storage Security Overall IT MobileDevices and
Services
YoY
IT s
pen
d g
row
th f
or
20
13
Source: Credit Suisse IT survey, August 2013.
Lessons from Sun. At its basic level, the onset and uptake of SDN involves the breakdown
of the composition of basic networking. Rather than proprietary bundled hardware and
software architecture, it allows network administrators to build networking separately to
more efficiently address the needs of growing and complex data traffic. The decoupling of
hardware and software of course has occurred before. We believe the experience of Sun
Microsystems is analogous to the onset of SDN, in terms of analyzing new industry
dynamics that networking vendors will face. First the failure to adapt quickly for the
incumbent can be severe in terms of performance. Indeed, Sun's revenue share of the
server industry eroded from 17% in 2000 to 7% in 2009 given its failure to gain traction in
the x86 segment as this segment rose. Next, over this period, Sun's GM fell by 1,300bps
from 53% to 40%, driven by scale, partially a reflection of commoditization of its end

18 September 2013
Cisco Systems Inc. (CSCO) 46
market. The concern is even if Cisco and Juniper do adapt and embrace SDN, today's
economics may ultimately look increasingly like the 'good times' of networking. Indeed, we
note whether it is margins or revenues, some 43% of our respondents believe it will cause
revenues in networking to shrink.
Exhibit 68: 43% of Respondents Say SDN Will Reduce Their Total Networking Spend Respondents asked what impact SDN will have on their total networking spend
Spending will increase, 36%
Spending will decrease, 43%
Spending will not change, 21%
Source: Credit Suisse Networking survey, August 2013.
Margins over time. While our view of declining gross margin profitability may look alarmist
to some, we would note that even adjusting Cisco and Juniper for major acquisitions, the
direction of gross margins over time has been downward. In fact, we find an R squared of
78% between networking margins and time based upon Cisco and Juniper’s experience,
with an average annual decline of 0.5% per year being the normal trend over the past
seven to eight years. There are margin cycles around this, but the downward pressure is
not insignificant.
Shrinking GP dollars will become a major headache. SDN promises huge change,
disruption, and opportunities. However, among all the hyperbole, we examine the savings
SDN offers and the economic consequences. We have benchmarked various costs to give
an order of magnitude the cost that an SDN-based solution may offer. We have compared
the total cost of ownership (ex-labor, running costs) for basic Cisco switches for the
datacenter (i.e., Nexus 3064), along with the SMARTnet services and software contracts
that network administrators would usually sell. The alternative in a SDN-based
environment would be to buy the Cumulus Linux software subscription and top of rack
bare metal switch. We conclude that the TCO is dramatically lower at approximately 80%
and that in turn the gross profit dollars available to the vendors are 75% lower. This
suggests to us that even if traditional networking vendors create successful SDN
environments, the economics will be drastically different.
Networking—Is It So Special? SDN May Change That
Cisco dominates the networking landscape; over any prolonged period of time, Cisco has
sustained market shares of between 30% (service provider routing) and 77% (enterprise
routing), with Juniper typically taking second place in routing markets (although we
acknowledge that Huawei has increasingly gained share in service provider routing to
equal Juniper's share essentially). While there have been all forms of competition over the
years, as shown in Exhibit 69, the one constant has been that combined both vendors
control approximately 60% of industry revenues for switching and routing.

18 September 2013
Cisco Systems Inc. (CSCO) 47
Exhibit 69: Cisco Has Seen Many Competitors, but Seems to Have Been the Constant
1990-1995 1996-2000 2001-2007 2008-Today 2015
ACC Bay Networks Alcatel HP ????????
WellFleet Ascend Ericsson Juniper
Proteon 3Com Siemens Microsoft
SynOptics Newbridge Foundry Checkpoint
DEC Fore Extreme Arista
3Com Xylan NEC Aruba
IBM Cabletron Nortel Riverbed
Riverstone Avaya
Lucent F5
Juniper Shortel
Redback Huawei
Dell
Fortinet
Brocade
Polycom
Source: Company data, Credit Suisse estimates.
An interesting point to note is that when viewed from a market share perspective, we note
that networking is perhaps one of the least competitive markets:
■ In storage the top vendor—EMC—only has a 31% market share, and the top three
vendors have 55%;
■ In x86 servers, the top vendor has a 33% share, and the top three vendors have 70%;
■ In wireless infrastructure, the top vendor has a 40% share, and the top three vendors
have 72%; and
■ In enterprise switching, we note that the number one vendor Cisco has a 65% share,
and the top three account for approximately 80%.
The networking market and specifically the wider networking market is possibly the least
competitive and most oligopolistic in nature of all the typical hardware segments. This
could be explained by several factors:
■ Networking is a distributed system, meaning that costs of switching infrastructure are
much higher. Originally, networking was designed in such a manner that if one area of
the network failed, all others would remain intact, meaning it served as a distributed
system. Given the intelligence is placed in so many nodes, this increases the need for
high-performance software and highly reliable hardware in terms of silicon. This
means that typically a given enterprise would select one vendor and remain with them,
especially as the protocols and hardware were and remain all proprietary. This
indicates that historically networking appliances, such as Cisco switches, have been
tested at scale, in turn creating a virtuous-circle and making it very hard for new
vendors to break in.
■ The switching costs are very high. Cisco in particular has invested significantly in
certified administrators for networks (Cisco Certified Entry Networking Technician—
CCENT, Cisco Certified Network Associate—CCNA, Cisco Certified Network
Professional—CCNP, Cisco Certified Internetwork Expert—CCIE). This creates a
significant inertia in moving vendors and platforms, as its network administrators not
only face the cost of replacing networking infrastructure, but these administrators will
in essence need to be retrained.
■ Networks affect the rest of the IT infrastructure. If a network fails, it impacts the
compute and storage IT as well, meaning the need for reliability and taking less risk
remains high.

1
8 S
ep
tem
ber 2
013
Cis
co
Sy
ste
ms In
c. (C
SC
O)
48
Exhibit 70: —Less Competitive, with Premium Margins and Average Innovation
Cisco
CiscoEricsson
IBM EMC
HP
Juniper
NSN HP
IBM
ZTE
HuaweiHuawei
Dell
NetApp
Juniper
Alcatel
Lucent
HP
0%
10%
20%
30%
40%
50%
60%
70%
80%
90%
100%
Switching Routing WirelessInfrastructure
All servers Storage
Share by IT segment …networking appears far less competitive
Source: Company data, Credit Suisse estimates
Compared with any other major area of IT or service provider spending
Networking is far less competitive, with fewer serious alternatives to the
number one competitor, creating an oligopolistic structure Q. Which segment has shown the most innovation in the past 5 years
and which do you think will in the next 5?
Source: Credit Suisse Networking Survey, August 2013
Networking delivering less innovation
0%
5%
10%
15%
20%
25%
30%
35%
Printing Servers PC Networking Software Services Storage Security
Perc
ent
of
Vo
te
Past 5 years Next 5 years
0.0%
10.0%
20.0%
30.0%
40.0%
50.0%
60.0%
70.0%
80.0%
Switching Routing Storage All servers Wireless
Infrastructure
Ble
nd
ed
GM
%
Source: Company data, Credit Suisse estimates
…leading to significant premium in margins
Source: Company data, Credit Suisse estimates.

18 September 2013
Cisco Systems Inc. (CSCO) 49
Additionally, it could simply be that there is a level of scale advantage and consistent
innovation that Cisco, for example, has produced, resulting in a fundamentally different
market structure to other segments. We believe that there is some truth to the fact that
Cisco has consistently over the years simply out-executed peers.
Alternatively, it could be that there has simply not been the architectural shift in networking
that say an opportunity such as SDN offered. Interestingly enough, based upon our IT
survey, we note that networking is perceived as delivering the least innovation of other IT
segments over the past five years, which is normally associated with markets that lack a
competitive structure. The difference is now we see scope for a potentially much more
competitive and different market structure.
More competition. With the altered industry structure, there will be more competition, as
firms go head to head to absorb increasing levels of functionality into their platforms and
increase the attractiveness of APIs. Certainly, as we show, traditional networking vendors
will play a part in this market, yet the primary question is whether they can replicate
current economies due to today's oligopolistic landscape in networking segments.
Expanded opportunity to add value. Not dissimilar from prior platform evolutions, we
expect that there will be an increasing opportunity to add value in conjunction with the
networking infrastructure. Here, API-enabled applications will bring value to network
optimization, security, and enhanced application performance while orchestration layers
will mitigate ever increasingly complex network architectures.
A market structure over time resembling other parts of IT spend could mean that
economics could change. The movement we believe over time could suggest a radical
change in industry structure, to not one where the top two vendors control over 60% of
revenues and 65% of profits (for switching and routing), but possibly more like the storage
market or even servers. We note in Exhibit 70 that the margins extracted for such
segments tends to be much lower indeed, whereas storage GM are 55% and servers are
lower still at 30%. Fundamentally however, we believe that SDN will over time result in a
competitive industry structure. We believe a quote from Frank Frankovsky, VP of hardware
engineering at Facebook, is relevant.
“We should be able to treat a switch like a server in the rack….We should be able to load a
Linux-based operating system, and that server just happens to have a lot of I/O ports on it."
Hardware and Software Decouple—Lessons from
Sun
At its basic level, the onset and uptake of SDN involves the breakdown of the composure
of basic networking. Rather than an architecture with proprietary bundled hardware and
software, it allows network administrators to build networking separately to more efficiently
address the needs of growing and complex data traffic. The decoupling of hardware and
software of course has occurred before with various generations of the PC industry, and
even within servers. In fact, the experience of Sun Microsystems is analogous to the onset
of SDN for several reasons.
■ Like servers, networking is seen as a core aspect of IT infrastructure, where reliability
is cherished, security is essential, and failure of the appliance will not be tolerated.
■ Sun operated in the server market very much like Cisco and Juniper do today. In the
UNIX market, it designed its own processors and ASICs, appliances, and bundled the
sale with the software operating system Solaris. As x86 servers delivered more
powerful compute; it ultimately became an alternative over time, whereby a commodity
x86 server could be purchased from Dell, HP, or a wide range of alternatives, and the
software was decoupled from suppliers such as Microsoft or Linux vendors. This to us
sounds very similar to the SDN alternative to today’s switching architecture.

18 September 2013
Cisco Systems Inc. (CSCO) 50
■ There was an underlying need as the rise of PC computing demanded that enterprises
deliver computing power at a lower price. This is similar to the building pressure on
datacenters today, with growing data traffic, mobility, and analytics all requiring more
networking fabric.
Of course, like all analogies, this is not perfect, and Sun Microsystems did have ample
opportunities to execute and change course. However, what is interesting is the end
impact on the company.
Failure to adapt meant the ongoing shift to x86 caused material revenue pressure. We see
in Exhibit 72 that Sun's revenues share of the server industry eroded from 17% in 2000 to
7% in 2009 given its failure to gain traction in the x86 segment, as the x86 server market
rose to become 60% of industry revenues from 40% between 2000 and 2009. Revenues
for Sun collapsed by 70% to $3 billion in 2009.
A rapid change in industry margins. Between 1998 and 2009, Sun's GM fell by 1,400bps
from 54% to 40%, partially a reflection of scale and partially a reflection of commoditization
of its end market. Indeed, we believe today that HP, Dell, and IBM's gross margins just for
hardware are somewhere between 27% and 35%, significantly below networking levels.
Exhibit 71: Between 1998 and 2009 Sun's GM's Fell by 1,400bps
-5%
5%
15%
25%
35%
45%
55%
-1,000
-500
0
500
1,000
1,500
2,000
2,500
3,000
3,500
19
98
19
99
20
00
20
01
20
02
20
03
20
04
20
05
20
06
20
07
20
08
20
09
Sun Operating Profit Sun Operating Margin Sun Gross Margin
Source: Company data, Credit Suisse research.
Industry pricing dramatically changed. The server market has essentially failed to grow
over the past 16 years. Although the end market for servers has grown, and x86 servers
have taken share, the end server market has actually in revenue terms has stayed flat.We
also note that the mix shift to x86 meant an acceleration in pricing pressure. From 1996 to
1998, prices came down 40%, and in the subsequent 14 years, they came down at a 7%
CAGR.
Of course the above cannot be simply overlayed to Cisco, Juniper, or the networking
industry directly, but it should be considered the worst case of the failure to adapt. What is
clear, however, is that if this is applicable, the net effect would be:
■ Limited growth in traditional networking over time and possibly a long-term decline;
■ A fundamentally different GM structure not in the 60-70% level, but rather in the
mid- 50's; and
■ A very different industry structure in market share terms.
The concern is that even if Cisco and Juniper do adapt and embrace SDN, today's
economics may, in the end, look increasingly like the good times of networking.

1
8 S
ep
tem
ber 2
013
Cis
co
Sy
ste
ms In
c. (C
SC
O)
51
Exhibit 72: Lessons from Sun—When Hardware and Software Decouple...It Gets Ugly
0%
2%
4%
6%
8%
10%
12%
14%
16%
18%
20%
0%
10%
20%
30%
40%
50%
60%
70%
2000 2001 2002 2003 2004 2005 2006 2007 2008 2009
Sun s
erv
er re
venue s
har
e
x86 S
har
e
x86 share of total server revenue Sun Server Revenue Share
-
10,000
20,000
30,000
40,000
50,000
60,000
1996 1997 1998 1999 2000 2001 2002 2003 2004 2005 2006 2007 2008 2009 2010 2011 2012
Serv
er
Reve
nues
x86 Other RISC IPF Unix
x86 share up, Sun-Micro server share down
… industry ASP’s saw pressure …server market has been ex growth
Gross Profit and GM’s under pressure
Source: Company data, InfoneticsSource: Company data, Infonetics
Source: Company data, Infonetics Source: Company data, Infonetics
Since the adoption of x86 servers, over any prolonged period industry revenues have peaked off at ~$50bn
With x86 servers increasingly in the mix server ASPs have declined at ~9% CAGR 1996 through 2012
1400bp compression in GMs from 1998-2009
30%
35%
40%
45%
50%
55%
60%
$0
$2,000
$4,000
$6,000
$8,000
$10,000
$12,000
1998 1999 2000 2001 2002 2003 2004 2005 2006 2007 2008 2009
Gro
ss P
rofi
t
Sun Product Gross Profit Sun Product GM
0%
10%
20%
30%
40%
50%
60%
70%
80%
0
5,000
10,000
15,000
20,000
25,000
30,000
1996 1997 1998 1999 2000 2001 2002 2003 2004 2005 2006 2007 2008 2009 2010 2011 2012
To
tal S
erv
er
AS
Ps
Total Server ASPs x86 mix
Steep initial decline of 40%+ over 2 years
9% ASP decline over the last 5 years
Source: Company data, Credit Suisse research, Infonetics

18 September 2013
Cisco Systems Inc. (CSCO) 52
SDN Drives a Major Headwind on Profit Dollars
While Cisco and Juniper have successfully dealt with various forms of competition over at
least the past ten years, the competitive response of the company cannot be
underestimated. As we previously discussed, the onset of SDN does present an
opportunity and a need for a generational shift in how networks within datacenters are
constructed. The issue is to what extent this evolution can disrupt Cisco's operating
structure. We believe the net impact over the long term would result in a gradual
commoditization of its business, even if the timing and extent becomes the "very" long
term.
The example of Cumulus. We believe there are a host of Silicon Valley start-ups that are
eager to change the economics of the networking industry with the onset of SDN and
Cumulus Networks is an interesting example.
Cumulus plans to replicate for the networking industry what Linux did for the server
industry, when it helped break up the stranglehold that vertically integrated computing
companies such as Sun Microsystems had before x86–based servers became
mainstream. Cumulus is supporting Linux for multiple reasons. First and foremost it has a
featured networking stack, with many networking companies either already using it for
implementation or even before this by building it into their proprietary platforms. Second
there is a material variety of vendor-agnostic tools for managing and operating Linux
platforms available. Coupled proliferating controllers from a variety of vendor, Cumulus
Linux allows a feature rich commodity hardware-based switch.
The Cumulus model. At its basic level, the company aims to alter networking so that
network devices run the same way that servers do, meaning using the same kind of tools
and operational platforms for deployment and management. The idea is that this will be
particularly attractive to companies whose datacenters are constantly expanding.
Supply chain and ecosystem. The company has built a supply chain of original design
manufacturers (ODMs), distributors, value-added resellers (VARs), and system integrators
to build and deliver bare-metal switches with Cumulus' software on-board, including Acton
and Quanta and silicon from Broadcom.
Exhibit 73: Cumulus Ecosystem
Technology Partners ODM Silicon/Components Distributors Customers
Open Compute Project Accton Broadcom Penguin Computing Dreamhost
AGEMA Quanta Finisar Synnex Fastly
CF Engine UNIXSurplus
Cloudscaling
Metacloud
Opscode
Piston Cloud
PLUMgrid
Puppet Labs
Quanta
10Gtek
VMware
Source: Company data, Credit Suisse research.
A change in cost structure. Given the nascence of software defined networking as
technology, while the debate will grow around the strength of the offering or the approach
of one vendor versus another, it is possible that Cisco and/or Juniper will embrace SDN
successfully. The question for investors is whether they will be able to extract the same
level of economics from the networking budgets. In Exhibit 116 we show a simplistic
analysis of the impact of SDN in economic terms. We have compared the total cost of
ownership (ex-labor, operating costs) for the basic Cisco switches for the datacenter (i.e.,
Nexus 3064), along with the SMARTnet services and software contracts that network

18 September 2013
Cisco Systems Inc. (CSCO) 53
administrators would usually sell. The alternative in a SDN-based environment would be to
buy a Cumulus Linux software subscription and top of rack bare metal switch. Our analysis
as shown in Exhibit 116 highlights the following main issues.
The TCO is dramatically lower. Even assuming that the Cumulus approach has a shorter
switch life of three years on a TCO basis, the cost is some 88% lower. The saving comes
from effectively unbundling the solution between hardware and software.
The gross profit dollar difference is 74% lower. An additional issue is that, whereas Cisco
will deliver a gross margin of 60% and 67% on its products and services in fiscal 2014, in
the Cumulus scenario, we believe the gross margin is lower in aggregate at 56%. Possibly
more importantly, the gross profits dollars are 74% lower. The point here is that even if
today’s networking vendors were to embrace an open SDN strategy, the gross margin
percentage and gross profit dollars would be significantly lower.
Can Cisco do the upsell? Seems unlikely. We believe Cisco and others understand this
risk, even if they continue to highlight the alternative advantages of integrated ASICs,
software, and services. Indeed, we believe the push into services or new software is
partially to offset this decline. Nevertheless, in order for Cisco to be able to be gross-profit
neutral versus today's economics, the customer would either need to spend an additional
$8,000 or 3.3 times versus the alternative from the Cumulus option or this much value in
Cisco’s wider offering and pay a premium. While we do not dispute the value of Cisco’s
installed base, trained administrators, new services, and new software it offers, this level
of difference would certainly lead us to conclude that the headwind on gross profit dollars
is significant. Moreover, Cisco’s push into expanded software offerings comes at a time
when Linux-based platforms are set to growth their application, developer, and services
ecosystems.
The above analysis is simplistic in many ways. We acknowledge that the above analysis is
simplistic in many ways as it excludes the costs of labor, power, and cooling, all which
have an impact on the relative TCO. Additionally, while hard to place a numerical value on
the risk of using a new supplier, the inertia of Cisco network administrators cannot be
underestimated. We do believe, however, that the relative magnitude in the economics of
today versus tomorrow present a headwind.

1
8 S
ep
tem
ber 2
013
Cis
co
Sy
ste
ms In
c. (C
SC
O)
54
Exhibit 74: SDN—Threatening the Last Bastion of Proprietary IT Profits
Cisco Proposal USD
Cisco Nexus 3064 list price 48,000
Cisco Nexus 3064 realised price 20,000
License 4500
Maintence 6,000
Average Switch Life years 5
TCO 54,500
TCO per year 10,900
Cisco Switching & Services GM 70%
Cisco GP 7,630
Cumulus Proposal
Top of rack bare metal switch 6,000
Cumulus Annual Subscription 1,500
Average Switch Life years 3
TCO 10,500
TCO per year 3,500
Cost Saving -68%
Hardware GM 30%
Hardware GP 600
Software GM 90%
Software GP 1,350
Total GP 1,950
Blended GM 56%
Difference -74%
Cisco Value add needed to be GP neutral 5,680
Cisco Upsell to be GP neutral 8,114
Multiple of Cumulus Propasal 3.32
1) A look at the economics of SDN. Perhaps the most significant issue for the networking
segment is what happens to economics with the onset of SDN. Even if traditional
networking vendors shift their portfolio, strategies and software to a SDN defined
approach can today’s economics can be replicated? Our analysis compares on a
simplistic TCO basis the relative costs savings to the customer and gross profit headwind
to networking vendors is around 70%
2) Cisco basis Nexus 3064 DC switch. We base our analysis on a lower end Cisco Nexus
3064 datacenter switch with a list price of $48,000. However we believe the price to most
enterprises would be more than 50% lower. Additionally Cisco will license the OS and
charge maintenance, assuming a standard 5 years switch life the TCO is $54.5k or
$10.9k per annum.
3) Cumulus Proposal, 70% cheaper per year. With Cumulus the customer buys a basic
commodity switch and they charge an annual subscription of $1,500, bringing the TCO to
$10,500, $3,500 per annum. Even assuming a lower life for switch the TCO is 80% lower.
4) Gross Profit Dollars at risk. In the Cisco proposal the GP dollars available (assuming a
70% GM) are $7.6k, in the cumulus proposal (assuming standard hardware commodity
GMs) the GP is $1950m some 74% lower. In other words even if networking vendors
offer this, it significant shrinks the profits available.
5) Can Cisco achieve the upsell? We believe that Cisco is aware to some degree of this
and will attempt to upsell services, or argue for higher value add (sales-force, support,
legacy, reliability), however the needed upsell needs to worth 3.3x the Cumulus proposal,
this seems like a stretch.
6) A simplistic analysis, but…This analysis ignores other costs like labor, cooling, power,
and does not take into account the value of support, alternative features or
platform/portfolio but does highlight the disruptive economics of SDN, and the economic
surplus being earned in networking. Moreover, it does not take into account the full
solution sale. For example, with Nexus 3000-series switches sold, Cisco would bundle a
Nexus 7000 router, which has carries more upgrades and support over time, which would
support margin and allow Cisco to get more aggressive on the Nexus 3000 switches.
Even with this discounting, SDN solutions would be less expensive with a Nexus 7500
selling for $200-250k versus $100-150k for an SDN alternative.
Source: Company data, Credit Suisse estimates.
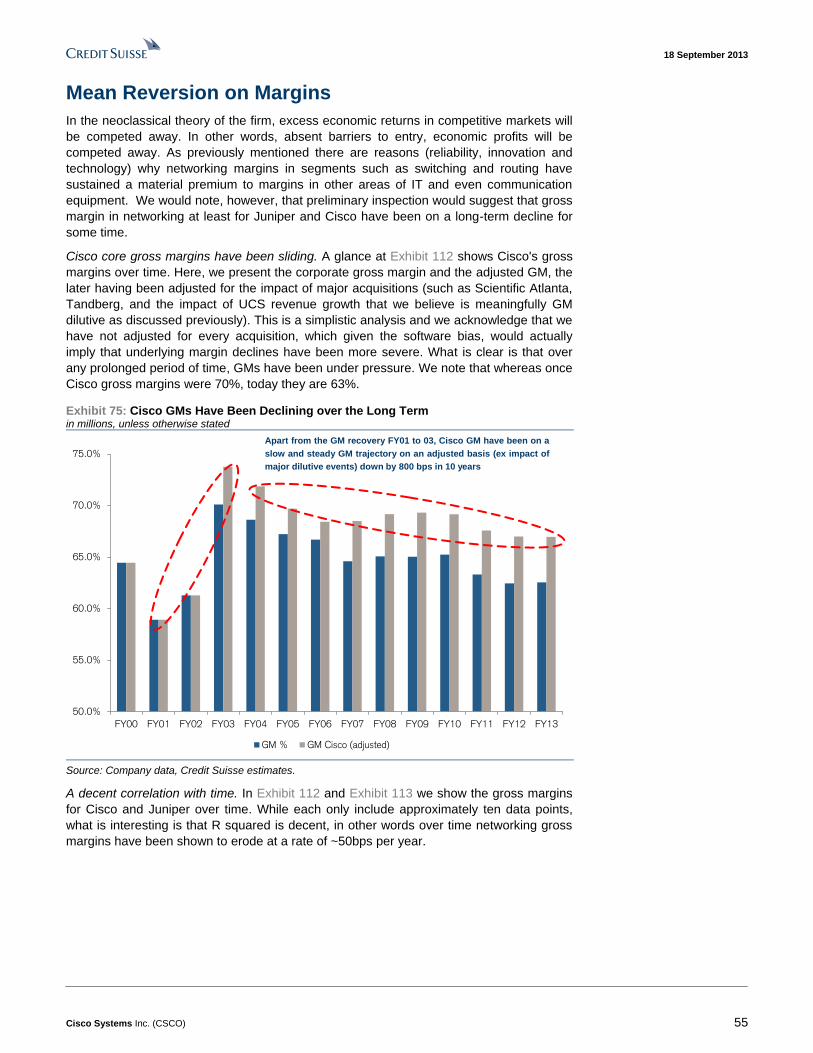
18 September 2013
Cisco Systems Inc. (CSCO) 55
Mean Reversion on Margins
In the neoclassical theory of the firm, excess economic returns in competitive markets will
be competed away. In other words, absent barriers to entry, economic profits will be
competed away. As previously mentioned there are reasons (reliability, innovation and
technology) why networking margins in segments such as switching and routing have
sustained a material premium to margins in other areas of IT and even communication
equipment. We would note, however, that preliminary inspection would suggest that gross
margin in networking at least for Juniper and Cisco have been on a long-term decline for
some time.
Cisco core gross margins have been sliding. A glance at Exhibit 112 shows Cisco's gross
margins over time. Here, we present the corporate gross margin and the adjusted GM, the
later having been adjusted for the impact of major acquisitions (such as Scientific Atlanta,
Tandberg, and the impact of UCS revenue growth that we believe is meaningfully GM
dilutive as discussed previously). This is a simplistic analysis and we acknowledge that we
have not adjusted for every acquisition, which given the software bias, would actually
imply that underlying margin declines have been more severe. What is clear is that over
any prolonged period of time, GMs have been under pressure. We note that whereas once
Cisco gross margins were 70%, today they are 63%.
Exhibit 75: Cisco GMs Have Been Declining over the Long Term in millions, unless otherwise stated
50.0%
55.0%
60.0%
65.0%
70.0%
75.0%
FY00 FY01 FY02 FY03 FY04 FY05 FY06 FY07 FY08 FY09 FY10 FY11 FY12 FY13
GM % GM Cisco (adjusted)
Apart from the GM recovery FY01 to 03, Cisco GM have been on a
slow and steady GM trajectory on an adjusted basis (ex impact of
major dilutive events) down by 800 bps in 10 years
Source: Company data, Credit Suisse estimates.
A decent correlation with time. In Exhibit 112 and Exhibit 113 we show the gross margins
for Cisco and Juniper over time. While each only include approximately ten data points,
what is interesting is that R squared is decent, in other words over time networking gross
margins have been shown to erode at a rate of ~50bps per year.

18 September 2013
Cisco Systems Inc. (CSCO) 56
Exhibit 76: A high correlation between Cisco GM and time in millions, unless otherwise stated
Exhibit 77: ...and for Juniper
FY03 FY04 FY05 FY06 FY07 FY08 FY09 FY10 FY11 FY12 FY13
y = -0.0052x + 0.7236
R² = 0.7233
60.0%
62.0%
64.0%
66.0%
68.0%
70.0%
72.0%
74.0%
76.0%
GM reported GM Cisco (adjusted)
FY03 FY04 FY05 FY06 FY07 FY08 FY09 FY10 FY11 FY12 FY13
y = -0.0056x + 0.7049
R² = 0.8522
60.0%
62.0%
64.0%
66.0%
68.0%
70.0%
72.0%
GM Juniper
Source: Company data, Credit Suisse estimates. Source: Company data, Credit Suisse estimates.
Cisco seems to be guiding for this. At the company’s analyst meeting in 2012, Cisco
published not only its revenue and gross profit breakdown, but also its targeted levels for
the next three to five years. What is interesting is, based upon our estimates, margins in
switching and routing may come down in the long term. (See Exhibit 114)
Exhibit 78: Cisco Has Implied that GMs in Switching and Routing May Decline in millions, unless otherwise stated
Gross Margin
FY16 Target
FY12 FY13E Low Mid High
Switching 71.5% 70.8% 66.4% 67.0% 67.5%
Routing 61.2% 61.3% 60.0% 60.5% 61.0%
Service Provider Video 30.0% 42.0% 40.7% 41.0% 41.3%
Datacenter 26.2% 31.0% 27.9% 28.1% 28.3%
Wireless 69.4% 71.0% 64.8% 65.3% 65.9%
Security 71.3% 71.3% 77.1% 77.7% 78.3%
Collaboration 61.1% 61.1% 63.0% 63.5% 64.0%
Other Products 54.9% 28.0% 54.2% 54.7% 55.1%
Services 66.7% 67.5% 66.6% 67.2% 67.7%
Total Revenue 62.4% 62.5% 61.0% 61.5% 62.0%
Source: Company data, Credit Suisse estimates.
Note we have estimated these based upon revenue and GP from analyst day 2012.

18 September 2013
Cisco Systems Inc. (CSCO) 57
UCS—Gaining Share in Servers One of Cisco’s key growth initiatives in recent years has been the growth in its datacenter
business, which has now grown successfully to a $2-billion business in fiscal 2013. The
principal driver has been the company's Unified Computing Systems (UCS) server
platform that now commands a 6% share in x86 servers. (See Exhibit 88.) We believe that
this level of share gain can continue, and we see this business growing to $2.9 billion by
fiscal 2015, based upon several factors.
x86 servers some pockets of strength. We see the x86 server market driving 3% long-term
revenue growth to $37 billion. However, we note very different dynamics by price point and
type of server.
■ 2-way/below $2,000: The growth side of a bifurcating segment. Strong unit demand
should propel unit demand for sub-$2,000 2-way servers. These servers are more
stripped down relative to x86 servers, geared toward virtualization but satisfy the
demands of the most rapidly growing workloads, web-centric, and HPC. However,
given commoditization, we see ASPs facing stagnation. In aggregate, as shown in
Exhibit 79, we expect revenues to grow at a 9% CAGR from 2010-15.
■ 2-way/above $2,000: As virtualization increasingly pressures units, we expect that 2-
way servers geared toward virtualization will see increasing unit pressure, despite
workload growth. Machines that support multiple virtual machines benefit from a
higher memory footprint and management functionality. Memory remains a key
constrain in virtualization, and as virtualization adoption and virtualization density
continue to increase, configuration should improve.
■ 4-way and above: Here we see unit decline accelerating. Similar to the virtualization
geared machines in the 2-way, $2,000 and above category, 4-way and above faces
pressures from virtualization, but to a greater extent, since more of these machines
are virtualized and can hold more virtual machines. As a result, units should see
significant pressure, something rising ASPs will be unable to offset.
Blade market seems to slowing. It is important to note that for UCS some 71% of units and
76% of revenues are based upon blade servers, according to Gartner. For blades, we see
this as a microcosm of the trends in the high-end x86 market due to the price points. While
blades help the management paradigm within the enterprise, with reduced cabling and
management overhead, the economics have become less favorable for vendors with the
growth of cloud architectures. As a result, blade revenue growth has ebbed. Given the
relative premium for blades is about 56%, it is understandable that the unit share of the
aggregate x86 market continues to fade and ASPs only support steady revenue share.
With this, we expect blade market growth, given higher ASPs, to tread water.
Share heading to 30%? With 20% of the blade server market, Cisco has the opportunity to
continue to gain share; we would not be surprised to see Cisco grow its share to 30% of
the market. This is increasing likely with the questions surrounding the future of IBM’s x86
business. Moreover, HP has been the leader, but has seen its share continue to decrease,
as Cisco challenges the industry leader with strong technology and a unique,
network-centric, systems management approach. However, we would note a cap to how
far this may extend. Interestingly, Cisco is gaining share in the blade market with
higher-priced, more richly configured systems. The ASP for a Cisco blade is higher than
that of IBM and HP, while from an architectural perspective, the solution costs less due to
lower switch content. We believe that Cisco's servers, given their ability to manage
workloads more efficiently, are being configured for heavier workloads and thus have
higher ASPs.

18 September 2013
Cisco Systems Inc. (CSCO) 58
x86 Server Outlook—Pockets of Strength
Over time, x86 servers have become key building blocks of various types of IT
infrastructures, ranging from pedestrian printing to cloud and high-end appliances such as
Oracle’s Exadata. The segment comprises 71% and 98% of server industry revenue and
unit, respectively, and represents the only growing subsegment of the broader server
market. While total x86 revenue has grown at a CAGR of 5% between 2005-2010 as seen
in Exhibit 79, there are certain subsegments of the market, specifically, 2-way servers
under $2,000, that are enjoying very healthy revenue growth (19% CAGR 2005-2010 and
9% 2010-15). This growth is offset by a 4% decline in 1-way from 2010-15 Considering
these market dynamics, we forecast the server market along the following categories.
■ 1-way: This category represents generic infrastructure servers largely used for file and
print, networking, security, and systems management. Effectively, these units run
ancillary functions in datacenters and small departmental and remote office workloads.
■ 2-way under $2,000: The critical 2-way or 2-processor x86 category, which accounts
for over half of server units, is bifurcating based on applications and workloads. Less
expensive servers, or those under $2,000, are being leveraged for web and high-
performance computing workloads for which having inexpensive compute power is
critical.
■ 2-way over $2,000: This category represents the more richly configured 2-way servers
that are being used as server virtualization platforms. Specifically, these machines
tend to have a larger memory footprint to support higher numbers of virtual machines.
These servers are the mainstay of traditional enterprise datacenters.
■ 4-way and above: This category represents more powerful servers that are
increasingly used in virtualization environments in which IT managers look to increase
virtual machine densities. In addition, given the increasing mission-critical nature of
x86, these systems are increasingly being used to absorb database workloads housed
on UNIX.

1
8 S
ep
tem
ber 2
013
Cis
co
Sy
ste
ms In
c. (C
SC
O)
59
Exhibit 79: Credit Suisse Worldwide Server Forecast—x86 Market Summary
Source: Gartner Servers Quarterly Statistics Worldwide Database, August 2013. Credit Suisse estimates for 2013-2015.
1) 1-way: Market should see slower growth. The 1-way market should see headwinds to growth as they lack a growth impetus and are challenged relative to 2-way servers on price/performance
metrics. 1-way servers, unlike 2-way servers and web and HPC specific workloads, lack a substantive growth driver.
2) 2-way/below $2,000: The growth side of a bifurcating segment. Strong unit demand should propel unit demand for sub-$2,000 2-way servers. These servers are more stripped down
relative to x86 servers geared toward virtualization but satisfy the demands of the most rapidly growing workloads, web-centric and HPC.
3) 2-way/below $2,000: ASPs face stagnation. Unlike other segments in the x86 market, these servers are not richly configured to support increasing numbers of virtual machines and are
relatively more simple in design. As such, commodity pressures increasingly factor, although there are elements of increased configurations as commodity elements become more richly configured.
4) 2-way/above $2,000: Virtualization increasingly pressures units. We calculate that the 2-way servers geared toward virtualization will see increasing unit pressure, despite workload growth.
5) 2-way/above $2,000: ASPs should see a marked benefit from richer configurations. Machines that support multiple virtual machines benefit from a higher memory footprint and
management functionality. Memory remains a key constrain in virtualization and as virtualization adoption increases and virtualization density continues to increase, configuration should improve.
6) 4-way and above: Unit decline accelerates. Similar to the virtualization geared machines in the 2-way, $2,000 and above category, 4-way and above faced pressures from virtualization,
but to a greater extent since more of these machines are virtualized and can hold more virtual machines. As a result, units should see significant pressure, something rising ASPs can only
partially offset.
Revenue (in $mn) 2005 2006 2007 2008 2009 2010 2011E 2012E 2013E 2014E 2015E CAGR '00-'10 CAGR '05-'10 CAGR '10-'15
x86
x86 1-w ay 2,678 3,098 3,673 3,568 2,938 3,245 3,482 3,040 2,859 2,785 2,699 1.2% 3.9% -3.6%
x86 2-w ay 18,107 19,101 21,541 20,156 18,018 24,168 26,117 28,804 29,917 29,903 29,374 8.3% 5.9% 4.0%
x86 2-w ay <$2,000 864 1,168 1,342 1,986 1,838 2,058 2,569 1,937 2,255 2,645 3,103 26.4% 19.0% 8.6%
x86 2-w ay >$2,000 17,243 17,933 20,199 18,169 16,180 22,110 23,547 26,867 27,662 27,258 26,271 7.5% 5.1% 3.5%
x86 4-w ay and above 4,872 4,908 5,087 4,788 3,772 4,568 5,975 5,685 5,353 5,540 4,788 -3.8% -1.3% 0.9%
Total 25,657 27,106 30,301 28,512 24,728 31,981 35,574 37,529 38,130 38,228 36,861 4.5% 4.5% 2.9%
Seq. change (%) 10.8% 5.6% 11.8% -5.9% -13.3% 29.3% 11.2% 5.5% 1.6% 0.3% -3.6%
Units (in thousands) 2005 2006 2007 2008 2009 2010 2011E 2012E 2013E 2014E 2015E CAGR '00-'10 CAGR '05-'10 CAGR '10-'15
x86
x86 1-w ay 1,386 1,552 1,835 1,901 1,599 1,853 2,021 1,959 1,989 2,039 2,080 7.7% 6.0% 2.3%
x86 2-w ay 5,245 5,707 6,059 6,291 5,369 6,467 6,875 7,148 7,434 7,598 7,793 10.3% 4.3% 3.8%
x86 2-w ay <$2,000 548 767 886 1,332 1,372 1,566 1,972 1,478 1,676 1,927 2,216 28.6% 23.4% 7.2%
x86 2-w ay >$2,000 4,697 4,940 5,173 4,958 3,997 4,900 4,903 5,671 5,759 5,671 5,577 7.9% 0.8% 2.6%
x86 4-w ay and above 372 438 473 468 330 359 426 399 364 366 307 -0.6% -0.8% -3.0%
Total 7,004 7,697 8,366 8,660 7,299 8,678 9,323 9,507 9,788 10,003 10,180 8.9% 4.4% 3.2%
Seq. change (%) 14.1% 9.9% 8.7% 3.5% -15.7% 18.9% 7.4% 2.0% 3.0% 2.2% 1.8%
ASP (in $) 2005 2006 2007 2008 2009 2010 2011E 2012E 2013E 2014E 2015E CAGR '00-'10 CAGR '05-'10 CAGR '10-'15
x86
x86 1-w ay 1,932 1,997 2,002 1,877 1,837 1,751 1,723 1,551 1,438 1,366 1,298 -6.0% -1.9% -5.8%
x86 2-w ay 3,452 3,347 3,555 3,204 3,356 3,737 3,799 4,030 4,024 3,936 3,769 -1.9% 1.6% 0.2%
x86 2-w ay <$2,000 1,577 1,523 1,515 1,491 1,339 1,314 1,303 1,311 1,346 1,373 1,400 -1.7% -3.6% 1.3%
x86 2-w ay >$2,000 3,671 3,630 3,905 3,664 4,048 4,512 4,802 4,738 4,803 4,807 4,711 -0.3% 4.2% 0.9%
x86 4-w ay and above 13,084 11,200 10,765 10,234 11,437 12,739 14,023 14,233 14,688 15,130 15,584 -3.2% -0.5% 4.1%
Total 3,663 3,522 3,622 3,293 3,388 3,685 3,816 3,947 3,896 3,822 3,621 -4.0% 0.1% -0.4%
Seq. change (%) -2.9% -3.9% 2.8% -9.1% 2.9% 8.8% 3.5% 3.4% -1.3% -1.9% -5.3%
Source: Gartner Servers Quarterly Statistics Worldwide Database, August 2013. Credit Suisse estimates for 2013-15.

18 September 2013
Cisco Systems Inc. (CSCO) 60
x86 Server Market—Positioning Critical
We highlight the following key drivers of the x86 server market over the next several years,
outside of core compute demand. First, internet traffic (Web tier), Web application, and
high-performance computing (HPC) workloads are generating strong demand for low-end
volume servers. Second, compelling x86 price performance relative to UNIX, driven by a
strong roadmap and a steady cadence of chip releases from Intel, provides incremental
growth. Finally, we see strong and continued developer and enterprise customer support
for the x86 platform. This is accentuated by the rising adoption of x86 virtualization.
(1) x86 Volumes Being Driven by Web/High-Performance Computing Workloads
There are discernible trends within the low end of the x86 server market that are worth
highlighting. While we expect commodity x86 1-way servers to continue to enjoy
mid-single-digit type volume growth driven by the need of generic infrastructure workloads,
the 2-way under $2,000 market should enjoy robust volume growth. We expect revenues
and volumes in this subsegment of the x86 market to grow by a CAGR of 8% between
2010-15 owing to strong underlying demand in Web/HPC workloads for which these
servers are best suited. As seen in Exhibit 80, Gartner estimates Web application, front-
end, indexing, and HPC workload growth of 13%, 13%, 14%, and 12% between 2010-15,
respectively, or 13% in aggregate. This compares with the relatively anemic 11% growth
for other types of workloads, and this is likely overstated because these are more likely to
be virtualized, resulting in lower physical server counts.
Exhibit 80: Gartner—Proportion of Server Shipments by Workload
2007 2008 2009 2010 2011 2012 2013 2014 2015 CAGR '10-'15E
Web Applications 12% 12% 12% 13% 13% 14% 13% 13% 14% 13%
Infrastructure 14% 13% 10% 9% 8% 7% 7% 7% 7% 5%
OLTP DBMS 9% 9% 9% 9% 9% 10% 9% 9% 9% 12%
Email/Messaging 10% 11% 11% 11% 12% 13% 12% 12% 12% 14%
Front-End 11% 11% 11% 12% 12% 13% 13% 13% 13% 13%
Indexing 9% 10% 10% 10% 10% 12% 11% 11% 11% 14%
Streaming Media 5% 5% 6% 6% 6% 7% 6% 6% 6% 13%
HPC 7% 7% 8% 8% 8% 9% 8% 8% 8% 12%
Data Warehouse 4% 4% 5% 5% 5% 5% 5% 5% 5% 12%
Collaboration 5% 5% 6% 7% 7% 1% 7% 7% 7% 13%
Virtual Desktop 1% 1% 1% 3% 3% 4% 4% 4% 4% 17%
Other 14% 12% 10% 7% 6% 5% 5% 4% 4% 1%
Web/Front-End/HPC/Indexing
% of total w orkloads 39% 40% 41% 43% 43% 48% 45% 45% 46%
Seq. change (%) 15% -8% 35% 12% 16% 12% 12% 12% 13%
Other
% of total w orkloads 61% 60% 59% 57% 57% 52% 55% 55% 54%
Seq. change (%) 10% -12% 24% 10% -4% 26% 12% 12% 11%
1) Front-end (web-tier/ Internet traffic), web applications, index ing and high performance computing (HPC) workloads. These workloads are among the biggest and fastest
growing. In aggregate, Gartner expects these workloads to grow at an 13% CAGR, faster than most of the other areas. These fast growing workloads do not require highly
configured servers with a significant memory footprint.
2) These three workloads account for a good portion of x86 growth. Excluding these relatively high growing workloads, all others are expected to grow at a more anemic 11%.
CAGR 2010-15. We note that this 11% CAGR is overstated when viewed from a physical server perspective given that many of these are virtualized workloads.
2
1
1
1
1
2
Source: Gartner.
Looked at in another way, increasing time spent online is driving demand for servers
dedicated to serving up Internet traffic, content, and applications. Herein, we highlight the
persistent and relatively high-level growth in the amount of minutes users spend online,
which is likely causing strains on back-end servers and providing an impetus to build out
more capacity.
(2) High-end x86 Continues to See Pressure and Blades Are No Exception
We expect to see continued pressure on the enterprise x86 as virtualization adoption
continues. We estimate that this increasing adoption of virtualization will result in more
highly configured x86 servers growing at a mere 3% y/y, although ASP increases should
lift revenue growth to 4% for the category. More powerful x86 servers, which can support
more virtual machines, continue to see yet more pressure. Here, we forecast unit declines

18 September 2013
Cisco Systems Inc. (CSCO) 61
of 11% y/y, with ASP support mitigating revenue declines to 7% through 2015. In short, we
continue to see significant pressure on tier 1 OEM enterprise servers due to consolidation
and over time, white box and Open Compute initiatives. We highlight virtualization’s
negative calculus in Exhibit 81.

1
8 S
ep
tem
ber 2
013
Cis
co
Sy
ste
ms In
c. (C
SC
O)
62
Exhibit 81: Virtualization and The Impact on Server Units US$ in millions, unless otherwise stated
1) Installed base. We start with the installed base of x86 servers that
are likely to be used in virtualization environments. Then using a
replacement rate of 4.2 years, which we believe is reasonable
based on the results of the Credit Suisse IT Survey, we estimate
the number of units that effectively fall out of the installed base
every quarter and the amount of units that need to be shipped to
replace them.
2) Gross additions. We model growth in new server shipments
using historical shipment rates that are in excess of the
replacement rate. We conservatively assume these shipments are
at pre-recession highs, prior to the mass virtualization.
3) New servers virtualized. As a base level, we conservatively
assumed 29% of all new shipments are being virtualized with that
number stepping up in the future. IDC expected 22.3% of all
machines being virtualized by 2013 while our Survey respondents
expect 61% of their new machines will be virtualized over time.
4) VMs per server. We adjust this by the number of virtual machines
coming from legacy servers vs. newly created ones. Our survey
results pointed to 13 VMs per machine in 2011 and 21 in 2013.
Our data indicates that 33% of virtual machines are coming from
legacy physical servers. This is a critical finding since it points to
the fact that only 1/3 of virtual machines are a result of
consolidation with 2/3 for organic workload growth.
5) Physical servers needed to support virtual machines. We
calculate the number of physical servers necessary to support the
newly created virtual machines, replacing physical servers.
Because the consolidation effect is somewhat mitigated by organic
VM growth, compression is not as significant as it potentially as it
might be otherwise. Nevertheless, there is a significant number of
servers annual lost to virtualization, approximately 2.3 million this
year and running to 3.2 million units by next year.
2011 2012 2013E 2014E 2015E
2-way over $2,000 server units (in millions)
Servers needed to maintain installed base 4.6 4.5 4.3 4.1 4.9
Incremental units in excess of refreshing installed base 0.3 1.2 2.9 4.8 4.8
Total theortical server demand 4.9 5.7 7.2 8.9 9.8
% of servers virtualized 29% 34% 38% 42% 48%
Virtualized physical servers 1.4 1.9 2.7 3.7 4.7
Virtual machines per server 12.6 16.2 20.5 24.3 29.0
% of virtual servers coming from legacy physical servers 0.3 0.3 0.3 0.3 0.3
% of virtual servers coming from w orkload grow th 0.7 0.7 0.7 0.7 0.7
Virtual machines per server coming from legacy servers 4.2 5.4 6.8 8.0 9.6
Virtual machines/server from organic w orkload grow th 8.5 10.9 13.7 16.3 19.4
Physical virtualized servers meeting demand 0.3 0.4 0.4 0.5 0.5
Non-virtualized servers 3.5 3.8 4.5 5.2 5.1
Total servers 3.8 4.1 4.9 5.7 5.6
YoY growth 0.1% 15.6% 1.6% -1.5% -1.7%
Physical servers lost to virtualization 1.1 1.5 2.3 3.2 4.2
Source: Company data, Credit Suisse estimates.

18 September 2013
Cisco Systems Inc. (CSCO) 63
For blades, we see this as a microcosm of the trends in high-end x86 due to the price
points. While blades help the management paradigm within the enterprise, with reduced
cabling and management overhead, the economics have become less favorable with the
growth of cloud architectures. (See Exhibit 82.) As a result, blade revenue growth has
ebbed. (See Exhibit 83.)
Exhibit 82: Blades: More Expensive Than Volume Servers 2Q13 ASP for x86 2-way
Exhibit 83: Revenue Growth for Blades Has Declined Worldwide x86 blade annual revenue growth
-
1,000
2,000
3,000
4,000
5,000
6,000
7,000
8,000
9,000
Rack mount Blade
-20%
-10%
0%
10%
20%
30%
40%
50%
60%
70%
80%
Source: Gartner. Source: Gartner.
Given the relative premium for blades, it is understandable that the unit share of the
aggregate x86 market continues to fade and ASPs only support steady revenue share.
(See Exhibit 84 and Exhibit 85.) With this, we expect blade market growth, given higher
ASPs, to tread water.
Exhibit 84: Blades: Units in a Share Downtrend Blade units as % of x86
Exhibit 85: Revenue Share Has Modesty Increased Blade revenue as % of x86
0%
5%
10%
15%
20%
25%
30%
0%
5%
10%
15%
20%
25%
30%
Source: Gartner. Source: Gartner.
Cisco Gaining Share with UCS
In 2009, Cisco entered the server market with its Unified Computing System (UCS). The
offering, comprised of compute, networking, and management resources is geared toward
improving the efficiency of virtualized datacenters. Given Cisco’s networking heritage, the
product obviated the need for multiple switches in the compute infrastructure and offered a
centralized approach, easing management overhead and cost. Effectively, while
competitors have to use a switch at each chassis level, Cisco allows for one centralized
switch. This approach proves more simple to manage and less expensive as the one
switch is amortized across chassis.

18 September 2013
Cisco Systems Inc. (CSCO) 64
Exhibit 86: Cisco's Advanced Blade Design Streamlines Networking
Blade
Traditional blade architecture
Blade Blade Blade
Blade Blade Blade Blade
Switch
Blade Blade Blade Blade
Blade Blade Blade Blade
Switch
Blade Blade Blade Blade
Blade Blade Blade Blade
Switch
Switch
Blade
Cisco blade architecture
Blade Blade Blade Blade
Blade Blade Blade Blade
Switch eliminated
Blade Blade Blade Blade
Blade Blade Blade Blade
Blade Blade Blade Blade
Blade Blade Blade Blade
Switch
Blade
Switch eliminated
Switch eliminated
Source: Company Data, Credit Suisse research.
These advantages helped Cisco quickly gain a solid server footprint. (See Exhibit 87 and
Exhibit 88.) We note that higher ASPs associated with blades have helped Cisco gain a
disproportionate amount of server revenue share.
Exhibit 87: Cisco Server Unit Share % of worldwide x86 units
Exhibit 88: Cisco Server Revenue Share % of worldwide x86 revenue
0%
1%
2%
3%
4%
5%
6%
7%
8%
9%
10%
0%
1%
2%
3%
4%
5%
6%
7%
8%
9%
10%
Source: Gartner. Source: Gartner.
Blades Servers Dominate Cisco UCS
With white box servers increasingly a factor in the lower cost, higher volume server market
given the need for inexpensive compute and consolidation in traditional enterprise, it is not
surprising that blades dominate the UCS segment, both on a unit and revenue basis. (See
Exhibit 89 and Exhibit 90.)

18 September 2013
Cisco Systems Inc. (CSCO) 65
Exhibit 89: Blades Account for 70% of UCS units… Blades as % of Cisco units
Exhibit 90: ... and Nearly 80% of Cisco UCS Revenue Blades as % of Cisco UCS revenue
40%
50%
60%
70%
80%
90%
100%
40%
50%
60%
70%
80%
90%
100%
Source: Gartner. Source: Gartner.
At a high level, Cisco blade revenue has grown extremely well. (See Exhibit 91.) Given
that blades are used to consolidate traditional enterprise infrastructures, rather than by
large hyperscale properties, we are concerned that growth could be limited.
Exhibit 91: Cisco Blade Revenue Has Grown Well Off a Small Base Y/Y % change in Cisco blade revenue
0%
50%
100%
150%
200%
250%
300%
350%
400%
450%
500%
1Q11 2Q11 3Q11 4Q11 1Q12 2Q12 3Q12 4Q12 1Q13 2Q13
Source: Gartner.
Cisco blade revenue has grown well at the expense of traditional server vendors IBM and
HP. Here, we note that Cisco has quickly taken share in the blade market and this has
allowed for growth. (See Exhibit 92.) Cisco is now the second leading blade vendor in the
like-for-like x86 category, recently topping IBM. We believe Cisco’s approach to server
management can lead to share gains in an ex-growth category but this has limited upside
potential over time.

18 September 2013
Cisco Systems Inc. (CSCO) 66
Exhibit 92: Cisco Has Gained Share In the Blade Market % of worldwide blade revenue
Exhibit 93: Cisco an Emerging Leader in Blades % of worldwide blade revenue
0%
5%
10%
15%
20%
25%
30%
35%
40%
45%
0%
10%
20%
30%
40%
50%
60%
HP IBM Cisco
Source: Gartner. Source: Gartner.
With 20% of the blade server market, Cisco has the opportunity to continue to gain share.
We would not be surprised to see this grow to 30% over time, especially given the
uncertainty of IBM’s x86 business. Moreover, the leader, HP has seen its share continue
to decline, as Cisco challenges the industry leader with strong technology and a unique
management approach.
Interestingly, Cisco is gaining share in the blade market with higher priced, more richly
configured systems. The ASP for a Cisco blade is markedly higher than that of IBM and
HP, while from an architectural perspective, the solution costs less due to lower switch
content. We believe that Cisco servers, given their ability to manage workloads more
efficiently, are being configured for heavier workloads and thus have higher ASPs.
Exhibit 94: Cisco Blades Carry a Premium ASPs for 2-processor x86 blades
-
1,000
2,000
3,000
4,000
5,000
6,000
7,000
8,000
9,000
IBM HP Cisco
Source: Gartner.
Unfavorable Margin Dynamics
While servers are a rapidly growing product line for Cisco, the margins are below the
corporate average. Traditional x86 gross margins are in the 25-30% range and these
products compose the majority of the Cisco configuration. Meanwhile, Cisco interconnects,
which are higher at 75%, form the minority. Even with these generous margin
assumptions, we estimate the blended UCS margin to be in the low 30% range, well below
the corporate average. (See Exhibit 95.)

18 September 2013
Cisco Systems Inc. (CSCO) 67
Exhibit 95: Cisco UCS: High 30% Gross Margins as Servers Dilute Switches Revenues and gross margins
Cisco UCS 6248UP Switch
2 x $24,589
M3 blade server + chassis
M3 blade server + chassis
M3 blade server + chassis
M3 blade server + chassis
8 x $7,853 + $2,850
8 x $7,853 + $2,850
8 x $7,853 + $2,850
8 x $7,853 + $2,850
70% gross margin
25% gross margin
25% gross margin
25% gross margin
25% gross margin
Sample Configuration Price
Blended margin 32% gross margin
Source: CDW, Credit Suisse research.

18 September 2013
Cisco Systems Inc. (CSCO) 68
Aiming for the IT Stack The first era of IT was arguably centered around mainframes and terminals. The second
era of IT was based around the PC, client server architectures, and smaller-scale, static
internet. We are now well within the third era, which is based around mobile devices,
richer content, more users that have driven the secular trends of cloud computing, broader
mobility, social networking, and Big Data. In this third era there are billions of users and
millions of applications that need support, causing IT to be fundamentally
re-architected. Driven by these needs and a less robust IT spending environment, we are
seeing companies that previously partnered now compete more intensely, whether it be
Oracle and HP, Cisco and EMC/VMware, or Cisco with HP. The opportunity is to become
a trusted end-to-end IT supplier, which in itself is attractive, given a $2 trillion TAM. After
our extensive review of the convergence strategies of the major enterprise vendors, we
arrived at three main conclusions.
The shift toward the integrated supplier will be slow. While there is an abundance of
literature addressing the $2-trillion market opportunity, our survey noted that 35% of
respondents do not even agree with the notion of converged infrastructure and 51% of
respondents prefer a best-of-breed approach when selecting vendors for different parts of
the network. This suggests quite emphatically to us that the movement to address new
segments as an integrated vendor will be at best a slow approach for the industry.
Additionally, we note our survey showed that 46% of respondents said that whether there
is a shift toward either the private or public, it will result in lower IT spending over time.
IT stack analysis: Everyone has their gaps. In Exhibit 100 we present the current offerings
from what would be described as the key IT players who have evolved their enterprise
infrastructure over time. It is interesting that even many strong vendors in their respective
segments have sizeable gaps. For example, Cisco is a strong networking player, has a
strong emerging server business, and has relationships for storage. However, it has
sizeable gaps in the areas of middleware, database software, and enterprise software. In
this respect, being able to become a more strategic player such as IBM could prove
challenging. We see similar issues for Juniper and NetApp.
The industry seems to appreciate the wider options from Cisco, IBM, and MSFT. Looking
at the strategies and evolution in a different way, we surveyed IT decision makers on the
key metrics that we believe determine success in the IT market, such as roadmap,
management, price/performance/reliability, management, sales, and cloud strategy. What
was clear is that Cisco is perceived to have the core competencies and ranked top three
across these metrics when benchmarked versus its peers, scoring well on price and
performance, management, and roadmap. We note IBM and Microsoft also seemed to do
well. Looking at cloud specifically, Cisco rated well along with IBM and EMC. We do
believe all these vendors have the capacity to leverage these competencies into new
segments and grow the TAM. In our view, the only question would be the rate at which
adoption occurs.
Chasing TAM Expansion Is the Norm
What is different in this third era of IT is that historically competition remained within
distinct IT categories such as servers, storage, software, PCs, and networking. Vendors
within these segments operated independently, and alliances were built where necessary.
The difference now is that there is a gradual convergence in all areas of IT vendors, which
means previous partners become competitors and all vendors are strategically evolving
into end-to-end IT partners. There are many examples of this building convergence, which
creates new areas of conflict.
■ Oracle making a push on its hardware platform through the acquisition of Sun
Microsystems and its Exadata and Exalogic systems. This has directly placed the
company into competition with former hardware partners, such as HP and IBM.
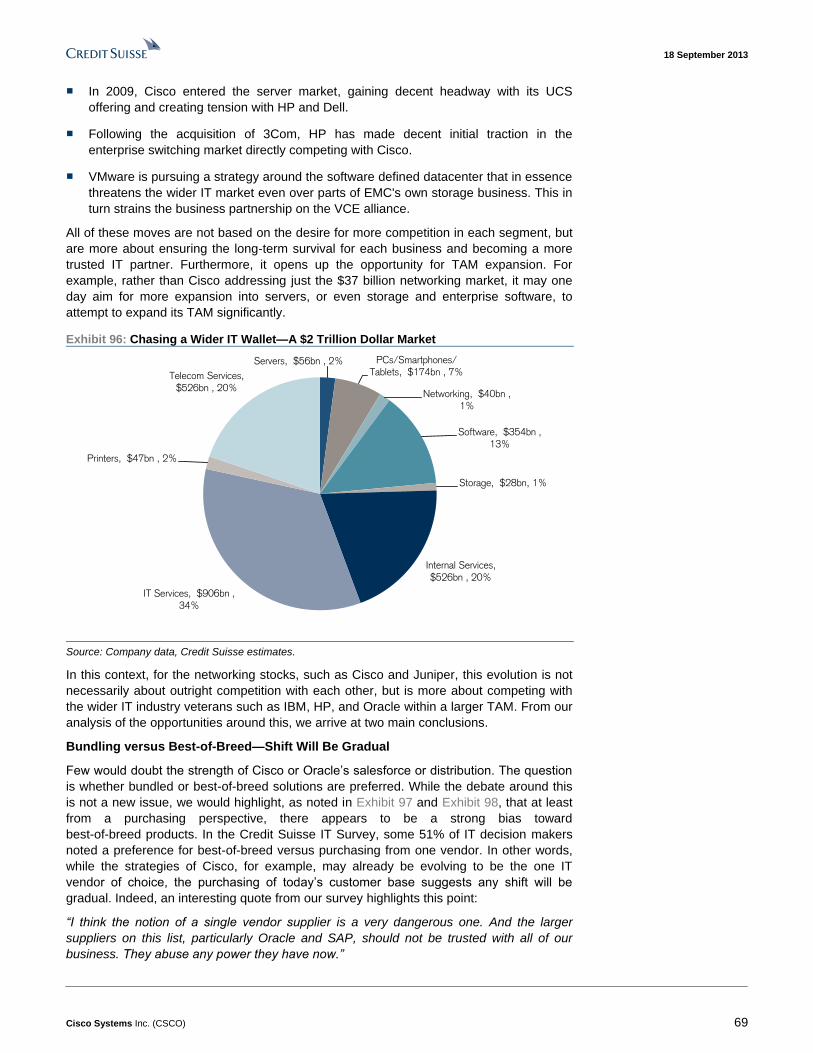
18 September 2013
Cisco Systems Inc. (CSCO) 69
■ In 2009, Cisco entered the server market, gaining decent headway with its UCS
offering and creating tension with HP and Dell.
■ Following the acquisition of 3Com, HP has made decent initial traction in the
enterprise switching market directly competing with Cisco.
■ VMware is pursuing a strategy around the software defined datacenter that in essence
threatens the wider IT market even over parts of EMC's own storage business. This in
turn strains the business partnership on the VCE alliance.
All of these moves are not based on the desire for more competition in each segment, but
are more about ensuring the long-term survival for each business and becoming a more
trusted IT partner. Furthermore, it opens up the opportunity for TAM expansion. For
example, rather than Cisco addressing just the $37 billion networking market, it may one
day aim for more expansion into servers, or even storage and enterprise software, to
attempt to expand its TAM significantly.
Exhibit 96: Chasing a Wider IT Wallet—A $2 Trillion Dollar Market
Servers, $56bn , 2% PCs/Smartphones/ Tablets, $174bn , 7%
Networking, $40bn , 1%
Software, $354bn , 13%
Storage, $28bn, 1%
Internal Services, $526bn , 20%
IT Services, $906bn ,
34%
Printers, $47bn , 2%
Telecom Services, $526bn , 20%
Source: Company data, Credit Suisse estimates.
In this context, for the networking stocks, such as Cisco and Juniper, this evolution is not
necessarily about outright competition with each other, but is more about competing with
the wider IT industry veterans such as IBM, HP, and Oracle within a larger TAM. From our
analysis of the opportunities around this, we arrive at two main conclusions.
Bundling versus Best-of-Breed—Shift Will Be Gradual
Few would doubt the strength of Cisco or Oracle’s salesforce or distribution. The question
is whether bundled or best-of-breed solutions are preferred. While the debate around this
is not a new issue, we would highlight, as noted in Exhibit 97 and Exhibit 98, that at least
from a purchasing perspective, there appears to be a strong bias toward
best-of-breed products. In the Credit Suisse IT Survey, some 51% of IT decision makers
noted a preference for best-of-breed versus purchasing from one vendor. In other words,
while the strategies of Cisco, for example, may already be evolving to be the one IT
vendor of choice, the purchasing of today’s customer base suggests any shift will be
gradual. Indeed, an interesting quote from our survey highlights this point:
“I think the notion of a single vendor supplier is a very dangerous one. And the larger
suppliers on this list, particularly Oracle and SAP, should not be trusted with all of our
business. They abuse any power they have now.”

18 September 2013
Cisco Systems Inc. (CSCO) 70
Exhibit 97: 51% of Respondents Prefer Best-of-Breed Question: If you were to build (or currently have) an internal private cloud, you would:
Exhibit 98: 36% of Respondents Don't Want One Supplier Question: In 2014, if you could choose to purchase the majority of your IT hardware/software/services from one vendor, who would it be?
Choose a single vendor that could provide all of the elements – only if
it was cheaper31%
Choose a single vendor that could provide all of the
elements –regardless of costs
18%
Build a solution from several best
of breed hardware, software,
networking and services vendors
51%
I don’t agree with the “converged
infrastructure” or “one IT supplier”
notion36%
Hewlett Packard15%
IBM8%
Dell5%
Cisco13%
Microsoft3%
EMC/VMWare13%
Source: Credit Suisse IT Survey, August 2013. Source: Credit Suisse IT Survey, August 2013.
The Cloud May Not Be That Incremental
Nowadays, rarely a conference call, presentation, or trade journal article goes by without
some reference to the revolutionary benefits of cloud computing as extolled by the IT
industry. However, what matters in the context of this report is what cloud computing
means for the IT industry from the viewpoint of investors.
In theory, if all workloads shifted to the public cloud, then the purchaser of IT infrastructure
would shift from enterprise IT departments to service providers. For example, we note that
certain service providers, such as Google, actually manufacture their own servers, while
other service providers, such as Rackspace, buy commodity components from IT vendors,
such as Dell. The location and the ongoing operations of the underlying hardware and
software are essentially transferred. When viewed from this perspective, the shift toward
cloud computing will only be partially incremental. As service providers grow in size and
numbers, the efficiencies they gain will allow them to use the same amount of IT
equipment (and headcount) to service a larger number of customers. Indeed, some 61%
of respondents in the Credit Suisse IT Survey felt that, as a result of cloud computing, IT
spending would be flat to down. (See Exhibit 99.)
Exhibit 99: Cloud Computing Will Reduce IT Spend in the Coming Years Question: Adoption of cloud computing will cause your overall IT spend to:
To grow39%
To decline46%
Will not change our IT spend
15%
Source: Credit Suisse IT Survey, August 2013.

1
8 S
ep
tem
ber 2
013
Cis
co
Sy
ste
ms In
c. (C
SC
O)
71
Exhibit 100: The IT Stack: IBM Has the Fullest Portfolio
Oracle IBM HP EMC Cisco SAP Microsoft Juniper Dell NetApp
E, M, T-Series/EX,
QFX-Series/Qfabric
7%
Operating system: $29bn
Management: $73bn
Applications: $168bn
Application dev. & deployment: $82bn
Middleware: $19bn
Database: $28bn
EqualLogic/
Compellent
7%
FAS/E-Series
11%
Virtualization: $3bn
Servers: $53bn
Networking: $37bn
Storage: $53bn
StorageTek/Sun
Storage
1%
IBM
DS/XIV/Storw ize
13%
3PAR/EVA/MSA
9%
VMAX/VNX/Isilon
34%
Partner/VCE/FlexPod
Pow erEdge
15%FlexPod/Partner
Partner/
IBM System
Netw ork
1%
ProCurve/3Com
7%VCE
Nexus/Catalyst/
Insieme/ASR/CRS
55%
Force10/Partner
1%FlexPod/Partner
OracleVM
1%
Pow erVM
7%
VSE
2%
VMw are
85%Partner/VCE/FlexPod
x86/SPARC/
Exadata/Exalogic
5%
System z/p/x
30%
ProLiant/Integrity
27%
VCE/Lenovo/
Partner
UCS/VCE/FlexPod
3%
Window s
79%
Hyper-V
1%FlexPod/Partner
Solaris/Linux
1%
AIX/zOS
6%
HP-UX Non
Stop/OpenVMS
3%
VMw are
Oracle
DB/TimesTen
MySQL
45%
DB2
18%
Vertica/Partner
0%
Greenplum/
Partner
0%
Sybase
5%
SQL Server
20%
NetWeaver
1%
.NET
5%
Java development
tools
22%
Rational/ILOG
20%
Quality/
Performance
Center
1%
Pivotal/Spring
Source
0%
Pow er Builder
6%
Fusion
Middlew are
16%
WebSphere
33%
VMw are/Pivotal/
Partner
0%
Backup Advisor/
RecoverPoint/
Control Center
5%
Partner/VCE/FlexPod
Visual Studio
11%
System Center
35%
Quest
1%
On Command
2%
E-business/
Fusion applications
6%
Lotus
Domino/Notes
3%
Webex/Partner
1%
ERP/
SuccessFactors
7%
Microsoft
Exchange/Lync/
Dynamics
14%
Tivoli 10%
OpenView /
Insight Manager
5%
Source: Company data, Credit Suisse estimates.

18 September 2013
Cisco Systems Inc. (CSCO) 72
IT Strategies in Evolution Oracle: For Oracle, covered by Credit Suisse analyst Phil Winslow, the focus is on
expanding its enterprise wallet share, leveraging its core premium, growing its database
footprint, extending this down the stack with Sun operating system/hardware and up in the
stack with strong horizontal on-premise application financials, HR, supply chain, and CRM.
As part of this effort, Oracle is looking to consolidate the former Sun hardware business
and turn it into an application platform, akin to the iPhone. Here the company contends
that the focus of IT managers is optimal application performance regardless of underlying
infrastructure, and as a result, optimizes Sun hardware to the server as the platform for
apps could result in TCO advantages. From our perspective, the core competitive
advantage of high performing hardware and on-premise applications will be increasingly
challenged by off-premise PaaS and SaaS models and the changing nature of
applications, which we discussed in our May 30, 2013 report, “IT Hardware: “Un” clouding
Storage – EMC Shines”.
IBM: IBM is positioned as a global technology infrastructure solutions provider that is
honed with its “Smarter” initiatives. In providing the full solution, with services, hardware,
and software, IBM is a one-stop solutions shop. This one-stop shop approach serves the
company well, as it targets the C-Suite with a services-led solutions model. By selling
solutions and services, IBM can attach the solution to its own software and proprietary
hardware, making an implementation 'sticky'. As technologies emerge, the company is
able to appropriate them on top of its stack and integrate them with the existing solution.
An example of this integration is Linux and Java workloads to mainframe. Similar to
Oracle, the company faces a challenge, as its solutions are relatively more expensive in
the context of the changing nature of applications and the espoused architecture is not
ideal for volume workloads. As a result, commodity infrastructures on premise are likely to
pose an increasing risk to the company. We detail our analysis in our August 6, 2013
downgrade report, titled, “IBM: Not so Easy Blue…”.
HP: In the enterprise, HP is targeting a converged strategy, bringing storage, servers, and
networking together. Given that HP is fairly unique in having a solid footprint across the
three product groups, this approach is rational. Surrounding these hardware assets is
management software that is bundled. HP continues to strive to improve its hardware
portfolio with initiatives such as Moon Shot, storage with software such as StoreOnce, and
networking with SDN. In addition, the company continues to move up the stack slowly with
Fortify code analytics and ArcSight security. Importantly, HP continues to make an
analytics push with the big data solution HAVEn (Hadoop, Autonomy, Vertica). In services,
the company has several broad offerings in infrastructure outsourcing and
application/business. While these services help the company garner a footprint, they are
not as C-Suite-centric as those of IBM. In our view, HP has several challenges. First, the
company plays in the lower elements of the stack where increasingly servers are seeing
commodity pressure, storage is seeing pure play consolidation, and networking is facing
entry from software-led vendors with cloud-managed offerings. Second, while the
company is attempting to increase offerings up the stack, the focus on infrastructure
leaves the company exposed to market pressures, such as lower cost for on-premise
infrastructures and off-premise workload migration.
EMC: EMC’s broad strategy is to take advantage of growth markets through continued
share gains, consolidation, and best-of-breed products. In the secularly growing storage
market, EMC continues to consolidate share, from 32% last year to 35% today, through
the acquisition of products at the leading edge of storage technology, SSDs, and volume
and service-level technology. While EMC storage is but one part of the IT stack, VMware,
which accounts for 20% of EMC revenue, is emerging as the datacenter operating system,
amalgamating server, and networking and storage functionality. While VMware leads in
consolidating traditional datacenter applications, Pivotal remains uniquely positioned to
capture next-generation application growth, which is expected to have a long-term CAGR

18 September 2013
Cisco Systems Inc. (CSCO) 73
of 70% or 4 times those of traditional applications. While Salesforce.com, Amazon, and
Microsoft PaaS offerings are solely off premise, Pivotal allows for the internal PaaS for
those that do not wish to go off premise or find the economics unappealing.
Cisco: Cisco dominates the networking market and is looking to fend off erosion of the
market by opening its platform with onePK. Similar to EMC, the company is looking to
extend out of networking with the UCS effort being one initiative. With UCS as part of
VCE, Cisco is increasingly brought into traditional enterprise datacenters. Nevertheless,
Cisco lacks critical in-house capability, notably across storage. Perhaps more importantly,
Cisco lacks any meaningful presence in further up the stack application, infrastructure, or
platform software. This may increasingly pressure revenues and margins as the core
networking business is exposed to competition.
SAP: SAP, covered by Credit Suisse analyst Phil Winslow, is dominant on the application
side, providing leading ERP solutions for customers. The company is extending its
application reach and importantly, how the data from the applications is used to improve
decisions. For this, the company created its HANA in-memory database appliance to
provide analytics to business users rapidly. Outside of these efforts, the company has
vertically integrated the Sybase database into its offering in an effort to provide a broader
solution. In our view, the company is challenged by off-premise SaaS firms, with natively
developed applications. To offset this, SAP has allowed its software to be used by
Amazon Web Services; however, the competitive dynamic is evolving.
Microsoft: Microsoft’s enterprise strategy revolves around several elements. First, the
company seeks to be the volume platform, with operating systems ranging from PCs to
datacenters to virtualization. Perhaps more importantly, the operating systems' dominance
allowed the company to build a loyal developer base. The company seeks to continue to
leverage this platform strategy with Azure, an off-premise PaaS, that eventually could be
brought on premise. In this way, the company hopes to compete with Amazon,
Salesforce.com, etc. Secondly, the company has a significant number of non-operating
systems, developer assets that it can bundle that are often 'good enough' for the needs of
SMB, and some enterprises, including ERP applications, SharePoint, SQL Server
databases, and other products. As a result of the sheer volume of these products,
Microsoft can be a top wallet share holder and a competitor to firms that have more
premium and category leading products. The company has several weaknesses, which
our interlinked. First, the off-premise dynamic introduces new competitors as new
applications are created. Second, as a part of this, there is a 're-platforming' occurring in
enterprises, from VMware as an OS to Amazon Web Services and Pivotal as platforms.
This could erode Microsoft’s core strength over time.
NetApp: NetApp’s focus is on providing storage and data management capabilities for
enterprises and service providers. Given the significant levels of data growth (40% for
external arrays by our estimates), this strategy is understandable. To extend its datacenter
presence, NetApp partnered with VMware and Cisco to create a VCE alternative.
Furthermore, to leverage its storage, NetApp is offering a Hadoop distribution.
Unfortunately, we are concerned that NetApp is seeing increased competitive pressure
from smaller private vendors, EMC, and alternatives for large-scale data storage. With few
assets outside storage, this may be an issue for the company over time.
The Industry Says…C sc , IBM, and MSFT
Assessing the quality of each companies' IT stack is challenging from an external
perspective. As such, we surveyed 40 main IT buyers on the portfolio. Based upon this
survey, customers believe that the vendors with the core competencies to address
increasing levels of the IT stack are Cisco, IBM, and MSFT, with Huawei, HP, and Juniper
ranking quite poorly.
Cisco ranked well on core competencies. Within our survey, we asked IT buyers not only
to rank the companies competing for this wider IT wallet and to score each vendor on a

18 September 2013
Cisco Systems Inc. (CSCO) 74
given metric ranging from product portfolio to roadmap, but also rank the quality of the
salesforce and cloud strategy. Our survey was aimed not at product-level network buyers,
but at IT decision makers. As such, we believe it gives a decent reflection of each player.
Interestingly, Cisco scored the highest, with a top-three position in every category. The
company scored notably well on product portfolio management and distribution. (See
Exhibit 101.) Cisco was followed closely by Microsoft and IBM, with the latter scoring well
on roadmap sales and management. Companies that scored poorly were no surprise: HP,
Dell, and Huawei.
Exhibit 101: Cisco, IBM, and MSFT Compete Well in Terms of Core Competencies Please rate the following IT vendors across the attributes below, using the following scale: 1 = Very poor performance 5 = Excellent performance
Source: Company data, Credit Suisse IT Survey, August 2013
Cisco, IBM, and EMC building cloud credentials. From a vendor perspective, we believe
that the components of cloud computing are similar to existing datacenter architectures.
Recently announced cloud offerings by all major vendors, including IBM, HP, and Dell, are
fundamentally similar to infrastructure outsourcing services in that they have provided their
service arms for several years. The real change is to ensure that their portfolios are
aligned with new purchasers—service providers, customers seeking private cloud
implementations, and customers seeking public cloud services directly from the vendors
themselves. The question becomes whether the shift towards cloud computing could allow
newer entrants for IT infrastructure to win share. We note that, according to the Credit
Suisse IT Survey, Cisco is heavily favored to win incremental cloud infrastructure business,
as seen in Exhibit 102, followed closely by IBM and EMC.

18 September 2013
Cisco Systems Inc. (CSCO) 75
Exhibit 102: Cisco Is Likely to Be a Key Beneficiary of Cloud Deployments On a scale of 1-5 (1= unlikely, 5= very likely), how likely are the following vendors to GAIN/LOSE significant revenue as cloud computing adoption increases?
0%
5%
10%
15%
20%
25%
30%
35%
Huawei SAP Juniper NetApp Dell Oracle HewlettPackard
Microsoft IBM EMC Cisco
Perc
enta
ge o
f R
esp
on
den
ts
Company will gain share with transtion to the cloud Company will lose share with transtion to the cloud
Source: Credit Suisse IT Survey, August 2013.
While no one vendor has yet mastered the complete stack of hardware, software, and
services (as shown in Exhibit 100), with many of their products and strategies still
evolving, we would highlight the following in order to determine the impact on the
technology industry.
Who is showing the most innovation? While the shift to the cloud will be gradual, perhaps
the best indicator in the IT environment is companies that are expected to show true
innovation and ones that are perhaps not. According to our survey, over the past five
years, Cisco is appreciated as showing the most innovation; however, on a
forward-looking basis, it drops to fifth behind NetApp, Microsoft, IBM, and SAP.
Exhibit 103: Cisco Has the Biggest Drop in Innovation Perceptions Which company has shown the most innovation in the past 5 years and which will in the next 5?
0%
5%
10%
15%
20%
25%
30%
35%
Dell Huawei Juniper HewlettPackard
EMC Oracle Cisco IBM Microsoft NetApp SAP
Past 5 years Next 5 years
Source: Credit Suisse IT Survey, August 2013.

18 September 2013
Cisco Systems Inc. (CSCO) 76
Major Headwinds on Margins Perhaps one the hardest aspects of predicting Cisco’s operating outlook comes to the
dynamic on margins, simply because there are so many different drivers of profitability—
business mix (UCS, services, software upselling), competitive pressure, acquisitions as
well basic cost management. Also complicating matters is that Cisco only disclose gross
margins at the product and services level. We have looked at the outlook for margins
through five different approaches, and the end conclusion that we believe is that the
pressure on profitability will remain more to the downside. As shown in Exhibit 105, we
project 26% LT OM, given several factors.
Segmentation analysis—Negative UCS mix shift, all depends on the software and services
upsell. Shown in Exhibit 106, our proprietary segmentation analysis for Cisco’s gross
margins by business segment reveals several major conclusions. First and not
surprisingly, UCS is materially GM dilutive; we believe margins are around 30%, half of
corporate levels, given that we believe growth will increasingly come from share gains
expansion here and on an even higher scale that seems unlikely. Second, approximately
43% of incremental gross profit or 43% that Cisco targets in the medium term comes from
the ability to mix-up from services (and software). Here we believe that the company has
shown decent growth of late and we acknowledge that a strong installed base should
mean that Cisco increasingly upsells software and services. The only doubt we have with
this part of this strategy is that it involves upselling software, restructuring contracts, as
well competing with large IT companies such Microsoft and IBM, compared to which we
believe Cisco's IT portfolio still has gaps. Third, we believe that there is a combination of
disruption to networking GMs over time from SDN. On balance, we believe that GMs over
time will erode.
Industry structure and SDN Gross profit dollar headwind. As we discuss extensively in our
sector note and in the section "SDN an opportunity to shake up margins," while the impact
may be over a five-year view, we believe SDN will alter the dynamics of the networking
market, whereby at its most basic level, hardware, software, and services may be
delivered in a far less integrated manner. It remains to be seen how the traditional
networking vendors adapt to this change; however, what we believe is that based upon
our analysis, SDN will present a major change and headwind in terms of gross profit
dollars.
GM over time, the long trend is downwards. Stepping back from the segmentation
analysis, we note that adjusting Cisco over time for major acquisitions, underlying gross
margins have continued to come down, whether it is because they are high versus other
areas of IT spend or competitive pressures, we believe this is something to note.
Interestingly enough, Cisco's own guidance suggests a continued drop in the switching
GM’s over time.
SDN a change to industry margins structure beckons, no matter who wins. We have
compared the cost and total cost of ownership (ex-labor, running costs) for the basic Cisco
switch for the datacenter the Nexus 3064, along with the Smartnet services and software
contract that network administrator would usually sell. The alternative in an SDN world to
buy Cumulus Linux software and top-of-line rack bare metal switch, we demonstrate that
the Cumulus Option is some 70% cheaper, but also will result in gross profits of hardware
and software combined which is 74% lower. In other words, even if Cisco were to embrace
SDN potentially the GP dollars available significantly shrink. While this is simplistic in
many ways, we believe that it does highlight the headwind facing the traditional margin
structure of Cisco and something that we believe the software and service upsell cannot
offset easily.

18 September 2013
Cisco Systems Inc. (CSCO) 77
Exhibit 104: Cisco, HP, and Juniper Expected to Be the Most Disrupted On a scale of 1-5 (1=not vulnerable, 5=very vulnerable) which of the following vendors do you think is the most vulnerable to SDN?
0%
5%
10%
15%
20%
25%
30%
35%
40%
45%
50%
NEC Brocade Dell AlcatelLucent
Ericsson Fujitsu ZTE Huawei Juniper HewlettPackard
Cisco
Perc
enta
ge o
f R
esp
on
den
ts
Source: Credit Suisse IT Survey, August 2013.
Huawei’s impact will be felt internationally. Huawei has already made an impact in the
service provider market, capturing a 16% share of this segment over time. Further, we
believe that it has the potential gain to share in the enterprise segment given its focus on
this segment and re-organization (away from telecom infrastructure), significant R&D base
(70,000 employees), and potential to be disruptive on pricing. While the company may
struggle for traction in the United States, we believe the remaining 80% and 90% of
service provider routing and enterprise switching markets are ripe for traction.
Cost management has been decent, danger of a perennial restructure. One aspect of
Cisco’s margin management that we believe has been solid is simply the focus on the cost
base. Here we note that the recent 4,000 employee workforce rebalancing shows this and
the need to consistently pursue operational excellence. We assume a long-term opex to
sales ratio of ~34% is sustainable given this. Equally however, we would note from a
revenue-per-head basis, or compared with other major IT companies, Cisco’s opex base
seems relatively lean.

1
8 S
ep
tem
ber 2
013
Cis
co
Sy
ste
ms In
c. (C
SC
O)
78
Exhibit 105: Cisco Gross Margin Segmentation—Long Term, We Expect GMs Around 60%
1) Proprietary segmentation analysis for GM. Based upon disclosure at the time
of the FY11/12 analyst meetings we have estimated GP and GM by business
line, based upon this we believe there is a secular underlying pressure and GM.
While the company targets 61-62%, we believe the risk is that over time they
undershoot this.
2) Switching and routing GM’s long term pressure. Interestingly Cisco’s own
guidance suggest GM’s declining. We see switching dropping to 66% and
routing to 59% given several factors
1) Increased competitive pressure in routing (mix shift to edge)
2) The gradual impact of SDN
3) Competitive factors in markets ex the US (Huawei)
3) UCS meaningfully dilutive. We estimate GM’s here at 31% roughly half the
corporate average. Given slowing growth in the blade server market, incremental
growth through share gains become challenging given it already has an 20%
share now, we essentially assume this rises to 30% over time.
4) WLAN risk of gradual commoditization. Based upon the FY12 analyst
meeting we believe Cisco’s GM’s in the wireless business to be ~71%, at a
material premium to the corporate avg. We question the sustainability of these
margins given that Enterprise WLAN (Aruba, Ruckus) is highly competitive.
5) Services and software the savior? Over the medium term Cisco targets some
43% to come from services growth. We accept that the company has a decent
installed base, and can achieve some of this, however equally we believe that
without material acquisition the needed level of expansion would need for the
company to become a strategic supplier in IT where it currently has material gaps
ex networking.
6) OPEX rising to $19bn…$2.13 EPS LT. An important focus of Cisco’s margin
management has been the solid focus on the cost base. The recent 4,000
employee restructuring shows this, as well as a general focus on operational
excellence. We assume a LT OPEX to sales of ~34% is sustainable and on a
revenue/head basis Cisco’s OPEX base seems lean compared to other major IT
companies.Source: Company data, Credit Suisse estimates
Revenue
In $ millions FY14 FY15 FY16 Target 13-16 CAGR CS FY16 13-16 CAGR
Switching 15,239 15,734 16,242 3.3% 16,049 2.9%
Routing 8,522 9,136 9,970 6.6% 9,501 4.9%
SP Video 4,836 4,806 5,066 1.4% 4,857 0.0%
DC 2,516 2,893 2,814 10.7% 3,182 15.4%
Wireless 2,708 3,077 2,573 5.9% 3,385 16.0%
Security 1,374 1,429 1,528 4.3% 1,472 3.0%
Collaboration 3,963 4,083 4,985 8.0% 4,207 2.1%
Other 398 359 724 2.9% 323 -21.4%
Services 11,267 12,139 13,990 9.8% 12,989 7.1%
Revenue 50,823 53,656 57,892 6.0% 55,965 4.8%
Gross Margin
FY14 FY15 FY16 Target Growth bps CS FY16 Growth bps
Switching 69.0% 67.2% 67.0% (382) 65.4% (5)
Routing 60.6% 59.1% 60.5% (74) 57.6% (4)
SP Video 42.0% 42.0% 41.0% (100) 42.0% -
DC 30.0% 29.0% 28.1% (289) 28.0% (3)
Wireless 70.0% 67.5% 65.3% (566) 65.0% (6)
Security 71.8% 72.3% 77.7% 635 72.8% 2
Collaboration 61.6% 62.1% 63.5% 235 62.6% 2
Other 28.0% 28.0% 54.7% 2,667 28.0% -
Services 68.0% 68.5% 67.2% (34) 69.0% 2
Gross Margin 62.1% 61.3% 61.5% (104) 60.5% (2)
Total Opex 17,132 18,213 19,394 5.1% 18,973 4.3%
OPEX % Sales 33.7% 33.9% 33.5% -0.9% 33.9%
In $ millions FY14 FY15 FY16 Target 13-16 CAGR CS FY16 13-16 CAGR
Operating Income 14,427 14,676 16,210 5.8% 14,727 2.5%
Operating Margin 28.4% 27.4% 28.0% -0.2% 26.3%
Net Income 11,485 11,714 13,297 7.0% 11,815 2.8%
Share Count 5,462 5,502 5,542 1.1% 5,542 1.1%
EPS 2.10 2.13 2.40 5.8% 2.13 1.7%
Source: Company data, Credit Suisse estimates.

18 September 2013
Cisco Systems Inc. (CSCO) 79
Segmentation Analysis—UCS Dilutive
We believe that any analysis of Cisco margins needs to look at the margins by business
line. The challenge is that Cisco does not disclose them. Here we have relied upon charts
initially disclosed at the Cisco FY12 analyst meeting that gave a breakdown of gross
profits by business line, as well as Cisco’s targets. We show our estimates on a full-year
basis by business segment in Exhibit 106 and would highlight three main conclusions.
UCS materially gross margin dilutive… According to our estimates, UCS delivers a GM of
25-30%, some 30% lower than the corporate average or at half the level. This puts Cisco
in-line with most server peers. For example, we believe Dell operates at close to 27%.
While the company has a much higher ASP than Dell, we note that it has far lower scale in
terms of purchasing x86 chips, so we believe on balance that our estimate makes sense.
While the company has made no secret of the impact of server growth, the magnitude of
the growth is somewhat surprising and from a mix perspective, the robust growth seen at
Cisco indicates that the company will face a headwind from this on a long-term basis.
Exhibit 106: Cisco GM by Business Line Significant Dilution from UCS
20.0%
30.0%
40.0%
50.0%
60.0%
70.0%
80.0%
Switching Security Wireless Services Corporate
average
Routing Collaboration Other SP Video Data Center
FY12 FY13
Source: Company data, Credit Suisse estimates.
…growth and GM expansion for UCS? We note that UCS today stands at a revenue run
rate of over $2.0bn per year and this has been a clear share gainer in the server market.
However, equally we would note that in the segments in which Cisco operates, i.e., the
blade server market, the market is ex-growth long term. We believe that if Cisco is to
continue to grow revenues, either it will need to become truly dominant or it will need to
embrace lower price points, especially given its blade server share stands at 20%. Our
estimate of $3.3bn assumes it raises market share to 30% effectively over time.
Wireless Networking, performing well, but GM headwinds? Based upon the FY12 analyst
meeting, we believe that Cisco delivers GMs in the wireless business of around 65%, at a
material premium to the corporate average. This itself is not surprising given that Cisco
competes with peers reporting similar gross margins at Aruba. This segment is expected
to grow at a rate of 15% and as such this provides a GM tailwind. The only concern that
we hold is that, given the highly competitive nature of Enterprise WLAN, remaining
accretive GM’s will actually decline. (See Exhibit 107.)

18 September 2013
Cisco Systems Inc. (CSCO) 80
Exhibit 107: WLAN a Competitive Market Although Cisco Dominates with over 50% Share
Cisco, 51%
Other, 20%
Aruba, 11%
HP, 6%
Ruckus, 5%
Motorola, 5%
Meru, 2%
Ubiquiti, 1%
Source: Company data, Credit Suisse estimates
Building Software and Services Some Challenges
Looking at the above analysis another way in terms of incremental gross profit dollars, we
note that over the medium term, Cisco targets some 44% to come from services growth.
We note that to date the company has been successful in transitioning the overall revenue
mix towards services. We note that services now represent some 22% of overall Cisco
revenues, up from 19% in 2010. Additionally, within services Cisco is executing relatively
well and shifting the focus towards smart services over time, where GM’s are higher than
today’s services average of 67%. We note that in terms of incremental GP dollars, it
seems that some 44% comes from services. Put another way, for Cisco to deliver on its
long-term vision and offset competitive pressures, the execution of higher software and
services attach is critical.
Exhibit 108: Cisco Is Targeting Some 44% of GP Dollars to Come from Services
$25
$26
$27
$28
$29
$30
$31
$32
$33
$34
$35
$36
$37
$ B
n
$30.40
FY16 GPFY13 GP
$35.60
Switching Routing ServicesOthers Wireless DC SP videoSecurity Collaboration
1%
44%
19%
14%
7%5%
4%3%3%
Source: Company data, Credit Suisse estimates.
This transition towards software and services, if it occurs, could be very powerful given
several factors.
■ It has the potential to change Cisco’s value add and annuity stream as an IT supplier
giving less volatility to revenues. Today this is 22% of revenues and Cisco aims to
expand this by 25-30% over time.

18 September 2013
Cisco Systems Inc. (CSCO) 81
■ It can elevate the company’s margin structure and deal with several competitive
elements and other mix factors.
The question is, can Cisco transform and perform a migration such as IBM performed
beginning in the late 1990s. We believe that the arguments for and against this means that
it will not necessarily be straightforward and assume a lower ramp. (See Exhibit 108.)
What is Cisco trying to sell? A key target that Cisco has emphasized over the past 12
months is to increase its recurring revenues through a combination of software and
services expansion. On the software side, we believe through the various embedded
software such as the IOS, the Nexus OS Cisco has always developed software. However,
now the company targets raising its software-related revenues from $6bn to $12bn, this
we believe is being driven by several factors.
Charging for software separately. Even though Cisco remains adamant that integrated
ASIC, software, and product strategy is a differentiator, the company will target to charge
for software separately. Indeed as noted by CEO John Chambers in late 2012:
“When you think about where we're going in software, remember software is across the
board for us. But we've got to learn how do we charge for it differently. How do we charge
in terms of recurring capability? How do we not get caught in bidding hardware and
software bundled together, against somebody who just provides hardware for a given price
point.”
It seems to us that Cisco aims to operate in a very similar manner to the past, the
difference being that it intends to charge for software more clearly. While this is plausible
and will no doubt increase focus, we question whether a change to market will actually
work easily. Of course as a dominant switching and routing supplier and the switching
costs of moving means that renegotiations of such sort are plausible, however, they can
equally backfire especially as large-scale customers begin to assess SDN strategies.
Upselling new software. One area where Cisco could gain traction on the area of adding
additional value through software is in the area of networking management, as
virtualization takes hold. This could present new opportunities for the company; however,
given Cisco’s desire to integrate with its own hardware could mean that its dominance in
today’s networking is unlikely to be replicated.
An installed base, and trusted position will help… One aspect of Cisco's strategy to grow
its software and services stream is simply its installed base. Today this amounts to over
$180bn of Cisco's equipment that is installed, with a highly trained base of network
administrators, we believe this in itself cannot be underestimated. It both allows the
company an initial entry into discussion for new software platforms and services, and
equally retains an inertia to moving away.
…but can Cisco really replicate IBM on software and services? A key delta between IBM
and Cisco was the ability of IBM to simultaneously dispose of commodity hardware (PCs,
retail solutions) and purchase software assets, while meaningfully cutting costs. The issue
we believe is ultimately that all of the company’s current software sales link to an actual
product sale, for example, OS will link with switching sales. The question is can Cisco
move from being a focused networking company to where the company could assemble a
software portfolio that makes it a more relevant software vendor. We note that Cisco has
over the past five years diverted significantly more of its attention to software acquisitions;
however, these still seem to relate largely to networking. In other words, we believe that a
major acquisition and/or internal move of R&D and focus may be needed. As shown in
Exhibit 110, although Cisco is aiming to become a more significant IT player, it lacks
breadth across the IT stack.
…but ranked well on core competencies. Within our survey, we posed the question to the
IT buyers to rank the companies competing for this wider IT wallet and score each vendor
on a given metric ranging from product portfolio, to roadmap, but also the quality of the

18 September 2013
Cisco Systems Inc. (CSCO) 82
salesforce and the cloud strategy. Note that our survey was aimed not at product-level
network buyers, but more at IT decision makers; as such, it gives a decent reflection of as
to how each player is seen more broadly. Interestingly, Cisco scored highly and achieved
the most #1 ranked responses and held a top-three position in every category. The
company scored notably well on product portfolio management and distribution. (See
Exhibit 109.) Cisco was followed closely by Microsoft and IBM, with the later scoring well
on roadmap sales and management. Companies that scored poorly here not surprisingly
were HP, Dell, and Huawei.
Exhibit 109: Cisco, IBM, and MSFT Compete Well in Terms of Core Competencies Please rate the following IT vendors across the attributes below, using the following scale: 1 = Very poor performance 5 = Excellent performance
Source: Company data, Credit Suisse estimates.

1
8 S
ep
tem
ber 2
013
Cis
co
Sy
ste
ms In
c. (C
SC
O)
83
Exhibit 110: Can Cisco Compete in the IT Stack? Many Gaps versus an IBM and Oracle in millions, unless otherwise stated
Oracle IBM HP EMC Cisco SAP Microsoft Juniper Dell NetApp
E, M, T-Series/EX,
QFX-Series/Qfabric
7%
Operating system: $29bn
Management: $73bn
Applications: $168bn
Application dev. & deployment: $82bn
Middleware: $19bn
Database: $28bn
EqualLogic/
Compellent
7%
FAS/E-Series
11%
Virtualization: $3bn
Servers: $53bn
Networking: $37bn
Storage: $53bn
StorageTek/Sun
Storage
1%
IBM
DS/XIV/Storw ize
13%
3PAR/EVA/MSA
9%
VMAX/VNX/Isilon
34%
Partner/VCE/FlexPod
Pow erEdge
15%FlexPod/Partner
Partner/
IBM System
Netw ork
1%
ProCurve/3Com
7%VCE
Nexus/Catalyst/
Insieme/ASR/CRS
55%
Force10/Partner
1%FlexPod/Partner
OracleVM
1%
Pow erVM
7%
VSE
2%
VMw are
85%Partner/VCE/FlexPod
x86/SPARC/
Exadata/Exalogic
5%
System z/p/x
30%
ProLiant/Integrity
27%
VCE/Lenovo/
Partner
UCS/VCE/FlexPod
3%
Window s
79%
Hyper-V
1%FlexPod/Partner
Solaris/Linux
1%
AIX/zOS
6%
HP-UX Non
Stop/OpenVMS
3%
VMw are
Oracle
DB/TimesTen
MySQL
45%
DB2
18%
Vertica/Partner
0%
Greenplum/
Partner
0%
Sybase
5%
SQL Server
20%
NetWeaver
1%
.NET
5%
Java development
tools
22%
Rational/ILOG
20%
Quality/
Performance
Center
1%
Pivotal/Spring
Source
0%
Pow er Builder
6%
Fusion
Middlew are
16%
WebSphere
33%
VMw are/Pivotal/
Partner
0%
Backup Advisor/
RecoverPoint/
Control Center
5%
Partner/VCE/FlexPod
Visual Studio
11%
System Center
35%
Quest
1%
On Command
2%
E-business/
Fusion applications
6%
Lotus
Domino/Notes
3%
Webex/Partner
1%
ERP/
SuccessFactors
7%
Microsoft
Exchange/Lync/
Dynamics
14%
Tivoli 10%
OpenView /
Insight Manager
5%
Source: Company data, Credit Suisse estimates.

18 September 2013
Cisco Systems Inc. (CSCO) 84
Mean Reversion on Margins
In the neoclassical theory of the firm excess economic returns in competitive markets will
be competed away. As previously mentioned there are reasons (reliability, innovation and
technology) why networking margins in segments such as switching and routing have
sustained a material premium to margins in other areas of IT and even communication
equipment. We would note however preliminary inspection would suggest that gross
margin in networking at least for Juniper and Cisco have been on a long term decline for
some time.
Cisco core GM has been sliding. A glance at Exhibit 112, shows Cisco gross margins over
time. Here, we present the corporate gross margin and the adjusted GM, the later has
been adjusted for the impact of major acquisitions (such as Scientific Atlanta, Tandberg
and the impact of UCS revenue growth that we believe is meaningfully GM dilutive as
discussed previously. This is a simplistic analysis and we acknowledge that we have not
adjusted for every acquisition, which given the software bias would actually be implying
that underlying margin declines have been more severe. What is clear that over any
prolonged period of time GM’s have been under pressure. Indeed we note that whereas
once Cisco gross margins were ~74%, today they are 63%.
Exhibit 111: Cisco GM's Have Been Declining over the Long Term in millions, unless otherwise stated
50.0%
55.0%
60.0%
65.0%
70.0%
75.0%
FY00 FY01 FY02 FY03 FY04 FY05 FY06 FY07 FY08 FY09 FY10 FY11 FY12 FY13
GM % GM Cisco (adjusted)
Apart from the GM recovery FY01 to 03, Cisco GM have been on a
slow and steady GM trajectory on an adjusted basis (ex impact of
major dilutive events) down by 800 bps in 10 years
Source: Company data, Credit Suisse estimates.
A decent correlation with time. In Exhibit 112 and Exhibit 113 we show the gross margins
for Cisco and Juniper over time, while each only includes approximately ten data points,
what is interesting, is that the R-squared is decent, in other words over time networking
gross margins have been shown to erode at a rate of about 20bps per year.
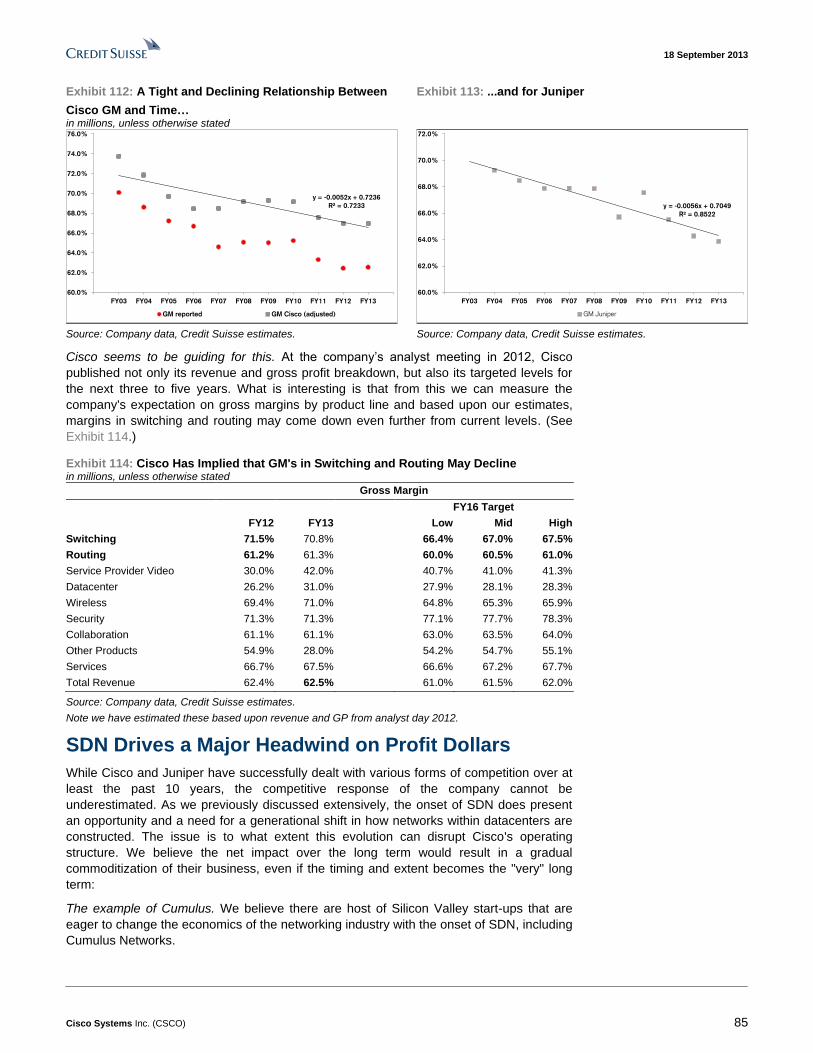
18 September 2013
Cisco Systems Inc. (CSCO) 85
Exhibit 112: A Tight and Declining Relationship Between
Cisco GM and Time… in millions, unless otherwise stated
Exhibit 113: ...and for Juniper
FY03 FY04 FY05 FY06 FY07 FY08 FY09 FY10 FY11 FY12 FY13
y = -0.0052x + 0.7236
R² = 0.7233
60.0%
62.0%
64.0%
66.0%
68.0%
70.0%
72.0%
74.0%
76.0%
GM reported GM Cisco (adjusted)
FY03 FY04 FY05 FY06 FY07 FY08 FY09 FY10 FY11 FY12 FY13
y = -0.0056x + 0.7049
R² = 0.8522
60.0%
62.0%
64.0%
66.0%
68.0%
70.0%
72.0%
GM Juniper
Source: Company data, Credit Suisse estimates. Source: Company data, Credit Suisse estimates.
Cisco seems to be guiding for this. At the company’s analyst meeting in 2012, Cisco
published not only its revenue and gross profit breakdown, but also its targeted levels for
the next three to five years. What is interesting is that from this we can measure the
company's expectation on gross margins by product line and based upon our estimates,
margins in switching and routing may come down even further from current levels. (See
Exhibit 114.)
Exhibit 114: Cisco Has Implied that GM's in Switching and Routing May Decline in millions, unless otherwise stated
Gross Margin
FY16 Target
FY12 FY13 Low Mid High
Switching 71.5% 70.8% 66.4% 67.0% 67.5%
Routing 61.2% 61.3% 60.0% 60.5% 61.0%
Service Provider Video 30.0% 42.0% 40.7% 41.0% 41.3%
Datacenter 26.2% 31.0% 27.9% 28.1% 28.3%
Wireless 69.4% 71.0% 64.8% 65.3% 65.9%
Security 71.3% 71.3% 77.1% 77.7% 78.3%
Collaboration 61.1% 61.1% 63.0% 63.5% 64.0%
Other Products 54.9% 28.0% 54.2% 54.7% 55.1%
Services 66.7% 67.5% 66.6% 67.2% 67.7%
Total Revenue 62.4% 62.5% 61.0% 61.5% 62.0%
Source: Company data, Credit Suisse estimates.
Note we have estimated these based upon revenue and GP from analyst day 2012.
SDN Drives a Major Headwind on Profit Dollars
While Cisco and Juniper have successfully dealt with various forms of competition over at
least the past 10 years, the competitive response of the company cannot be
underestimated. As we previously discussed extensively, the onset of SDN does present
an opportunity and a need for a generational shift in how networks within datacenters are
constructed. The issue is to what extent this evolution can disrupt Cisco's operating
structure. We believe the net impact over the long term would result in a gradual
commoditization of their business, even if the timing and extent becomes the "very" long
term:
The example of Cumulus. We believe there are host of Silicon Valley start-ups that are
eager to change the economics of the networking industry with the onset of SDN, including
Cumulus Networks.

18 September 2013
Cisco Systems Inc. (CSCO) 86
Cumulus plans to replicate for the networking industry what Linux did for the server
industry when it helped break up the stranglehold that vertically integrated computing
companies like Sun Microsystems had before x86–based servers became mainstream.
Cumulus is supporting Linux for multiple reasons. First and foremost it has a featured
networking stack, with many networking companies either already using it for
implementation, or even before this, by building it into their proprietary platforms. Second
there is a material variety of vendor-agnostic tools for managing and operating Linux
platforms available. By combining controllers from a variety of vendors, Cumulus'
operating system allows a feature rich commodity hardware-based switch.
The Cumulus model. At its basic level the company aims to alter networking so that
network devices run the same way that servers do, meaning using the same kind of tools
and operational platforms for deployment and management. The idea is that this will be
particularly attractive to companies whose data centers are constantly expanding.
Supply chain and ecosystem. The company has built a supply chain of original design
manufacturers (ODMs), distributors, value-added resellers (VARs) and system integrators
to build and deliver bare-metal switches with Cumulus' software on-board, including Acton
and Quanta and silicon from Broadcom.
Exhibit 115: Cumulus Ecosystem
Technology Partners ODM Silicon/Components Distributors Customers
Open Compute Project Accton Broadcom Penguin Computing Dreamhost
AGEMA Quanta Finisar Synnex Fastly
CF Engine UNIXSurplus
Cloudscaling
Metacloud
Opscode
Piston Cloud
PLUMgrid
Puppet Labs
Quanta
10Gtek
VMware
Source: Company data, Credit Suisse estimates.
A change in cost structure. Given the nascence of software defined networking as
technology, while the debate will grow around the strength of one vendor's offering versus
another's, it is possible that Cisco and/or Juniper will embrace SDN successfully. The
question for investors is whether they will be able to extract the same level of economics
from the networking budgets. In Exhibit 116 we show a simplistic analysis of the impact of
SDN in economic terms. We have compared the total cost of ownership (ex-labor,
operating costs) for basic Cisco switches for the datacenter (i.e. Nexus 3064), along with
the SMARTnet services and software contracts that network administrators would usually
sell. The alternative in a “SDN” based environment would be to buy Cumulus Linux
software subscription and top of rack bare metal switch. Our analysis as shown in Exhibit
116 highlights these main issues:
The TCO is dramatically lower. Even assuming that the Cumulus approach has a shorter
switch life of three years on a TCO basis, the cost is some 88% lower. The saving comes
from effectively unbundling the solution between hardware and software.
The gross profit dollar difference is 74% lower. An additional issue becomes whereas
Cisco will deliver a gross margins of 60% and 67% on its products and services in fiscal
2014, in the Cumulus scenario we believe the gross margin is lower in aggregate at 56%.
Possibly more importantly the gross profits dollars are 74% lower. The point here is that
even if today’s networking vendor was to embrace an open SDN strategy, the gross
margin percentage and gross profit dollars will be significantly lower.

18 September 2013
Cisco Systems Inc. (CSCO) 87
Can Cisco do the upsell? Seems unlikely. We believe Cisco and others understand this
risk, even if they continue to highlight the alternative advantages of integrated ASICs,
software and services. Indeed we believe the push into services or new software is
partially to offset this decline. Nevertheless, in order Cisco to be able to be gross profit
neutral versus today's economics the customer would either need to spend additional
$8,000 or 3.3x versus the alternative from the Cumulus option or this much value in
Cisco’s wider offering and pay a premium. While we do not dispute the value of Cisco’s
installed base, trained administrators, new services, and new software they offer, this level
of difference would certainly lead us to conclude that the headwind on gross profit dollars
is significant. Moreover, Cisco’s push into expanded software offerings comes at a time
when Linux-based platforms are set to growth their application, developer and services
ecosystems.
The above analysis is simplistic in many ways. We acknowledge that the above analysis is
simplistic in many ways as it excludes the costs of labor, power, cooling, that all have an
impact on the relative TCO. Additionally while hard to place a numerical value on the risk
of using a new supplier, the inertia of Cisco network administrators cannot be
underestimated. We do believe however that the relative magnitude in the economics of
today versus tomorrow present a headwind.

1
8 S
ep
tem
ber 2
013
Cis
co
Sy
ste
ms In
c. (C
SC
O)
88
Exhibit 116: SDN—Threatening the Last Bastion of Proprietary IT Profits
Cisco Proposal USD
Cisco Nexus 3064 list price 48,000
Cisco Nexus 3064 realised price 20,000
License 4500
Maintence 6,000
Average Switch Life years 5
TCO 54,500
TCO per year 10,900
Cisco Switching & Services GM 70%
Cisco GP 7,630
Cumulus Proposal
Top of rack bare metal switch 6,000
Cumulus Annual Subscription 1,500
Average Switch Life years 3
TCO 10,500
TCO per year 3,500
Cost Saving -68%
Hardware GM 30%
Hardware GP 600
Software GM 90%
Software GP 1,350
Total GP 1,950
Blended GM 56%
Difference -74%
Cisco Value add needed to be GP neutral 5,680
Cisco Upsell to be GP neutral 8,114
Multiple of Cumulus Propasal 3.32
1) A look at the economics of SDN. Perhaps the most significant issue for the networking
segment is what happens to economics with the onset of SDN. Even if traditional
networking vendors shift their portfolio, strategies and software to a SDN defined
approach can today’s economics can be replicated? Our analysis compares on a
simplistic TCO basis the relative costs savings to the customer and gross profit headwind
to networking vendors is around 70%
2) Cisco basis Nexus 3064 DC switch. We base our analysis on a lower end Cisco Nexus
3064 datacenter switch with a list price of $48,000. However we believe the price to most
enterprises would be more than 50% lower. Additionally Cisco will license the OS and
charge maintenance, assuming a standard 5 years switch life the TCO is $54.5k or
$10.9k per annum.
3) Cumulus Proposal, 70% cheaper per year. With Cumulus the customer buys a basic
commodity switch and they charge an annual subscription of $1,500, bringing the TCO to
$10,500, $3,500 per annum. Even assuming a lower life for switch the TCO is 80% lower.
4) Gross Profit Dollars at risk. In the Cisco proposal the GP dollars available (assuming a
70% GM) are $7.6k, in the cumulus proposal (assuming standard hardware commodity
GMs) the GP is $1950m some 74% lower. In other words even if networking vendors
offer this, it significant shrinks the profits available.
5) Can Cisco achieve the upsell? We believe that Cisco is aware to some degree of this
and will attempt to upsell services, or argue for higher value add (sales-force, support,
legacy, reliability), however the needed upsell needs to worth 3.3x the Cumulus proposal,
this seems like a stretch.
6) A simplistic analysis, but…This analysis ignores other costs like labor, cooling, power,
and does not take into account the value of support, alternative features or
platform/portfolio but does highlight the disruptive economics of SDN, and the economic
surplus being earned in networking. Moreover, it does not take into account the full
solution sale. For example, with Nexus 3000-series switches sold, Cisco would bundle a
Nexus 7000 router, which has carries more upgrades and support over time, which would
support margin and allow Cisco to get more aggressive on the Nexus 3000 switches.
Even with this discounting, SDN solutions would be less expensive with a Nexus 7500
selling for $200-250k versus $100-150k for an SDN alternative.
Source: Company data, Credit Suisse estimates.

18 September 2013
Cisco Systems Inc. (CSCO) 89
ASIC Strategy a Differentiator in an SDN World?
Cisco leverages a two silicon strategy that by and large can offer some offset on its margin
structure over time. The company leverages its custom ASICs with the aim to deliver
strategic and sustainable differentiation, schedule autonomy for product releases, and
investment protection. The company uses commodity components where needed to
facilitate time to market and opportunistic products. Here, we believe Cisco’s scale largely
comes in to its own, as it is able to engage a wide ecosystem of partners for its ASIC
strategy, in a manner that many of its rival peers cannot.
Exhibit 117: Cisco Silicon Ecosystem Is Comprehensive
Services
offered:
Industry
Leaders:
Foundries ASIC partners EDA suppliers IP suppliersMerchant Si
suppliers
ASIC and silicon
manufacturer
Cisco’s partners for
custom Silicon
development;
source IP & supply
design services
Manage foundry
relationships &
subcontractors
Provide front end
design tools (rtl
design simulation) and
back end design tools
(physical design
timing) for custom
ASIC development
Supply strategic
IP to Cisco (when
not developed
internally)
Cisco licenses
directly or via ASIC
partners
Cisco’s suppliers
for commercial,
off-the-shelf
silicon
Source: Company data, Credit Suisse research
Pricing pressure and competitive risks. By our measurement, switching accounts for 34%
of gross profits and routing accounts for 17% of gross profits; as such, while mix shifts can
have some impact, disproportionately the most significant is whether the GM levels in such
segments are sustainable. Indeed we note that, as shown in Exhibit 118, according the
Cisco’s own disclosures, by far the largest mix effect that seems to weigh on gross
margins has been at the product level, i.e. the pressure from “sales, discounts, rebates,
and product pricing”. Looking at the average of the past five years, this seems to be an
ongoing level of pressure at the rate of 2.50% that Cisco seeks to offset from other levers.
Exhibit 118: GM Drivers—Product Mix and Pricing, Offset by Manufacturing Cost Downs in millions, unless otherwise stated
PRODUCT GROSS MARGIN BRIDGE FY09 FY10 FY11 FY12
Previous Fiscal Year (GAAP) 64.8% 64.0% 64.2% 60.5%
Discounts, rebates, and product pricing -2.1% -2.2% -2.9% -2.8%
Mix of products sold -0.4% 0.1% -1.6% -0.6%
Restructuring and other charges 0.0% 0.0% -0.4% 0.5%
Amor. of purchased intang. and SBC 0.0% 0.0% -0.6% 0.3%
Acquisition fair value adjustment to inv. NA NA NA NA
Shipment volume, net of certain costs -0.4% 0.6% 0.4% 0.5%
Overall manufacturing costs 2.1% 1.7% 1.4% 1.7%
Current Fiscal Year (GAAP) 64.0% 64.2% 60.5% 60.1%
Source: Company data, Credit Suisse estimates.
ARM-based networking a threat long term? Cisco in our view heavily utilizes its own
ASICs and the company’s dominant share has shown that this strategy in turn has proved
effective. However, we would highlight a building threat that, we believe, can come from

18 September 2013
Cisco Systems Inc. (CSCO) 90
ARM-based Networking Chips that in turn could create a new alternative of networking
suppliers based on lower power, lower cost chips. Interestingly, ARM targets a 20% share
in routing and networking, which we believe in aggregate places some long-term risk on
Cisco.
Exhibit 119: ARM Targeting a 20% Share in Switching and Routing LT in millions, unless otherwise stated
2017 Enterprise Networking Chip TAM (m) Chip Value ($bn) Target Penetration
Base station equipment 65 $3.5 60%
Carrier Infrastructure 75 $3.0 <5%
Enterprise Access Points 270 $2.0 50%
L2/L3 Switching 150 $3.0 20%
Routing 80 $2.5 20%
Other 100 $2.5 20%
Total 700 $16.5
Source: Company data, Credit Suisse estimates.
Huawei a Threat Not to Be Underestimated
Although Huawei’s Enterprise Business group was only set up in 2011, it achieved $1.5bn
in revenues purely from opportunistic projects, for example as an extension of its existing
carrier and consumer businesses. In 2012, revenues grew some 26% to $1.9bn. While the
initial targets of some $15bn by 2017 have proved quite lofty, we equally believe it is a
threat and not be underestimated for several reasons.
A shift in organization and focus. Over the past two years, Huawei has emphasized the
growing importance of Enterprise, supported by the belief that Carrier and Consumer
markets will eventually cease to be distinct; and together with Enterprise it is expected to
form an ecosystem in which complex problems are addressed through an integrated
solution. For the Enterprise segment, although the company has not provided any specific
targets for 2012, Huawei is hoping for sales here to grow faster in 2012 compared to the
57% growth seen in 2011. In addition, in the long term, it expects the Enterprise segment
to account for as high as $10bn of revenue by 2017, with the specific goal being to take
share from traditional IT hardware companies.

18 September 2013
Cisco Systems Inc. (CSCO) 91
Figure 120: Huawei Offers a Range of Products and Services Focused at Enterprise Aimed at Select Verticals Brief description of Huawei’s Enterprise product and services portfolio
Source: Company data, Credit Suisse research.
R&D a major force to be reckoned with. Both the IT Hardware and Telecom Equipment
sectors remain R&D intensive businesses, which is crucial for ongoing cost reductions as
well as maintaining a competitive advantage. Interestingly, Huawei’s capabilities here
remain strong, with the company continuing to add more resources to maintain its
positioning with the industry.
Figure 121: Huawei Keeping Up with Innovation vs. Competitors with Rising R&D Spend US$ in millions, unless otherwise stated
R&D (US$ mn) 2007 2008 2009 2010 2011 2012
Comm. Equipment companies
Cisco 4,487 4,739 4,363 5,090 5,184 5,364
Ericsson 4,266 4,689 3,570 4,147 4,939 4,722
Huawei 992 1,506 1,953 2,611 3,671 4,774
Alcatel-Lucent 3,675 3,543 3,299 3,314 3,293 2,997
Nokia Siemens 2,841 3,328 2,867 2,591 2,954 2,604
ZTE 422 575 846 1,049 1,316 1,401
Juniper 584 684 682 837 926 992
Tellabs 343 305 269 300 324 239
Sub-total 17,611 19,369 17,849 19,939 22,606 23,092
IT Hardware companies
IBM 6,266 6,426 5,943 6,152 6,345 6,322
Hewlett-Packard 3,611 3,543 2,819 2,959 3,254 3,399
EMC 1,408 1,546 1,400 1,606 1,834 2,225
Dell 610 663 617 653 856 1,072
NetApp 382 442 485 568 643 717
Sub-total 12,276 12,621 11,264 11,938 12,932 13,735
Source: Company data, Credit Suisse research.
Also a significant number of staff to be reckoned with. As shown in Exhibit 122, at the end
of 2012, Huawei employed some 140K employees, of which ~70K or ~50% were in R&D.
This is significantly higher than 34% at ZTE (c22K R&D staff), 27% at Nokia (27K R&D

18 September 2013
Cisco Systems Inc. (CSCO) 92
engineers including Nokia Siemens), and 21% at Ericsson (c24K R&D employees). In
addition, the R&D cost per R&D employee at Huawei is $61K versus Ericsson at $196K
and Nokia at $205K, as shown in Exhibit 123, with only ZTE operating at a lower cost (at
around $47K). In addition to the higher level of R&D headcount, we believe this lower cost
per employee in R&D continues to give Huawei a material cost advantage versus peers.
This is aided by the company having a well distributed R&D base. Although in the past,
Huawei had a local R&D bias, now the company has R&D operations throughout the world
with centers in India, the United States, Germany, Russia, and Sweden.
Exhibit 122: With 70K R&D Staff, Huawei Remains a
Force…
Exhibit 123: …Especially with the Cost Advantage in R&D
0
10
20
30
40
50
60
70
80
Tellabs NetApp Juniper EMC Cisco Ericsson Alcatel-Lucent
ZTE Nokia (inclNSN)
Huawei
R&
D e
mp
loye
e c
ou
nt
('0
00
)
2007 2008 2009 2010 2011 2012
47
68
140159
170
196205
227 232243
0
50
100
150
200
250
300
ZTE Huawei Alcatel-Lucent EMC NetApp Ericsson Nokia Tellabs Cisco Juniper
R&
D c
ost
pe
r R
&D
em
plo
ye
e (
US
$ '0
00
) in
20
12
Source: Company data, Credit Suisse research. Source: Company data, Credit Suisse research.
Leveraging Huawei’s broader strengths for growth within the Enterprise. To support its
growth, the Enterprise business is also looking to tap into the company’s broader portfolio
of nearly 60K patent applications (including patent applications in China, patents under
patent cooperation treaties and patent applications overseas), which Huawei continues to
focus on expanding. With regard to geographic presence, the bulk of its Enterprise
Business today comes from Asia – specifically within China, somewhere in the range of
30-50%. The remainder of revenue comes from Africa and Europe, with a small portion
from Latin America and almost zero revenue from North America. Within these markets,
the primary verticals are government, education, and infrastructure (transportation).
Interestingly, for its Enterprise business, Huawei has adopted the same “outside in”
strategy as the broader company, focusing first on penetrating relatively untapped markets
(rural China, Eastern Europe, and Canada).
Margin structure conducive to Huawei’s strategy on Enterprise side. Compared to some of
the major players in the infrastructure space, Huawei commands gross margins in the
range of 37-40% and operating margins of around 10% (as per Huawei’s 2012 annual
report). This compares to Cisco and IBM’s gross/operating margins, which range around
62%/27% and 50%/22%, respectively. While Huawei’s margins are considerably lower
than those of its IT/Enterprise competitors, it is worth noting that despite a lower gross
margin profile, Huawei continues to be an operationally well-run organization. A close
parallel has been drawn between Huawei’s approach to enterprise and its history of
margin deflation tactics. Just as Huawei has built products at lower cost in the wireless
infrastructure and smartphone markets, it intends to compete in enterprise by building
channel programs that, from the outset, allow for better margins – a threatening strategy to
competitors with higher margin structures firmly in place. The company in the past has
noted that there has been significant consolidation and only a handful of new entrants into
the IT market over the last decade. It increasingly believes that by offering a broad
portfolio it can significantly shake up the competitive dynamics.

18 September 2013
Cisco Systems Inc. (CSCO) 93
Exhibit 124: Gross Margins Conducive to Huawei
Strategy...
Exhibit 125: ... as Are Operating Margins
0.0%
10.0%
20.0%
30.0%
40.0%
50.0%
60.0%
70.0%
-5.0%
0.0%
5.0%
10.0%
15.0%
20.0%
25.0%
30.0%
Source: Company data - 2012 gross margins Source: Company data - 2012 operating margins
What impact could Huawei have? Huawei has rapidly increased share in its Service
provider routing business over the past few years growing from 5% in 2007 to 15% by
2012. The experience of Huawei in the wireless infrastructure market and the above scale,
size, R&D dynamics means that the company cannot be underestimated. On the other
hand the incumbency within enterprise switching and installed base means there will be
some challenges. Not surprisingly the company has seen traction in the service provider
segment and especially in the area of routing, where it has a share of 18% in the EDGE
market as compared to 6% in 2007. Importantly, this segment is expected to grow at a 5%
CAGR through 2017. Huawei also has a 10% share in Core routing versus 3% in 2007,
although this business is only expected to grow 1% through 2017.
We do believe the company has the potential to be disruptive given a lack of installed base
even within switching. We note the recent launch of the Agile switch which is designed
with its own Ethernet network processor. The company claims its product will offer better
performance over rival switches built with application-specific integrated circuit (ASIC)
chips, but at a still affordable low price. We equally acknowledge that there is a cap to how
far their share will go in the medium term, given security pressures especially within the
United States.
There will be some cap as to how far Huawei will go. While we fundamentally believe that
Huawei has the potential to disrupt elements of the networking market starting with its
traditional strengths in service provider segments, we believe there is a cap as to how far it
will go within enterprise. We believe indeed that one difference is simply that North
America represents some 33% of the service provider segment, 42% of the enterprise
segment, and 25% of telecom capex. Here we acknowledge that political concerns could
be an issue over time.

18 September 2013
Cisco Systems Inc. (CSCO) 94
Exhibit 126: North America is a Sizable Proportion of Networking and Telco Capex US$ in millions, unless otherwise stated
4,006 8,313 14,372
81,737
2,666
5,987
10,239
86,280
3,936 4,687 11,020
118,789
698 782 1,852 30,705
0%
10%
20%
30%
40%
50%
60%
70%
80%
90%
100%
Service Provider
Routing
Enterprise Switching Networking Overall Telco Capex
Perc
enta
ge S
hare
by
regio
n
North America EMEA Asia Pacific CALA
Source: Company data, Credit Suisse estimates, Infonetics – 2012 Spending.
Cost Management Has Been Strong of Late
Whether it be due to the potential business mix shifts or secular pressure on gross
margins, what is clear is that Cisco is keeping a vigilant eye on its cost base. Indeed
based upon our analysis, we see scope for opex to remain within check and for this to
perhaps even prove a moderate offset versus gross margin pressures described.
Headcount managing down again. Since Cisco’s more focused strategy presented in 2H
FY12, Cisco management's approach has been somewhat more disciplined than the past.
There have been two main restructurings in the past five years, with a major employee cut
of 8,000 as shown implemented in late FY11. The company has recently decided to cut by
a further 4,000 employees, around 5% of its work force. It does appear that restructuring
and continuous cost monitoring will be a key part of the Cisco business model going
forward, to make room for movement of resources and the incremental investments that
need to be made.

18 September 2013
Cisco Systems Inc. (CSCO) 95
Exhibit 127: Headcount Post Increases (Due to Acquisition) Looking to Cut by Another
4,000
50,000
55,000
60,000
65,000
70,000
75,000
80,000
Head
co
un
t ('
000)
Source: Company data, Credit Suisse estimates.
Revenue per head. A glance at Exhibit 128 shows that the company is keen on expanding
revenue per head and this seems to be a metric to which the business is almost
benchmarked against, there was a step down to $650,000 per employee which seems to
have triggered the recent cut. We believe this has been more about the impact of the NDS
acquisition and now across the organization management are targeting new cost savings.
Exhibit 128: Revenue Per Head, Keeping It in a Tight Range
500
550
600
650
700
750
Re
ve
nu
e p
er
em
plo
ye
e (
'000
US
D)
Source: Company data, Credit Suisse estimates.
Opex to sales discipline. Cisco targets an operating margin of 28% and an opex to sales
ratio of ~34%. We would note that the recent execution around this has been strong.

18 September 2013
Cisco Systems Inc. (CSCO) 96
Exhibit 129: Opex to Sales Already at Long-Term Targets
0%
5%
10%
15%
20%
25%
30%
35%
40%
45%
50%
OP
EX
to
sale
s (
trailin
g)
Source: Company data, Credit Suisse estimates.
Is there more to come…we think probably unlikely. It is of course possible that Cisco could
offset certain gross margin and competitive pressures with incremental restructuring and
efficiency gains. We believe that, while this cannot be ruled out and the company is
focused on managing costs closely, it is subject to competitive factors and needs to
maintain a certain amount of resources and headcount. Here we note that on a revenue-
per-employee perspective, Cisco operates at close to $650-700k per employee, which is
already 90% above its peer group. While its superior scale and position in networking
justifies this, it is equally unlikely that the opex to sales base can move down sizably.
Exhibit 130: Cisco Revenue Per Employee Is Already 90% above Peers
-
100,000
200,000
300,000
400,000
500,000
600,000
700,000
800,000
ZTE
Hu
awe
i
IBM
Alc
ate
l-Lu
cen
t
NSN
Eric
sso
n
EMC
Hew
lett
-Pac
kard
Tella
bs
Jun
ipe
r
Net
Ap
p
De
ll
Cis
co S
yste
ms
20
12
Re
ven
ue
pe
r e
mp
loye
e $
Source: Company data, Credit Suisse research.

18 September 2013
Cisco Systems Inc. (CSCO) 97
Portfolio Refresh Helping Share Switching Portfolio Refresh
We believe a key driver around the recent market share turnaround for Cisco, especially in
the switching market, has been a fairly comprehensive portfolio refresh. (See Exhibit 132.)
Going back over the past 18 months, there has been a refresh across its modular and
fixed switching portfolio that we believe has been key to extending its competitive
advantage:
Exhibit 131: Cisco Market Share—Steady within Enterprise Switching and Routing
20%
30%
40%
50%
60%
70%
80%
90%
Cis
co
Mark
et
Sh
are
Enterprise switching Enterprise routing Service provider switching
Service provider routing Service provider edge routing Service provider core routing
Source: Company data, Credit Suisse research.
Datacenter portfolio. The company now has a range of switches aimed at optimizing
performance for the datacenter built around the Nexus portfolio of switches that span from
virtual switching to fixed and modular formats. The Cisco Nexus 7000 Series Switches
offers Cisco's highest switching capacity; up to 1.3 terabits per slot, 83+ terabits per
chassis and provides 1,10, 40, and 100 Gigabit Ethernet scalability.
Backbone and access portfolio. Aimed more at the Enterprise and campus markets the
company has introduced the Cisco Catalyst 6800 Series Switches are programmable
campus backbone switches optimized for 10/40/100 Gigabit Ethernet services. These
switches offer converged wired, wireless, and VPN security, and exceptional investment
protection with their Catalyst 6500 DNA. Whereas the catalyst 2960 is aimed at branch
offices or small- and medium-sized businesses, we would note such entry-level enterprise-
class Fast Ethernet switches support basic services.

18 September 2013
Cisco Systems Inc. (CSCO) 98
Exhibit 132: Cisco Has Refreshed the Switching Portfolio Meaningfully of Late
2012 2013
UCS Central
September
Cisco Catalyst
3850
January
MDS 9710 Multilayer Director,
UCS, and NVIDIA GPU
May
Cisco Catalyst
6800
June
Nexus 7700
June
Nexus 3548
November
Nexus 6001, 6004
and 1000V
February
Cisco Catalyst
2960-X
June
Supervisor 8E for
Cisco Catalyst 4500-E
June
Source: Company data, Credit Suisse research
Forward looking at the Insieme spin-in for SDN. Cisco’s initial response to the
opportunity/risk presented by Software Defined Networking (SDN) appears to be in the
form of Insieme Networks, a captive private company started by three former key Cisco
enterprise switching executives that Cisco has the right to acquire or 'spin-in' for $750
million. While initial product strategy and details remain forthcoming, we believe Cisco has
essentially outsourced to Insieme the development of its SDN response. We believe the
reason for this is to avoid the standard innovator's dilemma as the focus of Insieme will be
to become Cisco’s next-next generation switching platform, with a focus on 100Gbps
Ethernet datacenter switching, that goes beyond traditional enterprise switching to add
SDN and storage to Cisco’s Unified Computing System converged datacenter architecture.
We believe the strategy here shows flexibility on management's part and realistic
assessment that the approach to SDN for the impact it needs to kept separate from the
company. While there is always a risk that this remains an expensive decision, we believe
the approach with Nuova Systems, which brought to Cisco the Nexus product family is an
expensive decision; however, at 5–10x of what we estimate it would cost Cisco to develop
a solution internally.
Routing. Cisco holds a 45% share in the $15bn routing market, followed by Juniper,
Alcatel-Lucent, and Huawei. Given increased levels of competition, the company’s share
continues to erode gradually from 64% in 2005. We highlight the underlying portfolio.
Service provider. The majority of Cisco’s routing business is geared toward the service
provider business and within that, edge routing.
■ Edge: Cisco’s edge service provider routers include the XR 12000, 7300/7600/10000
series and ASR 1000/9000. The ASR 1000 has an overlap with high-end enterprise
routing. The ASR 1000 is targeted at providing secure, high performance
software-enabled services while the 9000 is geared for more intensive video and
carrier residential, mobile and business services. Meanwhile, the Cisco XR 12000
provides for secure virtualization and is able to prioritize voice, video, and services.
■ Core: The main line of Cisco core routing is the Carrier Routing System or CRS. While
the XR 12000 can be used in the core element, the CRS-1 and CRS-3 form the
backbone of Cisco’s offering. The product family is focused on high performance and
scale with a distinct focus on service providers, unlike smaller routing offerings.
Smaller variants of the portfolio offer up to one terabit of switching capacity but when
aggregated in a shelf system, this scales to over 900 terabits. The products enable
service providers to upgrade to 100GbE and blend optics for improved efficiency. CRS
18 September 2013
Cisco Systems Inc. (CSCO) 99
enables carriers to extend additional services through Layer 4-7 enablement. Cisco
believes that carriers can see a 24% lower TCO through more efficient demand
optimization and up to 50% lower TCO from enabling nLight, which improves optical
and capacity utilization.
■ Enterprise: On the enterprise side, Cisco’s strength is at the branch office and
mid-range, with less penetration in the low-end SOHO market and the high end.
Fortunately, these mid-segments comprise three quarters of the enterprise routing
business. Cisco’s mainline routers are the ASR 1000 and the Cisco 7200/7600. As
discussed above, these products are overlapping with lower-end service providers. In
the mid-range, the Cisco 3900 is an example product for the branch. This product can
deliver media and services, such as Telepresence. The 1900/2900 at the branch office
as well, focused on cost effective service delivery, although with lower speed
performance than the 3900. On the low end and SOHO market, Cisco participates with
the Cisco Small Business Router and the 800 series. The 800 series comes with
802.11n access point functionality. For the branch offerings, advanced encryption,
intrusion prevention, content filtering, and Cisco Unified Communications integration
are standard.

18 September 2013
Cisco Systems Inc. (CSCO) 100
Capital Distributions Could Move Higher A key positive over the past few years at Cisco for investors has been the company's
willingness to engage more significantly on cash distribution. After all the company
generates consistent FCF which totaled $11.7 billion in FY13 and holds a robust balance
sheet of $50 billion. The 'religion' of returning cash to shareholders is not necessarily a
new theme within large-cap technology; however, the question going forward is whether
we believe that such cash payouts are conservative and how they compare versus peers.
We would make several points:
■ FCF generation strong; $11.7bn in 2012. We note that compared with large-cap tech
peers, Cisco generates healthy levels of annual FCF. Over time, FCF margins have
expanded to 24% in FY13 from 21% in FY11 with conversion of 118% in FY13.
■ Dividend yield exceeds peers. Cisco's dividend yield is 2.8%, above large-cap tech
peers at 2.5%.
■ Cisco pay out levels second only to Apple over three years. Given the trend of late for
enterprise companies to begin paying out cash flow to investors, we note that Cisco
has committed over the next three years to paying out some 15% of the market cap in
buybacks and dividends, which puts it just behind Apple and narrowly ahead of an
Intel.
Overall our analysis implies that Cisco's current levels of cash return are relatively in-line
with peers.
Could Cisco Do More?
One interesting issue is, that based on our estimates, Cisco’s cash pile will continue to
swell absent any sizeable acquisitions. Indeed, even allowing for the onshore versus the
offshore cash dynamics, we see a situation whereby balancing with debt issuance the
company has high levels of excess cash. We note that the company has a net cash to
market cap ratio well above peers at 26%.
Exhibit 133: Net Cash to Market Cap for Large-Cap Tech—Cisco Still Hoards
-30%
-20%
-10%
0%
10%
20%
30%
40%
Net
Ap
p
Ap
ple
EMC
Cis
co
Qu
alco
mm
Mic
roso
ft
Del
l
Jun
iper
Acc
entu
re
Eric
sso
n
Ora
cle
Lexm
ark
Inte
l
IBM HP TI
Xer
ox
Net
cas
h a
s a
% o
f m
arke
t ca
p
Source: Company data, Factset

18 September 2013
Cisco Systems Inc. (CSCO) 101
It would be too simplistic to purely look at Cisco's $31bn of net cash and $51bn of gross
cash and reach the conclusion that the company holds an excessive amount of cash. A
more thorough analysis follows in which we look at the onshore/offshore cash generation
as well as the company's ability to access the debt market.
Current Estimates Allow for Cisco to Pay Out 50%+ of Ongoing Cash Generated: Per
current estimates, Cisco pays out ~50% of free cash flow generated in the form of
dividends and buybacks. With this cash distribution program, we believe Cisco could end
FY15 with $62.6bn in gross cash, with $59.8bn being offshore and $2.8bn onshore and a
net cash position of $43.6bn. Looking at these estimates, we believe that $59.8bn is an
excessive amount of cash to have offshore, while $2.8bn onshore might be somewhat
light. On account of the strong balance sheet, we believe the company has a significant
ability to have an expanded buyback program by taking on additional debt.
Debt Issuance/Buyback Scenario: Over the next two years, we assume Cisco has the
capacity to issue up to $25bn in with $12.5bn in each of FY14/FY15, which would bring
Cisco's leverage ratio to ~2.5x exiting FY15. In addition, we assume $4.6bn in cash
remains onshore in order to fund operations. In this scenario, Cisco is left with ~$22bn in
excess cash in FY14-15 to fund additional buybacks. Allowing for a conservative interest
rate (4.8%), we would have EPS estimates of $2.19 and $2.39 for FY14 and FY15, 4%
and 12% higher, respectively, than our current estimates. Based off the company’s two-
year forward PE multiple over the past five years, the target price range is from $21-25.
Significant Liquidity after Delivering Another $25bn: Even after levering up and
increasing cash distribution through buybacks, the company is still left with a pristine
balance sheet, with gross cash of $64.4bn ($4.6bn onshore/$59.8bn offshore) and net
cash of $23.2bn exiting FY15. We believe that this is ample liquidity for whichever
scenario results strategically.

1
8 S
ep
tem
ber 2
013
Cis
co
Sy
ste
ms In
c. (C
SC
O)
10
2
Exhibit 134: Cisco Screens Modestly above Peers on FCF Generation and Pay Outs. Could It Do More?
-5%
0%
5%
10%
15%
20%
25%
30%
35%
40%O
racl
e
Mic
roso
ft
Qua
lcom
m
EMC TI
Cisc
o
App
le
Net
App
IBM
(IB
M b
asis
)
Inte
l
Juni
per
IBM
(CS
basi
s)
Acc
entu
re
Xero
x
HP
Eric
sson
Lexm
ark
Del
l
FCF
Mar
gin
0.0%
5.0%
10.0%
15.0%
20.0%
25.0%
App
le
Net
App H
P
Ora
cle
Inte
l
Cisc
o
Mic
roso
ft TI
EMC
IBM
Xero
x
Juni
per
Lexm
ark
Eric
sson Del
l
Acc
entu
re
Qua
lcom
m
% o
f mar
ket
cap
0.0x
5.0x
10.0x
15.0x
20.0x
25.0x
Net
App
Jun
iper
IBM
(C
S b
asis
)
Eric
sso
n
Qu
alco
mm
Inte
l TI
Acc
entu
re
IBM
(IB
M b
asis
)
Cis
co
Ora
cle
Lexm
ark
Mic
roso
ft
App
le
EMC
Xero
x
HP
Pric
e to
FC
F
0.0%
0.5%
1.0%
1.5%
2.0%
2.5%
3.0%
3.5%
4.0%
4.5%
Inte
l
Lexm
ark
Eric
sson TI
Mic
roso
ft
Cis
co
App
le HP
Xero
x
Del
l
Acc
entu
re
Qua
lco
mm
IBM
EMC
Ora
cle
Net
App
Jun
iper
Div
iden
d Yi
eld
CSCO above on FCF margins …a slightly better dividend yield…
… trades in line Market Cap/FCF …returning cash at a higher rate than peers
Source: Company data, Credit Suisse estimates Source: Company data, Credit Suisse estimates
Source: Company data, Credit Suisse estimates Source: Company data, Credit Suisse estimates
Source: Company data, Credit Suisse estimates, FactSet 2014 FCF estimates, Credit Suisse research estimates

1
8 S
ep
tem
ber 2
013
Cis
co
Sy
ste
ms In
c. (C
SC
O)
10
3
Exhibit 135: Cisco Has the Capacity to Return Another $22bn
Increased debt issuance/buyback scenario1. Current estimates allow for Cisco to pay out 50% of ongoing
cash generated. Per current estimates Cisco pays out ~50% of free
cash flow generated in the form of dividends and buybacks. With this
cash distribution program, we believe Cisco would end FY15 with
$62.6bn in gross cash with $59.8bn being offshore and $2.8bn
onshore and a net cash position of $43.6bn.
i. Looking at these estimates we believe $59.8bn is an excessive
amount of cash to have offshore while $2.8bn onshore might be
somewhat light. On account of the strong balance sheet we
believe the company has significant ability to have an expanded
buyback program by taking on additional debt.
2. Debt issuance/buyback scenario
i. Over the next 2 years we assume Cisco has the capacity to issue
up to $25bn in debt, we assume $12.5bn in each of FY14/FY15,
which brings its leverage ratio to ~2.5x exiting FY15.
ii. In addition we assume $4.6bn in cash remains onshore in order
to fund operations.
iii. In this scenario Cisco is left with ~$22bn in excess cash in FY14-
15 to fund additional buybacks.
iv. Allowing for a conservative interest rate (4.8%) we have an EPS
of $2.19/$2.39 for FY14/FY15, 4%/12% higher. Based off the
company’s 2 year forward PE multiple over the past 5 years the
range of price targets is from $21-$25.
v. Even after levering up and increasing cash distribution through
buybacks, the company is still left with a pristine balance sheet,
with gross cash of $64.4bn ($4.6bn onshore/$59.8bn offshore)
and net cash of $23.2bn exiting FY15.
FY14E FY15E
Jul-14 Jul-15
Pre Debt Issuance
Gross Cash 56,750 62,598
On-Shore Cash 2,924 2,793
Off-Shore Cash 53,826 59,804
Total Debt 16,211 16,211
Net debt (cash) (37,615) (43,593)
EBITDA 16,290 16,323
Net Income 11,485 11,714
Diluted Shares 5,462 5,502
EPS 2.10 2.13
Post Debt Issuance
Debt issued 12,500 12,500
Cost of new debt 4.80% 4.80%
Additional Interest Payment 600 1,200
Total Debt 28,711 41,211
Leverage (Debt/EBITDA) 1.76x 2.52x
On Shore cash needed for operations 4,607 4,607
On Shore cash post Debt issuance 15,424 17,081
Excess On Shore Cash available for buybacks 10,217 11,274
On Shore Cash post issuance and accelerated buyback 4,607 4,607
Offshore Cash 53,826 59,804
Total Debt 28,711 41,211
Net Debt (Cash) (29,722) (23,200)
Shares repurchased @ $24.00 426 470
Shares outstanding post repurchase 5,036 4,531
Net Income 11,011 10,766
EPS FY15 post buyback 2.19 2.38
% upside due to buyback 4% 12%
Implied stock price Multiple
Downside scenario | -1 Stdv multiple 8.6x 20.54
Base scenario | Average multiple 9.7x 23.02
Upside scenario | +1 Stdv multiple 10.7x 25.49
Source: Company data, Credit Suisse estimates.

18 September 2013
Cisco Systems Inc. (CSCO) 104
Valuation—FV of $21 Per Share We focus our valuation on a three-pronged approach: (1) P/E multiple valuation
(comparing P/E with peers); (2) discounted cash flow (DCF) analysis; and (3) Credit
Suisse HOLT analysis. Our approach suggests that the company’s equity value is $114
billion to $120 billion, or $21 to $22 per share, with a blended value of $21 per share.
Exhibit 136: Cisco Average Value of $21
Approach Equity value (in $mn) Valuation Value/Share ($)
P/E 113,696 9.8x CY14 Earnings $20.91
DCF 116,457 Term. growth of 1%, WACC of 11% $21.42
Credit Suisse HOLT 119,779 R&D life of 5 years $22.03
Blended Average 116,644 $21.45
Source: Company data, Credit Suisse estimates.
Price/Earnings Multiple Suggests FV of $21 per Share
We apply a P/E multiple of 9.8 on Cisco’s 2014 Non-GAAP EPS estimate. Given that the
company is already very mature and has a stable operating structure, it is reasonable to
use standard forward P/E valuation.
Exhibit 137: Valuing Cisco at 9.8 times 2014 P/E in millions, unless otherwise stated
P/E Valuation
Current Price (in $, per share) 24.29
Diluted Share Count 5,437
Market Cap 130,899
Net Debt -34,399
Enterprise Value 96,500
Peer Group 12.5x
CSCO CY14 EPS $2.13
2Y Fwd. P/E Multiple 9.8x
Implied stock price $20.91
Implied equity value 113,696
Source: Company data, Credit Suisse estimates.
Apply a 9.8 CY14 P/E multiple based on comps. To analyze a fair earnings multiple for
Cisco, we have looked at the current P/E multiples for the company along with the related
peer group. Given Cisco’s growth trajectory in the networking industry and the size of
company, we form a peer group of comparable networking companies and a group of
large cap technology firms, which includes EMC, IBM, Microsoft, Oracle, and Qualcomm.
Additionally, over the past two years, Cisco has traded at an average of 9.8x consensus
two year forward earnings.
Cisco trades at a modest discount to large cap peers on 2014 P/E. On average,
comparable large cap companies trade at a P/E multiple of 12.5 on 2014 EPS. Given the
fact that Cisco has lower growth profile and part of its growth is inorganic, Cisco is valued
at a discounted multiple to fast growing networking companies such as Riverbed, F5
Networks, and Aruba.

18 September 2013
Cisco Systems Inc. (CSCO) 105
Exhibit 138: Cisco Trades at a Discount to Both Large-Cap Tech and Networking Peers P/E (x) EV/FCF(x) Mkt cap/ FCF FCF conversion FCF Margin
2013E 2014E 2013E 2014E 2013E 2014E 2013E 2013E
Large cap tech
Apple 11.7 9.6 6.8 6.7 9.9 9.6 119% 25%
EMC 14.2 12.0 7.5 6.8 9.2 8.3 154% 26%
HP 6.2 5.6 4.8 4.4 5.0 4.6 124% 8%
IBM 11.8 10.5 15.4 11.8 15.5 11.9 76% 13%
Google 20.3 17.3 17.2 13.6 20.6 16.4 99% 24%
Intel 12.7 12.0 15.8 13.9 16.4 14.4 78% 14%
Microsoft 12.2 11.4 8.4 7.7 10.8 9.9 113% 32%
Oracle 11.9 10.9 9.9 9.4 10.9 10.3 109% 37%
Qualcomm 15.2 13.7 11.7 10.9 15.3 14.3 99% 30%
TI 21.0 18.2 18.6 14.4 17.8 13.8 118% 21%Accenture 17.8 16.4 13.5 12.4 15.1 13.9 118% 11%
Mean 14.1 12.5 11.8 10.2 13.3 11.6 110% 22%
Networking/ infrastructure
Adtran 39.5 28.2 26.6 21.5 29.3 23.6 135% 8%
Alcatel-Lucent NM NM NM NM NM NM 230% -7%
Ciena 37.4 23.2 NM 28.7 NM 22.5 7% 0%
Ericsson 17.2 14.9 16.0 13.3 18.3 15.3 94% 7%
F5 Networks 19.7 17.3 14.4 13.3 15.6 14.4 126% 30%
Finisar 20.3 15.1 33.6 17.7 37.6 19.8 54% 6%
Quanta Services 18.8 15.7 34.6 18.3 36.9 19.5 51% 2%
Aruba 27.2 23.2 16.5 16.6 20.7 20.8 131% 15%
Riverbed 16.4 13.9 16.6 12.1 15.9 11.6 103% 15%
Cisco 11.9 11.4 8.2 7.8 11.1 10.6 106% 24%
Juniper 17.8 16.0 18.4 15.4 22.0 18.4 81% 11%
Mean 22.6 17.9 20.5 16.5 23.1 17.7 102% 10%
Company
Source: Company data, Credit Suisse estimates.
Over the past two years, Cisco has traded in the range of 8-13 times two year forward P/E.
Currently the stock is trading at 11 times our CY14 EPS estimate, which is slightly above
the two-year average. If we assume a historical average multiple of 9.8, the implied target
price for Cisco is $21.
Exhibit 139: Historical P/E Suggests Value of $21/Share
7.0
8.0
9.0
10.0
11.0
12.0
13.0
Aug-11 Oct-11 Dec-11 Feb-12 Apr-12 Jun-12 Aug-12 Oct-12 Dec-12 Feb-13 Apr-13 Jun-13 Aug-13
-1 SD PE FY2 +1 SD Avg
Source: Company data, Credit Suisse estimates, Factset.
FCF generation of $13 billion - Cheap on a FCF basis. We note that compared with large-
cap tech peers, Cisco generates healthy levels of annual free cash flow, which has been
consistently expanding over time. FCF margins are 24% and conversion is a respectable
108%. Currently, Cisco trades at 10 times our price to FCF multiple, which is below large-
cap tech peers.

18 September 2013
Cisco Systems Inc. (CSCO) 106
Exhibit 140: On a Price/FCF basis Cisco Remains Relatively Cheap to Large-Cap Tech Peers
0.0x
5.0x
10.0x
15.0x
20.0x
25.0x
Net
Ap
p
Jun
iper
IBM
(C
S b
asis
)
Eric
sso
n
Qu
alco
mm
Inte
l
TI
Acc
entu
re
IBM
(IB
M b
asis
)
Cis
co
Ora
cle
Lexm
ark
Mic
roso
ft
Ap
ple
EMC
Xer
ox
HP
Pri
ce t
o F
CF
Source: Company data, FactSet, Credit Suisse estimates.
DCF Analysis Yields an Equity Value of $116bn or $21 per Share for Cisco
Our discounted cash flow analysis for Cisco suggests a fair value of $21 per share. (See
Exhibit 141.) This is based on the following assumptions.
Revenue growth to moderate going forward. For 2014 and 2015, we expect Cisco to see
revenue growth of 5.6% and 4.7%, respectively. Beyond 2016, we expect revenue growth
to moderate around to 2% before stabilizing at 1% in the long term.
EBIT margins to decline to 21% in the long term. Driven by its dominant share position, we
believe Cisco’s gross margin will decline to 62% and 61% in 2014 and 2015. This, in turn,
will keep operating margins at 28% and 27% in the next two years. In the long term, we
expect gross margins to meaningfully decline with EBIT margins eventually reaching 21%,
as the company faces increasing competition within traditional networking as well as a
growing SDN threat.

1
8 S
ep
tem
ber 2
013
Cis
co
Sy
ste
ms In
c. (C
SC
O)
10
7
Exhibit 141: DCF Yields a Fair Value of $21 In US$ millions, unless otherwise stated
2013E 2014E 2015E 2016E 2017E 2018E 2019E 2020E 2021E 2022E 2023E
Revenue 49,520 52,293 54,768 56,411 57,539 58,690 59,863 60,462 61,067 61,677 62,294
% change 4.8% 5.6% 4.7% 3.0% 2.0% 2.0% 2.0% 1.0% 1.0% 1.0% 1.0%
Gross Profit 30,836 32,379 33,270 33,788 34,004 34,214 34,420 34,280 34,134 33,982 33,824
Gross Margin (%) 62.3% 61.9% 60.7% 59.9% 59.1% 58.3% 57.5% 56.7% 55.9% 55.1% 54.3%
R&D 5,637 6,040 6,476 6,670 6,804 6,940 7,079 7,149 7,221 7,293 7,366
% of sales 11% 12% 12% 12% 12% 12% 12% 12% 12% 12% 12%
S&M 9,086 9,596 9,926 10,224 10,428 10,637 10,850 10,958 11,068 11,178 11,290
% of sales 18% 18% 18.1% 18% 18% 18% 18% 18% 18% 18% 18%
G&A 2,157 2,078 2,081 2,143 2,186 2,230 2,275 2,297 2,320 2,344 2,367
% of sales 4% 4% 4% 4% 4% 4% 4% 4% 4% 4% 4%
EBIT 13,957 14,665 14,786 14,751 14,585 14,407 14,217 13,875 13,525 13,167 12,801
% of sales 28% 28% 27.0% 26.1% 25.3% 24.5% 23.7% 22.9% 22.1% 21.3% 20.5%
Add: Depreciation & Amortization 2,051 1,755 1,614 1,662 1,695 1,729 ,764 1,782 1,799 1,817 1,836
% of sales 4.1% 3.4% 2.9% 2.9% 2.9% 2.9% 2.9% 2.9% 2.9% 2.9% 2.9%
EBITDA 16,008 16,420 16,400 16,413 16,281 16,137 15,981 15,657 15,325 14,985 14,636
EBITDA Margin 32.3% 31.4% 29.9% 29.1% 28.3% 27.5% 26.7% 25.9% 25.1% 24.3% 23.5%
Less: CAPEX 1,251 1,317 1,400 1,442 1,471 1,500 1,530 1,546 1,561 1,577 1,592
% sales 2.5% 2.5% 2.6% 2.6% 2.6% 2.6% 2.6% 2.6% 2.6% 2.6% 2.6%
Add/Less: Working Capital change 1,322 984 833 469 322 328 335 171 173 174 176
Less: Net Other Assets/Liabilities change (305) (150) (85) 73 76 79 82 85 88 92 95
Add: Change in deferred revenue 269 534 426 310 213 217 222 113 114 115 116
Total Cash Flow before Tax 13,399 14,003 14,008 14,385 14,276 14,104 13,919 13,638 13,294 12,941 12,580
Cash Taxes 2,920 3,109 3,147 4,037 3,991 3,943 3,890 3,797 3,701 3,603 3,503
Cash Tax Rate 28.4% 28.3% 27.4% 27.4% 27.4% 27.4% 27.4% 27.4% 27.4% 27.4% 27.4%
Free Cash Flow 10,479 10,893 10,860 10,348 10,285 10,161 10,028 9,841 9,592 9,338 9,077
Source: Company data, Credit Suisse estimates.

18 September 2013
Cisco Systems Inc. (CSCO) 108
Exhibit 142: DCF Summary and Weighted Average Cost of Capital (WACC) Calculation for
Cisco in millions, unless otherwise stated
Summary Assumptions
PV of Free Cash Flow 61,163 WACC 10.6% Debt to Cap
Terminal Value 95,744 Beta 1.13 10.9%
PV of Terminal Value 35,038 Risk free rate 4.0%
Enterprise Value 96,201 Equity Risk Premium 6.5%
Plus: Cash & ST Investments 50,610 Cost of Equity 11.3%
On Shore 10,200 Avg cost of debt (pretax) 6.0%
Of Shore fully taxed 26,267 Avg Cost of debt (post tax) 4.3%
Tax rate 28.4%
Less: Debt 16,211
Equity Value 116,457
12-month share price target $21.42
Diluted share count 5,437
Source: Company data, Credit Suisse estimates.
Terminal Growth Rate of 1.0% and WACC of 10.6%. For the DCF analysis, we have
assumed a terminal growth rate of 1.0% for Cisco. We estimate the weighted average cost
of capital (WACC) to be 9.8%.
Credit Suisse HOLT Implies a Fair Value of $22 per Share
CFROI® ~13% in the long term. To take a long-term perspective on valuation, we utilize
our forecasts for the next five years until 2020 (from our discounted cash flow analysis) for
the Credit Suisse HOLT valuation methodology. For 2020, we project a Credit Suisse
HOLT CFROI of 13%. (See Exhibit 144.)
Exhibit 143: HOLT Implies a FV of $22 for Cisco in millions, except per share values
Valuation Results
PV of Existing Assets 125,479
NPV of Future Investments 2,476
+ Market Value of Investments 153
Total Economic Value 128,109
+ Share Issuance 316
- Debt & Equivalents 20,457
- Minority Interests 31
Warranted Market Cap. 107,936
Shares Outstanding 5,437
Warranted Share Price (USD) 22.03
Source: Company data, Credit Suisse estimates.
EBITDA margins to drop to 24% long term. As top-line growth for Cisco moderates toward
1%, we believe EBITDA margins will decline gradually, eventually reaching 24% in 2020.

18 September 2013
Cisco Systems Inc. (CSCO) 109
Exhibit 144: Cisco Long-Term HOLT Analysis
CFROI Results 2012 2013 2014 2015 2016 2017 2018 2019 2020
CFROI 13.57% 16.37% 15.17% 15.48% 14.92% 14.10% 13.54% 13.03% 12.61%
Transaction CFROI 10.71% 12.33% 11.56% 11.87% 11.54% 11.00% 10.65% 10.32% 10.04%
Normalized Real Growth Rate 6.84% 5.18% 4.01% 4.69% 4.16% 4.32% 3.68% 3.34% 2.82%
Real Growth Rate 4.48% -0.15% 2.77% 2.12% 1.10% 0.96% 0.54% 0.41% 0.08%
Sales Growth 6.58% 5.53% 4.56% 5.57% 3.00% 2.00% 2.00% 2.00% 1.00%
EBITDA Margins 26.68% 27.87% 29.55% 28.29% 27.44% 26.64% 25.84% 25.04% 24.24%
Asset Turns 0.51 0.53 0.53 0.54 0.54 0.54 0.54 0.53 0.53
Gross Cash Flow 16,840 19,351 19,200 20,188 20,317 20,340 20,360 20,374 20,381
Non Depreciating Assets 47,519 47,605 50,474 52,112 53,289 54,033 54,793 55,568 56,358
Gross Investment 90,197 91,452 95,742 99,246 102,135 104,958 107,413 109,777 111,831
Life 6.4 6.4 6.4 6.4 6.4 6.3 6.3 6.3 6.3
Country Specific Discount Rate 4.90%
Size Differential 0.70%
Leverage Differential 0.40%
Company Discount Rate 6.00%
Discount Rate Used 6.00%
Source: Company data, Credit Suisse estimates.

18 September 2013
Cisco Systems Inc. (CSCO) 110
Risks: Where Could We Be Wrong? Given our negative stance on Cisco, in this section, we review the several potential risks of
our Underperform rating.
Macro spending recovery? Cisco remains, in part, a call on the macroeconomic
environment. We tend to resist recommendations based upon such views, largely because
our ratings are relative to our overall sector coverage. In isolation, in Error! Reference
source not found., we looked at past economic cycles and looked at the relative level of
revenue growth and gross margin expansion in Cisco’s core networking business. We
arrive at several major conclusions:
If Cisco can reach EPS of $2.30 in FY14… We assume that Cisco is able to see
networking revenue growth of 9% in FY14, driven by a pick-up in IT spending in general.
This is in-line with how the company has managed to recover in previous spending cycles.
Further, we assume gross margins expand to 63% driven by continued strength in
services and switching. Additionally, we believe that the company hits its opex targets.
…the stock could head to $26 versus $21. This would result in EPS of $2.30, which is
some 10% above current consensus expectations. Applying the forward P/E one standard
deviation above the previous two-year average would suggest upside potential to $26,
which is about 24% above our current target price of $21.
Prefer EMC. We do acknowledge, however, in a broad IT spending recovery that many of
the names in our universe would benefit. However, we believe that in this scenario, our
relative preference would be to own EMC, given superior revenue, growth, a cheaper
valuation, and a higher-quality position in the industry. Indeed, as shown in Error!
Reference source not found., in a recovering IT spending environment, EMC screens
better than both IBM and Cisco.
SDN development is much later than expected. A core part of our thesis is that the onset
of SDN will create a more competitive structure and that will erode the premium level of
gross margins that networking vendors currently enjoy. This will result in an aggregate
lower level of profitability for the sector. Our current view is that pilots will be launched
over the next 18 months, with full-scale production over a 2 to 5 year period. We believe
that there are good business, technology, and performance reasons for this. However, as
with any new technology, we believe that this shift can be overstated in the near term. A
longer-time horizon may allow Cisco to reposition its business and to capitalize on its
opportunity; alternatively, Cisco could pursue new start-up vendors. In the end, we remain
confident that this would shrink gross profit dollars for the company.
Balance sheet receives little credit currently, but it could be increasingly important. Cisco
has a net cash pile of $34 billion. Given the relatively stable level of free cash flow, we
believe the company could take on board debt and use this as a form of accelerated
buybacks or capital distribution. While we believe that this strategy is unlikely to happen
overnight, the company may need to reposition itself in coming years. IndeedError!
Reference source not found., we note that by having a multiple of ~2x EBITDA in terms
of leverage could drive FY15 EPS towards $2.38, which drives a fair value on the stock of
$21-25 based on a range of historical multiples.

1
8 S
ep
tem
ber 2
013
Cis
co
Sy
ste
ms In
c. (C
SC
O)
11
1
Exhibit 145: Cisco Bull-Case Scenario Gives Upside Potential to $26
Cisco FY14 Base case yoy % FY14 Bull case yoy %
Switching 15,239 3.4% 16,510 12.0%
Routing 8,522 3.6% 8,888 8.0%
SP Video 4,836 -0.3% 4,836 -0.3%
DC 2,516 21.4% 2,695 30.0%
Wireless 2,708 25.0% 2,708 25.0%
Security 1,374 2.0% 1,374 2.0%
Collaboration 3,963 0.2% 3,963 0.2%
Other 398 -40.0% 398 -40.0%
Services 11,267 6.5% 11,267 6.5%
Revenue 50,823 4.6% 52,639 8.3%
GP 31,563 3.8% 33,373 9.8%
GM % 62.1% 63.4%
OPEX 17,132 2.5% 17,634 5.5%
OPEX as % sales 33.7% 33.5%
OP 14,431 2.6% 15,739 9.1%
OPM % 28.4% 29.9%
Other income 106 106
Tax rate % 21.0% 21.0%
Net income 11,485 5.7% 12,518 15.2%
Share count 5,462 5,462
EPS $2.10 3.9% $2.29 13.3%
Multiple
-1 Stdv 9.3x 9.3x
Average 10.4x 10.4x
+1 Stdv 11.5x 11.5x
Implied stock price
Downside scenario $19.64 $21.41
Base scenario $21.87 $23.84
Upside scenario $24.11 $26.28
The upside on the cycle. Understanding that Cisco is cyclical, herewe present a bull case in which the networking segment matchprevious upturns seen in 2003 and 2009 with:
12% growth in switching
8% in routing
30% growth in data centers
GM expands to 63%: better margin mix driven by continued strengthin services (+9% yoy) and switching (+12% yoy) with higher thancorporate average GMs.
Leading to an EPS. In this scenario the EPS comes out at $2.29versus our base case of $2.10, 8% above current consensus
Upside back to $26?: Based on our bull case revenue build andmargin structures as well as a forward P/E one standard deviationabove the previous two year average would suggest upside to $26which is about 24% above our current price target of $21.
CSCO’s switching/routing correlates with GDP
-6.0%
-4.0%
-2.0%
0.0%
2.0%
4.0%
-40.0%
-30.0%
-20.0%
-10.0%
0.0%
10.0%
20.0%
30.0%
40.0%
50.0%
Mar
-08
Jun
-08
Sep
-08
Dec
-08
Mar
-09
Jun
-09
Sep
-09
Dec
-09
Mar
-10
Jun
-10
Sep
-10
Dec
-10
Mar
-11
Jun
-11
Sep
-11
Dec
-11
Mar
-12
Jun
-12
Sep
-12
Dec
-12
Mar
-13
Swit
chin
g/R
ou
tin
g
CSCO routing CSCO switching Developed market GDP
Source: Company data, Credit Suisse Data
Source: Company data, Credit Suisse estimates.
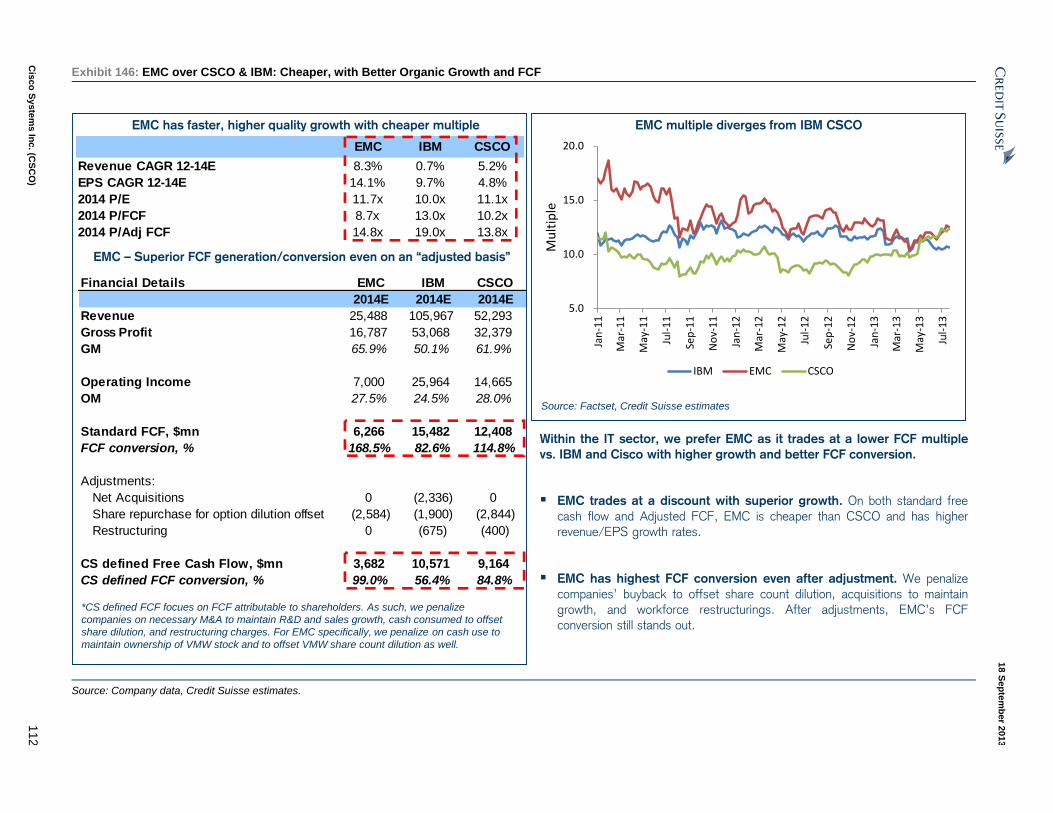
1
8 S
ep
tem
ber 2
013
Cis
co
Sy
ste
ms In
c. (C
SC
O)
11
2
Exhibit 146: EMC over CSCO & IBM: Cheaper, with Better Organic Growth and FCF
EMC IBM CSCO
Revenue CAGR 12-14E 8.3% 0.7% 5.2%
EPS CAGR 12-14E 14.1% 9.7% 4.8%
2014 P/E 11.7x 10.0x 11.1x
2014 P/FCF 8.7x 13.0x 10.2x
2014 P/Adj FCF 14.8x 19.0x 13.8x
Financial Details EMC IBM CSCO
2014E 2014E 2014E
Revenue 25,488 105,967 52,293
Gross Profit 16,787 53,068 32,379
GM 65.9% 50.1% 61.9%
Operating Income 7,000 25,964 14,665
OM 27.5% 24.5% 28.0%
Standard FCF, $mn 6,266 15,482 12,408
FCF conversion, % 168.5% 82.6% 114.8%
Adjustments:
Net Acquisitions 0 (2,336) 0
Share repurchase for option dilution offset (2,584) (1,900) (2,844)
Restructuring 0 (675) (400)
CS defined Free Cash Flow, $mn 3,682 10,571 9,164
CS defined FCF conversion, % 99.0% 56.4% 84.8%
1
EMC multiple diverges from IBM CSCOEMC has faster, higher quality growth with cheaper multiple
EMC – Superior FCF generation/conversion even on an “adjusted basis”
Source: Factset, Credit Suisse estimates
*CS defined FCF focues on FCF attributable to shareholders. As such, we penalize
companies on necessary M&A to maintain R&D and sales growth, cash consumed to offset
share dilution, and restructuring charges. For EMC specifically, we penalize on cash use to
maintain ownership of VMW stock and to offset VMW share count dilution as well.
Within the IT sector, we prefer EMC as it trades at a lower FCF multiple
vs. IBM and Cisco with higher growth and better FCF conversion.
EMC trades at a discount with superior growth. On both standard free
cash flow and Adjusted FCF, EMC is cheaper than CSCO and has higher
revenue/EPS growth rates.
EMC has highest FCF conversion even after adjustment. We penalize
companies’ buyback to offset share count dilution, acquisitions to maintain
growth, and workforce restructurings. After adjustments, EMC’s FCF
conversion still stands out.
5.0
10.0
15.0
20.0
Jan
-11
Mar
-11
May
-11
Jul-
11
Sep
-11
No
v-1
1
Jan
-12
Mar
-12
May
-12
Jul-
12
Sep
-12
No
v-1
2
Jan
-13
Mar
-13
May
-13
Jul-
13
Mu
ltip
le
IBM EMC CSCO
Source: Company data, Credit Suisse estimates.

18 September 2013
Cisco Systems Inc. (CSCO) 113
Management Team Cisco’s management team demonstrates a broad level of experience with leaders from
firms such as Motorola, Hitachi Data Systems, and IBM.
Figure 147: Seasoned Team
Name Position CSCO Holding At Firm At Position Experience
Frank Calderoni CFO & Exec. VP <1% May-04 Feb-08 - CFO & VP at QLogic, CFO & Senior VP of Administration
+1.3mn Options at SanDisk, and Controller at IBM
John Chambers Chairman & CEO <1% Jan-91 Jan-95 - President & CEO of TGV Software, Senior VP-US
+4.2mn Options Operations at Wang Laboratories, Board of Wal-Mart
Mark Chandler Secretary & Chief
Compliance Officer
<1%
Jul-96 Oct-01 - General Counsel at Stratacom
Blair Christie Chief Marketing
Officer
<1%
+350k options
Aug-99 Jan-11 - Senior VP of Global Corporate Communications at Cisco
Wim Elfrink Chief Globalisation
Officer
Nov-97 Dec-06 - Senior VP of Customer Advocacy at NetSolve
Robert Lloyd
President of
Development &
Sales
<1% +1.8mn options
Nov-94 Oct-12 - Executive VP, Worldwide Operations, and Senior VP of
US Canada and Japan Operations at Cisco
Gary Moore President & COO <1% Oct-01 Oct-12 - President & CEO at Hitachi Data Systems, CEO at Netigy
+940k options
Pankaj Patel Chief Development
Officer
+800k options Jul-96 Aug-12 - Senior VP at Redback Networks
Randy Pond Executive VP,
Operations,
Processes, Systems
Sept-93 Aug-07 - VP of Finance, CFO and VP of Operations of Crescendo
Communications
Padmasree
Warrior
Chief Technology &
Strategy Officer
Jan-07 Jan-07 - CTO & Executive VP at Motorola
Source: Company data, Credit Suisse research.
John Chambers, Chairman and Chief Executive Officer
John Chambers has served as chief executive officer since January 1995 and chairman of
the board of directors since November 2006. Chambers also served as president of Cisco.
Prior to Cisco, Chambers served as president and CEO of TGV Software and senior vice
president of U.S. Operations at Wang Laboratories. Chambers holds a JD and B.A. from
West Virginia University and an M.B.A. from Indiana University.
Frank Calderoni, Chief Financial Officer
Frank Calderoni is currently the CFO of Cisco and has held the position since February
2008. Prior to joining Cisco, Calderoni was the senior vice president and CFO of QLogic
Corporation, CFO of SanDisk, and controller at IBM. He sits on the board of directors for
Adobe Systems and Nimble Storage. Calderoni received a B.A. from Fordham University
and holds an M.B.A. from Pace University.
Robert Lloyd, President of Development & Sales
Robert Lloyd is currently the president of development & sales and has been with Cisco
since November 1994. Prior to his current role, Lloyd has held the positions of executive
vice president, worldwide operations, and senior vice president of U.S., Canada, and
Japan Operations. Lloyd also served as president of Cisco's Europe, Middle East, and
Africa (EMEA) region. Lloyd holds a B.Com. from the University of Manitoba.
Blair Christie, Chief Marketing Officer
Blair Christie serves as chief marketing officer, a role she has held since 2011. Prior to this
role, she served as senior vice president of Global Corporate Communications at Cisco.
Christie is an executive director and sits on Cisco's Operating Committee. She holds a
B.A. in marketing and an M.B.A. from Drexel University.

18 September 2013
Cisco Systems Inc. (CSCO) 114
Financial Statements Exhibit 148: Cisco Annual Income Statement in US$ millions, unless otherwise stated
Income statement FY11 FY12 FY13 FY14E FY15E
Total Sales 43,218 46,061 48,607 50,823 53,656
Cost of goods sold 15,857 17,298 18,207 19,260 20,789
Gross profit 27,361 28,763 30,400 31,563 32,867
Gross margin 63.3% 62.4% 63% 62.1% 61.3%
Products 62.4% 61.2% 61.3% 60.7% 59.4%
Services 67.1% 67.2% 67.0% 67.2% 67.5%
Operating Expenses
Research & Development 5,257 5,066 5,549 5,770 6,319
% of sales 12.2% 11.0% 11.4% 11.4% 11.8%
Sales & Marketing 9,141 9,055 9,048 9,254 9,801
% of sales 21.2% 19.7% 18.6% 18.2% 18.3%
General & Administrative 1,632 1,906 2,121 2,108 2,093
% of sales 3.8% 4.1% 4.4% 4.1% 3.9%
Total Operating Expenses 16,030 16,027 16,718 17,132 18,213
% sales 37.1% 34.8% 34.4% 33.7% 33.9%
Operating Income 11,331 12,736 13,682 14,431 14,654
Operating margin 26.2% 27.7% 28.1% 28.4% 27.3%
Interest and Other Inc/(Exp.), net 151 94 31 106 173
% of sales 0.3% 0.2% 0.1% 0.2% 0.3%
Pretax Income 11,482 12,830 13,713 14,538 14,827
% of sales 26.6% 27.9% 28.2% 28.6% 27.6%
Income Taxes 2,449 2,813 2,847 3,053 3,114
% tax rate 21.3% 21.9% 20.8% 21.0% 21.0%
Net income 9,033 10,017 10,866 11,485 11,714
% Net margin 20.9% 21.7% 22.4% 22.6% 21.8%
EPS Non-GAAP $1.62 $1.85 $2.02 $2.10 $2.13
Diluted shares outstanding (Non GAAP) 5,574 5,405 5,369 5,462 5,502
Source: Company data, Credit Suisse estimates.

18 September 2013
Cisco Systems Inc. (CSCO) 115
Exhibit 149: Cisco Annual Balance Sheet in US$ millions, unless otherwise stated
Balance Sheet FY11 FY12 FY13 FY14E FY15E
ASSETS
Cash and equivalents 7,662 9,799 7,925 13,378 18,527
Short term investments 36,923 38,917 42,685 43,372 44,070
Accounts Receivable - net 4,698 4,369 5,470 6,272 7,002
Inventories 1,486 1,663 1,476 1,835 2,190
Deferred tax assets 2,410 2,294 2,616 2,616 2,616
Financing Receivables, net - 3,661 4,037 4,037 4,037
Prepaid expenses and other assets 4,052 1,230 1,312 1,312 1,312
Total Current Assets 57,231 61,933 65,521 72,821 79,754
Property, plant, and equipment - net 3,916 3,402 3,322 2,763 2,447
Goodwill 16,818 16,998 21,919 22,809 23,735
Purchased Intangible Assets 2,541 1,959 3,403 3,541 3,685
Financing Receivables, net - 3,585 3,911 3,911 3,911
Other assets 6,589 3,882 3,115 3,115 3,115
Total assets 87,095 91,759 101,191 108,961 116,647
LIABILITIES
Current portion LT Debt - - - - -
Short-term Debt 588 31 3,283 3,283 3,283
Accounts payable 876 859 1,029 1,009 1,095
Income taxes payable 120 276 192 192 192
Accrued Payroll Expenses 3,163 2,928 3,378 3,576 3,757
Deferred Revenue 8,025 8,852 9,262 9,805 10,302
Other accrued liabilities 4,734 4,785 5,048 5,344 5,615
Restructuring Liabilities - - - - -
Total Current Liabilities 17,506 17,731 22,192 23,208 24,244
Long-term debt 16,234 16,297 12,928 12,928 12,928
Income Taxes Payable 1,191 1,844 1,748 1,748 1,748
Long-term Deferred Revenue 4,182 4,028 4,161 4,327 4,501
Other long-term liabilities 723 558 1,034 1,034 1,034
Total Long-term Liabilities 22,330 22,727 19,871 20,037 20,211
Stockholders' Equity 47,259 51,301 59,128 65,715 72,192
Total liabilities & stockholders' equity 87,095 91,759 101,191 108,961 116,647
Source: Company data, Credit Suisse estimates.
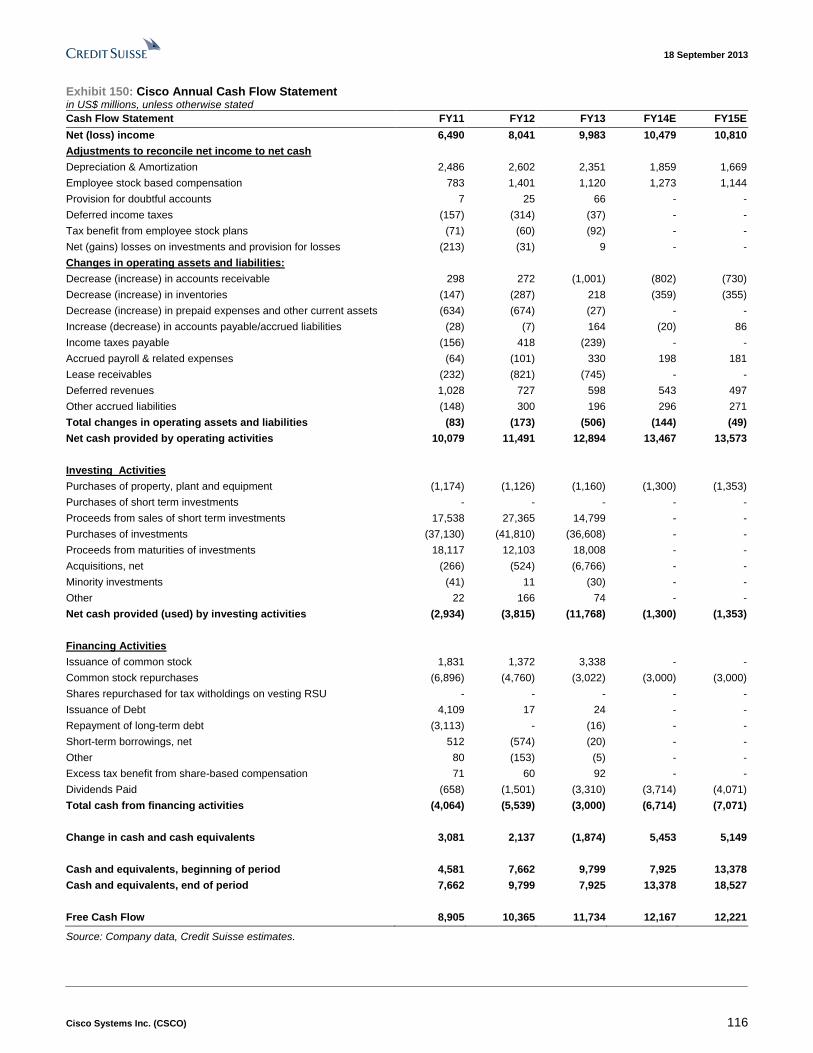
18 September 2013
Cisco Systems Inc. (CSCO) 116
Exhibit 150: Cisco Annual Cash Flow Statement in US$ millions, unless otherwise stated
Cash Flow Statement FY11 FY12 FY13 FY14E FY15E
Net (loss) income 6,490 8,041 9,983 10,479 10,810
Adjustments to reconcile net income to net cash
Depreciation & Amortization 2,486 2,602 2,351 1,859 1,669
Employee stock based compensation 783 1,401 1,120 1,273 1,144
Provision for doubtful accounts 7 25 66 - -
Deferred income taxes (157) (314) (37) - -
Tax benefit from employee stock plans (71) (60) (92) - -
Net (gains) losses on investments and provision for losses (213) (31) 9 - -
Changes in operating assets and liabilities:
Decrease (increase) in accounts receivable 298 272 (1,001) (802) (730)
Decrease (increase) in inventories (147) (287) 218 (359) (355)
Decrease (increase) in prepaid expenses and other current assets (634) (674) (27) - -
Increase (decrease) in accounts payable/accrued liabilities (28) (7) 164 (20) 86
Income taxes payable (156) 418 (239) - -
Accrued payroll & related expenses (64) (101) 330 198 181
Lease receivables (232) (821) (745) - -
Deferred revenues 1,028 727 598 543 497
Other accrued liabilities (148) 300 196 296 271
Total changes in operating assets and liabilities (83) (173) (506) (144) (49)
Net cash provided by operating activities 10,079 11,491 12,894 13,467 13,573
Investing Activities
Purchases of property, plant and equipment (1,174) (1,126) (1,160) (1,300) (1,353)
Purchases of short term investments - - - - -
Proceeds from sales of short term investments 17,538 27,365 14,799 - -
Purchases of investments (37,130) (41,810) (36,608) - -
Proceeds from maturities of investments 18,117 12,103 18,008 - -
Acquisitions, net (266) (524) (6,766) - -
Minority investments (41) 11 (30) - -
Other 22 166 74 - -
Net cash provided (used) by investing activities (2,934) (3,815) (11,768) (1,300) (1,353)
Financing Activities
Issuance of common stock 1,831 1,372 3,338 - -
Common stock repurchases (6,896) (4,760) (3,022) (3,000) (3,000)
Shares repurchased for tax witholdings on vesting RSU - - - - -
Issuance of Debt 4,109 17 24 - -
Repayment of long-term debt (3,113) - (16) - -
Short-term borrowings, net 512 (574) (20) - -
Other 80 (153) (5) - -
Excess tax benefit from share-based compensation 71 60 92 - -
Dividends Paid (658) (1,501) (3,310) (3,714) (4,071)
Total cash from financing activities (4,064) (5,539) (3,000) (6,714) (7,071)
Change in cash and cash equivalents 3,081 2,137 (1,874) 5,453 5,149
Cash and equivalents, beginning of period 4,581 7,662 9,799 7,925 13,378
Cash and equivalents, end of period 7,662 9,799 7,925 13,378 18,527
Free Cash Flow 8,905 10,365 11,734 12,167 12,221
Source: Company data, Credit Suisse estimates.
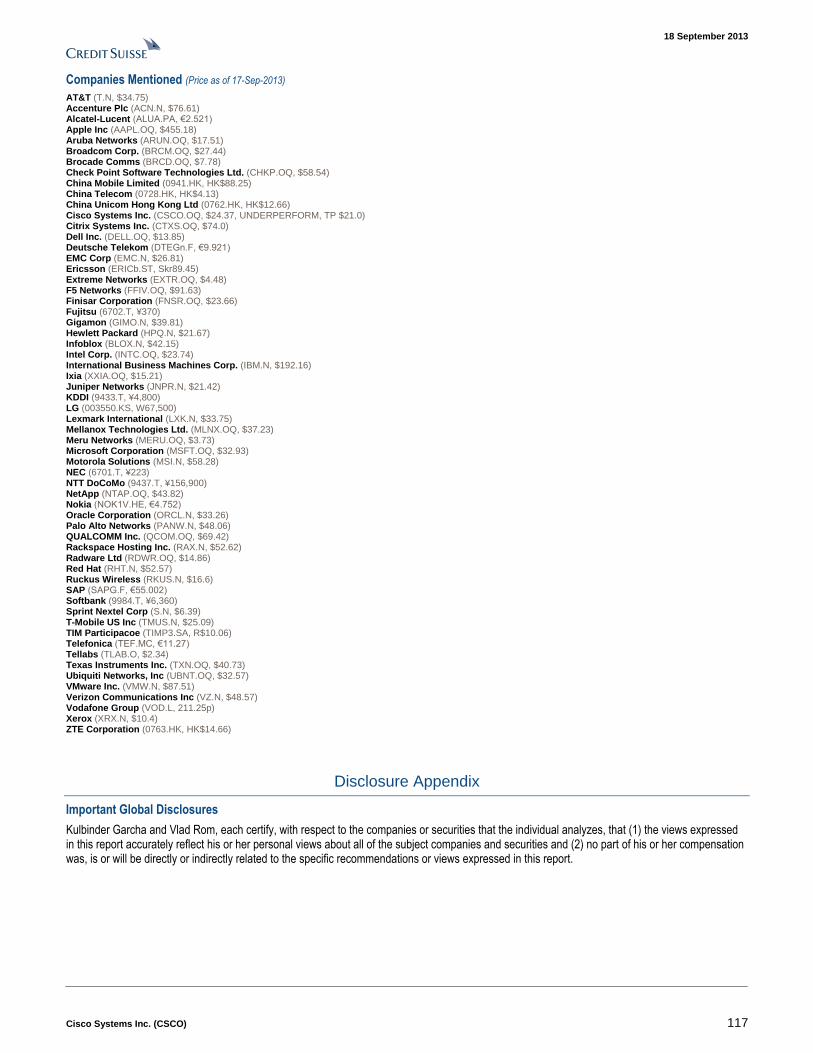
18 September 2013
Cisco Systems Inc. (CSCO) 117
Companies Mentioned (Price as of 17-Sep-2013)
AT&T (T.N, $34.75) Accenture Plc (ACN.N, $76.61) Alcatel-Lucent (ALUA.PA, €2.521) Apple Inc (AAPL.OQ, $455.18) Aruba Networks (ARUN.OQ, $17.51) Broadcom Corp. (BRCM.OQ, $27.44) Brocade Comms (BRCD.OQ, $7.78) Check Point Software Technologies Ltd. (CHKP.OQ, $58.54) China Mobile Limited (0941.HK, HK$88.25) China Telecom (0728.HK, HK$4.13) China Unicom Hong Kong Ltd (0762.HK, HK$12.66) Cisco Systems Inc. (CSCO.OQ, $24.37, UNDERPERFORM, TP $21.0) Citrix Systems Inc. (CTXS.OQ, $74.0) Dell Inc. (DELL.OQ, $13.85) Deutsche Telekom (DTEGn.F, €9.921) EMC Corp (EMC.N, $26.81) Ericsson (ERICb.ST, Skr89.45) Extreme Networks (EXTR.OQ, $4.48) F5 Networks (FFIV.OQ, $91.63) Finisar Corporation (FNSR.OQ, $23.66) Fujitsu (6702.T, ¥370) Gigamon (GIMO.N, $39.81) Hewlett Packard (HPQ.N, $21.67) Infoblox (BLOX.N, $42.15) Intel Corp. (INTC.OQ, $23.74) International Business Machines Corp. (IBM.N, $192.16) Ixia (XXIA.OQ, $15.21) Juniper Networks (JNPR.N, $21.42) KDDI (9433.T, ¥4,800) LG (003550.KS, W67,500) Lexmark International (LXK.N, $33.75) Mellanox Technologies Ltd. (MLNX.OQ, $37.23) Meru Networks (MERU.OQ, $3.73) Microsoft Corporation (MSFT.OQ, $32.93) Motorola Solutions (MSI.N, $58.28) NEC (6701.T, ¥223) NTT DoCoMo (9437.T, ¥156,900) NetApp (NTAP.OQ, $43.82) Nokia (NOK1V.HE, €4.752) Oracle Corporation (ORCL.N, $33.26) Palo Alto Networks (PANW.N, $48.06) QUALCOMM Inc. (QCOM.OQ, $69.42) Rackspace Hosting Inc. (RAX.N, $52.62) Radware Ltd (RDWR.OQ, $14.86) Red Hat (RHT.N, $52.57) Ruckus Wireless (RKUS.N, $16.6) SAP (SAPG.F, €55.002) Softbank (9984.T, ¥6,360) Sprint Nextel Corp (S.N, $6.39) T-Mobile US Inc (TMUS.N, $25.09) TIM Participacoe (TIMP3.SA, R$10.06) Telefonica (TEF.MC, €11.27) Tellabs (TLAB.O, $2.34) Texas Instruments Inc. (TXN.OQ, $40.73) Ubiquiti Networks, Inc (UBNT.OQ, $32.57) VMware Inc. (VMW.N, $87.51) Verizon Communications Inc (VZ.N, $48.57) Vodafone Group (VOD.L, 211.25p) Xerox (XRX.N, $10.4) ZTE Corporation (0763.HK, HK$14.66)
Disclosure Appendix
Important Global Disclosures
Kulbinder Garcha and Vlad Rom, each certify, with respect to the companies or securities that the individual analyzes, that (1) the views expressed in this report accurately reflect his or her personal views about all of the subject companies and securities and (2) no part of his or her compensation was, is or will be directly or indirectly related to the specific recommendations or views expressed in this report.

18 September 2013
Cisco Systems Inc. (CSCO) 118
3-Year Price and Rating History for Cisco Systems Inc. (CSCO.OQ)
CSCO.OQ Closing Price Target Price
Date (US$) (US$) Rating
11-Nov-10 20.58 27.00 O
10-Feb-11 18.92 24.00
12-May-11 16.93 26.00
11-Aug-11 15.92 25.00
10-Nov-11 18.61 26.00
09-Feb-12 20.00 27.00
16-Aug-12 19.00 25.00
28-Dec-12 19.45 NR
* Asterisk signifies initiation or assumption of coverage. O U T PERFO RM
N O T RA T ED
3-Year Price and Rating History for Dell Inc. (DELL.OQ)
DELL.OQ Closing Price Target Price
Date (US$) (US$) Rating
16-Mar-11 14.22 16.00 U *
23-May-12 12.49 14.00
22-Aug-12 11.68 11.00
16-Nov-12 8.84 9.00
05-Feb-13 13.42 R
* Asterisk signifies initiation or assumption of coverage.
U N D ERPERFO RM
REST RICT ED
3-Year Price and Rating History for EMC Corp (EMC.N)
EMC.N Closing Price Target Price
Date (US$) (US$) Rating
16-Mar-11 25.31 34.00 O *
18-Aug-11 20.59 27.00
24-Jan-12 25.14 30.00
22-Mar-12 29.13 35.00
18-Jul-12 25.08 30.00 *
01-Aug-12 26.14 *
25-Oct-12 24.14 30.00 O
* Asterisk signifies initiation or assumption of coverage.
O U T PERFO RM
The analyst(s) responsible for preparing this research report received Compensation that is based upon various factors including Credit Suisse's total revenues, a portion of which are generated by Credit Suisse's investment banking activities
As of December 10, 2012 Analysts’ stock rating are defined as follows:
Outperform (O) : The stock’s total return is expected to outperform the relevant benchmark*over the next 12 months.
Neutral (N) : The stock’s total return is expected to be in line with the relevant benchmark* over the next 12 months.
Underperform (U) : The stock’s total return is expected to underperform the relevant benchmark* over the next 12 months.
*Relevant benchmark by region: As of 10th December 2012, Japanese ratings are based on a stock’s total return relative to the analyst's coverage universe which consists of all companies covered by the analyst within the relevant secto r, with Outperforms representing the most attractive, Neutrals the less attractive, and Underperforms the least attractive investment opportunities. As of 2nd October 2012, U.S. and Canadian as well as European ra tings are based on a stock’s total return relative to the analyst's coverage universe which consists of all companies covered by the analyst within the relevant sector, with Outperforms representing the most attractive, Neutrals the less attractive, and Underperforms the least attractive investment opportunities. For Latin American and non-Japan Asia stocks, ratings are based on a stock’s total return relative to the average total return of the relevant country or regional benchmark; Austr alia, New Zealand are, and prior to 2nd

18 September 2013
Cisco Systems Inc. (CSCO) 119
October 2012 U.S. and Canadian ratings were based on (1) a stock’s absolute total return potential to its current share price and (2) the relative attractiveness of a stock’s total return potential within an analyst’s coverage universe. For Australian and New Zealand stocks, 1 2-month rolling yield is incorporated in the absolute total return calculation and a 15% and a 7.5% threshold replace the 10-15% level in the Outperform and Underperform stock rating definitions, respectively. The 15% and 7.5% thresholds replace the +10-15% and -10-15% levels in the Neutral stock rating definition, respectively. Prior to 10th December 2012, Japanese ratings were based on a stock’s total return relative to the average total return of the relevant country or regional benchmark.
Restricted (R) : In certain circumstances, Credit Suisse policy and/or applicable law and regulations preclude certain types of communications, including an investment recommendation, during the course of Credit Suisse's engagement in an investment banking transaction and in certain other circumstances.
Volatility Indicator [V] : A stock is defined as volatile if the stock price has moved up or down by 20% or more in a month in at least 8 of the past 24 months or the analyst expects significant volatility going forward.
Analysts’ sector weightings are distinct from analysts’ stock ratings and are based on the analyst’s expectations for the fundamentals and/or valuation of the sector* relative to the group’s historic fundamentals and/or valuation:
Overweight : The analyst’s expectation for the sector’s fundamentals and/or valuation is favorable over the next 12 months.
Market Weight : The analyst’s expectation for the sector’s fundamentals and/or valuation is neutral over the next 12 months.
Underweight : The analyst’s expectation for the sector’s fundamentals and/or valuation is cautious over the next 12 months.
*An analyst’s coverage sector consists of all companies covered by the analyst within the relevant sector. An analyst may cov er multiple sectors.
Credit Suisse's distribution of stock ratings (and banking clients) is:
Global Ratings Distribution
Rating Versus universe (%) Of which banking clients (%)
Outperform/Buy* 42% (55% banking clients)
Neutral/Hold* 40% (48% banking clients)
Underperform/Sell* 15% (40% banking clients)
Restricted 3%
*For purposes of the NYSE and NASD ratings distribution disclosure requirements, our stock ratings of Outperform, Neutral, an d Underperform most closely correspond to Buy, Hold, and Sell, respectively; however, the meanings are not the same, as our stock ratings are determined on a relative basis. (Please refer to definitions above.) An investor's decision to buy or sell a security should be based on investment objectives, current holdin gs, and other individual factors.
Credit Suisse’s policy is to update research reports as it deems appropriate, based on developments with the subject company, the sector or the market that may have a material impact on the research views or opinions stated herein.
Credit Suisse's policy is only to publish investment research that is impartial, independent, clear, fair and not misleading. For more detail please refer to Credit Suisse's Policies for Managing Conflicts of Interest in connection with Investment Research: http://www.csfb.com/research and analytics/disclaimer/managing_conflicts_disclaimer.html
Credit Suisse does not provide any tax advice. Any statement herein regarding any US federal tax is not intended or written to be used, and cannot be used, by any taxpayer for the purposes of avoiding any penalties.
Price Target: (12 months) for Cisco Systems Inc. (CSCO.OQ)
Method: Our valuation for CSCO's $21 target price is based on a three-pronged approach: i) P/E multiple valuation applying 9.8x to CY14 EPS; ii) discounted cash flow (DCF) analysis with terminal growth of 1% and a WACC of 11%; and iii) Credit Suisse HOLT analysis. Our approach
suggests that the company’s equity value is $114bn to $120bn, or $21 to $22 per share, with a blended value of $21 per share.
Risk: Risks to our $21 target price for CSCO include a stronger than expected macroeconomic recovery boosting IT spend, slower than anticipated SDN development and adoption and an increased commitment to cash return.
Please refer to the firm's disclosure website at https://rave.credit-suisse.com/disclosures for the definitions of abbreviations typically used in the target price method and risk sections.
See the Companies Mentioned section for full company names
The subject company (CSCO.OQ, DELL.OQ, EMC.N) currently is, or was during the 12-month period preceding the date of distribution of this report, a client of Credit Suisse.
Credit Suisse provided investment banking services to the subject company (CSCO.OQ, DELL.OQ, EMC.N) within the past 12 months.
Credit Suisse provided non-investment banking services to the subject company (CSCO.OQ) within the past 12 months
Credit Suisse has managed or co-managed a public offering of securities for the subject company (EMC.N) within the past 12 months.
Credit Suisse has received investment banking related compensation from the subject company (CSCO.OQ, DELL.OQ, EMC.N) within the past 12 months

18 September 2013
Cisco Systems Inc. (CSCO) 120
Credit Suisse expects to receive or intends to seek investment banking related compensation from the subject company (CSCO.OQ, DELL.OQ, EMC.N) within the next 3 months.
Credit Suisse has received compensation for products and services other than investment banking services from the subject company (CSCO.OQ) within the past 12 months
As of the date of this report, Credit Suisse makes a market in the following subject companies (CSCO.OQ, DELL.OQ, EMC.N).
Credit Suisse has a material conflict of interest with the subject company (DELL.OQ) . Credit Suisse Securities (USA) LLC is acting as a financial advisor to Silver Lake Partners in connection with the announced proposed acquisition of Dell Inc.
Important Regional Disclosures
Singapore recipients should contact Credit Suisse AG, Singapore Branch for any matters arising from this research report.
The analyst(s) involved in the preparation of this report have not visited the material operations of the subject company (CSCO.OQ, DELL.OQ, EMC.N) within the past 12 months
Restrictions on certain Canadian securities are indicated by the following abbreviations: NVS--Non-Voting shares; RVS--Restricted Voting Shares; SVS--Subordinate Voting Shares.
Individuals receiving this report from a Canadian investment dealer that is not affiliated with Credit Suisse should be advised that this report may not contain regulatory disclosures the non-affiliated Canadian investment dealer would be required to make if this were its own report.
For Credit Suisse Securities (Canada), Inc.'s policies and procedures regarding the dissemination of equity research, please visit http://www.csfb.com/legal_terms/canada_research_policy.shtml.
As of the date of this report, Credit Suisse acts as a market maker or liquidity provider in the equities securities that are the subject of this report.
Principal is not guaranteed in the case of equities because equity prices are variable.
Commission is the commission rate or the amount agreed with a customer when setting up an account or at any time after that.
Important Credit Suisse HOLT Disclosures
With respect to the analysis in this report based on the Credit Suisse HOLT methodology, Credit Suisse certifies that (1) the views expressed in this report accurately reflect the Credit Suisse HOLT methodology and (2) no part of the Firm’s compensation was, is, or will be directly related to the specific views disclosed in this report.
The Credit Suisse HOLT methodology does not assign ratings to a security. It is an analytical tool that involves use of a set of proprietary quantitative algorithms and warranted value calculations, collectively called the Credit Suisse HOLT valuation model, that are consistently applied to all the companies included in its database. Third-party data (including consensus earnings estimates) are systematically translated into a number of default algorithms available in the Credit Suisse HOLT valuation model. The source financial statement, pricing, and earnings data provided by outside data vendors are subject to quality control and may also be adjusted to more closely measure the underlying economics of firm performance. The adjustments provide consistency when analyzing a single company across time, or analyzing multiple companies across industries or national borders. The default scenario that is produced by the Credit Suisse HOLT valuation model establishes the baseline valuation for a security, and a user then may adjust the default variables to produce alternative scenarios, any of which could occur.
Additional information about the Credit Suisse HOLT methodology is available on request.
The Credit Suisse HOLT methodology does not assign a price target to a security. The default scenario that is produced by the Credit Suisse HOLT valuation model establishes a warranted price for a security, and as the third-party data are updated, the warranted price may also change. The default variable may also be adjusted to produce alternative warranted prices, any of which could occur.
CFROI®, HOLT, HOLTfolio, ValueSearch, AggreGator, Signal Flag and “Powered by HOLT” are trademarks or service marks or registered trademarks or registered service marks of Credit Suisse or its affiliates in the United States and other countries. HOLT is a corporate performance and valuation advisory service of Credit Suisse.
For Credit Suisse disclosure information on other companies mentioned in this report, please visit the website at https://rave.credit-suisse.com/disclosures or call +1 (877) 291-2683.

18 September 2013
Cisco Systems Inc. (CSCO) 121
References in this report to Credit Suisse include all of the subsidiaries and affiliates of Credit Suisse operating under its investment banking division. For more information on our structure, please use the following link: https://www.credit-suisse.com/who_we_are/en/This report may contain material that is not directed to, or intended for distribution to or use by, any person or entity who is a citizen or resident of or located in any locality, state, country or other jurisdiction where such distribution, publication, availability or use would be contrary to law or regulation or which would subject Credit Suisse AG or its affiliates ("CS") to any registration or licensing requirement within such jurisdiction. All material presented in this report, unless specifically indicated otherwise, is under copyright to CS. None of the material, nor its content, nor any copy of it, may be altered in any way, transmitted to, copied or distributed to any other party, without the prior express written permission of CS. All trademarks, service marks and logos used in this report are trademarks or service marks or registered trademarks or service marks of CS or its affiliates. The information, tools and material presented in this report are provided to you for information purposes only and are not to be used or considered as an offer or the solicitation of an offer to sell or to buy or subscribe for securities or other financial instruments. CS may not have taken any steps to ensure that the securities referred to in this report are suitable for any particular investor. CS will not treat recipients of this report as its customers by virtue of their receiving this report. The investments and services contained or referred to in this report may not be suitable for you and it is recommended that you consult an independent investment advisor if you are in doubt about such investments or investment services. Nothing in this report constitutes investment, legal, accounting or tax advice, or a representation that any investment or strategy is suitable or appropriate to your individual circumstances, or otherwise constitutes a personal recommendation to you. CS does not advise on the tax consequences of investments and you are advised to contact an independent tax adviser. Please note in particular that the bases and levels of taxation may change. Information and opinions presented in this report have been obtained or derived from sources believed by CS to be reliable, but CS makes no representation as to their accuracy or completeness. CS accepts no liability for loss arising from the use of the material presented in this report, except that this exclusion of liability does not apply to the extent that such liability arises under specific statutes or regulations applicable to CS. This report is not to be relied upon in substitution for the exercise of independent judgment. CS may have issued, and may in the future issue, other communications that are inconsistent with, and reach different conclusions from, the information presented in this report. Those communications reflect the different assumptions, views and analytical methods of the analysts who prepared them and CS is under no obligation to ensure that such other communications are brought to the attention of any recipient of this report. CS may, to the extent permitted by law, participate or invest in financing transactions with the issuer(s) of the securities referred to in this report, perform services for or solicit business from such issuers, and/or have a position or holding, or other material interest, or effect transactions, in such securities or options thereon, or other investments related thereto. In addition, it may make markets in the securities mentioned in the material presented in this report. CS may have, within the last three years, served as manager or co-manager of a public offering of securities for, or currently may make a primary market in issues of, any or all of the entities mentioned in this report or may be providing, or have provided within the previous 12 months, significant advice or investment services in relation to the investment concerned or a related investment. Additional information is, subject to duties of confidentiality, available on request. Some investments referred to in this report will be offered solely by a single entity and in the case of some investments solely by CS, or an associate of CS or CS may be the only market maker in such investments. Past performance should not be taken as an indication or guarantee of future performance, and no representation or warranty, express or implied, is made regarding future performance. Information, opinions and estimates contained in this report reflect a judgment at its original date of publication by CS and are subject to change without notice. The price, value of and income from any of the securities or financial instruments mentioned in this report can fall as well as rise. The value of securities and financial instruments is subject to exchange rate fluctuation that may have a positive or adverse effect on the price or income of such securities or financial instruments. Investors in securities such as ADR's, the values of which are influenced by currency volatility, effectively assume this risk. Structured securities are complex instruments, typically involve a high degree of risk and are intended for sale only to sophisticated investors who are capable of understanding and assuming the risks involved. The market value of any structured security may be affected by changes in economic, financial and political factors (including, but not limited to, spot and forward interest and exchange rates), time to maturity, market conditions and volatility, and the credit quality of any issuer or reference issuer. Any investor interested in purchasing a structured product should conduct their own investigation and analysis of the product and consult with their own professional advisers as to the risks involved in making such a purchase. Some investments discussed in this report may have a high level of volatility. High volatility investments may experience sudden and large falls in their value causing losses when that investment is realised. Those losses may equal your original investment. Indeed, in the case of some investments the potential losses may exceed the amount of initial investment and, in such circumstances, you may be required to pay more money to support those losses. Income yields from investments may fluctuate and, in consequence, initial capital paid to make the investment may be used as part of that income yield. Some investments may not be readily realisable and it may be difficult to sell or realise those investments, similarly it may prove difficult for you to obtain reliable information about the value, or risks, to which such an investment is exposed. This report may provide the addresses of, or contain hyperlinks to, websites. Except to the extent to which the report refers to website material of CS, CS has not reviewed any such site and takes no responsibility for the content contained therein. Such address or hyperlink (including addresses or hyperlinks to CS's own website material) is provided solely for your convenience and information and the content of any such website does not in any way form part of this document. Accessing such website or following such link through this report or CS's website shall be at your own risk. This report is issued and distributed in Europe (except Switzerland) by Credit Suisse Securities (Europe) Limited, One Cabot Square, London E14 4QJ, England, which is authorised by the Prudential Regulation Authority ("PRA") and regulated by the Financial Conduct Authority ("FCA") and the PRA. This report is being distributed in Germany by Credit Suisse Securities (Europe) Limited Niederlassung Frankfurt am Main regulated by the Bundesanstalt fuer Finanzdienstleistungsaufsicht ("BaFin"). This report is being distributed in the United States and Canada by Credit Suisse Securities (USA) LLC; in Switzerland by Credit Suisse AG; in Brazil by Banco de Investimentos Credit Suisse (Brasil) S.A or its affiliates; in Mexico by Banco Credit Suisse (México), S.A. (transactions related to the securities mentioned in this report will only be effected in compliance with applicable regulation); in Japan by Credit Suisse Securities (Japan) Limited, Financial Instruments Firm, Director-General of Kanto Local Finance Bureau (Kinsho) No. 66, a member of Japan Securities Dealers Association, The Financial Futures Association of Japan, Japan Investment Advisers Association, Type II Financial Instruments Firms Association; elsewhere in Asia/ Pacific by whichever of the following is the appropriately authorised entity in the relevant jurisdiction: Credit Suisse (Hong Kong) Limited, Credit Suisse Equities (Australia) Limited, Credit Suisse Securities (Thailand) Limited, having registered address at 990 Abdulrahim Place, 27 Floor, Unit 2701, Rama IV Road, Silom, Bangrak, Bangkok 10500, Thailand, Tel. +66 2614 6000, Credit Suisse Securities (Malaysia) Sdn Bhd, Credit Suisse AG, Singapore Branch, Credit Suisse Securities (India) Private Limited regulated by the Securities and Exchange Board of India (registration Nos. INB230970637; INF230970637; INB010970631; INF010970631), having registered address at 9th Floor, Ceejay House, Dr.A.B. Road, Worli, Mumbai - 18, India, T- +91-22 6777 3777, Credit Suisse Securities (Europe) Limited, Seoul Branch, Credit Suisse AG, Taipei Securities Branch, PT Credit Suisse Securities Indonesia, Credit Suisse Securities (Philippines ) Inc., and elsewhere in the world by the relevant authorised affiliate of the above. Research on Taiwanese securities produced by Credit Suisse AG, Taipei Securities Branch has been prepared by a registered Senior Business Person. Research provided to residents of Malaysia is authorised by the Head of Research for Credit Suisse Securities (Malaysia) Sdn Bhd, to whom they should direct any queries on +603 2723 2020. This report has been prepared and issued for distribution in Singapore to institutional investors, accredited investors and expert investors (each as defined under the Financial Advisers Regulations) only, and is also distributed by Credit Suisse AG, Singapore branch to overseas investors (as defined under the Financial Advisers Regulations). By virtue of your status as an institutional investor, accredited investor, expert investor or overseas investor, Credit Suisse AG, Singapore branch is exempted from complying with certain compliance requirements under the Financial Advisers Act, Chapter 110 of Singapore (the "FAA"), the Financial Advisers Regulations and the relevant Notices and Guidelines issued thereunder, in respect of any financial advisory service which Credit Suisse AG, Singapore branch may provide to you. This research may not conform to Canadian disclosure requirements. In jurisdictions where CS is not already registered or licensed to trade in securities, transactions will only be effected in accordance with applicable securities legislation, which will vary from jurisdiction to jurisdiction and may require that the trade be made in accordance with applicable exemptions from registration or licensing requirements. Non-U.S. customers wishing to effect a transaction should contact a CS entity in their local jurisdiction unless governing law permits otherwise. U.S. customers wishing to effect a transaction should do so only by contacting a representative at Credit Suisse Securities (USA) LLC in the U.S. Please note that this research was originally prepared and issued by CS for distribution to their market professional and institutional investor customers. Recipients who are not market professional or institutional investor customers of CS should seek the advice of their independent financial advisor prior to taking any investment decision based on this report or for any necessary explanation of its contents. This research may relate to investments or services of a person outside of the UK or to other matters which are not authorised by the PRA and regulated by the FCA and the PRA or in respect of which the protections of the PRA and FCA for private customers and/or the UK compensation scheme may not be available, and further details as to where this may be the case are available upon request in respect of this report. CS may provide various services to US municipal entities or obligated persons ("municipalities"), including suggesting individual transactions or trades and entering into such transactions. Any services CS provides to municipalities are not viewed as "advice" within the meaning of Section 975 of the Dodd-Frank Wall Street Reform and Consumer Protection Act. CS is providing any such services and related information solely on an arm's length basis and not as an advisor or fiduciary to the municipality. In connection with the provision of the any such services, there is no agreement, direct or indirect, between any municipality (including the officials, management, employees or agents thereof) and CS for CS to provide advice to the municipality. Municipalities should consult with their financial, accounting and legal advisors regarding any such services provided by CS. In addition, CS is not acting for direct or indirect compensation to solicit the municipality on behalf of an unaffiliated broker, dealer, municipal securities dealer, municipal advisor, or investment adviser for the purpose of obtaining or retaining an engagement by the municipality for or in connection with Municipal Financial Products, the issuance of municipal securities, or of an investment adviser to provide investment advisory services to or on behalf of the municipality. If this report is being distributed by a financial institution other than Credit Suisse AG, or its affiliates, that financial institution is solely responsible for distribution. Clients of that institution should contact that institution to effect a transaction in the securities mentioned in this report or require further information. This report does not constitute investment advice by Credit Suisse to the clients of the distributing financial institution, and neither Credit Suisse AG, its affiliates, and their respective officers, directors and employees accept any liability whatsoever for any direct or consequential loss arising from their use of this report or its content. Principal is not guaranteed. Commission is the commission rate or the amount agreed with a customer when setting up an account or at any time after that.
Copyright © 2013 CREDIT SUISSE AG and/or its affiliates. All rights reserved.
Investment principal on bonds can be eroded depending on sale price or market price. In addition, there are bonds on which investment principal can be eroded due to changes in redemption amounts. Care is required when investing in such instruments.
When you purchase non-listed Japanese fixed income securities (Japanese government bonds, Japanese municipal bonds, Japanese government guaranteed bonds, Japanese corporate bonds) from CS as a seller, you will be requested to pay the purchase price only.
Cisco Inititation new.doc