Pan-European Capital Goods - 2014 - Credit Suisse | PLUS
204
Pan-European Capital Goods 2014: Re-rating is done. Must deliver on earnings growth – Stock Ideas & 7 Themes for 2014 – Sector Valuation & Outlook – End Markets & Companies Analysis Dec 2013 CREDIT SUISSE SECURITIES RESEARCH & ANALYTICS BEYOND INFORMATION® Client-Driven Solutions, Insights, and Access DISCLOSURE APPENDIX CONTAINS ANALYST CERTIFICATIONS AND THE STATUS OF NON US ANALYSTS. FOR OTHER IMPORTANT DISCLOSURES, visit https://rave.credit- suisse.com/disclosures or call +1 (877) 291-2683 US Disclosure: Credit Suisse does and seeks to do business with companies covered in its research reports. As a result, investors should be aware that the Firm may have a conflict of interest that could affect the objectivity of this report. Investors should consider this report as only a single factor in making their investment decision. Research team Andre Kukhnin, CFA 44 20 7888 0350 [email protected] Jonathan Hurn, CFA 44 20 7883 4532 [email protected] Simon Toennessen 44 20 7883 6893 [email protected] Max Yates 44 20 7883 8501 [email protected] Tiantian Li 44 20 7883 1552 [email protected]
-
Upload
khangminh22 -
Category
Documents
-
view
1 -
download
0
Transcript of Pan-European Capital Goods - 2014 - Credit Suisse | PLUS

Pan-European Capital Goods 2014: Re-rating is done. Must deliver on earnings growth – Stock Ideas & 7 Themes for 2014 – Sector Valuation & Outlook – End Markets & Companies Analysis Dec 2013
CREDIT SUISSE SECURITIES RESEARCH & ANALYTICS BEYOND INFORMATION® Client-Driven Solutions, Insights, and Access
DISCLOSURE APPENDIX CONTAINS ANALYST CERTIFICATIONS AND THE STATUS OF NON US ANALYSTS. FOR OTHER IMPORTANT DISCLOSURES, visit https://rave.credit-
suisse.com/disclosures or call +1 (877) 291-2683 US Disclosure: Credit Suisse does and seeks to do business with companies covered in its research reports. As a result,
investors should be aware that the Firm may have a conflict of interest that could affect the objectivity of this report. Investors should consider this report as only a single factor
in making their investment decision.
Research team
Andre Kukhnin, CFA 44 20 7888 0350 [email protected]
Jonathan Hurn, CFA 44 20 7883 4532 [email protected]
Simon Toennessen 44 20 7883 6893 [email protected]
Max Yates 44 20 7883 8501 [email protected]
Tiantian Li 44 20 7883 1552 [email protected]

2
What’s inside & Our key recent research
I. Summary of Key Stock Ideas and Sector Themes Slides 3-7
II. 7 Sector Themes for 2014 Slides 8-23
III. Sector Performance & Valuation Slides 24-36
IV. End-Markets Outlook Slides 37-59
V. Companies Bull & Bear case & Summaries Slides 60-196
Sector / Themes:
02/12/2013 UK Capital Goods – Spotlight on Valuation / Global peer analysis
18/11/2013 CS Industrials China Trip – Steady, higher-quality growth ahead
04/11/2013 Gas turbine demand / market share
31/10/2013 Global Mining Equipment – Q3 reality check
11/09/2013 Pan-Euro Cap Goods – Searching for through-cycle value creation
16/07/2013 Global Industrials – Automation Software Deep-Dive
03/07/2013 Global Mining Equipment – Between a rock and a hard place
01/05/2013 Industrials Insight – In search for quality growth
12/02/2013 European Cables – Initiation – Follow the leader
Stock-specific:
02/12/2013 Metso – Rock, Paper, Spin-off
06/11/2013 SKF – China becoming more of a threat than opportunity
30/10/2013 ABB – Pace of early-cycle recovery could surprise
28/10/2013 Assa Abloy – Relentless progress. TP to SEK 350
22/10/2013 IMI – We see further upside from here
21/10/2013 Sandvik – Rising risks while expectations remain full
30/09/2013 Prysmian – Under-appreciated growth & returns profile
11/09/2013 Alstom – Structural issues to persist – Downgrade to U/P
11/09/2013 Geberit – High quality deserves the premium
19/09/2013 Fenner – Time to get involved – Upgrade to O/P
05/08/2013 Siemens – Potential CEO action points
20/08/2013 Senior – Four reasons to buy - TP up to 315p
11/07/2013 Melrose – Counting the potential cash return
20/02/2013 ABB – Initiation – A transforming business
Key recent research:

3
Key Conclusions
In 2013, the sector moved up 17% on an 8% EPS downgrade resulting in a 25% re-rating to 2014E 12x
EV/EBITA and 15.5x P/E. For 2014, we expect a year of relatively slow growth with self-help themes of
cost-cutting and acquired growth continue to work. With limited scope for further re-rating, we have
a Neutral view on the sector with c8-10% expected performance for 2014.
Top line. Expect some growth acceleration in 2014-15 from near-zero in 2013 but overall slow
growth environment to continue. Expect a gradual recovery in short-cycle but later-cycle to continue to
drag, especially in 2014.
Profitability. Expect margins to expand by c50bps pa in 2014-15 driven by combination of operational
gearing, cost-cutting, benign raw materials environment and broadly flat pricing.
Quality vs Cyclical. With Quality Growth premium vs Cyclical Growth at all time high for both Europe
and UK, we believe the overall theme has played out but we continue to see selective growth
opportunities within quality.
Electricals vs Mechanicals vs UK. We continue to have a preference for Electricals vs Mechanicals
for 2014 but acknowledge that c3-5% of the relative rerating already took place in 2013. We continue
to see UK space attractive given the M&A angle.
Key stock ideas. We favour ABB and Prysmian in Electricals, Assa Abloy and Metso in Mechanicals
and Spectris and IMI in the UK. We remain cautious on Alstom, SKF and Sandvik.
Please see next 4 slides for detailed summaries of our key stock ideas and sector themes.

4
Key Stock Ideas with Cyclical, Secular & Structural framework
-20%
-15%
-10%
-5%
0%
5%
10%
15%
2006-2008 2009 2010-2012 2013E-2015E
Cyclical Average Secular average Structural (ex Assa & Legrand) average
Organic growth performance by category
2004-2012 avg. cash conversion performance
0%
20%
40%
60%
80%
100%
120%
140%
Legr
and
Pry
smia
n
Spe
ctris
Sch
indl
er
Ass
a A
bloy
Kon
e
Geb
erit
Hal
ma
Sch
neid
er
Alfa
Lav
al
Sen
ior
IMI
AB
B
Bod
ycot
e
Rot
ork
Sie
men
s
Nex
ans
SK
F
Met
so
Laird
Atla
s C
opco
Sm
iths
Fen
ner
Wei
r
Ren
isha
w
Mel
rose
Spi
rax
Ele
ctro
lux
Ves
uviu
s
San
dvik
Als
tom
Phi
lips
Mor
gan
Adv
. Mat
s
GK
N
Sector average
Source: Company data, Credit Suisse estimates
Rating CCY TP Rating CCY TP Rating CCY TP
Prysmian OP € 21 1.2% 115% ABB OP CHF 26 7.1% 91% Assa Abloy OP SEK 360 1.9% 106%
Metso OP € 35 4.3% 69% Atlas Copco OP SEK 210 9.7% 68% Halma OP £ 6.2 4.8% 97%
GKN OP £ 4.30 3.6% 19% Fenner OP £ 4.9 8.7% 67% Schindler OP CHF 150 5.7% 106%
Bodycote OP £ 7.6 3.6% 89% Spectris OP £ 25.6 4.5% 111% Rotork OP £ 32.3 11.5% 85%
Electrolux OP SEK 190 1.3% 60% IMI OP £ 16.4 3.3% 94% Spirax Sarco N £ 30.3 6.0% 63%
Philips N € 26 1.5% 47% Siemens OP € 105 5.3% 77% Geberit N CHF 240 5.9% 102%
Nexans N € 31 0.4% 73% Senior OP £ 3.15 5.2% 94% Renishaw N £ 17.15 9.6% 66%
Sandvik UP SEK 75 7.4% 56% Smiths OP £ 14.6 1.6% 68% Kone N € 34 9.1% 104%
Morgan AM UP £ 2.70 1.6% 40% Schneider N € 58 4.6% 97% Legrand UP € 38 1.6% 126%
Laird UP £ 2.15 3.2% 69% Weir N £ 22.1 12.2% 66%
Vesuvius UP £ 4.05 2.6% 60% Alfa Laval N SEK 145 5.9% 94%
SKF UP SEK 150 3.7% 72% Melrose N £ 2.75 6.4% 64%
Alstom UP € 24 3.9% 55%
2005-12
organic
growth
2006-12
FCF
conv.
2005-12
organic
growth
2006-12
FCF
conv.
CYCLICAL SECULAR STRUCTURAL
2005-12
organic
growth
2006-12
FCF
conv.

5
Summary of Key Stock Ideas OUTPERFORM
Electricals
ABB – TP CHF 26 – Automation growth potential, Margin recovery in Power Products, Acquisitions potential, Quality returns profile.
Prysmian – TP €21 – Under-appreciated growth and returns profile. Attractive valuation.
Siemens – TP €105 – Self-help & Balance sheet use in near-term, EM Automation & US Gas longer-term themes.
Mechanicals
Assa Abloy – TP SEK 360 – Proven high quality ‘Acquire & Restructure’ model with several organic growth & margin levers.
Metso – TP €35 – >15% discount to SOTP ahead of Valmet spin off, strong €200m cost-cutting effort.
Atlas Copco – TP SEK 210 – High quality play in GI recovery, mining aftermarket exposure, further balance sheet potential.
UK
Spectris – TP 2560p – Attractive valuation vs. peers, strong cash conversion, automation play, B/S optionality, potential M&A target.
IMI – TP 1640p – Portfolio focus on better growth, margin, improving ROIC, high cash conversion, B/S optionality, potential M&A target.
GKN – TP 430p – Valuation re-rating potential, self-help (Driveline, Volvo Aero), business mix improvement (towards Aero).
Fenner – TP 490p – Attractive mining aftermarket exposure, valuation discount vs. peer group, healthy EPS growth through 2016.
Bodycote – TP 760p – Cyclical turn-around story, Margin resilience under-estimated, Un-geared balance sheet.
UNDERPERFORM
Alstom – TP €24 – Risk to Thermal Service margins, Challenging Power Gen Equipment outlook, On-going weak cash conversion
SKF – TP SEK 150 – Japanese and Chinese competition risks, full valuation, balance sheet capacity now used up.
Sandvik – TP SEK 75 – Further earnings risk in Mining and Construction from volume declines and potential pricing offsetting self-help.
NEUTRALS (that are generating client debate)
Alfa Laval – TP SEK 145 – High quality late-cyclical arriving at the bottom of its end-markets but expectations appear already full
Geberit – TP CHF 240 – Best in class growth, returns and cash conversion vs near-term end-markets
Schneider – TP €58 – High quality and Growth attractions VS M&A risk & Relatively full valuation.

6
7 themes for the sector in 2014
Theme #1: How to play a short cycle recovery
CS GDP and IP forecasts indicate a European recovery in 2014 but we remain
cautious on names where consensus expectations and valuations are already
relatively full (we forecast 6% organic growth for SKF with 35% operational gearing).
We prefer names with scope for positive surprises including GKN (OP), Bodycote
(OP) and Prysmian (OP).
Theme #2: Structural growth – Need to be selective in 2014
Structural growth as a theme has worked in 2013 and the relative valuation (32%
premium) of high quality European names (Assa Abloy, Geberit, Kone, Legrand &
Schindler) is now at its highest for ten years. Among these names we favour those
names where we see clear levers to generate best in class growth: Assa Abloy
(OP), and Schindler (OP).
Theme #3: Opportunity in mining aftermarket exposed names
There remains a consensus negative view in the market toward mining capex, but
we continue to see an opportunity in names with higher aftermarket exposure (Atlas
Copco (OP) & Fenner (OP). On new equipment we discount a cautious scenario (-
16% in 2014 and -21% in 2015) but expect aftermarket to grow in 2014/15 as mine
production continues to rise.
Theme #4: Stabilization of weaker businesses should allow Electricals to re-
rate further
In the last two quarters underperforming businesses in Electricals that have
received attention in the last 12mths have shown signs of stabilization. We believe
this can shift the market focus away from ABB Power, Siemens I&C and Prysmian
T&I and to the remainder of the businesses which ultimately drive group profitability.
In our view this can lead to further re-rating with, for example, ABB’s automation
business clearly trading at a discount to global peers.
-20%
-10%
0%
10%
20%
30%
40%
Nov-03 Nov-04 Nov-05 Nov-06 Nov-07 Nov-08 Nov-09 Nov-10 Nov-11 Nov-12 Nov-13
EU High quality stocks EV/EBIT premium / discount vs sector Average premium / discount
0%
10%
20%
30%
40%
50%
60%
70%
80%
90%
100%
Fenner Weir Atlas CAT Metso Sandvik FLS Outotec
New Equipment A/market
7.2%
6.4%
13.4%
11.4%
5.9%
-12.7%
6.4%
11.6%
3.5%
0.4%
4.0% 4.5%
10.0%
11.1%
12.2%
13.1%
11.1%
13.8%
14.6%
14.4%14.3%14.8%15.3%
0%
2%
4%
6%
8%
10%
12%
14%
16%
-18.0%
-14.0%
-10.0%
-6.0%
-2.0%
2.0%
6.0%
10.0%
14.0%
18.0%
2004
2005
2006
2007
2008
2009
2010
2011
2012
2013E
2014E
2015E
Sector EBIT margin, % Sector organic growth, %
Sector Organic Growth vs Margin
European Quality Growth vs Sector
Mining Players OE vs Aftermarket exposure
Source: Thomson Reuters, Company data, Credit Suisse estimates

7
7 themes for the sector in 2014
Theme #5: Balance sheet re-leverage
Across the sector we believe there is opportunity for balance sheet
re-leverage. We see the greatest acquisition opportunity as being
for Assa Abloy in Entrance systems while Siemens is likely to focus
on Process Automation. In our view, buybacks are most likely at
Atlas Copco and Alfa Laval (both have a history of buybacks and
currently have low leverage)
Theme #6: Competitive risk
We continue to believe Alstom (UP) bears the greatest medium
term structural risk from competition. We also believe the risk for
SKF (UP) (from Chinese and Japanese competitors) is rising and in
Mining Equipment see risk in the crushing and grinding segment.
We remain cautious on Sandvik (UP).
Theme #7: Potential M&A
We have re-run our HOLT® CFROI® M&A Screen for the Pan
European Capital Goods universe with analysis over 6 criteria. We
would highlight the following names from the Screen:
Met 5 criteria: Alfa Laval, Fenner, Legrand, Rotork
Met 4 criteria: Smiths Group, Spectris, Weir
Met 3 criteria: IMI
0%
1%
2%
3%
4%
5%
6%
7%
8%
Prys
mia
n
Assa
Abl
oy
ABB
Alfa
Lav
al
Atla
s C
opco
Schn
eide
r
Legr
and
Met
so
Nex
ans
SKF
Sand
vik
Kone
Siem
ens
Elec
trolu
x
Philip
s
Alst
om
Schi
ndle
r
Geb
erit
Average acquisition impact on sales (2007-12)
Acquired Growth Track Record
Emerging Markets Competition Risk Assessment
Risk Rating 1 2 3 4 5
High Power Gen.(Coal)
Appliances, T&D
Bearings
Trucks
Mining Equipment - Crushers & Grinders
Medium Drive systems
Transport
O&G (Fracking)
Heat exchangers
Elevator
Low
Heat Treatment
Timeframe in years
Automation
Construction Equipment
Low Voltage equipment
Auto components
Mining Equipment
Source: Company data, Credit Suisse research

8
Sector Themes

9
Theme #1: How to play a short-cycle recovery
-10.0%
-8.0%
-6.0%
-4.0%
-2.0%
0.0%
2.0%
4.0%
6.0%
8.0%
AB
B
Legr
and
Nex
ans
Pry
smia
n
Sch
neid
er
Sie
men
s
Atla
s C
opco
Met
so
San
dvik
SK
F
Q3 13 2014
Q313 organic growth and 2014 CS forecast CS economists’ EU GDP (+1.3%) and IP (4.5%) forecasts imply a
recovery for in shorter-cycle demand in 2014.
We acknowledge Sandvik and SKF have good gearing to a EU short
cycle recovery but believe this is already discounted in consensus –
CS forecasts 6% organic growth for their relevant businesses. We
also believe valuations on both of these stocks are relatively full.
In Europe we would rather gain exposure to this theme through Atlas
Copco in Europe where the CT and IT businesses give good
exposure to this theme and multiples are not at a level that we
believe is likely to absorb further earnings upgrades
In the UK we believe there is scope for positive surprises on growth
for Bodycote and Spectris in 2014.
Source: Company data, Credit Suisse estimates, IBES consensus, Thomson Reuters
% of group 2014 EV/EBIT CS EBITA vs Consensus
SKF Group 85% 5.9% 35% 11.2 0.3%
GKN Group ex Aerospace 74% 4.0% 30% 11.9 4.0%
Spectris Group 60% 3.2% 30% 14.6 1.7%
Bodycote AGI 56% 2.6% 35% 9.6 1.5%
ABB Low voltage & DAM 41% 7.0% 30% 11.0 9.3%
Nexans Distributors & Installers 51% 1.0% 15% 12.0 11.3%
Atlas Copco CT & IT 49% 5.5% 35% 12.6 2.8%
IMI Fluid Power 42% 4.0% 30% 15.2 0.0%
Sandvik Machine Solutions 30% 6.0% 35% 11.4 -0.6%
Prysmian Trade & Installers 28% 2.5% 15% 10.0 7.0%
Siemens Industry 24% 2.7% 30% 12.9 2.8%
Schneider Industry 19% 5.0% 30% 10.7 4.5%
Average 47% 4.1% 29% 11.9 3.7%
2014 organic
growth for these
divisions
Op. Leverage for these
divisions
Key short cycle
divisions
Group

10
Theme #2: Structural Growth – Need to be selective in 2014
Prefer Assa & Schindler in EU structural growth
In 2013 the high quality names (Assa, Geberit, Kone,
Legrand & Schindler) premium to the sector has
extended from 17% to 26%.
In our view this is justified by our expectation of on
average organic sales growth of 4.8% in 2013 for
structural growth names vs a sector average of 0.4%.
However, based on this re-rating we believe in 2014
there is less scope for structural growth to outperform
as a theme. We favour a more selective approach and
based on their clear growth drivers in 2014 we see
scope for outperformance at Assa & Schindler
0%
20%
40%
60%
80%
100%
120%
Nov-03 Nov-04 Nov-05 Nov-06 Nov-07 Nov-08 Nov-09 Nov-10 Nov-11 Nov-12 Nov-13
UK High quality names PE premium / discount vs the sector Average
-20%
-10%
0%
10%
20%
30%
40%
Nov-03 Nov-04 Nov-05 Nov-06 Nov-07 Nov-08 Nov-09 Nov-10 Nov-11 Nov-12 Nov-13
EU High quality stocks EV/EBIT premium / discount vs sector Average premium / discount
Prefer Halma among UK structural growth names
In 2013 the PE premium for high quality stocks
(Halma, Renishaw, Rotork and Spirax Sarco) has also
increased to 109% from 85%.
Among these names we favour Halma based on the
continued success of its business model focusing on
safety and legislative driven end markets with high
barriers to entry.
Relative to its structural peer group Halma trades at a
more attractive relative valuation.
Source: Thomson Reuters, Credit Suisse research

11
#2: Structural growth: More to go at Assa Abloy, Halma & Schindler
0.0
20.0
40.0
60.0
80.0
100.0
120.0
140.0
Pedestrian doors Gate & Windowautomation
Industrial doors Assa Abloy ESsales
Europe Rest of world
60
70
80
90
100
110
120
130
Dec-08 Jul-09 Feb-10 Sep-10 Apr-11 Nov-11 Jun-12 Jan-13 Aug-13
KONE Schindler Thyssen OTIS
Assa Abloy (OP) remains a top pick in to 2014 as we see scope
for a positive surprise in the Entrance systems market. Assa’s
sales in this market (SEK12bn) imply a c7% global market share
but we see opportunity for Assa to execute on its acquire and
restructure strategy in this fragmented SEK c180bn market.
Halma (OP) in the medium term can benefit from increasing
safety and regulation in Industry and buildings but in the near-
term we believe its acquisition pipeline remains full which should
support strong organic growth over the next 12 months (in Q3
Halma grew organically at 6% which was 2x the UK average).
Schindler (OP) is our preferred way to play the attractive
Elevator market. Schindler is now growing broadly in-line with
best in class Kone, is well positioned to increase its share with
investment in new capacity (listed above) yet continues to trade
at an attractive 13% discount vs high quality peers.
New factories ramp up at Schindler
Source: Company data
Country City Type Start target Purpose
Europe (Slovakia) Dunajská Streda Elevators Q4 2013 Replacement - cost reduction
US Pennsylvania Elevators Q4 2013 Replacement - change of technology
China Shanghai Escalators Q1 2014 Replacement and Expansion
China Shanghai Elevators 2015 Replacement and Expansion
India Pune Elevators Q1 2014 Expansion
India Pune Escalators 2014 Expansion
Organic growth of lift manufacturers
Market size estimates & Assa ES sales (bn SEK)

12
Theme #2: Cyclical vs Secular vs Structural Framework
-20%
-15%
-10%
-5%
0%
5%
10%
15%
2006-2008 2009 2010-2012 2013E-2015E
Cyclical Average Secular average Structural (ex Assa & Legrand) average
Cyclical Secular Structural
Alstom ABB Assa Abloy
Bodycote >>> Alfa Laval Geberit
Electrolux Atlas Copco >>> Halma
GKN >>> Fenner <<< Kone
Laird IMI Legrand
Metso Melrose Renishaw
Morgan Adv. Mats Schneider Rotork
Nexans Siemens Schindler
Philips >>> Senior Spirax Sarco
Prysmian >>> Smiths Group
Sandvik Spectris
SKF Weir
Vesuvius
European Cyclical
UK Secular
European Structural
UK Cyclical European Secular
UK Structural
7
8
9
10
11
12
13
14
15
5% 7% 9% 11% 13% 15% 17% 19%
2013-2014 Average ROIC vs 2014E EV/EBIT Here we show our cyclical vs secular vs structural
company framework and those shaded companies we
believe have potential to move between categories:
GKN (OP), Bodycote (OP), Prysmian (OP) & Atlas (OP)
being our key picks.
Between 2006-08 the secular growth companies (largely
mining capex driven) outgrew structural names but the
structural names proved more resilient in 2009.
Structural growth companies tend to trade on a EV/EBIT
multiple 2 points higher than secular and therefore we
see scope for re-rating if companies are perceived to
move between categories.
N.B. We classify secular growth companies as those companies that may be exposed to a c2 year growth theme (eg Automation)
vs structural growth which may be driven by a theme (aging populations) or a businesses model (acquire and restructure).
Organic growth performance by category
Source: Company data, Credit Suisse research

13
Theme #3: Opportunity in Mining Aftermarket names
CAT Atlas Copco Fenner Sandvik Metso Weir FLSmidth Outotec
New equipment
More decline in end-
user demand in 2014
than 2013, but less
destocking by dealers.
Overall more than 20%
decline.
Surface - remains soft;
Underground -
reasonable
N.A.
Satisfactory with
volatility expected to
continue
Some macro positive
signs but not
necessarily leading to
improved mining
business. Copprt good
but outlook for coal
deteriorated.
Continued slowness in
mining capex spending
Service Flat in 2014 Good
Customer sentiment is
gradually improving -
US coal recovering,
Australia stablizing
Good & expect
aftermarket destock to
finish by end 2013
See aftermarket growth
at around 5%+ through
cycle going forward.
Relatively good shape
except coal. Difficult to
cut opex with mines
running at full capacity.
Remain solid due to the
need to optimize
operations
Demand OutlookUPSTREAM DOWNSTREAM
First time saw
stabilisation of demand
Stable
Sentiment towards mining equipment players remains low: We believe against a backdrop of low sentiment
to mining equipment players there is opportunity among those names with greater exposure to aftermarket; Atlas
Copco (60% aftermarket) and Fenner (85% aftermarket). At Sandvik we see relatively higher volume risk due to
its greater exposure to new equipment and on pricing in the more competitive crushing and grinders market.
We have a -21% mining OE decline in our forecasts in 2015: For the mining equipment players we forecast
new equipment to decline by -16% and -21% in 2014 and 2015. We believe this is also supported by comments at
3Q13 results for Sandvik (demand in mining showed signs of stabilization at low levels in 3Q) and Atlas Copco
(sequentially orders for underground mining were stable). Taking 3Q order levels as a run rate in to 2014 would
imply order declines broadly in line with our -16% 2014 forecast.
Mine Production should grow in 2014: In mining aftermarket we forecast 2014 and 2015 to grow by 5% based
on continued increases in mine production. Despite mine production growing in 2013 we believe that aftermarket
demand in 2013 is broadly flat due to destocking that took place across the 1H13.
Retain positive view on Atlas Copco (OP) & Fenner (OP), cautious on Sandvik: We see greater risk to
consensus at Sandvik and see scope for Atlas to re-rate relatively vs Sandvik as it currently is only at a 10%
premium on 2014E EV/EBITA. We believe this under-appreciates remaining Compressors and Industrial
Technique businesses. Fenner trades at a 28% discount to the UK sector on 2014E, which we also view as
attractive.
Source: Company data, Credit Suisse research

14
0%
10%
20%
30%
40%
50%
60%
70%
80%
90%
100%
Fenner Weir Atlas CAT Metso Sandvik FLS Outotec
New Equipment A/market
Theme#3 Mining aftermarket: Mine production growing in 2014/15
-
20,000
40,000
60,000
80,000
100,000
120,000
2008 2009 2010 2011 2012 2013E 2014E 2015E
Large Diversified Miners Smaller Focused Players
Total- June forecast
60
80
100
120
140
160
180
2011 2012 2013E 2014E 2015E
COAL- Oct COPPER- Oct IRON ORE- Oct
PRECIOUS- Oct COPPER- June IRON ORE- June
COAL- June PRECIOUS- June
2012 2013E 2014E 2015E 2013-15
Iron Ore 1.8% 7.3% 12.9% 7.6% 9.3%
Met Coal 6.4% 6.4% 6.2% 6.7% 6.4%
Therm Coal 10.2% 5.1% 2.4% 3.9% 3.8%
Copper 3.5% 4.5% 4.4% 4.2% 4.4%
Aluminium 4.8% 5.0% 6.4% 5.4% 5.6%
Zinc 11.1% 5.7% 3.2% 3.6% 4.2%
Silver -2.5% -2.8% -0.1% 0.4% -0.8%
Platinum -7.8% 1.3% 2.3% 0.9% 1.5%
Total Average 3.4% 4.1% 4.7% 4.1% 4.3%
Our forecasts of -16% and -21% declines in NE in 2014/15 are based on the capex forecasts of 90 miners covered by CS.
According to CS mining analysts, mine production is expected to continue to rise in 2014/15 supporting aftermarket growth.
Fenner and Atlas have the largest exposure to mining aftermarket, which we view as favorable.
Coal in the US was the first commodity to see declines and it is now stabilizing at an earlier stage, which we view as positive
for Fenner.
Source: Company data, Credit Suisse estimates for aftermarket exposure

15
#3: Mining aftermarket: Equipment players valuations
-40%
-30%
-20%
-10%
0%
10%
20%
30%
Nov-
04
Nov-
05
Nov-
06
Nov-
07
Nov-
08
Nov-
09
Nov-
10
Nov-
11
Nov-
12
Nov-
13
Atlas EV/EBIT vs Mechanicals
Through-cycle Average (2004-07)
-20%
-10%
0%
10%
20%
30%
Nov
-04
Nov
-05
Nov
-06
Nov
-07
Nov
-08
Nov
-09
Nov
-10
Nov
-11
Nov
-12
Nov
-13
Sandvik EV/EBIT vs Mechanicals
Through-cycle Average (2004-07)
-50%
-40%
-30%
-20%
-10%
0%
10%
20%
30%
Nov-
04
Nov-
05
Nov-
06
Nov-
07
Nov-
08
Nov-
09
Nov-
10
Nov-
11
Nov-
12
Nov-
13
Metso EV/EBIT vs Mechanicals
Through cycle average (2004-07)
-60%
-50%
-40%
-30%
-20%
-10%
0%
10%
20%
30%
40%
Nov
-04
Nov
-05
Nov
-06
Nov
-07
Nov
-08
Nov
-09
Nov
-10
Nov
-11
Nov
-12
Nov
-13
Fenner EV/EBIT vs UK industrials
Through-cycle average (2004-07)
Relative Atlas Copco 2014E EV/EBITA: We view the broadly
in-line with the sector valuation as attractive
Relative Sandvik 2014E EV/EBITA: Despite de-rating we
continue to see a risk to consensus forecasts
Fenner 201E4 EV/EBITA: We are 5% ahead of consensus and
believe upgrades can drive further a further re-rating for Fenner
Relative Metso 2014E EV/EBITA: The focus currently is on
the value of the individual segments due to the group splitting
Source: Thomson Reuters

16
Theme #4: Stabilization should allow Electricals to re-rate
Prysmian T&I 10%
Rest of group90%
0.0%
4.0%
8.0%
12.0%
16.0%
20.0%
3Q10
4Q10
1Q11
2Q11
3Q11
4Q11
1Q12
2Q12
3Q12
4Q12
1Q13
2Q13
3Q13
ABB Power Products Siemens I&C Prysmian T&I
Siemens Infrastructure &
Cities14%
Rest of group86%
ABB Power Products + Systems
34%
Rest of group66%
ABB 2012 EBITDA split Prysmian 2012 profit split
We believe that, given the share of profits ABB Power
(particularly Systems), Siemens I&C and Prysmian’s T&I
divisions account for, they are given undue focus by the
market.
Increasingly at ABB’s, Siemens’ and Prysmian’s
underperforming businesses there are signs of stabilization and
even of improving profitability. Also at Siemens a new CEO
may result in a refreshed strategy for I&C.
We believe this stabilization can drive a re-rating for the overall
groups. In our view, the higher quality businesses of the group,
for example, ABB’s Automation business, are currently being
undervalued relative to its peers.
Siemens 2012 profit split
4Q MAV margins of underperforming Electricals divisions
Source: Company data, Credit Suisse estimates of profit split

17
#4: Electricals’ acquisitions should further improve business mix
0%
4%
8%
12%
16%
0
2000
4000
6000
8000
10000
ABB (to 1x) Siemens (1x Ind net debt) Prysmian (to 1.5x)
Acquisition firepower (€mn) Earning accretion scenario (RHS)
Date Company acquired End market
Sep-13 ELIBI Elektrik Low Voltage
Aug-13 Newron System Building Automation software
Jul-13 Alstom's Ring Motor Business Process Automation motors
May-13 Los Gatos Research Gas measurement
Apr-13 Power-One Solar Power Invertors
Feb-13 APS Technology Group Shipyard automation
Sep-12 Amarcon BV Shipping software
Aug-12 Newave Energy Holding SA Uninterruptible Power Supply
Jun-12 Tropos Networks Inc Wireless communications
May-12 Thomas & Betts Low Voltage
Date Company acquired End market
Jul-13 Service Guide Inc Metals and Mining
Jun-13 Preactor Group Industry Software
Nov-12 Invensys rail Rail signalling
Nov-12 LMS International Industry Software
Oct-12 Kineo CAM Industry Software
Sep-12 Perfect Costing Solutions GmbH Industry Software
Aug-12 Penrith Corporation Healthcare
Aug-12 Kaon Holdings Pty Ltd Power Transmission
Jul-12 Senergy Sistemas de Medição S.A Smart Metering
Apr-12 FCE Metals and Mining
Mar-12 Expro Measurements Division Subsea Oil & Gas
ABB
Siemens
Recent acquisitions by ABB and Siemens Based on re-leveraging below we show ABB, Siemens & Prysmian’s fire
power and an earnings accretion scenario based on this firepower
The recent strategy for ABB and Siemens has been to acquire in
end markets away from their underperforming divisions (excluding
Invensys rail which improved the business mix of I&C).
In our view this active acquisition strategy, particularly in Industry
automation software, improves their competitive offering and
therefore the medium term growth prospects and is supportive of
an overall re-rating for the groups.
We believe that, based on re-leveraging, acquisitions can drive
15% and 8% EPS accretion at ABB and Siemens, respectively. We
expect ABB to continue to acquire across the Automation end
market and Siemens’ focus to be on Process Automation
Source: Company data, Credit Suisse estimates

18
Theme #5: Balance sheet re-leveraging
0%
1%
2%
3%
4%
5%
6%
7%
8%
Prys
mia
n
Assa
Abl
oy
ABB
Alfa
Lav
al
Atla
s C
opco
Schn
eide
r
Legr
and
Met
so
Nex
ans
SKF
Sand
vik
Kone
Siem
ens
Elec
trolu
x
Philip
s
Alst
om
Schi
ndle
r
Geb
erit
Average acquisition impact on sales (2007-12)
-1.50
-1.00
-0.50
0.00
0.50
1.00
1.50
2.00
2.50
Sch
indl
er
Geb
erit
Ren
isha
w
Kon
e
Rot
ork
Bod
ycot
e
Spi
rax
Sar
co
Alfa
Lav
al
AB
B
Sen
ior
Spe
ctris
Hal
ma
Phi
lips
IMI
GK
N
Ele
ctro
lux
Met
so
Fenn
er
Legr
and
Atla
s C
opco
Mor
gan
Adv
. Mat
s.
Sie
men
s
Ves
uviu
s
Sch
neid
er
Laird
SK
F
San
dvik
Pry
smia
n
Wei
r G
roup
Ass
a A
bloy
Sm
iths
Als
tom
Nex
ans
Mel
rose
2014 net Debt/EBITDA 2007-12 average net debt/EBITDA
Average 2007-12 acquisition impact on sales
Companies with low leverage vs history are GKN, Fenner, Legrand, Sandvik, Bodycote, GKN, Senior, Spectris & Vesuvius
Source: Company data, Credit Suisse estimates
We would expect Legrand and Assa to continue on
their bolt on strategy.
We see scope for Siemens to acquire in the Process
Automation space.
We believe ABB may focus on expanding their
offering in valves through acquisitions.
We believe share buybacks are most likely at Atlas
Copco, Alfa Laval.
UK names most likely to acquire include Spectris,
Rotork, Bodycote, Melrose and Senior.

19
#5: Balance sheet re-leveraging – where is the potential
Source: Company data, Credit Suisse estimates
2014 Net Debt /
EBITDA
5 year
averageManagement comments / Previous corporate action
ABB 0.10x -0.32xTarget 3-4% inorganic sales CAGR. Recent acquisition focus in automation including Baldor ($4.2bn, Motors) and Thomas & Betts ($3.9bn,
Low Voltage). Buybacks less of a focus
Legrand 0.66x 1.26xStrategy of bolt on acquisitions predominantly in emerging markets. Added on average 5% to sales in 2011 and 2012 but this will fall to
c2.5% in 2013.
Siemens 0.92x 1.00xAnnounced a €3bn buyback in 2012 and a €4bn buyback in 2013. Recent acquisitions included Invensys rail for €2bn and also in Automation
software. An end market targeted for further expansion is Process Automation
Alfa Laval -0.17x 0.31xThe company has a track record of returning cash to shareholders and targets c4% growth from acquisitions per annum. We see a fair
probability of a special distribution in 2014.
Assa Abloy 1.33x 1.65xOne of the best quality 'Acquire & Restructure' models in the sector with a healthy pipeline of further deals. We expect acquired growth of
8.6% for 2014 and 8.2% for 2015.
Atlas Copco 0.74x 0.78xA very consistent track record of returning excess cash to shareholders in absence of acquisitions combined with a stream of successful bolt-
on deals. We do not discount further acquisitions beyond Edwards but expect a cSEK 5bn cash return.
Electrolux 0.49x 0.51xHistorically the company has returned cash to shareholders but the more recent focus has been on investment in growth internally and on
building up an acquisitions pipeline.
Kone -0.80x -0.74xConsistently has returned excess cash to shareholders. With special dividend announced at Q3 2013 results, we see a small probability of
an extra distribution over the next 6-9 months. Continue to target small bolt on service acquisitions.
Schindler -1.34x -1.62xHas returned some excess cash to shareholders in the past. The recent fixed price buyback offer would have amounted to c7% of share
capital but was only c30% taken up.
Bodycote -0.37x 0.54xHas returned cash to shareholders in the past but the recent focus has been more on bolt-on acquisitions. In absence of sizable deals over
the next 6 months, we would expect a cash distribution.
Halma 0.17x 0.33xStrategy of bolt on acquisitions and in FY12/13 Halma made six acquisitions. We believe their focus going forward will be on Health &
Analysis and estimate an average deal multiple of 9x EV/EBIT. We estimate at 2x net debt / EBITDA Halma has c£300m of firepower.
IMI 0.48x 0.52xIMI's acquisition strategy is to expand in to Process with the last three acquisitions including in Fluid Power and Severe Service. We
estimate IMI have £600m of firepower assuming releveraging to 2x net debt / EBITDA
Melrose 2.15x 1.42xMelrose have disposed of Crosby / Acco, Truth & Marelli in 2013. Bridon likely to go in 2014 and Energy in 2015. Management have stated
they are on the look out for the next deal. We believe the target size would be £3bn EV which would result in a rights issue.
Spectris 0.00x 1.12x
We estimate Spectris has c£470m of firepower upon releveraging to 2x net debt / EBITDA. We think acquisition focus will include Industrial
controls while maintaining their current global sales exposure. In 2012 their acquired Omega (now rolled out to China) for £290m implying an
12x EBIT acquisition multiple.

20
Theme #6: Competitive Risk
We believe competitive risk will become a more prominent theme in 2014 than it has been in 2013.
Key end markets where we see the risks increasing are bearings due to Japanese competitors benefitting from a
weakening Yen and also because of Chinese bearings makers increasingly focusing on higher end bearings. SKF in 2Q
and 3Q reported negative price mix and we believe with increasing competition this is unlikely to change in 2014.
We also believe the risks are increasing in the Crushing and Grinders segment (Sandvik, Weir & Metso) in mining
equipment with large Chinese players, such as Citic Heavy, gaining prominence and also gaining their first systems
contract in Europe in 2014.
Risk Rating 1 2 3 4 5
High Power Gen.(Coal)
Appliances, T&D
Bearings
Trucks
Mining Equipment - Crushers & Grinders
Medium Drive systems
Transport
O&G (Fracking)
Heat exchangers
Elevator
Low
Heat Treatment
Timeframe in years
Automation
Construction Equipment
Low Voltage equipment
Auto components
Mining Equipment
Risk Rating 1 2 3 4 5
High Alstom
Electrolux
ABB
Medium Philips
Sandvik
Atlas Copco
Low
Volvo, Man, Scania
SKF
Metso
Timeframe in years
Alfa Laval
Kone, Schindler
Legrand
Geberit
Schneider
Source: Credit Suisse research

21
#6: Charting the competitive risk
-15%
-10%
-5%
0%
5%
10%
15%
20%
SKF Qianchao(QC)
Wafangdian(ZWZ)
Tianma(TMB)
Longxi (LS) Xiangyang(ZXY)
Zhouyan Keji(ZYS)
Xibei (NXZ) Nanfang(NF)
ZhonghangHazhou(ZHHZ)
0
1,000
2,000
3,000
4,000
5,000
6,000
7,000
8,000
9,000
Total Revenue (RMB m) Bearing revenue (RMB m) Total EBIT margin
COMMUNITION
Crushing Grinding Screening Pumps Cyclones Concentration Refining
Atlas Copco Y
Sandvik Y Y
Astec Y Y Y
FL Smidth Y Y Y Y Y Y Y
Metso Y Y Y Y Y
Thyssen Krupp Y Y Y
TENOVA Y Y Y Y
FAM Y Y
Weir Y Y Y Y Y
CITIC HEAVY Y Y
SLURRY PROCESSING
European
Companies
Japanese
CompetitorsArea of Business
Relevance for
European
competitor
ABB Yokogawa Process Automation Low
Fanuc Discreet Automation (Robots) Low
Alstom Mitsubishi Heavy Thermal Power Division Medium
Atlas Copco Furukawa MRET and Construction Low
Furukawa Low
Komatsu Low
Kawasaki Low
SumitomoSandvik Tooling and Material
Technology Low
Kyocera Sandvik Tooling Medium
Mitsubishi Sandvik Tooling Medium
Furukawa Mining and Construction Low
Hitachi Material Technology Low
Mitsubishi Heavy Power Transmission & Fossil Power Medium
Toshiba Healthcare, Turbines Low
Hitachi Healthcare Low
Fanuc Drive Technology Low
NSK High
NTN High
JTEKT High
THK Actuation Motion Control Low
Metso Construction
Sandvik
Siemens
SKFBearing & Units
Chinese players are taking share from SKF and focusing on high end bearings
(rectangles indicate companies focused on export and rectangles on high end bearings)
Crushing & Grinding is a competitive mining sub-segment with prominent Chinese players
We also see risk for SKF from Japanese players in a sustained weak
Japanese Yen environment
100
110
120
130
140
150
Dec-12
Dec-12
Jan-13
Jan-13
Feb-13
Feb-13
Mar-13
Mar-13
Apr-13
Apr-13
Apr-13
May-13
May-13
Jun-13
Jun-13
Jul-13
Jul-13
Aug-13
Aug-13
Sep-13
Sep-13
Sep-13
Oct-13
Oct-13
Nov-13
Nov-13
Dec-13
EUR/JPY
xCS forecasts (next 12m): 148.8
Source: Company data, Bloomberg, Credit Suisse research

22
#6: Greatest structural competition risk continues to be for Alstom
0%
20%
40%
60%
80%
100%
2008 2013
General Electric Siemens Mitsubishi Alstom Other
We continue to see the greatest medium term structural risk for Alstom. This is primarily due to its sub-scale gas turbine
business and greatly reduced market share in steam turbines. In Rail Alstom has a c15% global market share but has
two large Chinese competitors in China Southern Rail and China Northern Rail.
In Gas Turbines Alstom had 4% market share in 2013 vs 5% in 2012. However, in that time Mitsubishi has increased its
share to 22% from 12% meaning there are now three established players in this market (GE, Siemens & Mitsubishi)
with combined 85% market share.
In Steam turbines (even excluding Chinese players which dominate China – the world’s largest market) Alstom’s share
fell to 5% in 2011 having been 9% between 2002-11.
We also remain concerned that an emerging threat for Alstom on the Power services side is the risk of Utilities trying to
offset weak earnings by potentially taking part of Power Plant servicing in-house to reduce their costs. This would
primarily negatively impact Alstom due to its large European Installed base.
0%
20%
40%
60%
80%
100%
2002-11 2011
BHEL Siemens Toshiba GE MHI Alstom Other
Global Gas Turbine market shares (2013 vs 2008) Steam turbine market shares (ex China) in 2011 vs shares between 2002-11
Source: McCoys, Company data, Credit Suisse research

23
Theme #7: Sector M&A
In 2013, we have seen further M&A within the
sector with Invensys taken out by Schneider
post Siemens acquiring the Rail segment.
We have re-run our HOLT CFROI M&A Screen
for the Pan European Capital Goods universe
with analysis over 6 criteria. We would highlight
the following names from the Screen:
From companies that met 5 criteria
Alfa Laval
Fenner
Legrand
Rotork
From companies that met 4 criteria
Smiths Group
Spectris
Weir
From companies that met 3 criteria
IMI
Score Company
Mkt Implied
CFROI below
1Fail and 5
year
median
CFROI FY1
above 8%
hurdle WACC
CFROI
improvement
expected in
FY1 over
FYFail
Consensus
estimates not
greater than
the median
FY1 Net
Debt/EBITDA
less than
2.Failx
Sustainable
Growth Rate
is greater
than 5%
6 ABB LIMITED Pass Pass Pass Pass Pass Pass
5 ALFA LAVAL AB Pass Pass Pass Fail Pass Pass
5 ASSA ABLOY AB Fail Pass Pass Pass Pass Pass
5 FENNER PLC Fail Pass Pass Pass Pass Pass
5 HALMA P.L.C. Pass Pass Pass Fail Pass Pass
5 KABA HOLDINGS AG Pass Pass Pass Pass Pass Fail
5 KONINKLIJKE PHILIPS NV Fail Pass Pass Pass Pass Pass
5 LEGRAND S.A. Pass Pass Pass Fail Pass Pass
5 ROTORK P.L.C. Pass Pass Pass Fail Pass Pass
4 ALSTOM SA Pass Pass Fail Fail Pass Pass
4 GEBERIT AG Fail Pass Pass Pass Pass Fail
4 KONE OYJ Fail Pass Pass Pass Pass Fail
4 SANDVIK AB Pass Pass Pass Fail Pass Fail
4 SCHINDLER HOLDING AG Pass Pass Fail Fail Pass Pass
4 SCHNEIDER Pass Pass Fail Fail Pass Pass
4 SMITHS GROUP PLC Pass Pass Fail Fail Pass Pass
4 SPECTRIS PLC Pass Pass Fail Fail Pass Pass
4 VESUVIUS PLC Fail Pass Pass Pass Pass Fail
4 WEIR GROUP PLC (THE) Pass Pass Fail Fail Pass Pass
3 ATLAS COPCO AB Pass Pass Fail Fail Pass Fail
3 IMI PLC Fail Pass Fail Fail Pass Pass
3 LAIRD PLC Fail Pass Pass Fail Pass Fail
3 MELROSE INDUSTRIES PLC Pass Pass Fail Fail Fail Pass
3 METSO OYJ Pass Pass Fail Fail Pass Fail
3 PRYSMIAN SPA Pass Pass Fail Fail Fail Pass
3 RENISHAW PLC Fail Pass Fail Fail Pass Pass
3 SENIOR PLC Fail Pass Fail Fail Pass Pass
3 SIEMENS AG Pass Pass Fail Fail Pass Fail
3 SKF AB Fail Pass Pass Fail Pass Fail
3 SPIRAX-SARCO ENGINEERING PLC Fail Pass Fail Fail Pass Pass
2 MORGAN ADVANCED MATERIALS PLC Fail Pass Fail Fail Pass Fail
1 BODYCOTE PLC Fail Fail Fail Fail Pass Fail
1 ELECTROLUX AB Fail Fail Fail Fail Pass Fail
1 GKN PLC Fail Fail Fail Fail Pass Fail
0 NEXANS SA Fail Fail Fail Fail Fail Fail
Criteria
Source: Credit Suisse HOLT®

24
Sector Performance

25
Growth and margin expectations for 2014
2.7%
1.4%
0.7%
0.4%
5.0%
4.4%4.2%
4.0%
0.0%
1.0%
2.0%
3.0%
4.0%
5.0%
6.0%
post 1Q13 post 2Q13 post 3Q13 Current
2013 organic growth forecast 2014 organic growth forecast
7.2%
6.4%
13.4%
11.4%
5.9%
-12.7%
6.4%
11.6%
3.5%
0.4%
4.0% 4.5%
10.0%
11.1%
12.2%
13.1%
11.1%
13.8%
14.6%
14.4%14.3%14.8%15.3%
0%
2%
4%
6%
8%
10%
12%
14%
16%
-18.0%
-14.0%
-10.0%
-6.0%
-2.0%
2.0%
6.0%
10.0%
14.0%
18.0%
2004
2005
2006
2007
2008
2009
2010
2011
2012
2013E
2014E
2015E
Sector EBIT margin, % Sector organic growth, %
Sector organic growth and margin forecast CS revisions to 2013 and 2014 organic growth forecasts YTD
We forecast 4% organic growth for the sector in 2014 and 40bps of margins expansion. The key drivers of margin expansion
in 2014 are 1) on-going cost cutting programmes across the sector (we assume c50% retention), 2) benign raw material
environment.
In 2013 organic growth disappointed with our expectations having declined by 230bps YTD. In that time expectations for
2014 have moderated by 100bps.
In our view, despite improvements in lead indicators, we find it moderately concerning that this has not filtered through to
demand in Europe for some of the shorter-cycle companies in the sector – SKF guides for sequentially flat demand in Q4.
Therefore, we believe the risk on 2014 consensus organic growth is somewhat to the downside, in particular as Q3
destocking in Europe continued to negatively impact volumes for Legrand and Schneider. In our view, this continues to be a
risk to the assumption of an strong European volume recovery in early 2014, most notably in France.
Source: Company data, Credit Suisse estimates

26
Lead indicators are supportive of a gradual 2014 recovery
Q1 Q2 Q3E Q4E Q1 Q2 Q3 Q4 12 13E 14E 15E
Global Real GDP (y/y) 2.4 2.7 2.9 3.2 3.6 3.6 3.7 3.8 3.1 2.9 3.7 3.9
US Real GDP (q/q ann) 1.1 2.5 2.8 1.9 2.5 2.7 3.0 3.0 2.8 1.7 2.6 2.8
Euro Area Real GDP (q/q ann) -0.9 1.1 0.4 1.3 1.3 1.4 1.8 1.5 -0.6 -0.4 1.3 1.7
China Real GDP (y/y) 7.7 7.5 7.8 7.7 7.7 7.7 7.8 7.7 7.7 7.6 7.7 8.2
India Real GDP (y/y) 4.8 4.4 5.2 5.9 6.2 6.7 6.8 6.7 5.0 5.4 6.6 6.9
Annual Average2013 2014E
-4%
0%
4%
8%
12%
16%
2011 2012 2013 2014
Global IP Euro area IP US IP China IP
In Europe the PMI has remained marginally above the 50 level for four months indicating growth, but at a moderate
level. The US ISM has indicated a stronger environment with its third consecutive reading >60 in Oct.
The CS Economics team forecasts global GDP growth of 3.7% in 2014 and Global IP growth of 4.4% (1.7% in EU).
20.00
30.00
40.00
50.00
60.00
70.00
Nov-04 Nov-05 Nov-06 Nov-07 Nov-08 Nov-09 Nov-10 Nov-11 Nov-12 Nov-13
EU PMI new orders US ISM new orders China PMI new orders
Source: Company data, Credit Suisse research

27
Pricing: Broadly similar trends in 2014 as in 2013
Automotive3%
General industrial14%
Construction Res6%
Construction non Res16%
Oil & Gas4%
Mining6%
Power T & D10%
Power Gen 12%
Transport 7%
Medical9%
Consumer/ Appliances
10%
Other3%
Sector exposure by geography
West Europe
38%
US20%
Emerging Mkt39%
Others3%
CS estimate of pricing as a % of sales per year by end market
We believe pricing trends will remain broadly similar in 2014 to 2013 but we
believe the end markets where there is the greatest risk of pricing taking a more
negative step-down is the bearings market.
We believe the end markets seeing the greatest pricing pressure are Healthcare
equipment (due to Japanese players lowering prices) and Gas turbines (due to
low demand levels) which are running at -4% to 5% of sales per year.
Our current assumption is that bearings are not seeing negative pricing pressure.
However, we believe this is the end market where pricing is most likely to worsen
in 2014/15 with the Chinese market being most vulnerable, followed by Emerging
markets where Chinese players have greatest scope to accelerate the exporting
of locally produced bearings (EM is 40% of SKF’s revenues).
Sector exposure by end-market
-5%
-4%
-3%
-2%
-1%
0%
1%
2%
Gas Turbines Healthcare LargeTransformers
Constructioncables
Appliances Miningaftermarket
Bearings Low Voltage
Pricing pressure as a % of sales
Source: Company data, Credit Suisse estimates

28
Margin driver #1: Cost cutting
Those companies we believe have potential to surprise
positively on cost savings are Prysmian and Assa Abloy.
The Electricals cost savings in 2014E are relatively
higher than the Mechanicals but the Electricals end
markets (Healthcare, Power Gen) are also those seeing
greatest pricing pressure.
A driver of share price outperformance in 2012 and
1H13 was cost cutting (Philips & Electrolux), but we
believe programmes across the sector are now well
understood by the market.
Broadly across the sector we assume a 50% retention
rate for cost savings in our models.
For SKF we currently discount the full SEK3bn of
savings by 2015 and therefore see limited scope for
surprise.
Finally, c50% of cost savings targeting in the sector
relate to reduced sourcing cost reduction (eg using lower
cost component suppliers). We believe this trend may
pose a risk to companies such as SKF that sell higher
quality parts (bearings) in to larger products.
Source: Credit Suisse estimates
Cost savings as a % of sales 2013E 2014E 2015E
Electricals
ABB 2.6% 2.5% 2.4%
Alstom nm 2.4% 2.3%
Legrand nm
Nexans 0.5% 1.1% 1.6%
Philips 0.2% 0.2% 0.1%
Prysmian 0.5% 0.6% 0.3%
Schneider 1.3% 0.0%
Siemens 2.6% 4.7%
Electrical Average 1.3% 1.5% 1.1%
Mechanical
Alfa Laval 0.3%
Assa Abloy 0.7% 0.6%
Atlas Copco nm 0.2%
Electrolux 1.2% 0.9% 0.8%
Geberit nm
Kone 0.4%
Metso 0.8% 2.2%
Sandvik 1.2% 0.8% 0.8%
Schindler 0.0% 0.3% 0.2%
SKF 0.3% 1.4% 1.6%
Mechanical Average 0.6% 1.0% 0.9%

29
Margin Driver #2: Raw materials as a small tailwind
0
20
40
60
80
100
120
140
160
180
200
Dec-07 Dec-08 Dec-09 Dec-10 Dec-11 Dec-12 Dec-13 Dec-14
Iron Ore Credit Suisse forecasts
2,000
3,000
4,000
5,000
6,000
7,000
8,000
9,000
10,000
Dec-07 Dec-08 Dec-09 Dec-10 Dec-11 Dec-12 Dec-13 Dec-14
Copper Credit Suisse forecasts
1000
1500
2000
2500
3000
3500
Dec-07 Dec-08 Dec-09 Dec-10 Dec-11 Dec-12 Dec-13 Dec-14
Aluminium Credit Suisse forecasts
The raw material environment was benign in 2013 and our CS
commodities team remains cautious on prices going in to 2014.
Their expectations are for copper prices at the end of 2014 to
have fallen by -14% from current levels and iron ore by -32%.
Most companies in the sector are relatively well hedged but we
believe a declining raw material price environment would be most
positive for Legrand, Schneider, Electrolux and SKF.
Current Electrolux guidance is for flat raw material impact on
EBIT in 2014, but it agrees the 2014 hedging price for steel in
4Q13. Therefore, a decline in steel prices is unlikely to benefit
Electrolux until 2015 (having hedged at a lower price in 4Q14).
Source: Thomson Reuters, Credit Suisse research

30
Sector Valuations

31
Valuation: We are currently at Mid-cycle multiples
8%
9%
10%
11%
12%
13%
14%
15%
16%
17%
0.50
0.70
0.90
1.10
1.30
1.50
1.70
1.90
Nov-0
3
Ma
y-0
4
Nov-0
4
May-0
5
Nov-0
5
Ma
y-0
6
Nov-0
6
Ma
y-0
7
Nov-0
7
Ma
y-0
8
Nov-0
8
Ma
y-0
9
Nov-0
9
Ma
y-1
0
Nov-1
0
Ma
y-1
1
Nov-1
1
Ma
y-1
2
Nov-1
2
Ma
y-1
3
Nov-1
3
Sector EV/Sales Sector underlying EBIT margin
6
7
8
9
10
11
12
13
14
Nov-03 Nov-05 Nov-07 Nov-09 Nov-11 Nov-13
European Cap Goods EV/EBIT Average
On balance we have a neutral view on the sector as, with 12mth FWD EV/EBIT for the sector at 11.8x earnings,
earnings upgrades are needed to drive further share-price performance in 2014.
The sector has re-rated through 2013 and is now trading above its mid-cycle multiple. In our view, based on the
sector margin having reached a new peak, a higher through cycle average than 2004-2007 is justified. However, we
still believe there is 6% downside in the event of a return to mid-cycle multiples.
In our view earnings upgrades in the medium term will be driven by the top-line (volume and price) rather than by
margin improvements driven by cost savings. The sector is already at peak margins and with competition in areas
such as bearings and mining equipment increasing, we believe the scope for a further margin step up is limited.
We believe those companies that can surprise positively on the topline in 2014 are ABB, Assa Abloy, Prysmian,
Bodycote, Fenner, GKN & Spectris.
Source: Thomson Reuters, Credit Suisse research

32
Valuation: Preference for sub-sectors
-40%
-30%
-20%
-10%
0%
10%
20%
30%
Nov-0
6
Ma
y-0
7
Nov-0
7
Ma
y-0
8
Nov-0
8
Ma
y-0
9
Nov-0
9
Ma
y-1
0
Nov-1
0
Ma
y-1
1
Nov-1
1
Ma
y-1
2
Nov-1
2
Ma
y-1
3
Nov-1
3
EV/EBIT (Elec vs Mech premium (discount))
-40%
-30%
-20%
-10%
0%
10%
20%
30%
Nov-0
6
Ma
y-0
7
Nov-0
7
Ma
y-0
8
Nov-0
8
Ma
y-0
9
Nov-0
9
May-1
0
Nov-1
0
Ma
y-1
1
Nov-1
1
Ma
y-1
2
Nov-1
2
Ma
y-1
3
Nov-1
3
EV/EBIT (UK vs European premium(discount))
Looking at the performance of sub-sectors into the year end, the Electricals have rallied relative to the Mechanicals with
their share prices outperforming by 5% over the last three months. In terms of sector positioning we believe that in
Electricals, Siemens remains the best owned name, with short mining capex (and particularly Atlas Copco) being the
most common trade in Mechanicals.
Into 2014 we do not have a strong preference for Electricals vs Mechanicals but based only on valuation downside we
see greater scope for de-rating based on our valuation framework (on the next page) in Electricals (-8% potential
downside in a return to mid-cycle) vs the Mechanicals (-3%).
We believe the UK sector has 6% downside in a return to mid-cycle multiples but there has been the clear trend in 2013
of the higher quality names re-rating vs the UK industrial average. Among the high quality names, we prefer Halma and
also those names with secular growth drivers including Spectris (Automation) and Bodycote & GKN (Aerospace).
Source: Thomson Reuters

33
Valuation: 6% potential downside on mid-cycle multiples
L. Growth Mid-cycle L. Growth Mid-cycle L. Growth Mid-cycle
Electricals
ABB SFR 9.0 10.0 21.6 24.0 -7% 4%
Alstom EUR 7.5 8.5 18.7 23.0 -30% -14%
Legrand EUR 9.5 11.0 29.7 33.1 -25% -17%
Philips EUR 8.0 9.5 20.3 24.7 -22% -6%
Prysmian EUR 8.5 9.5 16.4 19.0 -14% -1%
Schneider EUR 8.5 10.0 45.5 55.2 -26% -10%
Siemens EUR 8.5 10.0 68.3 83.6 -30% -14%
Average Electricals 8.4 9.7 -22% -8%
Mechanicals
Alfa Laval SEK 9.0 11.0 114.6 139.5 -25% -9%
Assa Abloy SEK 10.0 12.0 210.2 259.7 -37% -22%
Atlas Copco SEK 9.0 11.0 128.7 160.2 -31% -14%
Electrolux SEK 7.5 9.5 154.1 200.0 -3% 26%
Geberit CHF 10.5 13.0 171.6 208.5 -36% -22%
Kone EUR 10.0 12.0 44.9 53.1 -35% -23%
Metso EUR 7.5 9.5 27.0 34.8 -10% 16%
Sandvik SEK 8.5 10.0 96.8 111.3 6% 21%
Schindler CHF 10.0 12.0 104.7 122.8 -17% -3%
SKF SEK 7.5 9.5 126.7 168.1 -29% -5%
Average Mechanicals 9.0 11.0 -22% -3%
UK
Bodycote GBP 8.0 9.5 5.3 6.2 -14% 1%
Fenner GBP 8.5 10.5 5.2 6.4 20% 46%
GKN GBP 7.0 8.5 2.8 3.5 -25% -7%
Halma GBP 9.0 11.5 3.6 4.7 -39% -21%
IMI GBP 8.0 10.0 9.5 12.1 -36% -19%
Laird GBP 7.5 9.0 1.6 2.0 -39% -24%
Melrose GBP 9.0 10.0 2.3 2.5 -23% -15%
Morgan Adv. Mats. GBP 7.0 8.0 2.7 3.1 -8% 7%
Renishaw GBP 10.0 12.0 12.0 14.2 -35% -23%
Rotork GBP 10.5 13.0 21.0 25.7 -27% -10%
Senior GBP 8.0 9.5 2.2 2.6 -22% -7%
Smiths GBP 8.0 10.5 13.7 17.3 0% 26%
Spectris GBP 8.7 10.5 16.3 19.7 -31% -17%
Spirax Sarco GBP 9.0 11.5 18.9 23.9 -35% -18%
Vesuvius GBP 7.5 9.0 3.3 4.1 -33% -17%
Weir Group GBP 9.0 11.0 16.9 21.3 -21% -1%
Average UK 8.4 10.3 -23% -6%
Pan-Euro Sector Average 8.6 10.4 -22% -6%
Target EV/EBITA (2014)Scenario Valuation using
Target EV/EBITA (2014)
Upside / (Downside) vs
current share price
-20%
-18%
-16%
-14%
-12%
-10%
-8%
-6%
-4%
-2%
0%
Ele
ctric
al A
v.
Mec
hani
cal A
v.
UK
Av.
Sec
tor
Av.
Cyc
lical
Av.
Str
uctu
ral A
v.
Upside/ (Downside) vs current share price
Using target mid-cycle multiples for
companies and backing out the implied
share price using our forecasts, the
sector has -6% potential downside on a
return to these target multiples.
Having re-rated the structural growth
names show -18% potential downside
using this methodology and while
companies in our cyclicals category are
showing -3% potential downside.
Source: Credit Suisse estimates

34
-10%
-8%
-6%
-4%
-2%
0%
2%
4%
6%
8%
10%
-40%
-30%
-20%
-10%
0%
10%
20%
30%
40%
Nex
ans
Pry
smia
n
Sch
indl
er
Ass
a A
bloy
Ele
ctro
lux
Sie
men
s
San
dvik
Met
so
Gkn
Ves
uviu
s
Inve
nsys
Alfa
Lav
al
AB
B
Kon
e
SK
F
Sch
neid
er
Als
tom
Mor
gan
Cru
cibl
e
Bod
ycot
e
Spe
ctris
Sen
ior
Phi
lips
Laird IM
I
Ren
isha
w
Geb
erit
Hal
ma
Rot
ork
Spi
rax
Sar
co
Atla
s C
opco
Sm
iths
Gro
up
Wei
r
Legr
and
Fen
ner
2014 EV/EBIT premium / discount vs sector
2015 EV/EBIT premium / discount vs sector
Difference between 2015 and 2014 premium / discount (stocks on LHS look relatively cheapest on 2015 multiples vs 2014)
Valuation: Too early to look at the sector on 2015 multiples? Difference between 2015 and 2014 premium / discount to the sector –
Companies on the LHS of the chart look relatively cheaper vs the sector on 2015 EV/EBITA than on 2014.
We continue to believe that it is too early to start looking at companies on 2015 multiples. Currently, companies are indicating
broadly flat sequential demand in Q4 while consensus organic growth for the sector is c4% in 2014.
In our view the market will start looking at 2015 multiples at the end of 1Q14 and in this scenario we believe Schindler (OP)
(11% premium in 2015E) and Prysmian (OP) (-24% discount in 2015E) look relatively cheaper as compared to 2014 multiples.
On the above chart the higher quality names (IMI, Halma, Atlas Copco, Rotork & Spirax Sarco) look less attractive but clearly
the valuation focus for these stocks is the sustainability of longer term growth rather than a 2015 recovery in profitability.
Source: Company data, Credit Suisse research

35
ROIC – higher asset turns should be the future driver
8.0%
10.0%
12.0%
14.0%
16.0%
18.0%
20.0%
22.0%
2004 2005 2006 2007 2008 2009 2010 2011 2012 2013E 2014E 2015E
Sector average Mechanicals average Electricals average UK average
4.0%
5.0%
6.0%
7.0%
8.0%
9.0%
10.0%
11.0%
12.0%
13.0%
2004 2005 2006 2007 2008 2009 2010 2011 2012 2013E2014E2015E
Sector average Mechanicals average
Electricals average UK average
1.0
1.2
1.4
1.6
1.8
2.0
2.2
2.4
2004 2005 2006 2007 2008 2009 2010 2011 2012 2013E2014E2015E
Sector average Mechanicals average
Electricals average UK average
Since 2008/09 the sector has returned to 2008 ROICs driven by the
sector NOPAT margin achieving a new peak while asset turns have
declined (led by the Electricals sub-sector as they have invested in
working capital and R&D)
Current share prices are discounting ROICs to increase for the sector
on average and we believe for this to occur, given peak margin levels,
asset turns need to improve from current levels.
We believe companies positioned to deliver on this are Siemens (OP)
under a new CEO as it continues to take out cost following three years
of investing in the business. We also believe there is an opportunity for
improving asset turns at IMI (OP) across their remaining flow control
businesses
Source: Company data, Credit Suisse estimates

36
Cash conversion – we remain cautious on companies at the low end FCF conversion from clean net income 2004-2012
Companies that look attractive based on their
cash adjusted ROIC (cash conversion
multiplied by ROIC) are Prysmian, Senior and
Bodycote.
In the sector Legrand, Prysmian, Schindler
and Assa have the highest cash conversion
ratios driven by good working capital
management and limited restructuring
charges.
We remain cautious on those companies with
relatively weak cash conversion: Sandvik (UP),
Alstom (UP) and Morgan Adv. Mats (UP).
0%
20%
40%
60%
80%
100%
120%
140%
Legr
and
Pry
smia
n
Spe
ctris
Sch
indl
er
Ass
a A
bloy
Kon
e
Geb
erit
Hal
ma
Sch
neid
er
Alfa
Lav
al
Sen
ior
IMI
AB
B
Bod
ycot
e
Rot
ork
Sie
men
s
Nex
ans
SK
F
Met
so
Laird
Atla
s C
opco
Sm
iths
Fenn
er
Wei
r
Ren
isha
w
Mel
rose
Spi
rax
Ele
ctro
lux
Ves
uviu
s
San
dvik
Als
tom
Phi
lips
Mor
gan
Adv
. Mat
s
GK
N
Sector average
Alfa Laval
Assa Abloy
Atlas Copco
Electrolux
Kone
Metso
Sandvik
Schindler
SKF ABB
Alstom
LegrandNexans
PhilipsPrysmian
Schneider
Siemens
Bodycote
Fenner
GKN
Halma
IMI
Laird
Melrose
Morgan Adv. Mats
Renishaw
Senior Smiths Group
Spectris
Spirax
VesuviusWeir
Sector average
7
8
9
10
11
12
13
14
15
16
2% 4% 6% 8% 10% 12% 14% 16% 18% 20% 22% 24% 26% 28%
2014E
EV
/EB
IT
Cash Adjusted 2013-2014E ROIC
Geberit(ROIC 30.8%, EV/EBIT 16.7)
Rotork(ROIC 29.8%, EV/EBIT 14.1)
Source: Company data, Credit Suisse research

37
Key End Markets Outlook

38
End market forecasts
Source: Credit Suisse estimates
Key End Market Forecasts 2013E 2014E 2015E 2013E 2014E 2015E 2013E 2014E 2015E 2013E 2014E 2015E
Automotive -5% 3% 4% 5% 2% 4% 7% 7% 7% 2% 4% 5%
Automotive Aftermarket 2% 3% 3% 4% 3% 3% 7% 7% 7% 4% 4% 4%
Aerospace 7% 7% 6% 7% 7% 6% 7% 7% 6% 7% 7% 6%
Construction Residential -3% 2% 5% 15% 12% 10% 7% 8% 7% 6% 7% 7%
Construction Commercial -6% 0% 3% 5% 7% 7% 6% 8% 7% 2% 5% 6%
Construction Government -6% -2% 0% -2% 1% 5% 5% 5% 5% -1% 1% 3%
Consumer/ Appliances 1% 3% 5% 7% 10% 8% 8% 8% 7% 5% 7% 7%
Gen. Ind. Production 0% 2% 4% 2% 4% 5% 8% 10% 8% 3% 5% 6%
Gen. Ind. Capex -6% 0% 3% 3% 6% 6% 5% 5% 5% 1% 4% 5%
Gen. Ind. Aftermarket 3% 3% 4% 5% 5% 5% 7% 7% 7% 5% 5% 5%
Medical -4% -1% 4% -3% 3% 5% 10% 10% 8% 1% 4% 6%
Mining OE -30% -15% -5% -30% -15% -5% -30% -15% -5% -30% -15% -5%
Mining Aftermarket -7% 5% 5% -7% 5% 5% -7% 5% 5% -7% 5% 5%
Oil & Gas 3% 2% 3% 5% 4% 5% 8% 7% 7% 5% 4% 5%
Pulp & Paper OEM -10% -5% 0% -7% -3% 0% -5% 2% 3% -7% -2% 1%
Pulp & Paper Aftermarket -3% 0% 3% -3% 0% 3% 5% 5% 5% 0% 2% 4%
Power T&D -5% 5% 4% -3% 1% 3% 6% 6% 5% -1% 4% 4%
Power Generation -10% -6% 0% -3% 2% 4% 6% 6% 5% -2% 1% 3%
Transportation 4% 2% 2% 2% 3% 3% 8% 7% 7% 5% 4% 4%
Truck -3% -1% 2% 2% 9% 5% 8% 4% 5% 2% 4% 4%
Average -3.9% 0.4% 2.8% 0.2% 3.3% 4.4% 3.8% 5.4% 5.6% 0.0% 3.0% 4.2%
Europe North America Emerging Markets GLOBAL

39
Aerospace – strong growth expected in 2014 Airbus and Boeing production forecast
12 month rolling average aircraft orders
In Aerospace, we forecast growth of 7% in 2014.
Airbus and Boeing are seeing orders recovering
from a small trough in 2012, leading to higher
production volumes next year.
Long term demand for aircraft production is driven
by increasing demand for air travel worldwide and
growing international trade volume. Air passenger
traffic growth is geared on GDP around 2-3x.
Source: Company data, Credit Suisse research, KMT

40
Appliances – Emerging markets to drive growth, US recovery
Medium term growth expectation for appliances by Electrolux
Emerging markets are an important driver of European
companies’ performance in the appliances market.
US appliance market is expected to recover following the
housing recovery, while outlook for Europe is stable.
Online presence is becoming increasingly important with
85% of consumers looking at products on-line before
purchasing.
Consumers expect higher quality products for the same
price, as cost of appliances falling greatly for the past few
years – new product will be the main driver of
profitability.
Early stage of US Housing Recovery
US Appliance unit shipment outlook by Whirlpool
Source: Electrolux, Whirlpool

41
Automation – Value chain
Major players
PLM: Autodesk, Dassault, Siemens
ERP: Oracle, SAP
MES: Aspen, CDC Software, Invensys, Siemens
SCADA: ABB, Invensys, Siemens
DCS: ABB, Honeywell, Siemens, Yokogawa
PLC: ABB, Omron, Mitsubishi, Rockwell,
Schneider, Siemens
V ^ V ^
Computerized Numerical
Control (CNC)CNC: Fanuc, Siemens
V ^ V ^ V
V ^ V ^ Human Machine Interface (HMI)
Drives Sensors
Robots
MotorsMachine
Vision
Enterprise Level
Controls
Product Lifecycle Management (PLM)
Enterprise Resource Planning (ERP)
Manufacturing Execution System (MES)
Plant Level
Controls
Supervisory Control and Data Analysis (SCADA)
Process Factory
Distributed Control
System (DCS)
Programmable Logic
Controller (PLC)
HMI: ABB, Invensys, Mitsubishi, Siemens,
Schneider
Plant
InstrumentationValves Sensors Machine Tools
Sensors: ABB, Eaton, Honeywell, Omron
Machine Vision: Cognex, Teledyne
Drives: ABB, Danaher Mitsubishi
Robots: ABB, Fanuc, Kuka
Machine Tools: Gildemeister, Mori Seiki
Motors: ABB, Emerson, GE, Regal Beloit,
Rockwell, Schneider, Siemens, Weg,
Yaskawa
Source: Credit Suisse research
42
Automation – Growth opportunities in emerging markets
We expect automation markets to grow stronger in emerging
markets, notably China, where penetration levels in most end
markets are still significantly below developed market. Developed
markets use 13x numbers of robots per manufacturing employee
than in emerging markets.
We expect shorter-cycle factory automation to grow faster than
process automation, which tends to qualify as a later cyclical
market given the exposure to end markets such as utilities.
Automotive, consumer and transport sector will drive the growth
due to limited penetration.
% of global output and robots per employee highlights the
investment opportunity in EM Robot stock (base year = 1974 for Japan, 1999 for China)
50%41%
50%
7%
35%
8%
149
88
11 7 116
Developed Developed(ex Japan)
EmergingMarkets Total
EMEAEmerging
NJAEmerging
LatAmEmerging
% of Global Manufacturing Output
Number of Robots per 10,000 Manufacturing Employees
0
50,000
100,000
150,000
200,000
250,000
300,000
350,000
400,000
450,000
T+0 T+5 T+10 T+15 T+20 T+25 T+30
Japan
China
CS Pan-Euro Capital Goods +44 207 888 0350
Automation market revenue by region
Source: Company data, Credit Suisse research

43
Automotive – Sustained recovery into 2014
Global automotive production forecast by IHS
19.4 19.3 19.1 19.4
20.2 20.220.7
22.0
20.8
16.5
19.0
20.2
19.3 19.119.7
20.5
14.0
15.0
16.0
17.0
18.0
19.0
20.0
21.0
22.0
23.0
20
00
20
01
20
02
20
03
20
04
20
05
20
06
20
07
20
08
20
09
20
10
20
11
20
12
20
13
E
20
14
E
20
15
E
Pro
du
ctio
n (
Mil.
Un
its)
Europe
17.2
15.516.4
15.9 15.8 15.815.3 15.1
12.6
8.6
11.9
13.1
15.416.2
16.817.5
7.0
9.0
11.0
13.0
15.0
17.0
19.0
20
00
20
01
20
02
20
03
20
04
20
05
20
06
20
07
20
08
20
09
20
10
20
11
20
12
20
13
E
20
14
E
20
15
E
Pro
du
ctio
n (
Mil.
Un
its)
N. America
2.2 2.33.3
4.4 4.9 5.77.0
8.4 8.8
13.1
17.1 17.618.6
20.522.3
24.5
0.0
5.0
10.0
15.0
20.0
25.0
30.0
20
00
20
01
20
02
20
03
20
04
20
05
20
06
20
07
20
08
20
09
20
10
20
11
20
12
20
13
E
20
14
E
20
15
E
Pro
du
ctio
n (
Mil.
Un
its)
Greater China
12.612.2
12.9 12.9
13.3
14.0
14.715.1
14.7
11.1
13.3
12.5
14.0
13.4
12.6 12.4
10.0
11.0
12.0
13.0
14.0
15.0
16.02
00
0
20
01
20
02
20
03
20
04
20
05
20
06
20
07
20
08
20
09
20
10
20
11
20
12
20
13
E
20
14
E
20
15
E
Pro
du
ctio
n (
Mil.
Un
its)
Japan/Korea
2.0 2.1 1.9 1.9
2.52.8
3.1
3.63.8 3.7
4.2 4.3 4.34.5 4.7
5.1
0.0
1.0
2.0
3.0
4.0
5.0
6.0
20
00
20
01
20
02
20
03
20
04
20
05
20
06
20
07
20
08
20
09
20
10
20
11
20
12
20
13
E
20
14
E
20
15
E
Pro
du
ctio
n (
Mil.
Un
its)
S. America
2.3 2.4 2.63.1
3.64.2 4.3 4.6
5.1 4.8
6.6 6.9
8.3 8.28.8
9.8
0.0
2.0
4.0
6.0
8.0
10.0
12.0
20
00
20
01
20
02
20
03
20
04
20
05
20
06
20
07
20
08
20
09
20
10
20
11
20
12
20
13
E
20
14
E
20
15
E
Pro
du
ctio
n (
Mil.
Un
its)
S. Asia
2001 2002 2003 2004 2005 2006 2007 2008 2009 2010 2011 2012 2013E 2014E 2015E
Global growth rates -3.3% 4.6% 2.7% 5.0% 4.2% 4.1% 5.6% -4.3% -11.9% 25.0% 3.3% 6.0% 2.4% 3.9% 5.8%
Source: IHS

44
Construction (Europe) – France remains the key risk in 2014
-25%
-20%
-15%
-10%
-5%
0%
Total EUconstruction
Residential Non-residential Infrastructure
2012 spend from prev. peak
-5%
-4%
-3%
-2%
-1%
0%
1%
2%
3%
4%
Total market UK Germany France Italy Spain
2014 growth in construction spend
0%
2%
4%
6%
8%
LegrandFrance
Legrand Italy SchneiderPartner
Geberit Italy GeberitGermany
Assa AbloyEMEA
2014 organic growth forecast
We continue to be cautious on European construction into 2014 and
with we believe the greatest risks for disappointment being in France.
In Q313, construction spend in France was still declining by -5%
while Legrand and Schneider also reported weakness in the region,
with destocking having an impact.
In our view, destocking can continue to constrain demand for our
construction related names in central European countries in 2014
(This is most relevant for Schneider (N) and Legrand (UP)).
Spain and Italy construction spend are 72% and 25% below previous
peaks and companies have reported some signs of stabilization in
these regions at Q3 results (Prysmian on Italy, Geberit and Kone on
Spain). However, we do not expect a strong rebound in 2014.
Source: Euconstruct, Credit Suisse estimates

45
Construction (US Residential) – Growth to continue at high levels
0
500
1,000
1,500
2,000
2,500
198
01
98
11982
198
31
98
41
98
51
98
61
98
71
98
81989
199
01
99
11
99
21
99
31
99
41
99
51
99
61
99
71
99
81
99
92
00
02
00
12
00
22
00
32
00
42
00
52
00
62
00
72
00
82
00
92
01
02
01
12012
201
3E
201
4E
201
5E
201
6E
To
tal A
nn
ual
Ho
us
ing
Sta
rts
(00
0's
)
In 2014 we expect positive momentum to continue in the US housing market (our US Housing analyst forecasts 19% growth
in total housing starts which still implies the market is -54% below the previous peak.)
In terms of recent datapoints, our US analyst’s monthly October Survey of Real Estate Agents was relatively soft with the
buyer traffic index weakening primarily related to rising mortgage rates over the summer months. However, the view remains
that demand will improve in Q114 in line with historic seasonal trends.
We believe the key beneficiaries of this positive trend is Electrolux but also that this positive trend is fairly discounted in our
forecasts where we have +11% organic growth for North America in 2014.
Source: US Census Data, Credit Suisse estimates

46
Construction (US Non-residential) – Recovery in sight?
0%
-13%
-4%
4%
8%
16%
24%
11%
-16%
-24%
-1%
17%
7%
10%
8%
-30%
-20%
-10%
0%
10%
20%
30%
2001
2002
2003
2004
2005
2006
2007
2008
2009
2010
2011
2012
2013
E
2014
E
2015
E
US non-residential construction spend
30.0
35.0
40.0
45.0
50.0
55.0
60.0
65.0
Oct-03 Oct-04 Oct-05 Oct-06 Oct-07 Oct-08 Oct-09 Oct-10 Oct-11 Oct-12 Oct-13
ABI Billings
In US non-residential we forecast 10% growth in 2014 and 8% growth in 2015. Within non-residential the largest segment
is Lodging, Office and Commercial (29% of total), which we believe should grow at 15% in 2014. However, growth in
other non-residential segments, eg Education and Healthcare, is likely to be more subdued.
In 2013 company commentaries acknowledged some improvement in trends in US non-residential (Schneider) but not
yet a meaningful acceleration. To an extent the 10% growth we forecast in US non-residential is driven by a low base
effect – the Lodging, Office and Commercial segment in on our forecasts in 2015 would still be -28% below 2008 levels.
Further support is given by the ABI index in the US (this tends to lead demand for our companies by c18 months - it
takes 12 months between the architect’s design and breaking ground on a project and a further six months for demand to
feed through to our companies). This index has been above 50 for 14 out of 15 last months.
Source: ABI, US Census Data, Credit Suisse estimates

47
Construction (China) – Growth at a more moderate level in 2014
40
60
80
100
120
140
160
180
200
2007 2008 2009 2010 2011 2012 2013
Sales Completions Starts
Recent trends in housing starts in China have been positive with
positive sentiment also reflected in the CS China Property price index.
Our commodities team view is that sales stepped up in August due to
easing credit but this positive effect has moderated reflected in the
small decline in starts.
Into 2014 we remain confident that the trend of stable growth in
construction spend in China will continue as on our recent China trip it
was evident that private real estate markets were continuing to fare
much better than General Industrial demand.
66
65
75
73 73
75
74
77
68
7980
81
73
50
55
60
65
70
75
80
85
Oct-12 Dec-12 Feb-13 Apr-13 Jun-13 Aug-13 Oct-13
CS China Property price sentiment index
At Kone’s 2013 CMD the company indicated the expectation for 27bn
square meters to be added in Chinese housing stock between 2012
and 2025, implying annual new elevator demand of 460K pa vs 490K
in 2012.
Source: Thomson Reuters, Kone, Credit Suisse research

48
General Industrial – CS forecasts 4.4% Global IP growth in 2014
-30.0%
-25.0%
-20.0%
-15.0%
-10.0%
-5.0%
0.0%
5.0%
10.0%
15.0%
20.0%
Q1
1992
Q1
1994
Q1
1996
Q1
1998
Q1
2000
Q1
2002
Q1
2004
Q1
2006
Q1
2008
Q1
2010
Q1
2012
2014
CS Global IP Index (1 quarter shift)SKF Volume Growth
-4%
0%
4%
8%
12%
16%
2011 2012 2013 2014
Global IP Euro area IP US IP China IP
CS economics team forecasts 4.4% Global IP growth in 2014. Its view is that IP growth is likely to first moderate in
1Q14 (following a strong 2H13) returning to trend growth rate in spring, before a pick up over the summer. By region
US IP growth is expected to be slower in 2014 while the most significant improvement is forecast to be in Europe
moving from -1% in 2013 to +1.7% in 2014.
Above we show the correlation between Global IP and SKF and believe ours and consensus forecasts of 6% organic
growth in 2014 fully reflecting the CS forecast 2014 IP rebound
However, we would highlight that we believe the correlation with Global IP has become less relevant as SKF’s exposure
is more heavily weighted towards Europe (where IP has been weak) while Global IP has been supported by China. An
average of 2014 IP growth (assuming 7.5% in EM), weighted by SKF’s geographical exposure, implies 4.4% organic
growth for SKF in 2014.
Source: Company data, Credit Suisse estimates, KMT

49
Healthcare – Risk to growth assumptions from the US
0%
1%
2%
3%
4%
5%
6%
7%
8%
0
2
4
6
8
10
12
14
16
18
Imaging systems Patient care Home Healthcaresolutions
Market size (€bn) Market growth rate (RHS)
0%
10%
6%
4%
5%
-3%
-5%-5%
-10%
5%
-2%
-15%
-10%
-5%
0%
5%
10%
15%
Q1 11 Q2 11 Q3 11 Q4 11 Q1 12 Q2 12 Q3 12 Q4 12 Q1 13 Q2 13 Q3 13
Philip Healthcare orders in North America
Globally both Siemens expect the global healthcare equipment market to grow at c4-5% per year. This is
underpinned by strong emerging markets growth with Europe being at low single digits.
However we believe there are two themes that have emerged and pose a risk to this assumption in 2014.
1) Due to regulatory uncertainty the US healthcare market has been challenging in 2012 and 2013 and despite a
2Q13 recovery in orders this again turned negative in Q313 against an easier comparator. We believe this
weakness in the US can run into 2014 which may result in global growth in the Healthcare market of below 4-5%.
2) Comments from Siemens imply that the large Healthcare equipment market is currently seeing pricing pressure of
3-4% of sales due to Japanese players using the weak Yen to their advantage. In our view, based on
commentaries from the Japanese government, the weak Yen is unlikely to reverse in the near term and therefore
we expect pricing pressure of this magnitude to continue into 2014.
Source: Company data, Credit Suisse estimates

50
-
20,000
40,000
60,000
80,000
100,000
120,000
0
50
100
150
200
250
2008 2009 2010 2011 2012 2013 2014 2015
Mine Production Metal Price Index (LHS) Mining capex (€bn, RHS)
Capex Forecast
Commodities Forecast
Mining OE – We forecast 16% & 21% Capex decline in 2014/15
-
20,000
40,000
60,000
80,000
100,000
120,000
2008 2009 2010 2011 2012 2013E 2014E 2015E
DIVERSIFIED MINERS ALUMINIUM COAL COPPER / MOLY INDUSTRIAL MINERALS
IRON ORE NICKEL / ZINC URANIUM PRECIOUS METALS
Commodity prices support the expected capex reductions Mining capex outlook – further reductions in 2014 & 2015
On mining, we expect further slowdown in 2014 and 2015 for the new equipment business. Our aggregation of capex
forecast on 90 mining companies covered by Credit Suisse suggests 16% decline in 2014 and 21% in 2015. This is less
optimistic than the forecasts presented by Sandvik and Metso, where a pick-up in 2015 is expected. There are some positive
signs for brownfield projects and orders from mid-tier customers, while large, greenfield orders are still lagging.
By commodity, the sharpest decline in 2014 is expected in Iron ore due to capex peaking in 2013 as projects are completed.
We expect the overall pricing environment for mining new equipment not to deteriorate significantly in 2014, but see
comminution as an area of risk.
CAT Atlas Copco Fenner Metso FLSmidth Outotec
New equipment
More decline in end-user
demand in 2014 than
2013, but less
destocking by dealers.
Overall more than 20%
decline.
Surface - remains soft;
Underground -
reasonable
N.A.Satisfactory with volatility
expected to continue
Some macro positive
signs but not necessarily
lead to improved mining
business. Copper is good
but outlook for coal
deteriorated.
Continued slowness in
mining capex spending
Demand OutlookUPSTREAM DOWNSTREAM
First time saw stabilisation
of demand
Sandvik
Source: Company data, Credit Suisse estimates

51
Mining Aftermarket – We expect recovery in 2014
Demand for aftermarket services in mining is driven by mineral production levels. The outlook by Credit Suisse
commodities team suggests increasing production levels in 2014 and 2015 for all minerals except precious metals.
This is supportive of a stable demand outlook for mining aftermarket services next year. We also believe that while
investment in new equipment is being delayed, miners need to invest in improving efficiency of the existing assets
to keep up with the increasing production level.
We expect pricing to remain stable for mining aftermarket services, but see pressure on consumables and spare
parts to remain.
CAT Atlas Copco Fenner Sandvik Metso Weir FLSmidth Outotec
Service Flat in 2014 Good
Customer sentiment is
gradually improving -
US coal recovering,
Australia stablizing
Good & expect
aftermarket destock to
finish by end 2013
See aftermarket growth
at around 5%+ through
cycle going forward.
Relatively good shape
except coal. Difficult to
cut opex with mines
running at full capacity.
Remain solid due to the
need to optimize
operations
Demand OutlookUPSTREAM DOWNSTREAM
Stable
2012 2013E 2014E 2015E 2013-15
Iron Ore 1.8% 7.3% 12.9% 7.6% 9.3%
Met Coal 6.4% 6.4% 6.2% 6.7% 6.4%
Therm Coal 10.2% 5.1% 2.4% 3.9% 3.8%
Copper 3.5% 4.5% 4.4% 4.2% 4.4%
Aluminium 4.8% 5.0% 6.4% 5.4% 5.6%
Zinc 11.1% 5.7% 3.2% 3.6% 4.2%
Silver -2.5% -2.8% -0.1% 0.4% -0.8%
Platinum -7.8% 1.3% 2.3% 0.9% 1.5%
Total Average 3.4% 4.1% 4.7% 4.1% 4.3%
0%
10%
20%
30%
40%
50%
60%
70%
80%
90%
100%
Fenner Weir Atlas CAT Metso Sandvik FLS Outotec
New Equipment A/market
Mineral production outlook – increasing production level
supports opex spending by customers
Aftermarket exposure by mining equipment providers
Source: Company data, Credit Suisse estimates

52
Mining - Equipment supplier mapping COMMINUTION
Exploration
Blast hole -
O/P
Blast hole -
U/G Tools
Shovel -
Electric
Shovel -
Hydraulic Dragline
Longwall /
Continuous
Loaders -
O/P
Loaders -
U/G
Mine Trucks
- O/P
Mine
Trucks -
U/G
Conveyor
belts &
Systems Crushing Grinding Screening Pumps Cyclones Concentration Refining
SCHRAMM Y Y
Super Rock Drills Y Y
Atlas Copco Y Y Y Y Y Y Y
Sandvik Y Y Y Y Y Y Y Y Y Y
Boart Longyear Y Y Y
Furukawa Y Y Y Y
CAT (inc Bucyrus) Y Y Y Y Y Y Y Y Y
Joy Global Y Y Y Y
Komatsu Y Y
Liebherr Y Y
GHH Fahrzeuge Y
LiuGong Y
Terex Y Y
Astec Y Y Y Y
FL Smidth Y Y Y Y Y Y Y Y
Fenner Y
Metso Y Y Y Y Y Y
Thyssen Krupp Y Y Y Y
TENOVA Y Y Y Y Y
FAM Y Y Y
Weir Y Y Y Y Y
CITIC HEAVY Y Y
Outotec Y Y
DRILLING EXTRACTION HANDLING SLURRY PROCESSING
Source: Credit Suisse research

53
Mining - Equipment supplier profiling
ATLAS COPCO CAT FENNER METSO SANDVIK WEIR
Mining equipment vs Other
New equipment vs Aftermarket
Metal Exposure
Coal 22%
Copper15%Iron Ore
17%
Gold 27%
Platinum6%
Other base11%
Other2%
Coal 11%
Copper16%
Iron Ore14%
Gold 31%
Platinum5%
Other base12%
Other11%
Copper20%
Iron Ore29%
Gold 15%
Other base23%
Other13%
Coal 53%
Iron Ore23%
Other24%
Coal 12% Copper
27%
Iron Ore12%
Gold 17%
Other32%
Coal 38%
Copper20%
Iron Ore20%
Other22%
Mining Equipment
40%
Other60%
Mining Equipment
30%
Other70%
Mining Equipment
37%
Other63%
Mining Equipment
71%
Other29%
Mining Equipment
40%
Other60%
Mining Equipment
30%
Other70%
New Equipment
60%
A/market40%
New Equipment
46%
A/market54%
New Equipment
55%
A/market45%
New Equipment
15%
A/market85%
New Equipment
40%
A/market60%
New Equipment
47%
A/market53%
Source: Company data

54
Companies Comments at Q313 results
ABBProject tendering activity in oil and gas sector continues to increase
but the award of large orders remained slow.
Alfa laval
The U.S. reported continued growth, especially good development
within the oil and gas sector, despite lack of resources at
customers. Also, see a very good activity level offshore to the North
Sea.
BodycoteContinued lower demand from the Oil & Gas sector, particularly for
onshore requirements in the USA.
Prysmian
The Oil & Gas sector has confirmed the positive trend for offshore,
with major projects in the North Sea, Asia Pacific and South
America, while onshore demand is still weak.
Weir
Upstream markets expanded more gradually than anticipated, with
US rig count actually declining over the third quarter. The oil price
remains supportive of high activity levels.
Oil & Gas - Current softness in onshore should reverse in 2014
For Oil & Gas Capex we forecast 4% growth in 2014. The key driver
of this growth should continue to be offshore O&G where industry
forecasts are for 15% growth in 2014.
For 25 O&G companies covered at Credit Suisse we have also
aggregated capex forecasts and these imply that combined
onshore and offshore capex will increase by 2% in 2014.
Above we have also collated commentaries on the Oil & Gas market
at Q3 results. The common theme is softness in on-shore O&G in
the US while offshore demand, across all regions, remains strong.
We believe that the increasing project tendering at ABB is a positive
indication that 2014 should be another year of overall growth.
0
10
20
30
40
50
60
70
80
2007 2008 2009 2010 2011 2012 2013 2014 2015 2016
Exp
en
dit
ure
($ b
illi
on
s)
Europe North America Latin America
Deepwater Global O&G capex forecasts
0.0%
5.0%
10.0%
15.0%
20.0%
25.0%
2010 2011 2012 2013 2014 2015
YOY % change in O&G capex (from 27 covered CS Companies)
Source: Company data and estimates, Credit Suisse estimates, KMT

55
Power Generation – GT acceleration not expected until 2015
11 12 13 137 8
7 8 8 10 22 22
179
16 14
1517
37
6 7
109
22 27
2228
30
35
6062
65
72
84
90
0
10
20
30
40
50
60
70
80
90
100
2012 2013 2014 2015 2020 2030
China USA Middle East Europe RoW0
100
200
300
400
500
600
700
800
900
1000
Alstom GE Siemens Mitsubishi
Steam Plant Gas Turbine Plant (incl. ST for CC)
Installed base of Steam and Gas turbines at the end of 2007 (GW)
Siemens Long term forecasts for the Gas Turbine market by region (GW).
Long term forecasts for the Gas Turbine market are positive with
China and the US expected to be the fastest growing markets.
Siemens expectation set at their 2012 Energy CMD was for the
market to grow by 3% in 2013 but YTD the market has declined
by -11%. (Siemens, Alstom and Mitsubishi’s market shares are
broadly flat with GE having lost c5% share to ‘Others’).
We expect 2014 to be broadly flat with a return to growth in 2015.
For Power Plant, Alstom’s servicing mix is more heavily weighted
to steam than competitors. In the medium term we believe this
poses a structural threat as steam plants are increasingly retired
and replaced with GT’s in developed economies.
GT market declined by -11% YTD
0
10
20
30
40
50
9mths 12 9mths 13
General Electric Siemens Mitsubishi Alstom Other
Reported Gas Turbine demand declined by -11% in 9mths 13 (GW)
which was below Siemens expectation set at a 2012 CMD
Source: Company data and estimates, McCoys, Credit Suisse estimates

56
Power Generation – Renewable energy is attractive in long term
Global energy demand outlook by BP
Global energy demand is to grow at 1.6% p.a. in the long term according to forecast by BP, with non-OECD countries being
the main driver.
Growth in demand for renewable energy is expected to be the highest at 7.6% p.a. However, in the short term, government
incentive scheme is lacking as a growth driver, especially in developed markets such as Europe and North America.
In the US, we also expect shale gas to be a focus of investment in energy for the next 2-3 years.
Outlook for US Chemical Capex
related to share gas
Source: Company data and estimates, Credit Suisse estimates

57
Pulp & Paper – Continues to decline in 2014E
Global pulp & paper Capex forecast Paper consumption growth rate
CAGR 2001-2013 2013-2025E
Containerboard 3.6% 2.5%
Painting & Writing 1.2% 0.2%
Cartonboard 3.2% 2.2%
Tissue 3.3% 2.9%
Newsprint -1.4% -1.4%
For 25 pulp & paper companies covered at Credit Suisse we have aggregated
capex forecasts and these imply capex spending reducing by 18% in 2014.
Long term trend for paper consumption remains positive except for newsprint.
However, growth rate in the next decade is likely be lower.
End market Growth rate
+ Customers outsource non-core operations
+ Capacity increases in China, South America and Asia Pacific
+ Machine closures in EMEA region and North America
Moderate for EMEA and
North America
+ Customer cost pressure and efficiency requirements increase demand
for process improvements and maintenance services
+ Growth in paper, board and tissue consumption in Asia
+ Need for virgin wood
+ Increased size of pulp lines and mills
+ Growth in pulping in Asia and South America
+ World trade, e-commerce and emerging market demand for packaging
+ Shift from plastic to renewable materials
+ Growth in emerging markets
+ Rise in purchasing power and living standards in emerging markets
– Increasing role of digital media
+ Some growth in emerging markets
Demand drivers
Board 3% p.a.
Tissue 3% p.a.
Printing & Writing
Paper-1% p.a.
Service
5% p.a. between 2012-
2016 for China, South
America and Asia Pac
Pulp 1-2% p.a.
Source: Company data and estimates, Credit Suisse estimates

58
T&D– Currently strong EU tender activity should support 2014 growth
Transmission spending in Europe has also been subdued in 2013, in part due to uncertainty from the German election.
However, there are still significant grid upgrades planned and we believe against a more stable European economic
backdrop these will accelerate in 2014 – at a recent management meeting ABB commented that in Power in Europe it
was currently seeing the strongest tender activity in its history (mainly driven by renewable spending in Europe).
In the US there is a significant replacement opportunity in transmission due to the age of the grid. This is also because
over the last five years the approach from utilities has been for minimum required spend rather than proactively
upgrading for the future.
In the US we expect stable growth in grid spend in the medium term but we also believe this is being anticipated by
T&D players and has resulted in capacity being brought online to meet this demand. This should continue to drive
pricing pressure in this segment and in Transformers we assume an ongoing -2% per year in pricing pressure
We forecast Transmission and Distribution spend to
increase by 4% globally in 2014.
Trends in 2013 have been for c-5% declines in
European distribution spend as utilities have cut capex.
Going in to 2014 we would expect low single digit
growth in this market as we believe utilities have been
holding back on maintenance spend which should
provide a small positive catch up effect in 2014.
Within Transmission it is the HVDC market that is
outgrowing traditional AC products (28% CAGR to
2016 vs 1%). We believe ABB is best positioned to
take advantage of this trend.
Global Transmission market split by product type and growth rates
Source: Company data, Credit Suisse estimates
Conventional AC
HVDC
Service
10
20
30
40
FY11/12 FY12/13E FY13/14E FY14/15E FY15/16E
in €
b
CAGR12/13 - 15/16
4%
28%
1%

59
Alstom33%
Siemens 41%
Bombardier26%
0.00%
1.00%
2.00%
3.00%
4.00%
Infrastructure Rolling Stock Rail Control Services
2015-17 CAGR vs 2009-11
Transport – Flat 2014E following strong 2012/13 EU order flow
Rail control 15%
Infrastructure24%
Services 27%
Rolling stock34%
Western European market per year was €32bn
between 2009-11
Based on announced EU orders we believe Siemens
has a leading 40% market share in Europe
Western Europe
38%
Other Ems21%
Asia Pacific26%
N. America15%
The Global Rail Control market is expected to be
£11.5bn globally in 2015 and is split as follows
2015-17E CAGR vs 2009-11 by segment globally
The global rail market is forecast by UNIFE to be €124bn in 2015 and
to grow on average 2.7% pa 2015-17 vs 2009-12. Siemens and
Alstom’s order momentum over the last two years has been strong but
we expect limited growth in this market in 2014.
On the competition side, there are large Chinese players with
combined c25% global market share (China Southern and China
Northern). We expect this end market to become increasingly
competitive in the medium term.
On the rail controls and software side, this a market that is 26% Asia
Pacific and on our recent China trip we noticed this was an increasing
area of focus for automation players such as Hollysis. They compete
with Invensys Rail which was bought by Siemens in 2013.
Source: Company data and estimates, Credit Suisse estimates, Unife Worldwide Rail Market study 2012

Blank Page

61
Companies

62
ABB – Outperform, TP CHF 26
Bull Case Strong operational leverage potential if improvement short-cycle momentum
seen in Q3 accelerates into next year.
Attractive balanced business with exposure to short, mid and late cycle end
markets (Low Voltage, Automation, Power)
Margin recovery from better portfolio mix towards faster growing Automation
business + restructuring in PS + better pricing flow through in PP
Ungeared balance sheet allowing sizable M&A activity to enhance portfolio
Bear Case Risk of slower than expected short-cycle recovery in addition to negative
momentum in China
Pricing worsening in Power orders
Expensive M&A activity in Power
Strong markets share gains from EM competitors
Investment summary: Combination of strong balance sheet optionality and attractive margin improvement story
via strong operational leverage from potential short-cycle recovery in Low Voltage & Discrete Automation
supported by restructuring in Power Systems and better pricing flow through in Power Products.
-15%
-10%
-5%
0%
5%
10%
15%
20%
25%
8%
10%
12%
14%
16%
Margins % (LHS) Organic Growth (RHS)
0
5
10
15
20
25
30
35
-0.20
0.00
0.20
0.40
0.60
0.80
1.00
1.20
1.40
1.60
1.80
2.00
2004 2005 2006 2007 2008 2009 2010 2011 2012 2013
1 Yr Forward EPS (LHS) Share Price (RHS)
0%
20%
40%
60%
80%
100%
6%
11%
16%
21%
26%
31%
36%
ABB ROIC (LHS) Sector ROIC (LHS)ABB Cash conversion (RHS) Sector Cash conversion (RHS)
Source: Thomson Reuters, Company data, Credit Suisse estimates

63
ABB – Valuation Multiple analysis 2008A 2009A 2010A 2011A 2012A 2013E 2014E 2015E
Share Price (USD):
Average 23.1 17.3 20.5 22.3 18.8 25.8 25.8 25.8
High 32.7 22.2 23.2 27.5 21.9
Low 9.7 10.9 18.0 16.3 15.4
Year End 15.6 19.7 20.8 18.9 20.5
PE:
Average 14.8 15.2 17.6 14.8 14.4 17.5 14.6 13.1
High 21.0 19.6 20.0 18.3 16.8
Low 6.2 9.6 15.4 10.9 11.8
Year End 10.0 17.4 17.9 12.6 15.7
EV/Sales:
Average 1.5 1.1 1.4 1.4 1.2 1.5 1.4 1.3
High 2.1 1.5 1.6 1.7 1.4
Low 0.6 0.7 1.2 1.0 1.0
Year End 1.0 1.3 1.4 1.2 1.3
EV/EBIT:
Average 11.5 8.9 11.6 11.2 11.8 13.0 10.9 9.5
High 16.3 11.6 13.2 13.8 13.5
Low 4.7 5.3 10.1 8.3 9.9
Year End 7.7 10.2 11.8 9.6 12.7
Recurring EV/EBIT:
Average 10.1 9.3 11.1 10.38 10.62 12.33 10.33 9.07
High 14.4 12.2 12.7 12.8 12.2
Low 4.2 5.6 9.7 7.7 8.9
Year End 6.8 10.8 11.3 8.9 11.5
Recurring EBIT margin 14.8% 12.3% 12.6% 13.3% 11.4% 12.4% 13.6% 14.1%
EV/EBITDA:
Average 10.0 7.6 9.8 9.26 9.12 8.10 7.00 6.30
High 14.2 10.0 11.2 11.4 10.5
Low 4.1 4.6 8.5 6.8 7.6
Year End 6.7 8.8 10.0 7.9 9.9
Dividend Yield
Average 1.8% 2.9% 3.1% 3.1% 3.9% 3.1% 3.3% 3.5%
High 1.3% 2.3% 2.7% 2.5% 3.3%
Low 4.2% 4.6% 3.5% 4.3% 4.7%
Year End 2.6% 2.6% 3.0% 3.7% 3.5%
FCF Yield (based on EV)
Average 5.4% 8.4% 7.8% 5.2% 5.7% 4.0% 7.5% 7.5%
High 3.8% 6.4% 6.8% 4.2% 4.9%
Low 13.1% 13.9% 8.9% 7.0% 6.8%
Year End 8.1% 7.3% 7.6% 6.1% 5.2%
Source: Company data, Credit Suisse estimates

64
ABB – Financials P&L 2010A 2011A 2012A 2013E 2014E 2015E
Sales 31,589 37,990 39,336 42,102 43,844 46,158
Sales Growth -0.6% 20.3% 3.5% 7.0% 4.1% 5.3%
Cost of Sales -22,060 -26,556 -27,958 -29,676 -30,427 -31,778
Gross Profit 9,529 11,434 11,378 12,426 13,418 14,380
Gross Margin 30.2% 30.1% 28.9% 29.5% 30.6% 31.2%
S,G&A -4,615 -5,373 -5,756 -5,891 -6,051 -6,324
% of sales 14.6% 14.1% 14.6% 14.0% 13.8% 13.7%
R&D -1,082 -1,371 -1,464 -1,600 -1,710 -1,846
% of sales 3.4% 3.6% 3.7% 3.8% 3.9% 4.0%
Other Income (Expense) -14 -23 -100 -7 0 0
Reported EBIT 3,818 4,667 4,058 4,928 5,657 6,210
Underlying EBITA 4,145 5,230 4,677 5,390 6,134 6,710
Margin 13.1% 13.8% 11.9% 12.8% 14.0% 14.5%
Net Financial Income -78 -117 -220 -310 -233 -171
CS EBIT 3,965 5,050 4,497 5,210 5,954 6,530
Clean PBT 3,887 4,933 4,277 4,900 5,721 6,359
PBT 3,740 4,550 3,838 4,618 5,425 6,039
Provision for taxes -1,018 -1,244 -1,030 -1,291 -1,465 -1,631
CS tax adjustment 40 113 153 91 80 86
Underlying tax -1,058 -1,357 -1,183 -1,382 -1,545 -1,717
Underlying tax rate 27% 28% 27% 27% 27% 27%
Extraordinary Items (post tax) 10 9 4 -15 0 0
Minority -171 -147 -108 -97 -92 -88
Net Income from continuing ops 2,722 3,306 2,808 3,326 3,960 4,408
Net Income (Loss) 2,561 3,168 2,704 3,214 3,868 4,321
CS Net Income 2,668 3,438 2,990 3,405 4,084 4,554
Basic EPS (continuing, USD per share) 1.19 1.45 1.22 1.45 1.73 1.92
Diluted EPS (continuing, USD per share) 1.19 1.44 1.22 1.44 1.72 1.91
CS EPS (diluted, USD per share) 1.16 1.50 1.30 1.48 1.77 1.98
Dividend per share (CHF per share) 0.60 0.65 0.68 0.75 0.80 0.86
Weighted Average Shares (m) 2,291 2,291 2,295 2,304 2,302 2,302
Cash flow 2010A 2011A 2012A 2013E 2014E 2015E
Net income 2,561 3,168 2,704 3,214 3,868 4,321
Minority Interest 171 147 108 97 92 88
Depreciation + amortisation 702 995 1,182 1,333 1,381 1,461
Pension & Post retirement benefits -51 -49 -13 0 0 0
Deferred taxes 151 -34 64 0 0 0
Net gain from sale of plant property & equipment -39 -47 -26 0 0 0
Income from equity accounted companies -3 -4 -1 0 0 0
Others 106 111 172 0 0 0
Trade receivables -407 -731 -310 -214 -576 -329
Inventories -264 -600 61 -554 160 -116
Trade Payables 678 213 -57 60 998 412
Billings in excess of sales 89 150 152 143 90 120
Provisions -69 -391 -109 -50 -50 -50
Advances from customers -25 47 181 -382 -197 -126
Other assets & liabilities 597 637 -329 0 0 0
Net cash provided by operating activities 4,197 3,612 3,779 3,648 5,766 5,780
Change in Financing receivables -7 -55 85 0 0 0
Purchases of Marketable securities -5,621 -2,951 -2,355 0 0 0
Purchases of plant, property & equipment -840 -1,021 -1,293 -1,358 -1,410 -1,491
Acquisition of business -2,269 -4,020 -3,694 0 0 0
Proceeds from sale of marketable securities 4,904 4,729 1,682 0 0 0
Sale of Plant, property & equipment 47 57 0 0 0 0
Proceeds of sale of business & equity accounted companies83 8 0 0 0 0
Net cash used by investing activities -3,703 -3,253 -5,575 -1,358 -1,410 -1,491
Net changes in debt with maturities of 90 days or less 52 450 570 0 0 0
Increase in debt 277 2,580 5,986 0 0 0
Repayment of debt -497 -2,576 -1,104 0 0 0
Issue of shares 16 105 90 0 0 0
Purchase of treasury shares -166 5 0 0 0 0
Dividends paid -1,112 -1,569 -1,626 -1,823 -1,949 -2,085
Dividend paid to minority share holders -193 -157 -121 -109 -103 -98
Others 49 -46 -33 0 0 0
Net cash provided (used) by financing activities -1,574 -1,208 3,762 -1,931 -2,052 -2,183
Effect of exchange rates and others -142 -229 90 0 0 0
Net increase (decrease) in cash -1,222 -1,078 2,056 359 2,304 2,105
Source: Company data, Credit Suisse estimates

65
ABB – Company Summary
Operating Profit Split Sales Mix End Market Mix
Management
Chairman Hubertus Von Grunberg
CEO Joseph Hogan
CFO Eric Etzvik
IR Allana Abrahamson
Division Products End Markets / Channels Main Competitors Revenue Split by Geo Key Drivers/ Themes
Power Products
FY 2012 Sales $ 10.71 Bn
2% YoY organic growth
FY 2012 EBIT $ 1.33 Bn
12.3% Margin
Products and services for power transmission
and distribution. High voltage products,
medium voltage products and transformers.
Industry 33%, Utility Transimission 28%,
Utility Distribution 26% and Power Generation
13%,
Alstom, Hyundai, Siemens, Schneider, Europe 32%, Asia 32%, Americas 27%,
Middle East/Africa 9%.
Grade upgrades; Utitlity sector Capex;
Demand for power transmission in EM
Power Systems
FY 2012 Sales $ 7.85 Bn
2% YoY organic growth
FY 2012 EBIT $ 0.01 Bn
0.1% Margin
Generation, transmission & distribution of
electricity. Grid system, network
management, power generation and
substations
Utility Transmission 45%, Utility Distribution
20%, Power Generation 20% and Industry
15%
Alstom, Nexans, Prymian, Siemens, General
Electric, Emersons
Europe 40%, Middle East/Africa 22%, Asia
20%, Americas 18%.
Grade upgrades; Utitlity sector Capex;
Demand for power transmission in EM
Discrete Automation & Motion
FY 2012 Sales $ 9.41 Bn
10% YoY organic growth
FY 2012 EBIT $ 1.47 Bn
15.6% Margin
Low Voltage drives, Power electronics & MV
drives, Motors & Generators and Robotics.
Minerals & Metals 25%, Discrete
Manufacturing 20%, Transport 10%, Oil, Gas
& Petroleum 10%, Water 5%, Buildings 5%
and Others 10%
Fanuc, Kuka, Mitsubishi, Siemens, Rockwell,
Yasukawa, General Electric, Hyundai,
Schenider, Weg, Enercon,powerone, Vestas,
Alstom, Bombardier, Areva, Eaton, Emerson
Europe 37%, Americas 33%, Asia 27% and
Middle East/Africa 3%
Emerging market wage inflation; Increasing
automation of production processes; General
industrial capex
Low Voltage Products
FY 2012 Sales $ 6.64 Bn
0% YoY organic growth
FY 2012 EBIT $ 0.86 Bn
12.9% Margin
LV systems, LV breakers & switches,
Enclosures & DIN-Rail products, Control
products & Wiring Accessories.
Industrial 40%, Construction 30%, Residential
25% and Utility 5%
Legrand, Leviton, Schneider, Eaton, General
Electric, Siemens, Hager, Rittal, Phoenix
Contact, Mitsubishi
Europe 43%, Americas 26%, Asia 24%,
Middle East /Africa 7%
Residential & commercial building
construction; Increasing emphasis on power-
saving in buildings
Process Automation
FY 2012 Sales $ 8.16 Bn
3% YoY organic growth
FY 2012 EBIT $ 0.91 Bn
11.2% Margin
Fully engineered solutions and standalone
products for process automation, safety,
energy management and plant electrification
Chemical, Oil & Gas 35%, Metals & Mining
25%, marine 15%, Pulp & Paper 10%, Power
Generation 5% and others.
Emerson, Honeywell, invensys, Rockwell ,
Yokogawa, FLS, Siemens, SMS, TMEIC,
Converteam, Siemens, Wartsilla, Andritz,
Metso, MAN, Mitsubishi
Europe 37%, Asia 30%, Americas 23%,
Middle East/Africa 10%
Oil, gas & mining capex; Increasing emphasis
on health & safety in manufacturing in EM
ABB (ABBN.VX) - SIMON TOENNESSEN +44 20 7883 6893/ [email protected] Mix Shareholding Structure
Free Float: 71%
Top 5 shareholders
Investor AB 7%, Blackrock 4%, Vanguard 1%,
Credit Suisse Asset 2%, UBS Fund
Management 1%
Ownership by country
Sweden 40%, USA 32%, Switzerland 15%,
Luxembourg 6% and others
Pow er Products
29%
Pow er Systems
0%Discrete Automation &
Motion32%
LV Products
19%
Process Automation
20%
Pow er Products
24%
Pow erSystems
19%Discrete Automation &
Motion22%
LV Products
16%
Process Automation
19%
Europe36%
Americas27%
Middle East/Africa10%
Asia27%
Pow er Transmission
20%
Other15%
Oil & Gas10%
Pow er Generation10%
Pow er Distribution10%
Minerals15%
Building 5%
Automotive5%
Pulp & Paper5%
Marine5%
Source: Company data

66
Alfa Laval – Neutral, TP SEK 145 Investment summary: We see a broadly balanced risk / reward in Alfa Laval as its attractions of a high quality
late-cyclical industrial arriving at the bottom of the cycle with some growth options are offset by concerns over
margin sustainability and full valuation.
Bull Case Troughing Marine end-market – historically the highest margin;
Attractive exposure to Oil & Gas and especially LNG (c10-15% of sales)
High quality franchise with very high market shares across Heat Exchange
and Separation;
Attractive exposure to growth Food & Beverage capex market (c10%)
Environmental / energy efficient products offering in Marine – Ballast Water
Cleaning, SOx & NOx scrubbing, PureDry;
Late cyclical exposure within Mechanicals with sales >10% below previous
peak on like for like basis offering scope for a potential recovery;
Historically a company with pricing power.
Bear Case Margins came under significant pressure in 2012-2013 (down c200bps
from 2011) on flat volumes suggesting pricing deterioration or excessive
internal inflation;
Emerging markets competition making progress in the lower end Heat
Exchange applications (some of the recent acquisitions appear defensive);
Valuation suggests the market already discount margin improvement to
well-above the historic mid-cycle level of c18.5%.
0
20
40
60
80
100
120
140
160
180
0
2
4
6
8
10
12
2004 2005 2006 2007 2008 2009 2010 2011 2012 2013
1 Yr Forward EPS (LHS) Share Price (RHS)
-40%
-30%
-20%
-10%
0%
10%
20%
30%
0%
5%
10%
15%
20%
25%
30%
35%
40%
Margins % (LHS) Organic Growth (RHS)
0%
20%
40%
60%
80%
100%
6%
11%
16%
21%
26%
31%
ALF ROIC (LHS) Sector ROIC (LHS)
ALF Cash conversion (RHS) Sector Cash conversion (RHS)
Source: Thomson Reuters, Company data, Credit Suisse estimates

67
Alfa Laval – Valuation
DCF
EBITA NOPAT
margin margin 3.0% 3.5% 4.0% 4.5% 5.0%
16.0% 11.4% 127 129 131 133 135
16.5% 11.7% 130 132 134 136 138
17.0% 12.1% 134 136 138 140 142
17.5% 12.4% 137 139 141 144 146
18.0% 12.8% 140 143 145 147 150
18.5% 13.1% 144 146 149 151 153
19.0% 13.5% 147 150 152 155 157
19.5% 13.8% 151 153 156 158 161
20.0% 14.2% 154 157 159 162 165
20.5% 14.6% 157 160 163 166 168
Grow th (years 4 to 10) 4.0%
EBIT margin (years 4+) 18.0%
Tax rate 29.0%
NOPAT margin 12.8%
Invested capital 20,930
Invested capital grow th (years 4+) 2.0%
Terminal grow th rate 2.0%
WACC 9.0%
December y/e 2007 2008 2009 2010 2011 2012 2013E 2014E 2015E
Average/Current 100.3 82.3 76.8 111.8 127.7 126.5 149.0 149.0 149.0
High 130.8 107.5 99.0 142.0 146.3 146.4
Low 72.9 46.4 57.5 96.0 102.9 110.5
P/E average 12.9 8.4 9.9 14.0 14.0 14.2 17.5 16.0 14.8
P/E high 16.8 10.9 12.8 17.7 16.1 16.4
P/E low 9.4 4.7 7.4 12.0 11.3 12.4
EV:sales average 1.91 1.37 1.30 1.91 2.01 1.98 2.25 2.10 1.92
EV:sales high 2.45 1.76 1.66 2.43 2.29 2.26
EV:sales low 1.43 0.82 0.99 1.65 1.65 1.75
Operating margin 20.0% 22.1% 17.6% 18.9% 18.5% 16.5% 16.6% 17.5% 18.2%
EV:EBITDA average 9.1 5.9 6.8 9.3 10.1 11.0 12.4 11.1 9.8
EV:EBITDA high 11.6 7.6 8.7 11.8 11.4 12.5
EV:EBITDA low 6.8 3.6 5.2 8.0 8.2 9.7
EV:EBITA average 9.5 6.2 7.4 10.1 10.9 12.0 13.6 12.0 10.5
EV:EBITA high 12.2 8.0 9.4 12.8 12.4 13.6
EV:EBITA low 7.1 3.7 5.6 8.7 9.0 10.6
FCF yield average 5.8% 9.0% 14.3% 7.7% 5.1% 5.6% 6.4% 6.7% 6.8%
FCF yield high 4.4% 6.9% 11.1% 6.1% 4.4% 4.8%
FCF yield low 7.9% 15.9% 19.1% 9.0% 6.3% 6.4%
Dividend yield average 2.2% 2.7% 3.3% 2.7% 2.5% 2.8% 2.5% 2.7% 3.0%
Dividend yield high 1.7% 2.1% 2.5% 2.1% 2.2% 2.4%
Dividend yield low 3.1% 4.8% 4.3% 3.1% 3.2% 3.2%
EV/IC average 3.8 2.44 2.21 3.05 2.66 2.62 3.03 3.03 2.98
EV/IC high 4.8 3.13 2.82 3.87 3.02 2.99
EV/IC low 2.8 1.46 1.68 2.63 2.18 2.32
P/BV average 5.63 3.39 2.67 3.50 3.57 3.69 3.90 3.51 3.15
P/BV high 7.34 4.43 3.45 4.45 4.10 4.27
P/BV low 4.09 1.91 2.00 3.01 2.88 3.23
ROIC 27.6% 28.0% 21.8% 21.6% 16.9% 15.6% 16.2% 18.2% 20.3%
ROE 43.7% 40.5% 27.0% 25.1% 25.5% 26.1% 22.3% 21.9% 21.3%
ROCE 34.0% 35.4% 26.7% 26.2% 20.3% 18.9% 20.0% 22.6% 25.4%
Source: Company data, Credit Suisse estimates

68
Alfa Laval – Financials PROFIT & LOSS 2010 2011 2012E 2013E 2014E 2015E
REVENUE
Group Revenue 24,720 28,652 29,813 29,282 30,215 31,725
Change yoy, % -5.1% 15.9% 4.1% -1.8% 3.2% 5.0%
Organic growth, % -5.2% 12.7% 0.9% -0.5% 3.9% 5.0%
COGS (15,029) (17,829) (19,169) (19,419) (19,772) (20,272)
Gross Profit 9,691 10,823 10,644 9,863 10,443 11,453
Gross margin, % 39.2% 37.8% 35.7% 33.7% 34.6% 36.1%
SG&A (5,005) (5,659) (5,708) (5,614) (5,749) (5,938)
Amortisation of Goodw ill - - - - - -
Other operating income/expenses (285) (473) (540) (540) (540) (540)
Reported EBIT 4,401 4,691 4,396 3,709 4,153 4,975
Reported EBIT margin, % 17.8% 16.4% 14.7% 12.7% 13.7% 15.7%
Operating profit 4,682 5,287 4,934 4,852 5,288 5,766
Operating margin, % 18.9% 18.5% 16.5% 16.6% 17.5% 18.2%
Depreciation & Amortisation 796 875 934 1,030 973 927
EBITDA 5,107 5,736 5,381 5,332 5,712 6,193
Net interest income / (expense) (39) (15) 125 (100) (50) (48)
Profit Before Tax 4,364 4,676 4,529 4,209 4,695 5,225
Underlying PBT 4,645 5,272 5,067 4,759 5,245 5,725
Tax (1,248) (1,425) (1,306) (1,149) (1,315) (1,463)
Effective rate, % 28.6% 30.5% 28.8% 27.3% 28.0% 28.0%
Reported profit after tax 3,116 3,251 3,223 3,060 3,380 3,762
Minority interest 28 28 17 30 30 30
Reported Net Income 3,088 3,223 3,206 3,030 3,350 3,732
Operating Net Income 3,369 3,819 3,744 3,580 3,900 4,232
Net income margin, % 13.6% 13.3% 12.6% 12.2% 12.9% 13.3%
CS operating EPS 8.0 9.1 8.9 8.5 9.3 10.1
EPS growth, % 3.6% 13.6% -2.0% -4.4% 8.9% 8.5%
DPS, SEK 3.0 3.3 3.5 3.8 4.1 4.4
DPS growth, % 20.0% 8.3% 7.7% 7.1% 8.9% 8.5%
Dividend Cover (X) 2.7 2.8 2.6 2.3 2.3 2.3
Ordinary shares in issue 420.5 419.5 419.5 419.5 419.5 419.5
ANALYSIS 2010 2011 2012E 2013E 2014E 2015E
NOPAT 3,343 3,676 3,511 3,528 3,808 4,151
Invested Capital 15,495 21,716 22,553 21,725 20,930 20,422
ROIC 21.6% 16.9% 15.6% 16.2% 18.2% 20.3%
ROIC (average) 21.7% 19.8% 15.9% 15.9% 17.9% 20.1%
Operating Net Income 3,369 3,819 3,744 3,580 3,900 4,232
Equity 13,582 15,144 14,432 16,124 17,932 19,980
ROE 24.8% 25.2% 25.9% 22.2% 21.8% 21.2%
ROE (average) 26.1% 26.6% 25.3% 23.4% 22.9% 22.3%
EBITDA 5,107 5,736 5,381 5,332 5,712 6,193
Total debt 1,214 5,192 6,003 6,003 6,003 6,003
Net debt (689) 3,145 4,163 1,643 (959) (3,516)
Total debt / EBITDA 0.2 0.9 1.1 1.1 1.1 1.0
Net debt / EBITDA (0.1) 0.5 0.8 0.3 (0.2) (0.6)
BALANCE SHEET 2010 2011 2012E 2013E 2014E 2015E
PPE and Intangibles 12,045 16,981 17,422 16,428 15,509 14,716
Other f ixed assets 1,568 1,664 1,500 1,607 1,614 1,621
Fixed assets 13,613 18,645 18,922 18,035 17,123 16,337
Inventories 4,769 6,148 6,176 6,177 6,374 6,780
Trade and other receivables 6,240 7,360 7,716 7,621 7,864 8,257
Trade and other payables (9,127) (10,437) (10,261) (10,108) (10,430) (10,952)
Working capital 1,882 3,071 3,631 3,690 3,808 4,085
Working capital days 28 39 44 46 46 47
WC as % of sales 7.6% 10.7% 12.2% 12.6% 12.6% 12.9%
Short-term debt 173 132 395 600 600 600
Long-term debt 1,041 5,060 5,608 5,403 5,403 5,403
Net debt / (cash) (689) 3,145 4,163 1,643 (959) (3,516)
Pension deficit 847 852 1,691 1,691 1,691 1,691
Other liabilities 2,399 2,878 2,592 2,592 2,592 2,592
Other assets 644 303 325 325 325 325
Net assets 13,582 15,144 14,432 16,124 17,932 19,980
CASH FLOW 2010 2011 2012E 2013E 2014E 2015E
Operating profit 4,401 4,691 4,396 4,852 5,288 5,766
Depreciation & amortisation 796 875 934 1,030 973 927
Other non cash items 145 167 241 - - -
Tax paid (1,215) (1,446) (1,569) (1,149) (1,315) (1,463)
Net interest (87) (180) (155) (100) (50) (48)
Gross cash flow 4,040 4,107 3,847 4,633 4,897 5,182
Working capital change (29) (858) (416) (59) (118) (277)
Operating cash flow 4,011 3,249 3,431 4,574 4,779 4,905
Operating cash / Operating profit 0.9 0.6 0.7 0.9 0.9 0.9
Net Capex (398) (541) (482) (586) (604) (635)
Free cash flow 3,613 2,708 2,949 3,988 4,175 4,270
FCF / Net income 1.1 0.7 0.8 1.1 1.1 1.0
Acquisitions (1,019) (4,956) (2,778) - - -
Disposals - - - - - -
Borrow ings raised / (repaid) (641) 3,480 1,009 - - -
Change in other f inancial assets (389) - 5 - - -
Shares issue / (purchase) (253) - - - - -
Dividends paid (1,064) (1,268) (1,370) (1,468) (1,573) (1,714)
Others 3 285 104 - - -
Net cash flow 250 249 (81) 2,520 2,602 2,557
Source: Company data, Credit Suisse estimates

69
Alfa Laval – Company Summary
Operating Profit split Sales Mix End Market Order Mix
Management
Chairman Anders Narvinger
CEO Lars Renstrom
CFO Thomas Thuresson
IR Gabriella Grotte
Division Products End Markets / Channels Main Competitors Orders Received by Geography Key Drivers/ Themes
Equipment
FY 2012 Sales SEK 9.48 Bn
-0.1% YoY organic growth
FY 2012 EBIT SEK 1.39 Bn
14.7% Margin
Serving customers in the comfort and
refrigeration, marine and diesel, OEM, fluids
and utility, sanitary, and parts and service
industries
Industrial Equipment 40%, Sanitary 32%,
Parts & Services 17% and OEMs 11%
Asia 23%, North America 21%, Sweden 8%,
Latin America 4%, Other Europe 42%,Others
2%.
A sustained R&D effort (e.g. energy-efficient
solutions); Increasing footprint in EM
(changing consumption habit, improving
standard of living)
Process Technology
FY 2012 Sales SEK 12.81 Bn
4.2% YoY organic growth
FY 2012 EBIT SEK 2.19 Bn
17.1% Margin
Petrochemical products, plastics, polymers,
metals, minerals, biofuels, starch, paper and
sugar. Extraction of oil & gas; production of
energy in power plants; waste treatment
products. Solutions for the beverage and food
industries; production of beer, wine, juice etc,
Process Industry 29%, Parts & Services 28%,
Energy & Environment 27% and Food
Technology 16%
Asia 32%, North America 23%, Latin America
9%, Sweden 1%, Other Europe 31%, Others
4%
A sustained R&D effort; Increasing footprint in
EM (urbanization, changing demographic mix,
demand for energy);Rising aftermarket orders
due to mature installed base
Marine & Diesel
FY 2012 Sales SEK 7.52 Bn
-5.1% YoY organic growth
FY 2012 EBIT SEK 1.46 Bn
19.4% Margin
Modules and adapted systems, such as
boilers, separators, heat exchangers, inert
gas systems, freshwater generators, exhaust
gas cleaning systems, heat recycling
systems and ballast water treatment systems
Parts & Services 41%, Marine & Diesel
Equipment 37%, Marine & Offshore Systems
22%
Asia 47%, Europe 38%, North America 7%,
Latin America 6%, Others 2%
A sustained R&D effort in new technology;
Growth in Asia (50% of division's orders)
ALFA LAVAL (ALFA.ST) - ANDRE KUKHNIN, CFA +44 20 7883 0350/ [email protected]
Geographic MixShareholding Structure
Free Float: 73%
Top 5 shareholders
Tetra Laval BV 26.1%, Alecta 6.7%,
Foundation Asset Management 6.0%,
Swedbank Robur Fund 4.0%, AMF Insurance
Funds 3.4%
Separation: GEA, Mitsubishi Kakoki Kaisha,
Pieralisii, Guinard / Andritz, Flottweg
Heat Transfer: GEA, Hisaka, SPX/APV,
SWEP, Kangrim, SAACKE, Muira,
Heatmaster, Osaka
Fluid Handling: Gea, SPX / APV / Waukesha,
Cherry Burrell, Fristam
Equipment28%
Process Technology
43%
Marine&Diesel
29%
Equipment32%
Process Technology
43%
Marine&Diesel
25%
USA 15%
China11%
Sw eden3%
OtherEurope
35%
Latin America
7%Other Asia23%
Others6%
OEM3%
Food Technology
7%
Energy & Environment
12%
Sanitary11%
Industrial Equipment
13%
Marine & Diesel
8%
Process Industry
14%
Parts &Service
27%
Marine & Offsore systems
5%
Source: Company data

70
Alstom – Underperform, TP €24
Bear Case Ongoing power price weakness putting pressure on utility investments and
therefore equipment spend
Cost consciousness by utilities leading to margin pressure in high margin
Services business as utilities switch to third-party players/in-house operations
Capacity player even in a recovery scenario due to low market shares
Increasing emerging markets competition + Japanese players using FX
Weak free cash flow generation due to worsening payment conditions
Bull Case Improving power markets with power price acceleration
Power Services pricing not decelerating as utilities continue to sweat steam
power equipment
Improved payment condition positively impacting working capital
Well executed cost savings measures positively impacting profitability
Investment summary: Structurally challenged business due to c.80% profit exposure to weak Power markets
(particularly Europe) and low market shares (e.g. in gas fired power generation) supplemented by potentially
rising pricing pressure in high margin Power Services and weak balance sheet as well as cash flow conversion.
0
10
20
30
40
50
60
70
80
90
-14
-12
-10
-8
-6
-4
-2
0
2
4
6
2004 2005 2006 2007 2008 2009 2010 2011 2012 2013
1 Yr Forward EPS (LHS) Share Price (RHS)
-20%
-15%
-10%
-5%
0%
5%
10%
15%
20%
0%
2%
4%
6%
8%
10%
Margins % (LHS) Organic Growth (RHS)
0%
20%
40%
60%
80%
100%
0%
5%
10%
15%
20%
25%
30%
ALSO ROIC (LHS) Sector ROIC (LHS)ALSO Cash conversion (RHS) Sector Cash conversion (RHS)
Source: Thomson Reuters, Company data, Credit Suisse estimates

71
Alstom – Valuation 2008 2009 2010 2011 2012 2013 2014E 2015E 2016E
Share Price:
Average 63.2 39.0 41.2 39.2 32.4 28.5 25.6 25.6 25.6
High 83.6 44.6 54.1 48.0 45.1 35.5
Low 30.7 34.3 30.9 30.9 22.0 23.0
Year End 68.7 40.7 35.8 43.2 29.3 31.8
PE:
Average 20.6 9.6 9.6 12.4 10.2 10.2 8.9 8.3 7.6
High 27.2 11.0 12.5 15.2 14.2 12.8
Low 10.0 8.4 7.2 9.8 6.9 8.3
Year End 22.4 10.0 8.3 13.6 9.2 11.4
EV/Sales:
Average 1.09 0.56 0.55 0.70 0.70 0.64 0.61 0.58 0.54
High 1.43 0.65 0.73 0.82 0.88 0.75
Low 0.55 0.49 0.40 0.58 0.54 0.56
Year End 1.18 0.58 0.47 0.76 0.65 0.69
EBITA margin 8.3% 8.8% 9.2% 6.1% 7.6% 7.1% 7.5% 7.4% 7.6%
EV/EBITA:
Average 13.2 6.4 6.0 11.5 9.2 9.1 8.1 7.8 7.0
High 17.3 7.4 8.0 13.6 11.6 10.5
Low 6.7 5.5 4.4 9.6 7.2 7.9
Year End 14.2 6.5 5.1 12.4 8.6 9.7
EV/EBITDA:
Average 11.5 5.6 5.3 10.2 8.2 7.5 6.7 6.5 5.9
High 15.1 6.5 7.0 12.0 10.4 8.7
Low 5.8 4.8 3.9 8.5 6.4 6.6
Year End 12.4 5.7 4.5 11.0 7.7 8.1
EV/IC:
Average 6.6 4.7 3.3 2.0 1.6 1.4 1.2 1.1 1.1
High 8.6 5.4 4.3 2.4 2.0 1.6
Low 3.3 4.1 2.4 1.7 1.2 1.2
Year End 7.1 4.8 2.8 2.2 1.5 1.5
Dividend Yield
Average 1.3% 2.9% 3.0% 1.6% 2.5% 2.9% 3.3% 3.5% 3.9%
High 1.0% 2.5% 2.3% 1.3% 1.8% 2.4%
Low 2.6% 3.3% 4.0% 2.0% 3.6% 3.6%
Year End 1.2% 2.8% 3.5% 1.4% 2.7% 2.6%
FCF Yield (based on EV)
Average 6.9% 13.8% 2.0% -18.5% -3.7% 1.8% 1.9% 6.6% 8.9%
High 5.2% 12.0% 1.5% -15.7% -2.9% 1.6%
Low 13.6% 16.0% 2.7% -22.2% -4.8% 2.1%
Year End 6.3% 13.5% 2.3% -17.2% -4.0% 1.7%
Source: Company data, Credit Suisse estimates

72
Alstom – Financials Cash Flow Statement 2011A 2012A 2013A 2014E 2015E 2016E
Net income (loss) 462 732 768 836 891 978
Minority interests 28 12 16 15 15 15
Depreciation and amortisation 671 621 543 563 570 577
Depreciation 324 307 340 360 367 374
Acquisition related Amortization 249 201 121 121 121 121
Amortization of Capitalised Intangibles 98 113 82 82 82 82
Total Amortisation 347 314 203 203 203 203
Change in pension provisions (150) (61) (24) (24) (24) (24)
Net (gain) loss on disposals 70 1 34 0 0 0
Deferred tax (107) (94) (80) (31) (38) (36)
Other 0 (27) (18) 0 0 0
Net income (loss) after non cash items 974 1,184 1,239 1,359 1,414 1,510
Change in working capital (743) (968) (150) (657) (108) 53
Net cash flow from operations 231 216 1,089 702 1,306 1,563
Proceeds from disposals of assets 44 24 57 57 57 57
Capex (791) (813) (738) (773) (773) (773)
FA Investment (505) (520) (445) (480) (480) (480)
Capitalised Costs (286) (293) (293) (293) (293) (293)
Decrease (increase) in other fixed assets (1) 15 37 0 0 0
Acquisitions (2,265) (65) (474) 0 0 0
Investments (68) (73) 0 0 0 0
Net cash flow from investing (3,081) (912) (1,118) (716) (716) (716)
Capital increase 9 (1) 351 0 0 0
Issuance (repayment) of CBs 0 560 350 0 0 0
Dividends to Ord (378) (206) (243) (253) (271) (301)
Issuance/(repayment of borrowings 1,500 13 (174) 570 0 0
Issuance/(repayment of finance lease (41) (42) (45) 0 0 0
Dividend paid to minorities 0 0 0 0 0 0
Net cash flow from financing 1,180 87 180 317 (271) (301)
Net FX effect 24 0 (49) 0 0 0
Discontinued operations 0 0 0 0 0 0
Assets held for sale 0 0 0 0 0 0
Net effect of accounting change 0 0 0 0 0 0
Other changes (4) (1) 2 0 0 0
Increase (decrease) in cash (1,650) (610) 104 303 318 546
Cash tax 248 264 240 258 273 303
Cash interest (107) (170) (186) 0 0 0
Free Cash flow (516) (573) 408 (14) 590 847
Free Cash flow PS (1.8) (1.9) 1.4 (0.0) 1.9 2.7
P&L 2011A 2012A 2013A 2014E 2015E 2016E
Total Sales 20,923 19,934 20,269 20,375 20,999 21,515
Cost of sales (16,938) (16,144) (16,324) (16,404) (16,929) (17,293)
Gross Profit 3,985 3,790 3,945 3,971 4,070 4,223
Gross Margin 19.0% 19.0% 19.5% 19.5% 19.4% 19.6%
Selling expenses (902) (900) (952) (957) (986) (1,011)
% of Sales 4.3% 4.5% 4.7% 4.7% 4.7% 4.7%
Research & Development (703) (682) (737) (741) (764) (782)
% of Sales 3.4% 3.4% 3.6% 3.6% 3.6% 3.6%
Administrative expenses (810) (802) (793) (797) (822) (842)
% of Sales 3.9% 4.0% 3.9% 3.9% 3.9% 3.9%
Operating Income 1,570 1,406 1,463 1,476 1,499 1,588
EBITDA 1,435 1,693 1,732 1,844 1,874 1,970
Net Other Income (Expense) (806) (334) (274) (195) (195) (195)
EBIT 764 1,072 1,189 1,281 1,304 1,393
Margin % 3.7% 5.4% 5.9% 6.3% 6.2% 6.5%
EBIT pre Goodwill/Exceptionals 1,370 1,323 1,278 1,326 1,349 1,438
Financial income (Expense) (136) (177) (266) (250) (210) (180)
PBT 628 895 923 1,031 1,094 1,213
PBT pre Goodwill/Exceptionals 1,234 1,146 1,012 1,076 1,139 1,258
Income tax (141) (179) (186) (227) (235) (267)
Tax rate % 25% 25% 25% 25% 25% 25%
Share in net income of equity invst. 3 28 47 47 47 47
Minority interests (28) (12) (16) (15) (15) (15)
Goodwill amortisation 0 0 1 2 3 4
Net Income (Loss) Continuing 462 732 768 836 891 978
Net inc. pre Goodwill/Exceptionals 932 933 839 871 926 1,013
Discontinued 0 0 0 0 0 0
Net income (loss) 462 732 768 836 891 978
Basic EPS 1.57 2.49 2.55 2.71 2.89 3.17
Continuing EPS 1.57 2.49 2.55 2.71 2.89 3.17
Clean continuing EPS 3.17 3.17 2.78 2.89 3.07 3.36
Diluted EPS 1.56 2.46 2.52 2.69 2.86 3.14
DPS 0.62 0.80 0.84 0.84 0.90 1.00
Weighted average shares in issue (m) 294 294 301 308 308 308
Diluted shares in issue (m) 297 297 304 311 311 311
Share in issue (m) 294 294 301 301 301 301
Source: Company data, Credit Suisse estimates

73
Alstom – Company Summary
Operating Profit Split Sales Mix End Market Mix
Management
Chairman and MD Patrick Kron
Chairman & CEO Philippe Cochet
CFO Nicolas Tissot
Vice President IR Emmanuelle Chatelain
Division Products End Markets / Channels Main Competitors Revenue Split by Geo Key Drivers/ Themes
Thermal Power
FY 2012 Sales EUR 9.18 Bn
5% YoY organic growth
FY 2012 EBIT EUR 0.96 Bn
10.4% Margin
Designs, manufactures, and supplies a broad
range of products and systems in the power
generation industry for coal, gas, oil, nuclear
and biomass power plants.
Thermal Service 50%, Steam 35%, Gas 10%
and Nuclear 5%
General Electric, Siemens and Mitsubishi
Heavy
Asia Pacific 27%, Western Europe 23%,
Middle East/Africa 19%, North America 16%,
Eastern Europe 13%
Global electricity demand; Power plant
utilitzation
Renewable
FY 2012 Sales EUR 1.80 Bn
-11.0% YoY organic growth
FY 2012 EBIT EUR 0.09 Bn
4.9% Margin
Supplies wind and hydro equipment as well as
energy management solutions.Hydro 78%, Wind 20% and New Energies 2%
General Electric, Siemens, Vestas, Gamesa
and Harbin.
South % Central America 32%, Asia Oacific
20%, North America 16%, Western Europe
15%, Middle East/Africa 10%, Eastern
Europe 7%
Regulations on lower emission requirement;
Development of renewable energy
Transport
FY 2012 Sales EUR 5.46 Bn
4.0% YoY organic growth
FY 2012 EBIT EUR 0.30 Bn
5.4% Margin
High performance product rolling stock,
infrastructures, information systems, services,
turnkey solutions. It also designs and
manages railway lines and offers maintenance
and renovation programs.
Rolling Stock 60%, Services 15%, Signalling
10% and Systems 10%Siemens, General Electric and Bombardier
Western Europe 65%, Asia Pacific 10%,
Middle East/Africa 7%, South & Central
America 7%, North America 6%, Eastern
Europe 5%
Emission reduction from cars; Urbanization;
Increasing penetration in EM
Grid
FY 2012 Sales EUR 3.83 Bn
-3.0% YoY organic growth
FY 2012 EBIT EUR 0.24 Bn
6.3% Margin
Advanced technologies and expertise in areas
such as power, ultra high voltage, direct
current interconnections, integration of
renewables into the grid and network
management solutions
Product Systems & Services 80%, Power
Electronics & Automation 20%Siemens, Schneider and ABB.
Asia pacific 30%, Middle East/Africa 20%,
Western Europe 17%, North America 12%,
South & Central America 11%, Eastern
Europe 10%
Grade upgrades; Utitlity capex; Demand for
transmission in EM
ALSTOM (ALSO.PA) - SIMON TOENNESSEN +44 20 7883 6893/ [email protected] Mix Shareholding Structure
Free Float: 70%
Ownership by country
France 57%, Americas 24%, Rest of Europe
16%, Middle East/Africa 3%
Thermal Pow er
56%
Renew able5%
Transport19%
Grid15%
Thermal Pow er
44%
Renew able9%
Transport27%
Grid19%
WesternEurope
35% Middle East/Africa
3%
Asia Pacif ic
24%
NorthAmerica
22%
Latin America
8%
EasternEurope
5%
Transportation27%
Pow er Generation
56%
Pow er T&D17%
Source: Company data, Credit Suisse research

74
Assa Abloy – Outperform, TP SEK 360
Bull Case
Ongoing scope for further 7-8% pa acquired growth driven by Entrance
Systems (market still does not discount SEK 20bn sales run rate for 2015)
and traditional locks and doors markets;
Sustainable 100% clean Net Income to FCF conversion with restructuring
costs paid for by WC releases and lower Capex;
Organic growth acceleration potential driven by 1) end-markets recovery
(US Non-Res following Res, Europe troughing), 2) rising penetration of
electro-mechanical locks (2x units price vs traditional), penetration of seos
(key on mobile devices), payback from investment in presence;
Scope for positive margin surprise from combination of above organic
growth and ongoing substantial cost-cutting (MFP5 – SEK 1bn over 3 years),
Seamless Flow (SG&A reduction), VA/VE, Sourcing (‘should cost’).
Sustainable pricing power.
Bear Case Risk of acquisitions pipeline drying up or competitors bidding up prices;
Risk of a drop off in China construction market or a further protracted
downturn in Europe or US (government spent-related exposure);
Technology evolution in the locks market resulting in new competitors
entering the market (eg. Samsung in el-mech);
Expensive valuation.
Investment summary: High quality cash-generative Acquire & Restructure model with meaningful additional
organic growth options (el-mech, presence, seos) and margin improvement potential (MFP5, Seamless Flow).
0
50
100
150
200
250
300
350
0
2
4
6
8
10
12
14
16
2004 2005 2006 2007 2008 2009 2010 2011 2012 2013
1 Yr Forward EPS (LHS) Share Price (RHS)
-15%
-10%
-5%
0%
5%
10%
15%
12%
13%
14%
15%
16%
17%
18%
Margins % (LHS) Organic Growth (RHS)
Source: Thomson Reuters, Company data, Credit Suisse estimates
0%
20%
40%
60%
80%
100%
120%
6%
8%
10%
12%
14%
16%
18%
AASB ROIC (LHS) Sector ROIC (LHS)
AASB Cash conversion (RHS) Sector Cash conversion (RHS)

75
Assa Abloy – Valuation
Multiples
December y/e 2007 2008 2009 2010 2011 2012 2013E 2014E 2015E
Average/Current 146.0 95.6 105.4 159.6 164.8 204.9 322.0 322.0 322.0
High 164.0 129.8 142.5 199.2 194.9 244.8
Low 124.5 69.8 71.5 126.6 133.5 171.7
P/E average 16.4 9.9 11.0 14.6 11.7 14.8 21.7 18.7 16.1
P/E high 18.5 13.5 14.9 18.2 13.8 17.7
P/E low 14.0 7.2 7.5 11.6 9.5 12.4
EV:sales average 2.04 1.46 1.46 1.91 1.82 1.95 2.81 2.47 2.15
EV:sales high 2.25 1.83 1.86 2.31 2.08 2.26
EV:sales low 1.80 1.17 1.10 1.57 1.54 1.68
Operating margin 16.3% 15.8% 15.5% 16.5% 15.9% 16.1% 16.4% 16.8% 17.0%
EV:EBITDA average 10.8 7.9 8.0 9.9 9.9 10.6 15.2 13.0 11.4
EV:EBITDA high 11.8 9.9 10.1 12.0 11.4 12.4
EV:EBITDA low 9.5 6.4 6.0 8.2 8.4 9.2
EV:EBIT average 12.6 9.2 9.4 11.6 11.5 12.1 17.1 14.7 12.7
EV:EBIT high 13.8 11.6 12.0 14.0 13.1 14.1
EV:EBIT low 11.1 7.4 7.1 9.5 9.7 10.5
FCF yield average 6.4% 9.9% 13.3% 8.5% 7.3% 7.2% 4.2% 4.9% 5.8%
FCF yield high 5.7% 7.3% 9.8% 6.8% 6.2% 6.0%
FCF yield low 7.5% 13.6% 19.5% 10.7% 9.1% 8.6%
Dividend yield average 2.5% 3.8% 3.4% 2.5% 2.7% 2.5% 1.7% 1.9% 2.0%
Dividend yield high 2.2% 2.8% 2.5% 2.0% 2.3% 2.1%
Dividend yield low 2.9% 5.2% 5.0% 3.2% 3.4% 3.0%
EV/IC average 2.20 1.39 1.48 1.85 1.63 1.78 2.45 2.32 2.18
EV/IC high 2.42 1.74 1.88 2.23 1.87 2.07
EV/IC low 1.94 1.12 1.11 1.52 1.38 1.54
P/BV average 3.53 1.93 2.05 2.86 2.59 2.83 4.08 3.57 3.10
P/BV high 3.96 2.62 2.78 3.57 3.06 3.39
P/BV low 3.01 1.41 1.39 2.27 2.10 2.37
ROIC 12.6% 10.9% 11.3% 12.1% 10.8% 11.2% 10.7% 11.9% 12.9%
ROE 21.4% 19.5% 18.6% 19.6% 22.2% 19.1% 18.8% 19.1% 19.2%
ROCE 14.3% 12.5% 13.2% 15.2% 13.7% 14.2% 13.4% 14.6% 15.6%
5.0% 5.5% 6.0% 6.5% 7.0%
15.0% 11.3% 308 312 318 323 328
15.5% 11.6% 318 323 328 334 339
16.0% 12.0% 328 333 339 345 351
16.5% 12.4% 338 344 350 356 362
17.0% 12.8% 348 354 360 367 373
17.5% 13.1% 358 365 371 378 385
18.0% 13.5% 368 375 382 389 396
18.5% 13.9% 378 385 392 400 407
19.0% 14.3% 389 396 403 411 419
19.5% 14.6% 399 406 414 422 430
EBITA
margin
NOPAT
margin
DCF
Growth (years 4 to 10) 6.0%
EBIT margin (years 4+) 17.0%
NOPAT margin 12.8%
Invested capital 50,921
Invested capital growth (years 4+) 2.0%
Terminal growth rate 2.0%
10-year average FCF yield 12.3%
WACC 9.0%
Source: Company data, Credit Suisse estimates

76
Assa Abloy – Financials PROFIT & LOSS 2010 2011 2012 2013E 2014E 2015E
EMEA 13,036 13,030 13,382 13,208 14,045 15,288
Change yoy, % -4.2% 0.0% 2.7% -1.3% 6.3% 8.9%
Americas 9,536 8,906 9,670 9,979 11,556 12,943
Change yoy, % -3.5% -6.6% 8.6% 3.2% 15.8% 12.0%
Asia Pacific 6,081 6,633 7,224 7,499 8,255 9,184
Change yoy, % 60.5% 9.1% 8.9% 3.8% 10.1% 11.3%
Global Technologies 5,015 5,756 6,262 6,356 6,610 7,271
Change yoy, % 5.2% 14.8% 8.8% 1.5% 4.0% 10.0%
Entrance System 4,072 8,278 10,979 12,022 14,723 17,812
Change yoy, % 9.1% 103.3% 32.6% 9.5% 22.5% 21.0%
Intersegment Sales (916) (817) (898) (900) (900) (900)
Group Revenue 36,824 41,786 46,619 48,164 54,290 61,599
Change yoy, % 5.3% 13.5% 11.6% 3.3% 12.7% 13.5%
COGS (21,987) (26,831) (28,190) (28,417) (32,031) (36,343)
Gross Profit 14,837 14,955 18,429 19,747 22,259 25,255
Gross margin, % 40.3% 35.8% 39.5% 41.0% 41.0% 41.0%
SG&A (8,720) (9,719) (10,998) (10,641) (11,135) (11,654)
Exceptionals / one-offs (32) (1,420) - (1,000) - -
OPERATING PROFIT
EMEA 2,174 2,203 2,279 2,206 2,430 2,752
Margin, % 16.7% 16.9% 17.0% 16.7% 17.3% 18.0%
Americas 1,886 1,812 2,007 2,126 2,485 2,783
Margin, % 19.8% 20.3% 20.8% 21.3% 21.5% 21.5%
Asia Pacific 843 933 978 1,065 1,238 1,396
Margin, % 13.9% 14.1% 13.5% 14.2% 15.0% 15.2%
Global Technologies 862 896 1,074 1,169 1,210 1,345
Margin, % 17.2% 15.6% 17.2% 18.4% 18.3% 18.5%
Entrance System 659 1,196 1,546 1,707 2,208 2,672
Margin, % 16.2% 14.4% 14.1% 14.2% 15.0% 15.0%
Intersegment Sales (346) (416) (382) (385) (434) (493)
Operating profit 6,078 6,624 7,502 7,887 9,137 10,455
Operating margin, % 16.5% 15.9% 16.1% 16.4% 16.8% 17.0%
Depreciation & Amortisation (995) (1,022) (1,034) (1,035) (1,142) (1,193)
EBITDA 7,073 7,646 8,536 8,922 10,279 11,648
EBITDA margin, % 19.2% 18.3% 18.3% 18.5% 18.9% 18.9%
Net interest income / (expense) (680) (645) (770) (541) (641) (591)
Profit Before Tax 5,367 4,557 6,731 8,578 10,495 13,023
Underlying PBT 5,398 5,979 6,732 7,346 8,496 9,864
Tax (1,286) (1,095) (1,617) (1,837) (2,124) (2,466)
Effective rate, % 24.0% 24.0% 24.0% 25.0% 25.0% 25.0%
Minority interest (30) (26) (14) (15) (15) (15)
Operating Net Income 4,082 5,262 5,112 5,495 6,357 7,383
Net income margin, % 11.1% 12.6% 11.0% 11.4% 11.7% 12.0%
Dividend 1,491 1,677 1,885 2,033 2,218 2,402
CS operating EPS 10.9 14.1 13.8 14.9 17.2 20.0
EPS growth, % 14.5% 29.0% -2.1% 7.5% 15.7% 16.1%
DPS, SEK 4.0 4.5 5.1 5.5 6.0 6.5
DPS growth, % 11.1% 12.5% 13.3% 7.8% 9.1% 8.3%
Dividend Cover (X) 2.7 3.1 2.7 2.7 2.9 3.1
Ordinary shares in issue 373 373 370 370 370 370
BALANCE SHEET 2010 2011 2012 2013E 2014E 2015E
PPE and Intangibles 30,615 37,139 40,025 44,354 46,370 48,642
Other fixed assets 1,595 2,161 2,978 2,978 2,978 2,978
Fixed assets 32,210 39,300 43,003 47,332 49,348 51,620
Inventories 4,825 5,704 5,905 5,995 6,669 7,468
Trade and other receivables 6,904 8,418 9,293 9,633 10,709 11,982
Trade and other payables (5,881) (6,957) (7,280) (7,785) (8,951) (10,455)
Other Current Liabilities (2,375) (4,000) (6,243) (6,243) (6,243) (6,243)
Working capital 5,848 7,165 7,918 7,842 8,428 8,995
Working capital days 58 63 62 59 57 53
WC as % of sales 15.9% 17.1% 17.0% 16.3% 15.5% 14.6%
Cash 1,450 1,949 1,045 269 1,421 3,178
Short-term debt (2,864) (7,606) (3,388) (3,016) (3,016) (3,016)
Long-term debt (8,134) (7,422) (11,194) (12,066) (12,066) (12,066)
Net debt / (cash) 9,548 13,079 13,537 14,813 13,661 11,904
Pension deficit 1,078 1,173 1,224 1,224 1,224 1,224
Other investments 170 284 138 138 138 138
Other liabilities (4,236) (4,480) (3,801) (4,301) (3,901) (3,501)
Net assets 23,366 28,017 32,497 34,974 39,128 44,124
CASH FLOW 2010 2011 2012 2013E 2014E 2015E
Operating profit 6,046 5,204 7,502 6,887 9,137 10,455
Restructuring Cost - 1,420 - 1,000 - -
Op. profit (Ex restructuring) 6,078 6,624 7,502 7,887 9,137 10,455
Depreciation & amortisation 995 1,022 1,034 1,035 1,142 1,193
Tax paid (799) (1,206) (1,113) (1,837) (2,124) (2,466)
Net interest (455) (482) (546) (541) (641) (591)
Restructuring Payments (465) (373) (498) (500) (400) (400)
Other 45 - (312) - - -
Gross cash flow 5,399 5,585 6,067 6,045 7,114 8,191
Working capital change 362 (238) (77) 76 (585) (568)
Operating cash flow 5,761 5,347 5,990 6,121 6,528 7,623
Operating cash / Operating profit 94.8% 80.7% 79.8% 77.6% 71.5% 72.9%
Net Capex (708) (845) (557) (1,100) (750) (750)
Free cash flow 5,053 4,502 5,433 5,021 5,778 6,873
FCF / Net income 124% 86% 106% 91% 91% 93%
Disposals - - - - - -
Acquisitions (3,319) (6,511) (4,181) (4,264) (2,408) (2,714)
Sales / (Purchase) of investments - - - - - -
Borrowings raised / (repaid) (1,328) 5,500 (446) 500 - -
Shares issue / (purchase) 48 - 38 - - -
Dividends paid (1,317) (1,472) (1,683) (2,033) (2,218) (2,402)
Net cash flow (863) 316 (312) (776) 1,153 1,756
ANALYSIS 2010 2011 2012 2013E 2014E 2015E
NOPAT 4,621 5,033 5,700 5,916 6,852 7,841
Invested Capital 38,058 46,465 50,921 55,174 57,776 60,615
ROIC 12.1% 10.8% 11.2% 10.7% 11.9% 12.9%ROIC (average) 12.7% 11.9% 11.7% 11.2% 12.1% 13.2%
Operating Net Income 4,082 5,262 5,112 5,495 6,357 7,383
Equity 20,821 23,735 26,726 29,203 33,357 38,353
ROE 19.6% 22.2% 19.1% 18.8% 19.1% 19.2%ROE (average) 20.3% 23.6% 20.3% 19.6% 20.3% 20.6%
EBITDA 7,073 7,646 8,536 8,922 10,279 11,648
Total debt 10,998 15,028 14,582 15,082 15,082 15,082
Net debt 9,548 13,079 13,537 14,813 13,661 11,904
Total debt / EBITDA 1.6 2.0 1.7 1.7 1.5 1.3
Net debt / EBITDA 1.3 1.7 1.6 1.7 1.3 1.0
Source: Company data, Credit Suisse estimates

77
Assa Abloy – Company Summary
Operating Profit Split Sales Mix End Market Mix
Management
Chairman Lars Renstrom
CEO Johan Molin
CFO Carolina Happe
IR Niklas Ribbing
Division Products End Markets / Channels Main Competitors Revenue Split by Geo Key Drivers/ Themes
EMEA
FY 2012 Sales SEK 13.3 Bn
1.0% YoY organic growth
FY 2012 EBIT SEK 2.3 Bn
17.0% Margin
Locks, cylinders, electro- mechanical
products, security doors and fittings. Leading
brands: Abloy, Assa, Ikon, Tesa, Yale, Mul-T-
lock and Vachette
Mechanical Locks, lock systems and fittings
62%, Electromechanical & electronic locks
24% and Security doors & hardware 14%
Kaba and Dorma
Most sales take place in Western Europe,
but emerging markets in Eastern Europe and
the Middle East are gaining in importance.
Americas
FY 2012 Sales SEK 9.67 Bn
4.0% YoY organic growth
FY 2012 EBIT SEK 2.0 Bn
20.8% Margin
Locks, cylinders, electro- mechanical
products, security doors and fittings. Leading
brands: Ceco, Corbin Russwin, Curries,
Emtek, Medeco, Philipsm Sargent and La
Fonte
Mechanical Locks, lock systems and fittings
49%, Electromechanical & electronic locks
39% and Security doors & hardware 12%
Ingersoll Rand and Stanley Works
88% of the sales take place in the USA and
Canada. South America is growing in
significance, with Brazil as the most
important.
Asia Pacific
FY 2012 Sales SEK 7.2 Bn
3.0% YoY organic growth
FY 2012 EBIT SEK 0.98 Bn
13.5% Margin
Locks, cylinders, electro- mechanical
products, security doors and fittings. Leading
brands: Baodean, Beijing Tianming, Guli,
Interlock, iRevo, Lockwood, Shenfei and
Wangli
Mechanical Locks, lock systems and fittings
54%, Security doors & hardware 38% and
Electromechanical & electronic locks 8%
Tri-CircleChina 50%, Rest of Asia 20%, Australia &
New Zealand 20%, export 10%.
Global Technologies
FY 2012 Sales SEK 6.3 Bn
6.0% YoY organic growth
FY 2012 EBIT SEK 1.1 Bn
17.2% Margin
Electronic access management, secure card
issuance, identification technology and
electronic lock products for hotels. Leading
brands: HID, Fargo, Elsafe and VingCard
Access Control 52%, Identification technology
26% and Hotel locks 22%N.A.
Investment in R&D; Expansion in Emerging
markets; Growth in the electronic product
Entrance Systems
FY 2012 Sales SEK 10.98 Bn
-2.0% YoY organic growth
FY 2012 EBIT SEK 1.5 Bn
14.1% Margin
Automatic entrance solutions and service.
Leading brands: Besam, Ditec, FlexiForce,
Albany, Crawford,
Normstahl, Henderson and EM
Products 63% and Services 37% N.A.Investment in R&D; Expansion in Emerging
markets; Growth in the electronic product
ASSA ABLOY (ASSAb.ST) - ANDRE KUKHNIN, CFA +44 20 7883 0350/ [email protected]
Geographic MixShareholding Structure
Free Float: 90%
Top 5 shareholders
Investment AB Latour 9.5%, Capital Group
fonder 8.8%, Blackrock fonder 5.1%, Melker
Schorling AB 3.9%, Swedbank Robur Fonder
2.6%
Ownership by country
USA 50%, Sweden 31%, Norway 7%, UK 4%
and others
ADT Corporation, Napco Securities, Bosch
Security Systems, Filehold Systems and KL
security enterprises
Expansion in Emerging markets; Growth
through acquisitions. Increasing Emerging
market security concerns. Urbanisation.
EMEA29%
Americas25%
Asia Pacif ic
12%
Global Technologies
14%
Entrance Systems
20%EMEA28%
Americas20%
AsiaPacif ic
15%
Global Technologies
13%
EntranceSystems
23%
NorthAmerica
29%
South America
2%
Europe47%
Asia16%
Africa1%
Australia/New Zealand
5%
Mechanical Locks, lock systems and
f ittings36%
Electromechanical & electronic locks
22%
Entrance Automation
24%
Security doors & hardw are
18%
Source: Company data

78
Atlas Copco – Outperform, TP SEK 210 Investment summary: Attractive high-quality exposure to general industrial recovery, structural aftermarket
growth characteristics, mining exposure 80% weighted to aftermarket, further balance sheet potential.
Bull Case High quality General Industrial exposure – optimal play on a slow economic
recovery as historically outgrew Sandvik and SKF in such conditions;
Compressors and Industrial Tools aftermarket offers an attractive installed-base
driven growth characteristic similar to aero engines or elevators;
In Mining, Atlas’ exposure is 80% in aftermarket, which we expect to grow in
2014 after 12+ months of de-stock creating +ve mix effect while we already
discount 40-50% peak to trough declines in new equipment;
Further balance sheet flexibility even after Edwards acquisitions – Net Debt /
EBITDA of 0.7x for 2014 (our est) vs up to 1.4x historically.
Bear Case Scope for further deterioration in mining new equipment (miners capex cuts
beyond 40-50% with no reallocation to brownfield) or longer than expected de-
stocking in aftermarket (we currently discount c15 months);
Pricing deterioration in mining given the magnitude of the capex cuts (we see
underground equipment, 80% of Atlas, as relatively well protected);
Edwards acquisition integration and future performance with high exposure to
semiconductors manufacturing capex as the main risk of volatility;
Next cycle could see structurally slower growth in the General Industrial space
vs last as relocation of manufacturing capacity to China is completed (we see CT
and IT as adjacency to Automation which remains attractive);
Valuation appears full if taking only A-shares.
0
20
40
60
80
100
120
140
160
180
200
0
2
4
6
8
10
12
14
2004 2005 2006 2007 2008 2009 2010 2011 2012 2013
1 Yr Forward EPS (LHS) Share Price (RHS)
Source: Thomson Reuters, Company data, Credit Suisse estimates
0%
20%
40%
60%
80%
100%
6%
11%
16%
21%
26%
31%
ATCO ROIC (LHS) Sector ROIC (LHS)
ATCO Cash conversion (RHS) Sector Cash conversion (RHS)
-30%
-20%
-10%
0%
10%
20%
30%
12%
14%
16%
18%
20%
22%
24%
Margins % (LHS) Organic Growth (RHS)

79
Atlas Copco – Valuation
Grow th (years 4 to 10) 7.0%
EBIT margin (years 4+) 21.0%
NOPAT margin 15.8%
Invested capital 57,453
Invested capital grow th (years 4+) 2.0%
Terminal grow th rate 2.0%
10-year average FCF yield 13.4%
WACC 9.0%
Growth rate
6.0% 6.5% 7.0% 7.5% 8.0%
19.0% 14.3% 184 188 191 195 198
19.5% 14.6% 189 193 196 200 204
20.0% 15.0% 194 198 201 205 209
20.5% 15.4% 199 203 207 211 215
21.0% 15.8% 204 208 210 216 220
21.5% 16.1% 209 213 217 221 225
22.0% 16.5% 214 218 222 227 231
22.5% 16.9% 219 223 227 232 236
23.0% 17.3% 223 228 233 237 242
23.5% 17.6% 228 233 238 243 247
EBIT
Margin
NOPAT
margin
DCF December y/e 2007 2008 2009 2010 2011 2012 2013E 2014E 2015E
A shares: Ave/Curr 106.0 86.0 80.5 122.7 149.1 158.6 175.1 175.1 175.1
A shares: High 121.5 112.5 107.2 172.7 172.7 179.4
A shares: Low 89.6 48.6 54.5 96.0 115.5 138.3
B shares: Ave/Curr 95.9 75.7 69.5 107.5 133.3 141.1 159.1 159.1 159.1
B shares: High 109.3 100.2 92.3 150.2 154.9 159.0
B shares: Low 80.6 42.2 47.0 83.9 102.0 122.8
P/E average 16.1 11.3 14.4 14.9 14.3 13.8 17.1 15.9 14.4
P/E high 18.5 14.8 19.1 21.0 16.5 15.6
P/E low 13.6 6.4 9.7 11.7 11.1 12.0
EV/Sales average 2.38 1.75 1.75 2.25 2.44 2.17 2.66 2.44 2.27
EV/Sales high 2.68 2.19 2.26 3.12 2.79 2.53
EV/Sales low 2.06 1.14 1.25 1.78 1.93 1.98
Operating profit margin 18.9% 19.0% 15.1% 20.1% 21.8% 21.3% 20.7% 20.8% 21.2%
EV/EBITDA average 10.9 8.1 9.2 9.5 9.8 9.0 11.2 10.6 9.6
EV/EBITDA high 12.3 10.1 11.9 13.2 11.2 10.4
EV/EBITDA low 9.5 5.2 6.6 7.5 7.8 8.1
EV/EBIT average 12.6 9.2 11.6 11.2 11.2 10.2 12.9 11.7 10.7
EV/EBIT high 14.1 11.5 14.9 15.5 12.8 11.9
EV/EBIT low 10.9 6.0 8.3 8.9 8.9 9.3
FCF yield average 4.2% 5.6% 13.3% 6.4% 3.4% 5.9% 5.9% 5.6% 6.1%
FCF yield high 5.0% 9.9% 19.7% 8.2% 4.4% 6.7%
FCF yield low 3.7% 4.3% 10.0% 4.6% 2.9% 5.2%
Dividend yield average 2.8% 3.5% 3.7% 3.3% 3.4% 3.5% 3.4% 3.7% 4.0%
Dividend yield high 2.5% 2.7% 2.8% 2.3% 2.9% 3.1%
Dividend yield low 3.3% 6.2% 5.5% 4.2% 4.3% 4.0%
EV/IC average 4.6 3.2 3.3 4.6 4.6 4.5 4.0 3.8 3.6
EV/IC high 5.2 3.9 4.3 6.4 5.3 5.2
EV/IC low 4.0 2.0 2.4 3.6 3.7 4.1
P/BV average 8.9 4.4 3.8 5.1 6.3 5.6 5.4 5.1 4.8
P/BV high 10.2 5.8 5.1 7.2 7.3 6.4
P/BV low 7.5 2.5 2.6 4.0 4.9 4.9
ROIC 26.0% 26.0% 21.8% 30.1% 31.0% 32.8% 23.3% 24.1% 24.8%
ROE 55.3% 39.2% 26.7% 34.4% 44.2% 40.9% 31.3% 32.2% 33.6%
ROCE 25.0% 23.0% 19.6% 29.5% 30.5% 33.9% 23.9% 24.8% 25.6%
Source: Company data, Credit Suisse estimates

80
Atlas Copco – Financials
ANALYSIS 2010 2011 2012E 2013E 2014E 2015E
NOPAT 10,327 13,280 14,483 13,028 13,841 14,792
Invested Capital 34,297 42,886 44,151 55,830 57,453 59,590
ROIC 30.1% 31.0% 32.8% 23.3% 24.1% 24.8%
ROIC (average) 30.4% 34.4% 33.3% 26.1% 24.4% 25.3%
Operating Net Income 10,021 12,717 13,968 12,449 13,112 14,160
Equity 29,321 28,839 34,185 39,840 40,722 42,255
ROE 34.2% 44.1% 40.9% 31.2% 32.2% 33.5%
ROE (average) 36.4% 43.7% 44.3% 33.6% 32.6% 34.1%
EBITDA 16,513 20,187 21,959 20,000 20,686 22,357
Total debt 20,114 20,435 21,052 21,052 21,052 21,052
Net debt 5,850 14,719 8,636 14,660 15,224 15,538
Total debt / EBITDA 1.2 1.0 1.0 1.1 1.0 0.9
Net debt / EBITDA 0.4 0.7 0.4 0.7 0.7 0.7
PROFIT & LOSS 2010 2011 2012E 2013E 2014E 2015E
Revenue 69,875 81,203 90,533 83,929 89,955 95,041
Growth, % 9.6% 16.2% 11.5% -7.3% 7.2% 5.7%
COGS (43,468) (50,051) (55,779) (50,357) (53,973) (57,025)
Gross Profit 26,407 31,152 34,754 33,572 35,982 38,016
Gross margin, % 37.8% 38.4% 38.4% 40.0% 40.0% 40.0%
SG&A (11,087) (11,959) (13,641) (14,431) (15,382) (15,888)
R & D expenses (1,517) (1,805) (2,042) (2,098) (2,249) (2,376)
Other operating income/exp 99 166 156 329 352 372
Reported EBIT 13,915 17,560 19,230 17,371 18,704 20,125
Reported EBIT margin, % 19.9% 21.6% 21.2% 20.7% 20.8% 21.2%
Exceptionals / one-offs (100) (105) (65) 0 0 0
Operating profit 14,015 17,665 19,295 17,371 18,704 20,125
Operating profit margin, % 20.1% 21.8% 21.3% 20.7% 20.8% 21.2%
Depreciation & Amortisation 2,498 2,522 2,664 2,628 1,982 2,232
EBITDA 16,513 20,187 21,959 20,000 20,686 22,357
EBITDA margin, % 23.6% 24.9% 24.3% 23.8% 23.0% 23.5%
Net interest income / (expense) (420) (284) (690) (753) (958) (833)
Rate, % -7.2% -1.9% -8.0% -5.1% -6.3% -5.4%
Profit Before Tax 13,495 17,276 18,540 16,619 17,746 19,292
Underlying PBT 13,595 17,030 18,605 16,619 17,746 19,292
Tax (3,551) (4,288) (4,624) (4,155) (4,614) (5,112)
Effective rate, % 26.3% 24.8% 24.9% 25.0% 26.0% 26.5%
Reported profit after tax 9,944 12,988 13,916 12,464 13,132 14,180
Minority interest (23) (25) (13) (15) (20) (20)
Reported Net Income 9,921 12,963 13,903 12,449 13,112 14,160
Operating Net Income 10,021 12,717 13,968 12,449 13,112 14,160
Net income margin, % 14.3% 15.7% 15.4% 14.8% 14.6% 14.9%
CS operating EPS 8.2 10.4 11.5 10.2 11.0 12.2
EPS growth, % 47.0% 26.9% 10.0% -10.9% 7.7% 10.4%
DPS, SEK 4.0 5.0 5.5 6.0 6.5 7.0
DPS growth, % 33.3% 25.0% 10.0% 9.1% 8.3% 7.7%
Dividend Cover (X) 2.1 2.1 2.1 1.7 1.7 1.7
Ordinary shares in issue 1,216 1,214 1,214 1,214 1,187 1,159
BALANCE SHEET 2010 2011 2012E 2013E 2014E 2015E
PPE and Intangibles 21,009 24,007 24,755 36,946 38,113 39,157
Other f ixed assets 4,123 3,983 3,481 3,481 3,481 3,481
Fixed assets 25,132 27,990 28,236 40,427 41,594 42,638
Inventories 12,939 17,579 17,653 17,205 18,441 19,959
Trade and other receivables 17,474 21,996 21,155 19,723 21,589 23,285
Trade and other payables (17,125) (20,696) (19,412) (18,045) (20,690) (22,810)
Working capital 13,288 18,879 19,396 18,884 19,340 20,434
Working capital days 69 85 78 82 78 78
WC as % of sales 19.0% 23.2% 21.4% 22.5% 21.5% 21.5%
Cash 14,264 5,716 12,416 6,392 5,828 5,514
Short-term debt (499) (3,422) (902) (2,105) (2,105) (2,105)
Long-term debt (19,615) (17,013) (20,150) (18,947) (18,947) (18,947)
(Net debt) / cash (5,850) (14,719) (8,636) (14,660) (15,224) (15,538)
Pension deficit (1,578) (1,504) (2,149) (2,149) (2,149) (2,149)
Other assets 1,813 1,828 1,334 1,334 1,157 867
Other liabilities (3,484) (3,635) (3,996) (3,996) (3,996) (3,997)
Net assets 29,321 28,839 34,185 39,840 40,722 42,255
CASH FLOW
Operating profit 14,015 17,560 19,295 17,371 18,704 20,125
Depreciation & amortisation 2,498 2,522 2,664 2,628 1,982 2,232
Net interest (960) (1,275) (592) (753) (958) (833)
Tax paid (2,813) (3,307) (5,053) (4,155) (4,436) (4,823)
Other 260 (176) (309) 0 0 1
Gross cash flow 13,000 15,324 15,940 15,092 15,291 16,702
Working capital change (1,730) (6,115) (1,366) 512 (456) (1,093)
Operating cash flow 10,925 8,421 13,825 14,597 13,935 14,658
Operating cash / Operating profit 0.8 0.5 0.7 0.8 0.7 0.7
Net Capex (1,322) (2,283) (2,518) (2,075) (2,249) (2,326)
Free cash flow 9,603 6,138 11,307 12,522 11,686 12,333
FCF / Net income 1.0 0.5 0.8 1.0 0.9 0.9
Acquisitions (1,691) (2,206) (1,195) (11,737) 0 0
Disposals 0 0 0 0 0 0
Sales / (Purchase) of investments 195 154 928 0 0 0
Borrow ings raised / (repaid) (1,474) 181 1,636 0 0 0
Shares issue / (purchase) 384 (8,063) 164 0 (5,000) (5,000)
Dividends paid (3,650) (4,853) (6,070) (6,809) (7,250) (7,646)
Net cash flow 3,367 (8,649) 6,770 (6,024) (564) (314)
Source: Company data, Credit Suisse estimates

81
Atlas Copco – Company Summary
Operating Profit split Sales Mix End Market Mix
Management
Chairman Sune Carlsson
CEO Ronnie Leten
CFO Hans Ola Meyer
IR Mattias Olsson
Division Products End Markets / Channels Main Competitors Revenue Split by Geo Key Drivers/ Themes
Compressor Technique
FY 2012 Sales SEK 34.71 Bn
7.0% YoY organic growth
FY 2012 EBIT SEK 8.01 Bn
23.1% margin.
Oil-free and oil-injected stationary air
compressors, portable air compressors, oil
and gas boosters, gas and process
compressors, turbo expanders, generators, air
treatment equipment, and air management
systems.
Industrial Air Compressors 85%, Gas &
Process Compressots 10% and Speciality
Rental 5%
Ingersoll-Rand, Kaeser, Hitachi, Gardner-
Denver, Cameron, Sullair, and Parker Hannifin.
Europe 33%, Asia/Australia 31%, North
America 19%, Middle East/Africa 10%, South
America 7%
Investments in Machinery, Industrial
production and Energy cost
Mining Rock Excavation Technique
FY 2012 Sales SEK 34.05 Bn
14% YoY organic growth
FY 2012 EBIT SEK 8.31 Bn
24.4% margin
Equipment for drilling and rock excavation.
Surface and underground mining,
infrastructure, civil works, well drilling and
geotechnical applications.
Mining 69%, Construction 28%, Service 1%
and Other 2%
Sandvik,Furukawa, Boart Longyear, Joy
Global and Caterpillar
Asia/Australia 27%, North America 22%,
Europe 20%, Middle East/Africa 17%, South
America 14%
Mining Capex on equipment and Ore
Production (aftermarket).
Construction Technique
FY 2012 Sales SEK 12.89 Bn
-0.7% YoY organic growth
FY 2012 EBIT SEK 1.39 Bn
10.8% margin
Construction and demolition tools, portable
compressors, pumps and generators, lighting
towers, and compaction and paving equipment
Construction 62%, Manufacturing 11%, Mining
8%, Service 5%, Process Industry 2% and
Others 12%
Doosan Infracore, Kaeser, SullairVolvo,
Caterpillar, Wirtgen,Sandvik,Furukawa and
Wacker Neuson
Europe 35%, Asia/Australia 24%, North
America 16%, South America 13%, Middle
East/ Africa 12%
Infrastructure and public investments & non
building construction activity
Industrial Technique
FY 2012 Sales SEK 9.57 Bn
11.9% YoY organic growth
FY 2012 EBIT SEK 2.16 Bn
22.5% margin
Industrial power tools, assembly systems,
and aftermarket products and services.
Manufacturing 87%, Process Industry 2%,
Construction Industry 1%, Service 1% and
Others 9%.
Apex Tool Group, Ingersoll-Rand, Stanley
Black &Decker, Uryu and Bosch
Europe 47%, North America 25%,
Asia/Australia 22%, South America 5%,
Middle East 1%.
Demolition and recycling, Flexible/Potable
Equipment
ATLAS COPCO (ATCOa.ST) - ANDRE KUKHNIN, CFA +44 20 7883 0350/ [email protected]
Geographic Mix Shareholding Structure
Free Float: 83%
Top 5 shareholders
Investor AB 16.8%, Swedbank 4.4%, Alecta
2.8%, AP 4 1.1%, AMF 2.7% and others
Ownership by country
Sweden 51%, USA 21%,UK 18% and Other
11%
Compressor Technique
38%
Mining Rock Excavation
Technique37%
Construction Technique
14%
Industrial Technique
11%
Compressor Technique
40%
Mining Rock Excavation
Technique42%
Construction Technique
7%
Industrial Technique
11%North America
20%
South America
10%
Europe30%
Asia/Australia28%
Middle East/Africa
12% Manufacturing25%
Mining 30%
Construction22%
ProcessIndustry
10%
Service 6%
Others7%
Source: Company data

82
Bodycote – Outperform, TP 760p Investment summary: We see Bodycote as an attractive way to play the short-cycle recovery in Europe and US
with additional gearing from underlying margin improvement to above 18% and scope for value-creating deals.
Bull Case Margin resilience during the current soft top-line environment and scope for
an improvement to above 18% with some organic growth – driven by mix and
efficiency improvements as well as by pricing discipline;
Interesting geared play on a short-cycle recovery. We discount 6% and 5%
organic growth for 2014/15, in-line with other short-cycle peers, but with
limited operational gearing (c30% vs historic 40-45%);
Attractive exposure to Aerospace (23% of sales, higher of EBIT);
Scope for further value-creating acquisitions with company expected to turn
to net cash again at the end of 2013.
Attractive valuation relative to is UK and other short-cycle peers – trading
at a c10-20% discount on 2014E EV/EBIT of c10x.
Bear Case Margin improvement potential is fully understood and discounted in
consensus estimates. We are c5% ahead for 2014 and Bodycote’s 2014E
EV/Sales multiple of 1.8x suggest the market is not expecting above 18%
margin, especially when other short-cycle plays trade at premium to it margin
on EV/Sales.
US onshore oil & gas and industrial gas turbines exposures within Energy
likely to continue to drag down sales growth. We see this as discounted in
our estimates.
0
100
200
300
400
500
600
700
0
5
10
15
20
25
30
35
40
45
2004 2005 2006 2007 2008 2009 2010 2011 2012 2013
1 Yr Forward EPS (LHS) Share Price (RHS)
-30%
-15%
0%
15%
30%
0%
5%
10%
15%
20%
Margins % (LHS) Organic Growth (RHS)
0%
20%
40%
60%
80%
100%
0%
2%
4%
6%
8%
10%
12%
14%
16%
18%
BOY ROIC (LHS) Sector ROIC (LHS)
BOY Cash conversion (RHS) Sector Cash conversion (RHS)
Source: Thomson Reuters, Company data, Credit Suisse estimates

83
Bodycote – Valuation December y/e 2007 2008 2009 2010 2011 2012 2013E 2014E 2015E
Average/Current 2.91 1.93 1.45 2.24 3.10 3.70 6.20 6.20 6.20
High 3.48 2.61 1.98 3.01 3.98 4.53
Low 1.88 0.99 1.04 1.59 2.26 2.63
Year end 2.00 1.23 1.59 2.81 2.63 4.53
P/E average 14.2 7.2 33.3 12.1 9.7 9.7 15.1 13.7 13.0
P/E high 16.9 9.7 45.5 16.3 12.4 11.9
P/E low 9.2 3.7 23.8 8.6 7.0 6.9
P/E year-end 9.7 4.6 36.4 15.2 8.2 11.9
EV:sales average 1.80 1.24 0.85 0.96 1.06 1.27 1.89 1.75 1.60
EV:sales high 2.08 1.63 1.08 1.25 1.35 1.53
EV:sales low 1.29 0.71 0.68 0.72 0.78 0.93
EV:sales year-end 1.35 0.85 0.91 1.17 0.90 1.53
Underlying operating margin, % 14.3% 12.9% 1.8% 10.4% 15.0% 16.7% 17.0% 18.0% 18.2%
EV:EBITDA average 8.1 5.2 6.3 4.8 4.4 4.9 7.4 6.6 6.1
EV:EBITDA high 9.3 6.8 8.0 6.2 5.6 5.9
EV:EBITDA low 5.8 3.0 5.0 3.6 3.2 3.6
EV:EBITDA year-end 6.0 3.5 6.8 5.8 3.8 5.9
EV:EBIT average 12.6 9.6 46.5 9.2 7.0 7.6 11.1 9.7 8.8
EV:EBIT high 14.6 12.6 58.9 12.0 9.0 9.2
EV:EBIT low 9.1 5.5 37.0 6.9 5.2 5.6
EV:EBIT year-end 9.5 6.6 49.8 11.2 6.0 9.2
FCF yield average 2.7% -0.8% 8.8% 12.7% 12.6% 11.4% 6.3% 6.6% 6.6%
FCF yield high 2.3% -0.6% 6.4% 9.5% 9.8% 9.3%
FCF yield low 4.2% -1.6% 12.3% 17.9% 17.3% 16.0%
FCF yield year-end 4.0% -1.3% 8.0% 10.2% 14.8% 9.3%
Dividend yield average 2.7% 4.3% 5.7% 3.9% 3.5% 3.3% 2.2% 2.4% 2.6%
Dividend yield high 2.3% 3.2% 4.2% 2.9% 2.7% 2.7%
Dividend yield low 4.3% 8.3% 8.0% 5.5% 4.8% 4.7%
Dividend yield year-end 4.0% 6.7% 5.2% 3.1% 4.1% 2.7%
EV/IC average 2.0 1.2 0.8 1.1 1.4 1.7 2.6 2.5 2.4
EV/IC high 2.4 1.6 1.0 1.4 1.7 2.0
EV/IC low 1.5 0.7 0.6 0.8 1.0 1.2
EV/IC year-end 1.5 0.8 0.8 1.3 1.2 2.0
P/BV average 1.9 1.2 0.6 0.9 1.2 1.4 2.1 1.9 1.8
P/BV high 2.3 1.7 0.9 1.2 1.6 1.7
P/BV low 1.2 0.6 0.5 0.7 0.9 1.0
P/BV year-end 1.3 0.8 0.7 1.2 1.0 1.7
ROIC 13.1% 8.7% 1.6% 8.6% 14.4% 16.6% 17.8% 19.2% 19.8%
ROE 15.1% 9.9% 1.8% 8.6% 13.2% 14.6% 14.3% 14.2% 13.7%
ROCE 10.8% 8.7% 1.5% 7.7% 13.2% 13.7% 14.6% 15.8% 16.3%
EBITA NOPAT
margin margin 4.0% 4.5% 5.0% 5.5% 6.0%
14.0% 10.2% 5.80 5.93 6.08 6.22 6.37
15.0% 10.9% 6.14 6.29 6.44 6.59 6.75
16.0% 11.6% 6.48 6.64 6.80 6.97 7.14
17.0% 12.3% 6.83 6.99 7.16 7.34 7.52
18.0% 13.1% 7.17 7.35 7.60 7.71 7.90
19.0% 13.8% 7.51 7.70 7.89 8.09 8.29
20.0% 14.5% 7.86 8.05 8.25 8.46 8.67
21.0% 15.2% 8.20 8.41 8.62 8.83 9.06
22.0% 16.0% 8.54 8.76 8.98 9.21 9.44
23.0% 16.7% 8.89 9.11 9.34 9.58 9.82
Grow th (years 4 to 10) 5.0%
EBIT margin (years 4+) 18.0%
NOPAT margin 13.1%
Invested capital 444,300
Invested capital grow th (years 4+) 2.0%
Terminal grow th rate 2.0%
10-year average FCF yield 12.8%
WACC 9.00%
DCF
Source: Company data, Credit Suisse estimates
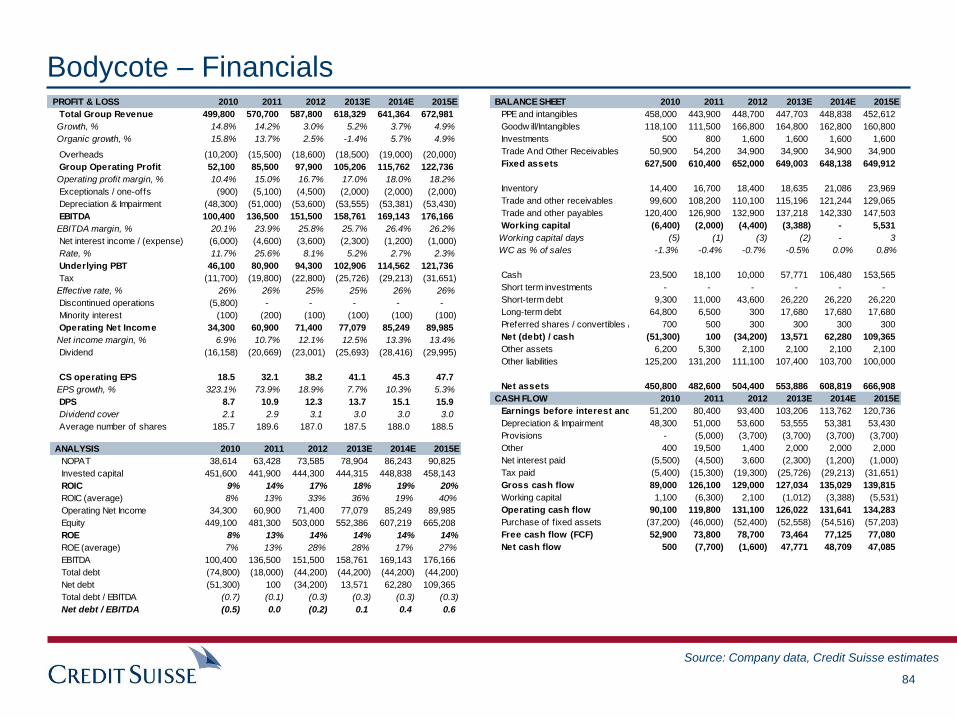
84
Bodycote – Financials PROFIT & LOSS 2010 2011 2012 2013E 2014E 2015E
Total Group Revenue 499,800 570,700 587,800 618,329 641,364 672,981
Growth, % 14.8% 14.2% 3.0% 5.2% 3.7% 4.9%
Organic growth, % 15.8% 13.7% 2.5% -1.4% 5.7% 4.9%
Overheads (10,200) (15,500) (18,600) (18,500) (19,000) (20,000)
Group Operating Profit 52,100 85,500 97,900 105,206 115,762 122,736
Operating profit margin, % 10.4% 15.0% 16.7% 17.0% 18.0% 18.2%
Exceptionals / one-offs (900) (5,100) (4,500) (2,000) (2,000) (2,000)
Depreciation & Impairment (48,300) (51,000) (53,600) (53,555) (53,381) (53,430)
EBITDA 100,400 136,500 151,500 158,761 169,143 176,166
EBITDA margin, % 20.1% 23.9% 25.8% 25.7% 26.4% 26.2%
Net interest income / (expense) (6,000) (4,600) (3,600) (2,300) (1,200) (1,000)
Rate, % 11.7% 25.6% 8.1% 5.2% 2.7% 2.3%
Underlying PBT 46,100 80,900 94,300 102,906 114,562 121,736
Tax (11,700) (19,800) (22,800) (25,726) (29,213) (31,651)
Effective rate, % 26% 26% 25% 25% 26% 26%
Discontinued operations (5,800) - - - - -
Minority interest (100) (200) (100) (100) (100) (100)
Operating Net Income 34,300 60,900 71,400 77,079 85,249 89,985
Net income margin, % 6.9% 10.7% 12.1% 12.5% 13.3% 13.4%
Dividend (16,158) (20,669) (23,001) (25,693) (28,416) (29,995)
CS operating EPS 18.5 32.1 38.2 41.1 45.3 47.7
EPS growth, % 323.1% 73.9% 18.9% 7.7% 10.3% 5.3%
DPS 8.7 10.9 12.3 13.7 15.1 15.9
Dividend cover 2.1 2.9 3.1 3.0 3.0 3.0
Average number of shares 185.7 189.6 187.0 187.5 188.0 188.5
ANALYSIS 2010 2011 2012 2013E 2014E 2015E
NOPAT 38,614 63,428 73,585 78,904 86,243 90,825
Invested capital 451,600 441,900 444,300 444,315 448,838 458,143
ROIC 9% 14% 17% 18% 19% 20%
ROIC (average) 8% 13% 33% 36% 19% 40%
Operating Net Income 34,300 60,900 71,400 77,079 85,249 89,985
Equity 449,100 481,300 503,000 552,386 607,219 665,208
ROE 8% 13% 14% 14% 14% 14%
ROE (average) 7% 13% 28% 28% 17% 27%
EBITDA 100,400 136,500 151,500 158,761 169,143 176,166
Total debt (74,800) (18,000) (44,200) (44,200) (44,200) (44,200)
Net debt (51,300) 100 (34,200) 13,571 62,280 109,365
Total debt / EBITDA (0.7) (0.1) (0.3) (0.3) (0.3) (0.3)
Net debt / EBITDA (0.5) 0.0 (0.2) 0.1 0.4 0.6
BALANCE SHEET 2010 2011 2012 2013E 2014E 2015E
PPE and intangibles 458,000 443,900 448,700 447,703 448,838 452,612
Goodw ill/Intangibles 118,100 111,500 166,800 164,800 162,800 160,800
Investments 500 800 1,600 1,600 1,600 1,600
Trade And Other Receivables 50,900 54,200 34,900 34,900 34,900 34,900
Fixed assets 627,500 610,400 652,000 649,003 648,138 649,912
Inventory 14,400 16,700 18,400 18,635 21,086 23,969
Trade and other receivables 99,600 108,200 110,100 115,196 121,244 129,065
Trade and other payables 120,400 126,900 132,900 137,218 142,330 147,503
Working capital (6,400) (2,000) (4,400) (3,388) - 5,531
Working capital days (5) (1) (3) (2) - 3
WC as % of sales -1.3% -0.4% -0.7% -0.5% 0.0% 0.8%
Cash 23,500 18,100 10,000 57,771 106,480 153,565
Short term investments - - - - - -
Short-term debt 9,300 11,000 43,600 26,220 26,220 26,220
Long-term debt 64,800 6,500 300 17,680 17,680 17,680
Preferred shares / convertibles / leases 700 500 300 300 300 300
Net (debt) / cash (51,300) 100 (34,200) 13,571 62,280 109,365
Other assets 6,200 5,300 2,100 2,100 2,100 2,100
Other liabilities 125,200 131,200 111,100 107,400 103,700 100,000
Net assets 450,800 482,600 504,400 553,886 608,819 666,908
CASH FLOW 2010 2011 2012 2013E 2014E 2015E
Earnings before interest and Tax51,200 80,400 93,400 103,206 113,762 120,736
Depreciation & Impairment 48,300 51,000 53,600 53,555 53,381 53,430
Provisions - (5,000) (3,700) (3,700) (3,700) (3,700)
Other 400 19,500 1,400 2,000 2,000 2,000
Net interest paid (5,500) (4,500) 3,600 (2,300) (1,200) (1,000)
Tax paid (5,400) (15,300) (19,300) (25,726) (29,213) (31,651)
Gross cash flow 89,000 126,100 129,000 127,034 135,029 139,815
Working capital 1,100 (6,300) 2,100 (1,012) (3,388) (5,531)
Operating cash flow 90,100 119,800 131,100 126,022 131,641 134,283
Purchase of f ixed assets (37,200) (46,000) (52,400) (52,558) (54,516) (57,203)
Free cash flow (FCF) 52,900 73,800 78,700 73,464 77,125 77,080
Net cash flow 500 (7,700) (1,600) 47,771 48,709 47,085
Source: Company data, Credit Suisse estimates

85
Bodycote – Company Summary
Geographic Split Operating Profit Mix Sales Mix End Market Split
Division Products End Markets / Channels Main Competitors / Positioning Revenue Split by Geo Key Drivers / Themes
Aerospace, Defence & Energy
FY2012 Sales - £261m,
8.4% org. growth
FY2012 EBITA - £64m,
24.6% margin
Provides thermal processing services
mainly to aerospace, defence and
energy end markets. Typically long supply
chain business, low to medium
volumes for later cycle industries.
46% Aerospace & defence, 26% energy,
28% general industrial
Western Europe - £112m (48%)
North America - £120.5m (52%)
Emerging markets - £1.5m (0.6%)
Commercial Aerospace build
rates. Increased outsourcing of
heat treatment. Penetration of
HIP
Automotive & General Industrial
FY2012 Sales - £339m,
-1.6% org. growth
FY2012 EBITA - £46m,
13.7% margin
Provides thermal processing services to
auto and
general industrials markets. Typically short
supply chains with a variety of batch sizes,
but lower parts in early/mid cycle industries
36% Automotive, 7% truck, 51% general
industrial, 6% energy
Western Europe - £240m (71%)
North America - £47m (14%)
Emerging markets - £50m (15%)
Automotive production build
rates. Expansion of heat
treatment network into Asia.
BODYCOTE (BOY.L / BOY LN) - ANDRE KUKHNIN, CFA +44 20 7883 0352 / [email protected]
Nihon Parkerizing (Jap), Aalberts (Neth),
Dowa (Jap), Bluewater (US), Gibraltar (US),
Paulo Products (US), Al-Fe Heat Treating
(US), Atmosphere Annealing (US), Hitech
Metal (US), Curtis Wright, Metal
Improvement, In-house facilities
Western Europe,
62%
North America,
29%
Emerging
markets, 9% General Industrial
42%
Automative
26%
Aerospace and
Defence20%
Energy
12%Aerospace,
Defence and Energy
46%
Automotive &
General Industrial54%
Aerospace,
Defence and Energy
60%
Automotive &
General Industrial40%
Shareholding structure
Free float: 100%
Top 5 shareholders: Standard Life
Investments - 14%, Dimensional Fund
Adv. - 8%, Old Mutual - 8%, Schroder -
7%, Mondrian Investment Partners-
6%
Ownership by Country: UK - 62%,
USA - 19%, Norway - 4%,
Luxembourg - 3%
Management
Chairman -Alan Thomson
CEO - Stephen Harris
CFO - David Landless
Source: Company data

86
Electrolux – Outperform, TP SEK 190 Investment summary: Self-help and US housing recovery exposure with attractive valuation should outweigh the
Brazil, Europe and FX headwinds.
Bull Case Self-help – one of the largest cost reduction programmes in the sector –
cSEK 1bn per annum, 20% of 2012/13E EBIT base.
Growth opportunity in the US with market recovery (housing and improving
consumer confidence with rising house prices) and market share gains
through Home Depot ramp up;
Balance sheet use potential – acquisition pipeline should start filling up
after nearly 2 years of focus from new CFO;
Attractive valuation.
Bear Case
Europe remains sluggish with potential further pricing & mix pressures;
Brazil cooling down (c14% of Electrolux sales, relatively high margin);
FX headwinds – transaction (BRL/USD) and translation;
Risk of an unsuccessful China ramp up;
Ever-increasing marketing spend consuming cost savings and operational
gearing benefits;
Ongoing risk of Korean and other EM competition disrupting pricing in
developed world markets.
0
50
100
150
200
250
0
2
4
6
8
10
12
14
16
18
2004 2005 2006 2007 2008 2009 2010 2011 2012 2013
1 Yr Forward EPS (LHS) Share Price (RHS)
-6%
-4%
-2%
0%
2%
4%
6%
8%
0%
1%
2%
3%
4%
5%
6%
7%
Margins % (LHS) Organic Growth (RHS)
0%
20%
40%
60%
80%
100%
6%
8%
10%
12%
14%
16%
18%
ELUX ROIC (LHS) Sector ROIC (LHS)
ELUX Cash conversion (RHS) Sector Cash conversion (RHS)
Source: Thomson Reuters, Company data, Credit Suisse estimates

87
Electrolux – Valuation
EBITA NOPAT
margin margin 2.0% 2.5% 3.0% 3.5% 4.0%
4.0% 3.0% 108 109 109 110 110
4.5% 3.4% 127 128 129 130 131
5.0% 3.8% 146 147 149 151 152
5.5% 4.1% 164 167 169 171 173
6.0% 4.5% 183 186 190 192 194
6.5% 4.9% 202 205 209 212 216
7.0% 5.3% 221 225 228 232 237
7.5% 5.6% 240 244 248 253 258
8.0% 6.0% 258 263 268 273 279
8.5% 6.4% 277 283 288 294 300
Grow th (years 4 to 10) 3.0%
EBIT margin (years 4+) 6.0%
Tax rate 25.0%
NOPAT margin 4.5%
Invested capital, SEK m 34,415
Invested capital grow th (years 4+) 2.0%
Terminal grow th rate 2.0%
10-year average FCF yield 3.2%
WACC 9.0%
DCF December y/e 2007 2008 2009 2010 2011 2012 2013E 2014E 2015E
Average/Current 149.2 83.5 117.8 169.3 138.2 149.3 156.0 156.0 156.0
High 190.0 108.5 184.1 194.7 195.6 179.0
Low 102.0 53.5 57.5 142.5 95.3 109.7
P/E average 12.9 8.9 7.7 9.5 13.5 12.6 13.6 10.0 8.7
P/E high 16.4 11.5 12.0 10.9 19.1 15.1
P/E low 8.8 5.7 3.7 8.0 9.3 9.3
EV:sales average 0.51 0.34 0.34 0.47 0.48 0.49 0.51 0.47 0.43
EV:sales high 0.62 0.41 0.51 0.54 0.64 0.56
EV:sales low 0.38 0.26 0.18 0.40 0.35 0.38
Operating margin 4.6% 3.3% 5.1% 6.2% 3.8% 4.6% 4.5% 5.7% 6.1%
EV:EBITDA average 7.1 5.5 4.1 5.1 6.8 6.5 6.6 5.2 4.6
EV:EBITDA high 8.6 6.6 6.2 5.8 9.2 7.5
EV:EBITDA low 5.3 4.2 2.2 4.3 5.1 5.1
EV:EBIT average 11.0 10.3 6.7 7.7 12.4 10.6 11.3 8.3 7.1
EV:EBIT high 13.4 12.4 10.1 8.8 16.6 12.3
EV:EBIT low 8.3 7.9 3.5 6.5 9.3 8.4
FCF yield average 4.1% 7.6% 29.9% 9.2% 2.8% 4.5% 2.7% 7.4% 9.2%
FCF yield high 3.2% 5.8% 19.1% 8.0% 2.0% 3.8%
FCF yield low 6.0% 11.8% 61.2% 10.9% 4.1% 6.2%
Dividend yield average 2.8% 0.0% 3.4% 3.8% 4.7% 4.4% 4.3% 4.5% 4.6%
Dividend yield high 2.2% 0.0% 2.2% 3.3% 3.3% 3.6%
Dividend yield low 4.2% 0.0% 7.0% 4.6% 6.8% 5.9%
EV/IC average 1.7 1.1 1.3 1.8 1.3 1.7 1.6 1.5 1.4
EV/IC high 2.0 1.3 2.0 2.0 1.8 1.9
EV/IC low 1.3 0.8 0.7 1.5 1.0 1.3
P/BV average 2.64 1.44 1.78 2.35 1.92 2.72 2.64 2.29 1.98
P/BV high 3.36 1.88 2.78 2.70 2.71 3.26
P/BV low 1.80 0.92 0.87 1.98 1.32 2.00
ROIC 11.4% 9.5% 16.3% 18.1% 8.7% 12.0% 10.8% 13.7% 15.0%
ROE 20.5% 16.3% 23.2% 24.8% 14.2% 21.6% 19.4% 23.0% 22.6%
ROCE 17.3% 14.4% 23.1% 26.0% 11.5% 17.8% 15.8% 19.7% 21.4%
Source: Company data, Credit Suisse estimates

88
Electrolux – Financials PROFIT & LOSS 2010 2011 2012 2013E 2014E 2015E
Revenue 106,326 101,598 109,994 110,188 115,219 121,836
COGS (82,647) (82,840) (87,807) (88,150) (92,175) (97,469)
Gross Profit 23,679 18,758 22,187 22,038 23,044 24,367
Gross Profit Margin, % 22.3% 18.5% 20.2% 20.0% 20.0% 20.0%
Selling Expenses (11,698) (10,821) (11,673) (12,121) (12,674) (13,402)
Administrative Expenses (5,428) (4,237) (5,541) (5,096) (3,951) (3,707)
S G & A (17,126) (15,058) (17,214) (17,217) (16,625) (17,109)
Items affecting comparability (1,114) (873) (1,032) - - -
Reported EBIT 5,430 3,017 4,000 4,976 6,574 7,413
Reported EBIT margin, % 5.1% 3.0% 3.6% 4.5% 5.7% 6.1%
Exceptionals / one-offs (1,114) (873) (1,032) - - -
Operating profit 6,544 3,890 5,032 4,976 6,574 7,413
Operating profit margin, % 6.2% 3.8% 4.6% 4.5% 5.7% 6.1%
Depreciation & Amortisation 3,328 3,173 3,251 3,552 3,847 4,043
EBITDA 9,872 7,063 8,283 8,528 10,422 11,456
EBITDA margin, % 9.3% 7.0% 7.5% 7.7% 9.0% 9.4%
Net interest income / (expense) (124) (237) (846) (555) (526) (496)
Profit Before Tax 5,306 2,780 3,154 4,421 6,048 6,917
Underlying PBT 6,420 3,653 4,186 4,421 6,048 6,917
Tax (1,309) (716) (789) (1,127) (1,572) (1,798)
Effective rate, % 24.7% 25.8% 25.0% 25.5% 26.0% 26.0%
Reported profit after tax 3,997 2,064 2,365 3,294 4,476 5,118
Operating Net Income 5,111 2,937 3,394 3,294 4,476 5,118
Net income margin, % 4.8% 2.9% 3.1% 3.0% 3.9% 4.2%
CS operating EPS 17.9 10.3 11.8 11.5 15.6 17.9
EPS growth, % 16.4% -42.6% 15.4% -3.0% 35.9% 14.4%
DPS, SEK 6.5 6.5 6.5 6.8 7.0 7.3
DPS growth, % 62.5% 0.0% 0.0% 3.8% 3.7% 3.6%
Dividend Cover (X) 2.7 1.6 1.8 1.7 2.2 2.5
Ordinary shares in issue 286 286 287 287 287 287
ANALYSIS 2010 2011 2012 2013E 2014E 2015E
NOPAT 5,210 3,128 3,849 3,707 4,865 5,486
Invested capital 28,749 35,760 32,058 34,415 35,580 36,598
ROIC 18.1% 8.7% 12.0% 10.8% 13.7% 15.0%
ROIC (average) 18.3% 9.7% 11.4% 11.2% 13.9% 15.2%
Operating Net Income 5,111 2,937 3,394 3,294 4,476 5,118
Equity 20,613 20,644 15,726 16,957 19,498 22,610
ROE 24.8% 14.2% 21.6% 19.4% 23.0% 22.6%
ROE (average) 25.9% 14.2% 18.7% 20.2% 24.6% 24.3%
EBITDA 9,872 7,063 8,283 8,528 10,422 11,456
Total debt 11,552 13,809 12,800 12,800 12,800 12,800
Net debt (559) 6,506 5,842 6,520 5,143 3,049
Total debt / EBITDA 1.2 2.0 1.5 1.5 1.2 1.1
Net debt / EBITDA (0.1) 0.9 0.7 0.8 0.5 0.3
BALANCE SHEET 2010 2011 2012 2013E 2014E 2015E
PPE and Intangibles 20,201 26,767 27,313 28,916 29,723 30,335
Other f ixed assets 3,575 3,515 4,505 4,505 4,505 4,505
Fixed assets 26,612 33,318 32,585 34,188 34,995 35,607
Inventories (Net of advances from customers) 11,130 11,957 12,963 12,981 13,574 14,353
Trade and other receivables 22,915 22,888 21,895 22,339 23,360 24,701
Other Current Assets 367 666 609 609 609 609
Trade and other payables 28,190 28,987 32,561 32,000 33,145 34,715
Other Current Liabilities 4,085 4,082 3,433 3,702 3,812 3,957
Working capital 2,137 2,442 (527) 228 585 991
Working capital days 7 9 nm 1 2 3
WC as % of sales 2.0% 2.4% nm 0.2% 0.5% 0.8%
Liquid funds 12,111 7,303 6,958 6,280 7,657 9,751
Short-term debt 3,139 4,170 2,795 3,200 3,200 3,200
Long-term debt 8,413 9,639 10,005 9,600 9,600 9,600
Net debt / (cash) (559) 6,506 5,842 6,520 5,143 3,049
Long term provisions 5,306 5,300 4,551 5,000 5,000 5,000
Pension deficit 2,486 2,111 4,765 4,765 4,765 4,765
Other liabilities 1,289 1,451 1,358 1,358 1,358 1,358
Net assets 20,613 20,644 15,726 16,957 19,498 22,610
CASH FLOW 2010 2011 2012 2013E 2014E 2015E
Operating Income 5,430 3,017 4,000 4,976 6,574 7,413
Depreciation 3,328 3,173 3,251 3,552 3,847 4,043
Capital gains/losses 4 (207) - (155) (155) (155)
Provision for restructuring and pension litigation 294 110 457 449 - -
Interest paid and received (72) (214) (673) (555) (526) (496)
Taxes paid (1,316) (1,625) (1,564) (1,327) (1,572) (1,798)
Others 73 29 81 - - -
Gross Cash Flow 7,741 4,283 5,552 6,940 8,168 9,007
Change in inventories (1,755) 269 (1,710) - - -
Change in accounts receivable (216) 244 (119) - - -
Change in other current assets (977) 200 271 - - -
Change in current liabilities and provisions 2,887 403 3,086 - - -
Working capital change (61) 1,116 1,528 (755) (357) (406)
Operating Cash flow 7,680 5,399 7,080 6,185 7,811 8,600
Operating cash / Operating profit 1.2 1.4 1.4 1.2 1.2 1.2
Net Capex (3,221) (4,281) (5,141) (5,000) (4,500) (4,500)
as % of Sales 3.0% 4.2% 4.7% 4.5% 3.9% 3.7%
Free Cash flow 4,459 1,118 1,939 1,185 3,311 4,100
FCF / Net income 0.9 0.4 0.6 0.4 0.7 0.8
Acquisition of operations - (6,377) (164) - - -
Divestment of operations 7 821 - - - -
Changes in borrow ings (2,427) 1,723 (819) - - -
Shares Repurchase/sales 18 - 212 - - -
Dividend payment (1,138) (1,850) (1,868) (1,863) (1,935) (2,006)
Change in other liquid funds 1,306 1,444 206 - - -
Other (1,260) (212) 603 - - -
Total Cash flow 965 (3,333) 109 (678) 1,376 2,094
Source: Company data, Credit Suisse estimates

89
Electrolux – Company Summary
Operating Profit split Sales Mix End Market Mix
Management
Chairman Marcus Wallenberg
CEO Keith McLoughlin
CFO Tomas Eliasson
IR Peter Nyquist
Division Products End Markets / Channels Main Competitors Revenue Split by Geo Key Drivers/ Themes
EMEA
FY 2012 Sales SEK 34.28 Bn
-2.1% % YoY organic growth
FY 2012 EBIT SEK 1.1 Bn
3.3% Margin
Electrolux market share: 17% Core appliances.
Kitchen specialists currently account for
approximately 25% of the total value of the
market for appliances in Western Europe, in
Germany and Italy the corresponding share is
approximately 40%.
Small, local and independent retailers; Growing
share of sales through kitchen specialist
Bosch-Siemens, Indesit, Whirlpool, Samsung,
LG Electronics
Germany 14%, Switzerland 11%, France 9%, Italy
9%, UK 7%, Others 50%
Replacement; New housing and renovations;
Design; Improved purchasing power in Eastern
Europe, Middle East and Africa
North America
FY 2012 Sales SEK 30.68 Bn
6.9% YoY organic growth
FY 2012 EBIT SEK 1.45 Bn
5.1% Margin
Electrolux market share: 22% Major appliances.
63% Mass market; 22% Premium segment; 8%
Low-price segment and 7% Super-premium
segment
Four largest retailers (Lowe’s, Sears, Home
Depot, Best Buy & Wal- Mart) account for 70%
of the market; Marketing focused on construction
companies
General Electric, Whirlpool, LG, TTI Group Not ApplicableReplacement; New housing and renovations;
Design; Energy- and water-efficient products
Latin America
FY 2012 Sales SEK 22.04 Bn
16.6% YoY organic growth
FY 2012 EBIT SEK 1.59 Bn
7.2% Margin
It is the second largest producer of core
appliances and is market leaders in vacuum
cleaners in Brazil. Growth is primarily in the low-
price segment.
High level of consolidation among retailers,
especially in Brazil
Whirlpool, Mabe, LG Electronics, Samsung,
Daewoo
Chile 27%, Argentina 26%, Mexico 10%,
Venezeula 9% and Others 28%
Improved household purchasing power; Growing
middle class
Asia Pacific
FY 2012 Sales SEK 8.40 Bn
3.0% YoY organic growth
FY 2012 EBIT SEK 0.75 Bn
8.9% Margin
In Australia, Electrolux is the
market leader with a market share 41% in core
appliances and 22% in floor care products. Asia
Pacific market is generally highly fragmented.
Asia: majority of sales through small, local
stores; Australia: five largest retail chains
account for c90% of the market
Fischer&Paykel, Samsung, LG Electronics,
Panasonic, Haier Group, Sanyo, MideaChina 68%, India 12% and South East Asia 20%
Asia: Improved household purchasing power;
Growing middle class; Australia: Replacement,
New housing and renovations, Design
Small Appliances
FY 2012 Sales SEK 9.01 Bn
8.4% YoY organic growth
FY 2012 EBIT SEK 0.47 Bn
5.2% Margin
Floor-care products and small domestic
appliances.
Majority of sales at department stores,
superstores or through retail chains
Dyson, Miele, Bosch-Siemens, Samsung, LG,
SEB Group, Whirlpool, Black &
Decker, Philips, TTI Group, Bissel
South East Asia & China 17%, Americas 18%,
EMEA 17%, Australia 11% and Others 37%
Growth markets:Rising income levels, Increased
demand on hygiene; Mature markets:
Replacement, Design, Innovations
Professional Products
FY 2012 Sales SEK 5.57 Bn
-3.9% YoY organic growth
FY 2012 EBIT SEK 0.60 Bn
10.7% Margin
Food Service and laundry Solutions
Laundry- Great proportion of direct sales
although trend is towards a growing share of
sales through dealers
Rational, Manitowoc, Middleby, Ali group,
Alliance, Primus, Girbau, Miele, Image, Sailstar,
ITW
65% in Western Europe, 35% others
Energy- and water-efficient products, US
restraurant chain expanding, Replacement,
Growing populaiton
ELECTROLUX (ELUXb.ST) - ANDRE KUKHNIN, CFA +44 20 7883 0350/ [email protected]
Geographic Mix Shareholding Structure
Free Float: 86%
Top 5 shareholders
Investor AB 15.5%, Alecta Pension Insurance
5.5%,Swedbank Robur Funds 4.6% Norges
Bank Investment Management 2.3%, SEB
Funds 1.8%
Ownership by country
Sweden 59%, USA 18%, UK 8% and others
EMEA20%
North America27%
Latin America30%
Asia Pacific14%
Small Appliances9%
EMEA31%
North America
28%
Latin America
20%
Asia Pacific
8%
Small Appliances
8%
Professional Products
5%
North America
31%
Latin America
21%
EMEA38%
Asia/Australia
10%
Kitchen60%
Laundry17%
Small Appliances
8%
Professional Food Equipment
3%
Others10%
Professional Laundry Equipment
2%
Source: Company data

90
Fenner – Outperform, TP 490p
Bull Case
While pressures in the mining cycle are not over we forecast 8% EPS
CAGR through 2016. CS forecasts are 4% ahead of consensus for 2014.
Conveyor belt demand remains commodity volume driven not price. We
expect further improvement in demand in key geographies including NAM
and Aus.
Within mining, service/consumables will remain as the favourable exposure.
We see potential for consolidation in the space with Fenner an attractive
M&A candidate.
Undemanding valuation – continues to trade at a discount to its weighted
peer group. Our peer group SOTP is 494p.
Bear Case
Conveyor belt pricing takes another step down in key geographies including
Australia.
Improving sentiment amongst mining customers is short lived and
resumption of deferred expenditures is only temporary.
UK£ continues to strengthen against key currencies including US$ and
Aus$.
Improvement in momentum at AEP reverses.
Investment summary: Key mining end market pick for 2014 with c85% of mining revenue opex derived. AEP still
an undervalued division. Trading at a discount to peer group. Remains a potential sector M&A candidate.
0
100
200
300
400
500
0
5
10
15
20
25
30
35
40
2004 2005 2006 2007 2008 2009 2010 2011 2012 2013
1 Yr Forward EPS (LHS) Share Price (RHS)
-15%
-10%
-5%
0%
5%
10%
15%
20%
25%
30%
8%
10%
12%
14%
16%
Margins % (LHS) Organic Growth (RHS)
0%
10%
20%
30%
40%
50%
60%
70%
80%
90%
4%
6%
8%
10%
12%
14%
16%
18%
FENR ROIC (LHS) Sector ROIC (LHS)
FENR Cash conversion (RHS) Sector Cash conversion (RHS)
Source: Thomson Reuters, Company data, Credit Suisse estimates

91
Fenner – Valuation Valuation Multiples Cumulative Cash Conversion Bridge
CFROI expectations: Market (dot) vs. Consensus (bar)
100%
67%
- 20%
1%
- 39%
2%
14%8%
20%
40%
60%
80%
100%
120%
Cle
an n
et in
com
e
Rep
orte
d ne
t inc
ome
Wor
king
cap
ital
Del
ta b
/w C
apex
&D
eper
ecia
tion
Del
ta b
/w R
&D
Cap
italis
ed &
Inta
ngib
les
Am
ort.
PP
A
Oth
er (
Def
erre
d ta
x, P
ensi
on,
Min
ority
etc
)
Fre
e C
ash
Flo
w
2007 2008 2009 2010 2011 2012 2013 2014e 2015e 2016e
Share price - year high 252.0 283.8 240.8 234.6 422.5 370.6 435.2 460.0 460.0 460.0
Share price - year low 191.0 215.0 33.8 115.8 206.8 280.0 305.9 460.0 460.0 460.0
Share price - year average 220.4 244.5 93.6 190.5 334.2 340.7 372.5 460.0 460.0 460.0
Enterprise value - high 445.5 565.4 629.0 567.0 914.3 875.1 1003.7 1013.1 1075.9 1041.1
Enterprise value - low 349.9 456.8 267.4 359.5 524.8 700.8 753.9 1013.1 1075.9 1041.1
Enterprise value - average 396.0 503.4 371.9 490.1 754.9 817.5 882.6 1013.1 1075.9 1041.1
EBITA 39.0 49.3 41.3 57.0 91.4 118.8 101.5 110.0 116.0 122.5
EV/EBITA - High 11.4 11.5 15.2 9.9 10.0 7.4 9.9 9.2 9.3 8.5
EV/EBITA - Low 9.0 9.3 6.5 6.3 5.7 5.9 7.4 9.2 9.3 8.5
EV/EBITA - Average 10.2 10.2 9.0 8.6 8.3 6.9 8.7 9.2 9.3 8.5
EBITDA 47.6 59.0 55.9 74.7 109.8 139.0 124.6 134.0 141.0 147.5
EV/EBITDA - high 9.4 9.6 11.3 7.6 8.3 6.3 8.1 7.6 7.6 7.1
EV/EBITDA - low 7.4 7.7 4.8 4.8 4.8 5.0 6.1 7.6 7.6 7.1
EV/EBITDA - average 8.3 8.5 6.7 6.6 6.9 5.9 7.1 7.6 7.6 7.1
Sales 380.8 437.8 499.4 552.5 718.3 830.6 820.6 840.0 874.5 908.0
EV/Sales - high 1.17 1.29 1.26 1.03 1.27 1.05 1.22 1.21 1.23 1.15
EV/Sales - low 0.92 1.04 0.54 0.65 0.73 0.84 0.92 1.21 1.23 1.15
EV/Sales - average 1.04 1.15 0.74 0.89 1.05 0.98 1.08 1.21 1.23 1.15
CS EPS Adjusted (p) 15.8 17.4 12.8 17.8 27.9 35.9 30.1 33.2 35.6 37.7
PER - high 16.0 16.3 18.9 13.2 15.1 10.3 14.5 13.8 12.9 12.2
PER - low 12.1 12.3 2.6 6.5 7.4 7.8 10.2 13.8 12.9 12.2
PER - average 14.0 14.0 7.3 10.7 12.0 9.5 12.4 13.8 12.9 12.2
NAV 90.4 123.8 111.9 142.2 156.8 170.3 186.9 198.1 209.8 227.3
PBV - high 2.8 2.3 2.2 1.6 2.7 2.2 2.3 2.3 2.2 2.0
PBV - low 2.1 1.7 0.3 0.8 1.3 1.6 1.6 2.3 2.2 2.0
PBV - average 2.4 2.0 0.8 1.3 2.1 2.0 2.0 2.3 2.2 2.0
Dividend Yield 6.2 6.6 6.6 7.2 8.0 10.5 11.3 12.4 13.6 15.0
Dividend Yield - high 2% 2% 3% 3% 2% 3% 3% 3% 3% 3%
Dividend Yield - low 3% 3% 20% 6% 4% 4% 4% 3% 3% 3%
Dividend Yield - average 3% 3% 7% 4% 2% 3% 3% 3% 3% 3%
Source: Company data, Credit Suisse estimates, Credit Suisse HOLT

92
Fenner – Financials PROFIT & LOSS 2006 2007 2008 2009 2010 2011 2012 2013 2014e 2015e 2016e
FY FY FY FY FY FY FY FY FY FY FY
Revenue 379.0 380.8 437.8 499.4 552.5 718.3 830.6 820.6 840.0 874.5 908.0
Change yoy, % 24.8% 0.5% 15.0% 14.1% 10.6% 30.0% 15.6% -1.2% 2.4% 4.1% 3.8%
EBITDA 42.1 47.6 59.0 55.9 74.7 109.8 139.0 124.6 134.0 141.0 147.5
Margin, % 11.1% 12.5% 13.5% 11.2% 13.5% 15.3% 16.7% 15.2% 16.0% 16.1% 16.2%
EBITA 34.1 39.0 49.3 41.3 57.0 91.4 118.8 101.5 110.0 116.0 122.5
Margin, % 9.0% 10.2% 11.3% 8.3% 10.3% 12.7% 14.3% 12.4% 13.1% 13.3% 13.5%
CS PBT 29.7 34.4 41.8 31.1 46.3 80.2 103.9 86.9 95.0 102.0 108.5
Income Tax (8.9) (10.3) (12.5) (8.7) (13.8) (23.9) (30.4) (25.0) (25.6) (28.0) (30.4)
Exceptional - Tax 0.2 0.6 2.1 7.7 3.1 3.7 4.2 6.3 2.9 2.9 2.9
CS EPS (Diluted) 13.2 15.8 17.4 12.8 17.8 27.9 35.9 30.1 33.2 35.6 37.7
Reported EPS (Diluted) 12.8 14.9 15.4 2.6 14.5 24.3 30.2 23.5 24.9 26.8 28.9
DPS, p 6.0 6.2 6.6 6.6 7.2 8.0 10.5 11.3 12.4 13.6 15.0
DPS growth yoy, % 3% 6% 0% 9% 11% 31% 7% 10% 10% 10%
CASH FLOW 2006 2007 2008 2009 2010 2011 2012 2013 2014e 2015e 2016e
EBITDA 42.1 47.6 59 55.9 74.7 109.8 139 124.6 134 141 147.5
Working Capital Change (2.4) 10.8 (8.2) 16.5 12.6 (11.2) (8.3) 6.4 19.4 (92.2) (5.8)
Operating Cash Flow 38.2 53.3 45.7 53.5 82.5 94.6 127.1 126.6 153.4 48.8 141.7
Net Financing Cost (4.4) (4.3) (6.3) (10.7) (10.7) (11.2) (12.3) (14.9) (16.0) (15.0) (15.0)
Tax Paid (7.5) (10.2) (6.3) (6.4) (5.0) (14.8) (23.5) (24.5) (22.7) (25.1) (27.5)
Net Operating Cash Flow 26.3 38.8 33.1 36.4 66.8 68.6 91.3 87.2 114.7 8.7 99.3
Net Capex (18.5) (31.3) (62.9) (32.9) (10.0) (14.0) (26.0) (25.2) (39.9) (34.9) (34.9)
Free Cash Flow 7.8 7.5 (29.8) 3.5 56.8 54.6 65.3 62.0 74.8 (26.2) 64.4
Acquisitions (0.5) (8.8) (45.9) (37.6) (16.9) (29.9) (34.3) (58.9) (8.2) (8.2) (8.2)
Disposals 0.0 5.2 4.8 0.1 0.1 0.1 0.0 4.5 0.0 0.0 0.0
Pre Financing Cash Flow 6.8 3.4 (71.1) (35.0) 39.8 24.0 28.7 5.8 66.7 (34.4) 56.2
Dividend Paid (8.2) (9.5) (9.9) (11.5) (11.5) (13.8) (15.4) (20.3) (22.4) (24.7) (17.7)
Net Cash / (Debt) Year End (33.1) (36.3) (97.6) (165.4) (110.4) (101.8) (97.7) (121.1) (80.5) (143.3) (108.5)
BALANCE SHEET 2006 2007 2008 2009 2010 2011 2012 2013 2014e 2015e 2016e
PPE 69 90 159 198 203 208 215 220 236 246 256
Goodwill 57 56 75 90 95 115 122 122 122 122 122
Inangible Assets 9 10 42 74 75 87 100 141 126 110 94
Working capital 72 66 92 92 97 122 134 79 59 151 157
Total assets 184 193 323 403 413 435 475 510 491 576 576
Shareholders' funds 121 142 205 194 255 284 313 347 369 391 425
Minorities 1 1 1 1 2 18 16 15 15 15 15
Total Borrowings 75 102 141 200 155 206 206 220 180 243 208
Cash and equivalents (41) (66) (44) (35) (45) (104) (109) (99) (99) (99) (99)
Net Debt / (Cash) 33 36 98 165 110 102 98 121 81 143 108
Pension Deficit 29 14 19 42 46 32 48 27 27 27 27
Total liabilities 184 193 323 403 413 435 475 510 491 576 576
Source: Company data, Credit Suisse estimates

93
Fenner – Company Summary
Geographic Split Operating Profit Mix Sales Mix End Market Split
Division Products End Markets / Channels Main Competitors / Positioning Revenue Split by Geo Key Drivers / Themes
Engineered Conveyor Solutions
FY2012 Sales - £593m,
10.3% org. growth
FY2012 EBITA - £84m,
14.2% margin
The suite of products and services which
serve the conveying needs of mining, power
generation and bulk handling markets. The
suite of products and services includes
heavyweight ply, solid woven and steel cord
conveyor belting and the design, installation,
monitoring and maintenance of conveyor
systems and components. Commercial
arrangements vary from a purely
transactional relationship to a full strategic
partnership to reduce both conveyor
downtime and total cost of ownership.
Product split 42% Thermal Coal, 12% Met
Coal, 28% Iron Ore, 18% Bulk Materials
Replacement 64%, Service 21%, OEM 15%
Continental (17%), Veyance (formerly
Goodyear, Private Equity owned (16%),
Semperit (6%), Bridgestone (5%), Svedala
(4%), Bando (4%)
Europe - £96m (16%)
Americas - £250m (42%)
Asia Pacific - £224m (38%)
Africa - £24mn (4%)
Volume of coal, iron ore,
copper and aggregate
mined. Increasing
outsourcing by majors of
mining service needs
Advanced Engineered Products
FY2012 Sales - £237m,
8.6% org. growth
FY2012 EBITA - £44m,
18.4% margin
Performance critical hydraulic seals for the
global fluid power industry, bespoke sealing,
products for process applications including
oil and gas, electronics, pumps, valves,
compressors and aerospace applications,
custom-engineered biomedcal textile
structures for implantable medical devices,
single use disposable devices (usually
silicone based), a wide range of
sophisticated industrial fabrics, critical
polymer components to the office
automation industry; extensive range of
bespoke solutions for mechanical power
transmission and motion transfer
applications, silicone and EPDM speciality
hoses for the diesel engine, truck, bus and
off-road equipment OEM market.
Oil & Gas 28%, Mining (seals) 3%, General
Industrial 20%, Fluid Power 5%,
Transportation 7%, Agriculture 5%,
Construction 13%, Automation 7%, Medical
12%
Varies according to product but includes
Parker Hannifin, John Crane and Trelleborg
(seals), Continental (hose). Medical remains
very specialised
Europe - £56m (23.6%)
Americas - £161m (67.8%)
Asia Pacific - £20m (8.6%)
Levels of global IP remains a
key driver for this division as
well as specific end markets
including truck and off road
vehicles.
FENNER (FENR.L / FENR LN) - JONATHAN HURN, CFA +44 20 7883 4532 / [email protected]
ECS
67%
AEP
33%
ECS
57%
AEP
43%
Europe, 18%
Americas, 50%
Asia Pacific, 29%
Africa, 3%Coal mining &
handling36%
Bulk Materials
19%
Other Mining
16%
General Industrial
7%
Oil&Gas
6%
Construction
4%
Medical
4%
Others
8%
Shareholding structure
Free float: 95%
Top 5 shareholders: Standard Life
Investments - 11%, Scottish Widows -
8%, Lloyds Banking Group Plc - 5%,
Legal & General - 5%, BNP Paribas - 5%
Ownership by Country: UK - 71%,
USA - 12%, Norway - 3%, France - 3%,
Luxembourg - 3%
Management
Chairman -Mark Abrahams
CEO - Nicholas Hobson
CFO - Richard Perry
CS - Debra Bradbury
Source: Company data

94
Geberit – Neutral, TP CHF 240
0
50
100
150
200
250
300
0
2
4
6
8
10
12
14
2004 2005 2006 2007 2008 2009 2010 2011 2012 2013
1 Yr Forward EPS (LHS) Share Price (RHS)
-10%
-5%
0%
5%
10%
15%
20%
15%
17%
19%
21%
23%
25%
Margins % (LHS) Organic Growth (RHS)
Investment summary: High quality growth attractions with best in class returns and cash conversion profile but
fully reflected in the stock valuation.
Bull Case Best in class Returns and Cash conversion profile across the sector;
Scope for organic growth acceleration driven by ongoing conversion of the
sanitary product market to concealed cisterns and with European
construction end-markets eventually troughing;
Potential for some margin improvement in a better growth scenario;
Scope for excess cash return to shareholders over the next 12 months;
Untapped Asia and possibly US markets potential;
Pricing power with annual price increases and ad hoc ones for raw
materials prices spikes.
Bear Case Construction markets in southern Europe and France may prove softer than
market anticipates for 2014 (company management is particularly downbeat
on any scope for a recovery);
Limited scope for cash redeployment within the company given firm
commitment to single-brand strategy and to ‘behind the wall’ only systems;
Exposure to CHF vs EUR volatility has historically impacted profitability
because of cross-country competition within Geberit;
Expensive valuation with stock trading on 16.7x 2014EV/EBITA. 0%
20%
40%
60%
80%
100%
120%
6%
11%
16%
21%
26%
31%
36%
GEBN ROIC (LHS) Sector ROIC (LHS)
GEBN Cash conversion (RHS) Sector Cash conversion (RHS)
Source: Thomson Reuters, Company data, Credit Suisse estimates

95
Geberit – Valuation
4.5% 5.0% 5.5% 6.0% 6.5%
20.0% 16.6% 214 218 222 227 231
20.5% 17.0% 219 223 227 231 236
21.0% 17.4% 223 227 231 236 241
21.5% 17.8% 227 232 236 241 245
22.0% 18.3% 231 236 240 245 250
22.5% 18.7% 236 240 245 250 255
23.0% 19.1% 240 245 250 254 260
23.5% 19.5% 244 249 254 259 264
24.0% 19.9% 248 253 259 264 269
24.5% 20.3% 253 258 263 268 274
EBIT
Margin
NOPAT
margin
Grow th (years 4 to 10) 5.5%
EBIT margin (years 4+) 22.0%
NOPAT margin 18.3%
Invested capital 1,228
Invested capital grow th (years 4+) 2.0%
Terminal grow th rate 2.0%
10-year average FCF yield 18.4%
WACC 9.0%
December y/e 2007 2008 2009 2010 2011 2012 2013E 2014E 2015E
Average/Current 187.2 142.3 138.9 184.4 188.5 193.3 259.1 259.1 259.1
High 221.4 178.4 184.0 219.9 219.1 209.8
Low 144.1 98.7 92.8 160.4 150.0 176.4
P/E average 18.7 12.1 13.7 17.9 19.2 18.8 22.4 20.6 19.1
P/E high 22.1 15.1 18.2 21.3 22.3 20.4
P/E low 14.4 8.4 9.2 15.6 15.3 17.2
EV/Sales average 3.11 2.29 2.45 3.25 3.42 3.31 4.14 3.85 3.55
EV/Sales high 3.67 2.87 3.27 3.90 3.98 3.59
EV/Sales low 2.39 1.59 1.62 2.80 2.71 3.01
Operating profit margin 22.3% 22.9% 24.1% 22.6% 21.2% 21.1% 22.2% 22.9% 23.1%
EV/EBITDA average 12.1 8.7 8.8 12.1 13.6 13.3 16.1 14.7 13.5
EV/EBITDA high 14.3 10.9 11.7 14.6 15.9 14.5
EV/EBITDA low 9.3 6.0 5.8 10.5 10.8 12.1
EV/EBIT average 13.9 10.0 10.2 14.3 16.1 15.6 18.6 16.8 15.4
EV/EBIT high 16.5 12.5 13.5 17.2 18.8 17.0
EV/EBIT low 10.7 6.9 6.7 12.4 12.8 14.3
FCF yield average 4.6% 7.1% 6.4% 6.8% 5.5% 5.5% 4.2% 4.5% 5.0%
FCF yield high 6.0% 10.2% 9.6% 7.8% 6.9% 6.1%
FCF yield low 3.9% 5.6% 4.8% 5.7% 4.7% 5.1%
Dividend yield average 2.8% 3.8% 4.6% 3.3% 3.3% 3.4% 2.9% 3.1% 3.4%
Dividend yield high 2.3% 3.0% 3.5% 2.7% 2.9% 3.1%
Dividend yield low 3.6% 5.5% 6.9% 3.7% 4.2% 3.7%
EV/IC average 5.33 4.05 3.75 5.67 6.06 5.90 7.60 7.30 7.04
EV/IC high 6.31 5.08 5.00 6.82 7.06 6.41
EV/IC low 4.10 2.81 2.48 4.90 4.80 5.37
P/BV average 5.5 4.3 3.6 4.8 5.2 5.2 6.1 5.6 5.0
P/BV high 6.5 5.4 4.8 5.7 6.0 5.6
P/BV low 4.2 3.0 2.4 4.2 4.1 4.7
ROIC 29.2% 33.2% 28.6% 34.1% 32.6% 32.5% 35.0% 37.0% 38.9%
ROCE 34.5% 39.8% 33.6% 41.6% 37.5% 36.7% 39.6% 41.7% 43.8%
DCF
Source: Company data, Credit Suisse estimates

96
Geberit – Financials PROFIT & LOSS 2010 2011 2012 2013E 2014E 2015E
Revenue 2,147 2,123 2,188 2,290 2,428 2,587
Growth, % -1.6% -1.1% 3.1% 4.7% 6.1% 6.6%
Sales Deductions (247) (255) (268) (291) (304) (323)
Cost of Materials (573) (588) (591) (598) (631) (686)
Personnel Expenses (447) (436) (464) (480) (502) (525)
Deprciation and Amortisation (88) (83) (80) (81) (81) (82)
Other operating income/(Expenses) (306) (312) (323) (332) (354) (373)
Group Reported EBIT 486 449 462 508 556 597
Exceptionals / one-offs - - - - - -
Operating profit 486 449 462 508 556 597
Operating profit margin, % 22.6% 21.2% 21.1% 22.2% 22.9% 23.1%
Underlying EBITDA 574 532 542 589 637 680
EBITDA margin, % 26.7% 25.1% 24.8% 25.7% 26.2% 26.3%
Net interest income / (expense) (14) (7) (7) (2) 1 3
Rate, %
Profit Before Tax 472 442 455 507 557 601
Underlying PBT 472 442 455 507 557 601
Tax (65) (58) (63) (71) (84) (90)
Effective rate, %
Reported profit after tax 407 384 392 436 474 511
Minority interest - - - - - -
Capital Gain on Discontinued operations - - - - - -
Reported Net Income 407 384 392 436 474 511
Operating Net Income 407 384 392 436 474 511
Net income margin, % 18.9% 18.1% 17.9% 19.0% 19.5% 19.7%
CS operating EPS, CHF 10.3 9.8 10.3 11.6 12.6 13.6
EPS growth, % 1.9% -4.7% 4.7% 12.6% 8.7% 7.8%
DPS, CHF 6.0 6.3 6.6 7.4 8.1 8.7
Dividend growth, % -6.3% 5.0% 4.8% 12.6% 8.7% 7.8%
Dividend Cover (x) 1.72 1.56 1.56 1.56 1.56 1.56
Diluted number of shares 39 39 38 38 38 38
ANALYSIS 2010 2011 2012 2013E 2014E 2015E
NOPAT 419 390 399 437 472 508
NOPAT Margin, % 20% 18% 18% 19% 19% 20%
Invested capital 1,228 1,197 1,227 1,248 1,279 1,304
ROIC 34% 33% 32% 35% 37% 39%
ROIC (average) 32% 32% 33% 35% 37% 39%
Operating Net Income 407 384 392 436 474 511
Equity 1,521 1,420 1,431 1,587 1,757 1,940
ROE 27% 27% 27% 27% 27% 26%
EBITDA 573.7 532.0 542.4 589.5 636.9 679.6
Total debt 73 76 15 15 15 15
Net debt (513) (379) (347) (483) (623) (782)
Total debt / EBITDA 0.1 0.1 0.0 0.0 0.0 0.0
Net debt / EBITDA (0.9) (0.7) (0.6) (0.8) (1.0) (1.2)
BALANCE SHEET 2010 2011 2012 2013E 2014E 2015E
PPE and Intangibles 1,173 1,161 1,159 1,178 1,197 1,215
Deferred tax receivables 79 79 67 67 67 67
Other long term financial assets 15 21 22 21 19 18
Fixed assets 1,267 1,262 1,248 1,266 1,283 1,300
Inventories 149 162 164 176 193 213
Trade and other receivables 169 157 173 185 199 209
Trade and other payables 206 221 199 220 233 248
Other current liabilities 57 62 70 71 78 84
Working capital 55 35 68 70 81 89
Working capital days 9 6 11 11 12 13
WC as % of sales 2.6% 1.7% 3.1% 3.1% 3.4% 3.5%
Cash 587 455 361 497 638 796
Short-term debt 3 65 4 4 4 4
Long-term debt 70 11 11 11 11 11
Net (debt) / cash 513 379 347 483 623 782
Other liabilities 314 344 293 293 293 293
Net assets 1,521 1,333 1,370 1,526 1,695 1,878
CASH FLOW 2010 2011 2012 2013E 2014E 2015E
Net Income 407 384 392 436 474 511
Depreciation, Amortisation & Imapirment 88 83 80 81 81 82
Finance Cost 14 7 7 2 (1) (3)
Income Tax Expense 65 58 63 71 84 90
EBITDA 600 549 569 589 637 680
Tax Paid (82) (48) (59) (71) (84) (90)
Interest Paid - - - (2) 1 3
Other (non-cash gains/losses) - - - - - -
Gross cash flow 518 501 510 517 555 593
Working capital change 52 (8) (16) (2) (12) (8)
Operating cash flows 570 493 494 515 543 585
Operating cash / Operating profit 117% 110% 107% 101% 98% 98%
Net capex (78) (89) (85) (100) (100) (100)
% of Sales 4.1% 4.8% 4.4% 5.0% 4.7% 4.4%
Free cash flow 492 404 409 415 443 485
FCF / Net Income 121% 105% 104% 95% 94% 95%
Acquisitions (of associates, subsidiaries) (1) (88) - - - -
Disposals (of associates, subsidiaries) - - - - - -
Loans raised / paid back (8) (4) (81) - - -
Shares issue / purchase 10 (196) (198) - - -
Dividends (253) (236) (242) (280) (304) (328)
Other Net (12) (9) 19 1 1 1
Net cash flow 229 (129) (92) 136 140 158
Source: Company data, Credit Suisse estimates

97
Geberit – Company Summary
Cost Mix Split Sales Mix Sales by product area
Management
Chairman&CEO Albert M. Baehny
CFO Roland Iff
IR Roman Sidler
Division Products End Markets / Channels Main Competitors Revenue Split by Geo Key Drivers/ Themes
Sanitary Systems
FY 2012 Sales CHF 1.24 Bn
4.3% YoY ex-FX growth
Installation Systems, Cisterns &
Mechanisms, Faucets & Flushing Systems
and Waste Fittings and Traps.
Growth in construction business; Demand in
the European residential renovation business;
Investment in R&D
Piping Systems
FY 2012 Sales CHF 0.95 Bn
4.8% YoY ex-FX growth
Building Drainage Systems and Supply
Systems
Growth in construction business; Demand in
the European residential renovation business;
Investment in R&D
Germany 35%, Switzerland 13%, italy 8%,
Benelux 8%, Austria 7%, Central/eastern
Europe 7%, Nordic Countries 5%, France 4%,
Americas 4% and Others 9%
Air Water Inc, Cleanup Corp, Coop Costruttori
Scarl, Eagle Industries, Grohe, Kohler Co,
Sanitec Corp, Uponor, Viega, Wavin, Ideal
Standarad, Elkay Manufacturing
Renovation 66% & New Construction 34%.
Geberit’s products are exclusively distributed
through wholesalers, which subsequently sell
to plumbers. The shower toilet segment is the
only part of the
group that operates a business– to customer
model.
GEBERIT (GEBN.VX) - ANDRE KUKHNIN, CFA +44 20 7883 0350/ [email protected] Mix Shareholding Structure
Free Float:91%
Top 5 shareholders
Capital Group Companies 9.72%, Barclays
PLC 5.4%, BlackRock 4.72%, Capital Group
4.43%, Geberit AG 3.18%
Ownership by country
United States 53%, UK 16%, Switzerland
15%, Luxembourg 5%, Germany 1% and
Others
Cash Discounts
15%
Materials34%
Personnel Expenses
27%
Depreciation & Amortisation
5%
Other Operating Expenses
19%
SanitarySystems
80%
Piping Systems
20%
Germany35%
Sw itzerland13%
Italy8%Benelux
8%
Austria7%
Central /Eastern Europe
7%
NordicCountries
5%
France4%
Americas4%
Others9%
Installation Systems
36%
Cisterns & Mechanisms
11%
Faucets & Flushing Systems
6%
Waste Fittings and Traps
4%
Building Drainage Systems
14% Supply Systems
29%
Source: Company data

98
GKN – Outperform, TP 430p
Bull Case Attractive valuation against both the UK Cap Goods sector (PE and
EV/EBITA) but also against its peer group weighted SOTP (implies c415p+).
Group margin improvement underpinned by increasing RoS at Driveline and
Aerospace.
Continued potential for self-help - incl. Volvo Aero synergy benefits and
asset turns at Driveline.
With major restructuring now sunk cash generation should improve going
forward with a similar trend playing out for Group ROIC.
Bear Case
Further delays in improvement in the aerospace aftermarket cycle for GKN
imply current aerospace consensus estimates could be too high for 2014.
Slower than expected margin improvement at Driveline while lack of higher
margin aftermarket impacts Aerospace.
UK£ continues to strengthen against key currencies including US$.
Acquisition risk - both overpaying for Spirits Wing business + with its poor
cash generation track record Spirit further extends GKN historic profile of
weak cash conversion.
Investment summary: Remains undervalued relative to its peer group weighted SOTP. Growing exposure to
Aerospace should drive re-rating further. Should deliver better cash conversion and ROIC this cycle vs. last.
0
50
100
150
200
250
300
350
400
0
5
10
15
20
25
30
2004 2005 2006 2007 2008 2009 2010 2011 2012 2013
1 Yr Forward EPS (LHS) Share Price (RHS)
-25%-20%-15%-10%-5%0%5%10%15%20%25%
0%
2%
4%
6%
8%
10%
12%
Margins % (LHS) Organic Growth (RHS)
0%
10%
20%
30%
40%
50%
60%
70%
80%
90%
2%
4%
6%
8%
10%
12%
14%
16%
18%
GKN ROIC (LHS) Sector ROIC (LHS)
GKN Cash conversion (RHS) Sector Cash conversion (RHS)
Source: Thomson Reuters, Company data, Credit Suisse estimates

99
GKN – Valuation Valuation Multiples Cumulative Cash Conversion Bridge
CFROI expectations: Market (dot) vs. Consensus (bar)
100%
19%
- 39%- 8%
- 15%
4%6%
- 29%0%
20%
40%
60%
80%
100%
120%
Cle
an n
et in
com
e
Rep
orte
d ne
t inc
ome
Wor
king
cap
ital
Del
ta b
/w C
apex
& D
epre
ciat
ion
Del
ta b
/w R
&D
Cap
italis
ed &
Inta
ngib
les
Am
ort.
PP
A
Oth
er (
Def
erre
d ta
x, P
ensi
on,
Min
ority
etc
)
Fre
e C
ash
Flo
w
2008 2009 2010 2011 2012 2013e 2014e 2015e
Share price - year high 216.5 127.5 226.0 245.0 237.2 364.4 364.4 364.4
Share price - year low 45.1 38.3 102.0 157.0 173.6 364.4 364.4 364.4
Share price - year average 149.5 88.2 147.0 201.7 208.7 364.4 364.4 364.4
Enterprise value - high 3100.3 2932.4 3982.0 5579.9 5884.0 8222.9 7974.7 7699.8
Enterprise value - low 1885.3 1798.1 2405.1 4213.6 4896.2 8222.9 7974.7 7699.8
Enterprise value - average 2625.7 2432.1 2976.8 4907.1 5441.2 8222.9 7974.7 7699.8
EBITA 201.0 152.0 411.0 495.0 577.0 652.5 731.0 800.0
EV/EBITA - High 15.4 19.3 9.7 11.3 10.2 12.6 10.9 9.6
EV/EBITA - Low 9.4 11.8 5.9 8.5 8.5 12.6 10.9 9.6
EV/EBITA - Average 13.1 16.0 7.2 9.9 9.4 12.6 10.9 9.6
EBITDA 367.0 347.0 602.0 686.0 791.0 882.5 971.0 1040.0
EV/EBITDA - high 8.4 8.5 6.6 8.1 7.4 9.3 8.2 7.4
EV/EBITDA - low 5.1 5.2 4.0 6.1 6.2 9.3 8.2 7.4
EV/EBITDA - average 7.2 7.0 4.9 7.2 6.9 9.3 8.2 7.4
Sales 4617.0 4468.0 5429.0 6112.0 6904.0 7695.0 7888.2 8241.4
EV/Sales - high 0.67 0.66 0.73 0.91 0.85 1.07 1.01 0.93
EV/Sales - low 0.41 0.40 0.44 0.69 0.71 1.07 1.01 0.93
EV/Sales - average 0.57 0.54 0.55 0.80 0.79 1.07 1.01 0.93
CS EPS Adjusted (p) 23.8 5.5 20.7 24.1 27.3 27.4 31.4 34.5
PER - high 9.1 23.2 10.9 10.2 8.7 13.3 11.6 10.6
PER - low 1.9 7.0 4.9 6.5 6.4 13.3 11.6 10.6
PER - average 6.3 16.0 7.1 8.4 7.6 13.3 11.6 10.6
NAV 131.7 76.4 108.7 104.6 121.4 113.3 132.7 153.9
PBV - high 1.6 1.7 2.1 2.3 2.0 3.2 2.7 2.4
PBV - low 0.3 0.5 0.9 1.5 1.4 3.2 2.7 2.4
PBV - average 1.1 1.2 1.4 1.9 1.7 3.2 2.7 2.4
Dividend Yield 4.5 0.0 5.0 6.0 7.3 8.0 8.8 9.7
Dividend Yield - high 2% 0% 2% 2% 3% 2% 2% 3%
Dividend Yield - low 10% 0% 5% 4% 4% 2% 2% 3%
Dividend Yield - average 3% 0% 3% 3% 3% 2% 2% 3%
FCF before distributions 50 107 -147 191 136 302 342 381
FCF/Sales 1% 2% -3% 3% 2% 4% 4% 5%
FCF per share 7.1 8.4 -9.5 12.2 8.5 18.5 20.9 23.3
FCF/EBITDA 14% 31% -24% 28% 17% 34% 35% 37% Source: Company data, Credit Suisse estimates, Credit Suisse HOLT

100
GKN – Financials PROFIT & LOSS 2005 2006 2007 2008 2009 2010 2011 2012 2013e 2014e 2015e
FY FY FY FY FY FY FY FY FY FY FY
Revenue 3,648 3,634 4,122 4,617 4,468 5,429 6,112 6,904 7,695 7,888 8,241
Change yoy, % -0.4% 13.4% 12.0% -3.2% 21.5% 12.6% 13.0% 11.5% 2.5% 4.5%
EBITDA 365.0 379.0 419.0 367.0 347.0 602.0 686.0 791.0 882.5 971.0 1,040.0
Margin, % 10.0% 10.4% 10.2% 7.9% 7.8% 11.1% 11.2% 11.5% 11.5% 12.3% 12.6%
EBITA 228.0 242.0 277.0 201.0 152.0 411.0 495.0 577.0 652.5 731.0 800.0
Margin, % 6.3% 6.7% 6.7% 4.4% 3.4% 7.6% 8.1% 8.4% 8.5% 9.3% 9.7%
CS PBT 203.0 221.0 255.0 167.0 83.0 363.0 442.0 514.0 563.5 655.0 727.0
Income Tax (14.0) (5.0) (1.0) 10.0 15.0 (20.0) (45.0) (85.0) (112.7) (137.6) (159.9)
Exceptional - Tax (26.0) (12.0) (5.0) 3.0 (11.0) (17.0) (15.0) 11.0 0.0 0.0 0.0
CS EPS (Diluted) 22.0 28.7 35.0 23.8 5.5 20.7 24.1 27.3 27.4 31.4 34.5
Reported EPS (Diluted) 7.6 24.9 27.8 -17.3 -3.2 19.6 17.9 30.0 20.3 27.8 30.8
DPS, p 12.2 12.8 13.5 4.5 0.0 5.0 6.0 7.3 8.0 8.8 9.7
DPS growth yoy, % 5% 5% - - - 20% 21% 10% 10% 10%
CASH FLOW 2005 2006 2007 2008 2009 2010 2011 2012 2013e 2014e 2015e
EBITDA 365.0 379.0 419.0 367.0 347.0 602.0 686.0 791.0 882.5 971.0 1040.0
Working Capital Change 15.0 (3.0) (49.0) (5.0) 133.0 (59.0) (89.0) (104.0) (77.2) (90.1) (104.0)
Operating Cash Flow 308.0 117.0 299.0 328.0 288.0 89.0 500.0 538.0 717.3 772.9 828.0
Net Financing Cost (14.0) (33.0) (44.0) (48.0) (61.0) (46.0) (43.0) (68.0) (53.9) (44.8) (42.7)
Tax Paid (35.0) (31.0) (28.0) (45.0) (15.0) (33.0) (38.0) (62.0) (90.2) (110.0) (128.0)
Net Operating Cash Flow 259.0 53.0 227.0 235.0 212.0 10.0 419.0 408.0 573.2 618.0 657.4
Net Capex (220.0) (217.0) (171.0) (185.0) (105.0) (157.0) (228.0) (272.0) (271.0) (276.0) (276.0)
Free Cash Flow 39.0 (164.0) 56.0 50.0 107.0 (147.0) 191.0 136.0 302.2 342.0 381.4
Acquisitions (51.0) (126.0) (71.0) (1.0) (99.0) (6.0) (450.0) (448.0) (70.0) 0.0 0.0
Disposals 1.0 13.0 0.0 25.0 1.0 6.0 13.0 3.0 0.0 0.0 0.0
Pre Financing Cash Flow (3.0) (269.0) (8.0) 86.0 26.0 (160.0) (264.0) (329.0) 273.2 383.0 422.4
Dividend Paid (86.0) (88.0) (91.0) (97.0) 0.0 (23.0) (85.0) (101.0) (119.6) (134.8) (147.5)
Net Cash / (Debt) Year End (65.0) (426.0) (506.0) (708.0) (300.0) (151.0) (538.0) (871.0) (717.3) (469.1) (194.3)
BALANCE SHEET 2005 2006 2007 2008 2009 2010 2011 2012 2013e 2014e 2015e
PPE 1,364 1,354 1,462 1,797 1,636 1,651 1,812 1,964 2,009 2,049 2,089
Goodwill 241 245 280 367 338 350 534 551 551 551 551
Intangible Assets 54 111 136 153 187 200 424 989 949 909 869
Working capital 567 516 459 583 510 535 614 866 943 1033 1137
Total assets 1851 1895 2033 2470 2268 2438 3030 3776 3796 3862 3932
Shareholders' funds 875 892 1,177 905 948 1,313 1,252 1,574 1,486 1,800 2,145
Minorities 26 16 19 23 24 374 372 353 353 353 353
Equity 901 908 1,196 928 972 1,687 1,624 1,927 1,839 2,153 2,498
Total Borrowings 789 768 788 822 636 593 694 1,052 898 650 375
Cash and equivalents (724) (342) (282) (114) (336) (442) (156) (181) (181) (181) (181)
Net Debt / (Cash) 65 426 506 708 300 151 538 871 717 469 194
Pension Deficit 885 561 331 834 996 600 868 978 1240 1240 1240
Total liabilities 1851 1895 2033 2470 2268 2438 3030 3776 3796 3862 3932
Source: Company data, Credit Suisse estimates

101
GKN – Company Summary
Geographic Split Operating Profit Mix Sales Mix End Market Split
Division Products End Markets / Channels Main Competitors / Positioning Revenue Split by Geo Key Drivers / Themes
Driveline
FY2012 Sales - £3,236m,
4.3% org. growth
FY2012 EBITA - £235m,
7.3% margin
CVJ driveshafts, propellershafts, torque
mgmt, geared products. CVJ sideshafts
60m units, propeller shafts 3m units, torque
2m, Geared Products 1.3m;
Global Automotive industry,
VW 16%, BMW 4%, Big3=24% Driveline
CVJ Systems = c75%, AWD / eDrive
= c25%. 41% Global market share in CVJ
CVJ - NTN, Dana, AAM; Torque mgmt -
Borg-Warner, Eaton, Dana,
Asia & RoW - £866m (31%)
Americas - £811m (29%)
Europe - £1,118m (40%)
Global automotive production volumes.
Electric vehicles market share gain
Aerospace
FY2012 Sales - £1,775m,
10.8% org. growth
FY2012 EBITA - £192m,
10.8% margin
15% Propulsion systems, 75%
integrated aerostructures
(composite tech) and 10% special products -
transparency sys.
Sales split is 85% OE and 15% aftermarket
with a split 70% civil and 30% military.
Sales method is directly into the aeroplane
and engine manufacturer.
Alenia, Spirit Aerosystems, Triumph,
Transdigm
Americas - £811m (52%)
Europe - £1,118m (48%)
Civil aerospace build rates. Through life
engine service schedules
Land Systems
FY2012 Sales - £933m,
1.6% org. growth
FY2012 EBITA - £88m,
9.4% margin
Driveline Systems, Wheels, Service and
Distribution. Structures, Industrial
Distribution Services
Global leader in manufacture of off-road
metal wheels. Agriculture 35% (European
Agr c25%), Construction & Mining 11%,
Commercial/Passenger Vehicle 24%,
Industrial
30%
Titan (wheel), Bondoli, Comer, Weasler
Driveline systems
Asia & RoW - £35m (4%)
Americas - £195m (22%)
Europe - £655m (74%)
Urbanisation, growing population, dietary
needs, renewable energy, military
Powder Metallurgy
FY2012 Sales - £874m,
5.4% org. growth
FY2012 EBITA - £87m,
10.0% margin
Hoeganaes c17%, Sinter Americas c38%,
Sinter Europe c38%, Sinter RoW c7%
Hoeganaes US No.1 & 22% global market
share. Automotive industry (75%).
Big3=17% of Powder Met sales, VW 2%
Sumimoto, Fine Sinter
Hitachi, Metaldyne, Hoganas AB.
Asia & RoW - £59m (7%)
Americas - £465m (55%)
Europe - £321m 38%)
Efficient transmissions, reduced
emissions, energy efficiency,
electrification
GKN (GKN.L / GKN LN) - JONATHAN HURN, CFA +44 20 7883 4532 / [email protected]
Automotive
59%Aerospace - Civil
22%
Aerospace -
Defence10%
Industrial
5%
Agriculture
4%Driveline
37%
Aerospace
37%
Land Systems
12%
Power Metallurgy
14% Driveline
46%
Aerospace
30%
Land Systems
12%
Power Metallurgy
12%Asia & RoW, 15%
Americas, 38%
Europe, 47%
Shareholding structure
Free float: 100%
Top 5 shareholders: Standard Life
Investments - 14%, Dimensional Fund
Adv. - 8%, Old Mutual - 8%, Schroder -
7%, Mondrian Investment Partners- 6%
Ownership by Country: UK, 54%, USA
- 29%, Norway - 3%, Luxembourg - 2%,
Ireland - 2%
Management
Chairman -Roy Brown
CEO - Nigel Stein
CFO - William Seeger
CS - Judith Felton
Source: Company data

102
Halma – Outperform, TP 620p
Bull Case Target to double profit every 5 years: Both organically and by acquisition.
Strong market positions with high barriers to entry drives organic growth. Cash
generation, low net debt /EBITDA underpins acquisitions.
High quality fundamentals: Lowest margin volatility in the sector (16%-22%),
>80% cash conversion, YoY dividend growth for last 35 years. We see no
change to this trend.
Emerging market potential: Significant scope to further sales to emerging
markets through products focusing on healthcare, process safety,
environmental protection and medical.
Attractive Valuation versus its higher quality UK structural growth peer group
of Rotork, Spirax Sarco and Renishaw
Bear Case
Unable to deliver 5% organic growth through cycle impacting ability to double
profit every 5 years.
Environmental & Analysis fails to deliver organic growth as forecast.
Lack of decent acquisition opportunities with multiples paid rising above
historic level of 9x EBIT.
CEO resignation.
Investment summary: Key pick amongst the UK structural names for 2014. Legislation driven end markets with
high barriers to entry maintain above sector average organic growth. Valuation undemanding vs. structural UK
peers.
0
100
200
300
400
500
600
700
0
5
10
15
20
25
30
35
2004 2005 2006 2007 2008 2009 2010 2011 2012 2013
1 Yr Forward EPS (LHS) Share Price (RHS)
-4%
-2%
0%
2%
4%
6%
8%
10%
12%
15%
17%
19%
21%
23%
Margins % (LHS) Organic Growth (RHS)
0%
20%
40%
60%
80%
100%
120%
10%
12%
14%
16%
18%
20%
HLMA ROIC (LHS) Sector ROIC (LHS)
HLMA Cash conversion (RHS) Sector Cash conversion (RHS)
Source: Thomson Reuters, Company data, Credit Suisse estimates

103
Halma – Valuation
2007 2008 2009 2010 2011 2012 2013 2014e 2015e
Share price - year high 239.5 246.0 221.5 263.8 366.6 429.6 531.5 571.0 571.0
Share price - year low 172.0 181.5 143.3 164.3 239.5 306.3 373.1 571.0 571.0
Share price - year average 204.6 217.8 190.3 213.7 306.7 362.5 430.7 571.0 571.0
Enterprise value - high 928.9 993.4 919.4 1020.2 1447.9 1667.7 2156.0 2272.5 2228.4
Enterprise value - low 679.7 754.0 627.7 648.0 970.6 1203.3 1559.0 2272.5 2228.4
Enterprise value - average 799.9 888.7 803.0 832.9 1223.0 1414.8 1775.9 2272.5 2228.4
EBITA 67.9 74.9 82.5 89.1 105.6 122.3 134.8 147.5 156.0
EV/EBITA - High 13.7 13.3 11.1 11.4 13.7 13.6 16.0 15.4 14.3
EV/EBITA - Low 10.0 10.1 7.6 7.3 9.2 9.8 11.6 15.4 14.3
EV/EBITA - Average 11.8 11.9 9.7 9.3 11.6 11.6 13.2 15.4 14.3
EBITDA 75.6 83.6 92.8 100.6 117.2 134.5 147.5 162.0 170.5
EV/EBITDA - high 12.3 11.9 9.9 10.1 12.4 12.4 14.6 14.0 13.1
EV/EBITDA - low 9.0 9.0 6.8 6.4 8.3 8.9 10.6 14.0 13.1
EV/EBITDA - average 10.6 10.6 8.7 8.3 10.4 10.5 12.0 14.0 13.1
Sales 354.6 395.1 455.9 459.1 518.4 579.9 619.2 682.7 705.2
EV/Sales - high 2.6 2.5 2.0 2.2 2.8 2.9 3.5 3.3 3.2
EV/Sales - low 1.9 1.9 1.4 1.4 1.9 2.1 2.5 3.3 3.2
EV/Sales - average 2.3 2.2 1.8 1.8 2.4 2.4 2.9 3.3 3.2
CS EPS Adjusted (p) 12.4 13.8 15.3 16.8 20.5 24.4 26.2 29.4 31.1
PER - high 19.3 17.8 14.5 15.7 17.9 17.6 20.3 19.4 18.3
PER - low 13.9 13.2 9.4 9.8 11.7 12.5 14.2 19.4 18.3
PER - average 16.5 15.8 12.5 12.7 15.0 14.8 16.4 19.4 18.3
NAV 55.7 64.1 80.1 85.9 94.4 105.6 120.0 134.7 144.5
PBV - high 4.3 3.8 2.8 3.1 3.9 4.1 4.4 4.2 4.0
PBV - low 3.1 2.8 1.8 1.9 2.5 2.9 3.1 4.2 4.0
PBV - average 3.7 3.4 2.4 2.5 3.3 3.4 3.6 4.2 4.0
Dividend Yield 7.2 7.6 7.9 8.5 9.1 9.7 10.4 11.2 11.9
Dividend Yield - high 3% 3% 4% 3% 2% 2% 2% 2% 2%
Dividend Yield - low 4% 4% 6% 5% 4% 3% 3% 2% 2%
Dividend Yield - average 4% 3% 4% 4% 3% 3% 2% 2% 2%
FCF before distributions 43 29 50 91 81 82 92 100 108
FCF/Sales 12.3% 7.4% 10.9% 19.7% 15.6% 14.2% 14.9% 14.6% 15.3%
FCF per share 11.62 7.82 13.30 24.05 21.42 21.84 24.44 26.40 28.51
FCF/EBITDA 57.5% 35.1% 53.8% 90.0% 69.0% 61.3% 62.6% 61.6% 63.2%
Valuation Multiples Cumulative Cash Conversion Bridge
CFROI expectations: Market (dot) vs. Consensus (bar)
100%97%
- 2%
- 4%- 4%
0%
8% 1%
50%
60%
70%
80%
90%
100%
Cle
an n
et in
com
e
Rep
orte
d ne
t inc
ome
Wor
king
cap
ital
Del
ta b
/w C
apex
&D
eper
ecia
tion
Del
ta b
/w R
&D
Cap
italis
ed &
Inta
ngib
les
Am
ort.
PP
A
Oth
er (
Def
erre
d ta
x, P
ensi
on,
Min
ority
etc
)
Fre
e C
ash
Flo
w
Source: Company data, Credit Suisse estimates, Credit Suisse HOLT

104
Halma – Financials PROFIT & LOSS 2006 2007 2008 2009 2010 2011 2012 2013 2014e 2015e 2016e
FY FY FY FY FY FY FY FY FY FY FY
Revenue 310.8 354.6 395.1 455.9 459.1 518.4 579.9 619.2 682.7 705.2 737.7
Change yoy, % 14.1% 11.4% 15.4% 0.7% 12.9% 11.9% 6.8% 10.3% 3.3% 4.6%
EBITDA 67.9 75.6 83.6 92.8 100.6 117.2 134.5 147.5 162.0 170.5 180.5
Margin, % 21.8% 21.3% 21.1% 20.3% 21.9% 22.6% 23.2% 23.8% 23.7% 24.2% 24.5%
EBITA 60.0 67.9 74.9 82.5 89.1 105.6 122.3 134.8 147.5 156.0 166.0
Margin, % 19.3% 19.2% 19.0% 18.1% 19.4% 20.4% 21.1% 21.8% 21.6% 22.1% 22.5%
CS PBT 58.1 66.1 72.8 79.1 86.2 104.6 120.5 130.7 142.1 150.9 160.9
Income Tax (17.5) (19.7) (21.1) (21.9) (22.8) (27.4) (28.3) (31.7) (31.0) (33.2) (35.7)
Exceptional - Tax 0.5 1.1 1.4 1.7 1.9 1.5 3.0 4.6 2.7 0.0 0.0
CS EPS (Diluted) 11.0 12.4 13.8 15.3 16.8 20.5 24.4 26.2 29.4 31.1 33.1
Reported EPS (Diluted) 11.0 11.8 13.4 14.0 16.1 19.2 23.0 25.2 25.3 26.4 28.4
DPS, p 6.8 7.2 7.6 7.9 8.5 9.10 9.74 10.43 11.16 11.94 12.78
DPS growth yoy, % 5% 5% 5% 7% 7% 7% 7% 7% 7% 7%
CASH FLOW 2006 2007 2008 2009 2010 2011 2012 2013 2014e 2015e 2016e
EBITDA 67.9 75.6 83.6 92.8 100.6 117.2 134.5 147.5 162.0 170.5 180.5
Working Capital Change (0.7) (4.1) (14.0) (5.4) 13.1 (3.6) (7.6) (10.9) (8.7) (8.3) (7.0)
Operating Cash Flow 70.8 70.3 62.6 86.4 112.7 113.2 125.5 133.7 146.1 155.1 166.3
Net Financing Cost (0.4) (0.9) (1.8) (2.7) (0.9) (0.5) (1.3) (2.3) (2.9) (1.9) (1.9)
Tax Paid (16.8) (19.5) (17.6) (20.5) (12.4) (18.1) (27.8) (25.5) (26.9) (29.9) (32.2)
Net Operating Cash Flow 53.6 49.9 43.2 63.2 99.5 94.6 96.4 105.9 116.3 123.3 132.3
Net Capex (10.8) (6.4) (14.0) (13.3) (8.9) (13.7) (14.0) (13.6) (16.5) (15.5) (15.5)
Free Cash Flow 42.7 43.5 29.3 49.9 90.6 80.8 82.5 92.4 99.8 107.8 116.8
Acquisitions (36.2) (27.5) (46.5) (12.4) (1.7) (82.1) (18.7) (148.8) (20.8) (20.8) (20.8)
Disposals 14.6 0.0 2.4 0.0 0.5 0.0 3.6 19.6 1.9 1.2 1.2
Pre Financing Cash Flow 19.4 11.2 (19.6) 31.8 85.0 (8.7) 61.3 (43.3) 78.0 88.2 97.2
Dividend Paid (24.5) (25.9) (27.3) (28.8) (30.4) (32.9) (35.2) (37.8) (40.4) (43.8) (46.4)
Net Cash / (Debt) Year End 3.5 (7.7) (44.3) (51.2) 9.1 (37.1) (18.7) (110.3) (73.7) (29.3) 21.6
BALANCE SHEET 2006 2007 2008 2009 2010 2011 2012 2013 2014e 2015e 2016e
PPE 50 50 57 71 67 70 72 77 79 81 82
Goodwill 122 130 161 198 195 260 267 352 352 352 352
Inangible Assets 12 15 33 41 34 73 74 134 118 102 86
Working capital 73 79 93 107 95 107 112 135 144 152 159
Total assets 231 252 319 393 356 429 450 611 629 622 613
Shareholders' funds 188 207 239 300 322 355 398 453 509 546 588
Minorities 0 0 0 0 0 0 0 0 0 0 0
Total Borrowings 32 30 72 86 22 80 64 160 123 79 28
Cash and equivalents (36) (22) (28) (35) (31) (43) (45) (50) (50) (50) (50)
Net Debt / (Cash) (4) 8 44 51 (9) 37 19 110 74 29 (22)
Pension Deficit 46 37 36 43 43 36 33 47 47 47 47
Total liabilities 231 252 319 393 356 429 450 611 629 622 613
Source: Company data, Credit Suisse estimates

105
Halma – Company Summary
Geographic Split Operating Profit Mix Sales Mix End Market Split
Division Products End Markets / Channels Main Competitors / Positioning Revenue Split by Geo Key Drivers / Themes
Infrastructure Safety
FY2013 Sales - £205m,
1% org. growth
FY2013 EBITA - £42.1m,
20.5% margin
Smoke and heat detectors, sounders, beacons and
interfaces, Beam smoke detectors and specialist fire
extinguishing systems, Sensors for automatic doors
Elevator safety components, Infrared safety systems for
elevator doors and elevator emergency communications,
Control panels for the elevator industry, Security sensors
and signalling products
Fire Detection, Automatic Door Sensors,
Elevator Safety, Security Sensors
Halma products are very niche focused and
designed to solve a specific problem. Large
competitors are few but include Roper
Industires and Danaher
UK - £53m (26%)
USA - £37m (18%)
Europe - £69m (34%)
Far east & Asia - £31m (15%)
Other - £14m (7%)
Health & Safety legislation in buildings
and the workplace
Environmental & Analysis
FY2013 Sales - £153m,
-6% org. growth
FY2013 EBITA - £30.4m,
19.9% margin
Ultraviolet treatment of drinking water, waste water, water
for re-use and water used in industrial processes,
Equipment and software for flow analysis of water and
sewerage systems and leak detection systems,
Electrochemical sensors, Mass flow meters and
controllers, Gas dryers and humidifiers
Water, Fluid Technology, Photonics
Halma products are very niche focused and
designed to solve a specific problem. Large
competitors are few but include Roper
Industires and Danaher
UK - £13m (13%)
USA - £44m (44%)
Europe - £16m (16%)
Far east & Asia - £19m (19%)
Other - £8m (8%)
Legislation focusing on reducing leakage
Medical
FY2013 Sales - £136m,
12% org. growth
FY2013 EBITA - £35.9m,
26.4% margin
Life sciences and medical diagnostics, Dichroic optical
filters and precision optics, Surgical and diagnostic
instruments and a variety of pharmaceuticals, Instruments
for ophthalmic surgery, Diagnostic medical devices,
Clinical grade non-invasive blood pressure monitoring
products and technologies, components for medical, life
science and scientific instruments.
Health Optics
Halma products are very niche focused and
designed to solve a specific problem. Large
competitors are few but include Roper
Industires and Danaher
UK - £7m (7%)
USA - £43m (43%)
Europe - £25m (25%)
Far east & Asia - £13m (13%)
Other - £12m (12%)
Increasing demand for Healthcare
particurlaly for the eye.
Process Safety
FY2013 Sales - £125.7m,
10% org. growth
FY2013 EBITA - £32.3m,
25.7% margin
Safety systems for controlling hazardous industrial
processes Safety systems for controlling access to
dangerous machines Key interlocks and interlocking
systems for the protection of personnel and equipment
Process safety systems for petrochemical and industrial
applications Safety systems for controlling access to
dangerous machines Process safety systems for
petrochemical and industrial applications Gas detection
instruments for personnel and plant safety
Safety Interlocks, Gas Detection, Bursting
Disks, Asset Monitoring
Halma products are very niche focused and
designed to solve a specific problem. Large
competitors are few but include Roper
Industires and Danaher
UK - £34m (28%)
USA - £27m (22%)
Europe - £32m (26%)
Far east & Asia - £17m (14%)
Other - £12m (10%)
Increasing demand for protection of
people and process within industrial
environment
HALMA (HLMA.L / HLMA LN) - JONATHAN HURN, CFA +44 20 7883 4532 / [email protected]
Infrastructure Safety
27%
Medical
23%
Process Safety
26%
Environmental &
Analysis24%
USA, 28%
Mainland Europe,
26%
UK, 22%
APAC, 15%
Africa/M.East, 5%
Other, 4% Photonics
9% Health Optics
8%
Water
7%
Fluid Technology
5%
Fire Detection
17%Automatic Door
Sensors12%
Elevator Safety
9%
Security Sensors
6%
Safety Interlocks
12%
Gas Detection
7%
Bursting Disks
5%
Asset Monitoring
3%Infrastructure Safety
33%
Medical
22%
Process Safety
20%
Environmental &
Analysis25%
Shareholding structure
Free float: 95%
Top 5 shareholders: Sun Life Financial
- 8%, Schroder Investment Mgmt Ltd -
4%, Legal & General - 4%, Neptune
Investment Management - 4%, Capital
Group - 3%
Ownership by Country: UK 51%, USA -
28%, Canada - 5%, Norway - 5%,
Luxembourg - 3%
Management
Chairman - Paul Walker
CEO - Andrew Williams
CFO - Kevin Thompson
Source: Company data

106
IMI – Outperform, TP 1640p
Bull Case IMI is now a more focused process business (Severe Service / Fluid Power
= c80% of group revenue) able to deliver better through cycle growth.
Group margins under the new structure (ex Merchandising / Beverage) to
potentially exceed 20% this cycle and within top quartile of the sector.
Mark Selway to improve asset turns of the business which alongside margin
improvement to drive ROIC higher.
Continued balance sheet optionality on the back of strong cash generation –
fund acquisitions or further cash returns to shareholders.
M&A target with large cap European and US players looking to increase
their exposure to Process.
Bear Case
Portfolio reorganisation now complete with the sale of Beverage /
Merchandising.
Valuation – IMI has rerated with discount vs. Process peers now closed.
Acquisition risk – overpaying for in demand Process assets.
Currency risk to consensus from strengthening UK£.
Investment summary: While having undergone a significant transformation into a more focused Process
business we believe there is still more to go for (self-help / acquisitions) under new CEO Mark Selway.
0
200
400
600
800
1000
1200
1400
1600
0
20
40
60
80
100
2004 2005 2006 2007 2008 2009 2010 2011 2012 2013
1 Yr Forward EPS (LHS) Share Price (RHS)
-24%
-16%
-8%
0%
8%
16%
10%
12%
14%
16%
18%
20%
Margins % (LHS) Organic Growth (RHS)
0%
20%
40%
60%
80%
100%
10%
12%
14%
16%
18%
20%
22%
24%
IMI ROIC (LHS) Sector ROIC (LHS)
IMI Cash conversion (RHS) Sector Cash conversion (RHS)
Source: Thomson Reuters, Company data, Credit Suisse estimates

107
IMI – Valuation
2007 2008 2009 2010 2011 2012 2013e 2014e 2015e
Share price - year high 637 533.5 537 948 1119 1107 1444 1444 1444
Share price - year low 387.25 220 222.5 518.5 636.5 760 1444 1444 1444
Share price - year average 544.9 398.46 367.69 711.39 905.48 921.85 1444 1444 1444
Enterprise value - high 2396.56 2133.17 2126.96 3401.42 3890.13 3912.79 5045.10 4916.38 4891.60
Enterprise value - low 1570.64 1132.16 1124.33 2031.32 2360.61 2812.80 5045.10 4916.38 4891.60
Enterprise value - average 2091.98 1701.98 1587.20 2646.63 3213.27 3325.86 5045.10 4916.38 4891.60
EBITA 210.8 266.3 234.2 319.7 374.1 373.0 324.5 347.0 371.5
EV/EBITA - High 11.4 8.0 9.1 10.6 10.4 10.5 15.5 14.2 13.2
EV/EBITA - Low 7.5 4.3 4.8 6.4 6.3 7.5 15.5 14.2 13.2
EV/EBITA - Average 9.9 6.4 6.8 8.3 8.6 8.9 15.5 14.2 13.2
EBITDA 246.7 309.4 282.9 366.9 417.7 414.6 364.5 387 411.5
EV/EBITDA - high 9.7 6.9 7.5 9.3 9.3 9.4 13.8 12.7 11.9
EV/EBITDA - low 6.4 3.7 4.0 5.5 5.7 6.8 13.8 12.7 11.9
EV/EBITDA - average 8.5 5.5 5.6 7.2 7.7 8.0 13.8 12.7 11.9
Sales 1599 1897 1792 1924 2131 2190 1757 1831 1927
EV/Sales - high 1.50 1.12 1.19 1.77 1.83 1.79 2.87 2.69 2.54
EV/Sales - low 0.98 0.60 0.63 1.06 1.11 1.28 2.87 2.69 2.54
EV/Sales - average 1.31 0.90 0.89 1.38 1.51 1.52 2.87 2.69 2.54
CS EPS Adjusted (p) 42.41 53.45 45.45 65.23 80.03 83.20 70.72 90.29 98.87
PER - high 15.02 9.98 11.81 14.53 13.98 13.30 20.42 15.99 14.60
PER - low 9.13 4.12 4.90 7.95 7.95 9.13 20.42 15.99 14.60
PER - average 12.85 7.45 8.09 10.91 11.31 11.08 20.42 15.99 14.60
NAV 124.9 144.6 126.1 180.5 193.8 215.1 214.5 247.8 284.6
PBV - high 5.1 3.7 4.3 5.3 5.8 5.1 6.7 5.8 5.1
PBV - low 3.1 1.5 1.8 2.9 3.3 3.5 6.7 5.8 5.1
PBV - average 4.4 2.8 2.9 3.9 4.7 4.3 6.7 5.8 5.1
Dividend Yield 20.20 20.70 21.20 26.00 30.00 32.50 35.75 39.33 43.26
Dividend Yield - high 3% 4% 4% 3% 3% 3% 2% 3% 3%
Dividend Yield - low 5% 9% 10% 5% 5% 4% 2% 3% 3%
Dividend Yield - average 4% 5% 6% 4% 3% 4% 2% 3% 3%
FCF before distributions 66 156 194 203 150 156 179 138 230
FCF/Sales 4.1% 8.2% 10.8% 10.6% 7.1% 7.1% 10.2% 7.5% 11.9%
FCF per share 19.80 48.60 60.50 62.75 46.64 48.53 57.51 50.66 85.57
FCF/EBITDA 26.6% 50.5% 68.6% 55.4% 36.0% 37.7% 49.1% 35.7% 55.9%
Valuation Multiples Cumulative Cash Conversion Bridge
CFROI expectations: Market (dot) vs. Consensus (bar)
100%94%
- 25%
3%
-1% -1%
8%9%
0%
20%
40%
60%
80%
100%
120%
Cle
an n
et in
com
e
Rep
orte
d ne
t inc
ome
Wor
king
cap
ital
Del
ta b
/w C
apex
&D
eper
ecia
tion
Del
ta b
/w R
&D
Cap
italis
ed &
Inta
ngib
les
Am
ort.
PP
A
Oth
er (
Def
erre
d ta
x, P
ensi
on,
Min
ority
etc
)
Fre
e C
ash
Flo
w
Source: Company data, Credit Suisse estimates, Credit Suisse HOLT

108
IMI – Financials PROFIT & LOSS 2005 2006 2007 2008 2009 2010 2011 2012 2013e 2014e 2015e
FY FY FY FY FY FY FY FY FY FY FY
Revenue 1,578.0 1,505.0 1,599.0 1,897.0 1,792.0 1,924.0 2,131.0 2,190.0 1,757.0 1,831.0 1,927.0
Change yoy, % -4.6% 6.2% 18.6% -5.5% 7.4% 10.8% 2.8% -19.8% 4.2% 5.2%
EBITDA 228.7 230.5 246.7 309.4 282.9 366.9 417.7 414.6 364.5 387.0 411.5
Margin, % 14.5% 15.3% 15.4% 16.3% 15.8% 19.1% 19.6% 18.9% 20.7% 21.1% 21.4%
EBITA 178.3 191.8 210.8 266.3 234.2 319.7 374.1 373.0 324.5 347.0 371.5
Margin, % 11% 12.7% 13.2% 14.0% 13.1% 16.6% 17.6% 17.0% 18.5% 19.0% 19.3%
CS PBT 176.1 192.6 208.5 254.0 211.7 304.2 363.2 372.3 310.0 341.5 367.5
Income Tax (56.6) (59.7) (64.9) (79.0) (63.6) (91.3) (101.8) (95.2) (74.7) (74.4) (80.4)
Exceptional - Tax 2.2 10.7 11.9 19.0 9.8 (1.2) 4.1 11.9 0.0 0.0 0.0
CS EPS (Diluted) 33.1 38.1 42.4 53.5 45.5 65.2 80.0 83.2 70.7 90.3 98.9
Reported EPS (Diluted) 3.8 21.3 35.3 35.1 40.6 69.4 62.1 71.6 75.1 76.7 85.1
DPS, p 17.5 18.7 20.2 20.7 21.2 26.0 30.0 32.5 35.8 39.3 43.3
DPS growth yoy, % 7% 8% 2% 2% 23% 15% 8% 10% 10% 10%
CASH FLOW 2005 2006 2007 2008 2009 2010 2011 2012 2013e 2014e 2015e
EBITDA 228.7 230.5 246.7 309.4 282.9 366.9 417.7 414.6 364.5 387.0 411.5
Working Capital Change (10.9) (26.7) (10.7) 1.2 60.7 32.2 (13.0) (30.6) (22.4) (23.6) (21.9)
Operating Cash Flow 165.4 170.7 157.1 271.8 302.1 313.7 307.5 314.3 325.3 276.6 372.8
Net Financing Cost (8.2) (8.7) (12.7) (16.6) (19.8) (15.5) (16.9) (17.7) (28.3) (25.9) (24.2)
Tax Paid (54.2) (40.0) (37.1) (54.4) (52.6) (56.3) (90.9) (102.9) (71.0) (70.7) (76.4)
Net Operating Cash Flow 103.0 122.0 107.3 200.8 229.7 241.9 199.7 193.7 226.1 180.0 272.2
Net Capex (41.9) (32.0) (41.6) (44.5) (35.5) (38.7) (49.3) (37.4) (47.0) (42.0) (42.0)
Free Cash Flow 61.1 90.0 65.7 156.3 194.2 203.2 150.4 156.3 179.1 138.0 230.2
Acquisitions (63.6) (118.4) (52.2) 0.0 (19.4) (129.8) (8.9) (83.1) (12.0) (7.0) (7.0)
Disposals 209.0 0.0 2.0 0.0 0.0 7.4 0.0 0.0 0.0 690.0 0.0
Pre Financing Cash Flow 200.2 0.6 11.2 151.2 161.9 80.3 143.7 78.5 148.6 821.0 223.2
Dividend Paid (59.4) (60.7) (63.9) (66.2) (66.0) (70.9) (88.8) (97.8) (103.3) (117.3) (128.4)
Net Cash / (Debt) Year End (10.6) (80.4) (233.1) (298.7) (172.4) (145.4) (108.2) (143.8) (245.2) (186.4) (91.7)
BALANCE SHEET 2005 2006 2007 2008 2009 2010 2011 2012 2013e 2014e 2015e
PPE 192 190 208 266 233 241 248 245 255 210 215
Goodwill 166 231 261 343 341 401 404 404 404 404 404
Intangible Assets 20 56 53 57 45 117 93 140 113 86 59
Working capital 292 308 354 457 368 371 371 409 431 455 477
Total assets 605 618 711 900 833 922 928 1060 1087 1034 1029
Shareholders' funds 418 413 407 452 400 526 565 636 611 617 706
Minorities 4 4 6 9 2 50 49 48 48 48 48
Total Borrowings 200 188 340 423 253 268 256 247 348 289 194
Cash and equivalents (189) (107) (107) (124) (81) (123) (148) (103) (103) (103) (103)
Net Debt / (Cash) 11 80 233 299 172 145 108 144 245 186 92
Pension Deficit 173 121 65 140 258 201 206 232 183 113 183
Total liabilities 605 618 711 900 833 922 928 1060 1087 964 1029
Source: Company data, Credit Suisse estimates

109
IMI – Company Summary
Geographic Split Operating Profit Mix Sales Mix End Market Split
Division Products End Markets / Channels Main Competitors / Positioning Revenue Split by Geo Key Drivers / Themes
Severe service
FY2012 Sales - £686m,
11.6% org. growth
FY2012 EBITA - £96m,
14.0% margin
Severe service valve apps (high
pressures drops, high flow rates,
extreme temperatures, fine control req.)
Products 1. Control valves (61% of
sales), 2) actuators & controls (2%), 3)
nuclear sol (21%), 4) Isolation valves
(17%).
29% O&G (with LNG focus), 26% fossil
power, 13% nuclear, 32% aftmarket
LNG (Koso, PBVS, Severn, Glocon, Tyco),
Nuclear (Emerson, Flowserve, GE,
Sempell),
Fossil (Bopp & Reuther, GE, ), Petrochem
(Curtiss Wright,
Poyam), Iron & steel (Fouress,
Siemens)
Emerging markets - £194m (34%)
North America - £103m (18%)
UK - £23m (4%)
Western Europe - £160m (28%)
RoW - £92m (16%)
Replacement of ageing coal power
generation capacity. Emerging market
power demand
Fluid power
FY2012 Sales - £717m,
(4.2)% org. growth
FY2012 EBITA - £142m,
19.8% margin
Pneumatic solutions (actuators, control
valves, cylinders, filters, regulators,
lubricators) to control air, water, oil and
other fluids in engineering apps. 45% of
sales on focus sectors, 33% aftermarket,
25% related to factory automation.
Sector sales - 16% trucks, 7% life sciences,
6% food and beverage, 4% energy, 2% rail,
CV - powertrain & cab (Bendix, Bosch,
Pierburg, Wabco), Life sciences fluid control
Bukert, Hamilton, Idex, Tecan), Food &
Beverage (Bukert, Festo, Parker, Seitz),
Rail (ACL, Bode, Muller, Parker), Energy
Asco, Bifold, Midland, Versa)
Emerging markets - £130m (17%)
North America - £176m (23%)
UK - £61m (8%)
Western Europe - £368m (48%)
RoW - £31m (4%)
Process automation.
Indoor climate
FY2012 Sales - £293m,
(1.2)% org. growth
FY2012 EBITA - £62m,
21.0% margin
Thermostatic radiator valves (TRV,
40% of sales), balancing valves
(60%), and automatic flow control
devices. 65% of sales are
aftermarket.
Buildings & Indoor environments
Hydronic balancing (Danfoss,
Oventrop), Hydronic conditioning
(Flamco, Relfex, Spirotech), TRV
(Danfoss, Honeywell, Oventrop)
Emerging markets - £56m (18%)
North America - £16m (5%)
UK - £6m (5%)
Western Europe - £229m (74%)
RoW - £3m (1%)
Legislation calling for increased heating
efficiency. Emission legislation
IMI (IMI.L / IMI LN) - JONATHAN HURN, CFA +44 20 7883 4532 / [email protected]
Severe Service
35%
Fluid Power
45%
Indoor Climate
20%
Auto
4%
Process
Industries38%
Environmental
Control16%
Capital
Equipment33%
Truck
9%Severe Service
40%
Fluid Power
42%
Indoor Climate
18%Emerging
Markets, 27%
North America,
18%RoW, 20%
Western Europe,
29%
UK, 6% Shareholding structure
Free float: 99%
Top 5 shareholders: Standard Life
Investments - 7%, Threadneedle Asset
Management - 5%, Ameriprise Financial
Inc - 5%, AXA - 5%, FIL - 4%
Ownership by Country: UK - 46%,
USA - 22%, Canada - 6%, Luxembourg -
5%, Norway - 3%
Management
Chairman -Roberto Quarta
CEO - Martin Lamb
CFO - Douglas Hurt
IR - Will Shaw
Source: Company data

110
KONE – Neutral, TP €34 Investment summary: Best positioning to benefit from China maintenance market development and scope for
margin increases offset by risk of China NI topping out and expensive valuation.
Bull Case Strongest positioning in China to capture the building maintenance market
opportunity (400 selling locations – highest by far among peers), especially
given new regulation coming into force in 2014;
Impressive new product momentum – UltraRope for high rise and new low-
rise offering;
Scope for margin improvement with efficiency improvements, rising density
and developing China maintenance market;
Best in class Returns and Cash Conversion profile combined with negative
incremental invested capital.
Bear Case China new installations growth topping out over the next 12-24 months
resulting in a slower earnings growth profile (China is a high margin NI
market) and hence de-rating;
Otis targeting to regain market share lost in China over the past 18 months
leading to pricing pressure;
Capacity ramp up in China across major international and local players
may lead to price pressure, especially if market growth comes to an end
(however, capacity in elevators space is relatively easy to manage);
Expensive valuation – relative to sector and to other high-quality
construction-exposed industrial peers.
0
5
10
15
20
25
30
35
40
0.00
0.20
0.40
0.60
0.80
1.00
1.20
1.40
1.60
2004 2005 2006 2007 2008 2009 2010 2011 2012 2013
1 Yr Forward EPS (LHS) Share Price (RHS)
0%
5%
10%
15%
20%
8%
10%
12%
14%
16%
Margins % (LHS) Organic Growth (RHS)
0%
20%
40%
60%
80%
100%
120%
5%
10%
15%
20%
25%
30%
35%
KNEB ROIC (LHS) Sector ROIC (LHS)
KNEB Cash conversion (RHS) Sector Cash conversion (RHS)
Source: Thomson Reuters, Company data, Credit Suisse estimates

111
Kone – Valuation
December y/e 2007 2008 2009 2010 2011 2012 2013E 2014E 2015E
Average/Current 23.5 21.2 22.0 34.5 40.2 48.7 32.6 32.6 32.6
High 29.7 27.6 30.0 42.9 43.8 59.4
Low 20.7 14.0 14.3 28.6 34.1 40.0
P/E average 36.0 25.7 22.4 33.0 35.5 36.8 22.1 20.2 18.2
P/E high 45.5 33.5 30.4 41.0 38.7 44.8
P/E low 31.7 17.0 14.5 27.3 30.1 30.2
EV:sales average 2.99 2.35 2.28 3.43 3.81 3.89 2.40 2.23 2.07
EV:sales high 3.76 3.06 3.13 4.29 4.17 4.76
EV:sales low 2.63 1.56 1.45 2.81 3.21 3.18
Operating margin 11.6% 12.1% 12.7% 14.0% 13.9% 11.4% 13.9% 14.5% 15.2%
EV:EBITDA average 22.5 17.3 16.2 22.4 25.2 26.0 15.4 13.9 12.4
EV:EBITDA high 28.2 22.6 22.3 28.0 27.5 31.8
EV:EBITDA low 19.8 11.5 10.3 18.4 21.2 21.2
EV:EBIT average 25.8 19.3 18.0 24.5 27.5 28.6 17.3 15.4 13.6
EV:EBIT high 32.4 25.2 24.7 30.7 30.0 35.0
EV:EBIT low 22.7 12.8 11.4 20.1 23.1 23.3
FCF yield average 1.9% 3.4% 5.9% 3.6% 2.5% 3.4% 4.9% 4.9% 5.4%
FCF yield high 1.5% 2.6% 4.3% 2.9% 2.3% 2.8%
FCF yield low 2.1% 5.1% 9.1% 4.4% 2.9% 4.1%
Dividend yield average 2.7% 3.1% 5.9% 2.6% 7.2% 3.6% 7.0% 3.3% 3.7%
Dividend yield high 2.1% 2.4% 4.3% 2.1% 6.6% 2.9%
Dividend yield low 3.1% 4.6% 9.1% 3.2% 8.5% 4.4%
EV/IC average 12.19 9.51 10.92 16.64 14.26 18.37 13.15 12.53 11.78
EV/IC high 15.33 12.39 15.00 20.82 15.59 22.50
EV/IC low 10.74 6.31 6.94 13.65 12.00 14.99
P/BV average 15.98 10.37 8.36 11.07 10.14 13.16 11.95 10.06 8.55
P/BV high 20.17 13.52 11.37 13.75 11.06 16.04
P/BV low 14.04 6.86 5.42 9.15 8.59 10.80
ROIC 38.0% 36.5% 45.8% 50.9% 40.0% 50.1% 58.3% 61.4% 64.8%
ROE 50.8% 40.0% 33.8% 32.7% 27.5% 34.9% 52.4% 48.1% 45.3%
ROCE 45.1% 42.3% 54.2% 61.3% 46.2% 58.2% 71.9% 75.1% 78.4%
Grow th (years 4 to 10) 7.0%
EBIT margin (years 4+) 16.0%
NOPAT margin 12.0%
Invested capital 1,257
Invested capital grow th (years 4+) 2.0%
Terminal grow th rate 2.0%
10-year average FCF yield 11.5%
WACC 9.0%
EBITA NOPAT
margin margin 6.0% 6.5% 7.0% 7.5% 8.0%
12.0% 9.0% 25 25 26 26 27
12.5% 9.4% 26 26 27 27 28
13.0% 9.8% 26 27 28 28 29
13.5% 10.1% 27 28 29 29 30
16.0% 12.0% 31 32 33 34 35
16.5% 12.4% 32 33 34 35 36
17.0% 12.8% 33 34 35 36 36
17.5% 13.1% 34 35 36 37 37
18.0% 13.5% 35 36 37 37 38
18.5% 13.9% 36 37 37 38 39
Source: Company data, Credit Suisse estimates

112
Kone – Financials
ANALYSIS 2010 2011 2012 2013E 2014E 2015E
NOPAT 523 559 665 733 801 887
Invested capital 1,027 1,397 1,329 1,257 1,304 1,369
ROIC 50.9% 40.0% 50.1% 58.3% 61.4% 64.8%
ROIC (average) 51.9% 46.1% 48.8% 56.7% 62.5% 66.3%
Operating Net Income 536 581 681 757 827 920
Equity 1,601 2,034 1,905 1,401 1,664 1,958
ROE 33.5% 28.6% 35.8% 54.0% 49.7% 47.0%
ROE (average) 36.5% 32.0% 34.6% 45.8% 54.0% 50.8%
EBITDA 762 791 940 1,074 1,177 1,296
Total debt 69 97 112 112 112 112
Net debt (748) (824) (761) (381) (598) (827)
Total debt / EBITDA 0.1 0.1 0.1 0.1 0.1 0.1
Net debt / EBITDA (1.0) (1.0) (0.8) (0.4) (0.5) (0.6)
PROFIT & LOSS 2010 2011 2012 2013E 2014E 2015E
Revenue 4,987 5,225 6,277 6,897 7,317 7,778
Change yoy, % 5.1% 4.8% 20.1% 9.9% 6.1% 6.3%
Direct Material Supplies & external services (1,797) (1,918) (2,477) (2,793) (2,927) (3,111)
Wages & Other salaries (1,152) (1,571) (1,747) (1,834) (1,926) (1,983)
Depreciation & amortisation (66) (66) (86) (115) (116) (114)
Other - - (37) 9 (1) (28)
Total Cost (4,290) (4,500) (5,493) (5,958) (6,261) (6,601)
Reported EBIT 697 725 784 939 1,056 1,177
Reported EBIT margin, % 14.0% 13.9% 12.5% 13.6% 14.4% 15.1%
Exceptionals / one-offs - - (37) - - -
Operating profit 697 725 854 959 1,061 1,182
Operating profit margin, % 14.0% 13.9% 13.6% 13.9% 14.5% 15.2%
Depreciation & Amortisation (66) (66) (86) (115) (116) (114)
EBITDA 762 791 940 1,074 1,177 1,296
EBITDA margin, % 15.3% 15.1% 15.0% 15.6% 16.1% 16.7%
Shares in Earnings of Associates 12 10 4 2 2 2
Net interest income / (expense) 6 18 16 28 32 42
Rate, % 7.3% 7.0% 21.0% 6.0% 7.0% 7.0%
Profit Before Tax 715 816 804 969 1,090 1,222
Underlying PBT 715 753 875 989 1,095 1,227
Tax (179) (172) (193) (232) (268) (307)
Effective rate, % 25.0% 22.9% 22.1% 23.5% 24.5% 25.0%
Minority interest 1 1 10 11 12 14
Operating Net Income 536 581 681 757 827 920
Net income margin, % 10.8% 11.1% 10.9% 11.0% 11.3% 11.8%
CS operating EPS 1.0 1.1 1.3 1.5 1.6 1.8
EPS growth, % 6.2% 8.3% 16.9% 11.0% 9.3% 11.3%
DPS, EUR 0.9 2.9 1.8 2.3 1.1 1.2
DPS growth, % -30.7% 222.2% -39.7% 30.3% -53.0% 11.3%
Dividend Cover (X) 1.2 0.4 0.8 1.5 1.5 1.5
Ordinary shares in issue 513 513 514 514 514 514
BALANCE SHEET 2010 2011 2012 2013E 2014E 2015E
PPE and Intangibles 1,065 1,397 1,546 1,580 1,624 1,660
Other f ixed assets 359 353 359 359 359 359
Fixed assets 1,423 1,750 1,905 1,939 1,983 2,019
Inventories (Net of advances from customers) (137) (167) (261) (470) (442) (408)
Trade and other receivables 1,141 1,262 1,350 1,625 1,704 1,811
Trade and other payables 1,302 1,359 1,529 1,701 1,804 1,918
Other Current Liabilities 99 89 136 136 136 136
Working capital (397) (353) (576) (682) (679) (650)
Working capital days nm nm nm nm nm nm
WC as % of sales nm nm nm nm nm nm
Cash 817 920 873 493 710 939
Short-term debt 41 76 91 78 78 78
Long-term debt 29 21 21 34 34 34
Net debt / (cash) (748) (824) (761) (381) (598) (827)
Pension deficit 113 105 97 150 150 150
Other liabilities 61 82 88 88 88 88
Net assets 1,601 2,034 1,905 1,401 1,664 1,958
CASH FLOW 2010 2011 2012 2013E 2014E 2015E
Operating Net Income 697 725 854 959 1,061 1,182
Depreciation & amortisation 66 66 86 115 116 114
Gross cash flow 762 791 940 1,074 1,177 1,296
Change in receivables (11) (29) (26) - - -
Change in Payables 28 (1) 425 - - -
Change in Inventory 79 (15) (170) - - -
Working capital change 95 (44) 230 106 (3) (28)
Operating cash flow 683 530 997 978 940 1,006
Operating cash / Operating profit 1.0 0.7 1.2 1.0 0.9 0.9
Exceptionals - 73 (37) (20) (5) (5)
Net capex (46) (92) (113) (130) (110) (100)
% of Sales 0.9% 1.8% 1.8% 1.9% 1.5% 1.3%
Free Cash Flow 637 511 846 828 825 901
FCF / Net income 1.2 0.9 1.2 1.1 1.0 1.0
Acquisitions (114) (144) (128) (20) (50) (50)
Disposals - 5 7 - - -
Loans raised / paid back (237) (80) 58 - - -
Shares issue / purchase 6 (24) (7) - - -
Dividends Paid (333) (230) (741) (1,188) (559) (622)
Other 17 5 13 - - -
Net Cash Flow (24) 43 48 (380) 217 229
Source: Company data, Credit Suisse estimates

113
Kone – Company Summary
Employee Mix E&E in Operation End Market Mix
Management
Chairman Antti Herlin
CEO Matti Alahuhta
CFO Henrik Ehrnrooth
IR Karla Lindahl
Division Products End Markets / Channels Main Competitors Revenue Split by Geo Key Drivers/ Themes
Elevators & Escalators
FY 2012 Sales EUR 6.28 Bn
9.6% YoY organic growth
FY 2012 EBIT EUR 0.85 Bn
13.6% Margin
Passenger Elevators, Goods Elevators,
Escalators, Autowalks
Residential Construction 60%, Commercial
Construction 20% and Government Construction
20%
OTIS, Thyssen, Schindler EMEA 49%, Asia Pacific 35%, Americas 16%
Urbanisation; Wealth creation in EM;
Development in energy efficiency; Demographic
change
KONE CORPORATION (KNEBV.HE) - ANDRE KUKHNIN, CFA +44 20 7883 0350/ [email protected]
Geographic MixShareholding Structure (Source)
Free Float:91%
Top 5 shareholders
Herlin Antti 9.2%%, Capital Group 7.5%,
Holdings Manutas Oy 6.4%, Toshiba Elev &
Building Systems 5.4%, D Sijoitus Oy 3.9%
Ownership by country
Germany 22%, US 21%, UK 11%, Qatar 8%,
Luxembourg 6% and others
EMEA48%
Asia Pacific 38%
Americas 14%
EMEA49%
North America
10%
Japan &Korea10%
China21%
South America
4%
Rest of APAC
6%
EMEA49%
Asia Pacific35%
Americas16%
Residential Construction
60%
Commercial Construction
20%
Government Construction
20%
Source: Company data

114
Laird – Underperform, TP 215p
Bear Case
Unjustified optimism: Laird trades at a premium to its peer group weighted
SOTP.
Poor EVA® track record: 2007A-20012A Laird ROIC has not covered its
Cost of Capital. With NOPAT margins seeing no material improvement we
see this trend continuing in 2014.
Below average capital turns: Significant balance sheet goodwill contributes
to low capital turns and highlights the need for acquisitions to drive growth
(organic growth was a disappointing 0% in 2012A, CS forecast -2% for
FY13E).
Unfavoured traits: Lack of pricing power, short product lifecycles, limited
aftermarket, no material order book, poor visibility, competition.
Bull Case Increased demand for connectivity and complexities of consumer
electronics will drive long term demand for EMI shielding and Thermal
Interface.
Under new management (CEO / Chairman) Laird re-positions itself
accompanied by potential for positive earning surprise 2014-15.
Investment summary: With Laird trading at a premium to its peer group weighted SOTP combined with
unfavourable business traits and ROIC consistently < WACC we rate the stock at Underperform.
0
100
200
300
400
500
600
0
5
10
15
20
25
30
35
40
2004 2005 2006 2007 2008 2009 2010 2011 2012 2013
1 Yr Forward EPS (LHS) Share Price (RHS)
-40%
-30%
-20%
-10%
0%
10%
20%
30%
40%
0%
4%
8%
12%
16%
Margins % (LHS) Organic Growth (RHS)
0%
10%
20%
30%
40%
50%
60%
70%
80%
90%
2%
4%
6%
8%
10%
12%
14%
16%
18%
LRD ROIC (LHS) Sector ROIC (LHS)
LRD Cash conversion (RHS) Sector Cash conversion (RHS)
Source: Thomson Reuters, Company data, Credit Suisse estimates

115
Laird – Valuation
2007 2008 2009 2010 2011 2012 2013e 2014e 2015e
Share price - year high 635.0 580.0 195.2 173.4 207.0 243.9 258.8 258.8 258.8
Share price - year low 417.5 65.3 47.7 98.8 127.9 148.1 258.8 258.8 258.8
Share price - year average 544.9 363.0 127.1 132.2 153.9 201.7 258.8 258.8 258.8
Enterprise value - high 1291.0 1221.6 396.2 570.4 674.4 762.6 797.2 782.5 767.4
Enterprise value - low 879.5 264.7 134.7 372.0 464.0 508.4 797.2 782.5 767.4
Enterprise value - average 1120.6 818.2 275.3 460.7 533.3 650.5 797.2 782.5 767.4
EBITA 80.0 68.5 33.6 46.4 59.4 68.1 63.2 68.2 73.5
EV/EBITA - High 16.1 17.8 11.8 12.3 11.4 11.2 12.6 11.5 10.4
EV/EBITA - Low 11.0 3.9 4.0 8.0 7.8 7.5 12.6 11.5 10.4
EV/EBITA - Average 14.0 11.9 8.2 9.9 9.0 9.6 12.6 11.5 10.4
EBITDA 90.3 80.9 50.3 64.9 76.0 81.9 79.2 84.2 89.5
EV/EBITDA - high 14.3 15.1 7.9 8.8 8.9 9.3 10.1 9.3 8.6
EV/EBITDA - low 9.7 3.3 2.7 5.7 6.1 6.2 10.1 9.3 8.6
EV/EBITDA - average 12.4 10.1 5.5 7.1 7.0 7.9 10.1 9.3 8.6
Sales 564.3 635.3 528.8 567.4 586.0 520.2 541.0 554.0 577.0
EV/Sales - high 2.3 1.9 0.7 1.0 1.2 1.5 1.5 1.4 1.3
EV/Sales - low 1.6 0.4 0.3 0.7 0.8 1.0 1.5 1.4 1.3
EV/Sales - average 2.0 1.3 0.5 0.8 0.9 1.3 1.5 1.4 1.3
CS EPS Adjusted (p) 32.8 27.3 9.6 11.7 16.3 18.9 16.9 18.7 20.5
PER - high 19.3 21.3 20.4 14.8 12.7 12.9 15.4 13.8 12.6
PER - low 12.7 2.4 5.0 8.4 7.8 7.8 15.4 13.8 12.6
PER - average 16.6 13.3 13.3 11.3 9.4 10.7 15.4 13.8 12.6
NAV 241.3 330.3 217.9 216.1 165.9 166.0 164.5 165.1 165.9
PBV - high 2.6 1.8 0.9 0.8 1.2 1.5 1.6 1.6 1.6
PBV - low 1.7 0.2 0.2 0.5 0.8 0.9 1.6 1.6 1.6
PBV - average 2.3 1.1 0.6 0.6 0.9 1.2 1.6 1.6 1.6
Dividend Yield 61.5 11.9 6.0 6.3 8.0 10.0 12.0 13.2 14.5
Dividend Yield - high 10% 2% 3% 4% 4% 4% 5% 5% 6%
Dividend Yield - low 15% 18% 13% 6% 6% 7% 5% 5% 6%
Dividend Yield - average 11% 3% 5% 5% 5% 5% 5% 5% 6%
FCF before distributions -2 11 31 29 33 57 37 47 51
FCF/Sales -0.4% 1.7% 5.9% 5.1% 5.6% 11.0% 6.8% 8.5% 8.9%
FCF per share -1.23 6.06 14.80 10.71 12.22 21.23 13.61 17.60 19.12
FCF/EBITDA -3% 13% 62% 44% 43% 70% 46% 56% 57%
Valuation Multiples Cumulative Cash Conversion Bridge
CFROI expectations: Market (dot) vs. Consensus (bar)
100%
69%
-65% - 7%
- 13%
- 6%
26%
34%
-30%
-10%
10%
30%
50%
70%
90%
Cle
an n
et in
com
e
Rep
orte
d ne
t inc
ome
Wor
king
cap
ital
Del
ta b
/w C
apex
& D
eper
ecia
tion
Del
ta b
/w R
&D
Cap
italis
ed &
Inta
ngib
les
Am
ort.
PP
A
Oth
er (D
efer
red
tax,
Pen
sion
,M
inor
ity e
tc)
Free
Cas
h Fl
ow
Source: Company data, Credit Suisse estimates, Credit Suisse HOLT

116
Laird – Financials PROFIT & LOSS 2006 2007 2008 2009 2010 2011 2012 2013e 2014e 2015e
FY FY FY FY FY FY FY FY FY FY
Revenue 370.6 564.3 635.3 528.8 549.7 586.0 520.2 541.0 554.0 577.0
Change yoy, % 52.3% 12.6% -16.8% 4.0% 6.6% -11.2% 4.0% 2.4% 4.2%
EBITDA 63.3 90.3 80.9 50.3 64.9 76.0 81.9 79.2 84.2 89.5
Margin, % 17.1% 16.0% 12.7% 9.5% 11.8% 13.0% 15.7% 14.6% 15.2% 15.5%
EBITA 55.4 80.0 68.5 33.6 46.4 59.4 68.1 63.2 68.2 73.5
Margin, % 14.9% 14.2% 10.8% 6.4% 8.4% 10.1% 13.1% 11.7% 12.3% 12.7%
CS PBT 45.5 72.4 60.6 26.5 40.2 52.7 60.7 55.2 61.2 67.0
Income Tax (6.3) (10.8) (12.0) (6.2) (8.8) (9.0) (10.0) (9.9) (11.0) (12.1)
Exceptional - Tax (2.5) (1.0) (0.2) 0.0 1.4 (8.3) (1.5) (1.7) 0.0 0.0
CS EPS (Diluted) 20.6 32.8 27.3 9.6 11.7 16.3 18.9 16.9 18.7 20.5
Reported EPS (Diluted) 26.6 68.0 8.0 -1.7 -6.0 -44.5 17.3 10.6 13.1 14.9
DPS, p 10.3 61.5 11.9 6.0 6.3 8.0 10.0 12.0 13.2 14.5
DPS growth yoy, % 5% 27% 25% 20% 10% 10%
CASH FLOW 2006 2007 2008 2009 2010 2011 2012 2013e 2014e 2015e
EBITDA 63.3 90.3 80.9 50.3 64.9 76.0 81.9 79.2 84.2 89.5
Working Capital Change (11.8) (32.3) 5.4 12.6 2.3 1.5 3.8 (8.3) (3.8) (3.9)
Operating Cash Flow 80.8 42.4 66.4 65.3 61.5 61.2 93.4 70.9 80.4 85.6
Net Financing Cost (9.7) (9.6) (9.7) (7.7) (6.6) (7.0) (7.0) (8.0) (7.0) (6.5)
Tax Paid (3.4) (7.7) (17.2) (9.8) (8.5) (9.5) (17.9) (12.8) (12.1) (13.3)
Net Operating Cash Flow 67.7 25.1 39.5 47.8 46.4 44.7 68.5 50.1 61.2 65.8
Net Capex (19.5) (27.4) (28.7) (16.4) (17.7) (12.0) (11.5) (13.5) (14.0) (14.5)
Free Cash Flow 48.2 (2.3) 10.8 31.4 28.7 32.7 57.0 36.6 47.2 51.3
Acquisitions (102.0) (81.4) (17.7) (1.8) (55.5) (19.0) (31.9) 0.0 0.0 0.0
Disposals (8.5) 219.9 11.5 (2.6) (0.7) (0.3) 15.5 3.0 0.0 0.0
Pre Financing Cash Flow (62.3) 136.2 4.6 15.9 (37.0) (1.2) 37.8 33.8 47.2 51.3
Dividend Paid (19.4) (120.0) (21.1) (14.0) (19.4) (18.4) (23.2) (28.4) (32.5) (36.2)
Net Cash / (Debt) Year End (109.1) (85.4) (139.5) (45.4) (103.6) (117.7) (106.8) (101.4) (86.6) (71.5)
BALANCE SHEET 2006 2007 2008 2009 2010 2011 2012 2013e 2014e 2015e
FY FY FY FY FY FY FY FY FY FY
PPE 87 76 124 109 110 84 71 69 68 67
Goodwill 354 362 500 445 481 414 437 437 437 437
Intangible Assets 76 89 110 97 116 101 77 62 47 32
Working capital 108 99 117 80 97 103 82 90 94 98
Total assets 529 538 729 630 684 564 556 547 534 521
Shareholders' funds 409 449 585 580 575 440 441 437 438 441
Minorities 0 0 0 0 0 0 0 0 0 0
Total Borrowings 153 118 186 99 158 194 176 170 155 140
Cash and equivalents (44) (33) (47) (54) (55) (76) (69) (69) (69) (69)
Net Debt / (Cash) 109 85 140 45 104 118 107 101 87 71
Pension Deficit 11 4 4 5 6 6 9 9 9 9
Total liabilities 529 538 729 630 684 564 556 547 534 521
Source: Company data, Credit Suisse estimates

117
Laird – Company Summary
Geographic Split Operating Profit Mix Sales Mix End Market Split
Division Products End Markets / Channels Main Competitors / Positioning Revenue Split by Geo Key Drivers / Themes
Performance materials
FY2012 Sales - £325m,
1.8% org. growth
FY2012 EBITA - £49m,
15.1% margin
EMI: board level shields, fabric over foam,
fingerstock, conductive elastomers.
Thermal: thermal interface materials,
thermoelectric assemblies, Signal integrity:
ferrite cable cores, chip inductors, Critical
for effcient performance of electronic
devices, Materials, components,
subsystems and systems, Specified with
OEMs. Short life cycles.
IT/Datacom, Handset,
Industrial/Medical/Military, Consumer,
Transportation
Includes contract manufacturers particularly
the Chinese as well as larger players
including Flextronics.
Electronic miniaturisation, complexity and
increasing heat and electro magntic
emmission.
Wireless systems
FY2012 Sales - £196m,
(3.2)% org. growth
FY2012 EBITA - £26m,
13.2% margin
Telematics/M2M: antennae systems and
M2M modules and solutions. Wireless
Automation and Control Solutions: remote
control systems Infrastructure. Antennae:
wireless (WLAN), RFID, Components or
comprehensive solutions. Solutions sold
direct to OEM, end users or distribution.
Long life cycles. Enable connectivity for
wired, wireless and remote control systems.
Developed within businesses, with service
and aftermarket support
IT/Datacom, Industrial, Consumer,
Transportation/Automative
Includes contract manufacturers particularly
the Chinese as well as larger players
including Flextronics. Also Eaton now it has
acquired Cooper Industries. Laird is a
volume manufacturer which historically has
been a price taker.
US automotive build rates. Increasing
penetration of telematics /digital radio
within automotive. Automation of
industrial process.
LAIRD (LRD.L / LRD LN) - JONATHAN HURN, CFA +44 20 7883 4532 / [email protected]
UK - £211m (36%)
USA - £94m (16%)
Europe - £264m (45%)
Far east & Asia - £12m (2%)
Other - £6m (1%)
Performance
Materials64%
Wireless Systems
36%Performance
Materials68%
Wireless Systems
32%
Transportation /
Auto19%
IT / Datacom
25%
Other
6%
Ind/Med/Military
16%
Handset
9%
Consumer
6%
Transportation
19%
North America,
36%
Europe, 15%
Asia, 47%
RoW, 2%
Shareholding structure
Free float: 94%
Top 5 shareholders: Franklin
Resources - 20%, Artemis Investment
Management Lt - 13%, Shroders PLC -
8%,
Mondrian Investment Partners Ltd - 7%,
Norges - 6%
Ownership by Country: UK - 61%,
USA - 24%, Ireland - 6%, Norway - 5%,
Luxembourg - 1%
Management
Chairman -Nigel Keen
CEO - David Lockwood
CFO - Jonathan Silver
CS - AM Downie
Source: Company data

118
Legrand – Underperform, TP €38
0
5
10
15
20
25
30
35
40
45
0.00
0.50
1.00
1.50
2.00
2.50
2006 2007 2008 2009 2010 2011 2012 2013
1 Yr Forward EPS (LHS) Share Price (RHS)
-20%
-15%
-10%
-5%
0%
5%
10%
15%
10%
12%
14%
16%
18%
20%
22%
Margins % (LHS) Organic Growth (RHS)
Investment summary: High-quality company with the strongest cash conversion in the sector yet valuation levels
are stretched at times when organic sales growth is unlikely going to improve significantly in FY14 and inorganic
initiatives so far rather sluggish.
Bear Case Limited top-line improvement potential with only c.1% GDP growth
expectations for FY14 in Europe and bearish market outlook for France not only
anticipated by Legrand butalso by peer Schneider and customer Rexel.
Clear bear case would be if France follows market pattern of Italy in FY14
Stretched valuation levels (17% sector premium) particularly given sluggish
top-line growth outlook and therefore limited margin expansion potential
Large scale M&A at unreasonable multiple causing significant returns dilution
Bull Case Improving construction markets particularly in France, Italy and the US
boosting organic sales growth
Stronger volume provides solid operational gearing potential (c.30%) hence
faster earnings growth
Continuous strong pricing power particularly in weaker end markets at least
offsetting translational FX impact from weaker emerging markets currencies
Valuation multiples will unlikely de-rate at times of improving top line and
profitability hence stock will at least keep current valuation
Reasonable M&A activity which doesn’t disrupt the existing business at
attractive valuation levels allowing market share gains 0%
20%
40%
60%
80%
100%
120%
140%
10%
12%
14%
16%
18%
20%
LEGD ROIC (LHS) Sector ROIC (LHS)
LEGD Cash conversion (RHS) Sector Cash conversion (RHS)
Source: Thomson Reuters, Company data, Credit Suisse estimates

119
Legrand – Valuation
2007 2008 2009 2010 2011 2012 2013E 2014E 2015E 2016E
Price
Year End 23.35 13.66 21.00 30.48 23.64 31.88 39.70 39.70 39.70 39.70
Average 24.68 17.11 16.16 25.07 27.66 27.55 39.70 39.70 39.70 39.70
High 27.59 23.35 20.66 31.98 31.40 32.03 39.70 39.70 39.70 39.70
Low 21.67 10.91 11.72 19.48 22.72 23.63 39.70 39.70 39.70 39.70
EV/EBITA
Year end 11.2 7.9 11.6 12.1 8.9 11.0 13.1 12.5 11.9 11.2
Average 11.7 9.2 10.1 10.3 10.2 9.7 13.1 12.5 11.9 11.2
High 12.7 11.7 12.2 12.6 11.3 11.1 13.1 12.5 11.9 11.2
Low 10.6 6.9 8.1 8.4 8.7 8.6 13.1 12.5 11.9 11.2
EV/ Sales
Year end 2.03 1.37 1.88 2.44 1.80 2.16 2.60 2.50 2.38 2.25
Average 2.11 1.60 1.64 2.07 2.05 1.91 2.60 2.50 2.38 2.25
High 2.30 2.01 1.97 2.54 2.28 2.17 2.60 2.50 2.38 2.25
Low 1.92 1.20 1.31 1.70 1.74 1.68 2.60 2.50 2.38 2.25
PE (CSFB)
Year end 12.8 8.6 15.9 18.0 11.9 15.8 19.2 19.1 18.5 17.9
Average 13.6 10.8 12.2 14.8 13.9 13.6 19.2 19.1 18.5 17.9
High 15.2 14.8 15.6 18.9 15.8 15.9 19.2 19.1 18.5 17.9
Low 11.9 6.9 8.8 11.5 11.4 11.7 19.2 19.1 18.5 17.9
FCF Yield
Year end 9.4% 11.8% 12.4% 8.4% 9.2% 8.3% 5.5% 6.0% 6.3% 6.7%
Average 9.0% 10.1% 14.2% 9.9% 8.1% 9.5% 5.5% 6.0% 6.3% 6.7%
HIgh 8.3% 8.0% 11.8% 8.1% 7.3% 8.3% 5.5% 6.0% 6.3% 6.7%
Low 10.0% 13.5% 17.7% 12.1% 9.5% 10.8% 5.5% 6.0% 6.3% 6.7%
Dividend Yield
Year end 3% 5% 3% 2.9% 3.9% 3.1% 2.5% 2.6% 2.7% 2.8%
Average 3% 4% 4% 3.5% 3.4% 3.6% 2.5% 2.6% 2.7% 2.8%
High 3% 3% 3% 2.8% 3.0% 3.1% 2.5% 2.6% 2.7% 2.8%
Low 3% 6% 6% 4.5% 4.1% 4.2% 2.5% 2.6% 2.7% 2.8%
ROCE 11.5% 10.9% 9.3% 12.1% 12.5% 13.4% 14.7% 13.2% 13.7% 14.3%
ROIC 14.1% 13.1% 11.3% 14.3% 14.4% 15.3% 14.7% 13.2% 13.7% 14.3%
ROE 22.8% 18.6% 14.5% 16.3% 17.8% 16.7% 15.8% 14.9% 14.4% 14.0%
Target multiple 12.0
EBIT 905
EPS
Net debt 686
Liabilities 180
Other liabilities 180
Equity valuation 9,991
NOSH 263
Implied TP (€) 38
Target Price (€)
2014 EV/EBIT
Multiple Valuation
Source: Company data, Credit Suisse estimates

120
Legrand – Financials Annual Income Statement 2010A 2011A 2012A 2013E 2014E 2015E 2016E
Revenue 3,891 4,250 4,467 4,464 4,531 4,639 4,765
Grow th Rate, % 9% 9% 5% (0)% 2% 2% 3%
Cost of Sales (ex restructuring) (1,798) (2,028) (2,158) (2,156) (2,189) (2,240) (2,302)
Cogs as a % of sales (46.2)% (47.7)% (48.3)% (48.3)% (48.3)% (48.3)% (48.3)%
Gross Profit 2,093 2,222 2,309 2,308 2,343 2,398 2,464
Gross profit margins 53.8% 52.3% 51.7% 51.7% 51.7% 51.7% 51.7%
SG&A (1,032) (1,137) (1,197) (1,183) (1,196) (1,220) (1,249)
SG&A as a % of sales (26.5)% (26.8)% (26.8)% (26.5)% (26.4)% (26.3)% (26.2)%
R&D (186) (202) (197) (198) (202) (207) (214)
R&D as a % of sales (4.8)% (4.7)% (4.4)% (4.4)% (4.5)% (4.5)% (4.5)%
Other Exp (117) (71) (67) (70) (70) (70) (70)
Of which Restructuring Charges (32) (19) (26) (26) (26) (26) (26)
Operating Profit 758 812 848 857 875 901 931
Margin, % 19.5% 19.1% 19.0% 19.2% 19.3% 19.4% 19.5%
Purchase Accounting /Acquisition cost 27 44 26 30 30 30 30
Adjusted EBIT incl restructuring 784 857 874 887 905 931 961
Margin, % 20.2% 20.2% 19.6% 19.9% 20.0% 20.1% 20.2%
EBITDA 951 1,011 1,017 1,025 1,043 1,069 1,100
Financial Costs (111) (72) (93) (85) (85) (85) (85)
Associates 0.0 0.0 0.0 0.0 0.0 0.0 0.0
Pre Tax Profit 647 741 755 772 790 816 846
Income Tax (227) (261) (248) (257) (271) (279) (289)
Effective Rate 35% 35% 33% 33% 34% 34% 34%
Minorities (1) (1) (1) (1) (1) (1) (1)
Profit for the year 418 479 506 514 518 535 556
Adjusted Profit for the year 445 523 532 544 548 565 586
Basic Earnings per share 1.59 1.82 1.92 1.95 1.97 2.03 2.11
Diluted Earnings per share 1.54 1.76 1.90 1.93 1.95 2.01 2.09
Adjusted Earnings per share 1.70 1.99 2.02 2.06 2.08 2.15 2.22
DPS 0.88 0.93 1.00 1.01 1.05 1.09 1.12
Weighted Average Share count (m) 262 263 263 263 263 263 263
Diluted Weighted Average share count 272 272 266 266 266 266 266
Interest cover using EBIT 10.6 9.9 10.4 10.1 10.3 10.6 11.0
Legrand Cash Flow (in € mn) 2010A 2011A 2012A 2013E 2014E 2015E 2016E
Profit for the year 419 479 507 515 519 537 557
Depreciation 120 111 105 105 105 105 105
Amortisation 73 88 63 63 63 63 63
Changes in non current deferred tax 2 7 11 0 0 0 0
Change in other non current assets/liabilities 35 38 32 0 0 0 0
FX (gains) losses 23 (7) 9 0 0 0 0
(gains) losses on disposal of assets/securities (2) (2) (3) 0 0 0 0
Change in Inventories (88) (33) 16 (30) (10) (10) (10)
Change in Trade receivables 47 (21) 65 (50) (30) (20) (20)
Change in Trade payables 57 (8) (1) 40 30 20 20
Change in Other current assets and liabilities 59 (6) (66) 0 0 0 0
Net cash from operating activities 749 646 739 644 678 695 716
Sale of Fixed Assets 9 14 8 0 0 0 0
Capital Expenditure (83) (107) (93) (93) (93) (93) (93)
Development costs capitalised (30) (30) (28) (28) (28) (28) (28)
Acquisitions (257) (342) (196) (140) 0 0 0
Net cash flow from investing activities (393) (465) (308) (261) (121) (121) (121)
Issuance of Share capital (Buyback) 4 3 15 1 1 1 1
Dividends to shareholders (184) (231) (245) (266) (277) (287) (295)
(Reduction) increase in Long-term debt 135 330 (104) 43 0 0 0
(Reduction) increase in Short-term debt (264) (26) (83) 0 0 0 0
Net cash flow from financing activities (310) 76 (418) (223) (276) (287) (295)
Effect of FX 12 (1) (7) 0 0 0 0
Increase/(decrease) in cash 59 256 6 159 280 287 300
Source: Company data, Credit Suisse estimates

121
Legrand – Company Summary
Operating Profit Split Sales Mix End Market Mix
Management
Chairman and CEO Giles Schnepp
CFO Antonie Burel
Investor Relations Francois Poisson
Investor Relations Nicolas Pasques
Division Products End Markets / Channels Main Competitors Revenue Split by Geo Key Drivers/ Themes
Building Infrastructures
FY 2012 Sales EUR 4.47 Bn
3.7% YoY organic growth
FY 2012 EBIT EUR 0.85 Bn
19% Margin
Products for control and command, cable
management, energy distribution and data
distribution, solutions that manage lighting,
heating, power, networks and building
Commercial Construction 45%, Residential
Construction 42% and General Industry
Production 13%
80% sales through distributors, 20% through
retailers
Hubbell, Schneider, ABB
France 24%, USA & Canada 17%, Italy 13%,
Rest of Europe 18% and Rest of the World
28%
60% refurbishment & 40% new build; global
construction; new product development
LEGRAND (LEGD.PA) - SIMON TOENNESSEN +44 20 7883 6893/ [email protected] Mix Shareholding Structure
Free Float: 85%
Top 5 shareholders
SunLife Financials 10.87%, BlackRock
9.35%, Morgan Stanley 6.51%, Legron BV
5.46%, Capital Group Companies 4.96%
Ownership by country
USA 56%, France 12%, Luxembourg 9%,
Netherlands 9%, UK 5%, Norway 4% and
Others
France30%
Italy21%
Other Europe
17%
USA14%
Rest of World
22%
France24%
Italy13%
Other Europe
18%
USA17%
Rest ofWorld
28%
France24%
Italy13%
Rest ofEurope
18%
United States and Canada
17%
Rest of the
w orld28%
Commercial Construction
45%
Residential Construction
42%
Rest ofEurope
18%
Source: Company data

122
Melrose – Neutral, TP 275p
Bull Case Impressive management track record of generating value from under
performing industrial assets.
Signs that SMART is starting to gain momentum at Elster Electricity.
High quality assets like Energy and Bridon are still to be sold with proceeds
to be returned to shareholders.
Both Elster and Energy likely to see +ve competitive tension at time of
disposal.
Bear Case
CS M&A disposal SOTP for Melrose (peak multiples) is 300p offering little
difference to current price.
Outside of Elster Book-to-Bill for the group has been < 1x. No signs that
this will immediately reverse.
Low hanging efficiency gains at Elster now complete. Upside to consensus
margins for Elster of 18% in 2015E harder to achieve.
Next acquisition is likely to be larger than Elster (£1.6bn) in our view,
potentially up to £3bn in EV, and will require a rights issue.
Acquisition risk – overpaying for in demand industrial assets at the stated
£3bn target EV.
Investment summary: A strong track record of value creation and turning around underperforming assets.
However, with the shares now re-rated vs. the sector we see this fully discounted in the current share price.
0
50
100
150
200
250
300
350
0
5
10
15
20
25
2005 2006 2007 2008 2009 2010 2011 2012
1 Yr Forward EPS (LHS) Share Price (RHS)
-20%
0%
20%
40%
60%
80%
100%
5%
8%
10%
13%
15%
18%
20%
Margins % (LHS) Sales Growth (RHS)
0%
10%
20%
30%
40%
50%
60%
70%
80%
90%
0%
2%
4%
6%
8%
10%
12%
14%
16%
18%
MRO ROIC (LHS) Sector ROIC (LHS)
MRO Cash conversion (RHS) Sector Cash conversion (RHS)
Source: Thomson Reuters, Company data, Credit Suisse estimates

123
Melrose – Valuation
2007 2008 2009 2010 2011 2012 2013e 2014e 2015e
Share price - year high 204.7 172.0 194.9 312.0 365.4 259.6 289.0 289.0 289.0
Share price - year low 145.8 58.3 59.5 162.0 268.0 193.4 289.0 289.0 289.0
Share price - year average 183.4 135.0 122.2 236.7 317.8 228.3 289.0 289.0 289.0
Enterprise value - high 424.4 1231.4 1461.4 1960.9 2071.1 3708.0 3924.9 3939.2 3904.7
Enterprise value - low 300.3 872.4 787.7 1214.5 1627.6 3082.3 3924.9 3939.2 3904.7
Enterprise value - average 379.5 1114.8 1099.9 1586.3 1854.3 3412.2 3924.9 3939.2 3904.7
EBITA 24.5 99.7 149.3 197.3 180.8 243.1 274.8 300.7 323.9
EV/EBITA - High 17.3 12.4 9.8 9.9 11.5 15.3 14.3 13.1 12.1
EV/EBITA - Low 12.3 8.8 5.3 6.2 9.0 12.7 14.3 13.1 12.1
EV/EBITA - Average 15.5 11.2 7.4 8.0 10.3 14.0 14.3 13.1 12.1
EBITDA 34.8 120.4 182.0 229.3 203.3 271.2 319.8 345.7 368.9
EV/EBITDA - high 12.2 10.2 8.0 8.6 10.2 13.7 12.3 11.4 10.6
EV/EBITDA - low 8.6 7.2 4.3 5.3 8.0 11.4 12.3 11.4 10.6
EV/EBITDA - average 10.9 9.3 6.0 6.9 9.1 12.6 12.3 11.4 10.6
Sales 344.0 938.3 1298.5 1379.5 1153.9 1551.4 1813.0 1874.0 1967.5
EV/Sales - high 1.2 1.3 1.1 1.4 1.8 2.4 2.2 2.1 2.0
EV/Sales - low 0.9 0.9 0.6 0.9 1.4 2.0 2.2 2.1 2.0
EV/Sales - average 1.1 1.2 0.8 1.1 1.6 2.2 2.2 2.1 2.0
CS EPS Adjusted (p) 9.1 16.8 16.3 24.2 24.7 16.1 12.7 17.1 19.1
PER - high 22.4 10.2 12.0 12.9 14.8 16.1 22.8 16.9 15.2
PER - low 16.0 3.5 3.7 6.7 10.8 12.0 22.8 16.9 15.2
PER - average 20.1 8.0 7.5 9.8 12.9 14.2 22.8 16.9 15.2
NAV 127.1 255.9 153.4 177.4 142.4 184.2 209.9 190.3 189.4
PBV - high 1.6 0.7 1.3 1.8 2.6 1.4 1.4 1.5 1.5
PBV - low 1.1 0.2 0.4 0.9 1.9 1.0 1.4 1.5 1.5
PBV - average 1.4 0.5 0.8 1.3 2.2 1.2 1.4 1.5 1.5
Dividend Yield 6.75 7.00 7.70 11.00 13.00 7.60 8.21 8.86 9.57
Dividend Yield - high 3% 4% 4% 4% 4% 3% 3% 3% 3%
Dividend Yield - low 5% 12% 13% 7% 5% 4% 3% 3% 3%
Dividend Yield - average 4% 5% 6% 5% 4% 3% 3% 3% 3%
FCF before distributions -13 93 157 98 64 3 50 122 148
FCF/Sales -3.7% 9.9% 12.1% 7.1% 5.5% 0.2% 2.8% 6.5% 7.5%
FCF per share -5.81 29.50 30.85 18.74 13.16 0.29 4.03 11.62 14.01
FCF/EBITDA -36% 77% 86% 43% 31% 1% 16% 35% 40%
Valuation Multiples Cumulative Cash Conversion Bridge
CFROI expectations: Market (dot) vs. Consensus (bar)
100%
64%
40% 7% - 8% 1%23%
- 100%
0%
50%
100%
150%
200%
Cle
an n
et in
com
e
Rep
orte
d ne
t inc
ome
Wor
king
cap
ital
Del
ta b
/w C
apex
&D
eper
ecia
tion
Del
ta b
/w R
&D
Cap
italis
ed &
Inta
ngib
les
Am
ort.
PP
A
Oth
er (
Def
erre
d ta
x, P
ensi
on,
Min
ority
etc
)
Fre
e C
ash
Flo
w
Source: Company data, Credit Suisse estimates, Credit Suisse HOLT

124
Melrose – Financials PROFIT & LOSS 2005 2006 2007 2008 2009 2010 2011 2012 2013e 2014e 2015e
FY FY FY FY FY FY FY FY FY FY FY
Revenue 269.9 507.0 344.0 938.3 1,298.5 1,379.5 1,153.9 1,551.4 1,813.0 1,874.0 1,967.5
Change yoy, % 87.8% -32.1% 172.8% 38.4% 6.2% -16.4% 34.4% 16.9% 3.4% 5.0%
EBITDA 35.3 69.5 34.8 120.4 182.0 229.3 203.3 271.2 319.8 345.7 368.9
Margin, % 13.1% 13.7% 10.1% 12.8% 14.0% 16.6% 17.6% 17.5% 17.6% 18.4% 18.7%
EBITA 26.9 55.3 24.5 99.7 149.3 197.3 180.8 243.1 274.8 300.7 323.9
Margin, % 10.0% 10.9% 7.1% 10.6% 11.5% 14.3% 15.7% 15.7% 15.2% 16.0% 16.5%
CS PBT 20.9 43.9 27.0 75.4 118.6 170.8 161.2 214.3 224.8 254.7 282.9
Income Tax (4.5) 3.7 (7.2) (21.8) (36.1) (44.4) (41.4) (57.8) (62.9) (71.3) (79.2)
Exceptional - Tax (0.9) (2.9) 1.6 11.7 8.8 30.4 58.8 8.7 13.1 0.0 0.0
CS EPS (Diluted) 5.2 6.8 5.2 9.6 9.3 13.8 14.1 16.1 12.7 17.1 19.1
Reported EPS (Diluted) -1.4 8.2 4.1 -8.3 8.9 15.4 33.7 4.4 11.3 10.0 11.9
DPS, p 1.7 3.4 3.8 4.0 4.4 6.3 7.4 7.6 8.2 8.9 9.6
DPS growth yoy, % 100% 13% 4% 10% 43% 18% 3% 8% 8% 8%
CASH FLOW 2005 2006 2007 2008 2009 2010 2011 2012 2013e 2014e 2015e
EBITDA 35.3 69.5 34.8 120.4 182.0 229.3 203.3 271.2 319.8 345.7 368.9
Working Capital Change (5.5) (8.4) (2.9) 43.0 80.1 3.1 (23.3) (44.0) (23.6) (21.8) (19.2)
Additional Pension Contribution (5.2) (5.4) (26.1) (19.8) (32.0) (27.5) (24.9) (33.7) (33.7) (33.7) (33.7)
Other (8.2) (10.9) (0.5) 23.7 (38.5) (33.9) (15.0) (58.8) (60.0) 0.0 0.0
Operating Cash Flow 16.4 44.8 5.3 167.3 191.6 171.0 140.1 134.7 202.5 290.2 316.0
Net Financing Cost (3.8) (7.5) 1.4 (28.2) (9.6) (16.6) (16.0) (31.8) (42.7) (45.6) (41.6)
Tax Paid (4.8) (4.0) (4.2) (16.1) (3.4) (27.2) (22.9) (49.4) (29.9) (42.8) (47.5)
Net Operating Cash Flow 7.8 33.3 2.5 123.0 178.6 127.2 101.2 53.5 129.8 201.8 226.9
Net Capex (6.7) (7.6) (15.1) (29.9) (21.9) (29.2) (37.3) (50.7) (79.4) (79.4) (79.4)
Free Cash Flow 1.1 25.7 (12.6) 93.1 156.7 98.0 63.9 2.8 50.4 122.4 147.5
Acquisitions (199.6) 0.0 (14.5) (171.7) 0.0 (9.1) 0.0 0.0 (11.0) 0.0 0.0
Disposals 0.0 7.4 446.7 (1.5) 48.6 (0.1) 370.7 30.7 928.5 0.0 0.0
Pre Financing Cash Flow (198.1) 33.3 419.1 (84.7) 204.6 87.9 428.4 29.7 964.3 124.9 150.0
Dividend Paid 0.0 (13.5) (13.0) (37.1) (27.0) (43.8) (52.8) (65.7) (95.1) (109.6) (115.5)
Net Cash / (Debt) Year End (198.7) (162.6) 32.4 (543.1) (321.7) (287.4) (289.6) (997.7) (158.4) (743.1) (708.6)
BALANCE SHEET 2005 2006 2007 2008 2009 2010 2011 2012 2013e 2014e 2015e
PPE 90 79 61 297 252 254 215 319 354 389 424
Goodwill 348 308 184 822 779 798 569 1,837 1,837 1,837 1,837
Intangible Assets 60 48 24 458 405 384 338 1,183 1,111 1,036 961
Working capital 72 81 50 402 293 287 258 457 480 502 521
Total assets 530 473 260 1494 1254 1290 1056 3001 2953 2920 2877
Shareholders' funds 270 254 266 805 762 882 648 1,735 2,586 1,969 1,959
Minorities 1 1 1 2 2 1 0 7 7 7 7
Total Borrowings 214 196 21 709 469 483 485 1,154 315 900 865
Cash and equivalents (15) (33) (54) (166) (148) (196) (196) (157) (157) (157) (157)
Net Debt / (Cash) 199 163 (33) 543 322 287 290 998 158 743 709
Pension Deficit 61 55 25 143 169 120 118 261 202 202 202
Total liabilities 530 473 260 1494 1254 1290 1056 3001 2953 2920 2877
Source: Company data, Credit Suisse estimates

125
Melrose – Company Summary
Geographic Split Operating Profit Mix Sales Mix End Market Split
Division Products End Markets / Channels Main Competitors / Positioning Revenue Split by Geo Key Drivers / Themes
Energy
FY2012 Sales - £487m,
9.9% org. growth
FY2012 EBITA - £93m,
19.2% margin
Power generation equipment with 10 kW to
250 MW electric generators, Synchronous
motors, induction motors, submersible and
traction motors, Power management and
excitation systems, Medium voltage AC and
DC switchgear, Power and system
transformers. Aftermarket servicing
Energy, Oil&Gas, Industrials, Other
20-130MW - GE (30% share), Siemens
(15%), Nanjing (1%), BHEL (3%). Other
Turbo sizes - Shanghai Electric
Europe - £291m (63%)
North America - £106m (23%)
Asia - £46m (10%)
RoW - £18m (4%)
Build out of gas-fired generation capacity
from 2014.
Lifting
FY2012 Sales - £524m,
7.7% org. growth
FY2012 EBITA - £95m,
18.2% margin
Wire rope, fibre rope and wire Hooks,
shackles, blocks, sheaves, clamps and
links Material handling products Monorail
systems Chain hoists Industrial carts and
trailers
Energy, Oil&Gas, Mining, Industrials, Other.
Crosby distribution channel is mostly
through distributors
Bridon - KisWire, WireCo, Usha, Haggie,
Redaelli. Crosby - Gunnebo Johnson,
Columbus Mckinnon, Campbell, Ropeblock,
Yoke, China Juli
Europe - £237m (49%)
North America - £107m (22%)
Asia - £82m (17%)
RoW - £58m (12%)
Off-shore and onshore gas explorations.
Basic industries including mining.
Other industrial
FY2012 Sales - £129m,
4.1% org. growth
FY2012 EBITA - £17m,
13.2% margin
Manufacture and service of a full range of
waste recycling equipment. Industrials, Automotive, Scrap processing,
OtherGeneral levels of IP
Elster
FY2012 Sales - £411m,
org. growth not disclosed for FY12
FY2012 EBITA - £58m,
14.1% margin
Advanced metering for gas, electricity,
water. Standard and Smart meters Gas, Electricity, Water, Energy
Itron (19%), Landis+Gyr (12%), Sensus
(8%), Neptune (4%). Concentrating on the
gas markets which is the largest for Elster
market share is Elster (29%), Itron (18%),
Dresser (5%), Landis+Gyr (5%), Sensus
(3%), Esco (3%)
Europe - £578m (49%)
North America - £602m (51%)
Traditional Metrology growth short to
medium term. Smart Meter growth from
medium term
MELROSE (MRON.L / MRO LN) - JONATHAN HURN, CFA +44 20 7883 4532 / [email protected]
Energy
60%
Oil&Gas
11%
Mining
4%
Industrials
10%
Other
3%
Water
10%
Scrap Process
2%
Energy
24%
Lifting
13%
Other Industrial
1%
Elster
62%
Energy
19%
Lifting
15%
Other Industrial
2%
Elster
64%
Europe, 39%
North America,
40%
Asia, 11%
RoW, 10%
Shareholding structure
Free float: 97%
Top 5 shareholders: Blackrock - 15%,
Schroders PLC - 7%, Legal & General -
6%, Threadneedle Asset Management -
6%, Artemis Inv. Mngmnt. - 5%
Ownership by Country: UK - 59%,
USA - 22%, Switzerland - 3%, Norway -
2%, France- 2%
Management
Chairman -Christopher Miller
Vice Chairman - David Roper
CEO - Simon Peckham
CFO - Geoffrey Martin
Source: Company data

126
Metso – Outperform, TP €35 Investment summary: Attractive valuation opportunity ahead of Valmet (ex-PPP) demerger in Jan 2014 with
Group trading at >15% discount to SOTP, plus one of the strongest self-help cases in the sector.
Bull Case Substantial discount to its SOTP despite a looming Valmet spin off – valuing
New Metso on 11x EBITA (inline with Mining & Construction and Automation
peers) and Valmet on 10.5x EBITA (>10% discount to Andritz) suggests €35/
share valuation;
Over €200m targeted cost savings across New Metso and Valmet should result
in margin stabilisation in 2014 despite tough end-markets outlook;
Already discounting a 50% peak-to-trough drop in Mining new equipment and a
c-10% further decline in Valmet new equipment (across PPP);
Heavily outsourced business equipment manufacturing setup combined with a
mid-single digit recovery in aftermarket should drive margin resilience;
Potential strategic attractions of both parts to other players post spin off.
Bear Case Scope for further deterioration in mining new equipment (miners capex cuts
beyond 40-50% with no reallocation to brownfield) or longer than expected de-
stocking in aftermarket (we currently discount c15 months);
Pricing deterioration in mining equipment beyond the c2% we discount in our
estimates (we see crushing and grinding as relatively higher risk);
Pricing deterioration in aftermarket (we discount only limited pressure in wear
parts for Mining & Construction).
Risk of not delivering on cost savings or not internalising any of the savings (we
discount c30-40% retention).
0
10
20
30
40
50
60
0.00
0.50
1.00
1.50
2.00
2.50
3.00
3.50
2004 2005 2006 2007 2008 2009 2010 2011 2012 2013
1 Yr Forward EPS (LHS) Share Price (RHS)
-30%
-20%
-10%
0%
10%
20%
30%
0%
2%
4%
6%
8%
10%
12%
Margins % (LHS) Sales Growth (RHS)
0%
20%
40%
60%
80%
100%
4%
6%
8%
10%
12%
14%
16%
18%
MEO ROIC (LHS) Sector ROIC (LHS)
MEO Cash conversion (RHS) Sector Cash conversion (RHS)
Source: Thomson Reuters, Company data, Credit Suisse estimates

127
Metso – Valuation
Per share Proportion Sales EBITA
pence % 2014E 2014E Valuation EV/Sales EV/EBITA
Metso M&C 22 63% 2,821 303 3,335 1.18 11.0
Metso Automation 8 24% 815 114 1,256 1.54 11.0
Valmet 8 24% 2,518 118 1,243 0.49 10.5
Enterprise value 39 111% 6,155 536 5,833 0.95 10.9
Net debt (2) (336)
Pensions deficit (2) (245)
Other EV Components 0 21
Equity value 35 5,273
Number of shares 150
Valuation per share 35
Price 2007 2008 2009 2010 2011 2012 2013E 2014E 2015E
Average/Current 41.8 24.5 14.6 29.8 33.3 30.1 28.4 28.4 28.4
High 49.9 37.3 24.7 43.2 42.8 36.9
Low 34.9 7.8 7.2 21.2 20.1 25.1
P/E average 13.6 8.2 8.1 14.8 12.0 9.9 11.9 12.2 10.9
P/E high 16.2 12.5 13.7 21.3 15.4 12.2
P/E low 11.3 2.6 4.0 10.5 7.2 8.3
EV:sales average 1.11 0.78 0.64 0.94 0.84 0.69 0.75 0.78 0.75
EV:sales high 1.30 1.08 0.96 1.30 1.06 0.83
EV:sales low 0.95 0.40 0.41 0.70 0.54 0.60
Operating profit margin 10.6% 11.0% 8.3% 8.8% 9.5% 9.2% 8.1% 8.7% 9.6%
EV:EBITDA average 9.1 6.3 6.2 8.5 7.5 6.5 7.5 7.0 6.3
EV:EBITDA high 10.7 8.6 9.2 11.8 9.4 7.7
EV:EBITDA low 7.8 3.2 4.0 6.4 4.8 5.6
EV:EBITA average 10.4 7.1 7.8 10.6 8.9 7.6 9.2 9.0 7.9
EV:EBITA high 12.2 9.8 11.6 14.7 11.2 9.1
EV:EBITA low 8.9 3.6 5.0 8.0 5.8 6.5
FCF yield average 2.6% -3.1% 32.6% 8.5% 6.2% 4.8% 4.1% 9.7% 9.4%
FCF yield high 2.1% -2.1% 19.3% 5.9% 4.9% 3.9%
FCF yield low 3.1% -9.9% 66.3% 11.9% 10.3% 5.8%
Dividend yield average 7.2% 2.9% 4.8% 5.2% 5.1% 6.2% 6.0% 6.5% 6.5%
Dividend yield high 6.0% 1.9% 2.8% 3.6% 4.0% 5.0%
Dividend yield low 8.6% 9.0% 9.7% 7.3% 8.4% 7.4%
EV/IC average 2.7 1.7 1.2 1.9 2.0 1.8 1.7 1.7 1.7
EV/IC high 3.2 2.3 1.7 2.7 2.5 2.2
EV/IC low 2.3 0.8 0.8 1.5 1.3 1.6
P/BV average 3.67 2.41 1.23 2.18 2.36 2.04 1.88 1.87 1.81
P/BV high 4.39 3.66 2.07 3.15 3.03 2.50
P/BV low 3.07 0.76 0.61 1.55 1.42 1.71
ROIC 19.0% 17.1% 11.0% 13.4% 16.7% 16.9% 13.3% 13.6% 15.3%
ROE 28.9% 34.1% 16.4% 17.5% 21.9% 22.0% 17.6% 17.2% 18.4%
ROCE 21.5% 19.2% 11.1% 12.9% 18.1% 17.6% 14.6% 14.9% 16.9%
SOTP
Source: Company data, Credit Suisse estimates

128
Metso – Financials PROFIT & LOSS 2010 2011 2012 2013E 2014E 2015E
Revenue 5,552 6,646 7,504 6,612 6,155 6,234
Growth, % 15% 20% 13% -12% -7% 1%
COGS (4,130) (4,978) (5,703) (4,827) (4,493) (4,551)
Gross Profit 1,422 1,668 1,801 1,785 1,662 1,683
Gross margin, % 26% 25% 24% 27% 27% 27%
SG&A (1,028) (1,107) (1,184) (1,203) (1,120) (1,135)
Other operating income 50 11 (16) 11 11 11
Reported EBIT 445 572 602 486 486 546
Reported EBIT margin, % 8% 9% 8% 7% 8% 9%
Exceptionals / Amortisation (46) (57) (86) (50) (50) (50)
Underlying EBITA 491 629 688 536 536 596
Operating profit margin, % 8.8% 9.5% 9.2% 8.1% 8.7% 9.6%
Depreciation 120 120 116 127 149 154
EBITDA 611 749 804 663 684 750
EBITDA margin, % 11% 11% 11% 10% 11% 12%
Net interest income / (expense) (75) (65) (59) (57) (57) (54)
Rate, % 10% 15% 11% 12% 17% 25%
Reported PBT 370 507 543 429 429 492
Underlying PBT 416 564 629 479 479 542
Tax (112) (149) (175) (124) (131) (150)
Effective rate, % 30% 29% 32% 29% 31% 31%
Minority interest (1) 2 1 3 - -
Reported Net Income 257 360 369 308 298 342
Operating Net Income 303 417 455 357 348 392
Net income margin, % 5% 6% 6% 5% 6% 6%
CS operating EPS 2.0 2.8 3.0 2.4 2.3 2.6
EPS growth, % 12% 37% 9% -21% -3% 13%
DPS, Euro 1.6 1.7 1.9 1.7 1.9 1.9
DPS growth, % 121% 10% 9% -8% 9% 0%
Dividend Cover (X) 1.3 1.6 1.6 1.4 1.3 1.4
Ordinary shares in issue 149.6 149.6 149.8 149.8 149.8 149.8
ANALYSIS 2010 2011 2012 2013E 2014E 2015E
NOPAT 359 463 486 398 391 433
Invested Capital 2,671 2,771 2,878 2,995 2,881 2,823
ROIC 13.4% 16.7% 16.9% 13.3% 13.6% 15.3%
Operating Net Income 303 417 455 357 348 392
Equity 2,049 2,115 2,207 2,260 2,281 2,346
ROE 14.8% 19.7% 20.6% 15.8% 15.3% 16.7%
EBITDA 611 749 804 663 684 750
Total debt 1,373 1,027 1,290 1,290 1,290 1,290
Net debt 728 437 559 472 336 215
Total debt / EBITDA 2.2 1.4 1.6 1.9 1.9 1.7
Net debt / EBITDA 1.2 0.6 0.7 0.7 0.5 0.3
BALANCE SHEET 2010 2011 2012 2013E 2014E 2015E
PPE and Intangibles 1,729 1,737 1,720 1,781 1,768 1,751
Other f ixed assets 410 245 250 260 269 278
Fixed assets 2,426 2,254 2,223 2,294 2,290 2,282
Inventories 1,305 1,677 1,529 1,449 1,332 1,332
Trade and other receivables 1,529 1,861 1,862 1,685 1,551 1,537
Trade and other payables (2,179) (2,776) (2,486) (2,174) (2,023) (2,049)
Working capital 655 762 905 960 860 820
Working capital days 43 42 44 53 51 48
WC as % of sales 12% 11% 12% 15% 14% 13%
Cash 645 590 731 818 954 1,075
Short-term debt (417) (272) (204) (258) (258) (258)
Long-term debt (956) (755) (1,086) (1,032) (1,032) (1,032)
Net (debt) / cash (728) (437) (559) (472) (336) (215)
Pension deficit (195) (238) (245) (245) (245) (245)
Other assets 327 236 297 146 146 146
Other liabilities (414) (441) (394) (405) (417) (428)
Net assets 2,071 2,136 2,227 2,277 2,298 2,363
CASH FLOW 2010 2011 2012 2013E 2014E 2015E
Operating profit 491 629 688 536 536 596
Depreciation 120 120 116 127 149 154
Associates - - (1) (1) - -
Net interest paid (58) (50) (39) (46) (46) (43)
Tax paid (98) (122) (188) (137) (131) (150)
Other 26 12 (37) (11) (11) (11)
Gross cash flow 481 589 539 468 497 546
Working capital change 25 (123) (176) (55) 100 40
Operating cash flow 506 466 363 413 597 586
Operating cash / Operating profit 1.03 0.74 0.53 0.77 1.11 0.98
Net Capex (127) (154) (146) (238) (185) (187)
Free cash flow 379 312 217 175 412 399
FCF / Net income 1.25 0.75 0.48 0.49 1.19 1.02
Acquisitions (21) (15) (5) - - -
Disposals 8 - - - - -
Sales / (Purchase) of investments (147) 235 (62) 163 - -
Dividends paid (105) (232) (254) (255) (277) (277)
Shares issue / (purchase) (7) - - - - -
Borrow ings raised / (repaid) (243) (352) 268 - - -
Other 21 (2) (1) - - -
Net cash flow (115) (54) 163 83 135 122
Source: Company data, Credit Suisse estimates

129
Metso – Company Summary
Operating Profit Split Sales Mix End Market Mix
Management
CEO Matti Kahkonen
CFO Harri Nikunen
IR Marja Makinen
Division Products End Markets / Channels Main Competitors Orders Received by Geography Key Drivers/ Themes
Mining & Construction
FY 2012 Sales EUR 3.49 Bn
18.0% YoY nominal growth
FY 2012 EBIT EUR 0.42 Bn
12.0% Margin
Grinding Mills, Crushers, Process Equipment,
Mobile Crushers, Conveyors, Spare Parts
Mining 38%, Construction 13%, Mining
Services 37%, Construction Services 10%,
Recycling Services 2%.
FLSmidth, ABB Mining, ThyssenKrupp, Sandvik,
Outotec, Siemens Mining, Rema Tip Top, Atlas
Copco, Terex, Caterpillar, Excel, Astec, Deister
North America 26%, Asia Pacific 24%, South &
Central America 24%, Other European Countries
21%, Middle East/Africa 9%, Other Nordic
Countries 7%, Finland 2%
Demand for minerals; Infrastructure investments;
Growth of middle class; Urbanization; Growth of
EM, Need for process efficiencies at mines
Automation
FY 2012 Sales EUR 0.86 Bn
11.5% YoY organic growth
FY 2012 EBIT EUR 0.1 Bn
11.8% Margin
Process Automation, Process measurement
system, Emergency shutdiown valves,
Positioners and Conditioners,
Oil & Gas 40%, Pulp & Paper 40%, Power 10%,
Mining and Others 10%
ABB, Honeywell, Emerson Process, General
Electric, Flowserve
North America 26%, Asia Pacific 24%, Other
European Countries 18%, Finland 14%, South &
Central America 9%, Middle East/Africa 6%,
Other Nordic Countries 3%
Growth in energy consumption; Growth of EM;
Supply of raw meterial
METSO (MEO1V.HE) - ANDRE KUKHNIN, CFA +44 20 7883 0350/ [email protected] Mix Shareholding Structure
Free Float: 89%
Top 5 shareholders
Solidium Oy 11.1%, Cevian Capital Partners
8.3%, Cevian Capital II Master Fund 5.5%
Illmarinen Mutual Pension Insurance Company
2.7% , Varma Mutual Pension Insurance
Company 1.9%
Ownership by country
Finland 45%, UK 25%, Norway 8%, US 7%,
Sweden 6% and Others.
Mining & Construction
81%
Automation19%
Automotive0%
Mining & Construction
76%
Automation19%
Automotive5%
Europe30%
North America19%
South and Central America
22%
APAC22%
Africa andMiddle East
7%
Mining55%
Pulp and Paper7%
Construction18%
Power Generation
12%
Other8%
Orders Recieved Split Sales Mix Employee by Geography
Management
CEO Pasi Laine
CFO Markku Honkasalo
IR Hanna- Maria Heikkinen
VALMET - ANDRE KUKHNIN, CFA +44 20 7883 0350/ [email protected] Mix Shareholding Structure
Top 5 shareholders
Solidium Oy 11.1%
Cevian Capital Partners 8.4%
Cevian Capital II Master Fund 5.5%
Illmarinen Mutual Pension Insurance Company
2.7%
Varma Mutual Pension Insurance Company
1.9%
Service Business 43%
Equipment, product & project business
57%
Paper27%
Pulp & Energy 39%
Services34%
APAC11%
South & Central America
17%
North America19%
EMEA40%
China13%
North America
9%
South America
4%
EMEA65%
APAC5%
China17%
Source: Company data

130
Morgan Advanced Materials – Underperform, TP 270p
Bear Case
Cumulative cash conversion has been below the sector average. At this
juncture we see this track record continuing.
No ROIC improvement. Despite a ‘changed’ business model ROIC has
seen little change and remains below the level achieved in 2007 questioning
whether the business has improved over the cycle
Organic Growth & EBITA margins have lagged the sector. We see this
trend likely to continue under the current portfolio structure.
Further downside risk to consensus from FX / strengthening UK£
Bull Case
Potential M&A candidate for either an Industry competitor (particularly
Ceramics) or Private Equity.
Portfolio reorganization self help – Morgan undertakes material portfolio
reorganisation and sells (as alluded to) underperforming assets
Undemanding valuation – trading at a material discount to its peer group
weighted SOTP.
Investment summary: Under the current portfolio structure Morgan has seen little change with the ROIC
generated in 2013E still below the level achieved in 2007. Against this backdrop we rate the share at
Underperform
0
50
100
150
200
250
300
350
400
0
5
10
15
20
25
30
35
2004 2005 2006 2007 2008 2009 2010 2011 2012 2013
1 Yr Forward EPS (LHS) Share Price (RHS)
-20%
-15%
-10%
-5%
0%
5%
10%
15%
8%
9%
10%
11%
12%
13%
14%
Margins % (LHS) Organic Growth (RHS)
0%
10%
20%
30%
40%
50%
60%
70%
80%
90%
6%
8%
10%
12%
14%
16%
18%
MGAM ROIC (LHS)Sector ROIC (LHS)MGAM Cash conversion (RHS)Sector Cash conversion (RHS)
Source: Thomson Reuters, Company data, Credit Suisse estimates

131
Morgan Advanced Materials – Valuation
2007 2008 2009 2010 2011 2012 2013e 2014e 2015e
Share price - year high 323.0 244.8 192.3 254.1 357.1 360.0 290.0 290.0 290.0
Share price - year low 173.0 67.8 70.3 157.7 224.0 220.3 290.0 290.0 290.0
Share price - year average 280.4 180.7 126.6 205.0 283.0 284.6 290.0 290.0 290.0
Enterprise value - high 1109.7 1095.6 902.6 1058.3 1353.4 1373.8 1177.8 1136.1 1086.9
Enterprise value - low 679.0 607.7 575.4 799.4 994.2 994.2 1177.8 1136.1 1086.9
Enterprise value - average 987.3 919.0 726.4 926.5 1153.4 1168.9 1177.8 1136.1 1086.9
EBITA 79.1 97.4 77.0 101.6 141.5 108.8 105.1 123.5 131.1
EV/EBITA - High 14.0 11.2 11.7 10.4 9.6 12.6 11.2 9.2 8.3
EV/EBITA - Low 8.6 6.2 7.5 7.9 7.0 9.1 11.2 9.2 8.3
EV/EBITA - Average 12.5 9.4 9.4 9.1 8.2 10.7 11.2 9.2 8.3
EBITDA 111.8 136.4 120.7 141.8 176.4 152.0 151.5 159.5 168.1
EV/EBITDA - high 9.9 8.0 7.5 7.5 7.7 9.0 7.8 7.1 6.5
EV/EBITDA - low 6.1 4.5 4.8 5.6 5.6 6.5 7.8 7.1 6.5
EV/EBITDA - average 8.8 6.7 6.0 6.5 6.5 7.7 7.8 7.1 6.5
Sales 693.2 835.0 942.6 1017.1 1101.0 1007.5 957.0 970.0 1008.0
EV/Sales - high 1.6 1.3 1.0 1.0 1.2 1.4 1.2 1.2 1.1
EV/Sales - low 1.0 0.7 0.6 0.8 0.9 1.0 1.2 1.2 1.1
EV/Sales - average 1.4 1.1 0.8 0.9 1.0 1.2 1.2 1.2 1.1
CS EPS Adjusted (p) 21.7 22.8 12.6 17.8 28.6 22.8 20.9 24.8 27.1
PER - high 14.9 10.8 15.2 14.3 12.5 15.8 13.9 11.7 10.7
PER - low 8.0 3.0 5.6 8.9 7.8 9.7 13.9 11.7 10.7
PER - average 12.9 7.9 10.0 11.5 9.9 12.5 13.9 11.7 10.7
NAV 71.2 77.9 80.1 93.4 99.5 98.1 114.8 134.7 153.5
PBV - high 4.5 3.1 2.4 2.7 3.6 3.7 2.5 2.2 1.9
PBV - low 2.4 0.9 0.9 1.7 2.3 2.2 2.5 2.2 1.9
PBV - average 3.9 2.3 1.6 2.2 2.8 2.9 2.5 2.2 1.9
Dividend Yield 6.8 7.0 7.0 7.7 9.3 10.1 10.7 11.3 12.0
Dividend Yield - high 2% 3% 4% 3% 3% 3% 4% 4% 4%
Dividend Yield - low 4% 10% 10% 5% 4% 5% 4% 4% 4%
Dividend Yield - average 2% 4% 6% 4% 3% 4% 4% 4% 4%
FCF before distributions 24 23 54 77 58 49 50 72 74
FCF/Sales 3% 3% 6% 8% 5% 5% 5% 7% 7%
FCF per share 8.36 8.46 19.13 26.95 20.32 17.38 17.60 25.24 26.09
FCF/EBITDA 21% 17% 44% 54% 33% 32% 33% 45% 44%
Valuation Multiples Cumulative Cash Conversion Bridge
CFROI expectations: Market (dot) vs. Consensus (bar)
100%
40%
- 33%
- 13% - 3%
2%7%
- 20%
0%
20%
40%
60%
80%
100%
120%
Cle
an n
et in
com
e
Rep
orte
d ne
t inc
ome
Wor
king
cap
ital
Del
ta b
/w C
apex
& D
eper
ecia
tion
Del
ta b
/w R
&D
Cap
italis
ed &
Inta
ngib
les
Am
ort.
PP
A
Oth
er (D
efer
red
tax,
Pen
sion
,M
inor
ity e
tc)
Free
Cas
h Fl
ow
Source: Company data, Credit Suisse estimates, Credit Suisse HOLT

132
Morgan Advanced Materials – Financials PROFIT & LOSS 2006 2007 2008 2009 2010 2011 2012 2013e 2014e 2015e
FY FY FY FY FY FY FY FY FY FY
Revenue 677.8 693.2 835.0 942.6 1,017.1 1,101.0 1,007.5 957.0 970.0 1,008.0
Change yoy, % 2.3% 20.5% 12.9% 7.9% 8.2% -8.5% -5.0% 1.4% 3.9%
EBITDA 99.6 111.8 136.4 120.7 141.8 176.4 152.0 151.5 159.5 168.1
Margin, % 14.7% 16.1% 16.3% 12.8% 13.9% 16.0% 15.1% 15.8% 16.4% 16.7%
EBITA 74.9 88.1 108.8 89.0 109.5 143.4 122.0 120.0 127.5 135.1
Margin, % 11.1% 12.7% 13.0% 9.4% 10.8% 13.0% 12.1% 12.5% 13.1% 13.4%
Restructuring Costs (recurring) (27.7) (9.0) (11.4) (12.0) (7.9) (1.9) (13.2) (27.9) (4.0) (4.0)
CS EBITA 47.2 79.1 97.4 77.0 101.6 141.5 108.8 92.1 123.5 131.1
Margin, % 7.0% 11.4% 11.7% 8.2% 10.0% 12.9% 10.8% 9.6% 12.7% 13.0%
Income Associates 0.0 0.2 1.2 0.0 0.0 0.0 0.0 0.0 0.0 0.0
Net interest Income / (Expense) (3.4) (5.5) (12.7) (29.3) (25.9) (21.8) (19.1) (22.0) (21.0) (19.0)
Restructuring Costs (recurring) 0.0 0.0 0.0 0.0 0.0 0.0 0.0 0.0 0.0 0.0
CS PBT 43.8 73.8 85.9 47.7 75.7 119.7 89.7 70.1 102.5 112.1
Income Tax (16.2) (15.8) (20.1) (8.7) (19.7) (32.6) (22.1) (20.8) (28.2) (31.3)
Exceptional - Tax 5.6 0.6 0.0 0.0 0.0 0.0 0.0 (2.8) 0.0 0.0
CS EPS (Diluted) 17.2 21.7 22.8 12.6 17.8 28.6 22.8 16.3 24.8 27.1
Reported EPS (Diluted) 12.3 18.5 21.6 6.8 15.0 25.7 27.3 12.3 21.8 23.9
DPS, p 5.5 6.8 7.0 7.0 7.7 9.3 10.1 10.7 11.3 12.0
DPS growth yoy, % 23% 4% 0% 10% 20% 9% 6% 6% 6%
CASH FLOW 2006 2007 2008 2009 2010 2011 2012 2013e 2014e 2015e
EBITDA 99.6 111.8 136.4 120.7 141.8 176.4 152 151.5 159.5 168.1
Working Capital Change (22.9) (18.5) (21.8) 25.8 10.5 (29.1) (12.6) (1.0) (6.8) (11.6)
Operating Cash Flow (8.9) 78.1 99.7 122.4 140.3 129.3 121.0 132.4 152.7 156.5
Net Financing Cost (4.7) (8.8) (16.9) (23.2) (22.7) (20.4) (18.5) (19.8) (18.9) (17.1)
Tax Paid (6.3) (12.5) (28.1) (32.0) (24.1) (25.6) (26.8) (23.6) (28.2) (31.3)
Net Operating Cash Flow (19.9) 56.8 54.7 67.2 93.5 83.3 75.7 88.9 105.6 108.0
Net Capex (32.9) (33.1) (31.5) (13.7) (17.0) (25.5) (26.7) (39.0) (34.0) (34.0)
Free Cash Flow (52.8) 23.7 23.2 53.5 76.5 57.8 49.0 49.9 71.6 74.0
Acquisitions (20.7) (9.4) (79.2) (31.9) (32.9) (10.4) (6.6) 0.0 0.0 0.0
Disposals 13.1 0.0 0.0 0.0 0.0 0.0 0.0 0.0 0.0 0.0
Pre Financing Cash Flow (62.2) 14.0 (63.0) 22.1 37.9 43.3 43.2 51.9 71.6 74.0
Dividend Paid (7.4) (18.8) (18.8) (12.1) (15.4) (18.4) (16.1) (26.9) (18.3) (24.8)
Net Cash / (Debt) Year End (34.1) (119.7) (290.4) (252.7) (236.2) (215.4) (192.8) (194.8) (141.5) (92.3)
BALANCE SHEET 2006 2007 2008 2009 2010 2011 2012 2013e 2014e 2015e
PPE 230 247 320 276 269 260 246 254 257 259
Goodwill 54 57 118 207 197 200 191 191 191 191
Intangible Assets 12 13 59 90 88 84 74 68 62 56
Working capital 127 141 215 194 200 227 212 213 219 231
Total assets 280 364 600 573 592 621 631 661 663 667
Shareholders' funds 187 176 178 185 215 229 234 285 341 394
Minorities 16 20 30 30 37 41 38 38 38 38
Total Borrowings 132 228 445 360 321 299 273 275 222 172
Cash and equivalents (97) (108) (155) (108) (85) (83) (80) (80) (80) (80)
Net Debt / (Cash) 34 120 290 253 236 215 193 195 142 92
Pension Deficit 43 48 102 106 104 135 167 143 143 143
Total liabilities 280 364 600 573 592 621 631 661 663 667
Source: Company data, Credit Suisse estimates

133
Morgan Advanced Materials – Company Summary
Geographic Split Operating Profit Mix Sales Mix End Market Split
We show Divisional breakdown below based on the old structure rather than the new geographic segmentation
Division Products End Markets / Channels Main Competitors / Positioning Revenue Split by Geo Key Drivers / Themes
Engineering Materials
FY2012 Sales - £347m,
(14.3)% org. growth
FY2012 EBITA - £33m,
9.4% margin
Electrical brushes
Seals and bearings
Protective ballistic armour
Ultra-high-temperature insulation
Crucibles
Lithium ion battery anode materials
Industrial
Security & Defence
Transportation
Energy
Electronics
Petrochemical
LeCarbone, Schunk, SGLCarbon,
ToyoTanso, StGobain, ESK,
Europe - £222m (53%)
North America - £148m (36%)
Asia & RoW - £46m (11%)
AMT (Carbon) is mostly a replacement driven market. MMS
is non ferous metal foundry while NPA is defence spending
exposed
Ceramics
FY2012 Sales - £661m,
(2.7)% org. growth
FY2012 EBITA - £95m,
14.3% margin
Insulating fibre, insulating bricks and
monolithics
Ceramic cores for complex turbine blades
Components for electron tubes
Feedthroughs for medical implants
Piezoelectric ceramic actuators
Industrial
Transportation
Electronics
Petrochemical
Energy
Healthcare
Kyocera, Ceramtec, Coorstek, St Gobain,
Ceradyne.
Europe - £207m (30%)
North America - £235m (34%)
Asia & RoW - £243m (36%)
Thermal Ceramics is IP driven + substitution of RCF.
Technical Ceramics operates with a low order book with
products made to order.
MORGAN ADVANCED MATERIALS (MGAMM.L / MGAM LN) - JONATHAN HURN, CFA +44 20 7883 4532 / [email protected]
Industrial
45%
Transportation
19%
Security &
Defence8%
Electronics
9%
Petrochemical
9%
Energy
6%
Healthcare
4%North America
38%
Europe
37%
Asia & ROW
25%Europe, 35%
North America,
34%
South America,
4%
Asia & RoW, 27%North America
45%
Europe
33%
Asia & ROW
22%
Shareholding structure
Free float: 96%
Top 5 shareholders: AXA - 16%,
Prudential PLC - 14%, HSBC IB UK Ltd. -
7%, Hsbc Holdings Plc - 5%, AVIVA PLC -
5%
Ownership by Country: UK - 76%, USA -
9%, France - 7%, Norway - 3%,
Luxembourg - 2%
Management
Chairman -Tim Stevenson OBE
CEO - Mark Robertshaw
CFO -Kevin Dangerfield
CS - Paul Boulton
Source: Company data

134
Nexans – Neutral, TP €31
Investment summary: Relatively low expectations but on-going uncertainty regarding 2015 targets following Q313
results. Risk of pricing pressure eroding cost savings due to exposure to commoditized cable end markets.
Bull Case Expectations are sufficiently low following c25% cuts to FY13 guidance and
a rights issue at the Q313 results.
The company can surprise positively on its cost improvements programme
which includes €50m of fixed cost savings and €40m of variable cost savings
by 2015.
Nexans hired a new Chief Operating Officer in July 2013 to oversee the
cost savings programme which could improve execution. Madeco (22.5%
shareholder) also now have three seats on the board.
Bear Case
Pricing pressure could erode cost savings due to Nexans’ exposure to
commoditized cable end markets (building cables).
Under the current management Nexans has disappointed on execution
(2012 Halden production issues) giving limited confidence in the execution of
the current programme.
ROIC to remain below the cost of capital out to 2015E and cumulative c€0
FCF generated in 2014/15E due to antitrust fine and restructuring costs.
The valuation discount vs the sector is in-line with the historical average and
therefore, despite the negative sentiment, the shares are not cheap.
Power Distribution
& D&I41%
Submarine cables26%
Other33%
-20%
-15%
-10%
-5%
0%
5%
10%
0%
2%
4%
6%
8%
10%
2007 2008 2009 2010 2011 2012 2013E2014E2015E
Margins % (LHS) Organic Growth (RHS)
0%
20%
40%
60%
80%
100%
2%
4%
6%
8%
10%
12%
14%
16%
18%
NXS ROIC (LHS) Sector ROIC (LHS)
NXS Cash conversion (RHS) Sector Cash conversion (RHS)
Source: Thomson Reuters, Company data, Credit Suisse estimates

135
Nexans – Valuation
Multiples
December y/e 2007 2008 2009 2010 2011 2012 2013E 2014E 2015E 2016E
Average/Current 110.8 68.9 44.1 54.9 56.7 35.4 34.3 34.3 34.3 34.3
High 131.7 92.0 59.3 66.0 73.1 54.5 34.3 34.3 34.3 34.3
Low 82.7 36.3 26.1 45.5 37.4 27.8 34.3 34.3 34.3 34.3
Year end 85.5 42.6 55.8 58.9 40.1 27.8 34.3 34.3 34.3 34.3
P/E average 12.7 7.4 13.2 18.9 13.6 20.2 39.7 17.2 9.9 8.9
P/E high 15.1 9.9 17.8 22.8 17.5 34.8 39.7 17.2 9.9 8.9
P/E low 9.5 3.9 7.8 15.7 9.0 17.7 39.7 17.2 9.9 8.9
P/E year-end 9.8 4.6 16.7 20.3 9.6 17.7 39.7 17.2 9.9 8.9
EV/Sales average 0.72 0.57 0.43 0.48 0.48 0.45 0.42 0.54 0.52 0.50
EV/Sales high 0.84 0.69 0.54 0.55 0.58 0.56 0.42 0.54 0.52 0.50
EV/Sales low 0.58 0.39 0.31 0.42 0.36 0.40 0.42 0.54 0.52 0.50
EV/Sales year-end 0.59 0.42 0.51 0.50 0.38 0.40 0.42 0.54 0.52 0.50
Operating profit margin 8.5% 8.9% 6.0% 4.8% 5.6% 4.1% 3.1% 4.5% 6.1% 6.1%
EV/EBIT average 8.5 6.3 7.2 10.0 8.6 10.8 13.7 12.2 8.6 8.2
EV/EBIT high 9.9 7.7 9.0 11.5 10.4 13.6 13.7 12.2 8.6 8.2
EV/EBIT low 6.8 4.3 5.1 8.7 6.4 9.6 13.7 12.2 8.6 8.2
EV/EBIT year-end 7.0 4.7 8.6 10.5 6.7 9.6 13.7 12.2 8.6 8.2
FCF yield average 11.8% 14.2% 17.6% 4.5% 2.0% 1.7% 3.0% -5.8% 6.1% 6.4%
FCF yield high 10.2% 11.6% 14.1% 3.9% 1.6% 1.3% 3.0% -5.8% 6.1% 6.4%
FCF yield low 14.8% 20.7% 24.7% 5.1% 2.7% 1.9% 3.0% -5.8% 6.1% 6.4%
FCF yield year-end 14.5% 19.1% 14.8% 4.2% 2.6% 1.9% 3.0% -5.8% 6.1% 6.4%
Dividend yield average 1.8% 2.9% 2.3% 2.0% 1.9% 1.4% 1.5% 1.5% 2.5% 2.8%
Dividend yield high 1.5% 2.2% 1.7% 1.7% 1.5% 0.9% 1.5% 1.5% 2.5% 2.8%
Dividend yield low 2.4% 5.5% 3.8% 2.4% 2.9% 1.8% 1.5% 1.5% 2.5% 2.8%
Dividend yield year-end 2.3% 4.7% 1.8% 1.9% 2.7% 1.8% 1.5% 1.5% 2.5% 2.8%
EV/IC average 1.47 1.09 0.73 0.77 0.89 0.75 0.71 0.85 0.83 0.80
EV/IC high 1.69 1.33 0.91 0.89 1.09 0.94 0.71 0.85 0.83 0.80
EV/IC low 1.16 0.75 0.52 0.67 0.67 0.67 0.71 0.85 0.83 0.80
EV/IC year-end 1.19 0.81 0.87 0.81 0.70 0.67 0.71 0.85 0.83 0.80
Valuation scenarios Bull case
Base case
and TP
Methodology
Bear case
Target Multiple (2015 EV/EBITA) 8.5 8.5 8.5
2015 operating profit € 331 € 301 € 271
Net Debt & Liabilities 1,152 1,152 1,152
Equity Valuation 1,663 1,408 1,153
Implied Share price (discounted back 1yr) € 36 € 31 € 25
Multiple Valuation
Source: Company data, Credit Suisse estimates
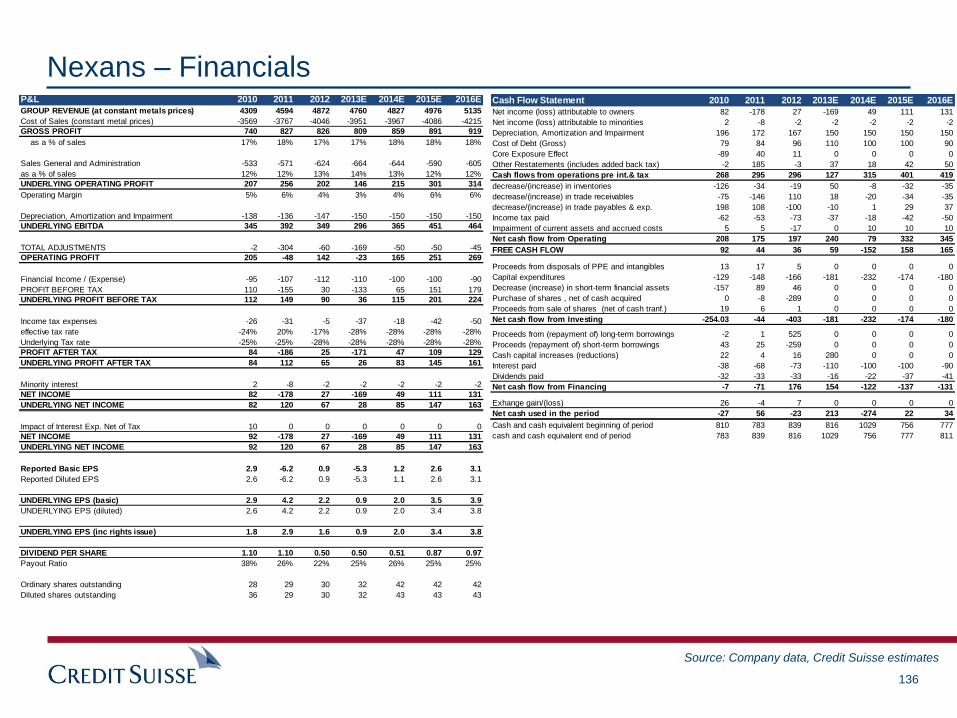
136
Nexans – Financials P&L 2010 2011 2012 2013E 2014E 2015E 2016E
GROUP REVENUE (at constant metals prices) 4309 4594 4872 4760 4827 4976 5135
Cost of Sales (constant metal prices) -3569 -3767 -4046 -3951 -3967 -4086 -4215
GROSS PROFIT 740 827 826 809 859 891 919
as a % of sales 17% 18% 17% 17% 18% 18% 18%
Sales General and Administration -533 -571 -624 -664 -644 -590 -605
as a % of sales 12% 12% 13% 14% 13% 12% 12%
UNDERLYING OPERATING PROFIT 207 256 202 146 215 301 314
Operating Margin 5% 6% 4% 3% 4% 6% 6%
Depreciation, Amortization and Impairment -138 -136 -147 -150 -150 -150 -150
UNDERLYING EBITDA 345 392 349 296 365 451 464
TOTAL ADJUSTMENTS -2 -304 -60 -169 -50 -50 -45
OPERATING PROFIT 205 -48 142 -23 165 251 269
Financial Income / (Expense) -95 -107 -112 -110 -100 -100 -90
PROFIT BEFORE TAX 110 -155 30 -133 65 151 179
UNDERLYING PROFIT BEFORE TAX 112 149 90 36 115 201 224
Income tax expenses -26 -31 -5 -37 -18 -42 -50
effective tax rate -24% 20% -17% -28% -28% -28% -28%
Underlying Tax rate -25% -25% -28% -28% -28% -28% -28%
PROFIT AFTER TAX 84 -186 25 -171 47 109 129
UNDERLYING PROFIT AFTER TAX 84 112 65 26 83 145 161
Minority interest 2 -8 -2 -2 -2 -2 -2
NET INCOME 82 -178 27 -169 49 111 131
UNDERLYING NET INCOME 82 120 67 28 85 147 163
Impact of Interest Exp. Net of Tax 10 0 0 0 0 0 0
NET INCOME 92 -178 27 -169 49 111 131
UNDERLYING NET INCOME 92 120 67 28 85 147 163
Reported Basic EPS 2.9 -6.2 0.9 -5.3 1.2 2.6 3.1
Reported Diluted EPS 2.6 -6.2 0.9 -5.3 1.1 2.6 3.1
UNDERLYING EPS (basic) 2.9 4.2 2.2 0.9 2.0 3.5 3.9
UNDERLYING EPS (diluted) 2.6 4.2 2.2 0.9 2.0 3.4 3.8
UNDERLYING EPS (inc rights issue) 1.8 2.9 1.6 0.9 2.0 3.4 3.8
DIVIDEND PER SHARE 1.10 1.10 0.50 0.50 0.51 0.87 0.97
Payout Ratio 38% 26% 22% 25% 26% 25% 25%
Ordinary shares outstanding 28 29 30 32 42 42 42
Diluted shares outstanding 36 29 30 32 43 43 43
Cash Flow Statement 2010 2011 2012 2013E 2014E 2015E 2016E
Net income (loss) attributable to owners 82 -178 27 -169 49 111 131
Net income (loss) attributable to minorities 2 -8 -2 -2 -2 -2 -2
Depreciation, Amortization and Impairment 196 172 167 150 150 150 150
Cost of Debt (Gross) 79 84 96 110 100 100 90
Core Exposure Effect -89 40 11 0 0 0 0
Other Restatements (includes added back tax) -2 185 -3 37 18 42 50
Cash flows from operations pre int.& tax 268 295 296 127 315 401 419
decrease/(increase) in inventories -126 -34 -19 50 -8 -32 -35
decrease/(increase) in trade receivables -75 -146 110 18 -20 -34 -35
decrease/(increase) in trade payables & exp. 198 108 -100 -10 1 29 37
Income tax paid -62 -53 -73 -37 -18 -42 -50
Impairment of current assets and accrued costs 5 5 -17 0 10 10 10
Net cash flow from Operating 208 175 197 240 79 332 345
FREE CASH FLOW 92 44 36 59 -152 158 165
Proceeds from disposals of PPE and intangibles 13 17 5 0 0 0 0
Capital expenditures -129 -148 -166 -181 -232 -174 -180
Decrease (increase) in short-term financial assets -157 89 46 0 0 0 0
Purchase of shares , net of cash acquired 0 -8 -289 0 0 0 0
Proceeds from sale of shares (net of cash tranf.) 19 6 1 0 0 0 0
Net cash flow from Investing -254.03 -44 -403 -181 -232 -174 -180
Proceeds from (repayment of) long-term borrowings -2 1 525 0 0 0 0
Proceeds (repayment of) short-term borrowings 43 25 -259 0 0 0 0
Cash capital increases (reductions) 22 4 16 280 0 0 0
Interest paid -38 -68 -73 -110 -100 -100 -90
Dividends paid -32 -33 -33 -16 -22 -37 -41
Net cash flow from Financing -7 -71 176 154 -122 -137 -131
Exhange gain/(loss) 26 -4 7 0 0 0 0
Net cash used in the period -27 56 -23 213 -274 22 34
Cash and cash equivalent beginning of period 810 783 839 816 1029 756 777
cash and cash equivalent end of period 783 839 816 1029 756 777 811
Source: Company data, Credit Suisse estimates

137
Nexans – Company Summary
Operating Profit Split Sales Mix End Market Mix
Management
Chairman & CEO Frederic Vincent
CFO Nicolas Badre
IR Laura Duquesne
Division Products End Markets / Channels Main Competitors Revenue Split by Geo Key Drivers/ Themes
Transmission, Distribution & Operators
FY 2012 Sales EUR 2.09 Bn
-4.0% YoY organic growth
FY 2012 EBIT EUR 0.07 Bn
3.4% Margin
Cables and cabling solutions for power
production, transmission and distribution and
Telecom
Transmission and Distribution, Telecom
network and Transport infrastructuresABB, Prysmian, General Cables, Southwire,
Developed market 60%, Emerging market
40%
Increasing share of renewables (offshore
wind); Grade upgrades (interconnection)
Industry
FY 2012 Sales EUR 1.20 Bn
3.7% YoY organic growth
FY 2012 EBIT EUR 0.04 Bn
3.7% Margin
Cables and solutions for market segments as
diverse as the automotive, rolling stock and
aerospace industries, shipbuilding, nuclear
power, oil & gas and petrochemicals, material
handling and automation
Automotive 30%, Transport 24%, Resources
21%, Automation 5% and others 20%Prysmian, Leoni, Pirelli, ABB
Increasing importance of APAC, weak Europe
and North America
Globacl industrial production; Oil & gas
capex; Automotive demand
Distributors & Installers
FY 2012 Sales EUR 1.29 Bn
2.0% YoY organic growth
FY 2012 EBIT EUR 0.08 Bn
3.3% Margin
Cables and network solutions for structures of
all types: from small residences to public and
office buildings and big industrial complexes
using power cables and LAN cabl.
Residential, Industrial and Commercial
Building.
General Cables, Prysmian, Sumitomo, Leoni,
Encore Wire, Southwire
Europe 39%, North America 24%, Asia
Pacific 15%, South America 13%, MERA 9%
European & US construction new build (50%);
Renovation (50%)
NEXANS (NEXS.PA) - MAX YATES +44 20 7883 6893/ [email protected] Mix Shareholding Structure
Free Float: 80%
Top 5 shareholders
Madeco 19.6%, FSI 5.5%, Dodge & Cox
5.2%, Manning & Napier 5.1%, Third Avenue
Management 5.1%.
Ownership by country
Germany 22%, US 21%, UK 11%, Qatar 8%,
Luxembourg 6% and others
T,D&O34%
Industry22%
Distributors & Installers
39%
Others5%
T,D&O43%
Industry25%
Distributors & Installers
26%
Others6%
Europe56%
NorthAmerica
15%
Asia Pacif ic
13%
Central &South America
9%
MERA7%
Pow er T&D44%
Commercial Construction
18%
Residential Construction
9%
Automotive7%
General Industry
6%
Others16%
Source: Company data

138
Philips – Neutral, TP €26
Bull Case Recovering Healthcare equipment demand in the US with on-going strong
volume trends in EM providing solid top-line growth
Potential commercial construction recovery in Europe and the US could
enhance organic sales growth in Lighting division
Strong cost savings focus providing margin support
Shareholder friendly management with on-going share buyback in place
Valuation supportive with 10% sector discount on EV/EBITA
Bear Case Ambitious 90bps margin improvement in FY14 Healthcare consensus at
times of limited self help potential, Siemens flagging Healthcare margin
peaking and rising pricing risk from Japanese competition
Disruption to becoming a higher quality company with improved cash flow
conversion and better returns generation (e.g. issues selling audio/video biz)
Consumer Lifestyle growth leveling out from c.10% avg. last quarters
Increased competition in Lighting from emerging and developed market
players putting pressure on margins
Investment summary: Attractive end market play with solid organic top-line growth potential from structurally
growing Healthcare markets in the developing world yet ambitious consensus margin expectations particularly in
Healthcare providing potential risk for disappointment.
-15%
-10%
-5%
0%
5%
10%
15%
0%
2%
4%
6%
8%
10%
12%
Margins % (LHS) Organic Growth (RHS)
0
5
10
15
20
25
30
0.00
0.50
1.00
1.50
2.00
2.50
2004 2005 2006 2007 2008 2009 2010 2011 2012 2013
1 Yr Forward EPS (LHS) Share Price (RHS)
0%
20%
40%
60%
80%
100%
2%
4%
6%
8%
10%
12%
14%
16%
18%
PHG ROIC (LHS) Sector ROIC (LHS)PHG Cash conversion (RHS) Sector Cash conversion (RHS)
Source: Thomson Reuters, Company data, Credit Suisse estimates

139
Philips – Valuation
Nature of
metric
Value of
metric
Multiple/
ShareFair value % of EV Comments
2014E 2014E 2014E 2014E
Healthcare EBITA 1,526 10.5 16,021 55% US healthcare multiples
Consumer Lifestyle EBITA 575 9.3 5,344 18% Higher quality consumer goods company
Lighting EBITA 874 8.5 7,426 26% Lighting peers
Unallocated costs EBITA -222 8.5 -1,887
Divisions 2,752 9.8 26,903 99%
Equity Stakes 168 1%
Net Debt (2013) -1,532
Pension -1,208
Net SOP Value 24,210
Value per Share 26
2007A 2008A 2009A 2010A 2011A 2012A 2013E 2014E 2015E
Share Price:
Average/ Current 29.7 21.4 15.3 23.1 17.4 16.7 25.7 25.7 25.7
High 33.0 29.5 21.0 27.0 23.1 20.3
Low 26.7 12.1 10.9 20.1 12.2 13.1
Year End 29.5 13.8 20.7 22.8 16.3 19.9
Year End 6.5 13.7 21.9 12.7 14.8 33.2
EV/Sales:
Average/ Current 1.03 0.89 0.62 0.87 0.83 0.74 1.13 1.07 0.99
High 1.17 1.30 0.70 1.02 1.07 0.89
Low 0.90 0.47 0.53 0.76 0.61 0.60
Year End 1.02 0.53 0.51 0.86 0.78 0.87
Recurring EBITA Margin 7.4% 5.6% 5.9% 10.1% 7.6% 6.6% 10.1% 10.9% 11.3%
EV/Recurring EBITA:
Average/ Current 13.9 15.9 10.4 8.7 10.9 11.3 11.2 9.8 8.7
High 15.7 23.2 11.8 10.1 14.0 13.5
Low 12.1 8.4 9.0 7.6 8.0 9.1
Year End 13.7 9.5 8.6 8.5 10.3 13.2
EV/EBITDA:
Average/ Current 9.4 14.9 6.9 6.4 15.8 8.5 7.7 6.9 6.3
High 10.6 21.7 7.8 7.4 20.3 10.2
Low 8.2 7.8 5.9 5.6 11.6 6.9
Year End 9.3 8.9 5.7 6.3 14.9 10.0
EV/IC:
Average/ Current 1.8 1.5 0.9 1.4 1.3 1.3 1.8 1.8 1.7
High 2.0 2.1 1.1 1.7 1.7 1.6
Low 1.6 0.8 0.8 1.2 0.9 1.1
Year End 1.8 0.9 0.8 1.4 1.2 1.5
Dividend Yield
Average/ Current 2.4% 3.3% 4.6% 3.2% 4.3% 4.5% 3.0% 3.3% 3.5%
High 2.1% 2.4% 3.3% 2.8% 3.2% 3.7%
Low 2.6% 5.8% 6.4% 3.7% 6.1% 5.7%
Year End 2.4% 5.1% 3.4% 3.3% 4.6% 3.8%
FCF Yield (based on EV)
Average/ Current -5.9% 4.3% 6.9% 6.4% 0.8% 11.0% 0.5% 5.6% 6.5%
High -5.2% 3.0% 6.1% 5.5% 0.7% 9.2%
Low -6.8% 8.2% 8.1% 7.4% 1.1% 13.6%
Year End -6.0% 7.2% 8.3% 6.5% 0.9% 9.4%
SOTP
Source: Company data, Credit Suisse estimates

140
Philips – Financials P&L 2010A 2011A 2012A 2013E 2014E 2015E 2016E
Healthcare 8,601 8,852 9,983 9,527 9,908 10,304 10,716
Consumer Lifestyle 8,906 5,615 4,319 4,636 5,040 5,393 5,771
Lighting 7,552 7,638 8,442 8,343 8,736 9,217 9,770
I,G&S 360 474 713 683 663 643 624
Net Sales 25,419 22,579 23,457 23,189 24,347 25,557 26,880
Healthcare 1,186 1,145 1,226 1,494 1,506 1,603 1,705
Margin 13.8% 12.9% 12.3% 15.7% 15.2% 15.6% 15.9%
Consumer Lifestyle 639 297 456 466 575 647 727
Margin 12.4% 5.3% 10.6% 10.1% 11.4% 12.0% 12.6%
Lighting 869 445 128 681 824 945 1,083
Margin 11.5% 5.8% 1.5% 8.2% 9.4% 10.3% 11.1%
I,G&S (142) (207) (704) (290) (252) (302) (292)
EBITA 2,552 1,680 1,106 2,351 2,652 2,893 3,224
Margin 10.0% 7.4% 4.7% 10.1% 10.9% 11.3% 12.0%
Healthcare 922 93 1,026 1,324 1,336 1,433 1,535
Consumer Lifestyle 595 217 400 406 515 587 667
Lighting 695 (362) (66) 531 674 795 933
I,G&S (147) (217) (712) (295) (252) (302) (292)
EBIT 2,065 (269) 648 1,966 2,272 2,513 2,844
Margin 8.1% -1.2% 2.8% 8.5% 9.3% 9.8% 10.6%
Financial Income (Expense) (122) (240) (329) (285) (250) (250) (250)
PBT 1,943 (509) 319 1,681 2,022 2,263 2,594
Income Tax (509) (283) (185) (511) (607) (679) (778)
Tax rate 26% -56% 58% 31% 31% 31% 31%
Normal Tax rate 29% 29% 30% 30% 30% 30% 30%
Results Relating to Unconsolidated Co.s 18 16 (211) 21 0 0 0
Extraordinary Items/Discontinued 0 (515) 47 12 0 0 0
Minority 0 (4) (5) (15) (18) (19) (22)
Net Income 1,452 (1,295) (35) 1,188 1,398 1,565 1,794
Credit Suisse Net Income 1,690 1,049 553 1,411 1,664 1,831 2,060
Headline EPS (Euro) 1.54 (1.36) (0.04) 1.30 1.55 1.77 2.08
Restated EPS (Euro) 1.80 1.10 0.60 1.55 1.84 2.07 2.39
EPS (ex Unconsolidated Cos) 1.78 1.09 0.83 1.53 1.84 2.07 2.39
Net dividend (Euro) 0.75 0.75 0.75 0.78 0.84 0.90 0.96
Weighted average shares 940 952 922 911 904 883 863
Cash flow 2010A 2011A 2012A 2013E 2014E 2015E 2016E
Net Income 1,452 (1,295) (35) 1,188 1,398 1,565 1,794
Depreciation & Amortization 1,422 1,456 1,398 1,440 1,483 1,528 1,573
Net Gain on Sale of Assets/ Impairment (206) 1,299 (127) 0 0 0 0
Income/(Loss) from Unconsolidated Co.s 1 30 20 (21) 0 0 0
Minority Interest (net of dividend) 0 0 1 3 4 4 4
Variation in Working Capital 16 (679) 546 (100) (100) (100) (100)
Variation in non-Current Assets (291) (596) (327) (580) (580) (580) (580)
Variation in Provisions (237) 6 429 (531) 79 83 91
Other Items (1) 615 177 (509) 0 0 0
Cash from operating activities 2,156 836 2,082 890 2,284 2,499 2,782
Purchase of Intangible Assets (299) (347) (219) (336) (341) (358) (376)
Capital Expenditures (653) (725) (661) (700) (730) (750) (770)
Proceeds from Disposal of Tangible Assets 129 128 425 0 0 0 0
Purchase of non-current Financial Assets (16) (43) (167) 0 0 0 0
Disposal of non-current Financial Assets 268 87 3 0 0 0 0
Purchase of Businesses (net of cash acq) (223) (509) (261) 0 0 0 0
Proceeds from Disposal of Businesses 117 19 1 0 0 0 0
Other (25) 26 (46) 0 0 0 0
Cash from investing activities (702) (1,364) (925) (1,036) (1,071) (1,108) (1,146)
Dividends Paid (296) (259) (255) (686) (713) (751) (786)
Share Issue & Treasury stocks 65 (671) (768) 0 (500) (500) (500)
Change in Net Debt 135 (857) 730 (1,502) (0) (7) 2
Cash from financing activities (96) (1,787) (293) (2,188) (1,213) (1,258) (1,284)
Effect of Exchange Rates and Others 89 (364) (177) 0 0 0 0
Net increase (decrease) in cash 1,447 (2,679) 687 (2,334) 0 134 352
FCF per share 1.5 (0.6) 1.3 (0.2) 1.3 1.6 1.9
Source: Company data, Credit Suisse estimates

141
Philips – Company Summary
Operating Profit Split Sales Mix End Market Mix
Management
CEO Frans van Houlen
EVP & CEO Ron Wirahadiraksa
IR Abhijit Bhattacharya
Division Products End Markets / Channels Main Competitors Revenue Split by Geo Key Drivers/ Themes
Healthcare
FY 2012 Sales EUR 9.98 Bn
6.4% YoY organic growth
FY 2012 EBIT EUR 1.16 Bn
11.6% Margin
Scanners, Nuclear medicine, EmergencY care
& Resuscitaion, Respiratory care, Monitoring,
Cardiology
Imaging Systems 38%, Customer Services
25%, Patient Care & Clinical Informatics 22%,
and Home Healthcare Solutions 15%
General Electric, Siemens, MindrayNorth America 44%, Emerging Markets 24%,
Western Europe 20%, Others 12%
Ageing population in EM; Increasing emphasis
on quality of life; Increasing access to
healthcare; Urbanization
Consumer Lifestyle
FY 2012 Sales EUR 4.32 Bn
8.7% YoY organic growth
FY 2012 EBIT EUR 0.46 Bn
10.6 % Margin
Audio Video Systems, Earphones, Portable
Multimedia, Grooming Products, Kitchen
Appliances, Skincare
Domestic Appliances 33%, Lifestyle
Entertainment 27%, Personal Care 25% and
Health & Wellness 15%
Sony, Samsung, LG Electronics, PanasonicEmerging Markets 46%, Western Europe
31%, North America 18%, Others 5%
Growth in EM; Urbanization; Increasing
importance of male grooming
Lighting
FY 2012 Sales EUR 8.44 Bn
3.8% YoY organic growth
FY 2012 EBIT EUR 0.25 Bn
2.9% Margin
Indoor & Outdoor Luminaires, Lamps,
Electronic Control Gear, Lighting Controls
Light Sources & Electronics 52%,
Professional Lighting Solutions 29%,
Automotive 9%, Lumileds 5% and Consumer
Luminaires 5%.
Zumptobel, Siemens, ActuityEmerging Markets 41%, Western Europe
28%, North America 25%, Others 6%
Increasing importance of energy saving;
Increasing reliability
PHILIPS (PHG.AS) - SIMON TOENNESSEN +44 20 7883 6893/ [email protected] Mix Shareholding Structure
Free Float:100%
Top 5 shareholders
Dodge & Cox 4.7%, Blackrock 4.6%, South
Eastern Asset Management 4.3%, Norges
Bank 2.4%, Franklin Resources 1.4%
Ownership by country
USA 54%, Netherlands 17%, Norway 6%,
Luxembourg 6% and others
Healthcare62%
ConsumerLifestyle
25%
Lighting13%
Healthcare44%
Consumer Lifestyle
19%
Lighting37%
Emerging Markets
35%
North America
31%
WesternEurope
26%
Other Mature Markets
8%
Medical39%
Consumer33%
Commercial Construction
18%
Residential Construction
8%
Automotive2%
Source: Company data

142
T&I & Power
Distribution22%
Submarine & Optical
Fibre cable36%
Other42%
Prysmian – Outperform, TP €21
Investment summary: Attractive valuation for a company improving its end market exposure (Submarine and Optical
Fibre). Combined with on-going cost savings this can result in growth and ROIC in-line with the sector average.
Bull Case Re-rating potential 1) On average 4% organic growth in 2014/15E (in-line with
sector average) having underperformed the sector average through the last
cycle by 250bps and 2) on-going above sector average FCF conversion and
ROIC rising to in-line with the sector average by 2015E.
Increasing exposure to higher growth and higher margin end markets of
Submarine and Optical Fibre cable which are now 36% of group EBITDA.
Gearing to a European short-cycle recovery and we estimate that 23% of
group sales would be directly impacted.
On-going potential for positive surprises on Draka synergies savings with the
company beating both its 2011 and 2012 synergy targets.
Bear Case The stock has already re-rated vs the sector and vs its historical average
limiting the upside potential.
Relatively high risks associated with producing and laying offshore wind
connection cables which could result in charges.
Soft pricing dynamics in the global cable industry result in synergies being
eroded and limit the scope for margin expansion.
Political risk from Germany placing less emphasis on renewables in its
energy mix which would have an adverse impact on submarine cable demand.
-20%
-10%
0%
10%
20%
30%
40%
0%
2%
4%
6%
8%
10%
12%
Margins % (LHS) Organic Growth (RHS)
0%
20%
40%
60%
80%
100%
120%
140%
5%
10%
15%
20%
25%
30%
PRY ROIC (LHS) Sector ROIC (LHS)PRY Cash conversion (RHS) Sector Cash conversion (RHS)
Source: Thomson Reuters, Company data, Credit Suisse estimates

143
Prysmian – Valuation
MULTIPLES 2007 2008 2009 2010 2011 2012E 2013E 2014E 2015E 2016E
Average/Current 18.4 13.7 10.6 13.1 12.9 15.2 18.3 18.3 18.3 18.3
High 21.2 18.6 13.8 15.8 16.0 16.5 16.5 16.5 16.5 16.5
Low 15.3 6.2 6.1 11.3 9.3 11.5 11.5 11.5 11.5 11.5
Year end 16.9 11.1 12.2 12.8 9.6 13.0 13.0 13.0 13.0 13.0
P/E average 12.9 10.7 8.7 14.6 12.3 12.4 15.5 12.7 11.0 10.4
P/E high 14.9 14.5 11.4 17.6 15.2 13.4 14.0 11.5 9.9 9.4
P/E low 10.8 4.8 5.0 12.6 8.8 9.4 9.7 8.0 6.9 6.5
P/E year-end 11.9 8.6 10.0 14.2 9.2 10.6 11.0 9.0 7.8 7.4
EV/Sales average 0.84 0.64 0.70 0.71 0.55 0.61 0.72 0.68 0.64 0.59
EV/Sales high 0.94 0.81 0.85 0.81 0.63 0.65 0.67 0.63 0.59 0.54
EV/Sales low 0.73 0.38 0.48 0.63 0.45 0.51 0.53 0.50 0.46 0.42
EV/Sales year-end 0.78 0.55 0.77 0.69 0.46 0.55 0.57 0.54 0.50 0.46
Operating profit margin 9.1% 9.3% 9.0% 6.8% 5.6% 6.2% 6.3% 7.0% 7.5% 7.6%
EV/EBITDA average 8.1 6.1 6.5 8.3 7.3 7.4 8.6 7.5 6.7 6.1
EV/EBITDA high 9.1 7.7 7.9 9.6 8.4 7.8 8.0 6.9 6.2 5.7
EV/EBITDA low 7.0 3.6 4.5 7.5 6.0 6.2 6.3 5.4 4.8 4.4
EV/EBITDA year-end 7.6 5.2 7.2 8.2 6.1 6.7 6.8 5.9 5.2 4.7
EV/EBIT average 9.2 6.9 7.8 10.4 9.7 9.9 11.5 9.7 8.5 7.8
EV/EBIT high 10.3 8.8 9.5 12.0 11.2 10.5 10.6 9.0 7.8 7.2
EV/EBIT low 8.0 4.1 5.4 9.4 8.0 8.3 8.4 7.1 6.1 5.5
EV/EBIT year-end 8.6 5.9 8.6 10.2 8.1 8.9 9.1 7.6 6.6 6.0
FCF yield average 6.7% 11.8% 8.7% 5.9% 10.3% 8.6% 5.2% 6.8% 7.6% 9.5%
FCF yield high 6.0% 9.3% 7.1% 5.1% 8.9% 8.1% 5.5% 7.4% 8.2% 10.3%
FCF yield low 7.7% 20.2% 12.6% 6.6% 12.6% 10.3% 7.0% 9.4% 10.6% 13.4%
FCF yield year-end 7.1% 13.8% 7.8% 6.0% 12.3% 9.5% 6.5% 8.7% 9.7% 12.3%
Dividend yield av. 3.1% 4.0% 3.2% 1.6% 2.8% 2.4% 2.9% 3.3% 3.5%
Dividend yield high 2.3% 3.0% 2.6% 1.3% 2.5% 2.6% 3.2% 3.7% 3.9%
Dividend yield low 6.7% 6.9% 3.7% 2.3% 3.7% 3.8% 4.6% 5.3% 5.6%
Dividend yield year-end 3.8% 3.4% 3.3% 2.2% 3.2% 3.3% 4.0% 4.7% 5.0%
EV/IC average 3.13 2.63 1.88 1.99 1.65 1.93 2.11 2.02 1.93 1.85
EV/IC high 3.51 3.33 2.30 2.28 1.91 2.04 1.96 1.88 1.79 1.71
EV/IC low 2.73 1.54 1.30 1.78 1.35 1.61 1.55 1.47 1.39 1.31
EV/IC year-end 2.93 2.25 2.09 1.94 1.38 1.74 1.67 1.59 1.51 1.43
Target Price Methodology 11.4
5% discount to 2014 multiple (EV/EBIT) 10.8
2014 EBIT 542
Equity Value 5,874
Net Debt Inc pension 1144
Liabilities 253
NOSH 211
Implied TP 21
Bull Case Valuation 11.4
5% discount to 2014 multiple (EV/EBITDA) 7.6
2015 EBITDA 826
Equity Value 6,278
Net Debt Inc pension 838
Liabilities 253
NOSH 211
Implied TP (discounted 1 yr back) 23
Multiple Valuation
Source: Company data, Credit Suisse estimates

144
Prysmian – Financials
P&L 2010 2011 2012 2013E 2014E 2015E 2016E
Group Sales 4571 7583 7848 7515 7724 8031 8355
COGS -2963 -4917 -5083 -4802 -4928 -5116 -5322
Gross Profit 1608 2666 2765 2713 2796 2915 3033
Gross Margin 35% 35% 35% 36% 36% 36% 36%
Sales, General and Administration -1243 -2405 -2229 -2126 -2129 -2188 -2274
as a % of sales 27% 32% 28% 28% 28% 27% 27%
Reported EBITDA 365 269 546 587 668 727 759
Margin 8.0% 3.5% 7.0% 7.8% 8.6% 9.0% 9.1%
Total non recurring expenses 22 299 101 45 39 40 42
of which restructuring costs 11 56
UNDERLYING EBITDA 387 568 647 632 706 767 800
Margin 8.5% 7.5% 8.2% 8.4% 9.1% 9.5% 9.6%
Depreciation -71 -117 -129 -128 -131 -128 -134
Amortization -7 -25 -35 -34 -32 -33 -34
Non Recurring Impairments -21 -38 -24 0 0 0 0
UNDERLYING OPERATING PROFIT 309 426 483 470 542 605 632
Margin 6.8% 5.6% 6.2% 6.3% 7.0% 7.5% 7.6%
Total non-recurring charges 2 407 121 45 39 40 42
REPORTED OPERATING PROFIT 307 19 362 425 504 565 591
Margin 6.7% 0.3% 4.6% 5.7% 6.5% 7.0% 7.1%
Net Interest -96 -129 -135 -130 -125 -120 -120
REPORTED PROFIT BEFORE TAX 213 -101 244 310 394 460 486
UNDERLYING PROFIT BEFORE TAX 215 306 365 355 432 500 527
Income tax expenses -63 -44 -73 -90 -114 -133 -141
Exceptional Tax -56 -80 -102 -103 -125 -145 -153
Effective tax rate 30% 44% 30% 29% 29% 29% 29%
Underlying Tax rate 26% 26% 28% 29% 29% 29% 29%
PROFIT AFTER TAX 150 -145 171 220 280 327 345
UNDERLYING PROFIT AFTER TAX 159 226 263 252 307 355 374
Minority interest 2 -9 -3 -3 -3 -3 -3
NET INCOME 148 -136 168 217 277 324 342
UNDERLYING NET INCOME 161 217 260 249 304 352 371
Reported EPS (basic) 0.82 -0.65 0.79 1.03 1.31 1.53 1.62
Repoted EPS (diluted) 0.82 -0.65 0.79 1.03 1.31 1.53 1.62
UNDERLYING EPS (BASIC) 0.90 1.05 1.23 1.18 1.44 1.67 1.76
UNDERLYING EPS (DILUTED) 0.90 1.05 1.23 1.18 1.44 1.67 1.76
DIVIDEND PER SHARE 0.42 0.21 0.42 0.43 0.52 0.61 0.65
Payout Ratio 51% -32% 53% 42% 40% 40% 40%
Ordinary shares outstanding ('000) 179 208 211 211 211 211 211
Diluted shares outstanding ('000) 179 208 211 211 211 211 211
Cash Flow Statement 2010 2011 2012 2013E 2014E 2015E 2016E
Net income/(loss) before income tax expenses 213 -101 244 310 394 460 486
Depreciation and Amortisation 99 180 188 162 164 161 168
Depreciation expense 71 150 153 128 131 128 134
Amortization expense 28 30 35 34 32 33 34
Gain on disposal of PP&E and intangible assets 0 -2 -14 0 0 0 0
Gain from disposal activities 0 0 0 0 0 0 0
Share of income from invetsment in associates -2 -9 -17 -15 -15 -15 -15
Share based payments 0 7 17 0 0 0 0
Fair value change in metal derivatives -41 63 -21 0 0 0 0
decrease/(increase) in inventories -131 115 23 -6 -24 -35 -39
Trade receivables and trade payables 164 50 55 -101 -53 -54 7
Other assets and other liabilities -38 35 -4 0 0 0 0
Fair value of currency derivatives -1 -3 1 0 0 0 0
Cash generated from operations 263 335 472 351 466 518 606
Utilization of provisions -50 -67 -104 0 0 0 0
Accruals of provisions 33 267 117 0 0 0 0
Income tax paid -59 -97 -74 -90 -114 -133 -141
Net f inance costs 96 129 135 130 125 120 120
NET CASH FROM OPERATING ACTIVITIES 283 567 546 391 477 504 586
Purchase of Energy & Telecom cables & Systems division0 0 0 0 0 0 0
Acquisition -21 -419 -86 0 0 0 0
Investment in PP&E -83 -135 -132 -128 -131 -128 -134
Disposal of PP&E 7 14 11 0 0 0 0
Investment in intangible assets -19 -24 -20 0 0 0 0
Investment in f inancial assets held for trading -18 -42 -33 0 0 0 0
disposal of f inancial assets held for trading 0 22 25 0 0 0 0
Investment in available for sale investments -152 0 0 0 0 0 0
Disposal in available for sale investments 12 143 3 0 0 0 0
Investment in associates 0 -1 -1 0 0 0 0
Dividends received from investment in associates 2 5 6 15 15 15 15
Effect of disposed operations 0 0 0 0 0 0 0
NET CASH FROM INVESTING ACTIVITIES -272 -437 -227 -113 -116 -113 -119
FREE CASH FLOW 190 427 411 278 361 391 467
Contribution capital 13 1 1 0 0 0 0
Dividend paid -75 -37 -45 -91 -111 -130 -137
Purchase of treasury shares 0 0 0 0 0 0 0
Net f inance costs -52 -130 -129 -130 -125 -120 -120
Net changes in short and long-term borrow ings 233 128 -65 0 0 0 0
NET CASH FROM FINANCING ACTIVITIES 119 -38 -238 -221 -236 -250 -257
Exchange gain/(loss) 8 5 4 0 0 0 0
Net cash used in the period 138 97 85 57 125 141 210
Cash and cash equivalent beginning of period 492 630 727 812 869 994 1135
Cash and cash equivalent end of period 630 727 812 869 994 1135 1345
Source: Company data, Credit Suisse research

145
Prysmian – Company Summary
Operating Profit Split Sales Mix End Market Mix
Management
CEO Valerio Battista
COO Massimo Battani
CFO Pier Fracesco Facchin
IR Luca Caserta
Division Products End Markets / Channels Main Competitors Revenue Split by Geo Key Drivers/ Themes
Utilities
FY 2012 Sales EUR 2.29 Bn
1.2% YoY organic growth
FY 2012 EBIT EUR 0.23 Bn
10.2% Margin
Cables for power transmission and distribution
at both power stations and within primary and
secondary distribution grids.
Power Distribution 43%, Transmission
Submarine 26%, Transmission High Voltage
24%, and Network Component 7%
Nexans, NKT cable, Belden cables, Coleman
Cable, General Cables,
Power Distribution: Italy & Spain 8%, Other
Central & Southern Europe 34%, Eastern
Europe 6%, Nordics 12%, North America
18%, Latin America 10%, Asia Pacific 12%
Increasing share of renewables (offshore
wind); Grade upgrades
Trade & Installers
FY 2012 Sales EUR 2.13 Bn
-2.6% YoY organic growth
FY 2012 EBIT EUR 0.05 Bn
2.3% Margin
Flexible low voltage cables for distributing
power to residential and non-residential
buildings.
Residential (33%) and non-residential
buildings (67%Nexans, Coleman Cable, General Cables
Eastern Europe 22%, Western Europe 36%,
Asia Pacific 10%, Italy & Spain 8%,Nordics
8%, North America 7%, Latin America 6%
European construction new build (50%);
Renovation (50%)
Industry Division
FY 2012 Sales EUR 1.80 Bn
-1.5% YoY organic growth
FY 2012 EBIT EUR 0.1 Bn
5.5% Margin
Cabling solution to large industrial group and
OEM’s
Specialities & OEM's 32%, OGP & SURF
23%, Automotive 22%, Renewables 12%,
Elevator 7% and Others 4%,
Leoni, Nexans, NKT cable, Belden cables,
Coleman Cable, Furukawa, Hitachi Cable
EMEA 48%, North America 26%, Asia Pacific
15%, Latin America 8%
Global industrial production; Oil & gas capex;
Automotive demand
Telecom
FY 2012 Sales EUR 1.47 Bn
-3.5% YoY organic growth
FY 2012 EBIT EUR 0.1 Bn
7.3% Margin
Optical and copper cables for telecom
applications that include voice, video and data
transmission. The division also manufactures
connectivity components and accessories.
Optical Connectivity & Fibre 45%, Multimedia
& Specials 18%, Copper 14%, JV's and
Others 23%.
Nexans, Belden Cables, General Cables,
Fujikura, Furukawa
EMEA 44%, Asia Pacific 27%, Latin America
15%, North America 14%
Increasing data usage; Increased exposure to
Asia; Investment in optical fiber cables
PRYSMIAN (PRY.MI) - MAX YATES +44 20 7883 6893/ [email protected] Mix Shareholding Structure
Free Float:100%
Top 5 shareholders
Clubtre S.R.I 6.2%, Norges Bank 3.3%, DMR
LLC 3.1%, JPM Chase 2.2%, Franklin
Templeton 2.2%
Ownership by country
US 26%, UK 25%, Italy 14%, France 8%,
Norway 4%, Germany 4% and others
Industry48%
Energy10%
Healthcare21%
Infrastructure& Cities
21%
Industry30%
Energy28%
Healthcare23%
Infrastructure & Cities
19%
Latin America9%
Asia Pacif ic14%
EMEA62%
North America15%
Residential Construction
15%
Commercial Construction
15%
GI Aftermarket3%
Oil & Gas5%
GI Capex4%
Pow er T&D33%
Others 25%
Source: Company data

146
Renishaw – Neutral, TP 1715p
Bull Case Number of longer term attractions: Including
i. Selling into customers product development expenditures
ii. Potentially high ROIC / capacity expansion from recently acquired
Miskin facility + sale proceeds
iii. Healthcare still on track to turn profitable on our estimates
iv. R&D (12% of revenue) underpinning market leadership in chosen
product areas.
One of the few ways in the UK to gain exposure to 3D / additive printing.
Remains on the radar screen of US EE Multinationals.
Bear Case
Below structural average cash conversion: as Renishaw has seen
consistent working capital outflows, capex > depreciation and capitalisation
of R&D.
Vs. peer group (HLMA,SPRX,ROR) Renishaw has seen greatest volatility in
group gross/operating margins and ROIC.
Low visibility /lack of order book accentuates volatile quarterly
performance.
Investment summary: Despite longer terms structural growth attractions Renishaw continues to experience
significant quarterly profit volatility. Against this backdrop we prefer HLMA and ROR amongst the UK structural
growth exposed names .
0
500
1000
1500
2000
2500
0
20
40
60
80
100
120
2004 2005 2006 2007 2008 2009 2010 2011 2012 2013
1 Yr Forward EPS (LHS) Share Price (RHS)
-40%-30%-20%-10%0%10%20%30%40%50%60%
0%
5%
10%
15%
20%
25%
30%
Margins % (LHS) Organic Growth (RHS)
0%
10%
20%
30%
40%
50%
60%
70%
80%
90%
0%
5%
10%
15%
20%
25%
30%
RSW ROIC (LHS) Sector ROIC (LHS)
RSW Cash conversion (RHS) Sector Cash conversion (RHS)
Source: Thomson Reuters, Company data, Credit Suisse estimates

147
Renishaw – Valuation
2007 2008 2009 2010 2011 2012 2013 2014e 2015e
Share price - year high 860.0 796.5 881.0 730.0 1819.0 1886.0 2081.0 1825.0 1825.0
Share price - year low 599.5 597.0 248.5 340.3 725.0 800.0 1260.0 1825.0 1825.0
Share price - year average 759.2 680.2 514.1 572.8 1311.1 1272.7 1724.5 1825.0 1825.0
Enterprise value - high 598.2 546.2 636.2 531.9 1330.0 1386.1 1521.1 1287.1 1266.0
Enterprise value - low 408.6 401.0 175.8 248.2 533.7 595.6 923.5 1287.1 1266.0
Enterprise value - average 524.8 461.5 369.1 417.4 960.4 939.7 1261.6 1287.1 1266.0
EBITA 29.7 37.6 6.3 28.1 78.9 83.2 79.1 80.0 87.5
EV/EBITA - High 20.1 14.5 100.9 18.9 16.8 16.7 19.2 16.1 14.5
EV/EBITA - Low 13.7 10.7 27.9 8.8 6.8 7.2 11.7 16.1 14.5
EV/EBITA - Average 17.7 12.3 58.5 14.9 12.2 11.3 16.0 16.1 14.5
EBITDA 37.6 45.7 15.2 36.0 86.5 92.7 89.4 91.0 98.5
EV/EBITDA - high 15.9 12.0 41.9 14.8 15.4 15.0 17.0 14.1 12.9
EV/EBITDA - low 10.9 8.8 11.6 6.9 6.2 6.4 10.3 14.1 12.9
EV/EBITDA - average 14.0 10.1 24.3 11.6 11.1 10.1 14.1 14.1 12.9
Sales 180.9 201.2 171.2 181.6 288.8 331.9 346.9 350.0 363.0
EV/Sales - high 3.3 2.7 3.7 2.9 4.6 4.2 4.4 3.7 3.5
EV/Sales - low 2.3 2.0 1.0 1.4 1.8 1.8 2.7 3.7 3.5
EV/Sales - average 2.9 2.3 2.2 2.3 3.3 2.8 3.6 3.7 3.5
CS EPS Adjusted (p) 28.4 45.6 10.6 30.9 87.4 94.6 90.0 91.2 100.0
PER - high 30.3 17.5 83.1 23.6 20.8 19.9 23.1 20.0 18.2
PER - low 21.1 13.1 23.4 11.0 8.3 8.5 14.0 20.0 18.2
PER - average 26.8 14.9 48.5 18.5 15.0 13.5 19.2 20.0 18.2
NAV 230.8 228.9 197.5 217.9 277.1 333.0 380.2 472.1 528.1
PBV - high 3.7 3.5 4.5 3.3 6.6 5.7 5.5 3.9 3.5
PBV - low 2.6 2.6 1.3 1.6 2.6 2.4 3.3 3.9 3.5
PBV - average 3.3 3.0 2.6 2.6 4.7 3.8 4.5 3.9 3.5
Dividend Yield 22.1 23.6 7.8 17.6 35.0 38.5 40.0 42.8 45.8
Dividend Yield - high 3% 3% 1% 2% 2% 2% 2% 2% 3%
Dividend Yield - low 4% 4% 3% 5% 5% 5% 3% 2% 3%
Dividend Yield - average 3% 3% 2% 3% 3% 3% 2% 2% 3%
FCF before distributions -6 45 21 22 32 34 53 46 52
FCF/Sales -3% 22% 12% 12% 11% 10% 15% 13% 14%
FCF per share -7.61 61.56 29.34 30.13 44.47 46.88 73.07 62.95 71.36
FCF/EBITDA -15% 98% 141% 61% 37% 37% 60% 50% 53%
Valuation Multiples Cumulative Cash Conversion Bridge
CFROI expectations: Market (dot) vs. Consensus (bar)
100%
66%
6%
- 17%
- 10%- 3% 0% - 10%
0%
20%
40%
60%
80%
100%
120%
Cle
an n
et in
com
e
Rep
orte
d ne
t inc
ome
Wor
king
cap
ital
Del
ta b
/w C
apex
&D
eper
ecia
tion
Del
ta b
/w R
&D
Cap
italis
ed &
Inta
ngib
les
Am
ort.
PP
A
Oth
er (
Def
erre
d ta
x, P
ensi
on,
Min
ority
etc
)
Fre
e C
ash
Flo
w
Source: Company data, Credit Suisse estimates, Credit Suisse HOLT

148
Renishaw – Financials PROFIT & LOSS 2006 2007 2008 2009 2010 2011 2012 2013 2014e 2015e 2016e
FY FY FY FY FY FY FY FY FY FY FY
Revenue 175.8 180.9 201.2 171.2 181.6 288.8 331.9 346.9 350.0 363.0 377.0
Change yoy, % 2.9% 11.2% -14.9% 6.0% 59.0% 14.9% 4.5% 0.9% 3.7% 3.9%
EBITDA 43.3 37.6 45.7 15.2 36.0 86.5 92.7 89.4 91.0 98.5 105.0
Margin, % 24.6% 20.8% 22.7% 8.9% 19.8% 30.0% 27.9% 25.8% 26.0% 27.1% 27.9%
EBITA 35.5 29.7 37.6 6.3 28.1 78.9 83.2 79.1 80.0 87.5 94.0
Margin, % 20.2% 16.4% 18.7% 3.7% 15.5% 27.3% 25.1% 22.8% 22.9% 24.1% 24.9%
CS PBT 38.1 32.7 41.7 8.8 28.7 80.4 86.0 81.5 83.5 91.5 98.0
Income Tax (7.6) (12.0) (8.4) (1.1) (5.7) (16.3) (17.0) (15.6) (16.7) (18.3) (19.6)
Exceptional - Tax 0.0 0.0 0.0 0.0 0.0 0.0 0.0 0.0 0.0 0.0 0.0
CS EPS (Diluted) 41.9 28.4 45.6 10.6 30.9 87.4 94.6 90.0 91.2 100.0 107.1
Reported EPS (Diluted) 41.9 55.2 47.6 4.9 29.3 90.8 95.6 95.4 92.6 101.4 108.5
DPS, p 21.8 22.1 23.6 7.8 17.6 35.0 38.5 40.0 42.8 45.8 49.0
DPS growth yoy, % 2% 7% -67% 126% 99% 10% 4% 7% 7% 7%
CASH FLOW 2006 2007 2008 2009 2010 2011 2012 2013 2014e 2015e 2016e
EBITDA 43.3 37.6 45.7 15.2 36.0 86.5 92.7 89.4 91.0 98.5 105.0
Working Capital Change (2.6) (11.1) 5.1 21.2 (12.3) (26.6) (23.5) (2.5) (5.2) (5.6) (6.4)
Operating Cash Flow 41.7 9.9 53.8 37.8 30.1 59.7 77.7 95.8 84.8 91.8 97.6
Net Financing Cost 1.9 1.4 1.6 0.9 0.1 0.2 0.4 0.8 1.8 2.1 2.1
Tax Paid (7.6) (7.0) (6.9) (6.4) (5.6) (11.7) (14.1) (15.7) (15.9) (17.2) (18.7)
Net Operating Cash Flow 36.0 4.3 48.5 32.4 24.6 48.2 64.0 80.9 70.6 76.7 81.0
Net Capex (12.4) (9.9) (3.7) (11.0) (2.7) (15.8) (29.9) (27.7) (24.8) (24.8) (24.8)
Free Cash Flow 23.5 (5.5) 44.8 21.4 21.9 32.4 34.1 53.2 45.8 51.9 56.2
Acquisitions 0.0 0.0 (0.5) 0.0 0.0 0.0 0.0 (7.5) 0.0 0.0 0.0
Disposals 0.0 0.0 0.0 0.3 0.0 0.0 0.0 0.0 32.0 0.0 0.0
Pre Financing Cash Flow 15.2 (16.1) 37.6 7.2 14.7 12.7 20.8 34.2 77.8 51.9 56.2
Dividend Paid (14.9) (16.1) (17.2) (15.6) (2.9) (17.6) (25.5) (28.8) (31.1) (31.9) (34.1)
Net Cash / (Debt) Year End 30.7 20.8 38.2 20.5 31.1 23.7 21.1 26.6 73.3 93.4 115.5
BALANCE SHEET 2006 2007 2008 2009 2010 2011 2012 2013 2014e 2015e 2016e
PPE 69 69 69 74 71 82 101 118 132 146 160
Goodwill 2 2 4 6 6 13 19 20 20 20 20
Intangible Assets 10 12 15 22 23 34 35 36 36 36 36
Working capital 55 63 64 47 66 98 114 115 120 126 132
Total assets 131 147 140 146 165 216 263 292 312 333 354
Shareholders' funds 143 168 166 144 159 202 243 278 345 386 429
Minorities 0 0 0 0 (0) (0) (1) (1) (1) (1) (1)
Total Borrowings 0 0 0 0 0 0 0 0 (47) (67) (89)
Cash and equivalents (31) (21) (38) (20) (31) (24) (21) (27) (27) (27) (27)
Net Debt / (Cash) (31) (21) (38) (20) (31) (24) (21) (27) (73) (93) (115)
Pension Deficit 19 0 11 22 37 38 42 42 42 42 42
Total liabilities 131 147 140 146 165 216 263 292 312 333 354
Source: Company data, Credit Suisse estimates

149
Renishaw – Company Summary
Geographic Split Operating Profit Mix Sales Mix End Market Split
Division Products End Markets / Channels Main Competitors / Positioning Revenue Split by Geo Key Drivers / Themes
Metrology
FY2013 Sales - £318m,
5% org. growth
FY2013 EBITA - £85m,
26.7% margin
Machine tool probe systems
Co-ordinate measuring machine (CMM)
products
Styli for probe systems
Performance testing products
Gauging
Large scale metrology
Fixtures
Materials research
Position encoders
Additive manufacturing
Far East - £122m (40%)
Europe - £87m (28%)
Americas - £71m (23%)
UK & Ireland - £17m (6%)
Others - £8m (3%)
Increasing investment in production
capacity, shorter product life cycles,
automation, increasing product quality,
shortening R&D life cycles
Healthcare
FY2013 Sales - £29m,
10.3% org. growth
FY2013 EBITA - £(5.5)m,
(18.8)% margin
Dental scanners
Dental CAD software
Dental milling machines
Dental structures manufacturing service
Neurosurgical robot
Neurosurgical planning software
Neurosurgical implantables
Raman microscopes
Combined Raman systems
Structural and chemical analyser
In situ monitors
Diagnostic systems
Far East - £8m (20%)
Europe - £9m (34%)
Americas - £6m (21%)
UK & Ireland - £2m (7%)
Others - £2m (7%)
Healthcare spend, Advanced operational
procedures, Dentistry.
RENISHAW (RSHW.L / RSW LN) - JONATHAN HURN, CFA +44 20 7883 4532 / [email protected]
Hexagon, Halma, Spectris, Oxford
Instruments, Danaher, Ametek, Perkin
Elmo, Thermo Fisher, Teledyne
Powergen, Medical, Agriculture, Automotive,
Aerospace, Consumer products,
Construction
Metrology
92%
Healthcare
8%
Metrology
94%
Healthcare
-6%
Far East, 39%
Europe, 29%
Americas, 23%
UK&Ireland, 6%Others, 3% Aerospace
10%
Automotive10%
Construction Equipment
10%
Energy10%
Consumer Electronics
10%
General Industrial
42%
Healthcare8%
Shareholding structure
Free float: 47%
Top 5 shareholders: Director &
Related Holdings - 53%, Mcmurtry David
Roberts - 36%, Deer Daniel John - 17%,
Baillie Gifford And Company - 8%,
Blackrock - 5%
Ownership by Country: UK - 30%,
USA - 13%, Luxembourg - 2%, Norway -
1%, Ireland - 1%
Management
Chairman and CEO -Sir David McMurtry
CFO -Allen Roberts
CS - N Tang
Source: Company data

150
0%
5%
10%
15%
20%
10%
15%
20%
25%
30%
Margins % (LHS) Organic Growth (RHS)
Rotork – Outperform, TP 3230p
Bull Case Strategically well positioned: Both to traditional upstream /mid stream /down
stream oil & gas expenditure plus developing trends - LNG / coal bed
methane / mining.
Increasing addressable market: Now c£3bn vs. £4bn target. Scope for
further M&A to underpin expansion. Strategy has not diluted group ROIC.
IQ3 and CMA actuator launched. Service expanded.
Group margins not peaked: Fluid Systems forecast to deliver an impressive
18% in H2 2013. Near term group expansion held back by sales network
expansion / R&D costs.
CS HOLT CFROI upside: Warranted price for Rotork is 3981p.
Potential M&A candidate for global multinationals wanting to increase their
Process exposure.
Bear Case
With order intake -7% at constant currency in Q3 2013 Rotork is showing
signs of going ex-growth.
Further expansion of Instruments likely to dilute both Group margin and
company ROIC.
Investment summary: Sector leading ROIC, healthy cash conversion and an industry leading product portfolio
are all attractive traits. Add in a recent de-rating vs. the UK sector and increasing M&A focus from global
multinationals on Process assets such as Rotork and we continue to rate the stock at Outperform.
0
500
1000
1500
2000
2500
3000
3500
0
20
40
60
80
100
120
140
2004 2005 2006 2007 2008 2009 2010 2011 2012 2013
1 Yr Forward EPS (LHS) Share Price (RHS)
0%
10%
20%
30%
40%
50%
60%
70%
80%
90%
5%
15%
25%
35%
45%
55%
ROR ROIC (LHS) Sector ROIC (LHS)
ROR Cash conversion (RHS) Sector Cash conversion (RHS)
Source: Thomson Reuters, Company data, Credit Suisse estimates

151
Rotork – Valuation
2007 2008 2009 2010 2011 2012 2013e 2014e 2015e
Share price - year high 1108 1212 1266 1895 1936 2566 2717 2717 2717
Share price - year low 781 615 674 1186 1501 1854 2717 2717 2717
Share price - year average 932.35 958.52 938.56 1490.33 1687.74 2158.35 2717 2717 2717
Enterprise value - high 927.12 1011.68 1036.46 1557.07 1652.74 2189.88 2336.80 2286.45 2234.25
Enterprise value - low 645.57 497.39 525.67 945.34 1276.88 1574.57 2336.80 2286.45 2234.25
Enterprise value - average 775.88 793.32 753.94 1207.92 1438.23 1837.59 2336.80 2286.45 2234.25
EBITA 55.5 76.0 92.1 99.4 115.9 131.9 150.6 159.8 169.6
EV/EBITA - High 16.7 13.3 11.3 15.7 14.3 16.6 15.5 14.3 13.2
EV/EBITA - Low 11.6 6.5 5.7 9.5 11.0 11.9 15.5 14.3 13.2
EV/EBITA - Average 14.0 10.4 8.2 12.1 12.4 13.9 15.5 14.3 13.2
EBITDA 58.091 79.295 95.652 103.414 120.4 137.318 157.1 166.8 177.1
EV/EBITDA - high 16.0 12.8 10.8 15.1 13.7 15.9 14.9 13.7 12.6
EV/EBITDA - low 11.1 6.3 5.5 9.1 10.6 11.5 14.9 13.7 12.6
EV/EBITDA - average 13.4 10.0 7.9 11.7 11.9 13.4 14.9 13.7 12.6
Sales 235.688 320.207 353.521 380.56 447.833 511.747 585.9 624.6 660.5
EV/Sales - high 3.93 3.16 2.93 4.09 3.69 4.28 3.99 3.66 3.38
EV/Sales - low 2.74 1.55 1.49 2.48 2.85 3.08 3.99 3.66 3.38
EV/Sales - average 3.29 2.48 2.13 3.17 3.21 3.59 3.99 3.66 3.38
CS EPS Adjusted (p) 45.32 62.92 74.52 82.20 97.09 108.73 123.58 130.78 137.94
PER - high 24.45 19.26 16.99 23.05 19.94 23.60 21.99 20.78 19.70
PER - low 17.23 9.77 9.04 14.43 15.46 17.05 21.99 20.78 19.70
PER - average 20.57 15.23 12.59 18.13 17.38 19.85 21.99 20.78 19.70
NAV 118.9 167.6 192.6 235.9 259.4 311.0 308.2 368.7 432.2
PBV - high 9.3 7.2 6.6 8.0 7.5 8.3 8.8 7.4 6.3
PBV - low 6.6 3.7 3.5 5.0 5.8 6.0 8.8 7.4 6.3
PBV - average 7.8 5.7 4.9 6.3 6.5 6.9 8.8 7.4 6.3
Dividend Yield 28.65 37.50 39.90 44.00 48.75 43.00 48.16 53.94 60.41
Dividend Yield - high 3% 3% 3% 2% 3% 2% 2% 2% 2%
Dividend Yield - low 4% 6% 6% 4% 3% 2% 2% 2% 2%
Dividend Yield - average 3% 4% 4% 3% 3% 2% 2% 2% 2%
FCF before distributions 39 47 76 64 64 69 86 100 106
FCF/Sales 17% 15% 22% 17% 14% 13% 15% 16% 16%
FCF per share 45.35 54.59 88.15 73.30 73.55 79.35 98.25 114.85 121.79
FCF/EBITDA 68% 60% 80% 61% 53% 50% 54% 60% 60%
Valuation Multiples Cumulative Cash Conversion Bridge
CFROI expectations: Market (dot) vs. Consensus (bar)
100%
85%
-3%
- 11%- 3%
3%
-2%
60%
70%
80%
90%
100%
110%
Cle
an n
et in
com
e
Rep
orte
d ne
t inc
ome
Wor
king
cap
ital
Del
ta b
/w C
apex
&D
eper
ecia
tion
Del
ta b
/w R
&D
Cap
italis
ed &
Inta
ngib
les
Am
ort.
PP
A
Oth
er (
Def
erre
d ta
x, P
ensi
on,
Min
ority
etc
)
Fre
e C
ash
Flo
w
Source: Company data, Credit Suisse estimates, Credit Suisse HOLT

152
Rotork – Financials PROFIT & LOSS 2005 2006 2007 2008 2009 2010 2011 2012 2013e 2014e 2015e
FY FY FY FY FY FY FY FY FY FY FY
Revenue 174.7 206.7 235.7 320.2 353.5 380.6 447.8 511.7 585.9 624.6 660.5
Change yoy, % 18.3% 14.0% 35.9% 10.4% 7.6% 17.7% 14.3% 14.5% 6.6% 5.7%
EBITDA 39.2 47.6 58.1 79.3 95.7 103.4 120.4 137.3 157.1 166.8 177.1
Margin, % 22.4% 23.0% 24.6% 24.8% 27.1% 27.2% 26.9% 26.8% 26.8% 26.7% 26.8%
EBITA 36.5 45.1 55.5 76.0 92.1 99.4 115.9 131.9 150.6 159.8 169.6
Margin, % 20.9% 21.8% 23.5% 23.7% 26.1% 26.1% 25.9% 25.8% 25.7% 25.6% 25.7%
CS PBT 36.7 46.1 57.3 76.9 91.5 99.6 116.5 131.6 149.4 159.2 169.1
Income Tax (12.0) (14.7) (18.0) (22.3) (26.9) (28.3) (32.1) (32.8) (41.8) (45.4) (49.0)
CS EPS (Diluted) 28.4 36.2 45.3 62.9 74.5 82.2 97.1 108.7 123.6 130.8 137.9
Reported EPS (Diluted) 28.2 36.0 45.2 61.6 73.9 80.2 92.6 102.6 109.8 117.0 124.1
DPS, p 15.6 27.7 28.7 37.5 39.9 44.0 48.8 43.0 48.2 53.9 60.4
DPS growth yoy, % 78% 3% 31% 6% 10% 11% -12% 12% 12% 12%
CASH FLOW 2005 2006 2007 2008 2009 2010 2011 2012 2013e 2014e 2015e
EBITDA 39.2 47.6 58.1 79.3 95.7 103.4 120.4 137.3 157.1 166.8 177.1
Working Capital Change (2.7) (0.7) (3.5) (7.0) 11.6 (10.8) (19.7) (15.0) (20.6) (13.1) (14.1)
Operating Cash Flow 36.3 42.5 56.2 73.9 107.2 94.4 100.9 118.6 132.5 149.7 159.0
Net Financing Cost 0.5 0.7 0.8 0.3 0.1 0.4 0.6 0.5 (0.5) (0.1) (0.1)
Tax Paid (11.3) (11.2) (15.1) (22.5) (27.5) (26.2) (27.8) (37.6) (37.6) (40.8) (44.1)
Net Operating Cash Flow 25.5 31.9 41.9 51.6 79.7 68.6 73.7 81.4 94.3 108.8 114.8
Net Capex (1.3) (2.3) (2.5) (4.3) (3.3) (5.0) (9.9) (12.4) (8.8) (8.8) (8.8)
Free Cash Flow 24.2 29.6 39.4 47.3 76.4 63.5 63.9 69.1 85.5 100.0 106.0
Acquisitions (7.2) (1.6) (0.0) (12.7) (4.9) (5.6) (59.9) (20.9) (53.1) (4.9) (4.9)
Disposals 0.0 0.0 0.0 0.0 0.0 0.2 0.0 0.0 0.0 0.0 0.0
Pre Financing Cash Flow 16.7 27.7 38.7 33.1 70.8 57.0 2.6 46.1 31.7 95.1 101.1
Dividend Paid (13.4) (24.1) (24.7) (30.0) (24.1) (35.9) (49.5) (33.9) (38.7) (44.7) (48.9)
Net Cash / (Debt) Year End 25.9 27.7 37.9 41.0 78.4 97.7 48.5 59.9 46.6 97.0 149.2
BALANCE SHEET 2005 2006 2007 2008 2009 2010 2011 2012 2013e 2014e 2015e
PPE 17 17 18 24 24 26 32 38 41 43 44
Goodwill 21 21 22 33 33 36 68 81 81 81 81
Intangible Assets 1 1 2 7 8 8 38 41 31 22 12
Working capital 48 50 59 90 74 88 121 131 151 164 178
Total assets 80 70 76 112 110 126 204 242 251 253 256
Shareholders' funds 81 89 102 144 166 204 224 269 267 319 374
Minorities 0 0 0 0 0 0 0 0 0 0 0
Total Borrowings 2 1 0 0 0 0 0 0 13 (37) (89)
Cash and equivalents (28) (28) (38) (41) (79) (98) (49) (60) (60) (60) (60)
Net Debt / (Cash) (26) (28) (38) (41) (78) (98) (48) (60) (47) (97) (149)
Pension Deficit 25 8 11 9 23 20 28 32 31 31 31
Total liabilities 80 70 76 112 110 126 204 242 251 253 256
Source: Company data, Credit Suisse estimates

153
Rotork – Company Summary
Geographic Split Operating Profit Mix Sales Mix End Market Split
Division Products End Markets / Channels Main Competitors / Positioning Revenue Split by Geo Key Drivers / Themes
Controls/Electrics
FY2012 Sales - £293m,
6.3% org. growth
FY2012 EBITA - £95m,
32.3% margin
Electric valve actuators and solutions to
industrial valve control and actuation
applications in a range of sizes and
complexities.
41% Oil & gas, 18% water, 30% power,
8% industrial, 3% other
Auma 20%; Limitorque (Flowserve) 12%;
EIM 8%, Biffi (Tyco) 5% and Bernard Control
4%
Europe - £70m (25%)
America - £53m (19%)
Asia - £131m (47%)
ME/Other - £25m (9%)
Oil & Gas capex is more downstream
focused. LNG.
Fluid Systems
FY2012 Sales - £161m,
24.1% org. growth
FY2012 EBITA - £25m,
15.3% margin
Manufactures high torque and
reliable fluid power valve actuators
82% Oil and gas (13%
transmission, 87% shutdown), 1%
water, 3% power, 8% ind, 6% other
Biffi 12% (Pentair); Betis (Emerson) 20%;
Ledeen (Cameron) 10%; Metso 5%
Europe - £38m (29%)
America - £27m (20%)
Asia - £30m (23%)
ME/Other - £37m (28%)
Oil & Gas capex is more upstream
focused. More bought in components
cause lower RoS vs. Controls. Demand
is more project based
Instruments
FY2012 Sales - £16m,
4.1% org. growth
FY2012 EBITA - £5m,
31.1% margin
High precision pneumatic controls &
power transmission - regulators,
boosters, relays & transducers (46%
MRO, 36% IE, 18% cap projects)
20% Oil and gas, rest pharma,
biomedical, tyre manufacture, robotics, food
processing & chem apps.
Honeywell, Pentair, Emerson, Flowserve
Europe - £0.2m (16%)
America - £0.8m (57%)
Asia - £0.2m (12%)
ME/Other - £0.2m (15%)
New market for Rotork. Looking to
develop wider prescence in flow control.
Driver of increase of addressable market
share to £4.2bn
Gears
FY2012 Sales - £53m,
13.9% org. growth
FY2012 EBITA - £12m,
22.9% margin
Valve gearboxes and accessories
associated with valve actuation. Low
cost manual operators to highly specified
versions for critical sub sea valves.
40% Oil and gas, 27% water, 11%
power, 16% industrial, 6% other
Very fragmented market with a large
number of small players
Europe - £25m (53%)
America - £11m (24%)
Asia - £5m (10%)
ME/Other - £6m (13%)
Drivers directly linked to the demand for
actuators. Sells into both Rotork and
external customers
ROTORK (ROR.L / ROR LN) - JONATHAN HURN, CFA +44 20 7883 4532 / [email protected]
Oil&Gas
53%
Power
12%
Water
22%
Industrial
8%
Other
5%
Controls/Electrics
53%
Fluid Systems
33%
Instruments
4%
Gears
10%UK, 5%Rest of Europe,
31%
USA, 21%
Other Americas,
10%
RoW, 33%
Controls/Electrics
65%
Fluid Systems
21%
Instruments
5%
Gears
9%
Shareholding structure
Free float: 97%
Top 5 shareholders: Blackrock - 7%,
AXA - 5%, Mondrian Investment Partners
Ltd - 5%, FMR LLC - 5%, Legal &
General - 4%
Ownership by Country: UK - 51%,
USA - 26%, Luxembourg - 4%, Norway -
4%, Germany - 3%
Management
Chairman -Roger Lockwood
CEO -Peter France
CFO -Jonathan Davis
CS -Stephen Jones
Source: Company data

154
Sandvik – Underperform, TP SEK 75 Investment summary: We are negative because of a meaningful near-term risk to consensus estimates from
Mining & Construction divisions while new product momentum and self-help are rather longer-term drivers.
Bear Case Near-term earnings risk from operational gearing on Mining declines – we see a
risk to Mining margins over the next 2-3 quarters as revenues continue to decline
further (following orders) with limited incremental cost savings coming through
until Q2 2014;
Ongoing softness in Construction – Sandvik Construction profitability declined
by 400bps in 2013 YTD to c5% on only c7% volume declines suggesting pricing
deterioration or internal inflation with company pointing to ongoing softness in the
near-term;
Pricing risk in Mining while we currently discount no pricing deterioration;
Risk of Japan-based competition for Sandvik Materials Technology and to some
extent for Machining Solutions.
Bull Case Geared exposure to short-cycle recovery. We already discount 6% and 7%
organic growth for Sandvik Machining Solutions for 2014/15 while over the past
2-3 years the business has lagged the global industrial production;
Self help with new SEK 500-700m programme in 2014 and a further SEK 3bn
worth programme later (details yet to be released). While we see the cost-
cutting effort as the right thing to do, we already discount SEK 700m of savings
per annum and the above factors may result in a low retention ratio;
New product momentum with multiple launches across the divisions;
Scope for future radical portfolio rationalisation.
0
20
40
60
80
100
120
140
160
-4
-2
0
2
4
6
8
10
2004 2005 2006 2007 2008 2009 2010 2011 2012 2013
1 Yr Forward EPS (LHS) Share Price (RHS)
-40%
-30%
-20%
-10%
0%
10%
20%
30%
0%
4%
8%
12%
16%
20%
Margins % (LHS) Organic Growth (RHS)
0%
20%
40%
60%
80%
100%
0%
5%
10%
15%
20%
SAND ROIC (LHS) Sector ROIC (LHS)
SAND Cash conversion (RHS) Sector Cash conversion (RHS)
Source: Thomson Reuters, Company data, Credit Suisse estimates

155
Sandvik – Valuation
Grow th (years 4 to 10) 4.5%
EBIT margin (years 4+) 13.5%
NOPAT margin 9.7%
Invested capital 71,958
Invested capital grow th (years 4+) 2.0%
Terminal grow th rate 2.0%
10-year average FCF yield 6.8%
WACC 9.0%
EBIT NOPAT Growth rate
margin margin 3.5% 4.0% 4.5% 5.0% 5.5%
11.5% 8.3% 60 60 60 60 60
12.0% 8.6% 63 64 64 64 64
12.5% 9.0% 67 67 67 68 68
13.0% 9.4% 70 71 71 71 72
13.5% 9.7% 73 74 75 75 76
14.0% 10.1% 77 78 78 79 79
14.5% 10.4% 80 81 82 83 83
15.0% 10.8% 84 85 85 86 87
15.5% 11.2% 87 88 89 90 91
16.0% 11.5% 90 92 93 94 95
December y/e 2007 2008 2009 2010 2011 2012 2013E 2014E 2015E
Average/Current 123.8 82.2 64.8 98.0 102.8 94.5 86.5 86.5 86.5
High 149.8 111.3 89.3 132.9 134.9 106.6
Low 93.5 41.8 41.5 76.5 72.9 82.3
P/E average 16.3 12.3 nm 17.9 13.0 13.2 15.6 14.5 12.9
P/E high 19.8 16.7 nm 24.2 17.0 14.8
P/E low 12.3 6.3 nm 13.9 9.2 11.5
EV/Sales average 2.07 1.44 1.52 1.72 1.60 1.48 1.61 1.54 1.42
EV/Sales high 2.43 1.82 1.93 2.22 2.01 1.63
EV/Sales low 1.65 0.93 1.14 1.41 1.23 1.32
Operating profit margin 16.7% 13.8% 1.5% 13.4% 14.3% 14.6% 12.8% 14.0% 14.9%
EV/EBITDA average 10.2 8.2 19.4 9.4 7.8 7.8 8.8 7.8 6.9
EV/EBITDA high 12.0 10.4 24.6 12.2 9.8 8.6
EV/EBITDA low 8.2 5.3 14.6 7.7 6.0 7.0
EV/EBIT average 12.4 10.5 99.8 12.9 11.2 10.1 12.6 11.0 9.6
EV/EBIT high 14.6 13.2 126.2 16.6 14.0 11.2
EV/EBIT low 9.9 6.7 74.7 10.5 8.6 9.1
FCF yield average 0.3% 2.9% 10.5% 7.7% 2.4% 6.8% 2.2% 8.3% 8.4%
FCF yield high 0.4% 5.8% 16.5% 9.9% 3.4% 7.7%
FCF yield low 0.3% 2.2% 7.6% 5.7% 1.8% 6.0%
Dividend yield average 3.2% 3.8% 1.5% 3.1% 3.2% 3.7% 4.0% 4.3% 4.9%
Dividend yield high 2.7% 2.8% 1.1% 2.3% 2.4% 3.3%
Dividend yield low 4.3% 7.5% 2.4% 3.9% 4.5% 4.3%
EV/IC average 2.6 1.6 1.5 2.0 2.0 2.0 1.9 1.9 1.8
EV/IC high 3.0 2.0 1.9 2.6 2.5 2.2
EV/IC low 2.1 1.0 1.1 1.7 1.5 1.8
P/BV average 5.2 2.7 2.7 3.6 3.8 3.7 3.2 2.9 2.6
P/BV high 6.2 3.7 3.7 4.8 4.9 4.1
P/BV low 3.9 1.4 1.7 2.8 2.7 3.2
ROIC 15.3% 11.4% 1.1% 11.6% 12.8% 13.7% 11.2% 12.7% 14.0%
ROE 31.5% 22.3% -3.2% 20.0% 28.9% 27.8% 20.5% 20.0% 20.4%
ROCE 19.2% 13.8% 1.4% 14.8% 16.8% 18.9% 14.1% 16.1% 17.7%
DCF
Source: Company data, Credit Suisse estimates

156
Sandvik – Financials PROFIT & LOSS 2010 2011 2012 2013E 2014E 2015E
Revenue 82,654 94,083 98,529 85,664 86,513 90,414
Growth, % 14.9% 13.8% 4.7% -13.1% 1.0% 4.5%
COGS (53,131) (61,704) (63,826) (59,965) (60,559) (63,290)
Gross Profit 29,523 32,379 34,703 25,699 25,954 27,124
Gross margin, % 35.7% 34.4% 35.2% 30.0% 30.0% 30.0%
SG&A (16,143) (19,511) (18,297) (16,533) (16,697) (17,450)
R & D expenses (2,106) (2,421) (2,572) (2,399) (2,422) (2,532)
Other operating income/exp (245) (300) (350) 78 79 90
Reported EBIT 11,029 10,147 13,490 9,936 12,115 13,450
Reported EBIT margin, % 13.3% 10.8% 13.7% 11.6% 14.0% 14.9%
Exceptionals / one-offs (25) (3,324) (920) (1,000) 0 0
Operating profit 11,054 13,471 14,410 10,936 12,115 13,450
Operating profit margin, % 13.4% 14.3% 14.6% 12.8% 14.0% 14.9%
Depreciation & Amortisation (4,037) (4,549) (4,216) (4,744) (5,008) (5,103)
EBITDA 15,092 19,294 18,732 15,680 17,123 18,553
EBITDA margin, % 18.3% 20.5% 19.0% 18.3% 19.8% 20.5%
Net interest income / (expense) (1,617) (1,969) (1,974) (1,822) (1,672) (1,572)
Rate, % 7.3% 8.0% 0.0% 6.5% 6.5% 6.5%
Profit Before Tax 9,412 8,178 11,516 8,114 10,443 11,878
Underlying PBT 9,237 11,302 12,236 8,914 10,243 11,678
Tax (2,469) (2,318) (3,409) (2,150) (2,715) (3,207)
Effective rate, % 26.2% 28.3% 29.6% 26.5% 26.0% 27.0%
Reported profit after tax 6,943 5,860 8,107 5,964 7,728 8,671
Minority interest (309) (363) (2) 0 0 0
Reported Net Income 6,634 5,497 8,105 5,964 7,728 8,671
CS Adjustments (131) 2,343 540 600 (150) (150)
Operating Net Income 6,503 9,402 9,005 6,964 7,478 8,421
Net income margin, % 7.9% 10.0% 9.1% 8.1% 8.6% 9.3%
CS operating EPS 5.5 7.9 7.2 5.6 6.0 6.7
EPS growth, % nm 45% -9% -23% 7% 13%
DPS, SEK 3.0 3.3 3.5 3.5 3.8 4.3
DPS growth, % 200.0% 8.3% 7.7% 0.0% 7.1% 13.3%
Dividend Cover (X) 1.9 1.4 1.8 1.4 1.6 1.6
Ordinary shares in issue 1,186 1,186 1,254 1,254 1,254 1,254ANALYSIS 2010 2011 2012 2013E 2014E 2015E
NOPAT 8,154 9,653 10,144 8,038 8,965 9,818
Invested Capital 70,260 75,577 74,232 71,958 70,704 70,253
ROIC 11.6% 12.8% 13.7% 11.2% 12.7% 14.0%
ROIC (average) 11.4% 13.2% 13.5% 11.0% 12.6% 13.9%
Operating Net Income 6,503 9,402 9,005 6,964 7,478 8,421
Equity 33,813 33,891 32,536 28,309 31,646 35,613
ROE 19.2% 27.7% 27.7% 24.6% 23.6% 23.6%
ROE (average) 20.4% 27.8% 27.1% 22.9% 24.9% 25.0%
EBITDA 15,092 19,294 18,732 15,680 17,123 18,553
Total debt (27,203) (30,715) (34,961) (34,961) (34,961) (34,961)
Net debt (22,420) (25,123) (21,132) (23,085) (18,494) (14,076)
Total debt / EBITDA 1.8 1.6 1.9 2.2 2.0 1.9
Net debt / EBITDA 1.5 1.3 1.1 1.5 1.1 0.8
BALANCE SHEET 2010 2011 2012 2013E 2014E 2015E
PPE and Intangibles 38,445 37,509 36,939 36,136 35,454 35,052
Other f ixed assets 6,023 6,835 6,268 6,268 6,268 6,268
Fixed assets 44,468 45,091 43,207 42,404 41,722 41,320
Inventories 21,420 26,077 25,508 23,986 23,791 23,960
Trade and other receivables 19,328 21,979 21,511 19,703 19,898 20,795
Trade and other payables (14,956) (17,570) (15,994) (14,135) (14,707) (15,822)
Working capital 25,792 30,486 31,025 29,554 28,982 28,933
Working capital days 114 118 115 126 122 117
WC as % of sales 31.2% 32.4% 31.5% 34.5% 33.5% 32.0%
Cash 4,783 5,592 13,829 11,876 16,467 20,885
Short-term debt (3,783) (5,948) (2,698) (6,992) (6,992) (6,992)
Long-term debt (23,420) (24,767) (32,263) (27,969) (27,969) (27,969)
(Net debt) / cash (22,420) (25,123) (21,132) (23,085) (18,494) (14,076)
Pension deficit (2,264) (2,358) (6,037) (6,037) (6,037) (6,037)
Other liabilities (11,763) (14,097) (14,527) (14,527) (14,527) (14,527)
Net assets 33,813 33,891 32,536 28,309 31,646 35,613
CASH FLOW 2010 2011 2012 2013E 2014E 2015E
Operating Profit 11,054 13,471 14,410 10,936 12,115 13,450
Depreciation & amortisation 4,038 5,823 4,322 4,744 5,008 5,103
Tax paid (1,056) (2,587) (3,056) (7,950) (2,715) (3,207)
Financing Cost (1,617) (1,969) (1,974) (1,822) (1,672) (1,572)
Other (155) (1,965) (669) (1,000) 0 0
Gross cash flow 12,264 12,773 13,033 4,907 12,735 13,774
Working capital change 48 (4,730) (592) 1,471 572 49
Operating cash flow 12,312 8,043 12,441 6,378 13,307 13,823
Operating cash / Operating profit 1.1 0.6 0.9 0.6 1.1 1.0
Net Capex (3,327) (5,122) (4,441) (3,941) (4,326) (4,702)
Free cash flow 8,985 2,921 8,000 2,438 8,982 9,122
FCF / Net income 1.4 0.3 0.9 0.4 1.2 1.1
Acquisitions (1,223) (361) (39) 0 0 0
Disposals 0 0 0 0 0 0
Borrow ings raised / (repaid) (9,257) 2,153 4,571 0 0 0
Redemption of Shares 0 0 0 0 0 0
Dividends paid (1,188) (3,807) (4,082) (4,390) (4,390) (4,704)
Other 0 0 0 0 0 0
Exchange rate differences (81) (98) (213) 0 0 0
Net cash flow (2,764) 808 8,237 (1,953) 4,591 4,418
Source: Company data, Credit Suisse estimates

157
Sandvik – Company Summary
Operating profit split Sales Mix End Market Mix
Management
Chairman Anders Nyren
CEO Olof Faxander
CFO Ola Salmen
IR Jan Lissaker
Division Products End Markets / Channels Main Competitors Revenue Split by Geo Key Drivers/ Themes
Sandvik Mining
FY 2012 Sales SEK 37.76 Bn
16.8% YoY organic growth
FY 2012 EBIT SEK 6.17 Bn
16.3% Margin
Equipment, tools and service for the mining
industries: Rock tools and systems, drill rigs
and rock drills, load and haul machines,
continuous mining and tunneling machines,
mobile and stationary crushers, bulk material
handling equipment, breakers and demolition
tools.
Equipment 37%, Customer Services 33%,
Mining Systems 19% and Rock Tools 11%.
Atlas Copco, Boart Longyear, Caterpillar,FLS
Minerals, Joy Global, Metso Minerals
Australia 23%, Middle East/Africa 22%, Asia
18%, South America 15%, North America
13%, Europe 9%
Demand for base metal, coal; Infrastructure
investments in mining industry; Growth of EM
Sandvik Machining
FY 2012 Sales SEK 29.71 Bn
1.2% YoY organic growth
FY 2012 EBIT SEK 6.45 Bn
21.7% Margin
Tools and tooling systems for the metal
cutting industry. Products are manufactured in
cemented carbide and other hard materials
such as diamond, cubic boron nitride and
special ceramics.
Engineering 48%, Automotive 28%,
Aerospace 11%, Energy 11% and Mining 2%
Iscar, Kennametal, Kyocera, Mitsubishi,
OSG, Sumitiomo
Europe 54%, North America 21%, Asia 20%,
South America 3%, Middle East/Africa 1%,
Australia 1%
Economic growth in developed countries &
China; demand in the engineering sector
Sandvik Material Technology
FY 2012 Sales SEK 15.37 Bn
-6.3% YoY organic growth
FY 2012 EBIT SEK 1.26 Bn
8.2% Margin
Advanced stainless materials, special alloys,
metallic, ceramic resistance materials and
process systems: Tube, Strip, Kanthal,
Process Systems and MedTec
Energy 33%, General Engineering 16%,
Consumer Electronics 15%, Chemical 12%,
Construction 7%, Mining 6%, Automotive 6%,
Aerospace 3% and Medical 2%
Böhler Uddeholm,Hitachi,Salzgitter
Mannesmann, Sumitomo, Tubacex ,Ugitech,
VDM
Europe 48%, North America 26%, Asia 16%,
Australia 7%, South America 2%, Middle
East/Africa 1%
Shift of business mix towards higher-end,
bespoke products and away from commodity
Sandvik Construction
FY 2012 Sales SEK 9.68 Bn
1.6% YoY organic growth
FY 2012 EBIT SEK 0.75 Bn
7.7% Margin
Rock tools, drilling rigs, breakers, bulk-
materials handling and crushing and screening
machinery
Aggregate and Cement Quarrying 30%,
Breaking,Crushing and Screening 30%,
Underground Civil Engineering 20% and
Surfaced Drilling and Blast Contracting 20%
Atlas Copco, Astec, Caterpillar, Furukawa,
Metso Minerals
Europe 37%, Asia 20%, North America 15%,
South America 11%,Middle East/Africa 9%,
Australia 8%
Economic growth in EM; Population growth;
Urbanization; Infrastructure investment
Sandvik Venture
FY 2012 Sales SEK 5.96 Bn
-5.5% YoY organic growth
FY 2012 EBIT SEK 1.12 Bn
18.8% Margin
Product areas which are too small to be
categorized as separate Business units:
Sandvik Hard Materials, Wolfarm and Dormer,
Process systems and Diamond Innovations.
Engineering 35%, Energy 15%, Mining 10%,
Chemical 10%, Construction 5%, Automotive
5%, Consumer Related 5%, Aerospace 5%
and Others 10%
Berndorf (process systems), Zapp (medtech)
Europe 50%, North America 21%, Asia 19%,
South America 5%, Middle East/Africa 3%,
Australia 2%,
Development of new product; Investment in
R&D
SANDVIK (SAND.ST) - ANDRE KUKHNIN, CFA +44 20 7883 0350/ [email protected]
Geographic MixShareholding Structure
Free Float: 88%
Top 5 shareholders
AB Industrivarden 11%, JPM Chase
5%,Swedbank Robur Funds 5%,
Handelsbanken's Pension Foundation 4%,
SSB CL Omnibus 4%.
Ownership by country
Sweden 64%, USA 15%, UK 12%,
Luxembourg 2%, Denmark 1% and others
Sandvik Mining
39%
SandvikMachining
41%
Sandvik Material Technology
8%
Sandvik Construction
5%
Sandvik Venture7%
Sandvik Mining38%
Sandvik Machining
30%
Sandvik Material
Technology16%
Sandvik Construction
10%
Sandvik Venture6%
Aerospace4%
Energy9%
Mining40%
Engineering 19%
Automotive10%
Construction11%
Consumer Related
3%
Others4%
NAFTA18%
South America
9%
Europe34%
Asia18%
Middle East/Africa
10%
Australia11%
Source: Company data

158
Schindler – Outperform, TP CHF 150 Investment summary: Attractive entry point opportunity with temporary margin pressure resulting from
investment for future growth through multiple new product introductions and manufacturing reset.
Bull Case Scope for continuing well-above market growth rate in China as Schindler is playing
catch up to its ‘fair share’ of the market by fully penetrating Tier 2 cities and building
presence in Tier 3/4s as well as by introduction of a China low-end specific product
(Schindler 3600) that is yet to make an impact;
Scope for further market share gains globally with Schindler 5500;
Innovative PORT technology for the high-end high-rise applications where
Schindler is the pioneer (destination control and people flow solutions);
As a result of above, potential for continuing high-single digit orders and top line
growth in mid-term;
Strong balance sheet post only 1/3 of fixed price share repurchase offer taken up
by shareholders (offer at CHF 129 / 129.9 for N/P shares) leaving scope for further
cash returns to shareholders.
Bear Case Margins came under pressure in mid-2013 and are likely to remain depressed
throughout 2014 as new factories continue to come online and new products
continue to ramp up;
Relatively weak current presence / positioning in China poses a risk of losing out on
the maintenance market opportunity, especially if the new regulation make an impact
as early as 2014;
Risk of Brazil cooling down and FX fluctuations;
Risk of failing to execute on LEAP cost-savings plan.
0
20
40
60
80
100
120
140
160
0
1
2
3
4
5
6
7
2004 2005 2006 2007 2008 2009 2010 2011 2012 2013
1 Yr Forward EPS (LHS) Share Price (RHS)
-10%
-5%
0%
5%
10%
15%
20%
25%
30%
0%
2%
4%
6%
8%
10%
12%
14%
Margins % (LHS) Sales Growth ex-currency(RHS)
0%
20%
40%
60%
80%
100%
120%
10%
15%
20%
25%
SCHP ROIC (LHS) Sector ROIC (LHS)
SCHP Cash conversion (RHS) Sector Cash conversion (RHS)
Source: Thomson Reuters, Company data, Credit Suisse estimates

159
Schindler – Valuation
5.5% 6.0% 6.5% 7.0% 7.5%
9.5% 6.9% 124 126 129 132 135
10.0% 7.3% 129 131 134 137 140
10.5% 7.6% 133 136 139 142 146
11.0% 8.0% 138 141 145 148 151
11.5% 8.3% 143 146 150 153 157
12.0% 8.7% 148 151 155 158 162
12.5% 9.1% 153 157 160 164 168
13.0% 9.4% 158 162 165 169 173
13.5% 9.8% 163 167 170 174 178
14.0% 10.2% 168 172 176 180 184
EBITA
margin
NOPAT
margin
Grow th (years 4 to 10) 6.5%
EBIT margin (years 4+) 11.5%
NOPAT margin 8.3%
Invested capital 1,906
Invested capital grow th (years 4+) 2.0%
Terminal grow th rate 2.0%
10-year average FCF yield 8.2%
December y/e 2007 2008 2009 2010 2011 2012 2013E 2014E 2015E
Average/Current 77.1 68.0 64.2 96.0 103.2 113.7 123.8 123.8 123.8
High 84.5 86.8 78.5 116.8 113.6 130.4
Low 67.0 45.4 47.1 77.7 81.0 104.6
Year end 73.0 47.1 78.4 111.9 109.1 129.8
P/E average 18.3 13.2 12.4 16.9 17.8 18.9 21.3 18.9 16.8
P/E high 20.0 16.9 15.1 20.6 19.6 21.6
P/E low 15.9 8.8 9.1 13.7 14.0 17.3
EV:sales average 0.66 0.52 0.74 1.16 1.27 1.37 1.50 1.27 1.13
EV:sales high 0.72 0.67 0.93 1.45 1.47 1.62
EV:sales low 0.56 0.32 0.48 0.88 0.98 1.25
Group operating margin 5.8% 6.3% 11.4% 11.9% 11.8% 11.2% 10.4% 10.5% 11.0%
EV:EBITDA average 9.8 7.1 5.8 8.5 9.6 10.2 12.3 10.3 8.9
EV:EBITDA high 10.7 9.3 7.3 10.8 11.1 12.0
EV:EBITDA low 8.4 4.4 3.7 6.5 7.4 9.3
EV:EBIT average 11.4 8.2 6.5 9.7 10.8 11.4 14.5 12.1 10.2
EV:EBIT high 12.4 10.6 8.2 12.2 12.5 13.5
EV:EBIT low 9.8 5.1 4.2 7.4 8.3 10.4
FCF yield average 5.2% 11.7% 11.9% 8.0% 4.6% 4.8% 4.0% 5.1% 6.3%
FCF yield high 4.7% 9.1% 9.7% 6.5% 4.2% 4.2%
FCF yield low 6.0% 17.4% 16.2% 9.8% 5.8% 5.2%
Dividend yield average 2.1% 2.9% 3.1% 3.1% 1.9% 1.9% 1.7% 2.0% 2.2%
Dividend yield high 1.9% 2.3% 2.5% 2.6% 1.8% 1.7%
Dividend yield low 2.4% 4.4% 4.3% 3.9% 2.5% 2.1%
EV/IC average 3.5 3.8 3.5 6.8 5.0 5.3 5.9 5.2 5.0
EV/IC high 3.8 5.0 4.4 8.6
EV/IC low 3.0 2.4 2.2 5.2
P/BV average 4.54 4.03 3.03 4.07 4.34 4.71 6.57 5.07 4.22
P/BV high 4.97 5.15 3.71 4.95
P/BV low 3.94 2.69 2.22 3.29
ROIC 16.8% 33.8% 36.8% 50.9% 33.9% 34.3% 30.0% 31.6% 35.7%
ROE 20.9% 31.8% 25.8% 25.0% 23.9% 26.1% 30.8% 27.2% 25.5%
ROCE 28.0% 65.4% 85.0% 106.8% 71.5% 78.1% 64.0% 65.6% 74.6%
DCF
Source: Company data, Credit Suisse estimates

160
Schindler – Financials PROFIT & LOSS 2010 2011 2012 2013E 2014E 2015E
Revenue 8,187 7,854 8,258 8,753 9,322 10,069
Growth, % -1.1% -4.1% 5.1% 6.0% 6.5% 8.0%
Material Cost (2,302) (2,329) (2,442) (2,626) (2,797) (3,021)
Personnel Cost (3,162) (2,965) (3,074) (3,151) (3,356) (3,575)
Other Operating Cost (1,641) (1,570) (1,557) (2,032) (2,019) (2,201)
Depreciation & Amortisation (132) (119) (119) (156) (171) (165)
Total Cost (7,237) (7,064) (7,268) (8,016) (8,344) (8,962)
Reported EBIT 950 790 990 738 979 1,108
Reported EBIT margin, % 11.6% 10.1% 12.0% 8.4% 10.5% 11.0%
Exceptionals / one-offs (25) (135) - (173) - -
Operating profit 975 925 990 910 979 1,108
Operating profit margin, % 11.9% 11.8% 12.0% 10.4% 10.5% 11.0%
Depreciation & Amortisation (132) (119) (119) (156) (171) (165)
EBITDA 1,107 1,044 1,109 1,066 1,150 1,273
EBITDA margin, % 13.5% 13.3% 13.4% 12.2% 12.3% 12.6%
Net inc/exp from investing & financing (12) - (7) 16 18 21
Profit Before Tax 938 790 983 754 997 1,128
Underlying PBT 963 925 983 927 997 1,128
Tax (259) (214) (253) (241) (264) (305)
Effective rate, % 27.6% 27.1% 25.7% 26.5% 26.5% 27.0%
Reported profit after tax 679 576 730 513 733 824
Minority interest 25 23 28 21 29 33
Reported Net Income 677 588 702 498 709 796
Operating Net Income 679 688 702 670 709 796
Net income margin, % 8.3% 8.8% 8.5% 7.7% 7.6% 7.9%
CS operating EPS 5.7 5.8 6.0 5.8 6.5 7.4
EPS growth, % 9.3% 2.1% 3.9% -3.7% 12.7% 12.3%
DPS, CHF 3.0 2.0 2.2 2.2 2.4 2.7
DPS growth, % 50.0% -33.3% 10.0% -2.2% 12.7% 12.3%
Dividend Cover (X) 1.9 2.9 2.7 2.7 2.7 2.7
Shares & BPC in issue 120 120 118 117 110 110
ANALYSIS 2010 2011 2012 2013E 2014E 2015E
NOPAT 706 674 735 669 719 809
Invested Capital 1,387 1,992 2,143 2,227 2,279 2,265
ROIC 50.9% 33.9% 34.3% 30.0% 31.6% 35.7%
ROIC (average) 44.8% 39.9% 35.6% 30.6% 31.9% 35.6%
Operating Net Income 706 674 735 669 719 809
Equity 2,819 2,817 2,813 2,173 2,644 3,173
ROE 25.0% 23.9% 26.1% 30.8% 27.2% 25.5%
ROE (average) 26.4% 23.9% 26.1% 26.8% 29.9% 27.8%
EBITDA 1,107 1,044 1,109 1,066 1,150 1,273
Total debt 277 788 754 754 754 754
Net debt (2,158) (1,874) (1,872) (1,127) (1,546) (2,089)
Total debt / EBITDA 0.3 0.8 0.7 0.7 0.7 0.6
Net debt / EBITDA (1.9) (1.8) (1.7) (1.1) (1.3) (1.6)
BALANCE SHEET 2010 2011 2012 2013E 2014E 2015E
PPE and Intangibles 1,224 1,325 1,326 1,375 1,379 1,318
Other f ixed assets 804 1,221 1,326 1,356 1,386 1,416
Fixed assets 2,028 2,546 2,652 2,731 2,765 2,734
Inventories 359 407 395 408 485 552
Production orders in progress 1,721 1,857 1,939 2,086 2,222 2,400
Advances against production orders (2,157) (2,283) (2,436) (2,566) (2,733) (2,952)
Trade and other receivables 1,463 1,552 1,656 1,751 1,839 2,014
Trade and other payables (2,027) (2,087) (2,063) (2,182) (2,299) (2,483)
Working capital (641) (554) (509) (504) (485) (469)
Working capital days (29) (26) (22) (21) (19) (17)
WC as % of sales -7.8% -7.1% -6.2% -5.8% -5.2% -4.7%
Cash and cash equivalents 2,435 2,662 2,626 1,881 2,300 2,843
Short-term debt (145) (169) (133) (133) (133) (133)
Long-term debt (132) (619) (621) (621) (621) (621)
Net debt / (cash) (2,158) (1,874) (1,872) (1,127) (1,546) (2,089)
Provisions (788) (875) (1,092) (1,072) (1,072) (1,072)
Other liabilities (164) (183) (124) (124) (124) (124)
Other assets 736 9 14 14 14 14
Net assets 3,329 2,817 2,813 2,173 2,644 3,173
CASH FLOW 2010 2011 2012 2013E 2014E 2015E
Operating Net Income 679 688 702 670 709 796
Minority interest 34 23 28 21 29 33
Exceptional costs (25) (100) - (18) - -
Depreciation & amortisation 139 119 119 156 171 165
Change of provisions 11 81 (76) (20) - -
Other non cash items 34 4 76 - - -
Contributions to pension fund (23) (47) (51) (30) (30) (30)
Gross cash flow 849 768 798 779 879 964
Working capital change 242 (78) (16) (5) (18) (16)
Operating cash flows 1,091 690 782 774 861 948
Operating cash / Operating profit 1.1 0.7 0.8 0.9 0.9 0.9
Net capex (179) (131) (148) (205) (175) (105)
Free Cash Flow 912 559 634 569 686 843
FCF / Net income 1.3 0.8 0.9 0.8 1.0 1.1
Acquisitions/disposals (167) (277) (38) - - -
Loans raised / paid back (13) 509 (80) - - -
Shares issue / purchase (59) (233) (124) (1,061) - -
Dividends Paid (267) (378) (255) (252) (267) (300)
Investments (15) (56) (346) - - -
Net Cash Flow 391 124 (209) (745) 419 543
Source: Company data, Credit Suisse estimates

161
Schindler – Company Summary
Order BacklogEmployee Mix End Market Mix
Management
Chairman Alfred N. Schindler
CEO Jurgen Tinggren
CFO Erich Ammann
IR Barbara Zach
Division Products End Markets / Channels Main Competitors Revenue Split by Geo Key Drivers/ Themes
Elevators & Escalators
FY 2012 Sales CHF 8.26 Bn
5.0% YoY Growth EX-FX
FY 2012 EBIT CHF 0.99 Bn
12.0% Margin
Elevators, Escalators, Moving walks,
Destination technology
Residential Construction 60%, Commercial
Construction 20% and Government
Construction 20%
OTIS, ThyssenKrupp, KoneEurope 46%, Americas 29%,
Asia/Australia/Africa 25%
Urbanisation; Wealth creation in EM;
Development in energy efficiency;
Demographic change
SCHINDLER (SCHP.VX) - ANDRE KUKHNIN, CFA +44 20 7883 0350/ [email protected]
Geographic MixShareholding Structure
Free Float:60%
Top 5 shareholders
Sunlife Financials 2.9%, FMR LLC 2.9%,
Credit Suisse Asset Management 2.7%,
Norges banks 2.4%, Franklin Resources 1.9%
Ownership by country
US 37%, Switzerland 24%, Luxembourg 17%,
Canada 9%,
Europe32%
Americas32%
Asia/Australia/Africa
36%
Americas28%
Sw itzerland 10%
Rest of Europe
33%
Asia/Australia/Africa
29%
Europe46%
Americas29%
Asia/Australia/Africa
25%
Residential Construction
60%
Commercial Construction
20%
Government Construction
20%
Source: Company data

162
Schneider – Neutral, TP €58
Bull Case Short-cycle recovery potential in Europe and the US could provide better
than expected organic top-line growth particularly in Industry and Partner
Return improvement following Invensys and integration focus meaning
limited M&A activity medium term
Stronger sales synergy potential in Industry from Invensys acquisition
Combination of less FX weakness in emerging markets than expected and
pricing increases / changing manufacturing can lead to margin surprise
Bear Case Prolonged volume weakness in Europe and France in particular
On-going FX weakness in emerging markets with limited success to raise
prices and shifting production to soft currency countries
Focus away from integration and towards more deals despite Invensys
On-going customer de-stocking such as recently see in Russia and Europe
Investment summary: High-quality Electrical company with recovering organic growth potential particularly in
the short-cycle divisions (Industry, Partner) in FY14 with strong cash flow conversion and less M&A risk in FY14
yet margin risk potential from FX weakness in EM, less pricing power and cost savings initiatives.
0
10
20
30
40
50
60
70
0
1
2
3
4
5
2007 2008 2009 2010 2011 2012 2013
1 Yr Forward EPS (LHS) Share Price (RHS)
-20%
-15%
-10%
-5%
0%
5%
10%
15%
20%
10%
11%
12%
13%
14%
15%
16%
Margins % (LHS) Organic Growth (RHS)
0%
20%
40%
60%
80%
100%
120%
6%
8%
10%
12%
14%
16%
18%
SCHN ROIC (LHS) Sector ROIC (LHS)SCHN Cash conversion (RHS) Sector Cash conversion (RHS)
Source: Thomson Reuters, Company data, Credit Suisse estimates

163
Schneider – Valuation 2007A 2008A 2009A 2010A 2011A 2012A 2013E 2014E 2015E
Share Price:
Average 48.0 34.2 26.0 45.0 50.4 48.0 59.4 59.4 59.4
High 55.1 46.3 28.7 59.6 61.6 56.0
Low 41.5 20.2 20.9 36.1 35.7 40.1
Year End 46.3 26.5 41.0 57.2 40.7 54.8
PE:
Average 14.0 9.1 11.9 12.9 13.8 11.9 15.1 13.4 12.3
High 16.1 12.3 13.2 17.1 16.9
Low 12.2 5.3 9.6 10.4 9.8
Year End 13.6 7.0 18.8 16.4 11.2
EV/Sales:
Average 1.66 1.25 1.05 1.39 1.50 1.32 1.56 1.46 1.35
High 1.86 1.51 1.14 1.78 1.77
Low 1.42 0.86 0.89 1.15 1.14
Year End 1.57 1.00 1.53 1.72 1.27
Recurring EBITA margin 14.2% 15.1% 12.6% 14.4% 13.5% 13.8% 13.6% 13.9% 14.4%
EV/EBITA:
Average 11.6 8.7 9.1 9.1 10.9 9.5 11.4 10.7 9.6
High 13.0 10.4 9.9 11.6 12.8
Low 9.9 6.0 7.7 7.5 8.3
Year End 10.6 6.6 13.2 11.2 9.2
EV/Recurring EBITA:
Average 11.7 8.3 8.4 9.6 11.1 9.5 11.5 10.5 9.4
High 13.1 10.0 9.1 12.3 13.0
Low 10.0 5.7 7.1 8.0 8.5
Year End 11.1 6.6 12.1 11.9 9.3
EV/EBITDA:
Average 9.5 7.2 7.2 7.8 9.2 8.1 10.2 9.6 8.7
High 10.7 8.6 7.8 10.0 10.8
Low 8.2 4.9 6.1 6.5 7.0
Year End 9.0 5.7 10.4 9.7 7.8
EV/IC:
Average 1.8 1.4 1.1 1.5 1.5 1.4 1.6 1.6 1.7
High 2.0 1.7 1.2 1.9 1.8
Low 1.6 0.9 0.9 1.2 1.1
Year End 1.7 1.1 1.5 1.8 1.3
Dividend Yield
Average 3.4% 5.0% 3.9% 3.6% 3.4% 3.9% 3.3% 3.5% 3.8%
High 3.0% 3.7% 3.6% 2.7% 2.8%
Low 4.0% 8.6% 4.9% 4.4% 4.8%
Year End 3.6% 6.5% 2.5% 2.8% 4.2%
FCF Yield (based on EV)
Average 6.3% 8.9% 14.1% 7.6% 5.7% 7.9% 6.2% 6.5% 7.2%
High 5.6% 7.4% 13.1% 6.0% 4.9%
Low 7.3% 13.0% 16.7% 9.2% 7.5%
Year End 6.6% 11.2% 9.8% 6.2% 6.8%
Source: Company data, Credit Suisse estimates

164
Schneider – Financials P&L 2010A 2011A 2012A 2013E 2014E 2015E
Group Sales 19,580 22,387 23,946 23,638 26,396 27,589
Cost of Sales -11,842 -13,958 -14,889 -14,703 -16,405 -17,083
Gross Margin 40% 38% 38% 38% 38% 38%
Research and Development -450 -539 -507 -591 -660 -690
% of sales -2% -2% -2% -3% -3% -3%
Selling, General and Admin Expenses -4,269 -4,658 -5,035 -4,926 -5,464 -5,656
% of sales -22% -21% -21% -21% -21% -21%
EBITDA 3,477 3,650 3,921 3,609 3,998 4,294
PPA effects -228 -226 -475 -475 -475 -475
Other Income and Development -88 -153 -174 -179 -254 -253
Group EBITA 2,931 3,079 3,341 3,239 3,613 3,907
Margin 15.0% 13.8% 14.0% 13.7% 13.7% 14.2%
Restructuring -96 -145 -164 -160 -160 -159
Group EBITA ex restructuring 3,027 3,224 3,505 3,399 3,773 4,066
Margin ex restructuring 15.5% 14.4% 14.6% 14.4% 14.3% 14.7%
Other adjustments 8 -8 -10 -19 -94 -94
Margin 15.4% 14.4% 14.7% 14.5% 14.7% 15.1%
Recurring EBIT 2,829 3,032 3,315 3,218 3,667 3,960
Margin 14.4% 13.5% 13.8% 13.6% 13.9% 14.4%
Group EBIT 2,703 2,853 2,866 2,764 3,138 3,432
Margin 13.8% 12.7% 12.0% 11.7% 11.9% 12.4%
Net Financials -347 -415 -405 -347 -317 -316
Reported Pre-tax Profit 2,362 2,466 2,495 2,417 2,821 3,116
Tax -566 -562 -568 -550 -642 -709
tax rate (%) 24% 23% 23% 23% 23% 23%
Net Profit to Total shareholders 1,796 1,904 1,927 1,867 2,179 2,407
Minority Interests -76 -84 -87 -84 -98 -109
Net Income to Equity Shareholders 1,720 1,820 1,840 1,783 2,080 2,298
CS Net Income 1,816 1,958 2,187 2,133 2,489 2,706
Reported EPS - Ordinary 3.30 3.39 3.39 3.28 3.71 4.10
CS EPS 3.48 3.64 4.03 3.93 4.44 4.83
Reported EPS - Dilued 3.28 3.35 3.36 3.25 3.68 4.07
Reported EPS pre goodwill - Ordinary 3.30 3.39 3.39 3.28 3.71 4.10
Dividend per share 1.60 1.70 1.87 1.94 2.10 2.25
Cash flow 2010A 2011A 2012A 2013E 2014E 2015E
Net income before minorities 1,796 1,904 1,927 1,867 2,179 2,407
Group share of (income)/loss of equity accounted cos net of divs recd-6 -28 -34 -34 -34 -34
Depreciation of property, plant and equipment 358 386 394 415 420 421
Amortisation of Intangible Assets (ex goodwill) 387 380 420 430 440 441
Impairment of assets 29 31 241 - - -
Increase (decrease) in provisions -51 -89 -77 -30 -30 -30
Change in deferred taxes -50 -65 -122 - - -
Losses (gains) on disposal of assets - net -21 12 -16 - - -
Other non-cash items 26 48 69 - - -
Net cash provided by operating activities pre working capital2,468 2,579 2,802 2,648 2,975 3,205
Net change in working capital requirement -206 -327 -1 -1 -1 -1
Cash Flow from operations 2,262 2,252 2,801 2,647 2,974 3,204
Net investment in operating assets -528 -746 -719 -688 -777 -815
Dividends paid -241 -925 -991 -1,015 -1,054 -1,177Net cash flow from ordinary operations 1,493 581 1,091 943 1,144 1,212
Financial Investments- net (Acquisitions) -1,754 -2,873 -242 - 1,800- -
Other long term investments 5 -54 107 - - -
Long term pension assets 0 -64 -79 - - -
Total of Acquisitions and change in LT invest -1,749 -2,991 -214 - 1,800- -
Cash Flow before financing -256 -2,410 877 943 -656 1,212
Opening Borrowings -2,851 -2,736 -5,266 -4,203 -3,260 -3,917
Share repurchases 249 - - - - -
Shares issued 305 210 221 - - -
Cash flow before financing -256 -2,410 877 943 -656 1,212
Effect of foreign exchange movements /acquired debt or cash 6 -166 -51 - - -
Other -189 -164 16 - - -
Closing Borrowings -2,736 -5,266 -4,203 -3,260 -3,917 -2,704
Source: Company data, Credit Suisse estimates

165
Schneider – Company Summary
Operating Profit Split Sales Mix End Market Mix
Management
Chairman Henri Lachmann
CEO Jean-Pascal Tricoire
CFO Emmanuel Babeau
IR Anthony Song
Division Products End Markets / Channels Main Competitors Revenue Split by Geo Key Drivers/ Themes
Power
FY 2012 Sales EUR 8.74 Bn
0.5% YoY organic growth
FY 2012 EBIT EUR 1.81 Bn
20.7% Margin
Low Voltage and Renewable Energies
products and solutionsUtilities, Marine, Residential and Oil & Gas. ABB, Siemens, Eaton, Legrand.
Residential & commercial construction;
Emphasis on power-saving in buildings
Infrastructure
FY 2012 Sales EUR 5.37 Bn
-1.5% YoY organic growth
FY 2012 EBIT EUR 0.58 Bn
10.7% Margin
Medium Voltage and Grid especially for
infrastructure and electrical utilities. The
product offering includes disconnectors, circuit
breakers and transformers.
Utilities, Building, Industries and Oil & Gas. ABB & SiemensUtility capex (distribution network
refurbisment)
Industry
FY 2012 Sales EUR 4.48 Bn
-3.8% YoY organic growth
FY 2012 EBIT EUR 0.82 Bn
18.4% Margin
Control systems and Process AutomationOEMs, Water Treatment and Mining, Minerals
& MetalsSiemens & Rockwell
Emerging market wage inflation; Increasing
automation of production processes; General
industrial capex
IT
FY 2012 Sales EUR 3.68 Bn
2.7% YoY organic growth
FY 2012 EBIT EUR 0.70 Bn
19.0% Margin
Critical Power & Cooling Services Data Centers and Financial Services Emerson & EatonData centre investment; Lower energy cost for
companies
Buildings
FY 2012 Sales EUR 1.68 Bn
-3.1% YoY organic growth
FY 2012 EBIT EUR 0.10 Bn
6.4% Margin
Critical Power, Security and Supply
Management.
Hotels, Hospitals, Office Buildings and Retail
BuildiSiemens, JCI & Rockwell
Regulations on building energy consumption;
Increasing building automation to lower energy
consumption
SCHNEIDER (SCHN.PA) - SIMON TOENNESSEN +44 20 7883 6893/ [email protected] Mix Shareholding Structure
Free Float:100%
Top 5 shareholders
Capital Group Companies 9.8%, Amundi
4.9%, AXA Investment Managers 4.6%,
Caisse Des Depots 3.7%, Norges Bank 2.4%
Ownership by country
USA 49%, France 31%, Luxembourg 7%, UK
4% and others
Western Europe 30%, Asia Pacific 27%,
North America 25%, Others 18%
Pow er45%
ConsumerLifestyle
25%
Industry20%
IT17%
Buildings3%
Pow er37%
Infrastructure22%
Industry19%
IT15%
Buildings7% Western
Europe 30%Asia
Pacif ic 27%
North America 25%
Others 18%
Buildings29%
Utilities & Infrastructure
25%
Industrial & Machines
22%Data Centers &
Netw ork
15%
Residential9%
Source: Company data

166
Senior – Outperform, 315p
Bull Case Top Quartile Cash Conversion: Senior cash conversion amongst the highest
in the sector (98% cumulative 2006A-2012A). We see no change to this
trend.
Above secular average ROIC and well ahead of WACC.
Attractive valuation: Senior trades at a >10% discount to its peer group
weighted SOTP.
Balance Sheet Optionality: Low gearing of net debt /EBITDA of 0.2x in
2014E allows plenty of scope for further acquisitions / cash returns.
Robust Equity story: Civil Aerospace, Truck emission control, Oil & Gas
exposure.
Bear Case
Pricing headwinds from large Aerospace OEM’s leading to margin
contraction at Aerospace.
Lack of an obvious catalyst to cause a valuation multiple re-rating and
closure of the valuation gap vs. peers.
Investment summary: Senior offers top quartile sector cash conversion combined with healthy ROIC at a
compelling valuation. Add in a robust equity story based on its civil aerospace exposure, truck emission control
and oil & gas exposure and we rate the shares at Outperform.
-20%
-10%
0%
10%
20%
30%
0%
4%
8%
12%
16%
20%
Margins % (LHS) Organic Growth (RHS)
0
50
100
150
200
250
300
350
0
5
10
15
20
2004 2005 2006 2007 2008 2009 2010 2011 2012 2013
1 Yr Forward EPS (LHS) Share Price (RHS)
0%
20%
40%
60%
80%
100%
2%
4%
6%
8%
10%
12%
14%
16%
18%
20%
SNR ROIC (LHS) Sector ROIC (LHS)
SNR Cash conversion (RHS) Sector Cash conversion (RHS)
Source: Thomson Reuters, Company data, Credit Suisse estimates

167
Senior – Valuation Valuation Multiples Cumulative Cash Conversion Bridge
CFROI expectations: Market (dot) vs. Consensus (bar)
2007 2008 2009 2010 2011 2012 2013e 2014e 2015e
Share price - year high 130.25 119.5 75 152.4 190.6 213 287.2 287.2 287.2
Share price - year low 64 27 24.25 74.5 132.6 171 287.2 287.2 287.2
Share price - year average 96.25 87.49 44.73 118.3 157.7 195.39 287.2 287.2 287.2
Enterprise value - high 586.71 690.56 446.65 708.91 889.14 964.26 1278.65 1246.94 1191.55
Enterprise value - low 354.97 330.73 246.19 398.63 657.37 795.42 1278.65 1246.94 1191.55
Enterprise value - average 467.78 566.04 327.08 573.09 757.67 893.47 1278.65 1246.94 1191.55
EBITA 45.0 64.5 59.4 75.4 88.3 100.7 109.9 117.7 123.7
EV/EBITA - High 13.0 10.7 7.5 9.4 10.1 9.6 11.6 10.6 9.6
EV/EBITA - Low 7.9 5.1 4.1 5.3 7.4 7.9 11.6 10.6 9.6
EV/EBITA - Average 10.4 8.8 5.5 7.6 8.6 8.9 11.6 10.6 9.6
EBITDA 59.1 82.6 79.5 94.8 106.3 120.8 131.9 140.7 147.7
EV/EBITDA - high 9.9 8.4 5.6 7.5 8.4 8.0 9.7 8.9 8.1
EV/EBITDA - low 6.0 4.0 3.1 4.2 6.2 6.6 9.7 8.9 8.1
EV/EBITDA - average 7.9 6.9 4.1 6.0 7.1 7.4 9.7 8.9 8.1
Sales 470.7 562.4 540.1 566.9 640.7 712 771 806 843
EV/Sales - high 1.25 1.23 0.83 1.25 1.39 1.35 1.66 1.55 1.41
EV/Sales - low 0.75 0.59 0.46 0.70 1.03 1.12 1.66 1.55 1.41
EV/Sales - average 0.99 1.01 0.61 1.01 1.18 1.25 1.66 1.55 1.41
CS EPS Adjusted (p) 7.53 10.47 8.74 11.61 14.05 17.31 18.54 20.23 21.21
PER - high 17.30 11.41 8.58 13.13 13.56 12.30 15.49 14.20 13.54
PER - low 8.50 2.58 2.77 6.42 9.44 9.88 15.49 14.20 13.54
PER - average 12.79 8.35 5.12 10.19 11.22 11.29 15.49 14.20 13.54
NAV 38.5 44.6 46.4 56.5 68.7 76.6 73.5 86.0 100.4
PBV - high 3.4 2.7 1.6 2.7 2.8 2.8 3.9 3.3 2.9
PBV - low 1.7 0.6 0.5 1.3 1.9 2.2 3.9 3.3 2.9
PBV - average 2.5 2.0 1.0 2.1 2.3 2.6 3.9 3.3 2.9
Dividend Yield 2.40 2.60 2.60 3.12 3.80 4.65 5.12 5.73 6.42
Dividend Yield - high 2% 2% 3% 2% 2% 2% 2% 2% 2%
Dividend Yield - low 4% 10% 11% 4% 3% 3% 2% 2% 2%
Dividend Yield - average 2% 3% 6% 3% 2% 2% 2% 2% 2%
FCF before distributions 19 53 60 60 57 58 56 71 80
FCF/Sales 4% 9% 11% 10% 9% 8% 7% 9% 9%
FCF per share 4.77 13.24 14.83 14.39 13.60 13.94 13.30 17.01 19.08
FCF/EBITDA 32% 64% 76% 63% 53% 48% 42% 51% 54%
100%
94%- 6%
2%
- 5%
2%
8%
- 7%
70%
80%
90%
100%
110%
120%
130%
Cle
an n
et in
com
e
Rep
orte
d ne
t inc
ome
Wor
king
cap
ital
Del
ta b
/w C
apex
&D
eper
ecia
tion
Del
ta b
/w R
&D
Cap
italis
ed &
Inta
ngib
les
Am
ort.
PP
A
Oth
er (
Def
erre
d ta
x, P
ensi
on,
Min
ority
etc
)
Fre
e C
ash
Flo
w
Source: Company data, Credit Suisse estimates, Credit Suisse HOLT

168
Senior – Financials PROFIT & LOSS 2005 2006 2007 2008 2009 2010 2011 2012 2013e 2014e 2015e
FY FY FY FY FY FY FY FY FY FY FY
Revenue 338.6 387.9 470.7 562.4 540.1 566.9 640.7 712.0 771.0 806.0 843.0
Change yoy, % 14.6% 21.3% 19.5% -4.0% 5.0% 13.0% 11.1% 8.3% 4.5% 4.6%
EBITDA 31.3 38.3 59.1 82.6 79.5 94.8 106.3 120.8 131.9 140.7 147.7
Margin, % 9.2% 9.9% 12.6% 14.7% 14.7% 16.7% 16.6% 17.0% 17.1% 17.5% 17.5%
EBITA 19.8 26.2 45.0 64.5 59.4 75.4 88.3 100.7 109.9 117.7 123.7
Margin, % 5.8% 6.8% 9.6% 11.5% 11.0% 13.3% 13.8% 14.1% 14.3% 14.6% 14.7%
Restructuring Costs (recurring) 0.0 0.0 0.0 0.0 0.0 0.0 0.0 0.0 0.0 0.0 0.0
CS PBT 14.8 19.8 37.8 56.0 48.0 65.3 78.0 90.3 98.4 106.7 113.4
Income Tax (2.5) (2.3) (5.0) (10.2) (8.8) (6.1) (15.9) (15.0) (20.6) (22.4) (24.8)
Exceptional - Tax 0.0 (0.6) (1.4) (1.9) (1.8) (5.6) (1.8) (1.8) 0.0 0.0 0.0
CS EPS (Diluted) 3.9 4.6 7.5 10.5 8.7 11.6 14.1 17.3 18.5 20.1 21.1
Reported EPS (Diluted) 4.5 4.2 7.0 9.8 9.6 9.8 13.2 16.7 15.3 19.0 20.0
DPS, p 2.0 2.0 2.4 2.6 2.6 3.1 3.8 4.7 5.1 5.7 6.4
CASH FLOW 2005 2006 2007 2008 2009 2010 2011 2012 2013e 2014e 2015e
EBITDA 31.3 38.3 59.1 82.6 79.5 94.8 106.3 120.8 131.9 140.7 147.7
Working Capital Change (9.5) 1.1 (10.3) 12.2 29.9 2.5 (4.7) (10.2) (10.4) (11.0) (13.0)
Operating Cash Flow 22.3 31.5 48.5 91.9 89.7 87.1 96.3 99.8 112.7 120.5 125.2
Net Financing Cost (3.5) (5.3) (6.2) (6.8) (6.1) (7.6) (8.2) (7.6) (9.0) (9.0) (8.6)
Tax Paid (0.9) (2.6) (6.2) (8.8) (11.2) (8.6) (10.7) (8.6) (10.3) (11.2) (12.4)
Net Operating Cash Flow 17.9 23.6 36.1 76.3 72.4 70.9 77.4 83.6 93.3 100.4 104.2
Net Capex (15.4) (17.9) (17.1) (23.2) (12.0) (11.4) (20.8) (25.2) (37.5) (29.5) (24.5)
Free Cash Flow 2.5 5.7 19.0 53.1 60.4 59.5 56.6 58.4 55.8 70.9 79.7
Acquisitions (0.1) (79.8) (8.2) (43.7) 0.0 (8.3) (68.6) (28.1) (30.7) 0.0 0.0
Disposals 0.0 0.1 0.1 0.1 0.0 0.0 0.0 4.5 0.0 0.0 0.0
Pre Financing Cash Flow 2.1 (74.6) 10.4 8.8 60.6 50.5 (13.0) 33.1 24.3 70.9 79.7
Dividend Paid (6.1) (6.5) (8.1) (10.3) (10.4) (10.8) (13.1) (16.4) (19.7) (22.7) (24.7)
Net Cash / (Debt) Year End (62.4) (96.7) (94.8) (174.5) (102.3) (63.7) (93.0) (70.9) (75.1) (27.0) 28.0
BALANCE SHEET 2005 2006 2007 2008 2009 2010 2011 2012 2013e 2014e 2015e
PPE 76 88 94 138 118 114 126 135 124 124 124
Goodwill 77 111 114 184 169 170 210 220 220 220 220
Inangible Assets 1 15 12 18 11 7 17 19 14 10 5
Working capital 68 85 102 134 94 101 124 126 136 147 160
Total assets 195 261 281 402 335 328 404 421 410 413 417
Shareholders' funds 92 127 150 176 185 226 276 313 305 356 415
Minorities 0 0 0 0 0 0 0 0 0 0 0
Total Borrowings 71 104 104 186 123 120 122 115 120 71 16
Cash and equivalents (9) (7) (9) (12) (20) (56) (29) (45) (45) (45) (45)
Net Debt / (Cash) 62 97 95 175 102 64 93 71 75 27 (28)
Pension Deficit 40 38 36 51 48 38 35 37 30 30 30
Total liabilities 195 261 281 402 335 328 404 421 410 413 417
Source: Company data, Credit Suisse estimates

169
Senior – Company Summary
Geographic Split Operating Profit Mix Sales Mix End Market Split
Division Products End Markets / Channels Main Competitors / Positioning Revenue Split by Geo Key Drivers / Themes
Aerospace
FY2012 Sales - £470m,
6.3% org. growth
FY2012 EBITA - £72m,
15.3% margin
Low pressure ducting and other
composites, Helicopter machined parts,
Engine structures and mountings,
High pressure ducting,
Airframe structural parts,
Low pressure ducting and other
composites, Fluid control systems
(medical, power, semi-con)
Large Commercial (33%), Military / Defence
Aerospace (16%), Regional & Business
Jets (9%), Space & Non Military Helicopter
(2%), Other Aerospace (6%)
Precision Castparts, Spirit AeroSystems,
Triumph Group, BE Aerospace, Transdigm
Large commercial build rates. Boeing
10% of group sales, Rolls Royce 10%
and UTC 7%
Flexonics
FY2012 Sales - £242m,
(2.4)% org. growth
FY2012 EBITA - £37.3m,
15.4% margin
Emission control (LV)
Exhaust flexes (LV) ,
Fuel distribution (LV)
Expansion joints, bellows, hoses (Ind)
Truck & Off-Highway (10%), Passenger
Vehicles (8%), Power & Energy (6%),
Petrochemical (4%), Heating, Ventilation &
Solar (2%), Other Industrial (4%)
Global No.1 in expansion joints. Market
leading position in common rail and EGR
emission technology. Exhaust flexes are
more commoditised products.
Rotork, Spirax-sarco (Pathway), Faurecia
(emission control), Benteler (exhaust
systems), TRW (engine-components),
Cummins (engines), BorgWarner (emission
systems)
Emission legislation. Cummins (heavy
truck) is 7% of group sales
SENIOR (SNR.L / SNR LN) - JONATHAN HURN, CFA +44 20 7883 4532 / [email protected]
USA - £342m (53%)
UK - £69m (11%)
RoW - £230m (36%)
Aerospace
65%
Flexonics
35%
Aerospace
65%
Flexonics
35%
Aerospace
60%
Heating,
Ventilation & Solar5%
Passenger
Vehicles12%
Truck
9%
Power & Energy
7%
Petrochemical
3%
Other Industrial
4%
North America,
66%
Rest of Europe,
13%
UK, 14%
RoW, 7%
Shareholding structure
Free float: 97%
Top 5 shareholders: Blackrock - 13%,
Henderson Global Investors Ltd - 8%,
Scottish Widows - 7%, Lloyds Banking
Group Plc - 6%, Legal & General - 5%
Ownership by Country: UK - 60%,
USA - 29%, Norway - 3%, Luxembourg -
2%, Ireland - 2%
Management
Chairman -Martin Clark
CEO -Mark Rollins
CFO -Derek Harding
CS -Andrew Bodenham
Source: Company data

170
Siemens – Outperform, TP €105
Bull Case Strong margin improvement potential from better project risk management, cost
savings feeding through from restructuring initiatives taken in FY13 (e.g. overhead
cost reduction) as well as operational leverage potential
Further portfolio adjustments by either divesting more margin dilutive businesses or
buying margin enhancing business such as in Process Automation
Limited risk for disappointment given very conservative management targets and
potential upside surprise in case of a strong short-cycle volume recovery (low
customer inventory levels)
Better operational result boosting free cash flow performance allowing more
inorganic growth opportunities or further capital allocation
Bear Case Recent CEO change has positively increased the sentiment around Siemens and
changes that come with that. Any discrepancies between management team and
supervisory board would be taken negatively given uncertainty around change and
management support.
Unexpected project charges flipping positive sentiment around changes
Management only meeting company targets on the back of weaker end markets
Limited amount of cost savings from restructuring efforts seen in FY13
Profit risk from potential decline high margin power gen service business
Investment summary: Attractive restructuring story with significant margin improvement potential from better
project execution, strong operational gearing in short-cycle Industry division and improving free cash flow
generation allowing either inorganic growth initiatives or further capital allocation measures.
0
20
40
60
80
100
120
0
2
4
6
8
10
12
14
16
2007 2008 2009 2010 2011 2012 2013
1 Yr Forward EPS (LHS) Share Price (RHS)
-12%
-8%
-4%
0%
4%
8%
12%
7%
8%
9%
10%
11%
12%
13%
2007 2008 2009 2010 2011 2012 2013E2014E2015E
Margins % (LHS) Organic Growth (RHS)
0%
20%
40%
60%
80%
100%
6%
8%
10%
12%
14%
16%
18%
SIE ROIC (LHS) Sector ROIC (LHS)
SIE Cash conversion (RHS) Sector Cash conversion (RHS)
Source: Thomson Reuters, Company data, Credit Suisse estimates

171
Siemens – Valuation
SOTP valuation Nature of Value of Target Fair % per Comments
metric metric multiple value of EV Share
Industrial Automation EBITA 1,630 10.3 16,784 18% 20.6 Competitor multiples
Drive Technologies EBITA 1,062 10.5 11,152 12% 13.7 Competitor multiples
Fossil Power EBITA 1,839 9.3 17,107 18% 21.0 Competitor multiples
Renewable EBITA 528 9.5 5,017 5% 6.2 Competitor multiples
Oil and Gas EBITA 654 9.8 6,438 7% 7.9 Competitor multiples
Power Transmission EBITA 393 8.0 3,146 3% 3.9 Competitor multiples
Diagnostics EBITA 648 11.3 7,322 8% 9.0 Competitor multiples
Other Healthcare EBITA 1,779 11.0 19,565 21% 24.1 Competitor multiples
Transport and Logistics EBITA 487 8.5 4,141 4% 5.1 Competitor multiples
Power Grid Solutions EBITA 612 9.9 6,059 6% 7.5 Competitor multiples
Building Technologies EBITA 621 9.8 6,085 6% 7.5 Competitor multiples
Unallocated costs EBITA -811 9.5 -7,705 -8% -9.5 SRE, CMPS, Corp. and Pension, Elim, C + T
Restructuring costs EBITA -498 9.5 -4,728 -5% -5.8 Modestly lower than group average multiple
Operations 8,945 10.1 90,383 96% 111.2
Financial Assets 4,230 4% 5.2 Equity Investments, SFS
Group EV 94,613 100% 116.4
Net Debt (2013) -9,818
Pension & Other -5,475
SFS debt 14,500
Minority interest -132 13.0 -1,720 13x earnings inline with Siemens valuation at our TP
Liabilities -2,513
Equity Fair Value 92,099
S-O-P value per share (€) 105 discounted back by 10 month
Multiple analysis 2007 2008 2009 2010 2011 2012 2013 2014E 2015E
Share Price:
Average 85.4 82.6 54.3 75.5 84.4 72.5 79.3 94.7 94.7
High 111.3 108.6 68.8 94.8 99.0 79.5 90.0
Low 66.9 64.5 38.0 54.1 64.5 63.1 73.7
Year End 96.3 66.3 64.4 93.2 73.8 77.9 89.2
PE:
Average 15.7 13.1 10.4 11.2 11.5 9.4 10.6 12.9 11.2
High 12.3 10.2 13.2 14.0 13.5 10.3 12.0
Low 20.5 17.2 7.3 8.0 8.8 8.2 9.8
Year End 17.7 10.5 12.3 13.8 10.1 10.1 11.9
EV/Sales:
Average 1.24 1.13 0.71 0.96 1.13 0.97 1.00 1.16 1.05
High 1.56 1.44 0.85 1.18 1.30 1.05 1.11
Low 1.01 0.92 0.63 0.71 0.89 0.87 0.93
Year End 1.37 0.94 0.71 1.16 1.00 1.03 1.11
EV/EBIT:
Average 17.2 28.8 12.4 12.5 9.3 8.3 9.4 11.5 9.5
High 21.6 36.6 14.7 15.4 10.7 9.0 10.5
Low 14.0 23.4 10.9 9.3 7.3 7.5 8.8
Year End 19.1 23.9 12.4 15.2 8.2 8.9 10.4
Recurring EV/EBIT:
Average 13.8 10.6 8.0 9.4 9.3 8.1 8.7 10.7 9.0
High 17.3 13.6 9.5 11.5 10.7 8.8 9.7
Low 11.2 8.6 7.0 7.0 7.3 7.3 8.1
Year End 15.3 8.8 8.0 11.4 8.2 8.6 9.6
Recurring EBIT margin 9.0% 10.6% 8.9% 10.2% 12.2% 11.9% 11.5% 10.8% 11.7%
EV/EBITDA:
Average 10.0 14.0 7.4 7.3 7.1 6.4 6.9 8.3 7.2
High 12.6 17.8 8.9 9.0 8.2 6.9 7.7
Low 8.1 11.3 6.6 5.5 5.6 5.7 6.5
Year End 11.1 11.6 7.4 8.9 6.3 6.8 7.7
Dividend Yield
Average 1.9% 1.9% 2.9% 3.6% 3.6% 4.1% 3.8% 3.3% 3.5%
High 2.4% 2.5% 2.3% 5.0% 4.7% 4.8% 4.1%
Low 1.4% 1.5% 4.2% 2.8% 3.0% 3.8% 3.3%
Year End 1.7% 2.4% 2.5% 2.9% 4.1% 3.9% 3.4%
FCF Yield (based on EV)
Average -4.6% 9.2% 4.4% 8.9% 6.2% 6.4% 7.0% 6.6% 7.6%
High -3.7% 7.2% 3.7% 12.0% 7.9% 7.1% 7.5%
Low -5.7% 11.4% 5.0% 7.3% 5.4% 5.9% 6.3%
Year End -4.2% 11.1% 4.4% 7.4% 7.0% 6.0% 6.3%
SOTP
Source: Company data, Credit Suisse estimates

172
Siemens – Financials P&L 2010R 2011 2012 2013 2014E 2015E
Sales 75,979 73,514 77,197 75,882 78,236 82,946
Sales Growth -0.9% -3.2% 5.0% -1.7% 3.1% 6.0%
Cost of Sales -54,331 -51,388 -56,092 -55,053 -55,485 -58,062
Gross Profit 21,648 22,126 21,105 20,829 22,751 24,884
Gross Margin 28.5% 30.1% 27.3% 27.4% 29.1% 30.0%
S,G&A -11,130 -10,297 -11,162 -11,286 -10,825 -11,198
% of sales -14.6% -14.0% -14.5% -14.9% -13.8% -13.5%
R&D -3,846 -3,925 -4,238 -4,291 -4,321 -4,581
% of sales -5.1% -5.3% -5.5% -5.7% -5.5% -5.5%
Operating Income 6,672 7,904 5,705 5,252 7,604 9,105
Margin 8.8% 10.8% 7.4% 6.9% 9.7% 11.0%
Equity Investments -40 147 -266 510 314 205
Other Income (Expense) -755 699 240 76 150 150
Interest Income(expense) -65 231 501 5 300 300
EBIT 5,811 8,981 8,980 8,049 7,897 9,137
Net financial Income (Expense) 0 260 -5 -154 -100 -100
Other Interest Income (expense) -65 491 506 159 400 400
CS EBIT 5,811 8,981 8,980 8,049 7,897 9,137
Clean PBT 7,972 9,206 9,215 8,564 8,511 9,642
PBT 5,811 9,241 7,261 5,843 8,368 9,760
Income Tax -1,699 -2,231 -2,094 -1,630 -2,264 -2,673
Clean Tax -2,175 -2,645 -2,318 -2,137 -2,290 -2,643
Exceptional Tax 476 414 224 507 26 -29
Effective tax rate 29% 24% 29% 28% 29% 29%
Clean Tax rate 27% 29% 25% 25% 27% 27%
Extraordinary Items (post tax) -44 -690 -595 197 -100 -100
Net Income cont (pre Min) 4,112 7,010 5,167 4,213 6,104 7,087
Minority -169 -176 -132 -126 -132 -139
Net Income from continuing ops 3,943 6,834 5,035 4,087 5,972 6,948
Net Income (Loss) 3,899 6,144 4,440 4,284 5,872 6,848
CS Net Income 5,628 6,385 6,765 6,301 6,088 6,860
Headline EPS (Euro) 4.49 7.04 5.07 5.09 7.06 8.42
Continuing EPS 4.54 7.82 5.75 4.85 7.18 8.54
Restated EPS (Euro) 6.48 7.31 7.72 7.48 7.32 8.44
Net dividend (Euro) 2.70 3.00 3.00 3.00 3.15 3.31
Weighted Average Shares (m) 868 874 876 843 832 813
Cash flow 2010R 2011 2012 2013 2014E 2015E
Net income 3,899 6,144 4,440 4,284 5,872 6,848
Minority interest 169 176 132 126 132 139
Amortization of Acquisition related intangibles 358 340 354 424 424 380
Depreciation & amortization 3,760 2,298 2,390 2,464 2,538 2,614
Total Depreciation & amortization 4,118 2,638 2,744 2,888 2,962 2,994
Loss (gain) on disposal of assets -306 -1,229
Income from investments -72 21
Others 82 315
Decrease (increase) in inventories -75 -1,135 -85 -218 -400 -600
Decrease (increase) in receivables -51 -609 157 -293 -600 -800
Increase (decrease) in payables 112 668 197 -217 200 400
Change in other current assets/liabilities 1,473 376 -2,218 576 0 0
Net cash provided by operating activities 9,349 7,365 6,979 7,340 8,166 8,981
Net cash provided by operating activities - continuing 9,447 7,767
Capital expenditures -2,336 -2,471 -2,195 -1,869 -2,100 -2,300
Proceeds from disposal of fixed assets 589 2,221 0
Acquisition of investments -907 -889 -1,547
Proceeds from disposal of investments 93 0
Decrease (increase) in receivables from financing activities -192 -1,770
Proceeds/Purchase of Marketable securities -94 0
Net cash used by investing activities -2,847 -2,909 -5,685 -5,076 -2,100 -2,300
Net cash used by investing activities - Continuing -2,768 -4,044
Free cash flow 6,502 4,894 4,784 5,471 6,066 6,681
Dividends paid -1,388 -2,356 -2,629 -2,528 -2,462 -2,522
Dividends paid to minority shareholders -199 -158 -155 -152 -160 -168
Capital increase (buyback) and minority interests 147 -764 -1,424 -1,409 -2,000
Change in net debt -766 -1,706 1,833
Other/ Interest -440 -1,883
Net cash provided (used) by financing activities -2,646 -6,867 -3,590 -3,396 -5,621 -5,690
Effect of exchange rates and others 167 5
Net increase (decrease) in cash 4,023 -1,968 1,262 1,491 445 992
FCFps 7.49 5.61 5.46 6.50 7.29 8.22
Source: Company data, Credit Suisse estimates

173
Siemens – Company Summary
Operating Profit Split Sales Mix End Market Mix
Management
Chairman Gerhard Cromme
CEO Joe Kaeser
CFO Ralf P.Thomas
IR Mariel von Drathe
Division Products End Markets / Channels Main Competitors External Revenue Split by Geo Key Drivers/ Themes
Industry
FY 2013 Sales EUR 18.59 Bn
-4.0% YoY organic growth
FY 2013 EBIT EUR 2.22 Bn
11.9% Margin
Automation, Drive Technology and ServicesDrive Technology 50% and Industry
Automation 50%Rockwell , General Electric, Schneider, ABB
Europe , CIS, Africa, ME 55% (there in
:Germany 25%), Asia/Australia 26%,
Americas 19% (there in US: 12%)
General industrial capex; General industrial
production
Energy
FY 2013 Sales EUR 26.64 Bn
-4.0% YoY organic growth
FY 2013 EBIT EUR 2.56 Bn
9.6% Margin
Products, services and solutions for power
generation and transmission.
Fossil power generation 40%, Power
Transmission 24%, Oil & Gas 18% and
Renewable Energy 18%.
ABB, Alstom, Prymian, General Electric,
Emersons
Europe , CIS, Africa, ME 54% (there in
:Germany 8%), Asia/Australia 19%, Americas
27% (there in US: 14%)
Gas turbines- increasing electricity demand;
Reducing emission from coal; Power plant
utilization
Healthcare
FY 2013 Sales EUR 13.62 Bn
2.0% YoY organic growth
FY 2013 EBIT EUR 2.33 Bn
17.1% Margin
Imaging systems, laboratory diagnostics,
healthcare IT, and hearing aidsDiagnostics 29% and Others 71% General Electric, Philips, Mindray
Europe , CIS, Africa, ME 34% (there in
:Germany 7%), Asia/Australia 25%, Americas
41% (there in US: 35%)
Ageing population in EM; Increasing emphasis
on quality of life; Increasing access to
healthcare; Urbanization
Infrastructure & Cities
FY 2013 Sales EUR 17.88 Bn
1.0% YoY organic growth
FY 2013 EBIT EUR 1.16 Bn
6.5% Margin
Integrated mobility solutions, building and
security systems, power distribution
equipment, smart grid applications, and low-
and medium-voltage products
Power Grid Solutions & Products 34%,
Transportation Logistics 33% and Building
Technologies 33%
Emerson, Rockwell, Schneider
Europe , CIS, Africa, ME 61% (there in
:Germany 15%), Asia/Australia 14%,
Americas 25% (there in US: 19%)
Urbanization; Reducing energy cost in
buildings; Increasing demand for security
SIEMENS (SIEGn.DE) - SIMON TOENNESSEN +44 20 7883 6893/ [email protected] Mix Shareholding Structure
Free Float:100%
Top 5 shareholders
Siemens Family 6.0%, BlackRock 5.2%,
Qatar Holdings 3.0%, Siemens AG 3.0%,
Norges Bank 2.4%.
Ownership by country
Germany 29%, US 16%, UK 8%, France 6%,
Switzerland 6% and Others.
Industry25% Energy
36%
Healthcare26%
Infrastructure & Cities13%
Industry24%
Energy35%
Healthcare18%
Infrastructure & Cities
23%Europe (ex
Germany), CIS,
Africa, ME38%
Germany14%
Americas(ex US)
9%
US19%
Asia/Australia (ex China)
12%
China8%
GI Prod3%
GI Capex10%
GI Aftermarket3%
Commercial construction
10%
Construction Government
5%Pow er T&D
13%
Pow er Gen.19%
Transportation11%Medical
17%
Oil&Gas6%
Mining OE3%
Source: Company data

174
SKF – Underperform, TP SEK 150 Investment summary: We see a meaningful risk to SKF earnings in the near- and mid-term from Japanese and
Chinese competition while the market already discounts a full end-markets recovery scenario and cost-savings.
Bear Case Japanese competition threat – we see a meaningful threat to SKF from
Japanese competitors taking share using the JPY depreciation advantage.
NSK, NTN and JTEKT have c30% combined market share with strong presence
overseas combined with substantial domestic industrial base of at least ½ of
total;
Increasing risk of Chinese competitive threat – our recent detailed study of
China local bearings market suggest SKF share has declined recently, pricing
has been tough for domestic and more recently imported products and there is
now a number of credible local mid-market competitors who target specifically
high-end and import-replacing product segments;
Limited further balance sheet capacity post Kaydon – on our estimates 2014
Net Debt / EBITDA is 1.2x vs 0.7x last 10-yr and 1x 5-yr averages.
Valuation full – on 2014E EV/EBITA of 11x and P/E of 13.7x, the stock is
trading already c15% above its mid-cycle valuation.
Bull Case Gearing to early cycle recovery. We already discount SKF top line to grow 6%
organic in 2014 and 5% in 2015 while feedback from our recent US Industrials
conference suggest still anaemic general industrial environment;
Substantial cost-cutting effort with SEK 3bn of savings targeted for 2015
(cSEK 300m in 2013). We already discount full savings in our estimates.
0
50
100
150
200
250
0
2
4
6
8
10
12
14
16
2004 2005 2006 2007 2008 2009 2010 2011 2012 2013
1 Yr Forward EPS (LHS) Share Price (RHS)
-30%
-20%
-10%
0%
10%
20%
5%
7%
9%
11%
13%
15%
Margins % (LHS) Organic Growth (RHS)
0%
20%
40%
60%
80%
100%
8%
10%
12%
14%
16%
18%
20%
SKF ROIC (LHS) Sector ROIC (LHS)
SKF Cash conversion (RHS) Sector Cash conversion (RHS)
Source: Thomson Reuters, Company data, Credit Suisse estimates

175
SKF – Valuation
EBITA NOPAT
margin margin 4.0% 4.5% 5.0% 5.5% 6.0%
12.0% 8.4% 116 117 118 119 120
12.5% 8.8% 124 125 126 127 128
13.0% 9.1% 131 133 134 135 137
13.5% 9.5% 139 140 142 144 145
14.0% 9.8% 146 148 150 152 153
14.5% 10.2% 154 156 158 160 162
15.0% 10.5% 161 163 166 168 170
15.5% 10.9% 169 171 174 176 179
16.0% 11.2% 176 179 182 184 187
16.5% 11.6% 183 186 189 192 195
Grow th (years 4 to 10) 5.0%
EBIT margin (years 10+) 14.0%
NOPAT margin 9.8%
Invested capital 47,051
Invested capital grow th (years 4+) 2.0%
Terminal grow th rate 2.0%
10-year average FCF yield 6.4%
WACC 9.0%
December y/e 2007 2008 2009 2010 2011 2012 2013E 2014E 2015E
Average/Current 126.1 95.2 96.8 145.2 162.4 151.2 174.3 174.3 174.3
High 145.0 119.9 125.5 196.2 195.9 174.2
Low 99.5 56.8 64.8 109.3 120.0 128.1
Year end 104.8 77.3 123.6 191.6 145.6 163.2
P/E average 12.5 9.3 16.9 12.6 12.6 14.8 17.7 13.6 12.4
P/E high 14.4 11.7 21.8 17.0 15.2 17.0
P/E low 9.9 5.6 11.3 9.5 9.3 12.5
P/E year-end 10.4 7.6 21.5 16.6 11.3 16.0
EV/Sales average 1.17 0.96 1.04 1.38 1.40 1.35 1.66 1.48 1.36
EV/Sales high 1.31 1.14 1.27 1.76 1.63 1.51
EV/Sales low 0.96 0.68 0.78 1.11 1.10 1.19
EV/Sales year-end 1.00 0.83 1.26 1.72 1.28 1.44
Operating profit margin 12.9% 12.2% 7.4% 13.7% 14.2% 11.3% 11.7% 13.4% 13.9%
EV/EBITDA average 7.3 6.3 9.2 8.1 8.2 9.6 11.3 8.6 7.9
EV/EBITDA high 8.3 7.4 11.3 10.4 9.6 10.7
EV/EBITDA low 6.0 4.5 6.9 6.5 6.5 8.4
EV/EBITDA year-end 6.3 5.4 11.1 10.2 7.6 10.2
EV/EBIT average 9.1 7.8 14.0 10.1 9.8 12.0 14.2 11.0 9.8
EV/EBIT high 10.2 9.3 17.1 12.9 11.4 13.4
EV/EBIT low 7.5 5.6 10.5 8.1 7.8 10.5
EV/EBIT year-end 7.8 6.8 16.9 12.6 9.0 12.7
FCF yield average 5.4% 2.8% 13.6% 5.9% 5.2% 5.1% 4.9% 6.4% 8.3%
FCF yield high 6.8% 4.7% 20.3% 7.9% 7.0% 6.1%
FCF yield low 4.7% 2.2% 10.5% 4.4% 4.3% 4.5%
FCF yield year-end 6.5% 3.4% 10.6% 4.5% 5.8% 4.8%
Dividend yield average 4.0% 3.7% 3.6% 3.4% 3.4% 3.6% 3.2% 3.9% 4.0%
Dividend yield high 3.4% 2.9% 2.8% 2.5% 2.8% 3.2%
Dividend yield low 5.0% 6.2% 5.4% 4.6% 4.6% 4.3%
Dividend yield year-end 4.8% 4.5% 2.8% 2.6% 3.8% 3.4%
EV/IC average 2.5 1.7 2.0 2.3 2.4 2.3 2.2 2.2 2.1
EV/IC high 2.8 2.0 2.4 2.9 2.8 2.6
EV/IC low 2.1 1.2 1.5 1.9 1.9 2.0
EV/IC year-end 2.2 1.5 2.4 2.9 2.2 2.5
P/BV average 3.3 2.2 2.5 3.5 3.4 3.2 3.5 3.1 2.8
P/BV high 3.8 2.8 3.3 4.7 4.2 3.7
P/BV low 2.6 1.3 1.7 2.6 2.5 2.7
P/BV year-end 2.7 1.8 3.2 4.6 3.1 3.5
ROIC 18.5% 15.1% 10.4% 16.1% 16.9% 13.6% 11.1% 13.9% 15.2%
ROE 26.1% 23.7% 15.0% 27.7% 27.3% 21.8% 19.5% 23.0% 22.6%
ROCE 22.1% 17.5% 12.9% 20.4% 21.8% 17.8% 13.7% 17.3% 19.0%
DCF
Source: Company data, Credit Suisse estimates

176
SKF – Financials
ANALYSIS 2010 2011 2012 2013E 2014E 2015E
NOPAT 5,846.8 6,602.2 5,125.6 5,203.2 6,605.3 7,194.1
Invested Capital 36,385 39,112 37,719 47,051 47,509 47,298
ROIC 16% 17% 14% 11% 14% 15%
ROIC (average) 18% 17% 13% 12% 14% 15%
Operating Net Income 5,246.0 5,851.0 4,655.0 4,477.0 5,825.7 6,405.6
Equity 18,935 21,436 21,340 22,987 25,317 28,291
ROE 28% 27% 22% 19% 23% 23%
ROE (average) 29% 29% 22% 20% 24% 24%
EBITDA 10,327.0 11,202.0 9,138.0 9,304.5 12,047.9 12,773.2
Total debt 12,175 13,613 15,675 15,675 15,675 15,675
Net debt 9,780 8,788 7,431 14,978 12,923 9,529
Total debt / EBITDA 1.2 1.2 1.7 1.7 1.3 1.2
Net debt / EBITDA 0.9 0.8 0.8 1.6 1.1 0.7
PROFIT & LOSS 2010 2011 2012 2013E 2014E 2015E
Revenue 61,029 66,215 64,575 63,399 70,109 73,832
Growth, % 8.5% 8.5% -2.5% -1.8% 10.6% 5.3%
COGS (44,216) (47,644) (48,121) (47,245) (52,245) (55,019)
Gross Profit 16,813 18,571 16,454 16,154 17,864 18,813
Gross margin, % 27.5% 28.0% 25.5% 25.5% 25.5% 25.5%
SG&A (8,222) (8,980) (9,087) (8,886) (8,697) (8,606)
Other operating income/(Expenses) (139) 36 (51) (51) (51) (51)
Reported EBIT 8,452 9,611 7,314 7,218 9,116 10,156
Reported EBIT margin, % 13.8% 14.5% 11.3% 11.4% 13.0% 13.8%
Exceptionals / one-offs (185) (100) (314) (500) (600) (400)
Operating profit 8,635 9,712 7,607 7,718 9,716 10,556
Operating profit margin, % 14.1% 14.7% 11.8% 12.2% 13.9% 14.3%
Restructuring classed as ongoing (300) (300) (300) (300) (300) (300)
CS Operating Profit 8,335 9,412 7,307 7,418 9,416 10,256
CS Operating margin, % 13.7% 14.2% 11.3% 11.7% 13.4% 13.9%
Depreciation & Amortisation (1,992) (1,790) (1,831) (1,887) (2,631) (2,517)
EBITDA 10,327 11,202 9,138 9,304 12,048 12,773
EBITDA margin, % 16.9% 16.9% 14.2% 14.7% 17.2% 17.3%
Net interest income / (expense) (903) (680) (906) (906) (962) (850)
Profit Before Tax 7,547 8,932 6,408 6,312 8,155 9,306
CS Underlying PBT 7,657 8,732 6,401 6,512 8,455 9,406
Tax (2,253) (2,708) (1,592) (1,894) (2,446) (2,792)
Effective rate, % 29.9% 29.9% 29.9% 29.9% 29.9% 29.9%
Reported profit after tax 5,294 6,224 4,816 4,418 5,708 6,514
Minority interest 158 173 154 141 183 208
Reported Net Income 5,136 6,051 4,662 4,277 5,526 6,306
Operating Net Income 5,246 5,851 4,655 4,477 5,826 6,406
Net income margin, % 8.6% 8.8% 7.2% 7.1% 8.3% 8.7%
CS operating EPS, SEK 11.5 12.8 10.2 9.8 12.8 14.1
EPS growth, % 100.5% 11.5% -20.4% -3.8% 30.1% 10.0%
DPS, SEK 5.0 5.5 5.5 5.5 6.7 7.0
Dividend growth, % 42.9% 10.0% 0.0% 0.0% 22.4% 4.5%
Dividend Cover (x) 2.30 2.34 1.86 1.79 1.90 2.00
Ordinary shares in issue 455.4 455.4 455.5 455.5 455.5 455.5
BALANCE SHEET 2010 2011 2012 2013E 2014E 2015E
PPE and Intangibles 23,116 23,233 22,886 31,622 30,990 30,473
Deferred tax assets 1,151.0 1,299.0 1,835.0 1,835.0 1,835.0 1,835.0
Other 1,411.0 1,494.0 1,188.0 1,188.0 1,188.0 1,188.0
Fixed assets 25,678 26,026 25,909 34,645 34,013 33,496
Inventories 12,879.0 14,191.0 12,856.0 12,996.9 14,021.9 14,397.3
Trade and other receivables 12,698.0 13,820.0 12,935.0 13,374.7 14,598.1 15,171.0
Trade and other payables (12,308) (12,132) (10,958) (10,943) (12,101) (12,744)
Other current liabilities - - - - - -
Working capital 13,269 15,879 14,833 15,429 16,519 16,825
Working capital days 79 88 84 89 86 83
WC as % of sales 21.7% 24.0% 23.0% 24.3% 23.6% 22.8%
Cash 2,395.0 4,825.0 8,244.0 697.4 2,751.8 6,145.7
Short-term debt (1,325) (1,113) (2,945) (2,351) (2,351) (2,351)
Long-term debt (10,850) (12,500) (12,730) (13,324) (13,324) (13,324)
Net (debt) / cash 9,780 8,788 7,431 14,978 12,923 9,529
Other investments 818 594 916 916 916 916
Other liabilities (2,931) (2,540) (1,775) (1,775) (1,775) (1,775)
Net assets 46,614 48,747 47,314 64,192 62,597 58,991
CASH FLOW 2010 2011 2012 2013E 2014E 2015E
Profit before Tax 8,450 9,612 7,314 7,218 9,116 10,156
Depreciation & amortisation 1,992 1,790 1,831 1,887 2,631 2,517
Tax paid (1,722) (2,858) (2,839) (1,894) (2,446) (2,792)
Contribution and payment to post employment benefit plans(466) - - - - -
Share of profit from associates and JV (2) - - - - -
Other (non-cash gains/losses) - - (129) (129) (129) (129)
Gross cash flow 6,765 7,981 5,527 6,176 8,211 8,902
Working capital (1,216) (2,395) 657 (596) (1,090) (306)
Operating cash flow 5,549 5,586 6,184 5,581 7,121 8,597
Operating cash / Operating profit 66.6% 59.3% 84.6% 75.2% 75.6% 83.8%
Net Capex (1,625) (1,738) (2,648) (1,700) (2,000) (2,000)
Free cash flow 3,924 3,848 3,536 3,881 5,121 6,597
FCF / Net income 75% 66% 76% 87% 88% 103%
Disposals - - - - - -
Acquisitions (6,764) - - (8,923) - -
Sales / (Purchase) of investments 208 22 (208) - - -
Borrow ings raised / (repaid) 2,270 865 2,687 - - -
Shares issue / (purchase) - - - - - -
Dividends paid (1,622) (2,307) (2,551) (2,504) (3,066) (3,203)
Others - - - - - -
Net cash flow (1,984) 2,428 3,464 (7,547) 2,054 3,394
Source: Company data, Credit Suisse estimates

177
SKF – Company Summary
Operating Profit Split Sales MixEnd Market Mix
Management
Chairman Leif Ostling
CEO Tom Johnstone
CFO Tore Bertilsson
IR Marita Bjork
Division Products End Markets / Channels Main Competitors Revenue Split by Geo Key Drivers/ Themes
Strategic Industries
FY 2012 Sales SEK 20.20 Bn
-3.00% YoY organic growth
FY 2012 EBIT SEK 3.14 Bn
15.5% Margin
7 business units that provides products,
solutions and services to both OEMs and end-
users: Aerospace, Renewable energy,
Traditional energy, Industrial drives, Precision,
Railway and Off-highway and Lubrication
Accelerated R&D Spending; Expansion of
footprint in emerging markets.
Regional Sales and Service
FY 2012 Sales SEK 25.33 Bn
-1.8% YoY organic growth
FY 2012 EBIT SEK 3.22 Bn
12.7% Margin
It is divided into seven geographical areas. It
offers and delivers a full range of products,
solutions and services to both OEMs and end-
users within different industries. Its focused
industries’ are: Metals, Pulp and Paper,
Mining and Cement, Food and Beverage and
Marine.
Accelerated R&D Spending; Expansion of
footprint in emerging markets.
Automotive
FY 2012 Sales SEK 17.12 Bn
-3.4% YoY organic growth
FY 2012 EBIT SEK0.47 Bn
2.7% Margin
It sells to automotive OEMs and related
aftermarket (VSM). Wheel hub bearing units,
tapered roller and small-deep groove ball
bearings, seals, specialist automotive
products and complete repair kits for the
vehicle service.
Cars & Light Trucks 46%, Vehicle Service
market 28%, Trucks 15%, Two Wheelers &
Electricals 7% and others 4%.
Europe 46%, North America 22%, Asia
Pacific 19%, Latin America 12%, Middle
East/Africa 1%
Accelerated R&D Spending;Expansion of
footprint in emerging markets; Development of
the Automotive industry.
SKF (SKFb.ST) - ANDRE KUKHNIN, CFA +44 20 7883 0350/ [email protected]
Geographic Mix
Industrial distribution 39%, Industry General
15%, Industry Heavy and Special 12%,
Aerospace 8%, Energy 8%, railway 6%, Off
highway 5% and others 7%.
Europe 43%, Asia Pacific 26%, North
America 20%, Latin America 7%, Middle
East/Africa 4%.
Bearings & Units: INA/FAG brands (German
Schaeffer Group), Parker Hannifin, Timken
(USA), NTN, JTEKK(Japan), Freudenberg
Group, Trelleborg, Federal Mogul, Dana,
Bruss, Elring Klinger, Lord;
Polymer Seals: Paulstra;
Actuation Montion Control: Linak, THK;
Lubrication: Lincoln Industrial Corp (USA),
Nevada unit (GE)
Shareholding Structure
Free Float: 71%
Top 5 shareholders
Foundation Asset Management
12.9%,Swedbank Robur Funds 4.7%, Alecta
3.5%, AMF Pension 2.8%, Handelsbanken
Funds 1.2%
Ownership by country
Sweden 56%, Rest of Europe 22%, USA 18%
and others 4%
Strategic Industries46%
Regional Sales & Service
47%
Automotive7%
Strategic Industries
32%
Regional Sales & Service
41%
Automotive27%
WesternEurope
35%
Middle East/Africa
3%
Asia Pacif ic
24%
NorthAmerica
22%
Latin America
8%
EasternEurope
5%
Sw eden3%
Industrial Distribution
29%
Cars &Light Trucks
13%
General Industry
12%
Energy6%
Industry Heavy & Special
9%
Vehicle service market
10%Aerospace
6%
Others15%
Source: Company data

178
Smiths Group – Outperform, TP 1460p Investment summary: We see Smiths as an attractively valued self-help story in the sector with additional
optionality from possible portfolio rationalisation or M&A.
Bull Case Self-help – management recently identified further £50m of savings to be
achieved over 3-4 years at a cost of £100m (equivalent of 150bps of margin
with current level of c18%).
Scope for a more active portfolio management – we expect management to
undertake a more active approach to Smiths’ portfolio management over the
next 12-18 months through acquisitions and possible disposals with pension
deficit issue now becoming less significant.
Potential for new targets to rebuild confidence in future performance –
management expect to issue new divisional growth and margin targets in March
2014 at H1 FY14 results.
Scope for turn-around in Detection with cost-cutting, new product launches
and a conscious build up of the service business.
Favourable exposure to Aerospace and US housing in Flex Tek.
Attractive valuation relative to UK peers or vs global SOTP.
Bear Case Government or quasi-government exposure (c4-% of sales) to continue to drag
earnings performance – Medical, Detection and parts of Interconnect. We
believe we reflect this in our estimates with limited growth in FY2014.
Poor recent larger acquisitions track record.
Questioning of portfolio rationalisation potential with management / Board
passing on now two opportunities for sale of Medical.
0
200
400
600
800
1000
1200
1400
1600
0
20
40
60
80
100
120
2004 2005 2006 2007 2008 2009 2010 2011 2012 2013
1 Yr Forward EPS (LHS) Share Price (RHS)
-30%
-20%
-10%
0%
10%
20%
5%
7%
9%
11%
13%
15%
17%
19%
21%
Margins % (LHS) Nominal Growth (RHS)
0%
10%
20%
30%
40%
50%
60%
70%
80%
90%
8%
10%
12%
14%
16%
18%
SMIN ROIC (LHS) Sector ROIC (LHS)
SMIN Cash conversion (RHS) Sector Cash conversion (RHS)
Source: Thomson Reuters, Company data, Credit Suisse estimates

179
Smiths Group – Valuation July Y/E 2007 2008 2009 2010 2011 2012 2013 2014E 2015E 2016E
Average/Current 1,022 1,019 860 967 1,240 1,290 1,170 1,371 1,371 1,371
High 1,056 1,063 923 1,010 1,429 1,040 1,209
Low 985 972 798 924 1,089 941 1,130
Year end 1,047 1,047 720 1,116 1,135 1,067 1,385
P/E average 17.8 13.8 10.2 11.7 14.5 14.0 12.8 14.5 13.6 13.1
P/E high 18.4 14.4 11.0 12.2 16.7 11.3 13.2
P/E low 17.1 13.2 9.5 11.2 12.7 10.2 12.3
P/E year-end 18.2 14.2 8.5 13.5 13.2 11.6 15.1
EV/Sales average 2.06 2.10 1.77 1.83 2.10 2.21 1.88 2.06 1.96 1.86
EV/Sales high 2.12 2.18 1.87 1.89 2.36 1.89 1.93
EV/Sales low 1.99 2.02 1.68 1.77 1.89 1.76 1.83
EV/Sales year-end 2.11 2.15 1.57 2.04 1.95 1.92 2.15
Operating profit margin 16.1% 16.4% 15.7% 17.8% 18.2% 18.3% 18.0% 18.5% 18.8% 18.9%
EV/EBITDA average 10.9 11.2 9.8 9.1 10.3 10.9 9.5 10.2 9.6 9.0
EV/EBITDA high 11.2 11.6 10.3 9.4 11.6 9.3 9.8
EV/EBITDA low 10.6 10.8 9.3 8.8 9.3 8.7 9.3
EV/EBITDA year-end 11.2 11.5 8.6 10.1 9.6 9.5 10.9
EV/EBIT average 12.8 12.8 11.3 10.3 11.5 12.1 10.4 11.2 10.4 9.8
EV/EBIT high 13.2 13.3 11.9 10.6 13.0 10.3 10.7
EV/EBIT low 12.4 12.3 10.7 10.0 10.4 9.6 10.1
EV/EBIT year-end 13.1 13.1 10.0 11.5 10.7 10.5 12.0
FCF yield average 0.9% 2.3% 8.1% 9.4% 4.8% 4.7% 5.6% 3.1% 4.0% 4.6%
FCF yield high 0.9% 2.4% 8.7% 9.8% 5.5% 6.5% 5.8%
FCF yield low 0.9% 2.2% 7.5% 9.0% 4.2% 5.9% 5.4%
FCF yield year-end 0.9% 2.2% 9.6% 8.1% 5.3% 5.7% 4.7%
Dividend yield average 3.3% 3.3% 4.0% 3.5% 2.9% 2.9% 3.4% 3.0% 2.9% 3.1%
Dividend yield high 3.2% 3.2% 3.7% 3.4% 2.5% 3.7% 3.3%
Dividend yield low 3.4% 3.5% 4.3% 3.7% 3.3% 4.0% 3.5%
Dividend yield year-end 3.2% 3.2% 4.7% 3.0% 3.2% 3.6% 2.9%
EV/IC average 2.8 2.4 1.9 1.9 2.2 2.4 2.0 2.2 2.1 2.1
EV/IC high 2.9 2.5 2.0 2.0 2.5 2.0 2.0
EV/IC low 2.7 2.3 1.8 1.8 2.0 1.9 1.9
EV/IC year-end 2.9 2.5 1.7 2.1 2.1 2.0 2.3
P/BV average 2.5 2.0 1.4 1.4 1.8 1.8 1.6 1.8 1.8 1.8
P/BV high 2.6 2.1 1.5 1.5 2.1 1.4 1.6
P/BV low 2.4 1.9 1.3 1.4 1.6 1.3 1.5
P/BV year-end 2.6 2.0 1.1 1.6 1.7 1.5 1.9
ROIC 15.8% 16.1% 15.4% 13.9% 14.1% 14.3% 14.0% 14.2% 14.9% 15.5%
ROE 24.8% 31.5% 38.3% 29.6% 24.5% 37.0% 24.4% 25.0% 23.9% 22.4%
ROCE 16.8% 19.2% 21.6% 19.2% 18.0% 22.9% 18.4% 17.8% 17.8% 17.7%
Per share Proportion Sales EBITA CY 2014E CY 2014E
pence % CY 2014E CY 2014E Valuation EV/sales EV/EBITA
Detection 194 11% 548 76 763 1.39 10.0
Medical 629 36% 853 190 2,473 2.90 13.0
John Crane 694 40% 1,045 242 2,730 2.61 11.3
Interconnect 175 10% 452 69 688 1.52 10.0
Flex Tek 127 7% 268 47 498 1.86 10.5
Central costs (89) -5% (35) (350) 10.0
Enterprise value 1,729 100% 3,167 589 6,802 2.15 11.5
Net debt (202) (793)
Pensions deficit (25) (100)
Litigation provisions (38) (150)
Equity value 1,464 5,760
Number of shares 393
Valuation per share 1,464
SOTP
Source: Company data, Credit Suisse estimates

180
Smiths Group – Financials PROFIT & LOSS 2011 2012 2013 2014E 2015E 2016E
Revenue 2,842 3,030 3,109 3,109 3,248 3,384
Growth, % 2.6% 6.6% 2.6% 0.0% 4.5% 4.2%
Organic growth, % 1.0% 4.6% 2.4% 1.0% 4.5% 4.2%
Operating Profit (EBITA) 516.9 553.7 559.7 574.0 611.0 640.6
Margin, % 18.2% 18.3% 18.0% 18.5% 18.8% 18.9%
EBITDA 580.3 612.7 612.0 626.3 665.6 697.5
EBITDA margin, % 20.4% 20.2% 19.7% 20.1% 20.5% 20.6%
Net interest income / (expense) (58.5) (62.6) (61.7) (60.0) (55.0) (55.0)
Underlying PBT 462.7 496.8 498.0 514.0 556.0 585.6
Amortisation (72.3) (83.1) (81.1) (81.1) (81.1) (81.1)
Exceptional items (15.3) (69.3) (102.8) (50.0) (30.0) (20.0)
Profit before Tax 397.9 365.9 441.8 409.0 466.0 505.6
Tax (91.8) (107.6) (83.6) (110.4) (128.1) (141.6)
Effective rate, % 23.1% 29.4% 18.9% 27.0% 27.5% 28.0%
Reported profit after tax 306.1 258.3 358.2 298.5 337.8 364.0
Reported Net Income 383.8 256.6 356.6 297.5 336.8 363.0
Operating Net Income 338.7 363.3 364.4 376.8 402.1 420.6
Net income margin, % 11.9% 12.0% 11.7% 12.1% 12.4% 12.4%
CS operating EPS 85.7 91.9 91.7 94.6 100.7 105.0
EPS growth, % 3.5% 7.2% -0.2% 3.1% 6.5% 4.4%
DPS 36.3 38.0 39.5 41.0 40.3 42.0
DPS growth, % 6.6% 4.8% 3.9% 3.8% -1.8% 4.4%
Dividend Cover (X) 2.4 2.4 2.3 2.3 2.5 2.5
Ordinary shares in issue 391.7 392.6 393.3 394.3 396.3 398.3
ANALYSIS 2011 2012 2013 2014E 2015E 2016E
NOPAT 379.8 406.7 411.3 421.9 442.9 461.2
Invested Capital 2,689.8 2,842.8 2,948.7 2,965.9 2,971.7 2,970.6
ROIC 14.1% 14.3% 14.0% 14.2% 14.9% 15.5%
ROIC (average) 14.2% 14.7% 14.2% 14.3% 14.9% 15.5%
Operating Net Income 338.7 363.3 364.4 376.8 402.1 420.6
Equity 1,379.9 980.8 1,493.6 1,509.1 1,684.4 1,878.4
ROE 24.5% 37.0% 24.4% 25.0% 23.9% 22.4%
ROE (average) 27.3% 30.8% 29.5% 25.1% 25.2% 23.6%
EBITDA 580.3 612.7 612.0 626.3 665.6 697.5
Total debt (990.1) (997.0) (1,138.2) (1,138.2) (1,138.2) (1,138.2)
Net debt (729.0) (791.4) (744.4) (860.1) (804.7) (723.4)
Total debt / EBITDA 1.7 1.6 1.9 1.8 1.7 1.6
Net debt / EBITDA 1.3 1.3 1.2 1.4 1.2 1.0
BALANCE SHEET 2011 2012 2013 2014E 2015E 2016E
PPE 283 271 280 350 409 461
Intangibles 1,610 1,717 1,746 1,665 1,584 1,503
Long term investments 50 61 86 86 86 86
Other f ixed assets 215 248 226 226 226 226
Fixed assets 2,158 2,296 2,338 2,327 2,304 2,275
Inventories 433 439 476 511 534 556
Trade receivables 613 634 696 681 712 742
Other receivables 22 23 42 0 0 0
Trade and other payables (536) (550) (602) (554) (578) (603)
Working capital 532 546 611 639 667 695
Working capital turn 5.3 5.5 5.1 4.9 4.9 4.9
WC as % of sales 18.7% 18.0% 19.6% 20.5% 20.5% 20.5%
Cash 261 206 394 278 334 415
Short-term debt (12) (175) (187) (11) (11) (11)
Long-term debt (978) (822) (951) (1,127) (1,127) (1,127)
Net debt / (cash) (729) (791) (744) (860) (805) (723)
Pension deficit (199) (620) (254) (140) (26) 88
Provisions (326) (401) (409) (409) (409) (409)
Other liabilities (56) (49) (48) (48) (48) (48)
Net assets 1,380 981 1,494 1,509 1,684 1,878
CASH FLOW 2011 2012 2013 2014E 2015E 2016E
Operating profit 510.3 489.7 574.3 574.0 611.0 640.6
Exceptional items 5.5 10.7 0.0 (50.0) (30.0) (20.0)
Depreciation 63.4 59.0 52.3 78.4 75.7 78.0
Tax paid (90.9) (93.7) (114.1) (110.4) (128.1) (141.6)
Net interest (66.8) (64.5) (59.6) (60.0) (55.0) (55.0)
Other (63.7) (59.5) (80.7) (114.0) (114.0) (114.0)
Gross cash flow 357.8 341.7 372.2 317.9 359.6 388.0
Working capital change (36.1) (10.2) (18.8) (28.1) (28.6) (27.9)
Operating cash flow 321.7 331.5 353.4 289.8 331.0 360.1
Operating cash / Operating profit 0.6 0.6 0.6 0.5 0.5 0.6
Net Capex (44.8) (49.4) (52.6) (94.1) (83.3) (78.0)
Intangibles capitalisation (10.2) (13.5) (11.1) 0.0 0.0 0.0
R&D capitalisation (30.6) (27.6) (28.4) (28.4) (29.7) (30.9)
Free cash flow 236.1 241.0 261.3 167.4 218.0 251.2
FCF / Net income 0.5 0.7 0.6 0.4 0.5 0.6
Disposals (2.3) 47.3 0.3 0.0 0.0 0.0
Acquisitions (18.5) (167.5) (0.5) 0.0 0.0 0.0
Borrow ings raised / (repaid) 0.4 1.3 88.1 0.0 0.0 0.0
Shares issue / (purchase) 5.8 (6.7) (1.7) (1.7) (1.7) (1.7)
Dividends paid (136.4) (144.4) (152.7) (281.4) (160.8) (168.2)
Others 3.4 (28.0) (12.0) 0.0 0.0 0.0
Net cash flow 88.5 (57.0) 182.8 (115.7) 55.5 81.2
Source: Company data, Credit Suisse estimates

181
Smiths Group – Company Summary
Division Products End Markets / Channels Main Competitors / Positioning Revenue Split by Geo Key Drivers / Themes
John Crane
FY2013 Sales - £986m,
2.0% org. growth
FY2013 EBITA - £231m,
23.4% margin
Mechanical seals and systems (76% of sales),
transmission couplings (5%), engineered
bearings (5%), filtration systems (4%), artificial
lift (10%).
37% OEM. Aftermarket - 38% O&G,
petrochem, 9% gen industry, 9% Chemical
& pharma, 7% Distributors
Flowserve, EagleBurgmann Industries
(mech seals) Kingsbury, Waukesha (eng
bearings), Pall and Hydac (filtration sys),
Rexnord and Emerson (couplings),
Weatherfird & Norris (upstream)
N. America - £321m
Europe - £341m
RoW - £311m Installed-base driven aftermarket growth. Drill
rig count. Oil & Gas prices. Targeting
expansion in adjacent markets to seals
(bearings, filtration)
Medical
FY2013 Sales - £850m,
0.1% org. growth
FY2013 EBITA - £189m,
22.2% margin
Medical devices and equipment for medication
delivery, vital care and safety devices (syringe)
markets. 75% hospitals, 20% surgery centres,
5% OEM.
28% Medication delivery (drug delivery,
acute + chronic pain, chermo), 41% Vital
care (airways, pre/post surgery, aid
breathing, monitor vital signs), 31% Safety
devices (needlestick injuries)
Covidien, Teleflex, B Braun, Becton
Dickinson, Hospira, C R Bard, CareFusion
and Vital Signs, among many others.
North America - £461m
Europe - £281m
RoW - £311mUS and European medical spend
Detection
FY2013 Sales - £559m,
7.7% org. growth
FY2013 EBITA - £58m,
10.4% margin
Products that detect + ID explosives, narcotics,
weapons, biohazards & contraband. Products -
cargo inspection, chem & bio sensors,
onventional x-ray, explosive detection, mm-
wave, trace, radiation & nuclear products & sys.
47% Air transportation, 16% Ports &
borders, 11% Military, 4% Emergency
responders, 21% Critical Infrastructure, 1%
Non security
Air transport - Morpho (20% shr), L3 (16%),
Rapiscan (8%), Reveal (6%), NucTech
(3%). Ports & Borders - AS&E (13%), SAIC
(10%), Nuctech (7%), Rapiscan (6%), L3
(4%). Military - Chemring, Bruker, Thermo
Fisher
North America - £202m
Europe - £130m
RoW - £187m Homeland Security, Airport Security,
Container/Port Security
Interconnect
FY2013 Sales - £461m,
-1.1% org. growth
FY2013 EBITA - £69m,
14.9% margin
Components which connect, protect and control
critical electronic systems. Split into 3 areas; 1)
connectors (35%), 2) microwave - defence
(25%) & telecoms (20%) and 3) power
management (20%)
44% Military and aero, 25% Wireless
Telco, 31% Medical, rail and automation
Connectors - Amphenol, Deutsch (TE),
Everett Charles (Dover), Glenair, ODU &
Harting. Microwave Anaren, Power Wave,
KMW, Dover, Commscope, Cobham, EMS
(Honeywell), Teledyne. Others - Emerson,
Cynerex (ABB), Eaton, Starline.
North America - £274m
Europe - £85m
RoW - £90m
Defence spending, Telecom capex
Flex-Tek
FY2013 Sales - £253m,
7.7% org. growth
FY2013 EBITA - £43m,
17.1% margin
Flexible housing and rigid tubing to move fluids
and gases.
35% Fluid mgmt - aero, military, 24% Heat
sol - appliance & HVAC, 26% Construction
products - HVAC, US construction, 15%
Flexible solutions - industrial, floor care,
medical
General - Parker, Eaton, Kongsberg. Heat
sol - Zoppas, Nibe, Watlow and Chromalox,
Kawai and Dongfang. Construction - Hitachi,
Atco, Omega Flex, Hart & Cooley and
Goodman.
North America - £163m
Europe - £35m
RoW - £35m Military spend, Non residential construction
particularly in North America
SMITHS GROUP (SMIN.L / SMINLN) - ANDRE KUKHNIN, CFA +44 20 7883 0350 /[email protected]
John Crane
32%
Medical
27%
Detection
18%
Interconnect
15%
Flex-Tek
8%
N America,
50%
UK, 4%
Europe,
20%
RoW, 26%
John Crane
39%
Medical
32%
Detection
10%
Interconnect
12%
Flex-Tek
7%
Geographic Split Operating Profit Mix Sales Mix End Market Split Shareholding structure
Free float: 100%
Top 5 shareholders:Harris
Associates - 5%, Prudential PLC - 4%,
Blackrock - 4%, Threadneedle Asset
Mngmnt. - 4%, Legal & General - 4%
Ownership by Country: UK - 46%,
USA - 30%, Germany - 6%, France -
3%, Norway - 2%
Management
Chairman - Donald Brydon
CEO - Philip Bowman
CFO - Peter Turner
IR - Peter Durman
Oil, gas,
petrochemicals19%
Chemical and
Pharma 4%
Healthcare
29%Homeland Security
16%
Industrial
12%
Defence
6%
Aerospace
4%
Telecoms
3%
Semiconductors
3%
Others
4%
Source: Company data

182
Spectris – Outperform, TP 2560p
Bull Case Upper sector quartile cash conversion combined with healthy CS adjusted
ROIC
c28% of group sales come from automation (on our estimates) making
Spectris amongst the best ways to gain exposure to this ongoing theme
Significant balance Sheet optionality with FY13E net debt / EBITDA of just
0.3x
As previously argued it would make a good fit with Danaher (Report: 19th
August: Analytical & Life Sciences – Attractive Market Dynamics: M&A Likely
to set up).
Peer group weighted SOTP equates to c2900p or c20% potential upside to
the current price.
Bear Case
No signs yet of a turning point in key end markets including Academic,
Electronics and Mining.
Q1 2013 profit warning shows Spectris has not lost all its cyclical
tendencies.
Lack of acquisition opportunities – competition for assets from global peers.
Investment summary: Attractive valuation vs. global Instrumentation peer group combined with good through
cycle cash generation, balance sheet optionality and potential M&A target.
0
500
1000
1500
2000
2500
3000
0
20
40
60
80
100
120
140
160
2004 2005 2006 2007 2008 2009 2010 2011 2012 2013
1 Yr Forward EPS (LHS) Share Price (RHS)
-30%
-20%
-10%
0%
10%
20%
10%
12%
14%
16%
18%
20%
Margins % (LHS) Organic Growth (RHS)
0%
20%
40%
60%
80%
100%
120%
6%
8%
10%
12%
14%
16%
18%
20%
SXS ROIC (LHS) Sector ROIC (LHS)
SXS Cash conversion (RHS) Sector Cash conversion (RHS)
Source: Thomson Reuters, Company data, Credit Suisse estimates

183
Spectris – Valuation
2007 2008 2009 2010 2011 2012 2013e 2014e 2015e
Share price - year high 988.5 830.5 759.0 1326.0 1679.0 2050.0 2370.0 2370.0 2370.0
Share price - year low 657.0 400.0 382.5 735.0 1039.0 1289.0 2370.0 2370.0 2370.0
Share price - year average 852.4 677.3 580.2 932.7 1375.7 1700.2 2370.0 2370.0 2370.0
Enterprise value - high 1317.1 1180.5 1023.3 1630.5 2313.6 2640.3 2882.0 2808.4 2712.5
Enterprise value - low 905.1 657.0 588.8 948.5 1572.5 1756.0 2882.0 2808.4 2712.5
Enterprise value - average 1147.9 994.2 816.9 1176.7 1962.4 2233.8 2882.0 2808.4 2712.5
EBITA 105.7 119.9 93.2 142.9 201.5 228.9 214.4 220.7 234.4
EV/EBITA - High 12.5 9.8 11.0 11.4 11.5 11.5 13.4 12.7 11.6
EV/EBITA - Low 8.6 5.5 6.3 6.6 7.8 7.7 13.4 12.7 11.6
EV/EBITA - Average 10.9 8.3 8.8 8.2 9.7 9.8 13.4 12.7 11.6
EBITDA 118.8 130.3 107.5 157.3 216.4 246.4 232.4 238.7 252.4
EV/EBITDA - high 11.1 9.1 9.5 10.4 10.7 10.7 12.4 11.8 10.7
EV/EBITDA - low 7.6 5.0 5.5 6.0 7.3 7.1 12.4 11.8 10.7
EV/EBITDA - average 9.7 7.6 7.6 7.5 9.1 9.1 12.4 11.8 10.7
Sales 668.4 787.1 787.3 901.9 1106.2 1230.8 1222.0 1271.5 1316.0
EV/Sales - high 2.0 1.5 1.3 1.8 2.1 2.1 2.4 2.2 2.1
EV/Sales - low 1.4 0.8 0.7 1.1 1.4 1.4 2.4 2.2 2.1
EV/Sales - average 1.7 1.3 1.0 1.3 1.8 1.8 2.4 2.2 2.1
CS EPS Adjusted (p) 58.2 72.3 45.3 85.1 122.0 135.9 128.7 132.8 142.3
PER - high 17.0 11.5 16.8 15.6 13.8 15.1 18.4 17.9 16.7
PER - low 11.3 5.5 8.5 8.6 8.5 9.5 18.4 17.9 16.7
PER - average 14.6 9.4 12.8 11.0 11.3 12.5 18.4 17.9 16.7
NAV 249.0 384.1 373.4 443.5 520.0 590.2 704.1 770.5 842.6
PBV - high 4.0 2.2 2.0 3.0 3.2 3.5 3.4 3.1 2.8
PBV - low 2.6 1.0 1.0 1.7 2.0 2.2 3.4 3.1 2.8
PBV - average 3.4 1.8 1.6 2.1 2.6 2.9 3.4 3.1 2.8
Dividend Yield 21.0 23.4 24.3 28.0 33.6 39.0 43.3 48.1 53.3
Dividend Yield - high 2% 3% 3% 2% 2% 2% 2% 2% 2%
Dividend Yield - low 3% 6% 6% 4% 3% 3% 2% 2% 2%
Dividend Yield - average 2% 3% 4% 3% 2% 2% 2% 2% 2%
FCF before distributions 73.6 69.6 78.0 126.8 128.4 160.8 119.5 143.6 154.7
FCF/Sales 11% 9% 10% 14% 12% 13% 10% 11% 12%
FCF per share 60.3 59.9 67.4 107.5 108.7 135.7 100.2 120.4 129.8
FCF/EBITDA 62% 53% 73% 81% 59% 65% 51% 60% 61%
Valuation Multiples Cumulative Cash Conversion Bridge
CFROI expectations: Market (dot) vs. Consensus (bar)
100%111%
- 9%
0%
- 5%
2%11%
13%
0%
20%
40%
60%
80%
100%
120%
Cle
an n
et in
com
e
Rep
orte
d ne
t inc
ome
Wor
king
cap
ital
Del
ta b
/w C
apex
&D
eper
ecia
tion
Del
ta b
/w R
&D
Cap
italis
ed &
Inta
ngib
les
Am
ort.
PP
A
Oth
er (
Def
erre
d ta
x, P
ensi
on,
Min
ority
etc
)
Fre
e C
ash
Flo
w
Source: Company data, Credit Suisse estimates, Credit Suisse HOLT

184
Spectris – Financials PROFIT & LOSS 2005 2006 2007 2008 2009 2010 2011 2012 2013e 2014e 2015e
FY FY FY FY FY FY FY FY FY FY FY
Revenue 655.9 684.5 668.4 787.1 787.3 901.9 1,106.2 1,230.8 1,222.0 1,271.5 1,316.0
Change yoy, % 4.4% -2.4% 17.8% 0.0% 14.6% 22.7% 11.3% -0.7% 4.1% 3.5%
EBITDA 88.6 106.6 118.8 130.3 107.5 157.3 216.4 246.4 232.4 238.7 252.4
Margin, % 13.5% 15.6% 17.8% 16.6% 13.7% 17.4% 19.6% 20.0% 19.0% 18.8% 19.2%
EBITA 76.0 93.4 105.7 119.9 93.2 142.9 201.5 228.9 214.4 220.7 234.4
Margin, % 11.6% 13.6% 15.8% 15.2% 11.8% 15.8% 18.2% 18.6% 17.5% 17.4% 17.8%
CS PBT 64.7 84.0 98.9 110.1 68.2 132.3 191.6 217.3 201.9 211.0 226.2
Income Tax (14.1) (20.8) (27.8) (23.9) (7.4) (15.4) (31.9) (34.6) (48.4) (52.8) (56.6)
Exceptional - Tax (1.5) (3.4) (4.1) (1.1) (4.2) (8.3) (7.8) (10.8) 0.0 0.0 0.0
CS EPS (Diluted) 41.3 50.7 58.2 72.3 45.3 85.1 122.0 135.9 128.7 132.8 142.3
Reported EPS (Diluted) 28.8 49.2 70.6 69.8 36.8 81.6 106.9 119.2 105.2 109.3 118.8
DPS, p 15.8 17.5 21.0 23.4 24.3 28.0 33.6 39.0 43.3 48.1 53.3
DPS growth yoy, % 11% 20% 11% 4% 15% 20% 16% 11% 11% 11%
CASH FLOW 2005 2006 2007 2008 2009 2010 2011 2012 2013e 2014e 2015e
EBITDA 88.6 106.6 118.8 130.3 107.5 157.3 216.4 246.4 232.4 238.7 252.4
Working Capital Change 4.5 (5.5) 1.2 (3.7) 26.2 22.3 (22.0) (8.4) (13.8) (14.7) (15.2)
Operating Cash Flow 90.6 102.0 115.0 123.1 118.2 175.4 204.0 239.8 208.6 224.0 237.2
Net Financing Cost (12.7) (11.2) (6.3) (8.5) (10.8) (10.1) (12.1) (11.5) (12.0) (9.5) (8.1)
Tax Paid (15.8) (21.5) (23.8) (24.0) (16.7) (21.0) (35.1) (40.9) (43.6) (47.5) (50.9)
Net Operating Cash Flow 62.1 69.3 84.9 90.6 90.7 144.3 156.8 187.4 153.0 167.1 178.2
Net Capex (12.2) (10.5) (11.3) (21.0) (12.7) (17.5) (28.4) (26.6) (33.5) (23.5) (23.5)
Free Cash Flow 49.9 58.8 73.6 69.6 78.0 126.8 128.4 160.8 119.5 143.6 154.7
Acquisitions 0.0 (13.6) (6.0) (87.8) (28.7) (62.6) (369.0) (15.5) 0.0 0.0 0.0
Disposals (2.3) 13.3 29.8 1.5 0.1 0.0 0.1 0.0 90.9 0.0 0.0
Pre Financing Cash Flow 49.4 58.5 97.4 (16.7) 49.4 64.2 (240.5) 145.8 210.4 143.6 154.7
Dividend Paid (18.1) (20.2) (22.2) (25.0) (27.0) (28.9) (33.8) (45.6) (47.2) (53.4) (58.8)
Net Cash / (Debt) Year End (119.9) (71.7) (77.3) (162.1) (123.9) (86.2) (356.2) (254.1) (91.0) (0.9) 95.1
BALANCE SHEET 2005 2006 2007 2008 2009 2010 2011 2012 2013e 2014e 2015e
PPE 93 83 88 118 108 111 153 153 158 165 172
Goodwill 210 207 223 343 325 355 545 527 527 527 527
Inangible Assets 4 8 12 44 70 97 206 192 159 131 103
Working capital 169 165 169 245 194 205 271 255 269 284 299
Total assets 398 385 391 614 578 614 974 949 936 924 913
Shareholders' funds 256 294 303 443 431 514 604 691 829 908 993
Minorities 0 0 0 0 0 0 0 0 0 0 0
Total Borrowings 197 123 129 227 161 151 398 283 132 42 (54)
Cash and equivalents (77) (51) (51) (64) (37) (65) (42) (41) (41) (41) (41)
Net Debt / (Cash) 120 72 77 162 124 86 356 242 91 1 (95)
Pension Deficit 23 19 11 9 24 14 13 16 16 16 16
Total liabilities 398 385 391 614 578 614 974 949 936 924 913
Source: Company data, Credit Suisse estimates

185
Spectris – Company Summary
Geographic Split Operating Profit Mix Sales Mix End Market Split
Division Products End Markets / Channels Main Competitors / Positioning Revenue Split by Geo Key Drivers / Themes
Material Analysis
FY2012 Sales - £348m,
5.5% org. growth
FY2012 EBITA - £63m,
18.1% margin
Material characterisation, contamination
detection, quality
Metals, Minerals and Mining 33%,
Pharmaceuticals 22%, R&D 17%,
Electronics
10%, Other 18%
Mettler Toledo, Perkin Elmer, Thermo
Fisher, Danaher
North America - £72m (21%)
Europe - £102m (30%)
Asia - £130m (38%)
RoW- £33m (10%)
Laboratory / Off-line. Real time production
monitoring in mining, pharmaceuticals
Test & Measurement
FY2012 Sales - 345m,
3.5% org. growth
FY2012 EBITA - £56m,
16.1% margin
Measurement, data acquisition and
processing, simulation
Auto 20%, aero 13%, environ 12%,
consumer
elec 9%, power 6%, machine building 21%
Mettler Toledo, Perkin Elmer, Thermo
Fisher, Danaher
North America - £57m (17%)
Europe - £162m (47%)
Asia - £108m (31%)
RoW- £20m (6%)
Laboratory / Off-line. R&D in aerospace and
automotive. Academia
In-line instrumentation
FY2012 Sales - £320m,
4.1% org. growth
FY2012 EBITA - £64m,
20.0% margin
Quality Control, metrology, process
technology, safety
Pulp&Paper 38%, Converting 25%,
Energy 15%, machine OEM's 17%,
machine builders 5%
Danaher, Roper, Ametek, Teledyne,
Hexagon, Siemens, ABB, Emerson,
North America - £84m (27%)
Europe - £98m (32%)
Asia - £107m (34%)
RoW- £20m (7%)
Process / Manufacturing. Paper (particurlalrly
tissue) and machine building. High % of
aftermarket vs. other divisions
Industrial Controls
FY2012 Sales - £217m,
(3.5)% org. growth
FY2012 EBITA - £46m,
21.3% margin
Product tracking, machine interface,
industrial networking
Distributors 82%, Electronics 7%, Pharma
4%, Other 7%
Danaher, Roper, Ametek, Teledyne,
Hexagon, Siemens, ABB, Emerson,
North America - £75m (66%)
Europe - £19m (17%)
Asia - £17m (15%)
RoW- £2m (2%)
Discrete / Factory Automation.
SPECTRIS (SXS.L / SXS LN) - JONATHAN HURN, CFA +44 20 7883 4532 / [email protected]
Automotive &
Aerospace12%
Metals, minerals,
mining11%
Pharmaceuticals,
fine chemicals10%
Academic
research9%Machine building
9%
Pulp and paper
9%
Semicon,
telecoms, electronics
9%
Energy & utiliites
8%
Web, print,
packaging5%
Environment
4%
Other, incl.
distribution14%
Material Analysis
30%
Test &
Measurement29%
In-line
Instrumentation22%
Industrial Controls
19%
North America,
32%
Europe, 30%
Asia, 32%
RoW, 6%
Material Analysis
28%
Test &
Measurement24%
In-line
Instrumentation26%
Industrial Controls
22%
Shareholding structure
Free float: 100%
Top 5 shareholders: Blackrock - 9%,
F&C Asset Mnmgnt. - 5%, Standard Life
Investments - 4%, Sun Life Financial -
4%, Legal & General - 4%
Ownership by Country: UK - 47%,
USA - 30%, Luxembourg - 6%, France -
3%, Germany - 3%
Management
Chairman -John Hughes CBE
CEO -John O' Higgins
CFO -Clive Watson
CS -Roger Stephens
Source: Company data

186
Spirax Sarco – Neutral, TP 3030p
Bull Case
Further margin expansion: Driven by
(i) % of group sales from AsiaPac (highest steam business margin)
continuing to grow - recently added headcount in region (from 2011 onwards)
still to materially contribute
(ii) Further expansion of Watson Marlow (29% margin) particularly into Asia
which is currently only 20% of revenue.
Market leading position. No competitor has replicated Spirax’s value added
routes to market. SPX continues to add sales headcount to expand further.
Special dividend distribution could happen every 2-3 years based on cash
profile, on our estimates.
Higher quality UK Engineer but at this juncture we prefer ROR / HLMA
Bear Case
Valuation - stock has rerated relative to UK Cap Goods structural peer
group
Trading at a 10% premium to its peer group weighted SOTP
Investment summary: High quality UK engineer with sector leading route to market. One of the few sector names
offering significant margin upside. However, potential discounted in current valuation in our view.
0
500
1000
1500
2000
2500
3000
3500
0
20
40
60
80
100
120
140
160
2004 2005 2006 2007 2008 2009 2010 2011 2012 2013
1 Yr Forward EPS (LHS) Share Price (RHS)
-10%
-5%
0%
5%
10%
15%
12%
14%
16%
18%
20%
22%
24%
Margins % (LHS) Organic Growth (RHS)
0%
10%
20%
30%
40%
50%
60%
70%
80%
90%
8%
10%
12%
14%
16%
18%
20%
22%
SPX ROIC (LHS) Sector ROIC (LHS)
SPX Cash conversion (RHS) Sector Cash conversion (RHS)
Source: Thomson Reuters, Company data, Credit Suisse estimates

187
Spirax Sarco – Valuation
2007 2008 2009 2010 2011 2012 2013e 2014e 2015e
Share price - year high 1081.0 1199.0 1309.0 1987.0 2063.0 2334.0 2872.0 2872.0 2872.0
Share price - year low 870.0 742.5 758.0 1224.0 1649.0 1858.0 2872.0 2872.0 2872.0
Share price - year average 992.8 987.0 939.3 1547.2 1876.1 2066.1 2872.0 2872.0 2872.0
Enterprise value - high 823.0 957.5 1053.2 1533.3 1638.0 1824.3 2282.7 2226.9 2178.8
Enterprise value - low 662.3 611.1 633.7 952.5 1319.7 1455.1 2282.7 2226.9 2178.8
Enterprise value - average 755.8 796.7 771.7 1198.5 1494.3 1616.5 2282.7 2226.9 2178.8
EBITA 68.7 85.7 89.9 118.3 135.2 136.2 152.4 157.2 168.4
EV/EBITA - High 12.0 11.2 11.7 13.0 12.1 13.4 15.0 14.2 12.9
EV/EBITA - Low 9.6 7.1 7.0 8.0 9.8 10.7 15.0 14.2 12.9
EV/EBITA - Average 11.0 9.3 8.6 10.1 11.1 11.9 15.0 14.2 12.9
EBITDA 80.5 100.4 106.5 135.2 151.6 157.2 175.4 180.2 192.4
EV/EBITDA - high 10.2 9.5 9.9 11.3 10.8 11.6 13.0 12.4 11.3
EV/EBITDA - low 8.2 6.1 6.0 7.0 8.7 9.3 13.0 12.4 11.3
EV/EBITDA - average 9.4 7.9 7.2 8.9 9.9 10.3 13.0 12.4 11.3
Sales 417.3 502.3 518.7 589.7 650.0 661.7 693.5 705.5 761.9
EV/Sales - high 2.0 1.9 2.0 2.6 2.5 2.8 3.3 3.2 2.9
EV/Sales - low 1.6 1.2 1.2 1.6 2.0 2.2 3.3 3.2 2.9
EV/Sales - average 1.8 1.6 1.5 2.0 2.3 2.4 3.3 3.2 2.9
CS EPS Adjusted (p) 65.3 83.3 82.1 107.2 123.2 124.1 135.0 139.3 150.3
PER - high 16.5 14.4 15.9 18.5 16.8 18.8 21.3 20.6 19.1
PER - low 13.3 8.9 9.2 11.4 13.4 15.0 21.3 20.6 19.1
PER - average 15.2 11.8 11.4 14.4 15.2 16.6 21.3 20.6 19.1
NAV 320.2 387.6 403.7 493.7 515.9 560.4 537.5 608.3 677.1
PBV - high 3.4 3.1 3.2 4.0 4.0 4.2 5.3 4.7 4.2
PBV - low 2.7 1.9 1.9 2.5 3.2 3.3 5.3 4.7 4.2
PBV - average 3.1 2.5 2.3 3.1 3.6 3.7 5.3 4.7 4.2
Dividend Yield 29.9 33.3 35.0 68.0 49.0 153.0 58.3 64.1 70.5
Dividend Yield - high 3% 3% 3% 3% 2% 7% 2% 2% 2%
Dividend Yield - low 3% 4% 5% 6% 3% 8% 2% 2% 2%
Dividend Yield - average 3% 3% 4% 4% 3% 7% 2% 2% 2%
FCF before distributions 42.3 43.5 40.8 52.6 37.8 88.1 85.4 98.8 104.9
FCF/Sales 10% 9% 8% 9% 6% 13% 12% 14% 14%
FCF per share 55.5 56.8 53.4 67.6 48.1 111.8 109.1 126.2 134.0
FCF/EBITDA 53% 43% 38% 39% 25% 56% 49% 55% 55%
Valuation Multiples Cumulative Cash Conversion Bridge
CFROI expectations: Market (dot) vs. Consensus (bar)
100%
63%
- 4%- 11%
- 15%
4% 3%
- 13%
0%
20%
40%
60%
80%
100%
120%
Cle
an n
et in
com
e
Rep
orte
d ne
t inc
ome
Wor
king
cap
ital
Del
ta b
/w C
apex
&D
eper
ecia
tion
Del
ta b
/w R
&D
Cap
italis
ed &
Inta
ngib
les
Am
ort.
PP
A
Oth
er (
Def
erre
d ta
x, P
ensi
on,
Min
ority
etc
)
Fre
e C
ash
Flo
w
Source: Company data, Credit Suisse estimates, Credit Suisse HOLT
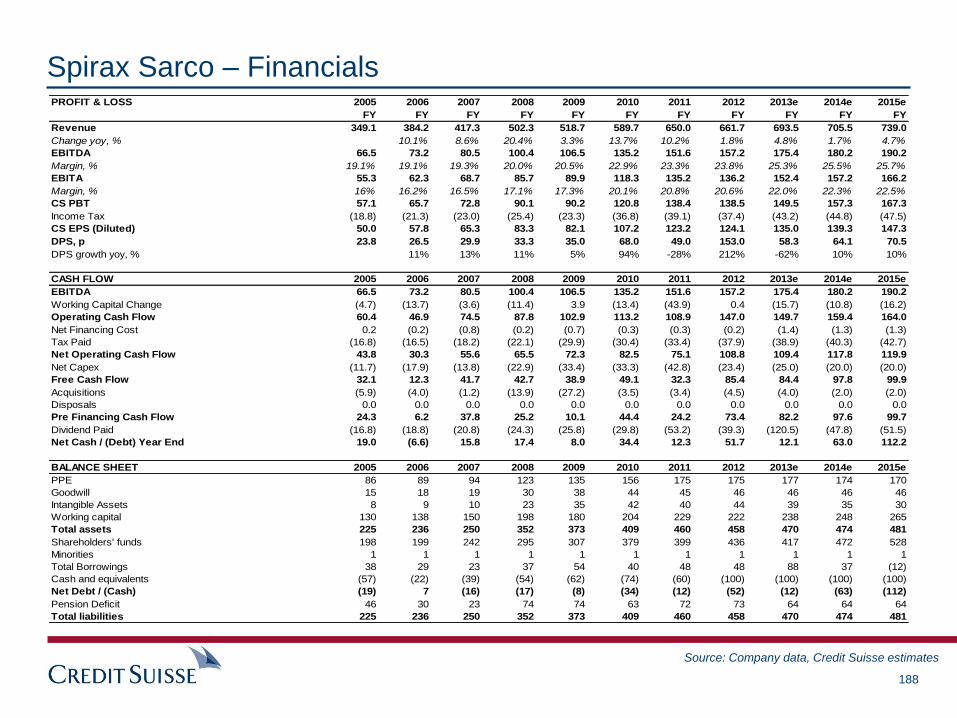
188
Spirax Sarco – Financials PROFIT & LOSS 2005 2006 2007 2008 2009 2010 2011 2012 2013e 2014e 2015e
FY FY FY FY FY FY FY FY FY FY FY
Revenue 349.1 384.2 417.3 502.3 518.7 589.7 650.0 661.7 693.5 705.5 739.0
Change yoy, % 10.1% 8.6% 20.4% 3.3% 13.7% 10.2% 1.8% 4.8% 1.7% 4.7%
EBITDA 66.5 73.2 80.5 100.4 106.5 135.2 151.6 157.2 175.4 180.2 190.2
Margin, % 19.1% 19.1% 19.3% 20.0% 20.5% 22.9% 23.3% 23.8% 25.3% 25.5% 25.7%
EBITA 55.3 62.3 68.7 85.7 89.9 118.3 135.2 136.2 152.4 157.2 166.2
Margin, % 16% 16.2% 16.5% 17.1% 17.3% 20.1% 20.8% 20.6% 22.0% 22.3% 22.5%
CS PBT 57.1 65.7 72.8 90.1 90.2 120.8 138.4 138.5 149.5 157.3 167.3
Income Tax (18.8) (21.3) (23.0) (25.4) (23.3) (36.8) (39.1) (37.4) (43.2) (44.8) (47.5)
CS EPS (Diluted) 50.0 57.8 65.3 83.3 82.1 107.2 123.2 124.1 135.0 139.3 147.3
DPS, p 23.8 26.5 29.9 33.3 35.0 68.0 49.0 153.0 58.3 64.1 70.5
DPS growth yoy, % 11% 13% 11% 5% 94% -28% 212% -62% 10% 10%
CASH FLOW 2005 2006 2007 2008 2009 2010 2011 2012 2013e 2014e 2015e
EBITDA 66.5 73.2 80.5 100.4 106.5 135.2 151.6 157.2 175.4 180.2 190.2
Working Capital Change (4.7) (13.7) (3.6) (11.4) 3.9 (13.4) (43.9) 0.4 (15.7) (10.8) (16.2)
Operating Cash Flow 60.4 46.9 74.5 87.8 102.9 113.2 108.9 147.0 149.7 159.4 164.0
Net Financing Cost 0.2 (0.2) (0.8) (0.2) (0.7) (0.3) (0.3) (0.2) (1.4) (1.3) (1.3)
Tax Paid (16.8) (16.5) (18.2) (22.1) (29.9) (30.4) (33.4) (37.9) (38.9) (40.3) (42.7)
Net Operating Cash Flow 43.8 30.3 55.6 65.5 72.3 82.5 75.1 108.8 109.4 117.8 119.9
Net Capex (11.7) (17.9) (13.8) (22.9) (33.4) (33.3) (42.8) (23.4) (25.0) (20.0) (20.0)
Free Cash Flow 32.1 12.3 41.7 42.7 38.9 49.1 32.3 85.4 84.4 97.8 99.9
Acquisitions (5.9) (4.0) (1.2) (13.9) (27.2) (3.5) (3.4) (4.5) (4.0) (2.0) (2.0)
Disposals 0.0 0.0 0.0 0.0 0.0 0.0 0.0 0.0 0.0 0.0 0.0
Pre Financing Cash Flow 24.3 6.2 37.8 25.2 10.1 44.4 24.2 73.4 82.2 97.6 99.7
Dividend Paid (16.8) (18.8) (20.8) (24.3) (25.8) (29.8) (53.2) (39.3) (120.5) (47.8) (51.5)
Net Cash / (Debt) Year End 19.0 (6.6) 15.8 17.4 8.0 34.4 12.3 51.7 12.1 63.0 112.2
BALANCE SHEET 2005 2006 2007 2008 2009 2010 2011 2012 2013e 2014e 2015e
PPE 86 89 94 123 135 156 175 175 177 174 170
Goodwill 15 18 19 30 38 44 45 46 46 46 46
Intangible Assets 8 9 10 23 35 42 40 44 39 35 30
Working capital 130 138 150 198 180 204 229 222 238 248 265
Total assets 225 236 250 352 373 409 460 458 470 474 481
Shareholders' funds 198 199 242 295 307 379 399 436 417 472 528
Minorities 1 1 1 1 1 1 1 1 1 1 1
Total Borrowings 38 29 23 37 54 40 48 48 88 37 (12)
Cash and equivalents (57) (22) (39) (54) (62) (74) (60) (100) (100) (100) (100)
Net Debt / (Cash) (19) 7 (16) (17) (8) (34) (12) (52) (12) (63) (112)
Pension Deficit 46 30 23 74 74 63 72 73 64 64 64
Total liabilities 225 236 250 352 373 409 460 458 470 474 481
Source: Company data, Credit Suisse estimates

189
Spirax Sarco – Company Summary
Geographic Split Operating Profit Mix Sales Mix End Market Split
Division Products End Markets / Channels Main Competitors / Positioning Revenue Split by Geo Key Drivers / Themes
Steam Specialities
FY2012 Sales - £586m,
3.2% org. growth
FY2012 EBITA - £107m,
18.2% margin
Products and services for the control and
efficient use of steam and other industrial
fluids. Products include steam traps,
isolation valves, safety valves, control
valves, regulators, flow meters, boiler
controls, systems and testing equip. Typical
order £2k, large £10-30k.
Combined heat and power, oil refining, ind
and agrichems, fine chems, pharma,
explosives, autos and aircraft, ship, boilers,
electronics, HVAC, textiles and fibres,
leather, food and bev.
Addressable Spirax Steam Market £3.8bn
and 85% of Spirax's total addressable
market. Spirax has a 14% global share. 28%
(of the 85%) is Condensate Management
(traditional mechanical markets, steam
traps) with SPX global share in this segment
at 25%; 22% of total addressable market is
Controls (boiler house, valves, instruments,
temp pressure electronic control) - SPX
global market share at 12%; 35% of total
addressable market is Energy Management
(heat exchange packages, metering) - SPX
global market share at 7%.
Gestra (Flowserve - Germany), Armstrong
(Private - US), ARI Armaturen (Private -
Germany), TLV (Private - Japan),
Spence/Nicholson (US). Products sold into
steam cycle but not specifically designed
for: Pentair, Fisher Controls (USA,
Emerson), Valtek (US, Flowserve)
Americas - £142m (24%)
EMEA - £291m (50%)
Asia Pacific - £153m (26%)Business is split 50% replacement, 40% upgrade
and 10% capex
Watson-Marlow
FY2012 Sales - £125m,
7.7% org. growth
FY2012 EBITA - £37m,
29.4% margin
Manufactures and suppliers peristaltic
pumps, which drive sensitive or
valuable media safely, accurately, without
contamination and with little
maintenance.
Agriculture, brewing, ceramics, chems,
contact lenses, gen eng, food and bev,
mining, OEM, paint and pigments, pharma
Addressable Peristaltic Pump Market £0.7bn
and 15% of Spirax's total addressable
market (incl. MasoSine Pump). Spirax has
a 18% global share.
Verder (Netherlands, private), Cole Parmer
(USA, Thermo Fisher), Abaque, Boyser and
PCM Delasco. Competing pump types; (i)
Industrial Lobe Pumps - Johnson,
Waukesha (US, SPX), Alfa-Laval;
Progressive Cavity Pumps - Moyno (US,
Dover), Allweiler. Comp in food & beverage,
water treatment, mining; (ii) Air Operated
Diaphragm Pumps - Wilden and Warren
Rupp. comp in Industrial & Printing; (iii)
Peristaltic Metering and OEM Pumps -
Masterflex,Verder. Comps in Laboratory and
Industrial; (iv) Mechanical Diaphragm
Pumps - Pulsafeeder, Bran+Luebber. comp
in Chemical dosing. (V) Solenoid Diaphragm
Pumps - Prominent, Alldos, Grundfos, LMI.
Comps mainly in water treatment; (vi)
Sanitary Lobe Pumps - Waukesha, ITT
Jabsco, Fristam. Comps mainly food &
beverage, Pharmaceuticals, Cosmetics.
Americas - £49m (51%)
EMEA - £21m (38%)
Asia Pacific - £3m (11%)
Replacement of the traditional Rotary Lobe pump
with a Peristaltic Pump. Higher initial price but
lower through life cost. Aftermarket for Peristaltic
Pump materialises after c6 moths +
SPIRAX-SARCO (SPX.L / SPX LN) - JONATHAN HURN, CFA +44 20 7883 4532 / [email protected]
Steam
Specialities75%
Watson-Marlow
25%
Steam
Specialities82%
Watson-Marlow
18%
Americas, 29%
EMEA, 44%
Asia Pacific, 27%
Foods
12%Brewing /
Distilling3%
HVAC
11%
OEM Machinery
11%
Refining &
Petrochem9%
Pharma
8%
Healthcare
5%
Precious Metal
Process3%
Water Treatment
2%
Chemicals
1%
Textiles
1%
Rubber & Plastic
1%
Other
33%
Shareholding structure
Free float: 96%
Top 5 shareholders: Blackrock - 10%,
Allianz Asset Mngmgnt. - 5%,
Sprucegrove Investment Mgmt Ltd - 5%,
Schroders Plc - 4%, Legal & General -
3%
Ownership by Country: UK - 46%,
USA - 29%, Canada - 6%, Luxembourg -
3%, Norway - 3%
Management
Chairman -Bill Whiteley
CEO -Nick Anderson
CFO -David Meredith
CS -WG Stebbings
Source: Company data

190
Vesuvius – Underperform, TP 405p
Bear Case
Poor track record of EVA creation (CS ROIC < WACC), we expect this to
continue in 2014.
With steel production growth (ex-China) only c4% in 2014 on CS forecasts
we see little scope for volume induced operational gearing to drive NOPAT
margins higher.
Unhelpful traits including ongoing pricing pressure in Foundry and China
representing only 11% of group sales.
Expensive valuation with our peer group weighted SOTP implying a fair
value for Vesuvius 10% below the current price.
Bull Case Vesuvius manages to return to peak margins offering c300bp upside to
current levels.
Outperformance vs. UK cyclical peers on cash conversion
Continued self help through portfolio optimization and increased vale based
selling.
Small chance of M&A within the Steel and Foundry market with Vesuvius a
possible M&A candidate, in our view
.
Investment summary: Trading at a premium to peer group with little potential for upside surprise to earnings
based on CS steel forecasts. Our favored cyclical names in the sector include Bodycote and GKN.
0
100
200
300
400
500
600
700
0
10
20
30
40
50
60
70
80
2004 2005 2006 2007 2008 2009 2010 2011 2012 2013
1 Yr Forward EPS (LHS) Share Price (RHS)
-10%
0%
10%
20%
30%
40%
0%
2%
4%
6%
8%
10%
12%
14%
2009 2010 2011 2012 2013E 2014E 2015E
Margins % (LHS) Organic Growth (RHS)
0%
10%
20%
30%
40%
50%
60%
70%
80%
90%
0%
2%
4%
6%
8%
10%
12%
14%
16%
18%
VSVS ROIC (LHS) Sector ROIC (LHS)
VSVS Cash conversion (RHS) Sector Cash conversion (RHS)
Source: Thomson Reuters, Company data, Credit Suisse estimates

191
Vesuvius – Valuation
2012 2013 2014 2015
Share price - year high 352 477.7 477.7 477.7
Share price - year low 324 477.7 477.7 477.7
Share price - year average 344.7 477.7 477.7 477.7
Enterprise value - high 1342.36 1663.35 1614.69 1557.62
Enterprise value - low 1265.17 1663.35 1614.69 1557.62
Enterprise value - average 1322.24 1663.35 1614.69 1557.62
EBITA 133.0 136.9 147.0 160.1
EV/EBITA - High 10.1 12.2 11.0 9.7
EV/EBITA - Low 9.5 12.2 11.0 9.7
EV/EBITA - Average 9.9 12.2 11.0 9.7
EBITDA 176.1 176.9 187 200.1
EV/EBITDA - high 7.6 9.4 8.6 7.8
EV/EBITDA - low 7.2 9.4 8.6 7.8
EV/EBITDA - average 7.5 9.4 8.6 7.8
Sales 1547.5 1510 1527 1585
EV/Sales - high 0.87 1.10 1.06 0.98
EV/Sales - low 0.82 1.10 1.06 0.98
EV/Sales - average 0.85 1.10 1.06 0.98
CS EPS Adjusted (p) 29.31 32.48 35.63 39.34
PER - high 12.01 14.71 13.41 12.14
PER - low 11.06 14.71 13.41 12.14
PER - average 11.76 14.71 13.41 12.14
NAV 312.8 322.0 334.4 349.1
PBV - high 1.1 1.5 1.4 1.4
PBV - low 1.0 1.5 1.4 1.4
PBV - average 1.1 1.5 1.4 1.4
Dividend Yield 17.00 14.96 15.71 16.50
Dividend Yield - high 5% 3% 3% 3%
Dividend Yield - low 5% 3% 3% 3%
Dividend Yield - average 5% 3% 3% 3%
FCF before distributions 10 71 91 100
FCF/Sales 0.6% 4.7% 6.0% 6.3%
FCF per share 3.50 25.43 32.82 36.04
FCF/EBITDA 5.6% 40.0% 48.8% 50.1%
Valuation Multiples Cumulative Cash Conversion Bridge
CFROI expectations: Market (dot) vs. Consensus (bar)
100%
60%-48%
- 38%
- 19%
0%
17%
48%
-20%
0%
20%
40%
60%
80%
100%
120%
Cle
an n
et in
com
e
Rep
orte
d ne
t inc
ome
Wor
king
cap
ital
Del
ta b
/w C
apex
&D
eper
ecia
tion
Del
ta b
/w R
&D
Cap
italis
ed &
Inta
ngib
les
Am
ort.
PP
A
Oth
er (
Def
erre
d ta
x, P
ensi
on,
Min
ority
etc
)
Fre
e C
ash
Flo
w
Source: Company data, Credit Suisse estimates, Credit Suisse HOLT

192
Vesuvius – Financials PROFIT & LOSS 2009 2010 2011 2012 2013e 2014e 2015e
FY FY FY FY FY FY FY
Revenue 1,263.6 1,629.2 1,818.1 1,547.5 1,510.0 1,527.0 1,585.0
Change yoy, % 28.9% 11.6% -14.9% -2.4% 1.1% 3.8%
EBITDA 114.8 230.5 237.8 176.1 176.9 187.0 200.1
Margin, % 9.1% 14.1% 13.1% 11.4% 11.7% 12.2% 12.6%
EBITA 70.5 185.1 190.1 133.0 136.9 147.0 160.1
Margin, % 5.6% 11.4% 10.5% 8.6% 9.1% 9.6% 10.1%
CS PBT 36.4 156.7 162.8 110.9 122.6 135.5 149.6
Income Tax (19.8) (38.7) (44.6) (29.6) (32.4) (36.6) (40.4)
Exceptional - Tax 7.5 8.8 5.7 (2.0) 0.0 2.0 2.0
CS EPS (Diluted) 5.1 40.1 40.0 29.0 32.4 35.6 39.3
Reported EPS (Diluted) -19.5 33.1 25.5 212.3 28.5 28.0 31.7
DPS, p 0.0 11.5 21.8 17.0 15.0 15.7 16.5
DPS growth yoy, % - - 89% -22% -12% 5% 5%
CASH FLOW 2009 2010 2011 2012 2013e 2014e 2015e
EBITDA 114.8 230.5 237.8 176.1 176.9 187.0 200.1
Working Capital Change 110.3 (68.1) (60.1) 11.2 (2.8) (4.0) (5.6)
Operating Cash Flow 178.7 139.2 156.9 165.3 158.1 173.0 184.5
Net Financing Cost (34.7) (17.9) (16.6) (18.7) (15.1) (12.6) (11.7)
Tax Paid (31.1) (34.1) (40.8) (60.1) (29.2) (31.1) (34.6)
Net Operating Cash Flow 112.9 87.2 99.5 86.5 113.8 129.3 138.3
Net Capex (29.2) (45.1) (66.7) (76.7) (43.0) (38.0) (38.0)
Free Cash Flow 83.7 42.1 32.8 9.8 70.8 91.3 100.3
Acquisitions (5.5) (3.2) (10.6) (26.1) 0.0 0.0 0.0
Disposals 6.2 0.1 (2.5) (46.2) 46.8 0.0 0.0
Pre Financing Cash Flow 79.4 31.0 15.1 (64.6) 117.0 92.3 101.3
Dividend Paid 0.0 0.0 (51.8) (61.2) (39.5) (42.7) (44.2)
Net Cash / (Debt) Year End (431.8) (393.7) (363.9) (295.3) (240.4) (190.8) (133.7)
BALANCE SHEET 2009 2010 2011 2012 2013e 2014e 2015e
PPE 327 342 324 278 283 283 283
Goodwill 586 608 599 599 599 599 599
Intangible Assets 242 228 207 165 147 129 111
Working capital 304 388 399 349 352 356 361
Total assets 1218 1314 1325 1232 1224 1209 1193
Shareholders' funds 675 834 874 841 867 901 942
Minorities 0 0 0 27 27 27 27
Total Borrowings 541 519 550 425 370 320 263
Cash and equivalents (109) (125) (132) (130) (130) (130) (130)
Net Debt / (Cash) 432 394 419 295 240 191 134
Pension Deficit 111 87 32 69 90 90 90
Total liabilities 1218 1314 1325 1232 1224 1209 1193
Source: Company data, Credit Suisse estimates

193
Vesuvius – Company Summary
Geographic Split Operating Profit Mix Sales Mix Split by Business Area
Division Products End Markets / Channels Main Competitors / Positioning Revenue Split by Geo Key Drivers / Themes
Steel
FY2012 Sales - £990m,
(10%)% org. growth
FY2012 EBITA - £96m,
9.7% margin
Vesuvius supplies the global steel industry
with consumable ceramic “flow control”
products used to contain and control the
flow of molten steel in the enclosed
continuous casting process. Vesuvius also
supplies the steel industry and other hot
process industries with advanced refractory
materials used for lining vessels such as
blast furnaces, ladles and tundishes to
enable them to withstand heat / molten
metal
Steel industry
RHI (Austria), TYK (Japan), Krosaki (Japan),
IFGL (India), Magnesita (Brazil), Shinagawa
(Japan) and Sinoref (China).
Competition for the Advanced Refractories
business is much more fragmented and
varies by region. Vesuvius is a regional
leader in the UK, NAFTA and South Africa.
Competitors and their headquarter locations
include RHI (Austria), Magnesita (Brazil),
Imerys (France) and Minerals Technologies
(USA).
Asia Pacific - 254mn
Europe - 305mn
NAFTA - 315mn
RoW - 142mn
Increasing use of continuous casting steel
making in China as it modernises and
demand for higher grade flat steel products
(white goods, automotive) increases relative
to long steel products (used in Construction).
Foundry
FY2012 Sales - £530m,
(13)% org. growth
FY2012 EBITA - £48m,
9.1% margin
Vesuvius supplies ceramic consumables,
such as filters and feeding systems, and
chemical coatings and binders to foundries
which use these products in the production
of metal castings. Foseco, the foundry
technologies business, is focussed on the
global foundry industry which produces
castings used in a variety of engineering
products.
Foundry casting industry
Competition for the Foundry Technologies
business is very fragmented, with
Vesuvius being a recognised global leader.
Global competitors include ASK and
Huttenes Albertus.
Asia Pacific - 186mn
Europe - 207mn
NAFTA - 74mn
RoW - 64mn
Automotive and Truck volumes. Construction,
Agriculture and Mining. Opportunities for
secular growth in Ductile and Aluminium
foundry castings.
VESUVIUS (VSVS.L / VSVS LN) - JONATHAN HURN, CFA +44 20 7883 4532 / [email protected]
Steel
60%
Foundry
40%
USA, 19%
Germany, 14%
China, 6%
UK, 5%France, 4%Brazil, 6%
India, 6%
Spain, 3%
RoW, 37%
Steel flow control
32%
Advanced
Refractories32%
Foundry
Technologies31%
Fused Silica
5%
Steel
67%
Foundry
33%
Shareholding structure
Free float: 75%
Top 5 shareholders: Cevian Capital -
20%, Artisan Partners Holdings - 6%,
Pelham Capital Long/ Sh - 6%, Fmr
Llc - 6%, Morgan Stanley Securitities -
5%
Ownership by Country: UK - 45%,
USA - 40%, France - 4%, Switzerland -
2%, Norway - 2%
Management
Chairman -John McDonough CBE
CEO -Francois Wanecq
CFO -Chris O'Shea
CS -Rachel Fell
Source: Company data

194
0
500
1000
1500
2000
2500
0
20
40
60
80
100
120
140
160
180
2004 2005 2006 2007 2008 2009 2010 2011 2012 2013
1 Yr Forward EPS (LHS) Share Price (RHS)
Weir – Neutral, 2210p
Bull Case Continues to ride out the Mining downturn with Book-to-Bill for OE declining
just 11% in Q3 while Aftermarket was +3%
Margin upside at Minerals from a greater aftermarket sales mix and at
Power & Industrial as through put / efficiency increases.
CS view capacity utilisation in upstream Oil & Gas as tighter than some may
think potentially implying upside surprise to 2014 upstream spares /
equipment demand.
In our view, Weir remains an attractive M&A candidate for US peers
wanting to expand Oil & Gas and possibly Mining exposure.
Bear Case
Valuation – little upside with the stock trading broadly inline with its peer
group weighted SOTP.
Weir’s later cycle position in the Minerals supply chain potentially means it
is yet to see the full impact of the OE capex cuts.
With US Gas <$4 extraction will focus on less aggressive shales resulting in
greater sales of legacy lower margin pumps / fluid ends.
Lower margin upstream Oil & Gas OE vs. spares means any pick up in OE
demand will create a margin drag.
Investment summary: Having de-rated vs. the UK Cap Goods sector Weir is now trading at a more attractive
valuation. However, versus its Global peer group it looks fairly valued while end market concerns still persist.
Against this backdrop we rate the stock Neutral with Fenner our preferred mining play for now.
-10%
-5%
0%
5%
10%
15%
20%
25%
30%
35%
0%
5%
10%
15%
20%
25%
Margins % (LHS) Organic Growth (RHS)
0%
10%
20%
30%
40%
50%
60%
70%
80%
90%
6%
8%
10%
12%
14%
16%
18%
WEIR ROIC (LHS) Sector ROIC (LHS)
WEIR Cash conversion (RHS) Sector Cash conversion (RHS)
Source: Thomson Reuters, Company data, Credit Suisse estimates

195
Weir – Valuation
2007 2008 2009 2010 2011 2012 2013e 2014e 2015e
Share price - year high 909.5 969 761 1861 2218 2236 2052 2052 2052
Share price - year low 530 271.5 310 717.5 1375 1397 2052 2052 2052
Share price - year average 703.26 705.67 540.72 1184.79 1839.71 1764.29 2052 2052 2052
Enterprise value - high 2063.97 2280.03 1787.74 4262.68 5431.11 5504.93 5192.85 5070.35 4942.51
Enterprise value - low 1278.03 825.05 841.09 1857.90 3655.75 3732.96 5192.85 5070.35 4942.51
Enterprise value - average 1636.85 1730.73 1325.37 2840.61 4634.43 4508.68 5192.85 5070.35 4942.51
EBITA 118.7 180.6 200.1 316.0 424.5 488.5 460.2 469.3 485.6
EV/EBITA - High 17.4 12.6 8.9 13.5 12.8 11.3 11.3 10.8 10.2
EV/EBITA - Low 10.8 4.6 4.2 5.9 8.6 7.6 11.3 10.8 10.2
EV/EBITA - Average 13.8 9.6 6.6 9.0 10.9 9.2 11.3 10.8 10.2
EBITDA 136.3 201.2 228.3 350.1 461.8 537.9 520.2 529.3 545.6
EV/EBITDA - high 15.1 11.3 7.8 12.2 11.8 10.2 10.0 9.6 9.1
EV/EBITDA - low 9.4 4.1 3.7 5.3 7.9 6.9 10.0 9.6 9.1
EV/EBITDA - average 12.0 8.6 5.8 8.1 10.0 8.4 10.0 9.6 9.1
Sales 1060.6 1353.6 1390.2 1635 2292 2538.3 2480 2505 2572
EV/Sales - high 1.95 1.68 1.29 2.61 2.37 2.17 2.09 2.02 1.92
EV/Sales - low 1.21 0.61 0.61 1.14 1.60 1.47 2.09 2.02 1.92
EV/Sales - average 1.54 1.28 0.95 1.74 2.02 1.78 2.09 2.02 1.92
CS EPS Adjusted (p) 40.87 58.96 63.58 104.18 139.97 153.44 143.85 147.34 153.85
PER - high 22.25 16.44 11.97 17.86 15.85 14.57 14.26 13.93 13.34
PER - low 12.97 4.61 4.88 6.89 9.82 9.10 14.26 13.93 13.34
PER - average 17.21 11.97 8.50 11.37 13.14 11.50 14.26 13.93 13.34
NAV 261.4 337.2 353.0 437.7 529.4 617.5 671.9 737.2 803.8
PBV - high 3.5 2.9 2.2 4.3 4.2 3.6 3.1 2.8 2.6
PBV - low 2.0 0.8 0.9 1.6 2.6 2.3 3.1 2.8 2.6
PBV - average 2.7 2.1 1.5 2.7 3.5 2.9 3.1 2.8 2.6
Dividend Yield 16.50 18.50 21.00 27.00 33.00 38.00 42.18 46.82 51.97
Dividend Yield - high 2% 2% 3% 1% 1% 2% 2% 2% 3%
Dividend Yield - low 3% 7% 7% 4% 2% 3% 2% 2% 3%
Dividend Yield - average 2% 3% 4% 2% 2% 2% 2% 2% 3%
FCF before distributions 67 97 192 136 94 142 238 252 265
FCF/Sales 6% 7% 14% 8% 4% 6% 10% 10% 10%
FCF per share 31.53 45.83 90.66 63.82 44.00 66.32 111.51 118.01 124.35
FCF/EBITDA 49% 48% 84% 39% 20% 26% 46% 48% 49%
Valuation Multiples Cumulative Cash Conversion Bridge
CFROI expectations: Market (dot) vs. Consensus (bar)
100%
70%
5%
- 18%
- 15%
4%5%
- 11%
0%
20%
40%
60%
80%
100%
120%
Cle
an n
et in
com
e
Rep
orte
d ne
t inc
ome
Wor
king
cap
ital
Del
ta b
/w C
apex
& D
eper
ecia
tion
Del
ta b
/w R
&D
Cap
italis
ed &
Inta
ngib
les
Am
ort.
PP
A
Oth
er (
Def
erre
d ta
x, P
ensi
on,
Min
ority
etc
)
Fre
e C
ash
Flo
w
Source: Company data, Credit Suisse estimates, Credit Suisse HOLT

196
Weir – Financials PROFIT & LOSS 2005 2006 2007 2008 2009 2010 2011 2012 2013e 2014e 2015e
FY FY FY FY FY FY FY FY FY FY FY
Revenue 789.4 940.9 1,060.6 1,353.6 1,390.2 1,635.0 2,292.0 2,538.3 2,480.0 2,505.0 2,572.0
Change yoy, % 19.2% 12.7% 27.6% 2.7% 17.6% 40.2% 10.7% -2.3% 1.0% 2.7%
EBITDA 71.2 92.9 136.3 201.2 228.3 350.1 461.8 537.9 520.2 529.3 545.6
Margin, % 9.0% 9.9% 12.9% 14.9% 16.4% 21.4% 20.1% 21.2% 21.0% 21.1% 21.2%
EBITA 57.1 77.2 118.7 180.6 200.1 316.0 424.5 488.5 460.2 469.3 485.6
Margin, % 7.2% 8.2% 11.2% 13.3% 14.4% 19.3% 18.5% 19.2% 18.6% 18.7% 18.9%
CS PBT 62.2 87.1 120.2 176.2 187.0 305.6 412.9 452.4 421.2 433.8 453.1
Income Tax (13.9) (19.9) (33.8) (51.8) (52.2) (82.8) (114.2) (124.2) (114.1) (119.2) (124.6)
Exceptional - Tax 0.0 (2.7) 2.1 5.3 5.4 5.4 1.7 12.6 0.0 0.0 0.0
CS EPS (Diluted) 23.3 32.0 40.9 59.0 63.6 104.2 140.0 153.4 143.9 147.3 153.9
Reported EPS (Diluted) 12.5 38.8 83.0 80.9 60.8 86.9 140.1 147.7 120.5 126.7 133.2
DPS, p 13.2 14.5 16.5 18.5 21.0 27.0 33.0 38.0 42.2 46.8 52.0
DPS growth yoy, % 10% 14% 12% 14% 29% 22% 15% 11% 11% 11%
CASH FLOW 2005 2006 2007 2008 2009 2010 2011 2012 2013e 2014e 2015e
EBITDA 71.2 92.9 136.3 201.2 228.3 350.1 461.8 537.9 520.2 529.3 545.6
Working Capital Change (5.4) 34.9 10.6 (9.0) 66.2 (67.4) (155.3) (116.9) 5.0 (13.9) (14.9)
Operating Cash Flow 44.8 121.7 145.0 207.9 291.1 265.6 296.0 391.1 504.7 497.8 513.1
Net Financing Cost (6.4) (4.9) (5.1) (10.1) (16.2) (9.2) (13.4) (28.3) (51.0) (42.5) (39.5)
Tax Paid (7.9) (14.6) (33.1) (49.0) (43.6) (72.4) (97.3) (104.9) (102.7) (107.3) (112.2)
Net Operating Cash Flow 30.4 102.2 106.8 148.8 231.3 184.0 185.3 257.9 351.1 348.0 361.5
Net Capex (25.4) (26.6) (40.3) (52.1) (39.1) (48.0) (91.4) (116.3) (113.0) (96.0) (96.0)
Free Cash Flow 5.1 75.6 66.5 96.7 192.2 136.0 93.9 141.6 238.1 252.0 265.5
FCF / Net Income 20% 93% 38% 57% 149% 73% 31% 45% 93% 93% 93%
Acquisitions (75.6) (2.1) (317.8) (140.9) (0.1) (203.4) (386.0) (123.3) (210.0) (40.0) (40.0)
Disposals 14.4 6.5 127.3 80.6 (1.5) (0.7) 0.0 22.9 (0.2) 0.0 0.0
Pre Financing Cash Flow (52.1) 81.5 (117.8) 39.9 196.5 (63.9) (288.0) 46.6 18.1 216.2 229.7
Dividend Paid (26.6) (27.7) (31.1) (35.7) (39.2) (46.7) (59.5) (71.7) (82.4) (93.7) (101.8)
Net Cash / (Debt) Year End (76.4) (7.1) (171.3) (239.9) (119.2) (283.6) (673.2) (688.9) (766.6) (644.1) (516.3)
BALANCE SHEET 2005 2006 2007 2008 2009 2010 2011 2012 2013e 2014e 2015e
PPE 119 117 136 190 199 260 322 374 494 534 574
Goodwill 160 154 349 512 494 606 998 909 997 997 997
Inangible Assets 27 26 155 280 246 352 335 545 501 457 413
Working capital 206 161 248 338 272 387 566 643 638 651 666
Total assets 429 391 725 966 933 1270 1876 2090 2261 2277 2291
Shareholders' funds 291 372 545 708 742 921 1,116 1,307 1,423 1,561 1,703
Minorities 0 0 1 0 0 0 2 3 3 3 3
Total Borrowings 186 153 226 314 176 368 787 1,080 1,158 1,035 907
Cash and equivalents (110) (146) (54) (74) (57) (84) (114) (391) (391) (391) (391)
Net Debt / (Cash) 76 7 171 240 119 284 673 689 767 644 516
Pension Deficit 62 12 9 19 71 65 85 90 69 69 69
Total liabilities 429 391 725 966 933 1270 1876 2090 2261 2277 2291
Source: Company data, Credit Suisse estimates

197
Weir – Company Summary
Geographic Split Operating Profit Mix Sales Mix End Market Split
Division Products End Markets / Channels Main Competitors / Positioning Revenue (order input) Split by Geo Key Drivers / Themes
Minerals
FY2012 Sales - £1,334m,
12.5% org. growth
FY2012 EBITA - £260m,
19.5% margin
Slurry handling equipment and processing in
mining and mineral applications - products -
slurry pumps (70% of sales), mill liners,
cyclones, slurry valves, MRO, spares.
Minerals - 76%
Power - 6%
Industrial - 9%
O&G - 7%
Other - 2%
FL Smidth, Svedala, KSB, ITT , Metso
South America - £290m (23%)
North America - £278m (22%)
Australia - £240m (19%)
MEA - £189m (15%)
Europe/FSU - £139m (11%)
Asia Pacific - £126m (10%)
OE Brownfield is more profitable than
Greenfield. Service revenues from the
installed base.
Power & Industrial
FY2012 Sales - £323m,
3.1% org. growth
FY2012 EBITA - £33m,
10.1% margin
4 separate areas; 1) Highly engineered
valves (50% of sales), 2) Hydro turbine
retrofit (10%), 3) Speciality pumpins (10% -
mainly US water and waste), 4) Service
(30%, nuclear).
Minerals - 3%
Power - 57%
Industrial - 14%
O&G - 13%
Water 9%, Other 4%
Isolation valves - Flowserve, Tyco, Velan,
GE. Safety valve - Leser, Tyco, Flowserve,
GE. Control valves - IMI, Fisher
South America - £3m (1%)
North America - £106m (34%)
MEA - £16m (5%)
Europe/FSU - £106m (34%)
(9%)Asia Pacific - £81m (26%)
Increasing levels of nuclear maintenance
spend.
Oil & Gas
FY2012 Sales - £844m,
(11.9)% org. growth
FY2012 EBITA - £209m,
24.7% margin
47% SPM, Mesa, Novatech (shale pumps
and flow control), 10% Gabbioneta (pumps
for refining & petrochem mkts), Service
(field services, North Sea & Middle East),
18% Seaboard (surface wellheads,
service/repair and rental), Mathena
(pressure control rental equipment)
Industrial - 1%
O&G - 99%
SPM: Pumps FMC, Gardner Denver, CAT,
National Oilwell Varco. Well Stimulation
Valve market: Mission (National Oilwell
Varco), Novatech, Gardner Denver,
MacClatchie. Surface Equipment: Cameron,
FMC. Flow FMC (50%). Downstream:
Flowserve, Sulzer, ITT
South America - £9m (1%)
North America - £692m (80%)
MEA - £78m (9%)
Europe/FSU - £69m (8%)
Asia Pacific - £17m (2%)
Turning upstream Oil & Gas into a fully
fledged aftermarket business. Roll out of
international shale gas
WEIR (WEIR.L / WEIR LN) - JONATHAN HURN, CFA +44 20 7883 4532 / [email protected]
UK, 3%
USA, 31%
Canada, 10%
Europe&FSU, 9%
Asia Pacific, 11%
Australia, 9%
South America,
13%
Middle East &
Africa, 14%
Minerals
40%
Oil & Gas
38%
Power
11%
Industrial
7%
Other
4%
Minerals
54%
Power &
Industrial14%
Oil & Gas
32%
Minerals
55%
Power &
Industrial7%
Oil & Gas
38%
Shareholding structure
Free float: 93%
Top 5 shareholders: AXA - 10%,
Aberdeen - 5%, Legal & General - 5%,
Norges Bank - 4%, Fmr Llc - 3%
Ownership by Country: UK - 45%, USA -
27%, France - 7%, Norway - 5%, Canada -
3%
Management
Chairman -Lord Smith of Kelvin
CEO -Keith Cochrane
CFO -Jon Stanton
IR -Andrew Nielsen
Source: Company data

Date Company Event Key End Markets Country / Region
1-Jan-14 Omron Q3 FY 2013 Results Automation Japan
14-Jan-14 Geberit 1st Info on 2013 Construction Equip Europe
15-Jan-14 Fenner Q1 FY 2014 IMS Mining Equip Europe
15-Jan-14 Fenner AGM Mining Equip Europe
17-Jan-14 General Electric Q4 2013 Results Power, Healthcare US
21-Jan-14 Alstom Q3 FY 2014 Results Power, T&D, Rail Europe
21-Jan-14 Group SEB 2013 sales Appliances Europe
21-Jan-14 Halliburton Q4 2013 Results Oil & Gas North America
27-Jan-14 CAT Q4 2013 Results Mining Equip North America
28-Jan-14 Siemens Q1 2014 Results Automation, Power, T&D, GI, Healthcare Europe
28-Jan-14 Siemens AGM Automation, Power, T&D, GI, Healthcare Europe
28-Jan-14 SKF Q4 2013 Results GI Europe
28-Jan-14 Philips Q4 2013 Results Appliances, Healthcare, Lighting Europe
28-Jan-14 KONE Q4 2013 Results Elevators Europe
29-Jan-14 Wartsila Q4 2013 Results Marine Europe
30-Jan-14 Atlas Copco Q4 2013 Results Mining Equip, Compressors, Construction Equip Europe
31-Jan-14 Electrolux Q4 2013 Results Appliances Europe
3-Feb-14 Sandvik Q4 2013 Results Mining Equip, Construction Equip, Tooling, GI Europe
5-Feb-14 Alfa Laval Q4 2013 Results Marine, Oil & Gas Europe
6-Feb-14 Dassault Systems Q4 2013 Results Automation Europe
6-Feb-14 Valmet Q4 2013 Results Pulp and Paper Europe
6-Feb-14 Metso Q4 2013 Results Mining Equip, Construction Equip Europe
7-Feb-14 Assa Abloy Q4 2013 Results Security Europe
7-Feb-14 Volvo Q4 2013 Results Construction Equip Europe
7-Feb-14 Outotec Q4 2013 Results Mining Equip Europe
11-Feb-14 Nexans Q4 2013 Results Cables Europe
13-Feb-14 ABB Q4 2013 Results Automation, T&D Europe
13-Feb-14 Legrand Q4 2013 Results Construction Equip Europe
13-Feb-14 FL Smidth Q4 2013 Results Mining Equip, Cement Equipment Europe
13-Feb-14 Bombardier Q4 2013 Results Rail North America
13-Feb-14 Morgan Adv Mats H2 2013 Results GI UK
14-Feb-14 Schindler Q4 2013 Results Elevators Europe
14-Feb-14 Thyssenkrupp Q1 FY 2014 Results Elevators Europe
20-Feb-14 Schneider Q4 2013 Results Power, Automation Europe
25-Feb-14 Durr Q4 2013 Results Automation Europe
26-Feb-14 Weir Q4 2013 Results Oil & Gas UK
27-Feb-14 Spectris Q4 2013 Results Automation, GI UK
27-Feb-14 Group SEB Q4 2013 Results Appliances Europe
28-Feb-14 Andritz Q4 2013 Results Pulp and Paper Europe
Capital Goods Global Catalyst Calendar

Date Company Event Key End Markets Country / Region
4-Mar-14 Vesuvius Q4 2013 Results GI UK
6-Mar-14 Wartsila AGM Marine Europe
11-Mar-14 Geberit Q4 2013 Results Construction Equip Europe
12-Mar-14 Kaba H1 FY 2014 Results Security Switzerland
19-Mar-14 Smiths Group H1 FY 2014 Results Oil & Gas, Healthcare, Security UK
20-Mar-14 KION Q4 2013 Results GI Europe
20-Mar-14 Schaeffler Q4 2013 Results GI Europe
21-Mar-14 Andritz AGM Pulp and Paper Europe
26-Mar-14 Electrolux AGM Appliances Europe
26-Mar-14 Metso AGM Mining Equip, Construction Equip Europe
26-Mar-14 Kuka Q4 2013 Results Automation Europe
27-Mar-14 FL Smidth AGM Mining Equip, Cement Equipment Europe
28-Mar-14 SKF AGM GI Europe
2-Apr-14 Volvo AGM Construction Equip Europe
3-Apr-14 Geberit AGM Construction Equip Europe
17-Apr-14 SKF Q1 2014 Results GI Europe
22-Apr-14 Schindler Q1 2014 Results Elevators Europe
22-Apr-14 Philips Q1 2014 Results Appliances, Healthcare, Lighting Europe
23-Apr-14 KONE Q1 2014 Results Elevators Europe
23-Apr-14 Fenner H1 FY 2014 Results Mining Equip Europe
24-Apr-14 Schneider Q1 2014 Results Power, Automation Europe
24-Apr-14 Wartsila Q1 2014 Results Marine Europe
24-Apr-14 CAT Q1 2014 Results Mining Equip North America
24-Apr-14 Dassault Systems Q1 2014 Results Automation Europe
24-Apr-14 Group SEB Q1 2014 Results Appliances Europe
24-Apr-14 Metso Q1 2014 Results Mining Equip, Construction Equip Europe
25-Apr-14 Valmet Q1 2014 Results Pulp and Paper Europe
25-Apr-14 Spectris AGM Automation, GI UK
25-Apr-14 Volvo Q1 2014 Results Construction Equip Europe
25-Apr-14 Electrolux Q1 2014 Results Appliances Europe
25-Apr-14 Sandvik Q1 2014 Results Mining Equip, Construction Equip, Tooling, GI Europe
28-Apr-14 Alfa Laval Q1 2014 Results Marine, Oil & Gas Europe
28-Apr-14 Alfa Laval AGM Marine, Oil & Gas Europe
29-Apr-14 ABB Q1 2014 Results Automation, T&D Europe
29-Apr-14 Assa Abloy Q1 2014 Results Security Europe
29-Apr-14 Atlas Copco Q1 2014 Results Mining Equip, Compressors, Construction Equip Europe
29-Apr-14 Geberit Q1 2014 Results Construction Equip Europe
29-Apr-14 Outotec Q1 2014 Results Mining Equip Europe
30-Apr-14 ABB AGM Automation, T&D Europe
30-Apr-14 Durr AGM Automation Europe
30-Apr-14 Rational Q1 2014 Results Appliances Europe
30-Apr-14 Rational AGM Appliances Europe

CS Pan-Euro Capital Goods +44 207 888 0350
Julian Mitchell
(US Electrical Equipment / Multi Industry)
julian.m [email protected]
+1 212 325 6668
Jam ie Cook
(US Engineering & Construction)
+1 212 538 6098
Europe
Amish Shah (India Capital Goods)
shah.am ish@@credit-suisse.com
+ 91 22 6777 3743
Credit Suisse Global Capital Goods Research Team
Asia N. America
Japan
China
Singapore
India
Gerald Wong
(Singapore Capital Goods
/ China Industrial Machinery)
+ 65 6212 3037
Andre Kukhnin, CFA
(European Mechanicals)
+44 207 888 0350
Simon Toennessen
(European Electricals)
+44 207 883 6893
Max Yates
(Cables)
+44 207 883 8501
Jonathan Hurn, CFA
(UK Small & Mid-Cap)
+44 207 883 4532
Tiantian Li
(European Mechanicals)
+44 207 883 1552
Patrick Laager
(Swiss Mid-Cap Engineering)
+41 44 334 6076
Vincent Chan (China Strategy)
+852 2101 6568
Edwin Pang (China Power Equipment)
+852 2101 6406
Shinji Kuroda (Japan Industrials)
+ 81 3 4550 9994

Slide 201
Disclosures

Companies Mentioned (Price as of 10-Dec-2013)
ABB (ABBN.VX, SFr22.3) Alfa Laval (ALFA.ST, Skr146.9) Alstom (ALSO.PA, €25.52) Assa Abloy (ASSAb.ST, Skr320.1) Atlas Copco (ATCOa.ST, Skr174.0) Bodycote Plc (BOY.L, 618.0p) Electrolux (ELUXb.ST, Skr158.2) Fenner (FENR.L, 454.7p) GKN (GKN.L, 358.8p) Geberit (GEBN.VX, SFr256.0) Halma (HLMA.L, 569.0p) IMI Plc (IMI.L, 1445.0p) Invensys (ISYS.L, 497.0p) KABA (KABN.S, SFr403.0) Kone Corporation (KNEBV.HE, €32.25) Laird (LRD.L, 257.5p) Legrand SA (LEGD.PA, €39.28) Melrose (MRON.L, 289.7p) Metso (MEO1V.HE, €28.24) Morgan Advanced Materials (MGAMM.L, 293.0p) Nexans (NEXS.PA, €34.64) Philips (PHG.AS, €25.22) Prysmian (PRY.MI, €18.57) Renishaw (RSW.L, 1887.0p) Rotork plc (ROR.L, 2672.0p) SKF (SKFb.ST, Skr174.9) Sandvik (SAND.ST, Skr86.75) Schindler-Holding AG (SCHP.VX, SFr123.8) Schneider (SCHN.PA, €59.19) Senior (SNR.L, 285.7p) Siemens (SIEGn.DE, €94.15) Smiths Group (SMIN.L, 1399.0p) Spectris (SXS.L, 2372.0p) Spirax Sarco (SPX.L, 2851.0p) Vesuvius (VSVS.L, 476.5p) Weir Group (WEIR.L, 2132.0p)
Disclosure Appendix
Important Global Disclosures
Simon Toennessen, Andre Kukhnin CFA, Max Yates, Jonathan Hurn, CFA and Tiantian Li each certify, with respect to the companies or securities that the individual analyzes, that (1) the views expressed in this report accurately reflect his or her personal views about all of the subject companies and securities and (2) no part of his or her compensation was, is or will be directly or indirectly related to the specific recommendations or views expressed in this report.
The analyst(s) responsible for preparing this research report received Compensation that is based upon various factors including Credit Suisse's total revenues, a portion of which are generated by Credit Suisse's investment banking activities
As of December 10, 2012 Analysts’ stock rating are defined as follows:
Outperform (O) : The stock’s total return is expected to outperform the relevant benchmark*over the next 12 months.
Neutral (N) : The stock’s total return is expected to be in line with the relevant benchmark* over the next 12 months.
Underperform (U) : The stock’s total return is expected to underperform the relevant benchmark* over the next 12 months.
*Relevant benchmark by region: As of 10th December 2012, Japanese ratings are based on a stock’s total return relative to the analyst's coverage universe which consists of all companies covered by the analyst within the relevant sector, with Outperforms representing the most attractiv e, Neutrals the less attractive, and Underperforms the least attractive investment opportunities. As of 2nd October 2012, U.S. and Canadian as well as European ra tings are based on a stock’s total return relative to the analyst's coverage universe which consists of all companies covered by the analyst within the relevant sector, with Outperforms representing the most attractive, Neutrals the less attractive, and Underperforms the least attractive investment opportunities. For Latin American and non-Japan Asia stocks, ratings are based on a stock’s total return relative to the average total return of the relevant country or regional benchmark; Australia, New Z ealand are, and prior to 2nd October 2012 U.S. and Canadian ratings were based on (1) a stock’s absolute total return potential to its current share price and (2) the relative attractiveness of a stock’s total return potential within an analyst’s coverage universe. For Australian and New Zealand stocks, 12 -month rolling yield is incorporated in the absolute total return calculation and a 15% and a 7.5% threshold replace the 10-15% level in the Outperform and Underperform stock rating definitions, respectively. The 15% and 7.5% thresholds replace the +10-15% and -10-15% levels in the Neutral stock rating definition, respectively. Prior to 10th December 2012, Japanese ratings were based on a stock’s total return relative to the average total return of the relevant country or regional benchmark.
Restricted (R) : In certain circumstances, Credit Suisse policy and/or applicable law and regulations preclude certain types of communications, including an investment recommendation, during the course of Credit Suisse's engagement in an investment banking transaction and in certain other circumstances.
Volatility Indicator [V] : A stock is defined as volatile if the stock price has moved up or down by 20% or more in a month in at least 8 of the past 24 months or the analyst expects significant volatility going forward.
Analysts’ sector weightings are distinct from analysts’ stock ratings and are based on the analyst’s expectations for the fundamentals and/or valuation of the sector* relative to the group’s historic fundamentals and/or valuation:
Overweight : The analyst’s expectation for the sector’s fundamentals and/or valuation is favorable over the next 12 months.
Market Weight : The analyst’s expectation for the sector’s fundamentals and/or valuation is neutral over the next 12 months.
Underweight : The analyst’s expectation for the sector’s fundamentals and/or valuation is cautious over the next 12 months.
*An analyst’s coverage sector consists of all companies covered by the analyst within the relevant sector. An analyst may cover multiple sectors.
Credit Suisse's distribution of stock ratings (and banking clients) is:
Global Ratings Distribution
Rating Versus universe (%) Of which banking clients (%)
Outperform/Buy* 42% (54% banking clients)
Neutral/Hold* 40% (50% banking clients)
Underperform/Sell* 15% (42% banking clients)
Restricted 3%
*For purposes of the NYSE and NASD ratings distribution disclosure requirements, our stock ratings of Outperform, Neutral, an d Underperform most closely correspond to Buy, Hold, and Sell, respectively; however, the meanings are not the same, as our stock ratings are determined on a relative basis. (Please refer to definitions above.) An investor's decision to buy or sell a security should be based on investment objectives, current holdings, and other indivi dual factors.
Credit Suisse’s policy is to update research reports as it deems appropriate, based on developments with the subject company, the sector or the market that may have a material impact on the research views or opinions stated herein.
Credit Suisse's policy is only to publish investment research that is impartial, independent, clear, fair and not misleading. For more detail please refer to Credit Suisse's Policies for Managing Conflicts of Interest in connection with Investment Research: http://www.csfb.com/research and analytics/disclaimer/managing_conflicts_disclaimer.html
Credit Suisse does not provide any tax advice. Any statement herein regarding any US federal tax is not intended or written to be used, and cannot be used, by any taxpayer for the purposes of avoiding any penalties.
Please refer to the firm's disclosure website at https://rave.credit-suisse.com/disclosures for the definitions of abbreviations typically used in the target price method and risk sections.
See the Companies Mentioned section for full company names
The subject company (ABBN.VX, ALSO.PA, WEIR.L, SCHN.PA, ASSAb.ST, SKFb.ST, HLMA.L, SMIN.L, ALFA.ST, ATCOa.ST, SIEGn.DE, IMI.L, MRON.L, MEO1V.HE) currently is, or was during the 12-month period preceding the date of distribution of this report, a client of Credit Suisse.
Credit Suisse provided investment banking services to the subject company (ABBN.VX, ASSAb.ST, SIEGn.DE) within the past 12 months.
Credit Suisse provided non-investment banking services to the subject company (ABBN.VX, ALSO.PA, SKFb.ST, SMIN.L, ATCOa.ST, SIEGn.DE, IMI.L) within the past 12 months
Credit Suisse has managed or co-managed a public offering of securities for the subject company (SIEGn.DE) within the past 12 months.
Credit Suisse has received investment banking related compensation from the subject company (ABBN.VX, ASSAb.ST, SIEGn.DE) within the past 12 months
Credit Suisse expects to receive or intends to seek investment banking related compensation from the subject company (ABBN.VX, GKN.L, WEIR.L, SCHN.PA, ASSAb.ST, HLMA.L, ALFA.ST, SIEGn.DE, IMI.L, MRON.L, MEO1V.HE, NEXS.PA, PRY.MI) within the next 3 months.
Credit Suisse has received compensation for products and services other than investment banking services from the subject company (ABBN.VX, ALSO.PA, SKFb.ST, SMIN.L, ATCOa.ST, SIEGn.DE, IMI.L) within the past 12 months
As of the end of the preceding month, Credit Suisse beneficially own 1% or more of a class of common equity securities of (ABBN.VX, WEIR.L, ISYS.L, PHG.AS, SIEGn.DE, PRY.MI).
Important Regional Disclosures
Singapore recipients should contact Credit Suisse AG, Singapore Branch for any matters arising from this research report.
The analyst(s) involved in the preparation of this report have not visited the material operations of the subject company (ABBN.VX, GKN.L, LRD.L, ALSO.PA, WEIR.L, SCHP.VX, SCHN.PA, ASSAb.ST, SKFb.ST, SXS.L, HLMA.L, ISYS.L, PHG.AS, SMIN.L, ROR.L, ALFA.ST, KNEBV.HE, SAND.ST, ATCOa.ST, SIEGn.DE, BOY.L, SPX.L, SNR.L, LEGD.PA, GEBN.VX, KABN.S, IMI.L, ELUXb.ST, MGAMM.L, FENR.L, MRON.L, RSW.L, VSVS.L, MEO1V.HE, NEXS.PA, PRY.MI) within the past 12 months
Restrictions on certain Canadian securities are indicated by the following abbreviations: NVS--Non-Voting shares; RVS--Restricted Voting Shares; SVS--Subordinate Voting Shares.
Individuals receiving this report from a Canadian investment dealer that is not affiliated with Credit Suisse should be advised that this report may not contain regulatory disclosures the non-affiliated Canadian investment dealer would be required to make if this were its own report.
For Credit Suisse Securities (Canada), Inc.'s policies and procedures regarding the dissemination of equity research, please visit http://www.csfb.com/legal_terms/canada_research_policy.shtml.
Credit Suisse Securities (Europe) Limited (Credit Suisse) acts as broker to (HLMA.L, SMIN.L, BOY.L, FENR.L).
The following disclosed European company/ies have estimates that comply with IFRS: (ABBN.VX, GKN.L, ALSO.PA, WEIR.L, SCHN.PA, ASSAb.ST, SKFb.ST, HLMA.L, ISYS.L, PHG.AS, SMIN.L, ALFA.ST, SAND.ST, ATCOa.ST, SIEGn.DE, BOY.L, SPX.L, LEGD.PA, IMI.L, ELUXb.ST, MGAMM.L, MEO1V.HE).
Credit Suisse has acted as lead manager or syndicate member in a public offering of securities for the subject company (ABBN.VX, PHG.AS, SIEGn.DE) within the past 3 years.
As of the date of this report, Credit Suisse acts as a market maker or liquidity provider in the equities securities that are the subject of this report.
Principal is not guaranteed in the case of equities because equity prices are variable.
Commission is the commission rate or the amount agreed with a customer when setting up an account or at any time after that.
To the extent this is a report authored in whole or in part by a non-U.S. analyst and is made available in the U.S., the following are important disclosures regarding any non-U.S. analyst contributors: The non-U.S. research analysts listed below (if any) are not registered/qualified as research analysts with FINRA. The non-U.S. research analysts listed below may not be associated persons of CSSU and therefore may not be subject to the NASD Rule 2711 and NYSE Rule 472 restrictions on communications with a subject company, public appearances and trading securities held by a research analyst account.

References in this report to Credit Suisse include all of the subsidiaries and affiliates of Credit Suisse operating under its investment banking division. For more information on our structure, please use the following link: https://www.credit-suisse.com/who_we_are/en/This report may contain material that is not directed to, or intended for distribution to or use by, any person or entity who is a citizen or resident of or located in any locality, state, country or other jurisdiction where such distribution, publication, availability or use would be contrary to law or regulation or which would subject Credit Suisse AG or its affiliates ("CS") to any registration or licensing requirement within such jurisdiction. All material presented in this report, unless specifically indicated otherwise, is under copyright to CS. None of the material, nor its content, nor any copy of it, may be altered in any way, transmitted to, copied or distributed to any other party, without the prior express written permission of CS. All trademarks, service marks and logos used in this report are trademarks or service marks or registered trademarks or service marks of CS or its affiliates. The information, tools and material presented in this report are provided to you for information purposes only and are not to be used or considered as an offer or the solicitation of an offer to sell or to buy or subscribe for securities or other financial instruments. CS may not have taken any steps to ensure that the securities referred to in this report are suitable for any particular investor. CS will not treat recipients of this report as its customers by virtue of their receiving this report. The investments and services contained or referred to in this report may not be suitable for you and it is recommended that you consult an independent investment advisor if you are in doubt about such investments or investment services. Nothing in this report constitutes investment, legal, accounting or tax advice, or a representation that any investment or strategy is suitable or appropriate to your individual circumstances, or otherwise constitutes a personal recommendation to you. CS does not advise on the tax consequences of investments and you are advised to contact an independent tax adviser. Please note in particular that the bases and levels of taxation may change. Information and opinions presented in this report have been obtained or derived from sources believed by CS to be reliable, but CS makes no representation as to their accuracy or completeness. CS accepts no liability for loss arising from the use of the material presented in this report, except that this exclusion of liability does not apply to the extent that such liability arises under specific statutes or regulations applicable to CS. This report is not to be relied upon in substitution for the exercise of independent judgment. CS may have issued, and may in the future issue, other communications that are inconsistent with, and reach different conclusions from, the information presented in this report. Those communications reflect the different assumptions, views and analytical methods of the analysts who prepared them and CS is under no obligation to ensure that such other communications are brought to the attention of any recipient of this report. CS may, to the extent permitted by law, participate or invest in financing transactions with the issuer(s) of the securities referred to in this report, perform services for or solicit business from such issuers, and/or have a position or holding, or other material interest, or effect transactions, in such securities or options thereon, or other investments related thereto. In addition, it may make markets in the securities mentioned in the material presented in this report. CS may have, within the last three years, served as manager or co-manager of a public offering of securities for, or currently may make a primary market in issues of, any or all of the entities mentioned in this report or may be providing, or have provided within the previous 12 months, significant advice or investment services in relation to the investment concerned or a related investment. Additional information is, subject to duties of confidentiality, available on request. Some investments referred to in this report will be offered solely by a single entity and in the case of some investments solely by CS, or an associate of CS or CS may be the only market maker in such investments. Past performance should not be taken as an indication or guarantee of future performance, and no representation or warranty, express or implied, is made regarding future performance. Information, opinions and estimates contained in this report reflect a judgment at its original date of publication by CS and are subject to change without notice. The price, value of and income from any of the securities or financial instruments mentioned in this report can fall as well as rise. The value of securities and financial instruments is subject to exchange rate fluctuation that may have a positive or adverse effect on the price or income of such securities or financial instruments. Investors in securities such as ADR's, the values of which are influenced by currency volatility, effectively assume this risk. Structured securities are complex instruments, typically involve a high degree of risk and are intended for sale only to sophisticated investors who are capable of understanding and assuming the risks involved. The market value of any structured security may be affected by changes in economic, financial and political factors (including, but not limited to, spot and forward interest and exchange rates), time to maturity, market conditions and volatility, and the credit quality of any issuer or reference issuer. Any investor interested in purchasing a structured product should conduct their own investigation and analysis of the product and consult with their own professional advisers as to the risks involved in making such a purchase. Some investments discussed in this report may have a high level of volatility. High volatility investments may experience sudden and large falls in their value causing losses when that investment is realised. Those losses may equal your original investment. Indeed, in the case of some investments the potential losses may exceed the amount of initial investment and, in such circumstances, you may be required to pay more money to support those losses. Income yields from investments may fluctuate and, in consequence, initial capital paid to make the investment may be used as part of that income yield. Some investments may not be readily realisable and it may be difficult to sell or realise those investments, similarly it may prove difficult for you to obtain reliable information about the value, or risks, to which such an investment is exposed. This report may provide the addresses of, or contain hyperlinks to, websites. Except to the extent to which the report refers to website material of CS, CS has not reviewed any such site and takes no responsibility for the content contained therein. Such address or hyperlink (including addresses or hyperlinks to CS's own website material) is provided solely for your convenience and information and the content of any such website does not in any way form part of this document. Accessing such website or following such link through this report or CS's website shall be at your own risk. This report is issued and distributed in Europe (except Switzerland) by Credit Suisse Securities (Europe) Limited, One Cabot Square, London E14 4QJ, England, which is authorised by the Prudential Regulation Authority ("PRA") and regulated by the Financial Conduct Authority ("FCA") and the PRA. This report is being distributed in Germany by Credit Suisse Securities (Europe) Limited Niederlassung Frankfurt am Main regulated by the Bundesanstalt fuer Finanzdienstleistungsaufsicht ("BaFin"). This report is being distributed in the United States and Canada by Credit Suisse Securities (USA) LLC; in Switzerland by Credit Suisse AG; in Brazil by Banco de Investimentos Credit Suisse (Brasil) S.A or its affiliates; in Mexico by Banco Credit Suisse (México), S.A. (transactions related to the securities mentioned in this report will only be effected in compliance with applicable regulation); in Japan by Credit Suisse Securities (Japan) Limited, Financial Instruments Firm, Director-General of Kanto Local Finance Bureau (Kinsho) No. 66, a member of Japan Securities Dealers Association, The Financial Futures Association of Japan, Japan Investment Advisers Association, Type II Financial Instruments Firms Association; elsewhere in Asia/ Pacific by whichever of the following is the appropriately authorised entity in the relevant jurisdiction: Credit Suisse (Hong Kong) Limited, Credit Suisse Equities (Australia) Limited, Credit Suisse Securities (Thailand) Limited, having registered address at 990 Abdulrahim Place, 27 Floor, Unit 2701, Rama IV Road, Silom, Bangrak, Bangkok 10500, Thailand, Tel. +66 2614 6000, Credit Suisse Securities (Malaysia) Sdn Bhd, Credit Suisse AG, Singapore Branch, Credit Suisse Securities (India) Private Limited regulated by the Securities and Exchange Board of India (registration Nos. INB230970637; INF230970637; INB010970631; INF010970631), having registered address at 9th Floor, Ceejay House, Dr.A.B. Road, Worli, Mumbai - 18, India, T- +91-22 6777 3777, Credit Suisse Securities (Europe) Limited, Seoul Branch, Credit Suisse AG, Taipei Securities Branch, PT Credit Suisse Securities Indonesia, Credit Suisse Securities (Philippines ) Inc., and elsewhere in the world by the relevant authorised affiliate of the above. Research on Taiwanese securities produced by Credit Suisse AG, Taipei Securities Branch has been prepared by a registered Senior Business Person. Research provided to residents of Malaysia is authorised by the Head of Research for Credit Suisse Securities (Malaysia) Sdn Bhd, to whom they should direct any queries on +603 2723 2020. This report has been prepared and issued for distribution in Singapore to institutional investors, accredited investors and expert investors (each as defined under the Financial Advisers Regulations) only, and is also distributed by Credit Suisse AG, Singapore branch to overseas investors (as defined under the Financial Advisers Regulations). By virtue of your status as an institutional investor, accredited investor, expert investor or overseas investor, Credit Suisse AG, Singapore branch is exempted from complying with certain compliance requirements under the Financial Advisers Act, Chapter 110 of Singapore (the "FAA"), the Financial Advisers Regulations and the relevant Notices and Guidelines issued thereunder, in respect of any financial advisory service which Credit Suisse AG, Singapore branch may provide to you. This research may not conform to Canadian disclosure requirements. In jurisdictions where CS is not already registered or licensed to trade in securities, transactions will only be effected in accordance with applicable securities legislation, which will vary from jurisdiction to jurisdiction and may require that the trade be made in accordance with applicable exemptions from registration or licensing requirements. Non-U.S. customers wishing to effect a transaction should contact a CS entity in their local jurisdiction unless governing law permits otherwise. U.S. customers wishing to effect a transaction should do so only by contacting a representative at Credit Suisse Securities (USA) LLC in the U.S. Please note that this research was originally prepared and issued by CS for distribution to their market professional and institutional investor customers. Recipients who are not market professional or institutional investor customers of CS should seek the advice of their independent financial advisor prior to taking any investment decision based on this report or for any necessary explanation of its contents. This research may relate to investments or services of a person outside of the UK or to other matters which are not authorised by the PRA and regulated by the FCA and the PRA or in respect of which the protections of the PRA and FCA for private customers and/or the UK compensation scheme may not be available, and further details as to where this may be the case are available upon request in respect of this report. CS may provide various services to US municipal entities or obligated persons ("municipalities"), including suggesting individual transactions or trades and entering into such transactions. Any services CS provides to municipalities are not viewed as "advice" within the meaning of Section 975 of the Dodd-Frank Wall Street Reform and Consumer Protection Act. CS is providing any such services and related information solely on an arm's length basis and not as an advisor or fiduciary to the municipality. In connection with the provision of the any such services, there is no agreement, direct or indirect, between any municipality (including the officials, management, employees or agents thereof) and CS for CS to provide advice to the municipality. Municipalities should consult with their financial, accounting and legal advisors regarding any such services provided by CS. In addition, CS is not acting for direct or indirect compensation to solicit the municipality on behalf of an unaffiliated broker, dealer, municipal securities dealer, municipal advisor, or investment adviser for the purpose of obtaining or retaining an engagement by the municipality for or in connection with Municipal Financial Products, the issuance of municipal securities, or of an investment adviser to provide investment advisory services to or on behalf of the municipality. If this report is being distributed by a financial institution other than Credit Suisse AG, or its affiliates, that financial institution is solely responsible for distribution. Clients of that institution should contact that institution to effect a transaction in the securities mentioned in this report or require further information. This report does not constitute investment advice by Credit Suisse to the clients of the distributing financial institution, and neither Credit Suisse AG, its affiliates, and their respective officers, directors and employees accept any liability whatsoever for any direct or consequential loss arising from their use of this report or its content. Principal is not guaranteed. Commission is the commission rate or the amount agreed with a customer when setting up an account or at any time after that.
Copyright © 2013 CREDIT SUISSE AG and/or its affiliates. All rights reserved.
Investment principal on bonds can be eroded depending on sale price or market price. In addition, there are bonds on which investment principal can be eroded due to changes in redemption amounts. Care is required when investing in such instruments.
When you purchase non-listed Japanese fixed income securities (Japanese government bonds, Japanese municipal bonds, Japanese government guaranteed bonds, Japanese corporate bonds) from CS as a seller, you will be requested to pay the purchase price only
Credit Suisse Securities (Europe) Limited...................Simon Toennessen ; Andre Kukhnin CFA ; Max Yates ; Jonathan Hurn, CFA ; Tiantian Li
Important Credit Suisse HOLT Disclosures
With respect to the analysis in this report based on the Credit Suisse HOLT methodology, Credit Suisse certifies that (1) the views expressed in this report accurately reflect the Credit Suisse HOLT methodology and (2) no part of the Firm’s compensation was, is, or will be directly related to the specific views disclosed in this report.
The Credit Suisse HOLT methodology does not assign ratings to a security. It is an analytical tool that involves use of a set of proprietary quantitative algorithms and warranted value calculations, collectively called the Credit Suisse HOLT valuation model, that are consistently applied to all the companies included in its database. Third-party data (including consensus earnings estimates) are systematically translated into a number of default algorithms available in the Credit Suisse HOLT valuation model. The source financial statement, pricing, and earnings data provided by outside data vendors are subject to quality control and may also be adjusted to more closely measure the underlying economics of firm performance. The adjustments provide consistency when analyzing a single company across time, or analyzing multiple companies across industries or national borders. The default scenario that is produced by the Credit Suisse HOLT valuation model establishes the baseline valuation for a security, and a user then may adjust the default variables to produce alternative scenarios, any of which could occur.
Additional information about the Credit Suisse HOLT methodology is available on request.
The Credit Suisse HOLT methodology does not assign a price target to a security. The default scenario that is produced by the Credit Suisse HOLT valuation model establishes a warranted price for a security, and as the third-party data are updated, the warranted price may also change. The default variable may also be adjusted to produce alternative warranted prices, any of which could occur.
CFROI®, HOLT, HOLTfolio, ValueSearch, AggreGator, Signal Flag and “Powered by HOLT” are trademarks or service marks or registered trademarks or registered service marks of Credit Suisse or its affiliates in the United States and other countries. HOLT is a corporate performance and valuation advisory service of Credit Suisse.
For Credit Suisse disclosure information on other companies mentioned in this report, please visit the website at https://rave.credit-suisse.com/disclosures or call +1 (877) 291-2683.