Taiwan LED Sector - Credit Suisse | PLUS
52
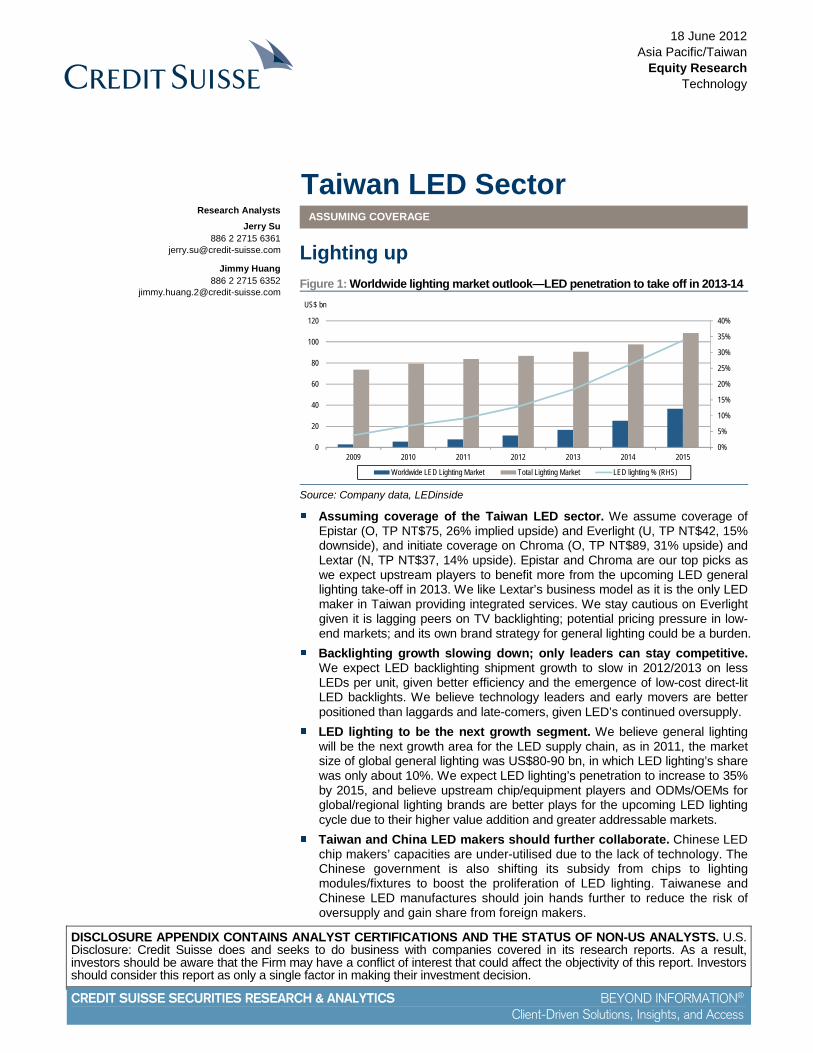
DISCLOSURE APPENDIX CONTAINS ANALYST CERTIFICATIONS AND THE STATUS OF NON-US ANALYSTS. U.S. Disclosure: Credit Suisse does and seeks to do business with companies covered in its research reports. As a result, investors should be aware that the Firm may have a conflict of interest that could affect the objectivity of this report. Investors should consider this report as only a single factor in making their investment decision. CREDIT SUISSE SECURITIES RESEARCH & ANALYTICS BEYOND INFORMATION ® Client-Driven Solutions, Insights, and Access 18 June 2012 Asia Pacific/Taiwan Equity Research Technology Taiwan LED Sector ASSUMING COVERAGE Lighting up Figure 1: Worldwide lighting market outlook—LED penetration to take off in 2013-14 0% 5% 10% 15% 20% 25% 30% 35% 40% 0 20 40 60 80 100 120 2009 2010 2011 2012 2013 2014 2015 US$ bn Worldwide LED Lighting Market Total Lighting Market LED lighting % (RHS) Source: Company data, LEDinside Assuming coverage of the Taiwan LED sector. We assume coverage of Epistar (O, TP NT$75, 26% implied upside) and Everlight (U, TP NT$42, 15% downside), and initiate coverage on Chroma (O, TP NT$89, 31% upside) and Lextar (N, TP NT$37, 14% upside). Epistar and Chroma are our top picks as we expect upstream players to benefit more from the upcoming LED general lighting take-off in 2013. We like Lextar’s business model as it is the only LED maker in Taiwan providing integrated services. We stay cautious on Everlight given it is lagging peers on TV backlighting; potential pricing pressure in low- end markets; and its own brand strategy for general lighting could be a burden. Backlighting growth slowing down; only leaders can stay competitive. We expect LED backlighting shipment growth to slow in 2012/2013 on less LEDs per unit, given better efficiency and the emergence of low-cost direct-lit LED backlights. We believe technology leaders and early movers are better positioned than laggards and late-comers, given LED’s continued oversupply. LED lighting to be the next growth segment. We believe general lighting will be the next growth area for the LED supply chain, as in 2011, the market size of global general lighting was US$80-90 bn, in which LED lighting’s share was only about 10%. We expect LED lighting’s penetration to increase to 35% by 2015, and believe upstream chip/equipment players and ODMs/OEMs for global/regional lighting brands are better plays for the upcoming LED lighting cycle due to their higher value addition and greater addressable markets. Taiwan and China LED makers should further collaborate. Chinese LED chip makers’ capacities are under-utilised due to the lack of technology. The Chinese government is also shifting its subsidy from chips to lighting modules/fixtures to boost the proliferation of LED lighting. Taiwanese and Chinese LED manufactures should join hands further to reduce the risk of oversupply and gain share from foreign makers. Research Analysts Jerry Su 886 2 2715 6361 [email protected] Jimmy Huang 886 2 2715 6352 [email protected]
-
Upload
khangminh22 -
Category
Documents
-
view
0 -
download
0
Transcript of Taiwan LED Sector - Credit Suisse | PLUS
DISCLOSURE APPENDIX CONTAINS ANALYST CERTIFICATIONS AND THE STATUS OF NON-US ANALYSTS. U.S. Disclosure: Credit Suisse does and seeks to do business with companies covered in its research reports. As a result, investors should be aware that the Firm may have a conflict of interest that could affect the objectivity of this report. Investors should consider this report as only a single factor in making their investment decision.
CREDIT SUISSE SECURITIES RESEARCH & ANALYTICS BEYOND INFORMATION®
Client-Driven Solutions, Insights, and Access
18 June 2012 Asia Pacific/Taiwan
Equity Research Technology
Taiwan LED Sector ASSUMING COVERAGE
Lighting up Figure 1: Worldwide lighting market outlook—LED penetration to take off in 2013-14
0%
5%
10%
15%
20%
25%
30%
35%
40%
0
20
40
60
80
100
120
2009 2010 2011 2012 2013 2014 2015
US$ bn
Worldwide LED Lighting Market Total Lighting Market LED lighting % (RHS)
Source: Company data, LEDinside
■ Assuming coverage of the Taiwan LED sector. We assume coverage of Epistar (O, TP NT$75, 26% implied upside) and Everlight (U, TP NT$42, 15% downside), and initiate coverage on Chroma (O, TP NT$89, 31% upside) and Lextar (N, TP NT$37, 14% upside). Epistar and Chroma are our top picks as we expect upstream players to benefit more from the upcoming LED general lighting take-off in 2013. We like Lextar’s business model as it is the only LED maker in Taiwan providing integrated services. We stay cautious on Everlight given it is lagging peers on TV backlighting; potential pricing pressure in low-end markets; and its own brand strategy for general lighting could be a burden.
■ Backlighting growth slowing down; only leaders can stay competitive. We expect LED backlighting shipment growth to slow in 2012/2013 on less LEDs per unit, given better efficiency and the emergence of low-cost direct-lit LED backlights. We believe technology leaders and early movers are better positioned than laggards and late-comers, given LED’s continued oversupply.
■ LED lighting to be the next growth segment. We believe general lighting will be the next growth area for the LED supply chain, as in 2011, the market size of global general lighting was US$80-90 bn, in which LED lighting’s share was only about 10%. We expect LED lighting’s penetration to increase to 35% by 2015, and believe upstream chip/equipment players and ODMs/OEMs for global/regional lighting brands are better plays for the upcoming LED lighting cycle due to their higher value addition and greater addressable markets.
■ Taiwan and China LED makers should further collaborate. Chinese LED chip makers’ capacities are under-utilised due to the lack of technology. The Chinese government is also shifting its subsidy from chips to lighting modules/fixtures to boost the proliferation of LED lighting. Taiwanese and Chinese LED manufactures should join hands further to reduce the risk of oversupply and gain share from foreign makers.
Research Analysts
Jerry Su 886 2 2715 6361
Jimmy Huang 886 2 2715 6352

18 June 2012
Taiwan LED Sector 2
Focus charts Figure 2: Worldwide high brightness LED market revenue
by application (2011)—backlighting leads
Figure 3: Worldwide high brightness LED market revenue
by application (2015E)—general lighting leads
Large size display BLU, 28%
Lighting, 24%Automotiv e, 12%
Sign & Signal, 10%
Others, 9%
Mobile application, 17%
Large size display BLU, 14%
Lighting, 52%
Automotiv e, 13%
Sign & Signal, 8%
Others, 6%
Mobile application, 7%
Source: Company data, LEDinside Source: Company data, LEDinside, Credit Suisse estimates
Figure 4: LED backlighting penetration will likely reach its
peak in 2013-14E
Figure 5: Mainstream TVs are shifting to low-cost direct
LED BLU starting 2012
0%
10%
20%
30%
40%
50%
60%
70%
80%
90%
100%
2008 2009 2010 2011 2012E 2013E 2014E
Mobile PC LCD TV LCD Monitor Large Area Total
0%
10%
20%
30%
40%
50%
60%
25"-29" 30"-34" 35"-39" 40"-44" 45"-49" 50"-54" 55"-59"
Low cost direct LED BLU %
2011 2012 2013 2014
Source: Company data, DisplaySearch, Credit Suisse estimates Source: Company data, DisplaySearch, Credit Suisse estimates
Figure 6: Worldwide lighting market outlook—LED
penetration is still low but should take-off in 2013–14E
Figure 7: Architectural and indoor lighting are the main
drivers for LED lighting demand
0%
5%
10%
15%
20%
25%
30%
35%
40%
0
20
40
60
80
100
120
2009 2010 2011 2012 2013 2014 2015
US$ bn
Worldwide LED Lighting Market Total Lighting Market LED lighting % (RHS)
0%
10%
20%
30%
40%
50%
60%
70%
80%
90%
100%
0
5
10
15
20
25
30
35
40
2010 2011 2012 2013 2014 2015
US$ bn Architectural Outdoor Area/Grid LED Indoor Others YoY (RHS)
Source: Company data, LEDinside, Credit Suisse estimates Source: Company data, LEDinside, Credit Suisse estimates

18 June 2012
Taiwan LED Sector 3
Lighting up Backlighting: Only leaders can stay competitive LED backlighting is the main growth driver of the LED industry since 2009/2010 due to LED backlight TV proliferation. We expect LED shipment growth for display backlighting to slow down in 2012 and 2013 given less LEDs per unit as a result of better efficiency and the emergence of low-cost direct-lit LED backlight TVs. This is despite the likely improvement of LED penetration for monitors and TVs from 40-45% in 2011 to ~70% in 2012E and 85-90% in 2013E.
Given the continued oversupply in the LED industry, we think technology leaders and early movers are better positioned than laggards and late-comers. LED chips for TV applications have tighter specifications than that for smartphones or lighting, given concerns about display uniformity. We also think it will be difficult for late comers (i.e., Chinese LED makers) to penetrate into global leading panel makers given the supply chain is already crowded and it takes at least 6-12 months to pass the qualification.
LED general lighting: The next growth area We believe general lighting will be the next growth area for the LED supply chain as in 2011, the market size of global general lighting was US$80-90 bn, in which LED lighting’s share was only ~10%. We forecast LED lighting demand will grow from US$7.6 bn in 2011 to US$37 bn by 2015 (~35% penetration), representing a 48% CAGR over 2011-15. We think architectural and indoor lighting are the main drivers for LED lighting demand, given LED has the advantages of lower power consumption and longer life, and is more environment friendly than incandescent and fluorescent lamps.
We think upstream chip/equipment players and ODM/OEMs for global/regional lighting brands are better plays for the upcoming LED lighting cycle, given their higher value addition and greater addressable markets. The Taiwanese LED supply chain should have more opportunities in the fixtures market rather than in the retrofit market as global Tier 1 players only account for ~25% share of the fixtures market, while the remaining ~75% share is split between regional brands and new entrants. The fixtures market is also less price sensitive versus retrofit market given fixtures’ designs and functionality can be highly customised.
Taiwanese and Chinese LEDs should further tie-up Taiwanese LED makers are moving towards downstream, to increase their revenue/profit, and to build relationships with channels to secure their orders. We view the virtual alliance via vertical integration as a positive for Taiwanese LED makers, especially to capture the growing lighting demand. We think Chinese LED supply chain will witness another round of consolidation in the next few years given (1) a lack of core technology, (2) intense competition, (3) government policy change and (4) global economic slowdown.
Chinese LED chip makers’ capacities are under-utilised due to the lack of technology. The Chinese government is also shifting its subsidy from chips to lighting modules/fixtures to boost the proliferation of LED lighting. The Taiwan-China tie-up for LED should help Chinese lighting brands secure LED chips/packages and reduce the risk of oversupply for Taiwan LED makers; this should also help them gain share from foreign makers.
Assuming coverage of the Taiwan LED sector We assume coverage of the Taiwan LED sector. Our top pick in the sector are Epistar (O, TP NT$75) and Chroma (O, TP NT$89), as we expect upstream players to benefit more from the upcoming LED lighting take-off in 2013. We like Lextar’s (N, TP NT$37) business model as it has been qualified by global Tier 1 general lighting brands for providing ODM business. Moreover, AUO (major shareholder of Lextar with a 46% holding) will absorb Lextar’s output for TFT backlighting. We stay cautious on Everlight (U, TP NT$42) as it has been lagging peers in entering the LED monitor/TV backlighting space, and its strategy to capture the LED general lighting market via own brands could face intense competition from global Tier 1 brands as well as regional lighting brands.
Backlighting growth is slowing down, only leaders can stay competitive
LED lighting’s penetration to grow from ~10% of the market in 2011 to ~35% by 2015E
Taiwanese and Chinese LEDs should further tie-up to reduce oversupply risk and gain share from foreign brands
Epistar and Chroma are our top picks in the Taiwan LED supply chain

18 Ju
ne 2012
Taiw
an L
ED
Secto
r 4
Sector valuation Figure 8: LED supply chain—valuation comparison
Reporting Price Marketcap CS 12mthCompany Currency 6/14/2012 US$ mn Rating Target 2012 2013 2012 2013 2012 2013 2012 2013 2012 2013Taiwan LED upstream2448.TW Epistar TWD 59.6 1,714 O 75.0 0.88 2.73 67.9 21.8 51.4 53.3 1.2 1.1 1.7 5.2 3061.TW ForeEpi* TWD 20.6 331 NC NA NA NA NA NA NA NA NA NA NA NA3339.TWO Tekcore* TWD 15.7 144 NC NA (1.29) NA NM NA 16 NA 1.0 NA NA NA3383.TW Genesis Photonics* TWD 27.7 253 NC NA NA NA NA NA NA NA NA NA NA NA2340.TW Opto Tech* TWD 11.9 217 NC NA NA NA NA NA NA NA NA NA NA NA8199.TW Huga* TWD 12.7 220 NC NA NA NA NA NA NA NA NA NA NA NA3698.TW Lextar TWD 32.4 454 N 37.0 1.02 2.05 31.8 15.8 19.8 21.4 1.6 1.5 9.5 11.1 Taiwan LED downstream2393.TW Everlight TWD 49.2 689 U 42.0 2.77 3.39 17.8 14.5 35.9 37.1 1.4 1.3 7.2 8.5 2301.TW Lite-on* TWD 36.5 2,778 NC NA 3.58 3.74 10.2 9.8 33 33 1.1 1.1 11.2 11.9 3591.TW Edison* TWD 50.4 186 NC NA 2.20 2.84 22.9 17.7 30.2 28.1 1.7 1.8 6.5 8.4 2499.TW Unity Opto* TWD 29.1 327 NC NA NA NA NA NA NA NA NA NA NA NATaiwan LED component/equipment6271.TW Tong Hsing* TWD 91.8 499 NC NA 6.34 6.77 14.5 13.6 38.4 40.1 2.4 2.3 12.5 12.8 2360.TW Chroma TWD 68.0 856 O 89.0 4.09 5.55 16.6 12.3 21.7 24.0 3.1 2.8 23.1 23.7 China peers600703.SS Sanan Opto* CNY 14.3 3,231 NC NA 0.75 0.95 19.0 15.0 4.8 5.8 3.0 2.5 16.1 18.2 600100.SS Tsinghua Tofang* CNY 8.7 2,725 NC NA 0.49 0.82 17.8 10.7 4.7 5.2 1.8 1.7 8.8 9.7 002005.SZ Elec-tech Int'l* CNY 8.3 1,520 NC NA 0.57 0.68 14.6 12.2 3.7 4.4 2.2 1.9 13.6 15.5 600261.SS Zhejiang Yankon* CNY 12.4 1,255 NC NA 0.50 0.65 24.7 19.2 3.1 3.6 4.0 3.4 15.5 16.9 600460.SS Hangzhou Silan* CNY 4.9 668 NC NA 0.31 0.36 15.6 13.5 2.2 2.4 2.2 2.0 14.0 11.0 300102.SZ Xiamen Changelight* CNY 13.1 605 NC NA 1.33 1.00 9.8 13.1 7.3 7.8 1.8 1.7 14.4 13.6 Global peers009150.KS SEMCO KRW 108,500 6,946 N 97,000 4,569 4,791 23.7 22.6 43,628 47,607 2.5 2.3 11.0 10.6 011070.KS LG Innotek KRW 87,300 1,509 U 58,000 (463) 1,203 NM 72.5 62,920 63,623 1.4 1.4 (0.7) 1.9 038060.KQ Lumens* KRW 5,220 180 NC NA 587 733 8.9 7.1 3,610 4,342 1.4 1.2 18.0 18.3 046890.KQ Seoul Semi KRW 21,400 1,069 U 13,000 338 588 63.4 36.4 10,927 11,315 2.0 1.9 3.2 5.3 7282 Toyoda Gosei JPY 1,613 2,630 N 1,650 69 124 23.3 13.0 1,708 1,793 0.9 0.9 4.1 7.1 CREE Cree USD 23.05 2,677 N 32 0.93 1.33 24.7 17.4 22 24 1.0 1.0 4.4 5.7 Global equipmentAIXGn.DE Axitron* EUR 11.6 1,482 NC NA 0.06 0.55 183.8 21.0 6.0 6.4 1.9 1.8 NA NAVECO Veeco USD 33.0 1,282 N 32.0 1.58 2.42 20.8 13.6 NA NA NA NA 7.9 11.1 0522.HK ASM Pacific HKD 93.0 4,766 N 89.5 4.99 6.64 18.7 14.0 18.9 22.5 4.9 4.1 28.7 32.0
ROAE (%)EPS P/E (X) P/B (X)BVPS
Source: Company data, Credit Suisse estimates, *IBES consensus estimates for NR stocks.

18 June 2012
Taiwan LED Sector 5
Backlighting growth is slowing down: Only leaders can stay competitive We expect LED shipment growth for display backlighting to slow down in 2012 and 2013 due to less LEDs per unit as a result of better efficiency and the emergence of low-cost direct-lit LED backlight TVs. This is despite the likely improvement of LED penetration for monitors and TVs from 40-45% in 2011 to ~70% in 2012E and 85-90% in 2013E. Given the continued oversupply in the LED industry, we think technology leaders and early movers are better positioned than laggards and late- comers.
Backlighting LED growth is decelerating We expect IT shipment growth to slow down in the next two years given gloomy demand on concerns about the global economy. TV has been an important growth driver to support LED consumption (~35% of backlighting demand), but we think its growth will start to decelerate in 2012-13 as a result of (1) the slower growth of the TV market, (2) an already high penetration of LED backlight and (3) share gain of low-cost LED backlight for low-end models. Figure 11 shows that despite LED TV unit growth being likely maintained at 67% YoY in 2012 and 33% YoY in 2013, the total LED chip demand for TV backlight will slow down to 19% YoY and 4% YoY for 2012 and 2013, respectively.
Figure 9: IT product shipment growth is slowing down,
especially for LCD TVs
Figure 10: LED backlighting penetration will likely reach
its peak in 2013-14
-5%
0%
5%
10%
15%
20%
25%
30%
35%
40%
2008 2009 2010 2011 2012E 2013E 2014E 2015E
Handsets NB/Tablet LCD Monitor LCD TV
0%
10%
20%
30%
40%
50%
60%
70%
80%
90%
100%
2008 2009 2010 2011 2012E 2013E 2014E
Mobile PC LCD TV LCD Monitor Large Area Total
Source: IDC, Gartner, DisplaySearch, Credit Suisse estimates Source: Company data, DisplaySearch, Credit Suisse estimates
Figure 11: LED TV backlighting growth is slowing down (mn units) 2010 2011 2012E 2013E
LCD TV 192 205 220 242
LED backlight penetration 24% 45% 70% 85%
LED backlight TV 46 92 154 205
Edge-lit LED 98% 98% 86% 80%
Direct-lit LED 2% 2% 2% 2%
Low cost direct-lit LED 0% 0% 12% 18%
Total LED demand for TV 10,619 12,117 14,369 14,969
YoY
Total LCD TV 32% 7% 7% 10%
LED backlight TV 1481% 101% 67% 33%
Total LED demand for TV 721% 14% 19% 4%
Source: Company data, DisplaySearch, Credit Suisse estimates
Backlighting growth is decelerating

18 June 2012
Taiwan LED Sector 6
We think the main reasons for decelerating of LED chip growth for TV backlighting are: (1) market share gain of low-cost direct-lit LED TVs and (2) improving efficiency of LED backlight on high power chips and new designs. Consumer expenditure behaviour is moving towards two extremes given the slowing macroeconomic condition and we believe consumers are paying less premium for TVs. Tier 1 TV brands have launched low-cost direct-lit LED TVs since 1Q12 to meet consumers’ needs for low-cost but high-energy efficient products, using the CCFL mechanical structure (thicker design). According to DisplaySearch, the price gap of CCFL and low-cost direct backlight could narrow to 1.2-1.3x by 2H12 from 1.4-1.5x currently on better LED efficiency and new designs. We think the low-cost direct-lit LED TV will quickly penetrate into mainstream sizes such as 32", 39" and 50" over 2012-14.
We forecast overall low-cost direct-lit LED TV penetration will increase from 7% in 1Q12 to 18% in 4Q12 and reach 25% in 4Q13. Although overall LED penetration could be pushed to ~70% in 2012 and reach ~85% in 2013, we believe the adoption of low-cost direct-lit LED TV and the new backlighting designs for edge-lit with less lightbar (as shown in Figure 14) will reduce total LED chips being used per TV set, leading to slow LED chip growth for TV backlighting.
Nevertheless, notebook PC and tablets could be a new growth area in 2012-13 on Windows 8 product launch, as well as the fast growth of Apple’s new iPad and iPad mini. High-end notebook PCs with higher resolution will adopt high-power LEDs. Being equipped with more LED chips per unit should essentially help the Taiwanese LED supply-chain. For Apple’s products, we expect Taiwanese LED suppliers to have limited exposure in the new iPad and iPad mini, given this is mostly dominated by Japanese LED makers, and panel makers have no decision-making power over LED suppliers.
Figure 12: 2012 LED TV proliferation is driven by low-cost
direct-lit LED backlight
Figure 13: Mainstream TV sizes are shifting to low-cost
direct LED BLU starting 2012
0%
2%
4%
6%
8%
10%
12%
14%
16%
18%
20%
0
10,000
20,000
30,000
40,000
50,000
60,000
70,000
80,000
1Q10 2Q10 3Q10 4Q10 1Q11 2Q11 3Q11 4Q11 1Q12 2Q12 3Q12 4Q12
000' sets
LED-Direct (T) LED-Edge CCFL LED-Direct (L) Low-cost direct % (RHS)
0%
10%
20%
30%
40%
50%
60%
25"-29" 30"-34" 35"-39" 40"-44" 45"-49" 50"-54" 55"-59"
Low cost direct LED BLU %
2011 2012 2013 2014
Source: Company data, DisplaySearch, Credit Suisse estimates Source: Company data, DisplaySearch, Credit Suisse estimates
Figure 14: Less LED chips being used per TV set on luminous improvement and cost reduction 4 sides 2 sides 2 sides 1 sides6 LED lightbars 4 LED lightbars 2 LED lightbars 1 LED lightbar
2H09 2H09 1H10 2H10
or or
37" TV
2H09 1H10 2011 201242" TV
Source: DisplaySearch, Witsview, Credit Suisse estimates
Low-cost direct-lit LED TV penetration is growing fast

18 June 2012
Taiwan LED Sector 7
Figure 15: Roadmap of backlights for direct LED-backlit TVs—less LEDs… 1H12 2H12 2H12 (Ultra low cost)
Specification
2nd LensLED
LED structure 3228/3528 PKG, 32ea 3228/3528 PKG, 20ea 3228/3528 PKG, 20ea
Optical sheet
PrismDiffuserDiffuser
PrismDiffuserPatterened Diffuser Film
PrismDiffuserPatterened Diffuser Film
Light source MCPCB FR4 FR4Bezel & Frame SECC SECC PlasticBLU cost vs CCFL 1.4x 1.3x 1.17x
LED structure32" HD Direct LED Backlight
Source: DisplaySearch
Only leaders can stay competitive Given the continued oversupply in the LED industry, we think technology leaders and early movers are in a better position than laggards and late-comers. LED chips for TV applications have tighter specifications than that for smartphones or LED general lighting given concerns about display uniformity. We also think it will be difficult for late-comers (i.e., Chinese LED makers) to penetrate into global leading panel makers, since the supply chain is already crowded and it takes at least 6-12 months to pass the qualification. In Taiwan, we prefer Epistar among other Taiwanese LED chip makers given its technology leadership and broad customer base. Epistar has penetrated into global top panel makers (Samsung, LGD, AUO, CMI, Sharp) and also supplies LED chips through its packaging partners for Chinese panel makers. We estimate TV and IT backlighting to account for ~30% of Epistar’s revenue in 1H12.
Figure 16: LED backlight TV supply chain—more challenges ahead for independent suppliers
LED Chip LED Package Panel Set/Brand
Samsung LED Samsung LED Samsung
Epistar, ForeEPI Lumens Open cell TFT
LG Innotek
Wooree ETI
LG Innotek
Wooree ETI
Epistar, ForeEPI Wooree, Everlight
Nichia Nichia/Sharp, Stanley Sharp Sharp
Nichia/CMLT AOT CMI Sony
Epistar, ForeEPI Harvatek
Lextar/Osram Lextar/Wellypower
Epistar Liteon
CMLT GIO, Harvatek
Epistar Everlight/Liteon
AUO Multiple TV brands
CMI Multiple TV brands
Samsung
LGD LGE
Source: Company data, Credit Suisse
Only leaders and early movers can stay competitive

18 June 2012
Taiwan LED Sector 8
LED lighting: The next growth segment We believe general lighting will be the next growth area for the LED supply-chain given in 2011, the market size of global general lighting was US$80-90 bn, in which LED lighting’s share was only ~10%. We forecast LED lighting demand will grow from US$7.6 bn in 2011 to US$37 bn by 2015 (~35% penetration), representing a 48% CAGR over 2011-15. We think architectural and indoor lighting are the main drivers for the LED lighting demand, since LED has the advantages of lower power consumption and longer life, and is more environmental friendly than incandescent and fluorescent lamps. We think upstream players and ODM/OEMs for global/regional lighting brands are better plays for the upcoming LED lighting cycle given their higher value addition and greater addressable markets.
Figure 17: Worldwide high brightness LED market
revenue by application (2011)—backlighting leads
Figure 18: Worldwide high brightness LED market
revenue by application (2015E)—general lighting leads
Large size display BLU, 28%
Lighting, 24%Automotiv e, 12%
Sign & Signal, 10%
Others, 9%
Mobile application, 17%
Large size display BLU, 14%
Lighting, 52%
Automotiv e, 13%
Sign & Signal, 8%
Others, 6%
Mobile application, 7%
Source: Company data, LEDinside Source: Company data, LEDinside, Credit Suisse estimates
Figure 19: Worldwide lighting market outlook—LED
penetration is still low but should take off in 2013-14
Figure 20: Architectural and indoor lighting are main
drivers for LED lighting demand
0%
5%
10%
15%
20%
25%
30%
35%
40%
0
20
40
60
80
100
120
2009 2010 2011 2012 2013 2014 2015
US$ bn
Worldwide LED Lighting Market Total Lighting Market LED lighting % (RHS)
0%
10%
20%
30%
40%
50%
60%
70%
80%
90%
100%
0
5
10
15
20
25
30
35
40
2010 2011 2012 2013 2014 2015
US$ bn Architectural Outdoor Area/Grid LED Indoor Others YoY (RHS)
Source: Company data, LEDinside Source: Company data, LEDinside
LED lighting is propelled by government initiatives The initial adoption of LED lighting is propelled by government policies and subsidies, given high fixture costs. Various countries have announced phasing out of or regulatory bans on incandescent light bulbs by setting up new energy efficiency standards, as well as prohibiting the use of hazardous materials such as mercury. Japan and Europe are the two fastest-growing markets for LED lighting, as both banned selling of incandescent light bulbs in 2011 and 2012, respectively. The US has set minimum efficiency standards for
LED lighting’s penetration should increase from ~10% in 2011 to ~35% by 2015
Government initiatives and subsidies drive LED lighting demand

18 June 2012
Taiwan LED Sector 9
lighting to be implemented between 2012 and 2014, instead of directly banning incandescent light bulbs. China will ban imports and sales of certain incandescent light bulbs starting from October 2012 and has launched subsidy programmes for LED lighting. The opportunity in China’s street lighting space has been perceived to likely create the largest market on the government’s push.
Figure 21: Incandescent phase-out plans in Europe, the US and Japan
Started phasing out traditional light bulbs from 2009 onwards in favor of a new generation of energy-efficient lighting.
Under the rule which came into force in September 2009, manufacturers and importers can no longer sell clear incandescent light bulbs (general-purpose, non-directional incandescent bulbs) of 100 watts or above in the EU.The ban will be expanded in September 2011 and 2012 to include lower wattages of clear incandescent bulbs. Frosted bulbs and high-energy halogen lights are also being phased out.Under the Energy Independence and Security Act of 2007 (EISA), USA has set minimum efficiency standards for lighting which would be implemented in phases between 2012 and 2014.
Minimum lighting wattages required to meet the criteria are: 100W in 2012, 75W in 2013, followed by 60W and 40W bulbs in 2014.
By 2020, a second tier of restrictions would become effective, which requires all generalpurpose bulbs to produce at least 45 lumens per watt (similar to current CFLs).
Japan Japan will stop producing and selling high-wattage incandescent bulbs in 2012.
EU
USA
Source: IEA, Credit Suisse
Is fluorescent lighting a threat? We think fluorescent lighting could be a transition technology, given the mercury content would cause environmental issues, accompanied with higher disposal costs. LED lighting should replace fluorescent lighting in 2013-14 given its falling retail price on the back of cost reduction resulting from better LED efficiency, improved design and greater scale. Nevertheless, fluorescent lamps could be a threat to LED lighting in the residential retrofit market if LED retail prices continue to remain at current levels as (1) LED lighting has a longer payback period and (2) fluorescent lighting is at ~6x of an equivalent incandescent light bulb, much cheaper than an equivalent LED light bulb (~10x of incandescent). Despite the continued decline in LED retrofit lamp cost on better efficiency and cost reduction, fluorescent lamps could still be a threat for LED retrofit lamps in the residential market in the near term, given the high upfront cost.
Figure 22: Fluorescent light bulb looks cheaper than LED LED Fluorescent Incandescent LED vs Fluorescent vs LED vs
(US$) (12W) (14W) (60W) incandescent (x) incandescent (x) fluorescent (x)
Amazon 15.95 8.50 1.99 8.0 4.3 1.9
Home depot 15.97 8.97 1.47 10.9 6.1 1.8
Lowes 19.98 9.01 1.62 12.4 5.6 2.2
Walmart 17.99 9.00 1.41 12.8 6.4 2.0
Average 17.47 8.87 1.62 10.8 5.5 2.0
Source: Company data
Figure 23: Assumptions for residential lighting retrofit under current pricing LED (12W) Fluorescent (14W) Incandescent (60W)
Electricity cost (US$/kWh) 0.15 0.15 0.15
Wattage 12 14 60
Lumens 800 800 860
Lm/W 67 57 14
Life time (hrs) 30,000 8,000 1,000
Lamp cost (US$) 17.47 8.87 1.62
Annual electricity cost (US$) 3.9 4.6 19.7
Source: Company data, Credit Suisse estimates
Fluorescent is a transitional technology but could be a threat for LED residential retrofit market if LED bulb pricing does not fall

18 June 2012
Taiwan LED Sector 10
Figure 24: Payback period for LED and fluorescent retrofit bulbs are both within a year, but LED retrofit light bulb has
higher upfront cost (assume six hours a day, 365 days a year for residential usage)
0
20
40
60
80
100
120
Year 0 Year 1 Year 2 Year 3 Year 4 Year 5
US$ LED (12W) Fluorescent (14W) Incandescent (60W)
Source: Company data, DOE, Credit Suisse
Is LED lighting really going to take off this time? LED lighting demand has been lukewarm for the past two years (2010-11) given the significant price gap between LED and fluorescent light bulbs. However, on aggressive ASP erosion, government subsidy and cost reduction of peripheral material through new design, 8W LED light bulb (for 40W retrofit) retail price has steadily declined by 6-8% QoQ and should hit US$10 in 3Q12.
The 12W LED light bulb (for 60W retrofit) retail price is still in the range of US$15-20 in 2Q12 but we expect more pricing erosion ahead on ~10% quarterly decline and expect 12W LED light bulb ASP to reach the tipping point of US$10 by 2H13, driving higher LED lighting demand.
Figure 25: LED light bulb retail price continues to fall and will likely be near the tipping
point by 2013
0
5
10
15
20
25
30
35
40
45
US$
8W 12W
Source: LEDinside, Credit Suisse estimates
18 June 2012
Taiwan LED Sector 11
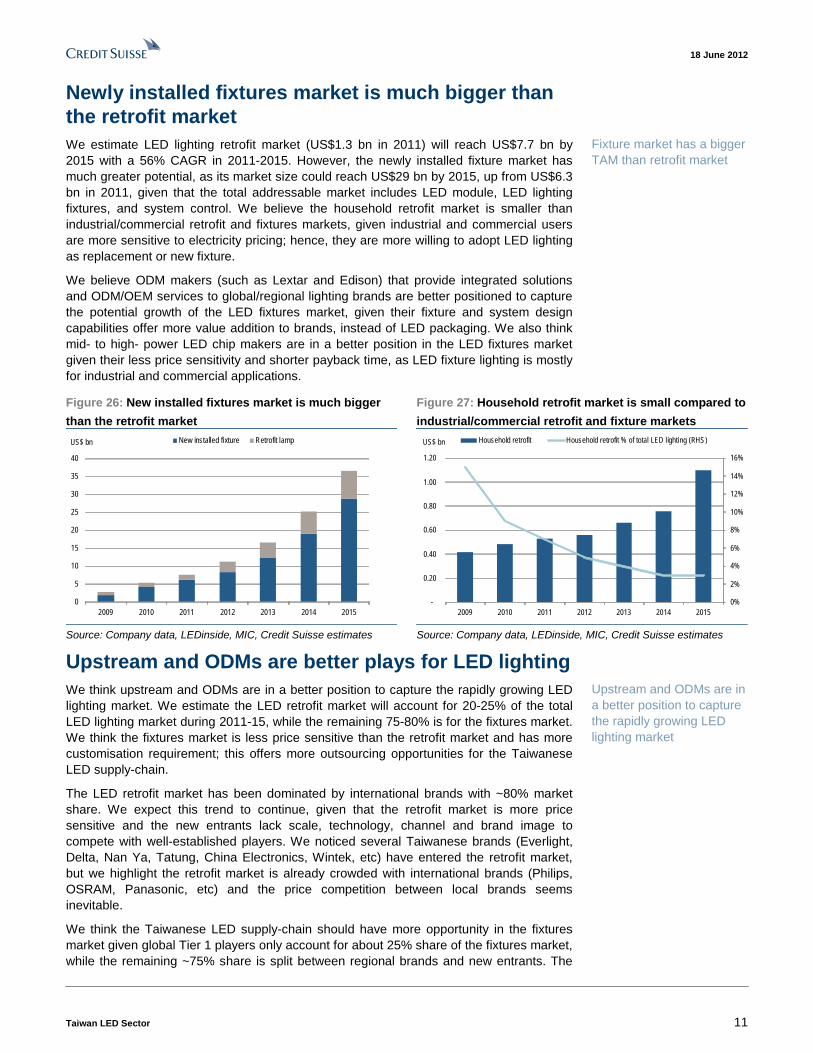
Newly installed fixtures market is much bigger than the retrofit market We estimate LED lighting retrofit market (US$1.3 bn in 2011) will reach US$7.7 bn by 2015 with a 56% CAGR in 2011-2015. However, the newly installed fixture market has much greater potential, as its market size could reach US$29 bn by 2015, up from US$6.3 bn in 2011, given that the total addressable market includes LED module, LED lighting fixtures, and system control. We believe the household retrofit market is smaller than industrial/commercial retrofit and fixtures markets, given industrial and commercial users are more sensitive to electricity pricing; hence, they are more willing to adopt LED lighting as replacement or new fixture.
We believe ODM makers (such as Lextar and Edison) that provide integrated solutions and ODM/OEM services to global/regional lighting brands are better positioned to capture the potential growth of the LED fixtures market, given their fixture and system design capabilities offer more value addition to brands, instead of LED packaging. We also think mid- to high- power LED chip makers are in a better position in the LED fixtures market given their less price sensitivity and shorter payback time, as LED fixture lighting is mostly for industrial and commercial applications.
Figure 26: New installed fixtures market is much bigger
than the retrofit market
Figure 27: Household retrofit market is small compared to
industrial/commercial retrofit and fixture markets
0
5
10
15
20
25
30
35
40
2009 2010 2011 2012 2013 2014 2015
US$ bn New installed fixture Retrofit lamp
0%
2%
4%
6%
8%
10%
12%
14%
16%
-
0.20
0.40
0.60
0.80
1.00
1.20
2009 2010 2011 2012 2013 2014 2015
US$ bn Household retrofit Household retrofit % of total LED lighting (RHS)
Source: Company data, LEDinside, MIC, Credit Suisse estimates Source: Company data, LEDinside, MIC, Credit Suisse estimates
Upstream and ODMs are better plays for LED lighting We think upstream and ODMs are in a better position to capture the rapidly growing LED lighting market. We estimate the LED retrofit market will account for 20-25% of the total LED lighting market during 2011-15, while the remaining 75-80% is for the fixtures market. We think the fixtures market is less price sensitive than the retrofit market and has more customisation requirement; this offers more outsourcing opportunities for the Taiwanese LED supply-chain.
The LED retrofit market has been dominated by international brands with ~80% market share. We expect this trend to continue, given that the retrofit market is more price sensitive and the new entrants lack scale, technology, channel and brand image to compete with well-established players. We noticed several Taiwanese brands (Everlight, Delta, Nan Ya, Tatung, China Electronics, Wintek, etc) have entered the retrofit market, but we highlight the retrofit market is already crowded with international brands (Philips, OSRAM, Panasonic, etc) and the price competition between local brands seems inevitable.
We think the Taiwanese LED supply-chain should have more opportunity in the fixtures market given global Tier 1 players only account for about 25% share of the fixtures market, while the remaining ~75% share is split between regional brands and new entrants. The
Fixture market has a bigger TAM than retrofit market
Upstream and ODMs are in a better position to capture the rapidly growing LED lighting market

18 June 2012
Taiwan LED Sector 12
fixtures market is also less price sensitive versus the retrofit market given fixture designs and functionality can be highly customised. Integrated solution providers for global/regional lighting brands and high power LED chip makers are in a better position to capture this market, in our view. Street lighting could also be an attractive area, but this is mostly price sensitive with lower value-adds given the nature of government tenders. China is the most aggressive country pushing street lighting, but we think it will be difficult for Taiwanese brands to benefit, given government projects normally compete on relationship and pricing. Upstream chip makers (such as Epistar) could have a better position given its alliance with local lighting makers.
Figure 28: Taiwanese LED maker’s own brand strategy on LED lighting—crowded area Brand Everlight (2393 TT) Delta (2308 TT) Nan Ya Photonics TK3C (2430 TT) China Electronic (1611 TT)
ProductSupply chain Epistar, Everlight Epistar, Delta Nan Ya Photonics Formosa Epitaxy, Unity Opto Formosa Epitaxy, Unity Opto
Brand BenQ TESS (5226 TT) Neo-Neon (911868 TT) Tatung (2371 TT) Genesis Photonics (3383 TT)
ProductSupply chain Lextar CREE Neo-Neon Formosa Epitaxy, Unity Opto Genesis Photonics Source: Company data
Figure 29: LED lighting retrofit market—dominated by international and regional brands Product diversifity Pricing sensitive Key criteria Competition Traditional player
Low High Brand & PricesMarketing skill
Basic quality, low cost
Dominated by int'l brands
Medium Medium QualityBetter quality, low costLocal connections for
new projects
Regional brandsFixture brands
High Low Design
Fixture design capability,
customization for customers
Regional brandsFixture brands
Low Low Cost and security Basic quality, low cost Regional Fixture brands
B2C B2B B2G
HouseholdRetrofit Commercial/
IndustrialRetrofit
Commercial/ Industrial
Fixture
Street lightingFixture
Residental/Commercial
Fixture
Source: Company data, MIC, Credit Suisse
Figure 30: Strategies for LED lighting fixture market—outsourcing is the trend Market segment
Existing lighting players New comers
Intl. brandsRegional
Fixture brandsLED
Fixture brandsLED component
makersRegional Fixture brands LED Fixture brands
Mainstream business model
OBM, partially outsourcing
OEM
OBM, outsource optical engine and assembly on their
own
Own production line and outsource optical
engine
Own production line and outsource optical
engine
Mostly only provide lamps and fixtures; have not
develop integrated LED luminaire
Own production line OBM
Industrial LED Fixture
LED Fixture player
Existing lighting players New comers
Residental/Commercial LED Fixture
Source: Company data, MIC, Credit Suisse

18 June 2012
Taiwan LED Sector 13
In the Taiwanese LED supply-chain, we think upstream chip makers such as Epistar and Forepi, equipment suppliers such as Chroma, and integrated solutions providers, including Lextar and Edison, look more interesting in the upcoming LED lighting cycle. We acknowledge Everlight’s efforts in building its brand business for LED lighting, but remain concerned about the intense competition from global/regional brands and new entrants, which could trigger inventory loss due to rapid retail price decline. We estimate Everlight will have the lowest LED general lighting exposure among Taiwanese LED players in 2012-13.
Figure 31: Everlight has lower exposure to LED general lighting in the Taiwan LED supply chain Company Name Marketcap (US$ mn) 2011 Revenue
(US$ mn) 2011 2012E 2013EEpistar 1,714 600 20% 26% 33%Everlight 689 550 9% 18% 25%Lextar 454 309 28% 35% 45%Forepi 331 139 20% 36% 50%Unity Opto 327 195 21% 25% 30%Genesis 253 152 30% 45% 60%Edison 186 84 85% 90% 90%
Lighting % of sales
Source: Company data, Credit Suisse estimates

18 June 2012
Taiwan LED Sector 14
More consolidation or alliance to happen for Taiwan/China LEDs The Taiwanese LED supply-chain has already experienced several rounds of M&A and alliance in the last few years, especially for Epistar. Recent trend for Taiwan LED makers are to move toward downstream, i.e. packaging, module, and lighting, to increase their revenue/profit, as well as to build their relationships with channels to secure its orders. We view the virtual alliance via vertical integration as a positive for Taiwanese LED makers, especially to capture the growing lighting demand.
However, we think the Chinese LED supply-chain will witness another round of consolidation in the next few years given (1) lack of core technology, (2) intense competition, (3) government policy change, and (4) global economy slowdown. We think the high inventory could be a burden for Chinese LED makers after the Chinese government concludes the MOCVD procurement subsidy in 2011, given industry wide oversupply.
Based on our industry checks, ~100 LED lighting makers in Shenzhen and Foshan went bankrupt in 2011 given intense pricing pressure and high inventory. The Chinese government also raised the bar for companies participating in the lighting bidding by requesting bidders to pass energy saving certifications.
Figure 32: China LED leader Sanan seems to have a better
ROE vs Taiwan LED makers on government subsidy
Figure 33: …but the bubble may burst on high inventory
days
(5)
0
5
10
15
20
25
2008 2009 2010 2011
ROE (%) Epistar Lextar Everlight Sanan Opto
0
50
100
150
200
250
300
350
400
2008 2009 2010 2011
Inventory Days Epistar Lextar Everlight Sanan Opto
Source: Company data, TEJ Source: Company data, TEJ
Taiwan and China LEDs should further tie-up China has installed ~400 sets of MOCVD in 2011 (~60% of global shipments), ahead of the end of MOCVD subsidy by Chinese government, but ~50% of the MOCVD tools installed in China remain idle given lack of technology and lower production yield, according to our industry checks. We think LED supply and demand sufficiency for high-power and mid-power application could improve in 2H12 on new lighting applications and low utilisation for Chinese LED makers, but low-power LEDs will still remain oversupplied.
According industry and government data as end of 2011, China has ~70 companies focusing on LED wafers manufacturing, ~1,000 companies on packaging, and more than 4,000 companies are involved in lighting fixtures, but most of the Chinese LED companies are facing declining revenue, high inventory on lack of technology, resulting in worsen balance sheets given the oversupply.
We believe the Taiwan/China tie-up for LED will help Chinese lighting brands in securing LED chip/package, reduce the risk of oversupply for Taiwanese LED makers, and benefit Chinese local lighting brands to gain share from foreign makers. The Chinese government is also shifting the subsidy from chip manufacturing to lighting module/fixture to boost the proliferation of LED lighting. We would expect more consolidation/alliance in 2012-2014.
More alliance or consolidation to happen for Taiwan/China LEDs

18 June 2012
Taiwan LED Sector 15
Figure 34: LED supply/demand: Mid- and high-power
application are improving, but low-power still oversupply
Figure 35: China LED makers are focusing on lower-end
applications
0%
5%
10%
15%
20%
25%
30%
2010 2011 2012E
LED supply/demand sufficiency
Low Power Mid Power High Power
NichiaCreeOSRAM
Korean LEDsTaiwan LEDs
China LEDs
High Power (>1W)
Niche application
Mid Power (0.5-1W)
Display backlighting
High brightness lighting, outdoor display
Low Power (<0.5W)
Lower power lighting, consumer electronics, mobile devices
Source: Company data, LEDinside, Credit Suisse estimates Source: Credit Suisse
Figure 36: Vertical integration of Taiwan LED makers Vertical integration Epistar (2448 TT) Everlight (2393 TT) Unity (2499 TT) Formosa Epitaxy (3061 TT)Chip Huga (51%) Epistar (5%) Formosa Epitaxy (4%) Wafer Works Optronics (1%)
Tekcore (24%) Tekcore (10%) Huga (1%)
Crystalwise Technology (9%) Huga (6%)
Nan Ya Photonics (41%)
Package Prolight (15%)
Lighting Feng Optoelectronics (40%) LumenMax Opto. (2%)
Kaistar (43%)
BLU Global Lighting Technology (1%)
Others I-Chiun (3%) Source: Company data
Figure 37: Taiwan LED maker’s JV and alliance in China
Company name Ticker China JV China Alliance
Epistar 2448.TW Epi-sky, ULED, Epicrystal, Kaistar, Crystalrich NVC lighting, Yankon
Formosa Epitaxy 3061.TW CanYang Opto
Genesis Photonics 3383.TW Genesis Phtonic Kunshan Potevio
Lextar 3698.TW Lextar Yangzhou
Everlight 2393.TW Evertop
Unity Opto 2499.TW Unity Opto Beijing Hongyar Electrical
Edison 3591.TW Edison Yangzhou Source: Company data

18 June 2012
Taiwan LED Sector 16
Assuming coverage of the Taiwan LED: Prefer Epistar and Chroma We assume coverage of the Taiwan LED sector and with Epistar and Chroma being our top picks, as we expect upstream players to benefit more from the upcoming general lighting take off in 2013. We like Lextar’s business model as it has been qualified by global Tier-one general lighting brands for providing ODM business. Moreover, AUO (major shareholder of Lextar with 46% holding) will absorb Lextar’s output for TFT backlighting. We remain cautious on Everlight as it has been lagging behind to enter the LED monitor/TV backlighting and its strategy to capture general lighting market via own brand could face intense competition from global Tier-one brands, as well as regional lighting brands.
Figure 38: EBITDA—LED upstream is ahead over the
cycle
Figure 39: Net debt/equity comparison—Epistar is having
net cash position
0%
5%
10%
15%
20%
25%
30%
35%
40%
2000 2001 2002 2003 2004 2005 2006 2007 2008 2009 2010 2011
EBITDA margin
Upstream Downstream
-100%
-80%
-60%
-40%
-20%
0%
20%
40%
60%
80%
2000 2001 2002 2003 2004 2005 2006 2007 2008 2009 2010 2011
Net debt to equity
Epistar Lextar Everlight
Source: Company data, TEJ Source: Company data, TEJ
Assume coverage of Epistar with OUTPERFORM: Well positioned for the next LED cycle We assume coverage of Epistar with an OUTPERFORM rating and a target price of NT$75 (26% upside potential), based on 1.4x 12-month forward P/B. Epistar’s solid technology on improving LED performance, strong customer base, and investments in China should benefit from the general lighting take-off. Epistar’s capacity has been fully utilised since late April and should continue into July. It has also taken full control of Huga (51% holding) starting 1Q12 and will help Huga to improve the production yield and fill the capacity by leasing Huga’s equipment.
TV application accounts for ~25% of Epistar’s sales. We think the recent slowdown witnessed by Korean panel makers on weak China May holiday sales and European economic crisis is temporary and should have limited impact to Epistar, given solid demand from Taiwanese and Chinese panel makers for holiday season. Upside surprise could come from better-than-expected LED TV demand in China from new energy efficient subsidy and conclusion of rural subsidy by end 2012, and additional street lighting projects announced by China government.
Epistar and Chroma are our top picks in Taiwan LED
Epistar is well positioned for next LED cycle

18 June 2012
Taiwan LED Sector 17
UNDERPERFORM on Everlight: Own brand strategy could be a burden We assume coverage of Everlight with an UNDERPERFORM rating and a target price of NT$42 (15% downside potential), based on 15x FY12 P/E. We remain cautious on Everlight, as it has been lagging behind its peers to enter the LED TV backlighting and could face price competition from existing players. According to our industry checks, Everlight’s LED monitor/TV backlighting business has been struggling on lower efficiency, despite it having large exposure to mobile and consumer applications. Although Everlight intends to increase its TFT backlighting sales mix from ~16% in 2011 to more than 20% in 2012, we think this will be at the expense of price competition, as it aims to focus on the low-cost direct-lit LED TV market.
Everlight claims it has more than 50% market share in the Taiwanese LED light bulb retail market via its own brand, and intends to enter the global market with dual brands strategy (Everlight for greater China, Zenano for Europe and the US). We think Everlight’s strategy to capture the general lighting market via own brand could lead to lower returns given (1) intense competition from global Tier-one brands and regional lighting players, (2) higher marketing expense is required to build brand image, and (3) total available market for retrofit is much smaller than new fixture on a long-term basis.
We forecast Everlight’s FY12 and FY13 EPS of NT$2.77 and NT$3.39, 8-14% lower than consensus estimate. The stock is trading at 18x FY12 P/E versus the historical 12x-22x range, while the company intend to issue 85 mn shares of GDR (17% dilution) in 2012. We think Everlight’s stock is overpriced and could de-rate on intense competition and lower return for building its own LED lighting brand.
Figure 40: Everlight OPEX is increasing on own brand
strategy
Figure 41: Everlight employee bonus trend—payout and
absolute dollar both decline….
10%
12%
14%
16%
18%
20%
1,000
1,500
2,000
2,500
3,000
3,500
2008 2009 2010 2011 2012E 2013E
NT$ mn ex Bonus OPEX Ex-bonus OPEX/Sales (RHS)
0%
2%
4%
6%
8%
10%
12%
14%
16%
18%
-
50
100
150
200
250
300
2008 2009 2010 2011
NT$ mn Employee bonus Employee bonus/Net profit (RHS)
Source: Company data, TEJ, Credit Suisse estimates Source: Company data, Credit Suisse
Initiate coverage on Chroma with OUTPERFORM: Innovator in LED testing We initiate coverage on Chroma with an OUTPERFORM rating and a target price of NT$89 (31% upside potential), based on 17x 12-month forward P/E and NT$2.5 cash dividend. We think Chroma has been undervalued as it is trading at 13.5x FY12 P/E, at the lower end of historical 13x-21x range. We also believe street has underestimated Chroma’s opportunity in LED and visual inspection given its proprietary testing and equipment design know-how has resulted in several new project wins from global Tier-one general lighting, consumer electronics and CIS (CMOS image sensor) makers. We think
Own brand strategy could be a burden to Everlight
Undervalued

18 June 2012
Taiwan LED Sector 18
these new project wins could turn into actual orders in 2H12 and estimate Chroma’s 2H12 standalone revenue of NT$3.3 bn, above consensus estimate of less than NT$3.0 bn.
Chroma’s technology leadership in power testing, visual inspection, and automation has provided the company with strong bargaining power on pricing and margin. Chroma has maintained a 50-55% gross margin since 2006 and we expect it to continue in the next few years. Thus, our FY13E EPS of NT$5.55 is 8% above consensus estimates on higher revenue assumption from new project wins, as well as solid margin profile.
Unique business model, initiate Lextar with NEUTRL We initiate coverage on Lextar with a NEUTRAL rating and a target price of NT$37 (14% upside potential), based on 1.7x 12-month forward P/B. Lextar is the only LED maker in Taiwan that provides vertical integration service from LED wafer manufacturing, packaging, light module, light source, and fixtures. We like its business model as it has been qualified by global tier one general lighting brands (i.e. Philip, OSRAM, etc) for providing lighting ODM business (30-35% of sales). Moreover, its TFT backlighting (60-65% of sales) output is guaranteed by its major shareholder AUO and also penetrated into other panel makers (CMI, Korean, Chinese panel makers).
Lextar is also the first Taiwanese LED maker to mass produce 6” LED wafer. It obtains key manufacturing IPs through cross-licensing and ODM for global Tier-one makers to avoid patent infringement. We think Lextar’s strategy of working with global Tier-ones and regional general lighting brands, and its R&D effort regarding cost reduction should support the growth of its general lighting business. Nevertheless, we initiate coverage on Lextar with a NEUTRAL rating as our target price of NT$37 only leaves 14% upside potential from current levels. We are also concerned on potential major shareholder sell down and domestic CB issuance could cap the stock. We could turn more optimistic on the stock on faster-than-expected growth of its general lighting business or recovery of global economy for better LED TV shipments.
Figure 42: Lextar provides total solution to capture LED lighting ODM market
Source: Company data
Figure 43: Epistar and Chroma offers more upside
Price Marketcap CS 12mthHistorical valuation
Ticker Company 6/14/2012 US$ mn Rating Target Multiple range 2012 2013 2012 20132448.TW Epistar 59.6 1,714 O 75.0 26% 1.5x forward P/B 1.0-2.0x P/B nm 21.8 1.2 1.12360.TW Chroma 68.0 856 O 89.0 31% 17x forward P/E 13-21x P/E 16.6 12.3 3.1 2.82393.TW Everlight 49.2 689 N 42.0 -15% 15x 2012 P/E 12-22x P/E 17.8 14.5 1.4 1.33698.TW Lextar 32.4 454 U 37.0 14% 1.7x forward P/B 1.0-2.1x P/B 31.8 15.8 1.6 1.5
P/E (x) P/B (x)Upside/
downside to PT
Source: TEJ, Credit Suisse estimates
Stable gross margin profile of 50-55% since 2006
Lextar is the only LED turnkey provider in Taiwan

18 June 2012
Taiwan LED Sector 19
Asia Pacific / Taiwan Electronic Components & Connectors
Epistar Corporation (2448.TW / 2448 TT)
Well positioned for the next LED cycle ■ Assume coverage with OUTPERFORM. We assume coverage of Epistar
with an OUTPERFORM rating and a target price of NT$75 (from NT$65), based on 1.4x 12-month forward P/B. We believe Epistar is well positioned for the next LED cycle driven by general lighting, given its solid technology for improving LED performance, strong customer base and China investments.
■ LED backlighting demand remains solid. TV backlighting accounts for ~25% of Epistar’s sales, while IT (monitor and NB) is around 5-10%. We think the recent slowdown witnessed by Korean panel makers on weak China May holiday sales and European economy crisis is temporary and should have limited impact on Epistar, given solid demand from Taiwanese and Chinese panel makers for 2H holiday season demand. Upside surprise could come from better-than-expected LED TV demand in China from new energy efficient subsidy and conclusion of rural subsidy by end-2012.
■ Capacity remains tight in 2012. Epistar’s capacity has been fully utilised since late April and should continue into July. Epistar does not intend to add new capacity in 2012 but will de-bottleneck some legacy equipment in 2H12 for 10% increase in capacity. We estimate its 2012 capex to be halved from NT$10 bn in 2011. We think the growing general lighting demand in 2H12 should help Epistar in maintaining high utilisation and improve its margins. Epistar has also formed a tighter alliance with Huga (51% holding) since 4Q11 and will help Huga in improving the production yield by transferring process recipe and fill the capacity by leasing Huga’s equipment.
■ Valuation is attractive. Epistar stock is trading at 1.2x FY12 P/B, at the lower end of historical of 1.0-2.0x range. Our target price of NT$75 is based on 1.4x 12-month forward P/B, mid-cycle average multiple. We expect Epistar’s revenue momentum to improve sequentially in 2Q12 and 3Q12 on improving LED demand for backlighting and general lighting take off in 2H12. Key risks will be new capacity additions, weak LED TV demand, and slower-than-expected take off for LED general lighting.
Share price performance
406080100120
406080
100120
Jun-10 Oct-10 Feb-11 Jun-11 Oct-11 Feb-12
Price (LHS) Rebased Rel (RHS)
The price relative chart measures performance against the TAIWAN SE WEIGHTED INDEX which closed at 7075.1 on 14/06/12 On 14/06/12 the spot exchange rate was NT$29.95/US$1
Performance Over 1M 3M 12M Absolute (%) -14.9 -27.8 -35.5 Relative (%) -10.5 -15.6 -15.6
Financial and valuation metrics
Year 12/11A 12/12E 12/13E 12/14E Revenue (NT$ mn) 21,963.6 22,061.9 23,526.3 28,323.1 EBITDA (NT$ mn) 3,964.0 4,703.7 7,414.5 8,835.1 EBIT (NT$ mn) 22.8 271.1 2,591.8 3,877.5 Net profit (NT$ mn) 480.3 755.3 2,349.9 3,481.1 EPS (CS adj.) (NT$) 0.56 0.88 2.73 4.04 Change from previous EPS (%) n.a. n.a. n.a. Consensus EPS (NT$) n.a. 0.89 2.44 3.01 EPS growth (%) -92.2 56.4 211.1 48.1 P/E (x) 106.2 67.9 21.8 14.7 Dividend yield (%) 7.5 1.8 1.0 3.2 EV/EBITDA (x) 12.2 11.1 6.7 5.5 P/B (x) 1.1 1.2 1.1 1.1 ROE (%) 1.1 1.7 5.2 7.5 Net debt/equity (%) net cash 1.3 net cash net cash
Source: Company data, Thomson Reuters, Credit Suisse estimates.
*Stock ratings are relative to the relevant country benchmark. ¹Target price is for 12 months.
Research Analysts
Jerry Su 886 2 2715 6361
Jimmy Huang 886 2 2715 6352
Rating (from Neutral) OUTPERFORM* Price (14 Jun 12, NT$) 59.60 Target price (NT$) (from 65.00) 75.00¹ Upside/downside (%) 25.8 Mkt cap (NT$ mn) 51,316 (US$ 1,714) Enterprise value (NT$ mn) 51,992 Number of shares (mn) 861.01 Free float (%) 91.0 52-week price range 92.4 - 51.1

18 June 2012
Taiwan LED Sector 20
Well positioned for the next LED cycle Margin improving on better utilisation; limited capacity addition in 2012
We think Epistar’s margin troughed in 4Q11-1Q12 and will recover on better utilisation. We estimate Epistar will run at full utilisation in June/July, up from ~90% in April and ~70% in 1Q12. Epistar currently has 360,000 pieces of 2" equivalent capacity for Nitride LED and will de-bottleneck some of its old equipment with Veeco E300 in 2Q12 for 10% additional capacity starting to ramp in 3Q12. We estimate its utilisation should be maintained at ~90% levels in 3Q12, after the ~10% capacity increase on debottlenecking.
We forecast Epistar’s gross margin to recover sequentially on better utilisation and product mix. Four-element LED (25-30% sales) gross margin should improve from 20% to 30%+ in 2H12 on seasonality and lower depreciation. Gross margin of high power Nitrid LED (~15% of sales) should also improve to ~30% from mid-teens on new product ramp and higher utilisation. We also estimate gross margin for its TV and smartphone applications (40%+ of sales) will improve from breakeven to ~10% in 2H12 on more shipments and better product mix.
Figure 44: Epistar—1Q12 revenue breakdown Figure 45: Epistar—gross margin vs utilisation
TV23%
Monitor4%
NB3%
Mobile15%Lighting
23%
Outdoor / Indoor Display
15%
Automotive5%
Others12%
50%
55%
60%
65%
70%
75%
80%
85%
90%
95%
100%
0%
5%
10%
15%
20%
25%
30%
35%
40%
45%
1Q2010 3Q2010 1Q2011 3Q2011 1Q2012 3Q2012E
Gross margin (parent only) Utilisation (RHS)
Source: Company data Source: Company data, Credit Suisse estimates
Huga to turn around on Epistar’s help; leveraging JVs for China market
Epistar invested in Huga (51% holding) in 2010 and only assigned two senior management personnel to run the company. Given lower yield and quality, Epistar started to transfer know-how and process recipes since 4Q11 to help Huga improve its production efficiency and yield. Epistar will also help fill Huga’s capacity by leasing its equipment starting 2H12 given its own capacity is already fully utilised.
We also think Epistar’s alliance and JVs in China for chip processing (Epicrystal), packaging (Prolight), and general lighting (Kaistar) should help the company to form virtual integration in China to capture general lighting opportunity. The upcoming announcement of street lighting bidding results could be a catalyst for Epistar’s 2H12 growth if its Chinese partners successfully win the biddings.
2Q12 recovery remains on track, 3Q12 should be better
Epistar reported May standalone sales of NT$1.66 bn, up 10% MoM but down 16% YoY. We estimate its 2Q12 standalone sales of NT$4.8 bn, up 34% QoQ but down 9% YoY. On a consolidated basis, we estimate Epistar’s 2Q12 consolidated revenue of NT$5.7 bn, up 35% QoQ but down 16% YoY. We forecast Epistar’s 2Q12 consolidated gross margin to improve by 14.7 pp from 1Q11 (3.9%) on better utilisation (700 bp contribution) and improving product mix. We estimate Epistar to report 2Q12 EPS of NT$0.38, versus 1Q12
Margin troughed in 4Q11-1Q12
Epistar is helping Huga to improve quality and yield
2Q12 recovery is on track

18 June 2012
Taiwan LED Sector 21
LPS of NT$0.60. We expect its revenue and gross margin recovery to continue into 3Q12 on better backlighting demand, lighting demand pick up, narrower loss from Huga, and turnaround of its investments.
Figure 46: Epistar—EBITDA margin trend Figure 47: Epistar—capex/sales is trending down after
2011 peak
0%
5%
10%
15%
20%
25%
30%
35%
40%
45%
1Q2008 4Q2008 3Q2009 2Q2010 1Q2011 4Q2011 3Q2012E
EBITDA margin
0%
5%
10%
15%
20%
25%
30%
35%
40%
45%
50%
2002 2003 2004 2005 2006 2007 2008 2009 2010 2011 2012E
Capex/Sales
Source: Company data, Credit Suisse estimates Source: Company data, , Credit Suisse estimates
Assuming coverage with OUTPERFORM and NT$75 TP
We assume coverage of Epistar with an OUTPERFORM rating and a target price of NT$75, based on 1.4x 12-months forward P/B. Our target price of NT$75 implies 26% potential upside from current levels as we believe Epistar is well positioned for the next LED cycle driven by general lighting given its solid technology for improving LED performance, strong customer base, and China investments. Epistar has been working with various global lighting makers given its superior processing yield and has less IP concerns than Korean and Chinese peers given its early mover position and IP cross-licensing with Toyoda Gosei and Philips. We also believe its technology leadership could offer potential opportunity to break into Japan LED supply chain.
We think 4Q11-1Q12 is the worst period for Epistar and fundamentals should improve sequentially from 2Q12 on better demand from both display backlighting and LED general lighting. We also expect LED ASPs to remain relatively stable comparing with 2011 on supply tightness for high-end and niche products, while low-end LEDs for China market continues on a downward trend.
Downside risks are: (1) More new capacity additions in China; (2) weak LED TV demand; (3) slower-than-expected take off for LED general lighting; (4) dilution from private placement, and (5) market share loss to competitors.
Figure 48: Epistar – One year forward P/B Figure 49: Epistar – Share price vs monthly sales YoY
0
20
40
60
80
100
120
140
160
Apr-01 Apr-02 Apr-03 Apr-04 Apr-05 Apr-06 Apr-07 Apr-08 Apr-09 Apr-10 Apr-11 Apr-12
NT$ Stock Price vs. One-Year Forward PB
Stock Price 0.5x 0.8x 1.0x 1.5x 2.0x
0
20
40
60
80
100
120
140
160
-50%
0%
50%
100%
150%
200%
250%
300%
350%
Jan-02 Jan-03 Jan-04 Jan-05 Jan-06 Jan-07 Jan-08 Jan-09 Jan-10 Jan-11 Jan-12
(NT$)YoY Monthly sales YoY Stock Price (RHS)
Source: Company data, TEJ, Credit Suisse estimates Source: Company data, TEJ
Assume coverage with OUTPERFORM

18 June 2012
Taiwan LED Sector 22
Figure 50: Epistar’s financial summary Year-end 31 Dec (NT$ mn) 2008 2009 2010 2011 2012E 2013E 2014ERevenue 10,321 12,849 20,888 21,964 22,062 23,526 28,323 COGS 9,013 9,607 13,044 19,260 19,268 18,373 21,695 Gross profit 1,308 3,242 7,844 2,704 2,794 5,153 6,628 Operating expense 1,381 1,462 2,337 2,681 2,523 2,561 2,751 EBIT (74) 1,780 5,507 23 271 2,592 3,878 EBITDA 1,867 3,921 7,902 3,964 4,704 7,415 8,835 Total non-op 159 164 829 (323) (122) 215 324 Pre-tax profit 85 1,944 6,336 (300) 149 2,807 4,202 Tax expense 44 116 512 (14) (88) 309 462 Net profit 42 1,732 5,766 480 755 2,350 3,481 EPS (NT$) 0.06 2.26 7.17 0.56 0.88 2.73 4.04Gross margin (%) 12.7 25.2 37.6 12.3 12.7 21.9 23.4Operating margin (%) (0.7) 13.9 26.4 0.1 1.2 11.0 13.7EBITDA margin (%) 18.1 30.5 37.8 18.0 21.3 31.5 31.2Net margin (%) 0.4 13.5 27.6 2.2 3.4 10.0 12.3
Balance sheet (NT$ mn) 2008 2009 2010 2011 2012E 2013E 2014ECash & ST investments 4,491 18,187 22,525 17,274 14,900 17,048 18,370 Receivables 3,120 4,644 7,864 7,402 9,538 10,581 12,159 Inventory 2,470 1,974 3,842 4,292 4,561 4,698 5,357 Other current assets 2,640 4,586 2,662 1,930 4,069 4,514 5,188 Current assets 12,720 29,390 36,892 30,898 33,068 36,841 41,074 Long-term investment 28 1,356 3,442 3,844 3,980 3,980 3,980 Total fixed assets 12,722 14,150 27,200 32,634 31,952 30,908 29,729 Total other assests 652 677 4,325 5,082 5,513 5,257 5,152 Total assets 26,122 45,573 71,860 72,458 74,513 76,986 79,934 Short-term debt 555 6,168 6,322 3,014 3,653 3,609 3,624 Payables 509 989 1,993 2,037 2,781 3,184 3,750 Other current liabilities 1,232 2,484 5,901 4,188 5,084 5,641 6,482 Total current liabilities 2,296 9,641 14,215 9,239 11,519 12,433 13,856 Long-term debt 1,717 - 4,434 11,601 11,923 11,776 11,827 Other long term liabilities 15 132 321 592 673 673 673 Total liabilities 4,028 9,773 18,970 21,432 24,115 24,883 26,356 Minority Interest 2 98 6,421 6,547 6,204 6,204 6,204Common stock 6,331 7,690 8,475 8,589 8,606 8,606 8,606 Retained earnings 132 1,784 5,993 1,947 2,924 4,628 6,104 Others 15,630 26,229 32,000 33,943 32,664 32,664 32,664 Total equity 22,094 35,800 52,890 51,026 50,398 52,103 53,578 Total liabilities & equity 26,122 45,573 71,860 72,458 74,513 76,986 79,934
Cash flow (NT$ mn) 2008 2009 2010 2011 2012E 2013E 2014ENet profit 42 1,732 5,766 480 755 2,350 3,481 Depreciation and Amortization 1,941 2,140 2,395 3,941 4,433 4,823 4,958 Change in working capital (587) 467 (2,059) (1,218) (3,355) (666) (1,503) Others (1) 3 (269) 328 40 - - Operating cash flow 1,395 4,342 5,834 3,531 1,873 6,507 6,936 Capital expenditure (2,652) (2,816) (5,725) (10,030) (4,617) (3,600) (3,600) Long term investments 393 (1,330) (1,818) (729) (176) - - Others 848 (778) (13,369) (102) 434 78 (74) Investment cash flow (1,411) (4,923) (20,911) (10,861) (4,358) (3,522) (3,674) Dividends paid (1,489) (75) (1,384) (3,842) (947) (529) (1,645) Equity financing (172) 11,529 7,014 339 1,423 (0) - Change in debt financing 167 4,013 4,777 4,130 1,042 (191) 66 Others 60 520 5,693 1,158 (1,859) (117) (361) Financing cash flow (1,434) 15,987 16,100 1,786 (340) (837) (1,940) Other adjustments 0 (0) - 0 (0) 0 (0) Total cash flow (1,450) 15,406 1,023 (5,544) (2,825) 2,148 1,323
Ratios 2008 2009 2010 2011 2012E 2013E 2014EYoY growth (%)Sales 1 24 63 5 0 7 20 Gross profit (58) 148 142 (66) 3 84 29 EBIT (104) (2,518) 209 (100) 1,091 856 50 EBITDA (49) 110 102 (50) 19 58 19 Net income (98) 3,981 233 (92) 57 211 48 Balance sheet ratios (%)ROE 0.2 6.0 14.0 1.1 1.7 5.2 7.5 Net debt/ equity (10.0) (33.6) (22.3) (5.2) 1.3 (3.2) (5.4) Source: Company data, Credit Suisse estimates

18 Ju
ne 2012
Taiw
an L
ED
Secto
r 23
Figure 51: Epistar quarterly income statement and forecasts Year-end 31 Dec (NT$mn) 1Q11 2Q11 3Q11 4Q11 1Q12 2Q12E 3Q12E 4Q12E 1Q13E 2Q13E 3Q13E 4Q13E 2011 2012E 2013E 2014ESales 5,618 6,804 4,863 4,679 4,248 5,735 6,194 5,884 4,884 5,714 6,400 6,528 21,964 22,062 23,526 28,323COGS 4,680 5,187 4,467 4,925 4,413 4,894 5,073 4,888 4,085 4,471 4,782 5,035 19,260 19,268 18,373 21,695Depreciation 861 902 932 981 1,053 1,035 1,065 1,101 1,135 1,161 1,179 1,170 3,676 4,254 4,644 4,779COGS ex D&A 3,795 4,237 3,500 3,788 3,315 3,814 3,964 3,742 2,905 3,266 3,559 3,821 15,318 14,836 13,551 16,737
Gross profits 938 1,616 396 (246) (165) 841 1,121 996 799 1,243 1,618 1,493 2,704 2,794 5,153 6,628 Total operating exp. 566 676 687 752 632 614 607 670 578 648 673 661 2,681 2,523 2,561 2,751
Operating exp. promotion 83 97 87 76 82 86 87 97 85 92 96 100 344 351 373 405 Operating exp. administrative 255 326 344 413 284 287 279 292 261 294 302 307 1,337 1,141 1,163 1,241 Operating expense R&D 228 253 255 263 266 241 242 282 232 263 276 255 1,000 1,030 1,025 1,105
EBIT 372 940 (291) (998) (796) 228 514 326 221 594 944 832 23 271 2,592 3,878 Non-oper. income (Loss) 42 (139) (75) (151) (84) (12) (28) 2 7 48 66 95 (323) (122) 215 324
Interest expenses (73) (87) (97) (90) (96) (98) (101) (101) (98) (97) (99) (99) (346) (396) (394) (397) Interest income 43 53 49 37 47 47 43 38 40 45 45 44 182 175 174 191 Other non-op. income/(loss) 71 (105) (27) (97) (36) 40 30 65 65 100 120 150 (158) 99 435 530
Pre-tax Income 414 801 (366) (1,149) (880) 216 486 328 228 642 1,010 926 (300) 149 2,807 4,202 Income taxes exp./(gains) 64 83 (66) (94) (48) (32) (24) 16 25 71 111 102 (14) (88) 309 462 Net income before extraord. 350 719 (299) (1,055) (832) 248 510 311 203 571 899 824 (286) 237 2,498 3,739
Net income 349 738 12 (619) (515) 328 587 355 198 558 845 749 480 755 2,350 3,481 EPS (NT$) 0.41 0.86 0.01 (0.72) (0.60) 0.38 0.68 0.41 0.23 0.65 0.98 0.87 0.56 0.88 2.73 4.04 Aveage shares 851 857 857 858 859 861 861 861 861 861 861 861 856 860 861 861
EBITDA 1,257 1,891 677 139 301 1,308 1,623 1,472 1,401 1,800 2,168 2,046 3,964 4,704 7,415 8,835
Margins (%)EBITDA margin 22.4 27.8 13.9 3.0 7.1 22.8 26.2 25.0 28.7 31.5 33.9 31.3 18.0 21.3 31.5 31.2 Gross margin 16.7 23.8 8.1 (5.3) (3.9) 14.7 18.1 16.9 16.4 21.7 25.3 22.9 12.3 12.7 21.9 23.4 Operating margin 6.6 13.8 (6.0) (21.3) (18.7) 4.0 8.3 5.5 4.5 10.4 14.8 12.7 0.1 1.2 11.0 13.7 Tax rate 15.5 10.3 18.2 8.2 5.5 (15.0) (5.0) 5.0 11.0 11.0 11.0 11.0 4.6 (59.2) 11.0 11.0 Net margin 6.2 10.8 0.3 (13.2) (12.1) 5.7 9.5 6.0 4.1 9.8 13.2 11.5 2.2 3.4 10.0 12.3
QoQ (%)Sales 13 21 (29) (4) (9.2) 35 8 (5) (17) 17 12 2 COGS 37 11 (14) 10 (10) 11 4 (4) (16) 9 7 5 Gross profit (40) 72 (76) (162) NM NM 33 (11) (20) 55 30 (8) Operating profit (58) 153 (131) NM NM NM 126 (37) (32) 169 59 (12) Net profit (70) 112 (98) (5,052) NM NM 79 (39) (44) 181 52 (11)
YoY (%)Sales 34 20 (20) (6) (24) (16) 27 26 15 (0) 3 11 5 0 7 20 COGS 77 52 26 44 (6) (6) 14 (1) (7) (9) (6) 3 48 0 (5) 18 Gross profit (39) (28) (84) (116) (118) (48) 183 NM NM 48 44 50 (66) 3 84 29 Operating profit (66) (44) (116) (214) (314) (76) NM NM NM 161 84 155 (100) 1,091 856 50 Net profit (65) (56) (99) (153) (248) (56) 4,597 NM NM 70 44 111 (92) 57 211 48 Source: Company data, Credit Suisse estimates

18 June 2012
Taiwan LED Sector 24
Asia Pacific / Taiwan Electronic Equipment & Instruments
Everlight Electronics Co Ltd (2393.TW / 2393 TT)
Own brand could be a burden ■ Assume coverage with UNDERPERFORM. We assume coverage of
Everlight with an UNDERPERFORM rating and a target price of NT$42 (from NT$54), based on 15x 2012 P/E. We remain cautious on Everlight as it has been lagging in entering LED-TV backlighting and could face price competition from existing players. We also think its strategy to capture the LED lighting via own brand could lead to lower return on high competition and could potentially harm its relationships with existing customers.
■ Own brand could be a burden. Everlight claims it has more than 50% market share in Taiwan LED light bulb retail market via its own brand, and intends to enter global market with dual brands strategy (Everlight for greater China, Zenano for Europe and US). We think Everlight’s strategy to capture the general lighting market via own brand could lead to lower return given: 1) intense competition from global tier one brands and regional lighting players, 2) higher marketing expense is required to build brand image, and 3) total available market for retrofit is much smaller than new fixture on a long-term basis. We are also concerned that building its own brand could potentially harm its relationships with existing customers.
■ Lagging on backlighting. Everlight’s LED monitor/TV backlighting business has been struggling on lower efficiency, although it has large exposure in mobile and consumer applications. Despite Everlight intending to increase its TFT backlighting sales mix from ~16% in 2011 to 20%+ in 2012, we think this will be at the expense of price competition as it aims to focus on the low-cost direct-lit LED TV market.
■ Looks overpriced. We forecast Everlight’s 2012/2013 EPS of NT$2.77/NT$3.39, 8-14% lower than consensus estimates. The stock is trading at 18x 2012 P/E versus historical 12x-22x range, while the company intend to issue 85 mn shares of GDR (17% dilution) in 2012. We think Everlight stock is overpriced and could de-rate on intense competition and lower return for building own LED lighting brand.
Share price performance
406080100120
40
60
80
100
Jun-10 Oct-10 Feb-11 Jun-11 Oct-11 Feb-12
Price (LHS) Rebased Rel (RHS)
The price relative chart measures performance against the TAIWAN SE WEIGHTED INDEX which closed at 7075.1 on 14/06/12 On 14/06/12 the spot exchange rate was NT$29.95/US$1
Performance Over 1M 3M 12M Absolute (%) -16.3 -24.3 -38.0 Relative (%) -12.0 -12.1 -18.1
Financial and valuation metrics
Year 12/11A 12/12E 12/13E 12/14E Revenue (NT$ mn) 18,642.3 20,241.2 21,998.7 22,772.5 EBITDA (NT$ mn) 3,368.3 3,410.1 3,837.6 3,912.5 EBIT (NT$ mn) 1,482.4 1,326.2 1,771.0 1,677.0 Net profit (NT$ mn) 1,316.3 1,159.3 1,419.6 1,327.2 EPS (CS adj.) (NT$) 3.14 2.77 3.39 3.17 Change from previous EPS (%) n.a. n.a. n.a. Consensus EPS (NT$) n.a. 3.20 3.66 3.57 EPS growth (%) -43.2 -11.9 22.5 -6.5 P/E (x) 15.7 17.8 14.5 15.5 Dividend yield (%) 7.3 5.1 3.9 5.0 EV/EBITDA (x) 6.9 6.9 6.1 5.9 P/B (x) 1.4 1.4 1.3 1.3 ROE (%) 8.7 7.6 9.3 8.5 Net debt/equity (%) 15.4 18.0 16.1 15.2
Source: Company data, Thomson Reuters, Credit Suisse estimates.
*Stock ratings are relative to the relevant country benchmark. ¹Target price is for 12 months.
Research Analysts
Jerry Su 886 2 2715 6361
Jimmy Huang 886 2 2715 6352
Rating (from Neutral) UNDERPERFORM* Price (14 Jun 12, NT$) 49.20 Target price (NT$) (from 54.00) 42.00¹ Upside/downside (%) -14.6 Mkt cap (NT$ mn) 20,624.7 (US$ 688.7) Enterprise value (NT$ mn) 23,535 Number of shares (mn) 419.20 Free float (%) 73.0 52-week price range 79.3 - 45.7

18 June 2012
Taiwan LED Sector 25
Own brand could be a burden The majority of Everlight’s revenue and profit was from handset, consumer products, and infrared, with only 16% from backlighting and 9% from lighting in 2011. We acknowledge Everlight’s effort to build its own brand to capture the LED general lighting growth. However, we remain concerned on Everlight as it will be competing with global lighting giants, namely Philips, OSRAM, Panasonic, etc, and these global Tier-one brands dominate the LED retrofit market with ~80% share.
Everlight claims it has more than 50% market share in the Taiwanese LED light bulb retail market. However, we are worried that it will face more pricing pressure from new entrants including Delta, Nan Ya, Tatung, China Electronics, TESS, BenQ, Wintek, etc, and price competition seems inevitable. Based on our survey from retail channels in Taiwan, Everlight’s 8W LED light bulb’s retail price has come down to NT$299 in May from NT$399 in January and NT$499 in September 2011.
Figure 52: Taiwanese LED maker’s own brand strategy on LED lighting—crowded area Brand Everlight (2393 TT) Delta (2308 TT) Nan Ya Photonics TK3C (2430 TT) China Electronic (1611 TT)
ProductSupply chain Epistar, Everlight Epistar, Delta Nan Ya Photonics Formosa Epitaxy, Unity Opto Formosa Epitaxy, Unity Opto
Brand BenQ TESS (5226 TT) Neo-Neon (911868 TT) Tatung (2371 TT) Genesis Photonics (3383 TT)
ProductSupply chain Lextar CREE Neo-Neon Formosa Epitaxy, Unity Opto Genesis Photonics Source: Company data
We also noticed Everlight has been cutting its employee bonus payout ratio since 2008 despite its earnings being on an upward trend. We understand Everlight might need to spend more on marketing campaign to build its brand image, but we still view lowering bonus payout as a negative for its long-term competitiveness, since it will be more difficult to retain R&D talent amid competition from Chinese LED makers.
Figure 53: Everlight 8W LED light bulb retail price fell 40%
in eight months
Figure 54: Everlight employee bonus trend—payout and
absolute dollar both declining….
0
100
200
300
400
500
600
Sep-11 Jan-12 May-12
NT$ Everlight 8W LED light bulb retail price
Down 40% in 8 months
0%
2%
4%
6%
8%
10%
12%
14%
16%
-
50
100
150
200
250
300
2008 2009 2010 2011
NT$ mn Employee bonus Employee bonus/Net profit (RHS)
Source: Company data Source: Company data, Credit Suisse
LED retrofit market is a crowded in Taiwan

18 June 2012
Taiwan LED Sector 26
Lagging behind on backlighting
Everlight’s LED monitor/TV backlighting business has been struggling on lower efficiency, despite it having a large exposure in mobile and consumer applications. Everlight intends to increase its TFT backlighting sales mix from ~16% in 2011 to more than 20% in 2012, but we think this will be at the expense of price competition, as it aims to focus on the low-cost direct-lit LED TV market. We think the value addition for backlighting will shift from LED packager to chip provider, given 80% of lighting efficiency improvement is from LED chip, not packaging. For example, the high resolution trend for mobile devices (smartphone, tablet, NB) has offered chip makers a better position to communicate with panel makers directly, which lowers the value for LED packagers.
Figure 55: Everlight—2011 revenue by product line, by different regions, and by applications
SMD57%
Lamp & Display
18%
Infrared24%
Others1%
Taiwan23%
US & Europe
20%
China & Asia57%
Handset & consumer products
51%
Infrared24%
BLU16%
Lighting9%
Source: Company data
Limited new capacity in 2012
Everlight’s 2011 capacity grew 12% YoY to 2,665 mn unit per month from 2,371 mn units per month at the end of 2010. 2011 capacity breakdown included 200 mn units/month for lamps, 2,100 mn units/month for SMD, 15 mn units/month for Display, 350 mn units/month for Infrared. For 2012, Everlight thinks capex will not increase much given it has enough capacity and the improving LED efficiency.
Figure 56: Everlight—monthly capacity Monthly capacity (mn units) 2004 2005 2006 2007 2008 2009 2010 2011
Lamp 150 170 190 240 240 240 260 200 SMD 300 400 600 700 1,000 1,350 1,850 2,100 Display 6 10 10 13 13 13 15 15 Infrared 60 70 150 150 150 190 240 350 Other - - - 2 2 2 6 - Total 516 650 950 1,105 1,405 1,795 2,371 2,665 YoY growth 26% 46% 16% 27% 28% 32% 12% Source: Company data
Recovery is slowing, stock is trading at peak multiple
Everlight’s May standalone sales came in at NT$1.456 bn, up 6% MoM but down 8% YoY. We estimate its 2Q12 standalone sales to come at NT$4.4 bn, up 16% QoQ but down 3% YoY, lower than Epistar’s 34% QoQ growth. On a consolidated basis, we estimate Everlight’s 2Q12 consolidated revenue of NT$4.9 bn, up 18% QoQ but down 9% YoY. We estimate Everlight to report 2Q12 EPS of NT$0.67, versus 1Q12 EPS of NT$0.20 on higher revenue base.
For 2012, we expect Everlight’s revenue to grow by 9% YoY but earnings to decline 12% YoY on intense competition in the lighting market, slower growth for display backlighting market, and continuous loss of its investment in Teckore. We also think Everlight will face more pressure from Chinese peers on SMD market for consumer electronics and mobile phone applications. The stock is trading at 18x FY12 P/E, at the higher end of historical
Everlight is lagging behind on backlighting
Everlight is trading at 18x 2012 P/E

18 June 2012
Taiwan LED Sector 27
P/E range of 12-22x, while the company plans to issue 85 mn shares of GDR (17% dilution) in 2012. We see downside on the stock.
Assuming coverage with an UNDERPERFORM and NT$42 TP
We assume Everlight with an UNDERPERFORM rating and a target price of NT$42 (from NT$54), based on 15x FY12 P/E. We remain cautious on Everlight as it has been lagging behind to enter the LED TV backlighting and could face price competition from existing players. We also think its strategy to capture the LED lighting via own brand could lead to lower return on high competition and could harm its relationships with existing customers. Its lawsuit with Nichia on IP infringement will remain an overhang on the stock. Everlight also has a lower financial transparency in Taiwan LED supply chain.
Upside risks are: (1) Market share gain; (2) Better-than-expect backlighting shipments for LED TV; (3) faster-than-expected take off for LED general lighting, (4) turnaround of its investments; and (5) industry consolidation.
Figure 57: Everlight—one year forward P/E Figure 58: Everlight—stock price vs QFII holding
0
20
40
60
80
100
120
140
160
Jan-02 Jan-03 Jan-04 Jan-05 Jan-06 Jan-07 Jan-08 Jan-09 Jan-10 Jan-11 Jan-12
NT$ Stock Price vs. PE (Incl. Bonus)
Stock Price 5x 10x 15x 20x 25x
0%
5%
10%
15%
20%
25%
30%
35%
40%
0
20
40
60
80
100
120
140
Jan-02 Jan-03 Jan-04 Jan-05 Jan-06 Jan-07 Jan-08 Jan-09 Jan-10 Jan-11 Jan-12
NT$ Stock Price vs. QFII Holding
Stock Price QFII Holding (RHS)
Source: Company data, TEJ, Credit Suisse estimates Source: TEJ

18 June 2012
Taiwan LED Sector 28
Figure 59: Everlight’s financial summary Year-end 31 Dec (NT$ mn) 2008 2009 2010 2011 2012E 2013E 2014ERevenue 11,321 11,405 17,471 18,642 20,241 21,999 22,772 COGS 7,925 7,427 12,246 14,034 15,647 16,915 17,853 Gross profit 3,396 3,978 5,225 4,609 4,595 5,084 4,919 Operating expense 1,994 2,297 2,995 3,126 3,268 3,313 3,242 EBIT 1,402 1,681 2,230 1,482 1,326 1,771 1,677 EBITDA 2,437 2,951 3,776 3,368 3,410 3,838 3,912 Total non-op 192 317 367 94 100 85 88 Pre-tax profit 1,594 1,997 2,597 1,576 1,426 1,856 1,765 Tax expense 231 196 274 271 288 371 353Net profit 1,358 1,800 2,310 1,316 1,159 1,420 1,327 EPS (NT$) 3.74 4.87 5.52 3.14 2.77 3.39 3.17Gross margin (%) 30.0 34.9 29.9 24.7 22.7 23.1 21.6Operating margin (%) 12.4 14.7 12.8 8.0 6.6 8.1 7.4EBITDA margin (%) 21.5 25.9 21.6 18.1 16.8 17.4 17.2Net margin (%) 12.0 15.8 13.2 7.1 5.7 6.5 5.8
Balance sheet (NT$ mn) 2008 2009 2010 2011 2012E 2013E 2014ECash & ST investments 2,046 5,322 5,361 4,972 4,824 5,154 5,287 Receivables 2,785 3,447 4,473 5,234 6,048 6,371 6,693 Inventory 797 859 1,380 1,898 2,054 2,137 2,306 Other current assets 535 3,209 1,936 2,050 607 640 672 Current assets 6,162 12,836 13,150 14,155 13,533 14,301 14,958 Long-term investment 3,981 5,628 6,038 6,222 6,205 6,205 6,205 Total fixed assets 6,256 6,804 9,504 10,595 10,419 10,525 10,462 Total other assests 565 677 733 736 689 689 689 Total assets 16,964 25,945 29,424 31,707 30,846 31,720 32,314 Short-term debt 991 4,483 4,944 8,855 7,621 7,722 7,725 Payables 2,081 2,565 3,317 3,493 4,130 4,286 4,607 Other current liabilities 1,233 1,909 2,704 2,579 2,473 2,605 2,736 Total current liabilities 4,304 8,957 10,966 14,927 14,224 14,613 15,069 Long-term debt 2,498 2,228 2,177 34 113 115 115 Other long term liabilities 358 190 283 336 330 330 330 Total liabilities 7,160 11,376 13,427 15,297 14,667 15,058 15,513 Minority Interest 28 35 864 1,155 1,118 1,118 1,118Common stock 3,646 4,102 4,192 4,192 4,192 4,192 4,192 Retained earnings 1,374 1,870 2,325 1,900 3,351 3,834 3,973 Others 4,755 8,562 8,616 9,163 7,518 7,518 7,518 Total equity 9,803 14,570 15,997 16,410 16,179 16,662 16,801 Total liabilities & equity 16,964 25,945 29,424 31,707 30,846 31,720 32,314
Cash flow (NT$ mn) 2008 2009 2010 2011 2012E 2013E 2014ENet profit 1,358 1,800 2,310 1,316 1,159 1,420 1,327 Depreciation and Amortization 1,035 1,270 1,546 1,886 2,084 2,067 2,235 Change in working capital 270 150 (185) (1,168) (384) (150) (72) Others 163 (100) (252) 298 36 0 - Operating cash flow 2,827 3,120 3,420 2,333 2,895 3,336 3,491 Capital expenditure (3,506) (1,702) (4,463) (2,378) (2,064) (2,000) (2,000) Long term investments 1,419 (1,546) (158) (482) (19) - - Others (2,251) (229) 162 (601) 203 (173) (173) Investment cash flow (4,337) (3,477) (4,459) (3,462) (1,881) (2,173) (2,173) Dividends paid (1,370) (1,167) (1,675) (1,509) (1,048) (811) (1,036) Equity financing 41 4,206 344 (797) 1,636 - 0 Change in debt financing 346 3,054 504 1,819 (1,160) 102 4 Others (484) (73) 448 1,403 (1,978) (125) (153) Financing cash flow (1,468) 6,021 (379) 915 (2,550) (834) (1,185) Other adjustments - - (0) 0 0 (0) - Total cash flow (2,978) 5,664 (1,419) (214) (1,536) 329 133
Ratios 2008 2009 2010 2011 2012E 2013E 2014EYoY growth (%)Sales 15 1 53 7 9 9 4 Gross profit 12 17 31 (12) (0) 11 (3) EBIT (32) 20 33 (34) (11) 34 (5) EBITDA (1) 21 28 (11) 1 13 2 Net income (39) 33 28 (43) (12) 22 (7) Balance sheet ratios (%)ROE 13.9 12.4 14.4 8.0 7.2 8.5 7.9 Net debt/ equity 14.7 9.5 11.0 23.9 18.0 16.1 15.2 Source: Company data, Credit Suisse estimates

18 Ju
ne 2012
Taiw
an L
ED
Secto
r 29
Figure 60: Everlight’s quarterly income statement and forecasts Year-end 31 Dec (NT$mn) 1Q11 2Q11 3Q11 4Q11 1Q12 2Q12E 3Q12E 4Q12E 1Q13E 2Q13E 3Q13E 4Q13E 2011 2012E 2013E 2014ESales 4,266 5,450 4,307 4,620 4,200 4,947 5,689 5,405 4,864 5,448 5,993 5,693 18,642 20,241 21,999 22,772COGS 3,160 4,098 3,276 3,499 3,353 3,833 4,309 4,152 3,888 4,221 4,486 4,320 14,034 15,647 16,915 17,853Depreciation 388 418 439 468 458 465 485 503 484 463 471 477 1,713 1,911 1,894 2,063COGS ex D&A 2,733 3,637 2,793 2,984 2,852 3,324 3,781 3,606 3,361 3,715 3,972 3,800 12,148 13,563 14,848 15,618
Gross profits 1,106 1,353 1,030 1,121 846 1,115 1,380 1,253 976 1,228 1,507 1,373 4,609 4,595 5,084 4,919 Total operating exp. 704 835 755 832 743 808 864 853 799 846 860 808 3,126 3,268 3,313 3,242
Operating exp. promotion 215 326 284 211 262 276 279 275 216 221 197 187 1,036 1,093 822 807 Operating exp. administrative 328 317 279 448 317 342 372 374 392 431 460 420 1,372 1,405 1,704 1,627 Operating expense R&D 162 192 191 173 164 191 213 204 191 193 202 201 718 771 788 809
EBIT 402 517 275 289 104 306 516 400 177 382 647 565 1,482 1,326 1,771 1,677 Non-oper. income (Loss) 158 (31) 104 (138) (17) 34 44 39 21 22 22 19 94 100 85 88
Interest expenses (36) (36) (40) (21) (38) (34) (35) (36) (35) (35) (36) (36) (133) (143) (143) (144) Interest income 11 10 9 21 20 18 19 15 16 18 18 16 51 72 68 72 Other non-op. income/(loss) 183 (5) 135 (137) 0 50 60 60 40 40 40 40 176 170 160 160
Pre-tax Income 560 486 379 151 87 340 560 439 198 404 669 585 1,576 1,426 1,856 1,765 Income taxes exp./(gains) 100 60 62 48 20 68 112 88 40 81 134 117 271 288 371 353 Net income before extraord. 460 426 317 103 66 272 448 351 158 323 535 468 1,306 1,138 1,485 1,412
Net income 457 430 316 113 83 282 443 351 148 308 515 448 1,316 1,159 1,420 1,327 EPS (NT$) 1.09 1.03 0.75 0.27 0.20 0.67 1.06 0.84 0.35 0.74 1.23 1.07 3.14 2.77 3.39 3.17 Aveage shares 419 419 419 419 419 419 419 419 419 419 419 419 419 419 419 419
EBITDA 829 978 758 804 605 815 1,045 946 704 888 1,161 1,085 3,368 3,410 3,838 3,912
Margins (%)EBITDA margin 19.4 17.9 17.6 17.4 14.4 16.5 18.4 17.5 14.5 16.3 19.4 19.1 18.1 16.8 17.4 17.2 Gross margin 25.9 24.8 23.9 24.3 20.2 22.5 24.3 23.2 20.1 22.5 25.1 24.1 24.7 22.7 23.1 21.6 Operating margin 9.4 9.5 6.4 6.2 2.5 6.2 9.1 7.4 3.6 7.0 10.8 9.9 8.0 6.6 8.1 7.4 Tax rate 17.8 12.4 16.4 32.1 23.4 20.0 20.0 20.0 20.0 20.0 20.0 20.0 17.2 20.2 20.0 20.0 Net margin 10.7 7.9 7.3 2.4 2.0 5.7 7.8 6.5 3.1 5.7 8.6 7.9 7.1 5.7 6.5 5.8
QoQ (%)Sales 1 28 (21) 7 (9.1) 18 15 (5) (10) 12 10 (5) COGS (3) 30 (20) 7 (4) 14 12 (4) (6) 9 6 (4) Gross profit 15 22 (24) 9 (24) 32 24 (9) (22) 26 23 (9) Operating profit 498 29 (47) 5 (64) 195 69 (23) (56) 116 70 (13) Net profit 107 (6) (27) (64) (27) 241 57 (21) (58) 108 67 (13)
YoY (%)Sales 15 18 (13) 10 (2) (9) 32 17 16 10 5 5 7 9 9 4 COGS 34 36 (9) 8 6 (6) 32 19 16 10 4 4 15 11 8 6 Gross profit (17) (15) (23) 17 (23) (18) 34 12 15 10 9 10 (12) (0) 11 (3) Operating profit (47) (29) (59) 330 (74) (41) 88 38 70 25 25 41 (34) (11) 34 (5) Net profit (15) (50) (54) (49) (82) (34) 40 211 80 9 16 27 (43) (12) 22 (7) Source: Company data, Credit Suisse estimates

18 June 2012
Taiwan LED Sector 30
Asia Pacific / Taiwan Electronic Equipment & Instruments
Chroma (2360.TW / 2360 TT)
Innovator in LED testing ■ Initiate coverage with OUTPERFORM. We initiate coverage on Chroma with
an OUTPERFORM rating and a target price of NT$89 (31% upside potential), based on 17x 12-month forward P/E and NT$2.5 dividend. We believe the street has underestimated Chroma’s opportunity in LED and visual inspection, given its proprietary testing and equipment design know-how resulted in several new project wins from global leading general lighting, consumer electronics, and CIS (CMOS sensor) makers. The stock looks undervalued, trading at ~13.5x 12-month forward P/E, at the lower end of the historical 13x-21x range.
■ Solid margin profile. Chroma is a testing solution provider for different technology sectors (Semiconductor, LED, Solar, PC, EV, etc). Its technology leadership in power testing, visual inspection, and automation has provided the company with strong bargaining power on pricing and margin. Chroma has maintained a 50-55% gross margin since 2006, as it dominates power testing, visual inspection, LED testing, etc, by providing customised solutions, which we believe will continue in the next few years.
■ Leveraging testing and automation expertise for LED market. Chroma leads other equipment makers globally to provide LED luminaire in-line testing and reliability testing solutions for both LED chip makers and lightbar assemblers. It has also designed an in-line LED light bulb/tube testing/ assembly line with high productivity and competitive pricing. We believe Chroma will maintain its leadership in LED testing for smartphone, IT, TV, and is well positioned to penetrate into LED lighting for global leading brands.
■ Valuation looks attractive. Chroma’s stock is trading at 13.5x 12-month P/E, at the lower end of historical of 13-21x range. We expect Chroma’s solid margin profile and new opportunities in LED testing to help the stock to re-rate. Near term catalysts include strong revenue pick up in 2H12 on battery cell project, IC testers for Nvidia’s GPU, visual inspection equipment shipment for smartphone makers and order wins for LED in-line testing solutions. Key risks will be slower-than-expected take off for LED general lighting, global economy slowdown, and delays in new product developments.
Share price performance
80
100
120
140
40
60
80
100
Jun-10 Oct-10 Feb-11 Jun-11 Oct-11 Feb-12
Price (LHS) Rebased Rel (RHS)
The price relative chart measures performance against the TAIWAN SE WEIGHTED INDEX which closed at 7075.1 on 14/06/12 On 14/06/12 the spot exchange rate was NT$29.95/US$1
Performance Over 1M 3M 12M Absolute (%) -0.7 -0.4 -22.8 Relative (%) 3.6 11.7 -2.9
Financial and valuation metrics
Year 12/11A 12/12E 12/13E 12/14E Revenue (NT$ mn) 5,338.4 5,302.9 6,487.6 6,884.9 EBITDA (NT$ mn) 1,495.2 1,677.3 2,160.9 2,361.9 EBIT (NT$ mn) 1,318.8 1,481.3 1,961.1 2,158.6 Net profit (NT$ mn) 1,522.6 1,542.6 2,092.8 2,263.8 EPS (CS adj.) (NT$) 4.04 4.09 5.55 6.01 Change from previous EPS (%) n.a. Consensus EPS (NT$) n.a. 3.94 5.12 5.64 EPS growth (%) -14.7 1.3 35.7 8.2 P/E (x) 16.8 16.6 12.2 11.3 Dividend yield (%) 3.7 3.9 5.7 6.2 EV/EBITDA (x) 16.8 15.3 11.1 9.9 P/B (x) 3.4 3.1 2.8 2.7 ROE (%) 20.3 19.6 24.3 24.3 Net debt/equity (%) net cash 1.2 net cash net cash
Source: Company data, Thomson Reuters, Credit Suisse estimates.
*Stock ratings are relative to the relevant country benchmark. ¹Target price is for 12 months.
Research Analysts
Jerry Su 886 2 2715 6361
Jimmy Huang 886 2 2715 6352
Rating OUTPERFORM* Price (14 Jun 12, NT$) 68.00 Target price (NT$) 89.00¹ Upside/downside (%) 30.9 Mkt cap (NT$ mn) 25,619.7 (US$ 855.5) Enterprise value (NT$ mn) 25,720 Number of shares (mn) 376.76 Free float (%) 81.0 52-week price range 89.4 - 54.0

18 June 2012
Taiwan LED Sector 31
Innovator in LED testing We initiate coverage on Chroma with an OUTPERFORM rating and a target price of NT$89 (31% potential upside), based on 17x 12-months forward P/E and NT$2.5 cash dividend. We think Chroma has been undervalued as it is trading at 13.5x 12-month forward P/E, at the lower end of historical 13x-21x range. We also believe street has underestimated Chroma’s opportunity in LED and visual inspection given its proprietary testing and equipment design know-how has resulted in several new project wins from global Tier one general lighting, consumer electronics, and CIS (CMOS image sensor) makers. We think these new project wins could turn into actual orders in 2H12 and estimate Chroma’s 2H12 revenue to be NT$3.3 bn, above consensus estimate of less than NT$3.0 bn.
Chroma is a testing solution provider for different technology sectors (Semiconductor, LED, Solar, PC, EV). Its technology leadership in power testing, visual inspection and automation has provided the company with strong bargaining power on pricing and margin. Chroma has maintained a 50-55% gross margin since 2006, as it dominates power testing, visual inspection, LED testing, etc, by providing customised solutions. We believe Chroma will maintain a 50-55% gross margin in the next few years and will show significant profit improvement in next few quarters on improving revenue run-rate. Thus, our FY13E EPS of NT$5.55 is 8% above consensus estimates on higher revenue assumption from new project wins, as well as solid margin profile.
Figure 61: Chroma—quarterly revenue and GM trend Figure 62: Chroma—consistent investment on R&D
0%
10%
20%
30%
40%
50%
60%
70%
0
200
400
600
800
1,000
1,200
1,400
1,600
1,800
2,000
1Q08 3Q08 1Q09 3Q09 1Q10 3Q10 1Q11 3Q11 1Q12
NT$ mn Revenue GM (RHS)
0%
5%
10%
15%
20%
25%
0
20
40
60
80
100
120
140
160
180
1Q08 3Q08 1Q09 3Q09 1Q10 3Q10 1Q11 3Q11 1Q12
NT$ mn R&D expense R&D % of sales (RHS)
Source: Company data Source: Company data
Leveraging testing and automation expertise for LED market
Chroma leads other equipment makers globally to provide LED luminaire in-line testing and reliability testing solutions for both LED chip makers and lightbar assemblers. Chroma’s luminaire testing is adopted by Chinese LED chip makers and Taiwan LED probing service providers for chip sorting (100% test). We expect the demand for Chroma’s LED luminaire testing to continue to grow in 2H12-2013 given aggressive LED MOCVD installation (~400 sets) by Chinese LED chip makers in 2011 (1 MOCVD requires 7 prober and sorter), despite Chinese chip makers requiring a lower spec LED testing equipment (brightness testing only, no electrical testing).
For LED packaging and module assemblers (i.e., Everlight, TSMT, etc), Chroma also provides brightness and electrical testing solution for LED package and lightbar. Although most of the LED package and module only requires sampling test, we think this is still another area of growth for Chroma given the increasing application of LEDs and the higher spec requirement on LED package/module.
Chroma has also designed an in-line LED light bulb/tube testing/assembly equipment with high productivity and competitive pricing. These LED light bulb/tube testing/assembly equipment are able to test brightness, colour, power spec, light decade, reliability, and
2H12 revenue momentum is better-than-expected
Stable gross margin of 50-55% since 2006
LED will be the growth area for Chroma in 2H12-2013
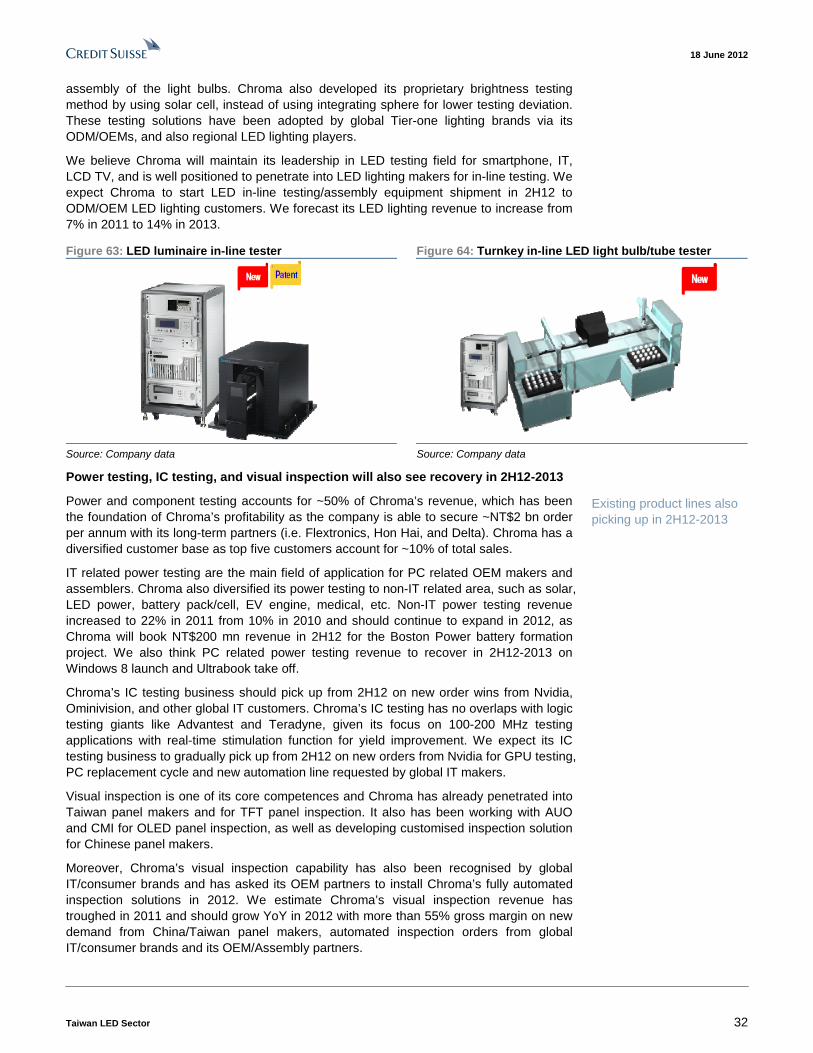
18 June 2012
Taiwan LED Sector 32
assembly of the light bulbs. Chroma also developed its proprietary brightness testing method by using solar cell, instead of using integrating sphere for lower testing deviation. These testing solutions have been adopted by global Tier-one lighting brands via its ODM/OEMs, and also regional LED lighting players.
We believe Chroma will maintain its leadership in LED testing field for smartphone, IT, LCD TV, and is well positioned to penetrate into LED lighting makers for in-line testing. We expect Chroma to start LED in-line testing/assembly equipment shipment in 2H12 to ODM/OEM LED lighting customers. We forecast its LED lighting revenue to increase from 7% in 2011 to 14% in 2013.
Figure 63: LED luminaire in-line tester Figure 64: Turnkey in-line LED light bulb/tube tester
Source: Company data Source: Company data
Power testing, IC testing, and visual inspection will also see recovery in 2H12-2013
Power and component testing accounts for ~50% of Chroma’s revenue, which has been the foundation of Chroma’s profitability as the company is able to secure ~NT$2 bn order per annum with its long-term partners (i.e. Flextronics, Hon Hai, and Delta). Chroma has a diversified customer base as top five customers account for ~10% of total sales.
IT related power testing are the main field of application for PC related OEM makers and assemblers. Chroma also diversified its power testing to non-IT related area, such as solar, LED power, battery pack/cell, EV engine, medical, etc. Non-IT power testing revenue increased to 22% in 2011 from 10% in 2010 and should continue to expand in 2012, as Chroma will book NT$200 mn revenue in 2H12 for the Boston Power battery formation project. We also think PC related power testing revenue to recover in 2H12-2013 on Windows 8 launch and Ultrabook take off.
Chroma’s IC testing business should pick up from 2H12 on new order wins from Nvidia, Ominivision, and other global IT customers. Chroma’s IC testing has no overlaps with logic testing giants like Advantest and Teradyne, given its focus on 100-200 MHz testing applications with real-time stimulation function for yield improvement. We expect its IC testing business to gradually pick up from 2H12 on new orders from Nvidia for GPU testing, PC replacement cycle and new automation line requested by global IT makers.
Visual inspection is one of its core competences and Chroma has already penetrated into Taiwan panel makers and for TFT panel inspection. It also has been working with AUO and CMI for OLED panel inspection, as well as developing customised inspection solution for Chinese panel makers.
Moreover, Chroma’s visual inspection capability has also been recognised by global IT/consumer brands and has asked its OEM partners to install Chroma’s fully automated inspection solutions in 2012. We estimate Chroma’s visual inspection revenue has troughed in 2011 and should grow YoY in 2012 with more than 55% gross margin on new demand from China/Taiwan panel makers, automated inspection orders from global IT/consumer brands and its OEM/Assembly partners.
Existing product lines also picking up in 2H12-2013

18 June 2012
Taiwan LED Sector 33
Figure 65: Chroma—revenue to recover from 2H12 Figure 66: Chroma—consistent cash dividend payout
- 200 400 600 800
1,000 1,200 1,400 1,600 1,800 2,000
1Q11 3Q11 1Q12 3Q12E 1Q13E 3Q13E
NT$ mn
Power & component testing LCD Panel/Video testing IC Testing
LED Testing Solar Power Testing Others
30%
40%
50%
60%
70%
80%
90%
-
1.00
2.00
3.00
4.00
5.00
6.00
2008 2009 2010 2011 2012E 2013E
NT$ Cash dividend per share EPS Payout
Source: Company data, Credit Suisse estimates Source: Company data, Credit Suisse estimates
Initiate coverage with OUTPERFORM and NT$89 TP
We Initiate coverage on Chroma with an OUTPERFORM rating and a target price of NT$89, based on 17x 12-month forward P/E and NT$2.5 cash dividend. Chroma’s stock is trading at 13.5x 12-month forward P/E, at the lower end of historical 13-21x range. We expect Chroma’s solid margin profile and new opportunities in LED testing to help the stock to re-rate. Near term catalysts include strong revenue pick up in 2H12 on battery cell formation project (~NT$200 mn), IC testers for Nvidia, visual inspection equipment for TFT and consumer makers and order wins for LED in-line testing solutions.
Downside risks to our target price
(1) Slower-than-expected take-off of LED general lighting: If LED testing revenue remains flattish in 2013, assuming general lighting take-off is delayed to 2014, this will have 9% EPS impact on Chroma’s 2013 EPS estimate.
(2) Global economic slowdown could lead to lower demand for power testing and visual inspection equipment.
(3) New products have 55-60% gross margins versus the corporate average of 50-55%. Delays in new product developments could negatively impact Chroma’s margin profile and profitability.
(4) Increased gross margin pressure: Every 1 pp change on gross margin should negatively impact EPS by 3%
Figure 67: Chroma—one-year forward P/E Figure 68: Chroma—stock price vs QFII holding
0
20
40
60
80
100
120
140
Jan-01 Jan-02 Jan-03 Jan-04 Jan-05 Jan-06 Jan-07 Jan-08 Jan-09 Jan-10 Jan-11 Jan-12
NT$ Stock Price vs. PE (Incl. Bonus)
Stock Price 5x 10x 15x 20x 25x
0
10
20
30
40
50
60
70
80
90
100
Jan- Jan- Jan- Jan- Jan- Jan- Jan- Jan- Jan- Jan- Jan- Ja
NT$ Stock Price vs. QFII Holding
Source: Company data, TEJ, Credit Suisse estimates Source: Company data, TEJ
Initiate with OUTPERFORM

18 June 2012
Taiwan LED Sector 34
Figure 69: Chroma’s financial summary Profit & Loss (NT$ mn) 2008 2009 2010 2011 2012E 2013E 2014ERevenue 4,158 3,444 5,640 5,338 5,303 6,488 6,885 COGS 1,890 1,639 2,530 2,493 2,414 3,038 3,226 Gross profit 2,268 1,805 3,110 2,846 2,889 3,449 3,659 Operating expense 1,237 1,104 1,470 1,457 1,388 1,488 1,500 EBIT 1,003 639 1,626 1,319 1,481 1,961 2,159 EBITDA 1,203 837 1,811 1,495 1,677 2,161 2,362 Total Non-op 60 123 175 222 46 177 182 Pre-tax profit 1,263 960 1,986 1,717 1,723 2,338 2,544 Tax expense 158 97 174 195 181 246 280Net profit 1,105 863 1,812 1,523 1,543 2,093 2,264 EPS (NT$) 2.86 2.24 4.74 4.04 4.09 5.55 6.01Gross margin (%) 54.6 52.4 55.1 53.3 54.5 53.2 53.1Operating margin (%) 24.1 18.6 28.8 24.7 27.9 30.2 31.4EBITDA margin (%) 28.9 24.3 32.1 28.0 31.6 33.3 34.3Pre-tax margin (%) 30.4 27.9 35.2 32.2 32.5 36.0 36.9Net margin (%) 26.6 25.1 32.1 28.5 29.1 32.3 32.9Balance Sheet (NT$ mn) 2008 2009 2010 2011 2012E 2013E 2014ECash & ST Investments 454 439 747 735 802 1,724 2,336 Receivables 1,189 1,578 1,924 1,705 1,801 1,923 1,964 Inventory 1,050 1,008 1,367 1,373 2,764 3,015 3,016 Other current assets 138 172 200 110 243 259 265 Current assets 2,831 3,197 4,237 3,924 5,610 6,921 7,580 Long-term Investment 2,587 2,999 3,147 3,346 3,415 3,415 3,415 Total Fixed Assets 1,987 2,023 2,044 2,055 1,977 1,893 1,805 Total other assests 329 269 207 222 563 563 563 Total assets 7,734 8,488 9,634 9,547 11,565 12,791 13,363 Short-term debt 920 790 200 50 100 100 100 Payables 191 610 645 498 1,211 1,454 1,484 Other current liabilities 344 346 902 812 1,638 1,749 1,786 Total current liabilities 1,455 1,746 1,747 1,360 2,949 3,303 3,370 Long-term debt - - - - - - - Other long term liabilities 223 293 329 422 440 440 440 Total liabilities 1,677 2,039 2,076 1,782 3,389 3,742 3,810 Minority InterestCommon stock 3,299 3,498 3,623 3,768 3,768 3,768 3,768 Retained earnings 1,115 1,037 1,954 1,774 3,253 4,126 4,630 Others 1,643 1,914 1,981 2,223 1,155 1,155 1,155 Total equity 6,057 6,449 7,558 7,765 8,176 9,049 9,553 Total liabilities & equity 7,734 8,488 9,634 9,547 11,565 12,791 13,363 Cash flow (NT$ mn) 2008 2009 2010 2011 2012E 2013E 2014ENet profit 1,105 863 1,812 1,523 1,543 2,093 2,264 Depreciation and Amortization 200 197 185 176 196 200 203 Change in working capital 69 58 (62) 64 (80) (36) 20 Others 22 (163) (254) (114) (66) (71) (71) Operating cash flow 1,397 956 1,681 1,649 1,592 2,186 2,416 Capital expenditure 81 161 139 109 69 69 69 Long term investments 406 (249) 105 (85) (3) 71 71 Others (750) (159) (429) (312) (527) (184) (184) Investment cash flow (263) (247) (184) (288) (461) (44) (44) Dividends paid (1,100) (664) (703) (1,377) (942) (1,003) (1,465) Equity financing (166) (71) 60 87 1,362 0 (0) Change in debt financing 90 (130) (590) (57) 68 - - Others 61 101 1 (26) (1,552) (217) (295) Financing cash flow (1,115) (764) (1,232) (1,372) (1,064) (1,220) (1,759) Total cash flow 18 (56) 265 (11) 67 921 612 Ratios 2008 2009 2010 2011 2012E 2013E 2014EYoY growth (%)Sales (1) (17) 64 (5) (1) 22 6 Gross profit (9) (20) 72 (8) 2 19 6 EBIT (35) (36) 154 (19) 12 32 10 EBITDA (29) (30) 116 (17) 12 29 9 Net income (29) (22) 110 (16) 1 36 8 ROE 18.2 13.4 24.0 19.6 18.9 23.1 23.7 ROA 14.3 10.2 18.8 15.9 13.3 16.4 16.9 Net debt/ equity 7.7 5.4 (7.2) (8.8) (8.6) (17.9) (23.4)
Source: Company data, Credit Suisse estimates

18 Ju
ne 2012
Taiw
an L
ED
Secto
r 35
Figure 70: Chroma quarterly income statement and forecasts Year-end 31 Dec (NT$mn) 1Q11 2Q11 3Q11 4Q11 1Q12 2Q12E 3Q12E 4Q12E 1Q13E 2Q13E 3Q13E 4Q13E 2011 2012E 2013E 2014ESales 1,465 1,694 1,289 891 875 1,129 1,655 1,643 1,276 1,565 1,892 1,754 5,338 5,303 6,488 6,885COGS 726 766 592 409 376 515 759 763 590 727 889 833 2,493 2,414 3,038 3,226Depreciation 27 26 26 26 37 37 37 38 38 38 38 39 105 149 153 156
Gross Profits 739 928 698 482 499 614 896 880 686 838 1,003 922 2,776 2,869 3,449 3,659 Total Operating Exp. 347 396 376 338 315 338 372 363 340 368 394 386 1,457 1,388 1,488 1,500
Operating Exp. Promotion 84 97 94 85 78 83 92 90 84 91 97 95 360 343 368 371 Operating Exp. Administrative 118 129 119 102 93 92 85 86 90 84 87 92 467 356 352 336 Operating Expense R&D 145 170 164 152 144 162 195 188 167 193 210 198 630 689 768 793
EBIT 378 499 311 131 164 277 524 517 346 470 609 536 1,319 1,481 1,961 2,159Non-Oper. Income (Loss) 65 89 172 73 19 56 88 79 66 83 117 111 399 242 377 385
Interest expenses (0) 0 (1) (1) (0) (0) (0) (1) (1) (0) (0) (0) (1) (2) (2) (1)Interest income 0 0 0 0 0 0 0 0 0 0 0 0 0 0 0 0Other Non-Op. Income/(Loss) 65 89 173 74 19 57 88 80 67 83 118 111 400 244 379 386
Pretax Income 443 588 482 204 183 333 612 595 412 553 726 647 1,717 1,723 2,338 2,544Income Taxes Exp./(Gains) (47) (57) (59) (32) (19) (35) (64) (63) (43) (58) (76) (68) (195) (181) (246) (280)Net Income before Extraord. 396 530 424 173 164 298 547 533 369 495 650 579 1,523 1,543 2,093 2,264
Net Income 396 530 424 173 164 298 547 533 369 495 650 579 1,523 1,543 2,093 2,264EPS 1.05 1.41 1.12 0.46 0.44 0.79 1.45 1.41 0.98 1.31 1.72 1.54 4.04 4.09 5.55 6.01 Aveage shares 377 377 377 377 377 377 377 377 377 377 377 377 377 377 377 377
EBITDA 421 543 355 176 213 325 573 566 396 520 659 586 1,720 1,894 2,509 2,758
Margins (%)EBITDA Margin 28.8 32.1 27.5 19.8 24.3 28.8 34.6 34.4 31.0 33.2 34.8 33.4 32.2 35.7 38.7 40.1 Gross Margin 50.4 54.8 54.1 54.1 57.0 54.4 54.1 53.5 53.8 53.6 53.0 52.5 52.0 54.1 53.2 53.1 Operating Margin 25.8 29.4 24.1 14.7 18.8 24.5 31.6 31.4 27.1 30.0 32.2 30.6 24.7 27.9 30.2 31.4 Tax Rate (10.6) (9.7) (12.2) (15.5) (10.4) (10.5) (10.5) (10.5) (10.5) (10.5) (10.5) (10.5) (11.3) (10.5) (10.5) (11.0) Net Margin 27.0 31.3 32.9 19.4 18.8 26.4 33.1 32.4 28.9 31.6 34.3 33.0 28.5 29.1 32.3 32.9
QoQ (%)Sales 21 16 (24) (31) (2) 29 47 (1) (22) 23 21 (7) COGS 26 5 (23) (31) (8) 37 48 1 (23) 23 22 (6) Gross Profit 15 26 (25) (31) 4 23 46 (2) (22) 22 20 (8) Operating Profit 26 32 (38) (58) 25 68 89 (1) (33) 36 29 (12) Net Profit 37 34 (20) (59) (5) 81 84 (3) (31) 34 31 (11)
YoY (%)Sales 25 13 (26) (27) (40) (33) 28 84 46 39 14 7 (5) (1) 22 6 COGS 38 17 (24) (29) (48) (33) 28 87 57 41 17 9 (1) (3) 26 6 Gross Profit 14 10 (29) (25) (32) (34) 28 83 38 36 12 5 (10) 3 20 6 Operating Profit 18 11 (44) (56) (57) (45) 69 293 111 70 16 4 (19) 12 32 10 Net Profit 19 (6) (33) (40) (58) (44) 29 208 125 66 19 9 (16) 1 36 8
Source: Company data, Credit Suisse estimates

18 June 2012
Taiwan LED Sector 36
Chroma company profile and strategy Established in 1984 and listed in 1996, Chroma is a pure testing and measurement (T&M) equipment player in Taiwan. The company has benefitted from the recovery of PC, TFT LCD and IC design businesses since 2009. Currently, power testing (Power + Component) remains the major sales contributor with more than 50% of total sales. It has diversified clients, including Delta, Hon Hai, Huawei, Wistron, AUO, CMI, Epistar, Nvidia, Motech. With its headquarters located in Taoyuan, Taiwan, Chroma provides engineering service offices worldwide, including China, Europe, Taiwan and United States.
Figure 71: Chroma’s revenue mix by product in 2011 Figure 72: Chroma’s financial performance since 2008
Power43%
LCD7%Passive
comp.7%
IC9%
LED7%
Solar18%
Customized system
2% Others7%
0%
10%
20%
30%
40%
50%
60%
-
500
1,000
1,500
2,000
2,500
2008 2009 2010 2011 2012E 2013E
NT$ mn
Net profit GM (RHS) OM (RHS)
Source: Company data Source: Company data, Credit Suisse estimates
Figure 73: Milestones for Chroma Figure 74: Chroma’s share structure as of May 2012 Date Event1984 Nov. Founded with an initial capital of NT$2mn1993 Feb. Chroma ATE Inc. (U.S.A.) established1996 Dec. IPO on Taiwan Stock Exchange1999 Sep. Chroma ATE Europe was established1999 Nov. Linkou factory grand opening2000 Aug. Acquired Zentech Technology Inc.2006 Aug. Formed a new subsidiary Chroma New Material Corp.2006. Sep. China Suzhou factory grand opening2007 1Q Acquired MAS Automation Corp.2007 1Q Acquired Sajet Technology Co., Ltd. and formed MES BU2007 1Q New subsidiary Testar Electronics Corp. established2008 May Chroma Japan Corp. established2011 Acquired Wise Life Technology
Share structure details Percentage of shares (%)Janus Capital Management 5.83Chin-Ming Huang 4.15T Rowe Price Associate 4.06Chen Chun-Sheng 4.01Fubon Life Insurance 3.41Columbia Wanger Asset Management 3.07Hsueh Yu-Mei 2.94Fidelity 2.54Standard Life 2.47Huang Chin-Ming Trust 2.27Other QFII 38.84Local ITC 3.00 Free float 23.41
Source: Company data Source: Company data, Bloomberg, TEJ
Chroma provides test solution for different fields
In 1Q12, power electronics testing remained the most important product line with 50% of total sales, followed by IC testing’s 12%, LCD’s 10%, component testing’s 8%, and solar’s 8%. Chroma targets 2012 revenue to remain flattish YoY on clients’ conservative capex plan as well as the uncertain macro outlook.
Chroma expects an increasing sales contribution from US, Europe and Japan (together reach 30% of total sales), and improving recognition from global top-tier customers. Its turnkey solution design capability strengthen Chroma’s leading position in the market.

18 June 2012
Taiwan LED Sector 37
Figure 75: Chroma provides broad testing solutions for different fields
Source: Company data
Figure 76: Management profile Name Position Experience Education background % of stake
Mr. Huang Chin-Ming Chairman/President President of Chroma Bachelor/National Chiao Tung University 4.15 Mr. Fan Chiang Cheng VP VP of Chroma Bachelor 0.11 Mr. Ho Tsun Yih VP VP of Chroma Bachelor/Tatung University 0.03 Mr.Feng Ching Chang VP VP of Chroma Master/National Taiwan University 0.20 Mr. Lin Chou VP VP of Chroma Bachelor 0.02 Mr. Ying Cheng CFO CFO of Chroma MBA/New York Tech University 0.03 Mr. Huang Kui-Lin VP VP of Chroma Master/National Taiwan University 0.04 Mr. Tseng I-Shih VP VP of Chroma Master/University of Penn. 0.10 Source: Company data, TEJ

18 June 2012
Taiwan LED Sector 38
Asia Pacific / Taiwan Electronic Components & Connectors
Lextar (3698.TW / 3698 TT)
Unique business model in Taiwan LED ■ Initiate coverage with NEUTRAL. We initiate coverage on Lextar with a
NEUTRAL rating and a target price of NT$37 (14% upside potential), based on 1.7x 12-month forward P/B. Lextar is AUO’s subsidiary (46% holding by AUO) and is the only LED maker in Taiwan to provide vertical integration service from LED chip, packaging, light module, light source, and fixtures. We like its business model and think its strong R&D capability offers it a solid position to capture in the upcoming LED general lighting growth in 2H12-2013.
■ Unique business model. We like Lextar’s business model as its LED outputs for backlighting (65-70% of sales) is mostly guaranteed by AUO (16% of global TFT market share in 2011). Lextar has also penetrated into other panel customers, such as CMI, Korean, Chinese panel makers to diversify its dependency on AUO. Besides backlighting, Lextar also provides turnkey ODM service for general lighting (30-35% of sales), which has been qualified by global Tier-one general lighting brands (i.e. Philip, OSRAM, etc).
■ Strong R&D capability, cross-licensing to avoid patent infringement. Lextar is also the first Taiwanese LED maker to mass produce 6” LED wafer, ahead of market leader Epistar. It obtains key manufacturing IPs through cross-licensing and ODM for global Tier-one makers to avoid patent infringement. We think Lextar’s strategy of working with global Tier-ones and regional general lighting brands and its R&D effort for cost reduction should support the growth of its LED general lighting business.
■ Valuation looks fair, major shareholder sell-down is a concern. Lextar’s stock is trading at 1.6x FY12 P/B, at the middle of historical of 1.0-2.1x range. We rate Lextar with a NEUTRAL rating as our target price of NT$37 (based on 1.7x 12-month forward P/B) only leaves 14% upside potential from the current levels. Its major shareholders, AUO/Qisda, holds ~50% stake and could look for divestment as the stock has moved ~100% since IPO. Lextar also announced that it will issue ~NT$2.05 bn worth domestic CB. We could turn more optimistic on the stock on faster-than-expected growth of its general lighting business or recovery of global economy for better LED TV shipments.
Share price performance
20
70
120
020406080
Jun-10 Oct-10 Feb-11 Jun-11 Oct-11 Feb-12
Price (LHS) Rebased Rel (RHS)
The price relative chart measures performance against the TAIWAN SE WEIGHTED INDEX which closed at 7075.1 on 14/06/12 On 14/06/12 the spot exchange rate was NT$29.95/US$1
Performance Over 1M 3M 12M Absolute (%) -6.8 -21.3 -20.2 Relative (%) -2.4 -9.1 -0.3
Financial and valuation metrics
Year 12/11A 12/12E 12/13E 12/14E Revenue (NT$ mn) 9,102.7 10,955.0 13,823.9 16,413.2 EBITDA (NT$ mn) 1,640.7 2,630.7 3,403.1 3,740.8 EBIT (NT$ mn) -66.3 636.2 1,151.0 1,373.7 Net profit (NT$ mn) -137.7 426.9 858.3 1,054.7 EPS (CS adj.) (NT$) -0.35 1.02 2.05 2.51 Change from previous EPS (%) n.a. Consensus EPS (NT$) n.a. 0.98 2.60 n.a. EPS growth (%) n.m. n.m. 101.1 22.9 P/E (x) -93.7 31.8 15.8 12.9 Dividend yield (%) 0 0 0.9 3.2 EV/EBITDA (x) 11.5 8.4 5.6 4.8 P/B (x) 1.7 1.6 1.5 1.4 ROE (%) -1.7 5.3 9.9 11.4 Net debt/equity (%) 67.4 101.8 61.6 47.9
Source: Company data, Thomson Reuters, Credit Suisse estimates.
*Stock ratings are relative to the relevant country benchmark. ¹Target price is for 12 months. [V] = Stock considered volatile (see Disclosure Appendix).
Research Analysts
Jerry Su 886 2 2715 6361
Jimmy Huang 886 2 2715 6352
Rating NEUTRAL* [V] Price (14 Jun 12, NT$) 32.40 Target price (NT$) 37.00¹ Upside/downside (%) 14.2 Mkt cap (NT$ mn) 13,590.7 (US$ 453.8) Enterprise value (NT$ mn) 22,068 Number of shares (mn) 419.47 Free float (%) 48.4 52-week price range 41.7 - 17.3

18 June 2012
Taiwan LED Sector 39
Unique business model in Taiwan LED We initiate coverage on Lextar with a NEUTRAL rating and a target price of NT$37 (14% upside potential), based on 1.7x 12-month forward P/B. Lextar is AUO’s subsidiary (46% holding by AUO) and is the only LED maker in Taiwan to provide vertical integration service from LED wafer manufacturing, packaging, light module, light source, and fixtures, which could minimise the total production cost through less inspection, testing and packaging process and could quickly respond to customer’s demand. We like its business model and think its strong R&D capability offers Lextar a solid position to capture the upcoming LED general lighting growth in 2H12-2013.
Unique business model We like Lextar’s business model as its LED outputs for backlighting (60-65% of sales) is mostly guaranteed by its major shareholder, AUO (16% of global TFT market share in 2011). By leveraging the close relationship with AUO, Lextar supplies a majority of LED lightbar to AUO with itself providing the higher value-added LED chips and outsources the lower entry barrier SMT production to both Wellypower and TSMT. Lextar has also penetrated into other panel makers, such as CMI, Korean and Chinese panel makers to diversify its dependency on AUO. We estimate Lextar accounts for 40-50% of AUO’s IT BLU demand and 60-70% of AUO’s TV BLU demand.
Besides backlighting, Lextar also provides turnkey ODM service for LED general lighting (30-35% of sales), which has been qualified by global Tier one general lighting brands. Lextar currently is an ODM partner for Philips and it targets to work with other global Tier-one lighting companies (i.e. OSRAM, GE) and other regional lighting brands in the long term. Lextar has no intention of building its own brand.
Figure 77: Unique strategy – a total solution provider in Taiwan
Source: Company data
Strong R&D capability, cross-licensing to avoid patent infringement Lextar is also the first Taiwanese LED maker to mass produce 6” LED wafer, ahead of market leader Epistar. It obtains key manufacturing IPs through cross-licensing and ODM for global Tier-one makers to avoid patent infringement. As a new comer in Taiwan LED industry, Lextar has the most advanced MOCVD and other equipment for better efficiency and productivity. It currently has 80 MOCVD tools in Taiwan and China (including three sets of 6” MOCVD, 52 sets of 4” MOCVD, and 25 sets of 2” MOCVD) for a total capacity of 210,000 wafers per month (2’ equivalent). It plans to fully utilise its Taiwanese MOCVD capacity in 2012 and gradually ramp up its Chinese capacity in 2013-2014.
Lextar is the only LED turnkey provider in Taiwan
Lextar provides ODM for Philips, OSRAM, and GE
First Taiwanese LED maker to mass produce 6” LED wafer

18 June 2012
Taiwan LED Sector 40
We think the total solution business model offers Lextar to communicate directly with lighting brands and provides product with the right price/performance. With strong supply chain management, cost reduction through R&D efforts, and achieving good yield at all stages (chip, packaging, module, fixture, etc), we think Lextar should grow its lighting business by working with global Tier-one and regional general lighting brands.
Figure 78: Lextar—quarterly revenue mix Figure 79: Lextar—utilisation improving
0%
10%
20%
30%
40%
50%
60%
70%
80%
90%
100%
1Q10 3Q10 1Q11 3Q11 1Q12 3Q12E
BLU Lighting
0%
10%
20%
30%
40%
50%
60%
70%
80%
90%
100%
1Q11 2Q11 3Q11 4Q11 1Q12 2Q12E 3Q12E
Utilisation %
Source: Company data, Credit Suisse estimates Source: Company data, Credit Suisse estimates
2012-13 strategy: Ramp up Suzhou fab Lextar aims to focus on mid-power LEDs for both backlighting and general lighting to avoid intense competition from global LED chip makers like Nichia and Cree for niche application and to avoid price competition with Chinese LED makers for the low-end segment. It thinks LED backlighting demand will continue to grow in 2012-13 on LED TV proliferation but total-available-market could start to decline in 2014 on higher base and ASP pressure. Besides backlighting, Lextar thinks the oversupply of mid-power LEDs is improving on new lighting application and could become tighter in 3Q12. Similar to our view, it thinks the low-power segment could still remain oversupplied and will face intense ASP competition from Chinese LED makers (such as San-an) given lower entry barrier. Lextar aims to ramp its Suzhou capacity from 2013 to capture the lighting growth opportunity in 2013-14, as its capacity in Taiwan will be fully utilised by 2H12.
2Q12 guidance and 2012 outlook Management guided 2Q12 revenue to grow by 15-20% QoQ (or 6-11% YoY) on LED TV backlight demand recovery and new lighting projects. It also expects utilisation to improve to 80-90% in 2Q12, up from above 70% in 1Q12. 2Q12 gross margin is also guided to improve QoQ from 11.9% in 1Q12 on higher utilisation and more favourable product mix. Lextar expects 3Q12 revenue to continue to grow sequentially on seasonality with improving gross margin and higher utilisation (~95%).
For 2012, management expects revenue to grow 20-30% YoY with both lighting and backlighting to grow sequentially in 2H12 on increasing LED TV penetration and new lighting projects for commercially used LED light tubes. Lextar expects revenue mix to slightly shift towards lighting with 65% backlighting and 35% lighting in 2012 versus 72% backlighting and 28% lighting in 2011. 2012 capex is guided at NT$2 bn where NT$1.5 bn is for balance of payments of MOCVD tools installed in Suzhou in 2011 and NT$500 mn for R&D purpose. We forecast its capex for 2013-14 to be NT$1 bn per annum on limited capacity addition. We expect Lextar to reduce its dependency at AUO in 2012 as it adds new lighting customers.
No new MOCVD capacity in 2012-13
Utilisation continues to improve

18 June 2012
Taiwan LED Sector 41
Figure 80: Lextar—quarterly revenue and GM trend Figure 81: Lextar—EBITDA margin
0%
5%
10%
15%
20%
25%
30%
35%
-
500
1,000
1,500
2,000
2,500
3,000
1Q10 2Q10 3Q10 4Q10 1Q11 2Q11 3Q11 4Q11 1Q12
Revenue GM (RHS)
0%
5%
10%
15%
20%
25%
30%
35%
1Q10 2Q10 3Q10 4Q10 1Q11 2Q11 3Q11 4Q11 1Q12
EBITDA margin
Source: Company data Source: Company data
Initiate coverage with NEUTRAL and NT$37 TP
We initiate coverage on of Lextar with a NEUTRAL rating and a target price of NT$37, based on 1.7x 12-month forward P/B. Lextar’s stock is trading at 1.6x 2012 P/B, in the middle of historical of 1.0-2.1x range. We rate Lextar with a NEUTRAL rating as our target price of NT$37 (based on 1.7x 12 month forward P/B) only leaves 14% upside potential from current levels.
Lextar’s major shareholder AUO and Qisda holds ~50% stake and could look for divestment to book the profit, as stock has moved ~100% since IPO. Lextar also announced to issue a ~NT$2.05 bn worth domestic CB and plans to conclude the deal before October. We initiate with a NEUTRAL rating but could turn more optimistic on the stock on faster-than-expected growth of its general lighting business or recovery of global economy for better LED TV shipments.
Upside risks to our target price
(1) Faster-than-expected growth of LED lighting demand should help Lextar boost its revenue. Every 10% increase in LED lighting revenue should increase its EPS by 3%.
(2) Better-than-expected LED TV demand: Every 10% increase of LED TV demand should increase its EPS by 6%
(3) Alliance or investment by global lighting brands could help Lextar secure lighting orders and improve sentiment.
Downside risks to our target price
(1) Slower-than-expected take-off of LED general lighting: If the LED general lighting take-off is delayed to 2014 (no growth in Lextar’s lighting revenue in 2013), our 2013 EPS estimate will be negatively impacted by 14%.
(2) Global economic slowdown, less NB, monitor and TV demand for LED backlighting: Every 10% decline in LED backlighting demand should negatively impact its EPS by 12%.
(3) Major shareholder sell-down could have a negative impact on Lextar’s share price.
Initiate with NEUTRAL rating, 14% upside potential seen
Major shareholder sell-down and CB issuance are main concerns

18 June 2012
Taiwan LED Sector 42
Figure 82: Lextar—one year forward P/B Figure 83: Lextar—EV/Forward book value
0
10
20
30
40
50
60
Oct-11 Nov-11 Dec-11 Jan-12 Feb-12 Mar-12 Apr-12 May-12 Jun-12
NT$ Stock Price vs. One-Year Forward PB
Stock Price 0.5x 1.0x 1.5x 2.0x 2.5x
1.0
1.2
1.4
1.6
1.8
2.0
2.2
2.4
2.6
2.8
3.0
Oct-11 Nov-11 Dec-11 Jan-12 Feb-12 Mar-12 Apr-12 May-12 Jun-12
EV/Forward Book
Source: Company data, TEJ, Credit Suisse estimates Source: Company data, TEJ, Credit Suisse estimates

18 June 2012
Taiwan LED Sector 43
Figure 84: Lextar’s financial summary Year-end 31 Dec (NT$ mn) 2009 2010 2011 2012E 2013E 2014ERevenue 2,032 8,058 9,103 10,955 13,824 16,413 COGS 1,886 6,061 8,274 9,254 11,424 13,714 Gross profit 146 1,996 828 1,701 2,400 2,699 Operating expense 223 702 895 1,065 1,249 1,325 EBIT (77) 1,295 (66) 636 1,151 1,374 EBITDA (33) 2,387 1,641 2,631 3,403 3,741 Total non-op 68 (39) (37) (126) (117) (103) Pre-tax profit (9) 1,255 (103) 510 1,034 1,271 Tax expense (16) 24 34 83 176 216 Net profit 7 1,231 (138) 427 858 1,055 EPS (NT$) 0.02 3.28 (0.35) 1.02 2.05 2.51Gross margin (%) 7.2 24.8 9.1 15.5 17.4 16.4Operating margin (%) (3.8) 16.1 (0.7) 5.8 8.3 8.4EBITDA margin (%) (1.6) 29.6 18.0 24.0 24.6 22.8Net margin (%) 0.4 15.3 (1.5) 3.9 6.2 6.4Balance sheet (NT$ mn) 2009 2010 2011 2012E 2013E 2014ECash & ST investments 414 1,504 2,151 790 2,186 2,777 Receivables 944 2,335 2,963 4,493 5,424 6,399 Inventory 360 2,055 1,832 2,545 878 1,038 Other current assets 56 323 543 940 1,135 1,339 Current assets 1,773 6,217 7,489 8,768 9,623 11,552 Long-term investment 445 3 27 129 129 129 Total fixed assets 2,260 9,619 10,767 10,704 9,433 8,047 Total other assests 24 542 493 641 774 913 Total assets 4,502 16,380 18,776 20,242 19,959 20,641 Short-term debt 168 588 533 1,318 1,099 1,042 Payables 677 1,357 2,379 1,460 1,808 2,142 Other current liabilities 452 1,177 916 1,143 1,380 1,628 Total current liabilities 1,297 3,121 3,828 3,921 4,287 4,812 Long-term debt 820 5,055 6,962 7,949 6,631 6,287 Other long term liabilities - 303 57 46 46 46 Total liabilities 2,117 8,479 10,848 11,916 10,964 11,145 Minority Interest - - - - - - Common stock 2,250 3,707 4,192 4,195 4,195 4,195 Retained earnings 9 1,239 420 971 1,640 2,141 Others 126 2,955 3,317 3,161 3,161 3,161 Total equity 2,385 7,901 7,928 8,326 8,995 9,497 Total liabilities & equity 4,502 16,380 18,776 20,242 19,959 20,641 Cash flow (NT$ mn) 2009 2010 2011 2012E 2013E 2014ENet profit 7 1,231 (138) 427 858 1,055 Depreciation and Amortization 44 1,093 1,707 1,994 2,252 2,367 Change in working capital (547) (1,327) 189 (3,332) 1,125 (756) Others (68) (2) (0) (2) - - Operating cash flow (563) 995 1,758 (912) 4,236 2,666 Capital expenditure (1,919) (7,013) (3,050) (2,093) (1,000) (1,000) Long term investments - 444 (24) (100) - - Others - (819) 67 13 (114) (120) Investment cash flow (2,199) (7,388) (3,008) (2,180) (1,114) (1,120) Dividends paid - - (373) - (128) (429) Equity financing - 4,277 391 126 0 0 Change in debt financing 988 4,224 1,853 1,760 (1,537) (401) Others 875 (1,002) (11) (155) (62) (124) Financing cash flow 1,863 7,498 1,861 1,731 (1,726) (955) Total cash flow (900) 1,091 647 (1,361) 1,396 592 Ratios 2009 2010 2011 2012E 2013E 2014EYoY growth (%)Sales NA 297 13 20 26 19 Gross profit NA 1,267 (59) 105 41 12 EBIT NA (1,778) (105) (1,059) 81 19 EBITDA NA (7,257) (31) 60 29 10 Net income NA 16,509 (111) (410) 101 23 Balance sheet ratios (%)ROE 0.3 15.6 (1.7) 5.1 9.5 11.1 ROA 0.2 7.5 (0.7) 2.1 4.3 5.1 Net debt/ equity 24.1 52.4 67.4 101.8 61.6 47.9 Source: Company data, Credit Suisse estimates

18 Ju
ne 2012
Taiw
an L
ED
Secto
r 44
Figure 85: Lextar quarterly income statement and forecasts Year-end 31 Dec (NT$mn) 1Q11 2Q11 3Q11 4Q11 1Q12 2Q12E 3Q12E 4Q12E 1Q13E 2Q13E 3Q13E 4Q13E 2011 2012E 2013E 2014ESales 1,797 2,376 2,519 2,410 2,194 2,600 3,107 3,055 2,848 3,387 3,900 3,689 9,103 10,955 13,824 16,413COGS 1,654 1,962 2,296 2,362 1,933 2,204 2,564 2,553 2,425 2,793 3,133 3,074 8,274 9,254 11,424 13,714Depreciation 364 412 433 441 453 470 494 517 533 543 553 562 1,650 1,934 2,191 2,306COGS ex D&A 1,277 1,536 1,848 1,905 1,465 1,718 2,056 2,021 1,876 2,235 2,565 2,496 6,567 7,260 9,172 11,347
Gross profits 143 414 223 48 261 396 542 502 423 594 768 615 828 1,701 2,400 2,699 Total operating exp. 216 240 199 240 236 260 288 280 280 316 336 317 895 1,065 1,249 1,325
Operating exp. promotion 56 51 51 69 92 110 131 129 120 143 164 155 227 461 582 691 Operating exp. administrative 73 89 73 84 71 70 60 57 70 66 54 57 318 258 247 172 Operating expense R&D 87 100 75 88 72 81 97 94 90 107 117 105 350 345 420 462
EBIT (73) 175 24 (192) 24 136 254 222 143 278 432 298 (66) 636 1,151 1,374Non-oper. income (Loss) (25) (13) 8 (7) (26) (27) (36) (37) (43) (24) (20) (31) (37) (126) (117) (103)
Interest expenses 19 18 30 18 25 32 36 37 34 30 31 31 85 130 127 115 Interest income - - - 0 1 - - - - - - - 0 1 - - Other non-op. income/(loss) (44) (31) (22) (25) (52) (58) (72) (75) (76) (54) (51) (62) (122) (257) (244) (218)
Pre-tax Income (98) 162 31 (199) (2) 109 218 185 100 255 412 267 (103) 510 1,034 1,271Income taxes exp./(gains) (23) 50 10 (2) (4) 19 37 31 17 43 70 45 34 83 176 216Net income before extraord. (74) 112 21 (197) 2 91 181 153 83 211 342 221 (138) 427 858 1,055
Net income (74) 112 21 (197) 2 91 181 153 83 211 342 221 (138) 427 858 1,055EPS (NT$) (0.19) 0.29 0.05 (0.47) 0.00 0.22 0.43 0.37 0.20 0.50 0.82 0.53 (0.35) 1.02 2.05 2.51 Aveage shares 390 393 398 419 419 419 419 419 419 419 419 419 398 419 419 419
EBITDA 304 601 471 265 493 621 763 754 691 837 1,000 875 1,641 2,631 3,403 3,741
Margins (%)EBITDA margin 16.9 25.3 18.7 11.0 22.5 23.9 24.6 24.7 24.3 24.7 25.6 23.7 18.0 24.0 24.6 22.8 Gross margin 8.0 17.4 8.8 2.0 11.9 15.2 17.5 16.4 14.9 17.5 19.7 16.7 9.1 15.5 17.4 16.4 Operating margin (4.0) 7.4 0.9 (8.0) 1.1 5.2 8.2 7.3 5.0 8.2 11.1 8.1 (0.7) 5.8 8.3 8.4 Tax rate 24.0 30.7 33.3 1.1 218.7 17.0 17.0 17.0 17.0 17.0 17.0 17.0 (33.4) 16.3 17.0 17.0 Net margin (4.1) 4.7 0.8 (8.2) 0.1 3.5 5.8 5.0 2.9 6.2 8.8 6.0 (1.5) 3.9 6.2 6.4
QoQ (%)Sales 4 32 6 (4) (9) 19 19 (2) (7) 19 15 (5) COGS 9 19 17 3 (18) 14 16 (0) (5) 15 12 (2) Gross profit (32) 190 (46) (78) 442 52 37 (7) (16) 40 29 (20) Operating profit (1,127) NM (86) (906) NM 455 87 (13) (36) 95 55 (31) Net profit (169) NM (81) (1,039) NM 4,428 100 (15) (46) 154 62 (35)
YoY (%)Sales 37 (0) (5) 40 22 9 23 27 30 30 26 21 13 20 26 19 COGS 60 16 27 56 17 12 12 8 25 27 22 20 37 12 23 20 Gross profit (48) (39) (73) (77) 82 (4) 143 944 62 50 42 22 (59) 105 41 12 Operating profit (144) (66) (96) (2,815) NM (22) 965 NM 484 105 70 34 (105) NM 81 19 Net profit (149) (76) (96) (284) NM (19) 764 NM 4,062 133 89 45 (111) NM 101 23 Source: Company data, Credit Suisse estimates

18 June 2012
Taiwan LED Sector 45
Lextar: Company profile and strategy Established in May 2008, Lextar Electronics Corp. is the integrated LED solution provider, which integrates upper stream epitaxial, middle stream chip, and downstream package, SMT and LED lighting applications. With 46% share owned by AUO group, Lextar specialises in manufacturing LED chips and packaging, as well as energy-saving and smart lighting products, with application including TFT-LCD BLU and LED lighting solutions.
Currently BLU remains around 70% of total sales, versus 30% from LED lighting products. Major customers include AUO, Philips, and Korean panel makers. Lextar has three factories in Taiwan and one plant in China Suzhou. Given the supply and demand situation, Lextar does not have a plan to further expand the capacity and current MOCVD is above 60 sets with 2” equivalent capacity of 160,000 pieces per month. The current capacity for LED package reached 800 mn units per month.
Figure 86: Monthly capacity Current quarterly capacity 2011 2Q12MOCVD machine (units) 50 602" equalent (units'000) 160 160Package capacity (units mn) 800 800 Source: Company data
Figure 87: Lextar’s revenue mix by product in 2011 Figure 88: Lextar’s customer mix in 2011
LED lighting
30%
BLU70%
AUO60%
Philips20%
Korea panel
makers10%
Others10%
Source: Company data Source: Company data

18 June 2012
Taiwan LED Sector 46
Figure 89: Milestones for Lextar Figure 90: Lextar’s share structure Date Event2008 May Founded with an initial capital of NT$300mn2009 Jul. Monthly shipment surpassed 100 mn units2010 Mar. Merged with LightHouse Technology2010 Mar. Listed on Emerging Stock Market2010 May Started to build China Suzhou fab2011 Sep. IPO on Taiwan Stock Exchange2011 Nov. Lextar announed its lighting assembly line at Suzhou China2012 May Announced domestic CB
Share structure details Percentage of shares (%)AUO 23.2 Lung Li Investment 15.3 Kang Li Investment 4.4 Qisda 2.0 Su Feng-Cheng (Chairman) 1.6 CDIB 3.1 Li Chih-Chung 1.4 Wei Bang Investment 1.3 Wellypower 1.2 Gong Fu international 1.2 CDIB Benture Capital 0.8 Other QFII 3.0 Local ITC 4.1 Free float 37.5
Source: Company data Source: Company data, TEJ
Lextar differentiates itself from local peers by providing one stop shopping solution for customers, including LED chip, package, light module, light source, and luminaire. By leveraging the close relationship with AUO, Lextar received the majority of LED BLU order from AUO and outsources SMT production to both Wellypower and TSMT. On the LED lighting business, it is currently an ODM partner for Philips and aims to work with other lighting companies (i.e. OSRAM, GE) in the long term.
Figure 91: Lextar has strong lighting design capability
Source: Company data
Figure 92: Management profile Name Position Experience Education background % of stake
Mr. Su Feng-Cheng Chairman/President Senior VP of AUO Doctor/New York State University 1.64 Mr. Lin Meng-Yih Senior AVP Vice President of Epistar Doctor/Purdue University 0.29 Mr. Chuang Ying-Tsun Senior AVP Vice President of LightHouse Bachelor/Soochow University 0.07 Mr. Tang Hsiu Mu Senior AVP RD head of Epistar Doctor/National Tsing Hua University 0.37 Mr. Cheng Shui Chin Senior AVP AVP of Qisda Master/National Taiwan University 0.06 Mr. Yen Chang-Ta Senior AVP AVP of AUO Sales Dep. Bachelor/Chung Yuan Christian University 0.03 Mr. B.Y. Chang CFO AVP of AUO MBA/China Europe International Univiersity 0.17 Source: Company data, TEJ

18 June 2012
Taiwan LED Sector 47
Figure 93: Organization chart - Lextar
Source: Company data

18 June 2012
Taiwan LED Sector 48
Companies Mentioned (Price as of 14 Jun 12) Advantest (6857, ¥1,172, NEUTRAL [V], TP ¥1,100, OVERWEIGHT) AIXTRON (AIXGn.DE, Eu11.58) Amazon.com Inc. (AMZN, $214.73, OUTPERFORM, TP $270.00) Apple Inc. (AAPL, $572.16, OUTPERFORM, TP $750.00) ASM Pacific Tech. (0522.HK, HK$93.00, NEUTRAL, TP HK$89.50) AU Optronics (2409.TW, NT$11.85, OUTPERFORM, TP NT$19.00) Chimei Innolux Corporation (3481.TW, NT$11.90, NEUTRAL [V], TP NT$16.00) China Electric (1611.TW, NT$19.60) Chroma (2360.TW, NT$68.00, OUTPERFORM, TP NT$89) Cree (CREE, $23.05, NEUTRAL [V], TP $32.00) Delta Electronics (2308.TW, NT$88.00, OUTPERFORM, TP NT$106.00) Edison Opto (3591.TW, NT$50.40) Elec-tech (002005.SZ, Rmb8.3) Epistar Corporation (2448.TW, NT$59.60, OUTPERFORM, TP NT$75.00) Everlight Electronics Co Ltd (2393.TW, NT$49.20, UNDERPERFORM, TP NT$42.00) Flextronics International (FLEX, $6.43) Formosa Epitaxy (3061.TW, NT$20.60) General Electric (GE, $19.37, OUTPERFORM, TP $22.00) Genesis Photonics (3383.TW, NT$27.65) GIO (3610.TWO, NT$2.31) GLT (4935.TW, NT$41.6) Hangzhou Silan Microelectronics (600460.SS, Rmb4.90) Harvatek Corp (6168.TW, NT$15.95) Home Depot (HD, $50.97, OUTPERFORM, TP $55.00) Hon Hai Precision (2317.TW, NT$82.10, NEUTRAL, TP NT$96.00) Huga (8199.TW, NT$12.7) Lextar (3698.TW, NT$32.40, NEUTRAL, TP NT$37) LG Display Co Ltd. (034220.KS, W22,350, OUTPERFORM, TP W35,000) LG Innotek (011070.KS, W87,300, UNDERPERFORM [V], TP W58,000) Lite-On Technology Corp (2301.TW, NT$36.50) Lowe's (LOW, $26.88, OUTPERFORM, TP $30.00) Lumens (038060.KQ, W5220) Motech (6244.TW, NT$41.45) Neo Neo (911868.TW, NT$4.16) Nvidia Corporation (NVDA, $12.18) Omnivision Technologies (OVTI, $14.01) Opto Tech (2340.TW, NT$11.9) Panasonic Corporation (6752, ¥567, OUTPERFORM, TP ¥700, MARKET WEIGHT) Philips (PHG.AS, Eu14.28, OUTPERFORM, TP Eu18.00) Qisda Corp (2352.TW, NT$7.00) Samsung Electro-Mechanics (009150.KS, W108,500, NEUTRAL, TP W97,000) Samsung Electronics (005930.KS, W1,261,000, OUTPERFORM, TP W1,610,000) Sanan Optoelectronics Co Ltd (600703.SS, Rmb14.25) Seoul Semiconductor Co Ltd (046890.KQ, W21,400, UNDERPERFORM [V], TP W13,000) Sharp Corp. (6753, ¥415, NEUTRAL, TP ¥570, MARKET WEIGHT) Sony (6758, ¥1,036, NEUTRAL, TP ¥1,750, MARKET WEIGHT) Stanley Electric (6923, ¥1,105) Taiwan Surface Mounting Technology (6278.TW, NT$55.00, OUTPERFORM, TP NT$73.00) Tekcore Co Ltd (3339.TWO, NT$15.70) Teradyne Inc. (TER, $14.02, OUTPERFORM [V], TP $22.50) TESS (5226.TWO, NT$12.55) Tong Hsin (6271.TW, NT$91.8) Toyoda Gosei (7282, ¥1,613, NEUTRAL, TP ¥1,650, MARKET WEIGHT) Tsann Kuen Enterprise Co Ltd (2430.TW, NT$64.10) Tsinghua Tongfang Co Ltd (600100.SS, Rmb8.73) Unity Opto (2499.TW, NT$29.05) Veeco Instruments (VECO, $32.99, NEUTRAL [V], TP $32.00) Wafer Works Corp (6182.TWO, NT$19.90) Wal-Mart Stores, Inc. (WMT, $67.07, NEUTRAL, TP $58.00) Wellypower (3080.TW, NT$12.7) Wintek Corp (2384.TW, NT$15.35, NEUTRAL [V], TP NT$19.00) Wistron (3231.TW, NT$37.35, OUTPERFORM, TP NT$50.00) Wooree (037400.KS, W4295) Xiamen Changelight (300102.SZ, Rmb13.1)

18 June 2012
Taiwan LED Sector 49
Zhejiang Yankon Group (600261.SS, Rmb12.4)
Disclosure Appendix Important Global Disclosures Jerry Su & Jimmy Huang each certify, with respect to the companies or securities that he or she analyzes, that (1) the views expressed in this report accurately reflect his or her personal views about all of the subject companies and securities and (2) no part of his or her compensation was, is or will be directly or indirectly related to the specific recommendations or views expressed in this report.
See the Companies Mentioned section for full company names. 3-Year Price, Target Price and Rating Change History Chart for 2360.TW 2360.TW Closing
Price Target
Price
Initiation/ Date (NT$) (NT$) Rating Assumption 14-Jan-10 64.133 80.6 O X 11-Aug-10 67.019 87 27-Oct-10 76.731 97 30-Jun-11 87.885 NC
81
87
97
14-Jan-10
O
NC
27
37
47
57
67
77
87
97
Closing Price Target Price Initiation/Assumption Rating
NT$
O=Outperform; N=Neutral; U=Underperform; R=Restricted; NR=Not Rated; NC=Not Covered
3-Year Price, Target Price and Rating Change History Chart for 2448.TW 2448.TW Closing
Price Target
Price
Initiation/ Date (NT$) (NT$) Rating Assumption 24-Aug-09 86.4 105 O 29-Oct-09 98.6 133 16-Jul-10 88.7 122 24-Aug-10 83.8 115 10-Mar-11 113.5 133 31-Mar-11 X 2-May-11 94.9 116 14-Jul-11 67.6 88 23-Aug-11 53 79 20-Oct-11 56 65 N
105
133
122115
133
116
88
79
65
31-Mar-11
O
N51
61
71
81
91
101
111
121
131
Closing Price Target Price Initiation/Assumption Rating
NT$
O=Outperform; N=Neutral; U=Underperform; R=Restricted; NR=Not Rated; NC=Not Covered
3-Year Price, Target Price and Rating Change History Chart for 2393.TW 2393.TW Closing
Price Target
Price
Initiation/ Date (NT$) (NT$) Rating Assumption 27-Aug-09 87.042 84 N 8-Jan-10 109 100 11-May-10 92.2 116 O 16-Jul-10 89.1 118 1-Nov-10 84.1 95 N 20-Apr-11 84.4 O 28-Jul-11 63.9 69 N 29-Sep-11 53.3 57 31-Oct-11 56 54
84
100
116 118
95
69
5754
NO
N O
N
45
55
65
75
85
95
105
115
Closing Price Target Price Initiation/Assumption Rating
NT$
O=Outperform; N=Neutral; U=Underperform; R=Restricted; NR=Not Rated; NC=Not Covered

18 June 2012
Taiwan LED Sector 50
3-Year Price, Target Price and Rating Change History Chart for 3698.TW 3698.TW Closing
Price Target
Price
Initiation/ Date (NT$) (NT$) Rating Assumption
0
10
20
30
40
50
60
70
Closing Price Target Price Initiation/Assumption Rating
NT$
O=Outperform; N=Neutral; U=Underperform; R=Restricted; NR=Not Rated; NC=Not Covered
The analyst(s) responsible for preparing this research report received compensation that is based upon various factors including Credit Suisse's total revenues, a portion of which are generated by Credit Suisse's investment banking activities. Analysts’ stock ratings are defined as follows: Outperform (O): The stock’s total return is expected to outperform the relevant benchmark* by at least 10-15% (or more, depending on perceived risk) over the next 12 months. Neutral (N): The stock’s total return is expected to be in line with the relevant benchmark* (range of ±10-15%) over the next 12 months. Underperform (U): The stock’s total return is expected to underperform the relevant benchmark* by 10-15% or more over the next 12 months. *Relevant benchmark by region: As of 29th May 2009, Australia, New Zealand, U.S. and Canadian ratings are based on (1) a stock’s absolute total return potential to its current share price and (2) the relative attractiveness of a stock’s total return potential within an analyst’s coverage universe**, with Outperforms representing the most attractive, Neutrals the less attractive, and Underperforms the least attractive investment opportunities. Some U.S. and Canadian ratings may fall outside the absolute total return ranges defined above, depending on market conditions and industry factors. For Latin American, Japanese, and non-Japan Asia stocks, ratings are based on a stock’s total return relative to the average total return of the relevant country or regional benchmark; for European stocks, ratings are based on a stock’s total return relative to the analyst's coverage universe**. For Australian and New Zealand stocks, 12-month rolling yield is incorporated in the absolute total return calculation and a 15% and a 7.5% threshold replace the 10-15% level in the Outperform and Underperform stock rating definitions, respectively. The 15% and 7.5% thresholds replace the +10-15% and -10-15% levels in the Neutral stock rating definition, respectively. **An analyst's coverage universe consists of all companies covered by the analyst within the relevant sector. Restricted (R): In certain circumstances, Credit Suisse policy and/or applicable law and regulations preclude certain types of communications, including an investment recommendation, during the course of Credit Suisse's engagement in an investment banking transaction and in certain other circumstances. Volatility Indicator [V]: A stock is defined as volatile if the stock price has moved up or down by 20% or more in a month in at least 8 of the past 24 months or the analyst expects significant volatility going forward.
Analysts’ coverage universe weightings are distinct from analysts’ stock ratings and are based on the expected performance of an analyst’s coverage universe* versus the relevant broad market benchmark**: Overweight: Industry expected to outperform the relevant broad market benchmark over the next 12 months. Market Weight: Industry expected to perform in-line with the relevant broad market benchmark over the next 12 months. Underweight: Industry expected to underperform the relevant broad market benchmark over the next 12 months. *An analyst’s coverage universe consists of all companies covered by the analyst within the relevant sector. **The broad market benchmark is based on the expected return of the local market index (e.g., the S&P 500 in the U.S.) over the next 12 months. Credit Suisse’s distribution of stock ratings (and banking clients) is:
Global Ratings Distribution Outperform/Buy* 48% (59% banking clients) Neutral/Hold* 41% (56% banking clients) Underperform/Sell* 9% (51% banking clients) Restricted 2% *For purposes of the NYSE and NASD ratings distribution disclosure requirements, our stock ratings of Outperform, Neutral, and Underperform most closely correspond to Buy, Hold, and Sell, respectively; however, the meanings are not the same, as our stock ratings are determined on a relative basis. (Please refer to definitions above.) An investor's decision to buy or sell a security should be based on investment objectives, current holdings, and other individual factors.
Credit Suisse’s policy is to update research reports as it deems appropriate, based on developments with the subject company, the sector or the market that may have a material impact on the research views or opinions stated herein.
Credit Suisse's policy is only to publish investment research that is impartial, independent, clear, fair and not misleading. For more detail please refer to Credit Suisse's Policies for Managing Conflicts of Interest in connection with Investment Research: http://www.csfb.com/research-and-analytics/disclaimer/managing_conflicts_disclaimer.html
Credit Suisse does not provide any tax advice. Any statement herein regarding any US federal tax is not intended or written to be used, and cannot be used, by any taxpayer for the purposes of avoiding any penalties.

18 June 2012
Taiwan LED Sector 51
See the Companies Mentioned section for full company names. Price Target: (12 months) for (2360.TW) Method: Our price target of NT$89 is based on 17x 12-months forward P/E and NT$2.5 cash dividend, versus historical 13-21x range. We expect Chroma to re-rate on solid margin profile and new oppourtunities in LED testing. Risks: 1) slower-than-expected take off for LED general lighting; 2) global economy slowdown; 3) delays in new product developments; and 4) increased gross margin pressures. Price Target: (12 months) for (2448.TW) Method: Our NT$75 target price for Epistar is derived from 1.4x 12 months P/B, middle of 1.0-2.0x range. Risks: Risks to our NT$75 target price for Epistar includes 1) More new capacity additions in China; (2) weak LED TV demand; (3) slower-than-expected take off for LED general lighting; (4) dilution from private placement; and (5) market share loss to competitors. Price Target: (12 months) for (2393.TW) Method: Our NT$42 target price for Everlight is derived from 15x 2012 P/E, mid-cycle average. Risks: Upside risks are (1) Market share gain; (2) better-than-expected backlighting shipments for LED TV; (3) faster-than-expected take off for LED general lighting; (4) turnaround of its investments, and (5) industry consolidation. Price Target: (12 months) for (3698.TW) Method: Our target price of NT$37 is based on 1.7x 12 month forward P/B, mid-cycle average. Risks: Upside risks are: (1) Faster-than-expected growth of LED general lighting demand; (2) better-than-expected LED TV demand; (3) alliance or investment by global lighting brands. Downside risks are: (1) Slower-than-expected take off for LED general lighting; (2) global economy slowdown, less LED TV demand; (3) major shareholder sell down. Please refer to the firm's disclosure website at www.credit-suisse.com/researchdisclosures for the definitions of abbreviations typically used in the target price method and risk sections.
See the Companies Mentioned section for full company names. The subject company (2448.TW) currently is, or was during the 12-month period preceding the date of distribution of this report, a client of Credit Suisse. Credit Suisse provided investment banking services to the subject company (2448.TW) within the past 12 months. Credit Suisse provided non-investment banking services, which may include Sales and Trading services, to the subject company (2448.TW) within the past 12 months. Credit Suisse expects to receive or intends to seek investment banking related compensation from the subject company (2448.TW) within the next 3 months. Important Regional Disclosures Singapore recipients should contact a Singapore financial adviser for any matters arising from this research report.
The analyst(s) involved in the preparation of this report have not visited the material operations of the subject company (2360.TW, 2448.TW, 2393.TW, 3698.TW) within the past 12 months.
Restrictions on certain Canadian securities are indicated by the following abbreviations: NVS--Non-Voting shares; RVS--Restricted Voting Shares; SVS--Subordinate Voting Shares. Individuals receiving this report from a Canadian investment dealer that is not affiliated with Credit Suisse should be advised that this report may not contain regulatory disclosures the non-affiliated Canadian investment dealer would be required to make if this were its own report. For Credit Suisse Securities (Canada), Inc.'s policies and procedures regarding the dissemination of equity research, please visit http://www.csfb.com/legal_terms/canada_research_policy.shtml.
As of the date of this report, Credit Suisse acts as a market maker or liquidity provider in the equities securities that are the subject of this report.
Principal is not guaranteed in the case of equities because equity prices are variable. Commission is the commission rate or the amount agreed with a customer when setting up an account or at anytime after that. Taiwanese Disclosures: This research report is for reference only. Investors should carefully consider their own investment risk. Investment results are the responsibility of the individual investor. Reports may not be reprinted without permission of CS. Reports written by Taiwan-based analysts on non-Taiwan listed companies are not considered recommendations to buy or sell securities under Taiwan Stock Exchange Operational Regulations Governing Securities Firms Recommending Trades in Securities to Customers. To the extent this is a report authored in whole or in part by a non-U.S. analyst and is made available in the U.S., the following are important disclosures regarding any non-U.S. analyst contributors: The non-U.S. research analysts listed below (if any) are not registered/qualified as research analysts with FINRA. The non-U.S. research analysts listed below may not be associated persons of CSSU and therefore may not be subject to the NASD Rule 2711 and NYSE Rule 472 restrictions on communications with a subject company, public appearances and trading securities held by a research analyst account. • Jerry Su, non-U.S. analyst, is a research analyst employed by Credit Suisse AG, Taipei Securities Branch. • Jimmy Huang, non-U.S. analyst, is a research analyst employed by Credit Suisse AG, Taipei Securities Branch. For Credit Suisse disclosure information on other companies mentioned in this report, please visit the website at www.credit-suisse.com/researchdisclosures or call +1 (877) 291-2683.

18 June 2012 Asia Pacific / Taiwan
Equity Research
TC1680.doc
This report is not directed to, or intended for distribution to or use by, any person or entity who is a citizen or resident of or located in any locality, state, country or other jurisdiction where such distribution, publication, availability or use would be contrary to law or regulation or which would subject Credit Suisse AG, the Swiss bank, or its subsidiaries or its affiliates (“CS”) to any registration or licensing requirement within such jurisdiction. All material presented in this report, unless specifically indicated otherwise, is under copyright to CS. None of the material, nor its content, nor any copy of it, may be altered in any way, transmitted to, copied or distributed to any other party, without the prior express written permission of CS. All trademarks, service marks and logos used in this report are trademarks or service marks or registered trademarks or service marks of CS or its affiliates. The information, tools and material presented in this report are provided to you for information purposes only and are not to be used or considered as an offer or the solicitation of an offer to sell or to buy or subscribe for securities or other financial instruments. CS may not have taken any steps to ensure that the securities referred to in this report are suitable for any particular investor. CS will not treat recipients as its customers by virtue of their receiving the report. The investments or services contained or referred to in this report may not be suitable for you and it is recommended that you consult an independent investment advisor if you are in doubt about such investments or investment services. Nothing in this report constitutes investment, legal, accounting or tax advice or a representation that any investment or strategy is suitable or appropriate to your individual circumstances or otherwise constitutes a personal recommendation to you. CS does not offer advice on the tax consequences of investment and you are advised to contact an independent tax adviser. Please note in particular that the bases and levels of taxation may change. CS believes the information and opinions in the Disclosure Appendix of this report are accurate and complete. Information and opinions presented in the other sections of the report were obtained or derived from sources CS believes are reliable, but CS makes no representations as to their accuracy or completeness. Additional information is available upon request. CS accepts no liability for loss arising from the use of the material presented in this report, except that this exclusion of liability does not apply to the extent that liability arises under specific statutes or regulations applicable to CS. This report is not to be relied upon in substitution for the exercise of independent judgment. CS may have issued, and may in the future issue, a trading call regarding this security. Trading calls are short term trading opportunities based on market events and catalysts, while stock ratings reflect investment recommendations based on expected total return over a 12-month period as defined in the disclosure section. Because trading calls and stock ratings reflect different assumptions and analytical methods, trading calls may differ directionally from the stock rating. In addition, CS may have issued, and may in the future issue, other reports that are inconsistent with, and reach different conclusions from, the information presented in this report. Those reports reflect the different assumptions, views and analytical methods of the analysts who prepared them and CS is under no obligation to ensure that such other reports are brought to the attention of any recipient of this report. CS is involved in many businesses that relate to companies mentioned in this report. These businesses include specialized trading, risk arbitrage, market making, and other proprietary trading. Past performance should not be taken as an indication or guarantee of future performance, and no representation or warranty, express or implied, is made regarding future performance. Information, opinions and estimates contained in this report reflect a judgement at its original date of publication by CS and are subject to change without notice. The price, value of and income from any of the securities or financial instruments mentioned in this report can fall as well as rise. The value of securities and financial instruments is subject to exchange rate fluctuation that may have a positive or adverse effect on the price or income of such securities or financial instruments. Investors in securities such as ADR’s, the values of which are influenced by currency volatility, effectively assume this risk. Structured securities are complex instruments, typically involve a high degree of risk and are intended for sale only to sophisticated investors who are capable of understanding and assuming the risks involved. The market value of any structured security may be affected by changes in economic, financial and political factors (including, but not limited to, spot and forward interest and exchange rates), time to maturity, market conditions and volatility, and the credit quality of any issuer or reference issuer. Any investor interested in purchasing a structured product should conduct their own investigation and analysis of the product and consult with their own professional advisers as to the risks involved in making such a purchase. Some investments discussed in this report have a high level of volatility. High volatility investments may experience sudden and large falls in their value causing losses when that investment is realised. Those losses may equal your original investment. Indeed, in the case of some investments the potential losses may exceed the amount of initial investment, in such circumstances you may be required to pay more money to support those losses. Income yields from investments may fluctuate and, in consequence, initial capital paid to make the investment may be used as part of that income yield. Some investments may not be readily realisable and it may be difficult to sell or realise those investments, similarly it may prove difficult for you to obtain reliable information about the value, or risks, to which such an investment is exposed. This report may provide the addresses of, or contain hyperlinks to, websites. Except to the extent to which the report refers to website material of CS, CS has not reviewed the linked site and takes no responsibility for the content contained therein. Such address or hyperlink (including addresses or hyperlinks to CS’s own website material) is provided solely for your convenience and information and the content of the linked site does not in any way form part of this document. Accessing such website or following such link through this report or CS’s website shall be at your own risk. This report is issued and distributed in Europe (except Switzerland) by Credit Suisse Securities (Europe) Limited, One Cabot Square, London E14 4QJ, England, which is regulated in the United Kingdom by The Financial Services Authority (“FSA”). This report is being distributed in Germany by Credit Suisse Securities (Europe) Limited Niederlassung Frankfurt am Main regulated by the Bundesanstalt fuer Finanzdienstleistungsaufsicht ("BaFin"). This report is being distributed in the United States by Credit Suisse Securities (USA) LLC ; in Switzerland by Credit Suisse AG; in Canada by Credit Suisse Securities (Canada), Inc.; in Brazil by Banco de Investimentos Credit Suisse (Brasil) S.A. or its affiliates; in Mexico by Banco Credit Suisse (México), S.A. (transactions related to the securities mentioned in this report will only be effected in compliance with applicable regulation); in Japan by Credit Suisse Securities (Japan) Limited, Financial Instrument Firm, Director-General of Kanto Local Finance Bureau (Kinsho) No. 66, a member of Japan Securities Dealers Association, The Financial Futures Association of Japan, Japan Securities Investment Advisers Association, Type II Financial Instruments Firms Association; elsewhere in Asia/Pacific by whichever of the following is the appropriately authorised entity in the relevant jurisdiction: Credit Suisse (Hong Kong) Limited, Credit Suisse Equities (Australia) Limited , Credit Suisse Securities (Thailand) Limited, Credit Suisse Securities (Malaysia) Sdn Bhd, Credit Suisse AG, Singapore Branch, Credit Suisse Securities (India) Private Limited regulated by the Securities and Exchange Board of India (registration Nos. INB230970637; INF230970637; INB010970631; INF010970631), having registered address at 9th Floor, Ceejay House,Dr.A.B. Road, Worli, Mumbai - 18, India, T- +91-22 6777 3777, Credit Suisse Securities (Europe) Limited, Seoul Branch, Credit Suisse AG, Taipei Securities Branch, PT Credit Suisse Securities Indonesia, Credit Suisse Securities (Philippines ) Inc., and elsewhere in the world by the relevant authorised affiliate of the above. Research on Taiwanese securities produced by Credit Suisse AG, Taipei Securities Branch has been prepared by a registered Senior Business Person. Research provided to residents of Malaysia is authorised by the Head of Research for Credit Suisse Securities (Malaysia) Sdn. Bhd., to whom they should direct any queries on +603 2723 2020. In jurisdictions where CS is not already registered or licensed to trade in securities, transactions will only be effected in accordance with applicable securities legislation, which will vary from jurisdiction to jurisdiction and may require that the trade be made in accordance with applicable exemptions from registration or licensing requirements. Non-U.S. customers wishing to effect a transaction should contact a CS entity in their local jurisdiction unless governing law permits otherwise. U.S. customers wishing to effect a transaction should do so only by contacting a representative at Credit Suisse Securities (USA) LLC in the U.S. Please note that this report was originally prepared and issued by CS for distribution to their market professional and institutional investor customers. Recipients who are not market professional or institutional investor customers of CS should seek the advice of their independent financial advisor prior to taking any investment decision based on this report or for any necessary explanation of its contents. This research may relate to investments or services of a person outside of the UK or to other matters which are not regulated by the FSA or in respect of which the protections of the FSA for private customers and/or the UK compensation scheme may not be available, and further details as to where this may be the case are available upon request in respect of this report. Any Nielsen Media Research material contained in this report represents Nielsen Media Research's estimates and does not represent facts. NMR has neither reviewed nor approved this report and/or any of the statements made herein. If this report is being distributed by a financial institution other than Credit Suisse AG, or its affiliates, that financial institution is solely responsible for distribution. Clients of that institution should contact that institution to effect a transaction in the securities mentioned in this report or require further information. This report does not constitute investment advice by Credit Suisse to the clients of the distributing financial institution, and neither Credit Suisse AG, its affiliates, and their respective officers, directors and employees accept any liability whatsoever for any direct or consequential loss arising from their use of this report or its content. Copyright 2012 CREDIT SUISSE AG and/or its affiliates. All rights reserved.