UNO Template - Credit Suisse | PLUS
13
DISCLOSURE APPENDIX CONTAINS ANALYST CERTIFICATIONS AND THE STATUS OF NON US ANALYSTS. FOR OTHER IMPORTANT DISCLOSURES, visit www.credit-suisse.com/researchdisclosures or call +1 (877) 291-2683 US Disclosure: Credit Suisse does and seeks to do business with companies covered in its research reports. As a result, investors should be aware that the Firm may have a conflict of interest that could affect the objectivity of this report. Investors should consider this report as only a single factor in making their investment decision. CREDIT SUISSE SECURITIES RESEARCH & ANALYTICS BEYOND INFORMATION ® Client-Driven Solutions, Insights, and Access 09 April 2013 Asia Pacific/Japan Equity Research Steel / Non Ferrous Metals (Steel (Japan)/Non Ferrous Metals (Japan)) / MARKET WEIGHT/MARKET WEIGHT Steel & Non Ferrous Metals SECTOR REVIEW Urge shift to non-price-driven stocks as steel and nonferrous metal prices have peaked ■ Steel and nonferrous metal prices following spring peak trend: Steel and nonferrous metal prices have started to soften in Asia. Historically, steel and nonferrous metal prices have tended to peak in spring and soften into summer/fall. We estimate that behind this lies the fact that amid declining consumption of steel and nonferrous metals, demand from China, which accounts for nearly half of global consumption, peaks after the Chinese New Year. That prices have already started to soften suggests that they are probably following the seasonal trend, and we therefore need to exercise caution with regard to investing in price-driven stocks, specifically Nippon Steel & Sumitomo Metal, JFE Holdings, Kobe Steel, Sumitomo Metal Mining, Mitsubishi Materials, Mitsui Mining & Smelting, and Dowa Holdings. The business structures of Kyoei Steel, Yamato Kogyo and other electric furnace steelmakers make them also price-driven to some extent, but their share prices correlate only weakly with steel scrap and steel prices, and we do not classify them as price-driven stocks. ■ Impact of electricity rate hikes: Nonferrous metal smelting and electric furnace steelmaking are leading heavy power-consuming industries. As such, they will not be able to avoid cost increases due to electricity rate hikes in FY3/14. We look for electric furnace steelmakers that manufacture ordinary steel to be able to absorb these higher costs by hiking their own prices, as they have narrow areas of operation and demand is firm. In contrast, we think that higher costs will directly depress profits at specialty steel manufacturers and nonferrous metal smelters. We think that companies such as Sanyo Special Steel, Osaka Titanium Technologies, and Pacific Metals, that have works in areas supplied by Kansai Electric Power and Tohoku Electric Power will be especially hard hit, as these companies have substantially hiked electricity rates. ■ Stock calls: We maintain our OUTPERFORM rating on Sumitomo Electric Industries, Daido Steel, Aichi Steel, Kyoei Steel, Maruichi Steel Tube, and Daiseki, whose share prices are weakly correlated with steel and nonferrous metal prices. However, we maintain our UNDERPERFORM rating on Kobe Steel, Dowa, Osaka Titanium, Toho Titanium, in light of their weak finances, high valuations, electricity rate hikes, and sluggish sales of titanium. Research Analysts Shinya Yamada 81 3 4550 9910 [email protected] Kazumasa Okumoto 81 3 4550 7266 [email protected]
-
Upload
khangminh22 -
Category
Documents
-
view
3 -
download
0
Transcript of UNO Template - Credit Suisse | PLUS

DISCLOSURE APPENDIX CONTAINS ANALYST CERTIFICATIONS AND THE STATUS OF NON US ANALYSTS. FOR OTHER IMPORTANT DISCLOSURES, visit www.credit-suisse.com/researchdisclosures or call +1 (877) 291-2683 US Disclosure: Credit Suisse does and seeks to do business with companies covered in its research reports. As a result, investors should be aware that the Firm may have a conflict of interest that could affect the objectivity of this report. Investors should consider this report as only a single factor in making their investment decision.
CREDIT SUISSE SECURITIES RESEARCH & ANALYTICS BEYOND INFORMATION®
Client-Driven Solutions, Insights, and Access
09 April 2013
Asia Pacific/Japan
Equity Research
Steel / Non Ferrous Metals (Steel (Japan)/Non Ferrous Metals (Japan)) /
MARKET WEIGHT/MARKET WEIGHT
Steel & Non Ferrous Metals SECTOR REVIEW
Urge shift to non-price-driven stocks as steel
and nonferrous metal prices have peaked
■ Steel and nonferrous metal prices following spring peak trend: Steel
and nonferrous metal prices have started to soften in Asia. Historically, steel
and nonferrous metal prices have tended to peak in spring and soften into
summer/fall. We estimate that behind this lies the fact that amid declining
consumption of steel and nonferrous metals, demand from China, which
accounts for nearly half of global consumption, peaks after the Chinese New
Year. That prices have already started to soften suggests that they are
probably following the seasonal trend, and we therefore need to exercise
caution with regard to investing in price-driven stocks, specifically Nippon
Steel & Sumitomo Metal, JFE Holdings, Kobe Steel, Sumitomo Metal Mining,
Mitsubishi Materials, Mitsui Mining & Smelting, and Dowa Holdings. The
business structures of Kyoei Steel, Yamato Kogyo and other electric furnace
steelmakers make them also price-driven to some extent, but their share
prices correlate only weakly with steel scrap and steel prices, and we do not
classify them as price-driven stocks.
■ Impact of electricity rate hikes: Nonferrous metal smelting and electric
furnace steelmaking are leading heavy power-consuming industries. As such,
they will not be able to avoid cost increases due to electricity rate hikes in
FY3/14. We look for electric furnace steelmakers that manufacture ordinary
steel to be able to absorb these higher costs by hiking their own prices, as
they have narrow areas of operation and demand is firm. In contrast, we
think that higher costs will directly depress profits at specialty steel
manufacturers and nonferrous metal smelters. We think that companies
such as Sanyo Special Steel, Osaka Titanium Technologies, and Pacific
Metals, that have works in areas supplied by Kansai Electric Power and
Tohoku Electric Power will be especially hard hit, as these companies have
substantially hiked electricity rates.
■ Stock calls: We maintain our OUTPERFORM rating on Sumitomo Electric
Industries, Daido Steel, Aichi Steel, Kyoei Steel, Maruichi Steel Tube, and
Daiseki, whose share prices are weakly correlated with steel and nonferrous
metal prices. However, we maintain our UNDERPERFORM rating on Kobe
Steel, Dowa, Osaka Titanium, Toho Titanium, in light of their weak finances,
high valuations, electricity rate hikes, and sluggish sales of titanium.
Research Analysts
Shinya Yamada
81 3 4550 9910
Kazumasa Okumoto
81 3 4550 7266

09 April 2013
Steel & Non Ferrous Metals 2
Steel and nonferrous metal investment strategy
Steel and nonferrous metal prices tend to follow a seasonal trend, being high in March and
April, softening in summer/fall, and rising from winter (Figure 1). Blast furnace steelmaker
and nonferrous metal stocks therefore tend to peak in spring and bottom in summer/fall
(Figure 2–3). This seasonality will likely remain in place, as long as Chinese consumption
continues to peak after the Chinese New Year and demand continues to dry up in the
summer due to summer holidays around the world. We could see a change in this
seasonality if global economic overheating, especially in China and emerging economies,
such as that seen through 2007, were to arise again, but China and India are currently far
from overheating, and we think that the abovementioned seasonality will be on display
again in 2013. Prices of Chinese iron ore, hot-rolled coils, and nonferrous metals have
turned downwards (Figure 4–5). We think that steel scrap prices will also soften from now
on.
Figure 1: Steel and nonferrous metal prices tend to follow a seasonal trend
80
85
90
95
100
105
110
115
120
125
Jan1W
Jan3W
Jan5W
Feb2W
Feb4W
Mar
2w
Mar
4w
Apr
2w
Apr
4w
May 2
w
May 4
w
Jun 1
w
Jun 3
w
Jul 1w
Jul 3w
Aug 1
w
Aug 3
w
Aug 5
w
Sep 2
w
Sep 4
W
Oct
2w
Oct
4w
Nov 1
w
Nov 3
w
Dec
1w
Dec
3w
Cu
Zn
Ni
China HRC
JPN Scrap
Note: 2010-2013 avg. Source: Thomson Reuters
Figure 2: Blast furnace steelmaker and steel prices tend
to follow a seasonal trend
Figure 3: Nonferrous metal stocks and prices tend to
follow a seasonal trend
70
75
80
85
90
95
100
105
110
80
85
90
95
100
105
110
115
120
125
Jan
1W
Jan
3W
Jan
5W
Feb
2W
Feb
4W
Mar
2w
Mar
4w
Ap
r 2
w
Ap
r 4
w
May
2w
May
4w
Jun
1w
Jun
3w
Jul 1
w
Jul 3
w
Au
g 1
w
Au
g 3
w
Au
g 5
w
Sep
2w
Sep
4W
Oct
2w
Oct
4w
No
v 1
w
No
v 3
w
Dec
1w
Dec
3w
China HRC (LHS)
Japan scrap (LHS)
3 BFs MV (RHS)
Note: 2010-2013 avg.
80
85
90
95
100
105
110
115
120
Jan1W
Jan3W
Jan5W
Feb2W
Feb4W
Mar
2w
Mar
4w
Apr
2w
Apr
4w
May 2
w
May 4
w
Jun 1
w
Jun 3
w
Jul 1w
Jul 3w
Aug 1
w
Aug 3
w
Aug 5
w
Sep 2
w
Sep 4
W
Oct
2w
Oct
4w
Nov 1
w
Nov 3
w
Dec
1w
Dec
3w
Cu
Zn
Ni
4 Nonferrous cos' MV
Note: 2010-2013 avg. Source: Thomson Reuters Source: Thomson Reuters

09 April 2013
Steel & Non Ferrous Metals 3
Figure 4: Prices of Chinese iron ore and hot-rolled coils
nonferrous metals have turned downwards
Figure 5: Prices of nonferrous metals have turned
downwards
60
70
80
90
100
110
120
130
140
150
160
500
550
600
650
700
750
12/01 12/03 12/05 12/07 12/09 12/11 13/01 13/03
(USD/t)
China HRC price (LHS)
China Iron ore price (RHS)
(USD/t)
10,000
12,000
14,000
16,000
18,000
20,000
22,000
24,000
1,000
2,000
3,000
4,000
5,000
6,000
7,000
8,000
9,000
'12/1 '12/3 '12/5 '12/7 '12/9 '12/11 '13/1 '13/3
(USD/t) (USD/t)Cu (LHS)
Zn (LHS)
Ni (RHS)
Source: Thomson Reuters Source: Thomson Reuters
We think that due in part to economic downturns in China and India there is a strong
likelihood of the usual seasonal trend being seen in 2013, and that price-related stocks will
thus likely remain flat or even start to lose ground. Accordingly, we downgraded the
nonferrous metals sector from Overweight to MARKET WEIGHT in January, and the steel
sector from Overweight to MARKET WEIGHT on 2 April. For details about the steel sector,
see Steel sector: Spring looks disappointing as steel prices peak, issued on 2 April. Here,
we shall re-examine the relationship between nonferrous metal prices and nonferrous
metal sector share prices.
The ranking of sector stocks in our coverage by correlation between share price and
prices of nonferrous metals (average of copper, lead, and nickel) over the past five years
is: Mitsui Mining & Smelting (0.86), Dowa (0.82), Toho Zinc (0.83), Sumitomo Metal Mining
(0.82), Mitsubishi Materials (0.70), and Pacific Metals (0.69) (Figure 6). Note that Mitsui
Mining & Smelting and Dowa have higher correlation coefficients than Sumitomo Metal
Mining, which investors often regard as a straight price-related stock. However, recently
(over the past two years) Dowa's correlation coefficient with nonferrous metals prices has
fallen to 0.37. The recent rise in Dowa's share price, therefore, is in our view due to the
stock's relativity within the nonferrous metals sector. In particular, we think that it has
accompanied a softening in the share price of Sumitomo Metal Mining, with which it has a
strong reverse correlation (Figure 7). Given that the nonferrous metals segment will likely
continue to affect Dowa's earnings (thanks in part to yen weakness, we expect the
nonferrous metals segment to account for 74% of the rise in Dowa's profits in FY3/14), if
nonferrous metals prices weaken further, we think that the company's currently high P/E
(our FY3/14 forecast 15.3x, Bloomberg consensus forecast 13.4x) will fall. In terms of
performance relative to the TOPIX over the past 10 years, we see a polarization between
sluggish Mitsui Mining and Dowa and outperformers such as Sumitomo Metal Mining and
Mitsubishi Materials (Figure 8). As such, we think that Mitsui Mining & Smelting and Dowa
will likely face stronger calls to improve their business and earnings structures.

09 April 2013
Steel & Non Ferrous Metals 4
Figure 6: Correlation between share price and prices of
nonferrous metals
Figure 7: Strong reverse correlation between DOWA and
Sumitomo Metal Mining
0.85
0.81
0.88
0.88
0.70
0.43
0.69
0.70
0.82
0.83
0.83
0.86
0.89
0.75
0.92
0.91
0.40
0.90
0.0 0.2 0.4 0.6 0.8 1.0
PACIFIC METALS
MITSUBISHI MATERIALS
SUMITOMO METAL MINING
TOHO ZINC
DOWA HDG.
MITSUI MNG.& SMELT.
2yrs (since '11)
5yrs (since '08)
10yrs (since '03)
Correlation with metal prices
30
50
70
90
110
130
150
0
100
200
300
400
500
600
700
'03/1
'03/7
'04/1
'04/7
'05/1
'05/7
'06/1
'06/7
'07/1
'07/7
'08/1
'08/7
'09/1
'09/7
'10/1
'10/7
'11/1
'11/7
'12/1
'12/7
'13/1
Avg. metal price in JPY (RHS)SMM rel. to nonferrous sectorDOWA rel. to nonferrous sector
Source: Thomson Reuters Source: Thomson Reuters
Figure 8: Polarization between sluggish Mitsui Mining and Dowa and decent Sumitomo
Metal Mining and Mitsubishi Materials
0
100
200
300
400
500
600
'03/1
'04/1
'05/1
'06/1
'07/1
'08/1
'09/1
'10/1
'11/1
'12/1
'13/1
(rel. to TOPIX)
Mitsui M&S
DOWA
Mitsubishi Mtrls
SMM
Toho Zinc
Pacific Metals
Source: Thomson Reuters

09 April 2013
Steel & Non Ferrous Metals 5
Nonferrous metals price forecasts
We have revised our nonferrous metal price forecasts in Commodity Forecasts: The
Setting Of The Sun…, issued by our global team on 3 April. We lower our forecasts for
prices of copper, nickel, zinc, and gold. We expect the downtrend in copper prices to
become particularly marked (Figure 9–10). Our bearish forecasts (Figure 11–13) are
based on the fact that easier supply–demand conditions have become established, with
copper and nickel apparently in considerable oversupply due to fresh increases in
production. LME inventories of nonferrous metals are on a notable uptrend (Figure 14–16).
Figure 9: Copper and nickel price assumptions Figure 10: Gold and zinc price assumptions
8.9
7.8
7.4
7.7 7.8
7.5 7.5
7.7 7.7 7.7 7.7 7.7
3.8
3.6 3.5
3.6 3.6
3.5
3.3
3.2 3.1
3.1 3.0
2.9
2.6
2.8
3.0
3.2
3.4
3.6
3.8
4.0
7.0
7.5
8.0
8.5
9.0
9.5
12/1Q 12/3Q 13/1QE 13/3QE 14/1QE 14/3QE
Ni (LHS)
(USD/lb) (USD/lb)
1,689
1,612
1,653
1,725
1,630
1,580 1,570
1,540
1,520 1,520
1,480 1,470
2,031 1,930
1,892 1,963
2,034 2,050 2,050
2,150
2,250 2,300
2,350
2,450
1,000
1,200
1,400
1,600
1,800
2,000
2,200
2,400
2,600
1,450
1,500
1,550
1,600
1,650
1,700
1,750
12/1Q 12/3Q 13/1QE 13/3QE 14/1QE 14/3QE
Gold (LHS)
Zn (RHS)
(USD/Toz) (USD/t)
Source: Credit Suisse estimates Source: Credit Suisse estimates
Figure 11: Global copper supply and demand estimates
(kt) 2008 2009 2010 2011 2012 2013f 2014f 2015f 2008 2009 2010 2011 2012 2013f 2014f 2015f
MINE PRODUCTION STOCKS
North America 1,952 1,695 1,646 1,732 1,715 1,995 2,159 2,142 LME + COMEX Stocks 371 592 437 459 384
Western Europe 198 205 253 285 334 364 367 383 SHFE Stocks 18 96 132 93 205
CIS & other E Europe 1,788 1,798 1,759 1,776 1,747 1,789 1,797 1,839 Total Exchange Stocks 389 688 569 552 589
China 1,157 1,056 1,258 1,375 1,550 1,651 1,692 1,740 Weeks Cons (Exch Stks) 1.1 2.1 1.5 1.4 1.5
Chile 5,402 5,453 5,480 5,291 5,482 5,869 6,132 6,215 Commercial Stocks 417 388 407 417 488
Australia 875 845 861 943 913 1,000 999 983 Total Reported Stocks 806 1,076 976 969 1,077
Indonesia 650 995 871 543 427 626 635 785 Price (US$/t) 6,932 5,149 7,547 8,813 7,956 7,482 6,675 6,200
ROW 3,691 3,898 4,057 4,278 4,537 5,280 5,914 6,404 TC (US$/t) 45 75 47 56 64 68 75 85
World Mine Production 15,713 15,947 16,184 16,222 16,705 18,574 19,695 20,491 RC (¢/lb) 4.5 7.5 4.7 5.6 6.4 6.8 7.5 8.5
Highly Probable Growth - - - - - - 91 265
Probable & Possible Growth - - - - - - 46 167 COPPER CONSUMPTION BY COUNTRY (Mt)
Disruption Allowance - - - - - (1,115) (1,190) (1,256) North America 2.19 1.78 1.90 1.90 2.01 2.05 2.11 2.17
SX/EW 3,071 3,274 3,335 3,444 3,640 3,572 3,941 4,149 Western Europe 3.37 2.77 3.03 2.90 2.75 2.71 2.71 2.70
Concentrate 12,646 12,677 12,853 12,782 13,070 13,891 14,705 15,522 Eastern Europe 1.11 0.77 0.85 1.11 1.11 1.13 1.16 1.20
World Mined Copper 15,713 15,947 16,184 16,222 16,705 17,459 18,642 19,667 China 5.10 6.38 7.20 7.93 8.34 8.84 9.34 9.80
% Change 3.6% 1.5% 1.5% 0.2% 3.0% 4.5% 6.8% 5.5% India 0.53 0.55 0.58 0.59 0.62 0.67 0.71 0.73
Conc. avail after direct use 12,630 12,656 12,831 12,760 13,048 13,869 14,683 15,500 Japan 1.20 0.88 1.06 1.01 1.03 1.04 1.05 1.05
Smelter Capacity 16,597 17,078 17,554 17,986 18,856 19,730 20,709 21,181 Middle East 0.74 0.76 0.92 0.95 0.97 1.02 1.07 1.12
Smelter Production 14,292 14,178 14,786 15,425 15,902 17,815 19,120 19,761 Other Asia 2.35 2.23 2.43 2.23 2.20 2.27 2.36 2.46
Required Adjustment - - - - - (950) (1,800) (1,800) Oceania 0.15 0.13 0.13 0.12 0.12 0.13 0.13 0.13
Scrap/Remelted Blister (2,067) (1,937) (2,618) (2,867) (3,021) (3,204) (3,224) (3,281) Africa 0.30 0.31 0.30 0.28 0.29 0.30 0.31 0.33
Smelter loss 482 440 471 456 445 455 471 474 Latin America (inc Mexico) 0.89 0.77 0.92 0.88 0.91 0.94 0.98 1.02
Primary Feed Required 12,707 12,681 12,639 13,015 13,326 14,116 14,675 15,423 World Consumption 17.93 17.32 19.33 19.89 20.34 21.09 21.92 22.71
SURPLUS/(DEFICIT) CONC (77) (25) 192 (255) (278) (247) 8 77 % Change -0.3% -3.4% 11.6% 2.9% 2.3% 3.7% 3.9% 3.6%
China 9.2% 25.0% 13.0% 10.0% 5.2% 5.9% 5.7% 4.9%
REFINED COPPER PRODUCTION World ex China -3.6% -14.7% 10.7% -1.3% 0.3% 2.1% 2.6% 2.7%
North America 1,710 1,496 1,405 1,282 1,284 1,340 1,422 1,425 COPPER CONSUMPTION BY SECTOR (Mt)
Western Europe 1,932 1,812 1,904 1,964 2,045 2,167 2,185 2,184 Building & Construction 6.03 5.47 5.57 5.66 5.79 5.97 6.18 6.38
Eastern Europe 1,558 1,567 1,692 1,736 1,744 1,757 1,829 1,835 % Change -1.6% -9.4% 1.9% 1.6% 2.2% 3.0% 3.7% 3.1%
China 3,795 4,109 4,534 5,197 5,665 7,227 8,656 9,485 Transport 2.01 2.34 1.94 1.93 2.02 2.12 2.26 2.41
Other Asia & Oceania 4,593 4,383 4,424 4,372 4,504 4,813 4,937 4,967 % Change -0.1% 16.5% -17.0% -0.8% 4.5% 5.2% 6.6% 6.6%
Africa 608 727 883 964 1,080 1,428 1,670 1,750 Electrical 5.84 5.80 6.71 6.94 7.11 7.35 7.63 7.90
Latin America (inc Mexico) 4,064 4,197 4,135 4,145 3,938 4,112 4,353 4,356 % Change 0.9% -0.7% 15.7% 3.4% 2.4% 3.3% 3.9% 3.5%
Probable Growth - - - - - - 109 269 Consumer Goods 1.80 1.69 2.44 2.56 2.60 2.73 2.83 2.94
Adjustments to refined prod - - - - 61 (1,580) (2,954) (3,017) % Change 0.6% -6.1% 44.8% 4.6% 1.5% 5.2% 3.7% 3.7%
Scrap/Blister 897 840 856 790 779 826 837 875 Machinery & Equipment 2.25 2.02 2.65 2.80 2.83 2.92 3.01 3.09
Electro Refined 15,189 15,018 15,642 16,216 16,681 17,692 18,266 19,105 % Change -0.7% -9.9% 30.9% 5.5% 1.3% 3.2% 2.8% 2.7%
Net SX/EW 3,071 3,274 3,335 3,444 3,640 3,572 3,941 4,149 Total 17.93 17.32 19.33 19.89 20.34 21.09 21.92 22.71
World Production 18,260 18,291 18,977 19,660 20,321 21,264 22,207 23,254 Annual Substitution (468) (394) (450) (550) (450) (450) (400) (400)
% Change 5.6% 0.2% 3.8% 3.6% 3.4% 4.6% 4.4% 4.7% SURPLUS/(DEFICIT) 332 968 (349) (228) (21) 176 288 540 Source: Brook Hunt, Credit Suisse estimates

09 April 2013
Steel & Non Ferrous Metals 6
Figure 12: Global zinc supply and demand estimates
(kt) 2008 2009 2010 2011 2012 2013f 2014f 2015f 2008 2009 2010 2011 2012 2013f 2014f 2015f
MINED ZINC SUPPLY STOCKS
North America (inc Mexico) 1,927 1,868 1,873 1,980 2,045 1,952 1,975 2,022 LME 253 457 701 822 1,221
C & S America 615 696 698 688 690 688 700 669 SHFE Stocks 63 172 311 364 311
Europe 838 788 780 798 842 900 881 885 Weeks Cons. (Exch. Stks) 1.5 3.2 4.5 4.9 6.1
CIS 657 612 657 630 713 827 870 852 Producer Stocks 365 317 313 366 315
China 3,160 3,198 3,703 4,307 4,734 5,036 5,223 5,296 Consumer Stocks 128 105 97 204 126
India 626 688 719 745 719 878 886 904 Merchant & US strategic 25 21 19 42 21
Other Asia 398 434 495 516 562 617 702 727 Reported stocks 834 1,072 1,441 1,798 1,994
Australia 1,508 1,316 1,481 1,483 1,438 1,598 1,603 1,514 Weeks Consumption 3.9 5.5 6.4 7.4 8.0
Africa 289 295 309 324 329 418 423 420 Price (US$/t) 1,874 1,543 2,094 2,193 1,952 2,071 2,338 2,600
Peru 1,550 1,430 1,403 1,185 1,213 1,287 1,384 1,439 ZINC CONSUMPTION BY COUNTRY
Highly Probable Projects - - - - - - - - USA 981 902 948 1,012 1,062 1,110 1,143 1,172
Probable Projects - - - - - 17 199 464 % Change -10.6% -8.0% 5.1% 6.7% 5.0% 4.5% 3.0% 2.5%
Disruption Allowance - - - - - (426) (439) (442) Other North America 356 279 298 311 320 334 346 356
World Mined Zinc Production 11,567 11,324 12,117 12,655 13,284 13,790 14,404 14,748 % Change -10.7% -21.7% 7.0% 4.4% 2.7% 4.4% 3.5% 3.2%
% Change 5.8% -2.1% 7.0% 4.4% 5.0% 3.8% 4.5% 2.4% C & S America 466 381 433 456 468 491 512 512
REFINED ZINC SUPPLY % Change 2.8% -18.2% 13.6% 5.5% 2.7% 4.9% 4.2% 0.0%
North America (inc Mexico) 1,334 1,224 1,266 1,236 1,274 1,284 1,374 1,374 Western Europe 1,931 1,466 1,838 2,040 1,959 1,961 1,974 1,984
C & S America 470 417 536 630 651 671 681 701 % Change -17.8% -24.1% 25.4% 11.0% -4.0% 0.1% 0.7% 0.5%
Europe 2,135 1,804 2,090 2,165 2,149 2,225 2,248 2,278 Eastern Europe 467 326 385 446 449 469 489 489
CIS 655 543 600 620 670 675 675 695 % Change -11.0% -30.1% 17.8% 15.9% 0.7% 4.5% 4.3% 0.0%
China 3,905 4,246 5,100 5,109 4,920 5,910 6,435 6,995 China 3,795 4,100 4,705 5,257 5,568 6,026 6,451 6,874
India 595 646 727 821 810 933 933 933 % Change 7.5% 8.0% 14.8% 11.7% 5.9% 8.2% 7.1% 6.6%
Japan 622 541 593 546 590 607 625 635 India 479 495 561 597 615 658 707 760
South Korea 738 722 779 859 920 960 1,010 1,010 % Change 2.1% 3.3% 13.5% 6.3% 3.0% 7.0% 7.5% 7.5%
Other Asia 204 223 247 252 283 283 283 283 Japan 562 421 538 497 485 499 507 512
Oceania 498 525 499 517 507 539 539 539 % Change -6.2% -25.0% 27.8% -7.6% -2.5% 3.0% 1.5% 1.0%
Africa 268 279 275 256 253 185 185 185 South Korea 528 426 522 547 569 580 595 610
Highly Probable Growth - - - - - - - - % Change -1.3% -19.3% 22.3% 4.9% 4.0% 2.0% 2.5% 2.5%
Disruption Allowance - - - - - (428) (450) (469) Other Asia 1,085 820 956 1,045 1,060 1,114 1,167 1,177
Adjustments to refined zinc - - - - - - - - % Change 7.8% -24.4% 16.6% 9.2% 1.5% 5.1% 4.8% 0.8%
World Refined Production 11,424 11,169 12,712 13,009 13,027 13,843 14,538 15,159 Oceania 284 217 223 226 230 238 246 246
% Change 2.3% -2.2% 13.8% 2.3% 0.1% 6.3% 5.0% 4.3% Africa 181 150 165 173 176 185 193 193
Incl. Scrap/secondary 888 773 925 956 976 1,026 1,076 1,126 China SRB & Provinces - 494 (50) 100 - - - -
Process losses/pipeline stocks 647 637 705 711 703 748 785 819 Restocking - - 200 50 - - - -
Required mined zinc 11,183 11,033 12,492 12,764 12,754 13,565 14,247 14,851 World Consumption 11,114 10,136 11,681 12,608 12,959 13,665 14,331 14,886
Concentrate Balance 384 291 (375) (109) 529 225 157 (103) % Change -2.9% -8.8% 15.2% 7.9% 2.8% 5.4% 4.9% 3.9%
World Consumption 11,114 10,136 11,681 12,608 12,959 13,665 14,331 14,886 World Refining Capacity 14,299 15,286 15,480 15,768 16,159 16,524 16,949 16,799
REFINED SURPLUS/(DEFICIT) 310 1,033 1,031 401 68 179 207 273 Capacity Utilisation (%) 79.9% 73.1% 82.1% 82.5% 80.6% 83.8% 85.8% 90.2% Source: Brook Hunt, Credit Suisse estimates

09 April 2013
Steel & Non Ferrous Metals 7
Figure 13: Global nickel supply and demand estimates
(kt) 2008 2009 2010 2011 2012 2013F 2014F 2015F (kt) 2008 2009 2010 2011 2012 2013F 2014F 2015F
Mine Production 1,597 1,450 1,657 1,946 1,902 2,012 2,151 2,246 Stainless production by CountryDisruption allowance (60) (65) (67) Europe 8,079 6,113 7,756 7,870 7,820 7,844 7,966 8,039
Mine Output 1,597 1,450 1,657 1,946 1,902 1,951 2,086 2,179 % change -4% -24% 27% 1% -1% 0% 2% 1%
REFINED Ni AND FeNi PRODUCTION China 7,200 9,158 12,415 14,000 14,490 15,722 16,979 18,168
Canada 164 117 107 148 150 132 137 122 % change -8% 27% 36% 13% 4% 9% 8% 7%
Western Europe 234 187 222 246 238 240 249 247 Japan 3,566 2,607 3,427 3,256 3,158 3,253 3,286 3,286
CIS 279 269 281 280 277 265 268 267 % change -8% -27% 31% -5% -3% 3% 1% 0%
Japan 157 144 166 157 168 183 196 206 South Korea 1,743 1,644 2,022 2,116 2,095 2,158 2,222 2,267
China 205 250 334 453 449 513 513 524 % change -21% -6% 23% 5% -1% 3% 3% 2%
Australia 109 131 101 110 129 122 125 125 Taiwan 1,313 1,357 1,526 1,191 1,108 1,174 1,227 1,252
Other 232 235 240 258 281 368 413 475 % change -12% 3% 12% -22% -7% 6% 5% 2%
Highly Probable Growth 0 1 5 8 India 1,550 1,690 2,170 2,365 2,507 2,682 2,897 3,129
Disruption Allowance 0 (55) (57) (59) % change -13% 9% 28% 9% 6% 7% 8% 8%
Required Adjustment - - - - USA 1,925 1,618 2,201 2,074 2,033 2,236 2,325 2,390
Total Production 1,380 1,333 1,451 1,652 1,693 1,768 1,849 1,913 % change -11% -16% 36% -6% -2% 10% 4% 3%
% change -2.4% -3.4% 8.8% 13.9% 2.5% 4.4% 4.6% 3.5% Brazil 450 339 464 499 519 555 577 601
Capacity Utilisation % 73% 66% 67% 65% 64% 65% 66% 68% % change -8% -25% 37% 8% 4% 7% 4% 4%
NPI 77 96 167 265 250 285 270 260 Other 809 625 467 410 500 549 570 587
CONSUMPTION Total World 26,635 25,151 32,448 33,781 34,229 36,173 38,051 39,718
Nth America 132 109 132 135 142 151 156 160 % change -8% -6% 29% 4% 1% 6% 5% 4%
Europe 422 361 408 414 415 421 429 435 Austenitic ratio 70.7% 73.7% 72.0% 71.5% 72.7% 73.0% 73.2% 73.3%
China 298 443 541 666 668 707 755 800 Scrap ratio 46.1% 40.3% 40.9% 37.6% 38.6% 39.4% 39.6% 39.7%
Japan 176 154 170 167 168 176 178 179
India 34 42 50 56 59 63 69 75
Other Asia 142 142 155 137 137 143 146 149
Other World 86 77 75 67 79 84 87 91
Total consumption 1,289 1,325 1,529 1,642 1,668 1,745 1,821 1,889
% change -6.1% 2.8% 15.4% 7.4% 1.6% 4.6% 4.3% 3.8%
For Stainless 779 834 1,010 1,103 1,106 1,156 1,209 1,255
% change -10.6% 7.2% 21.0% 9.2% 0.3% 4.6% 4.6% 3.8%
For Non-Stainless 511 491 519 541 562 589 611 634
% change 1.7% -4.0% 5.8% 4.3% 3.8% 4.8% 3.8% 3.7%
Restocking - - - - - - -
SURPLUS/(DEFICIT) 90 8 (78) 10 25 23 29 24
LME stocks 79 158 136 90
Producer Stocks 103 89 91 98
Estimated Total Stocks 389 402 331 329 354 377 405 429
Weeks Consumption 15.7 15.8 11.3 10.4 11.0 11.2 11.6 11.8
Price (US$/t) 21,204 14,651 21,806 22,843 17,536 16,823 17,000 18,500
0
500
1,000
1,500
2,000
2008 2009 2010 2011 2012 2013F
Nickel Production (bars) versus Consumption (kt Ni)
Nth America Europe China Japan India Other Asia Other World
Canada Western Europe CIS Japan China Australia Other
Source: Brook Hunt, Credit Suisse estimates
Figure 14: Copper inventories increasing
0
2,000
4,000
6,000
8,000
10,000
12,000
0
100
200
300
400
500
600
700
800
900
1,000
'03/1 '04/1 '05/1 '06/1 '07/1 '08/1 '09/1 '10/1 '11/1 '12/1 '13/1
Thousa
nds
LME Cu, Inventories (LHS)LME Cu (RHS)
(kt) (USD/t)
Source: Thomson Reuters

09 April 2013
Steel & Non Ferrous Metals 8
Figure 15: Zinc inventories increasing Figure 16: Nickel inventories increasing
0
500
1,000
1,500
2,000
2,500
3,000
3,500
4,000
4,500
5,000
0
200
400
600
800
1,000
1,200
1,400
'03/1 '04/1 '05/1 '06/1 '07/1 '08/1 '09/1 '10/1 '11/1 '12/1 '13/1
Thousa
nds
LME Zn, Inventories (LHS)LME Zn (RHS)
(kt) (USD/t)
0
10,000
20,000
30,000
40,000
50,000
60,000
0
20,000
40,000
60,000
80,000
100,000
120,000
140,000
160,000
180,000
'03/1 '05/1 '07/1 '09/1 '11/1 '13/1
LME Ni, Inventories (LHS)LME Ni (RHS)
(mnt) (USD/lb)
Source: Thomson Reuters Source: Thomson Reuters
With copper production costs at around $6,500/t ($2.9/lb) versus current $7,400/t, there is
12% potential downside. This is why we see copper prices as the most likely to decline.
Meanwhile, although nickel remains in oversupply, because Chinese pig iron makers'
production costs by our estimates are $16,500–22,000/t ($7.5–10.0/lb), we look for the
price of nickel to remain within its current range, and as such, we forecast that there will be
little scope for a major decline in the price of nickel compared with the current level
($16,000/t).
Figure 17 shows RP sensitivity to forex and nonferrous metal prices. Mitsubishi Materials
is highly sensitive to copper prices, Pacific Metals to forex and nickel prices, and Toho
Zinc to zinc and lead prices. We have a NEUTRAL rating on Mitsubishi Materials, as
although the company is highly sensitive to copper prices, which we expect to fall the
farthest, it also has robust business segments such as cement.
Figure 17: Earnings sensitivity to forex and nonferrous metal prices
FY3/13 Sensitivity
Cu Ni Gold Zn Pb FX
($100/t) (10¢/lb) $10/Toz $100/t $100/t \1/$
Mitsui M&S RP 132 800 100 200
Mitsubishi Mtrls RP 2,646 200
SMM RP 1,000 900 400 1,100
DOWA OP 30 260 340
Pacific Mtls OP 440 500
Toho Zinc OP 550 300 170
vs. FY3/13 CoE
Mitsui M&S RP 1.1% 6.7% 0.8% 1.7%
Mitsubishi Mtrls RP 3.8% 0.3%
SMM RP 1.1% 0.9% 0.4% 1.2%
DOWA OP 0.1% 1.1% 1.4%
Pacific Mtls OP 12.5% 14.2%
Toho Zinc OP 23.9% 13.0% 7.4% Source: Company data, Credit Suisse estimates

09 April 2013
Steel & Non Ferrous Metals 9
Figure 18: Electricity rate hike affects specialty steels and nonferrous metal smelters
0 1,000 2,000 3,000
Toho Zinc
Mitsui Mining & Smelting
Tokyo Tekko
Toho Titanium
Mitsubishi Materials
Yamato Kogyo
Tokyo Steel
Kyoei Steel
Osaka Steel
Godo Steel
Sumitomo Metal Mining
Pacific Metals
DOWA Holdings
Osaka Titanium Technologies
Sanyo Special Steel
0% 100% 200% 300%
ΔElec. Cost
ΔElec. Cost / CoE OP, FY12
(JPY mn)
Source: Company data, Credit Suisse estimates

09 April 2013
Steel & Non Ferrous Metals 10
Companies Mentioned (Price as of 08-Apr-2013)
Daiseki (9793.T, ¥1,624) Aichi Steel (5482.T, ¥386) Daido Steel (5471.T, ¥530) Dowa Holdings (5714.T, ¥723) JFE Holdings (5411.T, ¥1,869) Kansai Electric Power (9503.T, ¥912) Kobe Steel (5406.T, ¥118) Kyoei Steel (5440.T, ¥1,730) Maruichi Steel Tube (5463.T, ¥2,281) Mitsubishi Materials (5711.T, ¥264) Mitsui Mining & Smelting (5706.T, ¥222) Nippon Steel & Sumitomo Metal (5401.T, ¥233) Osaka Titanium Technologies (5726.T, ¥1,830) Pacific Metals (5541.T, ¥481) SSS (5481.T, ¥344) Sumitomo Electric Industries (5802.T, ¥1,235) Sumitomo Metal Mining (5713.T, ¥1,285) Toho Titanium (5727.T, ¥781) Toho Zinc (5707.T, ¥368) Tohoku Electric Power (9506.T, ¥756) Tokyo Steel Mfg. (5423.T, ¥414) Yamato Kogyo (5444.T, ¥2,763)
Disclosure Appendix
Important Global Disclosures
Shinya Yamada and Kazumasa Okumoto, each certify, with respect to the companies or securities that the individual analyzes, that (1) the views expressed in this report accurately reflect his or her personal views about all of the subject companies and securities and (2) no part of his or her compensation was, is or will be directly or indirectly related to the specific recommendations or views expressed in this report.
The analyst(s) responsible for preparing this research report received Compensation that is based upon various factors including Credit Suisse's total revenues, a portion of which are generated by Credit Suisse's investment banking activities
As of December 10, 2012 Analysts’ stock rating are defined as follows:
Outperform (O) : The stock’s total return is expected to outperform the relevant benchmark*over the next 12 months.
Neutral (N) : The stock’s total return is expected to be in line with the relevant benchmark* over the next 12 months.
Underperform (U) : The stock’s total return is expected to underperform the relevant benchmark* over the next 12 months.
*Relevant benchmark by region: As of 10th December 2012, Japanese ratings are based on a stock’s total return relative to the analyst's cover age universe which consists of all companies covered by the analyst within the relevant sector, with Outperforms representing the m ost attractive, Neutrals the less attractive, and Underperforms the least attractive investment opportunities. As of 2nd October 2012, U.S. and Canadian as well as European ra tings are based on a stock’s total return relative to the analyst's coverage universe which consists of all companies covered by the analyst within the relevant sector, with Outperforms representing the most attractive, Neutrals the less attractive, and Underperforms the least attractive investment opportunities. For Latin Ame rican and non-Japan Asia stocks, ratings are based on a stock’s total return relative to the average total return of the relevant country or regional benchmark; Austr alia, New Zealand are, and prior to 2nd October 2012 U.S. and Canadian ratings were based on (1) a stock’s absolute total return potential to its current share price and (2) the relative attractiveness of a stock’s total return potential within an analyst’s coverage universe. For Australian and New Zealand stocks, 12 -month rolling yield is incorporated in the absolute total return calculation and a 15% and a 7.5% threshold replace the 10-15% level in the Outperform and Underperform stock rating definitions, respectively. The 15% and 7.5% thresholds replace the +10-15% and -10-15% levels in the Neutral stock rating definition, respectively. Prior to 10th December 2012, Japanese ratings were based on a stock’s total return relative to the average total return of the relevant country or regional benchmark.
Restricted (R) : In certain circumstances, Credit Suisse policy and/or applicable law and regulations preclude certain types of communications, including an investment recommendation, during the course of Credit Suisse's engagement in an investment banking transaction and in certain other circumstances.
Volatility Indicator [V] : A stock is defined as volatile if the stock price has moved up or down by 20% or more in a month in at least 8 of the past 24 months or the analyst expects significant volatility going forward.
Analysts’ sector weightings are distinct from analysts’ stock ratings and are based on the analyst’s expectations for the fundamentals and/or valuation of the sector* relative to the group’s historic fundamentals and/or valuation:
Overweight : The analyst’s expectation for the sector’s fundamentals and/or valuation is favorable over the next 12 months.
Market Weight : The analyst’s expectation for the sector’s fundamentals and/or valuation is neutral over the next 12 months.
Underweight : The analyst’s expectation for the sector’s fundamentals and/or valuation is cautious over the next 12 months.
*An analyst’s coverage sector consists of all companies covered by the analyst within the relevant sector. An analyst may cov er multiple sectors.
09 April 2013
Steel & Non Ferrous Metals 11
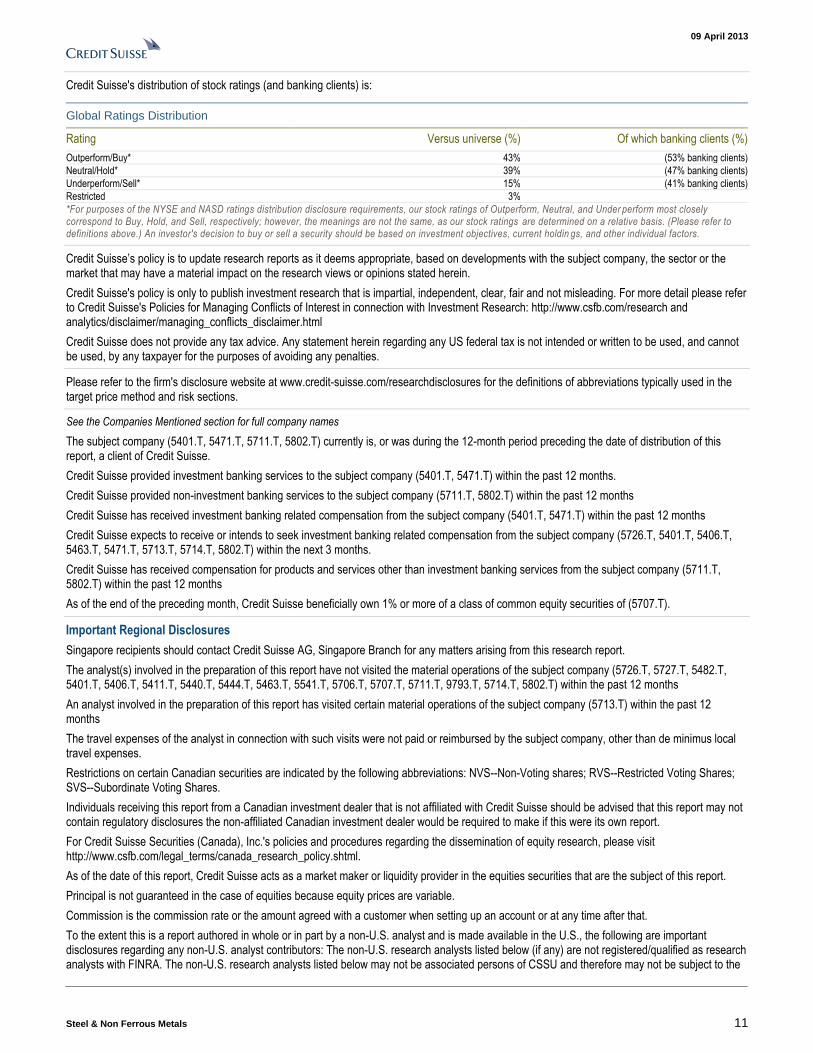
Credit Suisse's distribution of stock ratings (and banking clients) is:
Global Ratings Distribution
Rating Versus universe (%) Of which banking clients (%)
Outperform/Buy* 43% (53% banking clients)
Neutral/Hold* 39% (47% banking clients)
Underperform/Sell* 15% (41% banking clients)
Restricted 3%
*For purposes of the NYSE and NASD ratings distribution disclosure requirements, our stock ratings of Outperform, Neutral, and Under perform most closely correspond to Buy, Hold, and Sell, respectively; however, the meanings are not the same, as our stock ratings are determined on a relative basis. (Please refer to definitions above.) An investor's decision to buy or sell a security should be based on investment objectives, current holdin gs, and other individual factors.
Credit Suisse’s policy is to update research reports as it deems appropriate, based on developments with the subject company, the sector or the market that may have a material impact on the research views or opinions stated herein.
Credit Suisse's policy is only to publish investment research that is impartial, independent, clear, fair and not misleading. For more detail please refer to Credit Suisse's Policies for Managing Conflicts of Interest in connection with Investment Research: http://www.csfb.com/research and analytics/disclaimer/managing_conflicts_disclaimer.html
Credit Suisse does not provide any tax advice. Any statement herein regarding any US federal tax is not intended or written to be used, and cannot be used, by any taxpayer for the purposes of avoiding any penalties.
Please refer to the firm's disclosure website at www.credit-suisse.com/researchdisclosures for the definitions of abbreviations typically used in the target price method and risk sections.
See the Companies Mentioned section for full company names
The subject company (5401.T, 5471.T, 5711.T, 5802.T) currently is, or was during the 12-month period preceding the date of distribution of this report, a client of Credit Suisse.
Credit Suisse provided investment banking services to the subject company (5401.T, 5471.T) within the past 12 months.
Credit Suisse provided non-investment banking services to the subject company (5711.T, 5802.T) within the past 12 months
Credit Suisse has received investment banking related compensation from the subject company (5401.T, 5471.T) within the past 12 months
Credit Suisse expects to receive or intends to seek investment banking related compensation from the subject company (5726.T, 5401.T, 5406.T, 5463.T, 5471.T, 5713.T, 5714.T, 5802.T) within the next 3 months.
Credit Suisse has received compensation for products and services other than investment banking services from the subject company (5711.T, 5802.T) within the past 12 months
As of the end of the preceding month, Credit Suisse beneficially own 1% or more of a class of common equity securities of (5707.T).
Important Regional Disclosures
Singapore recipients should contact Credit Suisse AG, Singapore Branch for any matters arising from this research report.
The analyst(s) involved in the preparation of this report have not visited the material operations of the subject company (5726.T, 5727.T, 5482.T, 5401.T, 5406.T, 5411.T, 5440.T, 5444.T, 5463.T, 5541.T, 5706.T, 5707.T, 5711.T, 9793.T, 5714.T, 5802.T) within the past 12 months
An analyst involved in the preparation of this report has visited certain material operations of the subject company (5713.T) within the past 12 months
The travel expenses of the analyst in connection with such visits were not paid or reimbursed by the subject company, other than de minimus local travel expenses.
Restrictions on certain Canadian securities are indicated by the following abbreviations: NVS--Non-Voting shares; RVS--Restricted Voting Shares; SVS--Subordinate Voting Shares.
Individuals receiving this report from a Canadian investment dealer that is not affiliated with Credit Suisse should be advised that this report may not contain regulatory disclosures the non-affiliated Canadian investment dealer would be required to make if this were its own report.
For Credit Suisse Securities (Canada), Inc.'s policies and procedures regarding the dissemination of equity research, please visit http://www.csfb.com/legal_terms/canada_research_policy.shtml.
As of the date of this report, Credit Suisse acts as a market maker or liquidity provider in the equities securities that are the subject of this report.
Principal is not guaranteed in the case of equities because equity prices are variable.
Commission is the commission rate or the amount agreed with a customer when setting up an account or at any time after that.
To the extent this is a report authored in whole or in part by a non-U.S. analyst and is made available in the U.S., the following are important disclosures regarding any non-U.S. analyst contributors: The non-U.S. research analysts listed below (if any) are not registered/qualified as research analysts with FINRA. The non-U.S. research analysts listed below may not be associated persons of CSSU and therefore may not be subject to the

09 April 2013
Steel & Non Ferrous Metals 12
NASD Rule 2711 and NYSE Rule 472 restrictions on communications with a subject company, public appearances and trading securities held by a research analyst account.
Credit Suisse Securities (Japan) Limited ..................................................................................................... Shinya Yamada ; Kazumasa Okumoto
For Credit Suisse disclosure information on other companies mentioned in this report, please visit the website at www.credit-suisse.com/researchdisclosures or call +1 (877) 291-2683.

09 April 2013
Steel & Non Ferrous Metals 13
References in this report to Credit Suisse include all of the subsidiaries and affiliates of Credit Suisse operating under its investment banking division. For more information on our structure, please use the following link: https://www.credit-suisse.com/who_we_are/en/.This report may contain material that is not directed to, or intended for distribution to or use by, any person or entity who is a citizen or resident of or located in any locality, state, country or other jurisdiction where such distribution, publication, availability or use would be contrary to law or regulation or which would subject Credit Suisse AG or its affiliates ("CS") to any registration or licensing requirement within such jurisdiction. All material presented in this report, unless specifically indicated otherwise, is under copyright to CS. None of the material, nor its content, nor any copy of it, may be altered in any way, transmitted to, copied or distributed to any other party, without the prior express written permission of CS. All trademarks, service marks and logos used in this report are trademarks or service marks or registered trademarks or service marks of CS or its affiliates. The information, tools and material presented in this report are provided to you for information purposes only and are not to be used or considered as an offer or the solicitation of an offer to sell or to buy or subscribe for securities or other financial instruments. CS may not have taken any steps to ensure that the securities referred to in this report are suitable for any particular investor. CS will not treat recipients of this report as its customers by virtue of their receiving this report. The investments and services contained or referred to in this report may not be suitable for you and it is recommended that you consult an independent investment advisor if you are in doubt about such investments or investment services. Nothing in this report constitutes investment, legal, accounting or tax advice, or a representation that any investment or strategy is suitable or appropriate to your individual circumstances, or otherwise constitutes a personal recommendation to you. CS does not advise on the tax consequences of investments and you are advised to contact an independent tax adviser. Please note in particular that the bases and levels of taxation may change. Information and opinions presented in this report have been obtained or derived from sources believed by CS to be reliable, but CS makes no representation as to their accuracy or completeness. CS accepts no liability for loss arising from the use of the material presented in this report, except that this exclusion of liability does not apply to the extent that such liability arises under specific statutes or regulations applicable to CS. This report is not to be relied upon in substitution for the exercise of independent judgment. CS may have issued, and may in the future issue, other communications that are inconsistent with, and reach different conclusions from, the information presented in this report. Those communications reflect the different assumptions, views and analytical methods of the analysts who prepared them and CS is under no obligation to ensure that such other communications are brought to the attention of any recipient of this report. CS may, to the extent permitted by law, participate or invest in financing transactions with the issuer(s) of the securities referred to in this report, perform services for or solicit business from such issuers, and/or have a position or holding, or other material interest, or effect transactions, in such securities or options thereon, or other investments related thereto. In addition, it may make markets in the securities mentioned in the material presented in this report. CS may have, within the last three years, served as manager or co-manager of a public offering of securities for, or currently may make a primary market in issues of, any or all of the entities mentioned in this report or may be providing, or have provided within the previous 12 months, significant advice or investment services in relation to the investment concerned or a related investment. Additional information is, subject to duties of confidentiality, available on request. Some investments referred to in this report will be offered solely by a single entity and in the case of some investments solely by CS, or an associate of CS or CS may be the only market maker in such investments. Past performance should not be taken as an indication or guarantee of future performance, and no representation or warranty, express or implied, is made regarding future performance. Information, opinions and estimates contained in this report reflect a judgment at its original date of publication by CS and are subject to change without notice. The price, value of and income from any of the securities or financial instruments mentioned in this report can fall as well as rise. The value of securities and financial instruments is subject to exchange rate fluctuation that may have a positive or adverse effect on the price or income of such securities or financial instruments. Investors in securities such as ADR's, the values of which are influenced by currency volatility, effectively assume this risk. Structured securities are complex instruments, typically involve a high degree of risk and are intended for sale only to sophisticated investors who are capable of understanding and assuming the risks involved. The market value of any structured security may be affected by changes in economic, financial and political factors (including, but not limited to, spot and forward interest and exchange rates), time to maturity, market conditions and volatility, and the credit quality of any issuer or reference issuer. Any investor interested in purchasing a structured product should conduct their own investigation and analysis of the product and consult with their own professional advisers as to the risks involved in making such a purchase. Some investments discussed in this report may have a high level of volatility. High volatility investments may experience sudden and large falls in their value causing losses when that investment is realised. Those losses may equal your original investment. Indeed, in the case of some investments the potential losses may exceed the amount of initial investment and, in such circumstances, you may be required to pay more money to support those losses. Income yields from investments may fluctuate and, in consequence, initial capital paid to make the investment may be used as part of that income yield. Some investments may not be readily realisable and it may be difficult to sell or realise those investments, similarly it may prove difficult for you to obtain reliable information about the value, or risks, to which such an investment is exposed. This report may provide the addresses of, or contain hyperlinks to, websites. Except to the extent to which the report refers to website material of CS, CS has not reviewed any such site and takes no responsibility for the content contained therein. Such address or hyperlink (including addresses or hyperlinks to CS's own website material) is provided solely for your convenience and information and the content of any such website does not in any way form part of this document. Accessing such website or following such link through this report or CS's website shall be at your own risk. This report is issued and distributed in Europe (except Switzerland) by Credit Suisse Securities (Europe) Limited, One Cabot Square, London E14 4QJ, England, which is regulated in the United Kingdom by The Financial Services Authority ("FSA"). This report is being distributed in Germany by Credit Suisse Securities (Europe) This report is being distributed in the United States and Canada by Credit Suisse Securities (USA) LLC; in Switzerland by Credit Suisse AG; in Brazil by Banco de Investimentos Credit Suisse (Brasil) S.A or its affiliates; in Mexico by Banco Credit Suisse (México), S.A. (transactions related to the securities mentioned in this report will only be effected in compliance with applicable regulation); in Japan by Credit Suisse Securities (Japan) Limited, Financial Instruments Firm, Director-General of Kanto Local Finance Bureau (Kinsho) No. 66, a member of Japan Securities Dealers Association, The Financial Futures Association of Japan, Japan Investment Advisers Association, Type II Financial Instruments Firms Association; elsewhere in Asia/ Pacific by whichever of the following is the appropriately authorised entity in the relevant jurisdiction: Credit Suisse (Hong Kong) Limited, Credit Suisse Equities (Australia) Limited, Credit Suisse Securities (Thailand) Limited, Credit Suisse Securities (Malaysia) Sdn Bhd, Credit Suisse AG, Singapore Branch, Credit Suisse Securities (India) Private Limited regulated by the Securities and Exchange Board of India (registration Nos. INB230970637; INF230970637; INB010970631; INF010970631), having registered address at 9th Floor, Ceejay House, Dr.A.B. Road, Worli, Mumbai - 18, India, T- +91-22 6777 3777, Credit Suisse Securities (Europe) Limited, Seoul Branch, Credit Suisse AG, Taipei Securities Branch, PT Credit Suisse Securities Indonesia, Credit Suisse Securities (Philippines ) Inc., and elsewhere in the world by the relevant authorised affiliate of the above. Research on Taiwanese securities produced by Credit Suisse AG, Taipei Securities Branch has been prepared by a registered Senior Business Person. Research provided to residents of Malaysia is authorised by the Head of Research for Credit Suisse Securities (Malaysia) Sdn Bhd, to whom they should direct any queries on +603 2723 2020. This research may not conform to Canadian disclosure requirements. In jurisdictions where CS is not already registered or licensed to trade in securities, transactions will only be effected in accordance with applicable securities legislation, which will vary from jurisdiction to jurisdiction and may require that the trade be made in accordance with applicable exemptions from registration or licensing requirements. Non-U.S. customers wishing to effect a transaction should contact a CS entity in their local jurisdiction unless governing law permits otherwise. U.S. customers wishing to effect a transaction should do so only by contacting a representative at Credit Suisse Securities (USA) LLC in the U.S. Please note that this research was originally prepared and issued by CS for distribution to their market professional and institutional investor customers. Recipients who are not market professional or institutional investor customers of CS should seek the advice of their independent financial advisor prior to taking any investment decision based on this report or for any necessary explanation of its contents. This research may relate to investments or services of a person outside of the UK or to other matters which are not regulated by the FSA or in respect of which the protections of the FSA for private customers and/or the UK compensation scheme may not be available, and further details as to where this may be the case are available upon request in respect of this report. CS may provide various services to US municipal entities or obligated persons ("municipalities"), including suggesting individual transactions or trades and entering into such transactions. Any services CS provides to municipalities are not viewed as "advice" within the meaning of Section 975 of the Dodd-Frank Wall Street Reform and Consumer Protection Act. CS is providing any such services and related information solely on an arm's length basis and not as an advisor or fiduciary to the municipality. In connection with the provision of the any such services, there is no agreement, direct or indirect, between any municipality (including the officials, management, employees or agents thereof) and CS for CS to provide advice to the municipality. Municipalities should consult with their financial, accounting and legal advisors regarding any such services provided by CS. In addition, CS is not acting for direct or indirect compensation to solicit the municipality on behalf of an unaffiliated broker, dealer, municipal securities dealer, municipal advisor, or investment adviser for the purpose of obtaining or retaining an engagement by the municipality for or in connection with Municipal Financial Products, the issuance of municipal securities, or of an investment adviser to provide investment advisory services to or on behalf of the municipality. If this report is being distributed by a financial institution other than Credit Suisse AG, or its affiliates, that financial institution is solely responsible for distribution. Clients of that institution should contact that institution to effect a transaction in the securities mentioned in this report or require further information. This report does not constitute investment advice by Credit Suisse to the clients of the distributing financial institution, and neither Credit Suisse AG, its affiliates, and their respective officers, directors and employees accept any liability whatsoever for any direct or consequential loss arising from their use of this report or its content. Principal is not guaranteed. Commission is the commission rate or the amount agreed with a customer when setting up an account or at any time after that.
Copyright © 2013 CREDIT SUISSE AG and/or its affiliates. All rights reserved.
Investment principal on bonds can be eroded depending on sale price or market price. In addition, there are bonds on which investment principal can be eroded due to changes in redemption amounts. Care is required when investing in such instruments.
When you purchase non-listed Japanese fixed income securities (Japanese government bonds, Japanese municipal bonds, Japanese government guaranteed bonds, Japanese corporate bonds) from CS as a seller, you will be requested to pay the purchase price only.
steel_sector_20130409_E.doc