
India Telecoms Sector - Credit Suisse
70
DISCLOSURE APPENDIX CONTAINS ANALYST CERTIFICATIONS AND THE STATUS OF NON-US ANALYSTS. U.S. Disclosure: Credit Suisse does and seeks to do business with companies covered in its research reports. As a result, investors should be aware that the Firm may have a conflict of interest that could affect the objectivity of this report. Investors should consider this report as only a single factor in making their investment decision. CREDIT SUISSE SECURITIES RESEARCH & ANALYTICS BEYOND INFORMATION™ Client-Driven Solutions, Insights, and Access 21 August 2012 Asia Pacific Equity Research Telecommunication Services India Telecoms Sector DOWNGRADE RATING LTE in India: Piecing together RIL's strategy Figure 1: Bharti stock looks expensive at 1.1x EV/IC, with RoIC likely to stay significantly below WACC (even after three years) 0.0% 5.0% 10.0% 15.0% 20.0% 25.0% 30.0% - 1 2 3 4 5 6 Mar-04 Mar-05 Mar-06 Mar-07 Mar-08 Mar-09 Mar-10 Mar-11 Mar-12 Bharti EV/IC (LHS) Bharti 12M fwd ROIC(RHS) Source: Company data, Credit Suisse estimates ■ We downgrade Bharti to UNDERPERFORM. Despite the recent sharp correction in Bharti’s stock price, we believe that risks from key events over the next 12 months are not fully understood or appreciated by the street. In particular, 2G spectrum auctions over the next four to six months and RIL Infotel’s launch over the next 12 months pose significant risks to the business models of incumbent telcos. ■ Stepping into RIL Infotel’s shoes. Our analysis shows that a data + voice strategy could make a lot more sense for RIL Infotel than just a pure data strategy. In addition, its voice economics (on regular 2G, not VoIP) could be far superior compared to those of other pure voice new entrants (no need for price discounting). The key hurdle for the company is the device ecosystem—manifested in the device price upon launch. In our analysis, at a 12% WACC, RIL Infotel is in the game if it manages to negotiate a TDD- LTE handset price less than US$150 by next year (challenging but not impossible) and potentially stands to gain a significant share of industry revenues (this is not yet built into our telco models). ■ Do not expect easy 2G auction. This raises the possibility of RIL Infotel participating in the upcoming 2G auction. It does not help that the Indian telecoms industry is among the most spectrum-starved in the world. This increases the likelihood of auctions succeeding, and we thus build an additional Rs40 impact from regulatory issues into our Bharti target price (in addition to the Rs25 already in), taking it to Rs220 (16% potential downside). Similarly, our target price for Idea goes down to Rs55 (25% potential downside). Research Analysts Sunil Tirumalai 91 22 6777 3714 [email protected] Chunky Shah 91 22 6777 3872 [email protected]
-
Upload
khangminh22 -
Category
Documents
-
view
0 -
download
0
Transcript of India Telecoms Sector - Credit Suisse

DISCLOSURE APPENDIX CONTAINS ANALYST CERTIFICATIONS AND THE STATUS OF NON-US ANALYSTS. U.S. Disclosure: Credit Suisse does and seeks to do business with companies covered in its research reports. As a result, investors should be aware that the Firm may have a conflict of interest that could affect the objectivity of this report. Investors should consider this report as only a single factor in making their investment decision.
CREDIT SUISSE SECURITIES RESEARCH & ANALYTICS BEYOND INFORMATION™
Client-Driven Solutions, Insights, and Access
21 August 2012
Asia Pacific
Equity Research
Telecommunication Services
India Telecoms Sector DOWNGRADE RATING
LTE in India: Piecing together RIL's strategy
Figure 1: Bharti stock looks expensive at 1.1x EV/IC, with RoIC likely to stay
significantly below WACC (even after three years)
0.0%
5.0%
10.0%
15.0%
20.0%
25.0%
30.0%
-
1
2
3
4
5
6
Mar-04 Mar-05 Mar-06 Mar-07 Mar-08 Mar-09 Mar-10 Mar-11 Mar-12
Bharti EV/IC (LHS) Bharti 12M fwd ROIC(RHS) Source: Company data, Credit Suisse estimates
■ We downgrade Bharti to UNDERPERFORM. Despite the recent sharp
correction in Bharti’s stock price, we believe that risks from key events over
the next 12 months are not fully understood or appreciated by the street. In
particular, 2G spectrum auctions over the next four to six months and RIL
Infotel’s launch over the next 12 months pose significant risks to the
business models of incumbent telcos.
■ Stepping into RIL Infotel’s shoes. Our analysis shows that a data + voice
strategy could make a lot more sense for RIL Infotel than just a pure data
strategy. In addition, its voice economics (on regular 2G, not VoIP) could be
far superior compared to those of other pure voice new entrants (no need for
price discounting). The key hurdle for the company is the device
ecosystem—manifested in the device price upon launch. In our analysis, at
a 12% WACC, RIL Infotel is in the game if it manages to negotiate a TDD-
LTE handset price less than US$150 by next year (challenging but not
impossible) and potentially stands to gain a significant share of industry
revenues (this is not yet built into our telco models).
■ Do not expect easy 2G auction. This raises the possibility of RIL Infotel
participating in the upcoming 2G auction. It does not help that the Indian
telecoms industry is among the most spectrum-starved in the world. This
increases the likelihood of auctions succeeding, and we thus build an
additional Rs40 impact from regulatory issues into our Bharti target price (in
addition to the Rs25 already in), taking it to Rs220 (16% potential downside).
Similarly, our target price for Idea goes down to Rs55 (25% potential
downside).
Research Analysts
Sunil Tirumalai
91 22 6777 3714
Chunky Shah
91 22 6777 3872

21 August 2012
India Telecoms Sector 2
Focus charts and table Figure 2: In a spectrum-starved environment, a well-capitalised entrant is bound to push up spectrum prices
Spectrum allocations to telecom industries globally (across all spectrum bands)
-
50
100
150
200
250
300
350
400
450
India Australia UK Singapore Germany China US
MHz of Spectrum
BSNL/MTNL
Note: The stacks in each column represent allocation to different operators (except US –see inside for details);Source: Respective country
regulators, Credit Suisse estimates
Figure 3: RIL Infotel data + voice business—NPV sensitivity to handset price assumption
Base case
Selling price of handset in 2013 (US$) 136 105 115 125 135 145 155 165 175
Cut-off voice ARPU for affordability FY3/14 (Rs) 628 510 549 588 615 656 698 743 773
Addressable revenue market FY3/14 (US$ mn) 7,498 12,202 10,411 8,849 7,926 6,704 5,658 4,767 4,250
Addressable revenue market FY3/20(US$ mn) 27,142 33,017 30,137 28,759 27,142 24,967 23,539 22,437 20,565
RIL Infotel revenues FY3/20 (US$ mn) 7,664 9,552 8,724 8,334 7,664 7,241 6,656 6,347 5,968
RIL Infotel revenue market share FY3/20 (%) 14.7 18.3 16.7 16.0 14.7 13.9 12.8 12.2 11.4
EBITDA margins FY3/20 (%) 29.6 31.3 30.6 30.3 29.6 29.0 28.2 28.2 27.4
NPV (US$ mn) @ 12% WACC 971 3,239 2,317 1,648 965 338 (324) (914) (1,468)
RoCE FY3/20 (%) 21.1 24.4 23.0 22.4 21.0 20.2 18.8 18.6 17.5
Source: Credit Suisse estimates
Figure 4: LTE handset prices for RIL Infotel to have an
NPV +ve business case at various internal hurdle rates
Figure 5: Bharti: P/B of 1.8x looks expensive for RoE of
sub-10%
100
120
140
160
180
200
220
9.0% 9.4% 9.8% 10.2% 10.6% 11.0% 11.4% 11.8% 12.2% 12.6% 13.0% 13.4% 13.8%
RIL Infotel WACC
20
13
T
DD
-L
TE
Ha
nd
set
Pri
ce (
US
$)
0.0%
5.0%
10.0%
15.0%
20.0%
25.0%
30.0%
35.0%
40.0%
-
2
4
6
8
Jan-05 Jan-06 Jan-07 Jan-08 Jan-09 Jan-10 Jan-11 Jan-12
Bharti P/B (LHS) Bharti 12-month forward RoE (RHS)
Source: Bloomberg, Company data, Credit Suisse estimates Source: Bloomberg, Company data, Credit Suisse estimates

21 August 2012
India Telecoms Sector 3
LTE in India: Piecing together RIL’s strategy Expect fierce bidding in auctions—and no end to
competition
A key takeaway from our analysis in this report is that the threat from RIL Infotel may not
be restricted to the data business alone, but may even impact core voice businesses of
incumbent telcos. While over the longer term this means the competitive intensity could
remain high with a well-capitalised new entrant in the sector, the short-term impact could
be felt in spectrum auctions, with a likely participation of RIL Infotel. The India telecoms
sector is already in an extremely spectrum-starved situation compared to telcos across the
world. The entry of a large, well-capitalised player with a significant differentiator only
increases the likelihood of auction prices being bid up aggressively. We thus build an
additional Rs40 impact from spectrum-related issues into our target price for Bharti (total
regulatory hit Rs65, taking the target price to Rs220, with 16% potential downside).
In addition, we believe any hopes of a tariff increase post the auctions could prove utopian,
due to the high price elasticity in the subscriber base and given that a large part of the
spectrum burden is going to be felt by incumbents, rather than marginal players, in the
near term. We downgrade Bharti to UNDERPERFORM.
What can RIL Infotel achieve in Indian telecom?
With the technological barriers for RIL Infotel’s entry into the telecoms sector falling one-
by-one, what remains is the commercial barrier (manifested by high device price points).
With the visibility for RIL Infotel’s launch increasing, we try to answer the above question
looking at technical and commercial aspects (in consultation with equipment vendors).
We believe that RIL Infotel’s telecom strategy will be contrary to conventional thinking. A
data-only LTE strategy (as is popularly expected) could lead to a small addressable
market (~US$750 mn revenues)—not enough to build a business case given the
US$2.5 bn paid for spectrum in 2010. However, bundling voice with LTE could help RIL
Infotel achieve the proverbial “2+2>4”. Voice could help expand the addressable market
for LTE manifold (~US$8 bn). At the same time, LTE will offer the voice business a strong
selling point which few other telcos can match—that is, mobile broadband at unmatched
tariffs. In a yet-to-take-off data market, this can be used as a tool to attract customers from
the upper-end of the ARPU ladder, without needing to discount voice tariffs.
In our analysis, RIL Infotel could see an NPV positive business case if it manages to
negotiate LTE handset prices with voice capability (technical details inside) to less than
US$150 by next year (assuming a 12% WACC). At a lower WACC of 10% (likely, given
parent RIL’s strong balance sheet), even a US$190 handset price would suffice.
One ‘G’ to rule them all?
We work with equipment vendors to build network models that can help study the
economics of LTE in India. LTE achieves far greater speeds than any other existing mobile
broadband technology. It is also extremely flexible, in that it can work on a range of
spectrum allocations. However, these feats can be achieved because LTE was designed
from scratch using the best technology—without any historical baggage about being
backward compatible. This means that LTE cannot rely on an existing ecosystem and
customer base in its initial years (leading to high device prices initially). To worsen things
further, Indian LTE networks will be working on a high frequency band (2,300MHz), which
is not as good economically as existing 2G/3G deployments. Thus, a study of the
economics of LTE in India should take a balanced view of all these factors.
RIL Infotel better off and
also targetting voice market;
chances of participation in
auctions high
Bundling voice with LTE
could help RIL Infotel
achieve the proverbial
‘2+2>4’

21 August 2012
India Telecoms Sector 4
Table of contents Focus charts and table 2 LTE in India: Piecing together RIL’s strategy 3
Expect fierce bidding in auctions—and no end to competition 3 What can RIL Infotel achieve in Indian telecom? 3 One ‘G’ to rule them all? 3
Sector valuation summary 5 Chapter I: Expect fierce bidding in auctions—and no end to competition 6
RIL Infotel could potentially disrupt market shares significantly 6 Water is expensive in a desert 6 Chances of passing on spectrum burden to customer are slim 7 Downgrade Bharti to UNDERPERFORM 8 But wait … Bharti’s stock is already at five-year low! 9
Chapter II: What can RIL Infotel achieve in Indian telecom? 11 Data: What advantages does LTE bestow on RIL Infotel? 11 Voice: What can RIL Infotel achieve? 14 Bringing the device price into picture 20 Building a data + voice business case for RIL Infotel 24 Testing the conclusions for key assumptions 29 Could the LTE device ride on the existing phone of the subscriber? 30 Who is investing into the content ecosystem? 31
Chapter III: One ‘G’ to rule them all? 33 Avoiding square plugs and round holes… 33 Telecom world before 3GPP 34 The run-up to LTE: Constantly pushing the speed limits 35 Two roads beyond 3G 37 How does LTE manage higher speeds? 38 1. Cutting through the clutter 39 2. I’m sorry, say that again ... 43 3. Saying a lot more with a few words 44 4. Multiple antennas 50 Performance of LTE vs other data technologies 51 Developing a basic LTE model for the Indian context 53 Microwave as a near-term fix for backhaul? 55 LTE ≠ 4G 57
Bharti Airtel Ltd. (BRTI.BO / BHARTI IN) 58 Returns could stay low for long 58
Idea Cellular Ltd. (IDEA.BO / IDEA IN) 59 Vulnerable to competitive and regulatory risks 59
Appendix 1: RIL data + voice business financials 60 Appendix 2: RIL Infotel data-only (dongle) business model 64 Appendix 3: Calculation of rural coverage requirement for RIL Infotel 65

21 August 2012
India Telecoms Sector 5
Sector valuation summary Figure 6: Regional valuation summary
Close Mkt cap Target Normalised PE EV/EBITDA
20-Aug-12 Ticker Ccy price (US$ bn) Rating price FY3/13 FY3/14 FY3/13 FY3/14
12E 13E 12E 13E
AIS ADVANC TB Bt 210.0 19.8 O 220.0 17.3 15.1 9.9 9.5
AXIATA AXIATA MK RM 6.0 16.2 O 6.4 18.3 17.0 8.2 7.7
Bakrie BTEL IJ Rp 149.0 0.4 U 137.0 n.m. n.m. 8.3 8.0
Bharti BHARTI IN Rs 262.1 20.3 U 220.0 19.9 14.6 6.3 5.1
China Mobile 941 HK HK$ 82.4 213.2 O 101.0 10.9 10.6 4.0 3.7
DiGi DIGI MK RM 5.0 12.4 O 5.0 29.5 21.9 13.0 12.3
Excelcom EXCL IJ Rp 6,650.0 6.0 O 7,650.0 15.2 13.5 6.3 5.7
FarEasTone 4904 TT NT$ 73.3 8.0 O 82.4 20.2 17.2 9.0 8.5
Globe GLO PM P 1,125.0 3.5 O 1,330.0 15.0 13.4 5.6 5.0
IDEA IDEA IN Rs 75.4 4.8 U 55.0 22.8 17.2 5.5 5.0
Indosat ISAT IJ Rp 5,350.0 3.1 O 8,150.0 17.3 13.1 4.3 3.9
LGT 032640 KS W 7,450.0 3.4 U 6,000.0 10.4 8.2 3.9 3.4
Maxis MAXIS MK RM 7.0 16.7 O 8.0 23.6 24.2 13.1 13.4
M1 M1 SP S$ 2.6 1.9 O 3.0 14.9 14.0 8.6 8.1
NTT DoCoMo 9437 JP ¥ 134,400.0 70.1 O 150,000.0 9.9 9.6 2.9 2.8
PT Telkom TLKM IJ Rp 9,800 20.2 O 10,300 15.1 13.8 6.7 6.2
Reliance RCOM IN Rs 55.8 2.4 N 75.0 10.1 5.8 5.3 4.0
SKT 017670 KS W 149,500 10.6 O 201,000 6.4 6.1 3.2 3.1
TNZ TEL NZ A$ 2.7 5.4 U 2.2 14.9 12.9 5.4 5.3
SmarTone 315 HK HK$ 17 2.3 N 18 15.5 13.8 9.5 8.5
StarHub STH SP S$ 3.6 4.9 N 3.6 17.9 16.8 9.3 8.8
TAC DTAC TB Bt 82.3 6.2 O 104.0 17.7 16.2 7.8 7.4
Taiwan Mobile 3045 TT NT$ 109.0 12.4 O 115.0 18.2 15.8 13.3 12.2
Telstra TLS AU A$ 3.7 48.1 N 4.0 12.8 12.6 5.7 5.7
Regional average 13.5 12.4 5.6 5.2
Source: Company data, Credit Suisse estimates
How to read this report: Any report on new technology is bound to be full of technical
concepts, but we have tried to put these in simple terms that are relevant from a
business/financial perspective (and enjoyable to read!). Further, we restrict the technical
details to the third (last) chapter, so that the readers who are in a hurry can get the
investment takeaways from the first two chapters. However, we believe a full
understanding of the financial implications can be had only if one has a good
understanding of the technical details. For interested readers, we recommend reversing
the order, i.e., reading the third chapter first followed by the second and first chapters, in
that order.

21 August 2012
India Telecoms Sector 6
Expect fierce bidding in auctions—and no end to competition Two of the key bull arguments on the regulatory spectrum burden in India are that: (1) the
auction will find no takers and will fail, at recommended prices and (2) even if the auction
succeeds, the industry (in particular, the marginal players) will be so burdened with debt
that the incumbents will have enough room to push through tariff hikes. We disagree with
both these ideas.
A key takeaway from the next chapter will be that the threat from RIL Infotel may not be
restricted to the data business alone, but even impact the core voice business of
incumbent telcos. While over the longer term this means competitive intensity could
remain high with a well-capitalised new entrant in the sector, the short-term impact could
be felt in spectrum auctions, with likely participation from RIL Infotel. The Indian telecom
industry is already in an extremely spectrum-starved situation compared to telcos across
the world. While we have always maintained that the likelihood of the auctions succeeding
at the reserve price is high, the entry of a large, well-capitalised player with a significant
advantage (as will be seen in the next chapter) only increases the likelihood. We thus build
in a higher proportion of impact from spectrum-related issues for Bharti, leading to us to
cut our target price to Rs220 (from Rs260).
In addition, we believe any hopes of a tariff increase post the auction could prove utopian,
due to high price elasticity in the subscriber base and the fact that a large part of the
spectrum burden is going to be felt by incumbents in the near term rather than the
marginal players (thanks to the deferred payment rule).
We downgrade our recommendation on Bharti to UNDERPERFORM on the back of this
target price reduction.
RIL Infotel could potentially disrupt market shares
significantly
The entry of RIL Infotel into the telecom sector through a data + voice strategy should
have two levels of impact on Indian telcos:
■ Over the longer term, RIL Infotel could potentially gain a significant share of industry
revenue market share, denting the market share of incumbents. Thus, while the Bharti
bulls are hoping for reduced competitive intensity from one set of challengers in the
market post auctions, another new challenger could enter the fray leading to sustained
competitive pressure. This impact is not yet in our numbers. This also implies that
Bharti could soon lose the tag of having the ‘strongest balance sheet in Indian
telecom’, and the investor comfort that comes with this.
■ In the near term, however, the impact could be felt in the upcoming 2G auctions. RIL
Infotel would prefer to participate in the auction rather than acquire a company, in our
view (waiting for clarity on M&A rules, in particular on spectrum transfer charges, could
take up precious time). This adds a well-capitalised player to an already spectrum-
starved industry, making it more likely that the auction succeeds and spectrum gets
bid upon aggressively. We build this higher probability into our target price.
The next two chapters are devoted to the potential impact from RIL Infotel in the telecom
sector.
Water is expensive in a desert
Indian telcos operate under an extreme shortage of spectrum (Figure 7). Further, whatever
spectrum is given to the industry in India is fragmented (the stacks in each column in the
The entry of a large, well-
capitalised player with a
significant advantage only
increases the likelihood of
auctions succeeding
Bharti could soon lose the
tag of having the ‘strongest
balance sheet in Indian
telecom’

21 August 2012
India Telecoms Sector 7
chart). It is well known that a fragmented spectrum allocation is inefficient from an overall
industry capacity perspective. In addition, nearly 20% of the spectrum is allocated to state-
run telcos, with the private operators having to work with the remaining. The upcoming
spectrum auctions are not going to increase the spectrum allocation, but will only
redistribute spectrum holdings among existing/new operators.
Thus, we believe that all the noise around the reserve price of auctions should become
irrelevant once the auctions begin. The (artificial?) scarcity of spectrum in the country will
ensure this important raw material for the industry is bid for aggressively. In addition, we
also show in this report that RIL Infotel could also benefit from having a 2G spectrum and
running a 2G network.
Figure 7: Spectrum allocations to telecom industries globally (across all spectrum bands)
Note: The stacks in each column represent allocation to different operators
-
50
100
150
200
250
300
350
400
450
India Australia UK Singapore Germany China US
MHz of Spectrum
BSNL/MTNL
Note: (1) Number for India is the average spectrum allocation across 22 circles; (2) Australia: spectrum allocation in Metro regions presented
here; (3) only the total average spectrum across counties presented for the US, since the number of licence holders is high; (4) unpaired
spectrum treated as half paired.
Source: Respective country regulators, Credit Suisse estimates
Chances of passing on spectrum burden to customer
are slim
A lot of hope is being placed on the fact that post the upcoming spectrum auctions, the
industry will be so burdened with debt that the incumbents will have room to push through
tariff hikes. The chart below shows the spectrum-related payouts over the next three years
for the key industry players.
The left part of the chart shows that the payments (as a percentage of current debt) should
be highest for incumbents (Vodafone, Idea, Bharti in that order), while the challengers
(Tata and Aircel) will hardly feel the pinch. This is because incumbents have spectrum
renewals (and the related refarming) coming up in key circles over the next three years,
The entire Indian telecom
industry has less spectrum
than just China Mobile!

21 August 2012
India Telecoms Sector 8
while the challengers are all recent entrants with renewals due over a decade away
[Telenor has already announced it will be bidding in auctions selectively]. Thus, not all
players in the market face the spectrum burden at once—making it difficult for the ones
who do face the burden in the near future (read incumbents) to pass on the cost to
customers.
Further, if the challengers choose not to buy any ‘new’ spectrum in the auctions, there is
no material change to their financial health. We also show the impact on challengers’
gross debt levels if they choose to participate in auctions to pick up additional ‘new’
spectrum blocks in select circles.
Figure 8: Next three years’ spectrum payouts as a % of current debt
0.0%
5.0%
10.0%
15.0%
20.0%
25.0%
30.0%
Bharti Idea Vodafone Uninor Tata Aircel RCom MTNL/BSNL Tata Aircel Tata Aircel Tata
Reta
in 9
00
MH
z
Reta
in 9
00 M
Hz
Retain 900 MHz
Rene
wal
Rene
wal
Canc
elle
d
Cancelled
Renewal
2 bl
ocks
in le
adin
g ci
rcle
s
2 blocks in leading circles
2 bl
ocks
in a
ll ci
rcle
s
2 bl
ocks
in a
ll ci
rcle
s
6.8%
8.2%
1.0%
7.9%
1.5%
0.2%
23.7%
4.8%
10.7%
Del
hi C
ircle
(new
)
5.2%
Discretionary biddingMandatory payments
Spectrum payouts as % of current gross debt
0%
Canc
elle
d(9
cir
cles
)
0%
21.9%
Note: Payments calculated based on Cabinet reserve price.
Source: Company data, Credit Suisse estimates
In addition, we have earlier highlighted that the price points of a voice call in India are not
really cheap—considering the low income levels in the country (for details, see our report
What are the risks to growth expectations?, 23 February 2012). Thus, elasticity to voice
tariffs are likely to be high in India, and any increase in tariffs could meet with a drop in
usage, leading to a negligible transfer of the burden to subscribers.
Downgrade Bharti to UNDERPERFORM
We make no changes to our estimates (despite having a reasonable case to cut longer
term forecasts due to RIL Infotel’s threat discussed above), and are thus leaving the DCF
value of the core business unchanged at Rs285 (implying 5.6x FY3/13 EV/EBITDA).
For the past eight months, we have built in only a Rs25 impact from regulatory issues (a
37% probability of the full impact on the cabinet reserve price, 33% on the old TRAI
reserve price), into Bharti’s target price. Following the above discussion, we see the
Not all players in the market
face the spectrum burden at
once

21 August 2012
India Telecoms Sector 9
likelihood of auctions succeeding as being high, and the chances of the burden being
passed onto customers low. We thus take an additional Rs40 impact into our Bharti target
price (implying ~100% impact from regulatory issues on the reserve price). With no other
changes to business estimates, this brings down our target price to Rs220, implying 16%
potential downside to current levels. Similarly, our target price for Idea Cellular goes down
to Rs55 (the Rs85 core business value unchanged, but the regulatory impact increased by
Rs10 to Rs30). We reiterate that these target price changes do not build in the potential
long-term market share disruption from RIL Infotel’s entry, but only the impact on spectrum
auctions. We downgrade our recommendation on Bharti to UNDERPERFORM from
Neutral.
But wait … Bharti’s stock is already at five-year low!
Bharti stock’s recent sharp fall has taken the price close to multi-year lows—making the
stock price appear attractive.
Figure 9: Bharti stock price is at multi-year low Figure 10: Stock trading at lower end of historical
valuations
100
200
300
400
500
Jan-05 Jan-06 Jan-07 Jan-08 Jan-09 Jan-10 Jan-11 Jan-12
Bharti stock price (Rs)
10
14
18
22
26
30
Jan-05 Nov-05 Sep-06 Jul-07 May-08 Mar-09 Jan-10 Nov-10 Sep-11 Jul-12
Source: Bloomberg Source: Company data, Credit Suisse estimates
However, we believe that the low valuation is for a reason. The returns from the business
have fallen off significantly over the past three years—both in terms of RoE and RoIC as
seen below. Seen this way, the stock does not appear cheap. In fact, we would argue that
with an RoIC of less than 9% even three years from now against a WACC of 12% (used in
our DCF), the EV/IC of 1.1x actually looks expensive! The same holds for a P/B of 1.8x
versus an RoE of sub-10%.
Figure 11: Bharti RoIC is at all-time low— justifying a low
EV/IC
Figure 12: The same holds true for RoE and P/B
0.0%
5.0%
10.0%
15.0%
20.0%
25.0%
30.0%
-
1
2
3
4
5
6
Mar-04 Mar-05 Mar-06 Mar-07 Mar-08 Mar-09 Mar-10 Mar-11 Mar-12
Bharti EV/IC (LHS) Bharti 12M fwd ROIC(RHS)
0.0%
5.0%
10.0%
15.0%
20.0%
25.0%
30.0%
35.0%
40.0%
-
2
4
6
8
Jan-05 Jan-06 Jan-07 Jan-08 Jan-09 Jan-10 Jan-11 Jan-12
Bharti P/B (LHS) Bharti 12-month forward RoE (RHS)
Source: Bloomberg, Company data, Credit Suisse estimates Source: Bloomberg, Company data, Credit Suisse estimates
Bharti looks expensive on
EV/IC and P/B given the low
returns

21 August 2012
India Telecoms Sector 10
An important point on the above charts: The RoE and RoIC numbers above do not include
the impact of either spectrum payouts or RIL entry (both of these are only discounts to fair
value in our target price). The real visibility on RoE/RoIC improving near term is thus low,
in our view.
Consensus still bullish?
While consensus estimates have been slashed post poor Jun-12 quarter results for Bharti,
we highlight that the street is still significantly bullish on the stock (with nearly two-thirds
buy-style recommendations). The consensus target price of Rs326 on Bloomberg implies
high EV/EBITDA and P/E multiples of 7x and 25x for Bharti (FY3/13), down to 6.3x and
17x for FY3/14, respectively. We believe there are risks to these valuations due to the
headwinds over the next 12 months as discussed in this report.
Figure 13: Bharti: Street view is still significantly bullish
Buys
66%
Holds
20%
Sells
14%
Source: Bloomberg
Figure 14: Consensus target price implies significantly high multiple for Bharti near-term
FY13 FY14 FY15
Consensus TP (Rs) 326
EV/EBITDA implied by consensus TP and EBITDA estimates 7.2 6.3 5.6
P/E implied by consensus TP and EPS estimates 25 17 14
Source: Bloomberg, Company data

21 August 2012
India Telecoms Sector 11
What can RIL Infotel achieve in Indian telecom? All the technological barriers for RIL Infotel’s entry into the Indian telecom sector are falling
one after another (including multi-mode TDD-LTE handsets this year). What remain are
the commercial barriers of high device price points which will be surpassed with time.
Thus, we believe the time is right to find answers to the above question.
With its 20MHz of BWA spectrum, RIL Infotel’s approach to the Indian telecom market can
be quite different from that of other recent entrants, and also different from what investors
seem to be expecting.
The conventional view is that RIL Infotel will target the data segment and stay away from
the commoditised voice business. However, our calculations show that the addressable
market for such a service could be ~US$750 mn to start with—given current device prices.
Not enough to build a viable business case with the US$2.5 bn paid for spectrum in 2010,
in our view.
However, the situation changes markedly if RIL Infotel also bundles voice along with data.
The key point to note is that this approach for RIL Infotel will be more than just a sum of
disjointed data and voice businesses. Voice will help expand the addressable market for
the data business manifold (to ~US$8 bn according to our estimates). At the same time,
LTE will offer the voice business a strong selling point which few other telcos can match
(in fact, just one other telco in each circle): that is, high speed mobile broadband at
unmatched tariffs. In a nascent data market, this can be used as a tool to attract
customers from the upper-end of the ARPU ladder, without needing to discount voice
tariffs significantly (the opposite of the strategy of recent newcomers in the voice business
who have targeted the bottom end with tariff discounts). Thus, voice economics for RIL
Infotel could be quite different to the economics faced by recent entrants to the sector.
Using a WACC of 12%, we see an NPV positive case for RIL Infotel on voice if it manages
to negotiate LTE handset prices to less than US$150—a level that is challenging, but not
impossible, in our view.
Data: What advantages does LTE bestow on RIL
Infotel?
Conclusion:
LTE can deliver data at a tenth of the cost that 3G can, under Indian conditions.
The key aspiration behind designing LTE, as we shall study later, is to increase the data
capacities of sites with a given amount of spectrum. Our first exercise is to compare the
economics of generating unit data capacity by an Indian LTE operator versus the nearest
competing data technology that is in the market: 3.5G (HSPA). Note that most Indian 3G
operators have already deployed HSPA.
To begin with, we need a comparison of the data-carrying capacities of LTE and HSPA
(under Indian conditions). In the third chapter, we develop concepts which allow us to
compare the results of 3.5G with LTE in Indian settings (see Figure 63), developed in
consultation with equipment vendors (Ericsson, PointRed).
RIL Infotel’s approach to the
telecom sector can be quite
different from current
investor expectations

21 August 2012
India Telecoms Sector 12
Figure 15: LTE can carry 11x more data traffic than 3.5G per site for a similar coverage area
Technology HSPA @ 2,100MHz LTE @ 2,300MHz
Frequency band (MHz) 2,100 2,300
Intersite distance (m) 480 440
Coverage area (sq km) 0.20 0.17
Spectrum allocated (MHz) 5 20
Paired/Unpaired Paired Unpaired
Average throughput per site (Mbps) 6 66
Source: Company data, Credit Suisse estimates
What this implies is that an LTE site of nearly the same coverage area as a 3.5G site has
11x the capacity of a 3.5G site, given Indian spectrum allocations. Next, we consider the
costs of running the site, to get a comparison of running cost-per-unit data capacity
between the two technologies. Note that we consider the recurring network opex as well
as capex depreciation (over 15 years).
Figure 16: LTE can bring down data costs by 90% versus 3.5G
HSPA @ 2,100MHz LTE @ 2,300MHz LTE vs HSPA (x)
Average throughput per site (Mbps) (A) 6 66 11.1
Coverage area (sq km) (B) 0.20 0.17 0.8
Cost of 3-sector site (US$) (including backhaul) 15,000 22,000 1.5
Cost of 3-sector site (Rs) (including backhaul) 825,000 1,210,000
Life of equipment (years) 15 15
Annual depreciation (Rs) (C) 55,000 80,667
Tower rentals + passthrough (Rs/month) 45,000 45,000
Tower rentals + passthrough (Rs/year) (D) 540,000 540,000
Total annual operating cost (Rs) [E = C + D] 595,000 620,667
Annual cost of Mbps capacity (Rs) [F = E / A] 99,167 9,354 0.09
Annual cost of Mbps capacity per sq km (Rs) [G = F / B] 497,719 55,788 0.11
Note: INR/USD = 55; Source: Company data, Credit Suisse estimates
Thus, we note that LTE can beat 3.5G on data costs convincingly, as it can generate unit
capacity at a tenth of the cost required by a 3.5G site. Further, note that the cost of
equipment is a small fraction of the total costs (less than 10%); hence, the results are not
sensitive to variations in equipment prices from what we have assumed in this calculation.
LTE is just too efficient, and Indian LTE spectrum allocation (20MHz unpaired) is far higher
than 3G (5Mhz paired), more than compensating for the small advantage that 3G
operators enjoy on frequency band of operation (2,100MHz versus 2,300MHz).
How do Bharti’s LTE tariffs compare with 3G tariffs?
A look at the LTE (in two cities) and 3G data rates of Bharti shows that the entry-level LTE
plan (999) has half the data tariff per MB of the entry level 3G plans (a similar relationship
holds between the high-end plans on both technologies). This shows that there is
significant scope for the gap between 3G and LTE data tariffs to expand.
21 August 2012
India Telecoms Sector 13
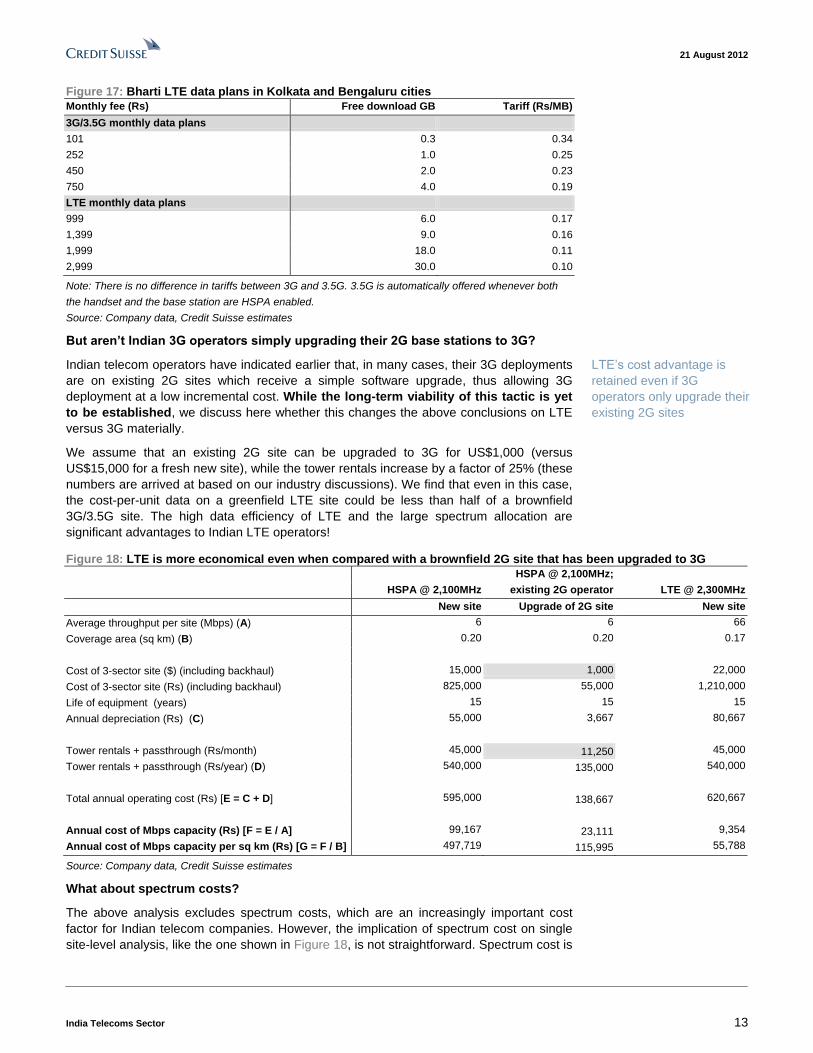
Figure 17: Bharti LTE data plans in Kolkata and Bengaluru cities
Monthly fee (Rs) Free download GB Tariff (Rs/MB)
3G/3.5G monthly data plans
101 0.3 0.34
252 1.0 0.25
450 2.0 0.23
750 4.0 0.19
LTE monthly data plans
999 6.0 0.17
1,399 9.0 0.16
1,999 18.0 0.11
2,999 30.0 0.10
Note: There is no difference in tariffs between 3G and 3.5G. 3.5G is automatically offered whenever both
the handset and the base station are HSPA enabled.
Source: Company data, Credit Suisse estimates
But aren’t Indian 3G operators simply upgrading their 2G base stations to 3G?
Indian telecom operators have indicated earlier that, in many cases, their 3G deployments
are on existing 2G sites which receive a simple software upgrade, thus allowing 3G
deployment at a low incremental cost. While the long-term viability of this tactic is yet
to be established, we discuss here whether this changes the above conclusions on LTE
versus 3G materially.
We assume that an existing 2G site can be upgraded to 3G for US$1,000 (versus
US$15,000 for a fresh new site), while the tower rentals increase by a factor of 25% (these
numbers are arrived at based on our industry discussions). We find that even in this case,
the cost-per-unit data on a greenfield LTE site could be less than half of a brownfield
3G/3.5G site. The high data efficiency of LTE and the large spectrum allocation are
significant advantages to Indian LTE operators!
Figure 18: LTE is more economical even when compared with a brownfield 2G site that has been upgraded to 3G
HSPA @ 2,100MHz;
HSPA @ 2,100MHz existing 2G operator LTE @ 2,300MHz
New site Upgrade of 2G site New site
Average throughput per site (Mbps) (A) 6 6 66
Coverage area (sq km) (B) 0.20 0.20 0.17
Cost of 3-sector site ($) (including backhaul) 15,000 1,000 22,000
Cost of 3-sector site (Rs) (including backhaul) 825,000 55,000 1,210,000
Life of equipment (years) 15 15 15
Annual depreciation (Rs) (C) 55,000 3,667 80,667
Tower rentals + passthrough (Rs/month) 45,000 11,250 45,000
Tower rentals + passthrough (Rs/year) (D) 540,000 135,000 540,000
Total annual operating cost (Rs) [E = C + D] 595,000 138,667 620,667
Annual cost of Mbps capacity (Rs) [F = E / A] 99,167 23,111 9,354
Annual cost of Mbps capacity per sq km (Rs) [G = F / B] 497,719 115,995 55,788
Source: Company data, Credit Suisse estimates
What about spectrum costs?
The above analysis excludes spectrum costs, which are an increasingly important cost
factor for Indian telecom companies. However, the implication of spectrum cost on single
site-level analysis, like the one shown in Figure 18, is not straightforward. Spectrum cost is
LTE’s cost advantage is
retained even if 3G
operators only upgrade their
existing 2G sites

21 August 2012
India Telecoms Sector 14
borne by the entire network and hence we need to assume a network size to arrive at a
spectrum cost allocation at the site level.
In the below table, we assume that, over the long term, a nationwide 3G network will reach
75,000 sites (note: Bharti reported ~18,000 3G sites in June 2012). The LTE site count is
arrived at by matching the coverage area of this 3G network with LTE sites. We find that
the spectrum cost does not make much difference to the relative costs (LTE remains 11%
of 3.5G). While it is true that 3G spectrum was more expensive than BWA (LTE) spectrum
in the 2010 auctions, spectrum cost spread over a large network is too small to move the
needle meaningfully.
In all these calculations, we have not considered spectrum usage charges. The fact that
LTE operators need to pay only 1% of revenues as spectrum fee while the fee for 3G
operators will be the same as their existing 2G operations (3-6% currently) could skew the
calculations further in favour of LTE.
Figure 19: Including spectrum costs does not make much difference to the conclusions
New site deployments HSPA @ 2,100MHz LTE @ 2,300MHz LTE vs. HSPA (x)
Results from Figure 16
Average throughput per site (Mbps) (A) 6 66 11.06
Coverage area (sq km) (B) 0.20 0.17 0.84
Total annual operating cost per site (Rs) (C) 595,000 620,667
Annual cost of Mbps capacity (Rs) 99,167 9,354 0.09
Annual cost of Mbps capacity per sq km (Rs) 497,719 55,788 0.11
No. of sites in network (D) 75,000 89,126
Coverage area of network (sq km) [E = B x D] 14,943 14,943
Nationwide spectrum auction cost (2010 auctions) (Rs mn) (F) 167,506 128,478 0.77
Spectrum licence duration (years) 20 20
Spectrum cost amortised per year per site (Rs) (G) 111,671 72,076 0.65
Total annual operating cost per site (incl. spectrum cost) Rs [H = C + G] 706,671 692,743 0.98
Annual cost (incl. spectrum) of Mbps capacity (Rs) [I = H / A] 117,778 10,440 0.09
Annual cost (incl. spectrum) of Mbps capacity per sq km (Rs) [J = I / B] 591,132 62,267 0.11
Amortised spectrum cost as % of total costs (%) 15.8 10.4
Source: Company data, Credit Suisse estimates
Voice: What can RIL Infotel achieve?
Conclusion:
■ VoIP calls on LTE will be cheaper than regular voice calls for the subscriber, but it is
not economical for the operator to offer ubiquitous VoIP coverage. So, we doubt it will
be a key service offered.
■ VoLTE standards still to be finalised.
■ CSFB (i.e., relying on an underlying 2G/3G network) is definitely possible, and we
explore this further in the report.
The big value and cash flows in the Indian telecom sector remain in the voice business
(and will do so for the foreseeable future). Further, the government’s recent intention to
allow unrestricted VoIP in India raises speculation over the possible actions from RIL
Infotel on this front. [Note that phone-to-phone VoIP is currently banned in India.]

21 August 2012
India Telecoms Sector 15
Thus, it is worthwhile understanding the options available for RIL Infotel to enter the voice
business, in our view.
Before we discuss the various voice options for RIL Infotel, let us understand how
regulations stand with respect to this issue. Regulations allow for BWA(LTE) spectrum
winners to offer voice calls—as can be seen from the clarifications issued by the
Dpeartment of Telecommunications (DoT) below. VoIP (restricted to PCs only) can be
offered with just an ISP (internet service provider) licence; however, circuit switched voice
will require a UASL licence. Note that under the new unified licence regime, a licence to
offer any service can be purchased for Rs200 mn (US$4 mn). Further, the new telecom
policy aims to allow unrestricted (phone-to-phone) VoIP as well.
Figure 20: DoT clarifications on voice being offered by LTE operators
Source: Dept. of Telecom
As we shall see when we study LTE’s design targets, LTE is a fully packet (IP) based
technology and does not support traditional circuit switched voice services. Circuit
switched voice requires the network to reserve (block) network resources for each user
during a call, whereas no such blocking happens in an IP network. LTE networks need to
find workarounds to handle voice calls.
There are mainly three options for LTE operators to provide voice services, and we study
them below.
1. Over the top VoIP (ex-Skype)
OTT VoIP services, like Skype, just require a broadband connection and use their own
techniques to deliver voice calls over a normal Internet connection (i.e., they create a
perception of ‘circuit-switched service’ while working on an IP network). The customer
does not pay specifically for each voice call, but the data usage for each call is deducted
from his monthly data allowance. This is a possible way out for LTE operators in India.
Let us understand the economics further with some numbers. On its website, Skype
recommends a bandwidth of 100 kbps (on both uplink and downlink each) to have a good
quality voice call. Even under current 3G tariffs, calls made using VoIP would be 30%
Regulations allow for LTE
operators to either offer
restricted VoIP, or normal
voice upon purchasing a
unified licence

21 August 2012
India Telecoms Sector 16
cheaper than regular voice calls as seen below (this was not the case a year ago,
however. 3G data tariffs have fallen ~75% over the past 12 months). VoIP calls could be
even cheaper on LTE networks given the lower data costs possible on LTE as we have
seen earlier.
Figure 21: VoIP calls can be significantly cheaper than regular voice calls in the Indian context
VoIP calls—economics Comment
Headline 2G voice tariff in India (Rs/min) 0.72
Bandwidth requirement–uplink (kbps) 100 Skype recommended
Bandwidth requirement–downlink (kbps) 100 Skype recommended
Total bandwidth required (up + down) (kbps) 200 Unpaired spectrum in India
Data used for a 60-second call (MB) 1.5 = (200 x 60) / (8 x 1000)
Data tariff (Rs/MB) 0.34 Entry level 3G tariff of Bharti
Data cost for a one-min Skype call (Rs) 0.51 Would be Rs0.24 if we use the entry level LTE plan of Bharti
Source: Company data, Credit Suisse estimates
However, the migration to a VoIP-based system is not straightforward, and we need to
keep in mind the following issues:
■ GSM is a technology that is tailor-made for voice services, and can work with voice
codecs of 12.2-13 kbps. However, as we have seen above, OTT VoIP requires a lot
more bandwidth in order to create a ‘circuit-switched’ feeling in a packet-based
environment. This is because of additional information that gets added to each voice
packet (overheads).
■ High-speed data services may not be required at all locations; however, voice
coverage needs to be ubiquitous (i.e., should be available even on highways, outskirts
of cities, etc.) where traffic may not be high. In India, LTE suffers from the fact that
spectrum allocated is in a higher frequency band.
We show below the economics of creating voice capacity to cover 70% of the Indian
population (a reasonable long-term objective for any voice player), on 2G and LTE. We
consider two scenarios in 2G: (1) an operator with 5Mhz in a 900MHz band representing
an incumbent and (2) an operator with 5MHz in a 1,800MHz band representing a new
entrant. On LTE, we consider three deployment scenarios as shown (these are the
deployment scenarios we develop in the third chapter of this report).
We see that the costs in the LTE options can be significantly higher than even the
new entrant 2G voice case (even after accounting for 2G spectrum at the Cabinet-
recommended reserve price). The long-range option in LTE (Macro 2) can cover an area
similar to a 2G 900MHz BTS, but the capacity gets spread out so thin over this range that
it can support only a quarter of the traffic that a 2G BTS can. On the other hand, the
shorter range options (Microcell and Macro 1) can provide high capacity but the cost of
covering the required 70% area becomes prohibitive since the range of these cells is too
short.

21 August 2012
India Telecoms Sector 17
Figure 22: Economics of 2G voice vs VoIP by an LTE operator in India
2G @ 900MHz 2G @ 1,800MHz LTE @ 2,300MHz LTE @ 2,300MHz LTE @ 2,300MHz
Microcell Macro 1 Macro 2
Spectrum allocation (MHz) [A] 5 5 20 20 20
Paired / unpaired Paired Paired Unpaired Unpaired Unpaired
Intersite distance (m) 4,508 2,962 200 440 4,000
Coverage area (sq km) [B] 18 8 0.035 0.2 13.9
2G: No. of channels of 200kHz
[C = Ax1000 / 200] 25 25
LTE: Average throughput per site (Mbps)
[see Figure 60 ] 93 66 10
Bandwidth requirement for voice call 7 calls supported per channel of
200kHz1
7 calls supported per channel of
200kHz1
200 kbps 200 kbps 200 kbps
No. of simultaneous calls supported per site2 [D] 175 175 465 332 50
Cost of 3-sector site (US$) 12,000 12,000 17,500 22,000 22,000
Cost of 3-sector site (Rs) 660,000 660,000 962,500 1,210,000 1,210,000
Life of equipment (years) 15 15 15 15 15
Annual depreciation (Rs) 44,000 44,000 64,167 80,667 80,667
Network opex per site (Rs/month) 45,000 45,000 45,000 45,000 45,000
Network opex per site (Rs/year) 540,000 540,000 540,000 540,000 540,000
Total annual operating cost per site (incl.
depreciation) (Rs) [E] 584,000 584,000 604,167 620,667 620,667
Total inhabited land area in India (sq km) 2,159,870 2,159,870 2,159,870 2,159,870 2,159,870
70% of area (sq km) [F] 1,511,909 1,511,909 1,511,909 1,511,909 1,511,909
No. sites required to cover 70% inhabited area [G
= F / B] 85,904 198,935 43,645,053 9,017,573 109,113
Voice capacity of network (mn simultaneous calls)
[H = G x D] 15 35 20,298 2,992 5
Total annual operating cost for network to cover
70% area (Rs mn) [I = E x G] 50,168 116,178 26,368,886 5,596,907 67,723
Spectrum cost per MHz (for 20 yrs) (Rs mn)
[EGoM / 2010 auctions] 60,000 30,000 6,424 6,424 6,424
Amortisation cost for allocated spectrum over 20
yrs (Rs mn) [J] 15,000 7,500 6,424 6,424 6,424
Total annual operating costs including spectrum
amortisation (Rs mn) [K = I + J] 65,168 123,678 26,375,310 5,603,331 74,146
Vs 2G @ 900MHz 100% 190% 40473% 8598% 114%
Total operating cost per unit voice capacity (Rs) [L
= K / H] 4,335 3,553 1,299 1,873 13,591
vs 2G @ 900MHz 100% 82% 30% 43% 314%
Note: (1) Assuming one BCCH slot; (2) If we were designing a network dimensioning strategy then we would have used the Erlang B function to
determine voice capacity for 2% blocking factor in each case. However, we skip this step since we are only comparing the overall capacities of
various technologies in this exercise. Further, we assume no frequency re-use in GSM.
Source: Company data, Credit Suisse estimates

21 August 2012
India Telecoms Sector 18
VoIP could exist in small pockets
The above two conclusions appear contradictory at first, but they aren’t. For the customer,
it will probably be cheaper to make a VoIP call on an LTE network than a regular 2G voice
call given the low data tariffs (thanks to LTE’s superior data capacity). However, it is not
economical for an LTE operator to promise omnipresent VoIP coverage given the high
frequency band of operation. Further, unlike voice operators which can ‘roam’ their
subscribers on other networks where there is no coverage of their own, roaming for a VoIP
customer is not straightforward (roaming onto a regular operator’s network would require
the phone to have circuit-switched capabilities as well !). So customers may have to switch
back to regular 2G/3G networks to make calls when out of an LTE coverage area—which
means that the LTE network will not be the sole service provider for the customer.
So, it is unlikely that LTE operators will offer/promise VoIP as a service. However, some
customers may still make use of the tariff arbitrage in urban areas with good LTE coverage
to make VoIP calls, and use other 2G/3G SIM cards in other areas. So VoIP on an LTE
operator’s network may be one of the voice options used by a customer, but not the sole
voice service.
Further, any new operator in a voice business will find that calls being made by its
subscribers will be to subscribers of other incumbents (same would hold true on incoming
calls). There are no technological limitations for calls made by a VoIP subscriber to land
on a regular 2G number. But the regulatory aspects are not clear. We can be certain that
the voice incumbents will resist opening up their networks to local VoIP calls, and even
when they do, the VoIP operator will have to pay a termination fee (which will put a floor
on the call tariff). Currently the termination charge in India is Rs0.20 per min. As a saving
grace, however, the few calls that come into the VoIP operator’s network from other
networks will generate termination revenue at significantly higher margin than for a regular
2G new entrant.
2. Voice over LTE (VoLTE)
We mentioned earlier that OTT VoIP is an effort to provide a circuit switched experience
over a packet-based network, and leads to a lot of overheads (i.e., lot of bandwidth is
required for a voice call). Efforts are on at 3GPP and outside to device a way to handle
voice calls efficiently on an LTE network and the technology will be called VoLTE. The
idea is to devise a way to handle many of the issues discussed earlier, including: handling
voice calls with few overheads, roaming, automatic fall-back onto a 2G network when
moving out of LTE coverage area (without the user realising it), developing commercial
models for termination of calls from/to regular 2G/3G networks, etc.
At the moment, the standards for VoLTE are still being developed, and the first
commercial deployments globally are expected only in 2013. We would not see this as a
significant near-term possibility in India. Even if the standards get finalised, we still believe
that the higher frequency of operation (and hence more sites per sq km) would continue to
be a disadvantage for Indian LTE operators to match the economics of voice business on
900MHz/1,800Mhz
3. CSFB (Circuit Switched Fall Back)
Under this method, whenever a voice call is made by a handset on an LTE network, the
network immediately transfers the call to an underlying 2G/3G network. From then
onwards, there is no economic difference between a CSFB call and a regular call made on
a 2G/3G network. Technology does not prevent the LTE operator from transferring the
voice call to a 2G/3G network of another operator through roaming arrangements.
RIL Infotel (which does not have any telecom business as of now) could tie up with
existing 2G/3G operators to offer voice calls using CSFB. However, we doubt if a voice
business can run completely on leased capacity (similar to an MVNO model)—especially
in a spectrum-starved situation such as the one in India (see chart in previous chapter).

21 August 2012
India Telecoms Sector 19
The other possibility is that RIL Infotel builds out its own 2G network by acquiring spectrum
in the upcoming auctions (or by acquiring an existing operator). Thus, RIL Infotel could
have an underlying 2G network to drive coverage (essential for voice service) and have an
LTE network as an overlay on this 2G network. We recall that RIL Infotel was an active
participant in TRAI’s spectrum auction consultation process (see our note, RIL could enter
voice before data?, 23 March 2012, for details).
In the following sections, we study how the economics with respect to CSFB work for RIL
Infotel. We assume the cost of spectrum to be as recommended by the cabinet recently
(Rs140 bn for 5MHz pan-India). We believe the results would be no different if RIL Infotel
were to acquire an existing operator—since the government intends to recover the full
spectrum value from any M&A transaction where the underlying spectrum was not
purchased at market price.
CSFB case study: NTT Docomo
Towards the end of 2011, NTT Docomo launched LTE smartphones with voice calls being
handled by an underlying 3G network. The company hopes to completely do away with 3G
once VoLTE is developed and voice calls can be handled on the LTE network itself.
Figure 23: LTE with CSFB—NTT Docomo in Japan
Source: Company data

21 August 2012
India Telecoms Sector 20
Figure 24: NTT Docomo—LTE smartphones recently introduced with CSFB functionality
Source: Company data
Bringing the device price into picture
Conclusion
In a data-only dongle strategy, the addressable market could be restricted to US$750 mn
of industry revenues upon launch in 2013 (versus US$2.5 bn paid for spectrum).
However, a data + voice handset strategy could lead to an addressable market of
US$8 bn upon launch (versus a US$5 bn spectrum cost).
Thus, entering voice makes a lot of sense for RIL Infotel.
As the following sections show, while LTE scores highly on data speeds, it suffers the
drawback of a weak device ecosystem—a significant hurdle to overcome before it can
challenge other, more well-established, technologies. This is more true in the Indian
context, where LTE operators will be working with TDD LTE on 2,300MHz spectrum
(unique on two counts). Thus, we believe that an exercise to determine the addressable
market for LTE in India depends crucially on the device price points that an operator is
able to achieve with its vendor negotiations. The exercise requires two sets of information:
■ a demand supply curve for mobile devices – which basically gives the % of subscriber
base (or population) that can afford devices at a given price point;
■ price points of devices that RIL can ‘achieve’ through its vendor negotiations.
We explore both these aspects in the following sub-sections, before proceeding to build a
business model for RIL Infotel.
Unlike the younger days of the mobile voice industry, we believe that not only cost, but
also the form of the user device, will determine the addressable market for LTE in India in
the near term.
The linkage with cost is pretty straightforward, only the segment of population that can
afford the device will be counted in the addressable market (note: we are not assuming
any upfront cash subsidies here). However, it is possible to offer LTE service in various

21 August 2012
India Telecoms Sector 21
forms: as a data-only service (through a dongle or a tablet) or as a ‘data + voice’ service
through a handset – which could have a bearing on the addressable market as well.
Developing a demand-supply curve for mobile devices in India
The Indian handset industry is quite unorganised with very little reliable data available
(even on annual handset sales, let alone volumes at each price point).
While the traditional voice market sizing models worked with affordability based on GDP
data (since the mass mobile telecom market was without any precedent), an exercise to
estimate the addressable market for data based on device prices can feed off the
experiences from the voice market. Here, we use some data which Bharti had submitted to
TRAI three years ago, giving the distribution of subscribers in its metro circles in various
monthly spend levels. The ARPU/price points have no doubt come down since then, but
we assume that the distribution around the average ARPU would not have changed
materially. We thus assume the same percentage distributions around the current ARPU
of ~Rs130 (TRAI: AGR on VLR subs) for India, as seen below.
Figure 25: Bharti 2009 data giving distribution of
subscribers in various ARPU buckets
Figure 26: Assuming the same distribution to hold
around the current average India ARPU
0%
2%
4%
6%
8%
10%
12%
14%
16%
0-4
0
40
-80
80
-120
12
0-1
60
16
0-2
00
20
0-2
40
24
0-2
80
28
0-3
20
32
0-3
60
36
0-4
00
40
0-4
40
44
0-4
80
48
0-5
20
52
0-5
60
56
0-6
00
60
0-6
40
64
0-6
80
68
0-7
20
72
0-7
60
76
0-8
00
80
0-8
40
84
0-8
80
88
0-9
20
92
0-9
60
96
0-1
00
0
10
00+
Distribution of Bharti subs across various ARPU buckets in metros -
2009. Mean ARPU Rs472
0%
2%
4%
6%
8%
10%
12%
14%
16%
0-1
1
11
-22
22
-33
33
-44
44
-55
55
-66
66
-77
77
-87
87
-98
98
-10
9
10
9-1
20
12
0-1
31
13
1-1
42
14
2-1
53
15
3-1
64
16
4-1
75
17
5-1
86
18
6-1
97
19
7-2
08
20
8-2
19
21
9-2
30
23
0-2
40
24
0-2
51
25
1-2
62
26
2-2
73
27
3+
Distribution of India subs across various ARPU buckets 2012. Mean
ARPU Rs130
Source: Company data, Credit Suisse estimates Source: Company data, Credit Suisse estimates
Next, we use this ARPU distribution to estimate the demand-supply curve for the
handset/device market. What we gather from our handset industry discussions is that the
average selling price (ASP) of the Indian mobile device industry is Rs2,300-2,400 (US$42-
44) currently. Along with the current mobile ARPU of Rs130, we conclude that the average
mobile subscriber buys a handset worth 17.5x his monthly telecom spend. We
simplistically assume that this ratio (17.5x) holds at each ARPU level. In other words, the
distribution of subscribers in various ARPU buckets should mirror the distribution of mobile
device demand at various price points with the above ratio holding at each price point
(i.e., the shapes of the curves around the mean should resemble each other).
We use the ARPU distribution function in Figure 26, along with the 17.5x ASP/ARPU ratio
derived earlier, to develop a distribution function for mobile device prices. What this chart
tells us is that a handset priced at Rs5,000 can be afforded by the top 10% of the
subscriber base, who contribute ~35% of industry voice revenues.

21 August 2012
India Telecoms Sector 22
Figure 27: Distribution function for device affordability
0%
10%
20%
30%
40%
50%
60%
70% 3
,100
3,9
00
4,7
00
5,5
00
6,3
00
7,1
00
7,9
00
8,7
00
9,5
00
10,3
00
11,1
00
11,9
00
12,7
00
13,5
00
14,3
00
15,1
00
Addressible market:
share of industry voice
revenues
Addressible market:
share of industry voice
subscribers
Device prices (Rs)
Indian telecom: Addressable market at each device price point
Rs 5000
Source: Company data, Credit Suisse estimates
How low can RIL Infotel price an LTE device?
The best starting point for this analysis is the data we already have from Bharti’s LTE
launch. Bharti’s LTE modem and dongle sell at Rs7,500-8,000 a piece (US$136-145);
these are full prices without any subsidy. We believe that RIL Infotel (launching a year
after Bharti, as we assume in this report) will be able to procure the devices at significantly
lower price points, because:
■ RIL’s scale of purchasing will be far higher than Bharti’s. Bharti launched its service in
just two cities (Kolkata and Bengaluru). We understand from our checks with channel
partners that the number of devices sold by Bharti in these two cities total a few
thousand so far (four months after launch). Lack of spectrum prevented Bharti from
launching in other large cities (notably Mumbai/Delhi, though this could change with
Bharti’s recent acquisition of Qualcomm’s India broadband entity). RIL Infotel, on the
other hand, has spectrum in all circles, and would likely be able to commit higher
volumes (in millions rather than thousands) to drive better scale for the device
vendors, in our view. This should help RIL get a further 20% bargain on the device’s
pricing, in our view.
■ Normal deflation in the technology hardware industry could shave off the device price
by ~15% by the time RIL Infotel launches next year.
Thus, we believe that it is not impossible for RIL Infotel to price an LTE dongle at a 35%
discount to Bharti’s current price or at around Rs5,000 (~US$90, assuming it launches in
2013).
Now, in order to estimate potential LTE handset prices (with voice capability on 2G/3G
with CSFB), we make use of the fact that the cost of entry-level 3G touchscreen
smartphones is higher than that of entry level 3G USB dongles by around Rs2,500-3,000
(Micromax device prices). Using this information, we estimate that RIL Infotel would be
able to launch handsets (with data on LTE, voice on 2G/3G) priced at Rs7,500-8,000
(US$136-145). The price points assumed here have significant bearing on final
results/conclusions, and we will test them for sensitivities later.
Important points to highlight in this discussion:
■ The TD-LTE handset ecosystem is small currently, though FDD-LTE handsets have
been around for some time. Our discussions with chipset vendors indicate that multi-
mode (TDD + FDD) chipsets have been developed. One European chipset vendor we
met recently indicated that TDD-LTE handsets using their chipsets have been
RIL Infotel should be able to
commit to higher volumes
and thus obtain lower device
price points than Bharti so
far

21 August 2012
India Telecoms Sector 23
developed by their China-based handset partners. At the recent Mobile Asia Expo,
ZTE indicated plans to launch TDD-LTE handsets this year.
■ All the device price points mentioned above are based on devices by Chinese vendors
(even Bharti’s LTE devices are of Huawei /ZTE make).
■ Bharti’s LTE devices have multi-mode chipsets so the same device latches onto a
2G/3G network when the user moves out of the LTE coverage area. This is important
from the context of CSFB that we discussed earlier.
Addressable market with a data-only dongle strategy
The important point to note is that a handset is a standalone device and can run all by
itself, while a dongle/tablet is likely to be the second device in addition to the primary voice
device (if the device is a dongle—it is probably even the tertiary device since it needs a
laptop computer to become usable). So, a customer capable of buying a tablet/dongle
device at a given price point must be significantly wealthier than a customer capable of
buying only a handset at the same price point. For our analysis, we assume the
addressable market for a dongle of a given price point would be the same as the
addressable market of a handset at 2.5x the price point. [Note that with cost deflation, the
addressable markets in both cases will only increase with each passing year.]
Our study leads us to conclude that if RIL Infotel launches with a data-only dongle priced
at ~Rs5,000 (US$91), it could target the high-end subscribers who currently contribute 5%
of industry revenues (and hope to win only the data spend of these customers). The total
addressable market for RIL Infotel is restricted to ~US$750 mn upon launch (of which RIL
Infotel can hope to gain some share)—not big enough to build a business case
considering the US$2.5 bn paid for spectrum by the company in 2010. In Appendix 2 we
give a financial model if RIL Infotel were to follow a data-only dongle strategy, and find that
there is no payback even over the entire 20-year licence period (assuming RIL Infotel gets
a 30% share of the addressable market).
It is possible for RIL Infotel to expand the addressable market by selling subsidised
devices on contract; however, given past experience we believe the possibility of such a
strategy is remote.
Figure 28: Addressable telecom market for RIL Infotel at various dongle price points
Selling price of dongle (US$) 50 60 70 80 90 100 110 120
Addressable data revenue market (US$ mn) 3,574 2,559 1,716 1,146 767 518 357 252
Source: Credit Suisse estimates
We thus conclude that a data-only strategy by RIL Infotel may not justify a business case
given the high amount paid for spectrum upfront.
Addressable market with a data + voice handset strategy: Worth a shot?
However, by launching a handset priced at Rs7,500 (US$136), the addressable market
upon launch becomes the subscribers who account for 20% of industry revenues worth
US$8 bn (and the company has a chance at capturing the entire spend of these
customers, including voice). This compares with ~US$5 bn the company may have to
spend on 2G and LTE spectrums combined (at the Cabinet reserve price for 2G auctions
with full upfront payment). While the business case even here is still not readily visible, it is
better than the data-only case above and seems worth a shot (and from our perspective,
worth further analysis).
Importantly, these voice subscribers will be from the higher-end of the market and are
unlikely to be price sensitive. What RIL Infotel can offer to these subscribers will be
something which very few other telcos can (actually, just one other telco in each circle):
mobile Internet at unmatched speeds at extremely low cost compared to other options in
the market. With voice already becoming commoditised, RIL Infotel could use data as a

21 August 2012
India Telecoms Sector 24
bait to target the top-end voice customers of incumbent telcos. The fact that the data
market (mobile or otherwise) has not yet taken off helps RIL Infotel’s case.
Thus, we believe that RIL Infotel’s approach to voice business will be very different from
the approach of recent entrants to the voice market. The pure voice newcomers have
used voice tariff discounting to gain market share. However, RIL Infotel can afford
to match the incumbents on voice tariffs, but use high-speed data as a market share
gaining tool. The corollary of this argument is that the voice economics of RIL Infotel
could be significantly better than that of pure voice newcomers.
Figure 29: Addressable telecom market for RIL Infotel at various handset price points
Selling price of handset (US$) 105 120 135 150 165 180 195 210
Addressable revenue market (US$ mn) 12,202 9,866 7,926 6,337 4,767 3,787 3,006 2,387
Source: Company data, Credit Suisse estimates
Building a data + voice business case for RIL Infotel
We now have the tools to build a financial model for RIL Infotel for its Indian telecom
business—offering data and voice through multi-mode handsets.
RIL Infotel’s financial model: Key takeaways assuming a Rs7,500 (US$136) handset
price in 2013
■ RIL Infotel could require a peak investment in terms of capex and operating losses of
US$8 bn by the fourth year of launch, after which the business would start generating
free cash (EBITDA-capex). This includes US$5 bn of spectrum payments on LTE and
(upfront) 2G.
■ If we had assumed deferred payments for 2G spectrum (with NPV preserved), the
peak investment would be ~US$7.2 bn.
■ The business could become EBITDA positive by the third year of launch, the key
driver being the focus on the higher end segment. The model gives a pay-back period
of ten years from launch of operations (FY23).
■ Assuming a 3% terminal growth and 12% WACC, we get a positive NPV of US$1 bn.
Any new business model depends on a number of assumptions. The broad top-level
assumptions are summarised below, and the detailed model is presented in Appendix 1.
We build our model assuming the start of commercial operations on 1 April 2013 (i.e.,
launch starting FY3/14), with FY3/13 being used to build out the initial network.
Top-level assumptions
■ We assume that RIL Infotel will be able to launch services through handsets priced at
Rs7,500. These would be LTE-capable phones with voice calls using CSFB. We also
assume 10-15% annual price deflation (which would help to expand the addressable
market with each passing year). With these assumptions, the addressable market
becomes 20% of total Indian telecom market revenues upon launch, going up to 45%
by the fifth year and 60% by the tenth year. The blended ARPU of the addressable
market starts at Rs840 upon launch and falls to Rs600 by the fifth year (as the
addressable market expands). [We acknowledge this starting price point is a
significant assumption, and provide a sensitivity analysis of our final conclusions to
handset prices later.]
■ We model RIL to start with a 6% revenue/subscriber market share of the addressable
segment, gradually going up to 30% by the fifth year. Recall that RIL Infotel will
probably face only one other operator as competition as far as the product offering is
concerned, given the current industry structure.

21 August 2012
India Telecoms Sector 25
■ This translates to ~11% overall industry revenue market share by the fifth year and
18% by the tenth year. Before one raises eyebrows at these assumptions, we highlight
that Uninor (not listed) had reached a 3-8% revenue market share in its core eight
circles within two years of launch (with a pure voice strategy). We expect RIL Infotel’s
task to be easier since it has a strong tool other than low-pricing to attract customers
from the top end.
■ In terms of subscribers, this translates to ~45 mn subscribers by the fifth year and
~90 mn by the tenth year of operation. The key point to note is that while subscriber
numbers may be far lower than for incumbent voice operators, these subscribers
would be from the higher ARPU segments of the customer base.
■ We conservatively assume data revenues, as a percentage of total revenues for the
addressable market, at 25% initially, gradually going up to 35-40% longer term. This
assumption implies that the top end of Indian telecom subscribers will only match the
data consumption trends of other emerging markets and stay less than the data
consumption of developed markets (40-50%).
■ We assume that RIL Infotel will follow an asset-light strategy on its network; i.e., it will
not build out its own towers but rent tower space from other towercos.
■ We use the cabinet-recommended reserve price for nationwide spectrum (Rs140 bn
for 5MHz) as the 2G spectrum cost, with one-shot upfront payment (rather than
deferred payment as suggested). The timing of payment should not make any
difference from an NPV perspective.
Data (LTE) assumptions
Before we dive into the LTE assumptions, we would like to highlight a point on capex in
telecoms. The supply-side in telecoms can be broadly divided into ‘coverage’ and
‘capacity’ site deployments. ‘Coverage’ sites help cover large areas to bring large
populations under network coverage. This is the bare minimum investment required before
an operator can offer services in an area. In some of the densely populated areas, the
capacity offered by the coverage sites may not be sufficient, and the need arises for
additional ‘capacity’ top-ups on a case-by-case basis.
In the technical discussion in the next chapter, we develop four deployment scenarios for
LTE in India. For the current discussion, we assume the results which will be developed in
the next section. Of the four deployment scenarios developed, we choose the ‘Macro 2’
option to build coverage requirement and the ‘microcell’ option to build capacity
requirements. ‘Coverage’ sites cover large areas but have low capacity, while ‘capacity’
sites do not cover any meaningful area, but offer high capacity. We reproduce the key
parameters of these two options below (details in the third chapter):
Figure 30: We use ‘microcells’ and ‘Macro 2’ deployment options in our RIL Infotel modelling
Microcell Macro 2
Cell deployment options (used as ‘capacity’ site) (used as ‘coverage’ site)
Inter-site distance (m) 200 4,000
Coverage area (sq km) 0.0 13.9
Average throughput (Mbps) 93 10
Cost per site (including backhaul US$) 17,500 22,000
Source: Company data, Credit Suisse estimates
Tariff strategy
■ We assume RIL Infotel will launch with data tariffs at 8p/MB. Note that Bharti’s data
tariffs range from 10p/MB-34p/MB across its 3G and LTE plans. Bharti also reported a
34p/MB data tariff in its June 2012 quarter results. Our assumption thus places RIL
Infotel at a 75% discount to Bharti’s current data tariffs.

21 August 2012
India Telecoms Sector 26
Coverage requirement
■ Overall, we build ~33%/40% nationwide population coverage within three/five years
of launch respectively. This includes an aggressive 100% population coverage in the
top 15 cities—the cream of the data market. The rollout in the remaining cities and
rural India could be less aggressive. We believe that the 16% rural population
coverage that we model by FY3/16 should take care of the rollout obligations in
licence (see Appendix 3 for details).
■ Using the ‘Macro 2’ site configuration above, this requires ~28,000/35,000 LTE sites
during this period (three/five years respectively).
Capacity requirement
■ The revenue projections drive capacity requirements. The network capacity
requirement in our model is arrived at by assuming a network utilisation factor during
the busy hour. Being a greenfield business, we assume that, in the initial years, RIL
Infotel’s sites run on low utilisation during the busy hour: starting at 10% and
progressively increasing to long-term utilisation of 70% (conservative, in our view).
■ The combination of actual data traffic and network utilisation gives us an estimate of
the network capacity requirement (in Mbps). Not all of this is fulfilled by the coverage
sites already estimated above. The deficit is satisfied by assuming a case-by-case
deployment of capacity sites (‘micro’ sites). Note that capacity sites do not contribute
to area/population coverage in our model. The demand projections require an
additional 6,500/14,000 LTE micro sites three/five years from launch (taking total LTE
sites to ~34,000/49,000 by this time). A comparative figure is the ~18,000/13,000 3G
sites that Bharti/Idea reported last quarter.
Capex projections
■ We have already projected the number of coverage and capex sites required and the
capex projection is pretty straightforward knowing the costs of the sites (Figure 30).
■ However, the sites/base stations form only one part of the network for a telco—the
part technically called the radio access network (RAN). The other part is called core
network (see Figure 64), and includes many high capacity switches, routers, long haul
fibre, etc. In our discussions with equipment vendors, we understand that these can be
accounted for by assuming a US$2 mn core network cost for every 500 sites deployed
in RAN.
Voice assumptions
Pricing strategy
■ Despite targeting the high-end segment, we assume RIL Infotel’s voice pricing (RPM)
at a 7-8% discount to Bharti’s current average RPM (implying a significantly higher
discount than Bharti’s voice pricing to its high-end subscribers). We believe there is
sufficient conservatism built into this assumption, since the focus would be on higher
end subscribers. We build industry voice RPM to stay flat at current levels (consistent
with our view on the sector).
Capex requirements
■ While an entire section is devoted later to develop concepts used in estimating LTE
capex, this is because there is no existing benchmark on TD-LTE for us to fall back
upon. However, the task is easier in case of voice capex since we have well-
established benchmarks in India.
■ We assume conservatively that RIL Infotel will not enter into ICR roaming agreements
with other operators, but instead builds out its own capacity for all its traffic.

21 August 2012
India Telecoms Sector 27
■ The 2G capex requirement is driven by the traffic carried on network. We assume that
the annual traffic per site for RIL Infotel stays less than 85%/60% of current numbers
for Idea/Bharti even in the longer term (note that the numbers for Bharti/Idea have
been increasing steadily and will continue to do so. Hence, the gap between RIL
Infotel and Idea/Bharti will be far higher than these 85%/60% numbers suggest). We
believe this ‘under-utilisation’ is justified since: (1) RIL Infotel’s 2G network would be
running on lower spectrum than both Idea and Bharti and (2) targeting top-end
customers may require RIL Infotel to invest in a better quality of service.
■ This requires RIL Infotel to have ~60,000 2G sites within three years of launch (higher
than Uninor’s ~30,000 sites currently, and nearly comparable to Idea’s ~84,000 sites
as of last quarter). While such a high site count seems counter-intuitive for a new
operator, we clarify that this is required to support the high ARPU/high volume
customer base that we expect RIL Infotel to target initially.
■ Based on our industry discussions, we assume the cost of a 2G BTS at US$12,000.
■ We use the same thumb-rule for core-network capex. Overall, we believe that our
US$400 mn core network capex over three years (out of a total US$2 bn+ capex) is a
reasonable assumption.
Cost projections
■ Variable cost projections are pretty straightforward, with regulatory charges as a
percentage of revenues and interconnect charges on per-unit volume basis. We
assume an 8% licence fee as a percentage of sales and 5% spectrum fee as a
percentage of 2G revenues (taking a higher number, lacking clarity on what the final
outcome on this issue would be). However, the LTE spectrum fee is only 1% as per
the 2010 notice inviting auction applications (a key regulatory benefit for LTE
operators versus 3G players over the longer term, in our view).
■ Network opex is largely driven by tower rentals and pass-through costs. We assume
Rs45,000 per month as the monthly network opex per 2G site (current industry
standard). We believe that RIL Infotel should be able to enjoy lower rentals on its LTE
sites, as these could be add-on sites on the same towers carrying the 2G sites. Thus,
we build a 25% additional load factor for LTE sites (or Rs11,250 network expense per
month per site).
■ We project SG&A (including personnel costs) to reach ~80% of Idea’s current annual
SG&A run-rate in absolute terms, within three years of launch. This includes ~Rs60 bn
in marketing and G&A spends (excluding dealer commissions) in the first two years of
launch, as against Rs3.0-3.3 bn that Bharti spent when it undertook a global (India +
Africa) rebranding exercise in Nov-2010. We believe that this level of marketing
investment would be required to create a new brand (distinct from the ‘Reliance’ brand
which is already used by RCOM). We build 8-10% CAGR in SG&A over following ten
years.
■ Our long-term capex-to-sales ratio is 12% plus. We believe this is a reasonable
number considering we are building a fully rented tower business model (i.e., network
opex is higher in order to avoid some capex).

21 August 2012
India Telecoms Sector 28
Figure 31: RIL Infotel data + voice summary model
Summary projections for RIL Infotel FY3/13 FY3/14 FY3/15 FY3/16 FY3/20 FY3/25
Subscribers (mn) - 2 8 18 68 112
Subscriber market share (%) 0 0 1 2 5 8
Urban population under LTE coverage (%) 35.1 47.6 60.1 70.1 85.1 85.1
Total population under LTE coverage (%) 12.3 19.6 27.0 32.9 40.3 40.3
Subs as a % of pop under LTE coverage (%) 0 1 2 4 12 19
Voice revenues (Rs mn) 9,279 34,986 77,998 286,634 406,999
Data revenues (Rs mn) 3,093 12,292 27,405 134,887 271,333
Total revenues (Rs mn) 12,372 47,279 105,402 421,521 678,332
Data as % of total 25 26 26 32 40
Voice revenue market share % 1% 2% 4% 15% 19%
Data revenue market share % 2% 6% 8% 15% 22%
Total revenue market share % 1% 2% 5% 15% 20%
Voice RPM (Rs/min) 0.38 0.38 0.38 0.39 0.39
Data tariffs (Rs/MB) 0.08 0.07 0.06 0.06 0.05
Total annual capex (Rs mn) 15,616 19,191 34,253 48,729 52,591 79,645
Total annual capex (US$ mn) 284 349 623 886 956 1,448
Capex/sales (%) - 155 72 46 12 12
EBITDA (Rs mn) (16,990) (17,328) (8,940) 9,190 124,563 253,807
EBITDA margin (%) -140.1 -18.9 8.7 29.6 37.4
EBITDA–capex -spectrum costs (Rs mn) (301,084) (36,519) (43,193) (39,539) 71,972 174,163
Cumulative cash flow (Rs mn) (301,084) (337,603) (380,796) (420,335) (315,037) 350,435
Cumulative cash flow (US$ mn) (5,474) (6,138) (6,924) (7,642) (5,728) 6,372
RoCE (%) -12.5 -11.3 -5.0 4.1 21.1 23.6
NPV (Rs mn) 53,402
NPV (US$ mn) 971
Source: Credit Suisse estimates
A few points on the final results
While the key conclusions from the financial model are summarised at the beginning of
this section, we discuss some of the finer points below.
■ A look at the summary results above indicates one of the key drivers of value for RIL
Infotel is the high EBITDA margin over the long term. The ~37% EBITDA margin in the
table above compares with the 30-32% current mobile EBITDA margins for Bharti. As
we show in the detailed financial model in the appendix, the key driver of these high
margins is lower SG&A as a percentage of sales (all other costs in our model are
broadly in line with current incumbent cost structures). We argue that the possession
of a strong tool to attract and retain customers (i.e., unmatched data service) should
help RIL Infotel avoid many of the costs incurred by current incumbents in retaining
their subscriber base in a commoditised, a high-churn voice market (tariff discounts
and wasteful dealer commissions).
■ As seen in Figure 32 below, our RIL Infotel model builds higher capex in the initial
years compared to Uninor for similar market share gain. For future years, Uninor has
guided to a fall in capex intensity, while in our RIL Infotel assumptions, the capex
intensity is sustained (given the expectation of market share gains) totalling a capex
spend of US$4.4 bn by the end of the fifth year of operations.
Figure 32: Comparison of initial capex and market shares for Uninor and RIL Infotel
Uninor RIL Infotel
(actual) (projection)
Cumulative capex by end of 2nd year of operations (US$ mn) 1,113 1,256
Revenue market share by end of 2nd year of operations (%) 2.4 2.5
Source: Company data, Credit Suisse estimates

21 August 2012
India Telecoms Sector 29
Figure 33: RIL Infotel—high capex intensity in initial years
RIL Infotel Year 0 Year 1 Year 2 Year 3 Year 4 Year 5
Capex (US$ mn) 284 349 623 886 996 1,229
Revenue market share (%) 0.0 0.7 2.5 5.1 7.8 11.4
Source: Credit Suisse estimates
Is this a mass-market strategy?
It is widely believed that RIL Infotel will do to data what RIL did to voice a decade ago—
democratise the product by taking the price points low enough to have mass appeal. The
strategy we have outlined above is seemingly elitist, in that the focus is not on the bottom
of the affordability ladder but on the top end.
We believe that the key hindrance for RIL Infotel to launch a truly mass-market strategy is
the weak device ecosystem and hence high prices. In voice, the company tried to resolve
the problem by offering upfront cash subsidy on device costs. However, we believe such a
strategy is now unlikely (given historical experience).
The data market is still in its infancy in India, and any new technology gets adopted first by
the higher levels of the affordability ladder. So it would make sense to start with the higher
end subscribers and then move down as the device price points fall.
In any case, we doubt if a strategy that targets 20 mn customers within three years of
launch would be called anything but mass market in any other country in the world (save
for China)!
Testing the conclusions for key assumptions
Handset prices
This is probably the most debatable of our assumptions, since the ecosystem is yet to
mature. We have assumed that RIL Infotel will be able to bring down handset pricing to
~US$136 by promising good volumes to vendors. We see below that as long as RIL Infotel
is able to bring TDD-LTE handsets with CSFB capability to less than US$150 by next
year (assumed launch time), the addressable market can be large enough to present a
decent business case for it.
Figure 34: RIL Infotel data + voice business—NPV sensitivity to handset price assumption
Base case
Selling price of handset in 2013 (US$) 136 105 115 125 135 145 155 165 175
Cut-off voice ARPU for affordability FY3/14 (Rs) 628 510 549 588 615 656 698 743 773
Addressable revenue market FY3/14 (US$ mn) 7,498 12,202 10,411 8,849 7,926 6,704 5,658 4,767 4,250
Addressable revenue market FY3/20 (US$ mn) 27,142 33,017 30,137 28,759 27,142 24,967 23,539 22,437 20,565
RIL Infotel revenues FY3/20 (US$ mn) 7,664 9,552 8,724 8,334 7,664 7,241 6,656 6,347 5,968
RIL Infotel revenue marketshare FY3/20 (%) 14.7 18.3 16.7 16.0 14.7 13.9 12.8 12.2 11.4
EBITDA margins FY3/20 (%) 29.6 31.3 30.6 30.3 29.6 29.0 28.2 28.2 27.4
NPV (US$ mn) @ 12% WACC 971 3,239 2,317 1,648 965 338 (324) (914) (1,468)
RoCE FY3/20 (%) 21.1 24.4 23.0 22.4 21.0 20.2 18.8 18.6 17.5
Source: Credit Suisse estimates
WACC
The 12% WACC that we have assumed in our DCF model for RIL Infotel is based on the
WACC assumed by our RIL analyst (Sanjay Mookim) for his RIL DCF calculations.
However, one could argue that RIL being among the most cash-rich business houses in a
struggling economy could enjoy lower funding costs than implied by the 12% WACC
number (note, that the WACC for RIL Infotel is the cost of funding seen by RIL for its
internal projects, as against the WACC used by equity investors to value RIL stock). A
lower internal WACC for RIL could give RIL Infotel:

21 August 2012
India Telecoms Sector 30
■ more room to bid aggressively in upcoming 2G auctions, and/or
■ more room on handset prices. At a 10% WACC, the company has a business case
even at handset prices of US$190.
Figure 35: NPV sensitivity to WACC at US$136 handset price assumption
WACC Base case (12%) 9% 10% 11% 12% 13% 14% 15%
NPV of telecom business model (US$ mn) 971 7,783 4,792 2,613 971 (299) (1,302) (2,107)
Source: Credit Suisse estimates
Figure 36: RIL Infotel NPV sensitivity to WACC and 2013 handset prices
US$ mn WACC
9% 10% 11% 12% 13% 14% 15%
2013 T
DD
-LT
E h
an
dse
t p
rice (
$)
105 11,709 8,001 5,290 3,239 1,645 381 (638)
115 10,097 6,688 4,198 2,317 857 (300) (1,231)
125 8,941 5,742 3,409 1,648 283 (796) (1,664)
135 7,778 4,787 2,608 965 (305) (1,308) (2,113)
145 6,689 3,898 1,867 338 (843) (1,774) (2,519)
155 5,567 2,974 1,091 (324) (1,414) (2,272) (2,957)
165 4,543 2,138 394 (914) (1,920) (2,710) (3,340)
175 3,575 1,350 (262) (1,468) (2,395) (3,121) (3,698)
185 2,560 515 (962) (2,065) (2,910) (3,569) (4,092)
195 1,608 (264) (1,614) (2,619) (3,386) (3,984) (4,456)
205 701 (1,007) (2,235) (3,147) (3,841) (4,379) (4,802)
215 (145) (1,696) (2,809) (3,633) (4,257) (4,740) (5,118)
225 (954) (2,354) (3,355) (4,094) (4,652) (5,081) (5,416)
235 (1,989) (3,201) (4,063) (4,695) (5,169) (5,530) (5,810)
Source: Credit Suisse estimates
Data tariffs
In the base case, we conservatively assume RIL Infotel launches with a steep 75%
discount to Bharti’s current data tariffs. If RIL Infotel can achieve the same market shares
with lower discounts to Bharti, then the NPV could increase significantly. With a 50%
discount, the NPV rises to US$2.5 bn.
Figure 37: RIL Infotel: Sensitivity to data tariff upon launch
RIL Infotel data tariff upon launch (p/MB) 3 8 13 18 23 28
Discount to current Bharti tariff (%) -91 -76 -62 -48 -34 -20
NPV ($ mn) (3,105) 971 1,990 2,452 2,714 2,880
Source: Company data, Credit Suisse estimates
Could the LTE device ride on the existing phone of
the subscriber?
Around six months ago, Huawei launched MiFi devices in India priced at Rs4,500
(US$80). These devices connect to the 2G/3G networks of any operator and create a Wi-
Fi hotspot around them. Any WiFi-enabled handset in the vicinity can connect to the WiFi
connection. The MiFi is a pocket sized device and can be carried around.

21 August 2012
India Telecoms Sector 31
Figure 38: Huawei's MiFi device priced at Rs4,500 Figure 39: MiFi could act as a bridge between LTE
network and non-LTE device
Source: Company data Source: Company data
This was followed in April 2012 by MTS’s launch of a MiFi router on its CDMA network
priced at less than Rs2,000 (US$36). With this device, even a GSM phone (WiFi-enabled)
can access MTS’s CDMA network. Recent media reports (including the Economic Times)
indicate that Bharti is in talks with device vendors to introduce MiFi devices on its LTE
network. In fact, one of Bharti’s LTE devices in the market—the indoor multi-user
modem—is actually a MiFi device that acts as a bridge between the LTE network and any
WiFi-enabled device (only it is not pocket-sized!).
We believe that MiFi could play an important part in the initial device strategy of LTE
operators in India. In the context of our earlier discussion on addressable market size, a
MiFi device at a given price point could find a larger audience than a dongle at the same
price. This is because while a dongle is likely to be a tertiary device (after the mobile
phone and a laptop computer), a MiFi can be the secondary device after the mobile
phone. Thus, a person capable of buying a dongle is likely to be wealthier than one
capable of purchasing only a Mi-Fi.
Who is investing into the content ecosystem?
Affordability of devices is but one of the two key hurdles which Indian telecom operators
face in kick-starting data revenues. RIL Infotel suffers this more than the incumbent 3G
operators (the key point of our addressable market calculations in the preceding sections).
The other hurdle, lack of local content, however, is common to all operators. And it is here
that we notice a possible loss of opportunity for the incumbents.
3G operators enjoyed a lead over RIL Infotel in technology maturity. However, with little or
no effort put into growing the content ecosystem, we believe that this advantage is being
lost. We reproduce below Idea Cellular management’s comments on the recent results
call—indicative of a passive approach to content by the incumbents.
“I think as the number of users in the country increases, as the relevance of 3G were to
improve, there are enough entrepreneurs in the country and around the globe, which will
bring in content for requirement of the consumers.”
– Mr Himanshu Kapania, MD, Idea Cellular on 1Q FY13 earnings call (24 July 2012)
At the same time, the table below shows RIL Infotel picking up important content/media
assets, thus building up a content back-end. We believe this could prove to be a significant
differentiator for RIL Infotel upon launch of its LTE services.

21 August 2012
India Telecoms Sector 32
Figure 40: RIL Infotel’s efforts in building a content back-end
Name of the Co. Nature Description What’s in it for RIL Infotel
Extramarks
Education [not
listed]
Acquisition Extramarks' digital distribution model provides students
with education support and study help at affordable prices
The acquisition of stake in Extramarks could strengthen
Infotel's content portfolio and help grow its business,
especially in the education sector, which is focusing
strongly on delivering content using information and
communication technologies (ICT).
Network
18/Eenadu
MoU As a part of the deal for acquisition of ETV Channels,
Network18 and TV18 have entered into a Memorandum of
Understanding with Infotel, under which Infotel will have the
right to distribute (1) the content of all media and web
properties of Network18 and (2) programming and digital
content of all the broadcasting channels (including the ETV
Channels which are being acquired by the company)
through Infotel’s fourth-generation broadband network.
Infotel shall have preferential access to this content on a
first-right basis as a most preferred customer.
Access to premium national news content and strong
regional language general entertainment content
UTV-Walt Disney MOU UTV has interests in television broadcasting, gaming and
film production, having made movies such as Rang De
Basanti and Rajneeti. Its channels include UTV World
Movies, UTV Bindass and UTV Action.
With this deal with Walt Disney India, RIL looks at
gaining access to games, entertainment and even
children’s content for its telecom operations
Den Networks 1.14% stake Den Networks provides cable television services, digital
cable television, cable television distributors, broadband
services, Internet services provider and analogue digital
services
Source: Company data, Media reports including Economic Times

21 August 2012
India Telecoms Sector 33
One ‘G’ to rule them all? TD-LTE is a reality today in India, with Bharti’s recent launch of commercial operations in
two cities. We believe it is important to understand the strengths and weaknesses of this
technology in order to understand the financial impact of LTE on the sector.
LTE achieves far greater speeds than any other existing mobile broadband technology: 2-
3x the nearest competing technology per MHz of bandwidth. It is also extremely flexible, in
that it can work on a range of spectrum allocations: this becomes increasingly important as
spectrum holdings become fragmented globally.
However, these feats are achieved because LTE was designed from scratch using the
best technology without any historical baggage of being backward compatible. This means
that LTE cannot rely on an existing ecosystem and customer base in its initial years—
important factors for any new technology in its infancy. Further, some of the techniques
used to achieve high speeds have their drawbacks: for instance, high speeds can be
delivered only over short distances and handset complexity/battery drain increase
significantly. To worsen things further, Indian LTE networks will be working on a high
frequency band (2,300MHz), which does not offer as good economics as existing 2G/3G
deployments.
Thus, a study of the economics of LTE in India should take a balanced view on all these
factors.
Avoiding square plugs and round holes…
Take the electric appliance industry (TVs, refrigerators, air-conditioners, night lamps, etc),
and imagine a few changes to the way the industry functions. Let us suppose that each
manufacturer, driven by an intent to ‘lock-in’ all the wallet share from his customers,
‘copyrights’ the design of the pins on the electric plugs that go into the wall sockets. No
two vendors make goods with the same pin design on the plug. In other words, a customer
buying lamps from vendor A, also needs to buy the wall sockets from vendor A (the plug
wouldn’t fit into any other vendor’s sockets). When the customer next thinks of buying a
steam-iron for his clothes, he would prefer to buy a product sold by the same vendor A. If
the vendor A does not sell steam-irons, then the customer has no choice but to purchase
the steam-iron from vendor B, and also purchase vendor B’s wall socket (and hire an
electrician to drill a hole in his wall again).
In such a world, the customer would either end up having all appliances from the same
vendor, or have his walls full of sockets from different vendors. The former outcome would
run foul of governments and regulators (monopoly practice). The latter could lead to
prohibitive costs of owning electrical appliances leading to low volumes and, hence, high
device prices (absent economies of scale for the manufacturers), reinforcing low demand.
Fortunately for us, the electric appliance industry has resolved this issue by deciding to
use the same design for pins/wall-sockets in each country, thus standardising the
designs. Thus, in the real world we can buy a steam-iron from any manufacturer and rest
assured that it will fit into the wall-socket back home.
Differences do exist in the designs adopted by different countries, though. But this is not a
major issue since the standards are all ‘open’. Nobody owns (or has ‘patented’) the design
of electric pins/wall-sockets in India. Any manufacturer anywhere in the world can make
and sell adapters that help to connect, for instance, Singapore laptops to Indian wall-
sockets.
Open standards may not be so noticeable in industries where the products work
standalone without interacting much with those of other manufacturers (for example,
newspapers come in different shapes, sizes, colours, fonts, and even time of delivery).

21 August 2012
India Telecoms Sector 34
However, open standards become very important in industries where products made by
many manufacturers have to work closely with each other (electric appliances).
The key benefits of having open standards in an industry are (each is dependent on the
other in some way):
■ Wider choice to customers and wider markets for manufacturers, due to
interoperability between products of different vendors.
■ Economies of scale, leading to lower price points.
■ Prevention of mono/oligopolies.
Needless to say, open standards are very important for the telecom sector where devices
from different manufacturers interact constantly with each other (not least being the
interaction between the handset and the tower). From a relatively simple concept of
standardisation in electrical plugs/sockets, we now look at the complex world of telecom
standards. Two organisations are important for telecom standards, and we shall encounter
them in the following pages:
■ ITU (International Telecommunication Union), an arm of the United Nations (UN)
tasked with, among other things, ensuring proper use of spectrum globally and guiding
the telecom industry towards common standards.
■ 3GPP (Third Generation Partnership Project), which is a collection of groups from
Europe, the US, China, Japan and Korea—each of which is an authority on telecom
standards in their respective regions. Many of the key global equipment/device
vendors, regulators and operators are part of 3GPP. 3GPP develops and maintains
standards to meet goals set by ITU.
Telecom world before 3GPP
The development of standards for (a large part of) the global telecom sector today
happens in a streamlined manner, with global coordination, thanks to 3GPP. But it has not
always been so smooth; 3GPP came into existence only in 1998.
Greek, Hebrew, Sanskrit: For the most part, prior to the formation of 3GPP, the
standardisation process in telecoms was akin to the evolution of languages in world
history. People of each region/country developed their own unique language which
attracted popularity within their own small captive populations. It was beyond human
capability to learn and understand more than a few languages which posed a natural limit
on the geographic spread of languages (and ideas). It was only very late in human history
that a few languages (notably English) started gaining popularity beyond their homelands
which allowed for easier exchange of ideas. Even now, we do not have a single,
standardised global language.
The early standards in the telecom world developed independently and almost parallely in
various parts of the world. During the late 1980s and early 1990s, for example, the
following standards for mobile telephony were being developed in parallel with the
objective of migrating from the old analog world (1G) to the new digital communications
world (2G):
1. The Telecommunications Industry Association (TIA) in the US developed a standard
(called IS-54).
2. Japan developed its own standard called PDC (personal digital cellular).
3. In Europe, a group of telecom regulators from several countries called the ETSI
(European Telecommunications Standards Institute) developed a standard called
Groupe Spécial Mobile (which came to be popularly known as GSM or Global System
for Mobile communications).

21 August 2012
India Telecoms Sector 35
4. Qualcomm/TIA in the US also developed a CDMA-based standard called IS-95 (or
popularly cmdaOne).
It is important to note that the level of differences among these various standards was far
higher than the simplistic electric plug/wall-sockets analogy we earlier talked about. These
standards worked on different spectrum bands, signals were transmitted in different
formats, and there were many other differences (which will become clearer in later
sections of this report). So, for example, signals from a CDMA handset (the fourth bullet
point above) appeared as pure noise to a GSM base station (the third bullet), so much so
that the two devices could not even recognise the presence of each other!
Among these standards, the GSM standard gained the most popularity (probably because
it was already a multi-country effort) and became widely adopted globally as the ‘2G’
standard. But not before many groups the world over had ‘re-invented the wheel’, over and
over again.
The experience from 2G standards evolution prompted regulators and industry participants
to come together and coordinate the standard development efforts in a better way. Thus,
an organisation called 3GPP came into existence in 1998, with members from Europe, the
US, China, Japan and Korea. The original objective of 3GPP was to evolve a common set
of standards for the existing GSM networks to evolve into 3G networks.
The run-up to LTE: Constantly pushing the speed
limits
2G technologies were excellent for voice communication but were poor on data speeds
(GSM gave peak speeds of 9.6 kbps—sufficient for simple applications like light website
browsing and email without attachments). While not much improvement was required on
the voice front, data speeds could use some help with better technologies. Some
improvements in speed took place in the late 1990s through GPRS (coordinated by the
same group which also developed GSM), reaching speeds of 114 kbps in ideal conditions.
Later, starting from 2003, EDGE helped improve speeds to 400 kbps (though this came
after 3G had become a reality). These enhancements came to be called, informally, as
2.5G. The rising popularity of these data services (notably in Japan) convinced the
industry of the importance of striving for higher data speeds on mobile phones. Time was
ripe to develop 3G technologies that could take existing mobile technologies to higher data
speeds.
The ITU took the lead in coordinating the formation of a single global 3G standard for all
2G technologies to migrate to. The set of goals to be achieved by 3G technologies were
collectively called IMT-2000 (international mobile telecommunications for the year 2000)
requirements. The IMT-2000 data speed target was set at 2 Mbps – nearly a 20x jump
from earlier technologies!
Industry participants (equipment vendors, handset makers, regulators) came together in
1998 to form the 3GPP in order to develop a common set of standards. Pretty soon the
target of a single global standard proved utopian, and a parallel organisation for
developing a 3G technology for 2G CDMA networks came into existence (called 3GPP2).
In end-1999, the (original) 3GPP finalised the 3G standards for 2G GSM networks in a
document called ‘Release 99’. The standard was called UMTS (universal mobile
telecommunications systems). The first 3G networks on UMTS standards came into
existence by end-2001.
3GPP2 also came out with 3G standards for 2G CDMA networks, called CDMA2000.
Along with other developments, around five families of technology are now good enough
to be called 3G IMT-2000 standards (as against the original goal of a single 3G standard
for the globe!). Interestingly, two of these are products of the same group—3GPP!

21 August 2012
India Telecoms Sector 36
Fortunately, most of the work post 3G has largely taken place in a single organisation:
3GPP.
Work continues at 3GPP
The ‘double decker’ road in Mumbai: At close to 30,000 people per sq km, Mumbai is
easily the most crowded metro in the world (a full 25% higher than the nearest competitor,
another Indian city Kolkata. Source: Citymayor.com). While the population in the main
island has remained largely stable, the population in some of the suburbs has doubled
over the past decade (mostly in the northern suburbs). However, the commercial areas are
still concentrated in the south of the city. Two expressways are the lifelines of the city—
carrying daily traffic between the residential north and the commercial south (apart from
the local train system, of course). In such a densely populated island city where
broadening of roads is near impossible, municipal authorities face a significant challenge
of managing the ever-growing north-south traffic. With fixed capacity of existing roads,
and no way to broaden the two main arteries, the only way out is to expand capacity by
building fly-over bridges. With a flurry of new fly-overs being inaugurated in the past
couple of years, the 40 km long Eastern Express highway now has a stretch of about 15
km with 14 ‘back-to-back’ fly-overs. A car traversing this stretch touches the ‘ground’ only
at a few points where the fly-overs break, making this literally a ‘double decker’ road!
Copper/fibre based communication has the flexibility that by installing more cables/fibre,
bandwidth can be increased. However, nature has bestowed us with a limited amount of
spectrum ‘usable’ for commercial mobile communications. With ever rising mobile data
traffic, the need is always to push more data through the limited spectrum—or to increase
the spectral efficiency (amount of data passed through unit spectrum measured in
bps/Hz—see picture below). New technologies need to be developed to enhance data
speeds, while at the same time ensuring costs do not escalate unreasonably.
Figure 41: Some terms we will commonly encounter in this report
Source: Credit Suisse estimates

21 August 2012
India Telecoms Sector 37
Two roads beyond 3G
In the early years of the last decade, 3GPP started working on new technologies to
improve speeds (spectral efficiencies) beyond what was capable on 3G. The key decision
to be taken was whether the new technology should build upon the existing 2G/3G
building blocks (backward compatible), or be developed from scratch without any historical
baggage. It was decided that both approaches had their merit and hence two parallel
streams within 3GPP started working on the new technologies.
Stream 1: Technology that needed to be backward compatible (HSDPA/HSPA):
■ This technology has to co-exist with the same building blocks of 2G/3G, in keeping
with GSM’s principle of backward compatibility. This basically means that the new
technology/base stations should provide new services and faster speeds, but at the
same time also support older handsets.
■ The advantage of insisting on backward compatibility is that there is a ready
subscriber base to bear the cost of development and deployment of new technology.
■ The disadvantage, however, is that one cannot bring in radically new concepts that
could give quantum leaps in performance. For instance, HSPA has to work on
spectrum blocks of 5MHz only (or multiples thereof) because this is how 3G works.
This becomes quite restrictive with increasingly fragmented spectrum allocations world
over.
The first standards for HSPA for downlink (HSDPA) got finalised by 3GPP in 2002
(Release 5), and promised download speeds of 14 Mbps. Enhancements to the uplink
were added in 2005 (Release 6), with upload speeds of up to 6 Mbps. These are
informally called 3.5G.
Stream 2: Technology with no historical baggage—developed from scratch (LTE):
■ This technology is free to pick and choose the best that 2G/3G had to offer but there
was no restriction on backward compatibility. In other words, everything from network
architecture to user equipment could be designed from scratch to incorporate the
latest available concepts.
■ The drawback of this approach is that one has to wait for the entire ecosystem to
develop before becoming commercially viable. Even the process of finalising LTE
standards took a lot of time. By the time the first LTE standard was finalised by 3GPP
in 2007, there were already 150+ commercial 3.5G networks worldwide!
LTE was built with the following design targets
■ Peak data rates of 100 Mbps on downlink and 50 Mbps on uplink when operating in
20MHz, with 2-4x more data pushed through given the amount of spectrum than 3.5G
(i.e., greater spectral efficiency).
■ LTE should also achieve the shortest delays in transferring data. The time taken for a
packet of data to travel from the handset to the network (called latency) should be
very short—less than 5ms (50-90% lower than other technologies).
■ Flexibility of deploying in both paired and unpaired spectrum: the first technology to
specifically have this as a target. See box below for discussion on this topic
■ Flexibility to operate on any quantity (bandwidth) of spectrum allocated: a significant
improvement over 3G/HSPA where only blocks of 5MHz were supported. This
becomes increasingly important due to fragmentation of spectrum allocations globally.
3GPP’s LTE design target was to support at least the following bandwidth sizes:
1.25MHz, 1.6MHz, 2.5MHz, 5MHz, 10MHz, 15MHz, 20MHz. We note that in India the
allocation is 20MHz unpaired spectrum.

21 August 2012
India Telecoms Sector 38
■ A completely packet-based network, with no requirement of supporting traditional
voice calls (circuit switched).
Paired and unpaired spectrum
In mobile communication, there are signals being exchanged between the handset and the
tower continuously. The message from tower to handset is called downlink, while the
reverse is called uplink. The messages in both directions travel through the same medium:
air/spectrum. A mechanism is needed to ensure that uplink and downlink messages do not
interfere with each other. The method of achieving this is called duplexing, and there are
two common ways in which this can be achieved.
The most common means to separate downlink and uplink messages is to make them
travel on different frequencies (spectrum pairs), separated by a large gap. This method is
called Frequency Division Duplexing (FDD). This method has been widely used in almost
all popular technologies till date (except for the Chinese 3G standard).
The other, less common duplexing method is to allow both uplink and downlink on the
same frequency (a single block of unpaired spectrum), but ensure that the tower and
handset speak at different times by assigning different time slots to the tower and the
handset. This method has the name Time Division Duplexing (TDD).
Both methods have their merits and shortcomings. FDD allows a simplistic and
straightforward implementation, while TDD requires extra effort to synchronise the
transmissions of the tower and handset (leading to overheads and sub-optimal speeds).
On the other hand, FDD works best when the traffic flow in both directions are similar (like
in voice conversations). Asymmetrical traffic flow like data traffic (people download more
data than they upload) will lead to the downlink being jammed but uplink frequency being
unused. TDD can fix this by assigning more time slots to downlink than uplink. Thus, TDD
is more suitable for asymmetrical traffic like data/Internet.
Most important of all, with increasingly fragmented spectrum allocations globally, it
becomes difficult for governments to find suitable paired spectrum bands, which means
TDD will become increasingly relevant.
The early days of mobile technology were centred on voice telephony with abundant
spectrum, making FDD the obvious choice. However, with fragmented spectrum and
increasing importance of data versus voice, it becomes important that even TDD
deployments be developed. This seems to be the thinking behind the requirement for LTE
to support both TDD and FDD modes.
In India, the fact that an unpaired block of 20MHz spectrum was auctioned in BWA
auctions in 2010 means that TDD is the only option for Indian telcos in this band. TDD-
LTE got chosen over other TDD options by Bharti, and likely by RIL as well.
Since LTE was designed with the aim of supporting both paired and unpaired spectrum
deployments, there is a fair degree of commonality between the FDD and TDD designs
(with only some minor changes in the frame structures that are actually transmitted over
the air). Our recent discussions with industry participants indicated that dual mode (FDD +
TDD) LTE chipsets have already been developed, implying TDD LTE could soon feed off
the scale economies built on the more widespread FDD-LTE ecosystem. For details, see
our note dated 14 May 2012 (Click here for the link).
How does LTE manage higher speeds?
In the following sections, we briefly study the techniques through which LTE achieves
superior data speeds compared to other existing technologies; this is important to also
understand the limitations of this technology. These learnings will be used in real life
modelling of LTE scenarios in India for RIL Infotel.

21 August 2012
India Telecoms Sector 39
Simplistically, LTE achieves better speeds by performing the following tasks more
efficiently than any other existing technology:
■ LTE does the best job of splitting the available spectrum amongst simultaneous users.
■ It packs more information into each symbol transmitted into the air.
■ LTE uses multiple antennas at both the base station and the handset.
■ It uses intelligent error handling.
In practice, it is seen that of the four factors mentioned above, the first and the third are
the biggest contributors to LTE’s superior speeds.
The big constraint is in your hands
While reading the following sections, it will become clear that the key limiting factor that
determined the various choices made for LTE was the handset. It was important to ensure
that the handset does not become too complex (leading to high cost), nor does the battery
drain out too fast. The base station has no major cost/power constraints since the costs
are split across many users.
This also means that the download performance in LTE is far superior than the upload
performance. This asymmetry is fine in the real world, however, as we normally download
more than we upload in terms of data!
1. Cutting through the clutter
Preventing Hamlet from killing Romeo:
Imagine ten people seated in a room, five in each of two rows (left and right). Each row
have their backs to the other, so that people from one row cannot see the ones in the
other. Every person in the left row has a partner assigned in the right row. Now each of the
five people in the left row is given a copy of one of Shakespeare’s plays, while each
person in the right row is given a blank notepad and a pen. The idea is for each person in
the left row to read out the play for his partner in the right row to correctly copy onto his
notepad. Each pair is in a hurry to get their task over with as soon as possible.
Left by themselves, all readers on the left would start reading simultaneously, creating so
much noise that the people on the right could mix up words from different readers (so one
version of the ‘play’ could end with Hamlet stabbing Romeo!). But with some coordination
within the group, it is possible to resolve this problem of simultaneous reading, in a
manner that ensures no pair is unfairly delayed. We list some of these methods below
(which correspond to methods used in real world telecom standards):
Method 1: Round robin (2G GSM): The five pairs are numbered 1 to 5. The first minute at
start is reserved for the first pair (when the remaining four pairs are silent). The second
minute is reserved for the second pair, and so on (the cycle repeating itself every five
minutes). So each person on the left gets a chance to talk for a minute, once every five
minutes. Since his partner in the right row knows the specific times that are reserved for
them, he only listens during these one-minute intervals and notes down all the words read
out. This technique is elegant as long as the group has sufficient time on their hands and
reading speed requirements are low. Any effort to read faster could lead to slurring of
words, with loss of clarity. Another drawback is that allowing only one reader to talk at any
time seems like a waste of ‘airtime’—as the other methods below show.
Method 2: Use different languages (3G UMTS): A careful listener can make out words
spoken in his native tongue—in the midst of simultaneous chatter in many languages. This
fact is exploited in the second method. The partners in each of the five pairs decide on a
common language that is different from the languages chosen by the other pairs. The
readers on the left translate the plays into their chosen languages, and read out all

21 August 2012
India Telecoms Sector 40
simultaneously. The people on the right carefully listen to the emanating noise, and filter
out only words that make sense in their chosen language and ignore all other words.
Then, they translate whatever they just heard back into English, before writing it onto their
notepads. This technique is significantly better than the earlier method since all readers
speak simultaneously. The entire task by the whole group can be completed in a fifth of
the time than what was required in the ‘round robin’ method (so speed is 5x). However,
beyond this gain in speed, any faster reading in this method also runs the risk of slurring
the words (more than the earlier method since the listener has to filter out relevant words
from five parallel voices).
This method obviously requires that the people in the room are capable of translating
between languages quickly (i.e., they need to be smarter than the people in the first
method).
Method 3: Use multiple pitches of voice (LTE): In a commotion of many male voices, a
woman’s voice stands out for the human ear because it is noticeably shriller (i.e., of a
higher pitch). This ability to filter out voices of different pitches is made use of in the third
method. The five pairs of people in our example decide on four frequencies of voice each
(i.e., a total of 20 voice pitches between the low pitch baritone and high pitch soprano are
chosen by the entire group). The readers on the left split their plays into four parts. The
four parts are read simultaneously in the four voice pitches chosen by them (they must be
from another galaxy to have this level of brainpower, of course!). This means each reader
is increasing his reading speed by 4x compared to the round robin. All readers talk
simultaneously (i.e., the group is working 5x faster than round robin). At the other end, the
people only listen to the five voice pitches chosen by their pair, and write down what they
hear. Chances of a mix-up are low since each pair within the group has decided on a
unique set of voice pitches (frequencies). So, in this method, the speed is 20x (=4x5) the
round robin method.
One of the key characteristics of wireless communications is that many users share the
same medium: spectrum/airwaves. One has to find a way to ensure that transmitted
messages are received by the right recipient, and not garbled with the messages meant
for another user. One should also strive to achieve fairness in allocating resources
amongst various operators.
Many solutions exist to ensure multiple users can use the spectrum simultaneously; the
process is called multiplexing. The choice of the multiplexing method has a significant
bearing on the device complexity and data speeds achieved.
2G GSM: Time division multiple access (TDMA)
GSM uses a simplistic ‘round robin’ multiplexing technique. The spectrum available with
the operator is broken down into buckets separated by 200kHz (called channels). Each
bucket of 200kHz can be shared by 7-8 users with the users taking turns one after the
other taking up one time slot each. So multiple users are supported in GSM by ensuring
no two users send messages on the same frequency at the same time. Whenever a call or
data session is to be set up for a handset, the base station assigns a particular bucket and
a time slot for the user. The user’s assigned time slots occur once in every eight time slots.
Pros/cons: The simplicity of the TDMA technique used by GSM implies ease of
implementation at the base station and, more importantly, in the handset. However, the
drawback is that during a time slot, the entire frequency bucket (of 200kHz width) is
reserved for a single user, who may or may not have sufficient information to
download/upload. This leads to inefficient usage of spectrum.
3G UMTS: Wideband Code Division (WCDMA)
The multiple access concept in 3G is built upon the technique used in 2G CDMA.
Let us study the CDMA technique by taking the downlink case of the base station
simultaneously transmitting to many handsets. Corruption of signals to various users is

21 August 2012
India Telecoms Sector 41
avoided by using ‘codes’. The base station assigns a unique set of codes to each user
upon initiating a session (codes are densely packed series of ‘0s’ and ‘1s’). Before
transmitting into the air, the base station ‘encodes’ the data using this code. What
emanates from the base station is thus a mixture of coded signals meant for all users in
the cell—and thus makes little sense to anybody.
At the receiver’s end, the handset ‘decodes’ the received signal with its assigned code.
This cancels the effect of all other signals and recovers the data meant for the handset.
The key here is that the base station and user share the same code, and the codes of
different users cancel one other (this property is called orthogonality). It is as if the base
station talks to each handset in a unique language, which other handsets do not
understand and thus ignore. The name for this method is code division multiple access
(CDMA).
Now 2G CDMA splits the available spectrum into buckets of 125kHz each, within which
the users are allocated codes. Hence a user is restricted to this bucket of 125kHz (and the
method is called narrowband CDMA).
In 3G, an entire block of 5MHz spectrum is simultaneously used by all users (hence the
name wideband). But the basic code division multiple access concept remains the same.
Pros/cons: Since WCDMA uses the entire available spectrum for all users
simultaneously, it leads to a more efficient usage of spectrum.
However, any efforts to expand the bandwidth further (say to 20MHz)—with the aim of
increasing data speeds—would lead to an unreasonable rise in costs. This is because of
the high complexity of radio electronics to be able to listen to the entire 20MHz at once
(note that the information from each user is spread out across the entire available
spectrum in 3G).
Another drawback of the original 3G specification is that the set of codes assigned to a
user remain static throughout the session which is a waste of resources (codes are
resources in one way). 3G has no provision to temporarily transfer some resources
(codes) from a slowing user to another user who is seeing a sudden surge in data traffic.
3.5G (HSDPA) improves upon 3G by assigning codes dynamically depending on traffic
loads at each user and environmental conditions. This flexibility is the key reason for
increased throughput of HSDPA.
LTE: OFDMA
LTE employs one of the most efficient means of multiple access known today called
Orthogonal Frequency Division Multiple Access (OFDMA).
OFDMA works by splitting a high speed datastream into a number of low speed data
streams which are then parallely transmitted over multiple frequencies. Since each of the
individual data streams are now at low speed, this brings in a level of robustness into the
transmission on air (remember the slurring of words when our Shakespearean people tried
to read too fast).
The entire spectrum bandwidth is thus split into a large number of frequency buckets
called sub-carriers. Multiple users are supported by assigning a few buckets to each user
at any time.
The allocation is dynamic: i.e., the network can decide the number of buckets assigned to
each user a thousand times a second. This level of flexibility comes in handy since data
traffic is mostly ‘bursty’ (some users may see a sudden burst in data traffic). So the same
frequency bucket can be assigned to different users at different points in time depending
on who needs the bandwidth most. This is a big improvement over 2G/3G techniques
where resources allocation is largely static.

21 August 2012
India Telecoms Sector 42
In 3GPP LTE, the buckets are spaced at intervals of 15kHz. This means that a 20MHz
spectrum block is split into 1300+ sub-carriers each of which can carry information
simultaneously.
How is LTE different from GSM?
The underlying multiplexing schemes in both 2G (GSM) and LTE appear similar: in both
cases, multiple users are handled by ensuring that no two users send messages on the
same frequency bucket at the same time (i.e., both technologies use a combination of
frequency division and time division).
However, GSM is quite rigid in its resource allocation: a user is assigned one frequency
bucket at the start of the session and he gets to send messages within that frequency
bucket once in every eight time slots. Further, the allocation is frozen at the beginning of
the session and remains fixed throughout the session.
LTE on the other hand is quite flexible: many frequency buckets can be assigned to a
user, for any number of time slots. Further, the allocations on both frequencies and time
slots can change continuously, in order to accommodate bursts in traffic or changing
environmental conditions. This allows for a more efficient usage of spectrum.
The two technologies also differ in the way the frequency buckets are chosen. Due to real
world imperfections, signals meant to travel on a particular frequency bucket usually also
spread out in adjacent frequencies thus causing interference on adjacent buckets. It has to
be ensured that signals on adjacent frequency buckets do not interfere with each other.
GSM uses a brute force approach wherein adjacent frequency buckets are separated by
an unused 200kHz zone; at this distance the interfering signal from an adjacent band is
too weak to cause any problems. So, in GSM, a raw physical barrier separates adjacent
frequency buckets.
LTE, on the other hand, manages a much tighter 15kHz separation between adjacent
frequency buckets by elegantly making use of a property called ‘orthogonality’. This uses
the law of physics that states that the interfering signal is not really uniform at all
frequencies but has some ‘silent points’ at regular intervals. By choosing the adjacent
buckets at these ‘silent points’, interference is avoided and a denser packing of buckets is
achieved.
Figure 42: LTE's frequency buckets are more tightly packed than GSM. There is less wastage vs GSM
Source: Credit Suisse estimates
Note that both GSM and LTE differ from 3G (WCDMA). In 3G, all users send messages on
all frequencies, all the time. Multiple users are supported since each user sends out
messages using unique codes (unique languages from our Shakespearean analogy).

21 August 2012
India Telecoms Sector 43
OFDMA/GSM see spectrum bandwidth allocation of any size as only a set of frequency
buckets. The same underlying principles hold, whether there are 1,000 buckets or 2,000
buckets. This gives LTE/GSM the flexibility to work on spectrum allocations of any
size while retaining the same system parameters or equipment design (but recall 3G
works only on blocks of 5MHz).
This is not new stuff: OFDM was first proposed in the mid-1960s and has been used in
high-end applications and HDTV for a while. What prevented mass adoption in mobile
telecom was the complexity. The task of splitting the data stream into many frequency
buckets and then sending them over air simultaneously (or doing the reverse process at
the receiver) requires a complex function called fast fourier transformation (FFT). This
function requires high speed processors which would have rendered handsets too
expensive.
However, thanks to developments in processing capabilities in chipsets and falling costs, it
is now possible to perform FFT in a device the size of a handset at a cost that is affordable
to individual users.
Pros/cons: OFDM is by far the best multiplexing technology available – it can push the
maximum amount of information through a given amount of spectrum compared to other
options. However, the complex processing also means that the power requirements in the
transmitting device will be very high, leading to a high cost. Also, the battery drains out
faster. This is not really a constraint in the base station, but a major issue in handsets. For
these reasons, LTE uses OFDMA only on the downlink (tower to handset), whereas a
modified but simpler technique called SC FDMA is used in the uplink (handset to tower).
The result is that upload speeds in LTE are lower than download speeds. Read on for
other reasons for this difference in upload/download speeds.
2. I’m sorry, say that again ...
The air is a hostile medium for communication compared to the cozy environment of a
cable/fibre. Various factors lead to signals weakening rapidly with distance. In addition,
airwave signals bounce off objects (buildings, vehicles), resulting in them taking multiple
paths between the transmitter and receiver. This means the receiver gets multiple copies
of the same message – some of these copies reaching the receiver so late that they
garble the next message in the sequence. Further, the same medium is shared by multiple
users who are customers of different operators, resulting in a high chance of unintended
interference.
All these factors render the air/spectrum as a highly unreliable medium to transport
information. Chances that the received signal is exactly the same as the transmitted signal
are low. In real life scenarios, 10-50% of the bits sent by the transmitter are heard wrongly
by the receiver! So mobile telecommunications systems assume that errors are bound to
occur, and go about their business by devising ways to communicate messages in spite of
the error-prone nature of the medium.
In most modern mobile telecom systems, before the data is transmitted into the air, the
transmitter adds some additional information which will help the receiver determine if the
received data is correct or not. How the receiver handles erroneous data is called error
handling, and could impact the overall system throughput.
Mobile systems up to 3G use a simplistic error handling mechanism, wherein an
erroneous block of data is discarded, and the transmitter is asked to resend the
information all over again. If there is an error in the second attempt as well, the receiver
just asks for the data to be transmitted again. The process continues till the receiver is
satisfied with the accuracy of the received bits. Under tough conditions, one can easily see
that multiple attempts to transmit the same data will lead to degradation of overall data
speeds.

21 August 2012
India Telecoms Sector 44
However, with increasing processing capabilities of devices, more intelligent error handling
is now possible. HSPA (3.5G) and LTE both use ‘soft combining’. In this method, the
receiver does not discard the erroneous data block but stores it temporarily – the idea
being that the erroneous data is not completely useless, but has some useful information.
This stored data is used along with data blocks received in subsequent attempts to
reconstruct the original data. This way, the number of attempts to transmit data could be
reduced, thereby increasing the overall throughput of the system.
3. Saying a lot more with a few words
The flags of Himmatpur
In ancient times, Himmatpur was a small kingdom in central India. It was actually a city-
state that managed to protect its sovereignty despite frequent attacks by neighbouring
kingdoms. The city was well protected by a strong fort, whose main gates faced North. A
river flowed along the Southern wall of the fort, and offered a natural barrier against enemy
attacks. The city boasted of some of the bravest warriors of the time. However, the biggest
factor that helped the city during an enemy attack was the presence of small hillock
around 2 km to the East of the main fort gates (the area was otherwise a flat plain).
Anybody at the top of the hillock got a panoramic view of the entire plain surrounding the
city. Guards posted at the top of the hillock gave an early warning of approaching enemy
troops, so that the army within the fort could prepare for a counter-attack.
Himmatpur’s army followed a simple system in sending warning signals from the hillock to
the fort. There was a flagpost on the hillock, where usually a white flag would be hoisted.
Whenever the guards on the hillock got sight of approaching enemies, they quickly
replaced the white flag with a black flag, which got picked up by the soldiers within the fort
as a sign of danger. The system worked very well for many decades.
After failing to penetrate the Himmatpur fort despite several attempts, one of the
neighbouring kingdoms built out a naval fleet, the first of its kind in these parts of India.
After a lot of planning, the enemy attacked Himmatpur not from the usual North side, but
from the South over the river. The guards on the hillock immediately noticed enemy
movement on the Southern border of the fort and raised an alarm by hoisting the black
flag.
However, the soldiers within the fort assumed that the attack is going to come from the
North as usual, and started preparing for a counter-attack in that direction. It was almost
when the enemies had already touched the South walls of the fort that some fishermen on
the river bank noticed the approaching enemy boats and raised an alarm. Himmatpur
managed to defend itself, but only at the cost of the lives of many of its brave soldiers.
The immediate danger being fended off, the army think-tanks got together to take stock of
the situation. They realised that with improving technologies (naval warfare and hence
multidirectional attack) their system of two coloured flags on the hillock was not giving
adequate information. Further, in some of the other recent attacks the army leaders had
felt that information about the type of attack would have also been useful (infantry, cavalry,
elephant-borne, aerial). One smart young general suggested that the two colour system be
extended into multiple colours, say eight. Each of the eight colours conveyed specific
information about impending enemy attack (type of attack and its direction). Under the new
system, the single flag but in multiple colour possibilities gave a lot more information
to the soldiers in the fort.

21 August 2012
India Telecoms Sector 45
Figure 43: New flag symbols at Himmatpur
Flag colour Message
White No danger
Violet Naval attack from the South
Indigo Aerial attack from South
Blue Infantry attack from the North
Green Cavalry attack from the North
Yellow Elephant-borne attack from the North
Orange Aerial attack from North
Red Attack from East/West (included to accommodate future improvements to enemy strategy)
Source: Company data, Credit Suisse estimates
The new system was a definite improvement over the early two-coloured system, and
helped Himmatpur improve the effectiveness of its counter attacks in many subsequent
enemy onslaughts. However, there was a drawback as well.
In the earlier system, it was easy to distinguish between the white and black flags even
though the hillock was 2km away from the fort. However, in the new system, the difference
between colours was not black-white stark, and there was a risk of colours being
interpreted wrongly by the soldiers at the fort (which would have proved catastrophic). This
risk was especially high when the sky was cloudy, or during dawn and dusk (warfare at
night was forbidden in ancient India).
Hence two changes were brought into the flag warning system. First, the flags were made
larger in size so as to be visible clearly even from a long distance. Second, it was decided
that the multi-coloured system was to be used only when the sky was clear and the sun
bright. Under overcast conditions, the guards reverted to the old two-colour system (with
army being put on high alert in all directions when the black flag came up).
Note: The story is completely fictional and made up to illustrate the benefits/pitfalls of
higher order modulations in telecom radio signals. Himmatpur is actually a small village of
~4,000 people in North India. The word Himmatpur in Hindi loosely translates into ‘City of
bravery’.
Modulation refers to the representation of information through physical symbols. In the
original two-coloured flag system at Himmatpur, a white flag symbolised peace while a
black flag indicated an approaching army. So information regarding peace/danger was
‘modulated’ through flag colours. In wireless communication, information in the form of
0’s/1’s is ‘modulated’ through different shapes/sizes of waves on air.
The modulation formats used by the various mobile technologies are summarised below.
Note that the endeavour with each new technology is to push through more bits of
information through a single symbol on air.
2G GSM: One bit per symbol
GSM uses a modulation scheme where the bits ‘1’ and ‘0’ are represented by waves of
different frequency. So for example, a lower frequency signal could stand for ‘1’ while a
higher frequency signal could stand for ‘0’. The receiver can easily identify a lower
frequency signal from a higher frequency signal, or in other words identify ‘1’s and ‘0’s,
and thus data is communicated. Thus the GSM alphabet consists of only two symbols,
each capable of representing one bit.
A series of bits is represented by continuous sequence of symbols (see Figure 46)

21 August 2012
India Telecoms Sector 46
Figure 44: Representation of '0' in 2G Figure 45: Representation of '1' in 2G
(1.0)
(0.5)
-
0.5
1.0
Symbol for 0
(1.0)
(0.5)
-
0.5
1.0
Symbol for 1
Source: Credit Suisse estimates Source: Credit Suisse estimates
Figure 46: Representation of '1-0-0-1' in GSM
(1.0)
(0.5)
-
0.5
1.0
Symbols for 1-0-0-1
<-symbol for 0-><-symbol for 0-><-symbol for 1-> <-symbol for 1->
Source: Credit Suisse estimates
3G UMTS: Two bits per symbol
3G UMTS uses a modulation format called QPSK (quadrature phase shift keying), where
the alphabet consists of four symbols, each capable of representing two bits of
information. The symbols differ from each other in phase (in simple terms, the starting
point of the waveforms).
Figure 47: Representation of '00' in 3G Figure 48: Representation of '01' in 3G
(1.0)
(0.5)
-
0.5
1.0
Symbol for 00
(1.0)
(0.5)
-
0.5
1.0
Symbol for 01
Source: Credit Suisse estimates Source: Credit Suisse estimates

21 August 2012
India Telecoms Sector 47
Figure 49: Representation of '10' in 3G Figure 50: Representation of '11' in 3G
(1.0)
(0.5)
-
0.5
1.0
Symbol for 10
(1.0)
(0.5)
-
0.5
1.0
Symbol for 11
Source: Credit Suisse estimates Source: Credit Suisse estimates
The same information series of ‘1001’ that required four symbols in 2G now requires only
two symbols in 3G:
Figure 51: Representation of '1001' in 3G using QPSK
(1.0)
(0.5)
-
0.5
1.0
Symbols for 1-0-0-1
<-symbol for 10-> <-symbol for 01->
Source: Credit Suisse estimates
EDGE – one of the intermediary technologies between 2G and 3G, uses a variation of the
abovementioned 8-PSK. The alphabet consists of three symbols and each symbol
represents 3 bits.
3.5G HSPA: Four bits per symbol
The successor to 3G, HSDPA, uses an even more complex modulation scheme to
increase data speeds. The HSDPA alphabet consists of sixteen symbols (16QAM), each
representing four bits of information. The symbols differ from each other based on both
phase and amplitude (amplitude = height of the peaks or depth of valleys in the waves). In
HSDPA the series ‘1-0-0-1’ can be represented by just a single symbol!

21 August 2012
India Telecoms Sector 48
Figure 52: Example modulation scheme used in 3.5G—each symbol represents 4 bits of information
Source: Credit Suisse estimates
Why 3G drains your battery faster?
An immediate observation in moving from the simpler modulation scheme of 2G to the
more complex modulation schemes in 3G and 3.5G, is that while more bits are packed into
each symbol, it becomes increasingly difficult to distinguish one symbol from another.
Thus, higher order modulation schemes are more prone to errors. This has the following
consequences:
■ To ensure that the receiver is able to identify the symbols correctly, the transmitter has
to send out stronger signals (i.e., shout louder). This is one of the reasons why
handset batteries drain out faster in 3G networks than in 2G networks. The other
related reason for batteries to drain out quicker in 3G is the faster processing required
for the complex modulation scheme.
■ In 3.5G (HSDPA), the network uses 16QAM only under good conditions, and switches
back to the less complex 3G QPSK under tough environments/high loads. This is
called adaptive modulation.
LTE: 6 bits per symbol
LTE takes the modulation scheme from 3.5G to the next level. LTE alphabet consists of 64
symbols (64QAM), each symbol representing 6 bits of information. Thus LTE packs 6x
more information into a single symbol than in 2G and 3x more information than in 3G.
While we are not showing the 64 symbols here (due to space constraints), one can easily
imagine the proximity of symbols to each other in an LTE alphabet. One can thus expect
LTE devices to send out even stronger signals. This has two consequences:

21 August 2012
India Telecoms Sector 49
■ Handset battery could drain even faster than in 3G networks.
■ Very strong radio signals are believed to be harmful for the human body. Handsets,
unlike base stations, are almost always close to the user’s body, and hence risk from
handset emissions is higher. In India (like in many other countries) there are rules on
the maximum-strength signals that a handset can send out.
It is for this reason that while LTE specifications make it mandatory for the downlink (tower
to handset) to use 64QAM, the uplink (handset to tower) is free to use lower modulation
schemes. Thus, the upload speeds in LTE would typically be far lower than download
speeds, in order to reduce the strength of signals sent out by the handset.
Higher capacity = smaller coverage
While the power requirements on the tower are less stringent than on the handset, there
are limitations here too:
(1) In some countries, governments impose a limit on the maximum power of signals
transmitted by telecom towers (in India the limit is currently at 9.2watt/sq. m, and is set to
go down by 90% after Sep-2012)
(2) Very strong signals from one site could interfere with signals in adjacent sites (unlike
frequency reuse in GSM, all sites in an LTE network normally work on same frequencies).
This places a limit on the strength of signals from towers too. This means that only
handsets closer to the tower will be able to listen to signals using complex modulations
such as 16QAM and 64QAM. The consequence of this is that there is an inverse
relationship between data speeds and distance from the site. In other words, higher
capacity cells cover smaller area (unlike GSM voice where erlang capacity normally does
not change with coverage area of the site). So, one can think of different categories of
sites, large ‘macro’ cells to drive coverage in rural/semi-urban area and smaller ‘micro’
cells that provide high capacity in focussed high-density urban localities. Macrocells cover
a larger area but promise slower data speeds than microcells.
The relationship between cell radius and throughput (Mbps) is not linear, as seen in Figure
53 (the exact values would depend on various parameters such as frequency band,
amount of spectrum allocated, height of tower and speed of user equipment. But the
general curve would resemble this figure).
This concept can be seen in a different way too. Under heavy traffic loads, the cell radius
could shrink for a given cell.
Figure 53: LTE—relationship between capacity of a cell and its size
Throughput (Mbps) vs distance
Ave
rage t
hro
ughput
of
cell
(Mbps)
Radius of the cell Source: Credit Suisse estimates

21 August 2012
India Telecoms Sector 50
4. Multiple antennas
All technologies up to HSPA (3.5G) normally use only one antenna at the handset.
However, with better processing capabilities in user equipment, it is now possible to use
multiple antennas in the base station and the handset to improve data speeds. If there are
two antennas at both the base station and the receiver, the base station splits the data into
two parallel streams and transmits them simultaneously over each of the transmit
antennas. With some proper processing at the receiver, it is possible to reconstruct the
two original data streams. In effect, the data transfer speed is doubled. See the box below
for a more technical discussion on how this is done.
The idea is called MIMO (Multiple Input Multiple Output), and is one of the biggest factors
that helps LTE achieve better speeds. Theoretically, it is possible for data speeds to
double if the number of antenna pairs are doubled (i.e., it is a linear relation)!
However, as we have seen as a common trend in this report, there is no such thing as a
free lunch. MIMO increases the cost of handsets. While there is no theoretical restriction
on the number of antennas in a device, current LTE deployments have only 2 antennas in
the handset (which is the minimum required by 3GPP).
We note here that while 3.5G (HSPA) does not use multiple antennas, a latter version of
HSPA uses MIMO to achieve higher speeds. This new technology came to be called
HSPA+ (or informally, 3.75G).
Simple example of use of multiple antennas
Imagine a simple radio communication system with one transmitter and one receiver, in an
open space separated by a distance (say 100 m). The data being communicated is a
random series of numbers from 1 to 100. The transmitter sends a signal of power 1W to
transmit the number ‘1’, a signal of power 2W to transmit the number ‘2’ and so on, up to
100W to transmit the number 100. (Note: no real world radio system works this way but
this example helps explain how multiple antennas work).
So, for a data series of four numbers, which reads 12,3,36,90, the transmitter sends out
signals of 12W, 3W, 36W and 90W one after the other in intervals of 1 second.
Now, air is an imperfect medium, and there is bound to be distortion by the time the signal
reaches the receiver. Let us assume that the air medium reduces the signal power and
allows only 60% of the original power to reach the receiver. So, the above transmitted
series of numbers would reach the receiver as a series of four signals with power: 7.2W,
1.8W, 21.6W, 54W (i.e., 60% of the original signal strength transmitted). If the receiver
knows that this number is 60%, it can easily reconstruct the original signals.
Now imagine that instead of one pair of transmitter-receiver, two pairs are used, as shown
in Figure 54. The transmitters now simultaneously send out signals for numbers 12 and 3,
i.e., signals of strengths 12W and 3W. These two signals reach both the receiving
antennas. Given that signals from each transmitting antenna to each receiving antenna
take a different path, the power-loss in each path would be different.
The receivers get signals from both transmitters simultaneously, and what gets heard is a
single signal, which is a combination of signals from both transmitters (8.7W and 5.4W in
the figure). However, knowing the actual power-loss characteristics of the path from each
transmitter, the receiver can reconstruct the original signal by looking at the signals
received at both receiving antennas.

21 August 2012
India Telecoms Sector 51
Figure 54: Receivers get signals from both antennas and recreate the original signals by solving a simple linear
equation
Source: Credit Suisse estimates
Performance of LTE vs other data technologies
The techniques that we discussed so far help LTE achieve far superior performance
compared to other existing technologies. Figure 55 shows that a two-antenna MIMO
(denoted as 2x2 - the minimum configuration for system to qualify as LTE) can push 9x
more information through a given amount of spectrum than 3G.

21 August 2012
India Telecoms Sector 52
Figure 55: LTE can push 8x more data through a given amount of spectrum vs 3G
-
0.5
1.0
1.5
2.0
2.5
3G
(WCDMA)
3.5G
(HSDPA)
3.75G
(HSPA+)
LTE
(2 antennas)
LTE
(4 antennas)
Spectral efficiency of 3GPP data technologies
Source: 3G Americas, Credit Suisse estimates
Similarly, LTE also delivers superior latency performance (Figure 56).
Figure 56: LTE achieves far lower delays in data transmission than other technologies
0
100
200
300
400
500
600
700
800
GPRSRel'97
EDGERel'99
EDGERel'4
WCDMARel'99
EvolvedEDGE
HSDPA HSPA HSPA + LTE
Latency of 3GPP technologiesmilliseconds
Source: Company data, Credit Suisse estimates
However, these findings are not directly applicable to all real life situations, and we
develop models to study LTE’s economics in the Indian context in the next section.
Different names for the same thing
In technical discussions, it is common to find various components of the network being
called by different names in different technology standards. While the base station is
commonly called BTS (base transceiver station) in 2G GSM, 3G specifications give the
name ‘NodeB’ while LTE specifications use the name ‘eNodeB’. Similarly, the mobile
handset is called ‘Mobile Equipment (ME)’ in 2G, and ‘User Equipment (UE)’ in 3G and
LTE specifications.

21 August 2012
India Telecoms Sector 53
To keep the discussion simple, in this report we simply use ‘site’ or ‘base station’ to refer
to a base station and ‘handset’ to refer to the user equipment.
Developing a basic LTE model for the Indian context
A high degree of care needs to be taken while comparing the performance of various
mobile data technologies. A number of factors/assumptions go into determining the exact
results: frequency band of operation, coverage area of site, height of the antenna, strength
of signals transmitted, sensitivity of receiving antennas, nature of surrounding environment
(i.e., plain line-of-sight available or lot of obstructions), mobility of the user, and sometimes
even the time of the day. Even small changes in these factors can change the
performance significantly.
To ensure a standard set of assumptions/factors for ease of comparison, the ITU has
specified a set of four scenarios for measuring the performance of LTE (and future
technologies).
Figure 57: Standard deployment scenarios specified by ITU
Name of deployment scenario Rural macrocell Urban macrocell Urban microcell Indoor Hotspot
Site-to-site distance (m) 1732 500 200 60
Carrier frequency (MHz) 800 2000 2500 3400
BS antenna height (m) 35 25 10 6
No BS antennas (up to) 8 8 8 8
No UT antennas (up to) 2 2 2 2
UT speed (km/h) 120 30 3 3
BS transmit power (dBm) (for 20MHz) 49.0 49.0 44.0 21.0
Note: 1) UT: User Terminal; 2) BS: Base Station;
Source: Guidelines for evaluation of radio interface technologies for IMT-Advanced, ITU-R
The various members of 3GPP submit their real-life results on these scenarios to 3GPP,
which in turn submits a consolidated result to ITU. Below are the results submitted by
3GPP in these scenarios for LTE. In our discussions with equipment vendors, we
understand that these are representative of the assumptions used in real life deployments,
except for the ‘Rural Macrocell’ case, where the results in the table look aggressive.
Figure 58: Actual performance results of LTE
Rural macrocell Urban macrocell Urban microcell Indoor Hotspot
Downlink results
Average spectral efficiency (bps/Hz/sector)
SU-MIMO 4x2 1.8 1.4 1.9 4.1
Uplink results
Average spectral efficiency (bps/Hz/sector)
SU-MIMO 1x4 1.8 1.6 1.9 3.9
Note: 1) SU-MIMO: Single User Multiple Input Multiple Output
Source: 3GPP 36.912 Feasibility study for further advancements of E-UTRA
To express these results in simpler terms, a three-sector base station with 20MHz spectrum
allocation can have the following capacities (in terms of Mbps) in these four scenarios. An
‘urban macrocell’ can support 10 users simultaneously, each enjoying an average download
speed of 8.4Mbps, since it has a capacity of 84Mbps (84 = 1.4 x 3 x 20).
Figure 59: Average base station capacity implied by 3GPP results
Rural macrocell Urban macro cell Urban microcell Indoor Hotspot
Average downlink throughput (Mbps / site) 108 84 114 246
Average uplink throughput (Mbps / site) 108 96 114 198
Source: Company data, Credit Suisse estimates
These results are good to have but not readily usable in the Indian context. The spectrum
allocations in India for LTE are in the 2300MHz band, which is not a part of the four ITU

21 August 2012
India Telecoms Sector 54
scenarios. Moving to a higher frequency would mean the coverage area of cells will
reduce. Or, keeping the area the same, the capacity of the cell (average throughput) would
reduce (all these concepts were discussed in the previous sections). Further, Indian telcos
have been allocated 20MHz of unpaired spectrum.
Using the above test results and adjusting for the fact that Indian telcos will be working on
unpaired spectrum in 2300MHz band, we obtain the following capacity scenarios for India.
We assume that only 80% of the 20MHz bandwidth is available for downloads (rest is
required for uploads). These numbers have been developed in consultation with
equipment vendors (Ericsson, PointRed).
This table says that a ‘Microcell’ in India with a range of 100 m (inter-site distance 200 m)
could have a download capacity of 93Mbps as seen below, i.e., it can support 10 users
each with an average 9.3Mbps download speed over the coverage area of this site. Note
that in line with our earlier discussion (capacity inversely proportional to size of cell), the
‘Macro 2’ case has significantly low capacity since it is required to reach up to 2 km (inter-
site distance 4 km).
Important note: The terms used in this table / report such as microcell and macrocell are
just names used by us to identify the different deployment scenarios. It is possible that the
term ‘Microcell’ used by different vendors may have different values for the fields below.
What really matters is the relationship between the coverage area and the throughput in
each scenario—for our purpose of building a top-down model.
Figure 60: LTE site deployment scenarios in Indian context (@2300MHz)
Cell deployment options Microcell Macro 1 Macro 2
Spectrum allocation MHz (unpaired) (A) 20 20 20
Inter-site distance (m) 200 440 4,000
Coverage area (sq m) 34,641 167,663 13,856,406
Download traffic as % of total (assumption) (B) 80% 80% 80%
Average downlink spectral efficiency per sector (bps/Hz) (C) 1.9 1.4 0.2
Average throughput (Mbps) [A x B x 3C] 93 66 10
Source: Company data, Credit Suisse estimates
Ericsson
Ericsson is a world-leading provider of telecommunications equipment and services to
mobile and fixed network operators. More than 40% of the world's mobile traffic passes
through Ericsson networks.
PointRed
PointRed Telecom Limited (not listed) is a leading India-based 4G equipment developer
and manufacturer. The company specialises in mobile backhaul and LTE products. It is
also among the largest suppliers of mobile Wimax equipment globally. PointRed has its
R&D facilities in Bangalore, India, with a manufacturing hub in Taiwan. PointRed boasts of
significant market share in developing economies such as India, Africa and Latin America.
Developing a comparative framework between LTE and 3G
The key aspiration behind designing LTE, as we have seen earlier, is to increase the data
capacity of sites with a given amount of spectrum. Our first exercise is to compare the
economics of generating unit data capacity by an Indian LTE operator versus the nearest
competing data technology that is in the market, or 3.5G (HSPA). Note that most Indian
3G operators have already deployed HSPA.
To start with, we need a comparison of the spectral efficiencies of LTE and HSPA (under
Indian conditions). Luckily, 3GPP has defined four scenarios for the purpose of comparing
these technologies.

21 August 2012
India Telecoms Sector 55
Figure 61: Standard scenarios specified by 3GPP for comparing performance of various technologies
Case number Case 1 Case 2 Case 3 Case 4
Carrier frequency (MHz) 2000 2000 2000 2000
Site-to-site distance (m) 500 500 1732 1000
UE Speed (km/h) 3 30 3 3
Note: UE = User Equipment; Source: 3GPP TR 25.814
Out of the following four scenarios used by 3GPP to compare different technologies, we
choose the results from ‘Case 1’, as this is likely to be closest to the real deployment in
urban India (the key market for data in initial years) in terms of cell ranges. Choice of any
other case would not make much difference to our analysis, as the results are broadly
similar in various scenarios.
The 3GPP results below show that LTE can push through 3.5x as much information into a
given amount of spectrum than 3.5G.
Figure 62: LTE can push 3.5x more information through a given amount of spectrum
than 3.5G
3GPP Case 1 Average spectral efficiency gain of LTE over HSPA
Downlink: 4x2 MIMO 3.5 x
Uplink: 1x2 MIMO 3.3 x
Source: 3GPP, Credit Suisse estimates
These results give the performance in 2000MHz frequency band for both LTE and 3.5G.
We now have to adjust these values to the Indian context: 3.5G on 2100Mhz band and
LTE on 2300MHz.
We have already done this for LTE—this is the ‘Macro 1’ scenario in Figure 60 (the reason
why we chose an unusual ‘440m’ inter-site distance versus well rounded numbers in other
scenarios). We only need to develop a 3.5G scenario that matches the cell size
assumptions in Figure 61 but on 2100MHz frequency band. We have developed this after
discussions with equipment vendors.
Figure 63: Translating the 3GPP results into Indian frequency bands for 3.5G and LTE
Technology HSPA @ 2100MHz LTE @ 2300MHz Comment
Frequency band (MHz) 2100 2300
Intersite distance (m) 480 440 LTE site coverage shrinks more since it is on a higher frequency band
Coverage area (sq km) 0.20 0.17
Average downlink spectral
efficiency per sector (bps/Hz) (A)
0.4 1.4 LTE = 3.5 x HSPA; LTE same as ‘Macro 1’ in Figure 60
Spectrum allocated (MHz) 5 20 Indian deployment scenario
Paired/Unpaired (B) Paired Unpaired
Download ratio (C) 100% 80% All of the downlink spectrum is available for download in HSPA,
Assuming 80% download ratio for unpaired LTE spectrum
Average throughput per site
(Mbps) [3A x B x C]
6 66 LTE = 11x HSPA;
Source: Company data, Credit Suisse estimates
These results were used to compare the economics of 3G vs LTE with respect to the cost
of running unit data capacity in an earlier chapter.
Microwave as a near-term fix for backhaul?
One of the key hurdles that investors perceive for Indian LTE networks is the lack of fibre
for backhaul. As seen in Figure 64, backhaul is the connectivity between the tower (site)
and the inner parts of the network. The backhaul is the conduit through which the
aggregate of all traffic from mobile terminals served by a tower is transported to the core
network (to be passed on to other parts of the network/Internet/other networks, etc.).

21 August 2012
India Telecoms Sector 56
Figure 64: Basic architecture of mobile networks
Source: Credit Suisse estimates
From our industry discussions, we understand that more than 80% of towers in India are
fed by microwave-based backhaul, with very few towers being fed by optic fibre.
Microwave has limited capacity while fibre can offer theoretically unlimited capacity.
Microwave backhaul is sufficient for towers that mainly handle voice, but for high-traffic
loads expected in data networks like LTE, it is believed that microwave will fall short of
capacity and operators will have to invest into fibre. Installing fibre is not easy, and can be
quite expensive in dense urban areas such as Mumbai/Delhi. So, this is perceived as a
hurdle for rapid deployment of LTE services in India. For rural areas, fibre cost can be
prohibitive given the low capacity requirements/large distances involved.
However, recent improvements to microwave technology (in particular the use of multiple
antennas and higher order modulations like 1024QAM) have resulted in significant
increase in capacity of microwave links. While the peak capacity of LTE base stations on
20MHz bandwidth claimed by equipment vendors today is around 300-350Mbps (real life
performance could be far lower as assumed in scenarios in Figure 60), microwave
backhaul can already deliver 1Gbps links, which means that the new microwave can
deliver much more capacity than what would be required by LTE sites in the near term.
Globally, the North American LTE operators use a mix of microwave and fibre for
backhaul, while CSL in Hong Kong primarily relies on microwave for backhaul.
Some of the backhaul specialists we spoke to (ex. Tellabs) indicated that the near-term
LTE backhaul deployments in India could be microwave-based, and microwave could start
becoming a bottleneck only when we move to LTE advanced (see our discussion later). In
fact, the vendors even hinted at a pickup in microwave sales with these new technologies
becoming commercially viable. Fibre would still be required, however, in the core network,
but that is a far smaller problem to tackle and control.
Our survey with equipment vendors on possible price points for base stations for LTE (and
older technologies) along with backhaul cost gave us the following results. We used these
numbers in our calculations in the previous chapter.

21 August 2012
India Telecoms Sector 57
Figure 65: Indicative cost of equipment per site (including backhaul)
2G 3G/HSPA LTE
Cost of three sector site including backhaul (US $) 10,000-12,000 15,000 17,000-22,000 depending on cell range
Source: Company data, Credit Suisse estimates
LTE ≠ 4G
There is a reason why we have refrained from using the term 4G till the very end of this
report. This report is about LTE, and LTE is quite far from qualifying for 4G.
We have seen earlier that the ITU’s IMT-2000 targets acted as a set of guidelines to
develop 3G standards. IMT-2000 targeted speeds of 2Mbps.
The next set of targets by ITU, collectively called IMT-Advanced, is what is generally
considered 4G. IMT-advanced raises the bar even further to a peak speed requirement of
1Gbps (among other stringent requirements). At 300-350Mbps (the highest speeds
claimed by equipment vendors), LTE comes nowhere close to the 4G targets. LTE is at
best an intermediate step between 3G and 4G (LTE is called 3.9G by many). The next
versions of LTE (called ‘LTE-advanced’) are expected to reach IMT-advanced speed
requirements, but the standards are still under development.
However, this has not stopped the marketing teams of operators and device makers
worldwide to sell LTE as ‘4G’!

21 August 2012
India Telecoms Sector 58
Asia Pacific / India
Integrated Telecommunication Services
Bharti Airtel Ltd.
(BRTI.BO / BHARTI IN)
Returns could stay low for long
■ We downgrade Bharti’s stock to UNDERPERFORM and cut our target
price to Rs220 (16% potential downside). We see a high likelihood of
spectrum auctions succeeding at current reserve prices and a low likelihood
of the spectrum burden being transferred to customers.
■ Long-term risks to market share: Over the longer term, we also see
significant risks to the industry leading revenue market share of Bharti from
the potential launch of data + voice services by RIL Infotel. While we have
not built in this potential market share impact in our numbers, we highlight
that this could add further pressure to the already low RoIC outlook for the
company over the next three years (sub-9%).
■ Catalysts: Key events to watch out for include (1) 1,800 MHz spectrum
auctions by end-2012, and (2) the potential launch of services by RIL Infotel
in 2013.
■ Key risks to our UNDERPERFORM call include: (1) the failure of
upcoming spectrum auctions at current reserve price (Rs140 bn) due to a
lack of demand, (2) further delays in the launch of services by RIL Infotel
thus giving incumbents more time to get their 3G strategy right and (3)
improvement in the competitive environment due to the exit of competitors
leading to sustained tariff hikes.
Share price performance
80
100
120
140
160
200
300
400
500
600
Aug-10 Dec-10 Apr-11 Aug-11 Dec-11 Apr-12
Price (LHS) Rebased Rel (RHS)
The price relative chart measures performance against the BSE
SENSEX IDX which closed at 17691.08 on 17/08/12
On 17/08/12 the spot exchange rate was Rs55.5/US$1
Performance Over 1M 3M 12M Absolute (%) -16.6 -7.0 -33.4 Relative (%) -19.7 -18.0 -41.7
Financial and valuation metrics
Year 3/12A 3/13E 3/14E 3/15E Revenue (Rs mn) 714,508.0 806,736.0 885,728.0 957,085.5 EBITDA (Rs mn) 236,573.0 266,766.9 312,862.0 358,744.2 EBIT (Rs mn) 102,892.0 114,639.7 146,640.8 181,029.2 Net profit (Rs mn) 42,044.0 49,975.5 68,239.9 90,025.1 EPS (CS adj.) (Rs) 11.08 13.17 17.98 23.72 Change from previous EPS (%) n.a. 0 0 0 Consensus EPS (Rs) n.a. 13.6 19.1 23.7 EPS growth (%) -29.7 18.9 36.5 31.9 P/E (x) 23.7 19.9 14.6 11.0 Dividend yield (%) 0.38 0.38 0.38 0.38 EV/EBITDA (x) 7.0 6.3 5.1 4.1 P/B (x) 2.0 1.8 1.6 1.4 ROE (%) 8.5 9.5 11.8 13.8 Net debt/equity (%) 121.5 118.2 94.1 66.5
Source: Company data, Thomson Reuters, Credit Suisse estimates.
Rating (from Neutral) UNDERPERFORM* Price (17 Aug 12, Rs) 262.10 Target price (Rs) (from 260.00) 220.00¹ Upside/downside (%) -16.1 Mkt cap (Rs mn) 995,333 (US$ 17,934) Enterprise value (Rs mn) 1,674,315 Number of shares (mn) 3,797.53 Free float (%) 31.7 52-week price range 408.7 - 255.8 ADTO - 6M (US$ mn) 26.3
*Stock ratings are relative to the relevant country benchmark.
¹Target price is for 12 months.
Research Analysts
Sunil Tirumalai
91 22 6777 3714
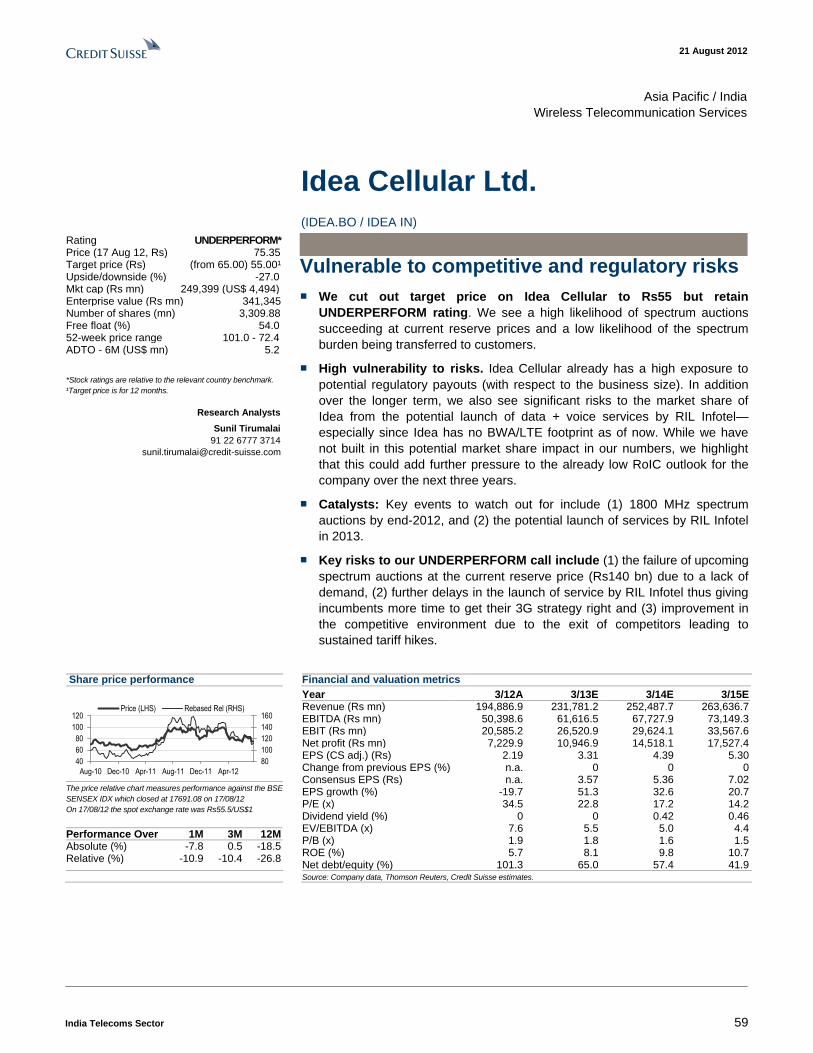
21 August 2012
India Telecoms Sector 59
Asia Pacific / India
Wireless Telecommunication Services
Idea Cellular Ltd.
(IDEA.BO / IDEA IN)
Vulnerable to competitive and regulatory risks
■ We cut out target price on Idea Cellular to Rs55 but retain
UNDERPERFORM rating. We see a high likelihood of spectrum auctions
succeeding at current reserve prices and a low likelihood of the spectrum
burden being transferred to customers.
■ High vulnerability to risks. Idea Cellular already has a high exposure to
potential regulatory payouts (with respect to the business size). In addition
over the longer term, we also see significant risks to the market share of
Idea from the potential launch of data + voice services by RIL Infotel—
especially since Idea has no BWA/LTE footprint as of now. While we have
not built in this potential market share impact in our numbers, we highlight
that this could add further pressure to the already low RoIC outlook for the
company over the next three years.
■ Catalysts: Key events to watch out for include (1) 1800 MHz spectrum
auctions by end-2012, and (2) the potential launch of services by RIL Infotel
in 2013.
■ Key risks to our UNDERPERFORM call include (1) the failure of upcoming
spectrum auctions at the current reserve price (Rs140 bn) due to a lack of
demand, (2) further delays in the launch of service by RIL Infotel thus giving
incumbents more time to get their 3G strategy right and (3) improvement in
the competitive environment due to the exit of competitors leading to
sustained tariff hikes.
Share price performance
80
100
120
140
160
40
60
80
100
120
Aug-10 Dec-10 Apr-11 Aug-11 Dec-11 Apr-12
Price (LHS) Rebased Rel (RHS)
The price relative chart measures performance against the BSE
SENSEX IDX which closed at 17691.08 on 17/08/12
On 17/08/12 the spot exchange rate was Rs55.5/US$1
Performance Over 1M 3M 12M Absolute (%) -7.8 0.5 -18.5 Relative (%) -10.9 -10.4 -26.8
Financial and valuation metrics
Year 3/12A 3/13E 3/14E 3/15E Revenue (Rs mn) 194,886.9 231,781.2 252,487.7 263,636.7 EBITDA (Rs mn) 50,398.6 61,616.5 67,727.9 73,149.3 EBIT (Rs mn) 20,585.2 26,520.9 29,624.1 33,567.6 Net profit (Rs mn) 7,229.9 10,946.9 14,518.1 17,527.4 EPS (CS adj.) (Rs) 2.19 3.31 4.39 5.30 Change from previous EPS (%) n.a. 0 0 0 Consensus EPS (Rs) n.a. 3.57 5.36 7.02 EPS growth (%) -19.7 51.3 32.6 20.7 P/E (x) 34.5 22.8 17.2 14.2 Dividend yield (%) 0 0 0.42 0.46 EV/EBITDA (x) 7.6 5.5 5.0 4.4 P/B (x) 1.9 1.8 1.6 1.5 ROE (%) 5.7 8.1 9.8 10.7 Net debt/equity (%) 101.3 65.0 57.4 41.9
Source: Company data, Thomson Reuters, Credit Suisse estimates.
Rating UNDERPERFORM* Price (17 Aug 12, Rs) 75.35 Target price (Rs) (from 65.00) 55.00¹ Upside/downside (%) -27.0 Mkt cap (Rs mn) 249,399 (US$ 4,494) Enterprise value (Rs mn) 341,345 Number of shares (mn) 3,309.88 Free float (%) 54.0 52-week price range 101.0 - 72.4 ADTO - 6M (US$ mn) 5.2
*Stock ratings are relative to the relevant country benchmark.
¹Target price is for 12 months.
Research Analysts
Sunil Tirumalai
91 22 6777 3714

2
1 A
ug
us
t 20
12
Ind
ia T
ele
co
ms S
ec
tor
60
Appendix 1: RIL data + voice business financials Figure 66: Industry level assumptions
Industry assumptions FY3/13 FY3/14 FY3/15 FY3/16 FY3/17 FY3/18 FY3/19 FY3/20 FY3/21 FY3/22 FY3/23 FY3/24 FY3/25
India subscribers (mn) 1,006 1,061 1,093 1,133 1,159 1,188 1,211 1,238 1,263 1,286 1,304 1,320 1,329
Penetration (%) 82% 86% 87% 89% 90% 92% 92% 93% 94% 95% 96% 96% 96%
Population (mn) 1,224 1,239 1,254 1,269 1,284 1,298 1,312 1,326 1,340 1,353 1,365 1,377 1,389
India wireless voice ARPU (Rs/month)1 130 131 130 131 133 133 133 133 133 133 133 133 133
India wireless voice RPM (Rs / min)1 0.36 0.36 0.36 0.36 0.37 0.37 0.37 0.37 0.37 0.37 0.37 0.37 0.37
India wireless voice revenue (Rs bn)1 1,505 1,621 1,686 1,751 1,824 1,879 1,918 1,951 1,992 2,031 2,063 2,090 2,110
India wireless data revenue (Rs bn) 79 141 208 334 485 660 862 918 981 1,046 1,111 1,176 1,239
India wireless data revenues as % of total 5% 8% 11% 16% 21% 26% 31% 32% 33% 34% 35% 36% 37%
Note: 1includes traditional data revenues like SMS, ringtones etc; Source: Company data, Credit Suisse estimates
Figure 67: Addressable market size for handset price point assumed in the model
FY3/14 FY3/15 FY3/16 FY3/17 FY3/18 FY3/19 FY3/20 FY3/21 FY3/22 FY3/23 FY3/24 FY3/25
Price of device Rs (handset) 7,500 6,375 5,419 4,877 4,389 3,950 3,674 3,417 3,177 2,955 2,807 2,667
% YoY -15% -15% -15% -10% -10% -10% -7% -7% -7% -7% -5% -5%
Price of device $ (handset) 136 116 99 89 80 72 67 62 58 54 51 48
Addressable subscribers at this price point (mn) 41 67 102 132 158 189 227 251 278 307 339 372
Addressable subscriber market at this pricepoint (%) 4% 6% 9% 11% 13% 16% 18% 20% 22% 24% 26% 28%
Addressable revenues at this price point (Rs mn) 412 573 778 923 1,126 1,300 1,493 1,663 1,830 2,009 2,200 2,325
Addressable revenue market at this pricepoint (%) 23% 30% 37% 40% 44% 47% 52% 56% 59% 63% 67% 69%
Voice ARPU of addressable market (Rs/month) 628 554 491 461 437 412 383 371 357 345 331 318
Data ARPU of addressable segment (Rs/month) 209 195 172 138 170 177 180 191 201 211 221 212
Total ARPU of addressable segment (Rs/month) 838 749 663 599 607 588 564 562 558 556 552 530
Source: Company data, Credit Suisse estimates

2
1 A
ug
us
t 20
12
Ind
ia T
ele
co
ms S
ec
tor
61
Figure 68: RIL Infotel revenue drivers
FY3/13 FY3/14 FY3/15 FY3/16 FY3/17 FY3/18 FY3/19 FY3/20 FY3/21 FY3/22 FY3/23 FY3/24 FY3/25
RIL Infotel market share within addressable segment 6% 12% 18% 24% 30% 30% 30% 30% 30% 30% 30% 30%
RIL Infotel subs (mn) 2 8 18 32 47 57 68 75 83 92 102 112
RIL Infotel overall subscribers market share 0.2% 0.7% 1.6% 2.7% 4.0% 4.7% 5.5% 6.0% 6.5% 7.1% 7.7% 8.4%
RIL Infotel Voice ARPU (Rs) (includes traditional data like SMS) 628 554 491 461 437 412 383 371 357 345 331 318
RIL Infotel Data ARPU (Rs) 209 195 172 138 170 177 180 191 201 211 221 212
RIL Infotel Blended ARPU (Rs) 838 749 663 599 607 588 564 562 558 556 552 530
RIL Infotel Voice RPM (Rs/min) 0.38 0.38 0.38 0.39 0.39 0.39 0.39 0.39 0.39 0.39 0.39 0.39
Discount to Bharti RPM (%) -7% -7% -7% -7% -7% -7% -7% -7% -7% -7% -7% -7%
RIL Infotel Data tariff (Rs / MB) 0.08 0.07 0.06 0.06 0.06 0.06 0.06 0.06 0.06 0.05 0.05 0.05
RIL Infotel Voice MoU (min) 1,649 1,457 1,284 1,192 1,124 1,060 990 957 923 890 855 822
RIL Infotel Data usage (GB per month) 2.8 2.9 2.7 2.3 2.8 3.0 3.1 3.4 3.6 3.9 4.2 4.1
RIL Infotel Voice revenues (Rs mn) 9,279 34,986 77,998 138,560 207,527 257,069 286,634 318,687 340,209 362,761 384,512 406,999
RIL Infotel Data revenues (Rs mn) 3,093 12,292 27,405 41,388 80,705 110,172 134,887 164,172 191,368 222,337 256,341 271,333
RIL Infotel Total revenues (Rs mn) 12,372 47,279 105,402 179,948 288,233 367,241 421,521 482,859 531,577 585,098 640,853 678,332
RIL Infotel Data as % of total 25.0% 26.0% 26.0% 23.0% 28.0% 30.0% 32.0% 34.0% 36.0% 38.0% 40.0% 40.0%
RIL Infotel Voice revenue market share 0.6% 2.1% 4.5% 7.6% 11.0% 13.4% 14.7% 16.0% 16.8% 17.6% 18.4% 19.3%
RIL Infotel Data revenue market share 2.2% 5.9% 8.2% 8.5% 12.2% 12.8% 14.7% 16.7% 18.3% 20.0% 21.8% 21.9%
RIL Infotel Total revenue market share 0.7% 2.5% 5.1% 7.8% 11.4% 13.2% 14.7% 16.2% 17.3% 18.4% 19.6% 20.3%
Source: Company data, Credit Suisse estimates
Figure 69: RIL Infotel voice capex projections
RIL Infotel voice capex projections FY3/13 FY3/14 FY3/15 FY3/16 FY3/17 FY3/18 FY3/19 FY3/20 FY3/21 FY3/22 FY3/23 FY3/24 FY3/25
RIL Infotel Traffic (mn min) - 24,346 91,975 203,986 358,196 533,181 661,450 740,300 823,084 878,671 936,915 993,092 1,051,172
% traffic carried on own sites 100% 100% 100% 100% 100% 100% 100% 100% 100% 100% 100% 100% 100%
Traffic carried per site (mn min / year) 1.0 2.1 3.1 3.3 3.5 3.8 4.0 4.2 4.4 4.4 4.4 4.4 4.4
As % of Idea FY12 20.0% 40.0% 60.0% 64.2% 68.3% 72.5% 76.7% 80.8% 85.0% 85.0% 85.0% 85.0% 85.0%
Number of 2G BTS required 5,877 11,753 29,601 61,388 101,223 142,013 166,602 176,851 186,989 199,617 212,849 225,611 238,806
Number of 2G BTS added 5,877 5,877 17,848 31,786 39,835 40,790 24,590 10,249 10,138 12,628 13,232 12,762 13,195
Cost per site ($) 12,000 11,760 11,525 11,294 11,068 10,847 10,630 10,418 10,209 10,005 9,805 9,609 9,417
% YoY 0.0% -2.0% -2.0% -2.0% -2.0% -2.0% -2.0% -2.0% -2.0% -2.0% -2.0% -2.0% -2.0%
RAN capex (Rs mn) 3,878 3,801 12,803 23,423 31,724 36,412 30,982 34,509 40,448 48,107 50,194 51,739 53,573
Core network capex (Rs mn) 3,232 1,293 3,927 6,993 8,764 8,974 5,410 2,255 2,230 2,778 2,911 2,808 2,903
Total capex (Rs mn) 7,111 5,094 16,730 30,416 40,488 45,386 36,392 36,764 42,679 50,885 53,106 54,547 56,475
Source: Company data, Credit Suisse estimates

2
1 A
ug
us
t 20
12
Ind
ia T
ele
co
ms S
ec
tor
62
Figure 70: RIL Infotel LTE capex projections
FY3/13 FY3/14 FY3/15 FY3/16 FY3/17 FY3/18 FY3/19 FY3/20 FY3/21 FY3/22 FY3/23 FY3/24 FY3/25
Coverage requirement
Top 15 cities
Inhabited Area ('000s sq km) 11 11 11 11 11 11 11 11 11 11 11 11 11
Population (mn) 97 98 100 101 103 104 106 108 109 111 112 114 116
% area(population) under LTE coverage 50% 70% 90% 100% 100% 100% 100% 100% 100% 100% 100% 100% 100%
Rest of urban India
Inhabited Area ('000s sq km) 67 67 67 67 67 67 67 67 67 67 67 67 67
Population (mn) 286 290 294 299 303 308 312 317 322 327 332 337 342
% area(population) under LTE coverage 30% 40% 50% 60% 70% 80% 80% 80% 80% 80% 80% 80% 80%
Rural India
Inhabited Area ('000s sq km) 2,083 2,083 2,083 2,083 2,083 2,083 2,083 2,083 2,083 2,083 2,083 2,083 2,083
Population (mn) 845 858 871 884 897 911 925 938 952 967 981 996 1,011
% area(population) under LTE coverage 2.0% 7.0% 12.0% 16.0% 18.0% 20.0% 20.0% 20.0% 20.0% 20.0% 20.0% 20.0% 20.0%
Nationwide consolidated
Inhabited Area ('000s sq km) 2,160 2,160 2,160 2,160 2,160 2,160 2,160 2,160 2,160 2,160 2,160 2,160 2,160
Population (mn) 1,228 1,247 1,265 1,284 1,304 1,323 1,343 1,363 1,384 1,404 1,425 1,447 1,468
Area brought under LTE coverage (mn sqkm) 67 180 293 384 432 481 481 481 481 481 481 481 481
Population under LTE coverage (mn) 151 245 342 422 477 533 541 549 557 566 574 583 591
% area brought under LTE coverage 3.1% 8.3% 13.6% 17.8% 20.0% 22.2% 22.2% 22.2% 22.2% 22.2% 22.2% 22.2% 22.2%
% population brought under LTE coverage 12.3% 19.6% 27.0% 32.9% 36.6% 40.3% 40.3% 40.3% 40.3% 40.3% 40.3% 40.3% 40.3%
RIL Infotel subs as % of population under coverage 0.0% 1.0% 2.4% 4.4% 6.6% 8.9% 10.5% 12.4% 13.5% 14.8% 16.0% 17.4% 18.9%
No. Macro 2 sites required for above coverage 4,833 12,982 21,131 27,701 31,189 34,677 34,677 34,677 34,677 34,677 34,677 34,677 34,677
Capacity offered by Macro 2 sites (‘000s Mbps) [@ 10Mbps per site] [A] 48 130 211 277 312 347 347 347 347 347 347 347 347
Capacity requirement
RIL Infotel data volume (mn GB / year) - 41 182 427 679 1,350 1,881 2,350 2,918 3,471 4,115 4,841 5,229
RIL Infotel traffic carried per day ('000s GB) - 113 498 1,169 1,859 3,699 5,153 6,438 7,995 9,510 11,275 13,264 14,327
RIL Infotel traffic carried in busy hour ('000s GB) [assume 10% busy hour ratio] [B] - 11 50 117 186 370 515 644 800 951 1,127 1,326 1,433
Busy hour utilisation (%) [C] 10% 10% 20% 30% 45% 50% 60% 70% 70% 70% 70% 70% 70%
Busy hour bandwidth required ('000s Mbps) [D = B / C] - 251 554 866 918 1,644 1,909 2,044 2,538 3,019 3,579 4,211 4,548
Capacity deficit ('000s Mbps) [C = D - A] - 121 342 589 606 1,297 1,562 1,697 2,191 2,672 3,233 3,864 4,201
No. of Micro sites required to cover deficit [@ 93Mbps capacity per Microsite] - 1,301 3,681 6,335 6,518 13,948 16,791 18,244 23,560 28,730 34,752 41,543 45,168
Total sites (macro+micro) 4,833 14,282 24,812 34,036 37,706 48,625 51,468 52,921 58,237 63,407 69,429 76,220 79,845
Total installed capacity ('000s Mbps) 48 251 554 866 918 1,644 1,909 2,044 2,538 3,019 3,579 4,211 4,548
Capex projections
Site capex [@ $17500 per Microsite and $ 22,000 per Macro 2, 5% annual deflation] Rs mn
5,848 10,556 10,967 9,006 3,581 8,800 2,011 977 3,395 3,136 3,471 3,718 1,886
Core network capex [@ $2mn for every 500 sites added 1] Rs mn 2,658 2,079 2,317 2,029 808 2,402 625 320 1,170 1,137 1,325 1,494 798
Maintenance capex (Rs mn) - 1,462 4,240 7,278 9,904 11,003 13,846 14,530 14,880 16,159 17,403 18,852 20,486
Total annual capex (Rs mn) 8,506 14,097 17,523 18,313 14,292 22,205 16,483 15,827 19,444 20,432 22,198 24,064 23,169
Source: Company data, Credit Suisse estimates

2
1 A
ug
us
t 20
12
Ind
ia T
ele
co
ms S
ec
tor
63
Figure 71: RIL Infotel’s total capex projection
Total capex (Voice + Data) FY3/13 FY3/14 FY3/15 FY3/16 FY3/17 FY3/18 FY3/19 FY3/20 FY3/21 FY3/22 FY3/23 FY3/24 FY3/25
No. of sites:
2G 5,877 11,753 29,601 61,388 101,223 142,013 166,602 176,851 186,989 199,617 212,849 225,611 238,806
LTE 4,833 14,282 24,812 34,036 37,706 48,625 51,468 52,921 58,237 63,407 69,429 76,220 79,845
Total 10,709 26,035 54,413 95,424 138,929 190,638 218,070 229,772 245,226 263,024 282,278 301,831 318,651
Total annual capex (Rs mn) 15,616.4 19,190.9 34,253.2 48,729.1 54,780.2 67,591.0 52,874.6 52,590.7 62,122.5 71,317.5 75,304.0 78,610.7 79,644.6
Total annual capex ($ mn) 284 349 623 886 996 1,229 961 956 1,130 1,297 1,369 1,429 1,448
Capex / sales n.m 155% 72% 46% 30% 23% 14% 12% 13% 13% 13% 12% 12%
Source: Company data, Credit Suisse estimates
Figure 72: RIL Infotel’s cost and returns projections
Cost projections FY3/13 FY3/14 FY3/15 FY3/16 FY3/17 FY3/18 FY3/19 FY3/20 FY3/21 FY3/22 FY3/23 FY3/24 FY3/25
RIL Infotel Total revenues (Rs mn) - 12,372 47,279 105,402 179,948 288,233 367,241 421,521 482,859 531,577 585,098 640,853 678,332
Rental + pass-through / site (Rs / month) [100% for
2G, 25% for LTE]
45,000 46,350 47,741 49,173 50,648 52,167 53,732 55,344 57,005 58,715 58,715 58,715 58,715
Network opex (Rs mn) 652 4,597 14,645 31,186 54,866 82,889 107,563 122,715 133,948 146,910 157,006 167,292 177,354
Network opex % of sales 0% 37% 31% 30% 30% 29% 29% 29% 28% 28% 27% 26% 26%
Regulatory fees (Rs mn) - 1,485 5,655 12,606 21,738 34,242 43,334 49,402 56,205 61,450 67,169 73,057 77,330
Regulatory fees as % of sales [License fee 8%,
Spectrum fee = 3% for 2G, 1% for LTE ]
0% 12% 12% 12% 12% 12% 12% 12% 12% 12% 11% 11% 11%
Interconnect (Rs mn) - 3,385 10,537 20,403 32,270 48,644 59,412 65,664 73,340 78,706 84,429 90,103 94,902
Interconnect % of sales1 0% 27% 22% 19% 18% 17% 16% 16% 15% 15% 14% 14% 14%
SG&A (Rs mn) 16,337 20,234 25,382 32,018 39,777 48,141 53,973 59,176 63,858 66,642 69,418 72,187 74,939
SG&A % of sales 0% 164% 54% 30% 22% 17% 15% 14% 13% 13% 12% 11% 11%
EBITDA (Rs mn) (16,990) (17,328) (8,940) 9,190 31,298 74,316 102,959 124,563 155,508 177,869 207,075 238,212 253,807
EBITDA margin 0% -140% -19% 9% 17% 26% 28% 30% 32% 33% 35% 37% 37%
Depreciation and amortisation 15,315 16,408 18,577 21,800 25,586 29,828 33,544 37,072 41,093 45,814 50,776 55,954 61,294
EBIT (Rs mn) (32,305) (33,737) (27,517) (12,610) 5,712 44,488 69,415 87,491 114,415 132,054 156,300 182,258 192,514
EBIT margin -273% -58% -12% 3% 15% 19% 21% 24% 25% 27% 28% 28%
Peak funding and ROCE
EBITDA - capex -spectrum (Rs mn) (172,606) (36,519) (43,193) (39,539) (23,483) 6,725 50,084 71,972 93,385 106,551 131,771 159,602 174,163
Cumulative cash flow (Rs mn) [incl. spectrum] (301,084) (337,603) (380,796) (420,335) (443,818) (437,093) (387,009) (315,037) (221,651) (115,100) 16,671 176,273 350,435
Cumulative cash flow ($ mn) [incl. spectrum] (5,474) (6,138) (6,924) (7,642) (8,069) (7,947) (7,037) (5,728) (4,030) (2,093) 303 3,205 6,372
ROCE (%) -12% -11% -5% 4% 11% 17% 20% 21% 23% 23% 24% 24% 24%
NPV ($ mn) [12% WACC, 3% terminal growth] 971
Note: 1) Interconnect costs fall as % of sales due to deflation in bandwidth prices assumed; Source: Company data, Credit Suisse estimates

2
1 A
ug
us
t 20
12
Ind
ia T
ele
co
ms S
ec
tor
64
Appendix 2: RIL Infotel data-only (dongle) business model Figure 73: Summary model for RIL Infotel data-only (dongle) business model
FY3/13 FY3/14 FY3/15 FY3/16 FY3/17 FY3/18 FY3/19 FY3/20 FY3/21 FY3/22 FY3/23 FY3/24 FY3/25
Device price (Rs) 5,000 4,250 3,613 3,251 2,926 2,634 2,449 2,278 2,118 1,970 1,872 1,778
Addressable market (% of industry revenues) 0.5% 1.2% 2.2% 3.1% 4.2% 5.7% 6.6% 7.7% 9.0% 10.5% 11.4% 13.3%
RIL data revenues (Rs mn) - 5,978 15,885 27,563 40,780 52,512 66,898 80,945 91,956 103,988 127,766 147,253 158,479
RIL addressable data revenue market share (%) 15% 30% 30% 30% 30% 30% 30% 30% 30% 30% 30% 30%
RIL overall data revenue market share (%) 0% 4% 8% 8% 8% 8% 8% 9% 9% 10% 12% 13% 13%
RIL overall industry revenue market share (%) 0% 0% 1% 2% 2% 3% 3% 4% 5% 5% 6% 7% 8%
RIL data tariffs (Rs/MB) 0.08 0.08 0.07 0.06 0.06 0.06 0.06 0.06 0.06 0.06 0.05 0.05 0.05
Population covered by LTE network 8.8% 18.0% 25.8% 32.9% 35.2% 37.5% 37.5% 37.5% 37.5% 37.5% 37.5% 37.5% 37.5%
Total annual capex (Rs mn) 5,876 18,747 14,828 15,058 10,612 11,241 12,477 14,405 14,263 14,569 16,327 16,178 15,378
Total annual capex ($ mn) 107 341 270 274 193 204 227 262 259 265 297 294 280
Capex / sales 0% 314% 93% 55% 26% 21% 19% 18% 16% 14% 13% 11% 10%
EBITDA (Rs mn) (15,289) (16,814) (18,466) (18,360) (16,040) (13,633) (6,522) 475 5,380 12,851 30,453 43,392 49,419
EBITDA margin 0.0% -281.2% -116.2% -66.6% -39.3% -26.0% -9.7% 0.6% 5.9% 12.4% 23.8% 29.5% 31.2%
EBITDA - capex (Rs mn) (21,165) (35,561) (33,295) (33,418) (26,652) (24,874) (18,999) (13,930) (8,883) (1,718) 14,127 27,214 34,041
Cumulative cash flow (Rs mn) (149,643) (185,204) (218,498) (251,916) (278,568) (303,442) (322,441) (336,371) (345,253) (346,972) (332,845) (305,631) (271,590)
Cumulative cash flow ($ mn) (2,721) (3,367) (3,973) (4,580) (5,065) (5,517) (5,863) (6,116) (6,277) (6,309) (6,052) (5,557) (4,938)
RoIC % n.m n.m n.m n.m n.m n.m n.m 0.1% 1.6% 3.7% 9.0% 13.6% 17.1%
NPV ($ mn) [12% WACC, 3% terminal growth] (2,995)
Source: Company data, Credit Suisse estimates

21 August 2012
India Telecoms Sector 65
Appendix 3: Calculation of rural coverage requirement for RIL Infotel The rollout obligations for the BWA spectrum that RIL Infotel won in 2010 auctions require
the company to provide coverage in 50% of rural short distance charging areas (SDCAs)
in the country, as mentioned below:
3.4.2 Roll-out obligations for BWA Spectrum
Metro service area
The licensee to whom the spectrum is assigned shall be required to provide required
street-level coverage using the BWA Spectrum in at least 90% of the service area within
five years of the Effective Date.
Category A, B and C service areas
The licensee to whom the spectrum is assigned shall ensure that at least 50% of the rural
SDCAs are covered within five years of the effective date using the BWA Spectrum.
Coverage of a rural SDCA would mean that at least 90% of the area bounded by the
municipal/ local body limits should get the required street level coverage.
The Effective Date shall be the later of the date when the right to use awarded spectrum
commercially commences and the date when the UAS licence or the ISP category ‘A’
licence, if and as applicable, is granted to the operator.
If the licensee does not achieve its roll out obligations, its spectrum assignment shall be
withdrawn.
Source: DoT notice inviting applications dated 25-Feb-2010
As per DoT, there are 2,645 SDCAs in the country, and a rural SDCA is one in which more
than 50% of the population lives in rural areas (as per census definition). While full detail
from census 2011 is not available, what we do know is that ~68% of the population is in
areas defined as ‘rural’. Assuming the same ratio, 68% of the total SDCAs being rural
would be a fair assumption in our view (or ~1800 rural SDCAs). So, RIL Infotel needs to
cover 50% of this or ~900 rural SDCAs.
Next, we look at some details in a 2006 presentation by COAI made in the context of
seeking subsidies for rural rollout. The presentation concludes that on an average eight
towers are required to cover a rural SDCA (on 900 MHz spectrum). Translating this to
2300MHz (on which RIL Infotel will be operating) works out to ~28 towers (sites) per rural
SDCA to achieve coverage. Using this information, we calculate that RIL Infotel would
need to install 25,600 LTE sites by Sep-2015 in rural areas to achieve the rollout
obligations. In the base case model, with 16% rural population coverage, we have RIL
Infotel rolling out ~26,000 LTE sites in rural areas by FY3/16.
Figure 74: Calculation of rollout obligations for RIL Infotel
Number of SDCAs 2,645
Rural as % of total 68%
Number of rural SDCAs 1,799
% of rural SDCAs to be covered in five years 50%
Number of rural SDCAs to be covered in five years 899
No of towers per SDCA on 900MHz [COAI 2006] 8
No. of towers per SDCA on 2300MHz 28
No. of towers for 50% rural SDCA coverage 25,589
Source: COAI, DOT, Company data, Credit Suisse estimates

21 August 2012
India Telecoms Sector 66
Companies Mentioned (Price as of 20 Aug 12; note, however, market closed on 20 Aug, so for Indian companies the price is as
at 17 Aug 12, cf notes on Bharti, Idea, page 59, 60) Bharti Airtel Ltd. (BRTI.BO, Rs 262.10, UNDERPERFORM, TP Rs 220.00) DEN Networks Ltd (DENN.NS) Ericsson (ERICb.ST, SKr 66.75, NEUTRAL, TP SKr 57.50) Idea Cellular Ltd. (IDEA.BO, Rs 75.35, UNDERPERFORM, TP Rs 55.00) Network 18 Media and Investments Ltd (NETM IN) QUALCOMM, Inc. (QCOM, $62.80, OUTPERFORM, TP $75.00) Reliance Industries (RELI.BO, Rs 815.10, OUTPERFORM, TP Rs 853.00) Vodafone Group (VOD.L, 187 p , OUTPERFORM, TP 170.00 p ) ZTE Corp. (0763.HK, HK$11.14, NEUTRAL, TP HK$11.50) For other companies mentioned, please see Figure 6 on page 5.
Disclosure Appendix Important Global Disclosures
I, Sunil Tirumalai, certify that (1) the views expressed in this report accurately reflect my personal views about all of the subject companies and securities and (2) no part of my compensation was, is or will be directly or indirectly related to the specific recommendations or views expressed in this report.
See the Companies Mentioned section for full company names.
3-Year Price, Target Price and Rating Change History Chart for BRTI.BO
BRTI.BO Closing
Price
Target
Price
Initiation/
Date (Rs) (Rs) Rating Assumption
2-Oct-09 435 375 U
22-Oct-09 337.5 290
25-Jan-10 331 320 N
9-Jul-10 307.5 360 O
17-Sep-10 359.5 415
6-May-11 X
24-May-11 369.5 450
4-Aug-11 423.4 500
7-Nov-11 397.95 475
8-Dec-11 367.1 375 N
9-Feb-12 350 330
1-Jun-12 300.95 280
9-Aug-12 256.85 260
375
290
320
360
415
450
500
475
375
330
280
2606-May-11
U
N
O
N
255
305
355
405
455
Closing Price Target Price Initiation/Assumption Rating
Rs
O=Outperform; N=Neutral; U=Underperform; R=Restricted; NR=Not Rated; NC=Not Covered
3-Year Price, Target Price and Rating Change History Chart for IDEA.BO
IDEA.BO Closing
Price
Target
Price
Initiation/
Date (Rs) (Rs) Rating Assumption
22-Oct-09 59.75 45 U
25-Jan-10 61.9 50
9-Jul-10 66.9 75 O
26-Jan-11 71.6 85
24-Feb-11 X
24-May-11 65 95 X
1-Aug-11 94.35 115
8-Dec-11 87.7 80 U
17-Apr-12 93.75 70
1-Jun-12 76.2 65
45
50
75
85
95
115
80
70
65
24-Feb-1124-May-11
U
O
U
45
55
65
75
85
95
105
115
Closing Price Target Price Initiation/Assumption Rating
Rs
O=Outperform; N=Neutral; U=Underperform; R=Restricted; NR=Not Rated; NC=Not Covered

21 August 2012
India Telecoms Sector 67
3-Year Price, Target Price and Rating Change History Chart for RELI.BO
RELI.BO Closing
Price
Target
Price
Initiation/
Date (Rs) (Rs) Rating Assumption
23-Sep-09 1,050.7 1232 O
30-Oct-09 965.63 1190
25-Jan-10 1,041.35 1182
10-Mar-10 1010 1163
26-Apr-10 1,068.75 1211
10-May-10 1,080.8 1217
14-Jun-10 1,063.35 1233
28-Jul-10 1,020.25 1215
1-Nov-10 1092 1183
24-Jan-11 972.55 1181
18-Feb-11 938 1132
12-May-11 944.85 1142
26-Jul-11 871.15 1057
17-Oct-11 833.2 1022
3-Jan-12 723.7 910
17-Apr-12 746.4 907
5-Jun-12 702.25 853
1232
1190 11821163
121112171233
12151183 1181
1132 1142
10571022
910 907
853
O
676
776
876
976
1076
1176
Closing Price Target Price Initiation/Assumption Rating
Rs
O=Outperform; N=Neutral; U=Underperform; R=Restricted; NR=Not Rated; NC=Not Covered
The analyst(s) responsible for preparing this research report received compensation that is based upon various factors including Credit Suisse's total revenues, a portion of which are generated by Credit Suisse's investment banking activities.
Analysts’ stock ratings are defined as follows: Outperform (O): The stock’s total return is expected to outperform the relevant benchmark* by at least 10-15% (or more, depending on perceived risk) over the next 12 months. Neutral (N): The stock’s total return is expected to be in line with the relevant benchmark* (range of ±10-15%) over the next 12 months. Underperform (U): The stock’s total return is expected to underperform the relevant benchmark* by 10-15% or more over the next 12 months. *Relevant benchmark by region: As of 29th May 2009, Australia, New Zealand, U.S. and Canadian ratings are based on (1) a stock’s absolute total return potential to its current share price and (2) the relative attractiveness of a stock’s total return potential within an analyst’s coverage universe**, with Outperforms representing the most attractive, Neutrals the less attractive, and Underperforms the least attractive investment opportunities. Some U.S. and Canadian ratings may fall outside the absolute total return ranges defined above, depending on market conditions and industry factors. For Latin American, Japanese, and non-Japan Asia stocks, ratings are based on a stock’s total return relative to the average total return of the relevant country or regional benchmark; for European stocks, ratings are based on a stock’s total return relative to the analyst's coverage universe**. For Australian and New Zealand stocks, 12-month rolling yield is incorporated in the absolute total return calculation and a 15% and a 7.5% threshold replace the 10-15% level in the Outperform and Underperform stock rating definitions, respectively. The 15% and 7.5% thresholds replace the +10-15% and -10-15% levels in the Neutral stock rating definition, respectively. **An analyst's coverage universe consists of all companies covered by the analyst within the relevant sector. Restricted (R): In certain circumstances, Credit Suisse policy and/or applicable law and regulations preclude certain types of communications, including an investment recommendation, during the course of Credit Suisse's engagement in an investment banking transaction and in certain other circumstances.
Volatility Indicator [V]: A stock is defined as volatile if the stock price has moved up or down by 20% or more in a month in at least 8 of the past 24 months or the analyst expects significant volatility going forward.
Analysts’ coverage universe weightings are distinct from analysts’ stock ratings and are based on the expected performance of an analyst’s coverage universe* versus the relevant broad market benchmark**: Overweight: Industry expected to outperform the relevant broad market benchmark over the next 12 months. Market Weight: Industry expected to perform in-line with the relevant broad market benchmark over the next 12 months. Underweight: Industry expected to underperform the relevant broad market benchmark over the next 12 months. *An analyst’s coverage universe consists of all companies covered by the analyst within the relevant sector. **The broad market benchmark is based on the expected return of the local market index (e.g., the S&P 500 in the U.S.) over the next 12 months.
Credit Suisse’s distribution of stock ratings (and banking clients) is:
Global Ratings Distribution Outperform/Buy* 46% (58% banking clients) Neutral/Hold* 42% (55% banking clients) Underperform/Sell* 10% (48% banking clients) Restricted 2%
*For purposes of the NYSE and NASD ratings distribution disclosure requirements, our stock ratings of Outperform, Neutral, and Underperform most closely correspond to Buy, Hold, and Sell, respectively; however, the meanings are not the same, as our stock ratings are determined on a relative basis. (Please refer to definitions above.) An investor's decision to buy or sell a security should be based on investment objectives, current holdings, and other individual factors.
Credit Suisse’s policy is to update research reports as it deems appropriate, based on developments with the subject company, the sector or the market that may have a material impact on the research views or opinions stated herein.

21 August 2012
India Telecoms Sector 68
Credit Suisse's policy is only to publish investment research that is impartial, independent, clear, fair and not misleading. For more detail please refer to Credit Suisse's Policies for Managing Conflicts of Interest in connection with Investment Research: http://www.csfb.com/research-and-analytics/disclaimer/managing_conflicts_disclaimer.html
Credit Suisse does not provide any tax advice. Any statement herein regarding any US federal tax is not intended or written to be used, and cannot be used, by any taxpayer for the purposes of avoiding any penalties.
See the Companies Mentioned section for full company names. Price Target: (12 months) for (BRTI.BO) Method: We arrive at our TP of Rs220 for Bharti as follows: We arrive at Rs287 DCF fair value for core business, assuming weighted average cost of capital (WACC) of 12%. Our DCF model builds in strong cashflow growth till FY3/15, a 8% medium term growth (FY3/15 - FY3/30) and 3% terminal growth. From this we subtract our estimated present value impact from TRAI's spectrum pricing and license renewal recommendations (Rs67). Risks: Risks to our 12-month target price of Rs220 for Bharti include 1) Spectrum auctions fail at the current reserve price 2) Significant reduction in India competition, leading to strong tariff hikes 3) Rapid uptake of 3G services. Price Target: (12 months) for (IDEA.BO) Method: We arrive at our TP of Rs55 for Idea as follows: We arrive at Rs84 DCF fair value for core business, assuming weighted average cost of capital (WACC) of 12%. Our DCF model builds in strong cashflow growth till FY3/15, a 8% medium term growth (FY3/15 - FY3/30) and 3% terminal growth. From this we subtract 45% of our estimated present value impact from TRAI's spectrum pricing and license renewal recommendations (Rs29). Risks: Risks to our 12-month target price of Rs55 for Idea are: 1) TRAI recommendations do not get implemented, or get implemented in a highly diluted form 2) Significant reduction in India competition, leading to strong tariff hikes 3) Rapid uptake of 3G services. Price Target: (12 months) for (RELI.BO) Method: Our target price for Reliance Industries is Rs853. We value the company using our discounted cash flow (DCF) based sum-of-the-parts valuation. For our DCF valuation, we use a weighted average cost of capital (WACC) of 11.5%. Our DCF-based valuations for the core business - chemicals and refining - imply an EV/EBITDA (enterprise value/earnings before interest, tax, depreciation, amortisation) of 6.4x and 9.4x, respectively, for FY13. We value the existing known blocks in E&P at US$5.6 bn, and the exploration at US$1.8 bn for the reserves that have not been discovered. We add US$2.5 bn for US Shale JVs in our SOTP. Risks: Risks: There are risks on the downside to our Rs853 target price for Reliance Industries if: (1) There is a correction in equity valuations (2) lack of re-investment of the surplus cash resulting in lower ROEs; (3) gas reserves are lower than modelled; (4) refining margins remain subdued for an extended time frame
Please refer to the firm's disclosure website at www.credit-suisse.com/researchdisclosures for the definitions of abbreviations typically used in the target price method and risk sections.
See the Companies Mentioned section for full company names. The subject company (BRTI.BO, IDEA.BO, RELI.BO) currently is, or was during the 12-month period preceding the date of distribution of this report, a client of Credit Suisse. Credit Suisse provided investment banking services to the subject company (BRTI.BO, IDEA.BO, RELI.BO) within the past 12 months. Credit Suisse provided non-investment banking services, which may include Sales and Trading services, to the subject company (RELI.BO) within the past 12 months. Credit Suisse expects to receive or intends to seek investment banking related compensation from the subject company (BRTI.BO, IDEA.BO, RELI.BO) within the next 3 months. Credit Suisse has received compensation for products and services other than investment banking services from the subject company (RELI.BO) within the past 12 months.
Important Regional Disclosures
Singapore recipients should contact a Singapore financial adviser for any matters arising from this research report.
The analyst(s) involved in the preparation of this report have not visited the material operations of the subject company (BRTI.BO, IDEA.BO, RELI.BO) within the past 12 months.
Restrictions on certain Canadian securities are indicated by the following abbreviations: NVS--Non-Voting shares; RVS--Restricted Voting Shares; SVS--Subordinate Voting Shares. Individuals receiving this report from a Canadian investment dealer that is not affiliated with Credit Suisse should be advised that this report may not contain regulatory disclosures the non-affiliated Canadian investment dealer would be required to make if this were its own report. For Credit Suisse Securities (Canada), Inc.'s policies and procedures regarding the dissemination of equity research, please visit http://www.csfb.com/legal_terms/canada_research_policy.shtml.
The following disclosed European company/ies have estimates that comply with IFRS: ERICb.ST, VOD.L.
As of the date of this report, Credit Suisse acts as a market maker or liquidity provider in the equities securities that are the subject of this report.
Principal is not guaranteed in the case of equities because equity prices are variable.
Commission is the commission rate or the amount agreed with a customer when setting up an account or at anytime after that. Taiwanese Disclosures: This research report is for reference only. Investors should carefully consider their own investment risk. Investment results are the responsibility of the individual investor. Reports may not be reprinted without permission of CS. Reports

21 August 2012
India Telecoms Sector 69
written by Taiwan-based analysts on non-Taiwan listed companies are not considered recommendations to buy or sell securities under Taiwan Stock Exchange Operational Regulations Governing Securities Firms Recommending Trades in Securities to Customers.
To the extent this is a report authored in whole or in part by a non-U.S. analyst and is made available in the U.S., the following are important disclosures regarding any non-U.S. analyst contributors: The non-U.S. research analysts listed below (if any) are not registered/qualified as research analysts with FINRA. The non-U.S. research analysts listed below may not be associated persons of CSSU and therefore may not be subject to the NASD Rule 2711 and NYSE Rule 472 restrictions on communications with a subject company, public appearances and trading securities held by a research analyst account. • Sunil Tirumalai, non-U.S. analyst, is a research analyst employed by Credit Suisse Securities (India) Private Limited. • Chunky Shah, non-U.S. analyst, is a research analyst employed by Credit Suisse Securities (India) Private Limited.
For Credit Suisse disclosure information on other companies mentioned in this report, please visit the website at www.credit-suisse.com/researchdisclosures or call +1 (877) 291-2683. Disclaimers continue on next page.

21 August 2012
Asia Pacific / India
Equity Research
TL1029.doc
This report is not directed to, or intended for distribution to or use by, any person or entity who is a citizen or resident of or located in any locality, state, country or other jurisdiction where such distribution, publication, availability or use would be contrary to law or regulation or which would subject Credit Suisse AG, the Swiss bank, or its subsidiaries or its affiliates (“CS”) to any registration or licensing requirement within such jurisdiction. All material presented in this report, unless specifically indicated otherwise, is under copyright to CS. None of the material, nor its content, nor any copy of it, may be altered in any way, transmitted to, copied or distributed to any other party, without the prior express written permission of CS. All trademarks, service marks and logos used in this report are trademarks or service marks or registered trademarks or service marks of CS or its affiliates.
The information, tools and material presented in this report are provided to you for information purposes only and are not to be used or considered as an offer or the solicitation of an offer to sell or to buy or subscribe for securities or other financial instruments. CS may not have taken any steps to ensure that the securities referred to in this report are suitable for any particular investor. CS will not treat recipients as its customers by virtue of their receiving the report. The investments or services contained or referred to in this report may not be suitable for you and it is recommended that you consult an independent investment advisor if you are in doubt about such investments or investment services. Nothing in this report constitutes investment, legal, accounting or tax advice or a representation that any investment or strategy is suitable or appropriate to your individual circumstances or otherwise constitutes a personal recommendation to you. CS does not offer advice on the tax consequences of investment and you are advised to contact an independent tax adviser. Please note in particular that the bases and levels of taxation may change.
CS believes the information and opinions in the Disclosure Appendix of this report are accurate and complete. Information and opinions presented in the other sections of the report were obtained or derived from sources CS believes are reliable, but CS makes no representations as to their accuracy or completeness. Additional information is available upon request. CS accepts no liability for loss arising from the use of the material presented in this report, except that this exclusion of liability does not apply to the extent that liability arises under specific statutes or regulations applicable to CS. This report is not to be relied upon in substitution for the exercise of independent judgment. CS may have issued, and may in the future issue, a trading call regarding this security. Trading calls are short term trading opportunities based on market events and catalysts, while stock ratings reflect investment recommendations based on expected total return over a 12-month period as defined in the disclosure section. Because trading calls and stock ratings reflect different assumptions and analytical methods, trading calls may differ directionally from the stock rating. In addition, CS may have issued, and may in the future issue, other reports that are inconsistent with, and reach different conclusions from, the information presented in this report. Those reports reflect the different assumptions, views and analytical methods of the analysts who prepared them and CS is under no obligation to ensure that such other reports are brought to the attention of any recipient of this report. CS is involved in many businesses that relate to companies mentioned in this report. These businesses include specialized trading, risk arbitrage, market making, and other proprietary trading.
Past performance should not be taken as an indication or guarantee of future performance, and no representation or warranty, express or implied, is made regarding future performance. Information, opinions and estimates contained in this report reflect a judgement at its original date of publication by CS and are subject to change without notice. The price, value of and income from any of the securities or financial instruments mentioned in this report can fall as well as rise. The value of securities and financial instruments is subject to exchange rate fluctuation that may have a positive or adverse effect on the price or income of such securities or financial instruments. Investors in securities such as ADR’s, the values of which are influenced by currency volatility, effectively assume this risk.
Structured securities are complex instruments, typically involve a high degree of risk and are intended for sale only to sophisticated investors who are capable of understanding and assuming the risks involved. The market value of any structured security may be affected by changes in economic, financial and political factors (including, but not limited to, spot and forward interest and exchange rates), time to maturity, market conditions and volatility, and the credit quality of any issuer or reference issuer. Any investor interested in purchasing a structured product should conduct their own investigation and analysis of the product and consult with their own professional advisers as to the risks involved in making such a purchase.
Some investments discussed in this report have a high level of volatility. High volatility investments may experience sudden and large falls in their value causing losses when that investment is realised. Those losses may equal your original investment. Indeed, in the case of some investments the potential losses may exceed the amount of initial investment, in such circumstances you may be required to pay more money to support those losses. Income yields from investments may fluctuate and, in consequence, initial capital paid to make the investment may be used as part of that income yield. Some investments may not be readily realisable and it may be difficult to sell or realise those investments, similarly it may prove difficult for you to obtain reliable information about the value, or risks, to which such an investment is exposed.
This report may provide the addresses of, or contain hyperlinks to, websites. Except to the extent to which the report refers to website material of CS, CS has not reviewed the linked site and takes no responsibility for the content contained therein. Such address or hyperlink (including addresses or hyperlinks to CS’s own website material) is provided solely for your convenience and information and the content of the linked site does not in any way form part of this document. Accessing such website or following such link through this report or CS’s website shall be at your own risk.
This report is issued and distributed in Europe (except Switzerland) by Credit Suisse Securities (Europe) Limited, One Cabot Square, London E14 4QJ, England, which is regulated in the United Kingdom by The Financial Services Authority (“FSA”). This report is being distributed in Germany by Credit Suisse Securities (Europe) Limited Niederlassung Frankfurt am Main regulated by the Bundesanstalt fuer Finanzdienstleistungsaufsicht ("BaFin"). This report is being distributed in the United States by Credit Suisse Securities (USA) LLC ; in Switzerland by Credit Suisse AG; in Canada by Credit Suisse Securities (Canada), Inc.; in Brazil by Banco de Investimentos Credit Suisse (Brasil) S.A. or its affiliates; in Mexico by Banco Credit Suisse (México), S.A. (transactions related to the securities mentioned in this report will only be effected in compliance with applicable regulation); in Japan by Credit Suisse Securities (Japan) Limited, Financial Instrument Firm, Director-General of Kanto Local Finance Bureau (Kinsho) No. 66, a member of Japan Securities Dealers Association, The Financial Futures Association of Japan, Japan Securities Investment Advisers Association, Type II Financial Instruments Firms Association; elsewhere in Asia/Pacific by whichever of the following is the appropriately authorised entity in the relevant jurisdiction: Credit Suisse (Hong Kong) Limited, Credit Suisse Equities (Australia) Limited , Credit Suisse Securities (Thailand) Limited, Credit Suisse Securities (Malaysia) Sdn Bhd, Credit Suisse AG, Singapore Branch, Credit Suisse Securities (India) Private Limited regulated by the Securities and Exchange Board of India (registration Nos. INB230970637; INF230970637; INB010970631; INF010970631), having registered address at 9th Floor, Ceejay House,Dr.A.B. Road, Worli, Mumbai - 18, India, T- +91-22 6777 3777, Credit Suisse Securities (Europe) Limited, Seoul Branch, Credit Suisse AG, Taipei Securities Branch, PT Credit Suisse Securities Indonesia, Credit Suisse Securities (Philippines ) Inc., and elsewhere in the world by the relevant authorised affiliate of the above. Research on Taiwanese securities produced by Credit Suisse AG, Taipei Securities Branch has been prepared by a registered Senior Business Person. Research provided to residents of Malaysia is authorised by the Head of Research for Credit Suisse Securities (Malaysia) Sdn. Bhd., to whom they should direct any queries on +603 2723 2020.
In jurisdictions where CS is not already registered or licensed to trade in securities, transactions will only be effected in accordance with applicable securities legislation, which will vary from jurisdiction to jurisdiction and may require that the trade be made in accordance with applicable exemptions from registration or licensing requirements. Non-U.S. customers wishing to effect a transaction should contact a CS entity in their local jurisdiction unless governing law permits otherwise. U.S. customers wishing to effect a transaction should do so only by contacting a representative at Credit Suisse Securities (USA) LLC in the U.S.
Please note that this report was originally prepared and issued by CS for distribution to their market professional and institutional investor customers. Recipients who are not market professional or institutional investor customers of CS should seek the advice of their independent financial advisor prior to taking any investment decision based on this report or for any necessary explanation of its contents. This research may relate to investments or services of a person outside of the UK or to other matters which are not regulated by the FSA or in respect of which the protections of the FSA for private customers and/or the UK compensation scheme may not be available, and further details as to where this may be the case are available upon request in respect of this report.
Any Nielsen Media Research material contained in this report represents Nielsen Media Research's estimates and does not represent facts. NMR has neither reviewed nor approved this report and/or any of the statements made herein.
If this report is being distributed by a financial institution other than Credit Suisse AG, or its affiliates, that financial institution is solely responsible for distribution. Clients of that institution should contact that institution to effect a transaction in the securities mentioned in this report or require further information. This report does not constitute investment advice by Credit Suisse to the clients of the distributing financial institution, and neither Credit Suisse AG, its affiliates, and their respective officers, directors and employees accept any liability whatsoever for any direct or consequential loss arising from their use of this report or its content.
Copyright 2012 CREDIT SUISSE AG and/or its affiliates. All rights reserved.