Chipotle Mexican Grill, Inc. (CMG) - Credit Suisse | PLUS
31
DISCLOSURE APPENDIX AT THE BACK OF THIS REPORT CONTAINS IMPORTANT DISCLOSURES, ANALYST CERTIFICATIONS, LEGAL ENTITY DISCLOSURE AND THE STATUS OF NON-US ANALYSTS. US Disclosure: Credit Suisse does and seeks to do business with companies covered in its research reports. As a result, investors should be aware that the Firm may have a conflict of interest that could affect the objectivity of this report. Investors should consider this report as only a single factor in making their investment decision. 25 June 2019 Americas/United States Equity Research Restaurants Chipotle Mexican Grill, Inc. (CMG) Rating OUTPERFORM Price (21-Jun-19, US$) 726.85 Target price (US$) 870.00 52-week price range (US$) 740.59 - 385.84 Market cap(US$ m) 20,144 Enterprise value (US$ m) 19,732 Target price is for 12 months. Research Analysts Lauren Silberman 212 325 2720 [email protected] INITIATION Guac is Worth the Extra Charge and So Is Growth; Initiate Outperform ■ We initiate coverage of Chipotle (CMG) with an Outperform rating and $870 target price. CMG has returned to a narrative of growth rather than recovery, with on-trend initiatives that well position the company to appeal to its target base and outperform peers. Contributions from traffic and average check growth should support mid-single-digit SSS longer-term and generate margin leverage to drive an EPS CAGR of ~33% over the next four years. ■ Confidence in Top-Line Performance: CMG’s comprehensive sales plan and omni-channel strategy should generate SSS of ~8% in 2019 and ~5.0- 5.5% longer-term. Digital/delivery make up ~15% of sales, with CMG well positioned with a younger consumer base, transportable food, and best-in- class operations. New menu innovation through recipes with existing ingredients and new menu items/processes could be a meaningful driver of growth. An improved social media and marketing strategy, new loyalty program, and increased analytical capabilities should drive more effective engagement. Improving new-unit productivity and the potential for alternative formats support mid-single-digit unit growth, with modest step-ups likely. ■ Power of the Economic Model: CMG is the only publicly traded restaurant company in quick serve/fast casual with a 100% company-owned model, supporting attractive upside potential. A return to $2.4MM average unit volumes (AUVs, $2MM currently) should enable restaurant-level margins expansion to ~23.5% by 2022 (18.7% in 2018) and new-unit returns of 70- 80%. We estimate each $100K in AUVs should translate to ~100bps of margin and ~10-15% in EPS. ■ Valuation: Our $870 target price is based on ~25x our NTM EBITDA in 12 months and implies ~46x our NTM EPS in 12 months, slightly below current multiples. Key risks: food safety headlines, consumer spending, inflation. Share price performance On 21-Jun-2019 the S&P 500 INDEX closed at 2950.46 Daily Jun22, 2018 - Jun21, 2019, 06/22/18 = US$469.94 Quarterly EPS Q1 Q2 Q3 Q4 2018A 2.13 2.87 2.16 1.72 2019E 3.40 3.80 3.26 3.15 2020E 4.19 5.13 4.20 4.36 Financial and valuation metrics Year 12/18A 12/19E 12/20E 12/21E EPS (CS adj.) (US$) 8.88 13.60 17.89 22.42 Prev. EPS (US$) - - - - P/E rel. (%) 458.0 309.5 261.6 228.8 Revenue (US$ m) 4,865.0 5,435.4 6,052.6 6,712.4 EBITDA (US$ m) 543.8 713.9 899.6 1,083.2 OCFPS (US$) 22.23 25.39 29.91 35.55 P/OCF (x) 19.4 28.6 24.3 20.4 EV/EBITDA (current) 36.5 27.8 22.1 18.3 Net debt (US$ m) -250 -412 -632 -889 ROIC (%) 20.26 29.20 36.63 44.24 Number of shares (m) 27.71 IC (current, US$ m) 1,191.39 BV/share (Next Qtr., US$) 151.1 Dividend (current, US$) - Net debt (Next Qtr., US$ m) -333.7 Net debt/tot eq (Next Qtr.,%) -21.4 Source: Company data, Refinitiv, Credit Suisse estimates
-
Upload
khangminh22 -
Category
Documents
-
view
0 -
download
0
Transcript of Chipotle Mexican Grill, Inc. (CMG) - Credit Suisse | PLUS

DISCLOSURE APPENDIX AT THE BACK OF THIS REPORT CONTAINS IMPORTANT DISCLOSURES, ANALYST CERTIFICATIONS, LEGAL ENTITY DISCLOSURE AND THE STATUS OF NON-US ANALYSTS. US Disclosure: Credit Suisse does and seeks to do business with companies covered in its research reports. As a result, investors should be aware that the Firm may have a conflict of interest that could affect the objectivity of this report. Investors should consider this report as only a single factor in making their investment decision.
25 June 2019 Americas/United States
Equity Research
Restaurants
Chipotle Mexican Grill, Inc. (CMG) Rating OUTPERFORM Price (21-Jun-19, US$) 726.85 Target price (US$) 870.00 52-week price range (US$) 740.59 - 385.84 Market cap(US$ m) 20,144 Enterprise value (US$ m) 19,732 Target price is for 12 months.
Research Analysts
Lauren Silberman
212 325 2720
INITIATION
Guac is Worth the Extra Charge and So Is
Growth; Initiate Outperform
■ We initiate coverage of Chipotle (CMG) with an Outperform rating and
$870 target price. CMG has returned to a narrative of growth rather than
recovery, with on-trend initiatives that well position the company to appeal to
its target base and outperform peers. Contributions from traffic and average
check growth should support mid-single-digit SSS longer-term and generate
margin leverage to drive an EPS CAGR of ~33% over the next four years.
■ Confidence in Top-Line Performance: CMG’s comprehensive sales plan
and omni-channel strategy should generate SSS of ~8% in 2019 and ~5.0-
5.5% longer-term. Digital/delivery make up ~15% of sales, with CMG well
positioned with a younger consumer base, transportable food, and best-in-
class operations. New menu innovation through recipes with existing
ingredients and new menu items/processes could be a meaningful driver of
growth. An improved social media and marketing strategy, new loyalty
program, and increased analytical capabilities should drive more effective
engagement. Improving new-unit productivity and the potential for alternative
formats support mid-single-digit unit growth, with modest step-ups likely.
■ Power of the Economic Model: CMG is the only publicly traded restaurant
company in quick serve/fast casual with a 100% company-owned model,
supporting attractive upside potential. A return to $2.4MM average unit
volumes (AUVs, $2MM currently) should enable restaurant-level margins
expansion to ~23.5% by 2022 (18.7% in 2018) and new-unit returns of 70-
80%. We estimate each $100K in AUVs should translate to ~100bps of
margin and ~10-15% in EPS.
■ Valuation: Our $870 target price is based on ~25x our NTM EBITDA in 12
months and implies ~46x our NTM EPS in 12 months, slightly below current
multiples. Key risks: food safety headlines, consumer spending, inflation.
Share price performance
On 21-Jun-2019 the S&P 500 INDEX closed at 2950.46
Daily Jun22, 2018 - Jun21, 2019, 06/22/18 = US$469.94
Quarterly EPS Q1 Q2 Q3 Q4 2018A 2.13 2.87 2.16 1.72 2019E 3.40 3.80 3.26 3.15 2020E 4.19 5.13 4.20 4.36
Financial and valuation metrics
Year 12/18A 12/19E 12/20E 12/21E EPS (CS adj.) (US$) 8.88 13.60 17.89 22.42 Prev. EPS (US$) - - - - P/E rel. (%) 458.0 309.5 261.6 228.8 Revenue (US$ m) 4,865.0 5,435.4 6,052.6 6,712.4 EBITDA (US$ m) 543.8 713.9 899.6 1,083.2 OCFPS (US$) 22.23 25.39 29.91 35.55 P/OCF (x) 19.4 28.6 24.3 20.4 EV/EBITDA (current) 36.5 27.8 22.1 18.3 Net debt (US$ m) -250 -412 -632 -889 ROIC (%) 20.26 29.20 36.63 44.24
Number of shares (m) 27.71 IC (current, US$ m) 1,191.39 BV/share (Next Qtr., US$) 151.1 Dividend (current, US$) - Net debt (Next Qtr., US$ m) -333.7 Net debt/tot eq (Next Qtr.,%) -21.4 Source: Company data, Refinitiv, Credit Suisse estimates

25 June 2019
Chipotle Mexican Grill, Inc. (CMG) 2
Chipotle Mexican Grill, Inc. (CMG)
Price (21 Jun 2019): US$726.85; Rating: OUTPERFORM; Target Price: 870.00; Analyst: Lauren Silberman
Income Statement 12/18A 12/19E 12/20E 12/21E
Revenue (US$ m) 4,865.0 5,435.4 6,052.6 6,712.4 EBITDA (US$ m) 544 714 900 1,083 Depr. & amort. (195) (215) (233) (252) EBIT (US$) 349 499 666 831 Net interest exp -0 -0 -0 -0 PBT (US$) 359 511 677 838 Income taxes (111) (133) (186) (235) Profit after tax 248 379 490 604 Net profit (US$) 248 379 490 604 Other NPAT adjustments 0 0 0 0
Cash Flow 12/18A 12/19E 12/20E 12/21E
Cash flow from operations 622 707 820 957 CAPEX (287) (304) (300) (300) Free cashflow to the firm 334 403 520 657 Cash flow from investments (388) (333) (300) (300) Net share issue(/repurchase) (161) (203) (300) (400) Dividends paid 0 0 0 0 Changes in Net Cash/Debt 65 162 220 257
Balance Sheet (US$) 12/18A 12/19E 12/20E 12/21E
Cash & cash equivalents 250 412 632 889 Account receivables 62 50 55 62 Other current assets 481 492 492 492 Total fixed assets 1,379 1,445 1,512 1,560 Investment securities 0 0 0 0 Total assets 2,266 4,843 5,138 5,451 Total current liabilities 450 606 627 650 Shareholder equity 1,441 1,677 1,951 2,241 Total liabilities and equity 2,266 4,843 5,138 5,451 Net debt (250) (412) (632) (889)
Per share 12/18A 12/19E 12/20E 12/21E
No. of shares (wtd avg) 28 28 27 27 CS adj. EPS 8.88 13.60 17.89 22.42 Prev. EPS (US$) Dividend (US$) 0.00 0.00 0.00 0.00 Free cash flow per share 11.95 14.46 18.96 24.40
Earnings 12/18A 12/19E 12/20E 12/21E
Sales growth (%) 8.7 11.7 11.4 10.9 EBIT growth (%) 16.1 42.9 33.5 24.7 Net profit growth (%) 31.8 52.5 29.5 23.1 EPS growth (%) 34.6 53.1 31.5 25.3 EBITDA margin (%) 11.2 13.1 14.9 16.1 EBIT margin (%) 7.2 9.2 11.0 12.4 Pretax margin (%) 7.4 9.4 11.2 12.5 Net margin (%) 5.1 7.0 8.1 9.0
Valuation 12/18A 12/19E 12/20E 12/21E
EV/EBITDA (x) 36.5 27.8 22.1 18.3 P/E (x) 81.8 53.4 40.6 32.4
Returns 12/18A 12/19E 12/20E 12/21E
ROIC (%) 20.3 29.2 36.6 44.2
Gearing 12/18A 12/19E 12/20E 12/21E
Net debt/equity (%) (17.3) (24.6) (32.4) (39.7)
Quarterly EPS Q1 Q2 Q3 Q4 2018A 2.13 2.87 2.16 1.72 2019E 3.40 3.80 3.26 3.15 2020E 4.19 5.13 4.20 4.36
Company Background
Chipotle Mexican Grill operates fast casual restaurants with a focused menu of burritos, tacos, burrito bowls and salads, made using fresh ingredients.
Blue/Grey Sky Scenario
Our Blue Sky Scenario (US$) 1000.00
Our $1,000 one-year valuation in a blue sky scenario is based on an EV/EBITDA of ~26x our blue sky FY20 EBITDA. Our blue sky FY20 EBITDA is based on: 1) SSS of 7%; 2) unit growth of 8%; and 3) restaurant-level margins of ~23%.
Our Grey Sky Scenario (US$) 550.00
Our $550 one-year valuation in a grey sky scenario is based on an EV/EBITDA of ~19x our grey sky FY20 EBITDA. Our grey sky FY20 EBITDA is based on: 1) SSS of 3%; 2) unit growth of ~5%; and 3) restaurant-level margins of ~20.7%.
Share price performance
On 21-Jun-2019 the S&P 500 INDEX closed at 2950.46
Daily Jun22, 2018 - Jun21, 2019, 06/22/18 = US$469.94
Source: Company data, Refinitiv, Credit Suisse estimates

25 June 2019
Chipotle Mexican Grill, Inc. (CMG) 3
Executive Summary We initiate coverage of Chipotle (CMG) with an Outperform rating and $870 target price.
CMG has returned to a narrative of growth rather than recovery, with on-trend initiatives
that well position the company to appeal to its target base and outperform peers. Mid-
single-digit SSS should enable margins to support an EPS CAGR of ~33% over the next
four years.
Please refer to our views summarizing the Restaurants industry: Phone to Table: Digitizing
Restaurants.
■ Implementing Slate of On-Trend Sales Initiatives: CMG should maintain mid-single-
digit SSS fueled by a slate of on-trend sales initiatives resonating with customers. Our
confidence in ongoing momentum includes contributions from: 1) digital initiatives; 2)
delivery growth; 3) the loyalty program; 4) new menu innovation; 5) social media
strategy; and 6) customer data analytics. More consistent price increases, improved
operations and potential benefits from catering growth should also contribute to SSS.
■ Long Runway for Growth: Chipotle has historically generated best-in-class cash-on-
cash returns, driven by strong average unit volumes (AUVs), favorable labor leverage
and attractive new-unit investment costs. Cash-on-cash returns are still above average at
~40%+, but far below peak levels of 70-80%. Stronger new-unit productivity, a multi-layer
sales plan to increase AUVs, and efforts to generate cost efficiencies should continue to
drive returns higher from more recent troughs. We expect Chipotle to step up unit growth
each year over the next few years, including the exploration of alternative formats such
as Chipotlanes, which should unlock additional real estate opportunities.
■ Sales Leverage to Enable Restaurant Margin Expansion: AUV growth is the
primary driver of margin expansion, and we estimate every $100K in AUV translates to
~100bps of restaurant-level margin expansion excluding inflation. We expect
restaurant margins to continue to expand, largely driven by sales leverage, with
ongoing opportunities for cost efficiencies. We model 20.4% restaurant-level margins in
2019 (+170bps) and ~100bps of expansion per year, reaching ~23.5% by 2022, behind
system AUVs of ~$2.4MM and prime costs of ~57.5% (from ~60% in 2018 and ~55-
56.5% historically).
Upside to our margin expectations exists if Chipotle is able to leverage labor costs
closer to historical levels. We model sustainably higher marketing and promo costs
(~3% vs ~1.5% historically) and overall other operating costs, largely due to delivery
fees, which represent incremental costs. Downside to expectations exists should AUV
growth be below our expectations, and Chipotle generates lower sales leverage.
Should Chipotle require marketing and promo costs above our estimate of ~3% of
sales (which implies ~10% dollar growth per year), margins could be further pressured.
■ Valuation: Our $870 target price is based on ~25x our NTM EBITDA in 12 months,
implying a P/E of ~46x our NTM EPS in 12 months. Our ~25x multiple is in line with
CMG’s multiple in recent weeks, and a slight discount to its current multiple (~26x).
CMG’s three-year average P/E multiple is ~42x, slightly below the P/E implied by our
target price.
■ Risks: Primary risks include: (1) food safety headlines, with consumer perceptions
more sensitive regarding Chipotle following food safety incidents (2009-2015); (2)
trends in consumer spending, with Chipotle’s more premium offering priced higher than
traditional QSR competitors; and (3) inflation, with every 100bps of margin translating
to ~10-15% in EPS.

25 June 2019
Chipotle Mexican Grill, Inc. (CMG) 4
Key Charts
Figure 1: We estimate SSS of 8% in 2019 and ~5%
long term, relative to consensus’ ~5.5% in 2019 and
~4-5% longer-term.
Figure 2: SSS leverage and cost efficiencies should
support ongoing margin improvement; we estimate
every $100K in AUVs translates to ~100bps of
margin improvement (excl inflation).
Source: Company data, Consensus Metrix, Credit Suisse estimates Source: Company data, Consensus Metrix, Credit Suisse estimates
Figure 3: Top-line growth of ~11% and margin
expansion should support an EPS CAGR of ~33%
over the next several years (consensus ~27%).
Figure 4: CMG currently trades at ~26x EV/EBITDA,
with a strong growth outlook supportive of an
above-average valuation multiple.
Source: Company data, Consensus Metrix, Credit Suisse estimates Source: FactSet, Credit Suisse estimates
0.0%
1.0%
2.0%
3.0%
4.0%
5.0%
6.0%
7.0%
8.0%
9.0%
SS
S
CSe Traffic CSe Check Consensus Traffic Consensus Check
10%
12%
14%
16%
18%
20%
22%
24%
26%
28%
30%
$1,000
$1,200
$1,400
$1,600
$1,800
$2,000
$2,200
$2,400
$2,600
20
05
20
06
20
07
20
08
20
09
20
10
20
11
20
12
20
13
20
14
20
15
20
16
20
17
20
18
20
19E
20
20E
20
21E
20
22E
Rest
aura
nt
Mar
gin
s
AU
Vs
($00
0s)
AUVs CSe Restaurant Margins Consensus Restaurant Margins
5%
15%
25%
35%
45%
55%
65%
$5.00
$10.00
$15.00
$20.00
$25.00
$30.00
2019E 2020E 2021E 2022E
EP
S G
row
th
EP
S
CSe EPS Consensus EPS CSe EPS Growth Consensus EPS Growth
5.0x
10.0x
15.0x
20.0x
25.0x
30.0x
Jun-1
6
Aug-1
6
Oct
-16
Dec-
16
Feb-1
7
Apr-
17
Jun-1
7
Aug-1
7
Oct
-17
Dec-
17
Feb-1
8
Apr-
18
Jun-1
8
Aug-1
8
Oct
-18
Dec-
18
Feb-1
9
Apr-
19
Jun-1
9
EV
/EB
ITD
A
NTM EV/EBITDA 3-yr Avg +1 Std Dev -1 Std Dev

25 June 2019
Chipotle Mexican Grill, Inc. (CMG) 5
Can Chipotle maintain mid-single-digit SSS long term? Credit Suisse View
Yes, we believe Chipotle can sustain SSS of ~5.0-5.5% over the next four years, with
contribution from both traffic and average check. The implementation of on-trend initiatives
should support ongoing sales growth, while better new-unit performance and the closing of
55-65 underperforming restaurants should optimize the health of the asset base. We
model SSS of 8% in 2019 (guide: mid- to high-single-digits), comprised of ~4% traffic and
~4% average check growth. Longer term, we model SSS of ~5.0-5.5%, with ~2-2.5%
contribution from traffic and ~3% from average check.
Chipotle has transitioned to a more focused organization with a methodical approach to
developing, testing and modifying new initiatives. Chipotle’s 100% company-operated
model and relatively small asset base allows it to be more agile and to roll out new
initiatives from concept to execution at a much faster pace than larger, heavily franchised
companies. As Chipotle builds a more robust database of customer information, we expect
the company to further enhance its processes.
Chipotle appeals to a prime demographic of younger consumers, and we are encouraged
the brand is implementing initiatives to enhance engagement and improve positioning.
Sales drivers contributing to our positive outlook include: 1) digital; 2) delivery; 3) loyalty
program; 4) innovation; 5) marketing; 6) social media; and 7) customer data analytics. We
also believe Chipotle maintains healthy pricing power and expect the brand to implement
lower and more consistent increases of ~2% per year. An increasing digital sales mix
drives our expectation of positive mix over the next few years.
Consensus Expectations
Consensus Metrix estimates SSS of 7.6% in 2019 (guide: mid- to high-single-digits),
including traffic of ~4% and average check of ~3.5%. Expectations include decelerating
SSS averaging ~4.5% over the next few years, including 5.3% in 2020, 4.7% in 2021 and
3.7% in 2022. Consensus models positive but declining traffic, with price of ~2% and
positive mix of ~1%.
Healthy SSS expectations in 2019
SSS is the primary driver of CMG’s stock, and healthy expectations in 2019 could leave
some on the sidelines. But AUVs are still down ~20% from 2014 peaks, and we believe
the company is as well positioned as ever to generate outperformance relative to the
group. In 1Q19, CMG raised its 2019 guidance for SSS to mid- to high-single-digit, from
mid-single-digit initially, driven by 1Q19 outperformance (SSS ~10%).
Traffic has improved sequentially over the last four quarters, including 2% in 4Q18 and
5.8% in 1Q19, reflective of initiatives gaining traction and a more sustainable trend. We
expect SSS to decelerate through 2019 against tougher compares and a drag from
deferred revenue related to the loyalty program. While 2020 will be up against the
toughest compares CMG has faced in several years, execution against early-stage
initiatives should continue to yield benefits.
While the consensus expectations for SSS of 7.6% in 2019 and 4-5% long-term are rich
relative to recent history, Chipotle has exhibited average SSS of ~4.5% over the last 10
years and ~8.5% in the seven years prior to the initial food safety incidents (2009-2015).
We believe Chipotle could outperform current expectations as it works to return to prior
peak AUVs of $2.5MM.
We model SSS of ~8% in 2019 and
~5.0-5.5% longer-term
Consensus models SSS of 7.6% in 2019
and ~4-5% longer-term
SSS average of 4.5% over last 10 years and
~8.5% prior to food safety incidents
25 June 2019
Chipotle Mexican Grill, Inc. (CMG) 6
Figure 5: Chipotle has exhibited SSS of ~4.5% over the
last 10 years, giving us confidence in the potential to
return to mid-single-digit comps long-term.
Figure 6: We model SSS of 8% in 2019 and ~5.0-
5.5% long-term, relative to consensus of ~7.6% in
2019 and ~4-5% longer-term.
Source: Company data, Credit Suisse estimates Source: Company data, Consensus Metrix, Credit Suisse estimates
Slate of initiatives to support ongoing momentum
Digital
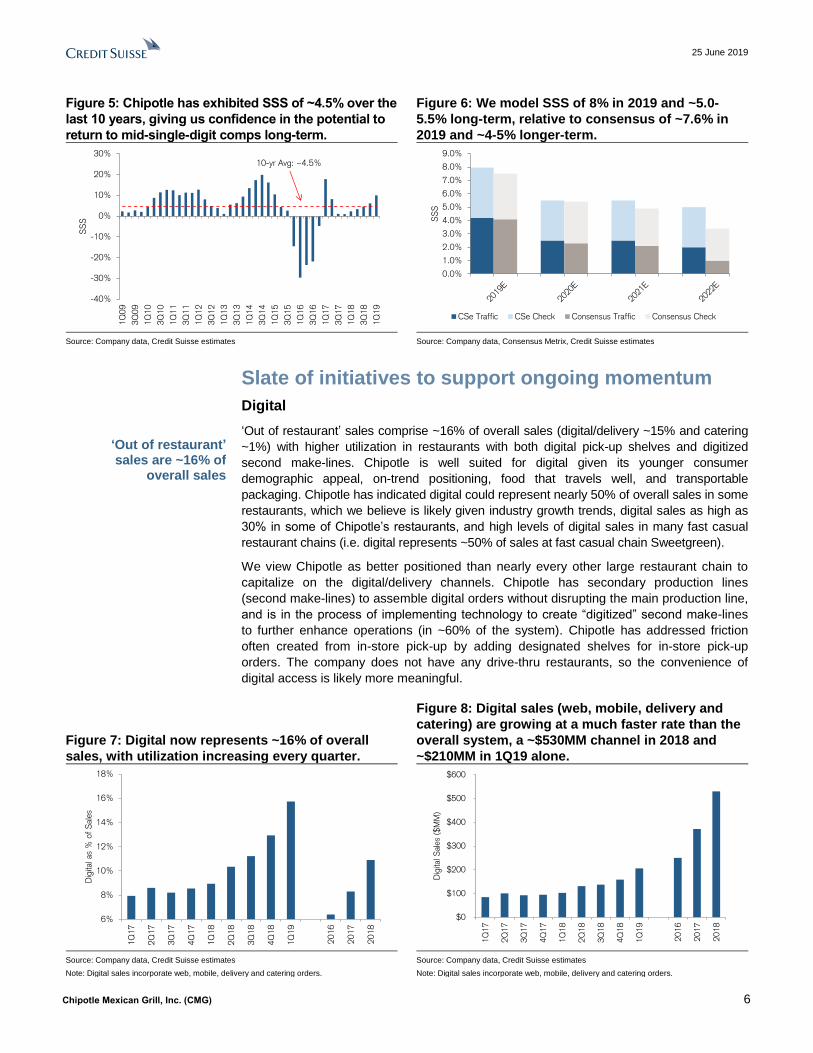
‘Out of restaurant’ sales comprise ~16% of overall sales (digital/delivery ~15% and catering
~1%) with higher utilization in restaurants with both digital pick-up shelves and digitized
second make-lines. Chipotle is well suited for digital given its younger consumer
demographic appeal, on-trend positioning, food that travels well, and transportable
packaging. Chipotle has indicated digital could represent nearly 50% of overall sales in some
restaurants, which we believe is likely given industry growth trends, digital sales as high as
30% in some of Chipotle’s restaurants, and high levels of digital sales in many fast casual
restaurant chains (i.e. digital represents ~50% of sales at fast casual chain Sweetgreen).
We view Chipotle as better positioned than nearly every other large restaurant chain to
capitalize on the digital/delivery channels. Chipotle has secondary production lines
(second make-lines) to assemble digital orders without disrupting the main production line,
and is in the process of implementing technology to create “digitized” second make-lines
to further enhance operations (in ~60% of the system). Chipotle has addressed friction
often created from in-store pick-up by adding designated shelves for in-store pick-up
orders. The company does not have any drive-thru restaurants, so the convenience of
digital access is likely more meaningful.
Figure 7: Digital now represents ~16% of overall
sales, with utilization increasing every quarter.
Figure 8: Digital sales (web, mobile, delivery and
catering) are growing at a much faster rate than the
overall system, a ~$530MM channel in 2018 and
~$210MM in 1Q19 alone.
Source: Company data, Credit Suisse estimates
Note: Digital sales incorporate web, mobile, delivery and catering orders.
Source: Company data, Credit Suisse estimates
Note: Digital sales incorporate web, mobile, delivery and catering orders.
-40%
-30%
-20%
-10%
0%
10%
20%
30%
1Q
09
3Q
09
1Q
10
3Q
10
1Q
11
3Q
11
1Q
12
3Q
12
1Q
13
3Q
13
1Q
14
3Q
14
1Q
15
3Q
15
1Q
16
3Q
16
1Q
17
3Q
17
1Q
18
3Q
18
1Q
19
SS
S
10-yr Avg: ~4.5%
0.0%
1.0%
2.0%
3.0%
4.0%
5.0%
6.0%
7.0%
8.0%
9.0%
SS
S
CSe Traffic CSe Check Consensus Traffic Consensus Check
6%
8%
10%
12%
14%
16%
18%
1Q
17
2Q
17
3Q
17
4Q
17
1Q
18
2Q
18
3Q
18
4Q
18
1Q
19
20
16
20
17
20
18
Dig
ital a
s %
of
Sale
s
$0
$100
$200
$300
$400
$500
$600
1Q
17
2Q
17
3Q
17
4Q
17
1Q
18
2Q
18
3Q
18
4Q
18
1Q
19
20
16
20
17
20
18
Dig
ital S
ale
s ($
MM
)
‘Out of restaurant’ sales are ~16% of
overall sales

25 June 2019
Chipotle Mexican Grill, Inc. (CMG) 7
Digitized Second Make-Lines and Digital Pick-Up Shelves
Chipotle has secondary production lines across its store base to assemble out-of-store
orders, including web, mobile, delivery and catering orders. Chipotle is in the process of
“digitizing” these secondary production lines to incorporate digital screens, improving
accuracy, throughput (~40% increase in throughput) and capacity.
The second make-lines well position Chipotle to increase capacity without disrupting
operations, with Chipotle noting orders from the second make-lines are more profitable
than a traditional in-store order. Digitized second make-lines are in ~60% of the system
(~1,500 restaurants), with expectations to be rolled out across the rest of the system by
the end of 2019. The integration of secondary production lines highlights Chipotle’s best-
in-class approach to operations and should serve as the operational foundation for
Chipotle to successfully execute against accelerating digital sales.
To further improve the digital experience, Chipotle has rolled out in-store pick-up shelves
for digital orders. The designated section for out-of-store orders creates a more convenient
and seamless experience for the customer, helps limit congestion and provides in-store
marketing for digital orders. The shelves also improve the delivery experience, as delivery
drivers know where to pick up the food and do not disrupt in-store operations.
Figure 9: Chipotle’s digitized make-lines improve
accuracy, throughput and increase capacity without
disrupting operations. The digitized make-lines are
expected to be rolled out to the entire system by the
end of 2019.
Figure 10: Chipotle has recently rolled out in-store
pick-up shelves for out-of-store orders across its
store base.
Source: Chipotle Presentation Source: Chipotle Presentation
Chipotlanes
Chipotle is testing digital drive-thru lanes, branded “Chipotlanes,” which are drive-up
windows for customers to pick up digital orders. Early feedback has been very positive, with
the ~10 restaurants with Chipotlanes generating digital sales above the national average
(~30% sales) and higher overall sales. Chipotle expects to expand this test to another few
dozen stores in 2019. While Chipotle does not build drive-thru lanes as part of its current
store layout, we can see Chipotle opportunistically building digital drive-up lanes where
appropriate, benefitting operations by shifting more orders to the second make-lines, without
significant investment and additional labor as required with a traditional drive-thru.
Across the restaurant industry, restaurants that add a drive-thru tend to see sales lifts of
~20-30%. We assume the addition of drive-up lanes will benefit from a similar lift, and new
restaurants with these drive-up lanes will likely generate AUVs above average new opens.
We do not expect Chipotle to focus on remodeling restaurants with drive-up lanes, but
rather to unlock sites that may not have been appropriate for a traditional restaurant.
Digital App
Out-of-restaurant sales make up ~16% of Chipotle sales, with digital and delivery
comprising ~15% of sales and ~1% sales mix from catering. We believe Chipotle’s skew
towards younger and more affluent cohorts should help drive higher digital sales relative to
Digitized second make-lines are expected to be
rolled out to the entire system by the end of
2019 (~60% currently)
Digital pick-up shelves are now rolled out across the system
Chipotlanes generate higher sales and digital mix, with opportunities
to unlock additional sites and unit potential

25 June 2019
Chipotle Mexican Grill, Inc. (CMG) 8
the industry. We would not be surprised if Chipotle approached a ~50% digital sales mix
long-term, with a digital sales mix that has nearly doubled over the last several quarters
and some restaurants exhibiting a digital sales mix as high as 25-30% of sales.
Chipotle has indicated the digital ecosystem is attracting light and medium users, which is
a best-case scenario to drive increased frequency and influence behavior. We would have
expected heavy users to adopt digital more quickly given the inherent loyalty implied from
customers downloading an app or joining a rewards program.
Delivery
Chipotle has partnered with DoorDash and Postmates, and delivery is seamlessly
integrated into Chipotle’s back-of-house system, avoiding operational disruptions. We
suspect Chipotle has negotiated extremely favorable rates from its partners, making
delivery a surprisingly margin-accretive channel (assuming incrementality). These
partnerships represent an opportunity for dual marketing, with delivery providers
selectively offering free delivery for Chipotle orders, and in return for these customer
acquisition costs, Chipotle marketing the channel to its customers, increasing awareness
of the third-party delivery providers.
Importantly, Chipotle is the first large restaurant chain to offer delivery directly through its
app, which should help enable digital sales, drive awareness of the channel, lower delivery
costs and support increasing delivery sales. One of the challenges restaurant brands are
faced with is the opportunity cost of shifting customers to a third-party platform. By offering
delivery directly on the app, delivery becomes an unlock for digital as customers must
download the app, Chipotle maintains its customers without transferring them to a different
platform and has full access to the customer data. Based on commentary from Chipotle,
there has been minimal customer overlap between its in-app delivery and third-party
delivery apps, highlighting the benefit of utilizing both channels.
Based on our analysis of Chipotle digital app users, ~10% use Postmates and ~25% use
DoorDash, suggesting there is overlap between customers and the benefits of Chipotle
offering delivery through its app to reduce fees paid to third parties. More importantly, just
~5% of Postmates and DoorDash users also use Chipotle, in-line with company commentary
suggesting minimal cannibalization and unlocking opportunities to increase awareness of
delivery and attract new customers. We believe Chipotle’s approach to integrate delivery in
its app and also separately through third-party platforms optimizes the potential.
Figure 11: ~10% of Chipotle digital app users also
use Postmates and ~25% of Chipotle digital app
users also use DoorDash.
Figure 12: Importantly, just ~5% of Postmates and
DoorDash users also use Chipotle digitally,
highlighting the potential incrementality from
presence on the platforms and limited cannibalization.
Source: comScore Credit Suisse estimates Source: comScore, Credit Suisse estimates
To increase awareness of the delivery feature in its app, Chipotle periodically offers free
delivery exclusively through its app. Delivery is generating order sizes ~1.5x that of an in-
store order ($16-17 vs $12-13 average in-store order), with commentary suggesting
incrementality of at least ~65-70%. Chipotle is well positioned for delivery with food that
travels well and is already in an easily transportable container. Execution appears strong,
with an average delivery time of less than 30 minutes.
14%
4%1% 2%
10%
21% 22%25%
0%
5%
10%
15%
20%
25%
30%
35%
40%
45%
Tac
o B
ell
Moe's
Del T
aco
Qdoba
Post
mate
s
Uber
Eat
s
Gru
bH
ub
DoorD
ash
Mexican Restaurant Peers Delivery
% C
hip
otle
Use
rs -
Cro
ss-V
isiti
ng
8%12%
4%
16%
5%8%
5% 6%
0%
5%
10%
15%
20%
25%
30%
35%
40%
45%
Tac
o B
ell
Moe's
Del T
aco
Qdoba
Post
mat
es
Uber
Eat
s
Gru
bH
ub
DoorD
ash
Mexican Restaurant Peers Delivery
% P
eers
/Deliv
ery
Use
rs -
Cro
ss-V
isiti
ng
Delivery is a margin- accretive channel for
Chipotle given high incrementality
Chipotle is optimizing its delivery channel, with app integration
and presence on platforms
Delivery is generating order sizes ~1.5x an in-
store order and incrementality of
65-70%

25 June 2019
Chipotle Mexican Grill, Inc. (CMG) 9
We expect delivery to contribute ~130bps to 2019, assuming delivery makes up ~4% of
sales and is ~70% incremental. In 2020, we estimate a delivery contribution of ~130bps to
SSS based on a ~5% sales mix and ~65% incrementality.
Figure 13: 2019 Delivery SSS Contribution Figure 14: 2020 Delivery SSS Contribution
Source: Company data, Credit Suisse estimates Source: Company data, Credit Suisse estimates
Loyalty
Chipotle Rewards launched nationally in March 2019 following an initial test in 3Q18. The
spend-based program rewards customers with a free entrée for every $125 spent (or ~10
visits), translating to a ~10% discount.
Chipotle has indicated a loyalty/rewards program has been a top consumer request, and
we believe the program could incentivize both new and existing customers. Within one
month, Chipotle amassed 3MM loyalty members, with March and April together generating
~1MM app downloads, representing the highest monthly downloads in the company’s
history. Chipotle has indicated the loyalty program has a higher incidence of light and
medium users enrolling (best case scenario), unlocking opportunities to increase
frequency and incentivize behavior.
In 1Q19, Chipotle deferred ~$3.5MM of revenue related to earned, unredeemed loyalty
points, translating to a ~30bps drag on revenue in the quarter. As reward points expire
within 60 days, Chipotle will recognize the full value of the deferral, though 2Q revenue
deferral should fully offset the benefit given a full quarter of the loyalty program being
implemented and greater awareness driving sign-up. Chipotle highlighted expectations for
an ongoing drag from the loyalty program deferral until it reaches ~100bps in magnitude
before reversing to a net neutral or positive impact.
Innovation
Chipotle is taking a more strategic approach to menu innovation, with opportunities to
market a combination of existing ingredients, add new ingredients and invest in new
processes/equipment.
In January, Chipotle added Lifestyle Bowls, which combined Chipotle’s existing ingredients
into marketable meals/recipes that increased customer convenience and generated new
news. Chipotle is taking a page out of the Taco Bell playbook by leveraging its existing
ingredients to create new innovation without affecting operations.
Chipotle is currently testing new menu items that are easy to implement by adding them
to the traditional line. Carne Asada, for example, is being tested in select markets.
Salads could also be added as a new menu category relatively simplistically (salad
dressings have been tested for a while in the NYC NEXT Kitchen). New products
requiring new processes are more difficult, with concerns around throughput and
operational disruption. Quesadillas, the most frequently requested item at Chipotle, are
in test with new pressers reducing cook time to ~30 seconds (from ~3 minutes
currently). Nachos similarly are more difficult to execute. Chipotle has also highlighted
an opportunity to enhance its beverage line-up.
2019 Scenario Analysis 2020 Scenario Analysis
1.3% 3.0% 3.5% 4.0% 5.0% 6.0%
50% 0.4% 0.7% 0.9% 1.4% 1.9%
60% 0.5% 0.8% 1.1% 1.7% 2.3%
70% 0.6% 0.9% 1.3% 2.0% 2.7%
80% 0.7% 1.1% 1.5% 2.3% 3.1%
90% 0.7% 1.2% 1.6% 2.6% 3.5%
Sales Mix
Incre
men
tali
ty
2020 Scenario Analysis
1.3% 4.0% 4.5% 5.0% 6.0% 7.0%
55% 0.5% 0.8% 1.1% 1.7% 2.3%
60% 0.5% 0.8% 1.2% 1.8% 2.5%
65% 0.6% 0.9% 1.3% 2.0% 2.7%
70% 0.6% 1.0% 1.4% 2.2% 2.9%
75% 0.6% 1.1% 1.5% 2.3% 3.1%
Sales Mix
Incre
men
tali
tyLoyalty program is attracting light and
medium users – key unlock to increase
frequency and influence behavior
Menu innovation 1) market recipe of
existing ingredients; 2) add new ingredients;
3) invest in new equipment

25 June 2019
Chipotle Mexican Grill, Inc. (CMG) 10
We expect Chipotle could selectively incorporate new innovation through digital channels
only, limiting the potential disruption from new products and processes. This would also
help increase digital utilization.
Previous efforts around menu expansion in recent years have been lackluster, with queso
receiving mixed reviews after an accelerated roll-out and chorizo removed from the menu
less than a year after roll-out. In 3Q17, Chipotle opened the NEXT restaurant in NYC as a
test kitchen to introduce, test and modify new menu items, though it seems the company is
taking a larger-scale approach to testing across different markets. We would not be
surprised to see a larger-scale test kitchen closer to its HQ to develop an innovative
pipeline that can be well tested through customer feedback and restaurant operations,
resulting in a more streamlined approach to national scale and commercialization.
Social Media
Chipotle has made a noticeable change in its social media strategy over the last 12-18
months, transitioning to a more engaging, humorous personality from a more food-centric
approach previously. Chipotle often features tweets from customers or non-food posts
unique to Chipotle. Engagement with followers appears to have increased, and the team
makes it more personal by signing their names with each response. We are encouraged
Chipotle has a more distinct personality and believe it is well positioned to drive increased
loyalty and affinity with its followers given the brand’s younger target demographic.
Figure 15: Chipotle has historically engaged a food-
centric social media approach, largely featuring its
menu items and ingredients (September/October
2017 posts).
Figure 16: More recently, Chipotle has been more
diversified in its posts, creating a more distinct
brand personality through humor and fun.
Source: Chipotle Instagram Source: Chipotle Instagram
Shift in strategy to personality-driven
content rather than food-centric content

25 June 2019
Chipotle Mexican Grill, Inc. (CMG) 11
Analytics
Overarching Chipotle’s new strategy is the utilization of customer data analytics to drive
decision making and implementation of initiatives. Over the past few years, Chipotle has
made several attempts to rebound traffic and sales primarily though new innovation and
marketing, but did not have the infrastructure in place to robustly test, evaluate and iterate
before full-scale roll-out. Prior to the food safety incidents, Chipotle was able to organically
drive sales growth based on its commitment to food, quality ingredients and grass-roots
marketing. Against a backdrop of heightened competition, the emergence of other fast
casual chains with mission driven strategies and digital penetration helping smaller chains
better compete, the timing of the food safety incident created somewhat of a “perfect
storm”. While Chipotle attempted to launch initiatives to compete in a more traditional way,
the brand was not prepared and operational execution suffered.
We believe that an organization’s ability to collect and utilize data is paramount to
understanding initiatives that will resonate with consumers. We expect these insights will
be relevant for generating marketing campaigns that appeal to new and existing
customers, as well as in building the innovation pipeline. Chipotle has already highlighted
strength among Millennials and Gen Z customers, and we believe initiatives geared
towards engaging marketing campaigns, new menu innovation, value and digital should
resonate with these customer segments.
Catering
Catering represents just ~1% of sales, a potentially significant and largely untapped
opportunity. Chipotle has amended the platform in recent years to lower the minimum
order size and offer catering delivery. Customers can also earn loyalty points through
catering transactions. Taken together, increased access through lower group order sizes,
lower pricing tiers, ability to earn loyalty points and delivery availability should help drive
channel growth.
Chipotle’s catering business has some seasonality, with catering sales higher in 2Q and
4Q from graduations and holidays, respectively, and generally skews at-home vs office.
We believe catering delivery could be a significant unlock to gain share among
businesses/offices, with the convenience of delivery a potentially meaningful factor in
restaurant catering choices and offices being relatively inelastic to delivery fees.
Over the last several years, different companies have emerged targeting the catering
channel, particularly focused on office buildings and through marketplace platforms. Fast
casual competitor, Sweetgreen, is testing a hybrid delivery-catering model, where the
company will deliver customized orders to office buildings with designated pick-up shelves.
We would not be surprised to see restaurants engaging in these types of opportunities
given the benefits of higher volume orders on delivery profitability.
Operations
Initiatives implemented to address operational execution thus far appear to be generating
results, with Chipotle experiencing improvements in restaurant AB scores, lower hourly
turnover, declines in guest complaints and improved guest satisfaction scores. Going
forward, improved throughput, consistent execution of food and consistent delivery of a
great atmosphere remain opportunities.
To evaluate employee satisfaction for Chipotle and select peers, we utilized self-reported
employee satisfaction scores through ratings on Glassdoor, which are rated on a scale of
1-5 (5 being the best). Over the last 11 years, employee satisfaction scores have largely
trended upward, with employee satisfaction ratings in 2018 at the highest level in the
history of our data set. Chipotle’s overall employee satisfaction score in 2018 is 3.77
representing an increase of 0.42 since 2013. Employee satisfaction with compensation
and benefits has increased 0.46 points since 2013 to 3.67 in 2018.

25 June 2019
Chipotle Mexican Grill, Inc. (CMG) 12
Figure 17: Chipotle employee satisfaction has
increased 0.42 over the last several years to 3.77 in
2018, the highest satisfaction ratings employees
have reported in the history of our data set.
Figure 18: In part, increasing satisfaction with
compensation and benefits has supported overall
employee satisfaction, highlighting the importance
of investments.
Source: Thinknum, Glassdoor, Credit Suisse Source: Thinknum, Glassdoor, Credit Suisse
Pricing
Chipotle has historically been conservative with its pricing strategy, enacting menu price
increases every 2-3 years to offset rising food costs. Following three to four years of flat
pricing, Chipotle rolled out price increases in tranches averaging ~5% across markets
starting in 2Q17 through early 2018. There appeared to be minimal resistance to the price
increase, with the majority flowing through to comp.
Chipotle implemented a price increase of ~1.7% in late December, which will carry through
2019. We expect Chipotle will enact more regular, but lower, price increases each year to
offset margin pressures. To maintain margins in a mid-single-digit inflationary cost
environment, transaction-growth must be approximately mid-single-digit, so prudent
pricing will likely be used to better leverage the economic model.
Figure 19: CMG has historically enacted price
increases every 2-3 years. CMG rolled out average
price increases ~5% system-wide for the first time in
3-4 years in 2017 and 2018, and another increase in
December 2018.
Figure 20: We expect CMG to implement lower and
more consistent price increases to better leverage
the economic model while limiting resistance.
Source: Company data, Credit Suisse Source: Company data, Consensus Metrix, Credit Suisse estimates
3.00
3.10
3.20
3.30
3.40
3.50
3.60
3.70
3.80
3.90
2013 2014 2015 2016 2017 2018
Ove
rall
Sat
isfa
ctio
n R
atin
g
3.00
3.10
3.20
3.30
3.40
3.50
3.60
3.70
3.80
2013 2014 2015 2016 2017 2018
Com
p &
Benefits
Satis
fact
ion R
atin
g
0.0%
1.0%
2.0%
3.0%
4.0%
5.0%
6.0%
7.0%
8.0%
9.0%
1Q
06
4Q
06
3Q
07
2Q
08
1Q
09
4Q
09
3Q
10
2Q
11
1Q
12
4Q
12
3Q
13
2Q
14
1Q
15
4Q
15
3Q
16
2Q
17
1Q
18
4Q
18
Price
4Q06: Select menu price
increases
2007/2008: Menu price
increases (market by
market)
1H11:
Menu price
increases
2Q14: Menu price
increase
2017/2018: Menu price
increases (market by
market)
0.0%
0.5%
1.0%
1.5%
2.0%
2.5%
3.0%
3.5%
4.0%
4.5%
20
13
20
14
20
15
20
16
20
17
20
18
20
19E
20
20E
20
21E
20
22E
Price
CSe Consensus Actual
We expect more consistent price
increases of ~2% per year

25 June 2019
Chipotle Mexican Grill, Inc. (CMG) 13
Will unit growth accelerate from current levels? Credit Suisse View
Yes, we expect unit growth to reaccelerate, though likely remaining below historical levels
over the near to medium-term. We model 144 net new units in 2019, and an incremental 10 units per year over the next several years.
Strong new unit opens in 2018 and the closing of 55-65 underperforming stores give us confidence Chipotle will continue to develop and optimize the health of its portfolio. 2018’s
137 new unit opens was the lowest in eight years, with guidance of 140-155 new opens in
2019 still reflecting multi-year lows. We believe Chipotle will further step up growth over time, including the exploration of alternative prototypes such as Chipotlanes.
Chipotle has historically generated best-in-class cash-on-cash returns, driven by strong AUVs, favorable labor leverage and attractive new-unit investment costs. Cash-on-cash
returns are still above average at ~40%+, but far below peak levels of 70-80%. Stronger
new-unit productivity, a multi-layer sales plan to increase AUVs and efforts to generate cost efficiencies should continue to drive returns higher from more recent troughs.
Consensus Expectations
Consensus models 142 net new units in 2019 and a step up each year for an average of
~165 units in 2020-2022.
Unit growth expectations appear achievable
Chipotle has been one of the fastest growing large chains in the restaurants space, generating consistent double-digit unit growth prior to brand challenges following food safety
incidents. Over the past two years, CMG has tempered unit growth in the US behind lower
sales volumes, soft unit productivity and a challenging growth environment with heightened
competition. Over the near to medium term, unit growth will likely remain lower than historical
levels as CMG prioritizes its existing asset base. We expect a slow and steady build will be more likely than a more immediate step up, especially with a tight labor market.
We model net unit growth of ~6% over the next few years, averaging ~165 units per year. We estimate 144 net new units in 2019 and an incremental step up of ~10 units each year
over the next few years. Consensus models 142 net new units in 2019, ~160 in 2020 and
2021, and 175 in 2022.
2018 was the first year CMG opened fewer than ~150 units since 2011, an intentional
reduction to focus on the existing base. Guidance for 2019 is gross new unit growth of 140-155 and continued planned closures of ~55-65 underperforming restaurants, with expectations for
improved sales and unit economics supporting acceleration from these levels.
Figure 21: Chipotle has generated average unit growth
of ~12% over the last several years, with tempered unit
growth over the past two as the company has focused
on improving the existing asset base.
Figure 22: We model 144 new units in 2019, and a
slow step up going forward, relatively in line with
the consensus.
Source: Company data, Credit Suisse Source: Consensus Metrix, Credit Suisse estimates
2%
4%
6%
8%
10%
12%
14%
16%
500
1,000
1,500
2,000
2,500
3,000
2012 2013 2014 2015 2016 2017 2018
YO
Y G
row
th %
Units
Units YOY Growth %
40
60
80
100
120
140
160
180
200
2019E 2020E 2021E 2022E
Unit
Gro
wth
CSe Consensus
We expect modest step ups in unit growth

25 June 2019
Chipotle Mexican Grill, Inc. (CMG) 14
Best-in-class returns supportive of development story
Chipotle has historically demonstrated best-in-class unit economics given its simplistic
operating structure, high AUVs, strong new unit productivity and labor leverage. At peak,
Chipotle was exhibiting cash-on-cash returns of 70-80%, which have come down to ~40%.
Chipotle has indicated its new classes of restaurants are opening at ~80%+ of the existing
base, reflecting historical new unit productivity highs (though on a lower AUV). We believe
confidence in strong new unit opens is required to accelerate unit growth from recently
tempered levels.
Chipotle has recently started testing Chipotlanes, a new format prototype with a digital pick-up
lane similar to a drive-thru. While only in ~10 restaurants, these units are generating higher
overall sales and a higher digital mix (~25-30% of sales). We believe the new format could
unlock new opportunities to open restaurants in trade areas that require higher volumes, or in
smaller footprints. We estimate the Chipotlanes could add ~20-30% to the volume of a
traditional restaurant. We expect the company to open a few dozen Chipotlane prototypes in
2019, with higher AUV openings that could boost net unit productivity levels.
Figure 23: Chipotle has generated best-in-class
returns, and while well off its 70-80% peak, is still
driving ~40%+ cash-on-cash returns.
Figure 24: Even at current levels, Chipotle’s cash-
on-cash returns are above nearly all restaurant
peers in our data set.
Source: Company data, Credit Suisse
Note: Calculated using system AUVs and restaurant level margins. New class opens likely lower than the system average.
Source: Company data, Restaurant Research Journal, Credit Suisse estimates
Note: Reflects 2018 AUVs, investment costs and EBITDAR margins.
Net new unit demographic trends mixed
New opens likely in established markets
~80% of Chipotle’s US system is concentrated in 15 markets, with the greatest exposure
in California (~17%), Texas (~8.5%), Ohio (~7.5%), Florida (~6.5%) and New York (~6%).
We expect growth to be largely concentrated in Chipotle’s core and established markets,
providing increased visibility into the economics of the restaurants, creating efficiencies for
marketing campaigns and making it easier to establish procedures to test, scale and
commercialize new initiatives. As Chipotle stabilizes its existing base, improves economics
in established markets and has a well-developed strategy, we expect the company to
return to greater expansion in newer markets.
0%
10%
20%
30%
40%
50%
60%
70%
80%
90%
20
05
20
06
20
07
20
08
20
09
20
10
20
11
20
12
20
13
20
14
20
15
20
16
20
17
20
18
Cash
-on-C
ash
Retu
rn %
0%
10%
20%
30%
40%
50%
60%
70%
Dom
ino's
Chip
otle
Moe's
McD
onal
d's
Pizza
Hut
Fiv
e G
uys
Dunkin
'
Tac
o B
ell
Pan
era
Jack
in t
he B
ox
Qdoba
Sonic
Burg
er
Kin
g
Wendy'
s
KF
C
Cash
-on-C
ash
Retu
rns
(Exc
l Rent
& G
&A
)
Chipotle is generating cash-on-cash returns
of ~40%, below 70-80% at peak, but still above
peers

25 June 2019
Chipotle Mexican Grill, Inc. (CMG) 15
Figure 25: ~80% of CMG’s units are concentrated in
15 markets.
Figure 26: We expect new unit growth to largely be
concentrated in more established markets.
Source: Company data, Credit Suisse Source: Company data, Thinknum, Credit Suisse
Demographics around new opens could be a factor affecting trends
Our analysis of new-unit opens suggests Chipotle has opened new units in less affluent
and less dense markets over the last few years, which could be a factor weighing on new-
unit trends. In 2017, new units were opened in markets with median incomes ~less than
that of the existing base. Given Chipotle’s more expensive pricing and appeal to a higher-
end consumer, moving into less affluent markets could represent a drag on sales. In 2016
and 2017, Chipotle opened units in less densely populated markets, which could affect
potential foot traffic. 2018 new opens appear to be located in areas with more favorable
demographics and closer to those of prior years, which could be a positive for new-unit
productivity and the health of the new classes, at least at the margin.
Figure 27: Over the past few years, new units have
opened in markets with lower median income
relative to the base, which could represent a drag
on sales volumes, though 2018 units were open in
more affluent areas.
Figure 28: In 2018, Chipotle opened units in more
densely populated markets relative to the existing
base, which we view as a potential positive for foot
traffic.
Source: Company data, Thinknum, Credit Suisse estimates
Note: (1) Existing Base Median Income represents average median income of Chipotle’s system for the year ended 12/31/15. (2) New Units Median Income vs Base represents the average median income of the new units opened in each respective year relative to the average median income of Chipotle’s 2015 existing base.
Source: Company data, Thinknum, Credit Suisse estimates
Note: (1) Existing Base Population represents average population by postal code of Chipotle’s system for the year ended 12/31/15. (2) New Units Population vs Base represents the average population by postal code of the new units opened in each respective year relative to the average population by postal code of Chipotle’s 2015 existing base.
0%
2%
4%
6%
8%
10%
12%
14%
16%
18%
CA TX OH FL NY IL VA MD PA AZ CO NJ MN NC MA
% U
S S
yste
m E
xposu
re
47% 46% 46%
73% 75%81%
0%
10%
20%
30%
40%
50%
60%
70%
80%
90%
2016 2017 2018
% U
nit
Gro
wth
Contr
ibutio
n
Top 5 States Top 10 States Top 15 States
$68.4K $68.5K
$66.2K
$70.4K
-4%
-2%
0%
2%
4%
6%
8%
10%
$64K
$65K
$66K
$67K
$68K
$69K
$70K
$71K
2015 Existing
Base
2016 New
Opens
2017 New
Opens
2018 New
Opens
New
Units
Media
n Inco
me v
s B
ase
Media
n Inco
me (
$00
0s)
Median Income New Units Median Income vs Base
35.4K
33.8K 33.8K
35.4K
-6%
-4%
-2%
0%
2%
4%
6%
8%
10%
30K
31K
32K
33K
34K
35K
36K
2015 Existing
Base
2016 New
Opens
2017 New
Opens
2018 New
Opens
New
Units
Popula
tion v
s B
ase
Popula
tion b
y P
ost
al C
ode (
000s)
Population New Units Population vs Base

25 June 2019
Chipotle Mexican Grill, Inc. (CMG) 16
What is the opportunity for restaurant margin expansion? Credit Suisse View
We expect restaurant margins to continue to expand, largely driven by sales leverage, with
ongoing opportunities for cost efficiencies. We model 20.4% in 2019 (+170bps) and
~100bps of expansion per year, to ~23.5% by 2022, behind system AUVs of ~$2.4MM and
prime costs of ~57.5% (from ~60% in 2018 and ~55-56.5% historically). We believe AUV
growth will be the key driver of margin expansion potential. We model AUVs of ~$2.2MM
in 2020 and ~$2.4MM in 2022, with every $100K in AUV translating to ~100bps of
restaurant margin excluding inflation.
Upside to our margin expectations exists if Chipotle is able to leverage labor costs closer
to historical levels. We are modeling sustainably higher marketing and promo costs (~3%
vs ~1.5% historically) and overall other operating costs, largely due to delivery fees, which
could be pressuring margins. Downside to expectations exists should AUV growth be
below our expectations, and Chipotle generates lower sales leverage. Should Chipotle
require marketing and promo costs above our estimated ~3% of sales (which implies
~10% dollar growth per year), margins could be further pressured.
Consensus Expectations
Consensus models margin improvement to ~20.2% in 2019 and ~22% by 2022.
Estimates include leverage across all cost buckets, including ~50bps from food and
packaging, ~110bps from labor, ~90bps from occupancy, and ~65bps from other
restaurant expenses.
AUV growth to support margin leverage and
profitability
We expect average unit volumes (AUVs) to continue to recover from current levels of
~$2MM. We estimate SSS of ~5.0-5.5% over the next four years, comprised of
contribution from digital initiatives, delivery, new menu innovation, and enhanced analytics.
We model AUV growth of ~$100K per year to ~$2.1MM in 2019 growing to ~$2.4MM by
2022. Top-line revenue growth represents the most significant factor driving margin
leverage and profitability. At current AUVs of ~$2MM, the economic model should
generate a ~20% restaurant-level margin, with expansion to mid-20% margins as AUVs
get closer to ~$2.4MM.
Figure 29: Top-line revenue growth is the most
significant factor driving restaurant-level margins.
Figure 30: We expect sales leverage to be the
primary driver of restaurant margin improvement.
Source: Company data, Credit Suisse Source: Company data, Consensus Metrix, Credit Suisse estimates
10%
12%
14%
16%
18%
20%
22%
24%
26%
28%
30%
$1,000
$1,200
$1,400
$1,600
$1,800
$2,000
$2,200
$2,400
$2,600
20
05
20
06
20
07
20
08
20
09
20
10
20
11
20
12
20
13
20
14
20
15
20
16
20
17
20
18
Rest
aura
nt
Mar
gin
s
AU
Vs
($00
0s)
AUVs Restaurant Margins
10%
12%
14%
16%
18%
20%
22%
24%
26%
28%
30%
$1,000
$1,200
$1,400
$1,600
$1,800
$2,000
$2,200
$2,400
$2,600
20
05
20
06
20
07
20
08
20
09
20
10
20
11
20
12
20
13
20
14
20
15
20
16
20
17
20
18
20
19E
20
20E
20
21E
20
22E
Rest
aura
nt
Marg
ins
AU
Vs
($00
0s)
AUVs CSe Restaurant Margins Consensus Restaurant Margins
Sales leverage and cost efficiencies should
support a return to mid-20% margins

25 June 2019
Chipotle Mexican Grill, Inc. (CMG) 17
We estimate SSS of ~8% in 2019 to drive AUVs of ~$2.1MM. There appear to be
opportunities for efficiencies in the food and labor lines, including contract negotiations,
waste savings, and better labor management. In our view, Chipotle has done well to
manage food margins with lower AUVs and structurally higher costs from food safety
related procedures. Better sales forecasting and labor scheduling, and an increase in the
digital mix should positively benefit labor margins. We expect prime costs to improve
~280bps, relative to consensus’ ~160bps of improvement, through 2022.
While there could be additional opportunities to reduce costs, we expect Chipotle to
prioritize top-line revenue. As new initiatives are rolled out, requiring crew training and
some inefficiencies, we do not expect the company to approach peak margins over the
near to medium term. Efficiencies in the labor line will likely be somewhat offset by
elevated marketing and promo costs and delivery expenses. We estimate marketing and
promo costs of ~3% of sales going forward.
We model restaurant-level margins of 20.4% in 2019, an increase of 170bps, reaching
23.5% by 2022. This compares to consensus for restaurant-level margins of 20.2% in
2019, expanding to 21.9% by 2022.
Figure 31: Strong AUVs and relatively low labor
margins have supported strong restaurant level
margins and best-in-class returns.
Figure 32: We expect restaurant-level margins to
expand to 23.5% by 2022, behind improving AUVs
and efficiency gains. Consensus estimates margin
improvement to ~22% by 2022.
Source: Company data, Credit Suisse
Note: Red line represents average over period shown.
Source: Company data, Consensus Metrix, Credit Suisse estimates
Figure 33: Sales leverage is a meaningful factor in driving margin expansion,
with opportunities for efficiencies supporting further benefits.
Source: Company data, Credit Suisse estimates
10.0%
12.0%
14.0%
16.0%
18.0%
20.0%
22.0%
24.0%
26.0%
28.0%
30.0%
20
05
20
06
20
07
20
08
20
09
20
10
20
11
20
12
20
13
20
14
20
15
20
16
20
17
20
18
Rest
aura
nt
Leve
l Mar
gin
s
18.0%
19.0%
20.0%
21.0%
22.0%
23.0%
24.0%
2019E 2020E 2021E 2022E
Rest
aura
nt
Leve
l M
arg
ins
CSe Restaurant Margins Consensus Restaurant Margins
Low double-
digits
Mid-to-high
teensLow 20%
Mid 20%
0%
5%
10%
15%
20%
25%
30%
$1.9MM $2.0MM $2.2MM $2.4-2.5MM
Rest
aura
nt
Leve
l M
arg
ins
AUVs ($MM)
Sales leverage is the primary driver of
margin expansion, with ~$2.4-2.5MM AUVs
supportive of mid-20% margins

25 June 2019
Chipotle Mexican Grill, Inc. (CMG) 18
What is the EPS growth opportunity? Credit Suisse View
We model EPS growth of ~33% over the next four years. Top-line growth of ~11%,
including SSS of ~5.0-5.5%, should enable margin expansion to support operating profit
growth of ~31% over the next few years.
For 2019, we model EPS growth of ~53%, including top-line growth of 11.7%, restaurant
margin expansion of ~170bps, G&A leverage and accretion from share repurchases.
Consensus Expectations
Consensus models EPS growth of ~27% over the next four years, including 47% in 2019.
For 2019, consensus estimates top-line growth of 11.4%, restaurant margin expansion of
~140bps, G&A leverage and benefits from share repurchases for EPS growth of ~47%.
Figure 34: In the seven years prior to food safety
challenges at the end of 2015, EPS growth averaged
~31.5%.
Figure 35: We model EPS growth of ~33% over the
next four years, above consensus’ ~27%.
Source: Company data, Credit Suisse Source: Consensus Metrix, Credit Suisse estimates
0.0%
10.0%
20.0%
30.0%
40.0%
50.0%
60.0%
70.0%
80.0%
$0.00
$2.00
$4.00
$6.00
$8.00
$10.00
$12.00
$14.00
$16.00
20
09
20
10
20
11
20
12
20
13
20
14
20
15
20
16
20
17
20
18
EP
S G
row
th
EP
S
EPS EPS Growth
5%
15%
25%
35%
45%
55%
65%
$5.00
$10.00
$15.00
$20.00
$25.00
$30.00
2019E 2020E 2021E 2022E
EP
S G
row
th
EP
S
CSe EPS Consensus EPS CSe EPS Growth Consensus EPS Growth

25 June 2019
Chipotle Mexican Grill, Inc. (CMG) 19
Valuation $870 Target Price
Our $870 target price is based on ~25x our NTM EBITDA in 12 months, implying a P/E of
~46x our NTM EPS in 12 months. Our ~25x multiple is in line with where CMG has been
trading, above its three-year average of ~19.5x. Our ~46x P/E multiple reflects a premium
to CMG’s three-year average of ~42x, and is lower than its current ~49x multiple.
Peer Group EV/EBITDA Analysis
CMG currently trades at ~26x consensus NTM EBITDA estimates, above its three-year
average EV/EBITDA multiple of ~19.5x. CMG has historically traded at a ~75% premium
to restaurant peers, but is currently trading at a ~115% premium, with the three-year
historical valuation premium implying CMG could trade at ~20.5x EBITDA. CMG has
maintained an average EV/EBITDA multiple of ~21x since Brian Niccol was appointed
CEO in March 2018 and ~24x year to date.
Figure 36: CMG NTM EV/EBITDA Figure 37: CMG EV/EBITDA vs Peers
Source: FactSet, Credit Suisse estimates Source: FactSet, Credit Suisse estimates
Note: Peers include average of publicly traded restaurant companies.
Peer Group P/E Analysis
CMG currently trades at ~49x consensus NTM EPS estimates, above its three-year
average P/E multiple of ~42x. CMG has historically traded at a ~100% premium to
restaurant peers. At current levels, CMG trades at a ~130% premium to peers, with its
historical premium implying a multiple of ~42x NTM EPS.
Figure 38: CMG NTM P/E Figure 39: CMG P/E vs Peers
Source: FactSet, Credit Suisse estimates Source: FactSet, Credit Suisse estimates
Note: Peers include average of publicly traded restaurant companies.
5.0x
10.0x
15.0x
20.0x
25.0x
30.0x
Jun-1
6
Aug-1
6
Oct
-16
Dec-
16
Feb-1
7
Apr-
17
Jun-1
7
Aug-1
7
Oct
-17
Dec-
17
Feb-1
8
Apr-
18
Jun-1
8
Aug-1
8
Oct
-18
Dec-
18
Feb-1
9
Apr-
19
Jun-1
9
EV
/EB
ITD
A
NTM EV/EBITDA 3-yr Avg +1 Std Dev -1 Std Dev
5.0x
10.0x
15.0x
20.0x
25.0x
30.0x
Jun-1
6
Aug-1
6
Oct
-16
Dec-
16
Feb-1
7
Apr-
17
Jun-1
7
Aug-1
7
Oct
-17
Dec-
17
Feb-1
8
Apr-
18
Jun-1
8
Aug-1
8
Oct
-18
Dec-
18
Feb-1
9
Apr-
19
Jun-1
9
EV
/EB
ITD
A
CMG Peers Implied Multiple on Avg. Premium
10.0x
15.0x
20.0x
25.0x
30.0x
35.0x
40.0x
45.0x
50.0x
55.0x
60.0x
Jun-1
6
Aug-1
6
Oct
-16
Dec-
16
Feb-1
7
Apr-
17
Jun-1
7
Aug-1
7
Oct
-17
Dec-
17
Feb-1
8
Apr-
18
Jun-1
8
Aug-1
8
Oct
-18
Dec-
18
Feb-1
9
Apr-
19
Jun-1
9
P/E
NTM P/E 3-yr Avg +1 Std Dev -1 Std Dev
10.0x
15.0x
20.0x
25.0x
30.0x
35.0x
40.0x
45.0x
50.0x
55.0x
60.0x
Jun-1
6
Aug-1
6
Oct
-16
Dec-
16
Feb-1
7
Apr-
17
Jun-1
7
Aug-1
7
Oct
-17
Dec-
17
Feb-1
8
Apr-
18
Jun-1
8
Aug-1
8
Oct
-18
Dec-
18
Feb-1
9
Apr-
19
Jun-1
9
P/E
CMG Peers Implied Multiple on Avg. Premium

25 June 2019
Chipotle Mexican Grill, Inc. (CMG) 20
Figure 40: Credit Suisse US Restaurants Coverage
Source: Company data, FactSet, Consensus Metrix
Note: (1) FCF, system sales and EBITDA growth calculated based on 3-yr forward CAGR using consensus estimates. (2) % Franchised/ Licensed reflects 2018 franchise mix. (3) Averages exclude SHAK.
Scenario Analysis
Blue Sky: $1,000 One-Year Valuation
Our $1,000 one-year valuation in a blue sky scenario is based on an EV/EBITDA of ~26x
our blue sky FY20 EBITDA. Our blue sky FY20 EBITDA is based on: 1) SSS of 7%; 2) unit
growth of 8%; and 3) restaurant-level margins of ~23%.
Grey Sky: $550 One-Year Valuation
Our $550 one-year valuation in a grey sky scenario is based on an EV/EBITDA of ~19x
our grey sky FY20 EBITDA. Our grey sky FY20 EBITDA is based on: 1) SSS of 3%; 2) unit
growth of ~5%; and 3) restaurant-level margins of ~20.7%.
NTM
EV/EBITDANTM P/E
System Sales
Growth% Unit Growth EBITDA Growth
% Franchised/
Licensed
SHAK 28.2x 113.8x 22.2% 22.8% 17.5% 40%
CMG 25.6x 53.0x 11.0% 5.9% 22.6% 0%
DPZ 20.4x 29.0x 9.7% 6.8% 10.5% 98%
YUM 20.1x 28.3x 6.8% 4.1% 7.3% 98%
DNKN 18.3x 26.4x 3.5% 1.5% 5.0% 100%
MCD 18.0x 24.8x 5.0% 2.1% 4.4% 93%
QSR 17.5x 25.5x 6.5% 5.4% 5.8% 100%
SBUX 17.4x 29.0x 7.1% 6.9% 7.5% 48%
PZZA 15.7x 36.8x 1.3% 2.8% 3.1% 88%
WEN 15.0x 30.3x 3.3% 1.9% 5.3% 95%
JACK 12.1x 19.1x 2.3% 0.9% 2.6% 94%
Average 18.0x 30.2x 5.7% 3.8% 7.4% 81.3%

25 June 2019
Chipotle Mexican Grill, Inc. (CMG) 21
Investment Risks
■ Headline risk related to food safety incidents: Chipotle headline risk is still elevated as
multiple food safety incidents have emerged over the last few years, damaging brand
perceptions which are likely still sensitive. While Chipotle has elevated its food safety
protocols since the initial food safety incident in 2015, the company has since faced
multiple and unrelated outbreaks, related to sourcing and in-store restaurant preparation
(i.e. food at unsafe temperatures, ill employees). While Chipotle has implemented robust
food safety procedures, continuous outbreaks likely have a compounding effect on
consumer perceptions and brand trust, and as a result of so many recent incidents,
Chipotle is under increased scrutiny by the market and consumers.
■ Competition: In recent years, there has been an emergence of smaller competitors
delivering on attributes that have differentiated Chipotle for many years, offering high-
quality food at reasonable prices, many of which are similarly mission-driven and
locally sourced. Given restaurant saturation, high levels of competitive activity and a
challenging consumer/retail environment, fast casual trends have been pressured in
recent years, highlighting a potentially challenging backdrop. Traditional QSRs are also
enhancing their menu and commitments, and while not perceived in the same way as
Chipotle, could be sufficient alternatives, particularly for price sensitive consumers.
■ Consumer Spending: CMG’s success in part depends on consumer confidence,
which is influenced by economic conditions and discretionary income levels. CMG’s
average restaurant sales could decline during economic downturns or periods of
uncertainty caused by higher unemployment, increased taxes, lower home prices or
other economic factors.
■ Food and Supply Costs: The prices of ingredients used in CMG products are
susceptible to increases from factors beyond CMG’s control such as weather, disease,
product recalls, government regulations and others. CMG also sources a significant
amount of its ingredients from Mexico and other countries outside the US. Increased
tariffs, taxes, political uncertainty or economic problems in these countries could
increase CMG’s food and supply costs and adversely affect its financial results.
More premium ingredients result in higher costs, increased production times and a limited
number of suppliers meeting the criteria. Food costs could increase and margins could
be adversely affected due to supplier shortage of ingredients or other events.

25 June 2019
Chipotle Mexican Grill, Inc. (CMG) 22
Financials
Figure 41: CMG Income Statement
Source: Company data, Credit Suisse estimates
Chipotle (CMG) Fiscal Yr Fiscal Yr 2018 Fiscal Yr 2019 Fiscal Yr 2020 Fiscal Yr Fiscal Yr Fiscal Yr
($ in millions) 2016 2017 1Q18 2Q18 3Q18 4Q18 2018 1Q19 2Q19E 3Q19E 4Q19E 2019E 1Q20E 2Q20E 3Q20E 4Q20E 2020E 2021E 2022E
2016 2017 Mar-18 Jun-18 Sep-18 Dec-18 2018 Mar-19 Jun-19 Sep-19 Dec-19 2019E Mar-20 Jun-20 Sep-20 Dec-20 2020E 2021E 2022E
Income Statement
Sales $3,904.4 $4,476.4 $1,148.4 $1,266.5 $1,225.0 $1,225.1 $4,865.0 $1,308.2 $1,399.6 $1,359.6 $1,368.0 $5,435.4 $1,453.2 $1,562.7 $1,516.7 $1,520.0 $6,052.6 $6,712.4 $7,411.1
YOY % -13.3% 14.7% 7.4% 8.3% 8.6% 10.4% 8.7% 13.9% 10.5% 11.0% 11.7% 11.7% 11.1% 11.7% 11.6% 11.1% 11.4% 10.9% 10.4%
Total Revenue $3,904.4 $4,476.4 $1,148.4 $1,266.5 $1,225.0 $1,225.1 $4,865.0 $1,308.2 $1,399.6 $1,359.6 $1,368.0 $5,435.4 $1,453.2 $1,562.7 $1,516.7 $1,520.0 $6,052.6 $6,712.4 $7,411.1
YOY % -13.3% 14.7% 7.4% 8.3% 8.6% 10.4% 8.7% 13.9% 10.5% 11.0% 11.7% 11.7% 11.1% 11.7% 11.6% 11.1% 11.4% 10.9% 10.4%
Food, beverage and packaging $1,365.6 $1,535.4 $371.9 $413.1 $409.2 $406.5 $1,600.8 $421.4 $462.1 $451.5 $449.9 $1,784.8 $468.1 $515.9 $503.6 $499.9 $1,987.5 $2,204.1 $2,433.6
YOY % -9.2% 12.4% 2.8% 3.5% 3.7% 7.0% 4.3% 13.3% 11.9% 10.3% 10.7% 11.5% 11.1% 11.7% 11.6% 11.1% 11.4% 10.9% 10.4%
% of Revenue 35.0% 34.3% 32.4% 32.6% 33.4% 33.2% 32.9% 32.2% 33.0% 33.2% 32.9% 32.8% 32.2% 33.0% 33.2% 32.9% 32.8% 32.8% 32.8%
Margin Chg. YOY 157bps -68bps -146bps -152bps -157bps -104bps -140bps -18bps 40bps -20bps -30bps -7bps 0bps 0bps 0bps 0bps 0bps 0bps 0bps
Labor $1,105.0 $1,206.0 $318.9 $341.8 $332.9 $332.5 $1,326.1 $348.8 $363.8 $358.6 $360.4 $1,431.5 $377.3 $395.2 $389.4 $389.8 $1,551.7 $1,680.6 $1,818.4
YOY % 5.7% 9.1% 10.8% 11.8% 8.5% 8.9% 10.0% 9.4% 6.4% 7.7% 8.4% 8.0% 8.2% 8.6% 8.6% 8.2% 8.4% 8.3% 8.2%
% of Revenue 28.3% 26.9% 27.8% 27.0% 27.2% 27.1% 27.3% 26.7% 26.0% 26.4% 26.3% 26.3% 26.0% 25.3% 25.7% 25.6% 25.6% 25.0% 24.5%
Margin Chg. YOY 507bps -136bps 83bps 84bps -3bps -37bps 32bps -110bps -100bps -80bps -80bps -92bps -70bps -70bps -70bps -70bps -70bps -60bps -50bps
Occupancy $293.6 $327.1 $85.3 $86.8 $86.7 $88.4 $347.1 $88.8 $88.9 $88.7 $89.1 $355.5 $93.5 $93.8 $93.7 $93.7 $374.7 $405.5 $436.6
YOY % 11.9% 11.4% 8.0% 8.0% 4.2% 4.4% 6.1% 4.1% 2.4% 2.4% 0.8% 2.4% 5.4% 5.5% 5.6% 5.1% 5.4% 8.2% 7.7%
% of Revenue 7.5% 7.3% 7.4% 6.9% 7.1% 7.2% 7.1% 6.8% 6.4% 6.5% 6.5% 6.5% 6.4% 6.0% 6.2% 6.2% 6.2% 6.0% 5.9%
Margin Chg. YOY 169bps -21bps 4bps -2bps -30bps -41bps -17bps -64bps -50bps -55bps -70bps -59bps -35bps -35bps -35bps -35bps -35bps -15bps -15bps
Other operating costs $642.0 $651.6 $148.1 $175.2 $167.5 $189.3 $680.0 $174.7 $192.2 $187.3 $199.1 $753.2 $198.5 $205.2 $207.4 $213.6 $824.6 $901.1 $983.8
YOY % 24.7% 1.5% -1.7% 7.0% 3.2% 8.1% 4.4% 18.0% 9.7% 11.8% 5.2% 10.8% 13.6% 6.8% 10.7% 7.3% 9.5% 9.3% 9.2%
% of Revenue 16.4% 14.6% 12.9% 13.8% 13.7% 15.5% 14.0% 13.4% 13.7% 13.8% 14.6% 13.9% 13.7% 13.1% 13.7% 14.1% 13.6% 13.4% 13.3%
Margin Chg. YOY 500bps -188bps -120bps -17bps -72bps -32bps -58bps 46bps -10bps 10bps -90bps -12bps 30bps -60bps -10bps -50bps -23bps -20bps -15bps
Total cost of sales $3,406.2 $3,720.2 $924.1 $1,016.9 $996.3 $1,016.8 $3,954.0 $1,033.7 $1,106.9 $1,086.0 $1,098.4 $4,325.1 $1,137.4 $1,210.1 $1,194.0 $1,197.0 $4,738.5 $5,191.3 $5,672.4
Restaurant Profit $498.2 $756.2 $224.3 $249.6 $228.8 $208.3 $911.0 $274.5 $292.7 $273.6 $269.5 $1,110.3 $315.8 $352.6 $322.6 $323.1 $1,314.1 $1,521.1 $1,738.7
Restaurant Margin 12.8% 16.9% 19.5% 19.7% 18.7% 17.0% 18.7% 21.0% 20.9% 20.1% 19.7% 20.4% 21.7% 22.6% 21.3% 21.3% 21.7% 22.7% 23.5%
Margin Chg. YOY -1333bps 413bps 179bps 86bps 262bps 213bps 183bps 145bps 120bps 145bps 270bps 170bps 75bps 165bps 115bps 155bps 128bps 95bps 80bps
General & administrative expenses $276.2 $266.4 $77.1 $84.7 $93.0 $88.6 $343.4 $96.8 $92.2 $92.4 $92.1 $373.4 $95.9 $97.4 $103.1 $97.0 $393.4 $416.1 $437.2
YOY % 10.4% -3.6% 11.0% 20.8% 34.5% 53.5% 28.9% 25.6% 8.9% -0.7% 3.9% 8.8% -0.9% 5.7% 11.6% 5.3% 5.3% 5.8% 5.1%
% of Revenue 7.1% 6.0% 6.7% 6.7% 7.6% 7.2% 7.1% 7.4% 6.6% 6.8% 6.7% 6.9% 6.6% 6.2% 6.8% 6.4% 6.5% 6.2% 5.9%
Margin Chg. YOY 152bps -112bps 21bps 69bps 146bps 203bps 111bps 69bps -10bps -80bps -50bps -19bps -80bps -35bps 0bps -35bps -37bps -30bps -30bps
Depreciation & amortization $146.4 $163.3 $46.9 $49.2 $46.7 $51.9 $194.7 $53.6 $53.7 $53.8 $53.9 $215.0 $58.1 $58.4 $58.5 $58.3 $233.3 $252.1 $270.9
YOY % 12.3% 11.6% 19.4% 19.7% 12.3% 25.3% 19.2% 14.3% 9.1% 15.4% 3.8% 10.4% 8.4% 8.7% 8.7% 8.3% 8.5% 8.0% 7.5%
% of Revenue 3.7% 3.6% 4.1% 3.9% 3.8% 4.2% 4.0% 4.1% 3.8% 4.0% 3.9% 4.0% 4.0% 3.7% 3.9% 3.8% 3.9% 3.8% 3.7%
Margin Chg. YOY 85bps -10bps 41bps 37bps 13bps 50bps 35bps 1bps -5bps 15bps -30bps -5bps -10bps -10bps -10bps -10bps -10bps -10bps -10bps
Pre-opening costs $17.2 $12.3 $2.6 $2.0 $2.1 $1.8 $8.5 $0.9 $1.7 $3.4 $4.0 $10.0 $2.4 $2.4 $2.4 $3.8 $11.1 $11.8 $12.4
Asset disposals $9.4 $13.3 $4.9 $3.9 $2.9 $3.7 $15.3 $5.4 $2.5 $2.5 $2.5 $12.9 $2.5 $2.5 $2.5 $2.5 $10.0 $10.0 $10.0
Total operating expenses $3,855.3 $4,175.6 $1,055.6 $1,156.6 $1,141.0 $1,162.7 $4,515.9 $1,190.5 $1,256.9 $1,238.1 $1,250.9 $4,936.5 $1,296.3 $1,370.9 $1,360.5 $1,358.6 $5,386.3 $5,881.3 $6,403.0
Operating Income $49.1 $300.8 $92.8 $109.9 $84.0 $62.3 $349.1 $117.7 $142.6 $121.5 $117.1 $498.9 $156.9 $191.8 $156.1 $161.4 $666.3 $831.1 $1,008.1
YOY % -93.6% 513.0% 26.8% 3.0% 38.1% 3.8% 16.1% 26.8% 29.8% 44.6% 87.8% 42.9% 33.3% 34.5% 28.5% 37.9% 33.5% 24.7% 21.3%
Operating Margin 1.3% 6.7% 8.1% 8.7% 6.9% 5.1% 7.2% 9.0% 10.2% 8.9% 8.6% 9.2% 10.8% 12.3% 10.3% 10.6% 11.0% 12.4% 13.6%
Margin Chg. YOY -1571bps 546bps 124bps -45bps 146bps -32bps 46bps 91bps 151bps 208bps 347bps 200bps 180bps 208bps 136bps 206bps 183bps 137bps 122bps
Interest and other income, net $4.2 $4.9 $1.4 $2.3 $2.5 $3.9 $10.1 $3.1 $3.1 $3.1 $3.1 $12.5 $2.6 $2.6 $2.6 $2.6 $10.3 $7.2 $4.9
Interest expense $0.0 $0.0 $0.0 $0.0 $0.0 $0.0 $0.0 $0.0 $0.0 $0.0 $0.0 $0.0 $0.0 $0.0 $0.0 $0.0 $0.0 $0.0 $0.0
Total other income $4.2 $4.9 $1.4 $2.3 $2.5 $3.9 $10.1 $3.1 $3.1 $3.1 $3.1 $12.5 $2.6 $2.6 $2.6 $2.6 $10.3 $7.2 $4.9
Pre-Tax Income $53.2 $305.7 $94.2 $112.2 $86.5 $66.2 $359.1 $120.8 $145.8 $124.6 $120.2 $511.4 $159.5 $194.4 $158.7 $164.0 $676.5 $838.4 $1,013.1
Pre-Tax Margin 1.4% 6.8% 8.2% 8.9% 7.1% 5.4% 7.4% 9.2% 10.4% 9.2% 8.8% 9.4% 11.0% 12.4% 10.5% 10.8% 11.2% 12.5% 13.7%
Income tax expense $21.6 $117.3 $34.8 $32.0 $25.9 $18.1 $110.8 $25.3 $40.1 $34.3 $33.1 $132.8 $43.9 $53.5 $43.6 $45.1 $186.0 $234.7 $283.7
Tax Rate 40.6% 38.4% 36.9% 28.5% 29.9% 27.4% 30.8% 21.0% 27.5% 27.5% 27.5% 26.0% 27.5% 27.5% 27.5% 27.5% 27.5% 28.0% 28.0%
Net Income $31.6 $188.5 $59.4 $80.2 $60.7 $48.1 $248.4 $95.5 $105.7 $90.4 $87.2 $378.7 $115.6 $140.9 $115.0 $118.9 $490.5 $603.6 $729.4
Net Income Margin 0.8% 4.2% 5.2% 6.3% 5.0% 3.9% 5.1% 7.3% 7.6% 6.6% 6.4% 7.0% 8.0% 9.0% 7.6% 7.8% 8.1% 9.0% 9.8%
Adj EPS $1.08 $6.60 $2.13 $2.87 $2.16 $1.72 $8.88 $3.40 $3.80 $3.26 $3.15 $13.60 $4.19 $5.13 $4.20 $4.36 $17.89 $22.42 $27.72
YOY % -92.9% 512.2% 33.0% 24.0% 62.7% 28.1% 34.6% 59.7% 32.2% 50.4% 83.1% 53.1% 23.4% 35.1% 29.1% 38.6% 31.5% 25.3% 23.6%
27.8 27.7 27.7 27.5 27.7 27.4 27.3 27.2 27.2 27.2 26.9 26.9
Weighted Average Basic Shares 29.3 28.5 27.9 27.8 27.8 27.8 27.8 27.7 27.6 27.6 27.5 27.6 27.4 27.3 27.2 27.1 27.2 26.7 26.1
YOY % -5.9% -2.6% -2.9% -2.9% -2.2% -1.4% -2.3% -0.8% -0.7% -0.9% -1.0% -0.8% -1.2% -1.3% -1.4% -1.5% -1.4% -1.8% -2.3%
Weighted Average Diluted Shares 29.4 28.6 28.0 27.9 28.0 27.9 28.0 28.1 27.8 27.8 27.7 27.8 27.6 27.5 27.4 27.3 27.4 26.9 26.3
YOY % -6.8% -2.7% -3.1% -3.0% -1.5% -0.8% -2.1% 0.6% -0.4% -0.9% -0.9% -0.4% -1.9% -1.3% -1.4% -1.5% -1.5% -1.8% -2.2%
Cash Dividends per Share $0.00 $0.00 $0.00 $0.00 $0.00 $0.00 $0.00 $0.00 $0.00 $0.00 $0.00 $0.00 $0.00 $0.00 $0.00 $0.00 $0.00 $0.00 $0.00
YOY % #DIV/0!
Payout Ratio 0.0% 0.0% 0.0% 0.0% 0.0% 0.0% 0.0% 0.0% 0.0% 0.0% 0.0% 0.0% 0.0% 0.0% 0.0% 0.0% 0.0% 0.0% 0.0%
EBITDA
Operating Income $49.1 $300.8 $92.8 $109.9 $84.0 $62.3 $349.1 $117.7 $142.6 $121.5 $117.1 $498.9 $156.9 $191.8 $156.1 $161.4 $666.3 $831.1 $1,008.1
Depreciation $146.4 $163.3 $46.9 $49.2 $46.7 $51.9 $194.7 $53.6 $53.7 $53.8 $53.9 $215.0 $58.1 $58.4 $58.5 $58.3 $233.3 $252.1 $270.9
EBITDA $195.4 $464.1 $139.7 $159.1 $130.7 $114.2 $543.8 $171.3 $196.3 $175.4 $170.9 $713.9 $215.0 $250.2 $214.7 $219.8 $899.6 $1,083.2 $1,279.0
YOY % -78.1% 137.5% 24.3% 7.6% 27.6% 12.6% 17.2% 22.6% 23.4% 34.2% 49.6% 31.3% 25.5% 27.4% 22.4% 28.6% 26.0% 20.4% 18.1%
EBITDA Margin 5.0% 10.4% 12.2% 12.6% 10.7% 9.3% 11.2% 13.1% 14.0% 12.9% 12.5% 13.1% 14.8% 16.0% 14.2% 14.5% 14.9% 16.1% 17.3%
Margin Chg. YOY -1485bps 536bps 165bps -8bps 159bps 19bps 81bps 93bps 146bps 223bps 317bps 196bps 170bps 198bps 126bps 196bps 173bps 127bps 112bps

25 June 2019
Chipotle Mexican Grill, Inc. (CMG) 23
Figure 42: CMG Balance Sheet
Source: Company data, Credit Suisse estimates
Chipotle (CMG) Fiscal Yr Fiscal Yr 2018 Fiscal Yr 2019 Fiscal Yr 2020 Fiscal Yr Fiscal Yr Fiscal Yr
($ in millions) 2016 2017 1Q18 2Q18 3Q18 4Q18 2018 1Q19 2Q19E 3Q19E 4Q19E 2019E 1Q20E 2Q20E 3Q20E 4Q20E 2020E 2021E 2022E
2016 2017 Mar-18 Jun-18 Sep-18 Dec-18 2018 Mar-19 Jun-19 Sep-19 Dec-19 2019E Mar-20 Jun-20 Sep-20 Dec-20 2020E 2021E 2022E
Balance Sheet
Cash and cash equivalents $87.9 $184.6 $231.8 $225.7 $343.0 $250.0 $250.0 $277.7 $333.7 $374.4 $412.0 $412.0 $452.1 $518.7 $570.8 $632.0 $632.0 $888.8 $1,195.5
Accounts and notes receivable, net $40.5 $40.5 $26.7 $23.7 $26.9 $62.3 $62.3 $49.7 $27.9 $28.2 $49.8 $49.8 $41.1 $31.1 $31.4 $55.5 $55.5 $61.5 $67.9
Inventory $15.0 $19.9 $17.4 $20.9 $18.3 $21.6 $21.6 $18.8 $21.8 $22.1 $23.1 $23.1 $21.2 $24.2 $24.6 $25.7 $25.7 $28.5 $31.5
Prepaid expenses and other current assets $44.1 $50.9 $55.7 $69.9 $55.4 $54.1 $54.1 $34.2 $34.2 $34.2 $34.2 $34.2 $34.2 $34.2 $34.2 $34.2 $34.2 $34.2 $34.2
Current deferred tax assets $0.0 $0.0 $0.0 $0.0 $0.0 $0.0 $0.0 $0.0 $0.0 $0.0 $0.0 $0.0 $0.0 $0.0 $0.0 $0.0 $0.0 $0.0 $0.0
Income tax receivable $5.1 $9.4 $0.0 $32.3 $21.7 $0.0 $0.0 $0.0 $0.0 $0.0 $0.0 $0.0 $0.0 $0.0 $0.0 $0.0 $0.0 $0.0 $0.0
Investments $329.8 $324.4 $298.8 $348.3 $327.8 $426.8 $426.8 $457.4 $457.4 $457.4 $457.4 $457.4 $457.4 $457.4 $457.4 $457.4 $457.4 $457.4 $457.4
Total Current Assets $522.4 $629.5 $630.4 $720.7 $793.1 $814.8 $814.8 $837.7 $875.0 $916.3 $976.5 $976.5 $1,006.0 $1,065.6 $1,118.3 $1,204.7 $1,204.7 $1,470.4 $1,786.5
Leasehold improvements, property and equipment, net$1,303.6 $1,338.4 $1,343.7 $1,333.9 $1,361.4 $1,379.3 $1,379.3 $1,366.7 $1,388.0 $1,414.2 $1,445.3 $1,445.3 $1,462.2 $1,478.9 $1,495.3 $1,512.0 $1,512.0 $1,559.9 $1,589.1
Restricted Cash $0.0 $29.6 $29.5 $29.6 $24.8 $30.2 $30.2 $28.4 $28.4 $28.4 $28.4 $28.4 $28.4 $28.4 $28.4 $28.4 $28.4 $28.4 $28.4
Long-term investments $125.1 $0.0 $49.4 $0.0 $0.0 $0.0 $0.0 $0.0 $0.0 $0.0 $0.0 $0.0 $0.0 $0.0 $0.0 $0.0 $0.0 $0.0 $0.0
Other assets $53.2 $26.3 $22.5 $22.5 $29.6 $19.3 $19.3 $20.7 $20.7 $20.7 $20.7 $20.7 $20.7 $20.7 $20.7 $20.7 $20.7 $20.7 $20.7
Right of use assets $0.0 $0.0 $2,350.0 $2,350.0 $2,350.0 $2,350.0 $2,350.0 $2,350.0 $2,350.0 $2,350.0 $2,350.0 $2,350.0 $2,350.0 $2,350.0
Goodwill $21.9 $21.9 $21.9 $21.9 $21.9 $21.9 $21.9 $21.9 $21.9 $21.9 $21.9 $21.9 $21.9 $21.9 $21.9 $21.9 $21.9 $21.9 $21.9
Total Assets $2,026.1 $2,045.7 $2,097.4 $2,128.6 $2,230.9 $2,265.5 $2,265.5 $4,625.5 $4,684.1 $4,751.5 $4,842.9 $4,842.9 $4,889.2 $4,965.5 $5,034.7 $5,137.8 $5,137.8 $5,451.4 $5,796.6
Accounts payable $78.4 $82.0 $99.0 $95.6 $103.5 $113.1 $113.1 $106.2 $96.2 $105.2 $108.8 $108.8 $113.9 $106.7 $117.0 $121.1 $121.1 $134.3 $148.3
Accrued payroll and benefits $76.3 $82.5 $110.3 $97.6 $127.3 $113.5 $113.5 $119.7 $119.7 $119.7 $119.7 $119.7 $119.7 $119.7 $119.7 $119.7 $119.7 $119.7 $119.7
Accrued liabilities $127.1 $95.7 $101.0 $116.9 $128.9 $147.8 $147.8 $119.8 $119.8 $119.8 $119.8 $119.8 $119.8 $119.8 $119.8 $119.8 $119.8 $119.8 $119.8
Unearned revenue $0.0 $63.6 $48.4 $45.1 $43.1 $70.5 $70.5 $57.1 $50.0 $48.1 $78.7 $78.7 $59.2 $55.7 $53.6 $87.7 $87.7 $97.2 $107.4
Income tax payable $0.0 $0.0 $8.6 $0.0 $0.0 $5.1 $5.1 $21.2 $21.2 $21.2 $21.2 $21.2 $21.2 $21.2 $21.2 $21.2 $21.2 $21.2 $21.2
Current operating lease liabilities $0.0 $0.0 $157.7 $157.7 $157.7 $157.7 $157.7 $157.7 $157.7 $157.7 $157.7 $157.7 $157.7 $157.7
Other $0.0 $0.0 $0.0 $0.0 $0.0 $0.0 $0.0 $0.0 $0.0 $0.0 $0.0 $0.0 $0.0 $0.0 $0.0 $0.0 $0.0 $0.0 $0.0
Total Current Liabilities $281.8 $323.9 $367.3 $355.2 $402.8 $450.0 $450.0 $581.7 $564.6 $571.6 $605.9 $605.9 $591.5 $580.8 $589.0 $627.2 $627.2 $649.9 $674.0
Deferred rent $288.9 $316.5 $321.9 $327.2 $327.8 $331.0 $331.0 $0.0 $0.0 $0.0 $0.0 $0.0 $0.0 $0.0 $0.0 $0.0 $0.0 $0.0 $0.0
Deferred landlord financing $0.0 $0.0 $0.0 $0.0 $0.0 $0.0 $0.0 $0.0 $0.0 $0.0 $0.0 $0.0 $0.0 $0.0 $0.0 $0.0 $0.0 $0.0 $0.0
Deferred income tax liabliity $18.9 $0.8 $6.5 $17.8 $27.3 $11.6 $11.6 $12.5 $12.5 $12.5 $12.5 $12.5 $12.5 $12.5 $12.5 $12.5 $12.5 $12.5 $12.5
Long-term operating lease liabilities $0.0 $0.0 $2,513.9 $2,513.9 $2,513.9 $2,513.9 $2,513.9 $2,513.9 $2,513.9 $2,513.9 $2,513.9 $2,513.9 $2,513.9 $2,513.9
Other liabilities $33.9 $40.0 $37.6 $36.5 $37.1 $31.6 $31.6 $33.6 $33.6 $33.6 $33.6 $33.6 $33.6 $33.6 $33.6 $33.6 $33.6 $33.6 $33.6
Total Liabilities $623.6 $681.2 $733.4 $736.6 $795.0 $824.2 $824.2 $3,141.7 $3,124.6 $3,131.6 $3,165.9 $3,165.9 $3,151.5 $3,140.8 $3,149.0 $3,187.2 $3,187.2 $3,209.9 $3,234.0
Preferred stock $0.0 $0.0 $0.0 $0.0 $0.0 $0.0 $0.0 $0.0 $0.0 $0.0 $0.0 $0.0 $0.0 $0.0 $0.0 $0.0 $0.0 $0.0 $0.0
Common Stock $0.4 $0.4 $0.4 $0.4 $0.4 $0.4 $0.4 $0.4 $0.4 $0.4 $0.4 $0.4 $0.4 $0.4 $0.4 $0.4 $0.4 $0.4 $0.4
Additional Paid in Capital $1,238.9 $1,305.1 $1,317.2 $1,328.5 $1,353.1 $1,374.2 $1,374.2 $1,393.3 $1,393.3 $1,393.3 $1,393.3 $1,393.3 $1,393.3 $1,393.3 $1,393.3 $1,393.3 $1,393.3 $1,393.3 $1,393.3
Treasury stock, at cost ($2,049.4) ($2,334.4) ($2,406.4) ($2,435.1) ($2,454.3) ($2,500.6) ($2,500.6) ($2,563.4) ($2,613.4) ($2,663.4) ($2,713.4) ($2,713.4) ($2,788.4) ($2,863.4) ($2,938.4) ($3,013.4) ($3,013.4) ($3,413.4) ($3,913.4)
Accumulated other comprehensive income/loss & NCI($8.2) ($3.7) ($3.6) ($5.1) ($4.9) ($6.2) ($6.2) ($5.9) ($5.9) ($5.9) ($5.9) ($5.9) ($5.9) ($5.9) ($5.9) ($5.9) ($5.9) ($5.9) ($5.9)
Retained earnings $2,220.8 $2,397.1 $2,456.5 $2,503.4 $2,541.6 $2,573.6 $2,573.6 $2,659.4 $2,785.1 $2,895.5 $3,002.6 $3,002.6 $3,138.3 $3,300.3 $3,436.3 $3,576.2 $3,576.2 $4,267.1 $5,088.1
Tax Receivable $0.0 $0.0 $0.4 $0.0 $0.0 $0.0 $0.0 $0.0 $0.0 $0.0 $0.0 $0.0 $0.0 $0.0 $0.0 $0.0 $0.0 $0.0 $0.0
Shareholders' Equity $1,402.5 $1,364.4 $1,364.0 $1,392.0 $1,435.8 $1,441.3 $1,441.3 $1,483.8 $1,559.5 $1,619.8 $1,677.0 $1,677.0 $1,737.7 $1,824.7 $1,885.7 $1,950.6 $1,950.6 $2,241.5 $2,562.5
Total Liabilities & Shareholders' Equity $2,026.1 $2,045.7 $2,097.4 $2,128.6 $2,230.9 $2,265.5 $2,265.5 $4,625.5 $4,684.1 $4,751.5 $4,842.9 $4,842.9 $4,889.2 $4,965.5 $5,034.7 $5,137.8 $5,137.8 $5,451.4 $5,796.6
check - - - - - - - - - - - - - - - - - - -
Balance Sheet Analysis 2016 2017 1Q18 2Q18 3Q18 4Q18 2018 1Q19 2Q19E 3Q19E 4Q19E 2019E 1Q20E 2Q20E 3Q20E 4Q20E 2020E 2021E 2022E
Debt Analysis
Total Debt $0.0 $0.0 $0.0 $0.0 $0.0 $0.0 $0.0 $0.0 $0.0 $0.0 $0.0 $0.0 $0.0 $0.0 $0.0 $0.0 $0.0 $0.0 $0.0
Less: Cash and cash equivalents $87.9 $184.6 $231.8 $225.7 $343.0 $250.0 $250.0 $277.7 $333.7 $374.4 $412.0 $412.0 $452.1 $518.7 $570.8 $632.0 $632.0 $888.8 $1,195.5
Net Debt ($87.9) ($184.6) ($231.8) ($225.7) ($343.0) ($250.0) ($250.0) ($277.7) ($333.7) ($374.4) ($412.0) ($412.0) ($452.1) ($518.7) ($570.8) ($632.0) ($632.0) ($888.8) ($1,195.5)
Average Debt $0.0 $0.0 $0.0 $0.0 $0.0 $0.0 $0.0 $0.0 $0.0 $0.0 $0.0 $0.0 $0.0 $0.0 $0.0 $0.0 $0.0 $0.0 $0.0
Average Net Debt ($167.9) ($136.2) ($208.2) ($228.7) ($284.3) ($296.5) ($217.3) ($263.8) ($305.7) ($354.1) ($393.2) ($331.0) ($432.1) ($485.4) ($544.7) ($601.4) ($522.0) ($760.4) ($1,042.1)
TTM EBITDA $195.4 $464.1 $491.4 $502.7 $531.0 $543.8 $543.8 $575.3 $612.6 $657.2 $713.9 $713.9 $757.6 $811.5 $850.8 $899.6 $899.6 $1,083.2 $1,279.0
NTM EBITDA $464.1 $543.8 $575.3 $612.6 $657.2 $713.9 $713.9 $757.6 $811.5 $850.8 $899.6 $899.6 $942.2 $989.8 $1,039.4 $1,083.2 $1,083.2 $1,279.0 $1,475.0
Total Debt/TTM EBITDA 0.0x 0.0x 0.0x 0.0x 0.0x 0.0x 0.0x 0.0x 0.0x 0.0x 0.0x 0.0x 0.0x 0.0x 0.0x 0.0x 0.0x 0.0x 0.0x
Net Debt/TTM EBITDA -0.4x -0.4x -0.5x -0.4x -0.6x -0.5x -0.5x -0.5x -0.5x -0.6x -0.6x -0.6x -0.6x -0.6x -0.7x -0.7x -0.7x -0.8x -0.9x

25 June 2019
Chipotle Mexican Grill, Inc. (CMG) 24
Figure 43: CMG Statement of Cash Flows
Source: Company data, Credit Suisse estimates
Chipotle (CMG) Fiscal Yr Fiscal Yr 2018 Fiscal Yr 2019 Fiscal Yr 2020 Fiscal Yr Fiscal Yr Fiscal Yr
($ in millions) 2016 2017 1Q18 2Q18 3Q18 4Q18 2018 1Q19 2Q19E 3Q19E 4Q19E 2019E 1Q20E 2Q20E 3Q20E 4Q20E 2020E 2021E 2022E
2016 2017 Mar-18 Jun-18 Sep-18 Dec-18 2018 Mar-19 Jun-19 Sep-19 Dec-19 2019E Mar-20 Jun-20 Sep-20 Dec-20 2020E 2021E 2022E
Cash Flow Statement
Operating Cash Flows
Net income $22.9 $176.3 $59.4 $46.9 $38.2 $32.0 $176.6 $88.1 $105.7 $90.4 $87.2 $371.3 $115.6 $140.9 $115.0 $118.9 $490.5 $603.6 $729.4
Depreciation and amortization $146.4 $163.3 $46.9 $49.2 $52.7 $53.2 $202.0 $53.8 $53.7 $53.8 $53.9 $215.1 $58.1 $58.4 $58.5 $58.3 $233.3 $252.1 $270.9
Amortization of operating lease assets $0.0 $0.0 $38.1 $0.0 $0.0 $0.0 $38.1 $0.0 $0.0 $0.0 $0.0 $0.0 $0.0 $0.0
Deferred income tax (benefit) provision ($14.2) ($18.0) $5.7 $11.3 $9.5 ($15.8) $10.6 $1.8 $0.0 $0.0 $0.0 $1.8 $0.0 $0.0 $0.0 $0.0 $0.0 $0.0 $0.0
Loss on disposal and impairment of assets $23.9 $13.3 $4.9 $45.3 $6.5 $5.4 $62.0 $4.1 $0.0 $0.0 $0.0 $4.1 $0.0 $0.0 $0.0 $0.0 $0.0 $0.0 $0.0
Bad debt allowance ($0.3) $0.2 $0.0 $0.1 $0.0 $0.0 $0.1 $0.2 $0.0 $0.0 $0.0 $0.2 $0.0 $0.0 $0.0 $0.0 $0.0 $0.0 $0.0
Stock-based compensation expense $64.2 $65.3 $12.1 $11.5 $24.6 $20.9 $69.2 $19.2 $20.0 $20.0 $20.0 $79.2 $20.1 $21.0 $21.0 $21.0 $83.1 $87.3 $91.6
Other ($1.9) ($0.2) ($0.3) ($0.9) ($0.7) ($1.0) ($2.9) ($1.3) $0.0 $0.0 $0.0 ($1.3) $0.0 $0.0 $0.0 $0.0 $0.0 $0.0 $0.0
Changes in working capital:
Accounts receivable ($1.9) ($0.1) $13.8 $2.9 ($3.2) ($21.7) ($8.3) $15.9 $21.8 ($0.2) ($21.6) $15.9 $8.7 $10.0 ($0.3) ($24.1) ($5.7) ($6.0) ($6.4)
Inventory ($0.1) ($5.3) $2.5 ($3.5) $2.6 ($3.3) ($1.7) $2.8 ($3.0) ($0.3) ($1.0) ($1.5) $1.9 ($3.0) ($0.4) ($1.1) ($2.6) ($2.8) ($3.0)
Prepaid expenses and other current assets ($4.3) ($6.7) ($4.8) ($14.7) $14.4 $1.2 ($3.8) ($3.7) $0.0 $0.0 $0.0 ($3.7) $0.0 $0.0 $0.0 $0.0 $0.0 $0.0 $0.0
Other assets ($4.9) ($2.6) $3.9 ($0.1) ($2.3) ($3.5) ($2.0) $0.2 $0.0 $0.0 $0.0 $0.2 $0.0 $0.0 $0.0 $0.0 $0.0 $0.0 $0.0
Accounts payable ($6.7) $10.9 $17.2 ($2.8) $3.7 $13.9 $32.1 ($4.3) ($10.0) $9.0 $3.6 ($1.7) $5.1 ($7.1) $10.3 $4.1 $12.4 $13.2 $14.0
Accrued liabilities $33.5 $38.6 $18.8 ($14.8) $34.1 $13.1 $51.2 $1.1 $0.0 $0.0 $0.0 $1.1 $0.0 $0.0 $0.0 $0.0 $0.0 $0.0 $0.0
Unearned Revenue ($13.4) ($7.1) ($2.0) $30.7 $8.3 ($19.5) ($3.5) ($2.1) $34.1 $8.9 $9.6 $10.1
Income tax payable/receivable $54.3 ($4.2) $18.0 ($41.0) $10.6 $26.8 $14.4 $16.1 $0.0 $0.0 $0.0 $16.1 $0.0 $0.0 $0.0 $0.0 $0.0 $0.0 $0.0
Deferred rent $37.0 $30.0 $5.4 $6.0 $5.6 $4.2 $21.3 $0.0 $0.0 $0.0 $0.0 $0.0 $0.0 $0.0 $0.0 $0.0 $0.0 $0.0 $0.0
Operating lease liabilities $0.0 $0.0 ($36.5) $0.0 $0.0 $0.0 ($36.5) $0.0 $0.0 $0.0 $0.0 $0.0 $0.0 $0.0
Other long-term liabilities $1.3 $6.3 ($2.3) ($1.1) $0.7 $3.6 $0.9 $0.4 $0.0 $0.0 $0.0 $0.4 $0.0 $0.0 $0.0 $0.0 $0.0 $0.0 $0.0
Net Operating Cash Flows $349.2 $467.1 $201.1 $94.3 $197.1 $129.1 $621.6 $182.6 $181.1 $170.7 $172.6 $706.9 $190.1 $216.6 $202.1 $211.2 $820.0 $956.8 $1,106.6
Year-to-date $201.1 $295.4 $492.5 $621.6 $182.6 $363.6 $534.3 $706.9 $190.1 $406.7 $608.8 $820.0
Investing Cash Flows
Purchases of leasehold improvements, property and equipment ($258.8) ($216.8) ($57.5) ($71.0) ($81.5) ($77.4) ($287.4) ($64.2) ($75.0) ($80.0) ($85.0) ($304.2) ($75.0) ($75.0) ($75.0) ($75.0) ($300.0) ($300.0) ($300.0)
Purchases of investments $0.0 ($199.8) ($168.7) ($39.5) ($88.9) ($188.0) ($485.2) ($89.1) $0.0 $0.0 $0.0 ($89.1) $0.0 $0.0 $0.0 $0.0 $0.0 $0.0 $0.0
Maturities of investments $585.6 $330.0 $145.0 $40.0 $110.0 $90.0 $385.0 $60.0 $0.0 $0.0 $0.0 $60.0 $0.0 $0.0 $0.0 $0.0 $0.0 $0.0 $0.0
Other, net $0.0 $0.0 $0.0 $0.0 $0.0 $0.0 $0.0 $0.0 $0.0 $0.0 $0.0 $0.0 $0.0 $0.0 $0.0 $0.0 $0.0 $0.0 $0.0
Net Investing Cash Flows $326.8 ($86.6) ($81.3) ($70.5) ($60.4) ($175.4) ($387.6) ($93.3) ($75.0) ($80.0) ($85.0) ($333.3) ($75.0) ($75.0) ($75.0) ($75.0) ($300.0) ($300.0) ($300.0)
Year-to-date ($81.3) ($151.8) ($212.2) ($387.6) ($93.3) ($168.3) ($248.3) ($333.3) ($75.0) ($150.0) ($225.0) ($300.0)
Financing Cash Flows
Acquisition of treasury stock ($837.7) ($285.9) ($72.6) ($29.2) ($14.6) ($44.5) ($160.9) ($52.9) ($50.0) ($50.0) ($50.0) ($202.9) ($75.0) ($75.0) ($75.0) ($75.0) ($300.0) ($400.0) ($500.0)
Stock plan transactions and other financing activities $0.1 $0.0 ($0.0) ($0.0) ($4.6) ($0.8) ($5.4) ($10.4) $0.0 $0.0 $0.0 ($10.4) $0.0 $0.0 $0.0 $0.0 $0.0 $0.0 $0.0
Excess tax benefits of stock-based compensation $1.3 $0.0 $0.0 $0.0 ($0.2) ($0.0) ($0.2) ($0.3) $0.0 $0.0 $0.0 ($0.3) $0.0 $0.0 $0.0 $0.0 $0.0 $0.0 $0.0
Net Financing Cash Flows ($836.3) ($285.9) ($72.6) ($29.2) ($19.3) ($45.4) ($166.5) ($63.5) ($50.0) ($50.0) ($50.0) ($213.5) ($75.0) ($75.0) ($75.0) ($75.0) ($300.0) ($400.0) ($500.0)
Effect of exchange rates $0.1 $2.1 ($0.0) ($0.7) $0.0 ($0.8) ($1.5) $0.2 $0.0 $0.0 $0.0 $0.2 $0.0 $0.0 $0.0 $0.0 $0.0 $0.0 $0.0
Year-to-date ($72.6) ($101.9) ($121.2) ($166.5) ($63.5) ($113.5) ($163.5) ($213.5) ($75.0) ($150.0) ($225.0) ($300.0)
Change in cash and equivalents incl restricted cash ($160.1) $96.7 $47.2 ($6.1) $117.4 ($92.5) $66.0 $25.9 $56.1 $40.7 $37.6 $160.3 $40.1 $66.6 $52.1 $61.2 $220.0 $256.8 $306.6
Cash at beginning of period $248.0 $87.9 $184.6 $231.8 $225.7 $343.0 $184.6 $250.0 $277.7 $333.7 $374.4 $250.0 $412.0 $452.1 $518.7 $570.8 $412.0 $632.0 $888.8
Less: change in restricted cash ($0.1) $0.1 $0.0 $0.6 $0.6 ($1.8) $0.0 $0.0 $0.0 ($1.8) $0.0 $0.0 $0.0 $0.0 $0.0 $0.0 $0.0
Cash at end of period $87.9 $184.6 $231.8 $225.7 $343.0 $250.0 $250.0 $277.7 $333.7 $374.4 $412.0 $412.0 $452.1 $518.7 $570.8 $632.0 $632.0 $888.8 $1,195.5
Restricted cash $28.5 $29.6 $29.5 $29.6 $29.6 $30.2 $30.2 $28.4 $28.4 $28.4 $28.4 $28.4 $28.4 $28.4 $28.4 $28.4 $28.4 $28.4 $28.4
Change in restricted cash $5.9 $1.1 ($0.1) $0.1 $0.0 $0.6 $0.6 ($1.8) $0.0 $0.0 $0.0 ($1.8) $0.0 $0.0 $0.0 $0.0 $0.0 $0.0 $0.0
Change in cash and cash equivalents excl restricted cash ($166.0) $95.6 $47.3 ($6.2) $117.4 ($93.1) $65.4 $27.7 $56.1 $40.7 $37.6 $162.1 $40.1 $66.6 $52.1 $61.2 $220.0 $256.8 $306.6
Cash on Balance Sheet $87.9 $184.6 $231.8 $225.7 $343.0 $250.0 $250.0 $277.7 $333.7 $374.4 $412.0 $412.0 $452.1 $518.7 $570.8 $632.0 $632.0 $888.8 $1,195.5
Difference (0) - (0) (0) - (0) - - - - - - - - - - - - -
Free Cash Flow 2016 2017 1Q18 2Q18 3Q18 4Q18 2018 1Q19 2Q19E 3Q19E 4Q19E 2019E 1Q20E 2Q20E 3Q20E 4Q20E 2020E 2021E 2022E
Operating Cash Flow $349.2 $467.1 $201.1 $94.3 $197.1 $129.1 $621.6 $182.6 $181.1 $170.7 $172.6 $706.9 $190.1 $216.6 $202.1 $211.2 $820.0 $956.8 $1,106.6
Less: Capex ($258.8) ($216.8) ($57.5) ($71.0) ($81.5) ($77.4) ($287.4) ($64.2) ($75.0) ($80.0) ($85.0) ($304.2) ($75.0) ($75.0) ($75.0) ($75.0) ($300.0) ($300.0) ($300.0)
Free Cash Flow $90.4 $250.3 $143.6 $23.3 $115.6 $51.7 $334.2 $118.4 $106.1 $90.7 $87.6 $402.7 $115.1 $141.6 $127.1 $136.2 $520.0 $656.8 $806.6
FCF/Share $3.1 $8.8 $5.1 $0.8 $4.1 $1.8 $12.0 $4.2 $3.8 $3.3 $3.2 $14.5 $4.2 $5.2 $4.6 $5.0 $19.0 $24.4 $30.7

25 June 2019
Chipotle Mexican Grill, Inc. (CMG) 25
Credit Suisse HOLT® Analysis
CMG's current price implies expectations of 7.3% sales growth. CMG’s valuation is more
sensitive to top-line growth, with every 100bps adding ~$126 per share, and every 100bps
of EBITDA margin adding ~$62 per share.
Figure 44: HOLT Market Implied Scenario
Source: Credit Suisse HOLT®
-200 bps -100 bps 0 bps +100 bps +200 bps
Assumptions and Methodology-
-
-
-
HO
LT m
ark
et
imp
lie
d s
ce
nari
o
CHIPOTLE MEXICAN GRILL INC (CMG)
Illustrative "What's Priced In" AssumptionsValuation Sensitivity Analysis
at Current Share Price of $741
Long-Term Sales growth
5.3% 6.3% 7.3% 8.3% 9.3%
Lo
ng
-Te
rm E
BIT
DA
Marg
in
-200 bps $881
-100 bps 12.9% $501 $582 $681 $808 $965
11.9% $456 $530 $620 $737
$1,049
+100 bps 14.9% $590 $686 $802 $951 $1,133
0 bps 13.9% $546 $634 $741 $880
EBITDA margins: 2019-2029 based on CS Research, then assumed
constant
+200 bps 15.9% $635 $738 $862 $1,021 $1,217
> 10%
downside
Within
10%
> 10%
upside
CMG's valuat ion is more sensit ive to top line growth with every
100bps increment adding ~$126 per share vs. ~$62 per share
added for 100bps incremental margins
Source: Credit Suisse HOLT®. CFROI and HOLT are trademarks or registered trademarks of Credit Suisse Group AG or its affiliates in the United States and other countries.
Sales growth: 2019-2025 based on CS Research; then solved for the
sales CAGR required to get to the current price
We have used expicit forecast period of 15 years since we believe
that the company would be able to sustain margings and growth over
that period.After the 15-year explicit forecast, the HOLT methodology
calculates the terminal value by fading returns on capital and growth
towards cost of capital and GDP growth respectively
For this analysis, we have made two adjustments consistently across
our coverage: first, we are using the US Country discount rate
(3.83%) for all companies and second, we have adjusted the final fade
rate from 10% to 5% to account for the sector's longer sustainability
of returns on capital
13.6 13.9 14.8
0
5
10
15
20
25
2012 2014 2016 2018 2020 2022 2024 2026 2028 2030 2032
Historical margins Forecast Historical median
EBITDA Margin (%)
2019-2029 based on CS Research, then assumed constant
CS Research
11.7 8.6 7.3
(15)
(10)
(5)
0
5
10
15
20
25
30
2012 2014 2016 2018 2020 2022 2024 2026 2028 2030 2032
Historical sales growth Market implied Historical median
Sales Growth (%)
2019-2025 based on CS Research, then solved long term sales growth
required to get to current price
10.0
12.1 12.8
0
2
4
6
8
10
12
14
16
2012 2014 2016 2018 2020 2022 2024 2026 2028 2030 2032
Historical CFROI Forecast CFROI Discount rate Historical median
CFROI (%)
6.0
3.4
6.4
(5)
0
5
10
15
20
2012 2014 2016 2018 2020 2022 2024 2026 2028 2030 2032
Historical asset growth rate Forecast asset growth
Asset Growth (%)
0.8
1.0 0.6
0.0
0.2
0.4
0.6
0.8
1.0
1.2
2012 2014 2016 2018 2020 2022 2024 2026 2028 2030 2032
Historical asset turns Forecast Historical median
Asset Turns (x): Sales/ Invested Capital
CS Research
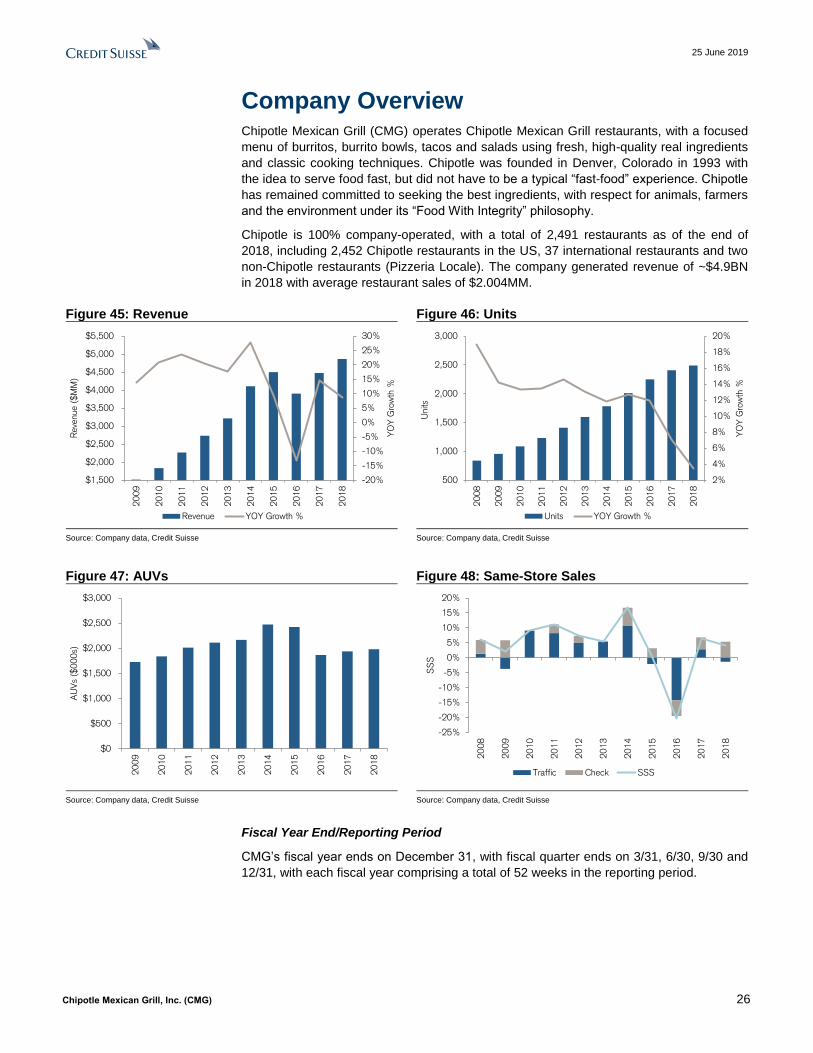
25 June 2019
Chipotle Mexican Grill, Inc. (CMG) 26
Company Overview Chipotle Mexican Grill (CMG) operates Chipotle Mexican Grill restaurants, with a focused
menu of burritos, burrito bowls, tacos and salads using fresh, high-quality real ingredients
and classic cooking techniques. Chipotle was founded in Denver, Colorado in 1993 with
the idea to serve food fast, but did not have to be a typical “fast-food” experience. Chipotle
has remained committed to seeking the best ingredients, with respect for animals, farmers
and the environment under its “Food With Integrity” philosophy.
Chipotle is 100% company-operated, with a total of 2,491 restaurants as of the end of
2018, including 2,452 Chipotle restaurants in the US, 37 international restaurants and two
non-Chipotle restaurants (Pizzeria Locale). The company generated revenue of ~$4.9BN
in 2018 with average restaurant sales of $2.004MM.
Figure 45: Revenue Figure 46: Units
Source: Company data, Credit Suisse Source: Company data, Credit Suisse
Figure 47: AUVs Figure 48: Same-Store Sales
Source: Company data, Credit Suisse Source: Company data, Credit Suisse
Fiscal Year End/Reporting Period
CMG’s fiscal year ends on December 31, with fiscal quarter ends on 3/31, 6/30, 9/30 and
12/31, with each fiscal year comprising a total of 52 weeks in the reporting period.
-20%
-15%
-10%
-5%
0%
5%
10%
15%
20%
25%
30%
$1,500
$2,000
$2,500
$3,000
$3,500
$4,000
$4,500
$5,000
$5,500
20
09
20
10
20
11
20
12
20
13
20
14
20
15
20
16
20
17
20
18
YO
Y G
row
th %
Reve
nue (
$M
M)
Revenue YOY Growth %
2%
4%
6%
8%
10%
12%
14%
16%
18%
20%
500
1,000
1,500
2,000
2,500
3,000
20
08
20
09
20
10
20
11
20
12
20
13
20
14
20
15
20
16
20
17
20
18
YO
Y G
row
th %
Units
Units YOY Growth %
$0
$500
$1,000
$1,500
$2,000
$2,500
$3,000
20
09
20
10
20
11
20
12
20
13
20
14
20
15
20
16
20
17
20
18
AU
Vs
($0
00
s)
-25%
-20%
-15%
-10%
-5%
0%
5%
10%
15%
20%
20
08
20
09
20
10
20
11
20
12
20
13
20
14
20
15
20
16
20
17
20
18
SS
S
Traffic Check SSS
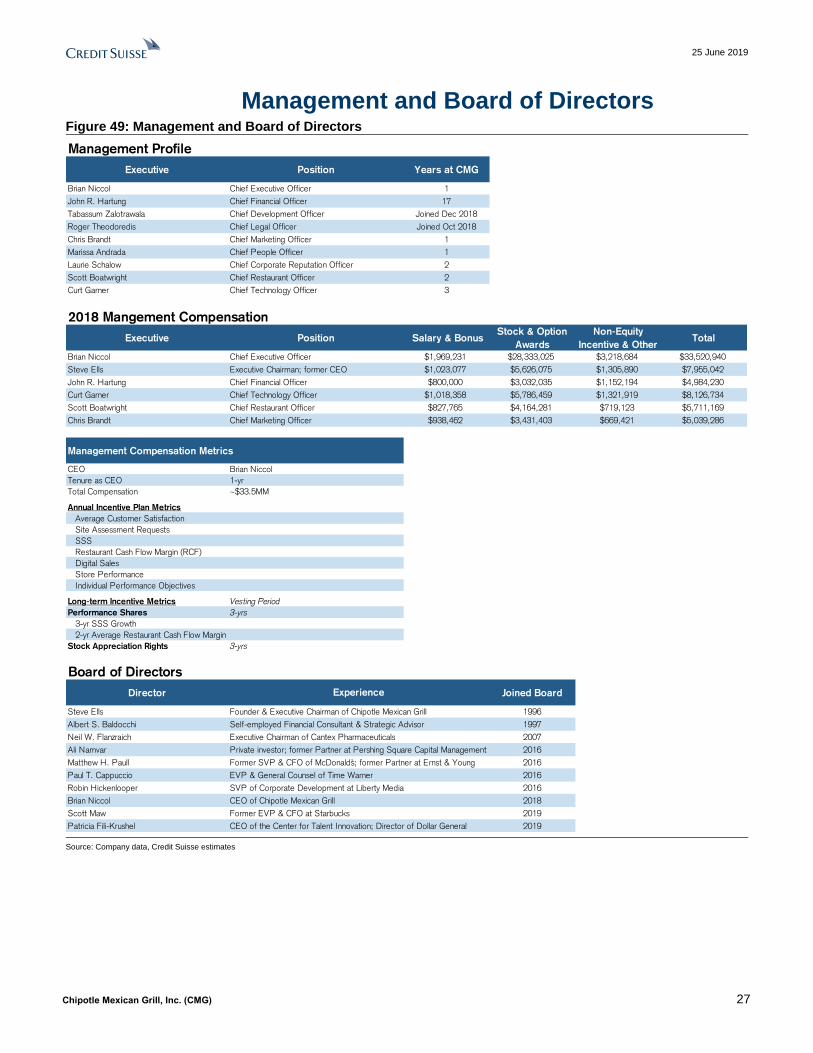
25 June 2019
Chipotle Mexican Grill, Inc. (CMG) 27
Management and Board of Directors Figure 49: Management and Board of Directors
Source: Company data, Credit Suisse estimates
Management Profile
Executive Position Years at CMG
Brian Niccol Chief Executive Officer 1
John R. Hartung Chief Financial Officer 17
Tabassum Zalotrawala Chief Development Officer Joined Dec 2018
Roger Theodoredis Chief Legal Officer Joined Oct 2018
Chris Brandt Chief Marketing Officer 1
Marissa Andrada Chief People Officer 1
Laurie Schalow Chief Corporate Reputation Officer 2
Scott Boatwright Chief Restaurant Officer 2
Curt Garner Chief Technology Officer 3
2018 Mangement Compensation
Executive Position Salary & BonusStock & Option
Awards
Non-Equity
Incentive & OtherTotal
Brian Niccol Chief Executive Officer $1,969,231 $28,333,025 $3,218,684 $33,520,940
Steve Ells Executive Chairman; former CEO $1,023,077 $5,626,075 $1,305,890 $7,955,042
John R. Hartung Chief Financial Officer $800,000 $3,032,035 $1,152,194 $4,984,230
Curt Garner Chief Technology Officer $1,018,358 $5,786,459 $1,321,919 $8,126,734
Scott Boatwright Chief Restaurant Officer $827,765 $4,164,281 $719,123 $5,711,169
Chris Brandt Chief Marketing Officer $938,462 $3,431,403 $669,421 $5,039,286
Management Compensation Metrics
CEO Brian Niccol
Tenure as CEO 1-yr
Total Compensation ~$33.5MM
Annual Incentive Plan Metrics
Average Customer Satisfaction
Site Assessment Requests
SSS
Restaurant Cash Flow Margin (RCF)
Digital Sales
Store Performance
Individual Performance Objectives
Long-term Incentive Metrics Vesting Period
Performance Shares 3-yrs
3-yr SSS Growth
2-yr Average Restaurant Cash Flow Margin
Stock Appreciation Rights 3-yrs
Board of Directors
Director Joined Board
Steve Ells Founder & Executive Chairman of Chipotle Mexican Grill 1996
Albert S. Baldocchi Self-employed Financial Consultant & Strategic Advisor 1997
Neil W. Flanzraich Executive Chairman of Cantex Pharmaceuticals 2007
Ali Namvar Private investor; former Partner at Pershing Square Capital Management 2016
Matthew H. Paull Former SVP & CFO of McDonald’s; former Partner at Ernst & Young 2016
Paul T. Cappuccio EVP & General Counsel of Time Warner 2016
Robin Hickenlooper SVP of Corporate Development at Liberty Media 2016
Brian Niccol CEO of Chipotle Mexican Grill 2018
Scott Maw Former EVP & CFO at Starbucks 2019
Patricia Fili-Krushel CEO of the Center for Talent Innovation; Director of Dollar General 2019
Experience

25 June 2019
Chipotle Mexican Grill, Inc. (CMG) 28
Companies Mentioned (Price as of 21-Jun-2019) Chipotle Mexican Grill, Inc. (CMG.N, $726.85, OUTPERFORM, TP $870.0) Domino’s Pizza Inc. (DPZ.N, $280.33) Dunkin’ Brands Group, Inc. (DNKN.OQ, $79.54) Jack in the Box Inc. (JACK.OQ, $85.08) KFC (3420.T, ¥1,736) McDonald’s Corporation (MCD.N, $204.26) Papa John’s International, Inc. (PZZA.OQ, $44.37) Pizza Hut (Unlisted) Restaurant Brands International Inc (QSR.N, $69.99) Shake Shack (SHAK.N, $66.75) Starbucks Corporation (SBUX.OQ, $83.82) The Wendy’s Company (WEN.OQ, $19.37) Yum! Brands, Inc. (YUM.N, $110.27)
Disclosure Appendix
Analyst Certification I, Lauren Silberman, certify that (1) the views expressed in this report accurately reflect my personal views about all of the subject companies and securities and (2) no part of my compensation was, is or will be directly or indirectly related to the specific recommendations or views expressed in this report.
3-Year Price and Rating History for Chipotle Mexican Grill, Inc. (CMG.N)
CMG.N Closing Price Target Price
Date (US$) (US$) Rating
19-Jul-16 415.31 500.00 O
26-Oct-16 368.02 375.00 N
26-Apr-17 482.99 425.00
24-Jul-17 339.98 325.00
26-Jul-17 340.60 335.00
25-Aug-17 308.79 320.00
25-Oct-17 277.01 275.00
23-Jan-18 328.71 330.00
07-Feb-18 272.21 275.00
19-Feb-18 305.63 290.00
14-Mar-18 319.66 NC
* Asterisk signifies initiation or assumption of coverage.
Effective July 3, 2016, NC denotes termination of coverage.
As of December 10, 2012 Analysts’ stock rating are defined as follows: Outperform (O) : The stock’s total return is expected to outperform the relevant benchmark* over the next 12 months. Neutral (N) : The stock’s total return is expected to be in line with the relevant benchmark* over the next 12 months. Underperform (U) : The stock’s total return is expected to underperform the relevant benchmark* over the next 12 months. *Relevant benchmark by region: As of 10th December 2012, Japanese ratings are based on a stock’s total return relative to the analyst's coverage universe which consists of all companies covered by the analyst within the relevant sector, with Outperforms representing the most attractiv e, Neutrals the less attractive, and Underperforms the least attractive investment opportunities. As of 2nd October 2012, U.S. and Canadian as well as European ra tings are based on a stock’s total return relative to the analyst's coverage universe which consists of all companies covered by the analyst within the relevant sector, with Outperforms representing the most attractive, Neutrals the less attractive, and Underperforms the least attractive investment opportunities. For Latin Ame rican and Asia stocks (excluding Japan and Australia), ratings are based on a stock’s total return relative to the average total return of the relevant country or r egional benchmark (India - S&P BSE Sensex Index); prior to 2nd October 2012 U.S. and Canadian ratings were based on (1) a stock’s absolute total return potential to its current share price and (2) the relative attractiveness of a stock’s total return potential within an analyst’s coverage universe. For Australian and New Zealand stoc ks, the expected total return (ETR) calculation includes 12-month rolling dividend yield. An Outperform rating is assigned where an ETR is greater than or equal to 7.5%; Underperform wh ere an ETR less than or equal to 5%. A Neutral may be assigned where the ETR is between -5% and 15%. The overlapping rating range allows analysts to assign a rating that puts ETR in the context of associated risks. Prior to 18 May 2015, ETR ranges for Outperform and Underperform ratings did not overlap with Neutral thresholds between 15% and 7.5%, which was in operation from 7 July 2011. Restricted (R) : In certain circumstances, Credit Suisse policy and/or applicable law and regulations preclude certain types of communications, including an investment recommendation, during the course of Credit Suisse's engagement in an investment banking transaction and in certain other circumstances. Not Rated (NR) : Credit Suisse Equity Research does not have an investment rating or view on the stock or any other securities related to the company at this time. Not Covered (NC) : Credit Suisse Equity Research does not provide ongoing coverage of the company or offer an investment rating or investment view on the equity security of the company or related products.
Volatility Indicator [V] : A stock is defined as volatile if the stock price has moved up or down by 20% or more in a month in at least 8 of the past 24 months or the analyst expects significant volatility going forward.
Analysts’ sector weightings are distinct from analysts’ stock ratings and are based on the analyst’s expectations for the fundamentals and/or valuation of the sector* relative to the group’s historic fundamentals and/or valuation: Overweight : The analyst’s expectation for the sector’s fundamentals and/or valuation is favorable over the next 12 months.
O U T PERFO RM
N EU T RA L
N O T CO V ERED

25 June 2019
Chipotle Mexican Grill, Inc. (CMG) 29
Market Weight : The analyst’s expectation for the sector’s fundamentals and/or valuation is neutral over the next 12 months. Underweight : The analyst’s expectation for the sector’s fundamentals and/or valuation is cautious over the next 12 months. *An analyst’s coverage sector consists of all companies covered by the analyst within the relevant sector. An analyst may cover multiple sectors.
Credit Suisse's distribution of stock ratings (and banking clients) is:
Global Ratings Distribution
Rating Versus universe (%) Of which banking clients (%) Outperform/Buy* 46% (32% banking clients) Neutral/Hold* 39% (27% banking clients) Underperform/Sell* 13% (22% banking clients) Restricted 2%
*For purposes of the NYSE and FINRA ratings distribution disclosure requirements, our stock ratings of Outperform, Neutral, and Underperform most closely correspond to Buy, Hold, and Sell, respectively; however, the meanings are not the same, as our stock ratings are determined on a relative basis. (Please refer to definitions above.) An investor's decision to buy or sell a security should be based on investment objectives, current holdings, and other individ ual factors.
Important Global Disclosures Credit Suisse’s research reports are made available to clients through our proprietary research portal on CS PLUS. Credit Suisse research products may also be made available through third-party vendors or alternate electronic means as a convenience. Certain research products are only made available through CS PLUS. The services provided by Credit Suisse’s analysts to clients may depend on a specific client’s preferences regarding the frequency and manner of receiving communications, the client’s risk profile and investment, the size and scope of the overall client relationship with the Firm, as well as legal and regulatory constraints. To access all of Credit Suisse’s research that you are entitled to receive in the most timely manner, please contact your sales representative or go to https://plus.credit-suisse.com . Credit Suisse’s policy is to update research reports as it deems appropriate, based on developments with the subject company, the sector or the market that may have a material impact on the research views or opinions stated herein. Credit Suisse's policy is only to publish investment research that is impartial, independent, clear, fair and not misleading. For more detail please refer to Credit Suisse's Policies for Managing Conflicts of Interest in connection with Investment Research: https://www.credit-suisse.com/sites/disclaimers-ib/en/managing-conflicts.html . Any information relating to the tax status of financial instruments discussed herein is not intended to provide tax advice or to be used by anyone to provide tax advice. Investors are urged to seek tax advice based on their particular circumstances from an independent tax professional. Credit Suisse has decided not to enter into business relationships with companies that Credit Suisse has determined to be involved in the development, manufacture, or acquisition of anti-personnel mines and cluster munitions. For Credit Suisse's position on the issue, please see https://www.credit-suisse.com/media/assets/corporate/docs/about-us/responsibility/banking/policy-summaries-en.pdf . The analyst(s) responsible for preparing this research report received compensation that is based upon various factors including Credit Suisse's total revenues, a portion of which are generated by Credit Suisse's investment banking activities
Target Price and Rating Valuation Methodology and Risks: (12 months) for Chipotle Mexican Grill, Inc. (CMG.N)
Method: Our $870 target price and Outperform rating is based on ~25x our NTM EBITDA in 12 months & implies ~46x our NTM EPS in 12 months, relatively in-line with current multiples.
Risk: Key risks to our Outperform rating $870 price target include: food safety headlines, competition and food safety. Chipotle's headline risk is still elevated as multiple food safety incidents have emerged over the last few years, with brand perceptions which are likely still sensitive. In recent years, there has been an emergence of smaller competitors delivering on attributes that have differentiated Chipotle for many years, offering high quality food at reasonable prices, many of which are similarly mission-driven and locally sourced.
Please refer to the firm's disclosure website at https://rave.credit-suisse.com/disclosures/view/selectArchive for the definitions of abbreviations typically used in the target price method and risk sections.
See the Companies Mentioned section for full company names Credit Suisse or a member of the Credit Suisse Group is a market maker or liquidity provider in the securities of the following subject issuer(s): CMG.N
For date and time of production, dissemination and history of recommendation for the subject company(ies) featured in this report, disseminated within the past 12 months, please refer to the link: https://rave.credit-suisse.com/disclosures/view/report?i=436738&v=-47001xwmlv95fr8aoq6us9bhb .
Important Regional Disclosures Singapore recipients should contact Credit Suisse AG, Singapore Branch for any matters arising from this research report. The analyst(s) involved in the preparation of this report may participate in events hosted by the subject company, including site visits. Credit Suisse does not accept or permit analysts to accept payment or reimbursement for travel expenses associated with these events. For Credit Suisse Securities (Canada), Inc.'s policies and procedures regarding the dissemination of equity research, please visit https://www.credit-suisse.com/sites/disclaimers-ib/en/canada-research-policy.html. Investors should note that income from such securities and other financial instruments, if any, may fluctuate and that price or value of such securities and instruments may rise or fall and, in some cases, investors may lose their entire principal investment. This research report is authored by: Credit Suisse Securities (USA) LLC ................................................................................................................................................ Lauren Silberman

25 June 2019
Chipotle Mexican Grill, Inc. (CMG) 30
Important Credit Suisse HOLT Disclosures The HOLT methodology does not assign ratings or a target price to a security. It is an analytical tool that involves use of a set of proprietary quantitative algorithms and warranted value calculations, collectively called the HOLT valuation model, that are consistently applied to all the companies included in its database. Third-party data (including consensus earnings estimates) are systematically translated into a number of default variables and incorporated into the algorithms available in the HOLT valuation model. The source financial statement, pricing, and earnings data provided by outside data vendors are subject to quality control and may also be adjusted to more closely measure the underlying economics of firm performance. These adjustments provide consistency when analyzing a single company across time, or analyzing multiple companies across industries or national borders. The default scenario that is produced by the HOLT valuation model establishes a warranted price for a security, and as the third-party data are updated, the warranted price may also change. The default variables may also be adjusted to produce alternative warranted prices, any of which could occur. The warranted price is an algorithmic output applied systematically across all companies based on historical levels and volatility of returns. Additional information about the HOLT methodology is available on request. CFROI, CFROE, HOLT, HOLT Lens, HOLTfolio, "Clarity is Confidence" and "Powered by HOLT" are trademarks or registered trademarks of Credit Suisse Group AG or its affiliates in the United States and other countries. HOLT is a corporate performance and valuation advisory service of Credit Suisse. © 2019 Credit Suisse Group AG and its subsidiaries and affiliates. All rights reserved.
Important disclosures regarding companies that are the subject of this report are available by calling +1 (877) 291-2683. The same important disclosures, with the exception of valuation methodology and risk discussions, are also available on Credit Suisse’s disclosure website at https://rave.credit-suisse.com/disclosures . For valuation methodology and risks associated with any recommendation, price target, or rating referenced in this report, please refer to the disclosures section of the most recent report regarding the subject company.

25 June 2019
Chipotle Mexican Grill, Inc. (CMG) 31
This report is produced by subsidiaries and affiliates of Credit Suisse operating under its Global Markets Division. For more information on our structure, please use the following link: https://www.credit-suisse.com/who-we-are This report may contain material that is not directed to, or intended for distribution to or use by, any person or entity who is a citizen or resident of or located in any locality, state, country or other jurisdiction where such distribution, publication, availability or use would be contrary to law or regulation or which would subject Credit Suisse or its affiliates ("CS") to any registration or licensing requirement within such jurisdiction. All material presented in this report, unless specifically indicated otherwise, is under copyright to CS. None of the material, nor its content, nor any copy of it, may be altered in any way, transmitted to, copied or distributed to any other party, without the prior express written permission of CS. All trademarks, service marks and logos used in this report are trademarks or service marks or registered trademarks or service marks of CS or its affiliates.The information, tools and material presented in this report are provided to you for information purposes only and are not to be used or considered as an offer or the solicitation of an offer to sell or to buy or subscribe for securities or other financial instruments. CS may not have taken any steps to ensure that the securities referred to in this report are suitable for any particular investor. CS will not treat recipients of this report as its customers by virtue of their receiving this report. The investments and services contained or referred to in this report may not be suitable for you and it is recommended that you consult an independent investment advisor if you are in doubt about such investments or investment services. Nothing in this report constitutes investment, legal, accounting or tax advice, or a representation that any investment or strategy is suitable or appropriate to your individual circumstances, or otherwise constitutes a personal recommendation to you. Please note in particular that the bases and levels of taxation may change. Information and opinions presented in this report have been obtained or derived from sources believed by CS to be reliable, but CS makes no representation as to their accuracy or completeness. CS accepts no liability for loss arising from the use of the material presented in this report, except that this exclusion of liability does not apply to the extent that such liability arises under specific statutes or regulations applicable to CS. This report is not to be relied upon in substitution for the exercise of independent judgment. CS may have issued, and may in the future issue, other communications that are inconsistent with, and reach different conclusions from, the information presented in this report. Those communications reflect the different assumptions, views and analytical methods of the analysts who prepared them and CS is under no obligation to ensure that such other communications are brought to the attention of any recipient of this report. Some investments referred to in this report will be offered solely by a single entity and in the case of some investments solely by CS, or an associate of CS or CS may be the only market maker in such investments. Past performance should not be taken as an indication or guarantee of future performance, and no representation or warranty, express or implied, is made regarding future performance. Information, opinions and estimates contained in this report reflect a judgment at its original date of publication by CS and are subject to change without notice. The price, value of and income from any of the securities or financial instruments mentioned in this report can fall as well as rise. The value of securities and financial instruments is subject to exchange rate fluctuation that may have a positive or adverse effect on the price or income of such securities or financial instruments. Investors in securities such as ADR's, the values of which are influenced by currency volatility, effectively assume this risk. Structured securities are complex instruments, typically involve a high degree of risk and are intended for sale only to sophisticated investors who are capable of understanding and assuming the risks involved. The market value of any structured security may be affected by changes in economic, financial and political factors (including, but not limited to, spot and forward interest and exchange rates), time to maturity, market conditions and volatility, and the credit quality of any issuer or reference issuer. Any investor interested in purchasing a structured product should conduct their own investigation and analysis of the product and consult with their own professional advisers as to the risks involved in making such a purchase. Some investments discussed in this report may have a high level of volatility. High volatility investments may experience sudden and large falls in their value causing losses when that investment is realised. Those losses may equal your original investment. Indeed, in the case of some investments the potential losses may exceed the amount of initial investment and, in such circumstances, you may be required to pay more money to support those losses. Income yields from investments may fluctuate and, in consequence, initial capital paid to make the investment may be used as part of that income yield. Some investments may not be readily realisable and it may be difficult to sell or realise those investments, similarly it may prove difficult for you to obtain reliable information about the value, or risks, to which such an investment is exposed. This report may provide the addresses of, or contain hyperlinks to, websites. Except to the extent to which the report refers to website material of CS, CS has not reviewed any such site and takes no responsibility for the content contained therein. Such address or hyperlink (including addresses or hyperlinks to CS's own website material) is provided solely for your convenience and information and the content of any such website does not in any way form part of this document. Accessing such website or following such link through this report or CS's website shall be at your own risk.
This report is issued and distributed in European Union (except Switzerland): by Credit Suisse Securities (Europe) Limited, One Cabot Square, London E14 4QJ, England, which is authorised by the Prudential Regulation Authority and regulated by the Financial Conduct Authority and the Prudential Regulation Authority. Germany: Credit Suisse (Deutschland) Aktiengesellschaft regulated by the Bundesanstalt fuer Finanzdienstleistungsaufsicht ("BaFin"). United States and Canada: Credit Suisse Securities (USA) LLC; Switzerland: Credit Suisse AG; Brazil: Banco de Investimentos Credit Suisse (Brasil) S.A or its affiliates; Mexico: Banco Credit Suisse (México), S.A., Institución de Banca Múltiple, Grupo Financiero Credit Suisse (México) and Casa de Bolsa Credit Suisse (México), S.A. de C.V., Grupo Financiero Credit Suisse (México) ("Credit Suisse Mexico"). This document has been prepared for information purposes only and is exclusively distributed in Mexico to Institutional Investors. Credit Suisse Mexico is not responsible for any onward distribution of this report to non-institutional investors by any third party. The authors of this report have not received payment or compensation from any entity or company other than from the relevant Credit Suisse Group company employing them; Japan: by Credit Suisse Securities (Japan) Limited, Financial Instruments Firm, Director-General of Kanto Local Finance Bureau ( Kinsho) No. 66, a member of Japan Securities Dealers Association, The Financial Futures Association of Japan, Japan Investment Advisers Association, Type II Financial Instruments Firms Association; Hong Kong: Credit Suisse (Hong Kong) Limited; Australia: Credit Suisse Equities (Australia) Limited; Thailand: Credit Suisse Securities (Thailand) Limited, regulated by the Office of the Securities and Exchange Commission, Thailand, having registered address at 990 Abdulrahim Place, 27th Floor, Unit 2701, Rama IV Road, Silom, Bangrak, Bangkok10500, Thailand, Tel. +66 2614 6000; Malaysia: Credit Suisse Securities (Malaysia) Sdn Bhd; Singapore: Credit Suisse AG, Singapore Branch; India: Credit Suisse Securities (India) Private Limited (CIN no.U67120MH1996PTC104392) regulated by the Securities and Exchange Board of India as Research Analyst (registration no. INH 000001030) and as Stock Broker (registration no. INZ000248233), having registered address at 9th Floor, Ceejay House, Dr.A.B. Road, Worli, Mumbai - 18, India, T- +91-22 6777 3777; South Korea: Credit Suisse Securities (Europe) Limited, Seoul Branch; Taiwan: Credit Suisse AG Taipei
Securities Branch; Indonesia: PT Credit Suisse Sekuritas Indonesia; Philippines:Credit Suisse Securities (Philippines ) Inc., and elsewhere in the world by the relevant authorised affiliate of the above. Additional Regional Disclaimers Australia: Credit Suisse Securities (Europe) Limited ("CSSEL") and Credit Suisse International ("CSI") are authorised by the Prudential Regulation Authority and regulated by the Financial Conduct Authority ("FCA") and the Prudential Regulation Authority under UK laws, which differ from Australian Laws. CSSEL and CSI do not hold an Australian Financial Services Licence ("AFSL") and are exempt from the requirement to hold an AFSL under the Corporations Act (Cth) 2001 ("Corporations Act") in respect of the financial services provided to Australian wholesale clients (within the meaning of section 761G of the Corporations Act) (hereinafter referred to as “Financial Services”). This material is not for distribution to retail clients and is directed exclusively at Credit Suisse's professional clients and eligible counterparties as defined by the FCA, and wholesale clients as defined under section 761G of the Corporations Act. Credit Suisse (Hong Kong) Limited ("CSHK") is licensed and regulated by the Securities and Futures Commission of Hong Kong under the laws of Hong Kong, which differ from Australian laws. CSHKL does not hold an AFSL and is exempt from the requirement to hold an AFSL under the Corporations Act in respect of providing Financial Services. Investment banking services in the United States are provided by Credit Suisse Securities (USA) LLC, an affiliate of Credit Suisse Group. CSSU is regulated by the United States Securities and Exchange Commission under United States laws, which differ from Australian laws. CSSU does not hold an AFSL and is exempt from the requirement to hold an AFSL under the Corporations Act in respect of providing Financial Services. Credit Suisse Asset Management LLC (CSAM) is authorised by the Securities and Exchange Commission under US laws, which differ from Australian laws. CSAM does not hold an AFSL and is exempt from the requirement to hold an AFSL under the Corporations Act in respect of providing Financial Services. This material is provided solely to Institutional Accounts (as defined in the FINRA rules) who are Eligible Contract Participants (as defined in the US Commodity Exchange Act). Credit Suisse Equities (Australia) Limited (ABN 35 068 232 708) ("CSEAL") is an AFSL holder in Australia (AFSL 237237). Malaysia: Research provided to residents of Malaysia is authorised by the Head of Research for Credit Suisse Securities (Malaysia) Sdn Bhd, to whom they should direct any queries on +603 2723 2020. Singapore: This report has been prepared and issued for distribution in Singapore to institutional investors, accredited investors and expert investors (each as defined under the Financial Advisers Regulations) only, and is also distributed by Credit Suisse AG, Singapore Branch to overseas investors (as defined under the Financial Advisers Regulations). Credit Suisse AG, Singapore Branch may distribute reports produced by its foreign entities or affiliates pursuant to an arrangement under Regulation 32C of the Financial Advisers Regulations. Singapore recipients should contact Credit Suisse AG, Singapore Branch at +65-6212-2000 for matters arising from, or in connection with, this report. By virtue of your status as an institutional investor, accredited investor, expert investor or overseas investor, Credit Suisse AG, Singapore Branch is exempted from complying with certain compliance requirements under the Financial Advisers Act, Chapter 110 of Singapore (the “FAA”), the Financial Advisers Regulations and the relevant Notices and Guidelines issued thereunder, in respect of any financial advisory service which Credit Suisse AG, Singapore Branch may provide to you. EU: This report has been produced by subsidiaries and affiliates of Credit Suisse operating under its Global Markets Division In jurisdictions where CS is not already registered or licensed to trade in securities, transactions will only be effected in accordance with applicable securities legislation, which will vary from jurisdiction to jurisdiction and may require that the trade be made in accordance with applicable exemptions from registration or licensing requirements. This material is issued and distributed in the U.S. by CSSU, a member of NYSE, FINRA, SIPC and the NFA, and CSSU accepts responsibility for its contents. Clients should contact analysts and execute transactions through a Credit Suisse subsidiary or affiliate in their home jurisdiction unless governing law permits otherwise. Please note that this research was originally prepared and issued by CS for distribution to their market professional and institutional investor customers. Recipients who are not market professional or institutional investor customers of CS should seek the advice of their independent financial advisor prior to taking any investment decision based on this report or for any necessary explanation of its contents. CS may provide various services to US municipal entities or obligated persons ("municipalities"), including suggesting individual transactions or trades and entering into such transactions. Any services CS provides to municipalities are not viewed as "advice" within the meaning of Section 975 of the Dodd-Frank Wall Street Reform and Consumer Protection Act. CS is providing any such services and related information solely on an arm's length basis and not as an advisor or fiduciary to the municipality. In connection with the provision of the any such services, there is no agreement, direct or indirect, between any municipality (including the officials,management, employees or agents thereof) and CS for CS to provide advice to the municipality. Municipalities should consult with their financial, accounting and legal advisors regarding any such services provided by CS. In addition, CS is not acting for direct or indirect compensation to solicit the municipality on behalf of an unaffiliated broker, dealer, municipal securities dealer, municipal advisor, or investment adviser for the purpose of obtaining or retaining an engagement by the municipality for or in connection with Municipal Financial Products, the issuance of municipal securities, or of an investment adviser to provide investment advisory services to or on behalf of the municipality. If this report is being distributed by a financial institution other than Credit Suisse AG, or its affiliates, that financial institution is solely responsible for distribution. Clients of that institution should contact that institution to effect a transaction in the securities mentioned in this report or require further information. This report does not constitute investment advice by Credit Suisse to the clients of the distributing financial institution, and neither Credit Suisse AG, its affiliates, and their respective officers, directors and employees accept any liability whatsoever for any direct or consequential loss arising from their use of this report or its content. No information or communication provided herein or otherwise is intended to be, or should be construed as, a recommendation within the meaning of the US Department of Labor’s final regulation defining "investment advice" for purposes of the Employee Retirement Income Security Act of 1974, as amended and Section 4975 of the Internal Revenue Code of 1986, as amended, and the information provided herein is intended to be general information, and should not be construed as, providing investment advice (impartial or otherwise). Copyright © 2019 CREDIT SUISSE AG and/or its affiliates. All rights reserved. When you purchase non-listed Japanese fixed income securities (Japanese government bonds, Japanese municipal bonds, Japanese government guaranteed bonds, Japanese corporate bonds) from CS as a seller, you will be requested to pay the purchase price only.


![Hamilton Beach Contact Grill With Reversible Grids [25340C] - Use ...](https://static.fdokumen.com/doc/165x107/6324aab3b5f3f5fc2b049aee/hamilton-beach-contact-grill-with-reversible-grids-25340c-use-.jpg)


