Jump-Start - Credit Suisse
75
DISCLOSURE APPENDIX AT THE BACK OF THIS REPORT CONTAINS IMPORTANT DISCLOSURES, ANALYST CERTIFICATIONS, AND THE STATUS OF NON-US ANALYSTS. US Disclosure: Credit Suisse does and seeks to do business with companies covered in its research reports. As a result, investors should be aware that the Firm may have a conflict of interest that could affect the objectivity of this report. Investors should consider this report as only a single factor in making their investment decision. CREDIT SUISSE SECURITIES RESEARCH & ANALYTICS BEYOND INFORMATION ™ Client-Driven Solutions, Insights, and Access 23 January 2014 Asia Pacific Equity Research Investment Strategy Jump-Start STRATEGY Jump-Start aims to provide you with a summary of the week that was and helps you prepare for the week ahead with a results calendar, economic forecasts and valuation summaries. Hong Kong Property Sector – Awakening dragons. The growing prominence of the China operations of Hong Kong property stocks will unlock their hidden value soon. Joyce Kwock analyses this in an Ideas Engine report, which also reveals how the strong balance sheet of HK developers and their sizeable rental portfolio add to their strength. Her top picks include Henderson Land, NWD, Cheung Kong and Swire Properties. India Utilities Sector: The smart (grid) way forward? Amish Shah, in a detailed note, feels that smart grid can address the plaguing issues at SEBs. He argues that smart grid implementation is a win-win situation for all stakeholders involved, although cautioning that funding and poor state support pose key near-term challenges. He remains negative on L&T, BHEL, Crompton, Voltas and most IPPs. China Internet Sector: Live and breathe the Net. Internet has been the most vibrant sector in the Chinese economy for the past ten years. Internet is penetrating into more traditional industries and increasing mobile and 4G penetration will likely further accelerate this process. In an aptly titled report, Dick Wei cites service digitisation as the next mega trend, with Internet finance, mobile games and IMs benefitting most. Tencent: WeChat Payment —The next growth frontier. In a separate report, Dick Wei upgrades Tencent to OUTPERFORM as he sees clearer signs of WeChat Payment emerging as one of the leading mobile wallets in China. He expects Tencent to tap into the Rmb18 tn electronic payment market in China with revenue opportunities of Rmb22.8 bn by 2015. Must-read recently published reports 1) Sino Hotspot Series: Internet Finance – A force of creative destruction? (2/1) Vincent Chan Victor Wang Online payment, online financing and financial product distribution are the three major businesses in Internet finance. Over the next two years, financial services should become a major area in the tide of service digitisation in China. 2) China Environment Sector – The start of "green" cycle (9/12) Trina Chen China is starting a decade-long "green cycle" on environment. Investment in the sector is defensive vs economic cycles; exciting with sustainable earnings growth. 3) China Utilities Sector – Caution! Divergence begins in 2014 (27/11) Dave Dai Analysing the various fundamental industry risks that could lead to divergence in earnings growth across sub- sectors, Dave arrives at his pecking order–WTE, wind, gas and IPPs. 4) India Four-Wheeler Sector – Why is it a challenge for MNCs? (25/11) Jatin Chawla Jatin believes MNCs need to do well on the following to succeed in India: (1) suitable products; (2) sales and service network; (3) India as an export base; (4) brand strength; (5) ownership costs, and (6) commitment to India. 5) Asia P&C Insurance Sector – Coming of age (13/11) Arjan van Veen The rise of regional P&C insurers has sharply lagged the life insurance sector in Asia to date. Arjan examines the relative attractiveness of the Asian P&C Insurance sector. 6) The Shale Revolution II (1/10) Richard Kersley We revisit the key investment theme of the 'shale revolution': the story is still in its early stages and presents end markets that display a secular growth quality. Research Analyst Manish Nigam 852 2101 7067 [email protected] Credit Suisse forthcoming events Hong Kong / China Seoul Semiconductor Co Ltd (046890.KQ) Date 19-21 February, Hong Kong Analyst Keon Han Singapore Seoul Semiconductor Co Ltd (046890.KQ) Date 17-18 February, Singapore Analyst Keon Han US DangDang.com (DANG.N) Date 23-January - 28-February, US Analyst Dick Wei Dewan Housing Finance Corporation Ltd (DWNH.BO) Date 28-29 January, US Analyst Sunil Tirumalai Others Nusantara Infrastructure TBK (META.JK) Date 27-28 January, Kuala Lumpur Analyst Ella Nusantoro PT Indoritel Makmur International Tbk (DNET.JK) Date 27-28 January, Kuala Lumpur Analyst Ella Nusantoro Asian Investment Conference 2014 Date 24-28 March, Hong Kong Contact [email protected] or your usual sales representative
-
Upload
khangminh22 -
Category
Documents
-
view
0 -
download
0
Transcript of Jump-Start - Credit Suisse

DISCLOSURE APPENDIX AT THE BACK OF THIS REPORT CONTAINS IMPORTANT DISCLOSURES, ANALYST CERTIFICATIONS, AND THE STATUS OF NON-US ANALYSTS. US Disclosure: Credit Suisse does and seeks to do business with companies covered in its research reports. As a result, investors should be aware that the Firm may have a conflict of interest that could affect the objectivity of this report. Investors should consider this report as only a single factor in making their investment decision.
CREDIT SUISSE SECURITIES RESEARCH & ANALYTICS BEYOND INFORMATION™
Client-Driven Solutions, Insights, and Access
23 January 2014
Asia Pacific
Equity Research
Investment Strategy
Jump-Start STRATEGY
Jump-Start aims to provide you with a summary of the week that was and helps you prepare
for the week ahead with a results calendar, economic forecasts and valuation summaries.
Hong Kong Property Sector – Awakening dragons. The growing prominence
of the China operations of Hong Kong property stocks will unlock their hidden
value soon. Joyce Kwock analyses this in an Ideas Engine report, which also
reveals how the strong balance sheet of HK developers and their sizeable rental
portfolio add to their strength. Her top picks include Henderson Land, NWD,
Cheung Kong and Swire Properties.
India Utilities Sector: The smart (grid) way forward? Amish Shah, in a detailed
note, feels that smart grid can address the plaguing issues at SEBs. He argues that
smart grid implementation is a win-win situation for all stakeholders involved,
although cautioning that funding and poor state support pose key near-term
challenges. He remains negative on L&T, BHEL, Crompton, Voltas and most IPPs.
China Internet Sector: Live and breathe the Net. Internet has been the most
vibrant sector in the Chinese economy for the past ten years. Internet is
penetrating into more traditional industries and increasing mobile and 4G
penetration will likely further accelerate this process. In an aptly titled report, Dick
Wei cites service digitisation as the next mega trend, with Internet finance, mobile
games and IMs benefitting most.
Tencent: WeChat Payment —The next growth frontier. In a separate report,
Dick Wei upgrades Tencent to OUTPERFORM as he sees clearer signs of
WeChat Payment emerging as one of the leading mobile wallets in China. He
expects Tencent to tap into the Rmb18 tn electronic payment market in China
with revenue opportunities of Rmb22.8 bn by 2015.
Must-read recently published reports
1) Sino Hotspot Series: Internet Finance – A force of creative destruction? (2/1)
Vincent Chan Victor Wang
Online payment, online financing and financial product distribution are the three major businesses in Internet finance. Over the next two years, financial services should become a major area in the tide of service digitisation in China.
2) China Environment Sector – The start of "green" cycle (9/12)
Trina Chen China is starting a decade-long "green cycle" on environment. Investment in the sector is defensive vs economic cycles; exciting with sustainable earnings growth.
3) China Utilities Sector – Caution! Divergence begins in 2014 (27/11)
Dave Dai Analysing the various fundamental industry risks that could lead to divergence in earnings growth across sub-sectors, Dave arrives at his pecking order–WTE, wind, gas and IPPs.
4) India Four-Wheeler Sector – Why is it a challenge for MNCs? (25/11)
Jatin Chawla Jatin believes MNCs need to do well on the following to succeed in India: (1) suitable products; (2) sales and service network; (3) India as an export base; (4) brand strength; (5) ownership costs, and (6) commitment to India.
5) Asia P&C Insurance Sector – Coming of age (13/11)
Arjan van Veen
The rise of regional P&C insurers has sharply lagged the life insurance sector in Asia to date. Arjan examines the relative attractiveness of the Asian P&C Insurance sector.
6) The Shale Revolution II (1/10)
Richard Kersley
We revisit the key investment theme of the 'shale revolution': the story is still in its early stages and presents end markets that display a secular growth quality.
Research Analyst
Manish Nigam
852 2101 7067
Credit Suisse forthcoming events
Hong Kong / China
Seoul Semiconductor Co Ltd (046890.KQ)
Date 19-21 February, Hong Kong
Analyst Keon Han
Singapore
Seoul Semiconductor Co Ltd (046890.KQ)
Date 17-18 February, Singapore
Analyst Keon Han
US
DangDang.com (DANG.N)
Date 23-January - 28-February, US
Analyst Dick Wei
Dewan Housing Finance Corporation Ltd (DWNH.BO)
Date 28-29 January, US
Analyst Sunil Tirumalai
Others
Nusantara Infrastructure TBK (META.JK)
Date 27-28 January, Kuala Lumpur
Analyst Ella Nusantoro
PT Indoritel Makmur International Tbk (DNET.JK)
Date 27-28 January, Kuala Lumpur
Analyst Ella Nusantoro
Asian Investment Conference 2014
Date 24-28 March, Hong Kong
Contact [email protected] or your usual sales representative

23 J
an
uary
201
4
Ju
mp
-Sta
rt 2
Weekly revision review
Company rating/earnings/target price changes
New EPS Old EPS
Last New Old forecasts forecasts % change
New Old closing target target % Curr Curr Curr Curr Curr Curr
Country Date RIC Company rating rating price price price change year yr + 1 year yr + 1 year yr + 1 Analyst
Upgrade
China 16-Jan 0700.HK Tencent O N HK$ 405.585 HK$ 619 HK$ 440 40.7 Rmb 9.2368 Rmb 11.2731 Rmb 9.2368 Rmb 11.1678 0.00 0.94 Dick Wei
China 21-Jan 0386.HK Sinopec O N HK$ 4.968 HK$ 8 HK$ 6.4 25.0 Rmb 0.6047 Rmb 0.6916 Rmb 0.553 Rmb 0.6086 9.36 13.64 Thomas Wong
Hong Kong 16-Jan 0027.HK Galaxy O N HK$ 81.45 HK$ 92.5 HK$ 65.6 41.0 HK$ 2.4268 HK$ 3.0953 HK$ 2.3908 HK$ 2.9631 1.51 4.46 Kenny Lau
Hong Kong 16-Jan 1928.HK Sands China O N HK$ 8.315 HK$ 78.2 HK$ 62 26.1 US$ 0.2791 US$ 0.3696 US$ 0.277 US$ 0.3596 0.78 2.78 Kenny Lau
Hong Kong 22-Jan 0683.HK Kerry Properties O N HK$ 24.95 HK$ 31.36 HK$ 28.1 11.6 HK$ 2.8293 HK$ 2.6756 HK$ 3.0281 HK$ 2.9213 -6.57 -8.41 Joyce Kwock
Thailand 20-Jan AAV.BK AAV O U Bt 3.82 Bt 4.9 Bt 5.4 -9.3 Bt 0.3124 Bt 0.3446 Bt 0.3124 Bt 0.39 0.00 -11.65 Annuar Aziz
Upward revision
China 16-Jan BIDU.OQ Baidu O O US$ 1044.835 US$ 220 US$ 200 10.0 Rmb 32.065 Rmb 43.2644 Rmb 32.2925 Rmb 42.3269 -0.70 2.21 Dick Wei
China 16-Jan SFUN.N Soufun Holdings O O US$ 88.07 US$ 110 US$ 87 26.4 US$ 3.3316 US$ 4.1511 US$ 3.3316 US$ 4.1511 0.00 0.00 Dick Wei
China 16-Jan VIPS.N Vipshop Holdings N N US$ 107.31 US$ 80 US$ 75 6.7 US$ 1.0613 US$ 2.054 US$ 1.0689 US$ 1.9982 -0.71 2.79 Evan Zhou
China 20-Jan 3337.HK Anton Oil U U HK$ 4.103 HK$ 3.5 HK$ 3 16.7 Rmb 0.1546 Rmb 0.1655 Rmb 0.1427 Rmb 0.1544 8.37 7.16 Horace Tse
China 21-Jan GOMO.OQ Sungy Mobile O O US$ 141.328 US$ 24 US$ 23 4.3 Rmb 2.7441 Rmb 4.5435 Rmb 2.7441 Rmb 4.5435 0.00 0.00 Dick Wei
China 22-Jan 600030.SS Citic Securities (A) N N Rmb 11.71 Rmb 13.5 Rmb 13 3.8 Rmb 0.4728 Rmb 0.5675 Rmb 0.4221 Rmb 0.5455 12.03 4.04 Frances Feng
China 22-Jan 6030.HK Citic Securities (H) N N HK$ 14.632 HK$ 17.8 HK$ 16.5 7.9 Rmb 0.4728 Rmb 0.5675 Rmb 0.4221 Rmb 0.5455 12.03 4.04 Frances Feng
Hong Kong 16-Jan 0880.HK SJM O O HK$ 25.95 HK$ 31.4 HK$ 29 8.3 HK$ 1.3584 HK$ 1.6225 HK$ 1.3894 HK$ 1.5768 -2.23 2.90 Kenny Lau
Hong Kong 16-Jan 2282.HK MGM China N N HK$ 34.95 HK$ 38.6 HK$ 27 43.0 HK$ 1.3493 HK$ 1.6347 HK$ 1.3501 HK$ 1.5784 -0.06 3.57 Kenny Lau
Hong Kong 16-Jan MPEL.OQ MPEL O O US$ 44.215 US$ 50.5 US$ 42.4 19.1 US$ 1.23 US$ 1.6376 US$ 1.1665 US$ 1.6002 5.44 2.33 Kenny Lau
Hong Kong 17-Jan 1680.HK Macau Legend N N HK$ 7.92 HK$ 6.6 HK$ 4.95 33.3 HK$ 0.09 HK$ 0.1435 HK$ 0.09 HK$ 0.1468 0.00 -2.24 Isis Wong
India 16-Jan HCLT.BO HCL Tech O O Rs 23.288 Rs 1675 Rs 1425 17.5 US$ 1.4026 US$ 1.6051 US$ 1.3363 US$ 1.4478 4.96 10.87 Anantha Narayan
India 16-Jan MINT.BO Mindtree O O Rs 1429.5 Rs 1750 Rs 1700 2.9 Rs 110.3927 Rs 120.6206 Rs 114.1179 Rs 120.7044 -3.26 -0.07 Anantha Narayan
India 16-Jan TCS.BO Tata Consultancy O O Rs 2280.65 Rs 2750 Rs 2650 3.8 Rs 95.376 Rs 110.0799 Rs 94.8677 Rs 110.4805 0.54 -0.36 Anantha Narayan
India 17-Jan HDBK.BO HDFC Bank O O Rs 676.75 Rs 770 Rs 770 0.0 Rs 35.939 Rs 43.9586 Rs 35.5447 Rs 43.7771 1.11 0.41 Ashish Gupta
India 17-Jan WIPR.BO Wipro O O Rs 571.5 Rs 650 Rs 600 8.3 Rs 31.0341 Rs 36.6444 Rs 31.0208 Rs 36.0954 0.04 1.52 Anantha Narayan
India 21-Jan HZNC.BO Hindustan Zinc O O Rs 135.2 Rs 159 Rs 158 0.6 Rs 16.0154 Rs 17.7282 Rs 16.0784 Rs 17.7732 -0.39 -0.25 Neelkanth Mishra
India 21-Jan SESA.BO Sesa Sterlite O O Rs 208.7 Rs 235 Rs 135 74.1 Rs 23.3786 Rs 27.5141 Rs 21.0632 Rs 24.8005 10.99 10.94 Neelkanth Mishra
India 21-Jan TORP.BO Torrent N N Rs 475.35 Rs 500 Rs 407.5 22.7 Rs 33.3217 Rs 34.8752 Rs 27.7679 Rs 32.8994 20.00 6.01 Anubhav Aggarwal
Singapore 21-Jan MAPI.SI MINT O O S$ 1.315 S$ 1.67 S$ 1.67 0.0 S$ 0.0965 S$ 0.1002 S$ 0.0941 S$ 0.0992 2.58 1.04 Yvonne Voon
Singapore 21-Jan MAPL.SI MLT O O S$ 1.035 S$ 1.42 S$ 1.414 0.5 S$ 0.081 S$ 0.0803 S$ 0.0807 S$ 0.0799 0.34 0.48 Yvonne Voon
Singapore 21-Jan MONE.SI M1 O O S$ 3.36 S$ 3.72 S$ 3.6 3.3 S$ 0.1841 S$ 0.2015 S$ 0.1841 S$ 0.2015 0.00 0.00 Chate Benchavitvilai
Taiwan 17-Jan 2330.TW TSMC O O NT$ 107.5 NT$ 116 NT$ 116 0.0 NT$ 7.2494 NT$ 8.004 NT$ 7.1319 NT$ 7.9971 1.65 0.09 Randy Abrams
Downgrade
China 16-Jan CYOU.OQ Changyou N O US$ 30.69 US$ 34 US$ 37 -8.1 US$ 4.5683 US$ 4.2343 US$ 4.5709 US$ 4.9046 -0.06 -13.67 Evan Zhou
China 21-Jan 0883.HK CNOOC N O HK$ 10.202 HK$ 16 HK$ 20 -20.0 Rmb 1.498 Rmb 1.4109 Rmb 1.6036 Rmb 1.4718 -6.58 -4.14 Thomas Wong
Hong Kong 16-Jan 1128.HK Wynn Macau N O HK$ 35.55 HK$ 37.8 HK$ 33.2 13.9 HK$ 1.4827 HK$ 1.6225 HK$ 1.4484 HK$ 1.531 2.37 5.98 Kenny Lau
India 15-Jan BRTI.BO Bharti Airtel N O Rs 305 Rs 310 Rs 420 -26.2 Rs 10.9107 Rs 17.9343 Rs 10.9107 Rs 22.9269 0.00 -21.78 Sunil Tirumalai
India 15-Jan EXID.BO Exide Industries N O Rs 102.7 Rs 108 Rs 156 -30.8 Rs 5.7746 Rs 6.7526 Rs 7.0083 Rs 8.2422 -17.60 -18.07 Jatin Chawla
India 15-Jan IDEA.BO Idea Cellular U O Rs 152.85 Rs 130 Rs 190 -31.6 Rs 6.1871 Rs 6.7308 Rs 6.1871 Rs 9.1171 0.00 -26.17 Sunil Tirumalai
India 21-Jan INED.NS InfoEdge N O Rs 569.6 Rs 540 Rs 540 0.0 Rs 10.262 Rs 13.0082 Rs 9.9698 Rs 13.0453 2.93 -0.28 Sagar Rastogi
Malaysia 15-Jan KPJH.KL KPJ U O RM 3.36 RM 3.5 RM 4.478 -21.8 RM 0.0943 RM 0.1084 RM 0.1832 RM 0.1977 -48.52 -45.19 Anand Swaminathan
Singapore 16-Jan STEL.SI SingTel N O S$ 3.52 S$ 3.9 S$ 4.1 -4.9 S$ 0.2342 S$ 0.2429 S$ 0.2344 S$ 0.2522 -0.09 -3.71 Chate Benchavitvilai
Taiwan 16-Jan 2393.TW Everlight U N NT$ 75.5 NT$ 62 NT$ 58 6.9 NT$ 3.5172 NT$ 3.8532 NT$ 3.5216 NT$ 3.5383 -0.12 8.90 Derrick Yang
Taiwan 20-Jan 2301.TW Lite-on Tech N O NT$ 45.85 NT$ 51 NT$ 57 -10.5 NT$ 3.6752 NT$ 3.9963 NT$ 3.6852 NT$ 4.2009 -0.27 -4.87 Pauline Chen
US$; Note: Entries are organised by changes in rating first, followed by that in target price and earnings; Source: Credit Suisse estimates

23 J
an
uary
201
4
Ju
mp
-Sta
rt 3
Company rating/earnings/target price changes
New EPS Old EPS
Last New Old forecasts forecasts % change
New Old closing target target % Curr Curr Curr Curr Curr Curr
Country Date RIC Company rating rating price price price change year yr + 1 year yr + 1 year yr + 1 Analyst
Downward revision
China 16-Jan 0813.HK Shimao Property O O HK$ 13.634 HK$ 22.5 HK$ 22.5 0.0 Rmb 2.0047 Rmb 2.4655 Rmb 2.0047 Rmb 2.6706 0.00 -7.68 Duo Chen
China 16-Jan CTRP.OQ Ctrip O O US$ 253.677 US$ 58 US$ 76 -23.7 Rmb 8.9238 Rmb 7.8766 Rmb 8.9238 Rmb 11.1997 0.00 -29.67 Dick Wei
China 16-Jan SOHU.OQ Sohu O O US$ 75.52 US$ 95 US$ 95 0.0 US$ 1.237 US$ 2.4919 US$ 1.2744 US$ 3.2582 -2.94 -23.52 Dick Wei
Hong Kong 16-Jan 1314.HK Tsui Wah O O HK$ 4.96 HK$ 6.5 HK$ 6.5 0.0 HK$ 0.1229 HK$ 0.201 HK$ 0.1514 HK$ 0.2461 -18.81 -18.32 Vivian Zhao
India 17-Jan BAJA.BO Bajaj Auto N N Rs 1942.45 Rs 2090 Rs 2270 -7.9 Rs 121.9062 Rs 136.502 Rs 128.6128 Rs 142.8387 -5.21 -4.44 Jatin Chawla
India 20-Jan ASPN.BO Asian Paints N N Rs 479 Rs 470 Rs 481 -2.3 Rs 12.973 Rs 14.8416 Rs 13.3382 Rs 15.2547 -2.74 -2.71 Arnab Mitra
India 20-Jan TTKL.BO TTK Prestige O O Rs 3411.3 Rs 3600 Rs 3800 -5.3 Rs 102.9776 Rs 128.9886 Rs 116.1946 Rs 141.7973 -11.37 -9.03 Arnab Mitra
India 20-Jan ULTC.BO Ultratech Cement N N Rs 1700.2 Rs 1700 Rs 1950 -12.8 Rs 67.9604 Rs 81.6119 Rs 86.0423 Rs 116.3524 -21.02 -29.86 Anubhav Aggarwal
India 21-Jan COLG.BO Colgate U U Rs 1310.6 Rs 1190 Rs 1230 -3.3 Rs 34.972 Rs 39.9503 Rs 38.291 Rs 44.5935 -8.67 -10.41 Arnab Mitra
India 21-Jan EMAM.BO Emami O O Rs 447.95 Rs 580 Rs 580 0.0 Rs 17.965 Rs 21.4263 Rs 17.981 Rs 21.9191 -0.09 -2.25 Arnab Mitra
Malaysia 15-Jan CIMB.KL CIMB Group N N RM 7.11 RM 7.75 RM 8.2 -5.5 RM 0.62 RM 0.6222 RM 0.6291 RM 0.6674 -1.44 -6.77 Danny Goh
Malaysia 17-Jan PREI.KL Pavilion REIT N N RM 1.3 RM 1.38 RM 1.49 -7.4 RM 0.0749 RM 0.0769 RM 0.0754 RM 0.0769 -0.66 0.08 Tingmin Tan
Singapore 20-Jan KASA.SI K-REIT N N S$ 1.16 S$ 1.3 S$ 1.318 -1.3 S$ 0.0523 S$ 0.0534 S$ 0.0551 S$ 0.0563 -5.15 -5.18 Yvonne Voon
Singapore 21-Jan FCRT.SI FCT N N S$ 1.79 S$ 2.1 S$ 2.2 -4.5 S$ 0.1038 S$ 0.1088 S$ 0.1065 S$ 0.1111 -2.57 -2.08 Yvonne Voon
Singapore 22-Jan ASRT.SI Ascott REIT N N S$ 1.235 S$ 1.31 S$ 1.421 -7.8 S$ 0.0509 S$ 0.05 S$ 0.0601 S$ 0.0601 -15.27 -16.81 Yvonne Voon
South Korea 17-Jan 032640.KS LG Uplus O O W 10600 W 13000 W 13000 0.0 W 691 W 1083 W 798 W 1157 -13.34 -6.36 Taewon Kim
South Korea 21-Jan 036570.KS NC Soft O O W 216500 W 300000 W 320000 -6.3 W 8268 W 19254 W 8268 W 20659 0.00 -6.80 Taewon Kim
Thailand 22-Jan PS.BK Preuksa N N Bt 18.1 Bt 21.1 Bt 24.7 -14.6 Bt 2.4716 Bt 2.2921 Bt 2.4768 Bt 2.5178 -0.21 -8.97 Chai Techakumpuch
Initiation
China 15-Jan 2386.HK SINOPEC SEG U - HK$ 8.252 HK$ 9 - n.a. Rmb 0.8913 Rmb 0.9231 - - n.a. n.a. Kelly Chen
China 15-Jan 601166.SS CIB O - Rmb 9.29 Rmb 13.221 - n.a. Rmb 2.2535 Rmb 2.6446 - - n.a. n.a. Victor Wang
China 16-Jan 1359.HK Cinda O - HK$ 5.3 HK$ 6.141 - n.a. HK$ 0.4037 HK$ 0.514 - - n.a. n.a. Victor Wang
China 21-Jan 1169.HK Haier Elec O - HK$ 18.758 HK$ 30 - n.a. Rmb 0.7808 Rmb 0.9918 - - n.a. n.a. Eva Wang
Thailand 16-Jan JAS.BK Jasmine O - Bt 7.3 Bt 9.3 - n.a. Bt 0.4131 Bt 0.4874 - - n.a. n.a. Colin McCallum
Thailand 16-Jan TBEV.SI ThaiBev O - S$ 14.272 S$ 0.6 - n.a. Bt 0.6899 Bt 0.7214 - - n.a. n.a. Sanjay Mookim
Others
India 15-Jan YESB.BO Yes Bank U U Rs 362.85 Rs 345 Rs 345 0.0 Rs 39.0448 Rs 45.4407 Rs 36.4488 Rs 45.4977 7.12 -0.13 Ashish Gupta
India 20-Jan LICH.BO LIC Housing Fin O O Rs 212.35 Rs 280 Rs 280 0.0 Rs 24.0031 Rs 26.5216 Rs 23.822 Rs 26.5312 0.76 -0.04 Sunil Tirumalai
South Korea 15-Jan 105560.KS KB Financial O O W 38700 W 48500 W 48500 0.0 W 3716 W 5465 W 3730 W 5465 -0.36 0.01 Gil Kim
Taiwan 20-Jan 2409.TW AUO O O NT$ 9.11 NT$ 13.5 NT$ 13.5 0.0 NT$ 0.3128 NT$ 0.6883 NT$ 0.2255 NT$ 0.6885 38.72 -0.03 Jerry Su
US$; Note: Entries are organised by changes in rating first, followed by that in target price and earnings.
Source: Credit Suisse estimates
23 January 2014
Jump-Start 4
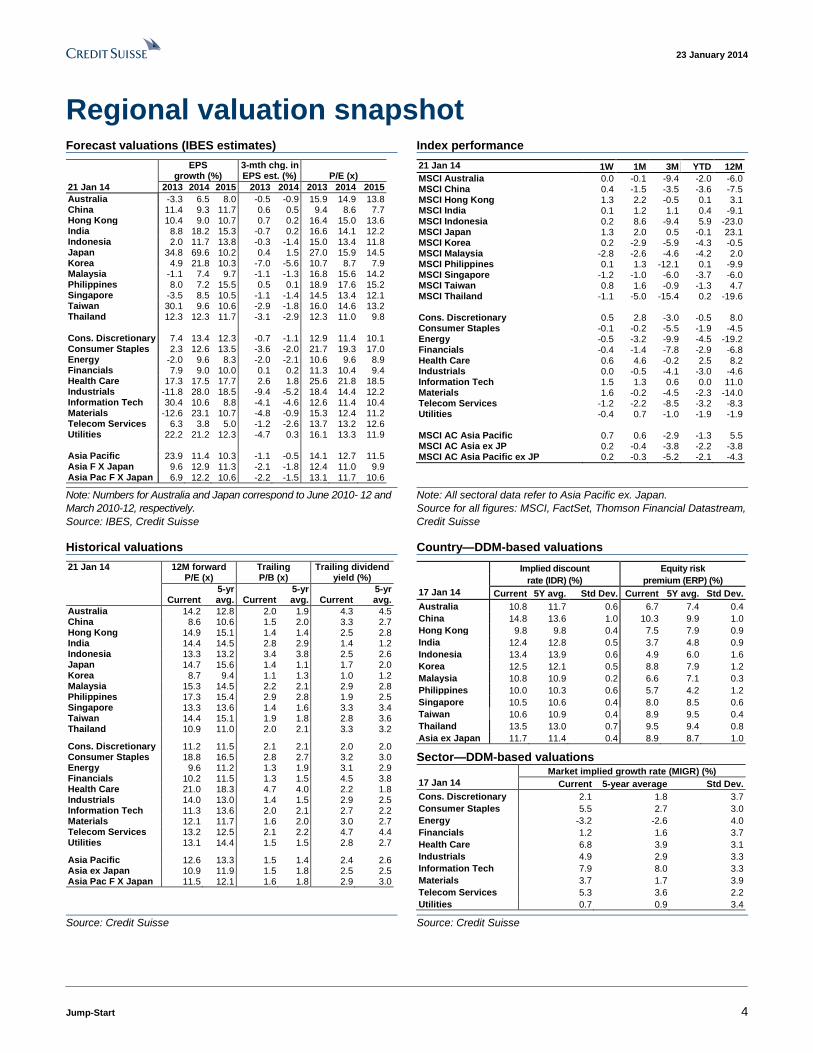
Regional valuation snapshot Forecast valuations (IBES estimates) Index performance
EPS 3-mth chg. in growth (%) EPS est. (%) P/E (x)
21 Jan 14 2013 2014 2015 2013 2014 2013 2014 2015
Australia -3.3 6.5 8.0 -0.5 -0.9 15.9 14.9 13.8 China 11.4 9.3 11.7 0.6 0.5 9.4 8.6 7.7 Hong Kong 10.4 9.0 10.7 0.7 0.2 16.4 15.0 13.6 India 8.8 18.2 15.3 -0.7 0.2 16.6 14.1 12.2 Indonesia 2.0 11.7 13.8 -0.3 -1.4 15.0 13.4 11.8 Japan 34.8 69.6 10.2 0.4 1.5 27.0 15.9 14.5 Korea 4.9 21.8 10.3 -7.0 -5.6 10.7 8.7 7.9 Malaysia -1.1 7.4 9.7 -1.1 -1.3 16.8 15.6 14.2 Philippines 8.0 7.2 15.5 0.5 0.1 18.9 17.6 15.2 Singapore -3.5 8.5 10.5 -1.1 -1.4 14.5 13.4 12.1 Taiwan 30.1 9.6 10.6 -2.9 -1.8 16.0 14.6 13.2 Thailand 12.3 12.3 11.7 -3.1 -2.9 12.3 11.0 9.8
Cons. Discretionary 7.4 13.4 12.3 -0.7 -1.1 12.9 11.4 10.1 Consumer Staples 2.3 12.6 13.5 -3.6 -2.0 21.7 19.3 17.0 Energy -2.0 9.6 8.3 -2.0 -2.1 10.6 9.6 8.9 Financials 7.9 9.0 10.0 0.1 0.2 11.3 10.4 9.4 Health Care 17.3 17.5 17.7 2.6 1.8 25.6 21.8 18.5 Industrials -11.8 28.0 18.5 -9.4 -5.2 18.4 14.4 12.2 Information Tech 30.4 10.6 8.8 -4.1 -4.6 12.6 11.4 10.4 Materials -12.6 23.1 10.7 -4.8 -0.9 15.3 12.4 11.2 Telecom Services 6.3 3.8 5.0 -1.2 -2.6 13.7 13.2 12.6 Utilities 22.2 21.2 12.3 -4.7 0.3 16.1 13.3 11.9
Asia Pacific 23.9 11.4 10.3 -1.1 -0.5 14.1 12.7 11.5 Asia F X Japan 9.6 12.9 11.3 -2.1 -1.8 12.4 11.0 9.9 Asia Pac F X Japan 6.9 12.2 10.6 -2.2 -1.5 13.1 11.7 10.6
21 Jan 14 1W 1M 3M YTD 12M
MSCI Australia 0.0 -0.1 -9.4 -2.0 -6.0 MSCI China 0.4 -1.5 -3.5 -3.6 -7.5 MSCI Hong Kong 1.3 2.2 -0.5 0.1 3.1 MSCI India 0.1 1.2 1.1 0.4 -9.1 MSCI Indonesia 0.2 8.6 -9.4 5.9 -23.0 MSCI Japan 1.3 2.0 0.5 -0.1 23.1 MSCI Korea 0.2 -2.9 -5.9 -4.3 -0.5 MSCI Malaysia -2.8 -2.6 -4.6 -4.2 2.0 MSCI Philippines 0.1 1.3 -12.1 0.1 -9.9 MSCI Singapore -1.2 -1.0 -6.0 -3.7 -6.0 MSCI Taiwan 0.8 1.6 -0.9 -1.3 4.7 MSCI Thailand -1.1 -5.0 -15.4 0.2 -19.6 Cons. Discretionary 0.5 2.8 -3.0 -0.5 8.0 Consumer Staples -0.1 -0.2 -5.5 -1.9 -4.5 Energy -0.5 -3.2 -9.9 -4.5 -19.2 Financials -0.4 -1.4 -7.8 -2.9 -6.8 Health Care 0.6 4.6 -0.2 2.5 8.2 Industrials 0.0 -0.5 -4.1 -3.0 -4.6 Information Tech 1.5 1.3 0.6 0.0 11.0 Materials 1.6 -0.2 -4.5 -2.3 -14.0 Telecom Services -1.2 -2.2 -8.5 -3.2 -8.3 Utilities -0.4 0.7 -1.0 -1.9 -1.9 MSCI AC Asia Pacific 0.7 0.6 -2.9 -1.3 5.5 MSCI AC Asia ex JP 0.2 -0.4 -3.8 -2.2 -3.8 MSCI AC Asia Pacific ex JP 0.2 -0.3 -5.2 -2.1 -4.3
Note: Numbers for Australia and Japan correspond to June 2010- 12 and
March 2010-12, respectively.
Source: IBES, Credit Suisse
Note: All sectoral data refer to Asia Pacific ex. Japan.
Source for all figures: MSCI, FactSet, Thomson Financial Datastream,
Credit Suisse
Historical valuations Country—DDM-based valuations
21 Jan 14 12M forward P/E (x)
Trailing P/B (x)
Trailing dividend yield (%)
Current 5-yr avg. Current
5-yr avg. Current
5-yr avg.
Australia 14.2 12.8 2.0 1.9 4.3 4.5 China 8.6 10.6 1.5 2.0 3.3 2.7 Hong Kong 14.9 15.1 1.4 1.4 2.5 2.8 India 14.4 14.5 2.8 2.9 1.4 1.2 Indonesia 13.3 13.2 3.4 3.8 2.5 2.6 Japan 14.7 15.6 1.4 1.1 1.7 2.0 Korea 8.7 9.4 1.1 1.3 1.0 1.2 Malaysia 15.3 14.5 2.2 2.1 2.9 2.8 Philippines 17.3 15.4 2.9 2.8 1.9 2.5 Singapore 13.3 13.6 1.4 1.6 3.3 3.4 Taiwan 14.4 15.1 1.9 1.8 2.8 3.6 Thailand 10.9 11.0 2.0 2.1 3.3 3.2
Cons. Discretionary 11.2 11.5 2.1 2.1 2.0 2.0 Consumer Staples 18.8 16.5 2.8 2.7 3.2 3.0 Energy 9.6 11.2 1.3 1.9 3.1 2.9 Financials 10.2 11.5 1.3 1.5 4.5 3.8 Health Care 21.0 18.3 4.7 4.0 2.2 1.8 Industrials 14.0 13.0 1.4 1.5 2.9 2.5 Information Tech 11.3 13.6 2.0 2.1 2.7 2.2 Materials 12.1 11.7 1.6 2.0 3.0 2.7 Telecom Services 13.2 12.5 2.1 2.2 4.7 4.4 Utilities 13.1 14.4 1.5 1.5 2.8 2.7
Asia Pacific 12.6 13.3 1.5 1.4 2.4 2.6 Asia ex Japan 10.9 11.9 1.5 1.8 2.5 2.5 Asia Pac F X Japan 11.5 12.1 1.6 1.8 2.9 3.0
Implied discount Equity risk
rate (IDR) (%) premium (ERP) (%)
17 Jan 14 Current 5Y avg. Std Dev. Current 5Y avg. Std Dev.
Australia 10.8 11.7 0.6 6.7 7.4 0.4
China 14.8 13.6 1.0 10.3 9.9 1.0
Hong Kong 9.8 9.8 0.4 7.5 7.9 0.9
India 12.4 12.8 0.5 3.7 4.8 0.9
Indonesia 13.4 13.9 0.6 4.9 6.0 1.6
Korea 12.5 12.1 0.5 8.8 7.9 1.2
Malaysia 10.8 10.9 0.2 6.6 7.1 0.3
Philippines 10.0 10.3 0.6 5.7 4.2 1.2
Singapore 10.5 10.6 0.4 8.0 8.5 0.6
Taiwan 10.6 10.9 0.4 8.9 9.5 0.4
Thailand 13.5 13.0 0.7 9.5 9.4 0.8
Asia ex Japan 11.7 11.4 0.4 8.9 8.7 1.0
Sector—DDM-based valuations Market implied growth rate (MIGR) (%)
17 Jan 14 Current 5-year average Std Dev.
Cons. Discretionary 2.1 1.8 3.7
Consumer Staples 5.5 2.7 3.0
Energy -3.2 -2.6 4.0
Financials 1.2 1.6 3.7
Health Care 6.8 3.9 3.1
Industrials 4.9 2.9 3.3
Information Tech 7.9 8.0 3.3
Materials 3.7 1.7 3.9
Telecom Services 5.3 3.6 2.2
Utilities 0.7 0.9 3.4
Source: Credit Suisse Source: Credit Suisse

23 January 2014
Jump-Start 5
GEM valuation snapshot Historical valuations Forecast valuations (IBES estimates) (continued)
21 Jan 14 12M P/E (x) Trailing P/B (x) Trailing DY (%)
Current 5-yr
avg. Current 5-yr avg. Current
5-yr avg.
Brazil 9.4 10.2 1.3 1.7 4.1 3.7 Chile 14.3 15.7 1.7 2.3 2.2 1.9 China 8.6 10.7 1.5 2.0 3.3 2.7 Colombia 12.9 15.5 1.5 2.0 3.3 2.9 Czech Republic 11.7 10.3 1.4 1.8 7.2 7.0 Egypt 8.7 8.6 1.6 1.7 2.2 4.0 Hungary 9.8 8.7 1.0 1.1 2.4 2.5 India 14.4 14.5 2.8 2.9 1.4 1.2 Indonesia 13.3 13.3 3.4 3.8 2.5 2.6 Korea 8.7 9.4 1.1 1.3 1.0 1.2 Malaysia 15.3 14.5 2.2 2.1 2.9 2.8 Mexico 17.5 14.8 2.8 2.8 1.5 1.7 Morocco 12.6 13.1 2.7 4.1 4.4 4.5 Pakistan 8.5 7.0 2.8 2.0 6.0 7.1 Peru 12.6 12.0 2.2 3.6 2.1 2.5 Philippines 17.3 15.4 2.9 2.8 1.9 2.5 Poland 12.9 11.4 1.3 1.4 4.5 4.3 Russia 4.7 5.9 0.7 1.0 3.5 2.5 South Africa 14.2 11.4 2.7 2.4 2.9 3.0 Taiwan 14.4 15.2 1.9 1.8 2.8 3.6 Thailand 10.9 11.0 2.0 2.1 3.3 3.2 Turkey 8.5 9.4 1.4 1.7 2.7 2.6
Consumer Discretionary 11.2 11.3 2.1 2.3 1.4 1.5 Consumer Staples 19.6 18.1 3.5 3.5 2.0 2.0 Energy 6.4 7.8 0.8 1.3 4.1 3.0 Financials 8.3 10.2 1.3 1.7 3.3 2.7 Health Care 19.8 17.3 3.6 3.5 1.1 1.0 Industrials 13.3 12.3 1.4 1.7 1.9 2.0 Information Technology 11.3 13.6 2.1 2.2 1.6 2.2 Materials 11.7 10.6 1.3 1.7 2.8 3.1 Telecomms Services 12.2 11.6 2.2 2.3 3.9 3.9 Utilities 11.0 11.6 1.0 1.1 3.2 3.3
EMF 10.1 10.7 1.5 1.8 2.7 2.6 EM Asia 10.3 11.5 1.5 1.8 2.4 2.3 EM Europe 6.4 7.0 0.9 1.1 3.6 2.9 EM Latin America 11.3 11.4 1.6 1.9 3.1 3.0
Forecast valuations (IBES estimates) 21 Jan 14 EPS growth 3M chg. in P/E
(%) est. (%) (x)
2013 2014 2015 2013 2014 2013 2014 2015
Brazil 10.8 17.9 11.6 -3.7 -0.3 11.2 9.5 8.5
Chile 3.9 23.5 16.8 -4.4 -2.8 17.9 14.5 12.4
China 11.4 9.3 11.7 0.6 0.5 9.4 8.6 7.7
Colombia -11.0 11.6 7.5 -2.5 -2.4 15.6 14.0 12.1
Czech Republic -7.7 -12.3 -5.2 0.3 -3.3 10.2 11.6 12.3
Egypt -19.5 58.6 15.6 -19.8 -12.5 14.0 8.8 7.6
Hungary -19.4 19.6 15.1 -9.8 -7.2 11.9 9.9 8.6
India 8.8 18.2 15.3 -0.7 0.2 16.6 14.1 12.2
Indonesia 2.0 11.7 13.8 -0.3 -1.4 15.0 13.4 11.8
Korea 4.9 21.8 10.3 -7.0 -5.6 10.7 8.7 7.9
Malaysia -1.1 7.4 9.7 -1.1 -1.3 16.8 15.6 14.2
Mexico -6.0 15.6 12.9 -4.1 -2.5 20.5 17.7 15.7
Morocco -5.8 7.8 6.1 -0.3 -0.1 13.6 12.6 11.9
Pakistan 2.4 22.0 17.6 1.4 1.2 11.0 9.0 7.7
Peru -30.9 18.2 18.9 -9.6 -6.9 28.2 23.9 20.1
Philippines 8.0 7.2 15.5 0.5 0.1 18.9 17.6 15.2
Poland -23.4 2.4 10.3 1.3 -0.3 13.4 13.0 11.8
Russia -2.7 -2.3 -2.3 0.4 0.1 4.6 4.7 4.8
South Africa 2.0 13.3 10.5 -2.1 -0.5 16.4 14.5 13.1
Taiwan 30.1 9.6 10.6 -2.9 -1.8 16.0 14.6 13.2
Thailand 12.3 12.3 11.7 -3.1 -2.9 12.3 11.0 9.8
Turkey 6.8 7.6 18.4 -1.3 -0.9 9.3 8.6 7.3
21 Jan 14 EPS growth 3M chg. in P/E
(%) est. (%) (x)
2013 2014 2015 2013 2014 2013 2014 2015
Consumer Discretionary 7.6 13.4 12.9 -1.0 -1.6 12.8 11.3 10.0
Consumer Staples 2.8 19.2 16.0 -4.0 -3.6 23.7 19.9 17.2
Energy -2.5 2.8 0.9 -1.6 0.1 6.5 6.3 6.3
Financials 23.6 10.5 13.0 0.2 0.0 9.3 8.5 7.4
Health Care 19.6 23.5 21.6 3.1 3.0 25.1 20.3 16.7
Industrials -17.7 41.1 20.2 -11.8 -4.5 19.2 13.6 11.3
Information Technology 30.4 10.6 8.8 -4.0 -4.5 12.6 11.4 10.5
Materials -9.6 19.2 12.6 -4.6 -2.5 14.2 11.9 10.5
Telecomms Services 4.9 5.9 5.3 -2.5 -2.6 13.0 12.3 11.7
Utilities 42.5 16.7 9.2 -2.6 0.1 12.9 11.1 10.1
EMF 10.6 11.5 10.2 -2.1 -1.5 11.3 10.2 9.2
EM Asia 10.5 13.7 11.4 -2.5 -2.0 11.8 10.4 9.3
EM Europe 21.2 -2.4 2.8 0.9 0.0 6.2 6.4 6.2
EM Latin America 3.9 17.2 12.1 -3.8 -1.1 13.5 11.5 10.2
Index US$ performance 21 Jan 14 1W 1M 3M YTD 12M
Argentina 1.2 -6.1 -3.2 -3.1 45.1
Brazil -2.6 -4.9 -18.2 -6.7 -26.0
Chile -1.4 -3.8 -13.4 -4.5 -31.2
China 0.4 -1.5 -3.5 -3.6 -7.5
Colombia -3.5 -8.7 -19.4 -7.1 -29.7
Czech Republic -1.9 0.8 -7.9 -2.2 -13.5
Egypt -2.2 2.2 13.7 2.4 7.8
Hungary -1.8 4.5 -5.5 2.6 -15.7
India 0.1 1.2 1.1 0.4 -9.1
Jordan 9.4 11.8 20.2 13.8 2.4
Indonesia 0.2 8.6 -9.4 5.9 -23.0
Israel 5.1 8.4 7.2 6.7 14.0
Korea 0.2 -2.9 -5.9 -4.3 -0.5
Malaysia -2.8 -2.6 -4.6 -4.2 2.0
Mexico -3.4 -3.4 0.0 -3.9 -10.6
Morocco 0.2 -1.5 -1.0 0.7 -5.7
Pakistan 1.1 2.7 19.4 4.6 35.4
Peru 2.7 5.0 -3.0 2.4 -32.8
Philippines 0.1 1.3 -12.1 0.1 -9.9
Poland 0.0 -0.8 -6.7 -1.4 -2.1
Russia 0.3 -3.0 -9.5 -3.6 -10.6
South Africa 0.9 -1.2 -7.7 -3.3 -7.8
Taiwan 0.8 1.6 -0.9 -1.3 4.7
Thailand -1.1 -5.0 -15.4 0.2 -19.6
Turkey -5.7 -11.5 -26.4 -7.0 -39.5
Consumer Discretionary -0.3 0.2 -6.0 -2.4 2.5
Consumer Staples -1.9 -4.0 -9.8 -5.3 -12.2
Energy -0.1 -3.5 -12.4 -4.4 -18.8
Financials -1.1 -2.8 -8.9 -3.7 -14.5
Health Care -1.3 0.8 -2.3 -0.4 8.0
Industrials -0.1 -1.5 -5.2 -3.5 -8.5
Information Technology 1.4 1.2 0.3 -0.1 11.4
Materials -0.3 -2.2 -6.8 -4.0 -22.8
Telecommunication Services -1.4 -2.6 -7.0 -3.9 -10.1
Utilities -1.1 -0.6 -4.0 -2.9 -12.2
EMF -0.5 -1.8 -6.9 -3.2 -10.0
EM Asia 0.1 -0.8 -4.1 -2.5 -4.6
EM Europe -1.0 -3.2 -11.4 -3.2 -14.9
EM Latin America -2.7 -4.4 -13.0 -5.6 -23.1
Note: Sectors are EMF sectors.
Source for all figures: MSCI, IBES Aggregates
23 January 2014
Jump-Start 6
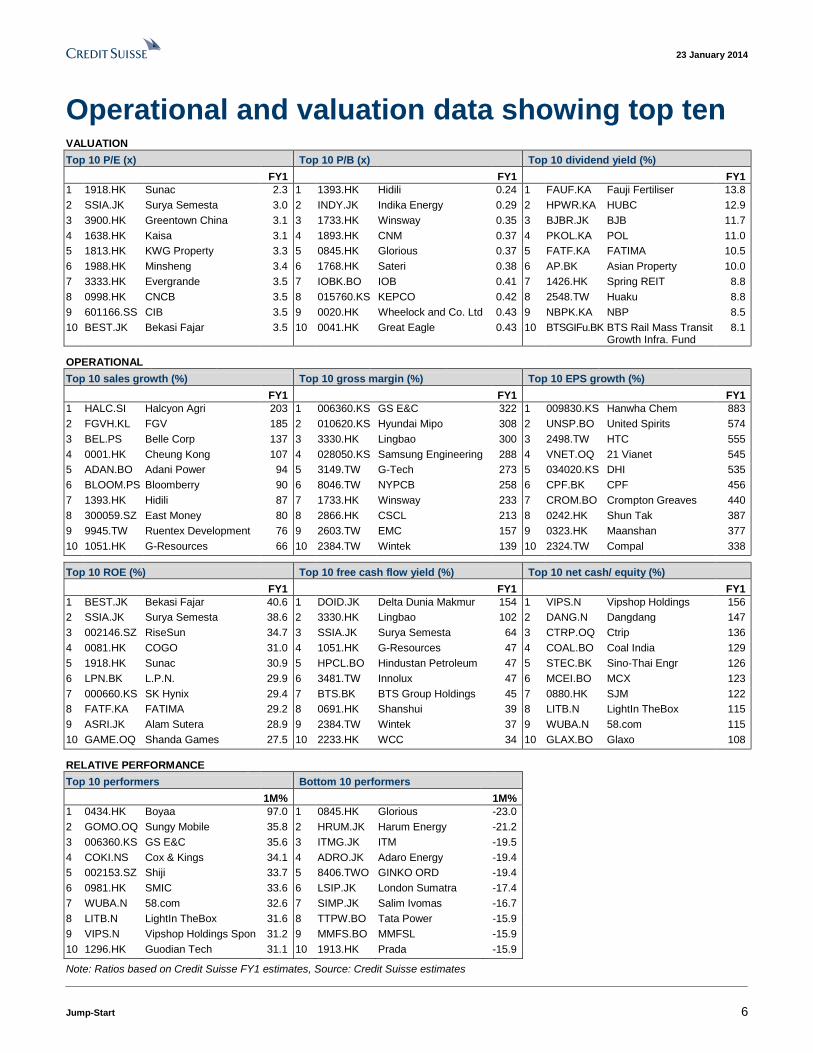
Operational and valuation data showing top ten VALUATION
Top 10 P/E (x) Top 10 P/B (x) Top 10 dividend yield (%)
FY1 FY1 FY1
1 1918.HK Sunac 2.3 1 1393.HK Hidili 0.24 1 FAUF.KA Fauji Fertiliser 13.8
2 SSIA.JK Surya Semesta 3.0 2 INDY.JK Indika Energy 0.29 2 HPWR.KA HUBC 12.9
3 3900.HK Greentown China 3.1 3 1733.HK Winsway 0.35 3 BJBR.JK BJB 11.7
4 1638.HK Kaisa 3.1 4 1893.HK CNM 0.37 4 PKOL.KA POL 11.0
5 1813.HK KWG Property 3.3 5 0845.HK Glorious 0.37 5 FATF.KA FATIMA 10.5
6 1988.HK Minsheng 3.4 6 1768.HK Sateri 0.38 6 AP.BK Asian Property 10.0
7 3333.HK Evergrande 3.5 7 IOBK.BO IOB 0.41 7 1426.HK Spring REIT 8.8
8 0998.HK CNCB 3.5 8 015760.KS KEPCO 0.42 8 2548.TW Huaku 8.8
9 601166.SS CIB 3.5 9 0020.HK Wheelock and Co. Ltd 0.43 9 NBPK.KA NBP 8.5
10 BEST.JK Bekasi Fajar 3.5 10 0041.HK Great Eagle 0.43 10 BTSGIFu.BK BTS Rail Mass Transit Growth Infra. Fund
8.1
OPERATIONAL
Top 10 sales growth (%) Top 10 gross margin (%) Top 10 EPS growth (%)
FY1 FY1 FY1
1 HALC.SI Halcyon Agri 203 1 006360.KS GS E&C 322 1 009830.KS Hanwha Chem 883
2 FGVH.KL FGV 185 2 010620.KS Hyundai Mipo 308 2 UNSP.BO United Spirits 574
3 BEL.PS Belle Corp 137 3 3330.HK Lingbao 300 3 2498.TW HTC 555
4 0001.HK Cheung Kong 107 4 028050.KS Samsung Engineering 288 4 VNET.OQ 21 Vianet 545
5 ADAN.BO Adani Power 94 5 3149.TW G-Tech 273 5 034020.KS DHI 535
6 BLOOM.PS Bloomberry 90 6 8046.TW NYPCB 258 6 CPF.BK CPF 456
7 1393.HK Hidili 87 7 1733.HK Winsway 233 7 CROM.BO Crompton Greaves 440
8 300059.SZ East Money 80 8 2866.HK CSCL 213 8 0242.HK Shun Tak 387
9 9945.TW Ruentex Development 76 9 2603.TW EMC 157 9 0323.HK Maanshan 377
10 1051.HK G-Resources 66 10 2384.TW Wintek 139 10 2324.TW Compal 338
Top 10 ROE (%) Top 10 free cash flow yield (%) Top 10 net cash/ equity (%)
FY1 FY1 FY1
1 BEST.JK Bekasi Fajar 40.6 1 DOID.JK Delta Dunia Makmur 154 1 VIPS.N Vipshop Holdings 156
2 SSIA.JK Surya Semesta 38.6 2 3330.HK Lingbao 102 2 DANG.N Dangdang 147
3 002146.SZ RiseSun 34.7 3 SSIA.JK Surya Semesta 64 3 CTRP.OQ Ctrip 136
4 0081.HK COGO 31.0 4 1051.HK G-Resources 47 4 COAL.BO Coal India 129
5 1918.HK Sunac 30.9 5 HPCL.BO Hindustan Petroleum 47 5 STEC.BK Sino-Thai Engr 126
6 LPN.BK L.P.N. 29.9 6 3481.TW Innolux 47 6 MCEI.BO MCX 123
7 000660.KS SK Hynix 29.4 7 BTS.BK BTS Group Holdings 45 7 0880.HK SJM 122
8 FATF.KA FATIMA 29.2 8 0691.HK Shanshui 39 8 LITB.N LightIn TheBox 115
9 ASRI.JK Alam Sutera 28.9 9 2384.TW Wintek 37 9 WUBA.N 58.com 115
10 GAME.OQ Shanda Games 27.5 10 2233.HK WCC 34 10 GLAX.BO Glaxo 108
RELATIVE PERFORMANCE
Top 10 performers Bottom 10 performers
1M% 1M%
1 0434.HK Boyaa 97.0 1 0845.HK Glorious -23.0 2 GOMO.OQ Sungy Mobile 35.8 2 HRUM.JK Harum Energy -21.2 3 006360.KS GS E&C 35.6 3 ITMG.JK ITM -19.5 4 COKI.NS Cox & Kings 34.1 4 ADRO.JK Adaro Energy -19.4 5 002153.SZ Shiji 33.7 5 8406.TWO GINKO ORD -19.4 6 0981.HK SMIC 33.6 6 LSIP.JK London Sumatra -17.4 7 WUBA.N 58.com 32.6 7 SIMP.JK Salim Ivomas -16.7 8 LITB.N LightIn TheBox 31.6 8 TTPW.BO Tata Power -15.9 9 VIPS.N Vipshop Holdings Spon 31.2 9 MMFS.BO MMFSL -15.9 10 1296.HK Guodian Tech 31.1 10 1913.HK Prada -15.9
Note: Ratios based on Credit Suisse FY1 estimates, Source: Credit Suisse estimates

23 January 2014
Jump-Start 7
Credit Suisse macroeconomic forecasts
23 January 2014
Jump-Start 8
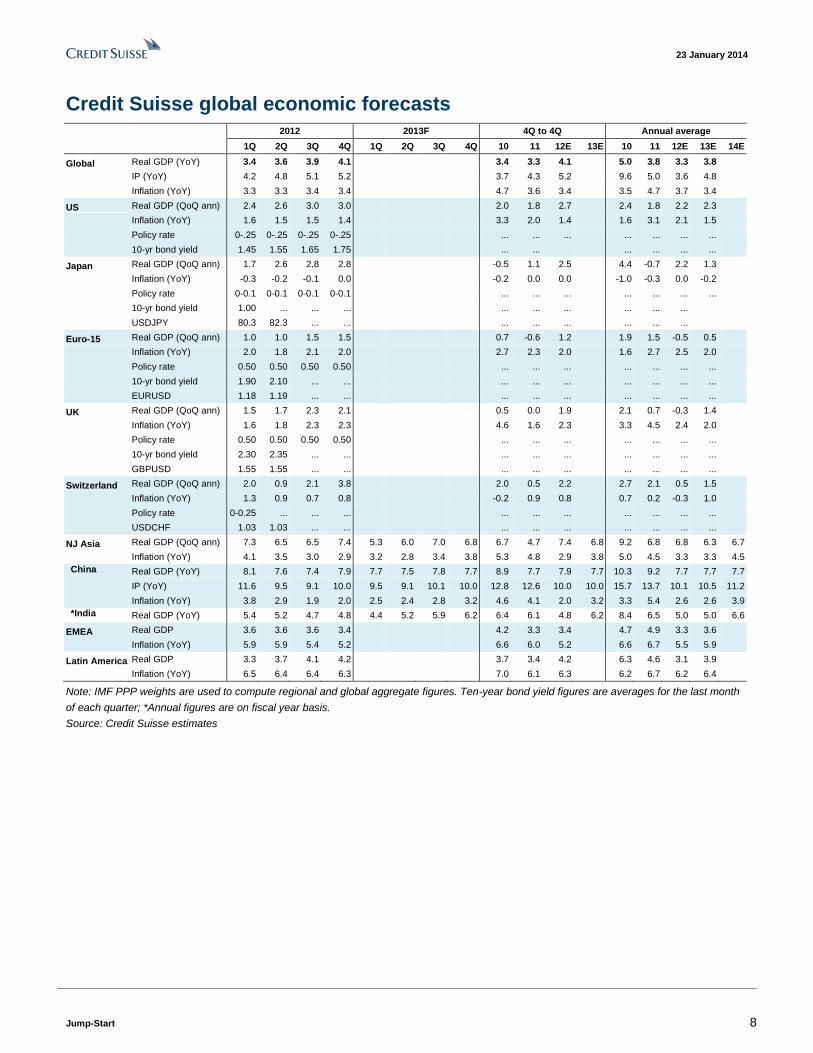
Credit Suisse global economic forecasts
2012 2013F 4Q to 4Q Annual average
1Q 2Q 3Q 4Q 1Q 2Q 3Q 4Q 10 11 12E 13E 10 11 12E 13E 14E
Global Real GDP (YoY) 3.4 3.6 3.9 4.1 3.4 3.3 4.1 5.0 3.8 3.3 3.8
IP (YoY) 4.2 4.8 5.1 5.2 3.7 4.3 5.2 9.6 5.0 3.6 4.8
Inflation (YoY) 3.3 3.3 3.4 3.4 4.7 3.6 3.4 3.5 4.7 3.7 3.4
US Real GDP (QoQ ann) 2.4 2.6 3.0 3.0 2.0 1.8 2.7 2.4 1.8 2.2 2.3
Inflation (YoY) 1.6 1.5 1.5 1.4 3.3 2.0 1.4 1.6 3.1 2.1 1.5
Policy rate 0-.25 0-.25 0-.25 0-.25 ... ... ... ... ... ... ...
10-yr bond yield 1.45 1.55 1.65 1.75 ... ... ... ... ... ...
Japan Real GDP (QoQ ann) 1.7 2.6 2.8 2.8 -0.5 1.1 2.5 4.4 -0.7 2.2 1.3
Inflation (YoY) -0.3 -0.2 -0.1 0.0 -0.2 0.0 0.0 -1.0 -0.3 0.0 -0.2
Policy rate 0-0.1 0-0.1 0-0.1 0-0.1 ... ... ... ... ... ... ...
10-yr bond yield 1.00 ... ... ... ... ... ... ... ... ...
USDJPY 80.3 82.3 ... ... ... ... ... ... ... ...
Euro-15 Real GDP (QoQ ann) 1.0 1.0 1.5 1.5 0.7 -0.6 1.2 1.9 1.5 -0.5 0.5
Inflation (YoY) 2.0 1.8 2.1 2.0 2.7 2.3 2.0 1.6 2.7 2.5 2.0
Policy rate 0.50 0.50 0.50 0.50 ... ... ... ... ... ... ...
10-yr bond yield 1.90 2.10 ... ... ... ... ... ... ... ... ...
EURUSD 1.18 1.19 ... ... ... ... ... ... ... ... ...
UK Real GDP (QoQ ann) 1.5 1.7 2.3 2.1 0.5 0.0 1.9 2.1 0.7 -0.3 1.4
Inflation (YoY) 1.6 1.8 2.3 2.3 4.6 1.6 2.3 3.3 4.5 2.4 2.0
Policy rate 0.50 0.50 0.50 0.50 ... ... ... ... ... ... ...
10-yr bond yield 2.30 2.35 ... ... ... ... ... ... ... ... ...
GBPUSD 1.55 1.55 ... ... ... ... ... ... ... ... ...
Switzerland Real GDP (QoQ ann) 2.0 0.9 2.1 3.8 2.0 0.5 2.2 2.7 2.1 0.5 1.5
Inflation (YoY) 1.3 0.9 0.7 0.8 -0.2 0.9 0.8 0.7 0.2 -0.3 1.0
Policy rate 0-0.25 ... ... ... ... ... ... ... ... ... ...
USDCHF 1.03 1.03 ... ... ... ... ... ... ... ... ...
NJ Asia Real GDP (QoQ ann) 7.3 6.5 6.5 7.4 5.3 6.0 7.0 6.8 6.7 4.7 7.4 6.8 9.2 6.8 6.8 6.3 6.7
Inflation (YoY) 4.1 3.5 3.0 2.9 3.2 2.8 3.4 3.8 5.3 4.8 2.9 3.8 5.0 4.5 3.3 3.3 4.5
China Real GDP (YoY) 8.1 7.6 7.4 7.9 7.7 7.5 7.8 7.7 8.9 7.7 7.9 7.7 10.3 9.2 7.7 7.7 7.7
IP (YoY) 11.6 9.5 9.1 10.0 9.5 9.1 10.1 10.0 12.8 12.6 10.0 10.0 15.7 13.7 10.1 10.5 11.2
Inflation (YoY) 3.8 2.9 1.9 2.0 2.5 2.4 2.8 3.2 4.6 4.1 2.0 3.2 3.3 5.4 2.6 2.6 3.9
*India Real GDP (YoY) 5.4 5.2 4.7 4.8 4.4 5.2 5.9 6.2 6.4 6.1 4.8 6.2 8.4 6.5 5.0 5.0 6.6
EMEA Real GDP 3.6 3.6 3.6 3.4 4.2 3.3 3.4 4.7 4.9 3.3 3.6
Inflation (YoY) 5.9 5.9 5.4 5.2 6.6 6.0 5.2 6.6 6.7 5.5 5.9
Latin America Real GDP 3.3 3.7 4.1 4.2 3.7 3.4 4.2 6.3 4.6 3.1 3.9
Inflation (YoY) 6.5 6.4 6.4 6.3 7.0 6.1 6.3 6.2 6.7 6.2 6.4
Note: IMF PPP weights are used to compute regional and global aggregate figures. Ten-year bond yield figures are averages for the last month
of each quarter; *Annual figures are on fiscal year basis.
Source: Credit Suisse estimates

23 January 2014
Jump-Start 9
Credit Suisse Asian economic forecasts Consensus
2011 2012 2013E 2014E 2015E 2011 2012 2013E 2014E 2015E
China Real GDP 9.2 7.7 7.7 7.7 8.2 9.2 7.7 7.7 7.5 7.4
CPI inflation (year-avg) 5.4 2.6 2.6 3.9 4.1 5.4 2.6 2.6 3.1 3.3
3-month interbank rate (end-year, %) 5.5 3.9 5.3 5.8 5.9 … … … …
Spot 3m 12m
Currency, per USD 6.05 6.03 6.00 6.01 5.98 … … … …
Hong Kong Real GDP 4.9 1.5 3.0 3.4 3.8 5.0 1.5 3.0 3.5 3.6
CPI inflation (year-avg) 5.3 4.1 4.2 3.8 4.0 5.3 4.1 4.3 3.8 3.6
3-month HIBOR (end-year, %) 0.3 0.4 0.4 0.4 0.8 … … … …
Spot 3m 12m
Currency, per USD 7.76 7.80 7.80 7.80 7.80 … … … …
India Real GDP 6.5 5.0 5.0 6.6 6.9 7.2 5.0 4.7 5.4 6.8
WPI inflation (year avg) 8.9 7.4 6.1 5.2 6.2 8.2 7.4
Repo rate (end-year, %) 8.50 7.50 8.00 7.75 7.50 … … … …
Spot 3m 12m . . .
Currency, per USD 61.91 63.50 65.50 65.50 66.50 … … … …
Indonesia Real GDP 6.5 6.2 5.7 5.0 5.3 6.4 6.2 5.7 5.4 5.8
CPI inflation (year-avg) 5.4 4.3 7.0 6.0 5.0 5.3 4.3 7.0 6.2 5.3
Overnight SBI yield (end-year,%) 6.00 5.75 7.50 6.75 6.75 … … … …
Spot 3m 12m
Currency, per USD 12166.00 12,400 12,350 12,400 12,350 … … … …
Korea Real GDP 3.6 2.0 2.8 3.3 3.6 3.6 2.0 2.8 3.5 3.7
CPI inflation (year-avg) 4.0 2.2 1.2 2.2 2.8 4.2 2.2 1.2 2.2 2.6
Overnight call rate (end-year, %) 3.25 2.75 2.50 2.50 2.50 … … … …
Spot 3m 12m
Currency, per USD 1073.79 1,075 1,060 1,055 1,055 … … … …
Malaysia Real GDP 5.1 5.6 4.5 5.0 4.7 4.8 5.6 4.5 5.1 5.0
CPI inflation (year-avg) 3.1 1.7 2.1 3.4 3.3 3.2 1.7 2.1 3.1 3.4
Overnight Policy rate (end-year, %) 3.00 3.00 3.00 3.25 3.50 … … … …
Spot 3m 12m
Currency, per USD 3.33 3.33 3.38 3.38 3.38 … … … …
Philippines Real GDP 3.9 6.8 7.0 6.8 7.0 3.9 6.8 6.9 6.3 6.2
CPI inflation (year-avg) 4.7 3.2 2.9 3.8 3.5 4.6 3.2 2.9 4.0 3.9
Overnight borrowing rate (end-year, %) 4.50 3.50 3.50 3.50 4.25 … … … …
Spot 3m 12m
Currency, per USD 45.30 45.50 45.50 45.80 44.50 …
Singapore Real GDP 4.9 1.3 3.7 4.0 5.0 5.0 1.3 3.7 3.8 3.9
CPI inflation (year-avg) 5.2 4.6 2.4 3.0 3.5 5.1 4.6 2.4 3.0 2.8
3m SIBOR (end-year, %) 0.4 0.4 0.4 0.5 0.8 … … … …
Spot 3m 12m
Currency, per USD 1.28 1.28 1.30 1.29 1.30 … … … …
Taiwan Real GDP 4.0 1.3 2.0 3.2 3.5 4.4 1.3 2.0 3.3 3.8
CPI inflation (year-avg) 1.4 1.9 1.0 1.6 2.2 1.4 1.9 0.8 1.4 1.8
Overnight call rate (end-year, %) 0.4 0.4 0.4 0.4 0.4 … … … …
Spot 3m 12m
Currency, per USD 30.32 30.50 30.30 29.90 29.90 … … … …
Thailand Real GDP 0.1 6.4 2.8 3.0 4.5 1.6 6.5 2.9 3.6 4.6
CPI inflation (year-avg) 3.8 3.0 2.2 2.4 3.0 3.9 3.0 2.2 2.4 2.8
Overnight Repo rate (end-year, %) 3.3 2.8 2.3 2.0 2.5 … … … …
Spot 3m 12m
Currency, per USD 32.93 34.50 34.50 34.50 34.50 … … … …
* Through 2006, Thailand's policy rate was the 14-day repo rate
Source: CEIC, Asia Pacific Consensus Forecasts, Credit Suisse estimates

23 January 2014
Jump-Start 10
Real interest rates Real policy rates
1
Annual forecast
Current 2012 2013(F) 2014(F)
China 3.50 4.00 3.50 2.00
Hong Kong -3.92 -3.39 -3.41 -3.54
India 1.59 0.76 2.00 2.75
Indonesia -0.88 1.34 -0.90 1.95
Korea 1.40 1.03 1.43 -0.60
Malaysia 0.10 1.69 0.08 0.19
Philippines -0.60 0.50 0.10 0.10
Singapore -2.19 -3.61 -1.66 -2.65
Taiwan 1.55 0.03 1.33 0.41
Thailand 0.58 -0.48 0.57 -0.74
1 NJA Policy Rates: China=average one year lending rate, Hong Kong=three-month interbank rate, India=
repo rate, Indonesia=overnight Rate, Korea=base rate, Malaysia-overnight rate, Philippines=overnight rate,
Singapore=three-month interbank rate, Taiwan=discount rate, Thailand=overnight repo rate,
Vietnam=discount rate
Real rates are calculated as 'policy rates – YoY inflation'
Source: Central banks, CEIC, Statistical agencies, Credit Suisse
23 January 2014
Jump-Start 11
Top stories from Credit Suisse research last week
23 January 2014
Jump-Start 12
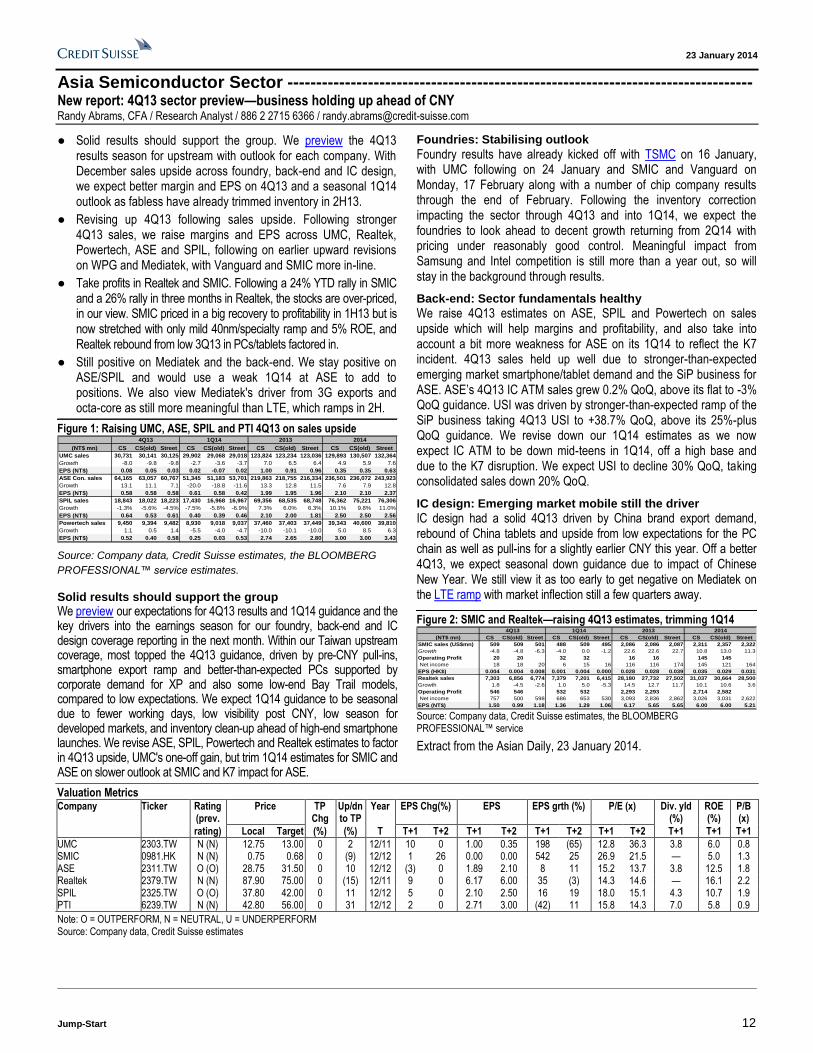
Asia Semiconductor Sector --------------------------------------------------------------------------------- New report: 4Q13 sector preview—business holding up ahead of CNY Randy Abrams, CFA / Research Analyst / 886 2 2715 6366 / [email protected]
● Solid results should support the group. We preview the 4Q13 results season for upstream with outlook for each company. With December sales upside across foundry, back-end and IC design, we expect better margin and EPS on 4Q13 and a seasonal 1Q14 outlook as fabless have already trimmed inventory in 2H13.
● Revising up 4Q13 following sales upside. Following stronger 4Q13 sales, we raise margins and EPS across UMC, Realtek, Powertech, ASE and SPIL, following on earlier upward revisions on WPG and Mediatek, with Vanguard and SMIC more in-line.
● Take profits in Realtek and SMIC. Following a 24% YTD rally in SMIC and a 26% rally in three months in Realtek, the stocks are over-priced, in our view. SMIC priced in a big recovery to profitability in 1H13 but is now stretched with only mild 40nm/specialty ramp and 5% ROE, and Realtek rebound from low 3Q13 in PCs/tablets factored in.
● Still positive on Mediatek and the back-end. We stay positive on ASE/SPIL and would use a weak 1Q14 at ASE to add to positions. We also view Mediatek's driver from 3G exports and octa-core as still more meaningful than LTE, which ramps in 2H.
Figure 1: Raising UMC, ASE, SPIL and PTI 4Q13 on sales upside 4Q13 1Q14 2013 2014
(NT$ mn) CS CS(old) Street CS CS(old) Street CS CS(old) Street CS CS(old) Street
UMC sales 30,731 30,141 30,125 29,902 29,068 29,018 123,824 123,234 123,036 129,893 130,507 132,364
Growth -8.0 -9.8 -9.8 -2.7 -3.6 -3.7 7.0 6.5 6.4 4.9 5.9 7.6
EPS (NT$) 0.08 0.05 0.03 0.02 -0.07 0.02 1.00 0.91 0.96 0.35 0.35 0.63
ASE Con. sales 64,165 63,057 60,767 51,345 51,183 53,701 219,863 218,755 216,334 236,501 236,072 243,923
Growth 13.1 11.1 7.1 -20.0 -18.8 -11.6 13.3 12.8 11.5 7.6 7.9 12.8
EPS (NT$) 0.58 0.58 0.58 0.61 0.58 0.42 1.99 1.95 1.96 2.10 2.10 2.37
SPIL sales 18,843 18,022 18,223 17,430 16,968 16,967 69,356 68,535 68,748 76,362 75,221 76,306
Growth -1.3% -5.6% -4.5% -7.5% -5.8% -6.9% 7.3% 6.0% 6.3% 10.1% 9.8% 11.0%
EPS (NT$) 0.64 0.53 0.61 0.40 0.39 0.46 2.10 2.00 1.81 2.50 2.50 2.56
Powertech sales 9,450 9,394 9,482 8,930 9,018 9,037 37,460 37,403 37,449 39,343 40,600 39,810
Growth 1.1 0.5 1.4 -5.5 -4.0 -4.7 -10.0 -10.1 -10.0 5.0 8.5 6.3
EPS (NT$) 0.52 0.40 0.58 0.25 0.03 0.53 2.74 2.65 2.80 3.00 3.00 3.43
Source: Company data, Credit Suisse estimates, the BLOOMBERG
PROFESSIONAL™ service estimates.
Solid results should support the group
We preview our expectations for 4Q13 results and 1Q14 guidance and the key drivers into the earnings season for our foundry, back-end and IC design coverage reporting in the next month. Within our Taiwan upstream coverage, most topped the 4Q13 guidance, driven by pre-CNY pull-ins, smartphone export ramp and better-than-expected PCs supported by corporate demand for XP and also some low-end Bay Trail models, compared to low expectations. We expect 1Q14 guidance to be seasonal due to fewer working days, low visibility post CNY, low season for developed markets, and inventory clean-up ahead of high-end smartphone launches. We revise ASE, SPIL, Powertech and Realtek estimates to factor in 4Q13 upside, UMC's one-off gain, but trim 1Q14 estimates for SMIC and ASE on slower outlook at SMIC and K7 impact for ASE.
Foundries: Stabilising outlook
Foundry results have already kicked off with TSMC on 16 January, with UMC following on 24 January and SMIC and Vanguard on Monday, 17 February along with a number of chip company results through the end of February. Following the inventory correction impacting the sector through 4Q13 and into 1Q14, we expect the foundries to look ahead to decent growth returning from 2Q14 with pricing under reasonably good control. Meaningful impact from Samsung and Intel competition is still more than a year out, so will stay in the background through results.
Back-end: Sector fundamentals healthy
We raise 4Q13 estimates on ASE, SPIL and Powertech on sales upside which will help margins and profitability, and also take into account a bit more weakness for ASE on its 1Q14 to reflect the K7 incident. 4Q13 sales held up well due to stronger-than-expected emerging market smartphone/tablet demand and the SiP business for ASE. ASE’s 4Q13 IC ATM sales grew 0.2% QoQ, above its flat to -3% QoQ guidance. USI was driven by stronger-than-expected ramp of the SiP business taking 4Q13 USI to +38.7% QoQ, above its 25%-plus QoQ guidance. We revise down our 1Q14 estimates as we now expect IC ATM to be down mid-teens in 1Q14, off a high base and due to the K7 disruption. We expect USI to decline 30% QoQ, taking consolidated sales down 20% QoQ.
IC design: Emerging market mobile still the driver
IC design had a solid 4Q13 driven by China brand export demand, rebound of China tablets and upside from low expectations for the PC chain as well as pull-ins for a slightly earlier CNY this year. Off a better 4Q13, we expect seasonal down guidance due to impact of Chinese New Year. We still view it as too early to get negative on Mediatek on the LTE ramp with market inflection still a few quarters away.
Figure 2: SMIC and Realtek—raising 4Q13 estimates, trimming 1Q14 4Q13 1Q14 2013 2014
(NT$ mn) CS CS(old) Street CS CS(old) Street CS CS(old) Street CS CS(old) Street
SMIC sales (US$mn) 509 509 501 488 509 495 2,086 2,086 2,087 2,311 2,357 2,322
Growth -4.8 -4.8 -6.3 -4.0 0.0 -1.2 22.6 22.6 22.7 10.8 13.0 11.3
Operating Profit 20 20 32 32 16 16 145 145
Net income 18 18 20 6 15 16 116 116 174 145 121 164
EPS (HK$) 0.004 0.004 0.008 0.001 0.004 0.000 0.028 0.028 0.039 0.035 0.029 0.031
Realtek sales 7,303 6,856 6,774 7,379 7,201 6,415 28,180 27,732 27,502 31,037 30,664 28,500
Growth 1.8 -4.5 -2.6 1.0 5.0 -5.3 14.5 12.7 11.7 10.1 10.6 3.6
Operating Profit 546 546 532 532 2,293 2,293 2,714 2,582
Net income 757 500 598 686 653 530 3,093 2,836 2,862 3,026 3,031 2,622
EPS (NT$) 1.50 0.99 1.18 1.36 1.29 1.06 6.17 5.65 5.65 6.00 6.00 5.21 Source: Company data, Credit Suisse estimates, the BLOOMBERG PROFESSIONAL™ service
Extract from the Asian Daily, 23 January 2014.
Valuation Metrics Company Ticker Rating
(prev. Price TP
Chg Up/dn to TP
Year EPS Chg(%) EPS EPS grth (%) P/E (x) Div. yld (%)
ROE (%)
P/B (x)
rating) Local Target (%) (%) T T+1 T+2 T+1 T+2 T+1 T+2 T+1 T+2 T+1 T+1 T+1
UMC 2303.TW N (N) 12.75 13.00 0 2 12/11 10 0 1.00 0.35 198 (65) 12.8 36.3 3.8 6.0 0.8 SMIC 0981.HK N (N) 0.75 0.68 0 (9) 12/12 1 26 0.00 0.00 542 25 26.9 21.5 — 5.0 1.3 ASE 2311.TW O (O) 28.75 31.50 0 10 12/12 (3) 0 1.89 2.10 8 11 15.2 13.7 3.8 12.5 1.8 Realtek 2379.TW N (N) 87.90 75.00 0 (15) 12/11 9 0 6.17 6.00 35 (3) 14.3 14.6 — 16.1 2.2 SPIL 2325.TW O (O) 37.80 42.00 0 11 12/12 5 0 2.10 2.50 16 19 18.0 15.1 4.3 10.7 1.9 PTI 6239.TW N (N) 42.80 56.00 0 31 12/12 2 0 2.71 3.00 (42) 11 15.8 14.3 7.0 5.8 0.9
Note: O = OUTPERFORM, N = NEUTRAL, U = UNDERPERFORM Source: Company data, Credit Suisse estimates
23 January 2014
Jump-Start 13
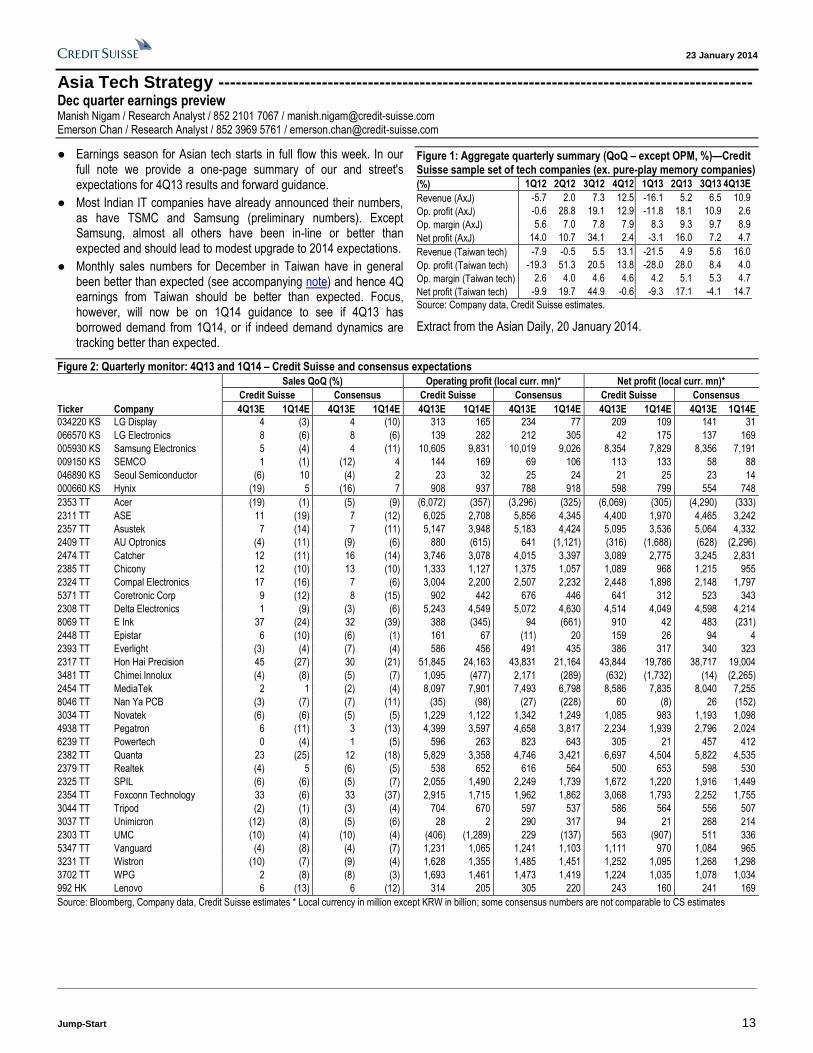
Asia Tech Strategy --------------------------------------------------------------------------------------------- Dec quarter earnings preview Manish Nigam / Research Analyst / 852 2101 7067 / [email protected] Emerson Chan / Research Analyst / 852 3969 5761 / [email protected]
● Earnings season for Asian tech starts in full flow this week. In our full note we provide a one-page summary of our and street's expectations for 4Q13 results and forward guidance.
● Most Indian IT companies have already announced their numbers, as have TSMC and Samsung (preliminary numbers). Except Samsung, almost all others have been in-line or better than expected and should lead to modest upgrade to 2014 expectations.
● Monthly sales numbers for December in Taiwan have in general been better than expected (see accompanying note) and hence 4Q earnings from Taiwan should be better than expected. Focus, however, will now be on 1Q14 guidance to see if 4Q13 has borrowed demand from 1Q14, or if indeed demand dynamics are tracking better than expected.
Figure 1: Aggregate quarterly summary (QoQ – except OPM, %)—Credit Suisse sample set of tech companies (ex. pure-play memory companies)
(%) 1Q12 2Q12 3Q12 4Q12 1Q13 2Q13 3Q13 4Q13E
Revenue (AxJ) -5.7 2.0 7.3 12.5 -16.1 5.2 6.5 10.9
Op. profit (AxJ) -0.6 28.8 19.1 12.9 -11.8 18.1 10.9 2.6
Op. margin (AxJ) 5.6 7.0 7.8 7.9 8.3 9.3 9.7 8.9
Net profit (AxJ) 14.0 10.7 34.1 2.4 -3.1 16.0 7.2 4.7
Revenue (Taiwan tech) -7.9 -0.5 5.5 13.1 -21.5 4.9 5.6 16.0
Op. profit (Taiwan tech) -19.3 51.3 20.5 13.8 -28.0 28.0 8.4 4.0
Op. margin (Taiwan tech) 2.6 4.0 4.6 4.6 4.2 5.1 5.3 4.7
Net profit (Taiwan tech) -9.9 19.7 44.9 -0.6 -9.3 17.1 -4.1 14.7
Source: Company data, Credit Suisse estimates.
Extract from the Asian Daily, 20 January 2014.
Figure 2: Quarterly monitor: 4Q13 and 1Q14 – Credit Suisse and consensus expectations
Sales QoQ (%) Operating profit (local curr. mn)* Net profit (local curr. mn)*
Credit Suisse Consensus Credit Suisse Consensus Credit Suisse Consensus
Ticker Company 4Q13E 1Q14E 4Q13E 1Q14E 4Q13E 1Q14E 4Q13E 1Q14E 4Q13E 1Q14E 4Q13E 1Q14E
034220 KS LG Display 4 (3) 4 (10) 313 165 234 77 209 109 141 31
066570 KS LG Electronics 8 (6) 8 (6) 139 282 212 305 42 175 137 169
005930 KS Samsung Electronics 5 (4) 4 (11) 10,605 9,831 10,019 9,026 8,354 7,829 8,356 7,191
009150 KS SEMCO 1 (1) (12) 4 144 169 69 106 113 133 58 88
046890 KS Seoul Semiconductor (6) 10 (4) 2 23 32 25 24 21 25 23 14
000660 KS Hynix (19) 5 (16) 7 908 937 788 918 598 799 554 748
2353 TT Acer (19) (1) (5) (9) (6,072) (357) (3,296) (325) (6,069) (305) (4,290) (333)
2311 TT ASE 11 (19) 7 (12) 6,025 2,708 5,856 4,345 4,400 1,970 4,465 3,242
2357 TT Asustek 7 (14) 7 (11) 5,147 3,948 5,183 4,424 5,095 3,536 5,064 4,332
2409 TT AU Optronics (4) (11) (9) (6) 880 (615) 641 (1,121) (316) (1,688) (628) (2,296)
2474 TT Catcher 12 (11) 16 (14) 3,746 3,078 4,015 3,397 3,089 2,775 3,245 2,831
2385 TT Chicony 12 (10) 13 (10) 1,333 1,127 1,375 1,057 1,089 968 1,215 955
2324 TT Compal Electronics 17 (16) 7 (6) 3,004 2,200 2,507 2,232 2,448 1,898 2,148 1,797
5371 TT Coretronic Corp 9 (12) 8 (15) 902 442 676 446 641 312 523 343
2308 TT Delta Electronics 1 (9) (3) (6) 5,243 4,549 5,072 4,630 4,514 4,049 4,598 4,214
8069 TT E Ink 37 (24) 32 (39) 388 (345) 94 (661) 910 42 483 (231)
2448 TT Epistar 6 (10) (6) (1) 161 67 (11) 20 159 26 94 4
2393 TT Everlight (3) (4) (7) (4) 586 456 491 435 386 317 340 323
2317 TT Hon Hai Precision 45 (27) 30 (21) 51,845 24,163 43,831 21,164 43,844 19,786 38,717 19,004
3481 TT Chimei Innolux (4) (8) (5) (7) 1,095 (477) 2,171 (289) (632) (1,732) (14) (2,265)
2454 TT MediaTek 2 1 (2) (4) 8,097 7,901 7,493 6,798 8,586 7,835 8,040 7,255
8046 TT Nan Ya PCB (3) (7) (7) (11) (35) (98) (27) (228) 60 (8) 26 (152)
3034 TT Novatek (6) (6) (5) (5) 1,229 1,122 1,342 1,249 1,085 983 1,193 1,098
4938 TT Pegatron 6 (11) 3 (13) 4,399 3,597 4,658 3,817 2,234 1,939 2,796 2,024
6239 TT Powertech 0 (4) 1 (5) 596 263 823 643 305 21 457 412
2382 TT Quanta 23 (25) 12 (18) 5,829 3,358 4,746 3,421 6,697 4,504 5,822 4,535
2379 TT Realtek (4) 5 (6) (5) 538 652 616 564 500 653 598 530
2325 TT SPIL (6) (6) (5) (7) 2,055 1,490 2,249 1,739 1,672 1,220 1,916 1,449
2354 TT Foxconn Technology 33 (6) 33 (37) 2,915 1,715 1,962 1,862 3,068 1,793 2,252 1,755
3044 TT Tripod (2) (1) (3) (4) 704 670 597 537 586 564 556 507
3037 TT Unimicron (12) (8) (5) (6) 28 2 290 317 94 21 268 214
2303 TT UMC (10) (4) (10) (4) (406) (1,289) 229 (137) 563 (907) 511 336
5347 TT Vanguard (4) (8) (4) (7) 1,231 1,065 1,241 1,103 1,111 970 1,084 965
3231 TT Wistron (10) (7) (9) (4) 1,628 1,355 1,485 1,451 1,252 1,095 1,268 1,298
3702 TT WPG 2 (8) (8) (3) 1,693 1,461 1,473 1,419 1,224 1,035 1,078 1,034
992 HK Lenovo 6 (13) 6 (12) 314 205 305 220 243 160 241 169
Source: Bloomberg, Company data, Credit Suisse estimates * Local currency in million except KRW in billion; some consensus numbers are not comparable to CS estimates

23 January 2014
Jump-Start 14
Australian Investment Strategy ---------------------------------------------------------------------------- Rise of the Selfies Hasan Tevfik ,CFA / Research Analyst / 61 2 8205 4284 / [email protected] Damien Boey / Research Analyst / 61 2 8205 4615 / [email protected]
● Self Managed Super Funds (Selfies) own A$220 bn, or 16%, of the Australian equity market. We estimate Selfies are currently committing an additional A$2 bn net per quarter to the asset class. Strong inflows will continue for a number of years. Full report.
● Our discussions with SMSF advisors suggest Selfies want high dividend yields, from large companies they identify with, and have a history of DPS growth. They have a Tier 1 group of stocks that include the big four Banks and Telstra. They hate dividend cuts and are not interested in financing capex.
● Strategies to adopt as SMSFs increasingly dominate Australian equities. First, do not short their Tier 1 stocks unless expecting a dividend cut. Second, concentrate more on dividend yields & DPS growth and less on PEs & EPS growth. Third, buy what they will buy next. Fourth, don't expect a massive capex rebound.
● SMSFs are retarding investment, employment and growth in Australia. We remove Westpac from our Short Ideas and replace with Brambles.
Figure 1: Selfies own 16% of the equity market Allocation to Aussie Equities by SMSFs $bn and % of All Ords
Source: ATO, ASX, Credit Suisse estimates.
Rise of the Selfies
Superannuation in Australia is one of the most advanced pension systems in the world. Within the broader pool of Superannuation there is a component which is growing at an extraordinary rate called the Self-Managed Superannuation Funds (SMSFs or Selfies). These are individual pools of capital managed by the eventual beneficiaries. SMSFs own A$220 bn worth of Aussie equities and are currently committing an additional A$2 bn a quarter into the market. They are now one of Australia's most powerful equity investors. In this report we outline how important this pool of capital has become. Our candid discussions with SMSF advisors help to reveal how they select stocks. We also outline strategies investors should adopt as Selfies continue to dominate the local market. Finally, we make some stock changes to our Strategy Long/Short Ideas. Amongst the Longs we remove Amcor, Myer, Orora and Telecom New Zealand. We replace with CSR, David Jones and SEEK. Amongst the Shorts we remove Westpac and replace with Brambles.
One of Australia's Biggest Equity Investors
Superannuation is the compulsory pension arrangement in Australia allowing employees to save for their retirement. Similar schemes in other countries include IRAs and 401ks in the US, the Mandatory
Provident Fund in Hong Kong and KiwiSaver in New Zealand. Superannuation has been in place for public sector employees since the 1980s and was extended to the private sector in 1992 when the government also made contributions compulsory. In 1993 and in 1997 legislation changes helped to drive the growth of Self-Managed Superannuation Funds (SMFSs or Selfies). These are tax advantaged funds managed by the eventual beneficiaries.
The growth of Selfies has been exceptional. There were 70 thousand SMSFs in 1994 and now there are 510 thousand. These funds manage money for almost a million members and assets under management have grown to more than A$500 bn (Figure 2). An investment culture is clearly entrenched in Australia. They are contributing A$15 bn of net new money to their funds per year. With inflows of this magnitude we can understand how Selfies can be an important marginal investor for many assets. Under the current legislation we expect flows into superannuation funds to be positive until 2026. Of course an industry this big will be generating considerable fees. The Australian Tax Office (ATO) notes that admin and investment expenses for SMSFs are closing in on A$2 bn per annum.
The asset allocation of this enormous pool of pension savings has a definite bias to Australian equities. 43% of assets is in equities and almost all of which is domestically listed. A further 29% is in cash and 23% is in property. We believe a natural asset for an aging pension scheme is Corporate Bonds. Corporate Bonds generally provide a higher yield than cash and government bonds but with much lower volatility than equities. Of course there is no real credit market in Australia for this massive group of investors to buy into. But it seems like Selfies are trying to re-create the return and volatility profile of corporate debt through their bar-bell position in equities and cash.
Figure 2: Selfies Have A$520 bn under management
Source: ATO, Credit Suisse estimates.
(This is an extract from Australian Investment Strategy report, Rise of the Selfies, published on 16 January 2014. For details, please see the CS Research & Analytics website.)
Extract from the Asian Daily, 17 January 2014.
23 January 2014
Jump-Start 15
China Internet Sector ------------------------------------------------------------------------------------------ New report: Live and breathe the Net Dick Wei / Research Analyst / 852 2101 7339 / [email protected] Evan Zhou / Research Analyst / 852 2101 6745 / [email protected]
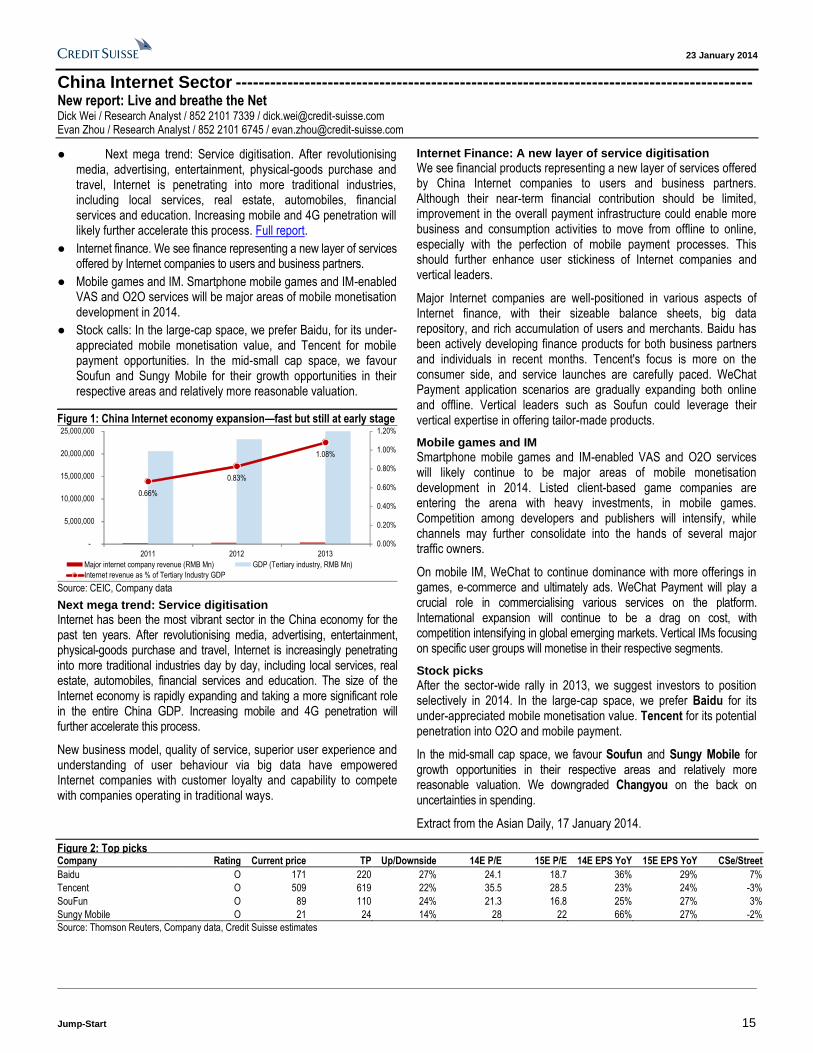
● Next mega trend: Service digitisation. After revolutionising media, advertising, entertainment, physical-goods purchase and travel, Internet is penetrating into more traditional industries, including local services, real estate, automobiles, financial services and education. Increasing mobile and 4G penetration will likely further accelerate this process. Full report.
● Internet finance. We see finance representing a new layer of services offered by Internet companies to users and business partners.
● Mobile games and IM. Smartphone mobile games and IM-enabled VAS and O2O services will be major areas of mobile monetisation development in 2014.
● Stock calls: In the large-cap space, we prefer Baidu, for its under-appreciated mobile monetisation value, and Tencent for mobile payment opportunities. In the mid-small cap space, we favour Soufun and Sungy Mobile for their growth opportunities in their respective areas and relatively more reasonable valuation.
Figure 1: China Internet economy expansion—fast but still at early stage
0.66%
0.83%
1.08%
0.00%
0.20%
0.40%
0.60%
0.80%
1.00%
1.20%
-
5,000,000
10,000,000
15,000,000
20,000,000
25,000,000
2011 2012 2013
Major internet company revenue (RMB Mn) GDP (Tertiary industry, RMB Mn)
Internet revenue as % of Tertiary Industry GDP Source: CEIC, Company data
Next mega trend: Service digitisation
Internet has been the most vibrant sector in the China economy for the past ten years. After revolutionising media, advertising, entertainment, physical-goods purchase and travel, Internet is increasingly penetrating into more traditional industries day by day, including local services, real estate, automobiles, financial services and education. The size of the Internet economy is rapidly expanding and taking a more significant role in the entire China GDP. Increasing mobile and 4G penetration will further accelerate this process.
New business model, quality of service, superior user experience and understanding of user behaviour via big data have empowered Internet companies with customer loyalty and capability to compete with companies operating in traditional ways.
Internet Finance: A new layer of service digitisation
We see financial products representing a new layer of services offered by China Internet companies to users and business partners. Although their near-term financial contribution should be limited, improvement in the overall payment infrastructure could enable more business and consumption activities to move from offline to online, especially with the perfection of mobile payment processes. This should further enhance user stickiness of Internet companies and vertical leaders.
Major Internet companies are well-positioned in various aspects of Internet finance, with their sizeable balance sheets, big data repository, and rich accumulation of users and merchants. Baidu has been actively developing finance products for both business partners and individuals in recent months. Tencent's focus is more on the consumer side, and service launches are carefully paced. WeChat Payment application scenarios are gradually expanding both online and offline. Vertical leaders such as Soufun could leverage their vertical expertise in offering tailor-made products.
Mobile games and IM
Smartphone mobile games and IM-enabled VAS and O2O services will likely continue to be major areas of mobile monetisation development in 2014. Listed client-based game companies are entering the arena with heavy investments, in mobile games. Competition among developers and publishers will intensify, while channels may further consolidate into the hands of several major traffic owners.
On mobile IM, WeChat to continue dominance with more offerings in games, e-commerce and ultimately ads. WeChat Payment will play a crucial role in commercialising various services on the platform. International expansion will continue to be a drag on cost, with competition intensifying in global emerging markets. Vertical IMs focusing on specific user groups will monetise in their respective segments.
Stock picks
After the sector-wide rally in 2013, we suggest investors to position selectively in 2014. In the large-cap space, we prefer Baidu for its under-appreciated mobile monetisation value. Tencent for its potential penetration into O2O and mobile payment.
In the mid-small cap space, we favour Soufun and Sungy Mobile for growth opportunities in their respective areas and relatively more reasonable valuation. We downgraded Changyou on the back on uncertainties in spending.
Extract from the Asian Daily, 17 January 2014.
Figure 2: Top picks Company Rating Current price TP Up/Downside 14E P/E 15E P/E 14E EPS YoY 15E EPS YoY CSe/Street
Baidu O 171 220 27% 24.1 18.7 36% 29% 7%
Tencent O 509 619 22% 35.5 28.5 23% 24% -3%
SouFun O 89 110 24% 21.3 16.8 25% 27% 3%
Sungy Mobile O 21 24 14% 28 22 66% 27% -2%
Source: Thomson Reuters, Company data, Credit Suisse estimates

23 January 2014
Jump-Start 16
CNOOC Ltd --------------------------------------------------------------------- Downgrade to NEUTRAL New report: Downgrade to NEUTRAL on lower production growth EPS: ▼ TP: ▼ Thomas Wong / Research Analyst / 852 2101 6738 / [email protected] Horace Tse / Research Analyst / 852 2101 7379 / [email protected] Kelly Chen / Research Analyst / 852 2101 7079 / [email protected]
● At its annual Strategy Preview on 20 January, CNOOC announced its 2014 production target (ex Nexen) of 0.6-4.3% YoY growth. This is below our forecast of 8%, and significantly below consensus expectations of 10-12% growth.
● Management maintained 6-10% production CAGR for 2011-15, which we think is too stretched. We believe a 3-4% target is more likely, implying 11% 2015E growth vs the company's low-end guidance of 22%. With the disclosure of new projects, assuming peak production for all projects in 2015, and applying a 9% discount rate for the existing projects, CNOOC still needs to add 167kboe/d production in 2015 to hit the low bar of its guidance of 6%.
● CNOOC capex has been ramping up from US$6.4 bn in 2011 to US$14-16 bn in 2014E while production ramp up is later/lower than expected. We believe CNOOC's maintenance capex might be higher than our expectation.
● We downgrade CNOOC to NEUTRAL, TP of HK$16.00, implying 8.9x 2014 P/E. We prefer COSL for its oil exposure in the China space. Full report.
Click here for detailed financials
Production growth – turning conservative
Production growth has always been one of the most important stock price driver for CNOOC. The low single-digit growth guidance for 2014E surely comes as a negative surprise to the market, especially after an average yearly growth of a mere 2.3% from 2011-13. While management still maintains its 2011-15 growth CAGR guidance of 6%-10% (ex Nexen), we believe this target is rather stretched. Based on CNOOC’s disclosure and assuming all projects will achieve its peak production in 2015, and applying a 9% discount rate for the existing projects, CNOOC still needs to add 167kboe/day production in 2015 to hit the low bar of its guidance of 6%. Our revised 2011-15 production CAGR is at 4%, implying 2.3%/11.4% growth in 2014E/15E.
Figure 1: Production shortfall to meet low end of five-year CAGR
360
4 47
61
0
100
200
300
400
500
600
2014
prod
uctio
n
Liw
anin
crem
enta
l
The
4 ne
wpr
ojec
tsdi
sclo
sed
Nat
ural
delin
e of
9%
Shor
tfall
6% C
AGR
impl
ied
2015
E
CS
-201
5E
400
440
(32)
(mnboe)
Source: Company data, Credit Suisse estimates
Higher maintenance capex than expected
CNOOC capex (ex Nexen) has increased from US$6.4 bn in 2011 to US$15 bn in 2014E (company guidance), with an aim to increase production. However, production ramp up has been later/lower than previously expected: volume CAGR for 2011-14 is only at 2.3%, which led us to believe that CNOOC's maintenance capex (capex required to keep production volume at current level) might be a lot higher than our expectations. We have therefore revised up CNOOC’s maintenance capex from US$6 bn to US$9 bn, the average of 2011-2013 capex.
Figure 2: CNOOC's production volume versus capex
0%
5%
10%
15%
20%
25%
30%
35%
40%
45%
50%
-
2,000
4,000
6,000
8,000
10,000
12,000
14,000
16,000
2003 2005 2007 2009 2011 2013E
Capex (excl. Nexen) (US$ mn) Production growth (RHS)
Source: Company data, Credit Suisse estimates
New target price of HK$16.0/sh
We revise down our earnings estimate for 2014/15 by 4% and 15% to reflect the lower production growth. We change our DCF-based target price to HK$16.00 (from HK$20.00), to reflect (1) lower earnings for 2014E/15E and (2) a higher end-year capex. Our new TP implies 8.9x and 8.1x 2014E and 2015E P/E.
Extract from the Asian Daily, 21 January 2014.
Bbg/RIC 883 HK / 0883.HK Rating (prev. rating) N (O) Shares outstanding (mn) 44,647 Daily trad vol - 6m avg (mn) 54.1 Daily trad val - 6m avg (US$ mn) 105.9 Free float (%) 35.6 Major shareholders CNOOC Group
Price (20 Jan 14 , HK$) 13.96 TP (prev. TP HK$) 16.00 (20.00) Est. pot. % chg. to TP 15 52-wk range (HK$) 16.4 - 12.3 Mkt cap (HK$/US$ bn) 623.3/ 80.4
Performance 1M 3M 12M
Absolute (%) (1.3) (12.1) (14.8) Relative (%) 0.9 (8.6) (6.9)
Year 12/11A 12/12A 12/13E 12/14E 12/15E
Revenue (Rmb mn) 240,944 247,627 300,302 290,256 303,301 EBITDA (Rmb mn) 121,128 120,044 148,944 145,323 154,127 Net profit (Rmb mn) 70,255 63,691 67,124 63,219 69,285 EPS (Rmb) 1.57 1.42 1.50 1.41 1.55 - Change from prev. EPS (%) n.a. n.a. (7) (4) (15) - Consensus EPS (Rmb) n.a. n.a. 1.42 1.45 1.53 EPS growth (%) 29.0 (9.3) 5.4 (5.8) 9.6 P/E (x) 7.0 7.7 7.3 7.7 7.0 Dividend yield (%) 3.8 3.2 4.1 4.5 5.7 EV/EBITDA (x) 4.1 4.1 3.3 3.5 3.4 P/B (x) 2.0 1.7 1.4 1.3 1.2 ROE (%) 31.6 24.0 21.4 17.6 17.3 Net debt(cash)/equity (%) 5.4 0.9 2.7 5.7 7.1
Note 1: ORD/ADR=100.00. Note 2: CNOOC is the largest oil & gas producer in Offshore China. CNOOC primarily engages in exploration, development & production oil and gas in Offshore China, but also has assets in Indonesia, Australia, Nigeria, Argentina, North Sea, Canada and the US.

23 January 2014
Jump-Start 17
Galaxy Entertainment Group ------------------------------------------ Upgrade to OUTPERFORM 4Q13 preview: Strength in both premium mass and high-roller EPS: ▲ TP: ▲ Kenny Lau, CFA / Research Analyst / 852 2101 7914 / [email protected] Isis Wong / Research Analyst / 852 2101 7109 / [email protected]
● We estimate Galaxy's EBITDA will grow 43% YoY to HK$3.6 bn in 4Q13 with strength in both mass-market and high-roller businesses. This concludes our full-year EBITDA projection of HK$12.6 bn in 2013, or 3% above the consensus estimate.
● We believe StarWorld should have strongly grown its EBITDA by 52% YoY, thanks to the expansion in the premium-mass segment. Galaxy Macau should have recorded 39% YoY growth in EBITDA to HK$2.6 bn, due to the good progress of the property ramp-up.
● In view of the good progress of premium-mass expansion and ramp-up of Galaxy Macau, we raise our 2013-15 forecasts by 2-8%. We set our new target price at HK$92.50 (up from HK$65.60), or a blended 18x 2015E EV/EBITDA. With potential upside of 19%, we upgrade our rating to an OUTPERFORM from Neutral.
● After a year of outperformance, the prospective EV/EBITDA discount between Galaxy and Sands China of 27% has turned into a premium of 5%. We believe that it will take time for the market to give Galaxy a higher premium to Sands China beyond 10%.
Click here for detailed financials
Expect 4Q13 EBITDA to grow 43% YoY
We estimate that Galaxy's EBITDA will grow 43% YoY to HK$3.6 bn in 4Q13 with strength in both premium mass-market and high-roller. This concludes our full-year EBITDA projection of HK$12.6 bn in 2013, or 3% above the consensus estimate. We believe that StarWorld should have strongly grown its EBITDA by 52% YoY to HK$985 mn on the back of 69% YoY growth in the mass-market GGR, thanks to the expansion in the premium-mass segment. We expect Galaxy Macau to have recorded 39% YoY growth in EBITDA to HK$2.6 bn, when high-roller and mass-market GGR increased 37-41% YoY with the good progress of the property ramp up. A new VIP room with 12 tables was added to Galaxy Macau in mid-September 2013.
Figure 1: Galaxy's 4Q13E EBITDA projections StarWorld (HK$ mn) 4Q13E 4Q12 YoY % chg 3Q13 QoQ % chg
- Mass-market 1,191 706 68.8 1,012 17.7 - High-roller 5,032 4,098 22.8 4,500 11.8 - Slots 38 66 -42.4 44 -13.6
GGR 6,261 4,870 28.6 5,556 12.7 Non-gaming revenue 90 109 -17.4 82 9.8
EBITDA 985 646 52.5 910 8.3
Rolling-chips turnover 181,935 146,915 23.8 169,121 7.6 High-roller win % 2.77 2.79 0.0 p.p. 2.66 0.1 p.p.
Galaxy Macau (HK$ mn) 4Q13E 4Q12 YoY % chg 3Q13 QoQ % chg
- Mass-market 2,953 2,096 40.9 2,730 8.2 - High-roller 8,157 5,956 37.0 6,473 26.0 - Slots 367 328 11.9 402 -8.7
GGR 11,478 8,380 37.0 9,605 19.5 Non-gaming revenue 386 368 4.9 378 2.1
EBITDA 2,602 1,870 39.2 2,302 13.1
Rolling-chips turnover 234,976 167,590 40.2 191,140 22.9 High-roller win % 3.47 3.55 -0.1 p.p. 3.39 0.1 p.p.
4Q13E 4Q12 YoY % chg 3Q13 QoQ % chg
- StarWorld 985 646 52.5 910 8.3 - Galaxy Macau 2,602 1,870 39.2 2,302 13.1 - City Club 48 42 14.3 48 0.0 - Construction material 132 118 11.9 138 -4.3 - Corporate expenses -171 -154 11.0 -159 7.5
Overall EBITDA (HK$ mn) 3,597 2,522 42.6 3,239 11.0
Market share (%) 4Q13E 4Q12 YoY % chg 3Q13 QoQ % chg
StarWorld 6.4 6.2 0.2 p.p. 6.4 0.0 p.p.
Galaxy Macau 11.8 10.7 1.1 p.p. 11.1 0.7 p.p.
Source: Company data, Credit Suisse estimates
From discount to premium
In view of the good progress of premium-mass expansion at StarWorld and ramp-up of Galaxy Macau, we raise our 2013-15 forecasts by 2-8%. As we are shifting into a new financial year, we set our new target price at HK$92.50 (from HK$65.60), or a blended 18x 2015E EV/EBITDA. With potential upside of 19%, we upgrade our rating to an OUTPERFORM from Neutral. After a year of outperformance driven by the improvement in the high-roller business and lower valuation, the prospective EV/EBITDA discount between Galaxy and Sands China of 27% has turned into a premium of 5%. Despite Galaxy's superior long-term growth profile, we believe that it will take time for the market to adapt the new valuation range to give Galaxy a higher premium to Sands China beyond 10%.
Figure 2: EV/EBITDA valuation differentials of Galaxy vs. Sands China
-60
-40
-20
0
20
2011 2012 2013
(%)
Premium
Discount
Source: Company data, Credit Suisse estimates.
Extract from the Asian Daily, 16 January 2014.
Bbg/RIC 27 HK / 0027.HK Rating (prev. rating) O (N) Shares outstanding (mn) 4,219.71 Daily trad vol - 6m avg (mn) 9.7 Daily trad val - 6m avg (US$ mn) 70.9 Free float (%) 53.9 Major shareholders Lui's Family (58.57%)
Price (15 Jan 14 , HK$) 77.75 TP (prev. TP HK$) 92.50 (65.60) Est. pot. % chg. to TP 19 52-wk range (HK$) 78.1 - 30.3 Mkt cap (HK$/US$ bn) 328.1/ 42.3
Performance 1M 3M 12M
Absolute (%) 11.8 35.3 141.8 Relative (%) 12.7 36.2 143.9
Year 12/11A 12/12A 12/13E 12/14E 12/15E
Revenue (HK$ mn) 41,186 56,746 65,931 75,113 80,979 EBITDA (HK$ mn) 5,749 9,847 12,624 15,263 20,230 Net profit (HK$ mn) 3,004 7,378 10,223 13,044 16,700 EPS (HK$) 0.71 1.73 2.43 3.10 3.96 - Change from prev. EPS (%) n.a. n.a. 2 4 8 - Consensus EPS (HK$) n.a. n.a. 2.37 2.98 3.82 EPS growth (%) 216.5 142.9 39.9 27.5 28.0 P/E (x) 108.9 44.8 32.0 25.1 19.6 Dividend yield (%) 0 0 0 0 0 EV/EBITDA (x) 57.8 32.8 25.4 20.5 15.0 P/B (x) 22.8 14.9 10.2 7.3 5.3 ROE (%) 25.7 40.9 37.9 33.8 31.2 Net debt(cash)/equity (%) 30.3 (22.5) (23.1) (32.6) (40.7)
Note 1: ORD/ADR=10.00. Note 2: Galaxy operates casino and hotel business in Macau. Besides, the company also manufactures and distribute construction materials in Hong Kong and China.
23 January 2014
Jump-Start 18
Haier Electronics Group Co. Ltd. ------------------ Initiating Coverage with OUTPERFORM New report: ICS—the future growth engine Eva Wang / Research Analyst / 852 2101 7365 / [email protected]
● We initiate coverage on Haier Electronics with an OUTPERFORM rating and a HK$30 target price, implying 31% potential upside.
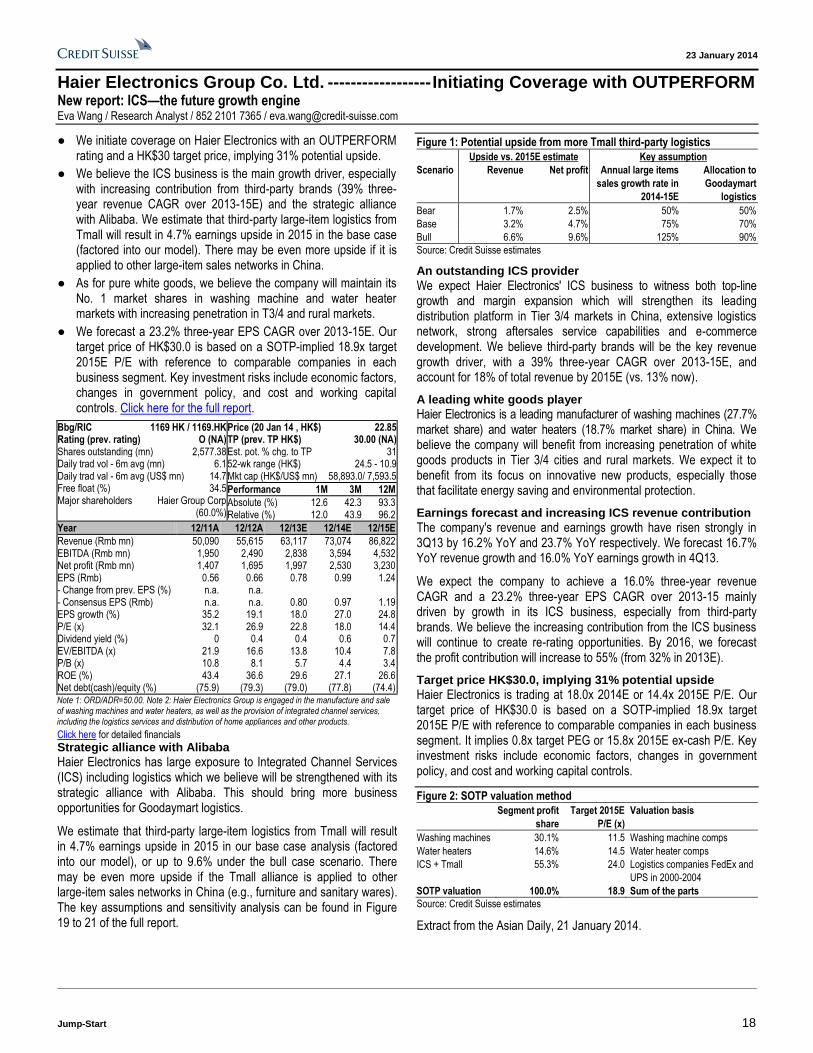
● We believe the ICS business is the main growth driver, especially with increasing contribution from third-party brands (39% three-year revenue CAGR over 2013-15E) and the strategic alliance with Alibaba. We estimate that third-party large-item logistics from Tmall will result in 4.7% earnings upside in 2015 in the base case (factored into our model). There may be even more upside if it is applied to other large-item sales networks in China.
● As for pure white goods, we believe the company will maintain its No. 1 market shares in washing machine and water heater markets with increasing penetration in T3/4 and rural markets.
● We forecast a 23.2% three-year EPS CAGR over 2013-15E. Our target price of HK$30.0 is based on a SOTP-implied 18.9x target 2015E P/E with reference to comparable companies in each business segment. Key investment risks include economic factors, changes in government policy, and cost and working capital controls. Click here for the full report.
Click here for detailed financials
Strategic alliance with Alibaba
Haier Electronics has large exposure to Integrated Channel Services (ICS) including logistics which we believe will be strengthened with its strategic alliance with Alibaba. This should bring more business opportunities for Goodaymart logistics.
We estimate that third-party large-item logistics from Tmall will result in 4.7% earnings upside in 2015 in our base case analysis (factored into our model), or up to 9.6% under the bull case scenario. There may be even more upside if the Tmall alliance is applied to other large-item sales networks in China (e.g., furniture and sanitary wares). The key assumptions and sensitivity analysis can be found in Figure 19 to 21 of the full report.
Figure 1: Potential upside from more Tmall third-party logistics
Upside vs. 2015E estimate Key assumption
Scenario Revenue Net profit Annual large items
sales growth rate in
2014-15E
Allocation to
Goodaymart
logistics
Bear 1.7% 2.5% 50% 50%
Base 3.2% 4.7% 75% 70%
Bull 6.6% 9.6% 125% 90%
Source: Credit Suisse estimates
An outstanding ICS provider
We expect Haier Electronics' ICS business to witness both top-line growth and margin expansion which will strengthen its leading distribution platform in Tier 3/4 markets in China, extensive logistics network, strong aftersales service capabilities and e-commerce development. We believe third-party brands will be the key revenue growth driver, with a 39% three-year CAGR over 2013-15E, and account for 18% of total revenue by 2015E (vs. 13% now).
A leading white goods player
Haier Electronics is a leading manufacturer of washing machines (27.7% market share) and water heaters (18.7% market share) in China. We believe the company will benefit from increasing penetration of white goods products in Tier 3/4 cities and rural markets. We expect it to benefit from its focus on innovative new products, especially those that facilitate energy saving and environmental protection.
Earnings forecast and increasing ICS revenue contribution
The company's revenue and earnings growth have risen strongly in 3Q13 by 16.2% YoY and 23.7% YoY respectively. We forecast 16.7% YoY revenue growth and 16.0% YoY earnings growth in 4Q13.
We expect the company to achieve a 16.0% three-year revenue CAGR and a 23.2% three-year EPS CAGR over 2013-15 mainly driven by growth in its ICS business, especially from third-party brands. We believe the increasing contribution from the ICS business will continue to create re-rating opportunities. By 2016, we forecast the profit contribution will increase to 55% (from 32% in 2013E).
Target price HK$30.0, implying 31% potential upside
Haier Electronics is trading at 18.0x 2014E or 14.4x 2015E P/E. Our target price of HK$30.0 is based on a SOTP-implied 18.9x target 2015E P/E with reference to comparable companies in each business segment. It implies 0.8x target PEG or 15.8x 2015E ex-cash P/E. Key investment risks include economic factors, changes in government policy, and cost and working capital controls.
Figure 2: SOTP valuation method
Segment profit
share
Target 2015E
P/E (x)
Valuation basis
Washing machines 30.1% 11.5 Washing machine comps
Water heaters 14.6% 14.5 Water heater comps
ICS + Tmall 55.3% 24.0 Logistics companies FedEx and
UPS in 2000-2004
SOTP valuation 100.0% 18.9 Sum of the parts
Source: Credit Suisse estimates
Extract from the Asian Daily, 21 January 2014.
Bbg/RIC 1169 HK / 1169.HK Rating (prev. rating) O (NA) Shares outstanding (mn) 2,577.38 Daily trad vol - 6m avg (mn) 6.1 Daily trad val - 6m avg (US$ mn) 14.7 Free float (%) 34.5 Major shareholders Haier Group Corp
(60.0%)
Price (20 Jan 14 , HK$) 22.85 TP (prev. TP HK$) 30.00 (NA) Est. pot. % chg. to TP 31 52-wk range (HK$) 24.5 - 10.9 Mkt cap (HK$/US$ mn) 58,893.0/ 7,593.5
Performance 1M 3M 12M
Absolute (%) 12.6 42.3 93.3 Relative (%) 12.0 43.9 96.2
Year 12/11A 12/12A 12/13E 12/14E 12/15E
Revenue (Rmb mn) 50,090 55,615 63,117 73,074 86,822 EBITDA (Rmb mn) 1,950 2,490 2,838 3,594 4,532 Net profit (Rmb mn) 1,407 1,695 1,997 2,530 3,230 EPS (Rmb) 0.56 0.66 0.78 0.99 1.24 - Change from prev. EPS (%) n.a. n.a. - Consensus EPS (Rmb) n.a. n.a. 0.80 0.97 1.19 EPS growth (%) 35.2 19.1 18.0 27.0 24.8 P/E (x) 32.1 26.9 22.8 18.0 14.4 Dividend yield (%) 0 0.4 0.4 0.6 0.7 EV/EBITDA (x) 21.9 16.6 13.8 10.4 7.8 P/B (x) 10.8 8.1 5.7 4.4 3.4 ROE (%) 43.4 36.6 29.6 27.1 26.6 Net debt(cash)/equity (%) (75.9) (79.3) (79.0) (77.8) (74.4)
Note 1: ORD/ADR=50.00. Note 2: Haier Electronics Group is engaged in the manufacture and sale of washing machines and water heaters, as well as the provision of integrated channel services, including the logistics services and distribution of home appliances and other products.

23 January 2014
Jump-Start 19
Hong Kong Property Sector --------------------------------------------------------------------------------- Ideas Engine: Awakening dragons Joyce Kwock / Research Analyst / 852 2101 7496 / [email protected] Wayne Lee / Research Analyst / 852 2101 7165 / [email protected] Jinsong Du / Research Analyst / 852 2101 6589 / [email protected]
● We believe the performance of Hong Kong property stocks will increasingly be driven by their performance in China, and not just in HK. The growing prominence of China operations and more disclosure should unlock their hidden value soon. We believe the significance of China's GAV for some HK developers is not fully appreciated. Full report.
● Another edge that HK developers have is their strong balance sheets and sizeable rental portfolios as cash cows, which allow them to further expand their China business. Assuming gearing levels go up to 30% with all the cash spent on China property expansion, China assets for these HK companies could grow to 34-64%.
● We believe wide discounts to NAV cannot last long or (1) the implied discount to HK residential properties is close to or even more than 100%; and (2) the prospect of spin-offs would loop in if the discount remains wide.
● We apply SOTP discounts to NAV for the all HK developers across different asset classes. Our top picks are Henderson, NWD, CKH and Swire Prop, while we rate SHKP, Wharf, Kerry (from Neutral) and Sino as OUTPERFORM. We maintain HLP as NEUTRAL.
Figure 1: Profits from China should increase significantly in FY14-FY16E
28%33%
29%34%
15%
8% 8%
0%
9%
48%
37%
53%49%
19% 20% 21% 21%12%
0%
10%
20%
30%
40%
50%
60%
Ker
ry
HLP
Wha
rf
NW
D
CK
H
Hen
ders
on
SH
KP
Sin
o La
nd
Sw
ire P
rop
FY09-13 FY14-16
AWAKENING DRAGONS
China business known & priced in
Source: Company data, Credit Suisse estimates.
Growing prominence of China property business
We believe the performance of HK property stocks will increasingly be driven by their performance in China, and not just in HK. The growing prominence of China operations and more disclosure should unlock their hidden value soon. The property for sale business in China could help fill in the potential earnings gap in FY14-15E should the market be concerned about the profitability of the HK DP business. The China property rental business could act as the additional growth driver of rental income on top of the income derived from portfolios in HK.
China strength: Some have it priced in, some have not
We have done a rigorous bottom-up modelling of both property development for sale and for rental businesses in China for eight Hong Kong-based companies, which have 9-49% of GAV in China. While the presence in China of names such as HLP, NWD, Kerry and Wharf has been well modelled and given a value to, other names—such as CKH, Henderson Land and SHKP, which have estimated percentages of GAV in China of 16%, 20% and 31%, respectively—have not been fully appreciated, in our view.
Strong balance sheets allow China expansion
Further to the significant landbanks and GAVs in China currently, another edge that distinguishes HK developers from their China peers is their strong balance sheets and sizeable rental portfolios as cash cows, which allow HK developers to further expand their China property portfolios. Currently, FY14E gearing of major HK property companies ranges from net cash to 22%. Assuming the gearing level goes up to 30% with cash being spent on China property business, the China business for the major HK property companies could be further expanded to 34-64%, which would be too big to be overlooked by the market anymore, in our view.
Wide discounts to NAV cannot last long or…
(1) Implied discount to HK residential properties is close to or even more than 100%: The chance of this happening would grow if the discount remains deep, while the exposure in China keeps rising. With strong balance sheets and sizeable rental portfolios in Hong Kong as cash cows, we believe China property assets owned by HK property companies deserve a narrow discount comparable to COLI, which is currently trading at a 21% discount to NAV.
(2) Prospect of spin-offs will loop in if the discount remains wide: Spin-offs as a way to unlock value from the deeply discounted holding companies will loop in eventually, in our view.
Henderson Land, NWD, CKH and Swire Prop as top picks
We apply sum-of-the-parts discounts to NAV for HK developers across different asset classes. For China property assets, we apply smaller target discounts, for: (1) completed investment properties in Tier 1 cities, which are subject to better demand-supply dynamics; (2) strong track records in China, for either/both investment properties and development properties for sale; and (3) investment properties with shorter completion pipelines. Top picks: Cheung Kong, Henderson Land, NWD, Swire Prop; OUTPERFORM: SHKP, Sino, Wharf, Kerry (from Neutral); NEUTRAL: Hang Lung Prop.
Figure 2: FY14E GAV% in China property assets by HK prop co.
16.4%(26.4%)
19.8%
9.1%
31.4%
(24.0%)
48.0%49.3%
16.8%29.0%
(33.0%)
0%10%20%30%40%50%60%70%80%90%
100%
CK
H
Hen
ders
on
Sin
o La
nd
SH
KP
NW
D
Ker
ry
HLP
Sw
ire P
rop
Wha
rf
HK - under dev HK - completed IP China - under dev
China - completed IP Others
Source: Company data, Credit Suisse estimates.
Extract from the Asian Daily, 21 January 2014.

23 January 2014
Jump-Start 20
India Utilities Sector -------------------------------------------------------------------------------------------- New report: The smart (grid) way forward? Amish Shah, CFA / Research Analyst / 91 22 6777 3743 / [email protected] Abhishek Bansal / Research Analyst / 91 22 6777 3968 / [email protected]
● Most SEBs took a tariff hike in CY12/13 and key loss-making SEBs also opted for debt restructuring plan which mandates tariff hikes. The issue of weak SEB finances was thus expected to be resolved but recent power tariff cuts by Haryana and Delhi has dented these hopes. Smart grid could also address this issue, in our view.
● We see gains for all stakeholders from smart grid implementation. For SEBs, it can help reduce AT&C losses to <10% (27% currently) resulting in >US$10 bn savings p.a., besides better asset utilisation and reduced equipment failure. As per our analysis, SEBs can break even with just 2% tariff hike (versus a 21% hike required currently).
● Funding for Smart Grid (c.US$40 bn) is a key concern. Our analysis suggests that SEBs could achieve a payback in just four years. But front-ended nature of capex deters SEBs from incurring these investments. Besides, despite a push from the central government and its obvious benefits, support from the states is not very encouraging.
● IT and industrial companies would be the key beneficiaries of this capex, when it kickstarts. However, given lack of visibility for such critical reforms, we currently remain negative on L&T, BHEL, Crompton, Voltas and most IPPs. Full report.
Valuation metrics Company Ticker Rating Price Year P/E (x) P/B (x)
Local Target T T+1 T+2 T+1
Adani Power ADAN.BO U 35.00 17.00 03/13 n.m. n.m. 2.1 Jaiprakash Power JAPR.BO O 17.45 35.00 03/13 23.9 18.8 0.8 KSK KSKE.BO O 66.15 107.00 03/12 16.4 22.6 0.8 Lanco LAIN.BO U 7.80 6.00 03/13 n.m. n.m. 0.6 NHPC NHPC.NS O 18.60 21.00 03/13 9.8 9.2 0.7 NTPC NTPC.BO O 132.35 170.00 03/13 10.4 9.0 1.3 Reliance Power RPOL.BO U 68.75 61.00 03/13 22.2 21.1 1.0 Tata Power TTPW.BO U 78.50 66.00 03/13 31.5 24.8 1.6 Note: O = OUTPERFORM, N = NEUTRAL, U = UNDERPERFORM Source: Company data, Credit Suisse estimates
Smart grid, if not tariff hikes, can address SEB issue
SEBs committing to sustainable tariff hikes was expected to resolve their issue of ailing finances. But recent power tariffs cuts by Haryana and Delhi led by a political agenda has dented these hopes. Smart grid could also address the SEB issue, in our view. Smart grid is a digital T&D network comprising: (1) smart meters for procuring data on the power flow, (2) telecom infra to transmit this data to a control centre and (3) software to regulate power flow, on an automated and real-time basis versus based on estimates and manual operations currently.
Figure 1: Smart grid benefits the entire value chain
Beneficiary Benefits
SEB Lower AT&C losses, better grid stability, peak load management,
renewable integration, better asset utilisation
Consumers Increased access to electricity, improved power quality, reduction in
power bills by shifting load to off-peak periods
Government,
Regulators
Financially sound SEBs, satisfied customers, tariff neutral system
upgrade and modernisation, reduced emissions
Generators Ability to match supply to demand pattern, better investment planning,
completion of projects in planned timelines
Source: PGCIL, Credit Suisse
See gains for all stakeholders from smart grid
We see gains for all the stakeholders from smart grid implementation. It can provide: (1) reliable and cheaper power supply for consumers, (2) reliable data for demand forecasts for generators, (3) stable loads preventing events such as the July 2012 grid collapse for PGCIL and (4) for SEBs, it can help reduce AT&C losses to <10% (27% currently) resulting in >US$10 bn savings p.a., besides better asset utilisation and reduced equipment failure. As per our analysis, SEBs can break even with just 2% tariff hike (21% currently).
Figure 2: SEBs can break even at minimal tariff hike with Smart Grid
0%
10%
20%
30%
40%
50%
60%
70%
80%
All-India(avg.)
UP Rajasthan MP Tamil Nadu AP
Tariff hike needed to cash breakeven in FY15
At existing AT&C losses At 10% AT&C losses
Source: Credit Suisse estimates
Figure 3: Sensitivity of SEB losses to reduction in AT&C losses is high
All-India SEB cash
loss in FY15 (Rs bn)
AT&C losses (%)
27%* 24% 21% 18% 15% 10%
Tar
iff
hik
e (%
) 0% (981) (823) (664) (506) (348) (84)
2% (904) (742) (581) (420) (258) 11
8% (673) (502) (331) (160) 11 283
14% (442) (261) (81) 100 271 494
20% (211) (21) 169 330 470 705
26% 20 220 374 522 670 916
*Current level; Source: PFC data, Credit Suisse estimates.
Funding/ poor SEB initiative key near-term challenges
Funding for smart grid (c.US$40 bn) is a key concern. Our analysis suggests that SEBs could achieve a payback in just four years. But front-ended nature of capex deters SEBs from incurring these investments. Besides, despite a push from the central government and its obvious benefits, support from the states is not very encouraging. IT and industrial companies would be the key beneficiaries of this capex, when it kickstarts. Given the lack of visibility for even such critical reforms, we remain negative on L&T, BHEL, Crompton, Voltas and most IPPs.
Figure 4: Potential beneficiaries of smart grid capex across segments
Segment Beneficiaries
IT/ Communication
systems
GE, Cisco, Siemens, Ericsson, IBM, Capgemini, Accenture,
Telvent^, KEMA^, TCS, Infosys, Wipro, Mahindra Satyam,
Kalkitech^, HCL Infosystems, HCL Technologies, L&T
Smart charging/ EV GM, Tata Motors, Hero Electric, GE, Nissan, Honda
Grid optimisation ABB, Siemens, Schneider Electric, Alstom, Crompton, PGCIL
Smart metering/ Meter
Data Management
Secure Meters^, Landis+Gyr^, Cyan Holdings, e-Meter^, L&T,
Itron, JnJ Powercom Systems
Power generation NTPC, NHPC, IPPs
Demand Response Ecolibrium Energy^
^Unlisted. Source: Company data, Credit Suisse
Extract from the Asian Daily, 20 January 2014.
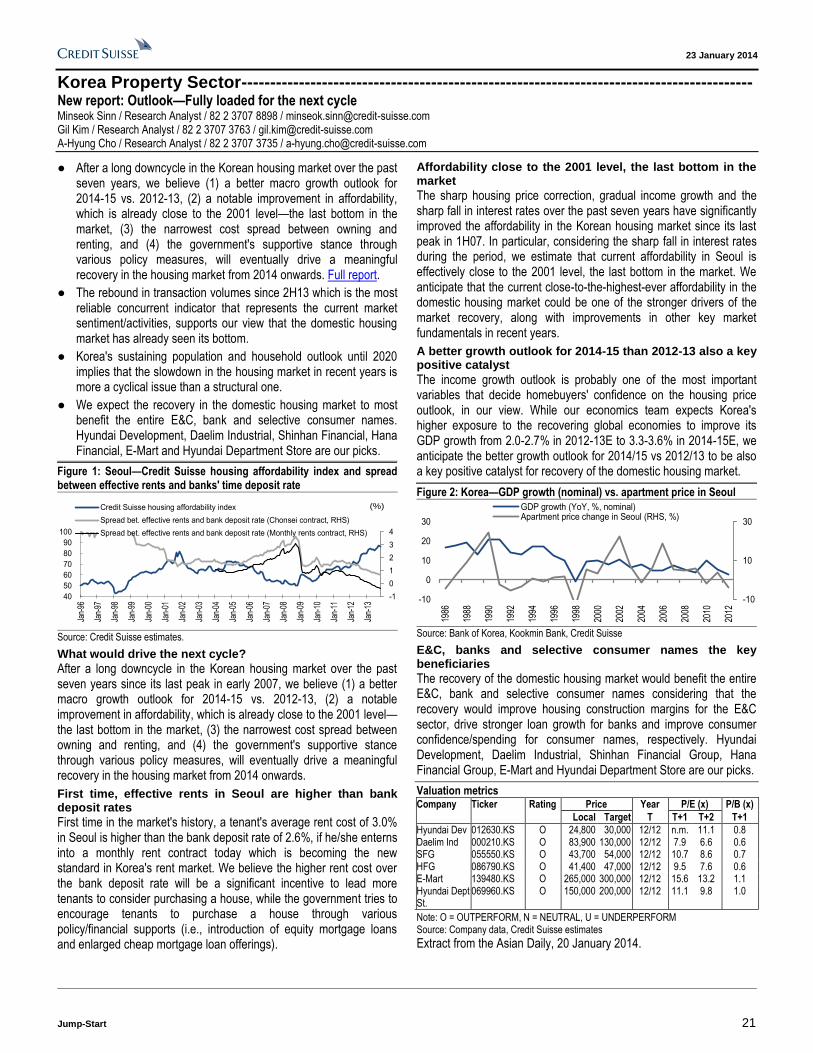
23 January 2014
Jump-Start 21
Korea Property Sector ----------------------------------------------------------------------------------------- New report: Outlook—Fully loaded for the next cycle Minseok Sinn / Research Analyst / 82 2 3707 8898 / [email protected] Gil Kim / Research Analyst / 82 2 3707 3763 / [email protected] A-Hyung Cho / Research Analyst / 82 2 3707 3735 / [email protected]
● After a long downcycle in the Korean housing market over the past seven years, we believe (1) a better macro growth outlook for 2014-15 vs. 2012-13, (2) a notable improvement in affordability, which is already close to the 2001 level—the last bottom in the market, (3) the narrowest cost spread between owning and renting, and (4) the government's supportive stance through various policy measures, will eventually drive a meaningful recovery in the housing market from 2014 onwards. Full report.
● The rebound in transaction volumes since 2H13 which is the most reliable concurrent indicator that represents the current market sentiment/activities, supports our view that the domestic housing market has already seen its bottom.
● Korea's sustaining population and household outlook until 2020 implies that the slowdown in the housing market in recent years is more a cyclical issue than a structural one.
● We expect the recovery in the domestic housing market to most benefit the entire E&C, bank and selective consumer names. Hyundai Development, Daelim Industrial, Shinhan Financial, Hana Financial, E-Mart and Hyundai Department Store are our picks.
Figure 1: Seoul—Credit Suisse housing affordability index and spread between effective rents and banks' time deposit rate
-1
0
1
2
3
4
40
50
60
70
80
90
100
Jan-
96
Jan-
97
Jan-
98
Jan-
99
Jan-
00
Jan-
01
Jan-
02
Jan-
03
Jan-
04
Jan-
05
Jan-
06
Jan-
07
Jan-
08
Jan-
09
Jan-
10
Jan-
11
Jan-
12
Jan-
13
Credit Suisse housing affordability index
Spread bet. effective rents and bank deposit rate (Chonsei contract, RHS)
Spread bet. effective rents and bank deposit rate (Monthly rents contract, RHS)
(%)
Source: Credit Suisse estimates.
What would drive the next cycle?
After a long downcycle in the Korean housing market over the past seven years since its last peak in early 2007, we believe (1) a better macro growth outlook for 2014-15 vs. 2012-13, (2) a notable improvement in affordability, which is already close to the 2001 level—the last bottom in the market, (3) the narrowest cost spread between owning and renting, and (4) the government's supportive stance through various policy measures, will eventually drive a meaningful recovery in the housing market from 2014 onwards.
First time, effective rents in Seoul are higher than bank deposit rates
First time in the market's history, a tenant's average rent cost of 3.0% in Seoul is higher than the bank deposit rate of 2.6%, if he/she enterns into a monthly rent contract today which is becoming the new standard in Korea's rent market. We believe the higher rent cost over the bank deposit rate will be a significant incentive to lead more tenants to consider purchasing a house, while the government tries to encourage tenants to purchase a house through various policy/financial supports (i.e., introduction of equity mortgage loans and enlarged cheap mortgage loan offerings).
Affordability close to the 2001 level, the last bottom in the market
The sharp housing price correction, gradual income growth and the sharp fall in interest rates over the past seven years have significantly improved the affordability in the Korean housing market since its last peak in 1H07. In particular, considering the sharp fall in interest rates during the period, we estimate that current affordability in Seoul is effectively close to the 2001 level, the last bottom in the market. We anticipate that the current close-to-the-highest-ever affordability in the domestic housing market could be one of the stronger drivers of the market recovery, along with improvements in other key market fundamentals in recent years.
A better growth outlook for 2014-15 than 2012-13 also a key positive catalyst
The income growth outlook is probably one of the most important variables that decide homebuyers' confidence on the housing price outlook, in our view. While our economics team expects Korea's higher exposure to the recovering global economies to improve its GDP growth from 2.0-2.7% in 2012-13E to 3.3-3.6% in 2014-15E, we anticipate the better growth outlook for 2014/15 vs 2012/13 to be also a key positive catalyst for recovery of the domestic housing market.
Figure 2: Korea—GDP growth (nominal) vs. apartment price in Seoul
-10
10
30
-10
0
10
20
30
1986
1988
1990
1992
1994
1996
1998
2000
2002
2004
2006
2008
2010
2012
GDP growth (YoY, %, nominal)Apartment price change in Seoul (RHS, %)
Source: Bank of Korea, Kookmin Bank, Credit Suisse
E&C, banks and selective consumer names the key beneficiaries
The recovery of the domestic housing market would benefit the entire E&C, bank and selective consumer names considering that the recovery would improve housing construction margins for the E&C sector, drive stronger loan growth for banks and improve consumer confidence/spending for consumer names, respectively. Hyundai Development, Daelim Industrial, Shinhan Financial Group, Hana Financial Group, E-Mart and Hyundai Department Store are our picks.
Valuation metrics Company Ticker Rating Price Year P/E (x) P/B (x)
Local Target T T+1 T+2 T+1
Hyundai Dev 012630.KS O 24,800 30,000 12/12 n.m. 11.1 0.8 Daelim Ind 000210.KS O 83,900 130,000 12/12 7.9 6.6 0.6 SFG 055550.KS O 43,700 54,000 12/12 10.7 8.6 0.7 HFG 086790.KS O 41,400 47,000 12/12 9.5 7.6 0.6 E-Mart 139480.KS O 265,000 300,000 12/12 15.6 13.2 1.1 Hyundai Dept St.
069960.KS O 150,000 200,000 12/12 11.1 9.8 1.0
Note: O = OUTPERFORM, N = NEUTRAL, U = UNDERPERFORM Source: Company data, Credit Suisse estimates
Extract from the Asian Daily, 20 January 2014.

23 January 2014
Jump-Start 22
Merry Electronics Co. Ltd ---------------------------- Initiating Coverage with OUTPERFORM New report: Multiple engines to drive earnings growth; initiate with OUTPERFORM EPS: ◄► TP: ◄► Derrick Yang / Research Analyst / 886 2 2715 6367 / [email protected] Pauline Chen / Research Analyst / 886 2 2715 6323 / [email protected]
● We initiate coverage on Merry with an OUTPERFORM rating and TP of NT$206 (21x 2014 EPS), as we expect it to deliver 53% earnings CAGR in 2014-15 on market share gains in the speaker and entertainment businesses, as well as margin expansion.
● We forecast 69% CAGR for its speaker revenues in 2014-15, as it will penetrate into the portable devices from its major US customer in 2H14, with the customer's shift in procurement strategy and its good track record in the NB speaker. We also forecast 29% CAGR for its entertainment business revenues in 2014-15, riding on the market growth and higher outsourcing ratios from customers.
● We expect its OPM to improve to 15.1% in 2015 from 11.2% in 2013 as a result of: (1) product mix shift to more higher-margin speaker and entertainment businesses, (2) benign competitive landscape, and (3) efficiency improvement and cost reductions.
● Our target multiple of 21x implies a 20-25% premium over its LT avg of 17x, which we believe can be justified by the 52% earnings CAGR in 2014-15 vs its LT avg of 21% since 2001. Full report.
Click here for detailed financials
Initiate coverage with OUTPERFORM and TP of NT$206
We initiate coverage on Merry, a major acoustic component and product supplier, with an OUTPERFORM rating and a target price of NT$206, based on 21x 2014 EPS of NT$9.65. We believe the increase of order allocation from its major speaker customer, market growth and share gains in the headset business, and the margin improvement will drive a 53% CAGR for its earnings in 2014-15, which we believe could justify the valuation premium for its shares.
Speakers to be biggest driver in 2014-15
We believe speaker products will become the biggest growth driver for Merry in 2014-15, as it stands a good likelihood of increasing the order allocation from its major US customer by penetrating into other portable devices. We think this is due to its customer’s diversification
strategy in component procurement and Merry’s good track record in the NB speaker business since 4Q12. We forecast Merry will see 50% YoY and 90% YoY growth for its speaker revenues in 2014 and 2015 and account for 25% and 36% of total revenues, respectively.
Market growth and share gain for headset business
With the value provided by Merry's total solution business model and high degree of involvement in the supply chain, we believe it will be able to grow its headset business revenues with a 29% CAGR in 2014-15, riding on: (1) the market growth of 15-20% YoY per year, propelled by the popularity of smart devices and portable audio/video demand, and (2) its market share gain among existing customers and new customer additions.
Margins continue to expand
We expect Merry to see its operating margin expand from 11.2% in 2013 to 15.1% in 2015, on: (1) more revenue contribution from higher-margin speaker and entertainment businesses, collectively from 60% in 2013 to 74% in 2015; (2) the benign nature of the competitive landscape in the global headset market and modest pricing pressure for the speaker business on the backdrop of its customer’s diversification strategy in procurement; and (3) the operating leverage, increasing automation of production lines, and relocation of production away from the coastal cities in China.
Valuation and risks
Our target price of NT$206 is based on 21x 2014E EPS of NT$9.65. Our target multiple of 21x represents 20-25% premium over its LT average of 17x since 2001, which we believe could be justified by the much stronger earnings growth in 2014-15 (53% CAGR vs the average of 21% since 2001). In terms of P/E-to-growth, our target multiple and earnings growth imply 3.7x P/E-to-earnings-growth ratio (vs LT avg of 8.0x). We thus consider our target multiple reasonable. Risks to our view would include: (1) slower progress in increasing the order allocation in its major speaker customer, (2) lower outsourcing ratio from major headset customers, and (3) aggressive pricing strategy from competitors for market share expansions.
Figure 1: Merry – product mix trend
18% 23%34% 39% 43% 38%4%
6%
11%
21%25% 36%73% 63%
40%20%
16%12%
2% 2%7% 15% 13% 11%
0%
10%
20%
30%
40%
50%
60%
70%
80%
90%
100%
2010 2011 2012 2013E 2014E 2015E
Others Power pack Handsfree Speaker Entertainment
Source: Company data, Credit Suisse estimates.
Extract from the Asian Daily, 23 January 2014.
Bbg/RIC 2439 TT / 2439.TW Rating (prev. rating) O (NA) [V] Shares outstanding (mn) 176.22 Daily trad vol - 6m avg (mn) 3.5 Daily trad val - 6m avg (US$ mn) 13.1 Free float (%) 74.0 Major shareholders Liao Li Mei (3.7%)
Price (22 Jan 14 , NT$) 170.00 TP (prev. TP NT$) 206.00 (NA) Est. pot. % chg. to TP 21 52-wk range (NT$) 176.5 - 37.0 Mkt cap (NT$/US$ mn) 29,956.8/ 993.3
Performance 1M 3M 12M
Absolute (%) 9.3 71.7 334.2 Relative (%) 7.3 69.2 323.1
Year 12/11A 12/12A 12/13E 12/14E 12/15E
Revenue (NT$ mn) 7,843 7,690 11,242 14,649 19,163 EBITDA (NT$ mn) 507 704 1,559 2,457 3,277 Net profit (NT$ mn) 315 481 1,004 1,701 2,347 EPS (NT$) 2.0 2.9 5.7 9.7 13.3 - Change from prev. EPS (%) n.a. n.a. - Consensus EPS (NT$) n.a. n.a. 5.6 9.1 12.8 EPS growth (%) (47.5) 46.4 96.4 69.4 38.0 P/E (x) 85.8 58.6 29.8 17.6 12.8 Dividend yield (%) 2.2 0.9 1.2 2.7 4.5 EV/EBITDA (x) 57.7 41.6 18.6 11.7 8.8 P/B (x) 6.2 6.3 5.7 4.8 4.2 ROE (%) 7.2 10.9 20.5 29.6 35.1 Net debt(cash)/equity (%) (16.2) (15.1) (17.7) (17.8) (16.1)
Note 1: Merry is an acoustic component and product manufacturer, with four major product lines, including entertainment, speaker, handsfree and power pack.
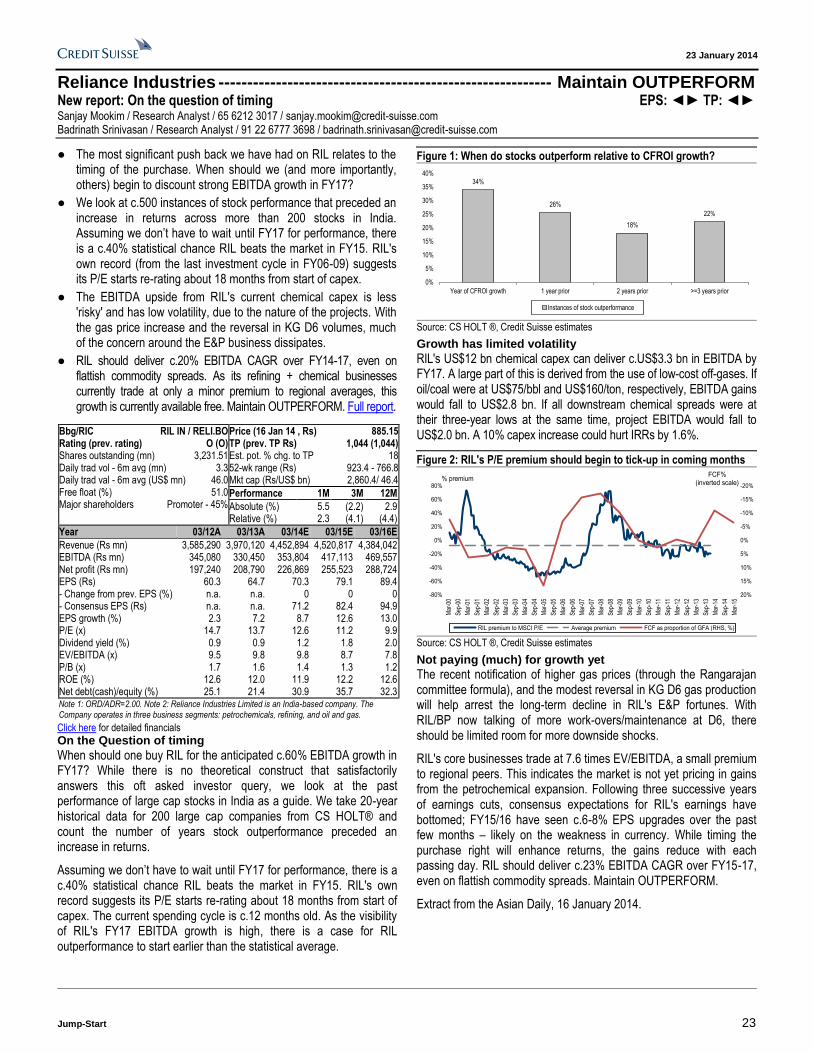
23 January 2014
Jump-Start 23
Reliance Industries ---------------------------------------------------------- Maintain OUTPERFORM New report: On the question of timing EPS: ◄► TP: ◄► Sanjay Mookim / Research Analyst / 65 6212 3017 / [email protected] Badrinath Srinivasan / Research Analyst / 91 22 6777 3698 / [email protected]
● The most significant push back we have had on RIL relates to the timing of the purchase. When should we (and more importantly, others) begin to discount strong EBITDA growth in FY17?
● We look at c.500 instances of stock performance that preceded an increase in returns across more than 200 stocks in India. Assuming we don’t have to wait until FY17 for performance, there is a c.40% statistical chance RIL beats the market in FY15. RIL's own record (from the last investment cycle in FY06-09) suggests its P/E starts re-rating about 18 months from start of capex.
● The EBITDA upside from RIL's current chemical capex is less 'risky' and has low volatility, due to the nature of the projects. With the gas price increase and the reversal in KG D6 volumes, much of the concern around the E&P business dissipates.
● RIL should deliver c.20% EBITDA CAGR over FY14-17, even on flattish commodity spreads. As its refining + chemical businesses currently trade at only a minor premium to regional averages, this growth is currently available free. Maintain OUTPERFORM. Full report.
Click here for detailed financials
On the Question of timing
When should one buy RIL for the anticipated c.60% EBITDA growth in FY17? While there is no theoretical construct that satisfactorily answers this oft asked investor query, we look at the past performance of large cap stocks in India as a guide. We take 20-year historical data for 200 large cap companies from CS HOLT® and count the number of years stock outperformance preceded an increase in returns.
Assuming we don’t have to wait until FY17 for performance, there is a c.40% statistical chance RIL beats the market in FY15. RIL's own record suggests its P/E starts re-rating about 18 months from start of capex. The current spending cycle is c.12 months old. As the visibility of RIL's FY17 EBITDA growth is high, there is a case for RIL outperformance to start earlier than the statistical average.
Figure 1: When do stocks outperform relative to CFROI growth?
34%
26%
18%
22%
0%
5%
10%
15%
20%
25%
30%
35%
40%
Year of CFROI growth 1 year prior 2 years prior >=3 years prior
Instances of stock outperformance
Source: CS HOLT ®, Credit Suisse estimates
Growth has limited volatility
RIL's US$12 bn chemical capex can deliver c.US$3.3 bn in EBITDA by FY17. A large part of this is derived from the use of low-cost off-gases. If oil/coal were at US$75/bbl and US$160/ton, respectively, EBITDA gains would fall to US$2.8 bn. If all downstream chemical spreads were at their three-year lows at the same time, project EBITDA would fall to US$2.0 bn. A 10% capex increase could hurt IRRs by 1.6%.
Figure 2: RIL's P/E premium should begin to tick-up in coming months
-20%
-15%
-10%
-5%
0%
5%
10%
15%
20%-80%
-60%
-40%
-20%
0%
20%
40%
60%
80%
Mar
-00
Sep
-00
Mar
-01
Sep
-01
Mar
-02
Sep
-02
Mar
-03
Sep
-03
Mar
-04
Sep
-04
Mar
-05
Sep
-05
Mar
-06
Sep
-06
Mar
-07
Sep
-07
Mar
-08
Sep
-08
Mar
-09
Sep
-09
Mar
-10
Sep
-10
Mar
-11
Sep
-11
Mar
-12
Sep
-12
Mar
-13
Sep
-13
Mar
-14
Sep
-14
Mar
-15
RIL premium to MSCI P/E Average premium FCF as proportion of GFA (RHS, %)
FCF%(inverted scale)
% premium
Source: CS HOLT ®, Credit Suisse estimates
Not paying (much) for growth yet
The recent notification of higher gas prices (through the Rangarajan committee formula), and the modest reversal in KG D6 gas production will help arrest the long-term decline in RIL's E&P fortunes. With RIL/BP now talking of more work-overs/maintenance at D6, there should be limited room for more downside shocks.
RIL's core businesses trade at 7.6 times EV/EBITDA, a small premium to regional peers. This indicates the market is not yet pricing in gains from the petrochemical expansion. Following three successive years of earnings cuts, consensus expectations for RIL's earnings have bottomed; FY15/16 have seen c.6-8% EPS upgrades over the past few months – likely on the weakness in currency. While timing the purchase right will enhance returns, the gains reduce with each passing day. RIL should deliver c.23% EBITDA CAGR over FY15-17, even on flattish commodity spreads. Maintain OUTPERFORM.
Extract from the Asian Daily, 16 January 2014.
Bbg/RIC RIL IN / RELI.BO Rating (prev. rating) O (O) Shares outstanding (mn) 3,231.51 Daily trad vol - 6m avg (mn) 3.3 Daily trad val - 6m avg (US$ mn) 46.0 Free float (%) 51.0 Major shareholders Promoter - 45%
Price (16 Jan 14 , Rs) 885.15 TP (prev. TP Rs) 1,044 (1,044) Est. pot. % chg. to TP 18 52-wk range (Rs) 923.4 - 766.8 Mkt cap (Rs/US$ bn) 2,860.4/ 46.4
Performance 1M 3M 12M
Absolute (%) 5.5 (2.2) 2.9 Relative (%) 2.3 (4.1) (4.4)
Year 03/12A 03/13A 03/14E 03/15E 03/16E
Revenue (Rs mn) 3,585,290 3,970,120 4,452,894 4,520,817 4,384,042 EBITDA (Rs mn) 345,080 330,450 353,804 417,113 469,557 Net profit (Rs mn) 197,240 208,790 226,869 255,523 288,724 EPS (Rs) 60.3 64.7 70.3 79.1 89.4 - Change from prev. EPS (%) n.a. n.a. 0 0 0 - Consensus EPS (Rs) n.a. n.a. 71.2 82.4 94.9 EPS growth (%) 2.3 7.2 8.7 12.6 13.0 P/E (x) 14.7 13.7 12.6 11.2 9.9 Dividend yield (%) 0.9 0.9 1.2 1.8 2.0 EV/EBITDA (x) 9.5 9.8 9.8 8.7 7.8 P/B (x) 1.7 1.6 1.4 1.3 1.2 ROE (%) 12.6 12.0 11.9 12.2 12.6 Net debt(cash)/equity (%) 25.1 21.4 30.9 35.7 32.3
Note 1: ORD/ADR=2.00. Note 2: Reliance Industries Limited is an India-based company. The Company operates in three business segments: petrochemicals, refining, and oil and gas.

23 January 2014
Jump-Start 24
Sinopec - H ------------------------------------------------------------------ Upgrade to OUTPERFORM New report: Buying on refining turnaround EPS: ▲ TP: ▲ Thomas Wong / Research Analyst / 852 2101 6738 / [email protected] Horace Tse / Research Analyst / 852 2101 7379 / [email protected] Kelly Chen / Research Analyst / 852 2101 7079 / [email protected]
● We believe Sinopec's refining segment should stabilise and stay above breakeven in 2014 and onwards based on our oil price forecast and the current regulatory framework. Coupled with the benefits from emission upgrades, Sinopec should record Rmb16 bn of refining EBIT in 2014, improving from Rmb3.5 bn in 2013. In addition, Sinopec's refining business should also trade at a higher multiple.
● Sinopec's recent success in Fuling might make its 3 bcm shale production target become possible. Sinopec is also building its coal-to-gas capability with a view to take CTG to around 8 bcm in 2017. Any significant progress in these developments should help investors change their perception on Sinopec’s E&P business.
● We also factor in a moderate recovery in chemical. An upswing in the global ethylene operating rate could have a significant impact on Sinopec's chemical profitability. In our model, we factor in Rmb8 bn of chemical EBIT in 2015, up from a Rmb0.7 bn loss in 2013.
● We upgrade Sinopec to OUTPERFORM (from Neutral), and raise our TP to HK$8.00 (from HK$6.40). Our SOTP-based TP implies 9x 2014E P/E and 1.1x P/B. Click here for full report
Click here for detailed financials
Buying on refining turnaround. We believe Sinopec's refining segment should stabilise and stay above breakeven in 2014 and onwards based on our oil price forecast (US$102 Brent in 2014) and the current regulatory framework. Coupled with the benefits from emission standards upgrades, Sinopec should record Rmb16 bn of refining EBIT in 2014, improving from Rmb3.5 bn in 2013 (ex. inventory gains). In addition, Sinopec's refining business should also trade at a higher multiple (from 0.5x to 0.8x 2014E P/B).
Coal-to-gas / shale gas should help sentiment too. Sinopec has a huge ambition in becoming the leader of non-conventional gas development in China. Its recent success in Fuling (first commercial
shale gas production in China) might make the 3 bcm target become possible. Sinopec is also building its coal-to-gas (CTG) capability with a view to take CTG to around 8 bcm in 2017. Any significant progress in these developments should help investors change their perception on Sinopec’s E&P business.
Figure 1: Brent vs China gasoline retail price—the NDRC has been delivering under the new mechanism
8,000
8,200
8,400
8,600
8,800
9,000
95
100
105
110
115
120
Mar-13 May-13 Jul-13 Sep-13 Nov-13 Jan-14
Brent price (LHS) Gasoline pump price (RHS)
(US$/bbl) (Rmb/ton)
Source: NDRC, Bloomberg, Credit Suisse estimates
We also factor in a moderate recovery in Chemical. An upswing in global ethylene operating rate has a significant impact on Sinopec's chemical profitability. In our model, we factor in Rmb8 bn of chemical EBIT in 2015, up from a Rmb0.7 bn loss in 2013. We estimate for every 1% increase in ethylene operating rate, its chemical EBIT will improve by Rmb2.5-3.0 bn.
Upgrade to OUTPERFORM, new TP of HK$8.00 (31% potential upside). Sinopec's share price has corrected 18% from its peak in November 2013. The stock is trading at 0.85x 2014E P/B, the lowest over the past five years. We upgrade Sinopec to OUTPERFORM (from Neutral), and raise our target price to HK$8.00 (from HK$6.40). Our SOTP-based target price of HK$8.00 implies 9x 2014E P/E and 1.1x 2014E P/B. Our pecking order within the China oil sector is Sinopec > CNOOC > PetroChina.
Figure 2: Sinopec historical P/B range—the lowest over the past five years
0.7
0.8
0.9
1.0
1.1
1.2
1.3
1.4
1.5
1.6
2009 2010 2011 2012 2013 2014
(x)
Avg. = 1.18x
+1 S.D. = 1.33x
-1 S.D. = 1.03x
Source: Datastream, company data, Credit Suisse estimates
Extract from the Asian Daily, 21 January 2014.
Bbg/RIC 386 HK / 0386.HK Rating (prev. rating) O (N) Shares outstanding (mn) 116,565 Daily trad vol - 6m avg (mn) 96.2 Daily trad val - 6m avg (US$ mn) 77.0 Free float (%) 26.6 Major shareholders Sinopec Group
73.3%
Price (20 Jan 14, HK$) 6.12 TP (prev. TP HK$) 8.00 (6.40) Est. pot. % chg. to TP 31 52-wk range (HK$) 7.26 - 5.08 Mkt cap (HK$/US$ bn) 695.2/ 89.6
Performance 1M 3M 12M
Absolute (%) (1.1) (1.3) (13.4) Relative (%) 1.1 2.2 (5.6)
Year 12/11A 12/12A 12/13E 12/14E 12/15E
Revenue (Rmb mn) 2,505,683 2,786,045 2,820,772 2,756,466 2,814,029 EBITDA (Rmb mn) 169,346 169,118 191,663 212,016 224,367 Net profit (Rmb mn) 73,225 63,879 70,490 80,612 86,288 EPS (Rmb) 0.63 0.55 0.60 0.69 0.74 - Change from prev. EPS (%) n.a. n.a. 9 14 12 - Consensus EPS (Rmb) n.a. n.a. 0.60 0.65 0.69 EPS growth (%) (0.7) (13.7) 10.9 14.4 7.0 P/E (x) 7.6 8.8 7.9 6.9 6.5 Dividend yield (%) 4.8 4.9 5.1 5.8 6.2 EV/EBITDA (x) 4.4 4.5 4.2 3.9 3.8 P/B (x) 1.1 1.1 1.0 0.9 0.8 ROE (%) 16.4 13.0 12.9 13.3 13.1 Net debt(cash)/equity (%) 39.0 41.0 40.7 42.9 43.3
Note 1: ORD/ADR=100.00. Note 2: Sinopec is a leading integrated oil and the largest downstream operator in China. Its principal operations include exploration & production of oil & gas, refining & marketing of petroleum products, petrochemical production and transmission of natural gas.

23 January 2014
Jump-Start 25
Tencent Holdings --------------------------------------------------------- Upgrade to OUTPERFORM New report: WeChat Payment: The next growth frontier EPS: ▲ TP: ▲ Dick Wei / Research Analyst / 852 2101 7339 / [email protected] Evan Zhou / Research Analyst / 852 2101 6745 / [email protected]
● We see clearer signs of WeChat Payment emerging as one of the leading mobile wallets in China. We expect Tencent to tap into an estimated Rmb18 tn electronic payment market in China with revenue opportunities of Rmb22.8 bn by 2015. We also expect mobile payment and financial products distribution to create a value of US$25.7 bn.
● We believe Tencent could see margins upside with mobile games revenue starting to kick in. Basic math suggests that mobile games could bring in an additional US$600 mn of profit.
● On the other side, key 2014 incremental spending items are US$100 mn on video content and a US$100-200 mn additional spending on WeChat marketing—leading to potentially higher OPM.
● Upgrade to OUTPERFORM with HK$619 TP: We value Tencent's current reporting segments at US$121.6 bn (HK$512 per share, or 29x 2015E P/E), and to that add Tenpay and WeChat Payment's valuation of ~US$25.7 bn (HK$107 per share). Our target price of HK$619 implies 43.2x FY14E and 34.7x FY15E diluted adjusted P/E. Click here for our 2014 China Internet outlook report.
Click here for detailed financials
WeChat Payment to revolutionise mobile payment in China: We see clearer signs of WeChat Payment emerging as one of the leading mobile wallets in China. Tencent drives WeChat Payment adoption via mobile game, taxi apps rebates, financial services and other offline applications. We expect Tencent to tap into an estimated Rmb18 tn electronic payment market in China with revenue opportunities of Rmb22.8 bn by 2015. Also, we expect mobile payment and financial products distribution to create a value of US$25.7 bn.
Potential earnings upside in 2014: We believe Tencent could see margins upside with mobile games revenue starting to kick in. Basic math suggests that mobile games could bring in an additional US$600 mn of profit. On the other side, key 2014 incremental spending items are US$100 mn on video content and a US$100-200 mn additional spending on WeChat marketing—leading to potentially higher OPM. In addition, BnS has seen good traction few months after launch; this could offset the potential weakness of CF in 2014. Furthermore, Mobile VIP Membership and other mobile social products should start contributing more meaningful revenue.
The key risks include: (1) marketing spend on WeChat international expansion and mobile products promotion, (2) higher-than-expected content spend on video; (3) slowdown of key legacy client-based game titles and (4) worse-than-expected user acceptance on Weixin Payment and mobile subscription packages.
Upgrade to OUTPERFORM with a HK$619 TP
Why upgrade now? Our previous relative Neutral call on Tencent (versus OUTPERFORM on Baidu) was based on the thesis that Tencent would not likely see earnings upside in 2H13, given high spending and initial Weixin games potential had already been reflected in street estimates. While this turned out to be right, we expect the market to put more focus on WeChat O2O, payment and Internet finance services. We value Tencent's current reporting segments at US$121.6 bn (HK$512 per share, or 29x 2015E P/E), and to that add Tenpay and WeChat Payment's valuation of ~US$25.7 bn (HK$107 per share). Our target price of HK$619 implies 43.2x FY14E and 34.7x FY15E diluted adjusted P/E.
Extract from the Asian Daily, 17 January 2014.
Figure 1: Tencent—SOTP valuation Business lines Revenue Earnings Multiple (x) Value (Rmb mn) Value Value per share
(Rmb mn) (Rmb mn) Low High Low High Mid-point (US$ bn) (Rmb)
Community VAS 22,349.6 8,939.8 25 30 223,496.2 268,195.5 245,845.8 40.3 132.0
Games 48,331.9 18,849.5 20 25 376,989.2 471,236.5 424,112.8 69.5 227.7
Online Ad 7,249.7 1,087.5 20 25 21,749.2 27,186.5 24,467.8 4.0 13.1
eCommerce 22,044.5 -1,322.7 0.4 0.8 8,817.8 17,635.6 13,226.7 2.2 7.1
Tenpay & WeChat Payment -2,440.0 156,900.0 156,900.0 156,900.0 25.7 84.2
Net cash and investments 34,400.4 34,400.4 34,400.4 5.6 18.5
Total Value 822,352.8 975,554.4 898,953.6 147.4 482.7
Price per diluted share (Rmb) 441.6 523.8 482.7
Price per diluted share (HK$) 566.1 671.6 618.9
Source: Company data, Credit Suisse estimates
Bbg/RIC 700 HK / 0700.HK Rating (prev. rating) O (N) Shares outstanding (mn) 1,862.11 Daily trad vol - 6m avg (mn) 3.9 Daily trad val - 6m avg (US$ mn) 207.2 Free float (%) 50.8 Major shareholders MIH TC (33.93%),
Huateng Ma (10.22%)
Price (16 Jan 14, HK$) 512.50 TP (prev. TP HK$) 619.00 (440.00) Est. pot. % chg. to TP 21 52-wk range (HK$) 512.5 - 237.2 Mkt cap (HK$/US$ bn) 954.3/ 123.1
Performance 1M 3M 12M
Absolute (%) 10.0 19.2 91.8 Relative (%) 13.0 21.8 97.7
Year 12/11A 12/12A 12/13E 12/14E 12/15E
Revenue (Rmb bn) 28.5 43.9 60.1 78.7 100.7 EBITDA (Rmb bn) 13.3 17.5 20.9 27.8 35.2 Net profit (Rmb bn) 10.9 14.3 17.4 21.7 27.2 EPS (Rmb) 5.9 7.7 9.2 11.3 14.0 - Change from prev. EPS (%) n.a. n.a. 0 1 (1) - Consensus EPS (Rmb) n.a. n.a. 8.8 11.3 14.3 EPS growth (%) 26.2 30.5 20.4 22.0 24.5 P/E (x) 68.0 52.1 43.3 35.5 28.5 Dividend yield (%) 0.2 0.3 0.2 0.3 0.3 EV/EBITDA (x) 54.9 41.5 34.6 25.3 19.3 P/B (x) 26.1 18.0 13.4 10.2 7.7 ROE (%) 43.6 41.0 35.7 33.0 30.9 Net debt(cash)/equity (%) (51.3) (39.9) (34.9) (51.9) (63.9)
Note 1: Tencent is a leading internet company in China, provides IVAS, MVAS, online ad services, and e-Commerce transactions services in Mainland China, the US, Europe, and internationally.

23 January 2014
Jump-Start 26
YST Dairy Farm ------------------------------------------ Initiating Coverage with OUTPERFORM New report: The fat of milk Kevin Yin / Research Analyst / 852 2101 7655 / [email protected]
● We initiate coverage on YuanShengTai (YST), China's fourth-largest cow farm operator. It focuses on farming (the best segment margin of 21% along the whole dairy value chain), and plans vertical integration in the long term. 100% raw milk was sold to Mengniu, Feihe, Yili, Bright and Aibeite.
● Given its strategic location in northern China and solid execution skills, YST enjoyed a higher yield (8.9 tonnes/pa in 2012 vs CMD's 8.23 tonnes/pa in FY13/6), lower feed cost/t milk (Rmb2,019 in 2012 vs CMD's Rmb2,445 in FY13/6) and higher cash EBITDA margin (38% in 2012 vs CMD's 27% in FY13/6).
● Stripping out the fair value gain on biological assets, one-off expenses and other items, we estimate YST’s recurrent earnings will witness a 42% CAGR over 2013-15, on a sales CAGR of 35%.
● Based on a benchmark 18x CY2014E P/E (a 10% discount to CMD's target P/E of 20x), we arrive at our YST target price of HK$2.8, implying 0.4x three-year PEG and 12x 2014E EV/cash EBITDA. OUTPERFORM. Full report.
Click here for detailed financials
Recent developments after IPO
(1) Average raw milk price was Rmb5.2/kg in November 2013. Management estimates the raw milk price will increase more than 10% YoY to Rmb5.3/kg in 2014 from Rmb4.8/kg (up nearly 20% YoY) in 2013—compared with our ASP assumption of Rmb5.2/kg for modeling. CMD recently fixed its selling price to Mengniu at Rmb5.1/kg for full year 2014, representing a 12.5% YoY increase.
An Rmb0.2/kg (or 3.8%) increase in raw milk price should lead to an 8.4% increase in 2014 earnings, according to our sensitivity analysis.
(2) Milk yield was nearly 9.4 tonnes/pa in July-Nov 2013. Assuming 9.4 tonnes/pa in Dec 2013, the full-year 2013 milk yield is likely reach 9.1 tonnes/pa (vs our model assumption of 8.9 tonnes/pa). Management expects a 2014 milk yield range of 9.4-9.6 tonnes/pa (vs our model assumption of 9.5 tonnes/pa).
A 0.2 tonne (or 2%) increase in milk yield would lead to a 4.4% increase in 2014 earnings, according to our sensitivity analysis.
(3) There are no further updates on feed cost/milkable cow. Our sensitivity analysis suggests that a 2% increase in feed cost/milkable cow would lead to a 2.1% decline in 2014 earnings.
(4) YST said it plans to import 18,000 cows in 2H14 and 2015. The current import price is about Rmb21,000-22,000/head, vs the peak of Rmb25,000-26,000/head in 1H12.
TP of HK$2.8 (18x 2014E P/E, 12x EV/EBITDA, 0.4 PEG)
We use P/E multiple as our primary matrix to derive our target price, cross-checked by our DCF methodology. Based on a benchmark 18x CY14E P/E (a 10% discount to CMD's target P/E of 20x), we arrive at our YST target price of HK$2.8, implying 0.4x three-year PEG and 12x 2014E EV/cash EBITDA. Mengniu trades at 25x, HS at 22.7x, and CMD at 21.6x (including bio-loss) or 18.8x (excluding bio-loss) 2014E P/E (all based on Bloomberg consensus).
Investment risks
Major investment risks include its short operating history (first farm started commercial production in 2010 vs CMD in 2006 and HS in 2009); animal diseases and farm concentration (YST's four farms vs CMD's 22 and HS's 50); product safety; intensifying competition; feed cost fluctuation; and regulatory risks.
Extract from the Asian Daily, 20 January 2014.
Figure 1: Farming has the best margin (21%) along the whole value chain
Feed
cost
Farm
ing ot
her C
OGS
Farm
ing S
G&A
Farm
ing
prof
its (2
1% m
argi
n)
Meng
niu O
pex
Meng
niu ot
her C
OGS
Meng
niu p
rofit
s (12
% m
argi
n)
Distr
ibutor
expe
nse
Dist
ribut
or p
rofit
s (3%
mar
gin)
Retai
ler ex
pens
e
Reta
iler p
rofit
s (5%
mar
gin)
Milk
Delux
e reta
il pric
e
0.9 0.5 0.9
3.4
2.7
1.4
5.7
0.5
3.4
1.1
-
5.0
10.0
15.0
20.0
25.0
2.3
(Rmb/kg) 22.7
Source: China Modern Dairy, China Mengniu, Credit Suisse estimates
Bbg/RIC 1431 HK / 1431.HK Rating (prev. rating) O (NA) [V] Shares outstanding (mn) 3,908.75 Daily trad vol - 6m avg (mn) 31.7 Daily trad val - 6m avg (US$ mn) 10.3 Free float (%) 28.0 Major shareholders Zhao Hongliang
(34.12%)
Price (16 Jan 14, HK$) 2.20 TP (prev. TP HK$) 2.80 (NA) Est. pot. % chg. to TP 27 52-wk range (HK$) 2.63 - 2.20 Mkt cap (HK$/US$ mn) 8,599.2/ 1,108.9
Performance 1M 3M 12M
Absolute (%) (4.3) — — Relative (%) (3.7) — —
Year 12/11A 12/12A 12/13E 12/14E 12/15E
Revenue (Rmb mn) 149 689 876 1,188 1,602 EBITDA (Rmb mn) 53.1 261.4 299.7 539.0 711.6 Net profit (Rmb mn) 189.9 209.7 205.3 476.0 607.3 EPS (Rmb) 0.05 0.05 0.05 0.12 0.16 - Change from prev. EPS (%) n.a. n.a. - Consensus EPS (Rmb) n.a. n.a. EPS growth (%) 2,241.3 10.5 (2.1) 131.8 27.6 P/E (x) 35.4 32.0 32.7 14.1 11.1 Dividend yield (%) 0 0 0 0 0 EV/EBITDA (x) 135.5 27.4 20.0 12.6 10.4 P/B (x) 17.6 11.4 2.3 2.0 1.7 ROE (%) 66.4 43.2 11.9 15.3 16.5 Net debt(cash)/equity (%) 124.5 77.4 (25.2) 2.3 17.1
Note 1: YuanShengTai operates four farms, with a herd size of 37,000 in 2012-end (vs CMD's 176,300 and HS's 119,000).It currently focuses on farming(the best segment margin of 21% along the whole dairy value chain), & plans vertical integration in the long term.
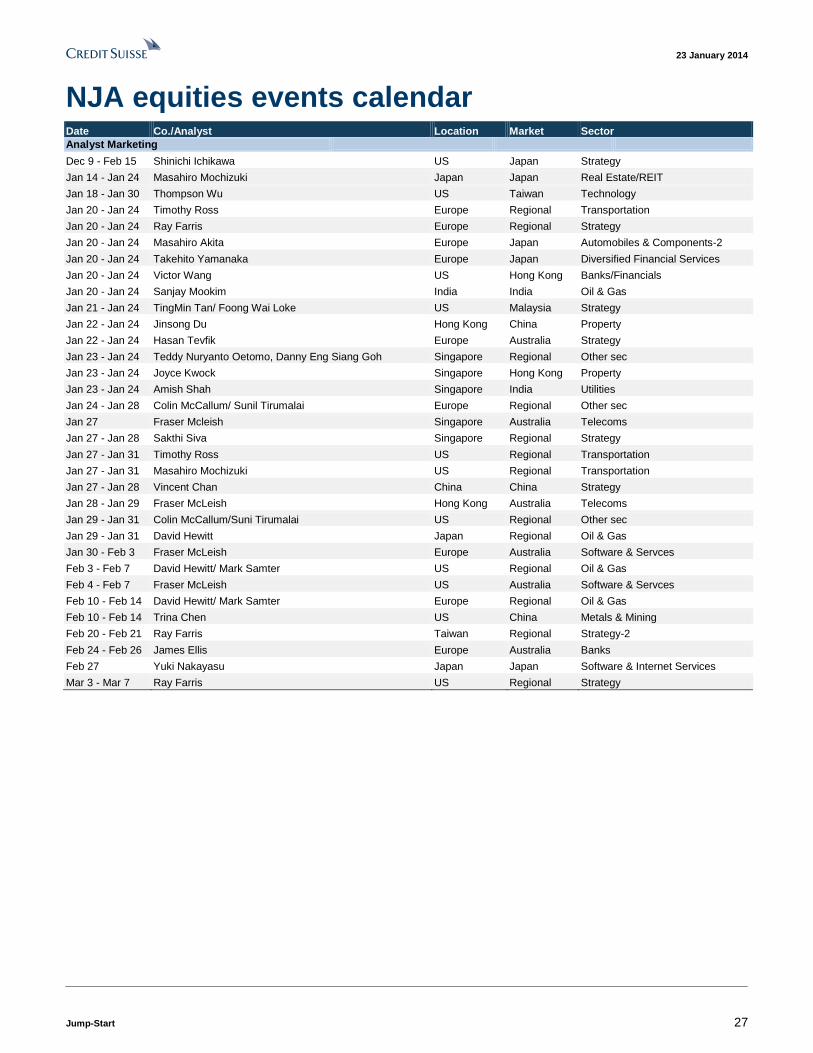
23 January 2014
Jump-Start 27
NJA equities events calendar Date Co./Analyst Location Market Sector
Analyst Marketing
Dec 9 - Feb 15 Shinichi Ichikawa US Japan Strategy
Jan 14 - Jan 24 Masahiro Mochizuki Japan Japan Real Estate/REIT
Jan 18 - Jan 30 Thompson Wu US Taiwan Technology
Jan 20 - Jan 24 Timothy Ross Europe Regional Transportation
Jan 20 - Jan 24 Ray Farris Europe Regional Strategy
Jan 20 - Jan 24 Masahiro Akita Europe Japan Automobiles & Components-2
Jan 20 - Jan 24 Takehito Yamanaka Europe Japan Diversified Financial Services
Jan 20 - Jan 24 Victor Wang US Hong Kong Banks/Financials
Jan 20 - Jan 24 Sanjay Mookim India India Oil & Gas
Jan 21 - Jan 24 TingMin Tan/ Foong Wai Loke US Malaysia Strategy
Jan 22 - Jan 24 Jinsong Du Hong Kong China Property
Jan 22 - Jan 24 Hasan Tevfik Europe Australia Strategy
Jan 23 - Jan 24 Teddy Nuryanto Oetomo, Danny Eng Siang Goh Singapore Regional Other sec
Jan 23 - Jan 24 Joyce Kwock Singapore Hong Kong Property
Jan 23 - Jan 24 Amish Shah Singapore India Utilities
Jan 24 - Jan 28 Colin McCallum/ Sunil Tirumalai Europe Regional Other sec
Jan 27 Fraser Mcleish Singapore Australia Telecoms
Jan 27 - Jan 28 Sakthi Siva Singapore Regional Strategy
Jan 27 - Jan 31 Timothy Ross US Regional Transportation
Jan 27 - Jan 31 Masahiro Mochizuki US Regional Transportation
Jan 27 - Jan 28 Vincent Chan China China Strategy
Jan 28 - Jan 29 Fraser McLeish Hong Kong Australia Telecoms
Jan 29 - Jan 31 Colin McCallum/Suni Tirumalai US Regional Other sec
Jan 29 - Jan 31 David Hewitt Japan Regional Oil & Gas
Jan 30 - Feb 3 Fraser McLeish Europe Australia Software & Servces
Feb 3 - Feb 7 David Hewitt/ Mark Samter US Regional Oil & Gas
Feb 4 - Feb 7 Fraser McLeish US Australia Software & Servces
Feb 10 - Feb 14 David Hewitt/ Mark Samter Europe Regional Oil & Gas
Feb 10 - Feb 14 Trina Chen US China Metals & Mining
Feb 20 - Feb 21 Ray Farris Taiwan Regional Strategy-2
Feb 24 - Feb 26 James Ellis Europe Australia Banks
Feb 27 Yuki Nakayasu Japan Japan Software & Internet Services
Mar 3 - Mar 7 Ray Farris US Regional Strategy
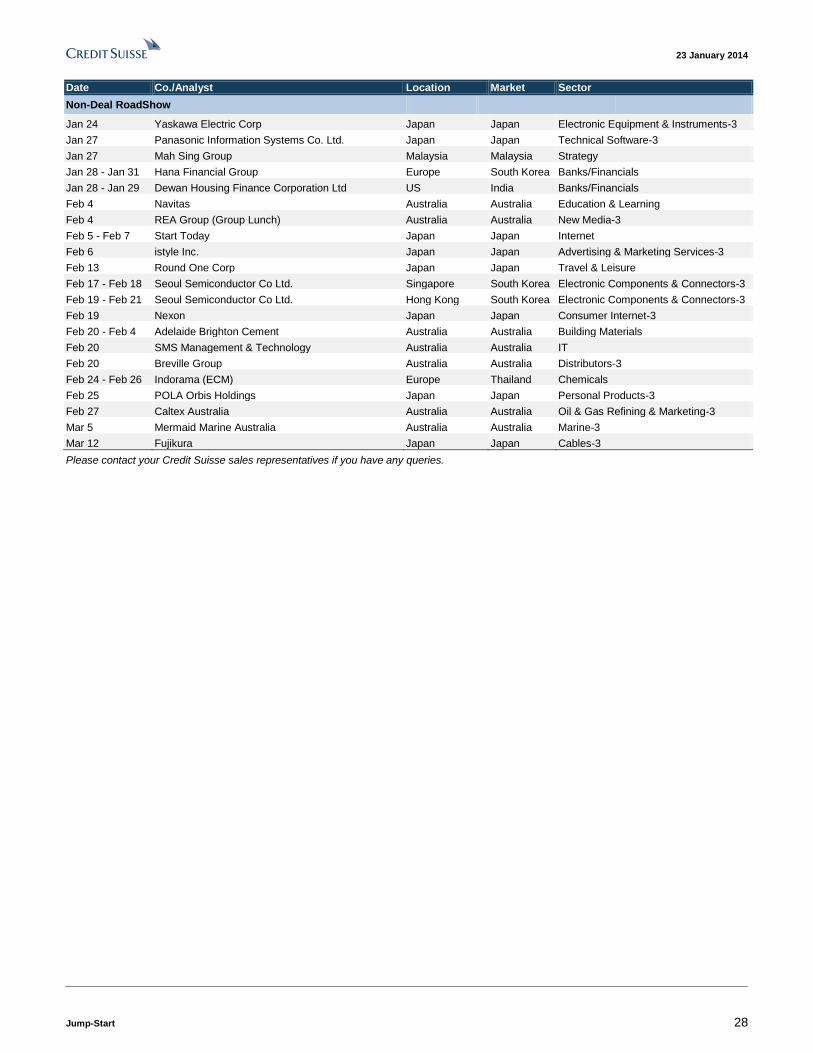
23 January 2014
Jump-Start 28
Date Co./Analyst Location Market Sector
Non-Deal RoadShow
Jan 24 Yaskawa Electric Corp Japan Japan Electronic Equipment & Instruments-3
Jan 27 Panasonic Information Systems Co. Ltd. Japan Japan Technical Software-3
Jan 27 Mah Sing Group Malaysia Malaysia Strategy
Jan 28 - Jan 31 Hana Financial Group Europe South Korea Banks/Financials
Jan 28 - Jan 29 Dewan Housing Finance Corporation Ltd US India Banks/Financials
Feb 4 Navitas Australia Australia Education & Learning
Feb 4 REA Group (Group Lunch) Australia Australia New Media-3
Feb 5 - Feb 7 Start Today Japan Japan Internet
Feb 6 istyle Inc. Japan Japan Advertising & Marketing Services-3
Feb 13 Round One Corp Japan Japan Travel & Leisure
Feb 17 - Feb 18 Seoul Semiconductor Co Ltd. Singapore South Korea Electronic Components & Connectors-3
Feb 19 - Feb 21 Seoul Semiconductor Co Ltd. Hong Kong South Korea Electronic Components & Connectors-3
Feb 19 Nexon Japan Japan Consumer Internet-3
Feb 20 - Feb 4 Adelaide Brighton Cement Australia Australia Building Materials
Feb 20 SMS Management & Technology Australia Australia IT
Feb 20 Breville Group Australia Australia Distributors-3
Feb 24 - Feb 26 Indorama (ECM) Europe Thailand Chemicals
Feb 25 POLA Orbis Holdings Japan Japan Personal Products-3
Feb 27 Caltex Australia Australia Australia Oil & Gas Refining & Marketing-3
Mar 5 Mermaid Marine Australia Australia Australia Marine-3
Mar 12 Fujikura Japan Japan Cables-3
Please contact your Credit Suisse sales representatives if you have any queries.

23 J
an
uary
201
4
Ju
mp
-Sta
rt 2
9
Credit Suisse Asian results calendar Forthcoming results ((23 Jan to 15 Feb 2014) (stocks with market cap > US$500 mn)
Net CS What we
Price profit vs EPS expect
Date of (local$) (local$ mn) Consensus (local$) in this
Results* Period Company Ctry Bberg 22 Jan Target Rating Consensus CS (%) Consensus CS results
Feb-04 (E) 2013 Baidu CN BIDU US US$174.43 US$220.00 O 10,749 11,296 5 30.44 32.06
Feb-04 (E) 2013 Changyou CN CYOU US US$30.74 US$34.00 N US$250 US$244 (2) US$4.65 US$4.57
Feb-04 (E) 2013 Sohu CN SOHU US US$76.97 US$95.00 O US$(23) US$48 n.m US$(0.84) US$1.24
Feb-05 (E) 2013 Glorious Property CN 845 HK HK$1.23 HK$1.00 U 786 769 (2) 0.11 0.10
Feb-07 (E) 2013 RDA CN RDA US US$18.17 US$17.50 O US$52 US$48 (8) US$1.11 US$1.00
Feb-07 (E) 2013 SouFun CN SFUN US US$94.80 US$110.00 O US$276 US$281 2 US$3.33 US$3.33
Feb-13 bef-mkt 2013 Ctrip CN CTRP US US$43.06 US$58.00 O 1,002 1,286 28 6.40 8.92
Feb-13 bef-mkt 2013 NetEase CN NTES US US$81.24 US$80.00 N 4,366 4,539 4 33.58 34.19
Jan-23 2013 HLP HK 101 HK 24.35 21.65 N 5,055 3,761 (26) 1.17 0.84
Jan-27 2014H1 Hopewell HK 54 HK 27.25 38.04 O 1,310 1,423 9 1.49 1.62
Late Jan (E) 2013 Wynn Macau HK 1128 HK 34.90 37.80 N 7,303 7,671 5 1.41 1.48
Early Feb (E) 2013 MPEL HK MPEL US US$43.07 US$50.50 O US$687 US$680 (1) US$1.25 US$1.23 In line
Early Feb (E) 2013 Sands China HK 1928 HK 61.85 78.20 O US$2,213 US$2,249 2 US$0.28 US$0.28
Mid Feb (E) 2014Q3 Lenovo HK 992 HK 10.32 10.60 O US$796 US$797 0 US$0.08 US$0.08
Mid Feb (E) 2013 MGM China HK 2282 HK 32.65 38.60 N 5,222 5,127 (2) 1.37 1.35 In line
Jan-30 (E) 2013 XL Axiata ID EXCL IJ 5,250 5,500 N 1,843,961 1,426,374 (23) 214.66 167.29
Feb-03 (E) 2013 BMRI ID BMRI IJ 8,950 10,500 O 17,219,769 16,967,389 (1) 734.59 727.15
Feb-05 (E) 2013 Kalbe Farma ID KLBF IJ 1,415 1,220 N 1,975,269 1,956,299 (1) 41.54 41.73
Feb-11 (E) 2013 Matahari ID LPPF IJ 13,075 10,000 N 1,157,807 1,171,913 1 394.97 401.63
Feb-14 (E) 2013 BTPN ID BTPN IJ 4,520 4,350 N 2,254,327 2,281,963 1 389.93 402.92
Feb-14 (E) 2013 Surya Citra ID SCMA IJ 2,625 2,775 N 1,361,680 1,437,041 6 95.45 98.28
Jan-23 2014Q3 Bharti Infratel IN BHIN IN 165.05 195.00 O 13,304 13,601 2 7.06 7.20
Jan-23 2014Q3 Cairn India IN CAIR IN 322.20 369.00 N 117,806 133,526 13 61.77 69.90
Jan-23 2014Q3 Dish TV IN DITV IN 50.50 71.00 O (652) (569) n.m (0.65) (0.53)
Jan-23 2014Q3 LTFH IN LTFH IN 73.10 50.00 U 7,056 6,136 (13) 4.17 3.58
Jan-23 (E) 2014Q3 Reliance Comm IN RCOM IN 133.15 90.00 U 13,019 23,090 77 6.00 11.19
Jan-23 (E) 2014Q3 Sun TV IN SUNTV IN 366.25 470.00 O 7,743 7,168 (7) 19.59 18.19
Jan-24 2014Q3 Glenmark IN GNP IN 504.80 640.00 O 7,151 7,002 (2) 26.15 25.91
Jan-24 (E) 2014Q3 Reliance Power IN RPWR IN 68.50 61.00 U 9,917 8,706 (12) 3.56 3.10
Jan-27 2014Q3 Adani Ports IN ADSEZ IN 147.65 186.00 O 18,512 18,394 (1) 8.93 8.89
Jan-27 2014Q3 Adani Power IN ADANI IN 34.65 17.00 U (15,804) (19,349) n.m (5.70) (6.74)
Jan-27 2014Q3 Hindustan Unilever IN HUVR IN 565.95 605.00 N 36,301 36,258 (0) 16.76 16.77
Jan-27 2014Q3 Idea Cellular IN IDEA IN 153.90 130.00 U 19,284 20,490 6 5.90 6.19
Jan-27 2014Q3 Titan IN TTAN IN 216.85 255.00 N 8,017 7,401 (8) 8.89 8.34

23 J
an
uary
201
4
Ju
mp
-Sta
rt 3
0
Net CS What we
Price profit vs EPS expect
Date of (local$) (local$ mn) Consensus (local$) in this
Results* Period Company Ctry Bberg 22 Jan Target Rating Consensus CS (%) Consensus CS results
Jan-28 (E) 2014Q3 Jaiprakash Power IN JPVL IN 16.15 35.00 O 2,832 2,145 (24) 1.13 0.73
Jan-28 2014Q3 JSPL IN JSP IN 261.85 230.00 N 26,439 22,430 (15) 28.43 23.98
Jan-28 2014Q3 JSW Steel IN JSTL IN 994.35 330.00 U 17,534 (1,671) n.m 75.55 (6.91)
Jan-28 2014Q3 Maruti Suzuki IN MSIL IN 1,805 1,960 O 28,871 27,436 (5) 95.58 90.85
Jan-28 2014Q3 NTPC IN NTPC IN 132.55 170.00 O 106,126 105,123 (1) 12.75 12.75
Jan-28 2014Q3 Sesa Sterlite IN SSLT IN 210.45 235.00 O 70,094 69,322 (1) 24.02 23.38
Jan-29 2014Q3 Bharti Airtel IN BHARTI IN 309.75 310.00 N 38,550 43,586 13 9.70 10.91
Jan-29 2014Q3 Crompton IN CRG IN 116.60 98.00 U 3,417 4,567 34 5.38 7.12
Jan-29 (E) 2014Q3 ESOIL IN ESOIL IN 52.80 49.00 U 1,316 (5,982) n.m 2.01 (4.38)
Jan-29 2014Q3 GAIL IN GAIL IN 343.20 400.00 O 41,937 42,189 1 33.24 33.26
Jan-29 2014Q3 ICICI Bank IN ICICIBC IN 1,087 1,036 N 94,495 91,314 (3) 81.73 79.15
Jan-29 2014Q3 IOB IN IOB IN 49.05 63.00 U 8,175 6,498 (21) 8.30 6.25
Jan-29 2014Q3 Shriram IN SHTF IN 625.70 760.00 O 13,989 15,702 12 62.16 69.22
Jan-30 2014Q3 BOI IN BOI IN 246.30 220.00 N 29,849 32,911 10 49.08 53.10
Jan-30 2014Q3 Hero Motocorp IN HMCL IN 2,060 1,900 U 21,583 22,062 2 108.17 110.48
Jan-31 2014Q3 Adani Enterprises IN ADE IN 246.00 198.00 U 12,337 15,181 23 11.14 13.80
Jan-31 (E) 2014Q3 BHEL IN BHEL IN 169.35 99.00 U 39,647 30,295 (24) 16.34 12.38
Jan-31 2014Q3 IDFC IN IDFC IN 100.80 144.00 O 19,656 19,997 2 12.94 13.20
Jan-31 2014Q3 ING Vysya IN VYSB IN 566.60 693.00 O 7,414 7,805 5 40.83 45.95
Jan-31 (E) 2014Q3 Lupin IN LPC IN 926.90 1,025 O 16,842 17,093 1 37.30 38.31
Jan-31 2014Q3 Marico IN MRCO IN 218.05 245.00 O 4,786 4,824 1 7.43 7.48
Jan-31 2014Q3 NHPC IN NHPC IN 18.15 21.00 O 23,395 23,298 (0) 1.91 1.89
Jan-31 2014Q3 Petronet LNG IN PLNG IN 112.35 132.00 N 8,428 9,335 11 11.26 12.45
Jan-31 2014Q3 PNB IN PNB IN 617.90 555.00 N 40,375 40,012 (1) 114.96 111.84
Jan-31 2014Q3 Union Bank IN UNBK IN 121.95 120.00 U 18,637 16,926 (9) 31.40 27.42
Feb-01 2014Q3 Godrej Consumer IN GCPL IN 768.05 940.00 O 8,182 7,987 (2) 24.00 23.47
Feb-01 2014Q3 Grasim IN GRASIM IN 2,586 3,280 O 24,815 24,636 (1) 261.71 268.60
Feb-04 (E) 2014Q3 BOB IN BOB IN 631.65 707.00 O 44,236 44,449 0 104.46 103.61
Feb-04 2014Q3 Cummins India IN KKC IN 457.45 382.00 N 6,108 6,190 1 21.99 22.33
Feb-04 (E) 2014Q3 J&K Bank IN JKBK IN 1,430 1,700 O 11,758 11,885 1 241.07 245.09
Feb-04 (E) 2014Q3 Jubilant Foodworks IN JUBI IN 1,164 1000.00 U 1,520 1,490 (2) 23.25 22.82
Feb-04 (E) 2014Q3 Taro Pharma IN TARO US US$104.35 US$85.00 O US$265 US$265 (0) US$5.93 US$5.93
Feb-04 2014Q3 Tech Mahindra IN TECHM IN 1,841 1,925 O 27,587 27,404 (1) 121.81 115.56
Feb-04 (E) 2014Q3 United Spirits IN UNSP IN 2,757 2,650 O 4,450 5,605 26 30.51 39.16
Feb-05 2013 GSK Consumer IN SKB IN 4,411 5,000 N 5,170 5,108 (1) 122.30 121.46
Feb-05 2013 Ranbaxy IN RBXY IN 416.35 345.00 N n.a 2,873 n.a n.a 6.81
Feb-06 2013 ACC IN ACC IN 1,024 1,450 O 10,556 11,259 7 56.11 59.90
Feb-06 2013 Ambuja Cements IN ACEM IN 171.00 180.00 N 12,047 11,850 (2) 7.69 7.68
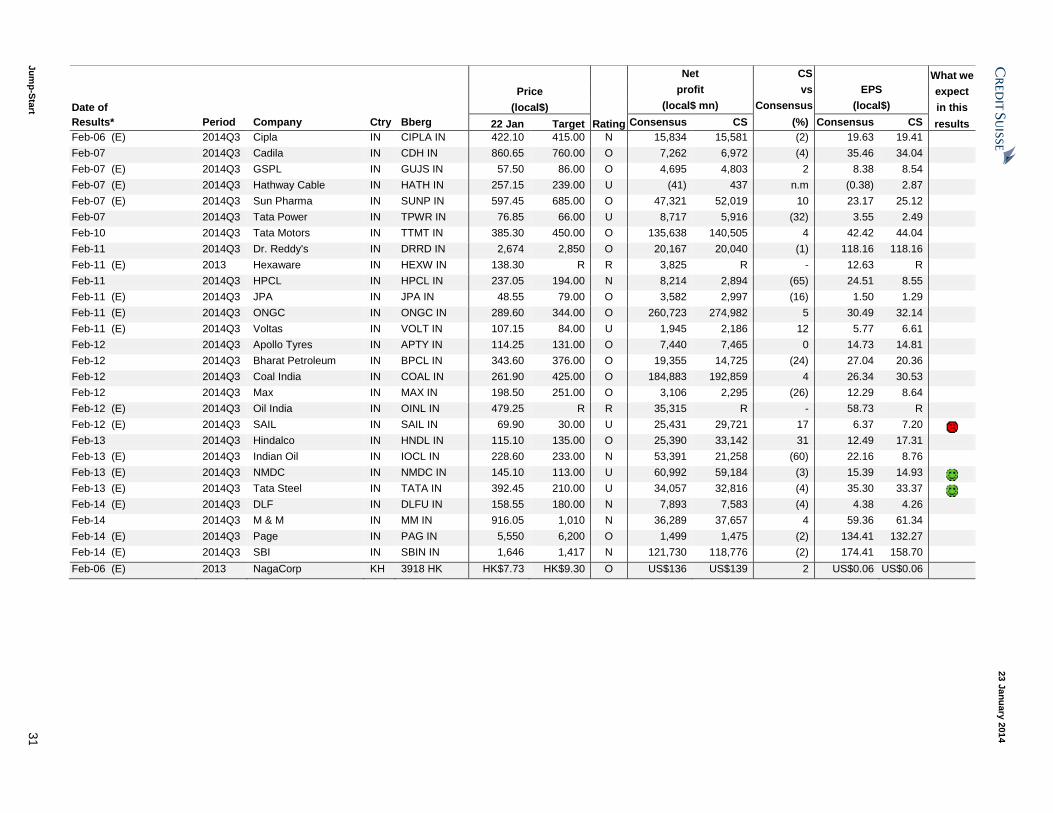
23 J
an
uary
201
4
Ju
mp
-Sta
rt 3
1
Net CS What we
Price profit vs EPS expect
Date of (local$) (local$ mn) Consensus (local$) in this
Results* Period Company Ctry Bberg 22 Jan Target Rating Consensus CS (%) Consensus CS results
Feb-06 (E) 2014Q3 Cipla IN CIPLA IN 422.10 415.00 N 15,834 15,581 (2) 19.63 19.41
Feb-07 2014Q3 Cadila IN CDH IN 860.65 760.00 O 7,262 6,972 (4) 35.46 34.04
Feb-07 (E) 2014Q3 GSPL IN GUJS IN 57.50 86.00 O 4,695 4,803 2 8.38 8.54
Feb-07 (E) 2014Q3 Hathway Cable IN HATH IN 257.15 239.00 U (41) 437 n.m (0.38) 2.87
Feb-07 (E) 2014Q3 Sun Pharma IN SUNP IN 597.45 685.00 O 47,321 52,019 10 23.17 25.12
Feb-07 2014Q3 Tata Power IN TPWR IN 76.85 66.00 U 8,717 5,916 (32) 3.55 2.49
Feb-10 2014Q3 Tata Motors IN TTMT IN 385.30 450.00 O 135,638 140,505 4 42.42 44.04
Feb-11 2014Q3 Dr. Reddy's IN DRRD IN 2,674 2,850 O 20,167 20,040 (1) 118.16 118.16
Feb-11 (E) 2013 Hexaware IN HEXW IN 138.30 R R 3,825 R - 12.63 R
Feb-11 2014Q3 HPCL IN HPCL IN 237.05 194.00 N 8,214 2,894 (65) 24.51 8.55
Feb-11 (E) 2014Q3 JPA IN JPA IN 48.55 79.00 O 3,582 2,997 (16) 1.50 1.29
Feb-11 (E) 2014Q3 ONGC IN ONGC IN 289.60 344.00 O 260,723 274,982 5 30.49 32.14
Feb-11 (E) 2014Q3 Voltas IN VOLT IN 107.15 84.00 U 1,945 2,186 12 5.77 6.61
Feb-12 2014Q3 Apollo Tyres IN APTY IN 114.25 131.00 O 7,440 7,465 0 14.73 14.81
Feb-12 2014Q3 Bharat Petroleum IN BPCL IN 343.60 376.00 O 19,355 14,725 (24) 27.04 20.36
Feb-12 2014Q3 Coal India IN COAL IN 261.90 425.00 O 184,883 192,859 4 26.34 30.53
Feb-12 2014Q3 Max IN MAX IN 198.50 251.00 O 3,106 2,295 (26) 12.29 8.64
Feb-12 (E) 2014Q3 Oil India IN OINL IN 479.25 R R 35,315 R - 58.73 R
Feb-12 (E) 2014Q3 SAIL IN SAIL IN 69.90 30.00 U 25,431 29,721 17 6.37 7.20
Feb-13 2014Q3 Hindalco IN HNDL IN 115.10 135.00 O 25,390 33,142 31 12.49 17.31
Feb-13 (E) 2014Q3 Indian Oil IN IOCL IN 228.60 233.00 N 53,391 21,258 (60) 22.16 8.76
Feb-13 (E) 2014Q3 NMDC IN NMDC IN 145.10 113.00 U 60,992 59,184 (3) 15.39 14.93
Feb-13 (E) 2014Q3 Tata Steel IN TATA IN 392.45 210.00 U 34,057 32,816 (4) 35.30 33.37
Feb-14 (E) 2014Q3 DLF IN DLFU IN 158.55 180.00 N 7,893 7,583 (4) 4.38 4.26
Feb-14 2014Q3 M & M IN MM IN 916.05 1,010 N 36,289 37,657 4 59.36 61.34
Feb-14 (E) 2014Q3 Page IN PAG IN 5,550 6,200 O 1,499 1,475 (2) 134.41 132.27
Feb-14 (E) 2014Q3 SBI IN SBIN IN 1,646 1,417 N 121,730 118,776 (2) 174.41 158.70
Feb-06 (E) 2013 NagaCorp KH 3918 HK HK$7.73 HK$9.30 O US$136 US$139 2 US$0.06 US$0.06

23 J
an
uary
201
4
Ju
mp
-Sta
rt 3
2
Net CS What we
Price profit vs EPS expect
Date of (local$) (local$ mn) Consensus (local$) in this
Results* Period Company Ctry Bberg 22 Jan Target Rating Consensus CS (%) Consensus CS results
Jan-23 @ 16:00 2013 Daelim KR 000210 KS 80,500 130,000 O 359,203 407,762 14 9,578 10,564
Jan-23 @ 14:00 2013 Hyundai Motor KR 005380 KS 236,500 299,000 O 8,717,057 8,913,002 2 34,373 42,591
Jan-23 around noon 2013 LG Display KR 034220 KS 26,950 25,000 N 517,687 556,938 8 1,435 1,485
Jan-23 afternoon 2013 LG H & H KR 051900 KS 562,000 640,000 O 354,560 370,499 4 21,663 20,911
Jan-24 to 27 (E) 2013 Hyundai Mobis KR 012330 KS 292,000 374,000 O 3,444,831 3,682,109 7 35,538 37,826
Jan-24 2013 Hyundai E&C KR 000720 KS 59,300 74,000 O 569,217 628,999 11 5,095 5,644
Jan-24 2013 Hyundai Wia KR 011210 KS 174,500 213,000 O 437,919 421,139 (4) 17,003 16,368
Jan-24 @ 10:00 2013 Kia Motors KR 000270 KS 53,100 71,000 N 3,796,228 4,049,157 7 9,382 9,998
Jan-24 2013 Samsung C&T KR 000830 KS 58,300 75,000 O 368,571 323,361 (12) 2,321 2,135
Jan-24 after noon 2013 Samsung SDI KR 006400 KS 156,500 142,000 N 428,992 422,553 (2) 9,229 9,275
Jan-27 2013 LG Chem KR 051910 KS 276,000 400,000 O 1,430,548 1,475,281 3 20,485 22,261
Jan-27 after noon 2013 LG Innotek KR 011070 KS 88,600 64,000 U 41,828 32,651 (22) 2,135 1,619
Jan-27 after noon 2013 LGE KR 066570 KS 69,600 77,000 N 418,177 327,948 (22) 2,399 1,813 In line
Jan-27 2013 S-Oil KR 010950 KS 70,100 100,000 O 449,889 614,231 37 3,974 5,456
Around Jan-28 (E) 2013 E-mart KR 139480 KS 253,000 300,000 O 479,555 474,488 (1) 16,980 17,021
Around Jan-28 (E) 2013 Shinsegae KR 004170 KS 227,000 270,000 N 167,707 165,095 (2) 17,814 16,769
Jan-28 (E) 2013 Daewoo E&C KR 047040 KS 6,240 8,500 N 175,027 293,947 68 431 707
Jan-28 2013 Hyundai Home KR 057050 KS 182,500 175,000 O 201,077 162,486 (19) 16,644 13,541
Jan-28 @ 11:00 2013 KT Corp KR 030200 KS 30,850 37,000 N 575,507 788,852 37 2,165 3,021
Jan-28 2013 POSCO KR 005490 KS 310,500 350,000 N 1,789,089 1,899,898 6 21,221 23,826
Jan-28 2013 Samsung Eng KR 028050 KS 72,300 60,000 U (715,216) (716,741) n.m (18,281) (19,392)
Jan-28 after noon 2013 SEMCO KR 009150 KS 70,500 100,000 O 434,275 502,982 16 5,663 6,734
Jan-28 morning 2013 SK Hynix KR 000660 KS 36,300 47,000 O 2,642,451 2,687,921 2 3,749 3,873
Jan-28 @ 16:00 2013 SK Telecom KR 017670 KS 219,000 280,000 O 1,748,713 1,954,759 12 22,149 24,209
Jan-29 @ 10:00 2013 LG Uplus KR 032640 KS 10,600 13,000 O 319,051 301,858 (5) 722 691
Jan-30 (E) 2013 GS HS KR 028150 KS 289,400 255,000 N 133,179 125,544 (6) 20,509 19,969
Late Jan (E) 2013 HDS KR 069960 KS 148,000 200,000 O 319,153 315,806 (1) 13,660 13,495
Late Jan-early Feb (E) 2013 Samsung Heavy KR 010140 KS 35,850 44,000 N 884,219 820,899 (7) 3,904 3,556
Early Feb (E) 2013 Doosan Heavy KR 034020 KS 36,700 40,000 N 159,699 52,840 (67) 1,662 499
Early to mid-Feb (E) 2013 Hyundai Hysco KR 010520 KS 41,500 45,000 N 365,215 315,481 (14) 4,505 3,968
Wk of Feb 3 (E) 2013 Hyundai Heavy KR 009540 KS 237,500 319,000 O 599,860 915,949 53 8,132 12,052
Feb-03 to 07 (E) 2013 Amorepacific KR 090430 KS 1,039,000 1,100,000 O 266,411 257,079 (4) 41,987 37,247
Feb-03 (E) 2013 Korean Air KR 003490 KS 33,600 38,500 N (243,236) (238,707) n.m (3,878) (3,784) In line
Feb-04 2013 CJ OS KR 035760 KS 408,000 400,000 O 123,739 148,468 20 20,451 24,675
Feb-04 (E) 2013 Hyundai Dev KR 012630 KS 25,250 30,000 O (66,531) (79,663) n.m (808) (1,083)
Feb-04 2013 SK Innovation KR 096770 KS 131,500 170,000 O 1,105,878 1,114,304 1 11,825 12,153
Feb-05 (E) 2013 GS Holdings KR 078930 KS 53,400 52,000 N 523,372 544,536 4 5,683 5,861
Feb-05 2013 Lotte Chemical KR 011170 KS 216,500 280,000 O 391,113 383,640 (2) 11,504 11,194
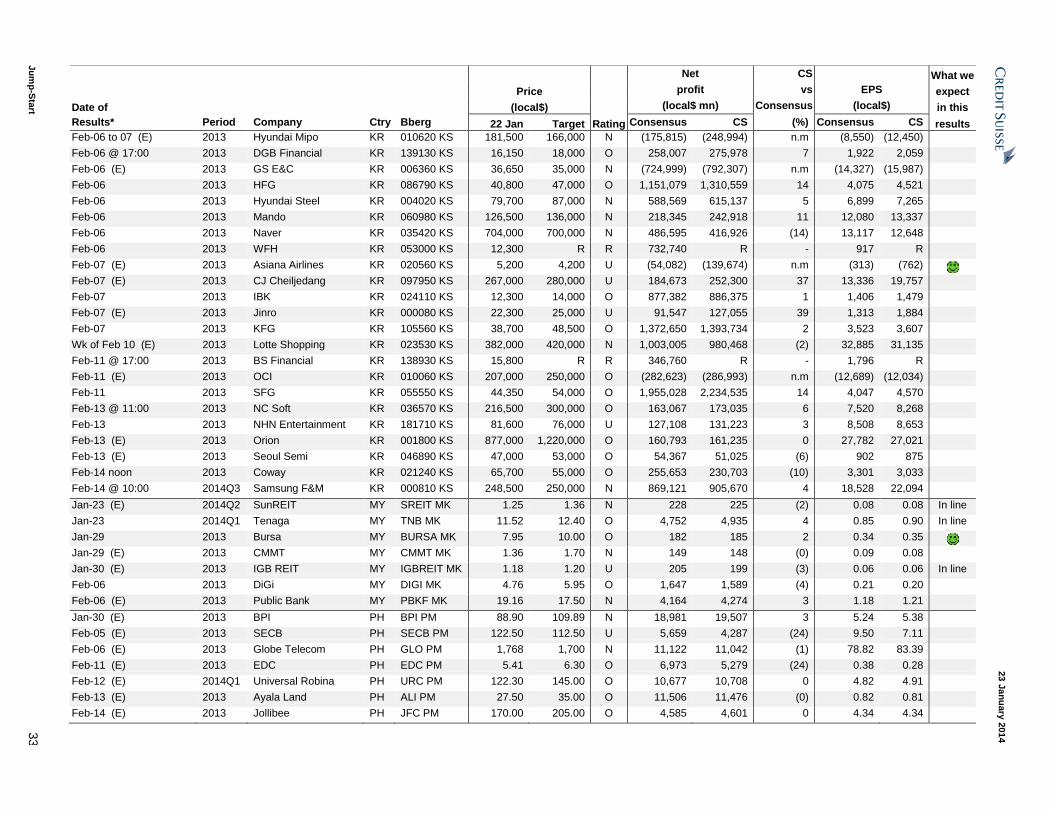
23 J
an
uary
201
4
Ju
mp
-Sta
rt 3
3
Net CS What we
Price profit vs EPS expect
Date of (local$) (local$ mn) Consensus (local$) in this
Results* Period Company Ctry Bberg 22 Jan Target Rating Consensus CS (%) Consensus CS results
Feb-06 to 07 (E) 2013 Hyundai Mipo KR 010620 KS 181,500 166,000 N (175,815) (248,994) n.m (8,550) (12,450)
Feb-06 @ 17:00 2013 DGB Financial KR 139130 KS 16,150 18,000 O 258,007 275,978 7 1,922 2,059
Feb-06 (E) 2013 GS E&C KR 006360 KS 36,650 35,000 N (724,999) (792,307) n.m (14,327) (15,987)
Feb-06 2013 HFG KR 086790 KS 40,800 47,000 O 1,151,079 1,310,559 14 4,075 4,521
Feb-06 2013 Hyundai Steel KR 004020 KS 79,700 87,000 N 588,569 615,137 5 6,899 7,265
Feb-06 2013 Mando KR 060980 KS 126,500 136,000 N 218,345 242,918 11 12,080 13,337
Feb-06 2013 Naver KR 035420 KS 704,000 700,000 N 486,595 416,926 (14) 13,117 12,648
Feb-06 2013 WFH KR 053000 KS 12,300 R R 732,740 R - 917 R
Feb-07 (E) 2013 Asiana Airlines KR 020560 KS 5,200 4,200 U (54,082) (139,674) n.m (313) (762)
Feb-07 (E) 2013 CJ Cheiljedang KR 097950 KS 267,000 280,000 U 184,673 252,300 37 13,336 19,757
Feb-07 2013 IBK KR 024110 KS 12,300 14,000 O 877,382 886,375 1 1,406 1,479
Feb-07 (E) 2013 Jinro KR 000080 KS 22,300 25,000 U 91,547 127,055 39 1,313 1,884
Feb-07 2013 KFG KR 105560 KS 38,700 48,500 O 1,372,650 1,393,734 2 3,523 3,607
Wk of Feb 10 (E) 2013 Lotte Shopping KR 023530 KS 382,000 420,000 N 1,003,005 980,468 (2) 32,885 31,135
Feb-11 @ 17:00 2013 BS Financial KR 138930 KS 15,800 R R 346,760 R - 1,796 R
Feb-11 (E) 2013 OCI KR 010060 KS 207,000 250,000 O (282,623) (286,993) n.m (12,689) (12,034)
Feb-11 2013 SFG KR 055550 KS 44,350 54,000 O 1,955,028 2,234,535 14 4,047 4,570
Feb-13 @ 11:00 2013 NC Soft KR 036570 KS 216,500 300,000 O 163,067 173,035 6 7,520 8,268
Feb-13 2013 NHN Entertainment KR 181710 KS 81,600 76,000 U 127,108 131,223 3 8,508 8,653
Feb-13 (E) 2013 Orion KR 001800 KS 877,000 1,220,000 O 160,793 161,235 0 27,782 27,021
Feb-13 (E) 2013 Seoul Semi KR 046890 KS 47,000 53,000 O 54,367 51,025 (6) 902 875
Feb-14 noon 2013 Coway KR 021240 KS 65,700 55,000 O 255,653 230,703 (10) 3,301 3,033
Feb-14 @ 10:00 2014Q3 Samsung F&M KR 000810 KS 248,500 250,000 N 869,121 905,670 4 18,528 22,094
Jan-23 (E) 2014Q2 SunREIT MY SREIT MK 1.25 1.36 N 228 225 (2) 0.08 0.08 In line
Jan-23 2014Q1 Tenaga MY TNB MK 11.52 12.40 O 4,752 4,935 4 0.85 0.90 In line
Jan-29 2013 Bursa MY BURSA MK 7.95 10.00 O 182 185 2 0.34 0.35
Jan-29 (E) 2013 CMMT MY CMMT MK 1.36 1.70 N 149 148 (0) 0.09 0.08
Jan-30 (E) 2013 IGB REIT MY IGBREIT MK 1.18 1.20 U 205 199 (3) 0.06 0.06 In line
Feb-06 2013 DiGi MY DIGI MK 4.76 5.95 O 1,647 1,589 (4) 0.21 0.20
Feb-06 (E) 2013 Public Bank MY PBKF MK 19.16 17.50 N 4,164 4,274 3 1.18 1.21
Jan-30 (E) 2013 BPI PH BPI PM 88.90 109.89 N 18,981 19,507 3 5.24 5.38
Feb-05 (E) 2013 SECB PH SECB PM 122.50 112.50 U 5,659 4,287 (24) 9.50 7.11
Feb-06 (E) 2013 Globe Telecom PH GLO PM 1,768 1,700 N 11,122 11,042 (1) 78.82 83.39
Feb-11 (E) 2013 EDC PH EDC PM 5.41 6.30 O 6,973 5,279 (24) 0.38 0.28
Feb-12 (E) 2014Q1 Universal Robina PH URC PM 122.30 145.00 O 10,677 10,708 0 4.82 4.91
Feb-13 (E) 2013 Ayala Land PH ALI PM 27.50 35.00 O 11,506 11,476 (0) 0.82 0.81
Feb-14 (E) 2013 Jollibee PH JFC PM 170.00 205.00 O 4,585 4,601 0 4.34 4.34

23 J
an
uary
201
4
Ju
mp
-Sta
rt 3
4
Net CS What we
Price profit vs EPS expect
Date of (local$) (local$ mn) Consensus (local$) in this
Results* Period Company Ctry Bberg 22 Jan Target Rating Consensus CS (%) Consensus CS results
Jan-28 (E) 2014Q2 LUCKY PK LUCK PA 316.52 335.00 O 10,926 11,563 6 34.29 35.76
Jan-29 2013 Fauji Fertilizer PK FFC PA 117.72 126.00 N 19,945 21,174 6 15.59 16.64
Jan-30 (E) 2013 Fatima PK FATIMA PA 28.62 30.50 O 8,378 8,378 (0) 3.99 3.99
Feb-11 (E) 2013 MCB PK MCB PA 289.27 350.00 O 21,692 22,122 2 21.67 21.86
Jan-23 bef-mkt 2013 CCT SG CCT SP 1.49 1.59 N 230 236 2 0.08 0.08 In line
Jan-23 2013 Keppel Corp SG KEP SP 11.00 12.90 O 1,507 1,496 (1) 0.84 0.83
Jan-23 2013 Suntec REIT SG SUN SP 1.59 1.63 U 207 209 1 0.09 0.09
Jan-27 2013 OSIM SG OSIM SP 2.43 2.50 O 103 101 (2) 0.14 0.14
Jan-28 2014Q3 SMRT SG MRT SP 1.20 1.15 U 69 84 21 0.05 0.06
Jan-29 (E) 2013 CDLHT SG CDREIT SP 1.62 2.00 O 103 116 12 0.11 0.11
Feb-01 (E) 2013 HPHT SG HPHT SP US$0.68 US$0.82 O HK$1,949 HK$1,986 2 HK$0.23 HK$0.23 In line
Feb-06 2014Q3 SIA SG SIA SP 9.97 11.30 N 512 624 22 0.44 0.52
Feb-07 (E) 2013 CMA SG CMA SP 1.85 2.58 O 282 254 (10) 0.07 0.07 In line
Feb-07 (E) 2013 ComfortDelGro SG CD SP 1.96 2.20 O 261 263 1 0.12 0.13
Feb-07 bef-mkt 2013 GE SG GE SP 17.86 25.00 O 629 694 10 1.31 1.47
Feb-07 (E) 2014Q2 Olam SG OLAM SP 1.50 1.50 N 369 391 6 0.15 0.16
Feb-07 (E) 2013 StarHub SG STH SP 4.24 4.40 N 375 385 3 0.22 0.22
Feb-11 2014Q3 SATS SG SATS SP 3.21 3.70 O 209 232 11 0.19 0.21
Feb-12 2014Q3 Biosensors SG BIG SP 0.90 1.00 N US$69 US$66 (4) US$0.04 US$0.04
Feb-12 2014Q3 GLP SG GLP SP 2.94 3.15 N US$254 US$278 9 US$0.05 US$0.06
Feb-14 bef-mkt 2013 DBS SG DBS SP 17.15 19.00 O 3,592 3,597 0 1.45 1.45
Feb-14 bef-mkt 2013 OCBC SG OCBC SP 9.65 10.20 U 2,685 2,720 1 0.77 0.79
Feb-14 (E) 2014Q3 SingTel SG ST SP 3.54 3.90 N 3,707 3,734 1 0.23 0.23
Feb-14 (E) 2013 STE SG STE SP 3.89 3.40 U 582 586 1 0.19 0.19
Feb-14 2013 UOB SG UOB SP 20.37 22.00 N 2,844 2,830 (1) 1.78 1.79

23 J
an
uary
201
4
Ju
mp
-Sta
rt 3
5
Net CS What we
Price profit vs EPS expect
Date of (local$) (local$ mn) Consensus (local$) in this
Results* Period Company Ctry Bberg 22 Jan Target Rating Consensus CS (%) Consensus CS results
Jan-28 (E) 2014Q3 VGI TH VGI TB 8.85 13.46 O 1,319 1,417 7 0.39 0.41
Jan-30 during lunch break 2013 SCC TH SCC TB 402.00 404.00 N 34,193 36,506 7 28.56 30.42 In line
Feb-07 (E) 2013 AIS TH ADVANC TB 211.00 280.00 O 36,613 37,576 3 12.30 12.64
Feb-11 2013 TAC TH DTAC TB 99.25 140.00 O 11,603 12,197 5 4.90 5.15
Feb-12 (E) 2013 STEC TH STEC TB 13.60 15.60 N 1,434 1,425 (1) 0.97 0.93
Feb-13 (E) 2014Q3 BTS Group TH BTS TB 8.45 11.20 O 2,538 2,572 1 0.21 0.22
Feb-13 (E) 2013 LPN TH LPN TB 15.00 26.00 O 2,594 2,535 (2) 1.75 1.72
Feb-13 (E) 2013 SCCC TH SCCC TB 379.00 380.00 U 4,927 4,798 (3) 21.43 20.86
Feb-13 (E) 2013 Shin Corp TH INTUCH TB 71.50 101.00 O 14,756 13,710 (7) 4.61 4.28
Feb-14 (E) 2013 PTTGC TH PTTGC TB 73.25 95.00 O 52,248 29,584 (43) 7.41 6.57
Feb-14/15 (E) 2014Q1 AOT TH AOT TB 160.00 220.00 O 12,774 12,969 2 8.96 9.08 In line
Jan-23 @ 14:30 2013 Largan TW 3008 TT 1,245 1,130 O 9,098 9,026 (1) 68.02 67.29
Jan-23 @ 14:00 2013 Realtek TW 2379 TT 87.90 75.00 N 2,809 3,093 10 5.49 6.17
Jan-24 @ 17:00 2013 UMC TW 2303 TT 12.75 13.00 N 11,590 12,465 8 0.91 1.00
Jan-27 @ 14:00 2013 AUO TW 2409 TT 9.11 13.50 O 2,903 2,924 1 0.31 0.31
Jan-27 @ 14:00 2013 MediaTek TW 2454 TT 399.00 500.00 O 27,057 27,346 1 20.09 20.39
Jan-27 @ 14:30 2013 SPIL TW 2325 TT 37.80 42.00 O 5,608 6,529 16 1.79 2.10
Feb-07 @ 14:30 2013 ASE TW 2311 TT 28.75 31.50 O 15,203 14,372 (5) 1.98 1.89
Feb-07 2013 WPG TW 3702 TT 36.35 39.50 N 4,800 4,975 4 2.89 3.00
Feb-12 2013 Novatek TW 3034 TT 125.50 104.00 U 4,947 4,839 (2) 8.08 7.97
Feb-14 2013 Powertech TW 6239 TT 42.80 56.00 N 1,701 2,070 22 2.75 2.71
Feb-14 2013 Unimicron TW 3037 TT 23.80 29.00 O 1,653 1,451 (12) 1.05 0.94
Notes: — Credit Suisse and consensus net profits and EPS are based on full year forecasts, — This calendar excludes stocks with market cap less than US$500 mn
— The date of release for stocks listed in US are based on HK date and time, all other stocks are based on the date & time of the listed exchange
* Confirmed dates but are subject to change, (E) = estimated date
Positive surprise, Negative surprise. Source: the BLOOMBERG PROFESSIONAL™ service., Company data, Datastream, Credit Suisse estimates.

23 J
an
uary
201
4
Ju
mp
-Sta
rt 3
6
Results reported 16 Jan - 22 Jan 2014 (stocks with market cap > US$3 bn) % chg in CS % chg in
% Consensus Consensus cons. EPS CS CS EPS
Date of Price ($) upside / Reported YoY QoQ EPS EPS EPS post pre- EPS post
Results Period Company Ctry Sector Bberg Rating Ccy 22 Jan Target downside Ccy EPS (%) (%) pre-results 22 Jan results results 22 Jan results
Jan-22 2013 BRI ID Banks BBRI IJ O IDR 8,400 10,250 22.0 IDR Q4 231.87 1 5 885.45 883.32 (0.2) 777.24 777.24 0.0
Jan-16 2014Q3 Axis Bank IN Banks AXSB IN O INR 1,187 1,450 22.2 INR Q3 34.19 8 18 124.52 125.97 1.2 126.39 126.39 0.0
Jan-16 2014Q3 Bajaj Auto IN Automobiles & Components BJAUT IN N INR 1,951 2,090 7.1 INR Q3 31.26 10 8 122.44 120.60 (1.5) 128.61 121.91 (5.2)
Jan-16 2014Q2 HCL Tech IN Technology HCLT IN O INR 1,446 1,675 15.8 USD Q2 0.35 35 5 1.29 1.35 5.0 1.34 1.40 5.0
Jan-16 2014Q3 TCS IN Technology TCS IN O INR 2,274 2,750 20.9 INR Q3 27.13 50 13 94.78 96.25 1.5 94.87 95.38 0.5
Jan-17 2014Q3 HDFC Bank IN Banks HDFCB IN O INR 677.70 770.00 13.6 INR Q3 9.80 24 18 35.28 35.38 0.3 35.54 35.94 1.1
Jan-17 2014Q3 Hindustan Zinc IN Metals & Mining HZ IN O INR 135.60 159.00 17.3 INR Q3 4.08 7 5 16.59 16.59 (0.0) 16.08 16.02 (0.4)
Jan-17 2014Q3 ITC IN Consumer Staples ITC IN O INR 327.40 385.00 17.6 INR Q3 3.01 15 7 10.92 10.92 (0.0) 10.87 10.87 0.0
Jan-17 2014Q3 Reliance Inds IN Energy RIL IN O INR 872.20 1,044 19.7 INR Q3 17.10 0 1 71.21 71.36 0.2 70.26 70.26 0.0
Jan-17 2014Q3 Wipro IN Technology WPRO IN O INR 577.45 650.00 12.6 INR Q3 8.20 17 4 30.76 31.01 0.8 31.02 31.03 0.0
Jan-20 2014Q3 Asian Paints IN Chemicals APNT IN N INR 473.75 470.00 (0.8) INR Q3 3.43 883 1 13.38 12.99 (2.9) 13.34 12.97 (2.7)
Jan-20 2014Q3 Ultratech IN Building Materials & Construction UTCEM IN N INR 1,700 1,700 0.0 INR Q3 13.49 (38) 40 86.02 79.35 (7.8) 86.04 67.96 (21.0)
Jan-21 2014Q3 Kotak Bank IN Banks KMB IN U INR 710.20 618.00 (13.0) INR Q3 7.69 (1) 1 32.72 32.64 (0.2) 32.81 32.81 0.0
Jan-22 2014Q3 Dabur IN Consumer Staples DABUR IN N INR 160.85 175.00 8.8 INR Q3 1.40 16 (2) 5.32 5.32 0.0 5.45 5.29 (2.9)
Jan-22 2014Q3 HDFC IN Diversified Financials HDFC IN O INR 842.25 1,045 24.1 INR Q3 8.19 11 1 35.74 35.74 0.0 36.25 36.25 0.0
Jan-22 2014Q3 L&T IN Capital Goods LT IN U INR 1,005 713.00 (29.1) INR Q3 13.40 65 27 53.35 53.35 0.0 58.51 58.51 0.0
Jan-22 2014Q3 ZEE IN Media Z IN O INR 284.45 320.00 12.5 INR Q3 2.23 10 (9) 9.00 9.00 0.0 7.31 10.95 49.8
Jan-16 2013 KT&G KR Consumer Staples 033780 KS U KRW 73,600 67,000 (9.0) KRW Q4 580.80 (32) (21) 5,741.54 5,671.85 (1.2) 5,742.21 5,742.21 0.0
Jan-17 2014Q3 A-REIT SG Real Estate AREIT SP N SGD 2.18 2.48 13.8 SGD Q3 0.04 26 40 0.14 0.14 (0.7) 0.14 0.14 0.0
Jan-22 2013 CMT SG Real Estate CT SP O SGD 1.89 2.40 27.0 SGD Q4 0.05 33 88 0.11 0.11 0.0 0.11 0.11 0.9
Jan-22 2013 KepLand SG Real Estate KPLD SP N SGD 3.26 3.80 16.6 SGD Q4 0.37 5 348 0.30 0.30 0.0 0.31 0.28 (9.1)
Jan-22 2014Q2 SGX SG Diversified Financials SGX SP N SGD 7.00 8.25 17.9 SGD Q2 0.07 (2) (19) 0.34 0.34 0.0 0.32 0.32 0.0
Jan-16 2013 KBANK TH Banks KBANK/F TB O THB 172.50 223.00 29.3 THB Q4 3.98 24 (11) 19.25 19.10 (0.8) 18.96 18.96 0.0
Jan-16 2013 SCB TH Banks SCB TB O THB 150.50 180.00 19.6 THB Q4 3.46 20 (7) 16.07 16.00 (0.4) 16.20 16.20 0.0
Jan-16 2013 TMB Bank TH Banks TMB TB N THB 2.30 2.60 13.0 THB Q4 0.04 n.m (4) 0.18 0.18 (1.6) 0.20 0.20 0.0
Jan-17 2013 BAY TH Banks BAY TB U THB 31.75 33.00 3.9 THB Q4 0.52 (16) (16) 3.11 3.00 (3.6) 3.08 3.08 0.0
Jan-17 2013 BBL TH Banks BBL/F TB N THB 175.50 230.00 31.1 THB Q4 4.03 (7) (14) 20.74 20.55 (0.9) 19.95 19.95 0.0
Jan-21 2013 KTB TH Banks KTB TB O THB 17.30 24.50 41.6 THB Q4 0.72 823 13 2.49 2.49 (0.0) 2.72 2.72 0.0
Jan-16 2013 TSMC TW Technology 2330 TT O TWD 107.50 116.00 7.9 TWD Q4 1.73 8 (14) 7.96 8.05 1.1 8.00 8.00 0.1
Source: the BLOOMBERG PROFESSIONAL™ service., IBES, Credit Suisse estimates.
23 J
an
uary
201
4
Ju
mp
-Sta
rt 3
7
Credit Suisse Valuation Summary (by country)
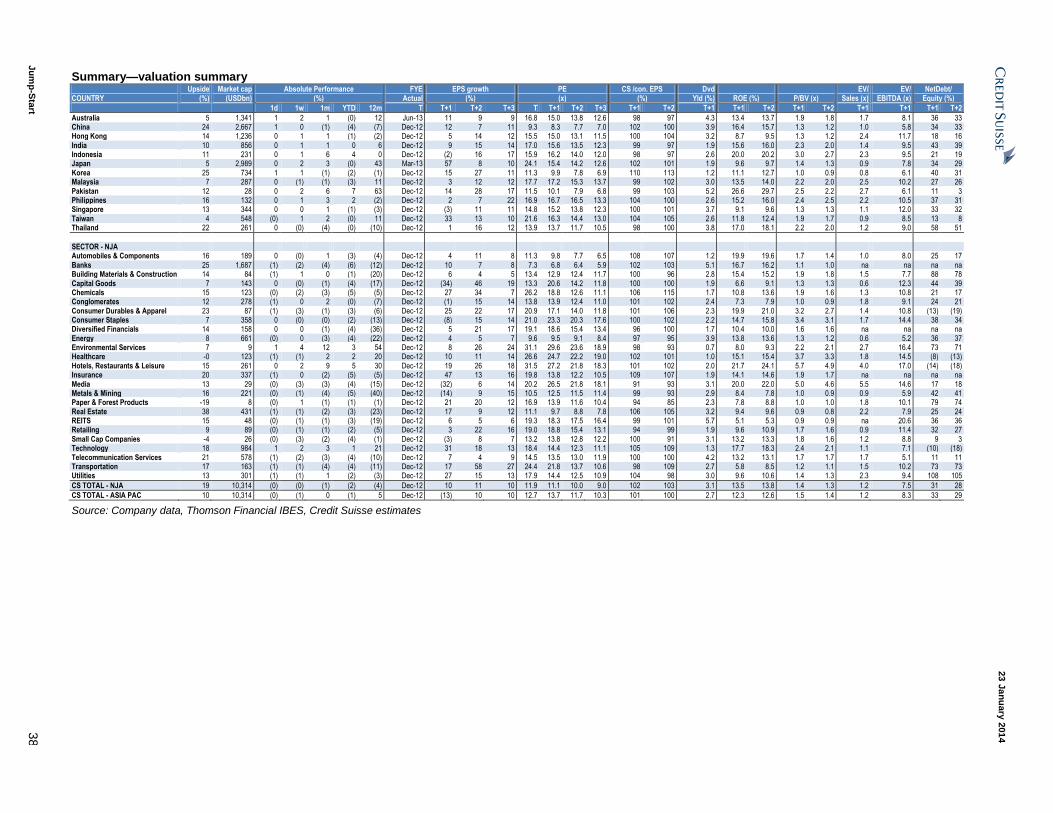
23 J
an
uary
201
4
Ju
mp
-Sta
rt 3
8
Summary—valuation summary Upside Market cap Absolute Performance FYE EPS growth PE CS /con. EPS Dvd EV/ EV/ NetDebt/ COUNTRY (%) (USDbn) (%) Actual (%) (x) (%) Yld (%) ROE (%) P/BV (x) Sales (x) EBITDA (x) Equity (%)
1d 1w 1m YTD 12m T T+1 T+2 T+3 T T+1 T+2 T+3 T+1 T+2 T+1 T+1 T+2 T+1 T+2 T+1 T+1 T+1 T+2
Australia 5 1,341 1 2 1 (0) 12 Jun-13 11 9 9 16.8 15.0 13.8 12.6 98 97 4.3 13.4 13.7 1.9 1.8 1.7 8.1 36 33 China 24 2,667 1 0 (1) (4) (7) Dec-12 12 7 11 9.3 8.3 7.7 7.0 102 100 3.9 16.4 15.7 1.3 1.2 1.0 5.8 34 33 Hong Kong 14 1,236 0 1 1 (1) (2) Dec-12 5 14 12 15.5 15.0 13.1 11.5 100 104 3.2 8.7 9.5 1.3 1.2 2.4 11.7 18 16 India 10 856 0 1 1 0 6 Dec-12 9 15 14 17.0 15.6 13.5 12.3 99 97 1.9 15.6 16.0 2.3 2.0 1.4 9.5 43 39 Indonesia 11 231 0 1 6 4 0 Dec-12 (2) 16 17 15.9 16.2 14.0 12.0 98 97 2.6 20.0 20.2 3.0 2.7 2.3 9.5 21 19 Japan 5 2,989 0 2 3 (0) 43 Mar-13 57 8 10 24.1 15.4 14.2 12.6 102 101 1.9 9.6 9.7 1.4 1.3 0.9 7.8 34 29 Korea 25 734 1 1 (1) (2) (1) Dec-12 15 27 11 11.3 9.9 7.8 6.9 110 113 1.2 11.1 12.7 1.0 0.9 0.8 6.1 40 31 Malaysia 7 287 0 (1) (1) (3) 11 Dec-12 3 12 12 17.7 17.2 15.3 13.7 99 102 3.0 13.5 14.0 2.2 2.0 2.5 10.2 27 26 Pakistan 12 28 0 2 6 7 63 Dec-12 14 28 17 11.5 10.1 7.9 6.8 99 103 5.2 26.6 29.7 2.5 2.2 2.7 6.1 11 3 Philippines 16 132 0 1 3 2 (2) Dec-12 2 7 22 16.9 16.7 16.5 13.3 104 100 2.6 15.2 16.0 2.4 2.5 2.2 10.5 37 31 Singapore 13 344 0 0 1 (1) (3) Dec-12 (3) 11 11 14.8 15.2 13.8 12.3 100 101 3.7 9.1 9.6 1.3 1.3 1.1 12.0 33 32 Taiwan 4 548 (0) 1 2 (0) 11 Dec-12 33 13 10 21.6 16.3 14.4 13.0 104 105 2.6 11.8 12.4 1.9 1.7 0.9 8.5 13 8 Thailand 22 261 0 (0) (4) (0) (10) Dec-12 1 16 12 13.9 13.7 11.7 10.5 98 100 3.8 17.0 18.1 2.2 2.0 1.2 9.0 58 51
SECTOR - NJA Automobiles & Components 16 189 0 (0) 1 (3) (4) Dec-12 4 11 8 11.3 9.8 7.7 6.5 108 107 1.2 19.9 19.6 1.7 1.4 1.0 8.0 25 17 Banks 25 1,687 (1) (2) (4) (6) (12) Dec-12 10 7 8 7.3 6.8 6.4 5.9 102 103 5.1 16.7 16.2 1.1 1.0 na na na na Building Materials & Construction 14 84 (1) 1 0 (1) (20) Dec-12 6 4 5 13.4 12.9 12.4 11.7 100 96 2.8 15.4 15.2 1.9 1.8 1.5 7.7 88 78 Capital Goods 7 143 0 (0) (1) (4) (17) Dec-12 (34) 46 19 13.3 20.6 14.2 11.8 100 100 1.9 6.6 9.1 1.3 1.3 0.6 12.3 44 39 Chemicals 15 123 (0) (2) (3) (5) (5) Dec-12 27 34 7 26.2 18.8 12.6 11.1 106 115 1.7 10.8 13.6 1.9 1.6 1.3 10.8 21 17 Conglomerates 12 278 (1) 0 2 (0) (7) Dec-12 (1) 15 14 13.8 13.9 12.4 11.0 101 102 2.4 7.3 7.9 1.0 0.9 1.8 9.1 24 21 Consumer Durables & Apparel 23 87 (1) (3) (1) (3) (6) Dec-12 25 22 17 20.9 17.1 14.0 11.8 101 106 2.3 19.9 21.0 3.2 2.7 1.4 10.8 (13) (19) Consumer Staples 7 358 0 (0) (0) (2) (13) Dec-12 (8) 15 14 21.0 23.3 20.3 17.6 100 102 2.2 14.7 15.8 3.4 3.1 1.7 14.4 38 34 Diversified Financials 14 158 0 0 (1) (4) (36) Dec-12 5 21 17 19.1 18.6 15.4 13.4 96 100 1.7 10.4 10.0 1.6 1.6 na na na na Energy 8 661 (0) 0 (3) (4) (22) Dec-12 4 5 7 9.6 9.5 9.1 8.4 97 95 3.9 13.8 13.6 1.3 1.2 0.6 5.2 36 37 Environmental Services 7 9 1 4 12 3 54 Dec-12 8 26 24 31.1 29.6 23.6 18.9 98 93 0.7 8.0 9.3 2.2 2.1 2.7 16.4 73 71 Healthcare -0 123 (1) (1) 2 2 20 Dec-12 10 11 14 26.6 24.7 22.2 19.0 102 101 1.0 15.1 15.4 3.7 3.3 1.8 14.5 (8) (13) Hotels, Restaurants & Leisure 15 261 0 2 9 5 30 Dec-12 19 26 18 31.5 27.2 21.8 18.3 101 102 2.0 21.7 24.1 5.7 4.9 4.0 17.0 (14) (18) Insurance 20 337 (1) 0 (2) (5) (5) Dec-12 47 13 16 19.8 13.8 12.2 10.5 109 107 1.9 14.1 14.6 1.9 1.7 na na na na Media 13 29 (0) (3) (3) (4) (15) Dec-12 (32) 6 14 20.2 26.5 21.8 18.1 91 93 3.1 20.0 22.0 5.0 4.6 5.5 14.6 17 18 Metals & Mining 16 221 (0) (1) (4) (5) (40) Dec-12 (14) 9 15 10.5 12.5 11.5 11.4 99 93 2.9 8.4 7.8 1.0 0.9 0.9 5.9 42 41 Paper & Forest Products -19 8 (0) 1 (1) (1) (1) Dec-12 21 20 12 16.9 13.9 11.6 10.4 94 85 2.3 7.8 8.8 1.0 1.0 1.8 10.1 79 74 Real Estate 38 431 (1) (1) (2) (3) (23) Dec-12 17 9 12 11.1 9.7 8.8 7.8 106 105 3.2 9.4 9.6 0.9 0.8 2.2 7.9 25 24 REITS 15 48 (0) (1) (1) (3) (19) Dec-12 6 5 6 19.3 18.3 17.5 16.4 99 101 5.7 5.1 5.3 0.9 0.9 na 20.6 36 36 Retailing 9 89 (0) (1) (1) (2) (5) Dec-12 3 22 16 19.0 18.8 15.4 13.1 94 99 1.9 9.6 10.9 1.7 1.6 0.9 11.4 32 27 Small Cap Companies -4 26 (0) (3) (2) (4) (1) Dec-12 (3) 8 7 13.2 13.8 12.8 12.2 100 91 3.1 13.2 13.3 1.8 1.6 1.2 8.8 9 3 Technology 18 984 1 2 3 1 21 Dec-12 31 18 13 18.4 14.4 12.3 11.1 105 109 1.3 17.7 18.3 2.4 2.1 1.1 7.1 (10) (18) Telecommunication Services 21 578 (1) (2) (3) (4) (10) Dec-12 7 4 9 14.5 13.5 13.0 11.9 100 100 4.2 13.2 13.1 1.7 1.7 1.7 5.1 11 11 Transportation 17 163 (1) (1) (4) (4) (11) Dec-12 17 58 27 24.4 21.8 13.7 10.6 98 109 2.7 5.8 8.5 1.2 1.1 1.5 10.2 73 73 Utilities 13 301 (1) (1) 1 (2) (3) Dec-12 27 15 13 17.9 14.4 12.5 10.9 104 98 3.0 9.6 10.6 1.4 1.3 2.3 9.4 108 105
CS TOTAL - NJA 19 10,314 (0) (0) (1) (2) (4) Dec-12 10 11 10 11.9 11.1 10.0 9.0 102 103 3.1 13.5 13.8 1.4 1.3 1.2 7.5 31 28
CS TOTAL - ASIA PAC 10 10,314 (0) (1) 0 (1) 5 Dec-12 (13) 10 10 12.7 13.7 11.7 10.3 101 100 2.7 12.3 12.6 1.5 1.4 1.2 8.3 33 29
Source: Company data, Thomson Financial IBES, Credit Suisse estimates

23 J
an
uary
201
4
Ju
mp
-Sta
rt 3
9
Australia—valuation summary Bberg Price Market Avg Absolute performance Relative performance FYE EPS growth P/E CS / Dvd ROE P/B EV/ EV/ Net debt/ daily con. EPS Yld sales EBITDA equity
Stock ticker View Local Target Upside cap t/o (%) (%) Actual (%) (x) (%) (%) (%) (x) (x) (x) (%)
21 January 2014 (%) (USDm) 1d 1w 1m 12m YTD 1d 1w 1m 12m YTD T T+1 T+2 T+3 T T+1 T+2 T+3 T+1 T+2 T+1
Automobiles & Components Paul Buys - 61 2 8205 4538
Fleetwood Corporation FWD AU N AUD 3.14 2.40 (24) 167 1.0 5 4 16 (1) (70) 4 2 15 (1) (82) Jun-13 (19) 47 28 11.4 14.1 9.6 7.5 79 93 2.2 6.0 0.8 0.7 5.9 22
Banks James Ellis / Jarrod Martin - 61 2 8205 4531 / 61 2 8205 4334
ANZ Banking Group ANZ AU O AUD 31.15 35.80 15 75,273 150.9 1 1 (2) (3) 21 0 (1) (3) (3) 10 Sep-13 7 7 6 13.6 12.7 11.9 11.2 100 101 5.6 15.2 1.8 na na na
Bank of Queensland BOQ AU N AUD 12.03 12.50 4 3,417 18.1 2 2 0 (1) 51 1 (1) (1) (1) 39 Aug-13 14 11 9 15.9 13.9 12.6 11.6 98 100 5.5 10.1 1.3 na na na Bendigo and Adelaide Bank BEN AU N AUD 11.72 12.20 4 4,231 11.9 1 0 3 (0) 30 0 (2) 1 0 18 Jun-13 8 4 3 15.0 13.9 13.4 13.0 99 94 5.5 8.8 1.1 na na na Commonwealth Bank Australia CBA AU U AUD 76.10 76.00 (0) 108,021 209.7 1 0 0 (2) 22 0 (2) (1) (2) 11 Jun-13 5 1 3 16.1 15.4 15.2 14.8 98 95 5.0 18.2 2.6 na na na
National Australia Bank NAB AU O AUD 33.99 38.00 12 70,382 149.7 1 1 (1) (2) 27 0 (1) (2) (2) 15 Sep-13 9 5 6 13.5 12.3 11.8 11.1 103 101 6.1 15.2 1.8 na na na Westpac WBC AU U AUD 31.79 33.50 5 87,036 162.5 1 1 1 (2) 21 0 (1) (1) (1) 10 Sep-13 2 3 (1) 14.3 13.9 13.5 13.7 98 96 5.7 15.7 2.1 na na na Sector* 7 348,360 1 1 (0) (2) 23 0 (1) (2) (2) 11 Jun-13 6 4 4 14.7 13.8 13.3 12.8 99 98 5.5 15.9 2.1 na na na
Building Materials & Construction
Andrew Peros - 61 2 8205 4013
Adelaide Brighton ABC AU U AUD 3.81 3.40 (11) 2,142 4.1 1 5 6 4 16 0 3 5 4 4 Dec-12 (4) 3 4 15.9 16.5 16.0 15.5 100 94 4.6 14.4 2.3 2.3 10.3 25 Boral BLD AU U AUD 4.80 5.00 4 3,292 15.1 0 2 2 1 (1) (0) (1) 1 1 (13) Jun-13 35 53 29 35.5 26.4 17.2 13.3 92 96 3.1 4.2 1.1 0.9 9.0 23 CSR CSR AU O AUD 2.97 2.90 (2) 1,323 5.6 3 11 13 12 42 3 9 11 12 31 Mar-13 105 37 37 46.0 22.4 16.4 12.0 95 96 3.7 6.5 1.5 0.9 8.0 (2)
James Hardie Industries SE JHX AU O AUD 13.25 13.50 2 5,175 12.5 1 6 5 2 42 0 4 4 3 30 Mar-13 36 27 19 36.4 26.8 21.0 17.6 106 105 4.5 (7,307.7) nm 3.5 16.1 nm Sector* (0) 11,932 1 5 5 3 25 0 3 4 4 14 Jun-13 29 29 30 30.1 23.2 18.0 12.7 97 97 4.0 10.8 2.5 1.6 11.0 21
Capital Goods Emma Alcock / Paul Buys - 61 2 8205 4403 / 61 2 8205 4538
Bradken Limited BKN AU O AUD 5.40 5.85 8 805 6.0 1 1 (1) (10) (10) 0 (2) (2) (10) (21) Jun-13 (13) 15 9 9.6 11.0 9.6 8.8 93 95 6.0 10.7 1.1 1.0 6.4 49 Clough CLO AU N AUD 1.46 1.46 0 996 2.4 0 0 0 0 43 (1) (2) (1) 0 31 Jun-13 10 (4) (28) 15.4 14.0 14.6 20.3 102 102 3.3 16.6 2.2 0.4 5.9 (93)
Emeco Holdings EHL AU N AUD 0.23 0.28 22 121 1.0 0 (2) 15 2 (65) (1) (4) 14 3 (77) Jun-13 (161) nm 390 5.7 nm 22.5 4.6 81 146 0.0 (2.5) 0.2 1.6 4.8 52 Leighton Holdings LEI AU U AUD 16.06 15.75 (2) 4,769 22.1 1 2 4 (0) (16) (0) 0 3 0 (28) Dec-12 16 (5) 2 12.2 10.5 11.1 10.8 96 91 6.9 17.1 1.7 0.3 3.2 21 Royal Wolf Holdings RWH AU O AUD 3.33 3.66 10 294 0.1 0 (1) 2 1 30 (0) (3) 1 1 18 Jun-13 17 15 15 17.5 15.0 13.1 11.4 106 107 3.3 15.1 2.2 2.5 9.0 60
UGL Limited UGL AU N AUD 6.88 7.75 13 1,009 6.0 (1) 3 (2) (6) (38) (1) 1 (4) (5) (50) Jun-13 20 (0) 6 11.9 9.9 9.9 9.4 102 92 6.5 10.2 1.0 0.4 7.3 50 Sector* 2 7,995 0 2 3 (2) (10) (0) (0) 1 (2) (21) Jun-13 0 3 3 11.5 11.5 11.1 10.8 95 92 5.6 12.6 1.4 0.4 4.0 20
Chemicals Andrew Peros / Larry Gandler - 61 2 8205 4013 / 61 3 9280 1855
Incitec Pivot Ltd. IPL AU O AUD 2.90 3.10 7 4,201 14.4 1 5 9 8 (9) 0 2 8 9 (20) Sep-12 (33) 18 36 10.6 15.8 13.5 9.9 100 109 3.2 7.2 1.1 1.8 9.5 33 Nufarm NUF AU N AUD 4.21 4.80 14 978 2.8 (0) (1) (2) (4) (34) (1) (4) (4) (4) (46) Jul-13 16 23 15 16.0 13.8 11.2 9.7 83 87 2.2 5.6 0.8 0.7 6.2 38
Orica ORI AU N AUD 24.08 23.10 (4) 7,851 28.3 (2) 3 2 1 (5) (2) 0 1 1 (17) Sep-13 4 10 10 14.6 14.0 12.7 11.6 96 96 4.1 15.6 2.1 1.5 9.0 51 Sector* 1 13,030 (1) 3 4 3 (8) (2) 1 3 3 (20) Jun-13 1 17 15 14.3 14.1 12.0 10.4 99 101 3.8 10.8 1.5 1.4 8.4 42
Consumer Durables & Apparel
Paul Buys - 61 2 8205 4538
G.U.D. Holdings GUD AU N AUD 5.74 5.77 1 360 1.4 0 (1) 6 (0) (30) (0) (3) 5 0 (41) Jun-13 (24) 26 9 11.1 14.6 11.6 10.6 93 106 6.3 12.4 1.9 0.9 8.4 47
Consumer Staples Grant Saligari / Larry Gandler - 61 3 9280 1720 / 61 3 9280 1855
Coca-Cola Amatil CCL AU U AUD 12.25 11.30 (8) 8,237 21.3 0 2 4 2 (7) (0) (0) 3 2 (19) Dec-12 (9) 1 1 16.7 18.4 18.2 17.9 98 94 4.9 24.1 4.4 2.2 10.5 94 Goodman Fielder GFF AU N AUD 0.68 0.72 6 1,171 3.2 1 4 5 (1) 5 0 2 3 (0) (6) Jun-13 23 16 6 20.2 16.4 14.1 13.2 90 89 4.6 5.4 0.9 0.8 7.3 32 Graincorp GNC AU U AUD 8.14 8.36 3 1,640 13.2 0 1 (4) (4) (32) (1) (1) (5) (4) (43) Sep-13 (32) 23 34 10.7 15.6 12.7 9.5 90 94 3.4 6.8 1.0 0.7 7.1 19
Metcash MTS AU U AUD 3.10 3.10 0 2,404 15.1 1 1 (4) (2) (15) 0 (1) (6) (2) (27) Apr-13 (7) (15) 5 10.0 10.7 12.7 12.1 98 87 6.7 10.6 1.1 0.3 7.6 56 Treasury Wine TWE AU U AUD 4.64 3.75 (19) 2,645 14.0 2 (3) (1) (4) (2) 1 (6) (3) (3) (13) Jun-13 55 20 (21) 22.5 14.5 12.1 15.4 123 128 3.4 6.9 1.0 1.9 10.5 13 Wesfarmers WES AU O AUD 43.55 46.00 6 43,845 82.0 0 2 1 (1) 15 (1) (1) (0) (1) 4 Jun-13 7 20 9 22.3 20.7 17.3 15.8 97 104 4.6 9.4 1.9 0.9 11.2 20
Woolworths WOW AU N AUD 34.39 36.30 6 37,995 71.3 1 2 2 2 11 0 (0) 1 2 (0) Jun-13 4 5 6 18.1 17.4 16.5 15.6 100 99 4.0 25.9 4.3 0.8 9.8 42 Sector* 4 97,937 1 2 2 0 10 (0) (1) 0 0 (2) Jun-13 4 11 7 19.1 18.3 16.6 15.6 99 101 4.4 13.2 2.4 0.8 10.2 30
Diversified Financials Andrew Adams / David Bailey / James Ellis - 61 2 8205 4106 / 61 2 8205 4739 / 61 2 8205 4531
ASX ASX AU U AUD 36.49 30.00 (18) 6,221 16.2 1 1 0 (1) 11 1 (1) (1) (0) (1) Jun-13 1 5 7 18.7 18.4 17.5 16.3 100 98 4.9 11.4 2.1 na na na BT Investment Management BTT AU N AUD 6.14 5.15 (16) 1,529 0.8 1 8 10 7 119 0 5 8 7 108 Sep-13 41 17 13 29.4 20.9 17.8 15.8 83 106 4.2 15.4 3.1 na na na
Challenger Limited CGF AU O AUD 6.29 7.00 11 2,940 9.1 3 5 5 1 68 2 3 4 2 56 Jun-13 9 (3) 9 10.7 9.8 10.1 9.3 102 101 3.7 16.0 1.5 na na na Computershare CPU AU O AUD 11.57 11.50 (1) 5,667 16.1 1 3 2 2 13 1 1 1 2 1 Jun-13 4 16 9 18.6 17.8 15.4 14.2 99 104 2.5 26.9 4.6 na na na Henderson group HGG AU N AUD 4.25 4.45 5 2,632 10.4 0 5 8 1 81 (0) 3 7 2 69 Dec-12 24 7 12 19.4 15.6 14.6 13.1 95 103 3.7 20.7 3.1 na na na
IOOF Holdings IFL AU N AUD 9.12 9.35 3 1,864 3.7 2 5 3 2 14 2 2 2 2 3 Jun-13 16 11 10 19.5 16.8 15.1 13.7 104 105 5.4 15.6 2.6 na na na Macquarie Group MQG AU O AUD 53.85 63.00 17 15,224 54.7 1 3 (2) (2) 48 0 0 (3) (2) 36 Mar-13 53 (0) 13 21.9 14.3 14.4 12.7 105 94 5.1 10.7 1.5 na na na Perpetual PPT AU N AUD 48.54 51.00 5 1,989 6.4 2 5 4 1 30 2 3 2 1 18 Jun-13 37 20 9 26.2 19.1 15.9 14.6 103 105 4.1 27.2 4.5 na na na
Platinum Asset Management PTM AU U AUD 7.00 6.00 (14) 3,567 3.0 3 7 6 2 55 2 4 5 2 43 Jun-13 33 11 9 31.0 23.2 20.8 19.1 101 100 4.1 49.3 10.8 na na na Suncorp Group Limited SUN AU U AUD 13.10 12.36 (6) 14,842 40.0 1 1 1 0 20 1 (1) 0 0 8 Jun-13 122 17 8 31.9 14.4 12.3 11.4 91 97 6.0 8.3 1.2 na na na Sector* 1 56,475 1 3 2 0 36 1 1 0 0 24 Jun-13 41 10 9 21.8 15.5 14.1 12.9 98 98 4.8 11.8 1.8 na na na

23 J
an
uary
201
4
Ju
mp
-Sta
rt 4
0
Australia—valuation summary (continued) Bberg Price Market Avg Absolute performance Relative performance FYE EPS growth P/E CS / Dvd ROE P/B EV/ EV/ Net debt/ daily con. EPS Yld sales EBITDA equity
Stock ticker View Local Target Upside cap t/o (%) (%) Actual (%) (x) (%) (%) (%) (x) (x) (x) (%)
21 January 2014 (%) (USDm) 1d 1w 1m 12m YTD 1d 1w 1m 12m YTD T T+1 T+2 T+3 T T+1 T+2 T+3 T+1 T+2 T+1
Energy Bradley Clibborn / Mark Samter / Paul McTaggart / Sandra McCullagh - 61 2 8205 4465 / 61 2 8205 4537 / 61 2 8205 4698 / 61 2 8205 4729
AWE Ltd AWE AU R AUD 1.33 612 2.0 2 5 4 (0) 11 1 3 2 0 (0) Jun-12 (45) 9 42 12.3 22.3 20.5 14.4 187 110 0.0 3.1 0.6 2.5 5.0 4 Aquila Resources AQA AU O AUD 2.44 2.60 7 885 0.7 2 4 12 6 (23) 1 2 11 6 (34) Jun-13 nm nm nm nm nm nm nm 131 175 0.0 (1.8) 1.2 nm nm (56)
Aurora Oil & Gas AUT AU O AUD 2.79 4.35 56 1,103 3.2 (1) (0) (5) (8) (19) (2) (3) (6) (7) (30) Dec-12 117 132 (8) 19.6 9.0 3.9 4.2 104 162 0.0 24.1 1.9 2.9 4.9 112 Beach Energy BPT AU N AUD 1.41 1.55 10 1,582 4.2 2 4 3 (2) 6 1 2 2 (1) (6) Jun-13 56 2 (16) 13.4 8.6 8.4 10.0 110 109 2.0 11.8 0.9 1.7 3.7 (8) Boart Longyear Group BLY AU U AUD 0.47 0.40 (15) 189 1.6 (1) 12 31 21 (76) (2) 10 30 21 (87) Dec-12 (211) nm nm 1.7 nm nm nm 77 58 0.0 (12.4) 0.2 0.7 6.9 98
Caltex Australia CTX AU O AUD 19.35 23.80 23 4,601 10.5 (0) 2 1 (3) 2 (1) (1) 0 (3) (9) Dec-12 (30) 35 10 11.4 16.3 12.1 11.0 90 105 2.1 14.1 2.2 nm 8.5 34 Karoon Gas KAR AU O AUD 3.79 6.40 69 854 2.8 (2) 0 (3) (13) (31) (3) (2) (4) (12) (43) Jun-12 nm nm nm nm nm nm nm 52 90 0.0 (3.6) 1.4 nm nm (35) New Hope Corporation NHC AU N AUD 3.59 3.70 3 2,627 0.5 (2) 8 7 8 (15) (2) 6 6 8 (26) Jul-13 (9) 18 14 24.0 26.2 22.2 19.4 110 94 3.8 5.8 1.6 3.5 13.6 (61)
Oil Search OSH AU O AUD 8.28 9.65 17 9,795 22.8 1 2 2 2 16 (0) 0 0 2 4 Dec-12 47 30 224 63.0 43.0 33.1 10.2 127 88 0.5 6.9 2.8 17.5 27.7 115 Origin Energy ORG AU N AUD 14.20 13.70 (4) 13,770 30.3 1 5 3 1 17 0 3 2 1 5 Jun-13 6 26 18 20.5 19.3 15.4 13.0 104 111 3.5 6.0 1.1 1.6 10.6 59 Santos Ltd STO AU U AUD 14.41 13.40 (7) 12,312 38.4 (0) 3 (0) (2) 23 (1) 0 (2) (1) 11 Dec-12 (6) (9) 83 22.8 24.3 26.6 14.5 93 80 2.1 5.9 1.4 5.4 10.2 47
Senex Energy Limited SXY AU O AUD 0.71 0.85 20 710 1.8 2 5 (4) (5) 1 1 3 (5) (4) (11) Jun-13 6 22 (1) 13.2 12.6 10.3 10.4 108 106 0.0 13.7 1.6 3.9 8.2 (19) Woodside Petroleum WPL AU U AUD 38.37 35.00 (9) 27,839 63.2 (1) 3 (1) (1) 10 (2) 0 (2) (1) (1) Dec-12 (19) 20 9 13.2 16.2 13.5 12.3 90 92 7.4 11.4 1.8 5.1 8.1 11 WorleyParsons WOR AU N AUD 16.98 17.10 1 3,641 19.8 (1) 1 2 2 (30) (2) (2) 1 3 (42) Jun-13 (19) 6 12 13.0 16.0 15.1 13.5 95 86 4.9 12.0 1.9 0.7 9.2 29
Sector* 1 80,518 (0) 3 1 (0) 9 (1) 1 (0) 0 (2) Jun-13 9 31 16 20.7 19.0 14.4 12.8 96 101 3.7 8.5 1.6 3.0 9.4 37
Environmental Services Paul Buys - 61 2 8205 4538
Transpacific Industries Group TPI AU N AUD 1.16 1.00 (14) 1,612 3.1 0 3 2 (1) 45 (1) 0 1 (0) 33 Jun-13 (9) 38 24 27.0 29.7 21.5 17.3 83 86 0.0 3.4 1.0 1.5 6.8 32
Healthcare Saul Hadassin / William Dunlop - 61 2 8205 4679 / 61 2 8205 4405
Ansell Limited ANN AU N AUD 20.24 21.00 4 2,723 9.1 1 2 (1) (2) 22 1 (0) (2) (2) 10 Jun-13 6 12 9 16.8 15.9 14.2 13.0 101 97 2.3 16.5 2.3 2.0 12.9 39 Australian Pharmaceutical Ind API AU O AUD 0.60 0.64 7 256 0.4 1 3 8 (1) 27 0 0 7 (0) 15 Aug-13 8 3 (0) 12.0 11.1 10.7 10.8 103 97 5.5 4.4 0.5 0.1 5.4 20
CSL Ltd CSL AU O AUD 70.68 74.55 5 30,167 61.2 1 5 5 2 31 0 3 4 3 19 Jun-13 14 10 11 25.6 22.5 20.6 18.6 100 97 1.9 43.4 9.4 5.8 16.2 30 Cochlear COH AU U AUD 59.60 53.00 (11) 2,995 14.2 2 1 4 1 (27) 2 (1) 3 2 (39) Jun-13 (2) 24 14 25.6 26.2 21.1 18.5 99 103 4.3 37.2 10.0 4.6 17.6 40 Mayne Pharma MYX AU N AUD 0.73 0.61 (16) 362 0.6 1 5 9 (1) 121 0 3 8 (1) 110 Jun-13 51 47 123 51.0 33.8 23.1 10.3 74 81 0.0 10.0 3.1 3.3 12.6 15
Mesoblast MSB AU O AUD 6.05 7.95 31 1,711 2.0 5 3 6 3 2 5 1 5 4 (9) Jun-13 nm nm nm nm nm nm 71.6 91 90 0.0 (13.7) 3.4 nm nm (32) Primary Health Care PRY AU N AUD 5.00 5.35 7 2,223 7.5 2 1 0 1 13 2 (1) (1) 1 2 Jun-13 11 12 10 16.7 15.1 13.4 12.2 99 102 3.9 6.1 0.9 2.4 8.7 38 Ramsay Health Care RHC AU N AUD 44.71 41.50 (7) 7,956 12.9 1 2 6 3 55 1 (0) 5 4 44 Jun-13 15 15 4 30.2 26.3 22.9 22.0 107 108 1.9 23.3 6.2 2.2 14.1 62
ResMed Inc. RMD AU N AUD 5.09 5.90 16 6,367 20.5 1 (1) (2) (4) 21 1 (3) (4) (4) 9 Jun-13 23 10 9 21.4 17.4 15.8 14.5 99 97 2.3 21.6 3.5 3.5 10.7 (39) Sigma Pharmaceuticals SIP AU N AUD 0.63 0.66 5 619 1.2 1 (1) (2) (4) (7) 0 (3) (3) (3) (18) Jan-13 (6) 7 5 13.8 14.6 13.6 13.0 104 96 7.2 8.5 1.3 0.2 8.5 (6) Sonic Healthcare SHL AU N AUD 16.99 16.50 (3) 5,996 15.1 2 0 5 2 26 1 (2) 3 3 14 Jun-13 19 8 6 20.2 16.9 15.7 14.8 102 100 4.3 13.5 2.2 2.2 11.1 53
Sector* 4 61,376 1 3 4 2 28 1 1 3 2 16 Jun-13 24 13 15 27.5 22.2 19.7 17.2 100 98 2.3 19.8 4.2 2.8 14.3 27
Hotels, Restaurants & Leisure
Chris Smith / Grant Saligari / Larry Gandler - 61 2 8205 4210 / 61 3 9280 1720 / 61 3 9280 1855
Aristocrat Leisure ALL AU U AUD 4.53 4.10 (9) 2,200 6.0 2 7 0 (3) 33 2 5 (1) (3) 21 Sep-13 13 8 11 23.4 20.7 19.1 17.2 97 90 3.6 30.5 6.0 3.0 12.2 35 Crown CWN AU U AUD 18.00 15.90 (12) 11,546 19.2 3 5 9 7 51 2 3 8 7 39 Jun-13 30 8 17 27.7 21.3 19.8 16.9 96 92 2.1 15.6 3.1 5.0 18.7 37
Domino's Pizza DMP AU N AUD 16.11 12.44 (23) 1,219 2.4 2 (0) 3 (0) 55 1 (3) 2 0 44 Jun-13 17 19 16 38.4 32.8 27.5 23.6 95 96 2.1 22.5 5.2 2.7 16.8 33 Echo Entertainment EGP AU N AUD 2.45 3.00 22 1,781 6.2 3 (1) 7 (0) (31) 2 (4) 5 (0) (43) Jun-13 (4) 20 1 16.4 17.1 14.3 14.1 91 93 2.4 4.2 0.7 1.4 6.7 25 Flight Centre FLT AU O AUD 46.35 58.00 25 4,104 18.1 2 3 3 (3) 64 2 1 2 (2) 52 Jun-13 17 13 12 20.1 17.2 15.2 13.6 101 103 3.5 25.0 4.0 1.4 7.3 (123)
Tabcorp Holdings TAH AU N AUD 3.59 3.55 (1) 2,385 7.3 2 2 2 (1) 18 2 (1) 1 (1) 6 Jun-13 (1) 13 9 19.1 19.2 17.0 15.6 98 101 4.2 9.7 1.8 1.9 8.1 77 Tatts Group TTS AU N AUD 3.06 3.16 3 3,819 9.4 2 3 1 (1) (3) 1 0 (0) (1) (15) Jun-13 5 2 6 18.6 17.8 17.5 16.6 101 96 5.6 8.6 1.5 1.9 10.7 49 Webjet WEB AU N AUD 2.88 2.90 1 201 0.9 (0) (4) 12 (9) (37) (1) (6) 10 (9) (48) Jun-13 24 18 12 18.3 14.7 12.5 11.2 99 101 4.6 25.1 3.4 1.6 6.5 (122)
Sector* (1) 27,253 2 4 5 2 35 2 1 4 2 24 Jun-13 15 10 12 22.9 19.8 18.0 16.1 98 95 3.1 12.2 2.3 2.5 11.6 27
Insurance Andrew Adams - 61 2 8205 4106
AMP AMP AU N AUD 4.49 4.96 10 11,695 34.9 1 2 5 2 (14) 0 (1) 3 3 (25) Dec-12 (15) 26 9 15.2 17.9 14.2 13.0 90 99 5.3 8.5 1.7 na na na Austbrokers AUB AU U AUD 11.31 10.41 (8) 594 0.6 (1) 1 (9) (6) 39 (2) (1) (10) (5) 27 Jun-13 11 9 9 22.5 20.4 18.7 17.1 90 90 3.4 15.9 3.1 na na na Insurance Australia Group IAG AU N AUD 5.75 6.00 4 11,638 32.5 1 2 1 (1) 16 1 (1) 0 (1) 4 Jun-13 (19) (13) 15 11.8 14.6 16.8 14.6 85 74 4.5 16.6 2.1 na na na
QBE Insurance Group QBE AU O AUD 11.75 13.65 16 12,920 69.1 1 (0) 2 2 (3) 0 (3) 1 2 (15) Dec-12 (132) nm 22 17.3 nm 14.2 11.6 nm 84 3.2 (2.2) 1.1 na na na Steadfast SDF AU U AUD 1.66 1.36 (18) 732 1.8 (2) 1 5 0 na (3) (1) 4 1 na Jun-13 7 6 9 23.3 21.7 20.4 18.7 100 96 2.8 7.3 1.5 na na na Tower Limited TWR AU N AUD 1.63 1.66 2 297 0.0 2 (1) 5 5 (14) 1 (4) 4 6 (25) Sep-13 (19) 5 5 10.4 12.8 12.2 11.6 95 93 7.4 7.4 0.9 na na na
Sector* 10 37,877 1 1 3 1 0 0 (1) 1 1 (12) Jun-13 (2) 36 14 19.0 19.3 14.2 14.8 72 86 4.3 8.1 1.5 na na na
Media Michael Senno - 212 325 1353
Nine Entertainment NEC AU O AUD 2.09 2.30 10 1,731 7.6 4 6 6 6 na 4 4 4 6 na Jun-13 10 6 8 14.4 13.0 12.3 11.3 105 115 2.0 7.9 0.9 1.6 8.0 27 Twenty First Century Fox CDI NWS AU O AUD 35.52 44.61 26 53,825 90.5 1 1 (6) (8) 46 (0) (1) (7) (7) 34 Jun-13 9 28 32 23.0 21.1 16.5 12.5 96 99 0.8 16.9 3.7 2.1 9.8 61 Sector* 25 55,556 1 1 (5) (7) 46 0 (1) (6) (7) 34 Jun-13 24 30 34 22.4 20.7 16.3 12.5 97 100 0.9 16.2 3.4 2.1 9.7 58

23 J
an
uary
201
4
Ju
mp
-Sta
rt 4
1
Australia—valuation summary (continued) Bberg Price Market Avg Absolute performance Relative performance FYE EPS growth P/E CS / Dvd ROE P/B EV/ EV/ Net debt/ daily con. EPS Yld sales EBITDA equity
Stock ticker View Local Target Upside cap t/o (%) (%) Actual (%) (x) (%) (%) (%) (x) (x) (x) (%)
21 January 2014 (%) (USDm) 1d 1w 1m 12m YTD 1d 1w 1m 12m YTD T T+1 T+2 T+3 T T+1 T+2 T+3 T+1 T+2 T+1
Metals & Mining Matthew Hope / Michael Slifirski / Paul McTaggart / Ralph Profiti - 61 2 8205 4669 / 61 3 9280 1845 / 61 2 8205 4698 / 416 352 4563
Alacer Gold Corp. AQG AU U AUD 2.69 2.20 (18) 681 2.0 0 14 17 19 (36) (1) 12 16 19 (48) Dec-12 58 (79) (203) 9.3 5.9 28.3 nm 137 55 0.0 14.8 1.4 0.7 1.6 (50) Altona Mining Limited AOH AT O AUD 0.17 0.26 53 80 0.1 (3) (6) 10 3 (32) (4) (8) 8 3 (44) Jun-13 14 (21) 221 7.2 6.3 8.0 2.5 108 79 0.0 13.0 0.8 1.0 3.2 (7)
Alumina Limited AWC AU O AUD 1.32 1.30 (2) 3,250 9.8 3 9 28 18 18 2 6 26 18 6 Dec-12 nm 136 325 nm 190.8 80.9 19.1 303 102 0.0 0.6 1.1 nm nm 5 Ampella Mining Limited AMX AU N AUD 0.15 0.19 27 33 0.1 0 3 20 11 (62) (1) 1 19 11 (73) Dec-12 nm nm nm nm nm nm nm 88 95 0.0 (90.1) 3.0 36.3 nm (58) Arrium OST AU U AUD 1.65 1.43 (13) 1,978 9.8 (1) 7 (2) (6) 85 (2) 5 (3) (5) 74 Jun-13 92 (25) (5) 13.2 6.9 9.1 9.6 98 85 7.3 8.0 0.5 0.5 4.6 41
Atlas Iron AGO AU O AUD 0.94 1.30 38 758 13.9 (4) (1) (20) (18) (39) (5) (3) (21) (18) (51) Jun-13 438 (2) (20) 62.1 11.6 11.8 14.8 69 68 3.2 5.3 0.5 0.7 2.3 (7) BHP Billiton BHP AU N AUD 37.95 38.00 0 171,853 215.0 (0) 5 2 (0) 4 (1) 3 1 0 (8) Jun-13 5 (6) 9 14.0 13.3 14.1 12.9 96 87 3.8 18.4 2.3 2.7 6.1 31 Bandanna Energy Limited BND AU N AUD 0.17 0.20 18 77 0.2 0 0 (11) (3) (48) (1) (2) (12) (3) (59) Jun-13 nm nm nm nm nm nm nm 32 70 0.0 (5.4) 0.3 nm nm (47)
Base Resources Ltd BSE AU O AUD 0.42 0.90 114 208 0.2 0 0 6 (1) 18 (1) (2) 5 (1) 7 Jun-13 nm nm 35 nm 36.2 2.6 1.9 27 107 0.0 2.9 1.1 5.9 16.2 77 BlueScope Steel BSL AU O AUD 5.70 5.70 0 2,805 14.4 (1) 5 (0) (2) 65 (2) 2 (2) (2) 53 Jun-13 133 136 49 109.4 46.9 19.9 13.3 59 74 0.0 1.7 0.8 0.4 6.4 1 Cockatoo Coal COK AU R AUD 0.04 132 0.2 (3) 0 (3) (10) (73) (3) (2) (4) (10) (85) Jun-12 nm nm nm nm nm nm 4.8 145 38 0.0 (6.3) 0.1 2.4 50.7 14
Energy Resources of Australia ERA AU O AUD 1.24 1.70 37 565 0.5 1 1 (7) (2) (7) 0 (1) (8) (1) (19) Dec-12 nm nm nm nm nm nm nm 83 63 0.0 (15.0) 0.7 1.2 6.5 (24)
Evolution Mining Limited EVN AT U AUD 0.65 0.64 (2) 406 1.1 0 4 14 6 (60) (1) 2 13 6 (71) Jun-13 (14) 22 (45) 10.4 12.0 9.9 17.9 71 73 2.6 4.9 0.6 0.9 3.0 9 Fortescue Metals Group Ltd FMG AU O AUD 5.41 7.50 39 14,834 77.0 (5) 5 (6) (7) 19 (5) 3 (7) (7) 8 Jun-13 83 (10) (22) 8.7 4.8 5.3 6.8 99 96 2.1 46.9 1.9 1.7 3.5 96
Gindalbie Metals Ltd GBG AU U AUD 0.10 0.06 (40) 132 0.3 0 0 (5) 0 (66) (1) (2) (6) 0 (78) Jun-13 nm nm nm nm nm nm nm 488 37 0.0 (0.9) 0.2 nm nm (6) Gryphon Minerals Limited GRY AU O AUD 0.18 0.85 372 62 0.2 (5) (13) 9 3 (68) (6) (15) 8 3 (80) Jun-12 nm nm nm nm nm nm nm 80 164 0.0 (2.6) 0.3 491.2 nm (5) Iluka Resources ILU AU N AUD 8.87 10.00 13 3,270 23.3 (1) 8 3 3 (9) (2) 5 2 3 (20) Dec-12 (87) 98 276 10.2 78.5 39.6 10.5 67 46 1.1 3.0 2.4 5.0 14.8 9
Independence Group NL IGO AU O AUD 3.42 3.70 8 703 2.0 3 7 17 10 (24) 2 5 15 10 (35) Jun-13 250 27 (8) 43.9 12.6 9.9 10.7 102 93 3.2 9.4 1.1 2.0 5.9 (4) Kula Gold KGD AU O AUD 0.10 0.35 250 11 0.0 0 0 (5) (5) (71) (1) (2) (6) (4) (82) Dec-12 nm nm nm nm nm nm 1.3 231 83 0.0 (1.4) 0.2 nm nm (22) Mineral Deposits Ltd. MDL AU O AUD 2.20 4.00 82 186 0.4 (9) (14) 7 (21) (39) (10) (16) 6 (21) (50) Dec-12 (70) (44) nm 8.0 26.7 47.2 2.8 46 37 0.0 1.7 0.5 nm nm (12)
Mount Gibson Iron MGX AU N AUD 0.99 1.00 1 946 3.9 2 9 (3) (3) 20 1 7 (4) (3) 9 Jun-13 153 (67) (69) 11.5 4.6 13.9 44.2 129 90 2.0 18.1 0.8 0.9 2.2 (16) Newcrest Mining NCM AU U AUD 9.64 8.20 (15) 6,507 51.7 (1) 10 25 24 (59) (1) 7 24 24 (70) Jun-13 (51) 100 12 16.4 33.2 16.6 14.8 87 88 0.0 2.2 0.7 3.0 9.8 42 OZ Minerals OZL AU O AUD 3.73 4.80 29 997 7.2 3 21 21 18 (50) 3 19 20 19 (62) Dec-12 (143) nm nm 7.6 nm nm nm 120 82 5.4 (2.6) 0.5 1.2 7.6 (17)
Paladin Energy PDN AU N AUD 0.56 0.73 30 483 0.4 (1) 24 24 20 (53) (2) 22 23 21 (65) Jun-13 nm nm 49 nm nm 12.5 8.4 154 183 0.0 (4.6) 0.7 2.4 19.6 44 PanAust PNADA AU O AUD 1.84 2.00 9 1,003 5.7 (0) 2 14 2 (45) (1) (0) 13 2 (57) Dec-12 (40) (74) 40 6.8 11.3 43.2 30.8 105 41 4.3 9.1 1.0 1.5 4.1 11 Panoramic Resources PAN AU N AUD 0.26 0.29 12 73 0.2 0 2 11 4 (54) (1) (0) 9 4 (65) Jun-13 nm nm nm nm nm nm 10.5 109 77 0.0 (6.2) 0.3 0.2 1.7 (15)
Perseus Mining PRU AU O AUD 0.42 0.50 19 169 2.4 0 24 91 71 (79) (1) 21 90 72 (90) Jun-13 (102) nm (73) 5.0 nm 19.1 72.1 199 44 0.0 (0.1) 0.4 0.6 5.4 (5) Regis Resources Limited RRL AU N AUD 2.77 3.00 8 1,215 7.6 (3) (4) (8) (5) (45) (3) (7) (9) (5) (57) Jun-13 (23) 55 (4) 9.2 11.9 7.7 8.0 101 113 4.2 21.2 2.5 2.8 6.2 (6) Rio Tinto RIO AU O AUD 65.80 75.00 14 100,451 113.9 (1) 4 (1) (3) (1) (2) 2 (3) (3) (13) Dec-12 9 9 7 11.6 10.6 9.7 9.1 107 104 3.3 21.1 2.2 2.4 5.7 29
Sandfire Resources NL SFR AU U AUD 6.48 5.75 (11) 888 2.9 (3) 6 1 0 (23) (4) 3 (0) 1 (35) Jun-13 14 12 26 11.3 9.9 8.9 7.0 90 91 0.0 39.3 3.3 2.3 4.2 16 Sims Metal Management SGM AU U AUD 10.80 10.00 (7) 1,944 6.5 1 5 2 (1) 14 0 3 1 (0) 2 Jun-13 151 197 32 129.1 51.5 17.4 13.1 41 75 1.0 2.3 1.2 0.3 11.5 7 Syrah Resources SYR AU O AUD 2.79 4.90 76 399 0.5 0 1 8 (10) (11) (0) (1) 6 (10) (23) Jun-13 nm nm nm nm nm nm 6.1 90 2 0.0 (15.2) 12.9 nm nm 154
Tigers Realm Coal TIG AU O AUD 0.17 0.25 47 76 0.0 0 0 0 0 6 (1) (2) (1) 0 (5) Dec-12 nm nm nm nm nm nm nm 80 306 0.0 (18.5) 0.9 nm nm (25) Western Areas WSA AU N AUD 2.74 2.75 0 475 1.6 (2) 3 20 16 (37) (3) 0 19 16 (49) Jun-13 (83) (69) nm 96.5 555.5 nm 11.6 13 1 0.0 0.4 2.2 2.4 6.9 50 Whitehaven Coal WHC AU O AUD 1.88 2.75 46 1,698 7.0 (1) 7 1 (2) (47) (1) 4 (0) (1) (59) Jun-13 nm nm 166 nm nm 31.6 11.9 82 78 0.0 (0.5) 0.6 3.2 26.3 22
Yancoal Australia YAL AU U AUD 0.72 0.65 (10) 630 0.0 0 4 (1) (5) (23) (1) 1 (3) (5) (35) Dec-12 (82) (491) nm 20.9 116.5 nm 4.8 nm 211 0.0 0.4 0.7 3.2 23.4 447 Sector* 7 319,976 (1) 5 1 (1) 1 (1) 3 0 (0) (10) Jun-13 24 6 10 15.3 12.3 11.6 10.5 98 93 3.3 16.5 1.9 2.3 6.0 30
Real Estate John Richmond / Stephen Rich - 61 2 8205 4580 / 61 2 8205 4617
Australand ALZ AU N AUD 3.91 3.81 (3) 1,991 7.1 1 2 0 2 15 0 (1) (1) 2 4 Dec-12 3 6 8 15.9 15.4 14.5 13.5 100 101 5.5 6.7 1.0 13.8 60 CFS Retail Property Trust CFX AU N AUD 1.99 2.04 3 5,274 15.2 1 1 3 2 1 0 (1) 1 3 (11) Jun-13 1 4 5 14.6 14.6 14.0 13.3 101 104 6.9 10.2 1.5 16.4 43
Charter Hall Group CHC AU N AUD 3.74 3.78 1 1,019 1.6 1 2 1 2 14 1 (0) (0) 3 2 Jun-13 2 6 8 15.6 15.3 14.4 13.3 99 100 5.9 7.6 1.2 15.1 2 Charter Hall Retail REIT CQR AU N AUD 3.66 3.99 9 1,170 3.9 1 1 (0) 2 (2) (0) (2) (2) 2 (13) Jun-13 2 1 5 12.3 12.0 11.9 11.4 100 98 7.5 9.1 1.1 13.9 49 Investa Office Fund IOF AU O AUD 3.19 3.33 4 1,725 5.4 1 1 1 2 6 1 (1) (1) 2 (6) Jun-12 11 2 4 15.8 14.2 14.0 13.5 100 94 5.6 6.4 0.9 15.0 31
Mirvac Group MGR AU O AUD 1.75 1.87 7 5,648 18.6 1 4 2 4 13 1 1 0 5 1 Jun-13 9 2 7 16.0 14.6 14.3 13.4 100 99 5.1 6.5 0.9 15.6 47 Sector* 4 16,827 1 2 2 3 8 0 (0) 0 3 (4) Jun-13 4 4 6 15.0 14.4 13.9 13.1 100 100 6.0 7.6 1.1 15.3 44
REITS John Richmond / Stephen Rich - 61 2 8205 4580 / 61 2 8205 4617
Commonwealth Property Office Fund
CPA AU N AUD 1.24 1.21 (2) 2,552 13.8 0 0 (2) (1) 12 (1) (2) (4) (0) 0 Jun-13 1 0 3 14.2 14.0 14.0 13.6 104 103 5.4 7.6 1.0 15.1 42
Dexus Property Group DXS AU O AUD 1.04 1.16 12 4,218 18.3 0 1 (1) 3 2 (1) (1) (2) 3 (9) Jun-13 7 4 2 13.4 12.5 12.0 11.8 102 102 6.0 7.4 0.9 14.3 53 Federation Centres CRF AU N AUD 2.39 2.43 2 3,005 10.9 2 1 1 2 5 1 (1) (0) 3 (7) Jun-13 5 5 3 15.1 14.4 13.7 13.2 99 99 6.1 7.0 1.0 15.0 29 GPT Group GPT AU N AUD 3.65 4.12 13 5,448 18.2 1 2 6 7 2 (0) (1) 5 8 (10) Dec-12 5 2 3 15.1 14.3 14.1 13.7 98 96 5.6 6.4 0.9 13.9 24
Goodman Group GMGDA AU N AUD 4.86 4.95 2 7,356 20.2 2 4 (0) 3 9 1 2 (2) 3 (3) Jun-13 7 5 6 15.0 13.9 13.2 12.5 101 99 4.3 7.7 1.1 15.0 26 Lend Lease LLC AU O AUD 11.12 12.44 12 5,647 15.9 0 3 1 (0) 12 (1) 0 0 0 (0) Jun-13 (6) 9 7 11.5 12.3 11.4 10.6 98 95 3.9 11.5 1.4 8.7 6 Stockland SGP AU N AUD 3.85 4.00 4 7,817 28.1 1 4 5 7 9 1 1 4 7 (2) Jun-13 6 8 8 17.2 16.2 15.1 14.0 99 98 6.2 6.6 1.1 20.2 34
Westfield WDC AU N AUD 10.27 11.27 10 19,114 63.3 1 3 1 2 (6) 0 1 0 2 (18) Dec-12 2 2 3 15.8 15.4 15.1 14.6 102 100 5.0 8.5 1.2 15.3 59 Westfield Retail Trust WRT AU O AUD 3.09 3.51 14 8,107 27.8 1 2 3 4 0 0 (1) 2 4 (11) Dec-12 6 4 3 16.5 15.5 14.9 14.4 101 94 6.4 5.8 0.9 15.6 30
Sector* 8 63,264 1 3 2 3 2 0 0 1 3 (9) Jun-13 3 4 5 15.0 14.5 13.9 13.2 100 98 5.4 7.4 1.1 14.8 40
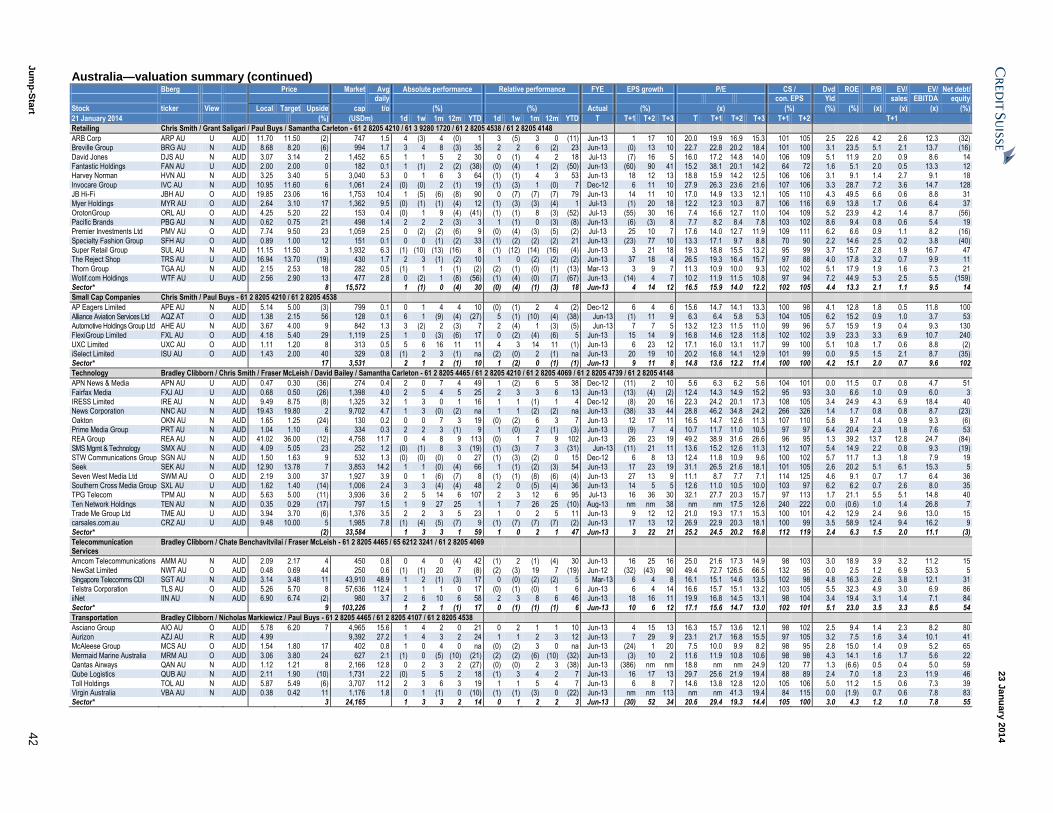
23 J
an
uary
201
4
Ju
mp
-Sta
rt 4
2
Australia—valuation summary (continued) Bberg Price Market Avg Absolute performance Relative performance FYE EPS growth P/E CS / Dvd ROE P/B EV/ EV/ Net debt/ daily con. EPS Yld sales EBITDA equity
Stock ticker View Local Target Upside cap t/o (%) (%) Actual (%) (x) (%) (%) (%) (x) (x) (x) (%)
21 January 2014 (%) (USDm) 1d 1w 1m 12m YTD 1d 1w 1m 12m YTD T T+1 T+2 T+3 T T+1 T+2 T+3 T+1 T+2 T+1
Retailing Chris Smith / Grant Saligari / Paul Buys / Samantha Carleton - 61 2 8205 4210 / 61 3 9280 1720 / 61 2 8205 4538 / 61 2 8205 4148
ARB Corp ARP AU U AUD 11.70 11.50 (2) 747 1.5 4 (3) 4 (0) 1 3 (5) 3 0 (11) Jun-13 1 17 10 20.0 19.9 16.9 15.3 101 105 2.5 22.6 4.2 2.6 12.3 (32) Breville Group BRG AU N AUD 8.68 8.20 (6) 994 1.7 3 4 8 (3) 35 2 2 6 (2) 23 Jun-13 (0) 13 10 22.7 22.8 20.2 18.4 101 100 3.1 23.5 5.1 2.1 13.7 (16)
David Jones DJS AU N AUD 3.07 3.14 2 1,452 6.5 1 1 5 2 30 0 (1) 4 2 18 Jul-13 (7) 16 5 16.0 17.2 14.8 14.0 106 109 5.1 11.9 2.0 0.9 8.6 14 Fantastic Holdings FAN AU U AUD 2.00 2.00 0 182 0.1 1 (1) 2 (2) (38) (0) (4) 1 (2) (50) Jun-13 (60) 90 41 15.2 38.1 20.1 14.2 64 72 1.6 5.1 2.0 0.5 13.3 12 Harvey Norman HVN AU N AUD 3.25 3.40 5 3,040 5.3 0 1 6 3 64 (1) (1) 4 3 53 Jun-13 18 12 13 18.8 15.9 14.2 12.5 106 106 3.1 9.1 1.4 2.7 9.1 18
Invocare Group IVC AU N AUD 10.95 11.60 6 1,061 2.4 (0) (0) 2 (1) 19 (1) (3) 1 (0) 7 Dec-12 6 11 10 27.9 26.3 23.6 21.6 107 106 3.3 28.7 7.2 3.6 14.7 128 JB Hi-Fi JBH AU O AUD 19.85 23.06 16 1,753 10.4 1 (5) (6) (8) 90 0 (7) (7) (7) 79 Jun-13 14 11 10 17.0 14.9 13.3 12.1 105 110 4.3 49.5 6.6 0.6 8.8 31 Myer Holdings MYR AU O AUD 2.64 3.10 17 1,362 9.5 (0) (1) (1) (4) 12 (1) (3) (3) (4) 1 Jul-13 (1) 20 18 12.2 12.3 10.3 8.7 106 116 6.9 13.8 1.7 0.6 6.4 37
OrotonGroup ORL AU O AUD 4.25 5.20 22 153 0.4 (0) 1 9 (4) (41) (1) (1) 8 (3) (52) Jul-13 (55) 30 16 7.4 16.6 12.7 11.0 104 109 5.2 23.9 4.2 1.4 8.7 (56) Pacific Brands PBG AU N AUD 0.62 0.75 21 498 1.4 2 2 2 (3) 3 1 (1) 0 (3) (8) Jun-13 (6) (3) 8 7.7 8.2 8.4 7.8 103 102 8.6 9.4 0.8 0.6 5.4 19 Premier Investments Ltd PMV AU O AUD 7.74 9.50 23 1,059 2.5 0 (2) (2) (6) 9 (0) (4) (3) (5) (2) Jul-13 25 10 7 17.6 14.0 12.7 11.9 109 111 6.2 6.6 0.9 1.1 8.2 (16)
Specialty Fashion Group SFH AU O AUD 0.89 1.00 12 151 0.1 0 0 (1) (2) 33 (1) (2) (2) (2) 21 Jun-13 (23) 77 10 13.3 17.1 9.7 8.8 70 90 2.2 14.6 2.5 0.2 3.8 (40) Super Retail Group SUL AU N AUD 11.15 11.50 3 1,932 6.3 (1) (10) (13) (16) 8 (1) (12) (14) (16) (4) Jun-13 3 21 18 19.3 18.8 15.5 13.2 95 99 3.7 15.7 2.8 1.9 16.7 47 The Reject Shop TRS AU U AUD 16.94 13.70 (19) 430 1.7 2 3 (1) (2) 10 1 0 (2) (2) (2) Jun-13 37 18 4 26.5 19.3 16.4 15.7 97 88 4.0 17.8 3.2 0.7 9.9 11
Thorn Group TGA AU N AUD 2.15 2.53 18 282 0.5 (1) 1 1 (1) (2) (2) (1) (0) (1) (13) Mar-13 3 9 7 11.3 10.9 10.0 9.3 102 102 5.1 17.9 1.9 1.6 7.3 21 Wotif.com Holdings WTF AU U AUD 2.56 2.90 13 477 2.8 0 (2) 1 (8) (56) (1) (4) (0) (7) (67) Jun-13 (14) 4 7 10.2 11.9 11.5 10.8 97 94 7.2 44.9 5.3 2.5 5.5 (159) Sector* 8 15,572 1 (1) 0 (4) 30 (0) (4) (1) (3) 18 Jun-13 4 14 12 16.5 15.9 14.0 12.2 102 105 4.4 13.3 2.1 1.1 9.5 14
Small Cap Companies Chris Smith / Paul Buys - 61 2 8205 4210 / 61 2 8205 4538
AP Eagers Limited APE AU N AUD 5.14 5.00 (3) 799 0.1 0 1 4 4 10 (0) (1) 2 4 (2) Dec-12 6 4 6 15.6 14.7 14.1 13.3 100 98 4.1 12.8 1.8 0.5 11.8 100
Alliance Aviation Services Ltd AQZ AT O AUD 1.38 2.15 56 128 0.1 6 1 (9) (4) (27) 5 (1) (10) (4) (38) Jun-13 (1) 11 9 6.3 6.4 5.8 5.3 104 105 6.2 15.2 0.9 1.0 3.7 53
Automotive Holdings Group Ltd AHE AU N AUD 3.67 4.00 9 842 1.3 3 (2) 2 (3) 7 2 (4) 1 (3) (5) Jun-13 7 7 5 13.2 12.3 11.5 11.0 99 96 5.7 15.9 1.9 0.4 9.3 130 FlexiGroup Limited FXL AU O AUD 4.18 5.40 29 1,119 2.5 1 0 (3) (6) 17 0 (2) (4) (6) 5 Jun-13 15 14 9 16.8 14.6 12.8 11.8 102 102 3.9 23.3 3.3 6.9 10.7 240
UXC Limited UXC AU O AUD 1.11 1.20 8 313 0.5 5 6 16 11 11 4 3 14 11 (1) Jun-13 6 23 12 17.1 16.0 13.1 11.7 99 100 5.1 10.8 1.7 0.6 8.8 (2) iSelect Limited ISU AU O AUD 1.43 2.00 40 329 0.8 (1) 2 3 (1) na (2) (0) 2 (1) na Jun-13 20 19 10 20.2 16.8 14.1 12.9 101 99 0.0 9.5 1.5 2.1 8.7 (35) Sector* 17 3,531 2 1 2 (1) 10 1 (2) 0 (1) (1) Jun-13 9 11 8 14.8 13.6 12.2 11.4 100 100 4.2 15.1 2.0 0.7 9.6 102
Technology Bradley Clibborn / Chris Smith / Fraser McLeish / David Bailey / Samantha Carleton - 61 2 8205 4465 / 61 2 8205 4210 / 61 2 8205 4069 / 61 2 8205 4739 / 61 2 8205 4148
APN News & Media APN AU U AUD 0.47 0.30 (36) 274 0.4 2 0 7 4 49 1 (2) 6 5 38 Dec-12 (11) 2 10 5.6 6.3 6.2 5.6 104 101 0.0 11.5 0.7 0.8 4.7 51
Fairfax Media FXJ AU U AUD 0.68 0.50 (26) 1,398 4.0 2 5 4 5 25 2 3 3 6 13 Jun-13 (13) (4) (2) 12.4 14.3 14.9 15.2 95 93 3.0 6.6 1.0 0.9 6.0 3 IRESS Limited IRE AU N AUD 9.49 8.75 (8) 1,325 3.2 1 3 0 1 16 1 1 (1) 1 4 Dec-12 (8) 20 16 22.3 24.2 20.1 17.3 108 105 3.4 24.9 4.3 6.9 18.4 40 News Corporation NNC AU N AUD 19.43 19.80 2 9,702 4.7 1 3 (0) (2) na 1 1 (2) (2) na Jun-13 (38) 33 44 28.8 46.2 34.8 24.2 266 326 1.4 1.7 0.8 0.8 8.7 (23)
Oakton OKN AU N AUD 1.65 1.25 (24) 130 0.2 0 0 7 3 19 (0) (2) 6 3 7 Jun-13 12 17 11 16.5 14.7 12.6 11.3 107 110 5.8 9.7 1.4 0.9 9.3 (6) Prime Media Group PRT AU N AUD 1.04 1.10 6 334 0.3 2 2 3 (1) 9 1 (0) 2 (1) (3) Jun-13 (9) 7 4 10.7 11.7 11.0 10.5 97 97 6.4 20.4 2.3 1.8 7.6 53 REA Group REA AU N AUD 41.02 36.00 (12) 4,758 11.7 0 4 8 9 113 (0) 1 7 9 102 Jun-13 26 23 19 49.2 38.9 31.6 26.6 96 95 1.3 39.2 13.7 12.8 24.7 (84)
SMS Mgmt & Technology SMX AU N AUD 4.09 5.05 23 252 1.2 (0) (1) 8 3 (19) (1) (3) 7 3 (31) Jun-13 (11) 21 11 13.6 15.2 12.6 11.3 112 107 5.4 14.9 2.2 0.8 9.3 (19)
STW Communications Group SGN AU N AUD 1.50 1.63 9 532 1.3 (0) (0) (0) 0 27 (1) (3) (2) 0 15 Dec-12 6 8 13 12.4 11.8 10.9 9.6 100 102 5.7 11.7 1.3 1.8 7.9 19 Seek SEK AU N AUD 12.90 13.78 7 3,853 14.2 1 1 (0) (4) 66 1 (1) (2) (3) 54 Jun-13 17 23 19 31.1 26.5 21.6 18.1 101 105 2.6 20.2 5.1 6.1 15.3 5
Seven West Media Ltd SWM AU O AUD 2.19 3.00 37 1,927 3.9 0 1 (6) (7) 8 (1) (1) (8) (6) (4) Jun-13 27 13 9 11.1 8.7 7.7 7.1 114 125 4.6 9.1 0.7 1.7 6.4 36 Southern Cross Media Group SXL AU U AUD 1.62 1.40 (14) 1,006 2.4 3 3 (4) (4) 48 2 0 (5) (4) 36 Jun-13 14 5 5 12.6 11.0 10.5 10.0 103 97 6.2 6.2 0.7 2.6 8.0 35 TPG Telecom TPM AU N AUD 5.63 5.00 (11) 3,936 3.6 2 5 14 6 107 2 3 12 6 95 Jul-13 16 36 30 32.1 27.7 20.3 15.7 97 113 1.7 21.1 5.5 5.1 14.8 40
Ten Network Holdings TEN AU N AUD 0.35 0.29 (17) 797 1.5 1 9 27 25 1 1 7 26 25 (10) Aug-13 nm nm 38 nm nm 17.5 12.6 240 222 0.0 (0.6) 1.0 1.4 26.8 7 Trade Me Group Ltd TME AU U AUD 3.94 3.70 (6) 1,376 3.5 2 2 3 5 23 1 0 2 5 11 Jun-13 9 12 12 21.0 19.3 17.1 15.3 100 101 4.2 12.9 2.4 9.6 13.0 15 carsales.com.au CRZ AU U AUD 9.48 10.00 5 1,985 7.8 (1) (4) (5) (7) 9 (1) (7) (7) (7) (2) Jun-13 17 13 12 26.9 22.9 20.3 18.1 100 99 3.5 58.9 12.4 9.4 16.2 9
Sector* (2) 33,584 1 3 3 1 59 1 0 2 1 47 Jun-13 3 22 21 25.2 24.5 20.2 16.8 112 119 2.4 6.3 1.5 2.0 11.1 (3)
Telecommunication Services
Bradley Clibborn / Chate Benchavitvilai / Fraser McLeish - 61 2 8205 4465 / 65 6212 3241 / 61 2 8205 4069
Amcom Telecommunications AMM AU N AUD 2.09 2.17 4 450 0.8 0 4 0 (4) 42 (1) 2 (1) (4) 30 Jun-13 16 25 16 25.0 21.6 17.3 14.9 98 103 3.0 18.9 3.9 3.2 11.2 15 NewSat Limited NWT AU O AUD 0.48 0.69 44 250 0.6 (1) (1) 20 7 (8) (2) (3) 19 7 (19) Jun-12 (32) (43) 90 49.4 72.7 126.5 66.5 132 95 0.0 2.5 1.2 6.9 53.3 5
Singapore Telecomms CDI SGT AU N AUD 3.14 3.48 11 43,910 48.9 1 2 (1) (3) 17 0 (0) (2) (2) 5 Mar-13 6 4 8 16.1 15.1 14.6 13.5 102 98 4.8 16.3 2.6 3.8 12.1 31
Telstra Corporation TLS AU O AUD 5.26 5.70 8 57,636 112.4 1 1 1 0 17 (0) (1) (0) 1 6 Jun-13 6 4 14 16.6 15.7 15.1 13.2 103 105 5.5 32.3 4.9 3.0 6.9 86 iiNet IIN AU N AUD 6.90 6.74 (2) 980 3.7 2 6 10 6 58 2 3 8 6 46 Jun-13 18 16 11 19.9 16.8 14.5 13.1 98 104 3.4 19.4 3.1 1.4 7.1 84
Sector* 9 103,226 1 2 1 (1) 17 0 (1) (1) (1) 6 Jun-13 10 6 12 17.1 15.6 14.7 13.0 102 101 5.1 23.0 3.5 3.3 8.5 54
Transportation Bradley Clibborn / Nicholas Markiewicz / Paul Buys - 61 2 8205 4465 / 61 2 8205 4107 / 61 2 8205 4538
Asciano Group AIO AU O AUD 5.78 6.20 7 4,965 15.6 1 4 2 0 21 0 2 1 1 10 Jun-13 4 15 13 16.3 15.7 13.6 12.1 98 102 2.5 9.4 1.4 2.3 8.2 80 Aurizon AZJ AU R AUD 4.99 9,392 27.2 1 4 3 2 24 1 1 2 3 12 Jun-13 7 29 9 23.1 21.7 16.8 15.5 97 105 3.2 7.5 1.6 3.4 10.1 41 McAleese Group MCS AU O AUD 1.54 1.80 17 402 0.8 1 0 4 0 na (0) (2) 3 0 na Jun-13 (24) 1 20 7.5 10.0 9.9 8.2 98 95 2.8 15.0 1.4 0.9 5.2 65
Mermaid Marine Australia MRM AU O AUD 3.06 3.80 24 627 2.1 (1) 0 (5) (10) (21) (2) (2) (6) (10) (32) Jun-13 (3) 10 2 11.6 11.9 10.8 10.6 98 98 4.3 14.1 1.6 1.7 5.6 22 Qantas Airways QAN AU N AUD 1.12 1.21 8 2,166 12.8 0 2 3 2 (27) (0) (0) 2 3 (38) Jun-13 (386) nm nm 18.8 nm nm 24.9 120 77 1.3 (6.6) 0.5 0.4 5.0 59 Qube Logistics QUB AU N AUD 2.11 1.90 (10) 1,731 2.2 (0) 5 5 2 18 (1) 3 4 2 7 Jun-13 16 17 13 29.7 25.6 21.9 19.4 88 89 2.4 7.0 1.8 2.3 11.9 46
Toll Holdings TOL AU N AUD 5.87 5.49 (6) 3,707 11.2 2 3 6 3 19 1 1 5 4 7 Jun-13 6 8 7 14.6 13.8 12.8 12.0 105 106 5.0 11.2 1.5 0.6 7.3 39 Virgin Australia VBA AU N AUD 0.38 0.42 11 1,176 1.8 0 1 (1) 0 (10) (1) (1) (3) 0 (22) Jun-13 nm nm 113 nm nm 41.3 19.4 84 115 0.0 (1.9) 0.7 0.6 7.8 83 Sector* 3 24,165 1 3 3 2 14 0 1 2 2 3 Jun-13 (30) 52 34 20.6 29.4 19.3 14.4 105 100 3.0 4.3 1.2 1.0 7.8 55
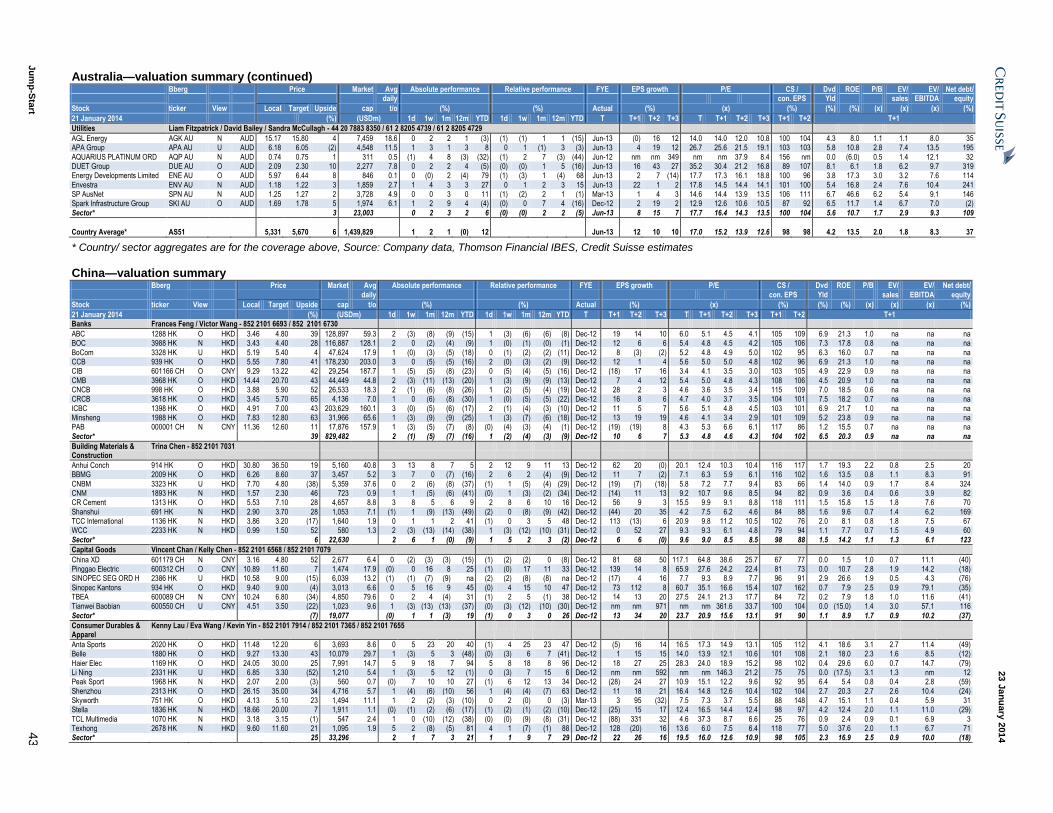
23 J
an
uary
201
4
Ju
mp
-Sta
rt 4
3
Australia—valuation summary (continued) Bberg Price Market Avg Absolute performance Relative performance FYE EPS growth P/E CS / Dvd ROE P/B EV/ EV/ Net debt/ daily con. EPS Yld sales EBITDA equity
Stock ticker View Local Target Upside cap t/o (%) (%) Actual (%) (x) (%) (%) (%) (x) (x) (x) (%)
21 January 2014 (%) (USDm) 1d 1w 1m 12m YTD 1d 1w 1m 12m YTD T T+1 T+2 T+3 T T+1 T+2 T+3 T+1 T+2 T+1
Utilities Liam Fitzpatrick / David Bailey / Sandra McCullagh - 44 20 7883 8350 / 61 2 8205 4739 / 61 2 8205 4729
AGL Energy AGK AU N AUD 15.17 15.80 4 7,459 18.6 0 2 2 1 (3) (1) (1) 1 1 (15) Jun-13 (0) 16 12 14.0 14.0 12.0 10.8 100 104 4.3 8.0 1.1 1.1 8.0 35 APA Group APA AU U AUD 6.18 6.05 (2) 4,548 11.5 1 3 1 3 8 0 1 (1) 3 (3) Jun-13 4 19 12 26.7 25.6 21.5 19.1 103 103 5.8 10.8 2.8 7.4 13.5 195
AQUARIUS PLATINUM ORD AQP AU N AUD 0.74 0.75 1 311 0.5 (1) 4 8 (3) (32) (1) 2 7 (3) (44) Jun-12 nm nm 349 nm nm 37.9 8.4 156 nm 0.0 (6.0) 0.5 1.4 12.1 32 DUET Group DUE AU O AUD 2.09 2.30 10 2,277 7.8 0 2 2 4 (5) (0) (0) 1 5 (16) Jun-13 16 43 27 35.2 30.4 21.2 16.8 89 107 8.1 6.1 1.8 6.2 9.7 319 Energy Developments Limited ENE AU O AUD 5.97 6.44 8 846 0.1 0 (0) 2 (4) 79 (1) (3) 1 (4) 68 Jun-13 2 7 (14) 17.7 17.3 16.1 18.8 100 96 3.8 17.3 3.0 3.2 7.6 114
Envestra ENV AU N AUD 1.18 1.22 3 1,859 2.7 1 4 3 3 27 0 1 2 3 15 Jun-13 22 1 2 17.8 14.5 14.4 14.1 101 100 5.4 16.8 2.4 7.6 10.4 241 SP AusNet SPN AU N AUD 1.25 1.27 2 3,728 4.9 0 0 3 0 11 (1) (2) 2 1 (1) Mar-13 1 4 3 14.6 14.4 13.9 13.5 106 111 6.7 46.6 6.2 5.4 9.1 146 Spark Infrastructure Group SKI AU O AUD 1.69 1.78 5 1,974 6.1 1 2 9 4 (4) (0) 0 7 4 (16) Dec-12 2 19 2 12.9 12.6 10.6 10.5 87 92 6.5 11.7 1.4 6.7 7.0 (2)
Sector* 3 23,003 0 2 3 2 6 (0) (0) 2 2 (5) Jun-13 8 15 7 17.7 16.4 14.3 13.5 100 104 5.6 10.7 1.7 2.9 9.3 109
Country Average* AS51 5,331 5,670 6 1,439,829 1 2 1 (0) 12 Jun-13 12 10 10 17.0 15.2 13.9 12.6 98 98 4.2 13.5 2.0 1.8 8.3 37
* Country/ sector aggregates are for the coverage above, Source: Company data, Thomson Financial IBES, Credit Suisse estimates
China—valuation summary Bberg Price Market Avg Absolute performance Relative performance FYE EPS growth P/E CS / Dvd ROE P/B EV/ EV/ Net debt/ daily con. EPS Yld sales EBITDA equity
Stock ticker View Local Target Upside cap t/o (%) (%) Actual (%) (x) (%) (%) (%) (x) (x) (x) (%)
21 January 2014 (%) (USDm) 1d 1w 1m 12m YTD 1d 1w 1m 12m YTD T T+1 T+2 T+3 T T+1 T+2 T+3 T+1 T+2 T+1 Banks Frances Feng / Victor Wang - 852 2101 6693 / 852 2101 6730
ABC 1288 HK O HKD 3.46 4.80 39 128,897 59.3 2 (3) (8) (9) (15) 1 (3) (6) (6) (8) Dec-12 19 14 10 6.0 5.1 4.5 4.1 105 109 6.9 21.3 1.0 na na na BOC 3988 HK N HKD 3.43 4.40 28 116,887 128.1 2 0 (2) (4) (9) 1 (0) (1) (0) (1) Dec-12 12 6 6 5.4 4.8 4.5 4.2 105 106 7.3 17.8 0.8 na na na
BoCom 3328 HK U HKD 5.19 5.40 4 47,624 17.9 1 (0) (3) (5) (18) 0 (1) (2) (2) (11) Dec-12 8 (3) (2) 5.2 4.8 4.9 5.0 102 95 6.3 16.0 0.7 na na na CCB 939 HK O HKD 5.55 7.80 41 178,230 203.0 3 0 (5) (5) (16) 2 (0) (3) (2) (9) Dec-12 12 1 4 5.6 5.0 5.0 4.8 102 96 6.9 21.3 1.0 na na na CIB 601166 CH O CNY 9.29 13.22 42 29,254 187.7 1 (5) (5) (8) (23) 0 (5) (4) (5) (16) Dec-12 (18) 17 16 3.4 4.1 3.5 3.0 103 105 4.9 22.9 0.9 na na na
CMB 3968 HK O HKD 14.44 20.70 43 44,449 44.8 2 (3) (11) (13) (20) 1 (3) (9) (9) (13) Dec-12 7 4 12 5.4 5.0 4.8 4.3 108 106 4.5 20.9 1.0 na na na CNCB 998 HK O HKD 3.88 5.90 52 26,533 18.3 2 (1) (6) (8) (26) 1 (2) (5) (4) (19) Dec-12 28 2 3 4.6 3.6 3.5 3.4 115 109 7.0 18.5 0.6 na na na CRCB 3618 HK O HKD 3.45 5.70 65 4,136 7.0 1 0 (6) (8) (30) 1 (0) (5) (5) (22) Dec-12 16 8 6 4.7 4.0 3.7 3.5 104 101 7.5 18.2 0.7 na na na
ICBC 1398 HK O HKD 4.91 7.00 43 203,629 160.1 3 (0) (5) (6) (17) 2 (1) (4) (3) (10) Dec-12 11 5 7 5.6 5.1 4.8 4.5 103 101 6.9 21.7 1.0 na na na Minsheng 1988 HK O HKD 7.83 12.80 63 31,966 65.6 1 (3) (9) (9) (25) 1 (3) (7) (6) (18) Dec-12 13 19 19 4.6 4.1 3.4 2.9 101 109 5.2 23.8 0.9 na na na PAB 000001 CH N CNY 11.36 12.60 11 17,876 157.9 1 (3) (5) (7) (8) (0) (4) (3) (4) (1) Dec-12 (19) (19) 8 4.3 5.3 6.6 6.1 117 86 1.2 15.5 0.7 na na na
Sector* 39 829,482 2 (1) (5) (7) (16) 1 (2) (4) (3) (9) Dec-12 10 6 7 5.3 4.8 4.6 4.3 104 102 6.5 20.3 0.9 na na na
Building Materials & Construction
Trina Chen - 852 2101 7031
Anhui Conch 914 HK O HKD 30.80 36.50 19 5,160 40.8 3 13 8 7 5 2 12 9 11 13 Dec-12 62 20 (0) 20.1 12.4 10.3 10.4 116 117 1.7 19.3 2.2 0.8 2.5 20 BBMG 2009 HK O HKD 6.26 8.60 37 3,457 5.2 3 7 0 (7) (16) 2 6 2 (4) (9) Dec-12 11 7 (2) 7.1 6.3 5.9 6.1 116 102 1.6 13.5 0.8 1.1 8.3 91
CNBM 3323 HK U HKD 7.70 4.80 (38) 5,359 37.6 0 2 (6) (8) (37) (1) 1 (5) (4) (29) Dec-12 (19) (7) (18) 5.8 7.2 7.7 9.4 83 66 1.4 14.0 0.9 1.7 8.4 324 CNM 1893 HK N HKD 1.57 2.30 46 723 0.9 1 1 (5) (6) (41) (0) 1 (3) (2) (34) Dec-12 (14) 11 13 9.2 10.7 9.6 8.5 94 82 0.9 3.6 0.4 0.6 3.9 82 CR Cement 1313 HK O HKD 5.53 7.10 28 4,657 8.8 3 8 5 6 9 2 8 6 10 16 Dec-12 56 9 3 15.5 9.9 9.1 8.8 118 111 1.5 15.8 1.5 1.8 7.6 70
Shanshui 691 HK N HKD 2.90 3.70 28 1,053 7.1 (1) 1 (9) (13) (49) (2) 0 (8) (9) (42) Dec-12 (44) 20 35 4.2 7.5 6.2 4.6 84 88 1.6 9.6 0.7 1.4 6.2 169 TCC International 1136 HK N HKD 3.86 3.20 (17) 1,640 1.9 0 1 1 2 41 (1) 0 3 5 48 Dec-12 113 (13) 6 20.9 9.8 11.2 10.5 102 76 2.0 8.1 0.8 1.8 7.5 67 WCC 2233 HK N HKD 0.99 1.50 52 580 1.3 2 (3) (13) (14) (38) 1 (3) (12) (10) (31) Dec-12 0 52 27 9.3 9.3 6.1 4.8 79 94 1.1 7.7 0.7 1.5 4.9 60
Sector* 6 22,630 2 6 1 (0) (9) 1 5 2 3 (2) Dec-12 6 6 (0) 9.6 9.0 8.5 8.5 98 88 1.5 14.2 1.1 1.3 6.1 123
Capital Goods Vincent Chan / Kelly Chen - 852 2101 6568 / 852 2101 7079
China XD 601179 CH N CNY 3.16 4.80 52 2,677 6.4 0 (2) (3) (3) (15) (1) (2) (2) 0 (8) Dec-12 81 68 50 117.1 64.8 38.6 25.7 67 77 0.0 1.5 1.0 0.7 11.1 (40) Pinggao Electric 600312 CH O CNY 10.89 11.60 7 1,474 17.9 (0) 0 16 8 25 (1) (0) 17 11 33 Dec-12 139 14 8 65.9 27.6 24.2 22.4 81 73 0.0 10.7 2.8 1.9 14.2 (18) SINOPEC SEG ORD H 2386 HK U HKD 10.58 9.00 (15) 6,039 13.2 (1) (1) (7) (9) na (2) (2) (8) (8) na Dec-12 (17) 4 16 7.7 9.3 8.9 7.7 96 91 2.9 26.6 1.9 0.5 4.3 (76)
Sinopec Kantons 934 HK O HKD 9.40 9.00 (4) 3,013 6.6 0 5 16 9 45 (0) 4 15 10 47 Dec-12 73 112 8 60.7 35.1 16.6 15.4 107 162 0.7 7.9 2.5 0.9 79.1 (35) TBEA 600089 CH N CNY 10.24 6.80 (34) 4,850 79.6 0 2 4 (4) 31 (1) 2 5 (1) 38 Dec-12 14 13 20 27.5 24.1 21.3 17.7 84 72 0.2 7.9 1.8 1.0 11.6 (41) Tianwei Baobian 600550 CH U CNY 4.51 3.50 (22) 1,023 9.6 1 (3) (13) (13) (37) (0) (3) (12) (10) (30) Dec-12 nm nm 971 nm nm 361.6 33.7 100 104 0.0 (15.0) 1.4 3.0 57.1 116
Sector* (7) 19,077 (0) 1 1 (3) 19 (1) 0 3 0 26 Dec-12 13 34 20 23.7 20.9 15.6 13.1 91 90 1.1 8.9 1.7 0.9 10.2 (37)
Consumer Durables & Apparel
Kenny Lau / Eva Wang / Kevin Yin - 852 2101 7914 / 852 2101 7365 / 852 2101 7655
Anta Sports 2020 HK O HKD 11.48 12.20 6 3,693 8.6 0 5 23 20 40 (1) 4 25 23 47 Dec-12 (5) 16 14 16.5 17.3 14.9 13.1 105 112 4.1 18.6 3.1 2.7 11.4 (49) Belle 1880 HK O HKD 9.27 13.30 43 10,079 29.7 1 (3) 5 3 (48) (0) (3) 6 7 (41) Dec-12 1 15 15 14.0 13.9 12.1 10.6 101 108 2.1 18.0 2.3 1.6 8.5 (12)
Haier Elec 1169 HK O HKD 24.05 30.00 25 7,991 14.7 5 9 18 7 94 5 8 18 8 96 Dec-12 18 27 25 28.3 24.0 18.9 15.2 98 102 0.4 29.6 6.0 0.7 14.7 (79) Li Ning 2331 HK U HKD 6.85 3.30 (52) 1,210 5.4 1 (3) 5 12 (1) 0 (3) 7 15 6 Dec-12 nm nm 592 nm nm 146.3 21.2 75 75 0.0 (17.5) 3.1 1.3 nm 12 Peak Sport 1968 HK N HKD 2.07 2.00 (3) 560 0.7 (0) 7 10 10 27 (1) 6 12 13 34 Dec-12 (28) 24 27 10.9 15.1 12.2 9.6 92 95 6.4 5.4 0.8 0.4 2.8 (59)
Shenzhou 2313 HK O HKD 26.15 35.00 34 4,716 5.7 1 (4) (6) (10) 56 1 (4) (4) (7) 63 Dec-12 11 18 21 16.4 14.8 12.6 10.4 102 104 2.7 20.3 2.7 2.6 10.4 (24) Skyworth 751 HK O HKD 4.13 5.10 23 1,494 11.1 1 2 (2) (3) (10) 0 2 (0) 0 (3) Mar-13 3 95 (32) 7.5 7.3 3.7 5.5 88 148 4.7 15.1 1.1 0.4 5.9 31 Stella 1836 HK N HKD 18.66 20.00 7 1,911 1.1 (0) (1) (2) (6) (17) (1) (2) (1) (2) (10) Dec-12 (25) 15 17 12.4 16.5 14.4 12.4 98 97 4.2 12.4 2.0 1.1 11.0 (29)
TCL Multimedia 1070 HK N HKD 3.18 3.15 (1) 547 2.4 1 0 (10) (12) (38) (0) (0) (9) (8) (31) Dec-12 (88) 331 32 4.6 37.3 8.7 6.6 25 76 0.9 2.4 0.9 0.1 6.9 3 Texhong 2678 HK N HKD 9.60 11.60 21 1,095 1.9 5 2 (8) (5) 81 4 1 (7) (1) 88 Dec-12 128 (20) 16 13.6 6.0 7.5 6.4 118 77 5.0 37.6 2.0 1.1 6.7 71 Sector* 25 33,296 2 1 7 3 21 1 1 9 7 29 Dec-12 22 26 16 19.5 16.0 12.6 10.9 98 105 2.3 16.9 2.5 0.9 10.0 (18)

23 J
an
uary
201
4
Ju
mp
-Sta
rt 4
4
China—valuation summary (continued) Bberg Price Market Avg Absolute performance Relative performance FYE EPS growth P/E CS / Dvd ROE P/B EV/ EV/ Net debt/ daily con. EPS Yld sales EBITDA equity
Stock ticker View Local Target Upside cap t/o (%) (%) Actual (%) (x) (%) (%) (%) (x) (x) (x) (%)
21 January 2014 (%) (USDm) 1d 1w 1m 12m YTD 1d 1w 1m 12m YTD T T+1 T+2 T+3 T T+1 T+2 T+3 T+1 T+2 T+1
Consumer Staples Eva Wang / Kevin Yin - 852 2101 7365 / 852 2101 7655
China Modern Dairy 1117 HK O HKD 3.65 4.50 23 2,271 12.1 (4) (6) (4) (13) 44 (5) (6) (3) (10) 51 Jun-13 96 55 42 42.2 21.5 13.9 9.8 93 103 0.0 10.9 2.2 4.7 17.3 61 Hengan 1044 HK N HKD 89.00 92.00 3 14,128 20.5 0 (0) (3) (3) 19 (1) (1) (2) 1 26 Dec-12 9 18 18 31.1 28.5 24.1 20.4 98 97 2.3 29.8 9.4 5.2 18.9 34 Mengniu Dairy 2319 HK O HKD 37.80 39.50 4 8,943 24.2 1 2 6 3 58 0 1 8 6 65 Dec-12 25 35 18 41.5 33.2 24.6 20.8 103 103 1.2 12.2 3.9 1.2 17.2 (16) Tenfu 6868 HK N HKD 3.70 3.80 3 585 0.1 0 0 (1) (12) (18) (1) (0) 0 (8) (11) Dec-12 (16) 25 16 12.0 14.2 11.4 9.8 101 109 4.2 13.2 1.8 1.8 7.1 (24) Tingyi 322 HK N HKD 21.95 22.80 4 15,836 16.1 1 2 (2) (2) 4 0 1 (1) 2 11 Dec-12 26 22 21 43.9 35.0 28.6 23.6 104 103 1.9 17.0 5.7 1.5 12.8 11 Vinda Int'l 3331 HK N HKD 11.30 8.00 (29) 1,454 5.9 (2) (2) (12) (12) 1 (3) (3) (10) (9) 8 Dec-12 6 15 19 20.6 19.4 16.8 14.1 106 104 1.3 14.1 2.8 1.7 12.5 25 Want Want 151 HK N HKD 10.76 12.00 12 18,342 18.4 3 2 1 (4) 5 2 1 3 (0) 12 Dec-12 18 13 16 33.1 28.2 24.9 21.4 99 95 2.5 38.5 10.2 4.5 18.4 (29) YST Dairy Farm 1431 HK O HKD 2.19 2.80 28 1,104 9.9 (3) (2) (1) (2) na (3) (3) (2) (1) na Dec-12 (2) 132 28 31.8 32.5 14.0 11.0 na na 0.0 11.9 2.3 6.8 19.9 (25) Sector* 6 62,665 1 1 (1) (3) 17 0 0 1 1 24 Dec-12 15 24 21 33.7 29.4 23.7 19.6 101 100 2.0 20.5 5.8 2.4 16.0 5
Diversified Financials Frances Feng - 852 2101 6693
Cinda 1359 HK O HKD 5.30 6.14 16 24,773 149.1 (2) 3 17 10 na (3) 2 16 11 na Dec-13 46 27 21 19.2 13.1 10.3 8.5 102 109 2.3 #DIV/0! nm na na na Citic Securities (A) 600030 CH N CNY 11.71 13.50 15 21,449 24.0 2 1 (4) (8) (15) 1 1 (3) (5) (8) Dec-12 23 20 14 30.4 24.8 20.6 18.1 104 95 0.0 5.8 1.4 na na na Citic Securities (H) 6030 HK N HKD 18.76 17.80 (5) 21,449 24.0 4 1 (9) (11) (8) 3 1 (8) (8) (1) Dec-12 23 20 14 38.0 30.9 25.8 22.6 99 88 0.0 5.8 1.8 na na na Galaxy 6881 HK O HKD 5.92 7.00 18 5,752 9.8 2 (3) (10) (12) na 2 (4) (11) (11) na Dec-12 23 4 18 19.5 15.8 15.3 12.9 103 89 1.9 9.4 1.3 na na na Haitong Securities (A) 600837 CH N CNY 10.44 11.20 7 16,268 20.2 2 1 (4) (8) 2 2 1 (3) (4) 9 Dec-12 18 35 12 30.6 26.0 19.3 17.2 83 92 1.2 6.4 1.6 na na na Haitong Securities (H) 6837 HK O HKD 11.98 14.20 19 16,268 20.2 2 (1) (10) (11) (9) 1 (2) (8) (8) (1) Dec-12 18 35 12 27.4 23.3 17.3 15.4 83 92 1.3 6.4 1.5 na na na Sector* 10 68,242 1 1 0 (4) (8) 0 0 2 (0) (1) Dec-12 15 32 21 25.5 22.3 16.8 14.0 90 95 1.0 9.7 2.4 na na na
Energy Thomas Wong / David Hewitt / Horace Tse - 852 2101 6738 / 65 6212 3064 / 852 2101 7379
Anton Oil 3337 HK U HKD 5.26 3.50 (33) 1,483 12.8 (6) (10) 11 11 41 (7) (11) 13 15 48 Dec-12 8 7 12 28.7 26.5 24.8 22.1 87 75 1.1 15.9 4.0 3.7 15.2 5 CNOOC 883 HK N HKD 13.08 16.00 22 75,285 105.8 (6) (5) (7) (9) (19) (7) (6) (6) (6) (12) Dec-12 5 (6) 10 7.2 6.8 7.2 6.6 105 98 4.4 21.4 1.4 1.5 3.1 3 COSL 2883 HK O HKD 23.75 25.00 5 16,051 21.2 2 10 3 (1) 45 1 9 5 2 52 Dec-12 38 15 15 18.3 13.3 11.5 10.1 102 106 2.3 18.6 2.4 4.4 10.6 54 GDG GDG LN O GBp 2.70 5.22 93 607 0.2 2 1 (3) (2) 11 1 0 (1) 2 19 Dec-12 nm nm nm nm nm nm nm 15 17 0.0 (2.3) 1.0 20.2 113,815.4 13 Hilong 1623 HK O HKD 6.54 7.30 12 1,429 5.0 (5) (3) 12 (2) 153 (6) (4) 11 (0) 156 Dec-12 32 31 30 23.5 17.8 13.6 10.5 123 112 1.6 20.3 3.3 3.4 12.6 22 PetroChina 857 HK U HKD 8.07 7.00 (13) 226,149 92.8 0 1 (4) (5) (27) (1) 1 (3) (2) (20) Dec-12 (1) 2 12 10.0 10.1 9.9 8.9 91 86 4.5 12.0 1.2 0.8 5.3 40 SPT Energy 1251 HK N HKD 5.42 4.00 (26) 1,069 3.1 (2) 1 13 18 54 (3) 1 14 21 62 Dec-12 1 15 19 22.8 22.6 19.7 16.6 85 75 0.9 16.9 3.6 2.8 12.4 (23) Sinopec 386 HK O HKD 6.37 8.00 26 90,328 77.0 4 8 3 1 (10) 3 8 4 4 (3) Dec-12 11 14 7 9.1 8.2 7.2 6.7 102 106 4.9 12.9 1.0 0.3 4.2 41 Sector* 3 412,403 (0) 2 (3) (4) (18) (1) 1 (1) (1) (11) Dec-12 4 3 10 9.4 9.0 8.7 7.9 97 94 4.4 14.0 1.2 0.6 4.7 34
Environmental Services Trina Chen - 852 2101 7031
BE Water 371 HK O HKD 4.74 5.30 12 5,155 14.1 0 6 7 (3) 136 (0) 5 7 (1) 138 Dec-12 34 28 25 43.6 32.6 25.4 20.2 104 103 1.1 10.2 2.8 9.3 29.6 44 Dongjiang Environmental 895 HK O HKD 25.05 31.50 26 729 1.1 (2) 1 15 (3) (1) (2) (0) 14 (2) 1 Dec-12 (25) 19 62 15.6 20.9 17.5 10.8 104 105 0.0 9.9 2.0 2.5 14.3 (24) Guodian Tech 1296 HK N HKD 2.47 2.35 (5) 1,931 2.5 (2) 12 32 25 13 (2) 11 31 26 16 Dec-12 (19) 19 18 16.8 20.8 17.4 14.8 90 78 0.0 5.9 1.2 1.3 11.6 119 Tianjin Capital 1065 HK O HKD 3.88 4.80 24 714 2.1 (3) (1) 6 (1) 62 (3) (2) 5 (0) 64 Dec-12 8 20 10 16.1 14.9 12.5 11.3 109 126 2.0 7.5 1.1 5.0 8.4 94 Yonker Environment 300187 CH N CNY 27.91 26.60 (5) 924 13.2 (0) 0 2 (3) 49 (1) 1 6 2 62 Dec-12 7 45 43 104.1 97.2 66.8 46.7 80 78 0.0 6.9 6.5 7.6 68.8 (34) Sector* 7 9,453 (0) 6 13 4 94 (1) 6 14 7 101 Dec-12 5 25 25 31.1 29.6 23.6 18.9 98 93 0.7 8.0 2.2 2.7 16.4 73
Healthcare Iris Wang - 852 2101 7646
Bloomage 963 HK O HKD 20.60 19.66 (5) 882 1.5 (5) (10) 21 20 365 (6) (11) 20 21 367 Dec-12 45 44 59 56.5 39.1 27.1 17.0 100 93 0.0 31.2 10.5 12.6 26.0 0 CMS 867 HK O HKD 8.43 9.00 7 2,624 4.4 1 2 7 2 35 0 2 9 5 42 Dec-12 27 33 28 30.9 24.4 18.3 14.2 104 108 1.6 22.4 5.1 6.9 21.1 (10) Dawnrays Pharma 2348 HK O HKD 5.80 6.80 17 600 1.0 (2) 4 18 18 219 (2) 3 17 19 221 Dec-12 46 27 26 31.6 21.7 17.1 13.6 104 110 1.8 16.9 3.5 3.8 14.0 (16) Microport 853 HK O HKD 5.21 6.66 28 946 1.1 (1) (1) 1 3 12 (2) (2) 3 6 19 Dec-12 (22) 23 33 16.5 21.1 17.2 12.9 105 109 0.0 11.8 2.4 5.3 14.1 (41) Mindray Medical MR US U USD 37.00 32.80 (11) 4,433 35.9 (4) (6) (2) 2 5 (5) (6) (1) 5 12 Dec-12 17 13 13 24.6 21.1 18.6 16.4 93 96 1.4 14.9 2.9 3.7 16.5 (3) Shandong Weigao 1066 HK N HKD 10.20 7.40 (27) 5,886 10.2 0 1 (7) (2) 36 (0) 0 (5) 1 43 Dec-12 7 16 17 35.7 33.5 28.8 24.6 104 96 0.9 11.6 3.7 7.7 25.5 (10) Shanghai Pharma 2607 HK N HKD 19.46 14.80 (24) 6,174 4.8 2 6 5 3 19 1 6 6 6 26 Dec-12 6 12 15 20.2 19.0 16.9 14.7 95 95 1.3 8.5 1.6 0.3 8.3 (35) Sihuan Pharma 460 HK O HKD 7.92 7.50 (5) 5,284 14.9 2 3 16 12 121 1 3 17 15 128 Dec-12 40 34 21 35.3 25.2 18.8 15.6 112 124 1.2 16.9 4.0 5.7 18.9 (28) Sino Biopharm 1177 HK N HKD 6.95 5.40 (22) 4,427 13.3 3 4 16 13 81 2 3 18 17 88 Dec-12 25 15 17 38.6 30.9 26.9 23.1 98 94 0.9 22.2 6.3 3.0 17.3 (47) Sinopharm 1099 HK N HKD 22.70 21.60 (5) 2,424 12.9 0 (1) 2 2 (9) (1) (1) 4 6 (2) Dec-12 15 13 16 21.6 18.7 16.5 14.2 104 100 1.6 12.3 2.0 0.1 2.7 16 WuXi PharmaTech WX US O USD 36.50 21.60 (41) 2,569 3.2 (4) (4) 1 (5) 128 (5) (5) 3 (1) 136 Dec-12 10 14 17 26.0 23.5 20.7 17.6 87 93 0.0 18.3 3.9 4.1 16.7 (17) Sector* (15) 36,249 0 1 5 4 61 (1) 1 7 8 68 Dec-12 15 19 19 27.4 23.9 20.1 16.8 100 101 1.1 13.0 3.0 0.8 11.0 (14)
Hotels, Restaurants & Leisure Kevin Yin / Vivian Zhao - 852 2101 7655 / 852 2101 7472
Ajisen China 538 HK O HKD 9.09 11.30 24 1,277 2.5 3 (1) 16 13 51 2 (1) 17 17 58 Dec-12 83 22 18 63.5 34.6 28.3 24.0 102 100 0.9 9.2 3.1 2.5 16.4 (58) China Lodging HTHT US O USD 27.90 31.00 11 1,728 1.1 (7) (2) 6 (8) 50 (8) (2) 8 (5) 57 Dec-12 48 33 21 59.6 40.2 30.2 24.9 97 91 0.0 10.0 3.8 2.4 12.8 (11) Home Inns HMIN US O USD 37.01 48.00 30 1,706 3.1 (8) (6) (9) (15) 19 (9) (7) (8) (12) 26 Dec-12 42 38 26 33.8 23.9 17.3 13.8 118 113 0.0 10.5 2.4 1.9 9.7 31 Sector* 21 4,711 (5) (3) 3 (5) 39 (6) (4) 5 (1) 46 Dec-12 51 33 23 46.9 31.0 23.4 19.0 107 103 0.3 10.0 2.9 2.2 11.7 (4)
Insurance Arjan van Veen / Frances Feng - 852 2101 7508 / 852 2101 6693
China Life (A) 601628 CH O CNY 14.30 21.00 47 71,184 91.9 1 0 (1) (5) (30) (0) (0) (0) (2) (23) Dec-12 187 48 21 36.5 12.8 8.6 7.2 111 132 2.7 13.6 1.6 na na na China Life (H) 2628 HK N HKD 22.90 27.00 18 71,184 91.9 2 2 (2) (6) (14) 1 2 (1) (2) (7) Dec-12 187 48 21 45.6 15.9 10.8 8.9 110 132 2.2 13.6 2.1 na na na China Pacific (A) 601601 CH O CNY 17.15 31.50 84 27,927 32.4 1 (0) (2) (7) (20) (0) (1) (0) (4) (13) Dec-12 85 43 21 29.8 16.1 11.3 9.3 100 116 2.2 9.7 1.5 na na na China Pacific (H) 2601 HK O HKD 28.25 40.00 42 27,927 32.4 2 0 (4) (7) (11) 1 (0) (2) (4) (4) Dec-12 85 43 21 38.2 20.7 14.5 12.0 95 113 1.7 9.7 1.9 na na na China Taiping 966 HK R HKD 14.46 3,180 6.3 0 2 (8) (9) (14) (1) 2 (7) (5) (6) Dec-12 33 61 16 26.3 19.7 12.2 10.6 105 117 0.0 11.5 2.8 na na na NCI (A) 601336 CH N CNY 21.52 25.00 16 10,657 19.9 1 (2) (3) (6) (22) (0) (2) (2) (2) (15) Dec-12 42 40 29 22.9 16.1 11.5 8.9 92 105 1.9 11.2 1.7 na na na NCI (H) 1336 HK N HKD 24.30 32.00 32 10,657 19.9 2 (1) (7) (7) (25) 1 (2) (5) (3) (18) Dec-12 42 40 29 20.1 14.2 10.1 7.9 91 102 2.1 11.2 1.5 na na na PICC Group 1339 HK N HKD 3.54 4.25 20 19,361 18.5 0 (1) (5) (6) (25) (1) (2) (4) (2) (17) Dec-12 76 (4) 27 15.5 8.8 9.2 7.2 131 109 2.3 18.9 1.6 na na na PICC P&C 2328 HK N HKD 10.54 14.00 33 18,485 27.2 2 1 (6) (8) (3) 2 0 (4) (5) 4 Dec-12 10 (7) 14 9.7 8.8 9.5 8.3 107 93 3.0 23.4 1.9 na na na Ping An (A) 601318 CH O CNY 41.35 69.00 67 59,926 118.2 2 3 6 (1) (10) 1 3 8 3 (3) Dec-12 56 4 8 16.3 10.5 10.1 9.3 108 96 2.1 18.3 1.8 na na na Ping An (H) 2318 HK O HKD 67.45 88.00 30 59,926 118.2 1 (0) 1 (3) (3) (0) (1) 2 1 4 Dec-12 56 4 8 20.8 13.4 12.9 11.9 107 95 1.7 18.3 2.3 na na na Sector* 27 210,721 1 1 (3) (5) (11) 1 0 (1) (2) (4) Dec-12 73 20 18 23.5 13.6 11.4 9.6 109 110 2.0 15.3 2.0 na na na

23 J
an
uary
201
4
Ju
mp
-Sta
rt 4
5
China—valuation summary (continued) Bberg Price Market Avg Absolute performance Relative performance FYE EPS growth P/E CS / Divd ROE P/B EV/ EV/ Net debt/ daily con. EPS yld sales EBITDA equity
Stock ticker View Local Target Upside cap t/o (%) (%) Actual (%) (x) (%) (%) (%) (x) (x) (x) (%)
21 January 2014 (%) (USDm) 1d 1w 1m 12m YTD 1d 1w 1m 12m YTD T T+1 T+2 T+3 T T+1 T+2 T+3 T+1 T+2 T+1
Metals & Mining Trina Chen / Frankie Zhu / Owen Liang - 852 2101 7031 / 852 2101 7426 / 852 2101 6093
Angang Steel 347 HK N HKD 5.03 5.20 3 704 10.3 1 2 (8) (13) (18) 0 2 (7) (9) (11) Dec-12 nm 81 35 nm 28.2 15.6 11.5 114 159 0.0 2.1 0.6 0.4 4.2 48 Baosteel 600019 CH O CNY 3.74 5.70 52 10,584 18.1 0 (4) (7) (9) (25) (1) (5) (6) (5) (18) Dec-12 (30) 20 11 6.3 9.0 7.5 6.7 119 113 4.5 6.2 0.5 0.5 4.7 21
Baotou Rare Earth 600111 CH U CNY 20.93 20.00 (4) 8,379 167.9 1 (3) (4) (6) (41) (0) (4) (2) (2) (34) Dec-12 5 (36) 16 33.6 32.1 49.8 42.9 103 59 0.9 21.8 6.5 6.3 21.5 0 CGG 2099 HK U HKD 21.80 13.60 (38) 1,114 0.4 1 5 10 10 (25) 1 4 11 14 (18) Dec-12 (17) (34) 254 15.7 19.0 28.7 8.1 102 74 0.0 4.1 0.7 4.2 11.8 13 CMOC 3993 HK O HKD 3.42 4.40 29 2,238 1.8 (0) 0 4 (1) (18) (1) (0) 5 2 (11) Dec-12 9 29 13 12.9 11.8 9.1 8.1 109 120 2.5 9.9 1.2 3.4 15.2 42
Chalco 2600 HK O HKD 2.84 3.30 16 4,952 4.9 2 5 6 5 (28) 1 4 7 9 (21) Dec-12 nm nm nm nm nm nm nm 71 37 0.0 (8.7) 0.7 1.1 24.2 231 China Coal 1898 HK N HKD 4.13 4.30 4 7,059 31.3 (0) (2) (7) (5) (53) (1) (3) (5) (2) (45) Dec-12 (48) (52) (50) 4.8 9.2 19.1 38.4 89 49 2.7 5.3 0.5 1.3 7.6 42 China Shenhua 1088 HK N HKD 21.70 22.30 3 9,507 56.5 0 (3) (8) (11) (35) (1) (4) (7) (8) (27) Dec-12 (13) (32) 9 6.9 7.9 11.6 10.6 98 68 4.4 15.9 1.2 0.3 1.0 7
Fushan 639 HK N HKD 2.42 2.70 12 1,654 4.1 (2) (0) (9) (11) (27) (3) (1) (8) (7) (20) Dec-12 (38) 12 9 7.3 11.6 10.3 9.5 96 113 3.9 5.7 0.7 1.6 3.0 (25) G-Resources 1051 HK N HKD 0.19 0.21 11 645 1.8 1 (1) 2 1 (50) (0) (1) 3 5 (43) Jun-13 121 (11) na 17.4 7.9 8.9 na 154 55 0.0 7.4 0.5 0.5 1.2 (33) HNC 2626 HK N HKD 2.38 2.32 (3) 1,125 1.0 0 1 10 (2) (10) (1) 1 11 1 (3) Dec-12 nm nm nm nm nm nm nm 100 98 0.0 (9.0) 1.7 0.7 14.5 238
Hidili 1393 HK N HKD 1.08 1.30 20 285 0.9 1 (1) (10) (8) (58) 0 (1) (9) (5) (51) Dec-12 nm nm 247 nm nm 21.3 6.1 63 nm 0.0 (2.8) 0.2 6.9 604.9 65 Jiangxi Copper 358 HK N HKD 13.84 15.90 15 6,178 20.1 0 0 1 (1) (36) (0) (0) 2 2 (29) Dec-12 (39) 2 13 7.2 11.9 11.7 10.3 102 97 2.5 7.2 0.8 0.2 5.8 (7) Lingbao 3330 HK U HKD 1.39 0.90 (35) 138 0.2 1 (1) (10) 3 (58) (0) (1) (8) 7 (51) Dec-12 (335) nm nm 5.1 nm nm nm 103 42 0.0 (17.7) 0.4 0.7 203.9 209
Maanshan 323 HK U HKD 1.90 1.70 (11) 1,886 3.5 (1) 0 (7) (10) (27) (1) (0) (5) (6) (20) Dec-12 nm nm 115 nm nm 13.5 6.3 8 203 0.0 (1.2) 0.5 0.4 5.9 74 Shanjin 600547 CH N CNY 15.48 20.00 29 3,641 46.2 0 (5) (11) (10) (60) (1) (5) (10) (7) (53) Dec-12 (44) (54) 59 10.1 18.0 39.3 24.7 83 42 0.8 15.1 2.6 0.6 8.1 52 Winsway 1733 HK N HKD 0.45 0.50 11 219 0.6 1 (1) (1) (8) (67) 0 (2) 0 (5) (60) Dec-12 nm nm nm nm nm nm nm 90 nm 0.0 (7.8) 0.3 0.4 33.0 63
Yanzhou Coal 1171 HK U HKD 6.31 4.60 (27) 4,001 25.4 1 (0) (13) (11) (54) (0) (1) (11) (7) (47) Dec-12 (93) (82) (116) 3.9 52.1 292.9 nm 49 4 3.2 1.0 0.5 1.3 12.4 75 Yitai Coal 3948 HK N HKD 11.28 10.50 (7) 474 0.2 0 (2) (17) (15) (48) (1) (3) (16) (11) (41) Dec-12 (37) (27) 3 4.2 6.6 9.1 8.9 95 68 4.5 20.7 1.3 0.8 2.2 62 Zhaojin 1818 HK U HKD 4.63 4.60 (1) 1,770 8.6 (1) 2 7 5 (62) (1) 1 8 8 (54) Dec-12 (59) (17) 7 5.6 13.7 16.5 15.4 76 80 2.9 9.3 1.3 3.0 9.9 82
Zhongjin 600489 CH N CNY 7.67 8.40 10 3,731 28.1 0 (3) (7) (10) (54) (0) (4) (6) (7) (47) Dec-12 (41) (57) 41 14.5 24.6 57.0 40.3 81 37 2.1 8.9 2.2 0.8 8.3 36 Zijin Mining 2899 HK N HKD 1.70 1.40 (18) 4,780 9.5 0 (1) 4 2 (46) (1) (1) 5 6 (39) Dec-12 (56) (9) 31 5.5 12.5 13.7 10.5 92 95 3.2 8.2 1.0 1.1 6.6 33 Sector* 13 75,066 0 (2) (5) (7) (38) (1) (3) (4) (3) (31) Dec-12 (30) (13) 22 10.2 14.5 16.6 13.8 98 75 2.7 8.3 0.9 0.7 4.8 37
Paper & Forest Products Kenny Lau - 852 2101 7914
Sateri 1768 HK N HKD 1.58 1.85 17 697 0.1 3 1 (8) (4) (22) 2 0 (7) (0) (15) Dec-12 (11) 106 14 12.5 14.0 6.8 6.0 97 91 1.7 2.9 0.4 2.0 6.7 31
Real Estate Jinsong Du / Duo Chen - 852 2101 6589 / 852 2101 7350
Agile Property 3383 HK N HKD 7.37 9.50 29 3,275 7.4 0 (6) (12) (11) (34) (1) (6) (11) (8) (26) Dec-12 (2) 11 3 4.3 4.4 4.0 3.9 96 95 5.5 18.6 0.8 1.2 4.1 65 CMPD 000024 CH O CNY 17.41 32.92 89 3,965 54.5 1 (0) (13) (16) (42) 0 (1) (12) (13) (35) Dec-12 26 26 27 9.0 7.1 5.6 4.5 94 94 1.4 16.4 1.1 0.7 2.7 (8) COGO 81 HK O HKD 6.67 12.30 84 1,962 3.5 1 (9) (10) (10) (36) 0 (10) (11) (9) (34) Dec-12 43 28 25 7.9 5.5 4.3 3.4 104 109 1.8 32.4 1.6 1.0 3.2 13
CR Land 1109 HK O HKD 19.18 26.50 38 14,417 20.9 1 (3) (0) (0) (17) 1 (4) 1 3 (10) Dec-12 31 28 23 15.4 11.8 9.2 7.4 100 104 2.5 13.0 1.5 2.0 7.9 43 China Overseas Land 688 HK N HKD 21.50 23.50 9 22,652 54.5 (0) (2) (3) (1) (13) (1) (2) (2) 2 (6) Dec-12 41 5 3 11.1 7.9 7.5 7.3 111 99 0.0 23.0 1.7 2.0 4.9 14 China Vanke (A) 000002 CH O CNY 7.22 14.30 98 11,552 122.5 1 (0) (8) (10) (35) 0 (1) (7) (7) (28) Dec-12 16 9 3 6.3 5.4 5.0 4.8 95 85 2.8 20.9 1.0 0.8 3.7 22
China Vanke (B) 200002 CH O HKD 12.09 17.80 47 2,049 3.0 2 2 1 (0) (12) 1 1 3 3 (5) Dec-12 27 9 8 8.3 6.5 6.0 5.5 103 92 0.0 22.6 1.3 0.3 1.1 22 Country Garden 2007 HK O HKD 4.30 5.70 33 10,232 14.9 (1) (8) (12) (8) 5 (2) (8) (11) (5) 12 Dec-12 30 21 12 9.0 6.9 5.7 5.1 108 104 5.4 21.6 1.4 1.6 5.8 54 E-House China EJ US O USD 14.14 16.60 17 1,696 2.6 3 (2) 3 (6) 195 2 (2) 5 (3) 202 Dec-12 nm 44 38 nm 23.1 16.1 11.7 104 104 1.3 11.2 2.6 2.3 18.3 (9)
Evergrande 3333 HK N HKD 2.80 4.10 46 5,792 15.3 2 (1) (5) (5) (36) 1 (2) (3) (2) (29) Dec-12 45 6 12 5.3 3.7 3.5 3.1 105 98 5.4 21.6 0.7 0.8 3.9 62 Financial Street 000402 CH N CNY 4.81 6.61 37 2,407 16.0 1 (1) (4) (8) (31) (0) (2) (3) (4) (24) Dec-12 18 14 13 6.4 5.4 4.8 4.2 106 105 6.5 12.8 0.7 1.4 9.7 49 Franshion PPT 817 HK O HKD 2.49 3.80 53 2,941 1.8 1 (8) (7) (8) (14) (0) (8) (6) (4) (7) Dec-12 79 23 13 12.5 7.0 5.7 5.0 111 111 2.4 14.9 1.0 1.6 4.0 36
Gemdale 600383 CH O CNY 5.91 8.94 51 4,368 50.5 (0) 2 (4) (12) (14) (1) 1 (2) (8) (7) Dec-12 15 19 14 7.8 6.8 5.7 5.0 104 104 2.5 16.0 1.1 0.7 4.4 8 Glorious 845 HK U HKD 1.24 1.00 (19) 1,246 1.8 (1) (28) (24) (26) (29) (2) (28) (23) (22) (22) Dec-12 9 68 26 10.7 9.8 5.8 4.6 87 122 0.0 4.1 0.4 2.3 15.0 72 Greentown China 3900 HK O HKD 10.98 16.00 46 3,055 5.5 0 (5) (8) (7) (31) (1) (6) (7) (4) (24) Dec-12 14 15 11 4.0 3.5 3.1 2.7 97 98 6.2 23.6 0.8 0.9 3.7 51
Guangzhou R&F 2777 HK N HKD 10.64 13.70 29 4,420 8.3 3 (4) (7) (6) (28) 2 (5) (6) (3) (21) Dec-12 2 6 7 5.3 5.2 4.9 4.6 93 86 6.7 18.2 0.9 1.5 4.4 81 Hopefluent 733 HK O HKD 3.02 3.90 29 197 0.2 (1) (3) 1 0 8 (2) (3) 2 4 15 Dec-12 25 12 8 7.5 6.0 5.4 5.0 100 100 5.0 17.1 1.0 0.5 2.9 (37) KWG Property 1813 HK N HKD 4.04 5.80 44 1,507 3.5 (2) (7) (4) (6) (32) (3) (8) (2) (3) (25) Dec-12 21 16 11 4.7 3.9 3.3 3.0 101 97 6.5 14.5 0.5 1.6 5.9 56
Kaisa 1638 HK O HKD 2.31 3.20 39 1,468 3.5 2 (1) 6 (8) (13) 1 (2) 7 (4) (6) Dec-12 55 25 13 6.0 3.9 3.1 2.7 103 96 0.0 16.4 0.6 1.2 4.8 75 Poly (HK) 119 HK O HKD 3.87 5.70 47 1,818 6.3 1 (5) (6) (7) (38) (0) (5) (5) (3) (31) Dec-12 13 11 8 6.1 5.4 4.8 4.5 94 92 3.7 9.3 0.5 1.7 7.8 84 Poly Real Estate 600048 CH O CNY 7.54 15.40 104 8,896 85.3 1 (1) (7) (9) (46) 1 (1) (5) (5) (39) Dec-12 29 30 29 6.4 4.9 3.8 2.9 101 103 3.3 23.2 1.0 0.9 4.6 47
RiseSun 002146 CH O CNY 8.82 16.76 90 2,729 25.0 5 1 (12) (12) (42) 4 0 (10) (8) (35) Dec-12 31 31 28 7.7 5.9 4.5 3.5 100 100 2.4 31.5 1.7 1.2 5.2 40 SOHO 410 HK O HKD 6.25 8.30 33 4,262 4.8 0 (1) (6) (6) (6) (0) (2) (7) (5) (3) Dec-12 54 (59) (25) 8.2 5.3 13.0 17.2 128 94 4.7 15.4 0.8 1.8 3.3 18 Shanghai Shimao 600823 CH O CNY 8.57 14.22 66 1,658 15.2 3 2 (2) (5) (27) 2 2 (1) (1) (20) Dec-12 21 21 19 7.3 6.1 5.0 4.2 105 106 0.0 12.3 0.7 1.5 5.3 13
Shimao Property 813 HK O HKD 17.48 22.50 29 7,825 16.5 (0) (2) (0) (2) 3 (1) (2) 1 2 10 Dec-12 58 23 22 10.8 6.8 5.5 4.5 106 103 4.4 18.2 1.2 1.7 6.0 60 Sino-Ocean Land 3377 HK O HKD 4.70 5.60 19 4,412 4.2 (3) (2) (6) (8) (24) (4) (2) (5) (4) (17) Dec-12 23 34 11 11.6 9.4 7.0 6.3 88 100 3.3 8.9 0.8 1.4 6.9 40 Sunac 1918 HK O HKD 4.66 6.80 46 1,999 9.6 (1) (6) 1 0 (35) (1) (7) 0 1 (33) Dec-12 29 37 20 4.0 3.1 2.3 1.9 113 116 2.9 31.9 0.8 0.8 3.3 70
Sector* 46 132,800 1 (3) (5) (6) (19) (0) (3) (4) (2) (11) Dec-12 29 15 14 7.9 6.2 5.4 4.7 103 99 3.0 18.5 1.0 1.1 4.4 39
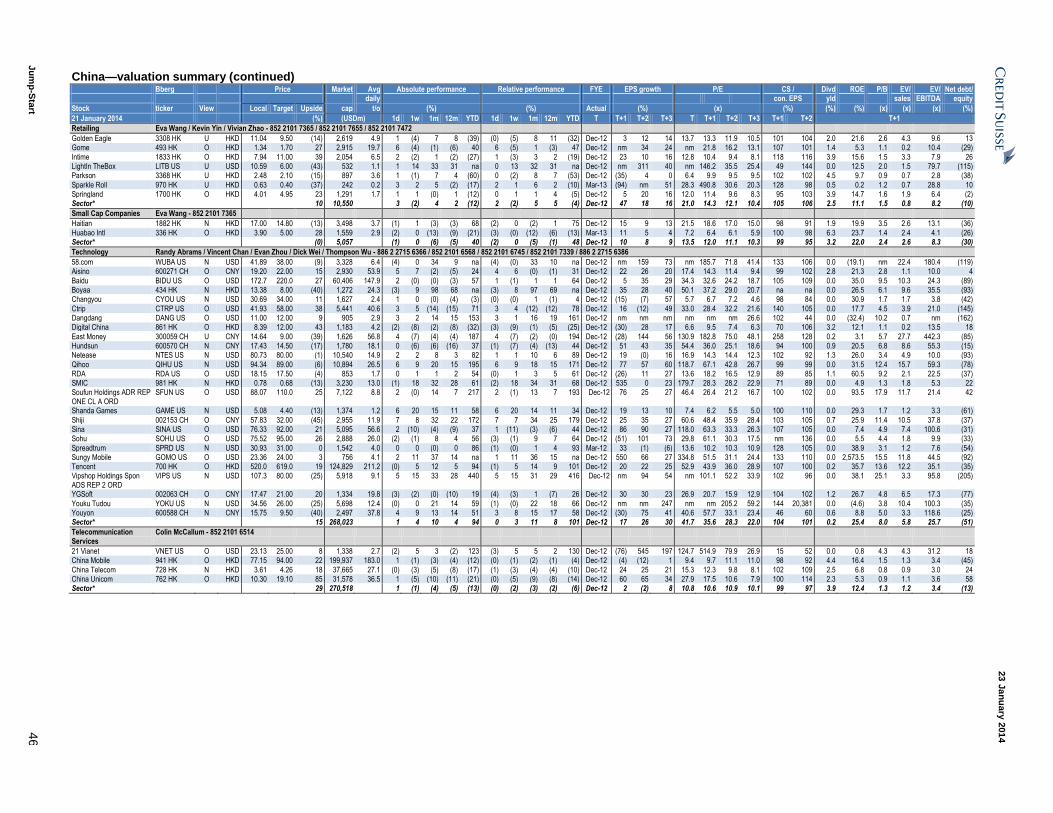
23 J
an
uary
201
4
Ju
mp
-Sta
rt 4
6
China—valuation summary (continued) Bberg Price Market Avg Absolute performance Relative performance FYE EPS growth P/E CS / Divd ROE P/B EV/ EV/ Net debt/ daily con. EPS yld sales EBITDA equity
Stock ticker View Local Target Upside cap t/o (%) (%) Actual (%) (x) (%) (%) (%) (x) (x) (x) (%)
21 January 2014 (%) (USDm) 1d 1w 1m 12m YTD 1d 1w 1m 12m YTD T T+1 T+2 T+3 T T+1 T+2 T+3 T+1 T+2 T+1
Retailing Eva Wang / Kevin Yin / Vivian Zhao - 852 2101 7365 / 852 2101 7655 / 852 2101 7472
Golden Eagle 3308 HK U HKD 11.04 9.50 (14) 2,619 4.9 1 (4) 7 8 (39) (0) (5) 8 11 (32) Dec-12 3 12 14 13.7 13.3 11.9 10.5 101 104 2.0 21.6 2.6 4.3 9.6 13 Gome 493 HK O HKD 1.34 1.70 27 2,915 19.7 6 (4) (1) (6) 40 6 (5) 1 (3) 47 Dec-12 nm 34 24 nm 21.8 16.2 13.1 107 101 1.4 5.3 1.1 0.2 10.4 (29)
Intime 1833 HK O HKD 7.94 11.00 39 2,054 6.5 2 (2) 1 (2) (27) 1 (3) 3 2 (19) Dec-12 23 10 16 12.8 10.4 9.4 8.1 118 116 3.9 15.6 1.5 3.3 7.9 26 LightIn TheBox LITB US U USD 10.59 6.00 (43) 532 1.1 1 14 33 31 na 0 13 32 31 na Dec-12 nm 311 40 nm 146.2 35.5 25.4 49 144 0.0 12.5 2.0 1.5 79.7 (115) Parkson 3368 HK U HKD 2.48 2.10 (15) 897 3.6 1 (1) 7 4 (60) 0 (2) 8 7 (53) Dec-12 (35) 4 0 6.4 9.9 9.5 9.5 102 102 4.5 9.7 0.9 0.7 2.8 (38)
Sparkle Roll 970 HK U HKD 0.63 0.40 (37) 242 0.2 3 2 5 (2) (17) 2 1 6 2 (10) Mar-13 (94) nm 51 28.3 490.8 30.6 20.3 128 98 0.5 0.2 1.2 0.7 28.8 10 Springland 1700 HK O HKD 4.01 4.95 23 1,291 1.7 1 1 (0) 1 (12) 0 1 1 4 (5) Dec-12 5 20 16 12.0 11.4 9.6 8.3 95 103 3.9 14.7 1.6 1.9 6.4 (2) Sector* 10 10,550 3 (2) 4 2 (12) 2 (2) 5 5 (4) Dec-12 47 18 16 21.0 14.3 12.1 10.4 105 106 2.5 11.1 1.5 0.8 8.2 (10)
Small Cap Companies Eva Wang - 852 2101 7365
Haitian 1882 HK N HKD 17.00 14.80 (13) 3,498 3.7 (1) 1 (3) (3) 68 (2) 0 (2) 1 75 Dec-12 15 9 13 21.5 18.6 17.0 15.0 98 91 1.9 19.9 3.5 2.6 13.1 (36)
Huabao Intl 336 HK O HKD 3.90 5.00 28 1,559 2.9 (2) 0 (13) (9) (21) (3) (0) (12) (6) (13) Mar-13 11 5 4 7.2 6.4 6.1 5.9 100 98 6.3 23.7 1.4 2.4 4.1 (26) Sector* (0) 5,057 (1) 0 (6) (5) 40 (2) 0 (5) (1) 48 Dec-12 10 8 9 13.5 12.0 11.1 10.3 99 95 3.2 22.0 2.4 2.6 8.3 (30)
Technology Randy Abrams / Vincent Chan / Evan Zhou / Dick Wei / Thompson Wu - 886 2 2715 6366 / 852 2101 6568 / 852 2101 6745 / 852 2101 7339 / 886 2 2715 6386
58.com WUBA US N USD 41.89 38.00 (9) 3,328 6.4 (4) 0 34 9 na (4) (0) 33 10 na Dec-12 nm 159 73 nm 185.7 71.8 41.4 133 106 0.0 (19.1) nm 22.4 180.4 (119) Aisino 600271 CH O CNY 19.20 22.00 15 2,930 53.9 5 7 (2) (5) 24 4 6 (0) (1) 31 Dec-12 22 26 20 17.4 14.3 11.4 9.4 99 102 2.8 21.3 2.8 1.1 10.0 4
Baidu BIDU US O USD 172.7 220.0 27 60,406 147.9 2 (0) (0) (3) 57 1 (1) 1 1 64 Dec-12 5 35 29 34.3 32.6 24.2 18.7 105 109 0.0 35.0 9.5 10.3 24.3 (89) Boyaa 434 HK N HKD 13.38 8.00 (40) 1,272 24.3 (3) 9 98 68 na (3) 8 97 69 na Dec-12 35 28 40 50.1 37.2 29.0 20.7 na na 0.0 26.5 6.1 9.6 35.5 (93) Changyou CYOU US N USD 30.69 34.00 11 1,627 2.4 1 0 (0) (4) (3) (0) (0) 1 (1) 4 Dec-12 (15) (7) 57 5.7 6.7 7.2 4.6 98 84 0.0 30.9 1.7 1.7 3.8 (42)
Ctrip CTRP US O USD 41.93 58.00 38 5,441 40.6 3 5 (14) (15) 71 3 4 (12) (12) 78 Dec-12 16 (12) 49 33.0 28.4 32.2 21.6 140 105 0.0 17.7 4.5 3.9 21.0 (145) Dangdang DANG US O USD 11.00 12.00 9 905 2.9 3 2 14 15 153 3 1 16 19 161 Dec-12 nm nm nm nm nm nm 26.6 102 44 0.0 (32.4) 10.2 0.7 nm (162) Digital China 861 HK O HKD 8.39 12.00 43 1,183 4.2 (2) (8) (2) (8) (32) (3) (9) (1) (5) (25) Dec-12 (30) 28 17 6.6 9.5 7.4 6.3 70 106 3.2 12.1 1.1 0.2 13.5 18
East Money 300059 CH U CNY 14.64 9.00 (39) 1,626 56.8 4 (7) (4) (4) 187 4 (7) (2) (0) 194 Dec-12 (28) 144 56 130.9 182.8 75.0 48.1 258 128 0.2 3.1 5.7 27.7 442.3 (85) Hundsun 600570 CH N CNY 17.43 14.50 (17) 1,780 18.1 0 (6) (6) (16) 37 (1) (7) (4) (13) 44 Dec-12 51 43 35 54.4 36.0 25.1 18.6 94 100 0.9 20.5 6.8 8.6 55.3 (15) Netease NTES US N USD 80.73 80.00 (1) 10,540 14.9 2 2 8 3 82 1 1 10 6 89 Dec-12 19 (0) 16 16.9 14.3 14.4 12.3 102 92 1.3 26.0 3.4 4.9 10.0 (93)
Qihoo QIHU US N USD 94.34 89.00 (6) 10,894 26.5 6 9 20 15 195 6 9 18 15 171 Dec-12 77 57 60 118.7 67.1 42.8 26.7 99 99 0.0 31.5 12.4 15.7 59.3 (78) RDA RDA US O USD 18.15 17.50 (4) 853 1.7 0 1 1 2 54 (0) 1 3 5 61 Dec-12 (26) 11 27 13.6 18.2 16.5 12.9 89 85 1.1 60.5 9.2 2.1 22.5 (37) SMIC 981 HK N HKD 0.78 0.68 (13) 3,230 13.0 (1) 18 32 28 61 (2) 18 34 31 68 Dec-12 535 0 23 179.7 28.3 28.2 22.9 71 89 0.0 4.9 1.3 1.8 5.3 22 Soufun Holdings ADR REP ONE CL A ORD
SFUN US O USD 88.07 110.0 25 7,122 8.8 2 (0) 14 7 217 2 (1) 13 7 193 Dec-12 76 25 27 46.4 26.4 21.2 16.7 100 102 0.0 93.5 17.9 11.7 21.4 42
Shanda Games GAME US N USD 5.08 4.40 (13) 1,374 1.2 6 20 15 11 58 6 20 14 11 34 Dec-12 19 13 10 7.4 6.2 5.5 5.0 100 110 0.0 29.3 1.7 1.2 3.3 (61)
Shiji 002153 CH O CNY 57.83 32.00 (45) 2,955 11.9 7 8 32 22 172 7 7 34 25 179 Dec-12 25 35 27 60.6 48.4 35.9 28.4 103 105 0.7 25.9 11.4 10.5 37.8 (37) Sina SINA US O USD 76.33 92.00 21 5,095 56.6 2 (10) (4) (9) 37 1 (11) (3) (6) 44 Dec-12 86 90 27 118.0 63.3 33.3 26.3 107 105 0.0 7.4 4.9 7.4 100.6 (31) Sohu SOHU US O USD 75.52 95.00 26 2,888 26.0 (2) (1) 8 4 56 (3) (1) 9 7 64 Dec-12 (51) 101 73 29.8 61.1 30.3 17.5 nm 136 0.0 5.5 4.4 1.8 9.9 (33)
Spreadtrum SPRD US N USD 30.93 31.00 0 1,542 4.0 0 0 (0) 0 86 (1) (0) 1 4 93 Mar-12 33 (1) (6) 13.6 10.2 10.3 10.9 128 105 0.0 38.9 3.1 1.2 7.6 (54) Sungy Mobile GOMO US O USD 23.36 24.00 3 756 4.1 2 11 37 14 na 1 11 36 15 na Dec-12 550 66 27 334.8 51.5 31.1 24.4 133 110 0.0 2,573.5 15.5 11.8 44.5 (92) Tencent 700 HK O HKD 520.0 619.0 19 124,829 211.2 (0) 5 12 5 94 (1) 5 14 9 101 Dec-12 20 22 25 52.9 43.9 36.0 28.9 107 100 0.2 35.7 13.6 12.2 35.1 (35) Vipshop Holdings Spon ADS REP 2 ORD
VIPS US N USD 107.3 80.00 (25) 5,918 9.1 5 15 33 28 440 5 15 31 29 416 Dec-12 nm 94 54 nm 101.1 52.2 33.9 102 96 0.0 38.1 25.1 3.3 95.8 (205)
YGSoft 002063 CH O CNY 17.47 21.00 20 1,334 19.8 (3) (2) (0) (10) 19 (4) (3) 1 (7) 26 Dec-12 30 30 23 26.9 20.7 15.9 12.9 104 102 1.2 26.7 4.8 6.5 17.3 (77)
Youku Tudou YOKU US N USD 34.56 26.00 (25) 5,698 12.4 (0) 0 21 14 59 (1) (0) 22 18 66 Dec-12 nm nm 247 nm nm 205.2 59.2 144 20,381 0.0 (4.6) 3.8 10.4 100.3 (35) Youyon 600588 CH N CNY 15.75 9.50 (40) 2,497 37.8 4 9 13 14 51 3 8 15 17 58 Dec-12 (30) 75 41 40.6 57.7 33.1 23.4 46 60 0.6 8.8 5.0 3.3 118.6 (25) Sector* 15 268,023 1 4 10 4 94 0 3 11 8 101 Dec-12 17 26 30 41.7 35.6 28.3 22.0 104 101 0.2 25.4 8.0 5.8 25.7 (51)
Telecommunication Services
Colin McCallum - 852 2101 6514
21 Vianet VNET US O USD 23.13 25.00 8 1,338 2.7 (2) 5 3 (2) 123 (3) 5 5 2 130 Dec-12 (76) 545 197 124.7 514.9 79.9 26.9 15 52 0.0 0.8 4.3 4.3 31.2 18 China Mobile 941 HK O HKD 77.15 94.00 22 199,937 183.0 1 (1) (3) (4) (12) (0) (1) (2) (1) (4) Dec-12 (4) (12) 1 9.4 9.7 11.1 11.0 98 92 4.4 16.4 1.5 1.3 3.4 (45)
China Telecom 728 HK N HKD 3.61 4.26 18 37,665 27.1 (0) (3) (5) (8) (17) (1) (3) (4) (4) (10) Dec-12 24 25 21 15.3 12.3 9.8 8.1 102 109 2.5 6.8 0.8 0.9 3.0 24 China Unicom 762 HK O HKD 10.30 19.10 85 31,578 36.5 1 (5) (10) (11) (21) (0) (5) (9) (8) (14) Dec-12 60 65 34 27.9 17.5 10.6 7.9 100 114 2.3 5.3 0.9 1.1 3.6 58 Sector* 29 270,518 1 (1) (4) (5) (13) (0) (2) (3) (2) (6) Dec-12 2 (2) 8 10.8 10.6 10.9 10.1 99 97 3.9 12.4 1.3 1.2 3.4 (13)

23 J
an
uary
201
4
Ju
mp
-Sta
rt 4
7
China—valuation summary (continued) Bberg Price Market Avg Absolute performance Relative performance FYE EPS growth P/E CS / Divd ROE P/B EV/ EV/ Net debt/ daily con. EPS yld sales EBITDA equity
Stock ticker View Local Target Upside cap t/o (%) (%) Actual (%) (x) (%) (%) (%) (x) (x) (x) (%)
21 January 2014 (%) (USDm) 1d 1w 1m 12m YTD 1d 1w 1m 12m YTD T T+1 T+2 T+3 T T+1 T+2 T+3 T+1 T+2 T+1
Transportation Vincent Chan / Davin Wu - 852 2101 6568 / 852 2101 6917
Air China 753 HK O HKD 5.15 7.00 36 8,206 8.5 0 (2) (6) (11) (30) (0) (2) (5) (8) (23) Dec-12 (7) 10 17 9.2 9.9 9.0 7.7 127 116 1.7 9.5 1.0 1.4 7.9 177 CEA 670 HK U HKD 2.72 2.30 (15) 5,031 3.6 0 (2) (4) (7) (27) (1) (2) (2) (3) (20) Dec-12 (20) 18 40 7.9 9.8 8.3 6.0 112 102 0.0 10.4 0.9 1.1 8.0 228
CMH 144 HK O HKD 27.45 30.00 9 8,941 15.6 0 3 (1) (3) 5 (1) 3 1 1 12 Dec-12 66 8 5 26.9 16.2 15.1 14.3 103 98 2.5 9.0 1.4 11.5 19.4 44 CSA 1055 HK O HKD 2.85 4.30 51 4,056 6.8 0 (1) (5) (6) (37) (1) (2) (3) (2) (30) Dec-12 18 30 39 8.6 7.3 5.6 4.0 159 158 0.0 9.1 0.6 0.9 7.3 150 CSCL 2866 HK U HKD 1.92 1.20 (38) 3,813 10.9 1 2 (3) (5) (28) (0) 2 (2) (1) (21) Dec-12 nm nm nm nm nm nm nm 47 nm 0.0 (8.9) 0.7 1.0 nm 39
China COSCO 1919 HK U HKD 3.49 3.00 (14) 5,035 6.1 2 3 (6) (8) (24) 1 2 (5) (4) (17) Dec-12 nm nm 345 nm nm 35.8 8.1 68 nm 3.2 (10.3) 1.0 1.1 24.4 101 China Shipping Dev 1138 HK N HKD 5.09 5.40 6 2,304 11.0 (1) (0) (11) (15) 4 (1) (1) (10) (12) 11 Dec-12 nm nm 245 nm nm 85.3 24.7 107 35 0.0 (4.5) 0.6 4.2 38.5 140 Cosco Pacific 1199 HK N HKD 10.20 11.50 13 3,830 7.4 0 (1) (3) (4) (19) (1) (1) (1) (1) (12) Dec-12 (11) (2) 2 10.4 11.8 11.9 11.8 60 90 7.8 7.3 0.8 7.6 14.3 51
Daqin 601006 CH O CNY 7.10 12.00 69 17,446 36.0 1 1 (4) (4) 0 (0) 1 (1) 1 14 Dec-12 8 6 6 9.2 8.5 8.0 7.6 97 94 5.5 16.9 1.4 2.1 4.7 (3) SIPG 600018 CH U CNY 4.81 4.50 (6) 18,090 116.2 1 (3) (12) (9) 74 0 (4) (11) (5) 81 Dec-12 10 5 0 22.3 20.3 19.3 19.2 103 96 2.7 11.0 2.2 3.9 12.9 20 Sinotrans 368 HK O HKD 2.59 3.30 27 1,333 1.1 0 (0) (5) (8) 21 (1) (1) (3) (5) 28 Dec-12 71 148 (4) 49.8 29.1 11.7 12.2 143 178 1.1 2.1 0.6 1.7 6.4 (42)
Sector* 20 78,085 1 (0) (6) (7) 8 (0) (1) (5) (3) 15 Dec-12 28 37 23 21.7 16.9 12.4 10.0 96 104 2.9 7.2 1.1 1.7 9.7 81
Utilities Vincent Chan / Edwin Pang / Dave Dai / Kelly Chen - 852 2101 6568 / 852 2101 6406 / 852 2101 7358 / 852 2101 7079
Beijing Enterprise 392 HK O HKD 68.30 78.00 14 11,184 9.8 (2) (2) (7) (11) 31 (3) (2) (6) (8) 38 Dec-12 18 18 25 24.4 20.6 17.5 14.0 103 96 1.5 8.9 1.7 2.4 30.0 24 CEI 257 HK O HKD 10.76 12.10 12 6,220 18.0 (1) 0 18 4 143 (2) (1) 17 5 145 Dec-12 8 24 43 36.3 33.7 27.2 19.0 101 104 0.6 12.2 3.4 8.5 22.2 7 CR Gas 1193 HK O HKD 25.35 27.00 7 7,268 9.2 0 1 1 (6) 51 (1) 1 2 (3) 58 Dec-12 22 28 20 31.0 25.3 19.8 16.5 102 106 0.6 17.4 4.1 2.4 13.6 19
CR Power 836 HK O HKD 19.26 22.00 14 11,897 17.4 2 (1) 8 5 (3) 1 (1) 9 8 4 Dec-12 38 5 18 12.1 8.7 8.3 7.1 98 104 3.6 17.9 1.5 2.5 7.3 101 China Datang 1798 HK N HKD 1.69 1.50 (11) 545 1.8 (1) 8 12 3 39 (1) 8 13 7 46 Dec-12 310 47 29 85.6 20.9 14.2 11.0 109 99 1.0 5.1 1.0 7.5 8.6 316 China Gas 384 HK U HKD 11.46 8.00 (30) 7,370 9.4 (4) 1 10 1 66 (5) 0 12 4 73 Mar-13 29 3 8 29.1 22.5 21.8 20.2 100 89 1.0 18.2 3.6 2.4 13.6 49
China Longyuan 916 HK O HKD 9.84 12.30 25 10,194 16.6 (2) 3 6 (2) 54 (2) 3 7 2 61 Dec-12 8 36 22 22.1 20.5 15.1 12.4 98 102 1.0 9.8 1.9 6.1 10.4 137 China Power 2380 HK R HKD 2.65 2,188 4.8 1 (3) (1) (4) 4 0 (4) 0 (0) 11 Dec-12 94 (24) (5) 10.4 5.4 7.1 7.4 96 82 7.5 16.2 0.7 3.1 8.1 202 Datang 991 HK N HKD 3.19 3.52 10 7,756 6.0 1 (6) (7) (11) 1 (0) (7) (5) (7) 8 Dec-12 21 (19) 25 8.0 6.6 8.2 6.6 108 86 4.9 11.4 0.7 2.8 8.3 278
ENN Energy 2688 HK U HKD 53.05 40.00 (25) 7,406 16.4 (2) (1) (3) (7) 47 (3) (2) (1) (4) 54 Dec-12 24 17 9 29.8 24.0 20.6 19.0 105 98 1.0 19.6 4.4 2.1 11.6 33 Huaneng 902 HK U HKD 7.33 6.40 (13) 11,620 21.5 1 (1) 7 5 4 1 (2) 8 8 11 Dec-12 105 (18) 6 14.6 7.1 8.7 8.2 98 85 7.0 19.2 1.3 1.7 5.8 206 Kunlun Energy 135 HK N HKD 14.00 15.20 9 14,551 38.0 1 4 2 2 (18) (0) 3 3 6 (11) Dec-12 6 14 11 16.8 15.8 13.9 12.5 97 96 1.6 15.2 2.3 3.0 7.5 20
Shenzhen Gas 601139 CH N CNY 6.97 9.12 31 2,281 9.6 1 (1) (13) (12) (29) (0) (2) (12) (8) (22) Dec-12 33 35 23 26.1 19.6 14.5 11.8 102 112 2.6 11.4 2.1 1.3 12.6 (14) Yangtze Power 600900 CH O CNY 6.05 8.30 37 16,499 19.1 2 1 (3) (4) (18) 1 0 (2) (1) (11) Dec-12 (4) 11 3 9.6 10.0 9.0 8.7 111 109 5.3 12.3 1.2 6.3 7.9 68 Sector* 10 116,980 (0) 0 2 (2) 20 (1) (0) 3 1 28 Dec-12 25 3 14 15.5 12.4 12.0 10.5 102 97 3.0 14.0 1.6 2.8 8.5 120
Country Average* MXCNX 6,214 7,678 24 2,666,703 1 0 (1) (4) (7) Dec-12 12 7 11 9.3 8.3 7.7 7.0 102 100 3.9 16.4 1.3 1.0 5.8 34
* Country/ sector aggregates are for the coverage above
Source: Company data, Thomson Financial IBES, Credit Suisse estimates

23 J
an
uary
201
4
Ju
mp
-Sta
rt 4
8
Hong Kong—valuation summary Bberg Price Market Avg Absolute performance Relative performance FYE EPS growth P/E CS / Divd ROE P/BV EV/ EV/ Net debt/ daily con. EPS yld sales EBITDA equity
Stock ticker View Local Target Upside cap t/o (%) (%) Actual (%) (x) (%) (%) (%) (x) (x) (x) (%)
21 January 2014 (%) (USDm) 1d 1w 1m 12m YTD 1d 1w 1m 12m YTD T T+1 T+2 T+3 T T+1 T+2 T+3 T+1 T+2 T+1
Banks Sanjay Jain - 852 2101 6088
BEA 23 HK U HKD 31.65 26.90 (15) 9,342 8.9 1 1 (2) (4) 1 1 (0) (3) (2) 3 Dec-12 7 8 9 13.7 12.7 11.7 10.8 97 103 3.5 9.3 1.1 na na na BoCHK 2388 HK O HKD 24.85 30.80 24 33,871 28.9 2 2 1 0 (4) 2 1 0 1 (2) Dec-12 16 8 8 13.9 12.0 11.1 10.3 100 100 5.2 14.1 1.7 na na na DSB 2356 HK N HKD 12.36 12.20 (1) 1,994 3.7 0 (4) (9) (9) 29 0 (5) (10) (8) 31 Dec-12 37 (1) 5 11.6 8.5 8.6 8.2 109 105 3.4 10.4 0.9 na na na
DSF 440 HK N HKD 39.70 39.90 1 1,518 2.4 (0) (6) (11) (11) 6 (1) (7) (12) (10) 8 Dec-12 25 5 3 10.6 8.5 8.1 7.8 102 105 3.5 8.2 0.7 na na na HSBC 5 HK O HKD 85.75 99.21 16 209,033 140.6 0 1 5 2 10 (0) (0) 4 3 12 Dec-12 9 17 10 13.0 11.9 10.2 9.3 99 107 5.0 9.7 1.1 na na na Hang Seng Bank 11 HK N HKD 123.6 134.8 9 30,463 16.8 1 1 (1) (2) 3 0 (0) (2) (0) 6 Dec-12 (12) 9 8 12.9 14.6 13.4 12.4 69 104 4.5 16.5 2.3 na na na
STAN 2888 HK U HKD 169.9 159.0 (6) 54,301 18.5 1 3 1 (2) (17) 0 2 0 (1) (14) Dec-12 (5) 5 5 10.2 10.8 10.3 9.8 99 95 3.8 10.9 1.2 na na na Wing Hang Bank 302 HK N HKD 107.4 72.00 (33) 4,256 6.9 (3) (7) (3) (8) 34 (4) (8) (4) (7) 36 Dec-12 10 16 7 21.3 19.3 16.6 15.6 85 98 2.6 8.4 1.6 na na na Sector* 11 344,778 0 1 3 0 4 (0) 0 2 2 6 Dec-12 5 13 9 12.6 12.0 10.6 9.7 96 103 4.7 10.5 1.2 na na na
Capital Goods Kenny Lau - 852 2101 7914
Johnson Electric 179 HK O HKD 7.63 6.45 (15) 3,521 2.7 2 4 4 2 37 1 3 3 3 39 Mar-13 14 11 10 18.4 16.1 14.6 13.3 100 102 1.8 13.2 2.0 1.4 8.6 (32)
Conglomerates Gerald Wong / Cusson Leung / Joyce Kwock - 65 6212 3037 / 852 2101 6621 / 852 2101 7496
First Pacific 142 HK O HKD 8.24 11.58 41 4,576 6.5 1 1 (6) (7) (9) 0 (0) (7) (5) (7) Dec-12 (6) 4 20 11.3 12.0 11.6 9.7 101 95 2.5 10.3 1.2 1.0 2.5 22 Hopewell 54 HK O HKD 27.20 38.04 40 3,059 4.0 1 4 6 4 (17) 0 3 5 5 (15) Jun-12 (4) 8 95 17.5 18.2 16.8 8.6 106 109 4.0 4.1 0.7 6.6 16.1 (10) Hutchison Whampoa 13 HK O HKD 104.3 109.7 5 57,325 73.4 (1) (1) 2 (1) 21 (2) (2) 1 0 24 Dec-12 20 19 7 17.0 14.1 11.9 11.1 105 109 2.1 7.6 1.0 2.1 7.9 32
Jardine Matheson JM SP N USD 56.17 63.00 12 38,228 14.7 2 3 9 7 (10) 1 2 8 9 (8) Dec-12 (0) 2 10 13.9 13.9 13.6 12.4 99 95 2.2 8.1 1.1 1.1 9.9 11 Jardine Strategic JS SP N USD 34.00 37.00 9 38,091 6.8 (0) 3 8 6 (8) (1) 2 7 7 (6) Dec-12 (2) 0 11 13.2 13.5 13.4 12.1 97 91 0.7 7.0 0.9 1.3 10.1 10 MTRC 66 HK N HKD 28.30 29.09 3 21,155 7.9 1 0 (2) (4) (9) 1 (1) (3) (2) (7) Dec-12 (16) 11 31 16.8 19.9 17.9 13.7 94 86 2.9 5.7 1.1 5.0 13.4 20
Shun Tak 242 HK O HKD 5.08 5.94 17 1,963 3.7 0 15 11 11 13 (0) 14 10 13 15 Dec-12 (79) 387 16 5.7 26.9 5.5 4.8 82 159 1.3 2.7 0.7 3.4 17.6 9 Swire 'A' 19 HK N HKD 86.65 87.90 1 16,564 15.7 0 (1) (4) (5) (13) (0) (2) (5) (4) (10) Dec-12 12 25 0 15.6 13.9 11.1 11.1 106 112 3.6 4.4 0.6 4.0 12.2 19 Wharf 4 HK O HKD 58.45 72.48 24 22,832 32.8 0 (1) (3) (1) (11) (0) (2) (3) (0) (9) Dec-12 (21) 18 32 13.1 16.6 14.1 10.6 93 95 2.9 4.3 0.7 7.5 14.3 24 Wheelock and Company Limited
20 HK O HKD 34.70 48.54 40 9,089 4.1 0 (2) (1) (3) (23) (0) (3) (2) (1) (20) Dec-12 (0) 49 30 9.7 9.7 6.5 5.0 82 116 3.5 4.7 0.4 4.0 9.2 27
Sector* 11 212,883 0 1 3 1 (2) (0) (0) 2 2 0 Dec-12 (1) 16 14 14.2 14.4 12.4 10.9 98 101 2.2 6.1 0.9 2.0 9.3 20
Consumer Durables & Apparel
Karim Salamatian / Eva Wang / Isis Wong - 852 2101 7996 / 852 2101 7365 / 852 2101 7109
CTF Jewellery 1929 HK O HKD 12.04 14.50 20 15,521 9.0 2 (0) 8 4 (9) 1 (2) 7 5 (7) Mar-13 29 15 18 21.9 16.9 14.7 12.4 98 100 1.8 19.9 3.1 1.6 11.6 (10) Chow Sang Sang 116 HK O HKD 21.35 25.40 19 1,863 1.6 (0) (1) 0 (3) (0) (1) (2) (1) (2) 2 Dec-12 26 15 25 14.7 11.6 10.1 8.1 102 102 3.0 16.7 1.8 0.6 9.3 24 Luk Fook 590 HK U HKD 27.15 26.60 (2) 2,062 8.1 1 (2) (6) (8) (9) 0 (3) (7) (7) (6) Mar-13 22 2 20 12.6 10.4 10.2 8.5 95 88 3.8 22.0 2.1 0.8 7.3 (21)
Pacific Textiles 1382 HK O HKD 11.26 12.40 10 2,100 1.0 1 (3) (4) (5) 56 0 (4) (5) (4) 58 Mar-13 26 12 14 17.5 13.9 12.4 10.9 98 97 6.4 29.4 4.1 1.9 9.4 (36) Prada 1913 HK O HKD 60.85 86.00 41 20,073 20.3 (1) (7) (15) (12) (17) (2) (8) (16) (11) (15) Jan-13 25 21 20 23.7 18.9 15.6 13.1 113 117 2.1 30.7 5.3 3.8 11.4 (13) Samsonite 1910 HK O HKD 23.25 25.00 8 4,218 10.5 (0) 1 2 (1) 39 (1) (0) 1 (0) 41 Dec-12 37 27 23 28.4 20.8 16.4 13.3 105 112 1.0 17.9 3.5 1.9 11.5 (22)
Texwinca 321 HK N HKD 7.64 8.10 6 1,351 1.1 1 (2) (1) (6) 3 1 (3) (2) (5) 5 Mar-13 15 26 14 14.2 12.4 9.8 8.6 100 109 6.7 14.3 1.7 0.8 7.2 (42) Sector* 26 47,188 0 (3) (4) (5) (5) (0) (5) (5) (4) (2) Dec-12 22 19 19 20.6 17.1 14.6 12.3 104 106 2.3 22.3 3.6 1.9 11.1 (13)
Consumer Staples Karim Salamatian - 852 2101 7996
L’Occitane 973 HK U HKD 15.84 14.00 (12) 3,016 5.1 5 (1) (4) (4) (40) 4 (2) (5) (3) (38) Mar-13 (27) 16 12 17.2 23.6 20.3 18.1 86 82 1.7 12.4 2.8 1.8 11.4 (35)
Diversified Financials Arjan van Veen / Frances Feng - 852 2101 7508 / 852 2101 6693
China Everbright 165 HK O HKD 11.28 14.60 29 2,501 4.6 1 (3) (4) (8) (24) 1 (3) (3) (4) (17) Dec-12 (18) 56 14 17.0 20.8 13.3 11.7 48 76 0.7 3.3 0.7 na na na
Hong Kong Exchange 388 HK N HKD 126.9 145.0 14 19,002 49.1 (0) 0 (1) (2) (15) (1) (1) (2) (1) (13) Dec-12 4 21 22 31.9 30.7 25.3 20.8 102 109 2.9 24.7 7.0 na na na VP 806 HK N HKD 5.61 5.00 (11) 1,269 2.3 0 2 4 (6) (2) (0) 1 3 (5) (0) Dec-12 (22) 42 12 26.2 33.5 23.6 21.2 72 70 2.6 11.7 4.1 na na na Sector* 15 22,772 (0) 0 (1) (3) (15) (0) (1) (2) (2) (13) Dec-12 (2) 28 20 28.8 29.3 22.9 19.2 85 98 2.7 11.9 3.4 na na na
Hotels, Restaurants & Leisure
Kenny Lau / Isis Wong / Vivian Zhao - 852 2101 7914 / 852 2101 7109 / 852 2101 7472
Galaxy 27 HK O HKD 81.45 92.50 14 44,353 73.2 (2) 5 24 17 137 (2) 4 23 18 140 Dec-12 40 28 28 47.0 33.6 26.3 20.6 102 103 0.0 37.9 10.7 5.1 26.7 (23) MGM China 2282 HK N HKD 34.95 38.60 10 17,121 15.3 (1) 3 15 6 99 (1) 2 14 7 101 Dec-12 13 21 6 29.3 25.9 21.4 20.3 98 101 3.0 84.0 21.1 5.1 20.9 (32) MPEL MPEL US O USD 44.22 50.50 14 24,563 22.2 (2) 2 17 13 124 (2) 1 16 14 126 Dec-12 63 33 13 58.6 35.9 27.0 24.0 99 100 0.0 18.2 6.0 5.0 19.0 2
Macau Legend 1680 HK N HKD 7.92 6.60 (17) 6,378 26.7 (1) 0 6 (3) na (2) (1) 5 (2) na Dec-12 (24) 60 64 67.0 88.0 55.2 33.7 87 110 0.0 9.5 8.2 28.5 57.4 8 SJM 880 HK O HKD 25.95 31.40 21 18,579 24.3 (0) 1 6 (0) 21 (1) (0) 5 1 24 Dec-12 12 19 8 21.5 19.1 16.0 14.7 100 106 3.9 35.9 6.5 1.4 13.7 (116) Sands China 1928 HK O HKD 64.50 78.20 21 67,046 75.8 (1) 2 6 2 69 (2) 1 5 3 71 Dec-12 82 32 26 54.2 29.8 22.5 17.8 102 99 3.4 37.9 10.7 7.6 23.5 8
Tsui Wah 1314 HK O HKD 4.96 6.50 31 892 2.7 (1) (8) (3) (9) 55 (2) (9) (4) (8) 58 Mar-13 7 63 49 43.2 40.3 24.7 16.6 80 92 1.0 15.6 6.0 4.1 25.2 (62) Wynn Macau 1128 HK N HKD 35.55 37.80 6 23,774 24.8 (2) (1) 5 1 60 (2) (2) 4 2 63 Dec-12 19 9 5 28.6 24.0 21.9 20.8 105 103 3.7 78.1 20.2 5.7 20.1 (53) Sector* 15 202,706 (1) 2 12 6 88 (2) 1 11 8 91 Dec-12 40 26 19 40.6 29.1 23.1 19.4 101 101 2.2 37.2 10.0 4.8 22.0 (23)
Insurance Arjan van Veen / Chris Esson / Gabriel Dechaine - 852 2101 7508 / 44 20 7888 0294 / 416 352 4583
AIA Group 1299 HK O HKD 38.30 44.00 15 59,467 107.4 1 4 1 (2) 30 0 3 0 (0) 32 Nov-12 19 (4) 12 19.7 16.5 17.2 15.3 117 99 1.2 13.4 2.2 na na na
Manulife 945 HK O HKD 155.5 138.4 (11) 36,809 53.4 1 1 4 2 39 0 0 3 3 42 Dec-12 16 18 11 18.5 16.0 13.6 12.2 99 98 2.4 10.8 1.7 na na na Prudential 2378 HK O HKD 183.0 185.2 1 56,222 0.0 0 2 11 5 59 (0) 1 10 6 61 Dec-12 (23) 44 12 16.7 21.8 15.2 13.5 89 102 2.2 15.3 3.2 na na na Sector* 4 152,498 0 2 5 2 43 (0) 1 5 3 45 Dec-12 0 18 12 18.0 18.0 15.3 13.7 102 100 1.8 12.8 2.2 na na na
Metals & Mining Trina Chen / Frankie Zhu / Owen Liang - 852 2101 7031 / 852 2101 7426 / 852 2101 6093
MMC 975 HK N HKD 0.92 1.20 30 439 0.6 (1) (4) (9) (11) (79) (2) (5) (10) (10) (76) Dec-12 nm nm nm nm nm 121.0 8.7 113 nm 0.0 (5.4) 0.6 2.1 14.0 115
MMG 1208 HK N HKD 1.71 2.10 23 1,166 1.3 (1) 1 4 4 (49) (2) (0) 3 5 (47) Dec-12 (36) (58) 111 6.1 9.4 22.4 10.6 94 29 0.0 7.8 0.7 1.1 3.3 78 Rusal 486 HK O HKD 2.74 4.50 64 5,367 0.8 10 18 21 19 (46) 10 17 20 20 (43) Dec-12 nm nm nm nm nm nm 23.3 na nm 0.0 (5.5) 0.5 1.1 16.2 107 Sector* 55 6,972 8 13 17 15 (48) 7 12 16 16 (46) Dec-12 na na na nm nm nm 17.8 nm nm 0.0 (3.8) 0.5 1.1 9.7 104

23 J
an
uary
201
4
Ju
mp
-Sta
rt 4
9
Hong Kong—valuation summary (continued) Bberg Price Market Avg Absolute performance Relative performance FYE EPS growth P/E CS / Divd ROE P/B EV/ EV/ Net debt/ daily con. EPS yld sales EBITDA equity
Stock ticker View Local Target Upside cap t/o (%) (%) Actual (%) (x) (%) (%) (%) (x) (x) (x) (%)
21 January 2014 (%) (USDm) 1d 1w 1m 12m YTD 1d 1w 1m 12m YTD T T+1 T+2 T+3 T T+1 T+2 T+3 T+1 T+2 T+1
Paper & Forest Products Kenny Lau - 852 2101 7914
Lee & Man Paper 2314 HK U HKD 5.09 4.30 (16) 3,081 3.9 0 2 (1) (0) 4 (0) 1 (2) 1 7 Dec-12 49 8 7 18.1 12.1 11.2 10.5 98 90 2.9 12.9 1.5 2.0 10.8 58 Nine Dragons Paper 2689 HK U HKD 6.75 4.65 (31) 4,060 10.6 0 4 1 0 1 (0) 3 (0) 1 4 Jun-13 8 13 14 15.7 14.5 12.8 11.3 83 77 2.1 7.2 1.0 1.6 9.9 111 Sector* (24) 7,142 0 3 0 (0) 3 (0) 2 (1) 1 5 Dec-12 27 9 10 17.5 13.8 12.6 11.5 94 84 2.4 9.2 1.2 1.8 10.5 96
Real Estate Joyce Kwock / Yvonne Voon - 852 2101 7496 / 65 6212 3026
CAPMALLSASIA-S ORD 6813 HK O HKD 15.00 15.84 6 5,604 7.8 0 0 0 0 (1) (0) (1) (1) 1 2 Dec-12 (54) 29 11 17.6 37.9 29.5 26.6 100 106 1.2 3.8 1.4 22.6 103.3 29
Cheung Kong 1 HK O HKD 120.5 151.2 25 35,980 52.7 (0) 1 (0) (2) (7) (1) (1) (1) (0) (5) Dec-12 (13) 21 8 8.7 9.9 8.2 7.6 100 112 2.6 8.0 0.8 10.1 9.6 9 Great Eagle 41 HK U HKD 26.60 24.44 (8) 2,193 2.4 3 0 (0) 0 (3) 2 (1) (1) 1 (1) Dec-12 (27) 8 10 9.3 12.8 11.9 10.8 81 91 1.7 3.5 0.4 3.2 5.1 (2) Hang Lung Prop 101 HK N HKD 24.40 26.84 10 14,089 14.9 1 2 2 (0) (20) 1 1 1 1 (17) Dec-12 (39) 37 34 17.7 28.9 21.1 15.7 72 85 2.9 3.2 0.9 7.4 19.4 (7)
Henderson Land 12 HK O HKD 44.50 67.80 52 15,483 17.3 0 0 2 1 (17) (0) (1) 1 2 (15) Dec-12 28 4 16 15.0 11.7 11.2 9.7 119 124 2.4 4.8 0.5 4.1 13.2 (1) Hongkong Land HKL SP O USD 6.37 8.30 30 14,987 9.8 1 2 10 8 (16) 0 1 9 9 (13) Dec-12 22 (13) 10 20.0 16.4 18.9 17.2 100 95 2.5 3.6 0.6 9.4 19.4 11 Hysan 14 HK O HKD 33.80 46.00 36 4,635 4.9 0 1 2 1 (13) (0) (0) 1 2 (11) Dec-12 33 6 9 22.0 16.6 15.7 14.5 106 106 3.7 3.7 0.6 12.6 13.7 5
Kerry Properties 683 HK N HKD 24.95 28.10 13 4,645 6.8 (2) (4) (7) (7) (34) (2) (5) (8) (6) (32) Dec-12 (7) (4) 8 7.6 8.2 8.5 7.9 95 105 3.6 6.0 0.5 1.9 8.2 30 Midland 1200 HK O HKD 3.74 3.67 (2) 346 1.0 2 3 2 0 (11) 1 2 1 1 (8) Dec-12 (164) nm 3 10.7 nm 17.9 17.5 84 190 0.0 (10.6) 1.9 0.4 nm (78) NWD 17 HK O HKD 10.24 14.64 43 8,506 17.7 1 2 5 5 (30) 0 1 4 6 (27) Jun-13 (31) (8) 20 4.5 6.5 7.1 6.0 133 121 3.9 6.8 0.4 1.9 6.6 29
SHKP 16 HK O HKD 98.70 140.9 43 34,413 51.0 1 2 2 0 (24) 0 1 1 2 (21) Jun-13 31 (11) 23 14.0 10.7 12.1 9.8 114 106 3.7 6.3 0.7 4.5 11.1 13 Sino Land 83 HK O HKD 10.78 15.02 39 8,312 8.6 1 (0) 3 2 (30) 0 (1) 2 3 (27) Jun-13 (12) 50 2 9.6 10.9 7.3 7.1 124 165 4.6 5.5 0.6 6.6 13.9 (1) Swire Properties 1972 HK O HKD 20.70 27.60 33 15,611 7.0 (0) 1 6 6 (24) (1) 0 6 7 (22) Dec-12 (14) 2 19 16.7 19.4 19.1 16.1 107 102 2.1 3.2 0.6 11.7 17.5 14
Sector* 32 164,804 0 1 2 1 (18) (0) 0 1 2 (16) Dec-12 (3) 7 11 11.9 12.2 11.4 10.3 107 111 2.9 5.5 0.7 5.5 12.5 11
REITS Joyce Kwock - 852 2101 7496
Champion REIT 2778 HK O HKD 3.40 4.20 24 2,504 2.1 (1) (1) (1) (1) (16) (1) (2) (2) 0 (13) Dec-12 2 2 6 18.0 17.7 17.3 16.3 98 113 6.0 2.8 0.5 20.2 30 Link REIT 823 HK U HKD 35.40 36.00 2 10,546 23.5 1 0 (6) (6) (12) 0 (1) (7) (5) (9) Mar-13 11 7 6 24.5 22.1 20.8 19.6 98 97 4.5 4.5 1.0 18.7 10 Spring REIT 1426 HK O HKD 3.17 4.29 35 449 2.1 1 1 1 0 na 0 0 (0) 1 na Dec-12 109 13 6 26.8 12.8 11.3 10.7 na na 7.7 5.6 0.7 21.6 55
Sector* 7 13,499 0 0 (4) (5) (12) (0) (1) (5) (4) (10) Dec-12 12 7 6 23.5 21.0 19.7 18.6 95 100 4.8 4.0 0.9 19.5 19
Retailing Karim Salamatian / Isis Wong - 852 2101 7996 / 852 2101 7109
Esprit 330 HK U HKD 15.72 6.90 (56) 3,931 12.0 3 (2) 4 5 42 2 (3) 3 6 44 Jun-13 nm nm nm nm nm nm 135.4 nm nm 0.0 (4.9) 1.9 1.1 116.6 (20) Li & Fung 494 HK N HKD 11.28 11.10 (2) 12,157 31.4 2 5 14 13 (5) 1 4 13 14 (3) Dec-12 (3) 16 18 19.4 20.0 17.3 14.7 100 96 3.8 12.7 2.5 0.7 13.5 47 Lifestyle Intl 1212 HK O HKD 14.02 22.55 61 2,984 2.3 0 (1) (6) (2) (32) (0) (2) (7) (1) (29) Dec-12 5 2 11 11.4 10.8 10.5 9.5 102 100 3.6 21.1 2.1 4.1 9.2 11
Sa Sa 178 HK N HKD 7.50 9.00 20 2,749 4.8 1 (5) (14) (17) 16 0 (6) (15) (16) 19 Mar-13 19 22 20 25.6 21.5 17.6 14.6 98 99 3.2 45.7 9.1 2.4 15.2 (20) Sector* (0) 21,821 2 1 6 6 2 1 0 5 7 5 Dec-12 (16) 68 24 28.6 34.2 20.4 16.4 71 87 3.0 8.0 2.5 0.9 15.4 23
Small Cap Companies Kenny Lau / Eva Wang - 852 2101 7914 / 852 2101 7365
ASM Pacific 522 HK U HKD 75.55 55.20 (27) 3,902 6.4 5 10 18 16 (20) 5 9 17 18 (17) Dec-12 6 (6) 20 43.6 41.2 43.9 36.6 95 44 1.3 10.8 4.3 2.6 21.3 (16) Kingboard 148 HK N HKD 18.74 20.18 8 2,478 4.2 (1) (3) (5) (7) (17) (2) (4) (6) (6) (14) Dec-12 6 26 (5) 9.2 8.7 6.9 7.2 99 101 3.7 7.1 0.6 0.9 6.1 36
Techtronic 669 HK N HKD 20.75 16.50 (20) 4,895 10.5 1 (4) (1) (6) 33 1 (5) (2) (5) 35 Dec-12 16 14 12 23.4 20.3 17.8 15.9 96 89 1.1 14.7 2.8 1.2 11.8 17 VTech 303 HK N HKD 95.95 113.0 18 3,103 4.9 3 (3) (7) (5) 11 2 (4) (8) (4) 14 Mar-13 4 4 6 15.3 14.7 14.1 13.3 98 96 6.8 36.5 5.3 1.4 10.5 (56) Varitronix 710 HK O HKD 8.17 8.70 6 344 0.9 (1) (2) 1 (1) 117 (2) (3) 0 (0) 119 Dec-12 50 38 11 15.5 10.3 7.5 6.8 100 100 5.5 15.8 1.6 1.0 6.5 (14)
Yue Yuen 551 HK U HKD 24.25 20.40 (16) 5,155 5.5 2 1 (4) (6) (5) 1 (0) (5) (5) (3) Dec-12 (29) (5) 9 8.8 12.4 13.1 12.0 98 83 3.4 10.8 1.2 0.7 8.1 3 Sector* (11) 19,877 2 0 1 (2) 5 2 (1) (0) (0) 7 Dec-12 (7) 8 6 14.4 15.5 14.4 13.5 98 86 3.0 11.4 1.7 1.1 9.5 13
Technology Thompson Wu - 886 2 2715 6386
Lenovo Group 992 HK O HKD 10.46 10.60 1 14,027 37.6 3 11 15 11 35 2 10 14 12 38 Mar-13 25 20 9 22.2 17.7 14.8 13.6 102 105 2.1 27.8 4.6 0.3 10.8 (104)
Telecommunication Services
Chate Benchavitvilai - 65 6212 3241
HKT Trust 6823 HK N HKD 7.63 8.00 5 6,312 4.9 (2) (1) 1 (0) 12 (2) (2) (0) 1 15 Dec-12 28 28 21 30.4 23.8 18.6 15.3 100 120 5.9 6.7 1.6 3.1 8.7 71 HTHK 215 HK O HKD 2.98 3.40 14 1,851 3.5 0 3 5 1 (14) (0) 2 4 3 (11) Dec-12 (22) (0) 9 11.7 15.0 15.1 13.8 91 87 5.0 8.6 1.3 1.4 6.3 28 PCCW 8 HK O HKD 3.54 4.10 16 3,319 4.4 2 (1) 5 2 7 2 (2) 4 3 9 Dec-12 (8) 25 12 15.5 16.8 13.5 12.0 91 103 5.6 16.9 2.8 1.7 5.7 257
Smartone 315 HK N HKD 8.70 9.65 11 1,164 5.1 (2) (3) (1) (2) (36) (2) (4) (2) (1) (34) Jun-13 (15) 1 3 10.7 12.6 12.5 12.1 100 91 4.7 22.8 2.8 0.8 3.2 3 Sector* 10 12,646 (1) (1) 2 0 3 (1) (2) 1 2 5 Dec-12 (2) 17 15 18.0 18.4 15.8 13.8 95 105 5.7 9.9 1.8 1.9 6.5 87
Transportation Timothy Ross - 65 6212 3337
Cathay Pacific 293 HK O HKD 17.12 17.70 3 8,682 6.3 1 0 7 4 11 1 (1) 6 6 13 Dec-12 245 47 34 54.8 15.9 10.8 8.1 161 126 1.8 7.2 1.1 1.2 9.2 69 OOIL 316 HK U HKD 35.65 38.00 7 2,876 7.1 0 1 (7) (8) (37) (0) (0) (8) (7) (35) Dec-12 (76) 211 76 10.0 41.0 13.2 7.5 72 86 0.6 1.6 0.6 0.7 11.2 29
Pacific Basin 2343 HK O HKD 5.28 5.80 10 1,318 4.9 2 4 3 (5) 12 1 3 2 (4) 14 Dec-12 5 262 36 27.5 26.2 7.2 5.3 144 204 0.9 3.7 1.0 0.9 12.8 31 Sector* 5 12,876 1 1 4 1 0 1 (0) 3 2 2 Dec-12 35 81 42 26.1 19.3 10.7 7.6 142 123 1.4 5.0 0.9 1.0 9.8 52
Utilities Edwin Pang - 852 2101 6406
CKI 1038 HK O HKD 46.60 59.00 27 14,658 10.3 0 (1) (4) (5) (1) (0) (2) (5) (4) 1 Dec-12 10 6 4 11.9 10.8 10.2 9.8 102 108 3.9 16.3 1.7 32.1 11.5 26 CLP 2 HK N HKD 60.80 64.50 6 19,803 22.2 (0) 1 1 (1) (6) (1) 0 (0) 0 (4) Dec-12 1 20 3 17.6 17.5 14.6 14.2 96 103 4.3 9.5 1.6 5.9 12.2 61
HKCG 3 HK U HKD 17.00 17.20 1 20,951 20.7 (0) (0) (3) (4) (12) (1) (2) (3) (3) (9) Dec-12 (11) 2 2 19.1 21.5 21.1 20.6 106 101 2.1 15.9 3.3 7.3 15.8 35 Power Assets 6 HK N HKD 60.65 68.88 14 16,687 24.0 (0) 1 1 (1) (7) (1) 0 (0) 1 (5) Dec-12 8 3 3 13.3 12.3 12.0 11.6 103 107 4.2 15.9 1.9 13.7 10.6 25 Sector* 11 72,099 (0) 0 (1) (3) (7) (1) (1) (2) (1) (5) Dec-12 2 8 3 15.3 15.0 13.9 13.5 101 105 3.6 13.8 2.0 8.9 12.4 39
Country Average* HSI 23,033 26,053 13 1,335,124 0 1 1 (1) (2) Dec-12 4 16 12 16.2 15.5 13.4 12.0 99 103 3.0 8.9 1.3 2.4 11.8 19
* Country/ sector aggregates are for the coverage above
Source: Company data, Thomson Financial IBES, Credit Suisse estimates

23 J
an
uary
201
4
Ju
mp
-Sta
rt 5
0
India: Valuation summary Bberg Price Market Avg Absolute performance Relative performance FYE EPS growth P/E CS / Divd ROE P/B EV/ EV/ Net debt/ daily con. EPS yld sales EBITDA equity
Stock ticker View Local Target Upside cap t/o (%) (%) Actual (%) (x) (%) (%) (%) (x) (x) (x) (%)
21 January 2014 (%) (USDm) 1d 1w 1m 12m YTD 1d 1w 1m 12m YTD T T+1 T+2 T+3 T T+1 T+2 T+3 T+1 T+2 T+1
Automobiles & Components
Jatin Chawla - 91 22 6777 3719
Apollo Tyres APTY IN O INR 115.9 131.0 13 944 10.7 (1) (1) 25 8 33 (1) (2) 24 8 28 Mar-13 22 12 18 9.5 7.8 7.0 5.9 101 103 0.4 19.9 1.4 0.6 4.6 45
Ashok Leyland AL IN N INR 16.80 15.00 (11) 722 2.7 (0) (4) 7 (2) (36) (1) (5) 6 (3) (42) Mar-13 (127) nm 59 10.4 nm 14.7 9.2 185 129 1.7 (2.7) 1.1 0.8 17.4 107 Bajaj Auto BJAUT IN N INR 1,942 2,090 8 9,083 12.9 0 4 1 2 (5) 0 3 (0) 1 (11) Mar-13 13 12 12 17.9 15.9 14.2 12.7 101 98 2.6 39.4 5.7 2.4 11.3 (75) Bosch Ltd. BOS IN O INR 9,564 10,020 5 4,853 1.2 0 (2) 2 (5) 3 0 (3) 1 (6) (2) Dec-11 (15) 19 31 26.8 31.3 26.2 20.0 100 113 0.6 18.8 5.5 3.4 21.7 (15)
Exide Industries EXID IN N INR 102.7 108.0 5 1,411 3.2 1 (2) (11) (17) (19) 1 (3) (12) (17) (25) Mar-13 (6) 17 20 16.7 17.8 15.2 12.6 95 94 1.9 13.8 2.3 1.4 10.5 (7) Hero Motocorp HMCL IN U INR 2,072 1,900 (8) 6,685 13.2 (1) 2 (3) (0) 17 (1) 1 (3) (1) 11 Mar-13 4 33 15 19.5 18.8 14.1 12.2 102 103 2.7 40.4 7.0 1.5 10.1 (61) Mahindra & Mahindra MM IN N INR 904.7 1,010 12 9,004 18.4 (0) 2 (7) (4) 3 (1) 1 (7) (4) (3) Mar-13 15 3 12 17.0 14.7 14.3 12.7 103 99 1.6 23.4 3.2 1.4 10.6 1
Maruti Suzuki MSIL IN O INR 1,803 1,960 9 8,802 19.7 1 2 (0) 2 15 1 1 (1) 2 9 Mar-13 15 19 27 22.8 19.8 16.7 13.1 95 95 0.4 13.8 2.6 1.0 8.4 (51) Tata Motors TTMT IN O INR 384.7 450.0 17 17,012 45.7 3 3 3 2 19 2 2 2 2 13 Mar-13 42 19 13 12.4 8.7 7.4 6.5 104 104 1.2 32.0 2.4 0.6 3.9 70 Sector* 9 58,516 1 2 0 (0) 9 1 1 (1) (1) 3 Dec-12 13 19 16 16.1 14.2 11.9 9.9 102 102 1.5 25.4 3.3 1.0 6.7 16
Banks Ashish Gupta - 91 22 6777 3895
Axis Bank AXSB IN O INR 1,189 1,450 22 9,018 67.6 2 1 (7) (9) (14) 2 0 (8) (9) (20) Mar-13 9 13 20 10.3 9.4 8.3 6.9 101 99 1.8 16.9 1.5 na na na
BOB BOB IN O INR 632.3 707.0 12 4,387 19.2 2 2 (3) (2) (28) 1 1 (4) (2) (34) Mar-13 (3) 23 10 5.9 6.1 5.0 4.5 99 105 3.9 13.5 0.8 na na na BOI BOI IN N INR 242.6 220.0 (9) 2,517 13.3 2 4 13 2 (36) 2 3 12 2 (42) Mar-13 15 12 23 5.3 4.6 4.1 3.3 108 104 4.5 13.4 0.6 na na na HDFC Bank HDFCB IN O INR 676.8 770.0 14 26,188 41.1 1 1 2 2 3 1 (0) 1 1 (3) Mar-13 27 22 23 23.9 18.8 15.4 12.5 102 101 1.1 21.5 3.7 na na na
ICICI ICICIBC IN N INR 1,079 1,036 (4) 20,131 71.6 3 4 (1) (2) (8) 3 3 (2) (2) (14) Mar-13 10 15 15 14.9 13.6 11.9 10.3 97 96 2.3 13.1 1.7 na na na ING Vysya Bank VYSB IN O INR 566.0 693.0 22 1,722 1.2 (0) (2) 2 (7) (0) (0) (3) 1 (8) (6) Mar-13 14 11 19 14.1 12.3 11.1 9.3 113 108 1.2 13.5 1.4 na na na IOB IOB IN U INR 49.50 63.00 27 923 1.1 1 2 1 (4) (43) 0 1 0 (4) (49) Mar-13 (15) 113 34 6.7 7.9 3.7 2.8 75 139 3.0 4.9 0.4 na na na
IndusInd Bank IIB IN U INR 433.8 401.0 (8) 3,680 20.4 0 4 2 3 5 (0) 3 1 3 (1) Mar-13 21 19 23 20.2 16.8 14.1 11.4 99 96 1.1 17.0 2.7 na na na J&K Bank JKBK IN O INR 1,445 1,700 18 1,132 1.4 4 7 2 1 10 4 6 1 0 4 Mar-13 14 6 12 6.7 5.9 5.6 4.9 102 98 3.8 22.3 1.2 na na na Kotak KMB IN U INR 706.1 618.0 (12) 8,782 10.8 (3) (1) (4) (3) 12 (3) (2) (4) (4) 7 Mar-13 12 20 16 24.1 21.5 18.0 15.4 100 100 0.2 14.9 3.0 na na na
PNB PNB IN N INR 610.7 555.0 (9) 3,488 16.6 2 2 3 (3) (32) 1 1 2 (3) (37) Mar-13 (24) 28 26 4.1 5.5 4.3 3.4 97 100 5.0 12.2 0.6 na na na SBI SBIN IN N INR 1,659 1,417 (15) 18,635 68.9 1 2 (5) (6) (34) 1 1 (6) (6) (39) Mar-13 (23) 30 24 8.0 10.5 8.0 6.4 91 98 2.8 10.9 1.0 na na na UnionBank UNBK IN U INR 122.7 120.0 (2) 1,183 9.9 1 0 (0) (6) (54) 1 (1) (1) (6) (60) Mar-13 (27) 41 31 3.3 4.5 3.2 2.4 87 99 7.6 10.2 0.4 na na na
Yes Bank YES IN U INR 362.9 345.0 (5) 2,115 65.8 1 5 (2) (2) (29) 1 4 (3) (2) (35) Mar-13 8 16 25 10.0 9.3 8.0 6.4 89 89 1.7 21.4 1.6 na na na Sector* 1 103,902 1 2 (1) (2) (12) 1 1 (2) (3) (17) Dec-12 1 16 21 11.5 11.4 9.8 8.1 98 99 2.0 14.1 1.5 na na na
Building Materials & Construction
Amish Shah / Anubhav Aggarwal - 91 22 6777 3743 / 91 22 6777 3808
ACC ACC IN O INR 1,031 1,450 41 3,129 6.2 0 1 (6) (7) (23) (0) (0) (7) (7) (28) Dec-12 (13) 45 20 15.0 17.2 11.9 9.9 107 127 2.9 14.8 2.5 1.4 10.3 (42)
Ambuja Cements ACEM IN N INR 171.2 180.0 5 4,276 6.6 (1) 2 (5) (6) (14) (1) 1 (6) (7) (20) Dec-12 (21) 40 19 17.7 22.3 15.9 13.4 100 117 2.1 13.1 2.8 2.5 13.8 (40) Jaiprakash Assoc JPA IN O INR 48.40 79.00 63 1,736 26.4 2 2 (9) (11) (47) 2 1 (10) (12) (53) Mar-13 (28) 57 40 27.2 37.6 23.9 17.1 86 77 1.0 2.1 0.8 2.3 10.4 141 Ultratech Cement UTCEM IN N INR 1,700 1,700 0 7,535 5.8 (1) 3 (3) (4) (12) (1) 2 (3) (4) (17) Mar-13 (31) 20 28 17.3 25.0 20.8 16.3 79 80 0.3 11.6 2.8 2.6 14.5 25
Sector* 16 16,676 (0) 2 (4) (6) (18) (1) 1 (5) (6) (24) Dec-12 (21) 25 24 17.3 22.0 17.7 14.3 93 99 1.4 10.2 2.2 2.3 12.0 38
Capital Goods Amish Shah / Anantha Narayan - 91 22 6777 3743 / 91 22 6777 3730
BHEL BHEL IN U INR 170.2 99.00 (42) 6,730 18.1 (2) 5 3 (4) (27) (2) 4 2 (4) (32) Mar-13 (52) (19) (8) 6.6 13.7 16.9 18.3 76 76 3.5 9.7 1.3 1.0 7.6 (15) Crompton Greaves CRG IN U INR 116.7 98.00 (16) 1,186 4.4 0 (1) (10) (9) 2 (0) (2) (11) (10) (3) Mar-13 440 37 22 88.5 16.4 12.0 9.8 132 116 1.3 12.2 1.9 0.6 8.6 28 Cummins India KKC IN N INR 460.2 382.0 (17) 2,061 2.2 2 (2) (4) (4) (6) 1 (3) (4) (4) (12) Mar-13 (12) 10 13 18.2 20.6 18.8 16.6 102 100 2.4 24.6 4.8 2.7 18.0 (35)
Kajaria Ceramics KJC IN O INR 296.0 360.0 22 361 0.5 (4) (2) 1 (5) 41 (4) (3) 0 (6) 35 Mar-13 10 32 24 20.9 19.0 14.3 11.6 104 111 1.2 27.5 4.5 1.3 9.0 51 L&T LT IN U INR 1,011 713.0 (29) 15,135 40.7 1 4 (5) (5) (3) 1 3 (6) (6) (9) Mar-13 13 (1) 12 19.5 17.3 17.4 15.5 110 96 1.3 15.1 2.5 1.8 13.1 123 Voltas VOLT IN U INR 107.4 84.00 (22) 574 4.2 (1) 2 (6) (7) 6 (2) 1 (7) (8) 0 Mar-13 12 40 21 18.2 16.2 11.6 9.5 115 118 1.5 12.8 2.0 0.6 10.7 (19)
Sector* (30) 26,048 0 3 (3) (5) (8) 0 2 (4) (5) (14) Dec-12 (16) (7) 6 13.0 15.4 16.7 15.8 97 93 2.0 14.2 2.1 1.4 11.0 56
Chemicals Arnab Mitra - 91 22 6777 3806
Asian Paints APNT IN N INR 479.0 470.0 (2) 7,425 9.5 (2) (2) (2) (2) 11 (2) (3) (3) (3) 6 Mar-13 12 14 17 41.2 36.9 32.3 27.6 98 94 0.0 34.1 11.7 3.6 23.4 (20)
Conglomerates Amish Shah / Anubhav Aggarwal - 91 22 6777 3743 / 91 22 6777 3808
Adani Enterprises ADE IN U INR 247.1 198.0 (20) 4,391 8.6 (0) 1 (5) (6) (10) (0) 0 (6) (6) (16) Mar-13 51 37 49 27.0 17.9 13.1 8.8 124 77 0.0 7.1 1.3 1.8 9.8 283 Grasim Industries GRASIM IN O INR 2,602 3,280 26 3,861 3.4 0 1 (1) (4) (14) 0 0 (2) (5) (20) Mar-12 5 (1) 29 10.0 9.5 9.7 7.5 100 103 1.0 13.7 1.2 1.0 4.9 14
Sector* 2 8,252 0 1 (3) (5) (12) (0) 0 (4) (5) (18) Dec-12 5 28 47 13.9 13.2 10.3 9.5 110 99 0.6 9.4 1.2 1.5 8.4 135
Consumer Durables & Apparel
Arnab Mitra - 91 22 6777 3806
Page PAG IN O INR 5,458 6,200 14 984 0.1 1 2 5 6 60 1 1 4 5 54 Mar-13 31 27 29 54.1 41.3 32.4 25.0 98 98 1.0 58.4 20.8 5.4 25.0 41
TTK Prestige TTKPT IN O INR 3,411 3,600 6 625 1.2 (0) (2) (0) (2) 2 (0) (3) (1) (2) (3) Mar-13 (12) 25 22 29.1 33.1 26.4 21.7 96 93 0.5 24.2 6.7 2.8 20.7 (25) Sector* 10 1,609 0 0 3 3 37 0 (1) 2 2 32 Dec-12 10 22 26 42.3 38.3 31.4 24.9 98 96 0.8 37.8 12.3 4.1 23.9 3

23 J
an
uary
201
4
Ju
mp
-Sta
rt 5
1
India: Valuation summary (continued) Bberg Price Market Avg Absolute performance Relative performance FYE EPS growth P/E CS / Divd ROE P/B EV/ EV/ Net debt/ daily con. EPS yld sales EBITDA equity
Stock ticker View Local Target Upside cap t/o (%) (%) Actual (%) (x) (%) (%) (%) (x) (x) (x) (%)
21 January 2014 (%) (USDm) 1d 1w 1m 12m YTD 1d 1w 1m 12m YTD T T+1 T+2 T+3 T T+1 T+2 T+3 T+1 T+2 T+1
Consumer Staples Arnab Mitra - 91 22 6777 3806
Colgate CLGT IN U INR 1,311 1,190 (9) 2,880 2.7 (1) (1) 1 (3) (12) (1) (2) (0) (4) (18) Mar-13 (4) 14 14 35.9 37.5 32.8 28.8 93 91 2.6 105.0 42.8 4.9 29.1 (62) Dabur DABUR IN N INR 167.6 171.0 2 4,723 4.6 (1) (2) 0 (2) 31 (1) (4) (1) (2) 25 Mar-13 24 17 15 38.0 30.8 26.3 22.9 102 101 1.2 39.7 11.0 4.2 23.3 (13)
Emami HMN IN O INR 448.0 580.0 29 1,643 1.3 1 (3) (3) (6) 16 1 (4) (4) (6) 10 Mar-13 30 19 16 32.3 24.9 20.9 18.0 104 107 1.6 46.0 10.2 5.3 21.8 (32) GCPL GCPL IN O INR 765.2 940.0 23 4,209 2.8 (2) (4) (7) (11) 7 (2) (5) (8) (11) 1 Mar-13 13 28 25 36.9 32.6 25.5 20.4 98 101 0.8 22.2 6.7 3.5 23.1 44 GSK Consumer SKB IN N INR 4,365 5,000 15 2,966 0.9 (1) 1 (2) (2) 16 (1) (0) (3) (2) 10 Dec-12 17 20 19 42.0 35.9 30.0 25.2 99 97 1.2 34.4 11.4 4.7 30.7 (97)
Hindustan Unilever HUVR IN N INR 560.6 605.0 8 19,591 16.8 1 4 (1) (2) 13 1 3 (2) (2) 7 Mar-13 (5) 12 17 31.9 33.4 29.9 25.7 100 101 1.9 116.7 34.2 4.3 26.2 (78) ITC ITC IN O INR 329.0 385.0 17 42,216 40.5 (0) 1 4 2 13 (1) 0 4 2 7 Mar-13 16 19 20 35.0 30.3 25.4 21.1 99 100 2.0 36.4 10.5 7.6 21.5 (25) Marico MRCO IN O INR 219.6 245.0 12 2,288 1.4 1 2 (0) 1 (1) 1 1 (1) 1 (6) Mar-13 33 20 18 39.0 29.3 24.4 20.7 101 103 0.4 22.1 5.9 3.0 20.1 8
Nestle NEST IN U INR 5,170 5,050 (2) 8,055 3.6 (1) (4) (5) (2) 8 (1) (5) (6) (3) 2 Dec-12 11 21 17 46.7 42.0 34.7 29.6 100 103 1.4 60.0 23.2 5.4 23.8 (0) United Spirits UNSP IN O INR 2,716 2,650 (2) 6,379 40.9 0 (2) 2 4 50 0 (3) 1 4 45 Mar-13 nm 52 34 nm 69.4 45.7 34.0 128 106 0.2 8.6 4.7 4.3 33.9 73 Sector* 11 94,949 (0) 1 1 (0) 15 (0) (0) 0 (0) 9 Dec-12 16 18 19 39.9 34.3 29.0 24.3 101 101 1.7 38.3 12.0 5.5 24.5 (4)
Diversified Financials Ashish Gupta / Sunil Tirumalai - 91 22 6777 3895 / 91 22 6777 3714
HDFC HDFC IN O INR 837.4 1,045 25 21,102 47.2 0 2 5 5 3 0 1 4 5 (3) Mar-13 13 18 19 26.1 23.1 19.5 16.3 101 103 2.1 21.3 4.7 na na na
IDFC IDFC IN O INR 100.9 144.0 43 2,471 20.4 0 1 (4) (8) (43) (0) (0) (5) (8) (49) Mar-13 9 18 na 8.3 7.6 6.5 na 102 109 3.8 13.9 1.0 na na na LIC Housing Finance LICHF IN O INR 212.4 280.0 32 1,732 12.6 1 2 2 (3) (25) 0 1 1 (4) (31) Mar-13 15 10 14 10.2 8.8 8.0 7.0 96 90 2.0 16.9 1.4 na na na LTFH LTFH IN U INR 72.25 50.00 (31) 2,005 3.8 1 (2) 6 (3) (19) 1 (3) 5 (4) (24) Mar-13 (16) 28 23 17.0 20.2 15.8 12.8 86 85 0.2 9.4 1.8 na na na
MMFSL MMFS IN N INR 267.1 240.0 (10) 2,455 6.6 (2) (3) (15) (17) 24 (2) (4) (16) (17) 18 Mar-13 13 11 30 16.0 14.2 12.8 9.8 104 94 1.8 21.7 2.8 na na na Magma Fincorp MGMA IN O INR 67.10 110.0 64 206 0.1 (1) (4) 3 (2) (31) (1) (5) 2 (2) (37) Mar-13 25 38 28 10.2 8.2 5.9 4.6 92 98 2.3 11.1 0.8 na na na Shriram Transport SHTF IN O INR 616.6 760.0 23 2,261 4.0 1 2 (7) (8) (19) 1 1 (7) (9) (25) Mar-13 7 15 13 9.6 8.9 7.8 6.9 111 110 1.4 19.6 1.6 na na na
Sector* 21 32,231 0 1 2 1 (4) (0) (0) 1 0 (9) Dec-12 12 16 19 18.6 16.6 14.4 13.4 102 101 2.0 18.0 2.8 na na na
Energy Sanjay Mookim - 65 6212 3017
Aban Offshore ABAN IN O INR 420.3 615.0 46 305 7.3 (1) 0 24 8 11 (1) (1) 23 8 6 Mar-13 78 29 3 9.4 5.3 4.1 4.0 116 111 0.8 9.5 0.5 3.7 7.1 337 Bharat Petroleum BPCL IN O INR 337.5 376.0 11 3,943 8.8 (1) 3 (2) (3) (23) (1) 2 (3) (3) (29) Mar-13 (22) 7 2 13.0 16.6 15.4 15.1 75 71 3.1 8.6 1.4 0.2 8.7 152 Cairn India CAIR IN N INR 323.8 369.0 14 9,997 12.4 (1) (2) (1) (0) (5) (1) (3) (2) (0) (11) Mar-13 12 (11) (13) 5.2 4.6 5.2 5.9 113 107 3.9 25.2 1.1 2.0 3.1 (23)
Essar Oil ESOIL IN U INR 52.25 49.00 (6) 1,224 1.0 (0) (2) 2 (4) (34) (1) (3) 1 (5) (40) Mar-13 nm nm 24 nm nm 6.1 4.9 nm 92 0.0 (74.1) 14.0 0.4 11.8 5,731 GAIL GAIL IN O INR 343.9 400.0 16 7,050 5.4 (2) (0) 1 1 (11) (2) (1) 0 0 (17) Mar-13 (4) (9) 13 10.0 10.3 11.3 10.1 100 91 2.7 14.0 1.4 1.1 7.9 56 GSPL GUJS IN O INR 57.60 86.00 49 524 0.5 0 (3) (2) (5) (25) (0) (4) (3) (6) (31) Mar-13 (11) (24) 24 6.0 6.7 8.9 7.2 102 78 1.6 15.2 1.0 3.2 3.6 12
Hindustan Petroleum HPCL IN N INR 233.7 194.0 (17) 1,279 4.7 0 7 2 (1) (37) (0) 6 1 (2) (43) Mar-13 (68) 104 2 8.7 27.3 13.4 13.1 35 54 1.4 2.1 0.6 0.2 10.3 231 Indian Oil IOCL IN N INR 225.1 233.0 4 8,830 2.2 0 9 10 5 (35) 0 8 10 5 (40) Mar-13 (52) 12 32 12.3 25.7 22.9 17.4 40 34 1.6 3.3 0.9 0.3 14.7 130 ONGC ONGC IN O INR 287.0 344.0 20 39,674 17.0 (0) (1) 1 (1) (15) (0) (2) 0 (1) (20) Mar-13 14 12 0 10.1 8.9 7.9 7.9 105 95 3.9 17.1 1.5 1.4 4.1 12
Oil India OINL IN R INR 479.1 4,654 2.7 1 (1) 2 (1) (14) 1 (2) 1 (2) (20) Mar-13 (9) 20 (24) 8.1 8.9 7.4 9.8 92 93 5.7 16.3 1.4 2.3 6.0 (29) Petronet LNG PLNG IN N INR 112.7 132.0 17 1,366 2.2 (2) (4) (6) (8) (29) (2) (5) (7) (8) (35) Mar-13 (19) (9) 18 7.4 9.1 9.9 8.4 111 90 1.8 19.3 1.6 0.3 6.2 62 Reliance Inds RIL IN O INR 864.1 1,044 21 45,123 45.8 (1) (2) (3) (3) (6) (1) (3) (4) (4) (12) Mar-13 9 13 13 13.4 12.3 10.9 9.7 99 96 1.2 11.9 1.4 0.8 9.6 31
Sector* 18 123,968 (0) (1) (0) (1) (13) (1) (2) (1) (2) (19) Dec-12 4 9 5 10.6 10.2 9.4 8.9 97 92 2.6 13.7 1.3 0.6 6.7 44
Healthcare Anubhav Aggarwal - 91 22 6777 3808
Cadila CDH IN O INR 861.9 760.0 (12) 2,852 1.5 1 (3) 12 7 (2) 0 (4) 11 6 (8) Mar-12 11 (3) 30 27.0 24.5 25.3 19.4 110 96 0.9 26.1 6.0 3.2 19.8 65 Cipla CIPLA IN N INR 417.3 415.0 (1) 5,414 9.3 (1) 1 4 4 3 (1) 0 3 4 (2) Mar-12 108 1 4 45.4 21.8 21.5 20.7 102 99 0.9 18.5 3.7 3.9 15.2 (14) Dr. Reddy DRRD IN O INR 2,652 2,850 7 7,291 11.6 (0) 0 6 5 38 (0) (1) 5 4 32 Mar-13 19 14 17 26.8 22.4 19.6 16.8 100 100 0.7 24.6 5.0 3.4 15.8 5
Glaxo GLXO IN N INR 2,978 2,055 (31) 4,076 1.9 0 (0) 2 (1) 37 (0) (1) 1 (1) 31 Dec-11 (6) 27 (6) 41.1 43.5 34.2 36.2 82 134 2.0 25.4 10.3 8.6 27.6 (107) Glenmark GNP IN O INR 502.6 640.0 27 2,202 5.3 0 (0) (5) (6) 2 (0) (1) (5) (6) (4) Mar-13 13 20 20 21.8 19.4 16.1 13.4 99 95 0.5 22.7 4.0 2.6 12.5 62 Lupin LPC IN O INR 908.0 1,025 13 6,577 12.8 (0) (3) (1) (0) 53 (0) (4) (2) (0) 47 Mar-13 30 17 19 30.8 23.7 20.3 17.1 103 100 0.8 29.0 6.1 3.8 16.3 1
Ranbaxy RBXY IN N INR 414.6 345.0 (17) 2,839 27.0 1 (4) (9) (9) (14) 1 (5) (10) (9) (20) Dec-12 (52) 130 43 29.0 60.9 26.5 18.6 na 103 0.2 7.7 5.2 2.1 23.5 145 Sun Pharma SUNP IN O INR 580.9 685.0 18 19,443 18.4 (1) (4) 0 2 66 (2) (5) (0) 2 60 Mar-13 39 11 17 32.0 23.1 20.9 17.9 108 103 0.8 32.8 7.2 7.1 16.4 (35) Taro Pharma TARO US O USD 105.3 85.00 (19) 4,714 2.8 (0) (0) 10 6 120 (1) (0) 9 7 96 Mar-13 (0) 7 8 17.7 17.7 16.6 15.3 100 100 0.0 26.1 4.1 5.9 11.4 (68)
Torrent TRP IN N INR 475.4 500.0 5 1,300 0.2 0 1 (1) 0 31 (0) 0 (2) (0) 25 Mar-13 30 5 15 18.6 14.3 13.6 11.8 111 101 2.5 34.7 4.4 2.1 12.3 1 Sector* 5 56,708 (1) (2) 2 2 47 (1) (3) 1 2 41 Dec-12 22 16 17 29.5 24.2 20.8 17.1 105 101 0.8 25.0 5.6 4.2 16.8 (10)
Hotels, Restaurants & Leisure
Arnab Mitra - 91 22 6777 3806
Jubilant Foodworks JUBI IN U INR 1,166 1,000 (14) 1,233 5.3 2 1 (10) (8) (8) 2 (1) (10) (8) (13) Mar-13 10 26 24 56.3 51.1 40.7 32.7 98 91 0.0 29.3 13.1 4.2 26.3 (6)
Insurance Ashish Gupta - 91 22 6777 3895
Max India MAX IN O INR 198.0 251.0 27 852 0.8 (0) 3 (1) (8) (19) (1) 2 (2) (8) (25) Mar-13 (71) 56 43 6.7 22.9 14.6 10.2 70 82 1.9 7.5 1.6 na na na
Media Jatin Chawla - 91 22 6777 3719
Dish TV DITV IN O INR 50.35 71.00 41 867 4.4 (2) 2 (15) (17) (35) (2) 0 (15) (17) (41) Mar-13 nm nm 199 nm nm 51.7 17.3 118 177 0.0 30.9 nm 2.6 10.5 nm Hathway Cable HATH IN U INR 253.5 239.0 (6) 623 0.3 (2) (1) (12) (10) (9) (2) (2) (13) (10) (15) Mar-13 163 80 94 232.1 88.3 49.0 25.3 nm 91 0.0 4.5 2.5 3.4 13.0 78
Sun TV SUNTV IN O INR 364.6 470.0 29 2,322 5.3 1 0 (2) (5) (14) 0 (1) (3) (5) (20) Mar-13 5 25 28 21.0 20.0 16.0 12.5 93 97 3.0 23.9 4.6 6.4 9.3 (17) ZEE Z IN O INR 281.6 290.0 3 4,369 10.4 (1) (1) 0 2 27 (1) (2) (0) 1 21 Mar-13 (3) 21 22 37.3 38.5 31.9 26.1 81 83 0.9 16.6 6.0 6.2 22.7 (36) Sector* 14 8,180 (1) (1) (3) (3) 6 (1) (2) (4) (3) 0 Dec-12 8 29 37 39.3 36.3 28.1 20.5 93 92 1.3 17.9 5.9 5.2 14.5 1
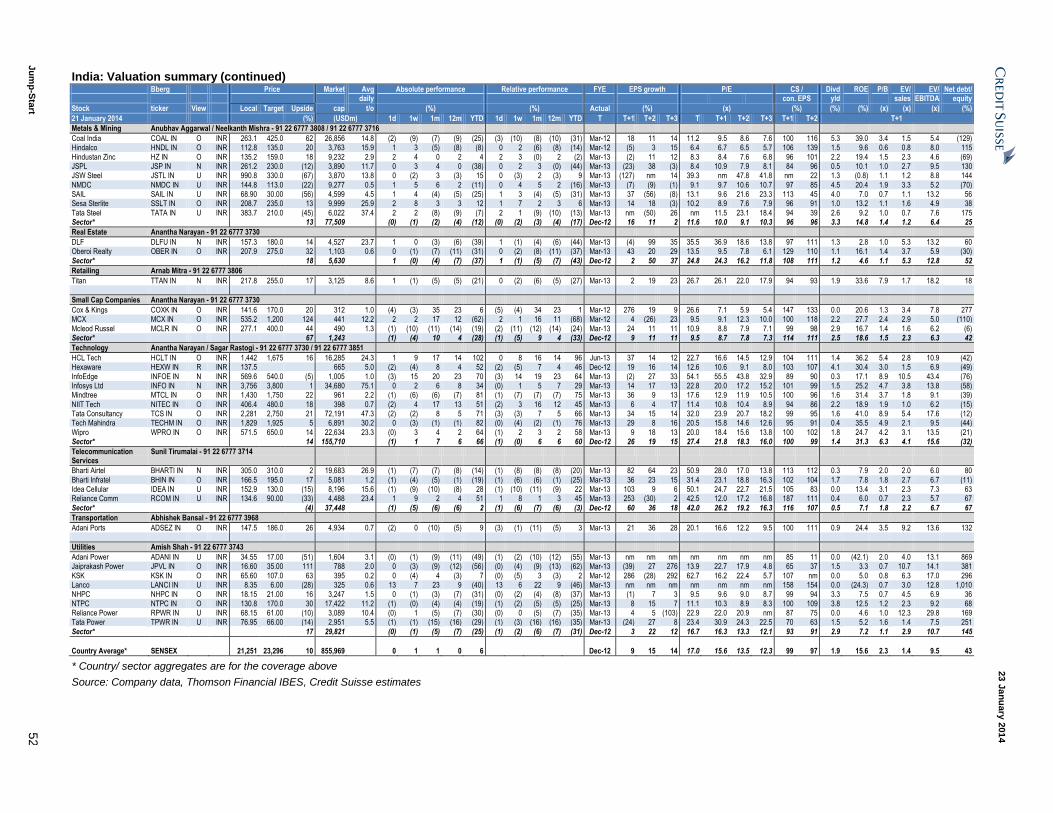
23 J
an
uary
201
4
Ju
mp
-Sta
rt 5
2
India: Valuation summary (continued) Bberg Price Market Avg Absolute performance Relative performance FYE EPS growth P/E CS / Divd ROE P/B EV/ EV/ Net debt/ daily con. EPS yld sales EBITDA equity
Stock ticker View Local Target Upside cap t/o (%) (%) Actual (%) (x) (%) (%) (%) (x) (x) (x) (%)
21 January 2014 (%) (USDm) 1d 1w 1m 12m YTD 1d 1w 1m 12m YTD T T+1 T+2 T+3 T T+1 T+2 T+3 T+1 T+2 T+1
Metals & Mining Anubhav Aggarwal / Neelkanth Mishra - 91 22 6777 3808 / 91 22 6777 3716
Coal India COAL IN O INR 263.1 425.0 62 26,856 14.8 (2) (9) (7) (9) (25) (3) (10) (8) (10) (31) Mar-12 18 11 14 11.2 9.5 8.6 7.6 100 116 5.3 39.0 3.4 1.5 5.4 (129) Hindalco HNDL IN O INR 112.8 135.0 20 3,763 15.9 1 3 (5) (8) (8) 0 2 (6) (8) (14) Mar-12 (5) 3 15 6.4 6.7 6.5 5.7 106 139 1.5 9.6 0.6 0.8 8.0 115
Hindustan Zinc HZ IN O INR 135.2 159.0 18 9,232 2.9 2 4 0 2 4 2 3 (0) 2 (2) Mar-13 (2) 11 12 8.3 8.4 7.6 6.8 96 101 2.2 19.4 1.5 2.3 4.6 (69) JSPL JSP IN N INR 261.2 230.0 (12) 3,890 11.7 0 3 4 0 (38) 0 2 3 (0) (44) Mar-13 (23) 38 (3) 8.4 10.9 7.9 8.1 84 96 0.5 10.1 1.0 2.7 9.5 130 JSW Steel JSTL IN U INR 990.8 330.0 (67) 3,870 13.8 0 (2) 3 (3) 15 0 (3) 2 (3) 9 Mar-13 (127) nm 14 39.3 nm 47.8 41.8 nm 22 1.3 (0.8) 1.1 1.2 8.8 144
NMDC NMDC IN U INR 144.8 113.0 (22) 9,277 0.5 1 5 6 2 (11) 0 4 5 2 (16) Mar-13 (7) (9) (1) 9.1 9.7 10.6 10.7 97 85 4.5 20.4 1.9 3.3 5.2 (70) SAIL SAIL IN U INR 68.90 30.00 (56) 4,599 4.5 1 4 (4) (5) (25) 1 3 (4) (5) (31) Mar-13 37 (56) (8) 13.1 9.6 21.6 23.3 113 45 4.0 7.0 0.7 1.1 13.2 56 Sesa Sterlite SSLT IN O INR 208.7 235.0 13 9,999 25.9 2 8 3 3 12 1 7 2 3 6 Mar-13 14 18 (3) 10.2 8.9 7.6 7.9 96 91 1.0 13.2 1.1 1.6 4.9 38
Tata Steel TATA IN U INR 383.7 210.0 (45) 6,022 37.4 2 2 (8) (9) (7) 2 1 (9) (10) (13) Mar-13 nm (50) 26 nm 11.5 23.1 18.4 94 39 2.6 9.2 1.0 0.7 7.6 175 Sector* 13 77,509 (0) (1) (2) (4) (12) (0) (2) (3) (4) (17) Dec-12 16 11 2 11.6 10.0 9.1 10.3 96 96 3.3 14.8 1.4 1.2 6.4 25
Real Estate Anantha Narayan - 91 22 6777 3730
DLF DLFU IN N INR 157.3 180.0 14 4,527 23.7 1 0 (3) (6) (39) 1 (1) (4) (6) (44) Mar-13 (4) 99 35 35.5 36.9 18.6 13.8 97 111 1.3 2.8 1.0 5.3 13.2 60 Oberoi Realty OBER IN O INR 207.9 275.0 32 1,103 0.6 0 (1) (7) (11) (31) 0 (2) (8) (11) (37) Mar-13 43 20 29 13.5 9.5 7.8 6.1 129 110 1.1 16.1 1.4 3.7 5.9 (30)
Sector* 18 5,630 1 (0) (4) (7) (37) 1 (1) (5) (7) (43) Dec-12 2 50 37 24.8 24.3 16.2 11.8 108 111 1.2 4.6 1.1 5.3 12.8 52
Retailing Arnab Mitra - 91 22 6777 3806
Titan TTAN IN N INR 217.8 255.0 17 3,125 8.6 1 (1) (5) (5) (21) 0 (2) (6) (5) (27) Mar-13 2 19 23 26.7 26.1 22.0 17.9 94 93 1.9 33.6 7.9 1.7 18.2 18
Small Cap Companies Anantha Narayan - 91 22 6777 3730
Cox & Kings COXK IN O INR 141.6 170.0 20 312 1.0 (4) (3) 35 23 6 (5) (4) 34 23 1 Mar-12 276 19 9 26.6 7.1 5.9 5.4 147 133 0.0 20.6 1.3 3.4 7.8 277 MCX MCX IN O INR 535.2 1,200 124 441 12.2 2 2 17 12 (62) 2 1 16 11 (68) Mar-12 4 (26) 23 9.5 9.1 12.3 10.0 100 118 2.2 27.7 2.4 2.9 5.0 (110)
Mcleod Russel MCLR IN O INR 277.1 400.0 44 490 1.3 (1) (10) (11) (14) (19) (2) (11) (12) (14) (24) Mar-13 24 11 11 10.9 8.8 7.9 7.1 99 98 2.9 16.7 1.4 1.6 6.2 (6) Sector* 67 1,243 (1) (4) 10 4 (28) (1) (5) 9 4 (33) Dec-12 9 11 11 9.5 8.7 7.8 7.3 114 111 2.5 18.6 1.5 2.3 6.3 42
Technology Anantha Narayan / Sagar Rastogi - 91 22 6777 3730 / 91 22 6777 3851
HCL Tech HCLT IN O INR 1,442 1,675 16 16,285 24.3 1 9 17 14 102 0 8 16 14 96 Jun-13 37 14 12 22.7 16.6 14.5 12.9 104 111 1.4 36.2 5.4 2.8 10.9 (42) Hexaware HEXW IN R INR 137.5 665 5.0 (2) (4) 8 4 52 (2) (5) 7 4 46 Dec-12 19 16 14 12.6 10.6 9.1 8.0 103 107 4.1 30.4 3.0 1.5 6.9 (49)
InfoEdge INFOE IN N INR 569.6 540.0 (5) 1,005 1.0 (3) 15 20 23 70 (3) 14 19 23 64 Mar-13 (2) 27 33 54.1 55.5 43.8 32.9 89 90 0.3 17.1 8.9 10.5 43.4 (76) Infosys Ltd INFO IN N INR 3,756 3,800 1 34,680 75.1 0 2 6 8 34 (0) 1 5 7 29 Mar-13 14 17 13 22.8 20.0 17.2 15.2 101 99 1.5 25.2 4.7 3.8 13.8 (58) Mindtree MTCL IN O INR 1,430 1,750 22 961 2.2 (1) (6) (6) (7) 81 (1) (7) (7) (7) 75 Mar-13 36 9 13 17.6 12.9 11.9 10.5 100 96 1.6 31.4 3.7 1.8 9.1 (39)
NIIT Tech NITEC IN O INR 406.4 480.0 18 398 0.7 (2) 4 17 13 51 (2) 3 16 12 45 Mar-13 6 4 17 11.4 10.8 10.4 8.9 94 86 2.2 18.9 1.9 1.0 6.2 (15) Tata Consultancy TCS IN O INR 2,281 2,750 21 72,191 47.3 (2) (2) 8 5 71 (3) (3) 7 5 66 Mar-13 34 15 14 32.0 23.9 20.7 18.2 99 95 1.6 41.0 8.9 5.4 17.6 (12) Tech Mahindra TECHM IN O INR 1,829 1,925 5 6,891 30.2 0 (3) (1) (1) 82 (0) (4) (2) (1) 76 Mar-13 29 8 16 20.5 15.8 14.6 12.6 95 91 0.4 35.5 4.9 2.1 9.5 (44)
Wipro WPRO IN O INR 571.5 650.0 14 22,634 23.3 (0) 3 4 2 64 (1) 2 3 2 58 Mar-13 9 18 13 20.0 18.4 15.6 13.8 100 102 1.8 24.7 4.2 3.1 13.5 (21) Sector* 14 155,710 (1) 1 7 6 66 (1) (0) 6 6 60 Dec-12 26 19 15 27.4 21.8 18.3 16.0 100 99 1.4 31.3 6.3 4.1 15.6 (32)
Telecommunication Services
Sunil Tirumalai - 91 22 6777 3714
Bharti Airtel BHARTI IN N INR 305.0 310.0 2 19,683 26.9 (1) (7) (7) (8) (14) (1) (8) (8) (8) (20) Mar-13 82 64 23 50.9 28.0 17.0 13.8 113 112 0.3 7.9 2.0 2.0 6.0 80
Bharti Infratel BHIN IN O INR 166.5 195.0 17 5,081 1.2 (1) (4) (5) (1) (19) (1) (6) (6) (1) (25) Mar-13 36 23 15 31.4 23.1 18.8 16.3 102 104 1.7 7.8 1.8 2.7 6.7 (11) Idea Cellular IDEA IN U INR 152.9 130.0 (15) 8,196 15.6 (1) (9) (10) (8) 28 (1) (10) (11) (9) 22 Mar-13 103 9 6 50.1 24.7 22.7 21.5 105 83 0.0 13.4 3.1 2.3 7.3 63 Reliance Comm RCOM IN U INR 134.6 90.00 (33) 4,488 23.4 1 9 2 4 51 1 8 1 3 45 Mar-13 253 (30) 2 42.5 12.0 17.2 16.8 187 111 0.4 6.0 0.7 2.3 5.7 67
Sector* (4) 37,448 (1) (5) (6) (6) 2 (1) (6) (7) (6) (3) Dec-12 60 36 18 42.0 26.2 19.2 16.3 116 107 0.5 7.1 1.8 2.2 6.7 67
Transportation Abhishek Bansal - 91 22 6777 3968
Adani Ports ADSEZ IN O INR 147.5 186.0 26 4,934 0.7 (2) 0 (10) (5) 9 (3) (1) (11) (5) 3 Mar-13 21 36 28 20.1 16.6 12.2 9.5 100 111 0.9 24.4 3.5 9.2 13.6 132
Utilities Amish Shah - 91 22 6777 3743
Adani Power ADANI IN U INR 34.55 17.00 (51) 1,604 3.1 (0) (1) (9) (11) (49) (1) (2) (10) (12) (55) Mar-13 nm nm nm nm nm nm nm 85 11 0.0 (42.1) 2.0 4.0 13.1 869 Jaiprakash Power JPVL IN O INR 16.60 35.00 111 788 2.0 0 (3) (9) (12) (56) (0) (4) (9) (13) (62) Mar-13 (39) 27 276 13.9 22.7 17.9 4.8 65 37 1.5 3.3 0.7 10.7 14.1 381
KSK KSK IN O INR 65.60 107.0 63 395 0.2 0 (4) 4 (3) 7 (0) (5) 3 (3) 2 Mar-12 286 (28) 292 62.7 16.2 22.4 5.7 107 nm 0.0 5.0 0.8 6.3 17.0 296 Lanco LANCI IN U INR 8.35 6.00 (28) 325 0.6 13 7 23 9 (40) 13 6 22 9 (46) Mar-13 nm nm nm nm nm nm nm 158 154 0.0 (24.3) 0.7 3.0 12.8 1,010 NHPC NHPC IN O INR 18.15 21.00 16 3,247 1.5 0 (1) (3) (7) (31) (0) (2) (4) (8) (37) Mar-13 (1) 7 3 9.5 9.6 9.0 8.7 99 94 3.3 7.5 0.7 4.5 6.9 36
NTPC NTPC IN O INR 130.8 170.0 30 17,422 11.2 (1) (0) (4) (4) (19) (1) (2) (5) (5) (25) Mar-13 8 15 7 11.1 10.3 8.9 8.3 100 109 3.8 12.5 1.2 2.3 9.2 68 Reliance Power RPWR IN U INR 68.15 61.00 (10) 3,089 10.4 (0) 1 (5) (7) (30) (0) 0 (5) (7) (35) Mar-13 4 5 (103) 22.9 22.0 20.9 nm 87 75 0.0 4.6 1.0 12.3 29.8 169 Tata Power TPWR IN U INR 76.95 66.00 (14) 2,951 5.5 (1) (1) (15) (16) (29) (1) (3) (16) (16) (35) Mar-13 (24) 27 8 23.4 30.9 24.3 22.5 70 63 1.5 5.2 1.6 1.4 7.5 251
Sector* 17 29,821 (0) (1) (5) (7) (25) (1) (2) (6) (7) (31) Dec-12 3 22 12 16.7 16.3 13.3 12.1 93 91 2.9 7.2 1.1 2.9 10.7 145
Country Average* SENSEX 21,251 23,296 10 855,969 0 1 1 0 6 Dec-12 9 15 14 17.0 15.6 13.5 12.3 99 97 1.9 15.6 2.3 1.4 9.5 43
* Country/ sector aggregates are for the coverage above
Source: Company data, Thomson Financial IBES, Credit Suisse estimates

23 J
an
uary
201
4
Ju
mp
-Sta
rt 5
3
Indonesia: Valuation summary Bberg Price Market Avg Absolute performance Relative performance FYE EPS growth P/E CS / Dvd ROE P/B EV/ EV/ Net debt/ daily con. EPS Yld sales EBITDA equity
Stock ticker View Local Target Upside cap t/o (%) (%) Actual (%) (x) (%) (%) (%) (x) (x) (x) (%)
21 January 2014 (%) (USDm) 1d 1w 1m 12m YTD 1d 1w 1m 12m YTD T T+1 T+2 T+3 T T+1 T+2 T+3 T+1 T+2 T+1
Automobiles & Components
Teddy Oetomo - 62 21 2553 7911
Astra International ASII IJ O IDR 6,750 8,370 24 22,537 15.2 (1) (4) 5 (1) (12) (2) (5) (1) (5) (13) Dec-12 (4) 20 15 14.1 14.6 12.2 10.6 101 107 4.3 25.0 3.5 1.6 11.6 38
Banks Teddy Oetomo - 62 21 2553 7911
BCA BBCA IJ N IDR 9,850 10,600 8 20,029 9.7 0 1 6 3 6 (0) (1) 0 (2) 6 Dec-12 16 6 21 20.6 17.8 16.8 13.9 98 91 1.9 24.1 4.0 na na na BJB BJBR IJ N IDR 900.0 975.0 8 713 0.7 (1) 8 5 1 (24) (1) 7 (1) (3) (24) Dec-12 8 15 14 7.3 6.8 5.9 5.1 96 100 10.2 19.5 1.2 na na na BNI BBNI IJ N IDR 4,265 4,700 10 6,494 7.1 1 1 9 8 11 0 (0) 3 4 10 Dec-12 23 6 10 11.3 9.2 8.6 7.9 103 101 3.3 18.7 1.6 na na na
BRI BBRI IJ O IDR 8,325 10,250 23 16,938 23.1 2 (1) 22 15 5 1 (2) 15 11 5 Dec-12 3 (1) 17 11.0 10.6 10.7 9.1 96 88 1.9 26.7 2.6 na na na BTN BBTN IJ U IDR 965.0 880.0 (9) 824 1.1 2 5 10 11 (37) 1 4 4 7 (38) Dec-12 3 26 13 7.5 7.3 5.8 5.1 99 107 0.0 15.4 1.0 na na na BTPN BTPN IJ N IDR 4,520 4,350 (4) 2,155 0.1 0 2 9 5 (14) (0) 0 3 1 (14) Dec-12 15 9 15 12.9 11.2 10.3 8.9 103 104 0.0 25.7 2.6 na na na
Bank Danamon BDMN IJ U IDR 4,550 3,000 (34) 3,561 1.6 7 14 21 21 (23) 7 12 15 16 (23) Dec-12 1 1 6 10.9 10.8 10.7 10.1 102 101 3.2 13.6 1.4 na na na Bank Mandiri BMRI IJ O IDR 8,775 10,500 20 16,718 22.2 0 (0) 10 12 3 (0) (2) 4 8 2 Dec-12 9 7 13 13.2 12.1 11.3 10.0 99 95 1.7 21.2 2.4 na na na Sector* 12 67,432 1 1 12 10 2 1 (0) 6 5 2 Dec-12 10 5 15 13.3 12.1 11.6 10.1 99 94 2.0 21.8 2.5 na na na
Building Materials & Construction
Ella Nusantoro - 62 21 255 37917
Holcim Indonesia SMCB IJ N IDR 2,310 2,825 22 1,460 0.5 0 (3) 6 2 (24) (0) (4) 0 (3) (24) Dec-12 (18) (2) 14 13.1 15.9 16.2 14.2 106 93 3.5 12.8 2.0 2.1 8.6 29 Indocement INTP IJ O IDR 21,450 25,700 20 6,512 5.0 (1) (2) 9 7 (0) (1) (4) 2 3 (1) Dec-12 6 9 14 16.6 15.6 14.3 12.6 100 98 1.8 23.8 3.4 3.8 9.7 (43) Semen Indonesia SMGR IJ O IDR 14,975 20,600 38 7,326 10.2 (1) (4) 7 6 (4) (1) (5) 1 2 (4) Dec-12 16 12 14 18.3 15.8 14.1 12.4 104 105 2.5 29.5 4.3 3.5 9.7 (4)
Sector* 29 15,298 (1) (3) 8 6 (4) (1) (4) 2 2 (5) Dec-12 8 9 14 16.9 15.7 14.4 12.6 102 101 2.3 24.1 3.5 3.4 9.6 (15)
Capital Goods Ami Tantri - 62 21 2553 7976
United Tractors UNTR IJ O IDR 19,800 23,000 16 6,091 4.0 2 4 6 4 (4) 1 3 (0) 0 (4) Dec-12 (13) 21 6 12.8 14.7 12.2 11.5 106 112 3.3 16.3 2.3 1.4 6.1 (8)
Consumer Staples Ella Nusantoro / Priscilla Tjitra - 62 21 255 37917 / 62 21 2553 7906
Astra Agro AALI IJ O IDR 21,900 26,500 21 2,844 2.5 1 3 (9) (13) 14 0 2 (15) (17) 14 Dec-12 (33) 50 8 14.3 21.2 14.1 13.1 102 103 3.5 17.5 3.6 3.1 12.3 8 BW Plantation BWPT IJ U IDR 1,315 870.0 (34) 485 1.9 1 10 (1) (1) (3) 1 9 (7) (5) (3) Dec-12 (44) 75 49 20.8 37.2 21.2 14.2 79 75 0.7 7.9 2.8 8.3 20.0 142
Bumitama BAL SP N SGD 0.93 1.00 8 1,279 0.5 1 1 (2) (1) (8) 0 (0) (8) (5) (8) Dec-12 (3) 40 13 20.7 21.4 15.3 13.5 100 88 0.5 13.9 2.8 4.0 13.0 18 DSN DSNG IJ O IDR 2,030 2,150 6 355 0.1 0 1 4 (1) na 0 (0) (3) (5) na Dec-12 12 59 14 20.1 18.0 11.4 10.0 100 100 0.7 15.8 2.3 1.7 8.7 92 First Resources FR SP O SGD 2.00 2.80 40 2,479 3.3 0 0 (0) (6) 8 (0) (1) (7) (10) 8 Dec-12 (7) 13 13 11.7 12.6 11.2 9.9 98 98 3.0 17.2 2.1 4.1 8.3 6
Gudang Garam GGRM IJ U IDR 45,000 37,500 (17) 7,141 5.3 (1) 6 7 7 (16) (1) 4 1 3 (16) Dec-12 8 14 18 21.6 20.1 17.6 14.9 99 100 1.8 15.5 3.0 1.7 13.0 32 Indofood Agri IFAR SP U SGD 0.81 0.61 (25) 912 1.4 (1) (4) (7) (9) (37) (1) (5) (13) (13) (37) Dec-12 (58) 74 15 10.5 25.3 14.5 12.6 88 91 1.9 3.1 0.8 1.1 7.2 14 Indofood CBP ICBP IJ N IDR 11,100 9,300 (16) 5,338 2.6 1 9 10 9 41 1 8 4 5 40 Dec-12 15 10 12 29.7 25.8 23.5 21.0 101 99 1.7 20.7 5.0 2.4 14.5 (34)
Indofood Sukses INDF IJ O IDR 6,775 8,100 20 4,906 5.1 0 1 5 3 13 (0) (1) (1) (2) 13 Dec-12 3 17 15 18.4 17.8 15.3 13.2 100 94 2.7 15.1 2.6 1.1 6.4 (2) London Sumatra LSIP IJ N IDR 1,695 1,300 (23) 954 4.5 2 14 (11) (12) (25) 1 12 (17) (16) (26) Dec-12 (59) 74 22 10.4 25.5 14.7 12.0 78 92 3.9 7.2 1.8 2.5 11.6 (31) Salim Ivomas SIMP IJ U IDR 715.0 510.0 (29) 933 1.0 4 1 (11) (8) (37) 3 0 (17) (13) (37) Dec-12 (75) 150 18 9.8 38.6 15.4 13.1 112 101 3.0 2.2 0.8 1.3 8.8 35
Sampoerna Agro SGRO IJ U IDR 1,865 1,300 (30) 291 0.2 0 (1) (4) (7) (25) (0) (2) (10) (11) (26) Dec-12 (68) 137 22 10.7 33.5 14.2 11.6 104 94 3.3 4.0 1.3 1.8 12.0 28 Unilever Indon UNVR IJ U IDR 28,150 20,600 (27) 17,714 5.0 0 4 8 8 22 (0) 3 2 4 22 Dec-12 12 2 12 44.4 39.8 39.0 34.7 99 93 2.3 127.1 47.4 6.8 28.7 23 Sector* (12) 45,630 0 4 5 4 11 (0) 3 (1) (0) 11 Dec-12 (8) 22 15 23.5 25.6 21.0 18.2 99 95 2.2 16.3 4.0 2.5 13.7 12
Energy Ami Tantri - 62 21 2553 7976
AKR Corporindo AKRA IJ N IDR 4,630 4,900 6 1,482 3.3 (0) (3) (3) 6 16 (1) (4) (9) 2 16 Dec-12 (2) 64 45 27.3 27.8 17.0 11.7 89 119 1.4 15.1 4.0 0.8 16.7 27
Healthcare Anand Swaminathan / Ella Nusantoro - 65 6212 3012 / 62 21 255 37917
Kalbe Farma KLBF IJ N IDR 1,410 1,220 (13) 5,451 7.8 0 (1) 18 13 36 (0) (3) 11 9 35 Dec-12 13 14 20 38.1 33.8 29.5 24.7 100 96 1.2 24.7 7.5 4.1 23.4 (24) Siloam Hospitals SILO IJ N IDR 9,450 10,500 11 901 4.6 0 (1) 0 (1) na (0) (2) (6) (5) na Dec-12 (41) 114 82 187.3 319.3 149.2 81.8 99 89 0.0 3.7 6.9 3.9 40.3 (55) Sector* (10) 6,352 0 (1) 15 11 36 (0) (3) 9 7 35 Dec-12 11 16 22 43.0 38.7 33.3 27.4 100 96 1.0 22.5 7.4 4.0 24.9 (29)
Media Ella Nusantoro - 62 21 255 37917
Media Nusantara MNCN IJ N IDR 2,390 3,150 32 2,779 4.4 (1) (5) (2) (9) (0) (2) (6) (9) (13) (1) Dec-12 14 19 16 20.1 17.7 14.8 12.7 101 102 2.5 23.8 3.9 4.5 12.2 (42)
Surya Citra SCMA IJ N IDR 2,565 2,775 8 3,093 2.1 1 (2) 4 (2) 12 0 (4) (2) (6) 11 Dec-12 (79) 20 16 5.4 26.1 21.7 18.6 103 103 3.8 60.4 14.6 9.5 18.9 (33) Sector* 19 5,872 (0) (3) 1 (5) 6 (1) (5) (5) (10) 6 Dec-12 (61) 20 16 8.3 21.3 17.8 15.3 102 103 3.2 32.2 6.4 6.3 15.2 (40)
Metals & Mining Ami Tantri / Paworamon (Poom) Suvarnatemee - 62 21 2553 7976 / 66 2 614 6210
ABM Investama ABMM IJ N IDR 3,000 2,600 (13) 681 0.1 0 2 4 0 7 (0) 0 (2) (4) 7 Dec-12 68 243 40 49.9 29.8 8.7 6.2 83 129 0.0 6.4 1.9 1.4 5.7 153 Adaro Energy ADRO IJ O IDR 980.0 1,450 48 2,585 5.7 1 3 (13) (10) (41) 0 1 (19) (14) (41) Dec-12 (36) 29 29 6.7 10.6 8.2 6.4 77 99 2.8 9.3 1.0 1.4 5.2 55
Delta Dunia Makmur DOID IJ N IDR 98.00 100.0 2 66 0.3 1 23 2 7 (59) 1 21 (4) 2 (59) Dec-12 nm nm 114 nm nm 6.9 3.2 104 121 0.0 (22.5) 0.9 1.2 4.2 1,107 Harum Energy HRUM IJ N IDR 2,505 2,900 16 559 2.2 2 7 (15) (9) (61) 1 6 (21) (13) (61) Dec-12 (63) 22 76 4.2 11.4 9.3 5.3 90 88 4.4 14.4 1.7 0.4 3.4 (45) ITM ITMG IJ N IDR 25,800 32,000 24 2,404 2.5 1 1 (13) (9) (36) 1 (1) (20) (14) (37) Dec-12 (44) (7) 4 5.6 9.9 10.6 10.2 96 87 8.6 25.9 2.7 1.0 5.7 (29)
Indika Energy INDY IJ N IDR 540.0 900.0 67 232 0.8 3 6 (8) (8) (64) 2 4 (15) (13) (64) Dec-12 (99) nm 74 3.4 493.4 7.1 4.1 2 78 0.1 0.1 0.3 1.0 3.1 55 PT Bukit Asam PTBA IJ O IDR 9,700 13,600 40 1,843 2.4 1 6 (8) (5) (39) 0 5 (15) (9) (40) Dec-12 (38) 15 35 7.7 12.3 10.7 7.9 103 104 4.9 21.2 2.6 1.4 7.7 (51) Sector* 32 8,371 1 3 (11) (8) (37) 0 2 (17) (12) (38) Dec-12 (40) 50 37 8.2 13.6 9.1 6.6 85 97 4.2 11.8 1.5 1.3 5.8 41
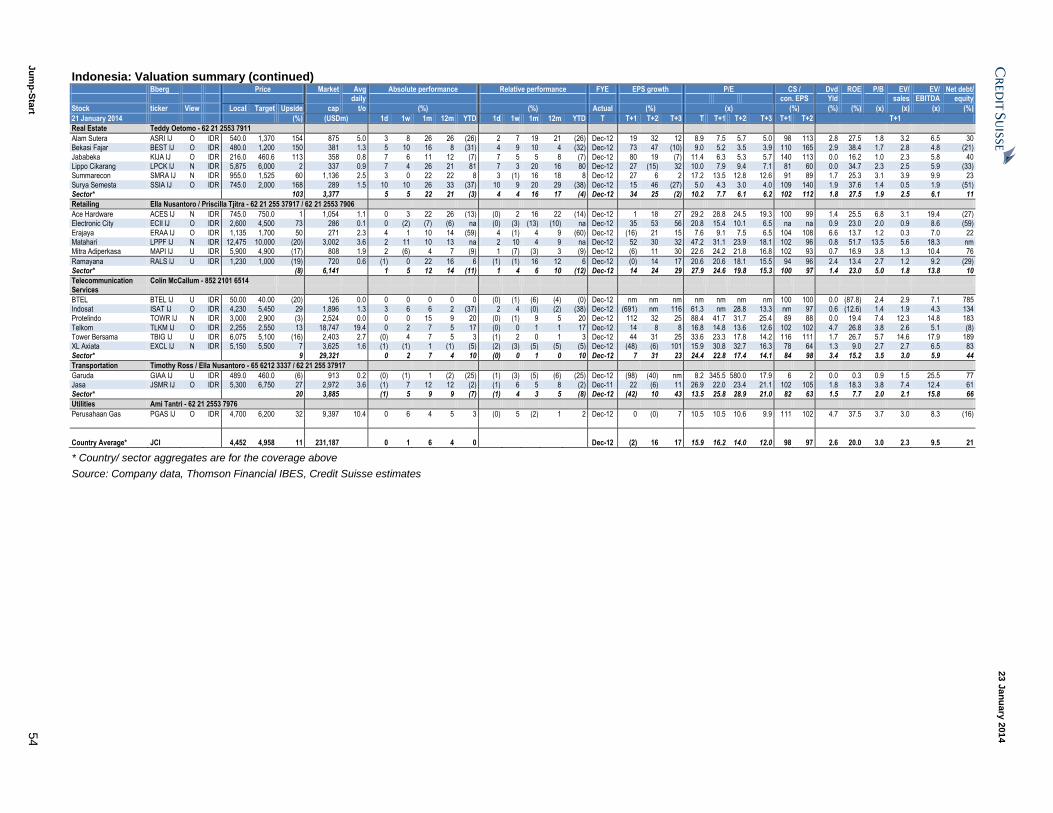
23 J
an
uary
201
4
Ju
mp
-Sta
rt 5
4
Indonesia: Valuation summary (continued) Bberg Price Market Avg Absolute performance Relative performance FYE EPS growth P/E CS / Dvd ROE P/B EV/ EV/ Net debt/ daily con. EPS Yld sales EBITDA equity
Stock ticker View Local Target Upside cap t/o (%) (%) Actual (%) (x) (%) (%) (%) (x) (x) (x) (%)
21 January 2014 (%) (USDm) 1d 1w 1m 12m YTD 1d 1w 1m 12m YTD T T+1 T+2 T+3 T T+1 T+2 T+3 T+1 T+2 T+1
Real Estate Teddy Oetomo - 62 21 2553 7911
Alam Sutera ASRI IJ O IDR 540.0 1,370 154 875 5.0 3 8 26 26 (26) 2 7 19 21 (26) Dec-12 19 32 12 8.9 7.5 5.7 5.0 98 113 2.8 27.5 1.8 3.2 6.5 30 Bekasi Fajar BEST IJ O IDR 480.0 1,200 150 381 1.3 5 10 16 8 (31) 4 9 10 4 (32) Dec-12 73 47 (10) 9.0 5.2 3.5 3.9 110 165 2.9 38.4 1.7 2.8 4.8 (21)
Jababeka KIJA IJ O IDR 216.0 460.6 113 358 0.8 7 6 11 12 (7) 7 5 5 8 (7) Dec-12 80 19 (7) 11.4 6.3 5.3 5.7 140 113 0.0 16.2 1.0 2.3 5.8 40 Lippo Cikarang LPCK IJ N IDR 5,875 6,000 2 337 0.9 7 4 26 21 81 7 3 20 16 80 Dec-12 27 (15) 32 10.0 7.9 9.4 7.1 81 60 0.0 34.7 2.3 2.5 5.9 (33) Summarecon SMRA IJ N IDR 955.0 1,525 60 1,136 2.5 3 0 22 22 8 3 (1) 16 18 8 Dec-12 27 6 2 17.2 13.5 12.8 12.6 91 89 1.7 25.3 3.1 3.9 9.9 23
Surya Semesta SSIA IJ O IDR 745.0 2,000 168 289 1.5 10 10 26 33 (37) 10 9 20 29 (38) Dec-12 15 46 (27) 5.0 4.3 3.0 4.0 109 140 1.9 37.6 1.4 0.5 1.9 (51) Sector* 103 3,377 5 5 22 21 (3) 4 4 16 17 (4) Dec-12 34 25 (2) 10.2 7.7 6.1 6.2 102 112 1.8 27.5 1.9 2.5 6.1 11
Retailing Ella Nusantoro / Priscilla Tjitra - 62 21 255 37917 / 62 21 2553 7906
Ace Hardware ACES IJ N IDR 745.0 750.0 1 1,054 1.1 0 3 22 26 (13) (0) 2 16 22 (14) Dec-12 1 18 27 29.2 28.8 24.5 19.3 100 99 1.4 25.5 6.8 3.1 19.4 (27) Electronic City ECII IJ O IDR 2,600 4,500 73 286 0.1 0 (2) (7) (6) na (0) (3) (13) (10) na Dec-12 35 53 56 20.8 15.4 10.1 6.5 na na 0.9 23.0 2.0 0.9 8.6 (59)
Erajaya ERAA IJ O IDR 1,135 1,700 50 271 2.3 4 1 10 14 (59) 4 (1) 4 9 (60) Dec-12 (16) 21 15 7.6 9.1 7.5 6.5 104 108 6.6 13.7 1.2 0.3 7.0 22 Matahari LPPF IJ N IDR 12,475 10,000 (20) 3,002 3.6 2 11 10 13 na 2 10 4 9 na Dec-12 52 30 32 47.2 31.1 23.9 18.1 102 96 0.8 51.7 13.5 5.6 18.3 nm Mitra Adiperkasa MAPI IJ U IDR 5,900 4,900 (17) 808 1.9 2 (6) 4 7 (9) 1 (7) (3) 3 (9) Dec-12 (6) 11 30 22.6 24.2 21.8 16.8 102 93 0.7 16.9 3.8 1.3 10.4 76
Ramayana RALS IJ U IDR 1,230 1,000 (19) 720 0.6 (1) 0 22 16 6 (1) (1) 16 12 6 Dec-12 (0) 14 17 20.6 20.6 18.1 15.5 94 96 2.4 13.4 2.7 1.2 9.2 (29) Sector* (8) 6,141 1 5 12 14 (11) 1 4 6 10 (12) Dec-12 14 24 29 27.9 24.6 19.8 15.3 100 97 1.4 23.0 5.0 1.8 13.8 10
Telecommunication Services
Colin McCallum - 852 2101 6514
BTEL BTEL IJ U IDR 50.00 40.00 (20) 126 0.0 0 0 0 0 0 (0) (1) (6) (4) (0) Dec-12 nm nm nm nm nm nm nm 100 100 0.0 (87.8) 2.4 2.9 7.1 785 Indosat ISAT IJ O IDR 4,230 5,450 29 1,896 1.3 3 6 6 2 (37) 2 4 (0) (2) (38) Dec-12 (691) nm 116 61.3 nm 28.8 13.3 nm 97 0.6 (12.6) 1.4 1.9 4.3 134 Protelindo TOWR IJ N IDR 3,000 2,900 (3) 2,524 0.0 0 0 15 9 20 (0) (1) 9 5 20 Dec-12 112 32 25 88.4 41.7 31.7 25.4 89 88 0.0 19.4 7.4 12.3 14.8 183
Telkom TLKM IJ O IDR 2,255 2,550 13 18,747 19.4 0 2 7 5 17 (0) 0 1 1 17 Dec-12 14 8 8 16.8 14.8 13.6 12.6 102 102 4.7 26.8 3.8 2.6 5.1 (8) Tower Bersama TBIG IJ U IDR 6,075 5,100 (16) 2,403 2.7 (0) 4 7 5 3 (1) 2 0 1 3 Dec-12 44 31 25 33.6 23.3 17.8 14.2 116 111 1.7 26.7 5.7 14.6 17.9 189 XL Axiata EXCL IJ N IDR 5,150 5,500 7 3,625 1.6 (1) (1) 1 (1) (5) (2) (3) (5) (5) (5) Dec-12 (48) (6) 101 15.9 30.8 32.7 16.3 78 64 1.3 9.0 2.7 2.7 6.5 83
Sector* 9 29,321 0 2 7 4 10 (0) 0 1 0 10 Dec-12 7 31 23 24.4 22.8 17.4 14.1 84 98 3.4 15.2 3.5 3.0 5.9 44
Transportation Timothy Ross / Ella Nusantoro - 65 6212 3337 / 62 21 255 37917
Garuda GIAA IJ U IDR 489.0 460.0 (6) 913 0.2 (0) (1) 1 (2) (25) (1) (3) (5) (6) (25) Dec-12 (98) (40) nm 8.2 345.5 580.0 17.9 6 2 0.0 0.3 0.9 1.5 25.5 77 Jasa JSMR IJ O IDR 5,300 6,750 27 2,972 3.6 (1) 7 12 12 (2) (1) 6 5 8 (2) Dec-11 22 (6) 11 26.9 22.0 23.4 21.1 102 105 1.8 18.3 3.8 7.4 12.4 61 Sector* 20 3,885 (1) 5 9 9 (7) (1) 4 3 5 (8) Dec-12 (42) 10 43 13.5 25.8 28.9 21.0 82 63 1.5 7.7 2.0 2.1 15.8 66
Utilities Ami Tantri - 62 21 2553 7976
Perusahaan Gas PGAS IJ O IDR 4,700 6,200 32 9,397 10.4 0 6 4 5 3 (0) 5 (2) 1 2 Dec-12 0 (0) 7 10.5 10.5 10.6 9.9 111 102 4.7 37.5 3.7 3.0 8.3 (16)
Country Average* JCI 4,452 4,958 11 231,187 0 1 6 4 0 Dec-12 (2) 16 17 15.9 16.2 14.0 12.0 98 97 2.6 20.0 3.0 2.3 9.5 21
* Country/ sector aggregates are for the coverage above
Source: Company data, Thomson Financial IBES, Credit Suisse estimates

23 J
an
uary
201
4
Ju
mp
-Sta
rt 5
5
Japan: Valuation summary Bberg Price Market Avg Absolute performance Relative performance FYE EPS growth P/E CS / Divd ROE P/B EV/ EV/ Net debt/ daily con. EPS yld sales EBITDA equity
Stock ticker View Local Target Upside cap t/o (%) (%) Actual (%) (x) (%) (%) (%) (x) (x) (x) (%)
21 January 2014 (%) (USDm) 1d 1w 1m 12m YTD 1d 1w 1m 12m YTD T T+1 T+2 T+3 T T+1 T+2 T+3 T+1 T+2 T+1
Automobiles & Components Issei Takahashi / Masahiro Akita - 81 3 4550 7884 / 81 3 4550 7361
Aisin Seiki 7259 JP O JPY 4,120 5,100 24 11,140 30.7 (1) 1 (1) (4) 46 (1) (1) (4) (3) 3 Mar-13 17 13 10 15.0 12.8 11.3 10.3 101 104 1.9 10.2 1.3 0.4 3.7 8 Bridgestone 5108 JT O JPY 3,931 4,500 14 29,501 99.2 1 2 2 (1) 66 1 0 (1) (1) 23 Dec-12 60 11 9 17.9 11.2 10.0 9.2 106 107 1.4 17.6 1.8 0.9 6.8 9
Calsonic Kansei 7248 JP N JPY 555.0 550.0 (1) 1,426 7.6 5 9 3 2 48 5 7 (0) 3 5 Mar-13 190 (13) 22 25.4 8.7 10.1 8.3 102 89 1.4 12.0 1.0 0.2 4.0 22 Daihatsu Motor 7262 JP N JPY 1,824 1,930 6 7,453 36.7 1 6 7 2 2 1 4 5 3 (41) Mar-13 3 1 2 9.5 9.2 9.2 9.0 101 103 3.2 15.8 1.4 0.4 3.5 0 Denso 6902 JP O JPY 5,662 6,450 14 43,238 91.9 0 4 9 2 72 (0) 1 6 3 29 Mar-13 55 11 10 25.0 16.1 14.5 13.1 101 106 1.8 11.8 1.8 1.1 7.5 (3)
Exedy 7278 JP O JPY 3,355 3,650 9 1,544 5.1 (1) 3 10 9 70 (1) 1 7 10 27 Mar-13 23 17 21 16.6 13.5 11.5 9.5 104 115 1.6 8.7 1.1 0.7 5.2 6 Fuji Heavy Industries 7270 JP O JPY 3,029 3,480 15 22,666 189.8 (1) 3 4 0 169 (1) 0 2 1 126 Mar-13 95 0 12 19.7 10.1 10.1 9.0 111 112 1.7 33.6 3.0 0.9 6.0 (14) Hino Motors 7205 JP O JPY 1,591 1,750 10 8,728 36.8 (0) (0) 3 (4) 80 (0) (2) (0) (3) 37 Mar-13 64 7 19 19.0 11.6 10.8 9.1 109 113 2.5 27.1 2.9 0.6 6.0 20
Honda Motor 7267 JP O JPY 4,129 5,060 23 71,356 212.3 (1) 0 (4) (5) 21 (1) (2) (7) (4) (22) Mar-13 68 21 3 20.4 12.1 10.0 9.7 101 104 1.9 11.3 1.3 1.0 9.8 71 Isuzu Motors 7202 JP O JPY 650.0 830.0 28 10,560 76.5 (1) 3 6 (1) 20 (1) 0 3 (0) (23) Mar-13 18 5 11 11.4 9.7 9.2 8.3 101 99 1.8 20.9 1.9 0.6 4.4 (19) Keihin 7251 JP N JPY 1,711 1,750 2 1,213 5.7 (0) 5 7 5 42 (1) 3 4 5 (2) Mar-13 239 20 21 47.6 14.1 11.7 9.7 100 98 1.8 6.6 0.9 0.4 3.6 0
Mazda Motor 7261 JP O JPY 552.0 600.0 9 22,273 261.7 (0) 0 9 1 154 (1) (2) 6 2 111 Mar-13 255 103 (29) 48.1 13.5 6.7 9.5 104 155 0.0 21.9 2.7 1.0 10.8 60 Musashi Seimitsu Industry 7220 JP O JPY 2,224 2,800 26 665 4.4 (1) (1) 1 (2) 24 (1) (3) (2) (2) (19) Mar-13 137 17 14 27.4 11.6 9.9 8.7 90 98 2.2 11.0 1.2 0.7 4.8 57 Nissan Motor 7201 JP N JPY 961.0 1,000 4 38,623 140.9 (0) 2 10 9 11 (0) 0 8 9 (32) Mar-13 (3) 20 18 11.8 12.2 10.2 8.6 90 88 3.1 8.4 1.0 0.7 9.0 91
Sumitomo Rubber Industries 5110 JP N JPY 1,504 1,500 (0) 3,783 17.8 0 (0) 4 1 29 (0) (2) 1 1 (14) Dec-12 18 5 9 11.1 9.4 9.0 8.2 101 99 2.3 16.1 1.4 0.8 5.5 78 Suzuki Motor 7269 JP N JPY 2,944 3,070 4 15,838 52.3 1 2 7 4 25 1 (0) 4 5 (18) Mar-13 44 14 7 20.5 14.3 12.5 11.7 106 114 0.7 9.7 1.3 0.5 4.4 (22) Takata Corporation 7312 JP O JPY 3,240 3,550 10 2,584 7.3 2 9 9 7 79 2 7 7 8 35 Mar-13 nm 115 6 nm 24.5 11.4 10.8 91 114 1.1 7.0 1.7 0.5 5.8 (8)
Tokai Rika 6995 JP N JPY 1,991 2,250 13 1,728 5.4 (1) (0) (1) (5) 54 (1) (2) (4) (4) 11 Mar-13 227 4 13 34.6 10.6 10.2 9.0 98 96 1.8 9.4 1.0 0.4 3.8 (4) Toyoda Gosei 7282 JP N JPY 2,267 2,500 10 2,814 8.0 0 (1) (4) (7) 14 0 (3) (7) (7) (29) Mar-13 21 4 4 13.7 11.3 10.9 10.5 99 96 2.3 9.9 1.1 0.4 3.3 (10) Toyota Boshoku 3116 JP U JPY 1,264 1,200 (5) 2,246 6.3 (1) 1 (2) (4) 12 (1) (1) (5) (3) (31) Mar-13 14 3 13 14.8 13.0 12.6 11.2 97 94 1.5 9.3 1.2 0.2 4.1 17
Toyota Industries 6201 JP O JPY 5,110 5,900 15 15,344 24.2 1 9 13 8 74 1 7 11 8 31 Mar-13 67 26 13 30.0 18.0 14.3 12.6 104 116 1.5 5.4 0.9 1.1 10.6 33 Toyota Motor 7203 JP O JPY 6,300 7,450 18 208,288 546.7 2 3 2 (2) 47 1 0 (1) (1) 4 Mar-13 105 3 2 20.7 10.1 9.8 9.6 107 101 3.0 15.2 1.4 0.8 6.4 0 Yamaha Motor 7272 JP U JPY 1,536 1,430 (7) 5,142 24.8 1 2 (1) (3) 42 1 (0) (4) (2) (1) Dec-12 343 55 26 71.6 16.2 10.4 8.3 96 105 1.3 9.9 1.5 0.5 8.1 53
Sector* 16 528,152 1 2 3 (0) 52 0 0 1 0 9 Mar-13 69 12 5 19.3 11.4 10.2 9.8 104 104 2.3 13.3 1.4 0.8 7.0 24
Banks Takehito Yamanaka - 81 3 4550 9150
Mitsubishi UFJ Financial Group 8306 JP O JPY 671.0 840.0 25 91,109 330.7 (1) 1 3 (3) 42 (1) (2) (0) (3) (1) Mar-13 12 (2) 9 11.1 9.9 10.2 9.3 104 110 2.1 7.8 0.7 na na na Mizuho Financial Group 8411 JP N JPY 232.0 260.0 12 53,822 270.0 (1) 0 8 2 36 (1) (2) 6 2 (7) Mar-13 16 (18) 20 10.0 8.6 10.5 8.7 105 100 2.6 11.1 1.0 na na na Sumitomo Mitsui Financial Group 8316 JP O JPY 5,284 6,015 14 69,279 313.6 (1) 1 0 (3) 60 (2) (1) (3) (2) 17 Mar-13 (2) (17) 10 9.0 9.2 11.1 10.1 100 96 2.3 11.4 1.0 na na na
Sector* 18 214,211 (1) 0 3 (2) 46 (1) (2) 1 (1) 3 Mar-13 8 (11) 12 10.1 9.3 10.5 9.4 103 103 2.3 9.6 0.9 na na na
Building Materials & Construction Jun Yamaguchi / Shinya Yamada - 81 3 4550 9789 / 81 3 4550 9910
Asahi Glass 5201 JP N JPY 630.0 660.0 5 6,982 38.3 (0) 0 (3) (4) 6 (1) (2) (6) (3) (37) Dec-12 (68) 131 28 16.6 51.3 22.2 17.3 116 97 2.9 1.4 0.7 0.9 5.9 39 Fujikura 5803 JP O JPY 515.0 610.0 18 1,617 13.1 (1) 9 8 4 94 (1) 7 5 5 50 Mar-13 238 50 23 57.7 17.1 11.4 9.2 121 140 1.4 5.1 0.8 0.5 6.4 65 Furukawa Electric 5801 JP O JPY 285.0 290.0 2 1,930 19.8 2 8 15 8 57 2 6 12 8 13 Mar-13 82 185 14 56.3 31.0 10.9 9.6 94 124 1.1 3.7 1.1 0.5 8.2 108
NGK Insulators 5333 JP N JPY 1,902 1,530 (20) 5,956 23.8 2 3 1 (5) 75 2 1 (1) (4) 32 Mar-13 130 27 12 54.4 23.6 18.7 16.7 97 100 1.2 8.4 1.9 2.2 11.7 12 NSG Group 5202 JP O JPY 146.0 150.0 3 1,263 21.1 0 (2) 13 7 40 (0) (4) 10 7 (3) Mar-13 nm nm 31 nm nm 14.8 11.3 105 234 0.0 (13.4) 0.9 0.8 11.8 230 Nippon Electric Glass 5214 JP U JPY 532.0 400.0 (25) 2,537 24.0 1 4 (0) (4) 21 1 2 (3) (3) (23) Mar-13 (21) (26) 21 25.0 31.5 42.7 35.3 91 97 1.9 1.7 0.5 0.9 4.1 (8)
Sumitomo Electric Industries 5802 JP O JPY 1,680 2,000 19 12,778 47.9 (1) (2) (2) (4) 67 (1) (4) (5) (4) 24 Mar-13 119 36 11 35.1 16.1 11.8 10.7 108 117 1.3 7.4 1.1 0.6 6.8 24 Sumitomo Osaka Cement 5232 JP O JPY 399.0 500.0 25 1,593 13.4 0 2 1 (1) 32 0 0 (1) (1) (11) Mar-13 62 7 12 22.3 13.7 12.9 11.5 105 101 1.3 8.2 1.1 1.0 6.1 43 Taiheiyo Cement 5233 JP N JPY 403.0 460.0 14 4,747 69.1 (0) 0 2 (0) 70 (0) (2) (1) 0 27 Mar-13 115 46 14 43.7 20.3 13.9 12.2 103 115 1.2 11.9 2.2 1.1 8.2 158
Tatsuta Electric Wire & Cable 5809 JP O JPY 675.0 900.0 33 413 4.5 (1) 7 20 6 (9) (2) 5 17 7 (52) Mar-13 8 50 27 15.5 14.4 9.6 7.6 86 110 1.5 9.8 1.4 0.8 6.4 (4) Toyo Tanso 5310 JP O JPY 2,243 2,500 11 446 1.6 (1) 5 14 12 21 (1) 3 11 13 (22) Dec-12 nm 224 32 nm 68.4 21.1 16.0 164 149 0.5 1.2 0.8 2.4 14.3 3 Sector* 6 40,261 0 1 1 (2) 52 (0) (1) (2) (2) 9 Mar-13 89 64 13 45.8 24.2 14.7 12.3 106 114 1.5 4.5 1.0 0.8 7.2 45
Capital Goods Hideyuki Maekawa / Jun Yamaguchi / Masahiro Mochizuki / Shinji Kuroda - 81 3 4550 9723 / 81 3 4550 9789 / 81 3 4550 7389 / 81 3 4550 9994
Amada 6113 JP N JPY 916.0 870.0 (5) 3,354 21.8 0 3 (1) (1) 61 0 0 (4) (1) 18 Mar-13 176 37 13 84.7 30.7 22.4 19.8 96 99 1.5 2.9 0.9 1.1 11.8 (17)
Anritsu 6754 JP O JPY 1,159 1,560 35 1,593 17.8 1 1 5 0 4 1 (1) 2 1 (39) Mar-13 (10) 14 0 11.9 13.3 11.6 11.6 109 109 1.6 18.0 2.2 1.4 7.1 (19) Central Glass 4044 JP N JPY 343.0 300.0 (13) 688 1.8 1 2 2 (2) 16 1 0 (1) (2) (27) Mar-13 23 7 5 14.8 12.0 11.2 10.7 122 112 2.3 4.7 0.6 0.5 5.7 19 Chiyoda Corporation 6366 JP N JPY 1,618 1,300 (20) 4,019 23.2 1 6 12 6 37 1 4 9 7 (6) Mar-13 5 7 8 26.1 24.9 23.4 21.6 94 94 1.1 8.6 2.1 0.8 13.1 (24)
DMG Mori Seiki 6141 JP U JPY 1,921 1,400 (27) 1,991 10.9 (1) (4) 5 2 144 (1) (6) 3 2 101 Mar-13 53 16 5 40.6 26.6 22.8 21.7 99 86 1.0 7.5 2.0 1.6 17.1 43 Daikin Industries 6367 JP N JPY 6,288 5,900 (6) 17,551 85.4 (0) 5 (2) (4) 95 (0) 3 (5) (4) 52 Mar-13 93 13 16 42.0 21.8 19.3 16.7 103 98 0.8 12.7 2.8 1.3 12.2 67 Ebara 6361 JP O JPY 709.0 760.0 7 3,157 22.7 (1) 3 8 5 97 (1) 1 5 5 54 Mar-13 (6) 19 15 19.7 21.0 17.6 15.3 100 97 0.7 8.0 1.8 0.8 7.5 2
Fanuc 6954 JP O JPY 17,860 19,000 6 33,514 172.7 2 3 (5) (7) 24 2 1 (8) (7) (19) Mar-13 (13) 22 11 29.0 33.3 27.3 24.6 101 103 0.9 9.3 3.0 6.1 15.4 (69) GS Yuasa 6674 JP U JPY 579.0 500.0 (14) 2,292 30.6 0 (1) (2) (4) 82 (0) (3) (5) (4) 39 Mar-13 157 5 14 41.4 16.2 15.3 13.4 131 96 1.4 11.1 1.7 0.9 10.5 38 HASEKO Corporation 1808 JP O JPY 848.0 910.0 7 2,444 29.2 (1) 4 12 6 82 (1) 2 9 6 39 Mar-13 26 11 15 19.5 15.5 13.9 12.1 105 97 0.0 14.1 2.0 0.6 10.5 55
Hitachi Construction Machinery 6305 JP N JPY 2,125 2,200 4 4,329 30.3 0 2 (3) (5) 11 0 (0) (6) (5) (32) Mar-13 53 6 25 19.2 12.5 11.9 9.5 118 114 1.9 9.5 1.2 0.9 6.4 66 IHI 7013 JP U JPY 499.0 350.0 (30) 7,019 49.2 (2) 5 12 10 109 (2) 2 9 10 66 Mar-13 (17) 5 10 21.9 26.4 25.2 23.0 91 83 1.0 9.5 2.4 0.7 9.9 75 JGC Corporation 1963 JP N JPY 4,160 3,800 (9) 10,071 46.4 0 4 6 1 62 0 2 3 1 19 Mar-13 8 1 4 22.7 21.1 20.8 20.0 100 93 1.2 14.0 2.8 1.1 10.0 (68)
JTEKT 6473 JP O JPY 1,681 1,750 4 5,511 22.0 0 2 (5) (6) 81 0 (0) (8) (6) 37 Mar-13 33 68 23 41.5 31.2 18.5 15.0 80 79 1.0 4.9 1.5 0.7 7.7 61 Kajima Corporation 1812 JP U JPY 400.0 360.0 (10) 3,983 38.6 0 3 7 1 45 0 0 4 2 2 Mar-13 (24) (2) 41 17.7 23.5 24.0 17.0 102 94 1.3 5.4 1.2 0.4 16.5 60 Keyence 6861 JP N JPY 43,790 38,000 (13) 25,475 51.0 2 0 (2) (3) 79 2 (2) (5) (2) 35 Mar-13 29 12 na 39.4 30.5 27.2 na 100 101 0.1 11.4 3.3 8.1 16.2 (62)
Komatsu 6301 JP N JPY 2,087 1,900 (9) 19,075 147.4 0 2 (1) (2) (11) (0) 0 (3) (2) (54) Mar-13 5 1 19 15.7 15.0 14.8 12.5 95 89 2.8 10.8 1.6 1.4 9.0 39 Kubota 6326 JP N JPY 1,811 1,750 (3) 21,816 70.7 0 6 7 4 76 0 4 5 5 33 Mar-13 54 6 9 27.8 18.1 17.1 15.7 101 101 1.0 15.4 2.8 1.6 10.5 18 LIXIL Group 5938 JP R JPY 2,909 8,110 42.2 (1) (0) 3 1 39 (1) (2) (0) 1 (5) Mar-13 84 14 (12) 39.6 21.5 18.9 21.6 95 96 1.4 6.8 1.4 0.7 9.4 52
Makita 6586 JP O JPY 5,750 5,800 1 7,484 31.9 (1) 6 8 4 38 (1) 4 6 5 (5) Mar-13 24 23 14 25.1 20.3 16.5 14.5 101 109 1.5 9.5 1.9 1.7 10.2 (34) Mitsubishi Heavy Industries 7011 JP O JPY 715.0 700.0 (2) 23,004 109.3 (1) 7 13 10 47 (1) 4 10 10 4 Mar-13 37 10 na 24.6 17.9 16.4 na 121 117 0.8 9.5 1.7 0.9 9.1 48
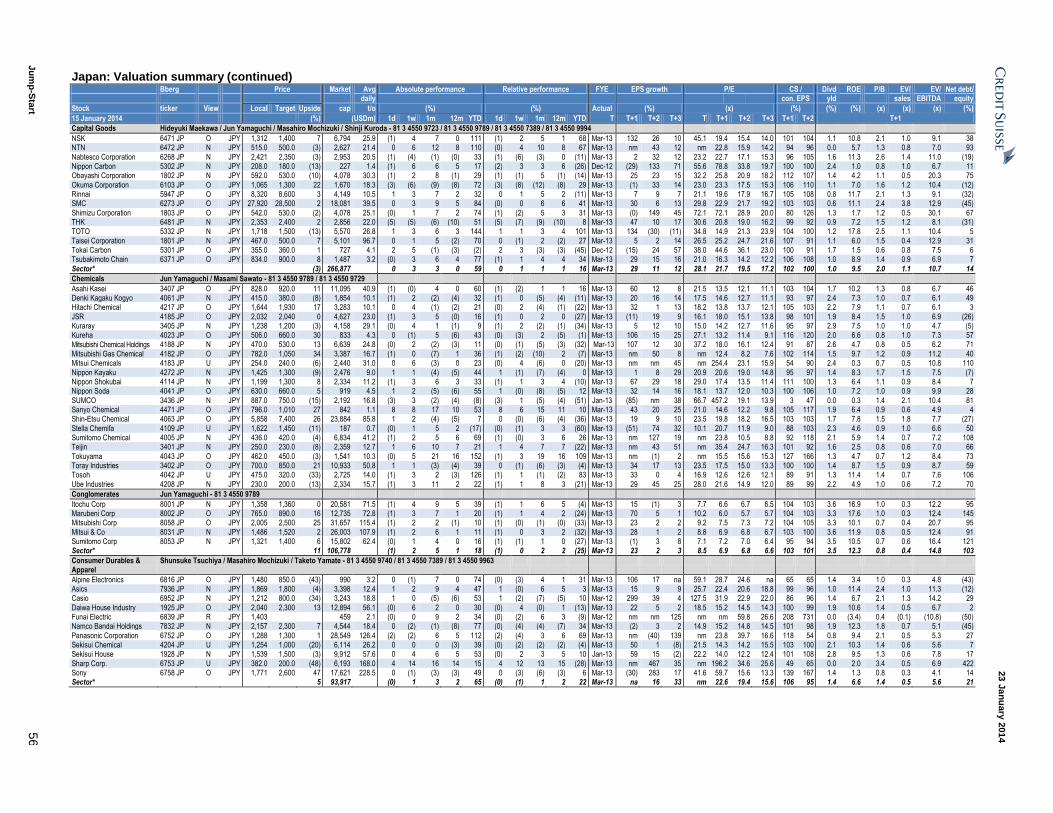
23 J
an
uary
201
4
Ju
mp
-Sta
rt 5
6
Japan: Valuation summary (continued) Bberg Price Market Avg Absolute performance Relative performance FYE EPS growth P/E CS / Divd ROE P/B EV/ EV/ Net debt/ daily
con. EPS yld sales EBITDA equity
Stock ticker View Local Target Upside cap t/o (%) (%) Actual (%) (x) (%) (%) (%) (x) (x) (x) (%)
15 January 2014 (%) (USDm) 1d 1w 1m 12m YTD 1d 1w 1m 12m YTD T T+1 T+2 T+3 T T+1 T+2 T+3 T+1 T+2 T+1
Capital Goods Hideyuki Maekawa / Jun Yamaguchi / Masahiro Mochizuki / Shinji Kuroda - 81 3 4550 9723 / 81 3 4550 9789 / 81 3 4550 7389 / 81 3 4550 9994
NSK 6471 JP O JPY 1,312 1,400 7 6,794 25.9 (1) 4 7 0 111 (1) 2 5 1 68 Mar-13 132 26 10 45.1 19.4 15.4 14.0 101 104 1.1 10.8 2.1 1.0 9.1 38 NTN 6472 JP N JPY 515.0 500.0 (3) 2,627 21.4 0 6 12 8 110 (0) 4 10 8 67 Mar-13 nm 43 12 nm 22.8 15.9 14.2 94 96 0.0 5.7 1.3 0.8 7.0 93
Nabtesco Corporation 6268 JP N JPY 2,421 2,350 (3) 2,953 20.5 (1) (4) (1) (0) 33 (1) (6) (3) 0 (11) Mar-13 2 32 12 23.2 22.7 17.1 15.3 96 105 1.6 11.3 2.6 1.4 11.0 (19) Nippon Carbon 5302 JP N JPY 208.0 180.0 (13) 227 1.4 (1) 6 6 5 17 (2) 3 3 6 (26) Dec-12 (29) 133 71 55.6 78.8 33.8 19.7 100 100 2.4 1.0 0.8 1.0 6.7 11 Obayashi Corporation 1802 JP N JPY 592.0 530.0 (10) 4,078 30.3 (1) 2 8 (1) 29 (1) (1) 5 (1) (14) Mar-13 25 23 15 32.2 25.8 20.9 18.2 112 107 1.4 4.2 1.1 0.5 20.3 75
Okuma Corporation 6103 JP O JPY 1,065 1,300 22 1,670 18.3 (3) (6) (9) (8) 72 (3) (8) (12) (8) 29 Mar-13 (1) 33 14 23.0 23.3 17.5 15.3 106 110 1.1 7.0 1.6 1.2 10.4 (12) Rinnai 5947 JP O JPY 8,320 8,600 3 4,149 10.5 1 3 7 2 32 0 1 5 2 (11) Mar-13 7 9 7 21.1 19.6 17.9 16.7 105 108 0.8 11.7 2.1 1.3 9.1 (32) SMC 6273 JP O JPY 27,920 28,500 2 18,081 39.5 0 3 9 5 84 (0) 0 6 6 41 Mar-13 30 6 13 29.8 22.9 21.7 19.2 103 103 0.6 11.1 2.4 3.8 12.9 (45)
Shimizu Corporation 1803 JP O JPY 542.0 530.0 (2) 4,078 25.1 (0) 1 7 2 74 (1) (2) 5 3 31 Mar-13 (0) 149 45 72.1 72.1 28.9 20.0 80 126 1.3 1.7 1.2 0.5 30.1 67 THK 6481 JP N JPY 2,353 2,400 2 2,856 22.0 (5) (5) (6) (10) 51 (5) (7) (9) (10) 8 Mar-13 47 10 17 30.6 20.8 19.0 16.2 99 92 0.9 7.2 1.5 1.2 8.1 (31) TOTO 5332 JP N JPY 1,718 1,500 (13) 5,570 26.8 1 3 6 3 144 1 1 3 4 101 Mar-13 134 (30) (11) 34.8 14.9 21.3 23.9 104 100 1.2 17.8 2.5 1.1 10.4 5
Taisei Corporation 1801 JP N JPY 467.0 500.0 7 5,101 96.7 0 1 5 (2) 70 0 (1) 2 (2) 27 Mar-13 5 2 14 26.5 25.2 24.7 21.6 107 91 1.1 6.0 1.5 0.4 12.9 31 Tokai Carbon 5301 JP O JPY 355.0 360.0 1 727 4.1 2 5 (1) (3) (2) 2 3 (3) (3) (45) Dec-12 (15) 24 57 38.0 44.6 36.1 23.0 100 91 1.7 1.5 0.6 0.8 7.5 6 Tsubakimoto Chain 6371 JP O JPY 834.0 900.0 8 1,487 3.2 (0) 3 6 4 77 (1) 1 4 4 34 Mar-13 29 15 16 21.0 16.3 14.2 12.2 106 108 1.0 8.9 1.4 0.9 6.9 7
Sector* (3) 266,877 0 3 3 0 59 0 1 1 1 16 Mar-13 29 11 12 28.1 21.7 19.5 17.2 102 100 1.0 9.5 2.0 1.1 10.7 14
Chemicals Jun Yamaguchi / Masami Sawato - 81 3 4550 9789 / 81 3 4550 9729
Asahi Kasei 3407 JP O JPY 828.0 920.0 11 11,095 40.9 (1) (0) 4 0 60 (1) (2) 1 1 16 Mar-13 60 12 8 21.5 13.5 12.1 11.1 103 104 1.7 10.2 1.3 0.8 6.7 46 Denki Kagaku Kogyo 4061 JP N JPY 415.0 380.0 (8) 1,854 10.1 (1) 2 (2) (4) 32 (1) 0 (5) (4) (11) Mar-13 20 16 14 17.5 14.6 12.7 11.1 93 97 2.4 7.3 1.0 0.7 6.1 49 Hitachi Chemical 4217 JP O JPY 1,644 1,930 17 3,283 10.1 0 4 (1) (2) 21 (0) 2 (4) (1) (22) Mar-13 32 1 13 18.2 13.8 13.7 12.1 105 103 2.2 7.9 1.1 0.7 6.1 3
JSR 4185 JP O JPY 2,032 2,040 0 4,627 23.0 (1) 3 5 (0) 16 (1) 0 2 0 (27) Mar-13 (11) 19 9 16.1 18.0 15.1 13.8 98 101 1.9 8.4 1.5 1.0 6.9 (26) Kuraray 3405 JP N JPY 1,238 1,200 (3) 4,158 29.1 (0) 4 1 (1) 9 (1) 2 (2) (1) (34) Mar-13 5 12 10 15.0 14.2 12.7 11.6 95 97 2.9 7.5 1.0 1.0 4.7 (5) Kureha 4023 JP O JPY 506.0 660.0 30 833 4.3 0 (1) 5 (6) 43 (0) (3) 2 (5) (1) Mar-13 106 15 25 27.1 13.2 11.4 9.1 116 120 2.0 6.6 0.8 1.0 7.3 57
Mitsubishi Chemical Holdings 4188 JP N JPY 470.0 530.0 13 6,639 24.8 (0) 2 (2) (3) 11 (0) (1) (5) (3) (32) Mar-13 107 12 30 37.2 18.0 16.1 12.4 91 87 2.6 4.7 0.8 0.5 6.2 71
Mitsubishi Gas Chemical 4182 JP O JPY 782.0 1,050 34 3,387 16.7 (1) 0 (7) 1 36 (1) (2) (10) 2 (7) Mar-13 nm 50 8 nm 12.4 8.2 7.6 102 114 1.5 9.7 1.2 0.9 11.2 40 Mitsui Chemicals 4183 JP U JPY 254.0 240.0 (6) 2,440 31.0 0 6 (3) 0 23 (0) 4 (6) 0 (20) Mar-13 nm nm 45 nm 254.4 23.1 15.9 54 90 2.4 0.3 0.7 0.5 10.8 110
Nippon Kayaku 4272 JP N JPY 1,425 1,300 (9) 2,476 9.0 1 1 (4) (5) 44 1 (1) (7) (4) 0 Mar-13 1 8 29 20.9 20.6 19.0 14.8 95 97 1.4 8.3 1.7 1.5 7.5 (7) Nippon Shokubai 4114 JP N JPY 1,199 1,300 8 2,334 11.2 (1) 3 6 3 33 (1) 1 3 4 (10) Mar-13 67 29 18 29.0 17.4 13.5 11.4 111 100 1.3 6.4 1.1 0.9 8.4 7 Nippon Soda 4041 JP O JPY 630.0 660.0 5 919 4.5 1 2 (5) (6) 55 1 (0) (8) (5) 12 Mar-13 32 14 16 18.1 13.7 12.0 10.3 100 106 1.0 7.2 1.0 0.9 9.9 28
SUMCO 3436 JP N JPY 887.0 750.0 (15) 2,192 16.8 (3) 3 (2) (4) (8) (3) 1 (5) (4) (51) Jan-13 (85) nm 38 66.7 457.2 19.1 13.9 3 47 0.0 0.3 1.4 2.1 10.4 81 Sanyo Chemical 4471 JP O JPY 796.0 1,010 27 842 1.1 8 8 17 10 53 8 6 15 11 10 Mar-13 43 20 25 21.0 14.6 12.2 9.8 105 117 1.9 6.4 0.9 0.6 4.9 4 Shin-Etsu Chemical 4063 JP O JPY 5,858 7,400 26 23,884 85.8 1 2 (4) (5) 7 0 (0) (6) (4) (36) Mar-13 19 9 10 23.5 19.8 18.2 16.5 103 103 1.7 7.8 1.5 1.8 7.7 (27)
Stella Chemifa 4109 JP U JPY 1,622 1,450 (11) 187 0.7 (0) 1 5 2 (17) (0) (1) 3 3 (60) Mar-13 (51) 74 32 10.1 20.7 11.9 9.0 88 103 2.3 4.6 0.9 1.0 6.6 50 Sumitomo Chemical 4005 JP N JPY 436.0 420.0 (4) 6,834 41.2 (1) 2 5 6 69 (1) (0) 3 6 26 Mar-13 nm 127 19 nm 23.8 10.5 8.8 92 118 2.1 5.9 1.4 0.7 7.2 108 Teijin 3401 JP N JPY 250.0 230.0 (8) 2,359 12.7 1 6 10 7 21 1 4 7 7 (22) Mar-13 nm 43 51 nm 35.4 24.7 16.3 101 92 1.6 2.5 0.8 0.6 7.0 66
Tokuyama 4043 JP O JPY 462.0 450.0 (3) 1,541 10.3 (0) 5 21 16 152 (1) 3 19 16 109 Mar-13 nm (1) 2 nm 15.5 15.6 15.3 127 166 1.3 4.7 0.7 1.2 8.4 73 Toray Industries 3402 JP O JPY 700.0 850.0 21 10,933 50.8 1 1 (3) (4) 39 0 (1) (6) (3) (4) Mar-13 34 17 13 23.5 17.5 15.0 13.3 100 100 1.4 8.7 1.5 0.9 8.7 59 Tosoh 4042 JP U JPY 475.0 320.0 (33) 2,725 14.0 (1) 3 2 (3) 126 (1) 1 (1) (2) 83 Mar-13 33 0 4 16.9 12.6 12.6 12.1 89 91 1.3 11.4 1.4 0.7 7.6 106
Ube Industries 4208 JP N JPY 230.0 200.0 (13) 2,334 15.7 (1) 3 11 2 22 (1) 1 8 3 (21) Mar-13 29 45 25 28.0 21.6 14.9 12.0 89 99 2.2 4.9 1.0 0.6 7.2 70
Conglomerates Jun Yamaguchi - 81 3 4550 9789
Itochu Corp 8001 JP N JPY 1,358 1,360 0 20,581 71.5 (1) 4 9 5 39 (1) 1 6 5 (4) Mar-13 15 (1) 3 7.7 6.6 6.7 6.5 104 103 3.6 16.9 1.0 0.3 12.2 95 Marubeni Corp 8002 JP O JPY 765.0 890.0 16 12,735 72.8 (1) 3 7 1 20 (1) 1 4 2 (24) Mar-13 70 5 1 10.2 6.0 5.7 5.7 104 103 3.3 17.6 1.0 0.3 12.4 145 Mitsubishi Corp 8058 JP O JPY 2,005 2,500 25 31,657 115.4 (1) 2 2 (1) 10 (1) (0) (1) (0) (33) Mar-13 23 2 2 9.2 7.5 7.3 7.2 104 105 3.3 10.1 0.7 0.4 20.7 95
Mitsui & Co 8031 JP N JPY 1,486 1,520 2 26,003 107.9 (1) 2 6 1 11 (1) 0 3 2 (32) Mar-13 28 1 2 8.8 6.9 6.8 6.7 103 100 3.6 11.9 0.8 0.5 12.4 91 Sumitomo Corp 8053 JP N JPY 1,321 1,400 6 15,802 62.4 (0) 1 4 0 16 (1) (1) 1 0 (27) Mar-13 (1) 3 8 7.1 7.2 7.0 6.4 95 94 3.5 10.5 0.7 0.6 16.4 121 Sector* 11 106,778 (1) 2 5 1 18 (1) 0 2 2 (25) Mar-13 23 2 3 8.5 6.9 6.8 6.6 103 101 3.5 12.3 0.8 0.4 14.8 103
Consumer Durables & Apparel
Shunsuke Tsuchiya / Masahiro Mochizuki / Taketo Yamate - 81 3 4550 9740 / 81 3 4550 7389 / 81 3 4550 9963
Alpine Electronics 6816 JP O JPY 1,480 850.0 (43) 990 3.2 0 (1) 7 0 74 (0) (3) 4 1 31 Mar-13 106 17 na 59.1 28.7 24.6 na 65 65 1.4 3.4 1.0 0.3 4.8 (43) Asics 7936 JP N JPY 1,869 1,800 (4) 3,398 12.4 1 2 9 4 47 1 (0) 6 5 3 Mar-13 15 9 9 25.7 22.4 20.6 18.8 99 96 1.0 11.4 2.4 1.0 11.3 (12) Casio 6952 JP N JPY 1,212 800.0 (34) 3,243 18.8 1 0 (5) (6) 53 1 (2) (7) (5) 10 Mar-12 299 39 4 127.5 31.9 22.9 22.0 86 96 1.4 6.7 2.1 1.3 14.2 29
Daiwa House Industry 1925 JP O JPY 2,040 2,300 13 12,894 56.1 (0) 6 2 0 30 (0) 4 (0) 1 (13) Mar-13 22 5 2 18.5 15.2 14.5 14.3 100 99 1.9 10.6 1.4 0.5 6.7 2 Funai Electric 6839 JP R JPY 1,403 459 2.1 (0) 0 9 2 34 (0) (2) 6 3 (9) Mar-12 nm nm 125 nm nm 59.8 26.6 208 731 0.0 (3.4) 0.4 (0.1) (10.8) (50) Namco Bandai Holdings 7832 JP N JPY 2,157 2,300 7 4,544 18.4 0 (2) (1) (8) 77 (0) (4) (4) (7) 34 Mar-13 (2) 3 2 14.9 15.2 14.8 14.5 101 98 1.9 12.3 1.8 0.7 5.1 (45)
Panasonic Corporation 6752 JP O JPY 1,288 1,300 1 28,549 126.4 (2) (2) 6 5 112 (2) (4) 3 6 69 Mar-13 nm (40) 139 nm 23.8 39.7 16.6 118 54 0.8 9.4 2.1 0.5 5.3 27 Sekisui Chemical 4204 JP U JPY 1,254 1,000 (20) 6,114 26.2 0 0 0 (3) 39 (0) (2) (2) (2) (4) Mar-13 50 1 (8) 21.5 14.3 14.2 15.5 103 100 2.1 10.3 1.4 0.6 5.6 7 Sekisui House 1928 JP N JPY 1,539 1,500 (3) 9,912 57.6 0 4 6 5 53 (0) 2 3 5 10 Jan-13 59 15 (2) 22.2 14.0 12.2 12.4 101 108 2.8 9.5 1.3 0.6 7.8 17
Sharp Corp. 6753 JP U JPY 382.0 200.0 (48) 6,193 168.0 4 14 16 14 15 4 12 13 15 (28) Mar-13 nm 467 35 nm 196.2 34.6 25.6 49 65 0.0 2.0 3.4 0.5 6.9 422 Sony 6758 JP O JPY 1,771 2,600 47 17,621 228.5 0 (1) (3) (3) 49 0 (3) (6) (3) 6 Mar-13 (30) 283 17 41.6 59.7 15.6 13.3 139 167 1.4 1.3 0.8 0.3 4.1 14 Sector* 5 93,917 (0) 1 3 2 65 (0) (1) 1 2 22 Mar-13 na 16 33 nm 22.6 19.4 15.6 106 95 1.4 6.6 1.4 0.5 5.6 21

23 J
an
uary
201
4
Ju
mp
-Sta
rt 5
7
Japan: Valuation summary (continued) Bberg Price Market Avg Absolute performance Relative performance FYE EPS growth P/E CS / Divd ROE P/B EV/ EV/ Net debt/ daily con. EPS yld sales EBITDA equity
Stock ticker View Local Target Upside cap t/o (%) (%) Actual (%) (x) (%) (%) (%) (x) (x) (x) (%)
15 January 2014 (%) (USDm) 1d 1w 1m 12m YTD 1d 1w 1m 12m YTD T T+1 T+2 T+3 T T+1 T+2 T+3 T+1 T+2 T+1
Consumer Staples Satsuki Kawasaki / Taketo Yamate - 81 3 4550 9941 / 81 3 4550 9963
Ajinomoto 2802 JP N JPY 1,566 1,400 (11) 9,184 31.4 1 10 4 3 28 1 8 1 3 (15) Mar-13 (1) 7 13 21.1 21.3 19.8 17.5 98 96 1.3 7.3 1.6 0.8 7.4 (18) Asahi Group Holdings 2502 JP O JPY 2,890 3,100 7 12,546 47.5 2 4 (2) (2) 54 2 2 (5) (2) 11 Dec-12 20 13 6 23.5 19.7 17.4 16.4 100 99 1.5 8.9 1.7 1.0 8.4 43
Calbee 2229 JP N JPY 2,453 2,600 6 3,106 14.5 0 1 0 (4) 46 0 (1) (3) (4) 2 Mar-13 20 9 15 34.0 28.3 26.1 22.8 100 97 0.7 12.5 3.4 1.5 11.1 (36) FamilyMart 8028 JP O JPY 4,745 5,000 5 4,319 17.8 (1) (3) 0 (1) 33 (1) (5) (3) (1) (11) Feb-13 (10) 16 na 18.0 20.1 17.4 na 96 103 2.3 9.2 1.8 1.0 5.2 (38) Japan Tobacco 2914 JP O JPY 3,231 4,200 30 56,308 151.0 1 2 (4) (6) 21 1 (0) (7) (5) (22) Mar-13 29 (2) 17 17.8 13.9 14.1 12.1 99 88 2.9 20.9 2.6 2.5 7.8 (1)
Kao 4452 JP N JPY 3,381 3,500 4 16,603 56.5 (0) 5 4 2 40 (0) 3 2 3 (3) Dec-12 21 28 14 33.4 27.5 21.5 18.9 93 102 1.9 10.6 2.9 1.3 8.3 (12) Kikkoman 2801 JP N JPY 1,930 1,700 (12) 3,893 14.4 1 4 (3) (3) 42 1 2 (6) (2) (1) Mar-13 25 6 8 35.2 28.1 26.6 24.7 101 95 0.9 7.0 1.9 1.4 12.9 29 Kirin Holdings 2503 JP N JPY 1,456 1,500 3 12,975 48.0 1 4 (3) (4) 39 1 2 (6) (3) (4) Dec-12 65 (28) 10 24.9 15.1 21.1 19.2 101 104 2.5 8.9 1.2 0.9 6.9 56
Lawson 2651 JP N JPY 7,950 7,200 (9) 7,615 24.0 0 0 3 1 28 (0) (2) 1 2 (15) Feb-13 8 8 na 23.9 22.3 20.6 na 98 97 2.8 15.2 3.3 1.3 5.9 (37) Nissin Foods Holdings 2897 JP U JPY 4,535 3,560 (21) 4,793 6.6 2 4 5 2 37 2 1 3 3 (7) Mar-13 9 5 5 26.5 24.4 23.2 22.1 104 105 1.7 6.5 1.6 1.1 10.8 (21) Pola Orbis Holdings 4927 JP O JPY 3,640 4,400 21 1,930 4.1 (1) 1 (5) (3) 39 (1) (1) (8) (3) (4) Dec-12 29 13 19 30.1 23.4 20.7 17.5 101 101 1.5 5.1 1.2 0.8 6.5 (29)
Shiseido 4911 JP N JPY 1,673 1,700 2 6,389 30.4 2 4 2 (1) 36 1 2 (1) (1) (7) Mar-13 nm 56 12 nm 38.8 24.8 22.2 85 98 1.2 5.5 2.0 0.9 8.6 8 Toyo Suisan 2875 JP O JPY 3,355 3,600 7 3,286 17.3 1 7 10 6 35 1 5 7 7 (8) Mar-13 28 (4) 5 19.8 15.4 16.2 15.4 105 101 1.6 10.6 1.6 0.7 5.7 (44) Unicharm 8113 JP O JPY 5,646 7,000 24 10,871 52.2 2 (3) (9) (6) 17 2 (5) (12) (5) (26) Mar-13 (17) 21 16 24.2 29.2 24.1 20.8 103 107 0.7 11.4 3.1 1.9 11.8 (13)
Yakult Honsha 2267 JP N JPY 5,290 5,000 (5) 8,388 14.8 1 4 2 (0) 42 1 2 (0) 0 (1) Mar-13 42 21 13 55.7 39.1 32.2 28.5 101 107 0.5 9.1 3.3 2.5 16.2 6 Sector* 12 162,205 1 3 (1) (2) 31 1 1 (4) (2) (12) Mar-13 25 4 15 23.5 18.7 18.1 15.5 99 95 2.0 12.2 2.2 1.4 8.1 5
Diversified Financials Takehito Yamanaka - 81 3 4550 9150
ACOM 8572 JP O JPY 324.0 470.0 45 4,867 12.2 (1) (6) (4) (9) 31 (1) (8) (6) (9) (12) Mar-13 81 54 5 24.4 13.4 8.7 8.3 86 116 0.0 12.6 1.6 na na na Aeon Financial Service 8570 JP O JPY 2,616 3,300 26 5,132 27.7 2 (2) (6) (7) 44 2 (4) (8) (7) 1 Mar-13 79 30 13 34.2 19.1 14.7 13.0 115 107 2.3 11.9 2.2 na na na
Credit Saison 8253 JP U JPY 2,725 2,570 (6) 4,798 28.5 1 4 (3) (1) 42 1 2 (5) (1) (1) Mar-13 (3) (3) 3 15.3 15.7 16.3 15.8 94 90 1.1 8.1 1.3 na na na Daiwa Securities Group 8601 JP N JPY 1,004 1,100 10 16,373 120.3 (0) 0 1 (4) 123 (0) (2) (2) (4) 79 Mar-13 115 (20) 2 23.4 10.9 13.5 13.2 102 96 2.6 16.2 1.7 na na na Japan Exchange Group 8697 JP U JPY 2,748 1,820 (34) 7,234 47.4 3 1 (5) (8) 139 2 (1) (8) (8) 96 Mar-13 (53) 3 10 11.7 24.8 24.2 21.9 101 105 1.6 16.0 3.7 na na na
Nomura Holdings 8604 JP O JPY 792.0 830.0 5 28,148 280.1 (0) 0 2 (2) 64 (0) (2) (1) (2) 20 Mar-13 139 21 3 27.4 11.5 9.5 9.3 125 150 2.4 10.6 1.2 na na na Orix 8591 JP O JPY 1,722 1,840 7 21,403 100.0 (1) (1) (4) (7) 81 (2) (3) (7) (6) 38 Mar-13 43 13 8 20.7 14.5 12.8 11.9 99 100 1.0 9.1 1.2 na na na Sector* 6 87,955 (0) (0) (1) (5) 81 (0) (2) (4) (4) 38 Mar-13 65 10 5 21.7 13.2 12.0 11.4 108 116 1.8 11.2 1.4 na na na
Energy David Hewitt - 65 6212 3064
INPEX Corporation 1605 JP O JPY 1,299 1,736 34 18,190 46.0 (1) 3 0 (4) 9 (1) 1 (3) (3) (34) Mar-13 (9) 10 (3) 10.4 11.4 10.3 10.7 106 113 1.3 6.9 0.8 1.4 2.4 8
Japan Petroleum Exploration 1662 JP O JPY 4,275 5,400 26 2,343 9.4 1 8 12 7 33 1 6 9 8 (10) Mar-13 nm (10) (7) nm 11.9 13.2 14.2 83 82 0.9 6.5 0.7 0.9 7.4 (8) Sector* 33 20,532 (0) 4 1 (2) 12 (1) 2 (1) (2) (32) Mar-13 3 8 (4) 11.8 11.4 10.6 11.0 103 109 1.3 6.9 0.8 1.3 2.5 6
Healthcare Fumiyoshi Sakai - 81 3 4550 9737
Astellas Pharma 4503 JP O JPY 6,210 6,900 11 26,568 103.5 2 3 3 (0) 39 2 1 0 0 (4) Mar-13 29 20 36 34.4 26.7 22.2 16.4 97 95 2.2 9.7 2.5 2.1 9.8 (32) Chugai Pharmaceutical 4519 JP O JPY 2,301 2,600 13 12,017 24.2 2 3 0 (1) 30 2 1 (2) (1) (14) Dec-12 11 2 23 26.0 23.4 23.0 18.7 104 102 2.0 10.6 2.4 2.5 11.0 (43)
Daiichi Sankyo 4568 JP U JPY 1,923 1,600 (17) 12,980 44.5 0 (1) 2 0 30 (0) (3) (1) 0 (13) Mar-13 (2) (5) 0 20.3 20.8 21.8 21.8 99 91 3.1 7.2 1.5 1.2 8.2 (9) Dainippon Sumitomo Pharma 4506 JP U JPY 1,857 1,300 (30) 7,075 16.5 3 6 23 13 66 3 3 20 13 23 Mar-13 69 (18) 14 73.5 43.4 52.7 46.1 93 103 1.0 4.8 2.1 1.9 9.1 (4) Eisai 4523 JP N JPY 4,007 3,800 (5) 10,958 45.9 1 2 1 (2) 4 1 (0) (1) (1) (39) Mar-13 (1) (10) 5 23.7 23.8 26.6 25.4 93 92 3.7 10.1 2.4 2.1 10.0 10
Kyowa Hakko Kirin 4151 JP N JPY 1,094 1,050 (4) 5,742 12.4 1 2 (5) (6) 27 1 (0) (8) (5) (17) Dec-12 18 (12) 12 24.8 21.0 24.0 21.4 99 103 2.3 5.1 1.1 1.5 6.2 (13) Mitsubishi Tanabe Pharma 4508 JP N JPY 1,545 1,400 (9) 8,311 12.4 1 1 7 5 31 1 (1) 5 6 (12) Mar-13 10 (4) 8 20.7 18.8 19.7 18.2 97 100 2.7 6.1 1.1 1.8 9.1 (13) Ono Pharmaceutical 4528 JP N JPY 9,670 8,200 (15) 9,830 24.7 (1) (1) 15 5 104 (1) (3) 13 5 61 Mar-13 (15) (3) 5 42.5 49.8 51.3 48.8 94 101 1.9 5.1 2.5 6.0 28.6 (32)
Otsuka Holdings 4578 JP N JPY 3,240 2,800 (14) 16,822 46.1 0 4 12 7 19 0 2 9 7 (24) Mar-13 29 11 (47) 14.6 11.3 10.3 19.5 98 110 2.0 11.3 1.2 0.8 4.4 (42) Santen Pharmaceutical 4536 JP O JPY 4,790 5,000 4 3,791 9.4 (1) 0 (2) (2) 33 (1) (2) (4) (2) (10) Mar-13 15 3 8 24.5 21.3 20.7 19.2 100 98 2.1 11.3 2.3 2.4 10.9 (33) Sawai Pharmaceutical 4555 JP O JPY 6,510 9,800 51 2,292 22.7 (1) (6) (4) (4) 39 (1) (8) (7) (4) (4) Mar-13 (47) (4) 9 8.4 15.8 16.5 15.2 106 94 2.1 19.2 2.9 2.9 10.3 29
Shionogi 4507 JP N JPY 2,206 2,200 (0) 7,084 29.0 0 (1) (1) (3) 38 0 (3) (4) (3) (5) Mar-13 (36) 2 9 11.1 17.2 16.8 15.4 99 107 2.0 9.9 1.6 2.3 8.3 (18) Sysmex 6869 JP O JPY 6,060 7,000 16 6,013 20.5 (0) (2) (1) (2) 43 (1) (4) (4) (2) 0 Mar-13 34 16 14 44.0 32.8 28.4 25.0 98 96 0.7 15.9 4.9 3.3 15.0 (22) Taisho Pharmaceutical 4581 JP N JPY 7,450 6,900 (7) 6,439 5.7 0 3 4 3 20 0 1 1 4 (23) Mar-13 13 3 3 22.9 20.1 19.5 18.9 102 106 1.5 5.2 0.9 1.8 10.1 (26)
Takeda Pharmaceutical 4502 JP N JPY 4,837 5,100 5 36,616 129.4 (0) 1 (4) 0 9 (0) (1) (6) 1 (34) Mar-13 (5) 18 28 29.1 30.5 25.8 20.1 113 141 3.7 5.8 1.8 2.2 9.9 (2) Terumo 4543 JP N JPY 4,985 5,400 8 9,076 39.3 4 4 (4) (2) 42 4 2 (6) (1) (2) Mar-13 (11) 10 7 20.1 22.5 20.6 19.3 98 100 1.2 9.3 2.0 2.3 9.0 19 Tsumura & Co 4540 JP N JPY 2,777 2,800 1 1,878 10.2 1 4 3 (0) (4) 0 1 0 0 (47) Mar-13 (2) (3) 16 12.7 13.0 13.3 11.5 99 101 2.3 12.3 1.5 1.9 7.5 9
Sector* (0) 183,492 1 2 3 1 31 1 (0) 0 1 (12) Mar-13 4 7 5 23.5 22.6 21.1 20.2 100 106 2.4 8.0 1.8 1.9 9.1 (17)
Insurance Takehito Yamanaka - 81 3 4550 9150
Dai-ichi Life Insurance 8750 JP O JPY 1,762 2,348 33 16,743 54.3 2 4 4 0 34 2 2 2 1 (9) Mar-13 20 12 27 53.8 45.0 40.2 31.7 69 65 1.1 2.3 1.0 na na na MS&AD Insurance Group Holdings
8725 JP O JPY 2,702 3,500 30 16,062 38.6 1 4 0 (4) 45 0 2 (3) (4) 2 Mar-13 55 27 10 20.1 13.0 10.2 9.3 98 131 2.1 6.1 0.7 na na na
NKSJ Holdings 8630 JP N JPY 2,988 2,900 (3) 11,793 36.2 1 5 4 2 58 1 3 2 3 15 Mar-13 47 (39) 141 28.4 19.3 31.5 13.1 101 84 2.0 4.9 0.9 na na na Sony Financial Holdings 8729 JP N JPY 1,847 1,750 (5) 7,704 18.6 1 (1) (1) (4) 19 0 (3) (4) (3) (24) Mar-13 (18) 10 67 17.8 21.8 19.9 12.0 92 91 1.6 8.7 2.0 na na na T&D Holdings 8795 JP N JPY 1,454 1,335 (8) 9,372 30.1 0 2 4 (1) 27 (0) 0 1 (1) (16) Mar-13 8 (0) (2) 15.4 14.3 14.3 14.6 97 93 1.5 7.2 1.0 na na na
Tokio Marine Holdings 8766 JP N JPY 3,303 3,700 12 24,290 72.1 0 1 (4) (6) 24 0 (1) (6) (6) (19) Mar-13 45 5 8 19.6 13.5 12.9 11.9 102 103 1.8 7.8 1.0 na na na Sector* 14 85,963 1 3 1 (3) 35 1 1 (2) (2) (9) Mar-13 32 5 22 22.6 17.1 16.3 13.3 96 101 1.7 5.9 1.0 na na na

23 J
an
uary
201
4
Ju
mp
-Sta
rt 5
8
Japan: Valuation summary (continued) Bberg Price Market Avg Absolute performance Relative performance FYE EPS growth P/E CS / Divd ROE P/B EV/ EV/ Net debt/ daily con. EPS yld sales EBITDA equity
Stock ticker View Local Target Upside cap t/o (%) (%) Actual (%) (x) (%) (%) (%) (x) (x) (x) (%)
21 January 2014 (%) (USDm) 1d 1w 1m 12m YTD 1d 1w 1m 12m YTD T T+1 T+2 T+3 T T+1 T+2 T+3 T+1 T+2 T+1
Metals & Mining Jun Yamaguchi / Shinya Yamada - 81 3 4550 9789 / 81 3 4550 9910
Aichi Steel 5482 JP U JPY 442.0 350.0 (21) 833 2.9 0 5 4 2 13 (0) 3 1 2 (30) Mar-13 16 11 21 17.7 15.2 13.8 11.4 97 100 2.3 4.4 0.6 0.6 6.0 34 Daido Steel 5471 JP U JPY 518.0 430.0 (17) 2,154 7.5 1 4 (2) (1) 21 1 2 (4) (0) (22) Mar-13 25 24 26 20.5 16.4 13.2 10.5 99 101 1.5 6.2 1.0 0.5 5.4 0
Dowa Holdings 5714 JP U JPY 989.0 740.0 (25) 2,807 15.5 1 1 (1) (4) 64 0 (1) (3) (3) 21 Mar-13 31 10 9 19.2 14.6 13.3 12.2 97 97 1.2 14.1 2.0 0.7 7.5 51 Hitachi Metals 5486 JP N JPY 1,537 1,200 (22) 6,303 20.1 (2) 2 7 3 98 (3) (0) 4 4 55 Mar-13 151 24 17 43.4 17.3 14.0 12.0 100 105 1.2 12.5 1.8 0.9 8.1 26 JFE Holdings 5411 JP N JPY 2,388 2,200 (8) 13,213 93.9 0 4 (0) (5) 40 0 2 (3) (4) (3) Mar-13 145 33 40 34.8 14.2 10.7 7.7 82 84 1.7 6.0 0.8 0.8 8.6 89
Kobe Steel 5406 JP U JPY 184.0 150.0 (18) 5,295 69.0 0 3 6 2 70 (0) 1 3 3 27 Mar-13 nm (28) 18 nm 9.1 12.6 10.6 98 86 1.6 11.2 1.0 0.7 7.5 128 Kyoei Steel 5440 JP O JPY 2,017 2,200 9 841 3.3 0 10 8 2 25 0 8 5 2 (18) Mar-13 1 100 21 42.4 41.7 20.9 17.2 229 123 1.0 1.7 0.7 0.4 8.3 (18) Maruichi Steel Tube 5463 JP N JPY 2,730 2,700 (1) 2,218 5.5 2 4 8 3 37 1 2 5 3 (7) Mar-13 (6) 35 10 21.8 23.1 17.1 15.6 82 101 2.3 4.5 1.0 1.3 8.2 (25)
Mitsubishi Materials 5711 JP O JPY 377.0 500.0 33 4,739 30.9 (1) 6 1 (3) 29 (1) 3 (2) (2) (15) Mar-13 27 10 11 13.4 10.5 9.6 8.7 101 104 1.6 10.8 1.1 0.7 7.9 111 Mitsui Mining & Smelting 5706 JP N JPY 307.0 250.0 (19) 1,682 13.7 (1) (0) (1) (5) 37 (1) (2) (4) (4) (6) Mar-13 15 23 4 17.7 15.4 12.5 12.1 86 85 1.0 7.4 1.1 0.8 7.4 101 Nippon Denko 5563 JP O JPY 328.0 350.0 7 346 1.3 (0) 7 10 3 27 (0) 5 8 4 (16) Dec-12 nm 13 9 nm 11.9 10.6 9.7 128 153 1.5 5.6 0.6 0.5 3.4 (16)
Nippon Steel & Sumitomo Metal 5401 JP N JPY 336.0 330.0 (2) 29,399 137.2 (0) 0 (1) (5) 46 (0) (2) (4) (4) 3 Mar-13 nm 30 23 nm 13.3 10.2 8.2 101 109 1.5 9.3 1.2 0.9 7.7 62 Osaka Titanium Technologies 5726 JP O JPY 1,768 2,800 58 624 3.3 1 4 4 (4) (12) 1 2 1 (3) (55) Mar-13 (216) nm 31 31.4 nm 13.3 10.1 92 287 0.3 (5.6) 1.6 2.8 11.3 127 Sumitomo Metal Mining 5713 JP N JPY 1,480 1,230 (17) 7,837 45.9 2 7 13 7 9 1 4 11 8 (35) Mar-13 (24) 3 17 9.4 12.4 12.0 10.3 97 93 2.3 8.3 1.0 1.1 8.9 12
Toho Titanium 5727 JP N JPY 695.0 750.0 8 474 1.4 (0) 1 0 (5) (19) (0) (1) (3) (5) (62) Mar-13 nm nm 72 nm nm 25.4 14.7 102 nm 0.0 (15.4) 1.4 3.0 44.4 128 Yamato Kogyo 5444 JP N JPY 3,260 3,500 7 2,132 4.7 (1) 2 0 (3) 26 (1) (0) (2) (2) (17) Mar-13 30 65 21 28.9 22.2 13.5 11.1 92 108 1.2 4.7 1.0 0.9 12.1 (22) Sector* (6) 80,897 (0) 3 2 (2) 44 (0) 0 (1) (1) 0 Mar-13 593 22 23 96.1 13.9 11.3 9.2 96 100 1.6 8.1 1.1 0.8 8.0 61
Paper & Forest Products Jun Yamaguchi - 81 3 4550 9789
Nippon Paper Industries Co. Ltd 3863 JP O JPY 1,808 2,100 16 2,015 12.5 1 (4) (6) (7) na 1 (6) (9) (7) na Mar-13 74 9 9 19.7 11.3 10.4 9.6 106 80 2.2 4.6 0.5 0.8 9.3 154
Oji Holdings 3861 JP O JPY 516.0 570.0 10 4,886 17.6 1 1 1 (4) 79 1 (1) (2) (4) 35 Mar-13 25 16 6 19.9 15.9 13.7 12.9 103 107 1.9 6.0 0.9 0.8 7.9 86 Rengo 3941 JP O JPY 588.0 630.0 7 1,397 5.1 (1) (3) (2) (7) 33 (2) (6) (5) (7) (10) Mar-13 (17) 29 15 11.5 13.9 10.8 9.4 101 105 2.0 5.6 0.7 0.7 7.3 93 Sector* 11 8,298 1 (1) (1) (6) 68 1 (3) (4) (5) 25 Mar-13 25 16 8 17.7 14.1 12.2 11.3 103 97 2.0 5.4 0.7 0.8 8.3 109
Real Estate Masahiro Mochizuki - 81 3 4550 7389
Daito Trust Construction 1878 JP O JPY 10,030 12,500 25 7,662 31.2 (0) 3 4 2 14 (0) 1 1 3 (29) Mar-13 10 3 5 15.5 14.0 13.6 12.9 102 98 3.6 28.4 3.7 0.5 6.4 (85)
Hulic 3003 JP U JPY 1,368 1,400 2 7,767 23.9 1 0 (6) (12) 135 1 (2) (9) (12) 91 Dec-12 37 14 (4) 70.3 51.2 44.9 46.8 109 102 0.5 10.2 5.0 12.5 35.8 307 Mitsubishi Estate 8802 JP N JPY 2,892 3,100 7 38,480 140.2 (0) 1 (4) (8) 38 (1) (1) (7) (8) (5) Mar-13 35 (9) (0) 88.2 65.3 71.7 71.8 100 84 0.4 4.9 3.1 5.5 25.2 137 Mitsui Fudosan 8801 JP O JPY 3,605 4,500 25 30,360 120.5 1 3 0 (5) 82 1 1 (2) (4) 39 Mar-13 10 21 4 53.3 48.3 40.0 38.3 94 102 0.6 5.4 2.6 3.4 23.4 165
Nomura Real Estate Holdings 3231 JP N JPY 2,386 2,400 1 4,367 19.1 (0) 5 4 1 46 (0) 3 1 1 3 Mar-13 39 3 (1) 23.5 16.9 16.4 16.6 116 100 1.7 7.7 1.3 2.0 12.8 142 Sumitomo Realty & Development 8830 JP O JPY 4,960 5,900 19 22,550 110.0 1 3 0 (5) 87 1 1 (3) (5) 44 Mar-13 18 0 0 39.3 33.3 33.2 33.2 101 96 0.4 10.7 3.4 6.2 24.4 351 Tokyo Tatemono 8804 JP O JPY 1,147 1,300 13 4,736 56.5 1 7 1 (2) 174 1 5 (2) (1) 131 Dec-12 (4) 24 29 48.2 50.4 40.5 31.5 112 116 0.3 4.7 2.3 4.0 24.7 190
Tokyu Fudosan Holdings Corp. 3289 JP O JPY 943.0 1,200 27 5,531 35.1 3 5 (2) (5) na 3 3 (4) (4) na Mar-13 (1) 10 4 22.6 22.8 20.8 20.0 103 105 0.8 7.9 1.5 2.2 18.1 246
Sector* 15 121,453 1 2 (1) (6) 70 0 0 (4) (5) 27 Mar-13 17 5 2 44.6 38.0 36.1 34.7 101 97 0.7 7.6 2.8 3.5 21.5 184
REITS Atsuro Takemura - 81 3 4550 7372
Advance Residence 3269 JP N JPY 223,500 240,000 7 2,657 6.3 (0) (0) 2 (2) 28 (0) (2) (1) (1) (15) Jul-13 7 (0) na 27.8 25.9 25.9 na 99 97 4.0 5.5 1.4 25.9 104 Frontier Real Estate Invest Corp 8964 JP U JPY 506,000 495,000 (2) 2,407 5.5 0 0 1 (3) 32 (0) (2) (2) (2) (11) Dec-12 3 (1) na 28.2 27.5 27.6 na 100 97 3.6 6.4 1.7 21.4 41
GLP J-REIT 3281 JP O JPY 101,900 127,000 25 2,050 6.8 (1) 1 2 (1) 50 (1) (1) (1) (0) 7 Aug-13 52 (4) na 42.0 27.6 28.9 na 98 97 2.0 6.3 1.6 26.5 104 Japan Logistics 8967 JP N JPY 1,131,000 1,100,000 (3) 1,800 5.4 0 3 8 1 45 0 1 5 2 2 Jul-13 14 3 na 34.7 30.4 29.3 na 100 100 3.3 5.7 1.6 24.4 48 Japan Prime Realty Invest Corp 8955 JP O JPY 348,000 390,000 12 2,753 6.0 (1) 3 4 3 40 (1) 1 1 4 (3) Dec-12 2 (0) na 29.8 29.4 29.4 na 98 97 3.4 5.0 1.5 25.6 68
Japan Real Estate Invest Corp 8952 JP O JPY 565,000 685,000 21 6,438 16.6 0 4 6 0 30 0 2 4 1 (13) Sep-12 (5) 2 na 35.7 37.5 36.7 na 49 99 2.7 4.6 1.7 30.1 73 Nippon Accommodations Fund 3226 JP N JPY 703,000 760,000 8 1,555 2.9 (1) (1) 4 (1) 11 (1) (3) 1 (0) (32) Aug-13 10 (2) na 26.7 24.4 24.9 na 101 100 4.1 5.1 1.3 23.6 95 Nippon Building Fund 8951 JP O JPY 594,000 725,000 22 7,883 21.1 (1) 2 1 (3) 32 (1) 0 (2) (2) (11) Dec-12 21 (10) na 38.0 31.3 34.9 na 98 101 2.8 5.4 1.6 27.3 83
Nippon Prologis REIT 3283 JP N JPY 1,017,000 1,040,000 2 1,782 9.9 (0) 0 6 1 na (0) (2) 4 2 na Nov-12 na 48 (1) na 47.7 32.2 32.7 93 98 2.4 nm 29.5 75
Nomura Real Estate Office Fund 8959 JP N JPY 467,500 500,000 7 1,670 6.7 1 1 0 (4) (10) 1 (1) (3) (4) (53) Oct-12 (19) (6) na 18.3 22.7 24.1 na 89 90 5.0 3.8 0.8 22.7 66 Tokyu REIT 8957 JP N JPY 642,000 690,000 7 1,204 5.3 (1) 4 5 (1) 34 (1) 1 3 (1) (9) Jul-13 10 (1) na 27.7 25.3 25.5 na 103 98 4.0 4.7 1.1 25.7 87
United Urban Investment Corp 8960 JP U JPY 148,100 150,000 1 3,380 8.0 1 0 4 (2) 46 1 (2) 2 (2) 3 Nov-12 6 12 na 32.8 31.0 27.7 na 96 100 3.7 5.1 1.5 24.4 76 Sector* 13 35,578 (0) 2 4 (1) 32 (1) (0) 1 (1) (11) Mar-13 3 8 na 31.3 30.8 27.6 na 90 99 3.2 5.0 1.5 26.4 77
Retailing Taketo Yamate - 81 3 4550 9963
AEON 8267 JP O JPY 1,357 1,300 (4) 10,891 38.3 (0) (2) (1) (5) 32 (0) (4) (4) (4) (11) Feb-13 (7) 7 na 14.2 15.3 14.3 na 97 99 1.9 6.9 1.0 0.4 6.1 81 Fast Retailing 9983 JP U JPY 39,120 16,000 (59) 38,202 282.7 3 0 (7) (10) 73 3 (2) (9) (9) 30 Aug-13 (21) 7 13 44.1 55.9 52.1 46.0 75 71 0.6 12.3 6.6 2.8 24.0 (47)
Isetan Mitsukoshi Holdings 3099 JP U JPY 1,427 740.0 (48) 5,399 22.6 (0) 5 (3) (5) 62 (0) 2 (6) (4) 19 Mar-13 (19) (18) 3 22.3 27.3 33.2 32.3 93 69 0.7 4.1 1.1 0.5 9.3 24 J. Front Retailing 3086 JP N JPY 741.0 700.0 (6) 3,753 17.9 1 5 (3) (7) 48 1 3 (6) (6) 4 Feb-13 138 (40) na 32.1 13.5 22.4 na 95 79 1.3 8.2 1.1 0.5 9.0 39 JIN 3046 JP O JPY 4,155 5,600 35 955 11.6 (1) (12) (7) (7) na (1) (14) (10) (6) na Aug-13 50 49 40 29.1 19.4 13.0 9.3 125 141 1.0 35.9 6.0 2.0 9.0 (31)
Nitori Holdings 9843 JP U JPY 9,990 6,500 (35) 5,283 15.9 2 2 2 0 48 1 (0) (0) 1 4 Feb-13 (1) (11) na 15.3 15.5 17.5 na 94 82 1.0 15.7 2.3 1.4 7.7 (6) Seven & i Holdings 3382 JP O JPY 4,264 4,300 1 36,123 78.4 1 (0) 5 2 59 1 (2) 3 2 16 Feb-13 29 12 na 27.3 21.1 18.8 na 101 105 1.6 9.2 1.9 0.7 8.0 18 Start Today 3092 JP O JPY 2,483 3,200 29 2,616 21.3 2 2 0 (5) 231 2 (0) (2) (4) 188 Mar-13 47 31 27 50.1 34.0 25.9 20.4 105 119 1.3 52.3 15.3 6.2 19.0 (92)
Takashimaya 8233 JP N JPY 1,047 1,100 5 3,312 18.9 (1) 6 4 0 55 (1) 4 2 0 12 Feb-13 6 (6) na 20.9 19.7 21.0 na 98 90 1.0 5.2 1.0 0.4 7.9 8 Yamada Denki 9831 JP N JPY 368.0 310.0 (16) 3,152 44.0 (4) (3) 10 7 3 (4) (5) 7 7 (40) Mar-13 (97) 158 39 1.6 52.7 20.4 14.7 69 76 3.8 1.2 0.6 0.3 12.9 42 Sector* (24) 109,687 1 0 (0) (4) 63 1 (2) (3) (3) 20 Mar-13 (26) 4 16 18.6 25.2 26.2 36.2 96 91 1.3 8.2 2.0 0.7 9.6 29

23 J
an
uary
201
4
Ju
mp
-Sta
rt 5
9
Japan: Valuation summary (continued) Bberg Price Market Avg Absolute performance Relative performance FYE EPS growth P/E CS / Divd ROE P/B EV/ EV/ Net debt/ daily con. EPS yld sales EBITDA equity
Stock ticker View Local Target Upside cap t/o (%) (%) Actual (%) (x) (%) (%) (%) (x) (x) (x) (%)
15 January 2014 (%) (USDm) 1d 1w 1m 12m YTD 1d 1w 1m 12m YTD T T+1 T+2 T+3 T T+1 T+2 T+3 T+1 T+2 T+1
Technology Hideyuki Maekawa / Akinori Kanemoto / Shinji Kuroda / Yohei Ohya / Shunsuke Tsuchiya / Yu Yoshida / Yuki Nakayasu - 81 3 4550 9723 / 81 3 4550 7363 / 81 3 4550 9994 / 81 3 4550 7366 / 81 3 4550 9740 / 81 3 4550 9815 / 81 3 4550 9966
ASKUL Corporation 2678 JP O JPY 3,655 4,500 23 1,917 6.3 5 17 13 18 187 5 15 11 19 144 May-13 (48) 67 32 34.0 64.8 38.8 29.4 96 100 0.8 5.3 3.4 0.6 17.1 (76) Advantest 6857 JP U JPY 1,261 960.0 (24) 2,106 33.3 2 8 (0) (4) (8) 2 6 (3) (3) (51) Mar-13 nm nm nm nm nm nm nm 42 nm 1.6 (15.5) 1.8 1.9 nm (8)
Alps Electric 6770 JP N JPY 1,294 740.0 (43) 2,224 24.5 8 14 11 8 152 8 12 9 9 109 Mar-13 nm 62 21 nm 20.8 12.9 10.7 99 119 0.8 9.2 1.9 0.5 6.1 26 Brother Industries 6448 JP O JPY 1,426 1,600 12 3,660 12.1 (0) 3 7 (1) 51 (0) 1 4 (0) 8 Mar-13 4 63 9 21.4 20.7 12.7 11.7 108 112 1.7 6.7 1.3 0.5 5.0 (15) Canon 7751 JP N JPY 3,215 3,300 3 35,051 177.1 (0) 0 (3) (3) (3) (0) (2) (6) (3) (47) Dec-12 (2) 26 6 16.8 17.1 13.6 12.8 91 102 4.0 8.1 1.3 0.8 5.1 (24)
Capcom 9697 JP O JPY 1,871 2,200 18 1,009 7.8 1 1 (2) (1) 30 0 (1) (4) (0) (13) Mar-13 132 13 8 36.2 15.6 13.8 12.8 92 99 2.1 10.6 1.6 0.9 5.3 (29) CyberAgent, Inc 4751 JP N JPY 4,540 3,900 (14) 2,711 55.0 4 4 5 6 125 4 1 2 7 82 Sep-13 (2) 8 8 27.3 27.7 25.6 23.8 91 79 0.8 20.8 5.3 1.4 10.0 (55) DISCO 6146 JP O JPY 7,310 7,300 (0) 2,362 14.7 (1) 8 6 5 46 (1) 6 4 5 3 Mar-13 50 7 6 33.0 22.0 20.5 19.4 102 91 1.1 9.9 2.1 2.2 10.2 (15)
Dai-ichi Seiko 6640 JP N JPY 1,248 1,260 1 200 1.1 (1) 2 2 (2) (5) (1) (0) (1) (1) (48) Dec-12 nm 40 77 nm 24.0 17.1 9.7 164 123 0.8 2.1 0.5 0.3 2.1 (21) Dainippon Screen Mfg. 7735 JP O JPY 561.0 640.0 14 1,277 16.5 0 (3) (2) (6) 21 (0) (5) (5) (5) (22) Mar-13 nm 112 12 nm 25.6 12.1 10.8 104 118 0.5 6.5 1.6 0.6 10.4 (2) DeNA 2432 JP N JPY 2,226 2,600 17 2,761 82.2 (0) (5) 7 1 (29) (0) (7) 4 1 (72) Mar-13 (29) (3) 2 6.3 8.9 9.2 9.0 98 98 1.7 24.4 2.0 1.1 3.4 (56)
Fujifilm Holdings 4901 JP U JPY 3,047 2,200 (28) 14,080 60.6 1 3 6 2 65 1 1 4 3 22 Mar-13 18 20 16 27.0 22.9 19.1 16.4 89 91 1.6 3.4 0.8 0.6 5.7 (7) Fujitsu 6702 JP N JPY 532.0 420.0 (21) 10,555 45.6 0 1 0 (2) 52 0 (1) (2) (2) 8 Mar-13 nm 92 4 nm 28.2 14.7 14.1 81 93 1.9 4.6 1.4 0.3 5.1 16 Gree 3632 JP N JPY 1,081 1,100 2 2,410 56.3 (0) (2) 10 4 (26) (0) (4) 7 5 (69) Jun-13 (7) 9 8 11.1 11.9 11.0 10.2 104 99 0.8 19.5 2.1 1.5 5.1 (36)
Hirose Electric 6806 JP U JPY 15,110 12,200 (19) 4,969 12.0 3 5 (0) 1 42 2 3 (3) 1 (1) Mar-13 45 10 8 38.6 26.7 24.4 22.6 92 94 1.1 7.5 2.3 3.1 9.2 (56) Hitachi 6501 JP N JPY 865.0 735.0 (15) 40,063 200.4 1 4 13 9 60 1 2 10 9 17 Mar-13 23 18 5 23.2 18.8 15.9 15.1 92 86 1.2 10.2 1.8 0.6 6.8 49 Hitachi Kokusai Electric 6756 JP O JPY 1,422 1,470 3 1,401 8.4 (2) (2) 3 (4) 119 (2) (5) (0) (3) 76 Mar-13 87 26 (16) 23.7 12.7 10.1 12.0 114 122 1.1 13.6 1.7 0.6 4.8 (60)
IBIDEN 4062 JP N JPY 2,101 1,550 (26) 2,782 16.3 1 5 10 7 53 1 3 7 7 10 Mar-13 704 7 1 129.9 16.2 15.0 14.8 129 131 1.4 6.2 1.1 0.8 4.2 (11) Infomart Corporation 2492 JP O JPY 1,822 2,100 15 516 1.3 (3) 6 25 (3) 516 (3) 4 22 (2) 472 Dec-12 30 76 27 106.2 81.9 46.6 36.8 100 92 0.6 21.1 16.5 12.5 25.7 3 Itochu Techno-Solutions 4739 JP O JPY 4,435 4,600 4 2,503 9.2 2 6 7 4 17 2 4 4 4 (26) Mar-13 (6) 16 14 16.5 17.6 15.2 13.4 104 105 2.6 8.9 1.5 0.5 5.8 (44)
Japan Aviation Electr Ind 6807 JP N JPY 1,489 1,090 (27) 1,294 8.6 1 6 15 10 137 1 4 13 11 94 Mar-13 49 1 4 26.6 17.8 17.7 17.0 94 85 0.7 10.6 1.8 0.9 4.4 (10) Kakaku.com 2371 JP O JPY 2,166 2,250 4 4,654 45.2 2 7 23 17 162 2 5 20 18 119 Mar-13 28 29 20 69.6 54.2 42.2 35.2 97 94 0.5 40.8 19.2 15.3 29.8 (99) Konami 9766 JP O JPY 2,367 2,750 16 3,146 32.0 (2) (1) (3) (3) 34 (2) (3) (5) (2) (9) Mar-13 (43) 128 (6) 24.9 43.7 19.2 20.4 57 86 1.4 3.3 1.4 1.3 11.8 (20)
Konica Minolta 4902 JP N JPY 1,121 1,100 (2) 5,700 25.6 (0) 3 11 7 66 (0) 1 9 7 23 Mar-13 66 60 8 39.3 23.7 14.8 13.7 106 105 1.6 5.2 1.2 0.6 5.3 (1) Kyocera 6971 JP N JPY 5,069 5,300 5 17,832 85.3 1 3 (4) (3) 22 1 1 (7) (3) (21) Mar-13 42 10 6 28.0 19.7 17.9 16.9 99 99 3.2 5.7 1.2 1.0 6.9 (29) M3, Inc. 2413 JP N JPY 275,000 220,000 (20) 4,193 19.7 1 4 10 4 82 1 1 8 5 39 Mar-13 26 25 20 77.9 61.6 49.4 41.2 94 95 0.5 28.4 15.9 12.4 34.6 (48)
Mitsubishi Electric 6503 JP N JPY 1,295 1,030 (20) 26,658 70.0 (1) 1 2 (2) 70 (2) (2) (1) (1) 27 Mar-13 85 18 10 40.0 21.7 18.3 16.6 97 95 0.9 9.5 2.0 0.7 7.8 9 Mitsumi Electric 6767 JP N JPY 791.0 820.0 4 663 9.8 1 (1) (11) (10) 53 1 (3) (14) (9) 10 Mar-13 nm 961 44 nm 126.0 11.9 8.2 90 208 0.0 0.5 0.7 0.2 3.9 (36) MonotaRO Co., Ltd. 3064 JP N JPY 2,276 2,100 (8) 1,330 13.0 (2) 1 17 6 62 (2) (1) 14 7 18 Dec-12 33 12 26 81.7 61.3 54.8 43.4 96 84 0.6 36.1 19.7 4.0 33.6 (29)
Murata Manufacturing 6981 JP N JPY 10,225 7,500 (27) 20,757 66.0 2 7 13 9 90 1 5 10 10 47 Mar-13 95 18 22 58.2 29.7 25.2 20.6 82 86 1.2 9.3 3.0 2.5 10.5 (16) NEC 6701 JP N JPY 276.0 220.0 (20) 6,876 37.8 1 1 22 16 27 1 (1) 19 17 (17) Mar-13 8 6 14 23.6 21.8 20.5 18.0 128 80 1.4 4.6 1.0 0.4 8.1 54 NEXON 3569 JT O JPY 925.0 1,400 51 3,897 15.8 0 (1) (3) (5) 2 (0) (3) (6) (4) (41) Dec-12 56 7 9 15.7 10.1 9.5 8.7 97 97 1.0 17.2 1.6 1.7 3.6 (53)
NGK Spark Plug 5334 JP U JPY 2,543 1,920 (24) 5,307 16.5 (0) 4 4 2 122 (0) 1 1 3 79 Mar-13 43 10 3 26.5 18.5 16.9 16.4 96 93 0.9 10.6 1.9 1.6 8.9 (15) NTT Data 9613 JP U JPY 3,740 2,600 (30) 10,059 30.8 3 5 (1) (4) 39 3 3 (3) (3) (4) Mar-13 (14) 8 8 24.1 28.1 26.0 24.1 130 86 1.6 5.7 1.6 0.9 5.2 21 Nidec 6594 JP O JPY 10,970 13,400 22 14,506 67.5 1 5 12 7 107 1 3 10 7 64 Mar-13 672 35 17 200.6 26.0 19.2 16.4 98 106 0.8 14.4 3.6 1.8 12.5 21
Nikon 7731 JP U JPY 1,945 1,700 (13) 7,396 69.2 2 2 (2) (3) (26) 2 (0) (5) (3) (69) Mar-13 17 (10) 22 18.2 15.6 17.3 14.2 99 85 1.6 9.7 1.5 0.7 6.8 (10) Nintendo 7974 JP N JPY 13,415 12,500 (7) 16,449 106.0 (2) (13) (3) (4) 45 (3) (16) (5) (4) 2 Mar-12 nm nm (5) nm nm 33.6 35.2 24 146 0.7 0.1 1.5 1.6 49.5 (41) Nomura Research Institute 4307 JP O JPY 3,540 3,000 (15) 6,743 15.9 (0) 8 9 7 89 (0) 6 6 7 46 Mar-13 6 4 4 24.3 22.9 22.0 21.2 94 91 2.9 19.7 20.8 1.8 7.9 (17)
Olympus Corporation 7733 JP N JPY 3,075 3,400 11 10,091 58.1 (1) (0) (8) (8) 65 (1) (2) (11) (7) 22 Mar-13 41 222 20 106.2 75.3 23.4 19.5 89 96 0.0 6.7 3.7 1.6 10.1 62 Rakuten 4755 JP O JPY 1,800 1,400 (22) 22,745 82.6 1 5 20 15 128 1 3 18 16 85 Dec-12 182 19 15 121.8 43.2 36.3 31.6 96 92 0.2 19.4 7.7 4.4 18.1 (5) Ricoh 7752 JP O JPY 1,214 1,200 (1) 8,439 51.4 0 11 11 9 14 (0) 9 8 9 (30) Mar-13 97 9 1 27.1 13.8 12.7 12.6 87 85 2.7 7.0 0.9 0.7 7.3 56
Seiko Epson 6724 JP O JPY 2,910 3,700 27 4,992 41.5 0 (1) 5 3 234 0 (3) 3 3 191 Mar-13 nm 3 (6) nm 11.3 10.9 11.6 117 116 1.4 16.3 1.7 0.8 6.4 68 Shinko Electric Industries 6967 JP N JPY 954.0 1,030 8 1,236 9.8 (1) 11 14 9 34 (1) 9 12 10 (10) Mar-13 251 (17) 5 44.8 12.8 15.4 14.7 111 110 2.1 7.5 0.9 0.6 2.7 (34) Square Enix Holdings 9684 JP N JPY 1,710 1,800 5 1,890 15.3 (1) (2) (4) (7) 57 (1) (4) (7) (7) 14 Mar-13 nm 51 42 nm 32.3 21.4 15.0 104 101 1.8 5.0 1.6 1.0 8.5 (43)
TDK 6762 JP O JPY 4,940 6,400 30 5,959 55.6 2 6 1 (2) 49 2 3 (1) (1) 6 Mar-13 nm 75 22 520.0 24.6 14.0 11.4 132 122 1.4 4.4 1.1 0.7 5.4 6
Taiyo Yuden 6976 JP N JPY 1,426 1,350 (5) 1,608 24.8 4 11 9 4 75 4 9 6 4 32 Mar-13 392 11 15 83.9 17.0 15.3 13.3 103 97 0.7 8.2 1.4 0.9 4.9 19
Tamron 7740 JP O JPY 2,741 2,500 (9) 721 4.2 (1) (2) 11 7 7 (2) (4) 8 8 (37) Dec-12 3 15 20 19.3 18.8 16.4 13.7 100 92 1.8 9.2 1.6 1.0 7.2 (13) Tokyo Electron 8035 JP O JPY 5,727 6,150 7 9,840 65.8 1 3 4 (1) 39 1 1 1 (0) (4) Mar-13 327 58 40 168.9 39.6 25.0 17.8 910 79 0.9 4.3 1.7 1.3 12.0 (37) Toshiba 6502 JP O JPY 496.0 610.0 23 20,140 137.9 (1) 7 16 12 35 (1) 5 14 13 (8) Mar-13 113 28 3 27.1 12.7 9.9 9.6 130 123 2.4 14.8 1.8 0.5 5.9 103
Toshiba Tec 6588 JP O JPY 756.0 760.0 1 1,990 4.3 3 5 11 4 51 3 3 8 4 8 Mar-13 48 61 12 33.4 22.5 14.0 12.5 107 99 1.1 5.9 1.3 0.3 3.8 (35) Wacom 6727 JP N JPY 688.0 800.0 16 1,098 16.2 1 (2) 4 (7) 5 1 (5) 2 (6) (38) Mar-13 33 12 8 23.1 17.3 15.5 14.4 100 89 2.5 21.6 3.5 1.1 7.6 (58) Yahoo Japan 4689 JP O JPY 629.0 460.0 (27) 34,424 82.1 3 1 8 8 102 2 (1) 5 8 59 Mar-13 13 6 5 31.7 28.1 26.5 25.3 103 102 0.7 21.8 5.6 7.9 13.5 (77)
Yaskawa Electric Corp 6506 JP O JPY 1,562 1,700 9 3,769 32.5 (1) 2 (1) (6) 86 (1) (0) (3) (6) 42 Mar-13 140 35 15 57.9 24.1 17.9 15.5 101 109 0.8 13.7 3.3 1.1 11.6 21 mixi 2121 JP U JPY 6,570 900.0 (86) 941 63.1 (2) (12) 26 (15) 243 (2) (14) 23 (14) 200 Mar-13 (257) nm nm 59.3 nm nm nm 78 nm 0.2 (17.5) 7.3 11.0 nm (73) Sector* (8) 421,901 1 3 6 4 63 0 1 4 4 20 Mar-13 66 22 9 36.7 22.1 18.1 16.4 100 97 1.5 8.4 1.8 0.8 7.5 4
Telecommunication Services
Hitoshi Hayakawa - 81 3 4550 9952
KDDI 9433 JP O JPY 6,399 6,000 (6) 55,036 186.4 3 3 4 (1) 106 3 1 1 (1) 63 Mar-13 37 20 12 22.1 16.1 13.5 12.0 99 98 1.9 14.0 2.1 1.6 5.6 36 NTT DoCoMo 9437 JP U JPY 1,746 1,500 (14) 69,424 110.2 1 1 3 1 32 1 (1) 1 2 (11) Mar-13 4 1 4 14.6 14.0 13.9 13.3 100 99 3.4 9.3 1.3 1.5 4.2 (9) Nippon Telegraph and Tel 9432 JP O JPY 5,811 6,000 3 63,336 133.3 (1) 4 6 3 53 (1) 2 3 3 10 Mar-13 17 (1) 12 13.4 11.5 11.5 10.3 100 97 2.9 5.5 0.8 0.8 2.9 21
Softbank 9984 JP R JPY 8,874 102,164 881.3 0 2 (1) (4) 199 0 (1) (3) (3) 156 Mar-13 69 (19) 29 34.9 20.6 25.5 19.7 112 96 0.5 30.0 5.3 2.4 8.3 185 Sector* (6) 289,960 1 2 3 (1) 110 1 0 (0) (0) 66 Mar-13 27 (1) 14 19.5 15.4 15.6 13.7 103 97 2.0 9.6 1.6 1.5 4.9 37
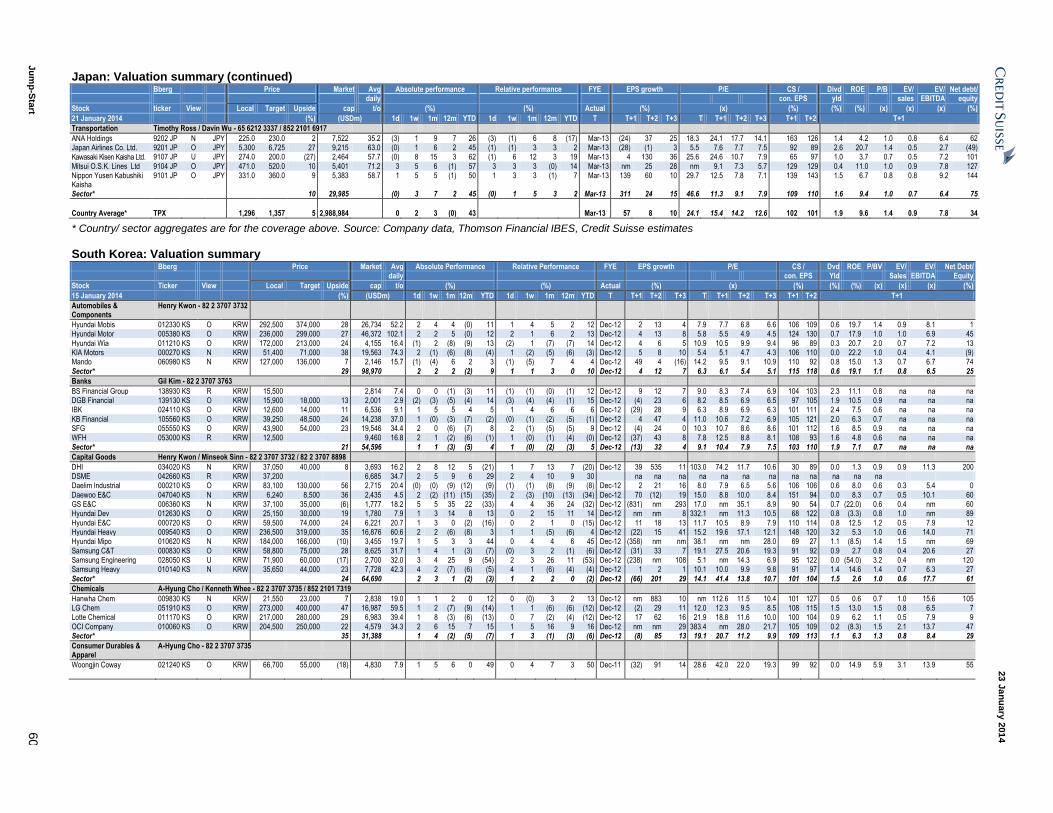
23 J
an
uary
201
4
Ju
mp
-Sta
rt 6
0
Japan: Valuation summary (continued) Bberg Price Market Avg Absolute performance Relative performance FYE EPS growth P/E CS / Divd ROE P/B EV/ EV/ Net debt/ daily con. EPS yld sales EBITDA equity
Stock ticker View Local Target Upside cap t/o (%) (%) Actual (%) (x) (%) (%) (%) (x) (x) (x) (%)
21 January 2014 (%) (USDm) 1d 1w 1m 12m YTD 1d 1w 1m 12m YTD T T+1 T+2 T+3 T T+1 T+2 T+3 T+1 T+2 T+1
Transportation Timothy Ross / Davin Wu - 65 6212 3337 / 852 2101 6917
ANA Holdings 9202 JP N JPY 225.0 230.0 2 7,522 35.2 (3) 1 9 7 26 (3) (1) 6 8 (17) Mar-13 (24) 37 25 18.3 24.1 17.7 14.1 163 126 1.4 4.2 1.0 0.8 6.4 62 Japan Airlines Co. Ltd. 9201 JP O JPY 5,300 6,725 27 9,215 63.0 (0) 1 6 2 45 (1) (1) 3 3 2 Mar-13 (28) (1) 3 5.5 7.6 7.7 7.5 92 89 2.6 20.7 1.4 0.5 2.7 (49)
Kawasaki Kisen Kaisha Ltd. 9107 JP U JPY 274.0 200.0 (27) 2,464 57.7 (0) 8 15 3 62 (1) 6 12 3 19 Mar-13 4 130 36 25.6 24.6 10.7 7.9 65 97 1.0 3.7 0.7 0.5 7.2 101
Mitsui O.S.K. Lines Ltd 9104 JP O JPY 471.0 520.0 10 5,401 71.2 3 5 6 (1) 57 3 3 3 (0) 14 Mar-13 nm 25 28 nm 9.1 7.3 5.7 129 129 0.4 11.0 1.0 0.9 7.8 127 Nippon Yusen Kabushiki Kaisha
9101 JP O JPY 331.0 360.0 9 5,383 58.7 1 5 5 (1) 50 1 3 3 (1) 7 Mar-13 139 60 10 29.7 12.5 7.8 7.1 139 143 1.5 6.7 0.8 0.8 9.2 144
Sector* 10 29,985 (0) 3 7 2 45 (0) 1 5 3 2 Mar-13 311 24 15 46.6 11.3 9.1 7.9 109 110 1.6 9.4 1.0 0.7 6.4 75
Country Average* TPX 1,296 1,357 5 2,988,984 0 2 3 (0) 43 Mar-13 57 8 10 24.1 15.4 14.2 12.6 102 101 1.9 9.6 1.4 0.9 7.8 34
* Country/ sector aggregates are for the coverage above. Source: Company data, Thomson Financial IBES, Credit Suisse estimates
South Korea: Valuation summary Bberg Price Market Avg Absolute Performance Relative Performance FYE EPS growth P/E CS / Dvd ROE P/BV EV/ EV/ Net Debt/ daily con. EPS Yld Sales EBITDA Equity
Stock Ticker View Local Target Upside cap t/o (%) (%) Actual (%) (x) (%) (%) (%) (x) (x) (x) (%)
15 January 2014 (%) (USDm) 1d 1w 1m 12m YTD 1d 1w 1m 12m YTD T T+1 T+2 T+3 T T+1 T+2 T+3 T+1 T+2 T+1
Automobiles & Components
Henry Kwon - 82 2 3707 3732
Hyundai Mobis 012330 KS O KRW 292,500 374,000 28 26,734 52.2 2 4 4 (0) 11 1 4 5 2 12 Dec-12 2 13 4 7.9 7.7 6.8 6.6 106 109 0.6 19.7 1.4 0.9 8.1 1 Hyundai Motor 005380 KS O KRW 236,000 299,000 27 46,372 102.1 2 2 5 (0) 12 2 1 6 2 13 Dec-12 4 13 8 5.8 5.5 4.9 4.5 124 130 0.7 17.9 1.0 1.0 6.9 45
Hyundai Wia 011210 KS O KRW 172,000 213,000 24 4,155 16.4 (1) 2 (8) (9) 13 (2) 1 (7) (7) 14 Dec-12 4 6 5 10.9 10.5 9.9 9.4 96 89 0.3 20.7 2.0 0.7 7.2 13 KIA Motors 000270 KS N KRW 51,400 71,000 38 19,563 74.3 2 (1) (6) (8) (4) 1 (2) (5) (6) (3) Dec-12 5 8 10 5.4 5.1 4.7 4.3 106 110 0.0 22.2 1.0 0.4 4.1 (9) Mando 060980 KS N KRW 127,000 136,000 7 2,146 15.7 (1) (4) 6 2 3 (1) (5) 7 4 4 Dec-12 49 4 (16) 14.2 9.5 9.1 10.9 110 92 0.8 15.0 1.3 0.7 6.7 74
Sector* 29 98,970 2 2 2 (2) 9 1 1 3 0 10 Dec-12 4 12 7 6.3 6.1 5.4 5.1 115 118 0.6 19.1 1.1 0.8 6.5 25
Banks Gil Kim - 82 2 3707 3763
BS Financial Group 138930 KS R KRW 15,500 2,814 7.4 0 0 (1) (3) 11 (1) (1) (0) (1) 12 Dec-12 9 12 7 9.0 8.3 7.4 6.9 104 103 2.3 11.1 0.8 na na na DGB Financial 139130 KS O KRW 15,900 18,000 13 2,001 2.9 (2) (3) (5) (4) 14 (3) (4) (4) (1) 15 Dec-12 (4) 23 6 8.2 8.5 6.9 6.5 97 105 1.9 10.5 0.9 na na na IBK 024110 KS O KRW 12,600 14,000 11 6,536 9.1 1 5 5 4 5 1 4 6 6 6 Dec-12 (29) 28 9 6.3 8.9 6.9 6.3 101 111 2.4 7.5 0.6 na na na
KB Financial 105560 KS O KRW 39,250 48,500 24 14,238 37.0 1 (0) (3) (7) (2) (0) (1) (2) (5) (1) Dec-12 4 47 4 11.0 10.6 7.2 6.9 105 121 2.0 6.3 0.7 na na na SFG 055550 KS O KRW 43,900 54,000 23 19,546 34.4 2 0 (6) (7) 8 2 (1) (5) (5) 9 Dec-12 (4) 24 0 10.3 10.7 8.6 8.6 101 112 1.6 8.5 0.9 na na na WFH 053000 KS R KRW 12,500 9,460 16.8 2 1 (2) (6) (1) 1 (0) (1) (4) (0) Dec-12 (37) 43 8 7.8 12.5 8.8 8.1 108 93 1.6 4.8 0.6 na na na
Sector* 21 54,596 1 1 (3) (5) 4 1 (0) (2) (3) 5 Dec-12 (13) 32 4 9.1 10.4 7.9 7.5 103 110 1.9 7.1 0.7 na na na
Capital Goods Henry Kwon / Minseok Sinn - 82 2 3707 3732 / 82 2 3707 8898
DHI 034020 KS N KRW 37,050 40,000 8 3,693 16.2 2 8 12 5 (21) 1 7 13 7 (20) Dec-12 39 535 11 103.0 74.2 11.7 10.6 30 89 0.0 1.3 0.9 0.9 11.3 200 DSME 042660 KS R KRW 37,200 6,685 34.7 2 5 9 6 29 2 4 10 9 30 na na na na na na na na na na na na Daelim Industrial 000210 KS O KRW 83,100 130,000 56 2,715 20.4 (0) (0) (9) (12) (9) (1) (1) (8) (9) (8) Dec-12 2 21 16 8.0 7.9 6.5 5.6 106 106 0.6 8.0 0.6 0.3 5.4 0
Daewoo E&C 047040 KS N KRW 6,240 8,500 36 2,435 4.5 2 (2) (11) (15) (35) 2 (3) (10) (13) (34) Dec-12 70 (12) 19 15.0 8.8 10.0 8.4 151 94 0.0 8.3 0.7 0.5 10.1 60 GS E&C 006360 KS N KRW 37,100 35,000 (6) 1,777 18.2 5 5 35 22 (33) 4 4 36 24 (32) Dec-12 (831) nm 293 17.0 nm 35.1 8.9 90 54 0.7 (22.0) 0.6 0.4 nm 60 Hyundai Dev 012630 KS O KRW 25,150 30,000 19 1,780 7.9 1 3 14 8 13 0 2 15 11 14 Dec-12 nm nm 8 332.1 nm 11.3 10.5 68 122 0.8 (3.3) 0.8 1.0 nm 89
Hyundai E&C 000720 KS O KRW 59,500 74,000 24 6,221 20.7 1 3 0 (2) (16) 0 2 1 0 (15) Dec-12 11 18 13 11.7 10.5 8.9 7.9 110 114 0.8 12.5 1.2 0.5 7.9 12 Hyundai Heavy 009540 KS O KRW 236,500 319,000 35 16,876 60.6 2 2 (6) (8) 3 1 1 (5) (6) 4 Dec-12 (22) 15 41 15.2 19.6 17.1 12.1 148 120 3.2 5.3 1.0 0.6 14.0 71 Hyundai Mipo 010620 KS N KRW 184,000 166,000 (10) 3,455 19.7 1 5 3 3 44 0 4 4 6 45 Dec-12 (358) nm nm 38.1 nm nm 28.0 69 27 1.1 (8.5) 1.4 1.5 nm 69
Samsung C&T 000830 KS O KRW 58,800 75,000 28 8,625 31.7 1 4 1 (3) (7) (0) 3 2 (1) (6) Dec-12 (31) 33 7 19.1 27.5 20.6 19.3 91 92 0.9 2.7 0.8 0.4 20.6 27 Samsung Engineering 028050 KS U KRW 71,900 60,000 (17) 2,700 32.0 3 4 25 9 (54) 2 3 26 11 (53) Dec-12 (238) nm 108 5.1 nm 14.3 6.9 95 122 0.0 (54.0) 3.2 0.4 nm 120 Samsung Heavy 010140 KS N KRW 35,650 44,000 23 7,728 42.3 4 2 (7) (6) (5) 4 1 (6) (4) (4) Dec-12 1 2 1 10.1 10.0 9.9 9.8 91 97 1.4 14.6 1.4 0.7 6.3 27
Sector* 24 64,690 2 3 1 (2) (3) 1 2 2 0 (2) Dec-12 (66) 201 29 14.1 41.4 13.8 10.7 101 104 1.5 2.6 1.0 0.6 17.7 61
Chemicals A-Hyung Cho / Kenneth Whee - 82 2 3707 3735 / 852 2101 7319
Hanwha Chem 009830 KS N KRW 21,550 23,000 7 2,838 19.0 1 1 2 0 12 0 (0) 3 2 13 Dec-12 nm 883 10 nm 112.6 11.5 10.4 101 127 0.5 0.6 0.7 1.0 15.6 105 LG Chem 051910 KS O KRW 273,000 400,000 47 16,987 59.5 1 2 (7) (9) (14) 1 1 (6) (6) (12) Dec-12 (2) 29 11 12.0 12.3 9.5 8.5 108 115 1.5 13.0 1.5 0.8 6.5 7 Lotte Chemical 011170 KS O KRW 217,000 280,000 29 6,983 39.4 1 8 (3) (6) (13) 0 7 (2) (4) (12) Dec-12 17 62 16 21.9 18.8 11.6 10.0 100 104 0.9 6.2 1.1 0.5 7.9 9
OCI Company 010060 KS O KRW 204,500 250,000 22 4,579 34.3 2 6 15 7 15 1 5 16 9 16 Dec-12 nm nm 29 383.4 nm 28.0 21.7 105 109 0.2 (8.3) 1.5 2.1 13.7 47 Sector* 35 31,388 1 4 (2) (5) (7) 1 3 (1) (3) (6) Dec-12 (8) 85 13 19.1 20.7 11.2 9.9 109 113 1.1 6.3 1.3 0.8 8.4 29
Consumer Durables & Apparel
A-Hyung Cho - 82 2 3707 3735
Woongjin Coway 021240 KS O KRW 66,700 55,000 (18) 4,830 7.9 1 5 6 0 49 0 4 7 3 50 Dec-11 (32) 91 14 28.6 42.0 22.0 19.3 99 92 0.0 14.9 5.9 3.1 13.9 55
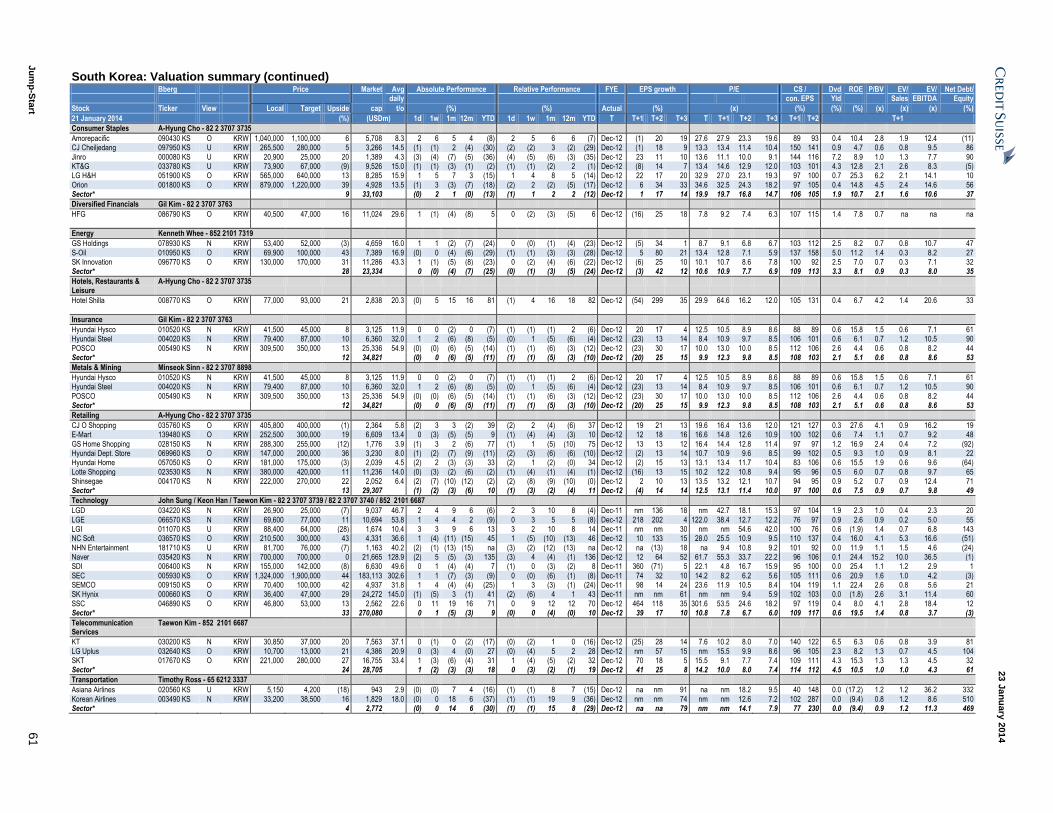
23 J
an
uary
201
4
Ju
mp
-Sta
rt 6
1
South Korea: Valuation summary (continued) Bberg Price Market Avg Absolute Performance Relative Performance FYE EPS growth P/E CS / Dvd ROE P/BV EV/ EV/ Net Debt/ daily con. EPS Yld Sales EBITDA Equity
Stock Ticker View Local Target Upside cap t/o (%) (%) Actual (%) (x) (%) (%) (%) (x) (x) (x) (%)
21 January 2014 (%) (USDm) 1d 1w 1m 12m YTD 1d 1w 1m 12m YTD T T+1 T+2 T+3 T T+1 T+2 T+3 T+1 T+2 T+1
Consumer Staples A-Hyung Cho - 82 2 3707 3735
Amorepacific 090430 KS O KRW 1,040,000 1,100,000 6 5,708 8.3 2 6 5 4 (8) 2 5 6 6 (7) Dec-12 (1) 20 19 27.6 27.9 23.3 19.6 89 93 0.4 10.4 2.8 1.9 12.4 (11) CJ Cheiljedang 097950 KS U KRW 265,500 280,000 5 3,266 14.5 (1) (1) 2 (4) (30) (2) (2) 3 (2) (29) Dec-12 (1) 18 9 13.3 13.4 11.4 10.4 150 141 0.9 4.7 0.6 0.8 9.5 86
Jinro 000080 KS U KRW 20,900 25,000 20 1,389 4.3 (3) (4) (7) (5) (36) (4) (5) (6) (3) (35) Dec-12 23 11 10 13.6 11.1 10.0 9.1 144 116 7.2 8.9 1.0 1.3 7.7 90 KT&G 033780 KS U KRW 73,900 67,000 (9) 9,526 15.0 (1) (1) (3) (1) (2) (1) (1) (2) 2 (1) Dec-12 (8) 14 7 13.4 14.6 12.9 12.0 103 101 4.3 12.8 2.1 2.6 8.3 (5) LG H&H 051900 KS O KRW 565,000 640,000 13 8,285 15.9 1 5 7 3 (15) 1 4 8 5 (14) Dec-12 22 17 20 32.9 27.0 23.1 19.3 97 100 0.7 25.3 6.2 2.1 14.1 10
Orion 001800 KS O KRW 879,000 1,220,000 39 4,928 13.5 (1) 3 (3) (7) (18) (2) 2 (2) (5) (17) Dec-12 6 34 33 34.6 32.5 24.3 18.2 97 105 0.4 14.8 4.5 2.4 14.6 56 Sector* 9 33,103 (0) 2 1 (0) (13) (1) 1 2 2 (12) Dec-12 1 17 14 19.9 19.7 16.8 14.7 106 105 1.9 10.7 2.1 1.6 10.6 37
Diversified Financials Gil Kim - 82 2 3707 3763
HFG 086790 KS O KRW 40,500 47,000 16 11,024 29.6 1 (1) (4) (8) 5 0 (2) (3) (5) 6 Dec-12 (16) 25 18 7.8 9.2 7.4 6.3 107 115 1.4 7.8 0.7 na na na
Energy Kenneth Whee - 852 2101 7319
GS Holdings 078930 KS N KRW 53,400 52,000 (3) 4,659 16.0 1 1 (2) (7) (24) 0 (0) (1) (4) (23) Dec-12 (5) 34 1 8.7 9.1 6.8 6.7 103 112 2.5 8.2 0.7 0.8 10.7 47
S-Oil 010950 KS O KRW 69,900 100,000 43 7,389 16.9 (0) 0 (4) (6) (29) (1) (1) (3) (3) (28) Dec-12 5 80 21 13.4 12.8 7.1 5.9 137 158 5.0 11.2 1.4 0.3 8.2 27 SK Innovation 096770 KS O KRW 130,000 170,000 31 11,286 43.3 1 (1) (5) (8) (23) 0 (2) (4) (6) (22) Dec-12 (6) 25 10 10.1 10.7 8.6 7.8 100 92 2.5 7.0 0.7 0.3 7.1 32 Sector* 28 23,334 0 (0) (4) (7) (25) (0) (1) (3) (5) (24) Dec-12 (3) 42 12 10.6 10.9 7.7 6.9 109 113 3.3 8.1 0.9 0.3 8.0 35
Hotels, Restaurants & Leisure
A-Hyung Cho - 82 2 3707 3735
Hotel Shilla 008770 KS O KRW 77,000 93,000 21 2,838 20.3 (0) 5 15 16 81 (1) 4 16 18 82 Dec-12 (54) 299 35 29.9 64.6 16.2 12.0 105 131 0.4 6.7 4.2 1.4 20.6 33
Insurance Gil Kim - 82 2 3707 3763
Hyundai Hysco 010520 KS N KRW 41,500 45,000 8 3,125 11.9 0 0 (2) 0 (7) (1) (1) (1) 2 (6) Dec-12 20 17 4 12.5 10.5 8.9 8.6 88 89 0.6 15.8 1.5 0.6 7.1 61 Hyundai Steel 004020 KS N KRW 79,400 87,000 10 6,360 32.0 1 2 (6) (8) (5) (0) 1 (5) (6) (4) Dec-12 (23) 13 14 8.4 10.9 9.7 8.5 106 101 0.6 6.1 0.7 1.2 10.5 90
POSCO 005490 KS N KRW 309,500 350,000 13 25,336 54.9 (0) (0) (6) (5) (14) (1) (1) (6) (3) (12) Dec-12 (23) 30 17 10.0 13.0 10.0 8.5 112 106 2.6 4.4 0.6 0.8 8.2 44 Sector* 12 34,821 (0) 0 (6) (5) (11) (1) (1) (5) (3) (10) Dec-12 (20) 25 15 9.9 12.3 9.8 8.5 108 103 2.1 5.1 0.6 0.8 8.6 53
Metals & Mining Minseok Sinn - 82 2 3707 8898
Hyundai Hysco 010520 KS N KRW 41,500 45,000 8 3,125 11.9 0 0 (2) 0 (7) (1) (1) (1) 2 (6) Dec-12 20 17 4 12.5 10.5 8.9 8.6 88 89 0.6 15.8 1.5 0.6 7.1 61 Hyundai Steel 004020 KS N KRW 79,400 87,000 10 6,360 32.0 1 2 (6) (8) (5) (0) 1 (5) (6) (4) Dec-12 (23) 13 14 8.4 10.9 9.7 8.5 106 101 0.6 6.1 0.7 1.2 10.5 90
POSCO 005490 KS N KRW 309,500 350,000 13 25,336 54.9 (0) (0) (6) (5) (14) (1) (1) (6) (3) (12) Dec-12 (23) 30 17 10.0 13.0 10.0 8.5 112 106 2.6 4.4 0.6 0.8 8.2 44 Sector* 12 34,821 (0) 0 (6) (5) (11) (1) (1) (5) (3) (10) Dec-12 (20) 25 15 9.9 12.3 9.8 8.5 108 103 2.1 5.1 0.6 0.8 8.6 53
Retailing A-Hyung Cho - 82 2 3707 3735
CJ O Shopping 035760 KS O KRW 405,800 400,000 (1) 2,364 5.8 (2) 3 3 (2) 39 (2) 2 (4) (6) 37 Dec-12 19 21 13 19.6 16.4 13.6 12.0 121 127 0.3 27.6 4.1 0.9 16.2 19 E-Mart 139480 KS O KRW 252,500 300,000 19 6,609 13.4 0 (3) (5) (5) 9 (1) (4) (4) (3) 10 Dec-12 12 18 16 16.6 14.8 12.6 10.9 100 102 0.6 7.4 1.1 0.7 9.2 48
GS Home Shopping 028150 KS N KRW 288,300 255,000 (12) 1,776 3.9 (1) 3 2 (6) 77 (1) 1 (5) (10) 75 Dec-12 13 13 12 16.4 14.4 12.8 11.4 97 97 1.2 16.9 2.4 0.4 7.2 (92) Hyundai Dept. Store 069960 KS O KRW 147,000 200,000 36 3,230 8.0 (1) (2) (7) (9) (11) (2) (3) (6) (6) (10) Dec-12 (2) 13 14 10.7 10.9 9.6 8.5 99 102 0.5 9.3 1.0 0.9 8.1 22 Hyundai Home 057050 KS O KRW 181,000 175,000 (3) 2,039 4.5 (2) 2 (3) (3) 33 (2) 1 (2) (0) 34 Dec-12 (2) 15 13 13.1 13.4 11.7 10.4 83 106 0.6 15.5 1.9 0.6 9.6 (64)
Lotte Shopping 023530 KS N KRW 380,000 420,000 11 11,236 14.0 (0) (3) (2) (6) (2) (1) (4) (1) (4) (1) Dec-12 (16) 13 15 10.2 12.2 10.8 9.4 95 96 0.5 6.0 0.7 0.8 9.7 65 Shinsegae 004170 KS N KRW 222,000 270,000 22 2,052 6.4 (2) (7) (10) (12) (2) (2) (8) (9) (10) (0) Dec-12 2 10 13 13.5 13.2 12.1 10.7 94 95 0.9 5.2 0.7 0.9 12.4 71 Sector* 13 29,307 (1) (2) (3) (6) 10 (1) (3) (2) (4) 11 Dec-12 (4) 14 14 12.5 13.1 11.4 10.0 97 100 0.6 7.5 0.9 0.7 9.8 49
Technology John Sung / Keon Han / Taewon Kim - 82 2 3707 3739 / 82 2 3707 3740 / 852 2101 6687
LGD 034220 KS N KRW 26,900 25,000 (7) 9,037 46.7 2 4 9 6 (6) 2 3 10 8 (4) Dec-11 nm 136 18 nm 42.7 18.1 15.3 97 104 1.9 2.3 1.0 0.4 2.3 20
LGE 066570 KS N KRW 69,600 77,000 11 10,694 53.8 1 4 4 2 (9) 0 3 5 5 (8) Dec-12 218 202 4 122.0 38.4 12.7 12.2 76 97 0.9 2.6 0.9 0.2 5.0 55 LGI 011070 KS U KRW 88,400 64,000 (28) 1,674 10.4 3 3 9 6 13 3 2 10 8 14 Dec-11 nm nm 30 nm nm 54.6 42.0 100 76 0.6 (1.9) 1.4 0.7 6.8 143 NC Soft 036570 KS O KRW 210,500 300,000 43 4,331 36.6 1 (4) (11) (15) 45 1 (5) (10) (13) 46 Dec-12 10 133 15 28.0 25.5 10.9 9.5 110 137 0.4 16.0 4.1 5.3 16.6 (51)
NHN Entertainment 181710 KS U KRW 81,700 76,000 (7) 1,163 40.2 (2) (1) (13) (15) na (3) (2) (12) (13) na Dec-12 na (13) 18 na 9.4 10.8 9.2 101 92 0.0 11.9 1.1 1.5 4.6 (24) Naver 035420 KS N KRW 700,000 700,000 0 21,665 128.9 (2) 5 (5) (3) 135 (3) 4 (4) (1) 136 Dec-12 12 64 52 61.7 55.3 33.7 22.2 96 106 0.1 24.4 15.2 10.0 36.5 (1) SDI 006400 KS N KRW 155,000 142,000 (8) 6,630 49.6 0 1 (4) (4) 7 (1) 0 (3) (2) 8 Dec-11 360 (71) 5 22.1 4.8 16.7 15.9 95 100 0.0 25.4 1.1 1.2 2.9 1
SEC 005930 KS O KRW 1,324,000 1,900,000 44 183,113 302.6 1 1 (7) (3) (9) 0 (0) (6) (1) (8) Dec-11 74 32 10 14.2 8.2 6.2 5.6 105 111 0.6 20.9 1.6 1.0 4.2 (3) SEMCO 009150 KS O KRW 70,400 100,000 42 4,937 31.8 1 4 (4) (4) (25) 1 3 (3) (1) (24) Dec-11 98 14 24 23.6 11.9 10.5 8.4 104 119 1.1 22.4 2.6 0.8 5.6 21 SK Hynix 000660 KS O KRW 36,400 47,000 29 24,272 145.0 (1) (5) 3 (1) 41 (2) (6) 4 1 43 Dec-11 nm nm 61 nm nm 9.4 5.9 102 103 0.0 (1.8) 2.6 3.1 11.4 60
SSC 046890 KS O KRW 46,800 53,000 13 2,562 22.6 0 11 19 16 71 0 9 12 12 70 Dec-12 464 118 35 301.6 53.5 24.6 18.2 97 119 0.4 8.0 4.1 2.8 18.4 12 Sector* 33 270,080 0 1 (5) (3) 9 (0) 0 (4) (0) 10 Dec-12 39 17 10 10.8 7.8 6.7 6.0 109 117 0.6 19.5 1.4 0.8 3.7 (3)
Telecommunication Services
Taewon Kim - 852 2101 6687
KT 030200 KS N KRW 30,850 37,000 20 7,563 37.1 0 (1) 0 (2) (17) (0) (2) 1 0 (16) Dec-12 (25) 28 14 7.6 10.2 8.0 7.0 140 122 6.5 6.3 0.6 0.8 3.9 81
LG Uplus 032640 KS O KRW 10,700 13,000 21 4,386 20.9 0 (3) 4 (0) 27 (0) (4) 5 2 28 Dec-12 nm 57 15 nm 15.5 9.9 8.6 96 105 2.3 8.2 1.3 0.7 4.5 104 SKT 017670 KS O KRW 221,000 280,000 27 16,755 33.4 1 (3) (6) (4) 31 1 (4) (5) (2) 32 Dec-12 70 18 5 15.5 9.1 7.7 7.4 109 111 4.3 15.3 1.3 1.3 4.5 32 Sector* 24 28,705 1 (2) (3) (3) 18 0 (3) (2) (1) 19 Dec-12 41 25 8 14.2 10.0 8.0 7.4 114 112 4.5 10.5 1.0 1.0 4.3 61
Transportation Timothy Ross - 65 6212 3337
Asiana Airlines 020560 KS U KRW 5,150 4,200 (18) 943 2.9 (0) (0) 7 4 (16) (1) (1) 8 7 (15) Dec-12 na nm 91 na nm 18.2 9.5 40 148 0.0 (17.2) 1.2 1.2 36.2 332
Korean Airlines 003490 KS N KRW 33,200 38,500 16 1,829 18.0 (0) 0 18 6 (37) (1) (1) 19 9 (36) Dec-12 nm nm 74 nm nm 12.6 7.2 102 287 0.0 (9.4) 0.8 1.2 8.6 510 Sector* 4 2,772 (0) 0 14 6 (30) (1) (1) 15 8 (29) Dec-12 na na 79 nm nm 14.1 7.9 77 230 0.0 (9.4) 0.9 1.2 11.3 469

23 J
an
uary
201
4
Ju
mp
-Sta
rt 6
2
South Korea: Valuation summary (continued) Bberg Price Market Avg Absolute Performance Relative Performance FYE EPS growth P/E CS / Dvd ROE P/BV EV/ EV/ Net Debt/ daily con. EPS Yld Sales EBITDA Equity
Stock Ticker View Local Target Upside cap t/o (%) (%) Actual (%) (x) (%) (%) (%) (x) (x) (x) (%)
21 January 2014 (%) (USDm) 1d 1w 1m 12m YTD 1d 1w 1m 12m YTD T T+1 T+2 T+3 T T+1 T+2 T+3 T+1 T+2 T+1
Utilities A-Hyung Cho - 82 2 3707 3735
KEPCO 015760 KS O KRW 33,950 40,000 18 20,464 45.3 (2) (4) 1 (2) 0 (3) (5) 2 0 1 Dec-12 nm nm 28 nm nm 9.7 7.6 466 93 0.7 (0.2) 0.4 1.5 9.5 116 KOGAS 036460 KS N KRW 68,300 67,667 (1) 5,920 21.4 1 (1) 5 3 (9) 0 (2) 6 5 (8) Dec-11 107 (27) 42 31.3 15.1 20.7 14.7 93 nm 2.3 4.4 0.7 0.9 13.1 288
Sector* 14 26,383 (2) (3) 2 (1) (2) (2) (4) 3 1 (1) Dec-12 na nm 28 nm 154.4 10.5 7.6 nm 90 1.1 0.3 0.5 1.2 10.1 140
Country Average* KOSPI 1,964 2,463 25 734,004 1 1 (1) (2) (1) Dec-12 15 27 11 11.3 9.9 7.8 6.9 110 113 1.2 11.1 1.0 0.8 6.1 40
* Country/ sector aggregates are for the coverage above
Source: Company data, Thomson Financial IBES, Credit Suisse estimates
Malaysia: Valuation summary Bberg Price Market Avg Absolute Performance Relative Performance FYE EPS growth P/E CS / Dvd ROE P/BV EV/ EV/ Net Debt/ daily con. EPS Yld Sales EBITDA Equity
Stock Ticker View Local Target Upside cap t/o (%) (%) Actual (%) (x) (%) (%) (%) (x) (x) (x) (%)
21 January 2014 (%) (USDm) 1d 1w 1m 12m YTD 1d 1w 1m 12m YTD T T+1 T+2 T+3 T T+1 T+2 T+3 T+1 T+2 T+1
Banks Danny Goh - 60 3 2723 2083
Alliance Financial Group AFG MK O MYR 4.71 5.63 20 2,194 2.0 0 (2) 0 (1) 11 (0) (1) 2 2 (0) Mar-13 18 12 14 13.6 11.5 10.3 9.0 111 114 3.9 15.1 1.7 na na na CIMB Group CIMB MK N MYR 7.11 7.75 9 16,538 26.1 0 (3) (6) (7) (2) (0) (2) (5) (4) (13) Dec-12 6 0 15 12.2 11.5 11.4 9.9 106 103 3.5 15.8 1.7 na na na
Hong Leong Bank HLBK MK N MYR 14.14 13.80 (2) 7,999 2.0 (0) 0 (0) (2) (2) (1) 1 1 1 (13) Jun-13 6 13 12 14.3 13.5 11.9 10.7 94 97 3.0 14.5 1.9 na na na Maybank MAY MK N MYR 9.86 10.30 4 26,298 26.2 1 (0) (2) (1) 11 0 1 (0) 2 0 Dec-12 6 8 7 14.5 13.6 12.6 11.8 100 103 5.5 14.5 1.9 na na na Public Bank PBKF MK N MYR 19.22 17.50 (9) 14,285 5.7 0 (0) 3 (2) 21 (0) 1 4 1 10 Dec-12 10 17 12 17.5 15.9 13.6 12.1 102 108 2.8 22.4 3.3 na na na
RHB Capital RHBC MK O MYR 7.82 8.80 13 5,994 3.2 0 (2) (2) (1) 1 (0) (1) (0) 2 (10) Dec-12 7 18 12 11.7 10.9 9.3 8.3 102 107 2.7 11.4 1.2 na na na Sector* 3 73,308 0 (1) (2) (2) 8 (0) 0 (0) 0 (3) Dec-12 8 9 11 14.1 13.1 12.1 10.9 101 104 3.8 15.7 1.9 na na na
Capital Goods Danny Goh - 60 3 2723 2083
Gamuda GAM MK O MYR 4.33 5.50 27 2,997 7.7 (2) (4) (9) (10) 20 (2) (2) (7) (7) 9 Jul-13 34 25 15 18.0 13.4 10.8 9.4 103 115 2.6 14.3 1.7 2.2 13.6 13 IJM Corporation IJM MK O MYR 5.70 7.28 28 2,428 3.8 (0) (2) (2) (3) 16 (1) (0) (0) (0) 5 Mar-13 39 21 24 18.8 13.6 11.2 9.0 107 113 1.5 10.2 1.3 2.2 7.8 35
Sector* 27 5,425 (1) (3) (6) (7) 18 (1) (2) (4) (4) 7 Dec-12 21 27 22 18.4 15.2 12.0 9.8 102 110 2.2 11.2 1.5 2.3 11.0 28
Chemicals Paworamon (Poom) Suvarnatemee - 66 2 614 6210
Petronas Chem PCHEM MK N MYR 6.72 6.60 (2) 16,178 9.2 1 (1) 1 (3) 8 1 0 3 (0) (3) Dec-12 11 7 (8) 15.3 13.8 12.8 14.0 108 110 3.6 18.3 2.4 2.5 6.6 (43)
Consumer Staples Tingmin Tan / Foong Wai Loke - 60 3 2723 2080 / 60 3 2723 2082
BAT Malaysia ROTH MK O MYR 62.12 72.00 16 5,338 2.4 0 (1) (1) (3) 4 (0) 0 1 (0) (7) Dec-12 5 6 3 22.2 21.1 19.9 19.3 102 103 4.6 164.9 33.1 4.1 15.0 41 FGV FGV MK N MYR 4.37 4.67 7 4,798 2.3 (1) (3) (3) (3) (1) (1) (2) (1) 0 (12) Dec-12 (28) 72 4 19.8 27.3 15.9 15.3 96 120 2.2 9.4 2.5 1.4 13.0 (33)
Genting Plantations GENP MK N MYR 10.50 10.28 (2) 2,398 0.8 1 (3) (4) (5) 27 0 (2) (2) (2) 16 Dec-12 (19) 64 24 24.4 30.1 18.4 14.9 98 118 0.9 7.5 2.2 5.7 19.4 (7) IOI Corp IOI MK N MYR 4.20 4.36 4 8,145 8.9 1 (1) (9) (11) 5 1 0 (8) (8) (6) Jun-13 11 18 8 21.0 18.9 16.1 14.9 86 93 2.6 20.6 3.6 2.5 13.8 27 KLK KLK MK U MYR 23.62 20.00 (15) 7,588 3.9 0 (2) (2) (5) 8 (0) (1) (1) (2) (3) Sep-13 7 19 13 25.1 23.5 19.8 17.6 93 101 2.5 13.2 2.9 2.6 15.5 23
Sime Darby SIME MK O MYR 9.13 10.70 17 16,511 18.6 0 (2) (5) (4) (1) (0) (1) (4) (1) (12) Jun-13 (9) 19 9 14.8 16.4 13.7 12.5 102 109 3.1 11.4 1.7 1.2 9.2 2 Sector* 7 44,777 0 (2) (5) (5) 4 (0) (1) (3) (3) (7) Dec-12 (7) 14 12 18.3 19.6 17.1 15.3 97 102 2.7 14.9 2.7 1.9 12.8 9
Diversified Financials Arjan van Veen / Danny Goh - 852 2101 7508 / 60 3 2723 2083
Bursa BURSA MK O MYR 8.00 10.00 25 1,282 2.0 1 (1) (1) (3) 25 1 0 1 (0) 14 Dec-12 22 24 14 28.1 23.0 18.6 16.3 102 112 4.0 21.9 5.2 na na na HLFG HLFG MK O MYR 15.40 17.10 11 4,879 1.0 2 0 (2) (1) 11 1 1 (1) 2 (0) Jun-13 0 15 13 10.9 10.8 9.4 8.3 97 105 2.3 14.1 1.4 na na na
Sector* 14 6,161 2 (0) (2) (1) 14 1 1 (0) 2 3 Dec-12 13 10 14 13.8 12.2 11.1 9.7 99 103 1.8 15.6 1.8 na na na
Energy Annuar Aziz - 60 3 2723 2084
Bumi Armada BAB MK O MYR 4.00 4.85 21 3,529 2.0 1 0 3 (1) 5 0 1 4 2 (6) Dec-12 36 25 2 30.4 22.3 17.8 17.4 105 102 0.8 13.2 2.8 6.6 13.0 54 Malaysia Marine MMHE MK U MYR 3.72 3.45 (7) 1,791 1.1 (1) (3) 9 6 (15) (1) (2) 10 9 (26) Dec-12 (15) 35 7 24.6 29.0 21.5 20.1 96 102 2.7 8.1 2.3 1.5 16.1 (54) UMWOG UMWOG MK N MYR 4.21 3.50 (17) 2,739 10.9 1 (1) 4 5 na 1 0 6 8 na Dec-12 112 74 11 106.0 50.0 28.7 25.8 102 109 0.0 29.9 9.0 11.8 33.8 3
Sector* 2 8,059 0 (1) 5 3 (2) (0) 0 6 6 (13) Dec-12 28 37 6 37.5 29.3 21.4 20.2 102 103 0.9 12.8 3.5 4.7 17.0 11
Healthcare Anand Swaminathan - 65 6212 3012
IHH IHH MK N MYR 3.77 3.30 (12) 9,229 5.5 1 (2) 1 (2) 14 0 (1) 2 0 3 Dec-12 14 24 23 55.9 48.9 39.5 32.1 99 95 0.0 3.5 1.7 4.9 24.7 7 KPJ KPJ MK U MYR 3.36 3.50 4 1,037 2.5 (1) (7) (14) (13) (8) (2) (6) (12) (11) (19) Dec-12 (38) 15 13 22.0 35.6 31.0 27.4 94 92 2.4 8.7 3.3 1.7 18.5 42 Sector* (11) 10,266 0 (3) (1) (3) 12 (0) (2) 0 (1) 1 Dec-12 3 23 22 48.4 47.1 38.4 31.6 98 95 0.2 3.8 1.8 4.0 23.8 9
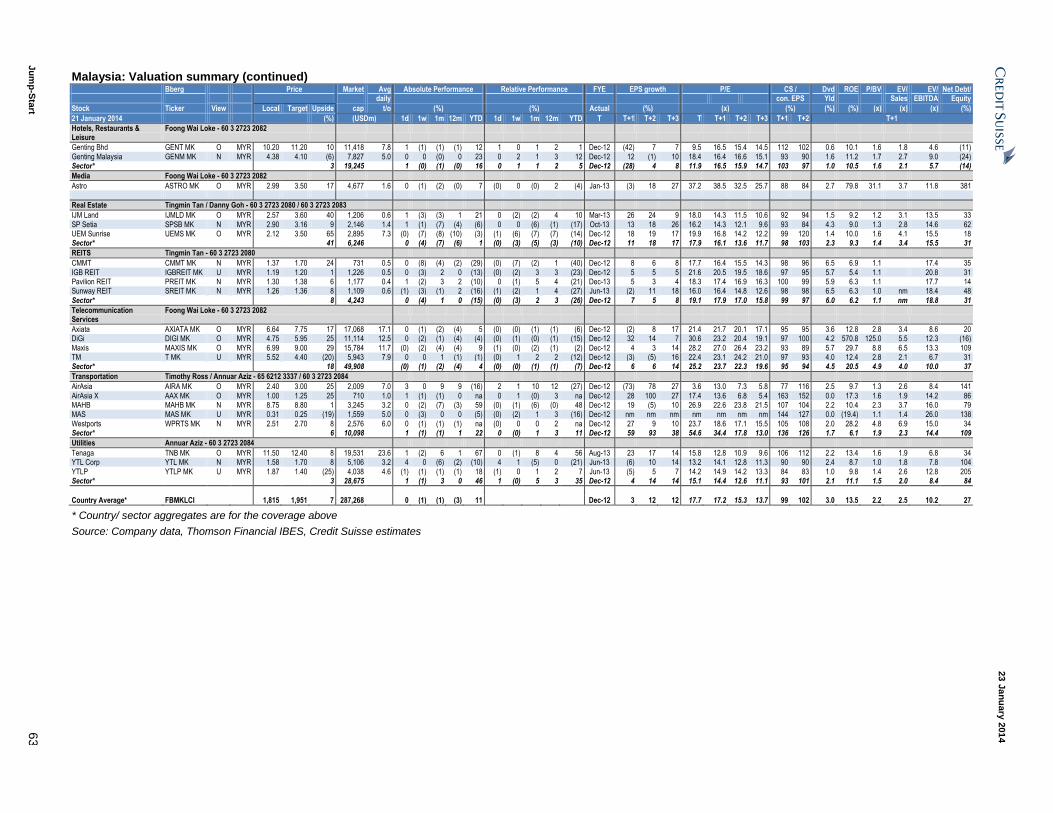
23 J
an
uary
201
4
Ju
mp
-Sta
rt 6
3
Malaysia: Valuation summary (continued) Bberg Price Market Avg Absolute Performance Relative Performance FYE EPS growth P/E CS / Dvd ROE P/BV EV/ EV/ Net Debt/ daily con. EPS Yld Sales EBITDA Equity
Stock Ticker View Local Target Upside cap t/o (%) (%) Actual (%) (x) (%) (%) (%) (x) (x) (x) (%)
21 January 2014 (%) (USDm) 1d 1w 1m 12m YTD 1d 1w 1m 12m YTD T T+1 T+2 T+3 T T+1 T+2 T+3 T+1 T+2 T+1
Hotels, Restaurants & Leisure
Foong Wai Loke - 60 3 2723 2082
Genting Bhd GENT MK O MYR 10.20 11.20 10 11,418 7.8 1 (1) (1) (1) 12 1 0 1 2 1 Dec-12 (42) 7 7 9.5 16.5 15.4 14.5 112 102 0.6 10.1 1.6 1.8 4.6 (11)
Genting Malaysia GENM MK N MYR 4.38 4.10 (6) 7,827 5.0 0 0 (0) 0 23 0 2 1 3 12 Dec-12 12 (1) 10 18.4 16.4 16.6 15.1 93 90 1.6 11.2 1.7 2.7 9.0 (24) Sector* 3 19,245 1 (0) (1) (0) 16 0 1 1 2 5 Dec-12 (28) 4 8 11.9 16.5 15.9 14.7 103 97 1.0 10.5 1.6 2.1 5.7 (14)
Media Foong Wai Loke - 60 3 2723 2082
Astro ASTRO MK O MYR 2.99 3.50 17 4,677 1.6 0 (1) (2) (0) 7 (0) 0 (0) 2 (4) Jan-13 (3) 18 27 37.2 38.5 32.5 25.7 88 84 2.7 79.8 31.1 3.7 11.8 381
Real Estate Tingmin Tan / Danny Goh - 60 3 2723 2080 / 60 3 2723 2083
IJM Land IJMLD MK O MYR 2.57 3.60 40 1,206 0.6 1 (3) (3) 1 21 0 (2) (2) 4 10 Mar-13 26 24 9 18.0 14.3 11.5 10.6 92 94 1.5 9.2 1.2 3.1 13.5 33
SP Setia SPSB MK N MYR 2.90 3.16 9 2,146 1.4 1 (1) (7) (4) (6) 0 0 (6) (1) (17) Oct-13 13 18 26 16.2 14.3 12.1 9.6 93 84 4.3 9.0 1.3 2.8 14.6 62 UEM Sunrise UEMS MK O MYR 2.12 3.50 65 2,895 7.3 (0) (7) (8) (10) (3) (1) (6) (7) (7) (14) Dec-12 18 19 17 19.9 16.8 14.2 12.2 99 120 1.4 10.0 1.6 4.1 15.5 18 Sector* 41 6,246 0 (4) (7) (6) 1 (0) (3) (5) (3) (10) Dec-12 11 18 17 17.9 16.1 13.6 11.7 98 103 2.3 9.3 1.4 3.4 15.5 31
REITS Tingmin Tan - 60 3 2723 2080
CMMT CMMT MK N MYR 1.37 1.70 24 731 0.5 0 (8) (4) (2) (29) (0) (7) (2) 1 (40) Dec-12 8 6 8 17.7 16.4 15.5 14.3 98 96 6.5 6.9 1.1 17.4 35
IGB REIT IGBREIT MK U MYR 1.19 1.20 1 1,226 0.5 0 (3) 2 0 (13) (0) (2) 3 3 (23) Dec-12 5 5 5 21.6 20.5 19.5 18.6 97 95 5.7 5.4 1.1 20.8 31 Pavilion REIT PREIT MK N MYR 1.30 1.38 6 1,177 0.4 1 (2) 3 2 (10) 0 (1) 5 4 (21) Dec-13 5 3 4 18.3 17.4 16.9 16.3 100 99 5.9 6.3 1.1 17.7 14 Sunway REIT SREIT MK N MYR 1.26 1.36 8 1,109 0.6 (1) (3) (1) 2 (16) (1) (2) 1 4 (27) Jun-13 (2) 11 18 16.0 16.4 14.8 12.6 98 98 6.5 6.3 1.0 nm 18.4 48
Sector* 8 4,243 0 (4) 1 0 (15) (0) (3) 2 3 (26) Dec-12 7 5 8 19.1 17.9 17.0 15.8 99 97 6.0 6.2 1.1 nm 18.8 31
Telecommunication Services
Foong Wai Loke - 60 3 2723 2082
Axiata AXIATA MK O MYR 6.64 7.75 17 17,068 17.1 0 (1) (2) (4) 5 (0) (0) (1) (1) (6) Dec-12 (2) 8 17 21.4 21.7 20.1 17.1 95 95 3.6 12.8 2.8 3.4 8.6 20 DiGi DIGI MK O MYR 4.75 5.95 25 11,114 12.5 0 (2) (1) (4) (4) (0) (1) (0) (1) (15) Dec-12 32 14 7 30.6 23.2 20.4 19.1 97 100 4.2 570.8 125.0 5.5 12.3 (16)
Maxis MAXIS MK O MYR 6.99 9.00 29 15,784 11.7 (0) (2) (4) (4) 9 (1) (0) (2) (1) (2) Dec-12 4 3 14 28.2 27.0 26.4 23.2 93 89 5.7 29.7 8.8 6.5 13.3 109 TM T MK U MYR 5.52 4.40 (20) 5,943 7.9 0 0 1 (1) (1) (0) 1 2 2 (12) Dec-12 (3) (5) 16 22.4 23.1 24.2 21.0 97 93 4.0 12.4 2.8 2.1 6.7 31 Sector* 18 49,908 (0) (1) (2) (4) 4 (0) (0) (1) (1) (7) Dec-12 6 6 14 25.2 23.7 22.3 19.6 95 94 4.5 20.5 4.9 4.0 10.0 37
Transportation Timothy Ross / Annuar Aziz - 65 6212 3337 / 60 3 2723 2084
AirAsia AIRA MK O MYR 2.40 3.00 25 2,009 7.0 3 0 9 9 (16) 2 1 10 12 (27) Dec-12 (73) 78 27 3.6 13.0 7.3 5.8 77 116 2.5 9.7 1.3 2.6 8.4 141
AirAsia X AAX MK O MYR 1.00 1.25 25 710 1.0 1 (1) (1) 0 na 0 1 (0) 3 na Dec-12 28 100 27 17.4 13.6 6.8 5.4 163 152 0.0 17.3 1.6 1.9 14.2 86 MAHB MAHB MK N MYR 8.75 8.80 1 3,245 3.2 0 (2) (7) (3) 59 (0) (1) (6) (0) 48 Dec-12 19 (5) 10 26.9 22.6 23.8 21.5 107 104 2.2 10.4 2.3 3.7 16.0 79 MAS MAS MK U MYR 0.31 0.25 (19) 1,559 5.0 0 (3) 0 0 (5) (0) (2) 1 3 (16) Dec-12 nm nm nm nm nm nm nm 144 127 0.0 (19.4) 1.1 1.4 26.0 138
Westports WPRTS MK N MYR 2.51 2.70 8 2,576 6.0 0 (1) (1) (1) na (0) 0 0 2 na Dec-12 27 9 10 23.7 18.6 17.1 15.5 105 108 2.0 28.2 4.8 6.9 15.0 34 Sector* 6 10,098 1 (1) (1) 1 22 0 (0) 1 3 11 Dec-12 59 93 38 54.6 34.4 17.8 13.0 136 126 1.7 6.1 1.9 2.3 14.4 109
Utilities Annuar Aziz - 60 3 2723 2084
Tenaga TNB MK O MYR 11.50 12.40 8 19,531 23.6 1 (2) 6 1 67 0 (1) 8 4 56 Aug-13 23 17 14 15.8 12.8 10.9 9.6 106 112 2.2 13.4 1.6 1.9 6.8 34 YTL Corp YTL MK N MYR 1.58 1.70 8 5,106 3.2 4 0 (6) (2) (10) 4 1 (5) 0 (21) Jun-13 (6) 10 14 13.2 14.1 12.8 11.3 90 90 2.4 8.7 1.0 1.8 7.8 104
YTLP YTLP MK U MYR 1.87 1.40 (25) 4,038 4.6 (1) (1) (1) (1) 18 (1) 0 1 2 7 Jun-13 (5) 5 7 14.2 14.9 14.2 13.3 84 83 1.0 9.8 1.4 2.6 12.8 205 Sector* 3 28,675 1 (1) 3 0 46 1 (0) 5 3 35 Dec-12 4 14 14 15.1 14.4 12.6 11.1 93 101 2.1 11.1 1.5 2.0 8.4 84
Country Average* FBMKLCI 1,815 1,951 7 287,268 0 (1) (1) (3) 11 Dec-12 3 12 12 17.7 17.2 15.3 13.7 99 102 3.0 13.5 2.2 2.5 10.2 27
* Country/ sector aggregates are for the coverage above
Source: Company data, Thomson Financial IBES, Credit Suisse estimates

23 J
an
uary
201
4
Ju
mp
-Sta
rt 6
4
Pakistan: Valuation summary Bberg Price Market Avg Absolute Performance Relative Performance FYE EPS growth P/E CS / Dvd ROE P/BV EV/ EV/ Net Debt/ daily con. EPS Yld Sales EBITDA Equity
Stock Ticker View Local Target Upside cap t/o (%) (%) Actual (%) (x) (%) (%) (%) (x) (x) (x) (%)
21 January 2014 (%) (USDm) 1d 1w 1m 12m YTD 1d 1w 1m 12m YTD T T+1 T+2 T+3 T T+1 T+2 T+3 T+1 T+2 T+1
Banks Farhan Rizvi - 65 6212 3036
MCB MCB PA O PKR 294.9 350.0 19 2,831 1.7 0 1 (2) 5 61 (0) (0) (8) (2) (2) Dec-12 3 17 16 13.9 13.5 11.6 10.0 101 107 4.4 20.0 2.6 na na na NBP NBP PA N PKR 58.91 53.00 (10) 1,189 3.4 1 1 (1) 1 39 1 (1) (7) (6) (24) Dec-12 (50) 83 14 7.7 15.4 8.4 7.4 65 93 5.9 5.6 0.9 na na na
UBL UBL PA O PKR 139.1 170.0 22 1,616 1.2 1 (1) 2 5 63 0 (3) (4) (2) (0) Dec-12 (3) 17 21 9.5 9.8 8.4 6.9 102 104 6.2 18.2 1.7 na na na Sector* 14 5,636 0 1 (0) 4 57 0 (1) (6) (3) (6) Dec-12 (14) 28 17 10.7 12.4 9.7 8.3 92 101 5.2 13.5 1.7 na na na
Building Materials & Construction
Farhan Rizvi - 65 6212 3036
DGKC DGKC PA O PKR 92.12 128.0 39 383 4.1 0 2 11 7 76 (0) 0 5 0 13 Jun-13 21 17 12 7.3 6.1 5.2 4.6 112 116 2.7 15.8 0.9 1.5 4.3 6
LUCKY LUCK PA O PKR 313.9 335.0 7 963 1.4 1 (1) 8 5 108 1 (2) 2 (3) 45 Jun-13 19 19 14 10.4 8.8 7.4 6.5 104 113 3.5 25.7 2.1 2.3 6.1 (3) Sector* 16 1,346 1 0 9 5 99 1 (2) 3 (2) 36 Dec-12 28 19 16 10.9 8.5 7.1 6.2 103 111 2.9 20.9 1.6 2.2 5.9 4
Chemicals Farhan Rizvi - 65 6212 3036
Engro Corp ENGRO PA O PKR 186.9 204.0 9 907 6.6 (1) 13 19 18 115 (1) 11 13 11 53 Dec-12 559 36 31 71.7 10.9 8.0 6.1 102 107 0.0 20.5 2.0 1.2 5.1 176 FATIMA FATIMA PA O PKR 28.54 30.50 7 569 0.4 (0) (1) (1) (0) 11 (1) (3) (7) (7) (52) Dec-12 39 24 11 10.0 7.2 5.7 5.2 100 100 8.8 26.9 1.8 2.9 4.9 93
Fauji Fertiliser FFC PA N PKR 116.9 126.0 8 1,411 1.5 0 (0) 1 4 (1) (0) (2) (5) (3) (64) Dec-12 2 2 3 7.1 7.0 6.9 6.7 107 106 13.5 79.5 5.5 2.0 5.0 5 Sector* 8 2,886 (0) 4 6 8 38 (0) 2 0 0 (25) Dec-12 36 15 13 10.8 7.9 6.9 6.1 104 105 8.3 38.1 2.8 1.6 5.0 111
Energy Fahd Niaz - 65 6212 3035
OGDC OGDC PK O PKR 285.0 325.0 14 11,631 1.5 (0) (1) 2 3 53 (1) (3) (4) (4) (10) Jun-13 46 29 13 13.4 9.2 7.1 6.3 99 106 4.9 37.0 3.1 4.4 6.2 (16) POL POL PA N PKR 528.7 440.0 (17) 1,187 1.1 1 4 4 6 20 1 2 (2) (1) (43) Jun-13 41 6 (6) 11.5 8.2 7.7 8.2 99 92 11.0 45.3 3.6 3.1 5.4 (13)
PPL PPL PK O PKR 221.1 255.0 15 4,136 3.9 1 2 2 3 51 0 0 (4) (4) (12) Jun-13 33 22 17 10.4 7.8 6.4 5.5 105 111 5.0 33.5 2.4 3.4 5.0 (4) Sector* 12 16,954 0 0 2 3 50 (0) (2) (4) (4) (13) Dec-12 19 32 18 12.2 10.3 7.7 6.6 100 103 4.5 34.1 3.2 4.4 6.4 (12)
Utilities Fahd Niaz - 65 6212 3035
HUBC HUBC PA O PKR 65.76 80.00 22 722 1.1 1 2 8 8 43 1 (0) 2 1 (20) Jun-13 9 15 17 8.1 7.4 6.4 5.5 100 99 12.9 31.3 2.3 0.6 5.9 90
Country Average* KSE100 27,105 30,486 12 27,544 0 2 6 7 63 Dec-12 14 28 17 11.5 10.1 7.9 6.8 99 103 5.2 26.6 2.5 2.7 6.1 11
* Country/ sector aggregates are for the coverage above. Source: Company data, Thomson Financial IBES, Credit Suisse estimates

23 J
an
uary
201
4
Ju
mp
-Sta
rt 6
5
Philippines: Valuation summary Bberg Price Market Avg Absolute Performance Relative Performance FYE EPS growth P/E CS / Dvd ROE P/BV EV/ EV/ Net Debt/ daily con. EPS Yld Sales EBITDA Equity
Stock Ticker View Local Target Upside cap t/o (%) (%) Actual (%) (x) (%) (%) (%) (x) (x) (x) (%)
21 January 2014 (%) (USDm) 1d 1w 1m 12m YTD 1d 1w 1m 12m YTD T T+1 T+2 T+3 T T+1 T+2 T+3 T+1 T+2 T+1
Banks Alvin Tan - 63 2 858 7752
Asia United Bank AUB PM N PHP 72.50 79.00 9 517 0.4 (0) 4 7 6 na (1) 3 4 4 na Dec-12 (11) (7) 26 12.2 13.8 14.7 11.6 97 91 0.0 10.0 1.3 na na na BDO BDO PM N PHP 73.90 85.00 15 5,829 5.7 2 3 8 8 (3) 2 2 5 6 (0) Dec-12 36 (13) 16 16.2 11.9 13.7 11.8 105 98 2.1 14.1 1.6 na na na
BPI BPI PM N PHP 86.05 109.9 28 7,443 3.0 1 3 6 3 (10) 0 2 3 1 (8) Dec-12 20 (2) 16 19.1 16.0 16.3 14.0 103 98 2.5 19.3 3.0 na na na Metrobank MBT PM U PHP 77.40 82.00 6 4,679 9.1 1 5 4 2 (4) 1 3 1 0 (2) Dec-12 45 (34) 23 14.2 9.8 14.8 12.0 101 86 2.0 17.7 1.6 na na na Security Bank SECB PM U PHP 119.1 112.5 (6) 1,581 2.7 1 2 3 3 (14) 1 1 (0) 1 (12) Dec-12 (43) 23 18 9.6 16.7 13.6 11.6 75 83 0.9 11.1 1.8 na na na
Sector* 16 20,049 1 4 6 4 (7) 1 2 3 2 (5) Dec-12 22 (14) 18 15.6 12.8 14.9 12.6 100 93 2.1 15.9 1.9 na na na
Conglomerates Alvin Arogo / Alvin Tan - 63 2 858 7716 / 63 2 858 7752
AEV AEV PM N PHP 52.60 50.70 (4) 6,398 1.4 (1) (1) (3) (4) (8) (1) (2) (6) (6) (5) Dec-12 (8) 5 11 12.1 13.2 12.6 11.3 105 112 3.8 22.6 2.8 4.0 13.2 37 Alliance Global AGI PM O PHP 26.40 31.60 20 5,972 7.5 1 4 4 2 49 1 2 0 0 51 Dec-12 6 32 17 19.2 18.1 13.7 11.7 96 114 1.4 15.9 2.4 2.3 8.7 (7) Ayala Corp AC PM N PHP 539.0 409.0 (24) 7,117 6.0 (0) 3 3 4 3 (0) 1 (0) 2 5 Dec-11 21 39 na 33.2 27.4 19.7 na 115 114 1.1 9.9 2.6 4.0 31.8 (7)
Metro Pacific MPI PM O PHP 4.12 6.40 55 2,362 3.5 (1) (3) (4) (5) (18) (1) (4) (7) (7) (16) Dec-12 11 19 24 15.6 14.0 11.8 9.5 98 103 0.9 8.8 1.1 4.5 8.1 33 San Miguel SMC PM O PHP 58.30 135.0 132 3,052 0.8 1 (1) (3) (7) (45) 1 (2) (6) (9) (43) Dec-10 31 36 24 9.9 7.5 5.5 4.4 157 117 0.0 6.6 0.5 0.8 6.0 110 Sector* 18 24,900 0 1 0 (0) 3 (0) (0) (3) (3) 6 Dec-12 13 17 16 13.8 12.3 12.8 11.1 116 111 1.8 12.5 1.4 1.5 8.0 35
Consumer Staples Karim Salamatian / Alvin Tan - 852 2101 7996 / 63 2 858 7752
Emperador EMP PM N PHP 11.72 12.00 2 3,872 2.1 0 7 10 10 32 (0) 6 6 7 34 Dec-12 (79) 17 11 6.1 29.1 24.9 22.4 99 97 2.1 30.6 5.7 5.4 20.3 (73)
Universal Robina URC PM O PHP 122.4 145.0 18 5,558 7.0 (0) 2 9 8 42 (0) 1 6 6 45 Sep-13 7 17 20 26.7 24.9 21.3 17.7 102 102 2.5 20.0 4.8 2.7 15.0 (13) Sector* 12 9,430 0 4 9 9 38 (0) 3 6 7 40 Dec-12 (57) 12 15 11.6 27.3 24.3 21.1 100 100 2.1 23.2 5.3 3.5 18.0 (37)
Energy Alvin Arogo - 63 2 858 7716
Petron PCOR PM N PHP 14.06 13.20 (6) 2,903 0.8 (0) 0 0 1 35 (0) (1) (3) (1) 38 Dec-12 56 (11) 284 105.8 67.7 76.3 19.8 80 53 0.7 3.9 2.6 0.6 15.8 133
Hotels, Restaurants & Leisure
Karim Salamatian / Alvin Tan - 852 2101 7996 / 63 2 858 7752
Belle Corp BEL PM O PHP 5.00 6.50 30 1,163 0.7 0 3 4 2 (2) (0) 1 1 (1) 1 Dec-11 26 174 160 212.8 169.2 61.8 23.7 45 99 0.0 1.9 3.2 115.1 314.0 42 Bloomberry BLOOM PM R PHP 8.70 2,029 1.2 (1) (3) 2 1 (34) (1) (5) (1) (1) (32) Dec-12 nm nm 28 nm 340.4 15.6 12.2 56 152 0.0 1.5 5.2 8.2 43.3 108 Jollibee JFC PM O PHP 168.0 205.0 22 3,895 2.5 1 3 (1) (3) 55 0 1 (4) (5) 58 Dec-12 23 18 24 47.8 38.7 32.8 26.5 100 101 1.5 23.2 8.5 2.1 20.3 (15)
Travellers RWM PM O PHP 10.02 13.50 35 3,477 2.9 1 (1) (3) (3) na 0 (3) (6) (5) na Dec-12 (9) 56 26 21.1 23.1 14.7 11.7 99 120 4.6 22.5 4.0 4.0 13.9 (38) Sector* 28 10,564 0 0 (0) (2) 20 0 (1) (4) (4) 23 Dec-12 16 93 29 44.5 38.3 19.8 15.3 98 121 2.1 14.9 5.0 3.7 21.7 4
Metals & Mining Alvin Arogo - 63 2 858 7716
Semirara SCC PM N PHP 301.6 285.0 (6) 2,367 1.1 0 0 9 5 25 (0) (1) 6 3 27 Dec-12 8 16 21 16.9 15.6 13.4 11.1 98 109 4.2 38.1 5.6 4.5 12.0 61
Real Estate Alvin Tan - 63 2 858 7752
ALI ALI PM O PHP 26.70 35.00 31 8,524 7.5 (0) 1 9 8 (2) (0) (0) 6 6 0 Dec-12 20 36 26 39.5 33.0 24.2 19.2 99 110 1.0 12.7 3.9 5.9 18.5 32
Filinvest Land FLI PM N PHP 1.36 1.60 18 726 0.8 (1) 0 1 (4) (19) (1) (1) (2) (6) (17) Dec-12 12 16 15 9.6 8.6 7.4 6.4 100 101 3.9 8.2 0.7 4.4 13.3 45 Megaworld MEG PM O PHP 3.59 4.25 18 2,528 3.8 0 4 11 11 12 (0) 3 8 9 15 Dec-12 3 20 22 12.8 12.4 10.4 8.6 105 117 0.8 11.1 1.3 3.5 12.7 (11) Robinsons Land RLC PM O PHP 19.70 25.00 27 1,776 1.4 (1) (1) 3 (1) (8) (1) (2) (1) (3) (6) Sep-12 13 21 21 19.0 16.9 13.9 11.5 107 104 2.1 9.9 1.6 5.6 11.2 26
SM Prime SMPH PM N PHP 14.10 17.50 24 8,640 6.5 (1) (2) (3) (4) (17) (1) (4) (6) (6) (15) Dec-12 13 15 18 23.9 21.2 18.4 15.6 98 102 1.7 11.6 2.4 7.1 14.0 36 Sector* 26 22,194 (0) 0 4 2 (7) (1) (1) 1 0 (5) Dec-12 13 22 21 23.5 20.8 17.1 14.2 101 107 1.4 11.2 2.2 5.8 14.8 26
Telecommunication Services
Chate Benchavitvilai - 65 6212 3241
Globe Telecom GLO PM N PHP 1,770 1,700 (4) 5,169 2.4 1 3 10 8 50 0 2 7 6 53 Dec-12 8 16 9 22.9 21.2 18.3 16.7 106 101 3.9 25.1 5.6 3.1 7.9 140
PLDT TEL PM O PHP 2,762 3,370 22 13,144 11.4 3 2 4 4 (4) 2 1 1 1 (2) Dec-12 2 3 10 16.0 15.6 15.1 13.7 100 99 6.4 25.7 4.0 4.0 8.6 48 Sector* 15 18,313 2 3 6 5 11 2 1 3 3 13 Dec-12 4 6 10 17.5 16.9 15.9 14.4 101 99 5.7 25.6 4.4 3.7 8.3 69
Transportation Alvin Arogo / Annuar Aziz - 63 2 858 7716 / 60 3 2723 2084
Cebu CEB PM O PHP 49.90 62.00 24 666 0.3 (0) (2) 6 7 (19) (0) (3) 3 4 (17) Dec-12 (47) 54 (1) 8.5 16.0 10.3 10.4 116 124 2.0 8.3 1.3 1.3 7.8 38 ICTSI ICT PM O PHP 95.00 64.00 (33) 4,256 3.8 (1) (3) (5) (7) 23 (2) (4) (8) (9) 26 Dec-11 11 19 18 33.6 30.2 25.4 21.5 120 111 0.5 19.5 5.5 6.4 14.5 65
Sector* (25) 4,922 (1) (3) (3) (5) 18 (1) (4) (7) (7) 20 Dec-12 (1) 21 (1) 21.8 23.2 18.6 10.4 113 113 0.7 15.2 3.4 3.2 11.1 50
Utilities Alvin Arogo - 63 2 858 7716
Aboitiz Power AP PM N PHP 35.80 37.90 6 5,803 1.6 0 1 8 5 (6) 0 (0) 5 3 (4) Dec-12 (19) 5 14 10.8 13.4 12.7 11.1 101 111 4.6 23.2 3.0 4.6 13.2 45 EDC EDC PM O PHP 5.40 6.30 17 2,230 1.3 0 0 6 1 (21) 0 (1) 3 (1) (18) Dec-12 (31) (94) nm 13.2 19.2 319.6 10.3 72 4 1.8 14.9 2.7 5.5 10.4 102 FGEN Corp FGEN PM O PHP 15.42 18.60 21 1,143 1.1 1 3 18 18 (36) 0 2 15 16 (34) Dec-12 (32) (55) 253 8.1 11.9 26.5 7.5 80 43 3.4 7.2 0.9 1.5 8.8 60
Manila Electric MER PM N PHP 253.0 339.0 34 6,292 4.4 0 1 0 1 (10) 0 (0) (3) (1) (7) Dec-12 14 8 13 17.5 15.4 14.2 12.6 103 104 3.9 26.6 3.9 0.8 6.6 (51) Manila Water MWC PM N PHP 23.45 25.20 7 1,040 1.5 (0) (0) 6 7 (30) (0) (2) 3 4 (28) Dec-12 1 (3) 13 9.3 9.2 9.4 8.4 103 99 3.4 18.6 1.6 4.3 6.1 76 Sector* 19 16,508 0 1 6 4 (13) 0 (0) 2 2 (11) Dec-12 (11) (9) 42 12.6 14.2 15.6 11.0 96 87 3.8 19.2 2.6 1.8 8.9 33
Country Average* PCOMP 6,019 7,008 16 132,151 0 1 3 2 (2) Dec-12 2 7 22 16.9 16.7 16.5 13.3 104 100 2.6 15.2 2.4 2.2 10.5 37
* Country/ sector aggregates are for the coverage above. Source: Company data, Thomson Financial IBES, Credit Suisse estimates
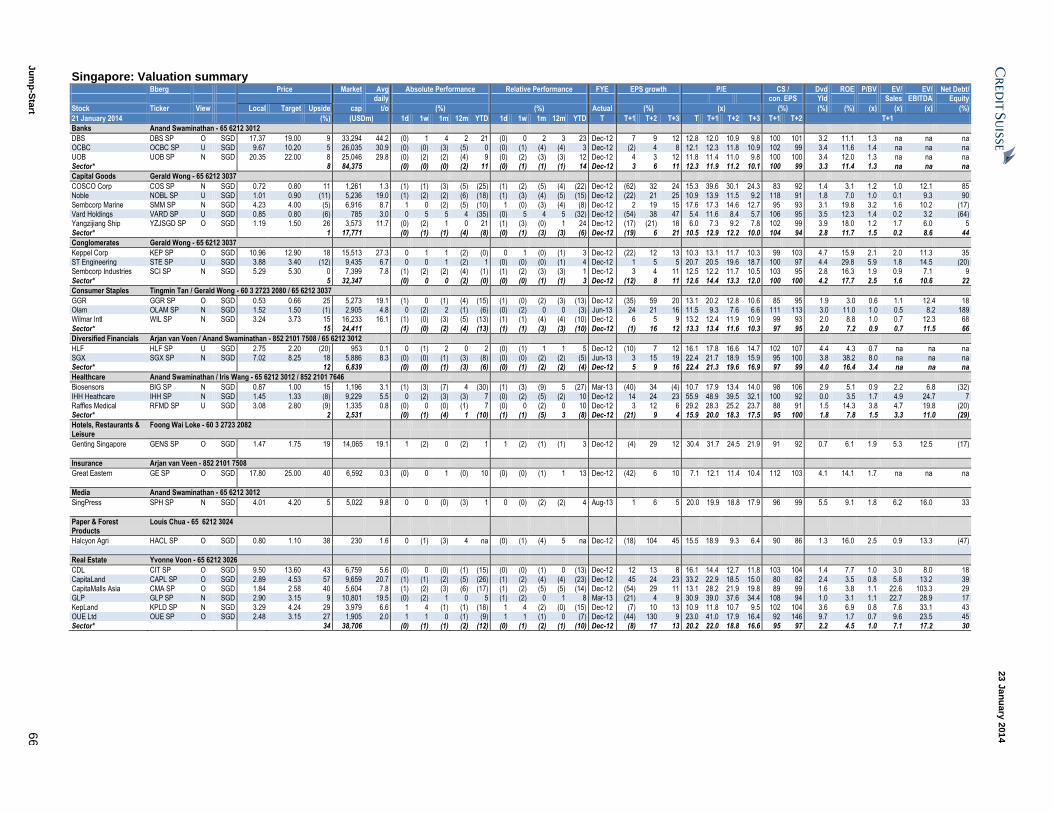
23 J
an
uary
201
4
Ju
mp
-Sta
rt 6
6
Singapore: Valuation summary Bberg Price Market Avg Absolute Performance Relative Performance FYE EPS growth P/E CS / Dvd ROE P/BV EV/ EV/ Net Debt/ daily con. EPS Yld Sales EBITDA Equity
Stock Ticker View Local Target Upside cap t/o (%) (%) Actual (%) (x) (%) (%) (%) (x) (x) (x) (%)
21 January 2014 (%) (USDm) 1d 1w 1m 12m YTD 1d 1w 1m 12m YTD T T+1 T+2 T+3 T T+1 T+2 T+3 T+1 T+2 T+1
Banks Anand Swaminathan - 65 6212 3012
DBS DBS SP O SGD 17.37 19.00 9 33,294 44.2 (0) 1 4 2 21 (0) 0 2 3 23 Dec-12 7 9 12 12.8 12.0 10.9 9.8 100 101 3.2 11.1 1.3 na na na OCBC OCBC SP U SGD 9.67 10.20 5 26,035 30.9 (0) (0) (3) (5) 0 (0) (1) (4) (4) 3 Dec-12 (2) 4 8 12.1 12.3 11.8 10.9 102 99 3.4 11.6 1.4 na na na
UOB UOB SP N SGD 20.35 22.00 8 25,046 29.8 (0) (2) (2) (4) 9 (0) (2) (3) (3) 12 Dec-12 4 3 12 11.8 11.4 11.0 9.8 100 100 3.4 12.0 1.3 na na na Sector* 8 84,375 (0) (0) (0) (2) 11 (0) (1) (1) (1) 14 Dec-12 3 6 11 12.3 11.9 11.2 10.1 100 99 3.3 11.4 1.3 na na na
Capital Goods Gerald Wong - 65 6212 3037
COSCO Corp COS SP N SGD 0.72 0.80 11 1,261 1.3 (1) (1) (3) (5) (25) (1) (2) (5) (4) (22) Dec-12 (62) 32 24 15.3 39.6 30.1 24.3 83 92 1.4 3.1 1.2 1.0 12.1 85 Noble NOBL SP U SGD 1.01 0.90 (11) 5,236 19.0 (1) (2) (2) (6) (18) (1) (3) (4) (5) (15) Dec-12 (22) 21 25 10.9 13.9 11.5 9.2 118 91 1.8 7.0 1.0 0.1 9.3 90
Sembcorp Marine SMM SP N SGD 4.23 4.00 (5) 6,916 8.7 1 0 (2) (5) (10) 1 (0) (3) (4) (8) Dec-12 2 19 15 17.6 17.3 14.6 12.7 95 93 3.1 19.8 3.2 1.6 10.2 (17) Vard Holdings VARD SP U SGD 0.85 0.80 (6) 785 3.0 0 5 5 4 (35) (0) 5 4 5 (32) Dec-12 (54) 38 47 5.4 11.6 8.4 5.7 106 95 3.5 12.3 1.4 0.2 3.2 (64) Yangzijiang Ship YZJSGD SP O SGD 1.19 1.50 26 3,573 11.7 (0) (2) 1 0 21 (1) (3) (0) 1 24 Dec-12 (17) (21) 18 6.0 7.3 9.2 7.8 102 99 3.9 18.0 1.2 1.7 6.0 5
Sector* 1 17,771 (0) (1) (1) (4) (8) (0) (1) (3) (3) (6) Dec-12 (19) 6 21 10.5 12.9 12.2 10.0 104 94 2.8 11.7 1.5 0.2 8.6 44
Conglomerates Gerald Wong - 65 6212 3037
Keppel Corp KEP SP O SGD 10.96 12.90 18 15,513 27.3 0 1 1 (2) (0) 0 1 (0) (1) 3 Dec-12 (22) 12 13 10.3 13.1 11.7 10.3 99 103 4.7 15.9 2.1 2.0 11.3 35 ST Engineering STE SP U SGD 3.88 3.40 (12) 9,435 6.7 0 0 1 (2) 1 (0) (0) (0) (1) 4 Dec-12 1 5 5 20.7 20.5 19.6 18.7 100 97 4.4 29.8 5.9 1.8 14.5 (20) Sembcorp Industries SCI SP N SGD 5.29 5.30 0 7,399 7.8 (1) (2) (2) (4) (1) (1) (2) (3) (3) 1 Dec-12 3 4 11 12.5 12.2 11.7 10.5 103 95 2.8 16.3 1.9 0.9 7.1 9
Sector* 5 32,347 (0) 0 0 (2) (0) (0) (0) (1) (1) 3 Dec-12 (12) 8 11 12.6 14.4 13.3 12.0 100 100 4.2 17.7 2.5 1.6 10.6 22
Consumer Staples Tingmin Tan / Gerald Wong - 60 3 2723 2080 / 65 6212 3037
GGR GGR SP O SGD 0.53 0.66 25 5,273 19.1 (1) 0 (1) (4) (15) (1) (0) (2) (3) (13) Dec-12 (35) 59 20 13.1 20.2 12.8 10.6 85 95 1.9 3.0 0.6 1.1 12.4 18 Olam OLAM SP N SGD 1.52 1.50 (1) 2,905 4.8 0 (2) 2 (1) (6) (0) (2) 0 0 (3) Jun-13 24 21 16 11.5 9.3 7.6 6.6 111 113 3.0 11.0 1.0 0.5 8.2 189 Wilmar Intl WIL SP N SGD 3.24 3.73 15 16,233 16.1 (1) (0) (3) (5) (13) (1) (1) (4) (4) (10) Dec-12 6 5 9 13.2 12.4 11.9 10.9 99 93 2.0 8.8 1.0 0.7 12.3 68
Sector* 15 24,411 (1) (0) (2) (4) (13) (1) (1) (3) (3) (10) Dec-12 (1) 16 12 13.3 13.4 11.6 10.3 97 95 2.0 7.2 0.9 0.7 11.5 66
Diversified Financials Arjan van Veen / Anand Swaminathan - 852 2101 7508 / 65 6212 3012
HLF HLF SP U SGD 2.75 2.20 (20) 953 0.1 0 (1) 2 0 2 (0) (1) 1 1 5 Dec-12 (10) 7 12 16.1 17.8 16.6 14.7 102 107 4.4 4.3 0.7 na na na SGX SGX SP N SGD 7.02 8.25 18 5,886 8.3 (0) (0) (1) (3) (8) (0) (0) (2) (2) (5) Jun-13 3 15 19 22.4 21.7 18.9 15.9 95 100 3.8 38.2 8.0 na na na Sector* 12 6,839 (0) (0) (1) (3) (6) (0) (1) (2) (2) (4) Dec-12 5 9 16 22.4 21.3 19.6 16.9 97 99 4.0 16.4 3.4 na na na
Healthcare Anand Swaminathan / Iris Wang - 65 6212 3012 / 852 2101 7646
Biosensors BIG SP N SGD 0.87 1.00 15 1,196 3.1 (1) (3) (7) 4 (30) (1) (3) (9) 5 (27) Mar-13 (40) 34 (4) 10.7 17.9 13.4 14.0 98 106 2.9 5.1 0.9 2.2 6.8 (32)
IHH Heathcare IHH SP N SGD 1.45 1.33 (8) 9,229 5.5 0 (2) (3) (3) 7 (0) (2) (5) (2) 10 Dec-12 14 24 23 55.9 48.9 39.5 32.1 100 92 0.0 3.5 1.7 4.9 24.7 7 Raffles Medical RFMD SP U SGD 3.08 2.80 (9) 1,335 0.8 (0) 0 (0) (1) 7 (0) 0 (2) 0 10 Dec-12 3 12 6 29.2 28.3 25.2 23.7 88 91 1.5 14.3 3.8 4.7 19.8 (20) Sector* 2 2,531 (0) (1) (4) 1 (10) (1) (1) (5) 3 (8) Dec-12 (21) 9 4 15.9 20.0 18.3 17.5 95 100 1.8 7.8 1.5 3.3 11.0 (29)
Hotels, Restaurants & Leisure
Foong Wai Loke - 60 3 2723 2082
Genting Singapore GENS SP O SGD 1.47 1.75 19 14,065 19.1 1 (2) 0 (2) 1 1 (2) (1) (1) 3 Dec-12 (4) 29 12 30.4 31.7 24.5 21.9 91 92 0.7 6.1 1.9 5.3 12.5 (17)
Insurance Arjan van Veen - 852 2101 7508
Great Eastern GE SP O SGD 17.80 25.00 40 6,592 0.3 (0) 0 1 (0) 10 (0) (0) (1) 1 13 Dec-12 (42) 6 10 7.1 12.1 11.4 10.4 112 103 4.1 14.1 1.7 na na na
Media Anand Swaminathan - 65 6212 3012
SingPress SPH SP N SGD 4.01 4.20 5 5,022 9.8 0 0 (0) (3) 1 0 (0) (2) (2) 4 Aug-13 1 6 5 20.0 19.9 18.8 17.9 96 99 5.5 9.1 1.8 6.2 16.0 33
Paper & Forest Products
Louis Chua - 65 6212 3024
Halcyon Agri HACL SP O SGD 0.80 1.10 38 230 1.6 0 (1) (3) 4 na (0) (1) (4) 5 na Dec-12 (18) 104 45 15.5 18.9 9.3 6.4 90 86 1.3 16.0 2.5 0.9 13.3 (47)
Real Estate Yvonne Voon - 65 6212 3026
CDL CIT SP O SGD 9.50 13.60 43 6,759 5.6 (0) 0 (0) (1) (15) (0) (0) (1) 0 (13) Dec-12 12 13 8 16.1 14.4 12.7 11.8 103 104 1.4 7.7 1.0 3.0 8.0 18
CapitaLand CAPL SP O SGD 2.89 4.53 57 9,659 20.7 (1) (1) (2) (5) (26) (1) (2) (4) (4) (23) Dec-12 45 24 23 33.2 22.9 18.5 15.0 80 82 2.4 3.5 0.8 5.8 13.2 39 CapitaMalls Asia CMA SP O SGD 1.84 2.58 40 5,604 7.8 (1) (2) (3) (6) (17) (1) (2) (5) (5) (14) Dec-12 (54) 29 11 13.1 28.2 21.9 19.8 89 99 1.6 3.8 1.1 22.6 103.3 29 GLP GLP SP N SGD 2.90 3.15 9 10,801 19.5 (0) (2) 1 0 5 (1) (2) 0 1 8 Mar-13 (21) 4 9 30.9 39.0 37.6 34.4 108 94 1.0 3.1 1.1 22.7 28.9 17
KepLand KPLD SP N SGD 3.29 4.24 29 3,979 6.6 1 4 (1) (1) (18) 1 4 (2) (0) (15) Dec-12 (7) 10 13 10.9 11.8 10.7 9.5 102 104 3.6 6.9 0.8 7.6 33.1 43 OUE Ltd OUE SP O SGD 2.48 3.15 27 1,905 2.0 1 1 0 (1) (9) 1 1 (1) 0 (7) Dec-12 (44) 130 9 23.0 41.0 17.9 16.4 92 146 9.7 1.7 0.7 9.6 23.5 45 Sector* 34 38,706 (0) (1) (1) (2) (12) (0) (1) (2) (1) (10) Dec-12 (8) 17 13 20.2 22.0 18.8 16.6 95 97 2.2 4.5 1.0 7.1 17.2 30
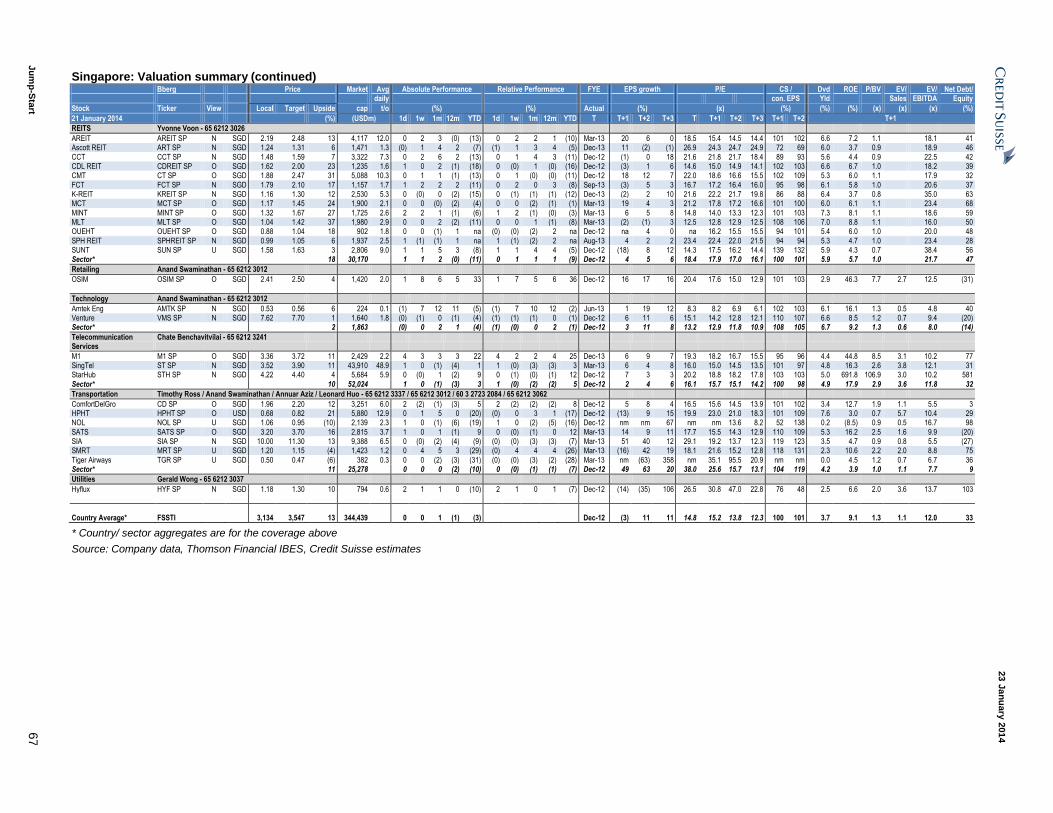
23 J
an
uary
201
4
Ju
mp
-Sta
rt 6
7
Singapore: Valuation summary (continued) Bberg Price Market Avg Absolute Performance Relative Performance FYE EPS growth P/E CS / Dvd ROE P/BV EV/ EV/ Net Debt/ daily con. EPS Yld Sales EBITDA Equity
Stock Ticker View Local Target Upside cap t/o (%) (%) Actual (%) (x) (%) (%) (%) (x) (x) (x) (%)
21 January 2014 (%) (USDm) 1d 1w 1m 12m YTD 1d 1w 1m 12m YTD T T+1 T+2 T+3 T T+1 T+2 T+3 T+1 T+2 T+1
REITS Yvonne Voon - 65 6212 3026
AREIT AREIT SP N SGD 2.19 2.48 13 4,117 12.0 0 2 3 (0) (13) 0 2 2 1 (10) Mar-13 20 6 0 18.5 15.4 14.5 14.4 101 102 6.6 7.2 1.1 18.1 41 Ascott REIT ART SP N SGD 1.24 1.31 6 1,471 1.3 (0) 1 4 2 (7) (1) 1 3 4 (5) Dec-13 11 (2) (1) 26.9 24.3 24.7 24.9 72 69 6.0 3.7 0.9 18.9 46
CCT CCT SP N SGD 1.48 1.59 7 3,322 7.3 0 2 6 2 (13) 0 1 4 3 (11) Dec-12 (1) 0 18 21.6 21.8 21.7 18.4 89 93 5.6 4.4 0.9 22.5 42 CDL REIT CDREIT SP O SGD 1.62 2.00 23 1,235 1.6 1 0 2 (1) (18) 0 (0) 1 (0) (16) Dec-12 (3) 1 6 14.6 15.0 14.9 14.1 102 103 6.6 6.7 1.0 18.2 39 CMT CT SP O SGD 1.88 2.47 31 5,088 10.3 0 1 1 (1) (13) 0 1 (0) (0) (11) Dec-12 18 12 7 22.0 18.6 16.6 15.5 102 109 5.3 6.0 1.1 17.9 32
FCT FCT SP N SGD 1.79 2.10 17 1,157 1.7 1 2 2 2 (11) 0 2 0 3 (8) Sep-13 (3) 5 3 16.7 17.2 16.4 16.0 95 98 6.1 5.8 1.0 20.6 37 K-REIT KREIT SP N SGD 1.16 1.30 12 2,530 5.3 0 (0) 0 (2) (15) 0 (1) (1) (1) (12) Dec-13 (2) 2 10 21.6 22.2 21.7 19.8 86 88 6.4 3.7 0.8 35.0 63 MCT MCT SP O SGD 1.17 1.45 24 1,900 2.1 0 0 (0) (2) (4) 0 0 (2) (1) (1) Mar-13 19 4 3 21.2 17.8 17.2 16.6 101 100 6.0 6.1 1.1 23.4 68
MINT MINT SP O SGD 1.32 1.67 27 1,725 2.6 2 2 1 (1) (6) 1 2 (1) (0) (3) Mar-13 6 5 8 14.8 14.0 13.3 12.3 101 103 7.3 8.1 1.1 18.6 59 MLT MLT SP O SGD 1.04 1.42 37 1,980 2.9 0 0 2 (2) (11) 0 0 1 (1) (8) Mar-13 (2) (1) 3 12.5 12.8 12.9 12.5 108 106 7.0 8.8 1.1 16.0 50 OUEHT OUEHT SP O SGD 0.88 1.04 18 902 1.8 0 0 (1) 1 na (0) (0) (2) 2 na Dec-12 na 4 0 na 16.2 15.5 15.5 94 101 5.4 6.0 1.0 20.0 48
SPH REIT SPHREIT SP N SGD 0.99 1.05 6 1,937 2.5 1 (1) (1) 1 na 1 (1) (2) 2 na Aug-13 4 2 2 23.4 22.4 22.0 21.5 94 94 5.3 4.7 1.0 23.4 28 SUNT SUN SP U SGD 1.58 1.63 3 2,806 9.0 1 1 5 3 (8) 1 1 4 4 (5) Dec-12 (18) 8 12 14.3 17.5 16.2 14.4 139 132 5.9 4.3 0.7 38.4 56 Sector* 18 30,170 1 1 2 (0) (11) 0 1 1 1 (9) Dec-12 4 5 6 18.4 17.9 17.0 16.1 100 101 5.9 5.7 1.0 21.7 47
Retailing Anand Swaminathan - 65 6212 3012
OSIM OSIM SP O SGD 2.41 2.50 4 1,420 2.0 1 8 6 5 33 1 7 5 6 36 Dec-12 16 17 16 20.4 17.6 15.0 12.9 101 103 2.9 46.3 7.7 2.7 12.5 (31)
Technology Anand Swaminathan - 65 6212 3012
Amtek Eng AMTK SP N SGD 0.53 0.56 6 224 0.1 (1) 7 12 11 (5) (1) 7 10 12 (2) Jun-13 1 19 12 8.3 8.2 6.9 6.1 102 103 6.1 16.1 1.3 0.5 4.8 40 Venture VMS SP N SGD 7.62 7.70 1 1,640 1.8 (0) (1) 0 (1) (4) (1) (1) (1) 0 (1) Dec-12 6 11 6 15.1 14.2 12.8 12.1 110 107 6.6 8.5 1.2 0.7 9.4 (20) Sector* 2 1,863 (0) 0 2 1 (4) (1) (0) 0 2 (1) Dec-12 3 11 8 13.2 12.9 11.8 10.9 108 105 6.7 9.2 1.3 0.6 8.0 (14)
Telecommunication Services
Chate Benchavitvilai - 65 6212 3241
M1 M1 SP O SGD 3.36 3.72 11 2,429 2.2 4 3 3 3 22 4 2 2 4 25 Dec-13 6 9 7 19.3 18.2 16.7 15.5 95 96 4.4 44.8 8.5 3.1 10.2 77 SingTel ST SP N SGD 3.52 3.90 11 43,910 48.9 1 0 (1) (4) 1 1 (0) (3) (3) 3 Mar-13 6 4 8 16.0 15.0 14.5 13.5 101 97 4.8 16.3 2.6 3.8 12.1 31 StarHub STH SP N SGD 4.22 4.40 4 5,684 5.9 0 (0) 1 (2) 9 0 (1) (0) (1) 12 Dec-12 7 3 3 20.2 18.8 18.2 17.8 103 103 5.0 691.8 106.9 3.0 10.2 581
Sector* 10 52,024 1 0 (1) (3) 3 1 (0) (2) (2) 5 Dec-12 2 4 6 16.1 15.7 15.1 14.2 100 98 4.9 17.9 2.9 3.6 11.8 32
Transportation Timothy Ross / Anand Swaminathan / Annuar Aziz / Leonard Huo - 65 6212 3337 / 65 6212 3012 / 60 3 2723 2084 / 65 6212 3062
ComfortDelGro CD SP O SGD 1.96 2.20 12 3,251 6.0 2 (2) (1) (3) 5 2 (2) (2) (2) 8 Dec-12 5 8 4 16.5 15.6 14.5 13.9 101 102 3.4 12.7 1.9 1.1 5.5 3 HPHT HPHT SP O USD 0.68 0.82 21 5,880 12.9 0 1 5 0 (20) (0) 0 3 1 (17) Dec-12 (13) 9 15 19.9 23.0 21.0 18.3 101 109 7.6 3.0 0.7 5.7 10.4 29 NOL NOL SP U SGD 1.06 0.95 (10) 2,139 2.3 1 0 (1) (6) (19) 1 0 (2) (5) (16) Dec-12 nm nm 67 nm nm 13.6 8.2 52 138 0.2 (8.5) 0.9 0.5 16.7 98
SATS SATS SP O SGD 3.20 3.70 16 2,815 3.7 1 0 1 (1) 9 0 (0) (1) 0 12 Mar-13 14 9 11 17.7 15.5 14.3 12.9 110 109 5.3 16.2 2.5 1.6 9.9 (20) SIA SIA SP N SGD 10.00 11.30 13 9,388 6.5 0 (0) (2) (4) (9) (0) (0) (3) (3) (7) Mar-13 51 40 12 29.1 19.2 13.7 12.3 119 123 3.5 4.7 0.9 0.8 5.5 (27) SMRT MRT SP U SGD 1.20 1.15 (4) 1,423 1.2 0 4 5 3 (29) (0) 4 4 4 (26) Mar-13 (16) 42 19 18.1 21.6 15.2 12.8 118 131 2.3 10.6 2.2 2.0 8.8 75
Tiger Airways TGR SP U SGD 0.50 0.47 (6) 382 0.3 0 0 (2) (3) (31) (0) (0) (3) (2) (28) Mar-13 nm (63) 358 nm 35.1 95.5 20.9 nm nm 0.0 4.5 1.2 0.7 6.7 36 Sector* 11 25,278 0 0 0 (2) (10) 0 (0) (1) (1) (7) Dec-12 49 63 20 38.0 25.6 15.7 13.1 104 119 4.2 3.9 1.0 1.1 7.7 9
Utilities Gerald Wong - 65 6212 3037
Hyflux HYF SP N SGD 1.18 1.30 10 794 0.6 2 1 1 0 (10) 2 1 0 1 (7) Dec-12 (14) (35) 106 26.5 30.8 47.0 22.8 76 48 2.5 6.6 2.0 3.6 13.7 103
Country Average* FSSTI 3,134 3,547 13 344,439 0 0 1 (1) (3) Dec-12 (3) 11 11 14.8 15.2 13.8 12.3 100 101 3.7 9.1 1.3 1.1 12.0 33
* Country/ sector aggregates are for the coverage above
Source: Company data, Thomson Financial IBES, Credit Suisse estimates

23 J
an
uary
201
4
Ju
mp
-Sta
rt 6
8
Taiwan: Valuation summary Bberg Price Market Avg Absolute Performance Relative Performance FYE EPS growth P/E CS / Dvd ROE P/BV EV/ EV/ Net Debt/ daily con. EPS Yld Sales EBITDA Equity
Stock Ticker View Local Target Upside cap t/o (%) (%) Actual (%) (x) (%) (%) (%) (x) (x) (x) (%)
21 January 2014 (%) (USDm) 1d 1w 1m 12m YTD 1d 1w 1m 12m YTD T T+1 T+2 T+3 T T+1 T+2 T+3 T+1 T+2 T+1
Automobiles & Components
Jeremy Chen - 886 2 2715 6368
Cheng Shin Rubber 2105 TT O TWD 79.50 97.50 23 8,524 18.6 (0) 2 7 2 25 0 1 4 2 13 Dec-12 16 14 10 16.2 13.9 12.2 11.1 101 108 1.9 26.8 3.4 2.2 9.4 54
Banks Chung Hsu - 886 2 2715 6362
CTBC Holding 2891 TT O TWD 20.20 22.50 11 9,830 18.7 (0) 1 3 (1) 31 (0) 1 0 (1) 20 Dec-12 (28) 58 (10) 11.5 16.0 10.1 11.2 88 112 2.6 9.6 1.5 na na na Chang Hwa Bank 2801 TT N TWD 18.30 16.00 (13) 4,690 5.9 (1) 0 2 (0) 24 (1) (0) (0) (0) 12 Dec-12 5 3 4 16.1 15.4 14.9 14.3 100 112 1.9 8.1 1.2 na na na E. Sun Financial 2884 TT N TWD 18.90 19.00 1 3,453 11.9 0 (1) (4) (5) 28 1 (2) (6) (4) 17 Dec-12 17 9 5 14.4 12.3 11.3 10.8 100 97 1.6 10.8 1.3 na na na
First FHC 2892 TT U TWD 18.30 16.00 (13) 5,238 6.0 (0) 0 2 (1) 11 (0) (1) (1) (1) (1) Dec-12 (3) 13 9 14.2 14.6 13.0 12.0 96 102 2.1 7.6 1.1 na na na Hua Nan Financial 2880 TT U TWD 17.40 14.48 (17) 5,212 3.0 (0) (1) 2 0 9 (0) (1) (1) 0 (3) Dec-12 7 10 16 17.8 16.6 15.0 13.0 96 98 1.5 6.8 1.1 na na na Mega Financial 2886 TT N TWD 24.70 24.17 (2) 10,171 17.8 (1) 0 1 (2) 9 (0) (0) (1) (1) (2) Dec-12 5 4 15 13.3 12.7 12.2 10.7 99 98 3.5 10.3 1.3 na na na
SinoPac Financial 2890 TT N TWD 14.45 15.00 4 3,923 6.2 (0) (0) 0 (3) 24 (0) (1) (2) (3) 12 Dec-12 1 1 8 12.1 12.0 11.9 11.0 92 96 3.3 9.7 1.1 na na na Ta Chong Bank 2847 TT O TWD 10.75 13.00 21 850 0.9 (1) 0 2 (1) 16 (1) (1) (0) (1) 5 Dec-12 54 8 9 13.8 8.9 8.3 7.6 100 100 3.3 9.8 0.9 na na na Taishin Financial 2887 TT U TWD 14.50 12.00 (17) 3,611 9.3 (1) (0) 1 (1) 36 (0) (1) (1) (1) 25 Dec-12 37 (20) 10 11.1 8.2 10.2 9.3 99 94 2.1 14.6 1.1 na na na
Sector* (3) 46,979 (0) 0 1 (1) 20 (0) (0) (1) (1) 9 Dec-12 1 12 5 13.3 13.3 11.9 11.2 96 102 2.5 9.5 1.2 na na na
Building Materials & Construction
Jeremy Chen - 886 2 2715 6368
Asia Cement 1102 TT O TWD 37.60 44.00 17 4,099 5.2 0 1 (1) (3) 6 0 0 (4) (2) (6) Dec-12 24 16 5 19.3 15.6 13.4 12.8 108 107 4.5 11.8 1.8 2.5 17.2 63 Taiwan Cement 1101 TT O TWD 44.90 48.20 7 5,483 13.0 2 2 (2) (3) 16 2 1 (4) (3) 4 Dec-12 27 18 7 21.4 16.9 14.3 13.4 105 109 4.2 13.0 2.2 1.6 10.2 52
Sector* 11 9,582 1 1 (2) (3) 11 1 1 (4) (3) 0 Dec-12 26 17 6 20.5 16.3 13.9 13.1 106 108 4.4 12.4 2.0 1.9 12.4 56
Chemicals Jeremy Chen / Michelle Chou - 886 2 2715 6368 / 886 2 2715 6363
FCFC 1326 TT N TWD 80.30 78.00 (3) 15,568 11.0 (1) (1) (4) (4) 3 (1) (1) (6) (4) (8) Dec-12 292 10 8 69.0 17.6 16.1 14.9 126 129 0.8 14.7 2.4 1.2 11.7 26 Formosa Plastics 1301 TT N TWD 79.50 75.00 (6) 16,739 13.5 1 1 2 (1) 3 1 1 0 (1) (8) Dec-12 36 33 10 34.5 25.5 19.1 17.4 89 93 1.5 10.5 2.6 2.6 28.9 11 NYPC 1303 TT O TWD 65.50 75.00 15 17,182 12.6 0 (1) (4) (5) 13 1 (2) (6) (5) 1 Dec-12 499 40 11 122.0 20.4 14.5 13.1 125 160 0.5 11.3 2.2 1.9 15.3 25
Taiwan Fertilizer 1722 TT N TWD 65.20 74.00 13 2,113 7.4 (1) (1) (2) (3) (11) (0) (1) (4) (3) (23) Dec-12 (4) 41 (9) 19.1 19.9 14.1 15.5 96 100 3.5 6.0 1.1 3.8 33.9 (5) Sector* 3 51,602 0 (0) (2) (4) 6 0 (1) (4) (3) (5) Dec-12 159 27 9 53.6 20.7 16.2 14.9 112 123 1.0 11.5 2.3 1.8 16.4 20
Consumer Staples Jeremy Chen - 886 2 2715 6368
Uni-President 1216 TT N TWD 50.70 56.60 12 8,644 18.0 (1) (3) (4) (6) 4 (1) (3) (6) (5) (8) Dec-12 12 15 15 21.1 18.8 16.4 14.3 108 113 3.1 16.7 3.0 0.7 8.8 62
Diversified Financials Chung Hsu / Michelle Chou - 886 2 2715 6362 / 886 2 2715 6363
China Development FHC 2883 TT O TWD 9.16 9.60 5 4,554 9.5 0 (0) 4 2 19 0 (1) 2 2 8 Dec-12 28 12 7 23.4 18.3 16.4 15.3 89 93 1.9 4.7 0.8 na na na
Yuanta FHC 2885 TT O TWD 17.40 19.50 12 5,694 7.5 1 1 4 (2) 15 1 1 2 (2) 4 Dec-12 15 17 3 28.4 24.8 21.2 20.6 93 96 1.4 4.5 1.1 na na na Sector* 9 10,248 1 1 4 (0) 17 1 0 2 (0) 5 Dec-12 21 14 5 26.0 21.4 18.8 17.9 91 94 1.6 4.6 1.0 na na na
Energy Jeremy Chen - 886 2 2715 6368
FPCC 6505 TT U TWD 76.80 69.00 (10) 24,199 6.8 0 (6) (4) (6) (9) 0 (7) (6) (6) (20) Dec-12 900 35 8 269.1 26.9 20.0 18.5 117 142 0.3 12.4 3.2 1.1 16.3 65
Healthcare Jeremy Chen - 886 2 2715 6368
GINKO ORD 8406 TT N TWD 514.0 515.0 0 1,567 5.5 (4) (9) (17) (9) 44 (4) (9) (19) (9) 32 Dec-12 31 34 19 42.5 32.3 24.2 20.3 102 103 1.0 22.7 6.8 9.0 24.5 (26)
ST.SHINE OPTICAL ORD 1565 TT O TWD 770.0 990.0 29 1,284 6.6 0 (5) (8) (10) 75 0 (5) (10) (9) 64 Dec-12 37 38 25 32.2 23.6 17.1 13.7 113 123 2.3 45.6 9.7 7.1 18.7 (11) Sector* 13 2,851 (2) (7) (13) (9) 58 (2) (7) (15) (9) 47 Dec-12 34 36 22 37.2 27.7 20.4 16.7 107 113 1.6 31.0 7.9 8.0 21.5 (20)
Insurance Chung Hsu - 886 2 2715 6362
Cathay FHC 2882 TT N TWD 47.70 47.50 (0) 18,878 27.2 1 2 3 (1) 60 2 2 0 (1) 49 Dec-12 73 3 8 32.5 18.8 18.2 16.8 102 101 0.8 11.9 2.1 na na na China Life Taiwan 2823 TT O TWD 30.70 34.04 11 2,764 11.0 (2) (0) 4 2 27 (2) (1) 2 2 15 Dec-12 6 13 (1) 15.3 14.4 12.8 13.0 105 117 1.1 9.3 1.3 na na na
Fubon FHC 2881 TT N TWD 43.70 43.00 (2) 14,792 19.7 0 1 4 0 20 0 0 1 0 9 Dec-12 9 4 16 14.4 13.1 12.7 10.9 100 97 2.5 10.3 1.3 na na na Shin Kong FHC 2888 TT U TWD 10.50 8.80 (16) 3,240 8.3 (0) 0 3 2 33 (0) (0) 1 2 22 Dec-12 28 (43) 9 9.0 7.1 12.4 11.4 133 90 0.0 15.0 1.0 na na na Sector* (1) 39,674 1 1 3 (0) 41 1 1 1 (0) 29 Dec-12 29 (4) 11 18.5 14.3 14.8 13.3 106 99 1.4 11.3 1.5 na na na
Metals & Mining Jeremy Chen - 886 2 2715 6368
China Steel 2002 TT U TWD 26.70 23.10 (13) 13,623 11.6 0 0 2 (1) (1) 0 (0) 0 (1) (13) Dec-12 147 23 8 69.8 28.2 23.0 21.3 92 104 1.5 5.5 1.5 1.7 10.2 72
Real Estate Chung Hsu / Jeremy Chen - 886 2 2715 6362 / 886 2 2715 6368
Huaku 2548 TT O TWD 76.50 111.0 45 700 3.4 (1) (1) (9) (9) 4 (0) (1) (12) (9) (7) Dec-12 81 2 8 12.6 6.9 6.8 6.3 114 141 8.6 23.7 1.5 2.7 9.1 59 Ruentex Development 9945 TT N TWD 54.50 64.00 17 2,149 10.4 5 1 (6) (6) (12) 5 1 (8) (6) (23) Dec-12 685 (77) 19 16.1 2.1 9.1 7.6 516 98 2.4 93.3 1.4 10.1 53.6 31 Sector* 24 2,849 3 1 (7) (7) (8) 4 0 (9) (6) (19) Dec-12 507 (70) 16 15.1 2.5 8.4 7.2 394 108 4.0 74.1 1.5 5.8 22.9 38
Retailing Jeremy Chen - 886 2 2715 6368
President Chain Store 2912 TT O TWD 196.0 264.5 35 6,740 10.2 1 1 (4) (5) 21 1 0 (6) (5) 10 Dec-12 28 22 1 30.0 23.4 19.3 19.0 105 114 2.5 35.0 7.7 0.8 10.9 (66)

23 J
an
uary
201
4
Ju
mp
-Sta
rt 6
9
Taiwan: Valuation summary Bberg Price Market Avg Absolute Performance Relative Performance FYE EPS growth P/E CS / Dvd ROE P/BV EV/ EV/ Net Debt/ daily con. EPS Yld Sales EBITDA Equity
Stock Ticker View Local Target Upside cap t/o (%) (%) Actual (%) (x) (%) (%) (%) (x) (x) (x) (%)
21 January 2014 (%) (USDm) 1d 1w 1m 12m YTD 1d 1w 1m 12m YTD T T+1 T+2 T+3 T T+1 T+2 T+3 T+1 T+2 T+1
Technology Randy Abrams / Derrick Yang / Pauline Chen / Jerry Su / Thompson Wu - 886 2 2715 6366 / 886 2 2715 6367 / 886 2 2715 6323 / 886 2 2715 6361 / 886 2 2715 6386
AIRTAC ORD 1590 TT N TWD 277.0 214.0 (23) 1,562 6.5 7 13 15 14 75 7 12 13 15 64 Dec-12 48 17 21 40.3 27.2 23.3 19.2 101 100 1.9 22.6 5.3 6.8 19.4 24 ASE 2311 TT O TWD 28.50 31.50 11 7,326 27.5 (1) 3 5 3 17 (1) 2 2 3 6 Dec-12 12 7 19 16.4 14.6 13.6 11.4 99 89 3.9 12.9 1.8 1.2 5.9 36
AUO 2409 TT O TWD 9.26 13.50 46 2,948 19.5 (1) (1) 3 (3) (21) (1) (2) 1 (3) (32) Dec-12 nm 120 20 nm 29.6 13.5 11.2 100 478 0.0 1.9 0.5 0.5 2.9 69 Acer 2353 TT U TWD 18.25 11.00 (40) 1,711 10.6 0 (1) 7 (0) (27) 0 (1) 4 (0) (38) Dec-12 nm nm 149 nm nm 341.1 136.8 79 nm 0.0 (28.9) 0.9 0.1 nm (21) Asustek 2357 TT U TWD 287.0 191.0 (33) 7,051 31.7 (0) (1) 5 7 (14) (0) (2) 2 7 (26) Dec-12 (6) (14) 3 9.6 10.3 12.0 11.7 100 94 5.8 16.1 1.6 0.4 7.5 (38)
Catcher 2474 TT O TWD 207.0 200.0 (3) 5,140 39.9 (0) 4 11 7 59 0 3 9 7 47 Dec-12 23 (3) 7 14.3 11.6 12.0 11.2 100 97 2.9 20.7 2.3 3.4 7.6 (21) Chicony 2385 TT N TWD 78.10 82.00 5 1,774 5.0 (1) 2 5 4 1 (1) 1 3 4 (11) Dec-12 (0) 13 7 13.9 13.9 12.2 11.4 94 97 5.9 20.3 2.8 0.8 9.5 20 Chipbond 6147 TT N TWD 49.70 49.00 (1) 1,066 14.5 (2) 10 7 6 (13) (2) 10 5 6 (25) Dec-12 (6) 2 29 11.6 12.3 12.1 9.4 100 100 5.3 13.4 1.6 2.1 6.4 2
Chroma 2360 TT N TWD 62.60 70.00 12 780 2.1 (0) 0 5 0 1 0 (0) 3 0 (11) Dec-12 25 24 24 25.0 19.9 16.0 12.9 101 97 3.6 15.6 3.1 2.3 15.2 (10) Compal 2324 TT O TWD 23.95 27.00 13 3,496 14.1 1 7 8 5 12 1 6 6 5 1 Dec-12 (61) 338 8 16.3 42.1 9.6 8.9 90 116 1.2 2.2 0.9 0.1 6.4 (2) Coretronic 5371 TT O TWD 29.65 34.00 15 710 3.2 1 3 6 1 30 1 3 4 1 19 Dec-12 110 14 8 24.1 11.5 10.1 9.3 112 120 3.4 9.2 1.0 0.2 3.1 (36)
Delta 2308 TT N TWD 172.0 164.0 (5) 13,868 21.5 1 4 4 1 64 1 4 1 1 52 Dec-12 9 8 7 25.9 23.8 22.0 20.6 99 91 3.3 18.5 4.6 2.2 14.3 (34) E Ink 8069 TT N TWD 16.90 16.00 (5) 638 3.2 2 4 10 3 (21) 2 3 8 3 (32) Dec-12 nm nm 15 nm nm 19.3 16.7 563 388 0.0 (0.3) 0.8 1.2 67.9 16 Elan 2458 TT O TWD 55.10 60.00 9 790 20.6 0 4 21 18 18 0 3 19 18 6 Dec-12 23 16 9 19.6 15.9 13.7 12.6 102 115 6.2 20.7 3.3 2.8 12.4 (25)
Epistar 2448 TT O TWD 64.00 75.00 17 1,977 14.0 (1) 4 17 11 20 (1) 3 15 12 9 Dec-12 nm nm 52 nm 344.8 31.0 20.4 48 108 0.0 0.4 1.3 2.8 12.6 3 Everlight 2393 TT U TWD 76.00 62.00 (18) 1,064 8.4 0 3 21 11 88 0 3 18 11 77 Dec-12 170 10 8 58.4 21.6 19.7 18.2 104 93 1.6 10.3 2.1 1.4 9.0 12 FTC 2354 TT N TWD 69.80 72.00 3 3,016 8.1 (0) 2 2 0 (14) (0) 1 (1) 0 (25) Dec-12 (15) 14 4 10.8 12.7 11.1 10.7 102 110 1.2 10.9 1.3 0.7 5.7 (35)
G-Tech 3149 TT U TWD 41.35 33.00 (20) 368 5.2 (2) 6 21 10 (38) (2) 6 19 10 (50) Dec-12 (216) nm 43 15.1 nm 20.3 14.2 21 346 0.0 (8.7) 1.2 1.3 33.4 26 HIWIN ORD 2049 TT N TWD 270.0 220.0 (19) 2,267 15.9 6 9 10 7 31 6 8 7 7 20 Dec-12 (1) 33 13 34.2 34.4 26.0 23.0 100 92 0.9 18.7 6.1 6.5 23.2 89 HTC 2498 TT U TWD 145.0 97.00 (33) 4,040 65.1 7 11 5 3 (49) 7 11 3 3 (61) Dec-12 (101) nm 16 7.4 nm 141.4 122.3 519 nm 0.0 (0.2) 1.6 0.4 96.8 (63)
Hon Hai 2317 TT O TWD 84.50 108.0 28 36,694 85.4 (1) 3 7 5 10 (1) 2 5 6 (1) Dec-12 3 9 6 10.5 10.2 9.3 8.8 105 107 1.8 14.8 1.4 0.3 5.3 (15) Innolux 3481 TT N TWD 10.85 10.80 (0) 3,269 23.8 (2) (3) 5 (4) (22) (2) (3) 3 (4) (33) Dec-12 nm (20) 33 nm 16.9 21.0 15.7 97 129 0.0 3.2 0.5 0.6 2.7 80 Kinsus 3189 TT N TWD 101.0 120.0 19 1,490 6.6 (1) 3 5 2 11 (1) 2 3 2 (1) Dec-12 18 16 9 16.1 13.6 11.8 10.8 101 99 3.6 12.9 1.7 1.6 5.6 (31)
Largan 3008 TT O TWD 1,250 1,130 (10) 5,546 38.9 2 12 5 3 70 2 12 3 3 59 Dec-12 62 6 8 30.1 18.6 17.5 16.2 99 91 2.2 40.1 7.6 5.9 13.5 (44) Lextar 3698 TT O TWD 33.15 37.00 12 584 8.4 3 3 15 6 33 4 2 13 6 22 Dec-12 170 (6) 37 48.1 17.8 19.0 13.9 97 114 1.4 9.7 1.5 1.3 6.7 (2) Lite-on Tech 2301 TT N TWD 45.50 51.00 12 3,503 7.7 (0) (1) (1) (5) 15 0 (2) (3) (5) 3 Dec-12 13 9 10 13.9 12.4 11.4 10.4 96 95 5.7 10.5 1.5 0.5 6.1 (3)
MStar 3697 TT R TWD 332.0 5,849 13.8 0 2 (1) (4) 64 0 1 (4) (4) 53 Dec-11 2 16 na 28.2 27.6 23.8 na 142 125 2.7 19.2 5.2 4.0 18.2 (80) MediaTek 2454 TT O TWD 388.0 500.0 29 17,322 80.0 (5) (7) (10) (13) 23 (5) (7) (13) (12) 11 Dec-12 60 23 14 30.4 19.0 15.5 13.6 102 98 0.0 14.8 2.7 3.1 15.8 (51) NYPCB 8046 TT N TWD 37.50 41.00 9 801 2.5 0 (0) 5 1 4 0 (1) 3 1 (7) Dec-12 nm nm 57 nm nm 21.8 13.9 95 88 0.0 (1.9) 0.7 0.4 7.7 (30)
Novatek 3034 TT U TWD 125.0 104.0 (17) 2,516 15.2 2 (3) 4 2 9 3 (3) 2 3 (2) Dec-12 8 5 9 17.0 15.7 15.0 13.8 99 88 4.8 19.9 3.1 1.5 10.7 (50) PTI 6239 TT N TWD 42.20 56.00 33 1,067 6.1 (1) (6) (4) (7) (8) (1) (6) (6) (7) (19) Dec-12 (43) 13 33 9.1 15.9 14.1 10.5 96 90 7.2 5.7 0.9 0.8 2.3 (4) Pegatron 4938 TT N TWD 41.50 34.00 (18) 3,178 14.2 (2) 5 13 8 4 (2) 4 11 8 (7) Dec-12 36 3 18 15.3 11.3 10.9 9.2 96 95 4.4 6.4 0.7 0.1 2.7 (13)
Quanta 2382 TT N TWD 76.90 65.00 (15) 9,824 14.4 (3) 3 13 11 20 (3) 2 11 11 9 Dec-12 (14) 15 10 12.8 14.9 13.0 11.8 104 108 4.4 15.0 2.2 0.3 12.4 (16) Radiant 6176 TT O TWD 137.0 150.0 9 2,107 13.6 0 7 24 26 29 1 7 22 26 18 Dec-12 (14) 20 8 11.7 13.7 11.4 10.6 102 104 5.8 21.9 2.9 0.6 5.9 (103) Realtek 2379 TT N TWD 88.20 75.00 (15) 1,473 11.7 (1) 13 11 10 44 (1) 12 9 10 33 Dec-12 24 6 6 19.4 15.6 14.7 13.9 103 120 3.8 15.5 2.4 1.2 9.0 (61)
SPIL 2325 TT O TWD 37.85 42.00 11 3,902 8.0 (0) 2 6 6 24 (0) 1 4 6 13 Dec-12 10 25 10 20.8 19.0 15.2 13.8 112 97 4.3 10.2 1.9 1.8 6.6 8 Silitech 3311 TT N TWD 39.80 31.00 (22) 247 1.1 1 3 20 12 (29) 2 3 17 12 (40) Dec-12 (65) (19) 26 8.7 25.1 31.1 24.7 66 103 2.8 4.9 1.3 0.6 6.9 (60) Synnex 2347 TT N TWD 54.30 46.00 (15) 2,850 18.0 1 5 25 15 (9) 1 4 22 15 (20) Dec-12 (11) 17 12 14.7 16.5 14.1 12.6 93 95 3.3 12.4 2.0 0.3 27.2 60
TECO ELECTRIC ORD 1504 TT N TWD 33.55 36.00 7 2,222 6.4 (1) (1) (1) (2) 44 (1) (2) (3) (2) 33 Dec-12 24 8 16 20.9 16.9 15.7 13.6 103 97 3.4 9.8 1.7 1.1 10.0 (15) TOPOINT 8021 TT O TWD 21.55 26.00 21 113 1.6 (1) (0) 7 2 24 (1) (1) 5 3 13 Dec-12 2 7 9 12.4 12.2 11.4 10.5 95 99 3.4 6.8 0.8 1.4 4.1 2 TPK 3673 TT N TWD 206.0 207.0 0 2,242 67.4 (1) 18 21 17 (58) (1) 18 19 17 (69) Dec-12 (44) (20) 45 4.9 8.8 11.0 7.6 96 128 10.1 18.1 1.5 0.6 5.3 59
TSMC 2330 TT O TWD 106.5 116.0 9 91,338 109.0 (1) 3 4 1 6 (1) 2 2 1 (5) Dec-12 13 10 12 16.5 14.7 13.3 11.8 100 99 2.8 23.9 3.3 4.6 7.5 (2) TSMT 6278 TT N TWD 46.80 49.00 5 418 1.9 1 0 6 4 11 2 (0) 3 4 (1) Dec-12 13 3 12 12.3 10.9 10.5 9.4 101 104 3.3 11.5 1.2 0.2 2.4 (43) TXC 3042 TT N TWD 37.50 36.00 (4) 384 3.7 (1) 1 14 4 (21) (1) 0 11 4 (32) Dec-12 (18) 17 15 10.1 12.4 10.6 9.2 90 103 5.1 12.1 1.5 1.3 6.5 11
Tripod 3044 TT N TWD 56.10 61.00 9 975 4.8 (1) (1) 8 5 (6) (1) (2) 6 5 (18) Dec-12 (20) 10 12 10.1 12.5 11.4 10.2 99 97 3.6 9.6 1.2 0.7 4.1 (9) UMC 2303 TT N TWD 12.80 13.00 2 5,375 19.9 0 2 4 4 12 0 1 2 4 0 Dec-12 171 (61) 86 38.2 14.1 36.5 19.6 100 57 3.8 5.5 0.7 1.1 3.2 (13) Unimicron 3037 TT O TWD 24.15 29.00 20 1,229 6.3 (0) (1) 15 7 (16) (0) (1) 13 7 (27) Dec-12 (58) 32 44 10.8 25.6 19.4 13.5 90 91 1.9 2.9 0.8 0.8 4.9 21
Vanguard 5347 TT N TWD 35.10 35.00 (0) 1,898 6.0 (1) 4 1 (1) 64 (1) 3 (2) (1) 53 Dec-12 84 16 11 23.8 12.9 11.1 10.0 101 108 2.7 19.2 2.3 2.0 5.8 (65) WPG 3702 TT N TWD 36.05 39.50 10 1,974 6.6 (0) 2 9 5 (8) (0) 1 7 5 (19) Dec-12 9 10 12 13.1 12.0 10.9 9.7 104 101 6.7 12.8 1.5 0.3 15.1 110 Wintek 2384 TT U TWD 10.45 7.80 (25) 639 6.9 (2) (2) 4 0 (26) (2) (3) 2 1 (37) Dec-12 nm nm nm nm nm nm nm 82 123 0.0 (22.4) 0.7 0.8 31.4 139
Wistron 3231 TT U TWD 25.20 21.00 (17) 1,982 13.0 0 (1) 3 1 (21) 0 (2) 1 1 (32) Dec-12 (12) (6) 14 8.2 9.4 9.9 8.7 101 96 5.2 9.5 0.9 0.1 5.5 28 Young Fast 3622 TT N TWD 31.20 45.00 44 156 1.9 (2) 4 5 (2) (40) (2) 4 3 (2) (51) Dec-12 nm 101 (10) nm 30.8 15.3 17.0 nm nm 1.7 1.5 0.5 0.2 1.5 (24) Sector* 7 274,761 (1) 3 5 2 14 (1) 2 3 2 2 Dec-12 26 16 12 19.9 15.8 13.5 12.0 100 102 2.8 12.5 1.9 0.7 6.9 (3)
Telecommunication Services
Chate Benchavitvilai - 65 6212 3241
CHT 2412 TT U TWD 91.90 80.00 (13) 23,581 20.3 0 (0) (1) (1) (3) 0 (1) (3) (1) (14) Dec-12 (1) 4 (1) 17.9 18.0 17.2 17.4 101 106 5.8 10.9 2.0 3.1 8.8 (3) FET 4904 TT N TWD 61.90 69.00 11 6,672 12.5 (1) 0 (3) (5) (15) (1) (0) (5) (5) (26) Dec-12 12 13 6 19.0 16.9 14.9 14.1 101 105 6.2 16.4 2.8 2.2 7.6 (3) TWM 3045 TT N TWD 92.50 100.0 8 10,466 16.3 (1) (2) (5) (4) (14) (0) (2) (7) (4) (25) Dec-12 9 4 (2) 16.9 15.5 14.9 15.2 103 103 6.4 19.8 3.9 3.3 11.6 81
Sector* (4) 40,718 (0) (0) (2) (3) (8) 0 (1) (4) (3) (19) Dec-12 4 6 (0) 17.8 17.1 16.2 16.2 101 105 6.0 13.0 2.4 2.9 9.2 5
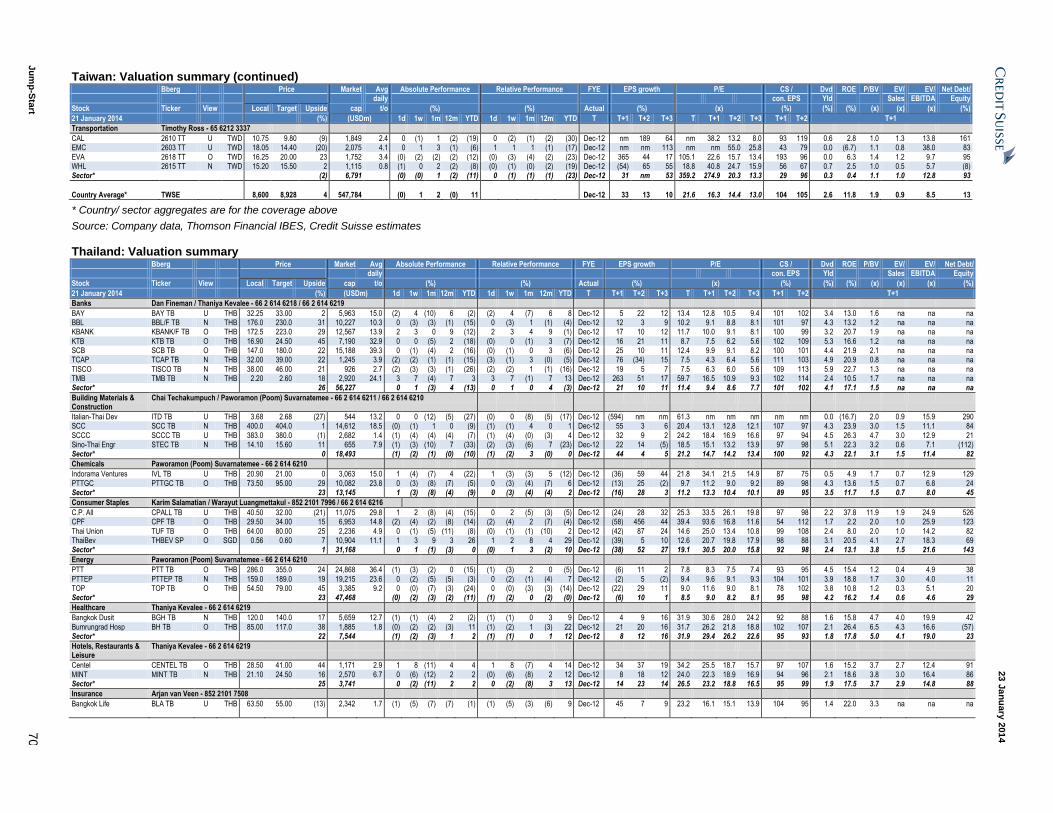
23 J
an
uary
201
4
Ju
mp
-Sta
rt 7
0
Taiwan: Valuation summary (continued) Bberg Price Market Avg Absolute Performance Relative Performance FYE EPS growth P/E CS / Dvd ROE P/BV EV/ EV/ Net Debt/ daily con. EPS Yld Sales EBITDA Equity
Stock Ticker View Local Target Upside cap t/o (%) (%) Actual (%) (x) (%) (%) (%) (x) (x) (x) (%)
21 January 2014 (%) (USDm) 1d 1w 1m 12m YTD 1d 1w 1m 12m YTD T T+1 T+2 T+3 T T+1 T+2 T+3 T+1 T+2 T+1
Transportation Timothy Ross - 65 6212 3337
CAL 2610 TT U TWD 10.75 9.80 (9) 1,849 2.4 0 (1) 1 (2) (19) 0 (2) (1) (2) (30) Dec-12 nm 189 64 nm 38.2 13.2 8.0 93 119 0.6 2.8 1.0 1.3 13.8 161 EMC 2603 TT U TWD 18.05 14.40 (20) 2,075 4.1 0 1 3 (1) (6) 1 1 1 (1) (17) Dec-12 nm nm 113 nm nm 55.0 25.8 43 79 0.0 (6.7) 1.1 0.8 38.0 83
EVA 2618 TT O TWD 16.25 20.00 23 1,752 3.4 (0) (2) (2) (2) (12) (0) (3) (4) (2) (23) Dec-12 365 44 17 105.1 22.6 15.7 13.4 193 96 0.0 6.3 1.4 1.2 9.7 95 WHL 2615 TT N TWD 15.20 15.50 2 1,115 0.8 (1) 0 2 (2) (8) (0) (1) (0) (2) (19) Dec-12 (54) 65 55 18.8 40.8 24.7 15.9 56 67 0.7 2.5 1.0 0.5 5.7 (8) Sector* (2) 6,791 (0) (0) 1 (2) (11) 0 (1) (1) (1) (23) Dec-12 31 nm 53 359.2 274.9 20.3 13.3 29 96 0.3 0.4 1.1 1.0 12.8 93
Country Average* TWSE 8,600 8,928 4 547,784 (0) 1 2 (0) 11 Dec-12 33 13 10 21.6 16.3 14.4 13.0 104 105 2.6 11.8 1.9 0.9 8.5 13
* Country/ sector aggregates are for the coverage above
Source: Company data, Thomson Financial IBES, Credit Suisse estimates
Thailand: Valuation summary Bberg Price Market Avg Absolute Performance Relative Performance FYE EPS growth P/E CS / Dvd ROE P/BV EV/ EV/ Net Debt/ daily con. EPS Yld Sales EBITDA Equity
Stock Ticker View Local Target Upside cap t/o (%) (%) Actual (%) (x) (%) (%) (%) (x) (x) (x) (%)
21 January 2014 (%) (USDm) 1d 1w 1m 12m YTD 1d 1w 1m 12m YTD T T+1 T+2 T+3 T T+1 T+2 T+3 T+1 T+2 T+1
Banks Dan Fineman / Thaniya Kevalee - 66 2 614 6218 / 66 2 614 6219
BAY BAY TB U THB 32.25 33.00 2 5,963 15.0 (2) 4 (10) 6 (2) (2) 4 (7) 6 8 Dec-12 5 22 12 13.4 12.8 10.5 9.4 101 102 3.4 13.0 1.6 na na na BBL BBL/F TB N THB 176.0 230.0 31 10,227 10.3 0 (3) (3) (1) (15) 0 (3) 1 (1) (4) Dec-12 12 3 9 10.2 9.1 8.8 8.1 101 97 4.3 13.2 1.2 na na na KBANK KBANK/F TB O THB 172.5 223.0 29 12,567 13.9 2 3 0 9 (12) 2 3 4 9 (1) Dec-12 17 10 12 11.7 10.0 9.1 8.1 100 99 3.2 20.7 1.9 na na na
KTB KTB TB O THB 16.90 24.50 45 7,190 32.9 0 0 (5) 2 (18) (0) 0 (1) 3 (7) Dec-12 16 21 11 8.7 7.5 6.2 5.6 102 109 5.3 16.6 1.2 na na na SCB SCB TB O THB 147.0 180.0 22 15,188 39.3 0 (1) (4) 2 (16) (0) (1) 0 3 (6) Dec-12 25 10 11 12.4 9.9 9.1 8.2 100 101 4.4 21.9 2.1 na na na TCAP TCAP TB N THB 32.00 39.00 22 1,245 3.9 (2) (2) (1) (1) (15) (3) (1) 3 (0) (5) Dec-12 76 (34) 15 7.5 4.3 6.4 5.6 111 103 4.9 20.9 0.8 na na na
TISCO TISCO TB N THB 38.00 46.00 21 926 2.7 (2) (3) (3) (1) (26) (2) (2) 1 (1) (16) Dec-12 19 5 7 7.5 6.3 6.0 5.6 109 113 5.9 22.7 1.3 na na na TMB TMB TB N THB 2.20 2.60 18 2,920 24.1 3 7 (4) 7 3 3 7 (1) 7 13 Dec-12 263 51 17 59.7 16.5 10.9 9.3 102 114 2.4 10.5 1.7 na na na Sector* 26 56,227 0 1 (3) 4 (13) 0 1 0 4 (3) Dec-12 21 10 11 11.4 9.4 8.6 7.7 101 102 4.1 17.1 1.5 na na na
Building Materials & Construction
Chai Techakumpuch / Paworamon (Poom) Suvarnatemee - 66 2 614 6211 / 66 2 614 6210
Italian-Thai Dev ITD TB U THB 3.68 2.68 (27) 544 13.2 0 0 (12) (5) (27) (0) 0 (8) (5) (17) Dec-12 (594) nm nm 61.3 nm nm nm nm nm 0.0 (16.7) 2.0 0.9 15.9 290 SCC SCC TB N THB 400.0 404.0 1 14,612 18.5 (0) (1) 1 0 (9) (1) (1) 4 0 1 Dec-12 55 3 6 20.4 13.1 12.8 12.1 107 97 4.3 23.9 3.0 1.5 11.1 84
SCCC SCCC TB U THB 383.0 380.0 (1) 2,682 1.4 (1) (4) (4) (4) (7) (1) (4) (0) (3) 4 Dec-12 32 9 2 24.2 18.4 16.9 16.6 97 94 4.5 26.3 4.7 3.0 12.9 21 Sino-Thai Engr STEC TB N THB 14.10 15.60 11 655 7.9 (1) (3) (10) 7 (33) (2) (3) (6) 7 (23) Dec-12 22 14 (5) 18.5 15.1 13.2 13.9 97 98 5.1 22.3 3.2 0.6 7.1 (112) Sector* 0 18,493 (1) (2) (1) (0) (10) (1) (2) 3 (0) 0 Dec-12 44 4 5 21.2 14.7 14.2 13.4 100 92 4.3 22.1 3.1 1.5 11.4 82
Chemicals Paworamon (Poom) Suvarnatemee - 66 2 614 6210
Indorama Ventures IVL TB U THB 20.90 21.00 0 3,063 15.0 1 (4) (7) 4 (22) 1 (3) (3) 5 (12) Dec-12 (36) 59 44 21.8 34.1 21.5 14.9 87 75 0.5 4.9 1.7 0.7 12.9 129
PTTGC PTTGC TB O THB 73.50 95.00 29 10,082 23.8 0 (3) (8) (7) (5) 0 (3) (4) (7) 6 Dec-12 (13) 25 (2) 9.7 11.2 9.0 9.2 89 98 4.3 13.6 1.5 0.7 6.8 24 Sector* 23 13,145 1 (3) (8) (4) (9) 0 (3) (4) (4) 2 Dec-12 (16) 28 3 11.2 13.3 10.4 10.1 89 95 3.5 11.7 1.5 0.7 8.0 45
Consumer Staples Karim Salamatian / Warayut Luangmettakul - 852 2101 7996 / 66 2 614 6216
C.P. All CPALL TB U THB 40.50 32.00 (21) 11,075 29.8 1 2 (8) (4) (15) 0 2 (5) (3) (5) Dec-12 (24) 28 32 25.3 33.5 26.1 19.8 97 98 2.2 37.8 11.9 1.9 24.9 526 CPF CPF TB O THB 29.50 34.00 15 6,953 14.8 (2) (4) (2) (8) (14) (2) (4) 2 (7) (4) Dec-12 (58) 456 44 39.4 93.6 16.8 11.6 54 112 1.7 2.2 2.0 1.0 25.9 123
Thai Union TUF TB O THB 64.00 80.00 25 2,236 4.9 0 (1) (5) (11) (8) (0) (1) (1) (10) 2 Dec-12 (42) 87 24 14.6 25.0 13.4 10.8 99 108 2.4 8.0 2.0 1.0 14.2 82 ThaiBev THBEV SP O SGD 0.56 0.60 7 10,904 11.1 1 3 9 3 26 1 2 8 4 29 Dec-12 (39) 5 10 12.6 20.7 19.8 17.9 98 88 3.1 20.5 4.1 2.7 18.3 69 Sector* 1 31,168 0 1 (1) (3) 0 (0) 1 3 (2) 10 Dec-12 (38) 52 27 19.1 30.5 20.0 15.8 92 98 2.4 13.1 3.8 1.5 21.6 143
Energy Paworamon (Poom) Suvarnatemee - 66 2 614 6210
PTT PTT TB O THB 286.0 355.0 24 24,868 36.4 (1) (3) (2) 0 (15) (1) (3) 2 0 (5) Dec-12 (6) 11 2 7.8 8.3 7.5 7.4 93 95 4.5 15.4 1.2 0.4 4.9 38
PTTEP PTTEP TB N THB 159.0 189.0 19 19,215 23.6 0 (2) (5) (5) (3) 0 (2) (1) (4) 7 Dec-12 (2) 5 (2) 9.4 9.6 9.1 9.3 104 101 3.9 18.8 1.7 3.0 4.0 11 TOP TOP TB O THB 54.50 79.00 45 3,385 9.2 0 (0) (7) (3) (24) 0 (0) (3) (3) (14) Dec-12 (22) 29 11 9.0 11.6 9.0 8.1 78 102 3.8 10.8 1.2 0.3 5.1 20 Sector* 23 47,468 (0) (2) (3) (2) (11) (1) (2) 0 (2) (0) Dec-12 (6) 10 1 8.5 9.0 8.2 8.1 95 98 4.2 16.2 1.4 0.6 4.6 29
Healthcare Thaniya Kevalee - 66 2 614 6219
Bangkok Dusit BGH TB N THB 120.0 140.0 17 5,659 12.7 (1) (1) (4) 2 (2) (1) (1) 0 3 9 Dec-12 4 9 16 31.9 30.6 28.0 24.2 92 88 1.6 15.8 4.7 4.0 19.9 42
Bumrungrad Hosp BH TB O THB 85.00 117.0 38 1,885 1.8 (0) (2) (2) (3) 11 (1) (2) 1 (3) 22 Dec-12 21 20 16 31.7 26.2 21.8 18.8 102 107 2.1 26.4 6.5 4.3 16.6 (57) Sector* 22 7,544 (1) (2) (3) 1 2 (1) (1) 0 1 12 Dec-12 8 12 16 31.9 29.4 26.2 22.6 95 93 1.8 17.8 5.0 4.1 19.0 23
Hotels, Restaurants & Leisure
Thaniya Kevalee - 66 2 614 6219
Centel CENTEL TB O THB 28.50 41.00 44 1,171 2.9 1 8 (11) 4 4 1 8 (7) 4 14 Dec-12 34 37 19 34.2 25.5 18.7 15.7 97 107 1.6 15.2 3.7 2.7 12.4 91
MINT MINT TB N THB 21.10 24.50 16 2,570 6.7 0 (6) (12) 2 2 (0) (6) (8) 2 12 Dec-12 8 18 12 24.0 22.3 18.9 16.9 94 96 2.1 18.6 3.8 3.0 16.4 86 Sector* 25 3,741 0 (2) (11) 2 2 0 (2) (8) 3 13 Dec-12 14 23 14 26.5 23.2 18.8 16.5 95 99 1.9 17.5 3.7 2.9 14.8 88
Insurance Arjan van Veen - 852 2101 7508
Bangkok Life BLA TB U THB 63.50 55.00 (13) 2,342 1.7 (1) (5) (7) (7) (1) (1) (5) (3) (6) 9 Dec-12 45 7 9 23.2 16.1 15.1 13.9 104 95 1.4 22.0 3.3 na na na

23 J
an
uary
201
4
Ju
mp
-Sta
rt 7
1
Thailand: Valuation summary (continued) Bberg Price Market Avg Absolute Performance Relative Performance FYE EPS growth P/E CS / Dvd ROE P/BV EV/ EV/ Net Debt/ daily con. EPS Yld Sales EBITDA Equity
Stock Ticker View Local Target Upside cap t/o (%) (%) Actual (%) (x) (%) (%) (%) (x) (x) (x) (%)
21 January 2014 (%) (USDm) 1d 1w 1m 12m YTD 1d 1w 1m 12m YTD T T+1 T+2 T+3 T T+1 T+2 T+3 T+1 T+2 T+1
Media Karim Salamatian / Thaniya Kevalee / Warayut Luangmettakul - 852 2101 7996 / 66 2 614 6219 / 66 2 614 6216
BEC BEC TB N THB 49.00 62.00 27 2,983 4.5 6 3 (4) (3) (26) 6 3 (0) (3) (16) Dec-12 19 7 4 20.5 17.3 16.1 15.5 101 99 5.8 70.2 12.1 5.6 10.2 (52) MCOT MCOT TB N THB 28.25 32.80 16 591 0.7 1 1 (3) (3) (38) 1 1 0 (2) (28) Dec-10 27 (6) 4 13.6 10.8 11.5 11.1 133 96 8.3 23.3 2.5 2.5 5.1 (48)
Major Cineplex MAJOR TB U THB 16.20 18.00 11 438 1.5 1 1 (7) (7) (20) 0 1 (4) (7) (10) Dec-12 48 (1) 9 21.0 14.2 14.4 13.2 97 89 6.4 16.0 2.2 2.2 8.4 52 VGI Global VGI TB O THB 9.00 13.46 50 940 4.1 2 0 (17) (8) 15 2 0 (13) (8) 25 Mar-13 39 30 21 30.4 21.8 16.8 13.8 106 113 3.7 66.1 12.5 7.9 15.7 (65) Sector* 28 4,952 4 2 (7) (4) (19) 4 2 (3) (4) (9) Dec-12 20 7 8 20.1 16.7 15.6 15.0 101 98 5.6 39.7 6.5 4.5 9.9 (20)
Metals & Mining Paworamon (Poom) Suvarnatemee - 66 2 614 6210
Banpu BANPU TB N THB 27.00 26.00 (4) 2,234 16.7 1 (4) (18) (11) (32) 1 (3) (14) (10) (22) Dec-12 (62) 54 32 7.9 20.7 13.4 10.2 79 97 2.6 4.5 1.0 1.5 9.8 99
Real Estate Chai Techakumpuch - 66 2 614 6211
Asian Property AP TB O THB 4.48 10.90 143 388 2.3 (1) 0 (7) 2 (52) (1) 0 (3) 2 (42) Dec-12 (4) 45 22 5.7 5.9 4.1 3.3 103 131 6.7 16.3 0.9 1.2 7.6 71 Central Pattana CPN TB O THB 39.00 55.05 41 5,328 8.8 0 (2) (7) (5) (6) (0) (2) (3) (4) 4 Dec-12 20 29 22 35.2 29.4 22.7 18.7 98 104 2.6 20.5 5.3 10.1 20.4 69 L.P.N. LPN TB O THB 15.00 26.00 73 674 2.5 1 (1) (9) (3) (27) 1 (1) (5) (3) (17) Dec-12 14 26 51 10.0 8.7 6.9 4.6 98 110 5.7 28.1 2.3 1.6 7.3 11
Land and Houses LH TB O THB 8.80 14.50 65 2,686 7.3 0 1 (3) (2) (25) (0) 1 0 (1) (15) Dec-12 20 26 13 16.0 13.3 10.5 9.3 103 116 6.3 20.5 2.6 4.4 16.9 74 Preuksa PS TB N THB 18.10 21.10 17 1,225 3.3 2 0 (8) (1) (34) 1 0 (4) (0) (23) Dec-12 41 (7) 63 10.3 7.3 7.9 4.9 105 91 4.1 24.5 1.6 1.9 9.5 129 Quality Houses QH TB O THB 2.70 4.00 48 755 8.0 2 1 0 2 (15) 2 1 4 3 (5) Dec-12 74 (4) 5 15.4 8.9 9.2 8.8 93 84 5.2 17.1 1.4 2.5 16.9 118
Supalai SPALI TB O THB 16.30 23.60 45 852 2.5 1 6 5 12 (18) 0 6 9 12 (7) Dec-12 10 38 29 10.2 9.3 6.7 5.2 100 102 4.7 22.9 2.0 2.3 7.3 11 Sector* 50 11,908 0 (0) (5) (2) (17) 0 0 (1) (1) (7) Dec-12 23 20 28 16.8 13.7 11.4 8.9 100 105 4.2 21.1 2.7 3.4 13.7 77
Retailing Karim Salamatian - 852 2101 7996
HomePro HMPRO TB U THB 9.20 7.30 (21) 2,686 9.2 2 3 (8) (2) (8) 2 4 (4) (1) 2 Dec-12 (16) 10 22 25.0 29.9 27.3 22.3 96 87 1.5 28.0 7.9 2.4 18.1 120 Robinson Dept ROBINS TB N THB 46.50 53.20 14 1,572 2.0 (1) (1) (9) (3) (35) (1) (1) (5) (3) (24) Dec-12 2 20 19 25.0 24.5 20.5 17.2 99 96 1.6 19.9 4.7 2.1 12.8 0
Siam Global House GLOBAL TB U THB 15.30 13.25 (13) 1,217 2.2 (1) (1) (7) (3) (13) (2) (1) (4) (3) (3) Dec-12 18 40 41 45.3 38.3 27.3 19.3 97 98 0.7 10.4 3.7 2.6 31.6 10 Siam Makro MAKRO TB N THB 30.75 39.35 28 4,493 1.7 0 2 0 6 40 (0) 2 4 6 51 Dec-12 7 15 14 41.5 38.6 33.5 29.3 88 84 1.7 33.7 12.3 1.2 24.8 24 Sector* 8 9,968 0 1 (4) 1 9 0 2 (1) 2 19 Dec-12 (1) 17 21 32.6 33.0 28.2 23.3 94 89 1.5 23.4 7.3 1.6 20.3 38
Telecommunication Services
Colin McCallum - 852 2101 6514
AIS ADVANC TB O THB 211.0 280.0 33 19,097 51.8 0 (0) 0 6 3 0 (0) 4 6 14 Dec-12 8 21 19 18.0 16.7 13.8 11.6 103 109 6.0 86.7 14.5 4.7 10.1 28 DTAC DTAC TB O THB 100.0 140.0 40 7,208 10.6 0 1 0 3 17 (0) 1 4 4 28 Dec-12 8 31 20 21.0 19.4 14.9 12.4 105 112 5.2 34.9 6.8 3.2 8.8 87 Jasmine JAS TB O THB 7.30 9.30 27 1,586 49.5 1 1 3 9 11 1 2 7 9 22 Dec-12 45 18 12 25.6 17.7 15.0 13.4 94 90 1.7 30.5 4.8 4.6 8.7 (2)
SHIN INTUCH TB O THB 71.75 101.0 41 7,003 42.8 0 0 (0) 6 5 (0) 1 3 6 15 Dec-12 14 23 21 19.2 16.8 13.7 11.3 93 97 5.9 93.6 15.3 16.2 16.5 (20) True Corp TRUE TB R THB 7.90 3,490 61.0 1 1 (8) 5 30 1 1 (4) 6 40 Dec-12 nm nm nm nm nm nm 103.2 413 416 0.0 (17.0) 10.2 2.5 10.0 957 Sector* 36 38,384 0 0 (1) 5 9 0 0 3 6 19 Dec-12 22 25 22 23.9 19.6 15.7 12.8 112 112 5.1 56.0 10.9 4.2 10.4 129
Transportation Timothy Ross / Annuar Aziz / Thaniya Kevalee / Warayut Luangmettakul - 65 6212 3337 / 60 3 2723 2084 / 66 2 614 6219 / 66 2 614 6216
AAV AAV TB O THB 3.82 4.90 28 564 2.1 1 2 (9) 4 (32) 0 2 (6) 5 (22) Dec-12 (91) 10 3 1.2 12.2 11.1 10.8 118 107 0.0 7.9 0.9 2.0 12.6 9
AOT AOT TB O THB 163.0 220.0 35 7,088 27.0 3 2 (6) 3 62 3 2 (2) 3 72 Sep-13 22 23 13 21.8 18.0 14.7 13.0 101 103 2.8 13.7 2.4 5.9 11.0 8 BTS Group Holdings BTS TB O THB 8.50 11.20 32 3,083 18.3 2 1 (4) (2) 13 2 1 (0) (2) 24 Mar-13 27 16 (3) 48.6 38.3 32.9 34.1 104 102 6.1 5.0 1.8 7.8 20.1 (52) BTS Rail Mass Transit Growth Infra. Fund
BTSGIF TB N THB 8.05 11.40 42 1,418 1.1 0 (1) (10) (6) na (0) (0) (6) (6) na Mar-13 na na na 8.1 12.0 12.4 (0)
Bangkok Expressway BECL TB N THB 32.00 39.60 24 750 1.7 (2) 0 (7) (4) (17) (2) 0 (3) (4) (7) Dec-12 50 17 (6) 18.6 12.4 10.6 11.3 97 92 4.2 9.0 1.0 5.2 7.8 68 THAI THAI TB O THB 14.30 16.00 12 950 2.8 (3) (1) (3) 4 (37) (3) (0) 0 4 (27) Dec-12 (190) nm 256 8.2 nm 16.9 4.7 72 88 0.0 (5.2) 0.5 1.1 12.5 269
Sector* 32 13,854 2 1 (6) 0 33 2 2 (2) 1 44 Dec-12 (55) 63 30 13.3 29.5 17.3 13.4 74 100 3.3 5.6 1.6 2.2 12.4 62
Country Average* SET 1,293 1,579 22 261,427 0 (0) (4) (0) (10) Dec-12 1 16 12 13.9 13.7 11.7 10.5 98 100 3.8 17.0 2.2 1.2 9.0 58
* Country/ sector aggregates are for the coverage above
Source: Company data, Thomson Financial IBES, Credit Suisse estimates

23 January 2014
Jump-Start 72
Appendix I: Research published in the past week Asia – Regional Analysts’ name Date
Asia-Pacific Transport Sector - Transportation costs rising Timothy Ross 17 Jan
The Asian Refiner - GRM nearly flat, so is index, TOP and RIL buoyant Kenneth Whee 20 Jan
Asia Pacific Equity Strategy - HSBC PMI falls below 50... sell cyclicals? Sakthi Siva 23 Jan
Asia Semiconductor Sector - 4Q13 sector preview: Business holding up ahead of CNY Randy Abrams 23 Jan
China Analysts’ name Date
China Cinda Asset Management Co., Ltd - A distressed asset leader in the right cycle Victor Wang 17 Jan
Tencent Holdings - W eChat Payment: The next growth frontier Dick Wei 17 Jan
Taiwan Semiconductor Manufacturing - Building into the high season Randy Abrams 17 Jan
China Basic Materials Monthly - January 2014: A positive surprise in construction? Trina Chen 17 Jan
YST Dairy Farm - The fat of milk Kevin Yin 20 Jan
China Insurance Sector - Strong start to 2014 / P&C growth motors on Arjan van Veen 20 Jan
CNOOC Ltd - Downgrade to NEUTRAL on lower production growth Thomas Wong 21 Jan
Haier Electronics - ICS: The future growth engine Eva Wang 21 Jan
Asia Semiconductor Sector - 4Q13 sector preview: Business holding up ahead of CNY Randy Abrams 23 Jan
Hong Kong Analysts’ name Date
Hong Kong Property Sector - A correction, not collapse Joyce Kwock 21 Jan
Hong Kong Property Sector - Idea Engine: Awakening dragons Joyce Kwock 21 Jan
India Analysts’ name Date
HCL Technologies - Strong numbers and some early signs of concerns getting addressed Anantha Narayan 16 Jan
Tata Consultancy Services - Solid numbers but lack of any positive surprise in this quarter Anantha Narayan 16 Jan
Reliance Industries - On the question of timing Sanjay Mookim 16 Jan
Wipro Ltd. - Revenue growth now in the middle of peer range; margin trajectory improves Anantha Narayan 17 Jan
India Utilities Sector - The smart (grid) way forward? Amish Shah 17 Jan
Reliance Industries - E&P helps 3Q; retail PAT, telco capex surprise Sanjay Mookim 20 Jan
Japan Analysts’ name Date
Mitsui O.S.K. Lines Ltd - Port JV enhances prospects Davin Wu 20 Jan
Singapore Analysts’ name Date
Asia Offshore and Marine Sector - A tougher 2014, but bright spots remain Gerald Wong 20 Jan
South Korea Analysts’ name Date
Korea Property Sector - Outlook: Fully loaded for the next cycle Minseok Sinn 20 Jan
Taiwan Analysts’ name Date
Merry Electronics Co. Ltd. - Multiple engines to drive earnings growth; initiate with OUTPERFORM Derrick Yang 22 Jan
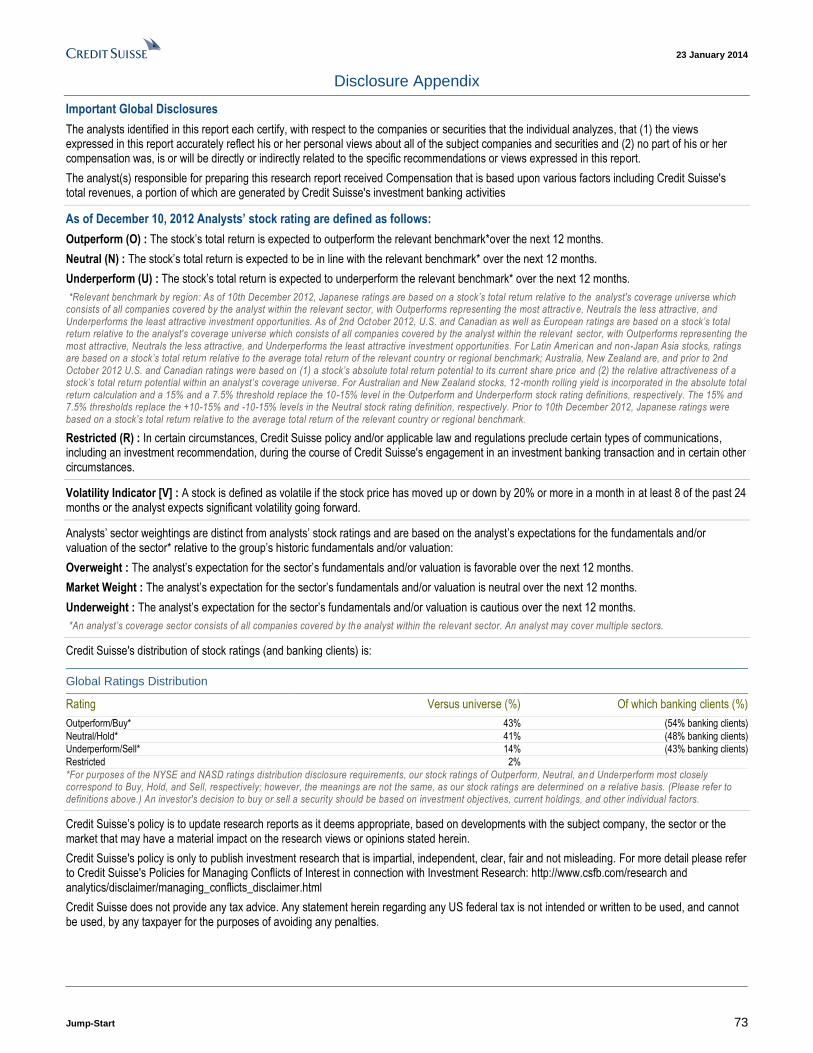
23 January 2014
Jump-Start 73
Disclosure Appendix
Important Global Disclosures
The analysts identified in this report each certify, with respect to the companies or securities that the individual analyzes, that (1) the views expressed in this report accurately reflect his or her personal views about all of the subject companies and securities and (2) no part of his or her compensation was, is or will be directly or indirectly related to the specific recommendations or views expressed in this report.
The analyst(s) responsible for preparing this research report received Compensation that is based upon various factors including Credit Suisse's total revenues, a portion of which are generated by Credit Suisse's investment banking activities
As of December 10, 2012 Analysts’ stock rating are defined as follows:
Outperform (O) : The stock’s total return is expected to outperform the relevant benchmark*over the next 12 months.
Neutral (N) : The stock’s total return is expected to be in line with the relevant benchmark* over the next 12 months.
Underperform (U) : The stock’s total return is expected to underperform the relevant benchmark* over the next 12 months.
*Relevant benchmark by region: As of 10th December 2012, Japanese ratings are based on a stock’s total return relative to the analyst's coverage universe which consists of all companies covered by the analyst within the relevant sector, with Outperforms representing the most attractiv e, Neutrals the less attractive, and Underperforms the least attractive investment opportunities. As of 2nd October 2012, U.S. and Canadian as well as European ratings are based on a stock’s total return relative to the analyst's coverage universe which consists of all companies covered by the analyst within the relevant sector, with Outperforms representing the most attractive, Neutrals the less attractive, and Underperforms the least attractive investment opportunities. For Latin Ameri can and non-Japan Asia stocks, ratings are based on a stock’s total return relative to the average total return of the relevant country or regional benchmark; Australia, New Zealand are, and prior to 2nd October 2012 U.S. and Canadian ratings were based on (1) a stock’s absolute total return potential to its current share price and (2) the relative attractiveness of a stock’s total return potential within an analyst’s coverage universe. For Australian and New Zealand stocks, 12 -month rolling yield is incorporated in the absolute total return calculation and a 15% and a 7.5% threshold replace the 10-15% level in the Outperform and Underperform stock rating definitions, respectively. The 15% and 7.5% thresholds replace the +10-15% and -10-15% levels in the Neutral stock rating definition, respectively. Prior to 10th December 2012, Japanese ratings were based on a stock’s total return relative to the average total return of the relevant country or regional benchmark.
Restricted (R) : In certain circumstances, Credit Suisse policy and/or applicable law and regulations preclude certain types of communications, including an investment recommendation, during the course of Credit Suisse's engagement in an investment banking transaction and in certain other circumstances.
Volatility Indicator [V] : A stock is defined as volatile if the stock price has moved up or down by 20% or more in a month in at least 8 of the past 24 months or the analyst expects significant volatility going forward.
Analysts’ sector weightings are distinct from analysts’ stock ratings and are based on the analyst’s expectations for the fundamentals and/or valuation of the sector* relative to the group’s historic fundamentals and/or valuation:
Overweight : The analyst’s expectation for the sector’s fundamentals and/or valuation is favorable over the next 12 months.
Market Weight : The analyst’s expectation for the sector’s fundamentals and/or valuation is neutral over the next 12 months.
Underweight : The analyst’s expectation for the sector’s fundamentals and/or valuation is cautious over the next 12 months.
*An analyst’s coverage sector consists of all companies covered by the analyst within the relevant sector. An analyst may cover multiple sectors.
Credit Suisse's distribution of stock ratings (and banking clients) is:
Global Ratings Distribution
Rating Versus universe (%) Of which banking clients (%)
Outperform/Buy* 43% (54% banking clients)
Neutral/Hold* 41% (48% banking clients)
Underperform/Sell* 14% (43% banking clients)
Restricted 2%
*For purposes of the NYSE and NASD ratings distribution disclosure requirements, our stock ratings of Outperform, Neutral, an d Underperform most closely correspond to Buy, Hold, and Sell, respectively; however, the meanings are not the same, as our stock ratings are determined on a relative basis. (Please refer to definitions above.) An investor's decision to buy or sell a security should be based on investment objectives, current holdings, and other individual factors.
Credit Suisse’s policy is to update research reports as it deems appropriate, based on developments with the subject company, the sector or the market that may have a material impact on the research views or opinions stated herein.
Credit Suisse's policy is only to publish investment research that is impartial, independent, clear, fair and not misleading. For more detail please refer to Credit Suisse's Policies for Managing Conflicts of Interest in connection with Investment Research: http://www.csfb.com/research and analytics/disclaimer/managing_conflicts_disclaimer.html
Credit Suisse does not provide any tax advice. Any statement herein regarding any US federal tax is not intended or written to be used, and cannot be used, by any taxpayer for the purposes of avoiding any penalties.

23 January 2014
Jump-Start 74
Please refer to the firm's disclosure website at https://rave.credit-suisse.com/disclosures for the definitions of abbreviations typically used in the target price method and risk sections.
Important Regional Disclosures
Singapore recipients should contact Credit Suisse AG, Singapore Branch for any matters arising from this research report.
Restrictions on certain Canadian securities are indicated by the following abbreviations: NVS--Non-Voting shares; RVS--Restricted Voting Shares; SVS--Subordinate Voting Shares.
Individuals receiving this report from a Canadian investment dealer that is not affiliated with Credit Suisse should be advised that this report may not contain regulatory disclosures the non-affiliated Canadian investment dealer would be required to make if this were its own report.
For Credit Suisse Securities (Canada), Inc.'s policies and procedures regarding the dissemination of equity research, please visit http://www.csfb.com/legal_terms/canada_research_policy.shtml.
As of the date of this report, Credit Suisse acts as a market maker or liquidity provider in the equities securities that are the subject of this report.
Principal is not guaranteed in the case of equities because equity prices are variable.
Commission is the commission rate or the amount agreed with a customer when setting up an account or at any time after that.
Taiwanese Disclosures: This research report is for reference only. Investors should carefully consider their own investment risk. Investment results are the responsibility of the individual investor. Reports may not be reprinted without permission of CS. Reports written by Taiwan based analysts on non-Taiwan listed companies are not considered recommendations to buy or sell securities under Taiwan Stock Exchange Operational Regulations Governing Securities Firms Recommending Trades in Securities to Customers.
Please find the full reports, including disclosure information, on Credit Suisse's Research and Analytics Website (http://www.researchandanalytics.com)
Important MSCI Disclosures
The MSCI sourced information is the exclusive property of Morgan Stanley Capital International Inc. (MSCI). Without prior written permission of MSCI, this information and any other MSCI intellectual property may not be reproduced, re-disseminated or used to create and financial products, including any indices. This information is provided on an "as is" basis. The user assumes the entire risk of any use made of this information. MSCI, its affiliates and any third party involved in, or related to, computing or compiling the information hereby expressly disclaim all warranties of originality, accuracy, completeness, merchantability or fitness for a particular purpose with respect to any of this information. Without limiting any of the foregoing, in no event shall MSCI, any of its affiliates or any third party involved in, or related to, computing or compiling the information have any liability for any damages of any kind. MSCI, Morgan Stanley Capital International and the MSCI indexes are services marks of MSCI and its affiliates.
The Global Industry Classification Standard (GICS) was developed by and is the exclusive property of Morgan Stanley Capital International Inc. and Standard & Poor’s. GICS is a service mark of MSCI and S&P and has been licensed for use by Credit Suisse.
Important Credit Suisse HOLT Disclosures
With respect to the analysis in this report based on the Credit Suisse HOLT methodology, Credit Suisse certifies that (1) the views expressed in this report accurately reflect the Credit Suisse HOLT methodology and (2) no part of the Firm’s compensation was, is, or will be directly related to the specific views disclosed in this report.
The Credit Suisse HOLT methodology does not assign ratings to a security. It is an analytical tool that involves use of a set of proprietary quantitative algorithms and warranted value calculations, collectively called the Credit Suisse HOLT valuation model, that are consistently applied to all the companies included in its database. Third-party data (including consensus earnings estimates) are systematically translated into a number of default algorithms available in the Credit Suisse HOLT valuation model. The source financial statement, pricing, and earnings data provided by outside data vendors are subject to quality control and may also be adjusted to more closely measure the underlying economics of firm performance. The adjustments provide consistency when analyzing a single company across time, or analyzing multiple companies across industries or national borders. The default scenario that is produced by the Credit Suisse HOLT valuation model establishes the baseline valuation for a security, and a user then may adjust the default variables to produce alternative scenarios, any of which could occur.
Additional information about the Credit Suisse HOLT methodology is available on request.
The Credit Suisse HOLT methodology does not assign a price target to a security. The default scenario that is produced by the Credit Suisse HOLT valuation model establishes a warranted price for a security, and as the third-party data are updated, the warranted price may also change. The default variable may also be adjusted to produce alternative warranted prices, any of which could occur.
CFROI®, HOLT, HOLTfolio, ValueSearch, AggreGator, Signal Flag and “Powered by HOLT” are trademarks or service marks or registered trademarks or registered service marks of Credit Suisse or its affiliates in the United States and other countries. HOLT is a corporate performance and valuation advisory service of Credit Suisse.
For Credit Suisse disclosure information on other companies mentioned in this report, please visit the website at https://rave.credit-suisse.com/disclosures or call +1 (877) 291-2683.

23 January 2014
Jump-Start 75
References in this report to Credit Suisse include all of the subsidiaries and affiliates of Credit Suisse operating under its investment banking division. For more information on our structure, please use the following link: https://www.credit-suisse.com/who_we_are/en/This report may contain material that is not directed to, or intended for distribution to or use by, any person or entity who is a citizen or resident of or located in any locality, state, country or other jurisdiction where such distribution, publication, availability or use would be contrary to law or regulation or which would subject Credit Suisse AG or its affiliates ("CS") to any registration or licensing requirement within such jurisdiction. All material presented in this report, unless specifically indicated otherwise, is under copyright to CS. None of the material, nor its content, nor any copy of it, may be altered in any way, transmitted to, copied or distributed to any other party, without the prior express written permission of CS. All trademarks, service marks and logos used in this report are trademarks or service marks or registered trademarks or service marks of CS or its affiliates. The information, tools and material presented in this report are provided to you for information purposes only and are not to be used or considered as an offer or the solicitation of an offer to sell or to buy or subscribe for securities or other financial instruments. CS may not have taken any steps to ensure that the securities referred to in this report are suitable for any particular investor. CS will not treat recipients of this report as its customers by virtue of their receiving this report. The investments and services contained or referred to in this report may not be suitable for you and it is recommended that you consult an independent investment advisor if you are in doubt about such investments or investment services. Nothing in this report constitutes investment, legal, accounting or tax advice, or a representation that any investment or strategy is suitable or appropriate to your individual circumstances, or otherwise constitutes a personal recommendation to you. CS does not advise on the tax consequences of investments and you are advised to contact an independent tax adviser. Please note in particular that the bases and levels of taxation may change. Information and opinions presented in this report have been obtained or derived from sources believed by CS to be reliable, but CS makes no representation as to their accuracy or completeness. CS accepts no liability for loss arising from the use of the material presented in this report, except that this exclusion of liability does not apply to the extent that such liability arises under specific statutes or regulations applicable to CS. This report is not to be relied upon in substitution for the exercise of independent judgment. CS may have issued, and may in the future issue, other communications that are inconsistent with, and reach different conclusions from, the information presented in this report. Those communications reflect the different assumptions, views and analytical methods of the analysts who prepared them and CS is under no obligation to ensure that such other communications are brought to the attention of any recipient of this report. CS may, to the extent permitted by law, participate or invest in financing transactions with the issuer(s) of the securities referred to in this report, perform services for or solicit business from such issuers, and/or have a position or holding, or other material interest, or effect transactions, in such securities or options thereon, or other investments related thereto. In addition, it may make markets in the securities mentioned in the material presented in this report. CS may have, within the last three years, served as manager or co-manager of a public offering of securities for, or currently may make a primary market in issues of, any or all of the entities mentioned in this report or may be providing, or have provided within the previous 12 months, significant advice or investment services in relation to the investment concerned or a related investment. Additional information is, subject to duties of confidentiality, available on request. Some investments referred to in this report will be offered solely by a single entity and in the case of some investments solely by CS, or an associate of CS or CS may be the only market maker in such investments. Past performance should not be taken as an indication or guarantee of future performance, and no representation or warranty, express or implied, is made regarding future performance. Information, opinions and estimates contained in this report reflect a judgment at its original date of publication by CS and are subject to change without notice. The price, value of and income from any of the securities or financial instruments mentioned in this report can fall as well as rise. The value of securities and financial instruments is subject to exchange rate fluctuation that may have a positive or adverse effect on the price or income of such securities or financial instruments. Investors in securities such as ADR's, the values of which are influenced by currency volatility, effectively assume this risk. Structured securities are complex instruments, typically involve a high degree of risk and are intended for sale only to sophisticated investors who are capable of understanding and assuming the risks involved. The market value of any structured security may be affected by changes in economic, financial and political factors (including, but not limited to, spot and forward interest and exchange rates), time to maturity, market conditions and volatility, and the credit quality of any issuer or reference issuer. Any investor interested in purchasing a structured product should conduct their own investigation and analysis of the product and consult with their own professional advisers as to the risks involved in making such a purchase. Some investments discussed in this report may have a high level of volatility. High volatility investments may experience sudden and large falls in their value causing losses when that investment is realised. Those losses may equal your original investment. Indeed, in the case of some investments the potential losses may exceed the amount of initial investment and, in such circumstances, you may be required to pay more money to support those losses. Income yields from investments may fluctuate and, in consequence, initial capital paid to make the investment may be used as part of that income yield. Some investments may not be readily realisable and it may be difficult to sell or realise those investments, similarly it may prove difficult for you to obtain reliable information about the value, or risks, to which such an investment is exposed. This report may provide the addresses of, or contain hyperlinks to, websites. Except to the extent to which the report refers to website material of CS, CS has not reviewed any such site and takes no responsibility for the content contained therein. Such address or hyperlink (including addresses or hyperlinks to CS's own website material) is provided solely for your convenience and information and the content of any such website does not in any way form part of this document. Accessing such website or following such link through this report or CS's website shall be at your own risk. This report is issued and distributed in Europe (except Switzerland) by Credit Suisse Securities (Europe) Limited, One Cabot Square, London E14 4QJ, England, which is authorised by the Prudential Regulation Authority ("PRA") and regulated by the Financial Conduct Authority ("FCA") and the PRA. This report is being distributed in Germany by Credit Suisse Securities (Europe) Limited Niederlassung Frankfurt am Main regulated by the Bundesanstalt fuer Finanzdienstleistungsaufsicht ("BaFin"). This report is being distributed in the United States and Canada by Credit Suisse Securities (USA) LLC; in Switzerland by Credit Suisse AG; in Brazil by Banco de Investimentos Credit Suisse (Brasil) S.A or its affiliates; in Mexico by Banco Credit Suisse (México), S.A. (transactions related to the securities mentioned in this report will only be effected in compliance with applicable regulation); in Japan by Credit Suisse Securities (Japan) Limited, Financial Instruments Firm, Director-General of Kanto Local Finance Bureau (Kinsho) No. 66, a member of Japan Securities Dealers Association, The Financial Futures Association of Japan, Japan Investment Advisers Association, Type II Financial Instruments Firms Association; elsewhere in Asia/ Pacific by whichever of the following is the appropriately authorised entity in the relevant jurisdiction: Credit Suisse (Hong Kong) Limited, Credit Suisse Equities (Australia) Limited, Credit Suisse Securities (Thailand) Limited, having registered address at 990 Abdulrahim Place, 27 Floor, Unit 2701, Rama IV Road, Silom, Bangrak, Bangkok 10500, Thailand, Tel. +66 2614 6000, Credit Suisse Securities (Malaysia) Sdn Bhd, Credit Suisse AG, Singapore Branch, Credit Suisse Securities (India) Private Limited regulated by the Securities and Exchange Board of India (registration Nos. INB230970637; INF230970637; INB010970631; INF010970631), having registered address at 9th Floor, Ceejay House, Dr.A.B. Road, Worli, Mumbai - 18, India, T- +91-22 6777 3777, Credit Suisse Securities (Europe) Limited, Seoul Branch, Credit Suisse AG, Taipei Securities Branch, PT Credit Suisse Securities Indonesia, Credit Suisse Securities (Philippines ) Inc., and elsewhere in the world by the relevant authorised affiliate of the above. Research on Taiwanese securities produced by Credit Suisse AG, Taipei Securities Branch has been prepared by a registered Senior Business Person. Research provided to residents of Malaysia is authorised by the Head of Research for Credit Suisse Securities (Malaysia) Sdn Bhd, to whom they should direct any queries on +603 2723 2020. This report has been prepared and issued for distribution in Singapore to institutional investors, accredited investors and expert investors (each as defined under the Financial Advisers Regulations) only, and is also distributed by Credit Suisse AG, Singapore branch to overseas investors (as defined under the Financial Advisers Regulations). By virtue of your status as an institutional investor, accredited investor, expert investor or overseas investor, Credit Suisse AG, Singapore branch is exempted from complying with certain compliance requirements under the Financial Advisers Act, Chapter 110 of Singapore (the "FAA"), the Financial Advisers Regulations and the relevant Notices and Guidelines issued thereunder, in respect of any financial advisory service which Credit Suisse AG, Singapore branch may provide to you. This research may not conform to Canadian disclosure requirements. In jurisdictions where CS is not already registered or licensed to trade in securities, transactions will only be effected in accordance with applicable securities legislation, which will vary from jurisdiction to jurisdiction and may require that the trade be made in accordance with applicable exemptions from registration or licensing requirements. Non-U.S. customers wishing to effect a transaction should contact a CS entity in their local jurisdiction unless governing law permits otherwise. U.S. customers wishing to effect a transaction should do so only by contacting a representative at Credit Suisse Securities (USA) LLC in the U.S. Please note that this research was originally prepared and issued by CS for distribution to their market professional and institutional investor customers. Recipients who are not market professional or institutional investor customers of CS should seek the advice of their independent financial advisor prior to taking any investment decision based on this report or for any necessary explanation of its contents. This research may relate to investments or services of a person outside of the UK or to other matters which are not authorised by the PRA and regulated by the FCA and the PRA or in respect of which the protections of the PRA and FCA for private customers and/or the UK compensation scheme may not be available, and further details as to where this may be the case are available upon request in respect of this report. CS may provide various services to US municipal entities or obligated persons ("municipalities"), including suggesting individual transactions or trades and entering into such transactions. Any services CS provides to municipalities are not viewed as "advice" within the meaning of Section 975 of the Dodd-Frank Wall Street Reform and Consumer Protection Act. CS is providing any such services and related information solely on an arm's length basis and not as an advisor or fiduciary to the municipality. In connection with the provision of the any such services, there is no agreement, direct or indirect, between any municipality (including the officials, management, employees or agents thereof) and CS for CS to provide advice to the municipality. Municipalities should consult with their financial, accounting and legal advisors regarding any such services provided by CS. In addition, CS is not acting for direct or indirect compensation to solicit the municipality on behalf of an unaffiliated broker, dealer, municipal securities dealer, municipal advisor, or investment adviser for the purpose of obtaining or retaining an engagement by the municipality for or in connection with Municipal Financial Products, the issuance of municipal securities, or of an investment adviser to provide investment advisory services to or on behalf of the municipality. If this report is being distributed by a financial institution other than Credit Suisse AG, or its affiliates, that financial institution is solely responsible for distribution. Clients of that institution should contact that institution to effect a transaction in the securities mentioned in this report or require further information. This report does not constitute investment advice by Credit Suisse to the clients of the distributing financial institution, and neither Credit Suisse AG, its affiliates, and their respective officers, directors and employees accept any liability whatsoever for any direct or consequential loss arising from their use of this report or its content. Principal is not guaranteed. Commission is the commission rate or the amount agreed with a customer when setting up an account or at any time after that.
Copyright © 2014 CREDIT SUISSE AG and/or its affiliates. All rights reserved.
Investment principal on bonds can be eroded depending on sale price or market price. In addition, there are bonds on which investment principal can be eroded due to changes in redemption amounts. Care is required when investing in such instruments.
When you purchase non-listed Japanese fixed income securities (Japanese government bonds, Japanese municipal bonds, Japanese government guaranteed bonds, Japanese corporate bonds) from CS as a seller, you will be requested to pay the purchase price only.
0123_jump start.doc