Planet Fitness Inc. - Credit Suisse
42
Planet Fitness Inc. Differentiated Model and Numerous Growth Opportunities Put This Investment Story in Good Shape August 31, 2015 Research Analysts: Seth Sigman 212-538-8043 [email protected] Initiating with Outperform Rating and $19 Target Price DISCLOSURE APPENDIX CONTAINS ANALYST CERTIFICATIONS AND THE STATUS OF NON-US ANALYSTS. U.S. Disclosure: Credit Suisse does and seeks to do business with companies covered in its research reports. As a result, investors should be aware that the Firm may have a conflict of interest that could affect the objectivity of this report. Investors should consider this report as only a single factor in making their investment decision. Melanie Appleby 212-325-5776 [email protected]
-
Upload
khangminh22 -
Category
Documents
-
view
3 -
download
0
Transcript of Planet Fitness Inc. - Credit Suisse

Planet Fitness Inc.
Differentiated Model and Numerous Growth
Opportunities Put This Investment Story in Good Shape
August 31, 2015
Research Analysts: Seth Sigman 212-538-8043 [email protected]
Initiating with Outperform Rating and $19 Target Price
DISCLOSURE APPENDIX CONTAINS ANALYST CERTIFICATIONS AND THE STATUS OF NON-US ANALYSTS. U.S. Disclosure: Credit Suisse does and seeks to do business with
companies covered in its research reports. As a result, investors should be aware that the Firm may have a conflict of interest that could affect the objectivity of this report. Investors should
consider this report as only a single factor in making their investment decision.
Melanie Appleby 212-325-5776 [email protected]

Table of Contents
Snapshot (3-4)
Key Charts (5)
Company Background (6-7)
Investment Background
− Solid Track Record of Growth (8-9)
− Favorable Industry Backdrop (10-12)
− PLNT’s Differentiated Model (13-16)
− Successful, High-Return Franchise Model (17-18)
− Operating Metrics Stack Up Well (19)
− Strong Cash Flow Story (20)
Key Drivers (21)
− Long Runway For Store Growth (22-23)
− Comparable Store Sales Growth (24-26)
− Growth in Royalty Rates Over Time (27)
− Equipment Sales Opportunity (28)
Risks (29-30)
Valuation (31-34)
HOLT Analysis (35-36)
Governance (37-38)
Financial Roadmap (39)
Survey Methodology (40)
Disclosures (41-42)
August 31, 2015 2

Snapshot: Initiating PLNT at Outperform Rating/ $19 TP
Investment Thesis
Key Investment Drivers:
Snapshot
Unique growth story, blending a best-in-class franchise model, with a differentiated consumer proposition that supports double-digit store growth, ~10% top-line growth, and 20%+ bottom-line growth. We see the current stock price rising from a combination of EPS upside and multiple expansion.
1. Significant Unit Growth Opportunity Our survey work confirms that PLNT’s differentiated model aligns well with consumer preferences, including how its low price point, convenient locations and experience. Combined with a fragmented sector and a high-return franchise model, that supports above average, double-digit unit growth.
2. Sustainable Mid- to High-Single-Digit Comps Growth Healthy industry backdrop (mid-single-digit consumer demand growth) and growing awareness supports member/store growth and ASP increases (trading up).
3. Multiple Other Drivers Royalty rates gradually increasing, equipment growth to accelerate, and EBITDA margins to expand, given highly scalable financial model.
Incremental Analysis
• Proprietary Survey: Historically a difficult sector, but PLNT’s model should offer more consistency over time as it key features attract a wider demographic base.
• Store Overlap Analysis: Our analysis shows the whitespace, as well as opportunity to fill in markets, given convenience needs (which our survey also confirms).
Sources: Company data, Credit Suisse estimates, Thomson Reuters.
August 31, 2015 3
Valuation
• Reasonable Valuation Versus Peers: PLNT trades at 30.0x on our 2016 earnings estimate versus over 30x for other high-growth retailers. Our $19 target price is based on a peer multiple analysis and long-term EPS analysis.
Rating OUTPERFORM
Price Target $19.00
Current Price $16.78
Market Cap $1,656 mn
Enter. Value $2,124 mn
52 Wk Range $15.05-$19.10
Street View N/A
Estimates/ Valuation
in millions 2014A 2015E 2016E 2017E
Sales 280 312 347 380
EBITDA 96 109 130 150
EPS $0.39 $0.45 $0.56 $0.69
EV/Sales 7.6x 6.8x 6.1x 5.6x
EV/EBITDA 22.2x 19.5x 16.3x 14.2x
P/E 43.0x 37.3x 30.0x 24.3x

Snapshot (cont’d)
Estimates & Valuation
Our Target Price of $19 equates to P/E multiples of 42x and 34x on our 2015 and 2016 EPS estimates, respectively. Our target valuation is based on a (1) peer multiple analysis, which includes other best-in- class franchisors and high-growth retailers; and (2) long-term EPS scenario, which yields $1.18 in EPS power in FY20, discounted back, using a 24x multiple.
PLNT currently trades at 18x 2016 EV/EBITDA, a slight premium to its franchise peers, which trade at a mid-teens multiple, yet PLNT’s growth profile may be better.
Our Estimates: We estimate pro-forma adjusted EPS of $0.45 in 2015 (+14.4% y/y), $0.56 in 2016 (+25.3%), and $0.69 in 2016 (+23.5%).
We forecast 12% revenue growth in 2015, and ~10-11% in 2016 and beyond, which reflects mid-single-digit comps and double-digit unit growth.
We forecast 14% adjusted EBITDA growth in 2015 and mid-teens to high teens in 2016 and beyond. Our estimates reflect EBITDA margins rising from 34.2% in 2014 to 39.4% by 2017, primarily driven by leverage of fixed costs such as rent, payroll, marketing and franchise support functions.
Key Risks
Competition from similar format fitness centers; Blink, its closest competitor recently announced plans to open 300 franchise locations by 2020.
Attrition: Low-cost model and lax cancellation policy may result in higher attrition.
Cannibalization: With 1,000 stores today and 67% overlap within 10 miles, PLNT faces cannibalization risk as they expand to meet the 4,000 store target.
Concentrated Franchise Base, increases risk profile. It is dependent on these parties for growth.
Key Catalysts
PLNT stock has pulled back recently to just above its IPO price of $16. If the company can maintain and point to high-teens EBITDA growth in 2015, we see the stock rising on results on September 2, 2015.
August 31, 2015 4

Key Charts
August 31, 2015 5
Sources: Company data, Credit Suisse estimates, Survey Monkey, ComScore.
Track Record of Consistent Comps Growth EBITDA Stacks up Very Well vs. Peers
36%
0%
10%
20%
30%
40%
EBITDA Margin, 2014ABest-In-Class Franchisors and High Growth Retailers
Model Aligns with Consumer Preferences Convenience Matters: Fill in Market Opportunity
10.1%
7.9%7.2% 7.4%
8.7%
7.3% 7.3%
10.4%
13.0%
10.7%9.7% 10.2%
10.9%
0%
2%
4%
6%
8%
10%
12%
14%
1Q12 2Q12 3Q12 4Q12 1Q13 2Q13 3Q13 4Q13 1Q14 2Q14 3Q14 4Q14 1Q15
Planet Fitness System-Wide Comps
Differentiated Model Catering to Diverse Group
8%
11%
12%
13%
16%
17%
27%
30%
34%
37%
60%
65%
84%
87%
0% 20% 40% 60% 80% 100%
Coffee / juice / snack bar
Free weight selection
Size of gym
Personal training
Locker room offerings
Cardio selection
Pool
Classes offered
Helpful and friendly personnel
Non-intimidating environment
Hours
Cleanliness of facilities
Location
Price
37% look for a non-intimidating gym environment, something
PLNT prides itself on
PLNT offers the most competitive pricing, as well
as the most locations vs. other low-cost players
In general, respondents found many of the extra amenities that PLNT does
not offer to be unimportant
19%
35%30%
11%
2% 3%
0%
10%
20%
30%
40%
Up to 5minutes
Up to 10minutes
Up to 15minutes
Up to 20minutes
Up to 25minutes
Up to 30minutes
How long would you be willing to drive / travel to a gym?
54% of respondents would not drive more than a few
miles to a gym
22% 23%
16% 17%
13%
8%
18-24 25-34 35-44 45-54 55-64 65+
Visitors to PLNT's website by Age

Company Background
Business Overview: Differentiated Model w/ Broad Consumer Appeal Market Position:
− Largest franchisor and operator of fitness centers across the U.S. and Canada, by number of members
and stores—976 locations, including 919 franchise and 57 corporate-owned, and over 7.1mn members.
Unique Proposition Targets Masses, Positioning PLNT for More Consistency Over Time:
− Targets the 80% of the population who do not belong to a gym. Stores offer a non-intimating, no-frills, no-strings-attached, experience for a low cost of $10/$20 per month.
Medium-Size Facilities:
− Gyms average 20k sq. ft. box, and include locker rooms with showers and various equipment (including
cardio, free weights, cable machines, a 30-minute circuit, and a stretching area), with cardio receiving the most floor space. They do not offer classes, personal training, daycare, juice bars, etc.
Diverse Customer Base:
− Broad appeal, spanning all ages, income levels, with more than 50% of their customers being female, which is evidenced by their success in many different types of markets.
August 31, 2015 6
Sources: Company data, Credit Suisse estimates, comScore data.
22% 23%
16%17%
13%
8%
0%
5%
10%
15%
20%
25%
18-24 25-34 35-44 45-54 55-64 65+
Visitors to PLNT's website by Age
21%
34%36%
9%
0%
5%
10%
15%
20%
25%
30%
35%
40%
<$39k $40-74k $75-149k $150+
Visitors to PLNT's website by HH Income

Company Background
Three Business Segments Franchise – 26% revenue, 48% of EBITDA
− PLNT generates most of its revenue from its 919 franchise-owned stores through royalty revenue,
commissions, and equipment placement fees.
Corporate – 30% revenue, 28% of EBITDA
− PLNT owns and operates 57 stores, allowing them to capture incremental profit and derive other operational benefits, such as learning the necessary franchise support functions and financial risks.
Equipment – 44% revenue, 24% of EBITDA
− Franchisees purchase branded equipment from PLNT and replace it every four to seven years.
August 31, 2015 7
Sources: Company data, Credit Suisse estimates.
Franchise26%
Corporate30%
Equipment44%
Revenue by Segment
Franchise48%
Corporate28%
Equipment24%
EBITDA by Segment

Solid Track Record of Growth
Consistent Top-Line Growth, with Above-Average Comps Trends
Revenue Growth:
− CAGR of 32% since 2010 to $280mn in 2014.
Member Growth:
− CAGR of 28% since 2010 to 7.1mn members today.
Unit Growth:
− CAGR of 24% since 2010 to ~1,000 stores today, through both franchise and corporate store additions.
Comparable Store-Sales Growth:
− Mid-single to low-double-digit comps over the past three years, which should continue over the near to medium term, supported by newer stores maturing, growth in members per store, and mix helping ASPs.
August 31, 2015 8
Sources: Company data, Credit Suisse estimates.
10.1%
7.9%7.2% 7.4%
8.7%
7.3% 7.3%
10.4%
13.0%
10.7%9.7% 10.2%
10.9%
0%
2%
4%
6%
8%
10%
12%
14%
1Q12 2Q12 3Q12 4Q12 1Q13 2Q13 3Q13 4Q13 1Q14 2Q14 3Q14 4Q14 1Q15
Planet Fitness System-Wide Comps

Solid Track Record of Growth (cont’d)
Steady EBITDA Margin Expansion: High Operating Leverage Model
Adj. EBITDA margins of ~34% stacks up well among other high growth retailers/franchise operators.
− Up ~1,040 bps since 2010, due to leverage of corporate store costs and franchise-related support costs.
August 31, 2015 9
Sources: Company data, Credit Suisse estimates.
22.0
37.5
51.3
66.3
95.7 109.2
130.1
149.5
23.8%
27.5%
32.1% 31.4%
34.2% 35.0%
37.5%39.4%
15%
20%
25%
30%
35%
40%
-
20
40
60
80
100
120
140
160
2010 2011 2012 2013 2014 2015E 2016E 2017E
Planet Fitness Adjusted EBITDA $ and Margin %
Adj EBITDA Adj EBITDA Margin

Favorable Industry Backdrop
Industry Growing Low/Mid-Single Digits, Which Stacks Up Well
Participating in a Growing Industry:
− ~$22bn fitness club industry that is growing at a low-to-mid-single-digit rate.
Membership on the Rise:
− 8.3% increase in gym membership penetration among the working age population since 2000, which equates to 21.3 million more fitness club members.
August 31, 2015 10
Sources: IHRSA
18.3% 18.6%19.7%
21.1%21.9% 21.6% 22.1%
23.9%23.2% 22.9%
25.2% 25.7%24.9%
26.2% 26.6%
15.0%
17.0%
19.0%
21.0%
23.0%
25.0%
27.0%
29.0%
2000 2001 2002 2003 2004 2005 2006 2007 2008 2009 2010 2011 2012 2013 2014
U.S. Fitness Club Memberships as Percent of the U.S. Working Age Population
+8.3% penetration = 21.3mn more fitness members

Favorable Industry Backdrop (cont’d)
Proprietary Survey Shows Positive Trend in Exercising
Survey Indicates Stable to Improving Exercise Trends:
− 60% of our survey respondents reported working out more or the same as five years ago.
– 30% workout the same
Other Stats on Activity:
− 46% of respondents workout on a weekly basis and 11% workout one to three times a month.
August 31, 2015 11
Sources: Credit Suisse estimates, Survey Monkey.
30% 30%
40%
0%
5%
10%
15%
20%
25%
30%
35%
40%
45%
More About the same Less
Do you workout more or less than you did 5 years ago?
60% of respondents workout more or about the same as 5 years ago
18%
28%
11%
24%
19%
0%
5%
10%
15%
20%
25%
30%
4+ times aweek
1-3 times aweek
1-3 times amonth
Rarely I don'tworkout
How often do you workout?Almost half of our respondents workout on a weekly basis

Favorable Industry Backdrop (cont’d)
Fragmented Industry with Room for Growth
Significant Market Share Potential:
− PLNT only represents ~2% of the fitness club market, despite ~1,000 locations.
− Other top-ten chains represent ~20% and other chains/independents account for 78%.
− The fragmented nature of this sector could support PLNT’s ~4,000 store target.
August 31, 2015 12
Sources: Company data, Credit Suisse estimates, ASF.
8.3%
5.9%
5.8%
3.9%
3.8%
2.0%1.2%
0.8%
0.7%
0.7%
66.8%
Fitness Club Market Share By Revenue
LA Fitness
24 Hour Fitness
Life Time Fitness
Equinox
ClubCorp
Town Sports
Planet Fitness
Capital Fitness
The Bay Club
Crunch
Top 10 Players = 33%
Fitness Club Market by Number of Stores
Planet Fitness2%
Top-10 Chains20%
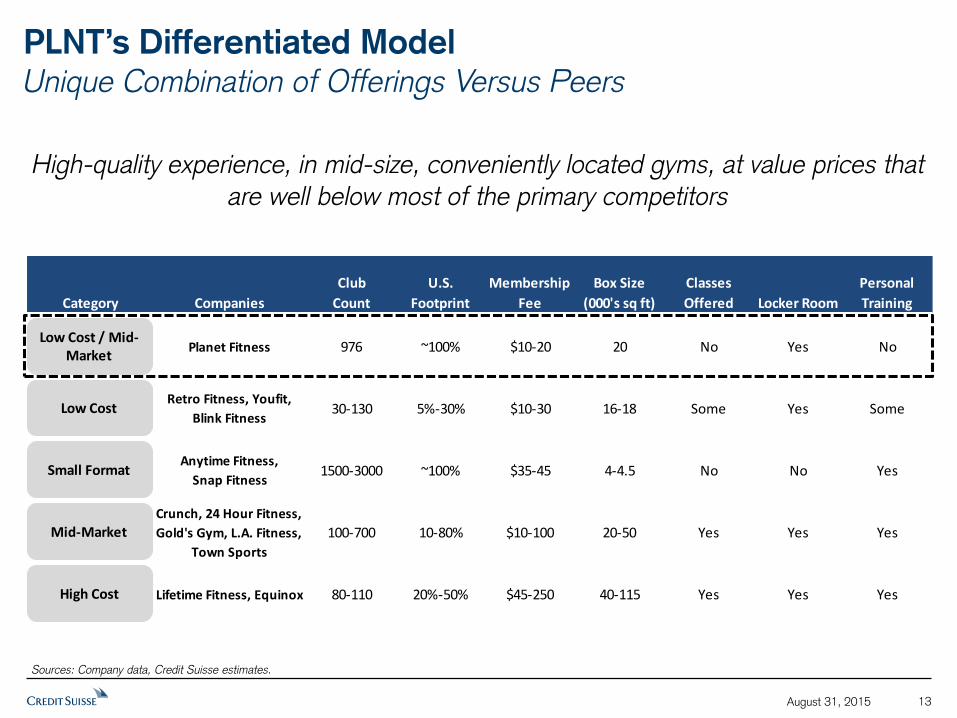
PLNT’s Differentiated Model
Unique Combination of Offerings Versus Peers
August 31, 2015 13
Sources: Company data, Credit Suisse estimates.
High-quality experience, in mid-size, conveniently located gyms, at value prices that are well below most of the primary competitors
Category Companies
Club
Count
U.S.
Footprint
Membership
Fee
Box Size
(000's sq ft)
Classes
Offered Locker Room
Personal
Training
Planet Fitness 976 ~100% $10-20 20 No Yes No
Retro Fitness, Youfit,
Blink Fitness30-130 5%-30% $10-30 16-18 Some Yes Some
Anytime Fitness,
Snap Fitness1500-3000 ~100% $35-45 4-4.5 No No Yes
Crunch, 24 Hour Fitness,
Gold's Gym, L.A. Fitness,
Town Sports
100-700 10-80% $10-100 20-50 Yes Yes Yes
Lifetime Fitness, Equinox 80-110 20%-50% $45-250 40-115 Yes Yes Yes
Low Cost / Mid-Market
Low Cost
Small Format
Mid-Market
High Cost

PLNT’s Differentiated Model (cont’d)
Offering In-Line with Customer Preferences, per Survey
August 31, 2015 14
What is most important to you in choosing a gym?
8%
11%
12%
13%
16%
17%
27%
30%
34%
37%
60%
65%
84%
87%
0% 20% 40% 60% 80% 100%
Coffee / juice / snack bar
Free weight selection
Size of gym
Personal training
Locker room offerings
Cardio selection
Pool
Classes offered
Helpful and friendly personnel
Non-intimidating environment
Hours
Cleanliness of facilities
Location
Price
37% look for a non-intimidating gym environment, something
PLNT prides itself on
PLNT offers the most competitive pricing, as well
as the most locations vs. other low-cost players
In general, respondents found many of the extra amenities that PLNT does
not offer to be unimportant
Sources: Company data, Credit Suisse estimates, Survey Monkey.

PLNT’s Differentiated Model (cont’d)
Price Point in Sweet Spot for Consumer, per Survey
Low Price Point Is an Important Differentiator
− 44% of survey respondent want to pay $20 or less
− PLNT offers $10 and $20 per month options
− No-strings-attached cancellation policy and a small or no initiation fee
August 31, 2015 15
Sources: Company data, Credit Suisse estimates, Survey Monkey.
* Includes only from those respondents who do not belong to a gym.
19%
44%
27%
6%3%
1%0%
10%
20%
30%
40%
50%
I would neverpay for a gymmembership.
< $20 $21-50 $51-100 $101-200 $200+
How much are you willing to pay for a gym membership?

PLNT’s Differentiated Model (cont’d)
Offering Unique Gym Experience, Catering to Broader Population
Non-intimidating Culture: The company instills a non-intimidating culture through their numerous mantras that can be seen on national advertising campaigns and on the gym walls, including: “Judgement Free Zone,” “Lunkhead,” “You belong,” “No gymtimidation,” and “Come as you are.”
No-Frills Experience: PLNT does not offer classes, personal training, daycare, juice or coffee bars, merchandise area, etc., in order to maximize space for equipment and minimize unnecessary costs.
August 31, 2015 16
Sources: Company data, Credit Suisse estimates, Thomson Reuters.
Yellow area represents floor space dedicated to
exercise equipment
and
stretching.
Cardio equipment Focus on Cardio: Gym layout focuses on cardio (more popular among first-time or infrequent gym users), but includes strength machines, free weights, a 30 minute circuit, and an ab and stretching area. This ensures that there is more likely to be an available cardio machine, even at peak times. This can be seen
in the store layout.

Successful, High-Return Franchise Model
Disciplined Franchise Selection Process
Rigorous Selection Process:
− PLNT employs a disciplined selection process for new franchise operators, requiring the candidate to have $1.5mn in net worth, $500k of liquidity, and outside income of $100k per year, among other qualifications. As a result, the company has seen zero SBA loan defaults from 2000-2014 and zero store
closures due to financial underperformance.
Concentrated Base Ensures Quality:
− >90% of PLNT’s store base is owned by multi-store operators with 187 franchisors operating 956 stores.
August 31, 2015 17
Sources: Company data, Credit Suisse estimates.
<3 stores12%
3-10 stores53%
11+ stores35%
Number of Stores Per Franchisor
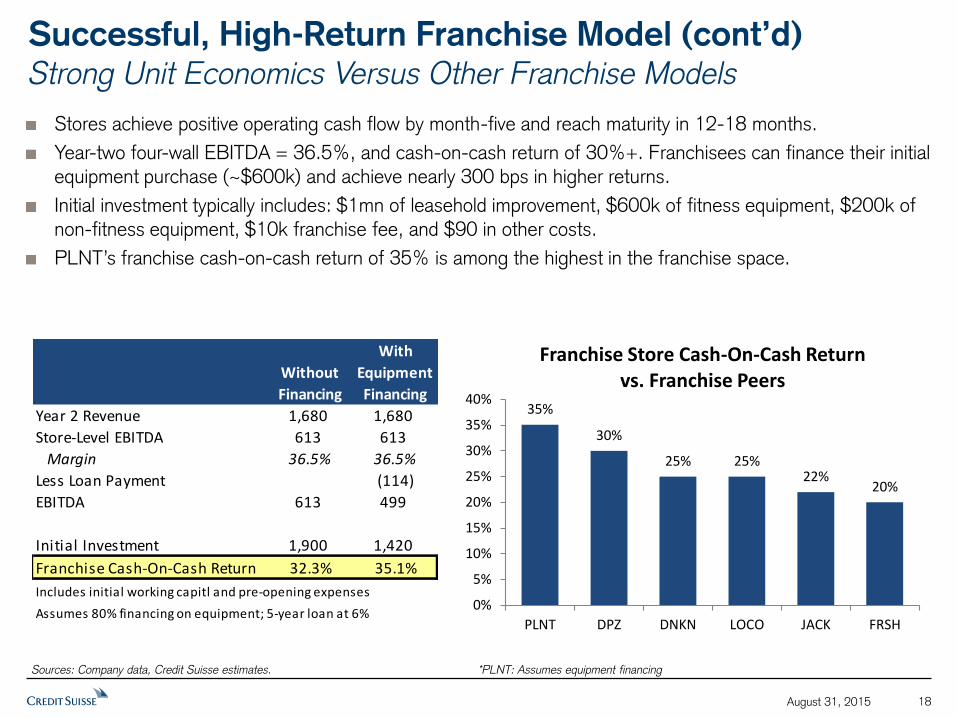
Successful, High-Return Franchise Model (cont’d)
Strong Unit Economics Versus Other Franchise Models
Stores achieve positive operating cash flow by month-five and reach maturity in 12-18 months.
Year-two four-wall EBITDA = 36.5%, and cash-on-cash return of 30%+. Franchisees can finance their initial equipment purchase (~$600k) and achieve nearly 300 bps in higher returns.
Initial investment typically includes: $1mn of leasehold improvement, $600k of fitness equipment, $200k of
non-fitness equipment, $10k franchise fee, and $90 in other costs.
PLNT’s franchise cash-on-cash return of 35% is among the highest in the franchise space.
August 31, 2015 18
Sources: Company data, Credit Suisse estimates.
Without
Financing
With
Equipment
Financing
Year 2 Revenue 1,680 1,680
Store-Level EBITDA 613 613
Margin 36.5% 36.5%
Less Loan Payment (114)
EBITDA 613 499
Initial Investment 1,900 1,420
Franchise Cash-On-Cash Return 32.3% 35.1%
Includes initial working capitl and pre-opening expenses
Assumes 80% financing on equipment; 5-year loan at 6%
35%
30%
25% 25%22%
20%
0%
5%
10%
15%
20%
25%
30%
35%
40%
PLNT DPZ DNKN LOCO JACK FRSH
Franchise Store Cash-On-Cash Return vs. Franchise Peers
*PLNT: Assumes equipment financing

Operating Metrics Stack Up Well
High Productivity Supports Industry-Leading EBITDA Margins
Best-in-Class EBITDA Margins:
− PLNT’s adj. EBITDA margins of over 36% stack up well vs. other franchisors and high-growth retailers
Strong Productivity Helps Explain the High Margins:
− Members per store has been steadily increasing over the past five years to 6,606 average members per
store in 2014, a 12% increase from 2010.
− PLNT has more members per square foot, on average, vs. other gym operators.
August 31, 2015 19
Sources: Company data, Credit Suisse estimates.
36%
0%
5%
10%
15%
20%
25%
30%
35%
40%
EBITDA Margin, 2014ABest-In-Class Franchisors and High Growth Retailers
420
305
95
19 17 7 70
50
100
150
200
250
300
350
400
450
Anytime PLNT 24 Hour TownSports
Retro Life Time Crunch
Members Per Square Foot

Strong Cash Flow Story
Recurring Revenue Stream
PLNT should be able to generate consistent free-cash-flow growth, given the strong recurring revenue
stream from royalties and commissions and the company’s industry leading EBITDA margins of 36%. This is further augmented by the minimal working capital required to run a franchise business.
80% of the franchise segment revenue comes from recurring revenue streams and 95% of this is processed through automated electronic billings.
Free cash flow will be used to fund investments in corporate stores and to pay down debt. The company currently has $481.6mn in net debt, which equates to 4.5x LTM EBITDA.
August 31, 2015 20
Sources: Company data, Credit Suisse estimates.
$60 $63
$45
$89
$102
$0
$20
$40
$60
$80
$100
$120
2013 2014 2015E 2016E 2017E
PLNT Free Cash Flow
Decrease in FCF in 2015 due to IPO costs

Key Drivers
1. Long Runway for Store Growth: PLNT has a long-term store target of 4,000 from ~1,000 today, implying mid-teens unit growth, or ~200 stores/year, contributing to comps in the mid- to high-single digits as new stores ramp, meaningful expense leverage, and brand awareness. Our analysis of metro market penetration and store overlap is supportive of a 4,000 store target, as well as our survey results shown
earlier, which highlight how PLNT’s model aligns well with consumers’ preferences.
2. Mid- to High-Single-Digit Comp Growth: We project comp growth of 7.1% in 2015 and 5-6% in the out years. We expect that to be supported by a healthy balance of members per store growth and pricing growth. Members per store grew 3.1% in 2014 and will likely continue to increase, given PLNT’s marketing presence and high consumer awareness (e.g., only 14% of survey respondents have not heard of PLNT). For pricing, we estimate low-single-digit increases in average monthly fee per member, with further increases in Black Card penetration and perhaps some price increases over time (e.g., our survey points to
some pricing power, where PLNT could potentially take prices up slightly from the $10 and $20 plans).
3. Franchise Growth Drivers: We expect Franchise revenue to grow to a third of the mix by 2017 from 26% in 2014, driven by steady increases in the average royalty rate, new franchise store growth, and strong franchise comps of 7.6% in 2015, and ~6% in the out years.
4. Re-Equipment Sales Opportunity: We expect this high margin segment to steadily grow in the high single digit range, supported by compounding re-equipment sales as older stores come due for new
equipment every 4-7 years and new equipment sales from the roughly 200 stores expected to open each year. Relative to expectations, we believe this could be a source of upside.
August 31, 2015 21

Driver #1: Long Runway for Store Growth
High-Teens Annual Unit Growth Opportunity
Significant Growth Opportunity
− Long-term store target of 4,000 from ~1,000 today, implies mid-teens unit growth, or ~200 stores/year.
− Over 1,000 stores are already committed in current franchise agreements, providing clear growth runway.
− Broad demographic appeal supports the opportunity.
PLNT Remains Under-penetrated in Most Markets
− Membership in most mature states account for 4%+ of the population.
− In less mature markets, penetration is sub 2%.
− Our analysis: we analyzed the number of stores per metro market population, which showed mature markets for PLNT have 100-200k population per store, but the company average is over 400k. We estimate another 3,000 locations can be added, assuming all stores move towards that 100-200k population per store range, supporting the long-term targets laid out by management.
August 31, 2015 22
Sources: Company data, Credit Suisse estimates, U.S. Census Bureau.
389 488 606 749 918 1,108
1,306 1,511
4,000
'10 '11 '12 '13 '14 '15E '16E '17E LT
Number of StoresWhite Space Opportunity
Most Penetrated
Market (ME) All 50 States
Metro Statistical Area Population (000's) 784 402,591
/ Current Number of PLNT Stores 9 968
Population Per Store 87 416
Assume Max Penetration In-Line with Most Penetrated Market
Potential Number of Stores @ 100k People / Store 4,026
Incremental Opportunity 3,058

Driver #1: Long Runway for Store Growth (cont’d) Store Analysis Shows Medium Overlap, but Convenience Is Important for Consumers, Which Supports Further Growth
Consumers Not Willing to Travel Far:
− 54% of survey respondents said they would not drive more than five or ten minutes to a gym.
Opportunity for PLNT to Still Fill In Markets:
− We estimate just 33% of PLNT’s stores overlap within a ten-minute drive, meaning that 67% of the store base has opportunities to add more stores to those markets.
August 31, 2015 23
Sources: Company data, Credit Suisse estimates, Survey Monkey.
2%12%
33%
67%
79%85%
1 mile 3 miles 5 miles 10 miles 15 miles 20 miles
% of Planet Fitness Store Base Overlapping With Itself
Driving Time @ 35 mph
2min 5min 9min 17min 26min 43min
Only 12% of stores overlap within a 5 min driving time
and 33% within 10 mins
19%
35%
30%
11%
2%3%
0%
5%
10%
15%
20%
25%
30%
35%
40%
Up to 5minutes
Up to 10minutes
Up to 15minutes
Up to 20minutes
Up to 25minutes
Up to 30minutes
How long would you be willing to drive / travel to a gym?
54% of respondents would not drive more than a few miles to a
gym

Driver #2: Healthy Comparable Store Sales Outlook
Member Growth/Store: High Awareness Should Support Growth
High Consumer Awareness, Should Help Support Future Growth
− Only 14% of our survey respondents have not heard of Planet Fitness
− 69% of our survey respondents said that they would or maybe would join PLNT if it opened near them (note: in 2014, new stores had, on average, 1,300 members signed up before even opening their doors)
Scale Provides Significant Marketing Advantage:
− PLNT is one of the only fitness clubs with a national advertising campaign, which contributes to its high awareness. Each franchise is required to give 2% of monthly membership dues to a national advertising fund and give 5-7% of monthly membership dues to a local advertising fund. They advertise through TV, direct mail, guerilla marketing, and digital mediums and usually focus on their “Judgement Free” mantra.
August 31, 2015 24
15%
54.07%
31%
0%
10%
20%
30%
40%
50%
60%
Yes. Maybe. No.
If a Planet Fitness was open near you, would you join?
69% of respondents said they would or maybe would join a PLNT if it
opened near them
Have heard of
PLNT86%
Have not
heard of PLNT14%
Sources: Company data, Credit Suisse estimates, Survey Monkey.
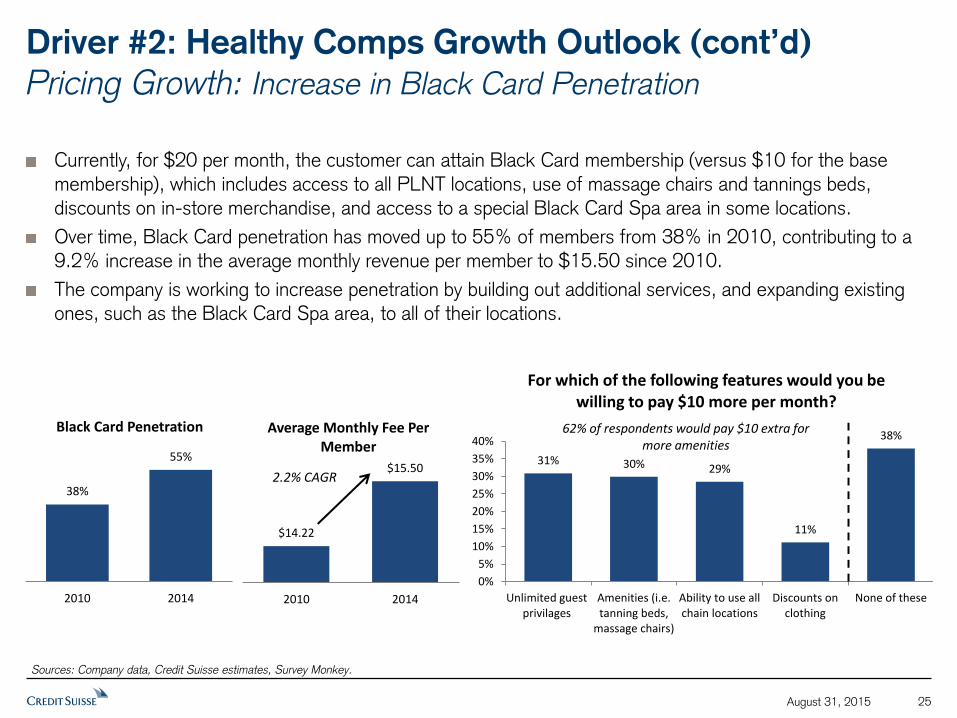
Currently, for $20 per month, the customer can attain Black Card membership (versus $10 for the base
membership), which includes access to all PLNT locations, use of massage chairs and tannings beds, discounts on in-store merchandise, and access to a special Black Card Spa area in some locations.
Over time, Black Card penetration has moved up to 55% of members from 38% in 2010, contributing to a 9.2% increase in the average monthly revenue per member to $15.50 since 2010.
The company is working to increase penetration by building out additional services, and expanding existing ones, such as the Black Card Spa area, to all of their locations.
August 31, 2015 25
31% 30% 29%
11%
38%
0%
5%
10%
15%
20%
25%
30%
35%
40%
Unlimited guestprivilages
Amenities (i.e.tanning beds,
massage chairs)
Ability to use allchain locations
Discounts onclothing
None of these
For which of the following features would you be willing to pay $10 more per month?
62% of respondents would pay $10 extra formore amenities
Driver #2: Healthy Comps Growth Outlook (cont’d)
Pricing Growth: Increase in Black Card Penetration
38%
55%
2010 2014
Black Card Penetration
$14.22
$15.50
2010 2014
Average Monthly Fee Per Member
2.2% CAGR
Sources: Company data, Credit Suisse estimates, Survey Monkey.

68% of respondents said they would be willing to accept a price increase for PLNT’s current offering, which
we believe points to the value in this model beyond price (convenience, experience, etc.).
Competition in this category remains fierce and seems to be increasing, so we don’t necessarily expect a major change in PLNT’s pricing, but it does point to some pricing power for PLNT.
August 31, 2015 26
Driver #2: Healthy Comps Growth Outlook (cont’d)
Pricing Growth: Survey Shows that PLNT Has Pricing Power
Sources: Company data, Credit Suisse estimates, Survey Monkey.
29%
24%
3%
12%
32%
0%
5%
10%
15%
20%
25%
30%
35%
I would pay up to$2 more per
month.
I would pay up to$5 more per
month.
I would pay up to$8 more per
month.
I would pay up to$10 more per
month.
I would not payincrementally
more.
If PLNT increased pricing, would you be willing to pay the following to still be a member?
68% of respondents would bewilling to pay incrementally
more for a PLNT membership

Driver #3: Growth in Royalty Rates Over Time
Long-Term Goal of 5% Versus Average Rate Today of 2.95%
Royalty revenue accounted for 45% of franchise revenue and 18% of total revenue in 2014.
The average royalty rate was 2.95%, which reflects a blend of older rates from existing franchise agreements and the 5% royalty rate in newer agreements.
Over time, we expect the average royalty rate to steadily increase toward 5% as older franchise agreements come up for renewal and as new franchise agreements become a larger part of the base. In 2014, 81% of store openings were at the 5% rate and 49% of the total store base paid a 5% royalty rate.
Royalty revenue will also be driven through the addition of new franchise locations and overall system-wide sales growth.
August 31, 2015 27
Sources: Company data, Credit Suisse estimates.
1.4%1.7%
2.1%2.5%
3.0%3.2%
3.5% 3.7%
5.0%
'10 '11 '12 '13 '14 '15E '16E '17E LT
Royalty Rate
Every 10 bps increase in the average royalty rate equates to $1.4mn in '15, $1.7mn in '16, and $2.0mn in '17, or $0.01-0.02 in EPS.
* Assuming system-wide franchise sales growth of 20%+ in out years

Driver #4: Equipment Sales Opportunity
Strong Growth from Re-Equips and New Store Growth
Each store is required to replace cardio equipment every four to five years and strength every six to seven
years. As the base of stores grows, more stores will be due for re-equipment, as shown in the chart below.
Given the process of replacing equipment usually happens over several months and the steady growth in new stores, the ramp in equipment revenue should be relatively smooth over time.
August 31, 2015 28
Sources: Company data, Credit Suisse estimates.
Historically, the re-equip requirement has not been strongly enforced, but corporate has made it more of a focus over the past few years. This leads to a lot of
low hanging fruit in the near term as older stores all re-equip in a shorter period of time.
Our waterfall analysis shows the potential equipment revenue assuming all stores re-equip on
time. Our estimates stay below this level, as it may take some time to work through the backlog, though our estimate may be conservative.
Equipment Potential Waterfall Analysis 2015 2016 2017 2018 2019
Re-Equipment Revenue 59,800 79,034 96,859 107,238 124,373
New Equipment Revenue 104,075 112,700 117,875 123,625 132,250
Total Potential Equipment Revenue 163,875 191,734 214,734 230,863 256,623
CS Estimate 129,684 138,705 148,781 161,934 175,751
Discount to Potential -21% -28% -31% -30% -32%
110
182
216233
259285
54
119 130 139 149163
0
50
100
150
200
250
300
2014 2015 2016 2017 2018 2019
Number of Store Potentially Up for Re-EquipmentCardio Equipment

Risks
Our $19 target price is 42x and 34x our 2015 and 2016 EPS estimates, respectively. Our target price is based on a (1) peer multiple analysis, which includes other best-in-class franchisors and high-growth retailers; and (2) long-term EPS scenario, which yields $1.18 in EPS power in FY20, discounted back, using a 24x multiple.
Increasing Competition: PLNT is competing in a highly fragmented industry, with many large players and growing competition from other exercising formats, such as spinning studios and class-based studios. The price point and brand awareness for PLNT has been an important differentiator.
Potentially High Attrition: PLNT’s low-cost model and lax cancellation policy may result in a non-sticky customer and potentially high attrition. That may shift the onus to drive comps to new member adds, or price increases for existing members
Retail Cannibalization: With 1,000 stores today and 67% overlap within ten miles, PLNT may face the risk of cannibalization as it expands towards its long-term target of 4,000 stores. To date, the company has
been able to generate solid high single digit or better comps despite that overlap.
Franchisors May Not Re-Equip: Franchisees may not abide by their agreement to replace equipment every four to seven years, resulting in lost sales. PLNT did not enforce this historically, resulting in a growing group of locations with aging equipment, which could also negatively affect PLNT’s member perception.
Franchisee Reliance: PLNT has a relatively concentrated franchise base of 187 franchisors operating 919 stores, which represents 70% of its sales. The health of each franchise business and their access to capital, to some degree, outside of the company’s hands.
August 31, 2015 29

Risks (cont’d)
Increasing Competition
The number of fitness clubs has been accelerating since 2011, outpacing industry revenue growth in 2013. While the total industry’s revenue has been growing at a healthy rate, it is possible that this growth has been among the higher-cost and “new age” models (i.e., spinning studios and other class-based studios).
PLNT’s closest competitor, Blink, recently announced plans to open 300 franchise locations by 2020.
August 31, 2015 30
Sources: Company data, Credit Suisse estimates.
-2.0%
0.0%
2.0%
4.0%
6.0%
8.0%
10.0%
2009 2010 2011 2012 2013 2014
Number of Fitness Clubs vs. Fitness Club Industry Revenue, Y/Y % Growth
Clubs Revenue

Valuation
Long-Term EPS Scenario
August 31, 2015 31
Sources: Company data, Credit Suisse estimates.
2015 2016 2017 2018 2019 2020
Corporate
Stores 58 59 60 60 60 60
Sq Ft Growth 5% 2% 2% 0% 0% 0%
Comps 1.1% 4.3% 2.3% 2.2% 2.0% 2.0%
Revenue 97 103 105 108 110 112
Franchise
Stores 1,050 1,247 1,451 1,671 1,906 2,156
Sq Ft Growth 22% 19% 16% 15% 14% 13%
Comps 7.6% 5.7% 5.9% 5.8% 5.5% 5.2%
Royalty Rate 3.23% 3.50% 3.71% 3.91% 4.11% 4.31%
Revenue 86 105 126 155 188 226
Equipment
Revenue 130 139 149 162 176 190 Valuation
Total Revenue 312 347 380 425 474 528 Year to Maturi ty 5
Long-Term Earnings Potentia l $1.18
Adjusted EBITDA 109 130 150 176 206 239 Multiple 24x
Adjusted EBITDA Margin 35.0% 37.5% 39.4% 41.4% 43.4% 45.3% 2020E Stock Price $27.91
Discount Rate 8%
EPS $0.45 $0.56 $0.69 $0.84 $1.00 $1.18 Discounted Stock Price $19.00
Y/Y % Growth 25% 23% 21% 19% 18%

Valuation
Multiple Analysis
August 31, 2015 32
Sources: Company data, Credit Suisse estimates, Thomson Reuters.
PLNT DPZ DNKN CHH SONC PLKI BOJA LOCO SBUX CMG LULU FIVE BOOT
Market Cap $1,656 $5,955 $4,923 $2,941 $1,445 $1,283 $771 $524 $82,566 $22,459 $8,935 $2,097 $552
Enterprise Value $2,124 $7,455 $7,097 $3,511 $1,888 $1,383 $999 $654 $83,290 $21,580 $8,279 $2,045 $640
Current Price $16.8 $108.4 $51.7 $51.1 $27.8 $56.0 $21.4 $13.7 $55.6 $721.2 $63.2 $38.5 $21.1
2014 Price Chg. N/A 35% -12% 14% 35% 46% N/A N/A 5% 28% -5% -5% N/A
YTD Price Chg. 5% 15% 21% -9% 2% 0% 13% -31% 36% 5% 13% -6% 16%
2015 adj EPS $0.45 $3.51 $1.92 $2.20 $1.09 $1.90 $0.77 $0.68 $1.58 $17.37 $1.82 $0.88 $0.70
2016 adj EPS $0.56 $4.02 $2.24 $2.46 $1.26 $2.22 $0.85 $0.78 $1.87 $20.68 $1.93 $1.05 $0.90
2017 adj EPS $0.69 $4.65 $2.55 $2.76 $1.42 N/A $0.99 $0.94 $2.17 $24.55 $2.31 $1.33 $1.12
2015 P/E 37.5x 30.9x 26.9x 23.2x 25.5x 29.4x 27.8x 20.1x 35.1x 41.5x 34.7x 43.9x 30.0x
2016 P/E 29.9x 26.9x 23.0x 20.7x 22.1x 25.3x 25.2x 17.7x 29.7x 34.9x 32.8x 36.7x 23.6x
2017 P/E 24.2x 23.3x 20.3x 18.5x 19.7x N/A 21.6x 14.6x 25.7x 29.4x 27.3x 28.9x 18.8x
LT EPS Growth 20% 16% 14% 9% 20% 16% 14% 15% 18% 21% 17% 25% 11%
2015 PEG 1.9x 1.9x 2.0x 2.7x 1.3x 1.8x 1.9x 1.3x 2.0x 2.0x 2.0x 1.7x 2.7x
2016 PEG 1.5x 1.6x 1.7x 2.4x 1.1x 1.6x 1.7x 1.2x 1.7x 1.7x 1.9x 1.4x 2.1x
EBITDA 2013-16 CAGR 25.2% 12.2% 9.7% 7.9% 10.3% 13.7% 14.1% 10.7% 21.9% 23.5% 2.8% 34.3% 33.6%
EBITDA 2014-17 CAGR 16.0% 11.8% 9.0% 7.4% 9.2% 13.3% 10.7% 9.7% 18.3% 18.6% 6.6% 19.4% 29.1%
2014 EV/EBITDA 22.2x 19.6x 19.1x 15.6x 13.3x 18.5x 15.5x 10.9x 23.5x 26.1x 18.8x 30.4x 16.7x
2015 EV/EBITDA 19.4x 17.2x 17.3x 14.7x 11.5x 16.4x 14.3x 10.2x 18.6x 21.2x 19.6x 21.5x 14.1x
2016 EV/EBITDA 16.3x 15.5x 16.0x 13.6x 10.7x 14.4x 12.7x 9.1x 16.1x 18.0x 18.1x 17.9x 9.6x
2017 EV/EBITDA 14.2x 14.0x 14.8x 12.6x 10.2x N/A 11.5x 8.3x 14.2x 15.6x 15.5x 14.1x 7.8x
Div Yield 0.0% 1.1% 2.1% 1.5% 1.3% 0.0% 0.0% 0.0% 1.2% 0.0% 0.0% 0.0% 0.0%
Short Interest. 3.4% 5.3% 8.7% 2.7% 10.5% 3.7% 3.0% 14.3% 0.8% 6.7% 17.5% 18.9% 13.3%
Revenue 2013-16 CAGR 18.0% 8.8% 6.3% 6.7% 5.4% 12.4% 12.7% 8.7% 12.8% 19.1% 14.2% 25.4% 36.1%
Revenue 2014-17 CAGR 10.7% 8.4% 6.8% 6.3% 6.0% 11.5% 12.0% 8.2% 12.6% 14.5% 13.5% 23.6% 26.5%
High Growth RetailBest-In-Class Franchise

Valuation
Multiple Analysis
August 31, 2015 33
Sources: Company data, Credit Suisse estimates, Thomson Reuters.
28.4x
0.0x
10.0x
20.0x
30.0x
40.0x
PLNT DPZ DNKN CHH SONC PLKI BOJA LOCO SBUX CMG LULU FIVE BOOT
P/E 2016Avg of High Growth Retail: 30.4xAvg of Best-In-Class Franchise: 22.3x
15.8x
0.0x
5.0x
10.0x
15.0x
20.0x
PLNT DPZ DNKN CHH SONC PLKI BOJA LOCO SBUX CMG LULU FIVE BOOT
EV/EBITDA 2016Avg of High Growth Retail: 15.4xAvg of Best-In-Class Franchise: 12.8x

August 31, 2015 34
Valuation Multiple Analysis
Sources: Company data, Credit Suisse estimates, Thomson Reuters.
10.7%
0.0%
10.0%
20.0%
30.0%
PLNT DPZ DNKN CHH SONC PLKI BOJA LOCO SBUX CMG LULU FIVE BOOT
Revenue CAGR 2014-17
Avg of High Growth Retail: 18.1%Avg of Best-In-Class Franchise: 8.4%
16.0%
0.0%
10.0%
20.0%
30.0%
PLNT DPZ DNKN CHH SONC PLKI BOJA LOCO SBUX CMG LULU FIVE BOOT
EBITDA CAGR 2014-17
Avg of High Growth Retail: 18.4%Avg of Best-In-Class Franchise: 10.5%

Valuation
HOLT®
August 31, 2015 35
PLNT stacks up well against other franchise and high growth peers on CFROI® and EBITDA margins. We do not view assets turns as a reliable metric for this business.
Sources: Company data, Credit Suisse estimates, HOLT.

Valuation
HOLT®
August 31, 2015 36
Market expectations seem conservative relative to peers, with the market implying little improvement in CFROI ®.
Sources: Company data, Credit Suisse estimates, HOLT.

Governance
Management and Board of Directors
August 31, 2015 37
Executive Position Years with PLNT
Chris Rondeau Chief Executive Officer and Director 22
Dorvin Lively Chief Financial Officer 2
Richard Moore Chief Administrative Officer and GC 2
Board of Directors Board Member Since Background
Chris Rondeau Recent Current CEO
Marc Grondahl Nov-12 Co-Found, Former CFO
Charles Esserman Nov-12 CEO and Found of TSG
Pierre LeComte Nov-12 MD at TSG; Previously at Bain & Co, Yahoo!, Nabisco, Yard House Restaurants
Michael Layman Mar-15 Principal at TSG; Investment banking at Jefferies and Wachovia
Edward Wong Nov-12 SVP at TSG; Previously at Falconhead Capital, Citigroup
Stephen Spinelli, Jr. Jan-12 President of Philadelphia University; Co-Founded Jiffy Lube
Sources: Company data.

Governance
Management Compensation
August 31, 2015 38
1. Base Salary
2. Cash Incentive Plan: This is calculated as a percentage of base salary. Performance metrics include corporate same-store sales, franchise same-store sales, franchise openings, EBITDA, and capex. Each performance metric has its own threshold, target, and maximum level of payout.
3. Stock-Based Incentive Plan: The Board can distribute Class M units to selected employees. Each employee has different vesting terms and conditions, as laid out in each individual award agreement.
Amounts owned are listed below.
4. Severance Arrangements: Each of the named executives is protected by a severance payment in the event of termination or change in control.
5. Other Compensation: Includes 401(k) company match contributions, health insurance, among others.
Executive Position Annual Base Salary Target Class-M Shares Owned
Chris Rondeau CEO $500,000 100% of base salary 0
Dorvin Lively CFO $450,000 50% of base salary 8,707,562
Richard Moore CAO, GC $300,000 50% of base salary 5,298,577
Sources: Company data.

Financial Roadmap
2015 Estimates:
− We project sales growth of 11.7% to $312.4mn and total comps of 7.1%, driven by
Corporate growth of 14.3% on store comps of 1.1% and unit growth of 5.5%,
Franchise growth of 19.1% on store comps of 7.6%, unit growth of 21.7%, and royalty rate expansion of 28 bps,
Equipment growth of 5.5%.
− Total operating expenses are projected to deleverage 320 bps to 81.1% as the company’s cost of equipment will
increase and the lower sales volume versus 2013 will result in deleverage of corporate store expenses and franchise
support function expenses.
− Overall adjusted EBITDA margins are projected to expand 70 bps to $109.2mn excluding certain
one-time costs associated with the IPO.
− 2015 EPS is estimated to be $0.45, or 14.4% y/y growth, assuming diluted shares of 98.71mn and a pro-forma tax
rate of 40.5%.
August 31, 2015 39
2016 Estimates:
− We project sales growth of 11.0% to $346.7mn and total comps of 5.6%, driven by:
Corporate growth of 6.0% on store comps of 4.3% and unit growth of 1.7%,
Franchise growth of 22.7% on store comps of 5.7%, unit growth of 18.8%, and royalty rate expansion of 27 bps,
Equipment growth of 7.0%.
− Total operating expenses is projected to leverage 880 bps to 72.4%, primarily driven by leverage of corporate store
expenses and franchise support expenses.
− Overall adjusted EBITDA margins are projected to expand 250 bps to $130.1mn excluding certain
one-time costs associated with the IPO.
− 2016 EPS is estimated to be $0.56, or 25.3% y/y growth, assuming diluted shares of 98.71mn and a pro-forma tax
rate of 40.5%.

Survey Methodology
We conducted a survey of 527 respondents. Survey respondents ranged in age from 18-60+, with 28% in
the 18-29 cohort, 32% in the 30-44 cohort, 35% in the 45-59 cohort, and 6% in the 60+ cohort. Genders were even, as was geographic diversity. 43% had household income of $0-49k, 22% had $50-99k, 15% had $100k-199k, and 4% had $200k+, with the balance choosing not to respond. We felt that this makeup reflects the general population.
August 31, 2015 40
Disclosures
August 31, 2015 41
Companies Mentioned (Price as of 28-Aug-2015)
Bojngls (BOJA.OQ, $21.44) Boot Barn Hldg (BOOT.N, $21.13) Chipotle Mexican Grill, Inc. (CMG.N, $721.2) Choice Hotels (CHH.N, $51.05) Dominos Pizza (DPZ.N, $108.41) Dunkin' Brands Group (DNKN.OQ, $51.69) El Pollo Loco (LOCO.OQ, $13.7) Five Below, Inc. (FIVE.OQ, $38.5) Habit (HABT.OQ, $25.96) Jack In The Box, Inc. (JACK.OQ, $81.77) Papa Murphy's (FRSH.OQ, $14.5) Planet Fitness, Inc. (PLNT.N, $16.78, OUTPERFORM[V], TP $19.0) Popeyes (PLKI.OQ, $56.02) Restaurant Brands International (QSR.N, $39.56) Shake Shack (SHAK.N, $50.61) Sonic Corp (SONC.OQ, $27.83) Starbucks (SBUX.OQ, $55.63) Zoe's Kitchen, Inc (ZOES.N, $36.78) lululemon athletica Inc. (LULU.OQ, $63.17)
Disclosure Appendix
Important Global Disclosures
The analysts identified in this report each certify, with respect to the companies or securities that the individual analyzes, that (1) the views expressed in this report accurately reflect his or her personal views about all of the subject companies and securities and (2) no part of his or her compensation was, is or will be directly or indirectly related to the specific recommendations or views expressed in this report.
The analyst(s) responsible for preparing this research report received Compensation that is based upon various factors including Credit Suisse's total revenues, a portion of which are generated by Credit Suisse's investment banking activities
As of December 10, 2012 Analysts’ stock rating are defined as follows:
Outperform (O) : The stock’s total return is expected to outperform the relevant benchmark*over the next 12 months.
Neutral (N) : The stock’s total return is expected to be in line with the relevant benchmark* over the next 12 months.
Underperform (U) : The stock’s total return is expected to underperform the relevant benchmark* over the next 12 months.
*Relevant benchmark by region: As of 10th December 2012, Japanese ratings are based on a stock’s total return relative to the analyst's coverage universe which consists of all companies covered by the analyst within the relevant sector, with Outperforms representing the most attractive, Neutrals the less attra ctive, and Underperforms the least attractive investment opportunities. As of 2nd October 2012, U.S. and Canadian as well as European ratings are based on a stock’s total return relative to the ana lyst's coverage universe which consists of all companies covered by the analyst within the relevant sector, with Outperforms representing the most attractive, Neutrals the less attractive, and Underperforms the least attractive investment opportunities. For Latin American and non-Japan Asia stocks, ratings are based on a stock’s total return relative to the average total return of the relevant country or regional benchmark; prior to 2nd October 2012 U.S. and Canadian ratings were based on (1) a stock’s absolute total return potential to its current share price and (2) the relative attractiveness of a stock’s total return potential within an analyst’s coverage universe. For Australian and New Zealand stocks, the expected total return (ETR) calculation includes 12 -month rolling dividend yield. An Outperform rating is assigned where an ETR is greater than or equal to 7.5%; Underperform where an ETR less than or equal to 5%. A Neutral may be assigned where the ETR is between -5% and 15%. The overlapping rating range allows analysts to assign a rating that puts ETR in the context of associated risks. Prior to 18 May 2015, ET R ranges for Outperform and Underperform ratings did not overlap with Neutral thresholds between 15% and 7.5%, which was in operation from 7 July 2011.
Restricted (R) : In certain circumstances, Credit Suisse policy and/or applicable law and regulations preclude certain types of communications, including an investment recommendation, during the course of Credit Suisse's engagement in an investment banking transaction and in certain other circumstances.
Volatility Indicator [V] : A stock is defined as volatile if the stock price has moved up or down by 20% or more in a month in at least 8 of the past 24 months or the analyst expects significant volatility going forward.
Analysts’ sector weightings are distinct from analysts’ stock ratings and are based on the analyst’s expectations for the fundamentals and/or valuation of the sector* relative to the group’s historic fundamentals and/or valuation:
Overweight : The analyst’s expectation for the sector’s fundamentals and/or valuation is favorable over the next 12 months.
Market Weight : The analyst’s expectation for the sector’s fundamentals and/or valuation is neutral over the next 12 months.
Underweight : The analyst’s expectation for the sector’s fundamentals and/or valuation is cautious over the next 12 months.
*An analyst’s coverage sector consists of all companies covered by the analyst within the relevant sector. An analyst may cover multiple sectors.
Credit Suisse's distribution of stock ratings (and banking clients) is:
Global Ratings Distribution
Rating Versus universe (%) Of which banking clients (%)
Outperform/Buy* 53% (30% banking clients)
Neutral/Hold* 32% (41% banking clients)
Underperform/Sell* 12% (33% banking clients)
Restricted 3%
*For purposes of the NYSE and NASD ratings distribution disclosure requirements, our stock ratings of Outperform, Neutral, an d Underperform most closely correspond to Buy, Hold, and Sell, respectively; however, the meanings are not the same, as our stock ratings are determined on a relative basis. (Please refer to definitions above.) An investor's decision to buy or sell a security should be based on investment objectives, current holdings, and other individual factors.
Credit Suisse’s policy is to update research reports as it deems appropriate, based on developments with the subject company, the sector or the market that may have a material impact on the research views or opinions stated herein.
Credit Suisse's policy is only to publish investment research that is impartial, independent, clear, fair and not misleading. For more detail please refer to Credit Suisse's Policies for Managing Conflicts of Interest in connection with Investment Research: http://www.csfb.com/research-and-analytics/disclaimer/managing_conflicts_disclaimer.html
Credit Suisse does not provide any tax advice. Any statement herein regarding any US federal tax is not intended or written to be used, and cannot be used, by any taxpayer for the purposes of avoiding any penalties.
Price Target: (12 months) for Planet Fitness, Inc. (PLNT.N)
Method: Our $19 target price for PLNT is 34x our 2016 EPS estimate of $0.56 and is based on a peer multiple analysis, which includes other best-in-class franchisors and high-growth retailers, and a long-term EPS scenario.
Risk: Risk to our $19 target price include increasing competition in the fitness industry, potentially high attrition given the company's low cost model, retail cannibalization as the company expands to its 4,000 store target, franchisee reliance, and reliance on a single supplier for equipment.
Please refer to the firm's disclosure website at https://rave.credit-suisse.com/disclosures for the definitions of abbreviations typically used in the target price method and risk sections.
See the Companies Mentioned section for full company names
The subject company (PLNT.N, CMG.N, FIVE.OQ, QSR.N) currently is, or was during the 12-month period preceding the date of distribution of this report, a client of Credit Suisse.
Credit Suisse provided investment banking services to the subject company (PLNT.N, CMG.N, QSR.N) within the past 12 months.
Credit Suisse has managed or co-managed a public offering of securities for the subject company (PLNT.N, QSR.N) within the past 12 months.
Credit Suisse has received investment banking related compensation from the subject company (PLNT.N, CMG.N, QSR.N) within the past 12 months
Credit Suisse expects to receive or intends to seek investment banking related compensation from the subject company (PLNT.N, CHH.N, CMG.N, DNKN.OQ, FIVE.OQ, LULU.OQ, QSR.N, SBUX.OQ) within the next 3 months.
As of the date of this report, Credit Suisse makes a market in the following subject companies (CMG.N, DNKN.OQ, FIVE.OQ, LULU.OQ, SBUX.OQ).
For other important disclosures concerning companies featured in this report, including price charts, please visit the website at https://rave.credit-suisse.com/disclosures or call +1 (877) 291-2683.
Important Regional Disclosures
Singapore recipients should contact Credit Suisse AG, Singapore Branch for any matters arising from this research report.
The analyst(s) involved in the preparation of this report have not visited the material operations of the subject company (PLNT.N, CHH.N, CMG.N, DNKN.OQ, FIVE.OQ, LULU.OQ, QSR.N, SBUX.OQ, ZOES.N) within the past 12 months
Restrictions on certain Canadian securities are indicated by the following abbreviations: NVS--Non-Voting shares; RVS--Restricted Voting Shares; SVS--Subordinate Voting Shares.
Individuals receiving this report from a Canadian investment dealer that is not affiliated with Credit Suisse should be advised that this report may not contain regulatory disclosures the non-affiliated Canadian investment dealer would be required to make if this were its own report.
For Credit Suisse Securities (Canada), Inc.'s policies and procedures regarding the dissemination of equity research, please visit https://www.credit-suisse.com/sites/disclaimers-ib/en/canada-research-policy.html.
Credit Suisse has acted as lead manager or syndicate member in a public offering of securities for the subject company (PLNT.N, FIVE.OQ, QSR.N) within the past 3 years.
As of the date of this report, Credit Suisse acts as a market maker or liquidity provider in the equities securities that are the subject of this report.
Principal is not guaranteed in the case of equities because equity prices are variable.
Commission is the commission rate or the amount agreed with a customer when setting up an account or at any time after that.

Disclosures
August 31, 2015 42
References in this report to Credit Suisse include all of the subsidiaries and affiliates of Credit Suisse operating under its investment banking division. For more information on our structure, please use the following link: https://www.credit-suisse.com/who-we-are This report may contain material that is not directed to, or intended for distribution to or use by, any person or entity who is a citizen or resident of or located in any locality, state, country or other jurisdiction where such distribution, publication, availability or use would be contrary to law or regulation or which would subject Credit Suisse AG or its affiliates ("CS") to any registration or licensing requirement within such jurisdiction. All material presented in this report, unless specifically indicated otherwise, is under copyright to CS. None of the material, nor its content, nor any copy of it, may be altered in any way, transmitted to, copied or distributed to any other party, without the prior express written permission of CS. All trademarks, service marks and logos used in this report are trademarks or service marks or registered trademarks or service marks of CS or its affiliates. The information, tools and material presented in this report are provided to you for information purposes only and are not to be used or considered as an offer or the solicitation of an offer to sell or to buy or subscribe for securities or other financial instruments. CS may not have taken any steps to ensure that the securities referred to in this report are suitable for any particular investor. CS will not treat recipients of this report as its customers by virtue of their receiving this report. The investments and services contained or referred to in this report may not be suitable for you and it is recommended that you consult an independent investment advisor if you are in doubt about such investments or investment services. Nothing in this report constitutes investment, legal, accounting or tax advice, or a representation that any investment or strategy is suitable or appropriate to your individual circumstances, or otherwise constitutes a personal recommendation to you. CS does not advise on the tax consequences of investments and you are advised to contact an independent tax adviser. Please note in particular that the bases and levels of taxation may change. Information and opinions presented in this report have been obtained or derived from sources believed by CS to be reliable, but CS makes no representation as to their accuracy or completeness. CS accepts no liability for loss arising from the use of the material presented in this report, except that this exclusion of liability does not apply to the extent that such liability arises under specific statutes or regulations applicable to CS. This report is not to be relied upon in substitution for the exercise of independent judgment. CS may have issued, and may in the future issue, other communications that are inconsistent with, and reach different conclusions from, the information presented in this report. Those communications reflect the different assumptions, views and analytical methods of the analysts who prepared them and CS is under no obligation to ensure that such other communications are brought to the attention of any recipient of this report. Some investments referred to in this report will be offered solely by a single entity and in the case of some investments solely by CS, or an associate of CS or CS may be the only market maker in such investments. Past performance should not be taken as an indication or guarantee of future performance, and no representation or warranty, express or implied, is made regarding future performance. Information, opinions and estimates contained in this report reflect a judgment at its original date of publication by CS and are subject to change without notice. The price, value of and income from any of the securities or financial instruments mentioned in this report can fall as well as rise. The value of securities and financial instruments is subject to exchange rate fluctuation that may have a positive or adverse effect on the price or income of such securities or financial instruments. Investors in securities such as ADR's, the values of which are influenced by currency volatility, effectively assume this risk. Structured securities are complex instruments, typically involve a high degree of risk and are intended for sale only to sophisticated investors who are capable of understanding and assuming the risks involved. The market value of any structured security may be affected by changes in economic, financial and political factors (including, but not limited to, spot and forward interest and exchange rates), time to maturity, market conditions and volatility, and the credit quality of any issuer or reference issuer. Any investor interested in purchasing a structured product should conduct their own investigation and analysis of the product and consult with their own professional advisers as to the risks involved in making such a purchase. Some investments discussed in this report may have a high level of volatility. High volatility investments may experience sudden and large falls in their value causing losses when that investment is realised. Those losses may equal your original investment. Indeed, in the case of some investments the potential losses may exceed the amount of initial investment and, in such circumstances, you may be required to pay more money to support those losses. Income yields from investments may fluctuate and, in consequence, initial capital paid to make the investment may be used as part of that income yield. Some investments may not be readily realisable and it may be difficult to sell or realise those investments, similarly it may prove difficult for you to obtain reliable information about the value, or risks, to which such an investment is exposed. This report may provide the addresses of, or contain hyperlinks to, websites. Except to the extent to which the report refers to website material of CS, CS has not reviewed any such site and takes no responsibility for the content contained therein. Such address or hyperlink (including addresses or hyperlinks to CS's own website material) is provided solely for your convenience and information and the content of any such website does not in any way form part of this document. Accessing such website or following such link through this report or CS's website shall be at your own risk. This report is issued and distributed in Europe (except Switzerland) by Credit Suisse Securities (Europe) Limited, One Cabot Square, London E14 4QJ, England, which is authorised by the Prudential Regulation Authority and regulated by the Financial Conduct Authority and the Prudential Regulation Authority. This report is being distributed in Germany by Credit Suisse Securities (Europe) Limited Niederlassung Frankfurt am Main regulated by the Bundesanstalt fuer Finanzdienstleistungsaufsicht ("BaFin"). This report is being distributed in the United States and Canada by Credit Suisse Securities (USA) LLC; in Switzerland by Credit Suisse AG; in Brazil by Banco de Investimentos Credit Suisse (Brasil) S.A or its affiliates; in Mexico by Banco Credit Suisse (México), S.A. (transactions related to the securities mentioned in this report will only be effected in compliance with applicable regulation); in Japan by Credit Suisse Securities (Japan) Limited, Financial Instruments Firm, Director-General of Kanto Local Finance Bureau (Kinsho) No. 66, a member of Japan Securities Dealers Association, The Financial Futures Association of Japan, Japan Investment Advisers Association, Type II Financial Instruments Firms Association; elsewhere in Asia/ Pacific by whichever of the following is the appropriately authorised entity in the relevant jurisdiction: Credit Suisse (Hong Kong) Limited, Credit Suisse Equities (Australia) Limited, Credit Suisse Securities (Thailand) Limited, regulated by the Office of the Securities and Exchange Commission, Thailand, having registered address at 990 Abdulrahim Place, 27th Floor, Unit 2701, Rama IV Road, Silom, Bangrak, Bangkok 10500, Thailand, Tel. +66 2614 6000, Credit Suisse Securities (Malaysia) Sdn Bhd, Credit Suisse AG, Singapore Branch, Credit Suisse Securities (India) Private Limited (CIN no. U67120MH1996PTC104392) regulated by the Securities and Exchange Board of India as Research Analyst (registration no. INH 000001030) and as Stock Broker (registration no. INB230970637; INF230970637; INB010970631; INF010970631), having registered address at 9th Floor, Ceejay House, Dr.A.B. Road, Worli, Mumbai - 18, India, T- +91-22 6777 3777, Credit Suisse Securities (Europe) Limited, Seoul Branch, Credit Suisse AG, Taipei Securities Branch, PT Credit Suisse Securities Indonesia, Credit Suisse Securities (Philippines ) Inc., and elsewhere in the world by the relevant authorised affiliate of the above. Research on Taiwanese securities produced by Credit Suisse AG, Taipei Securities Branch has been prepared by a registered Senior Business Person. Research provided to residents of Malaysia is authorised by the Head of Research for Credit Suisse Securities (Malaysia) Sdn Bhd, to whom they should direct any queries on +603 2723 2020. This report has been prepared and issued for distribution in Singapore to institutional investors, accredited investors and expert investors (each as defined under the Financial Advisers Regulations) only, and is also distributed by Credit Suisse AG, Singapore branch to overseas investors (as defined under the Financial Advisers Regulations). By virtue of your status as an institutional investor, accredited investor, expert investor or overseas investor, Credit Suisse AG, Singapore branch is exempted from complying with certain compliance requirements under the Financial Advisers Act, Chapter 110 of Singapore (the "FAA"), the Financial Advisers Regulations and the relevant Notices and Guidelines issued thereunder, in respect of any financial advisory service which Credit Suisse AG, Singapore branch may provide to you. This information is being distributed by Credit Suisse AG, Dubai Branch, duly licensed and regulated by the Dubai Financial Services Authority (DFSA), and is directed at Professional Clients or Market Counterparties only, as defined by the DFSA. The financial products or financial services to which the information relates will only be made available to a client who meets the regulatory criteria to be a Professional Client or Market Counterparty only, as defined by the DFSA, and is not intended for any other person. This research may not conform to Canadian disclosure requirements. In jurisdictions where CS is not already registered or licensed to trade in securities, transactions will only be effected in accordance with applicable securities legislation, which will vary from jurisdiction to jurisdiction and may require that the trade be made in accordance with applicable exemptions from registration or licensing requirements. Non-U.S. customers wishing to effect a transaction should contact a CS entity in their local jurisdiction unless governing law permits otherwise. U.S. customers wishing to effect a transaction should do so only by contacting a representative at Credit Suisse Securities (USA) LLC in the U.S. Please note that this research was originally prepared and issued by CS for distribution to their market professional and institutional investor customers. Recipients who are not market professional or institutional investor customers of CS should seek the advice of their independent financial advisor prior to taking any investment decision based on this report or for any necessary explanation of its contents. This research may relate to investments or services of a person outside of the UK or to other matters which are not authorised by the Prudential Regulation Authority and regulated by the Financial Conduct Authority and the Prudential Regulation Authority or in respect of which the protections of the Prudential Regulation Authority and Financial Conduct Authority for private customers and/or the UK compensation scheme may not be available, and further details as to where this may be the case are available upon request in respect of this report. CS may provide various services to US municipal entities or obligated persons ("municipalities"), including suggesting individual transactions or trades and entering into such transactions. Any services CS provides to municipalities are not viewed as "advice" within the meaning of Section 975 of the Dodd-Frank Wall Street Reform and Consumer Protection Act. CS is providing any such services and related information solely on an arm's length basis and not as an advisor or fiduciary to the municipality. In connection with the provision of the any such services, there is no agreement, direct or indirect, between any municipality (including the officials, management, employees or agents thereof) and CS for CS to provide advice to the municipality. Municipalities should consult with their financial, accounting and legal advisors regarding any such services provided by CS. In addition, CS is not acting for direct or indirect compensation to solicit the municipality on behalf of an unaffiliated broker, dealer, municipal securities dealer, municipal advisor, or investment adviser for the purpose of obtaining or retaining an engagement by the municipality for or in connection with Municipal Financial Products, the issuance of municipal securities, or of an investment adviser to provide investment advisory services to or on behalf of the municipality. If this report is being distributed by a financial institution other than Credit Suisse AG, or its affiliates, that financial institution is solely responsible for distribution. Clients of that institution should contact that institution to effect a transaction in the securities mentioned in this report or require further information. This report does not constitute investment advice by Credit Suisse to the clients of the distributing financial institution, and neither Credit Suisse AG, its affiliates, and their respective officers, directors and employees accept any liability whatsoever for any direct or consequential loss arising from their use of this report or its content. Principal is not guaranteed. Commission is the commission rate or the amount agreed with a customer when setting up an account or at any time after that.
Copyright © 2015 CREDIT SUISSE AG and/or its affiliates. All rights reserved.
Investment principal on bonds can be eroded depending on sale price or market price. In addition, there are bonds on which investment principal can be eroded due to changes in redemption amounts. Care is required when investing in such instruments.
When you purchase non-listed Japanese fixed income securities (Japanese government bonds, Japanese municipal bonds, Japanese government
guaranteed bonds, Japanese corporate bonds) from CS as a seller, you will be requested to pay the purchase price only.