Emerging Markets Quarterly - Credit Suisse | PLUS
242
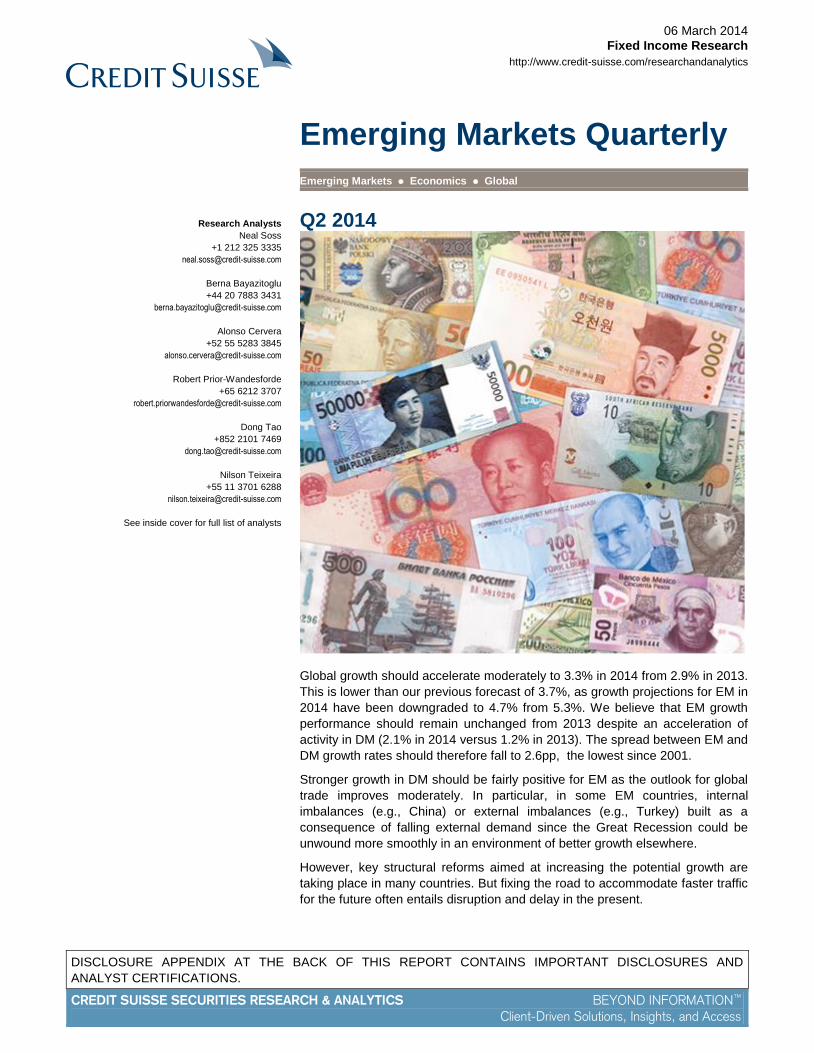
DISCLOSURE APPENDIX AT THE BACK OF THIS REPORT CONTAINS IMPORTANT DISCLOSURES AND ANALYST CERTIFICATIONS. CREDIT SUISSE SECURITIES RESEARCH & ANALYTICS BEYOND INFORMATION ™ Client-Driven Solutions, Insights, and Access Emerging Markets Quarterly Emerging Markets Economics Global Q2 2014 [Picture] Global growth should accelerate moderately to 3.3% in 2014 from 2.9% in 2013. This is lower than our previous forecast of 3.7%, as growth projections for EM in 2014 have been downgraded to 4.7% from 5.3%. We believe that EM growth performance should remain unchanged from 2013 despite an acceleration of activity in DM (2.1% in 2014 versus 1.2% in 2013). The spread between EM and DM growth rates should therefore fall to 2.6pp, the lowest since 2001. Stronger growth in DM should be fairly positive for EM as the outlook for global trade improves moderately. In particular, in some EM countries, internal imbalances (e.g., China) or external imbalances (e.g., Turkey) built as a consequence of falling external demand since the Great Recession could be unwound more smoothly in an environment of better growth elsewhere. However, key structural reforms aimed at increasing the potential growth are taking place in many countries. But fixing the road to accommodate faster traffic for the future often entails disruption and delay in the present. 06 March 2014 Fixed Income Research http://www.credit-suisse.com/researchandanalytics Research Analysts Neal Soss +1 212 325 3335 [email protected] Berna Bayazitoglu +44 20 7883 3431 [email protected] Alonso Cervera +52 55 5283 3845 [email protected] Robert Prior-Wandesforde +65 6212 3707 [email protected] Dong Tao +852 2101 7469 [email protected] Nilson Teixeira +55 11 3701 6288 [email protected] See inside cover for full list of analysts
-
Upload
khangminh22 -
Category
Documents
-
view
0 -
download
0
Transcript of Emerging Markets Quarterly - Credit Suisse | PLUS
DISCLOSURE APPENDIX AT THE BACK OF THIS REPORT CONTAINS IMPORTANT DISCLOSURES AND
ANALYST CERTIFICATIONS.
CREDIT SUISSE SECURITIES RESEARCH & ANALYTICS BEYOND INFORMATION™
Client-Driven Solutions, Insights, and Access
Emerging Markets Quarterly Emerging Markets Economics Global
Q2 2014 [Picture]
Global growth should accelerate moderately to 3.3% in 2014 from 2.9% in 2013.
This is lower than our previous forecast of 3.7%, as growth projections for EM in
2014 have been downgraded to 4.7% from 5.3%. We believe that EM growth
performance should remain unchanged from 2013 despite an acceleration of
activity in DM (2.1% in 2014 versus 1.2% in 2013). The spread between EM and
DM growth rates should therefore fall to 2.6pp, the lowest since 2001.
Stronger growth in DM should be fairly positive for EM as the outlook for global
trade improves moderately. In particular, in some EM countries, internal
imbalances (e.g., China) or external imbalances (e.g., Turkey) built as a
consequence of falling external demand since the Great Recession could be
unwound more smoothly in an environment of better growth elsewhere.
However, key structural reforms aimed at increasing the potential growth are
taking place in many countries. But fixing the road to accommodate faster traffic
for the future often entails disruption and delay in the present.
06 March 2014
Fixed Income Research
http://www.credit-suisse.com/researchandanalytics
Research Analysts
Neal Soss
+1 212 325 3335
Berna Bayazitoglu
+44 20 7883 3431
Alonso Cervera
+52 55 5283 3845
Robert Prior-Wandesforde
+65 6212 3707
Dong Tao
+852 2101 7469
Nilson Teixeira
+55 11 3701 6288
See inside cover for full list of analysts

06 March 2014
Emerging Markets Quarterly 2
06 March 2014
Emerging Markets Quarterly 3
Table of Contents
Global Economy: Speeding up to average 5
IP growth momentum slows further in EM as it strengthens notably in DM 14
Core inflation on the rise in EEMEA and Latin America 21
Latin America 47
Latin America: Growing pains 47
Argentina: Bandaged, but not cured 51
Brazil: Some fiscal austerity might mitigate the risks of a downgrade 56
Chile: The slowdown is not over yet 61
Colombia: Timing the next hiking cycle 65
Mexico: A transition year 70
Peru: Marginal improvement thanks to mining 75
Venezuela: The heat is on 79
Europe, Middle East and Africa 85
Emerging Europe, Middle East and Africa: Diverging growth outlook 86
Czech Republic: A strong rebound 90
Hungary: Taking it easy in election year 95
Israel: Still in easing mode 100
Poland: A more balanced growth outlook 105
Russia: Ukraine tensions prompt monetary policy action 110
South Africa: Adjusting policies as pressure mounts 115
Turkey: No end in sight for the turf war 120
Ukraine: A chance for comprehensive policy adjustment 126

06 March 2014
Emerging Markets Quarterly 4
Non-Japan Asia 131
Non-Japan Asia: Our high conviction calls 132
China: Embracing higher risks 134
Hong Kong: Looming long-term fiscal challenge 139
India: Inflation fighting, dismal growth & election issues 142
Indonesia: Re-balancing before rate cutting 146
Korea: Entering a soft patch 149
Malaysia: Changing the growth mix 154
Philippines: Against the consensus 158
Singapore: The consequences of stronger growth? 161
Taiwan: Developed markets' demand holds the key 164
Thailand: Political mess, economic stress 169
Long-term sovereign FX debt ratings 173
Key websites 175
Previous publications 181
Key dates 186
Gross financing needs for 2014 192
Balance of payments financing needs 193
Government funding needs 206
Quarterly and annual forecasts 216
Summary macroeconomic data for developed countries 217
Summary macroeconomic data for emerging countries 222
We would like to acknowledge the contribution made by Pawel Chmielniak, an employee of
CRISIL Global Research and Analytics, a business division of CRISIL Limited, a third-party
provider of research services to Credit Suisse, in compiling the information and data tables
presented at the end of this report.
06 March 2014
Emerging Markets Quarterly 5
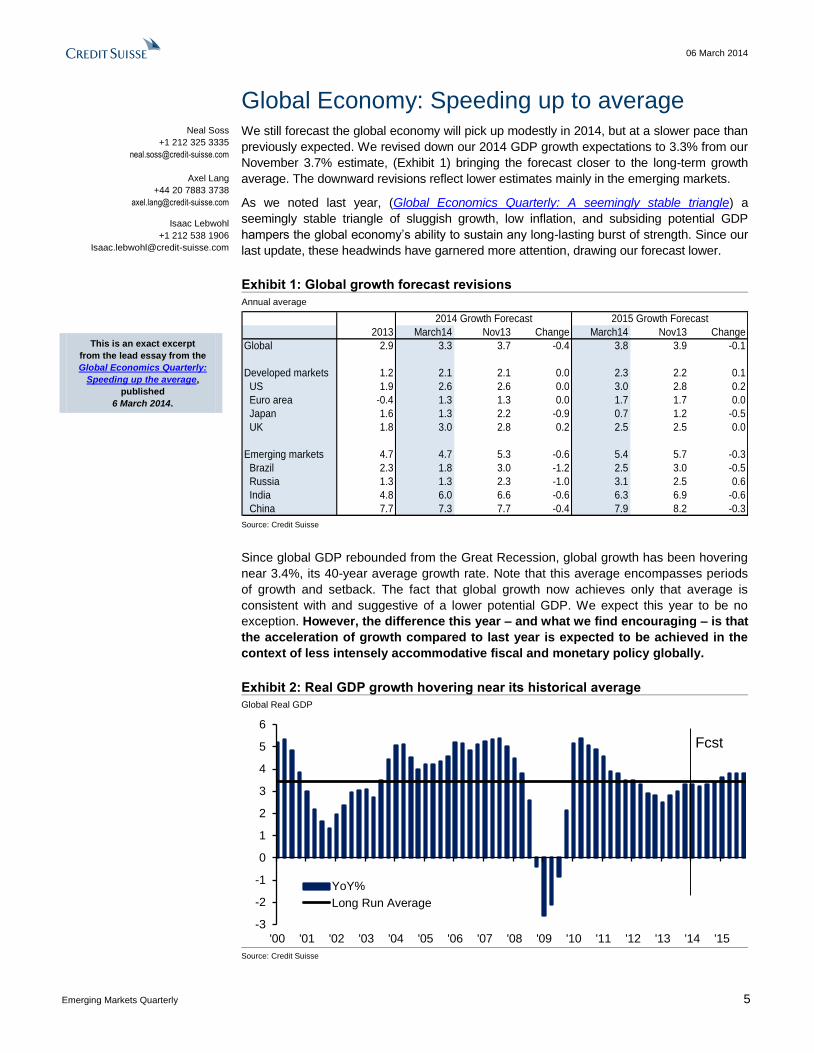
Global Economy: Speeding up to average We still forecast the global economy will pick up modestly in 2014, but at a slower pace than
previously expected. We revised down our 2014 GDP growth expectations to 3.3% from our
November 3.7% estimate, (Exhibit 1) bringing the forecast closer to the long-term growth
average. The downward revisions reflect lower estimates mainly in the emerging markets.
As we noted last year, (Global Economics Quarterly: A seemingly stable triangle) a
seemingly stable triangle of sluggish growth, low inflation, and subsiding potential GDP
hampers the global economy’s ability to sustain any long-lasting burst of strength. Since our
last update, these headwinds have garnered more attention, drawing our forecast lower.
Exhibit 1: Global growth forecast revisions
Annual average
2013 March14 Nov13 Change March14 Nov13 Change
Global 2.9 3.3 3.7 -0.4 3.8 3.9 -0.1
Developed markets 1.2 2.1 2.1 0.0 2.3 2.2 0.1
US 1.9 2.6 2.6 0.0 3.0 2.8 0.2
Euro area -0.4 1.3 1.3 0.0 1.7 1.7 0.0
Japan 1.6 1.3 2.2 -0.9 0.7 1.2 -0.5
UK 1.8 3.0 2.8 0.2 2.5 2.5 0.0
Emerging markets 4.7 4.7 5.3 -0.6 5.4 5.7 -0.3
Brazil 2.3 1.8 3.0 -1.2 2.5 3.0 -0.5
Russia 1.3 1.3 2.3 -1.0 3.1 2.5 0.6
India 4.8 6.0 6.6 -0.6 6.3 6.9 -0.6
China 7.7 7.3 7.7 -0.4 7.9 8.2 -0.3
2015 Growth Forecast2014 Growth Forecast
Source: Credit Suisse
Since global GDP rebounded from the Great Recession, global growth has been hovering
near 3.4%, its 40-year average growth rate. Note that this average encompasses periods
of growth and setback. The fact that global growth now achieves only that average is
consistent with and suggestive of a lower potential GDP. We expect this year to be no
exception. However, the difference this year – and what we find encouraging – is that
the acceleration of growth compared to last year is expected to be achieved in the
context of less intensely accommodative fiscal and monetary policy globally.
Neal Soss
+1 212 325 3335
Axel Lang
+44 20 7883 3738
Isaac Lebwohl
+1 212 538 1906
This is an exact excerpt
from the lead essay from the
Global Economics Quarterly:
Speeding up the average,
published
6 March 2014.
Exhibit 2: Real GDP growth hovering near its historical average
Global Real GDP
-3
-2
-1
0
1
2
3
4
5
6
'00 '01 '02 '03 '04 '05 '06 '07 '08 '09 '10 '11 '12 '13 '14 '15
YoY%
Long Run Average
Fcst
Source: Credit Suisse
06 March 2014
Emerging Markets Quarterly 6
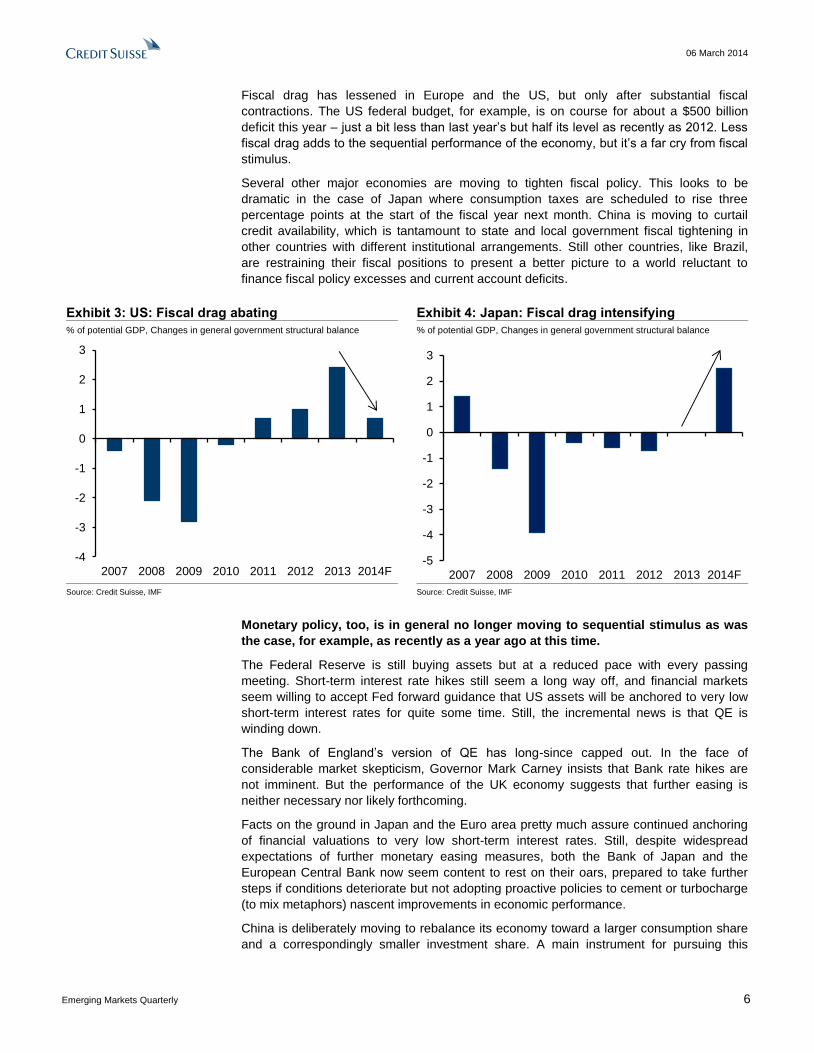
Fiscal drag has lessened in Europe and the US, but only after substantial fiscal
contractions. The US federal budget, for example, is on course for about a $500 billion
deficit this year – just a bit less than last year’s but half its level as recently as 2012. Less
fiscal drag adds to the sequential performance of the economy, but it’s a far cry from fiscal
stimulus.
Several other major economies are moving to tighten fiscal policy. This looks to be
dramatic in the case of Japan where consumption taxes are scheduled to rise three
percentage points at the start of the fiscal year next month. China is moving to curtail
credit availability, which is tantamount to state and local government fiscal tightening in
other countries with different institutional arrangements. Still other countries, like Brazil,
are restraining their fiscal positions to present a better picture to a world reluctant to
finance fiscal policy excesses and current account deficits.
Exhibit 3: US: Fiscal drag abating Exhibit 4: Japan: Fiscal drag intensifying
% of potential GDP, Changes in general government structural balance % of potential GDP, Changes in general government structural balance
-4
-3
-2
-1
0
1
2
3
2007 2008 2009 2010 2011 2012 2013 2014F
-5
-4
-3
-2
-1
0
1
2
3
2007 2008 2009 2010 2011 2012 2013 2014F Source: Credit Suisse, IMF Source: Credit Suisse, IMF
Monetary policy, too, is in general no longer moving to sequential stimulus as was
the case, for example, as recently as a year ago at this time.
The Federal Reserve is still buying assets but at a reduced pace with every passing
meeting. Short-term interest rate hikes still seem a long way off, and financial markets
seem willing to accept Fed forward guidance that US assets will be anchored to very low
short-term interest rates for quite some time. Still, the incremental news is that QE is
winding down.
The Bank of England’s version of QE has long-since capped out. In the face of
considerable market skepticism, Governor Mark Carney insists that Bank rate hikes are
not imminent. But the performance of the UK economy suggests that further easing is
neither necessary nor likely forthcoming.
Facts on the ground in Japan and the Euro area pretty much assure continued anchoring
of financial valuations to very low short-term interest rates. Still, despite widespread
expectations of further monetary easing measures, both the Bank of Japan and the
European Central Bank now seem content to rest on their oars, prepared to take further
steps if conditions deteriorate but not adopting proactive policies to cement or turbocharge
(to mix metaphors) nascent improvements in economic performance.
China is deliberately moving to rebalance its economy toward a larger consumption share
and a correspondingly smaller investment share. A main instrument for pursuing this

06 March 2014
Emerging Markets Quarterly 7
rebalancing is deregulation of the financial sector, which manifests itself in periodic spikes
in short-term interbank interest rates, episodic depreciations of the foreign exchange value
of its currency, and the seeking out of SETF (Small Enough To Fail) links in the financial
system. Among the hoped-for benefits are more efficient allocation of capital, reduced
corruption, and heightened sensitivity to environmental pollution concerns. However real
these long-term benefits turn out to be, the short-term effect is less policy stimulus to the
Chinese economy now.
Remarkably, with no new cyclical policy stimulus being applied, the global economy
seems to be stubbornly and grudgingly improving.
However, our expectations for close-to-average growth should not be confused with
growing at trend. Remember that average growth encompasses periods of expansion and
recession. Growth in periods of expansion should be higher than average growth, which
we are evidently not achieving.
Growth needs “escape velocity” to provide the necessary dynamism to promote a healthy
global economy. The fear is that such a continuous average state of global growth will
cause the world’s economic muscles to atrophy, embodied as lower potential GDP.
Exhibit 5: A declining trend: DM growth Exhibit 6: A declining trend: EM growth
YoY%, Ten-year moving average YoY%, Ten-year moving average
1.0
1.2
1.4
1.6
1.8
2.0
2.2
2.4
2.6
2.8
00 01 02 03 04 05 06 07 08 09 10 11 12 13 14 15
Fcst.
4.0
4.5
5.0
5.5
6.0
6.5
7.0
00 01 02 03 04 05 06 07 08 09 10 11 12 13 14 15
Fcst.
Source: Credit Suisse, Markit, Thomson Reuters Datastream, Haver Analytics® Source: Credit Suisse, Markit, Thomson Reuters Datastream, Haver Analytics®
We believe the Communique of the recent G-20 meeting in Sydney, Australia reflects the
recognition of a structurally impaired global economy (see: The CS Macro Playbook:
Growth: on the agenda, but off the menu). Without quite using the words, the most senior
economic policy-makers from the biggest countries in the world pledged themselves to
raising the potential growth rate of the global economy.
The specifics appear in point 3 of the Communique:
We will develop ambitious but realistic policies with the aim to lift our collective GDP by more than 2 percent above the trajectory implied by current policies over the coming 5 years.
In the nature of a G-20 Communique, there are very few specifics, but the laundry list
topics read like the textbook description of growth accounting. Growth comes from people
presenting themselves for work, getting jobs, being equipped with productivity-enhancing
capital, in an institutional context that promotes economic activity. To quote from the
Communique again, point 3 continues.

06 March 2014
Emerging Markets Quarterly 8
To achieve this we will take concrete actions across the G-20, including to increase investment, lift employment and participation, enhance trade and promote competition, in addition to macroeconomic policies.
And, point 7 elaborates:
We are committed to creating a climate that facilitates higher investment, particularly in infrastructure and small and medium enterprises. This is crucial for the global economy’s transition to stronger growth in the short and medium term. We will undertake reforms to remove constraints to private investment by establishing sound and predictable policy and regulatory frameworks and emphasising the role of market incentives and disciplines. These, along with other actions to promote long-term private sector investment, maximise the impact of public sector capital expenditure, and enhance the catalytic role of multilateral development banks will be an important part of our growth strategies and the Brisbane Action Plan.
We would not expect early implementation of specific policies to further the G-20
goal. We would, however, point to the G-20 emphasis. Labor force participation has
been sliding in many countries. Some of this reflects the demographics of aging
populations, and some reflects slack aggregate demand. Business fixed investment has
been poor in nearly all developed economies, and public infrastructure investment has
been weak in a few places.
Exhibit 7: US investment ratio Exhibit 8: Japan investment ratio
% of GDP % of GDP
13
14
15
16
17
18
19
20
50 55 60 65 70 75 80 85 90 95 00 05 10
20
22
24
26
28
30
32
80 82 84 86 88 90 92 94 96 98 00 02 04 06 08 10 12 14 Source: Credit Suisse, Thomson Reuters Datastream Source: Credit Suisse, Thomson Reuters Datastream
Inasmuch as most of the world is allergic to explicit fiscal stimulus and the public sector
balance sheet leverage it implies, the burden of macroeconomic policy to spur greater
potential GDP falls on central banks. Although most central banks are refraining from
offering more stimulus, they still proclaim their eagerness to maintain accommodative
monetary stances. The G-20 puts a global umbrella over policies most central banks might
wish to follow for domestic reasons anyway.
However, the ability of central banks to raise potential GDP is uncertain. In a recent
speech by Yves Mersch, member of the executive board of the ECB, monetary policy is
presented as a means of preventing a decay of potential GDP. But the question that
remains is for how long central banks can provide this cushion. According to Mersch, “If
there is no prospect of higher growth in the future, we could fall victim to self-fulfilling
negative expectations”.

06 March 2014
Emerging Markets Quarterly 9
Exhibit 9: Euro area investment ratio Exhibit 10: Euro area participation rate
% of GDP % of working age population
17
18
19
20
21
22
95 97 99 01 03 05 07 09 11 13
54.5
55.0
55.5
56.0
56.5
57.0
57.5
00 01 02 03 04 05 06 07 08 09 10 11 12 13 Source: Credit Suisse, Thomson Reuters Datastream Source: Credit Suisse, Eurostat
Immediate cyclical risks in the global economy appear to have diminished; the
structural risks of slower potential GDP thus come into sharper focus. The
challenges of the future will be much easier to manage with more GDP and much
harder to manage with less. These are medium-and long-term considerations. We would
not necessarily expect to see any near-term specific policy actions.
DM is needed for the heavy lifting. Our expectation for the global economy to achieve close
to average growth in 2014 (3.3%) is supported by a rebound in developed markets. Specifically,
real GDP growth in the developed markets should almost double to 2.1% in 2014 from the
estimated 1.2% in 2013. At the same time, we revised down our emerging market GDP growth
forecast to 4.7% from 5.3%. We therefore expect EM to grow at the same speed as in 2013.
As a result, the spread between EM and DM growth rates is expected to narrow to 2.6pp in
2014, the smallest since 2001 (Exhibit 12). Excluding Chinese growth, the spread between EM
and DM growth follows a similar pattern, suggesting that the slowdown in EM is broad-based
and is not just a China story.
Exhibit 11: Global growth outlook Exhibit 12: Growth gap between EM and DM
YoY% Ppt.
2.6
3.6
4.8 4.55.0 5.2
2.4
-0.8
5.2
3.93.1 2.9 3.3 3.8
1.42.0
3.12.6 2.8
2.4
-0.1
-3.7
2.6
1.5 1.4 1.2
2.1 2.3
4.5
6.1
7.5 7.3
8.38.8
5.5
2.7
8.2
6.4
4.9 4.7 4.75.4
-6
-4
-2
0
2
4
6
8
10
02 04 06 08 10 12 14E
Global
Developed markets
Emerging markets
0
1
2
3
4
5
6
7
00 02 04 06 08 10 12 14E
EM - DM
EM ex. China - DM
Source: Credit Suisse Source: Credit Suisse
06 March 2014
Emerging Markets Quarterly 10
Exhibit 13: Global PMI and real GDP growth Exhibit 14: Global inflation
CS forecasts y/y%, CS forecasts
-3.5
-2.5
-1.5
-0.5
0.5
1.5
2.5
3.5
4.5
5.5
6.5
25
30
35
40
45
50
55
60
65
1998 2002 2006 2010 2014
Global manufacturingPMI: new orders
Real global GDP growth2q lag (y/y%, rhs)
Fcst
0
1
2
3
4
5
6
7
1998 2002 2006 2010 2014
Fcst
Source: Credit Suisse, Markit, Thomson Reuters Datastream, Haver Analytics® Source: Credit Suisse , Thomson Reuters Datastream, Haver Analytics®
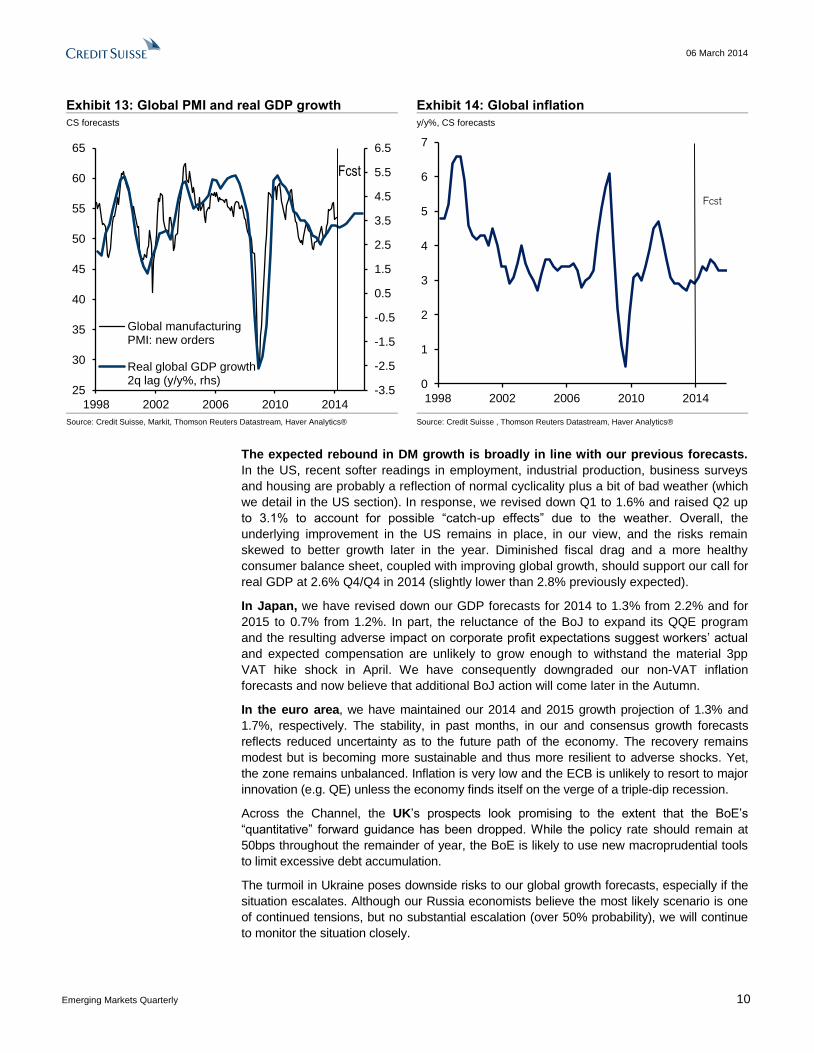
The expected rebound in DM growth is broadly in line with our previous forecasts.
In the US, recent softer readings in employment, industrial production, business surveys
and housing are probably a reflection of normal cyclicality plus a bit of bad weather (which
we detail in the US section). In response, we revised down Q1 to 1.6% and raised Q2 up
to 3.1% to account for possible “catch-up effects” due to the weather. Overall, the
underlying improvement in the US remains in place, in our view, and the risks remain
skewed to better growth later in the year. Diminished fiscal drag and a more healthy
consumer balance sheet, coupled with improving global growth, should support our call for
real GDP at 2.6% Q4/Q4 in 2014 (slightly lower than 2.8% previously expected).
In Japan, we have revised down our GDP forecasts for 2014 to 1.3% from 2.2% and for
2015 to 0.7% from 1.2%. In part, the reluctance of the BoJ to expand its QQE program
and the resulting adverse impact on corporate profit expectations suggest workers’ actual
and expected compensation are unlikely to grow enough to withstand the material 3pp
VAT hike shock in April. We have consequently downgraded our non-VAT inflation
forecasts and now believe that additional BoJ action will come later in the Autumn.
In the euro area, we have maintained our 2014 and 2015 growth projection of 1.3% and
1.7%, respectively. The stability, in past months, in our and consensus growth forecasts
reflects reduced uncertainty as to the future path of the economy. The recovery remains
modest but is becoming more sustainable and thus more resilient to adverse shocks. Yet,
the zone remains unbalanced. Inflation is very low and the ECB is unlikely to resort to major
innovation (e.g. QE) unless the economy finds itself on the verge of a triple-dip recession.
Across the Channel, the UK’s prospects look promising to the extent that the BoE’s
“quantitative” forward guidance has been dropped. While the policy rate should remain at
50bps throughout the remainder of year, the BoE is likely to use new macroprudential tools
to limit excessive debt accumulation.
The turmoil in Ukraine poses downside risks to our global growth forecasts, especially if the
situation escalates. Although our Russia economists believe the most likely scenario is one
of continued tensions, but no substantial escalation (over 50% probability), we will continue
to monitor the situation closely.
06 March 2014
Emerging Markets Quarterly 11
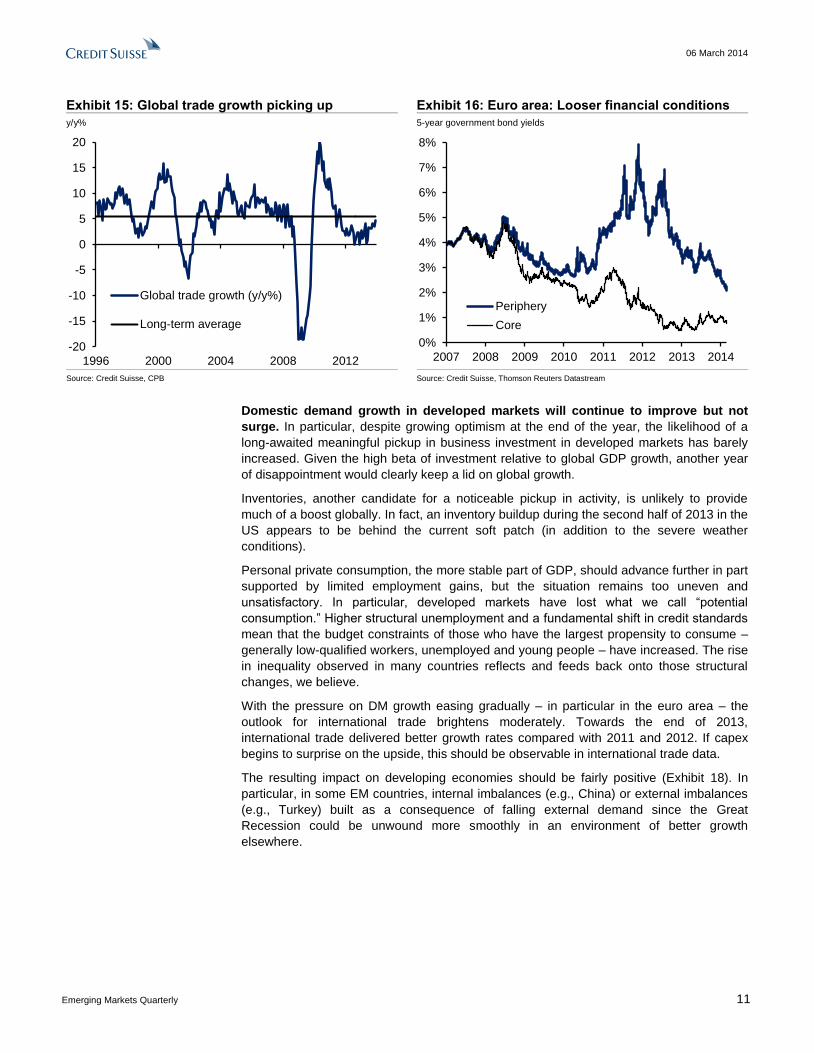
Exhibit 15: Global trade growth picking up Exhibit 16: Euro area: Looser financial conditions
y/y% 5-year government bond yields
-20
-15
-10
-5
0
5
10
15
20
1996 2000 2004 2008 2012
Global trade growth (y/y%)
Long-term average
0%
1%
2%
3%
4%
5%
6%
7%
8%
2007 2008 2009 2010 2011 2012 2013 2014
Periphery
Core
Source: Credit Suisse, CPB Source: Credit Suisse, Thomson Reuters Datastream
Domestic demand growth in developed markets will continue to improve but not
surge. In particular, despite growing optimism at the end of the year, the likelihood of a
long-awaited meaningful pickup in business investment in developed markets has barely
increased. Given the high beta of investment relative to global GDP growth, another year
of disappointment would clearly keep a lid on global growth.
Inventories, another candidate for a noticeable pickup in activity, is unlikely to provide
much of a boost globally. In fact, an inventory buildup during the second half of 2013 in the
US appears to be behind the current soft patch (in addition to the severe weather
conditions).
Personal private consumption, the more stable part of GDP, should advance further in part
supported by limited employment gains, but the situation remains too uneven and
unsatisfactory. In particular, developed markets have lost what we call “potential
consumption.” Higher structural unemployment and a fundamental shift in credit standards
mean that the budget constraints of those who have the largest propensity to consume –
generally low-qualified workers, unemployed and young people – have increased. The rise
in inequality observed in many countries reflects and feeds back onto those structural
changes, we believe.
With the pressure on DM growth easing gradually – in particular in the euro area – the
outlook for international trade brightens moderately. Towards the end of 2013,
international trade delivered better growth rates compared with 2011 and 2012. If capex
begins to surprise on the upside, this should be observable in international trade data.
The resulting impact on developing economies should be fairly positive (Exhibit 18). In
particular, in some EM countries, internal imbalances (e.g., China) or external imbalances
(e.g., Turkey) built as a consequence of falling external demand since the Great
Recession could be unwound more smoothly in an environment of better growth
elsewhere.

06 March 2014
Emerging Markets Quarterly 12
Exhibit 17: G3: Real domestic demand Exhibit 18: G3 demand vs. EM exports
4Q 2007=100 YoY%
94
96
98
100
102
104
4Q07 3Q08 2Q09 1Q10 4Q10 3Q11 2Q12 1Q13 4Q13
US
Japan
Euro area
-15
-10
-5
0
5
10
15
20
-5
-4
-3
-2
-1
0
1
2
3
4
5
'00 '02 '04 '06 '08 '10 '12 '14
G3 real demandgrowth (y/y%)
EM ex. China realexports, rhs
Fcst.
Source: Credit Suisse, Thomson Reuters DataStream, Haver Analytics® Source: Credit Suisse, Thomson Reuters DataStream, Haver Analytics®
In China, while the economy performed admirably well in the past, the government’s wide
array of reforms aims at transforming a growth model that is running out of steam (e.g.,
over-investment in production capacities made for a world growing at a faster pace, rising
debt accumulation by the private and public sectors or increasing pollution-related issues
to name a few). To put the economy on a more sustainable footing, the government
intends to further liberalize the economy and incentivize households consumption. In the
medium term, it’s possible that the loss of “potential consumption” mentioned above could
be recouped in China and other EM countries more generally (Exhibit 19).
But that’s not an immediate story. Instead, China’s growth rate is currently decelerating.
Risks of a more significant slowdown have increased, but the authorities may only
intervene in a measured way, favoring a continuation of the rebalancing of the economy.
Exhibit 19: Share of world consumption Exhibit 20: India’s stagflation needs to be addressed
% YoY%
20%
30%
40%
50%
60%
70%
80%
98 00 02 04 06 08 10 12 14E
DM
EM
2
4
6
8
10
12
14
06 07 08 09 10 11 12 13
Real GDP growth
Headline CPI inflation
Source: Credit Suisse, © 2014 Thomson Reuters Limited, Haver Analytics® Source: Credit Suisse, Haver Analytics®
06 March 2014
Emerging Markets Quarterly 13
India is another country where the central bank is willing to introduce key changes to its
operating framework. There, the central bank desires to switch from a dual growth and
inflation mandate to a stricter inflation targeting regime. Given the nature of the inflation
process – food and energy make up around 60% of the total basket – and its stubborn
level – inflation has averaged 8.4% since 2005 – extremely conservative policies will have
to be enacted to bring inflation down to the target of 4% within two years. This should be
negative for economic activity in coming quarters.
In the meantime, commodity exporters, such as Australia and Canada, which benefitted
for several years from China’s and other EM countries’ growing role in the global
production process have lost competitiveness since the resulting financial resources found
their way back into the energy and (non-productive) residential sectors. This phenomenon
was exacerbated by overvalued currencies. This is why their central banks will be content
with cheaper ones.
Behind imbalances reside structural issues that need to be addressed. In the short
term, fundamental changes in the structure of an economy – in both emerging or
developed economies – can be damaging from an economic and social point of view.
Furthermore, modifying the growth model of an economy with the aim of increasing
potential GDP could nonetheless have negative effects that persist for quite some time as
the losing sectors must adjust promptly while the winning sectors can adjust at leisure.
The more dramatic the changes are, the more likely the economy will underperform for a
period of time and the lower the probabilities that an increase in potential GDP will quickly
materialize. This is why central bank policies need to remain exceptionally accommodative
to accompany these reforms. Our concern in 2014 is that major structural changes
continue to take place without the support of more policy stimulus.
06 March 2014
Emerging Markets Quarterly 14
IP growth momentum slows further in EM as it strengthens notably in DM The pace of aggregate EM industrial output growth continued to slow in December,
moving further down from its recent peak in September. The momentum (3m/3m%,
annualized) of EM IP growth slowed to 4.4% in December from its eight-month peak of
5.3% in September (Exhibits 21 and 23). (December is the last month for which we have
data for all EM countries.) This diverges from DM IP growth which has steadily gained
momentum through 2H 2013 and reached its fastest pace in the past two years in January
2014 (Exhibits 24 and 26). IP growth momentum in DM is likely to have rolled over in
February, according to our economists' estimates.
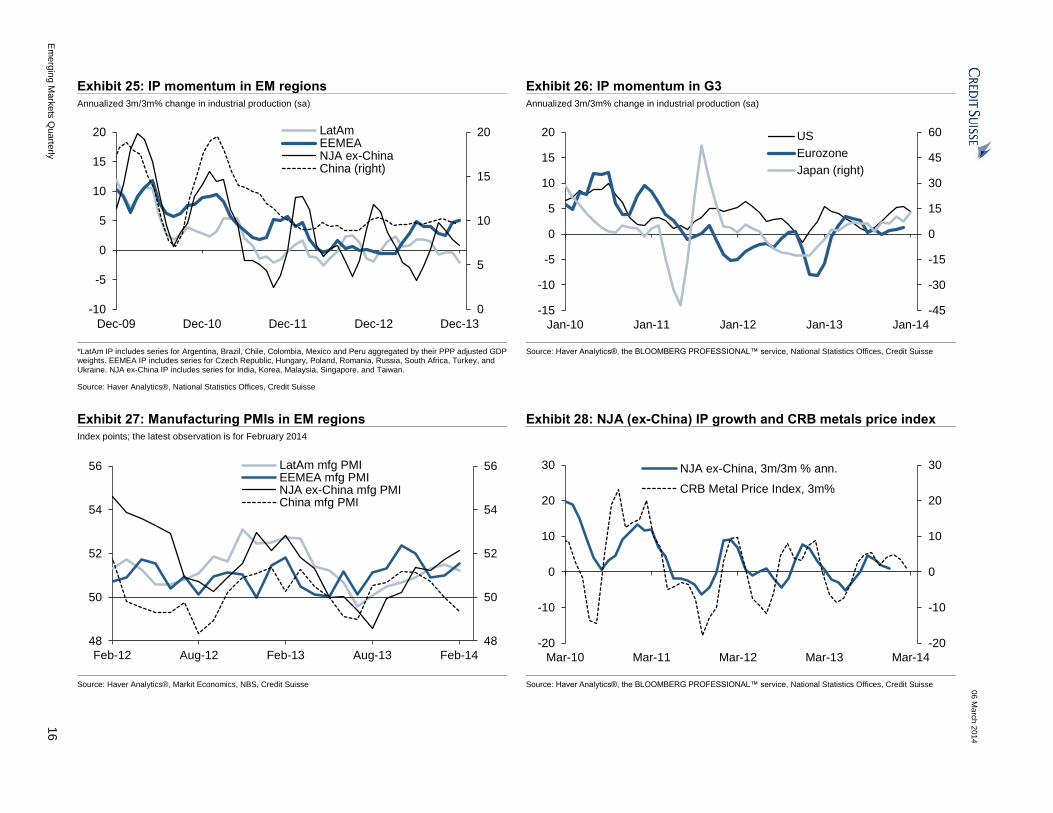
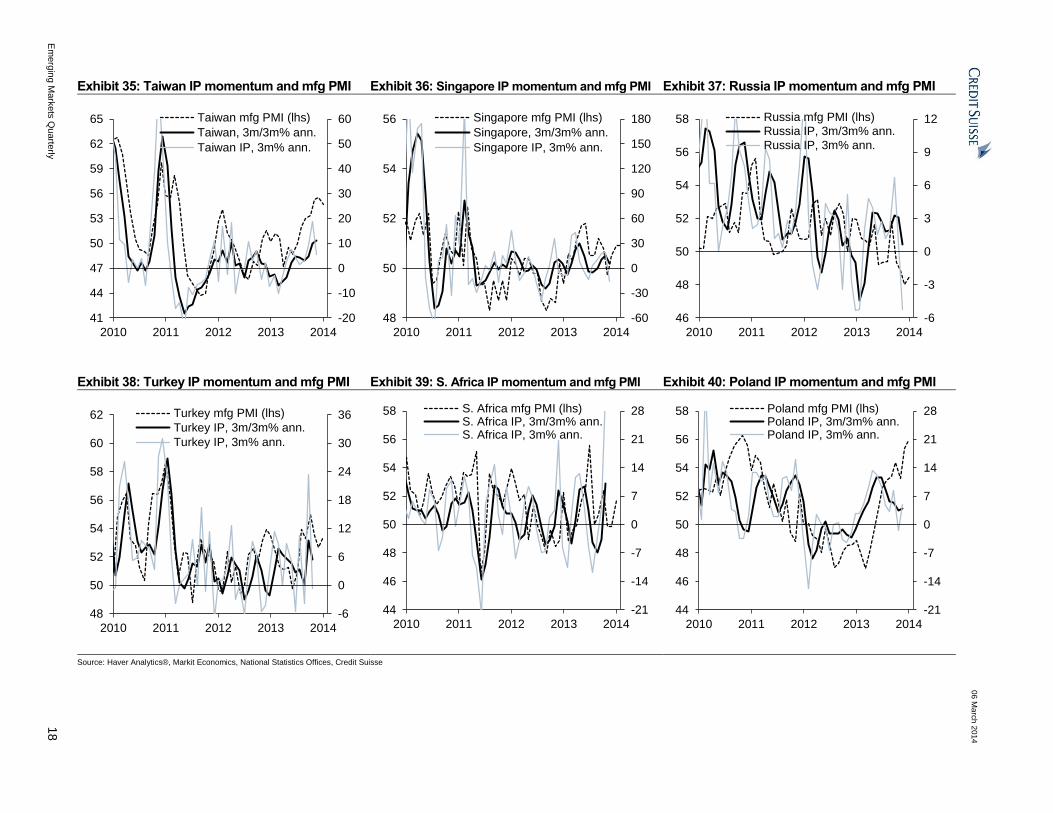
The slowdown in EM's overall IP growth momentum in 4Q 2013 was primarily driven by
India and the LatAm region (Exhibit 25). The EEMEA region's IP growth momentum
rebounded modestly in 4Q 2013 from its recent trough in September and reached its strongest
pace in the past two years. This pick-up was led primarily by Turkey and South Africa
(Exhibits 38-39). Meanwhile, IP growth momentum in CE3 continued to slow for the fourth
consecutive month in December after accelerating rapidly between January and August 2013.
IP growth momentum in the NJA (excluding China) region was on a downtrend trajectory
during 4Q, driven by a notable weakness in India, while it strengthened in the rest of emerging
Asia in late 2013. China's IP growth momentum has also softened modestly since October
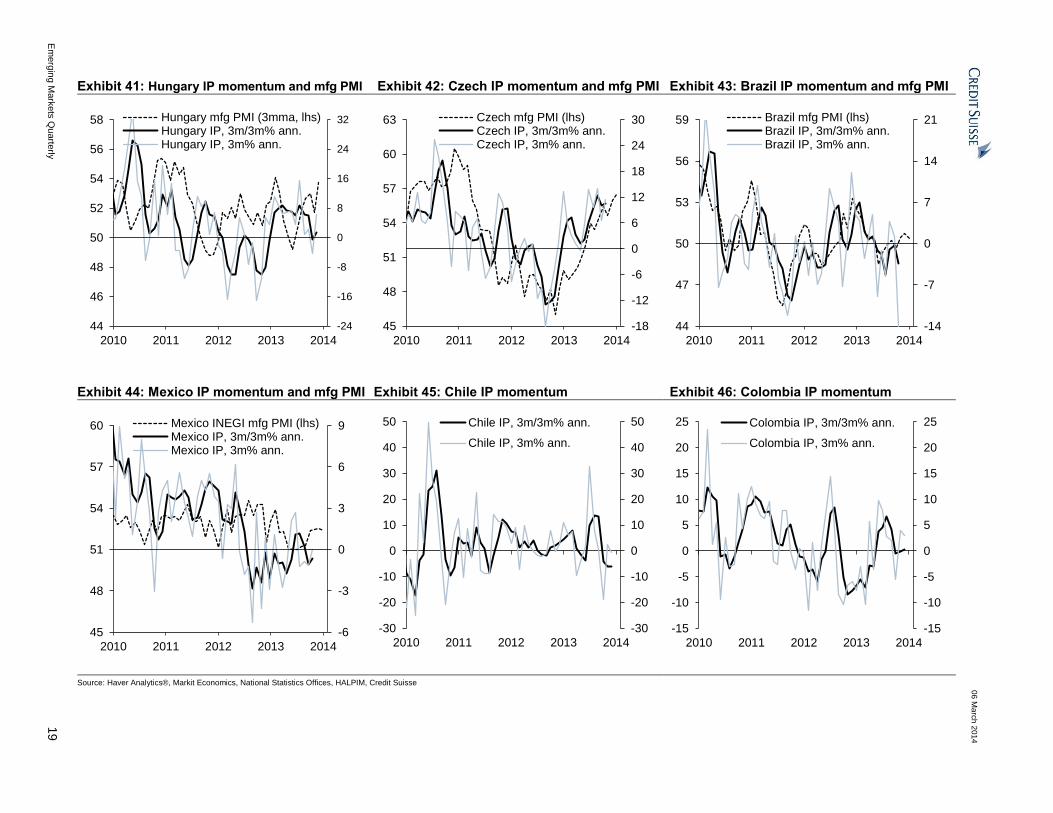
2013. LatAm's IP growth momentum slowed for the third consecutive quarter led by a broad-
based deceleration across the region. It is worth highlighting that Brazil's IP contracted in
sequential terms in 4Q for the second consecutive quarter (Exhibit 43). In 4Q 2013, IP growth
momentum improved in Turkey, South Africa, the Czech Republic, Russia, South Korea,
Singapore, Malaysia, and Taiwan (Exhibits 32-46).
The latest leading indicators suggest a further slowdown in EM IP growth
momentum coupled with some weakness in DM IP growth momentum in the coming
months (Exhibit 22). A deceleration in the run-rate (3m%, annualized) of EM IP in
December, which generally catches the turning points in IP growth momentum earlier, is
also suggesting that EM IP momentum should continue to slow in the near term (Exhibit
23). We note that the CSBMI – our leading indicator for global manufacturing activity –
declined (on 3mma basis) in January and December after a brief rebound in December,
pointing to weaker global IP growth momentum in the near term (Exhibit 22).
In NJA (excluding China) IP growth momentum weakened further in December. However,
we expect it to rebound in 1Q as also signaled by the latest three-month change in the
CRB metal price index which increased modestly between November and January before
coming off slightly in February (Exhibit 28). Our economists expect China’s IP growth
momentum to moderate further in 1Q before rebounding in 2Q, while India’s IP growth
momentum is expected to rebound sharply in 1Q.
According to our economists, IP growth momentum in EEMEA has eased during 1Q
despite stronger IP growth momentum in the CE3 countries and is set to bounce in 2Q. IP
growth momentum in CE3 has come down from its peak of 11% in August to about 4% in
December. It is expected to rebound in the near term and remain resilient at about 6.5%
throughout 2014, benefiting from the recovery in the euro area. We note that German Ifo
expectations index reached its multi-year high in January before easing slightly in
February. Russia’s IP growth momentum has been notably weak since late 2012 and this
weakness is likely to persist during 2014, according to our Russia economists.
IP growth momentum in LatAm fell sharply in December, driven mainly by a sharp drop in
Brazil's industrial output growth. However, our LatAm economists expect the region's IP
growth momentum to pick up gradually during 1H 2014, mainly driven by the rebound in
Brazil’s and Mexico's IP growth momentum.
Natig Mustafayev
+44 20 7888 1065

06
Ma
rch
20
14
Em
erg
ing M
ark
ets
Qu
arte
rly
15
EM Regional IP and PMIs
Exhibit 21: IP momentum in DM and EM Exhibit 22: DM/EM Manufacturing PMIs and CSBMI
Annualized 3m/3m% change in industrial production (sa); the latest observations for EM and DM are Dec 2013 and Jan 2014 respectively
Index points; the latest observation is for February 2014
-30
-25
-20
-15
-10
-5
0
5
10
15
20
25
-30
-25
-20
-15
-10
-5
0
5
10
15
20
25
2006 2007 2008 2009 2010 2011 2012 2013 2014
Global IP momentum
EM IP* momentum
DM IP momentum
-5
-4
-3
-2
-1
0
1
2
30
35
40
45
50
55
60
2006 2007 2008 2009 2010 2011 2012 2013 2014
DM PMIEM PMI*CSBMI (3mma, right)
*IP data for India, Korea, Malaysia, Singapore, Taiwan, Argentina, Brazil, Chile, Colombia, Mexico, Peru, Czech Republic, Hungary, Poland, Romania, Russia, S. Africa, Turkey and Ukraine were aggregated by PPP GDP weights.
Source: Haver Analytics®, National Statistics Offices, Credit Suisse
*We aggregate the country PMIs by their PPP adjusted GDP weights. **The EM PMI includes readings for Brazil, Mexico, Czech Republic, Hungary, Poland, Russia, South Africa, Turkey, China, India, South Korea, Singapore and Taiwan.
Source: Haver Analytics®, Markit Economics, NBS, Credit Suisse
Exhibit 23: EM IP momentum and run-rate Exhibit 24: DM IP momentum and run-rate
Annualized % change in industrial production (sa) Annualized % change in industrial production (sa)
09 10 10 10 10 10 10 10 10 10 10 10 10 11 11 11 11 11 11 11 11 11 11 11 11 12 12 12 12 12 12 12 12 12 12 12 12 13 13 13 13 13 13 13 13 13 13 13 13 14 14 14 14 14 14 14 14 14 14 14 14 15
0
5
10
15
20
0
5
10
15
20
Dec-09 Dec-10 Dec-11 Dec-12 Dec-13 Dec-14
EM IP momentum, 3m/3m% ann.
EM IP run-rate, 3m% ann.
10 10 10 10 10 10 10 10 10 10 10 10 11 11 11 11 11 11 11 11 11 11 11 11 12 12 12 12 12 12 12 12 12 12 12 12 13 13 13 13 13 13 13 13 13 13 13 13 14 14
-8
-4
0
4
8
12
16
-8
-4
0
4
8
12
16
Jan-10 Jan-11 Jan-12 Jan-13 Jan-14
DM IP momentum, 3m/3m% ann.
DM IP run-rate, 3m% ann.
Source: Haver Analytics®, National Statistics Offices, Credit Suisse Source: Haver Analytics®, National Statistics Offices, Credit Suisse
06
Ma
rch
20
14
Em
erg
ing M
ark
ets
Qu
arte
rly
16
Exhibit 25: IP momentum in EM regions Exhibit 26: IP momentum in G3
Annualized 3m/3m% change in industrial production (sa) Annualized 3m/3m% change in industrial production (sa)
09 10 10 10 10 10 10 10 10 10 10 10 10 11 11 11 11 11 11 11 11 11 11 11 11 12 12 12 12 12 12 12 12 12 12 12 12 13 13 13 13 13 13 13 13 13 13 13 13 14
0
5
10
15
20
-10
-5
0
5
10
15
20
Dec-09 Dec-10 Dec-11 Dec-12 Dec-13
LatAmEEMEANJA ex-ChinaChina (right)
-45
-30
-15
0
15
30
45
60
-15
-10
-5
0
5
10
15
20
Jan-10 Jan-11 Jan-12 Jan-13 Jan-14
US
Eurozone
Japan (right)
*LatAm IP includes series for Argentina, Brazil, Chile, Colombia, Mexico and Peru aggregated by their PPP adjusted GDP weights. EEMEA IP includes series for Czech Republic, Hungary, Poland, Romania, Russia, South Africa, Turkey, and Ukraine. NJA ex-China IP includes series for India, Korea, Malaysia, Singapore, and Taiwan.
Source: Haver Analytics®, National Statistics Offices, Credit Suisse
Source: Haver Analytics®, the BLOOMBERG PROFESSIONAL™ service, National Statistics Offices, Credit Suisse
Exhibit 27: Manufacturing PMIs in EM regions Exhibit 28: NJA (ex-China) IP growth and CRB metals price index
Index points; the latest observation is for February 2014
12 12 12 12 12 12 12 12 12 12 12 13 13 13 13 13 13 13 13 13 13 13 13 14 14 14
48
50
52
54
56
48
50
52
54
56
Feb-12 Aug-12 Feb-13 Aug-13 Feb-14
LatAm mfg PMIEEMEA mfg PMINJA ex-China mfg PMIChina mfg PMI
10 10 10 10 10 10 10 10 10 10 11 11 11 11 11 11 11 11 11 11 11 11 12 12 12 12 12 12 12 12 12 12 12 12 13 13 13 13 13 13 13 13 13 13 13 13 14 14 14 14
-20
-10
0
10
20
30
-20
-10
0
10
20
30
Mar-10 Mar-11 Mar-12 Mar-13 Mar-14
NJA ex-China, 3m/3m % ann.
CRB Metal Price Index, 3m%
Source: Haver Analytics®, Markit Economics, NBS, Credit Suisse Source: Haver Analytics®, the BLOOMBERG PROFESSIONAL™ service, National Statistics Offices, Credit Suisse

06
Ma
rch
20
14
Em
erg
ing M
ark
ets
Qu
arte
rly
17
Exhibit 29: NJA ex-China IP momentum and mfg PMI Exhibit 30: EEMEA IP momentum and mfg PMI Exhibit 31: LatAm IP momentum and mfg PMI
10 10 10 10 10 10 10 10 10 10 10 11 11 11 11 11 11 11 11 11 11 11 11 12 12 12 12 12 12 12 12 12 12 12 12 13 13 13 13 13 13 13 13 13 13 13 13 14 14 14
-3
0
3
6
9
12
15
48
50
52
54
56
58
60
2010 2011 2012 2013 2014
EEMEA mfg PMI** (lhs)
EEMEA IP, 3m/3m% ann.*
EEMEA IP, 3m% ann.*
10 10 10 10 10 10 10 10 10 10 10 11 11 11 11 11 11 11 11 11 11 11 11 12 12 12 12 12 12 12 12 12 12 12 12 13 13 13 13 13 13 13 13 13 13 13 13 14 14 14
-3
0
3
6
9
12
15
48
50
52
54
56
58
60
2010 2011 2012 2013 2014
EEMEA mfg PMI** (lhs)
EEMEA IP, 3m/3m% ann.*
EEMEA IP, 3m% ann.*
10 10 10 10 10 10 10 10 10 10 10 11 11 11 11 11 11 11 11 11 11 11 11 12 12 12 12 12 12 12 12 12 12 12 12 13 13 13 13 13 13 13 13 13 13 13 13 14 14 14
-8
-4
0
4
8
12
16
46
48
50
52
54
56
58
2010 2011 2012 2013 2014
LatAm mfg PMI** (lhs)
LatAm IP, 3m/3m% ann.*
LatAm IP, 3m% ann.*
Exhibit 32: China IP momentum and mfg PMI Exhibit 33: India IP momentum and mfg PMI Exhibit 34: Korea IP momentum and mfg PMI
10 10 10 10 10 10 10 10 10 10 10 11 11 11 11 11 11 11 11 11 11 11 11 12 12 12 12 12 12 12 12 12 12 12 12 13 13 13 13 13 13 13 13 13 13 13 13 14 14 14
6
9
12
15
18
21
24
48
50
52
54
56
58
2010 2011 2012 2013 2014
China mfg PMI** (lhs)
China IP, 3m/3m% ann.
China IP, 3m% ann.
10 10 10 10 10 10 10 10 10 10 10 11 11 11 11 11 11 11 11 11 11 11 11 12 12 12 12 12 12 12 12 12 12 12 12 13 13 13 13 13 13 13 13 13 13 13 13 14 14 14
-20
-15
-10
-5
0
5
10
15
20
25
48
50
52
54
56
58
60
62
2010 2011 2012 2013 2014
India mfg PMI (lhs)
India IP, 3m/3m% ann.
India IP, 3m% ann.
10 10 10 10 10 10 10 10 10 10 10 11 11 11 11 11 11 11 11 11 11 11 11 12 12 12 12 12 12 12 12 12 12 12 12 13 13 13 13 13 13 13 13 13 13 13 13 14 14 14
-18
-12
-6
0
6
12
18
24
30
44
46
48
50
52
54
56
58
60
2010 2011 2012 2013 2014
S. Korea mfg PMI (lhs)
S. Korea IP, 3m/3m% ann.
S. Korea IP, 3m% ann.
*LatAm IP includes series for Argentina, Brazil, Chile, Colombia, Mexico and Peru aggregated by their PPP adjusted GDP weights. EEMEA IP includes series for Czech Republic, Hungary, Poland, Romania, Russia, South Africa, Turkey, and Ukraine. NJA ex-China IP includes series for India, Korea, Malaysia, Singapore, and Taiwan. Country IP series are seasonally and workday-adjusted. The latest observation is for December 2013 or January 2014.
**LatAm PMI includes series for Brazil and Mexico aggregated by their PPP adjusted GDP weights. EEMEA PMI includes series for Czech Republic, Hungary, Poland, Russia, South Africa and Turkey. NJA ex-China PMI includes series for India, Korea, Singapore, and Taiwan. For China, we use the average of NBS and HSBC manufacturing PMIs. The latest observation is for February 2014.
Source: Haver Analytics®, Markit Economics, NBS, National Statistics Offices, Credit Suisse
06
Ma
rch
20
14
Em
erg
ing M
ark
ets
Qu
arte
rly
18
Exhibit 35: Taiwan IP momentum and mfg PMI Exhibit 36: Singapore IP momentum and mfg PMI Exhibit 37: Russia IP momentum and mfg PMI
10 10 10 10 10 10 10 10 10 10 10 11 11 11 11 11 11 11 11 11 11 11 11 12 12 12 12 12 12 12 12 12 12 12 12 13 13 13 13 13 13 13 13 13 13 13 13 14 14 14
-20
-10
0
10
20
30
40
50
60
41
44
47
50
53
56
59
62
65
2010 2011 2012 2013 2014
Taiwan mfg PMI (lhs)
Taiwan, 3m/3m% ann.
Taiwan IP, 3m% ann.
10 10 10 10 10 10 10 10 10 10 10 11 11 11 11 11 11 11 11 11 11 11 11 12 12 12 12 12 12 12 12 12 12 12 12 13 13 13 13 13 13 13 13 13 13 13 13 14 14 14
-60
-30
0
30
60
90
120
150
180
48
50
52
54
56
2010 2011 2012 2013 2014
Singapore mfg PMI (lhs)
Singapore, 3m/3m% ann.
Singapore IP, 3m% ann.
10 10 10 10 10 10 10 10 10 10 10 11 11 11 11 11 11 11 11 11 11 11 11 12 12 12 12 12 12 12 12 12 12 12 12 13 13 13 13 13 13 13 13 13 13 13 13 14 14 14
-6
-3
0
3
6
9
12
46
48
50
52
54
56
58
2010 2011 2012 2013 2014
Russia mfg PMI (lhs)
Russia IP, 3m/3m% ann.
Russia IP, 3m% ann.
Exhibit 38: Turkey IP momentum and mfg PMI Exhibit 39: S. Africa IP momentum and mfg PMI Exhibit 40: Poland IP momentum and mfg PMI
10 10 10 10 10 10 10 10 10 10 10 11 11 11 11 11 11 11 11 11 11 11 11 12 12 12 12 12 12 12 12 12 12 12 12 13 13 13 13 13 13 13 13 13 13 13 13 14 14 14
-6
0
6
12
18
24
30
36
48
50
52
54
56
58
60
62
2010 2011 2012 2013 2014
Turkey mfg PMI (lhs)
Turkey IP, 3m/3m% ann.
Turkey IP, 3m% ann.
10 10 10 10 10 10 10 10 10 10 10 11 11 11 11 11 11 11 11 11 11 11 11 12 12 12 12 12 12 12 12 12 12 12 12 13 13 13 13 13 13 13 13 13 13 13 13 14 14 14
-21
-14
-7
0
7
14
21
28
44
46
48
50
52
54
56
58
2010 2011 2012 2013 2014
S. Africa mfg PMI (lhs)S. Africa IP, 3m/3m% ann.S. Africa IP, 3m% ann.
10 10 10 10 10 10 10 10 10 10 10 11 11 11 11 11 11 11 11 11 11 11 11 12 12 12 12 12 12 12 12 12 12 12 12 13 13 13 13 13 13 13 13 13 13 13 13 14 14 14
-21
-14
-7
0
7
14
21
28
44
46
48
50
52
54
56
58
2010 2011 2012 2013 2014
Poland mfg PMI (lhs)Poland IP, 3m/3m% ann.Poland IP, 3m% ann.
Source: Haver Analytics®, Markit Economics, National Statistics Offices, Credit Suisse
06
Ma
rch
20
14
Em
erg
ing M
ark
ets
Qu
arte
rly
19
Exhibit 41: Hungary IP momentum and mfg PMI Exhibit 42: Czech IP momentum and mfg PMI Exhibit 43: Brazil IP momentum and mfg PMI
10 10 10 10 10 10 10 10 10 10 10 11 11 11 11 11 11 11 11 11 11 11 11 12 12 12 12 12 12 12 12 12 12 12 12 13 13 13 13 13 13 13 13 13 13 13 13 14 14 14
-24
-16
-8
0
8
16
24
32
44
46
48
50
52
54
56
58
2010 2011 2012 2013 2014
Hungary mfg PMI (3mma, lhs)Hungary IP, 3m/3m% ann.Hungary IP, 3m% ann.
10 10 10 10 10 10 10 10 10 10 10 11 11 11 11 11 11 11 11 11 11 11 11 12 12 12 12 12 12 12 12 12 12 12 12 13 13 13 13 13 13 13 13 13 13 13 13 14 14 14
-18
-12
-6
0
6
12
18
24
30
45
48
51
54
57
60
63
2010 2011 2012 2013 2014
Czech mfg PMI (lhs)Czech IP, 3m/3m% ann.Czech IP, 3m% ann.
10 10 10 10 10 10 10 10 10 10 10 11 11 11 11 11 11 11 11 11 11 11 11 12 12 12 12 12 12 12 12 12 12 12 12 13 13 13 13 13 13 13 13 13 13 13 13 14 14 14
-14
-7
0
7
14
21
44
47
50
53
56
59
2010 2011 2012 2013 2014
Brazil mfg PMI (lhs)Brazil IP, 3m/3m% ann.Brazil IP, 3m% ann.
Exhibit 44: Mexico IP momentum and mfg PMI Exhibit 45: Chile IP momentum Exhibit 46: Colombia IP momentum
10 10 10 10 10 10 10 10 10 10 10 11 11 11 11 11 11 11 11 11 11 11 11 12 12 12 12 12 12 12 12 12 12 12 12 13 13 13 13 13 13 13 13 13 13 13 13 14 14 14
-6
-3
0
3
6
9
45
48
51
54
57
60
2010 2011 2012 2013 2014
Mexico INEGI mfg PMI (lhs)Mexico IP, 3m/3m% ann.Mexico IP, 3m% ann.
-30
-20
-10
0
10
20
30
40
50
-30
-20
-10
0
10
20
30
40
50
2010 2011 2012 2013 2014
Chile IP, 3m/3m% ann.
Chile IP, 3m% ann.
-15
-10
-5
0
5
10
15
20
25
-15
-10
-5
0
5
10
15
20
25
2010 2011 2012 2013 2014
Colombia IP, 3m/3m% ann.
Colombia IP, 3m% ann.
Source: Haver Analytics®, Markit Economics, National Statistics Offices, HALPIM, Credit Suisse
06
Ma
rch
20
14
Em
erg
ing M
ark
ets
Qu
arte
rly
20
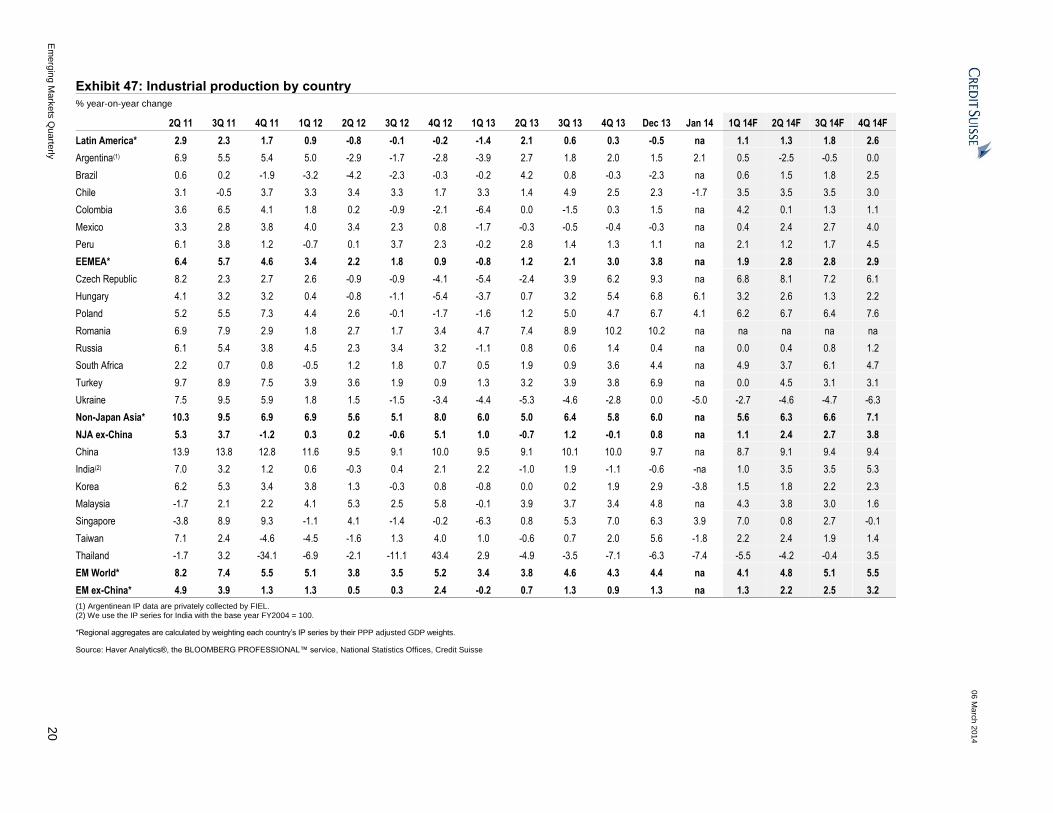
Exhibit 47: Industrial production by country
% year-on-year change
2Q 11 3Q 11 4Q 11 1Q 12 2Q 12 3Q 12 4Q 12 1Q 13 2Q 13 3Q 13 4Q 13 Dec 13 Jan 14 1Q 14F 2Q 14F 3Q 14F 4Q 14F
Latin America* 2.9 2.3 1.7 0.9 -0.8 -0.1 -0.2 -1.4 2.1 0.6 0.3 -0.5 na 1.1 1.3 1.8 2.6
Argentina(1) 6.9 5.5 5.4 5.0 -2.9 -1.7 -2.8 -3.9 2.7 1.8 2.0 1.5 2.1 0.5 -2.5 -0.5 0.0
Brazil 0.6 0.2 -1.9 -3.2 -4.2 -2.3 -0.3 -0.2 4.2 0.8 -0.3 -2.3 na 0.6 1.5 1.8 2.5
Chile 3.1 -0.5 3.7 3.3 3.4 3.3 1.7 3.3 1.4 4.9 2.5 2.3 -1.7 3.5 3.5 3.5 3.0
Colombia 3.6 6.5 4.1 1.8 0.2 -0.9 -2.1 -6.4 0.0 -1.5 0.3 1.5 na 4.2 0.1 1.3 1.1
Mexico 3.3 2.8 3.8 4.0 3.4 2.3 0.8 -1.7 -0.3 -0.5 -0.4 -0.3 na 0.4 2.4 2.7 4.0
Peru 6.1 3.8 1.2 -0.7 0.1 3.7 2.3 -0.2 2.8 1.4 1.3 1.1 na 2.1 1.2 1.7 4.5
EEMEA* 6.4 5.7 4.6 3.4 2.2 1.8 0.9 -0.8 1.2 2.1 3.0 3.8 na 1.9 2.8 2.8 2.9
Czech Republic 8.2 2.3 2.7 2.6 -0.9 -0.9 -4.1 -5.4 -2.4 3.9 6.2 9.3 na 6.8 8.1 7.2 6.1
Hungary 4.1 3.2 3.2 0.4 -0.8 -1.1 -5.4 -3.7 0.7 3.2 5.4 6.8 6.1 3.2 2.6 1.3 2.2
Poland 5.2 5.5 7.3 4.4 2.6 -0.1 -1.7 -1.6 1.2 5.0 4.7 6.7 4.1 6.2 6.7 6.4 7.6
Romania 6.9 7.9 2.9 1.8 2.7 1.7 3.4 4.7 7.4 8.9 10.2 10.2 na na na na na
Russia 6.1 5.4 3.8 4.5 2.3 3.4 3.2 -1.1 0.8 0.6 1.4 0.4 na 0.0 0.4 0.8 1.2
South Africa 2.2 0.7 0.8 -0.5 1.2 1.8 0.7 0.5 1.9 0.9 3.6 4.4 na 4.9 3.7 6.1 4.7
Turkey 9.7 8.9 7.5 3.9 3.6 1.9 0.9 1.3 3.2 3.9 3.8 6.9 na 0.0 4.5 3.1 3.1
Ukraine 7.5 9.5 5.9 1.8 1.5 -1.5 -3.4 -4.4 -5.3 -4.6 -2.8 0.0 -5.0 -2.7 -4.6 -4.7 -6.3
Non-Japan Asia* 10.3 9.5 6.9 6.9 5.6 5.1 8.0 6.0 5.0 6.4 5.8 6.0 na 5.6 6.3 6.6 7.1
NJA ex-China 5.3 3.7 -1.2 0.3 0.2 -0.6 5.1 1.0 -0.7 1.2 -0.1 0.8 na 1.1 2.4 2.7 3.8
China 13.9 13.8 12.8 11.6 9.5 9.1 10.0 9.5 9.1 10.1 10.0 9.7 na 8.7 9.1 9.4 9.4
India(2) 7.0 3.2 1.2 0.6 -0.3 0.4 2.1 2.2 -1.0 1.9 -1.1 -0.6 -na 1.0 3.5 3.5 5.3
Korea 6.2 5.3 3.4 3.8 1.3 -0.3 0.8 -0.8 0.0 0.2 1.9 2.9 -3.8 1.5 1.8 2.2 2.3
Malaysia -1.7 2.1 2.2 4.1 5.3 2.5 5.8 -0.1 3.9 3.7 3.4 4.8 na 4.3 3.8 3.0 1.6
Singapore -3.8 8.9 9.3 -1.1 4.1 -1.4 -0.2 -6.3 0.8 5.3 7.0 6.3 3.9 7.0 0.8 2.7 -0.1
Taiwan 7.1 2.4 -4.6 -4.5 -1.6 1.3 4.0 1.0 -0.6 0.7 2.0 5.6 -1.8 2.2 2.4 1.9 1.4
Thailand -1.7 3.2 -34.1 -6.9 -2.1 -11.1 43.4 2.9 -4.9 -3.5 -7.1 -6.3 -7.4 -5.5 -4.2 -0.4 3.5
EM World* 8.2 7.4 5.5 5.1 3.8 3.5 5.2 3.4 3.8 4.6 4.3 4.4 na 4.1 4.8 5.1 5.5
EM ex-China* 4.9 3.9 1.3 1.3 0.5 0.3 2.4 -0.2 0.7 1.3 0.9 1.3 na 1.3 2.2 2.5 3.2
(1) Argentinean IP data are privately collected by FIEL. (2) We use the IP series for India with the base year FY2004 = 100.
*Regional aggregates are calculated by weighting each country’s IP series by their PPP adjusted GDP weights.
Source: Haver Analytics®, the BLOOMBERG PROFESSIONAL™ service, National Statistics Offices, Credit Suisse

06 March 2014
Emerging Markets Quarterly 21
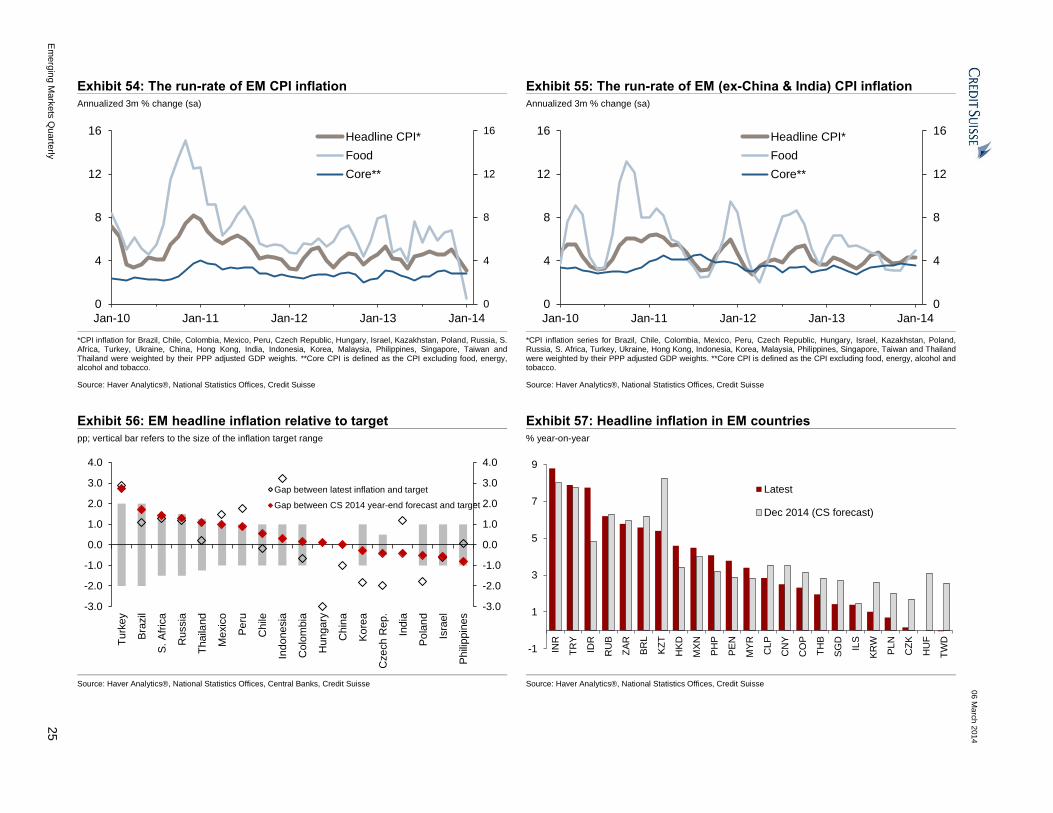
Core inflation on the rise in EEMEA and Latin America This section aims to present the latest inflation developments across the EM world.
In Exhibits 50-55 we provide an overview of headline and core inflation dynamics in EM,
the US and the euro area, and in Exhibits 58-60 and 83-91 we present regional inflation
charts along with medium-term inflation outlooks for EM countries.
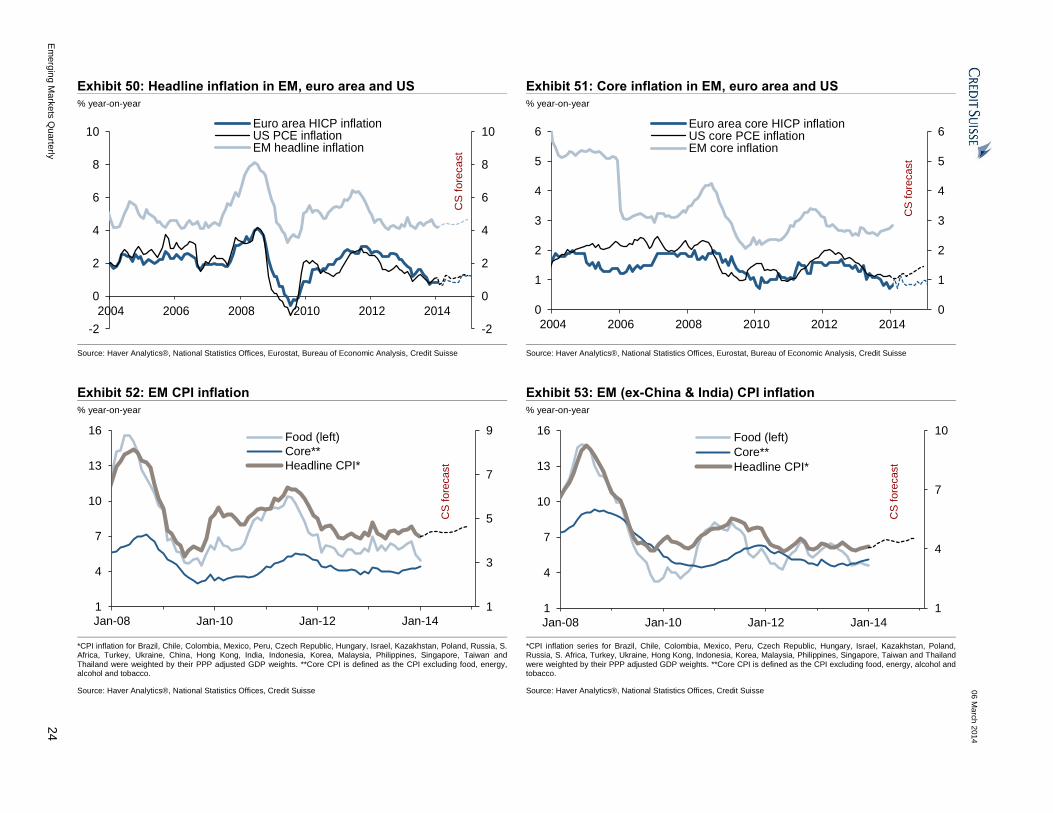
Year-on-year aggregate headline inflation in EM fell to 4.2% in January from its
recent high of 4.6% in November 2013 (Exhibits 52-53). The decline in EM headline
inflation between November 2013 and January 2014 was primarily driven by the sharp fall
in China's and India's food price inflation rates. Overall, we note that EM headline inflation
has been broadly stable since early 2012, while it moderated notably in DM during the
same period (Exhibit 50).
Indonesia, Turkey, Mexico and Peru stand out as the EM countries whose latest year-
on-year headline inflation readings exceed the upper bound of their respective headline
inflation target ranges, while in Poland, Hungary, the Czech Republic and Korea
headline inflation currently remains below the lower bound of their respective headline
inflation target ranges (Exhibits 56 and 61-82). We expect year-on-year headline inflation to
exceed the upper bound of the target range only in Turkey by end-2014.
The run-rate (annualized three-month % change) of aggregate EM inflation declined
notably to 3.1% in January from a nine-month high of 5.1% in November, driven
mainly by the slowdown in the run-rate of food inflation in recent months in India
and China (Exhibits 54-55). The run-rate of headline inflation has been picking up in
LatAm since September, but it is set to ease modestly in 1Q 2014. The run-rate of the
EEMEA region's headline inflation, however, troughed in November and will continue to
increase in 1Q 2014, according to CS forecasts. In NJA (ex-China and India) the run-rate
of headline inflation has been almost stable since November 2013 and is set to remain soft
in the near term. The latest data for January and February are suggesting that the run-rate
of headline inflation has been picking up in Mexico, Chile, Peru, Turkey, South Africa,
Romania, and the Philippines, while it has been declining in China, India, Singapore,
Taiwan, South Korea, the Czech Republic, Hungary, Israel, Poland and Russia in
recent months (Exhibits 61-82).
EM core1 inflation picked up modestly to 2.8% yoy in January from a 34-month low
of 2.5% yoy in August 2013 (Exhibits 51-53). This deterioration in core inflation dynamics
was driven primarily by sharp depreciation in some EM currencies during the past nine
months. However, we note that most EM economies (with the exception of Indonesia,
Malaysia, Thailand and Turkey) have been operating with notable excess capacities and
we forecast that they will continue to operate below potential in 2014, thus keeping
demand-pull inflationary pressures low, in our view. It is worth highlighting that Turkey and
Peru are the only EM countries that have their latest core inflation prints above the central
banks' target ranges for headline inflation.
The run-rate of EM’s core inflation remained flat at 2.8% since November 2013 after
increasing from as low as 2.2% in May 2013, driven by the pick-up in LatAm and
EEMEA regions in 2H 2013 (Exhibits 83, 86 and 89). EMFX weakness in early 2014 has
yet to pass through to core inflation, in our view. EEMEA’s core inflation dynamics have
been deteriorating since July 2013 and the run-rate of core inflation reached a 17-month
high of 4.3% in January 2014 (Exhibit 86). In LatAm where the core inflation pressure is
most acute among EM regions, the run-rate of core inflation has been on the uptrend since
May 2013 and reached a 34-month high of 4.9% in January (Exhibit 89). Meanwhile, in the
1 CPI excluding food, energy, alcohol and tobacco for most EM countries. For exceptions, please see Exhibit 157 footnotes.
Natig Mustafayev
+44 20 7888 1065

06 March 2014
Emerging Markets Quarterly 22
NJA region (excluding China and India), the run-rate of core inflation declined to 1.8% in
January from the recent high of 2.7% in September 2013 (Exhibit 83).
Overall, core inflation dynamics remain well-behaved in most EM countries, as the
run-rate of core inflation has remained within the respective central banks’ headline
inflation target ranges (Exhibits 92-153). The only exceptions are Turkey and Peru,
where the run-rate of core inflation has been above the target range for headline inflation
in recent months. We also note that the run-rate of core inflation remains elevated in
Brazil, Mexico and Russia as well.
EM’s year-on-year food price inflation has declined since November 2013 to a four-
year low of 5.0% in January (Exhibits 52-53). This was mainly driven by the sharp
decline in food price inflation in China and India while it remained broadly flat at record
low levels in the rest of NJA, EEMEA and LatAm in the past several months. However, the
recent sharp pick-up in agricultural commodities prices (Exhibit 48) (CRB food index has
increased by about 15% since late December to an eight-month high) poses upside risk to
EM food price inflation dynamics in the coming months (Exhibits 84, 87 and 90).
Exhibit 48: CRB food prices Exhibit 49: Brent oil price
% year-on-year % year-on-year
08 09 09 09 09 09 09 09 09 09 09 09 09 10 10 10 10 10 10 10 10 10 10 10 10 11 11 11 11 11 11 11 11 11 11 11 11 12 12 12 12 12 12 12 12 12 12 12 12 13 13 13 13 13 13 13 13 13 13 13 13 14 14 14 14 14 14 14 14 14 14 14 14
-30
-20
-10
0
10
20
30
40
50
-30
-20
-10
0
10
20
30
40
50
Dec-08 Dec-10 Dec-12 Dec-14
stable prices+/-15% shock
08 09 09 09 09 09 09 09 09 09 09 09 09 10 10 10 10 10 10 10 10 10 10 10 10 11 11 11 11 11 11 11 11 11 11 11 11 12 12 12 12 12 12 12 12 12 12 12 12 13 13 13 13 13 13 13 13 13 13 13 13 14 14 14 14 14 14 14 14 14 14 14 14
-60
-30
0
30
60
90
-60
-30
0
30
60
90
Dec-08 Dec-10 Dec-12 Dec-14
stable prices+/-15% shock
Note: We consider three different scenarios - global food prices remain at their March 2014 levels throughout 2014 and they are 15% higher/lower from their March 2014 levels throughout 2014.
Source: BLOOMBERG PROFESSIONAL™ service, Credit Suisse
Note: We consider three different scenarios - global oil prices remain at their March 2014 levels throughout 2014 and they are 15% higher/lower from their March 2014 levels throughout 2014.
Source: BLOOMBERG PROFESSIONAL™ service, Credit Suisse
If the current global oil price levels are sustained, this would support the benign
inflation dynamics in EM countries during the current year, in our view (Exhibits 85,
88 and 91). Global oil prices rose sharply in late summer 2013 before easing to about
$110/bbl (Brent oil) in early September 2013 and has been range-bound since then
(Exhibit 49). If the oil price remains at current levels, the contribution of energy prices to
EM year-on-year inflation might pick up slightly by mid-2014 due to unfavorable base
effects before coming off by the end of 2014, all else (such as EM nominal exchange rates
against USD and tax/subsidy levels) are unchanged. However, energy prices have a far
lower weight (about 10%) in the CPI baskets in EM countries than food (about 25%), and
the increase in energy prices would have to become very dramatic to generate an inflation
problem in EM countries on its own. We note that local energy inflation in most EEMEA
(South Africa, Poland, Romania, Israel and Turkey) and LatAm countries (Brazil, Chile,
Colombia and Peru), and in some NJA countries (South Korea, Singapore, Thailand
and Taiwan) have high correlation with global oil prices (Exhibits 94-155).
Our economists expect year-on-year aggregate EM headline inflation to pick up
from 4.2% in January to 4.4% by March 2014 and remain broadly stable at that level
until 4Q 2014 before picking up to 4.7% by end-2014 (Exhibit 52). The projected

06 March 2014
Emerging Markets Quarterly 23
gradual pick-up in EM inflation is mainly related to China where our economists expect the
year-on-year headline inflation to pick up from 2.5% in January to 3.5% by end-2014.
In NJA, we expect year-on-year headline inflation to increase from 4.0% in January to
4.4% by end-2014.
In LatAm, we expect year-on-year headline inflation to gradually increase from 4.6% in
January to 4.8% by 4Q 2014 after remaining stable through mid-2014.
In EEMEA, year-on-year headline inflation will increase modestly from 4.5% in January
to 5.5% by end-2014, according to our forecasts.
We expect the most notable increase in year-on-year headline inflation in 2014 to be
recorded in Kazakhstan, Hungary, Taiwan, South Korea and the Czech Republic, while
Indonesia’s and Hong Kong's headline inflation should decline modestly during the rest
of 2014, according to our forecasts (Exhibit 57).
06
Ma
rch
20
14
Em
erg
ing M
ark
ets
Qu
arte
rly
24
Exhibit 50: Headline inflation in EM, euro area and US Exhibit 51: Core inflation in EM, euro area and US
% year-on-year % year-on-year
-2
0
2
4
6
8
10
-2
0
2
4
6
8
10
2004 2006 2008 2010 2012 2014
Euro area HICP inflationUS PCE inflationEM headline inflation
CS
fo
reca
st
0
1
2
3
4
5
6
0
1
2
3
4
5
6
2004 2006 2008 2010 2012 2014
Euro area core HICP inflationUS core PCE inflationEM core inflation
CS
fore
cast
Source: Haver Analytics®, National Statistics Offices, Eurostat, Bureau of Economic Analysis, Credit Suisse Source: Haver Analytics®, National Statistics Offices, Eurostat, Bureau of Economic Analysis, Credit Suisse
Exhibit 52: EM CPI inflation Exhibit 53: EM (ex-China & India) CPI inflation
% year-on-year % year-on-year
1
3
5
7
9
1
4
7
10
13
16
Jan-08 Jan-10 Jan-12 Jan-14
Food (left)
Core**
Headline CPI*
CS
fore
cast
1
4
7
10
1
4
7
10
13
16
Jan-08 Jan-10 Jan-12 Jan-14
Food (left)
Core**
Headline CPI*
CS
fore
cast
*CPI inflation for Brazil, Chile, Colombia, Mexico, Peru, Czech Republic, Hungary, Israel, Kazakhstan, Poland, Russia, S. Africa, Turkey, Ukraine, China, Hong Kong, India, Indonesia, Korea, Malaysia, Philippines, Singapore, Taiwan and Thailand were weighted by their PPP adjusted GDP weights. **Core CPI is defined as the CPI excluding food, energy, alcohol and tobacco.
Source: Haver Analytics®, National Statistics Offices, Credit Suisse
*CPI inflation series for Brazil, Chile, Colombia, Mexico, Peru, Czech Republic, Hungary, Israel, Kazakhstan, Poland, Russia, S. Africa, Turkey, Ukraine, Hong Kong, Indonesia, Korea, Malaysia, Philippines, Singapore, Taiwan and Thailand were weighted by their PPP adjusted GDP weights. **Core CPI is defined as the CPI excluding food, energy, alcohol and tobacco.
Source: Haver Analytics®, National Statistics Offices, Credit Suisse
06
Ma
rch
20
14
Em
erg
ing M
ark
ets
Qu
arte
rly
25
Exhibit 54: The run-rate of EM CPI inflation Exhibit 55: The run-rate of EM (ex-China & India) CPI inflation
Annualized 3m % change (sa) Annualized 3m % change (sa)
0
4
8
12
16
0
4
8
12
16
Jan-10 Jan-11 Jan-12 Jan-13 Jan-14
Headline CPI*
Food
Core**
0
4
8
12
1610 10 10 10 10 10 10 10 10 10 10 10 11 11 11 11 11 11 11 11 11 11 11 11 12 12 12 12 12 12 12 12 12 12 12 12 13 13 13 13 13 13 13 13 13 13 13 13 14 14
0
4
8
12
16
Jan-10 Jan-11 Jan-12 Jan-13 Jan-14
Headline CPI*
Food
Core**
*CPI inflation for Brazil, Chile, Colombia, Mexico, Peru, Czech Republic, Hungary, Israel, Kazakhstan, Poland, Russia, S. Africa, Turkey, Ukraine, China, Hong Kong, India, Indonesia, Korea, Malaysia, Philippines, Singapore, Taiwan and Thailand were weighted by their PPP adjusted GDP weights. **Core CPI is defined as the CPI excluding food, energy, alcohol and tobacco.
Source: Haver Analytics®, National Statistics Offices, Credit Suisse
*CPI inflation series for Brazil, Chile, Colombia, Mexico, Peru, Czech Republic, Hungary, Israel, Kazakhstan, Poland, Russia, S. Africa, Turkey, Ukraine, Hong Kong, Indonesia, Korea, Malaysia, Philippines, Singapore, Taiwan and Thailand were weighted by their PPP adjusted GDP weights. **Core CPI is defined as the CPI excluding food, energy, alcohol and tobacco.
Source: Haver Analytics®, National Statistics Offices, Credit Suisse
Exhibit 56: EM headline inflation relative to target Exhibit 57: Headline inflation in EM countries
pp; vertical bar refers to the size of the inflation target range % year-on-year
-3.0
-2.0
-1.0
0.0
1.0
2.0
3.0
4.0
-3.0
-2.0
-1.0
0.0
1.0
2.0
3.0
4.0
Turk
ey
Bra
zil
S.
Afr
ica
Russia
Thaila
nd
Mexic
o
Pe
ru
Chile
Indonesia
Colo
mbia
Hungary
Chin
a
Ko
rea
Cze
ch R
ep.
India
Po
lan
d
Isra
el
Ph
ilippin
es
Gap between latest inflation and target
Gap between CS 2014 year-end forecast and target
-1
1
3
5
7
9
INR
TR
Y
IDR
RU
B
ZA
R
BR
L
KZ
T
HK
D
MX
N
PH
P
PE
N
MY
R
CL
P
CN
Y
CO
P
TH
B
SG
D
ILS
KR
W
PL
N
CZ
K
HU
F
TW
D
Latest
Dec 2014 (CS forecast)
Source: Haver Analytics®, National Statistics Offices, Central Banks, Credit Suisse Source: Haver Analytics®, National Statistics Offices, Credit Suisse

06
Ma
rch
20
14
Em
erg
ing M
ark
ets
Qu
arte
rly
26
Exhibit 58: NJA* (ex-Ch & In) headline inflation Exhibit 59: EEMEA* headline inflation Exhibit 60: LatAm* headline inflation
3m % change, annualized (sa) and % year-on-year 3m % change, annualized (sa) and % year-on-year 3m % change, annualized (sa) and % year-on-year
10 10 10 10 10 10 10 10 10 10 10 10 11 11 11 11 11 11 11 11 11 11 11 11 12 12 12 12 12 12 12 12 12 12 12 12 13 13 13 13 13 13 13 13 13 13 13 13 14 14 14 14 14 14 14 14 14 14 14 14 15 15
0
2
4
6
8
10
0
2
4
6
8
10
Jan-10 Jan-12 Jan-14
Headline CPI (%yoy)
Headline CPI (3m% ann.)
CS
fo
reca
st
10 10 10 10 10 10 10 10 10 10 10 10 11 11 11 11 11 11 11 11 11 11 11 11 12 12 12 12 12 12 12 12 12 12 12 12 13 13 13 13 13 13 13 13 13 13 13 13 14 14 14 14 14 14 14 14 14 14 14 14 15 15
0
2
4
6
8
10
0
2
4
6
8
10
Jan-10 Jan-12 Jan-14
Headline CPI (%yoy)
Headline CPI (3m% ann.)
CS
fo
reca
st
10 10 10 10 10 10 10 10 10 10 10 10 11 11 11 11 11 11 11 11 11 11 11 11 12 12 12 12 12 12 12 12 12 12 12 12 13 13 13 13 13 13 13 13 13 13 13 13 14 14 14 14 14 14 14 14 14 14 14 14 15 15
0
2
4
6
8
10
0
2
4
6
8
10
Jan-10 Jan-12 Jan-14
Headline CPI (%yoy)
Headline CPI (3m% ann.)
CS
fo
reca
st
Exhibit 61: China headline inflation Exhibit 62: India headline inflation Exhibit 63: Indonesia headline inflation
3m % change, annualized (sa) and % year-on-year 3m % change, annualized (sa) and % year-on-year 3m % change, annualized (sa) and % year-on-year
10 10 10 10 10 10 10 10 10 10 10 10 11 11 11 11 11 11 11 11 11 11 11 11 12 12 12 12 12 12 12 12 12 12 12 12 13 13 13 13 13 13 13 13 13 13 13 13 14 14 14 14 14 14 14 14 14 14 14 14 15 15
0
3
6
9
12
0
3
6
9
12
Jan-10 Jan-12 Jan-14
Headline CPI (%yoy)
Headline CPI (3m% ann.)
CS
fo
reca
st
10 10 10 10 10 10 10 10 10 10 10 10 11 11 11 11 11 11 11 11 11 11 11 11 12 12 12 12 12 12 12 12 12 12 12 12 13 13 13 13 13 13 13 13 13 13 13 13 14 14 14 14 14 14 14 14 14 14 14 14 15 15
0
5
10
15
20
25
0
5
10
15
20
25
Jan-10 Jan-12 Jan-14
Headline CPI (%yoy)
Headline CPI (3m% ann.)
CS
fo
reca
st
10 10 10 10 10 10 10 10 10 10 10 11 11 11 11 11 11 11 11 11 11 11 11 12 12 12 12 12 12 12 12 12 12 12 12 13 13 13 13 13 13 13 13 13 13 13 13 14 14 14 14 14 14 14 14 14 14 14 14 15 15 15
0
3
6
9
12
15
18
0
3
6
9
12
15
18
Feb-10 Feb-12 Feb-14
Headline CPI (%yoy)
Headline CPI (3m% ann.)
CS
fo
reca
st
*LatAm CPI includes series for Brazil, Chile, Colombia, Mexico and Peru aggregated by their PPP adjusted GDP weights. EEMEA CPI includes series for Czech Republic, Hungary, Israel, Poland, Romania, Russia, South Africa, Turkey, and Ukraine. NJA CPI includes series for Hong Kong, Indonesia, Korea, Malaysia, the Philippines, Singapore, Taiwan and Thailand.
Note: Bank Indonesia's headline inflation target for 2014 is 4.5% with a +/-1% permissible fluctuation band, illustrated by the shaded area in Exhibit 63.
Source: Haver Analytics®, National Statistics Offices, Credit Suisse

06
Ma
rch
20
14
Em
erg
ing M
ark
ets
Qu
arte
rly
27
Exhibit 64: South Korea headline inflation Exhibit 65: Malaysia headline inflation Exhibit 66: The Philippines headline inflation
3m % change, annualized (sa) and % year-on-year 3m % change, annualized (sa) and % year-on-year 3m % change, annualized (sa) and % year-on-year
10 10 10 10 10 10 10 10 10 10 10 11 11 11 11 11 11 11 11 11 11 11 11 12 12 12 12 12 12 12 12 12 12 12 12 13 13 13 13 13 13 13 13 13 13 13 13 14 14 14 14 14 14 14 14 14 14 14 14 15 15 15
-1
2
5
8
-1
2
5
8
Feb-10 Feb-12 Feb-14
Headline CPI (%yoy)Headline CPI (3m% ann.)
CS
fo
reca
st
10 10 10 10 10 10 10 10 10 10 10 10 11 11 11 11 11 11 11 11 11 11 11 11 12 12 12 12 12 12 12 12 12 12 12 12 13 13 13 13 13 13 13 13 13 13 13 13 14 14 14 14 14 14 14 14 14 14 14 14 15 15
0
2
4
6
8
0
2
4
6
8
Jan-10 Jan-12 Jan-14
Headline CPI (%yoy)
Headline CPI (3m% ann.)
CS
fo
reca
st
10 10 10 10 10 10 10 10 10 10 10 11 11 11 11 11 11 11 11 11 11 11 11 12 12 12 12 12 12 12 12 12 12 12 12 13 13 13 13 13 13 13 13 13 13 13 13 14 14 14 14 14 14 14 14 14 14 14 14 15 15 15
0
2
4
6
8
10
0
2
4
6
8
10
Feb-10 Feb-12 Feb-14
Headline CPI (%yoy)
Headline CPI (3m% ann.)
CS
fo
reca
st
Exhibit 67: Singapore headline inflation Exhibit 68: Taiwan headline inflation Exhibit 69: Thailand headline inflation
3m % change, annualized (sa) and % year-on-year 3m % change, annualized (sa) and % year-on-year 3m % change, annualized (sa) and % year-on-year
10 10 10 10 10 10 10 10 10 10 10 10 11 11 11 11 11 11 11 11 11 11 11 11 12 12 12 12 12 12 12 12 12 12 12 12 13 13 13 13 13 13 13 13 13 13 13 13 14 14 14 14 14 14 14 14 14 14 14 14 15 15
-8
-4
0
4
8
12
-8
-4
0
4
8
12
Jan-10 Jan-12 Jan-14
Headline CPI (%yoy)
Headline CPI (3m% ann.)
CS
fo
reca
st
10 10 10 10 10 10 10 10 10 10 10 10 11 11 11 11 11 11 11 11 11 11 11 11 12 12 12 12 12 12 12 12 12 12 12 12 13 13 13 13 13 13 13 13 13 13 13 13 14 14 14 14 14 14 14 14 14 14 14 14 15 15
-6
-4
-2
0
2
4
6
8
-6
-4
-2
0
2
4
6
8
Jan-10 Jan-12 Jan-14
Headline CPI (%yoy)
Headline CPI (3m% ann.)
CS
fo
reca
st
10 10 10 10 10 10 10 10 10 10 10 11 11 11 11 11 11 11 11 11 11 11 11 12 12 12 12 12 12 12 12 12 12 12 12 13 13 13 13 13 13 13 13 13 13 13 13 14 14 14 14 14 14 14 14 14 14 14 14 15 15 15
-2
0
2
4
6
8
-2
0
2
4
6
8
Feb-10 Feb-12 Feb-14
Headline CPI (%yoy)
Headline CPI (3m% ann.)
CS
fo
reca
st
Note: 1. Bank of Korea's headline inflation target range for 2014 is 2.5-3.5%, illustrated by the shaded area in Exhibit 64. The Philippines Central Bank's headline inflation target for 2012-2014 is 4.0% with a +/-1% permissible fluctuation band, illustrated by the shaded area in Exhibit 66.
Source: Haver Analytics®, National Statistics Offices, Credit Suisse

06
Ma
rch
20
14
Em
erg
ing M
ark
ets
Qu
arte
rly
28
Exhibit 70: Czech Republic headline inflation Exhibit 71: Hungary headline inflation Exhibit 72: Israel headline inflation
3m % change, annualized (sa) and % year-on-year 3m % change, annualized (sa) and % year-on-year 3m % change, annualized (sa) and % year-on-year
10 10 10 10 10 10 10 10 10 10 10 10 11 11 11 11 11 11 11 11 11 11 11 11 12 12 12 12 12 12 12 12 12 12 12 12 13 13 13 13 13 13 13 13 13 13 13 13 14 14 14 14 14 14 14 14 14 14 14 14 15 15
-4
-2
0
2
4
6
8
-4
-2
0
2
4
6
8
Jan-10 Jan-12 Jan-14
Headline CPI (%yoy)Headline CPI (3m% ann.)
CS
fo
reca
st
10 10 10 10 10 10 10 10 10 10 10 10 11 11 11 11 11 11 11 11 11 11 11 11 12 12 12 12 12 12 12 12 12 12 12 12 13 13 13 13 13 13 13 13 13 13 13 13 14 14 14 14 14 14 14 14 14 14 14 14 15 15
-2
1
4
7
10
13
-2
1
4
7
10
13
Jan-10 Jan-12 Jan-14
Headline CPI (%yoy)Headline CPI (3m% ann.)
CS
fo
reca
st
10 10 10 10 10 10 10 10 10 10 10 10 11 11 11 11 11 11 11 11 11 11 11 11 12 12 12 12 12 12 12 12 12 12 12 12 13 13 13 13 13 13 13 13 13 13 13 13 14 14 14 14 14 14 14 14 14 14 14 14 15 15
-3
0
3
6
9
-3
0
3
6
9
Jan-10 Jan-12 Jan-14
Headline CPI (%yoy)Headline CPI (3m% ann.)
CS
fo
reca
st
Exhibit 73: Poland headline inflation Exhibit 74: Romania headline inflation Exhibit 75: Russia headline inflation
3m % change, annualized (sa) and % year-on-year 3m % change, annualized (sa) and % year-on-year 3m % change, annualized (sa) and % year-on-year
10 10 10 10 10 10 10 10 10 10 10 10 11 11 11 11 11 11 11 11 11 11 11 11 12 12 12 12 12 12 12 12 12 12 12 12 13 13 13 13 13 13 13 13 13 13 13 13 14 14 14 14 14 14 14 14 14 14 14 14 15 15
-3
0
3
6
9
-3
0
3
6
9
Jan-10 Jan-12 Jan-14
Headline CPI (%yoy)Headline CPI (3m% ann.)
CS
fo
reca
st
10 10 10 10 10 10 10 10 10 10 10 10 11 11 11 11 11 11 11 11 11 11 11 11 12 12 12 12 12 12 12 12 12 12 12 12 13 13 13 13 13 13 13 13 13 13 13 13 14 14 14 14 14 14 14 14 14 14 14 14 15 15
-4
0
4
8
12
16
-4
0
4
8
12
16
Jan-10 Jan-12 Jan-14
Headline CPI (%yoy)Headline CPI (3m% ann.)
fore
ca
st
10 10 10 10 10 10 10 10 10 10 10 11 11 11 11 11 11 11 11 11 11 11 11 12 12 12 12 12 12 12 12 12 12 12 12 13 13 13 13 13 13 13 13 13 13 13 13 14 14 14 14 14 14 14 14 14 14 14 14 15 15 15
0
3
6
9
12
15
0
3
6
9
12
15
Feb-10 Feb-12 Feb-14
Headline CPI (%yoy)Headline CPI (3m% ann.)
CS
fo
reca
st
Note: Czech National Bank's headline inflation target for 2014 is 2% with a permissible fluctuation band of +/-1%, illustrated by the shaded area in Exhibit 70. Hungarian National Bank's medium-term target for headline inflation is 3%, as illustrated in Exhibit 71. Bank of Israel's headline inflation target for 2014 is 2.0% with a permissible fluctuation band of +/-1%, illustrated by the shaded area in Exhibit 72. The National Bank of Poland's headline inflation target has been 2.5% with a permissible fluctuation band of +/-1% since 2004, illustrated by the shaded area in Exhibit 73. The National Bank of Romania's headline inflation target for 2014 is 2.5% with a permissible fluctuation band of +/-1%, illustrated by the shaded area in Exhibit 74. Bank of Russia's headline inflation target for 2014 is 5% with a permissible fluctuation band of +/-1.5%, illustrated by the shaded area in Exhibit 75.
Source: Haver Analytics®, National Statistics Offices, Central Banks, Credit Suisse
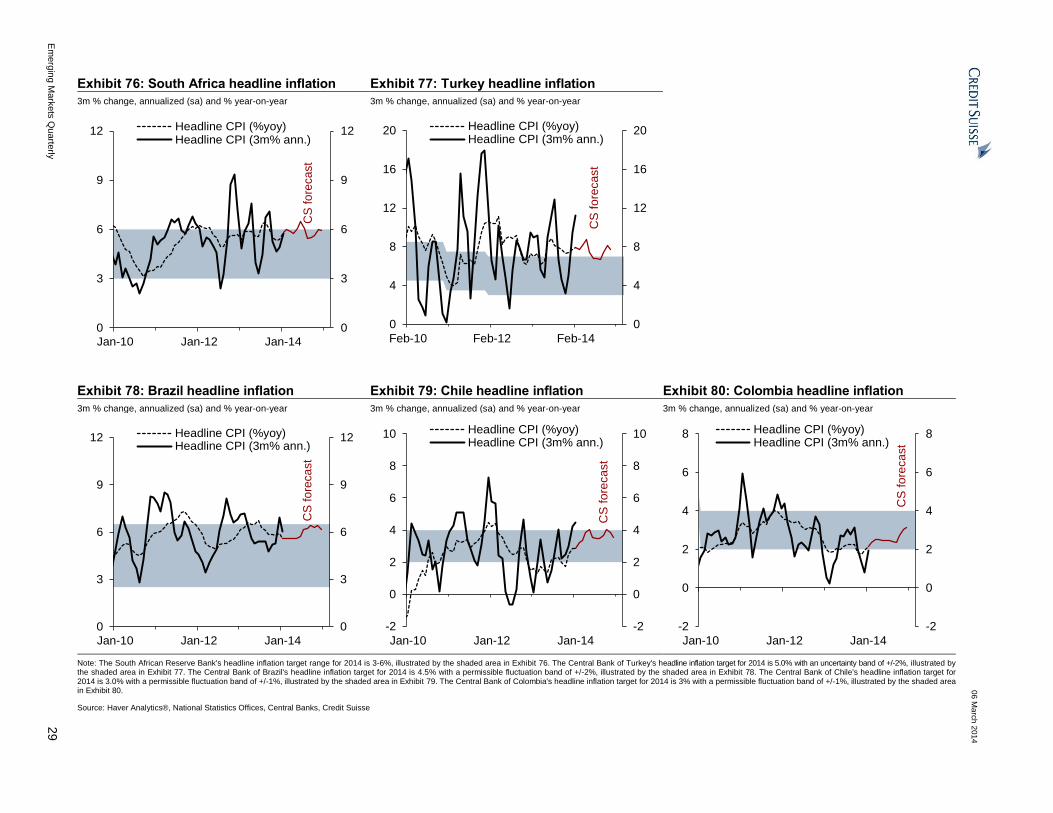
06
Ma
rch
20
14
Em
erg
ing M
ark
ets
Qu
arte
rly
29
Exhibit 76: South Africa headline inflation Exhibit 77: Turkey headline inflation
3m % change, annualized (sa) and % year-on-year 3m % change, annualized (sa) and % year-on-year
10 10 10 10 10 10 10 10 10 10 10 10 11 11 11 11 11 11 11 11 11 11 11 11 12 12 12 12 12 12 12 12 12 12 12 12 13 13 13 13 13 13 13 13 13 13 13 13 14 14 14 14 14 14 14 14 14 14 14 14 15 15
0
3
6
9
12
0
3
6
9
12
Jan-10 Jan-12 Jan-14
Headline CPI (%yoy)Headline CPI (3m% ann.)
CS
fo
reca
st
10 10 10 10 10 10 10 10 10 10 10 11 11 11 11 11 11 11 11 11 11 11 11 12 12 12 12 12 12 12 12 12 12 12 12 13 13 13 13 13 13 13 13 13 13 13 13 14 14 14 14 14 14 14 14 14 14 14 14 15 15 15
0
4
8
12
16
20
0
4
8
12
16
20
Feb-10 Feb-12 Feb-14
Headline CPI (%yoy)Headline CPI (3m% ann.)
CS
fo
reca
st
Exhibit 78: Brazil headline inflation Exhibit 79: Chile headline inflation Exhibit 80: Colombia headline inflation
3m % change, annualized (sa) and % year-on-year 3m % change, annualized (sa) and % year-on-year 3m % change, annualized (sa) and % year-on-year
10 10 10 10 10 10 10 10 10 10 10 10 11 11 11 11 11 11 11 11 11 11 11 11 12 12 12 12 12 12 12 12 12 12 12 12 13 13 13 13 13 13 13 13 13 13 13 13 14 14 14 14 14 14 14 14 14 14 14 14 15 15
0
3
6
9
12
0
3
6
9
12
Jan-10 Jan-12 Jan-14
Headline CPI (%yoy)Headline CPI (3m% ann.)
CS
fo
reca
st
10 10 10 10 10 10 10 10 10 10 10 10 11 11 11 11 11 11 11 11 11 11 11 11 12 12 12 12 12 12 12 12 12 12 12 12 13 13 13 13 13 13 13 13 13 13 13 13 14 14 14 14 14 14 14 14 14 14 14 14 15 15
-2
0
2
4
6
8
10
-2
0
2
4
6
8
10
Jan-10 Jan-12 Jan-14
Headline CPI (%yoy)Headline CPI (3m% ann.)
CS
fo
reca
st
10 10 10 10 10 10 10 10 10 10 10 10 11 11 11 11 11 11 11 11 11 11 11 11 12 12 12 12 12 12 12 12 12 12 12 12 13 13 13 13 13 13 13 13 13 13 13 13 14 14 14 14 14 14 14 14 14 14 14 14 15 15
-2
0
2
4
6
8
-2
0
2
4
6
8
Jan-10 Jan-12 Jan-14
Headline CPI (%yoy)Headline CPI (3m% ann.)
CS
fo
reca
st
Note: The South African Reserve Bank's headline inflation target range for 2014 is 3-6%, illustrated by the shaded area in Exhibit 76. The Central Bank of Turkey's headline inflation target for 2014 is 5.0% with an uncertainty band of +/-2%, illustrated by the shaded area in Exhibit 77. The Central Bank of Brazil's headline inflation target for 2014 is 4.5% with a permissible fluctuation band of +/-2%, illustrated by the shaded area in Exhibit 78. The Central Bank of Chile's headline inflation target for 2014 is 3.0% with a permissible fluctuation band of +/-1%, illustrated by the shaded area in Exhibit 79. The Central Bank of Colombia's headline inflation target for 2014 is 3% with a permissible fluctuation band of +/-1%, illustrated by the shaded area in Exhibit 80.
Source: Haver Analytics®, National Statistics Offices, Central Banks, Credit Suisse
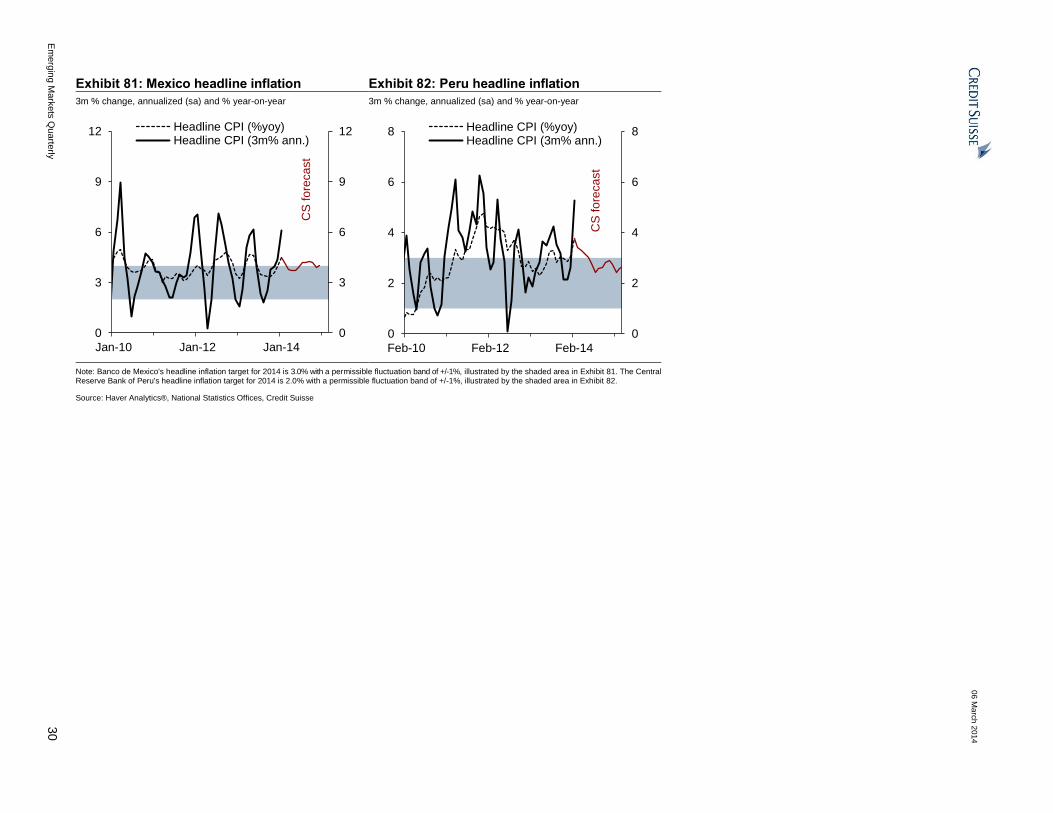
06
Ma
rch
20
14
Em
erg
ing M
ark
ets
Qu
arte
rly
30
Exhibit 81: Mexico headline inflation Exhibit 82: Peru headline inflation
3m % change, annualized (sa) and % year-on-year 3m % change, annualized (sa) and % year-on-year
10 10 10 10 10 10 10 10 10 10 10 10 11 11 11 11 11 11 11 11 11 11 11 11 12 12 12 12 12 12 12 12 12 12 12 12 13 13 13 13 13 13 13 13 13 13 13 13 14 14 14 14 14 14 14 14 14 14 14 14 15 15
0
3
6
9
12
0
3
6
9
12
Jan-10 Jan-12 Jan-14
Headline CPI (%yoy)Headline CPI (3m% ann.)
CS
fo
reca
st
10 10 10 10 10 10 10 10 10 10 10 11 11 11 11 11 11 11 11 11 11 11 11 12 12 12 12 12 12 12 12 12 12 12 12 13 13 13 13 13 13 13 13 13 13 13 13 14 14 14 14 14 14 14 14 14 14 14 14 15 15 15
0
2
4
6
8
0
2
4
6
8
Feb-10 Feb-12 Feb-14
Headline CPI (%yoy)Headline CPI (3m% ann.)
CS
fo
reca
st
Note: Banco de Mexico's headline inflation target for 2014 is 3.0% with a permissible fluctuation band of +/-1%, illustrated by the shaded area in Exhibit 81. The Central Reserve Bank of Peru's headline inflation target for 2014 is 2.0% with a permissible fluctuation band of +/-1%, illustrated by the shaded area in Exhibit 82.
Source: Haver Analytics®, National Statistics Offices, Credit Suisse

06
Ma
rch
20
14
Em
erg
ing M
ark
ets
Qu
arte
rly
31
Exhibit 83: NJA (ex-China & India) core inflation
Exhibit 84: NJA (ex-China & India) food price inflation
Exhibit 85: NJA (ex-China & India) energy inflation
% year-on-year and annualized 3m % change (sa) %year-on-year %year-on-year
10 10 10 10 10 10 10 10 10 10 10 10 11 11 11 11 11 11 11 11 11 11 11 11 12 12 12 12 12 12 12 12 12 12 12 12 13 13 13 13 13 13 13 13 13 13 13 13 14 14
0
1
2
3
4
5
0
1
2
3
4
5
Jan-10 May-11 Sep-12 Jan-14
Core CPI (%yoy)
Core CPI (3m% ann.)
08 09 09 09 09 09 09 09 09 09 09 09 09 10 10 10 10 10 10 10 10 10 10 10 10 11 11 11 11 11 11 11 11 11 11 11 11 12 12 12 12 12 12 12 12 12 12 12 12 13 13 13 13 13 13 13 13 13 13 13 13 14 14 14 14 14 14 14 14 14 14 14 14 15
0
3
6
9
12
15
-15
0
15
30
Dec-08 Dec-10 Dec-12 Dec-14
CRB food (lccy, %yoy, left)
NJA ex-Ch&In food CPI (%yoy)
Fcst*
08 09 09 09 09 09 09 09 09 09 09 09 09 10 10 10 10 10 10 10 10 10 10 10 10 11 11 11 11 11 11 11 11 11 11 11 11 12 12 12 12 12 12 12 12 12 12 12 12 13 13 13 13 13 13 13 13 13 13 13 13 14 14 14 14 14 14 14 14 14 14 14 14 15
-20
-10
0
10
20
30
-40
-20
0
20
40
60
Dec-08 Dec-10 Dec-12 Dec-14
Brent oil (lccy, %yoy, left)
NJA (ex-Ch&In) energy CPI (%yoy)
Fcst*
Exhibit 86: EEMEA core inflation Exhibit 87: EEMEA food price inflation Exhibit 88: EEMEA energy inflation
% year-on-year and annualized 3m % change (sa) %year-on-year %year-on-year
10 10 10 10 10 10 10 10 10 10 10 10 11 11 11 11 11 11 11 11 11 11 11 11 12 12 12 12 12 12 12 12 12 12 12 12 13 13 13 13 13 13 13 13 13 13 13 13 14 14
2
3
4
5
6
7
2
3
4
5
6
7
Jan-10 May-11 Sep-12 Jan-14
Core CPI (%yoy)
Core CPI (3m% ann.)
08 09 09 09 09 09 09 09 09 09 09 09 09 10 10 10 10 10 10 10 10 10 10 10 10 11 11 11 11 11 11 11 11 11 11 11 11 12 12 12 12 12 12 12 12 12 12 12 12 13 13 13 13 13 13 13 13 13 13 13 13 14 14 14 14 14 14 14 14 14 14 14 14 15
0
4
8
12
16
20
24
-10
0
10
20
30
40
50
Dec-08 Dec-10 Dec-12 Dec-14
CRB food (lccy, %yoy)
EEMEA food CPI (%yoy, right)
Fcst*
08 09 09 09 09 09 09 09 09 09 09 09 09 10 10 10 10 10 10 10 10 10 10 10 10 11 11 11 11 11 11 11 11 11 11 11 11 12 12 12 12 12 12 12 12 12 12 12 12 13 13 13 13 13 13 13 13 13 13 13 13 14 14 14 14 14 14 14 14 14 14 14 14 15
-5
0
5
10
15
20
25
-60
-30
0
30
60
90
Dec-08 Dec-10 Dec-12 Dec-14
Brent oil (lccy, %yoy)
EEMEA energy CPI (%yoy, right)
Fcst*
*Assuming unchanged CRB food, Brent oil prices and exchange rates for the rest of 2014
Source: Haver Analytics®, National Statistics Offices, Credit Suisse
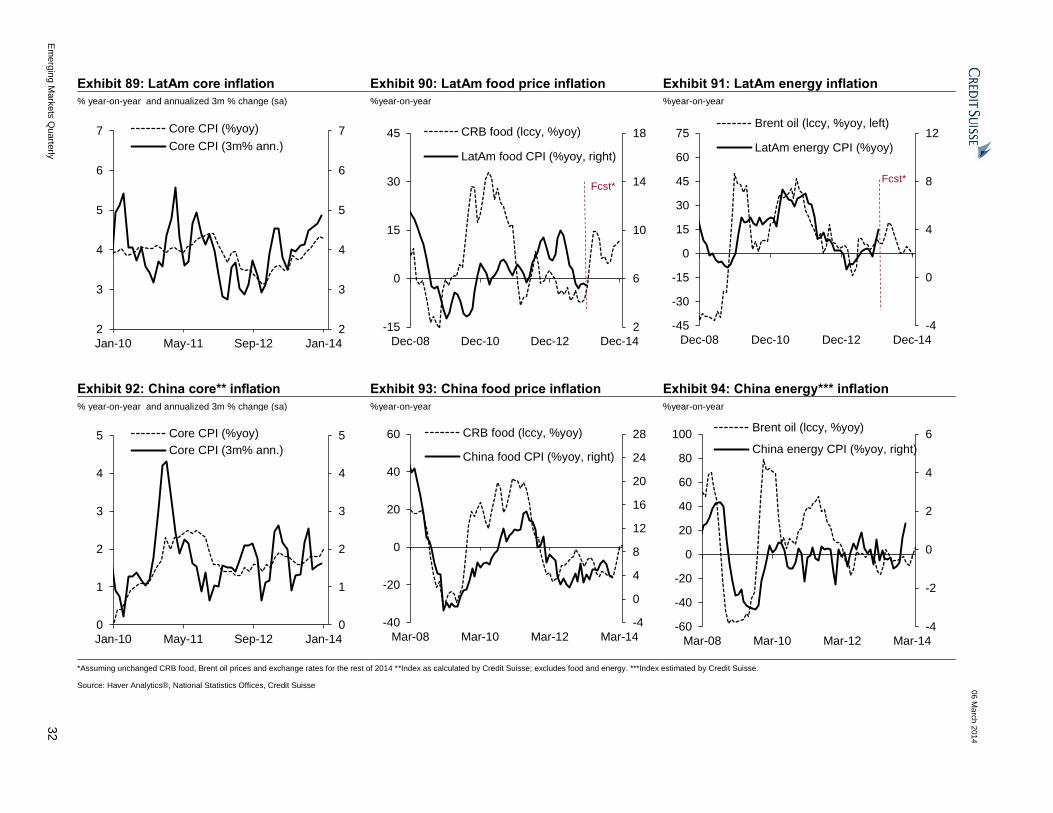
06
Ma
rch
20
14
Em
erg
ing M
ark
ets
Qu
arte
rly
32
Exhibit 89: LatAm core inflation Exhibit 90: LatAm food price inflation Exhibit 91: LatAm energy inflation
% year-on-year and annualized 3m % change (sa) %year-on-year %year-on-year
10 10 10 10 10 10 10 10 10 10 10 10 11 11 11 11 11 11 11 11 11 11 11 11 12 12 12 12 12 12 12 12 12 12 12 12 13 13 13 13 13 13 13 13 13 13 13 13 14 14
2
3
4
5
6
7
2
3
4
5
6
7
Jan-10 May-11 Sep-12 Jan-14
Core CPI (%yoy)
Core CPI (3m% ann.)
08 09 09 09 09 09 09 09 09 09 09 09 09 10 10 10 10 10 10 10 10 10 10 10 10 11 11 11 11 11 11 11 11 11 11 11 11 12 12 12 12 12 12 12 12 12 12 12 12 13 13 13 13 13 13 13 13 13 13 13 13 14 14 14 14 14 14 14 14 14 14 14 14 15
2
6
10
14
18
-15
0
15
30
45
Dec-08 Dec-10 Dec-12 Dec-14
CRB food (lccy, %yoy)
LatAm food CPI (%yoy, right)
Fcst*
08 09 09 09 09 09 09 09 09 09 09 09 09 10 10 10 10 10 10 10 10 10 10 10 10 11 11 11 11 11 11 11 11 11 11 11 11 12 12 12 12 12 12 12 12 12 12 12 12 13 13 13 13 13 13 13 13 13 13 13 13 14 14 14 14 14 14 14 14 14 14 14 14 15
-4
0
4
8
12
-45
-30
-15
0
15
30
45
60
75
Dec-08 Dec-10 Dec-12 Dec-14
Brent oil (lccy, %yoy, left)
LatAm energy CPI (%yoy)
Fcst*
Exhibit 92: China core** inflation Exhibit 93: China food price inflation Exhibit 94: China energy*** inflation
% year-on-year and annualized 3m % change (sa) %year-on-year %year-on-year
10 10 10 10 10 10 10 10 10 10 10 10 11 11 11 11 11 11 11 11 11 11 11 11 12 12 12 12 12 12 12 12 12 12 12 12 13 13 13 13 13 13 13 13 13 13 13 13 14 14
0
1
2
3
4
5
0
1
2
3
4
5
Jan-10 May-11 Sep-12 Jan-14
Core CPI (%yoy)
Core CPI (3m% ann.)
08 08 08 08 08 08 08 08 08 08 09 09 09 09 09 09 09 09 09 09 09 09 10 10 10 10 10 10 10 10 10 10 10 10 11 11 11 11 11 11 11 11 11 11 11 11 12 12 12 12 12 12 12 12 12 12 12 12 13 13 13 13 13 13 13 13 13 13 13 13 14 14 14 14
-4
0
4
8
12
16
20
24
28
-40
-20
0
20
40
60
Mar-08 Mar-10 Mar-12 Mar-14
CRB food (lccy, %yoy)
China food CPI (%yoy, right)
08 08 08 08 08 08 08 08 08 08 09 09 09 09 09 09 09 09 09 09 09 09 10 10 10 10 10 10 10 10 10 10 10 10 11 11 11 11 11 11 11 11 11 11 11 11 12 12 12 12 12 12 12 12 12 12 12 12 13 13 13 13 13 13 13 13 13 13 13 13 14 14 14 14
-4
-2
0
2
4
6
-60
-40
-20
0
20
40
60
80
100
Mar-08 Mar-10 Mar-12 Mar-14
Brent oil (lccy, %yoy)
China energy CPI (%yoy, right)
*Assuming unchanged CRB food, Brent oil prices and exchange rates for the rest of 2014 **Index as calculated by Credit Suisse; excludes food and energy. ***Index estimated by Credit Suisse.
Source: Haver Analytics®, National Statistics Offices, Credit Suisse

06
Ma
rch
20
14
Em
erg
ing M
ark
ets
Qu
arte
rly
33
Exhibit 95: India core* inflation Exhibit 96: India food price inflation Exhibit 97: India energy inflation
% year-on-year and annualized 3m % change (sa) %year-on-year %year-on-year
0
5
10
15
2010 10 10 10 10 10 10 10 10 10 10 10 11 11 11 11 11 11 11 11 11 11 11 11 12 12 12 12 12 12 12 12 12 12 12 12 13 13 13 13 13 13 13 13 13 13 13 13 14 14
0
5
10
15
20
Jan-10 May-11 Sep-12 Jan-14
Core CPI (%yoy)
Core CPI (3m% ann.)
08 08 08 08 08 08 08 08 08 08 09 09 09 09 09 09 09 09 09 09 09 09 10 10 10 10 10 10 10 10 10 10 10 10 11 11 11 11 11 11 11 11 11 11 11 11 12 12 12 12 12 12 12 12 12 12 12 12 13 13 13 13 13 13 13 13 13 13 13 13 14 14 14 14
2
6
10
14
18
22
26
-30
-15
0
15
30
45
60
Mar-08 Mar-10 Mar-12 Mar-14
CRB food (lccy, %yoy)
India food CPI (%yoy, right)
08 08 08 08 08 08 08 08 08 08 09 09 09 09 09 09 09 09 09 09 09 09 10 10 10 10 10 10 10 10 10 10 10 10 11 11 11 11 11 11 11 11 11 11 11 11 12 12 12 12 12 12 12 12 12 12 12 12 13 13 13 13 13 13 13 13 13 13 13 13 14 14 14 14
-5
0
5
10
15
20
-60
-40
-20
0
20
40
60
80
100
Mar-08 Mar-10 Mar-12 Mar-14
Brent oil (lccy, %yoy)
India energy CPI (%yoy, right)
Exhibit 98: South Korea core** inflation Exhibit 99: South Korea food price inflation Exhibit 100: South Korea energy inflation
% year-on-year and annualized 3m % change (sa) %year-on-year %year-on-year
10 10 10 10 10 10 10 10 10 10 10 11 11 11 11 11 11 11 11 11 11 11 11 12 12 12 12 12 12 12 12 12 12 12 12 13 13 13 13 13 13 13 13 13 13 13 13 14 14 14
0
1
2
3
4
5
0
1
2
3
4
5
Feb-10 Jun-11 Oct-12 Feb-14
Core CPI (%yoy)
Core CPI (3m% ann.)
08 08 08 08 08 08 08 08 08 08 09 09 09 09 09 09 09 09 09 09 09 09 10 10 10 10 10 10 10 10 10 10 10 10 11 11 11 11 11 11 11 11 11 11 11 11 12 12 12 12 12 12 12 12 12 12 12 12 13 13 13 13 13 13 13 13 13 13 13 13 14 14 14 14
-4
0
4
8
12
16
-60
-40
-20
0
20
40
60
Mar-08 Mar-10 Mar-12 Mar-14
CRB food (lccy, %yoy)
Korea food CPI (%yoy, right)
08 08 08 08 08 08 08 08 08 08 09 09 09 09 09 09 09 09 09 09 09 09 10 10 10 10 10 10 10 10 10 10 10 10 11 11 11 11 11 11 11 11 11 11 11 11 12 12 12 12 12 12 12 12 12 12 12 12 13 13 13 13 13 13 13 13 13 13 13 13 14 14 14 14
-15
-10
-5
0
5
10
15
20
25
-60
-40
-20
0
20
40
60
80
100
Mar-08 Mar-10 Mar-12 Mar-14
Brent oil (lccy, %yoy)
Korea energy CPI (%yoy, right)
*Index calculated by Credit Suisse: based on the WPI excluding primary food articles, manufactured food products, fuel and power, beverages and tobacco. **Index as calculated by Credit Suisse: excludes food and non-alcoholic beverages, alcohol and tobacco, ‘electricity, gas and other fuels’ and fuels for transport equipment.
Source: Haver Analytics®, National Statistics Offices, Credit Suisse

06
Ma
rch
20
14
Em
erg
ing M
ark
ets
Qu
arte
rly
34
Exhibit 101: Indonesia core* inflation Exhibit 102: Indonesia food price inflation
% year-on-year and annualized 3m % change (sa) %year-on-year
10 10 10 10 10 10 10 10 10 10 10 11 11 11 11 11 11 11 11 11 11 11 11 12 12 12 12 12 12 12 12 12 12 12 12 13 13 13 13 13 13 13 13 13 13 13 13 14 14 14
0
3
6
9
0
3
6
9
Feb-10 Jun-11 Oct-12 Feb-14
Core CPI (%yoy)
Core CPI (3m% ann.)
08 08 08 08 08 08 08 08 08 08 09 09 09 09 09 09 09 09 09 09 09 09 10 10 10 10 10 10 10 10 10 10 10 10 11 11 11 11 11 11 11 11 11 11 11 11 12 12 12 12 12 12 12 12 12 12 12 12 13 13 13 13 13 13 13 13 13 13 13 13 14 14 14 14
0
4
8
12
16
20
24
-30
-15
0
15
30
45
60
Mar-08 Mar-10 Mar-12 Mar-14
CRB food (lccy, %yoy)
Indonesia food CPI (%yoy, right)
Exhibit 103: Malaysia core** inflation Exhibit 104: Malaysia food price inflation Exhibit 105: Malaysia energy inflation
% year-on-year and annualized 3m % change (sa) %year-on-year %year-on-year
10 10 10 10 10 10 10 10 10 10 10 10 11 11 11 11 11 11 11 11 11 11 11 11 12 12 12 12 12 12 12 12 12 12 12 12 13 13 13 13 13 13 13 13 13 13 13 13 14 14
-1
0
1
2
3
4
-1
0
1
2
3
4
Jan-10 May-11 Sep-12 Jan-14
Core CPI (%yoy)
Core CPI (3m% ann.)
08 08 08 08 08 08 08 08 08 08 09 09 09 09 09 09 09 09 09 09 09 09 10 10 10 10 10 10 10 10 10 10 10 10 11 11 11 11 11 11 11 11 11 11 11 11 12 12 12 12 12 12 12 12 12 12 12 12 13 13 13 13 13 13 13 13 13 13 13 13 14 14 14 14
-1
2
5
8
11
14
-30
-15
0
15
30
45
60
Mar-08 Mar-10 Mar-12 Mar-14
CRB food (lccy, %yoy)
Malaysia food CPI (%yoy, right)
08 08 08 08 08 08 08 08 08 08 09 09 09 09 09 09 09 09 09 09 09 09 10 10 10 10 10 10 10 10 10 10 10 10 11 11 11 11 11 11 11 11 11 11 11 11 12 12 12 12 12 12 12 12 12 12 12 12 13 13 13 13 13 13 13 13 13 13 13 13 14 14 14 14
-30
-20
-10
0
10
20
30
40
-60
-40
-20
0
20
40
60
80
100
Mar-08 Mar-10 Mar-12 Mar-14
Brent oil (lccy, %yoy)
Malaysia energy CPI (%yoy, right)
*Official core - CPI excluding food (volatile good) and energy, fuel, transportation and water supply (administered commodities). **Index as calculated by Credit Suisse: excludes food and non-alcoholic beverages, alcohol and tobacco, ‘electricity, gas and other fuels’ and fuels and lubricants for personal equipment.
Source: Haver Analytics®, National Statistics Offices, Credit Suisse
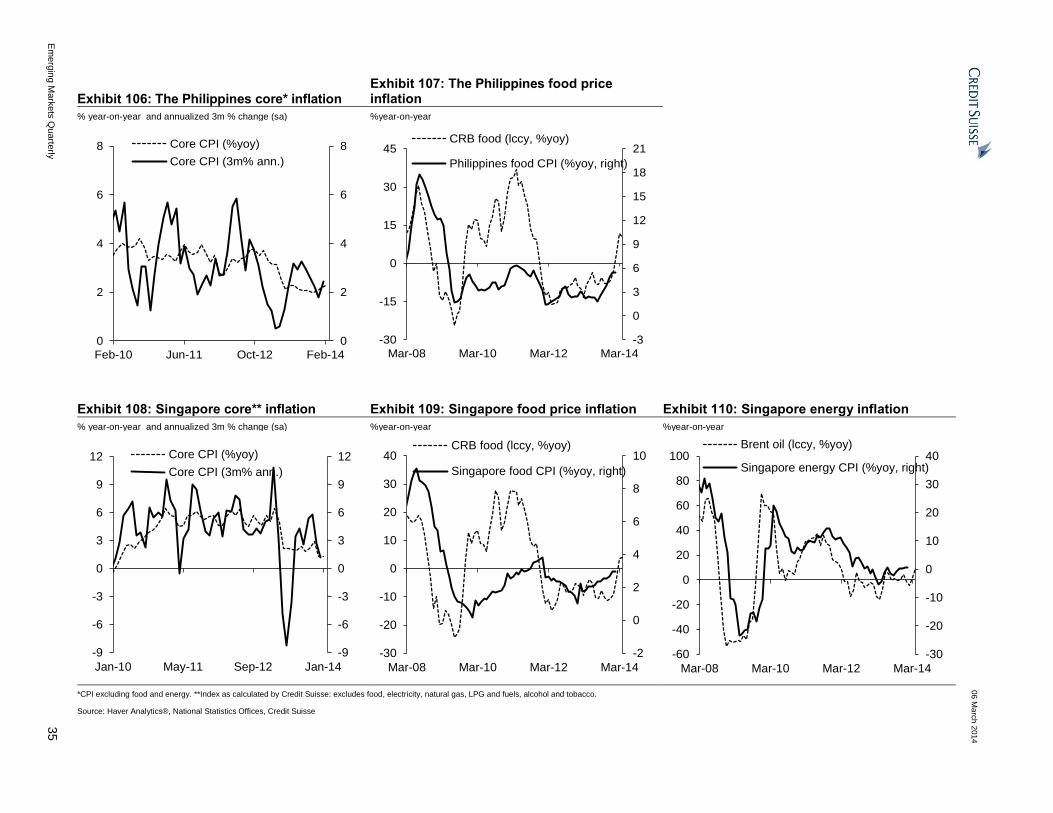
06
Ma
rch
20
14
Em
erg
ing M
ark
ets
Qu
arte
rly
35
Exhibit 106: The Philippines core* inflation Exhibit 107: The Philippines food price inflation
% year-on-year and annualized 3m % change (sa) %year-on-year
10 10 10 10 10 10 10 10 10 10 10 11 11 11 11 11 11 11 11 11 11 11 11 12 12 12 12 12 12 12 12 12 12 12 12 13 13 13 13 13 13 13 13 13 13 13 13 14 14 14
0
2
4
6
8
0
2
4
6
8
Feb-10 Jun-11 Oct-12 Feb-14
Core CPI (%yoy)
Core CPI (3m% ann.)
08 08 08 08 08 08 08 08 08 08 09 09 09 09 09 09 09 09 09 09 09 09 10 10 10 10 10 10 10 10 10 10 10 10 11 11 11 11 11 11 11 11 11 11 11 11 12 12 12 12 12 12 12 12 12 12 12 12 13 13 13 13 13 13 13 13 13 13 13 13 14 14 14 14
-3
0
3
6
9
12
15
18
21
-30
-15
0
15
30
45
Mar-08 Mar-10 Mar-12 Mar-14
CRB food (lccy, %yoy)
Philippines food CPI (%yoy, right)
Exhibit 108: Singapore core** inflation Exhibit 109: Singapore food price inflation Exhibit 110: Singapore energy inflation
% year-on-year and annualized 3m % change (sa) %year-on-year %year-on-year
10 10 10 10 10 10 10 10 10 10 10 10 11 11 11 11 11 11 11 11 11 11 11 11 12 12 12 12 12 12 12 12 12 12 12 12 13 13 13 13 13 13 13 13 13 13 13 13 14 14
-9
-6
-3
0
3
6
9
12
-9
-6
-3
0
3
6
9
12
Jan-10 May-11 Sep-12 Jan-14
Core CPI (%yoy)
Core CPI (3m% ann.)
08 08 08 08 08 08 08 08 08 08 09 09 09 09 09 09 09 09 09 09 09 09 10 10 10 10 10 10 10 10 10 10 10 10 11 11 11 11 11 11 11 11 11 11 11 11 12 12 12 12 12 12 12 12 12 12 12 12 13 13 13 13 13 13 13 13 13 13 13 13 14 14 14 14
-2
0
2
4
6
8
10
-30
-20
-10
0
10
20
30
40
Mar-08 Mar-10 Mar-12 Mar-14
CRB food (lccy, %yoy)
Singapore food CPI (%yoy, right)
08 08 08 08 08 08 08 08 08 08 09 09 09 09 09 09 09 09 09 09 09 09 10 10 10 10 10 10 10 10 10 10 10 10 11 11 11 11 11 11 11 11 11 11 11 11 12 12 12 12 12 12 12 12 12 12 12 12 13 13 13 13 13 13 13 13 13 13 13 13 14 14 14 14
-30
-20
-10
0
10
20
30
40
-60
-40
-20
0
20
40
60
80
100
Mar-08 Mar-10 Mar-12 Mar-14
Brent oil (lccy, %yoy)
Singapore energy CPI (%yoy, right)
*CPI excluding food and energy. **Index as calculated by Credit Suisse: excludes food, electricity, natural gas, LPG and fuels, alcohol and tobacco.
Source: Haver Analytics®, National Statistics Offices, Credit Suisse

06
Ma
rch
20
14
Em
erg
ing M
ark
ets
Qu
arte
rly
36
Exhibit 111: Taiwan core* inflation Exhibit 112: Taiwan food price inflation Exhibit 113: Taiwan energy inflation
% year-on-year and annualized 3m % change (sa) %year-on-year %year-on-year
10 10 10 10 10 10 10 10 10 10 10 11 11 11 11 11 11 11 11 11 11 11 11 12 12 12 12 12 12 12 12 12 12 12 12 13 13 13 13 13 13 13 13 13 13 13 13 14 14 14
-2
-1
0
1
2
3
-2
-1
0
1
2
3
Feb-10 Jun-11 Oct-12 Feb-14
Core CPI (%yoy)
Core CPI (3m% ann.)
08 08 08 08 08 08 08 08 08 08 09 09 09 09 09 09 09 09 09 09 09 09 10 10 10 10 10 10 10 10 10 10 10 10 11 11 11 11 11 11 11 11 11 11 11 11 12 12 12 12 12 12 12 12 12 12 12 12 13 13 13 13 13 13 13 13 13 13 13 13 14 14 14 14
-8
-4
0
4
8
12
16
-30
-20
-10
0
10
20
30
40
Mar-08 Mar-10 Mar-12 Mar-14
CRB food (lccy, %yoy)
Taiwan food CPI (%yoy, right)
08 08 08 08 08 08 08 08 08 08 09 09 09 09 09 09 09 09 09 09 09 09 10 10 10 10 10 10 10 10 10 10 10 10 11 11 11 11 11 11 11 11 11 11 11 11 12 12 12 12 12 12 12 12 12 12 12 12 13 13 13 13 13 13 13 13 13 13 13 13 14 14 14 14
-15
-10
-5
0
5
10
15
20
25
-60
-40
-20
0
20
40
60
80
100
Mar-08 Mar-10 Mar-12 Mar-14
Brent oil (lccy, %yoy)
Taiwan energy CPI (%yoy, right)
Exhibit 114: Thailand core** inflation Exhibit 115: Thailand food price inflation Exhibit 116: Thailand energy inflation
% year-on-year and annualized 3m % change (sa) %year-on-year %year-on-year
10 10 10 10 10 10 10 10 10 10 10 11 11 11 11 11 11 11 11 11 11 11 11 12 12 12 12 12 12 12 12 12 12 12 12 13 13 13 13 13 13 13 13 13 13 13 13 14 14 14
-2
0
2
4
-2
0
2
4
Feb-10 Feb-12 Feb-14
Core CPI (%yoy)Core CPI (3m% ann.)
08 08 08 08 08 08 08 08 08 08 09 09 09 09 09 09 09 09 09 09 09 09 10 10 10 10 10 10 10 10 10 10 10 10 11 11 11 11 11 11 11 11 11 11 11 11 12 12 12 12 12 12 12 12 12 12 12 12 13 13 13 13 13 13 13 13 13 13 13 13 14 14 14 14
-3
0
3
6
9
12
15
18
-30
-20
-10
0
10
20
30
40
Mar-08 Mar-10 Mar-12 Mar-14
CRB food (lccy, %yoy)
Thailand food CPI (%yoy, right)
08 08 08 08 08 08 08 08 08 08 09 09 09 09 09 09 09 09 09 09 09 09 10 10 10 10 10 10 10 10 10 10 10 10 11 11 11 11 11 11 11 11 11 11 11 11 12 12 12 12 12 12 12 12 12 12 12 12 13 13 13 13 13 13 13 13 13 13 13 13 14 14 14 14
-36
-27
-18
-9
0
9
18
27
36
45
54
-60
-45
-30
-15
0
15
30
45
60
75
90
Mar-08 Mar-10 Mar-12 Mar-14
Brent oil (lccy, %yoy)
Thailand energy CPI (%yoy, right)
*Index as calculated by Credit Suisse: excludes food and non-alcoholic beverages, gas, electricity and oils, alcohol and tobacco. **Index as calculated by Credit Suisse: excludes food and non-alcoholic beverages, energy, alcohol and tobacco.
Note: Bank of Thailand's core inflation target range for 2014 is 0.5%-3.0%, illustrated by the shaded area in Exhibit 114.
Source: Haver Analytics®, National Statistics Offices, Credit Suisse

06
Ma
rch
20
14
Em
erg
ing M
ark
ets
Qu
arte
rly
37
Exhibit 117: Czech core* inflation Exhibit 118: Czech food price inflation Exhibit 119: Czech energy inflation
% year-on-year and annualized 3m % change (sa) %year-on-year %year-on-year
10 10 10 10 10 10 10 10 10 10 10 10 11 11 11 11 11 11 11 11 11 11 11 11 12 12 12 12 12 12 12 12 12 12 12 12 13 13 13 13 13 13 13 13 13 13 13 13 14 14
-2
0
2
4
6
-2
0
2
4
6
Jan-10 May-11 Sep-12 Jan-14
Core CPI (%yoy)
Core CPI (3m% ann.)
08 08 08 08 08 08 08 08 08 08 09 09 09 09 09 09 09 09 09 09 09 09 10 10 10 10 10 10 10 10 10 10 10 10 11 11 11 11 11 11 11 11 11 11 11 11 12 12 12 12 12 12 12 12 12 12 12 12 13 13 13 13 13 13 13 13 13 13 13 13 14 14 14 14
-9
-6
-3
0
3
6
9
12
15
-30
-15
0
15
30
45
60
Mar-08 Mar-10 Mar-12 Mar-14
CRB food (lccy, %yoy)
Czech food CPI (%yoy, right)
08 08 08 08 08 08 08 08 08 08 09 09 09 09 09 09 09 09 09 09 09 09 10 10 10 10 10 10 10 10 10 10 10 10 11 11 11 11 11 11 11 11 11 11 11 11 12 12 12 12 12 12 12 12 12 12 12 12 13 13 13 13 13 13 13 13 13 13 13 13 14 14 14 14
-6
-3
0
3
6
9
12
15
-60
-40
-20
0
20
40
60
80
Mar-08 Mar-10 Mar-12 Mar-14
Brent oil (lccy, %yoy)
Czech energy CPI (%yoy, right)
Exhibit 120: Hungary core* inflation Exhibit 121: Hungary food price inflation Exhibit 122: Hungary energy inflation
% year-on-year and annualized 3m % change (sa) %year-on-year %year-on-year
10 10 10 10 10 10 10 10 10 10 10 10 11 11 11 11 11 11 11 11 11 11 11 11 12 12 12 12 12 12 12 12 12 12 12 12 13 13 13 13 13 13 13 13 13 13 13 13 14 14
0
3
6
9
0
3
6
9
Jan-10 May-11 Sep-12 Jan-14
Core CPI (%yoy)
Core CPI (3m% ann.)
08 08 08 08 08 08 08 08 08 08 09 09 09 09 09 09 09 09 09 09 09 09 10 10 10 10 10 10 10 10 10 10 10 10 11 11 11 11 11 11 11 11 11 11 11 11 12 12 12 12 12 12 12 12 12 12 12 12 13 13 13 13 13 13 13 13 13 13 13 13 14 14 14 14
-4
0
4
8
12
16
20
-30
-15
0
15
30
45
60
Mar-08 Mar-10 Mar-12 Mar-14
CRB food (lccy, %yoy)
Hungary food CPI (%yoy, right)
08 08 08 08 08 08 08 08 08 08 09 09 09 09 09 09 09 09 09 09 09 09 10 10 10 10 10 10 10 10 10 10 10 10 11 11 11 11 11 11 11 11 11 11 11 11 12 12 12 12 12 12 12 12 12 12 12 12 13 13 13 13 13 13 13 13 13 13 13 13 14 14 14 14
-12
-9
-6
-3
0
3
6
9
12
15
18
-60
-30
0
30
60
90
Mar-08 Mar-10 Mar-12 Mar-14
Brent oil (lccy, %yoy)
Hungary energy CPI (%yoy, right)
*Index calculated by Eurostat: excludes food and non-alcoholic beverages, energy, alcohol and tobacco.
Source: Haver Analytics®, National Statistics Offices, Credit Suisse

06
Ma
rch
20
14
Em
erg
ing M
ark
ets
Qu
arte
rly
38
Exhibit 123: Israel core* inflation Exhibit 124: Israel food price inflation Exhibit 125: Israel energy inflation
% year-on-year and annualized 3m % change (sa) %year-on-year %year-on-year
10 10 10 10 10 10 10 10 10 10 10 10 11 11 11 11 11 11 11 11 11 11 11 11 12 12 12 12 12 12 12 12 12 12 12 12 13 13 13 13 13 13 13 13 13 13 13 13 14 14
-2
0
2
4
6
8
-2
0
2
4
6
8
Jan-10 May-11 Sep-12 Jan-14
Core CPI (%yoy)
Core CPI (3m% ann.)
08 08 08 08 08 08 08 08 08 08 09 09 09 09 09 09 09 09 09 09 09 09 10 10 10 10 10 10 10 10 10 10 10 10 11 11 11 11 11 11 11 11 11 11 11 11 12 12 12 12 12 12 12 12 12 12 12 12 13 13 13 13 13 13 13 13 13 13 13 13 14 14 14 14
-6
-3
0
3
6
9
12
15
18
-30
-20
-10
0
10
20
30
40
50
Mar-08 Mar-10 Mar-12 Mar-14
CRB food (lccy, %yoy)
Israel food CPI (%yoy, right)
08 08 08 08 08 08 08 08 08 08 09 09 09 09 09 09 09 09 09 09 09 09 10 10 10 10 10 10 10 10 10 10 10 10 11 11 11 11 11 11 11 11 11 11 11 11 12 12 12 12 12 12 12 12 12 12 12 12 13 13 13 13 13 13 13 13 13 13 13 13 14 14 14 14
-15
-10
-5
0
5
10
15
20
25
-60
-40
-20
0
20
40
60
80
100
Mar-08 Mar-10 Mar-12 Mar-14
Brent oil (lccy, %yoy)
Israel energy CPI (%yoy, right)
Exhibit 126: Poland core** inflation Exhibit 127: Poland food price inflation Exhibit 128: Poland energy inflation
% year-on-year and annualized 3m % change (sa) %year-on-year %year-on-year
10 10 10 10 10 10 10 10 10 10 10 10 11 11 11 11 11 11 11 11 11 11 11 11 12 12 12 12 12 12 12 12 12 12 12 12 13 13 13 13 13 13 13 13 13 13 13 13 14 14
-2
0
2
4
6
8
-2
0
2
4
6
8
Jan-10 May-11 Sep-12 Jan-14
Core CPI (%yoy)
Core CPI (3m% ann.)
08 08 08 08 08 08 08 08 08 08 09 09 09 09 09 09 09 09 09 09 09 09 10 10 10 10 10 10 10 10 10 10 10 10 11 11 11 11 11 11 11 11 11 11 11 11 12 12 12 12 12 12 12 12 12 12 12 12 13 13 13 13 13 13 13 13 13 13 13 13 14 14 14 14
-6
-3
0
3
6
9
12
-30
-15
0
15
30
45
60
Mar-08 Mar-10 Mar-12 Mar-14
CRB food (lccy, %yoy)
Poland food CPI (%yoy, right)
08 08 08 08 08 08 08 08 08 08 09 09 09 09 09 09 09 09 09 09 09 09 10 10 10 10 10 10 10 10 10 10 10 10 11 11 11 11 11 11 11 11 11 11 11 11 12 12 12 12 12 12 12 12 12 12 12 12 13 13 13 13 13 13 13 13 13 13 13 13 14 14 14 14
-12
-8
-4
0
4
8
12
16
20
-60
-40
-20
0
20
40
60
80
100
Mar-08 Mar-10 Mar-12 Mar-14
Brent oil (lccy, %yoy)
Poland energy CPI (%yoy, right)
*Index as calculated by Credit Suisse: excludes food and non-alcoholic beverages, energy, alcohol and tobacco. **Index calculated by Eurostat: excludes food and non-alcoholic beverages, energy, alcohol and tobacco.
Source: Haver Analytics®, National Statistics Offices, Credit Suisse

06
Ma
rch
20
14
Em
erg
ing M
ark
ets
Qu
arte
rly
39
Exhibit 129: Romania core* inflation Exhibit 130: Romania food price inflation Exhibit 131: Romania energy inflation
% year-on-year and annualized 3m % change (sa) %year-on-year %year-on-year
10 10 10 10 10 10 10 10 10 10 10 10 11 11 11 11 11 11 11 11 11 11 11 11 12 12 12 12 12 12 12 12 12 12 12 12 13 13 13 13 13 13 13 13 13 13 13 13 14 14
0
2
4
6
8
10
0
2
4
6
8
10
Jan-10 May-11 Sep-12 Jan-14
Core CPI (%yoy)
Core CPI (3m% ann.)
08 08 08 08 08 08 08 08 08 08 09 09 09 09 09 09 09 09 09 09 09 09 10 10 10 10 10 10 10 10 10 10 10 10 11 11 11 11 11 11 11 11 11 11 11 11 12 12 12 12 12 12 12 12 12 12 12 12 13 13 13 13 13 13 13 13 13 13 13 13 14 14 14 14
-5
0
5
10
15
-20
-10
0
10
20
30
40
50
60
Mar-08 Mar-10 Mar-12 Mar-14
CRB food (lccy, %yoy)
Romania food CPI (%yoy, right)
08 08 08 08 08 08 08 08 08 08 09 09 09 09 09 09 09 09 09 09 09 09 10 10 10 10 10 10 10 10 10 10 10 10 11 11 11 11 11 11 11 11 11 11 11 11 12 12 12 12 12 12 12 12 12 12 12 12 13 13 13 13 13 13 13 13 13 13 13 13 14 14 14 14
-2
1
4
7
10
13
16
-50
-25
0
25
50
75
100
Mar-08 Mar-10 Mar-12 Mar-14
Brent oil (lccy, %yoy)
Romania energy CPI (%yoy, right)
Exhibit 132: Russia core** inflation Exhibit 133: Russia food price inflation Exhibit 134: Russia energy inflation
% year-on-year and annualized 3m % change (sa) %year-on-year %year-on-year
10 10 10 10 10 10 10 10 10 10 10 11 11 11 11 11 11 11 11 11 11 11 11 12 12 12 12 12 12 12 12 12 12 12 12 13 13 13 13 13 13 13 13 13 13 13 13 14 14 14
0
2
4
6
8
10
0
2
4
6
8
10
Feb-10 Jun-11 Oct-12 Feb-14
Core CPI (%yoy)
Core CPI (3m% ann.)
08 08 08 08 08 08 08 08 08 08 09 09 09 09 09 09 09 09 09 09 09 09 10 10 10 10 10 10 10 10 10 10 10 10 11 11 11 11 11 11 11 11 11 11 11 11 12 12 12 12 12 12 12 12 12 12 12 12 13 13 13 13 13 13 13 13 13 13 13 13 14 14 14 14
-5
0
5
10
15
20
25
30
-20
-10
0
10
20
30
40
50
Mar-08 Mar-10 Mar-12 Mar-14
CRB food (lccy, %yoy)
Russia food CPI (%yoy, right)
08 08 08 08 08 08 08 08 08 08 09 09 09 09 09 09 09 09 09 09 09 09 10 10 10 10 10 10 10 10 10 10 10 10 11 11 11 11 11 11 11 11 11 11 11 11 12 12 12 12 12 12 12 12 12 12 12 12 13 13 13 13 13 13 13 13 13 13 13 13 14 14 14 14
-6
-2
2
6
10
14
18
22
26
-60
-40
-20
0
20
40
60
80
100
Mar-08 Mar-10 Mar-12 Mar-14
Brent oil (lccy, %yoy)
Russia energy CPI (%yoy, right)
*Index calculated by Eurostat: excludes food and non-alcoholic beverages, energy, alcohol and tobacco. **Index calculated by Credit Suisse: excludes food and non-alcoholic beverages, alcohol, tobacco, gasoline and utilities.
Source: Haver Analytics®, National Statistics Offices, Credit Suisse

06
Ma
rch
20
14
Em
erg
ing M
ark
ets
Qu
arte
rly
40
Exhibit 135: S. Africa core* inflation Exhibit 136: S. Africa food price inflation Exhibit 137: S. Africa energy inflation
% year-on-year and annualized 3m % change (sa) %year-on-year %year-on-year
10 10 10 10 10 10 10 10 10 10 10 10 11 11 11 11 11 11 11 11 11 11 11 11 12 12 12 12 12 12 12 12 12 12 12 12 13 13 13 13 13 13 13 13 13 13 13 13 14 14
0
3
6
9
0
3
6
9
Jan-10 May-11 Sep-12 Jan-14
Core CPI (%yoy)
Core CPI (3m% ann.)
08 08 08 08 08 08 08 08 08 08 09 09 09 09 09 09 09 09 09 09 09 09 10 10 10 10 10 10 10 10 10 10 10 10 11 11 11 11 11 11 11 11 11 11 11 11 12 12 12 12 12 12 12 12 12 12 12 12 13 13 13 13 13 13 13 13 13 13 13 13 14 14 14 14
-5
0
5
10
15
20
-40
-20
0
20
40
60
Mar-08 Mar-10 Mar-12 Mar-14
CRB food (lccy, %yoy)
S. Africa food CPI (%yoy, right)
08 08 08 08 08 08 08 08 08 08 09 09 09 09 09 09 09 09 09 09 09 09 10 10 10 10 10 10 10 10 10 10 10 10 11 11 11 11 11 11 11 11 11 11 11 11 12 12 12 12 12 12 12 12 12 12 12 12 13 13 13 13 13 13 13 13 13 13 13 13 14 14 14 14
-20
-10
0
10
20
30
40
50
-60
-40
-20
0
20
40
60
80
100
Mar-08 Mar-10 Mar-12 Mar-14
Brent oil (lccy, %yoy, left)
S. Africa energy CPI (%yoy)
Exhibit 138: Turkey core** inflation Exhibit 139: Turkey food price inflation Exhibit 140: Turkey energy inflation
% year-on-year and annualized 3m % change (sa) %year-on-year %year-on-year
10 10 10 10 10 10 10 10 10 10 10 11 11 11 11 11 11 11 11 11 11 11 11 12 12 12 12 12 12 12 12 12 12 12 12 13 13 13 13 13 13 13 13 13 13 13 13 14 14 14
0
3
6
9
12
0
3
6
9
12
Feb-10 Jun-11 Oct-12 Feb-14
Core CPI (%yoy)
Core CPI (3m% ann.)
08 08 08 08 08 08 08 08 08 08 09 09 09 09 09 09 09 09 09 09 09 09 10 10 10 10 10 10 10 10 10 10 10 10 11 11 11 11 11 11 11 11 11 11 11 11 12 12 12 12 12 12 12 12 12 12 12 12 13 13 13 13 13 13 13 13 13 13 13 13 14 14 14 14
0
5
10
15
20
25
-20
-10
0
10
20
30
40
50
60
Mar-08 Mar-10 Mar-12 Mar-14
CRB food (lccy, %yoy)
Turkey food CPI (%yoy, right)
08 08 08 08 08 08 08 08 08 08 09 09 09 09 09 09 09 09 09 09 09 09 10 10 10 10 10 10 10 10 10 10 10 10 11 11 11 11 11 11 11 11 11 11 11 11 12 12 12 12 12 12 12 12 12 12 12 12 13 13 13 13 13 13 13 13 13 13 13 13 14 14 14 14
-8
-2
4
10
16
22
28
34
40
-60
-40
-20
0
20
40
60
80
100
Mar-08 Mar-10 Mar-12 Mar-14
Brent oil (lccy, %yoy)
Turkey energy CPI (%yoy, right)
*Index calculated by Credit Suisse: excludes food and non-alcoholic beverages, electricity and other fuels, petrol, alcohol and tobacco. **CPI excluding food and non-alcoholic beverages, energy, alcohol, tobacco and gold.
Source: Haver Analytics®, National Statistics Offices, Credit Suisse

06
Ma
rch
20
14
Em
erg
ing M
ark
ets
Qu
arte
rly
41
Exhibit 141: Brazil core* inflation Exhibit 142: Brazil food price inflation Exhibit 143: Brazil energy inflation
% year-on-year and annualized 3m % change (sa) %year-on-year %year-on-year
10 10 10 10 10 10 10 10 10 10 10 10 11 11 11 11 11 11 11 11 11 11 11 11 12 12 12 12 12 12 12 12 12 12 12 12 13 13 13 13 13 13 13 13 13 13 13 13 14 14
0
2
4
6
8
10
12
0
2
4
6
8
10
12
Jan-10 May-11 Sep-12 Jan-14
Core CPI (%yoy)
Core CPI (3m% ann.)
08 08 08 08 08 08 08 08 08 08 09 09 09 09 09 09 09 09 09 09 09 09 10 10 10 10 10 10 10 10 10 10 10 10 11 11 11 11 11 11 11 11 11 11 11 11 12 12 12 12 12 12 12 12 12 12 12 12 13 13 13 13 13 13 13 13 13 13 13 13 14 14 14 14
0
3
6
9
12
15
18
-30
-20
-10
0
10
20
30
40
Mar-08 Mar-10 Mar-12 Mar-14
CRB food (lccy, %yoy)
Brazil food CPI (%yoy, right)
08 08 08 08 08 08 08 08 08 08 09 09 09 09 09 09 09 09 09 09 09 09 10 10 10 10 10 10 10 10 10 10 10 10 11 11 11 11 11 11 11 11 11 11 11 11 12 12 12 12 12 12 12 12 12 12 12 12 13 13 13 13 13 13 13 13 13 13 13 13 14 14 14 14
-10
-6
-2
2
6
10
14
-50
-30
-10
10
30
50
70
Mar-08 Mar-10 Mar-12 Mar-14
Brent oil (lccy, %yoy)
Brazil energy CPI (%yoy, right)
Exhibit 144: Chile core** inflation Exhibit 145: Chile food price inflation Exhibit 146: Chile energy inflation
% year-on-year and annualized 3m % change (sa) %year-on-year %year-on-year
10 10 10 10 10 10 10 10 10 10 10 10 11 11 11 11 11 11 11 11 11 11 11 11 12 12 12 12 12 12 12 12 12 12 12 12 13 13 13 13 13 13 13 13 13 13 13 13 14 14
-2
0
2
4
6
8
-2
0
2
4
6
8
Jan-10 May-11 Sep-12 Jan-14
Core CPI (%yoy)
Core CPI (3m% ann.)
08 08 08 08 08 08 08 08 08 08 09 09 09 09 09 09 09 09 09 09 09 09 10 10 10 10 10 10 10 10 10 10 10 10 11 11 11 11 11 11 11 11 11 11 11 11 12 12 12 12 12 12 12 12 12 12 12 12 13 13 13 13 13 13 13 13 13 13 13 13 14 14 14 14
-5
0
5
10
15
20
25
-30
-20
-10
0
10
20
30
40
Mar-08 Mar-10 Mar-12 Mar-14
CRB food (lccy, %yoy)
Chile food CPI (%yoy, right)
08 08 08 08 08 08 08 08 08 08 09 09 09 09 09 09 09 09 09 09 09 09 10 10 10 10 10 10 10 10 10 10 10 10 11 11 11 11 11 11 11 11 11 11 11 11 12 12 12 12 12 12 12 12 12 12 12 12 13 13 13 13 13 13 13 13 13 13 13 13 14 14 14 14
-15
-10
-5
0
5
10
15
20
-60
-40
-20
0
20
40
60
80
Mar-08 Mar-10 Mar-12 Mar-14
Brent oil (lccy, %yoy)
Chile energy CPI (%yoy, right)
* Index calculated by Credit Suisse: excludes food and beverages, fuels and energy and fuels for personal transport. ** CPI excluding fuels and fresh fruit & vegetables.
Source: Haver Analytics®, National Statistics Offices, Credit Suisse

06
Ma
rch
20
14
Em
erg
ing M
ark
ets
Qu
arte
rly
42
Exhibit 147: Mexico core* inflation Exhibit 148: Mexico food price inflation Exhibit 149: Mexico energy inflation
% year-on-year and annualized 3m % change (sa) %year-on-year %year-on-year
10 10 10 10 10 10 10 10 10 10 10 10 11 11 11 11 11 11 11 11 11 11 11 11 12 12 12 12 12 12 12 12 12 12 12 12 13 13 13 13 13 13 13 13 13 13 13 13 14 14
0
2
4
6
8
0
2
4
6
8
Jan-10 May-11 Sep-12 Jan-14
Core CPI (%yoy)
Core CPI (3m% ann.)
08 08 08 08 08 08 08 08 08 08 09 09 09 09 09 09 09 09 09 09 09 09 10 10 10 10 10 10 10 10 10 10 10 10 11 11 11 11 11 11 11 11 11 11 11 11 12 12 12 12 12 12 12 12 12 12 12 12 13 13 13 13 13 13 13 13 13 13 13 13 14 14 14 14
0
3
6
9
12
15
-20
-10
0
10
20
30
40
50
Mar-08 Mar-10 Mar-12 Mar-14
CRB food (lccy, %yoy)
Mexico food CPI (%yoy, right)
08 08 08 08 08 08 08 08 08 08 09 09 09 09 09 09 09 09 09 09 09 09 10 10 10 10 10 10 10 10 10 10 10 10 11 11 11 11 11 11 11 11 11 11 11 11 12 12 12 12 12 12 12 12 12 12 12 12 13 13 13 13 13 13 13 13 13 13 13 13 14 14 14 14
-3
0
3
6
9
12
-60
-40
-20
0
20
40
60
80
100
Mar-08 Mar-10 Mar-12 Mar-14
Brent oil (lccy, %yoy)
Mexico energy CPI (%yoy, right)
Exhibit 150: Peru core* inflation Exhibit 151: Peru food price inflation Exhibit 152: Peru energy inflation
% year-on-year and annualized 3m % change (sa) %year-on-year %year-on-year
10 10 10 10 10 10 10 10 10 10 10 11 11 11 11 11 11 11 11 11 11 11 11 12 12 12 12 12 12 12 12 12 12 12 12 13 13 13 13 13 13 13 13 13 13 13 13 14 14 14
0
2
4
6
0
2
4
6
Feb-10 Jun-11 Oct-12 Feb-14
Core CPI (%yoy)
Core CPI (3m% ann.)
08 08 08 08 08 08 08 08 08 08 09 09 09 09 09 09 09 09 09 09 09 09 10 10 10 10 10 10 10 10 10 10 10 10 11 11 11 11 11 11 11 11 11 11 11 11 12 12 12 12 12 12 12 12 12 12 12 12 13 13 13 13 13 13 13 13 13 13 13 13 14 14 14 14
0
3
6
9
12
-30
-20
-10
0
10
20
30
40
50
Mar-08 Mar-10 Mar-12 Mar-14
CRB food (lccy, %yoy)
Peru food CPI (%yoy, right)
08 08 08 08 08 08 08 08 08 08 09 09 09 09 09 09 09 09 09 09 09 09 10 10 10 10 10 10 10 10 10 10 10 10 11 11 11 11 11 11 11 11 11 11 11 11 12 12 12 12 12 12 12 12 12 12 12 12 13 13 13 13 13 13 13 13 13 13 13 13 14 14 14 14
-15
-10
-5
0
5
10
15
20
-60
-40
-20
0
20
40
60
80
Mar-08 Mar-10 Mar-12 Mar-14
Brent oil (lccy, %yoy)
Peru energy CPI (%yoy, right)
*Index calculated by Credit Suisse: excludes food and beverages, tobacco, electricity and fuels.
Source: Haver Analytics®, National Statistics Offices, Credit Suisse
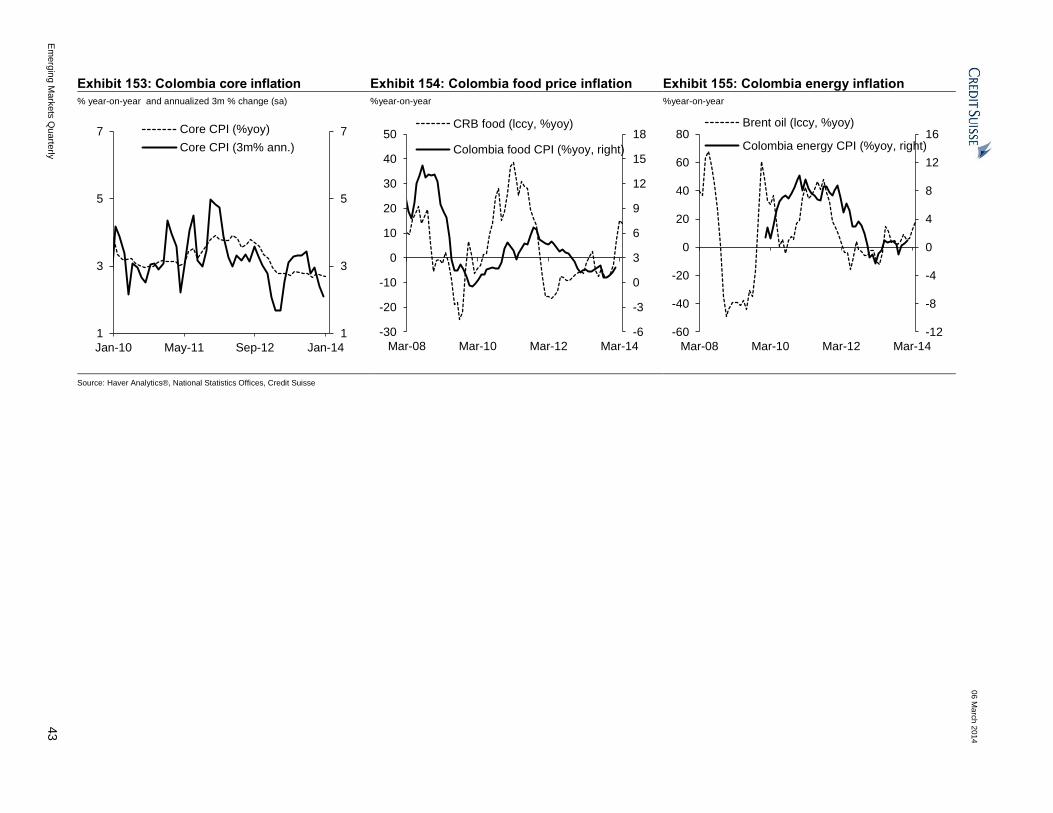
06
Ma
rch
20
14
Em
erg
ing M
ark
ets
Qu
arte
rly
43
Exhibit 153: Colombia core inflation Exhibit 154: Colombia food price inflation Exhibit 155: Colombia energy inflation
% year-on-year and annualized 3m % change (sa) %year-on-year %year-on-year
10 10 10 10 10 10 10 10 10 10 10 10 11 11 11 11 11 11 11 11 11 11 11 11 12 12 12 12 12 12 12 12 12 12 12 12 13 13 13 13 13 13 13 13 13 13 13 13 14 14
1
3
5
7
1
3
5
7
Jan-10 May-11 Sep-12 Jan-14
Core CPI (%yoy)
Core CPI (3m% ann.)
08 08 08 08 08 08 08 08 08 08 09 09 09 09 09 09 09 09 09 09 09 09 10 10 10 10 10 10 10 10 10 10 10 10 11 11 11 11 11 11 11 11 11 11 11 11 12 12 12 12 12 12 12 12 12 12 12 12 13 13 13 13 13 13 13 13 13 13 13 13 14 14 14 14
-6
-3
0
3
6
9
12
15
18
-30
-20
-10
0
10
20
30
40
50
Mar-08 Mar-10 Mar-12 Mar-14
CRB food (lccy, %yoy)
Colombia food CPI (%yoy, right)
08 08 08 08 08 08 08 08 08 08 09 09 09 09 09 09 09 09 09 09 09 09 10 10 10 10 10 10 10 10 10 10 10 10 11 11 11 11 11 11 11 11 11 11 11 11 12 12 12 12 12 12 12 12 12 12 12 12 13 13 13 13 13 13 13 13 13 13 13 13 14 14 14 14
-12
-8
-4
0
4
8
12
16
-60
-40
-20
0
20
40
60
80
Mar-08 Mar-10 Mar-12 Mar-14
Brent oil (lccy, %yoy)
Colombia energy CPI (%yoy, right)
Source: Haver Analytics®, National Statistics Offices, Credit Suisse
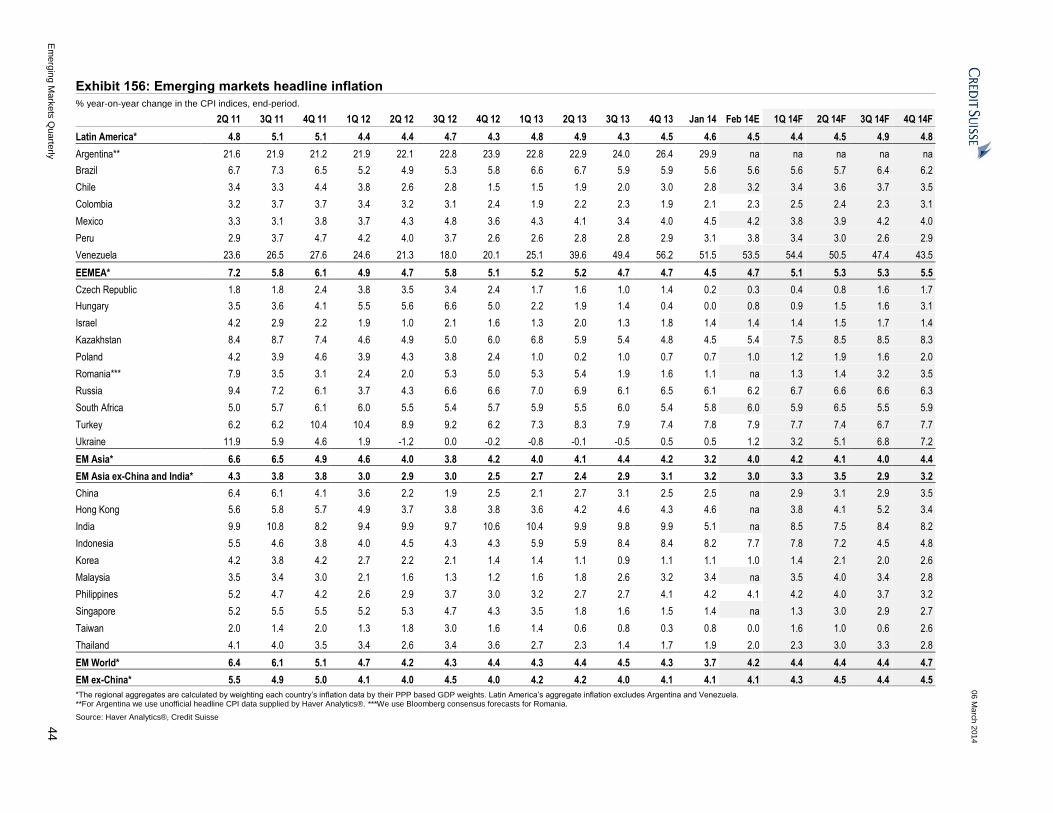
06
Ma
rch
20
14
Em
erg
ing M
ark
ets
Qu
arte
rly
44
Exhibit 156: Emerging markets headline inflation
% year-on-year change in the CPI indices, end-period.
2Q 11 3Q 11 4Q 11 1Q 12 2Q 12 3Q 12 4Q 12 1Q 13 2Q 13 3Q 13 4Q 13 Jan 14 Feb 14E 1Q 14F 2Q 14F 3Q 14F 4Q 14F
Latin America* 4.8 5.1 5.1 4.4 4.4 4.7 4.3 4.8 4.9 4.3 4.5 4.6 4.5 4.4 4.5 4.9 4.8
Argentina** 21.6 21.9 21.2 21.9 22.1 22.8 23.9 22.8 22.9 24.0 26.4 29.9 na na na na na
Brazil 6.7 7.3 6.5 5.2 4.9 5.3 5.8 6.6 6.7 5.9 5.9 5.6 5.6 5.6 5.7 6.4 6.2
Chile 3.4 3.3 4.4 3.8 2.6 2.8 1.5 1.5 1.9 2.0 3.0 2.8 3.2 3.4 3.6 3.7 3.5
Colombia 3.2 3.7 3.7 3.4 3.2 3.1 2.4 1.9 2.2 2.3 1.9 2.1 2.3 2.5 2.4 2.3 3.1
Mexico 3.3 3.1 3.8 3.7 4.3 4.8 3.6 4.3 4.1 3.4 4.0 4.5 4.2 3.8 3.9 4.2 4.0
Peru 2.9 3.7 4.7 4.2 4.0 3.7 2.6 2.6 2.8 2.8 2.9 3.1 3.8 3.4 3.0 2.6 2.9
Venezuela 23.6 26.5 27.6 24.6 21.3 18.0 20.1 25.1 39.6 49.4 56.2 51.5 53.5 54.4 50.5 47.4 43.5
EEMEA* 7.2 5.8 6.1 4.9 4.7 5.8 5.1 5.2 5.2 4.7 4.7 4.5 4.7 5.1 5.3 5.3 5.5
Czech Republic 1.8 1.8 2.4 3.8 3.5 3.4 2.4 1.7 1.6 1.0 1.4 0.2 0.3 0.4 0.8 1.6 1.7
Hungary 3.5 3.6 4.1 5.5 5.6 6.6 5.0 2.2 1.9 1.4 0.4 0.0 0.8 0.9 1.5 1.6 3.1
Israel 4.2 2.9 2.2 1.9 1.0 2.1 1.6 1.3 2.0 1.3 1.8 1.4 1.4 1.4 1.5 1.7 1.4
Kazakhstan 8.4 8.7 7.4 4.6 4.9 5.0 6.0 6.8 5.9 5.4 4.8 4.5 5.4 7.5 8.5 8.5 8.3
Poland 4.2 3.9 4.6 3.9 4.3 3.8 2.4 1.0 0.2 1.0 0.7 0.7 1.0 1.2 1.9 1.6 2.0
Romania*** 7.9 3.5 3.1 2.4 2.0 5.3 5.0 5.3 5.4 1.9 1.6 1.1 na 1.3 1.4 3.2 3.5
Russia 9.4 7.2 6.1 3.7 4.3 6.6 6.6 7.0 6.9 6.1 6.5 6.1 6.2 6.7 6.6 6.6 6.3
South Africa 5.0 5.7 6.1 6.0 5.5 5.4 5.7 5.9 5.5 6.0 5.4 5.8 6.0 5.9 6.5 5.5 5.9
Turkey 6.2 6.2 10.4 10.4 8.9 9.2 6.2 7.3 8.3 7.9 7.4 7.8 7.9 7.7 7.4 6.7 7.7
Ukraine 11.9 5.9 4.6 1.9 -1.2 0.0 -0.2 -0.8 -0.1 -0.5 0.5 0.5 1.2 3.2 5.1 6.8 7.2
EM Asia* 6.6 6.5 4.9 4.6 4.0 3.8 4.2 4.0 4.1 4.4 4.2 3.2 4.0 4.2 4.1 4.0 4.4
EM Asia ex-China and India* 4.3 3.8 3.8 3.0 2.9 3.0 2.5 2.7 2.4 2.9 3.1 3.2 3.0 3.3 3.5 2.9 3.2
China 6.4 6.1 4.1 3.6 2.2 1.9 2.5 2.1 2.7 3.1 2.5 2.5 na 2.9 3.1 2.9 3.5
Hong Kong 5.6 5.8 5.7 4.9 3.7 3.8 3.8 3.6 4.2 4.6 4.3 4.6 na 3.8 4.1 5.2 3.4
India 9.9 10.8 8.2 9.4 9.9 9.7 10.6 10.4 9.9 9.8 9.9 5.1 na 8.5 7.5 8.4 8.2
Indonesia 5.5 4.6 3.8 4.0 4.5 4.3 4.3 5.9 5.9 8.4 8.4 8.2 7.7 7.8 7.2 4.5 4.8
Korea 4.2 3.8 4.2 2.7 2.2 2.1 1.4 1.4 1.1 0.9 1.1 1.1 1.0 1.4 2.1 2.0 2.6
Malaysia 3.5 3.4 3.0 2.1 1.6 1.3 1.2 1.6 1.8 2.6 3.2 3.4 na 3.5 4.0 3.4 2.8
Philippines 5.2 4.7 4.2 2.6 2.9 3.7 3.0 3.2 2.7 2.7 4.1 4.2 4.1 4.2 4.0 3.7 3.2
Singapore 5.2 5.5 5.5 5.2 5.3 4.7 4.3 3.5 1.8 1.6 1.5 1.4 na 1.3 3.0 2.9 2.7
Taiwan 2.0 1.4 2.0 1.3 1.8 3.0 1.6 1.4 0.6 0.8 0.3 0.8 0.0 1.6 1.0 0.6 2.6
Thailand 4.1 4.0 3.5 3.4 2.6 3.4 3.6 2.7 2.3 1.4 1.7 1.9 2.0 2.3 3.0 3.3 2.8
EM World* 6.4 6.1 5.1 4.7 4.2 4.3 4.4 4.3 4.4 4.5 4.3 3.7 4.2 4.4 4.4 4.4 4.7
EM ex-China* 5.5 4.9 5.0 4.1 4.0 4.5 4.0 4.2 4.2 4.0 4.1 4.1 4.1 4.3 4.5 4.4 4.5
*The regional aggregates are calculated by weighting each country’s inflation data by their PPP based GDP weights. Latin America’s aggregate inflation excludes Argentina and Venezuela. **For Argentina we use unofficial headline CPI data supplied by Haver Analytics®. ***We use Bloomberg consensus forecasts for Romania.
Source: Haver Analytics®, Credit Suisse

06
Ma
rch
20
14
Em
erg
ing M
ark
ets
Qu
arte
rly
45
Exhibit 157: Emerging markets core inflation
% year-on-year change in the CPI indices (WPI for India) excluding food, energy, alcohol and tobacco; end-period.
2Q 10 3Q 10 4Q 10 1Q 11 2Q 11 3Q 11 4Q 11 1Q 12 2Q 12 3Q 12 4Q 12 1Q 13 2Q 13 3Q 13 4Q 13 Jan 14 Feb 14
Latin America* 3.9 4.0 4.0 4.1 4.1 4.3 4.4 3.7 3.5 3.4 3.2 3.6 3.8 3.9 4.3 4.3 na
Brazil 4.8 4.9 4.9 5.8 5.7 6.3 6.4 4.9 4.5 4.2 4.5 4.9 5.4 5.6 6.0 5.7 na
Chile 0.1 1.5 2.5 2.4 2.4 2.2 3.3 3.1 2.5 2.2 1.3 1.3 1.3 1.7 2.3 2.4 na
Colombia 3.1 3.0 3.2 3.1 3.4 3.4 3.9 3.8 3.6 3.7 3.2 2.8 2.8 2.8 2.7 2.7 na
Mexico 4.1 4.0 3.9 2.7 2.7 2.5 2.4 2.4 2.6 2.6 2.0 2.7 2.8 2.7 3.3 3.5 na
Peru 1.2 1.3 1.6 2.0 2.3 2.7 2.7 2.7 2.6 2.1 1.7 2.4 2.1 2.5 3.1 3.1 3.1
EEMEA* 3.7 3.2 3.2 3.6 4.2 4.8 5.1 5.1 4.9 4.6 4.2 4.0 3.9 3.9 3.9 4.1 na
Czech Republic 0.0 0.2 0.1 -0.3 -0.3 -0.1 0.5 1.6 1.7 1.6 1.1 0.5 0.2 0.1 0.4 -0.1 na
Hungary 3.7 1.6 1.6 1.4 1.9 1.8 2.2 3.5 3.4 3.7 3.5 2.5 2.5 2.2 2.2 2.0 na
Israel 2.7 2.3 2.3 3.4 3.1 3.1 2.0 1.7 1.0 0.5 0.7 0.3 0.5 0.8 1.0 0.7 na
Kazakhstan 7.3 6.6 6.3 6.0 5.3 6.1 5.5 4.2 5.6 5.8 6.3 8.0 6.6 6.0 5.9 5.6 6.2
Poland 0.9 0.9 0.9 1.7 1.9 2.1 3.2 2.5 2.5 2.0 1.0 0.8 0.4 0.7 0.5 0.2 na
Romania 3.1 4.8 4.8 4.5 3.7 2.5 2.8 3.2 3.5 3.0 2.7 2.7 2.6 2.2 2.3 2.6 na
Russia 4.3 4.0 4.1 4.6 5.5 5.9 5.9 5.9 5.6 5.3 5.0 4.7 4.7 4.0 4.1 4.4 4.5
South Africa 3.7 3.0 3.2 3.1 3.6 4.1 4.0 4.6 4.6 4.5 4.9 5.2 5.2 5.2 5.2 5.2 na
Turkey** 4.9 3.7 3.0 3.8 5.3 7.0 8.1 7.9 7.4 6.7 5.8 5.8 5.6 7.0 7.1 7.6 8.4
EM Asia* 4.3 3.7 4.2 3.8 4.0 4.3 3.6 3.5 3.1 3.1 3.2 3.4 3.0 3.2 3.1 3.2 na
EM Asia ex-China and India* 2.1 2.2 2.3 2.7 3.0 3.0 2.9 2.5 2.3 2.3 2.4 2.3 2.0 2.0 2.0 2.1 na
China*** 1.0 1.1 1.7 2.3 2.5 2.4 1.6 1.4 1.3 1.6 1.6 1.9 1.7 1.7 1.8 2.0 na
Hong Kong 1.2 0.5 1.9 3.3 4.7 5.7 5.7 5.1 3.8 3.6 3.6 3.6 4.1 4.2 4.2 4.2 na
India 15.3 11.9 12.6 8.7 9.1 10.7 9.4 10.1 8.8 8.0 8.2 8.6 7.9 8.5 7.9 8.0 na
Indonesia**** 4.0 4.0 4.3 4.5 4.6 4.9 4.3 4.3 4.2 4.1 4.4 4.2 4.0 4.7 5.0 4.5 4.6
Korea 1.9 1.9 1.8 2.4 2.7 2.6 2.9 1.9 1.4 1.3 1.3 1.5 1.5 1.5 1.6 1.5 1.4
Malaysia 1.0 1.2 1.2 1.4 2.0 2.1 2.0 1.8 1.2 1.0 1.1 1.0 1.4 1.2 1.5 1.6 na
Philippines*** 3.8 3.8 3.4 3.5 4.0 3.7 3.2 2.7 3.2 3.8 3.7 3.2 2.3 2.1 2.0 2.1 2.3
Singapore 2.2 3.9 5.4 5.6 5.7 5.6 5.6 5.6 6.3 5.7 5.7 4.9 2.1 1.8 1.3 1.3 na
Taiwan 0.5 0.6 0.8 0.8 1.0 0.7 0.7 0.4 0.6 0.9 0.9 0.9 0.4 0.3 -0.3 0.7 -1.1
Thailand 1.7 1.6 1.5 1.3 1.2 1.3 1.4 1.2 1.2 1.3 1.3 1.0 0.4 0.2 0.2 0.4 0.5
EM World* 4.1 3.7 4.0 3.8 4.1 4.4 4.0 3.8 3.5 3.4 3.3 3.5 3.3 3.4 3.4 3.5 na
EM ex-China and India* 3.2 3.1 3.2 3.4 3.8 4.0 4.2 3.8 3.6 3.4 3.3 3.3 3.2 3.3 3.4 3.4 na
*The regional aggregates are calculated by weighting each country’s inflation data by their PPP based GDP weights. **Official core excluding energy, food, beverages, tobacco and gold. ***Core inflation measured by CPI exc. food and energy. ****Official core inflation measured by CPI exc. food (volatile good) and energy, fuel, transportation and water supply (administered commodities).
Source: Haver Analytics®, National Statistics Offices, Credit Suisse
06 March 2014
Emerging Markets Quarterly 46
This page is intent ional ly left blank.
06 March 2014
Emerging Markets Quarterly 47
Latin America

06 March 2014
Emerging Markets Quarterly 48
Latin America: Growing pains Our regional growth forecast for 2014 stands at 2.2%, down from 3.4% last
November. We have lowered our growth forecasts for Argentina, Brazil, Mexico and
Venezuela in this period. Our regional growth forecast for 2015 is 3.1%, compared to 3.6%
in the previous quarterly. Our regional real GDP growth estimate for 2013 is 2.6% versus
2.5% in the previous quarterly. In our region, only Brazil, Mexico and Peru have reported
their official 2013 real GDP growth rates. Brazil grew 2.3% yoy in 2013, slightly below our
forecast of 2.4% last November. Meanwhile, Mexico grew 1.1% yoy in 2013, slightly above
our previous forecast of 1.0%, and Peru expanded 5.0%.
Exhibit 158. Latin America: Credit Suisse 2013-2014 real GDP growth and inflation forecasts
2013 real GDP growth 2014 real GDP growth 2013 inflation 2014 inflation
Nov-13 Mar-14 Nov-13 Mar-14 Nov-13 Mar-14 Nov-13 Mar-14
Argentina 4.2 4.7 2.8 -0.3 10.0 10.9 13.4 30.4
Brazil 2.4 2.3 3.0 1.8 5.8 5.9 5.8 6.2
Chile 4.3 4.0 3.6 3.8 2.1 3.0 3.5 3.5
Colombia 4.0 4.2 4.5 4.5 2.3 1.9 3.2 3.1
Mexico 1.0 1.1 3.7 2.8 3.3 4.0 3.8 4.0
Peru 5.1 5.0 5.5 5.5 3.1 2.9 2.6 2.9
Venezuela 1.7 1.6 1.6 -0.5 54.8 52.7 48.6 43.5
Latin America 2.5 2.6 3.4 2.2 8.1 8.2 8.3 10.1
Source: Credit Suisse
We project that 12-month regional consumer price inflation will rise to 10.1% at
year-end 2014 from 8.2% at year-end 2013. This is above our forecast of 8.3% last
November as we expect higher inflation in Argentina, Brazil, Mexico and Peru. In
Argentina, the higher-than-expected first print from the new national CPI, combined with
fundamental economic factors, drove the upward revision to our year-end 2014 inflation
forecast to 30.4% yoy from 13.4% previously. Venezuela, meanwhile, is likely to remain
the country with the highest official inflation among all emerging market economies we
cover globally, even after we have lowered our year-end 2014 inflation forecast to 43.5%
from 48.6% previously. In the rest of the region, we project higher 12-month inflation
figures for Brazil and Peru for year-end 2014.
We expect modest external imbalances to persist in 2014. At the regional level, we
forecast that the current account deficit will widen slightly to 2.6% of GDP in 2014, from
2.5% projected for 2013. This is a result of larger current account deficit forecasts for
Argentina, Colombia and Mexico, along with an erosion of the surplus in Venezuela,
counterbalanced by the consolidation of current account deficits in the rest of the region.
On the fiscal front, we project that the regional fiscal deficit will widen in 2014 to
3.6% of GDP versus an estimated deficit of 3.1% of GDP in 2013. We expect Peru’s
fiscal surplus in 2014 to deteriorate to only 0.2% of GDP from our estimate of 0.7% in
2013. Fiscal deficits should remain modest in most of the other countries under our
coverage, with the exception of Venezuela, which will likely run a deficit equivalent to
8.2% of GDP in 2014 despite some expected consolidation from last year. Finally, we
project that the region’s government debt-to-GDP ratio will increase slightly to 47.9% in
2014 from an estimated 44.7% in 2013 mainly due to deteriorating debt dynamics in
Argentina and Venezuela.
Alonso Cervera
+52 55 5283 3845
Di Fu
+1 212 538 4125
Juan Lorenzo Maldonado
+1 212 325 4245
Casey Reckman
+1 212 325 5570
Nilson Teixeira
+55 11 3701 6288
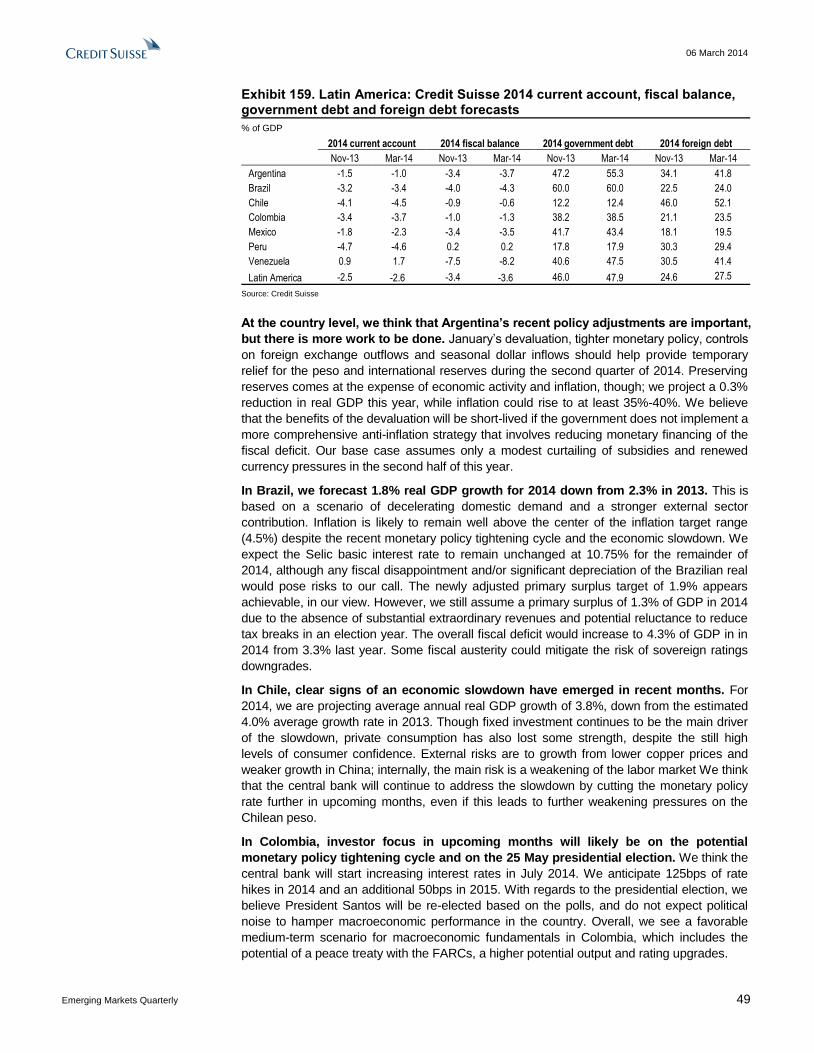
06 March 2014
Emerging Markets Quarterly 49
At the country level, we think that Argentina’s recent policy adjustments are important,
but there is more work to be done. January’s devaluation, tighter monetary policy, controls
on foreign exchange outflows and seasonal dollar inflows should help provide temporary
relief for the peso and international reserves during the second quarter of 2014. Preserving
reserves comes at the expense of economic activity and inflation, though; we project a 0.3%
reduction in real GDP this year, while inflation could rise to at least 35%-40%. We believe
that the benefits of the devaluation will be short-lived if the government does not implement a
more comprehensive anti-inflation strategy that involves reducing monetary financing of the
fiscal deficit. Our base case assumes only a modest curtailing of subsidies and renewed
currency pressures in the second half of this year.
In Brazil, we forecast 1.8% real GDP growth for 2014 down from 2.3% in 2013. This is
based on a scenario of decelerating domestic demand and a stronger external sector
contribution. Inflation is likely to remain well above the center of the inflation target range
(4.5%) despite the recent monetary policy tightening cycle and the economic slowdown. We
expect the Selic basic interest rate to remain unchanged at 10.75% for the remainder of
2014, although any fiscal disappointment and/or significant depreciation of the Brazilian real
would pose risks to our call. The newly adjusted primary surplus target of 1.9% appears
achievable, in our view. However, we still assume a primary surplus of 1.3% of GDP in 2014
due to the absence of substantial extraordinary revenues and potential reluctance to reduce
tax breaks in an election year. The overall fiscal deficit would increase to 4.3% of GDP in in
2014 from 3.3% last year. Some fiscal austerity could mitigate the risk of sovereign ratings
downgrades.
In Chile, clear signs of an economic slowdown have emerged in recent months. For
2014, we are projecting average annual real GDP growth of 3.8%, down from the estimated
4.0% average growth rate in 2013. Though fixed investment continues to be the main driver
of the slowdown, private consumption has also lost some strength, despite the still high
levels of consumer confidence. External risks are to growth from lower copper prices and
weaker growth in China; internally, the main risk is a weakening of the labor market We think
that the central bank will continue to address the slowdown by cutting the monetary policy
rate further in upcoming months, even if this leads to further weakening pressures on the
Chilean peso.
In Colombia, investor focus in upcoming months will likely be on the potential
monetary policy tightening cycle and on the 25 May presidential election. We think the
central bank will start increasing interest rates in July 2014. We anticipate 125bps of rate
hikes in 2014 and an additional 50bps in 2015. With regards to the presidential election, we
believe President Santos will be re-elected based on the polls, and do not expect political
noise to hamper macroeconomic performance in the country. Overall, we see a favorable
medium-term scenario for macroeconomic fundamentals in Colombia, which includes the
potential of a peace treaty with the FARCs, a higher potential output and rating upgrades.
Exhibit 159. Latin America: Credit Suisse 2014 current account, fiscal balance, government debt and foreign debt forecasts
% of GDP
2014 current account 2014 fiscal balance 2014 government debt 2014 foreign debt
Nov-13 Mar-14 Nov-13 Mar-14 Nov-13 Mar-14 Nov-13 Mar-14
Argentina -1.5 -1.0 -3.4 -3.7 47.2 55.3 34.1 41.8
Brazil -3.2 -3.4 -4.0 -4.3 60.0 60.0 22.5 24.0
Chile -4.1 -4.5 -0.9 -0.6 12.2 12.4 46.0 52.1
Colombia -3.4 -3.7 -1.0 -1.3 38.2 38.5 21.1 23.5
Mexico -1.8 -2.3 -3.4 -3.5 41.7 43.4 18.1 19.5
Peru -4.7 -4.6 0.2 0.2 17.8 17.9 30.3 29.4
Venezuela 0.9 1.7 -7.5 -8.2 40.6 47.5 30.5 41.4
Latin America -2.5 -2.6 -3.4 -3.6 46.0 47.9 24.6 27.5
Source: Credit Suisse

06 March 2014
Emerging Markets Quarterly 50
In Mexico, the economy is unlikely to reap in 2014 the full benefits of last year's
structural reforms, which are still being implemented. We view 2014 as a transition year.
We have lowered our annual average real GDP growth forecast to 2.8% from 3.7% to reflect
disappointing GDP figures in late 2013 and a slow start in 2014. The main risk to our growth
forecast for Mexico is that US imports remain stagnant. If this happens, domestic demand
strength in Mexico is unlikely to be enought to yield real GDP growth of 2.8%. Unfortunately,
we see no room for additional monetary or fiscal stimulus in 2014, even if growth were to
disappoint. This would likely leave the Mexican peso as the main adjustment variable to a
negative growth surprise.
In Peru, we maintain our forecast of 5.5% annual average real GDP growth for 2014
and 5.8% for 2015. We expect that as commodity prices continue to slip in 2014, the
recovery of the external balances will be only marginal and the fiscal surplus will continue to
shrink. With regards to monetary policy, the central bank will likely remain on hold during
2014 but hike its policy rate in 2015, as activity accelerates and headline inflation remains
high. We also expect continued intervention in the FX market if excessive depreciation
pressures on the currency resurface. Political noise will likely continue to be a risk in Peru to
the extent that it may hurt business confidence and deter investment decisions.
Finally, in Venezuela, anti-government demonstrations show no sign of abating.
President Nicolas Maduro’s government can probably weather the current storm, but the
situation highlights the risk that growing dissatisfaction could eventually become a
destabilizing force. On the economic front, the government is preparing to implement a more
flexible and transparent foreign exchange market in the near term. This could potentially help
reduce shortages, benefit fiscal accounts and bring inflation down later in the year, albeit
depending on still unknown factors including the exchange rate used and trading volumes.
We now expect real GDP to fall by 0.5% in 2014 as public and private consumption
decelerate further and investment continues to contract. We do not foresee an interruption in
foreign debt service in 2014, but the outlook for 2015 and beyond is riskier, in our view.
Exhibit 160: Summary macroeconomic data: GDP growth
1Q 13 2Q 13 3Q 13 4Q 13E 1Q 14F 2Q 14F 3Q 14F 4Q 14F 1Q 15F
Nominal GDP ($bn) Real GDP growth (% quarter on quarter, seasonally adjusted annual rate)
2013E 2014F 2015F
LATIN AMERICA 5,189.9 4,928.0 5,112.9 1.3 4.3 1.1 1.9 0.2 4.9 2.5 2.8 2.0
Argentina 482.4 363.1 323.3 8.5 9.0 -0.7 -5.2 0.3 0.3 2.3 -1.0 -3.5
Brazil 2,240 2,135 2,175 0.0 7.5 -2.1 2.8 0.3 5.7 -0.6 2.3 2.9
Chile 279.5 262.0 283.1 3.3 1.3 5.4 0.5 3.3 5.3 8.7 0.9 -0.6
Colombia 379.1 377.5 412.4 0.9 8.6 4.5 7.5 -1.9 9.5 5.1 2.0 1.6
Mexico 1,236 1,286 1,422 0.8 -2.7 3.9 0.7 0.8 6.0 4.3 5.2 3.1
Peru 206.6 213.5 232.7 5.4 4.0 4.9 6.4 4.4 6.1 8.4 8.1 5.6
Venezuela* 366.6 290.9 264.0 -5.5 6.8 0.0 7.1 -6.9 -2.3 0.0 0.9 1.4
*Forecasts based on a projected weighted average exchange rate across official FX markets (CENCOEX, SICAD 1 and SICAD 2)
IMF PPP weights are used to compute regional aggregate figures.
Source: the BLOOMBERG PROFESSIONAL™ service, National Statistical Offices, Credit Suisse

06 March 2014
Emerging Markets Quarterly 51
Argentina: Bandaged, but not cured Recent policy measures have bought the Argentine authorities some time. Tighter
monetary policy, controls on foreign exchange outflows and seasonal dollar inflows
should provide some temporary relief for the peso and international reserves during the
second quarter of 2014. Still, we remain concerned that the benefits of January’s
devaluation will be short-lived if the government does not implement a more
comprehensive strategy to reduce the monetary financing of the fiscal deficit as well.
Our base case assumes that Argentina will face not only higher inflation and economic
contraction in 2014, but also pressures to adjust the currency again later this year. We
expect President Cristina Kirchner to continue keeping a lower profile in terms of
economic management, leaving her cabinet to bear the brunt of the associated costs.
The agricultural harvest should provide favorable tailwinds for international
reserves and the peso this quarter. Last year, nearly 40% of the $22.8bn in export
proceeds reported by grains and oilseeds farmers was sold in the second quarter and
net central bank dollar purchases were $1.5bn during this period. We expect similar, if
not somewhat higher, volumes this year. In addition, banks will keep adjusting their
foreign exchange exposure in accordance with regulatory changes through April,
resulting in a one-off increase in the supply of dollars and net reserves. The recent
easing of restrictions on purchasing dollars for savings purposes may also continue to
help alleviate pressure on the informal exchange rate, which currently remains
approximately 35% weaker than the offical rate.
Protecting reserves comes at the cost of economic activity. Consumer confidence
was already falling sharply before the devaluation and it is now at its lowest level since
September 2002. Private consumption will likely collapse further under real wage losses
and higher interest rates, while economic uncertainty weighs on investment. From the
supply side, tighter foreign exchange controls should amplify the downturn in economic
activity, as was the case in 2012. Our projection for official data is a 0.3% reduction in
real GDP, while private estimates could suggest a contraction of 1.5%-3.0%.2
Ongoing wage negotiations pose a key economic risk. The government aims to limit
average nominal wage increases to between 25% and 30% yoy this year, compared to
26% in 2013. Doing so is necessary to help contain inflation to 35%-40% yoy in 2014,
up from 28.4% last year according to private estimates. Even with 30% wage increases,
it could be difficult to anchor inflation expectations, prices could rise sharply and fiscal
pressures would grow. Although the discussions are likely to remain particularly tense
following the devaluation and due to increased competition between unions, concerns
that employment will fall as the economy contracts could work in the government’s favor.
More active monetary policy management is a positive development. The central
bank has played a larger role in economic policymaking under President Juan Carlos
Fabrega, who seems to enjoy solid government support at least for the time being.
Interest rates moved up sharply following the devaluation and sterilization efforts have
increased. Growth of the monetary base is decelerating towards 20% yoy, about half its
pace 12 months ago. Unless assistance to the Treasury slows, sterilization (and its
costs) could expand further in the near term given the need to absorb peso liquidity
resulting from central bank purchases of dollars from agricultural exporters. We believe
that Fabrega would also be willing to allow interest rates to rise higher and the currency
to weaken more if necessary to contain price pressures and reduce demand for dollars.
Significant fiscal tightening is also needed, but is less likely to materialize. The
government is reportedly preparing a subsidy reduction plan to roll out once the principal
wage negotiations are concluded. We continue to expect only modest progress on this
front, though, given the political costs associated with increased rates for public
2 We acknowledge elevated uncertainty around official GDP data given the end-March deadline for the government to present
“revised GDP estimates” to the IMF and because INDEC also plans to rebase the series to 2004 from 1993.
Casey Reckman
+1 212 325 5570
06 March 2014
Emerging Markets Quarterly 52
services, transportation fares and utilities. Monetization of the deficit will likely remain a
fundamental underlying inflationary pressure. We project that the federal government’s
primary deficit will narrow slightly to 0.7% of GDP in 2014, from 0.9% last year. The
overall deficit would widen to 2.9% of GDP this year, compared to 2.4% in 2013,
assuming the government makes a GDP warrant payment worth 0.9% of GDP.
External pressures are likely to increase in the second half of 2014. Accelerating
inflation could erode the competitiveness gains from January’s devaluation in six
months’ time, according to our calculations. A weaker Brazilian Real and the end of the
harvest will probably also weigh on the peso and reserves. Our projections assume
another 30% currency devaluation in the fourth quarter and a year-end exchange rate of
11.5 pesos per dollar. If not accompanied by additional monetary tightening and
coordinated fiscal policy, this second adjustment could be an even riskier undertaking
from a credibility perspective, especially since reserves could easily have fallen below
$25.0bn by then.
We forecast that gross reserves will decline to $22.1bn by year-end. The
improvement in the trade surplus stemming from the devaluation and economic
slowdown will be limited by Argentina’s structural energy deficit. Meanwhile, we expect
the reduction in the services deficit associated with the easing of controls on dollar
purchases to be offset by increased capital flight. Another key component of our
projection is $7.8bn of dollar-denominated debt service to private creditors, including
GDP warrant payments. The main risks to our forecast are lower commodity prices and
a sharp depreciation of the Brazilian Real. On the other hand, larger-than-expected FDI
inflows following the deal to compensate Repsol could lend upside to our projections.
The debt service outlook is more complicated in 2015. We estimate that total foreign
currency debt service to private creditors, including sovereign, provincial and corporate
maturities, rises to $12.5bn next year. This is equivalent to 56.4% of our year-end 2014
projection for gross international reserves and 98.0% of our net reserves forecast. This
suggests increased pesification risks for local law debt unless the government is able to
regain market access or secure an alternative backstop.
We anticipate continued progress on the government’s international agenda. The
agreement with Repsol is the most recent affirmation of the government’s commitment
to normalizing relations with foreign investors. It should clear the way for increased
foreign participation in developing Argentina’s shale resources. The publication of the
new national consumer price index and a credible inflation print for January was another
positive signal. We would not be surprised to see Argentina agree to an Article IV
consultation with the IMF following the delivery of “revised GDP estimates” by the end of
March. Doing so could help advance prospects of a settlement with the Paris Club, albeit
after a lengthy negotiation process, and potentially increase the IMF’s support for
Argentina’s position before the US Supreme Court. Settling with holdout creditors
remains a thorny political and economic issue for the government, though, in our view.
Finally, we expect the Supreme Court to respond to Argentina’s second cert
petition by the end of June. Holdout creditors and amici have until 18 March to file
briefs, though this period could be extended by 30 days. Argentina would have another
two weeks to reply. Then it could take approximately 4 to 6 weeks for the justices to
discuss the appeal in conference. Thus, the case could easily be resolved before the
Court’s summer recess if it declines to hear the appeal. If the Court calls for the US
Solicitor General’s view and/or the New York Court of Appeals is asked to certify the pari
passu interpretation, we would expect the process to extend into 2015. Ultimately, we
continue to believe that the Supreme Court will not find Argentina’s arguments regarding
violations of the Foreign Sovereign Immunities Act compelling enough to overturn the
lower courts’ consistent rulings against the government.

06 March 2014
Emerging Markets Quarterly 53
January’s devaluation was a
welcome adjustment from a
competitiveness
perspective.
Subsequent government
measures and an
agreement with agricultural
exporters to sell crops in
storage helped to stem the
decline in international
reserves in February.
Exhibit 161: Real effective exchange rate
Exhibit 162: Gross central bank foreign exchange reserves
Increase = appreciation $bn
0
50
100
150
200
250
Feb-00 Oct-04 Jun-09 Feb-14
REER using the privatelyestimated inflation data
REER using the officialinflation data
25
30
35
40
45
50
55
Mar-10 Mar-11 Mar-12 Mar-13 Mar-14
Source: Credit Suisse Source: Central bank, Credit Suisse
The central bank moved
decisively to tighten
monetary policy, although
additional interest rate
increases and sterilization
operations may be needed
as inflation accelerates.
Seasonal agriculture-related
foreign exchange inflows
should temporarily reduce
pressure on Argentina’s
external accounts in the
second quarter.
Exhibit 163: Monetary aggregates and interest rates
Exhibit 164: Agricultural export proceeds vs. net dollar purchases
% change yoy, 20-day moving average for the monetary aggregates (lhs), % (rhs) data though 21 February 2014
$bn, 2013
10
15
20
25
30
20
25
30
35
40
45
50
Feb-11 Feb-12 Feb-13 Feb-14
M2 (lhs)Monetary base (lhs)Private Badlar (rhs)
-3
-2
-1
0
1
2
3
4
Jan
Fe
b
Ma
r
Ap
r
Ma
y
Jun
Jul
Aug
Se
p
Oct
No
v
Dec
Grains and oilseeds export proceedsNet central bank dollar purchases
Source: Central bank, Credit Suisse Source: CIARA-CEC, central bank, Credit Suisse
Import controls will hamper
economic activity, but are
unlikely to curb growing
energy-related outflows.
Meanwhile, monetization of
the fiscal deficit should keep
pressure on inflation as we
expect only a modest
reduction in primary
expenditure this year.
Exhibit 165: Energy deficit and imports
Exhibit 166: Federal government fiscal balance
$bn % of GDP
-8
-6
-4
-2
0
2
4
6
8
10
12
14
03 04 05 06 07 08 09 10 11 12 13
Energy trade deficit
Energy imports
-3
-2
-1
0
1
2
3
4
05 06 07 08 09 10 11 12 13 14F
Primary fiscal balance
Overall fiscal balance
Source: Central bank, Credit Suisse Source: Ministry of Economy, Credit Suisse

06 March 2014
Emerging Markets Quarterly 54
Difficult wage negotiations
with trade unions pose a
key near-term risk just as
inflation expectations have
risen sharply following the
devaluation.
Exhibit 167: Average wage growth Exhibit 168: Inflation expectations
% yoy % yoy
-10
-5
0
5
10
15
20
25
30
35
Dec-09 Dec-10 Dec-11 Dec-12 Dec-13
RealNominal
0
5
10
15
20
25
30
35
40
45
Feb-08 Feb-10 Feb-12 Feb-14
Median
Average
Source: Ministry of Economy, central bank, Credit Suisse Source: Di Tella University, Credit Suisse
Weaker domestic
confidence, as well as
higher interest rates and
inflation, will take a toll on
Argentina’s economy in
2014.
We expect a collapse in
private consumption and
investment to drive a
contraction in real GDP this
year.
Exhibit 169: Consumer confidence Exhibit 170: Confidence in government
Headline index Headline index
25
30
35
40
45
50
55
60
65
Feb-03 Oct-06 Jun-10 Feb-14
0
1
2
3
4
5
Feb-03 Oct-06 Jun-10 Feb-14
Nestor Kirchner
administration
Cristina Kirchner
administration
Source: Di Tella University, Credit Suisse Source: Di Tella University, Credit Suisse
Risks to dollar-denominated
debt service rise in 2015, as
the total amount due to
private creditors is
equivalent to 98% of our net
foreign exchange reserves
forecast for year-end 2014.
In the absence of a private
settlement, an adverse
Supreme Court ruling could
lead to a credit event as
soon as 2Q 2014.
Exhibit 171: Foreign currency debt service to private creditors
Exhibit 172: Upcoming foreign law debt payments and CDS expiration dates
$bn, interest and amortization $mn
0
2
4
6
8
10
12
14
16
18
2014* 2015 2016 2017 2018
Corporate Provincial
Sov. External Sov. Local
Payment Date Instrument Amount($mn)
3/20/2014 CDS -
3/31/2014 Par 164
6/2/2014 Global 17 42
6/20/2014 CDS -
6/30/2014 Discount 521
9/20/2014 CDS -
9/30/2014 Par 164
12/2/2014 Global 17 42
12/15/2014 GDP warrant 2568
12/20/2014 CDS -
12/31/2014 Discount 521
Source: the BLOOMBERG PROFESSIONAL™ service, Credit Suisse Source: the BLOOMBERG PROFESSIONAL™ service, Credit Suisse
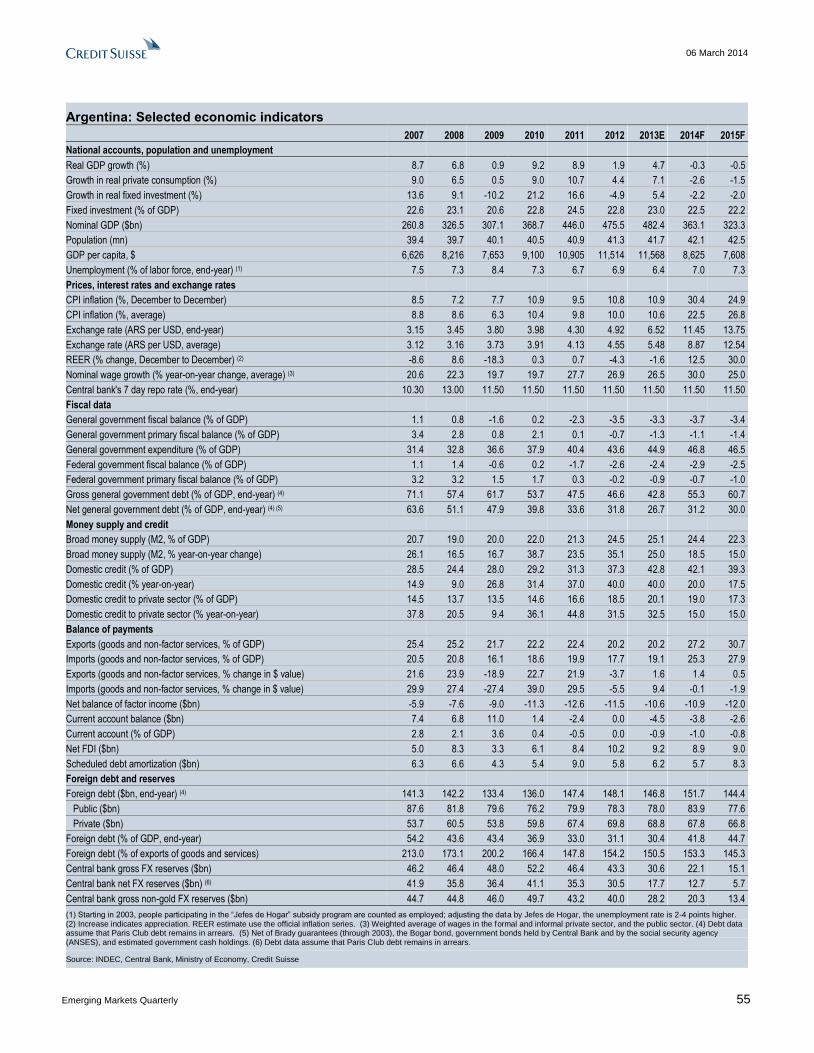
06 March 2014
Emerging Markets Quarterly 55
Argentina: Selected economic indicators
2007 2008 2009 2010 2011 2012 2013E 2014F 2015F
National accounts, population and unemployment
Real GDP growth (%) 8.7 6.8 0.9 9.2 8.9 1.9 4.7 -0.3 -0.5
Growth in real private consumption (%) 9.0 6.5 0.5 9.0 10.7 4.4 7.1 -2.6 -1.5
Growth in real fixed investment (%) 13.6 9.1 -10.2 21.2 16.6 -4.9 5.4 -2.2 -2.0
Fixed investment (% of GDP) 22.6 23.1 20.6 22.8 24.5 22.8 23.0 22.5 22.2
Nominal GDP ($bn) 260.8 326.5 307.1 368.7 446.0 475.5 482.4 363.1 323.3
Population (mn) 39.4 39.7 40.1 40.5 40.9 41.3 41.7 42.1 42.5
GDP per capita, $ 6,626 8,216 7,653 9,100 10,905 11,514 11,568 8,625 7,608
Unemployment (% of labor force, end-year) (1) 7.5 7.3 8.4 7.3 6.7 6.9 6.4 7.0 7.3
Prices, interest rates and exchange rates
CPI inflation (%, December to December) 8.5 7.2 7.7 10.9 9.5 10.8 10.9 30.4 24.9
CPI inflation (%, average) 8.8 8.6 6.3 10.4 9.8 10.0 10.6 22.5 26.8
Exchange rate (ARS per USD, end-year) 3.15 3.45 3.80 3.98 4.30 4.92 6.52 11.45 13.75
Exchange rate (ARS per USD, average) 3.12 3.16 3.73 3.91 4.13 4.55 5.48 8.87 12.54
REER (% change, December to December) (2) -8.6 8.6 -18.3 0.3 0.7 -4.3 -1.6 12.5 30.0
Nominal wage growth (% year-on-year change, average) (3) 20.6 22.3 19.7 19.7 27.7 26.9 26.5 30.0 25.0
Central bank's 7 day repo rate (%, end-year) 10.30 13.00 11.50 11.50 11.50 11.50 11.50 11.50 11.50
Fiscal data
General government fiscal balance (% of GDP) 1.1 0.8 -1.6 0.2 -2.3 -3.5 -3.3 -3.7 -3.4
General government primary fiscal balance (% of GDP) 3.4 2.8 0.8 2.1 0.1 -0.7 -1.3 -1.1 -1.4
General government expenditure (% of GDP) 31.4 32.8 36.6 37.9 40.4 43.6 44.9 46.8 46.5
Federal government fiscal balance (% of GDP) 1.1 1.4 -0.6 0.2 -1.7 -2.6 -2.4 -2.9 -2.5
Federal government primary fiscal balance (% of GDP) 3.2 3.2 1.5 1.7 0.3 -0.2 -0.9 -0.7 -1.0
Gross general government debt (% of GDP, end-year) (4) 71.1 57.4 61.7 53.7 47.5 46.6 42.8 55.3 60.7
Net general government debt (% of GDP, end-year) (4) (5) 63.6 51.1 47.9 39.8 33.6 31.8 26.7 31.2 30.0
Money supply and credit
Broad money supply (M2, % of GDP) 20.7 19.0 20.0 22.0 21.3 24.5 25.1 24.4 22.3
Broad money supply (M2, % year-on-year change) 26.1 16.5 16.7 38.7 23.5 35.1 25.0 18.5 15.0
Domestic credit (% of GDP) 28.5 24.4 28.0 29.2 31.3 37.3 42.8 42.1 39.3
Domestic credit (% year-on-year) 14.9 9.0 26.8 31.4 37.0 40.0 40.0 20.0 17.5
Domestic credit to private sector (% of GDP) 14.5 13.7 13.5 14.6 16.6 18.5 20.1 19.0 17.3
Domestic credit to private sector (% year-on-year) 37.8 20.5 9.4 36.1 44.8 31.5 32.5 15.0 15.0
Balance of payments
Exports (goods and non-factor services, % of GDP) 25.4 25.2 21.7 22.2 22.4 20.2 20.2 27.2 30.7
Imports (goods and non-factor services, % of GDP) 20.5 20.8 16.1 18.6 19.9 17.7 19.1 25.3 27.9
Exports (goods and non-factor services, % change in $ value) 21.6 23.9 -18.9 22.7 21.9 -3.7 1.6 1.4 0.5
Imports (goods and non-factor services, % change in $ value) 29.9 27.4 -27.4 39.0 29.5 -5.5 9.4 -0.1 -1.9
Net balance of factor income ($bn) -5.9 -7.6 -9.0 -11.3 -12.6 -11.5 -10.6 -10.9 -12.0
Current account balance ($bn) 7.4 6.8 11.0 1.4 -2.4 0.0 -4.5 -3.8 -2.6
Current account (% of GDP) 2.8 2.1 3.6 0.4 -0.5 0.0 -0.9 -1.0 -0.8
Net FDI ($bn) 5.0 8.3 3.3 6.1 8.4 10.2 9.2 8.9 9.0
Scheduled debt amortization ($bn) 6.3 6.6 4.3 5.4 9.0 5.8 6.2 5.7 8.3
Foreign debt and reserves
Foreign debt ($bn, end-year) (4) 141.3 142.2 133.4 136.0 147.4 148.1 146.8 151.7 144.4
Public ($bn) 87.6 81.8 79.6 76.2 79.9 78.3 78.0 83.9 77.6
Private ($bn) 53.7 60.5 53.8 59.8 67.4 69.8 68.8 67.8 66.8
Foreign debt (% of GDP, end-year) 54.2 43.6 43.4 36.9 33.0 31.1 30.4 41.8 44.7
Foreign debt (% of exports of goods and services) 213.0 173.1 200.2 166.4 147.8 154.2 150.5 153.3 145.3
Central bank gross FX reserves ($bn) 46.2 46.4 48.0 52.2 46.4 43.3 30.6 22.1 15.1
Central bank net FX reserves ($bn) (6) 41.9 35.8 36.4 41.1 35.3 30.5 17.7 12.7 5.7
Central bank gross non-gold FX reserves ($bn) 44.7 44.8 46.0 49.7 43.2 40.0 28.2 20.3 13.4
(1) Starting in 2003, people participating in the “Jefes de Hogar” subsidy program are counted as employed; adjusting the data by Jefes de Hogar, the unemployment rate is 2-4 points higher. (2) Increase indicates appreciation. REER estimate use the official inflation series. (3) Weighted average of wages in the formal and informal private sector, and the public sector. (4) Debt data assume that Paris Club debt remains in arrears. (5) Net of Brady guarantees (through 2003), the Bogar bond, government bonds held by Central Bank and by the social security agency (ANSES), and estimated government cash holdings. (6) Debt data assume that Paris Club debt remains in arrears.
Source: INDEC, Central Bank, Ministry of Economy, Credit Suisse

06 March 2014
Emerging Markets Quarterly 56
Brazil: Some fiscal austerity might mitigate the risks of a downgrade We forecast GDP growth of 1.8% in 2014, slightly lower than the 2.3% growth of
2013. Our scenario is compatible with growth remaining close to 0.4% qoq on average in
2014, similar to the average from 2011 to 2013. Domestic demand should decelerate in
2014, while the contribution from the external sector is likely to increase.
Investments expected to decelerate in 2014. Uncertainty regarding the outlook for
growth in the coming quarters increased substantially in the first two months of 2014.
We believe this was a result of heightened doubts regarding: (i) a greater likelihood of
electricity rationing, and (ii) diminishing growth prospects for a few key trade partners of
Brazil (e.g., Argentina and China). This more unfavorable scenario has been reinforced
by the continuous decline in business confidence in the country. Other factors such as
the longer-than-expected monetary tightening cycle and the reduction in BNDES funding
for capital goods should also hinder an expansion in investments in 2014. We forecast a
decline in investment growth, from 6.3% in 2013 to 1.1% in 2014, which will likely
decelerate domestic demand in 2014.
External sector to contribute positively to growth. The higher growth expected for
developed countries, e.g., the US and Europe, in a scenario of a more depreciated local
currency, should boost export growth in 2014. In the short term, however, Brazil’s dismal
trade balance figures for January and February and the decline in expected GDP
expansion for Argentina and China might partially offset some of the impact of the more
favorable scenario for the developed world on the Brazilian economy.
We expect household consumption growth to remain low in 2014. We expect growth
in household consumption to decline from 2.3% in 2013 to 1.9% in 2014, well below the
5.0% average expansion from 2008 to 2012. This scenario is compatible with a slight
increase in the unemployment rate, from 5.4% in 2013 to 5.7% in 2014. Hence, we expect
some deterioration in job market conditions in the year, with a deceleration in job creation
along with slower growth in the labor force and in real wages in comparison to last year.
The smaller increase in the minimum wage and still-high inflation, as we expect, should
contribute to reduce real wage growth even further in the coming years.
Risk of downgrade by rating agencies led government to announce budget cuts of
BRL 44bn for 2014. In June 2013, S&P lowered its outlook for Brazil’s sovereign rating to
negative, and Moody’s reduced its outlook from positive to stable in October of the same
year. Both moves were motivated by the significant deterioration in fiscal accounts seen
since early 2012 and the risk of lower GDP expansion in the next few years. In response, in
late February the federal government announced a few measures to increase budget
transparency as well as budget cuts of BRL 44bn. If the federal government is able to deliver
these cuts, the public-sector primary surplus could reach 1.9% of GDP in 2014, stable
versus 2013. Hence, in theory, the slightly higher fiscal discipline could prevent further
deterioration in important fiscal indicators. Overall, the announcements were taken as
positive by the market, but questions concerning the need to increase spending on subsidies
of electricity costs still remain. For the short term, the government was given the benefit of
the doubt, but the public sector is likely to struggle to deliver monthly fiscal results decent
enough to keep its BBB (Baa2) rating unchanged throughout the year.
We have not changed our forecasts for the public sector’s results in 2014.
Although we think the newly adjusted primary surplus target of 1.9% of GDP is doable,
we also believe an election year brings additional challenges for fiscal austerity. The
government usually spends more in election years than it does in other years. In
addition, the absence of substantial extraordinary revenues for the year and the
government’s reluctance to reduce tax breaks in place since 2012 further increase fiscal
uncertainty. We still assume a primary surplus of 1.3% of GDP in 2014 and an increase
in the fiscal deficit from 3.3% of GDP in 2013 to 4.3% in 2014.
Nilson Teixeira
+1 55 11 3701 6288
Paulo Coutinho
+55 11 3701 6353
Iana Ferrao
+1 55 11 3701 6345
Leonardo Fonseca
+1 55 11 3701 6348
Daniel Lavarda
+1 55 11 3701 6352
06 March 2014
Emerging Markets Quarterly 57
We expect the Selic basic interest rate to remain unchanged at 10.75% in 2014.
The current monetary tightening cycle has totaled 350 basis points in February, after the
25bps hike at the February 26 meeting of the Monetary Policy Committee. We think the
announcement of fiscal cuts in February, the appreciation of the local currency at the
end of that month, and the lower-than-expected inflation in January and February
suggest that the current monetary tightening cycle is almost over. Any disappointment in
fiscal results over the next few months or significant depreciation of the local currency
would pose a risk to our scenario of stable interest rates for the next few months.
IPCA inflation to increase to 6.2% in 2014. We expect consumer inflation to remain
well above the center of the inflation target (4.5%) for the fifth year in a row, despite the
recent monetary tightening cycle. This would mean average inflation of 6.1% from 2010
to 2014. The deceleration in real wages should bring down services inflation from 8.7%
in 2013 to 7.9% this year. However, the likely increase in administered prices in 2014,
after the 20% cut in residential electricity prices in February 2013 and the pass-through
of local currency depreciation to food and industrial prices, should more than offset the
more benign scenario for services inflation in 2014. The wider gap between international
and domestic fuel prices and the sharp increase in electricity costs are the main risks for
consumer inflation in the short term.
Disappointing trade balance figures at the beginning of this year increase the
probability of a trade surplus in 2014 lower than our forecast of USD 13 billion.
The increase in the trade deficit in the first two months of the year, from USD 5.3 billion
in 2013 to USD 7.2 billion, was due to the decline in commodity prices and the reduction
in exports of manufactured goods and commodities as a result of this year’s dry spell in
Brazil. The prospects of lower growth in Argentina and China than we previously
expected may contribute to a lower trade surplus. Therefore, there is a significant risk
that the current account in 2014 will post a deficit higher than our current forecast of
USD 72 billion (3.4% of GDP).
We expect further depreciation of local currency to a level closer to BRLUSD 2.60
at year-end 2014. The prospects of low GDP growth and high inflation lead us to expect
foreign direct investments to decline from USD 64 billion in 2013 to USD 55 billion in
2014. We also expect Brazilian investments abroad to increase for the same reasons.
Thus, our forecast of depreciation of the local currency from current levels is compatible
with an increase in the balance-of-payments deficit from USD 6 billion in 2013 to USD
15 billion in 2014.
President Dilma Rousseff maintains her lead in polls for 2014 election. Brazil will
hold general elections on October 3, 2014 (for president, governors, state and federal
deputies, and some senators). Currently, all polls suggest that President Rousseff will be
reelected, as she remains far ahead of the other candidates in voter intention polls.
However, we believe that uncertainty surrounding these results is very high, as the
percentage of respondents who said they would cast null or blank votes is still significant
(generally over 20%), and opposition candidates are still not well known to the general
public. We believe the percentage of respondents who say they will vote for opposition
candidates is likely to increase as the electoral campaign progresses. This would make
the election results a closer call than current polls suggest at first glance.

06 March 2014
Emerging Markets Quarterly 58
GDP growth was 2.3% in
2013. The sharp increase in
investments more than
offset the deceleration in
consumption in the period.
We expect investments to
decelerate substantially in
2014. This would explain
the slow pace of economic
activity in the period.
Exhibit 173: Contribution to GDP growth
Exhibit 174: GDP growth on supply and demand sides
%, annual %
12
2006 2007 2008 2009 2010 2011 2012 2013 2014e-4
-2
0
2
4
6
8
10
4.0
6.15.2
-0.3
7.5
2.7
1.0
2.31.8
External sector
Investments (Gross
fixed capital formation
plus inventories)
Consumption GDP
GDP
Agriculture
Industry
Governmentconsumption
Investments
Exports
Imports
Weight (%)
Services
Householdconsumption
7.5
10-0.3
09
11
2.7
12
1.0
13
2.3
14e
1.8
6.3-3.1 3.9 -2.1 7.0 1.1 3.5
10.4-5.6 1.6 -0.8 1.3 1.6 2.5
4.23.1 1.9 3.3 1.9 3.0 2.2
21.3-6.7 4.7 -4.0 6.3 1.1 3.5
11.5-9.1 4.5 0.5 2.5 1.5 4.5
35.8-7.6 9.7 0.2 8.4 -1.0 3.5
15e
2.5
5.52.1 2.7 1.9 2.0 1.7 2.0
6.94.4 4.1 3.2 2.3 1.9 1.9
5,7
24.9
62.5
22.0
18.0
12.6
15.1
69.4
100
Su
pp
lyD
eman
d
Source: Brazil Statistics Bureau (IBGE), Credit Suisse Source: Brazil Statistics Bureau (IBGE), Credit Suisse
Unemployment rate
declined from 5.5% in 2012
to 5.4% in 2013. This was
its lowest level since the
beginning of the data series.
We expect an increase in
unemployment rate to 5.7%
in 2014, as a result of the
deceleration in economic
activity. This scenario is
compatible with our
expectation of lower growth
in the real wage bill in 2014
compared to last year.
Exhibit 175: Unemployment rate Exhibit 176: Real wage bill
% %, annual
4
5
6
7
8
9
10
11
12
13
14
Jan-05 Jan-08 Jan-11 Jan-14
2004
2005
2006
2007
2008
2009
2010
2011
2012
2013
2014e
3.0
2.7
1.6
1.7
3.7
1.1
3.6
2.1
2.0
1.0
0.7
-1.5
1.7
4.0
3.2
3.6
2.9
3.7
2.7
4.1
1.6
2.0
Remunerated population (%)
Average real wage (%)
Source: Brazil Statistics Bureau (IBGE), Credit Suisse Source: Brazil Statistics Bureau (IBGE), Credit Suisse
We expect IPCA inflation to
increase slightly from 5.9%
in 2013 to 6.2% in 2014.
The main short-term risks
for inflation are the
dynamics of the foreign
exchange rate and the gap
between local and
international fuel prices,
which has been quite
significant since the middle
of last year.
Exhibit 177: Breakdown of IPCA inflation
Exhibit 178: Gap between international and local fuel prices
%, yoy %
Market Prices Administered Prices IPCA
6.9
4.2
7.0 6.86.5
7.3
6.7
3.5
4.5
3.2
5.6
3.7
1.5
4.3
5.9
4.3
5.9
6.5
5.8 5.96.2
2008 2009 2010 2011 2012 2013 2014e
21.6
13.2
0
5
10
15
20
25
30
35
40
45
Jan-13 Mar-13 May-13 Jul-13 Sep-13 Nov-13 Jan-14 Feb-14
Diesel
Gasoline
Source: Brazil Statistics Bureau (IBGE), Credit Suisse Source: The BLOOMBERG PROFESSIONAL™ Service, Credit Suisse
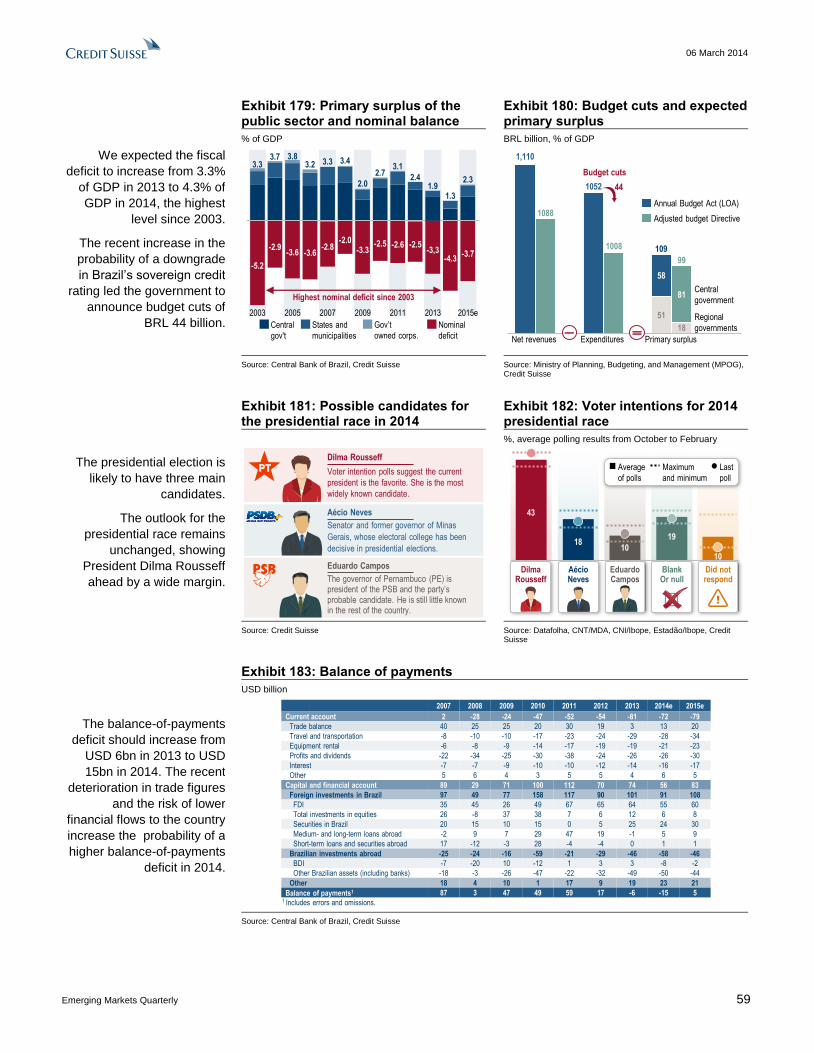
06 March 2014
Emerging Markets Quarterly 59
We expected the fiscal
deficit to increase from 3.3%
of GDP in 2013 to 4.3% of
GDP in 2014, the highest
level since 2003.
The recent increase in the
probability of a downgrade
in Brazil’s sovereign credit
rating led the government to
announce budget cuts of
BRL 44 billion.
Exhibit 179: Primary surplus of the public sector and nominal balance
Exhibit 180: Budget cuts and expected primary surplus
% of GDP BRL billion, % of GDP
Central
gov't
Gov’t
owned corps.
States and
municipalities
Nominal
deficit
2015e2003 2005 2007 2009 2011 2013
-5.2
3.7
-2.9
3.8
-3.6
3.2
-3.6
3.3
-2.8
3.4
-2.0
2.0
-3.3-2.5
3.1
-2.6
2.4
-2.5
1.3
-4.3
2.3
-3.7
Highest nominal deficit since 2003
-3,3
1.9
2.73.3
1,110
1088
1052
1008
51
58
81
109
99
Net revenues Expenditures Primary surplus
Central
government
Regional
governments
Annual Budget Act (LOA)
Adjusted budget Directive
44
Budget cuts
18
Source: Central Bank of Brazil, Credit Suisse Source: Ministry of Planning, Budgeting, and Management (MPOG), Credit Suisse
The presidential election is
likely to have three main
candidates.
The outlook for the
presidential race remains
unchanged, showing
President Dilma Rousseff
ahead by a wide margin.
Exhibit 181: Possible candidates for the presidential race in 2014
Exhibit 182: Voter intentions for 2014 presidential race
%, average polling results from October to February
Dilma Rousseff
Voter intention polls suggest the current
president is the favorite. She is the most
widely known candidate.
Eduardo Campos
The governor of Pernambuco (PE) is president of the PSB and the party’s probable candidate. He is still little known in the rest of the country.
Aécio Neves
Senator and former governor of Minas
Gerais, whose electoral college has been
decisive in presidential elections.
DilmaRousseff
AécioNeves
EduardoCampos
Did notrespond
BlankOr null
Average
of polls
Maximum
and minimum
Last
poll
43
1819
1010
Source: Credit Suisse Source: Datafolha, CNT/MDA, CNI/Ibope, Estadão/Ibope, Credit Suisse
The balance-of-payments
deficit should increase from
USD 6bn in 2013 to USD
15bn in 2014. The recent
deterioration in trade figures
and the risk of lower
financial flows to the country
increase the probability of a
higher balance-of-payments
deficit in 2014.
Exhibit 183: Balance of payments
USD billion
2007 2008 2009 2010 2011 2012 2013 2014e 2015e
Current account 2 -28 -24 -47 -52 -54 -81 -72 -79
Trade balance 40 25 25 20 30 19 3 13 20
Travel and transportation -8 -10 -10 -17 -23 -24 -29 -28 -34
Equipment rental -6 -8 -9 -14 -17 -19 -19 -21 -23
Profits and dividends -22 -34 -25 -30 -38 -24 -26 -26 -30
Interest -7 -7 -9 -10 -10 -12 -14 -16 -17
Other 5 6 4 3 5 5 4 6 5
Capital and financial account 89 29 71 100 112 70 74 56 83
Foreign investments in Brazil 97 49 77 158 117 90 101 91 108
FDI 35 45 26 49 67 65 64 55 60
Total investments in equities 26 -8 37 38 7 6 12 6 8
Securities in Brazil 20 15 10 15 0 5 25 24 30
Medium- and long-term loans abroad -2 9 7 29 47 19 -1 5 9
Short-term loans and securities abroad 17 -12 -3 28 -4 -4 0 1 1
Brazilian investments abroad -25 -24 -16 -59 -21 -29 -46 -58 -46
BDI -7 -20 10 -12 1 3 3 -8 -2
Other Brazilian assets (including banks) -18 -3 -26 -47 -22 -32 -49 -50 -44
Other 18 4 10 1 17 9 19 23 21
Balance of payments1 87 3 47 49 59 17 -6 -15 51 Includes errors and omissions.
Source: Central Bank of Brazil, Credit Suisse

06 March 2014
Emerging Markets Quarterly 60
Brazil: Selected economic indicators
2007 2008 2009 2010 2011 2012 2013 2014F 2015F
National accounts, population and unemployment
Real GDP growth (%) 6.1 5.2 -0.3 7.5 2.7 1.0 2.3 1.8 2.5
Growth in real private consumption (%) 6.1 5.7 4.4 6.9 4.1 3.2 2.3 1.9 1.9
Growth in real fixed investment (%) 13.9 13.6 -6.7 21.3 4.7 -4.0 6.3 1.1 3.5
Fixed investment (% of GDP) 17.4 19.1 18.1 19.5 19.3 18.2 18.4 18.3 18.6
Nominal GDP ($bn) 1,367 1,651 1,626 2,144 2,475 2,255 2,240 2,135 2,175
Population (mn) 189.5 191.5 193.5 195.5 197.4 199.2 201.0 202.8 204.4
GDP per capita, $ 7,211 8,621 8,401 10,966 12,538 11,320 11,143 10,330 10,445
Unemployment (% of labor force, end-year) 9.3 7.9 8.1 6.7 6.0 5.5 5.4 5.7 5.8
Prices, interest rates and exchange rates
CPI inflation (%, December to December) 4.5 5.9 4.3 5.9 6.5 5.8 5.9 6.2 5.5
CPI inflation (%, average) 3.6 5.7 4.9 5.0 6.6 5.4 6.2 5.9 5.9
Nominal wage growth (% year-on-year change)(1) 7.7 10.5 7.6 9.9 9.6 10.1 8.7 8.9 8.0
Exchange rate (BRL per USD, end-year) 1.77 2.34 1.74 1.67 1.88 2.04 2.35 2.60 2.60
Exchange rate (BRL per USD, average) 1.95 1.84 1.99 1.76 1.67 1.95 2.16 2.45 2.60
REER (% year-on-year change, annual average)(2) 7.2 2.7 0.7 12.8 2.6 -12.2 -6.9 -8.2 -0.3
REER (% change, December to December)(2) 12.7 -23.3 25.7 7.2 -7.6 -12.0 -8.5 -7.8 -1.2
Selic interest rate (%, end-year) 11.25 13.75 8.75 10.75 11.00 7.25 10.00 10.75 12.00
Fiscal data
General government fiscal balance (% of GDP) -2.8 -2.0 -3.3 -2.5 -2.6 -2.5 -3.3 -4.3 -3.7
General government primary balance (% of GDP) 3.3 3.4 2.0 2.7 3.1 2.4 1.9 1.3 2.3
General government expenditure (% of GDP)(3) 36.4 35.8 36.6 36.2 37.1 37.9 38.3 39.2 38.8
Gross general government debt (% of GDP, end-year)(4) 58.0 57.4 60.9 53.4 54.2 58.6 57.2 60.0 61.0
Net general government debt (% of GDP, end-year)(5) 45.5 38.5 42.1 39.1 36.4 35.1 33.8 34.5 35.5
Money supply and credit
Broad money supply (M2, % of GDP) 29.4 35.4 36.0 36.1 39.0 40.1 40.6 42.0 44.3
Broad money supply (M2, % year-on-year change) 18.1 37.3 8.8 16.7 18.7 9.1 10.0 12.5 15.0
Domestic credit (% of GDP) 97.4 102.1 107.2 99.5 104.0 113.1 117.0 121.3 124.6
Domestic credit (% year-on-year) na 10.8 11.9 -3.7 10.4 13.7 9.1 9.3 12.0
Domestic credit to private sector (% of GDP)(6) 43.4 49.5 52.1 53.9 58.2 64.1 67.8 71.9 76.5
Domestic credit to private sector (% year-on-year) na 30.1 12.5 20.3 18.7 17.0 14.0 15.7 16.0
Balance of payments
Exports (goods and non-factor services, % of GDP) 13.5 13.8 11.1 10.9 11.9 12.5 12.6 13.7 14.2
Imports (goods and non-factor services, % of GDP) 11.5 13.3 10.7 11.4 12.2 13.5 14.6 15.4 15.9
Exports (goods and non-factor services, % change in $ value) 17.4 23.7 -20.9 29.2 26.0 -4.0 -0.4 4.0 5.7
Imports (goods and non-factor services, % change in $ value) 31.0 39.6 -20.7 39.8 23.8 0.6 7.3 0.5 5.3
Current account balance ($bn) 1.6 -28.2 -24.3 -47.3 -52.5 -54.2 -81.4 -72.0 -79.0
Current account (% of GDP) 0.1 -1.7 -1.5 -2.2 -2.1 -2.4 -3.6 -3.4 -3.6
Net FDI ($bn)(7) 27.5 24.6 36.0 36.9 67.7 68.1 67.5 47.0 58.0
FDI ($bn)(8) 34.6 45.1 25.9 48.5 66.7 65.3 64.0 55.0 60.0
Scheduled debt amortization ($bn)(9) 38.2 22.4 30.1 33.8 37.7 39.7 60.1 50.5 64.1
Foreign debt and reserves
Public ($bn) 70.3 67.4 77.2 82.8 77.2 82.2 85.1 82.0 80.0
Private ($bn)(10) 170.2 195.6 200.4 269.1 326.8 358.4 403.2 430.0 440.0
Foreign debt (% of GDP, end-year)(10) 17.6 15.9 17.1 16.4 16.3 19.5 21.8 24.0 23.9
Foreign debt (% of exports of goods and services)(10) 130.3 115.1 153.6 150.7 137.3 156.0 173.6 175.0 168.1
Central bank gross FX reserves ($bn) 180.3 193.8 238.5 288.6 352.0 373.1 358.8 340.0 380.0
Central bank gross FX reserves, including forward FX transactions ($bn) 180.3 206.8 239.1 288.6 352.0 378.6 375.8 375.0 380.0
Central bank gross non-gold FX reserves ($bn) 179.4 192.8 237.4 287.1 350.4 369.6 356.2 338.0 378.0
(1) Average annual growth in nominal wages. (2) Real effective exchange rate. Deflator: CPIs. Increase indicates appreciation. (3) Total government expenditures; includes interest payments. (4) Figures related to the Central Bank's new methodology. (5) Net of international reserves, Worker's Fund (FAT) assets, Central Bank holdings of government securities, social security system holdings of government securities. (6) Includes bank lending to individuals and private corporate debt (debentures and bank loans to the sector). (7) Net FDI inflow minus Brazilian investments abroad. (8) Net inflow of foreign-owned companies. (9) Scheduled amortizations for public and private sectors. (10) Included intercompany loans.
Source: IBGE, Central Bank of Brazil, Credit Suisse

06 March 2014
Emerging Markets Quarterly 61
Chile: The slowdown is not over yet In Chile, clear signs of an economic slowdown have emerged in recent months.
For 2014, we are projecting average annual real GDP growth of 3.8%, down from the
estimated 4.0% average growth rate in 2013. This would be the lowest annual growth
rate since 2009. Though fixed investment continues to be the main driver of the
slowdown, private consumption has also lost some strength, despite the still high levels
of consumer confidence. We think that the central bank will continue to address the
slowdown by cutting the monetary policy rate further in upcoming months, even if this
leads to further weakening pressures on the Chilean peso.
Recent weakness in investment-related indicators has been in line with our long-
held view that Chile's strong investment cycle would inevitably come to an end.
Our 2014 house forecasts of lower copper prices and of weaker GDP growth in China
represent downside risks to investment growth in upcoming quarters. Private
consumption is another source of risk, particularly if labor market conditions were to
worsen further, as consumers remain generally optimistic about the economy and their
own personal situation, according to the latest surveys.
Weakening growth and the moderation in wage increases should help keep
inflation in-check, despite the recent depreciation of the peso. As we wrote in our
previous quarterly, however, there is inflation uncertainty as it is still unclear if the
recently revamped consumer price index will have a clear upward bias in the
measurement of inflation. In our view, the potential upward bias comes from the fact that
inflation categories that gained (lost) representation in the new index were for the most
part the ones showing the highest (lowest) inflation readings in recent quarters. Our
year-end 2014 inflation forecast is 3.5% and compares to consensus expectations of
3.0% in the latest central bank survey.
Central bank data show that the real exchange rate is now cheap to its ten-year
average. Despite this, we think that the Chilean peso remains vulnerable to further
weakness in upcoming months, as we think that the central bank will continue to ease
monetary policy to spur growth and to ensure that inflation is near the 3.0% target over
the policy horizon. Our year-end 2014 exchange rate forecast is 570 pesos per dollar,
versus 560 pesos per dollar at present. As for the monetary policy rate, our forecast is
unchanged that the central bank will make three additional rate cuts of 25bps each, from
4.25% to 3.5%, most likely by July. The swaps market is pricing in a terminal rate of
3.75% and a quick return to a tightening cycle, which we do not envision.
Chile's external savings remain abundant. The economic and social stabilization fund
had assets worth $15.6bn as of January 2014, equivalent to 6.0% of this year's
estimated GDP. This fund, as well as other assets owned by the Treasury (worth
$4.0bn), could be repatriated at any time, in the event of a more pronounced economic
downturn or if there were excessive weakening pressures on the Chilean peso. These
external savings along with the government's firm committment to fiscal discipline should
continue to help anchor the country's very solid (A+ and AA-) long-term foreign-currency
debt ratings.
Finally, on the political front, the inauguration of Michelle Bachelet as President
will take place on 11 March. We think that investor focus will remain on her ambitious
fiscal reform agenda that calls for an increase in tax collections in an amount equivalent
to 3% of GDP over four years. This would be achieved via higher corporate, excise and
financial transaction taxes, and the proceeds would be used to fund her ambitious
education reform. As we have stated before, market impact from these potential
changes would probably be felt mainly in a weaker exchange rate, as opposed to local
yields, given the government's net creditor position.
Alonso Cervera
+52 55 5283 3845

06 March 2014
Emerging Markets Quarterly 62
Real GDP growth has been
trending lower for the past
several months.
Consumption indicators that
had been resilient in the
past, like retail sales, are
now also showing signs of
a slowdown.
Exhibit 184: Real GDP proxy Exhibit 185: Retail sales
2008=100, seasonally adjusted; growth in % 2009=100, seasonally adjusted; growth in %
-0.6
-0.2
0.2
0.6
1.0
1.4
105
110
115
120
125
Dec-11 Dec-12 Dec-13
Index (lhs)
3M avg. of monthlygrowth (rhs)
-3
-2
-1
0
1
2
3
110
120
130
140
150
160
170
Jan-12 Jan-13 Jan-14
Index (lhs)
3M avg. of monthlygrowth (rhs)
Source: Central bank, Credit Suisse Source: INE, Credit Suisse
The loss in momentum
started earlier in investment-
related indicators, including
construction activity and
imports of capital goods.
We think that these trends
simply reflect the end of a
three-plus year investment
boom.
Exhibit 186: Construction activity index
Exhibit 187: Imports of capital and consumer goods
2008=100, seasonally adjusted $ billions, 3m moving average
-0.5%
0.0%
0.5%
1.0%
1.5%
2.0%
100
105
110
115
120
125
130
Dec-11 Aug-12 Apr-13 Dec-13
Index (lhs)
3M avg. of monthlygrowth (rhs)
0.8
1.0
1.2
1.4
1.6
1.8
2.0
Jan-11 Jan-12 Jan-13 Jan-14
Consumer goods
Capital goods
Source: Chilean Construction Chamber, Credit Suisse Source: Central bank, Credit Suisse
The labor market remains
generally tight, but there are
some indicators that
suggest some loosening of
conditions at the margin.
These include data on help
wanted indices and a slight
moderation in wage
increases.
Exhibit 188: Unemployment rates Exhibit 189: Nominal wage increases
% %, increases are year on year
2
4
6
8
10
12
14
4Q03 4Q05 4Q07 4Q09 4Q11 4Q13
National unemployment
Unemployment in Santiago
0
2
4
6
8
10
12
Dec-11 Jun-12 Dec-12 Jun-13 Dec-13
Construction
Mining
Total
Source: Central bank, Universidad de Chile, Credit Suisse Source: INE, Credit Suisse
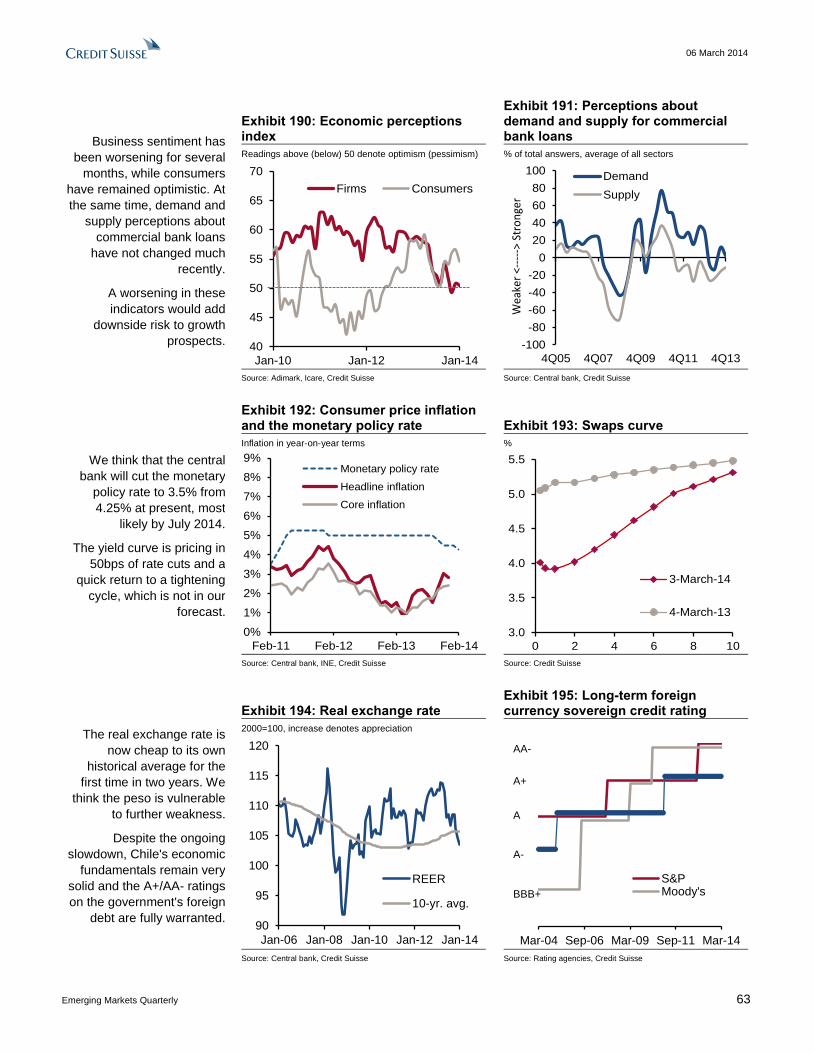
06 March 2014
Emerging Markets Quarterly 63
Business sentiment has
been worsening for several
months, while consumers
have remained optimistic. At
the same time, demand and
supply perceptions about
commercial bank loans
have not changed much
recently.
A worsening in these
indicators would add
downside risk to growth
prospects.
Exhibit 190: Economic perceptions index
Exhibit 191: Perceptions about demand and supply for commercial bank loans
Readings above (below) 50 denote optimism (pessimism) % of total answers, average of all sectors
40
45
50
55
60
65
70
Jan-10 Jan-12 Jan-14
Firms Consumers
-100
-80
-60
-40
-20
0
20
40
60
80
100
4Q05 4Q07 4Q09 4Q11 4Q13
Demand
Supply
Wea
ker
<---
-->
Stro
nge
r
Source: Adimark, Icare, Credit Suisse Source: Central bank, Credit Suisse
We think that the central
bank will cut the monetary
policy rate to 3.5% from
4.25% at present, most
likely by July 2014.
The yield curve is pricing in
50bps of rate cuts and a
quick return to a tightening
cycle, which is not in our
forecast.
Exhibit 192: Consumer price inflation and the monetary policy rate Exhibit 193: Swaps curve
Inflation in year-on-year terms %
0%
1%
2%
3%
4%
5%
6%
7%
8%
9%
Feb-11 Feb-12 Feb-13 Feb-14
Monetary policy rate
Headline inflation
Core inflation
3.0
3.5
4.0
4.5
5.0
5.5
0 2 4 6 8 10
3-March-14
4-March-13
Source: Central bank, INE, Credit Suisse Source: Credit Suisse
The real exchange rate is
now cheap to its own
historical average for the
first time in two years. We
think the peso is vulnerable
to further weakness.
Despite the ongoing
slowdown, Chile's economic
fundamentals remain very
solid and the A+/AA- ratings
on the government's foreign
debt are fully warranted.
Exhibit 194: Real exchange rate Exhibit 195: Long-term foreign currency sovereign credit rating
2000=100, increase denotes appreciation
90
95
100
105
110
115
120
Jan-06 Jan-08 Jan-10 Jan-12 Jan-14
REER
10-yr. avg.
Mar-04 Sep-06 Mar-09 Sep-11 Mar-14
S&PMoody'sBBB+
A-
A
A+
AA-
Source: Central bank, Credit Suisse Source: Rating agencies, Credit Suisse
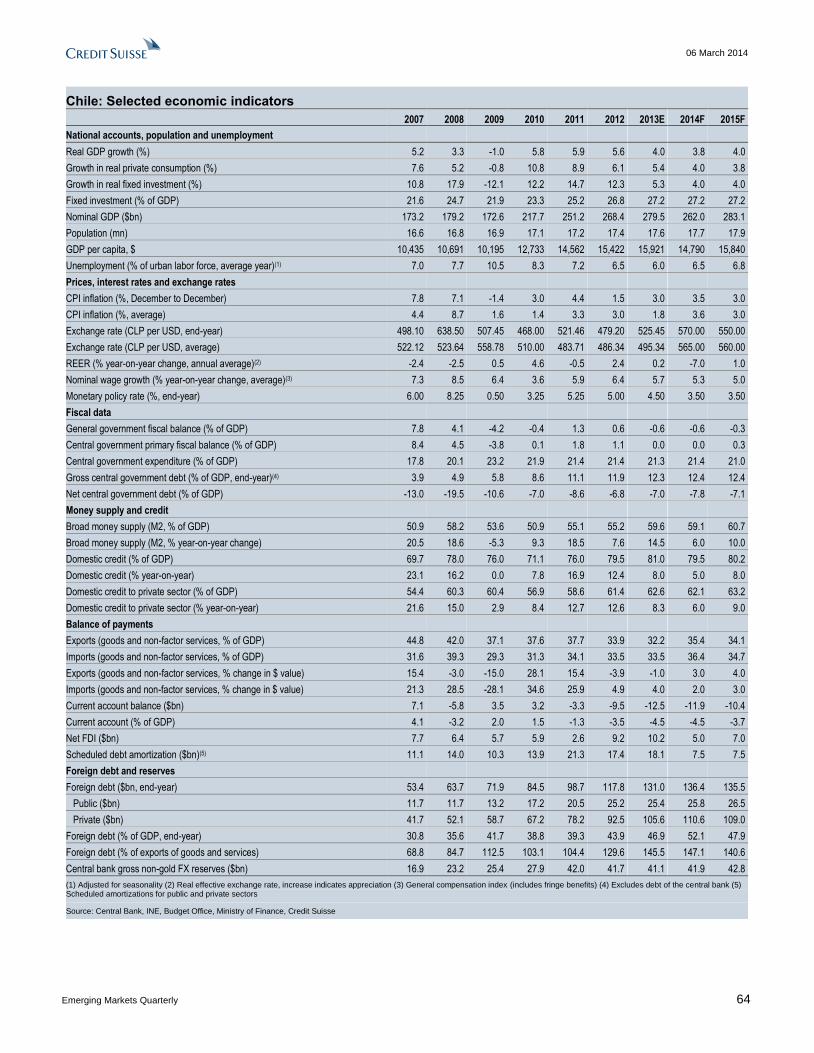
06 March 2014
Emerging Markets Quarterly 64
Chile: Selected economic indicators
2007 2008 2009 2010 2011 2012 2013E 2014F 2015F
National accounts, population and unemployment
Real GDP growth (%) 5.2 3.3 -1.0 5.8 5.9 5.6 4.0 3.8 4.0
Growth in real private consumption (%) 7.6 5.2 -0.8 10.8 8.9 6.1 5.4 4.0 3.8
Growth in real fixed investment (%) 10.8 17.9 -12.1 12.2 14.7 12.3 5.3 4.0 4.0
Fixed investment (% of GDP) 21.6 24.7 21.9 23.3 25.2 26.8 27.2 27.2 27.2
Nominal GDP ($bn) 173.2 179.2 172.6 217.7 251.2 268.4 279.5 262.0 283.1
Population (mn) 16.6 16.8 16.9 17.1 17.2 17.4 17.6 17.7 17.9
GDP per capita, $ 10,435 10,691 10,195 12,733 14,562 15,422 15,921 14,790 15,840
Unemployment (% of urban labor force, average year)(1) 7.0 7.7 10.5 8.3 7.2 6.5 6.0 6.5 6.8
Prices, interest rates and exchange rates
CPI inflation (%, December to December) 7.8 7.1 -1.4 3.0 4.4 1.5 3.0 3.5 3.0
CPI inflation (%, average) 4.4 8.7 1.6 1.4 3.3 3.0 1.8 3.6 3.0
Exchange rate (CLP per USD, end-year) 498.10 638.50 507.45 468.00 521.46 479.20 525.45 570.00 550.00
Exchange rate (CLP per USD, average) 522.12 523.64 558.78 510.00 483.71 486.34 495.34 565.00 560.00
REER (% year-on-year change, annual average)(2) -2.4 -2.5 0.5 4.6 -0.5 2.4 0.2 -7.0 1.0
Nominal wage growth (% year-on-year change, average)(3) 7.3 8.5 6.4 3.6 5.9 6.4 5.7 5.3 5.0
Monetary policy rate (%, end-year) 6.00 8.25 0.50 3.25 5.25 5.00 4.50 3.50 3.50
Fiscal data
General government fiscal balance (% of GDP) 7.8 4.1 -4.2 -0.4 1.3 0.6 -0.6 -0.6 -0.3
Central government primary fiscal balance (% of GDP) 8.4 4.5 -3.8 0.1 1.8 1.1 0.0 0.0 0.3
Central government expenditure (% of GDP) 17.8 20.1 23.2 21.9 21.4 21.4 21.3 21.4 21.0
Gross central government debt (% of GDP, end-year)(4) 3.9 4.9 5.8 8.6 11.1 11.9 12.3 12.4 12.4
Net central government debt (% of GDP) -13.0 -19.5 -10.6 -7.0 -8.6 -6.8 -7.0 -7.8 -7.1
Money supply and credit
Broad money supply (M2, % of GDP) 50.9 58.2 53.6 50.9 55.1 55.2 59.6 59.1 60.7
Broad money supply (M2, % year-on-year change) 20.5 18.6 -5.3 9.3 18.5 7.6 14.5 6.0 10.0
Domestic credit (% of GDP) 69.7 78.0 76.0 71.1 76.0 79.5 81.0 79.5 80.2
Domestic credit (% year-on-year) 23.1 16.2 0.0 7.8 16.9 12.4 8.0 5.0 8.0
Domestic credit to private sector (% of GDP) 54.4 60.3 60.4 56.9 58.6 61.4 62.6 62.1 63.2
Domestic credit to private sector (% year-on-year) 21.6 15.0 2.9 8.4 12.7 12.6 8.3 6.0 9.0
Balance of payments
Exports (goods and non-factor services, % of GDP) 44.8 42.0 37.1 37.6 37.7 33.9 32.2 35.4 34.1
Imports (goods and non-factor services, % of GDP) 31.6 39.3 29.3 31.3 34.1 33.5 33.5 36.4 34.7
Exports (goods and non-factor services, % change in $ value) 15.4 -3.0 -15.0 28.1 15.4 -3.9 -1.0 3.0 4.0
Imports (goods and non-factor services, % change in $ value) 21.3 28.5 -28.1 34.6 25.9 4.9 4.0 2.0 3.0
Current account balance ($bn) 7.1 -5.8 3.5 3.2 -3.3 -9.5 -12.5 -11.9 -10.4
Current account (% of GDP) 4.1 -3.2 2.0 1.5 -1.3 -3.5 -4.5 -4.5 -3.7
Net FDI ($bn) 7.7 6.4 5.7 5.9 2.6 9.2 10.2 5.0 7.0
Scheduled debt amortization ($bn)(5) 11.1 14.0 10.3 13.9 21.3 17.4 18.1 7.5 7.5
Foreign debt and reserves
Foreign debt ($bn, end-year) 53.4 63.7 71.9 84.5 98.7 117.8 131.0 136.4 135.5
Public ($bn) 11.7 11.7 13.2 17.2 20.5 25.2 25.4 25.8 26.5
Private ($bn) 41.7 52.1 58.7 67.2 78.2 92.5 105.6 110.6 109.0
Foreign debt (% of GDP, end-year) 30.8 35.6 41.7 38.8 39.3 43.9 46.9 52.1 47.9
Foreign debt (% of exports of goods and services) 68.8 84.7 112.5 103.1 104.4 129.6 145.5 147.1 140.6
Central bank gross non-gold FX reserves ($bn) 16.9 23.2 25.4 27.9 42.0 41.7 41.1 41.9 42.8
(1) Adjusted for seasonality (2) Real effective exchange rate, increase indicates appreciation (3) General compensation index (includes fringe benefits) (4) Excludes debt of the central bank (5) Scheduled amortizations for public and private sectors
Source: Central Bank, INE, Budget Office, Ministry of Finance, Credit Suisse
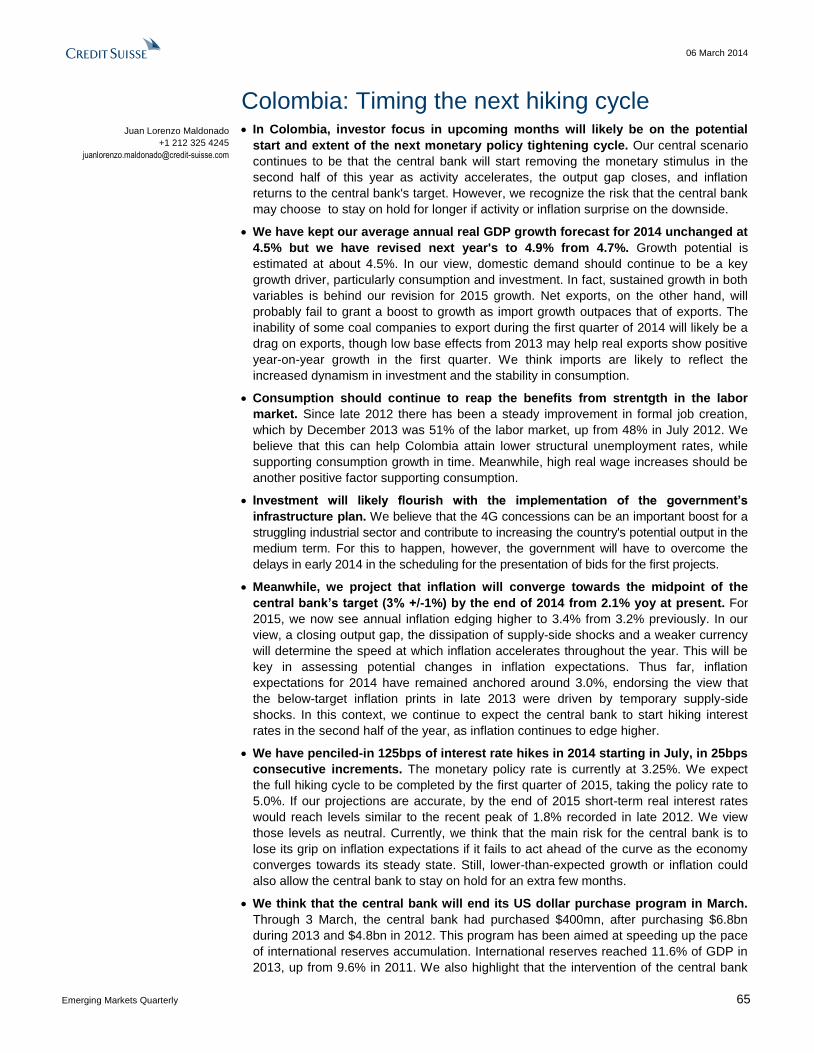
06 March 2014
Emerging Markets Quarterly 65
Colombia: Timing the next hiking cycle In Colombia, investor focus in upcoming months will likely be on the potential
start and extent of the next monetary policy tightening cycle. Our central scenario
continues to be that the central bank will start removing the monetary stimulus in the
second half of this year as activity accelerates, the output gap closes, and inflation
returns to the central bank's target. However, we recognize the risk that the central bank
may choose to stay on hold for longer if activity or inflation surprise on the downside.
We have kept our average annual real GDP growth forecast for 2014 unchanged at
4.5% but we have revised next year's to 4.9% from 4.7%. Growth potential is
estimated at about 4.5%. In our view, domestic demand should continue to be a key
growth driver, particularly consumption and investment. In fact, sustained growth in both
variables is behind our revision for 2015 growth. Net exports, on the other hand, will
probably fail to grant a boost to growth as import growth outpaces that of exports. The
inability of some coal companies to export during the first quarter of 2014 will likely be a
drag on exports, though low base effects from 2013 may help real exports show positive
year-on-year growth in the first quarter. We think imports are likely to reflect the
increased dynamism in investment and the stability in consumption.
Consumption should continue to reap the benefits from strentgth in the labor
market. Since late 2012 there has been a steady improvement in formal job creation,
which by December 2013 was 51% of the labor market, up from 48% in July 2012. We
believe that this can help Colombia attain lower structural unemployment rates, while
supporting consumption growth in time. Meanwhile, high real wage increases should be
another positive factor supporting consumption.
Investment will likely flourish with the implementation of the government’s
infrastructure plan. We believe that the 4G concessions can be an important boost for a
struggling industrial sector and contribute to increasing the country's potential output in the
medium term. For this to happen, however, the government will have to overcome the
delays in early 2014 in the scheduling for the presentation of bids for the first projects.
Meanwhile, we project that inflation will converge towards the midpoint of the
central bank’s target (3% +/-1%) by the end of 2014 from 2.1% yoy at present. For
2015, we now see annual inflation edging higher to 3.4% from 3.2% previously. In our
view, a closing output gap, the dissipation of supply-side shocks and a weaker currency
will determine the speed at which inflation accelerates throughout the year. This will be
key in assessing potential changes in inflation expectations. Thus far, inflation
expectations for 2014 have remained anchored around 3.0%, endorsing the view that
the below-target inflation prints in late 2013 were driven by temporary supply-side
shocks. In this context, we continue to expect the central bank to start hiking interest
rates in the second half of the year, as inflation continues to edge higher.
We have penciled-in 125bps of interest rate hikes in 2014 starting in July, in 25bps
consecutive increments. The monetary policy rate is currently at 3.25%. We expect
the full hiking cycle to be completed by the first quarter of 2015, taking the policy rate to
5.0%. If our projections are accurate, by the end of 2015 short-term real interest rates
would reach levels similar to the recent peak of 1.8% recorded in late 2012. We view
those levels as neutral. Currently, we think that the main risk for the central bank is to
lose its grip on inflation expectations if it fails to act ahead of the curve as the economy
converges towards its steady state. Still, lower-than-expected growth or inflation could
also allow the central bank to stay on hold for an extra few months.
We think that the central bank will end its US dollar purchase program in March.
Through 3 March, the central bank had purchased $400mn, after purchasing $6.8bn
during 2013 and $4.8bn in 2012. This program has been aimed at speeding up the pace
of international reserves accumulation. International reserves reached 11.6% of GDP in
2013, up from 9.6% in 2011. We also highlight that the intervention of the central bank
Juan Lorenzo Maldonado
+1 212 325 4245

06 March 2014
Emerging Markets Quarterly 66
does not have the size to affect the value of the currency, although it does send a signal
to the market regarding the bank’s comfort zone about the currency.
We do not see fundamental reasons for the Colombian peso to weaken
dramatically in our forecast horizon. We expect a slight strengthening from current
levels of 2,048 pesos per dollar towards a year-end 2014 level of 2,036 per dollar. For
2015, we believe the COP will end the year between 2,015 and 2,030 per dollar. Our
view is that at-potential growth, the coming hiking cycle and robust macroeconomic
fundamentals should have positive effects in the currency. The counterbalance will
probably come from reduced capital inflows due to lower international liquidity and the
inability of key sectors to soak in marginal FDI flows, and risk sentiment. Misaligned
expectations regarding tapering and future rate hikes in the US, and their impact on
capital flows to emerging markets, is the greatest risk to our currency forecast.
The outlook for fiscal accounts remains stable, and we expect Colombia to reach
its fiscal deficit target of 2.3% of GDP this year. Government debt is also likely to
continue on a downward trend, helping the strengthening of Colombia’s balance sheet.
The government issued $2.0bn in January as part of its 2014 financing plan, which was
the full amount it had allotted to foreign issuances this year. However, we cannot rule
out further issuance later in the year to pre-finance the 2015 budget, a similar strategy
used in 2013.
We have revised our forecast for the current account deficit to 3.7% of GDP from
3.4% of GDP previously. The main reason is the expected underperformance of
traditional exports in the context of sustained import growth, which will likely contribute to
a lower trade surplus this year. We are not overly concerned by Colombia’s current
account deficit, as long-term capital flows should fully fund the deficit.
On the political front, we expect President Juan Manuel Santos to be re-elected in
the 25 May presidential election based on recent voter intentions. Santos has
confirmed that German Vargas Lleras will be his running-mate as vice president in the
presidential campaign. Vargas Lleras is a seasoned and well-respected politician in
Colombia, and we expect him to boost Santos’ vote intentions further. Vargas Lleras
previously served as Minister of Housing and Interior under the Santos administration,
and has been a senator since the 1990s.
According to the most recent polls, the leading contender is Oscar Ivan Zuluaga,
who is running for the Centro Democratico party. The leader of the party is former
president Alvaro Uribe, who is currently running for the Senate. Zuluaga trails by around
20 points, according to the latest poll released by Ipsos, and by 25 points according to
Gallup. We expect the presidential race to run smoothly and do not expect political noise
to get in the way of the macroeconomic performance of the country. The main political
risk we see at this point is that governability may become a bit more difficult for
President Santos if Uribe pulls an important number of legislators into the Senate with
him. Uribe has become a vocal critic of President Santos, and could rally forces against
presidential initiatives in key topics like security.
Finally, we see a favorable medium-term scenario for macroeconomic
fundamentals in Colombia. The main positive event on the pipeline continues to be the
peace process with the FARC guerrillas. Together with a plentiful implementation of the
government’s infrastructure program, we believe potential output in Colombia could be
at least one percentage point higher in the next five years. Continued compliance with
the fiscal rule may also lead to further rating upgrades towards the end of the year or in
2015. Moody’s currently has a positive outlook on its Baa3 rating, but we believe further
improvement in fiscal accounts will be needed before a more definite action takes place.
Fitch and S&P may move towards assigning a positive outlook throughout the year, with
likely conditional upgrades happening in 2015.
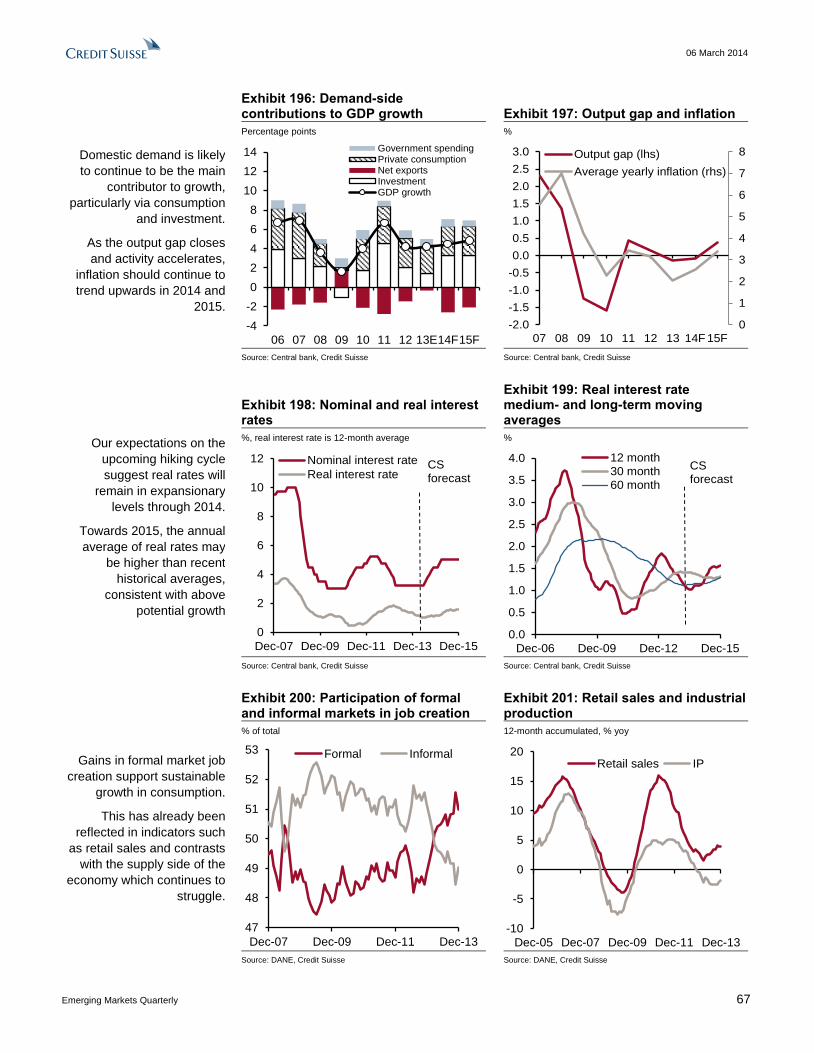
06 March 2014
Emerging Markets Quarterly 67
Domestic demand is likely
to continue to be the main
contributor to growth,
particularly via consumption
and investment.
As the output gap closes
and activity accelerates,
inflation should continue to
trend upwards in 2014 and
2015.
Exhibit 196: Demand-side contributions to GDP growth Exhibit 197: Output gap and inflation
Percentage points %
-4
-2
0
2
4
6
8
10
12
14
06 07 08 09 10 11 12 13E14F15F
Government spendingPrivate consumptionNet exportsInvestmentGDP growth
0
1
2
3
4
5
6
7
8
-2.0
-1.5
-1.0
-0.5
0.0
0.5
1.0
1.5
2.0
2.5
3.0
07 08 09 10 11 12 13 14F 15F
Output gap (lhs)
Average yearly inflation (rhs)
Source: Central bank, Credit Suisse Source: Central bank, Credit Suisse
Our expectations on the
upcoming hiking cycle
suggest real rates will
remain in expansionary
levels through 2014.
Towards 2015, the annual
average of real rates may
be higher than recent
historical averages,
consistent with above
potential growth
Exhibit 198: Nominal and real interest rates
Exhibit 199: Real interest rate medium- and long-term moving averages
%, real interest rate is 12-month average %
0
2
4
6
8
10
12
Dec-07 Dec-09 Dec-11 Dec-13 Dec-15
Nominal interest rate
Real interest rateCS forecast
0.0
0.5
1.0
1.5
2.0
2.5
3.0
3.5
4.0
Dec-06 Dec-09 Dec-12 Dec-15
12 month
30 month60 month
CS forecast
Source: Central bank, Credit Suisse Source: Central bank, Credit Suisse
Gains in formal market job
creation support sustainable
growth in consumption.
This has already been
reflected in indicators such
as retail sales and contrasts
with the supply side of the
economy which continues to
struggle.
Exhibit 200: Participation of formal and informal markets in job creation
Exhibit 201: Retail sales and industrial production
% of total 12-month accumulated, % yoy
47
48
49
50
51
52
53
Dec-07 Dec-09 Dec-11 Dec-13
Formal Informal
-10
-5
0
5
10
15
20
Dec-05 Dec-07 Dec-09 Dec-11 Dec-13
Retail sales IP
Source: DANE, Credit Suisse Source: DANE, Credit Suisse

06 March 2014
Emerging Markets Quarterly 68
Capital flows into Colombia
are expected to decelerate
from record-breaking levels
of 2012 and 2013, as
international liquidity
diminishes.
Central bank intervention
has remained in place,
despite a weaker peso, in
an effort to increase the
country’s international
reserve position
Exhibit 202: Net capital flows Exhibit 203: Daily dollar purchases and nominal exchange rate
Cash basis 12-month accumulated, $bn Dollar purchases are $mn
0
5
10
15
20
Jan 07 Oct 08 Jul 10 Apr 12 Jan 14
Portfolio flows FDI
1750
1800
1850
1900
1950
2000
2050
2100
0
10
20
30
40
50
60
3-Mar-13 3-Mar-14
Dollar purchases (lhs)
USDCOP (rhs)
Source: Central bank, Credit Suisse Source: Central bank, the BLOOMBERG PROFESSIONAL™
service, Credit Suisse
Further improvement in the
fiscal accounts will be
needed for more sovereign
credit upgrades to take
place, in our view.
Exhibit 204: Central government budget balance
Exhibit 205: Long-term foreign-currency sovereign debt ratings
% of GDP
-5
-4
-3
-2
-1
0
1
06 07 08 09 10 11 12 13
Nominal
Primary
Feb-05 Feb-08 Feb-11 Feb-14
S&P
Moody's
Fitch
BB
BB+
BBB-
BBB
Source: Ministry of Finance, Credit Suisse Source: Rating agencies, Credit Suisse
President Juan Manuel
Santos is still the favorite to
win the presidential election
in May, although a run-off
vote may be needed.
A peace agreement with the
FARC would be an
important boost for the
country in the medium term
in social as well as
economic terms.
Exhibit 206: Vote intentions for May presidential elections
Exhibit 207: Terrorist attacks to oil pipelines and oil production
% of total Oil production in millions of barrels per day
0
5
10
15
20
25
30
35
40
JuanManuelSantos
OscarIvan
Zuluaga
ClaraLópez
Obregón
MarthaLucia
Ramirez
Nov-13
Dec-13
Feb-14
0
10
20
30
40
50
60
0.6
0.7
0.8
0.9
1.0
1.1
Dec-10 Dec-11 Dec-12 Dec-13
Terrorist attacks (rhs)
Oil production (lhs)
Source: Gallup, Credit Suisse Source: ANH, Ministry of Defense, Credit Suisse
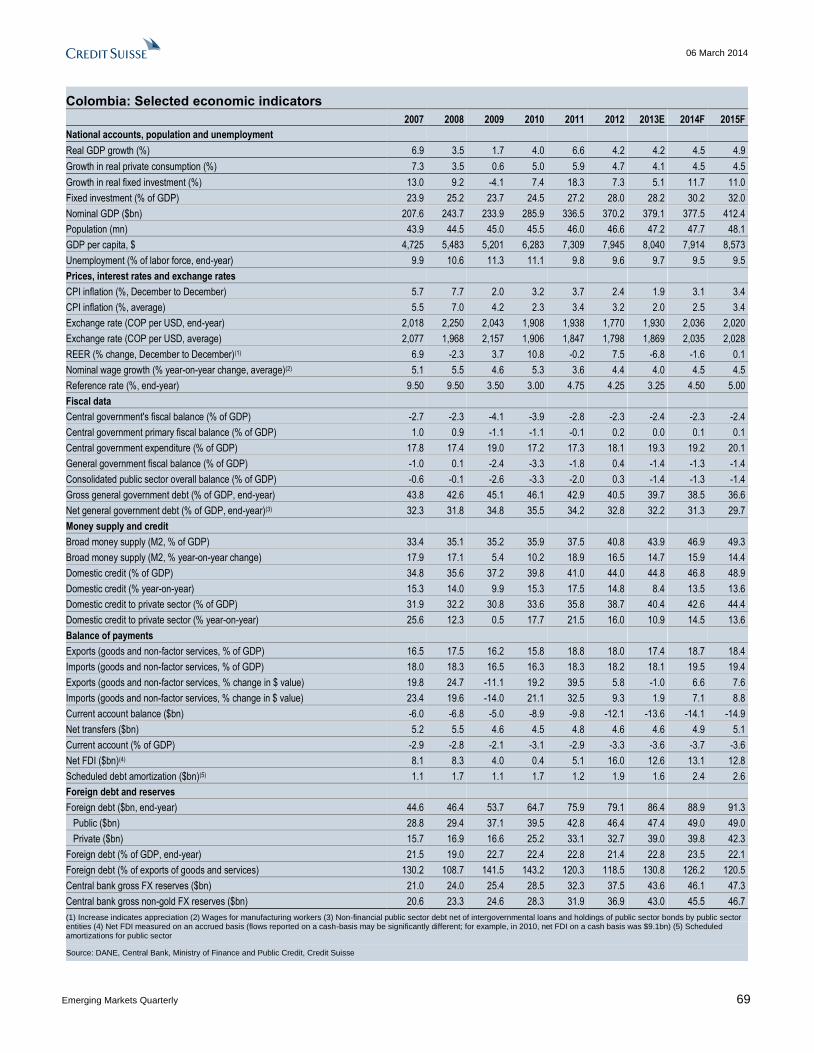
06 March 2014
Emerging Markets Quarterly 69
Colombia: Selected economic indicators
2007 2008 2009 2010 2011 2012 2013E 2014F 2015F
National accounts, population and unemployment
Real GDP growth (%) 6.9 3.5 1.7 4.0 6.6 4.2 4.2 4.5 4.9
Growth in real private consumption (%) 7.3 3.5 0.6 5.0 5.9 4.7 4.1 4.5 4.5
Growth in real fixed investment (%) 13.0 9.2 -4.1 7.4 18.3 7.3 5.1 11.7 11.0
Fixed investment (% of GDP) 23.9 25.2 23.7 24.5 27.2 28.0 28.2 30.2 32.0
Nominal GDP ($bn) 207.6 243.7 233.9 285.9 336.5 370.2 379.1 377.5 412.4
Population (mn) 43.9 44.5 45.0 45.5 46.0 46.6 47.2 47.7 48.1
GDP per capita, $ 4,725 5,483 5,201 6,283 7,309 7,945 8,040 7,914 8,573
Unemployment (% of labor force, end-year) 9.9 10.6 11.3 11.1 9.8 9.6 9.7 9.5 9.5
Prices, interest rates and exchange rates
CPI inflation (%, December to December) 5.7 7.7 2.0 3.2 3.7 2.4 1.9 3.1 3.4
CPI inflation (%, average) 5.5 7.0 4.2 2.3 3.4 3.2 2.0 2.5 3.4
Exchange rate (COP per USD, end-year) 2,018 2,250 2,043 1,908 1,938 1,770 1,930 2,036 2,020
Exchange rate (COP per USD, average) 2,077 1,968 2,157 1,906 1,847 1,798 1,869 2,035 2,028
REER (% change, December to December)(1) 6.9 -2.3 3.7 10.8 -0.2 7.5 -6.8 -1.6 0.1
Nominal wage growth (% year-on-year change, average)(2) 5.1 5.5 4.6 5.3 3.6 4.4 4.0 4.5 4.5
Reference rate (%, end-year) 9.50 9.50 3.50 3.00 4.75 4.25 3.25 4.50 5.00
Fiscal data
Central government's fiscal balance (% of GDP) -2.7 -2.3 -4.1 -3.9 -2.8 -2.3 -2.4 -2.3 -2.4
Central government primary fiscal balance (% of GDP) 1.0 0.9 -1.1 -1.1 -0.1 0.2 0.0 0.1 0.1
Central government expenditure (% of GDP) 17.8 17.4 19.0 17.2 17.3 18.1 19.3 19.2 20.1
General government fiscal balance (% of GDP) -1.0 0.1 -2.4 -3.3 -1.8 0.4 -1.4 -1.3 -1.4
Consolidated public sector overall balance (% of GDP) -0.6 -0.1 -2.6 -3.3 -2.0 0.3 -1.4 -1.3 -1.4
Gross general government debt (% of GDP, end-year) 43.8 42.6 45.1 46.1 42.9 40.5 39.7 38.5 36.6
Net general government debt (% of GDP, end-year)(3) 32.3 31.8 34.8 35.5 34.2 32.8 32.2 31.3 29.7
Money supply and credit
Broad money supply (M2, % of GDP) 33.4 35.1 35.2 35.9 37.5 40.8 43.9 46.9 49.3
Broad money supply (M2, % year-on-year change) 17.9 17.1 5.4 10.2 18.9 16.5 14.7 15.9 14.4
Domestic credit (% of GDP) 34.8 35.6 37.2 39.8 41.0 44.0 44.8 46.8 48.9
Domestic credit (% year-on-year) 15.3 14.0 9.9 15.3 17.5 14.8 8.4 13.5 13.6
Domestic credit to private sector (% of GDP) 31.9 32.2 30.8 33.6 35.8 38.7 40.4 42.6 44.4
Domestic credit to private sector (% year-on-year) 25.6 12.3 0.5 17.7 21.5 16.0 10.9 14.5 13.6
Balance of payments
Exports (goods and non-factor services, % of GDP) 16.5 17.5 16.2 15.8 18.8 18.0 17.4 18.7 18.4
Imports (goods and non-factor services, % of GDP) 18.0 18.3 16.5 16.3 18.3 18.2 18.1 19.5 19.4
Exports (goods and non-factor services, % change in $ value) 19.8 24.7 -11.1 19.2 39.5 5.8 -1.0 6.6 7.6
Imports (goods and non-factor services, % change in $ value) 23.4 19.6 -14.0 21.1 32.5 9.3 1.9 7.1 8.8
Current account balance ($bn) -6.0 -6.8 -5.0 -8.9 -9.8 -12.1 -13.6 -14.1 -14.9
Net transfers ($bn) 5.2 5.5 4.6 4.5 4.8 4.6 4.6 4.9 5.1
Current account (% of GDP) -2.9 -2.8 -2.1 -3.1 -2.9 -3.3 -3.6 -3.7 -3.6
Net FDI ($bn)(4) 8.1 8.3 4.0 0.4 5.1 16.0 12.6 13.1 12.8
Scheduled debt amortization ($bn)(5) 1.1 1.7 1.1 1.7 1.2 1.9 1.6 2.4 2.6
Foreign debt and reserves
Foreign debt ($bn, end-year) 44.6 46.4 53.7 64.7 75.9 79.1 86.4 88.9 91.3
Public ($bn) 28.8 29.4 37.1 39.5 42.8 46.4 47.4 49.0 49.0
Private ($bn) 15.7 16.9 16.6 25.2 33.1 32.7 39.0 39.8 42.3
Foreign debt (% of GDP, end-year) 21.5 19.0 22.7 22.4 22.8 21.4 22.8 23.5 22.1
Foreign debt (% of exports of goods and services) 130.2 108.7 141.5 143.2 120.3 118.5 130.8 126.2 120.5
Central bank gross FX reserves ($bn) 21.0 24.0 25.4 28.5 32.3 37.5 43.6 46.1 47.3
Central bank gross non-gold FX reserves ($bn) 20.6 23.3 24.6 28.3 31.9 36.9 43.0 45.5 46.7
(1) Increase indicates appreciation (2) Wages for manufacturing workers (3) Non-financial public sector debt net of intergovernmental loans and holdings of public sector bonds by public sector entities (4) Net FDI measured on an accrued basis (flows reported on a cash-basis may be significantly different; for example, in 2010, net FDI on a cash basis was $9.1bn) (5) Scheduled amortizations for public sector
Source: DANE, Central Bank, Ministry of Finance and Public Credit, Credit Suisse
06 March 2014
Emerging Markets Quarterly 70
Mexico: A transition year 2013 was the year of Mexico's structural reforms. It was a year in which, against the
consensus view, the Mexican government built enough congressional support to
approve the long-awaited and meaningful reforms that seek to boost GDP growth
potential over the medium and long term. In our view, these reforms are already in the
process of re-shaping the country's labor market, the education system, the anti-trust
regulator, as well as the media, telecommunication, energy and financial sectors.
We view 2014 as a transition year in which structural reforms will be fully
implemented. This will require the congressional approval of the secondary legislation
of some of the 2013 reforms, particularly those related to energy, telecommunications
and competition. We remain optimistic that the main political parties, PRI and PAN, will
support pending secondary legislation in the current congressional period which ends
30 April. Contrary to constitutional reforms, approval of secondary legislation requires
only a simple majority in both houses of congress (which PAN and PRI have) and no
ratification from state legislatures.
In a transition year, the Mexican economy is unlikely to reap the full benefits of
the reforms, however. We are lowering our annual average real GDP growth forecast
for 2014 to 2.8% from 3.7%. This downward revision reflects a very disappointing GDP
report for the final quarter of 2013, as well as a slow start in 2014, partly due to the
implementation of the fiscal reform in Mexico and to the weak numbers out of the US
year-to-date. Our 2014 growth forecast for Mexico is based on our real GDP growth
forecast of 2.6% for the US (3.9% growth in industrial output). We estimate that last year
US real GDP and industrial output growth rates were 1.9% and 2.6%, respectively.
We think that the first quarter of 2014 will be the most challenging one for the
Mexican economy. We project quarterly growth of just 0.3% (non-annualized) and 1.1%
in year-on-year terms. This quarter should reflect the impact on consumer spending from
the higher tax burden associated to income tax increases, the introduction of excise
taxes on soft drinks and junk food, and price increases for some important spending
items, like public transportation in large metropolitan cities. It should also reflect the
impact from advanced purchases made by firms and households in late 2013 as they
tried to avoid the impact from the fiscal changes. First quarter GDP data are due on
23 May. For the second, third and fourth quarters, our annual real GDP growth forecasts
are 2.7%, 3.0% and 4.1%, respecitively.
In our projections we have Mexico benefitting from an acceleration in US growth
starting in the second quarter. This is the biggest risk to our forecast. It implies that
stronger US GDP and industrial output growth will also lead to a recovery in US imports,
particularly for the types of goods that Mexico sells in the US. These include cars,
trucks, autoparts and all sorts of consumer electronics. US data through year-end 2013,
however, show that total US imports from the world (ex-oil and gas) have been
weakening steadily in recent years, posting annual nominal growth rates of 21%, 14%,
5% and 2% in 2010, 2011, 2012 and 2013, respectively. For Mexico's main export items,
we estimate that total US import growth last year was just 3.2%, versus 9.2% in 2012.
The main engine of growth for the domestic economy in 2014 will likely be the
expansion in public sector spending. Data from the Ministry of Finance already show
a significant acceleration in government spending since September 2013, a trend that
will likely persist as the year progresses. In our view, the main challenge for the federal
government resides in the timely launching of large infrastructure projects that will have
a large multiplier effect in the economy. Until now, the only high-profile project the
government has announced is the construction of a railroad from Toluca to Mexico City.
We think that more announcements of this sort would go a long way in strengthening
investor confidence in the country's investment outlook.
Alonso Cervera
+52 55 5283 3845
06 March 2014
Emerging Markets Quarterly 71
Meanwhile, some of the obstacles to growth in 2013 are unlikely to re-surface in
2014. These include the natural gas shortages in western Mexico, the under-execution
of the public sector budget in the first seven months of the year and the shock to
construction from the financial troubles of three of the largest home builders.
We see no room for additional monetary or fiscal stimulus in 2014, even if growth
were to disappoint. From a monetary policy standpoint, we think that the main
constraint to further action by the central bank are the expectations that annual headline
inflation will likely hover around 4.0% throughout this year. This level is the upper-end of
the variability range around the 3.0% target. In our view, the central bank would risk
losing credibility for no clear economic gain, if it were to ease monetary policy further.
From a fiscal standpoint, we would not expect the government to seek an
additional authorization from congress to widen the fiscal deficit for 2014. In late
2013 the government already sought congressional authorization to expand last year's
deficit, while it announced a larger-than-expected expansion of the deficit for 2014 and
subsequent years. In our view, a widening of the deficit from the projected 3.5% of GDP
in 2014 would impact investor sentiment, with potential negative consequences in the
local financial markets, given the additional net indebtedness that this could entail.
We project that annual headline inflation will close 2014 at 4.0%, unchanged
versus 2013. Our forecasts call for inflation to be below 4.0% from March to June, and
above 4.0% for most of the second half of the year. Our forecasts of core inflation are
more benign, as we project annual core readings near 3.0% for most of the year. Within
non-core inflation, we anticipated annual administered price inflation to remain very
sticky near 10% and to account for most of the gap between headline and core inflation.
We have tempered our optimism about the Mexican peso for 2014. We now expect
the exchange rate to end the year at 13.00 pesos per dollar, compared to our previous
expectations of 12.50. Some of the factors behind our revision include weaker growth
prospects, a worsening in investor sentiment towards emerging markets, and the
realization that the main direct investment flows associated to structural reforms will only
begin to fully materialize in 2015.
External accounts are unlikely to be a source of investor concern yet. We are
projecting a current account deficit of $29.3bn in 2014, equivalent to 2.3% of GDP. Last
year, the current account deficit was equivalent to 1.8% of GDP. Though net FDI inflows
are unlikely to be sufficient to fund the deficit, access to external financing should be
ample, as well as net portfolio inflows.
On the political front, we think that investor focus in upcoming months will be on
the congressional approval of pending legislation and on the internal elections
within PAN and PRD. The timing for the approval of secondary legislation on energy,
telecommunications and anti-trust reforms will most likely be March-April. Investor
anxiety on this issue, however, should be far less consuming than the one associated to
the approval of the constitutional reforms last year. Meanwhile, the processes to select
the leadership of the PAN and PRD should also be less exciting for investors,
particularly abroad, than last year's reform approval processes. Our central scenario is
that Gustavo Madero and Carlos Navarrete will be selected to lead the PAN and the
PRD respectively, which would be a favorable market development. The PAN elections
are in May, while the PRD's will take place by the end of September.
Finally, the only sovereign debt rating action we envision for now is the potential
for a change in the outlook from "stable" to "positive" by Fitch (BBB+ rating). We
think that this may happen by early May, before the first anniversary of the upgrade to
BBB+. S&P and Moody's announced a one-notch upgrade to Mexico's debt in
December 2013 and February 2014, respectively, and therefore do not expect any
ratings action from them in the foreseeable future.

06 March 2014
Emerging Markets Quarterly 72
Our annual average real
GDP growth forecast of
2.8% for 2014 implies a
significant sequential
recovery in upcoming
quarters.
The main growth driver for
the domestic economy will
likely be government
spending.
Exhibit 208: Real GDP growth Exhibit 209: Government spending growth
%, QoQ is from seasonally adjusted data YoY, real terms
-1.0
-0.5
0.0
0.5
1.0
1.5
2.0
0.0
1.0
2.0
3.0
4.0
5.0
6.0
4Q10 1Q12 2Q13 3Q14F 4Q15F
YoY (lhs)
QoQ (rhs)
-15%
-10%
-5%
0%
5%
10%
15%
20%
25%
30%
Jan-11 Jan-12 Jan-13 Jan-14 Source: INEGI, Credit Suisse Source: Ministry of Finance, Credit Suisse
Signs of a recovery in
construction are more
evident in the public sector
than among private sector
companies. Part of this may
reflect previous uncertainty
about the fiscal reform.
On the external front,
Mexican exports have
continued to gain market
share in a stagnant US
import market.
Exhibit 210: Construction spending by sector
Exhibit 211: Manufacturing exports and US total imports in US dollar terms
Dec-07=100, seasonally adjusted in real terms Dec-08=100
0
20
40
60
80
100
120
140
Dec-07 Dec-09 Dec-11 Dec-13
PublicTotalPrivate ex-housingPrivate
60
80
100
120
140
160
180
Dec-08 Aug-10 Apr-12 Dec-13
Manufacturing exports
US imports
Source: INEGI, Credit Suisse Source: US Department of Commerce, INEGI, Credit Suisse
Slowing US import growth
has been evident across
industry groups.
The weakening of US import
demand for some Mexican
exports like televisions and
computers in late 2013 is
concerning.
Exhibit 212: Annual US import growth in selected goods categories
Exhibit 213: US selected imports from Mexico
% Billions of dollars, seasonally adjusted
0%
5%
10%
15%
20%
25%
30%
35%
40%
2010 2011 2012 2013
All other imports excl. oil & gas
Computer & electronic pcts.
Transportation equipment
Electrical equipment
2.0
2.5
3.0
3.5
4.0
4.5
5.0
0.4
0.6
0.8
1.0
1.2
1.4
1.6
Dec-11 Dec-12 Dec-13
TV's (lhs)
Computers (lhs)
Vehicles and autoparts (rhs)
Source: USITC, Credit Suisse Source: USITC, Credit Suisse

06 March 2014
Emerging Markets Quarterly 73
The spike in headline and
core inflation in early 2014
was caused by the
implementation of the fiscal
reform. We project annual
core inflation to remain near
3.0% in 2014.
The swaps curve is pricing-
in some rate hikes in the
next six quarters, which we
do not think will materialize.
Exhibit 214: Consumer price inflation Exhibit 215: Swaps curve
%
2.0%
3.0%
4.0%
5.0%
6.0%
7.0%
Jan-08 Jan-10 Jan-12 Jan-14
Headline
Core
3
4
5
6
7
8
9
0 5 10 15 20
Six months agoOne year ago4-March-14
Source: INEGI, Credit Suisse Source: Credit Suisse
Foreign holdings of
government securities have
been remarkably resilient in
light of outflows from
emerging market funds.
Additional increases in net
indebtedness, which are not
in our central scenario,
could hurt market sentiment
in the local fixed income
market.
Exhibit 216: Daily foreign holdings of government securities
Exhibit 217: Gross financing needs of the federal government
Billions of pesos % of GDP
900
1,100
1,300
1,500
1,700
1,900
30-A
pr-
12
24-J
un-1
2
18-A
ug
-12
12-O
ct-1
2
06-D
ec-1
2
30-J
an-1
3
26-M
ar-
13
20-M
ay-
13
14-J
ul-1
3
07-S
ep
-13
01-N
ov-1
3
26-D
ec-1
3
19-F
eb
-14
0
2
4
6
8
10
12
2006 2008 2010 2012 2014
Gross financing needs
Amortizations
Net indebtedness
Source: Central bank, Credit Suisse Source: Ministry of Finance, Credit Suisse
The current account deficit
widened last year on higher
interest payments abroad
and on profit repatriation.
We expect an additional
widening of the deficit in
2014 to still manageable
levels.
We do not anticipate further
rating upgrades in the
foreseeable future. The next
move may be a change in
the outlook to "positive" by
Fitch.
Exhibit 218: Current account balance and net foreign direct investment
Exhibit 219: Long-term foreign currency sovereign debt rating
Billions of dollars; twelve-month rolling basis
-30
-20
-10
0
10
20
30
40
4Q03 4Q05 4Q07 4Q09 4Q11 4Q13
Net FDI
CA balance
Mar-04 Sep-06 Mar-09 Sep-11 Mar-14
Moody's
S&P
Fitch
BBB+
BBB-
BBB
A-
Source: Central bank, Credit Suisse Source: Rating agencies, Credit Suisse

06 March 2014
Emerging Markets Quarterly 74
Mexico: Selected economic indicators
2007 2008 2009 2010 2011 2012 2013E 2014F 2015F
National accounts, population and unemployment
Real GDP growth (%) 3.1 1.4 -4.7 5.1 4.0 3.9 1.1 2.8 4.5
Growth in real private consumption (%) 3.0 1.9 -6.5 5.3 4.9 4.7 2.4 2.5 4.3
Growth in real fixed investment (%) 6.0 5.0 -9.3 1.3 7.9 4.6 -0.2 4.5 7.0
Fixed investment (% of GDP) 22.3 23.1 22.0 21.2 22.0 22.1 21.8 22.2 22.7
Nominal GDP ($bn) 1,043 1,101 895.1 1,055 1,172 1,188 1,236 1,286 1,422
Population (mn) 106.9 108.7 110.5 112.3 113.7 115.1 116.4 117.7 119.0
GDP per capita, $ 9,758 10,131 8,100 9,387 10,303 10,319 10,615 10,927 11,955
Unemployment (% of labor force, end-year) 3.7 4.0 5.5 5.4 5.2 5.0 4.9 4.6 4.2
Prices, interest rates and exchange rates
CPI inflation (%, December to December) 3.8 6.5 3.6 4.4 3.8 3.6 4.0 4.0 3.8
CPI inflation (%, average) 4.0 5.1 5.3 4.2 3.4 4.1 3.8 4.0 3.7
Exchange rate (MXN per USD, end-year) 10.87 13.54 13.08 12.37 13.97 12.87 13.09 13.00 12.50
Exchange rate (MXN per USD, average) 10.93 11.13 13.51 12.60 12.40 13.13 13.01 13.10 12.75
REER (% change, December to December)(1) -2.1 -13.0 3.6 6.6 -9.5 9.0 2.1 1.0 2.0
Nominal wage growth (% year-on-year change, average)(2) 4.3 4.5 4.5 4.6 4.5 4.5 4.3 4.5 4.7
Reference rate (%, end-year) 7.50 8.25 4.50 4.50 4.50 4.50 3.50 3.50 3.50
Fiscal data
General government fiscal balance (% of GDP)(3) 0.0 -0.1 -2.2 -2.8 -2.5 -2.8 -2.6 -3.5 -3.2
General government primary fiscal balance (% of GDP) 2.1 1.8 -0.1 -0.9 -0.6 -0.7 -0.4 -1.1 -0.1
General government expenditure (% of GDP) 21.8 23.4 25.5 25.1 25.0 27.0 28.8 30.7 32.8
Oil-related revenues (% of total public sector revenues) 35.4 36.9 31.0 32.9 33.7 33.7 33.2 31.9 30.8
Gross general government debt (% of GDP, end-year)(4) 33.4 38.6 39.2 38.0 39.1 38.7 41.8 43.4 41.4
Money supply and credit
Broad money supply (M2, % of GDP) 47.2 51.2 55.1 54.2 55.5 56.1 59.1 62.2 64.7
Broad money supply (M2, % year-on-year change) 8.3 16.4 6.2 8.1 12.0 8.4 8.8 10.0 12.0
Domestic credit (% of GDP) 33.3 31.7 35.4 34.8 34.6 33.2 34.5 35.9 37.4
Domestic credit (% year-on-year) 11.1 2.4 10.2 8.0 8.8 3.0 7.0 9.0 12.0
Domestic credit to private sector (% of GDP) 22.7 23.4 24.1 23.8 24.8 25.4 27.0 28.9 30.6
Domestic credit to private sector (% year-on-year) 23.5 11.1 1.5 8.6 13.9 9.7 9.9 12.0 14.0
Balance of payments
Exports (goods and non-factor services, % of GDP) 27.7 28.1 27.3 29.8 31.2 32.6 32.4 33.0 31.9
Oil exports (% of GDP) 4.1 4.6 3.4 4.0 4.8 4.5 4.0 4.0 4.0
Imports (goods and non-factor services, % of GDP) 29.4 30.4 29.0 31.0 32.5 33.8 33.4 34.7 34.5
Exports (goods and non-factor services, % change in $ value) 8.8 6.9 -20.9 28.3 16.4 6.0 3.3 6.0 7.0
Imports (goods and non-factor services, % change in $ value) 9.9 9.0 -22.5 26.0 16.5 5.4 2.9 8.0 10.0
Current account balance ($bn) -14.7 -20.2 -8.1 -3.6 -12.3 -14.8 -22.3 -29.2 -42.3
Current account (% of GDP) -1.4 -1.8 -0.9 -0.3 -1.0 -1.2 -1.8 -2.3 -3.0
Net transfers ($bn) 26.4 25.5 21.6 21.5 23.0 22.6 21.8 22.2 22.9
Net FDI ($bn) 23.9 27.2 7.5 8.0 10.4 -5.2 25.2 15.0 20.0
Scheduled debt amortization ($bn)(5) 20.3 34.0 26.3 30.8 29.5 17.7 19.3 18.0 18.0
Foreign debt and reserves
Foreign debt ($bn, end-year) 128.1 129.4 166.0 198.1 210.8 227.3 238.0 250.0 260.0
Public ($bn)(6) 55.4 56.9 96.4 110.4 116.4 125.7 130.0 138.0 145.0
Private ($bn) 72.7 72.5 69.6 87.6 94.4 101.6 108.0 112.0 115.0
Foreign debt (% of GDP, end-year) 12.3 11.8 18.5 18.8 18.0 19.1 19.3 19.5 18.3
Foreign debt (% of exports of goods and services) 44.2 41.8 67.8 63.1 57.7 58.7 59.4 58.9 57.2
Central government gross FX reserves ($bn) 87.2 95.2 99.9 120.6 149.2 167.1 180.2 200.2 220.2
Central bank gross non-gold FX reserves ($bn) 87.1 95.1 99.6 120.3 144.0 160.4 175.5 195.5 210.2
(1) Real effective exchange rate, increase indicates appreciation. (2) Contractual wage increases at a national level in the public and private sectors (excludes fringe benefits). (3) Narrow definition that excludes off-balance expenditures. (4) Includes all contingent liabilities associated with IPAB, Pidiregas, FARAC, financial intermediation and other debtor support programs. (5) Scheduled short- and long-term market and non-market amortizations for public and private sectors. (6) Includes the total stock of Pidiregas debt.
Source: INEGI (Government's statistics agency), Banco de Mexico, Ministry of Finance, Credit Suisse
06 March 2014
Emerging Markets Quarterly 75
Peru: Marginal improvement thanks to mining We stand by our forecast of 5.5% annual average real GDP growth for 2014 and
5.8% for 2015. The key growth drivers should continue to be increased mining
production, improved business sentiment, and sustained consumption growth. In 2013,
Peru expanded at its lowest growth rate since 2004, excluding 2009. Going forward, we
see Peru growing faster but below its 6.0% potential growth rate, as its growth strategy
continues to be focused on copper mining.
The government's statistics agency will release on 6 March the new base year for
the national accounts (2007), which will likely show that mining represents nearly
15% of the economy. This is three times more than under the previous base year
(1994). We estimate that under the new base year, annual real GDP growth since 2006
may be revised downwards by approximately one-half of a percent per year, on average,
given the weak performance of the mining sector in those years. Conversely, stronger
mining production expected for 2014 and 2015, combined with the higher weight in the
mining sector, represents an upside risk to our current growth expectations.
During 2013, evidence of the strong impact of commodity prices on the economy
was overwhelming, in our view. Lower copper and gold prices affected external and
fiscal accounts dramatically. Peru posted its largest current account deficit since 1998
and its first trade deficit since 2001. Similarly, the government’s fiscal surplus narrowed
to 0.7% of GDP from 2.0% of GDP in 2012. We expect that as commodity prices
continue to slip in 2014, the recovery of the external balances will be marginal, with the
current account deficit narrowing to 4.6% of GDP from a deficit of 4.9% of GDP last
year. Meanwhile, fiscal accounts could weaken further to a surplus 0.2% of GDP.
We believe that the move towards establishing a structural fiscal balance rule will
be positive for the economy. The results of the Finance Ministry’s studies regarding the
structural fiscal balance show that, on a structural basis, Peru had a deficit equivalent to
0.6% of GDP in 2013, although it also smooths out important deficits of the beginning of
the past decade. The structural fiscal target for the non-financial public sector will be
implemented in 2015, and will be a deficit limit of 1.0% of GDP. In the meantime, the fiscal
rule for 2014 indicates that the fiscal balance for this year cannot be deficitary.
In the context of lower commodity prices and reduced global liquidity, we expect
capital inflows to decline in 2014. Long-term capital flows will likely continue to cover
the current account deficit, although at lower margins than before. Hence, we think that
the sol (PEN) will find a weaker equilibrium at 2.86 per dollar by year-end versus 2.81 at
present. For 2015, however, we are revising our PEN forecast stronger to 2.84 soles per
dollar from 2.91, on the back of improved growth, commodity prices and capital flows.
Inflation spiked in February due to supply-side factors, leading us to revise our
2014 forecast to 2.9% yoy from 2.6% yoy. However, we do not believe this will lead to
a change in the strategy of the central bank and, therefore, expect the policy rate to be
held unchanged at 4.0% throughout the year. In our view, the bank's main monetary
policy tool will likely continue to be reserve requirements. For 2015, we expect the
central bank to increase interest rates to 4.5% towards the end of the year, as economic
activity approaches potential and inflation remains high. We expect continued
intervention in the FX market if excessive depreciation pressures resurface.
Political noise remains a cause of concern, since it can hurt business confidence
and investment decisions. We think that political stability and stronger institutions
would be a catalyst for further upgrades to Peru’s sovereign ratings. Currently, Moody’s
rates Peru's long-term foreign currency debt at Baa2, while Fitch and S&P are at BBB+.
We still believe that a Moody’s upgrade is not far away since it has had a positive
outlook on Peru since August 2012. However, the jump to single A ratings will depend
on further improvements in Peru’s political landscape and on continued evidence of
macro stability and poverty alleviation, in our view.
Juan Lorenzo Maldonado
+1 212 325 4245

06 March 2014
Emerging Markets Quarterly 76
2014 growth will benefit
from a higher carryover,
while incremental growth is
likely to come from stronger
mining production.
Exhibit 220: Carryover and incremental growth
Exhibit 221: Projected copper production
Percentage points Millions of metric tons
0
2
4
6
8
10
12 Incremental growth
Growth carryover
0.0
0.2
0.4
0.6
0.8
1.0
1.2
1.4
1.6
1.8
2.0
2011 2012 2013 2014F 2015F
Source: Central bank, Credit Suisse Source: Central bank, Credit Suisse
A new base year for
national accounts likely led
to downward revisions to
growth for the past few
years.
For the next two years,
however, the mining
sector’s contribution to
growth will increase
alongside copper
production.
Exhibit 222: GDP growth according to 1994 and 2007 base years
Exhibit 223: Change in expected contribution to GDP growth
Annual average rates Percentage points
0
2
4
6
8
10
12
2007 2008 2009 2010 2011 2012 2013
Base 1994
Base 2007
0
0.5
1
1.5
2
2.5
1994 2007 1994 2007 1994 2007
Mining Commerce Services
2014
2015
Source: INEI, Credit Suisse Source: INEI, Credit Suisse
Stronger copper production
is also likely to help external
balances improve thanks to
stronger export growth.
The trade balance will likely
return to surplus in 2015,
helping the current account
deficit narrow.
Exhibit 224: Copper output and exports Exhibit 225: Trade balance
12-months accumulated, millions of metric tons 12-months accumulated, $bn
0.6
0.7
0.8
0.9
1.0
1.1
1.2
1.3
1.4
1.5
Dec-01 Dec-05 Dec-09 Dec-13
Copper productionCopper exports
-2
0
2
4
6
8
10
12
Dec-07 Dec-09 Dec-11 Dec-13 Dec-15
CS Forecast
Source: Central bank, Ministry of Production, Credit Suisse Source: Central bank, Credit Suisse
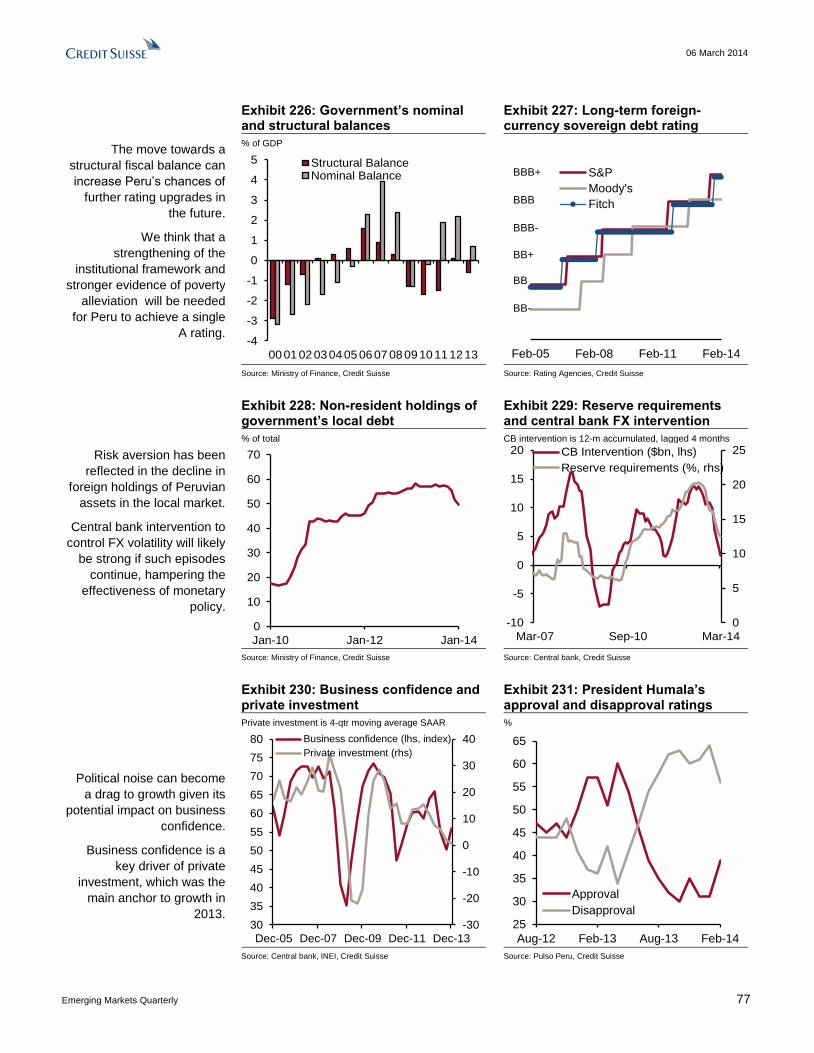
06 March 2014
Emerging Markets Quarterly 77
The move towards a
structural fiscal balance can
increase Peru’s chances of
further rating upgrades in
the future.
We think that a
strengthening of the
institutional framework and
stronger evidence of poverty
alleviation will be needed
for Peru to achieve a single
A rating.
Exhibit 226: Government’s nominal and structural balances
Exhibit 227: Long-term foreign-currency sovereign debt rating
% of GDP
-4
-3
-2
-1
0
1
2
3
4
5
00 01 02 03 04 05 06 07 08 09 10 11 12 13
Structural BalanceNominal Balance
Feb-05 Feb-08 Feb-11 Feb-14
S&P
Moody's
Fitch
BB-
BBB+
BB+
BB
BBB-
BBB
Source: Ministry of Finance, Credit Suisse Source: Rating Agencies, Credit Suisse
Risk aversion has been
reflected in the decline in
foreign holdings of Peruvian
assets in the local market.
Central bank intervention to
control FX volatility will likely
be strong if such episodes
continue, hampering the
effectiveness of monetary
policy.
Exhibit 228: Non-resident holdings of government’s local debt
Exhibit 229: Reserve requirements and central bank FX intervention
% of total CB intervention is 12-m accumulated, lagged 4 months
0
10
20
30
40
50
60
70
Jan-10 Jan-12 Jan-14
0
5
10
15
20
25
-10
-5
0
5
10
15
20
Mar-07 Sep-10 Mar-14
CB Intervention ($bn, lhs)
Reserve requirements (%, rhs)
Source: Ministry of Finance, Credit Suisse Source: Central bank, Credit Suisse
Political noise can become
a drag to growth given its
potential impact on business
confidence.
Business confidence is a
key driver of private
investment, which was the
main anchor to growth in
2013.
Exhibit 230: Business confidence and private investment
Exhibit 231: President Humala’s approval and disapproval ratings
Private investment is 4-qtr moving average SAAR %
-30
-20
-10
0
10
20
30
40
30
35
40
45
50
55
60
65
70
75
80
Dec-05 Dec-07 Dec-09 Dec-11 Dec-13
Business confidence (lhs, index)
Private investment (rhs)
25
30
35
40
45
50
55
60
65
Aug-12 Feb-13 Aug-13 Feb-14
Approval
Disapproval
Source: Central bank, INEI, Credit Suisse Source: Pulso Peru, Credit Suisse
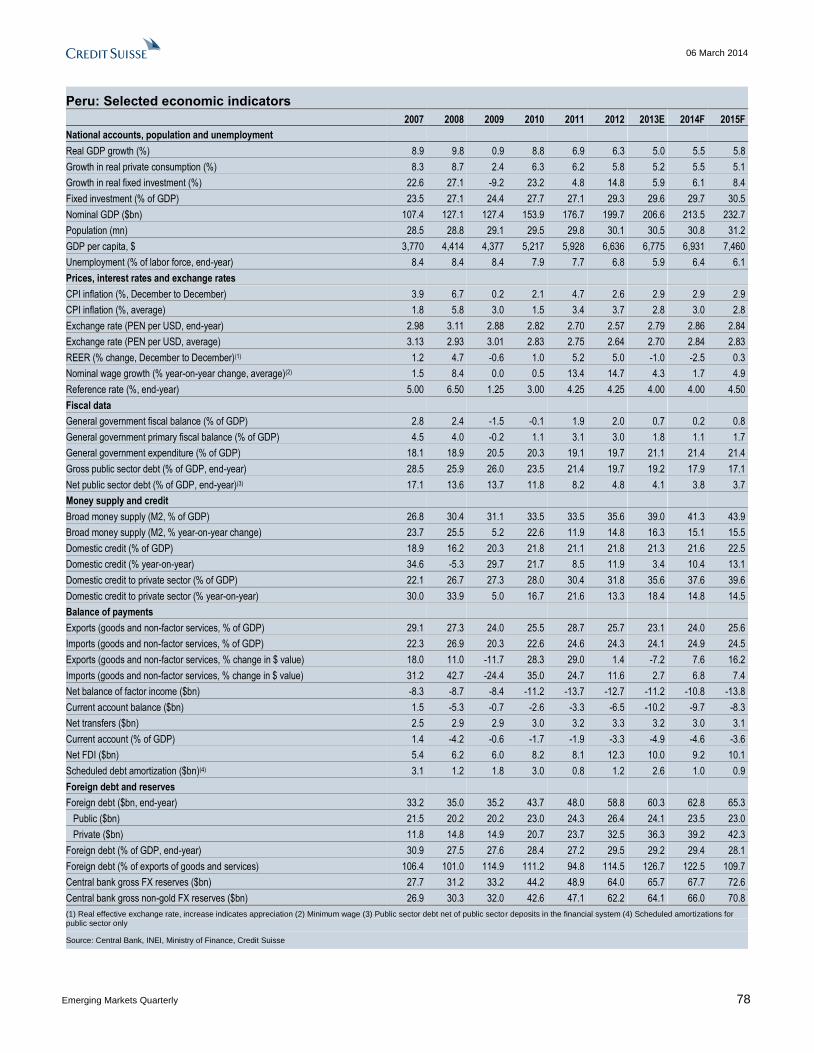
06 March 2014
Emerging Markets Quarterly 78
Peru: Selected economic indicators
2007 2008 2009 2010 2011 2012 2013E 2014F 2015F
National accounts, population and unemployment
Real GDP growth (%) 8.9 9.8 0.9 8.8 6.9 6.3 5.0 5.5 5.8
Growth in real private consumption (%) 8.3 8.7 2.4 6.3 6.2 5.8 5.2 5.5 5.1
Growth in real fixed investment (%) 22.6 27.1 -9.2 23.2 4.8 14.8 5.9 6.1 8.4
Fixed investment (% of GDP) 23.5 27.1 24.4 27.7 27.1 29.3 29.6 29.7 30.5
Nominal GDP ($bn) 107.4 127.1 127.4 153.9 176.7 199.7 206.6 213.5 232.7
Population (mn) 28.5 28.8 29.1 29.5 29.8 30.1 30.5 30.8 31.2
GDP per capita, $ 3,770 4,414 4,377 5,217 5,928 6,636 6,775 6,931 7,460
Unemployment (% of labor force, end-year) 8.4 8.4 8.4 7.9 7.7 6.8 5.9 6.4 6.1
Prices, interest rates and exchange rates
CPI inflation (%, December to December) 3.9 6.7 0.2 2.1 4.7 2.6 2.9 2.9 2.9
CPI inflation (%, average) 1.8 5.8 3.0 1.5 3.4 3.7 2.8 3.0 2.8
Exchange rate (PEN per USD, end-year) 2.98 3.11 2.88 2.82 2.70 2.57 2.79 2.86 2.84
Exchange rate (PEN per USD, average) 3.13 2.93 3.01 2.83 2.75 2.64 2.70 2.84 2.83
REER (% change, December to December)(1) 1.2 4.7 -0.6 1.0 5.2 5.0 -1.0 -2.5 0.3
Nominal wage growth (% year-on-year change, average)(2) 1.5 8.4 0.0 0.5 13.4 14.7 4.3 1.7 4.9
Reference rate (%, end-year) 5.00 6.50 1.25 3.00 4.25 4.25 4.00 4.00 4.50
Fiscal data
General government fiscal balance (% of GDP) 2.8 2.4 -1.5 -0.1 1.9 2.0 0.7 0.2 0.8
General government primary fiscal balance (% of GDP) 4.5 4.0 -0.2 1.1 3.1 3.0 1.8 1.1 1.7
General government expenditure (% of GDP) 18.1 18.9 20.5 20.3 19.1 19.7 21.1 21.4 21.4
Gross public sector debt (% of GDP, end-year) 28.5 25.9 26.0 23.5 21.4 19.7 19.2 17.9 17.1
Net public sector debt (% of GDP, end-year)(3) 17.1 13.6 13.7 11.8 8.2 4.8 4.1 3.8 3.7
Money supply and credit
Broad money supply (M2, % of GDP) 26.8 30.4 31.1 33.5 33.5 35.6 39.0 41.3 43.9
Broad money supply (M2, % year-on-year change) 23.7 25.5 5.2 22.6 11.9 14.8 16.3 15.1 15.5
Domestic credit (% of GDP) 18.9 16.2 20.3 21.8 21.1 21.8 21.3 21.6 22.5
Domestic credit (% year-on-year) 34.6 -5.3 29.7 21.7 8.5 11.9 3.4 10.4 13.1
Domestic credit to private sector (% of GDP) 22.1 26.7 27.3 28.0 30.4 31.8 35.6 37.6 39.6
Domestic credit to private sector (% year-on-year) 30.0 33.9 5.0 16.7 21.6 13.3 18.4 14.8 14.5
Balance of payments
Exports (goods and non-factor services, % of GDP) 29.1 27.3 24.0 25.5 28.7 25.7 23.1 24.0 25.6
Imports (goods and non-factor services, % of GDP) 22.3 26.9 20.3 22.6 24.6 24.3 24.1 24.9 24.5
Exports (goods and non-factor services, % change in $ value) 18.0 11.0 -11.7 28.3 29.0 1.4 -7.2 7.6 16.2
Imports (goods and non-factor services, % change in $ value) 31.2 42.7 -24.4 35.0 24.7 11.6 2.7 6.8 7.4
Net balance of factor income ($bn) -8.3 -8.7 -8.4 -11.2 -13.7 -12.7 -11.2 -10.8 -13.8
Current account balance ($bn) 1.5 -5.3 -0.7 -2.6 -3.3 -6.5 -10.2 -9.7 -8.3
Net transfers ($bn) 2.5 2.9 2.9 3.0 3.2 3.3 3.2 3.0 3.1
Current account (% of GDP) 1.4 -4.2 -0.6 -1.7 -1.9 -3.3 -4.9 -4.6 -3.6
Net FDI ($bn) 5.4 6.2 6.0 8.2 8.1 12.3 10.0 9.2 10.1
Scheduled debt amortization ($bn)(4) 3.1 1.2 1.8 3.0 0.8 1.2 2.6 1.0 0.9
Foreign debt and reserves
Foreign debt ($bn, end-year) 33.2 35.0 35.2 43.7 48.0 58.8 60.3 62.8 65.3
Public ($bn) 21.5 20.2 20.2 23.0 24.3 26.4 24.1 23.5 23.0
Private ($bn) 11.8 14.8 14.9 20.7 23.7 32.5 36.3 39.2 42.3
Foreign debt (% of GDP, end-year) 30.9 27.5 27.6 28.4 27.2 29.5 29.2 29.4 28.1
Foreign debt (% of exports of goods and services) 106.4 101.0 114.9 111.2 94.8 114.5 126.7 122.5 109.7
Central bank gross FX reserves ($bn) 27.7 31.2 33.2 44.2 48.9 64.0 65.7 67.7 72.6
Central bank gross non-gold FX reserves ($bn) 26.9 30.3 32.0 42.6 47.1 62.2 64.1 66.0 70.8
(1) Real effective exchange rate, increase indicates appreciation (2) Minimum wage (3) Public sector debt net of public sector deposits in the financial system (4) Scheduled amortizations for public sector only
Source: Central Bank, INEI, Ministry of Finance, Credit Suisse

06 March 2014
Emerging Markets Quarterly 79
Venezuela: The heat is on Venezuela has become the second hottest spot in our Emerging Markets
coverage universe, after Ukraine. Tensions between student and opposition protestors
and the government continue after at least 18 deaths and hundreds of detentions since
12 February. President Nicolas Maduro’s government can probably weather the current
storm, but the situation highlights the risk that growing dissatisfaction could eventually
become a destabilizing force. Meanwhile, the government is preparing to implement a
more flexible and transparent foreign exchange market. This could potentially help
reduce shortages, benefit fiscal accounts and bring down inflation later in the year, albeit
depending on still unknown factors including the exchange rate and trading volumes.
Anti-government demonstrations show no sign of abating, but President Maduro
retains control of key domestic institutions for the time being. These include the
military, national guard and police forces, the judiciary and most domestic media outlets.
The government also remains firmly in command of state oil company PDVSA, whose
production has not been jeopardized by the protests. Although the demonstrations have
re-energized the political opposition, they have also given the various factions of
Chavismo an opportunity to unify against a common threat. Tensions could be
prolonged, as neither side appears prepared to compromise presently, and the situation
should be monitored closely. Still, we do not expect Maduro to be forced out in the near
term, unless protest-related chaos and violence escalate sharply from current levels.
We remain concerned about political stability over the medium term. Rising
frustration with crime, basic goods shortages, the cost of living and unemployment could
erode the government’s popular base over time. Broadening of anti-government
demonstrations to include large numbers of lower-income Venezuelans could be a
game-changer in terms of forcing the government to choose between accommodation
and an even more severe crack-down than has been delivered so far. These dynamics
could expose the significant divisions among the various Chavista factions, the military
and Cuba and jeopardize governability before the current presidential term ends in
2019. Meanwhile, the next electoral test for the government is legislative elections in
2015.
On the economic front, the government is poised to finally roll out the SICAD 2
foreign exchange market. Additional specifications are pending, but private individuals
and companies, PDVSA and the central bank will be able to transact in dollars and dollar
assets through banks and brokers once this market is operational. Overall, this appears
to be a positive development that should broaden access to foreign exchange beyond
the restricted number of exporters and others approved to buy dollars from the National
Foreign Trade Center (CENCOEX) or in SICAD 1. It may also increase the
transparency, predictability and speed of foreign exchange sales. However, there are
significant implementation risks. We expect the government to actively regulate this
market, and its exchange rate in particular, which could limit its effectiveness.
SICAD 2 implies a further devaluation of the weighted average exchange rate. The
authorities have said that the SICAD 2 exchange rate will vary with central bank
intervention, but have not clarified how it will be determined. Allowing it to float is out of
the question, in our view, given the severe economic contraction and inflationary shock
that would result. We expect an initial SICAD 2 exchange rate around 20 bolivares per
USD. We would be surprised to see the government allow it to weaken beyond 25 in the
near term. Meanwhile, we assume that the CENCOEX exchange rate remains steady at
6.3 in 2014, while the SICAD 1 rate gradually weakens towards 15. Depending on
trading volumes, SICAD 2 could reduce pressure on the parallel exchange rate, which is
now around 80, but we do not anticipate convergence with the official exchange rates.
We now expect real GDP to contract by 0.5% in 2014. This compares to our previous
forecast of 1.6% growth and would be down from an estimated 1.6% expansion last
year. We project that growth in private consumption will decelerate further this year as
Casey Reckman
+1 212 325 5570

06 March 2014
Emerging Markets Quarterly 80
real wage losses endure and unemployment rises. A modest slowdown in government
spending and a continued contraction in investment driven by economic and political
uncertainty should also contribute to the reduction in economic activity. Oil production
could rise, but perhaps by only 50,000 barrels per day (an approximately 1.8% increase)
as Orinoco Belt projects advance rather slowly.
Inflation could recede but is likely to remain over 40%. We expect the implicit
devaluation associated with foreign exchange sales in SICAD 1 and SICAD 2 to keep
12-month inflation above 50% yoy during the first half of 2014. However, if somewhat
successful, SICAD 2 could help reduce inflation later in the year by easing bottlenecks,
reducing domestic liquidity pressures driven by monetary financing of PDVSA and
strengthening the parallel exchange rate. Thus, we project that headline Caracas CPI
inflation will fall to 43.5% yoy by December versus 52.7% one year earlier.
SICAD 2 may help alleviate basic goods shortages. Venezuela relies heavily on
certain consumer and intermediate goods imports after over a decade of difficult
conditions for the private sector. Thus, increased domestic access to foreign exchange
could lead to greater supply of some items. However, many administered price ceilings
must also be adjusted to ensure it makes economic sense to import those goods. The
government may be hesitant to do this due to the inflationary consequences, especially
while it is trying to contain the protests. As a result, some degree of scarcity will likely
persist as a highly visible result of Venezuela’s incoherent economic policies.
SICAD 2 should also support moderate fiscal consolidation. The increased bolivar
value of PDVSA’s dollar revenues sold in the new market and some expenditure
reduction should help narrow the overall public sector deficit to a still large 8.2% of GDP
in 2014, from an estimated 11.5% last year. This will likely decrease, but not eliminate,
monetary issuance associated with financing PDVSA’s domestic spending. Sizeable
bolivar-denominated borrowing will probably remain another main fiscal funding source.
We expect $5bn in combined public sector dollar bond issuance in 2014. Economic
Vice President Rafael Ramirez said recently that Venezuela could sell new dollar bonds
to supply SICAD 2. The central bank’s portfolio of dollar bonds to sell in SICAD 1 and
SICAD 2 may need to be restocked as soon as this second quarter, depending on the
volumes sold in those markets. This could imply another private placement by PDVSA to
repay bolivar-denominated financing from the central bank, especially if market
conditions for the sovereign and PDVSA remain challenging. We also do not rule out
liability management efforts to extend near-term maturities (the government and PDVSA
have $1.5bn and $3.0bn, respectively, in principal due in October).
We do not foresee an interruption in debt service this year. The combined public
sector owes a total of $10.2bn in dollar-denominated interest and principal in 2014.
Cash-generating oil exports are worth at least $4bn per month, according to our
calculations. This is based on our relatively stable in-house oil price projections as well
as conservative assumptions for domestic oil consumption and deliveries to China,
Cuba, Petrocaribe, etc. We also estimate that the government has around $5.0bn in
unencumbered liquid foreign assets, which provide a buffer for 2014 debt service. 3
Concerns about the transparency of holdings in off-budget funds and market access
make the outlook for 2015 and beyond more risky, though.
Debt dynamics will likely continue deteriorating. We project that consolidated
general government and PDVSA debt will rise to 47.5% of GDP this year, up from an
estimated 40.3% in 2013. We also forecast erosion of the public sector’s net external
creditor position to 1.4% of GDP by year-end 2014, down from approximately 2.4% in
2013 and 9.2% in 2012. These trends, along with poor economic prospects, could lead
to downgrades of Venezuela’s sovereign ratings, all of which face negative outlooks.
3 This excludes items such as gold reserves, SDR holdings, Venezuela’s net credit position with the IMF, loans from China for
projects and less liquid securities held by FONDEN.
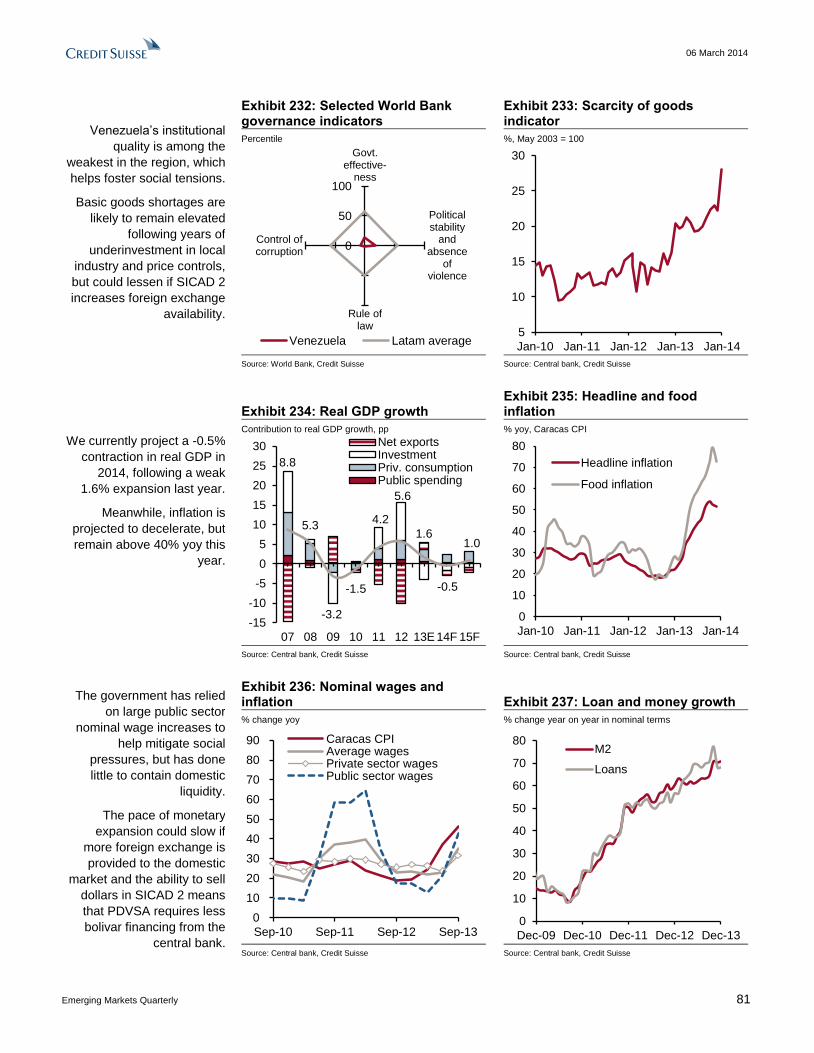
06 March 2014
Emerging Markets Quarterly 81
Venezuela’s institutional
quality is among the
weakest in the region, which
helps foster social tensions.
Basic goods shortages are
likely to remain elevated
following years of
underinvestment in local
industry and price controls,
but could lessen if SICAD 2
increases foreign exchange
availability.
Exhibit 232: Selected World Bank governance indicators
Exhibit 233: Scarcity of goods indicator
Percentile %, May 2003 = 100
0
50
100
Govt.effective-
ness
Politicalstability
andabsence
ofviolence
Rule oflaw
Control ofcorruption
Venezuela Latam average
5
10
15
20
25
30
Jan-10 Jan-11 Jan-12 Jan-13 Jan-14 Source: World Bank, Credit Suisse Source: Central bank, Credit Suisse
We currently project a -0.5%
contraction in real GDP in
2014, following a weak
1.6% expansion last year.
Meanwhile, inflation is
projected to decelerate, but
remain above 40% yoy this
year.
Exhibit 234: Real GDP growth Exhibit 235: Headline and food inflation
Contribution to real GDP growth, pp % yoy, Caracas CPI
8.8
5.3
-3.2
-1.5
4.2
5.6
1.6
-0.5
1.0
-15
-10
-5
0
5
10
15
20
25
30
07 08 09 10 11 12 13E 14F 15F
Net exportsInvestmentPriv. consumptionPublic spending
0
10
20
30
40
50
60
70
80
Jan-10 Jan-11 Jan-12 Jan-13 Jan-14
Headline inflation
Food inflation
Source: Central bank, Credit Suisse Source: Central bank, Credit Suisse
The government has relied
on large public sector
nominal wage increases to
help mitigate social
pressures, but has done
little to contain domestic
liquidity.
The pace of monetary
expansion could slow if
more foreign exchange is
provided to the domestic
market and the ability to sell
dollars in SICAD 2 means
that PDVSA requires less
bolivar financing from the
central bank.
Exhibit 236: Nominal wages and inflation Exhibit 237: Loan and money growth
% change yoy % change year on year in nominal terms
0
10
20
30
40
50
60
70
80
90
Sep-10 Sep-11 Sep-12 Sep-13
Caracas CPIAverage wagesPrivate sector wagesPublic sector wages
0
10
20
30
40
50
60
70
80
Dec-09 Dec-10 Dec-11 Dec-12 Dec-13
M2
Loans
Source: Central bank, Credit Suisse Source: Central bank, Credit Suisse

06 March 2014
Emerging Markets Quarterly 82
The upcoming
implementation of SICAD 2
will result in a devaluation of
the weighted-average
exchange rate, although the
magnitude will depend on
trading volumes and the
exchange rates applied.
It could also help
consolidate the overall
public sector deficit as
PDVSA sells foreign
exchange in this market.
Exhibit 238: Official and parallel exchange rates
Exhibit 239: Consolidated public sector fiscal balance
Bolivares per dollar, as of 4 March % of GDP
0
20
40
60
80
100
120
Mar-13 Jul-13 Nov-13 Mar-14
Official exchange rate
Parallel exchange rate
SICAD 1 auction exchange rate*
SICAD 2 exchange rate**
-15
-10
-5
0
5
10
05 07 09 11 13E 15F
Interest paymentsPublic sector primary balancePublic sector balanceCentral gov. balance
*Weighted average rates for individual and corporate bidders **Credit Suisse estimate Source: Central bank, paralelovenezuela.com, Credit Suisse
Source: Ministry of Finance, Credit Suisse
PDVSA and Venezuela both
have bonds maturing in
October 2014, which could
be targets for liability
management operations.
We do not expect a credit
event this year, but
acknowledge increased
risks to future debt service
capacity if off-budget assets
are depleted and external
financing is unavailable.
Exhibit 240: Monthly public sector external debt service payments
Exhibit 241: Annual public sector external debt service payments
$bn, principal and interest $bn, principal and interest
0
1
2
3
4
5
6
Jan
-14
Feb-1
4
Mar-
14
Ap
r-14
May-1
4
Jun
-14
Ju
l-1
4
Au
g-1
4
Se
p-1
4
Oct-
14
Nov-1
4
Dec-1
4
0
2
4
6
8
10
12
2014 2015 2016 2017
PDVSAVenezuela
Source: Ministry of Finance, PDVSA, the BLOOMBERG PROFESSIONAL™ service, Credit Suisse
Source: Ministry of Finance, PDVSA, the BLOOMBERG PROFESSIONAL™ service, Credit Suisse
Limited disclosure of public
sector asset figures reduces
our visibility and confidence
regarding medium-term
capacity to pay.
We would not be surprised
by additional ratings
downgrades, particularly
from Fitch, which has
Venezuela at B+ with a
negative outlook.
Exhibit 242: Public sector liquid foreign assets
Exhibit 243: Long-term foreign currency sovereign debt rating
Credit Suisse estimates for year-end 2013 Dotted part means SD; long-term foreign currency IDR for Fitch
Non-gold FX reserves$6.0bn
Gold reserves$15.4bn
Gran Vol.
China loan
$3.0bn
Joint China-Venz. fund
$5.0bn
Fonden$5.0bn
Bandes$0.5bn National
Treas.$0.5bn
Mar-08 Mar-10 Mar-12 Mar-14
S&P
Fitch
Moody'sCCC+
B-
B
B+
BB-
Source: Central bank, Credit Suisse Source: Fitch Ratings, Moody’s Investor Services, Standard & Poor’s
Ratings Services, Credit Suisse

06 March 2014
Emerging Markets Quarterly 83
Venezuela: Selected economic indicators
2007 2008 2009 2010 2011 2012 2013E 2014F 2015F
National accounts, population and unemployment
Real GDP growth (%) 8.8 5.3 -3.2 -1.5 4.2 5.6 1.6 -0.5 1.0
Growth in real private consumption (%) 16.9 7.5 -2.9 -1.9 4.0 7.0 4.5 2.8 3.5
Growth in real fixed investment (%) 25.6 2.4 -8.3 -6.3 4.4 23.3 -5.0 -3.5 0.0
Fixed investment (% of GDP) 34.6 33.7 31.9 30.3 30.4 35.5 33.2 32.2 31.9
Nominal GDP ($bn)(1) 230.4 315.6 329.4 236.5 315.7 381.5 366.6 290.9 264.0
Population (mn) 27.3 27.7 28.2 28.6 29.1 29.5 29.9 30.3 30.7
GDP per capita, $(1) 8,443 11,380 11,689 8,259 10,859 12,924 12,243 9,599 8,600
Unemployment (% of labor force, end-year) 6.2 6.1 6.6 6.5 6.5 5.9 5.6 6.0 5.9
Prices, interest rates and exchange rates
CPI inflation (%, December to December) 22.5 31.9 26.9 27.4 29.0 19.5 52.7 43.5 37.0
CPI inflation (%, average) 18.7 31.5 28.6 29.1 27.1 21.1 38.5 48.8 40.2
Nominal wage growth (% year-on-year change)(2) 20.6 25.0 21.2 22.3 31.0 28.8 28.8 29.3 27.6
Exchange rate (VEB per USD, end-year)(3) 2.15 2.15 2.15 4.30 4.30 4.30 6.30 12.93 19.79
Exchange rate (VEB per USD, average)(3) 2.15 2.15 2.15 4.30 4.30 4.30 6.29 11.76 18.33
REER (% change, December to December)(4) 10.9 37.3 16.4 -38.5 25.6 16.0 -2.0 -28.0 1.3
90 day deposit rate (%, end-year) 10.9 17.6 15.0 15.0 14.5 14.6 14.7 14.5 14.5
Fiscal data
Consolidated public sector overall balance (% of GDP)(5) -2.6 -3.5 -8.7 -10.4 -11.6 -12.5 -11.5 -8.2 -6.5
Consolidated public sector primary balance (% of GDP)(5) -1.0 -2.0 -7.2 -8.6 -9.4 -10.3 -9.0 -6.0 -4.0
Consolidated public sector expenditure (% of GDP)(5) 35.5 35.6 33.3 31.6 39.5 42.0 40.9 39.4 38.5
Central government balance (% of GDP) 3.0 -1.2 -5.0 -3.6 -4.0 -4.8 -4.0 -1.9 -0.3
General government and PDVSA debt (% of GDP, end-year)(6) 26.3 18.8 24.7 35.1 36.2 36.5 40.3 47.5 44.9
Money supply and credit
Broad money supply (M2, % of GDP) 35.8 32.2 35.2 29.2 32.9 43.8 52.9 53.5 52.9
Broad money supply (M2, % year-on-year change) 22.3 23.1 14.3 19.1 50.6 61.0 69.7 50.0 40.0
Domestic credit (% of GDP) 32.2 28.6 32.9 27.6 30.8 40.1 48.5 50.8 50.2
Domestic credit (% year-on-year) 20.2 22.0 20.1 20.3 49.2 57.4 70.2 55.0 40.0
Domestic credit to private sector (% of GDP) 22.8 20.8 22.9 18.6 20.4 25.1 29.0 29.4 29.1
Domestic credit to private sector (% year-on-year) 73.5 25.5 14.9 16.4 46.2 48.7 63.1 50.0 40.0
Balance of payments
Exports (goods and non-factor services, % of GDP) 31.2 30.8 18.2 28.6 30.0 26.1 26.3 33.6 36.2
Imports (goods and non-factor services, % of GDP) 23.6 19.1 15.1 20.3 18.3 18.7 18.1 23.1 25.6
Exports (goods and non-factor services, % change in $ value) 7.0 35.4 -38.4 13.0 40.2 5.0 -3.3 1.4 -2.0
Imports (goods and non-factor services, % change in $ value) 45.6 10.5 -17.5 -3.3 20.6 23.4 -7.2 1.1 0.7
Current account balance ($bn) 16.0 32.1 2.3 8.8 24.4 11.0 8.5 5.0 3.9
Current account (% of GDP) 6.9 10.2 0.7 3.7 7.7 2.9 2.3 1.7 1.5
Net FDI ($bn) 1.5 0.1 -4.4 0.1 4.9 0.8 3.0 0.7 0.7
Scheduled debt amortization ($bn)(7) 0.7 0.8 1.1 3.2 4.7 0.7 3.3 5.5 5.7
Foreign debt and reserves
Foreign debt ($bn, end-year) 56.3 65.7 81.9 92.8 110.7 118.9 120.9 120.5 119.7
Public ($bn) 38.7 50.7 67.4 83.2 98.0 105.8 106.4 106.0 105.2
Private ($bn) 17.6 14.9 14.5 9.6 12.7 13.2 14.5 14.5 14.5
Foreign debt (% of GDP, end-year) 24.4 20.8 24.9 39.3 35.1 31.2 33.0 41.4 45.4
Foreign debt (% of exports of goods and services) 78.3 67.6 137.0 137.3 116.8 119.5 125.6 123.4 125.3
Central bank gross FX reserves ($bn) 33.5 42.3 35.0 30.3 29.9 29.9 21.5 18.1 16.8
Central bank gross non-gold FX reserves ($bn) 24.2 33.1 21.7 14.0 9.9 9.9 6.0 5.8 5.5
Gap between public sector's external assets and liabilities ($bn, end-year) 51.2 67.3 41.1 22.2 36.1 35.0 8.9 4.0 5.3
Gap between public sector's external assets and liabilities (% of GDP, end-year) 22.2 21.3 12.5 9.4 11.4 9.2 2.4 1.4 2.0
(1) Forecasts based on a projected weighted average exchange rate across official FX markets (CENCOEX, SICAD 1 and SICAD 2). (2) Public and private sector wages (3) Expressed in strong bolivares for all years; 2014 and 2015 forecasts represent a weighted average exchange rate across official FX markets (CENCOEX, SICAD 1 and SICAD 2). (4) Real effective exchange rate, increase indicates appreciation. (5) Central government, regional governments, PDVSA; does not include liabilities of other public institutions such as the Central bank, National Development Bank, Foreign Trade Bank, Industrial Bank of Venezuela and Andean Region Development Bank. (6) Consolidation of Central Government, PDVSA, Non-Financial Public Enterprises, Venezuelan Social Security Institute and Deposit and Guarantee Fund for 2005-2009; preliminary consolidation of central government and PDVSA 2010-2011. (7) Central government only for 2004-2009.
Source: Central Bank, INE, Ministry of Finance, PDVSA, the BLOOMBERG PROFESSIONAL™ service, Credit Suisse

06 March 2014
Emerging Markets Quarterly 84
This page is intent ional ly left blank.
06 March 2014
Emerging Markets Quarterly 85
Europe, Middle East and Africa

06 March 2014
Emerging Markets Quarterly 86
Emerging Europe, Middle East and Africa: Diverging growth outlook Reflecting two separate developments within the EEMEA region, we revised lower
our regional real GDP growth forecast for 2014 to 2.2% from 2.9% previously. While
we revised higher our 2014 real GDP growth forecasts for CE3 countries on the back of a
stronger-than-expected rebound in 4Q 2013, we revised them lower for Russia, Turkey,
South Africa and Ukraine compared to our forecasts published in the November
Emerging Markets Quarterly. (Some of these forecast changes have already taken place
in between the two Quarterly publications.) Our real GDP growth forecast revision for
South Africa was primarily driven by the new data (and not impacted by the repo rate hike
on 29 January) while recent political, exchange rate and policy developments played a
large role in our revisions for Russia and Turkey.
Exhibit 244. EEMEA: Real GDP growth rates
%, annual
November 2013 Quarterly March 2014 Quarterly
2013E 2014F 2015F 2013E 2014F 2015F
EEMEA 2.1 2.9 3.4 2.2 2.2 3.4
Czech Republic -1.0 2.0 2.5 -1.1 2.5 2.5
Hungary 0.5 1.5 1.5 1.2 1.9 1.5
Israel 3.8 3.5 3.5 3.5 3.5 3.5
Kazakhstan 4.6 5.6 6.0 4.6 5.6 6.0
Poland 1.0 2.5 3.3 1.6 2.8 3.3
Russia 1.3 2.3 2.5 1.3 1.3 3.1
Saudi Arabia 4.2 4.4 4.7 3.8 4.4 4.6
South Africa 2.0 3.1 3.6 1.9 2.8 3.4
Turkey 4.0 4.2 4.5 4.3 2.2 3.1
Ukraine -1.0 -1.5 2.0 0.0 -4.0 2.5
United Arab Emirates 4.0 3.5 4.2 4.1 3.1 3.9
Source: National authorities, IHS Global Insight, Credit Suisse
In Russia, early indicators suggest that sequential real GDP growth is probably
decelerating in 1Q after a pick-up in 4Q 2013. Additionally, the sharp rouble depreciation
will likely put further downward pressure on real GDP growth in early 2014. In our base
case scenario, we see a further slowdown in consumer demand in 1H on the back of
higher inflation and no early rebound in capex this year. The growth outlook for 2H now
appears somewhat brighter than we expected earlier, due both to domestic and external
factors, but the full-year real GDP growth forecast is likely to be about 1pp lower than we
forecast at the time of the November Quarterly.
In Turkey, real GDP growth seems to have held up well in 4Q 2013 but is also likely
slowing now. (Turkey’s 4Q real GDP data will be released on 31 March.) The political
noise has driven both consumer and business confidence in January-February to their
lowest levels since 2H 2012. The confluence of macroprudential measures that were
announced on 31 December, the monetary policy tightening on 28 January and
moderating capital inflows is dampening the credit growth momentum – more notably for
consumer loans than overall loans – towards 15%, in our view. We also believe that the
risks to investment growth remain to the downside, especially if the weaker consumer and
business confidence is coupled with a more modest pick-up in the global economy than
we currently expect. Accordingly, we forecast that real GDP growth will be substantially
lower at 2.2% this year compared to our November forecast of 4.2%.
Berna Bayazitoglu
+44 20 7883 3431

06 March 2014
Emerging Markets Quarterly 87
We also revised our regional inflation forecast for end-2014 higher to 5.2% from
4.7% previously, mainly due to forecast changes in Russia, Turkey and Kazakhstan.
Our projection for further disinflation in Russia and Turkey in 2014 at the time of the
November Quarterly was not borne out by the recent developments as both countries
experienced notable exchange rate depreciation since November. In the case of Turkey,
tax hikes announced on 1 January also contributed to our higher inflation forecast. We are
now forecasting lower end-2014 inflation for CE3 countries compared to the November
Quarterly, mainly due to lower household utility prices, particularly in the case of Hungary,
but we expect core inflation to pick up gradually in all CE3 countries. We also expect lower
inflation in Israel now compared to the November Quarterly, largely due to the downside
surprise in January inflation. Our current forecast for South Africa’s end-2014 inflation is
broadly unchanged compared to the forecast published in the November Quarterly.
Exhibit 245. EEMEA: CPI inflation rates
%, end-period
November 2013 Quarterly March 2014 Quarterly
2013E 2014F 2015F 2013E 2014F 2015F
EEMEA 4.4 4.7 4.6 4.5 5.2 4.7
Czech Republic 1.1 2.0 2.0 1.4 1.7 2.2
Hungary 1.1 3.4 3.5 0.4 3.1 3.4
Israel 1.5 2.0 1.7 1.8 1.4 1.7
Kazakhstan 5.0 5.7 5.7 5.0 8.3 4.7
Poland 1.1 2.4 2.3 0.7 2.0 2.3
Russia 6.0 5.2 5.0 6.5 6.3 5.4
Saudi Arabia 3.0 3.0 3.1 3.0 3.0 3.1
South Africa 5.6 6.0 5.9 5.4 5.9 5.8
Turkey 7.7 7.1 7.5 7.4 7.7 7.2
Ukraine 0.5 7.2 6.2 0.5 7.2 6.2
United Arab Emirates 2.0 2.6 2.7 1.4 2.6 2.5
Source: National authorities, IHS Global Insight, Credit Suisse
We are now forecasting better current account deficit dynamics for most EEMEA
countries in 2014 compared to our previous forecasts. We maintain our view that the
large current account deficit countries of the region – South Africa and Turkey – will likely
exhibit different dynamics in 2014. While we expect Turkey’s current account deficit to
narrow as domestic demand slows notably and export performance is boosted by the
recovery in the euro area, we expect South Africa’s current account deficit to widen in
2014 based on our forecasts for the country’s terms of trade. Our new current account
deficit forecasts for South Africa are based on the revised historical balance of payments
data, published in the Reserve Bank’s Quarterly Bulletin on 10 December 2013, which
resulted in a 1pp decline in the ratio of the current account deficit to GDP for 2010 to 2013.
For Russia, we have revised our full-year current account surplus projection higher for
2014. Given the recent estimates of Economic Expert Group economists on import
demand elasticities and our forecast of subdued consumer and investment demand
growth, we believe that a sustained weakening of the rouble in 1H will stabilize Russia’s
current account surplus to GDP in 2H, at about 1.5% of GDP (compared with our previous
full-year forecast of 0.9% of GDP).

06 March 2014
Emerging Markets Quarterly 88
Exhibit 246. EEMEA: Current account balances
% of GDP
November 2013 Quarterly March 2014 Quarterly
2013E 2014F 2015F 2013E 2014F 2015F
EEMEA 1.4 0.3 -0.3 1.3 1.1 0.5
Czech Republic -1.4 -2.1 -2.3 -1.0 -1.2 -1.3
Hungary 1.6 1.2 0.5 1.9 1.1 0.5
Israel 2.1 2.3 2.8 1.2 1.6 2.1
Kazakhstan 3.9 3.1 3.2 3.9 3.1 3.2
Poland -2.0 -2.5 -2.9 -1.5 -2.0 -2.5
Russia 1.7 0.9 0.4 1.6 1.6 1.1
Saudi Arabia 19.0 15.0 11.2 19.0 17.7 13.6
South Africa -7.0 -8.3 -6.9 -5.7 -7.0 -6.4
Turkey -6.7 -6.6 -6.6 -7.7 -5.7 -5.6
Ukraine -7.6 -5.7 -6.2 -9.0 -8.8 -7.4
United Arab Emirates 13.5 8.1 6.9 12.8 8.2 7.5
Source: National authorities, IHS Global Insight, Credit Suisse
Given the overall current account dynamics, we expect most EEMEA currencies to
remain under depreciation pressure in 2014. The only EEMEA currency which we think
have the scope for appreciation in 2014 is the Polish zloty, on the back of rebounding
growth and returning cross-border lending inflows to Poland.
Exhibit 247. EEMEA: Exchange rates
% of GDP
November 2013 Quarterly March 2014 Quarterly
2013E 2014F 2014F 2013 2014F 2015F
Czech Republic (per EUR) 27.00 27.00 27.00 27.50 27.50 27.50
Hungary (per EUR) 300.00 310.00 320.00 300.00 315.00 320.00
Israel (per USD) 3.45 3.40 3.30 3.47 3.55 3.55
Kazakhstan (per USD) 153.00 152.50 151.50 153.00 182.50 181.50
Poland (per EUR) 4.15 4.10 4.00 4.15 4.10 4.00
Russia (against basket) 37.80 39.00 39.50 38.50 42.00 43.50
Saudi Arabia (per USD) 3.75 3.75 3.75 3.75 3.75 3.75
South Africa (per USD) 10.30 11.00 11.50 10.52 11.50 11.50
Turkey (against basket) 2.40 2.50 2.58 2.54 2.60 2.65
Ukraine (per USD) 8.46 8.92 9.24 8.24 12.28 10.76
United Arab Emirates (per USD) 3.67 3.67 3.67 3.67 3.67 3.67
Source: National authorities, IHS Global Insight, Credit Suisse
Monetary policy outlook across EEMEA countries appears quite divergent now.
Based on the inflation outlook, we expect Russia’s central bank to cut its one-week repo
rate by 50bps following the emergency rate hike of 150bps (to 7.0%) on 3 March which
was driven by excess rouble volatility due to the developments around Ukraine. Turkey’s
MPC was forced by the market to tighten monetary policy aggressively on 28 January and
simplify its operational framework. Although the extent of tightening on 28 January was not
as large as the hike in the one-week repo rate to 10.00% from 4.50% suggests, the
magnitude of the tightening was still significant at 225bps-275bps. The policy response on
28 January seems to have broadly stabilized the lira’s nominal basket exchange rate
within 2.60-2.65. However, in case further notable depreciation pressure on the lira
materializes (not our baseline), either due to global or domestic reasons, the MPC might
be forced to hike interest rates even further. Despite the unexpected 50bps hike in South
Africa’s repo rate on 29 January, we are maintaining our expectation for further 50bps
hikes in May and July this year. Our baseline projection envisages unchanged policy rates
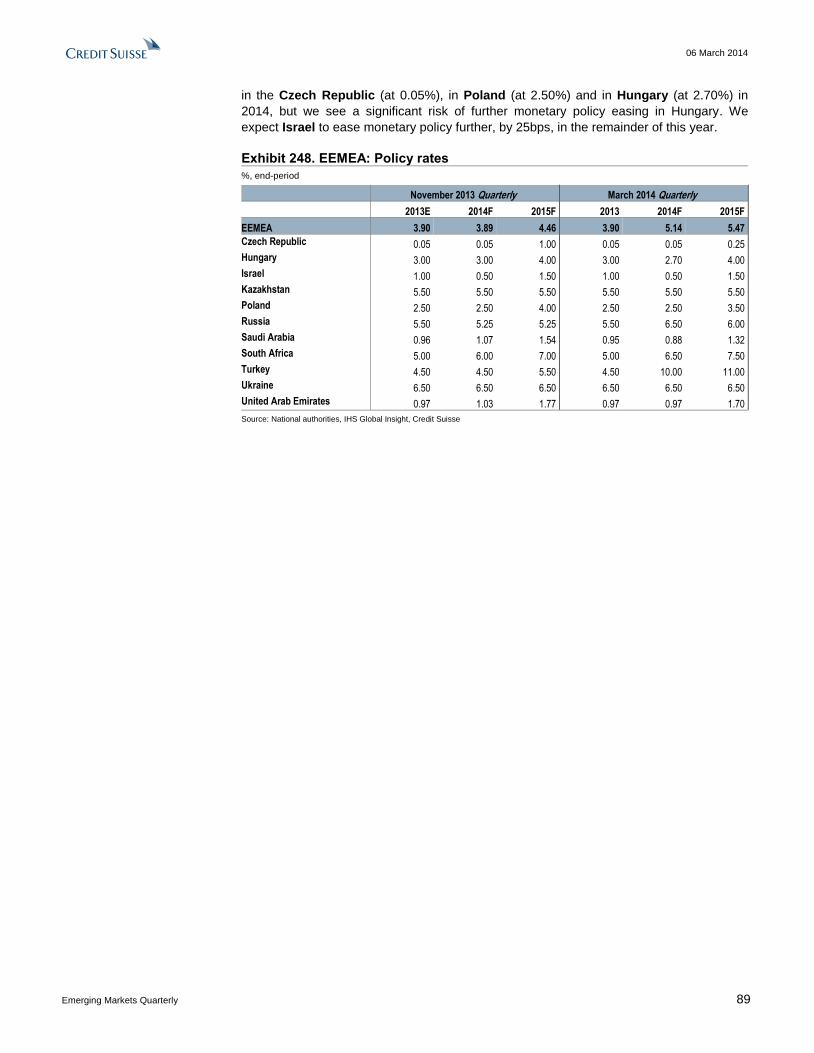
06 March 2014
Emerging Markets Quarterly 89
in the Czech Republic (at 0.05%), in Poland (at 2.50%) and in Hungary (at 2.70%) in
2014, but we see a significant risk of further monetary policy easing in Hungary. We
expect Israel to ease monetary policy further, by 25bps, in the remainder of this year.
Exhibit 248. EEMEA: Policy rates
%, end-period
November 2013 Quarterly March 2014 Quarterly
2013E 2014F 2015F 2013 2014F 2015F
EEMEA 3.90 3.89 4.46 3.90 5.14 5.47
Czech Republic 0.05 0.05 1.00 0.05 0.05 0.25
Hungary 3.00 3.00 4.00 3.00 2.70 4.00
Israel 1.00 0.50 1.50 1.00 0.50 1.50
Kazakhstan 5.50 5.50 5.50 5.50 5.50 5.50
Poland 2.50 2.50 4.00 2.50 2.50 3.50
Russia 5.50 5.25 5.25 5.50 6.50 6.00
Saudi Arabia 0.96 1.07 1.54 0.95 0.88 1.32
South Africa 5.00 6.00 7.00 5.00 6.50 7.50
Turkey 4.50 4.50 5.50 4.50 10.00 11.00
Ukraine 6.50 6.50 6.50 6.50 6.50 6.50
United Arab Emirates 0.97 1.03 1.77 0.97 0.97 1.70
Source: National authorities, IHS Global Insight, Credit Suisse

06 March 2014
Emerging Markets Quarterly 90
Czech Republic: A strong rebound Full-year real GDP in 2013 was 1.1% lower than in 2012, but a recovery has started
to take shape since 2Q 2013 in sequential terms. Following six quarters of
contraction, real GDP expanded 0.3% qoq in 2Q, 0.2% qoq in 3Q and 1.6% qoq in
4Q 2013. We believe that the particularly sharp rebound in 4Q was driven by industrial
exports, as the volume of industrial production rose 2.5% qoq, and the volume of goods
exports increased around 3% qoq, on our estimates, following 3.5% qoq in 3Q.
We forecast that real GDP growth will reach 2.5% in 2014. Continued expansion in
Germany and a weaker koruna exchange rate are likely to keep Czech export growth on
track, and the recovery in exports is likely to filter through to improving domestic
demand, in our view. Employment was 0.8% higher at end-2013 than a year earlier,
private sector credit growth picked up to around 4% yoy in 2013, from around 2% yoy in
2012, and retail sales were up 5.2% yoy in December, in volume terms. Accordingly, we
project that real GDP growth will stabilize around 0.5% qoq in 1Q-2Q 2014, reaching
around 2.5% in both full-year 2014 and 2015. Moreover, possible fiscal policy loosening
by the new government could lend additional support to economic activity, in our view.
We believe that the current account deficit is likely to widen gradually. The current
account deficit narrowed to around 1.0% of GDP in 2013 from 2.4% of GDP in 2012,
driven by an increase in the foreign trade surplus as exports rebounded and imports
remained subdued, but we project that the gradual recovery in domestic demand will
contribute to a moderate widening of the current account deficit to around 1.2% of GDP
in 2014 and 1.3% of GDP in 2015.
Stable sources of external financing (EU funds and FDI inflows) are likely to keep
the basic balance in a surplus in the coming years. Although net FDI inflows dipped
to 0.6% of GDP in 2013 from 4.7% of GDP in 2012, we believe that this is likely to be
temporary, and net EU capital transfers are likely to remain around 2% of GDP in the
coming years, keeping the Czech Republic’s basic balance (including the current
account, unclassified FX flows, EU funds, and FDI) in a surplus in 2014-2015.
In the meantime, cross-border lending inflows are recovering. Other investments
recorded on the balance of payments (which comprise mainly cross-border lending)
turned positive again in 2013. Following 2.9% of GDP net outflows in 2012, other
investments recorded 1.5% of GDP net inflows in 2013. We believe that this can be
primarily explained by the stabilization in the euro area, and the recovery in cross-border
lending is likely to continue in the coming months. Additionally, net portfolio investment
inflows reached 2.4% of GDP in 2013, but these might moderate in 2014, in our view.
CPI inflation was below the central bank’s 2.0% yoy target in 2013, and dropped
further at the beginning of 2014. CPI inflation declined to 0.2% yoy in January 2014
from a peak of 3.8% yoy in March 2012, mainly due to a decline in the contribution of
energy prices (by around 2pp) and food prices (by around 0.5pp). Our measure of core
inflation (excluding food, energy, alcohol and tobacco prices) declined from a peak of
1.9% in April 2012 to close to zero in January 2014, in year-on-year terms, shaving
around 1pp off year-on-year CPI inflation during this period. In the meantime, monetary-
policy relevant inflation (excluding the first-round effects of changes due to indirect
taxes) also came in close to zero, reaching 0.1% yoy in October 2014.
To accelerate the return of CPI inflation towards the central bank’s target, the
Czech National Bank (CNB) Board decided on 7 November 2013 to start FX-
interventions to weaken the koruna’s exchange rate. Accordingly, the CNB bought
foreign exchange worth about CZK200bn in the period up to 20 November, and the
koruna’s exchange rate versus the euro weakened from around 25.8 to around 27.3
during this period. Subsequently, the koruna’s exchange rate stabilized around levels
weaker than 27.0 versus the euro, even without further central bank intervention.
Gergely Hudecz
+33 1 7039 0103

06 March 2014
Emerging Markets Quarterly 91
Nevertheless, on 6 February, the CNB Board highlighted that the depreciation of the
koruna significantly contributed to averting the threat of deflation and confirmed its
commitment to intervening in the FX market, if needed, to keep the koruna’s exchange
rate weaker than 27.0 versus the euro. The CNB Board also reiterated on the same day
that “maintaining the exchange rate close to this level [27.0] at least until the beginning
of 2015 delivers the necessary easing of the monetary conditions” – suggesting that the
CNB Board had been satisfied with the impact of the koruna depreciation until
6 February 2014. Indeed, the FX interventions appear to have been successful so far,
as the run-rate of monetary-policy relevant inflation picked up to close to 2% by January
from -0.8% in September, on our estimates. (We define the run-rate as the annualized
three-month moving average of the month-on-month change in the seasonally adjusted
price index.)
In our view, the CNB’s primary aim with FX interventions is to avoid deflation, but
the weakening of the koruna’s exchange rate also supports economic growth. We
believe that a weaker koruna exchange rate could improve the Czech Republic’s price
competitiveness and thereby support exports. Furthermore, if the central bank’s FX
interventions are not sterilized, credit growth and domestic demand might also benefit
from the monetary easing, in our view. Such FX intervention may be seen as an
unconventional measure for a strictly inflation targeting central bank such as the CNB,
but it is a widely used monetary policy tool among central banks of other emerging
economies. Although other unconventional measures (such as balance sheet expansion
by increasing liquidity provision to banks) could also have an impact on domestic
demand, we believe that these remain unlikely at this juncture.
The central bank’s projection published on 6 February 2014 envisaged that year-
on-year CPI inflation would return to the central bank’s target in late 2014. Our
projection also envisages a gradual pick-up in CPI inflation, to 1.7% yoy by end-2014,
and we believe that the CNB is unlikely to extend its exchange rate commitment in 2015.
In the meantime, however, the recovery in economic activity could put some upward
pressure on the koruna’s exchange rate, and therefore the CNB Board is likely to exit its
FX intervention regime with dovish forward guidance on the policy rate, in our view, to
avoid a rapid appreciation of the koruna’s exchange rate. Our baseline scenario
envisages only 20bps of monetary policy tightening towards the end of 2015, and our
end-2015 policy rate forecast is 0.25%. In keeping with this, we project a broadly stable
koruna exchange rate versus the euro of around 27.5 throughout 2014 and 2015.
The new government might loosen fiscal policy, in our view. Following a general
government budget deficit of 4.4% of GDP in 2012, the previous government cut the
deficit to 2.7% of GDP in 2013, and we estimate that the deficit would continue to narrow
in 2014 on the back of recovering economic activity, assuming no policy change.
However, the new government might review the 2014 budget. Following parliamentary
elections on 25-26 October 2013, the Social Democrat CSSD party entered a coalition
with the pro-business ANO and Christian Democrat KDU-CSL, and our understanding is
that the new government is seeking to ease fiscal policy to stimulate domestic demand
and support the recovery in economic activity. Therefore, we believe that the general
government budget deficit is likely to widen in 2014, although there is only limited room
to loosen fiscal policy, in our view, if the government remains committed to complying
with the 3% of GDP deficit threshold. In keeping with this we believe that general
government gross debt is likely to stabilize around 47% of GDP by 2015.
Exposure to the euro area weighs on the Czech Republic’s credit ratings. The
Czech Republic’s long-term foreign-currency sovereign credit is currently rated AA- by
S&P, one notch above Moody’s A1, and Fitch’s A+ rating, all with stable outlook. We
believe that the Czech Republic’s sovereign credit rating is dependent on the outlook for
the euro area, but a credit rating change remains unlikely at this juncture, in our view.

06 March 2014
Emerging Markets Quarterly 92
Full-year real GDP in 2013
was 1.1% lower than in
2012, but a recovery has
started to take shape since
2Q 2013 in sequential
terms.
Following six quarters of
contraction, real GDP
expanded 0.3% qoq in 2Q,
0.2% qoq in 3Q and
1.6% qoq in 2013.
Exhibit 249: Level of real GDP Exhibit 250: Composition of GDP growth
Contributions to quarter-on-quarter real GDP growth, pps
13.4
13.5
13.6
13.7
13.8
Q4-01 Q4-05 Q4-09 Q4-13
Level of real GDP (in logs)
Long-term linear trend
-6
-4
-2
0
2
4
6
Q3-11 Q1-12 Q3-12 Q1-13 Q3-13
ExportsImports and inventoriesInvestment spendingGovernment spendingHousehold spendingGDP, % qoq
Source: CZSO, Eurostat, Credit Suisse Source: CZSO, Eurostat, Credit Suisse
We estimate that the
particularly sharp rebound in
4Q was driven by industrial
exports, as the volume of
industrial production rose
2.5% qoq, and the volume
of exports increased around
3% qoq.
Continued expansion in
Germany and a weaker
koruna exchange rate are
likely to keep Czech export
growth on track, and the
recovery in exports is likely
to filter through to improving
domestic demand.
Exhibit 251: Manufacturing PMI and industrial production volume
Exhibit 252: Volume of the Czech Republic’s goods exports and imports
Volume index 2010 = 100, sa, % qoq
43
45
47
49
51
53
55
57
-3
-2
-1
0
1
2
3
Dec-11 Jun-12 Dec-12 Jun-13 Dec-13
Industrial production,2010=100, sa, % qoq
Manufacturing PMI
-3
-2
-1
0
1
2
3
4
5
Q4-11 Q2-12 Q4-12 Q2-13 Q4-13
Exports
Imports
Source: Eurostat, Haver Analytics, Credit Suisse Note: December 2013 data is Credit Suisse estimate based on trade value data. Source: CZSO, Eurostat, Credit Suisse.
Employment was 0.8%
higher at end-2013 than a
year earlier, credit growth
picked up to around 4% yoy
in 2013, from a low of
around 2% yoy in 2012, and
retail sales were also up
5.2% yoy in December, in
volume terms.
We project that real GDP
growth will stabilize around
0.5% qoq in 1Q-2Q 2014,
reaching around 2.5% in
full-year 2014.
Exhibit 253: Employment and gross wages
Exhibit 254: Lending to households and retail sales volume
24
25
26
27
28
4.8
4.9
5.0
Dec-11 Dec-12 Dec-13
Employment, sa, mn
Gross wages, CZK thous,right scale
97
98
99
100
101
102
103
104
105
106
1,050
1,100
1,150
1,200
Dec-11 Dec-12 Dec-13
Outstanding loans tohouseholds, CZK bn
Retail sales, 2010=100, sa,right scale
Source: CZSO, Credit Suisse Source: CNB, CZSO, Credit Suisse

06 March 2014
Emerging Markets Quarterly 93
CPI inflation declined to
0.2% yoy in January 2014
from a peak of 3.8% yoy in
March 2012, mainly due to a
decline in the contribution of
energy prices (by around
2pp) and food prices (by
around 0.5pp).
In our view, the central
bank’s FX interventions
have been successful, as
the three-month run-rate of
monetary-policy relevant
inflation picked up close to
2% by January from -0.8%
in September.
Exhibit 255: CPI inflation and run-rate of monetary-policy relevant inflation
Exhibit 256: Exchange rate and policy rate
Contributions year-on-year CPI inflation, pps
-2
-1
0
1
2
3
4
5
6
Jan-12 Jan-13 Jan-14
EnergyFoodAlcohol and tobaccoCore, CS measureRun-rate of monetary-policy inflation, %
24
25
26
27
28
-2
-1
0
1
2
3
4
5
6
Mar-12 Mar-13 Mar-14
Policy rate, %
EURCZK, right scale
Source: CZSO, Eurostat, Credit Suisse Source: CNB, the BLOOMBERG PROFESSIONAL™ service
The current account deficit
narrowed from 2.4% of GDP
in 2012 to 1.0% of GDP in
2013, but we project that the
recovery in domestic
demand will contribute to a
widening of the current
account deficit to around
1.2% of GDP in 2014.
Nevertheless, stable
sources of external
financing are likely to keep
the basic balance in a
surplus in the coming years,
while cross-border lending
inflows are recovering.
Exhibit 257: Selected components of the balance of payments
12-month rolling, % of GDP
-6
-4
-2
0
2
4
6
8
Dec-11 Dec-12 Dec-13
Errors and omissionsCurrent account balanceNet direct investmentsNet EU capital transfersNet portfolio investmentsNet other investments
Source: CNB, CZSO, Credit Suisse
Following a general
government budget deficit of
4.4% of GDP in 2012, the
previous government cut the
deficit to 2.7% of GDP in
2013, but the new
government might loosen
fiscal policy.
In keeping with this we
believe that general
government gross debt is
likely to stabilize at around
47% of GDP by 2015.
Exhibit 258: Government budget Exhibit 259: Government debt (ESA95)
Narrowly defined budget, 12-month rolling, % of GDP General government gross debt, % of GDP
-4
-3
-2
-1
0
1
2
3
4
26
27
28
29
30
31
32
Jan-12 Jan-13 Jan-14
Balance, right scale
Revenues
Expenditures
20
25
30
35
40
45
50
2003 2005 2007 2009 2011 2013E 2015F Source: CZSO, Ministry of Finance, Credit Suisse Source: Eurostat, Credit Suisse

06 March 2014
Emerging Markets Quarterly 94
Czech Republic: Selected economic indicators
2007 2008 2009 2010 2011 2012 2013E 2014F 2015F
National accounts, population and unemployment
Real GDP growth (%) 5.7 3.1 -4.5 2.5 1.8 -1.0 -1.1 2.5 2.5
Real private consumption growth (%) 4.2 2.8 0.2 1.0 0.5 -2.2 -0.2 1.3 2.8
Real fixed investment growth (%) 13.2 4.1 -11.1 1.0 0.4 -4.5 -5.0 6.0 3.5
Fixed investment (% of GDP) 27.0 26.8 24.7 24.5 24.1 23.6 22.6 23.4 23.6
Nominal GDP ($bn) 181.6 226.7 198.8 198.8 216.3 196.4 199.5 197.6 207.5
Population (mn) 10.3 10.5 10.5 10.5 10.5 10.5 10.5 10.5 10.5
GDP per capita ($) 17,631 21,590 18,933 18,933 20,600 18,705 19,002 18,822 19,762
Unemployment (% of labor force, end-year)
Prices, interest rates and exchange rates
CPI inflation (% change, December to December) 5.5 3.3 0.5 2.3 2.8 2.4 1.4 1.7 2.2
CPI inflation (% change in average index for the year) 2.9 6.3 1.0 1.5 1.9 3.3 1.4 1.0 2.4
Nominal wage growth (% change, December to December) 7.2 7.9 3.4 2.2 2.5 2.7 1.0 2.0 3.0
Exchange rate (CZK per EUR, end-year) 26.5 26.9 26.4 25.0 25.6 25.1 27.5 27.5 27.5
Exchange rate (CZK per EUR, average) 27.8 25.0 26.5 25.2 24.6 25.4 26.3 27.5 27.5
Exchange rate (CZK per USD, average) 20.1 17.1 19.0 19.1 17.6 19.8 19.5 20.4 20.4
REER (% change, December to December) (1) 8.4 3.5 0.1 0.4 -1.0 -0.1 -8.8 -0.5 0.9
Central bank policy rate (%, end-year) 3.50 2.25 1.00 0.75 0.75 0.05 0.05 0.05 0.25
Fiscal data (2)
General government revenue (% of GDP) 40.3 38.9 38.9 39.1 40.0 40.1 40.5 41.0 41.0
General government expenditure (% of GDP) 42.5 41.2 44.7 43.8 43.2 44.5 43.2 44.0 44.0
General government primary balance (% of GDP) 0.4 -1.2 -4.5 -3.3 -1.8 -2.9 -1.2 -1.5 -1.5
General government balance (% of GDP) -0.7 -2.7 -5.8 -4.7 -3.2 -4.4 -2.7 -3.0 -3.0
General government gross debt, ESA95 (% of GDP, end-year) 27.9 28.7 34.6 38.4 41.4 46.2 46.1 46.4 46.8
Money supply and credit
Broad money supply (% of GDP) 63.0 68.4 70.5 71.4 73.7 77.0 80.5 81.8 83.6
Broad money supply (% year-on-year change) 16.3 14.1 0.6 2.2 4.1 4.6 5.0 5.3 7.3
Domestic credit outstanding (% of GDP) 59.0 63.5 67.5 69.8 74.3 78.2 79.2 80.6 82.3
Domestic credit growth (% year-on-year change) 21.6 13.0 3.9 4.4 7.4 5.4 1.6 5.3 7.3
Domestic credit to the private sector outstanding (% of GDP) 46.3 50.6 52.0 53.1 55.6 56.9 58.9 59.9 61.2
Domestic credit to the private sector growth (% year-on-year change) 26.3 15.8 0.1 4.0 5.9 2.5 3.8 5.3 7.3
Balance of payments
Exports (% of GDP) 68.3 64.7 59.7 67.9 73.7 78.3 79.9 81.9 80.7
Imports (% of GDP) 65.4 62.1 55.4 64.5 69.8 73.2 73.7 74.9 72.7
Exports (goods and non-factor services, % year-on-year change in $ value) 25.4 18.8 -18.8 14.3 18.1 -3.0 6.1 1.5 3.5
Imports (goods and non-factor services, % year-on-year change in $ value) 26.3 18.8 -21.4 17.1 17.7 -4.2 4.9 0.7 2.0
Current account balance ($bn) -7.9 -4.8 -4.8 -7.6 -6.1 -4.7 -2.0 -2.3 -2.7
Current account balance (% of GDP) -4.4 -2.1 -2.4 -3.8 -2.8 -2.4 -1.0 -1.2 -1.3
Net FDI inflows ($bn) 0.0 2.3 2.0 4.9 2.5 9.3 1.3 4.0 4.0
Scheduled external debt amortization ($bn) (3) 3.5 5.0 4.4 4.7 5.0 4.0 4.0 4.0 4.0
Foreign debt and reserves
Foreign debt ($bn) 76.0 83.1 89.2 94.2 94.2 101.9 100.0 100.0 100.0
Public ($bn) 15.2 15.3 20.1 24.8 23.8 28.8 30.0 30.0 30.0
Private ($bn) 60.8 67.8 69.1 69.4 70.4 73.1 70.0 70.0 70.0
Foreign debt (% of GDP) 41.9 36.7 44.9 47.4 43.6 51.9 50.1 50.6 48.2
Foreign debt (% of exports of goods and services) 61.2 56.7 75.2 69.8 59.1 66.3 62.7 61.8 59.7
Central bank foreign reserves ($bn) 34.9 37.0 41.6 42.5 40.3 44.9 56.2 61.4 61.4
Central bank foreign reserves, excl. gold ($bn) 34.5 36.7 41.2 41.9 39.7 44.3 55.8 61.0 61.0
(1) Real effective exchange rate (CPI-deflated), increase indicates appreciation. (2) Consolidated fiscal accounts of the broadly defined general government on an accrual basis. (3) Scheduled amortizations of medium- and long-term external debt of both the public and private sector, based on Credit Suisse assumptions.
Sources: CNB, CZSO, Eurostat, Ministry of Finance, IMF, JEDH, the BLOOMBERG PROFESSIONAL™ service, Haver Analytics, Credit Suisse
06 March 2014
Emerging Markets Quarterly 95
Hungary: Taking it easy in election year Real GDP growth rebounded in 2013, as external demand strengthened and the
domestic policy mix loosened ahead of the parliamentary elections in April 2014. Following 1.7% contraction in 2012, real GDP expanded 1.2% in 2013, mainly driven by a recovery in exports, which grew around 5% in volume terms, on our estimates. In addition, investment spending growth picked up, expanding around 3%, on our estimates, and household spending also showed tentative signs of recovery.
Real GDP growth is unlikely to accelerate in sequential quarter-on-quarter terms, but full-year growth may be higher in 2014 than it was in 2013, in our view. Real GDP growth slowed to 0.6% qoq in 4Q from 0.8% qoq in 3Q 2013, and industrial production contracted marginally in 4Q, in quarter-on-quarter terms. We believe that demand from Germany is likely to keep the Hungarian recovery on track, but Hungary’s real export growth might moderate to around 3% in 2014. Meanwhile, domestic demand is likely to continue to recover, as employment and wage growth have been picking up, driven by public investments and public wage hikes in the run-up to the parliamentary elections scheduled for 6 April 2014. However, recovering household and investment spending are likely to pull in imports and dampen net exports' contribution to real GDP growth, in our view. Accordingly, we forecast that real GDP growth is likely to stabilize around 0.4% qoq in 1Q-2Q 2014, reaching 1.9% in 2014 and 1.5% in 2015 full-year.
CPI inflation is likely to pick up gradually in 2014 and rise above the central bank’s 3% target in 2015, in our view. CPI inflation declined to close to nil in January 2014 from a peak of 6.6% in September 2012, in year-on-year terms, mainly driven by utility price cuts enforced by the government: the contribution of energy prices fell by 3.7pps, while the contribution of food prices declined by 1.7pps and the contribution of core prices by 0.7pp during this period. However, we believe that underlying inflationary pressures are gradually building up, as domestic demand is recovering. Our measure of core inflation (excluding energy, food, alcohol and tobacco prices) reached 2.0% yoy in January, and its run-rate in the three months to January was around 1.5%. (We define the run-rate as the annualized three-month moving average of the month-on-month change in the seasonally adjusted price index.) In keeping with this, we believe that once the impact of the utility price cuts falls out of the year-on-year series, CPI inflation is likely to rise above the central bank’s 3% target in 2015.
We believe that the monetary policy easing cycle is coming to an end. The Monetary Council (MC) embarked on an easing cycle in August 2012 and lowered the policy rate by a cumulative 430bps to 2.70% by end-February 2014. In addition, to stimulate domestic demand, the central bank launched a Funding for Growth Scheme, providing preferential refinancing to banks for SME lending. The first tranche of the program was open from June to September 2013, allocating HUF 750bn (around €2.5bn, or 2.5% of GDP), and the second tranche opened in October, providing an additional HUF 500bn (around €1.7bn, or 1.7% of GDP). Nevertheless, in February 2014 the MC indicated that it will decide on the need and possibility for continuing the easing cycle based on the upcoming March inflation report. The central bank’s previous projection (released in December) envisaged that average annual CPI inflation will be 1.3% in 2014 and 2.8% in 2015, but we believe that risks are skewed to the upside, and hence the MC is unlikely to continue the easing cycle. In contrast, we forecast that the MC will start monetary policy tightening in 2015, raising the policy rate to 4.00%.
Meanwhile, fiscal policy is likely to loosen further in 2014, in our view. Hungary’s general government budget deficit narrowed from 4.6% of GDP in 2009 to 2.0% of GDP in 2012, and the EU decided to abrogate the Excessive Deficit Procedure, averting the risk of suspending its transfers to Hungary. However, as general government spending picked up to 50.1% of GDP in 2013 from 48.6% of GDP in 2012, while revenues rose only to 47.7% of GDP in 2013 from 46.6% of GDP in 2012, the general government budget deficit widened to 2.4% of GDP in 2013. Moreover, we believe that the government is unlikely to tighten fiscal policy this year, as after the parliamentary elections, the European elections are due in May, and municipal elections are due in the autumn of this year. Hence, the general government budget deficit might reach 4% of GDP in 2014, in our view, and general government gross debt might rise to around 79% of GDP in 2014 from around 78% of GDP at end-2013 before stabilizing in 2015.
Gergely Hudecz
+33 1 7039 0103

06 March 2014
Emerging Markets Quarterly 96
The government’s FX-deposits at the central bank cover its external debt
repayments at least until end-September 2014, on our estimates. The government
had around $3.1bn of FX deposits at the central bank at end-January, and around $2.8bn
of its medium- and long-term FX-denominated debt matures by September 2014.
Additionally, inflows from EU transfers (around $4bn in 2014, on our estimates) also
support the government’s ability to repay its maturing FX-debt. Nevertheless, we believe
that foreign demand for forint-denominated government securities remains crucial for the
government to meet its overall funding needs, as non-residents’ holdings of forint-
denominated government securities amounted to around $20.7bn at end-February 2014
(36% of total forint-denominated government securities, on our estimates), and around
$1.7bn of non-residents’ holdings mature in 3Q 2014.
Hungary’s overall external financing needs remain elevated, but the surplus on its
basic balance is likely to cover net external debt repayments in 2014, in our view.
On the one hand, Hungary’s gross external debt stock was around $196bn (140% of GDP)
at end-September 2013, including around $22bn (16% of GDP) short-term debt with an
original maturity of one year or less, and around $16.5bn (12% of GDP) medium- and
long-term debt maturing in 2014. On the other hand, in the four quarters to 3Q 2013,
Hungary’s basic balance surplus (including the current account, unclassified FX flows, EU
funds, and FDI) reached around $9bn (7% of GDP) and around $2.5bn (2% of GDP) net
portfolio investment inflows helped to repay maturing external debt. Net portfolio
investment inflows might moderate, but we believe that the surplus on the basic balance is
likely to remain broadly unchanged, covering around 20% of Hungary’s maturing external
debt in 2014. Accordingly, we estimate that as long as 80% of Hungary’s maturing external
debt is rolled over, which we think is likely, the country will be able to meet its external
financing needs. Thus, the forint is likely to weaken only gradually versus the euro, and we
forecast EURHUF 315 at end-2014 and 320 at end-2015.
The issue of FX-mortgages continues to generate political noise and uncertainty.
The bulk of the household FX-mortgages are CHF-denominated and were taken out
between 2005 and 2008 with over five years as original maturity. The CHF value of this
stock reached its peak around CHF 25bn in 2009, but subsequently the authorities
implemented various measures which led to a reduction in the stock of outstanding FX-
mortgages to around CHF 15bn by end-2013. The government also introduced a voluntary
exchange rate cap scheme in 2011, fixing the exchange rate for the monthly repayments
of CHF and EUR-denominated housing loans at CHFHUF 180 / EURHUF 250. The
differential between the fixed and the market exchange rate has been accumulating in a
separate “overflow” account, which households will have to repay after an initial five-year
period. In our view, this measure is effectively a restructuring, as monthly repayments are
reduced for a five-year period. However, participation in this scheme (around 40%) has
been below the authorities’ expectations, and in November 2013 the scheme was opened
up to households with home-equity loans. Nevertheless, the government indicated that this
is merely a temporary measure until further steps are taken, and we anticipate additional
announcements during the election campaign.
Risks to Hungary’s credit ratings are skewed to the downside, but a downgrade is
not imminent, in our view. S&P revised the outlook for Hungary's long-term foreign
currency sovereign credit rating to negative from stable, while it affirmed its rating at BB on
21 March 2013. S&P stated that the revision indicates “the potential for a downgrade if a
deterioration of Hungary's policy framework weakens confidence and medium-term
economic growth prospects, or significantly raises financing costs and leaves Hungary
exposed to diminished capital inflows.” S&P’s move contrasts with Fitch’s move in
December 2012, as Fitch revised the outlook for Hungary's long-term foreign-currency
sovereign credit rating to stable from negative, while it affirmed its rating at BB+ (one notch
above S&P’s rating). Fitch stated that the revision “is underpinned by progress in reducing
the budget deficit and stabilising government debt along with improved fiscal and external
financing conditions.” Moody's Ba1 rating for Hungary’s long-term foreign-currency
sovereign credit is in line with Fitch’s rating, but Moody’s outlook is negative.
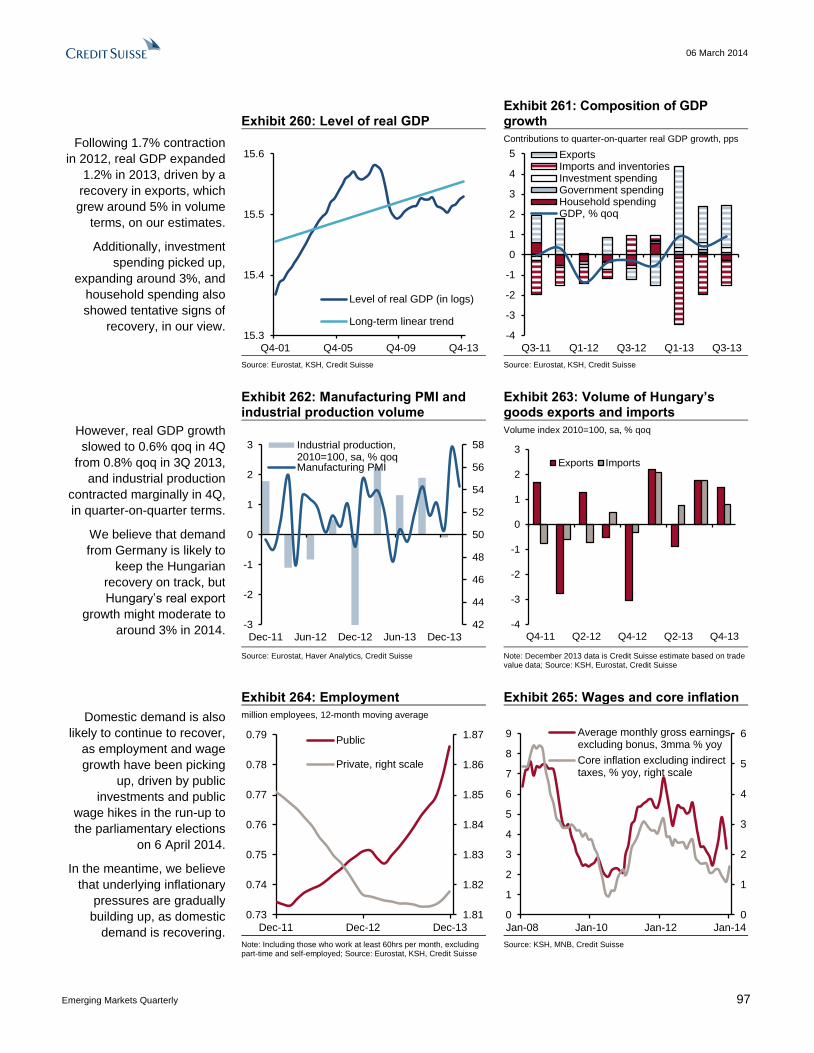
06 March 2014
Emerging Markets Quarterly 97
Following 1.7% contraction
in 2012, real GDP expanded
1.2% in 2013, driven by a
recovery in exports, which
grew around 5% in volume
terms, on our estimates.
Additionally, investment
spending picked up,
expanding around 3%, and
household spending also
showed tentative signs of
recovery, in our view.
Exhibit 260: Level of real GDP Exhibit 261: Composition of GDP growth
Contributions to quarter-on-quarter real GDP growth, pps
15.3
15.4
15.5
15.6
Q4-01 Q4-05 Q4-09 Q4-13
Level of real GDP (in logs)
Long-term linear trend
-4
-3
-2
-1
0
1
2
3
4
5
Q3-11 Q1-12 Q3-12 Q1-13 Q3-13
ExportsImports and inventoriesInvestment spendingGovernment spendingHousehold spendingGDP, % qoq
Source: Eurostat, KSH, Credit Suisse Source: Eurostat, KSH, Credit Suisse
However, real GDP growth
slowed to 0.6% qoq in 4Q
from 0.8% qoq in 3Q 2013,
and industrial production
contracted marginally in 4Q,
in quarter-on-quarter terms.
We believe that demand
from Germany is likely to
keep the Hungarian
recovery on track, but
Hungary’s real export
growth might moderate to
around 3% in 2014.
Exhibit 262: Manufacturing PMI and industrial production volume
Exhibit 263: Volume of Hungary’s goods exports and imports
Volume index 2010=100, sa, % qoq
42
44
46
48
50
52
54
56
58
-3
-2
-1
0
1
2
3
Dec-11 Jun-12 Dec-12 Jun-13 Dec-13
Industrial production,2010=100, sa, % qoqManufacturing PMI
-4
-3
-2
-1
0
1
2
3
Q4-11 Q2-12 Q4-12 Q2-13 Q4-13
Exports Imports
Source: Eurostat, Haver Analytics, Credit Suisse Note: December 2013 data is Credit Suisse estimate based on trade value data; Source: KSH, Eurostat, Credit Suisse
Domestic demand is also
likely to continue to recover,
as employment and wage
growth have been picking
up, driven by public
investments and public
wage hikes in the run-up to
the parliamentary elections
on 6 April 2014.
In the meantime, we believe
that underlying inflationary
pressures are gradually
building up, as domestic
demand is recovering.
Exhibit 264: Employment Exhibit 265: Wages and core inflation
million employees, 12-month moving average
1.81
1.82
1.83
1.84
1.85
1.86
1.87
0.73
0.74
0.75
0.76
0.77
0.78
0.79
Dec-11 Dec-12 Dec-13
Public
Private, right scale
0
1
2
3
4
5
6
0
1
2
3
4
5
6
7
8
9
Jan-08 Jan-10 Jan-12 Jan-14
Average monthly gross earningsexcluding bonus, 3mma % yoy
Core inflation excluding indirecttaxes, % yoy, right scale
Note: Including those who work at least 60hrs per month, excluding part-time and self-employed; Source: Eurostat, KSH, Credit Suisse
Source: KSH, MNB, Credit Suisse
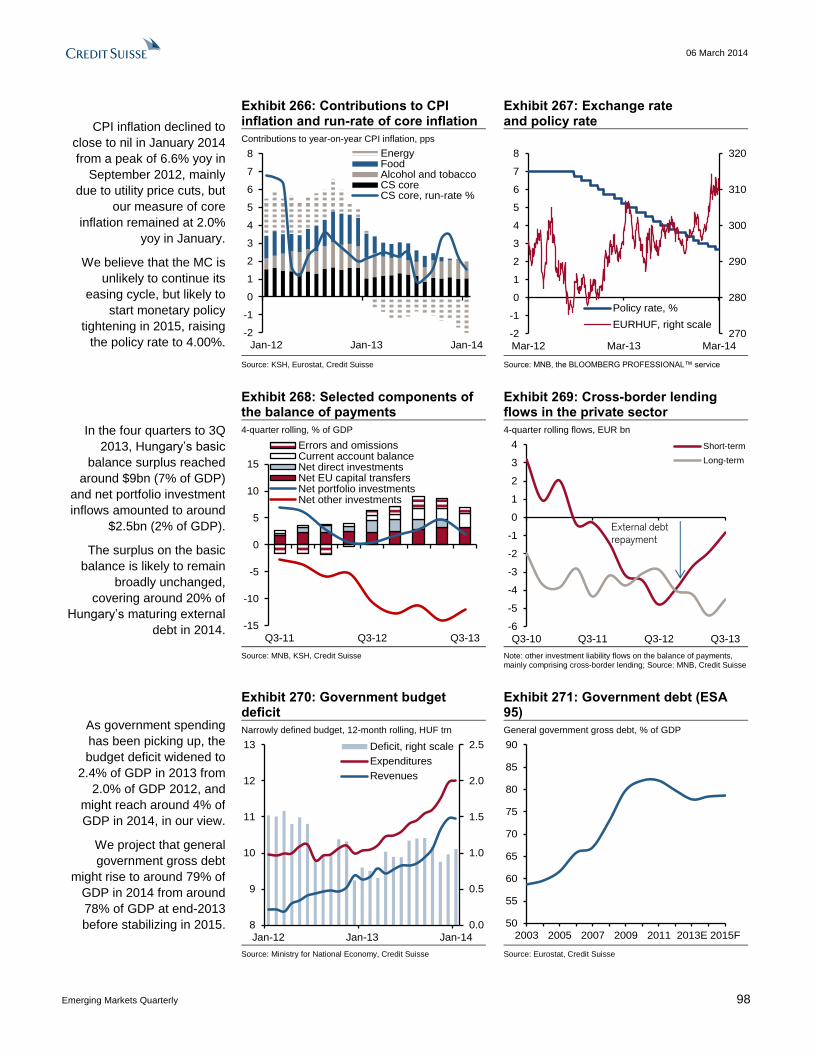
06 March 2014
Emerging Markets Quarterly 98
CPI inflation declined to
close to nil in January 2014
from a peak of 6.6% yoy in
September 2012, mainly
due to utility price cuts, but
our measure of core
inflation remained at 2.0%
yoy in January.
We believe that the MC is
unlikely to continue its
easing cycle, but likely to
start monetary policy
tightening in 2015, raising
the policy rate to 4.00%.
Exhibit 266: Contributions to CPI inflation and run-rate of core inflation
Exhibit 267: Exchange rate and policy rate
Contributions to year-on-year CPI inflation, pps
-2
-1
0
1
2
3
4
5
6
7
8
Jan-12 Jan-13 Jan-14
EnergyFoodAlcohol and tobaccoCS coreCS core, run-rate %
270
280
290
300
310
320
-2
-1
0
1
2
3
4
5
6
7
8
Mar-12 Mar-13 Mar-14
Policy rate, %
EURHUF, right scale
Source: KSH, Eurostat, Credit Suisse Source: MNB, the BLOOMBERG PROFESSIONAL™ service
In the four quarters to 3Q
2013, Hungary’s basic
balance surplus reached
around $9bn (7% of GDP)
and net portfolio investment
inflows amounted to around
$2.5bn (2% of GDP).
The surplus on the basic
balance is likely to remain
broadly unchanged,
covering around 20% of
Hungary’s maturing external
debt in 2014.
Exhibit 268: Selected components of the balance of payments
Exhibit 269: Cross-border lending flows in the private sector
4-quarter rolling, % of GDP 4-quarter rolling flows, EUR bn
-15
-10
-5
0
5
10
15
Q3-11 Q3-12 Q3-13
Errors and omissionsCurrent account balanceNet direct investmentsNet EU capital transfersNet portfolio investmentsNet other investments
-6
-5
-4
-3
-2
-1
0
1
2
3
4
Q3-10 Q3-11 Q3-12 Q3-13
Short-term
Long-term
External debt repayment
Source: MNB, KSH, Credit Suisse Note: other investment liability flows on the balance of payments,
mainly comprising cross-border lending; Source: MNB, Credit Suisse
As government spending
has been picking up, the
budget deficit widened to
2.4% of GDP in 2013 from
2.0% of GDP 2012, and
might reach around 4% of
GDP in 2014, in our view.
We project that general
government gross debt
might rise to around 79% of
GDP in 2014 from around
78% of GDP at end-2013
before stabilizing in 2015.
Exhibit 270: Government budget deficit
Exhibit 271: Government debt (ESA 95)
Narrowly defined budget, 12-month rolling, HUF trn General government gross debt, % of GDP
0.0
0.5
1.0
1.5
2.0
2.5
8
9
10
11
12
13
Jan-12 Jan-13 Jan-14
Deficit, right scale
Expenditures
Revenues
50
55
60
65
70
75
80
85
90
2003 2005 2007 2009 2011 2013E 2015F
Source: Ministry for National Economy, Credit Suisse Source: Eurostat, Credit Suisse
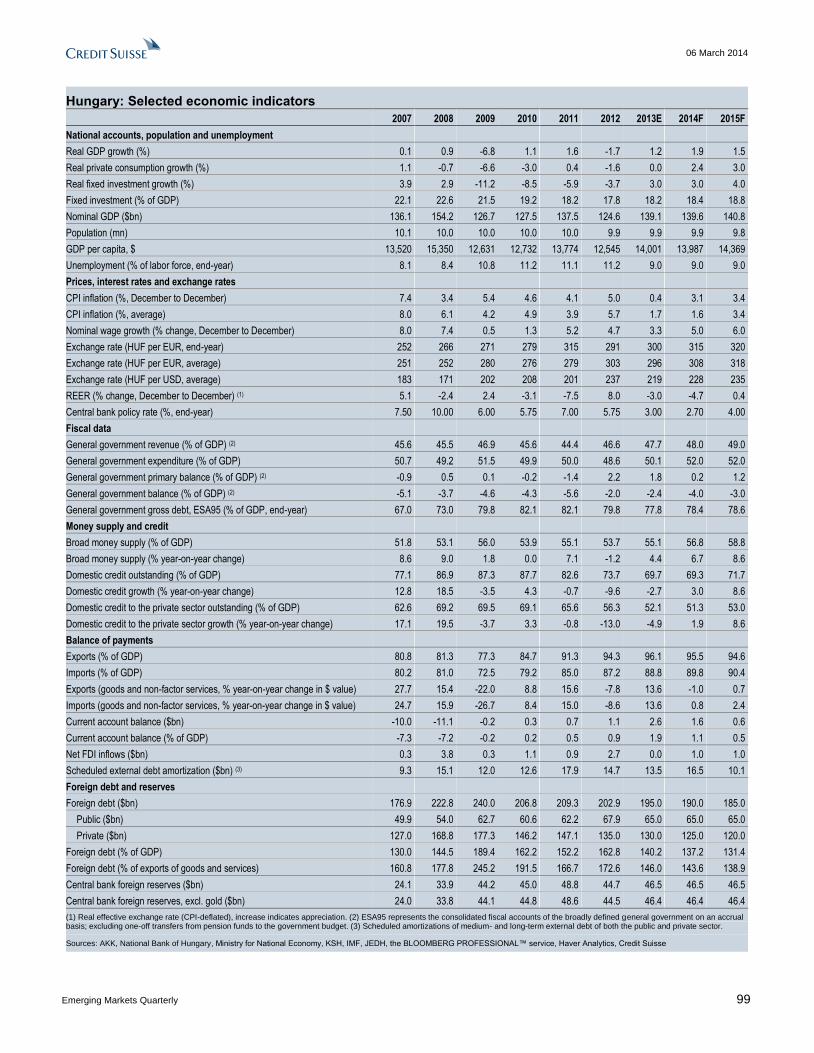
06 March 2014
Emerging Markets Quarterly 99
Hungary: Selected economic indicators
2007 2008 2009 2010 2011 2012 2013E 2014F 2015F
National accounts, population and unemployment
Real GDP growth (%) 0.1 0.9 -6.8 1.1 1.6 -1.7 1.2 1.9 1.5
Real private consumption growth (%) 1.1 -0.7 -6.6 -3.0 0.4 -1.6 0.0 2.4 3.0
Real fixed investment growth (%) 3.9 2.9 -11.2 -8.5 -5.9 -3.7 3.0 3.0 4.0
Fixed investment (% of GDP) 22.1 22.6 21.5 19.2 18.2 17.8 18.2 18.4 18.8
Nominal GDP ($bn) 136.1 154.2 126.7 127.5 137.5 124.6 139.1 139.6 140.8
Population (mn) 10.1 10.0 10.0 10.0 10.0 9.9 9.9 9.9 9.8
GDP per capita, $ 13,520 15,350 12,631 12,732 13,774 12,545 14,001 13,987 14,369
Unemployment (% of labor force, end-year) 8.1 8.4 10.8 11.2 11.1 11.2 9.0 9.0 9.0
Prices, interest rates and exchange rates
CPI inflation (%, December to December) 7.4 3.4 5.4 4.6 4.1 5.0 0.4 3.1 3.4
CPI inflation (%, average) 8.0 6.1 4.2 4.9 3.9 5.7 1.7 1.6 3.4
Nominal wage growth (% change, December to December) 8.0 7.4 0.5 1.3 5.2 4.7 3.3 5.0 6.0
Exchange rate (HUF per EUR, end-year) 252 266 271 279 315 291 300 315 320
Exchange rate (HUF per EUR, average) 251 252 280 276 279 303 296 308 318
Exchange rate (HUF per USD, average) 183 171 202 208 201 237 219 228 235
REER (% change, December to December) (1) 5.1 -2.4 2.4 -3.1 -7.5 8.0 -3.0 -4.7 0.4
Central bank policy rate (%, end-year) 7.50 10.00 6.00 5.75 7.00 5.75 3.00 2.70 4.00
Fiscal data
General government revenue (% of GDP) (2) 45.6 45.5 46.9 45.6 44.4 46.6 47.7 48.0 49.0
General government expenditure (% of GDP) 50.7 49.2 51.5 49.9 50.0 48.6 50.1 52.0 52.0
General government primary balance (% of GDP) (2) -0.9 0.5 0.1 -0.2 -1.4 2.2 1.8 0.2 1.2
General government balance (% of GDP) (2) -5.1 -3.7 -4.6 -4.3 -5.6 -2.0 -2.4 -4.0 -3.0
General government gross debt, ESA95 (% of GDP, end-year) 67.0 73.0 79.8 82.1 82.1 79.8 77.8 78.4 78.6
Money supply and credit
Broad money supply (% of GDP) 51.8 53.1 56.0 53.9 55.1 53.7 55.1 56.8 58.8
Broad money supply (% year-on-year change) 8.6 9.0 1.8 0.0 7.1 -1.2 4.4 6.7 8.6
Domestic credit outstanding (% of GDP) 77.1 86.9 87.3 87.7 82.6 73.7 69.7 69.3 71.7
Domestic credit growth (% year-on-year change) 12.8 18.5 -3.5 4.3 -0.7 -9.6 -2.7 3.0 8.6
Domestic credit to the private sector outstanding (% of GDP) 62.6 69.2 69.5 69.1 65.6 56.3 52.1 51.3 53.0
Domestic credit to the private sector growth (% year-on-year change) 17.1 19.5 -3.7 3.3 -0.8 -13.0 -4.9 1.9 8.6
Balance of payments
Exports (% of GDP) 80.8 81.3 77.3 84.7 91.3 94.3 96.1 95.5 94.6
Imports (% of GDP) 80.2 81.0 72.5 79.2 85.0 87.2 88.8 89.8 90.4
Exports (goods and non-factor services, % year-on-year change in $ value) 27.7 15.4 -22.0 8.8 15.6 -7.8 13.6 -1.0 0.7
Imports (goods and non-factor services, % year-on-year change in $ value) 24.7 15.9 -26.7 8.4 15.0 -8.6 13.6 0.8 2.4
Current account balance ($bn) -10.0 -11.1 -0.2 0.3 0.7 1.1 2.6 1.6 0.6
Current account balance (% of GDP) -7.3 -7.2 -0.2 0.2 0.5 0.9 1.9 1.1 0.5
Net FDI inflows ($bn) 0.3 3.8 0.3 1.1 0.9 2.7 0.0 1.0 1.0
Scheduled external debt amortization ($bn) (3) 9.3 15.1 12.0 12.6 17.9 14.7 13.5 16.5 10.1
Foreign debt and reserves
Foreign debt ($bn) 176.9 222.8 240.0 206.8 209.3 202.9 195.0 190.0 185.0
Public ($bn) 49.9 54.0 62.7 60.6 62.2 67.9 65.0 65.0 65.0
Private ($bn) 127.0 168.8 177.3 146.2 147.1 135.0 130.0 125.0 120.0
Foreign debt (% of GDP) 130.0 144.5 189.4 162.2 152.2 162.8 140.2 137.2 131.4
Foreign debt (% of exports of goods and services) 160.8 177.8 245.2 191.5 166.7 172.6 146.0 143.6 138.9
Central bank foreign reserves ($bn) 24.1 33.9 44.2 45.0 48.8 44.7 46.5 46.5 46.5
Central bank foreign reserves, excl. gold ($bn) 24.0 33.8 44.1 44.8 48.6 44.5 46.4 46.4 46.4
(1) Real effective exchange rate (CPI-deflated), increase indicates appreciation. (2) ESA95 represents the consolidated fiscal accounts of the broadly defined general government on an accrual basis; excluding one-off transfers from pension funds to the government budget. (3) Scheduled amortizations of medium- and long-term external debt of both the public and private sector.
Sources: AKK, National Bank of Hungary, Ministry for National Economy, KSH, IMF, JEDH, the BLOOMBERG PROFESSIONAL™ service, Haver Analytics, Credit Suisse
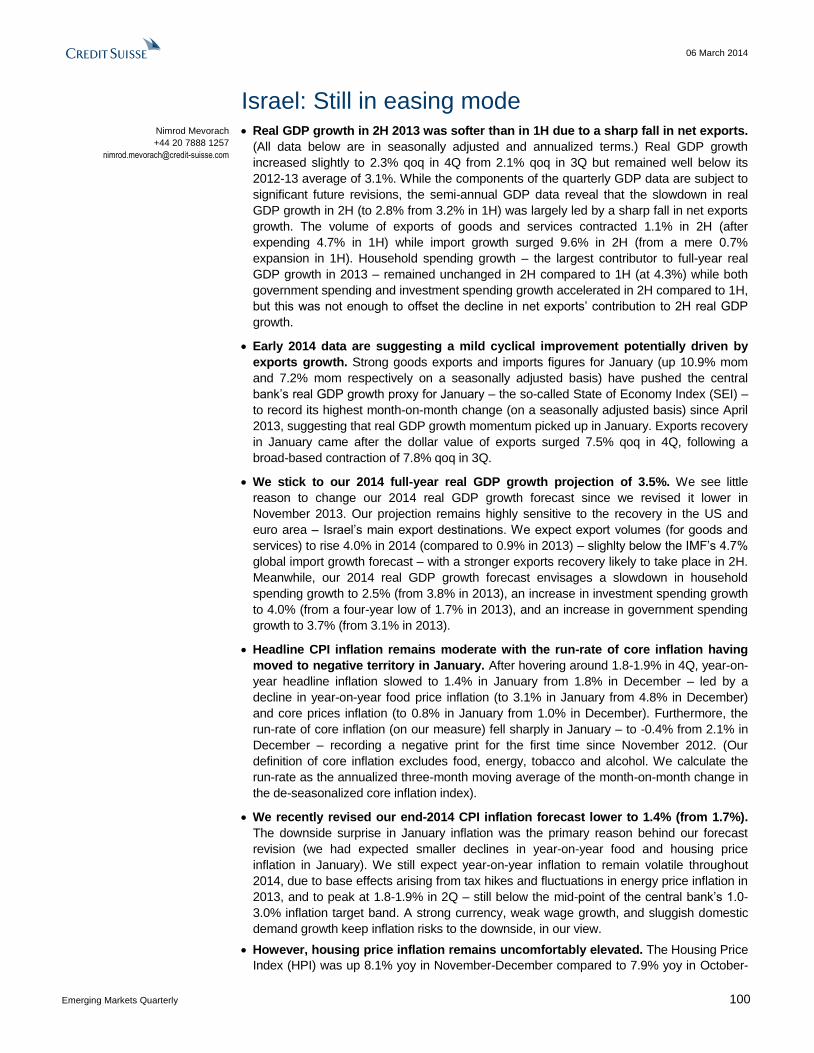
06 March 2014
Emerging Markets Quarterly 100
Israel: Still in easing mode Real GDP growth in 2H 2013 was softer than in 1H due to a sharp fall in net exports.
(All data below are in seasonally adjusted and annualized terms.) Real GDP growth
increased slightly to 2.3% qoq in 4Q from 2.1% qoq in 3Q but remained well below its
2012-13 average of 3.1%. While the components of the quarterly GDP data are subject to
significant future revisions, the semi-annual GDP data reveal that the slowdown in real
GDP growth in 2H (to 2.8% from 3.2% in 1H) was largely led by a sharp fall in net exports
growth. The volume of exports of goods and services contracted 1.1% in 2H (after
expending 4.7% in 1H) while import growth surged 9.6% in 2H (from a mere 0.7%
expansion in 1H). Household spending growth – the largest contributor to full-year real
GDP growth in 2013 – remained unchanged in 2H compared to 1H (at 4.3%) while both
government spending and investment spending growth accelerated in 2H compared to 1H,
but this was not enough to offset the decline in net exports’ contribution to 2H real GDP
growth.
Early 2014 data are suggesting a mild cyclical improvement potentially driven by
exports growth. Strong goods exports and imports figures for January (up 10.9% mom
and 7.2% mom respectively on a seasonally adjusted basis) have pushed the central
bank’s real GDP growth proxy for January – the so-called State of Economy Index (SEI) –
to record its highest month-on-month change (on a seasonally adjusted basis) since April
2013, suggesting that real GDP growth momentum picked up in January. Exports recovery
in January came after the dollar value of exports surged 7.5% qoq in 4Q, following a
broad-based contraction of 7.8% qoq in 3Q.
We stick to our 2014 full-year real GDP growth projection of 3.5%. We see little
reason to change our 2014 real GDP growth forecast since we revised it lower in
November 2013. Our projection remains highly sensitive to the recovery in the US and
euro area – Israel’s main export destinations. We expect export volumes (for goods and
services) to rise 4.0% in 2014 (compared to 0.9% in 2013) – slighlty below the IMF’s 4.7%
global import growth forecast – with a stronger exports recovery likely to take place in 2H.
Meanwhile, our 2014 real GDP growth forecast envisages a slowdown in household
spending growth to 2.5% (from 3.8% in 2013), an increase in investment spending growth
to 4.0% (from a four-year low of 1.7% in 2013), and an increase in government spending
growth to 3.7% (from 3.1% in 2013).
Headline CPI inflation remains moderate with the run-rate of core inflation having
moved to negative territory in January. After hovering around 1.8-1.9% in 4Q, year-on-
year headline inflation slowed to 1.4% in January from 1.8% in December – led by a
decline in year-on-year food price inflation (to 3.1% in January from 4.8% in December)
and core prices inflation (to 0.8% in January from 1.0% in December). Furthermore, the
run-rate of core inflation (on our measure) fell sharply in January – to -0.4% from 2.1% in
December – recording a negative print for the first time since November 2012. (Our
definition of core inflation excludes food, energy, tobacco and alcohol. We calculate the
run-rate as the annualized three-month moving average of the month-on-month change in
the de-seasonalized core inflation index).
We recently revised our end-2014 CPI inflation forecast lower to 1.4% (from 1.7%).
The downside surprise in January inflation was the primary reason behind our forecast
revision (we had expected smaller declines in year-on-year food and housing price
inflation in January). We still expect year-on-year inflation to remain volatile throughout
2014, due to base effects arising from tax hikes and fluctuations in energy price inflation in
2013, and to peak at 1.8-1.9% in 2Q – still below the mid-point of the central bank’s 1.0-
3.0% inflation target band. A strong currency, weak wage growth, and sluggish domestic
demand growth keep inflation risks to the downside, in our view.
However, housing price inflation remains uncomfortably elevated. The Housing Price
Index (HPI) was up 8.1% yoy in November-December compared to 7.9% yoy in October-
Nimrod Mevorach
+44 20 7888 1257
06 March 2014
Emerging Markets Quarterly 101
November – after slowing for four consecutive months. Meanwhile, the run-rate of housing
price inflation (according to the HPI) also accelerated in November-December – to 7.2%
from 5.7% in October-November – and is now within the range of the past six months.
The resilience of the shekel against a backdrop of an ongoing EM currency
weakness is supported by strong basic balance flows. (We define the basic balance
as the combined current account and net FDI flows). Although official balance of
payments data for 4Q are due to be published on 11 March, 4Q GDP data suggest that
the current account returned to a surplus of $1.5bn in 4Q 2013, after recording a deficit
of $1.8bn in 3Q. According to the partial financial account data, we also estimate that
net FDI inflows were probably in the order of $2.0bn in 4Q compared to $0.8bn in 3Q.
Meanwhile, the central bank purchased about $1.5bn throughout 4Q – absorbing slightly
half of these basic-balance inflows. We note that the shekel appreciated by 1.5%
against the dollar in 4Q.
Portfolio inflows turned positive in 4Q but were moderate. Non-residents were net
buyers of $0.8bn of Israeli bonds and equities in 4Q (according to the partial financial
account data), after being net sellers of $0.7bn in 3Q. Meanwhile, residents continued to
increase their portfolio positions abroad and bought $2.6bn of foreign bonds and equities
in 4Q (compared to $3.4bn in 3Q). However, in our understanding these sizable resident
portfolio outflows in 4Q were mostly FX hedged and therefore they only partly offset the
strong appreciation pressures on the shekel arising from the basic balance flows during
that period.
Following the 25bp cut in the policy rate on 24 February whose timing was a
surprise to us, we expect another 25bp policy rate cut later in the year – taking the
policy rate to 0.50% by end-2014. The surprising policy rate cut came after the
Monetary Committee (MC) had kept the policy rate steady for four consecutive months,
and was largely driven by the combination of the soft 4Q GDP data and the decline in
January CPI inflation. Benign inflation dynamics and continuing domestic pressures on
the central bank (and on the Ministry of Finance) from exporters to continue to address
the strong shekel would lead to another 25bp policy rate cut later in the year – probably
in 2Q-3Q – in our view.
Setting a floor to the shekel’s exchange rate against the dollar (or against a basket
of curreinces) is unlikely but other FX measures to weaken the shekel are still on
the table, in our view. Although the central bank and the Ministry of Finance are still
considering various FX measures (other than FX interventions and policy rate cuts) to
address the strong currency – such as increasing the tax burden on foreign portfolio
holdings or by providing significant government support to exporters – Central Bank
Governor Flug remains reluctant to set a floor to the shekel’s exchange rate, in our view.
We think that only a sharp appreciation of the shekel (not our base case) could lead the
central bank to seriously consider a floor similar to those implemented by the Swiss and
the Czech central banks.
Meanwhile, the fiscal position is solid and we expect a credit rating upgrade later in
the year. The 12-month rolling budget deficit narrowed further to 3.0% of GDP in January
from 3.1% of GDP in December (which was significantly below the full-year budget deficit
target of 4.65% of GDP in 2013). In the absence of a significant change in the real GDP
growth outlook and with the government remaining responsive to a potential shortfall in
revenues, we feel confident with our full-year budget deficit forecasts of 3.0% of GDP for
both 2014 and 2015. Meanwhile, Fitch revised its outlook on Israel’s long-term foreign
currency debt credit rating (currently A) to “positive watch” (from “neutral”) on 29
November 2013. The revision was largely driven by the positive fiscal performance,
improving public debt sustainability, and the initiation of gas production in 2013. We
believe that Fitch is likely to upgrade Israel’s credit rating this year to A+ which would bring
it in line with the ratings assigned by S&P (A+) and Moody’s (A1).

06 March 2014
Emerging Markets Quarterly 102
Sequential quarter-on-
quarter real GDP growth in
3Q and 4Q remains well
below its 2012-13 average
of 3.1%.
The 2013 real GDP growth
pattern was similar to that of
2012 – with household
spending as the primary
driver followed by smaller
contributions of government
spending and net exports.
Exhibit 272: Real GDP growth Exhibit 273: Contributions to real GDP growth
% qoq, annualized and seasonally adjusted pps, with the exception of real GDP growth
2.8 2.8
4.3
3.9
2.2
4.6
2.12.3
0.0
0.5
1.0
1.5
2.0
2.5
3.0
3.5
4.0
4.5
5.0
-8
-6
-4
-2
0
2
4
6
8
2008 2009 2010 2011 2012 2013
Net exportsStatistical discrepancyInvestment spendingHousehold spendingGovernment consumptionReal GDP growth
Source: Central Bureau of Statistics, Credit Suisse Note: Statistical discrepancy includes changes in inventories.
Source: Central Bureau of Statistics, Credit Suisse
After a broad-based
contraction in 3Q (-7.8%
qoq), the dollar value of
exports surged in 4Q
(+7.5% qoq).
The central bank’s real GDP
growth proxy for January
recorded its highest month-
on-month change since
April 2013, suggesting that
real GDP growth
momentum picked up in
early 2014.
Exhibit 274: Export components Exhibit 275: State of the Economy Index
qoq growth of the seasonally adjusted dollar value of exports 2011 = 100, seasonally adjusted
-15%
-10%
-5%
0%
5%
10%
15%
20%
25%
30%
1Q/2013 2Q/2013 3Q/2013 4Q/2013
High tech industries
Medium-high tech industries
Low-medium tech industries
Services
All
0.0
0.1
0.2
0.3
0.4
0.5
0.6
0.7
0.8
80
85
90
95
100
105
110
115
120
Jan-11 Jan-12 Jan-13 Jan-14
Index (2011=100)
% mom (right)
Source: Central Bureau of Statistics, Haver Analytics®, Credit Suisse Source: Bank of Israel, Credit Suisse
Year-on-year headline
inflation slowed to 1.4% in
January from 1.8% in
December – led by a
decline in year-on-year food
prices inflation and core
prices inflation
The run-rate of core inflation
fell sharply in January – to
-0.4% from 2.1% in
December – recording a
negative figure for the first
time since November 2012.
Exhibit 276: Contributions to year-on-year CPI inflation
Exhibit 277: Run-rates of headline and core inflation
pps, with the exception of CPI Annualized three-month moving average of the month-on-month change in the de-seasonalized price index (%)
-2
-1
0
1
2
3
4
Jan-13 Apr-13 Jul-13 Oct-13 Jan-14
Food Housing
Energy Other
CPI
-3
0
3
6
9
Jan-11 Jan-12 Jan-13 Jan-14
Headline Inflation
Core inflation
Source: Central Bureau of Statistics, Credit Suisse Source: Central Bureau of Statistics, Credit Suisse
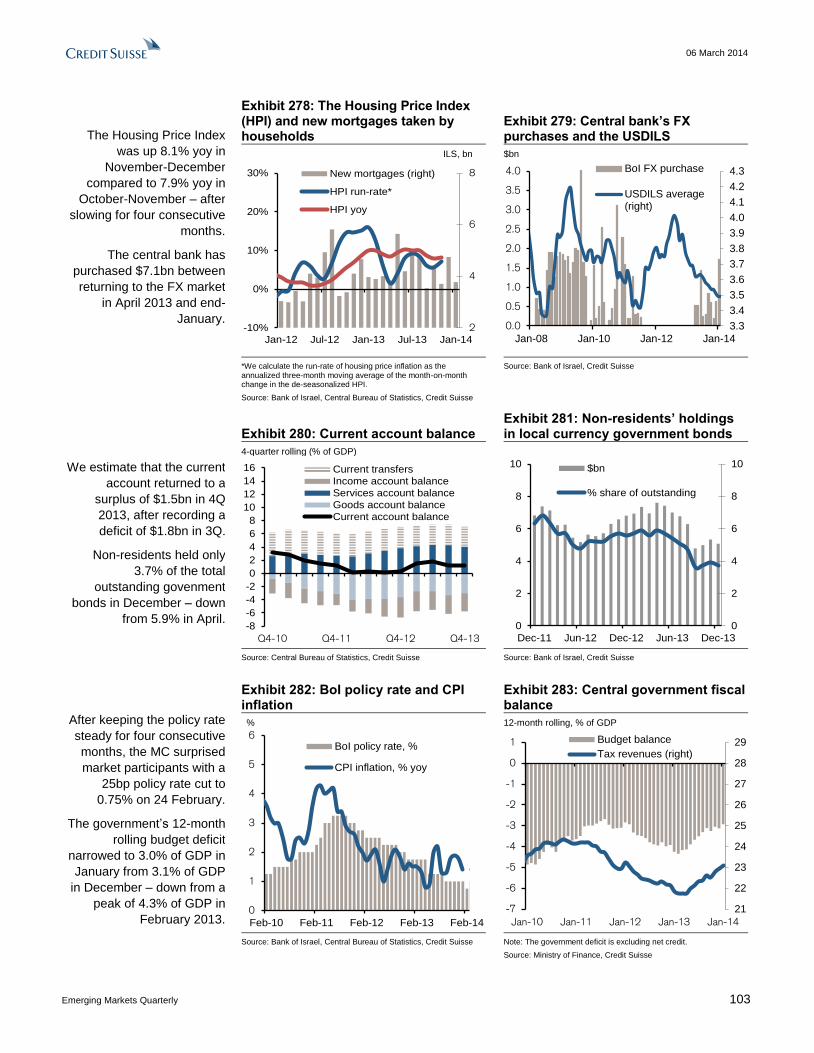
06 March 2014
Emerging Markets Quarterly 103
The Housing Price Index
was up 8.1% yoy in
November-December
compared to 7.9% yoy in
October-November – after
slowing for four consecutive
months.
The central bank has
purchased $7.1bn between
returning to the FX market
in April 2013 and end-
January.
Exhibit 278: The Housing Price Index (HPI) and new mortgages taken by households
Exhibit 279: Central bank’s FX purchases and the USDILS
ILS, bn $bn
2
4
6
8
-10%
0%
10%
20%
30%
Jan-12 Jul-12 Jan-13 Jul-13 Jan-14
New mortgages (right)
HPI run-rate*
HPI yoy
3.3
3.4
3.5
3.6
3.7
3.8
3.9
4.0
4.1
4.2
4.3
0.0
0.5
1.0
1.5
2.0
2.5
3.0
3.5
4.0
Jan-08 Jan-10 Jan-12 Jan-14
BoI FX purchase
USDILS average(right)
*We calculate the run-rate of housing price inflation as the annualized three-month moving average of the month-on-month change in the de-seasonalized HPI.
Source: Bank of Israel, Central Bureau of Statistics, Credit Suisse
Source: Bank of Israel, Credit Suisse
We estimate that the current
account returned to a
surplus of $1.5bn in 4Q
2013, after recording a
deficit of $1.8bn in 3Q.
Non-residents held only
3.7% of the total
outstanding govenment
bonds in December – down
from 5.9% in April.
Exhibit 280: Current account balance Exhibit 281: Non-residents’ holdings in local currency government bonds
4-quarter rolling (% of GDP)
-8
-6
-4
-2
0
2
4
6
8
10
12
14
16
Q4-10 Q4-11 Q4-12 Q4-13
Current transfers
Income account balance
Services account balance
Goods account balanceCurrent account balance
0
2
4
6
8
10
0
2
4
6
8
10
Dec-11 Jun-12 Dec-12 Jun-13 Dec-13
$bn
% share of outstanding
Source: Central Bureau of Statistics, Credit Suisse Source: Bank of Israel, Credit Suisse
After keeping the policy rate
steady for four consecutive
months, the MC surprised
market participants with a
25bp policy rate cut to
0.75% on 24 February.
The government’s 12-month
rolling budget deficit
narrowed to 3.0% of GDP in
January from 3.1% of GDP
in December – down from a
peak of 4.3% of GDP in
February 2013.
Exhibit 282: BoI policy rate and CPI inflation
Exhibit 283: Central government fiscal balance
% 12-month rolling, % of GDP
0
1
2
3
4
5
6
Feb-10 Feb-11 Feb-12 Feb-13 Feb-14
BoI policy rate, %
CPI inflation, % yoy
21
22
23
24
25
26
27
28
29
-7
-6
-5
-4
-3
-2
-1
0
1
Jan-10 Jan-11 Jan-12 Jan-13 Jan-14
Budget balance
Tax revenues (right)
Source: Bank of Israel, Central Bureau of Statistics, Credit Suisse Note: The government deficit is excluding net credit.
Source: Ministry of Finance, Credit Suisse
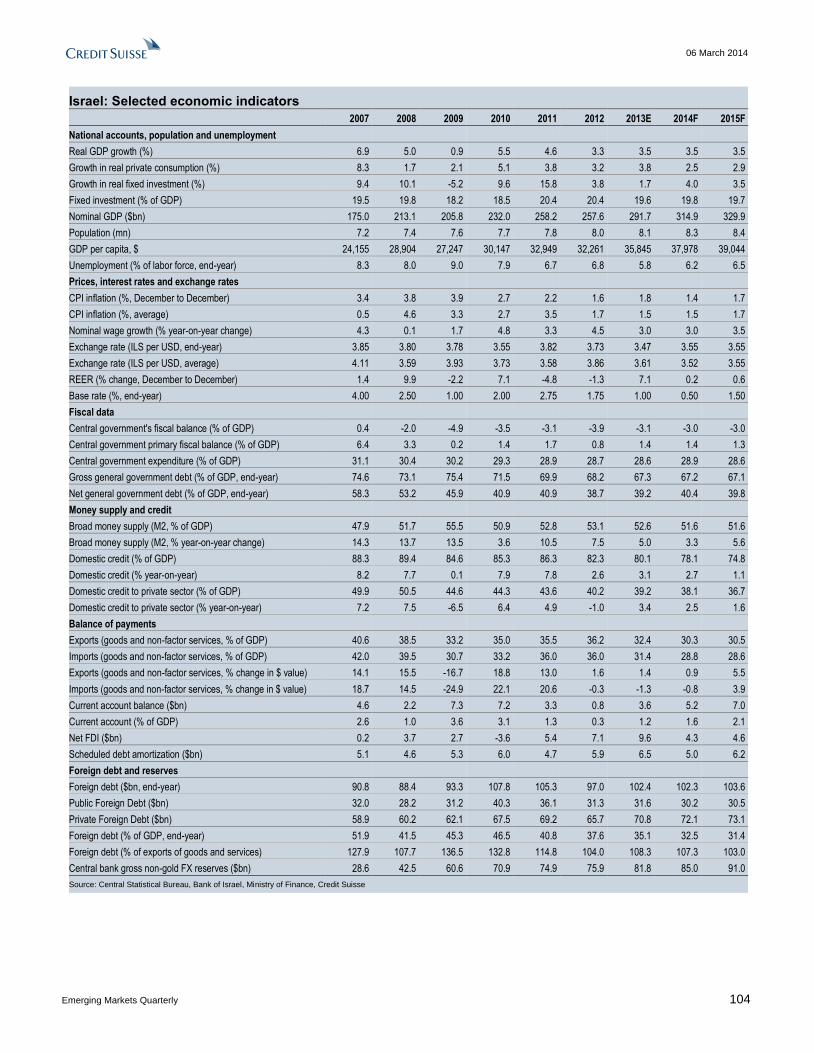
06 March 2014
Emerging Markets Quarterly 104
Israel: Selected economic indicators
2007 2008 2009 2010 2011 2012 2013E 2014F 2015F
National accounts, population and unemployment
Real GDP growth (%) 6.9 5.0 0.9 5.5 4.6 3.3 3.5 3.5 3.5
Growth in real private consumption (%) 8.3 1.7 2.1 5.1 3.8 3.2 3.8 2.5 2.9
Growth in real fixed investment (%) 9.4 10.1 -5.2 9.6 15.8 3.8 1.7 4.0 3.5
Fixed investment (% of GDP) 19.5 19.8 18.2 18.5 20.4 20.4 19.6 19.8 19.7
Nominal GDP ($bn) 175.0 213.1 205.8 232.0 258.2 257.6 291.7 314.9 329.9
Population (mn) 7.2 7.4 7.6 7.7 7.8 8.0 8.1 8.3 8.4
GDP per capita, $ 24,155 28,904 27,247 30,147 32,949 32,261 35,845 37,978 39,044
Unemployment (% of labor force, end-year) 8.3 8.0 9.0 7.9 6.7 6.8 5.8 6.2 6.5
Prices, interest rates and exchange rates
CPI inflation (%, December to December) 3.4 3.8 3.9 2.7 2.2 1.6 1.8 1.4 1.7
CPI inflation (%, average) 0.5 4.6 3.3 2.7 3.5 1.7 1.5 1.5 1.7
Nominal wage growth (% year-on-year change) 4.3 0.1 1.7 4.8 3.3 4.5 3.0 3.0 3.5
Exchange rate (ILS per USD, end-year) 3.85 3.80 3.78 3.55 3.82 3.73 3.47 3.55 3.55
Exchange rate (ILS per USD, average) 4.11 3.59 3.93 3.73 3.58 3.86 3.61 3.52 3.55
REER (% change, December to December) 1.4 9.9 -2.2 7.1 -4.8 -1.3 7.1 0.2 0.6
Base rate (%, end-year) 4.00 2.50 1.00 2.00 2.75 1.75 1.00 0.50 1.50
Fiscal data
Central government's fiscal balance (% of GDP) 0.4 -2.0 -4.9 -3.5 -3.1 -3.9 -3.1 -3.0 -3.0
Central government primary fiscal balance (% of GDP) 6.4 3.3 0.2 1.4 1.7 0.8 1.4 1.4 1.3
Central government expenditure (% of GDP) 31.1 30.4 30.2 29.3 28.9 28.7 28.6 28.9 28.6
Gross general government debt (% of GDP, end-year) 74.6 73.1 75.4 71.5 69.9 68.2 67.3 67.2 67.1
Net general government debt (% of GDP, end-year) 58.3 53.2 45.9 40.9 40.9 38.7 39.2 40.4 39.8
Money supply and credit
Broad money supply (M2, % of GDP) 47.9 51.7 55.5 50.9 52.8 53.1 52.6 51.6 51.6
Broad money supply (M2, % year-on-year change) 14.3 13.7 13.5 3.6 10.5 7.5 5.0 3.3 5.6
Domestic credit (% of GDP) 88.3 89.4 84.6 85.3 86.3 82.3 80.1 78.1 74.8
Domestic credit (% year-on-year) 8.2 7.7 0.1 7.9 7.8 2.6 3.1 2.7 1.1
Domestic credit to private sector (% of GDP) 49.9 50.5 44.6 44.3 43.6 40.2 39.2 38.1 36.7
Domestic credit to private sector (% year-on-year) 7.2 7.5 -6.5 6.4 4.9 -1.0 3.4 2.5 1.6
Balance of payments
Exports (goods and non-factor services, % of GDP) 40.6 38.5 33.2 35.0 35.5 36.2 32.4 30.3 30.5
Imports (goods and non-factor services, % of GDP) 42.0 39.5 30.7 33.2 36.0 36.0 31.4 28.8 28.6
Exports (goods and non-factor services, % change in $ value) 14.1 15.5 -16.7 18.8 13.0 1.6 1.4 0.9 5.5
Imports (goods and non-factor services, % change in $ value) 18.7 14.5 -24.9 22.1 20.6 -0.3 -1.3 -0.8 3.9
Current account balance ($bn) 4.6 2.2 7.3 7.2 3.3 0.8 3.6 5.2 7.0
Current account (% of GDP) 2.6 1.0 3.6 3.1 1.3 0.3 1.2 1.6 2.1
Net FDI ($bn) 0.2 3.7 2.7 -3.6 5.4 7.1 9.6 4.3 4.6
Scheduled debt amortization ($bn) 5.1 4.6 5.3 6.0 4.7 5.9 6.5 5.0 6.2
Foreign debt and reserves
Foreign debt ($bn, end-year) 90.8 88.4 93.3 107.8 105.3 97.0 102.4 102.3 103.6
Public Foreign Debt ($bn) 32.0 28.2 31.2 40.3 36.1 31.3 31.6 30.2 30.5
Private Foreign Debt ($bn) 58.9 60.2 62.1 67.5 69.2 65.7 70.8 72.1 73.1
Foreign debt (% of GDP, end-year) 51.9 41.5 45.3 46.5 40.8 37.6 35.1 32.5 31.4
Foreign debt (% of exports of goods and services) 127.9 107.7 136.5 132.8 114.8 104.0 108.3 107.3 103.0
Central bank gross non-gold FX reserves ($bn) 28.6 42.5 60.6 70.9 74.9 75.9 81.8 85.0 91.0
Source: Central Statistical Bureau, Bank of Israel, Ministry of Finance, Credit Suisse

06 March 2014
Emerging Markets Quarterly 105
Poland: A more balanced growth outlook Following a low in mid-2012, sequential quarter-on-quarter real GDP growth
started to pick up gradually in 2H 012 and gained further momentum in 2013. The
initial phase of the rebound in 2H 2012 was mainly driven by a higher contribution of net
exports, as exports expanded and imports remained subdued, but domestic demand
has also been strengthening since the beginning of 2013. Following a marginal
contraction in 3Q 2012, household spending growth has been reviving and reached
0.6% in 4Q 2013, in quarter-on-quarter terms, while investment spending also bottomed
out in 2H 2012 and rebounded in 2013. Nevertheless, real GDP in 2013 full-year was
only 1.6% higher than in 2012 full-year, following 1.9% growth in 2012 full-year.
The improvements in the labor market are likely to sustain the rebound in
domestic demand and real GDP growth is likely to reach 2.8% in 2014, in our view.
Employment bottomed out in 2Q and started to pick up gradually in 2H 2013, while real
wage growth was around 2% in 2013 full-year, up from close to zero in 2012, on our
estimates. Furthermore, credit growth rose to around to 7% yoy in 2013 from a low of
around 0.5% yoy in 2012. Although real export growth slowed to 1.5% qoq in 4Q from
2.6% qoq in 3Q and industrial production growth slowed to 0.8% qoq in 4Q from 2.1%
qoq in 3Q, we believe that the slowdown was temporary, as industrial production
rebounded sharply in January and the manufacturing PMI indicator continued to improve
in February. Against this backdrop, we forecast that real GDP growth is likely to stabilize
around 0.7% qoq in 1Q-2Q 2014, reaching 2.8% in 2014 and 3.3% in 2015 full-year,
mainly driven by rebounding growth in domestic demand. In the meantime, possible
additional fiscal policy loosening in the run-up to the 2015 parliamentary elections
represents an upside risk to our forecasts, while potential spill-over from the crisis in
Ukraine may pose a downside risk to real GDP growth in Poland, in our view.
We project that the current account deficit is likely to widen gradually. Poland’s
current account deficit narrowed considerably over the past years, to 1.5% of GDP in
2013 from a peak of 5.7% of GDP in the 12 months to July 2011, driven by a narrowing
foreign trade deficit, as imports remained subdued while exports continued to expand. In
the meantime, unclassified FX outflows also moderated significantly, to 1.6% of GDP in
2013 from a peak of 3.3% of GDP in the 12 months to May 2011, and hence the sum of
the current account deficit and unclassified FX outflows narrowed to 3.2% of GDP in
2013 from a peak of 8.5% of GDP in the 12 months to June 2011. However, we believe
that the adjustment is coming to an end. As Poland’s domestic demand growth is
gaining momentum, the current account deficit is likely to widen and reach around 2.0%
of GDP in 2014 and 2.5% of GDP in 2015, in our view. Nevertheless, we believe that
stable sources of external financing (EU funds and FDI inflows) will continue to cover
most of the deficit due to the current account and to unclassified FX outflows.
Portfolio investment inflows are fading, but cross-border lending to Poland is
reviving. Poland’s stock of gross external debt reached around $377bn (73% of GDP)
at end-September 2013, including around $81bn (15% of GDP) short-term debt with an
original maturity of one year or less, and around $34bn (6% of GDP) medium- and long-
term debt maturing in 2014, according to IMF estimates. Nevertheless, we believe that
Poland will be able to roll over its maturing external debt. Although net portfolio
investment inflows were close to zero in 2013 (following 4.1% of GDP net inflows in
2012), net other investment inflows (which mainly comprise cross-border lending)
reached 0.8% of GDP in 2013 (following net outflows of 1.2% of GDP in 2012). As the
financial stress in the euro area continues to abate, cross-border lending inflows to
Poland are likely to strengthen further in 2014 and in 2015, in our view. In keeping with
this, we forecast a gradual strengthening of the zloty’s exchange rate versus the euro to
4.10 by end-2014 and to 4.00 by end-2015.
Gergely Hudecz
+33 1 7039 0103
06 March 2014
Emerging Markets Quarterly 106
Meanwhile, central bank FX-intervention remains a possibility, if the zloty’s
exchange rate versus the euro weakens sharply. The central bank previously
intervened in the FX market by selling euros on 7 June 2013, when the zloty’s exchange
rate weakened to around 4.30 versus the euro, and the Monetary Policy Council (MPC)
noted in its 2014 guidelines that the floating exchange rate regime does not rule out FX-
interventions to ensure “macroeconomic and financial stability." The central bank has
substantial FX reserves (€78.5bn at end-January) to defend the zloty's exchange rate,
and the IMF’s Flexible Credit Line (FCL) provides an additional buffer against external
shocks. The precautionary FCL arrangement is effective until the beginning of 2015 in
the amount of around SDR 22bn ($33bn or €25bn). The authorities do not intend to draw
on the FCL, but this arrangement reduces Poland’s external vulnerabilities, in our view.
We believe that CPI inflation is likely to remain subdued, below the central bank’s
2.5% target throughout 2014 and 2015. CPI inflation has been hovering around 0.7%
yoy between October 2013 and January 2014, while our measure of core inflation
(excluding energy, food, alcohol and tobacco prices) reached a low of 0.2% yoy in
January 2014 (down from a peak of 3.2% yoy in December 2011) and its run-rated
dipped into negative territory. (We define the run-rate as the annualized three-month
moving average of the month-on-month change in the seasonally adjusted price index.)
After its meeting on 5-6 November 2013, the MPC stated that inflationary pressures
were likely to remain subdued in the coming quarters and the policy rate “should be kept
unchanged at least until the end of the first half of 2014” – subsequently, the MPC
reaffirmed this guidance on 6 February 2014. We also project that inflationary pressures
are likely to be subdued in 2014, as the output gap remains negative, and CPI inflation
is likely to pick up only gradually, remaining below the central bank’s target in 2015.
Accordingly, our baseline scenario envisages that the MPC will keep the policy rate
unchanged at 2.50% throughout 2014 and likely to tighten monetary policy only in 2015.
We forecast 100bps policy rate hikes, bringing the policy rate to 3.50% by end-2015.
The pension reform opens some fiscal space for the government ahead of the
elections in 2014 and in 2015, in our view. Following 3.9% of GDP general
government budget deficit in 2012, the deficit widened to 4.4% of GDP in 2013, due to
lower revenues. Nevertheless, we project that the rebound in economic activity will lead
to a recovery in revenues, improving the deficit to around 4.0% of GDP in 2014.
Additionally, on 3 February, privately managed pension funds transferred government
securities held in their portfolios (worth around 9% of GDP) to the government, which
technically push the budget balance into a surplus of around 5% of GDP in 2014, on our
estimates. In the meantime, we estimate that the broadly defined general government
gross debt is likely to drop to around 52% of GDP by end-2015 from around 58% of
GDP at end-2013, due to the transfers from privately managed pension funds. Although
the improvement will be merely optical, as the government is also taking on ‘implicit’
pension liabilities (claims by future pensioners on the government), we believe that the
government might use this opportunity to ease fiscal policy, ahead of the municipal
elections (due in 2H 2014) and parliamentary elections (due in 2H 2015).
Without further fiscal consolidation, a credit rating upgrade is unlikely, in our
view. Poland’s long-term foreign-currency sovereign credit is currently rated A2 by
Moody’s and A- by Fitch and S&P. Fitch revised the outlook for Poland’s long-term
foreign-currency sovereign credit rating to stable from positive on 23 August 2013, due
to the fiscal slippage in 2013 and reduced fiscal credibility. The outlooks for Moody’s and
S&P’s rating for Poland’s long-term foreign-currency sovereign credit are also stable.

06 March 2014
Emerging Markets Quarterly 107
Following a low in mid-2012,
sequential quarter-on-
quarter real GDP growth
started to pick up gradually
in 2H 012 and gained
further momentum in 2013.
The initial phase of the
rebound in 2H 2012 was
mainly driven by a higher
contribution of net exports,
as exports expanded and
imports remained subdued,
but domestic demand has
also been strengthening
since the beginning of 2013.
Exhibit 284: Level of real GDP Exhibit 285: Composition of GDP growth
Contributions to quarter-on-quarter real GDP growth, pps
5.4
5.5
5.6
5.7
5.8
5.9
Q2-03 Q4-05 Q4-07 Q4-09 Q4-11 Q4-13
Level of real GDP (in logs)
Long-term linear trend
-2
-1
0
1
2
Q4-11 Q2-12 Q4-12 Q2-13 Q4-13
ExportsImports and inventoriesInvestment spendingGovernment spendingHousehold spendingGDP, % qoq
Source: GUS, Eurostat, Credit Suisse Source: GUS, Eurostat, Credit Suisse
Real export growth (goods
and services combined)
slowed to 1.5% qoq in 4Q
from 2.6% qoq in 3Q and
industrial production growth
slowed to 0.8% qoq in 4Q
from 2.1% qoq in 3Q, but
we believe that the
slowdown was merely
temporary, as industrial
production rebounded in
January and the
manufacturing PMI indicator
continued to improve in
February.
Exhibit 286: Manufacturing PMI and industrial production volume
Exhibit 287: Volume of Poland’s goods exports and imports
Volume index 2010=100, sa, % qoq
44
46
48
50
52
54
56
-3
-2
-1
0
1
2
3
4
Dec-11 Jun-12 Dec-12 Jun-13 Dec-13
Industrial production,2010=100, sa, % qoq
Manufacturing PMI
-2
-1
0
1
2
3
4
5
Q4-11 Q2-12 Q4-12 Q2-13 Q4-13
Exports
Imports
Source: Eurostat, Haver Analytics, Credit Suisse Note: December 2013 data is Credit Suisse estimate based on trade
value data; Source: GUS, Eurostat, Credit Suisse
We believe that the
improvements in the labor
market are likely to sustain
the rebound in domestic
demand. Employment
bottomed out in 2Q and
started to pick up gradually
in 2H 2013, while real wage
growth was around 2% in
2013 full-year, up from close
to zero in 2012.
Furthermore, credit growth
rose to around to 7% yoy in
2013 from a low of around
0.5% yoy in 2012.
Exhibit 288: Employment and gross wages
Exhibit 289: Lending to households and retail sales volume
3,600
3,700
3,800
3,900
4,000
5.4
5.5
5.6
Jan-12 Jan-13 Jan-14
Employment in enterprisesector, number ofemployees, mnAverage monthly earnings,PLN, sa, right scale
185
190
195
200
520
530
540
550
560
570
Jan-12 Jan-13 Jan-14
Otstanding loansto households,PLN bn
Retail sales,2000=100, sa,right scale
Source: GUS, Credit Suisse Source: GUS, NBP, Credit Suisse
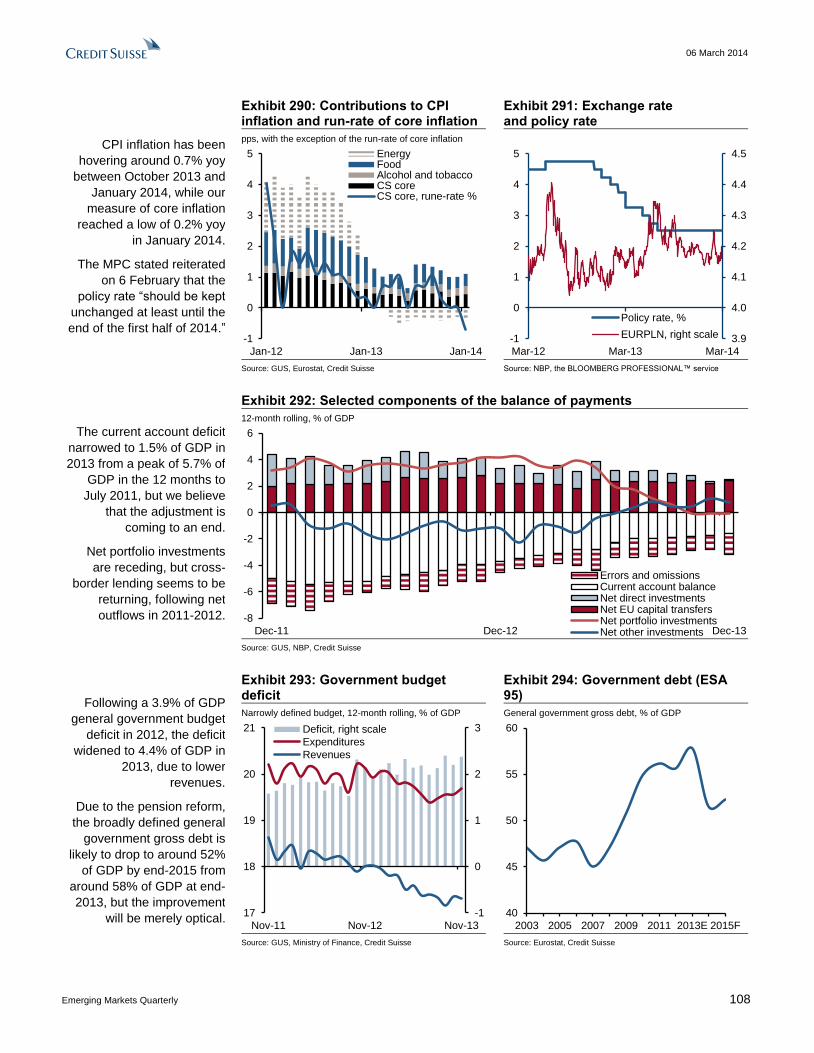
06 March 2014
Emerging Markets Quarterly 108
CPI inflation has been
hovering around 0.7% yoy
between October 2013 and
January 2014, while our
measure of core inflation
reached a low of 0.2% yoy
in January 2014.
The MPC stated reiterated
on 6 February that the
policy rate “should be kept
unchanged at least until the
end of the first half of 2014.”
Exhibit 290: Contributions to CPI inflation and run-rate of core inflation
Exhibit 291: Exchange rate and policy rate
pps, with the exception of the run-rate of core inflation
-1
0
1
2
3
4
5
Jan-12 Jan-13 Jan-14
EnergyFoodAlcohol and tobaccoCS coreCS core, rune-rate %
3.9
4.0
4.1
4.2
4.3
4.4
4.5
-1
0
1
2
3
4
5
Mar-12 Mar-13 Mar-14
Policy rate, %
EURPLN, right scale
Source: GUS, Eurostat, Credit Suisse Source: NBP, the BLOOMBERG PROFESSIONAL™ service
The current account deficit
narrowed to 1.5% of GDP in
2013 from a peak of 5.7% of
GDP in the 12 months to
July 2011, but we believe
that the adjustment is
coming to an end.
Net portfolio investments
are receding, but cross-
border lending seems to be
returning, following net
outflows in 2011-2012.
Exhibit 292: Selected components of the balance of payments
12-month rolling, % of GDP
-8
-6
-4
-2
0
2
4
6
Dec-11 Dec-12 Dec-13
Errors and omissionsCurrent account balanceNet direct investmentsNet EU capital transfersNet portfolio investmentsNet other investments
Source: GUS, NBP, Credit Suisse
Following a 3.9% of GDP
general government budget
deficit in 2012, the deficit
widened to 4.4% of GDP in
2013, due to lower
revenues.
Due to the pension reform,
the broadly defined general
government gross debt is
likely to drop to around 52%
of GDP by end-2015 from
around 58% of GDP at end-
2013, but the improvement
will be merely optical.
Exhibit 293: Government budget deficit
Exhibit 294: Government debt (ESA 95)
Narrowly defined budget, 12-month rolling, % of GDP General government gross debt, % of GDP
-1
0
1
2
3
17
18
19
20
21
Nov-11 Nov-12 Nov-13
Deficit, right scale
Expenditures
Revenues
40
45
50
55
60
2003 2005 2007 2009 2011 2013E 2015F Source: GUS, Ministry of Finance, Credit Suisse Source: Eurostat, Credit Suisse

06 March 2014
Emerging Markets Quarterly 109
Poland: Selected economic indicators
2007 2008 2009 2010 2011 2012 2013E 2014F 2015F
National accounts, population and unemployment
Real GDP growth (%) 6.8 5.1 1.6 3.9 4.5 1.9 1.6 2.8 3.3
Real private consumption growth (%) 4.9 5.7 2.0 3.1 2.6 1.2 0.8 2.0 3.2
Real fixed investment growth (%) 17.6 9.6 -1.2 -0.4 8.5 -1.7 -0.4 8.0 9.0
Fixed investment (% of GDP) 21.7 22.6 22.0 21.1 21.9 21.1 20.7 21.7 22.9
Nominal GDP ($bn) 425.3 529.4 430.9 469.8 515.8 489.9 533.9 556.2 598.4
Population (mn) 38.1 38.1 38.2 38.5 38.5 38.5 38.5 38.5 38.5
GDP per capita, $ 11,163 13,895 11,280 12,203 13,397 12,725 13,867 14,446 15,544
Unemployment (% of labor force, end-year) 8.4 7.0 9.0 9.6 10.0 10.4 10.2 9.5 9.0
Prices, interest rates and exchange rates
CPI inflation (%, December to December) 4.2 3.3 3.8 2.9 4.5 2.4 0.7 2.0 2.3
CPI inflation (%, average) 2.4 4.4 3.8 2.7 4.2 3.8 0.9 1.5 2.3
Nominal wage growth (% change, December to December) 9.1 10.5 4.2 3.6 4.9 3.5 2.7 3.0 3.5
Exchange rate (PLN per EUR, end-year) 3.60 4.15 4.11 3.96 4.47 4.08 4.15 4.10 4.00
Exchange rate (PLN per EUR, average) 3.78 3.52 4.33 3.99 4.12 4.17 4.12 4.13 4.05
Exchange rate (PLN per USD, average) 2.76 2.39 3.12 3.02 2.97 3.26 3.05 3.06 3.00
REER (% change, December to December) (1) 7.2 -7.3 -0.7 0.2 -9.2 10.9 -2.3 1.2 3.3
Central bank policy rate (%, end-year) 5.00 5.00 3.50 3.50 4.50 4.25 2.50 2.50 3.50
Fiscal data
General government revenue (% of GDP) (2) 40.3 39.5 37.2 37.5 38.4 38.3 37.4 38.0 38.5
General government expenditure (% of GDP) 42.2 43.2 44.6 45.4 43.4 42.2 41.8 42.0 42.0
General government primary balance (% of GDP) (2) 0.4 -1.5 -4.8 -5.2 -2.3 -1.1 -1.8 -1.4 -0.9
General government balance (% of GDP) (2) -1.9 -3.7 -7.5 -7.9 -5.0 -3.9 -4.4 -4.0 -3.5
General government gross debt, ESA95 (% of GDP, end-year) 45.0 47.1 50.9 54.9 56.2 55.6 57.8 51.6 52.3
Money supply and credit
Broad money supply (% of GDP) 46.7 51.8 53.2 54.7 56.5 56.4 58.0 59.2 60.5
Broad money supply (% year-on-year change) 14.2 20.2 8.3 8.4 11.5 4.2 6.6 6.4 8.0
Domestic credit outstanding (% of GDP) 46.3 59.9 61.4 63.5 66.1 63.8 67.0 68.4 69.9
Domestic credit growth (% year-on-year change) 26.2 35.2 8.1 7.8 11.7 0.9 7.3 6.4 8.0
Domestic credit to the private sector outstanding (% of GDP) 41.0 51.2 52.8 54.7 58.1 57.1 58.1 59.3 60.6
Domestic credit to the private sector growth (% year-on-year change) 26.5 35.3 7.0 6.8 10.7 2.5 4.1 6.4 8.0
Balance of payments
Exports (% of GDP) 40.8 40.0 39.4 42.2 45.1 46.7 49.2 50.9 52.6
Imports (% of GDP) 44.1 44.8 40.0 44.1 46.7 46.8 47.4 48.1 48.8
Exports (goods and non-factor services, % year-on-year change in $ value) 26.2 23.0 -20.2 16.1 17.2 -1.7 7.7 7.8 11.0
Imports (goods and non-factor services, % year-on-year change in $ value) 30.3 27.3 -27.5 19.2 16.3 -4.8 3.3 5.7 9.2
Current account balance ($bn) -26.5 -34.9 -17.3 -24.1 -25.8 -18.1 -7.9 -11.3 -15.2
Current account balance (% of GDP) -6.2 -6.6 -4.0 -5.1 -5.0 -3.7 -1.5 -2.0 -2.5
Net FDI inflows ($bn) 18.0 10.3 8.6 7.1 12.2 5.2 0.3 5.0 5.0
Scheduled external debt amortization ($bn) (3) 43.8 30.0 12.7 26.2 18.5 32.7 31.1 34.1 26.0
Foreign debt and reserves
Foreign debt ($bn) 233.3 245.5 280.2 317.1 323.3 365.7 370.0 370.0 370.0
Public ($bn) 78.5 67.7 86.8 109.6 116.0 150.3 150.0 150.0 150.0
Private ($bn) 154.8 177.8 193.4 207.5 207.3 215.4 220.0 220.0 220.0
Foreign debt (% of GDP) 54.9 46.4 65.0 67.5 62.7 74.6 69.3 66.5 61.8
Foreign debt (% of exports of goods and services) 134.6 116.1 165.1 159.9 139.1 159.9 140.8 130.6 117.6
Central bank official reserve assets ($bn) 65.8 62.2 79.6 93.5 97.9 108.9 106.2 106.2 106.2
Central bank official reserve assets, excl. gold ($bn) 63.0 59.3 75.9 88.8 92.2 103.4 102.2 102.2 102.2
(1) Real effective exchange rate (CPI-deflated), increase indicates appreciation. (2) Consolidated fiscal accounts of the broadly defined general government on an accrual basis; excluding one-off transfers from pension funds to the government budget. (3) Scheduled amortizations of medium- and long-term external debt of both the public and private sector.
Sources: GUS, Ministry of Finance, National Bank of Poland, IMF, JEDH, the BLOOMBERG PROFESSIONAL™ service, Haver Analyitcs, Credit Suisse

06 March 2014
Emerging Markets Quarterly 110
Russia: Ukraine tensions prompt monetary policy action The risk of military confrontation with Ukraine rattled Russia's markets at the start
of this month and triggered early action from the central bank (CBR) to defend
financial stability. President Putin's request on 1 March for parliamentary approval of the
use of armed forces in Ukraine shocked observers and investors alike leading to a sharp
sell-off in all Russian assets on 3 March. The selling pressure on the rouble was
particularly strong, leading to record-high interventions by the CBR (over $11.3bn in a day)
and an early (and credible) hike in all policy rates, by 150bps. The CBR's decision to
amend the intervention mechanism in order to reduce currency volatility aimed to curb
household demand for FX. Near-term prospects for the rouble and other local assets are
closely linked to the outcome of the confrontation over Crimea and Russia's potential
support for separatists in Eastern Ukraine. In the longer run, the persistently slow pace of
economic growth and the declining current account surplus suggest that a recovery in the
rouble would require measures to boost productivity and help the investment climate.
Sequential GDP growth picked up in 4Q 2013 to an estimated 0.3% qoq sa, after a
0.2% qoq sa drop in 3Q, but will likely decelerate again in 1Q, on weak investment
activity. The first official estimate of 2013 real GDP growth at 1.3% yoy was in line with
our own projection and below market consensus of 1.5% yoy. Growth in domestic demand
slowed to 3.4% yoy (from 6.9% yoy in 2012), including in the household sector to 4.7%
yoy (from 7.9% yoy in 2012). Fixed investment fell 0.3% yoy, following 6.4% yoy growth in
2012. From the supply side, the strongest growth was registered in financial intermediation
(12.0% yoy, after 19.6% yoy in 2012) and agriculture (3.2% yoy). Performance of all the
sectors comprising industrial output was dismal: manufacturing expanded 0.8% yoy,
following 2.7% yoy growth in 2012, mining and quarrying rose 0.9% yoy, compared to
1.9% yoy in the previous year, while utilities output fell 1.6%, following the virtually
stagnant (0.2% yoy) output in 2012.
The sharp rouble depreciation and uncertainty over Ukraine will likely put further
downward pressure on real GDP growth in 1H 2014. We cut our GDP growth forecast
for this year sharply in early February (Russia: No respite for growth and the rouble until
2H 2014), from 2.3% yoy to 1.6% yoy, on the back of a projected spike in inflation, with a
further slowdown in consumer demand and weaker investment activity. Following the
eruption of the Ukraine crisis, with likely negative implications for bilateral trade flows, we
further scaled down our 2014 growth forecast, to 1.3% (in line with the 2013 outturn).
Outlook for 2H now appears somewhat brighter than we expected earlier, due both to
domestic (higher competitiveness of some local manufacturers after the rouble’s slide) and
external factors (a pick-up in global IP momentum, projected from mid-2014).
Outlook for inflation this year deteriorated materially following the nearly 11%
rouble depreciation in January-February. Making a reliable estimate of the impact of
the sharply weaker exchange rate on this year’s inflation outturn is not straightforward, due
to the lack of a comparable pattern in Russia’s recent economic history. The CBR’s own
pass-through coefficient estimate cited in the monetary policy report published on 18
February is close to 10%. The brunt of the pass-through from the rouble’s move in
January-February will probably materialize with one quarter’s lag (in April-May). Taking
into account the fact that some 0.5pp of food price increases in 4Q 2013 (particularly for
eggs and dairy products) were due to temporary supply shocks (expected to dissipate in
1H 2014), we estimate that headline inflation will likely peak in April (below 7% yoy),
before edging closer to 6% in July (when headline inflation is set to reflect the much lower
annual tariff increases compared with those in 2013). The inflation path in 2H will depend
on the pace of recovery in economic activity and the rouble’s performance over the
summer months. At this stage, we think that any progress on inflation in 2H will be modest,
projecting end-2014 inflation at 6.3%, above the 5.0% target but within the +/- 1.5pps
range around it.
Sergei Voloboev
+44 20 7888 3694
Alexey Pogorelov
+7 495 967 8772
06 March 2014
Emerging Markets Quarterly 111
The CBR adopted a tightening bias at its meeting on 14 February but was reluctant
to hike policy rates then, only to go for a large (and pre-emptive) hike, of 150 bps, in
the early stages of the Ukraine-related sell-off on 3 March. Further rouble weakness
would likely put at risk the CBR’s ability to reach even the "enlarged" inflation target this
year, of 6.5%, so an early cut in policy rates (including the key
1-week repo rate, currently at 7.0%) appears unlikely to us at the moment. We expect the
CBR to reverse part of the 150bps hike in 3Q or early 4Q, once it becomes confident that
headline inflation will be comfortably within the 6.5% upper target level, by cutting all policy
rates by 50bps. An alternative, of cutting the repo rate while keeping the RUB implied FX
swap rate (the upper edge of interest rates corridor) flat, would mean a widening of the
interest rate corridor which would contradict the CBR’s longer-term objective of
progressively narrowing the interest rates corridor.
We believe that the narrowing current account surplus, unfavorable global risk
environment and subdued domestic economic activity were the main reasons
behind the unexpectedly sharp rouble depreciation. Since the beginning of 2014, the
rouble has weakened to all-time lows, by about 10% against the dollar, the euro and the
basket. The CBR spent roughly $13bn in FX interventions in order to smooth out the
volatility in the FX market. A number of changes in the FX policy have been introduced
since the beginning of the year. In January, the CBR abandoned its "regular" (planned) FX
interventions, in order to increase the flexibility of its intervention mechanism. Effective 19
February, the CBR has been purchasing $100mn a day on behalf of the Finance Ministry,
for the transfers to the Reserve Fund. Both developments were in line with the CBR's
objective of increasing exchange rate volatility in the run-up to introduction of inflation
targeting at end-2014. However, amid the sharp rouble sell-off on 3 March the CBR moved
to curb rouble volatility, by boosting the threshold of accumulated interventions required for
a RUB 0.05 shift in the RUB band, from $350mn most recently to $1.5bn. In the absence
of proactive reforms to boost productivity and help investment climate, or a sustained
improvement in the balance of payments, we see no reason to be bullish the rouble,
notwithstanding the likely pullbacks due to heavy long USD positioning; we see the rouble
at about 37.0 per USD at end-2014.
The current account surplus narrowed to $33bn (1.6% of GDP) in 2013 from $72bn
(3.5% of GDP) in 2012. The narrowing of the current account surplus was attributed
mainly to non-tradable components, including services trade balance and paid investment
income, while the goods trade surplus was resilient. Based on the recent estimates of
import demand elasticities by economists at the Economic Expert Group4 and our own
forecast for subdued growth in consumer and investment demand, we believe that a
sustained weakening of the rouble in 1H 2014 would lead to stabilization in the ratio of
current account surplus to GDP in 2H, at about 1.5% of GDP (compared with our previous
full-year forecast of 0.8% of GDP).
Fiscal balances should benefit from a weaker rouble and oil price stability in 2014.
The government should be able to not only accumulate significant fiscal reserves this year
but also retain a significant degree of flexibility regarding its debt strategy. On Finance
Ministry's estimates, a weakening of the exchange rate by 1 rouble against the dollar
would lead to additional nominal revenue of RUB180bn (0.25 pp of GDP) at the federal
budget level. Based on our higher average Urals oil price assumption for 2014 and 2015
($109/bbl and $104/bbl respectively) compared to that of the government ($100/bbl and
$97/bbl, respectively), a weaker exchange rate (RUB 36.5 versus 33.4 in 2014, and 37.9
versus 33.9 in 2015) and somewhat weaker growth, we have revised our federal budget
balance forecast to near zero in 2014 and 2015, from a deficit of 0.5% of GDP in 2014 and
0.7% in 2015. Under these assumptions, the Finance Ministry should have a high degree
of flexibility in meeting its debt issuance targets.
4 E.Gurvich, I.Prilepskiy, How to Provide External Sustainability of the Russian Economy. 2013.
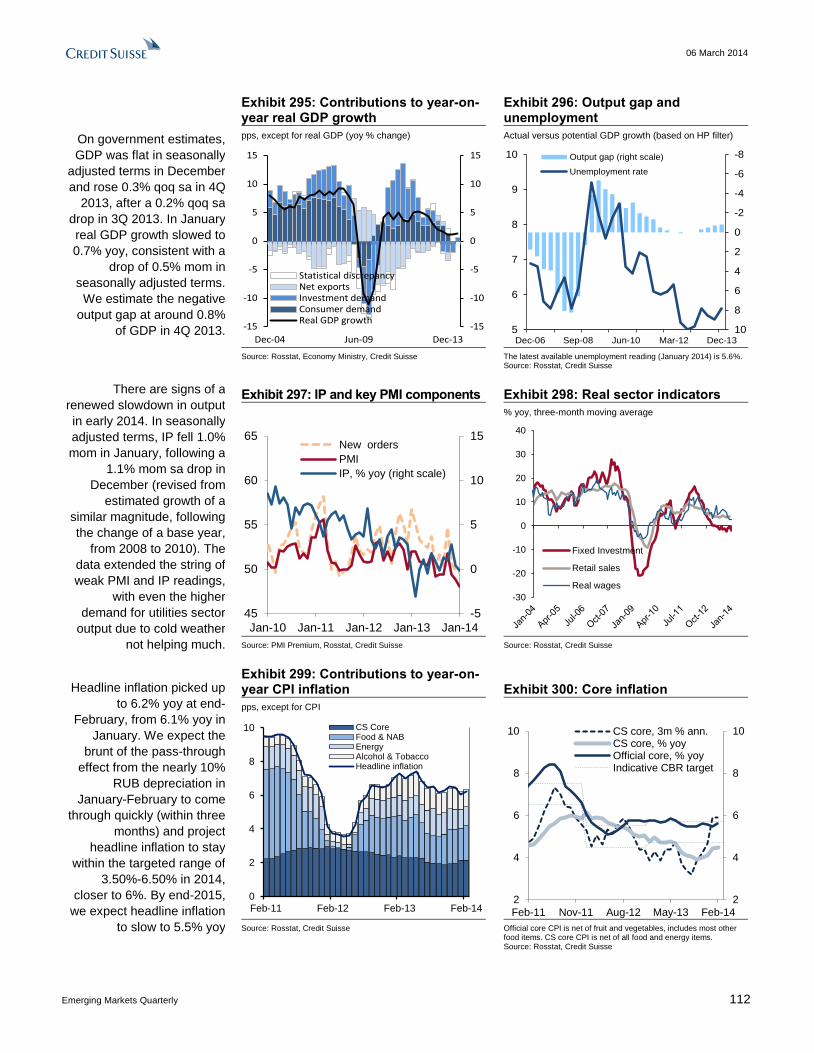
06 March 2014
Emerging Markets Quarterly 112
On government estimates,
GDP was flat in seasonally
adjusted terms in December
and rose 0.3% qoq sa in 4Q
2013, after a 0.2% qoq sa
drop in 3Q 2013. In January
real GDP growth slowed to
0.7% yoy, consistent with a
drop of 0.5% mom in
seasonally adjusted terms.
We estimate the negative
output gap at around 0.8%
of GDP in 4Q 2013.
Exhibit 295: Contributions to year-on-year real GDP growth
Exhibit 296: Output gap and unemployment
pps, except for real GDP (yoy % change) Actual versus potential GDP growth (based on HP filter)
-15
-10
-5
0
5
10
15
-15
-10
-5
0
5
10
15
Dec-04 Jun-09 Dec-13
Statistical discrepancyNet exportsInvestment demandConsumer demandReal GDP growth
-8
-6
-4
-2
0
2
4
6
8
105
6
7
8
9
10
Dec-06 Sep-08 Jun-10 Mar-12 Dec-13
Output gap (right scale)
Unemployment rate
Source: Rosstat, Economy Ministry, Credit Suisse The latest available unemployment reading (January 2014) is 5.6%.
Source: Rosstat, Credit Suisse
There are signs of a
renewed slowdown in output
in early 2014. In seasonally
adjusted terms, IP fell 1.0%
mom in January, following a
1.1% mom sa drop in
December (revised from
estimated growth of a
similar magnitude, following
the change of a base year,
from 2008 to 2010). The
data extended the string of
weak PMI and IP readings,
with even the higher
demand for utilities sector
output due to cold weather
not helping much.
Exhibit 297: IP and key PMI components Exhibit 298: Real sector indicators
% yoy, three-month moving average
-5
0
5
10
15
45
50
55
60
65
Jan-10 Jan-11 Jan-12 Jan-13 Jan-14
New orders
PMI
IP, % yoy (right scale)
-30
-20
-10
0
10
20
30
40
Fixed Investment
Retail sales
Real wages
Source: PMI Premium, Rosstat, Credit Suisse Source: Rosstat, Credit Suisse
Headline inflation picked up
to 6.2% yoy at end-
February, from 6.1% yoy in
January. We expect the
brunt of the pass-through
effect from the nearly 10%
RUB depreciation in
January-February to come
through quickly (within three
months) and project
headline inflation to stay
within the targeted range of
3.50%-6.50% in 2014,
closer to 6%. By end-2015,
we expect headline inflation
to slow to 5.5% yoy
Exhibit 299: Contributions to year-on-year CPI inflation Exhibit 300: Core inflation
pps, except for CPI
0
2
4
6
8
10
Feb-11 Feb-12 Feb-13 Feb-14
CS CoreFood & NABEnergyAlcohol & TobaccoHeadline inflation
2
4
6
8
1011 11 11 11 11 11 11 11 11 11 11 12 12 12 12 12 12 12 12 12 12 12 12 13 13 13 13 13 13 13 13 13 13 13 13 14 14 14
2
4
6
8
10
Feb-11 Nov-11 Aug-12 May-13 Feb-14
CS core, 3m % ann.CS core, % yoyOfficial core, % yoyIndicative CBR target
Source: Rosstat, Credit Suisse Official core CPI is net of fruit and vegetables, includes most other
food items. CS core CPI is net of all food and energy items. Source: Rosstat, Credit Suisse

06 March 2014
Emerging Markets Quarterly 113
The CBR left all policy rates
on hold on 14 February,
adopting a tightening bias. It
later hiked all policy rates by
150bps on 3 March, to
counter the impact of sharply
higher geopolitical risks. The
weak output data and higher
inflation will likely further
complicate the central bank's
policy dilemma. We expect
the CBR to reverse part of
this hike once headline
inflation is deemed on
course to meet the 6.50%
target at end-2014.
Exhibit 301: FX reserves and money Exhibit 302: Interest rates
% yoy US$ bn % per annum
200
250
300
350
400
450
500
550
600
650
-20
-10
0
10
20
30
40
50
60
70
Jan-09 Apr-10 Jul-11 Sep-12 Dec-13
FX reserves (right scale)M2 (left scale)M0 (left scale)
2
4
6
8
10
12
14
2
4
6
8
10
12
14
May-09 Jul-10 Sep-11 Dec-12 Feb-14
Fixed tom-next deposit rate
Mosprime O/N
1-week direct repo
CBR RUB XCCY o/n rate
Source: Central Bank of Russia, BLOOMBERG PROFESSIONAL™ service, Credit Suisse
Source: Central Bank of Russia, BLOOMBERG PROFESSIONAL™ service, Credit Suisse
In mid-February, the rouble
weakened to the record
level of 41.90 against the
basket despite stable oil
prices and the CBR’s heavy
interventions in the FX
market. The latest leg of
rouble depreciation came on
the back of the Finance
Ministry’s start of FX
purchases for the Reserve
Fund, alongside the
escalation of the conflict in
Ukraine. We expect the
rouble to trade around 42
against the basket this year.
Exhibit 303: Rouble and Brent oil price Exhibit 304: Approximate rouble band
$/bbl RUB against the basket comprising $0.55 and €0.45
70
80
90
100
110
12033
34
35
36
37
38
39
40
41
42
43
44
Dec-11 Jun-12 Jan-13 Jul-13 Feb-14
Rouble vs basket (LHS)
Oil price (Brent), (RHS, inv)
31
32
33
34
35
36
37
38
39
40
41
42
43
31
32
33
34
35
36
37
38
39
40
41
42
43
Oct-10 Nov-11 Dec-12 Feb-14
Source: Central Bank of Russia, Credit Suisse Note: The $0.55/€0.45 basket is in effect since 8 February 2007. Source: BLOOMBERG PROFESSIONAL™ service, Credit Suisse.
The 12-month rolling goods
trade balance was resilient
in 2H 2013, having stayed
at around 8.4%-8.6% of
GDP. We expect imports
growth to fall starting from
February in response to
weaker rouble and subdued
economic demand.
January's federal budget
was in a surplus of 0.3% of
GDP (on a 12-month rolling
basis), after a deficit of 0.5%
in 2013 thanks both to
weaker rouble, and sharply
lower expenditure.
Exhibit 305: Merchandise trade Exhibit 306: Federal budget operations
$bn % yoy change in dollar values 12-month rolling, % of GDP
-50
-35
-20
-5
10
25
40
55
70
85
100
50
75
100
125
150
175
200
225
Sep-10 Oct-11 Nov-12 Dec-13
Balance (12m rolling, left scale)
Imports, % yoy, 3mma
Exports, % yoy, 3mma
-15
-10
-5
0
5
10
15
20
25
-15
-10
-5
0
5
10
15
20
25
Jan-09 Apr-10 Jul-11 Oct-12 Jan-14
Non-oil budget balance
Overall budget balance
Primary expenditure
Source: Central Bank of Russia, Credit Suisse Source: Finance Ministry, Credit Suisse
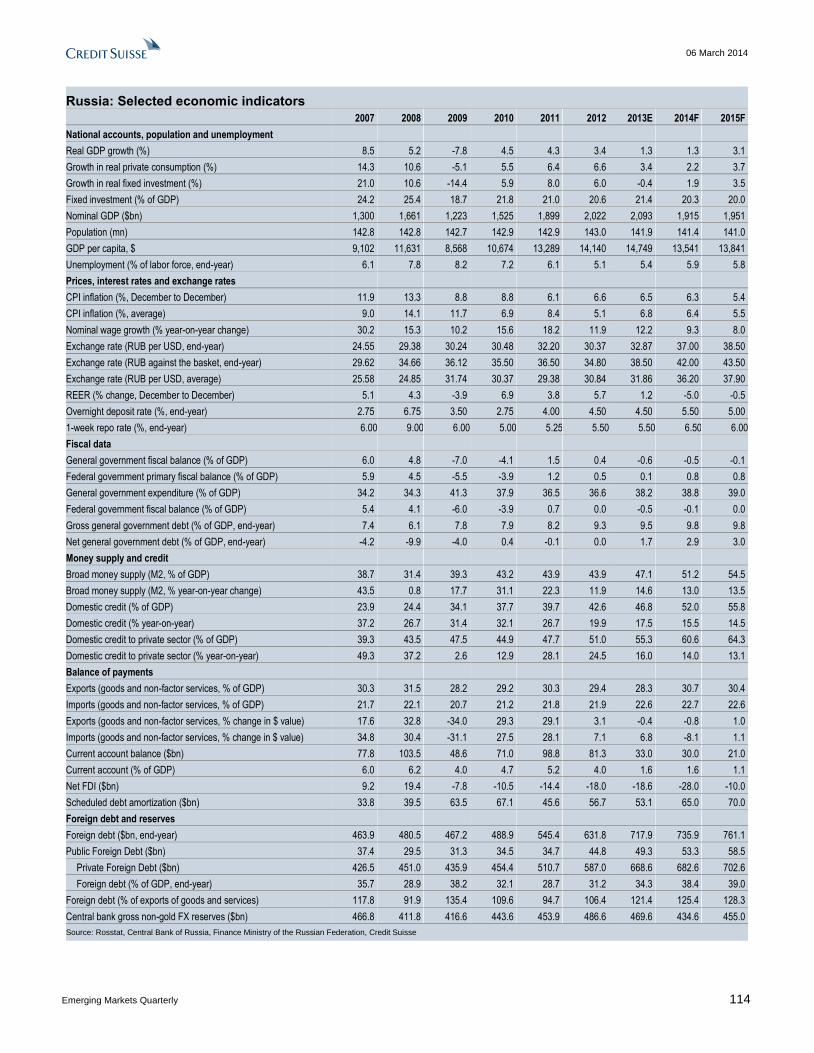
06 March 2014
Emerging Markets Quarterly 114
Russia: Selected economic indicators
2007 2008 2009 2010 2011 2012 2013E 2014F 2015F
National accounts, population and unemployment
Real GDP growth (%) 8.5 5.2 -7.8 4.5 4.3 3.4 1.3 1.3 3.1
Growth in real private consumption (%) 14.3 10.6 -5.1 5.5 6.4 6.6 3.4 2.2 3.7
Growth in real fixed investment (%) 21.0 10.6 -14.4 5.9 8.0 6.0 -0.4 1.9 3.5
Fixed investment (% of GDP) 24.2 25.4 18.7 21.8 21.0 20.6 21.4 20.3 20.0
Nominal GDP ($bn) 1,300 1,661 1,223 1,525 1,899 2,022 2,093 1,915 1,951
Population (mn) 142.8 142.8 142.7 142.9 142.9 143.0 141.9 141.4 141.0
GDP per capita, $ 9,102 11,631 8,568 10,674 13,289 14,140 14,749 13,541 13,841
Unemployment (% of labor force, end-year) 6.1 7.8 8.2 7.2 6.1 5.1 5.4 5.9 5.8
Prices, interest rates and exchange rates
CPI inflation (%, December to December) 11.9 13.3 8.8 8.8 6.1 6.6 6.5 6.3 5.4
CPI inflation (%, average) 9.0 14.1 11.7 6.9 8.4 5.1 6.8 6.4 5.5
Nominal wage growth (% year-on-year change) 30.2 15.3 10.2 15.6 18.2 11.9 12.2 9.3 8.0
Exchange rate (RUB per USD, end-year) 24.55 29.38 30.24 30.48 32.20 30.37 32.87 37.00 38.50
Exchange rate (RUB against the basket, end-year) 29.62 34.66 36.12 35.50 36.50 34.80 38.50 42.00 43.50
Exchange rate (RUB per USD, average) 25.58 24.85 31.74 30.37 29.38 30.84 31.86 36.20 37.90
REER (% change, December to December) 5.1 4.3 -3.9 6.9 3.8 5.7 1.2 -5.0 -0.5
Overnight deposit rate (%, end-year) 2.75 6.75 3.50 2.75 4.00 4.50 4.50 5.50 5.00
1-week repo rate (%, end-year) 6.00 9.00 6.00 5.00 5.25 5.50 5.50 6.50 6.00
Fiscal data
General government fiscal balance (% of GDP) 6.0 4.8 -7.0 -4.1 1.5 0.4 -0.6 -0.5 -0.1
Federal government primary fiscal balance (% of GDP) 5.9 4.5 -5.5 -3.9 1.2 0.5 0.1 0.8 0.8
General government expenditure (% of GDP) 34.2 34.3 41.3 37.9 36.5 36.6 38.2 38.8 39.0
Federal government fiscal balance (% of GDP) 5.4 4.1 -6.0 -3.9 0.7 0.0 -0.5 -0.1 0.0
Gross general government debt (% of GDP, end-year) 7.4 6.1 7.8 7.9 8.2 9.3 9.5 9.8 9.8
Net general government debt (% of GDP, end-year) -4.2 -9.9 -4.0 0.4 -0.1 0.0 1.7 2.9 3.0
Money supply and credit
Broad money supply (M2, % of GDP) 38.7 31.4 39.3 43.2 43.9 43.9 47.1 51.2 54.5
Broad money supply (M2, % year-on-year change) 43.5 0.8 17.7 31.1 22.3 11.9 14.6 13.0 13.5
Domestic credit (% of GDP) 23.9 24.4 34.1 37.7 39.7 42.6 46.8 52.0 55.8
Domestic credit (% year-on-year) 37.2 26.7 31.4 32.1 26.7 19.9 17.5 15.5 14.5
Domestic credit to private sector (% of GDP) 39.3 43.5 47.5 44.9 47.7 51.0 55.3 60.6 64.3
Domestic credit to private sector (% year-on-year) 49.3 37.2 2.6 12.9 28.1 24.5 16.0 14.0 13.1
Balance of payments
Exports (goods and non-factor services, % of GDP) 30.3 31.5 28.2 29.2 30.3 29.4 28.3 30.7 30.4
Imports (goods and non-factor services, % of GDP) 21.7 22.1 20.7 21.2 21.8 21.9 22.6 22.7 22.6
Exports (goods and non-factor services, % change in $ value) 17.6 32.8 -34.0 29.3 29.1 3.1 -0.4 -0.8 1.0
Imports (goods and non-factor services, % change in $ value) 34.8 30.4 -31.1 27.5 28.1 7.1 6.8 -8.1 1.1
Current account balance ($bn) 77.8 103.5 48.6 71.0 98.8 81.3 33.0 30.0 21.0
Current account (% of GDP) 6.0 6.2 4.0 4.7 5.2 4.0 1.6 1.6 1.1
Net FDI ($bn) 9.2 19.4 -7.8 -10.5 -14.4 -18.0 -18.6 -28.0 -10.0
Scheduled debt amortization ($bn) 33.8 39.5 63.5 67.1 45.6 56.7 53.1 65.0 70.0
Foreign debt and reserves
Foreign debt ($bn, end-year) 463.9 480.5 467.2 488.9 545.4 631.8 717.9 735.9 761.1
Public Foreign Debt ($bn) 37.4 29.5 31.3 34.5 34.7 44.8 49.3 53.3 58.5
Private Foreign Debt ($bn) 426.5 451.0 435.9 454.4 510.7 587.0 668.6 682.6 702.6
Foreign debt (% of GDP, end-year) 35.7 28.9 38.2 32.1 28.7 31.2 34.3 38.4 39.0
Foreign debt (% of exports of goods and services) 117.8 91.9 135.4 109.6 94.7 106.4 121.4 125.4 128.3
Central bank gross non-gold FX reserves ($bn) 466.8 411.8 416.6 443.6 453.9 486.6 469.6 434.6 455.0
Source: Rosstat, Central Bank of Russia, Finance Ministry of the Russian Federation, Credit Suisse
06 March 2014
Emerging Markets Quarterly 115
South Africa: Adjusting policies as pressure mounts The changes to South Africa's monetary and fiscal policies that started in January
and February, respectively, will need to continue through the rest of the year, in
our view. Further policy adjustments will be needed in response to the following global
developments: (a) a likely end to US quantitative easing by 3Q 2014; (b) a likely
renewed rise in 10-year US Treasury yields to 3.65% by 4Q 2014; (c) a likely stronger
dollar; (d) stronger economic growth in developed markets, which will likely (e) continue
to attract capital away from emerging markets; (f) likely below trend growth in China,
with negative implications for (g) industrial metals' prices. We think that the Reserve
Bank will hike rates further this year, although not to the extent currently priced in the
market, in our view. Furthermore, the National Treasury will need to deliver on its
renewed commitment to fiscal tightening. These policy adjustments will be necessary as
a result of six likely South African macro developments.
First, we continue to expect the current account deficit to widen further this year.
The current account deficit in 4Q 2013 looks likely to have narrowed sharply. We view this
as a temporary reprieve. Based on our commodity analysts' price forecasts for gold, iron
ore, coal, platinum and oil, we estimate another year of a decline in South Africa's terms of
trade in 2014, of 1.8%, compared to an estimated decline of 1.1% in 2013. According to
our estimates an expected acceleration in the growth rate of export volumes in 2014
(5.1%) will be insufficient to negate the negative terms-of-trade effect that we are
estimating. The growth rate of import volumes also looks likely to be sustained at a level
similar to that of 2013 (5.7%). We forecast a current account deficit of 7.0% of GDP for
2014, compared to an estimated deficit of 5.7% in 2013 (5.2% in 2012).
Second, international capital inflows are likely to remain weak, in our view. Net
international purchases of South African equities were broadly flat in 2013. Net
international purchases of South African government bonds declined to $1.7bn in 2013,
compared to net purchases of $10.5bn in 2012. Total net international portfolio flows
were negative for four consecutive months until February 2014, when flows turned a
positive $1.3bn. Domestic and international developments over the next three to six
months are not supportive of strong international capital inflows into South Africa, in our
view: the unresolved strike in the platinum sector will likely keep investors wary; the
National elections on 7 May are likely to keep investors cautious; US Treasury yields are
likely to resume their climb; and the dollar is likely to appreciate.
Third, in this context for the current and capital accounts the rand looks likely to
resume its depreciation, in our view. Our forecasts remain 11.20 and 11.50 on 3- and
12-month horizons. We estimate real depreciation in the currency of 2.5% this year
compared to 11% in 2013. As at 3 March, the rand's real effective exchange rate
(REER) was 24% cheap to our estimated fair value, the fourth cheapest currency in EM.
The rand was 2.3 standard deviations cheap to fair value, compared to 0.8 in May 2013.
We think that this cheapness is likely to persist this year.
Fourth, we expect that inflation will accelerate to 6.5% yoy by June, before
declining in 2H 2014. The sharp increase in domestic maize prices over the past two
months, both as a result of the weaker rand as well as domestic inventory shortages,
looks likely to push food price inflation higher, to 7.2% yoy by June (from 4.3% in
January 2014), according to our estimates. The weaker rand will also transmit to
headline inflation via the transport component of CPI, which we estimate will be up
9.1% yoy by June (from 7.8% in January 2014). We assume that both maize prices and
Brent oil prices decline in 2H 2014, resulting in a decline in headline CPI inflation to
5.9% by the end of the year. Our assumption for the average oil price for the year is
$102 per barrel. If we assume an average oil price for calendar 2014 of $110 and keep
all other inputs unchanged, then inflation increases to 6.7% by June and declines to only
6.4% by December 2014.
Carlos Teixeira
+27 11 012 8054

06 March 2014
Emerging Markets Quarterly 116
Fifth, structural reforms that could help cushion the country from expected
adverse external developments look likely to be delayed until well after the
National Elections on 7 May, in our view. Consequently, the burden of adjustment will
continue to rest on the monetary and fiscal authorities, which (in the absence of
structural reforms) have to respond to the risks that confront the economy. These
include a deterioration in the terms of trade, high financing needs, a vulnerable rand,
and upside risks to inflation. A tightening of policy is therefore required even though
GDP growth is mediocre and fragile, and unemployment rates remain high.
The ratings agencies continue to highlight these risks, despite a generally
positive reaction to the Budget Speech on 26 February. Moody's and Standard &
Poor's look likely to maintain their negative outlooks until after the elections, in our view5.
In line with recent polls, we expect the ANC to win the elections, with a slightly reduced
majority. President Zuma is likely to reshuffle his cabinet, which will deliver a 100-day
plan of action for the government. Thereafter, the ANC government will prepare its
Medium-Term Strategic five-year plan. We, and likely the ratings agencies, will be
looking for an unambiguous reference to the National Development Plan.
The fiscal consolidation plan that has been delivered for FY 2014-FY 2015 is
achievable, in our view. We are less convinced on FY 2015-FY 2016 and FY 2016-
FY 2017. While the National Treasury's GDP growth and inflation assumptions for
FY 2015- FY 2016 and FY 2016- FY 2017 are reasonable, there are downside risks to
the revenue estimates and upside risks to the expenditure estimates. On the former, we
think that hikes in tax rates will be necessary to achieve the budgeted figures. On the
latter, we think that the budgeted low nominal growth rates for employee compensation
of 6.7% and 6.4% for these two fiscal years, respectively, will be difficult to achieve. The
public sector's three-year wage agreement comes up for renegotiation in 2015.
In response to the above described risks we expect the Reserve Bank's monetary
policy committee to increase the policy interest rate by an additional 100bps this
year. We think that the monetary policy committee (MPC) will hold the rate at 5.50% at
its meeting on 27 March, but hike by 50bps in May and in July. The market is pricing
200bps of rate hikes by January 2015, 100bps more than our forecast. For 2015, we
expect the MPC to hike by 50bps in March and 50bps in May. Here again, the market is
more aggressive in its rate hike expectations, as reflected in the forward rate
agreements (FRAs).
Current market interest rates (both in real and nominal terms and both in level and
spread terms), the rand and monetary conditions all continue to suggest that
monetary policy needs to be adjusted (tightened further). First, real short-term
interest rates and the real effective exchange rate remain near historical lows. Second,
monetary conditions have eased to five-year lows, according to our estimates, and are
well below their long- and medium-term averages. Third, the current loose monetary
conditions suggest that there is upside risk to inflation. Fourth, monetary conditions
remain loose enough to be supportive of a lagged improvement in GDP growth. Fifth,
the premium for real (inflation-adjusted) ZAR exposure has declined to four-year lows, at
both the short and longer ends of the yield curve. Sixth, our Taylor Rule estimates,
under a variety of different assumptions for the appropriate equilibrium real short-term
interest rate, suggest a range for the policy rate by the end of 2015 between 6.5% and
9.5%, or an average 8.0%, compared to the current 5.5%.
5 Moody's: changed outlook to negative on 9 November 2011, cut rating on 27 September 2012, and maintained negative outlook.
Moody's reaffirmed its negative outlook on 6 January 2014. S&P: changed outlook to negative on 28 March 2012, cut rating on 12 October 2012, and maintained negative outlook. S&P reaffirmed its negative outlook on 20 December 2013. Fitch: changed outlook to negative on 13 January 2012, cut rating on 10 January 2013, and moved outlook back to neutral.

06 March 2014
Emerging Markets Quarterly 117
The current account deficit
in 4Q 2013 looks likely to
have narrowed, but we
expect it to widen again in
2014 as a result of a further
decline in the terms of trade.
International portfolio
inflows to fund the basic
balance deficit dried up in
the four months to February,
when inflows turned
positive, totaling $1.3bn.
Exhibit 307: Basic balance Exhibit 308: Total net portfolio flows
% of GDP, 4-quarter rolling net FDI + current account $bn $bn
-8
-6
-4
-2
0
2
4
6
8
90 92 94 96 98 00 02 04 06 08 10 12 14
-15
-12
-9
-6
-3
0
3
6
9
12
15
-4
-3
-2
-1
0
1
2
3
4
10 11 12 13 14
Monthly
Rolling 12-month sum (right)
Source: Reserve Bank, Credit Suisse Source: JSE, the BLOOMBERG PROFESSIONAL™ service, Thomson Reuters DataStream, Credit Suisse
The outlook for portfolio
inflows is uncertain.
Stronger GDP growth
should attract renewed
inflows into the equity
market, where international
holdings are low. However,
our global equity strategists
believe that South Africa is
expensive. Similarly, the
sell-off in domestic debt
since October 2013 and a
significantly weaker rand
could entice investors back
into this asset class.
However, international
holdings are already at
historical highs.
Exhibit 309: Net international purchases of South African equities
Exhibit 310: Net international purchases of South African bonds
$bn $bn $bn $bn
-11
-9
-7
-5
-3
-1
1
3
5
7
9
11
-3
-2
-1
0
1
2
3
Jan-12 Jul-12 Jan-13 Jul-13 Jan-14
Monthly (left)
Rolling 12-month sum
-11
-9
-7
-5
-3
-1
1
3
5
7
9
11
-3
-2
-1
0
1
2
3
Jan-12 Jul-12 Jan-13 Jul-13 Jan-14
Monthly (left)
Rolling 12-month sum
Source: JSE, the BLOOMBERG PROFESSIONAL™ service, Thomson Reuters DataStream, Credit Suisse
Source: JSE, the BLOOMBERG PROFESSIONAL™ service, Thomson Reuters DataStream, Credit Suisse
The rand is undervalued
according to our models, yet
we think that it will resume
its depreciation in the
months ahead.
Consequently, we expect
CPI inflation to continue to
increase until mid-year.
Food prices also look likely
to accelerate as a result of
the two-month rally in
domestic maize prices.
Exhibit 311: Nominal effective rand and nominal interest rates
Exhibit 312: Maize prices and food price inflation
% Index: higher = appreciation % year-on-year change
45
65
85
105
125
145
165
185
205
225
0
5
10
15
20
25
90 92 94 96 98 00 02 04 06 08 10 12 14
Nominal long rate
Nominal short rate
NEER (right)
-60
-50
-40
-30
-20
-10
0
10
20
30
40
50
60
-25
-20
-15
-10
-5
0
5
10
15
20
25
09 10 11 12 13 14
Food (14.20% of CPI)
Meat (4.56% of CPI)
Breads, Cereals (3.55% of CPI)
Maize (right)
Source: the BLOOMBERG PROFESSIONAL™ service, Thomson Reuters DataStream, Credit Suisse
Source: Statistics South Africa, Thomson Reuters DataStream, Credit Suisse

06 March 2014
Emerging Markets Quarterly 118
The growth rate of tax
revenues has accelerated,
helping to push the budget
deficit target for the current
fiscal year to 4.0% of GDP,
from an original estimate of
4.2%. In contrast, the
growth rate of expenditure
has been running below
budget.
Exhibit 313: Fiscal revenues as a percentage of GDP
Exhibit 314: Fiscal expenses as a percentage of GDP
% of annualized GDP, nominal prices % of annualized GDP, nominal prices
23.0
23.5
24.0
24.5
25.0
25.5
26.0
26.5
27.0
05 06 07 08 09 10 11 12 13
25.0
25.5
26.0
26.5
27.0
27.5
28.0
28.5
29.0
29.5
30.0
30.5
05 06 07 08 09 10 11 12 13 Source: National Treasury, Reserve Bank, Credit Suisse Source: National Treasury, Reserve Bank, Credit Suisse
Finance Minister Gordhan presented a budget that
recommits the government to fiscal tightening over the
next three years. The National Treasury delivered lower-than-expected deficit targets of 4.0% of GDP for
FY 2013- FY 2014, declining to 2.8% by FY
2016-FY 2017. Consequently, borrowing
needs over the next three fiscal years are budgeted to
be 5% lower than was estimated in the Medium
Term Budget Policy Statement (MTBPS) in
October 2013.
Exhibit 315: National government budget deficit
Exhibit 316: National government budget deficit
% of GDP pps
-6.0
-5.0
-4.0
-3.0
-2.0
-1.0
0.0
1.0
2.0
05 06 07 08 09 10 11 12 13 14
-1.0
-0.8
-0.6
-0.4
-0.2
0.0
0.2
0.4
0.6
0.8
06 07 08 09 10 11 12 13 14
Above cyclically adjusted fiscal deficit
Below cyclically adjusted fiscal deficit
Source: National Treasury, Reserve Bank, Credit Suisse Source: National Treasury, Reserve Bank, Credit Suisse
Current monetary
conditions are loose
enough to suggest that
there is upside risk to
inflation and loose enough
to be supportive of a
lagged improvement in
GDP growth. The response
from the Reserve Bank is
likely to be a continued
tightening of monetary
policy. We expect an
additional 100bps this year
and 100bps in 2015.
Exhibit 317: Monetary conditions index Exhibit 318: Taylor Rule
Index: January 2002 = 0 %
-5
-3
-1
1
3
5
7
9
05 06 07 08 09 10 11 12 13 14
Tighter
Looser
Average
4.0
4.5
5.0
5.5
6.0
6.5
7.0
7.5
8.0
8.5
9.0
9.5
10.0
10 11 12 13 14 15 16
Taylor Rule Repo Rate
Actual Repo Rate
Source: Statistics South Africa, Reserve Bank, the BLOOMBERG PROFESSIONAL™ service, Thomson Reuters DataStream, Credit Suisse
Source: Statistics South Africa, Reserve Bank, the BLOOMBERG PROFESSIONAL™ service, Thomson Reuters DataStream, Credit Suisse

06 March 2014
Emerging Markets Quarterly 119
South Africa: Selected economic indicators
2007 2008 2009 2010 2011 2012 2013E 2014F 2015F
National accounts, population and unemployment
Real GDP growth (%) 5.7 3.5 -1.3 3.2 3.5 2.4 1.9 2.8 3.4
Growth in real private consumption (%) 5.5 2.2 -1.6 4.4 4.9 3.5 2.7 2.9 3.2
Growth in real fixed investment (%) 14.0 13.0 -4.3 -2.1 4.2 4.4 3.0 3.4 4.7
Fixed investment (% of GDP) 20.1 23.1 21.5 19.2 18.8 18.9 20.1 20.2 20.5
Nominal GDP ($bn) 285.8 273.5 286.0 365.3 403.8 382.4 350.3 328.3 349.1
Population (mn) 48.9 49.6 50.2 50.9 51.6 52.3 53.0 53.7 54.4
GDP per capita, $ 5,837 5,636 5,799 7,307 7,982 7,470 6,612 6,115 6,416
Unemployment (% of labor force, end-year) 21.0 21.5 24.1 23.9 23.8 24.5 24.1 24.1 24.2
Prices, interest rates and exchange rates
CPI inflation (%, December to December) 7.4 9.0 6.3 3.5 6.1 5.7 5.4 5.9 5.8
CPI inflation (%, average) 6.0 9.9 7.1 4.3 5.0 5.6 5.7 5.9 5.6
Nominal wage growth (% year-on-year change)(1) 7.2 12.5 15.5 9.8 6.8 6.6 8.2 8.3 7.7
Exchange rate (ZAR per USD, end-year) 6.81 9.53 7.38 6.63 8.09 8.48 10.52 11.50 11.50
Exchange rate (ZAR per USD, average) 7.05 8.27 8.42 7.32 7.26 8.21 9.65 11.20 11.50
REER (% change, December to December)(2) 0.1 -16.5 22.5 10.0 -13.8 -2.5 -10.9 -2.5 2.5
Repo rate (%, end-year) 11.00 11.50 7.00 5.50 5.50 5.00 5.00 6.50 7.50
Fiscal data(3)
General government fiscal balance (% of GDP) 0.9 -1.1 -6.5 -4.3 -3.7 -4.3 -4.0 -4.2 -4.0
General government primary balance (% of GDP) 3.4 1.3 -4.2 -1.8 -1.2 -1.5 -1.1 -1.2 -0.9
General government expenditure (% of GDP) 26.1 30.8 33.5 32.0 32.0 32.7 33.0 32.7 32.5
Gross general government debt (% of GDP, end-year) 27.6 27.3 32.8 36.2 39.8 42.7 45.8 47.0 48.9
Net general government debt (% of GDP, end-year) 23.0 22.9 27.4 29.7 33.0 36.1 39.5 41.8 44.2
Money supply and credit
Broad money supply (M2, % of GDP) 69.3 69.2 65.9 62.7 61.3 59.5 60.7 60.0 59.7
Broad money supply (M2, % year-on-year change) 20.7 11.8 1.7 5.6 7.2 3.9 9.9 7.6 8.6
Domestic credit (% of GDP) 92.3 95.7 91.4 87.5 86.0 88.4 86.3 86.1 85.7
Domestic credit (% year-on-year) 20.2 16.1 1.9 6.2 7.9 9.9 5.2 8.6 8.6
Domestic credit to private sector (% of GDP) 86.5 87.8 82.2 78.0 75.5 77.7 76.5 76.4 76.0
Domestic credit to private sector (% year-on-year) 21.5 13.6 -0.1 5.5 6.2 10.1 6.1 8.6 8.6
Balance of payments
Exports (goods and non-factor services, % of GDP) 31.5 35.9 27.3 28.4 30.6 29.9 31.2 29.6 27.8
Imports (goods and non-factor services, % of GDP) 34.2 38.9 28.2 27.7 30.2 31.8 34.1 33.1 30.3
Exports (goods and non-factor services, % change in $ value) 14.8 9.1 -20.4 32.8 19.2 -7.4 -4.4 -11.1 -0.1
Imports (goods and non-factor services, % change in $ value) 15.4 8.9 -24.3 25.8 20.2 -0.1 -2.0 -8.9 -2.8
Current account balance ($bn) -19.9 -19.6 -11.5 -7.2 -9.4 -20.0 -20.9 -23.1 -22.4
Current account (% of GDP) -7.0 -7.2 -4.0 -2.0 -2.3 -5.2 -5.7 -7.0 -6.4
Net FDI ($bn) 3.6 12.4 6.4 3.7 4.5 1.6 3.5 3.2 4.5
Scheduled debt amortization ($bn)(4) 1.8 2.0 2.1 1.8 2.3 6.7 5.0 5.5 2.8
Foreign debt and reserves
Foreign debt ($bn, end-year)(5) 75.3 74.9 82.9 111.3 118.2 142.3 151.5 160.2 169.1
Public ($bn) 24.4 22.3 27.9 43.4 53.7 71.6 76.8 80.4 84.3
Private ($bn) 52.8 52.7 55.0 67.9 64.5 70.7 74.7 79.7 84.7
Foreign debt (% of GDP, end-year) 26.4 27.4 29.0 30.5 29.3 37.2 43.2 48.8 48.4
Foreign debt (% of exports of goods and services) 83.7 76.4 106.2 107.3 95.6 124.4 138.5 164.8 174.2
Central bank gross FX reserves, including forward FX transactions ($bn) 33.0 34.1 39.7 43.8 48.9 50.7 49.6 44.9 44.3
Central bank net FX reserves ($bn) 31.3 33.5 39.0 43.4 47.9 47.9 45.5 40.8 40.2
Central bank gross non-gold FX reserves ($bn) 29.6 30.6 35.3 38.2 42.6 44.0 44.8 40.5 40.0
(1) Based on remuneration per worker, index 2000=100. (2) Real effective exchange rate, increase indicates appreciation. (3) Data for fiscal years starting 1 April. Selected data refer to the government’s consolidated fiscal balances from 2009. (4) Of medium- and long-term debt only. (5) Including rand-denominated debt held by non-residents.
Source: South African Reserve Bank, Statistics South Africa, National Treasury, Credit Suisse

06 March 2014
Emerging Markets Quarterly 120
Turkey: No end in sight for the turf war The next few months appear to be potentially very challenging for Turkey. Political
visibility remains low and might get even more blurred in the coming period, in our view.
This is because the power struggle between Prime Minister Erdogan and the supporters of
Fethullah Gulen – a Muslim preacher in self-imposed exile in Pennsylvania since 1999 –
might intensify ahead of the 30 March municipal elections and perhaps also ahead of the
nomination of the candidates before late June if Erdogan decides to run in the August
presidential elections. Meanwhile, domestic demand growth is slowing and the economy is
rebalancing towards external demand, reducing the country’s main vulnerability, i.e., the
large current account deficit. However, the near-term inflation outlook (especially in April-
May) is quite challenging, raising the possibility of further monetary policy tightening (not
our baseline scenario).
Credible opinion polls (before 24 February) show the AKP winning the 30 March
municipal elections. The AKP is still the leading political party in Turkey, although its
support has declined since the power struggle (see above) became public in the local
media on 17 December when corruption investigations were launched against AKP
members and their families by the alleged Gulenists in the judiciary and the police force.
Credible opinion polls as reported by the local media (before 24 February) put the AKP’s
support level at 43-48%, down from about 50% prior to mid-December. However, an audio
recording (claimed by the government to be fabricated) apparently of Erdogan asking one
of his sons to dispose of large cash sums that appeared in the social media on 24
February may have reduced support for the AKP further since then.
In our view, an AKP victory on 30 March is unlikely to end the power struggle
between Erdogan and the Gulenists. If the AKP garners 40-45% of the votes in the
municipal elections and also wins in Istanbul and Ankara, as most available opinion polls
suggest, this should improve political visibility somewhat. However, such an outcome is
unlikely to stop the Gulenists, in our view, as their ultimate objective appears to be the
prevention of Erdogan’s presidency. We attach a high probability to Erdogan’s nomination
for the presidency (sometime in June) if the AKP gets 40-45% of the votes on 30 March.
(In the less likely scenarios of the AKP winning less than 40% or the AKP losing its
stronghold in Istanbul even if its country-wide support level exceeds 40%, Erdogan might
reconsider his nomination for the presidency. If Erdogan decides not to run, he may try
and change the AKP’s “three-term rule” to run in the parliamentary elections that are
currently scheduled for June 2015 and continue as prime minister.)
In our view, the AKP government has so far failed to achieve the delicate balance
between the need to address the issue of a “parallel state” and the need to ensure
an independent judiciary to probe the corruption allegations appropriately.
According to Erdogan, a group of prosecutors and police, which he collectively refers to as
"a state within the state" or “parallel state,” has cooperated with Gulen to stage a coup
against him since 17 December. Accordingly, the government has intervened directly in
the corruption investigations, and many members of the police force and the judiciary have
been removed from their posts. Subsequently, all detainees under the 17 December probe
were freed on 28 February. Not surprisingly, Erdogan has also been arguing that an AKP
victory on 30 March will free him and others of all allegations, underscoring the likelihood
that an appropriate investigation into corruption allegations will not be carried out in the
case of an AKP victory.
Although political stability in terms of the rule of a single-party government might
be maintained, the country’s democratic credentials and the credibility of the state
institutions have been eroded considerably, in our view. While the AKP claims that it
is purging state institutions of Gulenist elements, its critics maintain that it is meddling with
the independence of the judiciary. Additionally, the AKP has, over the past two months,
enacted legislation that tightens the government's control over the judiciary and the
internet. These bills also cast a shadow on Turkey’s relations with the EU, which have
Berna Bayazitoglu
+44 20 7883 3431
06 March 2014
Emerging Markets Quarterly 121
been revived somewhat since the November 2013 opening of a negotiation chapter
following a three-year hiatus and the resumption of peace talks in Cyprus a few weeks
ago. The bills appear to move Turkey away from the EU’s standards on the independence
of the judiciary and the freedom of expression. While, in the near term, investors in
government bonds might focus on the unity of the government and its continuing rule
rather than the country’s democratic credentials and the rule of law, we think the erosion of
the democratic institutions might at some point turn into a sovereign creditworthiness
problem if its adverse impact on the business climate and real GDP growth becomes long-
lasting.
The government’s immediate economic policy response to the political
developments was prudent, in our view. As the lira’s nominal basket exchange rate
weakened after 17 December, the government proactively tightened the policy mix by
announcing various macroprudential measures on 31 December and tax hikes on 1
January. However, the market was not convinced by the adequacy of this policy response
and the lira has depreciated further in the second half of January.
Subsequently, the monetary policy committee (MPC) was forced by the market to
tighten monetary policy aggressively on 28 January and simplify its operational
framework. The lira’s depreciation quickened following the MPC’s 21 January meeting,
when the MPC tightened monetary policy on an occasional basis under its complicated
monetary policy framework and did not adopt a clear tightening stance. Following a sizable
($3.15bn) but ineffective FX intervention on 23 January, the MPC held an extraordinary
meeting on 28 January. Although the extent of tightening on 28 January was not as large
as the hike in the one-week repo rate to 10.00% from 4.50% suggests, the magnitude of
the tightening was still significant at 225-275bps. (Prior to 28 January, the central bank
provided most of its funding at the upper end of the short-term interest rate corridor,
7.75%, rather than at the one-week repo rate of 4.50%.) The MPC also simplified its
operational framework on 28 January – the interest rate corridor is now between 8.00%
and 12.00%, with the bulk of central bank funding provided at the one-week repo rate of
10.00%.
Year-on-year headline inflation increased modestly to 7.9% in February from 7.4% in
December, but this masks a sharp deterioration in core inflation dynamics. The
central bank’s favorite core inflation indicator (the so-called core index I, which excludes
food, energy, tobacco, alcoholic beverages and gold from the CPI basket) increased to
8.4% yoy in February from 7.1% yoy in December, recording its highest level since early
2012 (following the exchange rate shock of 2011). More importantly, the run-rate of core
inflation rose more sharply than we expected to 9.5% in February from about 7.0%-7.5% in
December-January. (We calculate the run-rate of core inflation as the annualized three-
month moving average of the month-on-month change in the de-seasonalized core index
I.) Admittedly, with the existing data, we cannot discern the impacts of the moves in the
lira’s exchange rate and the tax adjustments that were announced on 1 January.
Nevertheless, the data underscore that economic activity was still strong enough in
February to allow the producers to pass on to consumers both the exchange rate
weakness and the tax adjustments at a high pace.
We maintain our end-2014 inflation forecast at 7.7% under our nominal basket
exchange rate assumption of 2.60 throughout this year; that said, the inflation
outlook is pretty challenging in the near term (especially in April-May). Headline
inflation might move towards 8.5-9.0% in April-May from 7.9% in February given the
unfavorable base effects for food price inflation in those months and depending on the
pace of pass-through in the coming months from the lira's depreciation in January. Our
end-year headline inflation forecast of 7.7% incorporates utility price adjustments in
October. However, if the government decides to increase utility prices in 2Q, following the
municipal elections on 30 March, this would make 2Q even more challenging.

06 March 2014
Emerging Markets Quarterly 122
The MPC hopes that the “strong and front-loaded” rate hike of 28 January will be
adequate to rein in the inflation expectations. The policy response on 28 January
seems to have broadly stabilized the lira’s nominal basket exchange rate within 2.60-2.65.
In our view, this should also stabilize inflation expectations, which have worsened steadily
since May-June 2013 and quite abruptly in January-February 2014. We expect the central
bank to be able to navigate 2Q without having to amend the interest rate corridor, but it
might have to tighten lira liquidity by limiting the amount of lira provided at the one-week
repo rate of 10.00% if the inflation outlook deteriorates further. Under its simplified
operational framework, the central bank can easily push the interbank overnight rate close
to 12% (or even higher to 15% which is the interest rate at its late liquidity window) simply
by restricting the amount of lira liquidity provided at 10.00%. In case further notable
depreciation pressure on the lira materializes (not our baseline), either due to global or
domestic reasons, the MPC might be forced to hike interest rates even further.
Real GDP growth seems to have held up well in 4Q 2013 but is likely slowing now.
(Real GDP data for 4Q will be released on 31 March.) Industrial production expanded
1.3% qoq in 4Q on a seasonally and workday adjusted basis, up from 0.8% qoq in 3Q.
However, the environment has changed markedly since mid-December. The capacity
utilization rate in the manufacturing industry declined to 74.5% on average in January-
February, after increasing to 75.6% in 4Q from 75.0% in 3Q on a seasonally adjusted
basis. The political noise has driven both consumer and business confidence in January-
February to their lowest levels since 2H 2012. The confluence of macroprudential
measures that were announced on 31 December, the monetary policy tightening on 28
January, and moderating capital inflows is dampening the credit growth momentum –
more notably for consumer loans than overall loans – towards 15%, in our view. We also
believe that the risks to investment growth remain to the downside, especially if the weaker
consumer and business confidence is coupled with a more modest pick-up in the global
economy than we currently expect. Accordingly, we forecast that real GDP growth will
halve to 2.2% this year from a projected 4.3% in 2013.
Aggregate demand is rebalancing towards external demand and the current
account deficit is adjusting narrower. Mainly driven by the pick-up in the euro area,
Turkey’s merchandise goods exports increased 3.1% qoq in 3Q and 3.0% qoq in 4Q in
volume terms, after contracting on average 2.1% qoq in the previous three quarters.
Although three-month ahead export orders have weakened recently, we think that the
continuing recovery in the euro area should broadly continue to support Turkey’s exports.
Combined with the slowdown in domestic demand growth, this should lead to a much-
needed downward adjustment in the current account deficit in 2014. The run-rate of the
current account deficit was 8.0% of GDP in December, on our estimates, up from about
7.0% of GDP in September but lower than 9.5% of GDP in June. (We define the run-rate
of the current account deficit as the annualized three-month moving average of the
seasonally adjusted current account deficit.) We forecast that the current account deficit
will narrow to 5.7% of GDP in 2014 from 7.7% of GDP in 2013, but a further revival in
Turkey’s export orders would lead us to revise our 2014 current account deficit forecast
lower.
Moody’s and Fitch do not seem to be in a rush to reconsider their investment grade
ratings for Turkey’s long-term sovereign FX debt despite the political noise. Both
agencies keep the outlook on their ratings at “stable”. We do not expect either agency to
downgrade Turkey in the near term, but we think both agencies will be watching the
outcome of the municipal elections on 30 March and the presidential elections in August
closely to assess whether political stability will be maintained. On 7 February, S&P revised
the outlook on its sub-investment BB+ rating for Turkey’s long-term sovereign FX debt to
“negative” from “stable”. The timing of this move was not meaningful, in our view, as it
followed the MPC’s aggressive monetary policy response on 28 January.

06 March 2014
Emerging Markets Quarterly 123
The lira’s nominal basket
exchange rate depreciated
to as weak as 2.77 before
the MPC’s extraordinary
meeting on 28 January and
has stabilized around 2.60-
2.65 since then. The lira’s
REER was 101.9 in
February (compared to a
base of 100 in 2003),
corresponding to
“excessively cheap” territory
in the central bank’s view.
As of 3 March, the lira’s
REER was about 12% (one
standard deviation) cheaper
than our estimate of its fair
value.
Exhibit 319: Lira’s nominal basket exchange rate
Exhibit 320: Lira’s real effective exchange rate (REER)
Average of USDTRY and EURTRY 2003=100
2.00
2.10
2.20
2.30
2.40
2.50
2.60
2.70
2.80
Mar-13 Jul-13 Nov-13 Mar-14
80.00
90.00
100.00
110.00
120.00
130.00
140.00
Feb-06 Feb-08 Feb-10 Feb-12 Feb-14
REER
1.5% appreciation p.a. after 2003
2.0% appreciation p.a. after 2003
Source: Central Bank, Credit Suisse Source: Central Bank, Credit Suisse
The central bank sold about
$24bn since June 2013
during which time residents’
FX deposits increased by
about $23bn, with
households’ FX deposits
rising by $12bn and
corporates’ FX deposits
increasing by $11bn.
Residents’ demand for
dollars continued even after
the aggressive rate hike on
28 January.
Exhibit 321: Central bank’s FX sales Exhibit 322: Short-term interest rates
$bn %
0.0
1.0
2.0
3.0
4.0
5.0
6.0
7.0
Jun
-13
Jul-1
3
Au
g-13
Se
p-13
Oct
-13
Nov
-13
Dec
-13
Jan
-14
Feb
-14
Mar
-14*
0.0
2.0
4.0
6.0
8.0
10.0
12.0
Jul-1
3
Au
g-13
Se
p-13
Oct
-13
Nov
-13
Dec
-13
Jan
-14
Feb
-14
Mar
-14
Interbank overnight rateCentral bank's effective funding rateOne-week repo rate
*CS estimate for the full month. Source: Central Bank, Credit Suisse
Source: Borsa Istanbul, Central Bank, Credit Suisse
The run-rate of core inflation
rose more sharply than we
expected to 9.5% in
February from about 7.0-
7.5% in December-January,
underscoring that economic
activity was still strong
enough in February to allow
producers to pass on to
consumers both the
exchange rate weakness
and the tax adjustments at a
high pace. Inflation
expectations have
worsened steadily since
May-June 2013 and quite
abruptly in January-
February 2014.
Exhibit 323: Core prices Exhibit 324: Inflation expectations
%, annual %, annual
-2
0
2
4
6
8
10
12
14
Feb-11 Feb-12 Feb-13 Feb-14
Core index I*
Run-rate of core index I**
5.0
6.0
7.0
8.0
Feb-11 Feb-12 Feb-13 Feb-14
12-month forward
24-month forward
*Core index I excludes food, energy, tobacco products, alcoholic beverages and gold from the CPI basket. **Calculated as the annualized three-month moving average of the month-on-month changes in the seasonally adjusted core index I. Source: Statistics Office, Credit Suisse
Source: Central Bank

06 March 2014
Emerging Markets Quarterly 124
The confluence of
macroprudential measures
that were announced on 31
December, the monetary
policy tightening on 28
January, and moderating
capital inflows is dampening
the credit growth
momentum – more notably
for consumer loans than
overall loans – towards
15%, in our view.
Exhibit 325: Consumer loan growth Exhibit 326: Overall loan growth
%, annualized, 13-week moving average, week-on-week change in loan stock
%, annualized,13-week moving average, week-on-week change in loan stock
0.0
5.0
10.0
15.0
20.0
25.0
30.0
35.0
40.0
45.0
1 5 9 13 17 21 25 29 33 37 41 45 49
2013
Average 2007-2012
2014
Weeks
0.0
5.0
10.0
15.0
20.0
25.0
30.0
35.0
40.0
45.0
1 5 9 13 17 21 25 29 33 37 41 45 49
2013
Average 2007-2012
2014
Weeks
Source: Central Bank, Credit Suisse Source: Banking Regulation and Supervision Agency, Central Bank, Credit Suisse
Mainly driven by the pick-up
in the euro area, Turkey’s
merchandise goods exports
increased 3.1% qoq in 3Q
and 3.0% qoq in 4Q in
volume terms, after
contracting on average
2.1% qoq in the previous
three quarters. Although the
three-month ahead export
orders have been
weakening recently, we
think the continuing
recovery in the euro area
should broadly continue to
support Turkey’s exports.
Exhibit 327: Export and import volumes
Exhibit 328: Three-month ahead export orders
For goods only, 2010=100 Seasonally adjusted
60.0
80.0
100.0
120.0
140.0
Q4-09 Q4-10 Q4-11 Q4-12 Q4-13
Export volumes
Import volumes
100.0
105.0
110.0
115.0
120.0
125.0
130.0
135.0
Feb-12 Aug-12 Feb-13 Aug-13 Feb-14
Source: Statistics Office, Credit Suisse Source: Central Bank
Combined with the
slowdown in domestic
demand growth, this should
lead to a much-needed
downward adjustment in the
foreign trade and current
account deficits in 2014
following a deterioration in
4Q compared to 3Q 2013.
We forecast that the current
account deficit will narrow to
5.7% of GDP in 2014 from
7.7% of GDP in 2013.
Exhibit 329: Foreign trade deficit Exhibit 330: Current account deficit
$bn, seasonally adjusted $bn, seasonally adjusted, 3mma
0.0
2.0
4.0
6.0
8.0
10.0
12.0
Jan-11 Jan-12 Jan-13 Jan-14
Foreign trade deficit
Foreign trade deficit (3mma)
3.0
4.0
5.0
6.0
7.0
8.0
Dec-10 Dec-11 Dec-12 Dec-13
Source: Statistics Office, Credit Suisse Source: Central Bank, Credit Suisse
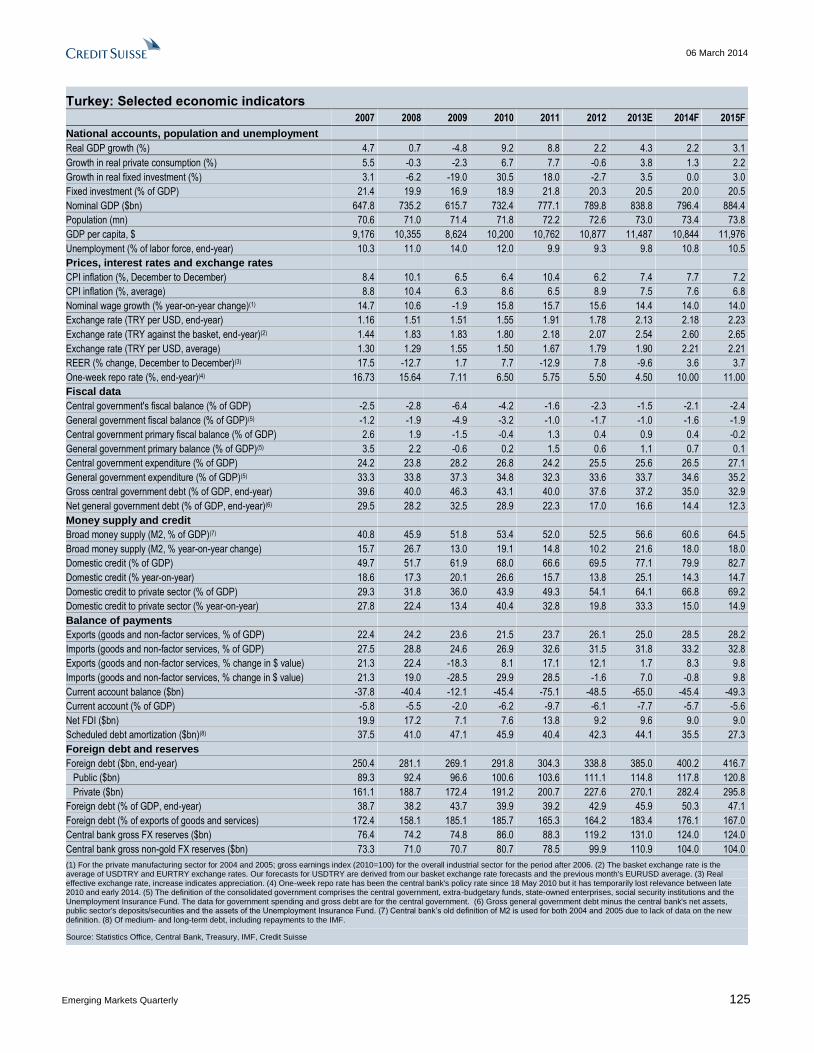
06 March 2014
Emerging Markets Quarterly 125
Turkey: Selected economic indicators
2007 2008 2009 2010 2011 2012 2013E 2014F 2015F
National accounts, population and unemployment
Real GDP growth (%) 4.7 0.7 -4.8 9.2 8.8 2.2 4.3 2.2 3.1
Growth in real private consumption (%) 5.5 -0.3 -2.3 6.7 7.7 -0.6 3.8 1.3 2.2
Growth in real fixed investment (%) 3.1 -6.2 -19.0 30.5 18.0 -2.7 3.5 0.0 3.0
Fixed investment (% of GDP) 21.4 19.9 16.9 18.9 21.8 20.3 20.5 20.0 20.5
Nominal GDP ($bn) 647.8 735.2 615.7 732.4 777.1 789.8 838.8 796.4 884.4
Population (mn) 70.6 71.0 71.4 71.8 72.2 72.6 73.0 73.4 73.8
GDP per capita, $ 9,176 10,355 8,624 10,200 10,762 10,877 11,487 10,844 11,976
Unemployment (% of labor force, end-year) 10.3 11.0 14.0 12.0 9.9 9.3 9.8 10.8 10.5
Prices, interest rates and exchange rates
CPI inflation (%, December to December) 8.4 10.1 6.5 6.4 10.4 6.2 7.4 7.7 7.2
CPI inflation (%, average) 8.8 10.4 6.3 8.6 6.5 8.9 7.5 7.6 6.8
Nominal wage growth (% year-on-year change)(1) 14.7 10.6 -1.9 15.8 15.7 15.6 14.4 14.0 14.0
Exchange rate (TRY per USD, end-year) 1.16 1.51 1.51 1.55 1.91 1.78 2.13 2.18 2.23
Exchange rate (TRY against the basket, end-year)(2) 1.44 1.83 1.83 1.80 2.18 2.07 2.54 2.60 2.65
Exchange rate (TRY per USD, average) 1.30 1.29 1.55 1.50 1.67 1.79 1.90 2.21 2.21
REER (% change, December to December)(3) 17.5 -12.7 1.7 7.7 -12.9 7.8 -9.6 3.6 3.7
One-week repo rate (%, end-year)(4) 16.73 15.64 7.11 6.50 5.75 5.50 4.50 10.00 11.00
Fiscal data
Central government's fiscal balance (% of GDP) -2.5 -2.8 -6.4 -4.2 -1.6 -2.3 -1.5 -2.1 -2.4
General government fiscal balance (% of GDP)(5) -1.2 -1.9 -4.9 -3.2 -1.0 -1.7 -1.0 -1.6 -1.9
Central government primary fiscal balance (% of GDP) 2.6 1.9 -1.5 -0.4 1.3 0.4 0.9 0.4 -0.2
General government primary balance (% of GDP)(5) 3.5 2.2 -0.6 0.2 1.5 0.6 1.1 0.7 0.1
Central government expenditure (% of GDP) 24.2 23.8 28.2 26.8 24.2 25.5 25.6 26.5 27.1
General government expenditure (% of GDP)(5) 33.3 33.8 37.3 34.8 32.3 33.6 33.7 34.6 35.2
Gross central government debt (% of GDP, end-year) 39.6 40.0 46.3 43.1 40.0 37.6 37.2 35.0 32.9
Net general government debt (% of GDP, end-year)(6) 29.5 28.2 32.5 28.9 22.3 17.0 16.6 14.4 12.3
Money supply and credit
Broad money supply (M2, % of GDP)(7) 40.8 45.9 51.8 53.4 52.0 52.5 56.6 60.6 64.5
Broad money supply (M2, % year-on-year change) 15.7 26.7 13.0 19.1 14.8 10.2 21.6 18.0 18.0
Domestic credit (% of GDP) 49.7 51.7 61.9 68.0 66.6 69.5 77.1 79.9 82.7
Domestic credit (% year-on-year) 18.6 17.3 20.1 26.6 15.7 13.8 25.1 14.3 14.7
Domestic credit to private sector (% of GDP) 29.3 31.8 36.0 43.9 49.3 54.1 64.1 66.8 69.2
Domestic credit to private sector (% year-on-year) 27.8 22.4 13.4 40.4 32.8 19.8 33.3 15.0 14.9
Balance of payments
Exports (goods and non-factor services, % of GDP) 22.4 24.2 23.6 21.5 23.7 26.1 25.0 28.5 28.2
Imports (goods and non-factor services, % of GDP) 27.5 28.8 24.6 26.9 32.6 31.5 31.8 33.2 32.8
Exports (goods and non-factor services, % change in $ value) 21.3 22.4 -18.3 8.1 17.1 12.1 1.7 8.3 9.8
Imports (goods and non-factor services, % change in $ value) 21.3 19.0 -28.5 29.9 28.5 -1.6 7.0 -0.8 9.8
Current account balance ($bn) -37.8 -40.4 -12.1 -45.4 -75.1 -48.5 -65.0 -45.4 -49.3
Current account (% of GDP) -5.8 -5.5 -2.0 -6.2 -9.7 -6.1 -7.7 -5.7 -5.6
Net FDI ($bn) 19.9 17.2 7.1 7.6 13.8 9.2 9.6 9.0 9.0
Scheduled debt amortization ($bn)(8) 37.5 41.0 47.1 45.9 40.4 42.3 44.1 35.5 27.3
Foreign debt and reserves
Foreign debt ($bn, end-year) 250.4 281.1 269.1 291.8 304.3 338.8 385.0 400.2 416.7
Public ($bn) 89.3 92.4 96.6 100.6 103.6 111.1 114.8 117.8 120.8
Private ($bn) 161.1 188.7 172.4 191.2 200.7 227.6 270.1 282.4 295.8
Foreign debt (% of GDP, end-year) 38.7 38.2 43.7 39.9 39.2 42.9 45.9 50.3 47.1
Foreign debt (% of exports of goods and services) 172.4 158.1 185.1 185.7 165.3 164.2 183.4 176.1 167.0
Central bank gross FX reserves ($bn) 76.4 74.2 74.8 86.0 88.3 119.2 131.0 124.0 124.0
Central bank gross non-gold FX reserves ($bn) 73.3 71.0 70.7 80.7 78.5 99.9 110.9 104.0 104.0
(1) For the private manufacturing sector for 2004 and 2005; gross earnings index (2010=100) for the overall industrial sector for the period after 2006. (2) The basket exchange rate is the average of USDTRY and EURTRY exchange rates. Our forecasts for USDTRY are derived from our basket exchange rate forecasts and the previous month's EURUSD average. (3) Real effective exchange rate, increase indicates appreciation. (4) One-week repo rate has been the central bank's policy rate since 18 May 2010 but it has temporarily lost relevance between late 2010 and early 2014. (5) The definition of the consolidated government comprises the central government, extra-budgetary funds, state-owned enterprises, social security institutions and the Unemployment Insurance Fund. The data for government spending and gross debt are for the central government. (6) Gross general government debt minus the central bank's net assets, public sector's deposits/securities and the assets of the Unemployment Insurance Fund. (7) Central bank’s old definition of M2 is used for both 2004 and 2005 due to lack of data on the new definition. (8) Of medium- and long-term debt, including repayments to the IMF.
Source: Statistics Office, Central Bank, Treasury, IMF, Credit Suisse
06 March 2014
Emerging Markets Quarterly 126
Ukraine: A chance for comprehensive policy adjustment The dramatic change of power in Kiev over 21-22 February has opened an opportunity
for comprehensive policy adjustment and large-scale Western aid. However, it has also
prompted Russia's leaders to deploy military forces in Crimea and to indicate possible
intervention in support of ethnic Russians in Eastern regions, thus sharply raising risks to
Ukraine's integrity and control over its territory. While the risk of a full-scale military
confrontation with Russia appears to have declined somewhat in recent days (to probably
not more than 15%-20%, on our estimates), investors clearly cannot afford to ignore it
altogether, in view of the dire implications of such a scenario for Ukraine's territorial and fiscal
integrity, ability to negotiate with lenders and capacity to service FX debt.
The swift political changes over several days in late February left Ukraine with an
entirely different political configuration. The prolonged confrontation between anti-
Yanukovich protesters and government forces led to an unprecedented loss of human
life over 18-20 February and an EU-brokered power-sharing agreement that proved to
be short-lived, after Maidan leaders failed to support it and threatened further armed
resistance. The Rada promptly voted to reinstate the 2004 constitution, sharply boosting
the authority of the parliament and the government at the expense of the presidency. It
also passed a bill that allowed Yulia Tymoshenko to be released from prison. Late on 21
February Yanukovich fled Kiev, emerging in Russia a week later. The political vacuum
was swiftly filled by anti-Yanukovich figures who formed a coalition with unaffiliated MPs
and some of the 70 Regions Party deputies who crossed the floor. Early presidential
elections have been scheduled for 25 May. Tymoshenko's close allies have become the
acting head of state (Turchinov) and the new prime minister (Yatsenyuk).
President Putin’s move on 1 March to seek parliament’s consent to Russia’s use of
its armed forces in Ukraine came as a shock to observers and investors, even after
reports of earlier movements of Russia-affiliated forces in Crimea. The permission to
use troops in Ukraine (and not just in Crimea) could in theory cover a much larger
operation, including deployment of troops in at least three Eastern regions of Ukraine
(Donetsk, Kharkiv and Luhansk). Putin subsequently defended Russia's decision to "assist
its allies in Crimea," while indicating that further use of its military elsewhere in Ukraine
was unlikely. Putin has also warned that Russia may not recognize the outcome of early
presidential elections, pointing in our view to the potential for future bilateral tensions.
Notwithstanding the high security, solvency and fiscal integrity risks, the new
government (which includes a core group of technocrats) is well positioned to make
progress on the much-needed policy adjustment in key areas, in our view. Strong
political support from the EU and the US looks set to translate into large-scale financial
support, part of which could be available prior to the conclusion of talks with the IMF on a
multi-year stand-by program. The core elements of the EU part of the package (unveiled
on 5 March) will include €1.6bn in macro-financial assistance (over a two-year period,
usable for debt service purposes) and various project loans and guarantees from the EU,
EBRD and the EIB, for up to €11bn in total. The US government has made a decision to
allocate $1bn to Ukraine, mainly in the form of loan guarantees, including for the purposes
of supporting energy sector reform. Urgent measures to advance energy reform are
imperative in order to reduce the remarkably large energy subsidies (over 7% of GDP in
economic terms, on IMF estimates), with implications for both fiscal and external accounts.
We also find it likely that multilateral creditors will demand private sector involvement (PSI)
as part of a comprehensive improvement of the country's debt profile.
Growth performance in early 2014 was exceptionally weak, reversing the
improvement in late 2013. Sequential GDP growth is estimated to have rebounded by
1% qoq sa in 4Q 2013, following a drop of similar magnitude in 3Q. The recovery in
GDP growth late last year (yet to be backed by official data) was due primarily to a good
harvest that supported both agriculture and the food industry. However, so far in 2014,
Sergei Voloboev
+44 20 7888 3694
Alexey Pogorelov
+7 495 967 8772
06 March 2014
Emerging Markets Quarterly 127
even prior to the outbreak of violence in Kiev in February and the ensuing run on the
currency and bank deposits, activity indicators were dismal. Industrial output
performance deteriorated sharply in January, to a 5.0% yoy decline, compared to -0.5%
yoy in December. In seasonally adjusted terms, on our estimates, output fell a massive
2.1% mom, after a 0.7% mom sa increase in December. The particularly poor output
data on the Kiev region (down 19.4% yoy) and the city of Kiev (-9.7% yoy) point to the
likely impact of political strikes in Kiev and its region. We now project that GDP will likely
drop 5.3% yoy in 1Q 2014, consistent with a 4.4% qoq sa collapse.
A near-term recovery in growth looks unlikely, due to the impact of the dramatic
political developments and exchange rate volatility on capital expenditure. In
addition, any stabilization program backed by the IMF would have to include urgent
measures to reduce the gapping current account deficit (9% of GDP in 2013). This
means that, even after financing sources become available, the government would not
be able to use fiscal policy as a viable counter-cyclical tool in order to support domestic
demand. Accordingly, we expect GDP to be broadly flat in seasonally adjusted terms in
both 2Q and 3Q, returning to growth in 4Q 2014. This would result in a GDP decline of
about 4% yoy in 2014. In 2015, growth prospects look much better, thanks to more
stable politics (post presidential election) and a much more competitive exchange rate.
The current account deficit stayed very large in 4Q 2013. On the four-quarter rolling
basis, the deficit in 4Q totaled $16.1bn (9.0% of GDP), in line with the 3Q outturn and
compared to 8.2% of GDP deficit in 2012. The pace of a decline in goods exports in
USD value terms slowed to 4.3% yoy in 4Q, compared to 9.6% yoy in 3Q. Over the
same period, imports values fell 4.2% yoy, compared to a 2.0% yoy increase in the
previous quarter. For 2013 as a whole, export values fell 7.6% yoy (compared to a 1.2%
yoy increase in December 2012), driven by steep declines in exports of chemical
products (nearly a 14% drop), steel products (7.0% yoy) and agricultural goods (by 4.8%
yoy). Import values fell 5.8% yoy in 2013, including that of natural gas by 17.2% yoy,
machinery and equipment (by 12.6% yoy). The capital and financial account surplus
widened to $18.2bn (10.2% of GDP) from $10.1bn (5.8% of GDP) in 2012, due mainly to
large-scale external borrowing by the sovereign and corporate entities. FX debt rollover
ratios by corporate non-bank entities rose to 101% in 2013, from 81% in 2012; for the
banking sector liabilities, rollover ratios declined to 111%, from 152% in 2012. Net direct
investment fell twofold, to $3.3bn, from $6.6bn in 2012.
Ukraine’s external situation has been deteriorating through end-February, as
illustrated by the large-scale declines in the stock of FX reserves. The 12-month
decline in the stock of non-gold reserves increased to $6.7bn (30% of total) in January.
Reserves fell by $2.7bn in January 2014 alone and by a similar amount in February (when
gross reserves reportedly fell to $15bn, from $17.8bn in January). Urgent financial aid has
now become critical for uninterrupted FX debt service by the public sector (estimated at
$1.0bn in March-May, prior to the $1.0bn Eurobond maturity in early June). In late
February, the central bank stopped intervening in support of the hryvnia. Combined with
the large-scale liquidity support for the banking system, this led to a sharp spike in UAH to
10.7 against USD, followed by a swift correction. Despite the good prospects for large-
scale external aid later in the year, we expect the terms to the IMF program to preclude
any sizeable support for the hryvnia, in order to help compress domestic demand and the
large current account deficit. With the growth picture remaining bleak until much later in the
year, we expect further large-scale declines in the exchange rate, towards 12 in late 2014,
before a recovery in both growth and UAH in 2015.
Fiscal policy is set to be tightened significantly under the forthcoming IMF
program, primarily through sharp cuts in spending. Prime Minister Yatsenyuk has
already suggested a reduction in the initial 2014 budget targets by 14%-17%. We expect
the consolidated budget deficit to be cut to 3.5% of GDP in 2014, from 4.3% in 2013,
despite the recessionary environment.
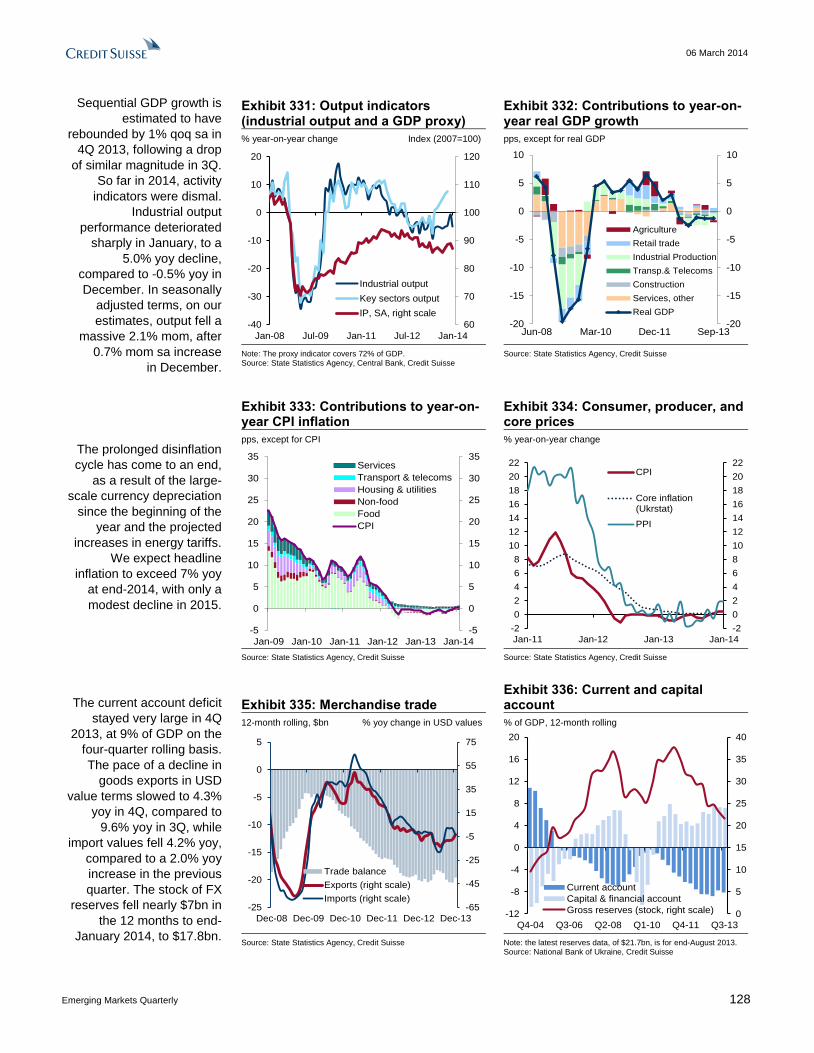
06 March 2014
Emerging Markets Quarterly 128
Sequential GDP growth is
estimated to have
rebounded by 1% qoq sa in
4Q 2013, following a drop
of similar magnitude in 3Q.
So far in 2014, activity
indicators were dismal.
Industrial output
performance deteriorated
sharply in January, to a
5.0% yoy decline,
compared to -0.5% yoy in
December. In seasonally
adjusted terms, on our
estimates, output fell a
massive 2.1% mom, after
0.7% mom sa increase
in December.
Exhibit 331: Output indicators (industrial output and a GDP proxy)
Exhibit 332: Contributions to year-on-year real GDP growth
% year-on-year change Index (2007=100) pps, except for real GDP
60
70
80
90
100
110
120
-40
-30
-20
-10
0
10
20
Jan-08 Jul-09 Jan-11 Jul-12 Jan-14
Industrial output
Key sectors output
IP, SA, right scale
-20
-15
-10
-5
0
5
10
-20
-15
-10
-5
0
5
10
Jun-08 Mar-10 Dec-11 Sep-13
Agriculture
Retail trade
Industrial Production
Transp.& Telecoms
Construction
Services, other
Real GDP
Note: The proxy indicator covers 72% of GDP. Source: State Statistics Agency, Central Bank, Credit Suisse
Source: State Statistics Agency, Credit Suisse
The prolonged disinflation
cycle has come to an end,
as a result of the large-
scale currency depreciation
since the beginning of the
year and the projected
increases in energy tariffs.
We expect headline
inflation to exceed 7% yoy
at end-2014, with only a
modest decline in 2015.
Exhibit 333: Contributions to year-on-year CPI inflation
Exhibit 334: Consumer, producer, and core prices
pps, except for CPI % year-on-year change
-5
0
5
10
15
20
25
30
35
-5
0
5
10
15
20
25
30
35
Jan-09 Jan-10 Jan-11 Jan-12 Jan-13 Jan-14
Services
Transport & telecoms
Housing & utilities
Non-food
Food
CPI
-2
0
2
4
6
8
10
12
14
16
18
20
22
-2
0
2
4
6
8
10
12
14
16
18
20
22
Jan-11 Jan-12 Jan-13 Jan-14
CPI
Core inflation(Ukrstat)
PPI
Source: State Statistics Agency, Credit Suisse Source: State Statistics Agency, Credit Suisse
The current account deficit
stayed very large in 4Q
2013, at 9% of GDP on the
four-quarter rolling basis.
The pace of a decline in
goods exports in USD
value terms slowed to 4.3%
yoy in 4Q, compared to
9.6% yoy in 3Q, while
import values fell 4.2% yoy,
compared to a 2.0% yoy
increase in the previous
quarter. The stock of FX
reserves fell nearly $7bn in
the 12 months to end-
January 2014, to $17.8bn.
Exhibit 335: Merchandise trade Exhibit 336: Current and capital account
12-month rolling, $bn % yoy change in USD values % of GDP, 12-month rolling
-65
-45
-25
-5
15
35
55
75
-25
-20
-15
-10
-5
0
5
Dec-08 Dec-09 Dec-10 Dec-11 Dec-12 Dec-13
Trade balance
Exports (right scale)
Imports (right scale)
0
5
10
15
20
25
30
35
40
-12
-8
-4
0
4
8
12
16
20
Q4-04 Q3-06 Q2-08 Q1-10 Q4-11 Q3-13
Current account
Capital & financial account
Gross reserves (stock, right scale)
Source: State Statistics Agency, Credit Suisse Note: the latest reserves data, of $21.7bn, is for end-August 2013. Source: National Bank of Ukraine, Credit Suisse

06 March 2014
Emerging Markets Quarterly 129
In late February, the
central bank stopped
intervening in support of
the hryvnia, in order to
preserve FX reserves for
near-term FX debt
payments ($1bn in March-
May). Combined with the
large-scale liquidity
support for the banks, this
led to a sharp spike in
UAH to 10.7 against USD,
followed by a swift
correction. We expect
further large-scale
declines in UAH, towards
12.0 in late 2014.
Exhibit 337: Hryvnia’s exchange rates Exhibit 338: Interest rates
UAH REER* (2001 = 100) UAH per USD, spot % p.a.
4
5
6
7
8
9
10
11
1290
95
100
105
110
115
120
125
130
135
May-06 Apr-08 Apr-10 Mar-12 Mar-14
REER of UAH
UAH vs USD, rightscale
0
5
10
15
20
25
0
5
10
15
20
25
Jan-10 Jan-11 Jan-12 Jan-13 Jan-14
NBU Discount rate
T-bill yields, primary, wa
Interbank lending rate 7-30 day
UAH loan rates to residents, wa
Source: BLOOMBERG PROFESSIONAL
TM Service, Credit Suisse Source: National Bank of Ukraine, Credit Suisse
Ukraine’s external
situation has been
deteriorating through end-
February, as illustrated by
the large-scale declines in
the stock of FX reserves.
The 12-month decline in
the stock of non-gold
reserves increased to
$6.7bn (30% of total) in
January. Reserves fell by
$2.7bn in January 2014
alone and by a similar
amount in February (when
gross reserves reportedly
reached $15bn, from
$17.8bn in January.
Exhibit 339: FX reserves, interventions Exhibit 340: Monetary aggregates
$bn % year-on-year change
16
20
24
28
32
36
40
-4.0
-3.0
-2.0
-1.0
0.0
1.0
2.0
Jan-09 Jan-10 Jan-11 Jan-12 Jan-13 Jan-14
Net FX purchases (left scale)
Stock of non-gold reserves
-5
5
15
25
35
45
-5
5
15
25
35
45
Dec-08 Dec-09 Dec-10 Dec-11 Dec-12 Dec-13
M0
M2
Source: National Bank of Ukraine, Credit Suisse Source: National Bank of Ukraine, Credit Suisse
Private sector credit
growth (7.7% yoy in
November) has been
lagging accumulation of
deposits (20.5% yoy). In
early 2014, accumulation
of deposits stopped,
followed by a run on
deposits (a 7% decline) at
the peak of the street
violence in Kiev over 18-
20 February. The fiscal
position was very
precarious in early 2014,
with fiscal reserves
near zero.
Exhibit 341: Credit to the private sector Exhibit 342: Consolidated budget
% year-on-year change % of GDP, 12-month rolling
-30
-15
0
15
30
45
60
75
90
-30
-15
0
15
30
45
60
75
90
Dec-08 Dec-09 Dec-10 Dec-11 Dec-12 Dec-13
Total (UAH equivalents)
in local currency
in FX (US$ equivalents)
21
22
23
24
25
26
27
28
29
30
-5
-4
-3
-2
-1
0
1
2
3
4
Dec-08 Dec-09 Dec-10 Dec-11 Dec-12 Dec-13
Overall balance (left scale)
Revenue
Expenditure
Source: National Bank of Ukraine, Credit Suisse Source: Economy Ministry, Credit Suisse
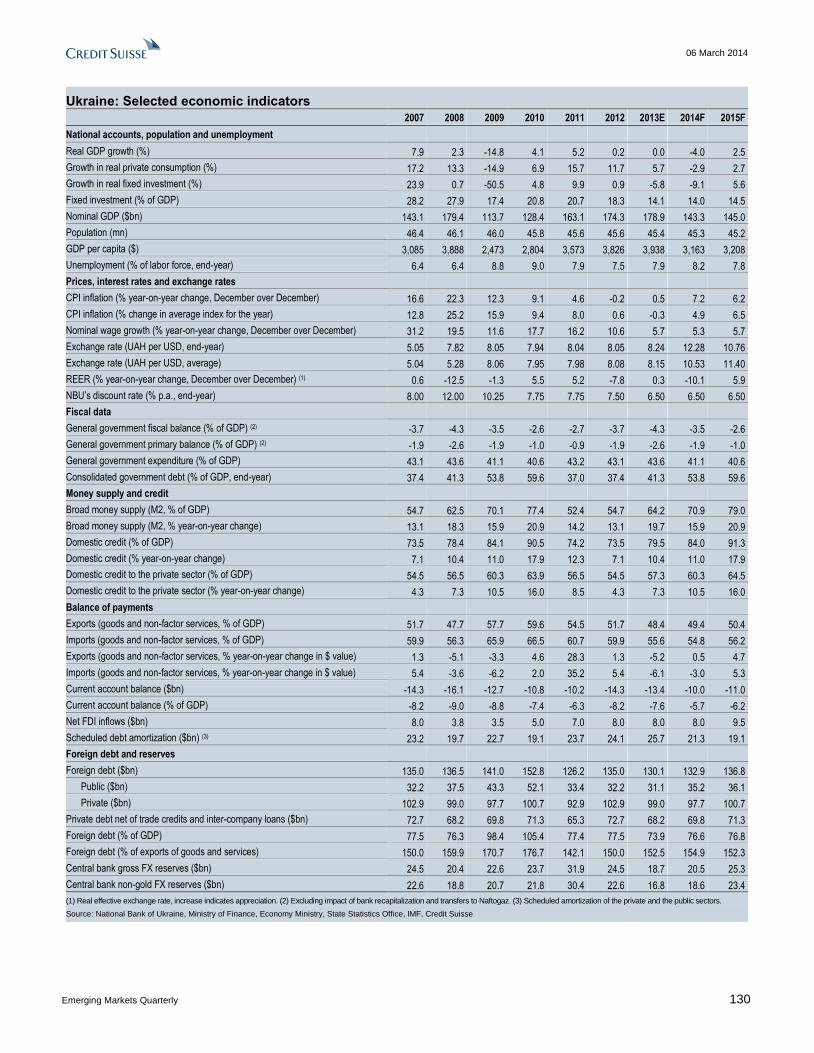
06 March 2014
Emerging Markets Quarterly 130
Ukraine: Selected economic indicators
2007 2008 2009 2010 2011 2012 2013E 2014F 2015F
National accounts, population and unemployment
Real GDP growth (%) 7.9 2.3 -14.8 4.1 5.2 0.2 0.0 -4.0 2.5
Growth in real private consumption (%) 17.2 13.3 -14.9 6.9 15.7 11.7 5.7 -2.9 2.7
Growth in real fixed investment (%) 23.9 0.7 -50.5 4.8 9.9 0.9 -5.8 -9.1 5.6
Fixed investment (% of GDP) 28.2 27.9 17.4 20.8 20.7 18.3 14.1 14.0 14.5
Nominal GDP ($bn) 143.1 179.4 113.7 128.4 163.1 174.3 178.9 143.3 145.0
Population (mn) 46.4 46.1 46.0 45.8 45.6 45.6 45.4 45.3 45.2
GDP per capita ($) 3,085 3,888 2,473 2,804 3,573 3,826 3,938 3,163 3,208
Unemployment (% of labor force, end-year) 6.4 6.4 8.8 9.0 7.9 7.5 7.9 8.2 7.8
Prices, interest rates and exchange rates
CPI inflation (% year-on-year change, December over December) 16.6 22.3 12.3 9.1 4.6 -0.2 0.5 7.2 6.2
CPI inflation (% change in average index for the year) 12.8 25.2 15.9 9.4 8.0 0.6 -0.3 4.9 6.5
Nominal wage growth (% year-on-year change, December over December) 31.2 19.5 11.6 17.7 16.2 10.6 5.7 5.3 5.7
Exchange rate (UAH per USD, end-year) 5.05 7.82 8.05 7.94 8.04 8.05 8.24 12.28 10.76
Exchange rate (UAH per USD, average) 5.04 5.28 8.06 7.95 7.98 8.08 8.15 10.53 11.40
REER (% year-on-year change, December over December) (1) 0.6 -12.5 -1.3 5.5 5.2 -7.8 0.3 -10.1 5.9
NBU’s discount rate (% p.a., end-year) 8.00 12.00 10.25 7.75 7.75 7.50 6.50 6.50 6.50
Fiscal data
General government fiscal balance (% of GDP) (2) -3.7 -4.3 -3.5 -2.6 -2.7 -3.7 -4.3 -3.5 -2.6
General government primary balance (% of GDP) (2) -1.9 -2.6 -1.9 -1.0 -0.9 -1.9 -2.6 -1.9 -1.0
General government expenditure (% of GDP) 43.1 43.6 41.1 40.6 43.2 43.1 43.6 41.1 40.6
Consolidated government debt (% of GDP, end-year) 37.4 41.3 53.8 59.6 37.0 37.4 41.3 53.8 59.6
Money supply and credit
Broad money supply (M2, % of GDP) 54.7 62.5 70.1 77.4 52.4 54.7 64.2 70.9 79.0
Broad money supply (M2, % year-on-year change) 13.1 18.3 15.9 20.9 14.2 13.1 19.7 15.9 20.9
Domestic credit (% of GDP) 73.5 78.4 84.1 90.5 74.2 73.5 79.5 84.0 91.3
Domestic credit (% year-on-year change) 7.1 10.4 11.0 17.9 12.3 7.1 10.4 11.0 17.9
Domestic credit to the private sector (% of GDP) 54.5 56.5 60.3 63.9 56.5 54.5 57.3 60.3 64.5
Domestic credit to the private sector (% year-on-year change) 4.3 7.3 10.5 16.0 8.5 4.3 7.3 10.5 16.0
Balance of payments
Exports (goods and non-factor services, % of GDP) 51.7 47.7 57.7 59.6 54.5 51.7 48.4 49.4 50.4
Imports (goods and non-factor services, % of GDP) 59.9 56.3 65.9 66.5 60.7 59.9 55.6 54.8 56.2
Exports (goods and non-factor services, % year-on-year change in $ value) 1.3 -5.1 -3.3 4.6 28.3 1.3 -5.2 0.5 4.7
Imports (goods and non-factor services, % year-on-year change in $ value) 5.4 -3.6 -6.2 2.0 35.2 5.4 -6.1 -3.0 5.3
Current account balance ($bn) -14.3 -16.1 -12.7 -10.8 -10.2 -14.3 -13.4 -10.0 -11.0
Current account balance (% of GDP) -8.2 -9.0 -8.8 -7.4 -6.3 -8.2 -7.6 -5.7 -6.2
Net FDI inflows ($bn) 8.0 3.8 3.5 5.0 7.0 8.0 8.0 8.0 9.5
Scheduled debt amortization ($bn) (3) 23.2 19.7 22.7 19.1 23.7 24.1 25.7 21.3 19.1
Foreign debt and reserves
Foreign debt ($bn) 135.0 136.5 141.0 152.8 126.2 135.0 130.1 132.9 136.8
Public ($bn) 32.2 37.5 43.3 52.1 33.4 32.2 31.1 35.2 36.1
Private ($bn) 102.9 99.0 97.7 100.7 92.9 102.9 99.0 97.7 100.7
Private debt net of trade credits and inter-company loans ($bn) 72.7 68.2 69.8 71.3 65.3 72.7 68.2 69.8 71.3
Foreign debt (% of GDP) 77.5 76.3 98.4 105.4 77.4 77.5 73.9 76.6 76.8
Foreign debt (% of exports of goods and services) 150.0 159.9 170.7 176.7 142.1 150.0 152.5 154.9 152.3
Central bank gross FX reserves ($bn) 24.5 20.4 22.6 23.7 31.9 24.5 18.7 20.5 25.3
Central bank non-gold FX reserves ($bn) 22.6 18.8 20.7 21.8 30.4 22.6 16.8 18.6 23.4
(1) Real effective exchange rate, increase indicates appreciation. (2) Excluding impact of bank recapitalization and transfers to Naftogaz. (3) Scheduled amortization of the private and the public sectors.
Source: National Bank of Ukraine, Ministry of Finance, Economy Ministry, State Statistics Office, IMF, Credit Suisse

06 March 2014
Emerging Markets Quarterly 131
Non-Japan Asia

06 March 2014
Emerging Markets Quarterly 132
Non-Japan Asia: Our high conviction calls By way of a summary, we have briefly outlined our highest conviction, mainly non-
consensus, economic calls, covering each of the ten non-Japan Asian economies we
follow. These are spelt out in more detail in the individual country sections as well as our
latest Focus Asia report.
China's comprehensive and ambitious reform plan should make significant
progress: Although some measures, particularly those designed to tackle the huge local
government debt problem, will hit growth in the short term, the platform for higher quality
economic growth over the medium to long term will continue to be laid, in our view.
Hong Kong property prices should start to fall this year, although a collapse is
likely to be avoided: Record-low transaction volumes do not bode well for property
prices, which have risen 135% over the past five years. But while prices look set to fall
we doubt they will collapse this year, underpinned to some extent by demand from the
mainland.
India policy rates to rise 75bps: The Reserve Bank of India is shifting its monetary
policy regime away from its existing dual mandate to a pure inflation target. We believe
the stated headline CPI objectives will be very hard to achieve, particularly without
government buy-in, and expect RBI Governor Rajan to deliver further rate increases –
25bps in each of the upcoming September, December and March quarters.
Indonesian domestic demand growth likely to disappoint and we expect 100bps of
policy rate cuts in H2: Likely ongoing weakness in commodity prices should keep a lid
on investment growth, while private consumption growth looks set to soften from Q2.
Meanwhile, we believe sharply lower inflation will mean Bank Indonesia cuts rates
100bps in the second half of the year.
Korea's economic recovery is most unlikely to be derailed by yen weakness or QE
tapering: In our view, the consensus is overestimating the impact these two factors will
have on GDP growth, which we expect to hold up reasonably well.
Malaysia GDP growth should shift towards investment and away from
consumption: Further subsidy cuts and a central bank keen to keep credit conditions
tight to contain property prices and consumer leverage should cap consumption growth.
Meanwhile, the government will likely press on with key infrastructure projects under the
ETP program.
Philippines' monetary policy too loose for too long and GDP growth expected to
surprise on the upside: We doubt the BSP will start to hike rates in 2014 as it is
likely to see the recent rise in inflation as transitory. Separately, analysts are probably
too pessimistic about 2014 GDP growth, overestimating the negative effects of
Typhoon Haiyan.
Singapore's supply-side constraints likely to become increasingly binding: A
further tightening of foreign labor restrictions should mean stronger GDP growth will be
accompanied by higher wage growth and CPI inflation.
Taiwan should enjoy stronger growth in 2014 despite recent disappointments:
While the country has yet to benefit much from stronger global growth, this is likely to
change somewhat this year as the nature of developed world demand broadens.
Thailand’s GDP growth expected to disappoint: We believe most market observers
are underestimating the sensitivity of the economy to the current political uncertainty.
Even when there is a new government, we believe its main focus will be on
governance reforms and scaling back controversial fiscal programs rather than adding
a major fiscal stimulus.
Dong Tao
+852 2101 7469
Robert Prior-Wandesforde
+65 6212 3707
Christiaan Tuntono
+852 2101 7409
Santitarn Sathirathai
+65 6212 5675
Weishen Deng
+852 2101 7162
Michael Wan
+65 6212 3418

06 March 2014
Emerging Markets Quarterly 133
Summary of non-Japan Asia economic forecasts
GDP growth (% yoy) CPI inflation (year end, % yoy) Policy rates (year-end, %)**
Current
Previous (as per last Global Quarterly) Current
Previous (as per last Global Quarterly) Current
Previous (as per last Global Quarterly)
2014F 2015F 2014F 2015F 2014F 2015F 2014F 2015F 2014F 2015F 2014F 2015F
China 7.3 7.9 7.7 8.2 3.5 3.6 4.0 4.1 6.00 6.00 6.00 6.00
Hong Kong 3.4 3.8 3.4 3.8 3.4 3.6 3.9 3.8 0.40 0.80 0.40 0.80
India* 6.0 6.3 6.6 6.9 8.0 6.5 - - 8.75 8.75 7.75 7.50
Indonesia 5.0 5.3 5.0 5.3 4.8 5.0 4.8 5.0 6.50 6.50 6.50 6.50
Korea 3.3 3.6 3.3 3.6 2.6 2.4 3.1 2.5 2.50 2.50 2.50 2.50
Malaysia 5.3 4.7 5.0 4.7 2.8 3.5 2.7 3.4 3.25 3.50 3.25 3.50
Philippines 7.0 6.8 6.8 6.8 3.2 3.7 4.1 3.8 3.50 4.00 3.50 4.25
Singapore 4.0 5.0 4.0 5.0 2.7 2.9 3.2 3.5 0.50 0.80 0.50 0.80
Taiwan 3.2 3.5 3.2 3.5 2.6 1.9 1.5 2.5 1.88 1.88 1.88 1.88
Thailand 2.0 4.5 4.5 5.0 2.8 3.0 2.6 3.0 2.00 2.50 2.50 3.00
NJA weighted average 6.2 6.7 6.6 7.0 4.3 4.1 4.6 4.4
NJCA weighted average 4.8 5.3 5.3 5.6 5.3 4.7 5.3 4.7
Note: IMF PPP weights are used to compute regional aggregate figures. *CPI for India. Forecasts for CPI not available in last Global Quarterly; fiscal years from April-March. **China: 1 year lending rate, Hong Kong: 3m HIBOR, India: repo rate, Indonesia: overnight rate, Korea: overnight rate, Malaysia: overnight rate, Philippines: reverse repo rate, Singapore: 3m SIBOR, Taiwan: rediscount rate, Thailand: overnight repo rate. Source: CEIC, Credit Suisse
Summary macroeconomic data: GDP growth
3Q 13 4Q 13 1Q 14F 2Q 14F 3Q 14F 4Q 14F 1Q 15F 2Q 15F 3Q 15F 4Q 15F
Nominal GDP ($bn) Real GDP growth (% quarter on quarter, seasonally adjusted annual rate)
2013F 2014F 2015F
NON-JAPAN ASIA 15,022.6 16,149.8 17,786.9 6.3 6.3 6.2 6.0 6.1 6.3 6.9 6.8 6.6 7.0
NJA ex-China 5,923.2 6,250.8 6,796.8 3.0 5.1 6.5 4.4 4.2 4.7 6.1 5.3 4.9 6.1
NJA ex-China and India 4,061.1 4,220.8 4,524.1 3.7 5.1 3.0 3.8 4.0 4.6 4.5 4.3 4.8 5.0
China 9,099.4 9,899.0 10,990.1 9.1 7.4 6.0 7.4 7.8 7.8 7.6 8.2 8.1 7.8
Hong Kong 272.1 287.4 302.6 6.8 5.1 3.3 3.1 -1.6 5.0 6.2 4.0 3.8 1.8
India 1,862.1 2,030.0 2,272.7 2.0 5.1 10.8 5.1 4.4 4.8 8.1 6.6 5.1 7.6
Indonesia 836.3 842.3 927.0 5.3 6.7 4.3 3.9 4.8 6.1 5.2 4.9 5.4 6.3
Korea 1,198.6 1,295.5 1,364.5 4.5 4.0 3.1 2.4 2.5 2.9 3.4 4.5 4.9 4.8
Malaysia 316.6 324.9 347.8 7.0 9.1 2.4 4.5 4.9 5.3 5.7 2.8 4.5 4.9
Philippines 272.0 282.5 311.8 5.2 6.1 8.2 7.4 7.4 7.0 6.6 6.6 6.6 6.1
Singapore 295.8 307.3 328.7 0.3 6.1 -0.4 5.3 5.7 5.7 5.3 4.3 3.9 3.9
Taiwan 487.2 497.5 519.1 1.4 5.8 2.8 2.6 3.4 2.1 3.4 4.4 4.7 4.6
Thailand 382.6 383.5 422.7 5.8 2.4 -9.0 4.7 13.8 9.9 -5.4 1.4 11.2 8.4
Note: IMF PPP weights are used to compute regional aggregate figures.
Source: the BLOOMBERG PROFESSIONAL™ service, national statistical offices, Credit Suisse

06 March 2014
Emerging Markets Quarterly 134
China: Embracing higher risks Growth is expected to surprise on the downside, even after the market has turned
significantly more bearish on China. This time, the surprise comes from the low end
of consumption as a result of the anti-corruption campaign. Orders from SOEs and
government bodies have fallen dramatically, as executives and officials, nervous about
attracting corruption probes, have suspended spending, even on projects that seem
legitimate to us (for details, see our note China: Themes for 2014 - R³: Retreat, Reform
and Risk, 29 January). Public works-related spending accounts for 20% of total retail
sales and we think that the economy is growing at 6% SAAR for 1Q 2014, though year-
on-year growth at 7.3% is benefitting from an extraordinarily favorable base effect. The
luxury end of consumption has suffered as well.
Fixed asset investment also seems to be moderating, due to the anti-corruption
campaign and shrinking shadow banking financing. However, the weakness is
covered by strong land acquisitions which are included in fixed asset investment but not
in the gross capital formation in GDP under the national accounts. Industrial production
has softened too, as reflected in the poor PMI figures, though bad weather could be
partially blamed for the slow production in February. We consider this to be the cost of
reforms, which should be positive for long-term growth.
Government response to the growth slowdown may be late and limited in size, in
our judgment. (1) It is politically incorrect to complain about the slowdown as the clamp
down on corruption has been engineered by senior leaders and endorsed by the
National People’s Congress (NPC). (2) The threshold for stimulus is higher for this
administration than the previous one. (3) The decision-making center seems to have
shifted from the state council to the president's office. This undermines the power of the
premier to launch counter-cyclical measures. We expect a minor stimulus around mid-
year, which could stabilize the economy but without much upward momentum.
Credit cycle has turned after a decade of expansion, in our view. The PBoC
started to drain liquidity through open market operations in June 2013. SHIBOR is
clearly on the rise, even after stripping out mid-year, year-end, and Chinese New Year
seasonality. China as a whole has no shortage of liquidity as the real economy
undertakes limited investment and SOEs always have access to bank lending. The
property sector is flooded with liquidity with only some areas, e.g., smaller banks,
developers, and local governments finding themselves short of liquidity. We expect the
central bank to continue to drain liquidity gently though we do not rule out the PBoC
returning liquidity tactically when the market is in panic before withdrawing it again.
New total social financing stood at RMB2.6tn and bank credit was RMB1.3tn in
January, growing by 17.8% and 14.3% yoy respectively. These are solid numbers
compared to 4Q 2013 data, but lending activity is usually high in the beginning of the
year. We expect the government to rein in shadow banking activity a little in 1H 2014,
but show more tolerance as the economy loses growth momentum. Bank lending has
become less important as shadow banking counts for more than 40% of total lending
and the key credit channel for marginal lending. Wealth management products and trust
funds, each exceeding RMB10tn, are the pillars of funding nowadays.
Credit default risks related to local government are on the rise, in our view. China
has RMB3.5tn in local debt maturing this year, by far the largest in history. Trust
funds alone have about RMB2.3tn coming due in 2H 2014. This batch of trust funds,
mainly lending to local governments, was incorporated in 2012 and we see higher risks
than with previous batches which lent largely to the property sector. In our opinion, the
near-default related to a product from the China Credit Trust may happen frequently
after May and much more frequently during the summer. Unlike bank lending, shadow
banking is funded by millions of individual investors who could be more sentiment
driven. Policy errors could trigger a chain reaction that would amplify the systematic risk
in the shadow banking system.
Dong Tao
+852 2101 7469
Weishen Deng
+852 2101 7162

06 March 2014
Emerging Markets Quarterly 135
The latest report from the National Audit Office suggests RMB20.7tn in
government-related direct debt and RMB10.9tn in local direct debt. We suspect an
underestimation at the local debt level, especially in local government investment
vehicles, the segment with high default risk. Local government infrastructure projects are
mainly long-term utility investments but are funded by short-term capital, with an obvious
duration mismatch. While Beijing is setting up a mechanism for future funding (e.g.,
municipal bond market, rating agency), it has not done enough to address the existing
local debt issue. Beijing seems keen to “teach the local officials a lesson” to stop moral
hazards, but that may be cause for concern. Further, structured products tend to bundle
risks together, so a few defaults potentially could provoke bigger problems.
Export picture looks a little brighter, with 10.6% yoy rise in January. The global
recovery, led by the developed world, does help, though we are skeptical about double-
digit export growth as the acceleration in global GDP growth is fuelled by reduced fiscal
drag rather than a large rise in demand. We expect weak imports, as infrastructure
investment slows down. However, we are observing rising demand for commodities for
financial use, as importers seek collateral for credit.
We think it is unlikely that Beijing will launch harsh policies against the property
sector in the near future. This is the only growth engine that is still on the rise, critical
for maintaining the economy afloat. China has a very high savings rate and with a closed
capital account. Besides wealth management products, the public needs vehicles for
storing value. Housing fits that purpose well. Unlike the Wen administration, the present
government prefers market-based measures, e.g., mortgage rates and land supply, to
cool off speculation. Without the launch of a property tax, local housing probably can
hold up well. We do think the high prices in the tier 1 cities and high inventory in the
lower tier cities pose a threat to housing prices, but that risk does not seem imminent.
RMB exchange rate saw some large devaluations lately. We believe that the PBoC
attempted to introduce volatility to stop the “one-way focus” mentality in the FX market.
This has triggered large-scale unwinding of structured products in the offshore market
and carry trades among domestic players. We still expect the RMB to appreciate against
the USD beyond this round of “lesson teaching” because Beijing cannot afford to turn
around the expectation of RMB appreciation as it may result in capital flight. Meanwhile,
infrastructure build-up in RMB internationalization continues, with further easing in QFII
and QDII schemes and more functions being added to the offshore centers on the
horizon.
We expect more executions on structural reforms. In the third plenary session of the
party congress last November, 60 reform initiatives were revealed. This is the most
comprehensive and ambitious reform package seen in the history of the People’s
Republic. The success of these reforms very much depends on details and execution,
but if half of the plan goes through, China would look very different five to seven years
down the road. President Xi is driving the reforms very hard, with the establishment of
the Comprehensive and Deepening Reform Commission. We expect details about fiscal
reforms and SOE reforms to become available to the public in the near future.

06 March 2014
Emerging Markets Quarterly 136
Growth is expected to
surprise to the downside,
even after the market turns
significantly more bearish.
Chinese New Year Retail
sales growth in 2014 was
the lowest since 2007,
dragged down by the anti-
corruption campaign.
Exhibit 343: GDP growth Exhibit 344: Chinese New Year sales growth
3
4
5
6
7
8
9
10
11
12Real GDPGrowth(%SAAR)
CSForecast
June 13, stimuluswas launched.
May 12, stimuluswas launched.
New regulations were launched against shadow banking.
PBoC started to drain liquidity and anti-corruption campaign.
Anti-speculation measures in housing sector.
?
13
14
15
16
17
18
19
20
2007 2008 2009 2010 2011 2012 2013 2014
Chinese New Year Catering and Retail SalesGrowth (%)
13.3
Source: NBS, Credit Suisse estimates Source: The Ministry of Commerce, Credit Suisse
The deteriorating PMI
readings suggest an
underlying weakness in
industrial activity.
The very soft CPI provides
another data point that
reflects weakened overall
domestic demand.
Exhibit 345: HSBC PMI vs. NBS PMI Exhibit 346: CPI inflation
35.0
40.0
45.0
50.0
55.0
60.0
65.0
Feb-0
8
Au
g-0
8
Feb-0
9
Au
g-0
9
Feb-1
0
Au
g-1
0
Feb-1
1
Au
g-1
1
Feb-1
2
Au
g-1
2
Feb-1
3
Au
g-1
3
Feb-1
4
NBS PMI (sa)
HSBC PMI (sa)Feb NBS PMI :50.2
Feb HSBC PMI :48.5
2.7
8.7
1.0
2.7
4.94.5
3.2
2.5
0.0
1.0
2.0
3.0
4.0
5.0
6.0
7.0
8.0
9.0
07 08 09 10 11 12 13 14
Headline CPI Inflation in theChinese New Year month(% yoy)
Source: NBS, Markit Economics, Credit Suisse Source: NBS, Credit Suisse
The credit cycle has turned
around and M2 growth has
slowed down since the
PBoC started to withdraw
liquidity through its open
market operations.
Exhibit 347: Total social credit and M2 growth
Exhibit 348: PBoC’s net injection into the Open Market
0
5
10
15
20
25
30
35
40
Jan
-09
Jun
-09
Nov-0
9
Ap
r-10
Se
p-1
0
Feb-1
1
Jul-1
1
Dec-1
1
Ma
y-1
2
Oct-1
2
Ma
r-13
Au
g-1
3
Jan
-14
Total Credit(%yoy)
M2(%yoy)
17.8
13.2
-250
-200
-150
-100
-50
0
50
100
150
200
30
.Ma
r.1
24.M
ay.1
28.J
un.1
213.J
ul.1
21
7.A
ug
.12
21
.Se
p.1
226.O
ct.12
30.N
ov.1
24.J
an.1
38.F
eb
.13
15
.Ma
r.1
319.A
pr.
13
24.M
ay.1
328.J
un.1
32.A
ug.1
36.S
ep.1
311.O
ct.13
12.N
ov.1
320.D
ec.1
324.J
an.1
428.F
eb.1
4
Net Injection intothe Open Market (4-week movingaverage, Rmb bn)
Source: PBoC, CEIC, Credit Suisse Source: PBoC, CEIC, Credit Suisse

06 March 2014
Emerging Markets Quarterly 137
Interbank interest rates are
on the rise after stripping
out seasonality.
Shadow banking is the key
credit channel for marginal
new lending.
Exhibit 349: Interbank rates Exhibit 350: Total social credit to GDP ratio
3.5
4.0
4.5
5.0
5.5
6.0
6.5
0.0
2.0
4.0
6.0
8.0
10.0
12.0
14.0 1W Repo -lhs
1M Shibor quarterly average -rhs
70
90
110
130
150
170
190Total social credit*-to-GDP(%)
Loan-to-GDP(%)
* Based on PBoC's total social financing
Source: PBoC, CEIC, Credit Suisse Source: PBoC, CEIC, Credit Suisse
We expect to see a peak of
trust fund repayments in 2H
2014 when RMB2.3tn is due
to mature.
Trade growth seemed a little
brighter in January, helped
by the global recovery, but
we are skeptical about
double-digit export growth.
Exhibit 351: Trust fund repayment Exhibit 352: Trade Growth
0
200
400
600
800
1,000
1,200
1,400
1,600
1,800 Trust fund repayment of 14,348 products(Rmb bn)
1 Trillion line
-40
-20
0
20
40
60
80
-25
-15
-5
5
15
25
35
45
Export growth (%yoy, 3m mav) -lhs
Import growth (%yoy, 3m mav) -rhs
Source: WIND, Credit Suisse Source: General Administration of Customs, Credit Suisse
The PBoC attempted to
introduce volatility to stop
the “one-way focus”
mentality in the FX market.
With higher volatility, we
expect the CNY to stay on
an appreciation track
against the USD.
Exhibit 353: CNY deviation from central bank’s fixing Exhibit 354: USDCNY exchange rate
-1.5
-1.0
-0.5
0.0
0.5
1.0
1.5
2010 2011 2012 2013
% deviation of CNY spot from daily fix
Onshore CNY daily trading band around fixing
6.00
6.10
6.20
6.30
6.40
6.50
6.60
6.70
6.80
Mar-
11
Jun
-11
Se
p-1
1
Dec-1
1
Mar-
12
Jun
-12
Se
p-1
2
Dec-1
2
Mar-
13
Jun
-13
Se
p-1
3
Dec-1
3
Mar-
14
USDCNY
Source: CEIC, Credit Suisse Source: CEIC, Credit Suisse
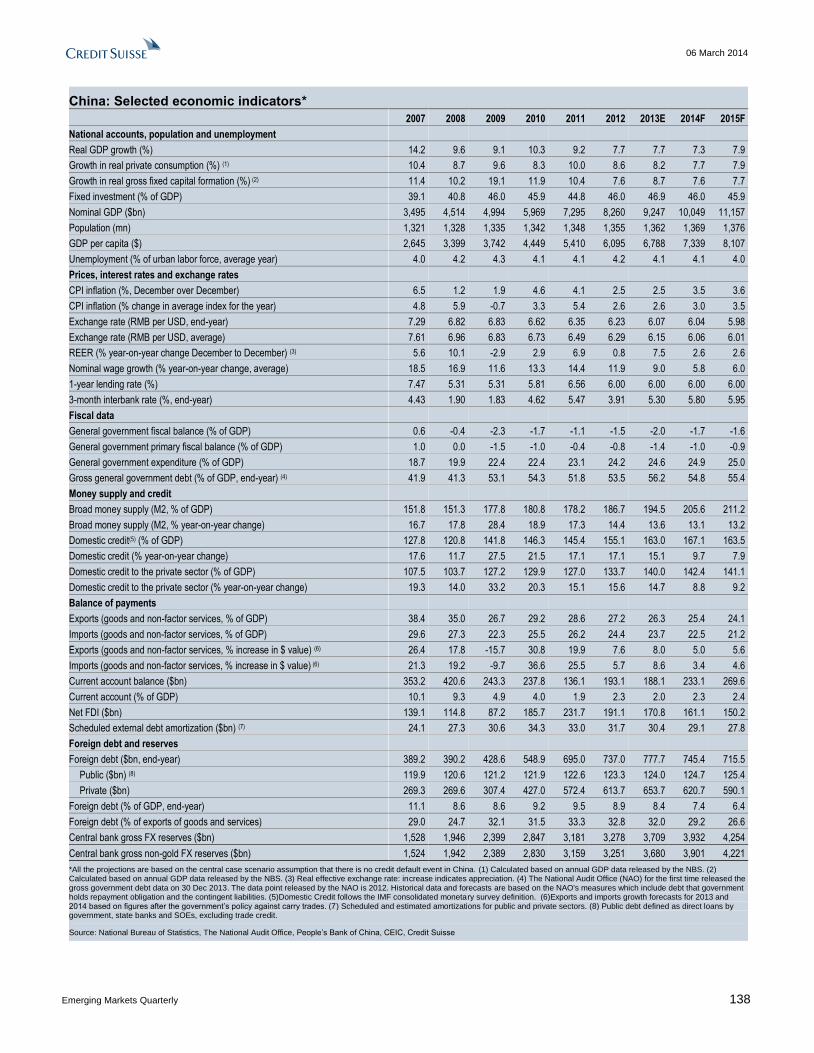
06 March 2014
Emerging Markets Quarterly 138
China: Selected economic indicators*
2007 2008 2009 2010 2011 2012 2013E 2014F 2015F
National accounts, population and unemployment
Real GDP growth (%) 14.2 9.6 9.1 10.3 9.2 7.7 7.7 7.3 7.9
Growth in real private consumption (%) (1) 10.4 8.7 9.6 8.3 10.0 8.6 8.2 7.7 7.9
Growth in real gross fixed capital formation (%) (2) 11.4 10.2 19.1 11.9 10.4 7.6 8.7 7.6 7.7
Fixed investment (% of GDP) 39.1 40.8 46.0 45.9 44.8 46.0 46.9 46.0 45.9
Nominal GDP ($bn) 3,495 4,514 4,994 5,969 7,295 8,260 9,247 10,049 11,157
Population (mn) 1,321 1,328 1,335 1,342 1,348 1,355 1,362 1,369 1,376
GDP per capita ($) 2,645 3,399 3,742 4,449 5,410 6,095 6,788 7,339 8,107
Unemployment (% of urban labor force, average year) 4.0 4.2 4.3 4.1 4.1 4.2 4.1 4.1 4.0
Prices, interest rates and exchange rates
CPI inflation (%, December over December) 6.5 1.2 1.9 4.6 4.1 2.5 2.5 3.5 3.6
CPI inflation (% change in average index for the year) 4.8 5.9 -0.7 3.3 5.4 2.6 2.6 3.0 3.5
Exchange rate (RMB per USD, end-year) 7.29 6.82 6.83 6.62 6.35 6.23 6.07 6.04 5.98
Exchange rate (RMB per USD, average) 7.61 6.96 6.83 6.73 6.49 6.29 6.15 6.06 6.01
REER (% year-on-year change December to December) (3) 5.6 10.1 -2.9 2.9 6.9 0.8 7.5 2.6 2.6
Nominal wage growth (% year-on-year change, average) 18.5 16.9 11.6 13.3 14.4 11.9 9.0 5.8 6.0
1-year lending rate (%) 7.47 5.31 5.31 5.81 6.56 6.00 6.00 6.00 6.00
3-month interbank rate (%, end-year) 4.43 1.90 1.83 4.62 5.47 3.91 5.30 5.80 5.95
Fiscal data
General government fiscal balance (% of GDP) 0.6 -0.4 -2.3 -1.7 -1.1 -1.5 -2.0 -1.7 -1.6
General government primary fiscal balance (% of GDP) 1.0 0.0 -1.5 -1.0 -0.4 -0.8 -1.4 -1.0 -0.9
General government expenditure (% of GDP) 18.7 19.9 22.4 22.4 23.1 24.2 24.6 24.9 25.0
Gross general government debt (% of GDP, end-year) (4) 41.9 41.3 53.1 54.3 51.8 53.5 56.2 54.8 55.4
Money supply and credit
Broad money supply (M2, % of GDP) 151.8 151.3 177.8 180.8 178.2 186.7 194.5 205.6 211.2
Broad money supply (M2, % year-on-year change) 16.7 17.8 28.4 18.9 17.3 14.4 13.6 13.1 13.2
Domestic credit(5) (% of GDP) 127.8 120.8 141.8 146.3 145.4 155.1 163.0 167.1 163.5
Domestic credit (% year-on-year change) 17.6 11.7 27.5 21.5 17.1 17.1 15.1 9.7 7.9
Domestic credit to the private sector (% of GDP) 107.5 103.7 127.2 129.9 127.0 133.7 140.0 142.4 141.1
Domestic credit to the private sector (% year-on-year change) 19.3 14.0 33.2 20.3 15.1 15.6 14.7 8.8 9.2
Balance of payments
Exports (goods and non-factor services, % of GDP) 38.4 35.0 26.7 29.2 28.6 27.2 26.3 25.4 24.1
Imports (goods and non-factor services, % of GDP) 29.6 27.3 22.3 25.5 26.2 24.4 23.7 22.5 21.2
Exports (goods and non-factor services, % increase in $ value) (6) 26.4 17.8 -15.7 30.8 19.9 7.6 8.0 5.0 5.6
Imports (goods and non-factor services, % increase in $ value) (6) 21.3 19.2 -9.7 36.6 25.5 5.7 8.6 3.4 4.6
Current account balance ($bn) 353.2 420.6 243.3 237.8 136.1 193.1 188.1 233.1 269.6
Current account (% of GDP) 10.1 9.3 4.9 4.0 1.9 2.3 2.0 2.3 2.4
Net FDI ($bn) 139.1 114.8 87.2 185.7 231.7 191.1 170.8 161.1 150.2
Scheduled external debt amortization ($bn) (7) 24.1 27.3 30.6 34.3 33.0 31.7 30.4 29.1 27.8
Foreign debt and reserves
Foreign debt ($bn, end-year) 389.2 390.2 428.6 548.9 695.0 737.0 777.7 745.4 715.5
Public ($bn) (8) 119.9 120.6 121.2 121.9 122.6 123.3 124.0 124.7 125.4
Private ($bn) 269.3 269.6 307.4 427.0 572.4 613.7 653.7 620.7 590.1
Foreign debt (% of GDP, end-year) 11.1 8.6 8.6 9.2 9.5 8.9 8.4 7.4 6.4
Foreign debt (% of exports of goods and services) 29.0 24.7 32.1 31.5 33.3 32.8 32.0 29.2 26.6
Central bank gross FX reserves ($bn) 1,528 1,946 2,399 2,847 3,181 3,278 3,709 3,932 4,254
Central bank gross non-gold FX reserves ($bn) 1,524 1,942 2,389 2,830 3,159 3,251 3,680 3,901 4,221
*All the projections are based on the central case scenario assumption that there is no credit default event in China. (1) Calculated based on annual GDP data released by the NBS. (2) Calculated based on annual GDP data released by the NBS. (3) Real effective exchange rate: increase indicates appreciation. (4) The National Audit Office (NAO) for the first time released the gross government debt data on 30 Dec 2013. The data point released by the NAO is 2012. Historical data and forecasts are based on the NAO's measures which include debt that government holds repayment obligation and the contingent liabilities. (5)Domestic Credit follows the IMF consolidated monetary survey definition. (6)Exports and imports growth forecasts for 2013 and 2014 based on figures after the government’s policy against carry trades. (7) Scheduled and estimated amortizations for public and private sectors. (8) Public debt defined as direct loans by government, state banks and SOEs, excluding trade credit.
Source: National Bureau of Statistics, The National Audit Office, People’s Bank of China, CEIC, Credit Suisse
06 March 2014
Emerging Markets Quarterly 139
Hong Kong: Looming long-term fiscal challenge Concerns over a weaker-than-expected US and global recovery and further
slowdown in China are posing uncertainty over our sanguine outlook on Hong
Kong's economy this year. The slide in the ISM index and the weakish US macro data
during the snow-heavy January have cast uncertainty on the strength of the global
recovery we expected to be seen this year. The Chinese economy may also see further
moderation, as the anti-corruption campaign and the turn of the credit cycle are expected
to weaken consumption and investment growth. We are concerned that any worse-than-
expected development in the two global economic giants would negatively affect Hong
Kong's exports and domestic demand this year.
Retail sales growth has stabilized at around mid-single digit level in recent months,
but we expect to see it slow in 2Q on a higher statistical base. The robust gold sales
last year have driven retail sales growth to surge between April and June. Since then, the
demand on gold has dissipated, and we do not expect to see the same rigor this year. On
the national account, we expect to see service export growth weaken in 2Q, narrowing the
contribution it makes to headline GDP.
We think the impasse in the property market would continue, until it is met with a
growth or interest rate shock. Home transactions remain very low, even worse than the
lows seen after the onset of the SARS epidemic in 2003. With interest rates not rising and
the global economy continuing on its gradual recovery, we do not see a strong catalyst to
break through the current stalemate. We maintain our view that although home prices are
pressured to decline at this juncture, the risk of a sharp fall remains low this year. We think
the most likely timing of a sharper drop in home prices could be in 2016, when the Fed is
expected to start normalizing the Fed funds rate.
Chief Executive Leung Chun-ying aims to bolster Hong Kong's economic
competitiveness, summarizing his measures in the second Policy Address. Focuses
of Leung's Policy Address are on the economy, social welfare, education, housing and
environmental protection. In the face of an aging population, we think Leung's initiatives
are important to maintain Hong Kong's productivity growth and to provide the necessary
support to the elderly and other social needies. Leung's policies were echoed by Financial
Secretary John Tsang in the Budget Speech, in which he provided the needed funding to
support the various industries and social welfare programs.
We think the key to resolving Hong Kong's long-term fiscal challenge lies in
correcting the inherent volatility of the revenue base. In the Budget Speech, Tsang
laid out the long-term fiscal challenge Hong Kong faces, but said that the government's
priorities remain on supporting economic growth to overcome the constraints posed by the
aging population. We think the real weakness of Hong Kong's fiscal structure lies in its
over reliance on a narrow and pro-cyclical revenue base. A revamp over the revenue
structure is needed, but Tsang has only recognized that without offering any solid plans to
tackle it. In our view, the government is at the very beginning stage of raising public
awareness on this fundamental issue, and that it may proceed cautiously in the coming
years to address it.
We have raised our projection on 2014's CPI inflation, as a number of government
subsidies were removed in the latest budget. The removal of the electricity tariff
subsidies and the scale down of the public rent waiver are expected to cause prices to
step up from a year ago. This should help offset the downward pressure on inflation led by
weaker imported food inflation and the peaking of commercial and residential rents. We
have raised our headline CPI inflation forecast for 2014 to 4.3%, from 3.8% previously,
and expect the underlying inflation rate to be at 3.6%.
The outlook for Hong Kong’s ratings appears stable. An adjustment remains unlikely
over the next six months, in our view. Hong Kong is rated Aa1 (Moody’s), AAA (S&P) and
AA+ (Fitch).
Christiaan Tuntono
+852 2101 7409
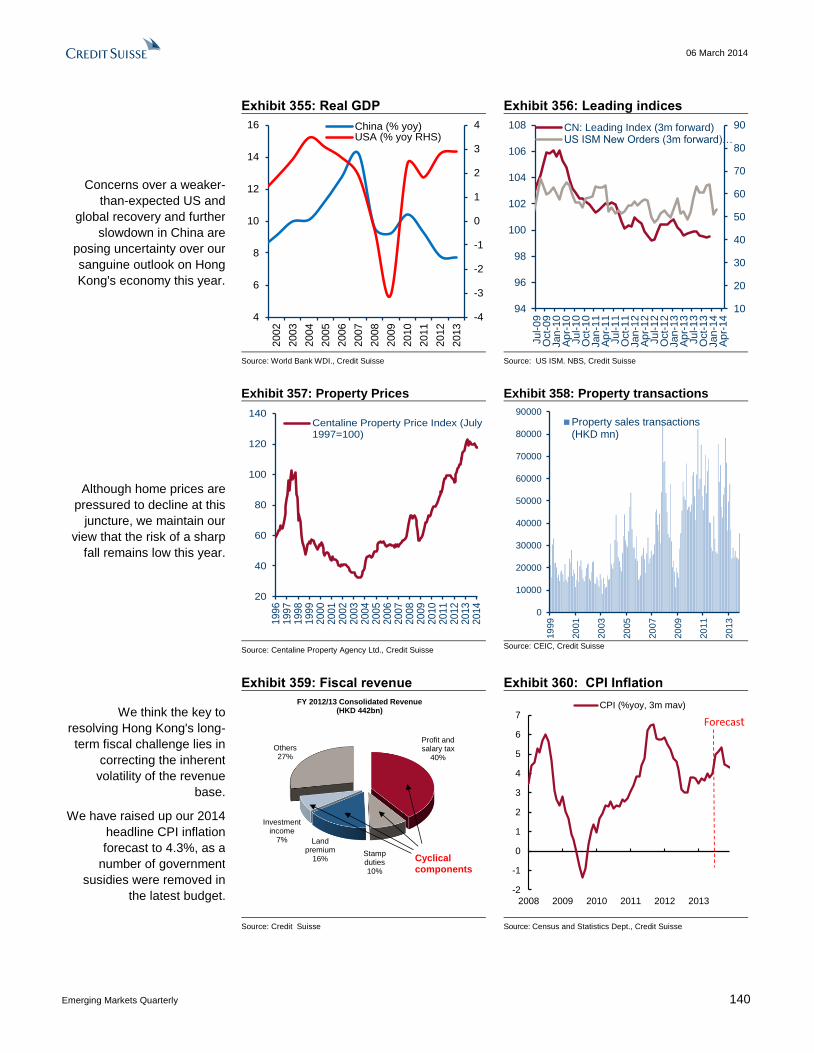
06 March 2014
Emerging Markets Quarterly 140
Concerns over a weaker-
than-expected US and
global recovery and further
slowdown in China are
posing uncertainty over our
sanguine outlook on Hong
Kong's economy this year.
Exhibit 355: Real GDP Exhibit 356: Leading indices
-4
-3
-2
-1
0
1
2
3
4
4
6
8
10
12
14
16
2002
2003
2004
2005
2006
2007
2008
2009
2010
2011
2012
2013
China (% yoy)USA (% yoy RHS)
10
20
30
40
50
60
70
80
90
94
96
98
100
102
104
106
108
Jul-0
9O
ct-
09
Jan
-10
Ap
r-10
Jul-1
0O
ct-
10
Jan
-11
Ap
r-11
Jul-1
1O
ct-
11
Jan
-12
Ap
r-12
Jul-1
2O
ct-
12
Jan
-13
Ap
r-13
Jul-1
3O
ct-
13
Jan
-14
Ap
r-14
CN: Leading Index (3m forward)US ISM New Orders (3m forward)…
Source: World Bank WDI., Credit Suisse Source: US ISM. NBS, Credit Suisse
Although home prices are
pressured to decline at this
juncture, we maintain our
view that the risk of a sharp
fall remains low this year.
Exhibit 357: Property Prices Exhibit 358: Property transactions
20
40
60
80
100
120
140
1996
1997
1998
1999
2000
2001
2002
2003
2004
2005
2006
2007
2008
2009
2010
2011
2012
2013
2014
Centaline Property Price Index (July1997=100)
0
10000
20000
30000
40000
50000
60000
70000
80000
90000
19
99
20
01
20
03
20
05
20
07
20
09
20
11
20
13
Property sales transactions(HKD mn)
Source: Centaline Property Agency Ltd., Credit Suisse Source: CEIC, Credit Suisse
We think the key to
resolving Hong Kong's long-
term fiscal challenge lies in
correcting the inherent
volatility of the revenue
base.
We have raised up our 2014
headline CPI inflation
forecast to 4.3%, as a
number of government
susidies were removed in
the latest budget.
Exhibit 359: Fiscal revenue Exhibit 360: CPI Inflation
Profit and salary tax
40%
Stamp duties10%
Land premium
16%
Investment income
7%
Others27%
FY 2012/13 Consolidated Revenue (HKD 442bn)
Cyclical components
-2
-1
0
1
2
3
4
5
6
7
2008 2009 2010 2011 2012 2013
CPI (%yoy, 3m mav)
Forecast
Source: Credit Suisse Source: Census and Statistics Dept., Credit Suisse

06 March 2014
Emerging Markets Quarterly 141
Hong Kong: Selected economic indicators
2007 2008 2009 2010 2011 2012 2013E 2014F 2015F
National accounts, population and unemployment
Real GDP growth (%) 6.4 2.1 -2.3 6.8 4.5 1.5 2.9 3.4 3.8
Growth in real private consumption (%) 7.8 1.9 0.2 6.1 8.4 4.1 4.2 3.8 3.7
Growth in real fixed investment (%) 4.2 1.4 -3.5 7.7 10.2 6.8 3.3 5.0 7.4
Fixed investment (% of GDP) 20.4 22.4 22.1 22.3 23.5 24.8 24.8 25.2 26.1
Nominal GDP ($bn) 207.2 218.9 212.7 227.7 248.0 261.2 272.1 287.4 302.6
Population (mn) 6.9 7.0 7.0 7.1 7.1 7.1 7.1 7.2 7.2
GDP per capita ($) 29,828 31,285 30,277 32,281 35,010 36,718 38,100 40,079 42,023
Unemployment (% of labor force, end-year) 3.4 3.8 5.5 4.0 3.2 3.5 3.3 3.3 3.2
Prices, interest rates and exchange rates
CPI inflation (%, December over December) 3.8 2.1 1.3 3.0 5.7 3.7 4.3 3.4 3.6
CPI inflation (% change in average index for the year) 2.0 4.3 0.5 2.4 5.3 4.1 4.3 4.3 3.5
Exchange rate (HKD per USD, end-year) 7.78 7.75 7.76 7.77 7.78 7.75 7.75 7.80 7.80
Exchange rate (HKD per USD, average) 7.78 7.78 7.75 7.77 7.78 7.76 7.75 7.78 7.80
REER (% year-on-year change December to December) (1) -5.9 0.6 -1.9 -4.4 0.6 2.4 3.4 2.9 2.1
Nominal wage growth (% year-on-year change, average) 2.6 3.4 -1.0 2.5 6.0 2.0 3.3 2.4 2.6
3-month HIBOR (%, end-year) 3.5 1.0 0.1 0.3 0.3 0.4 0.4 0.4 0.8
Fiscal data
General government fiscal balance (% of GDP) 7.7 0.1 1.6 4.2 3.8 3.2 0.6 0.8 -0.3
General government primary fiscal balance (% of GDP) 7.7 0.1 1.6 4.3 3.8 3.2 0.6 0.9 -0.2
General government expenditure (% of GDP) 14.6 18.5 17.6 17.0 18.8 18.5 20.5 18.3 19.9
Gross general government debt (% of GDP, end-year) (2) 1.2 1.0 0.7 0.6 0.6 0.5 0.5 0.5 0.5
Money supply and credit
Broad money supply (HKD M2, % of GDP) 203.1 193.2 210.3 211.6 219.0 231.8 250.1 256.0 262.0
Broad money supply (HKD M2, % year-on-year change) 18.1 -1.3 5.3 8.0 12.9 11.1 12.3 8.5 8.1
Domestic credit (% of GDP) 125.7 122.6 165.1 196.2 207.5 202.8 227.7 230.6 233.1
Domestic credit (% year-on-year change) 2.1 3.2 30.3 27.5 15.4 2.5 16.9 7.3 6.8
Domestic credit to the private sector (% of GDP) 140.0 140.6 154.8 192.2 208.8 218.8 233.8 247.5 259.8
Domestic credit to the private sector (% year-on-year change) 9.7 6.2 6.5 33.2 18.6 9.9 11.3 12.2 10.8
Balance of payments
Exports (goods and non-factor services, % of GDP) 207.3 208.8 191.2 219.4 225.5 225.5 230.0 238.2 249.0
Imports (goods and non-factor services, % of GDP) 196.4 198.6 183.4 213.5 221.6 224.4 229.0 237.5 249.0
Exports (goods and non-factor services, % increase in $ value) 10.8 6.0 -11.0 22.8 11.9 5.4 6.3 9.4 10.1
Imports (goods and non-factor services, % increase in $ value) 11.2 6.4 -10.3 24.7 13.0 6.6 6.3 9.5 10.4
Current account balance ($bn) 25.6 32.9 20.3 14.9 11.9 3.5 6.3 8.7 9.9
Current account (% of GDP) 12.4 15.0 9.6 6.6 4.8 1.3 2.3 3.0 3.3
Net FDI ($bn) -6.8 9.9 -3.7 -15.6 0.2 -9.3 -9.5 -9.5 -9.3
Scheduled external debt amortization ($ bn) (3) 18.6 13.3 10.3 11.4 11.8 11.9 12.2 13.2 14.2
Foreign debt and reserves
Foreign debt ($bn, end-year) (4) 85.6 50.1 79.0 100.7 125.8 133.9 133.7 135.9 141.0
Public ($bn) 2.2 2.3 1.7 1.7 1.5 1.9 1.9 2.0 2.1
Private ($bn) 83.3 47.9 77.3 98.9 124.3 132.0 131.8 134.0 138.9
Foreign debt (% of GDP, end-year) 41.3 22.9 37.1 44.2 50.7 51.3 49.1 47.3 46.6
Foreign debt (% of exports of goods and services) 19.9 11.0 19.4 20.1 22.5 22.7 21.4 19.9 18.7
Central bank gross FX reserves ($bn) 152.7 182.5 255.8 268.7 285.4 317.3 340.9 366.9 394.5
Central bank gross non-gold FX reserves ($bn) 152.7 182.5 255.8 268.7 285.4 317.3 340.9 366.9 394.5
(1) Real effective exchange rate, increase indicates appreciation. (2) Also includes debt issued under the Government Bond Program. Excludes debt guaranteed by the government. (3) Scheduled and estimated amortizations for total medium- and long-term public and private sector debt. (4) Non-bank foreign debt to Hong Kong entities.
Source: Census and Statistics Department, Hong Kong Monetary Authority, CEIC, Credit Suisse
06 March 2014
Emerging Markets Quarterly 142
India: Inflation fighting, dismal growth & election issues
A single-minded approach: Reserve Bank of India Governor Raguram Rajan has
made no secret of his desire to switch to an explicit inflation targeting regime, moving
away from the existing dual growth and inflation mandate. Arguably, he has already
started to practice what he has preached, justifying the unexpected January interest rate
hike on the basis that without such action consumer price inflation would probably
overshoot "the recommended disinflationary path" set by the Urjit Commitee. The latter
was set up Rajan himself in September last year and was chaired by Dr. Urjit Patel, a
deputy governor of the central bank. Amongst other things, it suggested the appropriate
headline CPI objectives should be 8% by January 2015, 6% by January 2016 and 4%
(+/- 2pp) thereafter. By way of context, inflation was 8.8% at the beginning of this year
and has averaged 8.4% since 2005.
Tough targets: Given the problems stubbornly high inflation has been causing in India
over recent years, these represent admirable objectives and ones that the governor
looks to have broadly accepted. The trouble is we think there is little chance of achieving
them and, by attempting to do so at this stage, could inflict unnecessary damage on
growth and the RBI's own credibility.
The importance of non-monetary factors: The crux of the problem is that inflation is
far from a pure monetary phenomenon in India. Food and fuel account for 57% of the
CPI basket (comfortably the highest in Asia), with prices heavily influenced by supply-
side factors and government policies. Simple arithemetic suggests if food and fuel
inflation was to remain at 9%, the core rate would need to fall to roughly 2% (from 8%
currently) to achieve a 6% headline inflation rate. While there is clear statistical evidence
that the repo rate influences inflation, the monetary tightening required to achieve this
would almost certainly be prohibitive.
Government buy-in is essential, but far from guaranteed: The government has much
greater, albeit far from complete, control over food and energy prices by setting
Minimum Support Prices for many agricultural products and the subsidised price of
some fuels (although the latter is being gradually dismantled). With this in mind, we
believe the government must fully buy into the project, something that, judging by
Finance Minister Chidambaram's recent comments, is most unlikely before this year's
general election and is far from guaranteed thereafter.
Further rate rises to come ...: Rajan has already raised the repo rate 75bps since he
took the helm at the RBI last September and although further rate increases are unlikely
to be required to meet the 8% inflation objective in January 2015, we expect him to
deliver three more 25bp repo rate hikes during the 2014/15 fiscal year. In our view,
these are most likely to come in the September, December, and March quarters as the
RBI begins to focus on achieving the 6% target, recognising the lags with which interest
rates work.
... which has led us to revise down our GDP growth forecast: With the prospect of
tighter monetary policy than we previously envisaged, we have lowered our 2014/15 and
2015/16 GDP growth projections by 60bps to 6.0% and 6.3% respectively. The former
compares with a consensus forecast of 5.4%, however, and is still at the top of the
consensus range (there is no formal consensus for 2015/16 yet, although it seems likely
we would be at or close to the top again). In our view, second-round effects from the
recent pick-up in agricultural growth, stronger investment reflecting replacement capex
as well as the first benefits of the Cabinet Commitee's efforts to unlock many stalled
projects, improved exports and lower inflation, which will boost real incomes, mean
economic activity is likely to outpace the gloomy prognosis of most India commentators.
Robert Prior-Wandesforde
+65 6212 3707

06 March 2014
Emerging Markets Quarterly 143
Growth still stuck in a sub-par steady state: While many forecasters overreacted to
the mini-crisis of August/September, slashing their 2013/14 forecasts close to 4% or
below in some cases, GDP growth in the December quarter could hardly be desribed as
stellar. On a year-on-year basis it actually slipped slightly to 4.7% from 4.8% in the
September quarter. Yes, growth probably bottomed in the June quarter (at 4.4%), but
the economy has now registered four consecutive GDP rises of less than 5%. For the
reasons mentioned, we expect growth to break out of this range shortly (while upward
revisions, not least to agricultural output, are entirely possible), but for now the economy
appears to be stuck in what may be termed a worrisome sub-par steady state.
What about India's double deficits? On the back of our GDP growth downgrades we
have also built in smaller current account deficits over the forecast period. Specifically,
we now look for the external shortfall to amount to 2.6% of GDP in 2014/15 and 2.9% in
2015/16, compared with 2.9% and 3.5% previously. The former still represents an
increase from the 2.2% of GDP outcome we anticipate in the current fiscal year, albeit
largely because we assume the authorities will ease existing duties and restrictions on
gold imports in the coming fiscal year. The helpful effect these measures have had is
illustrated by the fact that in the year to October (the latest available data), India's gold
imports fell US$5.7bn, explaining 60% of the improvement in the visible trade balance
over the same period. At the same time, we have opted to leave our central government
budget projections for 2014/15 and 2015/16 unchanged at 4.7% and 4.5% of GDP
respectively. Although economic growth is likely to be softer than previously imagined
we expect the new government, be it Congress or BJP-led, to keep the fiscal shortfall in
check in order to avoid a politically damaging ratings downgrade.
Bonds and the rupee: In reaction to the macroeconomic revisions we have made, our
local rates strategist has revised up his 10-year government bond yield forecast to 8.5%
from 8.0% for March 2015. He has, however, left his March 2016 projection at 8.0%,
implying an inverted yield curve. This is based largely on the view that inflation will have
fallen meaningfully by then, while the RBI will have improved its inflation-fighting
credentials and the budget deficit will remain under control. Finally, our foreign exchange
strategy team has revised its 12-month ahead INR forecast to 64.0 from 65.5 previously.
A smaller current account deficit and higher real interest rates are the two key reasons
for the change. (For more details of the issues surrounding the RBI's effective adoption
of inflation targeting see India's Risky Regime Shift).
Election effects: The current government must call a general election in the next couple
of months (its five-year term finishes on 31 May) and, according to all opinion polls,
Congress will win far fewer seats that the main oppoistion party – the BJP. At the same
time, however, the same polls suggest the BJP-led National Democratic Alliance (NDA),
will fall short of the 272 seats required for a majority in the lower house of parliament.
History suggests the opinion polls are often inaccurate, but at this stage the most likely
outcome is an NDA government relying on a few "fringe" parties to gain a parliamentary
majority. The previous BJP-led govenment of 1999-2004 privatized many companies,
encouraged foreign investment, set up export processing zones and gave the go ahead
to the so-called Golden-Quadilateral – a road network linking the cities of Delhi, Mumbai,
Kolkata, and Chennai. Further business/market friendly measures should be expected if
it returns to power, but it is unlikely to have a completely free rein.
Rating risk? The main rating agencies will almost certainty wait for the election results
and the first actions (including the budget) of the new government before coming to any
rating decision. We expect all of them to keep India at Investment Grade in 2014/15,
although it's fair to say our conviction level is low given the election uncertainties.

06 March 2014
Emerging Markets Quarterly 144
The production of durable
consumer goods has
collapsed in India, currently
falling more than at the
height of the global financial
crisis. By contrast, capital
goods production has
strengthened although it is
hardly stellar.
Although extremely
tentative, we see signs that
domestic motor vehicle
sales and mobile phone
subscriptions are finally
bottoming.
Exhibit 361: Consumer output collapse Exhibit 362: Finally bottoming?
-20
-10
0
10
20
30
40
50
60
70
06 07 08 09 10 11 12 13 14
Cap. goods*
Con. Durables**
Industrial Production (% yoy)
-30
-20
-10
0
10
20
30
40
50
60
-20
0
20
40
60
80
100
120
140
03 05 07 09 11 13
Cellular Sub.** (%yoy)
MV* sales (RHS, %yoy)
* Capital goods. ** Consumer durables. Source: CEIC, Credit Suisse
* Domestic motor vehicle sales. ** Mobile phone subscriptions. Source: CEIC, Credit Suisse
We have never found a
reliable lead indicator of
industrial or GDP growth in
India. One of the better
coincident indicators is the
Dun & Bradstreet survey
although even here the link
has weakened. For what it's
worth the series rose in the
March quarter, reaching its
highest level since the June
quarter of 2011.
In our view, GDP growth will
improve through 2014/15.
While we have cut our
growth forecast, our 6%
number is at the top of the
consensus range.
Exhibit 363: Confidence and GDP growth has bottomed
4
5
6
7
8
9
10
11
12
90
110
130
150
170
190
210
03 04 05 06 07 08 09 10 11 12 13 14 15
D&B* business optimism index (LHS) GDP growth (RHS)
F'cst
* Dun and Bradstreet. Source: CEIC, Credit Suisse
The RBI is now focusing
squarely on headline
consumer price inflation,
with Rajan seemingly intent
on getting it down to 8% in
January 2015 and 6% in
January 2016. While we
believe he has done enough
to achieve the former,
further rate increases are
likely to be necessary to
achieve the latter. We
expect 75bps of further repo
rate hikes in 2014/15.
Exhibit 364: Repo up, inflation down Exhibit 365: Real rate to turn positive
2
4
6
8
10
12
14
02 04 06 08 10 12 14 16
CPI (%yoy) Repo rate
F'cst
-10
-8
-6
-4
-2
0
2
4
02 04 06 08 10 12 14 16
Real repo rate (%)
F'cst
Source: Credit Suisse, CEIC Source: Credit Suisse, CEIC

06 March 2014
Emerging Markets Quarterly 145
India: Selected economic indicators
(Fiscal year beginning April) (1) 2007 2008 2009 2010 2011 2012 2013F 2014F 2015F
National accounts, population and unemployment
Real GDP growth (%)(2) 9.3 6.7 8.6 9.3 6.2 4.6 4.8 6.0 6.3
Growth in agricultural GDP (%) 5.8 0.1 0.8 8.6 5.0 1.4 4.2 3.4 2.5
Growth in industrial GDP (%) 9.7 4.4 9.2 7.6 7.8 1.0 0.7 4.7 6.5
Growth in services GDP (%) 10.3 10.0 10.5 9.7 6.6 7.0 6.8 7.1 7.0
Growth in real private consumption (%) 9.4 7.2 7.4 8.6 8.6 4.7 2.8 5.4 5.8
Growth in real fixed investment (%) 16.2 3.5 7.7 14.0 8.0 0.8 0.9 9.4 11.1
Fixed investment (% of GDP) 33.7 33.5 33.3 34.3 34.9 33.7 32.6 33.6 35.2
Nominal GDP ($bn) 1243 1226 1368 1711 1879 1851 1862 2030 2273
Population (mn) 1138 1154 1170 1186 1202 1217 1233 1249 1264
GDP per capita ($) 1092 1063 1169 1443 1566 1529 1510 1625 1798
Prices, interest rates and exchange rates
WPI inflation (% year-on-year change, fiscal year – March over March) 7.6 8.0 11.8 9.7 9.4 10.4 8.3 8.0 6.5
WPI inflation (% change in average index for the year) 5.9 9.2 10.6 9.5 9.5 10.2 9.5 8.0 7.0
Exchange rate (INR per USD, end-year) 40.4 51.2 45.5 45.0 50.9 54.3 62.0 64.0 64.0
Exchange rate (INR per USD, average) 40.1 45.9 47.4 45.5 47.9 54.4 60.5 63.3 64.0
REER (% year-on-year change, March over March) (3) 2.7 -11.5 14.3 3.1 -5.2 -2.7 -10.0 -1.5 1.0
Repo rate (%, end-year) (4) 7.75 5.00 5.00 6.75 8.50 7.50 8.00 8.75 8.75
Reverse repo rate (%, end-year) (4) 6.00 3.50 3.50 5.75 7.50 6.50 7.00 7.75 7.75
Fiscal data
General government fiscal balance (% of GDP) (5) -4.0 -8.3 -9.4 -6.8 -8.1 -7.2 -7.1 -7.2 -7.0
General government budget balance (% of GDP) excl. disinvestment receipts -4.9 -8.3 -9.7 -7.2 -8.3 -7.5 -7.3 -7.4 -7.2
Central government fiscal balance (% of GDP) (5) -2.5 -6.0 -6.4 -4.7 -5.7 -4.8 -4.6 -4.7 -4.5
Central government budget balance (% of GDP) excl. disinvestment receipts -3.5 -6.1 -6.7 -5.1 -5.9 -5.1 -4.8 -4.9 -4.7
Central government primary fiscal balance (% of GDP) 0.9 -2.6 -3.1 -1.8 -3.0 -1.8 -1.6 -1.6 -1.7
Central government expenditure (% of GDP) 14.3 15.8 15.6 15.2 14.5 13.9 13.5 13.6 13.8
Central government revenue (% of GDP) 11.7 9.8 9.3 10.5 8.7 9.1 8.9 8.9 9.3
Gross general government debt (% of GDP, end-year) 71.4 72.2 70.8 66.0 65.6 65.8 65.5 64.8 64.0
Money supply and credit
Broad money supply (M3, % of GDP) 80.6 85.2 86.5 83.6 81.7 82.9 85.2 86.3 89.2
Broad money supply (M3, % year-on-year change) 21.4 19.3 16.9 16.1 13.2 13.8 14.5 15.5 17.0
Domestic credit (% of GDP) 73.0 79.4 82.5 82.3 83.0 84.9 88.0 90.3 94.1
Domestic credit (% year-on-year change) 17.5 22.9 19.5 20.0 16.7 14.8 15.5 17.0 18.0
Domestic credit to the private sector (% of GDP) 55.0 56.9 57.0 57.2 57.1 58.6 60.5 62.3 65.5
Domestic credit to the private sector (% year-on-year change) 20.8 16.7 15.3 20.6 15.5 15.2 15.0 17.5 19.0
Balance of payments
Exports (goods and non-factor services, % of GDP) 20.6 23.7 20.3 22.3 23.9 24.3 26.2 27.2 27.9
Imports (goods and non-factor services, % of GDP) 24.9 29.4 26.3 27.1 30.6 31.3 30.7 32.2 33.5
Exports (goods and non-factor services, % year-on-year change in $ value) 26.6 13.3 -4.4 37.5 17.9 0.3 8.0 13.0 15.0
Imports (goods and non-factor services, % year-on-year change in $ value) 31.6 16.6 -0.1 28.8 24.2 1.1 -2.0 14.5 16.5
Current account balance ($bn) -15.7 -27.9 -38.4 -46.0 -78.2 -87.8 -40.0 -52.8 -65.9
Current account balance (% of GDP) -1.3 -2.3 -2.8 -2.7 -4.2 -4.7 -2.2 -2.6 -2.9
Net FDI inflows ($bn) 15.9 19.8 18.0 9.4 22.1 19.8 21.0 23.0 27.0
Foreign debt and reserves
Foreign debt ($bn) 224 224 261 318 346 392 420 440 460
Foreign debt (% of GDP) 18.1 18.3 19.1 18.6 18.4 21.1 22.6 21.7 20.2
Foreign debt (% of exports of goods and services) 87.5 77.2 94.6 83.4 76.7 86.7 86.0 79.7 72.5
Central bank gross FX reserves ($bn) 309.7 252.0 279.1 305.5 294.4 292.0 295.0 290.0 285.0
Central bank gross non-gold FX reserves ($bn) 299.7 242.4 261.1 282.5 267.4 266.4 270.0 265.0 260.0
(1) The years above are fiscal years beginning in April and ending in March, i.e., 2010 refers to the period of April 2010-March 2011, also written as FY2010/11. (2) Revised GDP series with base 2004-05. All historical ratios expressed as % of GDP may appear smaller since the revised GDP values in the new series (with base year of 2004) are higher. (3) Real effective exchange rate: an increase indicates appreciation. (4) The RBI uses a mix of instruments such as the repo rate, reverse repo rate, CRR (Cash Reserve Ratio), etc. (5) Note, effective from 2010, the central government includes proceeds from disinvestments as revenue in calculating the fiscal deficit.
Source: Ministry of Finance, Reserve Bank of India, CSO, CEIC, Credit Suisse

06 March 2014
Emerging Markets Quarterly 146
Indonesia: Re-balancing before rate cutting What a difference (a change of) year makes: After a fairly dismal 18 months,
Indonesia's markets have sprung to life this year – the equity market rising 7%, helped by
renewed foreign inflows totaling USD826mn; the rupiah appreciating from 12,200 to
11,560 against the US dollar; and the 10-year government bond yield falling sharply to
8.1% from 9.0%. All in all, not a bad performance and certainly better than we imagined a
few weeks ago when we argued there was "light at the end of the tunnel" for the country's
economy and markets (see Focus Asia, 1Q 2014).
Better fundamentals, but…: Recent economic data have generally been favourable,
although not startlingly so. For example, while GDP growth for the fourth quarter
unexpectedly strengthened (from 5.6% to 5.7%), leading some to argue that the economy
had bottomed, the pick-up largely reflected a temporary export boost as domestic growth
softened. The export surge, as companies attempted to beat the government's ban on the
sale of unprocessed mineral ores abroad, also helped the merchandise trade position
towards the end of last year, but Indonesia returned to deficit in January. Finally, headline
consumer price inflation dropped to a sub-consensus 7.7% in February (from 8.2%), albeit
entirely as a result of fall in food and fuel inflation – the core rate edged up to 4.6%.
Still worried about GDP growth: Looking ahead, we continue to see downside risks to
economic activity on several fronts. First, export growth will almost certainly weaken as the
ban on unprocessed mineral exports takes effect and Chinese domestic growth remains
relatively soft. Second, while private consumption growth is set to bounce in Q1, ahead of
the Parliamentary elections on 9 April, we expect it to slow through the rest of 2014 as the
lagged impact of the real income squeeze, mining/investment slowdown and the central
bank's 175bps of rate hikes bite. Third, we don't see a catalyst for a meaningful
improvement in capex, particularly while coal prices remain so depressed.
Trend trade improvement: The plus side of a further softening in domestic demand,
however, is that it will keep a firm lid on import growth, which we expect to underperform
exports. As such, we very much doubt the export ban (worth around 0.3% of GDP) will
prevent the merchandise trade and current account positions from continuing to trend
improve through 2014. Specifically, we expect the current account deficit to narrow to
2.8% of GDP this year from 3.3% in 2013. This would obviously be above Bank
Indonesia's 2% "target", although this should be seen as a more medium term objective.
Much more disinflation: The best macroeconomic news should come in the form of
sharply lower headline CPI inflation, which is set to fall close to 4% by July. Another
helpful, food-related base effect will see it drop further in March, while a big decline will
come in June and July when last year's 44% hike in the subsidised gasoline price drops
out of the annual comparison. This, of course, assumes the president will not raise the
subsidised fuel price further, but given he/she will probably only take power in September
(after a second round) and the most likely winner according to polls – current Jakarta
governor, Joko Widodo – opposed last year's increase this seems the most likely outcome.
Sticking with 100bps of cuts: We have removed our forecast of a final 25bp Bank
Indonesia rate hike and continue to expect the central bank to lower the policy rate by
100bps in the second half of this year. Although BI governor, Agus Martowardojo, recently
played down the chances of rate cuts in the context of rising international interest rates, we
find it hard to believe this will be avoided when, as seems likely, the real policy rate rises
by 3pp-3.5pp in July (the nominal policy rate is currently 7.5%). The politicians would likely
demand action if our central scenario plays out, while BI could argue it is simply taking its
foot of the brake rather than pressing the accelerator if it were to cut. Barring significant
turmoil in international markets, the rupiah is also unlikely to be badly affected and could
even strengthen to the extent the rate action encourages more in the way of bond and
equity inflows.
The bottom line: All in all, while markets may have overdone the optimism in the short
run, we believe the macroeconomic fundamentals generally bode well for the performance
of Indonesian rates and equities this year.
Robert Prior-Wandesforde
+65 6212 3707
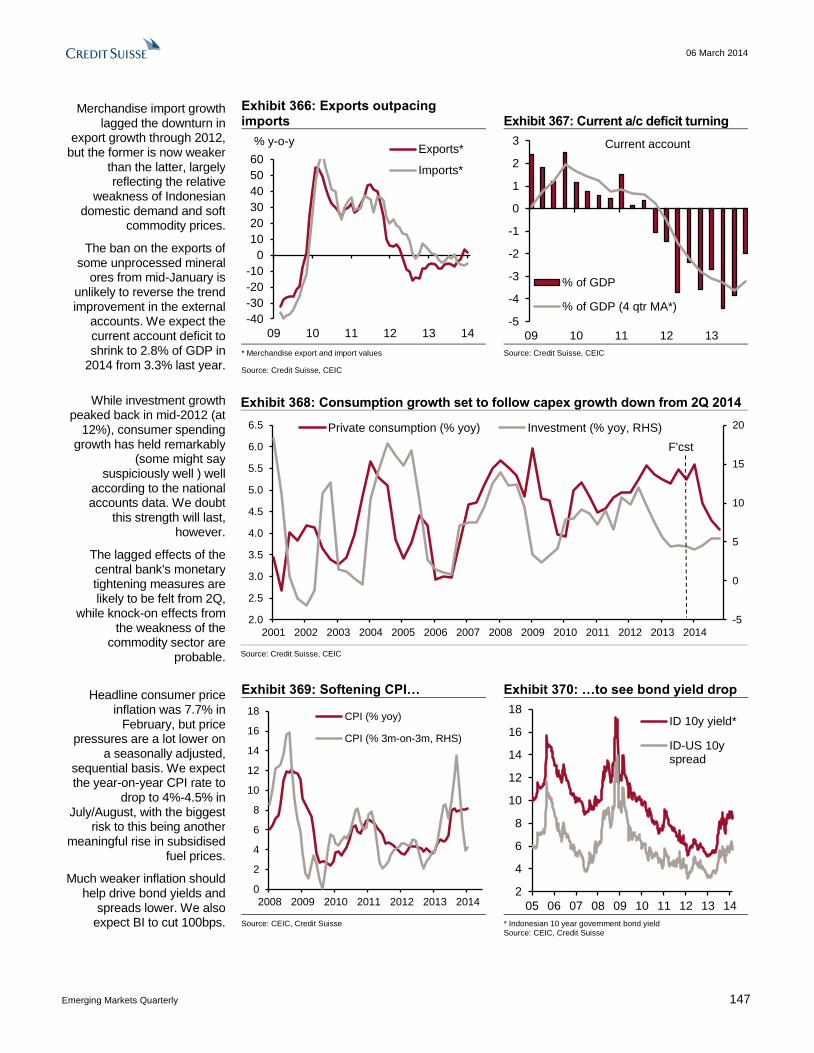
06 March 2014
Emerging Markets Quarterly 147
Merchandise import growth lagged the downturn in
export growth through 2012, but the former is now weaker
than the latter, largely reflecting the relative
weakness of Indonesian domestic demand and soft
commodity prices.
The ban on the exports of some unprocessed mineral
ores from mid-January is unlikely to reverse the trend improvement in the external
accounts. We expect the current account deficit to shrink to 2.8% of GDP in
2014 from 3.3% last year.
Exhibit 366: Exports outpacing imports Exhibit 367: Current a/c deficit turning
-40
-30
-20
-10
0
10
20
30
40
50
60
09 10 11 12 13 14
Exports*
Imports*
% y-o-y
-5
-4
-3
-2
-1
0
1
2
3
09 10 11 12 13
% of GDP
% of GDP (4 qtr MA*)
Current account
* Merchandise export and import values
Source: Credit Suisse, CEIC
Source: Credit Suisse, CEIC
While investment growth peaked back in mid-2012 (at
12%), consumer spending growth has held remarkably
(some might say suspiciously well ) well
according to the national accounts data. We doubt
this strength will last, however.
The lagged effects of the central bank's monetary tightening measures are likely to be felt from 2Q,
while knock-on effects from the weakness of the
commodity sector are probable.
Exhibit 368: Consumption growth set to follow capex growth down from 2Q 2014
-5
0
5
10
15
20
2.0
2.5
3.0
3.5
4.0
4.5
5.0
5.5
6.0
6.5
2001 2002 2003 2004 2005 2006 2007 2008 2009 2010 2011 2012 2013 2014
Private consumption (% yoy) Investment (% yoy, RHS)
F'cst
Source: Credit Suisse, CEIC
Headline consumer price inflation was 7.7% in
February, but price pressures are a lot lower on
a seasonally adjusted, sequential basis. We expect the year-on-year CPI rate to
drop to 4%-4.5% in July/August, with the biggest
risk to this being another meaningful rise in subsidised
fuel prices.
Much weaker inflation should help drive bond yields and
spreads lower. We also expect BI to cut 100bps.
Exhibit 369: Softening CPI… Exhibit 370: …to see bond yield drop
0
2
4
6
8
10
12
14
16
18
2008 2009 2010 2011 2012 2013 2014
CPI (% yoy)
CPI (% 3m-on-3m, RHS)
2
4
6
8
10
12
14
16
18
05 06 07 08 09 10 11 12 13 14
ID 10y yield*
ID-US 10yspread
Source: CEIC, Credit Suisse * Indonesian 10 year government bond yield
Source: CEIC, Credit Suisse

06 March 2014
Emerging Markets Quarterly 148
Indonesia: Selected economic indicators
2007 2008 2009 2010 2011 2012 2013E 2014F 2015F
National accounts, population and unemployment
Real GDP growth (%) 6.3 6.0 4.6 6.2 6.5 6.3 5.8 5.0 5.3
Growth in real private consumption (%) 5.0 5.3 4.9 4.7 4.7 5.3 5.3 4.7 4.5
Growth in real fixed investment (%) 9.3 11.9 3.3 8.5 8.3 9.7 4.7 4.9 6.3
Fixed investment (% of GDP) 24.9 27.7 31.1 32.0 31.9 32.7 31.7 30.5 29.7
Nominal GDP ($bn) 432.3 510.6 538.6 709.5 845.4 876.9 836.3 842.3 927.0
Population (mn) 225.6 228.5 231.4 237.6 244.0 247.2 250.4 253.4 256.4
GDP per capita ($) 1,916 2,234 2,328 2,985 3,465 3,547 3,340 3,324 3,615
Prices, interest rates and exchange rates
CPI inflation (% year-on-year change, December over December) 6.6 9.8 4.8 5.1 5.4 4.3 8.0 4.8 5.0
CPI inflation (% change in average index for the year) 6.4 9.8 4.8 5.1 5.3 3.7 6.4 6.0 5.0
Exchange rate (IDR per USD, end-year) 9,419 10,950 9,400 8,991 9,068 9,670 12189 12100 12000
Exchange rate (IDR per USD, average) 9,139 9,692 10,408 9,087 8,776 9,384 10863 11975 12000
REER (% year-on-year change, December over December) (1) -6.5 -8.6 15.6 5.9 -1.2 -4.7 -11.6 2.0 3.0
Nominal wage growth (% year-on-year change) (2) 4.2 7.6 5.3 12.2 3.4 20.4 5.0 6.0 5.0
Overnight rate (%, end-year) (3) 8.00 9.25 6.50 6.50 6.00 5.75 7.50 6.50 6.50
Fiscal data (4)
General government fiscal balance (% of GDP) -1.3 -0.1 -1.6 -0.7 -1.1 -1.9 -2.2 -2.3 -2.0
General government primary fiscal balance (% of GDP) 0.8 1.7 0.1 0.6 0.1 -0.6 -0.9 -0.7 -0.5
General government expenditure (% of GDP) 19.2 19.9 16.7 16.2 17.5 18.1 18.4 18.0 17.7
General government revenue (% of GDP) 17.9 19.8 15.1 15.4 16.3 16.3 16.2 15.7 15.7
Gross general government debt (% of GDP, end-year) (5) 34.1 29.3 31.4 26.4 23.6 23.3 23.0 24.5 24.2
Money supply and credit
Broad money supply (M2, % of GDP) 41.8 38.3 38.2 38.3 38.8 40.2 41.0 40.7 41.3
Broad money supply (M2, % year-on-year change) 19.3 14.9 13.0 15.4 16.4 15.0 12.7 10.0 12.0
Domestic credit (% of GDP) 28.8 26.3 26.1 24.9 26.5 28.5 29.9 30.7 32.3
Domestic credit (% year on year change) 16.2 14.3 12.2 9.9 22.4 19.2 16.0 14.0 16.0
Domestic credit to the private sector (% of GDP) 25.5 26.6 25.0 26.1 28.6 31.4 34.1 35.3 37.1
Domestic credit to the private sector (% year-on-year change) 22.4 30.7 6.8 20.0 25.8 21.9 20.0 15.0 16.0
Balance of payments (6)
Exports (goods and non-factor services, % of GDP) 30.3 30.5 24.7 24.6 26.2 24.1 23.7 24.2 23.3
Imports (goods and non-factor services, % of GDP) 25.4 28.6 20.7 21.6 23.3 24.3 24.3 23.6 22.3
Exports (goods and non-factor services, % year-on-year change in $ value) 13.4 18.7 -14.2 31.7 26.7 -4.5 -2.6 -1.0 6.0
Imports (goods and non-factor services, % year-on-year change in $ value) 15.0 32.3 -23.0 37.6 28.5 8.1 -0.9 -6.0 4.0
Current account balance ($bn) 10.5 0.1 10.6 5.1 1.7 -24.4 -27.6 -23.6 -21.3
Current account balance (% of GDP) 2.4 0.0 2.0 0.7 0.2 -2.8 -3.3 -2.8 -2.3
Net FDI inflows ($bn) 2.3 3.4 2.6 11.1 11.5 13.7 14.8 14.0 11.0
Scheduled external debt amortization ($bn) 14.4 15.5 17.1 18.7 26.5 36.4 34.6 42.0 48.0
Foreign debt and reserves
Foreign debt ($bn) 141.2 155.1 172.9 202.4 225.4 252.4 264.1 273.0 281.0
Public ($bn) 80.6 86.6 99.3 118.6 118.6 126.1 123.5 132.0 135.0
Private ($bn) 60.6 68.5 73.6 83.8 106.7 126.2 140.5 141.0 146.0
Foreign debt (% of GDP) 32.7 30.4 32.1 28.5 26.7 28.8 31.6 32.4 30.3
Foreign debt (% of exports of goods and services) 107.9 99.5 130.2 115.8 101.8 119.3 133.0 133.8 129.9
Central bank gross FX reserves ($bn) 56.9 51.6 66.1 96.2 110.1 112.8 99.4 103.0 108.0
Central bank net non-gold FX reserves ($bn) 55.0 49.6 63.6 92.9 106.5 108.8 96.4 100.0 105.0
(1) Real effective exchange rate, increase indicates appreciation. (2) Nominal wage: manufacturing. (3) BI changed its policy target from 1m SBI rate to overnight rate in 2008. (4) Refers to central government. The government assumed an oil price of $61 per barrel for 2009 in its revised budget announced in June 2009. (5) Excludes SOE and BI debt. (6) BoP numbers from 2004 onwards have been revised; exports & imports include credits & debits on net income, respectively, in 2000-03.
Source: Bank Indonesia, Ministry of Finance, Central Bureau Statistics, CEIC, World Bank, Credit Suisse

06 March 2014
Emerging Markets Quarterly 149
Korea: Entering a soft patch We think a weaker US ISM index, together with the peaked momentum in the CS
Basic Material Index and CRB metal price index, suggests that Korea's export
growth is likely to enter a soft patch in the near term. Both indices have an
approximate three-month lead over Korea's trend export growth, prompting us to expect
headwinds against export momentum in the coming months. In our view, global
industrial activities may moderate to a trend growth in 1Q 2014 from an above-trend
level seen in the prior quarter. This suggests that the underlying short-term outlook for
global activity is likely to be reasonable, but not tremendous.
The weaker-than-expected January-February export growth supported our near-
term cautious stance. Combining January-February together, we saw exports rise
0.6% yoy and imports increase 1.4% yoy. Export growth has weakened from the mid-
single-digit gain in 4Q last year, but import growth has remained resilient when
compared to the prior quarter. Geographically, export growth to Asia bounced in
February, but exports to the US fell. Product-wise, wireless telecommunication,
semiconductors and automobile exports recorded strong gains. We maintain our view
that a better global recovery should help support exports this year, but the trade surplus
is likely to narrow as import growth recovers.
The latest momentum in industrial production remains unclear under the lunar
new year effect, but we expect to see some softness nonetheless. Manufacturing
industrial production fell by a more-than-expected 3.8% yoy in January. We expect to
see some softness in the near term as global industrial activities take a breather, but
have maintained our view that the Korean economy should continue cruising on a
gradual recovery path this year. Indications from other macro-data have remained mixed
so far. Producers’ shipments fell 4.7% yoy in January, but retail sales jumped 5.7% yoy.
The value of construction completed, on the other hand, saw a very strong bounce at
12.8% yoy, possibly reflecting the pick-up in building construction activities.
Inflationary pressure remains very tame. Combining January-February together,
headline inflation was at 1.1% yoy, slowing for the third consecutive year from as high as
3.9% yoy back in 2011. Food and alcoholic beverage prices (-1.3% yoy) and
transportation prices (-0.8% yoy) fell when compared to a year ago. We think the
discrepancy between headline and core inflation suggests that the weak food and crude
oil prices are the main drags on an otherwise low but stable inflation trend in Korea. We
have revised down our forecast for the 2014 headline inflation rate further to 1.9%, from
2.2% previously, anticipating the low price pressure to continue in the coming months.
We expect the BoK to keep the policy base rate unchanged throughout 2014.
Despite the soft patch ahead, we believe better global demand should continue to
drive the Korean economy on a gradual recovery path. This should lessen the need for
the BoK to lower the policy base rate in support of the economy at this juncture. At the
same time, inflationary pressure remains at bay, suppressed by the low agricultural
and fuel price changes. We think continued growth and the current low inflation
environment suggest that the timing for an adjustment in the policy base rate could still
be sometime away. The possibility of a rate hike in 2H may exist, if the global
economy poses stronger-than-expected growth that closes Korea's output gap earlier
than expected; consideration for a rate cut, on the other hand, would need exports and
other macro-data to disappoint visibly to challenge the BoK's current sanguine outlook
on the economy.
Christiaan Tuntono
+852 2101 7409

06 March 2014
Emerging Markets Quarterly 150
Former BoK Senior Deputy Governor Lee Ju-yeol is nominated by President Park
as the new BoK Governor. Lee will succeed the current Governor Kim Choong-soo as
the head of the central bank after Kim finishes his term by the end of March this year. A
long-time central banker, Lee joined the Bank of Korea back in 1977 and served in
various posts before retiring as its senior deputy chief in 2012. Lee will chair the BoK's
Monetary Policy Committee from April onwards, driving Korea's interest rate decision
amidst the challenge posed by the Fed's QE exit and a weak global growth recovery.
We think the nomination of Lee could be read with a neutral-to-dovish tone (vis-a-vis
Kim), though we think the strength of the domestic economy and inflation trend would
remain the main drivers of monetary policy decisions going forward.
We expect the KRW to strengthen on the resumption of positive seasonality on
the current account in the coming quarters. Negative current account seasonality in
1Q and the recent sell-off across EM currencies have been putting pressure on the
KRW, driving it up to its current level against the USD. We maintain our view that the
KRW should see support in the coming quarters, driven by the expected recovery in
exports and favorable seasonality in its current account balance. This should drive
USDKRW lower to 1055 by the end of this year, in our view. The lack of stronger
monetary easing measures from the Bank of Japan has also helped curb the JPY's
weakness recently, lessening the depreciation pressure on the KRW.
Although the Fed's exit from its quantitative easing program has triggered selling
across a number of emerging market currencies, we do not think it would lead to a
severe capital flight from Korea. We believe the strong current surplus and the hefty
foreign exchange reserves Korea has would help stem the rise of significant selling on
the KRW. In addition, the government's comprehensive measures to reduce FX liquidity
risks in 2009 and 2010 have lowered the short-term external debt exposure. In terms of
the domestic economy, bank lending rates, which are priced on short-term interest
rates, remain largely unaffected by the Fed's action so far, even though Korea's long-
term bond yield is on the rise. We do not expect the limited rise in mortgage and
consumer lending rates to hamper the recovery of housing and consumption demand
this year.
President Park has launched the Three-Year Economic Innovation Plan, which
aims at boosting Korea's domestic demand and raising the country's potential
growth rate. Highlights of the package include deregulation on the services sector and
other red-tape regarding business investments. The Plan also aims at normalizing
publicly owned enterprises by selling assets and streamlining operations. We think these
initiatives are similar to what China vowed to do by launching its structural reform
package at the Third Plenum. While we agree with Park's efforts, we believe Korea
could face more challenges than China to make it successful: (1) Korea is more
urbanized than China, implying a lesser boost to consumption; (2) Korea is a more
market-based economy than China; hence, further regulatory liberalization may not yield
as much growth dividend; and (3) Korea is already much more developed than China,
implying less room to accelerate labor productivity gains.
Fiscal revenue may disappoint again in 2014, causing constraints on fiscal
spending. The government's gross fiscal revenue shortfall reached an 11-year high at
KRW 10.9trn in 2013, dragged down by the decline in corporate and capital gains taxes
amidst a slow economy. Given that the government’s official forecast of 3.9% GDP
growth this year is likely to be overly optimistic, we think the chance of seeing another
fiscal revenue shortfall this year does exist. This may cause headwinds for the
government to deliver on President Park’s welfare promise and to balance the fiscal
account (excluding social security funds) over the medium term.
We expect no change to Korea’s sovereign debt rating over the next six months.
Korea is currently rated Aa3 (Moody’s), A+ (S&P) and AA- (Fitch), with a stable outlook.

06 March 2014
Emerging Markets Quarterly 151
We think a weaker US ISM
index, together with the
peaked momentum in the
CS Basic Material Index and
CRB metal price index,
suggests that Korea's
export growth is likely to
enter a soft patch in the
near term.
Exhibit 371: US ISM and metal prices Exhibit 372: Exports to US
20
30
40
50
60
70
80
-50
-30
-10
10
30
50
Ju
l-08
Oct-
08
Ja
n-0
9A
pr-
09
Ju
l-09
Oct-
09
Ja
n-1
0A
pr-
10
Ju
l-10
Oct-
10
Ja
n-1
1A
pr-
11
Ju
l-11
Oct-
11
Ja
n-1
2A
pr-
12
Ju
l-12
Oct-
12
Ja
n-1
3A
pr-
13
Ju
l-13
Oct-
13
Ja
n-1
4A
pr-
14
Korea exports to US (% yoy, 3m mav)
CRB Metal prices (% yoy, 3mma forward,RHS)US ISM New orders (3m forward, RHS)
-3
-2
-1
0
1
2
3
-50
-40
-30
-20
-10
0
10
20
30
40
50
Ju
l-08
Oct-
08
Ja
n-0
9A
pr-
09
Ju
l-09
Oct-
09
Ja
n-1
0A
pr-
10
Jul-10
Oct-
10
Ja
n-1
1A
pr-
11
Ju
l-11
Oct-
11
Ja
n-1
2A
pr-
12
Ju
l-12
Oct-
12
Jan-1
3A
pr-
13
Ju
l-13
Oct-
13
Jan-1
4A
pr-
14
Korea exports to US (% yoy,3m mav)
CS BMI (% yoy, 3m mav, RHS)
Source: ISM, CEIC, Credit Suisse Source: CEIC, Credit Suisse
The weaker-than-expected
January-February export
growth supported our near-
term cautious stance.
We maintain our view that a
better global recovery
should help support exports
this year, but the trade
surplus is likely to narrow as
import growth recovers.
Exhibit 373: Merchandise trade Exhibit 374: Export growth
-40
-30
-20
-10
0
10
20
30
40
50
60
-40
-30
-20
-10
0
10
20
30
40
50
60
2004 2006 2008 2010 2012 2014
Trade balance (USD mn, 12-month rollingsum)Exports (% yoy, RHS)
Imports (% yoy, RHS)
-60
-40
-20
0
20
40
60
80
100
Ju
l-08
Oct-
08
Ja
n-0
9A
pr-
09
Ju
l-09
Oct-
09
Ja
n-1
0A
pr-
10
Ju
l-10
Oct-
10
Ja
n-1
1A
pr-
11
Ju
l-11
Oct-
11
Ja
n-1
2A
pr-
12
Ju
l-12
Oct-
12
Ja
n-1
3A
pr-
13
Ju
l-13
Oct-
13
Ja
n-1
4
US EU
China Japan
ASEAN
Korea exports (% yoy, 3m mav)
Source: MITE, Credit Suisse Source: MITE, Credit Suisse
The latest momentum in
industrial production
remains unclear under the
lunar new year effect, but
we expect to see some
softness as global industrial
activities take a breather.
Exhibit 375: Industrial production and other macro data
(% YoY, unless otherwise stated) 1Q13 2Q13 3Q13 4Q13 Jul-13 Aug-13 Sep-13 Oct-13 Nov-13 Dec-13 Jan-14 Feb-14 Mar-14
Manufacturing industrial production -1.5 -0.8 0.1 1.9 0.9 3.2 -3.9 3.3 -0.7 2.9 -3.8
% mom, seasonally adjusted -1.5 0.4 -0.3 1.7 -0.2 1.6 -2.5 2.6 0.0 2.4 0.1
Consumer sales 0.1 1.1 0.8 1.0 1.0 2.5 -1.2 1.7 1.3 0.2 5.7
Shipments -2.0 -0.7 0.2 1.8 0.4 4.5 -4.8 3.2 0.4 1.9 -4.7
Inventories 5.4 2.9 6.4 7.3 7.0 3.4 9.0 9.4 6.5 6.1 6.3
Production capacity 1.1 1.2 1.6 1.7 1.7 1.5 1.6 1.6 1.7 1.9 1.3
Leading indicator index (% MoM) 0.2 0.7 0.6 0.8 0.8 0.7 0.3 0.8 0.8 0.7 0.4
Manufacturing confidence index outlook 76.0 82.0 77.0 78.0 78.0 73.0 77.0 82.0 84.0 78.0 79.0 81.0 85.0
National Statistical Office, Bank of Korea, Credit Suisse research
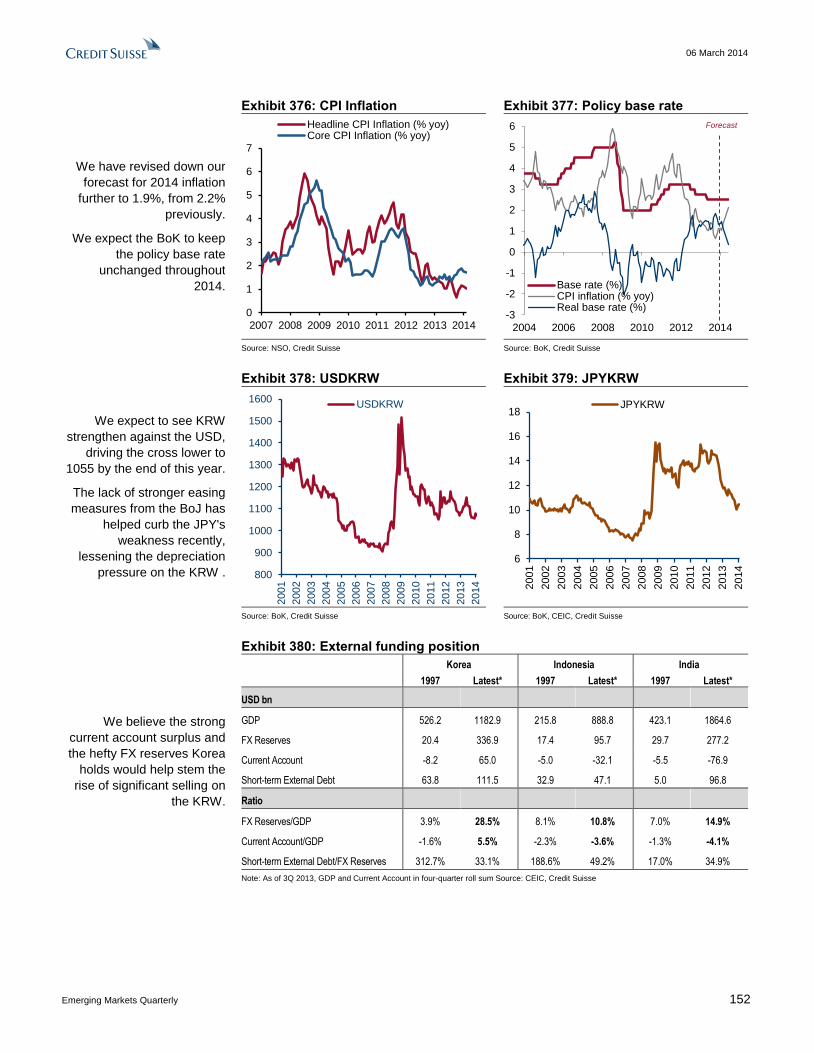
06 March 2014
Emerging Markets Quarterly 152
We have revised down our
forecast for 2014 inflation
further to 1.9%, from 2.2%
previously.
We expect the BoK to keep
the policy base rate
unchanged throughout
2014.
Exhibit 376: CPI Inflation Exhibit 377: Policy base rate
0
1
2
3
4
5
6
7
2007 2008 2009 2010 2011 2012 2013 2014
Headline CPI Inflation (% yoy)Core CPI Inflation (% yoy)
-3
-2
-1
0
1
2
3
4
5
6
2004 2006 2008 2010 2012 2014
Base rate (%)CPI inflation (% yoy)Real base rate (%)
Forecast
Source: NSO, Credit Suisse Source: BoK, Credit Suisse
We expect to see KRW
strengthen against the USD,
driving the cross lower to
1055 by the end of this year.
The lack of stronger easing
measures from the BoJ has
helped curb the JPY's
weakness recently,
lessening the depreciation
pressure on the KRW .
Exhibit 378: USDKRW Exhibit 379: JPYKRW
800
900
1000
1100
1200
1300
1400
1500
1600
2001
2002
2003
2004
2005
2006
2007
2008
2009
2010
2011
2012
2013
2014
USDKRW
6
8
10
12
14
16
18
2001
2002
2003
2004
2005
2006
2007
2008
2009
2010
2011
2012
2013
2014
JPYKRW
Source: BoK, Credit Suisse Source: BoK, CEIC, Credit Suisse
We believe the strong
current account surplus and
the hefty FX reserves Korea
holds would help stem the
rise of significant selling on
the KRW.
Exhibit 380: External funding position
Korea Indonesia India
1997 Latest* 1997 Latest* 1997 Latest*
USD bn
GDP 526.2 1182.9 215.8 888.8 423.1 1864.6
FX Reserves 20.4 336.9 17.4 95.7 29.7 277.2
Current Account -8.2 65.0 -5.0 -32.1 -5.5 -76.9
Short-term External Debt 63.8 111.5 32.9 47.1 5.0 96.8
Ratio
FX Reserves/GDP 3.9% 28.5% 8.1% 10.8% 7.0% 14.9%
Current Account/GDP -1.6% 5.5% -2.3% -3.6% -1.3% -4.1%
Short-term External Debt/FX Reserves 312.7% 33.1% 188.6% 49.2% 17.0% 34.9%
Note: As of 3Q 2013, GDP and Current Account in four-quarter roll sum Source: CEIC, Credit Suisse

06 March 2014
Emerging Markets Quarterly 153
Korea: Selected economic indicators
2007 2008 2009 2010 2011 2012 2013E 2014F 2015F
National accounts, population and unemployment
Real GDP growth (%) 5.1 2.3 0.3 6.3 3.6 2.0 2.8 3.3 3.6
Growth in real private consumption (%) 5.1 1.3 0.0 4.1 2.3 1.7 1.9 2.9 3.3
Growth in real fixed investment (%) 4.2 -1.9 -1.0 7.0 -2.1 -1.7 3.8 2.4 2.7
Fixed investment (% of GDP) 28.5 29.3 29.1 28.6 27.1 26.1 26.4 26.1 25.9
Nominal GDP ($bn) 1049.1 929.1 831.1 1,012.0 1,114.8 1,148.0 1,198.6 1,295.5 1,364.5
Population (million) 48.5 48.6 48.7 48.9 49.0 49.2 49.3 49.5 49.6
GDP per capita ($) 21,650 19,115 17,050 20,705 22,740 23,347 24,304 26,190 27,503
Unemployment (% of labor force, end-year) 3.1 3.3 3.4 3.4 3.1 3.0 3.1 3.1 3.1
Prices, interest rates and exchange rates
CPI inflation (% year-on-year change, December over December) 3.6 4.1 2.8 3.0 4.2 1.4 1.1 2.6 2.7
CPI inflation (% change in average index for the year) 2.5 4.7 2.8 2.9 4.0 2.2 1.3 1.9 2.4
Exchange rate (KRW per USD, end-year) 938 1,257.5 1,167.6 1,139 1,153 1,064 1,055 1,055 1,055
Exchange rate (KRW per USD, average) 929 1,104.8 1,281.4 1,159 1,108 1,108 1,094 1,055 1,055
REER (% year-on-year change) (1) -6.6 -24.5 7.0 0.5 -2.7 9.8 2.0 2.6 2.4
Nominal wage growth (% year-on-year change) 5.9 3.1 -0.7 6.1 -0.7 -0.9 0.2 2.3 4.4
Overnight base rate (%, end year) 5.00 3.00 2.00 2.50 3.25 2.75 2.50 2.50 2.50
Fiscal data
Consolidated government fiscal balance, (% of GDP) (2) 1.9 -0.3 -2.7 -0.8 -0.4 -0.2 -1.0 -0.9 -0.5
Consolidated government primary balance, (% of GDP) 3.0 0.8 -1.6 0.4 0.8 0.9 0.0 0.1 0.4
Consolidated government expenditure, (% of GDP) 28.0 29.6 31.0 27.7 28.1 28.8 29.2 29.8 30.0
Consolidated government debt, (% of GDP, end-year) (3) 36.3 36.2 39.5 39.4 40.9 42.1 43.8 42.7 41.1
Money supply and credit
Broad money supply (M2, % of GDP) 130.6 138.9 147.1 141.5 141.8 144.3 146.5 150.1 155.0
Broad money supply (M2, % year-on-year change) 10.8 12.0 9.9 6.0 5.5 4.8 4.6 6.8 8.8
Domestic credit (% of GDP) 101.8 112.3 112.1 103.1 103.6 103.4 105.0 107.6 111.1
Domestic credit (% year-on-year change) 9.4 16.1 3.6 1.3 5.8 2.8 4.6 6.8 8.8
Domestic credit to the private sector (% of GDP) 99.6 108.8 107.4 100.8 101.7 100.5 104.0 108.6 114.2
Domestic credit to the private sector (% year-on-year change) 12.4 14.9 2.4 3.4 6.2 1.8 6.6 8.8 10.8
Balance of payments
Exports (goods and non-factor services, % of GDP) 44.1 56.5 52.0 54.2 58.0 58.0 57.1 54.3 53.7
Imports (goods and non-factor services, % of GDP) 41.7 56.6 48.2 51.1 55.7 54.0 51.5 49.7 49.3
Exports (goods and non-factor services, % year-on-year change in $ value) 17.6 13.6 -17.8 27.1 17.9 2.9 2.7 2.9 4.2
Imports (goods and non-factor services, % year-on-year change in $ value) 16.6 20.2 -23.8 29.1 20.1 -0.2 -0.5 4.3 4.6
Current account balance ($bn) 21.8 3.2 32.8 29.4 26.1 48.1 70.7 61.6 57.2
Current account balance (% of GDP) 2.1 0.3 3.9 2.9 2.3 4.2 5.9 4.8 4.2
Net FDI inflows ($bn) -17.9 -16.9 -14.9 -22.2 -16.4 -18.9 -13.1 -12.1 -11.1
Scheduled debt amortization ($bn) (4) 35.4 39.1 30.5 33.7 34.3 35.2 36.1 37.0 37.9
Foreign debt and reserves
Foreign debt ($bn) (5) 333.4 317.4 345.4 360.0 398.7 413.6 411.8 409.6 407.3
Public ($bn) (6) 61.3 61.8 80.3 96.1 104.1 123.4 125.9 128.4 130.9
Private ($bn) 272.1 255.6 265.1 263.9 294.6 290.2 285.9 281.2 276.5
Foreign debt (% of GDP) 31.8 34.2 41.6 35.6 35.8 36.0 34.4 31.6 29.9
Foreign debt (% of exports of goods and services) 72.1 60.4 80.0 65.6 61.6 62.1 60.2 58.2 55.6
Central bank gross FX reserves ($bn) 262.2 201.2 270.0 291.6 306.4 327.0 341.4 349.8 356.8
Central bank gross non-gold FX reserves ($bn) (7) 262.1 201.1 269.9 291.5 306.3 326.9 341.4 349.7 356.7
(1) Real effective exchange rate (CPI-deflated); increase indicates appreciation. (2) Include social security funds. (3) Include Grain Securities, Seoul Metro bonds, National Housing Bonds, Seoul Metro Subway Bonds, and Industrial Finance Debentures (4) Scheduled amortizations of medium- and long-term external debt of both the public and private sectors. (5) Liabilities vis-à-vis non-residents (i.e., includes FX-denominated and local-currency debt). (6) Includes government and central bank. (7) Central bank forex reserves minus monetary authorities’ other liabilities.
Source: Bank of Korea, National Statistical Office, Ministry of Strategy and Finance, CEIC, Credit Suisse

06 March 2014
Emerging Markets Quarterly 154
Malaysia: Changing the growth mix Changing the fiscal policy mix. To lower subsidy expenses and move towards a budget
deficit target of 3.5% of GDP this year (3.9% in 2013), we think the government will need
to hike the subsidized fuel price again in 2014, on top of its recent move to increase
electricity tariffs. This will likely add to headline inflation and have some negative
implications for GDP growth, while allowing the federal budget shortfall to reach its target
and preventing government debt from exceeding the 55% of GDP self-imposed limit. To
offset the negative effects on GDP, the government will boost capital spending by non-
financial public enterprises (NFPE). While the government is projecting investment by
these entities to fall by 13% yoy in 2014, we note that it projected an 11% yoy decline in its
2013 budget announcement only to revise this figure recently up to a 50% yoy increase.
Keeping investment growth robust is also consistent with the government’s stated
commitment to implement the key infrastructure projects under the Economic
Transformation Program (e.g., double tracking of southern railways, Klang Valley MRT).
Shifting the domestic spending growth mix. We continue to doubt that the strength of
household spending growth seen last year is sustainable given the following headwinds:
(1) Lowering of government subsidies in the context of weak palm oil and rubber prices
should result in a real income squeeze for households. (2) High household leverage and
recent macro-prudential measures by the central bank will likely cap consumer borrowing.
In fact, the sharp downturn in the consumer sentiment index recently fits with our view that
2014 private consumption growth will likely slow more than the market expects (5.5% vs.
6% yoy consensus). On the other hand, the anticipated improvement in export growth and
NFPE capital spending discussed above should keep investment growth robust, after a
weak public investment print last year.
Tourism to provide additional boost to growth. As noted in ASEAN tourism (full report),
we think Malaysia tourist arrivals will be boosted by three key factors: (1) “Visit Malaysia
Year 2014”, (2) the ongoing political turmoil in Thailand, diverting tourists to Malaysia, and
3) a weaker ringgit. The likely tourism boost along with anticipated robust merchandise
export and investment growth prompted the recent upgrade to our Malaysia 2014 GDP
growth projection to 5.3% (from 5%, consensus 5.1%).
Current account to deteriorate further but at a slower pace. While improvement in
tourism and merchandise exports should boost revenue from trade, we expect import
demand to more than offset the gain in nominal exports, thanks to strong investment
growth. This will probably result in a further deterioration of the current account surplus this
year, albeit at a more modest pace than previously. We expect the current account surplus
to decline to 3.3% of GDP from 3.8% in 2013.
Inflation to surprise on the upside, interest rates to move higher. Factoring in the
higher-than-expected electricity tariff increase at the turn of the year, currency
depreciation, and the prospect of another subsidized fuel price hike, we maintain our view
that inflation is likely to surprise the market to the upside (consensus for 2014 average CPI
inflation: 3%; CS: 3.5%). We suspect that strong economic growth has enabled firms to
pass on the higher costs to consumer prices, explaining strong sequential inflation
momentum in recent months. While we do not see Bank Negara’s recent statements as
particularly hawkish, this could change in coming months if we are right in thinking that
inflation will continue to rise, pushing the real policy rate deeper into negative territory. We
maintain our view that Bank Negara will raise the overnight policy rate by 25bps to 3.25%
by end-2014.
Ringgit and bonds to remain vulnerable. With a declining current account surplus and
foreign positioning in Malaysia's bond market still large (about 45%), we think the ringgit
will remain under some pressure. Our rates strategist also sees room for the back end of
the yield curve to sell off further, against the backdrop of strong GDP growth, rising
inflation, and the risk of a policy rate hike.
Santitarn Sathirathai
+65 6212 5675
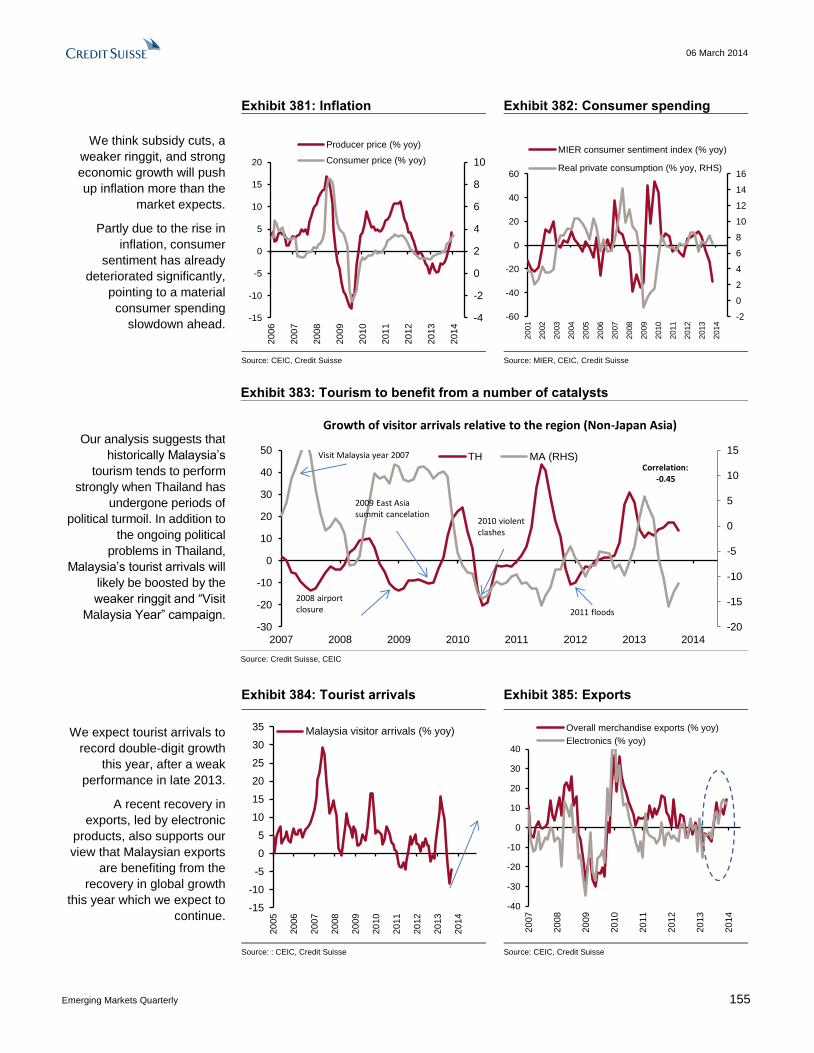
06 March 2014
Emerging Markets Quarterly 155
We think subsidy cuts, a
weaker ringgit, and strong
economic growth will push
up inflation more than the
market expects.
Partly due to the rise in
inflation, consumer
sentiment has already
deteriorated significantly,
pointing to a material
consumer spending
slowdown ahead.
Exhibit 381: Inflation Exhibit 382: Consumer spending
-4
-2
0
2
4
6
8
10
-15
-10
-5
0
5
10
15
20
20
06
20
07
20
08
20
09
20
10
20
11
20
12
20
13
20
14
Producer price (% yoy)
Consumer price (% yoy)
-2
0
2
4
6
8
10
12
14
16
-60
-40
-20
0
20
40
60
20
01
20
02
20
03
20
04
20
05
20
06
20
07
20
08
20
09
20
10
20
11
20
12
20
13
20
14
MIER consumer sentiment index (% yoy)
Real private consumption (% yoy, RHS)
Source: CEIC, Credit Suisse Source: MIER, CEIC, Credit Suisse
Our analysis suggests that
historically Malaysia’s
tourism tends to perform
strongly when Thailand has
undergone periods of
political turmoil. In addition to
the ongoing political
problems in Thailand,
Malaysia’s tourist arrivals will
likely be boosted by the
weaker ringgit and “Visit
Malaysia Year” campaign.
Exhibit 383: Tourism to benefit from a number of catalysts
-20
-15
-10
-5
0
5
10
15
-30
-20
-10
0
10
20
30
40
50
2007 2008 2009 2010 2011 2012 2013 2014
TH MA (RHS)
2008 airport closure
2010 violent clashes
2009 East Asia summit cancelation
2011 floods
Growth of visitor arrivals relative to the region (Non-Japan Asia)
Visit Malaysia year 2007
Correlation:-0.45
Source: Credit Suisse, CEIC
We expect tourist arrivals to
record double-digit growth
this year, after a weak
performance in late 2013.
A recent recovery in
exports, led by electronic
products, also supports our
view that Malaysian exports
are benefiting from the
recovery in global growth
this year which we expect to
continue.
Exhibit 384: Tourist arrivals Exhibit 385: Exports
-15
-10
-5
0
5
10
15
20
25
30
35
20
05
20
06
20
07
20
08
20
09
20
10
20
11
20
12
20
13
20
14
Malaysia visitor arrivals (% yoy)
-40
-30
-20
-10
0
10
20
30
40
20
07
20
08
20
09
20
10
20
11
20
12
20
13
20
14
Overall merchandise exports (% yoy)
Electronics (% yoy)
Source: : CEIC, Credit Suisse Source: CEIC, Credit Suisse

06 March 2014
Emerging Markets Quarterly 156
We think the government
will cut the federal budget
deficit to 3.5% of GDP as
planned but prompt state
enterprises to invest more.
Public investment growth
weakened significantly last
year, probably partly due to
the general and internal
UMNO elections. We expect
it to rebound this year on
the back of the
government's infrastructure
push.
.
Exhibit 386: Fiscal deficits Exhibit 387: Investment by ownership
-14%
-12%
-10%
-8%
-6%
-4%
-2%
0%
2010 2011 2012 2013 2014F
Public sector wide deficit (% of GDP)
Federal government deficit (% of GDP)
We think public sector-wide deficit could surprise significnatly on the upside
-30
-20
-10
0
10
20
30
40
50
2007 2008 2009 2010 2011 2012 2013 2014
Public investment
Private investment
% yoy
Source: MOF, CEIC, Credit Suisse Source: CEIC, Credit Suisse
We expect to see a smaller
contribution to 2014 headline
GDP growth from private
consumption, while net
exports and investment
become more helpful than
last year.
Exhibit 388: Contribution to headline real GDP growth from spending components
-5
-3
-1
2
4
6
8
10
2010 2011 2012 2013 2014F
Priv consumption Govt consumptionInvestment Net exportsReal GDP (% yoy)
Contribution to headline GDP growth
Source: Credit Suisse, CEIC
We expect the current
account surplus to
deteriorate further to 3.3%
of GDP in 2014 from 3.8%
of GDP in 2013, before
recovering in 2015.
While the current account
will likely remain in surplus
and net direct investment
flows have improved,
Malaysia is still susceptible
to changes in short-term
flows, putting pressure on
its reserves/currency.
Exhibit 389: Current account Exhibit 390: Balance of payments
0
2
4
6
8
10
12
14
16
18
20
05
20
06
20
07
20
08
20
09
20
10
20
11
20
12
20
13
20
14
F
20
15
F
Current account balance (% of GDP)
-15%
-10%
-5%
0%
5%
10%
15%
20%
2008 2009 2010 2011 2012 2013
Change in reserves (% of GDP, 4qtr rolling sum)
Current account (% of GDP, 4qtr rolling sum)
Direct Inv (% of GDP, 4qtr rolling sum)
Source: CEIC, Credit Suisse Source: CEIC, Credit Suisse
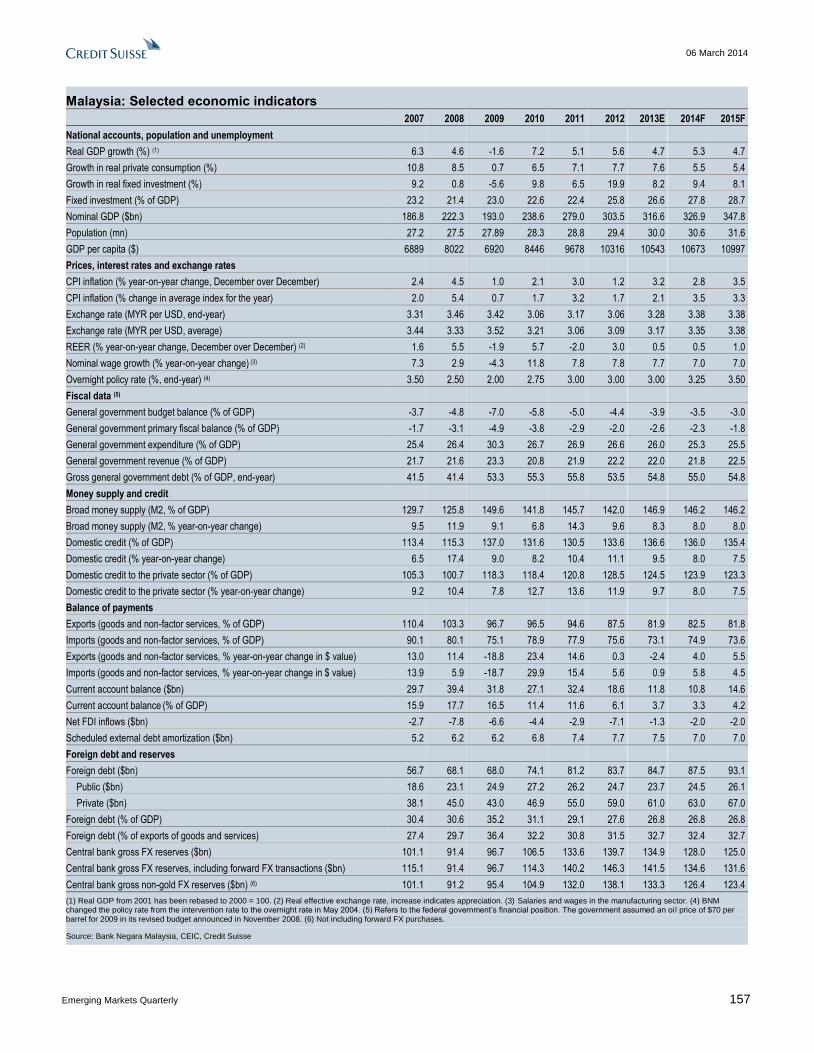
06 March 2014
Emerging Markets Quarterly 157
Malaysia: Selected economic indicators
2007 2008 2009 2010 2011 2012 2013E 2014F 2015F
National accounts, population and unemployment
Real GDP growth (%) (1) 6.3 4.6 -1.6 7.2 5.1 5.6 4.7 5.3 4.7
Growth in real private consumption (%) 10.8 8.5 0.7 6.5 7.1 7.7 7.6 5.5 5.4
Growth in real fixed investment (%) 9.2 0.8 -5.6 9.8 6.5 19.9 8.2 9.4 8.1
Fixed investment (% of GDP) 23.2 21.4 23.0 22.6 22.4 25.8 26.6 27.8 28.7
Nominal GDP ($bn) 186.8 222.3 193.0 238.6 279.0 303.5 316.6 326.9 347.8
Population (mn) 27.2 27.5 27.89 28.3 28.8 29.4 30.0 30.6 31.6
GDP per capita ($) 6889 8022 6920 8446 9678 10316 10543 10673 10997
Prices, interest rates and exchange rates
CPI inflation (% year-on-year change, December over December) 2.4 4.5 1.0 2.1 3.0 1.2 3.2 2.8 3.5
CPI inflation (% change in average index for the year) 2.0 5.4 0.7 1.7 3.2 1.7 2.1 3.5 3.3
Exchange rate (MYR per USD, end-year) 3.31 3.46 3.42 3.06 3.17 3.06 3.28 3.38 3.38
Exchange rate (MYR per USD, average) 3.44 3.33 3.52 3.21 3.06 3.09 3.17 3.35 3.38
REER (% year-on-year change, December over December) (2) 1.6 5.5 -1.9 5.7 -2.0 3.0 0.5 0.5 1.0
Nominal wage growth (% year-on-year change) (3) 7.3 2.9 -4.3 11.8 7.8 7.8 7.7 7.0 7.0
Overnight policy rate (%, end-year) (4) 3.50 2.50 2.00 2.75 3.00 3.00 3.00 3.25 3.50
Fiscal data (5)
General government budget balance (% of GDP) -3.7 -4.8 -7.0 -5.8 -5.0 -4.4 -3.9 -3.5 -3.0
General government primary fiscal balance (% of GDP) -1.7 -3.1 -4.9 -3.8 -2.9 -2.0 -2.6 -2.3 -1.8
General government expenditure (% of GDP) 25.4 26.4 30.3 26.7 26.9 26.6 26.0 25.3 25.5
General government revenue (% of GDP) 21.7 21.6 23.3 20.8 21.9 22.2 22.0 21.8 22.5
Gross general government debt (% of GDP, end-year) 41.5 41.4 53.3 55.3 55.8 53.5 54.8 55.0 54.8
Money supply and credit
Broad money supply (M2, % of GDP) 129.7 125.8 149.6 141.8 145.7 142.0 146.9 146.2 146.2
Broad money supply (M2, % year-on-year change) 9.5 11.9 9.1 6.8 14.3 9.6 8.3 8.0 8.0
Domestic credit (% of GDP) 113.4 115.3 137.0 131.6 130.5 133.6 136.6 136.0 135.4
Domestic credit (% year-on-year change) 6.5 17.4 9.0 8.2 10.4 11.1 9.5 8.0 7.5
Domestic credit to the private sector (% of GDP) 105.3 100.7 118.3 118.4 120.8 128.5 124.5 123.9 123.3
Domestic credit to the private sector (% year-on-year change) 9.2 10.4 7.8 12.7 13.6 11.9 9.7 8.0 7.5
Balance of payments
Exports (goods and non-factor services, % of GDP) 110.4 103.3 96.7 96.5 94.6 87.5 81.9 82.5 81.8
Imports (goods and non-factor services, % of GDP) 90.1 80.1 75.1 78.9 77.9 75.6 73.1 74.9 73.6
Exports (goods and non-factor services, % year-on-year change in $ value) 13.0 11.4 -18.8 23.4 14.6 0.3 -2.4 4.0 5.5
Imports (goods and non-factor services, % year-on-year change in $ value) 13.9 5.9 -18.7 29.9 15.4 5.6 0.9 5.8 4.5
Current account balance ($bn) 29.7 39.4 31.8 27.1 32.4 18.6 11.8 10.8 14.6
Current account balance (% of GDP) 15.9 17.7 16.5 11.4 11.6 6.1 3.7 3.3 4.2
Net FDI inflows ($bn) -2.7 -7.8 -6.6 -4.4 -2.9 -7.1 -1.3 -2.0 -2.0
Scheduled external debt amortization ($bn) 5.2 6.2 6.2 6.8 7.4 7.7 7.5 7.0 7.0
Foreign debt and reserves
Foreign debt ($bn) 56.7 68.1 68.0 74.1 81.2 83.7 84.7 87.5 93.1
Public ($bn) 18.6 23.1 24.9 27.2 26.2 24.7 23.7 24.5 26.1
Private ($bn) 38.1 45.0 43.0 46.9 55.0 59.0 61.0 63.0 67.0
Foreign debt (% of GDP) 30.4 30.6 35.2 31.1 29.1 27.6 26.8 26.8 26.8
Foreign debt (% of exports of goods and services) 27.4 29.7 36.4 32.2 30.8 31.5 32.7 32.4 32.7
Central bank gross FX reserves ($bn) 101.1 91.4 96.7 106.5 133.6 139.7 134.9 128.0 125.0
Central bank gross FX reserves, including forward FX transactions ($bn) 115.1 91.4 96.7 114.3 140.2 146.3 141.5 134.6 131.6
Central bank gross non-gold FX reserves ($bn) (6) 101.1 91.2 95.4 104.9 132.0 138.1 133.3 126.4 123.4
(1) Real GDP from 2001 has been rebased to 2000 = 100. (2) Real effective exchange rate, increase indicates appreciation. (3) Salaries and wages in the manufacturing sector. (4) BNM changed the policy rate from the intervention rate to the overnight rate in May 2004. (5) Refers to the federal government’s financial position. The government assumed an oi l price of $70 per barrel for 2009 in its revised budget announced in November 2008. (6) Not including forward FX purchases.
Source: Bank Negara Malaysia, CEIC, Credit Suisse
06 March 2014
Emerging Markets Quarterly 158
Philippines: Against the consensus We have raised our above-consensus 2014 GDP growth forecast to 7% from 6.8%
previously (vs consensus of 6.4%): While Typhoon Haiyan (which hit on 7 November)
will no doubt impact GDP growth, particularly agricultural production, we think that many
analysts are too pessimistic in their growth forecasts. We have pointed out that the areas
most badly affected by the typhoon account for a relatively small proportion of GDP and
that the typhoon did not damage the vast majority of manufacturing and Business Process
Outsourcing (BPO) activity. The latest 4Q13 GDP print, which surprised on the upside at
6.5%yoy, is partly a testament to that. Looking forward, we think that reconstruction activity
will boost GDP in 2014. Our relatively strong 2014 growth forecast also reflects: 1) the
lagged impact of an accommodative monetary policy, and 2) a stronger global trade cycle.
We expect growth to continue to be supported by private consumption and investment
spending in particular.
Inflation should generally moderate after supply-side disruptions abate:
Notwithstanding our projection of another year of above-trend GDP growth, we have kept
our below consensus 2014 CPI inflation forecast at 3.8% (vs consensus of 4.2%). While
CPI inflation has exceeded 4%yoy over the last 2 months, from an average of 2.9% in
2013, this was no doubt partly the result of Typhoon Haiyan. We note that most of the
recent increase in headline inflation has been driven by food prices, and, to a smaller
extent, by electricity and fuel prices. Moving forward, while inflation could be volatile
depending on the outcome of the Supreme Court's Temporary Restraining Order (TRO)
on Meralco's electricity price hikes, it should generally trend down after supply-side
disruptions from typhoon-related effects abate. In addition, domestic rice prices (which
form a significant 9% weight in the CPI) could moderate if the Thailand government, as it is
now doing, manages to sell some of its huge stockpile of rice to fund payments to farmers.
Accommodative monetary policy to continue – we doubt the central bank will
tighten monetary policy meaningfully in 2014: While many analysts have built in
expectations that the central bank will start tightening policy settings meaningfully in 2014
(the consensus is for 50bps of rate hikes), we disagree with this consensus. Arguably, the
market has started to price in some of this tightening, on the back of recent comments by
the central bank governor highlighting that the space to maintain rates has 'narrowed'. In
our view, the central bank still sees the recent rise in CPI as transitory and supply driven,
thereby not warranting a monetary policy response in its view. We maintain our non-
consensus view that the central bank will leave its key policy rate and the Special Deposit
Account (SDA) rate unchanged this year. In addition, while the BSP could theoretically
start mopping up liquidity through issuing its own securities if the new BSP charter is
passed, we doubt this will be a game changer in itself. It seems to us that the central bank
is still genuinely comfortable with the level of liquidity in the economy given its bullish
estimates of trend growth, and the introduction of new ways of sterilizing liquidity will not
fundamentally alter the central bank's calculations for now.
Is it all hunky-dory? – Central bank risks keeping policy settings too loose for too
long: If our key non-consensus views are correct, we will see upside surprises in GDP
growth, downside surprises in CPI inflation, and a more dovish central bank in 2014 than
the market currently expects. Nonetheless, it is not all hunky-dory. We note that
manageable inflation does not necessarily preclude an overheating economy. As our Asia
Regional Economist, Robert Prior-Wandesforde, has consistently argued, low inflation is
far from the definitive proof of overheating that many take it to be. Inflation is often the last
indicator to signal a problem, if indeed it ever does, based on the experience of bubbly
economies such as the US prior to the housing crisis and Indonesia prior to the recent US
QE Tapering. The variable that flashes red to us right now is the surge in money supply
growth. Meanwhile, other indicators such as property prices and capacity utilisation are
flashing amber in our view. Fast forward one to two years, and on the basis of current
monetary conditions we suspect that most of these other indicators will have turned red
(See Philippines: Mad Money?).
Michael Wan
+65 6212 3418
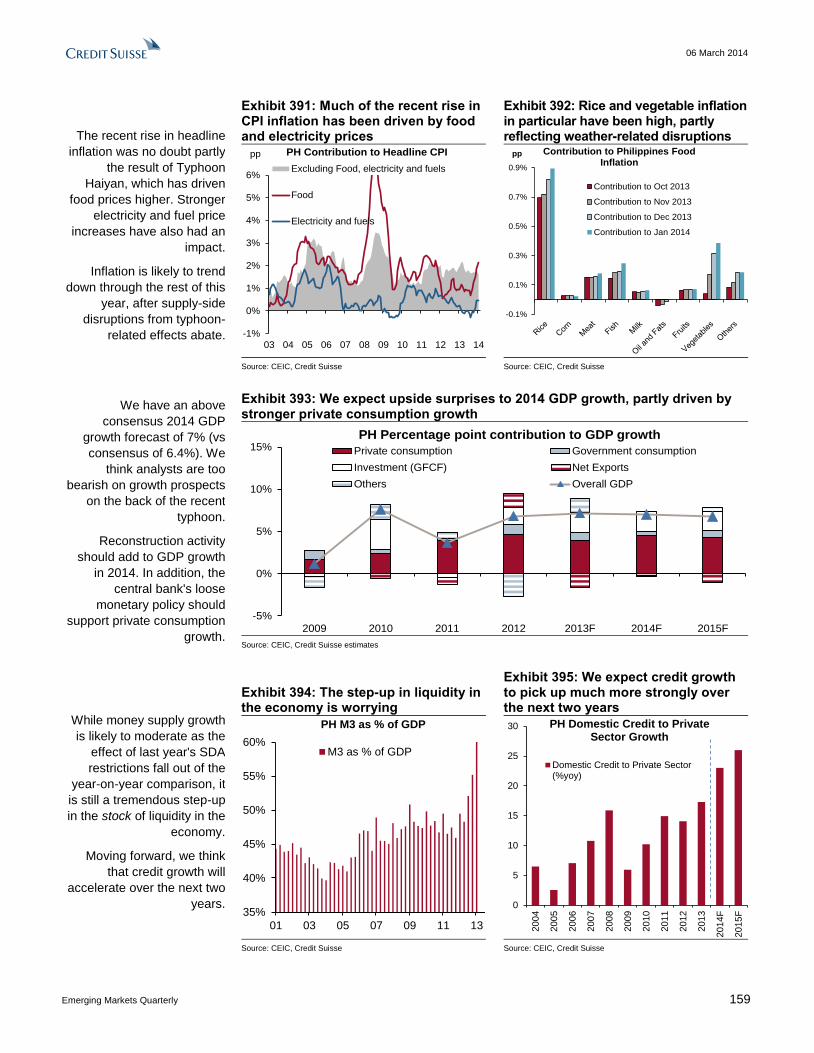
06 March 2014
Emerging Markets Quarterly 159
The recent rise in headline
inflation was no doubt partly
the result of Typhoon
Haiyan, which has driven
food prices higher. Stronger
electricity and fuel price
increases have also had an
impact.
Inflation is likely to trend
down through the rest of this
year, after supply-side
disruptions from typhoon-
related effects abate.
Exhibit 391: Much of the recent rise in CPI inflation has been driven by food and electricity prices
Exhibit 392: Rice and vegetable inflation in particular have been high, partly reflecting weather-related disruptions
-1%
0%
1%
2%
3%
4%
5%
6%
03 04 05 06 07 08 09 10 11 12 13 14
pp PH Contribution to Headline CPI
Excluding Food, electricity and fuels
Food
Electricity and fuels
-0.1%
0.1%
0.3%
0.5%
0.7%
0.9%
pp Contribution to Philippines Food Inflation
Contribution to Oct 2013
Contribution to Nov 2013
Contribution to Dec 2013
Contribution to Jan 2014
Source: CEIC, Credit Suisse Source: CEIC, Credit Suisse
We have an above
consensus 2014 GDP
growth forecast of 7% (vs
consensus of 6.4%). We
think analysts are too
bearish on growth prospects
on the back of the recent
typhoon.
Reconstruction activity
should add to GDP growth
in 2014. In addition, the
central bank's loose
monetary policy should
support private consumption
growth.
Exhibit 393: We expect upside surprises to 2014 GDP growth, partly driven by stronger private consumption growth
-5%
0%
5%
10%
15%
2009 2010 2011 2012 2013F 2014F 2015F
PH Percentage point contribution to GDP growth
Private consumption Government consumption
Investment (GFCF) Net Exports
Others Overall GDP
Source: CEIC, Credit Suisse estimates
While money supply growth
is likely to moderate as the
effect of last year's SDA
restrictions fall out of the
year-on-year comparison, it
is still a tremendous step-up
in the stock of liquidity in the
economy.
Moving forward, we think
that credit growth will
accelerate over the next two
years.
Exhibit 394: The step-up in liquidity in the economy is worrying
Exhibit 395: We expect credit growth to pick up much more strongly over the next two years
35%
40%
45%
50%
55%
60%
01 03 05 07 09 11 13
PH M3 as % of GDP
M3 as % of GDP
0
5
10
15
20
25
30
2004
2005
2006
2007
2008
2009
2010
2011
2012
2013
2014F
2015F
PH Domestic Credit to Private Sector Growth
Domestic Credit to Private Sector(%yoy)
Source: CEIC, Credit Suisse Source: CEIC, Credit Suisse
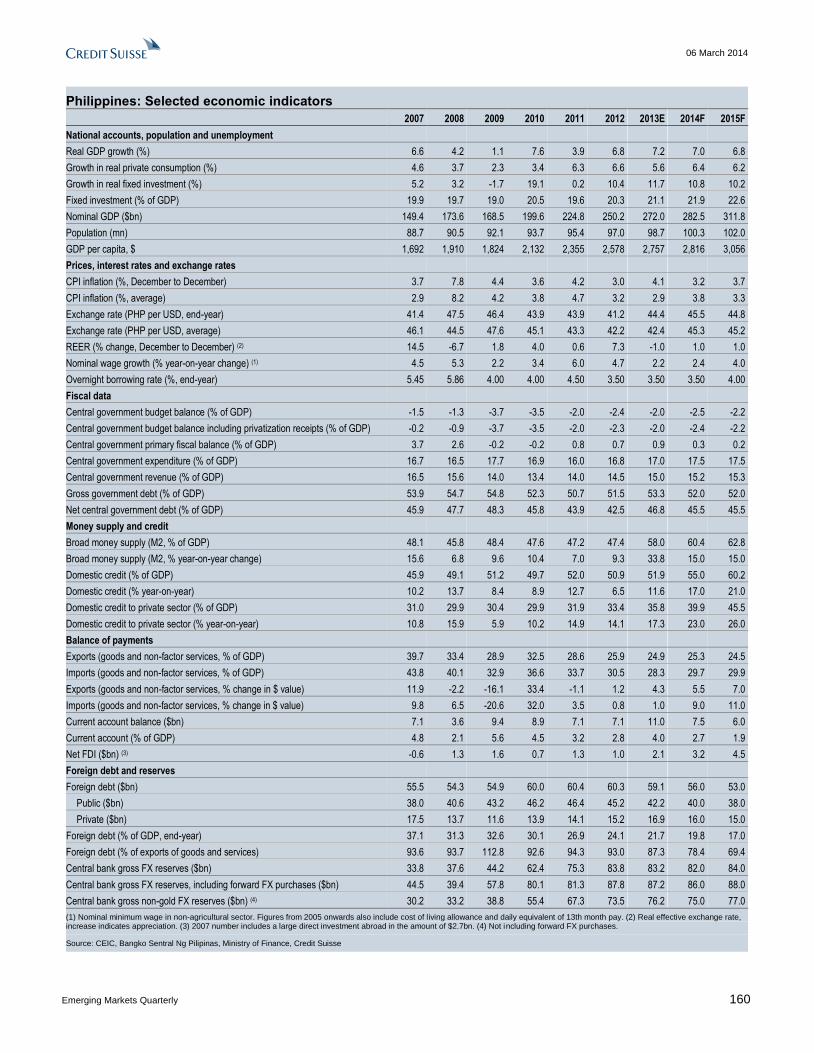
06 March 2014
Emerging Markets Quarterly 160
Philippines: Selected economic indicators
2007 2008 2009 2010 2011 2012 2013E 2014F 2015F
National accounts, population and unemployment
Real GDP growth (%) 6.6 4.2 1.1 7.6 3.9 6.8 7.2 7.0 6.8
Growth in real private consumption (%) 4.6 3.7 2.3 3.4 6.3 6.6 5.6 6.4 6.2
Growth in real fixed investment (%) 5.2 3.2 -1.7 19.1 0.2 10.4 11.7 10.8 10.2
Fixed investment (% of GDP) 19.9 19.7 19.0 20.5 19.6 20.3 21.1 21.9 22.6
Nominal GDP ($bn) 149.4 173.6 168.5 199.6 224.8 250.2 272.0 282.5 311.8
Population (mn) 88.7 90.5 92.1 93.7 95.4 97.0 98.7 100.3 102.0
GDP per capita, $ 1,692 1,910 1,824 2,132 2,355 2,578 2,757 2,816 3,056
Prices, interest rates and exchange rates
CPI inflation (%, December to December) 3.7 7.8 4.4 3.6 4.2 3.0 4.1 3.2 3.7
CPI inflation (%, average) 2.9 8.2 4.2 3.8 4.7 3.2 2.9 3.8 3.3
Exchange rate (PHP per USD, end-year) 41.4 47.5 46.4 43.9 43.9 41.2 44.4 45.5 44.8
Exchange rate (PHP per USD, average) 46.1 44.5 47.6 45.1 43.3 42.2 42.4 45.3 45.2
REER (% change, December to December) (2) 14.5 -6.7 1.8 4.0 0.6 7.3 -1.0 1.0 1.0
Nominal wage growth (% year-on-year change) (1) 4.5 5.3 2.2 3.4 6.0 4.7 2.2 2.4 4.0
Overnight borrowing rate (%, end-year) 5.45 5.86 4.00 4.00 4.50 3.50 3.50 3.50 4.00
Fiscal data
Central government budget balance (% of GDP) -1.5 -1.3 -3.7 -3.5 -2.0 -2.4 -2.0 -2.5 -2.2
Central government budget balance including privatization receipts (% of GDP) -0.2 -0.9 -3.7 -3.5 -2.0 -2.3 -2.0 -2.4 -2.2
Central government primary fiscal balance (% of GDP) 3.7 2.6 -0.2 -0.2 0.8 0.7 0.9 0.3 0.2
Central government expenditure (% of GDP) 16.7 16.5 17.7 16.9 16.0 16.8 17.0 17.5 17.5
Central government revenue (% of GDP) 16.5 15.6 14.0 13.4 14.0 14.5 15.0 15.2 15.3
Gross government debt (% of GDP) 53.9 54.7 54.8 52.3 50.7 51.5 53.3 52.0 52.0
Net central government debt (% of GDP) 45.9 47.7 48.3 45.8 43.9 42.5 46.8 45.5 45.5
Money supply and credit
Broad money supply (M2, % of GDP) 48.1 45.8 48.4 47.6 47.2 47.4 58.0 60.4 62.8
Broad money supply (M2, % year-on-year change) 15.6 6.8 9.6 10.4 7.0 9.3 33.8 15.0 15.0
Domestic credit (% of GDP) 45.9 49.1 51.2 49.7 52.0 50.9 51.9 55.0 60.2
Domestic credit (% year-on-year) 10.2 13.7 8.4 8.9 12.7 6.5 11.6 17.0 21.0
Domestic credit to private sector (% of GDP) 31.0 29.9 30.4 29.9 31.9 33.4 35.8 39.9 45.5
Domestic credit to private sector (% year-on-year) 10.8 15.9 5.9 10.2 14.9 14.1 17.3 23.0 26.0
Balance of payments
Exports (goods and non-factor services, % of GDP) 39.7 33.4 28.9 32.5 28.6 25.9 24.9 25.3 24.5
Imports (goods and non-factor services, % of GDP) 43.8 40.1 32.9 36.6 33.7 30.5 28.3 29.7 29.9
Exports (goods and non-factor services, % change in $ value) 11.9 -2.2 -16.1 33.4 -1.1 1.2 4.3 5.5 7.0
Imports (goods and non-factor services, % change in $ value) 9.8 6.5 -20.6 32.0 3.5 0.8 1.0 9.0 11.0
Current account balance ($bn) 7.1 3.6 9.4 8.9 7.1 7.1 11.0 7.5 6.0
Current account (% of GDP) 4.8 2.1 5.6 4.5 3.2 2.8 4.0 2.7 1.9
Net FDI ($bn) (3) -0.6 1.3 1.6 0.7 1.3 1.0 2.1 3.2 4.5
Foreign debt and reserves
Foreign debt ($bn) 55.5 54.3 54.9 60.0 60.4 60.3 59.1 56.0 53.0
Public ($bn) 38.0 40.6 43.2 46.2 46.4 45.2 42.2 40.0 38.0
Private ($bn) 17.5 13.7 11.6 13.9 14.1 15.2 16.9 16.0 15.0
Foreign debt (% of GDP, end-year) 37.1 31.3 32.6 30.1 26.9 24.1 21.7 19.8 17.0
Foreign debt (% of exports of goods and services) 93.6 93.7 112.8 92.6 94.3 93.0 87.3 78.4 69.4
Central bank gross FX reserves ($bn) 33.8 37.6 44.2 62.4 75.3 83.8 83.2 82.0 84.0
Central bank gross FX reserves, including forward FX purchases ($bn) 44.5 39.4 57.8 80.1 81.3 87.8 87.2 86.0 88.0
Central bank gross non-gold FX reserves ($bn) (4) 30.2 33.2 38.8 55.4 67.3 73.5 76.2 75.0 77.0
(1) Nominal minimum wage in non-agricultural sector. Figures from 2005 onwards also include cost of living allowance and daily equivalent of 13th month pay. (2) Real effective exchange rate, increase indicates appreciation. (3) 2007 number includes a large direct investment abroad in the amount of $2.7bn. (4) Not including forward FX purchases.
Source: CEIC, Bangko Sentral Ng Pilipinas, Ministry of Finance, Credit Suisse

06 March 2014
Emerging Markets Quarterly 161
Singapore: The consequences of stronger growth? We have kept our 2014 GDP forecast at 4% (vs consensus of 3.8%), while also
maintaining our 2015 forecast at 5%: Singapore's full-year GDP growth last year came
in at 4.1%, a significant improvement from the lacklustre 1.9% growth seen in 2012, led by
better manufacturing and trade-related services activity. It was also interesting to note that
government consumption rose 11%yoy – the highest growth rate in more than 10 years.
Looking forward, we expect GDP growth to continue to be driven by trade-related activity.
While recent weak US data, such as the ISM and retail sales numbers, have once again
instilled doubts about the ever elusive pick-up in global growth, it remains to be seen
whether these numbers portend further softness or are mainly weather-related aberrations.
We note that our preferred lead indicator for the region, the CRB Metal Price Index,
suggests a plateauing of industrial activity rather than a significant correction moving
forward. We have kept our 2014 GDP forecast, building in some softness in 1Q while also
penciling in an acceleration in growth from the 2nd
quarter.
Budget 2014: Enough is enough?: In what was an important, and marked, departure
from its previous four Budgets, the government decided not to announce further across the
board foreign labour tightening measures. Instead, it announced much more targeted
tweaks aimed at the construction sector, raising levies for basic-skilled construction
workers starting in 2016. With these more targeted changes, it seems to us that the
government, at least for now, is comfortable with the current trajectory of foreign workforce
growth, with the expectation that it will continue to moderate over the next two years on the
basis of the measures that are already in place and set to take effect over the next two
years. We note that foreign employment growth has already moderated to around 4%yoy
as of December 2013, from 7% in 2012, although still some way below the 2% to 2.5%
CAGR rate envisioned in the Population White Paper over the rest of this decade.
Nonetheless, with more foreign labour restrictions in the pipeline, coupled with the fact that
companies are still feeling the pain from existing labour curbs, we believe that GDP growth
will be capped from the supply side.
We expect core inflation to pick up over the next two years. With the labour market
still structurally tight, we expect wage growth to continue trending higher over the next two
years. We have penciled in a 5-6% rise in wage growth from the 4.3%yoy rate seen in
2013. The government's administrative measures as well as incentives to raise the wages
of lower income workers (for example, through the Wage Credit Scheme, and also
mandatory baseline salaries for cleaners) are likely to add to overall wage growth over the
coming years. We expect MAS core inflation (which excludes housing accommodation and
private transport costs) to rise from 2.2% currently, to above 3% by the end of this year.
The hurdle for monetary policy easing is high: The MAS is highly likely to keep its tight
exchange rate policy come its April meeting. Economic activity has improved, while wage
growth and MAS core inflation should pick up further given the structurally tight labour
market. In addition, the government still views the overall fiscal policy stance as
expansionary in 2014, with a positive fiscal impulse of around 1% of GDP for FY2014,
from more than +1% of GDP in FY2013.
Household balance sheets are strong, but private consumption will inevitably be
crimped when short-term interest rates rise: In the context of the inevitable eventual
rise in short-term interest rates, clients have asked whether Singapore's rapidly rising
household debt over the past few years poses dangers to the performance of the
macroeconomy. We take a relatively sanguine view (see Singapore: Household debt
dangers?). Aggregate data show that household balance sheets look strong as: 1) even
liquid assets comfortably exceed overall debt, and 2) while debt has risen, incomes have
risen too. In addition, micro-data from the CS Equity Research's proprietary housing
survey make us relatively sanguine about the ability of households to service debt for two
reasons: 1) the proportion of households that have overstretched themselves looks small,
and 2) households with higher debt service burdens generally have substantial liquid
assets. We note that with the property market cooling measures that are already in place,
household debt as a % of GDP has already come down slightly for the first time since
2Q2010. While the risk of a macro crisis looks small, private consumption will likely be
crimped once interest rates rise.
Michael Wan
+65 6212 3418

06 March 2014
Emerging Markets Quarterly 162
While recent weak US data
have, once again, instilled
doubts about the ever
elusive pick-up in global
growth, it remains to be
seen whether the numbers
portend further weakness or
are simply weather-related
aberrations.
Our preferred lead indicator
for the region, the CRB
Metal Price Index, suggests
a plateauing of industrial
activity rather than a
significant correction moving
forward.
Exhibit 396: Our preferred lead indicator for the region, the CRB Metal Price Index, suggests a plateauing of industrial activity rather than a significant correction
-40%
-30%
-20%
-10%
0%
10%
20%
30%
40%
-15%
-10%
-5%
0%
5%
10%
15%
03 04 05 06 07 08 09 10 11 12 13
%3m change%3m/3m saar
SG IP ex biomed sa CRB Metal (RHS)
Source: Bloomberg, CEIC
The government decided
not to announce further
across the board foreign
labour tightening measures
in Budget 2014, indicating it
is comfortable with the
current trajectory of foreign
workforce growth.
We note, however, that
foreign employment growth
is still some way above the
rates envisioned in the
government's Population
White Paper.
Exhibit 397: Foreign employment growth has slowed, while local employment has risen
Exhibit 398: Some way to go before achieving the forecasts set out in the Population White Paper
0%
2%
4%
6%
8%
10%
% yoy Singapore YoY Growth in Employment
Total Foreign Workforce
Total Local Workforce
53,300
35,000
0
10,000
20,000
30,000
40,000
50,000
60,000
Foreign EmploymentGrowth (Dec 2013)
Implied Annual ForeignEmployment Growth
(2014 to 2020)*
Actual Foreign Employment Growth vs Forecast
Ministry of Manpower, Credit Suisse * Based on numbers implied by Population White Paper
Source: Ministry of Manpower, NPTD, Credit Suisse
With the labour market still
structurally tight, and with
the government's
administrative measures to
boost the income of lower
wage workers, we expect
wage growth to continue
picking up over the next two
years.
We expect MAS core
inflation to rise above
3%yoy by the end of 2014.
Exhibit 399: We expect wage growth to continue to pick up given the still tight labour market…
Exhibit 400: … which is expected to add to MAS core inflation
-2
-1
0
1
2
3
4
5
6
7
20
02
20
03
20
04
20
05
20
06
20
07
20
08
20
09
20
10
20
11
20
12
20
13
20
14F
20
15F
Nominal Wage Growth (%yoy)
-2%
0%
2%
4%
6%
8%
10%
04 05 06 07 08 09 10 11 12 13 14 15
Headline CPI %yoy
MAS core inflation* %yoyF'cst
Source: CEIC, Credit Suisse
* excludes housing accommodation and private transport costs Source: CEIC, Credit Suisse
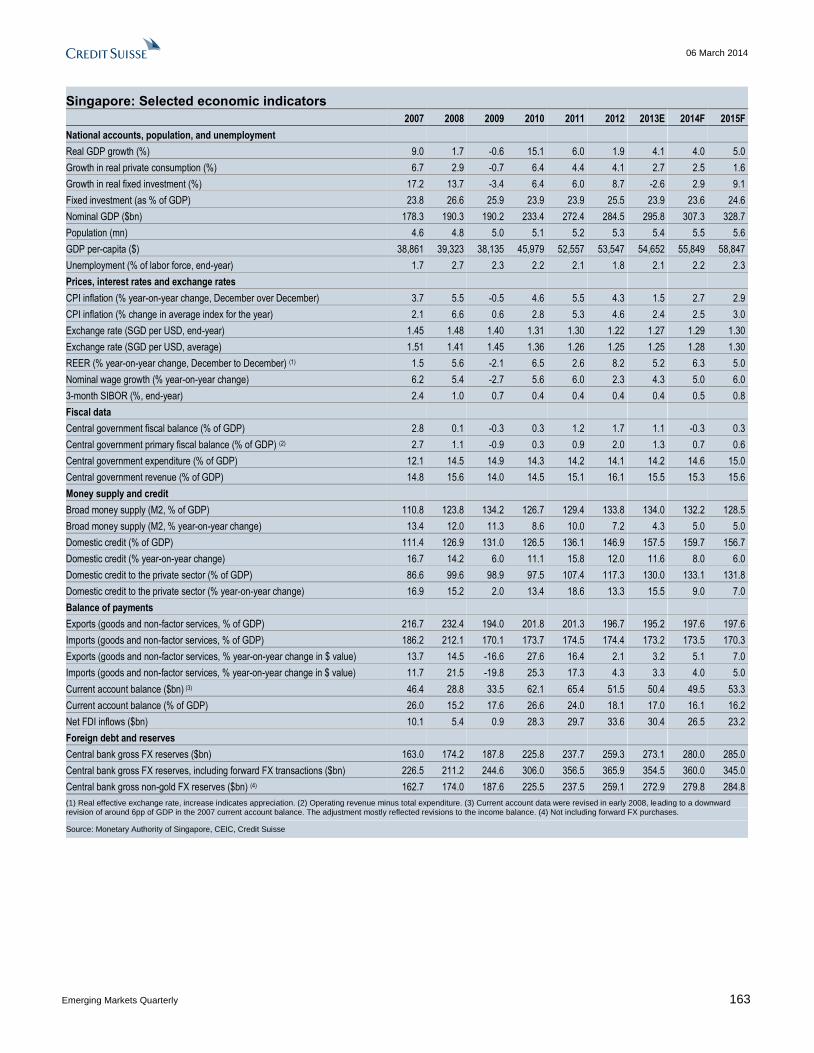
06 March 2014
Emerging Markets Quarterly 163
Singapore: Selected economic indicators
2007 2008 2009 2010 2011 2012 2013E 2014F 2015F
National accounts, population, and unemployment
Real GDP growth (%) 9.0 1.7 -0.6 15.1 6.0 1.9 4.1 4.0 5.0
Growth in real private consumption (%) 6.7 2.9 -0.7 6.4 4.4 4.1 2.7 2.5 1.6
Growth in real fixed investment (%) 17.2 13.7 -3.4 6.4 6.0 8.7 -2.6 2.9 9.1
Fixed investment (as % of GDP) 23.8 26.6 25.9 23.9 23.9 25.5 23.9 23.6 24.6
Nominal GDP ($bn) 178.3 190.3 190.2 233.4 272.4 284.5 295.8 307.3 328.7
Population (mn) 4.6 4.8 5.0 5.1 5.2 5.3 5.4 5.5 5.6
GDP per-capita ($) 38,861 39,323 38,135 45,979 52,557 53,547 54,652 55,849 58,847
Unemployment (% of labor force, end-year) 1.7 2.7 2.3 2.2 2.1 1.8 2.1 2.2 2.3
Prices, interest rates and exchange rates
CPI inflation (% year-on-year change, December over December) 3.7 5.5 -0.5 4.6 5.5 4.3 1.5 2.7 2.9
CPI inflation (% change in average index for the year) 2.1 6.6 0.6 2.8 5.3 4.6 2.4 2.5 3.0
Exchange rate (SGD per USD, end-year) 1.45 1.48 1.40 1.31 1.30 1.22 1.27 1.29 1.30
Exchange rate (SGD per USD, average) 1.51 1.41 1.45 1.36 1.26 1.25 1.25 1.28 1.30
REER (% year-on-year change, December to December) (1) 1.5 5.6 -2.1 6.5 2.6 8.2 5.2 6.3 5.0
Nominal wage growth (% year-on-year change) 6.2 5.4 -2.7 5.6 6.0 2.3 4.3 5.0 6.0
3-month SIBOR (%, end-year) 2.4 1.0 0.7 0.4 0.4 0.4 0.4 0.5 0.8
Fiscal data
Central government fiscal balance (% of GDP) 2.8 0.1 -0.3 0.3 1.2 1.7 1.1 -0.3 0.3
Central government primary fiscal balance (% of GDP) (2) 2.7 1.1 -0.9 0.3 0.9 2.0 1.3 0.7 0.6
Central government expenditure (% of GDP) 12.1 14.5 14.9 14.3 14.2 14.1 14.2 14.6 15.0
Central government revenue (% of GDP) 14.8 15.6 14.0 14.5 15.1 16.1 15.5 15.3 15.6
Money supply and credit
Broad money supply (M2, % of GDP) 110.8 123.8 134.2 126.7 129.4 133.8 134.0 132.2 128.5
Broad money supply (M2, % year-on-year change) 13.4 12.0 11.3 8.6 10.0 7.2 4.3 5.0 5.0
Domestic credit (% of GDP) 111.4 126.9 131.0 126.5 136.1 146.9 157.5 159.7 156.7
Domestic credit (% year-on-year change) 16.7 14.2 6.0 11.1 15.8 12.0 11.6 8.0 6.0
Domestic credit to the private sector (% of GDP) 86.6 99.6 98.9 97.5 107.4 117.3 130.0 133.1 131.8
Domestic credit to the private sector (% year-on-year change) 16.9 15.2 2.0 13.4 18.6 13.3 15.5 9.0 7.0
Balance of payments
Exports (goods and non-factor services, % of GDP) 216.7 232.4 194.0 201.8 201.3 196.7 195.2 197.6 197.6
Imports (goods and non-factor services, % of GDP) 186.2 212.1 170.1 173.7 174.5 174.4 173.2 173.5 170.3
Exports (goods and non-factor services, % year-on-year change in $ value) 13.7 14.5 -16.6 27.6 16.4 2.1 3.2 5.1 7.0
Imports (goods and non-factor services, % year-on-year change in $ value) 11.7 21.5 -19.8 25.3 17.3 4.3 3.3 4.0 5.0
Current account balance ($bn) (3) 46.4 28.8 33.5 62.1 65.4 51.5 50.4 49.5 53.3
Current account balance (% of GDP) 26.0 15.2 17.6 26.6 24.0 18.1 17.0 16.1 16.2
Net FDI inflows ($bn) 10.1 5.4 0.9 28.3 29.7 33.6 30.4 26.5 23.2
Foreign debt and reserves
Central bank gross FX reserves ($bn) 163.0 174.2 187.8 225.8 237.7 259.3 273.1 280.0 285.0
Central bank gross FX reserves, including forward FX transactions ($bn) 226.5 211.2 244.6 306.0 356.5 365.9 354.5 360.0 345.0
Central bank gross non-gold FX reserves ($bn) (4) 162.7 174.0 187.6 225.5 237.5 259.1 272.9 279.8 284.8
(1) Real effective exchange rate, increase indicates appreciation. (2) Operating revenue minus total expenditure. (3) Current account data were revised in early 2008, leading to a downward revision of around 6pp of GDP in the 2007 current account balance. The adjustment mostly reflected revisions to the income balance. (4) Not including forward FX purchases.
Source: Monetary Authority of Singapore, CEIC, Credit Suisse
06 March 2014
Emerging Markets Quarterly 164
Taiwan: Developed markets' demand holds the key
Growth improved in 4Q, a delayed response to the improvement in better global
economic environment. Taiwan’s 4Q13 GDP growth surprised on the upside, up 3% yoy
and 1.8% qoq (sa) (7.3% qoq annualized). A pick-up in domestic demand growth was the
driver, but we suspect it also reflect the volatility in the capital investment schedule of the
semiconductor sector. On external trade, real export growth was up 4% yoy, but real
import growth rose faster to cause a 0.3pp deduction from net trade. Assuming that global
growth will continue to improve, we expect Taiwan's export growth, facility investments and
consumer sentiment to continue to see support, helping headline GDP growth to improve
further in 2014.
Despite the rising share of Taiwan's exports to China/Hong Kong, the final demand
from developed markets remain pivotal. The recent weakness in US data and our
downgrade of China's GDP growth have casted uncertainty over the strength of the global
economy in 2014, which is pivotal to Taiwan's recovery. We use the OECD-WTO's
"Exports in Value Added" data and found that the developed world (G3) continues to be
Taiwan's most important export destination, despite its higher share of gross exports
towards China/Hong Kong (please see Korea and Taiwan: Recovery set in stone? How
weaker global demand may affect exports and growth, 10 February 2014). The analysis
shows that a genuine recovery in Taiwan is still very much dependent upon the final
demand of the developed world. China's weaker growth is no doubt negative, but unless
growth drops off more significantly than expected, the impact should still be manageable
and be offset by the stronger developed markets' demand.
Orders for technology exports remain resilient, driven by the robust demand from
the rest of the world. Export orders fell 2.8% yoy and dropped 10.7% mom (sa) in
January, heavily distorted by the lunar new year effect, in our view. But despite the
distortion, orders for information/communication and electronics exports continued to see
positive low single-digit gains. We believe this reflect the strong international demand for
telecommunication and electronic products, which have a high overseas production ratio
outside of Taiwan. Non-tech export orders, however, remained sluggish, in reflection of
their weak demand vis-à-vis the tech sectors.
Export growth recovered in 4Q13 but may see headwinds in the near term. January
exports and imports fell 5.3% yoy and 15.3% yoy, respectively, both weaker than
expected. We think the weakening of the US leading indicators suggests that Taiwan's
export growth may see some headwinds in the near term, though we continue to expect
better momentum this year upon a continued global recovery. Geographically, Taiwan's
exports to China/Hong Kong and the US saw improvement, but exports to Europe, Japan,
and other Asian countries still saw mild contractions. Within emerging markets, Taiwan's
exposure towards China/Hong Kong remain substantial, while those towards
ASEAN/India, Latin America and the Middle East/Africa are scattered. Unless emerging
markets face a synchronized slowdown, we believe its impact on Taiwan should remain
manageable.
Industrial production activities remained weak, though we would opt to wait for the
February data to give us a clearer picture. After a quick spike in December, industrial
production weakened again and fell 1.8% yoy and 1.7% mom (sa) in January. We expect
to have a clearer view on the latest IP momentum when the February data is released,
though we think it is likely to remain gradual amidst a temporal peaking in global industrial
production growth. The product breakdown details show that the production of electronic
components and chemicals managed to record positive gains from a year ago, helped by
the strong global demand for mobile devices and the re-stocking by chemical companies.
The production of computers, electronic and optical goods, basic metals, machinery and
automobile dropped, however, dragged by their more sluggish demand.
Christiaan Tuntono
+852 2101 7409
06 March 2014
Emerging Markets Quarterly 165
Inflationary pressure remains very tamed amidst a slow economy. CPI inflation was
low at 0.4% yoy in January-February. With the domestic economy still weak and supply-
side factors such as food and crude oil prices remaining moderate, we do not think there is
visible upward pressure on prices at this juncture. What concerns us is the gradual
moderation of core inflation, which has softened to 0.4% yoy on a trend basis in February.
This suggests that there is room for the central bank to ease monetary policy further due to
the lack of price pressure, but we do not think it will do so. This is because: (1) we do not
think that an even lower interest rate level can stimulate facility investments on a
sustainable basis; (2) it may risk fueling property speculation, as monetary policy is being
kept too easy for too long.
We do not think the Central Bank of China will adjust its policy rediscount rate in
2014. As growth is expected to continue recovering in 2014, we expect the CBC to keep
the policy rediscount rate on hold, allowing better external demand to do the heavy lifting
of raising Taiwan’s growth momentum. The risk of a rate hike may rise in 2H 2014, if the
developed market economies show a stronger recovery and global oil prices rebound to
exert upside pressure on inflation, though we reckon that this year could be too early for
the central bank to commence its rate normalization process. Looking ahead, we think the
performance of Taiwan’s macro data will remain the ultimate driver behind the CBC’s
monetary policy decision, despite the Fed's gradual exit from its quantitative easing
measures this year.
Taiwan has one of the strongest external liquidity positions in Non-Japan Asia,
protecting the TWD from the selling pressures seen in other emerging market
currencies. Taiwan's current account surplus is strong at 11.5% of GDP as of 3Q14 (four-
quarter roll sum basis). This has provided more than enough cushion to finance the
outflows through the direct investment and portfolio investment channels. We think the
strong external liquidity position has helped the central bank to maintain USDTWD within a
stable range, fluctuating not more than 7% between 28.5 to 30.5 since 2011. We expect
the cross to remain within the range, and project it to strengthen mildly to 29.9 by the end
of this year. The current account surplus is likely to remain resilient at over $50bn (10% of
GDP) in 2014, as we expect the rise in import demand is not likely to be overly strong
throughout the year.
The Ministry of Finance launched a comprehensive fiscal reform proposal in late
February, which we think represents the start of a lengthy reform process. We think
the MoF is making the right decision in tackling the deteriorating fiscal condition, though
we do not expect it will be a smooth process. The proposal for central government fiscal
reform includes ways to limit the government debt level, adjust expenditure structure and
widen the revenue sources. To increase tax revenue, the MoF proposes three short-term
tax reform measures, which include (1) raising the business tax for banks and insurance
companies to 5%; (2) cutting the current tax credit on share dividends by 50% under the
integrated tax system; and (3) creating a new individual income tax bracket with a marginal
tax rate of 45% for income over TWD 10mn a year. Netting out other tax reductions
offered, the short-term tax adjustment is estimated to contribute about TWD 71bn (0.4% of
GDP) to the fiscal account. The MoF's proposal will need to be rectified by the Legislative
Yuan before becoming effective.
We do not expect changes in Taiwan’s ratings over the next six months. Taiwan is
currently rated at Aa3 (Moody’s), AA- (S&P) and A+ (Fitch), with a stable outlook.

06 March 2014
Emerging Markets Quarterly 166
Taiwan’s 4Q13 GDP
growth surprised on the
upside, up 3% yoy and
1.8% qoq (sa) (7.3% qoq
annualized). On a full-year
basis, the economy gained
2.1% in 2013.
Exhibit 401: Real GDP growth Exhibit 402: Net grade
-2
-1
0
1
2
3
4
5
6
2009
2Q
09
3Q
09
4Q
09
2010
2Q
10
3Q
10
4Q
10
2011
2Q
11
3Q
11
4Q
11
2012
2Q
12
3Q
12
4Q
12
2013
2Q
13
3Q
13
4Q
13
Taiwan Real GDP (%qoq, sa)
1.70.67 0.79
3.89
2.1
-0.22
2.020.87
-0.25
-1.0
0.0
1.0
2.0
3.0
4.0
5.0
4Q12 2013 2Q13 3Q13 4Q13
Contribution to Real GDP growth (pp)
Domestic Demand Net Trade
Source: NSO, CEIC, Credit Suisse Source: NSO, CEIC, Credit Suisse
We use the OECD-WTO's
"Exports in Value Added"
data and found that the
developed world (G3)
continues to be Taiwan's
most important export
destination, despite its
higher share of gross
exports towards
China/Hong Kong.
Exhibit 403: Exports value added – geographic breakdown
Exhibit 404: Exports value added – as % of GDP
US20.5%
EU20.4%China/H
K18.3%
ASEAN/IN
9.1%
Japan8.5%
Latam5.9%
Oceania2.0%
MEA1.9% Others
13.4%
Taiwan: Exports of Value Added (% of Total Exports)
7.1 7.1
6.3
3.1 2.9
2.0
0.7 0.7
4.6
0
1
2
3
4
5
6
7
8Taiwan: Exports of Value Added (%
of GDP)
Source: OECD-WTO, Credit Suisse Source: OECD-WTO, Credit Suisse
Export orders fell in
January, heavily distorted
by the lunar new year effect.
We think the weakening of
the US leading indicators
suggests that export growth
may see some headwinds in
the near term.
Exhibit 405: Export orders Exhibit 406: Tech exports
-60
-40
-20
0
20
40
60
2005 2006 2007 2008 2009 2010 2011 2012 2013 2014
Export orders (% yoy)
Exports (% yoy)
-60
-40
-20
0
20
40
60
80
100
Jan
-06
Jul-0
6
Jan
-07
Jul-0
7
Jan
-08
Jul-0
8
Jan
-09
Jul-0
9
Jan
-10
Jul-1
0
Jan
-11
Jul-1
1
Jan
-12
Jul-1
2
Jan
-13
Jul-1
3
Jan
-14
Chemical exports (% yoy, 3m mav)
Electronic exports (% yoy, 3m mav)
Machinery exports (% yoy, 3m mav)
Info & Comm exports (% yoy, 3m mav)
Source: CEIC, Credit Suisse Source: CEIC, ISM, Institute for Economic Research, Credit Suisse

06 March 2014
Emerging Markets Quarterly 167
Export growth recovered in
4Q13 but may see
headwinds in the near term.
Industrial production
activities remained weak,
though we would opt to wait
for the February data to give
us a clearer picture.
Exhibit 407: Merchandise exports Exhibit 408: Industrial production
-80
-60
-40
-20
0
20
40
60
80
-40
-30
-20
-10
0
10
20
30
40
2005 2006 2007 2008 2009 2010 2011 2012 2013 2014
Trade balance ($ bn, 12 roll sum, LHS)
Exports (% yoy)
Imports (% yoy)
-40
-30
-20
-10
0
10
20
30
40
50
60
2002 2004 2006 2008 2010 2012 2014
Export orders (% yoy)
Industrial production (% yoy)
Note: Data are smoothed for new year effect Source: MoF, Credit Suisse Research
Note: Data are smoothed for lunar new year effect Source: CEIC, Credit Suisse
Inflationary pressure
remains very tamed amidst
a slow economy.
We do not think the Central
Bank of China will adjust its
policy rediscount rate in
2014.
Exhibit 409: CPI inflation Exhibit 410: Policy rediscount rate
-15
-10
-5
0
5
10
15
20
25
30
-3
-2
-1
0
1
2
3
4
5
6
2005
2006
2007
2008
2009
2010
2011
2012
2013
2014
Consumer price index (% yoy)
Core CPI (% yoy)
Import price inflation (% yoy, RHS)
0
1
2
3
4
5
6
2004 2006 2008 2010 2012 2014
Taiwan rediscount rate (%)
Taiwan overnight rate (%)
US Federal Funds rate (%)Forecast
Source: NBS, Credit Suisse Source: CEIC, Credit Suisse
We think the strong
external liquidity position
has helped the central bank
to maintain USDTWD
within a stable range.
Exhibit 411: Current account Exhibit 412: USDTWD
-10
-5
0
5
10
15
20
1999 2001 2003 2005 2007 2009 2011 2013
Current account balance (% of GDP)
Capital & Financial account (% of GDP)
Overall balance (% of GDP)
262728293031323334353637383940
2002
2003
2004
2005
2006
2007
2008
2009
2010
2011
2012
2013
2014
USDTW
Source: MoF, CEIC, Credit Suisse Source: CEIC, Credit Suisse
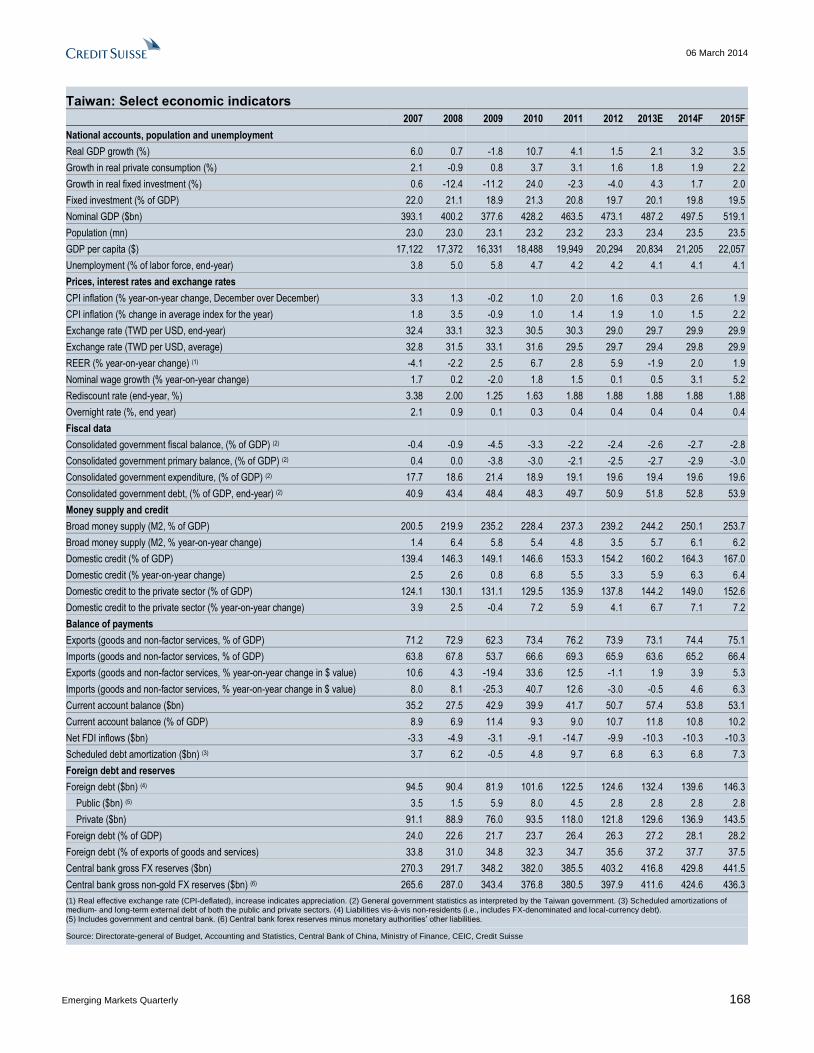
06 March 2014
Emerging Markets Quarterly 168
Taiwan: Select economic indicators
2007 2008 2009 2010 2011 2012 2013E 2014F 2015F
National accounts, population and unemployment
Real GDP growth (%) 6.0 0.7 -1.8 10.7 4.1 1.5 2.1 3.2 3.5
Growth in real private consumption (%) 2.1 -0.9 0.8 3.7 3.1 1.6 1.8 1.9 2.2
Growth in real fixed investment (%) 0.6 -12.4 -11.2 24.0 -2.3 -4.0 4.3 1.7 2.0
Fixed investment (% of GDP) 22.0 21.1 18.9 21.3 20.8 19.7 20.1 19.8 19.5
Nominal GDP ($bn) 393.1 400.2 377.6 428.2 463.5 473.1 487.2 497.5 519.1
Population (mn) 23.0 23.0 23.1 23.2 23.2 23.3 23.4 23.5 23.5
GDP per capita ($) 17,122 17,372 16,331 18,488 19,949 20,294 20,834 21,205 22,057
Unemployment (% of labor force, end-year) 3.8 5.0 5.8 4.7 4.2 4.2 4.1 4.1 4.1
Prices, interest rates and exchange rates
CPI inflation (% year-on-year change, December over December) 3.3 1.3 -0.2 1.0 2.0 1.6 0.3 2.6 1.9
CPI inflation (% change in average index for the year) 1.8 3.5 -0.9 1.0 1.4 1.9 1.0 1.5 2.2
Exchange rate (TWD per USD, end-year) 32.4 33.1 32.3 30.5 30.3 29.0 29.7 29.9 29.9
Exchange rate (TWD per USD, average) 32.8 31.5 33.1 31.6 29.5 29.7 29.4 29.8 29.9
REER (% year-on-year change) (1) -4.1 -2.2 2.5 6.7 2.8 5.9 -1.9 2.0 1.9
Nominal wage growth (% year-on-year change) 1.7 0.2 -2.0 1.8 1.5 0.1 0.5 3.1 5.2
Rediscount rate (end-year, %) 3.38 2.00 1.25 1.63 1.88 1.88 1.88 1.88 1.88
Overnight rate (%, end year) 2.1 0.9 0.1 0.3 0.4 0.4 0.4 0.4 0.4
Fiscal data
Consolidated government fiscal balance, (% of GDP) (2) -0.4 -0.9 -4.5 -3.3 -2.2 -2.4 -2.6 -2.7 -2.8
Consolidated government primary balance, (% of GDP) (2) 0.4 0.0 -3.8 -3.0 -2.1 -2.5 -2.7 -2.9 -3.0
Consolidated government expenditure, (% of GDP) (2) 17.7 18.6 21.4 18.9 19.1 19.6 19.4 19.6 19.6
Consolidated government debt, (% of GDP, end-year) (2) 40.9 43.4 48.4 48.3 49.7 50.9 51.8 52.8 53.9
Money supply and credit
Broad money supply (M2, % of GDP) 200.5 219.9 235.2 228.4 237.3 239.2 244.2 250.1 253.7
Broad money supply (M2, % year-on-year change) 1.4 6.4 5.8 5.4 4.8 3.5 5.7 6.1 6.2
Domestic credit (% of GDP) 139.4 146.3 149.1 146.6 153.3 154.2 160.2 164.3 167.0
Domestic credit (% year-on-year change) 2.5 2.6 0.8 6.8 5.5 3.3 5.9 6.3 6.4
Domestic credit to the private sector (% of GDP) 124.1 130.1 131.1 129.5 135.9 137.8 144.2 149.0 152.6
Domestic credit to the private sector (% year-on-year change) 3.9 2.5 -0.4 7.2 5.9 4.1 6.7 7.1 7.2
Balance of payments
Exports (goods and non-factor services, % of GDP) 71.2 72.9 62.3 73.4 76.2 73.9 73.1 74.4 75.1
Imports (goods and non-factor services, % of GDP) 63.8 67.8 53.7 66.6 69.3 65.9 63.6 65.2 66.4
Exports (goods and non-factor services, % year-on-year change in $ value) 10.6 4.3 -19.4 33.6 12.5 -1.1 1.9 3.9 5.3
Imports (goods and non-factor services, % year-on-year change in $ value) 8.0 8.1 -25.3 40.7 12.6 -3.0 -0.5 4.6 6.3
Current account balance ($bn) 35.2 27.5 42.9 39.9 41.7 50.7 57.4 53.8 53.1
Current account balance (% of GDP) 8.9 6.9 11.4 9.3 9.0 10.7 11.8 10.8 10.2
Net FDI inflows ($bn) -3.3 -4.9 -3.1 -9.1 -14.7 -9.9 -10.3 -10.3 -10.3
Scheduled debt amortization ($bn) (3) 3.7 6.2 -0.5 4.8 9.7 6.8 6.3 6.8 7.3
Foreign debt and reserves
Foreign debt ($bn) (4) 94.5 90.4 81.9 101.6 122.5 124.6 132.4 139.6 146.3
Public ($bn) (5) 3.5 1.5 5.9 8.0 4.5 2.8 2.8 2.8 2.8
Private ($bn) 91.1 88.9 76.0 93.5 118.0 121.8 129.6 136.9 143.5
Foreign debt (% of GDP) 24.0 22.6 21.7 23.7 26.4 26.3 27.2 28.1 28.2
Foreign debt (% of exports of goods and services) 33.8 31.0 34.8 32.3 34.7 35.6 37.2 37.7 37.5
Central bank gross FX reserves ($bn) 270.3 291.7 348.2 382.0 385.5 403.2 416.8 429.8 441.5
Central bank gross non-gold FX reserves ($bn) (6) 265.6 287.0 343.4 376.8 380.5 397.9 411.6 424.6 436.3
(1) Real effective exchange rate (CPI-deflated), increase indicates appreciation. (2) General government statistics as interpreted by the Taiwan government. (3) Scheduled amortizations of medium- and long-term external debt of both the public and private sectors. (4) Liabilities vis-à-vis non-residents (i.e., includes FX-denominated and local-currency debt). (5) Includes government and central bank. (6) Central bank forex reserves minus monetary authorities’ other liabilities.
Source: Directorate-general of Budget, Accounting and Statistics, Central Bank of China, Ministry of Finance, CEIC, Credit Suisse
06 March 2014
Emerging Markets Quarterly 169
Thailand: Political mess, economic stress
Short-term economic costs of political uncertainty are likely to be significant.
Given the recent deterioration in Thailand’s political situation, we have cut our 2014
GDP growth forecast to 2.0% from 3.0% (vs the BoT's figure of “around 3%” and
consensus’ 3.2%). Both the market’s and government’s GDP growth forecasts have
been coming down rapidly but we expect more to go. Our GDP downgrade mainly
reflects the expectation of weaker tourism growth and a more severe fiscal drag than we
initially anticipated.
Tourism hit. Our recent work suggests that Thai tourism growth faces two important
headwinds: 1) the on-going political crisis (particularly now that Mainland Chinese
tourists, which tend to be more sensitive to negative political events, now account for
around 20% of total arrivals); and 2) the Malaysian government’s “Visit Malaysia Year
2014“ promotion that historically tends to divert tourists away from Thailand. (Read our
full report here). This is why we have trimmed our 2014 forecast for the export of goods
and services by almost 1 percentage point to 4.5%.
Fiscal drag. Given our expectation that politics will likely remain highly unstable at least
until the end of 2Q, we think fiscal policy will continue to act as a drag on GDP growth in
the coming months. In particular, we make the following assumptions for our central
scenario: 1) the amount that the government owes rice farmers, equivalent to around 1%
of GDP, will not be paid in full until 2Q; 2) the rice pledging scheme for the second crop
of the year will likely be trimmed or replaced by a less generous version; 3) the
government will not implement any significant fiscal stimulus measures until the second
half at the earliest; and 4) off-budget infrastructure spending will be postponed until next
year. All of these developments imply a decline equivalent of at least 1% of GDP in fiscal
spending in 2014 relative to 2013, according to our estimates. We have incorporated this
into our recent downward revision to our GDP forecast via reductions in investment and
private consumption growth projections.
Manageable inflation, lower policy rate. We expect inflation to remain soft on the back
of weak economic activity and the government’s on-going cap on diesel prices. While the
monetary policy committee was reportedly disputing the benefit of a rate cut to GDP
growth, given the magnitude of downside risk to growth, we suspect it will be difficult to
avoid lowering the policy rate further. As such, we continue to look for a 25bps cut in the
policy rate in the not too distant future, despite a weaker baht.
A ‘forced’ rebalancing process. The silver lining in the likely ongoing weakness of
domestic spending is that the economy is rebalancing more quickly – we expect the
current account to turn to surplus later this year and credit growth to soften further.
Export growth will continue to benefit from stronger global growth while temporary
factors that depressed exports last year are reversing. In our view, the
underperformance of Thai exports late last year was not the result of a loss of
competitiveness (see full report examining Asia’s export competitiveness here). With
softer import growth likely to dominate the impact of weaker tourism revenue, the current
account balance will likely improve more than we thought previously – we have revised
our 2014 current account balance projection to 1.8% of GDP, from 0.5% earlier. Credit
growth has already slowed sharply and will likely continue to do so, alleviating the
central bank’s concerns over rising leverage.
The baht: Near-term weakness, better macroeconomic support in the long term.
Our FX strategist continues to see headwinds for the baht in the near term stemming
from: 1) ongoing political unrest, which could intensify before getting better; and 2) still-
somewhat rich valuations. However, the anticipated improvement in the current account
balance and direct investment flows should provide support for the currency over a 12-
month horizon.
Santitarn Sathirathai
+65 6212 5675

06 March 2014
Emerging Markets Quarterly 170
Recent pick up in export
growth helped alleviate
concerns that Thai exports
would continue to
underperform the region.
Our preferred lead indicator
suggests export growth
could moderate in the next
couple of months but still
see a decent gain
A product breakdown of
Thai exports shows that
agricultural products and
gold were the main drags
last year.
Exhibit 413: Export growth Exhibit 414: Export growth decomposition
-20
-15
-10
-5
0
5
10
15
-40
-30
-20
-10
0
10
20
30
2007 2008 2009 2010 2011 2012 2013 2014
CRB metal ( %3m change, RHS)
Exports % 3m-on-3m sa
-2.5
-2.0
-1.5
-1.0
-0.5
0.0
0.5
1.0
1.5
2.0
2.5
3.0
2013
Transport
Machinery
Metals
preciousmetals
Laborintensive
Chemicals
Agri
Overallexports
Percentage point contributionto YoY export growth
Source: BLOOMBERG PROFESSIONAL™ service, Credit Suisse Source: CEIC, Credit Suisse
The latest international
tourist arrival data for
January already showed a
substantial sequential
decline led by mainland
Chinese tourists.
Thailand’s market share of
visitor arrivals has tended to
fall during previous “Visit
Malaysia” years.
Exhibit 415: Tourist arrivals Exhibit 416: Tourism market share
Change in market share of arrivals during “Visit Malaysia Year”
-200%
-150%
-100%
-50%
0%
50%
100%
150%
200%
2009 2010 2011 2012 2013 2014
Visitor Arrivals (% 3m on 3mseasonally adjusted annualized)Mainland Chinese tourists
2011 floods2010 clashes
-2.5%
-2.0%
-1.5%
-1.0%
-0.5%
0.0%
0.5%
1.0%
1.5%
2.0%
-6%
-4%
-2%
0%
2%
4%
6%
198
5
198
7
198
9
199
1
199
3
199
5
199
7
199
9
200
1
200
3
200
5
200
7
200
9
201
1
MA TH (RHS)
Visit Malaysia Year
Source: CEIC, Credit Suisse Source: CEIC, Credit Suisse
We think likely delays in off-
budget infrastructure
spending and the rice
scheme debacle could
produce a significant fiscal
drag on GDP growth.
The recent development in
rubber prices is also not
helpful for the already weak
private consumption growth.
Exhibit 417: Fiscal policy Exhibit 418: Rubber price &consumption
30
35
40
45
50
55-6
-5
-4
-3
-2
-1
0
1
20
02
20
03
20
04
20
05
20
06
20
07
20
08
20
09
20
10
20
11
20
12
20
13
F
20
14
F
Series3
Fiscal balance/ GDP (%)
Public debt/GDP (%, RHS)
off -budget infrastructure
-3
-1
1
3
-40
-20
0
20
40
20
07
20
08
20
09
20
10
20
11
20
12
20
13
20
14
Rubber prices (% 3m on 3m)
Priv consumption index (%3m on 3m, RHS)
Post flood effects and policy boosts
Source: MOF, Credit Suisse Source: BLOOMBERG PROFESSIONAL™ service, Credit Suisse

06 March 2014
Emerging Markets Quarterly 171
4Q GDP release revealed
that final domestic demand
contracted as much as it did
at the trough of the Global
Financial crisis.
We now expect the BoT to
cut the policy rate by 25bps
to 2%, amidst weak GDP
growth and a benign
inflation environment.
Exhibit 419: GDP growth mix Exhibit 420: Policy rate and inflation
value
-10
-5
0
5
10
15
20
-60
-40
-20
0
20
40
60
80
Net exports (% yoy)
Final domestic demand (% yoy, RHS)
Global financial crisis
Floods
-2
0
2
4
6
2007
2008
2009
2010
2011
2012
2013
2014
Real policy rate
Headline inflation (% yoy)
Policy rate (%)
f'cast
Source: CEIC, Credit Suisse Source: CEIC, Credit Suisse
The slowdown in overall and
consumer credit growth
should alleviate the central
bank’s concerns over
excess leverage growth.
We expect the current
account balance to improve
materially on the back of
weak import growth, and the
ongoing export recovery.
Exhibit 421: Credit growth Exhibit 422: Current account trend
0
5
10
15
20
25
2005
2006
2007
2008
2009
2010
2011
2012
2013
Total credit to private sector (% yoy)
Consumer credit (% yoy)
-2
-1
0
1
2
3
4
5
6
7
8
9
2007
2008
2009
2010
2011
2012
2013
2014F
2015F
Current Account/GDP (%)
Source: CEIC, Credit Suisse Source: CEIC, Credit Suisse
The recent decline in direct
investment outflows helped
bring net direct investment
back into surplus. We
believe the weaker baht has
contributed to this and
expect the net position to
stay in surplus this year.
The value of FDI
applications in 2013
remained healthy, albeit
lower than the recent peak
in 2012
Exhibit 423: Net direct investment Exhibit 424: FDI applications
-20
-15
-10
-5
0
5
10
15
20
2009 2010 2011 2012 2013
Net Direct invetsment flows (USD bn, 12m rollingsum)NET non-resident inflows
NET resident outflows
-
1.0
2.0
3.0
4.0
5.0
6.0
2008 2009 2010 2011 2012 2013
Value of investment application approved(% of GDP)
Source: CEIC, Credit Suisse Source: CEIC, Credit Suisse

06 March 2014
Emerging Markets Quarterly 172
Thailand: Selected economic indicators
2007 2008 2009 2010 2011 2012 2013E 2014F 2015F
National accounts, population and unemployment
Real GDP growth (%) 4.9 2.5 -2.2 7.8 0.1 6.4 2.9 2.0 4.5
Growth in real private consumption (%) 1.7 2.7 -1.1 4.8 1.3 6.6 0.2 2.0 3.1
Growth in real fixed investment (%) 1.5 1.2 -9.0 9.4 3.3 13.3 -1.9 2.6 7.5
Fixed investment (% of GDP) 22.3 22.1 20.5 20.8 21.4 22.8 21.7 22.3 24.0
Nominal GDP ($bn) 264.7 275.4 263.8 318.8 342.2 366.0 382.6 383.2 422.8
Population (mn) 63.0 63.4 63.5 63.9 64.2 64.5 64.9 65.2 65.6
GDP per capita ($) 4198.3 4344.9 4152.5 4990.4 5117.0 5394.5 5896.3 5876.1 6449.1
Prices, interest rates and exchange rates
CPI inflation (% year-on-year change, December over December) 3.2 0.4 3.5 3.0 3.5 3.6 1.7 3.0 3.0
CPI inflation (% change in average index for the year) 2.2 5.5 -0.8 3.3 3.8 3.0 2.2 2.8 3.0
Exchange rate (THB per USD, end-year) 29.6 34.7 33.2 30.1 31.0 30.6 32.7 33.5 33.8
Exchange rate (THB per USD, average) 32.2 33.0 34.3 31.7 30.8 31.1 31.1 33.5 33.7
REER (% year-on-year change, December over December) (1) 1.3 -3.2 2.5 8.0 0.2 0.3 6.2 -4.0 0.0
Nominal wage growth (% year-on-year change) (2) 3.0 10.2 -2.5 6.5 7.5 12.1 10.0 5.0 5.0
Overnight policy rate (%, end-year) (3) 3.25 2.75 1.25 2.00 3.25 2.75 2.25 2.00 2.50
Fiscal data (4)
General government budget balance (% of GDP) -1.6 -1.0 -5.7 -0.9 -2.7 -2.7 -2.5 -2.0 -1.5
General government primary fiscal balance (% of GDP) -0.3 0.2 -4.4 0.3 -1.2 -1.4 -1.5 -0.9 -1.5
General government expenditure (% of GDP) 19.0 17.9 21.7 18.0 20.4 20.0 20.1 19.7 19.5
General government revenue (% of GDP) 17.4 16.9 15.9 17.1 17.7 17.2 17.6 17.8 18.1
Gross general government debt (% of GDP, end-year) (5) 38.3 37.3 45.2 42.6 42.3 42.9 45.5 45.7 45.8
Money supply and credit 0.0
Broad money supply (M2, % of GDP) 106.9 109.5 117.4 116.6 128.7 131.7 134.8 135.0 132.7
Broad money supply (M2, % year-on-year change) 6.3 9.2 6.8 10.9 15.1 10.3 7.3 8.0 9.0
Domestic credit (% of GDP) 105.0 107.6 113.7 113.4 125.6 131.2 138.0 136.2 133.3
Domestic credit (% year-on-year change) 3.9 9.2 5.2 11.5 15.5 12.6 10.0 6.5 8.5
Domestic credit to the private sector (% of GDP) 102.6 105.3 111.1 110.2 122.1 128.9 136.2 136.3 133.4
Domestic credit to the private sector (% year-on-year change) 4.8 9.3 5.0 10.9 15.6 13.8 10.5 8.0 8.5
Balance of payments
Exports (goods and non-factor services, % of GDP) 68.6 75.8 68.5 71.4 78.7 75.3 72.7 75.9 73.9
Imports (goods and non-factor services, % of GDP) 61.6 74.1 59.1 65.0 75.5 74.6 71.2 74.6 72.4
Exports (goods and non-factor services, % year-on-year change in $ value) 18.9 14.9 -13.4 26.0 17.5 3.0 1.0 4.5 7.5
Imports (goods and non-factor services, % year-on-year change in $ value) 10.7 25.3 -23.7 33.0 24.0 6.3 -0.2 5.0 7.0
Current account balance ($bn) 15.7 1.6 21.9 14.8 4.1 -1.5 -2.8 6.8 8.6
Current account balance (% of GDP) 5.9 0.6 8.3 4.6 1.2 -0.4 -0.7 1.8 2.0
Net FDI inflows ($bn) 8.3 4.4 0.7 4.5 5.0 -2.0 6.5 6.5 6.0
Scheduled external debt amortization ($bn) 19.5 13.2 11.0 11.0 8.9 6.1 6.0 10.5 9.0
Foreign debt and reserves
Foreign debt ($bn) 74.4 76.1 75.3 100.5 106.6 133.2 141.5 130.3 139.5
Public ($bn) 14.9 14.8 15.4 11.0 16.6 22.1 18.0 20.0 24.0
Private ($bn) 59.5 61.3 59.9 89.5 90.0 111.1 123.5 110.3 115.5
Foreign debt (% of GDP) 28.1 27.6 28.5 30.4 31.2 36.4 37.0 34.0 33.0
Foreign debt (% of exports of goods and services) 41.0 36.5 41.7 42.6 39.8 48.4 50.9 44.8 44.6
Central bank gross FX reserves ($bn) 87.5 111.0 138.4 172.1 175.1 181.6 167.2 160.0 160.0
Central bank gross FX reserves, including forward FX transactions ($bn) 106.7 117.8 154.1 191.7 194.7 201.2 190.2 183.0 183.0
Central bank gross non-gold FX reserves ($bn) (6) 85.2 108.7 135.5 167.5 167.4 173.3 161.3 154.0 154.0
(1) Real effective exchange rate, increase indicates appreciation. (2) From Labor Force Survey: Average Monthly Wage in the private sector. (3) Through 2006, the policy rate was the 14-day repo rate. (4) Data for central government, based on cash basis prior to 2004, based on fiscal year ending September. (5) Includes central government, non-financial SOEs and financial institution development fund. (6) Not including forward FX purchases.
Source: Bank of Thailand, National Economic & Social Development Board, CEIC, Credit Suisse

06 March 2014
Emerging Markets Quarterly 173
Long-term sovereign FX debt ratings (pos) Outlook positive (neg) Outlook negative No sign indicates stable outlook
Moody's S&P Fitch
LATIN AMERICA
Argentina B3 (neg) CCC+ (u) (1) (neg) CC (neg)
Brazil Baa2 BBB (neg) BBB
Chile Aa3 AA– A+
Colombia Baa3 (pos) BBB BBB
Mexico A3 BBB+ BBB+
Panama Baa2 BBB BBB
Peru Baa2 (pos) BBB+ BBB+
Venezuela Caa1 (neg) B– (neg) B+ (neg)
EASTERN EUROPE, MIDDLE EAST & AFRICA
Czech Republic A1 AA– A+
Hungary Ba1 (neg) BB (neg) BB+
Israel A1 A+ A (pos)
Kazakhstan Baa2 (pos) BBB+ BBB+
Poland A2 A– A–
Russia Baa1 BBB BBB
Saudi Arabia Aa3 AA– (pos) AA– (pos)
South Africa Baa1 (neg) BBB (neg) BBB
Turkey Baa3 BB+ (neg) BBB–
Ukraine Caa2 (neg) CCC (neg) CCC (neg)
United Arab Emirates Aa2
EMERGING ASIA
China Aa3 AA– A+
Hong Kong Aa1 AAA AA+
India Baa3 BBB– u (neg) BBB–
Indonesia Baa3 BB+ BBB–
Korea Aa3 A+ AA–
Malaysia A3 (pos) A– A– (neg)
Philippines Baa3 (pos) BBB– BBB–
Singapore Aaa AAAu AAA
Taiwan Aa3 AA–u A+
Thailand Baa1 BBB+ BBB+
Moody's rating scale S&P rating scale Fitch rating scale
Investment
grade
Sub-
investment
grade
Investment
grade
Sub-
investment
grade
Investment
grade
Sub-
investment
grade
Aa1 Ba1 AAA BB+ AAA BB+
Aa2 Ba2 AA BB AA BB
Aa3 Ba3 AA– BB– AA– BB–
A1 B1 A+ B+ A+ B+
A2 B2 A B A B
A3 B3 A– B– A– B–-
Baa1 Caa1 BBB+ CCC+ BBB+ CCC+
Baa2 BBB BBB
Baa3 BBB- BBB-
(1) “u” denotes “unsolicited”.
Source: Standard & Poor’s, Moody’s and Fitch

06
Ma
rch
20
14
Em
erg
ing M
ark
ets
Qu
arte
rly
17
4
Long-term sovereign FX debt ratings Investment Grade
Aa2 Aa3 A1 A2 A3 Baa1 Baa2 Baa3 Moody’s Kuwait
Qatar United Arab Emirates
Chile China Korea
Saudi Arabia
Taiwan
Czech Republic Estonia
Israel Oman
Botswana Poland
Slovakia
Malaysia + Mexico
Lithuania Russia
South Africa – Thailand
Bahrain – Brazil
Bulgaria Latvia +
Kazakhstan + Panama
Peru +
Azerbaijan Colombia +
India Indonesia
Philippines + Romania –
Turkey Uruguay +
AA AA- A+ A A- BBB+ BBB BBB- S&P Kuwait
Qatar
Chile China
Czech Republic Estonia
Saudi Arabia + Taiwan
Israel Korea
Oman Slovakia
Botswana Malaysia
Poland Slovenia
Kazakhstan Latvia + Mexico
Peru Thailand
Bahrain Brazil –
Bulgaria – Colombia
Lithuania + Panama
Russia South Africa –
Azerbaijan India –
Morocco – Philippines
Uruguay
Fitch Kuwait
Korea Saudi Arabia +
China Chile
Czech Republic Estonia
Slovakia Taiwan
Israel + Malaysia – Poland
Kazakhstan Latvia
Lithuania Mexico
Peru Slovenia –
Thailand
Bahrain Brazil
Colombia Panama
Russia South Africa
Azerbaijan Bulgaria
India Indonesia Morocco
Philippines Romania
Turkey Uruguay
Sub-Investment Grade Ba1 Ba2 Ba3 B1 B2 B3 Caa1 and below Moody’s Croatia
Hungary – Morocco –
Slovenia
El Salvador Nigeria
Portugal Tunisia –
Ghana – Lebanon –
Serbia Sri Lanka
Vietnam Argentina – Belarus –
Cyprus – Egypt –
Ecuador Greece
Pakistan – Ukraine –
Venezuela –
BB+ BB BB- B+ B B- CCC+ and below S&P Indonesia
Romania + Turkey –
Croatia Hungary – Portugal –
El Salvador – Gabon Nigeria
Serbia – Vietnam
Sri Lanka
Ecuador + Ghana –
Belarus Cyprus
Egypt Greece
Lebanon – Pakistan
Venezuela –
Argentina – Ukraine –
Fitch Croatia – Hungary
Portugal –
El Salvador – Gabon Nigeria
Sri Lanka Tunisia –
Serbia Venezuela –
Vietnam +
Ecuador Ghana
Lebanon –
Cyprus – Egypt
Greece
Argentina – Ukraine –
Source: Standard & Poor’s, Moody’s & Fitch + Outlook positive – Outlook negative No sign indicates stable outlook

06 March 2014
Emerging Markets Quarterly 175
Key websites GENERAL WEBSITES
Central bank websites www.bis.org/cbanks.htm
National statistical offices unstats.un.org
Global election calendar www.electionguide.org
LATIN AMERICA
ARGENTINA
Central Bank www.bcra.gov.ar
Ministry of Economy www.mecon.gob.ar
Statistical Office www.indec.mecon.ar
ANSES www.anses.gob.ar
Federal tax agency www.afip.gov.ar
Di Tella University www.utdt.edu
News sources www.ambito.com – www.cronista.com – www.clarin.com – www.lanacion.com.ar – www.infobae.com
BRAZIL
Central Bank www.bcb.gov.br
Statistics Office www.ibge.gov.br
Ministry of Finance www.fazenda.gov.br
National Treasury www.tesouro.fazenda.gov.br
Brazilian Federal Revenue Service www.receita.fazenda.gov.br
Development, Industry and Trade Ministry www.mdic.gov.br
Planning Ministry www.planejamento.gov.br
Economic Research Official Bureau www.ipea.gov.br
CHILE
Central Bank www.bcentral.cl
Office of the President www.gobiernodechile.cl
Ministry of Finance and Office of the Budget www.hacienda.cl – www.dipres.gob.cl
Statistical Office www.ine.cl
Pension Fund Regulator www.safp.cl
National Emergencies Office / Ministry of the Interior www.onemi.cl
News sources www.latercera.cl – www.emol.com – www.elmercurio.cl – www.df.cl
COLOMBIA
Central Bank www.banrep.gov.co
Ministry of Finance www.minhacienda.gov.co
Statistical Office www.dane.gov.co
Financial Regulator www.superfinanciera.gov.co
News sources www.elpais.com.co – www.elespectador.com – www.eltiempo.com – www.portafolio.co – www.larepublica.co –
www.semana.com – www.dinero.com
ECUADOR
Central Bank www.bce.fin.ec
Ministry of Finance www.finanzas.gob.ec
Statistical Office www.ecuadorencifras.gob.ec
News sources www.eluniverso.com – www.elcomercio.com – www.lahora.com.ec – www.hoy.com.ec
– www.revistagestion.ec
EL SALVADOR
Central Bank www.bcr.gob.sv
Finance Ministry www.mh.gob.sv
Legislative Assembly www.asamblea.gob.sv
Bank Superintendence www.ssf.gob.sv
News Sources www.elsalvador.com – www.laprensagrafica.com – www.elmundo.com.sv – www.elfaro.net
Source: Credit Suisse
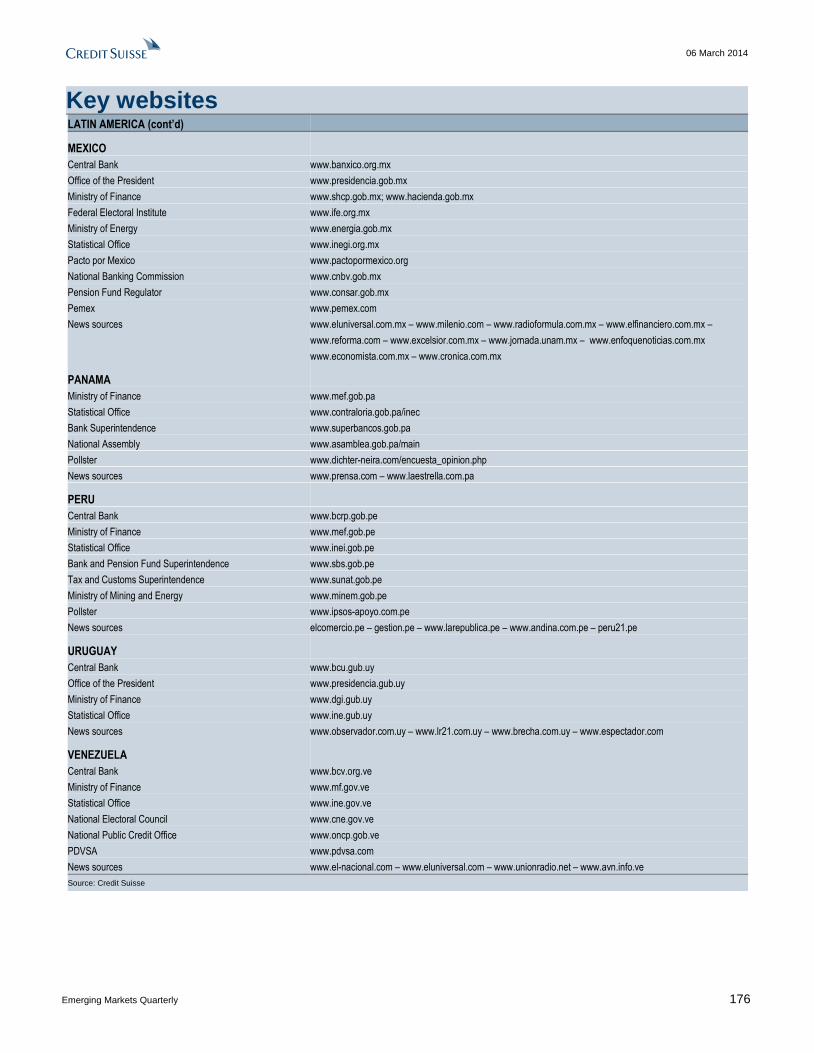
06 March 2014
Emerging Markets Quarterly 176
Key websites LATIN AMERICA (cont’d)
MEXICO
Central Bank www.banxico.org.mx
Office of the President www.presidencia.gob.mx
Ministry of Finance www.shcp.gob.mx; www.hacienda.gob.mx
Federal Electoral Institute www.ife.org.mx
Ministry of Energy www.energia.gob.mx
Statistical Office www.inegi.org.mx
Pacto por Mexico www.pactopormexico.org
National Banking Commission www.cnbv.gob.mx
Pension Fund Regulator www.consar.gob.mx
Pemex www.pemex.com
News sources www.eluniversal.com.mx – www.milenio.com – www.radioformula.com.mx – www.elfinanciero.com.mx –
www.reforma.com – www.excelsior.com.mx – www.jornada.unam.mx – www.enfoquenoticias.com.mx
www.economista.com.mx – www.cronica.com.mx
PANAMA
Ministry of Finance www.mef.gob.pa
Statistical Office www.contraloria.gob.pa/inec
Bank Superintendence www.superbancos.gob.pa
National Assembly www.asamblea.gob.pa/main
Pollster www.dichter-neira.com/encuesta_opinion.php
News sources www.prensa.com – www.laestrella.com.pa
PERU
Central Bank www.bcrp.gob.pe
Ministry of Finance www.mef.gob.pe
Statistical Office www.inei.gob.pe
Bank and Pension Fund Superintendence www.sbs.gob.pe
Tax and Customs Superintendence www.sunat.gob.pe
Ministry of Mining and Energy www.minem.gob.pe
Pollster www.ipsos-apoyo.com.pe
News sources elcomercio.pe – gestion.pe – www.larepublica.pe – www.andina.com.pe – peru21.pe
URUGUAY
Central Bank www.bcu.gub.uy
Office of the President www.presidencia.gub.uy
Ministry of Finance www.dgi.gub.uy
Statistical Office www.ine.gub.uy
News sources www.observador.com.uy – www.lr21.com.uy – www.brecha.com.uy – www.espectador.com
VENEZUELA
Central Bank www.bcv.org.ve
Ministry of Finance www.mf.gov.ve
Statistical Office www.ine.gov.ve
National Electoral Council www.cne.gov.ve
National Public Credit Office www.oncp.gob.ve
PDVSA www.pdvsa.com
News sources www.el-nacional.com – www.eluniversal.com – www.unionradio.net – www.avn.info.ve
Source: Credit Suisse
06 March 2014
Emerging Markets Quarterly 177
Key websites EASTERN EUROPE, MIDDLE EAST & AFRICA
CZECH REPUBLIC
Czech National Bank www.cnb.cz
Czech Statistical Office www.czso.cz
Ministry of Finance www.mfcr.cz
Parliament www.psp.cz
News sources www.radio.cz – www.praguepost.com
EGYPT
Central Bank of Egypt www.cbe.org.eg
Finance Ministry www.mof.gov.eg
Statistics Office www.capmas.gov.eg
News sources www.businesstodayegypt.com – english.ahram.org.eg – www.almasryalyoum.com/en
GCC
Central Bank of Kuwait www.cbk.gov.kw
Ministry of Finance Kuwait www.mof.gov.kw
Qatar Central Bank www.qcb.gov.qa
Ministry of Finance Qatar www.mof.gov.qa
Saudi Arabian Monetary Agency www.sama.gov.sa
Ministry of Finance Saudi Arabia www.mof.gov.sa/en
Central Bank of the UAE www.centralbank.ae
Ministry of Finance and Industry UAE www.mofi.gov.ae
News sources GCC www.arabianbusiness.com
HUNGARY
National Bank of Hungary www.mnb.hu
Website of the Hungarian Government www.kormany.hu
Ministry for National Economy www.ngm.gov.hu
Debt Management Agency www.allampapir.hu
Central Statistical Office www.ksh.hu
Parliament www.parlament.hu
Hungarian Financial Supervisory Authority www.pszaf.hu
News sources www.budapesttimes.hu – www.portfolio.hu
ISRAEL
Central Bank of Israel www.bankisrael.gov.il
Central Bureau of Statistics www.cbs.gov.il
Ministry of Finance govx.mof.gov.il
Israel Securities Authority www.isa.gov.il
News sources www.haaretz.com – www.globes.co.il
KAZAKHSTAN
National Bank of Kazakhstan www.nationalbank.kz
Ministry of Finance mf.minfin.kz
Statistical Agency www.stat.kz
Ministry of Economy and Budget Planning www.minplan.kz
Financial Services Supervisory Agency www.afn.kz
Official site of the president www.akorda.kz
News sources www.kt.kz
Source: Credit Suisse
06 March 2014
Emerging Markets Quarterly 178
Key websites EASTERN EUROPE, MIDDLE EAST & AFRICA (cont’d)
NIGERIA
Central Bank of Nigeria www.cenbank.org
Ministry of Finance www.fmf.gov.ng
Debt Management Office www.dmo.gov.ng
Nigerian National Petroleum Corporation www.nnpcgroup.com
News sources www.thisdayonline.com – www.allafrica.com
POLAND
National Bank of Poland www.nbp.pl
Ministry of Finance www.mf.gov.pl
Central Statistical Office www.stat.gov.pl
Polish Financial Supervision Authority www.knf.gov.pl
Parliament www.sejm.gov.pl
News sources www thenews.pl – www.polandmonthly.pl – www.warsawvoice.pl
ROMANIA
Central Bank www.bnr.ro
Statistics Office www.insse.ro
Ministry of Finance www.mfinante.ro
RUSSIA
Central Bank of Russia www.cbr.ru
Finance Ministry www.minfin.ru
State Statistics Agency www.gks.ru
Economic Expert Group www.eeg.ru
The State Duma www.duma.ru
News sources www.themoscowtimes.com
SOUTH AFRICA
South African Reserve Bank www.reservebank.co.za
National Treasury www.treasury.gov.za
Statistics South Africa www.statssa.gov.za
South Africa Revenue Services www.sars.gov.za
Bureau for Economic Research www.ber.sun.ac.za
Bond Exchange of South Africa www.bondexchange.co.za
Johannesburg Stock Exchange www.jse.co.za
News sources www.businessday.co.za – www.mg.co.za – www.financialmail.co.za – www.thestar.co.za
TURKEY
Central Bank www.tcmb.gov.tr
Treasury www.treasury.gov.tr
Ministry of Finance www.maliye.gov.tr
Ministry of Development www.dpt.gov.tr
State Institute of Statistics www.tuik.gov.tr
News sources www.ntvmsnbc.com.tr – www.turkishdailynews.com.tr
UKRAINE
National Bank of Ukraine www.bank.gov.ua
Finance Ministry www.minfin.gov.ua
Economy Ministry www.me.gov.ua
State Statistics Agency www.ukrstat.gov.ua
News sources www.kyivpost.com
Source: Credit Suisse
06 March 2014
Emerging Markets Quarterly 179
Key websites EMERGING ASIA
CHINA
Central Bank www.pbc.gov.cn/english
Statistics Office www.stats.gov.cn
Ministry of Finance www.mof.gov.cn
News sources www.chinadaily.com – english.peopledaily.com.cn – www.xinhuanet.com
HONG KONG
Central Bank www.info.gov.hk/hkma
Statistics Office www.info.gov.hk/censtatd
Treasury Department www.try.gov.hk
News sources www.scmp.com – www.thestandard.com.hk – www.feer.com
INDIA
Central Bank www.rbi.org.in
Ministry of Finance finmin.nic.in
Government press releases www.pib.nic.in
Ministry of Statistics www.mospi.nic.in
Ministry of Commerce & Industry www.commerce.nic.in
INDONESIA
Central Bank www.bi.go.id
Investment Coordinating Board www.bkpm.go.id
News sources www.thejakartapost.com – www.antara.co.id
KOREA
Central Bank www.bok.or.kr
Statistics Office www.nso.go.kr/eng – www.mocie.go.kr
Ministry of Finance english.mofe.go.kr
News sources times.hankooki.com – english.chosun.com – www.koreaherald.co.kr – www.koreapost.com
www.theseoultimes.com – english.yna.co.kr – joongangdaily.joins.com
english.donga.com – english.yna.co.kr
MALAYSIA
Central Bank www.bnm.gov.my
Ministry of Finance www.treasury.gov.my/englishversionbaru
Department of Statistics www.statistics.gov.my
News sources thestar.com.my – www.nst.com.my – www.bernama.com – www.theedgedaily.com
PHILIPPINES
Central Bank www.bsp.gov.ph
National Statistics Office www.census.gov.ph
Department of Finance www.dof.gov.ph
Department of Budget and Management www.dbm.gov.ph
News sources www.bworld.com.ph – www.inq7.net – www.gmanews.tv/business
SINGAPORE
Central Bank www.mas.gov.sg
Department of Statistics www.singstat.gov.sg
Department of Finance www.mof.gov.sg
News sources www.asiaone.com.sg – www.channelnewsasia.com
Source: Credit Suisse
Source: Credit Suisse
06 March 2014
Emerging Markets Quarterly 180
Key websites EMERGING ASIA (cont’d)
TAIWAN
Central Bank www.cbc.gov.tw
Statistics Offices eng.dgbas.gov.tw – eng.stat.gov.tw – www.moea.gov.tw – www.cepd.gov.tw
Ministry of Finance www.mof.gov.tw
News sources www.taipeitimes.com – www.chinapost.com.tw – www.taiwanheadlines.com
www.etaiwannews.com – news.cens.com – www.cna.com.tw – taiwansnews.net
THAILAND
Central Bank www.bot.or.th
National Statistical Office www.nso.go.th
Ministry of Finance www2.mof.go.th
News sources www.nationmultimedia.com – www.bangkokpost.net
VIETNAM
Vietnam Economic News www.ven.org.vn
Ministry of Finance www.mof.gov.vn
World Bank in Vietnam web.worldbank.org.vn
Vietnam Economic Portal www.vnep.org.vn
Source: Credit Suisse
06 March 2014
Emerging Markets Quarterly 181
Previous publications From Credit Suisse’s Economics Team since the last Emerging Markets Quarterly
GLOBAL EMERGING MARKETS
Weekly Emerging Markets Forecasts Details, B. Bayazitoglu, A. Cervera, R. Prior-Wandesforde, D. Tao, N. Teixeira
Monthly Emerging Markets: Manufacturing PMI Roundup, I. Lebwohl, N. Mustafayev, N. Soss
Monthly Emerging Markets: Non-residents’ holdings in local currency government bonds, N. Mevorach, A. Agrawal, D. Chodos
18 Feb 2014 EM IP growth momentum slows further in EM as it flattens out in DM, N. Mustafayev
16 Jan 2014 EM IP growth momentum moderates, diverging from DM, N. Mustafayev
12 Dec 2013 Global Inflation Watch: Low and steady N. Mustafayev, N. Soss
19 Nov 2013 Global Outlook: Closer to the Top, Further from the Exit, E.Miller, N. Soss
LATIN AMERICA
06 Feb 2014 Latin America: Sovereign Credit Ratings Monitor, A. Cervera, D. Fu, J.L. Maldonado, C. Reckman, O. Rodriguez
05 Feb 2014 Latin America: Hard currency relative value report, D. Chodos, D. Fu
29 Jan 2014 Latin America: Why worry about Argentina…, A. Cervera, D. Chodos, D. Fu, J.L. Maldonado, C. Reckman, N. Teixeira
27 Jan 2014 Chile and Peru: Pension fund snapshot as of Dec-2013, A. Cervera, D. Fu, J.L. Maldonado, O. Rodriguez
16 Jan 2014 Latin America: 2013 inflation recap, D. Fu, A. Cervera, C. Reckman, J.L. Maldonado, P. Coutinho, L. Fonseca
07 Jan 2014 Latin America: Hard currency relative value report, D. Chodos
04 Dec 2013 Latin America: Hard currency relative value report, D. Chodos
ARGENTINA
25 February Argentina: A better deal for the country than for bonds, D. Chodos, C. Reckman
10 Feb 2014 Argentina: An unsteady state, C. Reckman, D. Chodos
23 Jan 2014 Argentina: Throwing in the towel? C. Reckman, D. Chodos
14 Jan 2014 Argentina: Tactically underweight, cover by adding PDVSA’14, D. Chodos, C. Reckman
10 Dec 2013 Argentina: Trip notes, C. Reckman
18 Nov 2013 Argentina: Updated GDP warrants valuation, D. Chodos, C. Reckman
BRAZIL
26 Feb 2014 Brazil: Breakdown of IPCA suggests high inflation in 2014, N. Teixeira, P. Coutinho, I. Ferrao, L. Fonseca, D. Lavarda
21 Feb 2014 Brazil: We project GDP growth of 2.1% for 2013, N. Teixeira, P. Coutinho, I. Ferrao, L. Fonseca, D. Lavarda
11 Feb 2014 Brazil: We expect announcement of spending cuts of BRL 43 billion in February, N. Teixeira, P. Coutinho, I. Ferrao, L. Fonseca, D. Lavarda
05 Feb 2014 Brazil: We have lowered our forecast for GDP growth in 2014 from 2.0% to 1.5%, N. Teixeira, P. Coutinho, I. Ferrao, L. Fonseca, D. Lavarda
30 Jan 2014 Brazil: Isolated deterioration in Argentina’s economy would have limited impact on activity in Brazil, N. Teixeira, P. Coutinho, I. Ferrao, L. Fonseca, D. Lavarda
28 Jan 2014 Brazil: Deficit in balance of payments to rise in 2014, N. Teixeira, P. Coutinho, I. Ferrao, L. Fonseca, D. Lavarda
21 Jan 2014 Brazil: Despite president’s lead in voter intention polls, scenario still uncertain, N. Teixeira, P. Coutinho, I. Ferrao, L. Fonseca, D. Lavarda
14 Jan 2014 Brazil: IPCA inflation to remain near upper limit of target range in 2014, N. Teixeira, P. Coutinho, I. Ferrao, L. Fonseca, D. Lavarda
CHILE
08 Jan 2014 Chile: What drove inflation in 2013? A. Cervera
COLOMBIA
20 February 2014 Colombia: Sell 5Y CDS versus Mexico, D. Chodos, A. Cervera, J.L. Maldonado
MEXICO
17 Jan 2014 Mexico: Pension fund snapshot as of Dec-2013, A. Cervera, O. Rodriguez
19 Dec 2013 Mexico: Steep curves favor flatteners and forward starting swaps; short CADMXN, D. Chodos, A. Cervera, A. Marino, M. Derr
13 Dec 2013 Mexico: A bullet-proof energy reform, A. Cervera
09 Dec 2013 Mexico: The energy bill under discussion, A. Cervera
VENEZUELA
30 Jan 2014 Venezuela: Take profits on PD’14 vs. PD’22; stay long PD’14, D. Chodos, C. Reckman
Source: Credit Suisse

06 March 2014
Emerging Markets Quarterly 182
Previous publications From Credit Suisse’s Economics Team since the last Emerging Markets Quarterly
EASTERN EUROPE, MIDDLE EAST & AFRICA
17 Jan 2014 EEMEA strategy: EEMEA Hard Currency Sovereign Debt Monitor, S. Hasan, N. Mevorach
09 Dec 2013 EEMEA strategy: EEMEA Hard Currency Monitor, S. Hasan, N. Mevorach
25 Nov 2013 A story of two halves: EEMEA Fixed Income Outlook for 2014, B. Bayazitoglu, S. Hasan, N. Mevorach
CZECH REPUBLIC
12 Feb 2014 Czech Republic: CPI inflation dropped sharply in January, G. Hudecz
06 Feb 2014 Czech Republic: Central bank confirms exchange rate commitment until end-2014, G. Hudecz
09 Jan 2014 Czech Republic: Koruna depreciation's impact starting to show, G. Hudecz
09 Dec 2013 Czech Republic: Core inflation still subdued, despite a pick-up in headline CPI, G. Hudecz
HUNGARY
18 Feb 2014 Hungary: MC: Waiting for the March inflation report, G. Hudecz
14 Feb 2014 Hungary: CPI inflation might have bottomed out in January, G. Hudecz
21 Jan 2014 Hungary: Slowing the pace of monetary policy easing, G. Hudecz
15 Jan 2014 Hungary: CPI inflation dropped in December, due to utility price cuts, G. Hudecz
17 Dec 2013 Hungary: The MC cut the policy rate to 3% and remained dovish, G. Hudecz
11 Dec 2013 Hungary: CPI inflation unchanged in November, likely to dip in December, G. Hudecz
26 Nov 2013 Hungary: Another 20bps policy rate cut today, and "further cautious easing of policy may follow", G. Hudecz
ISRAEL
24 Feb 2014 Israel: A surprise rate cut, N. Mevorach
15 Jan 2014 Israel: December CPI inflation data are unlikely to shift the MC's focus from the growth dynamics and the shekel, N. Mevorach
23 Dec 2013 Israel: MC on hold today, but we still expect the monetary policy easing cycle to continue in 1H 2014, N. Mevorach
25 Nov 2013 Israel: MC on hold, mainly because of the shekel, N. Mevorach
15 Nov 2013 Israel: October CPI and HPI suggest MC to remain on hold on 25 November, N. Mevorach
POLAND
02 Feb 2014: Poland: Central bank sees no need to react to exchange rate moves, G. Hudecz
15 Jan 2014: Poland: CPI inflation picked up marginally in December, but likely to remain subdued in 2014, G. Hudecz
08 Jan 2014: Poland: Still no change in the MPC’s guidance, G. Hudecz
13 Dec 2013: Poland: Core inflation still subdued in November, G. Hudecz
04 Dec 2013: Poland: No change in the MPC’s guidance, G. Hudecz
29 Nov 2013: Poland: Modest pick-up in growth in 3Q, driven by investments, G. Hudecz
14 Nov 2013: Poland: Energy and food prices drive the fall in inflation in October, G. Hudecz
RUSSIA
04 Mar 2014 Russia: Cautious but tactical opportunities arise, S.Voloboev, A.Pogorelov, N.Mevorach, A.Christovova
03 Mar 2014 Russia: FX intervention rules on hold as volatility starts to bite S. Voloboev, A. Pogorelov
02 Mar 2014 Russia/Ukraine: Putin sharply raises stakes by threatening to annex Crimea; a wider military involvement would risk comprehensive sanctions, S. Voloboev, A.
Pogorelov
14 Feb 2014 Russia: CBR adopted a hawkish policy stance, left rates on hold, S. Voloboev, A. Pogorelov
10 Feb 2014 Russia: No respite for growth and the rouble until 2H 2014, S. Voloboev, A. Pogorelov
21 Jan 2014 Russia: Weaker rouble to contain budget financing needs, S. Voloboev, A. Pogorelov, S.Hasan
16 Jan 2014 Russia: Current account and trade surpluses narrow further in 4Q 2013, S. Voloboev, A. Pogorelov
13 Dec 2013 Russia: CBR sees inflation target reached in 2H 2014; will switch to monthly liquidity auctions, S. Voloboev, A. Pogorelov
10 Dec 2013 Russia: Assessing relative value in the OFZ curve, S. Hasan, N. Mevorach
Source: Credit Suisse

06 March 2014
Emerging Markets Quarterly 183
Previous publications From Credit Suisse’s Economics Team since the last Emerging Markets Quarterly
RUSSIA (cont’d)
05 Dec 2013 Russia: High November inflation warrants CBR policy caution, S. Voloboev, A. Pogorelov
18 Nov 2013 Russia: Weak October IP data boosts the case for an early cut, S. Voloboev, A. Pogorelov
SOUTH AFRICA
26 Feb 2014 South Africa: Budget speech delivers some positive news, C. Teixeira
25 Feb 2014 South Africa: Budget Speech – opportunity for some positive news, C. Teixeira
19 Feb 2014 South Africa: Headline CPI inflation accelerates as food and transport prices jump, C. Teixeira
30 Jan 2014 South Africa: Put on 2s5s IRS flatteners, C. Teixeira, S. Hasan, N. Mevorach, M. Derr
29 Jan 2014 South Africa: SARB hikes pre-emptively; more will be needed, C. Teixeira
22 Jan 2014 South Africa: Headline CPI inflation benefits from temporarily lower food prices, C. Teixeira
15 Jan 2014 South Africa: Retail sales recover; apparel retailers outperform, C. Teixeira
14 Jan 2014 South Africa: Platinum production declines once again; iron ore volumes recover further, C. Teixeira
09 Jan 2014 South Africa: Manufacturing production volumes hold steady, boding well for 4Q GDP growth, C. Teixeira
09 Jan 2014 South Africa: Portfolio outflows and a wide basic balance deficit, C. Teixeira
08 Jan 2014 South Africa: Wage negotiations advance in the platinum sector, C. Teixeira
08 Jan 2014 South Africa: Challenged by diverging commodity prices, C. Teixeira
11 Dec 2013 South Africa: Retail sales reflect low consumer confidence, C. Teixeira
11 Dec 2013 South Africa: Headline CPI inflation declines to 5.3%, a temporary low, C. Teixeira
10 Dec 2013 South Africa: Manufacturing production rebounds, led by motor vehicle sector, C. Teixeira
10 Dec 2013 South Africa: Mining production rebounds, led by PGMs, gold and iron ore, C. Teixeira
10 Dec 2013 South Africa: Employment in the formal economy struggles to grow, C. Teixeira
21 Nov 2013 South Africa: MPC focuses on the Fed, funding for the current account and the rand, C. Teixeira
21 Nov 2013 South Africa: Strained electricity system limps towards year-end holidays, C. Teixeira
20 Nov 2013 South Africa: Wage negotiations at an impasse in the platinum sector, C. Teixeira
20 Nov 2013 South Africa: Headline CPI inflation declines to a 4-month low; core inflation steady, C. Teixeira
18 Nov 2013 South Africa: MPC stance – dovish on data; hawkish on risks, C. Teixeira
TURKEY
03 Mar 2014 Turkey: Core inflation dynamics worsened more sharply than we expected in February, B. Bayazitoglu
18 Feb 2014 Turkey - MPC: Low on adrenaline, B. Bayazitoglu
03 Feb 2014 Turkey: A good inflation print despite the tax adjustments and lira weakness, B. Bayazitoglu
29 Jan 2014 Turkey: More constructive on credit than rates, S. Hasan, N. Mevorach
28 Jan 2014 Turkey - MPC: A positive surprise for the markets, B. Bayazitoglu
28 Jan 2014 Turkey: The devil is always in the detail, B. Bayazitoglu
21 Jan 2014 Turkey - MPC: Deep into the bag of tricks, B. Bayazitoglu
03 Jan 2014 Turkey: Counting on the fiscal and macro-prudential measures, B. Bayazitoglu
24 Dec 2013 Turkey: $7bn in FX liquidity through end-January, B. Bayazitoglu
17 Dec 2013 Turkey - MPC: Further operational changes to reduce the need for "exceptional days", B. Bayazitoglu
13 Dec 2013 Turkey: Long Jan ‘15s, S. Hasan, N. Mevorach
10 Dec 2013 Turkey: Aggregate demand growth slowed and rebalanced in 3Q, B. Bayazitoglu
03 Dec 2013 Turkey: Summer's lira shock has run its course, B. Bayazitoglu
19 Nov 2013 Turkey - MPC: Some extra room to push short-term market rates higher, B. Bayazitoglu
UKRAINE
02 Mar 2014 Russia/Ukraine: Putin sharply raises stakes by threatening to annex Crimea; a wider military involvement would risk comprehensive sanctions, S. Voloboev, A. Pogorelov
26 Feb 2014 Ukraine: New cabinet to give key roles to technocrats capable of negotiating a bail-out, S. Voloboev, A. Pogorelov
17 Dec 2013 Ukraine: Russia's large financing package curbs near-term solvency risks but leaves policy direction and political outlook highly uncertain, S. Voloboev, A. Pogorelov
21 Nov 2013 Ukraine: Suspension of EU integration effort may bring near-term relief from Russia but loss of reform momentum a longer-term negative, S. Voloboev, A. Pogorelov
Source: Credit Suisse
06 March 2014
Emerging Markets Quarterly 184
Previous publications From Credit Suisse’s Economics Team since the last Emerging Markets Quarterly
EMERGING ASIA
07 Feb 2014 Asia rates: January non-resident flows, A. Agrawal
18 Feb 2014 ASEAN: Thailand's political crisis: What it means for ASEAN tourism, S. Sathirathai
28 Jan 2014 Contagion? Re-testing Asian vulnerability, M. Wan, R. Prior-Wandesforde, S. Sathirathai
22 Jan 2014 Focus Asia (1Q 2014): High-conviction calls for 2014, R. Prior-Wandesforde, D. Tao, S. Sathirathai, C. Tuntono, M. Wan, W. Deng, R. Farris, A. Agrawal, T.
Thuy Le
15 Jan 2014 Asia's export recovery: Seeking the leaders and laggards, S. Sathirathai
10 Dec 2013 Asia: FDI truths, myths and prospects, R. Prior-Wandesforde
03 Dec 2013 Asia Industrial Cycle: The beginning of the end or the end of the beginning?, R. Prior-Wandesforde
07 Jan 2014 Asia rates: December non-resident flows, A. Agrawal
10 Dec 2013 Asia rates: November non-resident flows, A. Agrawal
CHINA
18 Feb 2014 China: PBoC conducts the first repo operation in eight months, D.Tao, W.Deng
10 Feb 2014 China: We expect lower inflation now, D.Tao, W.Deng
10 Feb 2014 China: Higher emphasis on local debt and less on inflation in the 4Q PBOC report, D.Tao
29 Jan 2014 China: The pain first: Growth forecast downgrade, D.Tao, W.Deng
29 Jan 2014 China: Themes for 2014: R3 Retreat, Reform & Risk, D.Tao, W.Deng
21 Jan 2014 China: SHIBOR softened, for now, D.Tao, W.Deng
20 Jan 2014 China: GDP growth at 7.7%, in line with expectations, D.Tao, W.Deng
19 Dec 2013 China: Interbank rates increased as year-end approaches, D.Tao, W.Deng
17 Dec 2013 China: Shanghai launched SOE reform guidance, D.Tao, W.Deng
16 Dec 2013 China: The government kicks off the new-urbanisation concept, D.Tao
16 Dec 2013 China: The Economic Working Conference set the tone for 2014, D.Tao
06 Dec 2013 China: Abolishing the one child policy, D. Tao, W.Deng, A.Roy, S.Punhani, A.Hsieh
05 Dec 2013 China: PBoC's absence led to a net liquidity drain this week, D.Tao, W.Deng
04 Dec 2013 China: Politburo set tone for economic policies in 2014, D.Tao
28 Nov 2013 China: Is the rising bond yield a cause of concern?, D.Tao, W.Deng
18 Nov 2013 China: Detailed reform framework announced, D. Tao, W.Deng
13 Nov 2013 China: Xi's reform ideas – Comprehensive but lacking details, D. Tao
06 Nov 2013 China: PBoC warns of a prolonged period of deleveraging, D. Tao, W. Deng
HONG KONG
24 Jan 2014 Hong Kong: The fiscal surplus is expected to shrink in FY13/14, reflecting the instability of the revenue stream, C. Tuntono
16 Jan 2014 Hong Kong: The Chief Executive has maintained his policy stances on housing and the economy in his second Policy Address, C. Tuntono
28 Nov 2013 Hong Kong: Retail sales volume growth stabilised at 5.8% YoY in October, supported by better jewellery and ex-jewellery sales, C. Tuntono
18 Nov 2013 Hong Kong: 3Q13 GDP grew weaker than expected at 2.9% YoY, as consumption and service export growth slowed, C. Tuntono
INDIA
26 Feb 2014 India: RBI's risky regime shift, R. Prior-Wandesforde
28 Jan 2014 Asia rates: India – fade the sell-off, add duration risk…, A. Agrawal
19 Dec 2014 Asia rates: India – bullish despite headwinds, A. Agrawal
INDONESIA
04 Dec 2013 Asia rates: Indonesia: a mini rally or panic?, A. Agrawal
Source: Credit Suisse

06 March 2014
Emerging Markets Quarterly 185
Previous publications From Credit Suisse’s Economics Team since the last Emerging Markets Quarterly
KOREA
13 Feb 2014 Korea: The BoK remains on hold in February, but expresses some concerns over EM growth and domestic demand, C.Tuntono
10 Feb 2014 Korea & Taiwan: Recovery set in stone? How weaker global demand may affect exports and growth, C.Tuntono
03 Feb 2014 Korea: Export growth slowed in January, narrowing the trade surplus as per seasonal trend, C.Tuntono
23 Jan 2014 Korea: 4Q13 GDP growth increases to 3.9% YoY, C.Tuntono
09 Jan 2014 Korea: The BoK stays on hold in the beginning of 2014, turning more positive on the domestic economy, C.Tuntono
02 Jan 2014 Korea: Would weaker JPY and QE tapering derail growth?, C. Tuntono
13 Nov 2013 Korea & Taiwan: Weakness likely to be transitory, QE tapering risk should not weaken near-term strengths, C. Tuntono
MALAYSIA
22 Nov 2013 Asia rates: Malaysia – stay underweight, A. Agrawal
PHILIPPINES
12 Feb 2014 Philippines: Mad money?, M. Wan
TAIWAN
25 Feb 2014 Taiwan: Fiscal reform commences, C.Tuntono
24 Feb 2014 Taiwan: Industrial production fell 1.8% YoY in January, distorted by the lunar year effect, C.Tuntono
10 Feb 2014 Taiwan: Exports contracted more than expected in January, distorted by the lunar new year effect, C.Tuntono
10 Feb 2014 Korea & Taiwan: Recovery set in stone? How weaker global demand may affect exports and growth, C.Tuntono
06 Feb 2014 Taiwan: Inflation edges up to 0.8% YoY in January, distorted by the Lunar New Year effect, C.Tuntono
28 Jan 2014 Taiwan: 4Q13 GDP growth surprised on the upside, helped by rise in fixed investments, C.Tuntono
09 Dec 2013 Taiwan: What's wrong with exports lately?, C. Tuntono
13 Nov 2013 Korea & Taiwan: Weakness likely to be transitory, QE tapering risk should not weaken near-term strengths, C. Tuntono
THAILAND
07 Jan 2014 Thailand: Forecast reductions. Assessing the economic costs of political uncertainty, S. Sathirathai
Source: Credit Suisse

06 March 2014
Emerging Markets Quarterly 186
Key dates LATIN AMERICA
ARGENTINA
Interest payment on foreign law bonds (Pars) 31 March 2014
Interest payment on foreign law bonds (Global 17) 2 June 2014
Interest payment on foreign law bonds (Discounts) 30 June 2014
Last day of U.S. Supreme Court’s term 30 June 2014
Opening conference of U.S. Supreme Court’s term 29 September 2014
Interest payment on foreign law bonds (Pars) 30 September 2014
End of ordinary session in Congress 30 November 2014
Interest payment on foreign law bonds (Global 17) 2 December 2014
Interest payment on foreign law bonds (Discounts) 31 December 2014
BRAZIL
Monetary policy decision 1 April 2014
Monetary policy decision 27 May 204
Monetary policy decision 15 July 2014
Monetary policy decision 2 September 2014
Presidential, congressional and governor elections 5 October 2014
Presidential, congressional and governor elections, second round, if needed
Monetary policy decision
26 October 2014
28 October 2014
Monetary policy decision 2 December 2014
CHILE
Monetary policy decision 13 March 2014
Monetary policy minutes 28 March 2014
Monetary policy decision 17 April 2014
Monetary policy minutes 5 May 2014
Monetary policy decision 15 May 2014
Start of session in Congress 21 May 2014
Monetary policy minutes 2 June 2014
Monetary policy decision 12 June 2014
Monetary policy minutes 27 June 2014
Monetary policy decision 15 July 2014
Monetary policy minutes 31 July 2014
Monetary policy decision 14 August 2014
Monetary policy minutes 1 September 2014
End of session in Congress 18 September 2014
COLOMBIA
Legislative elections 9 March 2014
Monetary policy minutes 14 March 2014
Start of second ordinary session in Congress 16 March 2014
Monetary policy decision 21 March 2014
Monetary policy minutes 4 April 2014
Monetary policy decision 25 April 2014
Monetary policy minutes 9 May 2014
Presidential elections 25 May 2014
Monetary policy decision 30 May 2014
Monetary policy minutes 13 June 2014
Presidential elections, second round, if needed 15 June 2014
End of second ordinary session in Congress 20 June 2014
Monetary policy decision 20 June 2014
Monetary policy minutes 4 July 2014
Source: Credit Suisse

06 March 2014
Emerging Markets Quarterly 187
Key dates COLOMBIA (cont’d)
Start of first ordinary session in Congress 20 July 2014
Monetary policy decision 31 July 2014
Monetary policy minutes 14 August 2014
Monetary policy decision 29 August 2014
Monetary policy minutes 12 September 2014
Monetary policy decision 26 September 2014
Monetary policy minutes 10 October 2014
Monetary policy decision 31 October 2014
Monetary policy minutes 14 November 2014
Monetary policy decision 28 November 2014
Monetary policy minutes 12 December 2014
End of first ordinary session in Congress 16 December 2014
Monetary policy decision 19 December 2014
MEXICO
Monetary policy decision 21 March 2014
Monetary policy minutes 4 April 2014
Monetary policy decision 25 April 2014
End of the first ordinary session in Congress 30 April 2014
Monetary policy minutes 9 May 2014
Quarterly inflation report 21May 2014
Monetary policy decision 6 June 2014
Monetary policy minutes 20 June 2014
Monetary policy decision 11 July 2014
Monetary policy minutes 25 July 2014
Quarterly inflation report 13 August 2014
Start of second ordinary session in Congress 1 September 2014
Monetary policy decision 5 September 2014
Monetary policy minutes 19 September 2014
Monetary policy decision 31 October 2014
Quarterly inflation report 19 November 2014
Monetary policy minutes 14 November 2014
Monetary policy decision 5 December 2014
End of second ordinary session in Congress 15 December 2014
Monetary policy minutes 19 December 2014
PERU
Monetary policy decision 13 March 2014
New Municipal elections 16 March 2014
Monetary policy decision 10 April 2014
Monetary policy decision 8 May 2014
Monetary policy decision 12 June 2014
End of second ordinary session in Congress 15 June 2014
Monetary policy decision 10 July 2014
Start of first ordinary session in Congress 27 July 2014
Monetary policy decision 7 August 2014
Monetary policy decision 11 September 2014
Municipal elections 5 October 2014
Monetary policy decision 9 October 2014
Monetary policy decision 13 November 2014
Monetary policy decision 11 December 2014
End of first ordinary session in Congress 15 December 2014
Source: Credit Suisse
06 March 2014
Emerging Markets Quarterly 188
Key dates VENEZUELA
End of first ordinary session in Congress 15 August 2014
Start of second ordinary session in Congress 15 September 2014
End of second ordinary session in Congress 15 December 2014
Source: Credit Suisse
06 March 2014
Emerging Markets Quarterly 189
Key dates EASTERN EUROPE, MIDDLE EAST & AFRICA
CZECH REPUBLIC
Czech National Bank Board policy rate decision 27 March 2014
Czech National Bank Board policy rate decision 7 May 2014
Elections to the European Parliament 23-24 May 2014
Czech National Bank Board policy rate decision 26 June 2014
Czech National Bank Board policy rate decision 31 July 2014
Czech National Bank Board policy rate decision 25 September 2014
Czech National Bank Board policy rate decision 6 November 2014
Czech National Bank Board policy rate decision 17 December 2014
HUNGARY
Monetary Council rate-setting meeting 25 March 2014
Parliamentary elections 6 April 2014
Monetary Council rate-setting meeting 29 April 2014
Elections to the European Parliament 25 May 2014
Monetary Council rate-setting meeting 27 May 2014
Monetary Council rate-setting meeting 24 June 2014
Monetary Council rate-setting meeting 22 July 2014
Monetary Council rate-setting meeting 26 August 2014
Municipal elections Autumn
Monetary Council rate-setting meeting 23 September 2014
Monetary Council rate-setting meeting 28 October 2014
Monetary Council rate-setting meeting 25 November 2014
Monetary Council rate-setting meeting 16 December 2016
ISRAEL
Monetary Committee rate-setting meeting 24 March 2014
Monetary Committee rate-setting meeting 28 April 2014
Monetary Committee rate-setting meeting 26 May 2014
Monetary Committee rate-setting meeting 23 June 2014
POLAND
Monetary Policy Council rate-setting meeting 8-9 April 2014
Monetary Policy Council rate-setting meeting 6-7 May 2014
Elections to the European Parliament 25 May 2014
Monetary Policy Council rate-setting meeting 3-4 June 2014
Monetary Policy Council rate-setting meeting 1-2 July 2014
Monetary Policy Council rate-setting meeting 2-3 September 2014
Municipal elections Autumn
Monetary Policy Council rate-setting meeting 7-8 October 2014
Monetary Policy Council rate-setting meeting 4-5 November 2014
Monetary Policy Council rate-setting meeting 2-3 December 2014
RUSSIA
Central bank policy meeting 14 March 2014
Central bank policy meeting 25 April 2014
G8 Summit in Sochi 4-5 June 2014
Central bank policy meeting 16 June 2014
Publication of the central bank’s monetary policy report 18 June 2014
City of Moscow legislative elections By 14 September 2014
SOUTH AFRICA
Reserve Bank Quarterly Bulletin (4Q 2013) 12 March 2014
Source: Credit Suisse

06 March 2014
Emerging Markets Quarterly 190
Key dates SOUTH AFRICA (cont’d)
Monetary Policy Committee meeting 27 March 2014
National Elections 7 May 2014
Monetary Policy Committee meeting 22 May 2014
Statistics South Africa supply side 1Q 2014 GDP data 27 May 2014
TURKEY
Monetary policy committee meeting 18 March 2014
Municipal elections 30 March 2014
Monetary policy committee meeting 24 April 2014
Release of the quarterly inflation report 30 April 2014
Monetary policy committee meeting 22 May 2014
Monetary policy committee meeting 24 June 2014
Monetary policy committee meeting 17 July 2014
Release of the quarterly inflation report 24 July 2014
Monetary policy committee meeting 27 August 2014
Presidential elections August 2014
Monetary policy committee meeting 25 September 2014
Submission of the draft 2015 budget to parliament 17 October 2014
Monetary policy committee meeting 23 October 2014
Monetary policy committee meeting 31 October 2014
Monetary policy committee meeting 20 November 2014
Announcement of the 2015 monetary policy framework 10 December 2014
Monetary policy committee meeting 24 December 2014
Deadline for the approval of the 2015 budget 31 December 2014
Parliamentary elections June 2015
UKRAINE
Publication of FX reserves data for February 7-10 March 2014
Referendum on in Crimea (on the autonomy’s self-determination) 16 March 2014
Presidential elections 25 May 2014
Maturity of the $1.0bn Eurobond 4 June 2014
Maturity of the $1.6bn Naftogaz Eurobond (guaranteed by the sovereign) 30 September 2014
Source: Credit Suisse

06 March 2014
Emerging Markets Quarterly 191
Key dates EMERGING ASIA
CHINA
The 2nd Session of the 12th National People's Congress March 2014
The 2nd Session of the 12th Chinese People's Political Consultative Conference March 2014
Economic working conference for 2015 December 2014
INDIA
RBI policy review 1 April 2014
General Elections Before 31 May 2014
INDONESIA
Bank Indonesia Monetary Policy meeting 13 March 2014
Bank Indonesia Monetary Policy meeting 8 April 2014
Legislative Elections 9 April 2014
Bank Indonesia Monetary Policy meeting 8 May 2014
Bank Indonesia Monetary Policy meeting 12 June 2014
Presidential Elections 9 July 2014
KOREA
Bank of Korea Monetary Policy meeting 13 March 2014
Bank of Korea Monetary Policy meeting 10 April 2014
Bank of Korea Monetary Policy meeting 9 May 2014
Bank of Korea Monetary Policy meeting 12 June 2014
Bank of Korea Monetary Policy meeting 10 July 2014
MALAYSIA
Bank Negara Monetary Policy Meeting 6 March 2014
Bank Negara Monetary Policy Meeting 8 May 2014
PHILIPPINES
Banko Sentral ng Pilipinas Monetary Policy meeting 27 March 2014
Banko Sentral ng Pilipinas Monetary Policy meeting 8 May 2014
Banko Sentral ng Pilipinas Monetary Policy meeting 19 June 2014
SINGAPORE
Monetary Authority of Singapore Meeting April 2014
TAIWAN
Central Bank of China quarterly Monetary Policy meeting 31 March 2014
Central Bank of China quarterly Monetary Policy Meeting 30 June 2014
Central Bank of China quarterly Monetary Policy Meeting 30 September 2014
Municipal Election 29 November 2014
THAILAND
Bank of Thailand Monetary Policy Committee meeting 12 March 2014
Bank of Thailand Monetary Policy Committee meeting 23 April 2014
Bank of Thailand Monetary Policy Committee meeting 18 June 2014
Source: Credit Suisse
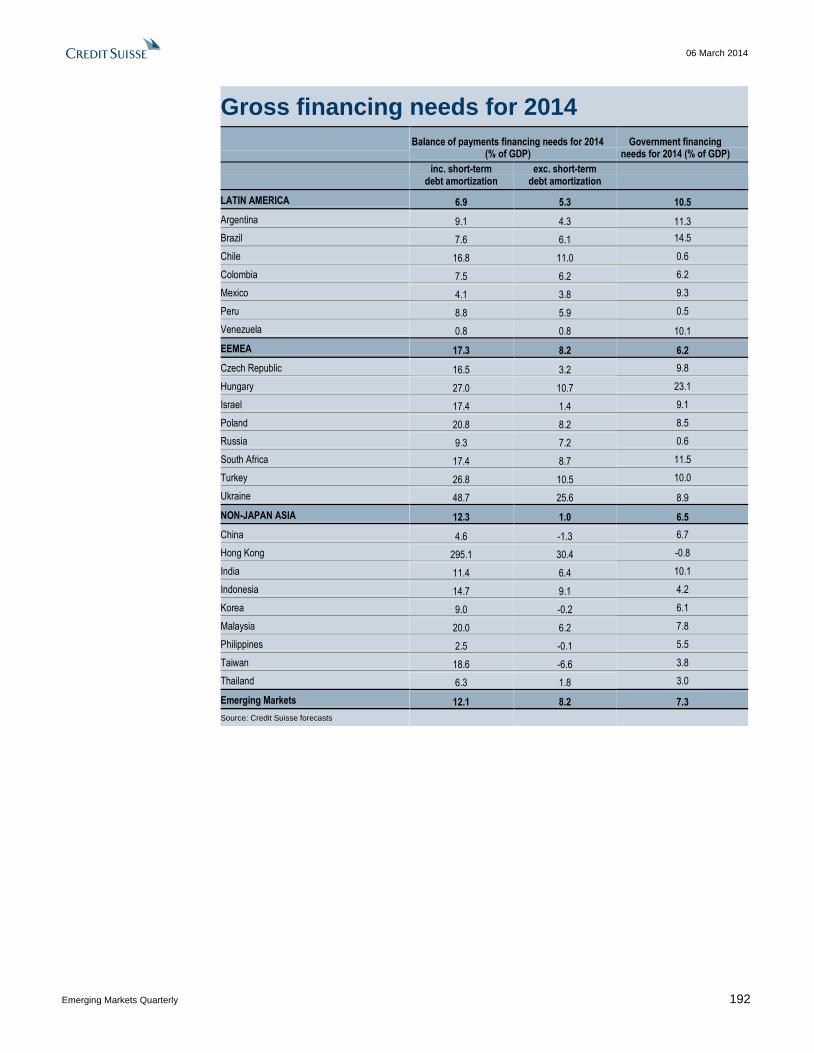
06 March 2014
Emerging Markets Quarterly 192
Gross financing needs for 2014
Balance of payments financing needs for 2014 (% of GDP)
Government financing needs for 2014 (% of GDP)
inc. short-term debt amortization
exc. short-term debt amortization
LATIN AMERICA 6.9 5.3 10.5
Argentina 9.1 4.3 11.3
Brazil 7.6 6.1 14.5
Chile 16.8 11.0 0.6
Colombia 7.5 6.2 6.2
Mexico 4.1 3.8 9.3
Peru 8.8 5.9 0.5
Venezuela 0.8 0.8 10.1
EEMEA 17.3 8.2 6.2
Czech Republic 16.5 3.2 9.8
Hungary 27.0 10.7 23.1
Israel 17.4 1.4 9.1
Poland 20.8 8.2 8.5
Russia 9.3 7.2 0.6
South Africa 17.4 8.7 11.5
Turkey 26.8 10.5 10.0
Ukraine 48.7 25.6 8.9
NON-JAPAN ASIA 12.3 1.0 6.5
China 4.6 -1.3 6.7
Hong Kong 295.1 30.4 -0.8
India 11.4 6.4 10.1
Indonesia 14.7 9.1 4.2
Korea 9.0 -0.2 6.1
Malaysia 20.0 6.2 7.8
Philippines 2.5 -0.1 5.5
Taiwan 18.6 -6.6 3.8
Thailand 6.3 1.8 3.0
Emerging Markets 12.1 8.2 7.3
Source: Credit Suisse forecasts

06 March 2014
Emerging Markets Quarterly 193
Balance of payments financing needs LATIN AMERICA
ARGENTINA
$bn 2009 2010 2011 2012 2013 2014F
Funding need (including short-term debt amortization) 12.2 22.5 37.0 29.1 35.1 33.2
Funding need (excluding short-term debt amortization) -4.1 11.4 17.5 11.5 17.6 15.7
Current account deficit -11.0 -1.4 2.4 0.0 4.5 3.8
FDI outflows 0.7 1.0 1.5 1.1 1.2 1.0
Medium- and long-term debt amortization 6.2 11.8 13.7 10.5 11.9 10.9
Public 4.3 5.4 9.0 5.8 6.2 5.7
Private 1.9 6.3 4.6 4.7 5.7 5.2
Short-term debt(1) 16.3 11.1 19.5 17.6 17.5 17.5
Funding sources (including gross short-term borrowing) 12.2 22.5 37.0 29.1 35.1 33.2
FDI inflows 4.0 7.1 9.9 12.1 10.4 9.9
Net portfolio investments -4.4 11.1 -4.4 -3.2 -1.6 -2.0
Government borrowing from IFIs, excluding the BIS 3.2 2.4 2.6 2.2 2.2 2.3
Central bank borrowing from BIS and bilateral lenders 11.6 11.1 11.1 12.8 12.9 9.4
Medium-term private sector borrowing 0.7 4.3 3.4 3.9 3.5 3.3
Short-term private sector borrowing 11.1 19.5 17.6 17.5 17.5 17.5
Other capital flows, including capital flight(2) -13.3 -28.4 -8.9 -21.1 -22.7 -12.2
Change in FX reserves net of borrowing from the BIS and bilateral lenders (- indicates increase) -0.6 -4.7 5.8 4.8 12.8 5.0
(1) The IMF’s data dissemination system reports that Argentina has a larger stock of short-term debt, but our understanding is that the IMF number includes debt that has been in arrears since 2001 and is not being serviced. (2) This includes accumulation of new arrears and capital flight.
Source: Central Bank, Ministry of Finance, Credit Suisse
BRAZIL
$bn 2009 2010 2011 2012 2013 2014F
Funding need (including short-term debt amortization) 80.8 123.7 146.5 131.2 170.6 161.9
Funding need (excluding short-term debt amortization) 44.3 92.7 89.1 91.1 138.0 130.5
Current account deficit 24.3 47.3 52.5 54.2 81.4 72.0
FDI outflows -10.1 11.6 -1.0 -2.8 -3.5 8.0
Medium- and long-term debt amortization 30.1 33.8 37.7 39.7 60.1 50.5
Public 5.0 8.1 7.7 5.0 5.0 4.5
Private 25.1 25.8 30.0 34.7 55.1 46.0
Short-term debt amortization 36.4 31.0 57.3 40.1 32.6 31.4
Funding sources (including gross short-term borrowing) 80.8 123.7 146.5 131.2 170.6 161.9
FDI inflows 25.9 48.5 66.7 65.3 64.0 55.0
Portfolio investments 50.9 53.9 8.6 14.2 38.5 29.5
Stocks 37.1 37.7 7.2 5.6 11.6 6.0
Fixed income 9.7 13.4 -0.2 4.8 22.8 20.5
Government bonds 4.2 2.8 1.7 3.9 4.1 3.0
Borrowing by the government (from other sources than the IMF) 4.6 5.6 2.8 3.6 1.9 2.5
Medium- and long-term borrowing by the private sector 27.1 54.2 79.1 50.4 54.9 51.4
Short-term debt contracted from abroad (gross) 31.0 57.3 40.1 32.6 31.4 30.0
Other capital inflows and errors and omissions -12.1 -46.7 7.7 -15.9 -14.2 8.5
Change in international net reserves (- indicates increase) -46.7 -49.1 -58.6 -18.9 -5.9 -15.0
Source: Central Bank, Ministry of Finance, Credit Suisse

06 March 2014
Emerging Markets Quarterly 194
Balance of payments financing needs CHILE
$bn 2009 2010 2011 2012 2013 2014F
Funding need (including short-term debt amortization) 29.8 36.4 64.1 60.9 56.8 43.9
Funding need (excluding short-term debt amortization) 14.0 20.0 44.7 43.0 38.2 28.9
Current account deficit -3.5 -3.2 3.3 9.5 12.5 11.9
FDI outflows 7.2 9.5 20.4 21.1 10.7 5.0
Medium- and long-term debt amortization 10.3 13.8 21.0 12.4 15.0 12.0
Short-term debt amortization 15.8 16.5 19.4 17.9 18.7 15.0
Funding sources (including gross short-term borrowing) 29.8 36.4 64.1 60.9 56.8 43.9
FDI inflows 12.9 15.4 22.9 30.3 20.9 10.0
Net portfolio flows -12.4 -6.4 11.5 -3.4 7.0 5.0
Portfolio outflows 14.3 15.7 -0.8 13.9 9.1 7.4
Portfolio inflows 1.9 9.3 10.7 10.5 16.1 12.4
External debt issuance 5.1 9.5 12.0 10.0 10.0 10.0
Other loans 17.6 13.6 20.7 20.6 16.0 15.0
Residual 8.8 6.8 11.0 3.1 2.3 4.7
Change in gross reserves (- indicates increase) -2.2 -2.5 -14.1 0.3 0.6 -0.8
Memo items:
Nominal GDP ($ bn) 173 218 251 268 280 262
Source: Central Bank, Credit Suisse
COLOMBIA
$bn 2009 2010 2011 2012 2013 2014F
Funding need (including short-term debt amortization) 17.4 24.5 27.1 26.7 29.6 28.3
Funding need (excluding short-term debt amortization) 12.3 20.4 22.8 21.5 23.1 23.3
Current account deficit 5.0 8.9 10.0 12.1 13.6 14.1
FDI outflows 3.1 6.5 8.3 -0.3 3.7 2.8
Medium- and long-term debt amortization 4.2 5.0 4.5 9.7 5.8 6.4
Public sector 1.1 1.7 1.2 1.9 1.5 2.4
IFIs 0.5 0.7 0.8 0.7 0.9 1.4
Non-IFIs 0.6 1.0 0.5 1.2 0.6 1.0
Private sector 3.1 3.3 3.3 7.8 4.3 4.0
Non-financial private sector 2.8 3.2 2.2 7.6 3.5 3.3
Financial private sector 0.3 0.1 1.1 0.2 0.8 0.7
Short-term debt amortization 5.1 4.2 4.3 5.2 6.5 5.0
Funding sources (including gross short-term borrowing) 17.4 24.5 27.2 26.7 29.6 28.3
FDI inflows 7.1 6.9 13.4 15.7 16.3 15.8
IFI lending 2.1 2.1 1.5 0.8 1.0 2.0
Public sector borrowing (excluding IFI lending)* 3.5 3.3 2.0 1.7 2.6 2.0
Net portfolio investments -0.1 0.9 5.3 3.7 7.0 3.2
Medium-term private sector borrowing 3.5 8.3 7.7 6.7 5.0 5.4
Short-term financing 4.4 5.8 5.7 7.1 4.5 4.5
Other capital flows/errors and omissions -1.8 0.3 -4.7 -3.5 0.1 -2.1
Change in FX reserves (- indicates increase) -1.3 -3.1 -3.7 -5.5 -6.8 -2.5
* Includes 2014 budget pre-financing in 2013
Source: Central Bank, Ministry of Finance, Credit Suisse

06 March 2014
Emerging Markets Quarterly 195
Balance of payments financing needs MEXICO
$bn 2009 2010 2011 2012 2013 2014F
Funding need (including short-term debt amortization) 44.0 49.4 55.1 54.9 48.6 52.9
Funding need (excluding non-market debt amortization) 28.8 29.5 34.5 47.8 44.3 49.1
Current account deficit 8.1 3.6 12.3 14.8 22.3 29.2
FDI outflows 9.6 15.0 12.6 22.5 10.0 10.0
Medium- and long-term market debt amortization 5.8 7.1 6.0 2.6 4.1 5.4
Public 3.7 5.4 5.4 1.7 3.7 3.7
Private 2.1 1.7 0.6 0.9 0.4 1.7
Public sector non-market debt payments 5.3 3.8 3.6 8.0 7.9 4.5
Private sector non-market debt amortization* 15.2 19.9 20.6 7.1 4.3 3.7
Funding sources (including gross short-term borrowing) 44.0 49.4 55.1 54.9 48.6 52.9
FDI inflows 17.1 23.0 23.0 17.2 35.2 29.0
Net Portfolio investments -15.0 31.4 45.9 72.9 48.3 21.1
Medium- and long-term borrowing 14.0 27.8 12.7 8.4 6.0 10.0
Short-term loans 12.8 7.6 11.7 10.0 5.0 10.0
Other 22.9 -0.1 0.0 -17.0 -14.0 2.8
Error and omissions -3.2 -19.7 -9.6 -18.7 -18.7 0.0
Change in net international reserves (- indicates increase) -4.6 -20.7 -28.6 -17.8 -13.2 -20.0
Memo items:
Nominal GDP ($ bn) 895 1,055 1,172 1,188 1,236 1,284
* Reflects credit lines from suppliers, commercial bank loans and external trade loans. We do not have data on the exact original maturity of these loans, but we assume that they were typically less than one year, so that it fits with the “short-term” debt definition.
Source: Central Bank, Ministry of Finance, Credit Suisse
PERU
$bn 2009 2010 2011 2012 2013 2014F
Funding need (including short-term debt amortization) 10.4 12.8 11.7 16.2 24.5 18.7
Funding need (excluding short-term debt amortization) 4.1 8.1 5.4 9.8 16.0 12.6
Current account deficit 0.7 2.6 3.3 6.5 10.2 9.7
FDI outflows 0.4 0.3 0.1 -0.1 0.1 0.1
Medium- and long-term debt amortization 3.0 5.2 1.9 3.3 5.7 2.8
Public sector 1.8 3.9 0.8 1.2 2.6 1.0
IFIs 0.7 1.9 0.6 0.7 2.4 0.4
Paris Club 1.2 1.1 0.3 0.2 0.2 0.2
External market debt amortization 0.0 0.9 0.0 0.3 0.0 0.4
Private sector 1.2 1.3 1.1 2.1 3.1 1.8
Short-term debt amortization 6.2 4.7 6.3 6.3 8.5 6.1
Funding sources (including gross short-term borrowing) 10.4 12.8 11.7 16.2 24.5 18.7
FDI inflows 6.4 8.5 8.2 12.2 10.2 9.2
Net portfolio investments -2.8 -0.7 -1.0 -0.2 4.5 -0.4
IFI lending (excluding IMF) 1.0 1.3 0.7 0.4 0.4 0.4
Paris Club lending to Peru’s government sector 0.2 0.3 0.3 0.1 0.0 0.4
Public sector external bond issuance 2.0 2.7 0.0 0.5 0.0 0.0
Medium-term private-sector borrowing 2.2 5.3 4.0 6.3 4.1 4.4
Short-term financing 4.7 6.3 6.3 8.5 6.1 8.8
Other -1.4 0.2 -2.2 3.5 0.9 -2.1
Change in FX reserves (- indicates increase) -1.9 -11.0 -4.7 -15.2 -1.7 -2.0
Source: Central Bank, Ministry of Finance, Credit Suisse

06 March 2014
Emerging Markets Quarterly 196
Balance of payments financing needs VENEZUELA
$bn 2009 2010 2011 2012 2013 2014F
Funding need (excluding short-term debt amortization) 1.1 -3.8 -20.8 -7.9 -3.6 2.4
Current account deficit -2.3 -8.8 -24.4 -11.0 -8.5 -5.0
FDI outflows 2.2 1.8 -1.1 2.5 1.5 2.0
Medium- and long-term debt amortization 1.1 3.2 4.7 0.7 3.3 5.5
Funding sources (including net short-term borrowing) 1.1 -3.8 -20.8 -7.9 -3.6 2.4
FDI inflows -2.2 1.8 3.8 3.2 4.5 2.7
Net portfolio investments 9.9 3.2 2.0 4.0 -4.5 8.9
Other investment -14.8 -17.0 -31.7 -13.6 -11.4 -14.3
Trade credits -3.6 -2.0 -8.2 -8.6 -0.4 -6.7
Loans 2.8 7.2 11.0 2.1 -3.5 -1.3
Currency and deposits -17.0 -19.9 -31.1 1.9 -1.7 1.3
Other assets 3.0 -2.3 -3.5 -8.9 -5.8 -7.6
Other, including errors and omissions -2.1 0.0 1.1 -2.5 -0.7 1.8
Change in gross reserves (- indicates increase) 10.3 8.1 4.0 1.0 8.4 3.4
Source: Central Bank, Ministry of Finance, Credit Suisse

06 March 2014
Emerging Markets Quarterly 197
Balance of payments financing needs EASTERN EUROPE, MIDDLE EAST AND AFRICA
CZECH REPUBLIC
$bn 2009 2010 2011 2012 2013 2014F
Funding need (including short-term debt amortization) 37.2 37.4 34.4 37.1 35.5 32.5
Funding need (excluding short-term debt amortization) 10.1 13.5 10.8 10.0 9.3 6.3
Current account deficit 4.8 7.6 6.1 4.7 2.0 2.3
FDI outflows 0.9 1.2 -0.3 1.3 3.3 0.0
Medium- and long-term external debt amortization 4.4 4.7 5.0 4.0 4.0 4.0
Short-term external debt amortization 27.1 23.9 23.6 27.1 26.2 26.2
Funding sources (including gross short-term borrowing) 37.2 37.4 34.4 37.1 35.5 32.5
Net EU transfers (capital account) 2.7 1.7 0.8 2.7 3.8 3.5
FDI inflows 2.9 6.1 2.2 10.6 4.6 4.0
Net portfolio equity inflows 0.8 -0.3 0.1 -0.4 0.0 0.0
Medium- and long-term borrowing (incl. bonds) 12.6 9.9 1.5 12.6 4.0 4.0
Short-term borrowing (incl. bills) 23.9 23.6 27.1 26.2 26.2 26.2
Financial derivatives 0.0 -0.2 -0.1 0.4 0.3 0.0
Other items (net errors and omissions) -1.1 -2.5 0.6 -10.4 7.9 0.0
Change in reserves (- indicates increase) -4.6 -0.9 2.2 -4.6 -11.3 -5.2
Roll-over ratios: Assumptions
Medium- and long-term debt 2.9 2.1 0.3 3.2 1.0 1.0
Short-term debt 0.9 1.0 1.1 1.0 1.0 1.0
Source: IMF, Central Bank, Credit Suisse
HUNGARY
$bn 2009 2010 2011 2012 2013 2014F
Funding need (including short-term debt amortization) 41.6 41.5 54.3 56.6 33.7 37.7
Funding need (excluding short-term debt amortization) 14.1 13.5 21.4 24.8 10.9 14.9
Current account deficit (- indicates surplus) 0.2 -0.3 -0.7 -1.1 -2.6 -1.6
FDI outflows 1.9 1.2 4.2 11.2 0.0 0.0
Medium- and long-term external debt amortization 12.0 12.6 17.9 14.7 13.5 16.5
Short-term external debt amortization 27.5 28.0 32.9 31.8 22.8 22.8
Funding sources (including gross short-term borrowing) 41.6 41.5 54.3 56.6 33.7 37.7
Net EU transfers (capital account) 1.4 2.3 3.2 3.2 4.0 4.0
FDI inflows 2.2 2.3 5.1 13.9 0.0 1.0
Net portfolio equity inflows -0.4 -0.9 2.6 2.8 2.0 0.0
Medium- and long-term borrowing (incl. bonds) 21.5 2.5 8.7 15.4 10.8 13.2
- o/w IMF-EU-WB funding 10.0 0.0 0.0 0.0 0.0 0.0
Short-term borrowing (incl. bills) 28.0 32.9 31.8 22.8 22.8 22.8
Financial derivatives 1.0 0.8 -1.1 0.3 0.0 0.0
Other items (incl. errors and omissions) -1.8 2.3 7.8 -5.9 -4.1 -3.3
Change in reserves (- indicates increase) -10.3 -0.8 -3.8 4.1 -1.8 0.0
Roll-over ratios: Assumptions
Medium- and long-term debt 1.8 0.2 0.5 1.0 0.8 0.8
Short-term debt 1.0 1.2 1.0 0.7 1.0 1.0
Source: National Bank of Hungary, Ministry for National Economy, IMF, JEDH, Credit Suisse
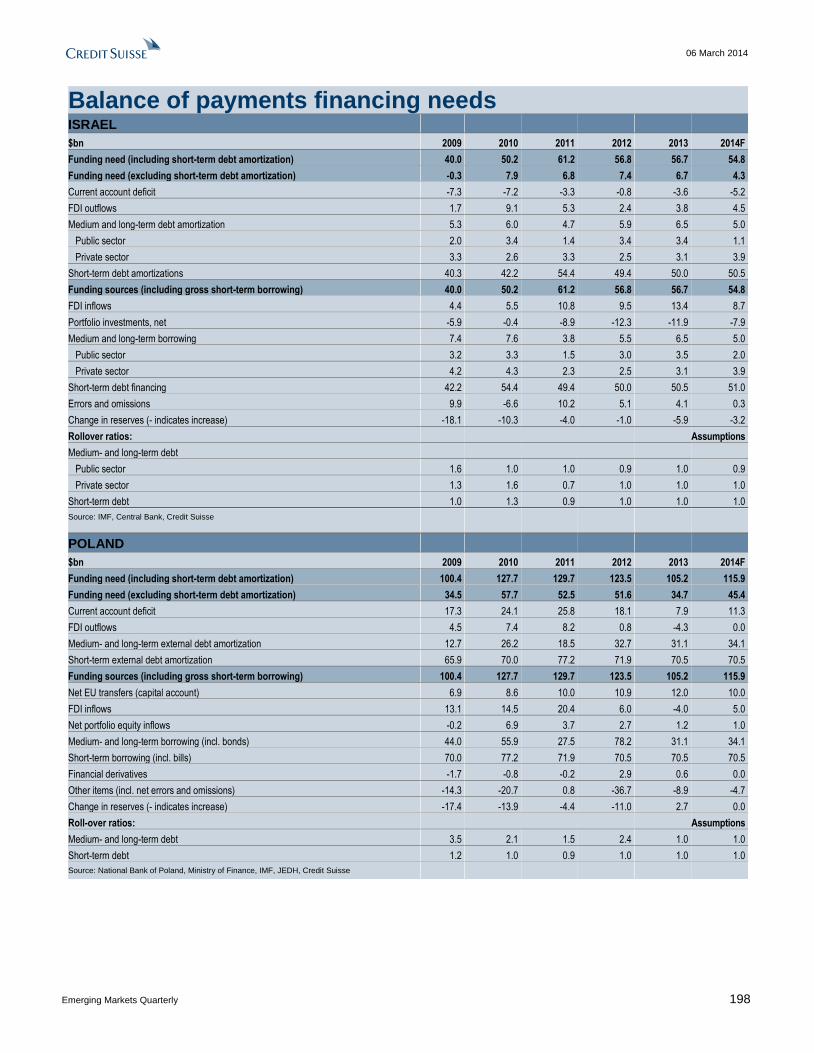
06 March 2014
Emerging Markets Quarterly 198
Balance of payments financing needs ISRAEL
$bn 2009 2010 2011 2012 2013 2014F
Funding need (including short-term debt amortization) 40.0 50.2 61.2 56.8 56.7 54.8
Funding need (excluding short-term debt amortization) -0.3 7.9 6.8 7.4 6.7 4.3
Current account deficit -7.3 -7.2 -3.3 -0.8 -3.6 -5.2
FDI outflows 1.7 9.1 5.3 2.4 3.8 4.5
Medium and long-term debt amortization 5.3 6.0 4.7 5.9 6.5 5.0
Public sector 2.0 3.4 1.4 3.4 3.4 1.1
Private sector 3.3 2.6 3.3 2.5 3.1 3.9
Short-term debt amortizations 40.3 42.2 54.4 49.4 50.0 50.5
Funding sources (including gross short-term borrowing) 40.0 50.2 61.2 56.8 56.7 54.8
FDI inflows 4.4 5.5 10.8 9.5 13.4 8.7
Portfolio investments, net -5.9 -0.4 -8.9 -12.3 -11.9 -7.9
Medium and long-term borrowing 7.4 7.6 3.8 5.5 6.5 5.0
Public sector 3.2 3.3 1.5 3.0 3.5 2.0
Private sector 4.2 4.3 2.3 2.5 3.1 3.9
Short-term debt financing 42.2 54.4 49.4 50.0 50.5 51.0
Errors and omissions 9.9 -6.6 10.2 5.1 4.1 0.3
Change in reserves (- indicates increase) -18.1 -10.3 -4.0 -1.0 -5.9 -3.2
Rollover ratios: Assumptions
Medium- and long-term debt
Public sector 1.6 1.0 1.0 0.9 1.0 0.9
Private sector 1.3 1.6 0.7 1.0 1.0 1.0
Short-term debt 1.0 1.3 0.9 1.0 1.0 1.0
Source: IMF, Central Bank, Credit Suisse
POLAND
$bn 2009 2010 2011 2012 2013 2014F
Funding need (including short-term debt amortization) 100.4 127.7 129.7 123.5 105.2 115.9
Funding need (excluding short-term debt amortization) 34.5 57.7 52.5 51.6 34.7 45.4
Current account deficit 17.3 24.1 25.8 18.1 7.9 11.3
FDI outflows 4.5 7.4 8.2 0.8 -4.3 0.0
Medium- and long-term external debt amortization 12.7 26.2 18.5 32.7 31.1 34.1
Short-term external debt amortization 65.9 70.0 77.2 71.9 70.5 70.5
Funding sources (including gross short-term borrowing) 100.4 127.7 129.7 123.5 105.2 115.9
Net EU transfers (capital account) 6.9 8.6 10.0 10.9 12.0 10.0
FDI inflows 13.1 14.5 20.4 6.0 -4.0 5.0
Net portfolio equity inflows -0.2 6.9 3.7 2.7 1.2 1.0
Medium- and long-term borrowing (incl. bonds) 44.0 55.9 27.5 78.2 31.1 34.1
Short-term borrowing (incl. bills) 70.0 77.2 71.9 70.5 70.5 70.5
Financial derivatives -1.7 -0.8 -0.2 2.9 0.6 0.0
Other items (incl. net errors and omissions) -14.3 -20.7 0.8 -36.7 -8.9 -4.7
Change in reserves (- indicates increase) -17.4 -13.9 -4.4 -11.0 2.7 0.0
Roll-over ratios: Assumptions
Medium- and long-term debt 3.5 2.1 1.5 2.4 1.0 1.0
Short-term debt 1.2 1.0 0.9 1.0 1.0 1.0
Source: National Bank of Poland, Ministry of Finance, IMF, JEDH, Credit Suisse

06 March 2014
Emerging Markets Quarterly 199
Balance of payments financing needs RUSSIA
$bn 2009 2010 2011 2012 2013 2014F
Funding need (including short-term debt amortization) 132.9 100.5 68.1 85.4 157.1 178.0
Funding need (excluding short-term debt amortization) 59.4 47.8 14.0 40.4 117.1 138.0
Current account deficit -48.6 -71.0 -98.8 -81.3 -33.0 -30.0
FDI outflows 44.5 51.7 67.3 65.0 97.0 103.0
Medium- and long-term debt amortization 63.5 67.1 45.6 56.7 53.1 65.0
Public 2.9 3.2 4.8 2.8 3.0 4.0
Private 60.6 63.9 40.8 53.9 50.1 61.0
Short-term debt amortization 73.5 52.7 54.1 45.0 40.0 40.0
Funding sources (including gross short-term borrowing) 132.9 100.5 68.1 85.4 157.1 178.0
FDI inflows 36.8 41.2 52.9 47.0 78.4 75.0
Portfolio investments -2.2 -1.6 -15.0 5.0 -11.7 8.0
Medium- and long-term borrowing 73.3 64.2 47.9 90.0 83.4 35.0
Short-term loans 52.7 54.1 45.0 40.0 40.0 40.0
Other flows, including errors and omissions -24.3 -20.6 -52.3 -64.0 -50.0 -15.0
Change in net international reserves (- indicates increase) -3.4 -36.8 -10.4 -32.6 17.0 35.0
Memo items:
Nominal GDP ($ bn) 1,223 1,525 1,899 2,022 2,093 1,915
Source: Central Bank of Russia, IIF, Credit Suisse
SOUTH AFRICA
$bn 2009 2010 2011 2012 2013 2014F
Funding need (including short-term debt amortization) 40.3 30.2 33.3 50.2 58.5 57.1
Funding need (excluding short-term debt amortization) 14.8 8.9 11.5 29.7 30.6 28.6
Current account deficit 11.5 7.2 9.4 20.0 20.9 23.1
FDI outflows 1.2 -0.1 -0.3 3.0 4.8 0.0
Medium- and long-term debt amortization 2.1 1.8 2.3 6.7 5.0 5.5
Public 1.2 0.7 0.7 1.7 3.1 2.0
Private 0.9 1.1 1.6 4.9 1.9 3.5
Short-term debt amortization(1) 25.5 21.3 21.8 20.5 27.9 28.5
Funding sources (including gross short-term borrowing) 40.3 30.2 33.3 50.2 58.5 57.1
FDI inflows 7.6 3.6 4.2 4.6 8.3 3.2
Portfolio investments 11.1 10.2 -1.1 6.6 -1.1 2.7
Medium- and long-term borrowing by public sector(2) 6.0 15.5 10.2 17.8 5.2 3.6
Medium- and long-term borrowing by private sector(2) 6.2 12.3 -2.0 -1.0 4.0 5.0
Short-term loans 21.3 21.8 20.5 27.9 28.5 29.2
Other(3) -9.8 -29.1 6.1 -4.6 9.0 7.1
Change in net reserves owing to BOPs (- indicates increase) -2.1 -4.1 -4.7 -1.1 4.6 6.3
Roll-over ratios:
Medium- and long-term debt 5.7 15.7 3.5 2.5 1.8 1.6
Short-term debt 0.8 1.0 0.9 1.4 1.0 1.0
(1) Includes non-residents' deposits. (2) Estimates based on stock data. (3) Includes residents' portfolio and other investments, transfers and net errors and omissions. Repatriation of $8.6bn from abroad and net errors and omissions of $10.6bn are behind the unusually large figure in 2008.
Source: Reserve Bank, Credit Suisse
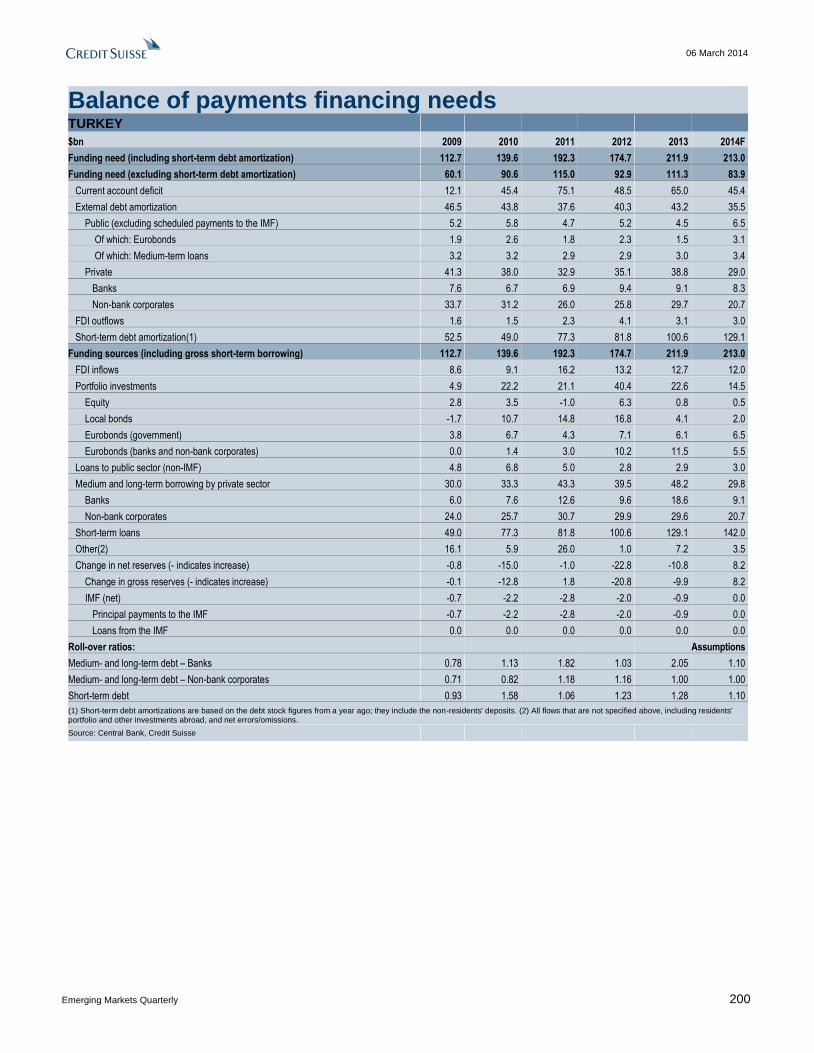
06 March 2014
Emerging Markets Quarterly 200
Balance of payments financing needs TURKEY
$bn 2009 2010 2011 2012 2013 2014F
Funding need (including short-term debt amortization) 112.7 139.6 192.3 174.7 211.9 213.0
Funding need (excluding short-term debt amortization) 60.1 90.6 115.0 92.9 111.3 83.9
Current account deficit 12.1 45.4 75.1 48.5 65.0 45.4
External debt amortization 46.5 43.8 37.6 40.3 43.2 35.5
Public (excluding scheduled payments to the IMF) 5.2 5.8 4.7 5.2 4.5 6.5
Of which: Eurobonds 1.9 2.6 1.8 2.3 1.5 3.1
Of which: Medium-term loans 3.2 3.2 2.9 2.9 3.0 3.4
Private 41.3 38.0 32.9 35.1 38.8 29.0
Banks 7.6 6.7 6.9 9.4 9.1 8.3
Non-bank corporates 33.7 31.2 26.0 25.8 29.7 20.7
FDI outflows 1.6 1.5 2.3 4.1 3.1 3.0
Short-term debt amortization(1) 52.5 49.0 77.3 81.8 100.6 129.1
Funding sources (including gross short-term borrowing) 112.7 139.6 192.3 174.7 211.9 213.0
FDI inflows 8.6 9.1 16.2 13.2 12.7 12.0
Portfolio investments 4.9 22.2 21.1 40.4 22.6 14.5
Equity 2.8 3.5 -1.0 6.3 0.8 0.5
Local bonds -1.7 10.7 14.8 16.8 4.1 2.0
Eurobonds (government) 3.8 6.7 4.3 7.1 6.1 6.5
Eurobonds (banks and non-bank corporates) 0.0 1.4 3.0 10.2 11.5 5.5
Loans to public sector (non-IMF) 4.8 6.8 5.0 2.8 2.9 3.0
Medium and long-term borrowing by private sector 30.0 33.3 43.3 39.5 48.2 29.8
Banks 6.0 7.6 12.6 9.6 18.6 9.1
Non-bank corporates 24.0 25.7 30.7 29.9 29.6 20.7
Short-term loans 49.0 77.3 81.8 100.6 129.1 142.0
Other(2) 16.1 5.9 26.0 1.0 7.2 3.5
Change in net reserves (- indicates increase) -0.8 -15.0 -1.0 -22.8 -10.8 8.2
Change in gross reserves (- indicates increase) -0.1 -12.8 1.8 -20.8 -9.9 8.2
IMF (net) -0.7 -2.2 -2.8 -2.0 -0.9 0.0
Principal payments to the IMF -0.7 -2.2 -2.8 -2.0 -0.9 0.0
Loans from the IMF 0.0 0.0 0.0 0.0 0.0 0.0
Roll-over ratios: Assumptions
Medium- and long-term debt – Banks 0.78 1.13 1.82 1.03 2.05 1.10
Medium- and long-term debt – Non-bank corporates 0.71 0.82 1.18 1.16 1.00 1.00
Short-term debt 0.93 1.58 1.06 1.23 1.28 1.10
(1) Short-term debt amortizations are based on the debt stock figures from a year ago; they include the non-residents' deposits. (2) All flows that are not specified above, including residents' portfolio and other investments abroad, and net errors/omissions.
Source: Central Bank, Credit Suisse
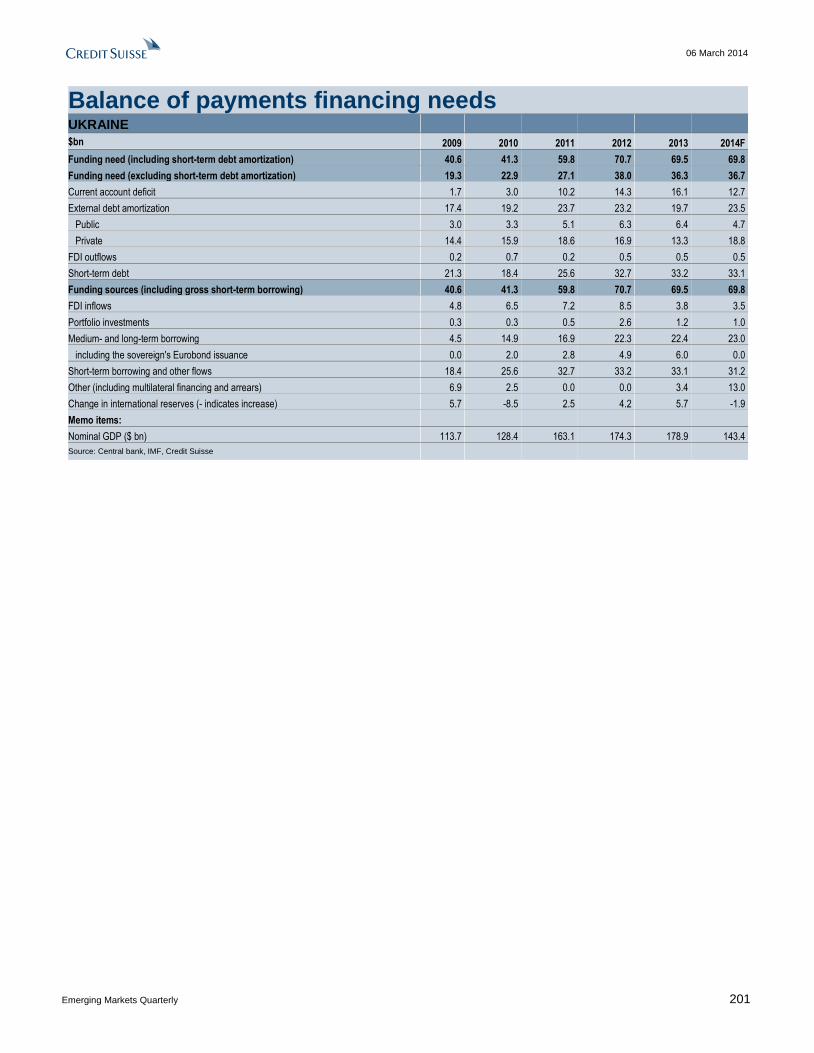
06 March 2014
Emerging Markets Quarterly 201
Balance of payments financing needs UKRAINE
$bn 2009 2010 2011 2012 2013 2014F
Funding need (including short-term debt amortization) 40.6 41.3 59.8 70.7 69.5 69.8
Funding need (excluding short-term debt amortization) 19.3 22.9 27.1 38.0 36.3 36.7
Current account deficit 1.7 3.0 10.2 14.3 16.1 12.7
External debt amortization 17.4 19.2 23.7 23.2 19.7 23.5
Public 3.0 3.3 5.1 6.3 6.4 4.7
Private 14.4 15.9 18.6 16.9 13.3 18.8
FDI outflows 0.2 0.7 0.2 0.5 0.5 0.5
Short-term debt 21.3 18.4 25.6 32.7 33.2 33.1
Funding sources (including gross short-term borrowing) 40.6 41.3 59.8 70.7 69.5 69.8
FDI inflows 4.8 6.5 7.2 8.5 3.8 3.5
Portfolio investments 0.3 0.3 0.5 2.6 1.2 1.0
Medium- and long-term borrowing 4.5 14.9 16.9 22.3 22.4 23.0
including the sovereign's Eurobond issuance 0.0 2.0 2.8 4.9 6.0 0.0
Short-term borrowing and other flows 18.4 25.6 32.7 33.2 33.1 31.2
Other (including multilateral financing and arrears) 6.9 2.5 0.0 0.0 3.4 13.0
Change in international reserves (- indicates increase) 5.7 -8.5 2.5 4.2 5.7 -1.9
Memo items:
Nominal GDP ($ bn) 113.7 128.4 163.1 174.3 178.9 143.4
Source: Central bank, IMF, Credit Suisse

06 March 2014
Emerging Markets Quarterly 202
Balance of payments financing needs EMERGING ASIA
CHINA $bn 2009 2010 2011 2012 2013 2014F
Funding need (including short-term debt amortization) 57.5 113.7 321.1 401.9 462.6 466.1
Funding need (excluding short-term debt amortization) -168.8 -145.5 -54.6 -99.0 -90.3 -133.1
Current account deficit -243.3 -237.8 -136.1 -193.1 -188.1 -233.1
FDI outflows 43.9 58.0 48.4 62.4 67.4 70.9
Medium- and long-term debt amortization 30.6 34.3 33.0 31.7 30.4 29.1
Short-term debt amortization 226.3 259.3 375.7 500.9 552.9 599.2
Funding sources (including gross short-term borrowing) 57.5 113.7 321.1 401.9 462.6 466.1
FDI inflows 131.1 243.7 280.1 253.5 238.2 231.9
Net portfolio inflows 27.1 24.0 19.6 47.8 49.4 43.1
Short term debt borrowing 259.3 375.7 500.9 540.9 577.2 537.9
Medium- and long-term borrowings 36.1 38.2 53.9 33.7 34.9 36.1
Other capital flows / errors and omissions 4.3 -96.1 -145.6 -377.5 -5.7 -159.6
Changes in reserves (- indicates increase) -400.3 -471.7 -387.8 -96.6 -431.4 -223.4
Source: People’s Bank of China, Credit Suisse
HONG KONG $bn 2009 2010 2011 2012 2013 2014F
Funding need (including short-term debt amortization) 518.8 588.6 742.8 806.8 837.4 848.1
Funding need (excluding short-term debt amortization) 47.9 94.5 95.5 91.9 89.6 87.4
Current account deficit -20.3 -14.9 -11.9 -3.5 -6.3 -8.7
FDI outflows 57.9 98.0 95.7 83.5 83.9 84.1
Medium- and long-term debt amortization 10.3 11.4 11.8 11.9 12.2 13.2
Short-term debt amortization 470.9 494.1 647.3 714.9 747.9 760.7
Funding sources (including gross short-term borrowing) 518.8 588.6 742.8 806.8 837.4 848.1
FDI inflows 54.3 82.4 95.9 74.2 74.4 74.6
Net portfolio inflows -40.0 -56.7 -1.4 -1.6 -4.6 -4.4
Short-term loans 497.3 647.3 714.9 747.9 760.7 767.1
Medium- and long-term borrowings 16.5 2.9 39.6 14.6 10.7 14.1
Other capital flows / errors & omissions 69.8 -79.6 -95.1 -3.5 19.7 22.8
Changes in reserves (- indicates increase) -79.0 -7.6 -11.1 -24.8 -23.5 -26.0
Source: Census and Statistics Department, Credit Suisse
INDIA* $bn 2009 2010 2011 2012 2013 2014F
Funding need (including short-term debt amortization) 152.2 171.1 188.9 268.2 214.9 230.5
Funding need (excluding short-term debt amortization) 108.9 118.8 124.0 190.0 118.2 130.5
Current account deficit 38.4 46.0 78.2 87.8 40.2 53.0
FDI outflows 14.4 16.5 10.9 7.1 6.0 7.0
Portfolio outflows 0.0 1.2 0.2 0.9 2.0 0.5
Medium- and long-term debt amortization 53.5 55.1 34.7 94.1 70.0 70.0
Short-term debt at beginning of period 43.3 52.3 64.9 78.2 96.7 100.0
Funding sources (including gross short-term borrowing) 152.2 171.1 188.9 268.2 214.9 230.5
FDI inflows 33.1 25.9 33.0 27.0 27.0 30.0
Portfolio inflows 29.0 29.4 16.8 27.6 5.0 20.0
Medium- and long-term debt disbursements 61.0 67.6 63.0 85.0 91.4 85.0
Short-term borrowing 53.6 75.7 65.0 109.3 80.0 80.0
Other capital inflows -4.0 -9.0 2.4 14.3 12.0 8.0
Errors and omissions 4.3 7.9 -2.4 2.7 2.5 2.5
Change in reserves (- indicates increase) -24.9 -26.4 11.1 2.4 -3.0 5.0
* Years are fiscal years beginning April. For instance 2010 is April 2010 to March 2011.
Source: Reserve Bank of India, Credit Suisse

06 March 2014
Emerging Markets Quarterly 203
Balance of payments financing needs INDONESIA
$bn 2009 2010 2011 2012 2013 2014F
Funding need (including short-term debt amortization) 26.3 41.3 63.4 109.6 109.8 123.8
Funding need (excluding short-term debt amortization) 5.8 17.3 30.3 71.4 65.6 76.4
Current account deficit -10.7 -5.1 -1.7 24.4 27.6 23.4
Medium- and long-term debt amortization 17.1 18.7 26.5 36.4 34.6 42.0
FDI outflows 2.2 2.7 7.7 5.4 3.7 4.0
Portfolio outflows 0.1 2.5 1.2 5.5 1.3 7.0
Short-term debt (original maturity) at beginning of period 20.5 24.0 33.0 38.2 44.3 47.4
Unclassified capital outflows and E&O -3.0 -1.5 -3.4 -0.3 -1.6 0.0
Funding sources (including gross short-term borrowing) 26.3 41.3 63.4 109.6 109.8 123.8
FDI inflows 4.9 13.8 19.2 19.1 18.4 18.0
Portfolio inflows 10.5 15.7 5.0 14.7 11.1 7.0
Portfolio equity inflows 0.8 2.1 -0.3 1.7 -1.8 2.0
Portfolio debt inflows 9.7 13.6 5.3 13.0 13.0 5.0
Loan disbursements 1.9 0.1 3.2 1.2 1.7 2.0
Short-term debt inflows 24.0 25.4 35.0 30.0 50.0 55.0
Other inflows -11.0 0.7 9.8 32.7 4.0 31.2
Change in reserves (- indicates increase) -14.5 -30.1 -13.9 -2.7 13.4 3.6
Memo items:
BI FX reserves, including valuation changes 66.1 96.2 110.1 112.8 99.4 95.8
ST external debt (remaining maturity) 37.6 42.7 59.5 74.6 78.9 89.4
Central bank FX reserves-to-ST external debt (%) 275.0 291.0 288.0 255.0 210.0 174.2
Rollover ratios (ST debt, times)* 1.17 1.06 1.06 0.79 1.13 1.16
*1998-2003 BOP data were based on old classification. Short-term debt figures came from IMF 2008 Article IV Consultation report published September 2008 on Indonesia.
Source: Bank Indonesia, CEIC, Credit Suisse
KOREA
$bn 2009 2010 2011 2012 2013 2014F
Funding need (including short-term debt amortization) 164.8 176.8 168.8 149.0 112.0 116.9
Funding need (excluding short-term debt amortization) 14.9 27.6 29.5 11.7 -14.7 -2.7
Current account deficit -32.8 -29.4 -26.1 -48.1 -70.7 -61.6
FDI outflows 17.2 23.3 21.2 24.6 19.9 21.9
Medium- and long-term debt amortization 30.5 33.7 34.3 35.2 36.1 37.0
Short-term debt amortization 149.9 149.2 139.4 137.4 126.8 119.6
Funding sources (including gross short-term borrowing) 164.8 176.8 168.8 149.0 112.0 116.9
FDI inflows 2.2 1.1 4.8 5.6 6.8 9.8
Net portfolio inflows 49.7 42.5 13.1 6.9 -6.9 -7.9
Short-term loans 153.3 159.2 154.4 147.4 138.0 132.1
Medium- and long-term borrowings 1.3 5.4 11.5 -13.1 -6.5 -8.5
Other capital flows / errors and omissions 26.9 -4.5 -1.1 15.4 -4.9 -0.2
Changes in reserves (- indicates increase) -68.7 -27.0 -14.0 -13.2 -14.5 -8.4
Source: Bank of Korea, Credit Suisse
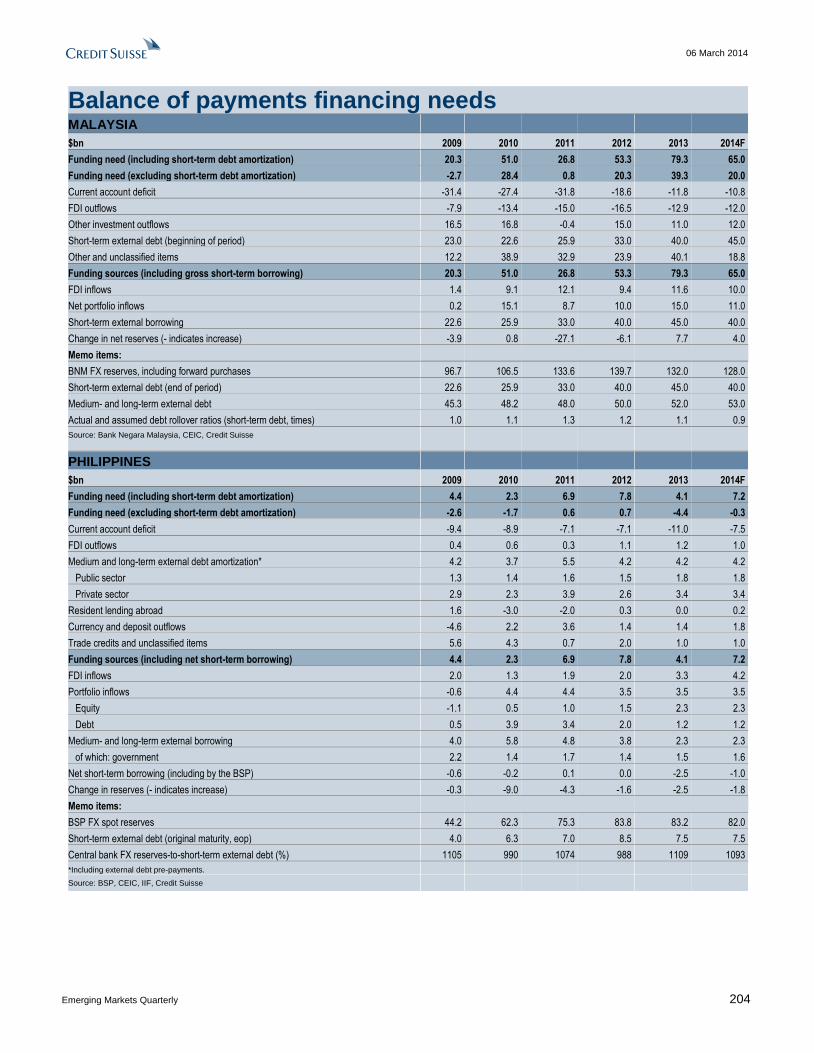
06 March 2014
Emerging Markets Quarterly 204
Balance of payments financing needs MALAYSIA
$bn 2009 2010 2011 2012 2013 2014F
Funding need (including short-term debt amortization) 20.3 51.0 26.8 53.3 79.3 65.0
Funding need (excluding short-term debt amortization) -2.7 28.4 0.8 20.3 39.3 20.0
Current account deficit -31.4 -27.4 -31.8 -18.6 -11.8 -10.8
FDI outflows -7.9 -13.4 -15.0 -16.5 -12.9 -12.0
Other investment outflows 16.5 16.8 -0.4 15.0 11.0 12.0
Short-term external debt (beginning of period) 23.0 22.6 25.9 33.0 40.0 45.0
Other and unclassified items 12.2 38.9 32.9 23.9 40.1 18.8
Funding sources (including gross short-term borrowing) 20.3 51.0 26.8 53.3 79.3 65.0
FDI inflows 1.4 9.1 12.1 9.4 11.6 10.0
Net portfolio inflows 0.2 15.1 8.7 10.0 15.0 11.0
Short-term external borrowing 22.6 25.9 33.0 40.0 45.0 40.0
Change in net reserves (- indicates increase) -3.9 0.8 -27.1 -6.1 7.7 4.0
Memo items:
BNM FX reserves, including forward purchases 96.7 106.5 133.6 139.7 132.0 128.0
Short-term external debt (end of period) 22.6 25.9 33.0 40.0 45.0 40.0
Medium- and long-term external debt 45.3 48.2 48.0 50.0 52.0 53.0
Actual and assumed debt rollover ratios (short-term debt, times) 1.0 1.1 1.3 1.2 1.1 0.9
Source: Bank Negara Malaysia, CEIC, Credit Suisse
PHILIPPINES
$bn 2009 2010 2011 2012 2013 2014F
Funding need (including short-term debt amortization) 4.4 2.3 6.9 7.8 4.1 7.2
Funding need (excluding short-term debt amortization) -2.6 -1.7 0.6 0.7 -4.4 -0.3
Current account deficit -9.4 -8.9 -7.1 -7.1 -11.0 -7.5
FDI outflows 0.4 0.6 0.3 1.1 1.2 1.0
Medium and long-term external debt amortization* 4.2 3.7 5.5 4.2 4.2 4.2
Public sector 1.3 1.4 1.6 1.5 1.8 1.8
Private sector 2.9 2.3 3.9 2.6 3.4 3.4
Resident lending abroad 1.6 -3.0 -2.0 0.3 0.0 0.2
Currency and deposit outflows -4.6 2.2 3.6 1.4 1.4 1.8
Trade credits and unclassified items 5.6 4.3 0.7 2.0 1.0 1.0
Funding sources (including net short-term borrowing) 4.4 2.3 6.9 7.8 4.1 7.2
FDI inflows 2.0 1.3 1.9 2.0 3.3 4.2
Portfolio inflows -0.6 4.4 4.4 3.5 3.5 3.5
Equity -1.1 0.5 1.0 1.5 2.3 2.3
Debt 0.5 3.9 3.4 2.0 1.2 1.2
Medium- and long-term external borrowing 4.0 5.8 4.8 3.8 2.3 2.3
of which: government 2.2 1.4 1.7 1.4 1.5 1.6
Net short-term borrowing (including by the BSP) -0.6 -0.2 0.1 0.0 -2.5 -1.0
Change in reserves (- indicates increase) -0.3 -9.0 -4.3 -1.6 -2.5 -1.8
Memo items:
BSP FX spot reserves 44.2 62.3 75.3 83.8 83.2 82.0
Short-term external debt (original maturity, eop) 4.0 6.3 7.0 8.5 7.5 7.5
Central bank FX reserves-to-short-term external debt (%) 1105 990 1074 988 1109 1093
*Including external debt pre-payments.
Source: BSP, CEIC, IIF, Credit Suisse

06 March 2014
Emerging Markets Quarterly 205
Balance of payments financing needs TAIWAN
$bn 2009 2010 2011 2012 2013 2014F
Funding need (including short-term debt amortization) 41.3 44.7 64.5 77.0 73.5 92.5
Funding need (excluding short-term debt amortization) -37.5 -23.5 -19.2 -30.7 -36.7 -32.6
Current account deficit -42.9 -39.9 -41.7 -50.7 -57.4 -53.8
FDI outflows 5.9 11.6 12.8 13.1 14.3 14.3
Medium- and long-term debt amortization -0.5 4.8 9.7 6.8 6.3 6.8
Short-term debt amortization 78.8 68.2 83.7 107.8 110.2 125.1
Funding sources (including gross short-term borrowing) 41.3 44.7 64.5 77.0 73.5 92.5
FDI inflows 2.8 2.5 -2.0 3.2 4.0 4.0
Net portfolio inflows -10.3 -20.7 -35.7 -42.1 -29.2 -29.2
Short-term loans 84.2 84.2 87.9 119.6 125.1 139.8
Medium- and long-term borrowings 5.4 -0.2 -5.2 -5.1 -7.0 -7.5
Other capital flows / errors and omissions 13.4 19.0 25.6 16.9 -8.1 -1.7
Changes in reserves (- indicates increase) -54.1 -40.2 -6.2 -15.5 -11.3 -13.0
Source: Central Bank of China, Credit Suisse
THAILAND
$bn 2009 2010 2011 2012 2013 2014F
Funding need (including short-term debt amortization) -29.5 5.8 15.3 44.2 44.8 24.1
Funding need (excluding short-term debt amortization) -39.0 -8.6 1.8 26.9 27.1 7.0
Current account deficit -21.9 -10.0 -5.9 -0.2 2.8 -6.8
FDI outflows 4.2 4.6 8.2 12.1 6.0 6.0
Medium- and long-term debt amortization 10.7 9.4 8.9 6.1 6.0 5.5
Government 1.0 0.9 1.3 0.7 1.0 1.5
SOEs and private sector 9.7 8.5 7.6 5.5 5.0 4.0
Short-term external debt (beginning of period) 9.5 14.5 13.5 17.3 17.7 17.1
Resident lending abroad -1.9 5.6 7.7 8.9 8.0 8.0
Currency and deposit outflows 2.0 0.5 -6.4 -4.3 -4.3 -4.3
Trade credits, unclassified items, residual -29.5 -18.7 -10.7 4.2 8.6 -1.4
Funding sources (including gross short-term borrowing) -29.5 5.8 15.3 44.2 44.8 24.1
FDI inflows 4.9 9.1 7.8 10.2 12.5 12.5
Portfolio inflows 2.7 9.1 4.5 13.9 13.0 16.0
Asset (resident flows) 0.0 0.0 0.0 0.0 0.0 0.0
Equity (nonresident flows) 1.7 3.2 0.9 3.6 3.0 4.0
Debt (nonresident flows) 1.0 5.9 3.6 10.3 10.0 12.0
External borrowing (excluding short-term borrowing) -0.8 25.2 6.1 26.6 8.3 -11.6
Government 0.6 -4.4 5.6 5.5 -4.1 2.0
SOEs and private sector -1.4 29.6 0.5 21.1 12.4 -13.6
Short-term external borrowing 33.1 17.5 -3.4 13.4 1.4 -2.0
Change in net reserves (- indicates increase) -36.3 -37.6 -3.0 -6.5 10.9 7.2
Memo items:
BoT FX reserves, including forward purchases 154.1 191.7 194.7 201.2 190.2 183.0
Short-term external debt (end of period) 33.1 50.7 47.3 60.6 62.0 60.0
Total external debt 75.3 100.5 106.6 133.2 141.5 129.9
Government debt 15.4 11.0 16.6 22.1 18.0 20.0
SOEs and private sector 59.9 89.5 90.0 111.1 123.5 109.9
Actual and assumed rollover ratios (medium- and long-term debt) 1.5 1.2 1.3 1.4 1.6 1.6
Actual and assumed rollover ratios (short-term debt) 3.5 3.3 3.0 3.4 3.6 3.6
Source: Bank of Thailand, Credit Suisse

06 March 2014
Emerging Markets Quarterly 206
Government funding needs LATIN AMERICA
ARGENTINA 2011 2012 2013 2014F
$ bn % of GDP $ bn % of GDP $ bn % of GDP $ bn % of GDP
Total borrowing requirements 33.4 7.5 41.9 8.8 45.5 9.4 41.2 11.3
Overall fiscal deficit* 7.4 1.7 12.2 2.6 11.8 2.4 10.6 2.9
Primary fiscal deficit -1.2 -0.3 0.9 0.2 4.1 0.9 2.6 0.7
Interest payments 8.6 1.9 11.3 2.4 7.7 1.6 8.0 2.2
Total amortization payments on medium- and long-term debt 25.9 5.8 29.7 6.3 33.7 7.0 30.6 8.4
Domestic debt 16.9 3.8 21.1 4.4 27.5 5.7 24.9 6.9
External debt 9.0 2.0 8.6 1.8 6.2 1.3 5.7 1.6
Funding sources 33.4 7.5 41.9 8.8 45.5 9.4 41.2 11.3
Central bank FX reserves 7.5 1.7 5.7 1.2 8.0 1.7 9.9 2.7
IFIs 2.1 0.5 2.2 0.5 2.2 0.5 2.3 0.6
International capital markets 0.0 0.0 0.0 0.0 0.0 0.0 0.0 0.0
Debt operations with public sector entities (including roll over) 23.8 5.3 34.0 7.2 35.3 7.3 29.0 8.0
*Federal government
BRAZIL 2011 2012 2013 2014F
$ bn % of GDP $ bn % of GDP $ bn % of GDP $ bn % of GDP
Total borrowing requirements 292.8 11.8 238.4 10.6 280.4 12.5 308.4 14.5
Overall fiscal deficit 64.0 2.6 55.3 2.5 73.3 3.3 91.0 4.3
Primary fiscal deficit -77.8 -3.1 -55.1 -2.4 -42.6 -1.9 -27.2 -1.3
Interest payments 141.8 5.7 110.4 4.9 115.9 5.2 118.2 5.5
Debt amortization 228.8 9.2 183.1 8.1 207.1 9.2 217.4 10.2
Domestic debt 221.4 8.9 179.4 8.0 201.0 9.0 215.0 10.1
External debt 7.4 0.3 3.7 0.2 6.2 0.3 2.4 0.1
Funding sources 292.8 11.8 238.4 10.6 280.4 12.5 308.4 14.5
New privatization proceeds 0.0 0.0 0.0 0.0 0.0 0.0 0.0 0.0
Transfer of privatization proceeds from previous year 0.0 0.0 0.0 0.0 0.0 0.0 0.0 0.0
External bonds 1.7 0.1 3.9 0.2 0.8 0.0 2.5 0.1
IFIs 0.0 0.0 0.0 0.0 0.0 0.0 0.0 0.0
Project finance 0.0 0.0 0.0 0.0 0.0 0.0 0.0 0.0
Domestic debt issuance 291.2 11.8 234.5 10.4 279.6 12.5 305.9 14.4
CHILE 2011 2012 2013 2014F
$ bn % of GDP $ bn % of GDP $ bn % of GDP $ bn % of GDP
Total borrowing requirements -2.9 -1.2 -0.8 -0.3 1.7 0.6 1.6 0.6
Overall fiscal deficit -3.2 -1.3 -1.6 -0.6 1.7 0.6 0.8 0.3
Primary fiscal deficit -4.5 -1.8 -2.9 -1.1 0.0 0.0 -0.8 -0.3
Interest payments 1.2 0.5 1.3 0.5 1.7 0.6 1.6 0.6
Debt amortization 0.3 0.1 0.8 0.3 0.0 0.0 0.8 0.3
Domestic debt 0.2 0.1 0.0 0.0 0.0 0.0 0.8 0.3
External debt 0.1 0.0 0.8 0.3 0.0 0.0 0.0 0.0
Funding sources -3.0 -1.2 -0.8 -0.3 1.7 0.6 1.6 0.6
Domestic -5.0 -2.0 0.0 0.0 1.7 0.6 0.6 0.2
External* 2.0 0.8 -0.8 -0.3 0.0 0.0 1.0 0.4
*Includes resources from the Economic and Social Stabilization Fund and debt placements.
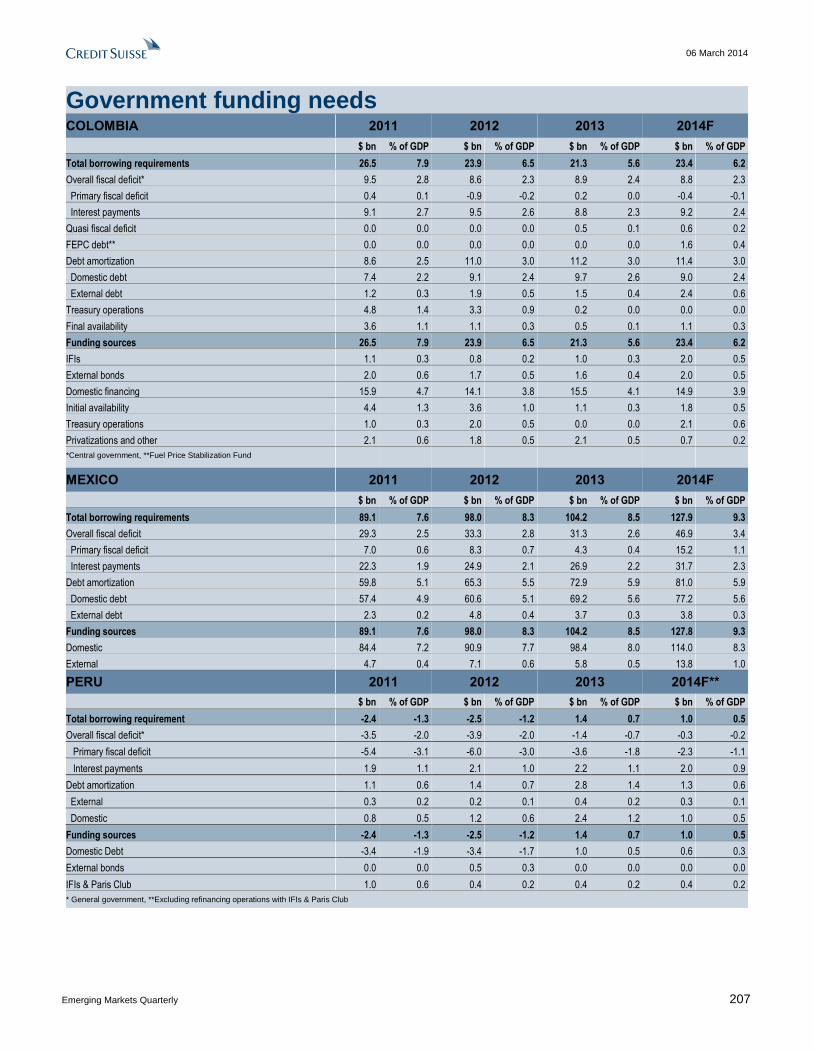
06 March 2014
Emerging Markets Quarterly 207
Government funding needs COLOMBIA 2011 2012 2013 2014F
$ bn % of GDP $ bn % of GDP $ bn % of GDP $ bn % of GDP
Total borrowing requirements 26.5 7.9 23.9 6.5 21.3 5.6 23.4 6.2
Overall fiscal deficit* 9.5 2.8 8.6 2.3 8.9 2.4 8.8 2.3
Primary fiscal deficit 0.4 0.1 -0.9 -0.2 0.2 0.0 -0.4 -0.1
Interest payments 9.1 2.7 9.5 2.6 8.8 2.3 9.2 2.4
Quasi fiscal deficit 0.0 0.0 0.0 0.0 0.5 0.1 0.6 0.2
FEPC debt** 0.0 0.0 0.0 0.0 0.0 0.0 1.6 0.4
Debt amortization 8.6 2.5 11.0 3.0 11.2 3.0 11.4 3.0
Domestic debt 7.4 2.2 9.1 2.4 9.7 2.6 9.0 2.4
External debt 1.2 0.3 1.9 0.5 1.5 0.4 2.4 0.6
Treasury operations 4.8 1.4 3.3 0.9 0.2 0.0 0.0 0.0
Final availability 3.6 1.1 1.1 0.3 0.5 0.1 1.1 0.3
Funding sources 26.5 7.9 23.9 6.5 21.3 5.6 23.4 6.2
IFIs 1.1 0.3 0.8 0.2 1.0 0.3 2.0 0.5
External bonds 2.0 0.6 1.7 0.5 1.6 0.4 2.0 0.5
Domestic financing 15.9 4.7 14.1 3.8 15.5 4.1 14.9 3.9
Initial availability 4.4 1.3 3.6 1.0 1.1 0.3 1.8 0.5
Treasury operations 1.0 0.3 2.0 0.5 0.0 0.0 2.1 0.6
Privatizations and other 2.1 0.6 1.8 0.5 2.1 0.5 0.7 0.2
*Central government, **Fuel Price Stabilization Fund
MEXICO 2011 2012 2013 2014F
$ bn % of GDP $ bn % of GDP $ bn % of GDP $ bn % of GDP
Total borrowing requirements 89.1 7.6 98.0 8.3 104.2 8.5 127.9 9.3
Overall fiscal deficit 29.3 2.5 33.3 2.8 31.3 2.6 46.9 3.4
Primary fiscal deficit 7.0 0.6 8.3 0.7 4.3 0.4 15.2 1.1
Interest payments 22.3 1.9 24.9 2.1 26.9 2.2 31.7 2.3
Debt amortization 59.8 5.1 65.3 5.5 72.9 5.9 81.0 5.9
Domestic debt 57.4 4.9 60.6 5.1 69.2 5.6 77.2 5.6
External debt 2.3 0.2 4.8 0.4 3.7 0.3 3.8 0.3
Funding sources 89.1 7.6 98.0 8.3 104.2 8.5 127.8 9.3
Domestic 84.4 7.2 90.9 7.7 98.4 8.0 114.0 8.3
External 4.7 0.4 7.1 0.6 5.8 0.5 13.8 1.0
PERU 2011 2012 2013 2014F**
$ bn % of GDP $ bn % of GDP $ bn % of GDP $ bn % of GDP
Total borrowing requirement -2.4 -1.3 -2.5 -1.2 1.4 0.7 1.0 0.5
Overall fiscal deficit* -3.5 -2.0 -3.9 -2.0 -1.4 -0.7 -0.3 -0.2
Primary fiscal deficit -5.4 -3.1 -6.0 -3.0 -3.6 -1.8 -2.3 -1.1
Interest payments 1.9 1.1 2.1 1.0 2.2 1.1 2.0 0.9
Debt amortization 1.1 0.6 1.4 0.7 2.8 1.4 1.3 0.6
External 0.3 0.2 0.2 0.1 0.4 0.2 0.3 0.1
Domestic 0.8 0.5 1.2 0.6 2.4 1.2 1.0 0.5
Funding sources -2.4 -1.3 -2.5 -1.2 1.4 0.7 1.0 0.5
Domestic Debt -3.4 -1.9 -3.4 -1.7 1.0 0.5 0.6 0.3
External bonds 0.0 0.0 0.5 0.3 0.0 0.0 0.0 0.0
IFIs & Paris Club 1.0 0.6 0.4 0.2 0.4 0.2 0.4 0.2
* General government, **Excluding refinancing operations with IFIs & Paris Club
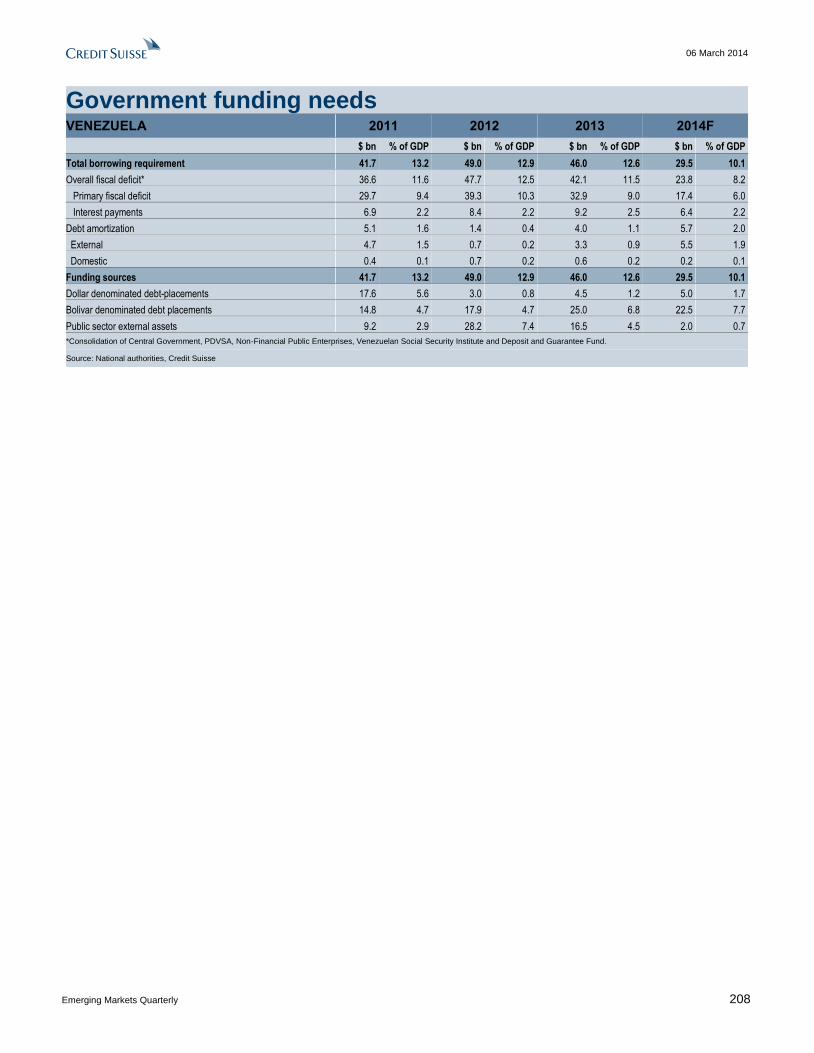
06 March 2014
Emerging Markets Quarterly 208
Government funding needs VENEZUELA 2011 2012 2013 2014F
$ bn % of GDP $ bn % of GDP $ bn % of GDP $ bn % of GDP
Total borrowing requirement 41.7 13.2 49.0 12.9 46.0 12.6 29.5 10.1
Overall fiscal deficit* 36.6 11.6 47.7 12.5 42.1 11.5 23.8 8.2
Primary fiscal deficit 29.7 9.4 39.3 10.3 32.9 9.0 17.4 6.0
Interest payments 6.9 2.2 8.4 2.2 9.2 2.5 6.4 2.2
Debt amortization 5.1 1.6 1.4 0.4 4.0 1.1 5.7 2.0
External 4.7 1.5 0.7 0.2 3.3 0.9 5.5 1.9
Domestic 0.4 0.1 0.7 0.2 0.6 0.2 0.2 0.1
Funding sources 41.7 13.2 49.0 12.9 46.0 12.6 29.5 10.1
Dollar denominated debt-placements 17.6 5.6 3.0 0.8 4.5 1.2 5.0 1.7
Bolivar denominated debt placements 14.8 4.7 17.9 4.7 25.0 6.8 22.5 7.7
Public sector external assets 9.2 2.9 28.2 7.4 16.5 4.5 2.0 0.7
*Consolidation of Central Government, PDVSA, Non-Financial Public Enterprises, Venezuelan Social Security Institute and Deposit and Guarantee Fund.
Source: National authorities, Credit Suisse

06 March 2014
Emerging Markets Quarterly 209
Government funding needs EASTERN EUROPE, MIDDLE EAST & AFRICA
CZECH REPUBLIC 2011 2012 2013 2014F
$ bn % of GDP $ bn % of GDP $ bn % of GDP $ bn % of GDP
Total borrowing requirements 18.8 8.7 23.3 11.9 21.4 10.7 19.3 9.8
General government budget deficit ESA95 6.9 3.2 8.6 4.4 5.4 2.7 5.9 3.0
Primary deficit 3.9 1.8 5.7 2.9 2.4 1.2 3.0 1.5
Interest payments 3.0 1.4 2.9 1.5 3.0 1.5 3.0 1.5
Debt amortization 5.8 2.7 6.4 3.3 6.0 3.0 7.3 3.7
CZK-denominated bonds (incl. retail securities) 5.8 2.7 6.4 3.3 6.0 3.0 7.3 3.7
FX-denominated debt 0.0 0.0 0.0 0.0 0.0 0.0 0.0 0.0
Stock of T-bills at the beginning of the period 6.1 2.8 8.3 4.2 10.0 5.0 6.1 3.1
Funding sources 18.8 8.7 23.3 11.9 21.4 10.7 19.3 9.8
Bond issuance 11.5 5.3 14.1 7.2 9.5 4.8 14.0 7.1
CZK-denominated bonds (incl. retail securities) 11.4 5.3 10.6 5.4 9.5 4.8 11.0 5.6
FX-denominated bonds 0.1 0.0 3.5 1.8 0.0 0.0 3.0 1.5
Stock of T-bills at the end of the period 8.3 3.8 10.0 5.1 6.1 3.1 6.0 3.0
Other international financing (incl. EIB loans) 0.2 0.1 0.0 0.0 0.1 0.1 0.0 0.0
Change in government cash reserves (- indicates increase) 2.4 1.1 -2.7 -1.4 5.0 2.5 -0.7 -0.3
Other sources / change in public assets (- indicates increase) -3.6 -1.7 1.9 1.0 0.7 0.3 0.0 0.0
Memo item:
GDP ($bn) 216.3 196.4 199.5 197.6
HUNGARY 2011 2012 2013 2014F
$ bn % of GDP $ bn % of GDP $ bn % of GDP $ bn % of GDP
Total borrowing requirements* 27.1 19.7 19.3 15.5 33.4 24.0 32.2 23.1
General government budget deficit** 7.7 5.6 2.5 2.0 3.3 2.4 5.6 4.0
Primary deficit (- indicates surplus) 1.9 1.4 -2.7 -2.2 -2.5 -1.8 -0.3 -0.2
Interest payments 5.8 4.2 5.2 4.2 5.8 4.2 5.9 4.2
Debt amortization and redemptions 11.4 8.3 10.1 8.1 21.1 15.2 17.5 12.5
HUF-denominated bonds (incl. retail securities) 5.9 4.3 4.0 3.2 11.3 8.1 10.4 7.4
FX-denominated debt (incl. EU/IMF repayment) 5.5 4.0 6.1 4.9 9.8 7.0 7.1 5.1
Stock of T-bills at the beginning of the period 8.0 5.8 6.7 5.4 9.0 6.5 9.1 6.5
Funds used for asset purchases 2.6 1.9 na na na na na na
Additional debt reduction due to pension reform 6.8 5.0 na na na na na na
Funding sources 36.5 26.6 19.3 15.5 33.4 24.0 32.2 23.1
Bond issuance 15.3 11.1 9.7 7.8 23.9 17.2 20.0 14.3
HUF-denominated bonds (incl. retail securities) 9.5 6.9 9.7 7.8 15.1 10.9 15.0 10.7
FX-denominated bonds (incl. on domestic market) 5.8 4.2 0.0 0.0 8.8 6.3 5.0 3.6
Stock of T-bills at the end of the period 6.7 4.9 9.0 7.2 9.1 6.5 10.0 7.2
Other international financing (incl. IFI loans) 0.0 0.0 0.0 0.0 1.0 0.7 1.0 0.7
Change in government cash reserves (- indicates increase) -0.6 -0.4 -0.5 -0.4 2.8 2.0 1.0 0.7
Other sources / change in public assets (- indicates increase) 0.5 0.4 1.1 0.9 -3.4 -2.4 0.2 0.1
Transfers from private pension funds 14.7 10.7 na na na na na na
Memo item:
GDP ($bn) 137.5 124.6 139.1 139.6
*Excluding additional debt reduction due to pension reform; **Excluding one-off transfers from pension funds to the government.

06 March 2014
Emerging Markets Quarterly 210
Government funding needs ISRAEL 2011 2012 2013 2014F
$ bn % of GDP $ bn % of GDP $ bn % of GDP $ bn % of GDP
Total borrowing requirements 30.1 11.6 31.7 12.3 27.7 9.5 28.5 9.1
Overall fiscal deficit 8.0 3.1 10.1 3.9 9.1 3.1 9.4 3.0
Primary fiscal deficit -4.5 -1.7 -2.1 -0.8 -4.1 -1.4 -4.4 -1.4
Interest payments* 12.5 4.8 12.2 4.7 13.2 4.5 13.8 4.4
Debt amortization 22.1 8.5 21.6 8.4 18.6 6.4 19.1 6.1
Domestic 20.7 8.0 18.2 7.1 15.2 5.2 17.9 5.7
External 1.4 0.5 3.4 1.3 3.4 1.2 1.1 0.4
Funding sources 30.1 11.6 31.7 12.3 27.7 9.5 28.5 9.1
Bond issuance 25.6 9.9 32.4 12.6 32.7 11.2 30.1 9.5
Domestic 24.1 9.3 29.4 11.4 29.2 10.0 29.0 9.2
External 1.5 0.6 3.0 1.2 3.5 1.2 1.1 0.3
Privatization 2.0 0.8 0.2 0.1 0.3 0.1 0.9 0.3
Other domestic financing 1.4 0.6 -0.1 0.0 -3.3 -1.1 -2.4 -0.8
Change in cash reserves** (- indicates increase) 1.1 0.4 -0.8 -0.3 -1.9 -0.7 0.0 0.0
Memo item:
GDP ($bn) 258.2 257.6 291.7 314.9
*Including repayment of loans to National Insurance Institute.**Positive/negative number indicates a decline/increase in the government’s cash reserves.
POLAND 2011 2012 2013 2014F
$ bn % of GDP $ bn % of GDP $ bn % of GDP $ bn % of GDP
Total borrowing requirements* 62.2 12.1 55.5 11.3 56.2 10.5 47.5 8.5
General government budget deficit** 25.8 5.0 19.1 3.9 23.5 4.4 22.2 4.0
Primary deficit 11.9 2.3 5.4 1.1 9.6 1.8 7.8 1.4
Interest payments 13.9 2.7 13.7 2.8 13.9 2.6 14.5 2.6
Debt amortization 27.0 5.2 32.9 6.7 30.7 5.8 25.3 4.5
PLN-denominated bonds 25.0 4.8 28.5 5.8 25.6 4.8 19.3 3.5
FX-denominated debt (incl. IFI loan repayments) 2.0 0.4 4.4 0.9 5.1 1.0 6.0 1.1
Stock of T-bills at the beginning of the period 9.4 1.8 3.5 0.7 2.0 0.4 0.0 0.0
Additional debt reduction due to pension reform na na na na na na 42.5 7.6
Funding sources 62.2 12.1 55.5 11.3 56.2 10.5 90.1 16.2
Bond issuance 43.2 8.4 53.6 10.9 43.2 8.1 45.0 8.1
PLN-denominated bonds 36.3 7.0 42.6 8.7 39.9 7.5 40.0 7.2
FX-denominated bonds 6.9 1.3 11.0 2.2 3.3 0.6 5.0 0.9
Stock of T-bills at the end of the period 3.5 0.7 2.0 0.4 0.0 0.0 0.0 0.0
Other international financing (incl. IFI loans) 3.1 0.6 1.5 0.3 3.6 0.7 0.0 0.0
Change in government cash reserves (- indicates increase) -5.6 -1.1 -3.0 -0.6 5.2 1.0 -2.5 -0.4
Other sources / change in public assets (- indicates increase) 18.0 3.5 1.4 0.3 4.2 0.8 -2.5 -0.5
Transfers from private pension funds na na na na na na 50.1 9.0
Memo item:
GDP ($bn) 515.8 489.9 533.9 556.2
*Excluding additional debt reduction due to pension reform; **Excluding one-off transfers from pension funds to the government.
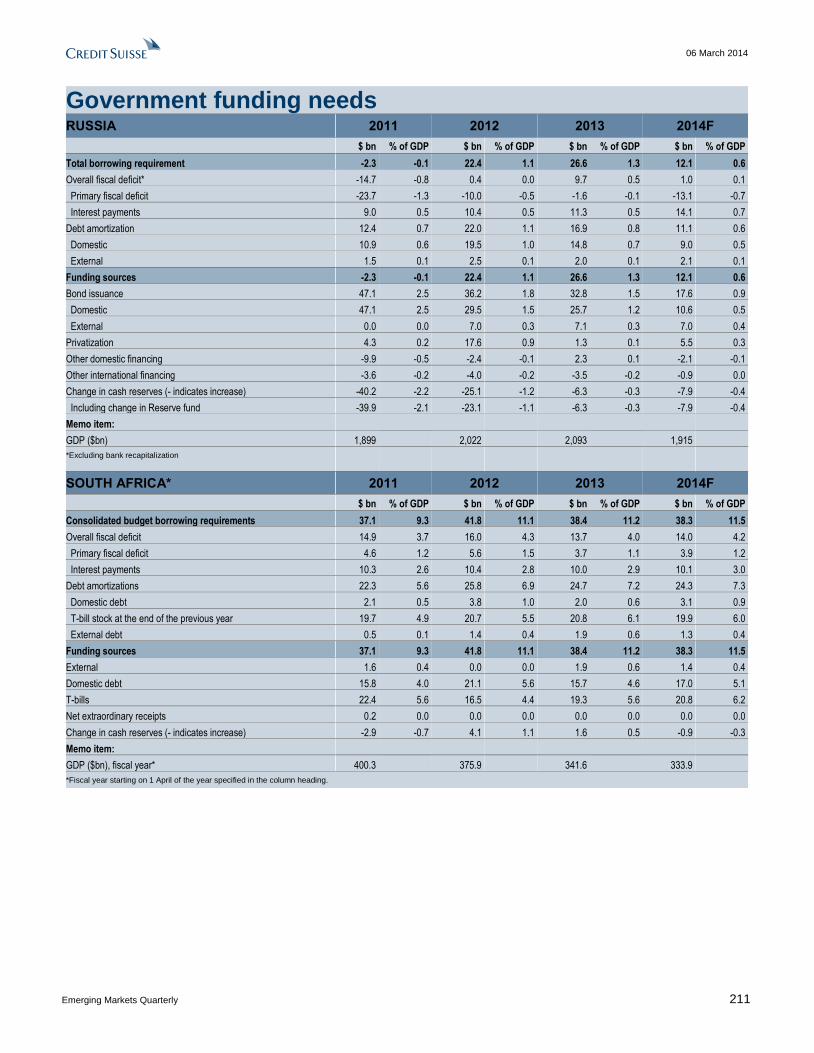
06 March 2014
Emerging Markets Quarterly 211
Government funding needs RUSSIA 2011 2012 2013 2014F
$ bn % of GDP $ bn % of GDP $ bn % of GDP $ bn % of GDP
Total borrowing requirement -2.3 -0.1 22.4 1.1 26.6 1.3 12.1 0.6
Overall fiscal deficit* -14.7 -0.8 0.4 0.0 9.7 0.5 1.0 0.1
Primary fiscal deficit -23.7 -1.3 -10.0 -0.5 -1.6 -0.1 -13.1 -0.7
Interest payments 9.0 0.5 10.4 0.5 11.3 0.5 14.1 0.7
Debt amortization 12.4 0.7 22.0 1.1 16.9 0.8 11.1 0.6
Domestic 10.9 0.6 19.5 1.0 14.8 0.7 9.0 0.5
External 1.5 0.1 2.5 0.1 2.0 0.1 2.1 0.1
Funding sources -2.3 -0.1 22.4 1.1 26.6 1.3 12.1 0.6
Bond issuance 47.1 2.5 36.2 1.8 32.8 1.5 17.6 0.9
Domestic 47.1 2.5 29.5 1.5 25.7 1.2 10.6 0.5
External 0.0 0.0 7.0 0.3 7.1 0.3 7.0 0.4
Privatization 4.3 0.2 17.6 0.9 1.3 0.1 5.5 0.3
Other domestic financing -9.9 -0.5 -2.4 -0.1 2.3 0.1 -2.1 -0.1
Other international financing -3.6 -0.2 -4.0 -0.2 -3.5 -0.2 -0.9 0.0
Change in cash reserves (- indicates increase) -40.2 -2.2 -25.1 -1.2 -6.3 -0.3 -7.9 -0.4
Including change in Reserve fund -39.9 -2.1 -23.1 -1.1 -6.3 -0.3 -7.9 -0.4
Memo item:
GDP ($bn) 1,899 2,022 2,093 1,915
*Excluding bank recapitalization
SOUTH AFRICA* 2011 2012 2013 2014F
$ bn % of GDP $ bn % of GDP $ bn % of GDP $ bn % of GDP
Consolidated budget borrowing requirements 37.1 9.3 41.8 11.1 38.4 11.2 38.3 11.5
Overall fiscal deficit 14.9 3.7 16.0 4.3 13.7 4.0 14.0 4.2
Primary fiscal deficit 4.6 1.2 5.6 1.5 3.7 1.1 3.9 1.2
Interest payments 10.3 2.6 10.4 2.8 10.0 2.9 10.1 3.0
Debt amortizations 22.3 5.6 25.8 6.9 24.7 7.2 24.3 7.3
Domestic debt 2.1 0.5 3.8 1.0 2.0 0.6 3.1 0.9
T-bill stock at the end of the previous year 19.7 4.9 20.7 5.5 20.8 6.1 19.9 6.0
External debt 0.5 0.1 1.4 0.4 1.9 0.6 1.3 0.4
Funding sources 37.1 9.3 41.8 11.1 38.4 11.2 38.3 11.5
External 1.6 0.4 0.0 0.0 1.9 0.6 1.4 0.4
Domestic debt 15.8 4.0 21.1 5.6 15.7 4.6 17.0 5.1
T-bills 22.4 5.6 16.5 4.4 19.3 5.6 20.8 6.2
Net extraordinary receipts 0.2 0.0 0.0 0.0 0.0 0.0 0.0 0.0
Change in cash reserves (- indicates increase) -2.9 -0.7 4.1 1.1 1.6 0.5 -0.9 -0.3
Memo item:
GDP ($bn), fiscal year* 400.3 375.9 341.6 333.9
*Fiscal year starting on 1 April of the year specified in the column heading.

06 March 2014
Emerging Markets Quarterly 212
Government funding needs TURKEY 2011 2012 2013 2014F
$ bn % of GDP $ bn % of GDP $ bn % of GDP $ bn % of GDP
Total borrowing requirement 80.8 10.4 77.9 9.9 90.9 10.8 80.0 10.0
Overall fiscal deficit* 15.8 2.0 24.4 3.1 19.0 2.3 21.5 2.7
Primary fiscal deficit -10.0 -1.3 -2.6 -0.3 -7.3 -0.9 -3.4 -0.4
Interest payments 25.7 3.3 27.0 3.4 26.3 3.1 24.9 3.1
Debt amortization 59.3 7.6 53.5 6.8 70.0 8.3 58.5 7.4
Government bonds 52.5 6.8 46.9 5.9 65.4 7.8 53.3 6.7
External debt 6.9 0.9 6.6 0.8 4.5 0.5 5.2 0.7
Stock of T-bills at the beginning of the period 5.7 0.7 0.0 0.0 1.9 0.2 0.0 0.0
Funding sources 80.8 10.4 77.9 9.9 90.9 10.8 80.0 10.0
Bond issuance 71.6 9.2 61.7 7.8 80.4 9.6 69.9 8.8
Domestic 67.3 8.7 54.6 6.9 74.3 8.9 63.4 8.0
External 4.3 0.6 7.1 0.9 6.1 0.7 6.5 0.8
T-bill issuance 0.0 0.0 2.1 0.3 0.0 0.0 0.0 0.0
Other domestic financing 9.7 1.3 11.9 1.5 14.8 1.8 10.0 1.2
Other international financing 1.3 0.2 0.5 0.1 1.0 0.1 0.2 0.0
Change in cash reserves (- indicates increase) -1.8 -0.2 1.8 0.2 -5.2 -0.6 0.0 0.0
Memo item:
GDP ($bn) 777.1 789.8 838.8 796.4
* The difference between the overall fiscal deficit figures here and the central government budget deficit figures presented in the Selected Economic Indicators table for Turkey is due to interest revenues. The government's interest revenues are included in other financing in this presentation.
UKRAINE 2011 2012 2013 2014F
$ bn % of GDP $ bn % of GDP $ bn % of GDP $ bn % of GDP
Total borrowing requirement 12.6 7.7 17.1 9.8 18.2 10.2 12.8 8.9
Overall fiscal deficit* 4.4 2.7 6.4 3.7 7.5 4.3 5.1 3.5
Primary fiscal deficit 1.5 0.9 3.3 1.9 4.5 2.5 2.2 1.5
Interest payments 2.9 1.8 3.1 1.8 3.1 1.7 2.9 2.0
Total amortization payments 5.7 3.5 7.2 4.1 8.7 4.9 6.2 4.3
Domestic debt 4.0 2.4 3.7 2.1 4.0 2.2 2.7 1.9
External debt** 1.7 1.0 3.5 2.0 4.7 2.6 3.6 2.5
Naftogaz operational deficit 2.5 1.5 3.5 2.0 2.0 1.1 1.5 1.0
Funding sources 12.6 7.7 17.1 9.8 18.2 10.2 12.8 8.9
External 3.4 2.1 4.9 2.8 6.0 3.4 3.6 2.5
Domestic financing sources, of which 7.7 4.7 11.0 6.3 11.7 6.5 5.8 4.0
Gross domestic borrowing 7.9 4.8 10.0 6.5 10.9 6.1 5.8 4.0
Drawdowns on fiscal deposits -0.2 -0.1 1.0 0.6 0.8 0.4 -0.1 -0.1
Privatization 1.4 0.9 1.2 0.7 0.5 0.3 1.2 0.8
Memo item:
GDP ($bn) 163.1 174.3 178.9 143.4
*Excluding bank recapitalization costs. **Net of central bank's repayments to the IMF.

06 March 2014
Emerging Markets Quarterly 213
Government funding needs NON-JAPAN ASIA
CHINA 2011 2012 2013 2014F
$ bn % of GDP $ bn % of GDP $ bn % of GDP $ bn % of GDP
Total borrowing requirement 478.1 6.6 541.7 6.6 616.4 6.7 674.8 6.7
Overall fiscal deficit 80.0 1.1 127.2 1.5 188.6 2.0 173.4 1.7
Primary fiscal deficit 28.7 0.4 68.8 0.8 129.9 1.4 103.8 1.0
Interest payments 51.3 0.7 58.4 0.7 58.6 0.6 69.5 0.7
Debt amortization 398.0 5.5 414.5 5.0 427.8 4.6 501.4 5.0
Domestic 397.8 5.5 414.1 5.0 427.4 4.6 501.0 5.0
External 0.3 0.0 0.3 0.0 0.4 0.0 0.4 0.0
Funding sources 478.1 6.6 541.7 6.6 616.4 6.7 674.8 6.7
Domestic 478.1 6.6 541.7 6.6 616.4 6.7 674.8 6.7
Memo items:
GDP ($bn) 7,295.0 8,260.0 9,246.5 10,048.9
Average exchange rate (USDCNY) 6.5 6.3 6.2 6.1
HONG KONG 2011 2012 2013 2014F
$ bn % of GDP $ bn % of GDP $ bn % of GDP $ bn % of GDP
Total borrowing requirement -9.3 -3.7 -8.1 -3.1 -1.5 -0.6 -2.4 -0.8
Overall fiscal deficit -9.4 -3.8 -8.3 -3.2 -1.5 -0.6 -2.4 -0.8
Primary fiscal deficit -9.5 -3.8 -8.4 -3.2 -1.6 -0.6 -2.5 -0.9
Interest payments 0.1 0.0 0.1 0.0 0.1 0.0 0.1 0.0
Debt amortization 0.0 0.0 0.0 0.0 0.0 0.0 0.0 0.0
Domestic 0.0 0.0 0.0 0.0 0.0 0.0 0.0 0.0
External 0.0 0.0 0.0 0.0 0.0 0.0 0.0 0.0
Government bond program 0.2 0.1 0.2 0.1 0.0 0.0 0.0 0.0
Funding sources -9.3 -3.7 -8.1 -3.1 -1.5 -0.6 -2.4 -0.8
Drawdown on fiscal reserves -9.4 -3.8 -8.3 -3.2 -1.5 -0.6 -2.4 -0.8
Domestic debt issuance 0.2 0.1 0.2 0.1 0.0 0.0 0.0 0.0
Memo items:
Fiscal reserves (year-end, $bn) 84.3 92.7 94.2 96.6
GDP ($bn) 248.0 261.2 272.1 287.4
Average exchange rate (USDHKD) 7.8 7.8 7.8 7.8
INDIA* 2011 2012 2013 2014F
$ bn % of GDP $ bn % of GDP $ bn % of GDP $ bn % of GDP
Total borrowing requirements 207.0 11.0 190.0 10.3 193.0 10.3 205.0 10.1
General Government fiscal deficit (incl. disinvestment proceeds) 152.0 8.1 132.4 7.2 132.7 7.1 146.7 7.2
o/w Central government fiscal deficit (incl. disinvestment proceeds) 107.0 5.7 89.3 4.8 86.0 4.6 95.8 4.7
Primary fiscal balance 49.2 2.6 32.4 1.8 29.9 1.6 32.6 1.6
Interest payments 58.0 3.1 56.9 3.1 56.1 3.0 63.2 3.1
Debt amortization 55.0 2.9 57.6 3.1 60.3 3.2 58.3 2.9
Funding sources 207.0 11.0 190.0 10.3 193.0 10.3 205.0 10.1
Domestic 197.0 10.5 175.0 9.5 180.0 9.6 185.0 9.1
Debt issuance 172.0 9.2 160.0 8.7 165.0 8.8 170.0 8.3
Others(1) 25.0 1.3 15.0 0.8 15.0 0.8 15.0 0.7
Foreign Borrowings(2) 10.0 0.5 15.0 0.8 13.0 0.7 20.0 1.0
Memo items:
GDP ($bn) 1876 1844 1869 2038
Average exchange rate (USDINR) 47.9 54.4 60.5 63.3
Disinvestment proceeds(3) 0.8 0.0 6.0 0.3 4.0 0.2 4.0 0.2
* Fiscal year beginning April. For instance, 2010 is April 2010 to March 2011. (1) 'Others' includes small savings, state provident funds and changes in cash. (2) Foreign borrowings are net of repayments. (3) The central government has decided to include proceeds from disinvestments as revenue in calculating the fiscal deficit. Proceeds are to be used to fund certain social sector schemes that lead to capital formation. This is effective from 2009.
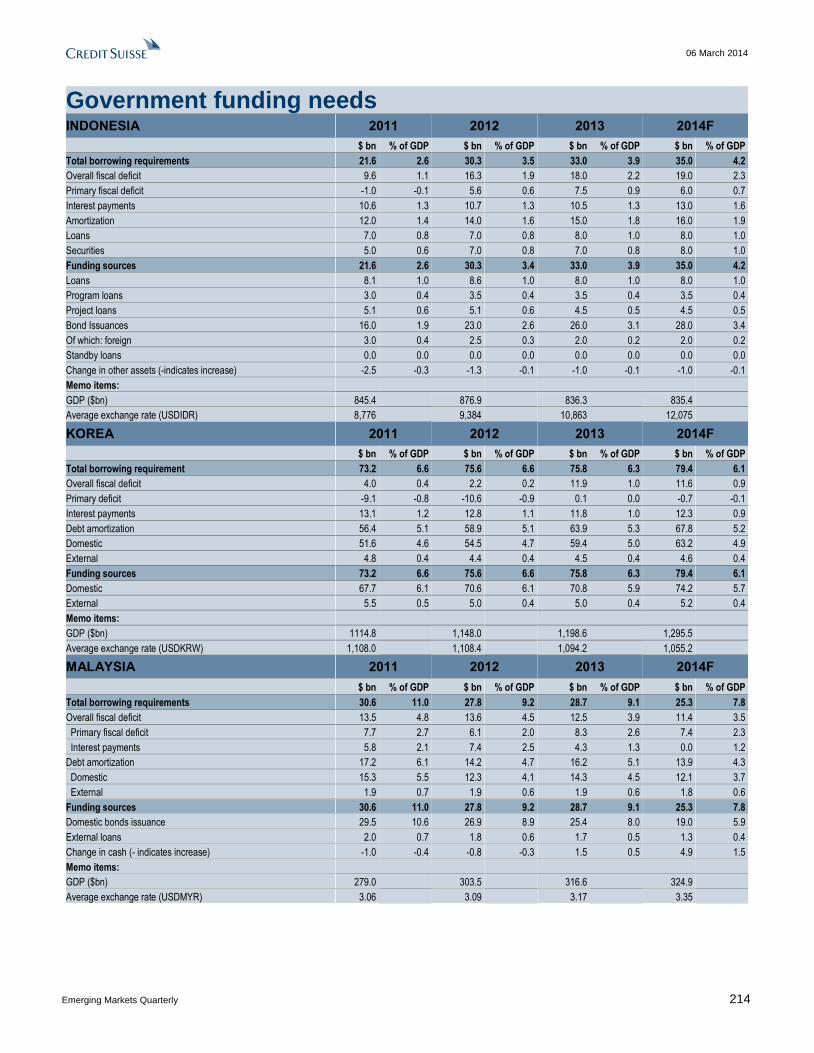
06 March 2014
Emerging Markets Quarterly 214
Government funding needs INDONESIA 2011 2012 2013 2014F
$ bn % of GDP $ bn % of GDP $ bn % of GDP $ bn % of GDP
Total borrowing requirements 21.6 2.6 30.3 3.5 33.0 3.9 35.0 4.2
Overall fiscal deficit 9.6 1.1 16.3 1.9 18.0 2.2 19.0 2.3
Primary fiscal deficit -1.0 -0.1 5.6 0.6 7.5 0.9 6.0 0.7
Interest payments 10.6 1.3 10.7 1.3 10.5 1.3 13.0 1.6
Amortization 12.0 1.4 14.0 1.6 15.0 1.8 16.0 1.9
Loans 7.0 0.8 7.0 0.8 8.0 1.0 8.0 1.0
Securities 5.0 0.6 7.0 0.8 7.0 0.8 8.0 1.0
Funding sources 21.6 2.6 30.3 3.4 33.0 3.9 35.0 4.2
Loans 8.1 1.0 8.6 1.0 8.0 1.0 8.0 1.0
Program loans 3.0 0.4 3.5 0.4 3.5 0.4 3.5 0.4
Project loans 5.1 0.6 5.1 0.6 4.5 0.5 4.5 0.5
Bond Issuances 16.0 1.9 23.0 2.6 26.0 3.1 28.0 3.4
Of which: foreign 3.0 0.4 2.5 0.3 2.0 0.2 2.0 0.2
Standby loans 0.0 0.0 0.0 0.0 0.0 0.0 0.0 0.0
Change in other assets (-indicates increase) -2.5 -0.3 -1.3 -0.1 -1.0 -0.1 -1.0 -0.1
Memo items:
GDP ($bn) 845.4 876.9 836.3 835.4
Average exchange rate (USDIDR) 8,776 9,384 10,863 12,075
KOREA 2011 2012 2013 2014F
$ bn % of GDP $ bn % of GDP $ bn % of GDP $ bn % of GDP
Total borrowing requirement 73.2 6.6 75.6 6.6 75.8 6.3 79.4 6.1
Overall fiscal deficit 4.0 0.4 2.2 0.2 11.9 1.0 11.6 0.9
Primary deficit -9.1 -0.8 -10.6 -0.9 0.1 0.0 -0.7 -0.1
Interest payments 13.1 1.2 12.8 1.1 11.8 1.0 12.3 0.9
Debt amortization 56.4 5.1 58.9 5.1 63.9 5.3 67.8 5.2
Domestic 51.6 4.6 54.5 4.7 59.4 5.0 63.2 4.9
External 4.8 0.4 4.4 0.4 4.5 0.4 4.6 0.4
Funding sources 73.2 6.6 75.6 6.6 75.8 6.3 79.4 6.1
Domestic 67.7 6.1 70.6 6.1 70.8 5.9 74.2 5.7
External 5.5 0.5 5.0 0.4 5.0 0.4 5.2 0.4
Memo items:
GDP ($bn) 1114.8 1,148.0 1,198.6 1,295.5
Average exchange rate (USDKRW) 1,108.0 1,108.4 1,094.2 1,055.2
MALAYSIA 2011 2012 2013 2014F
$ bn % of GDP $ bn % of GDP $ bn % of GDP $ bn % of GDP
Total borrowing requirements 30.6 11.0 27.8 9.2 28.7 9.1 25.3 7.8
Overall fiscal deficit 13.5 4.8 13.6 4.5 12.5 3.9 11.4 3.5
Primary fiscal deficit 7.7 2.7 6.1 2.0 8.3 2.6 7.4 2.3
Interest payments 5.8 2.1 7.4 2.5 4.3 1.3 0.0 1.2
Debt amortization 17.2 6.1 14.2 4.7 16.2 5.1 13.9 4.3
Domestic 15.3 5.5 12.3 4.1 14.3 4.5 12.1 3.7
External 1.9 0.7 1.9 0.6 1.9 0.6 1.8 0.6
Funding sources 30.6 11.0 27.8 9.2 28.7 9.1 25.3 7.8
Domestic bonds issuance 29.5 10.6 26.9 8.9 25.4 8.0 19.0 5.9
External loans 2.0 0.7 1.8 0.6 1.7 0.5 1.3 0.4
Change in cash (- indicates increase) -1.0 -0.4 -0.8 -0.3 1.5 0.5 4.9 1.5
Memo items:
GDP ($bn) 279.0 303.5 316.6 324.9
Average exchange rate (USDMYR) 3.06 3.09 3.17 3.35

06 March 2014
Emerging Markets Quarterly 215
Government funding needs PHILIPPINES 2011 2012 2013 2014F
$ bn % of GDP $ bn % of GDP $ bn % of GDP $ bn % of GDP
Total borrowing requirements 14.9 6.6 18.0 7.2 18.3 6.7 15.4 5.5
Overall fiscal deficit 4.6 2.0 5.9 2.4 5.5 2.0 6.9 2.5
Primary fiscal deficit -1.9 -0.8 -1.7 -0.7 -2.4 -0.9 -0.8 -0.3
Interest payments 6.5 2.9 7.6 3.0 8.0 2.9 7.7 2.7
Debt amortization 10.3 4.6 12.0 4.8 12.8 4.7 8.5 3.0
Domestic 7.0 3.1 9.0 3.6 9.2 3.4 5.6 2.0
External 3.4 1.5 3.0 1.2 3.5 1.3 2.8 1.0
Funding sources 14.9 6.6 18.0 7.2 18.3 6.7 15.4 5.5
External borrowing 6.6 2.9 5.5 2.2 3.5 1.3 3.7 1.3
Program and project loans 1.1 0.5 2.0 0.8 1.4 0.5 1.4 0.5
Bonds and other inflows 2.7 1.2 3.3 1.3 2.2 0.8 2.3 0.8
Domestic borrowing 8.3 3.7 8.3 3.3 10.9 4.0 8.5 3.0
Privatization receipts 0.0 0.0 0.2 0.1 0.2 0.1 0.2 0.1
Change in cash (- indicates increase) 0.0 0.0 4.0 1.6 3.7 1.4 3.1 1.1
Memo items:
GDP ($bn) 224.8 250.2 272.0 282.5
Average exchange rate (USDPHP) 43.3 42.2 42.4 45.3
TAIWAN 2011 2012 2013 2014F
$ bn % of GDP $ bn % of GDP $ bn % of GDP $ bn % of GDP
Total borrowing requirement 11.0 2.4 16.9 3.6 18.0 3.7 19.0 3.8
Overall fiscal deficit 10.4 2.2 11.5 2.4 12.6 2.6 13.6 2.7
Primary fiscal deficit 9.6 2.1 11.7 2.5 13.4 2.8 14.6 2.9
Interest payments 0.8 0.2 -0.1 0.0 -0.8 -0.2 -1.0 -0.2
Debt amortization 7.8 1.7 5.4 1.1 5.4 1.1 5.4 1.1
Domestic 7.8 1.7 5.4 1.1 5.4 1.1 5.4 1.1
External 0.0 0.0 0.0 0.0 0.0 0.0 0.0 0.0
Funding sources 11.0 2.4 16.9 3.6 18.0 3.7 19.0 3.8
Domestic 11.0 2.4 16.9 3.6 18.0 3.7 19.0 3.8
External 0.0 0.0 0.0 0.0 0.0 0.0 0.0 0.0
Memo items:
GDP ($bn) 463.5 473.1 491.4 499.0
Average exchange rate (USDTWD) 29.5 29.7 29.1 29.8
THAILAND* 2011 2012 2013 2014F
$ bn % of GDP $ bn % of GDP $ bn % of GDP $ bn % of GDP
Total borrowing requirements 9.3 2.7 10.0 2.7 12.3 3.2 11.3 3.0
Overall fiscal deficit** 9.3 2.7 10.0 2.7 12.3 3.2 11.3 3.0
Primary fiscal deficit 4.1 1.2 5.2 1.4 5.6 1.5 3.6 0.9
Interest payments 5.1 1.5 4.8 1.3 6.7 1.7 7.7 2.0
Funding sources 9.3 2.7 10.0 2.7 12.3 3.2 11.3 3.0
Net domestic borrowing 8.9 2.6 5.3 1.5 7.2 1.9 18.1 4.7
Net foreign borrowing 0.0 0.0 0.3 0.1 0.5 0.1 1.5 0.4
Change in cash (- indicates increase) 0.4 0.1 4.4 1.2 4.6 1.2 -8.3 -2.2
Memo items:
GDP ($bn) 346.4 366.0 382.6 382.2
Average exchange rate (USDTHB) 30.8 31.1 31.1 33.5
*Fiscal year ending September; **Including the principal payments on outstanding debts.
Source: National authorities, Credit Suisse

06 March 2014
Emerging Markets Quarterly 216
Quarterly and annual forecasts As of 5 Mar 2014
2013E 2014F Q4/Q4 Annual average
Q1 Q2 Q3 Q4 Q1 Q2 Q3 Q4 12 13E 14F 15F 12 13E 14F 15F
Global Real GDP (y/y) 2.4 3.6 3.4 3.5 2.9 3.2 3.6 3.7 2.8 3.3 3.4 3.8 3.1 2.9 3.3 3.8
IP (y/y) 3.2 2.7 3.9 4.2 4.2 3.8 4.7 4.8 2.1 3.5 4.4 4.4 2.6 2.5 4.1 4.4
Inflation (y/y) 2.8 2.7 3.0 2.9 3.1 3.4 3.3 3.6 2.9 2.9 3.6 3.3 3.3 3.0 3.3 3.3
DM Real GDP (y/y) 1.2 2.3 2.5 1.9 2.0 1.7 2.4 2.4 0.6 2.0 2.1 2.2 1.4 1.2 2.1 2.3
Inflation (y/y) 1.5 1.3 1.4 1.2 1.2 1.6 1.5 1.7 1.8 1.2 1.7 1.6 1.9 1.3 1.5 1.5
US Real GDP (q/q ann) 1.1 2.5 4.1 2.4 1.6 3.1 2.8 3.1 2.0 2.5 2.6 3.0 2.8 1.9 2.6 3.0
IP (y/y) 4.1 1.2 2.5 5.5 2.3 5.6 4.7 4.7 2.8 3.3 4.3 4.1 3.6 2.6 3.9 4.4
Inflation (y/y) 1.7 1.4 1.5 1.2 1.3 1.6 1.6 1.8 1.9 1.2 1.8 1.8 2.1 1.5 1.6 1.8
Japan Real GDP (q/q ann) 4.8 3.9 1.1 0.6 5.0 -3.9 2.0 1.6 -0.3 2.7 1.1 0.3 1.4 1.6 1.3 0.7
IP (y/y) 2.3 6.2 7.0 7.6 18.6 -9.4 2.8 2.2 -5.9 5.8 3.1 0.0 0.6 -0.9 5.7 0.1
Inflation ex. fresh food (y/y) -0.3 0.0 0.7 1.1 1.3 2.9 2.5 2.4 -0.1 1.1 2.4 1.5 -0.1 0.4 2.3 1.0
Euro Area Real GDP (q/q ann) -0.8 1.3 0.6 1.1 1.2 1.5 1.8 1.7 -1.0 0.5 1.5 1.8 -0.6 -0.4 1.3 1.7
IP (y/y) 1.6 2.8 -0.1 1.3 2.4 2.6 3.1 3.1 -3.3 1.4 2.7 3.3 -2.5 -0.7 2.0 3.3
Inflation (y/y) 1.9 1.4 1.3 0.8 0.7 1.0 0.8 1.2 2.2 0.8 1.2 1.2 2.5 1.4 0.9 1.2
UK Real GDP (q/q ann) 1.1 2.9 3.4 2.9 2.9 3.0 3.1 2.8 0.2 2.7 2.9 2.3 0.3 1.8 3.0 2.5
Inflation (y/y) 2.8 2.7 2.7 2.1 1.7 1.9 1.8 2.1 2.7 2.1 2.1 2.5 2.8 2.6 1.9 2.6
EM Real GDP (q/q ann) 3.9 5.1 4.5 5.2 3.9 5.0 5.0 5.2 5.1 4.7 4.8 5.6 4.9 4.7 4.7 5.4
Inflation (y/y) 4.3 4.1 4.7 4.8 5.2 5.3 5.3 5.6 4.2 4.8 5.6 5.2 4.7 4.8 5.2 5.2
NJA Real GDP (q/q ann) 5.3 6.0 6.3 6.4 6.0 6.0 6.3 6.4 6.7 6.1 6.2 6.8 6.1 6.1 6.2 6.7
Inflation (y/y) 3.4 2.9 3.7 3.8 4.2 4.1 4.0 4.4 3.4 3.8 4.4 4.2 4.2 4.1 4.1 4.2
China Real GDP (q/q ann) 6.1 7.4 9.1 7.4 6.1 7.4 7.8 7.8 7.9 7.7 7.4 7.9 7.7 7.7 7.3 7.9
IP (y/y) 9.5 9.8 10.0 9.6 5.6 10.9 10.9 9.9 10.0 10.0 9.4 9.5 10.1 9.7 10.0 10.3
Inflation (y/y) 2.4 2.4 2.8 2.9 2.9 3.1 2.9 3.5 2.1 2.9 3.5 3.6 2.6 2.6 3.0 3.5
India* Real GDP (q/q ann) 7.9 3.9 2.0 5.1 10.8 5.1 4.4 4.8 4.7 4.7 6.2 6.8 4.6 4.8 6.0 6.3
Inflation (y/y) 6.7 4.8 6.6 7.0 8.5 7.5 8.4 8.2 7.3 7.0 8.2 6.8 10.2 9.5 8.0 7.0
EEMEA Real GDP (q/q ann) 1.2 2.3 1.5 3.9 -0.1 1.3 2.7 2.9 1.3 2.4 1.7 3.6 2.9 2.2 2.2 3.4
Inflation (y/y) 5.2 5.0 5.1 4.8 4.9 5.5 5.2 5.5 5.2 4.8 5.5 5.0 4.8 4.7 4.9 4.7
Russia Real GDP (q/q ann) -1.0 -0.4 0.8 4.5 -1.2 0.4 3.2 2.4 1.5 1.3 1.2 3.8 3.4 1.3 1.3 3.1
Inflation (y/y) 7.1 7.2 6.4 6.4 6.3 6.7 6.5 6.3 6.5 6.4 6.3 5.5 5.1 6.8 6.4 5.5
Turkey Real GDP (q/q ann) 6.2 8.4 3.5 2.8 1.2 0.0 2.0 3.2 1.5 5.2 1.6 3.2 2.2 4.3 2.2 3.1
Inflation (y/y) 7.2 7.0 8.3 7.5 7.8 8.1 6.8 7.7 6.8 7.5 7.7 7.1 8.9 7.5 7.6 6.8
LATAM Real GDP (q/q ann) 1.3 4.3 1.1 1.9 0.2 4.9 2.5 2.8 3.0 2.1 2.8 2.9 3.0 2.6 2.2 3.1
Inflation (y/y) 6.4 7.4 7.8 8.4 9.0 9.4 9.8 10.1 6.1 8.4 10.1 9.0 6.2 7.3 9.4 9.3
Brazil Real GDP (q/q ann) 0.0 7.5 -2.1 2.8 0.3 5.7 -0.6 2.3 1.8 2.0 1.9 2.5 1.0 2.3 1.8 2.5
Inflation (y/y) 6.4 6.6 6.1 5.8 5.6 5.6 6.3 6.3 5.6 5.8 6.3 5.6 5.4 6.2 5.9 5.9
Mexico Real GDP (q/q ann) 0.8 -2.7 3.9 0.7 0.8 6.0 4.3 5.2 3.2 0.7 4.1 4.3 3.9 1.1 2.8 4.5
Inflation (y/y) 3.7 4.5 3.4 3.7 4.1 3.8 4.2 4.0 4.1 3.7 4.0 3.8 4.1 3.8 4.0 3.7
Note: IMF PPP weights are used to compute regional and global aggregate figures. *Annual figures for India are on a fiscal year basis.
Source: Credit Suisse estimates, Thomson Reuters DataStream, Haver Analytics®
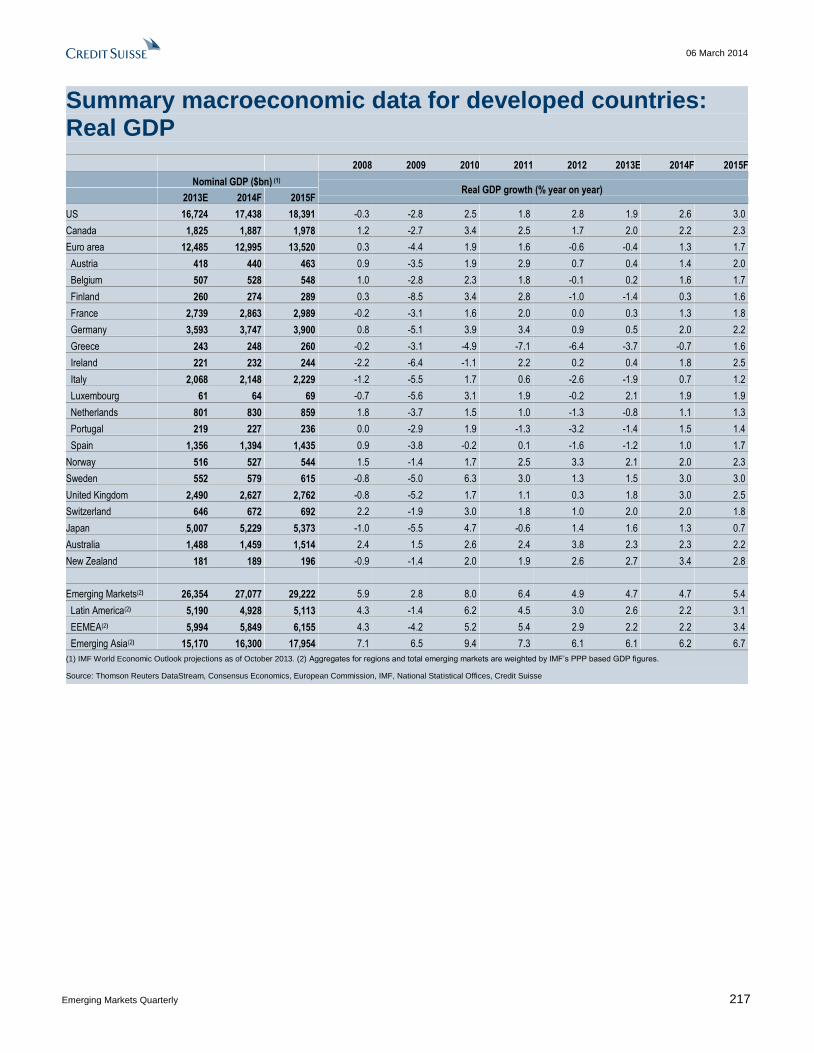
06 March 2014
Emerging Markets Quarterly 217
Summary macroeconomic data for developed countries: Real GDP
2008 2009 2010 2011 2012 2013E 2014F 2015F
Nominal GDP ($bn) (1) Real GDP growth (% year on year)
2013E 2014F 2015F
US 16,724 17,438 18,391 -0.3 -2.8 2.5 1.8 2.8 1.9 2.6 3.0
Canada 1,825 1,887 1,978 1.2 -2.7 3.4 2.5 1.7 2.0 2.2 2.3
Euro area 12,485 12,995 13,520 0.3 -4.4 1.9 1.6 -0.6 -0.4 1.3 1.7
Austria 418 440 463 0.9 -3.5 1.9 2.9 0.7 0.4 1.4 2.0
Belgium 507 528 548 1.0 -2.8 2.3 1.8 -0.1 0.2 1.6 1.7
Finland 260 274 289 0.3 -8.5 3.4 2.8 -1.0 -1.4 0.3 1.6
France 2,739 2,863 2,989 -0.2 -3.1 1.6 2.0 0.0 0.3 1.3 1.8
Germany 3,593 3,747 3,900 0.8 -5.1 3.9 3.4 0.9 0.5 2.0 2.2
Greece 243 248 260 -0.2 -3.1 -4.9 -7.1 -6.4 -3.7 -0.7 1.6
Ireland 221 232 244 -2.2 -6.4 -1.1 2.2 0.2 0.4 1.8 2.5
Italy 2,068 2,148 2,229 -1.2 -5.5 1.7 0.6 -2.6 -1.9 0.7 1.2
Luxembourg 61 64 69 -0.7 -5.6 3.1 1.9 -0.2 2.1 1.9 1.9
Netherlands 801 830 859 1.8 -3.7 1.5 1.0 -1.3 -0.8 1.1 1.3
Portugal 219 227 236 0.0 -2.9 1.9 -1.3 -3.2 -1.4 1.5 1.4
Spain 1,356 1,394 1,435 0.9 -3.8 -0.2 0.1 -1.6 -1.2 1.0 1.7
Norway 516 527 544 1.5 -1.4 1.7 2.5 3.3 2.1 2.0 2.3
Sweden 552 579 615 -0.8 -5.0 6.3 3.0 1.3 1.5 3.0 3.0
United Kingdom 2,490 2,627 2,762 -0.8 -5.2 1.7 1.1 0.3 1.8 3.0 2.5
Switzerland 646 672 692 2.2 -1.9 3.0 1.8 1.0 2.0 2.0 1.8
Japan 5,007 5,229 5,373 -1.0 -5.5 4.7 -0.6 1.4 1.6 1.3 0.7
Australia 1,488 1,459 1,514 2.4 1.5 2.6 2.4 3.8 2.3 2.3 2.2
New Zealand 181 189 196 -0.9 -1.4 2.0 1.9 2.6 2.7 3.4 2.8
Emerging Markets(2) 26,354 27,077 29,222 5.9 2.8 8.0 6.4 4.9 4.7 4.7 5.4
Latin America(2) 5,190 4,928 5,113 4.3 -1.4 6.2 4.5 3.0 2.6 2.2 3.1
EEMEA(2) 5,994 5,849 6,155 4.3 -4.2 5.2 5.4 2.9 2.2 2.2 3.4
Emerging Asia(2) 15,170 16,300 17,954 7.1 6.5 9.4 7.3 6.1 6.1 6.2 6.7
(1) IMF World Economic Outlook projections as of October 2013. (2) Aggregates for regions and total emerging markets are weighted by IMF’s PPP based GDP figures.
Source: Thomson Reuters DataStream, Consensus Economics, European Commission, IMF, National Statistical Offices, Credit Suisse
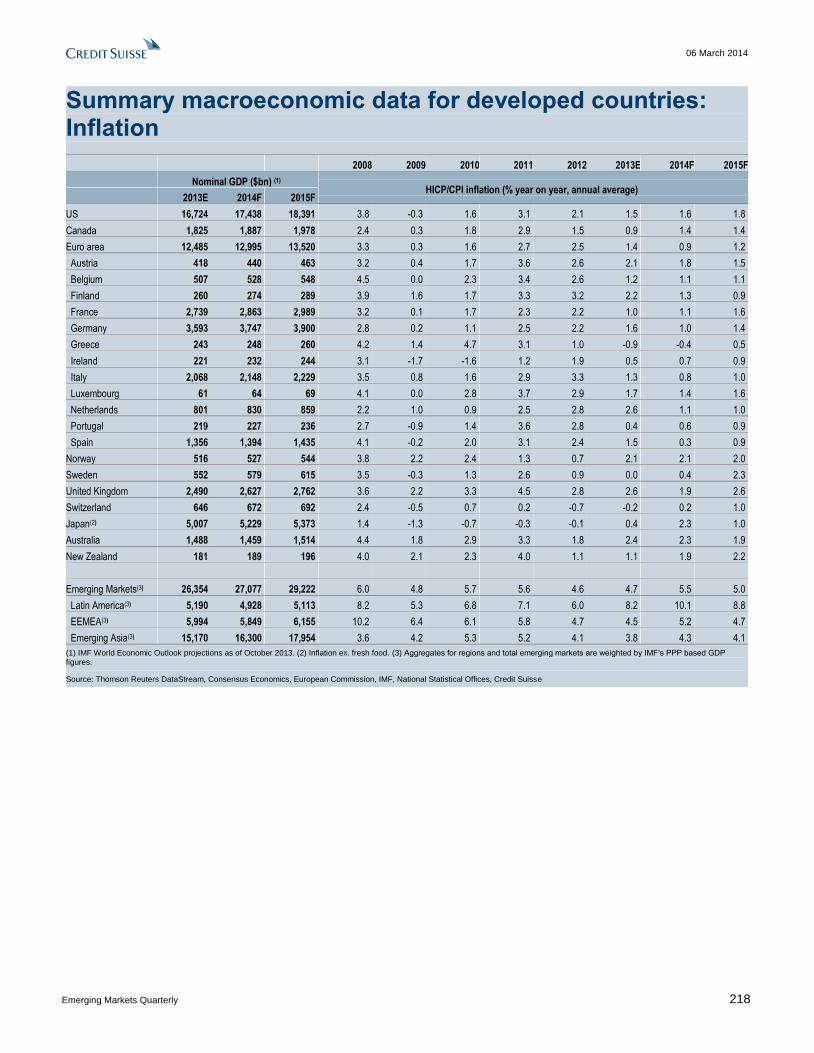
06 March 2014
Emerging Markets Quarterly 218
Summary macroeconomic data for developed countries: Inflation
2008 2009 2010 2011 2012 2013E 2014F 2015F
Nominal GDP ($bn) (1) HICP/CPI inflation (% year on year, annual average)
2013E 2014F 2015F
US 16,724 17,438 18,391 3.8 -0.3 1.6 3.1 2.1 1.5 1.6 1.8
Canada 1,825 1,887 1,978 2.4 0.3 1.8 2.9 1.5 0.9 1.4 1.4
Euro area 12,485 12,995 13,520 3.3 0.3 1.6 2.7 2.5 1.4 0.9 1.2
Austria 418 440 463 3.2 0.4 1.7 3.6 2.6 2.1 1.8 1.5
Belgium 507 528 548 4.5 0.0 2.3 3.4 2.6 1.2 1.1 1.1
Finland 260 274 289 3.9 1.6 1.7 3.3 3.2 2.2 1.3 0.9
France 2,739 2,863 2,989 3.2 0.1 1.7 2.3 2.2 1.0 1.1 1.6
Germany 3,593 3,747 3,900 2.8 0.2 1.1 2.5 2.2 1.6 1.0 1.4
Greece 243 248 260 4.2 1.4 4.7 3.1 1.0 -0.9 -0.4 0.5
Ireland 221 232 244 3.1 -1.7 -1.6 1.2 1.9 0.5 0.7 0.9
Italy 2,068 2,148 2,229 3.5 0.8 1.6 2.9 3.3 1.3 0.8 1.0
Luxembourg 61 64 69 4.1 0.0 2.8 3.7 2.9 1.7 1.4 1.6
Netherlands 801 830 859 2.2 1.0 0.9 2.5 2.8 2.6 1.1 1.0
Portugal 219 227 236 2.7 -0.9 1.4 3.6 2.8 0.4 0.6 0.9
Spain 1,356 1,394 1,435 4.1 -0.2 2.0 3.1 2.4 1.5 0.3 0.9
Norway 516 527 544 3.8 2.2 2.4 1.3 0.7 2.1 2.1 2.0
Sweden 552 579 615 3.5 -0.3 1.3 2.6 0.9 0.0 0.4 2.3
United Kingdom 2,490 2,627 2,762 3.6 2.2 3.3 4.5 2.8 2.6 1.9 2.6
Switzerland 646 672 692 2.4 -0.5 0.7 0.2 -0.7 -0.2 0.2 1.0
Japan(2) 5,007 5,229 5,373 1.4 -1.3 -0.7 -0.3 -0.1 0.4 2.3 1.0
Australia 1,488 1,459 1,514 4.4 1.8 2.9 3.3 1.8 2.4 2.3 1.9
New Zealand 181 189 196 4.0 2.1 2.3 4.0 1.1 1.1 1.9 2.2
Emerging Markets(3) 26,354 27,077 29,222 6.0 4.8 5.7 5.6 4.6 4.7 5.5 5.0
Latin America(3) 5,190 4,928 5,113 8.2 5.3 6.8 7.1 6.0 8.2 10.1 8.8
EEMEA(3) 5,994 5,849 6,155 10.2 6.4 6.1 5.8 4.7 4.5 5.2 4.7
Emerging Asia(3) 15,170 16,300 17,954 3.6 4.2 5.3 5.2 4.1 3.8 4.3 4.1
(1) IMF World Economic Outlook projections as of October 2013. (2) Inflation ex. fresh food. (3) Aggregates for regions and total emerging markets are weighted by IMF’s PPP based GDP figures.
Source: Thomson Reuters DataStream, Consensus Economics, European Commission, IMF, National Statistical Offices, Credit Suisse
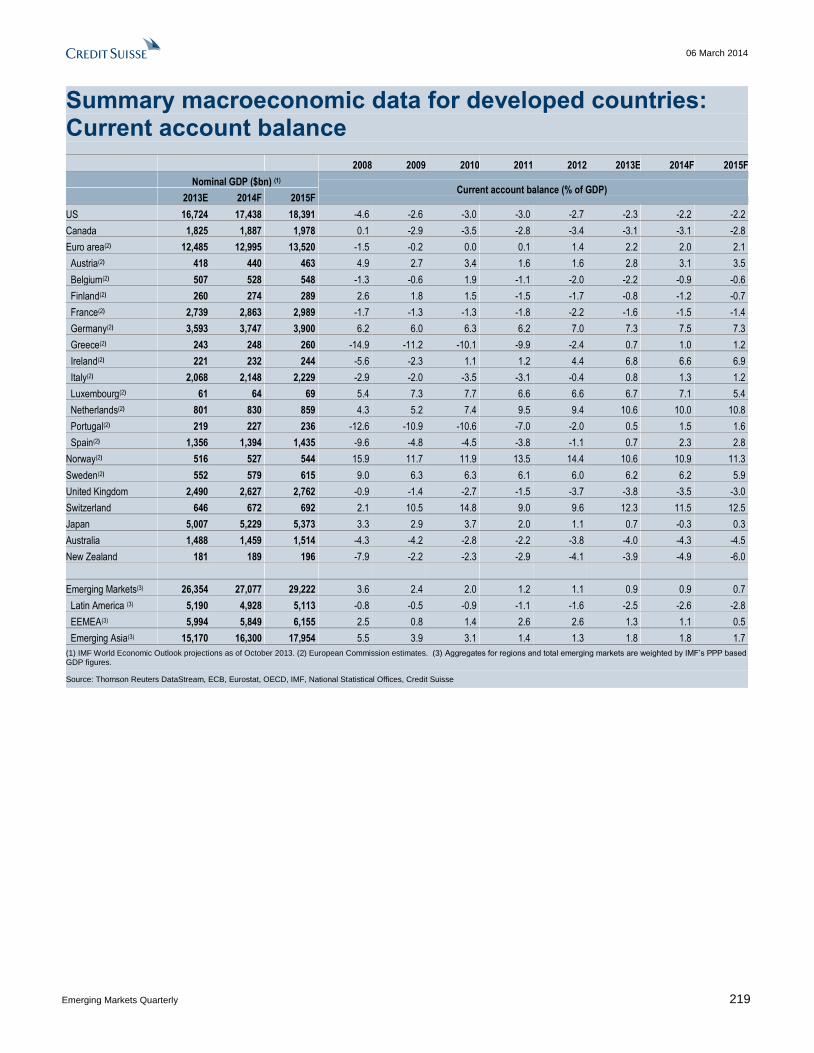
06 March 2014
Emerging Markets Quarterly 219
Summary macroeconomic data for developed countries: Current account balance
2008 2009 2010 2011 2012 2013E 2014F 2015F
Nominal GDP ($bn) (1) Current account balance (% of GDP)
2013E 2014F 2015F
US 16,724 17,438 18,391 -4.6 -2.6 -3.0 -3.0 -2.7 -2.3 -2.2 -2.2
Canada 1,825 1,887 1,978 0.1 -2.9 -3.5 -2.8 -3.4 -3.1 -3.1 -2.8
Euro area(2) 12,485 12,995 13,520 -1.5 -0.2 0.0 0.1 1.4 2.2 2.0 2.1
Austria(2) 418 440 463 4.9 2.7 3.4 1.6 1.6 2.8 3.1 3.5
Belgium(2) 507 528 548 -1.3 -0.6 1.9 -1.1 -2.0 -2.2 -0.9 -0.6
Finland(2) 260 274 289 2.6 1.8 1.5 -1.5 -1.7 -0.8 -1.2 -0.7
France(2) 2,739 2,863 2,989 -1.7 -1.3 -1.3 -1.8 -2.2 -1.6 -1.5 -1.4
Germany(2) 3,593 3,747 3,900 6.2 6.0 6.3 6.2 7.0 7.3 7.5 7.3
Greece(2) 243 248 260 -14.9 -11.2 -10.1 -9.9 -2.4 0.7 1.0 1.2
Ireland(2) 221 232 244 -5.6 -2.3 1.1 1.2 4.4 6.8 6.6 6.9
Italy(2) 2,068 2,148 2,229 -2.9 -2.0 -3.5 -3.1 -0.4 0.8 1.3 1.2
Luxembourg(2) 61 64 69 5.4 7.3 7.7 6.6 6.6 6.7 7.1 5.4
Netherlands(2) 801 830 859 4.3 5.2 7.4 9.5 9.4 10.6 10.0 10.8
Portugal(2) 219 227 236 -12.6 -10.9 -10.6 -7.0 -2.0 0.5 1.5 1.6
Spain(2) 1,356 1,394 1,435 -9.6 -4.8 -4.5 -3.8 -1.1 0.7 2.3 2.8
Norway(2) 516 527 544 15.9 11.7 11.9 13.5 14.4 10.6 10.9 11.3
Sweden(2) 552 579 615 9.0 6.3 6.3 6.1 6.0 6.2 6.2 5.9
United Kingdom 2,490 2,627 2,762 -0.9 -1.4 -2.7 -1.5 -3.7 -3.8 -3.5 -3.0
Switzerland 646 672 692 2.1 10.5 14.8 9.0 9.6 12.3 11.5 12.5
Japan 5,007 5,229 5,373 3.3 2.9 3.7 2.0 1.1 0.7 -0.3 0.3
Australia 1,488 1,459 1,514 -4.3 -4.2 -2.8 -2.2 -3.8 -4.0 -4.3 -4.5
New Zealand 181 189 196 -7.9 -2.2 -2.3 -2.9 -4.1 -3.9 -4.9 -6.0
Emerging Markets(3) 26,354 27,077 29,222 3.6 2.4 2.0 1.2 1.1 0.9 0.9 0.7
Latin America (3) 5,190 4,928 5,113 -0.8 -0.5 -0.9 -1.1 -1.6 -2.5 -2.6 -2.8
EEMEA(3) 5,994 5,849 6,155 2.5 0.8 1.4 2.6 2.6 1.3 1.1 0.5
Emerging Asia(3) 15,170 16,300 17,954 5.5 3.9 3.1 1.4 1.3 1.8 1.8 1.7
(1) IMF World Economic Outlook projections as of October 2013. (2) European Commission estimates. (3) Aggregates for regions and total emerging markets are weighted by IMF’s PPP based GDP figures.
Source: Thomson Reuters DataStream, ECB, Eurostat, OECD, IMF, National Statistical Offices, Credit Suisse

06 March 2014
Emerging Markets Quarterly 220
Summary macroeconomic data for developed countries: Fiscal balance
2008 2009 2010 2011 2012 2013E 2014F 2015F
Nominal GDP ($bn) (1) Fiscal balance (% of GDP)
2013E 2014F 2015F
US 16,724 17,438 18,391 -4.2 -11.7 -10.4 -9.8 -8.3 -5.4 -4.1 -3.7
Canada 1,825 1,887 1,978 -0.3 -4.5 -4.9 -3.7 -3.4 -3.4 -2.9 -2.3
Euro area 12,485 12,995 13,520 -2.1 -6.4 -6.2 -4.1 -3.7 -2.9 -2.4 -2.1
Austria 418 440 463 -1.0 -4.1 -4.5 -2.4 -2.5 -1.7 -1.7 -1.5
Belgium 507 528 548 -1.1 -5.6 -3.9 -3.9 -4.1 -2.8 -2.5 -2.2
Finland 260 274 289 4.3 -2.7 -2.8 -1.0 -2.2 -2.0 -2.0 -1.7
France 2,739 2,863 2,989 -3.3 -7.6 -7.1 -5.3 -4.8 -4.3 -3.7 -3.5
Germany 3,593 3,747 3,900 -0.1 -3.1 -4.2 -0.8 0.1 -0.1 0.0 0.2
Greece 243 248 260 -9.9 -15.6 -10.8 -9.6 -9.0 -13.1 -2.0 -1.0
Ireland 221 232 244 -7.4 -13.7 -30.6 -13.1 -8.1 -7.3 -4.5 -3.0
Italy 2,068 2,148 2,229 -2.7 -5.4 -4.3 -3.7 -2.9 -3.0 -2.5 -2.0
Luxembourg(2) 61 64 69 3.2 -0.7 -0.8 0.1 -0.6 -0.9 -1.0 -2.7
Netherlands 801 830 859 0.5 -5.6 -5.1 -4.3 -4.1 -3.1 -3.3 -3.0
Portugal 219 227 236 -3.7 -10.2 -9.9 -4.3 -6.5 -4.5 -4.0 -3.0
Spain 1,356 1,394 1,435 -4.5 -11.1 -9.6 -9.6 -10.6 -6.5 -5.7 -5.0
Norway(2) 516 527 544 18.8 10.5 11.1 13.6 13.9 13.5 13.1 12.9
Sweden(2) 552 579 615 2.2 -1.0 0.0 0.0 -0.4 -1.2 -1.5 -0.7
United Kingdom 2,490 2,627 2,762 -4.6 -3.7 -3.5 -2.8 -3.3 -3.4 -3.4 -3.5
Switzerland 646 672 692 2.0 0.8 0.3 0.5 0.8 0.4 0.2 0.5
Japan(3) 5,007 5,229 5,373 -3.2 -9.5 -8.6 -8.9 -8.7 -8.0 -7.1 -5.7
Australia (4) 1,488 1,459 1,514 -2.1 -4.2 -3.4 -2.9 -1.2 -2.2 -1.8 -1.5
New Zealand 181 189 196 3.0 -2.1 -3.3 -9.2 -4.4 -2.1 -0.4 0.3
Emerging Markets(5) 26,354 27,077 29,222 -0.5 -4.4 -2.8 -1.9 -2.0 -2.5 -2.5 -2.3
Latin America (5) 5,190 4,928 5,113 -0.6 -3.1 -2.6 -2.6 -2.7 -3.1 -3.6 -3.1
EEMEA(5) 5,994 5,849 6,155 4.0 -6.5 -3.4 0.7 0.5 -0.5 -0.4 -0.5
Emerging Asia(5) 15,170 16,300 17,954 -2.2 -4.0 -2.7 -2.6 -2.7 -3.0 -2.9 -2.7
(1) IMF World Economic Outlook projections as of October 2013. (2) European Commission estimates. (3) Fiscal year, general government (central + local + social security), special factors adjusted. (4) Commonwealth budget. (5) Aggregates for regions and total emerging markets are weighted by IMF’s PPP based GDP figures.
Source: Thomson Reuters DataStream, European Commission, OECD, IMF, National Statistical Offices, Credit Suisse
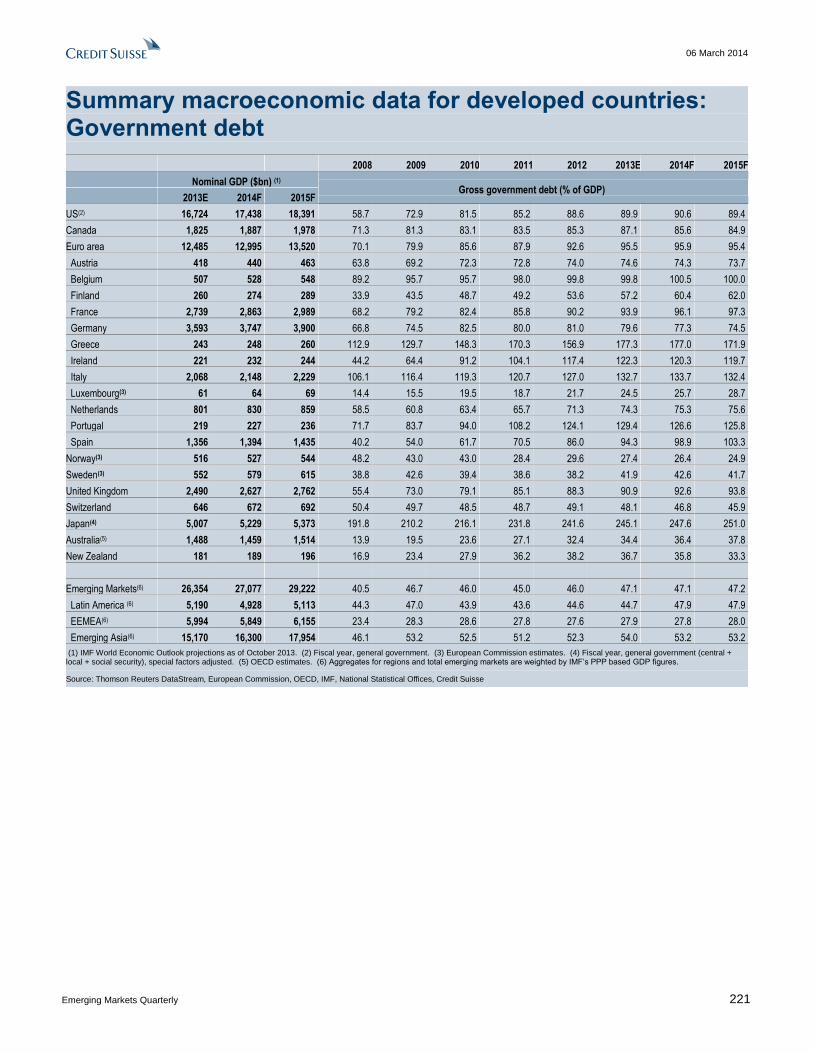
06 March 2014
Emerging Markets Quarterly 221
Summary macroeconomic data for developed countries: Government debt
2008 2009 2010 2011 2012 2013E 2014F 2015F
Nominal GDP ($bn) (1) Gross government debt (% of GDP)
2013E 2014F 2015F
US(2) 16,724 17,438 18,391 58.7 72.9 81.5 85.2 88.6 89.9 90.6 89.4
Canada 1,825 1,887 1,978 71.3 81.3 83.1 83.5 85.3 87.1 85.6 84.9
Euro area 12,485 12,995 13,520 70.1 79.9 85.6 87.9 92.6 95.5 95.9 95.4
Austria 418 440 463 63.8 69.2 72.3 72.8 74.0 74.6 74.3 73.7
Belgium 507 528 548 89.2 95.7 95.7 98.0 99.8 99.8 100.5 100.0
Finland 260 274 289 33.9 43.5 48.7 49.2 53.6 57.2 60.4 62.0
France 2,739 2,863 2,989 68.2 79.2 82.4 85.8 90.2 93.9 96.1 97.3
Germany 3,593 3,747 3,900 66.8 74.5 82.5 80.0 81.0 79.6 77.3 74.5
Greece 243 248 260 112.9 129.7 148.3 170.3 156.9 177.3 177.0 171.9
Ireland 221 232 244 44.2 64.4 91.2 104.1 117.4 122.3 120.3 119.7
Italy 2,068 2,148 2,229 106.1 116.4 119.3 120.7 127.0 132.7 133.7 132.4
Luxembourg(3) 61 64 69 14.4 15.5 19.5 18.7 21.7 24.5 25.7 28.7
Netherlands 801 830 859 58.5 60.8 63.4 65.7 71.3 74.3 75.3 75.6
Portugal 219 227 236 71.7 83.7 94.0 108.2 124.1 129.4 126.6 125.8
Spain 1,356 1,394 1,435 40.2 54.0 61.7 70.5 86.0 94.3 98.9 103.3
Norway(3) 516 527 544 48.2 43.0 43.0 28.4 29.6 27.4 26.4 24.9
Sweden(3) 552 579 615 38.8 42.6 39.4 38.6 38.2 41.9 42.6 41.7
United Kingdom 2,490 2,627 2,762 55.4 73.0 79.1 85.1 88.3 90.9 92.6 93.8
Switzerland 646 672 692 50.4 49.7 48.5 48.7 49.1 48.1 46.8 45.9
Japan(4) 5,007 5,229 5,373 191.8 210.2 216.1 231.8 241.6 245.1 247.6 251.0
Australia(5) 1,488 1,459 1,514 13.9 19.5 23.6 27.1 32.4 34.4 36.4 37.8
New Zealand 181 189 196 16.9 23.4 27.9 36.2 38.2 36.7 35.8 33.3
Emerging Markets(6) 26,354 27,077 29,222 40.5 46.7 46.0 45.0 46.0 47.1 47.1 47.2
Latin America (6) 5,190 4,928 5,113 44.3 47.0 43.9 43.6 44.6 44.7 47.9 47.9
EEMEA(6) 5,994 5,849 6,155 23.4 28.3 28.6 27.8 27.6 27.9 27.8 28.0
Emerging Asia(6) 15,170 16,300 17,954 46.1 53.2 52.5 51.2 52.3 54.0 53.2 53.2
(1) IMF World Economic Outlook projections as of October 2013. (2) Fiscal year, general government. (3) European Commission estimates. (4) Fiscal year, general government (central + local + social security), special factors adjusted. (5) OECD estimates. (6) Aggregates for regions and total emerging markets are weighted by IMF’s PPP based GDP figures.
Source: Thomson Reuters DataStream, European Commission, OECD, IMF, National Statistical Offices, Credit Suisse

06 March 2014
Emerging Markets Quarterly 222
Summary macroeconomic data: GDP growth
2007 2008 2009 2010 2011 2012 2013E 2014F 2015F
Nominal GDP ($bn) Real GDP growth (% year on year)
2013E 2014F 2015F
LATIN AMERICA 5,189.9 4,928.0 5,112.9 5.8 4.3 -1.4 6.2 4.5 3.0 2.6 2.2 3.1
Argentina 482.4 363.1 323.3 8.7 6.8 0.9 9.2 8.9 1.9 4.7 -0.3 -0.5
Brazil 2,240.0 2,135.0 2,175.0 6.1 5.2 -0.3 7.5 2.7 1.0 2.3 1.8 2.5
Chile 279.5 262.0 283.1 5.2 3.3 -1.0 5.8 5.9 5.6 4.0 3.8 4.0
Colombia 379.1 377.5 412.4 6.9 3.5 1.7 4.0 6.6 4.2 4.2 4.5 4.9
Mexico 1,235.7 1,286.1 1,422.4 3.1 1.4 -4.7 5.1 4.0 3.9 1.1 2.8 4.5
Peru 206.6 213.5 232.7 8.9 9.8 0.9 8.8 6.9 6.3 5.0 5.5 5.8
Venezuela 366.6 290.9 264.0 8.8 5.3 -3.2 -1.5 4.2 5.6 1.6 -0.5 1.0
EEMEA 5,994.1 5,848.8 6,155.2 6.6 4.3 -4.2 5.2 5.4 2.9 2.2 2.2 3.4
Czech Republic 199.5 197.6 207.5 5.7 3.1 -4.5 2.5 1.8 -1.0 -1.1 2.5 2.5
Hungary 139.1 139.6 140.8 0.1 0.9 -6.8 1.1 1.6 -1.7 1.2 1.9 1.5
Israel 291.7 314.9 329.9 6.9 5.0 0.9 5.5 4.6 3.3 3.5 3.5 3.5
Kazakhstan 219.0 234.0 251.8 8.7 3.3 1.2 7.3 7.5 5.0 4.6 5.6 6.0
Poland 533.9 556.2 598.4 6.8 5.1 1.6 3.9 4.5 1.9 1.6 2.8 3.3
Russia 2,093.2 1,915.2 1,951.0 8.5 5.2 -7.8 4.5 4.3 3.4 1.3 1.3 3.1
Saudi Arabia 745.3 796.3 847.4 6.0 8.4 1.8 7.4 8.6 5.8 3.8 4.4 4.6
South Africa 350.3 328.3 349.1 5.7 3.5 -1.3 3.2 3.5 2.4 1.9 2.8 3.4
Turkey 838.8 796.4 884.4 4.7 0.7 -4.8 9.2 8.8 2.2 4.3 2.2 3.1
Ukraine 178.9 143.3 145.0 7.9 2.3 -14.8 4.1 5.2 0.2 0.0 -4.0 2.5
United Arab Emirates 404.4 427.1 449.8 3.2 3.2 -4.8 1.7 3.9 4.4 4.1 3.1 3.9
EMERGING ASIA 15,169.8 16,299.8 17,954.2 10.7 7.1 6.5 9.4 7.3 6.1 6.1 6.2 6.7
China 9,246.5 10,048.9 11,157.4 14.2 9.6 9.1 10.3 9.2 7.7 7.7 7.3 7.9
Hong Kong 272.1 287.4 302.6 6.4 2.1 -2.3 6.8 4.5 1.5 2.9 3.4 3.8
India (1) 1,862.1 2,030.0 2,272.7 9.3 6.7 8.6 9.3 6.2 4.6 4.8 6.0 6.3
Indonesia 836.3 842.3 927.0 6.3 6.0 4.6 6.2 6.5 6.3 5.8 5.0 5.3
Korea 1,198.6 1,295.5 1,364.5 5.1 2.3 0.3 6.3 3.6 2.0 2.8 3.3 3.6
Malaysia (2) 316.6 324.9 347.8 6.3 4.6 -1.5 7.4 5.1 5.6 4.7 5.3 4.7
Philippines 272.0 282.5 311.8 6.6 4.2 1.1 7.6 3.9 6.8 7.2 7.0 6.8
Singapore 295.8 307.3 328.7 9.0 1.7 -0.6 15.1 6.0 1.9 4.1 4.0 5.0
Taiwan 487.2 497.5 519.1 6.0 0.7 -1.8 10.7 4.1 1.5 2.1 3.2 3.5
Thailand 382.6 383.5 422.7 4.9 2.5 -2.2 7.8 0.1 6.4 2.9 2.0 4.5
Emerging Markets 26,353.7 27,076.6 29,222.3 8.8 5.9 2.8 8.0 6.4 4.9 4.7 4.7 5.4
EM nominal GDP according to the IMF ($bn) (3) 17,126.2 20,455.5 19,568.5 23,295.6 27,194.7 28,687.9 29,802.2 31,452.7 33,808.8
EM nominal GDP as a share of global nominal GDP (%) (3) 30.4 33.1 33.4 36.4 38.4 39.7 40.6 40.9 41.6
EM PPP GDP according to the IMF ($bn) (3) 31,299.8 33,679.0 34,781.9 37,846.5 40,786.3 43,392.1 45,913.6 48,974.4 52,592.9
EM PPP GDP as a share of global PPP GDP (%) (3) 46.4 47.7 49.3 50.4 51.4 52.2 53.0 53.7 54.4
Aggregates for regions and total emerging markets are weighted by IMF’s PPP based GDP figures. The data for India are for fiscal years.
(1) Revised GDP series with base 2004-05. All historical ratios expressed as % of GDP may appear smaller since the revised GDP values in the new series (with base year of 2004) are higher. (2) Real GDP from 2001 has been rebased to 2000 = 100. (3) Based on GDP data (historical and forecast) from the IMF’s latest World Economic Outlook. We have amended the group of countries that the IMF classifies as emerging markets to include the Czech Republic, Hong Kong, Israel, Korea, Singapore and Taiwan; note that the IMF’s group of emerging markets countries includes many (typically small) economies that are not included in the table above.
Source: the BLOOMBERG PROFESSIONAL™ service, National Statistical Offices, IMF World Economic Outlook, IHS Global Insight, Credit Suisse

06 March 2014
Emerging Markets Quarterly 223
Summary macroeconomic data: GDP growth
1Q 13 2Q 13 3Q 13 4Q 13E 1Q 14F 2Q 14F 3Q 14F 4Q 14F 1Q 15F
Nominal GDP ($bn) Real GDP growth (% quarter on quarter, seasonally adjusted annual rate)
2013E 2014F 2015F
LATIN AMERICA 5,189.9 4,928.0 5,112.9 1.3 4.3 1.1 1.9 0.2 4.9 2.5 2.8 2.0
Argentina 482.4 363.1 323.3 8.5 9.0 -0.7 -5.2 0.3 0.3 2.3 -1.0 -3.5
Brazil 2,240.0 2,135.0 2,175.0 0.0 7.5 -2.1 2.8 0.3 5.7 -0.6 2.3 2.9
Chile 279.5 262.0 283.1 3.3 1.3 5.4 0.5 3.3 5.3 8.7 0.9 -0.6
Colombia 379.1 377.5 412.4 0.9 8.6 4.5 7.5 -1.9 9.5 5.1 2.0 1.6
Mexico 1,235.7 1,286.1 1,422.4 0.8 -2.7 3.9 0.7 0.8 6.0 4.3 5.2 3.1
Peru 206.6 213.5 232.7 5.4 4.0 4.9 6.4 4.4 6.1 8.4 8.1 5.6
Venezuela 366.6 290.9 264.0 -5.5 6.8 0.0 7.1 -6.9 -2.3 0.0 0.9 1.4
EEMEA 4,844.4 4,625.5 4,857.9 1.2 2.3 1.5 3.9 -0.1 1.3 2.7 2.9 3.2
Czech Republic 199.5 197.6 207.5 -5.1 1.0 0.9 6.6 1.6 2.0 2.0 2.0 2.8
Hungary 139.1 139.6 140.8 3.6 1.7 3.6 2.4 1.6 1.6 1.6 1.6 1.6
Israel 291.7 314.9 329.9 2.2 4.6 2.1 2.3 2.9 3.3 3.8 3.8 3.5
Kazakhstan 219.0 234.0 251.8 3.2 4.5 4.1 7.4 5.3 5.7 3.6 6.6 5.7
Poland 533.9 556.2 598.4 1.6 2.4 2.8 2.4 2.8 2.8 3.2 3.2 3.2
Russia 2,093.2 1,915.2 1,951.0 -1.0 -0.4 0.8 4.5 -1.2 0.4 3.2 2.4 2.4
South Africa 350.3 328.3 349.1 0.8 3.2 0.7 3.8 2.9 2.8 2.8 2.8 3.7
Turkey 838.8 796.4 884.4 6.2 8.4 3.5 2.8 1.2 0.0 2.0 3.2 4.1
Ukraine 178.9 143.3 145.0 4.1 -1.2 -3.9 4.1 -16.5 0.8 0.0 3.2 4.1
NON-JAPAN ASIA 15,169.8 16,299.8 17,954.2 5.3 6.0 6.3 6.4 6.0 6.0 6.3 6.4 6.7
NJA ex-China 5,923.3 6,250.8 6,796.8 4.3 4.5 3.1 5.3 5.9 4.3 4.5 4.8 5.4
NJA ex-China and India 4,061.2 4,220.8 4,524.1 1.5 5.0 4.0 5.5 2.1 3.7 4.7 4.9 3.3
China 3,678.6 3,837.4 4,101.4 6.1 7.4 9.1 7.4 6.1 7.4 7.8 7.8 7.8
Hong Kong 9,246.5 10,048.9 11,157.4 2.0 2.4 2.8 4.5 3.3 3.1 -1.6 5.0 6.2
India 272.1 287.4 302.6 7.9 3.9 2.0 5.1 10.8 5.1 4.4 4.8 8.1
Indonesia 1,862.1 2,030.0 2,272.7 5.5 5.4 5.3 6.7 4.3 3.9 4.8 6.1 5.2
Korea 836.3 842.3 927.0 3.4 4.5 4.3 3.7 3.2 2.4 2.3 2.8 3.1
Malaysia 1,198.6 1,295.5 1,364.5 -1.0 5.5 7.0 9.1 2.4 4.5 4.9 5.3 5.7
Philippines 316.6 324.9 347.8 9.4 6.2 5.2 6.1 8.2 7.4 7.4 7.0 6.6
Singapore 272.0 282.5 311.8 1.5 14.9 0.3 6.1 -0.4 5.3 5.7 5.7 5.3
Taiwan 295.8 307.3 328.7 -2.4 4.1 0.3 7.3 2.8 2.8 3.2 2.0 3.2
Thailand 487.2 497.5 519.1 -8.2 2.3 5.8 2.4 -9.0 4.7 13.8 9.9 -5.4
Emerging Markets 382.6 383.5 422.7 3.9 5.1 4.5 5.2 3.9 5.0 5.0 5.2 5.3
EM ex-China 25,204.0 25,853.2 27,925.0 2.6 3.8 2.1 4.0 2.6 3.7 3.5 3.8 3.9
EM ex-China and India 15,957.5 15,804.3 16,767.6 1.4 3.8 2.2 3.7 0.7 3.3 3.3 3.5 2.8
Aggregates for regions and total emerging markets are weighted by IMF’s PPP based GDP figures.
Source: the BLOOMBERG PROFESSIONAL™ service, National Statistical Offices, Credit Suisse

06 March 2014
Emerging Markets Quarterly 224
Summary macroeconomic data: Inflation
2007 2008 2009 2010 2011 2012 2013E 2014F 2015F
CPI inflation (%, December to December)
LATIN AMERICA 6.1 8.2 5.3 6.8 7.1 6.0 8.2 10.1 8.8
Argentina 8.5 7.2 7.7 10.9 9.5 10.8 10.9 30.4 24.9
Brazil 4.5 5.9 4.3 5.9 6.5 5.8 5.9 6.2 5.5
Chile 7.8 7.1 -1.4 3.0 4.4 1.5 3.0 3.5 3.0
Colombia 5.7 7.7 2.0 3.2 3.7 2.4 1.9 3.1 3.4
Mexico 3.8 6.5 3.6 4.4 3.8 3.6 4.0 4.0 3.8
Peru 3.9 6.7 0.2 2.1 4.7 2.6 2.9 2.9 2.9
Venezuela 22.5 31.9 26.9 27.4 29.0 19.5 52.7 43.5 37.0
EEMEA 9.4 10.2 6.4 6.1 5.8 4.7 4.5 5.2 4.7
Czech Republic 5.5 3.3 0.5 2.3 2.8 2.4 1.4 1.7 2.2
Hungary 7.4 3.4 5.4 4.6 4.1 5.0 0.4 3.1 3.4
Israel 3.4 3.8 3.9 2.7 2.2 1.6 1.8 1.4 1.7
Kazakhstan 18.8 9.5 6.2 8.0 7.4 6.0 5.0 8.3 4.7
Poland 4.2 3.3 3.8 2.9 4.5 2.4 0.7 2.0 2.3
Russia 11.9 13.3 8.8 8.8 6.1 6.6 6.5 6.3 5.4
Saudi Arabia 6.5 9.0 4.2 5.4 4.2 3.6 3.0 3.0 3.1
South Africa 7.4 9.0 6.3 3.5 6.1 5.7 5.4 5.9 5.8
Turkey 8.4 10.1 6.5 6.4 10.4 6.2 7.4 7.7 7.2
Ukraine 16.6 22.3 12.3 9.1 4.6 -0.2 0.5 7.2 6.2
United Arab Emirates na na -0.3 1.7 0.2 0.6 1.4 2.6 2.5
EMERGING ASIA 6.0 3.6 4.2 5.3 5.2 4.1 3.8 4.3 4.1
China 6.5 1.2 1.9 4.6 4.1 2.5 2.5 3.5 3.6
Hong Kong 3.8 2.1 1.3 3.0 5.7 3.7 4.3 3.4 3.6
India 7.6 8.0 11.8 9.7 9.4 10.4 8.3 8.0 6.5
Indonesia 6.6 9.8 4.8 5.1 5.4 4.3 8.0 4.8 5.0
Korea 3.6 4.1 2.8 3.0 4.2 1.4 1.1 2.6 2.7
Malaysia 2.4 4.5 1.0 2.1 3.0 1.2 3.2 2.8 3.5
Philippines 3.7 7.8 4.4 3.6 4.2 2.6 4.1 3.2 3.7
Singapore 3.7 5.5 -0.5 4.6 5.5 4.3 1.5 2.7 2.9
Taiwan 3.3 1.3 -0.2 1.0 2.0 1.6 0.3 2.6 1.9
Thailand 3.2 0.4 3.5 3.0 3.5 3.6 1.7 2.8 3.0
Emerging Markets 6.7 6.0 4.8 5.7 5.6 4.6 4.7 5.5 5.0
Aggregates for regions and total emerging markets are weighted by IMF’s PPP based GDP figures. The data for India are for fiscal years.
Source: the BLOOMBERG PROFESSIONAL™ service, National Statistical Offices, IHS Global Insight, Credit Suisse

06 March 2014
Emerging Markets Quarterly 225
Summary macroeconomic data: Wage inflation
2007 2008 2009 2010 2011 2012 2013E 2014F 2015F
Nominal wage (%, December to December)
LATIN AMERICA 8.4 10.4 8.3 9.2 11.1 11.2 10.0 10.5 9.7
Argentina (1) 20.6 22.3 19.7 19.7 27.7 26.9 26.5 30.0 25.0
Brazil (2) 7.7 10.5 7.6 9.9 9.6 10.1 8.7 8.9 8.0
Chile (3) 7.3 8.5 6.4 3.6 5.9 6.4 5.7 5.3 5.0
Colombia (4) 5.1 5.5 4.6 5.3 3.6 4.4 4.0 4.5 4.5
Mexico (5) 4.3 4.5 4.5 4.6 4.5 4.5 4.3 4.5 4.7
Peru (6) 1.5 8.4 0.0 0.5 13.4 14.7 4.3 1.7 4.9
Venezuela (7) 20.6 25.0 21.2 22.3 31.0 28.8 28.8 29.3 27.6
EEMEA 20.0 12.7 7.1 12.1 13.1 10.0 9.3 8.2 7.8
Czech Republic 7.2 7.9 3.4 2.2 2.5 2.7 1.0 2.0 3.0
Hungary 8.0 7.4 0.5 1.3 5.2 4.7 3.3 5.0 6.0
Israel 4.3 0.1 1.7 4.8 3.3 4.5 3.0 3.0 3.5
Kazakhstan (8) 28.1 16.2 14.2 15.6 16.9 11.5 6.9 7.0 7.0
Poland 9.1 10.5 4.2 3.6 4.9 3.5 2.7 3.0 3.5
Russia 30.2 15.3 10.2 15.6 18.2 11.9 12.2 9.3 8.0
South Africa (9) 7.2 12.5 15.5 9.8 6.8 6.6 8.2 8.3 7.7
Turkey (10) 14.7 10.6 -1.9 15.8 15.7 15.6 14.4 14.0 14.0
Ukraine 31.2 19.5 11.6 17.7 16.2 10.6 5.7 5.3 5.7
EMERGING ASIA 13.1 12.3 7.5 11.0 10.7 10.1 7.2 5.2 5.6
China (11) 18.5 16.9 11.6 13.3 14.4 11.9 9.0 5.8 6.0
Hong Kong 2.6 3.4 -1.0 2.5 6.0 2.0 3.3 2.4 2.6
Indonesia (12) 4.2 7.6 5.3 12.2 3.4 20.4 5.0 6.0 5.0
Korea 5.9 3.1 -0.7 6.1 -0.7 -0.9 0.2 2.3 4.4
Malaysia (13) 7.3 2.9 -4.3 11.8 7.8 7.8 7.7 7.0 7.0
Philippines (14) 4.5 5.3 2.2 3.4 6.0 4.7 2.2 2.4 4.0
Singapore 6.2 5.4 -2.7 5.6 6.0 2.3 4.3 5.0 6.0
Taiwan 1.7 0.2 -2.0 1.8 1.5 0.1 0.5 3.1 5.2
Thailand (15) 3.0 10.2 -2.5 6.5 7.5 12.1 10.0 5.0 5.0
Emerging Markets 13.6 12.0 7.6 10.8 11.3 10.3 8.2 6.9 6.9
Aggregates for regions and total emerging markets are weighted by IMF’s PPP based GDP figures. The data for India are for fiscal years.
(1) Weighted average of wages in the formal and informal private sector, and the public sector. (2) Average annual growth in nominal wages. (3) General compensation index (includes fringe benefits) (4) Wages for manufacturing workers. (5) Contractual wage increases at a national level in the public and private sectors (excludes fringe benefits). (6) Minimum wage (7) Public and private sector wages (8) Annual average of monthly average wages in the economy. (9) Based on remuneration per worker, index 2000=100. (10) For the private manufacturing sector for 2004 and 2005; gross earnings index (2010=100) for the overall industrial sector for the period after 2006. (11) Data are from the official average wage index published by the NBS which include the basic wages of government civil servants and staffs and workers of large SOEs, but exclude their allowances and the wages of township and village enterprises and private enterprises. We do not think the series accurately reflects the extent of wage increases in China. (12) For the manufacturing sector. (13) Salaries and wages in the manufacturing sector. (14) Nominal minimum wage in the non-agricultural sector. Figures from 2005 onwards also include cost of living allowance and daily equivalent of 13th month pay. (15) From Labor Force Survey: Average Monthly Wage in the private sector.
Source: the BLOOMBERG PROFESSIONAL™ service, National Statistical Offices, IMF World Economic Outlook, IHS Global Insight, Credit Suisse
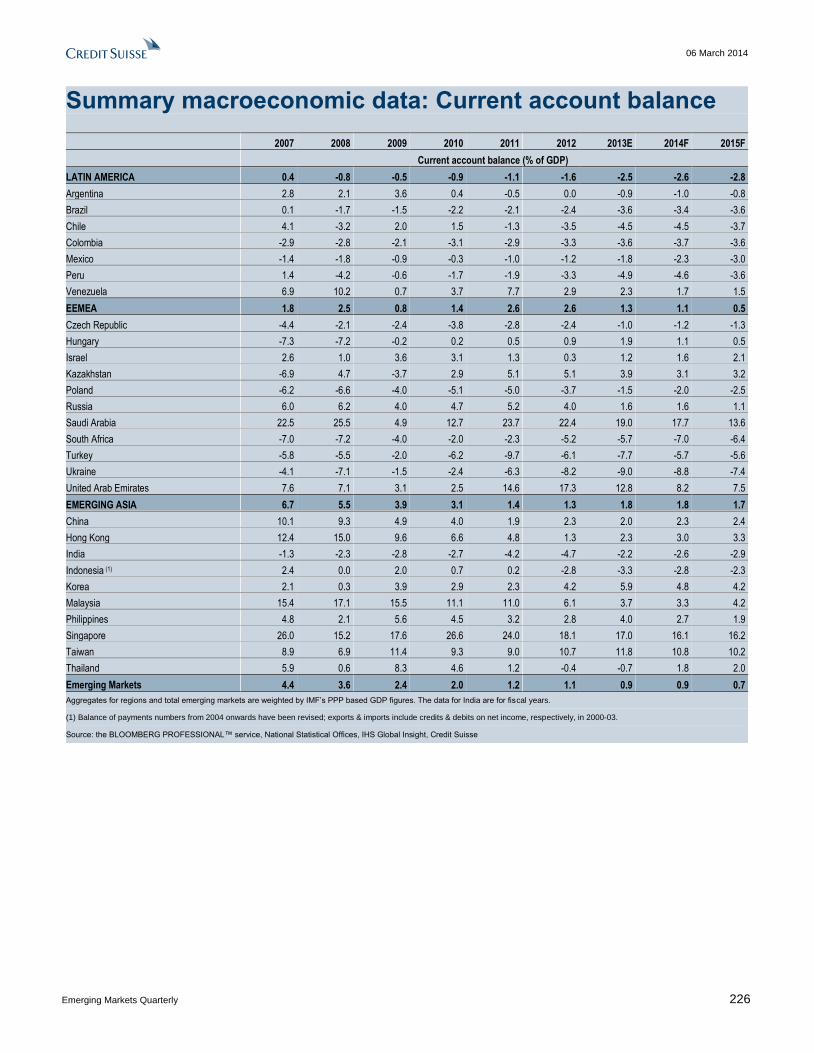
06 March 2014
Emerging Markets Quarterly 226
Summary macroeconomic data: Current account balance
2007 2008 2009 2010 2011 2012 2013E 2014F 2015F
Current account balance (% of GDP)
LATIN AMERICA 0.4 -0.8 -0.5 -0.9 -1.1 -1.6 -2.5 -2.6 -2.8
Argentina 2.8 2.1 3.6 0.4 -0.5 0.0 -0.9 -1.0 -0.8
Brazil 0.1 -1.7 -1.5 -2.2 -2.1 -2.4 -3.6 -3.4 -3.6
Chile 4.1 -3.2 2.0 1.5 -1.3 -3.5 -4.5 -4.5 -3.7
Colombia -2.9 -2.8 -2.1 -3.1 -2.9 -3.3 -3.6 -3.7 -3.6
Mexico -1.4 -1.8 -0.9 -0.3 -1.0 -1.2 -1.8 -2.3 -3.0
Peru 1.4 -4.2 -0.6 -1.7 -1.9 -3.3 -4.9 -4.6 -3.6
Venezuela 6.9 10.2 0.7 3.7 7.7 2.9 2.3 1.7 1.5
EEMEA 1.8 2.5 0.8 1.4 2.6 2.6 1.3 1.1 0.5
Czech Republic -4.4 -2.1 -2.4 -3.8 -2.8 -2.4 -1.0 -1.2 -1.3
Hungary -7.3 -7.2 -0.2 0.2 0.5 0.9 1.9 1.1 0.5
Israel 2.6 1.0 3.6 3.1 1.3 0.3 1.2 1.6 2.1
Kazakhstan -6.9 4.7 -3.7 2.9 5.1 5.1 3.9 3.1 3.2
Poland -6.2 -6.6 -4.0 -5.1 -5.0 -3.7 -1.5 -2.0 -2.5
Russia 6.0 6.2 4.0 4.7 5.2 4.0 1.6 1.6 1.1
Saudi Arabia 22.5 25.5 4.9 12.7 23.7 22.4 19.0 17.7 13.6
South Africa -7.0 -7.2 -4.0 -2.0 -2.3 -5.2 -5.7 -7.0 -6.4
Turkey -5.8 -5.5 -2.0 -6.2 -9.7 -6.1 -7.7 -5.7 -5.6
Ukraine -4.1 -7.1 -1.5 -2.4 -6.3 -8.2 -9.0 -8.8 -7.4
United Arab Emirates 7.6 7.1 3.1 2.5 14.6 17.3 12.8 8.2 7.5
EMERGING ASIA 6.7 5.5 3.9 3.1 1.4 1.3 1.8 1.8 1.7
China 10.1 9.3 4.9 4.0 1.9 2.3 2.0 2.3 2.4
Hong Kong 12.4 15.0 9.6 6.6 4.8 1.3 2.3 3.0 3.3
India -1.3 -2.3 -2.8 -2.7 -4.2 -4.7 -2.2 -2.6 -2.9
Indonesia (1) 2.4 0.0 2.0 0.7 0.2 -2.8 -3.3 -2.8 -2.3
Korea 2.1 0.3 3.9 2.9 2.3 4.2 5.9 4.8 4.2
Malaysia 15.4 17.1 15.5 11.1 11.0 6.1 3.7 3.3 4.2
Philippines 4.8 2.1 5.6 4.5 3.2 2.8 4.0 2.7 1.9
Singapore 26.0 15.2 17.6 26.6 24.0 18.1 17.0 16.1 16.2
Taiwan 8.9 6.9 11.4 9.3 9.0 10.7 11.8 10.8 10.2
Thailand 5.9 0.6 8.3 4.6 1.2 -0.4 -0.7 1.8 2.0
Emerging Markets 4.4 3.6 2.4 2.0 1.2 1.1 0.9 0.9 0.7
Aggregates for regions and total emerging markets are weighted by IMF’s PPP based GDP figures. The data for India are for fiscal years.
(1) Balance of payments numbers from 2004 onwards have been revised; exports & imports include credits & debits on net income, respectively, in 2000-03.
Source: the BLOOMBERG PROFESSIONAL™ service, National Statistical Offices, IHS Global Insight, Credit Suisse

06 March 2014
Emerging Markets Quarterly 227
Summary macroeconomic data: Exports
2007 2008 2009 2010 2011 2012 2013E 2014F 2015F
Exports of goods and services (% of GDP)
LATIN AMERICA 22.6 22.5 19.5 20.9 22.2 22.0 21.8 23.9 24.3
Argentina 25.4 25.2 21.7 22.2 22.4 20.2 20.2 27.2 30.7
Brazil 13.5 13.8 11.1 10.9 11.9 12.5 12.6 13.7 14.2
Chile 44.8 42.0 37.1 37.6 37.7 33.9 32.2 35.4 34.1
Colombia 16.5 17.5 16.2 15.8 18.8 18.0 17.4 18.7 18.4
Mexico 27.7 28.1 27.3 29.8 31.2 32.6 32.4 33.0 31.9
Peru 29.1 27.3 24.0 25.5 28.7 25.7 23.1 24.0 25.6
Venezuela 31.2 30.8 18.2 28.6 30.0 26.1 26.3 33.6 36.2
EEMEA 39.7 41.3 36.9 38.4 41.1 41.4 40.9 42.4 41.9
Czech Republic 68.3 64.7 59.7 67.9 73.7 78.3 79.9 81.9 80.7
Hungary 80.8 81.3 77.3 84.7 91.3 94.3 96.1 95.5 94.6
Israel 40.6 38.5 33.2 35.0 35.5 36.2 32.4 30.3 30.5
Kazakhstan 49.4 57.2 42.0 44.0 44.4 46.3 49.9 44.3 41.5
Poland 40.8 40.0 39.4 42.2 45.1 46.7 49.2 50.9 52.6
Russia 30.3 31.5 28.2 29.2 30.3 29.4 28.3 30.7 30.4
Saudi Arabia 60.0 62.1 47.1 49.7 56.2 54.4 52.1 50.5 47.3
South Africa 31.5 35.9 27.3 28.4 30.6 29.9 31.2 29.6 27.8
Turkey 22.4 24.2 23.6 21.5 23.7 26.1 25.0 28.5 28.2
Ukraine 44.7 47.7 47.7 54.0 54.5 51.7 47.7 57.7 59.6
United Arab Emirates 72.4 78.9 79.3 78.4 90.3 95.2 96.9 97.0 98.5
EMERGING ASIA 45.2 45.1 36.7 39.8 40.1 38.6 38.2 38.1 37.6
China 38.4 35.0 26.7 29.2 28.6 27.2 26.3 25.4 24.1
Hong Kong 207.3 208.8 191.2 219.4 225.5 225.5 230.0 238.2 249.0
India 20.6 23.7 20.3 22.3 23.9 24.3 26.2 27.2 27.9
Indonesia (1) 30.3 30.5 24.7 24.6 26.2 24.1 23.7 24.2 23.3
Korea 44.1 56.5 52.0 54.2 58.0 58.0 57.1 54.3 53.7
Malaysia 106.2 99.5 91.4 93.7 91.6 87.5 81.9 83.0 81.8
Philippines 39.7 33.4 28.9 32.5 28.6 25.9 24.9 25.3 24.5
Singapore 216.7 232.4 194.0 201.8 201.3 196.7 195.2 197.5 197.6
Taiwan 71.2 72.9 62.3 73.4 76.2 73.9 73.1 74.4 75.1
Thailand 68.6 75.8 68.5 71.4 78.2 75.3 72.7 75.8 73.9
Emerging Markets 39.5 39.9 33.6 36.1 37.2 36.3 35.9 36.5 36.2
Aggregates for regions and total emerging markets are weighted by IMF’s PPP based GDP figures. The data for India are for fiscal years.
(1) Balance of payments numbers from 2004 onwards have been revised; exports & imports include credits & debits on net income, respectively, in 2000-03.
Source: the BLOOMBERG PROFESSIONAL™ service, National Statistical Offices, IHS Global Insight, Credit Suisse
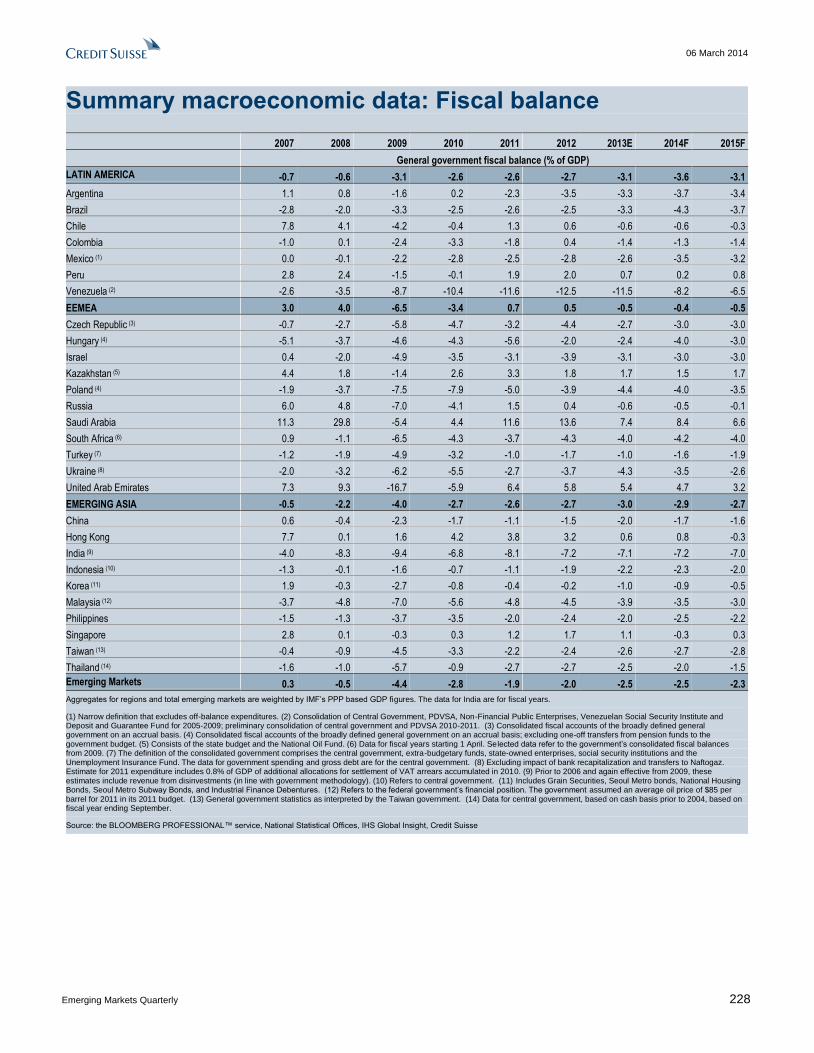
06 March 2014
Emerging Markets Quarterly 228
Summary macroeconomic data: Fiscal balance
2007 2008 2009 2010 2011 2012 2013E 2014F 2015F
General government fiscal balance (% of GDP) LATIN AMERICA
-0.7 -0.6 -3.1 -2.6 -2.6 -2.7 -3.1 -3.6 -3.1
Argentina 1.1 0.8 -1.6 0.2 -2.3 -3.5 -3.3 -3.7 -3.4
Brazil -2.8 -2.0 -3.3 -2.5 -2.6 -2.5 -3.3 -4.3 -3.7
Chile 7.8 4.1 -4.2 -0.4 1.3 0.6 -0.6 -0.6 -0.3
Colombia -1.0 0.1 -2.4 -3.3 -1.8 0.4 -1.4 -1.3 -1.4
Mexico (1) 0.0 -0.1 -2.2 -2.8 -2.5 -2.8 -2.6 -3.5 -3.2
Peru 2.8 2.4 -1.5 -0.1 1.9 2.0 0.7 0.2 0.8
Venezuela (2) -2.6 -3.5 -8.7 -10.4 -11.6 -12.5 -11.5 -8.2 -6.5
EEMEA 3.0 4.0 -6.5 -3.4 0.7 0.5 -0.5 -0.4 -0.5
Czech Republic (3) -0.7 -2.7 -5.8 -4.7 -3.2 -4.4 -2.7 -3.0 -3.0
Hungary (4) -5.1 -3.7 -4.6 -4.3 -5.6 -2.0 -2.4 -4.0 -3.0
Israel 0.4 -2.0 -4.9 -3.5 -3.1 -3.9 -3.1 -3.0 -3.0
Kazakhstan (5) 4.4 1.8 -1.4 2.6 3.3 1.8 1.7 1.5 1.7
Poland (4) -1.9 -3.7 -7.5 -7.9 -5.0 -3.9 -4.4 -4.0 -3.5
Russia 6.0 4.8 -7.0 -4.1 1.5 0.4 -0.6 -0.5 -0.1
Saudi Arabia 11.3 29.8 -5.4 4.4 11.6 13.6 7.4 8.4 6.6
South Africa (6) 0.9 -1.1 -6.5 -4.3 -3.7 -4.3 -4.0 -4.2 -4.0
Turkey (7) -1.2 -1.9 -4.9 -3.2 -1.0 -1.7 -1.0 -1.6 -1.9
Ukraine (8) -2.0 -3.2 -6.2 -5.5 -2.7 -3.7 -4.3 -3.5 -2.6
United Arab Emirates 7.3 9.3 -16.7 -5.9 6.4 5.8 5.4 4.7 3.2
EMERGING ASIA -0.5 -2.2 -4.0 -2.7 -2.6 -2.7 -3.0 -2.9 -2.7
China 0.6 -0.4 -2.3 -1.7 -1.1 -1.5 -2.0 -1.7 -1.6
Hong Kong 7.7 0.1 1.6 4.2 3.8 3.2 0.6 0.8 -0.3
India (9) -4.0 -8.3 -9.4 -6.8 -8.1 -7.2 -7.1 -7.2 -7.0
Indonesia (10) -1.3 -0.1 -1.6 -0.7 -1.1 -1.9 -2.2 -2.3 -2.0
Korea (11) 1.9 -0.3 -2.7 -0.8 -0.4 -0.2 -1.0 -0.9 -0.5
Malaysia (12) -3.7 -4.8 -7.0 -5.6 -4.8 -4.5 -3.9 -3.5 -3.0
Philippines -1.5 -1.3 -3.7 -3.5 -2.0 -2.4 -2.0 -2.5 -2.2
Singapore 2.8 0.1 -0.3 0.3 1.2 1.7 1.1 -0.3 0.3
Taiwan (13) -0.4 -0.9 -4.5 -3.3 -2.2 -2.4 -2.6 -2.7 -2.8
Thailand (14) -1.6 -1.0 -5.7 -0.9 -2.7 -2.7 -2.5 -2.0 -1.5
Emerging Markets 0.3 -0.5 -4.4 -2.8 -1.9 -2.0 -2.5 -2.5 -2.3
Aggregates for regions and total emerging markets are weighted by IMF’s PPP based GDP figures. The data for India are for fiscal years.
(1) Narrow definition that excludes off-balance expenditures. (2) Consolidation of Central Government, PDVSA, Non-Financial Public Enterprises, Venezuelan Social Security Institute and Deposit and Guarantee Fund for 2005-2009; preliminary consolidation of central government and PDVSA 2010-2011. (3) Consolidated fiscal accounts of the broadly defined general government on an accrual basis. (4) Consolidated fiscal accounts of the broadly defined general government on an accrual basis; excluding one-off transfers from pension funds to the government budget. (5) Consists of the state budget and the National Oil Fund. (6) Data for fiscal years starting 1 April. Se lected data refer to the government’s consolidated fiscal balances from 2009. (7) The definition of the consolidated government comprises the central government, extra-budgetary funds, state-owned enterprises, social security institutions and the Unemployment Insurance Fund. The data for government spending and gross debt are for the central government. (8) Excluding impact of bank recapitalization and transfers to Naftogaz. Estimate for 2011 expenditure includes 0.8% of GDP of additional allocations for settlement of VAT arrears accumulated in 2010. (9) Prior to 2006 and again effective from 2009, these estimates include revenue from disinvestments (in line with government methodology). (10) Refers to central government. (11) Includes Grain Securities, Seoul Metro bonds, National Housing Bonds, Seoul Metro Subway Bonds, and Industrial Finance Debentures. (12) Refers to the federal government’s financial position. The government assumed an average oil price of $85 per barrel for 2011 in its 2011 budget. (13) General government statistics as interpreted by the Taiwan government. (14) Data for central government, based on cash basis prior to 2004, based on fiscal year ending September.
Source: the BLOOMBERG PROFESSIONAL™ service, National Statistical Offices, IHS Global Insight, Credit Suisse
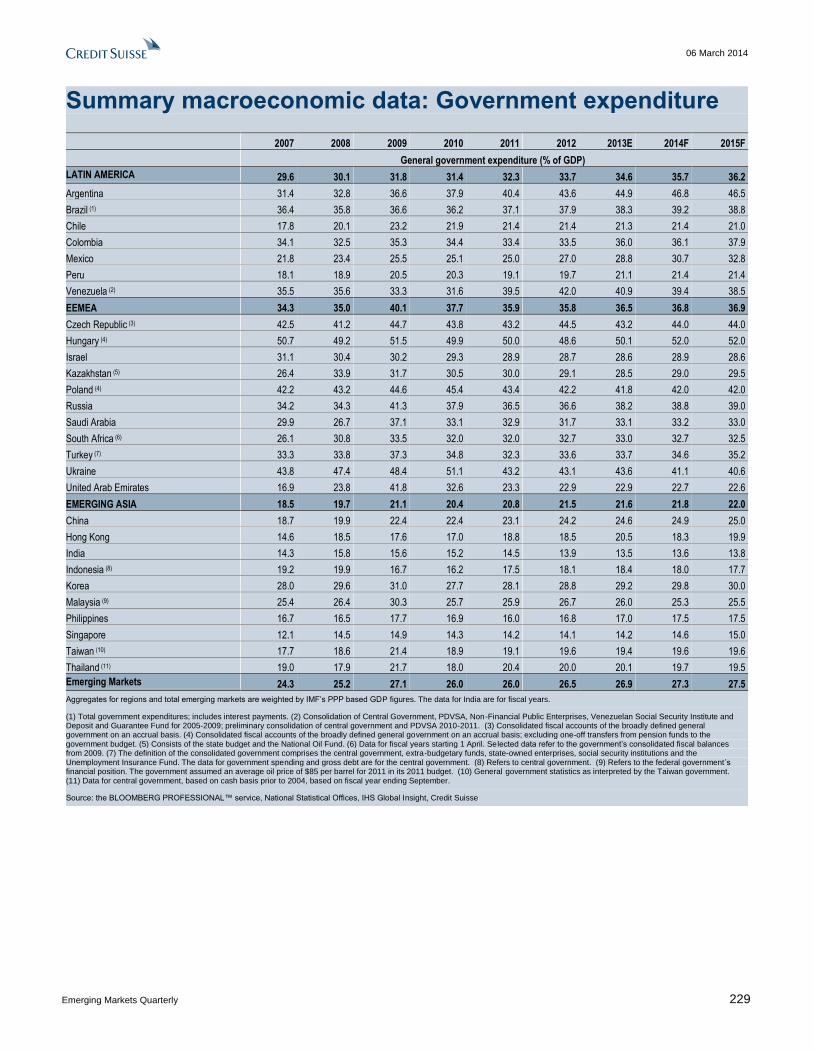
06 March 2014
Emerging Markets Quarterly 229
Summary macroeconomic data: Government expenditure
2007 2008 2009 2010 2011 2012 2013E 2014F 2015F
General government expenditure (% of GDP)
LATIN AMERICA 29.6 30.1 31.8 31.4 32.3 33.7 34.6 35.7 36.2
Argentina 31.4 32.8 36.6 37.9 40.4 43.6 44.9 46.8 46.5
Brazil (1) 36.4 35.8 36.6 36.2 37.1 37.9 38.3 39.2 38.8
Chile 17.8 20.1 23.2 21.9 21.4 21.4 21.3 21.4 21.0
Colombia 34.1 32.5 35.3 34.4 33.4 33.5 36.0 36.1 37.9
Mexico 21.8 23.4 25.5 25.1 25.0 27.0 28.8 30.7 32.8
Peru 18.1 18.9 20.5 20.3 19.1 19.7 21.1 21.4 21.4
Venezuela (2) 35.5 35.6 33.3 31.6 39.5 42.0 40.9 39.4 38.5
EEMEA 34.3 35.0 40.1 37.7 35.9 35.8 36.5 36.8 36.9
Czech Republic (3) 42.5 41.2 44.7 43.8 43.2 44.5 43.2 44.0 44.0
Hungary (4) 50.7 49.2 51.5 49.9 50.0 48.6 50.1 52.0 52.0
Israel 31.1 30.4 30.2 29.3 28.9 28.7 28.6 28.9 28.6
Kazakhstan (5) 26.4 33.9 31.7 30.5 30.0 29.1 28.5 29.0 29.5
Poland (4) 42.2 43.2 44.6 45.4 43.4 42.2 41.8 42.0 42.0
Russia 34.2 34.3 41.3 37.9 36.5 36.6 38.2 38.8 39.0
Saudi Arabia 29.9 26.7 37.1 33.1 32.9 31.7 33.1 33.2 33.0
South Africa (6) 26.1 30.8 33.5 32.0 32.0 32.7 33.0 32.7 32.5
Turkey (7) 33.3 33.8 37.3 34.8 32.3 33.6 33.7 34.6 35.2
Ukraine 43.8 47.4 48.4 51.1 43.2 43.1 43.6 41.1 40.6
United Arab Emirates 16.9 23.8 41.8 32.6 23.3 22.9 22.9 22.7 22.6
EMERGING ASIA 18.5 19.7 21.1 20.4 20.8 21.5 21.6 21.8 22.0
China 18.7 19.9 22.4 22.4 23.1 24.2 24.6 24.9 25.0
Hong Kong 14.6 18.5 17.6 17.0 18.8 18.5 20.5 18.3 19.9
India 14.3 15.8 15.6 15.2 14.5 13.9 13.5 13.6 13.8
Indonesia (8) 19.2 19.9 16.7 16.2 17.5 18.1 18.4 18.0 17.7
Korea 28.0 29.6 31.0 27.7 28.1 28.8 29.2 29.8 30.0
Malaysia (9) 25.4 26.4 30.3 25.7 25.9 26.7 26.0 25.3 25.5
Philippines 16.7 16.5 17.7 16.9 16.0 16.8 17.0 17.5 17.5
Singapore 12.1 14.5 14.9 14.3 14.2 14.1 14.2 14.6 15.0
Taiwan (10) 17.7 18.6 21.4 18.9 19.1 19.6 19.4 19.6 19.6
Thailand (11) 19.0 17.9 21.7 18.0 20.4 20.0 20.1 19.7 19.5
Emerging Markets 24.3 25.2 27.1 26.0 26.0 26.5 26.9 27.3 27.5
Aggregates for regions and total emerging markets are weighted by IMF’s PPP based GDP figures. The data for India are for fiscal years.
(1) Total government expenditures; includes interest payments. (2) Consolidation of Central Government, PDVSA, Non-Financial Public Enterprises, Venezuelan Social Security Institute and Deposit and Guarantee Fund for 2005-2009; preliminary consolidation of central government and PDVSA 2010-2011. (3) Consolidated fiscal accounts of the broadly defined general government on an accrual basis. (4) Consolidated fiscal accounts of the broadly defined general government on an accrual basis; excluding one-off transfers from pension funds to the government budget. (5) Consists of the state budget and the National Oil Fund. (6) Data for fiscal years starting 1 April. Se lected data refer to the government’s consolidated fiscal balances from 2009. (7) The definition of the consolidated government comprises the central government, extra-budgetary funds, state-owned enterprises, social security institutions and the Unemployment Insurance Fund. The data for government spending and gross debt are for the central government. (8) Refers to central government. (9) Refers to the federal government ’s financial position. The government assumed an average oil price of $85 per barrel for 2011 in its 2011 budget. (10) General government statistics as interpreted by the Taiwan government. (11) Data for central government, based on cash basis prior to 2004, based on fiscal year ending September.
Source: the BLOOMBERG PROFESSIONAL™ service, National Statistical Offices, IHS Global Insight, Credit Suisse
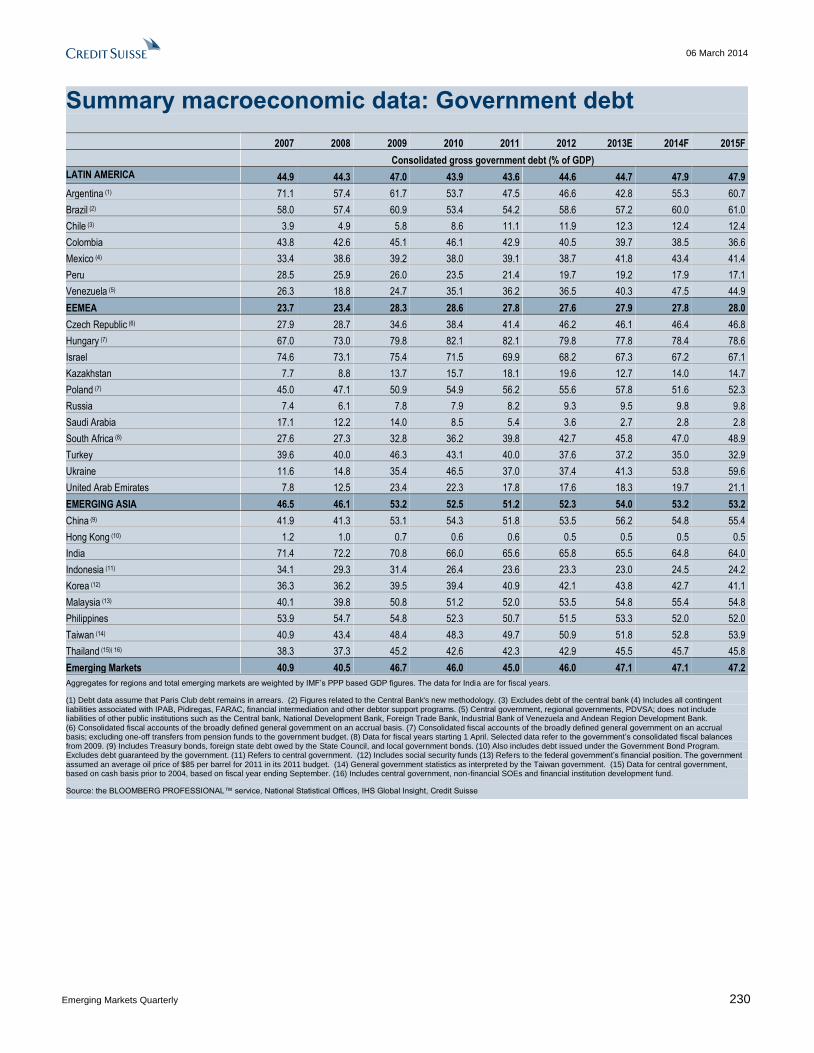
06 March 2014
Emerging Markets Quarterly 230
Summary macroeconomic data: Government debt
2007 2008 2009 2010 2011 2012 2013E 2014F 2015F
Consolidated gross government debt (% of GDP)
LATIN AMERICA 44.9 44.3 47.0 43.9 43.6 44.6 44.7 47.9 47.9
Argentina (1) 71.1 57.4 61.7 53.7 47.5 46.6 42.8 55.3 60.7
Brazil (2) 58.0 57.4 60.9 53.4 54.2 58.6 57.2 60.0 61.0
Chile (3) 3.9 4.9 5.8 8.6 11.1 11.9 12.3 12.4 12.4
Colombia 43.8 42.6 45.1 46.1 42.9 40.5 39.7 38.5 36.6
Mexico (4) 33.4 38.6 39.2 38.0 39.1 38.7 41.8 43.4 41.4
Peru 28.5 25.9 26.0 23.5 21.4 19.7 19.2 17.9 17.1
Venezuela (5) 26.3 18.8 24.7 35.1 36.2 36.5 40.3 47.5 44.9
EEMEA 23.7 23.4 28.3 28.6 27.8 27.6 27.9 27.8 28.0
Czech Republic (6) 27.9 28.7 34.6 38.4 41.4 46.2 46.1 46.4 46.8
Hungary (7) 67.0 73.0 79.8 82.1 82.1 79.8 77.8 78.4 78.6
Israel 74.6 73.1 75.4 71.5 69.9 68.2 67.3 67.2 67.1
Kazakhstan 7.7 8.8 13.7 15.7 18.1 19.6 12.7 14.0 14.7
Poland (7) 45.0 47.1 50.9 54.9 56.2 55.6 57.8 51.6 52.3
Russia 7.4 6.1 7.8 7.9 8.2 9.3 9.5 9.8 9.8
Saudi Arabia 17.1 12.2 14.0 8.5 5.4 3.6 2.7 2.8 2.8
South Africa (8) 27.6 27.3 32.8 36.2 39.8 42.7 45.8 47.0 48.9
Turkey 39.6 40.0 46.3 43.1 40.0 37.6 37.2 35.0 32.9
Ukraine 11.6 14.8 35.4 46.5 37.0 37.4 41.3 53.8 59.6
United Arab Emirates 7.8 12.5 23.4 22.3 17.8 17.6 18.3 19.7 21.1
EMERGING ASIA 46.5 46.1 53.2 52.5 51.2 52.3 54.0 53.2 53.2
China (9) 41.9 41.3 53.1 54.3 51.8 53.5 56.2 54.8 55.4
Hong Kong (10) 1.2 1.0 0.7 0.6 0.6 0.5 0.5 0.5 0.5
India 71.4 72.2 70.8 66.0 65.6 65.8 65.5 64.8 64.0
Indonesia (11) 34.1 29.3 31.4 26.4 23.6 23.3 23.0 24.5 24.2
Korea (12) 36.3 36.2 39.5 39.4 40.9 42.1 43.8 42.7 41.1
Malaysia (13) 40.1 39.8 50.8 51.2 52.0 53.5 54.8 55.4 54.8
Philippines 53.9 54.7 54.8 52.3 50.7 51.5 53.3 52.0 52.0
Taiwan (14) 40.9 43.4 48.4 48.3 49.7 50.9 51.8 52.8 53.9
Thailand (15)( 16) 38.3 37.3 45.2 42.6 42.3 42.9 45.5 45.7 45.8
Emerging Markets 40.9 40.5 46.7 46.0 45.0 46.0 47.1 47.1 47.2
Aggregates for regions and total emerging markets are weighted by IMF’s PPP based GDP figures. The data for India are for fiscal years.
(1) Debt data assume that Paris Club debt remains in arrears. (2) Figures related to the Central Bank's new methodology. (3) Excludes debt of the central bank (4) Includes all contingent liabilities associated with IPAB, Pidiregas, FARAC, financial intermediation and other debtor support programs. (5) Central government, regional governments, PDVSA; does not include liabilities of other public institutions such as the Central bank, National Development Bank, Foreign Trade Bank, Industrial Bank of Venezuela and Andean Region Development Bank. (6) Consolidated fiscal accounts of the broadly defined general government on an accrual basis. (7) Consolidated fiscal accounts of the broadly defined general government on an accrual basis; excluding one-off transfers from pension funds to the government budget. (8) Data for fiscal years starting 1 April. Selected data refer to the government’s consolidated fiscal balances from 2009. (9) Includes Treasury bonds, foreign state debt owed by the State Council, and local government bonds. (10) Also includes debt issued under the Government Bond Program. Excludes debt guaranteed by the government. (11) Refers to central government. (12) Includes social security funds (13) Refers to the federal government’s financial position. The government assumed an average oil price of $85 per barrel for 2011 in its 2011 budget. (14) General government statistics as interpreted by the Taiwan government. (15) Data for central government, based on cash basis prior to 2004, based on fiscal year ending September. (16) Includes central government, non-financial SOEs and financial institution development fund.
Source: the BLOOMBERG PROFESSIONAL™ service, National Statistical Offices, IHS Global Insight, Credit Suisse

06 March 2014
Emerging Markets Quarterly 231
Summary macroeconomic data: Foreign debt
2007 2008 2009 2010 2011 2012 2013E 2014F 2015F
Total foreign debt (% of GDP)
LATIN AMERICA 21.7 19.6 23.0 22.8 22.0 23.3 24.5 27.5 27.3
Argentina 54.2 43.6 43.4 36.9 33.0 31.1 30.4 41.8 44.7
Brazil (1) 17.6 15.9 17.1 16.4 16.3 19.5 21.8 24.0 23.9
Chile 30.8 35.6 41.7 38.8 39.3 43.9 46.9 52.1 47.9
Colombia 21.5 19.0 22.7 22.4 22.8 21.4 22.8 23.5 22.1
Mexico 12.3 11.8 18.5 18.8 18.0 19.1 19.3 19.5 18.3
Peru 30.9 27.5 27.6 28.4 27.2 29.5 29.2 29.4 28.1
Venezuela 24.4 20.8 24.9 39.3 35.1 31.2 33.0 41.4 45.4
EEMEA 42.5 38.3 49.2 45.0 40.6 43.6 44.1 46.9 46.0
Czech Republic 41.9 36.7 44.9 47.4 43.6 51.9 50.1 50.6 48.2
Hungary 130.0 144.5 189.4 162.2 152.2 162.8 140.2 137.2 131.4
Israel 51.9 41.5 45.3 46.5 40.8 37.6 35.1 32.5 31.4
Kazakhstan 92.3 82.5 100.5 81.7 71.1 62.5 59.7 56.4 55.6
Poland 54.9 46.4 65.0 67.5 62.7 74.6 69.3 66.5 61.8
Russia 35.7 28.9 38.2 32.1 28.7 31.2 34.3 38.4 39.0
Saudi Arabia 17.5 15.3 20.0 17.1 13.0 11.3 11.5 11.2 10.9
South Africa 26.4 27.4 29.0 30.5 29.3 37.2 43.2 48.8 48.4
Turkey 38.7 38.2 43.7 39.9 39.2 42.9 45.9 50.3 47.1
Ukraine 55.9 56.7 90.9 91.4 77.4 77.5 76.3 98.4 105.4
United Arab Emirates 51.7 46.3 58.9 51.8 43.9 43.9 41.8 39.8 37.7
EMERGING ASIA 18.5 16.6 17.5 17.0 17.0 17.3 17.3 16.3 15.1
China 11.1 8.6 8.6 9.2 9.5 8.9 8.4 7.4 6.4
Hong Kong 41.3 22.9 37.1 44.2 50.7 51.3 49.1 47.3 46.6
India 18.1 18.3 19.1 18.6 18.4 21.1 22.6 21.7 20.2
Indonesia 32.7 30.4 32.1 28.5 26.7 28.8 31.6 32.4 30.3
Korea 31.8 34.2 41.6 35.6 35.8 36.0 34.4 31.6 29.9
Malaysia 30.4 30.6 35.2 29.9 28.2 27.6 26.8 26.8 26.8
Philippines 37.1 31.3 32.6 30.1 26.9 24.1 21.7 19.8 17.0
Taiwan 24.0 22.6 21.7 23.7 26.4 26.3 27.2 28.1 28.2
Thailand 28.1 27.6 28.5 30.4 31.2 36.4 37.0 34.0 33.0
Emerging Markets 24.7 22.2 25.3 23.9 22.8 23.7 24.0 24.5 23.6
Aggregates for regions and total emerging markets are weighted by IMF’s PPP based GDP figures. The data for India are for fiscal years.
(1) Included intercompany loans.
Source: the BLOOMBERG PROFESSIONAL™ service, National Statistical Offices, IHS Global Insight, Credit Suisse
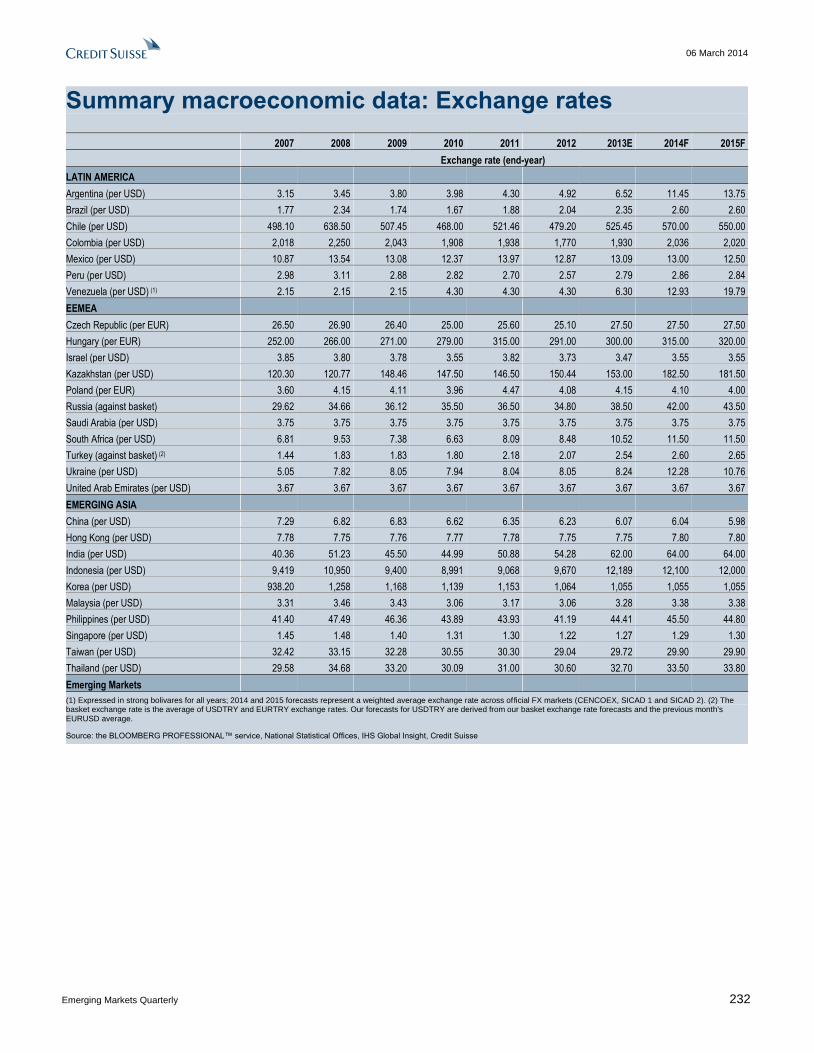
06 March 2014
Emerging Markets Quarterly 232
Summary macroeconomic data: Exchange rates
2007 2008 2009 2010 2011 2012 2013E 2014F 2015F
Exchange rate (end-year)
LATIN AMERICA
Argentina (per USD) 3.15 3.45 3.80 3.98 4.30 4.92 6.52 11.45 13.75
Brazil (per USD) 1.77 2.34 1.74 1.67 1.88 2.04 2.35 2.60 2.60
Chile (per USD) 498.10 638.50 507.45 468.00 521.46 479.20 525.45 570.00 550.00
Colombia (per USD) 2,018 2,250 2,043 1,908 1,938 1,770 1,930 2,036 2,020
Mexico (per USD) 10.87 13.54 13.08 12.37 13.97 12.87 13.09 13.00 12.50
Peru (per USD) 2.98 3.11 2.88 2.82 2.70 2.57 2.79 2.86 2.84
Venezuela (per USD) (1) 2.15 2.15 2.15 4.30 4.30 4.30 6.30 12.93 19.79
EEMEA
Czech Republic (per EUR) 26.50 26.90 26.40 25.00 25.60 25.10 27.50 27.50 27.50
Hungary (per EUR) 252.00 266.00 271.00 279.00 315.00 291.00 300.00 315.00 320.00
Israel (per USD) 3.85 3.80 3.78 3.55 3.82 3.73 3.47 3.55 3.55
Kazakhstan (per USD) 120.30 120.77 148.46 147.50 146.50 150.44 153.00 182.50 181.50
Poland (per EUR) 3.60 4.15 4.11 3.96 4.47 4.08 4.15 4.10 4.00
Russia (against basket) 29.62 34.66 36.12 35.50 36.50 34.80 38.50 42.00 43.50
Saudi Arabia (per USD) 3.75 3.75 3.75 3.75 3.75 3.75 3.75 3.75 3.75
South Africa (per USD) 6.81 9.53 7.38 6.63 8.09 8.48 10.52 11.50 11.50
Turkey (against basket) (2) 1.44 1.83 1.83 1.80 2.18 2.07 2.54 2.60 2.65
Ukraine (per USD) 5.05 7.82 8.05 7.94 8.04 8.05 8.24 12.28 10.76
United Arab Emirates (per USD) 3.67 3.67 3.67 3.67 3.67 3.67 3.67 3.67 3.67
EMERGING ASIA
China (per USD) 7.29 6.82 6.83 6.62 6.35 6.23 6.07 6.04 5.98
Hong Kong (per USD) 7.78 7.75 7.76 7.77 7.78 7.75 7.75 7.80 7.80
India (per USD) 40.36 51.23 45.50 44.99 50.88 54.28 62.00 64.00 64.00
Indonesia (per USD) 9,419 10,950 9,400 8,991 9,068 9,670 12,189 12,100 12,000
Korea (per USD) 938.20 1,258 1,168 1,139 1,153 1,064 1,055 1,055 1,055
Malaysia (per USD) 3.31 3.46 3.43 3.06 3.17 3.06 3.28 3.38 3.38
Philippines (per USD) 41.40 47.49 46.36 43.89 43.93 41.19 44.41 45.50 44.80
Singapore (per USD) 1.45 1.48 1.40 1.31 1.30 1.22 1.27 1.29 1.30
Taiwan (per USD) 32.42 33.15 32.28 30.55 30.30 29.04 29.72 29.90 29.90
Thailand (per USD) 29.58 34.68 33.20 30.09 31.00 30.60 32.70 33.50 33.80
Emerging Markets
(1) Expressed in strong bolivares for all years; 2014 and 2015 forecasts represent a weighted average exchange rate across official FX markets (CENCOEX, SICAD 1 and SICAD 2). (2) The basket exchange rate is the average of USDTRY and EURTRY exchange rates. Our forecasts for USDTRY are derived from our basket exchange rate forecasts and the previous month's EURUSD average.
Source: the BLOOMBERG PROFESSIONAL™ service, National Statistical Offices, IHS Global Insight, Credit Suisse

06 March 2014
Emerging Markets Quarterly 233
Summary macroeconomic data: Interest rates
2007 2008 2009 2010 2011 2012 2013E 2014F 2015F
Interest rate (end-year, %)
LATIN AMERICA 9.35 11.41 7.11 8.03 8.37 6.92 7.54 7.85 8.37
Argentina - Central bank's 7 day repo rate 10.30 13.00 11.50 11.50 11.50 11.50 11.50 11.50 11.50
Brazil - Selic interest rate 11.25 13.75 8.75 10.75 11.00 7.25 10.00 10.75 12.00
Chile - Monetary policy rate 6.00 8.25 0.50 3.25 5.25 5.00 4.50 3.50 3.50
Colombia - Reference rate 9.50 9.50 3.50 3.00 4.75 4.25 3.25 4.50 5.00
Mexico - Reference rate 7.50 8.25 4.50 4.50 4.50 4.50 3.50 3.50 3.50
Peru - Reference rate 5.00 6.50 1.25 3.00 4.25 4.25 4.00 4.00 4.50
Venezuela - 90 day deposit rate 10.89 17.60 15.00 15.00 14.50 14.55 14.73 14.50 14.50
EEMEA 7.83 8.59 5.16 4.44 4.58 4.39 3.90 5.14 5.47
Czech Republic - 2-week repo rate 3.50 2.25 1.00 0.75 0.75 0.05 0.05 0.05 0.25
Hungary - 2-week deposit rate 7.50 10.00 6.00 5.75 7.00 5.75 3.00 2.70 4.00
Israel - Base rate 4.00 2.50 1.00 2.00 2.75 1.75 1.00 0.50 1.50
Kazakhstan - Refinancing rate (1) 11.00 10.50 7.00 7.00 7.50 5.50 5.50 5.50 5.50
Poland - 1-week reference rate 5.00 5.00 3.50 3.50 4.50 4.25 2.50 2.50 3.50
Russia - 1-week repo rate 6.00 9.00 6.00 5.00 5.25 5.50 5.50 6.50 6.00
Saudi Arabia - 3-month deposit rate 4.79 2.89 1.33 0.74 0.69 0.92 0.95 0.88 1.32
South Africa - Repo rate 11.00 11.50 7.00 5.50 5.50 5.00 5.00 6.50 7.50
Turkey - 1-week repo rate (2) 16.73 15.64 7.11 6.50 5.75 5.50 4.50 10.00 11.00
Ukraine - Discount rate 8.00 12.00 10.25 7.75 7.75 7.50 6.50 6.50 6.50
United Arab Emirates - 3-month deposit rate 5.14 2.82 2.40 2.22 1.72 1.42 0.97 0.97 1.70
EMERGING ASIA 4.80 2.77 2.36 4.35 5.26 4.16 5.06 5.43 5.55
China - 3-month interbank rate 4.43 1.90 1.83 4.62 5.47 3.91 5.30 5.80 5.95
Hong Kong - 3-month HIBOR 3.45 0.95 0.13 0.30 0.30 0.40 0.40 0.40 0.80
India - Reverse repo rate (3) 6.00 3.50 3.50 5.75 7.50 6.50 7.00 7.75 7.75
Indonesia - Overnight rate (4) 8.00 9.25 6.50 6.50 6.00 5.75 7.50 6.50 6.50
Korea - Overnight base rate 5.00 3.00 2.00 2.50 3.25 2.75 2.50 2.50 2.50
Malaysia - Overnight policy rate (5) 3.50 2.50 2.00 2.75 3.00 3.00 3.00 3.25 3.50
Philippines - Overnight borrowing rate 5.45 5.86 4.00 4.00 4.50 3.50 3.50 3.50 4.00
Singapore - 3-month SIBOR 2.38 1.00 0.69 0.44 0.38 0.38 0.40 0.50 0.80
Taiwan - Overnight rate 2.08 0.87 0.11 0.25 0.40 0.40 0.40 0.40 0.40
Thailand - Overnight repo rate (6) 3.25 2.75 1.25 2.00 3.25 2.75 2.25 2.00 2.50
Emerging Markets 6.38 5.75 3.83 5.03 5.67 4.69 5.26 5.80 6.02
Aggregates for regions and total emerging markets are weighted by IMF’s PPP based GDP figures. The data for India are for fiscal years.
(1) The central bank 1-month deposit rate equals half of the refinancing rate and until the banking crisis in the summer of 2007 represented a more effective policy instrument. (2) One-week repo rate has been the central bank's policy rate since 18 May 2010 but it has temporarily lost relevance between late 2010 and early 2014. (3) The RBI uses a mix of instruments, such as the repo rate, reverse repo rate, CRR (cash reserve ratio), etc. (4) BI changed its policy target from 1m SBI rate to overnight rate in 2008. (5) BNM changed the policy rate from the intervention rate to the overnight rate in May 2004. (6) Through 2006, the policy rate was the 14-day repo rate.
Source: the BLOOMBERG PROFESSIONAL™ service, National Statistical Offices, IHS Global Insight, Credit Suisse
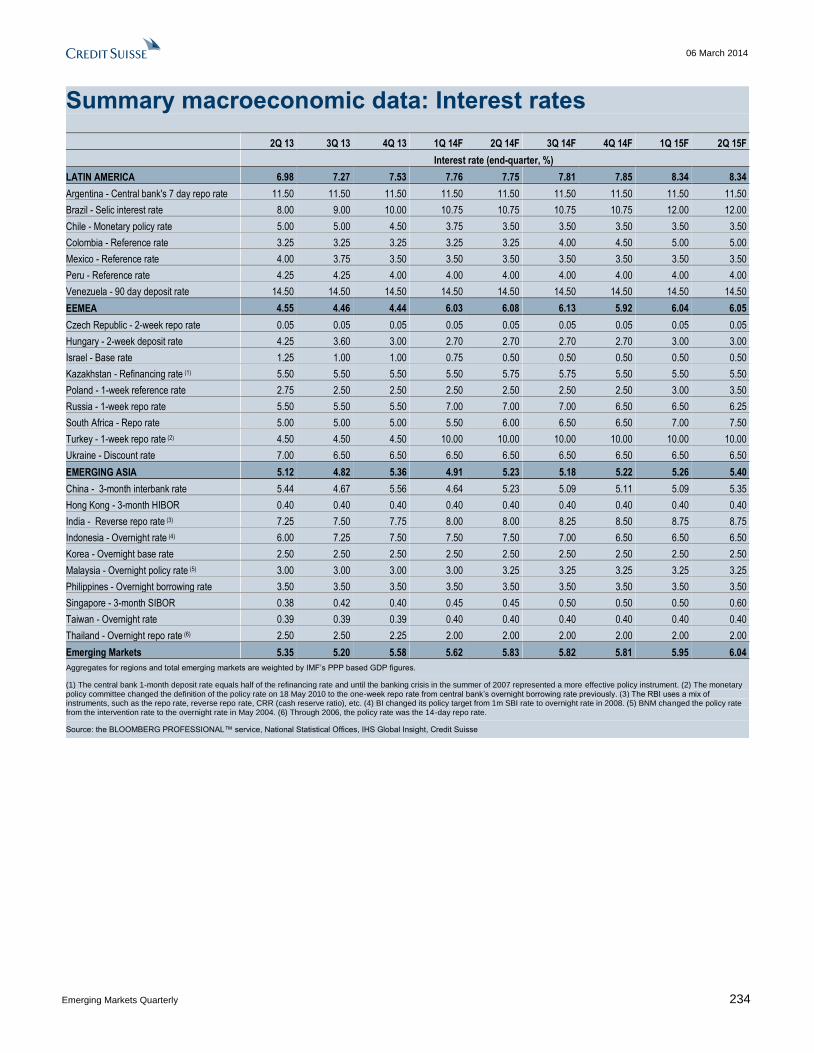
06 March 2014
Emerging Markets Quarterly 234
Summary macroeconomic data: Interest rates
2Q 13 3Q 13 4Q 13 1Q 14F 2Q 14F 3Q 14F 4Q 14F 1Q 15F 2Q 15F
Interest rate (end-quarter, %)
LATIN AMERICA 6.98 7.27 7.53 7.76 7.75 7.81 7.85 8.34 8.34
Argentina - Central bank's 7 day repo rate 11.50 11.50 11.50 11.50 11.50 11.50 11.50 11.50 11.50
Brazil - Selic interest rate 8.00 9.00 10.00 10.75 10.75 10.75 10.75 12.00 12.00
Chile - Monetary policy rate 5.00 5.00 4.50 3.75 3.50 3.50 3.50 3.50 3.50
Colombia - Reference rate 3.25 3.25 3.25 3.25 3.25 4.00 4.50 5.00 5.00
Mexico - Reference rate 4.00 3.75 3.50 3.50 3.50 3.50 3.50 3.50 3.50
Peru - Reference rate 4.25 4.25 4.00 4.00 4.00 4.00 4.00 4.00 4.00
Venezuela - 90 day deposit rate 14.50 14.50 14.50 14.50 14.50 14.50 14.50 14.50 14.50
EEMEA 4.55 4.46 4.44 6.03 6.08 6.13 5.92 6.04 6.05
Czech Republic - 2-week repo rate 0.05 0.05 0.05 0.05 0.05 0.05 0.05 0.05 0.05
Hungary - 2-week deposit rate 4.25 3.60 3.00 2.70 2.70 2.70 2.70 3.00 3.00
Israel - Base rate 1.25 1.00 1.00 0.75 0.50 0.50 0.50 0.50 0.50
Kazakhstan - Refinancing rate (1) 5.50 5.50 5.50 5.50 5.75 5.75 5.50 5.50 5.50
Poland - 1-week reference rate 2.75 2.50 2.50 2.50 2.50 2.50 2.50 3.00 3.50
Russia - 1-week repo rate 5.50 5.50 5.50 7.00 7.00 7.00 6.50 6.50 6.25
South Africa - Repo rate 5.00 5.00 5.00 5.50 6.00 6.50 6.50 7.00 7.50
Turkey - 1-week repo rate (2) 4.50 4.50 4.50 10.00 10.00 10.00 10.00 10.00 10.00
Ukraine - Discount rate 7.00 6.50 6.50 6.50 6.50 6.50 6.50 6.50 6.50
EMERGING ASIA 5.12 4.82 5.36 4.91 5.23 5.18 5.22 5.26 5.40
China - 3-month interbank rate 5.44 4.67 5.56 4.64 5.23 5.09 5.11 5.09 5.35
Hong Kong - 3-month HIBOR 0.40 0.40 0.40 0.40 0.40 0.40 0.40 0.40 0.40
India - Reverse repo rate (3) 7.25 7.50 7.75 8.00 8.00 8.25 8.50 8.75 8.75
Indonesia - Overnight rate (4) 6.00 7.25 7.50 7.50 7.50 7.00 6.50 6.50 6.50
Korea - Overnight base rate 2.50 2.50 2.50 2.50 2.50 2.50 2.50 2.50 2.50
Malaysia - Overnight policy rate (5) 3.00 3.00 3.00 3.00 3.25 3.25 3.25 3.25 3.25
Philippines - Overnight borrowing rate 3.50 3.50 3.50 3.50 3.50 3.50 3.50 3.50 3.50
Singapore - 3-month SIBOR 0.38 0.42 0.40 0.45 0.45 0.50 0.50 0.50 0.60
Taiwan - Overnight rate 0.39 0.39 0.39 0.40 0.40 0.40 0.40 0.40 0.40
Thailand - Overnight repo rate (6) 2.50 2.50 2.25 2.00 2.00 2.00 2.00 2.00 2.00
Emerging Markets 5.35 5.20 5.58 5.62 5.83 5.82 5.81 5.95 6.04
Aggregates for regions and total emerging markets are weighted by IMF’s PPP based GDP figures.
(1) The central bank 1-month deposit rate equals half of the refinancing rate and until the banking crisis in the summer of 2007 represented a more effective policy instrument. (2) The monetary policy committee changed the definition of the policy rate on 18 May 2010 to the one-week repo rate from central bank’s overnight borrowing rate previously. (3) The RBI uses a mix of instruments, such as the repo rate, reverse repo rate, CRR (cash reserve ratio), etc. (4) BI changed its policy target from 1m SBI rate to overnight rate in 2008. (5) BNM changed the policy rate from the intervention rate to the overnight rate in May 2004. (6) Through 2006, the policy rate was the 14-day repo rate.
Source: the BLOOMBERG PROFESSIONAL™ service, National Statistical Offices, IHS Global Insight, Credit Suisse
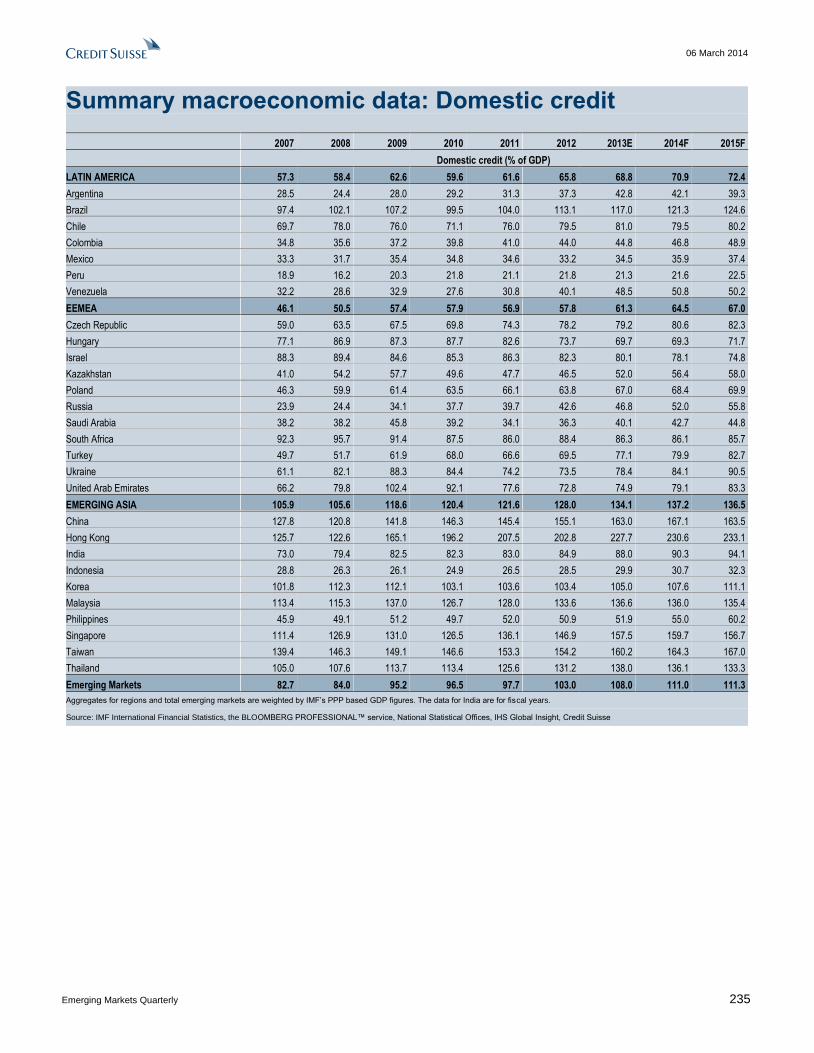
06 March 2014
Emerging Markets Quarterly 235
Summary macroeconomic data: Domestic credit
2007 2008 2009 2010 2011 2012 2013E 2014F 2015F
Domestic credit (% of GDP)
LATIN AMERICA 57.3 58.4 62.6 59.6 61.6 65.8 68.8 70.9 72.4
Argentina 28.5 24.4 28.0 29.2 31.3 37.3 42.8 42.1 39.3
Brazil 97.4 102.1 107.2 99.5 104.0 113.1 117.0 121.3 124.6
Chile 69.7 78.0 76.0 71.1 76.0 79.5 81.0 79.5 80.2
Colombia 34.8 35.6 37.2 39.8 41.0 44.0 44.8 46.8 48.9
Mexico 33.3 31.7 35.4 34.8 34.6 33.2 34.5 35.9 37.4
Peru 18.9 16.2 20.3 21.8 21.1 21.8 21.3 21.6 22.5
Venezuela 32.2 28.6 32.9 27.6 30.8 40.1 48.5 50.8 50.2
EEMEA 46.1 50.5 57.4 57.9 56.9 57.8 61.3 64.5 67.0
Czech Republic 59.0 63.5 67.5 69.8 74.3 78.2 79.2 80.6 82.3
Hungary 77.1 86.9 87.3 87.7 82.6 73.7 69.7 69.3 71.7
Israel 88.3 89.4 84.6 85.3 86.3 82.3 80.1 78.1 74.8
Kazakhstan 41.0 54.2 57.7 49.6 47.7 46.5 52.0 56.4 58.0
Poland 46.3 59.9 61.4 63.5 66.1 63.8 67.0 68.4 69.9
Russia 23.9 24.4 34.1 37.7 39.7 42.6 46.8 52.0 55.8
Saudi Arabia 38.2 38.2 45.8 39.2 34.1 36.3 40.1 42.7 44.8
South Africa 92.3 95.7 91.4 87.5 86.0 88.4 86.3 86.1 85.7
Turkey 49.7 51.7 61.9 68.0 66.6 69.5 77.1 79.9 82.7
Ukraine 61.1 82.1 88.3 84.4 74.2 73.5 78.4 84.1 90.5
United Arab Emirates 66.2 79.8 102.4 92.1 77.6 72.8 74.9 79.1 83.3
EMERGING ASIA 105.9 105.6 118.6 120.4 121.6 128.0 134.1 137.2 136.5
China 127.8 120.8 141.8 146.3 145.4 155.1 163.0 167.1 163.5
Hong Kong 125.7 122.6 165.1 196.2 207.5 202.8 227.7 230.6 233.1
India 73.0 79.4 82.5 82.3 83.0 84.9 88.0 90.3 94.1
Indonesia 28.8 26.3 26.1 24.9 26.5 28.5 29.9 30.7 32.3
Korea 101.8 112.3 112.1 103.1 103.6 103.4 105.0 107.6 111.1
Malaysia 113.4 115.3 137.0 126.7 128.0 133.6 136.6 136.0 135.4
Philippines 45.9 49.1 51.2 49.7 52.0 50.9 51.9 55.0 60.2
Singapore 111.4 126.9 131.0 126.5 136.1 146.9 157.5 159.7 156.7
Taiwan 139.4 146.3 149.1 146.6 153.3 154.2 160.2 164.3 167.0
Thailand 105.0 107.6 113.7 113.4 125.6 131.2 138.0 136.1 133.3
Emerging Markets 82.7 84.0 95.2 96.5 97.7 103.0 108.0 111.0 111.3
Aggregates for regions and total emerging markets are weighted by IMF’s PPP based GDP figures. The data for India are for fiscal years.
Source: IMF International Financial Statistics, the BLOOMBERG PROFESSIONAL™ service, National Statistical Offices, IHS Global Insight, Credit Suisse
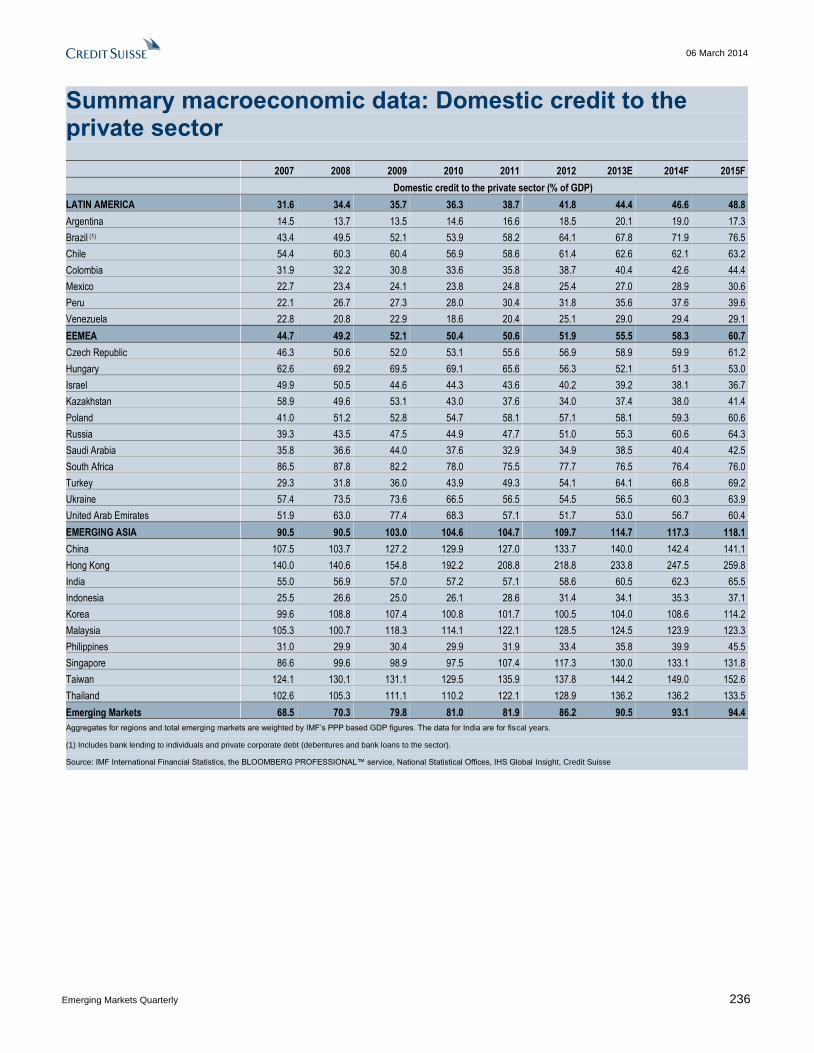
06 March 2014
Emerging Markets Quarterly 236
Summary macroeconomic data: Domestic credit to the private sector
2007 2008 2009 2010 2011 2012 2013E 2014F 2015F
Domestic credit to the private sector (% of GDP)
LATIN AMERICA 31.6 34.4 35.7 36.3 38.7 41.8 44.4 46.6 48.8
Argentina 14.5 13.7 13.5 14.6 16.6 18.5 20.1 19.0 17.3
Brazil (1) 43.4 49.5 52.1 53.9 58.2 64.1 67.8 71.9 76.5
Chile 54.4 60.3 60.4 56.9 58.6 61.4 62.6 62.1 63.2
Colombia 31.9 32.2 30.8 33.6 35.8 38.7 40.4 42.6 44.4
Mexico 22.7 23.4 24.1 23.8 24.8 25.4 27.0 28.9 30.6
Peru 22.1 26.7 27.3 28.0 30.4 31.8 35.6 37.6 39.6
Venezuela 22.8 20.8 22.9 18.6 20.4 25.1 29.0 29.4 29.1
EEMEA 44.7 49.2 52.1 50.4 50.6 51.9 55.5 58.3 60.7
Czech Republic 46.3 50.6 52.0 53.1 55.6 56.9 58.9 59.9 61.2
Hungary 62.6 69.2 69.5 69.1 65.6 56.3 52.1 51.3 53.0
Israel 49.9 50.5 44.6 44.3 43.6 40.2 39.2 38.1 36.7
Kazakhstan 58.9 49.6 53.1 43.0 37.6 34.0 37.4 38.0 41.4
Poland 41.0 51.2 52.8 54.7 58.1 57.1 58.1 59.3 60.6
Russia 39.3 43.5 47.5 44.9 47.7 51.0 55.3 60.6 64.3
Saudi Arabia 35.8 36.6 44.0 37.6 32.9 34.9 38.5 40.4 42.5
South Africa 86.5 87.8 82.2 78.0 75.5 77.7 76.5 76.4 76.0
Turkey 29.3 31.8 36.0 43.9 49.3 54.1 64.1 66.8 69.2
Ukraine 57.4 73.5 73.6 66.5 56.5 54.5 56.5 60.3 63.9
United Arab Emirates 51.9 63.0 77.4 68.3 57.1 51.7 53.0 56.7 60.4
EMERGING ASIA 90.5 90.5 103.0 104.6 104.7 109.7 114.7 117.3 118.1
China 107.5 103.7 127.2 129.9 127.0 133.7 140.0 142.4 141.1
Hong Kong 140.0 140.6 154.8 192.2 208.8 218.8 233.8 247.5 259.8
India 55.0 56.9 57.0 57.2 57.1 58.6 60.5 62.3 65.5
Indonesia 25.5 26.6 25.0 26.1 28.6 31.4 34.1 35.3 37.1
Korea 99.6 108.8 107.4 100.8 101.7 100.5 104.0 108.6 114.2
Malaysia 105.3 100.7 118.3 114.1 122.1 128.5 124.5 123.9 123.3
Philippines 31.0 29.9 30.4 29.9 31.9 33.4 35.8 39.9 45.5
Singapore 86.6 99.6 98.9 97.5 107.4 117.3 130.0 133.1 131.8
Taiwan 124.1 130.1 131.1 129.5 135.9 137.8 144.2 149.0 152.6
Thailand 102.6 105.3 111.1 110.2 122.1 128.9 136.2 136.2 133.5
Emerging Markets 68.5 70.3 79.8 81.0 81.9 86.2 90.5 93.1 94.4
Aggregates for regions and total emerging markets are weighted by IMF’s PPP based GDP figures. The data for India are for fiscal years.
(1) Includes bank lending to individuals and private corporate debt (debentures and bank loans to the sector).
Source: IMF International Financial Statistics, the BLOOMBERG PROFESSIONAL™ service, National Statistical Offices, IHS Global Insight, Credit Suisse
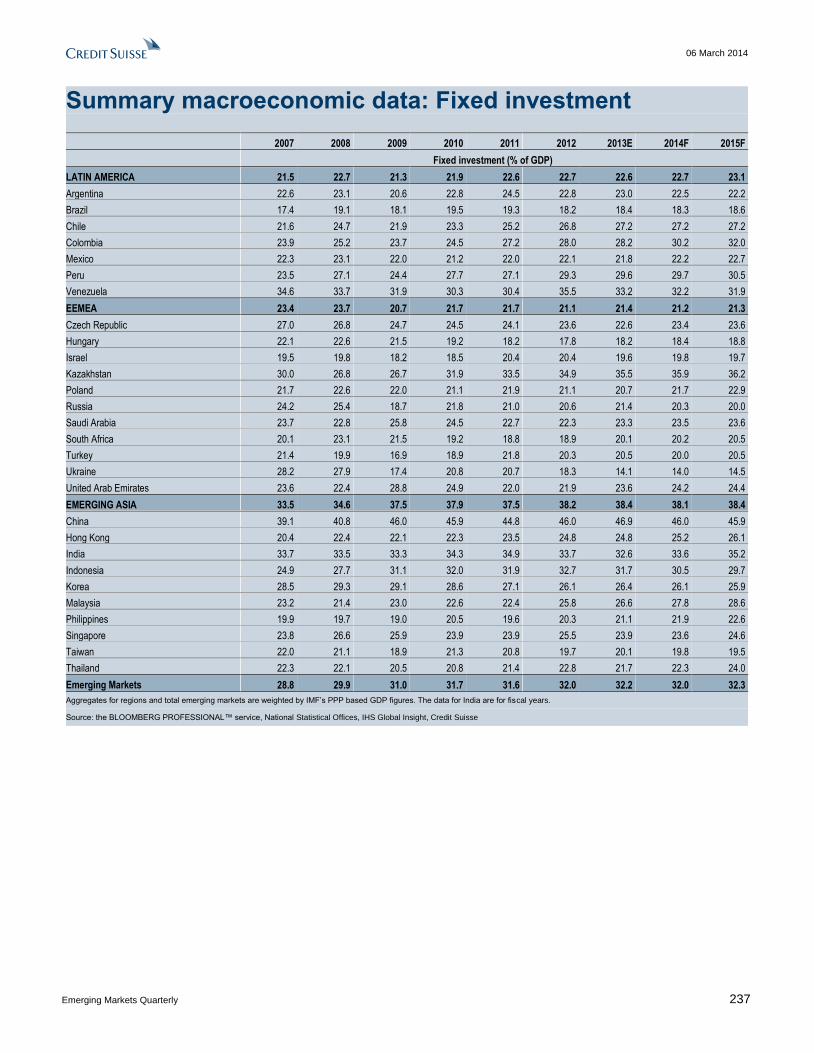
06 March 2014
Emerging Markets Quarterly 237
Summary macroeconomic data: Fixed investment
2007 2008 2009 2010 2011 2012 2013E 2014F 2015F
Fixed investment (% of GDP)
LATIN AMERICA 21.5 22.7 21.3 21.9 22.6 22.7 22.6 22.7 23.1
Argentina 22.6 23.1 20.6 22.8 24.5 22.8 23.0 22.5 22.2
Brazil 17.4 19.1 18.1 19.5 19.3 18.2 18.4 18.3 18.6
Chile 21.6 24.7 21.9 23.3 25.2 26.8 27.2 27.2 27.2
Colombia 23.9 25.2 23.7 24.5 27.2 28.0 28.2 30.2 32.0
Mexico 22.3 23.1 22.0 21.2 22.0 22.1 21.8 22.2 22.7
Peru 23.5 27.1 24.4 27.7 27.1 29.3 29.6 29.7 30.5
Venezuela 34.6 33.7 31.9 30.3 30.4 35.5 33.2 32.2 31.9
EEMEA 23.4 23.7 20.7 21.7 21.7 21.1 21.4 21.2 21.3
Czech Republic 27.0 26.8 24.7 24.5 24.1 23.6 22.6 23.4 23.6
Hungary 22.1 22.6 21.5 19.2 18.2 17.8 18.2 18.4 18.8
Israel 19.5 19.8 18.2 18.5 20.4 20.4 19.6 19.8 19.7
Kazakhstan 30.0 26.8 26.7 31.9 33.5 34.9 35.5 35.9 36.2
Poland 21.7 22.6 22.0 21.1 21.9 21.1 20.7 21.7 22.9
Russia 24.2 25.4 18.7 21.8 21.0 20.6 21.4 20.3 20.0
Saudi Arabia 23.7 22.8 25.8 24.5 22.7 22.3 23.3 23.5 23.6
South Africa 20.1 23.1 21.5 19.2 18.8 18.9 20.1 20.2 20.5
Turkey 21.4 19.9 16.9 18.9 21.8 20.3 20.5 20.0 20.5
Ukraine 28.2 27.9 17.4 20.8 20.7 18.3 14.1 14.0 14.5
United Arab Emirates 23.6 22.4 28.8 24.9 22.0 21.9 23.6 24.2 24.4
EMERGING ASIA 33.5 34.6 37.5 37.9 37.5 38.2 38.4 38.1 38.4
China 39.1 40.8 46.0 45.9 44.8 46.0 46.9 46.0 45.9
Hong Kong 20.4 22.4 22.1 22.3 23.5 24.8 24.8 25.2 26.1
India 33.7 33.5 33.3 34.3 34.9 33.7 32.6 33.6 35.2
Indonesia 24.9 27.7 31.1 32.0 31.9 32.7 31.7 30.5 29.7
Korea 28.5 29.3 29.1 28.6 27.1 26.1 26.4 26.1 25.9
Malaysia 23.2 21.4 23.0 22.6 22.4 25.8 26.6 27.8 28.6
Philippines 19.9 19.7 19.0 20.5 19.6 20.3 21.1 21.9 22.6
Singapore 23.8 26.6 25.9 23.9 23.9 25.5 23.9 23.6 24.6
Taiwan 22.0 21.1 18.9 21.3 20.8 19.7 20.1 19.8 19.5
Thailand 22.3 22.1 20.5 20.8 21.4 22.8 21.7 22.3 24.0
Emerging Markets 28.8 29.9 31.0 31.7 31.6 32.0 32.2 32.0 32.3
Aggregates for regions and total emerging markets are weighted by IMF’s PPP based GDP figures. The data for India are for fiscal years.
Source: the BLOOMBERG PROFESSIONAL™ service, National Statistical Offices, IHS Global Insight, Credit Suisse
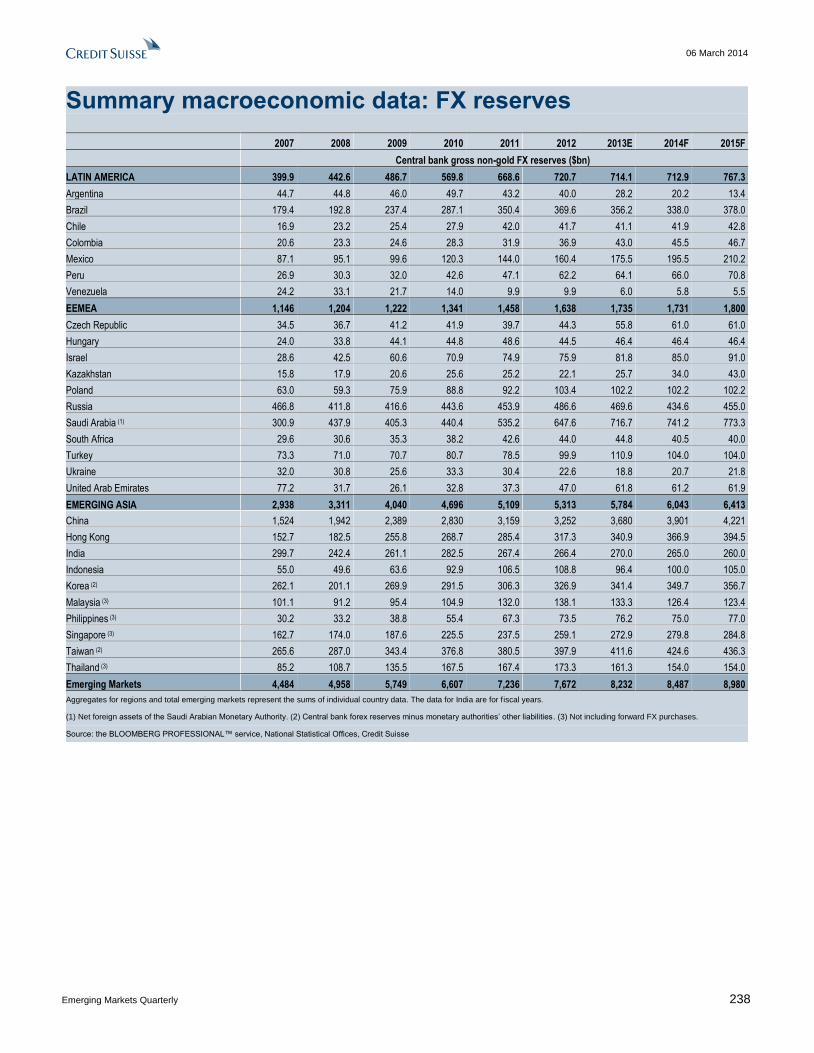
06 March 2014
Emerging Markets Quarterly 238
Summary macroeconomic data: FX reserves
2007 2008 2009 2010 2011 2012 2013E 2014F 2015F
Central bank gross non-gold FX reserves ($bn)
LATIN AMERICA 399.9 442.6 486.7 569.8 668.6 720.7 714.1 712.9 767.3
Argentina 44.7 44.8 46.0 49.7 43.2 40.0 28.2 20.2 13.4
Brazil 179.4 192.8 237.4 287.1 350.4 369.6 356.2 338.0 378.0
Chile 16.9 23.2 25.4 27.9 42.0 41.7 41.1 41.9 42.8
Colombia 20.6 23.3 24.6 28.3 31.9 36.9 43.0 45.5 46.7
Mexico 87.1 95.1 99.6 120.3 144.0 160.4 175.5 195.5 210.2
Peru 26.9 30.3 32.0 42.6 47.1 62.2 64.1 66.0 70.8
Venezuela 24.2 33.1 21.7 14.0 9.9 9.9 6.0 5.8 5.5
EEMEA 1,146 1,204 1,222 1,341 1,458 1,638 1,735 1,731 1,800
Czech Republic 34.5 36.7 41.2 41.9 39.7 44.3 55.8 61.0 61.0
Hungary 24.0 33.8 44.1 44.8 48.6 44.5 46.4 46.4 46.4
Israel 28.6 42.5 60.6 70.9 74.9 75.9 81.8 85.0 91.0
Kazakhstan 15.8 17.9 20.6 25.6 25.2 22.1 25.7 34.0 43.0
Poland 63.0 59.3 75.9 88.8 92.2 103.4 102.2 102.2 102.2
Russia 466.8 411.8 416.6 443.6 453.9 486.6 469.6 434.6 455.0
Saudi Arabia (1) 300.9 437.9 405.3 440.4 535.2 647.6 716.7 741.2 773.3
South Africa 29.6 30.6 35.3 38.2 42.6 44.0 44.8 40.5 40.0
Turkey 73.3 71.0 70.7 80.7 78.5 99.9 110.9 104.0 104.0
Ukraine 32.0 30.8 25.6 33.3 30.4 22.6 18.8 20.7 21.8
United Arab Emirates 77.2 31.7 26.1 32.8 37.3 47.0 61.8 61.2 61.9
EMERGING ASIA 2,938 3,311 4,040 4,696 5,109 5,313 5,784 6,043 6,413
China 1,524 1,942 2,389 2,830 3,159 3,252 3,680 3,901 4,221
Hong Kong 152.7 182.5 255.8 268.7 285.4 317.3 340.9 366.9 394.5
India 299.7 242.4 261.1 282.5 267.4 266.4 270.0 265.0 260.0
Indonesia 55.0 49.6 63.6 92.9 106.5 108.8 96.4 100.0 105.0
Korea (2) 262.1 201.1 269.9 291.5 306.3 326.9 341.4 349.7 356.7
Malaysia (3) 101.1 91.2 95.4 104.9 132.0 138.1 133.3 126.4 123.4
Philippines (3) 30.2 33.2 38.8 55.4 67.3 73.5 76.2 75.0 77.0
Singapore (3) 162.7 174.0 187.6 225.5 237.5 259.1 272.9 279.8 284.8
Taiwan (2) 265.6 287.0 343.4 376.8 380.5 397.9 411.6 424.6 436.3
Thailand (3) 85.2 108.7 135.5 167.5 167.4 173.3 161.3 154.0 154.0
Emerging Markets 4,484 4,958 5,749 6,607 7,236 7,672 8,232 8,487 8,980
Aggregates for regions and total emerging markets represent the sums of individual country data. The data for India are for fiscal years.
(1) Net foreign assets of the Saudi Arabian Monetary Authority. (2) Central bank forex reserves minus monetary authorities’ other liabilities. (3) Not including forward FX purchases.
Source: the BLOOMBERG PROFESSIONAL™ service, National Statistical Offices, Credit Suisse
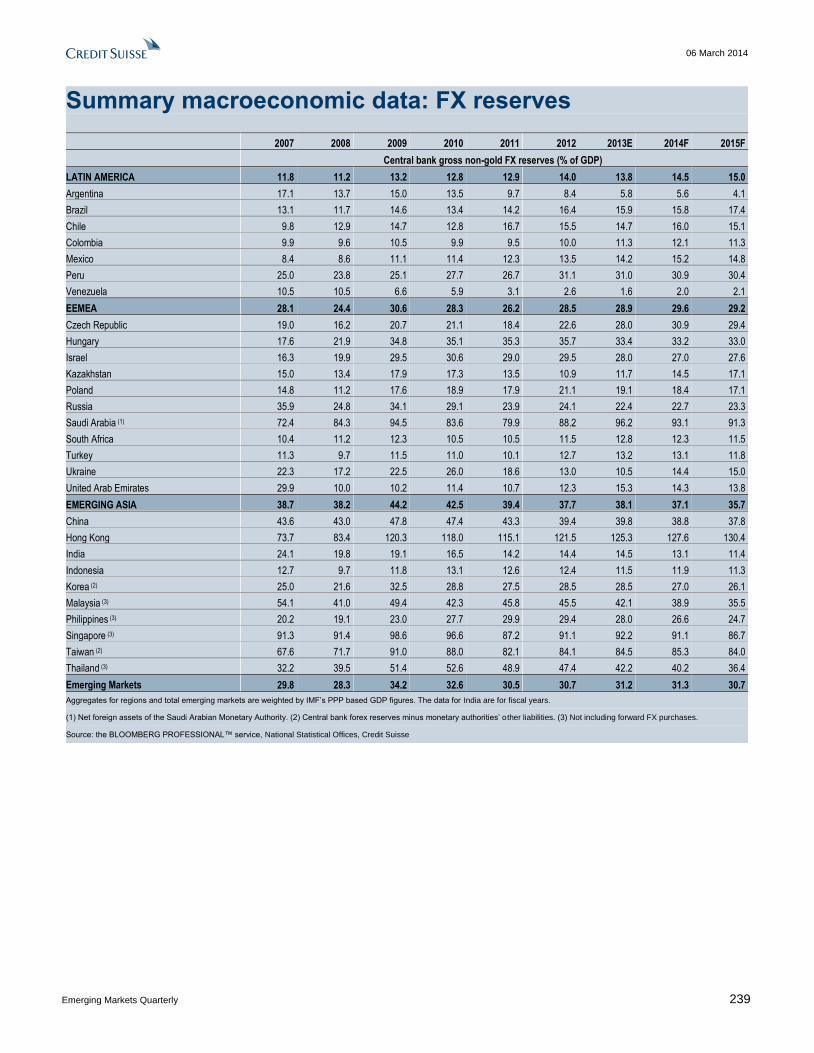
06 March 2014
Emerging Markets Quarterly 239
Summary macroeconomic data: FX reserves
2007 2008 2009 2010 2011 2012 2013E 2014F 2015F
Central bank gross non-gold FX reserves (% of GDP)
LATIN AMERICA 11.8 11.2 13.2 12.8 12.9 14.0 13.8 14.5 15.0
Argentina 17.1 13.7 15.0 13.5 9.7 8.4 5.8 5.6 4.1
Brazil 13.1 11.7 14.6 13.4 14.2 16.4 15.9 15.8 17.4
Chile 9.8 12.9 14.7 12.8 16.7 15.5 14.7 16.0 15.1
Colombia 9.9 9.6 10.5 9.9 9.5 10.0 11.3 12.1 11.3
Mexico 8.4 8.6 11.1 11.4 12.3 13.5 14.2 15.2 14.8
Peru 25.0 23.8 25.1 27.7 26.7 31.1 31.0 30.9 30.4
Venezuela 10.5 10.5 6.6 5.9 3.1 2.6 1.6 2.0 2.1
EEMEA 28.1 24.4 30.6 28.3 26.2 28.5 28.9 29.6 29.2
Czech Republic 19.0 16.2 20.7 21.1 18.4 22.6 28.0 30.9 29.4
Hungary 17.6 21.9 34.8 35.1 35.3 35.7 33.4 33.2 33.0
Israel 16.3 19.9 29.5 30.6 29.0 29.5 28.0 27.0 27.6
Kazakhstan 15.0 13.4 17.9 17.3 13.5 10.9 11.7 14.5 17.1
Poland 14.8 11.2 17.6 18.9 17.9 21.1 19.1 18.4 17.1
Russia 35.9 24.8 34.1 29.1 23.9 24.1 22.4 22.7 23.3
Saudi Arabia (1) 72.4 84.3 94.5 83.6 79.9 88.2 96.2 93.1 91.3
South Africa 10.4 11.2 12.3 10.5 10.5 11.5 12.8 12.3 11.5
Turkey 11.3 9.7 11.5 11.0 10.1 12.7 13.2 13.1 11.8
Ukraine 22.3 17.2 22.5 26.0 18.6 13.0 10.5 14.4 15.0
United Arab Emirates 29.9 10.0 10.2 11.4 10.7 12.3 15.3 14.3 13.8
EMERGING ASIA 38.7 38.2 44.2 42.5 39.4 37.7 38.1 37.1 35.7
China 43.6 43.0 47.8 47.4 43.3 39.4 39.8 38.8 37.8
Hong Kong 73.7 83.4 120.3 118.0 115.1 121.5 125.3 127.6 130.4
India 24.1 19.8 19.1 16.5 14.2 14.4 14.5 13.1 11.4
Indonesia 12.7 9.7 11.8 13.1 12.6 12.4 11.5 11.9 11.3
Korea (2) 25.0 21.6 32.5 28.8 27.5 28.5 28.5 27.0 26.1
Malaysia (3) 54.1 41.0 49.4 42.3 45.8 45.5 42.1 38.9 35.5
Philippines (3) 20.2 19.1 23.0 27.7 29.9 29.4 28.0 26.6 24.7
Singapore (3) 91.3 91.4 98.6 96.6 87.2 91.1 92.2 91.1 86.7
Taiwan (2) 67.6 71.7 91.0 88.0 82.1 84.1 84.5 85.3 84.0
Thailand (3) 32.2 39.5 51.4 52.6 48.9 47.4 42.2 40.2 36.4
Emerging Markets 29.8 28.3 34.2 32.6 30.5 30.7 31.2 31.3 30.7
Aggregates for regions and total emerging markets are weighted by IMF’s PPP based GDP figures. The data for India are for fiscal years.
(1) Net foreign assets of the Saudi Arabian Monetary Authority. (2) Central bank forex reserves minus monetary authorities’ other liabilities. (3) Not including forward FX purchases.
Source: the BLOOMBERG PROFESSIONAL™ service, National Statistical Offices, Credit Suisse
GLOBAL FIXED INCOME AND ECONOMIC RESEARCH Dr. Neal Soss
Global Head of Economics and Demographics Research (212) 325 3335
Ric Deverell Global Head of Fixed Income and Economics Research
+44 20 7883 2523 [email protected]
ECONOMICS AND DEMOGRAPHICS RESEARCH
GLOBAL / US ECONOMICS
Dr. Neal Soss
(212) 325 3335
Jay Feldman
(212) 325 7634
Dana Saporta
(212) 538 3163
Isaac Lebwohl
(212) 538 1906
Axel Lang
(212) 538 4530
Xiao Cui
(212) 538 2511
LATIN AMERICA (LATAM) ECONOMICS
Alonso Cervera
Head of Latam Economics
52 55 5283 3845
Mexico, Chile
Casey Reckman
(212) 325 5570
Argentina, Venezuela
Daniel Chodos
(212) 325 7708
Latam Strategy
Juan Lorenzo Maldonado
(212) 325 4245
Colombia, Peru
Di Fu
(212) 538 4125
Omar Rodriguez
+52 55 5283 8995
BRAZIL ECONOMICS
Nilson Teixeira
Head of Brazil Economics
55 11 3701 6288
Daniel Lavarda
55 11 3701 6352
Iana Ferrao
55 11 3701 6345
Leonardo Fonseca
55 11 3701 6348
Paulo Coutinho
55 11 3701-6353
EURO AREA / UK ECONOMICS
Neville Hill
Head of European Economics
44 20 7888 1334
Christel Aranda-Hassel
44 20 7888 1383
Giovanni Zanni
44 20 7888 6827
Violante di Canossa
44 20 7883 4192
Steven Bryce
44 20 7883 7360
Mirco Bulega
44 20 7883 9315
EASTERN EUROPE, MIDDLE EAST AND AFRICA (EEMEA) ECONOMICS
Berna Bayazitoglu
Head of EEMEA Economics
44 20 7883 3431
Turkey
Sergei Voloboev
44 20 7888 3694
Russia, Ukraine, Kazakhstan
Carlos Teixeira
27 11 012 8054
South Africa
Gergely Hudecz
33 1 7039 0103
Czech Republic, Hungary, Poland
Alexey Pogorelov
7 495 967 8772
Russia, Ukraine, Kazakhstan
Natig Mustafayev
44 20 7888 1065
EM and EEMEA cross-country analysis
Nimrod Mevorach
44 20 7888 1257
EEMEA Strategy, Israel
JAPAN ECONOMICS NON-JAPAN (NJA) ECONOMICS
Hiromichi Shirakawa
Head of Japan Economics
81 3 4550 7117
Takashi Shiono
81 3 4550 7189
Dong Tao
Head of NJA Economics
852 2101 7469
China
Robert Prior-Wandesforde
65 6212 3707
Regional, India, Indonesia, Australia
Christiaan Tuntono
852 2101 7409
Hong Kong, Korea, Taiwan
Dr. Santitarn Sathirathai
65 6212 5675
Regional, Malaysia, Thailand
Michael Wan
65 6212 3418
Singapore, Philippines
Weishen Deng
852 2101 7162
China
GLOBAL DEMOGRAPHICS & PENSIONS RESEARCH
Dr. Amlan Roy
Head of Global Demographics
44 20 7888 1501
Sonali Punhani
44 20 7883 4297
Angela Hsieh
44 20 7883 9639
Disclosure Appendix
Analyst Certification The analysts identified in this report each certify, with respect to the companies or securities that the individual analyzes, that (1) the views expressed in this report accurately reflect his or her personal views about all of the subject companies and securities and (2) no part of his or her compensation was, is or will be directly or indirectly related to the specific recommendations or views expressed in this report.
Important Disclosures Credit Suisse's policy is only to publish investment research that is impartial, independent, clear, fair and not misleading. For more detail, please refer to Credit Suisse's Policies for Managing Conflicts of Interest in connection with Investment Research: http://www.csfb.com/research-and-analytics/disclaimer/managing_conflicts_disclaimer.html . Credit Suisse's policy is to publish research reports as it deems appropriate, based on developments with the subject issuer, the sector or the market that may have a material impact on the research views or opinions stated herein. The analyst(s) involved in the preparation of this research report received compensation that is based upon various factors, including Credit Suisse's total revenues, a portion of which are generated by Credit Suisse's Investment Banking and Fixed Income Divisions. Credit Suisse may trade as principal in the securities or derivatives of the issuers that are the subject of this report. At any point in time, Credit Suisse is likely to have significant holdings in the securities mentioned in this report. As at the date of this report, Credit Suisse acts as a market maker or liquidity provider in the debt securities of the subject issuer(s) mentioned in this report. For important disclosure information on securities recommended in this report, please visit the website at https://firesearchdisclosure.credit-suisse.com or call +1-212-538-7625. For the history of any relative value trade ideas suggested by the Fixed Income research department as well as fundamental recommendations provided by the Emerging Markets Sovereign Strategy Group over the previous 12 months, please view the document at http://research-and-analytics.csfb.com/docpopup.asp?ctbdocid=330703_1_en . Credit Suisse clients with access to the Locus website may refer to http://www.credit-suisse.com/locus For the history of recommendations provided by Technical Analysis, please visit the website at www.credit-suisse.com/techanalysis . Credit Suisse does not provide any tax advice. Any statement herein regarding any US federal tax is not intended or written to be used, and cannot be used, by any taxpayer for the purposes of avoiding any penalties.
Emerging Markets Bond Recommendation Definitions Buy: Indicates a recommended buy on our expectation that the issue will deliver a return higher than the risk-free rate. Sell: Indicates a recommended sell on our expectation that the issue will deliver a return lower than the risk-free rate.
Corporate Bond Fundamental Recommendation Definitions Buy: Indicates a recommended buy on our expectation that the issue will be a top performer in its sector. Outperform: Indicates an above-average total return performer within its sector. Bonds in this category have stable or improving credit profiles and are undervalued, or they may be weaker credits that, we believe, are cheap relative to the sector and are expected to outperform on a total-return basis. These bonds may possess price risk in a volatile environment. Market Perform: Indicates a bond that is expected to return average performance in its sector. Underperform: Indicates a below-average total-return performer within its sector. Bonds in this category have weak or worsening credit trends, or they may be stable credits that, we believe, are overvalued or rich relative to the sector. Sell: Indicates a recommended sell on the expectation that the issue will be among the poor performers in its sector. Restricted: In certain circumstances, Credit Suisse policy and/or applicable law and regulations preclude certain types of communications, including an investment recommendation, during the course of Credit Suisse's engagement in an investment banking transaction and in certain other circumstances. Not Rated: Credit Suisse Global Credit Research or Global Leveraged Finance Research covers the issuer but currently does not offer an investment view on the subject issue. Not Covered: Neither Credit Suisse Global Credit Research nor Global Leveraged Finance Research covers the issuer or offers an investment view on the issuer or any securities related to it. Any communication from Research on securities or companies that Credit Suisse does not cover is a reasonable, non-material deduction based on an analysis of publicly available information.
Corporate Bond Risk Category Definitions In addition to the recommendation, each issue may have a risk category indicating that it is an appropriate holding for an "average" high yield investor, designated as Market, or that it has a higher or lower risk profile, designated as Speculative, and Conservative, respectively.
Credit Suisse Credit Rating Definitions Credit Suisse may assign rating opinions to investment-grade and crossover issuers. Ratings are based on our assessment of a company's creditworthiness and are not recommendations to buy or sell a security. The ratings scale (AAA, AA, A, BBB, BB, B) is dependent on our assessment of an issuer's ability to meet its financial commitments in a timely manner. Within each category, creditworthiness is further detailed with a scale of High, Mid, or Low − with High being the strongest sub-category rating: High AAA, Mid AAA, Low AAA - obligor's capacity to meet its financial commitments is extremely strong; High AA, Mid AA, Low AA − obligor's capacity to meet its financial commitments is very strong; High A, Mid A, Low A − obligor's capacity to meet its financial commitments is strong; High BBB, Mid BBB, Low BBB − obligor's capacity to meet its financial commitments is adequate, but adverse economic/operating/financial circumstances are more likely to lead to a weakened capacity to meet its obligations; High BB, Mid BB, Low BB − obligations have speculative characteristics and are subject to substantial credit risk; High B, Mid B, Low B − obligor's capacity to meet its financial commitments is very weak and highly vulnerable to adverse economic, operating, and financial circumstances; High CCC, Mid CCC, Low CCC – obligor's capacity to meet its financial commitments is extremely weak and is dependent on favorable economic, operating, and financial circumstances. Credit Suisse's rating opinions do not necessarily correlate with those of the rating agencies.

References in this report to Credit Suisse include all of the subsidiaries and affiliates of Credit Suisse operating under its investment banking division. For more information on our structure, please use the following link: https://www.credit-suisse.com/who_we_are/en/This report may contain material that is not directed to, or intended for distribution to or use by, any person or entity who is a citizen or resident of or located in any locality, state, country or other jurisdiction where such distribution, publication, availability or use would be contrary to law or regulation or which would subject Credit Suisse AG or its affiliates ("CS") to any registration or licensing requirement within such jurisdiction. All material presented in this report, unless specifically indicated otherwise, is under copyright to CS. None of the material, nor its content, nor any copy of it, may be altered in any way, transmitted to, copied or distributed to any other party, without the prior express written permission of CS. All trademarks, service marks and logos used in this report are trademarks or service marks or registered trademarks or service marks of CS or its affiliates. The information, tools and material presented in this report are provided to you for information purposes only and are not to be used or considered as an offer or the solicitation of an offer to sell or to buy or subscribe for securities or other financial instruments. CS may not have taken any steps to ensure that the securities referred to in this report are suitable for any particular investor. CS will not treat recipients of this report as its customers by virtue of their receiving this report. The investments and services contained or referred to in this report may not be suitable for you and it is recommended that you consult an independent investment advisor if you are in doubt about such investments or investment services. Nothing in this report constitutes investment, legal, accounting or tax advice, or a representation that any investment or strategy is suitable or appropriate to your individual circumstances, or otherwise constitutes a personal recommendation to you. CS does not advise on the tax consequences of investments and you are advised to contact an independent tax adviser. Please note in particular that the bases and levels of taxation may change. Information and opinions presented in this report have been obtained or derived from sources believed by CS to be reliable, but CS makes no representation as to their accuracy or completeness. CS accepts no liability for loss arising from the use of the material presented in this report, except that this exclusion of liability does not apply to the extent that such liability arises under specific statutes or regulations applicable to CS. This report is not to be relied upon in substitution for the exercise of independent judgment. CS may have issued, and may in the future issue, other communications that are inconsistent with, and reach different conclusions from, the information presented in this report. Those communications reflect the different assumptions, views and analytical methods of the analysts who prepared them and CS is under no obligation to ensure that such other communications are brought to the attention of any recipient of this report. CS may, to the extent permitted by law, participate or invest in financing transactions with the issuer(s) of the securities referred to in this report, perform services for or solicit business from such issuers, and/or have a position or holding, or other material interest, or effect transactions, in such securities or options thereon, or other investments related thereto. In addition, it may make markets in the securities mentioned in the material presented in this report. CS may have, within the last three years, served as manager or co-manager of a public offering of securities for, or currently may make a primary market in issues of, any or all of the entities mentioned in this report or may be providing, or have provided within the previous 12 months, significant advice or investment services in relation to the investment concerned or a related investment. Additional information is, subject to duties of confidentiality, available on request. Some investments referred to in this report will be offered solely by a single entity and in the case of some investments solely by CS, or an associate of CS or CS may be the only market maker in such investments. Past performance should not be taken as an indication or guarantee of future performance, and no representation or warranty, express or implied, is made regarding future performance. Information, opinions and estimates contained in this report reflect a judgment at its original date of publication by CS and are subject to change without notice. The price, value of and income from any of the securities or financial instruments mentioned in this report can fall as well as rise. The value of securities and financial instruments is subject to exchange rate fluctuation that may have a positive or adverse effect on the price or income of such securities or financial instruments. Investors in securities such as ADR's, the values of which are influenced by currency volatility, effectively assume this risk. Structured securities are complex instruments, typically involve a high degree of risk and are intended for sale only to sophisticated investors who are capable of understanding and assuming the risks involved. The market value of any structured security may be affected by changes in economic, financial and political factors (including, but not limited to, spot and forward interest and exchange rates), time to maturity, market conditions and volatility, and the credit quality of any issuer or reference issuer. Any investor interested in purchasing a structured product should conduct their own investigation and analysis of the product and consult with their own professional advisers as to the risks involved in making such a purchase. Some investments discussed in this report may have a high level of volatility. High volatility investments may experience sudden and large falls in their value causing losses when that investment is realised. Those losses may equal your original investment. Indeed, in the case of some investments the potential losses may exceed the amount of initial investment and, in such circumstances, you may be required to pay more money to support those losses. Income yields from investments may fluctuate and, in consequence, initial capital paid to make the investment may be used as part of that income yield. Some investments may not be readily realisable and it may be difficult to sell or realise those investments, similarly it may prove difficult for you to obtain reliable information about the value, or risks, to which such an investment is exposed. This report may provide the addresses of, or contain hyperlinks to, websites. Except to the extent to which the report refers to website material of CS, CS has not reviewed any such site and takes no responsibility for the content contained therein. Such address or hyperlink (including addresses or hyperlinks to CS's own website material) is provided solely for your convenience and information and the content of any such website does not in any way form part of this document. Accessing such website or following such link through this report or CS's website shall be at your own risk. This report is issued and distributed in Europe (except Switzerland) by Credit Suisse Securities (Europe) Limited, One Cabot Square, London E14 4QJ, England, which is authorised by the Prudential Regulation Authority and regulated by the Financial Conduct Authority and the Prudential Regulation Authority. This report is being distributed in Germany by Credit Suisse Securities (Europe) Limited Niederlassung Frankfurt am Main regulated by the Bundesanstalt fuer Finanzdienstleistungsaufsicht ("BaFin"). This report is being distributed in the United States and Canada by Credit Suisse Securities (USA) LLC; in Switzerland by Credit Suisse AG; in Brazil by Banco de Investimentos Credit Suisse (Brasil) S.A or its affiliates; in Mexico by Banco Credit Suisse (México), S.A. (transactions related to the securities mentioned in this report will only be effected in compliance with applicable regulation); in Japan by Credit Suisse Securities (Japan) Limited, Financial Instruments Firm, Director-General of Kanto Local Finance Bureau (Kinsho) No. 66, a member of Japan Securities Dealers Association, The Financial Futures Association of Japan, Japan Investment Advisers Association, Type II Financial Instruments Firms Association; elsewhere in Asia/ Pacific by whichever of the following is the appropriately authorised entity in the relevant jurisdiction: Credit Suisse (Hong Kong) Limited, Credit Suisse Equities (Australia) Limited, Credit Suisse Securities (Thailand) Limited, having registered address at 990 Abdulrahim Place, 27 Floor, Unit 2701, Rama IV Road, Silom, Bangrak, Bangkok 10500, Thailand, Tel. +66 2614 6000, Credit Suisse Securities (Malaysia) Sdn Bhd, Credit Suisse AG, Singapore Branch, Credit Suisse Securities (India) Private Limited regulated by the Securities and Exchange Board of India (registration Nos. INB230970637; INF230970637; INB010970631; INF010970631), having registered address at 9th Floor, Ceejay House, Dr.A.B. Road, Worli, Mumbai - 18, India, T- +91-22 6777 3777, Credit Suisse Securities (Europe) Limited, Seoul Branch, Credit Suisse AG, Taipei Securities Branch, PT Credit Suisse Securities Indonesia, Credit Suisse Securities (Philippines ) Inc., and elsewhere in the world by the relevant authorised affiliate of the above. Research on Taiwanese securities produced by Credit Suisse AG, Taipei Securities Branch has been prepared by a registered Senior Business Person. Research provided to residents of Malaysia is authorised by the Head of Research for Credit Suisse Securities (Malaysia) Sdn Bhd, to whom they should direct any queries on +603 2723 2020. This report has been prepared and issued for distribution in Singapore to institutional investors, accredited investors and expert investors (each as defined under the Financial Advisers Regulations) only, and is also distributed by Credit Suisse AG, Singapore branch to overseas investors (as defined under the Financial Advisers Regulations). By virtue of your status as an institutional investor, accredited investor, expert investor or overseas investor, Credit Suisse AG, Singapore branch is exempted from complying with certain compliance requirements under the Financial Advisers Act, Chapter 110 of Singapore (the "FAA"), the Financial Advisers Regulations and the relevant Notices and Guidelines issued thereunder, in respect of any financial advisory service which Credit Suisse AG, Singapore branch may provide to you. This research may not conform to Canadian disclosure requirements. In jurisdictions where CS is not already registered or licensed to trade in securities, transactions will only be effected in accordance with applicable securities legislation, which will vary from jurisdiction to jurisdiction and may require that the trade be made in accordance with applicable exemptions from registration or licensing requirements. Non-U.S. customers wishing to effect a transaction should contact a CS entity in their local jurisdiction unless governing law permits otherwise. U.S. customers wishing to effect a transaction should do so only by contacting a representative at Credit Suisse Securities (USA) LLC in the U.S. Please note that this research was originally prepared and issued by CS for distribution to their market professional and institutional investor customers. Recipients who are not market professional or institutional investor customers of CS should seek the advice of their independent financial advisor prior to taking any investment decision based on this report or for any necessary explanation of its contents. This research may relate to investments or services of a person outside of the UK or to other matters which are not authorised by the Prudential Regulation Authority and regulated by the Financial Conduct Authority and the Prudential Regulation Authority or in respect of which the protections of the Prudential Regulation Authority and Financial Conduct Authority for private customers and/or the UK compensation scheme may not be available, and further details as to where this may be the case are available upon request in respect of this report. CS may provide various services to US municipal entities or obligated persons ("municipalities"), including suggesting individual transactions or trades and entering into such transactions. Any services CS provides to municipalities are not viewed as "advice" within the meaning of Section 975 of the Dodd-Frank Wall Street Reform and Consumer Protection Act. CS is providing any such services and related information solely on an arm's length basis and not as an advisor or fiduciary to the municipality. In connection with the provision of the any such services, there is no agreement, direct or indirect, between any municipality (including the officials, management, employees or agents thereof) and CS for CS to provide advice to the municipality. Municipalities should consult with their financial, accounting and legal advisors regarding any such services provided by CS. In addition, CS is not acting for direct or indirect compensation to solicit the municipality on behalf of an unaffiliated broker, dealer, municipal securities dealer, municipal advisor, or investment adviser for the purpose of obtaining or retaining an engagement by the municipality for or in connection with Municipal Financial Products, the issuance of municipal securities, or of an investment adviser to provide investment advisory services to or on behalf of the municipality. If this report is being distributed by a financial institution other than Credit Suisse AG, or its affiliates, that financial institution is solely responsible for distribution. Clients of that institution should contact that institution to effect a transaction in the securities mentioned in this report or require further information. This report does not constitute investment advice by Credit Suisse to the clients of the distributing financial institution, and neither Credit Suisse AG, its affiliates, and their respective officers, directors and employees accept any liability whatsoever for any direct or consequential loss arising from their use of this report or its content. Principal is not guaranteed. Commission is the commission rate or the amount agreed with a customer when setting up an account or at any time after that. Copyright © 2014 CREDIT SUISSE AG and/or its affiliates. All rights reserved.
Investment principal on bonds can be eroded depending on sale price or market price. In addition, there are bonds on which investment principal can be eroded due to changes in redemption amounts. Care is required when investing in such instruments. When you purchase non-listed Japanese fixed income securities (Japanese government bonds, Japanese municipal bonds, Japanese government guaranteed bonds, Japanese corporate bonds) from CS as a seller, you will be requested to pay the purchase price only.