Mitsui Fudosan (8801) - Credit Suisse | PLUS
28
DISCLOSURE APPENDIX AT THE BACK OF THIS REPORT CONTAINS IMPORTANT DISCLOSURES, ANALYST CERTIFICATIONS, LEGAL ENTITY DISCLOSURE AND THE STATUS OF NON-US ANALYSTS. US Disclosure: Credit Suisse does and seeks to do business with companies covered in its research reports. As a result, investors should be aware that the Firm may have a conflict of interest that could affect the objectivity of this report. Investors should consider this report as only a single factor in making their investment decision. 17 January 2017 Asia Pacific/Japan Equity Research Real Estate Management & Development (Real Estate (Japan)) Mitsui Fudosan (8801) INCREASE TARGET PRICE Rating OUTPERFORM Price (16 Jan 17, ¥) 2,640 Target price (¥) (from 2,500) 3,300 Chg to TP (%) 25.0 Market cap (¥ bn) 2,608.21 (US$ 22.85) Enterprise value (¥ bn) 4,972.81 Number of shares (mn) 988.15 Free float (%) 85.0 52-week price range 3,012–2,039 Target price is for 12 months. Research Analysts Masahiro Mochizuki 81 3 4550 7389 [email protected] Yasuko Fukuda 81 3 4550 9259 [email protected] Greater appreciation of development capabilities likely ■ Action: We revise our forecasts for Mitsui Fudosan and raise our target price from ¥2,500 to ¥3,300 (potential return 25%) owing mainly to a cut in EBITDA yield, which drives our model. We reiterate our OUTPERFORM rating. ■ Investment case: The share price has risen about 30% over three months, but still looks undervalued in terms of implied EBITDA yield and P/NAV. ■ We believe the share price could rise on (1) profit growth backed by development capabilities, (2) foreign profits, and (3) expectations for improvement at Mitsui Home (1868). We believe the company’s valuations will pivot on profit growth driven by its development capabilities. ■ In our previous report (on 3 Oct 2016), we noted such challenges as the cost of rebuilding structurally unsound tilting condos in Yokohama, which Mitsui Fudosan estimated could reach ¥39bn at most (see the 2Q earnings release). We now believe negative news about these costs has run its course. ■ Catalysts/risks: Catalysts include (1) confirmation of guidance for FY3/18 OP of at least ¥245bn, (2) profit contributions from overseas business, and (3) an explanation at the May 2017 results briefing of how management plans to leverage Mitsui Home. Risks include (1) worsening margins on built- for-sale condos and income properties, (2) a decline in office rents, and (3) worsening profitability overseas. ■ Valuation: We base our target price on a FY3/18E EBITDA yield of 5.25% (previously 6.0%). Share price performance Price (LHS) Rebased Rel (RHS) Ju l- 1 5 Jan - 1 6 Ju l- 1 6 Jan - 1 7 2,000 2,500 3,000 3,500 4,000 The price relative chart measures performance against the TOPIX which closed at 1,530.64 on 16-Jan-2017 On 16-Jan-2017 the spot exchange rate was ¥114.14/US$1 Performance 1M 3M 12M Absolute (%) -4.9 21.7 -5.3 Relative (%) -3.6 8.9 -14.5 Financial and valuation metrics Year 3/16A 3/17E 3/18E 3/19E Sales (¥ bn) 1,568.0 1,754.7 1,809.9 1,779.6 Operating profit (¥ bn) 202.5 227.7 246.3 247.8 Recurring profit (¥ bn) 182.5 205.7 227.8 228.6 Net income (¥ bn) 117.7 131.0 145.7 146.6 EPS (¥) 119.1 132.6 147.5 148.4 IBES Consensus EPS (¥) n.a. 129.8 140.8 145.6 EPS growth (%) 17.5 11.3 11.2 0.6 P/E (x) 23.6 19.9 17.9 17.8 Dividend yield (%) 1.1 1.3 1.4 1.4 EV/EBITDA (x) 17.6 16.7 16.0 15.8 P/B (x) 1.4 1.3 1.2 1.2 ROE(%) 6.2 6.6 7.0 6.7 Net debt/equity (%) 110.0 116.9 116.3 111.3 Source: Company data, Thomson Reuters, Credit Suisse estimates
-
Upload
khangminh22 -
Category
Documents
-
view
1 -
download
0
Transcript of Mitsui Fudosan (8801) - Credit Suisse | PLUS

DISCLOSURE APPENDIX AT THE BACK OF THIS REPORT CONTAINS IMPORTANT DISCLOSURES, ANALYST CERTIFICATIONS, LEGAL ENTITY DISCLOSURE AND THE STATUS OF NON-US ANALYSTS. US Disclosure: Credit Suisse does and seeks to do business with companies covered in its research reports. As a result, investors should be aware that the Firm may have a conflict of interest that could affect the objectivity of this report. Investors should consider this report as only a single factor in making their investment decision.
17 January 2017Asia Pacific/JapanEquity Research
Real Estate Management & Development (Real Estate (Japan))
Mitsui Fudosan (8801)
INCREASE TARGET PRICE Rating OUTPERFORMPrice (16 Jan 17, ¥) 2,640Target price (¥) (from 2,500) 3,300Chg to TP (%) 25.0Market cap (¥ bn) 2,608.21 (US$ 22.85)Enterprise value (¥ bn) 4,972.81Number of shares (mn) 988.15Free float (%) 85.052-week price range 3,012–2,039Target price is for 12 months.
Research AnalystsMasahiro Mochizuki
81 3 4550 [email protected]
Yasuko Fukuda81 3 4550 9259
Greater appreciation of development capabilities likely■ Action: We revise our forecasts for Mitsui Fudosan and raise our target price
from ¥2,500 to ¥3,300 (potential return 25%) owing mainly to a cut in EBITDA yield, which drives our model. We reiterate our OUTPERFORM rating.
■ Investment case: The share price has risen about 30% over three months, but still looks undervalued in terms of implied EBITDA yield and P/NAV.
■ We believe the share price could rise on (1) profit growth backed by development capabilities, (2) foreign profits, and (3) expectations for improvement at Mitsui Home (1868). We believe the company’s valuations will pivot on profit growth driven by its development capabilities.
■ In our previous report (on 3 Oct 2016), we noted such challenges as the cost of rebuilding structurally unsound tilting condos in Yokohama, which Mitsui Fudosan estimated could reach ¥39bn at most (see the 2Q earnings release). We now believe negative news about these costs has run its course.
■ Catalysts/risks: Catalysts include (1) confirmation of guidance for FY3/18 OP of at least ¥245bn, (2) profit contributions from overseas business, and (3) an explanation at the May 2017 results briefing of how management plans to leverage Mitsui Home. Risks include (1) worsening margins on built-for-sale condos and income properties, (2) a decline in office rents, and (3) worsening profitability overseas.
■ Valuation: We base our target price on a FY3/18E EBITDA yield of 5.25% (previously 6.0%).
Share price performancePr ice (LH S) Reb ased Re l (RH S)
Ju l - 1 5 Jan - 1 6 Ju l - 1 6 Jan - 1 72 ,0 0 0
2 ,5 0 0
3 ,0 0 0
3 ,5 0 0
4 ,0 0 0
The price relative chart measures performance against the TOPIX which closed at 1,530.64 on 16-Jan-2017On 16-Jan-2017 the spot exchange rate was ¥114.14/US$1
Performance 1M 3M 12MAbsolute (%) -4.9 21.7 -5.3Relative (%) -3.6 8.9 -14.5
Financial and valuation metricsYear 3/16A 3/17E 3/18E 3/19ESales (¥ bn) 1,568.0 1,754.7 1,809.9 1,779.6Operating profit (¥ bn) 202.5 227.7 246.3 247.8Recurring profit (¥ bn) 182.5 205.7 227.8 228.6Net income (¥ bn) 117.7 131.0 145.7 146.6EPS (¥) 119.1 132.6 147.5 148.4IBES Consensus EPS (¥) n.a. 129.8 140.8 145.6EPS growth (%) 17.5 11.3 11.2 0.6P/E (x) 23.6 19.9 17.9 17.8Dividend yield (%) 1.1 1.3 1.4 1.4EV/EBITDA (x) 17.6 16.7 16.0 15.8P/B (x) 1.4 1.3 1.2 1.2ROE(%) 6.2 6.6 7.0 6.7Net debt/equity (%) 110.0 116.9 116.3 111.3
Source: Company data, Thomson Reuters, Credit Suisse estimates

17 January 2017
Mitsui Fudosan (8801) 2
Mitsui Fudosan (8801)Price (16 Jan 2017): ¥2,640 (upside: 25.02%); Rating: OUTPERFORM; Target Price: (from ¥2,500) ¥3,300; Analyst: Masahiro MochizukiIncome statement (¥ bn) 3/16A 3/17E 3/18E 3/19ESales 1,568.0 1,754.7 1,809.9 1,779.6EBITDA 269.9 297.7 319.2 323.6Operating profit 202.5 227.7 246.3 247.8Recurring profit 182.5 205.7 227.8 228.6Extraordinary gain & loss (1.2) (10.0) (10.5) (10.0)Profit before tax 181.3 195.7 217.3 218.6Net income 117.7 131.0 145.7 146.6Cash flow (¥ bn) 3/16A 3/17E 3/18E 3/19EOperating cash flow 32.2 13.8 120.3 221.5Depreciation & Amortization 67.5 70.0 72.9 75.8Financing cash flow 201.1 191.2 94.4 (17.5)Issuance (retirement) of stock - - - -Dividends paid (27.7) (32.6) (35.6) (37.5)Investing cash flow (239.7) (230.0) (200.0) (200.0)Capex (197.1) (230.0) (200.0) (200.0)Free cash flow (207.6) (216.2) (79.7) 21.5Net change in cash (6.5) (25.0) 14.7 4.0Balance sheet (¥ bn) 3/16A 3/17E 3/18E 3/19ECash & cash equivalents 111.2 86.2 100.9 104.9Current receivable 36.1 35.1 36.2 35.6Inventories 1,167.7 1,347.7 1,447.7 1,447.7Other current assets 205.6 205.6 205.6 205.6Current assets 1,520.6 1,674.6 1,790.4 1,793.8Property, plant & equipment 2,902.2 3,062.2 3,189.3 3,313.5Investments - - - -Intangibles 66.8 66.8 66.8 66.8Other non-current assets 884.7 884.7 884.7 884.7Total assets 5,374.3 5,688.3 5,931.2 6,058.8Payables 95.9 87.7 90.5 89.0Short term debt 350.0 350.0 350.0 350.0Other current liabilities 394.8 394.8 394.8 394.8Current liabilities 840.7 832.5 835.3 833.8Long term debt 1,532.1 1,755.8 1,885.8 1,905.8Other non-current liabilities 1,012.5 1,012.6 1,012.6 1,012.6Total liabilities 3,385.2 3,600.9 3,733.7 3,752.2Shareholders' equity 1,923.3 2,021.7 2,131.8 2,240.9Minority interests 65.7 65.7 65.7 65.7
Key ratios 3/16A 3/17E 3/18E 3/19EGrowth (%)Sales 2.5 11.9 3.1 (1.7)Operating profit 8.8 12.5 8.2 0.6EPS 17.5 11.3 11.2 0.6Margins (%)Gross margin 22.5 22.1 23.0 24.0EBITDA margin 17.2 17.0 17.6 18.2OP margin 12.9 13.0 13.6 13.9DuPont analysisROE (%) 6.2 6.6 7.0 6.7Net profit margin (%) 7.5 7.5 8.1 8.2Sales/Assets 0.3 0.3 0.3 0.3Assets/Equity 2.8 2.8 2.8 2.7Credit ratios (%)Equity ratio 35.8 35.5 35.9 37.0Net D/E ratio 1.1 1.2 1.2 1.1Per share data (¥)Number of shares (mn) 988.1 988.1 988.1 988.1EPS 119.1 132.6 147.5 148.4BPS 1946.5 2046.0 2157.4 2267.8DPS 30.0 33.0 36.0 38.0Dividend payout ratio (%) 25.2 24.9 24.4 25.6Valuation (x) 3/16A 3/17E 3/18E 3/19EP/E 23.6 19.9 17.9 17.8P/B 1.4 1.3 1.2 1.2EV/EBITDA 17.6 16.7 16.0 15.8Dividend yield (%) 1.1 1.3 1.4 1.4FCF yield (%) (5.9) (8.3) (3.1) 0.8
Source: Company data, Thomson Reuters, Credit Suisse estimates

17 January 2017
Mitsui Fudosan (8801) 3
Reiterating OUTPERFORM Shares still look undervaluedWe revise our earnings estimates for Mitsui Fudosan and raise our target price from ¥2,500 to ¥3,300 (potential return: 25%). We maintain our OUTPERFORM rating.
The share price has appreciated about 30% over the past three months, but still looks undervalued to us. Company shares have underperformed Mitsubishi Estate (8802) since 2016, making P/NAV look undervalued in comparison.
We believe the share price could rise on (1) profit growth backed by the company’s development capabilities, (2) profit contributions from overseas business, and (3) expectations for improvement at Mitsui Home.
Figure 1: Consolidated earnings summary
¥mn YoY (%) ¥mn YoY (%) ¥mn YoY (%) ¥mn YoY (%) ¥ YoY (%)ConsolidatedMar-16 Actual 1,567,969 2.5 202,482 8.8 182,521 11.7 117,722 17.5 119.1 17.5Mar-17 1Q Actual 356,470 -0.3 47,581 -8.7 45,119 -9.8 34,264 -3.5 34.7 3.6
2Q Actual 454,509 3.0 67,171 16.9 63,155 17.9 38,576 22.2 39.0 22.31H Actual 810,979 1.5 114,752 4.7 108,274 4.5 72,840 8.6 73.7 8.73Q CS E 378,900 9.0 41,100 -5.7 33,300 -16.7 21,500 -23.4 - -4Q CS E 564,900 34.1 71,800 45.7 64,100 64.5 36,700 62.6 - -
Mar-17 CS E (new) 1,754,700 11.9 227,700 12.5 205,700 12.7 131,000 11.3 132.6 11.3CS E (prev) 1,782,900 13.7 227,700 12.5 205,700 12.7 131,000 11.3 132.6 11.3CoE 1,750,000 11.6 220,000 8.7 198,000 8.5 125,000 6.2 126.5 6.2Shikiho E 1,750,000 11.6 222,000 9.6 200,000 9.6 126,000 7.0 127.5 7.0IBES E 1,733,271 10.5 223,589 10.4 - - 128,222 8.9 129.8 8.9
Mar-18 CS E (new) 1,809,900 3.1 246,300 8.2 227,800 10.7 145,700 11.2 147.5 11.2CS E (prev) 1,853,800 4.0 250,700 10.1 232,200 12.9 148,400 13.3 150.2 13.3Shikiho E 1,750,000 0.0 224,000 0.9 202,000 1.0 127,000 0.8 128.5 0.8IBES E 1,753,058 1.1 235,843 5.5 - - 139,669 8.9 140.8 8.5
Mar-19 CS E (new) 1,779,600 -1.7 247,800 0.6 228,600 0.4 146,600 0.6 148.4 0.6CS E (prev) 1,799,100 -3.0 243,900 -2.7 224,700 -3.2 144,000 -3.0 145.7 -3.0IBES E 1,770,897 1.0 240,526 2.0 - - 144,272 3.3 145.6 3.4
Operating profit Recurring profit Net profit EPSSales
Source: Company data, Toyo Keizai "Shikiho"(Japan Company Handbook), I/B/E/S, Credit Suisse estimates
Negative news about condo rebuilding costs dries upIn our 3 October 2016 report Imperative clear; maintain OUTPERFORM, we pointed out four main challenges facing Mitsui Fudosan: (1) running its core businesses of leasing, sales, and management in Japan; (2) doing business overseas; (3) rebuilding the structurally deficient tilting condominiums sold in Yokohama; and (4) reversing the slide in earnings at consolidated subsidiary Mitsui Home.
Results for 2Q, which were reported on 11 November, confirmed robust performance in core domestic businesses and clarified the maximum potential losses to rebuild the tilting condos. In the macro environment, stronger expectations for an increase in the CPI gave a boost to the company’s shares.
Mitsui Fudosan estimates it will cost ¥39bn at most to rebuild the tilting condos in Yokohama. We believe Mitsui Fudosan, Sumitomo Mitsui Construction (1821), Hitachi High-Technologies (8036), and Asahi Kasei (3407) will shoulder this cost. Mitsui Fudosan’s 2Q earnings release indicates it will seek damages for this entire amount from Sumitomo Mitsui Construction, Hitachi High-Technologies, and Asahi Kasei.
Raising target price to ¥3,300, maintaining
OUTPERFORM
Negative news about one management
challenge we previously highlighted
has run its course

17 January 2017
Mitsui Fudosan (8801) 4
Factors that could be reflected in the share priceGreater appreciation of profit growth driven by development capabilities Our forecasts for the leasing business only take into account projects currently under development, and we estimate new development projects from FY3/17 to FY3/20 and beyond will add ¥46.8bn to OP growth compared with FY3/16. Since prices are high for income-generating property, we believe investors will view companies like Mitsui Fudosan, which grow profits by developing their own properties, more favorably than companies aiming to grow profits via property acquisitions.
Profit contributions from overseas to start in FY3/18In foreign operations, the company has made smooth progress developing income-generating properties and built-for-sale condos in the UK. In New York, the company is developing high-income real estate in Manhattan, while built-for-sale homes in Asia should begin contributing to profits in FY3/18. Our estimates for FY3/18 assume the booking of ¥5bn in equity-method profit from the built-for-sale housing business in Asia.
Overseas assets amounted to roughly ¥600bn as of end-FY3/16 (11% of total assets), broken down as 58% in the US, 23% in Europe, and 19% in Asia.
Shoring up of Mitsui HomeWe believe making Mitsui Home into a wholly owned subsidiary would increase resource allocation efficiency and improve earnings. If management decides to discuss a strategy for improving earnings at Mitsui Home at a future results briefing, we believe it could be taken as a positive surprise.
On 20 December, Panasonic (6752) and PanaHome (1924) announced the delisting of PanaHome and its conversion into a wholly owned consolidated subsidiary of Panasonic. For details, see our 21 December 2016 report PanaHome to become wholly owned; neutral.
PanaHome is a profitable and growing company. However, Panasonic explained that resource allocation had been inefficient within the Panasonic group prior to PanaHome becoming a wholly owned consolidated subsidiary. We believe Mitsui Home faces the same problem.

17 January 2017
Mitsui Fudosan (8801) 5
Shares still look undervaluedThere are two reasons we believe the share price is undervalued: (1) it does not reflect the high implied EBITDA yield or expectations for profit growth as an operating company and (2) it does not reflect the value of the company’s real estate holdings with price trending below NAV.
In addition, in our view the company has a rock-solid financial foundation and excels at limiting its exposure to rising interest rates. For a J-REIT, such a rise in interest rates would take away funds for dividends and thereby depress investment unit prices. However, for a real estate developer, a rise in interest rates due to growing inflation prospects should foster expectations for an increase in office building rents and higher gains on the sell-off of income-generating properties.
Figure 2: Absolute share prices (Dec 2012=100) Figure 3: Relative share prices (Dec 2012=100)
80
100
120
140
160
180
200
Dec
-12
Mar
-13
Jun-
13
Sep
-13
Dec
-13
Mar
-14
Jun-
14
Sep
-14
Dec
-14
Mar
-15
Jun-
15
Sep
-15
Dec
-15
Mar
-16
Jun-
16
Sep
-16
Dec
-16
Mitsui Fudosan TSEREAL
60
70
80
90
100
110
120
130
140
150
Dec
-12
Feb-
13A
pr-1
3Ju
n-13
Aug
-13
Oct
-13
Dec
-13
Feb-
14A
pr-1
4Ju
n-14
Aug
-14
Oct
-14
Dec
-14
Feb-
15A
pr-1
5Ju
n-15
Aug
-15
Oct
-15
Dec
-15
Feb-
16A
pr-1
6Ju
n-16
Aug
-16
Oct
-16
Dec
-16
vs Mitsubishi Estate vs Sumitomo R&D vs TSEREAL vs TOPIX
Source: Thomson Reuters, Credit Suisse Source: Thomson Reuters, Credit Suisse
Little likelihood of share buybacks at this junctureMitsui Fudosan’s shares remain undervalued compared with breakup value, making management announcement of a share buyback program a potential catalyst for the shares. Even if such a program only entailed modest amounts, we believe the announcement alone could boost the share price.
Since buyback expectations started strengthening at Mitsubishi Estate, its valuation has been better than that of Mitsui Fudosan or Sumitomo Realty & Development (8830). Although Mitsui Fudosan is unlikely to buy back its shares anytime soon, we believe a buyback program would be an effective means of supporting share price appreciation in the company’s financial strategy.
In the past, Mitsui Fudosan has announced capital increases when the P/NAV multiple was above 1x, as it is natural for management at such times to take advantage of capital markets with the aim of increasing profits. With the shares looking strongly undervalued, however, we believe management must constantly keep shareholder value in mind when engaging in investor dialog.
Shares look undervalued in cash
flow growth potential and breakup value

17 January 2017
Mitsui Fudosan (8801) 6
Attractive valuationImplied EBITDA yieldThe implied EBITDA yield now exceeds 5.5%, which it has previously exceeded on three occasions: the first half of 2000, amid concerns about Japan’s financial system, from 2007 to 2008, when the global credit crisis emerged, and from 2010 to 2011, after the governing parties changed and a major earthquake struck in Japan. In our view, all three occasions had one point in common: concerns about deflation stoked by an increase in systemic risk.
The company’s implied EBITDA yield has declined since October 2016 but remains lofty.
Target price calculationWe base our target price on an EBITDA yield of 5.25% applied to our FY3/18E.
The EBITDA yield of 5.25% is the average for 2010–11, when concerns eased about the credit crunch but uncertainties about earnings persisted. The current price already reflects concerns about the possibility of sustained quantitative easing, but we believe possible trends in macro conditions could alter expectations for company earnings. We therefore decided to use the average EBITDA yield for 2010–11 in our target price calculation.
Figure 4: Implied EBITDA yields
3.0%3.5%4.0%4.5%5.0%5.5%6.0%6.5%7.0%7.5%8.0%8.5%
Dec-9
9Au
g-00
Apr-0
1De
c-01
Aug-
02Ap
r-03
Dec-0
3Au
g-04
Apr-0
5De
c-05
Aug-
06Ap
r-07
Dec-0
7Au
g-08
Apr-0
9De
c-09
Aug-
10Ap
r-11
Dec-1
1Au
g-12
Apr-1
3De
c-13
Aug-
14Ap
r-15
Dec-1
5Au
g-16
FY1 EBITDA yield FY2 EBITDA yield
Source: Thomson Reuters, Credit Suisse
High risk premiumThe risk premium, which has moved in response to long-term growth expectations, remains high. Its current level is on a par with 2002–03, when concerns were spreading that Japan’s financial system would collapse.
Current implied EBITDA yield looks
high

17 January 2017
Mitsui Fudosan (8801) 7
Figure 5: Risk premium (implied EBITDA yield minus 10-year JGB yields)
2.0%2.5%3.0%3.5%4.0%4.5%5.0%5.5%6.0%6.5%7.0%7.5%
Dec-9
9Au
g-00
Apr-0
1De
c-01
Aug-
02Ap
r-03
Dec-0
3Au
g-04
Apr-0
5De
c-05
Aug-
06Ap
r-07
Dec-0
7Au
g-08
Apr-0
9De
c-09
Aug-
10Ap
r-11
Dec-1
1Au
g-12
Apr-1
3De
c-13
Aug-
14Ap
r-15
Dec-1
5Au
g-16
FY1 risk premium (EBITDA yield) FY2 risk premium (EBITDA yield)
Source: Thomson Reuters, Credit Suisse
P/NAVP/NAV is 0.81x based on after-tax NAV from FY3/16 actuals. The shares look undervalued in terms of breakup value.
Figure 6: P/NAV (after tax)
0.60
0.80
1.00
1.20
1.40
1.60
1.80
2.00
Mar-1
0Ma
y-10
Jul-1
0Se
p-10
Nov-1
0Ja
n-11
Mar-1
1Ma
y-11
Jul-1
1Se
p-11
Nov-1
1Ja
n-12
Mar-1
2Ma
y-12
Jul-1
2Se
p-12
Nov-1
2Ja
n-13
Mar-1
3Ma
y-13
Jul-1
3Se
p-13
Nov-1
3Ja
n-14
Mar-1
4Ma
y-14
Jul-1
4Se
p-14
Nov-1
4Ja
n-15
Mar-1
5Ma
y-15
Jul-1
5Se
p-15
Nov-1
5Ja
n-16
Mar-1
6Ma
y-16
Jul-1
6Se
p-16
Nov-1
6
(X)
Source: Thomson Reuters, Credit Suisse
Shares still look undervalued value in
terms of breakup value

17 January 2017
Mitsui Fudosan (8801) 8
Undervaluation widens based on FY3/18EWe assume share prices normally reflect possible future trends. Reaching out to FY3/18 estimates, we calculate a NAV of ¥3,511 while the current share price incorporates a 20% or so decline in the market value of the company’s fixed assets.
Despite concerns that selling prices for built-for-sale condos will decline, we expect prices to continue rising for income-generating real estate. Considering the company’s unrealized gains on fixed assets and its prospects for profit growth, we see current share price valuations as quite attractive.
Figure 7: Share price implies about 20% drop in value of fixed assets based on FY3/18E NAV
Share price 2,640 yen1/16/2017
NAVPS NAVPSShare price
/NAVPSShare price
/NAVPSMarket value
increase rate of Rental Property
17/3 18/3 17/3 18/3
15.0% 3,884 3,996 68.0% 66.1%10.0% 3,723 3,834 70.9% 68.8%
5.0% 3,561 3,673 74.1% 71.9%1.0% 3,432 3,543 76.9% 74.5%0.0% 3,400 3,511 77.6% 75.2%
-1.0% 3,367 3,479 78.4% 75.9%-5.0% 3,238 3,349 81.5% 78.8%
-10.0% 3,077 3,188 85.8% 82.8%-15.0% 2,915 3,026 90.5% 87.2%-20.0% 2,753 2,865 95.9% 92.1%-25.0% 2,592 2,703 101.8% 97.6%-30.0% 2,430 2,542 108.6% 103.8%
Source: Thomson Reuters, Credit Suisse estimates
Unrealized gains on inventoriesFigures 6 and 7 above are based on an NAV estimate that only takes into account unrealized gains on fixed assets, as Mitsui Fudosan’s NAV disclosures only include unrealized gains on fixed assets. However, the company’s inventories also include condos and income-generating real estate that it plans to sell.
In Figure 8 below, Case 1 shows the NAVPS of fixed assets as ¥3,261 in FY3/16, whereas Case Two, includes unrealized gains on inventories by assuming the company is holding a 15% unrealized profit on inventories, shows a higher NAVPS of ¥3,403 (also based on FY3/16).

17 January 2017
Mitsui Fudosan (8801) 9
Figure 8: Estimated NAV when unrealized gains on inventories are included Case 1 Case 2
In million yen Unrealized gains on fixed assets only: Unrealized gains on fixed assets & inventory:Fixed assets
Book value 2,648,353 2,648,353Market value 4,560,531 4,560,531Unrealized gains 1,912,178 1,912,178
InventoryBook value 1,167,743Market value 1,373,815Unrealized gains 206,072
Investment propertiesBook value 701,300Market value 825,059
CondosBook value 466,443Market value 548,756
Unrealized gains (pre-tax) 1,912,178 2,118,250Unrealized gains (after-tax) 1,300,281 1,440,410Shareholders’ equity 1,922,304 1,922,304Shares (mn) 988.16 988.16NAV/share (¥) 1/16/2017 3,261 3,403
Share price (¥) 2,640 2,640P/NAV (x) 0.81 0.78
Source: Thomson Reuters, Credit Suisse

17 January 2017
Mitsui Fudosan (8801) 10
Improvement in financial leverageLower financial leverage The company’s D/E ratio was 1.16 as of end-FY3/16. Since then, Mitsui Fudosan has made some investments that increased its financial leverage somewhat. Nonetheless, the current D/E ratio is still low, meaning the company is in excellent financial health.
An increase in long-term interest rates poses the risk of higher interest payments at a company like Mitsui Fudosan. When such a company has high financial leverage, rising interest rates could induce the company to raise new capital. However, the company’s financial leverage is low enough now, in our view, for management to continue procuring funds at low interest rates.
Figure 9: D/E ratio
1.21
-
0.50
1.00
1.50
2.00
2.50
3.00
3.50
4.00
4.50
5.00
1980
/03
1981
/03
1982
/03
1983
/03
1984
/03
1985
/03
1986
/03
1987
/03
1988
/03
1989
/03
1990
/03
1991
/03
1992
/03
1993
/03
1994
/03
1995
/03
1996
/03
1997
/03
1998
/03
1999
/03
2000
/03
2001
/03
2002
/03
2003
/03
2004
/03
2005
/03
2006
/03
2007
/03
2008
/03
2009
/03
2010
/03
2011
/03
2012
/03
2013
/03
2014
/03
2015
/03
2016
/03
2017
/03
CSE
2018
/03
CSE
2019
/03
CSE
(X)
Source: Company data, Credit Suisse estimates
Correlation between share price and interest rates, excluding expectations for quantitative easing in 2012In the past, the company’s share price has sometimes risen when interest rates increased. We see no need for concern that the share price will be adversely affected by higher rates, as long as the rising rates are precipitated by a higher expected rate of inflation on the back of an economic recovery.
However, an increase in long-term interest rates without any improvement in earnings would heighten the risk of a decline in the share price, in our opinion, because the discount rate would increase in the absence of any (1) improvement in cash flow or (2) change in the risk premium. Such circumstances would probably affect J-REITs, but real estate developers are likely to see profits grow from property development and an increase in rental revenue.
Financial leverage is low enough to lessen relative exposure to a
rise in interest rates

17 January 2017
Mitsui Fudosan (8801) 11
Figure 10: Correlation between 10-year JGB yields and share prices
0
800
1,600
2,400
3,200
4,000
4,800
-0.50%
0.00%
0.50%
1.00%
1.50%
2.00%
2.50%
12/3
1/19
997/
31/2
000
2/28
/200
19/
30/2
001
4/30
/200
211
/30/
2002
6/30
/200
31/
31/2
004
8/31
/200
43/
31/2
005
10/3
1/20
055/
31/2
006
12/3
1/20
067/
31/2
007
2/29
/200
89/
30/2
008
4/30
/200
911
/30/
2009
6/30
/201
01/
31/2
011
8/31
/201
13/
31/2
012
10/3
1/20
125/
31/2
013
12/3
1/20
137/
31/2
014
2/28
/201
59/
30/2
015
4/30
/201
611
/30/
2016
10-year government bond yield(LHS)
Share prices (RHS)
Expectations of asset inflation by quantitative easing
Source: Thomson Reuters, Credit Suisse
17 January 2017
Mitsui Fudosan (8801) 12
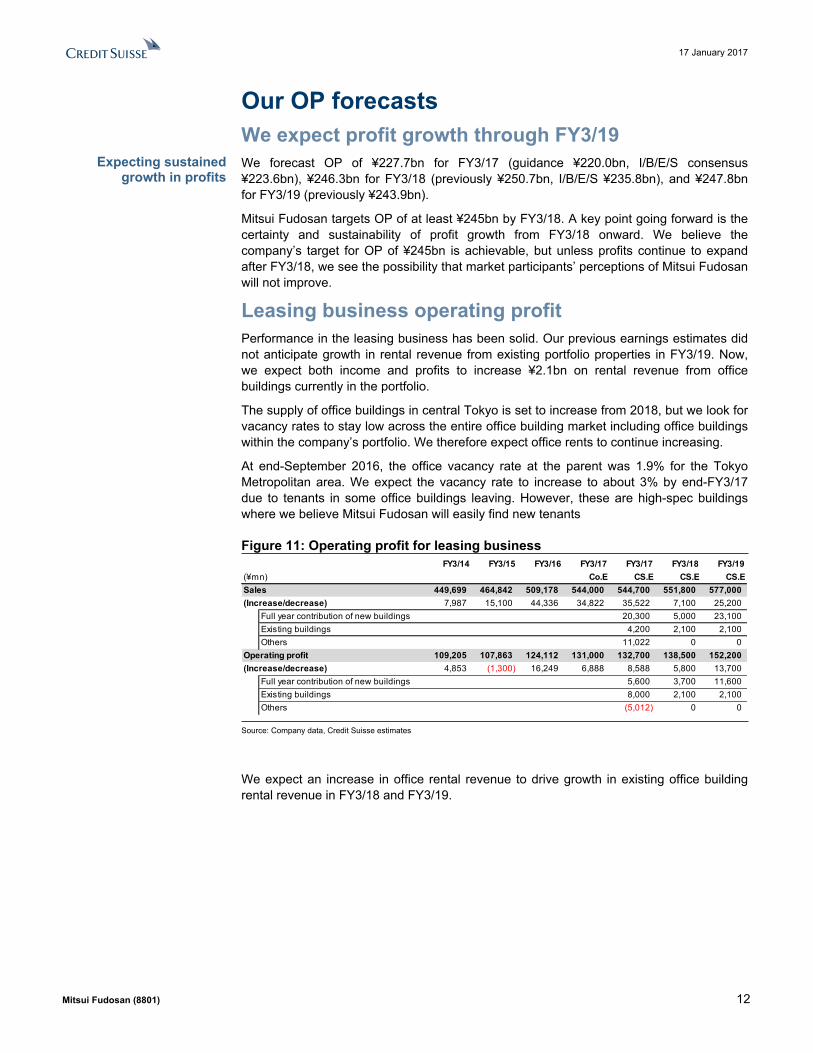
Our OP forecastsWe expect profit growth through FY3/19We forecast OP of ¥227.7bn for FY3/17 (guidance ¥220.0bn, I/B/E/S consensus ¥223.6bn), ¥246.3bn for FY3/18 (previously ¥250.7bn, I/B/E/S ¥235.8bn), and ¥247.8bn for FY3/19 (previously ¥243.9bn).
Mitsui Fudosan targets OP of at least ¥245bn by FY3/18. A key point going forward is the certainty and sustainability of profit growth from FY3/18 onward. We believe the company’s target for OP of ¥245bn is achievable, but unless profits continue to expand after FY3/18, we see the possibility that market participants’ perceptions of Mitsui Fudosan will not improve.
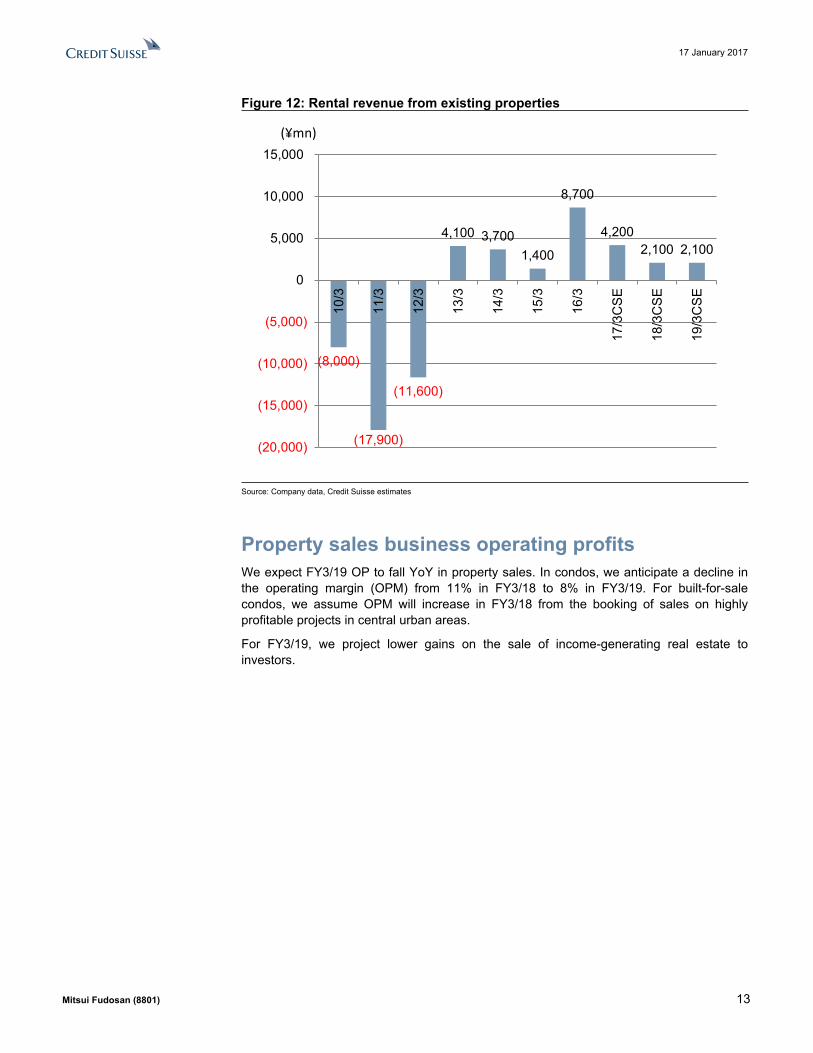
Leasing business operating profitPerformance in the leasing business has been solid. Our previous earnings estimates did not anticipate growth in rental revenue from existing portfolio properties in FY3/19. Now, we expect both income and profits to increase ¥2.1bn on rental revenue from office buildings currently in the portfolio.
The supply of office buildings in central Tokyo is set to increase from 2018, but we look for vacancy rates to stay low across the entire office building market including office buildings within the company’s portfolio. We therefore expect office rents to continue increasing.
At end-September 2016, the office vacancy rate at the parent was 1.9% for the Tokyo Metropolitan area. We expect the vacancy rate to increase to about 3% by end-FY3/17 due to tenants in some office buildings leaving. However, these are high-spec buildings where we believe Mitsui Fudosan will easily find new tenants
Figure 11: Operating profit for leasing business FY3/14 FY3/15 FY3/16 FY3/17 FY3/17 FY3/18 FY3/19
(¥mn) Co.E CS.E CS.E CS.ESales 449,699 464,842 509,178 544,000 544,700 551,800 577,000(Increase/decrease) 7,987 15,100 44,336 34,822 35,522 7,100 25,200
Full year contribution of new buildings 20,300 5,000 23,100Existing buildings 4,200 2,100 2,100Others 11,022 0 0
Operating profit 109,205 107,863 124,112 131,000 132,700 138,500 152,200(Increase/decrease) 4,853 (1,300) 16,249 6,888 8,588 5,800 13,700
Full year contribution of new buildings 5,600 3,700 11,600Existing buildings 8,000 2,100 2,100Others (5,012) 0 0
Source: Company data, Credit Suisse estimates
We expect an increase in office rental revenue to drive growth in existing office building rental revenue in FY3/18 and FY3/19.
Expecting sustained growth in profits
17 January 2017
Mitsui Fudosan (8801) 13
Figure 12: Rental revenue from existing properties
(8,000)
(17,900)
(11,600)
4,100 3,700 1,400
8,700
4,200 2,100 2,100
(20,000)
(15,000)
(10,000)
(5,000)
0
5,000
10,000
15,000
10/3
11/3
12/3
13/3
14/3
15/3
16/3
17/3
CS
E
18/3
CS
E
19/3
CS
E
(¥mn)
Source: Company data, Credit Suisse estimates
Property sales business operating profitsWe expect FY3/19 OP to fall YoY in property sales. In condos, we anticipate a decline in the operating margin (OPM) from 11% in FY3/18 to 8% in FY3/19. For built-for-sale condos, we assume OPM will increase in FY3/18 from the booking of sales on highly profitable projects in central urban areas.
For FY3/19, we project lower gains on the sale of income-generating real estate to investors.

17 January 2017
Mitsui Fudosan (8801) 14
Figure 13: Operating profit for property sales businessFY3/14 FY3/15 FY3/16 FY3/17 FY3/17 FY3/18 FY3/19
(¥mn) CoE CS.E CS.E CS.ESales 409,466 425,442 391,577 525,000 525,000 546,100 480,600Housing sales 345,172 298,126 295,283 333,000 333,000 296,100 280,600
Unit (dwelling) 7,473 5,757 5,142 6,150 6,150 4,900 5,000Unit price(¥mn) 46.2 51.8 57.4 54.1 54.1 60.4 56.1
Detached-houseSales (¥mn) 49,689 48,598 41,845 44,000 44,100 44,100 44,100Unit (dwelling) 916 899 751 700 700 700 700Unit price(¥mn) 54.2 54.1 55.7 62.9 63.0 63.0 63.0
CondominiumsSales (¥mn) 295,482 249,528 253,438 289,000 288,900 252,000 236,500Unit (dwelling) 6,557 4,858 4,391 5,450 5,450 4,200 4,300Unit price(¥mn) 45.1 51.4 57.7 53.0 53.0 60.0 55.0
Property for investors 64,294 127,315 96,293 192,000 192,000 250,000 200,000Operating profit 27,099 45,493 44,525 60,000 64,300 74,600 57,400(increase/decrease) 4,040 18,394 (968) 10,000 19,800 10,300 (17,200)Housing 22,781 26,730 23,934 27,000 28,300 32,600 22,400
(Operating profit ratio) 6.6% 9.0% 8.1% 8.1% 8.5% 11.0% 8.0%Property for investors 4,317 18,763 20,591 33,000 36,000 42,000 35,000
(Operating profit ratio) 6.7% 14.7% 21.4% 17.2% 18.8% 16.8% 17.5%
Source: Company data, Credit Suisse estimates
Plentiful inventory of property for investorsAs of end-FY3/16, Mitsui Fudosan’s inventory of property for investors (income-generating real estate for sale to investors) stood at ¥701.3bn.
Of this amount, 38% is property currently under development or scheduled for development, and the other 62% consists of properties already on the market. In 1–2Q, investor property sales generated revenues of ¥149.9bn and OP of ¥35.0bn.
Mitsui Fudosan Logistics Park, a REIT sponsored by Mitsui Fudosan, listed on the stock market in August with assets amounting to roughly ¥75.5bn. Mitsui Fudosan transferred some logistics facilities to the REIT when it listed.

17 January 2017
Mitsui Fudosan (8801) 15
Figure 14: Breakdown of investor property inventory (end-FY3/16)
Being constructed/to be constructed
38%
Residential in operation
8%
Logistics in operation
14%
Retail in operation15%
Office in operation25%
Source: Company data, Credit Suisse estimates
Continues to develop propertiesSince FY3/07, Mitsui Fudosan’s inventories have ranged between ¥450–700bn while the company has sold approximately ¥100bn worth of properties each fiscal year. For FY3/17, we estimate revenues from investor property sales will reach ¥192bn along with the listing of the REIT. We believe the company may sell income-generating properties located overseas starting from FY3/18.
Mitsui Fudosan continues to develop new properties while selling off income-generating real estate. We understand its outstanding investments stand at around ¥500bn. Earnings in the company’s investor property business have been supported by its development capabilities and the ability of the REIT to purchase properties.
Figure 15: Inventories of investor properties (Y bn) Total commercial real estate of buit-for-sales
3/07 103.8 586.73/08 111.9 534.73/09 91.1 567.1 85.1 39.7 45.4 397.03/10 85.3 519.0 155.7 129.8 77.9 155.73/11 88.9 442.0 110.5 88.4 44.2 198.93/12 64.1 447.0 160.9 84.9 8.9 192.23/13 110.8 518.7 160.8 150.4 15.6 191.93/14 64.3 557.0 222.8 150.4 22.3 222.83/15 127.3 616.8 148.0 117.2 30.8 30.8 289.93/16 96.3 701.3 175.3 105.2 56.1 98.2 259.5
Sales of commercial real estate
of buit-for-salesCompleted office in
operationCompleted retail
facility in operation
Completed apartment in
operation
Completed logistics in operation
accommodation
Under or planned development
Source: Company data, Credit Suisse estimates

17 January 2017
Mitsui Fudosan (8801) 16
Completion of high-quality development projectsWe anticipate a boost to earnings from FY3/19 onward due to completion of high-quality office buildings and retail complexes. In the leasing business, we look for OP to increase by ¥25.9bn through FY3/20 (compared with FY3/16), and by ¥46.8bn when projects completed after FY3/20 are included.
Development of office buildingsAs of end-FY3/16, Mitsui Fudosan’s leasable office space (including sub-leases) totaled 2,799,000 m2, of which the company owned 1,177,000 m2. We project that the company's ownership of leasable space in office buildings will expand 25% by FY3/20 (compared with FY3/16), or 45% if projects scheduled for completion after FY3/20 are included.
We estimate that rental revenues from office buildings owned by the company were roughly ¥180bn in FY3/16. Assuming OPM of 50% on office building leases, we estimate OP of about ¥90bn in this segment.
As the company expands its floor space under ownership through property development, we project that OP will increase by ¥22.5bn from FY3/17 to FY3/20, or by ¥40bn if projects to be finished after FY3/20 are included. Moreover, most of the properties due for completion in FY3/18 are high-rent projects in central urban areas, so their contribution to earnings could be more than we expect.
Figure 16: Office development projects
Diversity Tokyo Office Tower (*) Koto-ku, Tokyo 43,800Nihonbashi Astellas Mitsui Building (*) Chuo-ku, Tokyo 15,600Muromachi Furukawa Mitsui Building (area 2-3) (*) Chuo-ku, Tokyo 19,600Muromachi Chibagin Mitsui Building (area 1-5) (*) Chuo-ku, Tokyo 9,300Moorgate City, London 12,100Gate Square (Kashiwanoha Campus, area 148) Kashiwa, Chiba 8,000Sapporo Mitsui JP Building (*) Sapporo, Hokkaido 25,4001200 17th Street (*) Washington DC, USA 15,600Iidabashi Grand Bloom (*) Chiyoda-ku, Tokyo 71,300Mark Lane development project City, London 16,400
Shinagawa-ku, Tokyo 53,70022,300
270 Brannan (*) San Francisco 16,9002016 1 Angel Court development plan (*) City, London 29,400
Hibiya Project Chiyoda-ku, Tokyo 189,000New Tokyo Takeda Building (*) Chuo-ku, Tokyo 45,000
209,000Nihonbashi 2-chome redevelopment Project (Block C) (*) Chuo-ku, Tokyo 143,400
132,60055 Hudson Yards (*) NYC 117,600
55,000Nihonbashi Muromachi 3-chome area redevelopment plan (*) Chuo-ku, Tokyo 168,000
2019 OH-1 plan (Otemachi 1-chome, area 2) (*) Chiyoda-ku, Tokyo 357,800Yaesu 2-Chome Central Block Project (*) Chuo-ku, Tokyo 410,000Yaesu 2-Chome North Block Project (*) Chuo-ku, Tokyo 293,600Nihonbashi Muromachi 1-Chome project (*) Chuo-ku, Tokyo TBD (8,000m²)Nihonbashi 1-Chome Block1,2 Project (*) Chuo-ku, Tokyo TBD (7,000m²)Nihonbashi 1-Chome Central Block (4-12 Square) Project (*) Chuo-ku, Tokyo TBD (23,000m²)Toyoso 2/3-chome block 2 development plan (*) Koto-ku, Tokyo 259,000
Leasable floors from FY12 to FY16 and total foors from FY17
total floor area from FY2017(m2, site area)
Major new projects
Completion date (FY)
2014
2015
2017
LocationProject name
(Asterisks denote joint developments)
Each FY completed and total floor space may change in the future. Some project names are tentative.
2012
2013
2018
After 2020
Source: Company data, Credit Suisse estimates
Sustained profit growth likely on completion of
high-quality development projects

17 January 2017
Mitsui Fudosan (8801) 17
Retail complex development projectsAs of end-FY3/16, Mitsui Fudosan’s leasable space in retail complexes (including subleases) totaled 2,023,000 m2,of which 1,500,000 m2 was owned by the company. We project that its ownership of leasable space in retail complexes will increase roughly 10% by FY3/20 (as compared with FY3/16), or 20% if projects scheduled for completion after FY3/20 are included.
We estimate that OP on rental revenues from retail complexes was ¥34.1bn in FY3/16. As the company expands its owned floor space through property development, we forecast that OP will increase ¥3.4bn from FY3/17 to FY3/20, or ¥6.8bn including projects to be finished after FY3/20.
Figure 17: Retail complex development projects
Project name
(Asterisks denote joint developments)Diversity Tokyo Plaza (*) Koto-ku, Tokyo 45,300 Mitsui Outlet Park Kisarazu Kisarazu, Chiba 28,000 LaLaport Shin-Misato Annex Misato, Saitama 3,300 Mitsui Outlet Park Shiga Ryuo (2nd stage) Gamo-gun, Shiga 10,000 LoveLa2 Niigata City, Niigata 11,200 LaLaport Tokyo Bay West rebuilding Funabashi, Chiba 24,000 COREDO Muromachi 2 (area 2-3) (*) Chuo-ku, Tokyo 13,600 COREDO Muromachi 3 (area 1-5) (*) Chuo-ku, Tokyo 5,000 Ikebukuro Globe Toshima-ku, Tokyo 4,400 LaLaTerrace MUSASHIKOSUGI Kawasaki, Kanagawa 8,000 Mitsui Outlet Park Sapporo Kitahiroshima (2nd stage) Kitahiroshima, Hokkaido 7,700 Mitsui Outlet Park Kisarazu (2nd stage ) Kisarazu, Chiba 8,500 LaLaport Kashiwanoha (North Building) Kashiwa, Chiba 7,500 Akarenga TERRACE (*) Sapporo, Hokkaido 8,500 IIDABASHI SAKURA TERRACE (*) Chuo-ku, Tokyo 4,900 LaLaport Izumi Izumi, Osaka 55,000 Shin Kawasaki Square Kawasaki, Kanagawa 11,000LaLaport Fujimi Fujimi, Saitama 80,000 MITSUI OUTRET PARK Kuala Lumpur International Airport Sepang
MalaysiaSelangor 24,000
MITSUI OUTRET PARK HOKURIKU OYABE Oyabe, Toyama 26,000 MITSUI OUTRET PARK MAKUHARI (3rd stage) Chiba, Chiba 6,500 LaLaport Ebina Ebina, Kanagawa 5,400 Osaka Expoland Site Plan Suita, Osaka 71,000 Linkou Enterprise Zone Project (Taiwan, Outlet project) (*) Kinkou District, Taiwan 45,000
2016 Retail Facility Development Project in Hiratsuka Hiratsuka, Kanagawa 60,000
2017 MITSUI OUTRET PARKJAZZ DREAM NAGASHIMA(*)
Kuwana, Mie 6,200
2018 Retail Facility Development Project in Nagoya Nagoya, Aichi 54,600 MITSUI OUTRET PARK MalaysiaKuala Lumpur International Airport Sepang(*) Kuala Lumpur
2nd stage 9,900 3rd stage 9,900
2021 Lalaport Kuala Lumpur(*) MalaysiaKuala Lumpur
8,000
Retail Facility Development Project in Togocho, Aichi Aichigun, Aichi TBD Miyashita Park project Shibuya, Tokyo TBD
2015
2014
2012
2013
Each FY completed and total floor space may change in the future. Some project names are tentative.
Major new projects
Retail floor area(m2)Opening date
(FY) Location
TBD
Source: Company data, Credit Suisse

17 January 2017
Mitsui Fudosan (8801) 18
ROEWe forecast ROE will remain above 6.5% from FY3/17 onward. Mitsui Fudosan aims for ROE of 7% in FY3/18.
Our earnings estimates assume extraordinary losses of ¥35.5bn will be booked in FY3/18 for rebuilding the tilting condos in Yokohama. However, we also expect the company to record extraordinary gains on the sale of investment securities. We ultimately expect NP to be high, with ROE at 7% in FY3/18.
ROE may be an issue from FY3/19 onward, however; it could be dented by a worsening in profitability or turnover rates in the built-for-sale condo business. We believe offsetting the risk of weaker profits in the built-for-sale business with gains in other segments will be an issue for management to address in FY3/19 and after.
Figure 18: ROE
6.0%
4.9% 4.8%
5.3%
6.3%6.4% 6.2%
6.6%7.0%
6.7%
4.0%
4.5%
5.0%
5.5%
6.0%
6.5%
7.0%
7.5%
8.0%
3/10
3/11
3/12
3/13
3/14
3/15
3/16
3/17
CS
E
3/18
CS
E
3/19
CS
ESource: Company data, Credit Suisse estimates
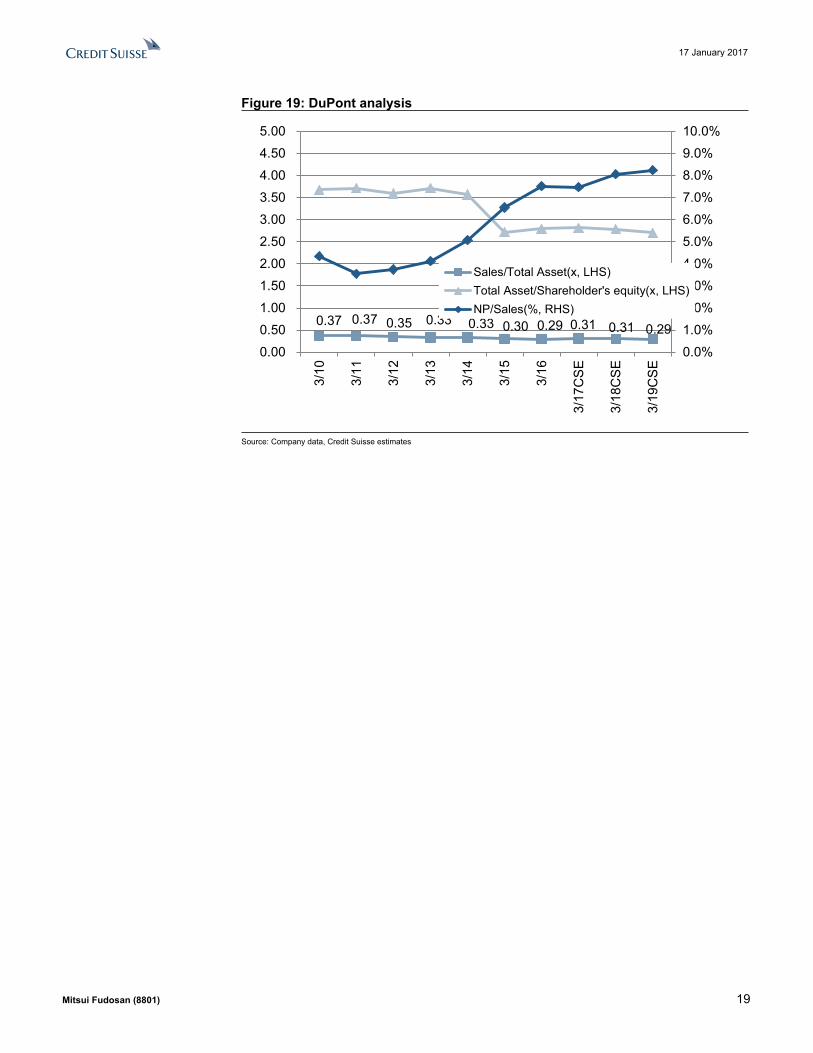
DuPont analysisAccording to our DuPont analysis, ROE has improved thanks to better profitability. We expect profitability in the leasing business to improve from FY3/19 as earnings begin to benefit from newly developed office buildings and retail complexes.
However, there is a risk that these improvements in profitability will come to a halt if sales prices begin to decline for income-generating real estate and rental condos.
ROE could reach 7% in FY3/18 as long as
extraordinary losses do not worsen
ROE improved alongside higher
profitability
17 January 2017
Mitsui Fudosan (8801) 19
Figure 19: DuPont analysis
0.37 0.37 0.35 0.33 0.33 0.30 0.29 0.31 0.31 0.29
0.0%
1.0%
2.0%
3.0%
4.0%
5.0%
6.0%
7.0%
8.0%
9.0%
10.0%
0.00
0.50
1.00
1.50
2.00
2.50
3.00
3.50
4.00
4.50
5.00
3/10
3/11
3/12
3/13
3/14
3/15
3/16
3/17
CS
E
3/18
CS
E
3/19
CS
E
Sales/Total Asset(x, LHS)Total Asset/Shareholder's equity(x, LHS)NP/Sales(%, RHS)
Source: Company data, Credit Suisse estimates

17 January 2017
Mitsui Fudosan (8801) 20
Forecasts and valuationsFigure 20: Consolidated income statement
FY3/14 FY3/15 FY3/16 FY3/17 FY3/17 FY3/18 FY3/19(¥mn) CO.E CSE CSE CSESales 1,515,252 1,529,036 1,567,969 1,750,000 1,754,700 1,809,900 1,779,600
Leasing 449,699 464,842 509,178 544,000 544,700 551,800 577,000Property Sales 409,466 425,442 391,577 525,000 525,000 546,100 480,600Management 297,934 317,818 334,652 340,000 343,000 365,000 367,000Mitsui Home 237,068 242,150 247,455 249,000 250,000 250,000 250,000Other 104,787 78,782 85,104 92,000 92,000 97,000 105,000
Operating profit 172,567 186,074 202,482 220,000 227,700 246,300 247,800Leasing 109,205 107,863 124,112 131,000 132,700 138,500 152,200Property Sales 27,099 45,493 44,525 60,000 64,300 74,600 57,400Management 49,945 49,317 52,446 52,000 54,000 56,000 58,000Mitsui Home 4,192 4,017 4,724 4,200 4,200 4,700 4,700Other 3,071 5,186 7,163 7,000 7,000 7,000 10,000Eliminations or corporate -20,947 -25,804 -30,490 -34,200 -34,500 -34,500 -34,500
Operating profit margin 11.4% 12.2% 12.9% 12.6% 13.0% 13.6% 13.9%Leasing 24.3% 23.2% 24.4% 24.1% 24.4% 25.1% 26.4%Property Sales 6.6% 10.7% 11.4% 11.4% 12.2% 13.7% 11.9%Management 16.8% 15.5% 15.7% 15.3% 15.7% 15.3% 15.8%Mitsui Home 1.8% 1.7% 1.9% 1.7% 1.7% 1.9% 1.9%Other 2.9% 6.6% 8.4% 7.6% 7.6% 7.2% 9.5%
Nonoperating income and expense -27,980 -22,702 -19,961 -22,000 -22,000 -18,500 -19,200 Recurring profit 144,587 163,373 182,521 198,000 205,700 227,800 228,600(% of sales) 9.5% 10.7% 11.6% 11.3% 11.7% 12.6% 12.8%Extraordinary profit and expense -17,877 3,467 -1,203 -10,000 -10,000 -10,500 -10,000 Extraordinary profit 13,189 5,603 2,690 0 5,000 25,000 5,000Extraordinary expense 31,066 2,136 3,893 0 15,000 35,500 15,000Income before income tax 126,710 166,840 181,317 188,000 195,700 217,300 218,600Income tax 47,035 61,693 62,011 60,000 61,700 68,600 69,000(Tax rate) 37.1% 37.0% 34.2% 31.9% 31.5% 31.6% 31.6%Minority interests 2,832 4,962 1,583 3,000 3,000 3,000 3,000Net income 76,843 100,185 117,722 125,000 131,000 145,700 146,600
Source: Company data, Credit Suisse estimates

17 January 2017
Mitsui Fudosan (8801) 21
Figure 21: Consolidated balance sheet FY3/14 FY3/15 FY3/16 FY3/17 FY3/18 FY3/19
(¥mn) CSE CSE CSECurrent assets 1,316,170 1,374,892 1,520,585 1,674,600 1,790,400 1,793,800
Cash and deposits 127,882 107,151 111,156 86,200 100,900 104,900Notes and accounts receivable 34,399 34,760 36,093 35,100 36,200 35,600(% of sales) 2.3% 2.3% 2.3% 2.0% 2.0% 2.0%Marketable securities 243 12,303 142 142 142 142Inventories 961,449 1,027,889 1,167,743 1,347,700 1,447,700 1,447,700Others 192,197 192,789 205,451 205,500 205,500 205,500
Fixed assets 3,232,651 3,702,255 3,853,691 4,013,700 4,140,800 4,265,000Tangible fixed assets 2,467,642 2,721,519 2,902,171 3,062,200 3,189,300 3,313,500Intangible fixed assets 58,497 67,113 66,803 66,800 66,800 66,800Investments and other assets 706,511 913,621 884,716 884,700 884,700 884,700
Total assets 4,548,822 5,077,148 5,374,277 5,688,300 5,931,200 6,058,800
Current liabilities 846,312 672,430 840,656 832,500 835,300 833,800Notes and accounts payable 130,695 98,247 95,876 87,700 90,500 89,000(% of sales) 8.6% 6.4% 0.0% 5.0% 5.0% 5.0%Short-term loans repayable 188,832 203,313 223,084 223,100 223,100 223,100Non-recourse short-term loan 95,216 6,213 17,894 17,900 17,900 17,900CP 0 0 109,000 109,000 109,000 109,000Current portion of long term interest-bearing debt 0 0 0 0 0 0Current portion of bond/CB 30,000 30,000 40,000 40,000 40,000 40,000Others 381,469 327,140 339,960 340,000 340,000 340,000
Fixed liabilities 2,377,089 2,472,633 2,544,579 2,768,400 2,898,400 2,918,400Bonds 270,000 240,000 210,000 210,000 210,000 210,000Non-recourse bonds 26,585 102,587 94,055 94,100 94,100 94,100Long-term loans 1,314,972 1,231,244 1,322,072 1,545,800 1,675,800 1,695,800Non-recourse long-term bonds 94,365 155,273 195,286 195,300 195,300 195,300Deposits received from tenants 345,617 365,297 373,084 373,100 373,100 373,100Others 325,550 378,232 350,082 350,100 350,100 350,100
Total liabilities 3,223,401 3,145,064 3,385,235 3,600,900 3,733,700 3,752,200Equitycapital 1,275,177 1,872,835 1,923,335 2,021,700 2,131,800 2,240,900
Shareholders' equity 871,413 1,297,159 1,387,425 1,485,800 1,595,900 1,705,000Valuation and translation adjustments 402,941 574,762 534,879 534,900 534,900 534,900Stock acquisition right 823 914 1,031 1,000 1,000 1,000
Minority interests 50,241 59,247 65,704 65,700 65,700 65,700Total net assets 1,325,420 1,932,084 1,989,041 2,087,400 2,197,500 2,306,600Total liability and shareholders' equity 4,548,822 5,077,148 5,374,277 5,688,300 5,931,200 6,058,800
Source: Company data, Credit Suisse estimates

17 January 2017
Mitsui Fudosan (8801) 22
Figure 22: Consolidated cashflow statementFY3/14 FY3/15 FY3/16 FY3/17 FY3/18 FY3/19
(¥mn) CSE CSE CSEOperating activities 189,903 30,343 32,154 13,800 120,300 221,500
Net income 76,843 100,185 117,722 131,000 145,700 146,600Depreciation 56,030 61,242 67,460 70,000 72,900 75,800Write-down of inventories 0 0 0 0 0 0Trade receivable -5,133 -361 -1,333 1,000 -1,100 600Inventories -46,228 -66,440 -139,854 -180,000 -100,000 0Accounts payable 29,990 -32,448 -2,371 -8,200 2,800 -1,500 Others 78,401 -31,835 -9,470 0 0 0
Investing activities -44,056 -261,640 -239,719 -230,000 -200,000 -200,000 Tangible fixed assets -43,645 -299,895 -197,078 -230,000 -200,000 -200,000 Investment securities -11,283 -8,261 6,575 0 0 0Others 10,872 46,516 -49,216 0 0 0
Financing activities -123,713 221,508 201,110 191,200 94,400 -17,500 Loan payable -65,327 -63,800 271,293 223,800 130,000 20,000Bond -33,543 -124 -21,207 0 0 0Equity issuance 0 329,125 0 0 0 0Dividends -19,332 -20,537 -27,673 -32,600 -35,600 -37,500 Others -5,511 -23,156 -21,303 0 0 0
Net increase (decrease) in cash 22,134 -9,789 -6,455 -25,000 14,700 4,000
Source: Company data, Credit Suisse estimates

17 January 2017
Mitsui Fudosan (8801) 23
Figure 23: Consolidated valuations FY3/14 FY3/15 FY3/16 FY3/17 FY3/18 FY3/19
(¥mn) CSE CSE CSENet working capital 865,153 964,402 1,107,960 1,295,100 1,393,400 1,394,300Fixed assets 3,232,651 3,702,255 3,853,691 4,013,700 4,140,800 4,265,000Estimated invested capital 4,097,804 4,666,657 4,961,651 5,308,800 5,534,200 5,659,300Operating profit 172,567 186,074 202,482 227,700 246,300 247,800Tax rate (%) 37.1% 37.0% 34.2% 31.5% 31.6% 31.6%NOPAT 108,510 117,269 133,233 155,911 168,545 169,583ROIC (%) 2.6% 2.5% 2.7% 2.9% 3.0% 3.0%Common shares outstanding (mn) 878 988 988 988 988 988Current share price (¥) 3,149 3,529 2,640 2,640 2,640 2,640Market capitalization 2,765,306 3,487,220 2,608,146 2,608,146 2,608,146 2,608,146Interest-bearing debt 2,040,071 1,976,148 2,226,233 2,450,000 2,580,000 2,600,000Cash and marketable securities 127,882 107,151 111,156 86,200 100,900 104,900Net debt 1,912,189 1,868,997 2,115,077 2,363,800 2,479,100 2,495,100Enterprise value 4,677,495 5,356,217 4,723,223 4,971,946 5,087,246 5,103,246EBITDA 228,597 247,316 269,942 297,700 319,200 323,600EV/EBITDA (X) 20.5 21.7 17.5 16.7 15.9 15.8EV/Sales (X) 3.1 3.5 3.0 2.8 2.8 2.9EPS (¥) 87.5 101.4 119.1 132.6 147.5 148.4EPS growth (%) 29.3 15.9 17.5 11.3 11.2 0.6Dividend yield (%) 0.7% 0.7% 1.1% 1.3% 1.4% 1.4%ROE (%) 6.3% 6.4% 6.2% 6.6% 7.0% 6.7%ROA (%) 1.7% 2.0% 2.2% 2.3% 2.5% 2.4%PER (X) 36.0 34.8 22.2 19.9 17.9 17.8P/NAV 1.34 1.21 0.81 0.78 0.75 0.73PBR (X) 2.2 1.9 1.4 1.3 1.2 1.2NAVPS 2,351 2,923 3,261 3,400 3,511 3,621BPS 1,452 1,895 1,946 2,046 2,157 2,268Debt / equity 1.6 1.1 1.2 1.2 1.2 1.2DPS (¥) 22.0 25.0 30.0 33.0 36.0 38.0Dividend payout ratio (%) 25.1% 24.7% 25.2% 24.9% 24.4% 25.6%
Source: Company data, Credit Suisse estimates

17 January 2017
Mitsui Fudosan (8801) 24
Companies Mentioned (Price as of 16-Jan-2017)Asahi Kasei (3407.T, ¥1,028)Hitachi High-Tec (8036.T, ¥4,695)MFLP (3471.T, ¥336,500)Mitsubishi Estate (8802.T, ¥2,300)Mitsui Fudosan (8801.T, ¥2,640, OUTPERFORM, TP ¥3,300)Mitsui Home (1868.T, ¥542)PanaHome (1924.T, ¥960)Panasonic (6752.T, ¥1,206)Sumi Mitsu Const (1821.T, ¥122)Sumitomo Realty & Development (8830.T, ¥3,100)
Disclosure AppendixAnalyst Certification Masahiro Mochizuki and Yasuko Fukuda each certify, with respect to the companies or securities that the individual analyzes, that (1) the views expressed in this report accurately reflect his or her personal views about all of the subject companies and securities and (2) no part of his or her compensation was, is or will be directly or indirectly related to the specific recommendations or views expressed in this report.
3-Year Price and Rating History for Asahi Kasei (3407.T)
3407.T Closing Price Target Price Date (¥) (¥) Rating 25-Feb-14 739 920 O 14-Jan-15 1,106 1,070 N 17-Mar-15 1,225 1,170 28-May-15 1,107 1,200 08-Sep-15 867 1,000 07-Jan-16 809 930 01-Apr-16 743 840 01-Jul-16 714 820 19-Dec-16 1,047 1,000 * Asterisk signifies initiation or assumption of coverage.
Target Price Closing Price 3407.T
01- Jan- 2015 01- Jan- 2016 01- Jan- 2017600
850
1,100
1,350
O U T PERFO RMN EU T RA L
3-Year Price and Rating History for Mitsubishi Estate (8802.T)
8802.T Closing Price Target Price Date (¥) (¥) Rating 18-Mar-14 2,370 2,600 N 22-Sep-14 2,389 2,400 13-Jan-15 2,426 2,600 17-Mar-15 2,896 2,800 08-Jun-15 2,733 2,700 09-Sep-15 2,518 2,900 03-Dec-15 2,644 2,800 08-Mar-16 2,190 2,200 U 15-Jun-16 1,961 1,900 03-Oct-16 1,874 1,600 31-Oct-16 2,082 2,000 N * Asterisk signifies initiation or assumption of coverage.
Target Price Closing Price 8802.T
01- Jan- 2015 01- Jan- 2016 01- Jan- 20171,500
2,000
2,500
3,000
N EU T RA LU N D ERPERFO RM

17 January 2017
Mitsui Fudosan (8801) 25
3-Year Price and Rating History for Mitsui Fudosan (8801.T)
8801.T Closing Price Target Price Date (¥) (¥) Rating 23-Jan-14 3,593 4,900 O 18-Mar-14 3,076 4,300 27-May-14 3,340 3,700 11-Aug-14 3,264 3,800 08-Jun-15 3,526 4,000 03-Dec-15 3,177 3,700 08-Mar-16 2,768 3,200 15-Jun-16 2,484 3,000 03-Oct-16 2,128 2,500 * Asterisk signifies initiation or assumption of coverage.
Target Price Closing Price 8801.T
01- Jan- 2015 01- Jan- 2016 01- Jan- 20172,000
3,000
4,000
5,000
O U T PERFO RM
3-Year Price and Rating History for Panasonic (6752.T)
6752.T Closing Price Target Price Date (¥) (¥) Rating 31-Jul-14 1,258 1,300 O 22-Dec-14 1,439 1,600 27-Feb-15 1,495 NR 03-Sep-15 1,273 1,500 N * 03-Mar-16 1,021 1,200 31-May-16 1,032 1,100 * Asterisk signifies initiation or assumption of coverage.
Target Price Closing Price 6752.T
01- Jan- 2015 01- Jan- 2016 01- Jan- 2017500
1,000
1,500
2,000
O U T PERFO RMN O T RA T ED
N EU T RA L
3-Year Price and Rating History for Sumitomo Realty & Development (8830.T)
8830.T Closing Price Target Price Date (¥) (¥) Rating 18-Mar-14 4,046 4,900 O 17-Jun-14 4,309 4,700 N 22-Sep-14 3,948 4,100 13-Jan-15 3,988 4,400 17-Mar-15 4,316 4,700 08-Jun-15 4,633 5,400 O 03-Dec-15 3,817 4,300 08-Mar-16 3,299 3,500 N 15-Jun-16 2,748 3,000 03-Oct-16 2,598 2,100 U * Asterisk signifies initiation or assumption of coverage.
Target Price Closing Price 8830.T
01- Jan- 2015 01- Jan- 2016 01- Jan- 20172,000
3,000
4,000
5,000
6,000
O U T PERFO RMN EU T RA L
U N D ERPERFO RM
The analyst(s) responsible for preparing this research report received Compensation that is based upon various factors including Credit Suisse's total revenues, a portion of which are generated by Credit Suisse's investment banking activitiesAs of December 10, 2012 Analysts’ stock rating are defined as follows:Outperform (O) : The stock’s total return is expected to outperform the relevant benchmark* over the next 12 months.Neutral (N) : The stock’s total return is expected to be in line with the relevant benchmark* over the next 12 months.Underperform (U) : The stock’s total return is expected to underperform the relevant benchmark* over the next 12 months. *Relevant benchmark by region: As of 10th December 2012, Japanese ratings are based on a stock’s total return relative to the analyst's coverage universe which consists of all companies covered by the analyst within the relevant sector, with Outperforms representing the most attractive, Neutrals the less attractive, and Underperforms the least attractive investment opportunities. As of 2nd October 2012, U.S. and Canadian as well as European ratings are based on a stock’s total return relative to the analyst's coverage universe which consists of all companies covered by the analyst within the relevant sector, with Outperforms representing the most attractive, Neutrals the less attractive, and Underperforms the least attractive investment opportunities. For Latin American and non-Japan Asia stocks, ratings are based on a stock’s total return relative to the average total return of the relevant country or regional benchmark; prior to 2nd October 2012 U.S. and Canadian ratings were based on (1) a stock’s absolute total return potential to its current share price and (2) the relative attractiveness of a stock’s total return potential within an analyst’s coverage universe. For Australian and New Zealand stocks, the expected total return (ETR) calculation includes 12-month rolling dividend yield. An

17 January 2017
Mitsui Fudosan (8801) 26
Outperform rating is assigned where an ETR is greater than or equal to 7.5%; Underperform where an ETR less than or equal to 5%. A Neutral may be assigned where the ETR is between -5% and 15%. The overlapping rating range allows analysts to assign a rating that puts ETR in the context of associated risks. Prior to 18 May 2015, ETR ranges for Outperform and Underperform ratings did not overlap with Neutral thresholds between 15% and 7.5%, which was in operation from 7 July 2011.Restricted (R) : In certain circumstances, Credit Suisse policy and/or applicable law and regulations preclude certain types of communications, including an investment recommendation, during the course of Credit Suisse's engagement in an investment banking transaction and in certain other circumstances.Not Rated (NR) : Credit Suisse Equity Research does not have an investment rating or view on the stock or any other securities related to the company at this time.Not Covered (NC) : Credit Suisse Equity Research does not provide ongoing coverage of the company or offer an investment rating or investment view on the equity security of the company or related products.Volatility Indicator [V] : A stock is defined as volatile if the stock price has moved up or down by 20% or more in a month in at least 8 of the past 24 months or the analyst expects significant volatility going forward.Analysts’ sector weightings are distinct from analysts’ stock ratings and are based on the analyst’s expectations for the fundamentals and/or valuation of the sector* relative to the group’s historic fundamentals and/or valuation:Overweight : The analyst’s expectation for the sector’s fundamentals and/or valuation is favorable over the next 12 months.Market Weight : The analyst’s expectation for the sector’s fundamentals and/or valuation is neutral over the next 12 months.Underweight : The analyst’s expectation for the sector’s fundamentals and/or valuation is cautious over the next 12 months. *An analyst’s coverage sector consists of all companies covered by the analyst within the relevant sector. An analyst may cover multiple sectors.
Credit Suisse's distribution of stock ratings (and banking clients) is:
Global Ratings DistributionRating Versus universe (%) Of which banking clients (%)Outperform/Buy* 45% (64% banking clients)Neutral/Hold* 38% (60% banking clients)Underperform/Sell* 15% (54% banking clients)Restricted 3%*For purposes of the NYSE and NASD ratings distribution disclosure requirements, our stock ratings of Outperform, Neutral, and Underperform most closely correspond to Buy, Hold, and Sell, respectively; however, the meanings are not the same, as our stock ratings are determined on a relative basis. (Please refer to definitions above.) An investor's decision to buy or sell a security should be based on investment objectives, current holdings, and other individual factors.
Important Global Disclosures Credit Suisse’s research reports are made available to clients through our proprietary research portal on CS PLUS. Credit Suisse research products may also be made available through third-party vendors or alternate electronic means as a convenience. Certain research products are only made available through CS PLUS. The services provided by Credit Suisse’s analysts to clients may depend on a specific client’s preferences regarding the frequency and manner of receiving communications, the client’s risk profile and investment, the size and scope of the overall client relationship with the Firm, as well as legal and regulatory constraints. To access all of Credit Suisse’s research that you are entitled to receive in the most timely manner, please contact your sales representative or go to https://plus.credit-suisse.com . Credit Suisse’s policy is to update research reports as it deems appropriate, based on developments with the subject company, the sector or the market that may have a material impact on the research views or opinions stated herein.Credit Suisse's policy is only to publish investment research that is impartial, independent, clear, fair and not misleading. For more detail please refer to Credit Suisse's Policies for Managing Conflicts of Interest in connection with Investment Research: http://www.csfb.com/research-and-analytics/disclaimer/managing_conflicts_disclaimer.html . Credit Suisse's policy is only to publish investment research that is impartial, independent, clear, fair and not misleading. For more detail please refer to Credit Suisse's Policies for Managing Conflicts of Interest in connection with Investment Research:
Target Price and RatingValuation Methodology and Risks: (12 months) for Mitsui Fudosan (8801.T)
Method: Our ¥3,300 target price on an EBITDA yield of 5.25% applied to our FY3/18E. The EBITDA yield of 5.25% is the average for 2010–11, when concerns eased about the credit crunch but uncertainties about earnings persisted. The current price already reflects concerns about the possibility of sustained quantitative easing, but we believe possible trends in macro conditions could alter expectations for company earnings. We therefore decided to use the average EBITDA yield for 2010–11 in our target price calculation. We believe the share price could rise on (1) profit growth backed by development capabilities, (2) foreign profits, and (3) expectations for improvement at Mitsui Home (1868). We believe the company’s valuations will pivot on profit growth driven by its development capabilities. Our OUTPERFORM rating is based on a comparison of the company's potential total return over a 12-month period versus our coverage universe.
Risk: Risks to our ¥3,300 target price and OUTPERFORM rating for Mitsui Fudosan Risks include (1) worsening margins on built-for-sale condos and income properties, (2) a decline in office rents, and (3) worsening profitability overseas.
Please refer to the firm's disclosure website at https://rave.credit-suisse.com/disclosures for the definitions of abbreviations typically used in the target price method and risk sections. See the Companies Mentioned section for full company names

17 January 2017
Mitsui Fudosan (8801) 27
The subject company (6752.T) currently is, or was during the 12-month period preceding the date of distribution of this report, a client of Credit Suisse.Credit Suisse expects to receive or intends to seek investment banking related compensation from the subject company (3407.T, 6752.T) within the next 3 months.For date and time of production, dissemination and history of recommendation for the subject company(ies) featured in this report, disseminated within the past 12 months, please refer to the link: https://rave.credit-suisse.com/disclosures/view/report?i=278194&v=38uut4t2fccq9px0tr4h839vc . Important Regional Disclosures Singapore recipients should contact Credit Suisse AG, Singapore Branch for any matters arising from this research report.The analyst(s) involved in the preparation of this report may participate in events hosted by the subject company, including site visits. Credit Suisse does not accept or permit analysts to accept payment or reimbursement for travel expenses associated with these events.Restrictions on certain Canadian securities are indicated by the following abbreviations: NVS--Non-Voting shares; RVS--Restricted Voting Shares; SVS--Subordinate Voting Shares.Individuals receiving this report from a Canadian investment dealer that is not affiliated with Credit Suisse should be advised that this report may not contain regulatory disclosures the non-affiliated Canadian investment dealer would be required to make if this were its own report.For Credit Suisse Securities (Canada), Inc.'s policies and procedures regarding the dissemination of equity research, please visit https://www.credit-suisse.com/sites/disclaimers-ib/en/canada-research-policy.html.The following disclosed European company/ies have estimates that comply with IFRS: (3407.T).Principal is not guaranteed in the case of equities because equity prices are variable.Commission is the commission rate or the amount agreed with a customer when setting up an account or at any time after that.This research report is authored by:Credit Suisse Securities (Japan) Limited ......................................................................................................Masahiro Mochizuki ; Yasuko FukudaTo the extent this is a report authored in whole or in part by a non-U.S. analyst and is made available in the U.S., the following are important disclosures regarding any non-U.S. analyst contributors: The non-U.S. research analysts listed below (if any) are not registered/qualified as research analysts with FINRA. The non-U.S. research analysts listed below may not be associated persons of CSSU and therefore may not be subject to the NASD Rule 2711 and NYSE Rule 472 restrictions on communications with a subject company, public appearances and trading securities held by a research analyst account.Credit Suisse Securities (Japan) Limited ......................................................................................................Masahiro Mochizuki ; Yasuko FukudaFor Credit Suisse disclosure information on other companies mentioned in this report, please visit the website at https://rave.credit-suisse.com/disclosures or call +1 (877) 291-2683.

17 January 2017
Mitsui Fudosan (8801) 28
This report is produced by subsidiaries and affiliates of Credit Suisse operating under its Global Markets Division. For more information on our structure, please use the following link: https://www.credit-suisse.com/who-we-are This report may contain material that is not directed to, or intended for distribution to or use by, any person or entity who is a citizen or resident of or located in any locality, state, country or other jurisdiction where such distribution, publication, availability or use would be contrary to law or regulation or which would subject Credit Suisse or its affiliates ("CS") to any registration or licensing requirement within such jurisdiction. All material presented in this report, unless specifically indicated otherwise, is under copyright to CS. None of the material, nor its content, nor any copy of it, may be altered in any way, transmitted to, copied or distributed to any other party, without the prior express written permission of CS. All trademarks, service marks and logos used in this report are trademarks or service marks or registered trademarks or service marks of CS or its affiliates.The information, tools and material presented in this report are provided to you for information purposes only and are not to be used or considered as an offer or the solicitation of an offer to sell or to buy or subscribe for securities or other financial instruments. CS may not have taken any steps to ensure that the securities referred to in this report are suitable for any particular investor. CS will not treat recipients of this report as its customers by virtue of their receiving this report. The investments and services contained or referred to in this report may not be suitable for you and it is recommended that you consult an independent investment advisor if you are in doubt about such investments or investment services. Nothing in this report constitutes investment, legal, accounting or tax advice, or a representation that any investment or strategy is suitable or appropriate to your individual circumstances, or otherwise constitutes a personal recommendation to you. CS does not advise on the tax consequences of investments and you are advised to contact an independent tax adviser. Please note in particular that the bases and levels of taxation may change. Information and opinions presented in this report have been obtained or derived from sources believed by CS to be reliable, but CS makes no representation as to their accuracy or completeness. CS accepts no liability for loss arising from the use of the material presented in this report, except that this exclusion of liability does not apply to the extent that such liability arises under specific statutes or regulations applicable to CS. This report is not to be relied upon in substitution for the exercise of independent judgment. CS may have issued, and may in the future issue, other communications that are inconsistent with, and reach different conclusions from, the information presented in this report. Those communications reflect the different assumptions, views and analytical methods of the analysts who prepared them and CS is under no obligation to ensure that such other communications are brought to the attention of any recipient of this report. Some investments referred to in this report will be offered solely by a single entity and in the case of some investments solely by CS, or an associate of CS or CS may be the only market maker in such investments. Past performance should not be taken as an indication or guarantee of future performance, and no representation or warranty, express or implied, is made regarding future performance. Information, opinions and estimates contained in this report reflect a judgment at its original date of publication by CS and are subject to change without notice. The price, value of and income from any of the securities or financial instruments mentioned in this report can fall as well as rise. The value of securities and financial instruments is subject to exchange rate fluctuation that may have a positive or adverse effect on the price or income of such securities or financial instruments. Investors in securities such as ADR's, the values of which are influenced by currency volatility, effectively assume this risk. Structured securities are complex instruments, typically involve a high degree of risk and are intended for sale only to sophisticated investors who are capable of understanding and assuming the risks involved. The market value of any structured security may be affected by changes in economic, financial and political factors (including, but not limited to, spot and forward interest and exchange rates), time to maturity, market conditions and volatility, and the credit quality of any issuer or reference issuer. Any investor interested in purchasing a structured product should conduct their own investigation and analysis of the product and consult with their own professional advisers as to the risks involved in making such a purchase. Some investments discussed in this report may have a high level of volatility. High volatility investments may experience sudden and large falls in their value causing losses when that investment is realised. Those losses may equal your original investment. Indeed, in the case of some investments the potential losses may exceed the amount of initial investment and, in such circumstances, you may be required to pay more money to support those losses. Income yields from investments may fluctuate and, in consequence, initial capital paid to make the investment may be used as part of that income yield. Some investments may not be readily realisable and it may be difficult to sell or realise those investments, similarly it may prove difficult for you to obtain reliable information about the value, or risks, to which such an investment is exposed. This report may provide the addresses of, or contain hyperlinks to, websites. Except to the extent to which the report refers to website material of CS, CS has not reviewed any such site and takes no responsibility for the content contained therein. Such address or hyperlink (including addresses or hyperlinks to CS's own website material) is provided solely for your convenience and information and the content of any such website does not in any way form part of this document. Accessing such website or following such link through this report or CS's website shall be at your own risk.
This report is issued and distributed in European Union (except Switzerland): by Credit Suisse Securities (Europe) Limited, One Cabot Square, London E14 4QJ, England, which is authorised by the Prudential Regulation Authority and regulated by the Financial Conduct Authority and the Prudential Regulation Authority. Germany: Credit Suisse Securities (Europe) Limited Niederlassung Frankfurt am Main regulated by the Bundesanstalt fuer Finanzdienstleistungsaufsicht ("BaFin"). United States and Canada: Credit Suisse Securities (USA) LLC; Switzerland: Credit Suisse AG; Brazil: Banco de Investimentos Credit Suisse (Brasil) S.A or its affiliates; Mexico: Banco Credit Suisse (México), S.A. (transactions related to the securities mentioned in this report will only be effected in compliance with applicable regulation); Japan: by Credit Suisse Securities (Japan) Limited, Financial Instruments Firm, Director-General of Kanto Local Finance Bureau ( Kinsho) No. 66, a member of Japan Securities Dealers Association, The Financial Futures Association of Japan, Japan Investment Advisers Association, Type II Financial Instruments Firms Association; Hong Kong: Credit Suisse (Hong Kong) Limited; Australia: Credit Suisse Equities (Australia) Limited; Thailand: Credit Suisse Securities (Thailand) Limited, regulated by the Office of the Securities and Exchange Commission, Thailand, having registered address at 990 Abdulrahim Place, 27th Floor, Unit 2701, Rama IV Road, Silom, Bangrak, Bangkok10500, Thailand, Tel. +66 2614 6000; Malaysia: Credit Suisse Securities (Malaysia) Sdn Bhd; Singapore: Credit Suisse AG, Singapore Branch; India: Credit Suisse Securities (India) Private Limited (CIN no.U67120MH1996PTC104392) regulated by the Securities and Exchange Board of India as Research Analyst (registration no. INH 000001030) and as Stock Broker (registration no. INB230970637; INF230970637; INB010970631; INF010970631), having registered address at 9th Floor, Ceejay House, Dr.A.B. Road, Worli, Mumbai - 18, India, T- +91-22 6777 3777; South Korea: Credit Suisse Securities (Europe) Limited, Seoul Branch; Taiwan: Credit Suisse AG Taipei Securities Branch; Indonesia: PT Credit Suisse Securities Indonesia; Philippines:Credit Suisse Securities (Philippines ) Inc., and elsewhere in the world by the relevant authorised affiliate of the above.Additional Regional DisclaimersHong Kong: Credit Suisse (Hong Kong) Limited ("CSHK") is licensed and regulated by the Securities and Futures Commission of Hong Kong under the laws of Hong Kong, which differ from Australian laws. CSHKL does not hold an Australian financial services licence (AFSL) and is exempt from the requirement to hold an AFSL under the Corporations Act 2001 (the Act) under Class Order 03/1103 published by the ASIC in respect of financial services provided to Australian wholesale clients (within the meaning of section 761G of the Act). Research on Taiwanese securities produced by Credit Suisse AG, Taipei Securities Branch has been prepared by a registered Senior Business Person. Australia (to the extent services are offered in Australia): Credit Suisse Securities (Europe) Limited (“CSSEL”) and Credit Suisse International (“CSI”) are authorised by the Prudential Regulation Authority and regulated by the Financial Conduct Authority (“FCA”) and the Prudential Regulation Authority under UK laws, which differ from Australian Laws. CSSEL and CSI do not hold an Australian Financial Services Licence (“AFSL”) and are exempt from the requirement to hold an AFSL under the Corporations Act (Cth) 2001 (“Corporations Act”) under Class Order 03/1099 published by the Australian Securities and Investments Commission (“ASIC”), in respect of the financial services provided to Australian wholesale clients (within the meaning of section 761G of the Corporations Act). This material is not for distribution to retail clients and is directed exclusively at Credit Suisse's professional clients and eligible counterparties as defined by the FCA, and wholesale clients as defined under section 761G of the Corporations Act. Credit Suisse (Hong Kong) Limited (“CSHK”) is licensed and regulated by the Securities and Futures Commission of Hong Kong under the laws of Hong Kong, which differ from Australian laws. CSHKL does not hold an AFSL and is exempt from the requirement to hold an AFSL under the Corporations Act under Class Order 03/1103 published by the ASIC in respect of financial services provided to Australian wholesale clients (within the meaning of section 761G of the Corporations Act). Credit Suisse Securities (USA) LLC (CSSU) and Credit Suisse Asset Management LLC (CSAM LLC) are licensed and regulated by the Securities Exchange Commission of the United States under the laws of the United States, which differ from Australian laws. CSSU and CSAM LLC do not hold an AFSL and is exempt from the requirement to hold an AFSL under the Corporations Act under Class Order 03/1100 published by the ASIC in respect of financial services provided to Australian wholesale clients (within the meaning of section 761G of the Corporations Act). Malaysia: Research provided to residents of Malaysia is authorised by the Head of Research for Credit Suisse Securities (Malaysia) Sdn Bhd, to whom they should direct any queries on +603 2723 2020. Singapore: This report has been prepared and issued for distribution in Singapore to institutional investors, accredited investors and expert investors (each as defined under the Financial Advisers Regulations) only, and is also distributed by Credit Suisse AG, Singapore Branch to overseas investors (as defined under the Financial Advisers Regulations). Credit Suisse AG, Singapore Branch may distribute reports produced by its foreign entities or affiliates pursuant to an arrangement under Regulation 32C of the Financial Advisers Regulations. Singapore recipients should contact Credit Suisse AG, Singapore Branch at +65-6212-2000 for matters arising from, or in connection with, this report. By virtue of your status as an institutional investor, accredited investor, expert investor or overseas investor, Credit Suisse AG, Singapore Branch is exempted from complying with certain compliance requirements under the Financial Advisers Act, Chapter 110 of Singapore (the “FAA”), the Financial Advisers Regulations and the relevant Notices and Guidelines issued thereunder, in respect of any financial advisory service which Credit Suisse AG, Singapore Branch may provide to you. UAE: This information is being distributed by Credit Suisse AG (DIFC Branch), duly licensed and regulated by the Dubai Financial Services Authority (“DFSA”). Related financial services or products are only made available to Professional Clients or Market Counterparties, as defined by the DFSA, and are not intended for any other persons. Credit Suisse AG (DIFC Branch) is located on Level 9 East, The Gate Building, DIFC, Dubai, United Arab Emirates. EU: This report has been produced by subsidiaries and affiliates of Credit Suisse operating under its Global Markets Division This research may not conform to Canadian disclosure requirements. In jurisdictions where CS is not already registered or licensed to trade in securities, transactions will only be effected in accordance with applicable securities legislation, which will vary from jurisdiction to jurisdiction and may require that the trade be made in accordance with applicable exemptions from registration or licensing requirements. Non-US customers wishing to effect a transaction should contact a CS entity in their local jurisdiction unless governing law permits otherwise. US customers wishing to effect a transaction should do so only by contacting a representative at Credit Suisse Securities (USA) LLC in the US. Please note that this research was originally prepared and issued by CS for distribution to their market professional and institutional investor customers. Recipients who are not market professional or institutional investor customers of CS should seek the advice of their independent financial advisor prior to taking any investment decision based on this report or for any necessary explanation of its contents. This research may relate to investments or services of a person outside of the UK or to other matters which are not authorised by the Prudential Regulation Authority and regulated by the Financial Conduct Authority and the Prudential Regulation Authority or in respect of which the protections of the Prudential Regulation Authority and Financial Conduct Authority for private customers and/or the UK compensation scheme may not be available, and further details as to where this may be the case are available upon request in respect of this report. CS may provide various services to US municipal entities or obligated persons ("municipalities"), including suggesting individual transactions or trades and entering into such transactions. Any services CS provides to municipalities are not viewed as "advice" within the meaning of Section 975 of the Dodd-Frank Wall Street Reform and Consumer Protection Act. CS is providing any such services and related information solely on an arm's length basis and not as an advisor or fiduciary to the municipality. In connection with the provision of the any such services, there is no agreement, direct or indirect, between any municipality (including the officials,management, employees or agents thereof) and CS for CS to provide advice to the municipality. Municipalities should consult with their financial, accounting and legal advisors regarding any such services provided by CS. In addition, CS is not acting for direct or indirect compensation to solicit the municipality on behalf of an unaffiliated broker, dealer, municipal securities dealer, municipal advisor, or investment adviser for the purpose of obtaining or retaining an engagement by the municipality for or in connection with Municipal Financial Products, the issuance of municipal securities, or of an investment adviser to provide investment advisory services to or on behalf of the municipality. If this report is being distributed by a financial institution other than Credit Suisse AG, or its affiliates, that financial institution is solely responsible for distribution. Clients of that institution should contact that institution to effect a transaction in the securities mentioned in this report or require further information. This report does not constitute investment advice by Credit Suisse to the clients of the distributing financial institution, and neither Credit Suisse AG, its affiliates, and their respective officers, directors and employees accept any liability whatsoever for any direct or consequential loss arising from their use of this report or its content. Principal is not guaranteed. Commission is the commission rate or the amount agreed with a customer when setting up an account or at any time after that. Copyright © 2017 CREDIT SUISSE AG and/or its affiliates. All rights reserved. Investment principal on bonds can be eroded depending on sale price or market price. In addition, there are bonds on which investment principal can be eroded due to changes in redemption amounts. Care is required when investing in such instruments. When you purchase non-listed Japanese fixed income securities (Japanese government bonds, Japanese municipal bonds, Japanese government guaranteed bonds, Japanese corporate bonds) from CS as a seller, you will be requested to pay the purchase price only.