Mobile pricing - Credit Suisse | PLUS
39
DISCLOSURE APPENDIX CONTAINS ANALYST CERTIFICATIONS AND THE STATUS OF NON-US ANALYSTS. U.S. Disclosure: Credit Suisse does and seeks to do business with companies covered in its research reports. As a result, investors should be aware that the Firm may have a conflict of interest that could affect the objectivity of this report. Investors should consider this report as only a single factor in making their investment decision. CREDIT SUISSE SECURITIES RESEARCH & ANALYTICS BEYOND INFORMATION ® Client-Driven Solutions, Insights, and Access 04 April 2012 Europe/United Kingdom Equity Research Telecommunication Services Mobile pricing THEME Approaching cost in some markets now Figure 1: Some mobile prices below cost – e.g. 3Austria, BiBob (Denmark) 0.0 10.0 20.0 30.0 40.0 50.0 60.0 3Austria BiBob DNA Iliad 3UK Telfort 3 Italia Yoigo e u /m Price Max. cost - today Max cost - long term Source: Company data, Credit Suisse estimates Summary: We highlight how in some European markets—in particular in Austria and Denmark—the cheapest tariffs on offer are now approaching the marginal cost of carrying the traffic on the network plus interconnect costs. Pricing is potentially approaching a floor in these markets, irrespective of the outcome of attempts to consolidate. We see this as bullish. Stock calls: We maintain Telekom Austria as Neutral due to the challenges remaining in its Eastern Europe operations (37% of EBITDA). On TDC (Neutral), Consumer Mobile ARPU still has to adjust to the price cutting of the past nine months. But longer term, the outlook for the stock is now improving in our view. We reiterate our Outperform rating on Elisa. We also update forecasts for Telekom Austria, TDC and Elisa in the company sections of this report after Q4 11 results. Research Analysts Justin Funnell 44 20 7888 0268 [email protected] Paul Sidney 44 20 7888 6015 [email protected] Jakob Bluestone 44 20 7883 0834 [email protected] Henrik Herbst 44 20 7888 0286 [email protected]
-
Upload
khangminh22 -
Category
Documents
-
view
1 -
download
0
Transcript of Mobile pricing - Credit Suisse | PLUS

DISCLOSURE APPENDIX CONTAINS ANALYST CERTIFICATIONS AND THE STATUS OF NON-US ANALYSTS. U.S. Disclosure: Credit Suisse does and seeks to do business with companies covered in its research reports. As a result, investors should be aware that the Firm may have a conflict of interest that could affect the objectivity of this report. Investors should consider this report as only a single factor in making their investment decision.
CREDIT SUISSE SECURITIES RESEARCH & ANALYTICS BEYOND INFORMATION®
Client-Driven Solutions, Insights, and Access
04 April 2012 Europe/United Kingdom
Equity Research Telecommunication Services
Mobile pricing THEME
Approaching cost in some markets now Figure 1: Some mobile prices below cost – e.g. 3Austria, BiBob (Denmark)
0.0
10.0
20.0
30.0
40.0
50.0
60.0
3Austria BiBob DNA Iliad 3UK Telfort 3 Italia Yoigo
eu
/m
Price Max. cost - today Max cost - long term
Source: Company data, Credit Suisse estimates
■ Summary: We highlight how in some European markets—in particular in Austria and Denmark—the cheapest tariffs on offer are now approaching the marginal cost of carrying the traffic on the network plus interconnect costs. Pricing is potentially approaching a floor in these markets, irrespective of the outcome of attempts to consolidate. We see this as bullish.
■ Stock calls: We maintain Telekom Austria as Neutral due to the challenges remaining in its Eastern Europe operations (37% of EBITDA). On TDC (Neutral), Consumer Mobile ARPU still has to adjust to the price cutting of the past nine months. But longer term, the outlook for the stock is now improving in our view. We reiterate our Outperform rating on Elisa.
■ We also update forecasts for Telekom Austria, TDC and Elisa in the company sections of this report after Q4 11 results.
Research Analysts
Justin Funnell 44 20 7888 0268
Paul Sidney 44 20 7888 6015
Jakob Bluestone 44 20 7883 0834
Henrik Herbst 44 20 7888 0286

04 April 2012
Mobile pricing 2
MTRs – the results so far
When the European Commission decided to lower European MTRs (mobile termination rates) to eu1c/m investors were left wondering what the impact would be on mobile pricing. There was always the likelihood that by lowering marginal cost, the lower MTRs would lead to mobile voice pricing. During 2010 and for much of 2011 pricing remained quite benign – indeed yield erosion slowed as MTR erosion accelerated. Unfortunately, mobile pricing is starting to fall faster now – see Figure 2.
Figure 2: MTR erosion vs mobile yield erosion
-40%
-35%
-30%
-25%
-20%
-15%
-10%
-5%
0%
Q1 09 Q2 09 Q3 09 Q4 09 Q1 10 Q2 10 Q3 10 Q4 10 Q1 11 Q2 11 Q3 11 Q4 11 Q112E
Q212E
Q312E
Q412E
MTR y/y Outbound yield Y/Y
Source: Company data, Credit Suisse estimates
Quite how low pricing can go when MTRs fall is a lot clearer to the stock-market following Iliad’s launch in France (where MTRs are now eu1.5c/min). As French regulator Arcep has demonstrated, if you give a new entrant low MTRs to pay, cheap spectrum and put sustained pressure on an existing operator to agree 2G and 3G national roaming rights, the new entrant can even offer mobile for free to some customers – see Figure 3.
Figure 3: The logical end-game – Iliad mobile pricing at launch – all SIM only Monthly fee (inc. VAT)
Voice SMS Data Extra calls Extra SMS Other
eu19.99* Unlimited Unlimited 3GB
eu15.99* Unlimited Unlimited 3GB + subscribe to Iliad fixed broadband
eu2.0* 60 mins per month 60 SMS per month 5c/min 1c/SMS
eu0.0* 60 mins per month 60 SMS per month 5c/min 1c/SMS + subscribe to Iliad fixed broadband
Source: Iliad, Credit Suisse research * Iliad announced at launch that these tariffs are only for the first 3m subscribers that sign
Meanwhile, mobile tariffs in over-crowded markets such as Denmark and Austria have been falling to similar levels:
■ The latest 3 Austria pricing offer 1000 mins, 1000 SMS and 1GB data for eu7 per month, SIM only
■ In Denmark, the SIM-only sub-brands have got as low as DKK119/m (eu16/m) for 360 mins, unlimited SMS and 6GB of data, again SIM only.
■ In Finland, DNA for example offers 500 voice minutes and 400 SMS and unlimited data for eu18.95/m SIM only.

04 April 2012
Mobile pricing 3
Our 2012 sector view
In our 2012 sector outlook piece (2012 Outlook – Smartphones for everyone, 28 November 2011) one point we made was that mobile pricing could converge more; ie that whilst pricing would fall in markets where it was relatively high like Spain and France, price erosion in markets where pricing was cheaper (see Figure 4) could slow – indeed at the time we published, some prices were even rising – see again Figure 4.
The idea that price could slow or stop in markets like Denmark and Austria is anti-consensus - because prices have fallen for so many years in such markets they are seen as broken and therefore at further risk. Rather than buy TDC or Telekom Austria, investors are simply avoiding the sector altogether.
Figure 4: Price of average contract plan by European market – June 2011
-
10.0
20.0
30.0
40.0
50.0
60.0
70.0
80.0
90.0
Switzer
land
Spain
Franc
e
Portu
gal
Sweden
German
y
Belgium
Europe
Nether
lands
Norway UK
Italy
Denm
ark
Austria
Finl
andM
ont
hly
co
st o
f av
erag
e co
ntac
t pl
an (
eu)
-
10.0
20.0
30.0
40.0
50.0
60.0
70.0
80.0
90.0
Switzer
land
Spain
Franc
e
Portu
gal
Sweden
German
y
Belgium
Europe
Nether
lands
Norway UK
Italy
Denm
ark
Austria
Finl
andM
ont
hly
co
st o
f av
erag
e co
ntac
t pl
an (
eu)
-
10.0
20.0
30.0
40.0
50.0
60.0
70.0
80.0
90.0
Switzer
land
Spain
Franc
e
Portu
gal
Sweden
German
y
Belgium
Europe
Nether
lands
Norway UK
Italy
Denm
ark
Austria
Finl
andM
ont
hly
co
st o
f av
erag
e co
ntac
t pl
an (
eu)
Source: Credit Suisse research
As we said in the report…
“We expect mobile price erosion to slow in the markets with the lowest pricing, whilst continue where prices are highest. This would seem obvious but is the opposite trend to how the stockmarket sees things, with Denmark and Austria seen stuck in eternal price wars, and Switzerland an impregnable fortress. This reflects pricing changes of the past. A reversal of this investor sentiment would generate significant alpha for investors in 2012. “
Marginal pricing in Denmark and Austria is now close to cost
■ Austria: BigBob is eu12.8/m for 1GB data, 1000 minutes and 1000 SMS SIM only.
■ Denmark: typical no frills offers are DKK149/m (eu20/m) for 1GB data, 300 minutes and unlimited SMS – SIM only
■ Finland: Saunalahti eu14.90/m for unlimited data and 250mins, SMS at eu9c, SIM only
We have previously calculated the long run cost of data to be usd4/GB. So 1GB of data and 500 minutes (equivalent to 37.5MB, running at 10kbps) would cost around eu4 in net work cost. So prices in Austria are now around 2-3x network cost, implying capex/sales at this price long term of around 33-50%, leaving little for profit once customer service, interconnect and selling costs are considered. Pricing in these markets is approaching total cost.”“

04 April 2012
Mobile pricing 4
Pricing approach cost? Meeting investors in January, with equity markets rallying, telcos dividends and earnings being cut and a big rotation out of the sector, we did not find much interest in a bullish point like this. But given the weakness of sector sentiment currently, and continued attractive sector valuation (12% 2012E equity FCF yield), any good news could lead to significant upside for the stocks concerned. So we revisit this idea, to explain it more.
Cost of increasing network capacity
We first looked at the cost of a GB (gigabyte) of data in a mobile network in 2010. In our note (Mobile CAPEX – 10% not sustainable, 6 January 2010) we calculated the cost of increasing network capacity, as follows:
■ We used detailed US industry data (from 2007) for the cost of building a new cell site (usd250,000) and the cost of running that cell site (around usd80,000 pa).
■ We could also use this data, which broke down the main cost items, to calculate the cost of increasing capacity by adding more spectrum or refarming spectrum (e.g. from 3G to LTE) on to an existing cell site.
■ One key point of the cost breakdown is that only 25% of the cost of a new cell was radio equipment, even in 2007. This will be 20% or lower now, given the ongoing deflation in radio network costs vs inflation in some of the physical costs (e.g. site rental). Price deflation from China on radio equipment is going to have only a small effect on cost per cell and therefore cost per GB going forward.
■ We used projections of how theoretical capacity per cell grows as radio technology continues to evolve – see Figure 5. Between 2002 and 2010, 3G capacity had grown almost 10-fold from a spectral efficiency of 0.125bps/Hz (Release 99) to 1.1bps/Hz (HSPA+ or 3GPP Release 7). The spectral efficiency of LTE was expected at the time of our work in 2010 to start at 1.3bps/Hz and rise to 2.4bps/Hz with 4x4 MiMo. We have recently seen news of a first trial (in Germany) of this 4x4MiMo.
■ One point from this technology roadmap, is that whilst 3G increased spectral efficiency by a factor of 10 over its development (mainly by adopting HSDPA), the gains by moving to LTE do not seem quite so big. A Tele2 CTO told us he expects a long term LTE spectral efficiency of 6bps/Hz, but this seems some way off. Furthermore, a lot of the efficiency gains come from multiple antenna technology (i.e. MiMo), which has a cost in the user device in terms of size and battery life and may therefore not be fully supported. So we do not expect the same size of easy technology gains ahead as we have seen in the past 10 years.
■ Using industry assumptions of average peak hour network utilisation (ie how daily traffic is spread over the 24 hours in a day), one can then calculate the cost of increasing network capacity in that peak hour, the bottleneck which the network capacity is scaled for.
We then back-checked this work, meeting Vodafone, who agreed with the methodology but pointed out that the US industry cost assumptions we had used were 25% higher than Vodafone was seeing in Europe in 2010, partly due to lower technology costs. Adjusting for this, our new costings were broadly supported when discussing our mobile start-up model (which used the same cost assumptions) with Iliad last year (2011).
Adjusting for these 25% lower unit costs, we came to the following conclusions:
■ The cost of increasing network capacity by adding spectrum to an existing cell (or by refarming spectrum on an existing cell) is around usd1.7 (eu1.3) per GB – see Figure 7. This is the short term cost of network capacity expansion.

04 A
pril 2012
Mo
bile p
ricing
5
Figure 5: Radio technology roadmap (c. 2010) Timing Generation Technology Theoretical
maximum downlink speed
Actual downlink speed
Spectral efficiency (bps/Hz)
New technical features
1992 2G GSM 10 kbps 10 kbps Digital, TDMA
GSM-HSCSD 20 kbps 20 kbps
2000-1 2.5G GPRS 128 kbps 64 kbps Packet data, IP core
EDGE 256 kbps 100 kbps
2002+ 3G (Release 99) W-CDMA 384 kbps 100-200 kbps 0.125 CDMA, 5Mhz channels
(IMT-2000)
2005-7 3GPP Release 5 HSDPA (cat 4) 1.8 Mbps down / 384 kbps up
500 kbps 0.5 HS-DSCH, adaptive modulation (QPSK - 2bit/symbol or 16QAM - 4 bit/symbol), IMS
HSDPA (cat 6) 3.6 Mbps down 500 kbps - 1 Mbps 0.6
HSDPA (cat 8) 7.2 Mbps down 700-1.7 Mbps 0.7
HSDPA (cat 10) 14.4 Mbps down 2-3 Mbps 0.9
3GPP Release 6 HSUPA / upto 5.8 Mbps up 1 Mbps uplink Multimedia support (MBMS), initial VoIP capability, IMS enhancements
2009+ 3GPP Release 7 HSPA Evolved (Phase 1)
21 Mbps down / 11 Mbps up
1.5 - 7Mbps 1.1 64QAM downlink, evolved EDGE, beamforming, 2x2 MiMo, Continuous packet connectivity
(HSPA+, I-HSPA)
2010+ 3GPP Release 8 HSPA Evolved (Phase 2)
42 Mbps down / 11Mbps up
1.3 Under development: simultaneous use of MIMO and 64QAM, dual carrier HSPA (ie combine adjacent 5Mhz bands)
2011+ 3GPP Release 9 HSPA Evolved (Phase 3)
84 Mbps down / 23 Mbps up
> 1.3 Under development: will include 10Mhz channels
2010+ LTE Release 8 OFDMA 173 Mbps down / 58 Mbps up
4-24Mbps down (2 x 20MHz)
1.5 Under development: will include OFDMA, 2x2 MiMo, upto 20Mhz channels, system architecture evolution (unified IP core)
2011+ LTE Release 9 OFDMA 326 Mbps down/ 86 Mbps up
2.4 Under development: 4x2 and 4x4 MiMo
? 4G LTE advanced (IMT advanced)
OFDMA 1 Gbps down ? ? Under development: may include 40Mhz channels, 8 layer spatial multiplexing, co-ordinated multi-cell transmission
Source: Company data, Credit Suisse estimates

04 April 2012
Mobile pricing 6
Figure 6: Cost per GB of increasing network capacity by building a new cell site usd UMTS HSDPA (7.2) HSPA+ LTE
Spectrum (Mhz) 2 x 10 2 x 10 2 x 10 2 x 10
Spectral efficiency (bits/s/Hz) 0.15 0.70 1.10 1.50
Full buffer capacity of sector - downlink (Mbps) 1.5 7.0 11.0 15.0
Average load (to avoid excessive latency) 86% 86% 86% 86%
Utilisation rate (5.54 : 1) 0.18 0.18 0.18 0.18
Average sector/site (not all sites have 3 sectors) 2.40 2.40 2.40 2.40
Effective downlink capacity (Mbps) 0.56 2.61 4.10 5.59
Monthly site throughput - downlink (GB/month) 181 845 1328 1811
Full buffer capacity of sector - uplink (Mbps) 0.53 2.47 3.88 5.29
Average load 0.86 0.86 0.86 0.86
Traffic distribution factor 0.18 0.18 0.18 0.18
Average sector/site 2.40 2.40 2.40 2.40
Effective uplink capacity (Mbps) 0.20 0.92 1.45 1.97
Monthly site throughput - uplink (GB/month) 64 298 469 639
Incremental annual cost (usd) 138,127 149,691 154,881 165,424
Cost/month (usd) 11,511 12,474 12,907 13,785
Cost per Gigabyte used (usd) - 2007 US benchmark 47.0 10.9 7.2 5.6
Cost per GB used (usd) - 2010 Europe 30.5 7.1 4.7 3.7
Source: Credit Suisse research
Figure 7: Cost per GB of increasing network capacity by adding spectrum or upgrading from HSDPA to HSPA+ Cost/GB upgrade HSDPA
upgrade (3.6 to 7.2)
HSDPA (7.2 to 14.4)
HSPA+ upgrade
Extra radio carrier (HSPA+)
Extra radio carrier (LTE)
Incremental spectrum (Mhz) 2 x 10 2 x 10 2 x 10 2 x 5 2 x 5
Spectral efficiency (bits/s/Hz) 0.7 0.9 1.1 1.1 1.50
Incremental buffer capacity of sector - downlink (Mbps) 1.5 2.0 4.0 5.5 7.5
Average load (to avoid excessive latency) 86% 86% 86% 86% 86%
Utilisation rate (5.54 : 1) 0.18 0.18 0.18 0.18 0.18
Average sector/site (not all sites have 3 sectors) 2.40 2.40 2.40 2.40 2.40
Effective downlink capacity (Mbps) 0.56 0.75 1.49 2.05 2.79
Incremental site throughput - downlink (GB/month) 181 241 483 664 905
Incremental buffer capacity of sector - uplink (Mbps) 0.53 0.71 1.41 1.94 2.65
Average load 86% 86% 86% 86% 86%
Traffic distribution factor 0.18 0.18 0.18 0.18 0.18
Average sector/site 2.40 2.40 2.40 2.40 2.40
Effective uplink capacity (Mbps) 0.20 0.26 0.53 0.72 0.99
Incremental site throughput - uplink (GB/month) 64 85 170 234 320
Incremental annual cost (usd) 8,758 7,440 20,005 30,883 38,516
Cost/month (usd) 730 620 1,667 2,574 3,210
Cost per Gigabyte used (usd) - 2007 US benchmark 3.0 1.9 2.6 2.9 2.6
Cost per GB used (usd) - 2010 Europe 1.9 1.2 1.7 1.9 1.7
Source: Credit Suisse research

04 April 2012
Mobile pricing 7
■ The cost of increasing network capacity by building a new HSPA+ cell site in Europe was in 2010 an average usd4.7 or eu3.5 per GB. This falls to around usd3.7 or eu2.8 per GB when building LTE (due to higher bps/Hz) – see Figure 6. This is the long term cost of network capacity expansion, once extra spectrum and refarming spectrum to use new technology (e.g. LTE) have been fully exploited.
With mobile voice running at an average 2x10kbps (ie 0.000075 GB/min), this also implies a cost per minute of voice in the network of eu0.02c/min today (ie expanding capacity through spectrum and refarming) and eu0.05c/min in the long term (through more cell sites). This cost would be higher by a factor of 3-4x if a customer uses over the top VOIP services instead (which would typically run at a higher bit rate—a few years ago Skype said it needed a minimum 60kbps to run on mobile).
Key issue is traffic costs not margins
We focus in this report only on direct costs i.e. network costs and termination costs, rather than other costs (such as SAC and overheads). These latter costs will likely be flexed down over time. India shows how much SAC and overheads can be lowered with Bharti and Vodafone India making similar OpFCF margins to Vodafone in Europe and the UK with one tenth the voice yield (rev/min).
Figure 8: Yield vs OpFCF margin (ex regulation) Bharti (Airtel) Vodafone India Vodafone Europe Vodafone UK
Yield (eu'c/min) 0.635 0.842 6.6 7.9
EBITDA margin ex regulatory fees* 43% 35% 34% 24%
OpFCF margin ex regulatory fees* 27.6% 19.7% 24.6% 14.3%
Source: Company data, Credit Suisse estimates *Bharti incurs 10% of revenues on regulatory fees, we assume Vodafone India does too,
numbers relates to 2011 for Bharti and H1 FY3/12 for Vodafone
As we highlight in Figure 9 Vodafone India has similar direct costs (interconnect) to Vodafone UK, with India having a much lower yield but also a much lower MTR. Vodafone India has much higher operating expenses to sales, the result of its higher network costs relative to sales due to the low pricing in the market, as well as revenue taxes. But it makes similar EBITDA margins to Vodafone UK by incurring much lower customer costs (ie SAC and shops). In Europe making lower FCF margins is not sufficient for pricing to bottom whilst the industry is still wasting money on SACs and distribution. Pricing is still falling in plenty of markets where the marginal player is struggling to generate FCF. The floor is reached when pricing does not even cover direct (network and termination) costs.

04 April 2012
Mobile pricing 8
Figure 9: Vodafone India vs Vodafone UK
0%
10%
20%
30%
40%
50%
60%
70%
80%
Vodafone India Vodafone UK
Co
sts/
sal
es
Direct costs Customer costs Operating expenses
Source: Company data, Credit Suisse research, Note: data as of H1 FY3/12
Pricing has reached direct cost in some markets
We can use these our calculation of network costs to compare these direct costs (network plus termination) to current mobile pricing.
In Figure 10 we show the direct cost to the network operator of providing a typical bundle of 1000 mins, 1000 SMS and 1GB (the typical 3x1000 bundle in Austria – Denmark typically offers less voice and more SMS and data but the approach is similar). We break down direct costs as follows:
■ Network cost – this is the cost of expanding the capacity of the network to deal with the traffic generated by the customer, as discussed above. For today’s operator we assume that all the network expansion is through using new spectrum and from technology upgrades (rather than the more expensive route of building new cells sites).
■ Termination cost – this is the termination costs incurred on cross network traffic. We assume 25% of traffic is on-net (typical for a challenger operator), 35% to other mobile (at the eu1c/min target for the current MTR glide path) and 40% to fixed line (current FTRs average 0.5c/min).
On this calculation if a customer were to use all of the 3x1000 bundle, it would cost the network operator around eu12+VAT/month. Separately, based on typical usage today (500MB of data, 200 voice minutes and 120 SMS), a customer using the 3x1000 bundle would cost the network operator eu2.4+VAT/month.
Figure 10: Cost of 3 x 1000 bundle - current Today Unit cost Bundle Max cost per
month Typical usage Typical cost
per month Network Termination*
Voice eu0.02c/min eu0.55c/min 1000 mins 5.7 200 mins 1.14
Data eu1.3/GB eu0.0/GB 1000 MB 1.3 500 MB 0.7
SMS eu0.0c/SMS eu0.5c/SMS 1000 SMS 5.0 120 SMS 0.6
12.0 2.4
Source: Company data, Credit Suisse research * target for current glide path

04 April 2012
Mobile pricing 9
In the longer term (see Figure 11) once spectrum and technology gain has been exhausted, operators have to build new cells to meet capacity. This is more expensive, as previously discussed. On the other hand, in the long term it is possible termination will approach zero, ie bill and keep. Assuming growth in voice and data usage over time, the cost per bundle would be around eu3.0 - 3.3/month, not far from current 3Austria pricing ex VAT.
Figure 11: Cost of 3 x 1000 bundle – long term Long term Unit cost Bundle Max cost per
month Typical usage Typical cost
per month Network Termination*
Voice eu0.05c/min 0 1000 mins 0.5 300 mins 0.15
Data eu2.8/GB 0 1000 MB 2.8 1000 MB 2.8
SMS eu0.0c/SMS 0 1000 SMS 0.0 50 SMS 0.0
3.3 2.95
Source: Company data, Credit Suisse research
In Figure 12, we then compare these costs to the prices being offered by challenger operators in a number of European markets. We summarise the findings in Figure 12 to Figure 16. We highlight:
Austria – 3Austria pricing below direct cost for many users
In Austria, 3Austria is pricing below direct cost on its eu7 plan if customers use all the bundle. If customers use the 1GB allowance, plus the 1000 minutes and texts, this costs 3Austria today in network and interconnect around eu12 vs its eu5.6 price ex VAT. Customers have to use less than half the bundle for 3Austria to break even. We should add that T-Mobile is at eu8 and Telekom Austria (BigBob) at eu9 for a similar product. It is no coincidence the Austrian market is now trying to consolidate.
3Austria only makes money if customers do not use a lot of the bundle. Even if we take average contract smartphone usage in W.Europe of 500MB, only 200 minutes and 120 SMS, this would cost eu2.4 per month. On this average a price of eu5.6 ex VAT generates a gross margin over direct costs (interconnect and network) of around 60% on a typical customer vs a sector average of 77.5% (15pp of interconnect/sales and around 7.5pp of network CAPEX/sales). Furthermore:
■ the 3x1000 bundles are likely to attract higher users
■ whilst average usage is 500MB/200 voice calls, there are typically relatively few average data customers with usage clustered either at low levels or high levels of data usage.
3Austria gross margins on its marginal price point of eu7 are likely to be even lower than 60%. Most importantly, it is tough for 3Austria to cut much below this eu7 (inc VAT) price point currently.
In the longer term, termination rates may fall to zero, lowering cost further. But at this point (which is not on the current EC regulatory horizon), 3Austria will likely be having to build a higher amount of new cells to expand network capacity, as the gains from spectrum and technology are further exhausted. So as we show in Figure 10 and Figure 11, the direct cost of 3Austria for the average customer is unlikely to fall much below this current eu2.4 per GB level, suggesting that this pricing level is close to a long term as well as a near term floor.
So in the case of Austria we can say that price is close to or at the floor. We consider the investment case for Telekom Austria later in this note.
04 April 2012
Mobile pricing 10
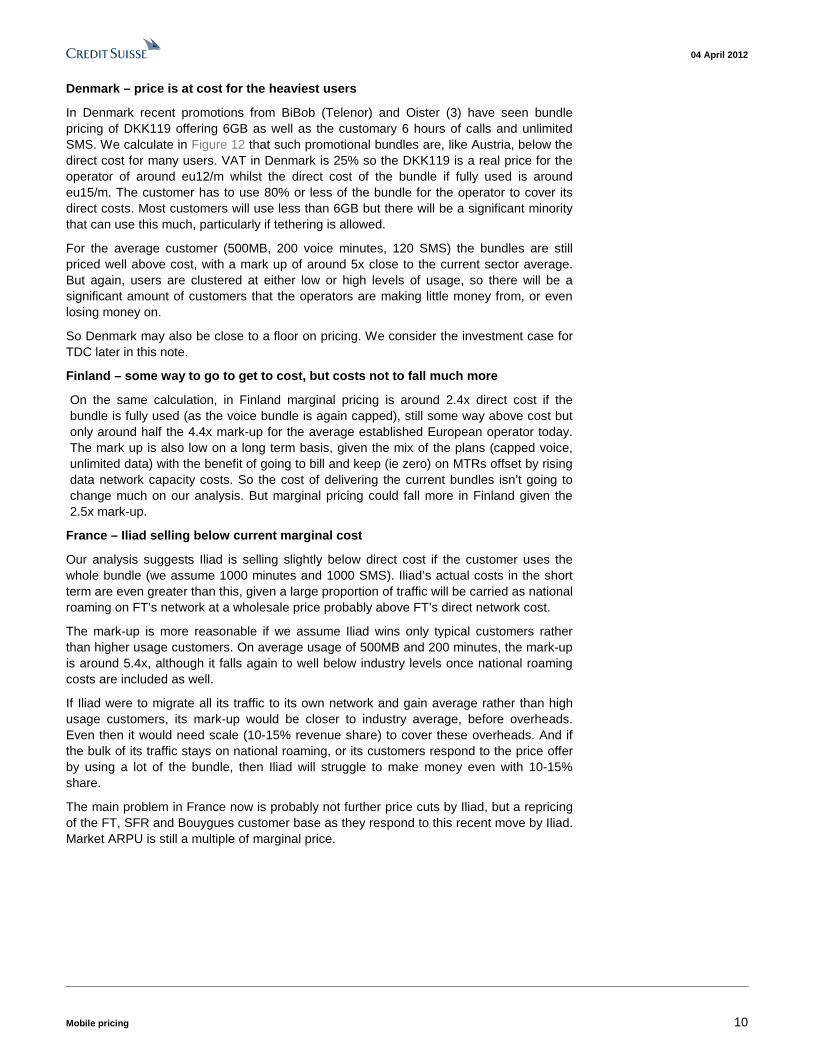
Denmark – price is at cost for the heaviest users
In Denmark recent promotions from BiBob (Telenor) and Oister (3) have seen bundle pricing of DKK119 offering 6GB as well as the customary 6 hours of calls and unlimited SMS. We calculate in Figure 12 that such promotional bundles are, like Austria, below the direct cost for many users. VAT in Denmark is 25% so the DKK119 is a real price for the operator of around eu12/m whilst the direct cost of the bundle if fully used is around eu15/m. The customer has to use 80% or less of the bundle for the operator to cover its direct costs. Most customers will use less than 6GB but there will be a significant minority that can use this much, particularly if tethering is allowed.
For the average customer (500MB, 200 voice minutes, 120 SMS) the bundles are still priced well above cost, with a mark up of around 5x close to the current sector average. But again, users are clustered at either low or high levels of usage, so there will be a significant amount of customers that the operators are making little money from, or even losing money on.
So Denmark may also be close to a floor on pricing. We consider the investment case for TDC later in this note.
Finland – some way to go to get to cost, but costs not to fall much more
On the same calculation, in Finland marginal pricing is around 2.4x direct cost if the bundle is fully used (as the voice bundle is again capped), still some way above cost but only around half the 4.4x mark-up for the average established European operator today. The mark up is also low on a long term basis, given the mix of the plans (capped voice, unlimited data) with the benefit of going to bill and keep (ie zero) on MTRs offset by rising data network capacity costs. So the cost of delivering the current bundles isn’t going to change much on our analysis. But marginal pricing could fall more in Finland given the 2.5x mark-up.
France – Iliad selling below current marginal cost
Our analysis suggests Iliad is selling slightly below direct cost if the customer uses the whole bundle (we assume 1000 minutes and 1000 SMS). Iliad’s actual costs in the short term are even greater than this, given a large proportion of traffic will be carried as national roaming on FT’s network at a wholesale price probably above FT’s direct network cost.
The mark-up is more reasonable if we assume Iliad wins only typical customers rather than higher usage customers. On average usage of 500MB and 200 minutes, the mark-up is around 5.4x, although it falls again to well below industry levels once national roaming costs are included as well.
If Iliad were to migrate all its traffic to its own network and gain average rather than high usage customers, its mark-up would be closer to industry average, before overheads. Even then it would need scale (10-15% revenue share) to cover these overheads. And if the bulk of its traffic stays on national roaming, or its customers respond to the price offer by using a lot of the bundle, then Iliad will struggle to make money even with 10-15% share.
The main problem in France now is probably not further price cuts by Iliad, but a repricing of the FT, SFR and Bouygues customer base as they respond to this recent move by Iliad. Market ARPU is still a multiple of marginal price.

04 A
pril 2012
Mo
bile p
ricing
11
Figure 12: Price vs direct cost (network cost plus interconnect) of big bundles Market Austria Denmark Finland France UK Neths Italy Spain
Operator 3Austria BiBoB DNA Iliad 3UK Telfort 3 Italia Yoigo
Bundle 3SuperSIM Comfort
SIM 300 12m TOP SIM La Mega Plana 55
Type of bundle SIM only SIM only SIM only SIM only SIM only SIM only SIM only SIM only
Price local FX 7.0 119 18.95 16.0 * 12.0 24.85 25.0 55
Price (eu) 7.0 16.1 18.95 16.0 * 14.4 24.85 25.0 55
VAT rate 20% 25% 23% 19.6% 20% 19% 23% 18%
Price ex VAT 5.6 12.1 14.6 12.9 11.5 20.1 19.3 55
Voice (mins) 1000 360 500 Unlimited 300 400 800 1200
Data (GB) 1.0 6.0 Unlimited 3.0 1.0 1.0 2.0 1.2
SMS 1000 Unlimited 400 Unlimited 3000 300 200 0
Maximum traffic cost per month*
Cost today 12.00 14.85 6.15 14.60 18.01 5.08 8.16 8.40
Price relative to cost today 0.47 0.81 2.37 0.88 0.64 3.96 2.36 6.55
Cost long term 3.30 16.98 5.85 8.90 2.95 3.00 6.00 3.96
Price relative to cost long term 1.70 0.71 2.49 1.44 3.91 6.71 3.21 13.89
Typical traffic cost per month
Cost today 2.39 2.39 2.39 2.39 2.39 2.39 2.39 2.39
Price relative to cost today 2.34 5.05 6.11 5.38 4.82 8.42 8.05 23.01
Cost long term 2.95 2.95 2.95 2.95 2.95 2.95 2.95 2.95
Price relative to cost long term 1.90 4.09 4.95 4.36 3.91 6.82 6.53 18.64
Source: Company data, Credit Suisse research * for Iliad fixed broadband customers ** for calculating the maximum cost of an unlimited offer we assume 1000 mins, 2GB and 1000 SMS. In
some cases, usage would be even higher. *** interconnect plus network costs divided by monthly fee

04 A
pril 2012
Mo
bile p
ricing
12
Figure 13: Mark-up of customer bill over direct costs if customer uses the
whole bundle (red line is actual average ratio of customer bill to direct costs
for established operators today =4.4x)
Figure 14: Mark-up of customer bill over direct costs based on average
customer usage in W.Europe (red line is actual average ratio of customer bill
to direct costs for established operators today =4.4x)
Based on typical usage of bundle
-
5.0
10.0
15.0
20.0
25.0
3Austria BiBob DNA Iliad 3UK Telfort 3 Italia Yoigo
Cu
sto
mer
bill
/ tr
affi
c co
sts
Current Long term
Source: Company data, Credit Suisse research Source: Company data, Credit Suisse research
Figure 15: Price vs maximum cost of cheapest big bundles in each market Figure 16: Price vs typical cost of cheapest big bundles in each market*
0.0
10.0
20.0
30.0
40.0
50.0
60.0
3Austria BiBob DNA Iliad 3UK Telfort 3 Italia Yoigo
eu/m
(ex
VA
T)
Price Max. cost - today Max cost - long term
0.0
10.0
20.0
30.0
40.0
50.0
60.0
3Austria BiBob DNA Iliad 3UK Telfort 3 Italia Yoigo
eu p
er m
on
th (
ex V
AT
)
Price Typical cost - today Typical cost - long term
Source: Company data, Credit Suisse research Source: Company data, Credit Suisse research
Based on maximum usage of bundle
-
2.0
4.0
6.0
8.0
10.0
12.0
14.0
16.0
3Austria BiBob DNA Iliad 3UK Telfort 3 Italia Yoigo
Cu
stom
er b
ill/t
raff
ic c
ost
s
Current Long term

04 A
pril 2012
Mo
bile p
ricing
13
Figure 17: Cost structure of Bharti India vs Vodafone Europe and UK Bharti (2011) Vodafone Europe (H1, FY3/12e) Vodafone UK (H1, FY3/12e)
ARPM INR 0.43 Outbound yield (eu'c) 6.6 Voice yield (eu'c per min) 7.9
Yield (eu'c/min) 0.635
Regulatory fee 10% Regulatory fee 0% Regulatory fee 0%
Interconnect / sales 12% Direct costs (interconnect, ULL, airtime commission)
23.8% Direct costs (interconnect, airtime commission) 28.3%
Customer costs (subsidies, commission, own shops)
30.5% Customer costs (subsidies, commission, own shops)
37.2%
Network opex 20% Operating expenses 11.6% Operating expenses 10.6%
SG&A 21%
Personnel 4%
EBITDA margin 33% EBITDA margin 34% EBITDA margin 34%
EBITDA margin ex regulatory fees 43% EBITDA margin ex regulatory fees 34% EBITDA margin ex regulatory fees 34%
CAPEX/sales CAPEX/sales 9.4% CAPEX/sales 9.4%
Source: Company data, Credit Suisse estimates

04 April 2012
Mobile pricing 14
Europe / Finland Wireless Telecommunication Services
Elisa Corporation (ELI1V.HE) COMPANY UPDATE
Reiterate Outperform ■ Action: We have raised our revenue forecasts by 1-2% and EBITDA by 3-
5% and are 2-4% ahead of consensus revenue forecasts for 2012-13E. We reiterate our Outperform rating and €20 TP.
■ Finnish mobile outlook improving – After being one of the weaker mobile markets in Europe we now believe the Finnish market is starting to look like one of the stronger as: 1) Headline pricing is no longer falling and the promotional activity has reduced over the last couple of quarters with Elisa ARPU trends improving 420bp the same period; 2) The Finnish market has already implemented bundled price plans reducing the risk of data cannibalising on voice and SMS revenues; and 3) Smartphone penetration has lagged the rest of Europe with Elisa only having 14% smartphone penetration at the end of Q4 11 and penetration could potentially accelerate in 2012 driven by the launch of Nokia’s Windows handsets.
■ We further believe Elisa Vhiide (Elisa’s IPTV product) will continue to drive fixed line revenues and with 91% of call volumes already over mobile we see little risk of FTM substitution.
■ Elisa’s guidance incorporates a deterioration in the Finnish economy in 2012, this has so far not happened and Elisa’s guidance could prove conservative.
■ Catalysts: Elisa reports Q1 12 results on 27 April
■ Valuation: Elisa is trading at 8.2% 2012E FCF yield.
Share price performance
12
17
Apr-10 Aug-10 Dec-10 Apr-11 Aug-11 Dec-11
Price Price relative
The price relative chart measures performance against the HEX25 INDEX. which closed at 2217.66 on 02/04/12 On 02/04/12 the spot exchange rate was Eu .75 /US$1
Performance Over 1M 3M 12M Absolute (%) 3.6 10.3 14.0 Relative (%) 0.7 -9.1 13.7
Financial and valuation metrics
Year 12/11A 12/12E 12/13E 12/14E Revenue (Eu m) 1,530.0 1,571.8 1,602.1 1,622.1 EBITDA (Eu m) 506.00 529.98 548.31 554.20 Net Income (Eu m) 201.4 218.9 226.7 231.5 CS adj. EPS (Eu) 1.30 1.40 1.45 1.49 Prev. EPS (Eu) — 1.30 1.36 1.43 ROIC (%) 13.89 14.82 15.01 15.40 P/E (adj., x) 13.82 12.77 12.33 12.07 P/E rel. (%) 96.3 94.6 105.6 112.4 EV/EBITDA 7.5 7.2 6.9 6.8
Dividend (12/12E, Eu) 1.43 IC (12/12E, Eu m) 1,648.27 Dividend yield (%) 8.0 EV/IC 2.3 Net debt (12/12E, Eu m) 803.1 Current WACC 8.0 Net debt/equity (12/12E, %) 95.0 Free float (%) 87.8 BV/share (12/12E, Eu) 5.4 Number of shares (m) 166.66
Source: FTI, Company data, Thomson Reuters, Credit Suisse Securities (EUROPE) LTD. Estimates.
*Stock ratings are relative to the coverage universe in each analyst's or each team's respective sector. ¹Target price is for 12 months.
Research Analysts
Henrik Herbst 44 20 7888 0286
Paul Sidney 44 20 7888 6015
Rating OUTPERFORM* Price (02 Apr 12, Eu) 17.93 Target price (Eu) 20.00¹ Market cap. (Eu m) 2,988.26 Enterprise value (Eu m) 3,791.4

04 April 2012
Mobile pricing 15
2-4% ahead of 2012-14E consensus revenues We are 2-4% ahead of consensus revenues and 3-6% ahead of consensus EBITDA for 2012-14E (set out in Figure 18). We believe we are mainly more positive than consensus on the Finnish mobile market which, in our view, has become more benign with fewer price promotions and further upside from Elisa lagging in terms of smartphone penetration. We forecast Elisa’s mobile ARPU trends to further improve from 11.6% decline in 2011 to 6.3% decline in 2012E and 4.5% decline in 2013E.
We believe Elisa’s guidance could be conservative (consensus is broadly in line with 0.8% revenue growth) and we forecast 2.7% revenue growth in 2012 vs guidance of flat revenues. Elisa stated on its Q4 11 conference call it had taken a cautious view on the macro economic development in Finland; however so far we believe the Finnish economy has held up well and we have not seen a deterioration so far.
Figure 18: Credit Suisse versus consensus € in millions, unless otherwise stated 2012E 2013E 2014E
CS est Cons Diff CS est Cons Diff CS est Cons Diff
Revenues 1,572 1,543 1.9% 1,602 1,555 3.0% 1,622 1562 3.8%
EBITDA 530 514 3.1% 548 521 5.3% 554 525.5 5.5%
margin 33.7% 33.3% 34.2% 33.5% 34.2% 33.6%
EBIT 319 308 3.8% 337 317 6.3% 343 319.8 7.4%
Net Income 219 208 5.4% 227 212 6.7% 232 214.4 8.0%
Source: Credit Suisse estimates, the BLOOMBERG PROFESSIONAL™ service
Figure 19: Elisa guidance vs Credit Suisse and consensus Company guidance 2012 CSe Cons
Revenues flat 2.7% 0.8%
EBITDA (ex one-offs) flat 4.7% 1.3%
CAPEX/sales <=12% 12.0%
Net debt/EBITDA 1.5-2x 1.5
Source: Company data, Credit Suisse estimates, the BLOOMBERG PROFESSIONAL™ service
Finnish mobile market improving Mobile price competition has at least temporarily bottomed out. In Q4 11 we saw fewer aggressive Christmas promotions than usual whilst the consensus view among the operators is that the pricing environment is still competitive but not getting worse. ARPU trends for both Elisa and TeliaSonera has improved over the last 3-4 quarters – set out in Figure 20, in our view, further implying that the pricing cuts in Finnish mobile is bottoming out is that y/y.
Talking to Elisa and TeliaSonera, we get the impression that the promotional activity has remained low going into Q1 12 as none of the operators has seen the other launching aggressive promotions. However whether telemarketing sales activity has increased is harder to tell. .

04 April 2012
Mobile pricing 16
Figure 20: Elisa and TeliaSonera ARPU trends improving
-16%
-14%
-12%
-10%
-8%
-6%
-4%
-2%
0%
Q110 Q210 Q310 Q410 Q111 Q211 Q311 Q411
y/y
chag
ne in
AR
PU
Elisa Telia
Source: Company data, Credit Suisse research
A further indication that the Finnish mobile market is turning more rational is churn levels coming down in the last couple of quarters, mainly for TeliaSonera while Elisa churn has stabilised below 15%. We set out TeliaSonera and Elisa churn levels in Figure 21.
Figure 21: Elisa and TeliaSonera churn stabilising
0%
5%
10%
15%
20%
25%
30%
35%
Q1 10 Q2 10 Q3 10 Q4 10 Q1 11 Q2 11 Q3 11 Q4 11
Annu
alis
ed c
hurn
(%)
Elisa TLSN
Source: Company data, Credit Suisse research
Smartphone catch-up effect to continue
In our view future recovery of ARPU is also likely to be driven by a catch up in smartphone penetration in Finland. Finland has lagged the rest of Europe, in our view, partly driven by the absence of a Nokia smartphone. With the launch of the Nokia Lumia (with a Windows operating system) in February this year in Finland, we believe smartphone penetration could further accelerate. The Nokia Lumia 800 was the best selling handset for Elisa, Telia and DNA in February.
By end of Q4 11 smartphone penetration of Elisa’s phone base was still only 14% on a definition containing only handsets with a iOS, Android, Symbian 2 or Windows operating system.
We set out the development in Elisa’s smartphone penetration in Figure 22, and acceleration in smartphone penetration in Q4 11.

04 April 2012
Mobile pricing 17
Figure 22: Elisa smartphone penetration
0%
2%
4%
6%
8%
10%
12%
14%
16%
Q1 10 Q2 10 Q3 10 Q4 10 Q1 11 Q2 11 Q3 11 Q4 11
smar
tpho
ne p
enet
ratio
n
0.0 pp
0.5 pp
1.0 pp
1.5 pp
2.0 pp
2.5 pp
3.0 pp
3.5 pp
4.0 pp
4.5 pp
5.0 pp
incr
emen
tal s
mar
tpho
ne p
enet
ratio
n q/
q
Elisa Smartphone penetration Incrementeal penetration (pp q/q)
Source: Company data, Credit Suisse research, Note: definition of smartphone includes handsets with iOS,
Symbian3, Android and Windows operating systems
Raising 2012-13 forecasts We raise our revenue forecasts for 2012-14E by 1-3% on the back of higher mobile forecasts. We have adjusted our forecasts for a stronger than expected ARPU in Q4 11 and less price promotion and an accelerating smartphone promotion, leading to higher ARPU. In the second half of 2011 Elisa’s mobile ARPU y/y trends improved by 420bp and we now forecast a 310bp improvement in 2012 versus 240bp on previous forecasts.
We have only marginally changed our Finnish fixed revenue forecasts.
Figure 23: Elisa: Credit Suisse changes to forecasts € in millions, unless otherwise stated 2012E 2012E 2013E 2013E 2014E 2014E
Group new old change new old change new old change
Revenues 1,572 1,557 1.0% 1,602 1,566 2.3% 1,622 1,576 3.0%
Underlying EBITDA 530 523 1.4% 548 534 2.8% 554 547 1.4%
EBITDA margin 33.5% 33.5% 0.0pp 33.7% 33.7% 0.0pp 33.7% 33.7% 0.0pp
EBIT 319 305 4.8% 337 317 6.1% 554 332 66.7%
Underlying net income 219 202 8.3% 227 212 7.2% 232 223 3.9%
EPS 1.40 1.30 8.3% 1.45 1.36 7.2% 1.49 1.43 3.9%
CAPEX 189 176 6.9% 192 179 7.4% 195 189 3.0%
FCF 215 225 -4.2% 244 232 5.4% 252 241 4.4%
Net debt 803 788 1.9% 802 788 1.8% 800 785 1.8%
Finnish Mobile
Mobile subscribers (000s) 3,839 3,902 -1.6% 3,999 4,062 -1.6% 4,139 4,062 1.9%
Revenues 888 871 1.9% 892 859 3.8% 893 853 4.8%
Finnish Fixed
Revenues 618 623 -0.7% 636 636 -0.1% 647 645 0.3%
Source: Credit Suisse estimates

04 April 2012
Mobile pricing 18
Figure 24: Elisa financial forecasts € in millions, unless otherwise stated EURm 2009 2010 2011A 2012E 2013E 2014E 2015E 2016E
P&L
Mobile 884 938 979 999 1,011 1,020 1,030 1,037
Finland 800 848 879 888 892 893 898 900
Estonia 84 90 100 111 120 127 132 137
Fixed 591 571 596 618 636 647 654 660
Internal and other (45) (46) (45) (45) (45) (45) (45) (45)
Total Revenue 1,430 1,463 1,530 1,572 1,602 1,622 1,639 1,652
growth y/y -3.7% 2.3% 4.6% 2.7% 1.9% 1.2% 1.0% 0.8%
999
Costs
Materials and services (576) (600) (644) (661) (668) (673) (677) (679)
Employee expenses (189) (208) (223) (231) (237) (244) (251) (259)
Other (181) (170) (157) (150) (149) (151) (152) (154)
Total OPEX (ex one-offs) (946) (978) (1,023) (1,042) (1,054) (1,068) (1,081) (1,092)
One-offs OPEX 0 0 1 0 0 0 0 0
EBITDA 484 485 506 530 548 554 558 561
margin % 33.8% 33.2% 33.1% 33.7% 34.2% 34.2% 34.1% 33.9%
growth y/y 0.2% 4.3% 4.7% 3.5% 1.1% 0.8% 0.4%
EBITDA excl. one-offs 484 485 507 530 548 554 558 561
margin % 34.0% 33.0% 33.1% 33.7% 34.2% 34.2% 34.1% 33.9%
D&A (ex one-offs) (217) (217) (211) (211) (211) (211) (210) (208)
One-offs 0 0 (1) 0 0 0 0 0
EBIT 267 268 296 319 337 343 349 353
EBIT excl. one-offs 267 268 297 319 337 343 349 353
margin % 19% 18% 19% 20% 21% 21% 21% 21%
Net financials (33) (71) (30) (31) (31) (30) (30) (30)
PBT 234 197 266 288 306 313 318 322
Income taxes (58) (47) (64) (69) (80) (81) (83) (84)
Effective tax-rate 25% 24% 24% 24% 26% 26% 26% 26%
Net income 176 151 201 219 227 232 235 238
EPS (€) 1.13 0.96 1.30 1.40 1.45 1.49 1.51 1.53
Average number of shares ('m)
Basic 155.6 155.7 155.9 155.9 155.9 155.9 155.9 155.9
DPS (€)
Ordinary proposed 0.92 0.90 0.90 0.98 1.02 1.04 1.06 1.07
Payout ratio 81.4% 93.8% 69.3% 70% 70% 70% 70% 70%
Special announced 0.50 0.40 0.45 0.45 0.45 0.45 0.45 0.45
Total DPS, € 1.42 1.30 1.35 1.43 1.47 1.49 1.51 1.52
CAPEX (171) (181) (189) (189) (192) (195) (197) (198)
CAPEX/sales 12.0% 12.4% 12.4% 12.0% 12.0% 12.0% 12.0% 12.0%
Net debt 719 776 788 803 802 800 799 801
Net debt / EBITDA 1.5 1.6 1.6 1.5 1.5 1.4 1.4 1.4
Source: Company data, Credit Suisse estimates
04 April 2012
Mobile pricing 19
Europe / Denmark Integrated Telecommunication Services
TDC (TDC.CO) COMPANY UPDATE
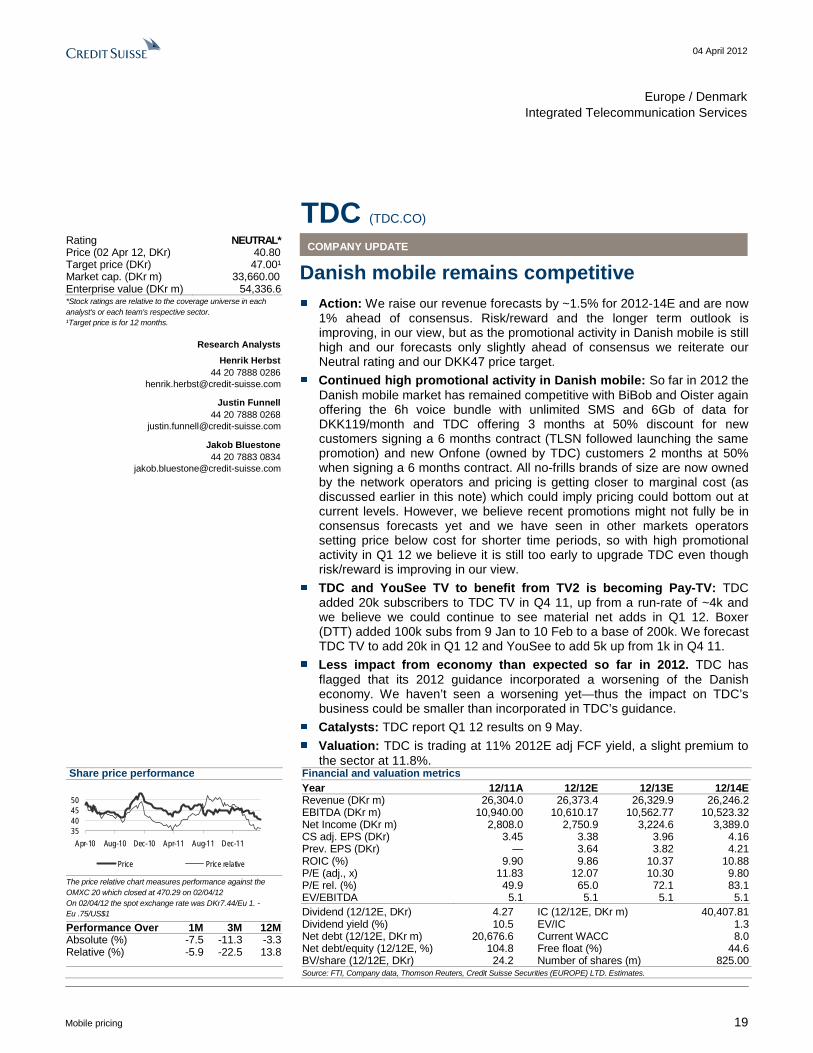
Danish mobile remains competitive ■ Action: We raise our revenue forecasts by ~1.5% for 2012-14E and are now
1% ahead of consensus. Risk/reward and the longer term outlook is improving, in our view, but as the promotional activity in Danish mobile is still high and our forecasts only slightly ahead of consensus we reiterate our Neutral rating and our DKK47 price target.
■ Continued high promotional activity in Danish mobile: So far in 2012 the Danish mobile market has remained competitive with BiBob and Oister again offering the 6h voice bundle with unlimited SMS and 6Gb of data for DKK119/month and TDC offering 3 months at 50% discount for new customers signing a 6 months contract (TLSN followed launching the same promotion) and new Onfone (owned by TDC) customers 2 months at 50% when signing a 6 months contract. All no-frills brands of size are now owned by the network operators and pricing is getting closer to marginal cost (as discussed earlier in this note) which could imply pricing could bottom out at current levels. However, we believe recent promotions might not fully be in consensus forecasts yet and we have seen in other markets operators setting price below cost for shorter time periods, so with high promotional activity in Q1 12 we believe it is still too early to upgrade TDC even though risk/reward is improving in our view.
■ TDC and YouSee TV to benefit from TV2 is becoming Pay-TV: TDC added 20k subscribers to TDC TV in Q4 11, up from a run-rate of ~4k and we believe we could continue to see material net adds in Q1 12. Boxer (DTT) added 100k subs from 9 Jan to 10 Feb to a base of 200k. We forecast TDC TV to add 20k in Q1 12 and YouSee to add 5k up from 1k in Q4 11.
■ Less impact from economy than expected so far in 2012. TDC has flagged that its 2012 guidance incorporated a worsening of the Danish economy. We haven’t seen a worsening yet—thus the impact on TDC’s business could be smaller than incorporated in TDC’s guidance.
■ Catalysts: TDC report Q1 12 results on 9 May.
■ Valuation: TDC is trading at 11% 2012E adj FCF yield, a slight premium to the sector at 11.8%.
Share price performance
35404550
Apr-10 Aug-10 Dec-10 Apr-11 Aug-11 Dec-11
Price Price relative
The price relative chart measures performance against the OMXC 20 which closed at 470.29 on 02/04/12 On 02/04/12 the spot exchange rate was DKr7.44/Eu 1. - Eu .75/US$1
Performance Over 1M 3M 12M Absolute (%) -7.5 -11.3 -3.3 Relative (%) -5.9 -22.5 13.8
Financial and valuation metrics
Year 12/11A 12/12E 12/13E 12/14E Revenue (DKr m) 26,304.0 26,373.4 26,329.9 26,246.2 EBITDA (DKr m) 10,940.00 10,610.17 10,562.77 10,523.32 Net Income (DKr m) 2,808.0 2,750.9 3,224.6 3,389.0 CS adj. EPS (DKr) 3.45 3.38 3.96 4.16 Prev. EPS (DKr) — 3.64 3.82 4.21 ROIC (%) 9.90 9.86 10.37 10.88 P/E (adj., x) 11.83 12.07 10.30 9.80 P/E rel. (%) 49.9 65.0 72.1 83.1 EV/EBITDA 5.1 5.1 5.1 5.1
Dividend (12/12E, DKr) 4.27 IC (12/12E, DKr m) 40,407.81 Dividend yield (%) 10.5 EV/IC 1.3 Net debt (12/12E, DKr m) 20,676.6 Current WACC 8.0 Net debt/equity (12/12E, %) 104.8 Free float (%) 44.6 BV/share (12/12E, DKr) 24.2 Number of shares (m) 825.00
Source: FTI, Company data, Thomson Reuters, Credit Suisse Securities (EUROPE) LTD. Estimates.
*Stock ratings are relative to the coverage universe in each analyst's or each team's respective sector. ¹Target price is for 12 months.
Research Analysts
Henrik Herbst 44 20 7888 0286
Justin Funnell 44 20 7888 0268
Jakob Bluestone 44 20 7883 0834
Rating NEUTRAL* Price (02 Apr 12, DKr) 40.80 Target price (DKr) 47.00¹ Market cap. (DKr m) 33,660.00 Enterprise value (DKr m) 54,336.6

04 April 2012
Mobile pricing 20
1% ahead of 2012-13E consensus revenues We are only marginally (~1%) ahead of consensus revenues for 2012-14E and retain our Neutral rating, awaiting further evidence that price promotions in the Danish mobile market are bottoming out after a Q1 12 with high promotional activity and TDC’s promotions being especially aggressive, in our view.
We are >2% ahead of Bloomberg consensus EBITDA for 2012-14E, although we flag that Bloomberg consensus historically has been lower than the consensus provided by TDC and we could be slightly less ahead were we to strip out some outliers. We set out our forecasts vs consensus in Figure 25.
We believe mobile pricing could consolidate near term around current levels as marginal revenue is now close to marginal cost and without any further mobile price cuts we believe consensus forecasts have fallen enough and we could potentially even see increases to forecasts.
We further believe the Danish economy has held up better to date in 2012 than had been allowed for in TDC’s guidance, and we forecast revenues towards the upper end of TDC’s guidance. We set out TDC’s guidance versus our forecasts in Figure 26.
Figure 25: TDC: Credit Suisse versus consensus in millions, unless otherwise stated 2012E 2013E 2014E
CS est Consensus diff CS est Consensus diff CS est Consensus diff
Revenues 26,373 26,121 1.0% 26,330 26,059 1.0% 26,246 26,098 0.6%
EBITDA 10,610 10,384 2.2% 10,563 10,311 2.4% 10,523 10,273 2.4%
EBIT 5,493 5,324 3.2% 5,590 5,313 5.2% 5,674 5,318 6.7%
Net income 2,751 3,145 -12.5% 3,225 2,880 12.0% 3,389 3,163 7.1%
Source: Credit Suisse estimates, the BLOOMBERG PROFESSIONAL™ service
Figure 26: TDC guidance versus Credit Suisse forecasts DKK in billions, unless otherwise stated Guidance 2012 CSe
Revenues 26-26.5 26.4
EBITDA (pre-pension income) 10.3-10.5 10.4
P&L CAPEX 3.4-3.5 3.4
Source: Company data, Credit Suisse estimates
Continued high promotional activity in mobile in Q1 12 TDC initiating another round of promotions in Q1 12
While Telenor was the most aggressive operator in Q4 11 (re-introducing handset subsidies) and TDC staying away from promotional activity TDC, in our view, was the most aggressive in Q1 12.
TDC also launched a new round of promotions when it started to offer new TDC customers 3 months at a 50% discount when signing a 6 months contract and new Onfone customers 2 months at 50% discount when signing a 6 months contract. TeliaSonera immediately responded to the promotion in the TDC brand launching the same offer.
TDC also slightly increased the size of the bundles for Onfone and Telmore, although still including less data than competitors.
BiBob (owned by Telenor) and Oister (owned by 3) also ran promotions in March offering 6h of voice, unlimited SMS and 6Gb of data for DKK119/month (on Oister and BiBob), a level we had in July to September last year as well. The promotions were only available for new customers for about a month (prices went back up to DKK149/month 1 April). Pricing was DKK119/month last July-Sept last year as well, but prices went back up, implying the operators seem unwilling to make the DKK119/month to the permanent pricing. However we do not rule out DKK119/month becoming the new headline price level.

04 April 2012
Mobile pricing 21
In Figure 27 we set out the development of the marginal pricing of a 5h bundle (now 6h) with unlimited SMS and ~1Gb (now ~6Gb) of data against Danish market ARPU since the December 2010, ahead of the start of the Danish price war.
At DKK119/month marginal revenue is close to today’s marginal cost and we believe this could remain a floor to pricing. Especially as after TDC’s acquisition of Onfone all no-frills brands of any material size in the Danish market are now owned by the network operators (Telenor owns BiBob, 3 owns Oister, TDC owns Onfone and Telmore and TeliaSonera owns CallMe), we believe this is likely to further reduce sentiment for price cuts in the no-frills brands as it is likely to cannibalise on the premium brands.
Figure 27: Danish no-frills pricing against market ARPU
0
50
100
150
200
250
Dec-10
Jan-1
1
Feb-11
Mar-11
Apr-11
May-11
Jun-11
Jul-1
1
Aug-11
Sep-11
Oct-11
Nov-11
Dec-11
Jan-1
2
Feb-12
Mar-12
DKK
/mon
th
5h with unlimited SMS Average ARPU (TDC consumer, TLSN and TNOR)
Source: Company data, Credit Suisse research
TDC consumer mobile forecasts
We forecast a broadly flat Danish consumer mobile service revenue trends to -10.2% y/y (excluding Onfone) in 2012 from a 10.4% fall in 2011.
We forecast Q1 and Q2 Consumer mobile revenues (excluding Onfone) to fall by 13% and 15.2% y/y respectively as 1) there are still some customers to migrate to the new lower priced tariffs introduced in July 2011; however with only 6 months contracts lengths in Denmark we expect most customers to have migrated by now; and 2) TDC launched another round of promotions in late Q1 12 both in the TDC and Onfone brand with the majority of the negative impact coming through in Q2.
We set out our full TDC Consumer mobile forecasts in Figure 28.

04 April 2012
Mobile pricing 22
Figure 28: TDC consumer mobile forecasts DKK in millions, unless otherwise stated Mobile Voice 2009 2010 Q111 Q211 Q311 Q411 2011 Q112E Q212E Q312E Q412E 2012E 2013E 2014E
Total TDC mobile revenues 4,312 4,343 1,019 1,042 1,084 1,039 4,164 1,025 997 1,041 1,035 4,098 4,129 4,152
y/y 4.7% 0.7% -8.2% -3.5% 0.5% -3.3% -4.1% 0.6% -4.3% -4.0% -0.4% -1.6% 0.8% 0.5%
Mobile service revenues (incl Onfone)
4,160 4,167 983 1,016 1,030 1,040 4,070 1,000 972 1,015 1,009 3,996 4,027 4,050
% yoy growth 0.4% 0.2% -5.6% -2.5% -1.1% -0.1% -2.3% 1.7% -4.3% -1.5% -3.0% -1.8% 0.8% 0.6%
Other revenues 152 176 36 26 54 -1 94 26 25 26 26 102 101 101
Blended ARPU (DKK) 180 169 161 159 156 157 159 152 148 154 152 151 151 151
% yoy growth -2.2% -6.1% -2.4% -4.8% -10.3% -8.7% -5.9% -5.5% -6.9% -1.5% -3.1% -5.2% 0.2% 0.2%
Total subs 2051 2046 2194 2186 2217 2201 2201 2181 2196 2206 2216 2216 2226 2231
Net adds 134 -5 148 -8 31 -16 155 -20 15 10 10 15 10 5
Mobile Revenue (ex Onfone) 4,312 4,343 1,019 1,003 970 899 3,891 881 853 885 876 3,494 3,483 3,474
y/y 4.7% 0.7% -8.2% -7.1% -10.1% -16.3% -10.4% -13.6% -14.9% -8.8% -2.6% -10.2% -0.3% -0.3%
Service Revenue 4,160 4,167 983 977 916 900 3,777 855 828 859 850 3,393 3,381 3,373
y/y 0.4% 0.2% -5.6% -6.2% -12.1% -13.5% -9.4% -13.0% -15.2% -6.2% -5.6% -10.2% -0.3% -0.3%
Other Revenue 152 176 36 26 54 (1) 114 26 25 26 26 102 101 101
Proportion % 3.6% 4.2% 3.7% 2.6% 5.9% -0.2% 3.0% 3.0% 3.0% 3.0% 3.0% 3.0% 3.0% 3.0%
ARPU ex Onfone 180.0 169.0 161.0 158.7 152.3 150.3 156.4 144.9 141.3 146.2 144.3 144.1 143.4 143.4
growth y/y -2.2% -6.1% -2.4% -5.0% -12.5% -12.6% -7.5% -10.0% -11.0% -4.0% -4.0% -7.8% -0.5% 0.0%
Subscribers, ex Onfone ('000) 2,051 2,046 2,024 1,999 2,013 1,982 1,982 1,952 1,957 1,962 1,967 1,967 1,962 1,957
% yoy growth 7.0% -0.2% -6.2% -0.2% 1.2% -3.1% -3.1% -3.6% -2.1% -2.5% -0.8% -0.8% -0.3% -0.3%
Avg Subs ('000) 1,984 2,049 2,035 2,012 2,006 1,998 2,013 1,967 1,955 1,960 1,965 1,961 1,965 1,960
Net Adds ('000) 134 (5) (22) (25) 14 (31) (64) (30) 5 5 5 (15) (5) (5)
Onfone Revenues 39 114 140 293 144 144 156 159 603 646 678
ARPU (DKK/sub/month) 146 194 221 215 205 215 215 213 210 210
Subscribers (’00) 170 187 204 219 219 229 239 244 249 249 264 274
Net adds (‘000) 17 17 15 49 10 10 5 5 30 15 10
Source: Company data, Credit Suisse estimates
TDC ARPU to fall 9% from levels pre the price cut in the TDC brand
TDC cut pricing in the TDC brand by ~20% in July 2011. We believe some of the ARPU impact from the price cut will be offset by cheaper data pricing and the introduction of TDC rate stimulating growth in smartphone penetration.
We forecast TDC’s ARPU (excluding Onfone) to fall by 9% from Q2 11 (ie before the price cut in the TDC brand).
With TDC’s July 11 price cuts the gap between TDC’s main brand and Onfone has materially reduced (from DKK250/month to DKK150/month) and we believe pricing could now have bottomed out and we forecast ARPU to remain broadly flat for 2013 and 2014.
Customers to continue to migrate to cheaper tariffs
TDC cut the pricing in the TDC brand by 20% (ex VAT) on what we believe is the most common price plan (including 240min of voice, unlimited SMS and 5Gb of data) on 11 July 2011.
The maximum contract length in Denmark is 6 months implying that all customers should have had the opportunity to migrate to the new price plans in January 2012 (6 months from the introduction of the new prices in July 2011) we believe the migration from the TDC brand to both no-frills brands and to the new lower priced tariffs in the TDC brand could continue at least throughout the first half of 2012.

04 April 2012
Mobile pricing 23
In Figure 29 we set out current pricing of a bundle including ~5h of voice, unlimited SMS and >1Gb data.
Figure 29: DKK/month pricing on a 4-7h bundle with unlimited SMS
0 50 100 150 200 250 300 350
Bibob (6h, 6Gb)
Oister (6h, 6Gb)
Onfone (6h, 1Gb)
Telmore (5h, 3Gb)
Call Me (7h , 10Gb)
3 Denmark (5h, 5Gb)
Telenor (5h, 3Gb)
Te lia (6h, 5Gb)
TDC (4h, 5Gb)
DKK/month
Source: Company data, Credit Suisse research
Q1 12 price moves in more detail
After Telenor ran some aggressive promotions in Q4 11 there were relatively few at the beginning of Q1 12. However towards the end of the quarter Oister (owned by 3) and BiBob (owned by Telenor) re-introduced the DKK119/month pricing on a 6h voice bundle with unlimited SMS and 6Gb of data. TDC responded by re-introducing the 2 months at 50% discount promotion in the Onfone brand.
TDC also introduced a promotion in the TDC brand beginning of March offering new customers a 50% discount on the monthly fee for the first 3 months of a 6 months contract. Telia very quickly responded and introduced a promotion offering new customers 50% discount for the first 4 months on a 6 months contract.
We note the following key changes over the last 3 months:
■ 3 Denmark has materially cut its pricing since January, from DKK399/month to DKK179/month. However it has also reduced included voice usage from 360mins to 300mins and the data bundle from 10Gb to 5Gb per month. We believe this is a response to Telenor and TeliaSonera cutting price in Q2 11 and TDC in early Q3 11.
■ BiBob (owned by Telenor) and Oister (owned by 3) has both cut pricing back to DKK119/month (from DKK149/month) without adjusting either the voice or data bundle.
■ TeliaSonera has slightly increased pricing (from DKK240/month to DKK279/month) although also included more data (now 5Gb, up from 1Gb per month) in the bundle.
■ Onfone (owned by TDC) increased the DKK149/month bundle to 360mins (from 300mins) of voice and 1Gb (from 0.5Gb) of voice per month.

04 April 2012
Mobile pricing 24
Figure 30: Headline pricing and change over the last 3 months
0
50
100
150
200
250
300
350
400
450
Bibob (6h,6Gb)
Oister (6h,6Gb)
Onfone (6h,1Gb)
Telmore (5h,3Gb)
Call Me (7h,10Gb)
3 Denm ark(5h, 5Gb)
Te lenor (5h,3Gb)
Telia (6h,5Gb)
TD C (4h,5Gb)
DKK
/mon
th
Jan uary March
Source: Company data, Credit Suisse research
Figure 31: Monthly voice bundle and change over the last 3 months
0
1
2
3
4
5
6
7
8
TDC(DKK2 99/m,
5G b)
Telmore( DK K149 /m,
3Gb)
3 Den ma rk(DKK17 9/m,
5Gb)
Telen or(DKK 230/m,
3 Gb)
B ibob(DKK11 9/m,
6Gb )
O ister(DKK1 19/m,
6G b)
Onfone(DK K149 /m,
1Gb)
Te lia(DKK2 79/m,
5G b)
Call Me(DK K149 /m,
10G b)
h/m
onth
Jan uary March
Source: Company data, Credit Suisse research
Figure 32: Monthly data bundle and change over the last 3 months
0
2
4
6
8
10
12
O nfo ne(DKK1 49/m,
6h)
Telmore(DKK1 49/m,
5h)
Te lenor(DKK2 30/m,
5h)
TDC(DKK29 9/m,
4h)
3 Den ma rk(DKK1 79/m,
5h)
Telia(DKK27 9/m,
6h)
B ibob(DKK11 9/m,
6h)
Oiste r(DK K11 9/m,
6 h)
Call Me(DK K149 /m,
7 h)
Gb/
mon
th
Ja nuar y March
Source: Company data, Credit Suisse research

04 April 2012
Mobile pricing 25
Changes to forecasts We raise our revenue forecasts by 1.3-1.5% and cut our EBITDA including pension income by 1.3-1.6% for 2012-13E. In more detail (set out in Figure 33) we adjust our forecasts for:
TDC TV to benefit from TV2 turning pay-TV
We raise our TDC TV (included in Consumer) estimate by 10% for 2012 as we expect some increased uptake of TV customers coming from TV2 becoming a pay-TV channel and price increases put through from 1 Jan 2012. TDC has also launched a new entry 3-play level bundle called TDC HomeTrio Mini to stimulate uptake of FTA customers; the company also ran some promotions which will have a negative impact on ARPU and offset some of the positive impact from price increases from 1 Jan 2012.
Overall we forecast TV revenue growth to accelerate to 32% in 2012 from 26% in 2011.
2-3% cut to 2012-13E Consumer mobile revenue forecasts
To reflect mainly the above-mentioned price promotions in the Danish market and also weaker than expected Q4 results, we have cut our TDC Consumer mobile revenue forecasts. This mainly comes through as cuts to our ARPU forecasts.
2-3% cut to TDC wholesale revenues
We have materially cut our forecasts for TDC wholesale on the back of weak Q4 11 results across the board mainly on the subscriber side but also in terms of slightly weaker than expected ARPU.

04 April 2012
Mobile pricing 26
Figure 33: TDC: Credit Suisse changes to forecasts DKK in millions, unless otherwise stated 2012E 2013E 2014E
New Old diff New Old diff New Old diff
Summary
Revenues 26,373 26,032 1.3% 26,330 25,933 1.5% 26,246 25,920 1.3%
y/y growth 0.3% -0.5% -0.2% -0.4% -0.3% 0.0%
Revenues ex impact Onfone 25,770 25,626 0.6% 25,684 25,460 0.9% 25,568 25,397 0.7%
EBITDA (incl pension income) 10,610 10,754 -1.3% 10,563 10,731 -1.6% 10,523 10,732 -1.9%
y/y growth -3.0% -1.7% -0.4% -0.2% -0.4% 0.0%
EBITDA margin 40.2% 41.3% -2.6% 40.1% 41.4% -3.1% 40.1% 41.4% -3.2%
D&A and impairment losses (5,118) (4,967) 3.0% (4,973) (4,969) 0.1% (4,849) (4,694) 3.3%
Special items (inc leaver charges)
(600) (600) 0.0% (300) (300) 0.0% (250) (250) 0.0%
Net financial costs (inc JV & associate profits)
(1,072) (1,069) 0.2% (932) (1,255) -25.7% (906) (1,220) -25.8%
Income tax charge (1,070) (1,153) -7.2% (1,133) (1,094) 3.6% (1,130) (1,142) -1.1%
Income from discontinued operations
0 0 0 0 0 0
Net income 2,751 2,965 -7.2% 3,225 3,113 3.6% 3,389 3,426 -1.1%
Cash CAPEX (3,337) (3,364) -0.8% (3,403) (3,351) 1.5% (3,392) (3,350) 1.3%
Equity FCF - Codefinition 4,342 4,576 -5.1% 4,600 4,538 1.4% 4,575 4,483 2.1%
Cashflow related to special items
(465) (700) -33.6% (350) (350) 0.0% (250) (250) 0.0%
Equity FCF - CS definition 3,877 3,876 0.0% 4,250 4,188 1.5% 4,325 4,233 2.2%
Net financial debt (20,677) (22,038) (20,199) (21,571) (19,717) (21,103)
Net debt / EBITDA 1.95 2.05 -4.9% 1.91 2.01 -4.9% 1.87 1.97 -4.7%
Revenues 26,373 26,032 1.3% 26,330 25,933 1.5% 26,246 25,920 1.3%
TDC Consumer 9,058 8,776 3.2% 9,017 8,668 4.0% 8,945 8,574 4.3%
y/y growth 0.6% -1.8% -0.5% -1.2% -0.8% -1.1%
TDC consumer mobile 4,098 4,205 -2.6% 4,129 4,262 -3.1% 4,129 4,322 -4.5%
y/y growth
TDC Business 7,139 7,095 0.6% 6,781 6,842 -0.9% 6,504 6,629 -1.9%
y/y growth -5.0% -4.9% -5.0% -3.6% -4.1% -3.1%
TDC Nordic 4,807 4,673 2.9% 5,001 4,812 3.9% 5,175 4,997 3.6%
y/y growth 7.1% 5.1% 4.0% 3.0% 3.5% 3.8%
Operations & Wholesale 2,003 2,074 -3.4% 1,966 2,008 -2.1% 1,907 1,951 -2.3%
y/y growth -6.9% -3.9% -1.8% -3.2% -3.0% -2.8%
YouSee 4,505 4,527 -0.5% 4,703 4,712 -0.2% 4,850 4,877 -0.6%
y/y growth 5.8% 5.7% 4.4% 4.1% 3.1% 3.5%
Other (1,140) (1,113) 2.4% (1,138) (1,109) 2.6% (1,134) (1,109) 2.3%
EBITDA (including PI) 10,610 10,754 -1.3% 10,563 10,731 -1.6% 10,523 10,732 -1.9%
Source: Credit Suisse estimates

04 April 2012
Mobile pricing 27
Figure 34: TDC: Financial forecast summary DKK in millions, unless otherwise stated 2009 2010 2011 Q112E Q212E Q312E Q412E 2012E 2013E 2014E
Summary
Revenues 26,079 26,167 26,304 6,638 6,549 6,498 6,674 26,373 26,330 26,246
y/y growth -3.1% 0.3% 0.5% 0.4% 0.1% 0.5% -0.2% 0.3% -0.2% -0.3%
EBITDA (incl pension income) 10,536 10,772 10,940 2,627 2,582 2,723 2,677 10,610 10,563 10,523
y/y growth 4.8% 2.2% 1.6% -3.1% -1.9% -3.5% -3.5% -3.0% -0.4% -0.4%
EBITDA margin 40.4% 41.2% 41.6% 39.6% 39.4% 41.9% 40.1% 40.2% 40.1% 40.1%
D&A (4,659) (5,356) (5,227) (1,310) (1,287) (1,268) (1,253) (5,118) (4,973) (4,849)
Special items (1,119) (1,347) (864) (150) (150) (150) (150) (600) (300) (250)
Net financial costs (inc JV & associate profits)
(3,542) (3,074) (905) (284) (276) (265) (247) (1,072) (932) (906)
Income tax charge (809) (782) (1,131) (247) (243) (291) (288) (1,070) (1,133) (1,130)
Income from discontinued operations
422 1,203 (5) 0 0 0 0 0 0 0
Net income 2,383 3,007 2,808 636 626 749 740 2,751 3,225 3,389
Cash CAPEX (3,857) (3,508) (3,376) (839) (828) (823) (847) (3,337) (3,403) (3,392)
Equity FCF - Company definition 4,426 4,515 4,594 698 686 1,303 1,655 4,342 4,600 4,575
Cashflow related to special items (793) (792) (786) (15) (150) (150) (150) (465) (350) (250)
Equity FCF - CS definition 3,633 3,723 3,808 683 536 1,153 1,505 3,877 4,250 4,325
Net financial debt (34,791) (23,381) (21,790) (20,677) (20,199) (19,717)
Net debt / EBITDA 3.30 2.17 1.99 1.95 1.91 1.87
Source: Company data, Credit Suisse estimates
Figure 35: TDC: Breakdown of revenue forecasts DKK in millions, unless otherwise stated 2008 2009 2010 2011 Q112E Q212E Q312E Q412E 2012E 2013E 2014E
Revenues 26,917 26,079 26,167 26,304 6,638 6,549 6,498 6,674 26,373 26,330 26,246
y/y growth -3.7% -3.1% 0.3% 0.5% 0.4% 0.1% 0.5% -0.2% 0.3% -0.2% -0.3%
TDC Consumer 9,662 9,455 9,130 9,004 2,271 2,226 2,258 2,303 9,058 9,017 8,945
y/y growth -4.5% -2.1% -3.4% -1.4% 1.3% 0.3% 1.2% -1.1% 0.6% -0.5% -0.8%
TDC Business 8,785 8,182 7,804 7,517 1,860 1,763 1,731 1,773 7,139 6,781 6,504
y/y growth -0.9% -6.9% -4.6% -3.7% -4.9% -5.7% -5.0% -5.1% -5.0% -5.0% -4.1%
TDC Nordic 3,854 3,515 4,087 4,487 1,183 1,199 1,149 1,277 4,807 5,001 5,175
y/y growth -0.2% -8.8% 16.3% 9.8% 8.3% 7.5% 6.8% 5.9% 7.1% 4.0% 3.5%
Operations & Wholesale 2,334 2,185 2,234 2,153 486 509 500 510 2,003 1,966 1,907
y/y growth -35.2% -6.4% 2.3% -3.6% -8.3% -7.4% -8.0% -4.0% -6.9% -1.8% -3.0%
YouSee 3,189 3,598 4,012 4,259 1,117 1,130 1,129 1,127 4,505 4,703 4,850
y/y growth 12.7% 12.8% 11.5% 6.2% 4.9% 6.1% 6.3% 5.7% 5.8% 4.4% 3.1%
Other (907) (856) (1,100) (1,136) (278) (277) (267) (316) (1,140) (1,138) (1,134)
Source: Company data, Credit Suisse estimates

04 April 2012
Mobile pricing 28
Figure 36: TDC: Breakdown of TDC EBITDA forecasts DKK in millions, unless otherwise stated 2009 2010 2011 Q112E Q212E Q312E Q412E 2012E 2013E 2014E
EBITDA (including pension income) 10,536 10,772 10,940 2,627 2,582 2,723 2,677 10,610 10,563 10,523
y/y growth 4.8% 2.2% 1.6% -3.1% -1.9% -3.5% -3.5% -3.0% -0.4% -0.4%
EBITDA Margin 40.4% 41.2% 41.6% 39.6% 39.4% 41.9% 40.1% 40.2% 40.1% 40.1%
TDC Consumer 3,821 3,864 3,684 874 863 984 962 3,683 3,739 3,752
y/y growth 2.3% 1.1% -4.7% -2.8% -1.1% 5.0% -1.3% 0.0% 1.5% 0.3%
Segment EBITDA Margin 40.4% 42.3% 40.9% 38.5% 38.8% 43.6% 41.8% 40.7% 41.5% 41.9%
TDC Business 3,895 3,821 3,903 958 916 912 904 3,690 3,457 3,314
y/y growth 1.8% -1.9% 2.1% -3.9% -4.3% -8.1% -5.6% -5.5% -6.3% -4.1%
Segment EBITDA Margin 47.6% 49.0% 51.9% 51.5% 52.0% 52.7% 51.0% 51.7% 51.0% 51.0%
TDC Nordic 497 564 649 158 157 181 179 675 728 772
y/y growth 8.5% 13.5% 15.1% 6.3% -0.2% -2.7% 14.2% 4.1% 7.8% 6.1%
Segment EBITDA Margin 14.1% 13.8% 14.5% 13.4% 13.1% 15.8% 14.0% 14.0% 14.6% 14.9%
Operations & Wholesale 988 995 1,031 232 244 244 232 952 935 907
y/y growth -16.6% 0.7% 3.6% -5.9% -5.8% -11.1% -7.5% -7.7% -1.7% -3.0%
Segment EBITDA Margin 45.2% 44.5% 47.9% 47.7% 48.0% 48.9% 45.6% 47.5% 47.6% 47.6%
YouSee 1,141 1,353 1,521 400 397 397 395 1,589 1,684 1,758
y/y growth 19.6% 18.6% 12.4% 6.5% 6.2% 2.0% 3.4% 4.5% 6.0% 4.4%
Segment EBITDA Margin 31.7% 33.7% 35.7% 35.8% 35.2% 35.2% 35.0% 35.3% 35.8% 36.3%
Other 194 175 152 5 5 5 5 20 20 20
Pension income 287 435 439 53 53 53 53 210 210 210
EBITDA (ex pensions income) 10,249 10,337 10,501 2,575 2,530 2,671 2,625 10,400 10,353 10,313
y/y growth 6.0% 0.9% 1.6% -1.0% 0.3% -1.5% -1.5% -1.0% -0.5% -0.4%
EBITDA Margin 39.3% 39.5% 39.9% 38.8% 38.6% 41.1% 39.3% 39.4% 39.3% 39.3%
Source: Company data, Credit Suisse estimates

04 April 2012
Mobile pricing 29
Europe / Austria Wireless Telecommunication Services
Telekom Austria (TELA.VI) COMPANY UPDATE
Mobile prices close to cost ■ Action: We cut 2012E EBITDA 0.4% and are close to consensus estimates.
We reiterate our Neutral rating. We believe Austrian mobile is bottoming out but this is insufficient to outweigh the headwinds in Eastern Europe.
■ Rationality coming back to mobile. Austria has been Europe’s toughest mobile market for several years but as we discuss earlier in this note we believe it is now close to bottoming. 1,000 minutes/1,000 SMS/1GB of data costs as little as €7/month with most no-frills packages around €10-13. The introduction of €10-20 annual SIM charges and TKA’s ending of some no-frills bob tariffs (taking prices from €9.9 to €12.8) suggest some rationality.
■ The market could also consolidate. If the Orange consolidation deal wins regulatory approval then we believe the market could stabilize through market repair. If regulation proves a hurdle (as it did with tele.ring in 2005-6) then some irrationality could come back to the market. However, with price close to cost, we think the scope for further price cutting is much more limited than in the past no matter the outcome of the Orange deal.
■ But CEE challenging and stake holder Ronny Pecik’s intentions main stock drivers. We have become more bullish on Austrian mobile and raise our 2012 service revenue growth estimates 2%, to -3.8%. However, Eastern Europe remains a major headwind (Bulgaria, Croatia and Belarus) and we believe the stock price depends more on Ronny Pecik’s intentions which are uncertain than the fundamental performance of the company.
■ Catalysts: TKA publishes 1Q 11 results on 10 May and hosts its AGM on 23 May. Press reports (e.g., Telecompaper) have suggested Pecik will seek board representation at the AGM, though it is unclear how many board seats he will seek.
■ Valuation: TKA shares trade on a 12.6% 2013E FCFY vs the Incumbent peers trading on 11.9%.
Share price performance
6
8
10
12
Apr-10 Aug-10 Dec-10 Apr-11 Aug-11 Dec-11
Price Price relative
The price relative chart measures performance against the VIENNA SE AUSTRIAN TRADED IDX which closed at 2158.03 on 02/04/12 On 02/04/12 the spot exchange rate was Eu .75 /US$1
Performance Over 1M 3M 12M Absolute (%) -1.2 -3.3 -14.9 Relative (%) -4.1 -22.7 -15.2
Financial and valuation metrics
Year 12/11A 12/12E 12/13E 12/14E Revenue (Eu m) 4,454.6 4,339.3 4,302.4 4,288.2 EBITDA (Eu m) 1,537.42 1,466.31 1,473.51 1,479.93 Net Income (Eu m) -255.3 131.0 174.5 250.7 CS adj. EPS (Eu) 0.46 0.46 0.50 0.68 Prev. EPS (Eu) — 0.53 0.74 0.95 ROIC (%) 10.66 7.45 9.41 11.40 P/E (adj., x) 18.87 18.84 17.27 12.88 P/E rel. (%) 154.1 189.7 204.2 169.4 EV/EBITDA 4.7 4.7 4.6 4.4
Dividend (12/12E, Eu) 0.38 IC (12/12E, Eu m) 4,015.41 Dividend yield (%) 4.4 EV/IC 1.7 Net debt (12/12E, Eu m) 3,001.3 Current WACC 7.0 Net debt/equity (12/12E, %) 296.0 Free float (%) 71.6 BV/share (12/12E, Eu) 1.9 Number of shares (m) 443.00
Source: FTI, Company data, Thomson Reuters, Credit Suisse Securities (EUROPE) LTD. Estimates.
*Stock ratings are relative to the coverage universe in each analyst's or each team's respective sector. ¹Target price is for 12 months.
Research Analysts
Jakob Bluestone 44 20 7883 0834
Justin Funnell 44 20 7888 0268
Rating NEUTRAL* Price (02 Apr 12, Eu) 8.72 Target price (Eu) 10.00¹ Market cap. (Eu m) 3,862.96 Enterprise value (Eu m) 6,864.3

04 April 2012
Mobile pricing 30
Change in estimates We raise Austrian mobile numbers but lower CEE – 2013E EBITDA cut 2%
We slightly raise our estimates for Austrian mobile in our Telekom Austria model, following the 4Q 11 results. We now assume service revenue growth in 2012 only falls 3.8% (previously -5.8%), as we believe the Austrian mobile market is slowly bottoming out. We discuss this in further detail below.
However, we have cut estimates for other parts of the business to reflect the fact that Telekom Austria’s international operations remain under significant pressure. In 4Q 11:
■ Bulgarian mobile service revenue growth deteriorated to -17% vs -13% in 3Q 11. This should take another step down in 1Q 12 when MTR cuts resume.
■ Croatia mobile service revenue growth deteriorated to -10% vs -8.2% in 3Q 11. We see continued pressure as Croatia is likely to bring its wholesale rates in line with the EU rules, ahead of EU accession in July 2013. The caveat would be if Tele2 exited the market, though visibility on such a move is low.
■ Belarus growth was strongly impacted by the country’s inflation (inflation is currently running above 100%). Revenues fell 55% in euro in 4Q 11 despite Velcom raising prices 22% (following a previous 20% price hike). Local currency growth slowed from 66% in 3Q 11 to 56% (ie negative 40-50% in real terms).
We show our detailed changes in estimates in Figure 38.
Our estimates are in line with consensus
Overall this puts our EBITDA estimates in line with consensus (2012E 0.7% above, 2013E 0.4% above), suggesting that there is unlikely to be sufficient earnings momentum to justify an outperform rating.
Figure 37: Credit Suisse vs consensus € in millions, unless otherwise stated 2012E 2013E 2014E 2012E 2013E 2014E 2012E 2013E 2014E
CS CS CS Cons Cons Cons % delta % delta % delta
Revenues 4,294 4,302 4,288 4,325 4,323 4,289 -0.7% -0.5% 0.0%
EBITDA 1,466 1,474 1,480 1,456 1,467 1,456 0.7% 0.4% 1.6%
Operating income 401 488 574 441 482 526 -9.0% 1.2% 9.2%
Net income 205 223 300 195 227 254 5.0% -1.5% 18.0%
Source: Credit Suisse estimates. the BLOOMBERG PROFESSIONAL™ service Revenues and Net income may differ to the databox due to
adjustments for One-offs
We would also note that with Ronny Pecik’s stake building and the continued uncertainty about his intentions, the stock performance is arguably more likely to be driven by this special situation than by fundamentals.

04 April 2012
Mobile pricing 31
Figure 38: Changes to estimates € in millions, unless otherwise stated 2012E 2013E 2014E 2012E 2013E 2014E 2012E 2013E 2014E
Old Old Old New New New % chge % chge % chge
Segment Austria 2,848 2,832 2,817 2,902 2,873 2,849 1.9% 1.4% 1.2%
Segment Bulgaria 518 515 516 484 470 455 -6.5% -8.7% -11.9%
Segment Croatia 405 389 379 361 325 309 -10.9% -16.6% -18.5%
Segment Belarus 204 188 182 225 213 206 10.6% 13.0% 12.8%
Slovenia 207 225 245 212 237 262 2.5% 5.3% 7.1%
Republic of Serbia 167 186 202 175 202 219 4.7% 8.8% 8.7%
Republic of Macedonia 62 67 71 63 69 74 2.3% 3.5% 3.7%
Liechtenstein 7 8 8 7 7 8 -0.6% -1.8% -1.8%
Corporate, Others & Elimination
-97 -97 -97 -95 -94 -94 -2.4% -2.9% -3.5%
Revenues 4,321 4,313 4,323 4,294 4,302 4,288 -0.6% -0.2% -0.8%
Segment Austria 918 931 946 966 967 973 5.3% 3.8% 2.9%
Segment Bulgaria 263 261 262 236 228 218 -10.2% -12.7% -16.6%
Segment Croatia 136 130 127 133 127 120 -1.7% -2.9% -5.1%
Segment Belarus 80 73 71 40 43 41 -49.7% -42.0% -42.1%
Slovenia 60 70 81 61 68 76 1.3% -2.6% -7.0%
Republic of Serbia 42 56 61 51 71 77 21.2% 26.9% 26.8%
Republic of Macedonia 4 10 14 19 10 15 N/M 3.5% 3.7%
Liechtenstein 1 2 2 -3 -3 -3 N/M N/M N/M
Corporate, Others & Elimination
-31 -32 -32 -37 -37 -37 18.1% 16.3% 14.6%
EBITDA comparable 1,472 1,502 1,531 1,466 1,474 1,480 -0.4% -1.9% -3.4%
% margin 34.1% 34.8% 35.4% 34.1% 34.2% 34.5%
Depreciation and Amortization
-962 -882 -802 -1,066 -986 -906 10.7% 11.7% 12.8%
Operating Income 460 570 679 351 438 524 -23.7% -23.1% -22.8%
Financial Result -223 -210 -198 -225 -212 -200 1.0% 1.1% 1.1%
Income Before Income Taxes
236 358 480 170 227 326 -27.8% -36.7% -32.2%
Income Tax Expense -54 -82 -110 -39 -52 -75 -27.8% -36.7% -32.2%
Net income 181 276 369 131 174 251 -27.8% -36.7% -32.2%
Clean EPS, € 0.53 0.74 0.95 0.46 0.50 0.68 -12.1% -31.7% -28.8%
DPS, € 0.38 0.38 0.74 0.38 0.38 0.42 0.0% 0.0% -43.3%
Net debt 3,254 2,976 2,868 3,001 2,953 2,698 -7.8% -0.8% -5.9%
Capex 721 712 717 760 693 696 5.5% -2.6% -2.9%
Free Cash flow per Share, €
0.95 1.01 0.98 1.74 1.05 0.99 82.0% 4.6% 1.2%
Source: Company data, Credit Suisse estimates, revenues and Net income differs due to adjustments for One-offs

04 April 2012
Mobile pricing 32
Austrian mobile pricing bottoming out Austrian mobile revenues continue to deteriorate after several price wars
The Austrian mobile market has been one of Europe’s most difficult markets for several years, with continuous price wars. The first one was from tele.ring (acquired by DT in 2005-6) and then more recently from Orange Austria (currently in the process of being acquired by 3 and Telekom Austria, subject to regulatory approval).
Market revenues were slowly improving in late 2010/early 2011 but have since rolled over again, with end user revenues shrinking 3.0% in 3Q 11. There is no data available for 4Q 11 but TKA’s service revenue growth fell 7.8% in 4Q 11, vs only a 6.7% decline in 3Q 11. We show revenue growth for the Austrian market overall and for Telekom Austria in Figure 39.
SMS volume growth has remained strong and has even accelerated but voice traffic volume growth has deteriorated. As the market has moved towards increasingly large bundles pricing is almost flat-rate, so volume trends are becoming increasingly irrelevant. We show SMS and minute traffic growth in Figure 40.
Figure 39: Austrian mobile revenue growth Figure 40: Traffic and SMS volume growth
-14%
-12%
-10%
-8%
-6%
-4%
-2%
0%
2%
4Q 09 1Q 10 2Q 10 3Q 10 4Q 10 1Q 11 2Q 11 3Q 11 4Q 11
Market revs TKA service revs
0%
2%
4%
6%
8%
10%
12%
14%
16%
18%
4Q 09 1Q 10 2Q 10 3Q 10 4Q 10 1Q 11 2Q 11 3Q 11
Market mins Market SMS
Source: Company data, RTR Source: RTR
Prices now down to €7 for 1000 minutes/1000 SMS
The result of several years of price wars is that Austrian mobile prices are now the lowest in Europe. Prices for 1,000 minutes / 1,000 SMS and 1GB data are as low as €7, which we believe is around cost, and which the average MoU per inhabitant in Austria of around 213 minutes per month.
In Figure 41 we compare how the main brands in the market price this package. Most of the no-frills brands price at €10-13 (including €4 for 1GB data bolt-ons at Telekom Austria’s bob brand and Orange’s yesss! Brand). The premium brands of T-Mobile and Telekom Austria have kept these sort of packages in the €20-30 range, while Orange has been aggressive and brought its main brand prices down almost to the SIM-only levels.
We summarise the main tariff plans in more detail in Figure 43.

04 April 2012
Mobile pricing 33
Figure 41: Monthly cost of 1,000 min / 1,000 SMS / 1GB
29.9
24.9
15.012.8 12.8
10.0
7.0
0
5
10
15
20
25
30
35
Tmo (DT) A1 (TKA) Orange bob (TKA) yesss! (Ora) tele.ring (DT) 3
€/month
Source: Company websites
There have been tentative signs of stabilisation of pricing in the Austrian market.
■ Most high end tariffs now include a €10.0-19.9 annual SIM-charge, adding around €1.4 to monthly ARPU. With market ARPU below €20 this is potentially quite a significant contribution to ARPU, though the rate of adoption is fairly slow (the charge is only applied to customers taking new contracts or renewing contracts).
■ Some more aggressive promotions have been withdrawn. In September and October Telekom Austria ran a no-frills smartphone tariff called “smartbob” which cost €9.9 for 1,000 minutes/1,000 SMS and 1GB of data. Currently the cheapest no-frills offering from TKA is the regular “superbob” tariff which costs €8.8 but does not include data. Including 1GB of data would take the equivalent package to €12.8.
In our model we assume that this leads to an improvement in mobile revenue growth and revenue growth in domestic mobile gradually stabilises during 2012.
Figure 42: TKA mobile service revenue growth
-10%
-8%
-6%
-4%
-2%
0%
2%
2010 Q1 11 Q2 11 Q3 11 Q4 11 Q1 12E Q2 12E Q3 12E Q4 12E 2013E 2014E 2015E
TKA mobile service revenue growth
Source: Company data, Credit Suisse estimates

04 April 2012
Mobile pricing 34
Figure 43: Monthly tariffs € per month, unless otherwise stated Main brands (with handsets)
A1 (Telekom Austria)
Tariff Cost Mins SMS Data Overage Overage Comment
/month GB Voice SMS
A1 smart 3000 24.9 1000 1000 1 0.29 0.25 Mins shown offnet; same amount to offnet
A1 smart 4500 34.9 1500 1500 Unltd 0.29 0.25 Mins shown offnet; same amount to offnet
A1 smart 9000 49.9 3000 3000 Unltd 0.29 0.25 Mins shown offnet; same amount to offnet
A1 Xcite 4000 19.9 1500 1000 Unltd 0.29 0.25 Mins shown offnet; same amount to offnet
T-Mobile (DT)
Tariff Cost Mins SMS Data Overage Overage Comment
/month GB Voice SMS
All inclusive XL 29.9 2000 2000 3 Unltd on-net min/SMS
All inclusive 19.9 1000 1000 3 Unltd on-net min/SMS
HIT 1000 10.0 1000 0 0.29 0.29
3 (Hutch)
Tariff Cost Mins SMS Data Overage Overage Comment
/month GB Voice SMS
Superphone XXL 24.0 3000 1000 6 0.35 0.35
Superphone XL 18.0 2000 1000 4 0.35 0.35
Superphone L 12.0 1000 1000 2 0.35 0.35
Comfort 7.0 1000 1000 1 0.35 0.35
Light 3.0 250 0.35 0.35
Orange
Tariff Cost Mins SMS Data Overage Overage Comment
/month GB Voice SMS
All in 40 40.0 4000 1000 4 0.10 0.10 50% cheaper for SIM-only
All in 30 30.0 3000 1000 3 0.10 0.10 50% cheaper for SIM-only
All in 20 20.0 2000 1000 2 0.10 0.10 50% cheaper for SIM-only
All in 15 15.0 1000 1000 1 0.10 0.10 50% cheaper for SIM-only
All in 10 10.0 1000 100 0.1 0.10 0.10 20% cheaper for SIM-only
No-frills SIM-only brands
tele.ring (DT)
Tariff Cost Mins SMS Data Overage Overage Comment
/month GB Voice SMS
Masta Max Plus 15.0 1000 1000 2 0.20 0.20
Mast mini plus 10.0 1000 1000 0.1 0.20 0.20
bob (TKA)
Tariff Cost Mins SMS Data Overage Overage Comment
/month GB Voice SMS
bigbob 12.8 1000 1000 1 0.04 0.04 Price inc. €4 for 1GB data (€8.8 ex data)
bob vierer 4.0 0 0 1 0.04 0.04
yesss! (Orange)
Tariff Cost Mins SMS Data Overage Overage Comment
/month GB Voice SMS
X-yesss! 12.8 1000 1000 1 0.09 0.09 Price inc. €4 for 1GB data (€8.8 ex data)
yesss! Laudah 9.0 Inc. 2000 units where 1 unit = 1 SMS = 1min = 1MB
Source: Company data, Credit Suisse estimates

04 April 2012
Mobile pricing 35
Companies Mentioned (Price as of 02 Apr 12) Bharti Airtel Ltd (BRTI.BO, Rs336.70, NEUTRAL, TP Rs330.00) Deutsche Telekom (DTEGn.F, Eu9.14, UNDERPERFORM, TP Eu8.50) Elisa Corporation (ELI1V.HE, Eu17.93, OUTPERFORM, TP Eu20.00) France Telecom (FTE.PA, Eu11.19, NEUTRAL, TP Eu15.50) Iliad (ILD.PA, Eu104.40, NEUTRAL, TP Eu95.00) Nokia (NOK1V.HE, Eu4.07, OUTPERFORM [V], TP Eu6.00) TDC (TDC.CO, DKr40.80, NEUTRAL, TP DKr47.00) Telekom Austria (TELA.VI, Eu8.72, NEUTRAL, TP Eu10.00) Telenor (TEL.OL, NKr106.40, OUTPERFORM, TP NKr114.00) TeliaSonera (TLSN.ST, SKr46.61, NEUTRAL, TP SKr50.00) Vodafone Group (VOD.L, 176 p, OUTPERFORM, TP 170.00 p)
Disclosure Appendix Important Global Disclosures The analysts identified in this report each certify, with respect to the companies or securities that the individual analyzes, that (1) the views expressed in this report accurately reflect his or her personal views about all of the subject companies and securities and (2) no part of his or her compensation was, is or will be directly or indirectly related to the specific recommendations or views expressed in this report.
See the Companies Mentioned section for full company names. 3-Year Price, Target Price and Rating Change History Chart for ELI1V.HE ELI1V.HE Closing
Price Target
Price
Initiation/ Date (Eu) (Eu) Rating Assumption 29-Jun-09 11.92 O 27-Aug-09 13.75 16 11-Jan-10 15.46 17.5 30-Sep-10 16.85 20 16-Jan-12 X
16
18
20
16-Jan-12
O
9
11
13
15
17
19
21
4-Apr-0
9
4-Jun-0
9
4-Aug-0
9
4-Oct-
09
4-Dec
-09
4-Feb-10
4-Apr-
10
4-Jun-1
0
4-Aug-1
0
4-Oct-
10
4-Dec
-10
4-Feb-1
1
4-Apr-
11
4-Jun-11
4-Aug
-11
4-Oct-
11
4-Dec
-11
4-Feb-12
Closing Price Target Price Initiation/Assumption Rating
Eu
O=Outperform; N=Neutral; U=Underperform; R=Restricted; NR=Not Rated; NC=Not Covered
3-Year Price, Target Price and Rating Change History Chart for TDC.CO TDC.CO Closing
Price Target
Price
Initiation/ Date (DKr) (DKr) Rating Assumption 19-Jan-11 47.3 50 N X 22-Jun-11 45.33 47
50
47
19-Jan-11
N
32
37
42
47
52
4-Apr-0
9
4-Jun-0
9
4-Aug-0
9
4-Oct-
09
4-Dec
-09
4-Feb-10
4-Apr-
10
4-Jun-1
0
4-Aug-1
0
4-Oct-
10
4-Dec
-10
4-Feb-1
1
4-Apr-
11
4-Jun-11
4-Aug
-11
4-Oct-
11
4-Dec
-11
4-Feb-12
Closing Price Target Price Initiation/Assumption Rating
DKr
O=Outperform; N=Neutral; U=Underperform; R=Restricted; NR=Not Rated; NC=Not Covered

04 April 2012
Mobile pricing 36
3-Year Price, Target Price and Rating Change History Chart for TELA.VI TELA.VI Closing
Price Target
Price
Initiation/ Date (Eu) (Eu) Rating Assumption 26-Aug-09 12.39 12 X 11-Jan-10 10.16 10 15-Apr-10 10.63 N 10-Mar-11 10.34 12 O 04-Jul-11 8.76 10 N 14-Sep-11 X
12
10
12
10
26-Aug-09 14-Sep-11
N
ON
6
7
8
9
10
11
12
13
14
4-Apr-0
9
4-Jun-0
9
4-Aug-0
9
4-Oct-
09
4-Dec
-09
4-Feb-10
4-Apr-
10
4-Jun-1
0
4-Aug-1
0
4-Oct-
10
4-Dec
-10
4-Feb-1
1
4-Apr-
11
4-Jun-11
4-Aug
-11
4-Oct-
11
4-Dec
-11
4-Feb-12
Closing Price Target Price Initiation/Assumption Rating
Eu
O=Outperform; N=Neutral; U=Underperform; R=Restricted; NR=Not Rated; NC=Not Covered
The analyst(s) responsible for preparing this research report received compensation that is based upon various factors including Credit Suisse's total revenues, a portion of which are generated by Credit Suisse's investment banking activities. Analysts’ stock ratings are defined as follows: Outperform (O): The stock’s total return is expected to outperform the relevant benchmark* by at least 10-15% (or more, depending on perceived risk) over the next 12 months. Neutral (N): The stock’s total return is expected to be in line with the relevant benchmark* (range of ±10-15%) over the next 12 months. Underperform (U): The stock’s total return is expected to underperform the relevant benchmark* by 10-15% or more over the next 12 months. *Relevant benchmark by region: As of 29th May 2009, Australia, New Zealand, U.S. and Canadian ratings are based on (1) a stock’s absolute total return potential to its current share price and (2) the relative attractiveness of a stock’s total return potential within an analyst’s coverage universe**, with Outperforms representing the most attractive, Neutrals the less attractive, and Underperforms the least attractive investment opportunities. Some U.S. and Canadian ratings may fall outside the absolute total return ranges defined above, depending on market conditions and industry factors. For Latin American, Japanese, and non-Japan Asia stocks, ratings are based on a stock’s total return relative to the average total return of the relevant country or regional benchmark; for European stocks, ratings are based on a stock’s total return relative to the analyst's coverage universe**. For Australian and New Zealand stocks, 12-month rolling yield is incorporated in the absolute total return calculation and a 15% and a 7.5% threshold replace the 10-15% level in the Outperform and Underperform stock rating definitions, respectively. The 15% and 7.5% thresholds replace the +10-15% and -10-15% levels in the Neutral stock rating definition, respectively. **An analyst's coverage universe consists of all companies covered by the analyst within the relevant sector. Restricted (R): In certain circumstances, Credit Suisse policy and/or applicable law and regulations preclude certain types of communications, including an investment recommendation, during the course of Credit Suisse's engagement in an investment banking transaction and in certain other circumstances. Volatility Indicator [V]: A stock is defined as volatile if the stock price has moved up or down by 20% or more in a month in at least 8 of the past 24 months or the analyst expects significant volatility going forward.
Analysts’ coverage universe weightings are distinct from analysts’ stock ratings and are based on the expected performance of an analyst’s coverage universe* versus the relevant broad market benchmark**: Overweight: Industry expected to outperform the relevant broad market benchmark over the next 12 months. Market Weight: Industry expected to perform in-line with the relevant broad market benchmark over the next 12 months. Underweight: Industry expected to underperform the relevant broad market benchmark over the next 12 months. *An analyst’s coverage universe consists of all companies covered by the analyst within the relevant sector. **The broad market benchmark is based on the expected return of the local market index (e.g., the S&P 500 in the U.S.) over the next 12 months. Credit Suisse’s distribution of stock ratings (and banking clients) is:
Global Ratings Distribution Outperform/Buy* 46% (61% banking clients) Neutral/Hold* 42% (57% banking clients) Underperform/Sell* 10% (53% banking clients) Restricted 2%
*For purposes of the NYSE and NASD ratings distribution disclosure requirements, our stock ratings of Outperform, Neutral, and Underperform most closely correspond to Buy, Hold, and Sell, respectively; however, the meanings are not the same, as our stock ratings are determined on a relative basis. (Please refer to definitions above.) An investor's decision to buy or sell a security should be based on investment objectives, current holdings, and other individual factors.
Credit Suisse’s policy is to update research reports as it deems appropriate, based on developments with the subject company, the sector or the market that may have a material impact on the research views or opinions stated herein.
Credit Suisse's policy is only to publish investment research that is impartial, independent, clear, fair and not misleading. For more detail please refer to Credit Suisse's Policies for Managing Conflicts of Interest in connection with Investment Research: http://www.csfb.com/research-and-analytics/disclaimer/managing_conflicts_disclaimer.html

04 April 2012
Mobile pricing 37
Credit Suisse does not provide any tax advice. Any statement herein regarding any US federal tax is not intended or written to be used, and cannot be used, by any taxpayer for the purposes of avoiding any penalties.
See the Companies Mentioned section for full company names. Price Target: (12 months) for (ELI1V.HE) Method: DCF-based price target of Eu20.0 based on a 10% discount to full DCF valuation using the following assumptions - a WACC of 8% (derived from a Rf 4.6%, ERP4.4%, Beta 1.0, Spread 2.0%, Tax rate 26.0%, Gearing 30.0%) and a terminal growth rate of 0%. Risks: Prepaid ARPU dilution and international expansion. As Elisa looks to expand overseas by acquisition (its strategy is to search for growth) with the Baltic region a possibility. Price Target: (12 months) for (TDC.CO) Method: We set our TP using a discounted DCF with WACC of 8%, terminal growth of -1% and a 15% minority discount to reflect the lack of control of cash flows as a minority shareholder. Risks: We see a risk to our TP from weakness in the domestic fixed business from FTM substitution as LTE over 800MHz becomes available. We further see a risk in a new mobile price war in the Danish market. Price Target: (12 months) for (TELA.VI) Method: We derive our eu10 price target for Telekom Austria by applying a 2012E adjusted free cashflow yield of 10% to reflect its premium growth. Risks: Risks to our eu10 price target for Telekom Austria include: Emerging market economic and currency risk, competitive risk in Austria market. Please refer to the firm's disclosure website at www.credit-suisse.com/researchdisclosures for the definitions of abbreviations typically used in the target price method and risk sections.
See the Companies Mentioned section for full company names. The subject company (TDC.CO, TELA.VI) currently is, or was during the 12-month period preceding the date of distribution of this report, a client of Credit Suisse. Credit Suisse provided investment banking services to the subject company (TDC.CO) within the past 12 months. Credit Suisse provided non-investment banking services, which may include Sales and Trading services, to the subject company (TELA.VI) within the past 12 months. Credit Suisse expects to receive or intends to seek investment banking related compensation from the subject company (ELI1V.HE, TDC.CO, TELA.VI) within the next 3 months. Credit Suisse has received compensation for products and services other than investment banking services from the subject company (TELA.VI) within the past 12 months. Important Regional Disclosures Singapore recipients should contact a Singapore financial adviser for any matters arising from this research report.
The analyst(s) involved in the preparation of this report have not visited the material operations of the subject company (ELI1V.HE, TDC.CO, TELA.VI) within the past 12 months.
Restrictions on certain Canadian securities are indicated by the following abbreviations: NVS--Non-Voting shares; RVS--Restricted Voting Shares; SVS--Subordinate Voting Shares. Individuals receiving this report from a Canadian investment dealer that is not affiliated with Credit Suisse should be advised that this report may not contain regulatory disclosures the non-affiliated Canadian investment dealer would be required to make if this were its own report. For Credit Suisse Securities (Canada), Inc.'s policies and procedures regarding the dissemination of equity research, please visit http://www.csfb.com/legal_terms/canada_research_policy.shtml.
The following disclosed European company/ies have estimates that comply with IFRS: ELI1V.HE, TDC.CO, TELA.VI, DTEGn.F, FTE.PA, ILD.PA, NOK1V.HE, TEL.OL, TLSN.ST, VOD.L.
As of the date of this report, Credit Suisse acts as a market maker or liquidity provider in the equities securities that are the subject of this report.
Principal is not guaranteed in the case of equities because equity prices are variable. Commission is the commission rate or the amount agreed with a customer when setting up an account or at anytime after that. Taiwanese Disclosures: This research report is for reference only. Investors should carefully consider their own investment risk. Investment results are the responsibility of the individual investor. Reports may not be reprinted without permission of CS. Reports written by Taiwan-based analysts on non-Taiwan listed companies are not considered recommendations to buy or sell securities under Taiwan Stock Exchange Operational Regulations Governing Securities Firms Recommending Trades in Securities to Customers. To the extent this is a report authored in whole or in part by a non-U.S. analyst and is made available in the U.S., the following are important disclosures regarding any non-U.S. analyst contributors: The non-U.S. research analysts listed below (if any) are not registered/qualified as research analysts with FINRA. The non-U.S. research analysts listed below may not be associated persons of CSSU and therefore may not be subject to the NASD Rule 2711 and NYSE Rule 472 restrictions on communications with a subject company, public appearances and trading securities held by a research analyst account. • Henrik Herbst, non-U.S. analyst, is a research analyst employed by Credit Suisse Securities (Europe) Limited. • Jakob Bluestone, non-U.S. analyst, is a research analyst employed by Credit Suisse Securities (Europe) Limited. • Justin Funnell, non-U.S. analyst, is a research analyst employed by Credit Suisse Securities (Europe) Limited. • Paul Sidney, non-U.S. analyst, is a research analyst employed by Credit Suisse Securities (Europe) Limited. For Credit Suisse disclosure information on other companies mentioned in this report, please visit the website at www.credit-suisse.com/researchdisclosures or call +1 (877) 291-2683.

04 April 2012
Mobile pricing 38
Disclaimers continue on next page.

04 April 2012 Europe / Austria
Equity Research
XX5284EU.doc
This report is not directed to, or intended for distribution to or use by, any person or entity who is a citizen or resident of or located in any locality, state, country or other jurisdiction where such distribution, publication, availability or use would be contrary to law or regulation or which would subject Credit Suisse AG, the Swiss bank, or its subsidiaries or its affiliates (“CS”) to any registration or licensing requirement within such jurisdiction. All material presented in this report, unless specifically indicated otherwise, is under copyright to CS. None of the material, nor its content, nor any copy of it, may be altered in any way, transmitted to, copied or distributed to any other party, without the prior express written permission of CS. All trademarks, service marks and logos used in this report are trademarks or service marks or registered trademarks or service marks of CS or its affiliates. The information, tools and material presented in this report are provided to you for information purposes only and are not to be used or considered as an offer or the solicitation of an offer to sell or to buy or subscribe for securities or other financial instruments. CS may not have taken any steps to ensure that the securities referred to in this report are suitable for any particular investor. CS will not treat recipients as its customers by virtue of their receiving the report. The investments or services contained or referred to in this report may not be suitable for you and it is recommended that you consult an independent investment advisor if you are in doubt about such investments or investment services. Nothing in this report constitutes investment, legal, accounting or tax advice or a representation that any investment or strategy is suitable or appropriate to your individual circumstances or otherwise constitutes a personal recommendation to you. CS does not offer advice on the tax consequences of investment and you are advised to contact an independent tax adviser. Please note in particular that the bases and levels of taxation may change. CS believes the information and opinions in the Disclosure Appendix of this report are accurate and complete. Information and opinions presented in the other sections of the report were obtained or derived from sources CS believes are reliable, but CS makes no representations as to their accuracy or completeness. Additional information is available upon request. CS accepts no liability for loss arising from the use of the material presented in this report, except that this exclusion of liability does not apply to the extent that liability arises under specific statutes or regulations applicable to CS. This report is not to be relied upon in substitution for the exercise of independent judgment. CS may have issued, and may in the future issue, a trading call regarding this security. Trading calls are short term trading opportunities based on market events and catalysts, while stock ratings reflect investment recommendations based on expected total return over a 12-month period as defined in the disclosure section. Because trading calls and stock ratings reflect different assumptions and analytical methods, trading calls may differ directionally from the stock rating. In addition, CS may have issued, and may in the future issue, other reports that are inconsistent with, and reach different conclusions from, the information presented in this report. Those reports reflect the different assumptions, views and analytical methods of the analysts who prepared them and CS is under no obligation to ensure that such other reports are brought to the attention of any recipient of this report. CS is involved in many businesses that relate to companies mentioned in this report. These businesses include specialized trading, risk arbitrage, market making, and other proprietary trading. Past performance should not be taken as an indication or guarantee of future performance, and no representation or warranty, express or implied, is made regarding future performance. Information, opinions and estimates contained in this report reflect a judgement at its original date of publication by CS and are subject to change without notice. The price, value of and income from any of the securities or financial instruments mentioned in this report can fall as well as rise. The value of securities and financial instruments is subject to exchange rate fluctuation that may have a positive or adverse effect on the price or income of such securities or financial instruments. Investors in securities such as ADR’s, the values of which are influenced by currency volatility, effectively assume this risk. Structured securities are complex instruments, typically involve a high degree of risk and are intended for sale only to sophisticated investors who are capable of understanding and assuming the risks involved. The market value of any structured security may be affected by changes in economic, financial and political factors (including, but not limited to, spot and forward interest and exchange rates), time to maturity, market conditions and volatility, and the credit quality of any issuer or reference issuer. Any investor interested in purchasing a structured product should conduct their own investigation and analysis of the product and consult with their own professional advisers as to the risks involved in making such a purchase. Some investments discussed in this report have a high level of volatility. High volatility investments may experience sudden and large falls in their value causing losses when that investment is realised. Those losses may equal your original investment. Indeed, in the case of some investments the potential losses may exceed the amount of initial investment, in such circumstances you may be required to pay more money to support those losses. Income yields from investments may fluctuate and, in consequence, initial capital paid to make the investment may be used as part of that income yield. Some investments may not be readily realisable and it may be difficult to sell or realise those investments, similarly it may prove difficult for you to obtain reliable information about the value, or risks, to which such an investment is exposed. This report may provide the addresses of, or contain hyperlinks to, websites. Except to the extent to which the report refers to website material of CS, CS has not reviewed the linked site and takes no responsibility for the content contained therein. Such address or hyperlink (including addresses or hyperlinks to CS’s own website material) is provided solely for your convenience and information and the content of the linked site does not in any way form part of this document. Accessing such website or following such link through this report or CS’s website shall be at your own risk. This report is issued and distributed in Europe (except Switzerland) by Credit Suisse Securities (Europe) Limited, One Cabot Square, London E14 4QJ, England, which is regulated in the United Kingdom by The Financial Services Authority (“FSA”). This report is being distributed in Germany by Credit Suisse Securities (Europe) Limited Niederlassung Frankfurt am Main regulated by the Bundesanstalt fuer Finanzdienstleistungsaufsicht ("BaFin"). This report is being distributed in the United States by Credit Suisse Securities (USA) LLC ; in Switzerland by Credit Suisse AG; in Canada by Credit Suisse Securities (Canada), Inc.; in Brazil by Banco de Investimentos Credit Suisse (Brasil) S.A. or its affiliates; in Mexico by Banco Credit Suisse (México), S.A. (transactions related to the securities mentioned in this report will only be effected in compliance with applicable regulation); in Japan by Credit Suisse Securities (Japan) Limited, Financial Instrument Firm, Director-General of Kanto Local Finance Bureau (Kinsho) No. 66, a member of Japan Securities Dealers Association, The Financial Futures Association of Japan, Japan Securities Investment Advisers Association, Type II Financial Instruments Firms Association; elsewhere in Asia/Pacific by whichever of the following is the appropriately authorised entity in the relevant jurisdiction: Credit Suisse (Hong Kong) Limited, Credit Suisse Equities (Australia) Limited , Credit Suisse Securities (Thailand) Limited, Credit Suisse Securities (Malaysia) Sdn Bhd, Credit Suisse AG, Singapore Branch, Credit Suisse Securities (India) Private Limited regulated by the Securities and Exchange Board of India (registration Nos. INB230970637; INF230970637; INB010970631; INF010970631), having registered address at 9th Floor, Ceejay House,Dr.A.B. Road, Worli, Mumbai - 18, India, T- +91-22 6777 3777, Credit Suisse Securities (Europe) Limited, Seoul Branch, Credit Suisse AG, Taipei Securities Branch, PT Credit Suisse Securities Indonesia, Credit Suisse Securities (Philippines ) Inc., and elsewhere in the world by the relevant authorised affiliate of the above. Research on Taiwanese securities produced by Credit Suisse AG, Taipei Securities Branch has been prepared by a registered Senior Business Person. Research provided to residents of Malaysia is authorised by the Head of Research for Credit Suisse Securities (Malaysia) Sdn. Bhd., to whom they should direct any queries on +603 2723 2020. In jurisdictions where CS is not already registered or licensed to trade in securities, transactions will only be effected in accordance with applicable securities legislation, which will vary from jurisdiction to jurisdiction and may require that the trade be made in accordance with applicable exemptions from registration or licensing requirements. Non-U.S. customers wishing to effect a transaction should contact a CS entity in their local jurisdiction unless governing law permits otherwise. U.S. customers wishing to effect a transaction should do so only by contacting a representative at Credit Suisse Securities (USA) LLC in the U.S. Please note that this report was originally prepared and issued by CS for distribution to their market professional and institutional investor customers. Recipients who are not market professional or institutional investor customers of CS should seek the advice of their independent financial advisor prior to taking any investment decision based on this report or for any necessary explanation of its contents. This research may relate to investments or services of a person outside of the UK or to other matters which are not regulated by the FSA or in respect of which the protections of the FSA for private customers and/or the UK compensation scheme may not be available, and further details as to where this may be the case are available upon request in respect of this report. Any Nielsen Media Research material contained in this report represents Nielsen Media Research's estimates and does not represent facts. NMR has neither reviewed nor approved this report and/or any of the statements made herein. If this report is being distributed by a financial institution other than Credit Suisse AG, or its affiliates, that financial institution is solely responsible for distribution. Clients of that institution should contact that institution to effect a transaction in the securities mentioned in this report or require further information. This report does not constitute investment advice by Credit Suisse to the clients of the distributing financial institution, and neither Credit Suisse AG, its affiliates, and their respective officers, directors and employees accept any liability whatsoever for any direct or consequential loss arising from their use of this report or its content. Copyright 2012 CREDIT SUISSE AG and/or its affiliates. All rights reserved.
CREDIT SUISSE SECURITIES (Europe) Limited Europe: +44 (20) 7888-8888