CMBS Market Watch Weekly - Credit Suisse | PLUS
18
DISCLOSURE APPENDIX AT THE BACK OF THIS REPORT CONTAINS IMPORTANT DISCLOSURES AND ANALYST CERTIFICATIONS. CREDIT SUISSE SECURITIES RESEARCH & ANALYTICS BEYOND INFORMATION ® Client-Driven Solutions, Insights, and Access CMBS Market Watch Weekly Securitized Products Americas Market activity and relative value The themes that we have been discussing over the past few weeks remain in place across CMBS, and we continue to be positive on the sector. A light new issue calendar, a very positive outlook for commercial real estate fundamentals and wide relative spreads, we believe, support our positive stance. In addition, there has been a clear decline in macro-market volatility over the past few weeks. The biggest obstacle to near-term buying was the all-in level of rates, as the 10-year Treasury was below the 2% threshold. That impediment has been removed as the yield has climbed 15 bp over the past week and a half. CMBS loans in the news We discuss the sales of Stafford Place I & II, 801 Travis, Palisades II and Pensacola Place and the upcoming defeasance of Great Wolf – Poconos. GGP is selling another 12.5% stake in Ala Moana Center. This follows the sale of a 25% stake back in March that valued the property at approximately $5.5 billion, according to the company. Preliminary CMBS exposure to Seritage Sears made several announcements in early April with regard to its real estate holdings in an effort to monetize the value of these assets. These include joint venture agreements with GGP and Simon Properties encompassing 22 locations. In addition, and related to these joint ventures, the company also announced that it was forming a REIT, called Seritage Growth, which would purchase approximately 254 of the company’s properties. We review the new REIT’s portfolio as outlined in company filings. Based on the released information, we did a preliminary mapping of Seritage-related properties to CMBS. We found 73 of the 254 properties have some CMBS exposure. These 73 properties across 85 loan components have a total balance of $8.9 billion. Most of the exposure appears in relatively recent deals, including those in single-borrower transactions. Institutional Investor 2015 All-America Fixed Income Research Team If you are interested in voting and have not received a ballot, please click here. Select Research Teams and choose “All-America Fixed-Income Research Team” and “Request Questionnaire” from the dropdowns. Thank you for your support. Research Analysts Roger Lehman +1 212 325 2123 [email protected] Sylvain Jousseaume, CFA +1 212 325 1356 [email protected] Serif Ustun, CFA +1 212 538 4582 [email protected] CMBS and CMBX spreads and prices CMBS swap spread/price 1-wk chg Trailing 12-month 4/28/15 Min Max Avg Legacy CMBS AAA 10yr 99 -1 84 118 98 AM 125 -1 123 155 137 AJ 340 -2 335 420 368 New issue CMBS AAA 5yr (30% CE) 52 -1 50 68 57 AAA 10yr (30% CE) 84 -1 71 95 84 AAA Junior 108 -2 96 130 113 AA 144 -1 118 180 145 A 193 -2 158 245 195 BBB- 338 -2 290 380 339 CMBX.7 AAA 97.76 0.01 96.14 97.83 97.11 AS 99.51 -0.05 97.28 100.12 98.77 AA 100.50 -0.10 98.08 101.49 100.12 A 100.82 -0.17 97.98 102.17 100.45 BBB- 99.53 -0.24 95.47 100.68 98.54 BB 99.55 -0.28 94.57 101.07 98.56 Agency CMBS GNR 10yr 100 0 100 125 110 FNA 10yr 52 0 32 52 44 FREMF 10yr 47 0 30 47 41 SBA 504 10yr 44 0 27 45 35 Source: Credit Suisse, Markit 30 April 2015 Fixed Income Research http://www.credit-suisse.com/researchandanalytics FOR INSTITUTIONAL CLIENT USE ONLY
-
Upload
khangminh22 -
Category
Documents
-
view
1 -
download
0
Transcript of CMBS Market Watch Weekly - Credit Suisse | PLUS

DISCLOSURE APPENDIX AT THE BACK OF THIS REPORT CONTAINS IMPORTANT DISCLOSURES AND
ANALYST CERTIFICATIONS.
CREDIT SUISSE SECURITIES RESEARCH & ANALYTICS BEYOND INFORMATION®
Client-Driven Solutions, Insights, and Access
CMBS Market Watch Weekly Securitized Products Americas
Market activity and relative value The themes that we have been discussing over the past few weeks remain in
place across CMBS, and we continue to be positive on the sector.
A light new issue calendar, a very positive outlook for commercial real estate
fundamentals and wide relative spreads, we believe, support our positive
stance. In addition, there has been a clear decline in macro-market volatility
over the past few weeks.
The biggest obstacle to near-term buying was the all-in level of rates, as the
10-year Treasury was below the 2% threshold. That impediment has been
removed as the yield has climbed 15 bp over the past week and a half.
CMBS loans in the news We discuss the sales of Stafford Place I & II, 801 Travis, Palisades II and
Pensacola Place and the upcoming defeasance of Great Wolf – Poconos.
GGP is selling another 12.5% stake in Ala Moana Center. This follows the
sale of a 25% stake back in March that valued the property at approximately
$5.5 billion, according to the company.
Preliminary CMBS exposure to Seritage Sears made several announcements in early April with regard to its real
estate holdings in an effort to monetize the value of these assets. These
include joint venture agreements with GGP and Simon Properties
encompassing 22 locations.
In addition, and related to these joint ventures, the company also announced
that it was forming a REIT, called Seritage Growth, which would purchase
approximately 254 of the company’s properties.
We review the new REIT’s portfolio as outlined in company filings. Based on
the released information, we did a preliminary mapping of Seritage-related
properties to CMBS.
We found 73 of the 254 properties have some CMBS exposure. These 73
properties across 85 loan components have a total balance of $8.9 billion.
Most of the exposure appears in relatively recent deals, including those in
single-borrower transactions.
Institutional Investor 2015
All-America Fixed Income Research Team
If you are interested in voting and have not received a ballot, please click here.
Select Research Teams and choose “All-America Fixed-Income Research Team”
and “Request Questionnaire” from the dropdowns.
Thank you for your support.
Research Analysts
Roger Lehman
+1 212 325 2123
Sylvain Jousseaume, CFA
+1 212 325 1356
Serif Ustun, CFA
+1 212 538 4582
CMBS and CMBX spreads and prices
CMBS swap spread/price
1-wk chg
Trailing 12-month
4/28/15 Min Max Avg
Legacy CMBS
AAA 10yr 99 -1 84 118 98
AM 125 -1 123 155 137
AJ 340 -2 335 420 368
New issue CMBS
AAA 5yr (30% CE) 52 -1 50 68 57
AAA 10yr (30% CE) 84 -1 71 95 84
AAA Junior 108 -2 96 130 113
AA 144 -1 118 180 145
A 193 -2 158 245 195
BBB- 338 -2 290 380 339
CMBX.7
AAA 97.76 0.01 96.14 97.83 97.11
AS 99.51 -0.05 97.28 100.12 98.77
AA 100.50 -0.10 98.08 101.49 100.12
A 100.82 -0.17 97.98 102.17 100.45
BBB- 99.53 -0.24 95.47 100.68 98.54
BB 99.55 -0.28 94.57 101.07 98.56
Agency CMBS
GNR 10yr 100 0 100 125 110
FNA 10yr 52 0 32 52 44
FREMF 10yr 47 0 30 47 41
SBA 504 10yr 44 0 27 45 35
Source: Credit Suisse, Markit
30 April 2015
Fixed Income Research
http://www.credit-suisse.com/researchandanalytics
FOR INSTITUTIONAL CLIENT USE ONLY

30 April 2015
CMBS Market Watch Weekly 2
Market activity and relative value The themes we have been discussing over the past few weeks remain in place across the
CMBS sector. Secondary flows remained light over the past week and the new issue
calendar was also quiet with only two new conduit deals in the pre-marketing stage.
Cash spreads were mostly unchanged to slightly tighter on the week and outperformed
corporates, which were marginally wider on Wednesday. Nevertheless, as we have been
discussing, corporates (and for the matter equities) remain very close to the tightest
spreads/highest prices of the year and make CMBS relatively attractive, in our view.
We have been positive on CMBS for the past few weeks and remain that way as the same
drivers are still in place. A light new issue calendar, a very positive outlook for commercial
real estate fundamentals and wide relative spreads, we believe, support our positive stance.
In addition, there has been a clear decline in macro-market volatility over the past few
weeks, leaving such indicators as the VIX (equity volatility) and the CIRVE (rate volatility)
at or near the lowest levels of the year (Exhibits 1 and 2).
Exhibit 1: Equity volatility (VIX index) Exhibit 2: Rates volatility (CIRVE index)
10
12
14
16
18
20
22
24
1/7
1/1
4
1/2
1
1/2
8
2/4
2/1
1
2/1
8
2/2
5
3/4
3/1
1
3/1
8
3/2
5
4/1
4/8
4/1
5
4/2
2
4/2
9
60
65
70
75
80
85
90
95
100
1/7
1/1
4
1/2
1
1/2
8
2/4
2/1
1
2/1
8
2/2
5
3/4
3/1
1
3/1
8
3/2
5
4/1
4/8
4/1
5
4/2
2
4/2
9
Source: the BLOOMBERG PROFESSIONAL™ service, Credit Suisse Source: Credit Suisse
Although we believe the demand for CMBS remains strong, from a technical standpoint we
had discussed how the biggest obstacle to near-term buying was the all-in level of rates,
as the 10-year Treasury was below the 2% threshold. That impediment has been removed
as the yield has climbed 15 bp over the past week and a half. We think the higher yield
could boost demand for longer duration, triple-A CMBS, helping spreads to tighten across
conduits and single-borrower transactions.
Increased demand should help the slate of upcoming deals. While the new issue market has
been relatively quiet, we believe the pace of transactions is likely to pick up at the start of May.
Within the sector we still find the best long-term value in the middle of the credit stack
(single-As and double-As). Over the near term, we could see triple-Bs outperform as
investors reach for yield. However, although this carry trade may be attractive over the
short run, we are less convinced of the value at this level over a long-term horizon.
Our concern around the recently issued triple-Bs has been the decline in credit quality that
has not been fully offset by a rise in subordination levels. We have, over the past few
weeks, discussed our view of the first quarter credit metrics as well as Moody’s report,
which detailed its analysis of quality changes. While Moody’s warned that triple-As may
need more than 30% credit enhancement, if the underwriting deterioration continues, we

30 April 2015
CMBS Market Watch Weekly 3
do not believe that the timing of such a move is imminent. Furthermore, originators do not
need higher subordination levels to encourage them to push credit even further, it is a
trend that has been in place since the reintroduction of the conduit market in 2010.
For the past two weeks, we have noted that while CMBX prices also lagged the move in
other asset classes, the sector tightened a little bit more than the cash markets. As a result,
as we have been discussing, CMBX on recently issued bonds appeared a little snug to us
relative to cash.
Over the past week that trend has started to reverse somewhat and while cash spreads
were unchanged, CMBX were marginally wider (Exhibits 3 and 4).
Exhibit 3: Basis between CMBX.7 AAA to cash Exhibit 4: Basis between CMBX.7 BBB to cash
0
2
4
6
8
10
12
14
1-Jan 1-Feb 1-Mar 1-Apr
bp
0
5
10
15
20
25
30
1-Jan 1-Feb 1-Mar 1-Apr
bp
Source: Credit Suisse, Markit, Trepp Pricing Source: Credit Suisse, Markit, Trepp Pricing
Sale of Stafford Place I and II lined up
GCCFC 2007-GG9 and JPMCC 2005-LDP2
A tentative agreement for the sale of Stafford Place I & II has been reached, according to
Real Estate Alert. Jamestown Properties is preparing to buy the two Arlington, Virginia,
office properties for nearly $300 million (or $774 per square foot), according to the article.
Each building backs a separate securitized loan.
Stafford Place I in GCCFC 2007-GG9
The Stafford Place I loan totals $176 million and represents 3.8% of GCCFC 2007-GG9.
The property totals nearly 486k square feet, and on an allocated balance basis the
transaction would value the asset at approximately $220 million. That is slightly below the
August 2006 appraised value of $236 million.
The loan has been on the servicer’s watchlist since late 2013. The property serves as the
National Science Foundation’s (NSF) global headquarters and it is the main tenant, occupying
97% of the space. The NSF lease initially expired in 2013 but a four-year extension was
negotiated, after which the NSF would vacate the property to move to its new headquarters,
which is in the process of being built. Our prior discussion of this loan, including the lease
expiration, renewal and the marketing of the asset, can be found in the link above.
The loan is scheduled to mature in December 2016 and is subject to defeasance for the
next 16 months before it becomes open to prepay. The article did not mention if
Jamestown was planning on assuming the loan if the sale is completed or if it was seeking
alternative financing. Given the coming maturity on Stafford Place II, we would not be
surprised if this loan is defeased in the near future.
30 April 2015
CMBS Market Watch Weekly 4
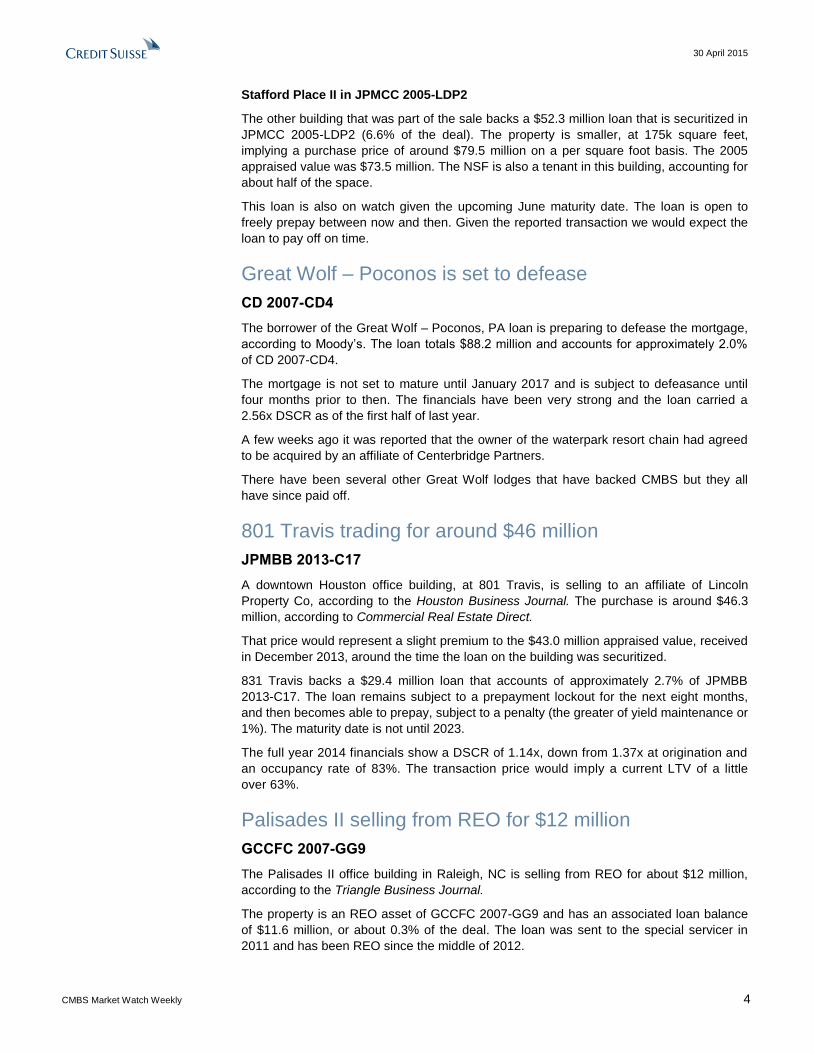
Stafford Place II in JPMCC 2005-LDP2
The other building that was part of the sale backs a $52.3 million loan that is securitized in
JPMCC 2005-LDP2 (6.6% of the deal). The property is smaller, at 175k square feet,
implying a purchase price of around $79.5 million on a per square foot basis. The 2005
appraised value was $73.5 million. The NSF is also a tenant in this building, accounting for
about half of the space.
This loan is also on watch given the upcoming June maturity date. The loan is open to
freely prepay between now and then. Given the reported transaction we would expect the
loan to pay off on time.
Great Wolf – Poconos is set to defease
CD 2007-CD4
The borrower of the Great Wolf – Poconos, PA loan is preparing to defease the mortgage,
according to Moody’s. The loan totals $88.2 million and accounts for approximately 2.0%
of CD 2007-CD4.
The mortgage is not set to mature until January 2017 and is subject to defeasance until
four months prior to then. The financials have been very strong and the loan carried a
2.56x DSCR as of the first half of last year.
A few weeks ago it was reported that the owner of the waterpark resort chain had agreed
to be acquired by an affiliate of Centerbridge Partners.
There have been several other Great Wolf lodges that have backed CMBS but they all
have since paid off.
801 Travis trading for around $46 million
JPMBB 2013-C17
A downtown Houston office building, at 801 Travis, is selling to an affiliate of Lincoln
Property Co, according to the Houston Business Journal. The purchase is around $46.3
million, according to Commercial Real Estate Direct.
That price would represent a slight premium to the $43.0 million appraised value, received
in December 2013, around the time the loan on the building was securitized.
831 Travis backs a $29.4 million loan that accounts of approximately 2.7% of JPMBB
2013-C17. The loan remains subject to a prepayment lockout for the next eight months,
and then becomes able to prepay, subject to a penalty (the greater of yield maintenance or
1%). The maturity date is not until 2023.
The full year 2014 financials show a DSCR of 1.14x, down from 1.37x at origination and
an occupancy rate of 83%. The transaction price would imply a current LTV of a little
over 63%.
Palisades II selling from REO for $12 million
GCCFC 2007-GG9
The Palisades II office building in Raleigh, NC is selling from REO for about $12 million,
according to the Triangle Business Journal.
The property is an REO asset of GCCFC 2007-GG9 and has an associated loan balance
of $11.6 million, or about 0.3% of the deal. The loan was sent to the special servicer in
2011 and has been REO since the middle of 2012.

30 April 2015
CMBS Market Watch Weekly 5
The sale price is slightly above the most recent appraised value of $11.3 million, dated
May 2014. The prior appraisal, in June 2013 was $7.3 million.
In addition to the associated balance, the loan has accumulated $2.4 million in advances
and fees as well as a cumulative ASER over $1.0 million.
After factoring in these amounts, we believe the trust could realize a loss of around
$3.0 million-$4.0 million, as a result of this liquidation.
As we previously discussed, there are other liquidations from this deal that are likely to
flow through in the next remittance period. We recently discussed how the last property
from the Southern California Portfolio loan ($33.1 million and 0.7% of the deal) sold, and
several other assets were recently auctioned (Exhibit 5).
Exhibit 5: GCCFC 2007-GG9 recently auctioned assets
Loan Auction
date Loan bal
($mn) % of deal
Advances ($mn)
ASERs ($mn)
ARA ($mn)
Southern California Portfolio Feb-15 33.12 0.7% 0.55 0.63 26.30
Blackwell II Feb-15 31.20 0.7% 3.57 4.09 25.93
Linden Park Feb-15 13.00 0.3% 1.21 0.65 8.20
Palisades II Feb-15 11.55 0.3% 2.37 1.03 4.26
Princess Road Medical Arts Building * Mar-15 10.19 0.2% 0.51 0.22 4.96
Eastern Hills Center - Phase L Feb-15 3.06 0.1% 0.08 0.07 1.50
Barnett Medical Center Apr-15 2.85 0.1% 0.23 0.03 1.11
*It was the note on Princess Road Medical Arts that was auctioned not the property itself Source: Credit Suisse, Auction.com
In addition, the Hyatt Regency - Bethesda property ($140.0 million and 3.0% of the deal) is
under contract and expected to close this month, according to the servicing notes.
As a result, we would not be surprised to see other losses (and ASER recoveries) flow
through on the upcoming May remittance report.
Pensacola Place sells for $66 million
FREMF 2011-K701 / FHMS K701
An apartment building in Chicago known as Pensacola Place sold for around $65.8 million,
according to Crain’s. The building has 264 units.
The property backs a $26.8 million that accounts for 2.8% of FREMF 2011-K701 / FHMS
K701. The loan is not set to mature until July 2017 and is subject to defeasance until three
months prior to that date.
We believe the loan will likely be defeased. The article indicates that the purchase was
financed with a $61.2 million loan.
The property was reported as 95% occupied, as of last September, and the loan carried a
1.4x DSCR, at that time.
The deal currently has an additional 11 other loans, totaling 15.9% of the balance, which
have already defeased.
30 April 2015
CMBS Market Watch Weekly 6
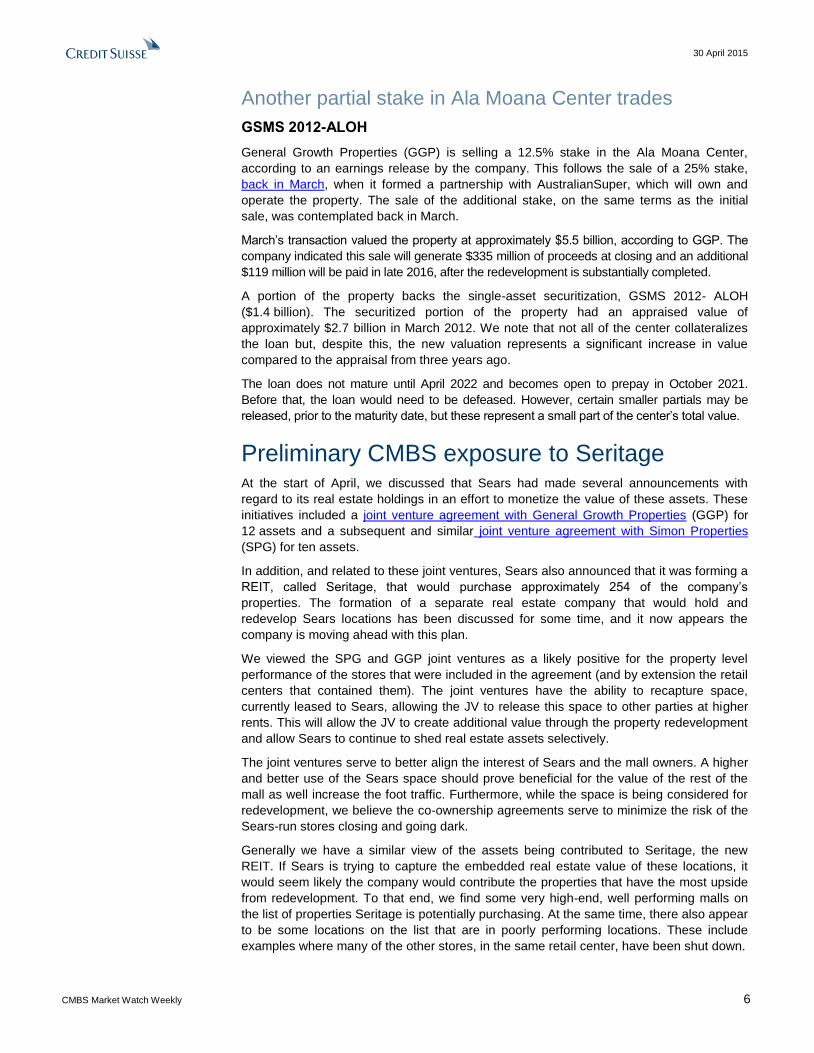
Another partial stake in Ala Moana Center trades
GSMS 2012-ALOH
General Growth Properties (GGP) is selling a 12.5% stake in the Ala Moana Center,
according to an earnings release by the company. This follows the sale of a 25% stake,
back in March, when it formed a partnership with AustralianSuper, which will own and
operate the property. The sale of the additional stake, on the same terms as the initial
sale, was contemplated back in March.
March’s transaction valued the property at approximately $5.5 billion, according to GGP. The
company indicated this sale will generate $335 million of proceeds at closing and an additional
$119 million will be paid in late 2016, after the redevelopment is substantially completed.
A portion of the property backs the single-asset securitization, GSMS 2012- ALOH
($1.4 billion). The securitized portion of the property had an appraised value of
approximately $2.7 billion in March 2012. We note that not all of the center collateralizes
the loan but, despite this, the new valuation represents a significant increase in value
compared to the appraisal from three years ago.
The loan does not mature until April 2022 and becomes open to prepay in October 2021.
Before that, the loan would need to be defeased. However, certain smaller partials may be
released, prior to the maturity date, but these represent a small part of the center’s total value.
Preliminary CMBS exposure to Seritage At the start of April, we discussed that Sears had made several announcements with
regard to its real estate holdings in an effort to monetize the value of these assets. These
initiatives included a joint venture agreement with General Growth Properties (GGP) for
12 assets and a subsequent and similar joint venture agreement with Simon Properties
(SPG) for ten assets.
In addition, and related to these joint ventures, Sears also announced that it was forming a
REIT, called Seritage, that would purchase approximately 254 of the company’s
properties. The formation of a separate real estate company that would hold and
redevelop Sears locations has been discussed for some time, and it now appears the
company is moving ahead with this plan.
We viewed the SPG and GGP joint ventures as a likely positive for the property level
performance of the stores that were included in the agreement (and by extension the retail
centers that contained them). The joint ventures have the ability to recapture space,
currently leased to Sears, allowing the JV to release this space to other parties at higher
rents. This will allow the JV to create additional value through the property redevelopment
and allow Sears to continue to shed real estate assets selectively.
The joint ventures serve to better align the interest of Sears and the mall owners. A higher
and better use of the Sears space should prove beneficial for the value of the rest of the
mall as well increase the foot traffic. Furthermore, while the space is being considered for
redevelopment, we believe the co-ownership agreements serve to minimize the risk of the
Sears-run stores closing and going dark.
Generally we have a similar view of the assets being contributed to Seritage, the new
REIT. If Sears is trying to capture the embedded real estate value of these locations, it
would seem likely the company would contribute the properties that have the most upside
from redevelopment. To that end, we find some very high-end, well performing malls on
the list of properties Seritage is potentially purchasing. At the same time, there also appear
to be some locations on the list that are in poorly performing locations. These include
examples where many of the other stores, in the same retail center, have been shut down.

30 April 2015
CMBS Market Watch Weekly 7
Seritage Growth
The new real estate company will be called Seritage Growth and it will be a publicly traded
REIT. The REIT plans to purchase for approximately $2.5 billion around 254 properties
that are currently owned by Sears (in seven cases the properties are actually ground
leased by Sears). The company will then lease or sublease a substantial majority of the
space back to Sears, under a master lease agreement.
The initial portfolio covers approximately 40.3 million square feet (equating the purchase
price to around $62 per square foot). The 254 stores are geographically diverse and are
located in 49 states, as well as Puerto Rico. Sears accounts for 158 locations and there
are 85 Kmart banners, with the remaining 11 properties wholly leased to third parties.
The master lease agreement allows Seritage to recapture some of the space within the
Sears and Kmart stores. In most cases, Seritage can recapture 50% of the space but in
22 locations, it is able to recapture 100% of the space. This would allow Seritage to
reconfigure and release the recaptured space and lease to new tenants, on what would
presumably be better terms.
This structure is very similar to the plan on the 22 properties involved in the GGP and SPG JVs.
As of the latest financial report, the company indicated that as of the end of January it
operated 1,725 locations. Of these, the company owned 684 and leased the remaining
1,000+ stores. We show the breakdown by store type in Exhibit 6.
Exhibit 6: Sears store base by type and owned vs. leased
Kmart Sears
Discount Super Full-line Sears essentials/ Specialty
stores centers mall stores grand stores stores
Owned 175 8 472 7 22
Leased 793 3 237 1 7
Total 968 11 709 8 29
Source: Credit Suisse, company filings
We provided our most recent update on Sears/Kmart exposure in CMBS in February. In
this analysis we looked at the change in performance of loans with exposure to closures
announced in 2014 as well as the exposure to stores with 2015 and 2016 lease
expirations (as we viewed properties as having a greater risk of shutting down).
CMBS exposure to Seritage
We initially mapped the 22 locations that were named in the GGP and SPG joint ventures
to the CMBS universe and discussed those in the previous articles (here and here). We
have republished that list below as well (Exhibit 7).
Exhibit 7: Sears JV malls with GGP and Simon
JV Deal CMBX Loan/Property Loan bal
($mn) Deal pct
Loan status
MR DSCR
MR occ (%)
MR date City, state
GGP GSMS 2013-PEMB Pembroke Lakes Mall 260.0 100.0% Current 2.71 98 2014 12 Pembroke Pines, FL
GGP BACM 2005-6 3 Paramus Park Mall 91.3 5.0% Current 1.73 94 2014 12 Paramus, NJ
SPG COMM 2012-CR3 6 Midland Park Mall 81.4 6.7% Current 2.08 97 2014 09 Midland, TX
Source: Credit Suisse, company filings, Trepp
As we mentioned above, our initial perception is that the properties being contributed to
the new REIT are viewed as having some upside. However, that said, the upside is
relative to Seritage’s (unknown) purchase price and does not necessarily mean that a loan
backed by the property will improve in performance.

30 April 2015
CMBS Market Watch Weekly 8
Nevertheless, we thought mapping these Seritage-related properties to CMBS would be
interesting and would be worth tracking their performance as the company forms and
begins operations. We also thought it may be interesting to follow the performance
differential between Sears-owned properties contributed to Seritage versus those that
were excluded.
To that end, we have mapped the CMBS exposure to all of the Seritage-related properties
in CMBS and show that in Exhibit 10 (at the end of this article).
While many of the properties shown in our Seritage-exposure list are performing well,
others are clearly not. There are several locations that are associated with a CMBS asset
that is underperforming or, in some cases, already REO.
The mapping of the 2541 locations that were linked to Seritage proved more difficult to
map than the Simon and GGP joint venture lists, as limited information was provided. The
rights offering listed the store location by city and state as well as some information about
the store size.
For the vast majority of stores, we have a high degree of certainty of which Sears and
Kmart locations are referenced in this list of locations being purchased. However, in
cases where a store is located in a city with multiple locations (e.g., Miami, Chicago,
etc.) it proved more difficult to establish the specific property and, therefore, the CMBS
exposure. We used a variety of other sources to triangulate to our best estimation and
have noted, in our exposure table, the properties we were less certain about and the
potential alternative exposure.
We also highlight that we have limited our exposure search only to the CMBS loans that
are directly associated with the Sears and Kmart in question (even if the store serves as a
shadow anchor). We have not extended the search to other CMBS assets that are in the
same general proximate geographic area (such as another center down the block or
across the street), as we think the potential the impact on these properties is far less
significant, if there is any impact at all.
In our exposure list we have also included the “Type” category, assigned by Seritage. We
show the Type classifications in Exhibit 8.
Exhibit 8: Seritage store Type breakdown
Type Number of stores Description
Type I 22 Seritage can recapture 100% of the space leased to Sears
Type II 215 Can recapture approximately 50% of the space in addition to automotive "appendages" and outparcels
Type III 10 Stores not currently leased to Sears
Type IV 7 Ground leases where Seritage does not own the land on which the property is located
Source: Credit Suisse, company filings
In total, we found 73 of the 254 properties have some CMBS exposure. These
73 properties across 85 loan components have a total balance of $8.9 billion. We show the
breakdown of this total by deal type in Exhibit 9. Most of the exposure appears in relatively
recent deals, although some of that amount is boosted by a concentration in single-
borrower transactions
1 It should be noted that the 254 locations we mapped are listed in the Seritgage Growth Properties SEC registration. We believe
that the list of purchased properties may change slightly.

30 April 2015
CMBS Market Watch Weekly 9
Exhibit 9: Seritage CMBS exposure
Number of loans Loan exposure ($mn)
Vintage Conduit Floater Single
Borrower Total Vintage Conduit Floater Single
Borrower Total
Legacy 23 23 Legacy 1.93 1.93
Post-legacy 51 2 9 62 Post-legacy 3.80 0.18 2.95 6.99
Total 74 2 9 85 Total 5.79 0.18 2.95 8.92
Source: Credit Suisse, company filings, Trepp
Since Sears owns most of the properties being contributed to Seritage, the Sears and
Kmart stores we found generally serve as shadow anchors in the vast majority of retail
centers with CMBS exposure and therefore do not serve as collateral for the loans. There
are a few exceptions to this.
Most of the CMBS exposure has a Sears store in the location, but four of the properties
are occupied by a Kmart. The vast majority on our list are also classified as Type II
properties, but this is in line with the overall percentage of properties being contributed.
Not surprisingly, the largest four exposures are all retail centers that back single-borrower
transactions. The largest of these loans is backed by the Aventura Mall loan, which totals
$1.2 billion (AVMT 2013-AVM). We previously discussed how Sears has already
submitted plans to redevelop this property and wants to create an “open-air village.” Sears,
which currently operates a 192k square foot property, would maintain a small presence
with a 20k square foot format store.
The largest loan that is not in a single-borrower deal is the Mall at Rockingham Park
($260.0 million and 5.5% of WBCMT 2007-C31). The Simon-owned mall completed a
major renovation project at this mall last year. This property was not included in the
Sears/SPG joint venture.

30 April 2015
CMBS Market Watch Weekly 10
Exhibit 10: Seritage CMBS exposure
Deal Loan/Property CMBX
Loan bal
($mn) Deal pct
Loan status
MR DSCR
MR Occ
MR date
Sears/ Kmart
GLA ('000 sf) City, State
Seritage Type Note
AVMT 2013-AVM Aventura Mall 1,200.0 100.0% Current 2.20 100 2014 12 Sears 173 Miami, FL Type I
BACM 2005-6 Flagstaff Mall 1 37.0 1.8% Current 1.68 91 2014 12 Sears 66 Flagstaff, AZ Type II
BACM 2007-1 Tanforan Shopping Center 3 138.5 9.0% <30 day 1.00 98 2014 09 Sears 277 San Bruno, CA Type II
BACM 2007-2 Mall of Acadiana 4 131.1 7.3% Current 1.34 100 2014 12 Sears 195 Lafayette, LA Type II
BAMLL 2013-WBRK Willowbrook Mall 360.0 100.0% Current 3.10 97 2014 12 Sears 327 Wayne, NJ Type II
BBCMS 2015-VFM Vintage Faire Mall 279.6 100.0% Current 1.62 97 Secur Sears 149 Modesto, CA Type II (a)
BBUBS 2012-TFT Town East Mall 160.3 28.2% Current 2.59 99 2014 12 Sears 205 Dallas, TX Type II
BSCMS 2004-PWR3 Great Northern Mall 34.1 46.7% FCL 1.16 72 2014 06 Sears 147 Clay, NY Type II
BSCMS 2005-T18 Boulevard Market Fair 4.2 5.5% Current 1.30 95 2014 09 Kmart 119 Anderson, SC Type II
BSCMS 2005-T20 West Towne Mall 1 93.5 7.1% Current 1.93 97 2014 09 Sears 138 Madison, WI Type II (b)
BSCMS 2007-PW16 Hastings Ranch Plaza 4 15.7 0.7% Current 1.38 100 2014 12 Sears 221 Pasadena, CA Type IV
CGCC 2014-FL2 Colonie Center 110.0 21.5% Current 2.09 94 2014 12 Sears 341 Albany, NY Type II (c)
CGCMT 2007-C6 Moreno Valley Mall 4 80.0 2.1% REO 0.79 81 2013 12 Sears 169 Moreno Valley, CA Type II
CGCMT 2014-GC23 Chula Vista Center 8 70.0 5.7% Current 1.71 93 Secur Sears 219 Chula Vista, CA Type II (d)
CGCMT 2015-GC29 Audubon Plaza 2.5 0.2% Current 1.40 98 Secur Kmart 68 Owensboro, KY Type II
COMM 2012-CR3 Solano Mall 6 105.0 8.6% Current 2.62 94 2014 09 Sears 164 Fairfield, CA Type II
COMM 2012-CR3 Midland Park Mall 6 81.4 6.7% Current 2.08 97 2014 09 Sears 112 Midland, TX Type II
COMM 2012-CR4 Eastview Mall and Commons 6 120.0 11.1% Current 2.12 93 2014 12 Sears 123 Victor, NY Type II
COMM 2012-CR5 Eastview Mall and Commons 6 90.0 8.2% Current 2.12 93 2014 12 Sears 123 Victor, NY Type II
COMM 2012-LC4 Square One Mall 95.6 10.6% Current 2.08 95 2014 09 Sears 210 Saugus, MA Type II
COMM 2012-LTRT The Oaks Mall 113.6 45.7% Current 1.94 100 2014 12 Sears 141 Gainesville, FL Type II
COMM 2013-CR11 Oglethorpe Mall 7 90.0 7.1% Current 2.48 98 2014 06 Sears 156 Savannah, GA Type I
COMM 2013-CR12 Oglethorpe Mall 7 60.0 5.1% <30 day 2.48 98 2014 06 Sears 156 Savannah, GA Type I
COMM 2013-CR7 Lakeland Square Mall 67.6 7.5% Current 1.66 96 2014 06 Sears 156 Lakeland, FL Type II
COMM 2013-CR9 Northridge Mall 7 78.8 6.2% Current 2.03 94 2014 12 Sears 133 Salinas, CA Type II
COMM 2013-CR9 Sarasota Square 7 38.0 3.0% Current 2.96 87 2014 12 Sears 212 Sarasota, FL Type II
COMM 2013-LC6 Coastland Center 124.2 8.5% Current 1.83 94 2014 06 Sears 152 Naples, FL Type II
COMM 2014-UBS6 Larkridge Shopping Center 8 30.5 2.4% Current 1.04 93 2014 12 Sears 190 Thornton, CO Type II (e)
CSMC 2007-C5 Kmart Chicago 5 6.0 0.3% Current 1.45 100 2013 12 Kmart 169 Chicago, IL Type II
DBUBS 2011-LC1A Centro Retail Portfolio Pool A
(Southland Shopping Center)
47.9 2.4% Current 1.72 92 2014 12 Sears 308 Middleburg Hts, OH Type II
GCCFC 2005-GG5 Imperial Valley 1 49.5 2.2% <30 day 2.17 98 2014 09 Sears 140 El Centro, CA Type II
GECMC 2007-C1 Wolfchase Galleria 225.0 8.8% Current 1.25 92 2014 09 Sears 161 Cordova, TN Type II
GSMS 2010-C1 Burnsville Center 75.1 11.2% Current 1.85 96 2014 12 Sears 167 Burnsville, MN Type II
GSMS 2011-GC5 Park Place Mall 188.6 11.3% Current 1.58 94 2014 12 Sears 250 Tucson, AZ Type II
GSMS 2012-GC6 Meadowood Mall 119.5 10.8% Current 1.61 95 2014 12 Sears 199 Reno, NV Type II
JPMBB 2013-C12 Southridge Mall 50.0 3.8% Current 2.28 97 2014 12 Sears 238 Greendale, WI Type II
JPMBB 2013-C14 Meadows Mall 7 105.4 9.4% Current 1.53 96 2013 12 Sears 150 Las Vegas, NV Type II
JPMBB 2013-C14 Southridge Mall 7 75.0 6.7% Current 2.28 97 2014 12 Sears 238 Greendale, WI Type II
JPMBB 2014-C18 Miami International Mall 100.0 10.5% Current 2.68 94 2014 12 Sears 213 Doral, FL Type II (f)
JPMBB 2014-C18 Meadows Mall 52.2 5.5% Current 1.53 96 2013 12 Sears 150 Las Vegas, NV Type II
JPMBB 2014-C21 Westminster Mall 8 54.2 4.3% Current 2.02 81 2014 12 Sears 198 Westminster, CA Type I
JPMBB 2014-C21 Miami International Mall 8 60.0 4.8% Current 2.68 94 2014 12 Sears 213 Doral, FL Type II (f)
JPMBB 2014-C22 Las Catalinas Mall 8 75.0 6.6% Current 1.72 95 Secur Sears 139 Caguas, PR Type II
JPMBB 2014-C23 Las Catalinas Mall 8 55.0 4.0% Current 1.72 95 Secur Sears 139 Caguas, PR Type II
JPMBB 2014-C24 North Riverside Park Mall 8 74.5 5.8% Current 1.47 92 Secur Sears 203 North Riverside, IL Type II (g)
JPMCC 2006-LDP6 Valley Mall 80.4 5.8% Current 1.20 98 2014 09 Sears 123 Hagerstown, MD Type II
JPMCC 2006-LDP7 Westfield Centro Portfolio
(Westfield Westland Town Ctr)
2 240.0 8.4% FCL 0.86 83 2014 05 Sears 153 Lakewood, CO Type II
JPMCC 2010-C2 Greece Ridge Center 70.4 7.3% Current 1.29 79 2014 09 Sears 129 Rochester, NY Type II

30 April 2015
CMBS Market Watch Weekly 11
Exhibit 10: Seritage CMBS exposure
Deal Loan/Property CMBX
Loan bal
($mn) Deal pct
Loan status
MR DSCR
MR Occ
MR date
Sears/ Kmart
GLA ('000 sf) City, State
Seritage Type Note
JPMCC 2011-C5 Asheville Mall 72.7 7.6% Current 1.52 100 2012 12 Sears 241 Asheville, NC Type II
JPMCC 2012-C6 Northwoods Mall 6 69.8 6.4% Current 1.80 99 2014 12 Sears 132 Charleston, SC Type II
JPMCC 2014-C20 Westminster Mall 8 29.5 3.4% Current 2.02 81 2014 12 Sears 198 Westminster, CA Type I
JPMCC 2014-FL6 Southland Mall 67.5 13.4% Current 4.23 97 Secur Sears 170 Miami, FL Type I
LBUBS 2005-C5 9200 Mentor Avenue 1 7.0 0.9% Current 1.42 100 2014 12 Kmart 219 Mentor, OH Type II
LBUBS 2006-C6 Chapel Hill Mall 2 66.7 2.8% REO 0.96 99 2013 12 Sears 175 Chapel Hill, OH Type II
LBUBS 2006-C6 Greenbrier Mall 2 73.3 3.1% Current 1.35 98 2014 12 Sears 169 Chesapeake, VA Type II (h)
LBUBS 2007-C1 Kentucky Oaks Mall 3 21.5 0.9% Current 3.88 74 2014 09 Sears 108 Paducah, KY Type II
MLCFC 2007-9 Janss Marketplace - A/B/C 5 54.0 3.2% <30 day 1.01 95 2014 09 Sears 153 ThousandOaks, CA Type II
MLMT 2005-CKI1 Galileo NXL Retail Portfolio
(Shops at Prospect)
1 208.0 12.8% Current 1.85 91 2014 12 Kmart 87 Columbia, PA Type II
MLMT 2005-MKB2 Simon - DeSoto Square - A/B 41.3 32.3% <30 day 2.31 89 2014 09 Sears 100 Bradenton, FL Type II
MSBAM 2012-CKSV Clackamas Town Center 216.0 54.3% Current 2.61 95 2014 12 Sears 144 Happy Valley, OR Type II
MSBAM 2012-CKSV Sunvalley Shopping Center 182.0 45.7% Current 1.96 100 2014 12 Sears 275 Concord, CA Type IV
MSBAM 2013-C11 Westfield Countryside 7 100.0 11.9% Current 2.54 92 2014 12 Sears 202 Clearwater, FL Type II
MSBAM 2013-C12 Westfield Countryside 7 55.0 4.4% Current 2.54 92 2014 12 Sears 202 Clearwater, FL Type II
MSBAM 2013-C7 Sunvalley Shopping Ctr Fee 22.9 1.7% Current 1.50 100 2013 12 Sears 275 Concord, CA Type IV
MSBAM 2015-C21 Westfield Palm Desert 62.5 6.9% Current 2.63 93 Secur Sears 151 Palm Desert, CA Type II
MSC 2005-HQ7 Hilltop Mall 1 64.4 5.4% REO 1.44 83 2012 03 Sears 134 Richmond, CA Type II
MSC 2011-C2 Ingram Park Mall 137.2 12.0% Current 1.70 90 2014 09 Sears 168 Ingram, TX Type II
MSC 2011-C3 Westfield Belden Village 100.0 7.3% Current 2.44 100 2014 12 Sears 219 Canton, OH Type II
MSC 2013-ALTM Altamonte Mall 160.0 100.0% Current 1.76 99 Secur Sears 206 Altamonte Spr., FL Type II
PNCMA 2000-C1 K-Mart (D) 1.2 14.8% Current 2.05 100 2011 12 Kmart 112 El Paso, TX Type II
UBSBB 2012-C2 Crystal Mall 6 93.8 8.0% Current 2.29 88 2014 09 Sears 149 Waterford, CT Type II
UBSBB 2012-C2 Louis Joliet Mall 6 85.0 7.2% Current 2.35 93 Secur Sears 205 Joliet, IL Type II
UBSBB 2013-C6 Broward Mall 95.0 7.5% Current 5.60 92 2014 12 Sears 202 Plantation, FL Type II
UBSBM 2012-WRM Westfield Galleria at Roseville 275.0 66.3% Current 3.12 98 2014 09 Sears 139 Roseville, CA Type II
WBCMT 2007-C31 Mall at Rockingham Park 4 260.0 5.5% Current 1.56 95 2014 09 Sears 207 Salem, NH Type II
WFCM 2013-LC12 Cumberland Mall 7 90.0 6.5% Current 2.51 94 2014 12 Sears 226 Atlanta, GA Type II
WFCM 2015-C27 Westfield Palm Desert 62.5 6.0% Current 2.61 96 Secur Sears 151 Palm Desert, CA Type II (i)
WFRBS 2011-C2 Westfield Westland Mall 53.2 4.3% Current 2.67 85 2014 09 Sears 197 Hialeah, FL Type II
WFRBS 2011-C3 Jackson Crossing 23.4 1.7% Current 1.77 96 2014 12 Sears 144 Jackson, MI Type II
WFRBS 2011-C3 Oakdale Mall 53.7 4.0% Current 1.54 88 2014 12 Sears 155 Johnson City, NY Type II
WFRBS 2012-C10 Dayton Mall 6 82.0 6.5% Current 2.52 98 2014 12 Sears 193 Dayton, OH Type II
WFRBS 2012-C7 Northridge Fashion Center 6 150.5 14.1% Current 1.65 97 2014 12 Sears 292 Northridge, CA Type II
WFRBS 2012-C8 Northridge Fashion Center 6 85.6 6.8% Current 1.65 97 2014 12 Sears 292 Northridge, CA Type II
WFRBS 2013-C14 Cumberland Mall 70.0 4.8% Current 2.51 94 2014 12 Sears 226 Atlanta, GA Type II
WFRBS 2014-C25 Southgate Mall 8 11.1 1.3% Current 1.62 91 Secur Sears 106 Yuma, AZ Type II
(a) Sears had approximately $26.8 million of sales at this location (b) This could also possibly be East Towne Mall in BSCMS 2005-T20 (c) Sears sales per square feet estimate: $186 psf (as of TTM June 2014) (d) Sears sales per square feet estimate: $128 psf (as of YE 2013) (e) This could possibly be Thorton Place Kmart which is not in CMBS (f) Sears sales per square feet estimate: $121 psf (as of YE 2013) (g) Sears sales per square feet estimate: $105 psf (as of TTM June 2014) (h) This could also possibly be Chesapeake Crossing Kmart which is not in CMBS (i) Sears sales per square feet estimate:$156 (26% greater than its national average) Source: Credit Suisse, company filings, Trepp

30 April 2015
CMBS Market Watch Weekly 12
Technical update
Exhibit 11: US CMBS pipeline
April 2015 Deal type Rate type Size ($ million)
Deutsche (Tricon American Homes) - TRICON 2015-SFR1 (Deal is in the market) Other Floating 381
May 2015
Deutsche, Cantor, Ladder Capital Multiple Borrower Fixed 1,400
Wells Fargo, Rialto, C-III, Liberty Island, Basis Multiple Borrower Fixed 1,250
Credit Suisse, UBS, Bancorp, MC-Five Mile Multiple Borrower Fixed 1,250
Goldman Sachs, CCRE, Citigroup, Starwood, MC-Five Mile Multiple Borrower Fixed 1,250
Morgan Stanley, Bank of America Multiple Borrower Fixed 1,250
Deutsche Bank, UBS Multiple Borrower Fixed 1,250
J.P. Morgan, Barclays, Starwood, RAIT Multiple Borrower Fixed 1,250
Credit Suisse (Ashford Portfolio) Single Borrower Floating 800
Deutsche (Clarion Partners - hotel portfolio) Single Borrower Fixed 670
J.P. Morgan Floater Floating 400
Barclays (Westmont Hospitality - Red Roof Inn portfolio) Single Borrower Floating 350
Announced Total 11,501
Source: Credit Suisse, Commercial Mortgage Alert, Commercial Real Estate Direct
Exhibit 12: 2015 CMBS issuance (in $ millions)
Month
Multi-
Borrower
Floating
Rate
Single
Borrower Other
2015
US Total
2015
Non-US Total
2015
Global Total
US Agency
CMBS*
US Resecur./
CDO
January 3,765 0 900 1,100 5,765 555 6,320 4,265 371
February 5,029 0 6,769 553 12,351 260 12,611 6,683 646
March 4,387 545 4,963 749 10,644 191 10,835 5,473 0
April 4,324 0 3,938 470 8,732 0 8,732 4,390 0
Total 17,505 545 16,569 2,872 37,492 1,006 38,497 20,812 1,017
* Multiple-pool Agency CMBS transactions only (i.e. deal tickers with GNR, FREMF, FNA, GEMS, MFMEG, SBAP and SBIC). Standalone DUS MBS and GN MBS pools are not included. Source: Credit Suisse, Commercial Mortgage Alert
30 April 2015
CMBS Market Watch Weekly 13
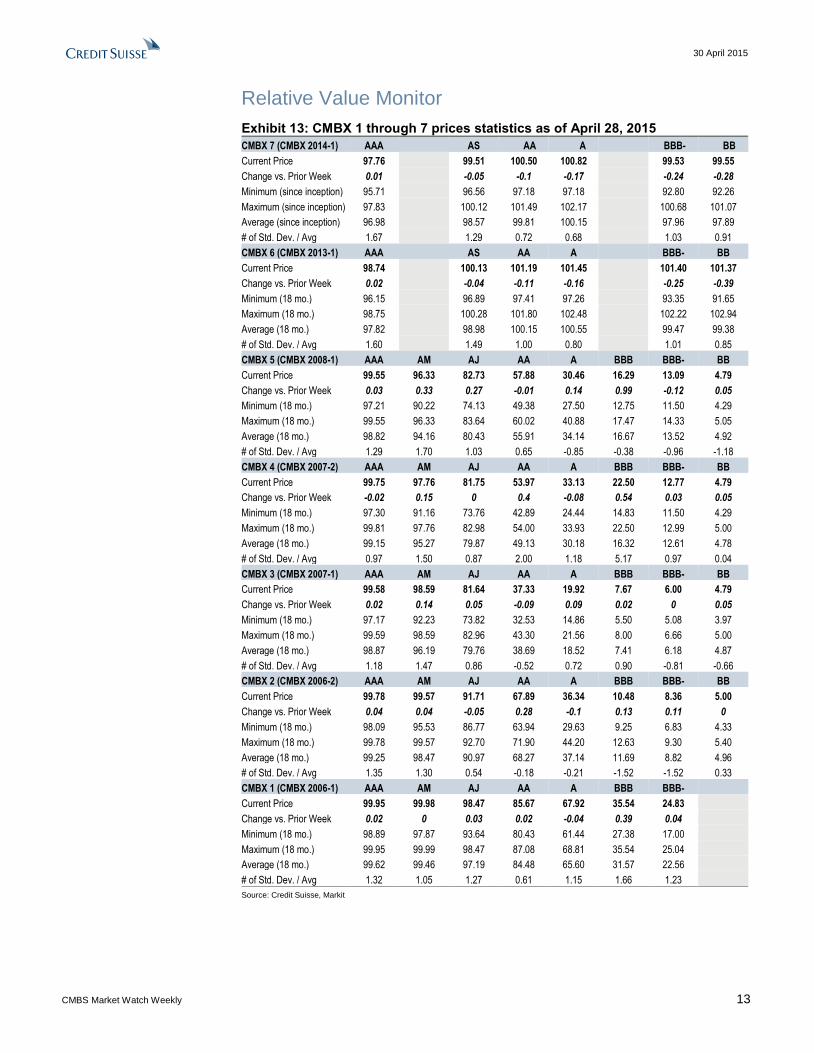
Relative Value Monitor
Exhibit 13: CMBX 1 through 7 prices statistics as of April 28, 2015
CMBX 7 (CMBX 2014-1) AAA AS AA A BBB- BB
Current Price 97.76 99.51 100.50 100.82 99.53 99.55
Change vs. Prior Week 0.01 -0.05 -0.1 -0.17 -0.24 -0.28
Minimum (since inception) 95.71 96.56 97.18 97.18 92.80 92.26
Maximum (since inception) 97.83 100.12 101.49 102.17 100.68 101.07
Average (since inception) 96.98 98.57 99.81 100.15 97.96 97.89
# of Std. Dev. / Avg 1.67 1.29 0.72 0.68 1.03 0.91
CMBX 6 (CMBX 2013-1) AAA AS AA A BBB- BB
Current Price 98.74 100.13 101.19 101.45 101.40 101.37
Change vs. Prior Week 0.02 -0.04 -0.11 -0.16 -0.25 -0.39
Minimum (18 mo.) 96.15 96.89 97.41 97.26 93.35 91.65
Maximum (18 mo.) 98.75 100.28 101.80 102.48 102.22 102.94
Average (18 mo.) 97.82 98.98 100.15 100.55 99.47 99.38
# of Std. Dev. / Avg 1.60 1.49 1.00 0.80 1.01 0.85
CMBX 5 (CMBX 2008-1) AAA AM AJ AA A BBB BBB- BB
Current Price 99.55 96.33 82.73 57.88 30.46 16.29 13.09 4.79
Change vs. Prior Week 0.03 0.33 0.27 -0.01 0.14 0.99 -0.12 0.05
Minimum (18 mo.) 97.21 90.22 74.13 49.38 27.50 12.75 11.50 4.29
Maximum (18 mo.) 99.55 96.33 83.64 60.02 40.88 17.47 14.33 5.05
Average (18 mo.) 98.82 94.16 80.43 55.91 34.14 16.67 13.52 4.92
# of Std. Dev. / Avg 1.29 1.70 1.03 0.65 -0.85 -0.38 -0.96 -1.18
CMBX 4 (CMBX 2007-2) AAA AM AJ AA A BBB BBB- BB
Current Price 99.75 97.76 81.75 53.97 33.13 22.50 12.77 4.79
Change vs. Prior Week -0.02 0.15 0 0.4 -0.08 0.54 0.03 0.05
Minimum (18 mo.) 97.30 91.16 73.76 42.89 24.44 14.83 11.50 4.29
Maximum (18 mo.) 99.81 97.76 82.98 54.00 33.93 22.50 12.99 5.00
Average (18 mo.) 99.15 95.27 79.87 49.13 30.18 16.32 12.61 4.78
# of Std. Dev. / Avg 0.97 1.50 0.87 2.00 1.18 5.17 0.97 0.04
CMBX 3 (CMBX 2007-1) AAA AM AJ AA A BBB BBB- BB
Current Price 99.58 98.59 81.64 37.33 19.92 7.67 6.00 4.79
Change vs. Prior Week 0.02 0.14 0.05 -0.09 0.09 0.02 0 0.05
Minimum (18 mo.) 97.17 92.23 73.82 32.53 14.86 5.50 5.08 3.97
Maximum (18 mo.) 99.59 98.59 82.96 43.30 21.56 8.00 6.66 5.00
Average (18 mo.) 98.87 96.19 79.76 38.69 18.52 7.41 6.18 4.87
# of Std. Dev. / Avg 1.18 1.47 0.86 -0.52 0.72 0.90 -0.81 -0.66
CMBX 2 (CMBX 2006-2) AAA AM AJ AA A BBB BBB- BB
Current Price 99.78 99.57 91.71 67.89 36.34 10.48 8.36 5.00
Change vs. Prior Week 0.04 0.04 -0.05 0.28 -0.1 0.13 0.11 0
Minimum (18 mo.) 98.09 95.53 86.77 63.94 29.63 9.25 6.83 4.33
Maximum (18 mo.) 99.78 99.57 92.70 71.90 44.20 12.63 9.30 5.40
Average (18 mo.) 99.25 98.47 90.97 68.27 37.14 11.69 8.82 4.96
# of Std. Dev. / Avg 1.35 1.30 0.54 -0.18 -0.21 -1.52 -1.52 0.33
CMBX 1 (CMBX 2006-1) AAA AM AJ AA A BBB BBB-
Current Price 99.95 99.98 98.47 85.67 67.92 35.54 24.83
Change vs. Prior Week 0.02 0 0.03 0.02 -0.04 0.39 0.04
Minimum (18 mo.) 98.89 97.87 93.64 80.43 61.44 27.38 17.00
Maximum (18 mo.) 99.95 99.99 98.47 87.08 68.81 35.54 25.04
Average (18 mo.) 99.62 99.46 97.19 84.48 65.60 31.57 22.56
# of Std. Dev. / Avg 1.32 1.05 1.27 0.61 1.15 1.66 1.23
Source: Credit Suisse, Markit

30 April 2015
CMBS Market Watch Weekly 14
Recent publications The table below provides links to some of our recent CMBS publications.
Date published Loans in the News
Apr-23 Moody’s reviews Q1 conduit leverage
Rent Guideline Board report released
Last property from Southern California Portfolio trades (GCCFC 2007-GG9)
Seven hotel properties backing three loans trade hands (CGCMT 2006-C4)
Online auction update
April CMBS conduit credit update
Apr-20 Large 2011 loan sent to special servicing (Hudson Valley Mall in CFCRE 2011-C1)
Another large GG10 loan to defease (Harbor Point Apartments in GSMS 2007-GG10)
Apr-15 Another Sears JV – this time with Simon (COMM 2012-CR3, JPMCC 2011-C3 and UBSBB 2012-C3)
One South Wacker selling for $345 million (WFRBS 2013-C11, WFRBS 2013-C12)
Grandeville on Saxon sells from REO (WBCMT 2006-C24)
Ridgmar Mall adding a new tenant (COMM 2014-UBS5)
Preliminary Q1 2015 CRE fundamentals
Apr-14 The Belnord liquidated at only a small loss (JPMCC 2006-LDP9)
Apr-09 Midtown Plaza reportedly under contract for $95 million (LBUBS 2006-C7)
Sahara Pavilion North and others liquidated from deal (MLCFC 2006-4)
Several loans to defease after refinancing in new deal (BACM 2006-1, WBCMT 2006-C23, GSMS
2010-C1 and MSBAM 2015-C22)
Harden Ranch Plaza ready to defease (WBCMT 2006-C27)
Plaza Evergreen Park update (CSMC 2006-C4)
Stoneview Point, part of REO loan, sells for $16.6 million (MSC 2006-HQ8)
Watchlisted Montclair on the Park trades for $18 million (WFRBS 2012- C6)
Willow Springs Apartments selling from REO (MLCFC 2007-7)
Latitude 33 Townhomes sells for $58 million (FREMF 2014-KF03/FHMS KF03)
Update on new issue conduit metrics
Apr-02 Sears announces real estate plans
One and Two Securities Centre selling from REO (CGCMT 2006-C5)
Madison At River Sound sells for $58 million (FREMF 2010-K5 / FHMS K005)
Wells Fargo extends lease at One Orlando Center (LBCMT 2007-C3)
Office Depot/OfficeMax announce more closures (LBUBS 2006-C4)
Multifamily backing modified loan sells (CGCMT 2006-C4)
Carlsbad Corporate Plaza REO selling for $16.4 million (MLCFC 2007-7)
Kimco buying remaining interest in Montgomery Plaza (COMM 2012-CR2)
March Credit Update
Mar-19 Refresh on Columbia Center mod (MSC 2007-HQ12)
Willis Tower (FKA Sears Tower) selling for $1.3 billion (various)
9200 Sunset Boulevard approaching defeasance (GSMS 2007-GG10)
Quick Belnord update (JPMCC 2007-LDP9)
Barrington Mill apartments sells for $58 million (FREMF 2011-K702 / FHMS K702)
Bi-Lo closings deal second blow to two CMBS loans (CD 2007-CD4 and DBUBS 2011-LC2A)
Farms at Cool Springs sells for nearly $82 million (FRMF 2011-K704 / FHMS K704)
Circuit City Distribution Center leads to defeasance (WBCMT 2007-C33)
March remit highlights

GLOBAL FIXED INCOME AND ECONOMIC RESEARCH
Ric Deverell
Head of Global Fixed Income and Economic Research
+1 212 538 8964
GLOBAL SECURITIZED PRODUCTS RESEARCH
Roger Lehman
Head of Global Securitized Products Research
+1 212 325 2123
RESIDENTIAL MORTGAGES CMBS
Mahesh Swaminathan Roger Lehman
Group Head Group Head
+1 212 325 8789 +1 212 325 2123
[email protected] [email protected]
AGENCY MBS NON-AGENCY MBS
Qumber Hassan Marc Firestein Serif Ustun, CFA Sylvain Jousseaume, CFA
+1 212 538 4988 +1 212 325 4379 +1 212 538 4582 +1 212 325 1356
[email protected] [email protected] [email protected] [email protected]
Glenn Russo Jonathan Corwin
+1 212 538 6881 +1 212 538 6490
[email protected] [email protected]
EUROPE
Helen Haworth, CFA
Group Head
+44 20 7888 0757
Carlos Diaz Marion Pelata
+44 20 7888 2414 +44 20 7883 1333

Disclosure Appendix
Analyst Certification Roger Lehman, Serif Ustun and Sylvain Jousseaume each certify, with respect to the companies or securities that the individual analyzes, that (1) the views expressed in this report accurately reflect his or her personal views about all of the subject companies and securities and (2) no part of his or her compensation was, is or will be directly or indirectly related to the specific recommendations or views expressed in this report.
Important Disclosures Credit Suisse's policy is only to publish investment research that is impartial, independent, clear, fair and not misleading. For more detail, please refer to Credit Suisse's Policies for Managing Conflicts of Interest in connection with Investment Research: http://www.csfb.com/research-and-analytics/disclaimer/managing_conflicts_disclaimer.html . Credit Suisse's policy is to publish research reports as it deems appropriate, based on developments with the subject issuer, the sector or the market that may have a material impact on the research views or opinions stated herein. The analyst(s) involved in the preparation of this research report received compensation that is based upon various factors, including Credit Suisse's total revenues, a portion of which are generated by Credit Suisse's Investment Banking and Fixed Income Divisions. Credit Suisse may trade as principal in the securities or derivatives of the issuers that are the subject of this report. At any point in time, Credit Suisse is likely to have significant holdings in the securities mentioned in this report. As at the date of this report, Credit Suisse acts as a market maker or liquidity provider in the debt securities of the subject issuer(s) mentioned in this report. For important disclosure information on securities recommended in this report, please visit the website at https://rave.credit-suisse.com/disclosures/view/fixedincome or call +1-212-538-7625. For the history of any relative value trade ideas suggested by the Fixed Income research department as well as fundamental recommendations provided by the Emerging Markets Sovereign Strategy Group over the previous 12 months, please view the document at http://research-and-analytics.csfb.com/docpopup.asp?ctbdocid=330703_1_en . Credit Suisse clients with access to the Locus website may refer to http://www.credit-suisse.com/locus For the history of recommendations provided by Technical Analysis, please visit the website at https://plus.credit-suisse.com/ECP_S/app/container.html#loc=/MENU_FI_ECON_TECHNICAL_ANALYSIS . Credit Suisse does not provide any tax advice. Any statement herein regarding any US federal tax is not intended or written to be used, and cannot be used, by any taxpayer for the purposes of avoiding any penalties.
Emerging Markets Bond Recommendation Definitions Buy: Indicates a recommended buy on our expectation that the issue will deliver a return higher than the risk-free rate. Sell: Indicates a recommended sell on our expectation that the issue will deliver a return lower than the risk-free rate.
Corporate Bond Fundamental Recommendation Definitions Buy: Indicates a recommended buy on our expectation that the issue will be a top performer in its sector. Outperform: Indicates an above-average total return performer within its sector. Bonds in this category have stable or improving credit profiles and are undervalued, or they may be weaker credits that, we believe, are cheap relative to the sector and are expected to outperform on a total-return basis. These bonds may possess price risk in a volatile environment. Market Perform: Indicates a bond that is expected to return average performance in its sector. Underperform: Indicates a below-average total-return performer within its sector. Bonds in this category have weak or worsening credit trends, or they may be stable credits that, we believe, are overvalued or rich relative to the sector. Sell: Indicates a recommended sell on the expectation that the issue will be among the poor performers in its sector. Restricted: In certain circumstances, Credit Suisse policy and/or applicable law and regulations preclude certain types of communications, including an investment recommendation, during the course of Credit Suisse's engagement in an investment banking transaction and in certain other circumstances. Not Rated: Credit Suisse Global Credit Research or Global Leveraged Finance Research covers the issuer but currently does not offer an investment view on the subject issue. Not Covered: Neither Credit Suisse Global Credit Research nor Global Leveraged Finance Research covers the issuer or offers an investment view on the issuer or any securities related to it. Any communication from Research on securities or companies that Credit Suisse does not cover is a reasonable, non-material deduction based on an analysis of publicly available information.
Corporate Bond Risk Category Definitions In addition to the recommendation, each issue may have a risk category indicating that it is an appropriate holding for an "average" high yield investor, designated as Market, or that it has a higher or lower risk profile, designated as Speculative, and Conservative, respectively.
Credit Suisse Credit Rating Definitions Credit Suisse may assign rating opinions to investment-grade and crossover issuers. Ratings are based on our assessment of a company's creditworthiness and are not recommendations to buy or sell a security. The ratings scale (AAA, AA, A, BBB, BB, B) is dependent on our assessment of an issuer's ability to meet its financial commitments in a timely manner. Within each category, creditworthiness is further detailed with a scale of High, Mid, or Low − with High being the strongest sub-category rating: High AAA, Mid AAA, Low AAA - obligor's capacity to meet its financial commitments is extremely strong; High AA, Mid AA, Low AA − obligor's capacity to meet its financial commitments is very strong; High A, Mid A, Low A − obligor's capacity to meet its financial commitments is strong; High BBB, Mid BBB, Low BBB − obligor's capacity to meet its financial commitments is adequate, but adverse economic/operating/financial circumstances are more likely to lead to a weakened capacity to meet its obligations; High BB, Mid BB, Low BB − obligations have speculative characteristics and are subject to substantial credit risk; High B, Mid B, Low B − obligor's capacity to meet its financial commitments is very weak and highly vulnerable to adverse economic, operating, and financial circumstances; High CCC, Mid CCC, Low CCC – obligor's capacity to meet its financial commitments is extremely weak and is dependent on favorable economic, operating, and financial circumstances. Credit Suisse's rating opinions do not necessarily correlate with those of the rating agencies.

Structured Securities, Derivatives, Options, and Futures Disclaimer General risks: Structured securities, derivatives, options (OTC and listed), and futures (including, but not limited to, commodity, foreign exchange, and security futures) are complex instruments that are not suitable for every investor, may involve a high degree of risk, may be highly illiquid, and may be appropriate investments only for sophisticated investors who are capable of understanding and assuming the risks involved. There is a risk of unlimited, total, or significant loss resulting from the use of these instruments for trading and investment. Before entering into any transaction involving these instruments, you should ensure that you fully understand their potential risks and rewards and independently determine that they are appropriate for you given your objectives, experience, financial and operational resources, and other relevant circumstances. For options, please ensure that you have read the Options Clearing Corporation's disclosure document, available at: http://www.optionsclearing.com/publications/risks/riskchap1.jsp. Risk of losses on options: The maximum potential loss on buying a call or put option is the loss of total premium paid. The maximum potential loss on selling a call option is unlimited. The maximum potential loss on selling a put option is substantial and may exceed the premium received by a significant amount. There are many other options combinations that entail significant risks and transaction costs: you should ensure they are appropriate for your situation and that you understand the risks. Risk of losses on futures: The maximum potential loss on buying a futures contract is substantial (the loss of the value of the contract) and can be amplified by leverage. The maximum potential loss on selling a futures contract is unlimited. OTC options and other derivatives: In discussions of OTC options and other derivatives, the results and risks are based solely on the hypothetical examples cited; actual results and risks will vary depending on specific circumstances. Investors are urged to consider carefully whether these products, as well as the products or strategies discussed herein, are suitable to their needs. While some OTC markets may be liquid, transactions in OTC derivatives may involve greater risk than investments in exchange-listed derivatives because there is no exchange market on which to liquidate a position and it may be very difficult to assess the value of the position because bid and offer prices need not be quoted. Structured products: These products often have a derivative component. As a result, they carry not only the risk of loss of principal, but also the possibility that at expiration the investor will own the reference asset at a depressed price. Even if a structured product is listed on an exchange, active and liquid trading markets may not develop and the structured product may be thinly traded. Taxation: Because of the importance of tax considerations for many option and other derivative transactions, investors considering these products should consult with their tax advisors as to how taxes affect the outcome of contemplated options or other derivatives transactions. You should consult with such tax, accounting, legal or other advisors as you deem necessary to assist you in making these determinations. Transaction costs: Such costs may be significant in option strategies calling for multiple purchases and sales of options and other derivatives, such as spreads and straddles. Commissions and transaction costs may be a factor in actual returns realized by the investor and should be taken into consideration. Trading on margin: Margin requirements vary and should be determined before investing as they can impact your profit potential. If the market moves against your position, you may be called upon by your broker to deposit a substantial amount of additional margin funds, on short notice, in order to maintain your position. If you do not provide the required funds within the time required by your broker, your position may be liquidated at a loss, and you will be liable for any resulting deficit in your account. Further information: Supporting documentation for any claims, comparisons, recommendations, statistics or other technical data in this material will be supplied upon request. Any trade information is preliminary and not intended as an official transaction confirmation. If you have any questions about whether you are eligible to enter into these transactions with Credit Suisse, please contact your sales representative.

References in this report to Credit Suisse include all of the subsidiaries and affiliates of Credit Suisse operating under its investment banking division. For more information on our structure, please use the following link: https://www.credit-suisse.com/who_we_are/en/This report may contain material that is not directed to, or intended for distribution to or use by, any person or entity who is a citizen or resident of or located in any locality, state, country or other jurisdiction where such distribution, publication, availability or use would be contrary to law or regulation or which would subject Credit Suisse AG or its affiliates ("CS") to any registration or licensing requirement within such jurisdiction. All material presented in this report, unless specifically indicated otherwise, is under copyright to CS. None of the material, nor its content, nor any copy of it, may be altered in any way, transmitted to, copied or distributed to any other party, without the prior express written permission of CS. All trademarks, service marks and logos used in this report are trademarks or service marks or registered trademarks or service marks of CS or its affiliates. The information, tools and material presented in this report are provided to you for information purposes only and are not to be used or considered as an offer or the solicitation of an offer to sell or to buy or subscribe for securities or other financial instruments. CS may not have taken any steps to ensure that the securities referred to in this report are suitable for any particular investor. CS will not treat recipients of this report as its customers by virtue of their receiving this report. The investments and services contained or referred to in this report may not be suitable for you and it is recommended that you consult an independent investment advisor if you are in doubt about such investments or investment services. Nothing in this report constitutes investment, legal, accounting or tax advice, or a representation that any investment or strategy is suitable or appropriate to your individual circumstances, or otherwise constitutes a personal recommendation to you. CS does not advise on the tax consequences of investments and you are advised to contact an independent tax adviser. Please note in particular that the bases and levels of taxation may change. Information and opinions presented in this report have been obtained or derived from sources believed by CS to be reliable, but CS makes no representation as to their accuracy or completeness. CS accepts no liability for loss arising from the use of the material presented in this report, except that this exclusion of liability does not apply to the extent that such liability arises under specific statutes or regulations applicable to CS. This report is not to be relied upon in substitution for the exercise of independent judgment. CS may have issued, and may in the future issue, other communications that are inconsistent with, and reach different conclusions from, the information presented in this report. Those communications reflect the different assumptions, views and analytical methods of the analysts who prepared them and CS is under no obligation to ensure that such other communications are brought to the attention of any recipient of this report. Some investments referred to in this report will be offered solely by a single entity and in the case of some investments solely by CS, or an associate of CS or CS may be the only market maker in such investments. Past performance should not be taken as an indication or guarantee of future performance, and no representation or warranty, express or implied, is made regarding future performance. Information, opinions and estimates contained in this report reflect a judgment at its original date of publication by CS and are subject to change without notice. The price, value of and income from any of the securities or financial instruments mentioned in this report can fall as well as rise. The value of securities and financial instruments is subject to exchange rate fluctuation that may have a positive or adverse effect on the price or income of such securities or financial instruments. Investors in securities such as ADR's, the values of which are influenced by currency volatility, effectively assume this risk. Structured securities are complex instruments, typically involve a high degree of risk and are intended for sale only to sophisticated investors who are capable of understanding and assuming the risks involved. The market value of any structured security may be affected by changes in economic, financial and political factors (including, but not limited to, spot and forward interest and exchange rates), time to maturity, market conditions and volatility, and the credit quality of any issuer or reference issuer. Any investor interested in purchasing a structured product should conduct their own investigation and analysis of the product and consult with their own professional advisers as to the risks involved in making such a purchase. Some investments discussed in this report may have a high level of volatility. High volatility investments may experience sudden and large falls in their value causing losses when that investment is realised. Those losses may equal your original investment. Indeed, in the case of some investments the potential losses may exceed the amount of initial investment and, in such circumstances, you may be required to pay more money to support those losses. Income yields from investments may fluctuate and, in consequence, initial capital paid to make the investment may be used as part of that income yield. Some investments may not be readily realisable and it may be difficult to sell or realise those investments, similarly it may prove difficult for you to obtain reliable information about the value, or risks, to which such an investment is exposed. This report may provide the addresses of, or contain hyperlinks to, websites. Except to the extent to which the report refers to website material of CS, CS has not reviewed any such site and takes no responsibility for the content contained therein. Such address or hyperlink (including addresses or hyperlinks to CS's own website material) is provided solely for your convenience and information and the content of any such website does not in any way form part of this document. Accessing such website or following such link through this report or CS's website shall be at your own risk. This report is issued and distributed in Europe (except Switzerland) by Credit Suisse Securities (Europe) Limited, One Cabot Square, London E14 4QJ, England, which is authorised by the Prudential Regulation Authority and regulated by the Financial Conduct Authority and the Prudential Regulation Authority. This report is being distributed in Germany by Credit Suisse Securities (Europe) Limited Niederlassung Frankfurt am Main regulated by the Bundesanstalt fuer Finanzdienstleistungsaufsicht ("BaFin"). This report is being distributed in the United States and Canada by Credit Suisse Securities (USA) LLC; in Switzerland by Credit Suisse AG; in Brazil by Banco de Investimentos Credit Suisse (Brasil) S.A or its affiliates; in Mexico by Banco Credit Suisse (México), S.A. (transactions related to the securities mentioned in this report will only be effected in compliance with applicable regulation); in Japan by Credit Suisse Securities (Japan) Limited, Financial Instruments Firm, Director-General of Kanto Local Finance Bureau (Kinsho) No. 66, a member of Japan Securities Dealers Association, The Financial Futures Association of Japan, Japan Investment Advisers Association, Type II Financial Instruments Firms Association; elsewhere in Asia/ Pacific by whichever of the following is the appropriately authorised entity in the relevant jurisdiction: Credit Suisse (Hong Kong) Limited, Credit Suisse Equities (Australia) Limited, Credit Suisse Securities (Thailand) Limited, regulated by the Office of the Securities and Exchange Commission, Thailand, having registered address at 990 Abdulrahim Place, 27th Floor, Unit 2701, Rama IV Road, Silom, Bangrak, Bangkok 10500, Thailand, Tel. +66 2614 6000, Credit Suisse Securities (Malaysia) Sdn Bhd, Credit Suisse AG, Singapore Branch, Credit Suisse Securities (India) Private Limited (CIN no. U67120MH1996PTC104392) regulated by the Securities and Exchange Board of India (registration Nos. INB230970637; INF230970637; INB010970631; INF010970631), having registered address at 9th Floor, Ceejay House, Dr.A.B. Road, Worli, Mumbai - 18, India, T- +91-22 6777 3777, Credit Suisse Securities (Europe) Limited, Seoul Branch, Credit Suisse AG, Taipei Securities Branch, PT Credit Suisse Securities Indonesia, Credit Suisse Securities (Philippines ) Inc., and elsewhere in the world by the relevant authorised affiliate of the above. Research on Taiwanese securities produced by Credit Suisse AG, Taipei Securities Branch has been prepared by a registered Senior Business Person. Research provided to residents of Malaysia is authorised by the Head of Research for Credit Suisse Securities (Malaysia) Sdn Bhd, to whom they should direct any queries on +603 2723 2020. This report has been prepared and issued for distribution in Singapore to institutional investors, accredited investors and expert investors (each as defined under the Financial Advisers Regulations) only, and is also distributed by Credit Suisse AG, Singapore branch to overseas investors (as defined under the Financial Advisers Regulations). By virtue of your status as an institutional investor, accredited investor, expert investor or overseas investor, Credit Suisse AG, Singapore branch is exempted from complying with certain compliance requirements under the Financial Advisers Act, Chapter 110 of Singapore (the "FAA"), the Financial Advisers Regulations and the relevant Notices and Guidelines issued thereunder, in respect of any financial advisory service which Credit Suisse AG, Singapore branch may provide to you. This information is being distributed by Credit Suisse AG, Dubai Branch, duly licensed and regulated by the Dubai Financial Services Authority (DFSA), and is directed at Professional Clients or Market Counterparties only, as defined by the DFSA. The financial products or financial services to which the information relates will only be made available to a client who meets the regulatory criteria to be a Professional Client or Market Counterparty only, as defined by the DFSA, and is not intended for any other person. This research may not conform to Canadian disclosure requirements. In jurisdictions where CS is not already registered or licensed to trade in securities, transactions will only be effected in accordance with applicable securities legislation, which will vary from jurisdiction to jurisdiction and may require that the trade be made in accordance with applicable exemptions from registration or licensing requirements. Non-U.S. customers wishing to effect a transaction should contact a CS entity in their local jurisdiction unless governing law permits otherwise. U.S. customers wishing to effect a transaction should do so only by contacting a representative at Credit Suisse Securities (USA) LLC in the U.S. Please note that this research was originally prepared and issued by CS for distribution to their market professional and institutional investor customers. Recipients who are not market professional or institutional investor customers of CS should seek the advice of their independent financial advisor prior to taking any investment decision based on this report or for any necessary explanation of its contents. This research may relate to investments or services of a person outside of the UK or to other matters which are not authorised by the Prudential Regulation Authority and regulated by the Financial Conduct Authority and the Prudential Regulation Authority or in respect of which the protections of the Prudential Regulation Authority and Financial Conduct Authority for private customers and/or the UK compensation scheme may not be available, and further details as to where this may be the case are available upon request in respect of this report. CS may provide various services to US municipal entities or obligated persons ("municipalities"), including suggesting individual transactions or trades and entering into such transactions. Any services CS provides to municipalities are not viewed as "advice" within the meaning of Section 975 of the Dodd-Frank Wall Street Reform and Consumer Protection Act. CS is providing any such services and related information solely on an arm's length basis and not as an advisor or fiduciary to the municipality. In connection with the provision of the any such services, there is no agreement, direct or indirect, between any municipality (including the officials, management, employees or agents thereof) and CS for CS to provide advice to the municipality. Municipalities should consult with their financial, accounting and legal advisors regarding any such services provided by CS. In addition, CS is not acting for direct or indirect compensation to solicit the municipality on behalf of an unaffiliated broker, dealer, municipal securities dealer, municipal advisor, or investment adviser for the purpose of obtaining or retaining an engagement by the municipality for or in connection with Municipal Financial Products, the issuance of municipal securities, or of an investment adviser to provide investment advisory services to or on behalf of the municipality. If this report is being distributed by a financial institution other than Credit Suisse AG, or its affiliates, that financial institution is solely responsible for distribution. Clients of that institution should contact that institution to effect a transaction in the securities mentioned in this report or require further information. This report does not constitute investment advice by Credit Suisse to the clients of the distributing financial institution, and neither Credit Suisse AG, its affiliates, and their respective officers, directors and employees accept any liability whatsoever for any direct or consequential loss arising from their use of this report or its content. Principal is not guaranteed. Commission is the commission rate or the amount agreed with a customer when setting up an account or at any time after that. Copyright © 2015 CREDIT SUISSE AG and/or its affiliates. All rights reserved.
Investment principal on bonds can be eroded depending on sale price or market price. In addition, there are bonds on which investment principal can be eroded due to changes in redemption amounts. Care is required when investing in such instruments. When you purchase non-listed Japanese fixed income securities (Japanese government bonds, Japanese municipal bonds, Japanese government guaranteed bonds, Japanese corporate bonds) from CS as a seller, you will be requested to pay the purchase price only.