CMBS Market Watch Weekly - Credit Suisse
17
ANALYST CERTIFICATIONS AND IMPORTANT DISCLOSURES ARE IN THE DISCLOSURE APPENDIX. FOR OTHER IMPORTANT DISCLOSURES, PLEASE REFER TO https://firesearchdisclosure.credit-suisse.com . CMBS Market Watch Weekly Structured Products Americas Market Monitor Interest in higher-yielding CMBS bonds remained strong this week and the focus shifted down the capital structure slightly to encompass originally AA- rated and A-rated bonds. Relative to these bonds, the top of the capital structure appeared to lag a little and we believe spreads on these bonds will tighten further. On the week, super senior AAAs tightened 10bp to S+240bp. The third quarter flow of funds data released by the Federal Reserve showed that most CRE lenders are still in a deleveraging mode; however, CMBS originators and life insurance companies should lead the way out of this phase in terms of CRE lending outside of multi-family properties. A/B note splits, a game change for credit IOs With the majority of CMBS losses from delinquent loans yet to be realized, a large number of the most junior classes in CMBS trusts are priced like strips of interest without expecting any principal recovery, the so called “credit IOs.” We think that the increase in loan modifications involving A/B note splits and/or rate reductions should have a material impact on such classes, in particular with respect to interest shortfall recoveries. CMBS and CMBX Spreads and Prices ∆ bps ∆ bps ∆ bps ∆ bps ∆ $ ∆ $ ∆ $ CMBS Spreads 12/09/10 12/02/10 11/10/10 12/09/10 12/02/10 11/10/10 12/09/10 12/02/10 CMBX.4 12/09/10 12/02/10 11/10/10 AAA 5y r 293 -8 -12 275 0 0 CMBX.NA.AAA 95.13 -0.17 0.34 AAA 10yr (Super SR)* 250 -17 -30 240 -10 -25 CMBX.NA.AM 87.19 -0.29 0.33 AAA 10yr (AM) 415 -32 -120 405 -25 -115 $96 +$1 CMBX.NA.AJ 72.04 0.83 -1.64 AAA 10yr (Juni or ) 900 -87 -190 890 -80 -185 $75 +$2 CMBX.NA.AA 49.17 1.93 0.63 AA 10yr 2790 -112 -685 2780 -105 -680 $33 +$1 CMBX.NA.A 39.75 1.04 -0.11 A 10yr 3570 -152 -705 3560 -145 -700 $25 +$1 CMBX.NA.BBB 20.15 0.01 -0.37 BBB 10yr na na na na na na $7 --- CMBX.NA.BBB- 19.00 -0.05 -0.88 BBB- 10yr na na na na na na $5 --- CMBX.NA.BB 5.00 0.00 0.00 BB 10yr na na na $2 --- Source: M arkit B 10yr na na na $1 --- PAC IO 300 0 0 CMBS ∆ bps ∆ bps Support IO 790 0 -10 Credit Curve 12/09/10 12/02/10 11/10/10 St rip IO 790 0 -10 AAA 5y r/10y r -1 -11 -16 AAA/AA 2506 -94 -664 Interest-Rate Swap Spreads to UST AA/A 780 -40 -20 5y r Sw ap 18 -8 -12 10y r Sw ap 10 -7 -5 SWAP SWAP UST PRICE PRICE * 2006+ TRX constituents. Source: Credit Suisse 10 December 2010 Fixed Income Research http://www.credit-suisse.com/researchandanalytics Contributors Serif Ustun, CFA Vice President +1 212 538 4582 [email protected] Sylvain Jousseaume Vice President +1 212 325 1356 [email protected] Tee Chew Associate +1 212 325 8703 [email protected]
-
Upload
khangminh22 -
Category
Documents
-
view
1 -
download
0
Transcript of CMBS Market Watch Weekly - Credit Suisse

ANALYST CERTIFICATIONS AND IMPORTANT DISCLOSURES ARE IN THE DISCLOSURE APPENDIX. FOR OTHER IMPORTANT DISCLOSURES, PLEASE REFER TO https://firesearchdisclosure.credit-suisse.com.
CMBS Market Watch Weekly Structured Products Americas
Market Monitor Interest in higher-yielding CMBS bonds remained strong this week and the focus shifted down the capital structure slightly to encompass originally AA-rated and A-rated bonds. Relative to these bonds, the top of the capital structure appeared to lag a little and we believe spreads on these bonds will tighten further. On the week, super senior AAAs tightened 10bp to S+240bp.
The third quarter flow of funds data released by the Federal Reserve showed that most CRE lenders are still in a deleveraging mode; however, CMBS originators and life insurance companies should lead the way out of this phase in terms of CRE lending outside of multi-family properties.
A/B note splits, a game change for credit IOs With the majority of CMBS losses from delinquent loans yet to be realized, a large number of the most junior classes in CMBS trusts are priced like strips of interest without expecting any principal recovery, the so called “credit IOs.” We think that the increase in loan modifications involving A/B note splits and/or rate reductions should have a material impact on such classes, in particular with respect to interest shortfall recoveries.
CMBS and CMBX Spreads and Prices
∆ bps ∆ bps ∆ bps ∆ bps ∆ $ ∆ $ ∆ $CMBS Spreads 12/09/10 12/02/10 11/10/10 12/09/10 12/02/10 11/10/10 12/09/10 12/02/10 CMBX.4 12/09/10 12/02/10 11/10/10AAA 5y r 293 -8 -12 275 0 0 CMBX.NA.AAA 95.13 -0.17 0.34AAA 10y r (Super SR)* 250 -17 -30 240 -10 -25 CMBX.NA.AM 87.19 -0.29 0.33AAA 10y r (AM) 415 -32 -120 405 -25 -115 $96 +$1 CMBX.NA.AJ 72.04 0.83 -1.64AAA 10y r (Junior) 900 -87 -190 890 -80 -185 $75 +$2 CMBX.NA.AA 49.17 1.93 0.63AA 10y r 2790 -112 -685 2780 -105 -680 $33 +$1 CMBX.NA.A 39.75 1.04 -0.11A 10y r 3570 -152 -705 3560 -145 -700 $25 +$1 CMBX.NA.BBB 20.15 0.01 -0.37BBB 10y r na na na na na na $7 --- CMBX.NA.BBB- 19.00 -0.05 -0.88BBB- 10y r na na na na na na $5 --- CMBX.NA.BB 5.00 0.00 0.00BB 10y r na na na $2 --- Source: M arkit
B 10y r na na na $1 ---PAC IO 300 0 0 CMBS ∆ bps ∆ bpsSupport IO 790 0 -10 Credit Curve 12/09/10 12/02/10 11/10/10Strip IO 790 0 -10 AAA 5y r/10y r -1 -11 -16
AAA/AA 2506 -94 -664Interest-Rate Swap Spreads to UST AA/A 780 -40 -205y r Sw ap 18 -8 -1210y r Sw ap 10 -7 -5
SWAP
SWAPUST PRICEPRICE
* 2006+ TRX constituents. Source: Credit Suisse
10 December 2010Fixed Income Research
http://www.credit-suisse.com/researchandanalytics
Contributors Serif Ustun, CFA
Vice President +1 212 538 4582
Sylvain Jousseaume Vice President
+1 212 325 1356 [email protected]
Tee Chew Associate
+1 212 325 8703 [email protected]
10 December 2010
CMBS Market Watch Weekly 2
Market Monitor Interest in higher-yielding CMBS bonds remained strong this week and the focus shifted down the capital structure slightly from AMs and AJs to include originally AA-rated and A-rated bonds. We estimate AMs gained $1 on the week to $96 and AJs $2 to $75. Originally AA-rated and A-rated bonds also gained $1 on average over the past week. Relative to these bonds, the top of the capital structure appeared to lag a little. Recent vintage super senior AAAs tightened 10bp, spread-wise, to S+240bp, with bonds that were perceived to be weaker tightening more. CMBX was a mixed bag this week; most of the more seasoned CMBX.1 tranches sold off and the more recent CMBX.3-5 “middle” tranches – the AJ, AA and A – rallied.
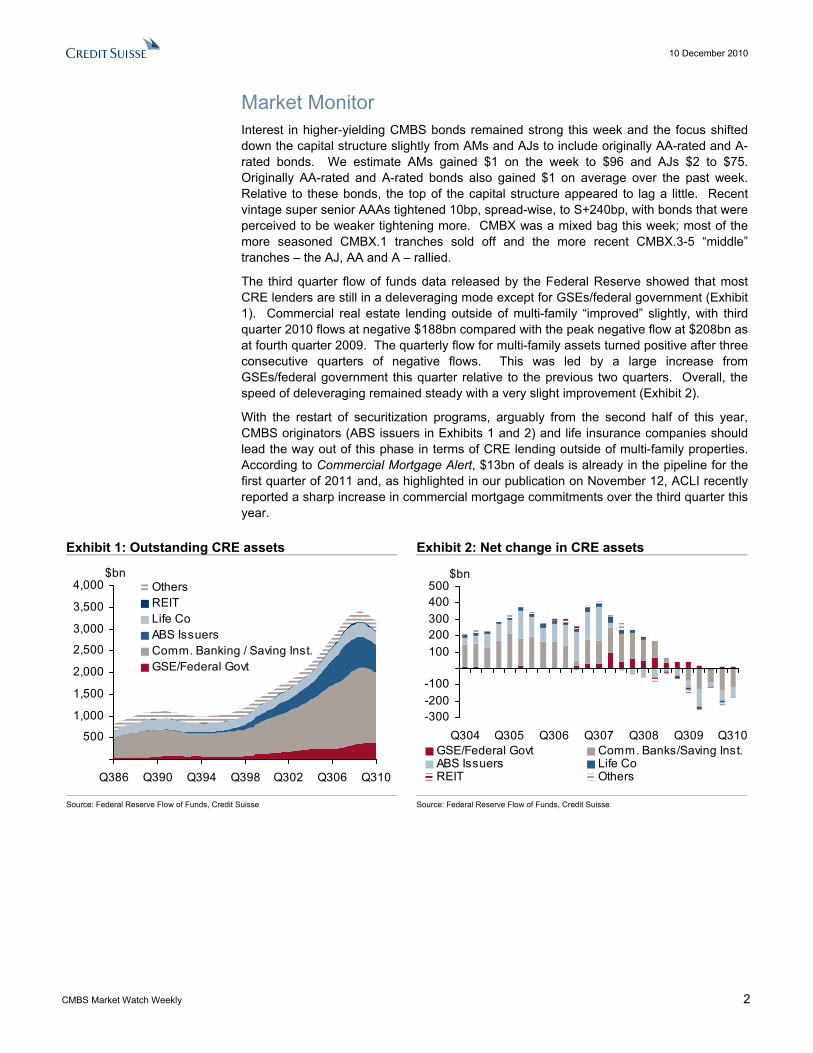
The third quarter flow of funds data released by the Federal Reserve showed that most CRE lenders are still in a deleveraging mode except for GSEs/federal government (Exhibit 1). Commercial real estate lending outside of multi-family “improved” slightly, with third quarter 2010 flows at negative $188bn compared with the peak negative flow at $208bn as at fourth quarter 2009. The quarterly flow for multi-family assets turned positive after three consecutive quarters of negative flows. This was led by a large increase from GSEs/federal government this quarter relative to the previous two quarters. Overall, the speed of deleveraging remained steady with a very slight improvement (Exhibit 2).
With the restart of securitization programs, arguably from the second half of this year, CMBS originators (ABS issuers in Exhibits 1 and 2) and life insurance companies should lead the way out of this phase in terms of CRE lending outside of multi-family properties. According to Commercial Mortgage Alert, $13bn of deals is already in the pipeline for the first quarter of 2011 and, as highlighted in our publication on November 12, ACLI recently reported a sharp increase in commercial mortgage commitments over the third quarter this year.
Exhibit 1: Outstanding CRE assets Exhibit 2: Net change in CRE assets
500
1,000
1,500
2,000
2,500
3,000
3,500
4,000
Q386 Q390 Q394 Q398 Q302 Q306 Q310
OthersREITLife CoABS IssuersComm. Banking / Saving Inst.GSE/Federal Govt
$bn
-300-200-100
100200300400500
Q304 Q305 Q306 Q307 Q308 Q309 Q310GSE/Federal Govt Comm. Banks/Saving Inst.ABS Issuers Life CoREIT Others
$bn
Source: Federal Reserve Flow of Funds, Credit Suisse Source: Federal Reserve Flow of Funds, Credit Suisse

10 December 2010
CMBS Market Watch Weekly 3
A/B note splits could be a game change for “credit IOs” With the majority of CMBS losses from delinquent loans yet to be realized, a large number of the most junior classes in CMBS trusts are priced like strips of interest without expecting any principal recovery, the so called “credit IOs.” We think that the increase in loan modifications involving A/B note splits should have a material impact on such classes, in particular with respect to interest shortfall recoveries.
While it is apparent that rate modifications will create non-recoverable interest shortfalls at the bottom of the capital stack, the mechanics and effects of A/B note splits are more convoluted. To create a framework for understanding this process, we consider a hypothetical CMBS transaction that includes three sub-pools of performing loans of equal aggregate balance: pools X, Y and Z. Similarly, the bond capital structure is simplified, with only six equal size, sequential pay certificates, with Class A the most senior class and Class F the most junior class (Exhibit 3). All certificates and loans are assumed to be paying a 6.25% coupon. The lifespan of the deal is six years, grouped into three periods of 24 months each in which key events occur (i.e., delinquency, modification, liquidation and maturity).
Exhibit 3: Sample Transaction Tranches Collateral Period Class A $50mn, 6.25% coupon Pool X ($100mn, 6.25% coupon, full IO) Period 1: Year 1 & 2Class B $50mn, 6.25% coupon Pool Y ($100mn, 6.25% coupon, full IO) Period 2: Year 3 & 4Class C $50mn, 6.25% coupon Pool Z ($100mn, 6.25% coupon, full IO) Period 3: Year 5 & 6Class D $50mn, 6.25% coupon Class E $50mn, 6.25% coupon Class F $50mn, 6.25% coupon Source: Credit Suisse
We examine the principal and interest cash flow profiles under two scenarios. In the first scenario, any delinquent loans go through the typical delinquency/foreclosure/REO/liquidation cycle without any modification (Scenario 1). The second scenario involves loan modifications for some of the delinquent loans (Scenario 2).
In Scenario 1, we assume that two pools (Y and Z) become delinquent at the end of the first period, with the servicer only advancing 50% during period 2 based on the appraisal reduction amount, implying 50% ASER1. Consequently the most junior classes, E and F, do not receive any interest during period 2.
The delinquent pools Y and Z are liquidated at the end of period 2 with only 50% of the balance recovered, in line with the appraisal reduction.
As discussed in one of our previous reports (“Focus on Appraisal Reductions and Shortfalls”, July 16, 2010), any loan recoveries are applied first to repay servicer advancing and unpaid accrued interest shortfall. As a result, all interest shortfalls on Classes E and F are recovered at the end of period 2 and the effective principal severity increases to 62.5% (Exhibit 5).2
At the deal level, 62.5% severity on two-thirds of the collateral equals approximately a 42% write-down, wiping out the entire Classes E and F, and writing down Class D by half. The principal recoveries equal 25% of deal balance, resulting in full paydown of Class A and 50% of Class B (Exhibit 4).
1 ASER, or Appraisal Subordination Entitlement Reduction, is a fraction of interest due on the mortgage asset that is not advanced
by servicers to alleviate losses. 2 50% recovered net from 6.25% x 2 years is 37.5% principal recovered for the CMBS bonds (i.e., 62.5% loss severity).
Developing a framework for
implications of A/B note splits
Scenario 1: shortfall
recoveries

10 December 2010
CMBS Market Watch Weekly 4
At the end of period 3, pool X is paid off, retiring all outstanding classes.
Exhibit 4: Profile of principal balances when there are no A/B splits
Source: Credit Suisse
Exhibit 5: Profile of interest accruals when there are no A/B splits
Source: Credit Suisse
In Scenario 2, we assume all the loans in pool Y turn delinquent at the end of period 1. All such loans are modified shortly thereafter using an A/B note split strategy. The pool Z is unchanged, with default by the end of period 1 and liquidation by the end of period 2. Similarly, pool X continues to perform (Exhibit 6).
A/B note splits for pool Y are scaled to 50% using property appraisals and anticipated recovery amounts. The servicer advances interest payments on the A-notes of pool Y. The B-notes accrue without an effective interest payment (a hope note, Exhibit 7).
By the end of period 2, pool Z is liquidated with all associated accruals and advances repaid. The deal is written down 21%; 12.5% is recovered from the loans and used to pay down 75% of Class A. However, the modified pool Y remains outstanding until maturity at the end of period 3.
At the end of period 3, pool X balloons as anticipated. For pool Y, we assume that no progress was made on the properties and only 50% can be recovered upon liquidation. At this particular point, a major difference compared to Scenario 1 arises, namely modification loan terms and CMBS pooling and servicing agreements typically state that proceeds for pool Y should be applied as follows:
1. Interest advances and unpaid interest on the A-note;
2. Principal balance of the A-note;
3. Interest advances and unpaid interest on the B-note; and
4. Principal balance of the B-note.
Scenario 2: permanent
shortfall

10 December 2010
CMBS Market Watch Weekly 5
In the case of pool Y, we find that 12.5% of the initial pool balance is applied to repay the A-note accruals and 37.5% is applied to repay a fraction of the A-note balance. The B-note does not receive any proceeds.
Based on these rules, none of the interest shortfalls on Class F are recovered at the end of period 2. Similarly, Class E will not recover interest accrued in period 3 and Class D will not recover 25% of the interest accrued in the same period.
At the deal level, a 62.5% severity on two-thirds of the collateral generates an additional 21% write-down, setting the cumulative write-down at 42%.
Exhibit 6: Profile of principal balances when there are A/B splits
Source: Credit Suisse
Exhibit 7: Profile of interest distributions when there are A/B splits
Source: Credit Suisse

10 December 2010
CMBS Market Watch Weekly 6
Comparing Scenario 2 with Scenario 1, we note the following differences:
• The full repayment of Class A is postponed to the end of period 3 in Scenario 2. • Classes D and E experience non-recoverable interest shortfalls during period 3. • Class F’s interest shortfall during period 2 is not recoverable.
In the light of those observations, our conclusions about CMBS performance are as follows:
• The increase in A/B splits modifications should delay the repayment speed of shorter super senior classes. In particular, loans that were initially expected to be liquidated over the medium term could now extend to their full initial maturity. This could increase the value of select premium short bonds.
• The increase in A/B splits modifications should delay the write-down of underwater classes and reduce interest shortfall recoveries. We recommend that investors considering the purchase of a subordinated class screen the transaction for any potential large loan modification in the deal, especially if the class credit support is close to or below expected loss levels. Indeed, if one had bought Class F by the end of period 1, expecting an additional 24 months of interest, one would face very low recovery on investment in Scenario 2.
The effect on total write-down at the deal level is harder to assess and is likely to vary depending on the specifics of the loan: the expected increase in resolution lag, the location of the A/B split cut and whether the additional time and sponsor incentive will materialize into better loan recoveries.
Over the past quarter, trustees have reported an increasing number of loan modifications. In particular, A/B note splits seem to be gaining traction, with $1,538mn realized in the second half of this year so far compared with $115mn done in the first half of 2010.
Consider MSC 2007-HQ12 as an example, in which November interest shortfalls reached to Class D with a $698,128 monthly amount. Of that amount, $264,126 (38%) came from special servicing fees, $387,156 (55%) was attributable to the deferred interest on the hope note created from the Columbia Center loan modification3 and $46,847 (7%) resulted from ASER on other loans4. Had the Columbia Center A/B split not occurred, we would have expected to recover this fraction of interest shortfall at liquidation with very high certainty; we now believe that this amount could be facing tangible risks of non-recoverability, depending on whether the A-Note can be fully recovered.
3 Appraisal reduction reported on 8/20, modification reported on 9/17 4 $32,705 from North Main Office, $8,495 from Overland Retail Plaza and $5,647 from Whispering Wind Drive.
Watch out for deep credit IOs
A/B splits and modifications are
increasing

10 December 2010
CMBS Market Watch Weekly 7
TECHNICAL UPDATE Exhibit 8: Americold 2010 LLC Trust, 2010-ART Priced: December 9, 2010
Tranche Size($mn) Fitch S&P Realpoint Subordination Average Life (yr.) Pricing Spread (bp)A-1 157.066 AAA AAA AAA 34.17 5.53 S+160
A-2FX 150.334 AAA AAA AAA 34.17 10.08 S+170 A-2FL 87.600 AAA AAA AAA 34.17 10.08 L+150
B 60.000 AA AA AA 24.17 10.08 S+280 C 62.400 A A A 13.77 10.08 S+360 D 82.600 BBB- BBB- BBB- 0.00 10.08 S+425
Property types: Warehouse (100%). Concentrations: Pennsylvania (21.9%), California (21.7%), Texas (16%) and Wisconsin (11.4%). Loan Contributor: Americold, an Atlanta REIT. Source: Credit Suisse
Exhibit 9: Recent CMBS transactions
Deal Deal Type Date Priced Thickest
AAA Tranche Subordination of the
AAA Tranche (%) Average Life (yr) Pricing Spread (bp) /
Yield (%) ACRE 2010-ART Single Borrower 12/9/10 A-2FX 34.17 10.1 Swaps+170 BALL 2010-HLTN Floater 11/18/10 Single Class 0.00 2.9 7.5% ESA 2010-ESH Single Borrower 11/3/10 A 40.00 4.7 Swaps+165 WFCMT 2010-C1 Multi Borrower 10/28/10 A-2 17.75 9.7 Swaps+135 COMM 2010-C1 Multi Borrower 10/20/2010 A-3 17.38 9.6 Swaps+140 JPMCC 2010-C2 Multi Borrower 10/7/2010 A-3 18.25 9.8 Swaps+150 JPMCC 2010-CNTR Single Borrower 9/1/2010 A-2 29.40 9.8 Swaps+165 VNO 2010-VNO Single Borrower 8/10/2010 A-2FX 23.59 10.1 Swaps+120 GSMC 2010-C1 Multi Borrower 8/4/2010 A-2 18.50 9.9 Swaps+135 OBP 2010-OBP Single Borrower 6/25/2010 Single Class 0.00 10.0 Swaps+150 JPMCC 2010-C1 Multi Borrower 6/11/2010 A-3 15.00 9.5 Swaps+165 RBSCF 2010-MB1* Multi Borrower 4/9/2010 A-2 22.25 4.9 Swaps+90 JPMCC 2009-IWST Single Borrower 12/10/2009 A-2 22.20 10.0 Swaps+205 BALL 2009-FDG* Single Borrower 12/3/2009 A 23.91 6.7 Swaps+225 * Please note the mismatch in average life and generic spreads. Source: Credit Suisse
Exhibit 10: US CMBS pipeline Deals in Q4 2010 Deal Type Rate Type Estimated Size ($bn) GSMS 2010-C2 Multiple borrower Fixed 0.88 Deals in Q1 2011 Deal Type Rate Type Estimated Size ($bn) Deutsche Bank, UBS, Ladder Multiple borrower Fixed 2.90 Morgan Stanley, Bank of America Multiple borrower Fixed 1.80 Wells Fargo, RBS, Basis Capital, Natixis Multiple borrower Fixed 1.70 J.P. Morgan Multiple borrower Fixed 1.50 Hines partnership (California office portfolio) Single borrower Fixed 1.50 Genesis Healthcare/JER (healthcare portfolio) Single borrower Fixed 1.50 Goldman Sachs Multiple borrower Fixed 1.25 Cerberus Partners/Kyo-ya (hotel portfolio) Single borrower Fixed 0.90 Total Pipeline 13.93 Source: Commercial Mortgage Alert
10 December 2010
CMBS Market Watch Weekly 8
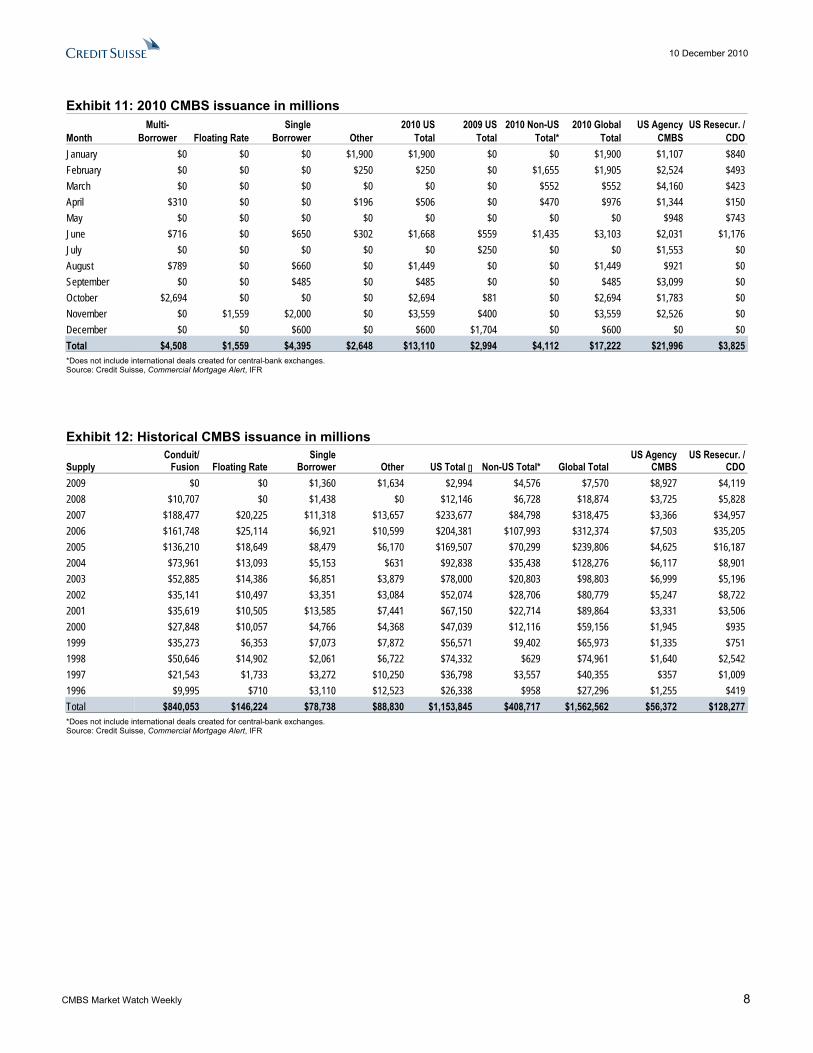
Exhibit 11: 2010 CMBS issuance in millions
Month Multi-
Borrower Floating Rate Single
Borrower Other2010 US
Total2009 US
Total2010 Non-US
Total*2010 Global
Total US Agency
CMBSUS Resecur. /
CDOJanuary $0 $0 $0 $1,900 $1,900 $0 $0 $1,900 $1,107 $840 February $0 $0 $0 $250 $250 $0 $1,655 $1,905 $2,524 $493 March $0 $0 $0 $0 $0 $0 $552 $552 $4,160 $423 April $310 $0 $0 $196 $506 $0 $470 $976 $1,344 $150 May $0 $0 $0 $0 $0 $0 $0 $0 $948 $743 June $716 $0 $650 $302 $1,668 $559 $1,435 $3,103 $2,031 $1,176 July $0 $0 $0 $0 $0 $250 $0 $0 $1,553 $0 August $789 $0 $660 $0 $1,449 $0 $0 $1,449 $921 $0 September $0 $0 $485 $0 $485 $0 $0 $485 $3,099 $0 October $2,694 $0 $0 $0 $2,694 $81 $0 $2,694 $1,783 $0 November $0 $1,559 $2,000 $0 $3,559 $400 $0 $3,559 $2,526 $0 December $0 $0 $600 $0 $600 $1,704 $0 $600 $0 $0 Total $4,508 $1,559 $4,395 $2,648 $13,110 $2,994 $4,112 $17,222 $21,996 $3,825 *Does not include international deals created for central-bank exchanges. Source: Credit Suisse, Commercial Mortgage Alert, IFR
Exhibit 12: Historical CMBS issuance in millions
Supply Conduit/
Fusion Floating Rate Single
Borrower Other US Total [] Non-US Total* Global Total US Agency
CMBSUS Resecur. /
CDO2009 $0 $0 $1,360 $1,634 $2,994 $4,576 $7,570 $8,927 $4,119 2008 $10,707 $0 $1,438 $0 $12,146 $6,728 $18,874 $3,725 $5,828 2007 $188,477 $20,225 $11,318 $13,657 $233,677 $84,798 $318,475 $3,366 $34,957 2006 $161,748 $25,114 $6,921 $10,599 $204,381 $107,993 $312,374 $7,503 $35,205 2005 $136,210 $18,649 $8,479 $6,170 $169,507 $70,299 $239,806 $4,625 $16,187 2004 $73,961 $13,093 $5,153 $631 $92,838 $35,438 $128,276 $6,117 $8,901 2003 $52,885 $14,386 $6,851 $3,879 $78,000 $20,803 $98,803 $6,999 $5,196 2002 $35,141 $10,497 $3,351 $3,084 $52,074 $28,706 $80,779 $5,247 $8,722 2001 $35,619 $10,505 $13,585 $7,441 $67,150 $22,714 $89,864 $3,331 $3,506 2000 $27,848 $10,057 $4,766 $4,368 $47,039 $12,116 $59,156 $1,945 $935 1999 $35,273 $6,353 $7,073 $7,872 $56,571 $9,402 $65,973 $1,335 $751 1998 $50,646 $14,902 $2,061 $6,722 $74,332 $629 $74,961 $1,640 $2,542 1997 $21,543 $1,733 $3,272 $10,250 $36,798 $3,557 $40,355 $357 $1,009 1996 $9,995 $710 $3,110 $12,523 $26,338 $958 $27,296 $1,255 $419 Total $840,053 $146,224 $78,738 $88,830 $1,153,845 $408,717 $1,562,562 $56,372 $128,277 *Does not include international deals created for central-bank exchanges. Source: Credit Suisse, Commercial Mortgage Alert, IFR

10 December 2010
CMBS Market Watch Weekly 9
Exhibit 13: Implied loss analysis as of December 9, 2010
Index Cpn Market
Price Imp
Spread(1) IO
Value(2) PO
Value
Imp Cum Bond Lvl
Loss
Imp Avg Life
Avg Size of the
Tranche(3)Avg CE
Imp Cum Loan Lvl
Loss
Annual Loan Lvl
Loss Rate
Loan Lvl
Severity
Annual Loan Lvl
Dft Rate(4)
CMBX 5 CMBX-NA-AAA 5 35 94.96 117 2.14 92.82 7.18% 6.56 70.50% 29.52% 34.58% 5.27% 60% 8.78%CMBX-NA-AM 5 50 87.17 265 2.98 84.19 15.81% 6.42 10.08% 19.87% 21.46% 3.34% 60% 5.57%CMBX-NA-AJ 5 98 77.27 507 5.44 71.83 28.17% 5.97 7.20% 12.66% 14.69% 2.46% 60% 4.10%CMBX-NA-AA 5 175 60.47 1000 8.38 52.09 47.91% 5.14 1.20% 10.64% 11.21% 2.18% 60% 3.64%CMBX-NA-A 5 350 48.27 1647 13.96 34.31 65.69% 4.26 0.90% 8.00% 8.59% 2.02% 60% 3.36%CMBX-NA-BBB 5 500 20.10 3916 11.70 8.40 91.60% 2.49 1.10% 4.72% 5.73% 2.30% 60% 3.83%CMBX-NA-BBB- 5 500 19.02 4069 11.34 7.68 92.32% 2.42 1.00% 3.68% 4.60% 1.91% 60% 3.18%CMBX-NA-BB 5 500 5.00 11287 4.40 0.60 99.40% 0.97 0.40% 2.69% 3.09% 3.18% 60% 5.30%CMBX 4 CMBX-NA-AAA 4 35 95.13 117 2.07 93.06 6.94% 6.34 70.10% 29.90% 34.77% 5.49% 60% 9.14%CMBX-NA-AM 4 50 87.19 273 2.87 84.32 15.68% 6.16 10.06% 19.99% 21.57% 3.50% 60% 5.84%CMBX-NA-AJ 4 96 72.04 637 4.96 67.08 32.92% 5.53 7.56% 12.33% 14.82% 2.68% 60% 4.47%CMBX-NA-AA 4 165 49.17 1379 6.91 42.26 57.74% 4.47 1.43% 10.23% 11.06% 2.48% 60% 4.13%CMBX-NA-A 4 348 39.75 2054 12.29 27.46 72.54% 3.76 0.97% 7.77% 8.47% 2.25% 60% 3.75%CMBX-NA-BBB 4 500 20.15 3984 11.46 8.69 91.31% 2.44 1.10% 4.44% 5.44% 2.23% 60% 3.72%CMBX-NA-BBB- 4 500 19.00 4149 11.10 7.90 92.10% 2.36 1.08% 3.36% 4.35% 1.84% 60% 3.07%CMBX-NA-BB 4 500 5.00 11303 4.40 0.60 99.40% 0.97 0.31% 2.50% 2.80% 2.89% 60% 4.82%CMBX 3 CMBX-NA-AAA 3 8 95.38 91 0.45 94.93 5.07% 5.93 70.00% 30.00% 33.55% 5.66% 60% 9.43%CMBX-NA-AM 3 50 88.15 269 2.70 85.45 14.55% 5.76 10.12% 20.05% 21.52% 3.74% 60% 6.23%CMBX-NA-AJ 3 147 77.94 592 7.28 70.66 29.34% 5.27 8.46% 11.46% 13.94% 2.65% 60% 4.41%CMBX-NA-AA 3 27 51.04 1186 1.14 49.90 50.10% 4.49 1.61% 9.49% 10.30% 2.29% 60% 3.82%CMBX-NA-A 3 62 38.60 1732 2.28 36.32 63.68% 3.90 1.18% 7.17% 7.92% 2.03% 60% 3.38%CMBX-NA-BBB 3 200 19.16 3398 5.06 14.10 85.90% 2.68 1.02% 3.92% 4.80% 1.79% 60% 2.98%CMBX-NA-BBB- 3 320 16.96 4053 7.12 9.84 90.16% 2.36 1.11% 2.78% 3.78% 1.60% 60% 2.67%CMBX-NA-BB 3 500 5.00 11351 4.38 0.62 99.38% 0.96 0.29% 2.15% 2.44% 2.53% 60% 4.21%CMBX 2 CMBX-NA-AAA 2 7 96.32 78 0.36 95.96 4.04% 5.44 69.60% 30.40% 33.21% 6.10% 60% 10.17%CMBX-NA-AM 2 50 92.21 201 2.57 89.64 10.36% 5.44 10.30% 20.34% 21.41% 3.93% 60% 6.55%CMBX-NA-AJ 2 109 86.67 380 5.36 81.31 18.69% 5.21 7.78% 12.40% 13.85% 2.66% 60% 4.43%CMBX-NA-AA 2 15 73.13 590 0.70 72.43 27.57% 4.94 1.61% 9.49% 9.93% 2.01% 60% 3.35%CMBX-NA-A 2 25 57.80 1035 1.04 56.76 43.24% 4.42 1.18% 7.17% 7.68% 1.74% 60% 2.90%CMBX-NA-BBB 2 60 23.44 2766 1.70 21.74 78.26% 3.00 1.02% 3.92% 4.72% 1.58% 60% 2.63%CMBX-NA-BBB- 2 87 19.04 3224 2.25 16.79 83.21% 2.73 1.11% 2.78% 3.70% 1.35% 60% 2.26%CMBX-NA-BB 2 180 5.00 7063 2.48 2.52 97.48% 1.48 0.29% 2.15% 2.43% 1.64% 60% 2.74%CMBX 1 CMBX-NA-AAA 1 10 97.45 66 0.45 97.00 3.00% 4.74 69.64% 30.36% 32.45% 6.85% 60% 11.41%CMBX-NA-AM 1 50 95.53 147 2.31 93.22 6.78% 4.86 10.41% 20.55% 21.26% 4.37% 60% 7.29%CMBX-NA-AJ 1 84 90.44 297 3.77 86.67 13.33% 4.72 7.36% 12.77% 13.75% 2.91% 60% 4.85%CMBX-NA-AA 1 25 81.02 462 1.08 79.94 20.06% 4.56 1.65% 10.63% 10.96% 2.40% 60% 4.01%CMBX-NA-A 1 35 70.61 758 1.42 69.19 30.81% 4.27 1.49% 7.88% 8.34% 1.95% 60% 3.25%CMBX-NA-BBB 1 76 40.48 1916 2.46 38.02 61.98% 3.41 1.03% 4.58% 5.21% 1.53% 60% 2.55%CMBX-NA-BBB- 1 134 28.75 2599 3.87 24.88 75.12% 3.06 1.18% 3.39% 4.27% 1.40% 60% 2.33%We assume zero prepayment on the underlying loans, which, unless they otherwise go into default, will be paid off as scheduled. Detailed loan-level information can be found in Trepp or Intex.(1) Assumes a flat constant default curve, with default occurring immediately (2) Based on coupon (3) As a % of entire capital structure, and also include pari passu tranches (4) As a % of current balance
Source: Credit Suisse

10 December 2010
CMBS Market Watch Weekly 10
Relative Value Monitor Exhibit 14: 10-Year sector – CMBS, REIT, and corporate spreads
0
100
200
300
400
500
600
700
800
10/30/09 12/14/09 1/28/10 3/14/10 4/28/10 6/12/10 7/27/10 9/10/10 10/25/10 12/9/10
Spre
ads
to U
ST
0
100
200
300
400
500
600
700
800
Spreads to UST
CMBS AAA
REIT BBB Index
Corporate A
Source: Credit Suisse
Exhibit 15: 5-Year sector Exhibit 16: 10-Year sector ∆ bps ∆ bps 3-month 12/09/10 12/02/10 11/04/10 Hi Lo Avg UST Yield 1.90 % +22 +57 1.90 1.03 1.38 Swap 18bp -8 -12 30 18 25 AAA CMBS 293 -8 -12 310 261 297 Agency 19 0 -0 29 19 22 LUCI Single-A 94 -4 +4 106 90 97
∆ bps ∆ bps 3-month 12/09/10 12/02/10 11/04/10 Hi Lo Avg
UST Yield 3.22 % +22 +49 3.22 2.49 2.76 Swap 10bp -8 -6 17 6 12 AAA CMBS 250 -17 -15 276 250 263 Agency 17 -1 +3 21 12 16 FNMA DUS 80 -7 -15 95 80 88 LUCI Single-A 115 -6 +11 121 104 113
Liquid U.S. Corporate Index is an investment grade, corporate bond index consisting of ~800 liquid, US dollar-denominated issues, priced daily and rebalanced monthly by Credit Suisse. Source: Credit Suisse
Liquid U.S. Corporate Index is an investment grade, corporate bond index consisting of ~800 liquid, US dollar-denominated issues, priced daily and rebalanced monthly by Credit Suisse. Source: Credit Suisse

10 December 2010
CMBS Market Watch Weekly 11
Exhibit 17: AAA and AJ CMBX-2, 3, 4 prices
$20$30$40$50$60$70$80$90
$100
8/19/10 8/26/10 9/2/10 9/9/10 9/16/10 9/23/10 9/30/10 10/7/10 10/14/10 10/21/10 10/28/10 11/4/10 11/11/10 11/18/10 11/25/10 12/2/10 12/9/10$20$30$40$50$60$70$80$90$100
CMBX-NA-AAA 2 CMBX-NA-AAA 3 CMBX-NA-AAA 4CMBX-NA-AJ 2 CMBX-NA-AJ 3 CMBX-NA-AJ 4
Prices before April 20, 2009 are based on Credit Suisse estimates . Source: Credit Suisse
Exhibit 18: AA & A CMBX-2, 3, 4 prices
$20
$30
$40
$50
$60
$70
$80
8/19/10 8/26/10 9/2/10 9/9/10 9/16/10 9/23/10 9/30/10 10/7/10 10/14/10 10/21/10 10/28/10 11/4/10 11/11/10 11/18/10 11/25/10 12/2/10 12/9/10$20
$30
$40
$50
$60
$70
$80CMBX-NA-AA 2 CMBX-NA-A 2CMBX-NA-AA 3 CMBX-NA-A 3CMBX-NA-AA 4 CMBX-NA-A 4
Prices before April 20, 2009 are based on Credit Suisse estimates . Source: Credit Suisse
Exhibit 19: BBB, BBB- and BB CMBX-2, 3, 4 Prices
$0
$5
$10
$15
$20
$25
$30
$35
8/19/10 8/26/10 9/2/10 9/9/10 9/16/10 9/23/10 9/30/10 10/7/10 10/14/10 10/21/10 10/28/10 11/4/10 11/11/10 11/18/10 11/25/10 12/2/10 12/9/10$0
$5
$10
$15
$20
$25
$30
$35CMBX-NA-BBB 2 CMBX-NA-BBB- 2 CMBX-NA-BB 2CMBX-NA-BBB 3 CMBX-NA-BBB- 3 CMBX-NA-BB 3CMBX-NA-BBB 4 CMBX-NA-BBB- 4 CMBX-NA-BB 4
Prices before April 20, 2009 are based on Credit Suisse estimates . Source: Credit Suisse

10 December 2010
CMBS Market Watch Weekly 12
Exhibit 20: CMBX prices as at December 9, 2010 CMBX 5 (CMBX 2008-1) AAA AM AJ AA A BBB BBB- BB Current Price 94.96 87.17 77.27 60.47 48.27 20.10 19.02 5.00 Change vs. Prior Week -0.02 -0.26 0.57 0.79 0.86 -0.02 -0.08 0.00 Minimum (18 mo.) 67.72 68.38 28.60 17.02 15.00 11.27 10.54 5.00 Maximum (18 mo.) 96.41 89.90 80.86 60.83 48.27 22.70 21.07 6.61 Average (18 mo.) 85.04 79.46 55.70 36.44 29.29 18.18 16.96 5.34 Standard Deviation 6.52 5.78 11.14 9.93 7.90 2.51 2.52 0.49 # of Std. Dev. 1.52 1.33 1.94 2.42 2.40 0.77 0.82 -0.69 CMBX 4 (CMBX 2007-2) AAA AM AJ AA A BBB BBB- BB Current Price 95.13 87.19 72.04 49.17 39.75 20.15 19.00 5.00 Change vs. Prior Week -0.17 -0.29 0.83 1.93 1.04 0.01 -0.05 0.00 Minimum (18 mo.) 67.73 65.07 28.52 17.11 15.04 11.27 10.54 5.00 Maximum (18 mo.) 96.14 89.17 75.79 50.75 45.38 22.56 21.14 6.64 Average (18 mo.) 84.33 77.51 52.08 33.53 27.13 18.01 16.97 5.33 Standard Deviation 6.49 6.28 9.94 7.78 6.88 2.56 2.62 0.49 # of Std. Dev. 1.67 1.54 2.01 2.01 1.84 0.84 0.78 -0.68 CMBX 3 (CMBX 2007-1) AAA AM AJ AA A BBB BBB- BB Current Price 95.38 88.15 77.94 51.04 38.60 19.16 16.96 5.00 Change vs. Prior Week -0.19 -0.40 0.58 1.04 0.74 0.07 0.05 0.00 Minimum (18 mo.) 69.61 68.86 30.21 17.33 14.98 11.43 10.54 5.00 Maximum (18 mo.) 96.66 89.98 80.94 52.10 40.14 23.13 20.31 6.79 Average (18 mo.) 85.75 80.58 56.04 34.08 25.80 16.79 15.06 5.33 Standard Deviation 6.08 5.68 10.89 7.58 5.60 2.43 1.94 0.50 # of Std. Dev. 1.58 1.33 2.01 2.24 2.29 0.97 0.98 -0.67 CMBX 2 (CMBX 2006-2) AAA AM AJ AA A BBB BBB- BB Current Price 96.32 92.21 86.67 73.13 57.80 23.44 19.04 5.00 Change vs. Prior Week -0.34 -0.41 0.44 0.06 0.25 0.25 0.11 0.00 Minimum (18 mo.) 76.38 76.68 40.92 24.38 18.17 12.40 10.81 4.52 Maximum (18 mo.) 97.00 93.93 89.75 76.79 61.35 26.36 22.70 5.66 Average (18 mo.) 89.87 85.43 67.76 48.57 38.23 20.66 16.64 5.02 Standard Deviation 4.32 4.94 11.71 12.61 10.39 3.38 2.43 0.10 # of Std. Dev. 1.49 1.37 1.61 1.95 1.88 0.82 0.99 -0.22 CMBX 1 (CMBX 2006-1) AAA AM AJ AA A BBB BBB- Current Price 97.45 95.53 90.44 81.02 70.61 40.48 28.75 Change vs. Prior Week -0.20 -0.24 -0.45 -0.77 -0.39 0.36 0.54 Minimum (18 mo.) 84.43 84.69 50.32 36.00 26.52 17.02 14.09 Maximum (18 mo.) 98.04 96.00 92.52 86.17 73.96 44.46 32.19 Average (18 mo.) 92.99 89.86 77.37 62.36 51.44 31.30 24.23 Standard Deviation 2.77 3.65 9.17 12.02 10.78 6.38 4.07 # of Std. Dev. 1.61 1.55 1.42 1.55 1.78 1.44 1.11 Prices before April 20, 2009 are based on Credit Suisse estimates. CMBX 2007-1 AJ and CMBX 2007-2 AJ were added on January 4, 2008. CMBX 2007-1 AM and CMBX 2007-2 AM were added on February 9, 2010 Source: Credit Suisse

10 December 2010
CMBS Market Watch Weekly 13
Exhibit 21: CMBS historical spreads CMBS Spreads - Change on the YearSPREAD TO SWAPS 5AAA 10AAA 10AA 10A 10BBB 10BBB-12/9/2010 275 240 2780 3560 na na12/30/2009 350 300 3525 4825 na naChange (75) (60) (745) (1265) na na
SPREAD TO UST 5AAA 10AAA 10AA 10A 10BBB 10BBB-12/9/2010 293 250 2790 3570 na na12/30/2009 381 514 3539 4839 na naChange (88) (264) (749) (1269) na na
SWAP SPREADS 5yr Sw ap 10yr Sw ap12/9/2010 18 1012/30/2009 31 14Change (13) (4)CMBS Spread to Swaps History
5AAA 10AAA 10AA 10A 10BBB 10BBB-YTD Average 275 312 3381 4443 na naRange 235 - 350 220 - 415 2780 - 3525 3560 - 4900 na na2009 Average 736 634 4029 5729 na naRange 350-1450 300-1200 3000-5500 3900-8100 na na2008 Average 466 365 1362 1807 2747 3202Range 125-1500 82-1400 275-5500 400-6500 825-9000 950-97002007 Average 49 44 101 142 315 386Range 16-125 21-105 33-260 42-380 65-900 85-10002006 Average 17 26 38 47 87 122Range 14 - 22 22 - 32 32 - 51 40 - 61 75 - 120 85 - 1752005 Average 19 28 41 51 103 151Range 16 - 25 22 - 34 28 - 49 36 - 59 80 - 122 125 - 1752004 Average 28 30 37 45 84 126Range 24 - 33 26 - 35 32 - 43 40 - 54 75 - 95 115 - 1352003 Average 36 37 47 56 111 162Range 28 - 45 29 - 47 36 - 61 44 - 77 85 - 140 130 - 1852002 Average 44 47 59 73 121 155Range 38 - 51 42 - 54 52 - 74 62 - 95 105 - 150 135 - 1862001 Average 46 52 69 87 141 185Range 35 - 60 45 - 64 59 - 84 74 - 105 125 - 170 164 - 2152000 Average 25 36 53 70 119 165Range 22 - 35 31 - 45 47 - 63 62 - 84 102 - 143 138 - 2171999 Average 35 42 61 82 144 232Range 19 - 51 35 - 54 51 - 79 66 - 109 105 - 199 185 - 2981998 Average 32 41 57 77 125 174Range 11-95 21-105 35-125 50-160 82-245 106-321
Source: Credit Suisse

..
STRUCTURED PRODUCTS RESEARCH
NORTH AMERICA Eleven Madison Avenue, New York, NY 10010
Asset-Backed Securities (ABS)
Chandrajit Bhattacharya, Director Senior Strategist, Group Head +1 212 325 1546 [email protected]
Aashish Marfatia, Vice President +1 212 325 4142 [email protected]
Thomas Suehr, Associate +1 212 325 3663 [email protected]
Collateralized Debt Obligations (CDO) / Collateralized Loan Obligations (CLO)
David Yan, Director +1 212 325 5792 [email protected]
Commercial Mortgage Backed Securities (CMBS)
Sylvain Jousseaume, Vice President +1 212 325 1356 [email protected]
Serif Ustun, Vice President +1 212 538 4582 [email protected]
Tee Chew, Associate +1 212 325 8703 [email protected]
Mortgage Backed Securities — Residential (MBS)
Mahesh Swaminathan, Director Senior Strategist, Group Head +1 212 325 8789 [email protected]
Mukul Chhabra, Vice President +1 212 325 0709 [email protected]
Qumber Hassan, Vice President +1 212 538 4988 [email protected]
LONDON One Cabot Square, London E14 4QJ
Carlos Diaz, Associate + 44 20 7888 2414 [email protected]
JAPAN Izumi Garden Tower, 1-6 Roppongi 1-Chome, Minato-ku, Tokyo 106-6024
Tomohiro Miyasaka, Director Japan Head + 81 3 4550 7171 [email protected]
Hua Wang, Associate + 81 3 4550 7447 [email protected]

Disclosure Appendix
Analyst Certification Serif Ustun, Sylvain Jousseaume and Tee Chew each certify, with respect to the companies or securities that he or she analyzes, that (1) the views expressed in this report accurately reflect his or her personal views about all of the subject companies and securities and (2) no part of his or her compensation was, is or will be directly or indirectly related to the specific recommendations or views expressed in this report.
Important Disclosures Credit Suisse's policy is only to publish investment research that is impartial, independent, clear, fair and not misleading. For more detail, please refer to Credit Suisse's Policies for Managing Conflicts of Interest in connection with Investment Research: http://www.csfb.com/research-and-analytics/disclaimer/managing_conflicts_disclaimer.html Credit Suisse’s policy is to publish research reports as it deems appropriate, based on developments with the subject issuer, the sector or the market that may have a material impact on the research views or opinions stated herein. The analyst(s) involved in the preparation of this research report received compensation that is based upon various factors, including Credit Suisse's total revenues, a portion of which are generated by Credit Suisse's Investment Banking and Fixed Income Divisions. Credit Suisse may trade as principal in the securities or derivatives of the issuers that are the subject of this report. At any point in time, Credit Suisse is likely to have significant holdings in the securities mentioned in this report. As at the date of this report, Credit Suisse acts as a market maker or liquidity provider in the debt securities of the subject issuer(s) mentioned in this report. For important disclosure information on securities recommended in this report, please visit the website at https://firesearchdisclosure.credit-suisse.com or call +1-212-538-7625. For the history of any relative value trade ideas suggested by the Fixed Income research department as well as fundamental recommendations provided by the Emerging Markets Sovereign Strategy Group over the previous 12 months, please view the document at http://research-and-analytics.csfb.com/docpopup.asp?ctbdocid=330703_1_en. Credit Suisse clients with access to the Locus website may refer to http://www.credit-suisse.com/locus. For the history of recommendations provided by Technical Analysis, please visit the website at http://www.credit-suisse.com/techanalysis. Credit Suisse does not provide any tax advice. Any statement herein regarding any US federal tax is not intended or written to be used, and cannot be used, by any taxpayer for the purposes of avoiding any penalties.
Emerging Markets Bond Recommendation Definitions Buy: Indicates a recommended buy on our expectation that the issue will deliver a return higher than the risk-free rate. Sell: Indicates a recommended sell on our expectation that the issue will deliver a return lower than the risk-free rate.
Corporate Bond Fundamental Recommendation Definitions Buy: Indicates a recommended buy on our expectation that the issue will be a top performer in its sector. Outperform: Indicates an above-average total return performer within its sector. Bonds in this category have stable or improving credit profiles and are undervalued, or they may be weaker credits that, we believe, are cheap relative to the sector and are expected to outperform on a total-return basis. These bonds may possess price risk in a volatile environment. Market Perform: Indicates a bond that is expected to return average performance in its sector. Underperform: Indicates a below-average total-return performer within its sector. Bonds in this category have weak or worsening credit trends, or they may be stable credits that, we believe, are overvalued or rich relative to the sector. Sell: Indicates a recommended sell on the expectation that the issue will be among the poor performers in its sector. Restricted: In certain circumstances, Credit Suisse policy and/or applicable law and regulations preclude certain types of communications, including an investment recommendation, during the course of Credit Suisse's engagement in an investment banking transaction and in certain other circumstances. Not Rated: Credit Suisse Global Credit Research or Global Leveraged Finance Research covers the issuer but currently does not offer an investment view on the subject issue. Not Covered: Neither Credit Suisse Global Credit Research nor Global Leveraged Finance Research covers the issuer or offers an investment view on the issuer or any securities related to it. Any communication from Research on securities or companies that Credit Suisse does not cover is factual or a reasonable, non-material deduction based on an analysis of publicly available information.
Corporate Bond Risk Category Definitions In addition to the recommendation, each issue may have a risk category indicating that it is an appropriate holding for an "average" high yield investor, designated as Market, or that it has a higher or lower risk profile, designated as Speculative and Conservative, respectively.
Credit Suisse Credit Rating Definitions Credit Suisse may assign rating opinions to investment-grade and crossover issuers. Ratings are based on our assessment of a company's creditworthiness and are not recommendations to buy or sell a security. The ratings scale (AAA, AA, A, BBB, BB, B) is dependent on our assessment of an issuer's ability to meet its financial commitments in a timely manner. Within each category, creditworthiness is further detailed with a scale of High, Mid, or Low – with High being the strongest sub-category rating: High AAA, Mid AAA, Low AAA – obligor's capacity to meet its financial commitments is extremely strong; High AA, Mid AA, Low AA – obligor's capacity to meet its financial commitments is very strong; High A, Mid A, Low A – obligor's capacity to meet its financial commitments is strong; High BBB, Mid BBB, Low BBB – obligor's capacity to meet its financial commitments is adequate, but adverse economic/operating/financial circumstances are more likely to lead to a weakened capacity to meet its obligations; High BB, Mid BB, Low BB – obligations have speculative characteristics and are subject to substantial credit risk; High B, Mid B, Low B – obligor's capacity to meet its financial commitments is very weak and highly vulnerable to adverse economic, operating, and financial circumstances; High CCC, Mid CCC, Low CCC – obligor's capacity to meet its financial commitments is extremely weak and is dependent on favorable economic, operating, and financial circumstances. Credit Suisse's rating opinions do not necessarily correlate with those of the rating agencies.

Structured Securities, Derivatives, and Options Disclaimer Structured securities, derivatives, and options (including OTC derivatives and options) are complex instruments that are not suitable for every investor, may involve a high degree of risk, and may be appropriate investments only for sophisticated investors who are capable of understanding and assuming the risks involved. Supporting documentation for any claims, comparisons, recommendations, statistics or other technical data will be supplied upon request. Any trade information is preliminary and not intended as an official transaction confirmation. OTC derivative transactions are not highly liquid investments; before entering into any such transaction you should ensure that you fully understand its potential risks and rewards and independently determine that it is appropriate for you given your objectives, experience, financial and operational resources, and other relevant circumstances. You should consult with such tax, accounting, legal or other advisors as you deem necessary to assist you in making these determinations. In discussions of OTC options and other strategies, the results and risks are based solely on the hypothetical examples cited; actual results and risks will vary depending on specific circumstances. Investors are urged to consider carefully whether OTC options or option-related products, as well as the products or strategies discussed herein, are suitable to their needs. CS does not offer tax or accounting advice or act as a financial advisor or fiduciary (unless it has agreed specifically in writing to do so). Because of the importance of tax considerations to many option transactions, the investor considering options should consult with his/her tax advisor as to how taxes affect the outcome of contemplated options transactions. Use the following link to read the Options Clearing Corporation's disclosure document: http://www.theocc.com/publications/risks/riskstoc.pdf Transaction costs may be significant in option strategies calling for multiple purchases and sales of options, such as spreads and straddles. Commissions and transaction costs may be a factor in actual returns realized by the investor and should be taken into consideration.

References in this report to Credit Suisse include all of the subsidiaries and affiliates of Credit Suisse AG operating under its investment banking division. For more information on our structure, please use the following link: https://www.credit-suisse.com/who_we_are/en/. This report is not directed to, or intended for distribution to or use by, any person or entity who is a citizen or resident of or located in any locality, state, country or other jurisdiction where such distribution, publication, availability or use would be contrary to law or regulation or which would subject Credit Suisse AG or its affiliates (“CS”) to any registration or licensing requirement within such jurisdiction. All material presented in this report, unless specifically indicated otherwise, is under copyright to CS. None of the material, nor its content, nor any copy of it, may be altered in any way, transmitted to, copied or distributed to any other party, without the prior express written permission of CS. All trademarks, service marks and logos used in this report are trademarks or service marks or registered trademarks or service marks of CS or its affiliates. The information, tools and material presented in this report are provided to you for information purposes only and are not to be used or considered as an offer or the solicitation of an offer to sell or to buy or subscribe for securities or other financial instruments. CS may not have taken any steps to ensure that the securities referred to in this report are suitable for any particular investor. CS will not treat recipients of this report as its customers by virtue of their receiving this report. The investments and services contained or referred to in this report may not be suitable for you and it is recommended that you consult an independent investment advisor if you are in doubt about such investments or investment services. Nothing in this report constitutes investment, legal, accounting or tax advice, or a representation that any investment or strategy is suitable or appropriate to your individual circumstances, or otherwise constitutes a personal recommendation to you. CS does not advise on the tax consequences of investments and you are advised to contact an independent tax adviser. Please note in particular that the bases and levels of taxation may change. Information and opinions presented in this report have been obtained or derived from sources believed by CS to be reliable, but CS makes no representation as to their accuracy or completeness. CS accepts no liability for loss arising from the use of the material presented in this report, except that this exclusion of liability does not apply to the extent that such liability arises under specific statutes or regulations applicable to CS. This report is not to be relied upon in substitution for the exercise of independent judgment. CS may have issued, and may in the future issue, other reports that are inconsistent with, and reach different conclusions from, the information presented in this report. Those reports reflect the different assumptions, views and analytical methods of the analysts who prepared them and CS is under no obligation to ensure that such other reports are brought to the attention of any recipient of this report. CS may, to the extent permitted by law, participate or invest in financing transactions with the issuer(s) of the securities referred to in this report, perform services for or solicit business from such issuers, and/or have a position or holding, or other material interest, or effect transactions, in such securities or options thereon, or other investments related thereto. In addition, it may make markets in the securities mentioned in the material presented in this report. CS may have, within the last three years, served as manager or co-manager of a public offering of securities for, or currently may make a primary market in issues of, any or all of the entities mentioned in this report or may be providing, or have provided within the previous 12 months, significant advice or investment services in relation to the investment concerned or a related investment. Additional information is, subject to duties of confidentiality, available on request. Some investments referred to in this report will be offered solely by a single entity and in the case of some investments solely by CS, or an associate of CS or CS may be the only market maker in such investments. Past performance should not be taken as an indication or guarantee of future performance, and no representation or warranty, express or implied, is made regarding future performance. Information, opinions and estimates contained in this report reflect a judgement at its original date of publication by CS and are subject to change without notice. The price, value of and income from any of the securities or financial instruments mentioned in this report can fall as well as rise. The value of securities and financial instruments is subject to exchange rate fluctuation that may have a positive or adverse effect on the price or income of such securities or financial instruments. Investors in securities such as ADR’s, the values of which are influenced by currency volatility, effectively assume this risk. Structured securities are complex instruments, typically involve a high degree of risk and are intended for sale only to sophisticated investors who are capable of understanding and assuming the risks involved. The market value of any structured security may be affected by changes in economic, financial and political factors (including, but not limited to, spot and forward interest and exchange rates), time to maturity, market conditions and volatility, and the credit quality of any issuer or reference issuer. Any investor interested in purchasing a structured product should conduct their own investigation and analysis of the product and consult with their own professional advisers as to the risks involved in making such a purchase. Some investments discussed in this report may have a high level of volatility. High volatility investments may experience sudden and large falls in their value causing losses when that investment is realised. Those losses may equal your original investment. Indeed, in the case of some investments the potential losses may exceed the amount of initial investment and, in such circumstances, you may be required to pay more money to support those losses. Income yields from investments may fluctuate and, in consequence, initial capital paid to make the investment may be used as part of that income yield. Some investments may not be readily realisable and it may be difficult to sell or realise those investments, similarly it may prove difficult for you to obtain reliable information about the value, or risks, to which such an investment is exposed. This report may provide the addresses of, or contain hyperlinks to, websites. Except to the extent to which the report refers to website material of CS, CS has not reviewed any such site and takes no responsibility for the content contained therein. Such address or hyperlink (including addresses or hyperlinks to CS’s own website material) is provided solely for your convenience and information and the content of any such website does not in any way form part of this document. Accessing such website or following such link through this report or CS’s website shall be at your own risk. This report is issued and distributed in Europe (except Switzerland) by Credit Suisse Securities (Europe) Limited, One Cabot Square, London E14 4QJ, England, which is regulated in the United Kingdom by The Financial Services Authority (“FSA”). This report is being distributed in Germany by Credit Suisse Securities (Europe) Limited Niederlassung Frankfurt am Main regulated by the Bundesanstalt fuer Finanzdienstleistungsaufsicht ("BaFin"). This report is being distributed in the United States and Canada by Credit Suisse Securities (USA) LLC; in Switzerland by Credit Suisse AG; in Brazil by Banco de Investimentos Credit Suisse (Brasil) S.A; in Mexico by Banco Credit Suisse (México), S.A. (transactions related to the securities mentioned in this report will only be effected in compliance with applicable regulation); in Japan by Credit Suisse Securities (Japan) Limited, Financial Instruments Firm, Director-General of Kanto Local Finance Bureau (Kinsho) No. 66, a member of Japan Securities Dealers Association, The Financial Futures Association of Japan, Japan Securities Investment Advisers Association; elsewhere in Asia/ Pacific by whichever of the following is the appropriately authorised entity in the relevant jurisdiction: Credit Suisse (Hong Kong) Limited, Credit Suisse Equities (Australia) Limited, Credit Suisse Securities (Thailand) Limited, Credit Suisse Securities (Malaysia) Sdn Bhd, Credit Suisse AG, Singapore Branch, and elsewhere in the world by the relevant authorised affiliate of the above. Research on Taiwanese securities produced by Credit Suisse AG, Taipei Branch has been prepared by a registered Senior Business Person. Research provided to residents of Malaysia is authorised by the Head of Research for Credit Suisse Securities (Malaysia) Sdn Bhd, to whom they should direct any queries on +603 2723 2020. This research may not conform to Canadian disclosure requirements. In jurisdictions where CS is not already registered or licensed to trade in securities, transactions will only be effected in accordance with applicable securities legislation, which will vary from jurisdiction to jurisdiction and may require that the trade be made in accordance with applicable exemptions from registration or licensing requirements. Non-U.S. customers wishing to effect a transaction should contact a CS entity in their local jurisdiction unless governing law permits otherwise. U.S. customers wishing to effect a transaction should do so only by contacting a representative at Credit Suisse Securities (USA) LLC in the U.S. This material is not for distribution to retail clients and is directed exclusively at Credit Suisse's market professional and institutional clients. Recipients who are not market professional or institutional investor clients of CS should seek the advice of their independent financial advisor prior to taking any investment decision based on this report or for any necessary explanation of its contents. This research may relate to investments or services of a person outside of the UK or to other matters which are not regulated by the FSA or in respect of which the protections of the FSA for private customers and/or the UK compensation scheme may not be available, and further details as to where this may be the case are available upon request in respect of this report. CS may provide various services to US municipal entities or obligated persons ("municipalities"), including suggesting individual transactions or trades and entering into such transactions. Any services CS provides to municipalities are not viewed as “advice” within the meaning of Section 975 of the Dodd-Frank Wall Street Reform and Consumer Protection Act. CS is providing any such services and related information solely on an arm’s length basis and not as an advisor or fiduciary to the municipality. In connection with the provision of the any such services, there is no agreement, direct or indirect, between any municipality (including the officials, management, employees or agents thereof) and CS for CS to provide advice to the municipality. Municipalities should consult with their financial, accounting and legal advisors regarding any such services provided by CS. In addition, CS is not acting for direct or indirect compensation to solicit the municipality on behalf of an unaffiliated broker, dealer, municipal securities dealer, municipal advisor, or investment adviser for the purpose of obtaining or retaining an engagement by the municipality for or in connection with Municipal Financial Products, the issuance of municipal securities, or of an investment adviser to provide investment advisory services to or on behalf of the municipality. Copyright © 2010 CREDIT SUISSE GROUP AG and/or its affiliates. All rights reserved. Investment principal on bonds can be eroded depending on sale price or market price. In addition, there are bonds on which investment principal can be eroded due to changes in redemption amounts. Care is required when investing in such instruments. When you purchase non-listed Japanese fixed income securities (Japanese government bonds, Japanese municipal bonds, Japanese government guaranteed bonds, Japanese corporate bonds) from CS as a seller, you will be requested to pay purchase price only.