Themes in Energy Efficiency - Credit Suisse | PLUS
112
DISCLOSURE APPENDIX AT THE BACK OF THIS REPORT CONTAINS IMPORTANT DISCLOSURES, ANALYST CERTIFICATIONS, AND THE STATUS OF NON-US ANALYSTS. US Disclosure: Credit Suisse does and seeks to do business with companies covered in its research reports. As a result, investors should be aware that the Firm may have a conflict of interest that could affect the objectivity of this report. Investors should consider this report as only a single factor in making their investment decision. CREDIT SUISSE SECURITIES RESEARCH & ANALYTICS BEYOND INFORMATION ® Client-Driven Solutions, Insights, and Access 03 April 2014 Global Equity Research Themes in Energy Efficiency Connections Series Source: Thinkstock As part of our global energy efficiency research, this report reviews building energy efficiency challenges and investment opportunities. Challenges: Buildings are the largest energy consumers, with a c35% share of global energy consumption. Without further efficiency gains, our research indicates that energy consumption and CO² emissions by buildings could increase more than 50% by 2050. This is led by emerging countries, where residential floor space looks set to expand by 50bn m², or more than the current amount for the US and Europe combined. Opportunities: Interest in energy efficiency from property owners is rapidly increasing owing to cost-savings and the positive impact on property values. According to our research, refurbishing the existing building stock across developed countries would require investment of more than $3,000bn. This provides long-term structural growth dynamics to OEMs, property consultants, technical installation companies and construction firms. Stock implications: We identify c170 stocks exposed to this theme, with our Credit Suisse HOLT ® analysis indicating that they have generated above- average through-cycle cash-flow returns. In addition, HOLT indicates the companies have outperformed the MSCI Global Industrials and MSCI World indices on a 1-, 3- and 5-year basis. We highlight 46 companies with significant exposure to the theme: 20 are rated Outperform by our global equity analysts. Credit Suisse has a Delta One basket (CSGLBENF Index) featuring companies exposed to this theme. The Credit Suisse Connections Series leverages our exceptional breadth of macro and micro research to deliver incisive cross-sector and cross-border thematic insights for our clients. Thematic Research Eugene Klerk 44 20 7883 4678 [email protected] Richard Kersley 44 20 7888 0313 [email protected] Ashlee Ramanathan 44 20 7883 9934 [email protected] Stefano Natella 212 325 4217 [email protected] Thematic Research: This report forms part of Credit Suisse's Global Thematic Research offering.
-
Upload
khangminh22 -
Category
Documents
-
view
3 -
download
0
Transcript of Themes in Energy Efficiency - Credit Suisse | PLUS

DISCLOSURE APPENDIX AT THE BACK OF THIS REPORT CONTAINS IMPORTANT DISCLOSURES, ANALYST CERTIFICATIONS, AND THE STATUS OF NON-US ANALYSTS. US Disclosure: Credit Suisse does and seeks to do business with companies covered in its research reports. As a result, investors should be aware that the Firm may have a conflict of interest that could affect the objectivity of this report. Investors should consider this report as only a single factor in making their investment decision.
CREDIT SUISSE SECURITIES RESEARCH & ANALYTICS BEYOND INFORMATION®
Client-Driven Solutions, Insights, and Access
03 April 2014
Global
Equity Research
Themes in Energy Efficiency Connections Series
Source: Thinkstock
As part of our global energy efficiency research, this report reviews
building energy efficiency challenges and investment opportunities.
Challenges: Buildings are the largest energy consumers, with a c35% share of
global energy consumption. Without further efficiency gains, our research
indicates that energy consumption and CO² emissions by buildings could
increase more than 50% by 2050. This is led by emerging countries, where
residential floor space looks set to expand by 50bn m², or more than the current
amount for the US and Europe combined.
Opportunities: Interest in energy efficiency from property owners is rapidly
increasing owing to cost-savings and the positive impact on property values.
According to our research, refurbishing the existing building stock across
developed countries would require investment of more than $3,000bn. This
provides long-term structural growth dynamics to OEMs, property consultants,
technical installation companies and construction firms.
Stock implications: We identify c170 stocks exposed to this theme, with our
Credit Suisse HOLT® analysis indicating that they have generated above-
average through-cycle cash-flow returns. In addition, HOLT indicates the
companies have outperformed the MSCI Global Industrials and MSCI World
indices on a 1-, 3- and 5-year basis. We highlight 46 companies with significant
exposure to the theme: 20 are rated Outperform by our global equity analysts.
Credit Suisse has a Delta One basket (CSGLBENF Index) featuring companies
exposed to this theme.
The Credit Suisse Connections Series
leverages our exceptional breadth of
macro and micro research to deliver
incisive cross-sector and cross-border
thematic insights for our clients.
Thematic Research
Eugene Klerk
44 20 7883 4678
Richard Kersley
44 20 7888 0313
Ashlee Ramanathan
44 20 7883 9934
Stefano Natella
212 325 4217
Thematic Research:
This report forms part of Credit Suisse's
Global Thematic Research offering.

03 April 2014
Themes in Energy Efficiency 2
Table of contents Credit Suisse research 3 Key macro charts 4 Key stock-related charts 5 Executive summary 6
Global energy demand growth set to continue 6 Buildings drive energy consumption globally 6 The residential building efficiency market 8 The non-residential opportunity 9 Energy efficiency is a strong investment theme 10
Energy demand unlikely to slow down 12 Three key demand drivers 12 Consumption in case efficiency does not improve 15 Rising supply concerns to act as efficiency catalyst 17
Buildings and energy efficiency 18 Environmental concerns in no-change scenario 19 Building efficiency for the residential market 21 Building efficiency for non-residential buildings 31
Legislation plays a key role 34 Building-related policies 34 Component policies 38
Engagement from the private sector 39 Key products and technologies 42
Improving the building envelope 44 Reducing heating and cooling requirements 46 Improving lighting and appliances 47
Identifying investment opportunities 50 Who is exposed to building energy efficiency? 50 Building efficiency related stocks 52 Efficiency-related stocks vs. global industrials 53 Efficiency-exposed companies by subsector 55 Global stock ideas using Credit Suisse HOLT 59 Key global stock ideas from our analysts 61
Company profiles 62 Appendix: Building efficiency stocks 96 Appendix: Key technologies 102
03 April 2014
Themes in Energy Efficiency 3
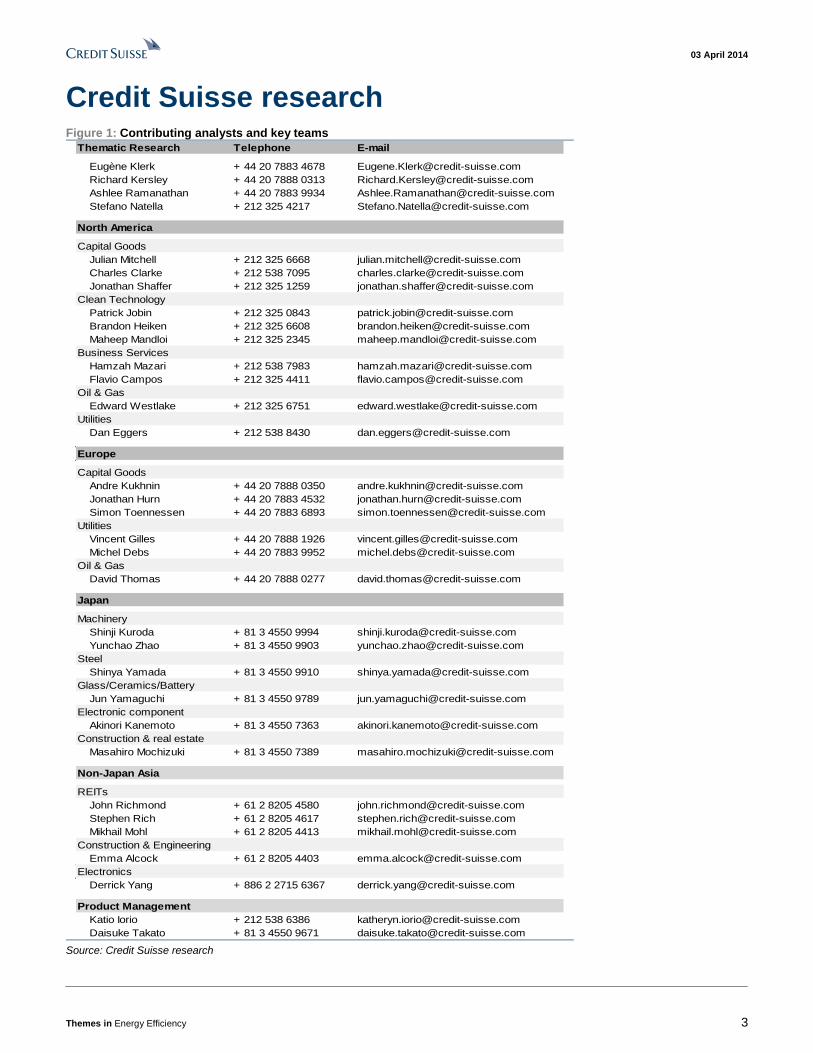
Credit Suisse research Figure 1: Contributing analysts and key teams
Thematic Research Telephone E-mail
Eugène Klerk + 44 20 7883 4678 [email protected]
Richard Kersley + 44 20 7888 0313 [email protected]
Ashlee Ramanathan + 44 20 7883 9934 [email protected]
Stefano Natella + 212 325 4217 [email protected]
North America
Capital Goods
Julian Mitchell + 212 325 6668 [email protected]
Charles Clarke + 212 538 7095 [email protected]
Jonathan Shaffer + 212 325 1259 [email protected]
Clean Technology
Patrick Jobin + 212 325 0843 [email protected]
Brandon Heiken + 212 325 6608 [email protected]
Maheep Mandloi + 212 325 2345 [email protected]
Business Services
Hamzah Mazari + 212 538 7983 [email protected]
Flavio Campos + 212 325 4411 [email protected]
Oil & Gas
Edward Westlake + 212 325 6751 [email protected]
Utilities
Dan Eggers + 212 538 8430 [email protected]
Europe
Capital Goods
Andre Kukhnin + 44 20 7888 0350 [email protected]
Jonathan Hurn + 44 20 7883 4532 [email protected]
Simon Toennessen + 44 20 7883 6893 [email protected]
Utilities
Vincent Gilles + 44 20 7888 1926 [email protected]
Michel Debs + 44 20 7883 9952 [email protected]
Oil & Gas
David Thomas + 44 20 7888 0277 [email protected]
Japan
Machinery
Shinji Kuroda + 81 3 4550 9994 [email protected]
Yunchao Zhao + 81 3 4550 9903 [email protected]
Steel
Shinya Yamada + 81 3 4550 9910 [email protected]
Glass/Ceramics/Battery
Jun Yamaguchi + 81 3 4550 9789 [email protected]
Electronic component
Akinori Kanemoto + 81 3 4550 7363 [email protected]
Construction & real estate
Masahiro Mochizuki + 81 3 4550 7389 [email protected]
Non-Japan Asia
REITs
John Richmond + 61 2 8205 4580 [email protected]
Stephen Rich + 61 2 8205 4617 [email protected]
Mikhail Mohl + 61 2 8205 4413 [email protected]
Construction & Engineering
Emma Alcock + 61 2 8205 4403 [email protected]
Electronics
Derrick Yang + 886 2 2715 6367 [email protected]
Product Management
Katio Iorio + 212 538 6386 [email protected]
Daisuke Takato + 81 3 4550 9671 [email protected] Source: Credit Suisse research
03 April 2014
Themes in Energy Efficiency 4
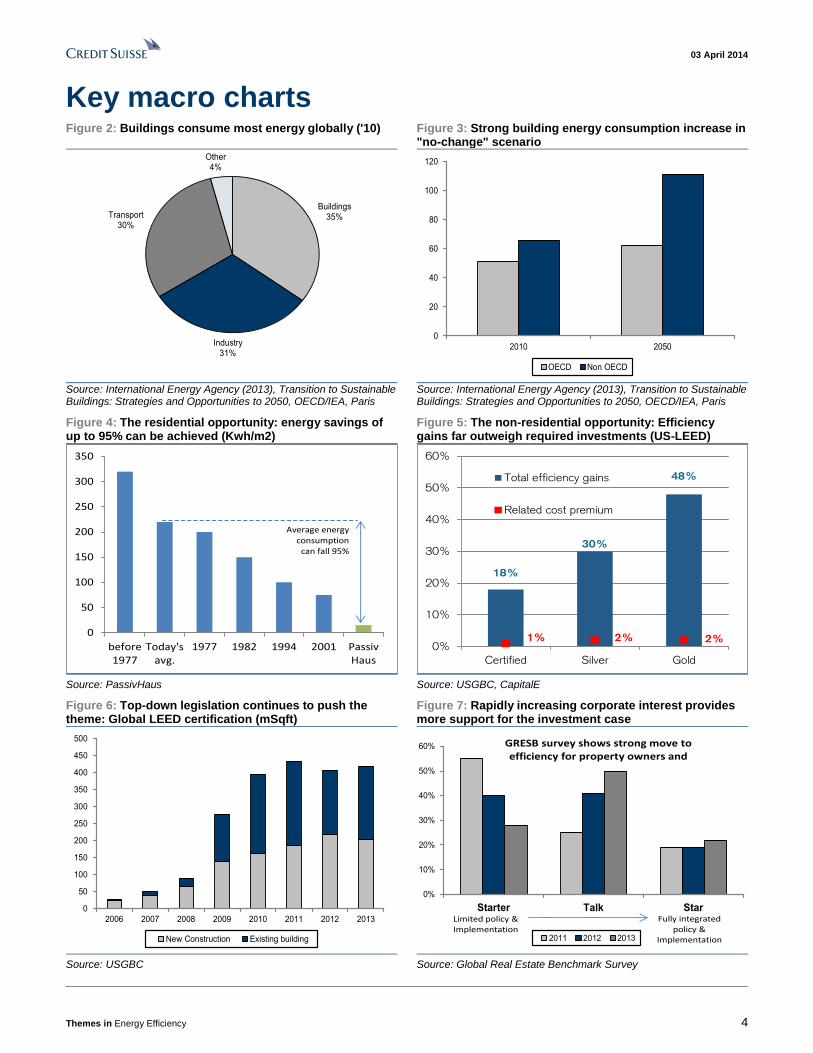
Key macro charts Figure 2: Buildings consume most energy globally ('10) Figure 3: Strong building energy consumption increase in
"no-change" scenario
Buildings35%
Industry31%
Transport30%
Other4%
0
20
40
60
80
100
120
2010 2050
OECD Non OECD
Source: International Energy Agency (2013), Transition to Sustainable Buildings: Strategies and Opportunities to 2050, OECD/IEA, Paris
Source: International Energy Agency (2013), Transition to Sustainable Buildings: Strategies and Opportunities to 2050, OECD/IEA, Paris
Figure 4: The residential opportunity: energy savings of up to 95% can be achieved (Kwh/m2)
Figure 5: The non-residential opportunity: Efficiency gains far outweigh required investments (US-LEED)
0
50
100
150
200
250
300
350
before1977
Today'savg.
1977 1982 1994 2001 PassivHaus
Average energyconsumption
can fall 95%
18%
30%
48%
1% 2% 2%0%
10%
20%
30%
40%
50%
60%
Certified Silver Gold
Total efficiency gains
Related cost premium
Source: PassivHaus Source: USGBC, CapitalE
Figure 6: Top-down legislation continues to push the theme: Global LEED certification (mSqft)
Figure 7: Rapidly increasing corporate interest provides more support for the investment case
0
50
100
150
200
250
300
350
400
450
500
2006 2007 2008 2009 2010 2011 2012 2013
New Construction Existing building
0%
10%
20%
30%
40%
50%
60%
Starter Talk Star
2011 2012 2013
Limited policy & Implementation
Fully integrated policy &
Implementation
GRESB survey shows strong move to efficiency for property owners and
Source: USGBC Source: Global Real Estate Benchmark Survey

03 April 2014
Themes in Energy Efficiency 5
Key stock-related charts Figure 8: We see c170 companies with exposure: c75% of stocks have a Mcap of less than $10bn
Figure 9: Building efficiency exposed companies have generated higher cash flow returns than global industrials…
Europe,
82
N.Americ
a, 57
Asia, 17
Japan,
20
-2.00
0.00
2.00
4.00
6.00
8.00
10.00
1995 1997 1999 2001 2003 2005 2007 2009 2011 2013
Value creation: CFROI -/- discount rate
Efficiency universe Global industrials
Source: Credit Suisse research Note: Past performance should not be taken as an indication or guarantee of future performance. Source: Credit Suisse HOLT
Figure 10: …and have generated superior returns to global equities and industrials on 1, 3 and 5 years
Figure 11: Undervalued subsectors on Credit Suisse HOLT are cooling, consultancy, appliances and lighting
1.0
1.5
2.0
2.5
3.0
3.5
Feb-09 Jan-10 Dec-10 Nov-11 Oct-12 Sep-13
Universe
MSCI World
MSCI Industrials
Returns 1yr 3yr 5yr
Universe 22% 38% 199% MSCI World 16% 25% 101%
0
2
4
6
8
10
12
14
16
18
10yr Last fiscal year Forecast Market implied CFROI
Undervalued Overvalued
Source: Credit Suisse HOLT Source: Credit Suisse HOLT, Credit Suisse research
Figure 12: Outperform-rated companies highlighted by our analysts, grouped by region and ranked by Mcap
Ctry Company Ticker Sector Exposure
HOLT
score
Mcap
($m) CS Rating
% to
CS TP
P/E '14E
(x) CFROI EG Revenue
North America
US United Technologies Corp UTX.N OEM High 5 107,077 OUTPERFORM 11% -12% 17.0 19% 10% 4%
US Emerson EMR.N OEM High 5 46,959 OUTPERFORM 14% 33% 17.1 18% 10% 3%
US Eaton Corporation ETN.N OEM High 4 35,754 OUTPERFORM 9% -18% 15.9 19% 13% 4%
US Ingersoll-Rand Plc IR.N OEM High 2 15,915 OUTPERFORM 21% -16% 17.9 20% 22% 5%
US SolarCity SCTY.OQ OEM Medium 1 5,730 OUTPERFORM 20% -90% -37% 28% 94%
US Wesco International WCC.N Technical Services High 5 3,694 OUTPERFORM 8% 68% 14.6 23% 14% 5%
US Regal Beloit RBC.N OEM Medium 5 3,280 OUTPERFORM 11% 67% 16.0 11% 6% 4%
Europe
CH ABB ABBN.VX OEM Medium 4 59,675 OUTPERFORM 14% 40% 13.8 15% 17% 4%
CH Schindler-Holding AG SCHP.VX OEM Medium 2 17,215 OUTPERFORM 15% -1% 20.6 15% 11% 6%
FR GDF Suez GSZ.PA Technical Services High 3 66,013 OUTPERFORM 3% -22% 15.1 4% -2% 3%
GB IMI Plc IMI.L OEM High 1 6,592 OUTPERFORM 12% -8% 16.8 16% 16% 3%
GB Halma HLMA.L OEM High 4 3,625 OUTPERFORM 8% -7% 19.3 25% 6% 4%
NL ARCADIS ARDS.AS Consultancy High 5 2,877 OUTPERFORM 13% 11% 14.9 18% 10% 4%
Japan
JP Nidec 6594.T OEM Medium 1 17,204 OUTPERFORM 4% -50% 24.1 8% 41% 11%
JP Sumitomo Electric Industries 5802.T OEM Medium 3 11,991 OUTPERFORM 28% 23% 12.2 2% 34% 8%
JP Rinnai 5947.T OEM High 4 4,462 OUTPERFORM -3% -19% 19.5 8% 8% 6%
JP NSG Group 5202.T OEM High 1 1,293 OUTPERFORM 15% -104% nm -1% 535% 4%
JP Toyo Tanso 5310.T OEM High 2 475 OUTPERFORM 6% 6% 21.3 -1% 1093% 40%
Non-Japan Asia
AU Charter Hall Group CHC.AX Property Owners High 5 1,279 OUTPERFORM 9% -20% 14.8 41% 8%
TW Epistar Corporation 2448.TW OEM High 1 2,263 OUTPERFORM 18% -21% 50.3 4% 927% 17%
HOLT Price
to Best
Growth 2013-15E
Source: Credit Suisse research, Thomson Reuters
03 April 2014
Themes in Energy Efficiency 6
Executive summary We believe that the need for energy efficiency has never been higher as the world's
population looks set to increase by an additional 2bn people, urbanisation rises further and
3bn more consumers enter the middle class during the next 20 years. These factors drive
energy demand ever higher and create increasing supply frictions and environmental
challenges, making a "no-change" scenario not an option, in our view.
This report reviews energy efficiency challenges and investment opportunities related to
buildings. It adds to existing work on energy efficiency from several of Credit Suisse's
other global equity research teams, including work done by our utility team, the clean-tech
research product and research from our industrials teams in Europe and the US.
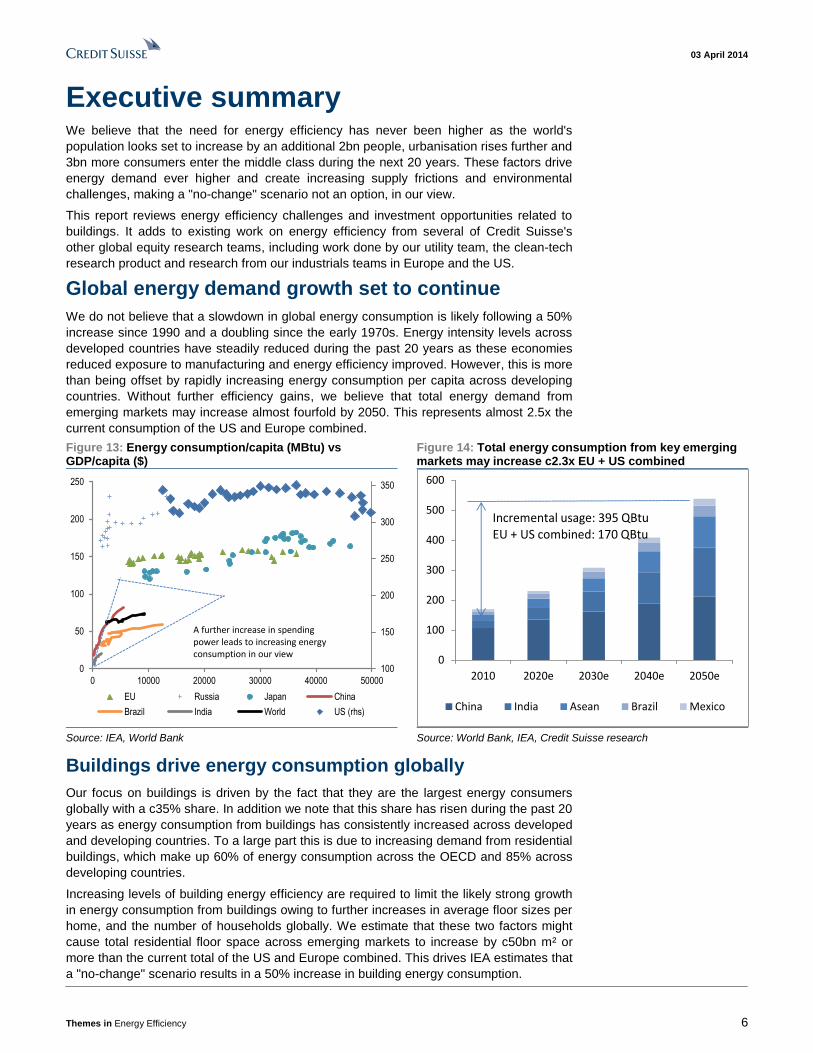
Global energy demand growth set to continue
We do not believe that a slowdown in global energy consumption is likely following a 50%
increase since 1990 and a doubling since the early 1970s. Energy intensity levels across
developed countries have steadily reduced during the past 20 years as these economies
reduced exposure to manufacturing and energy efficiency improved. However, this is more
than being offset by rapidly increasing energy consumption per capita across developing
countries. Without further efficiency gains, we believe that total energy demand from
emerging markets may increase almost fourfold by 2050. This represents almost 2.5x the
current consumption of the US and Europe combined.
Figure 13: Energy consumption/capita (MBtu) vs GDP/capita ($)
Figure 14: Total energy consumption from key emerging markets may increase c2.3x EU + US combined
100
150
200
250
300
350
0
50
100
150
200
250
0 10000 20000 30000 40000 50000
EU Russia Japan China
Brazil India World US (rhs)
A further increase in spending power leads to increasing energyconsumption in our view
0
100
200
300
400
500
600
2010 2020e 2030e 2040e 2050e
China India Asean Brazil Mexico
Incremental usage: 395 QBtuEU + US combined: 170 QBtu
Source: IEA, World Bank Source: World Bank, IEA, Credit Suisse research
Buildings drive energy consumption globally
Our focus on buildings is driven by the fact that they are the largest energy consumers
globally with a c35% share. In addition we note that this share has risen during the past 20
years as energy consumption from buildings has consistently increased across developed
and developing countries. To a large part this is due to increasing demand from residential
buildings, which make up 60% of energy consumption across the OECD and 85% across
developing countries.
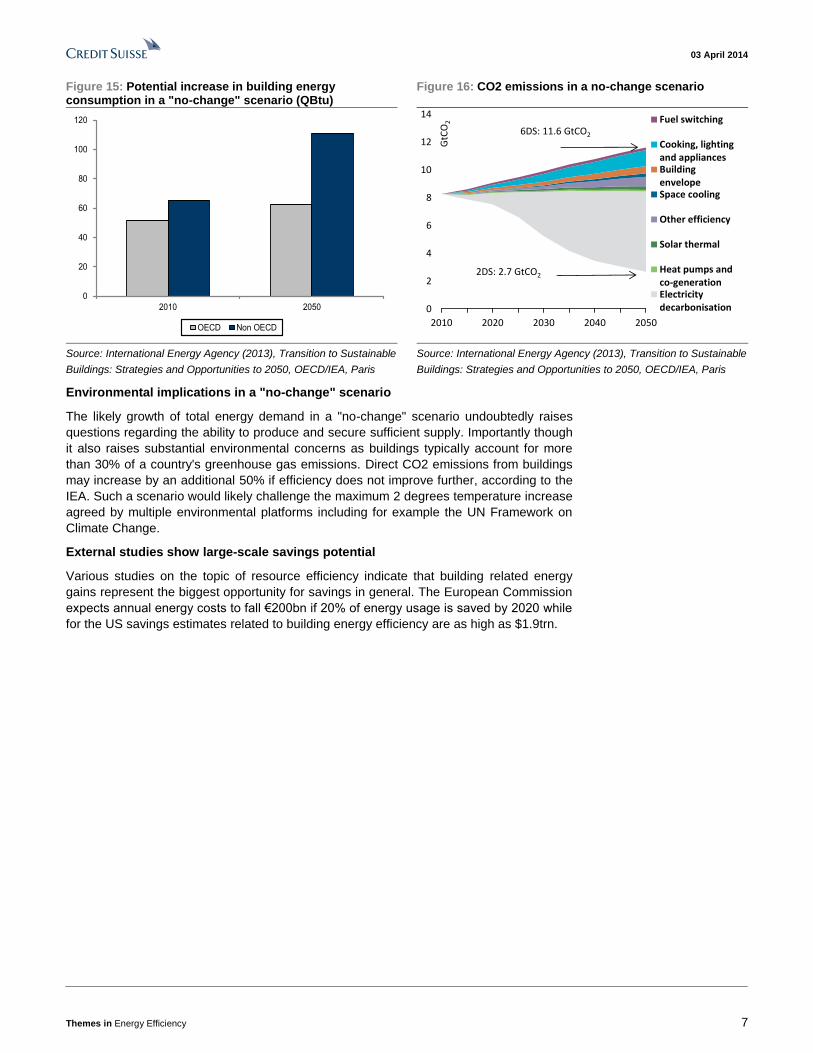
Increasing levels of building energy efficiency are required to limit the likely strong growth
in energy consumption from buildings owing to further increases in average floor sizes per
home, and the number of households globally. We estimate that these two factors might
cause total residential floor space across emerging markets to increase by c50bn m² or
more than the current total of the US and Europe combined. This drives IEA estimates that
a "no-change" scenario results in a 50% increase in building energy consumption.
03 April 2014
Themes in Energy Efficiency 7
Figure 15: Potential increase in building energy consumption in a "no-change" scenario (QBtu)
Figure 16: CO2 emissions in a no-change scenario
0
20
40
60
80
100
120
2010 2050
OECD Non OECD
0
2
4
6
8
10
12
14
2010 2020 2030 2040 2050
GtC
O2 Fuel switching
Cooking, lightingand appliancesBuildingenvelopeSpace cooling
Other efficiency
Solar thermal
Heat pumps andco-generationElectricitydecarbonisation
2DS: 2.7 GtCO2
6DS: 11.6 GtCO2
Source: International Energy Agency (2013), Transition to Sustainable
Buildings: Strategies and Opportunities to 2050, OECD/IEA, Paris
Source: International Energy Agency (2013), Transition to Sustainable
Buildings: Strategies and Opportunities to 2050, OECD/IEA, Paris
Environmental implications in a "no-change" scenario
The likely growth of total energy demand in a "no-change" scenario undoubtedly raises
questions regarding the ability to produce and secure sufficient supply. Importantly though
it also raises substantial environmental concerns as buildings typically account for more
than 30% of a country's greenhouse gas emissions. Direct CO2 emissions from buildings
may increase by an additional 50% if efficiency does not improve further, according to the
IEA. Such a scenario would likely challenge the maximum 2 degrees temperature increase
agreed by multiple environmental platforms including for example the UN Framework on
Climate Change.
External studies show large-scale savings potential
Various studies on the topic of resource efficiency indicate that building related energy
gains represent the biggest opportunity for savings in general. The European Commission
expects annual energy costs to fall €200bn if 20% of energy usage is saved by 2020 while
for the US savings estimates related to building energy efficiency are as high as $1.9trn.
03 April 2014
Themes in Energy Efficiency 8
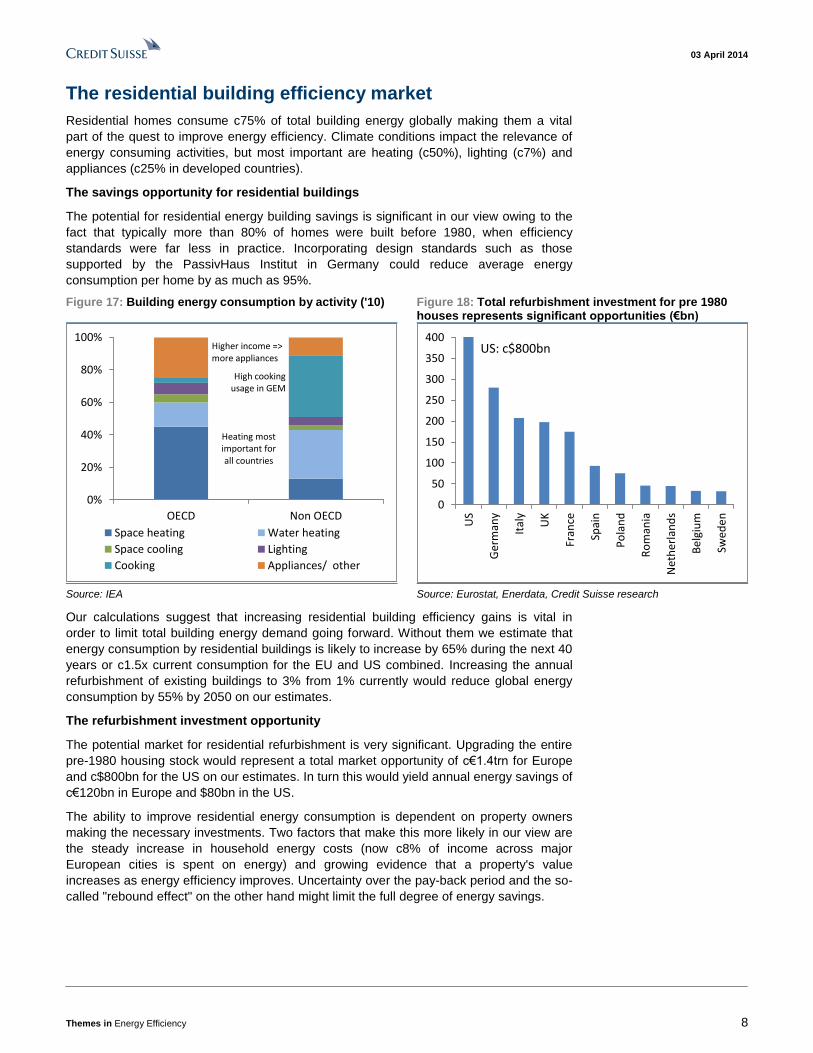
The residential building efficiency market
Residential homes consume c75% of total building energy globally making them a vital
part of the quest to improve energy efficiency. Climate conditions impact the relevance of
energy consuming activities, but most important are heating (c50%), lighting (c7%) and
appliances (c25% in developed countries).
The savings opportunity for residential buildings
The potential for residential energy building savings is significant in our view owing to the
fact that typically more than 80% of homes were built before 1980, when efficiency
standards were far less in practice. Incorporating design standards such as those
supported by the PassivHaus Institut in Germany could reduce average energy
consumption per home by as much as 95%.
Figure 17: Building energy consumption by activity ('10) Figure 18: Total refurbishment investment for pre 1980 houses represents significant opportunities (€bn)
0%
20%
40%
60%
80%
100%
OECD Non OECD
Space heating Water heating
Space cooling Lighting
Cooking Appliances/ other
Higher income => more appliances
High cooking usage in GEM
Heating mostimportant forall countries
0
50
100
150
200
250
300
350
400
US
Ger
man
y
Ital
y
UK
Fran
ce
Spai
n
Po
lan
d
Ro
man
ia
Net
her
lan
ds
Be
lgiu
m
Swed
en
US: c$800bn
Source: IEA Source: Eurostat, Enerdata, Credit Suisse research
Our calculations suggest that increasing residential building efficiency gains is vital in
order to limit total building energy demand going forward. Without them we estimate that
energy consumption by residential buildings is likely to increase by 65% during the next 40
years or c1.5x current consumption for the EU and US combined. Increasing the annual
refurbishment of existing buildings to 3% from 1% currently would reduce global energy
consumption by 55% by 2050 on our estimates.
The refurbishment investment opportunity
The potential market for residential refurbishment is very significant. Upgrading the entire
pre-1980 housing stock would represent a total market opportunity of c€1.4trn for Europe
and c$800bn for the US on our estimates. In turn this would yield annual energy savings of
c€120bn in Europe and $80bn in the US.
The ability to improve residential energy consumption is dependent on property owners
making the necessary investments. Two factors that make this more likely in our view are
the steady increase in household energy costs (now c8% of income across major
European cities is spent on energy) and growing evidence that a property's value
increases as energy efficiency improves. Uncertainty over the pay-back period and the so-
called "rebound effect" on the other hand might limit the full degree of energy savings.
03 April 2014
Themes in Energy Efficiency 9
The non-residential opportunity
The non-residential building market makes up c25% of the global building market but
consumes c40% of total energy owing to the higher penetration of electricity-consuming
products (for example HVAC, Computers and lighting). We believe that the energy
efficiency investment opportunity for non-residential buildings is significant given that:
■ Ownership is far less fragmented than in the case of residential buildings (in the US
the top 50 property managers manage c50% of the country's office space); and
■ Commercial real estate is increasingly owned by professional investors. In London, for
example, we find that 45% of office buildings are currently owned by specialist real
estate investors, up from 17% in 1975.
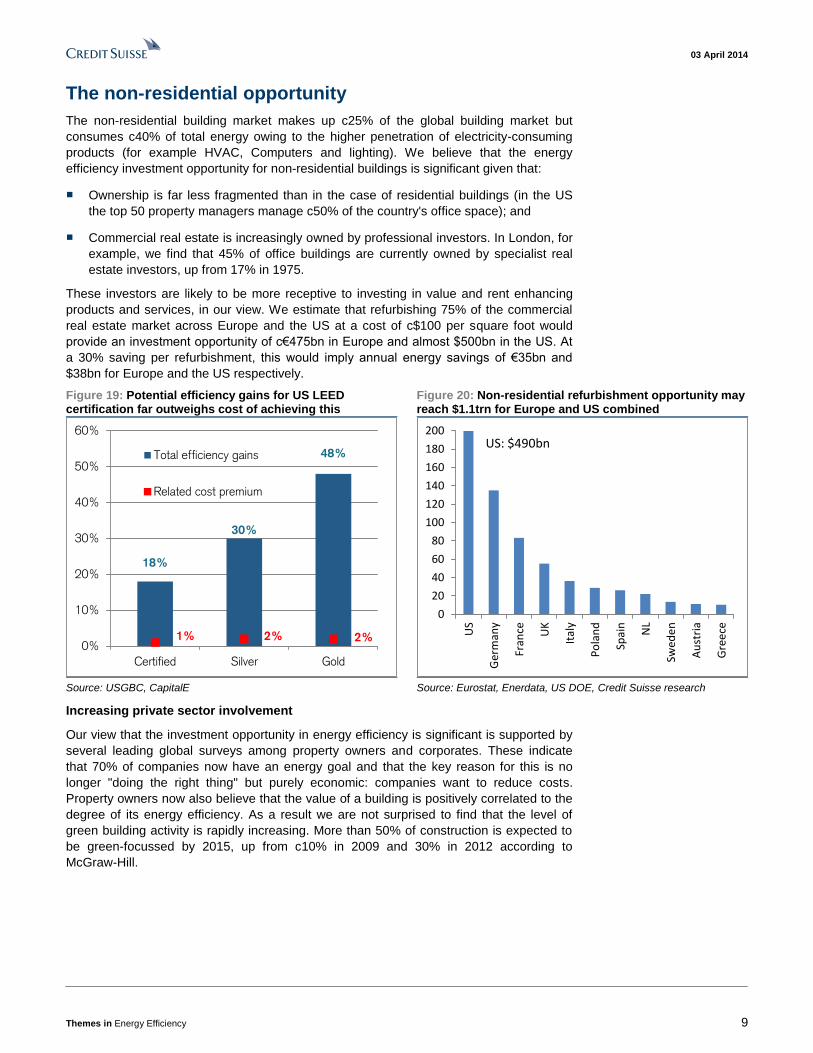
These investors are likely to be more receptive to investing in value and rent enhancing
products and services, in our view. We estimate that refurbishing 75% of the commercial
real estate market across Europe and the US at a cost of c$100 per square foot would
provide an investment opportunity of c€475bn in Europe and almost $500bn in the US. At
a 30% saving per refurbishment, this would imply annual energy savings of €35bn and
$38bn for Europe and the US respectively.
Figure 19: Potential efficiency gains for US LEED certification far outweighs cost of achieving this
Figure 20: Non-residential refurbishment opportunity may reach $1.1trn for Europe and US combined
18%
30%
48%
1% 2% 2%0%
10%
20%
30%
40%
50%
60%
Certified Silver Gold
Total efficiency gains
Related cost premium
0
20
40
60
80
100
120
140
160
180
200
US
Ger
man
y
Fran
ce UK
Ital
y
Po
lan
d
Spai
n
NL
Swed
en
Au
stri
a
Gre
ece
US: $490bn
Source: USGBC, CapitalE Source: Eurostat, Enerdata, US DOE, Credit Suisse research
Increasing private sector involvement
Our view that the investment opportunity in energy efficiency is significant is supported by
several leading global surveys among property owners and corporates. These indicate
that 70% of companies now have an energy goal and that the key reason for this is no
longer "doing the right thing" but purely economic: companies want to reduce costs.
Property owners now also believe that the value of a building is positively correlated to the
degree of its energy efficiency. As a result we are not surprised to find that the level of
green building activity is rapidly increasing. More than 50% of construction is expected to
be green-focussed by 2015, up from c10% in 2009 and 30% in 2012 according to
McGraw-Hill.

03 April 2014
Themes in Energy Efficiency 10
Energy efficiency is a strong investment theme
In cooperation with analysts across Credit Suisse's global equity research platform we
have identified c170 companies that have significant revenue exposure to the theme.
These companies can be grouped into consultancy firms, construction/home builders,
technical service companies, equipment manufacturers and property/real estate owners.
Superior value creation translates into long-term outperformance
We believe that the through-cycle cash flow characteristics for energy efficiency exposed
companies are attractive relative to the broader industrials universe. The structural degree
of strong cash flow returns is in our view one reason why the efficiency related group has
outperformed on a 1-, 3- and 5-year basis.
Most value found in Cooling, Consultancy, Appliances and Lighting companies
Credit Suisse HOLT indicates that cooling companies, consultancy firms, appliance
manufacturers and lighting companies are most undervalued at this stage. Insulation,
heating and construction firms on the other hand appear overvalued when comparing cash
flow based valuations to current share prices.
Figure 21: Building efficiency exposed companies have generated higher cash flow returns than global industrials
Figure 22: Undervalued subsectors on Credit Suisse HOLT are those with market-implied CFROI below the "forecast" CFROI
-2.00
0.00
2.00
4.00
6.00
8.00
10.00
1995 1997 1999 2001 2003 2005 2007 2009 2011 2013
Value creation: CFROI -/- discount rate
Efficiency universe Global industrials
0
2
4
6
8
10
12
14
16
18
10yr Last fiscal year Forecast Market implied CFROI
Undervalued Overvalued
Global Industrials refers to Credit Suisse HOLT classified industrials.
Past performance should not be taken as an indication or guarantee
of future performance. Source: Credit Suisse HOLT
Source: Credit Suisse HOLT, Credit Suisse research
03 April 2014
Themes in Energy Efficiency 11
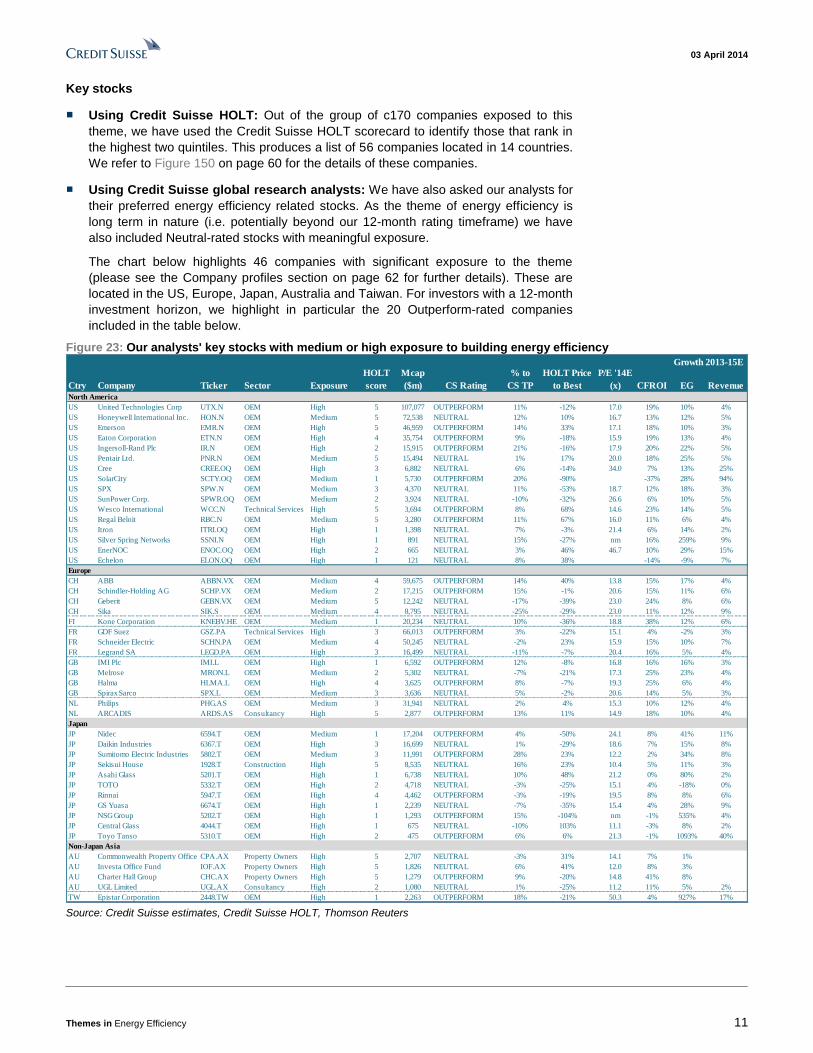
Key stocks
■ Using Credit Suisse HOLT: Out of the group of c170 companies exposed to this
theme, we have used the Credit Suisse HOLT scorecard to identify those that rank in
the highest two quintiles. This produces a list of 56 companies located in 14 countries.
We refer to Figure 150 on page 60 for the details of these companies.
■ Using Credit Suisse global research analysts: We have also asked our analysts for
their preferred energy efficiency related stocks. As the theme of energy efficiency is
long term in nature (i.e. potentially beyond our 12-month rating timeframe) we have
also included Neutral-rated stocks with meaningful exposure.
The chart below highlights 46 companies with significant exposure to the theme
(please see the Company profiles section on page 62 for further details). These are
located in the US, Europe, Japan, Australia and Taiwan. For investors with a 12-month
investment horizon, we highlight in particular the 20 Outperform-rated companies
included in the table below.
Figure 23: Our analysts' key stocks with medium or high exposure to building energy efficiency
Ctry Company Ticker Sector Exposure
HOLT
score
Mcap
($m) CS Rating
% to
CS TP
P/E '14E
(x) CFROI EG Revenue
North America
US United Technologies Corp UTX.N OEM High 5 107,077 OUTPERFORM 11% -12% 17.0 19% 10% 4%
US Honeywell International Inc. HON.N OEM Medium 5 72,538 NEUTRAL 12% 10% 16.7 13% 12% 5%
US Emerson EMR.N OEM High 5 46,959 OUTPERFORM 14% 33% 17.1 18% 10% 3%
US Eaton Corporation ETN.N OEM High 4 35,754 OUTPERFORM 9% -18% 15.9 19% 13% 4%
US Ingersoll-Rand Plc IR.N OEM High 2 15,915 OUTPERFORM 21% -16% 17.9 20% 22% 5%
US Pentair Ltd. PNR.N OEM Medium 5 15,494 NEUTRAL 1% 17% 20.0 18% 25% 5%
US Cree CREE.OQ OEM High 3 6,882 NEUTRAL 6% -14% 34.0 7% 13% 25%
US SolarCity SCTY.OQ OEM Medium 1 5,730 OUTPERFORM 20% -90% -37% 28% 94%
US SPX SPW.N OEM Medium 3 4,370 NEUTRAL 11% -53% 18.7 12% 18% 3%
US SunPower Corp. SPWR.OQ OEM Medium 2 3,924 NEUTRAL -10% -32% 26.6 6% 10% 5%
US Wesco International WCC.N Technical Services High 5 3,694 OUTPERFORM 8% 68% 14.6 23% 14% 5%
US Regal Beloit RBC.N OEM Medium 5 3,280 OUTPERFORM 11% 67% 16.0 11% 6% 4%
US Itron ITRI.OQ OEM High 1 1,398 NEUTRAL 7% -3% 21.4 6% 14% 2%
US Silver Spring Networks SSNI.N OEM High 1 891 NEUTRAL 15% -27% nm 16% 259% 9%
US EnerNOC ENOC.OQ OEM High 2 665 NEUTRAL 3% 46% 46.7 10% 29% 15%
US Echelon ELON.OQ OEM High 1 121 NEUTRAL 8% 38% -14% -9% 7%
Europe
CH ABB ABBN.VX OEM Medium 4 59,675 OUTPERFORM 14% 40% 13.8 15% 17% 4%
CH Schindler-Holding AG SCHP.VX OEM Medium 2 17,215 OUTPERFORM 15% -1% 20.6 15% 11% 6%
CH Geberit GEBN.VX OEM Medium 5 12,242 NEUTRAL -17% -39% 23.0 24% 8% 6%
CH Sika SIK.S OEM Medium 4 8,795 NEUTRAL -25% -29% 23.0 11% 12% 9%
FI Kone Corporation KNEBV.HE OEM Medium 1 20,234 NEUTRAL 10% -36% 18.8 38% 12% 6%
FR GDF Suez GSZ.PA Technical Services High 3 66,013 OUTPERFORM 3% -22% 15.1 4% -2% 3%
FR Schneider Electric SCHN.PA OEM Medium 4 50,245 NEUTRAL -2% 23% 15.9 15% 10% 7%
FR Legrand SA LEGD.PA OEM High 3 16,499 NEUTRAL -11% -7% 20.4 16% 5% 4%
GB IMI Plc IMI.L OEM High 1 6,592 OUTPERFORM 12% -8% 16.8 16% 16% 3%
GB Melrose MRON.L OEM Medium 2 5,302 NEUTRAL -7% -21% 17.3 25% 23% 4%
GB Halma HLMA.L OEM High 4 3,625 OUTPERFORM 8% -7% 19.3 25% 6% 4%
GB Spirax Sarco SPX.L OEM Medium 3 3,636 NEUTRAL 5% -2% 20.6 14% 5% 3%
NL Philips PHG.AS OEM Medium 3 31,941 NEUTRAL 2% 4% 15.3 10% 12% 4%
NL ARCADIS ARDS.AS Consultancy High 5 2,877 OUTPERFORM 13% 11% 14.9 18% 10% 4%
Japan
JP Nidec 6594.T OEM Medium 1 17,204 OUTPERFORM 4% -50% 24.1 8% 41% 11%
JP Daikin Industries 6367.T OEM High 3 16,699 NEUTRAL 1% -29% 18.6 7% 15% 8%
JP Sumitomo Electric Industries 5802.T OEM Medium 3 11,991 OUTPERFORM 28% 23% 12.2 2% 34% 8%
JP Sekisui House 1928.T Construction High 5 8,535 NEUTRAL 16% 23% 10.4 5% 11% 3%
JP Asahi Glass 5201.T OEM High 1 6,738 NEUTRAL 10% 48% 21.2 0% 80% 2%
JP TOTO 5332.T OEM High 2 4,718 NEUTRAL -3% -25% 15.1 4% -18% 0%
JP Rinnai 5947.T OEM High 4 4,462 OUTPERFORM -3% -19% 19.5 8% 8% 6%
JP GS Yuasa 6674.T OEM High 1 2,239 NEUTRAL -7% -35% 15.4 4% 28% 9%
JP NSG Group 5202.T OEM High 1 1,293 OUTPERFORM 15% -104% nm -1% 535% 4%
JP Central Glass 4044.T OEM High 1 675 NEUTRAL -10% 103% 11.1 -3% 8% 2%
JP Toyo Tanso 5310.T OEM High 2 475 OUTPERFORM 6% 6% 21.3 -1% 1093% 40%
Non-Japan Asia
AU Commonwealth Property Office FundCPA.AX Property Owners High 5 2,707 NEUTRAL -3% 31% 14.1 7% 1%
AU Investa Office Fund IOF.AX Property Owners High 5 1,826 NEUTRAL 6% 41% 12.0 8% 3%
AU Charter Hall Group CHC.AX Property Owners High 5 1,279 OUTPERFORM 9% -20% 14.8 41% 8%
AU UGL Limited UGL.AX Consultancy High 2 1,080 NEUTRAL 1% -25% 11.2 11% 5% 2%
TW Epistar Corporation 2448.TW OEM High 1 2,263 OUTPERFORM 18% -21% 50.3 4% 927% 17%
HOLT Price
to Best
Growth 2013-15E
Source: Credit Suisse estimates, Credit Suisse HOLT, Thomson Reuters

03 April 2014
Themes in Energy Efficiency 12
Energy demand unlikely to slow down In recent decades, worries regarding the long term impact of population growth on
available resources globally started to rise since the "Club of Rome" reported their findings
in the early 1970s. Demand for the world's key resources (energy, water, land and food)
did indeed increase rapidly during the past 40 years, and we believe that the key drivers
for this remain very much in place.
Since the early 1970s global primary energy consumption has more than doubled whereas
it increased by c50% since 1990 (Figure 24). This growth has largely been driven by
developing economies as consumption from non-OECD countries has doubled since 1990
compared to an increase from OECD members of just 20%. The share of energy
consumption from developed countries has fallen to 41% in 2011 from 60% in 1973 while
Asian economies, including China, raised their share to 31% from 14% (Figure 25).
Figure 24: World energy consumption (QBtu) Figure 25: Energy consumption by region
0
100
200
300
400
500
600
1990 2000 2010
Non-OECD: +100%
OECD: +20%
60%41%
8%18%
6%13%
0%
20%
40%
60%
80%
100%
120%
1973 2011
OECD China
Asia Latam
Non-OECD Europe Middle East
Africa Other
Source: IEA Source: IEA
Three key demand drivers
In a global context, we see three key drivers behind the continued increase in demand for
energy. These three drivers are population growth, urbanisation and the developing middle
class.
Population growth
To date productivity improvements, technological progress and expansion into low-cost
sources of supply has allowed the global economy to continue to grow and cope with an
increase in the world's population from less than 3 billion in 1950 to approximately 7 billion
today.
However we believe that the challenges of meeting incremental demand for water, energy,
land and basic materials going forward are likely to remain high as the world's population
is expected to increase further to approximately 9 billion by 2050 with an upper estimate of
as more than 10bn, according to McKinsey.
Most of this expected population growth is set to originate in developing economies. This
in our view makes the resource issue more challenging given incremental logistical
challenges as infrastructure across emerging countries is typically less developed.

03 April 2014
Themes in Energy Efficiency 13
Figure 26: World population projections to 2050: Strong growth expected to continue
Figure 27: Urbanisation in emerging market regions (urban population, % of total)
500
2,500
4,500
6,500
8,500
10,500
1950 1970 1990 2010 2030 2050
World
World upper estimate
World lower estimate
LEDC
MEDC
0
10
20
30
40
50
60
70
80
90
100
1950 1970 1990 2010 2030 2050
Latin America Eastern Europe
MENA Non-Japan Asia
Sub-Saharan Africa
Source: United Nations, Credit Suisse research Source: Population Division of the Department of Economic and
Social Affairs of the UN Secretariat, Credit Suisse research
Urbanisation
Urbanisation is another factor impacting resource challenges in our view. For example
some academic studies show that every 1% increase in the urbanisation rate increases
energy consumption by an additional 0.47% (Jones, 1991). Urbanisation in low income
countries may reduce total energy use as households start to switch to more efficient
heating and cooking practices. However, this changes once countries enter the middle to
higher income levels (Figure 28) and (Figure 29).
Urbanisation also impacts carbon emission generation. For example, carbon emissions
per capita for cities in middle and higher income countries are typically c10x higher than
for cities in low developing countries with underdeveloped infrastructure (Figure 31).
Figure 28: Elasticity between economic growth and energy use and carbon emissions for households
Figure 29: Energy consumption increases with urbanisation and income levels
$ 1,500 $5,500 $20,000Low-income Middle High-income
29% 58% 76%
Urbanisation (mean)
GDP/capita(mean)
Household energytransation
Biomass Biomass/Oil Nat.gas/electr.
Urbanisation elasticityof residential energy use
Urbanisation elasticityof residential emissions
0
10
20
30
40
50
60
70
80
90
0
100
200
300
400
500
600
700
800
900
Low-income Middle-income High-income
Ura
bisa
tion
(%)
kgoe
per
cap
ita
Energy , '75 Energy, '05
Urbanisation, '75 (rhs) Urbanisation, '05 (rhs)
Source: Phetkeo Poumanyvong, Shinji Kaneko, Shobhakar Dhakal,
Impacts of urbanization on national transport and road energy use:
Evidence from low-, middle- and high-income countries, Hiroshima
University, 2012
Source: Phetkeo Poumanyvong, Shinji Kaneko, Shobhakar Dhakal,
Impacts of urbanization on national transport and road energy use:
Evidence from low-, middle- and high-income countries, Hiroshima
University, 2012
03 April 2014
Themes in Energy Efficiency 14
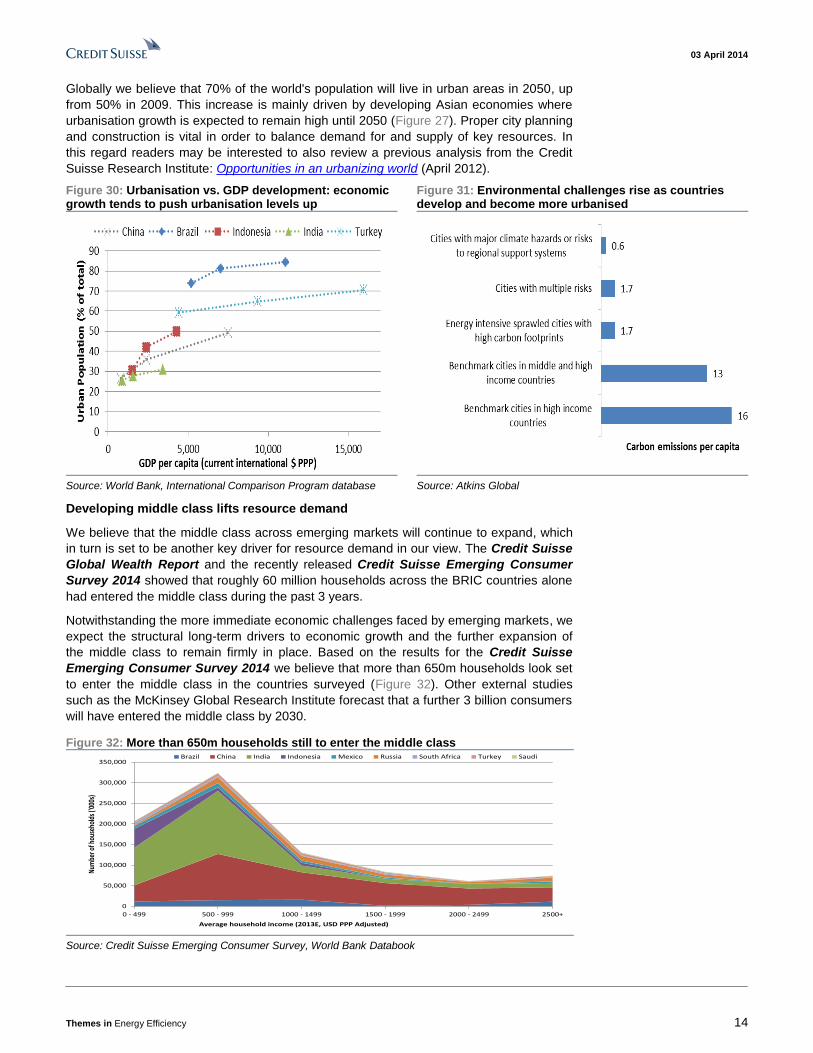
Globally we believe that 70% of the world's population will live in urban areas in 2050, up
from 50% in 2009. This increase is mainly driven by developing Asian economies where
urbanisation growth is expected to remain high until 2050 (Figure 27). Proper city planning
and construction is vital in order to balance demand for and supply of key resources. In
this regard readers may be interested to also review a previous analysis from the Credit
Suisse Research Institute: Opportunities in an urbanizing world (April 2012).
Figure 30: Urbanisation vs. GDP development: economic growth tends to push urbanisation levels up
Figure 31: Environmental challenges rise as countries develop and become more urbanised
Source: World Bank, International Comparison Program database Source: Atkins Global
Developing middle class lifts resource demand
We believe that the middle class across emerging markets will continue to expand, which
in turn is set to be another key driver for resource demand in our view. The Credit Suisse
Global Wealth Report and the recently released Credit Suisse Emerging Consumer
Survey 2014 showed that roughly 60 million households across the BRIC countries alone
had entered the middle class during the past 3 years.
Notwithstanding the more immediate economic challenges faced by emerging markets, we
expect the structural long-term drivers to economic growth and the further expansion of
the middle class to remain firmly in place. Based on the results for the Credit Suisse
Emerging Consumer Survey 2014 we believe that more than 650m households look set
to enter the middle class in the countries surveyed (Figure 32). Other external studies
such as the McKinsey Global Research Institute forecast that a further 3 billion consumers
will have entered the middle class by 2030.
Figure 32: More than 650m households still to enter the middle class
0
50,000
100,000
150,000
200,000
250,000
300,000
350,000
0 - 499 500 - 999 1000 - 1499 1500 - 1999 2000 - 2499 2500+
Num
ber o
f hou
seho
lds (
'000
s)
Average household income (2013E, USD PPP Adjusted)
Brazil China India Indonesia Mexico Russia South Africa Turkey Saudi
Source: Credit Suisse Emerging Consumer Survey, World Bank Databook

03 April 2014
Themes in Energy Efficiency 15
We believe that some of the largest emerging economies are at or close to the "sweet
spot" where acceleration in middle class discretionary spending typically accelerates. This
in turn typically leads to significant growth in energy consuming appliances and products.
Consumption in case efficiency does not improve
Energy intensity for developed regions has been declining for years owing to a shift away
from manufacturing and the adoption of energy efficiency measures. This is less the case
for emerging countries (Figure 33). In fact we note that energy consumption per capita in
countries such as China, Brazil, India and Indonesia is rising rapidly owing to population
growth, urbanisation and the developing middle class (Figure 34).
Figure 33: Energy intensity across key geographies Figure 34: Energy consumption/capita (M BTU/year)
0
5000
10000
15000
20000
25000
30000
35000
40000 Energy consumption per dollar of GDP (Btu/year), 2011
0
10
20
30
40
50
60
70
80
90
1980 1985 1990 1995 2000 2005 2010
China Brazil India Indonesia
Source: World Bank Source: World Bank
Energy consumption per capita in developing countries remains substantially below levels
seen in developed markets (Figure 35). However we believe that further economic
expansion will push energy consumption per capita in developing countries higher and
closer to levels seen in developed economies. Continued emerging market growth is
therefore likely to have a profound impact on total energy consumption if no efficiency
gains are achieved.
Figure 35: Energy consumption per capita vs GDP/capita (MBtu/capita/year)
100.0
150.0
200.0
250.0
300.0
350.0
0
50
100
150
200
250
0 5000 10000 15000 20000 25000 30000 35000 40000 45000 50000
EU Russia Japan China Brazil India World US (rhs)
Source: EIA, World Bank

03 April 2014
Themes in Energy Efficiency 16
Assuming that emerging countries converge economically with developed markets by
2050 would suggest a possible increase in average energy consumption levels per capita
to c150 MBtu/capita by 2050 (Figure 36). This together with population expectations
implies that total energy consumption for these emerging economies may increase almost
fourfold by 2050 from 2010. To put this in context, the potential increase between 2010
and 2050 for these countries would be 2.3 times the total energy consumption of the EU
and US combined (Figure 37).
Figure 36: Potential energy consumption/capita for key emerging countries (M Btu)
Figure 37: Total energy demand for key emerging countries could increase c2.3 times the EU/US total
0
20
40
60
80
100
120
140
160
180
200
0 5000 10000 15000 20000 25000 30000 35000
Asean Brazil China India Mexico
0
100
200
300
400
500
600
2010 2020 2030 2040 2050
China India Asean Brazil Mexico
Incremental usage: 395 QBtuEU + US combined: 170 QBtu
Source: World Bank, IEA, Credit Suisse research Source: World Bank, IEA, Credit Suisse research
Our calculations are similar to those from the McKinsey Global Institute which predicts that
between 2010 and 2030 demand for energy may increase by an additional 32% or the
equivalent of the current annual consumption of the US and EU members of the OECD
combined.
Our calculations imply that without further energy efficiency gains, pressure on energy
supply conditions are likely to intensify going forward.
Figure 38: Total global energy supply requirements
340460
130
160
0
100
200
300
400
500
600
700
1990-2010 2010-2030
Primary Energy (QBTU)
Incremental supply Supply replacement (at historical rates)
+32%
Source: McKinsey Global Institute
03 April 2014
Themes in Energy Efficiency 17
Rising supply concerns to act as efficiency catalyst
Our calculations show that energy demand globally is set to increase strongly if no
efficiency gains are achieved. While this report does not have a focus on supply-side
related issues, we do point out that the potentially strong increase in total energy demand
is likely to create supply concerns on multiple levels, which in turn provides support for the
efficiency agenda. We see at least three reasons why supply-side related concerns are
likely to increase and act as a catalyst for the efficiency agenda:
■ Firstly we note that the ability to produce the required level of resources is not a given.
Energy reserves in the case of oil and coal for example appear to be sufficient for at
least another few decades; however, accessing these resources is becoming more
problematic while the marginal cost of extracting them is increasing. In the case of oil
we note higher costs for drilling and oil-field services. The development of shale gas
may help in this regard, especially from a US perspective; however, uncertainty
remains over the impact that this may have on the global energy supply.
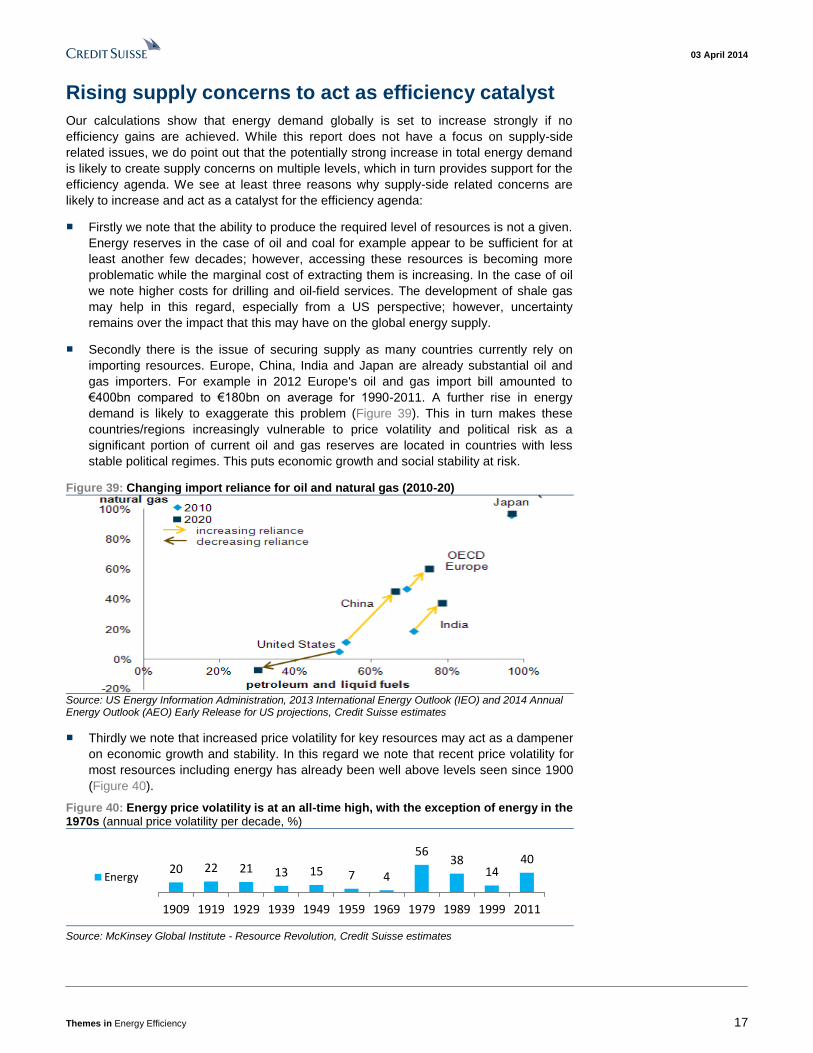
■ Secondly there is the issue of securing supply as many countries currently rely on
importing resources. Europe, China, India and Japan are already substantial oil and
gas importers. For example in 2012 Europe's oil and gas import bill amounted to
€400bn compared to €180bn on average for 1990-2011. A further rise in energy
demand is likely to exaggerate this problem (Figure 39). This in turn makes these
countries/regions increasingly vulnerable to price volatility and political risk as a
significant portion of current oil and gas reserves are located in countries with less
stable political regimes. This puts economic growth and social stability at risk.
Figure 39: Changing import reliance for oil and natural gas (2010-20)
Source: US Energy Information Administration, 2013 International Energy Outlook (IEO) and 2014 Annual Energy Outlook (AEO) Early Release for US projections, Credit Suisse estimates
■ Thirdly we note that increased price volatility for key resources may act as a dampener
on economic growth and stability. In this regard we note that recent price volatility for
most resources including energy has already been well above levels seen since 1900
(Figure 40).
Figure 40: Energy price volatility is at an all-time high, with the exception of energy in the 1970s (annual price volatility per decade, %)
20 22 21 13 15 7 4
5638
1440
1909 1919 1929 1939 1949 1959 1969 1979 1989 1999 2011
Energy
Source: McKinsey Global Institute - Resource Revolution, Credit Suisse estimates
03 April 2014
Themes in Energy Efficiency 18
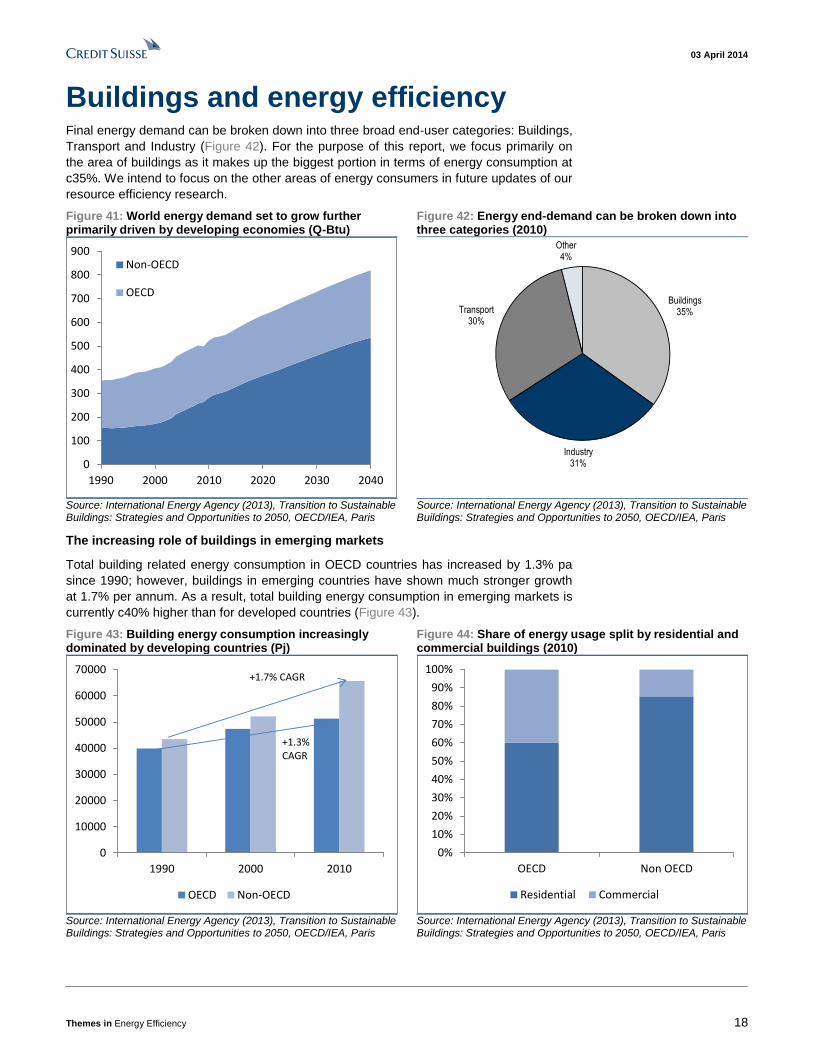
Buildings and energy efficiency Final energy demand can be broken down into three broad end-user categories: Buildings,
Transport and Industry (Figure 42). For the purpose of this report, we focus primarily on
the area of buildings as it makes up the biggest portion in terms of energy consumption at
c35%. We intend to focus on the other areas of energy consumers in future updates of our
resource efficiency research.
Figure 41: World energy demand set to grow further primarily driven by developing economies (Q-Btu)
Figure 42: Energy end-demand can be broken down into three categories (2010)
0
100
200
300
400
500
600
700
800
900
1990 2000 2010 2020 2030 2040
Non-OECD
OECD
Buildings35%
Industry31%
Transport30%
Other4%
Source: International Energy Agency (2013), Transition to Sustainable Buildings: Strategies and Opportunities to 2050, OECD/IEA, Paris
Source: International Energy Agency (2013), Transition to Sustainable Buildings: Strategies and Opportunities to 2050, OECD/IEA, Paris
The increasing role of buildings in emerging markets
Total building related energy consumption in OECD countries has increased by 1.3% pa
since 1990; however, buildings in emerging countries have shown much stronger growth
at 1.7% per annum. As a result, total building energy consumption in emerging markets is
currently c40% higher than for developed countries (Figure 43).
Figure 43: Building energy consumption increasingly dominated by developing countries (Pj)
Figure 44: Share of energy usage split by residential and commercial buildings (2010)
0
10000
20000
30000
40000
50000
60000
70000
1990 2000 2010
OECD Non-OECD
+1.3% CAGR
+1.7% CAGR
0%
10%
20%
30%
40%
50%
60%
70%
80%
90%
100%
OECD Non OECD
Residential Commercial
Source: International Energy Agency (2013), Transition to Sustainable Buildings: Strategies and Opportunities to 2050, OECD/IEA, Paris
Source: International Energy Agency (2013), Transition to Sustainable Buildings: Strategies and Opportunities to 2050, OECD/IEA, Paris
03 April 2014
Themes in Energy Efficiency 19
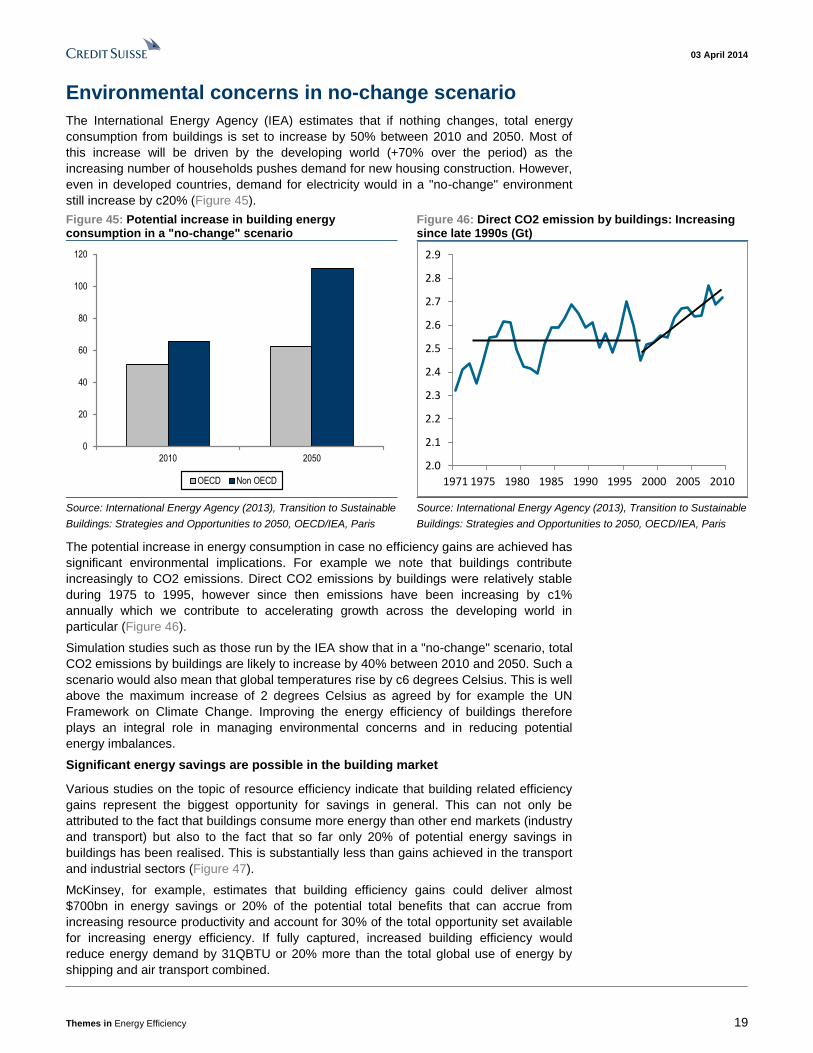
Environmental concerns in no-change scenario
The International Energy Agency (IEA) estimates that if nothing changes, total energy
consumption from buildings is set to increase by 50% between 2010 and 2050. Most of
this increase will be driven by the developing world (+70% over the period) as the
increasing number of households pushes demand for new housing construction. However,
even in developed countries, demand for electricity would in a "no-change" environment
still increase by c20% (Figure 45).
Figure 45: Potential increase in building energy consumption in a "no-change" scenario
Figure 46: Direct CO2 emission by buildings: Increasing since late 1990s (Gt)
0
20
40
60
80
100
120
2010 2050
OECD Non OECD
2.0
2.1
2.2
2.3
2.4
2.5
2.6
2.7
2.8
2.9
1971 1975 1980 1985 1990 1995 2000 2005 2010
Source: International Energy Agency (2013), Transition to Sustainable
Buildings: Strategies and Opportunities to 2050, OECD/IEA, Paris
Source: International Energy Agency (2013), Transition to Sustainable
Buildings: Strategies and Opportunities to 2050, OECD/IEA, Paris
The potential increase in energy consumption in case no efficiency gains are achieved has
significant environmental implications. For example we note that buildings contribute
increasingly to CO2 emissions. Direct CO2 emissions by buildings were relatively stable
during 1975 to 1995, however since then emissions have been increasing by c1%
annually which we contribute to accelerating growth across the developing world in
particular (Figure 46).
Simulation studies such as those run by the IEA show that in a "no-change" scenario, total
CO2 emissions by buildings are likely to increase by 40% between 2010 and 2050. Such a
scenario would also mean that global temperatures rise by c6 degrees Celsius. This is well
above the maximum increase of 2 degrees Celsius as agreed by for example the UN
Framework on Climate Change. Improving the energy efficiency of buildings therefore
plays an integral role in managing environmental concerns and in reducing potential
energy imbalances.
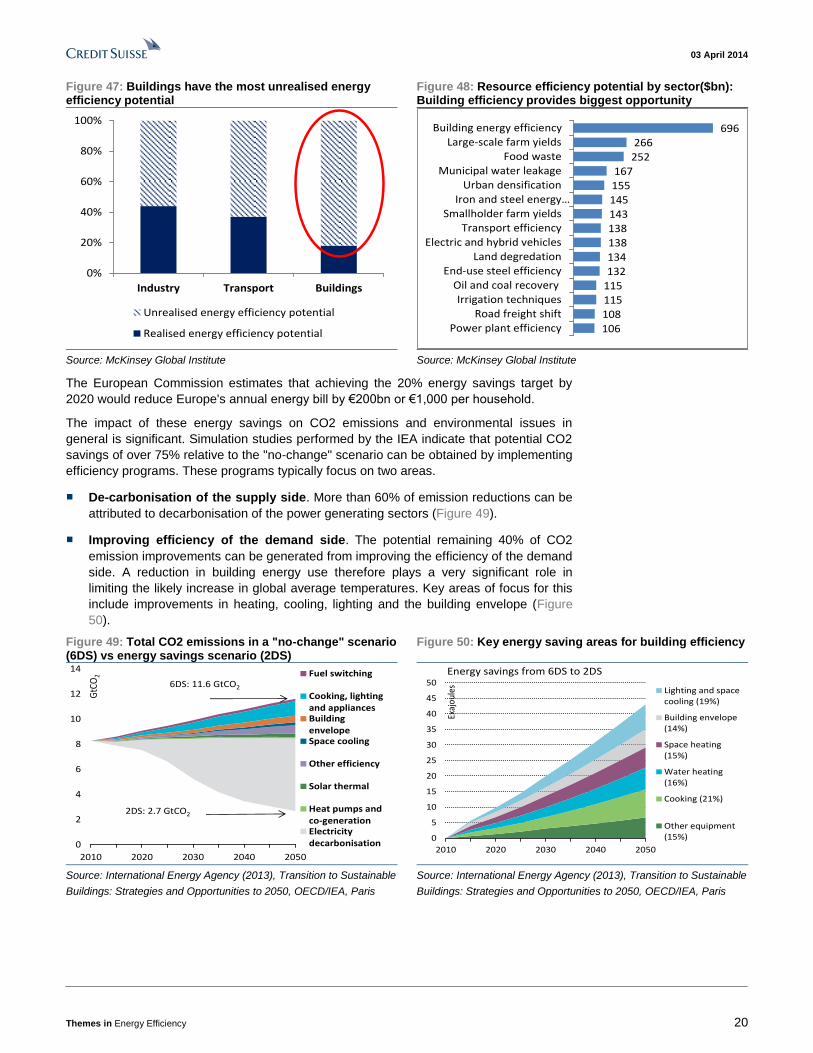
Significant energy savings are possible in the building market
Various studies on the topic of resource efficiency indicate that building related efficiency
gains represent the biggest opportunity for savings in general. This can not only be
attributed to the fact that buildings consume more energy than other end markets (industry
and transport) but also to the fact that so far only 20% of potential energy savings in
buildings has been realised. This is substantially less than gains achieved in the transport
and industrial sectors (Figure 47).
McKinsey, for example, estimates that building efficiency gains could deliver almost
$700bn in energy savings or 20% of the potential total benefits that can accrue from
increasing resource productivity and account for 30% of the total opportunity set available
for increasing energy efficiency. If fully captured, increased building efficiency would
reduce energy demand by 31QBTU or 20% more than the total global use of energy by
shipping and air transport combined.
03 April 2014
Themes in Energy Efficiency 20
Figure 47: Buildings have the most unrealised energy efficiency potential
Figure 48: Resource efficiency potential by sector($bn): Building efficiency provides biggest opportunity
0%
20%
40%
60%
80%
100%
Industry Transport Buildings
Unrealised energy efficiency potential
Realised energy efficiency potential
106
108
115115
132134138
138143145
155167
252
266696
Power plant efficiency
Road freight shiftIrrigation techniques
Oil and coal recovery
End-use steel efficiencyLand degredation
Electric and hybrid vehicles
Transport efficiencySmallholder farm yields
Iron and steel energy…
Urban densificationMunicipal water leakage
Food waste
Large-scale farm yieldsBuilding energy efficiency
Source: McKinsey Global Institute Source: McKinsey Global Institute
The European Commission estimates that achieving the 20% energy savings target by
2020 would reduce Europe's annual energy bill by €200bn or €1,000 per household.
The impact of these energy savings on CO2 emissions and environmental issues in
general is significant. Simulation studies performed by the IEA indicate that potential CO2
savings of over 75% relative to the "no-change" scenario can be obtained by implementing
efficiency programs. These programs typically focus on two areas.
■ De-carbonisation of the supply side. More than 60% of emission reductions can be
attributed to decarbonisation of the power generating sectors (Figure 49).
■ Improving efficiency of the demand side. The potential remaining 40% of CO2
emission improvements can be generated from improving the efficiency of the demand
side. A reduction in building energy use therefore plays a very significant role in
limiting the likely increase in global average temperatures. Key areas of focus for this
include improvements in heating, cooling, lighting and the building envelope (Figure
50).
Figure 49: Total CO2 emissions in a "no-change" scenario (6DS) vs energy savings scenario (2DS)
Figure 50: Key energy saving areas for building efficiency
0
2
4
6
8
10
12
14
2010 2020 2030 2040 2050
GtC
O2 Fuel switching
Cooking, lightingand appliancesBuildingenvelopeSpace cooling
Other efficiency
Solar thermal
Heat pumps andco-generationElectricitydecarbonisation
2DS: 2.7 GtCO2
6DS: 11.6 GtCO2
0
5
10
15
20
25
30
35
40
45
50
2010 2020 2030 2040 2050
Exaj
oule
s
Energy savings from 6DS to 2DS
Lighting and spacecooling (19%)
Building envelope(14%)
Space heating(15%)
Water heating(16%)
Cooking (21%)
Other equipment(15%)
Source: International Energy Agency (2013), Transition to Sustainable
Buildings: Strategies and Opportunities to 2050, OECD/IEA, Paris
Source: International Energy Agency (2013), Transition to Sustainable
Buildings: Strategies and Opportunities to 2050, OECD/IEA, Paris
03 April 2014
Themes in Energy Efficiency 21
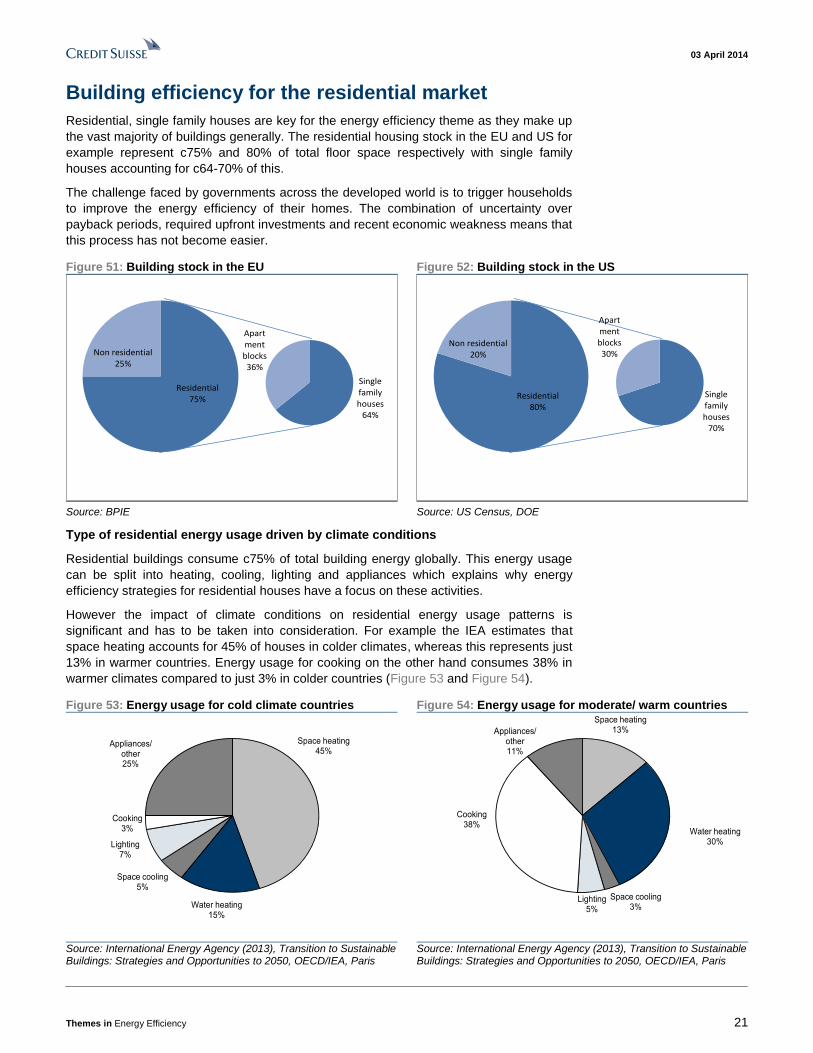
Building efficiency for the residential market
Residential, single family houses are key for the energy efficiency theme as they make up
the vast majority of buildings generally. The residential housing stock in the EU and US for
example represent c75% and 80% of total floor space respectively with single family
houses accounting for c64-70% of this.
The challenge faced by governments across the developed world is to trigger households
to improve the energy efficiency of their homes. The combination of uncertainty over
payback periods, required upfront investments and recent economic weakness means that
this process has not become easier.
Figure 51: Building stock in the EU Figure 52: Building stock in the US
Residential75%
Non residential25%
Single family houses
64%
Apartment blocks36%
Residential80%
Non residential20%
Single family houses
70%
Apartment blocks30%
Source: BPIE Source: US Census, DOE
Type of residential energy usage driven by climate conditions
Residential buildings consume c75% of total building energy globally. This energy usage
can be split into heating, cooling, lighting and appliances which explains why energy
efficiency strategies for residential houses have a focus on these activities.
However the impact of climate conditions on residential energy usage patterns is
significant and has to be taken into consideration. For example the IEA estimates that
space heating accounts for 45% of houses in colder climates, whereas this represents just
13% in warmer countries. Energy usage for cooking on the other hand consumes 38% in
warmer climates compared to just 3% in colder countries (Figure 53 and Figure 54).
Figure 53: Energy usage for cold climate countries Figure 54: Energy usage for moderate/ warm countries
Space heating45%
Water heating15%
Space cooling5%
Lighting7%
Cooking3%
Appliances/ other25%
Space heating13%
Water heating30%
Space cooling3%
Lighting5%
Cooking38%
Appliances/ other11%
Source: International Energy Agency (2013), Transition to Sustainable Buildings: Strategies and Opportunities to 2050, OECD/IEA, Paris
Source: International Energy Agency (2013), Transition to Sustainable Buildings: Strategies and Opportunities to 2050, OECD/IEA, Paris
03 April 2014
Themes in Energy Efficiency 22
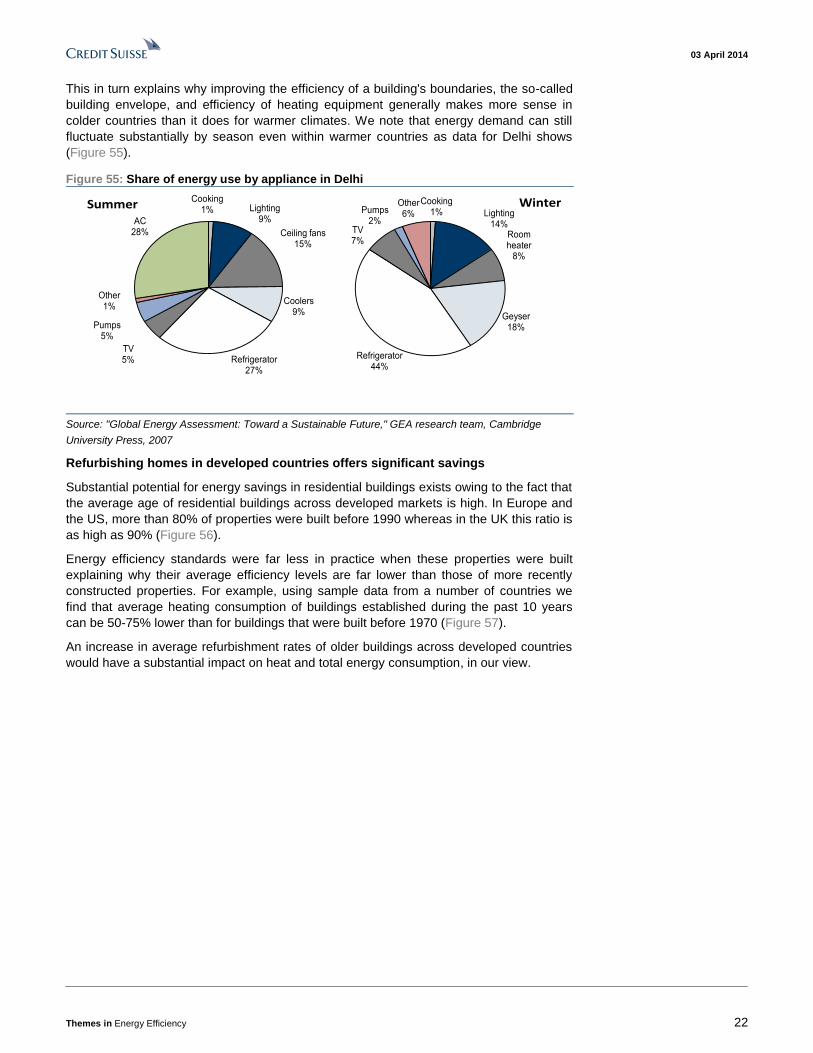
This in turn explains why improving the efficiency of a building's boundaries, the so-called
building envelope, and efficiency of heating equipment generally makes more sense in
colder countries than it does for warmer climates. We note that energy demand can still
fluctuate substantially by season even within warmer countries as data for Delhi shows
(Figure 55).
Figure 55: Share of energy use by appliance in Delhi
Cooking1% Lighting
14%Room heater
8%
Geyser18%
Refrigerator44%
TV7%
Pumps2%
Other6%
WinterCooking1% Lighting
9%
Ceiling fans15%
Coolers9%
Refrigerator27%
TV5%
Pumps5%
Other1%
AC28%
Summer
Source: "Global Energy Assessment: Toward a Sustainable Future," GEA research team, Cambridge
University Press, 2007
Refurbishing homes in developed countries offers significant savings
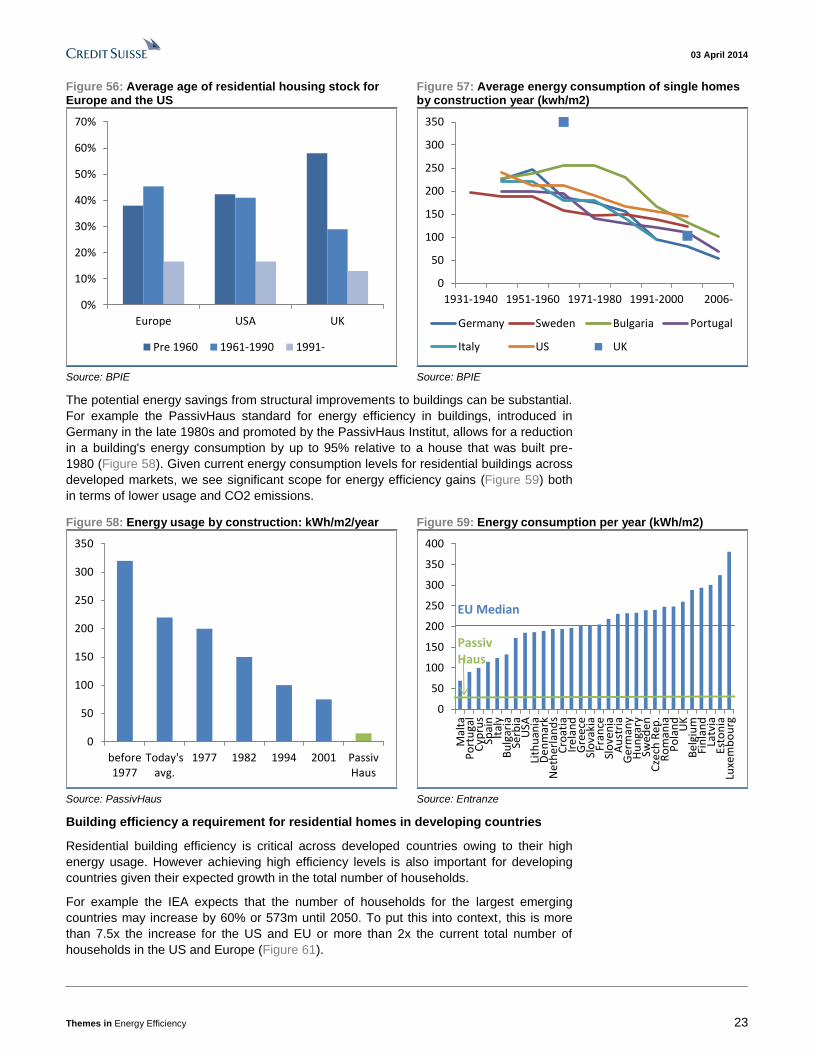
Substantial potential for energy savings in residential buildings exists owing to the fact that
the average age of residential buildings across developed markets is high. In Europe and
the US, more than 80% of properties were built before 1990 whereas in the UK this ratio is
as high as 90% (Figure 56).
Energy efficiency standards were far less in practice when these properties were built
explaining why their average efficiency levels are far lower than those of more recently
constructed properties. For example, using sample data from a number of countries we
find that average heating consumption of buildings established during the past 10 years
can be 50-75% lower than for buildings that were built before 1970 (Figure 57).
An increase in average refurbishment rates of older buildings across developed countries
would have a substantial impact on heat and total energy consumption, in our view.
03 April 2014
Themes in Energy Efficiency 23
Figure 56: Average age of residential housing stock for Europe and the US
Figure 57: Average energy consumption of single homes by construction year (kwh/m2)
0%
10%
20%
30%
40%
50%
60%
70%
Europe USA UK
Pre 1960 1961-1990 1991-
0
50
100
150
200
250
300
350
1931-1940 1951-1960 1971-1980 1991-2000 2006-
Germany Sweden Bulgaria Portugal
Italy US UK
Source: BPIE Source: BPIE
The potential energy savings from structural improvements to buildings can be substantial.
For example the PassivHaus standard for energy efficiency in buildings, introduced in
Germany in the late 1980s and promoted by the PassivHaus Institut, allows for a reduction
in a building's energy consumption by up to 95% relative to a house that was built pre-
1980 (Figure 58). Given current energy consumption levels for residential buildings across
developed markets, we see significant scope for energy efficiency gains (Figure 59) both
in terms of lower usage and CO2 emissions.
Figure 58: Energy usage by construction: kWh/m2/year Figure 59: Energy consumption per year (kWh/m2)
0
50
100
150
200
250
300
350
before1977
Today'savg.
1977 1982 1994 2001 PassivHaus
0
50
100
150
200
250
300
350
400
Mal
taP
ort
uga
lC
ypru
sSp
ain
Ital
yB
ulg
aria
Serb
iaU
SALi
thu
ania
De
nm
ark
Net
her
lan
ds
Cro
atia
Ire
lan
dG
ree
ceSl
ova
kia
Fran
ceSl
ove
nia
Au
stri
aG
erm
any
Hu
nga
rySw
ede
nC
zech
Rep
.R
om
ania
Po
lan
dU
KB
elg
ium
Fin
lan
dLa
tvia
Esto
nia
Luxe
mb
ou
rg
EU Median
PassivHaus
Source: PassivHaus Source: Entranze
Building efficiency a requirement for residential homes in developing countries
Residential building efficiency is critical across developed countries owing to their high
energy usage. However achieving high efficiency levels is also important for developing
countries given their expected growth in the total number of households.
For example the IEA expects that the number of households for the largest emerging
countries may increase by 60% or 573m until 2050. To put this into context, this is more
than 7.5x the increase for the US and EU or more than 2x the current total number of
households in the US and Europe (Figure 61).

03 April 2014
Themes in Energy Efficiency 24
Figure 60: Average house size across emerging and developed markets (2010)
0
50
100
150
200
250
Developed: 104m2
Emerging: 58m2
Source: IEA, UN
Future energy consumption from residential houses is not just driven by the expected
increase in the number of houses but also by their size. The average home in developed
markets is almost twice as a big as in developing countries (Figure 60). As wealth
increases, we would generally expect demand for bigger living space to increase also,
which in turn increases energy requirements further.
We estimate that the growth in households and the size per home across developing
countries may increase the total residential floor space that needs heating or cooling by
50bn m2 (Figure 62). This increase is more than the current total residential floor space for
the US and EU-27 combined.
Figure 61: Emerging households set to rise by c573m up to 2050 or 7.5x the increase for the US/EU
Figure 62: Residential emerging floor space may rise by 50bn m2 or more than current US and EU combined
0
200
400
600
800
1 000
1 200
1 400
1 600
1 800
2 000
2010 2020 2030 2040 2050
EU+US Emerging
+60%: +573m
+23%: +75m
0
20
40
60
80
100
120
140
160
2010 2020 2030 2040 2050
EU+US Emerging
+80%: +42bn m2
+32%: +14bn m2
Source: IEA. Emerging = Asean, Brazil, China, India, Mexico, Russia and South Africa
Source: IEA. Emerging = Asean, Brazil, China, India, Mexico, Russia and South Africa
The need for refurbishment: mapping total residential energy consumption
In order to indicate what the impact of the expected growth in households globally might
mean for energy consumption we have run some scenarios. Using forecasts for household
formation across key regions and countries, assuming that average house sizes for
developing countries increase as income levels rise and using existing energy
consumption levels per square meter we can forecast potential total energy consumption.

03 April 2014
Themes in Energy Efficiency 25
We can then estimate what level of annual refurbishment of existing homes is needed to
stabilise total energy consumption from residential buildings.
Based on our data we calculate that without additional efficiency gains, total energy
consumption by residential buildings globally could increase by 71% until 2050 (Figure
63). This is not only driven by emerging markets (+118%) but also by a further 17%
increase from Europe and the US over that period.
To slow down the global growth in residential energy consumption requires energy savings
and therefore investments into refurbishment. We estimate that the current c1%
refurbishment rate in Europe and the US is sufficient to keep developed market growth
flat, however, this is not sufficient for emerging markets.
To keep global residential energy consumption flat, we believe that the annual
refurbishment rate has to increase to c3% per annum. This is in line with suggestions from
the "Renovate Europe" group but we note that it would have only a material impact on a
global basis as of 2030 (Figure 66).
Figure 63: No efficiency improvements implies residential energy consumption increase of 71% on a global basis
Figure 64: 1% refurbishment annually not sufficient to limit global energy consumption
0
10
20
30
40
50
60
70
80
90
2010 2020 2030 2040 2050
EU+US GEM
+118%
+ 17%
0
10
20
30
40
50
60
70
80
2010 2020 2030 2040 2050
EU+US GEM
+84%
+ 2%
Source: IEA, World Bank, Credit Suisse estimates Source: IEA, World Bank, Credit Suisse estimates
Figure 65: A 2% refurbishment stops consumption growth in EMG but only as of 2030
Figure 66: A 3% refurbishment rate would be sufficient to lower global residential energy consumption from 2030
0
10
20
30
40
50
60
70
2010 2020 2030 2040 2050
EU+US GEM
+40% to peak in 2030 then decline in Emg.
- 20%
0
10
20
30
40
50
60
2010 2020 2030 2040 2050
EU+US GEM
-24% global decline
Source: IEA, World Bank, Credit Suisse estimates Source: IEA, World Bank, Credit Suisse estimates
03 April 2014
Themes in Energy Efficiency 26
Our calculations for the "no-change" scenario show that further energy efficiency
improvements for residential buildings are vital in order to address potential energy supply-
demand concerns and related environmental challenges.
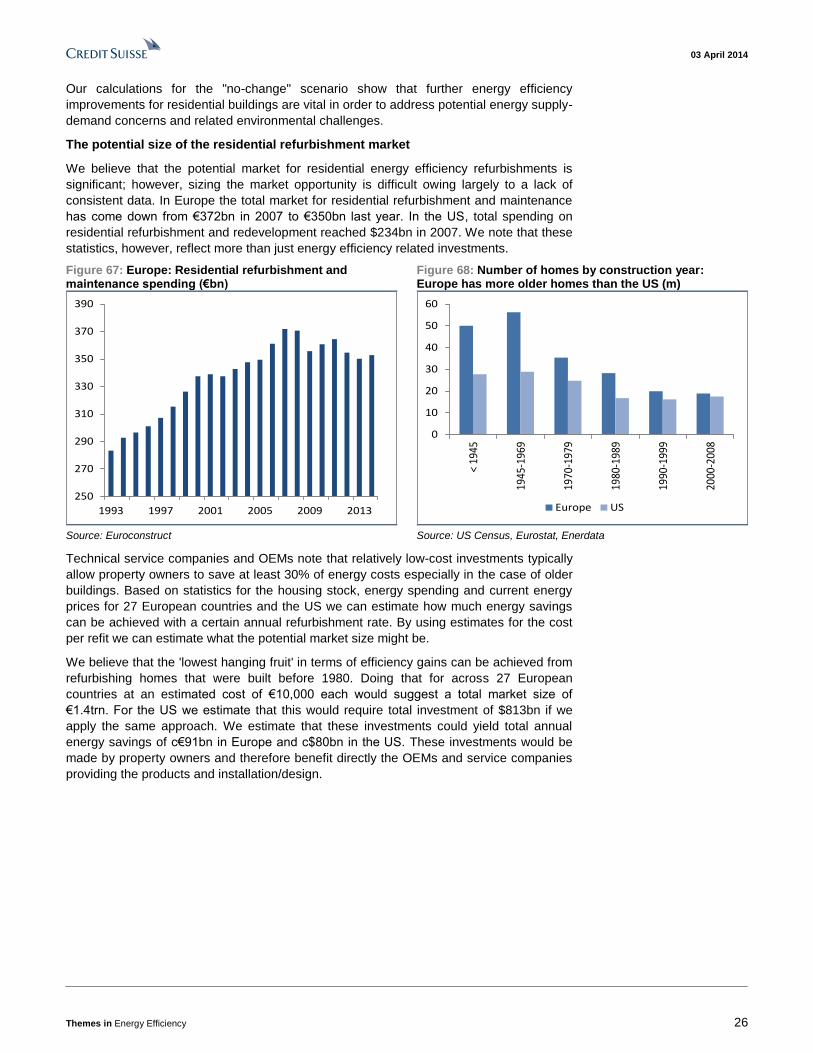
The potential size of the residential refurbishment market
We believe that the potential market for residential energy efficiency refurbishments is
significant; however, sizing the market opportunity is difficult owing largely to a lack of
consistent data. In Europe the total market for residential refurbishment and maintenance
has come down from €372bn in 2007 to €350bn last year. In the US, total spending on
residential refurbishment and redevelopment reached $234bn in 2007. We note that these
statistics, however, reflect more than just energy efficiency related investments.
Figure 67: Europe: Residential refurbishment and maintenance spending (€bn)
Figure 68: Number of homes by construction year: Europe has more older homes than the US (m)
250
270
290
310
330
350
370
390
1993 1997 2001 2005 2009 2013
0
10
20
30
40
50
60
< 19
45
1945
-196
9
1970
-197
9
1980
-198
9
1990
-199
9
2000
-200
8
Europe US
Source: Euroconstruct Source: US Census, Eurostat, Enerdata
Technical service companies and OEMs note that relatively low-cost investments typically
allow property owners to save at least 30% of energy costs especially in the case of older
buildings. Based on statistics for the housing stock, energy spending and current energy
prices for 27 European countries and the US we can estimate how much energy savings
can be achieved with a certain annual refurbishment rate. By using estimates for the cost
per refit we can estimate what the potential market size might be.
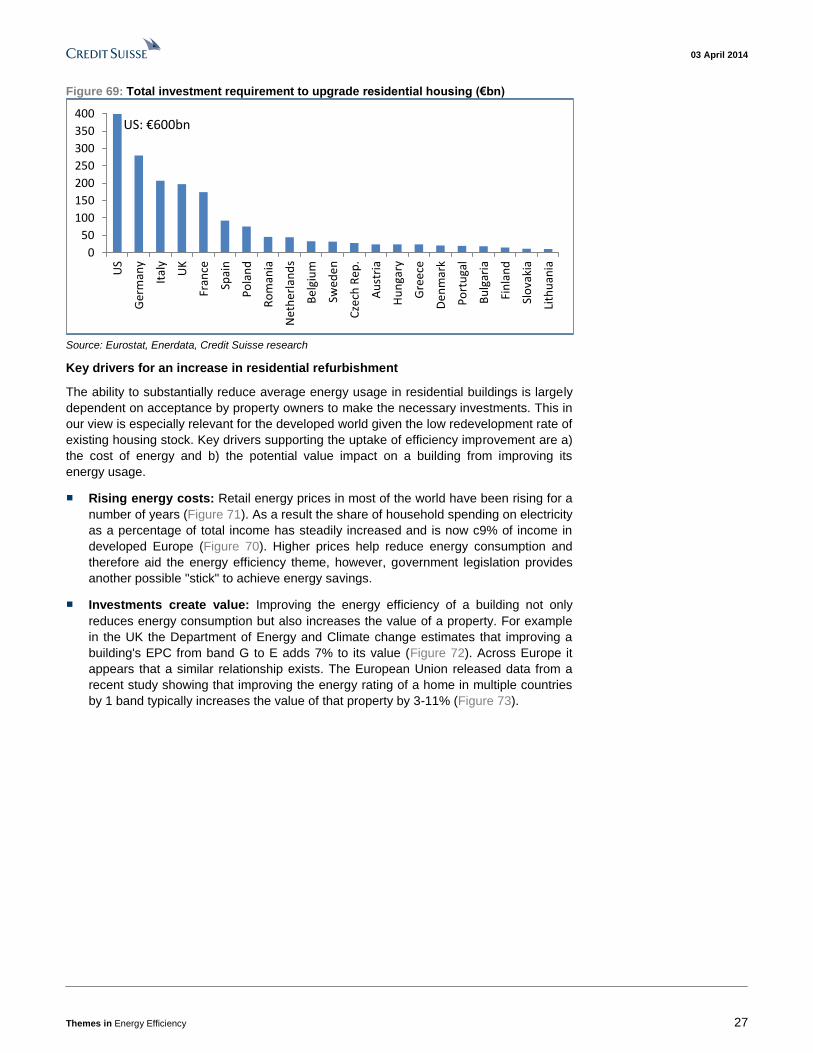
We believe that the 'lowest hanging fruit' in terms of efficiency gains can be achieved from
refurbishing homes that were built before 1980. Doing that for across 27 European
countries at an estimated cost of €10,000 each would suggest a total market size of
€1.4trn. For the US we estimate that this would require total investment of $813bn if we
apply the same approach. We estimate that these investments could yield total annual
energy savings of c€91bn in Europe and c$80bn in the US. These investments would be
made by property owners and therefore benefit directly the OEMs and service companies
providing the products and installation/design.
03 April 2014
Themes in Energy Efficiency 27
Figure 69: Total investment requirement to upgrade residential housing (€bn)
0
50
100
150
200
250
300
350
400U
S
Ger
man
y
Ital
y
UK
Fran
ce
Spai
n
Po
lan
d
Ro
man
ia
Net
her
lan
ds
Be
lgiu
m
Swed
en
Cze
ch R
ep.
Au
stri
a
Hu
nga
ry
Gre
ece
De
nm
ark
Po
rtu
gal
Bu
lgar
ia
Fin
lan
d
Slo
vaki
a
Lith
uan
ia
US: €600bn
Source: Eurostat, Enerdata, Credit Suisse research
Key drivers for an increase in residential refurbishment
The ability to substantially reduce average energy usage in residential buildings is largely
dependent on acceptance by property owners to make the necessary investments. This in
our view is especially relevant for the developed world given the low redevelopment rate of
existing housing stock. Key drivers supporting the uptake of efficiency improvement are a)
the cost of energy and b) the potential value impact on a building from improving its
energy usage.
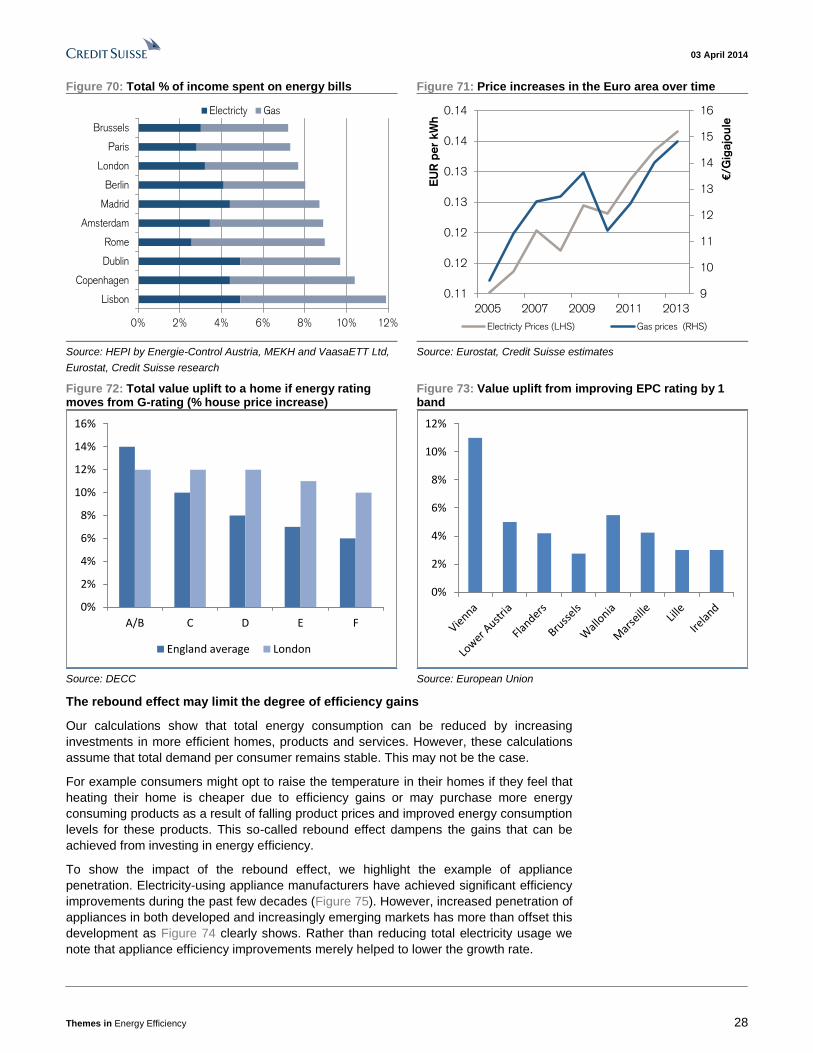
■ Rising energy costs: Retail energy prices in most of the world have been rising for a
number of years (Figure 71). As a result the share of household spending on electricity
as a percentage of total income has steadily increased and is now c9% of income in
developed Europe (Figure 70). Higher prices help reduce energy consumption and
therefore aid the energy efficiency theme, however, government legislation provides
another possible "stick" to achieve energy savings.
■ Investments create value: Improving the energy efficiency of a building not only
reduces energy consumption but also increases the value of a property. For example
in the UK the Department of Energy and Climate change estimates that improving a
building's EPC from band G to E adds 7% to its value (Figure 72). Across Europe it
appears that a similar relationship exists. The European Union released data from a
recent study showing that improving the energy rating of a home in multiple countries
by 1 band typically increases the value of that property by 3-11% (Figure 73).
03 April 2014
Themes in Energy Efficiency 28
Figure 70: Total % of income spent on energy bills Figure 71: Price increases in the Euro area over time
0% 2% 4% 6% 8% 10% 12%
Lisbon
Copenhagen
Dublin
Rome
Amsterdam
Madrid
Berlin
London
Paris
Brussels
Electricty Gas
9
10
11
12
13
14
15
16
0.11
0.12
0.12
0.13
0.13
0.14
0.14
2005 2007 2009 2011 2013
€/G
igajo
ule
EU
R p
er
kW
h
Electricty Prices (LHS) Gas prices (RHS)
Source: HEPI by Energie-Control Austria, MEKH and VaasaETT Ltd,
Eurostat, Credit Suisse research
Source: Eurostat, Credit Suisse estimates
Figure 72: Total value uplift to a home if energy rating moves from G-rating (% house price increase)
Figure 73: Value uplift from improving EPC rating by 1 band
0%
2%
4%
6%
8%
10%
12%
14%
16%
A/B C D E F
England average London
0%
2%
4%
6%
8%
10%
12%
Source: DECC Source: European Union
The rebound effect may limit the degree of efficiency gains
Our calculations show that total energy consumption can be reduced by increasing
investments in more efficient homes, products and services. However, these calculations
assume that total demand per consumer remains stable. This may not be the case.
For example consumers might opt to raise the temperature in their homes if they feel that
heating their home is cheaper due to efficiency gains or may purchase more energy
consuming products as a result of falling product prices and improved energy consumption
levels for these products. This so-called rebound effect dampens the gains that can be
achieved from investing in energy efficiency.
To show the impact of the rebound effect, we highlight the example of appliance
penetration. Electricity-using appliance manufacturers have achieved significant efficiency
improvements during the past few decades (Figure 75). However, increased penetration of
appliances in both developed and increasingly emerging markets has more than offset this
development as Figure 74 clearly shows. Rather than reducing total electricity usage we
note that appliance efficiency improvements merely helped to lower the growth rate.
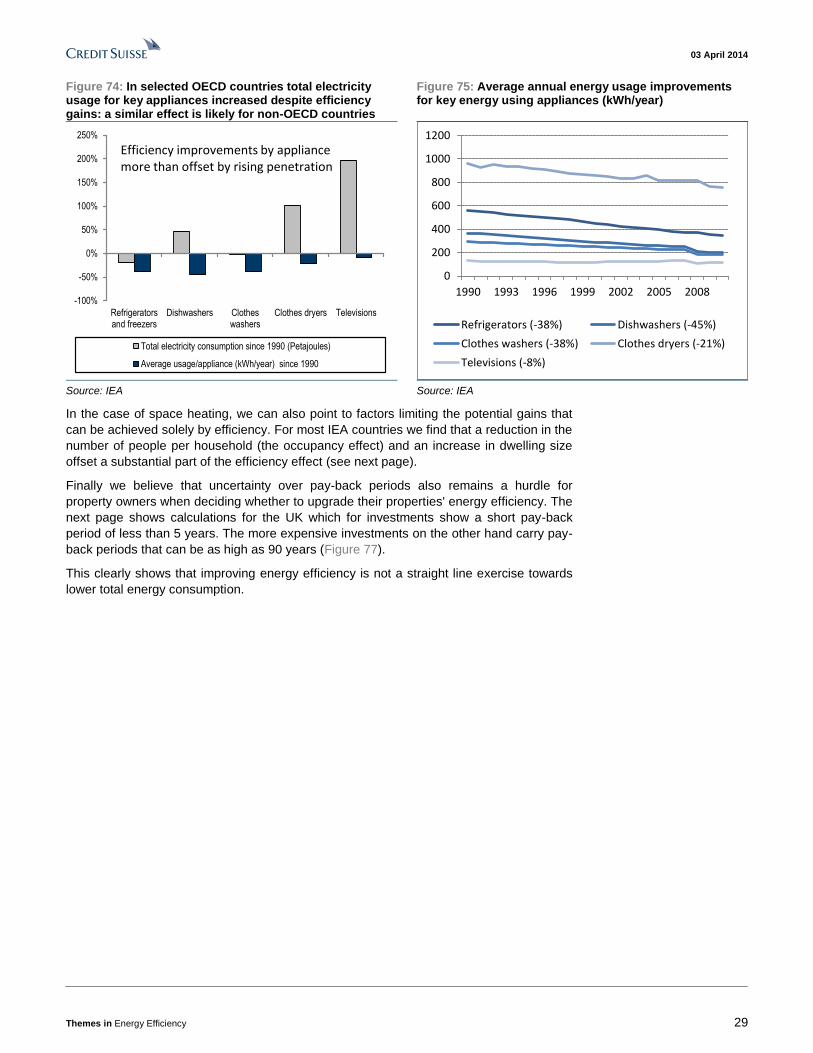
03 April 2014
Themes in Energy Efficiency 29
Figure 74: In selected OECD countries total electricity usage for key appliances increased despite efficiency gains: a similar effect is likely for non-OECD countries
Figure 75: Average annual energy usage improvements for key energy using appliances (kWh/year)
-100%
-50%
0%
50%
100%
150%
200%
250%
Refrigeratorsand freezers
Dishwashers Clotheswashers
Clothes dryers Televisions
Total electricity consumption since 1990 (Petajoules)
Average usage/appliance (kWh/year) since 1990
Efficiency improvements by appliancemore than offset by rising penetration
0
200
400
600
800
1000
1200
1990 1993 1996 1999 2002 2005 2008
Refrigerators (-38%) Dishwashers (-45%)
Clothes washers (-38%) Clothes dryers (-21%)
Televisions (-8%)
Source: IEA Source: IEA
In the case of space heating, we can also point to factors limiting the potential gains that
can be achieved solely by efficiency. For most IEA countries we find that a reduction in the
number of people per household (the occupancy effect) and an increase in dwelling size
offset a substantial part of the efficiency effect (see next page).
Finally we believe that uncertainty over pay-back periods also remains a hurdle for
property owners when deciding whether to upgrade their properties' energy efficiency. The
next page shows calculations for the UK which for investments show a short pay-back
period of less than 5 years. The more expensive investments on the other hand carry pay-
back periods that can be as high as 90 years (Figure 77).
This clearly shows that improving energy efficiency is not a straight line exercise towards
lower total energy consumption.
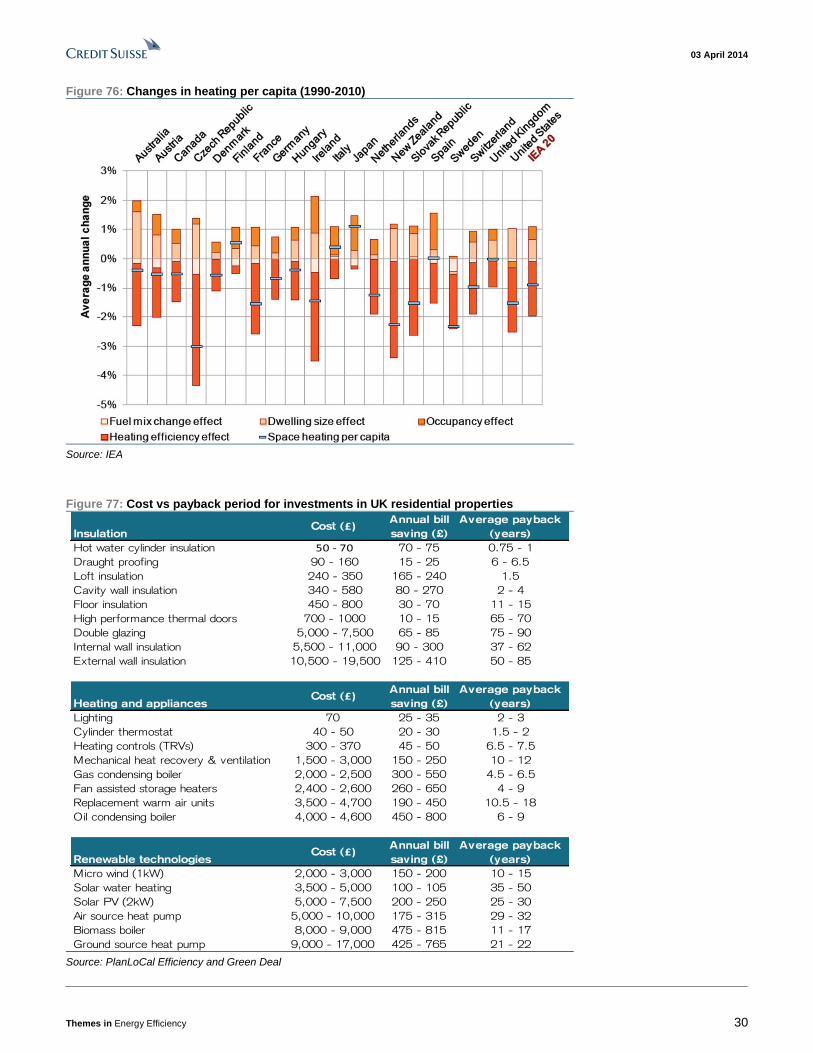
03 April 2014
Themes in Energy Efficiency 30
Figure 76: Changes in heating per capita (1990-2010)
Source: IEA
Figure 77: Cost vs payback period for investments in UK residential properties
InsulationCost (£)
Annual bill
saving (£)
Average payback
(years)
Hot water cylinder insulation 50 - 70 70 - 75 0.75 - 1
Draught proofing 90 - 160 15 - 25 6 - 6.5
Loft insulation 240 - 350 165 - 240 1.5
Cavity wall insulation 340 - 580 80 - 270 2 - 4
Floor insulation 450 - 800 30 - 70 11 - 15
High performance thermal doors 700 - 1000 10 - 15 65 - 70
Double glazing 5,000 - 7,500 65 - 85 75 - 90
Internal wall insulation 5,500 - 11,000 90 - 300 37 - 62
External wall insulation 10,500 - 19,500 125 - 410 50 - 85
Heating and appliancesCost (£)
Annual bill
saving (£)
Average payback
(years)
Lighting 70 25 - 35 2 - 3
Cylinder thermostat 40 - 50 20 - 30 1.5 - 2
Heating controls (TRVs) 300 - 370 45 - 50 6.5 - 7.5
Mechanical heat recovery & ventilation 1,500 - 3,000 150 - 250 10 - 12
Gas condensing boiler 2,000 - 2,500 300 - 550 4.5 - 6.5
Fan assisted storage heaters 2,400 - 2,600 260 - 650 4 - 9
Replacement warm air units 3,500 - 4,700 190 - 450 10.5 - 18
Oil condensing boiler 4,000 - 4,600 450 - 800 6 - 9
Renewable technologiesCost (£)
Annual bill
saving (£)
Average payback
(years)
Micro wind (1kW) 2,000 - 3,000 150 - 200 10 - 15
Solar water heating 3,500 - 5,000 100 - 105 35 - 50
Solar PV (2kW) 5,000 - 7,500 200 - 250 25 - 30
Air source heat pump 5,000 - 10,000 175 - 315 29 - 32
Biomass boiler 8,000 - 9,000 475 - 815 11 - 17
Ground source heat pump 9,000 - 17,000 425 - 765 21 - 22 Source: PlanLoCal Efficiency and Green Deal
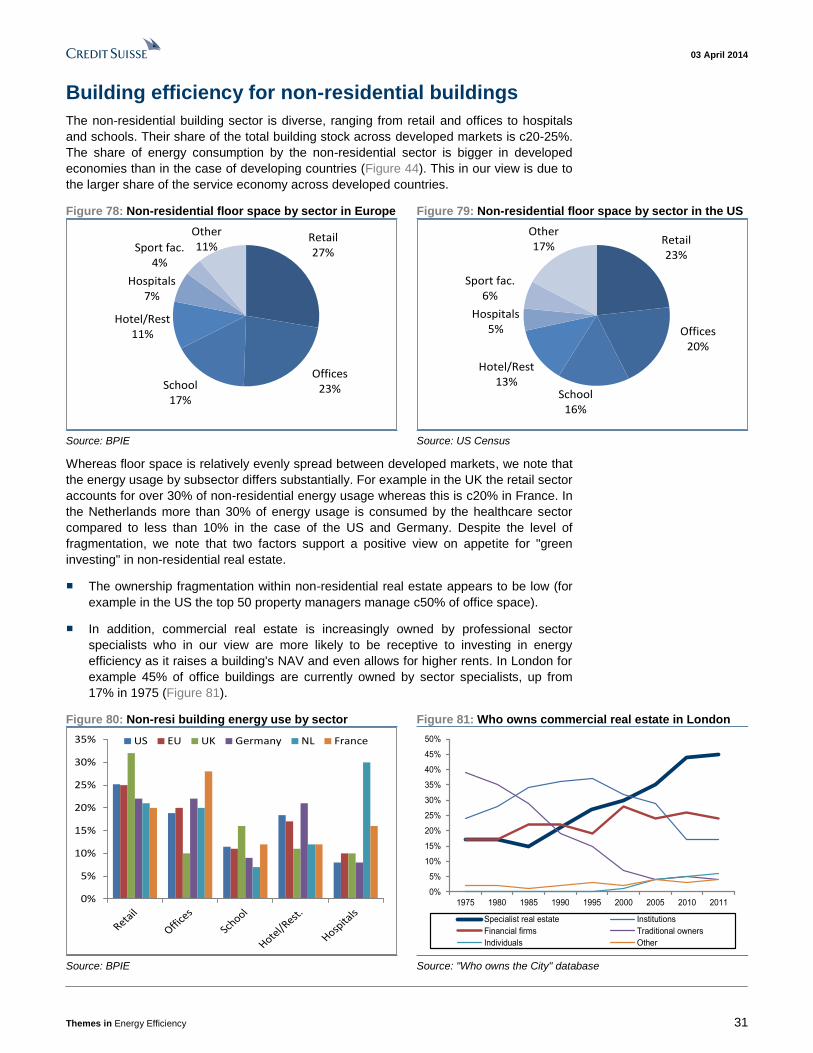
03 April 2014
Themes in Energy Efficiency 31
Building efficiency for non-residential buildings
The non-residential building sector is diverse, ranging from retail and offices to hospitals
and schools. Their share of the total building stock across developed markets is c20-25%.
The share of energy consumption by the non-residential sector is bigger in developed
economies than in the case of developing countries (Figure 44). This in our view is due to
the larger share of the service economy across developed countries.
Figure 78: Non-residential floor space by sector in Europe Figure 79: Non-residential floor space by sector in the US
Retail27%
Offices23%School
17%
Hotel/Rest11%
Hospitals7%
Sport fac.4%
Other11%
Retail23%
Offices20%
School16%
Hotel/Rest13%
Hospitals5%
Sport fac.6%
Other17%
Source: BPIE Source: US Census
Whereas floor space is relatively evenly spread between developed markets, we note that
the energy usage by subsector differs substantially. For example in the UK the retail sector
accounts for over 30% of non-residential energy usage whereas this is c20% in France. In
the Netherlands more than 30% of energy usage is consumed by the healthcare sector
compared to less than 10% in the case of the US and Germany. Despite the level of
fragmentation, we note that two factors support a positive view on appetite for "green
investing" in non-residential real estate.
■ The ownership fragmentation within non-residential real estate appears to be low (for
example in the US the top 50 property managers manage c50% of office space).
■ In addition, commercial real estate is increasingly owned by professional sector
specialists who in our view are more likely to be receptive to investing in energy
efficiency as it raises a building's NAV and even allows for higher rents. In London for
example 45% of office buildings are currently owned by sector specialists, up from
17% in 1975 (Figure 81).
Figure 80: Non-resi building energy use by sector Figure 81: Who owns commercial real estate in London
0%
5%
10%
15%
20%
25%
30%
35% US EU UK Germany NL France
0%
5%
10%
15%
20%
25%
30%
35%
40%
45%
50%
1975 1980 1985 1990 1995 2000 2005 2010 2011
Specialist real estate Institutions
Financial firms Traditional owners
Individuals Other
Source: BPIE Source: "Who owns the City" database
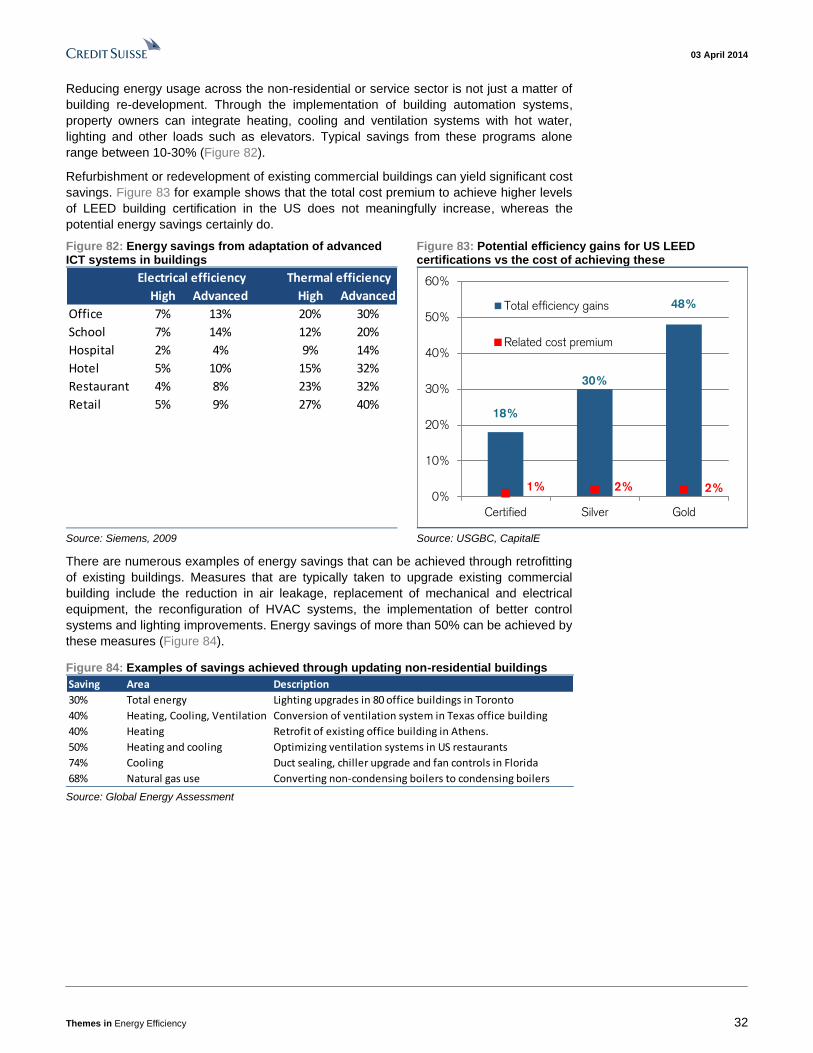
03 April 2014
Themes in Energy Efficiency 32
Reducing energy usage across the non-residential or service sector is not just a matter of
building re-development. Through the implementation of building automation systems,
property owners can integrate heating, cooling and ventilation systems with hot water,
lighting and other loads such as elevators. Typical savings from these programs alone
range between 10-30% (Figure 82).
Refurbishment or redevelopment of existing commercial buildings can yield significant cost
savings. Figure 83 for example shows that the total cost premium to achieve higher levels
of LEED building certification in the US does not meaningfully increase, whereas the
potential energy savings certainly do.
Figure 82: Energy savings from adaptation of advanced ICT systems in buildings
Figure 83: Potential efficiency gains for US LEED certifications vs the cost of achieving these
High Advanced High Advanced
Office 7% 13% 20% 30%
School 7% 14% 12% 20%
Hospital 2% 4% 9% 14%
Hotel 5% 10% 15% 32%
Restaurant 4% 8% 23% 32%
Retail 5% 9% 27% 40%
Electrical efficiency Thermal efficiency
18%
30%
48%
1% 2% 2%0%
10%
20%
30%
40%
50%
60%
Certified Silver Gold
Total efficiency gains
Related cost premium
Source: Siemens, 2009 Source: USGBC, CapitalE
There are numerous examples of energy savings that can be achieved through retrofitting
of existing buildings. Measures that are typically taken to upgrade existing commercial
building include the reduction in air leakage, replacement of mechanical and electrical
equipment, the reconfiguration of HVAC systems, the implementation of better control
systems and lighting improvements. Energy savings of more than 50% can be achieved by
these measures (Figure 84).
Figure 84: Examples of savings achieved through updating non-residential buildings
Saving Area Description
30% Total energy Lighting upgrades in 80 office buildings in Toronto
40% Heating, Cooling, Ventilation Conversion of ventilation system in Texas office building
40% Heating Retrofit of existing office building in Athens.
50% Heating and cooling Optimizing ventilation systems in US restaurants
74% Cooling Duct sealing, chiller upgrade and fan controls in Florida
68% Natural gas use Converting non-condensing boilers to condensing boilers Source: Global Energy Assessment
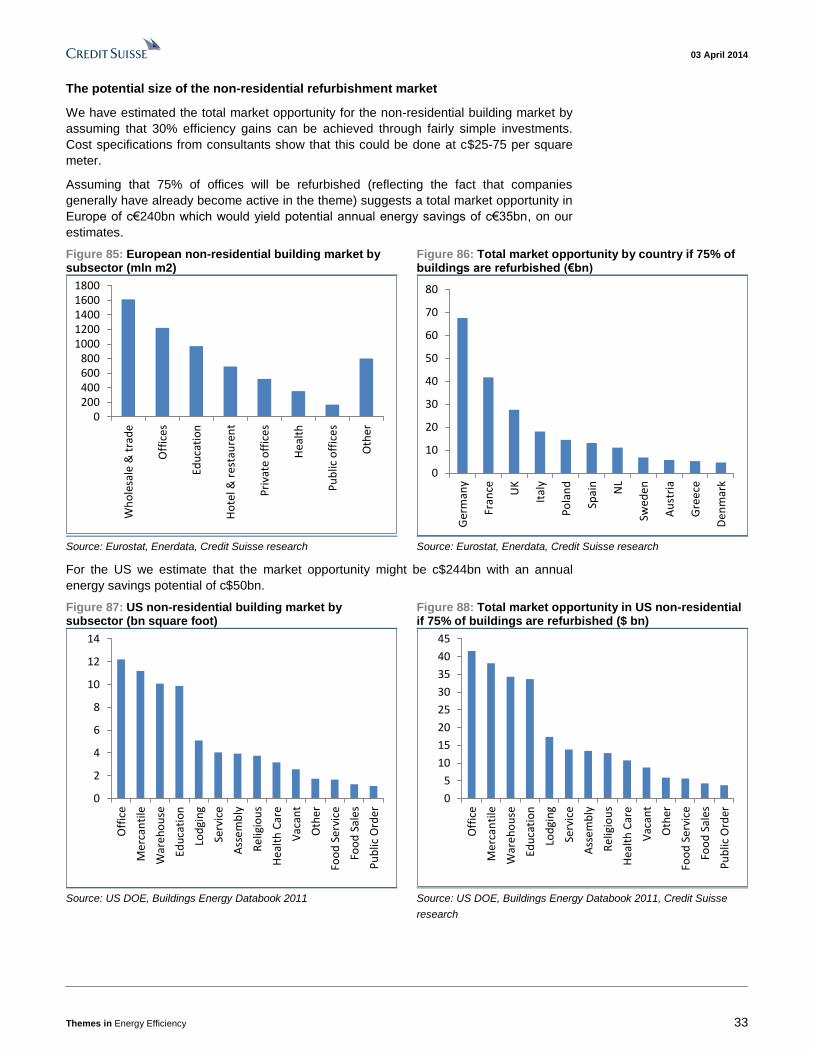
03 April 2014
Themes in Energy Efficiency 33
The potential size of the non-residential refurbishment market
We have estimated the total market opportunity for the non-residential building market by
assuming that 30% efficiency gains can be achieved through fairly simple investments.
Cost specifications from consultants show that this could be done at c$25-75 per square
meter.
Assuming that 75% of offices will be refurbished (reflecting the fact that companies
generally have already become active in the theme) suggests a total market opportunity in
Europe of c€240bn which would yield potential annual energy savings of c€35bn, on our
estimates.
Figure 85: European non-residential building market by subsector (mln m2)
Figure 86: Total market opportunity by country if 75% of buildings are refurbished (€bn)
0200400600800
10001200140016001800
Wh
ole
sale
& t
rad
e
Off
ice
s
Edu
cati
on
Ho
tel &
res
tau
ren
t
Pri
vate
off
ice
s
Hea
lth
Pu
blic
off
ice
s
Oth
er
0
10
20
30
40
50
60
70
80
Ger
man
y
Fran
ce UK
Ital
y
Po
lan
d
Spai
n
NL
Swed
en
Au
stri
a
Gre
ece
De
nm
ark
Source: Eurostat, Enerdata, Credit Suisse research Source: Eurostat, Enerdata, Credit Suisse research
For the US we estimate that the market opportunity might be c$244bn with an annual
energy savings potential of c$50bn.
Figure 87: US non-residential building market by subsector (bn square foot)
Figure 88: Total market opportunity in US non-residential if 75% of buildings are refurbished ($ bn)
0
2
4
6
8
10
12
14
Off
ice
Me
rcan
tile
War
eh
ou
se
Edu
cati
on
Lod
gin
g
Serv
ice
Ass
em
bly
Re
ligio
us
Hea
lth
Car
e
Vac
ant
Oth
er
Foo
d S
erv
ice
Foo
d S
ale
s
Pu
blic
Ord
er
0
5
10
15
20
25
30
35
40
45
Off
ice
Me
rcan
tile
War
eh
ou
se
Edu
cati
on
Lod
gin
g
Serv
ice
Ass
em
bly
Re
ligio
us
Hea
lth
Car
e
Vac
ant
Oth
er
Foo
d S
erv
ice
Foo
d S
ale
s
Pu
blic
Ord
er
Source: US DOE, Buildings Energy Databook 2011 Source: US DOE, Buildings Energy Databook 2011, Credit Suisse
research
03 April 2014
Themes in Energy Efficiency 34
Legislation plays a key role Energy efficiency legislation has for years functioned as the "stick" to generating savings
from energy producers, consumers and equipment manufacturers. Legislation has also
addressed increasing concerns that without improved energy efficiency, carbon emissions
related to energy production are set to increase too much to meet global warming
requirements.
We believe that legislation has been broadly successful in pushing the energy efficiency
agenda. Reasons for this include the rising share of renewables in energy production and
efficiency improvements achieved in energy consuming products. Legislation or policies
can broadly speaking be categorised into equipment policies and whole building programs.
Building-related policies
Building codes typically require structures to meet a typical energy consumption metric,
such as an allowable amount of energy per unit of floor. It is widely accepted that building
codes are one of the most effective policy instruments to influence construction, with many
countries pursuing policy initiatives globally. However, whilst building codes succeed in
creating holistic, top-down classifications of buildings which are user-friendly, they often
fail to take account of variations, density or behaviour of occupants.
Historically government energy efficiency programs focused on new construction;
however, more recently we observe a trend to stricter targets for existing buildings. Over
time governments have tightened the standards of their building codes. From "minimum
energy efficiency saving" requirements several governments now have a "zero energy"
target (ZEB) as part of their energy efficiency policy.
For example many EU countries demand ZEB policies for all new construction from 2020,
whereas legally existing public buildings will have to be ZEB-classified by the end of 2019.
Interestingly in the US the DOE Building Technologies Platform changed its ZEB
requirement recently to a 50% cost savings in the entire building sector by 2030.
Certification plays a major role
In addition to government-initiated green building targets, there exist a number of
successful industry-supported building certification programs that aim to improve energy
efficiency.
■ In the US the Green Building Council (GBC) initiated the Leadership in Energy and
Environmental Design (LEED) certification program in 2000. Today LEED has been
certified in 130 countries.
■ In the UK the Building Research Establishment Environmental Assessment
Method (BREEAM) was initiated in 1990. BREEAM is the preferred designation for a
number of European building programs. As part of these programs, buildings often
receive performance certificates indicating the degree of energy efficiency.
The certification programs initiated by governments and industry bodies are having a
successful impact on the buildings market. The LEED certification program for example
has increased substantially on a global scale (Figure 89). In the US we find that more than
10% of office buildings are LEED certified in most metropolitan areas.
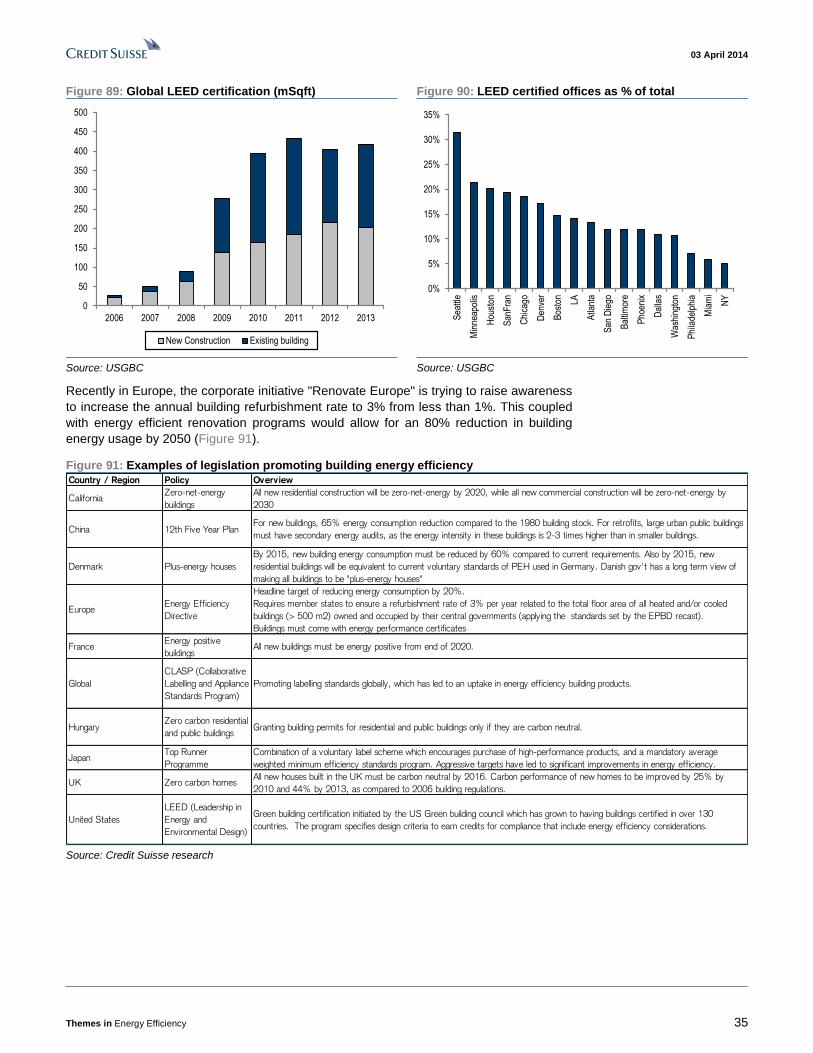
03 April 2014
Themes in Energy Efficiency 35
Figure 89: Global LEED certification (mSqft) Figure 90: LEED certified offices as % of total
0
50
100
150
200
250
300
350
400
450
500
2006 2007 2008 2009 2010 2011 2012 2013
New Construction Existing building
0%
5%
10%
15%
20%
25%
30%
35%
Sea
ttle
Min
neap
olis
Hou
ston
San
Fra
n
Chi
cago
Den
ver
Bos
ton
LA
Atla
nta
San
Die
go
Bal
timor
e
Pho
enix
Dal
las
Was
hing
ton
Phi
lade
lphi
a
Mia
mi
NY
Source: USGBC Source: USGBC
Recently in Europe, the corporate initiative "Renovate Europe" is trying to raise awareness
to increase the annual building refurbishment rate to 3% from less than 1%. This coupled
with energy efficient renovation programs would allow for an 80% reduction in building
energy usage by 2050 (Figure 91).
Figure 91: Examples of legislation promoting building energy efficiency Country / Region Policy Overview
CaliforniaZero-net-energy
buildings
All new residential construction will be zero-net-energy by 2020, while all new commercial construction will be zero-net-energy by
2030
China 12th Five Year PlanFor new buildings, 65% energy consumption reduction compared to the 1980 building stock. For retrofits, large urban public buildings
must have secondary energy audits, as the energy intensity in these buildings is 2-3 times higher than in smaller buildings.
Denmark Plus-energy houses
By 2015, new building energy consumption must be reduced by 60% compared to current requirements. Also by 2015, new
residential buildings will be equivalent to current voluntary standards of PEH used in Germany. Danish gov't has a long term view of
making all buildings to be "plus-energy houses"
EuropeEnergy Efficiency
Directive
Headline target of reducing energy consumption by 20%.
Requires member states to ensure a refurbishment rate of 3% per year related to the total floor area of all heated and/or cooled
buildings (> 500 m2) owned and occupied by their central governments (applying the standards set by the EPBD recast).
Buildings must come with energy performance certificates
FranceEnergy positive
buildingsAll new buildings must be energy positive from end of 2020.
Global
CLASP (Collaborative
Labelling and Appliance
Standards Program)
Promoting labelling standards globally, which has led to an uptake in energy efficiency building products.
HungaryZero carbon residential
and public buildingsGranting building permits for residential and public buildings only if they are carbon neutral.
JapanTop Runner
Programme
Combination of a voluntary label scheme which encourages purchase of high-performance products, and a mandatory average
weighted minimum efficiency standards program. Aggressive targets have led to significant improvements in energy efficiency.
UK Zero carbon homesAll new houses built in the UK must be carbon neutral by 2016. Carbon performance of new homes to be improved by 25% by
2010 and 44% by 2013, as compared to 2006 building regulations.
United States
LEED (Leadership in
Energy and
Environmental Design)
Green building certification initiated by the US Green building council which has grown to having buildings certified in over 130
countries. The program specifies design criteria to earn credits for compliance that include energy efficiency considerations.
Source: Credit Suisse research
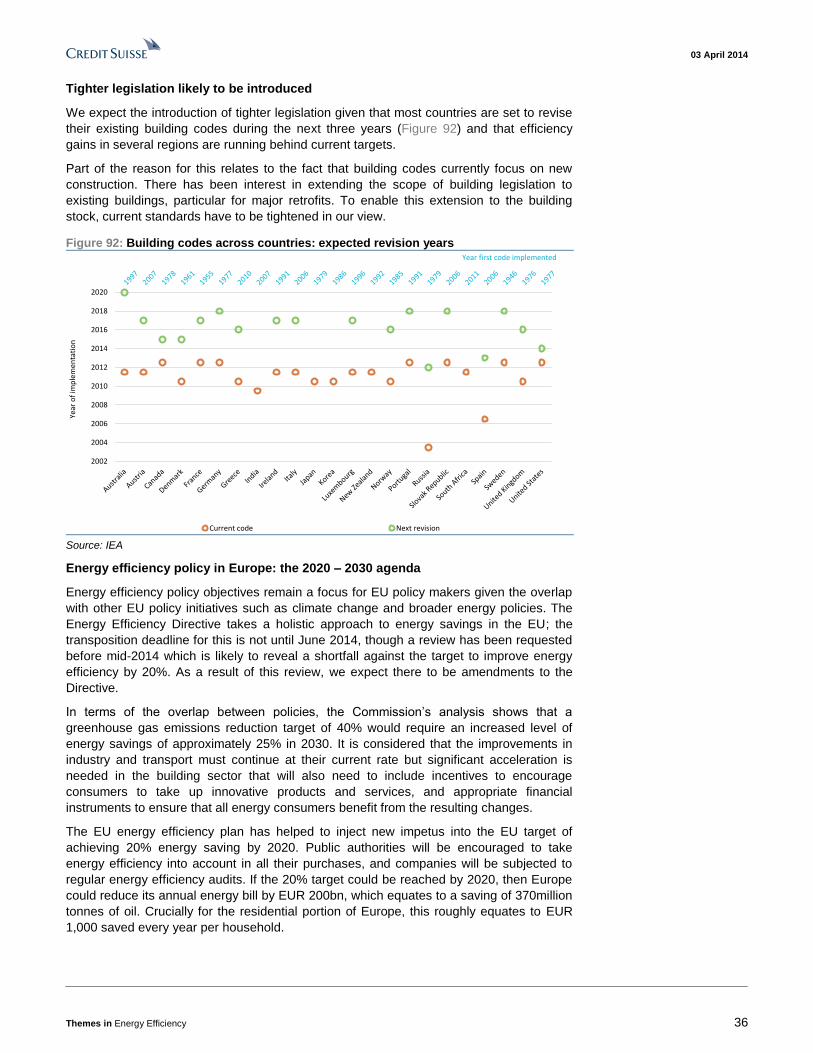
03 April 2014
Themes in Energy Efficiency 36
Tighter legislation likely to be introduced
We expect the introduction of tighter legislation given that most countries are set to revise
their existing building codes during the next three years (Figure 92) and that efficiency
gains in several regions are running behind current targets.
Part of the reason for this relates to the fact that building codes currently focus on new
construction. There has been interest in extending the scope of building legislation to
existing buildings, particular for major retrofits. To enable this extension to the building
stock, current standards have to be tightened in our view.
Figure 92: Building codes across countries: expected revision years
2002
2004
2006
2008
2010
2012
2014
2016
2018
2020
Year
of
imp
lem
enta
tio
n
Current code Next revision
Year first code implemented
Source: IEA
Energy efficiency policy in Europe: the 2020 – 2030 agenda
Energy efficiency policy objectives remain a focus for EU policy makers given the overlap
with other EU policy initiatives such as climate change and broader energy policies. The
Energy Efficiency Directive takes a holistic approach to energy savings in the EU; the
transposition deadline for this is not until June 2014, though a review has been requested
before mid-2014 which is likely to reveal a shortfall against the target to improve energy
efficiency by 20%. As a result of this review, we expect there to be amendments to the
Directive.
In terms of the overlap between policies, the Commission’s analysis shows that a
greenhouse gas emissions reduction target of 40% would require an increased level of
energy savings of approximately 25% in 2030. It is considered that the improvements in
industry and transport must continue at their current rate but significant acceleration is
needed in the building sector that will also need to include incentives to encourage
consumers to take up innovative products and services, and appropriate financial
instruments to ensure that all energy consumers benefit from the resulting changes.
The EU energy efficiency plan has helped to inject new impetus into the EU target of
achieving 20% energy saving by 2020. Public authorities will be encouraged to take
energy efficiency into account in all their purchases, and companies will be subjected to
regular energy efficiency audits. If the 20% target could be reached by 2020, then Europe
could reduce its annual energy bill by EUR 200bn, which equates to a saving of 370million
tonnes of oil. Crucially for the residential portion of Europe, this roughly equates to EUR
1,000 saved every year per household.

03 April 2014
Themes in Energy Efficiency 37
Energy-using products account for most of the energy consumed in households and a
third of the EU’s energy consumption. The EU’s labelling scheme has proved a success so
far in terms of raising consumer awareness of the financial benefits of owning a top-rated
energy-efficient appliance. Examples include the potential saving of EUR 4,100 (over the
product’s lifetime) for the most cost-efficient boiler when compared to the market average.
Recent changes in the EU law to include ratings going up to A+++ for goods such as
fridges have helped to provide further incentives to manufacturers to continually innovate
to enhance the energy efficiency of their products. It is hoped that over time, these
improvements will marginalise the lowest category F/G band appliances until they are
squeezed out of the market.
Energy labels will also soon be in place for buildings across the EU, with energy efficiency
certificates for each property. This should serve to increase the awareness of the owners
and occupiers of these buildings as to their energy performance. Furthermore, this has the
potential to create up to 450,000 new jobs. All new buildings are required to use nearly
zero energy by the end of 2020, and those occupied and owned by public authorities must
meet this requirement by 2018. A key advancement in this field is the development of a
common comparative framework which takes into account the different climatic conditions
in the Member States.
Legislation in emerging markets
Unlike in developed economies such as the United States or the European Union, policy
objectives in developing economies have been largely focused on channelling the rampant
growth of the past decade. However, recently we have seen a shift in the policy focus of
emerging economies with key countries such as China and India announcing stricter
controls around building efficiency as they look to consolidate past growth, and more
importantly, establish a sustainable future.
China has imposed building design standards for public buildings and for residential
buildings in three separate climate zones depending on temperatures un the summer and
winter: "cold and very cold", "hot in the summer and cold in the winter", and "hot in the
summer and warm in the winter". As part of the 12th Five-Year Plan, the standard required
a reduction in energy consumption of 65% relative to consumption in the 1980s. Both
construction companies and design institutes that did not comply with the regulations
faced fines of CNY100,000-500,000.
In India, the Indian Green Building Council has initiated the building of capacity and
services to have 20 billion sq.ft. of Green Buildings by 2025. The focus here remains on
tier-1 and tier-2 cities with one million houses across the country to be constructed in the
next four years. In addition to forward-looking plans, the IGBC have also introduced a
voluntary rating system which uses well accepted national and international standards.
Beyond domestic policies, there have also recently been cross-border commitments in this
area, such as the US and China joint statement to "commit to devote significant effort and
resources to secure concrete results by the Sixth U.S.-China Strategic and Economic
Dialogue in 2014".
However, a key outstanding issue amongst emerging economies especially in relation to
real estate is the maturity of the legal system. Uncertainty over title deeds, property rights
and ultimately the enforcement of these rules may delay building development and
refurbishment.

03 April 2014
Themes in Energy Efficiency 38
Component policies
Key to energy savings in the building sector is the increasing penetration of highly efficient
components. Government policies in the past focused on Research and Development
sponsorship during the development phase and incentive schemes to allow a product to
establish market share. Voluntary and mandatory labelling, however, has been a long
running policy and proven to be highly successful in driving acceptance of a new, more
energy efficient product. The key labelling programs are:
European Union appliance labelling
The European Union has been promoting energy efficiency products through their "A" to
"G" program for more than 20 years. The EU directive includes A+, A++ and A+++ ratings.
US Energy Star program
In the US the "Energy Star" program is applicable to a range of building products and
energy-related products. In contrast to the European program, the Energy Star label does
not indicate the degree of efficiency but rather whether or not efficiency is higher than a
pre-set threshold. The general guideline is that a product's efficiency levels should be at
least 20% better than other similar products.
Japan's Top Runner
Japan's Top Runner program combines a voluntary label that encourages purchase of
high-performance products and a mandatory average weighted minimum efficiency
standards programme. The target for efficiency improvement is based on the Best
Available Technology (BAT) that is currently on the market.
The combination of equipment labelling, minimum efficiency requirements and (particularly
in the case of the EU and Japan) mandatory tariffs and taxes has had a positive impact on
energy usage. Data from the IEA show that appliance electricity consumption did decrease
substantially for a number of countries.
Figure 93: Electricity consumption and price changes
Source: IEA, 2010. A/c=air conditioner, CD=clothes dryers, CW=clothes washers, Cold=refrigerators and
freezers, F=freezers, Rf=refrigerators

03 April 2014
Themes in Energy Efficiency 39
Engagement from the private sector Historically the theme of energy efficiency appeared to be largely a legislative top-down
topic. Property owners and tenants typically cited "doing the right thing" and the availability
of financial incentives as drivers for investing in energy efficiency.
We believe that legislation is likely to remain a key driver for the theme, while multiple
surveys also show that bottom-up support from property owners and tenants has
increased substantially during the past few years. This development appears increasingly
driven by economic considerations rather than by the historically more intangible reasons.
More than 70% of property owners now have a stated energy efficiency goal, according to
the Institute for Building Efficiency. This in our view supports our claim that the theme has
gained critical mass, making it relevant for equity investors.
Institute for Building Efficiency survey
The Institute for Building Efficiency, an initiative of Johnson Controls, runs an annual
building efficiency survey which draws from over 3,000 respondents from 10 countries.
The results of the most recent annual "Energy efficiency indicator survey" strongly suggest
that the theme of energy efficiency is becoming increasingly important for commercial and
institutional property owners/tenants. More than 70% of companies now have a stated
goal regarding energy efficiency.
The share of companies that perceive energy management as extremely important to their
business has doubled to 40% in 2013 from 20% in 2010.
Figure 94: % of companies with an energy efficiency goal Figure 95: % of companies for whom energy management is extremely important
0%
10%
20%
30%
40%
50%
60%
70%
80%
2011 2012 2013
Goal No goal
0%
5%
10%
15%
20%
25%
30%
35%
40%
45%
2010 2011 2012 2013
Source: Institute for Building Efficiency Source: Institute for Building Efficiency
Meanwhile, the latest survey showed that "energy cost savings" was the biggest driver for
an organisation's energy efficiency strategy in all surveyed countries (Figure 96).
The results in Figure 96 are supported by other studies such as those performed by
McGraw-Hill. Their most recent survey, based on over 800 respondents including
architects, engineers, contractors, consultants, owners, manufacturers and suppliers, also
showed that economic considerations are key in companies' focus on green investments
(Figure 97).

03 April 2014
Themes in Energy Efficiency 40
Figure 96: How significant are the following drivers in your organisation's energy efficiency decisions?
Drivers of Efficiency US / Can UK Germany France Brazil India China Australia Singapore
Energy cost savings 1 1 1 1 1 1 1 1 1
Government & utility incentives/rebates 2 2 4 2 2 2
Increased asset value 3 5 3 3
Energy security 5 3 2 5 2 2 2
Customer attraction & retention 5 3 3 5 4
Existing government policy 3 4 3
Enhanced brand or public image 4 3 4 5 5 4 5
GHG footprint reduction 4 4
Attracting, retaining employees 4 4 Source: Institute for Building Efficiency
Green building activity set to grow
These survey results suggest that the share of "green activity" in building projects is set to
continue. By 2015 industry experts expect that more than 51% of building projects will
have a "green share" of more than 60%, up from 13% in 2009 and 28% in 2012. The
strong increase in "green building activity" is expected throughout all countries surveyed
by McGraw-Hill, again supporting the notion that energy efficiency is a global
phenomenon.
Figure 97: What are the key drivers in future green building activity?
0%
5%
10%
15%
20%
25%
30%
35%
40%
45%
Client Demand Market Demand Lower OperatingCosts
Branding/PublicRelations
Right Thing to Do MarketTransformation
2008 2012
Source: McGraw-Hill Construction, 2013
Figure 98: Level of green building activity Figure 99: Percentage of firms with more than 60% of work being green
0%
10%
20%
30%
40%
50%
60%
No Green 1%-15% 16%-30% 31%-60% More than 60%
2009 2012 2015
0%
10%
20%
30%
40%
50%
60%
70%
80%
90%
100%
2012 2015
Source: McGraw-Hill Construction, 2013 Source: McGraw-Hill Construction, 2013
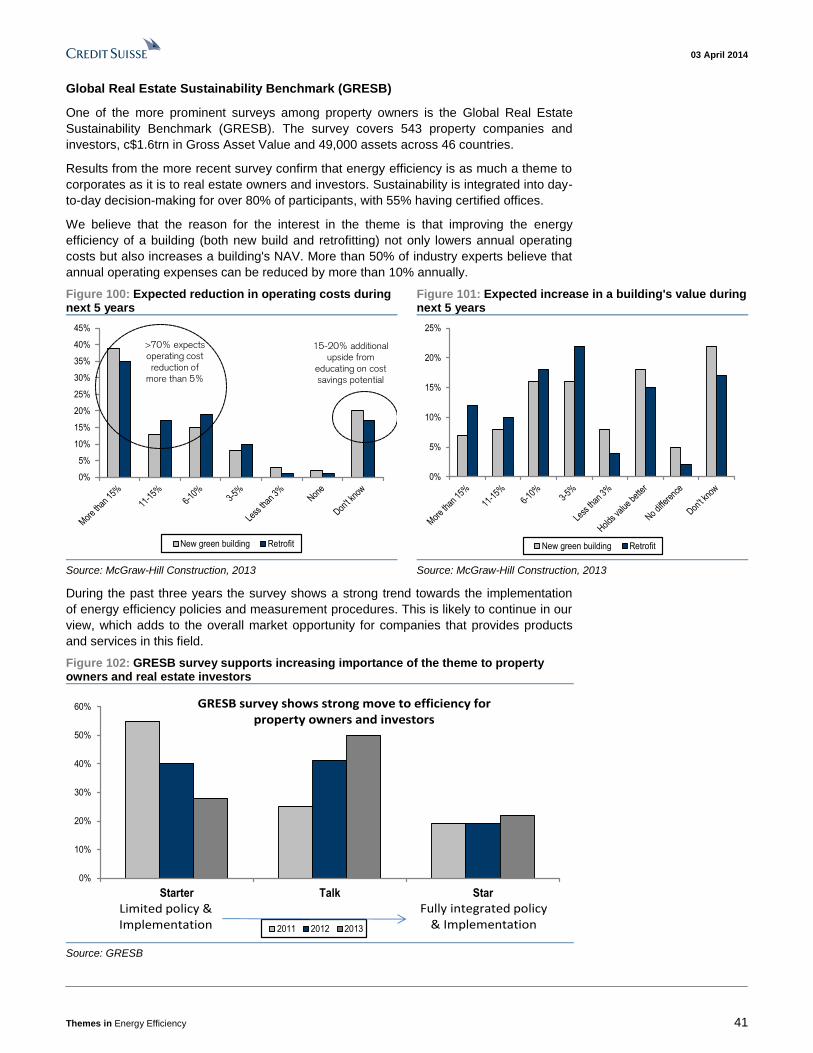
03 April 2014
Themes in Energy Efficiency 41
Global Real Estate Sustainability Benchmark (GRESB)
One of the more prominent surveys among property owners is the Global Real Estate
Sustainability Benchmark (GRESB). The survey covers 543 property companies and
investors, c$1.6trn in Gross Asset Value and 49,000 assets across 46 countries.
Results from the more recent survey confirm that energy efficiency is as much a theme to
corporates as it is to real estate owners and investors. Sustainability is integrated into day-
to-day decision-making for over 80% of participants, with 55% having certified offices.
We believe that the reason for the interest in the theme is that improving the energy
efficiency of a building (both new build and retrofitting) not only lowers annual operating
costs but also increases a building's NAV. More than 50% of industry experts believe that
annual operating expenses can be reduced by more than 10% annually.
Figure 100: Expected reduction in operating costs during next 5 years
Figure 101: Expected increase in a building's value during next 5 years
0%
5%
10%
15%
20%
25%
30%
35%
40%
45%
New green building Retrofit
>70% expectsoperating cost
reduction ofmore than 5%
15-20% additionalupside from
educating on cost savings potential
0%
5%
10%
15%
20%
25%
New green building Retrofit
Source: McGraw-Hill Construction, 2013 Source: McGraw-Hill Construction, 2013
During the past three years the survey shows a strong trend towards the implementation
of energy efficiency policies and measurement procedures. This is likely to continue in our
view, which adds to the overall market opportunity for companies that provides products
and services in this field.
Figure 102: GRESB survey supports increasing importance of the theme to property owners and real estate investors
0%
10%
20%
30%
40%
50%
60%
Starter Talk Star
2011 2012 2013
Limited policy & Implementation
Fully integrated policy & Implementation
GRESB survey shows strong move to efficiency for property owners and investors
Source: GRESB

03 April 2014
Themes in Energy Efficiency 42
Key products and technologies As mentioned before, building energy consumption is dominated by heating, cooling and
lighting (Figure 103). Therefore it comes as no surprise that lighting and HVAC (Heating,
Ventilation, Air conditioning and Cooling) are the most important efficiency programs for
corporates and owners seeking to improve building efficiency (Figure 104). We refer to the
Appendix on page 102 for a more detailed overview of the key technologies.
Figure 103: Household energy consumption by activity Figure 104: The relative importance of energy efficiency solutions to corporations/owners
10%
10%
30%
12%
30%
30%
20%
20%
13%
45%
28%
10%
40%
70%
15%
32%
5%
10%
10%
60%
0% 20% 40% 60% 80% 100%
USA
Europe
Japan
China
India
Air conditioning Lighting and appliances
Domestic hot water Space heating
Cooking
21%
24%
25%
26%
26%
35%
35%
42%
44%
Demand management
Retro commissioning
Building envelope
Smart building technology
Onsite renewable energy
Water efficiency
Behavioural programs
HVAC
Lighting improvements
High priority investments
Source: Council for Sustainable Development Source: Institute for Building Efficiency
The lifespan of building products drives supply and demand of products/services
Demand for and supply of efficiency-enhancing equipment and services is not only driven
by the level of energy consumption but also by the replacement rate (Figure 105).
Technological improvements for products and equipment with relatively short lifespans
tend to have a more immediate impact on energy savings as these products are replaced
or refurbished more frequently. These products typically also represent goods that are
purchased first when households enter the middle class and income levels rise.
Therefore further efficiency gains are not only relevant to improve energy usage in
developed markets but also to slow down the growth that might otherwise appear in
developing economies. Examples of these products are light bulbs, electronics and
appliances.
Figure 105: Average lifespan for different energy-consuming infrastructure
0 20 40 60 80 100 120
Building stock
Power stations
Other
Commercial heater and cooler
Residential heater and cooler
Residential water heater
Consumer appliances
Consumer electronics
Office equipment
Light bulbs: fluorescent
Light bulbs: incandescent
Years
Source: International Energy Agency (2013), Transition to Sustainable Buildings: Strategies and Opportunities to 2050, OECD/IEA, Paris
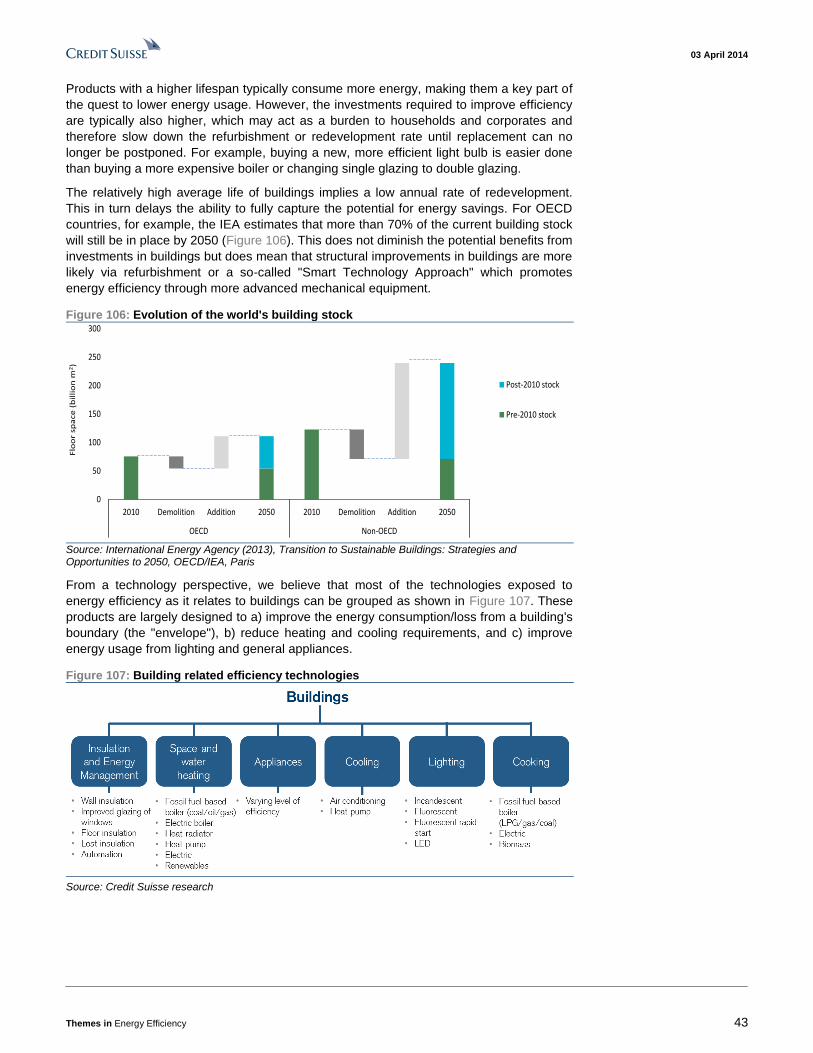
03 April 2014
Themes in Energy Efficiency 43
Products with a higher lifespan typically consume more energy, making them a key part of
the quest to lower energy usage. However, the investments required to improve efficiency
are typically also higher, which may act as a burden to households and corporates and
therefore slow down the refurbishment or redevelopment rate until replacement can no
longer be postponed. For example, buying a new, more efficient light bulb is easier done
than buying a more expensive boiler or changing single glazing to double glazing.
The relatively high average life of buildings implies a low annual rate of redevelopment.
This in turn delays the ability to fully capture the potential for energy savings. For OECD
countries, for example, the IEA estimates that more than 70% of the current building stock
will still be in place by 2050 (Figure 106). This does not diminish the potential benefits from
investments in buildings but does mean that structural improvements in buildings are more
likely via refurbishment or a so-called "Smart Technology Approach" which promotes
energy efficiency through more advanced mechanical equipment.
Figure 106: Evolution of the world's building stock
0
50
100
150
200
250
300
2010 Demolition Addition 2050 2010 Demolition Addition 2050
OECD Non-OECD
Flo
or
spa
ce
(b
illi
on
m2)
Post-2010 stock
Pre-2010 stock
Source: International Energy Agency (2013), Transition to Sustainable Buildings: Strategies and Opportunities to 2050, OECD/IEA, Paris
From a technology perspective, we believe that most of the technologies exposed to
energy efficiency as it relates to buildings can be grouped as shown in Figure 107. These
products are largely designed to a) improve the energy consumption/loss from a building's
boundary (the "envelope"), b) reduce heating and cooling requirements, and c) improve
energy usage from lighting and general appliances.
Figure 107: Building related efficiency technologies
Source: Credit Suisse research
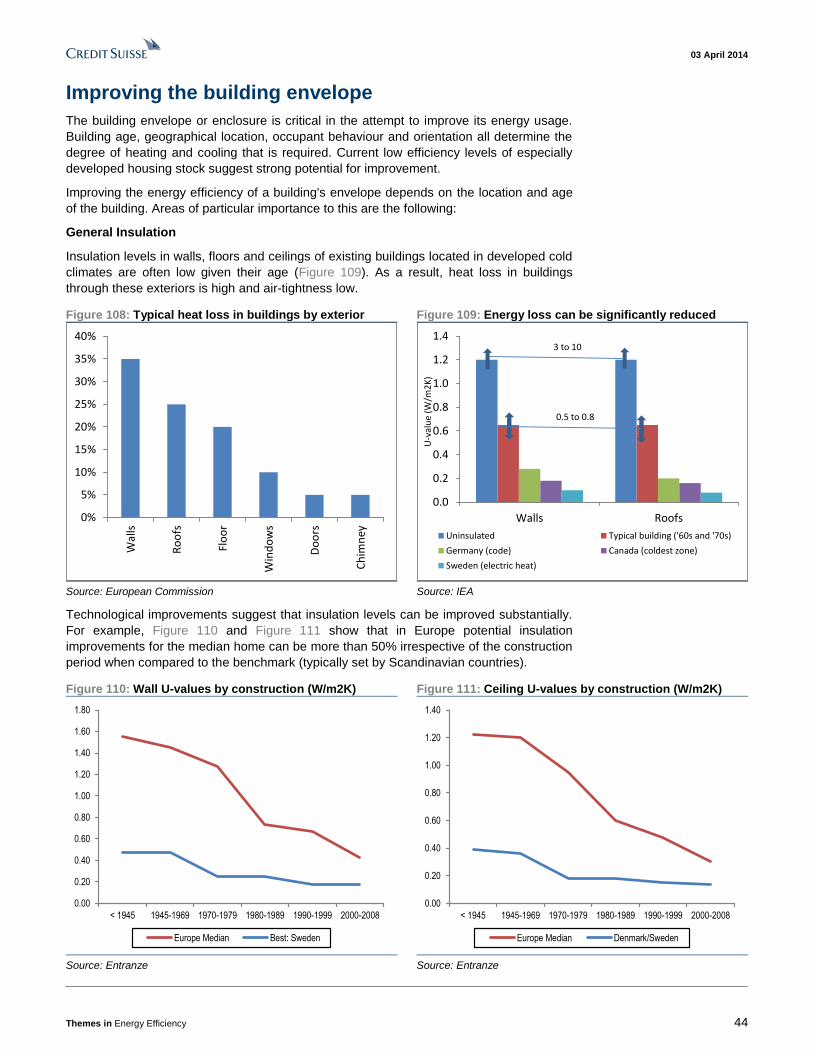
03 April 2014
Themes in Energy Efficiency 44
Improving the building envelope
The building envelope or enclosure is critical in the attempt to improve its energy usage.
Building age, geographical location, occupant behaviour and orientation all determine the
degree of heating and cooling that is required. Current low efficiency levels of especially
developed housing stock suggest strong potential for improvement.
Improving the energy efficiency of a building's envelope depends on the location and age
of the building. Areas of particular importance to this are the following:
General Insulation
Insulation levels in walls, floors and ceilings of existing buildings located in developed cold
climates are often low given their age (Figure 109). As a result, heat loss in buildings
through these exteriors is high and air-tightness low.
Figure 108: Typical heat loss in buildings by exterior Figure 109: Energy loss can be significantly reduced
0%
5%
10%
15%
20%
25%
30%
35%
40%
Wal
ls
Ro
ofs
Flo
or
Win
do
ws
Do
ors
Ch
imn
ey
0.0
0.2
0.4
0.6
0.8
1.0
1.2
1.4
Walls Roofs
U-v
alu
e (W
/m2
K)
Uninsulated Typical building ('60s and '70s)
Germany (code) Canada (coldest zone)
Sweden (electric heat)
3 to 10
0.5 to 0.8
Source: European Commission Source: IEA
Technological improvements suggest that insulation levels can be improved substantially.
For example, Figure 110 and Figure 111 show that in Europe potential insulation
improvements for the median home can be more than 50% irrespective of the construction
period when compared to the benchmark (typically set by Scandinavian countries).
Figure 110: Wall U-values by construction (W/m2K) Figure 111: Ceiling U-values by construction (W/m2K)
0.00
0.20
0.40
0.60
0.80
1.00
1.20
1.40
1.60
1.80
< 1945 1945-1969 1970-1979 1980-1989 1990-1999 2000-2008
Europe Median Best: Sweden
0.00
0.20
0.40
0.60
0.80
1.00
1.20
1.40
< 1945 1945-1969 1970-1979 1980-1989 1990-1999 2000-2008
Europe Median Denmark/Sweden
Source: Entranze Source: Entranze
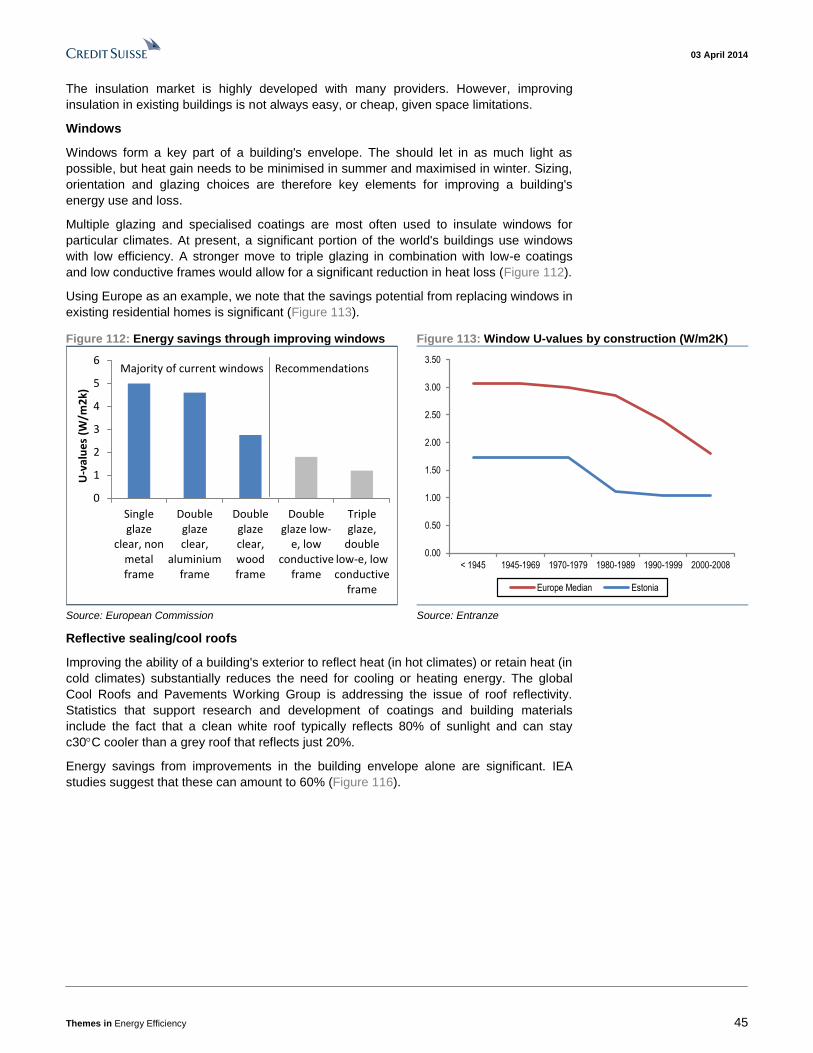
03 April 2014
Themes in Energy Efficiency 45
The insulation market is highly developed with many providers. However, improving
insulation in existing buildings is not always easy, or cheap, given space limitations.
Windows
Windows form a key part of a building's envelope. The should let in as much light as
possible, but heat gain needs to be minimised in summer and maximised in winter. Sizing,
orientation and glazing choices are therefore key elements for improving a building's
energy use and loss.
Multiple glazing and specialised coatings are most often used to insulate windows for
particular climates. At present, a significant portion of the world's buildings use windows
with low efficiency. A stronger move to triple glazing in combination with low-e coatings
and low conductive frames would allow for a significant reduction in heat loss (Figure 112).
Using Europe as an example, we note that the savings potential from replacing windows in
existing residential homes is significant (Figure 113).
Figure 112: Energy savings through improving windows Figure 113: Window U-values by construction (W/m2K)
0
1
2
3
4
5
6
Singleglaze
clear, nonmetalframe
Doubleglazeclear,
aluminiumframe
Doubleglazeclear,woodframe
Doubleglaze low-
e, lowconductive
frame
Tripleglaze,
doublelow-e, lowconductive
frame
U-v
alu
es
(W/m
2k)
Majority of current windows Recommendations
0.00
0.50
1.00
1.50
2.00
2.50
3.00
3.50
< 1945 1945-1969 1970-1979 1980-1989 1990-1999 2000-2008
Europe Median Estonia
Source: European Commission Source: Entranze
Reflective sealing/cool roofs
Improving the ability of a building's exterior to reflect heat (in hot climates) or retain heat (in
cold climates) substantially reduces the need for cooling or heating energy. The global
Cool Roofs and Pavements Working Group is addressing the issue of roof reflectivity.
Statistics that support research and development of coatings and building materials
include the fact that a clean white roof typically reflects 80% of sunlight and can stay
c30C cooler than a grey roof that reflects just 20%.
Energy savings from improvements in the building envelope alone are significant. IEA
studies suggest that these can amount to 60% (Figure 116).
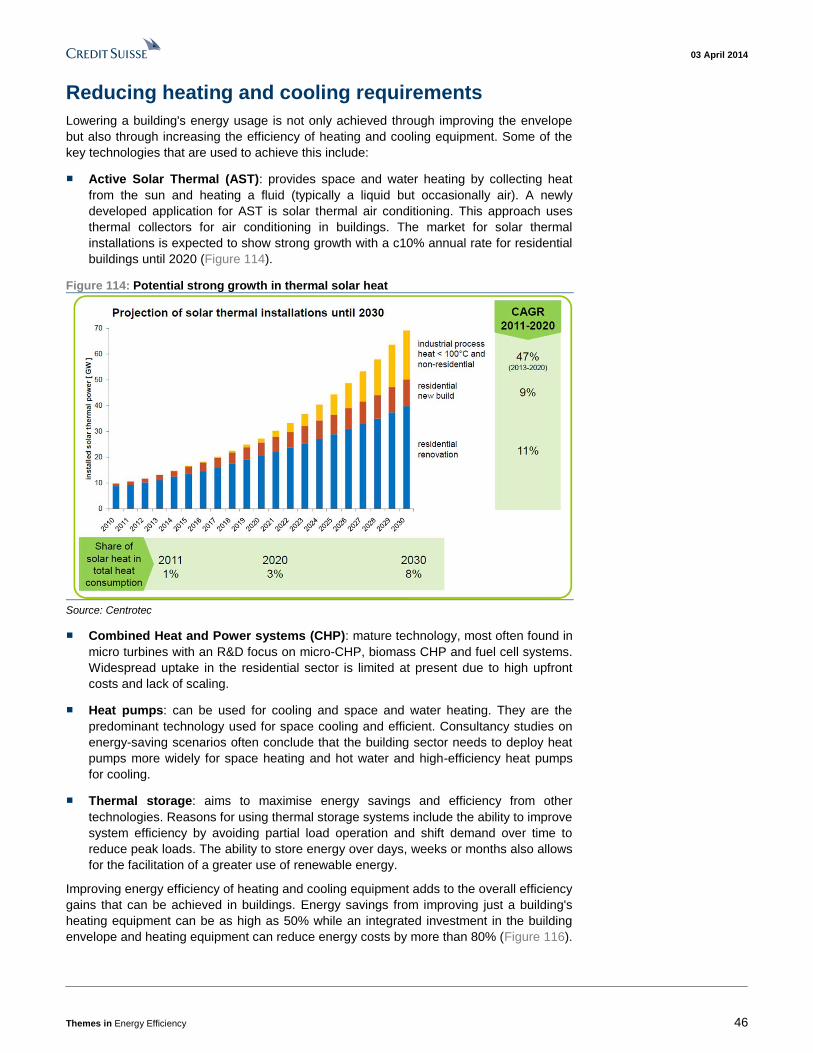
03 April 2014
Themes in Energy Efficiency 46
Reducing heating and cooling requirements
Lowering a building's energy usage is not only achieved through improving the envelope
but also through increasing the efficiency of heating and cooling equipment. Some of the
key technologies that are used to achieve this include:
■ Active Solar Thermal (AST): provides space and water heating by collecting heat
from the sun and heating a fluid (typically a liquid but occasionally air). A newly
developed application for AST is solar thermal air conditioning. This approach uses
thermal collectors for air conditioning in buildings. The market for solar thermal
installations is expected to show strong growth with a c10% annual rate for residential
buildings until 2020 (Figure 114).
Figure 114: Potential strong growth in thermal solar heat
Source: Centrotec
■ Combined Heat and Power systems (CHP): mature technology, most often found in
micro turbines with an R&D focus on micro-CHP, biomass CHP and fuel cell systems.
Widespread uptake in the residential sector is limited at present due to high upfront
costs and lack of scaling.
■ Heat pumps: can be used for cooling and space and water heating. They are the
predominant technology used for space cooling and efficient. Consultancy studies on
energy-saving scenarios often conclude that the building sector needs to deploy heat
pumps more widely for space heating and hot water and high-efficiency heat pumps
for cooling.
■ Thermal storage: aims to maximise energy savings and efficiency from other
technologies. Reasons for using thermal storage systems include the ability to improve
system efficiency by avoiding partial load operation and shift demand over time to
reduce peak loads. The ability to store energy over days, weeks or months also allows
for the facilitation of a greater use of renewable energy.
Improving energy efficiency of heating and cooling equipment adds to the overall efficiency
gains that can be achieved in buildings. Energy savings from improving just a building's
heating equipment can be as high as 50% while an integrated investment in the building
envelope and heating equipment can reduce energy costs by more than 80% (Figure 116).
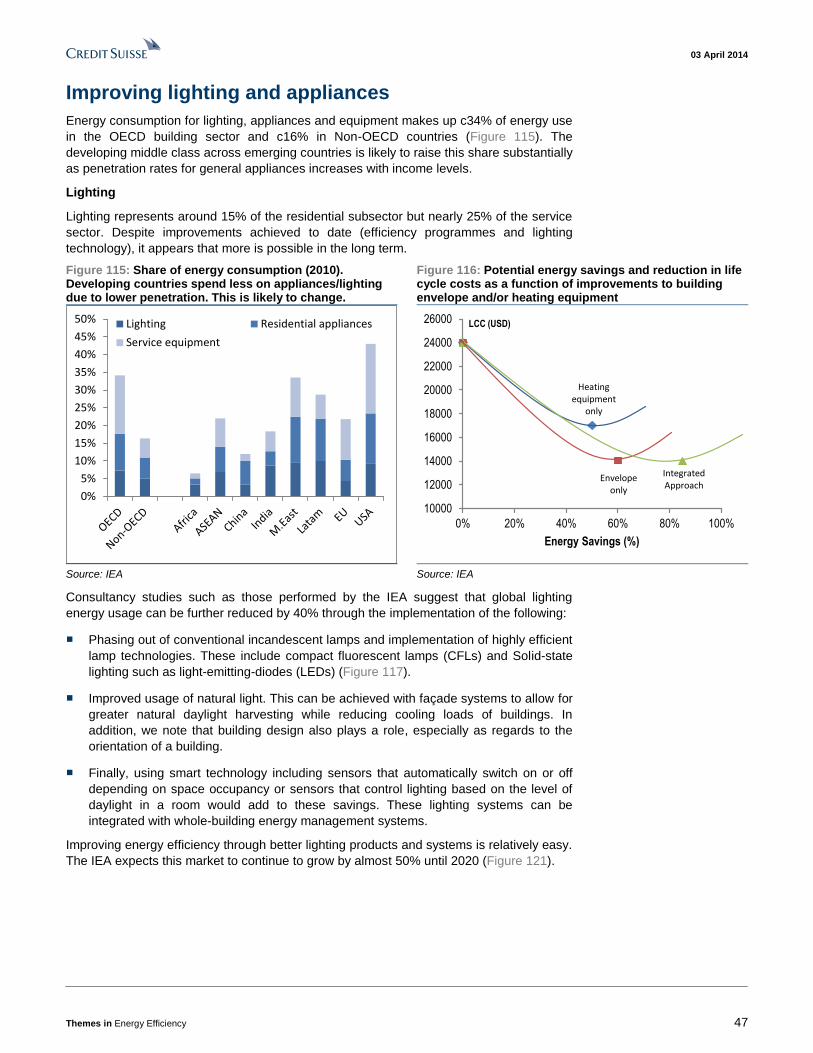
03 April 2014
Themes in Energy Efficiency 47
Improving lighting and appliances
Energy consumption for lighting, appliances and equipment makes up c34% of energy use
in the OECD building sector and c16% in Non-OECD countries (Figure 115). The
developing middle class across emerging countries is likely to raise this share substantially
as penetration rates for general appliances increases with income levels.
Lighting
Lighting represents around 15% of the residential subsector but nearly 25% of the service
sector. Despite improvements achieved to date (efficiency programmes and lighting
technology), it appears that more is possible in the long term.
Figure 115: Share of energy consumption (2010). Developing countries spend less on appliances/lighting due to lower penetration. This is likely to change.
Figure 116: Potential energy savings and reduction in life cycle costs as a function of improvements to building envelope and/or heating equipment
0%
5%
10%
15%
20%
25%
30%
35%
40%
45%
50% Lighting Residential appliances
Service equipment
10000
12000
14000
16000
18000
20000
22000
24000
26000
0% 20% 40% 60% 80% 100%
LCC (USD)
Energy Savings (%)
Envelopeonly
Heatingequipment
only
IntegratedApproach
Source: IEA Source: IEA
Consultancy studies such as those performed by the IEA suggest that global lighting
energy usage can be further reduced by 40% through the implementation of the following:
■ Phasing out of conventional incandescent lamps and implementation of highly efficient
lamp technologies. These include compact fluorescent lamps (CFLs) and Solid-state
lighting such as light-emitting-diodes (LEDs) (Figure 117).
■ Improved usage of natural light. This can be achieved with façade systems to allow for
greater natural daylight harvesting while reducing cooling loads of buildings. In
addition, we note that building design also plays a role, especially as regards to the
orientation of a building.
■ Finally, using smart technology including sensors that automatically switch on or off
depending on space occupancy or sensors that control lighting based on the level of
daylight in a room would add to these savings. These lighting systems can be
integrated with whole-building energy management systems.
Improving energy efficiency through better lighting products and systems is relatively easy.
The IEA expects this market to continue to grow by almost 50% until 2020 (Figure 121).
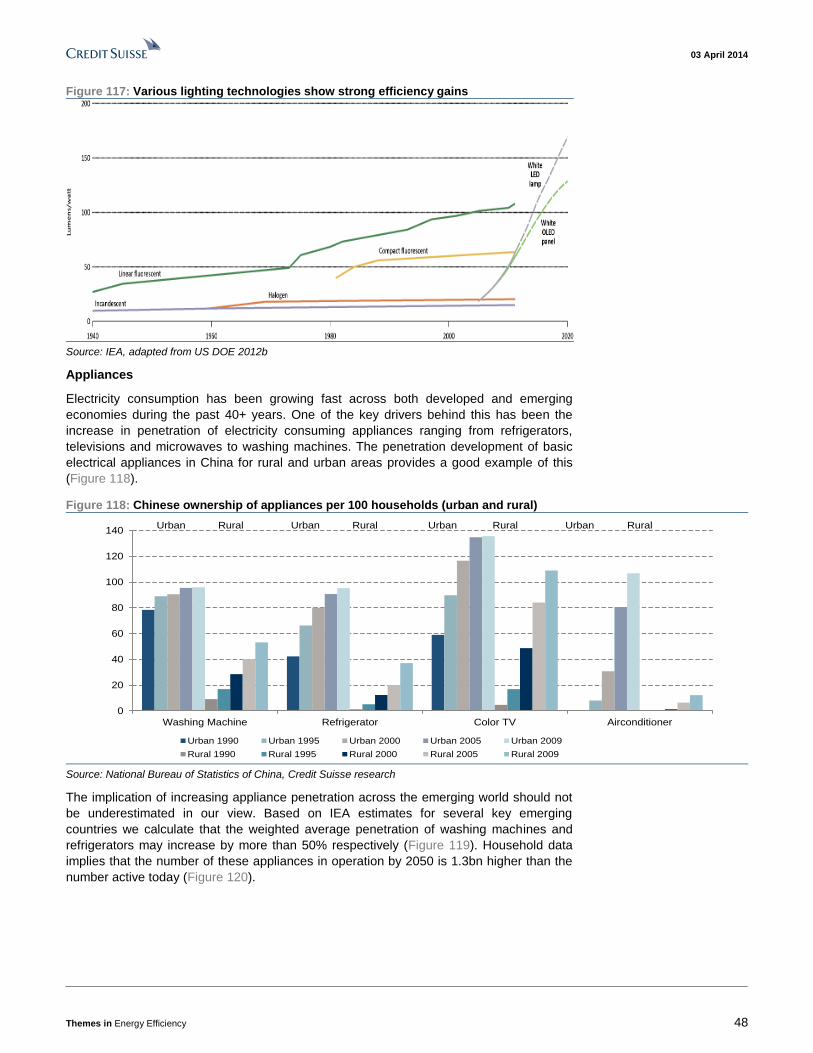
03 April 2014
Themes in Energy Efficiency 48
Figure 117: Various lighting technologies show strong efficiency gains
Source: IEA, adapted from US DOE 2012b
Appliances
Electricity consumption has been growing fast across both developed and emerging
economies during the past 40+ years. One of the key drivers behind this has been the
increase in penetration of electricity consuming appliances ranging from refrigerators,
televisions and microwaves to washing machines. The penetration development of basic
electrical appliances in China for rural and urban areas provides a good example of this
(Figure 118).
Figure 118: Chinese ownership of appliances per 100 households (urban and rural)
0
20
40
60
80
100
120
140
Washing Machine Refrigerator Color TV Airconditioner
Urban 1990 Urban 1995 Urban 2000 Urban 2005 Urban 2009
Rural 1990 Rural 1995 Rural 2000 Rural 2005 Rural 2009
Urban Rural Urban Rural Urban Rural Urban Rural
Source: National Bureau of Statistics of China, Credit Suisse research
The implication of increasing appliance penetration across the emerging world should not
be underestimated in our view. Based on IEA estimates for several key emerging
countries we calculate that the weighted average penetration of washing machines and
refrigerators may increase by more than 50% respectively (Figure 119). Household data
implies that the number of these appliances in operation by 2050 is 1.3bn higher than the
number active today (Figure 120).

03 April 2014
Themes in Energy Efficiency 49
Figure 119: Weighted average penetration of clothes washers and refrigerators set to increase strongly across key emerging markets
Figure 120: Number of active washing machines and refrigerators may increase by more than 800m and 500m across emerging markets as penetration rises
20%
30%
40%
50%
60%
70%
80%
90%
100%
2010 2020 2030 2040 2050
Clothes washer penetration rate Refrigerator penetration
0
200
400
600
800
1,000
1,200
1,400
1,600
2010 2020 2030 2040 2050
Clothe washing machines Refrigerators
+807m
+500m
Source: IEA. Emerging = Asean, Brazil, China, India, Mexico, Russia
and South Africa
Source: IEA. Emerging = Asean, Brazil, China, India, Mexico, Russia
and South Africa
Figure 121: Lighting market growth from developing countries
Figure 122: The IEA expects the global market for smart appliances to grow very strongly
15 19 20
1214 15
10
151912
15
19
4
5
6
3
4
4
0
10
20
30
40
50
60
70
80
90
2011 2016 2020
EU
R b
illio
n
Middle East and
Africa
Latin America
Asia (excl. China)
China
North America
Europe
0
5
10
15
20
25
3020
10
20
11
20
12
20
13
20
14
20
15
20
16
20
17
20
18
20
19
US
$ b
n
Source: IEA Source: IEA

03 April 2014
Themes in Energy Efficiency 50
Identifying investment opportunities Energy efficiency impacts all aspects of a building's life cycle, ranging from the planning
phase all the way through to the redefining/redevelopment of a building (Figure 123).
Figure 123: Different companies involved in a building's life cycle
• Consultants
• Construction firms
• Technical service companies
• Equipment manufacturers
•Real estate agents
•Property company (owner)
•Asset consultants
•Technical service companies
•Equipment manufacturers
• Local authorities
• Developers
• Consultants
• Architects
• Property company (owner)
• Consultants
• Technical services companies
• Construction firms
4
Redefining
1
Planning
2
Creating
3
Operating
Source: Credit Suisse research
Who is exposed to building energy efficiency?
We group the companies exposed to the various stages of a building's life cycle into the
following categories: property consultancy firms, construction firms and homebuilders,
technical service companies, equipment manufacturers and real estate owners.
Property consultancy firms
Property consultants and architects offer services ranging from planning, design,
environmental assessment studies, project management services, and property and asset
management consultancy. Consultancy firms form an integral part of the entire life cycle of
buildings and given its increasingly complex and technical nature have become a more
important partner to property owners and developers over time.
Consultancy firms with a strong asset-build-operate capability for "green building" should
benefit from increasing demand for refitting of existing buildings (largely in developed
markets) as well as demand for new build, particularly in developing markets.
The market of property consultancy is highly fragmented, with thousands of architects,
designers and real estate service companies. Only a handful of consultancy firms have a
multi-regional approach, with even fewer having a true global footprint. These companies
tend to have global contracts for their corporate clients, providing them with a more robust
financial performance than the tail of this subsector for which barriers to entry appear low.

03 April 2014
Themes in Energy Efficiency 51
Construction firms
New buildings (both residential and commercial) provide an opportunity for construction
firms and homebuilders. We do note, however, that most of the new build activity appears
set to take place in emerging markets.
For developed markets, it is likely that retrofitting existing buildings will be more relevant
from an energy efficiency perspective. However, this is likely to involve engineering
service companies more than general construction firms.
The financial performance of construction firms tends to be more cyclical than that of the
other subsectors on this page. New build construction activity, especially in residential
Europe, remains subdued with the UK as the exception. New non-residential construction
remains well below peak levels across Europe and the US. This does limit shorter term
potential for the group, in our view.
Engineering or technical service companies
Engineering or technical service companies are an increasingly important part of the
energy efficiency theme. They typically offer consultancy capability on mechanical,
electrical and ICT challenges and provide installation work for required improvements to
buildings generally. They typically do not manufacture the equipment and materials used.
The market for technical services is highly fragmented, with small average contract sizes.
Energy efficiency across the developed world relates more to upgrading existing buildings
rather than the construction of new green buildings. As a result, the role of engineering
service or technical installation firms in Europe and the US is probably greater than that of
construction firms.
Technical service companies typically generate a significant share of revenues from
longer-term service contracts as opposed to project or one-off related work. This suggests
that the volatility in their financial performance is lower than that of construction firms.
Dedicated technical service or engineering firms compete with service divisions from the
larger equipment manufacturers (e.g. Siemens, ABB) and utility companies (e.g. GDF
Suez and EDF) as well as the so-called hard FM divisions from larger facility management
groups.
Equipment manufacturers
The equipment manufacturers clearly provide direct exposure to energy efficiency
demand. Companies that manufacture energy-efficient building products, specialty
chemicals used for walls and roofs or electrical and mechanical products such as heat
pumps, boilers or smart metering technology should all benefit from the further increase in
green building construction. Barriers to entry for this sub group are higher than for the
others due to product-related IP which in turn should allow for higher profitability.
Property owners and investors
Real estate owners and investors benefit from the drive to improve energy efficiency as
this is seen to increase the value of a building and rents. At the same time, however, they
also face the capex requirements that are associated with this.

03 April 2014
Themes in Energy Efficiency 52
Building efficiency related stocks
Energy efficiency runs across many firms with various degrees of significance. In order to
identify potentially interesting investment opportunities, we have collaborated with our
global research analyst platform and identified c170 companies that have significant
revenue exposure to the theme (see the Appendix on page 96 for an overview of these
companies). From a geographical perspective, c50% of this group is located in Europe
(Figure 124). This may partly be a result of the strong "green" agenda that the European
Union has had for a long time.
Style-wise, it appears that the energy efficiency theme is largely a small- and mid-cap-
driven investment thesis. Some 40% of the companies we have identified have a market
capitalisation of less than $2.5bn compared to 8% with a capitalisation of more than $25bn
(Figure 125).
Figure 124: Building energy efficiency exposed companies by region
Figure 125: Building energy efficiency exposed companies by market cap ($m)
Europe, 82
N.America,
56
Asia, 14
Japan, 20
<1bn
17%
1-2.5bn
27%
2.5-5.0bn
12%
5-10bn
21%
10-25bn
15%
>25bn
8%
Small
cap: 40%
Large
cap: 23%
Mid
cap: 33%
Source: Credit Suisse research Source: Credit Suisse research, Thomson Reuters
The size of the companies in this group tends to be inversely related to the degree of
exposure. The average market cap of highly-exposed companies is c$7bn compared to
c$18bn for companies with low exposure (Figure 126).
Figure 126: Efficiency-related companies grouped by perceived level of exposure
Number Market cap Europe N.America Asia Japan
low 25 17,959 12 7 0 6
medium 65 9,890 39 21 3 2
high 82 7,287 30 28 11 12 Source: Credit Suisse research
Figure 127: Efficiency-related group by service/product offering (Mcap in $m)
Category of companyNo. of
companies
Average
Market capEurope N.America Asia Japan
Consultancy 18 3,394 7 8 3 0
Construction 20 7,069 14 4 1 1
Technical Services 17 6,296 12 5 0 0
OEM 107 12,345 46 36 6 19
Cooling 7 23,193 2 2 1 2
Lighting 16 5,216 8 4 3 1
Insulation and energy management 47 10,667 21 15 1 10
Appliances 4 33,830 2 1 0 1
Space and water heating 13 6,507 6 4 0 3
Property Owners 10 5,455 3 3 4 0 Source: Credit Suisse research, Thomson Reuters
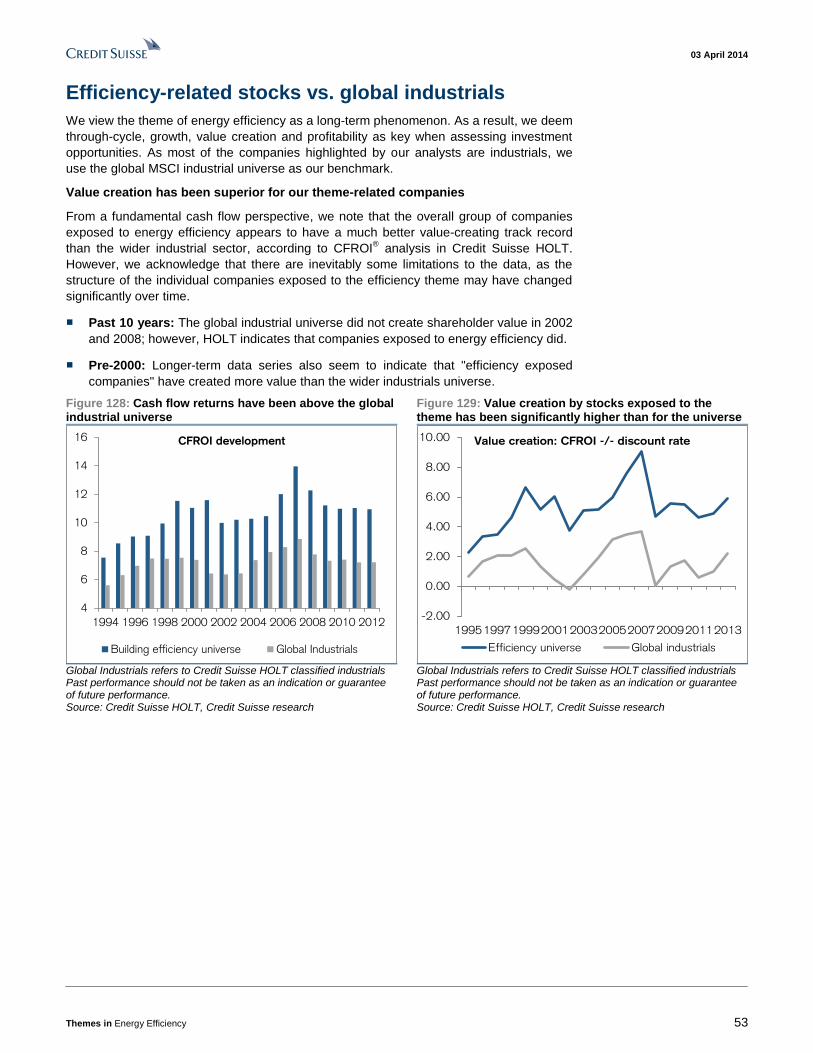
03 April 2014
Themes in Energy Efficiency 53
Efficiency-related stocks vs. global industrials
We view the theme of energy efficiency as a long-term phenomenon. As a result, we deem
through-cycle, growth, value creation and profitability as key when assessing investment
opportunities. As most of the companies highlighted by our analysts are industrials, we
use the global MSCI industrial universe as our benchmark.
Value creation has been superior for our theme-related companies
From a fundamental cash flow perspective, we note that the overall group of companies
exposed to energy efficiency appears to have a much better value-creating track record
than the wider industrial sector, according to CFROI® analysis in Credit Suisse HOLT.
However, we acknowledge that there are inevitably some limitations to the data, as the
structure of the individual companies exposed to the efficiency theme may have changed
significantly over time.
■ Past 10 years: The global industrial universe did not create shareholder value in 2002
and 2008; however, HOLT indicates that companies exposed to energy efficiency did.
■ Pre-2000: Longer-term data series also seem to indicate that "efficiency exposed
companies" have created more value than the wider industrials universe.
Figure 128: Cash flow returns have been above the global industrial universe
Figure 129: Value creation by stocks exposed to the theme has been significantly higher than for the universe
4
6
8
10
12
14
16
1994 1996 1998 2000 2002 2004 2006 2008 2010 2012
CFROI development
Building efficiency universe Global Industrials
-2.00
0.00
2.00
4.00
6.00
8.00
10.00
1995199719992001200320052007200920112013
Value creation: CFROI -/- discount rate
Efficiency universe Global industrials
Global Industrials refers to Credit Suisse HOLT classified industrials Past performance should not be taken as an indication or guarantee of future performance. Source: Credit Suisse HOLT, Credit Suisse research
Global Industrials refers to Credit Suisse HOLT classified industrials Past performance should not be taken as an indication or guarantee of future performance. Source: Credit Suisse HOLT, Credit Suisse research
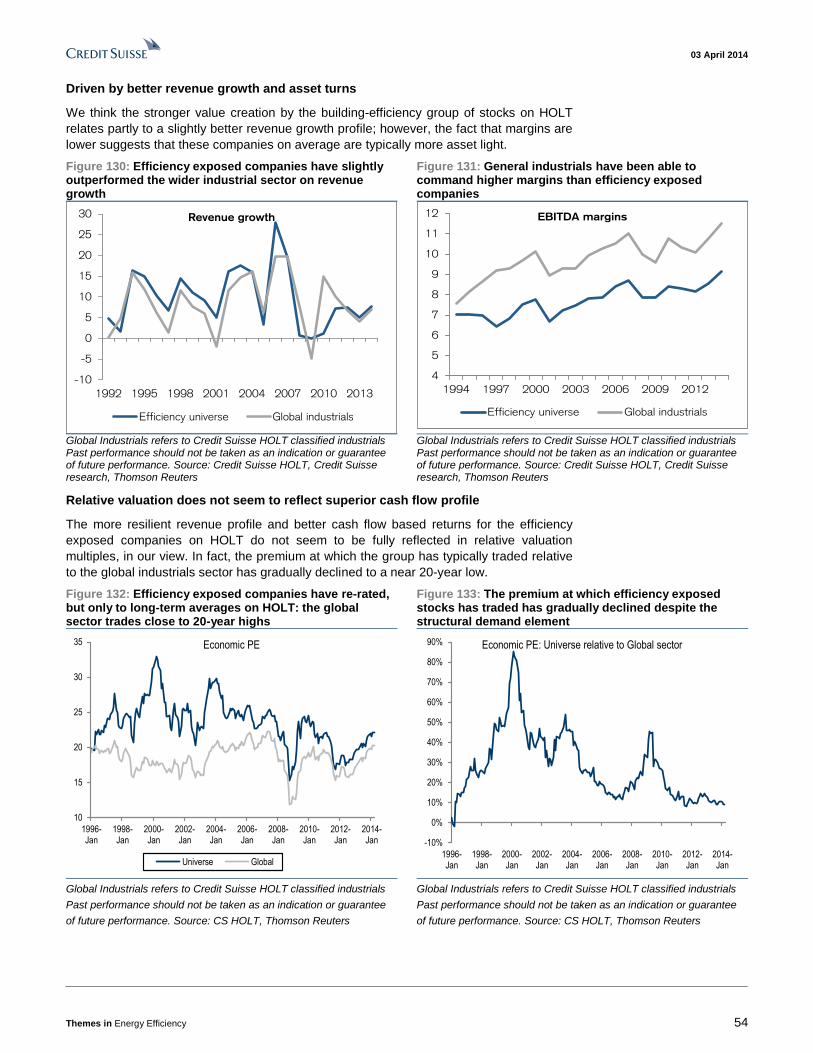
03 April 2014
Themes in Energy Efficiency 54
Driven by better revenue growth and asset turns
We think the stronger value creation by the building-efficiency group of stocks on HOLT
relates partly to a slightly better revenue growth profile; however, the fact that margins are
lower suggests that these companies on average are typically more asset light.
Figure 130: Efficiency exposed companies have slightly outperformed the wider industrial sector on revenue growth
Figure 131: General industrials have been able to command higher margins than efficiency exposed companies
-10
-5
0
5
10
15
20
25
30
1992 1995 1998 2001 2004 2007 2010 2013
Revenue growth
Efficiency universe Global industrials
4
5
6
7
8
9
10
11
12
1994 1997 2000 2003 2006 2009 2012
EBITDA margins
Efficiency universe Global industrials
Global Industrials refers to Credit Suisse HOLT classified industrials Past performance should not be taken as an indication or guarantee of future performance. Source: Credit Suisse HOLT, Credit Suisse research, Thomson Reuters
Global Industrials refers to Credit Suisse HOLT classified industrials Past performance should not be taken as an indication or guarantee of future performance. Source: Credit Suisse HOLT, Credit Suisse research, Thomson Reuters
Relative valuation does not seem to reflect superior cash flow profile
The more resilient revenue profile and better cash flow based returns for the efficiency
exposed companies on HOLT do not seem to be fully reflected in relative valuation
multiples, in our view. In fact, the premium at which the group has typically traded relative
to the global industrials sector has gradually declined to a near 20-year low.
Figure 132: Efficiency exposed companies have re-rated, but only to long-term averages on HOLT: the global sector trades close to 20-year highs
Figure 133: The premium at which efficiency exposed stocks has traded has gradually declined despite the structural demand element
10
15
20
25
30
35
1996-Jan
1998-Jan
2000-Jan
2002-Jan
2004-Jan
2006-Jan
2008-Jan
2010-Jan
2012-Jan
2014-Jan
Economic PE
Universe Global
-10%
0%
10%
20%
30%
40%
50%
60%
70%
80%
90%
1996-Jan
1998-Jan
2000-Jan
2002-Jan
2004-Jan
2006-Jan
2008-Jan
2010-Jan
2012-Jan
2014-Jan
Economic PE: Universe relative to Global sector
Global Industrials refers to Credit Suisse HOLT classified industrials
Past performance should not be taken as an indication or guarantee
of future performance. Source: CS HOLT, Thomson Reuters
Global Industrials refers to Credit Suisse HOLT classified industrials
Past performance should not be taken as an indication or guarantee
of future performance. Source: CS HOLT, Thomson Reuters
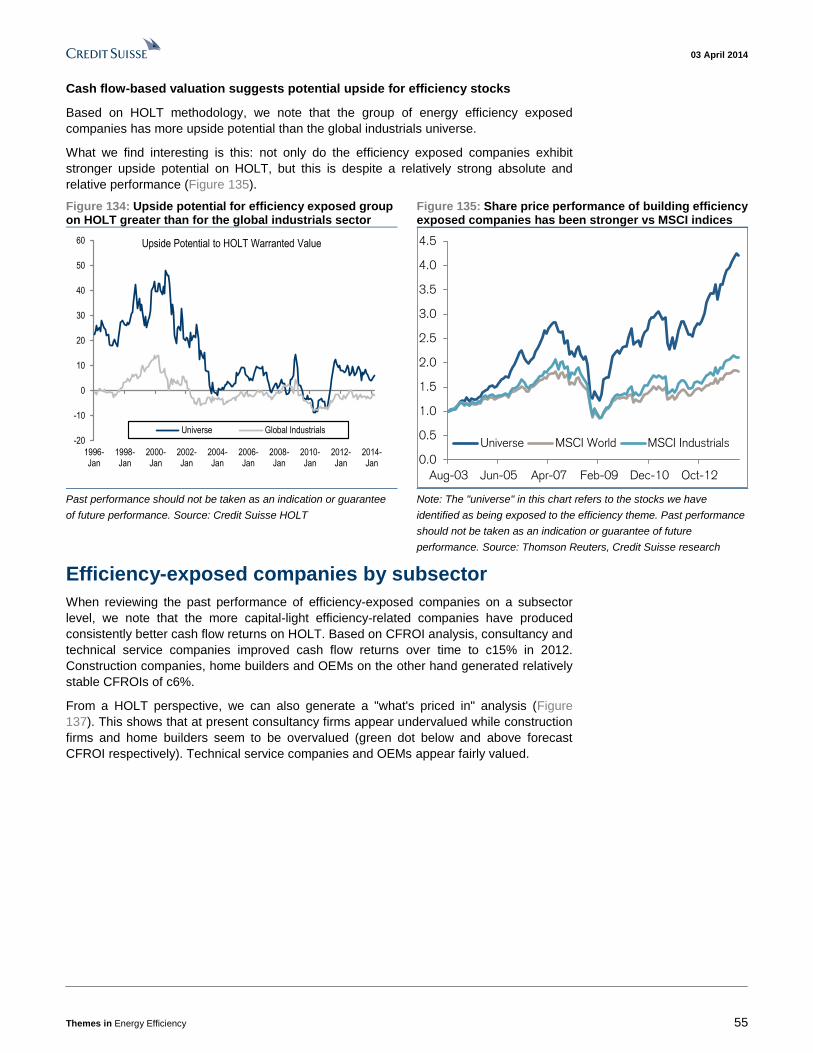
03 April 2014
Themes in Energy Efficiency 55
Cash flow-based valuation suggests potential upside for efficiency stocks
Based on HOLT methodology, we note that the group of energy efficiency exposed
companies has more upside potential than the global industrials universe.
What we find interesting is this: not only do the efficiency exposed companies exhibit
stronger upside potential on HOLT, but this is despite a relatively strong absolute and
relative performance (Figure 135).
Figure 134: Upside potential for efficiency exposed group on HOLT greater than for the global industrials sector
Figure 135: Share price performance of building efficiency exposed companies has been stronger vs MSCI indices
-20
-10
0
10
20
30
40
50
60
1996-Jan
1998-Jan
2000-Jan
2002-Jan
2004-Jan
2006-Jan
2008-Jan
2010-Jan
2012-Jan
2014-Jan
Upside Potential to HOLT Warranted Value
Universe Global Industrials
0.0
0.5
1.0
1.5
2.0
2.5
3.0
3.5
4.0
4.5
Aug-03 Jun-05 Apr-07 Feb-09 Dec-10 Oct-12
Universe MSCI World MSCI Industrials
Past performance should not be taken as an indication or guarantee
of future performance. Source: Credit Suisse HOLT
Note: The "universe" in this chart refers to the stocks we have
identified as being exposed to the efficiency theme. Past performance
should not be taken as an indication or guarantee of future
performance. Source: Thomson Reuters, Credit Suisse research
Efficiency-exposed companies by subsector
When reviewing the past performance of efficiency-exposed companies on a subsector
level, we note that the more capital-light efficiency-related companies have produced
consistently better cash flow returns on HOLT. Based on CFROI analysis, consultancy and
technical service companies improved cash flow returns over time to c15% in 2012.
Construction companies, home builders and OEMs on the other hand generated relatively
stable CFROIs of c6%.
From a HOLT perspective, we can also generate a "what's priced in" analysis (Figure
137). This shows that at present consultancy firms appear undervalued while construction
firms and home builders seem to be overvalued (green dot below and above forecast
CFROI respectively). Technical service companies and OEMs appear fairly valued.
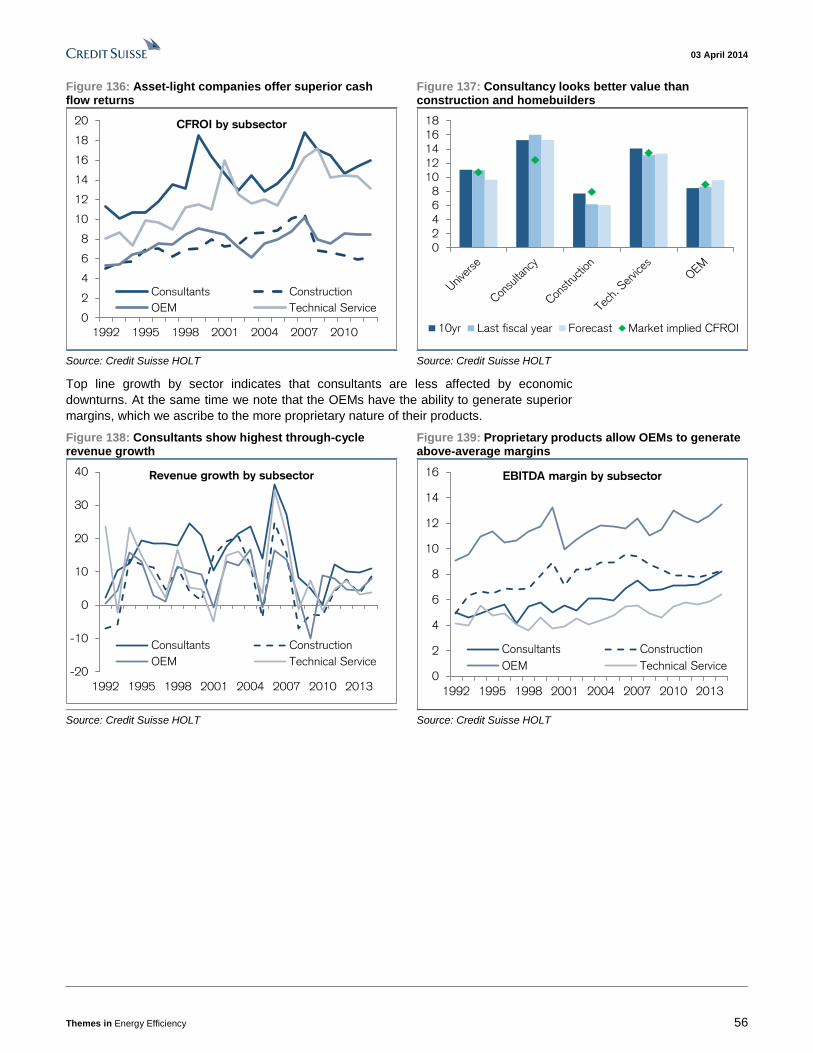
03 April 2014
Themes in Energy Efficiency 56
Figure 136: Asset-light companies offer superior cash flow returns
Figure 137: Consultancy looks better value than construction and homebuilders
0
2
4
6
8
10
12
14
16
18
20
1992 1995 1998 2001 2004 2007 2010
CFROI by subsector
Consultants Construction
OEM Technical Service
0
2
4
6
8
10
12
14
16
18
10yr Last fiscal year Forecast Market implied CFROI
Source: Credit Suisse HOLT Source: Credit Suisse HOLT
Top line growth by sector indicates that consultants are less affected by economic
downturns. At the same time we note that the OEMs have the ability to generate superior
margins, which we ascribe to the more proprietary nature of their products.
Figure 138: Consultants show highest through-cycle revenue growth
Figure 139: Proprietary products allow OEMs to generate above-average margins
-20
-10
0
10
20
30
40
1992 1995 1998 2001 2004 2007 2010 2013
Revenue growth by subsector
Consultants Construction
OEM Technical Service
0
2
4
6
8
10
12
14
16
1992 1995 1998 2001 2004 2007 2010 2013
EBITDA margin by subsector
Consultants Construction
OEM Technical Service
Source: Credit Suisse HOLT Source: Credit Suisse HOLT
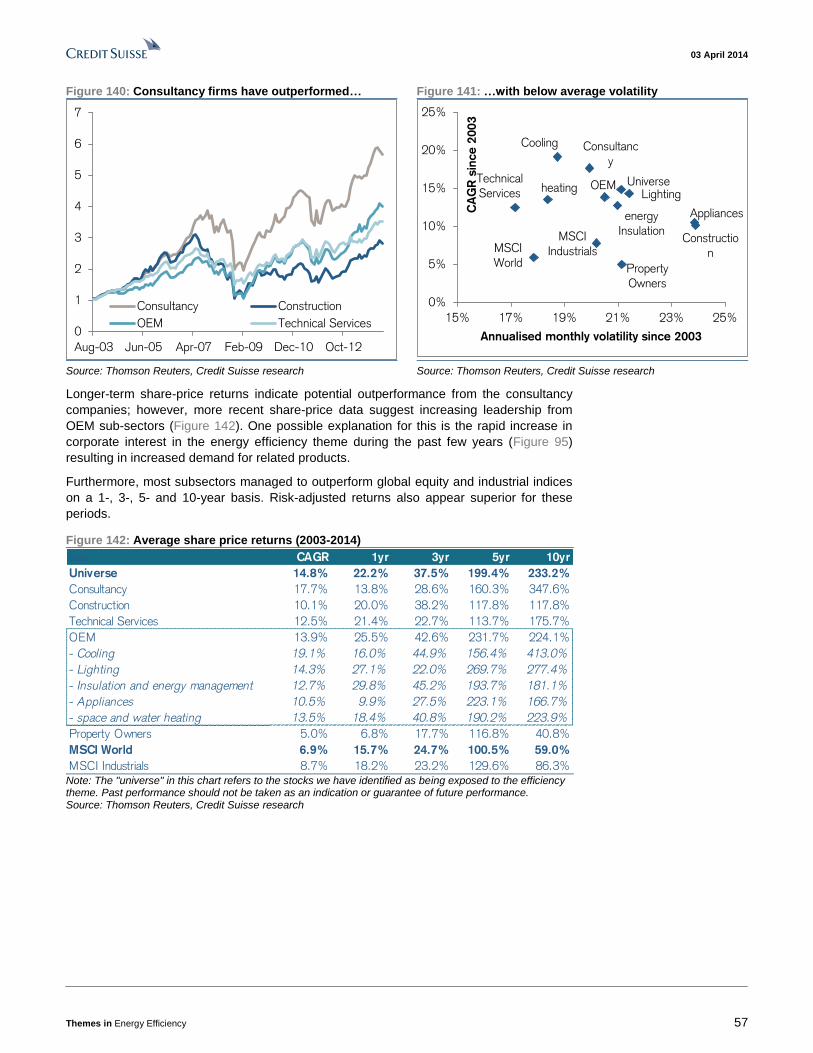
03 April 2014
Themes in Energy Efficiency 57
Figure 140: Consultancy firms have outperformed… Figure 141: …with below average volatility
0
1
2
3
4
5
6
7
Aug-03 Jun-05 Apr-07 Feb-09 Dec-10 Oct-12
Consultancy Construction
OEM Technical Services
Universe
Consultanc
y
Constructio
n
Technical
ServicesOEM
Cooling
Lighting
energy
Insulation
Appliances
heating
Property
Owners
MSCI
World
MSCI
Industrials
0%
5%
10%
15%
20%
25%
15% 17% 19% 21% 23% 25%
CA
GR
sin
ce
200
3
Annualised monthly volatility since 2003
Source: Thomson Reuters, Credit Suisse research Source: Thomson Reuters, Credit Suisse research
Longer-term share-price returns indicate potential outperformance from the consultancy
companies; however, more recent share-price data suggest increasing leadership from
OEM sub-sectors (Figure 142). One possible explanation for this is the rapid increase in
corporate interest in the energy efficiency theme during the past few years (Figure 95)
resulting in increased demand for related products.
Furthermore, most subsectors managed to outperform global equity and industrial indices
on a 1-, 3-, 5- and 10-year basis. Risk-adjusted returns also appear superior for these
periods.
Figure 142: Average share price returns (2003-2014)
MSCI Industrials CAGR 1yr 3yr 5yr 10yr
Universe 14.8% 22.2% 37.5% 199.4% 233.2%
Consultancy 17.7% 13.8% 28.6% 160.3% 347.6%
Construction 10.1% 20.0% 38.2% 117.8% 117.8%
Technical Services 12.5% 21.4% 22.7% 113.7% 175.7%
OEM 13.9% 25.5% 42.6% 231.7% 224.1%
- Cooling 19.1% 16.0% 44.9% 156.4% 413.0%
- Lighting 14.3% 27.1% 22.0% 269.7% 277.4%
- Insulation and energy management 12.7% 29.8% 45.2% 193.7% 181.1%
- Appliances 10.5% 9.9% 27.5% 223.1% 166.7%
- space and water heating 13.5% 18.4% 40.8% 190.2% 223.9%
Property Owners 5.0% 6.8% 17.7% 116.8% 40.8%
MSCI World 6.9% 15.7% 24.7% 100.5% 59.0%
MSCI Industrials 8.7% 18.2% 23.2% 129.6% 86.3% Note: The "universe" in this chart refers to the stocks we have identified as being exposed to the efficiency theme. Past performance should not be taken as an indication or guarantee of future performance. Source: Thomson Reuters, Credit Suisse research
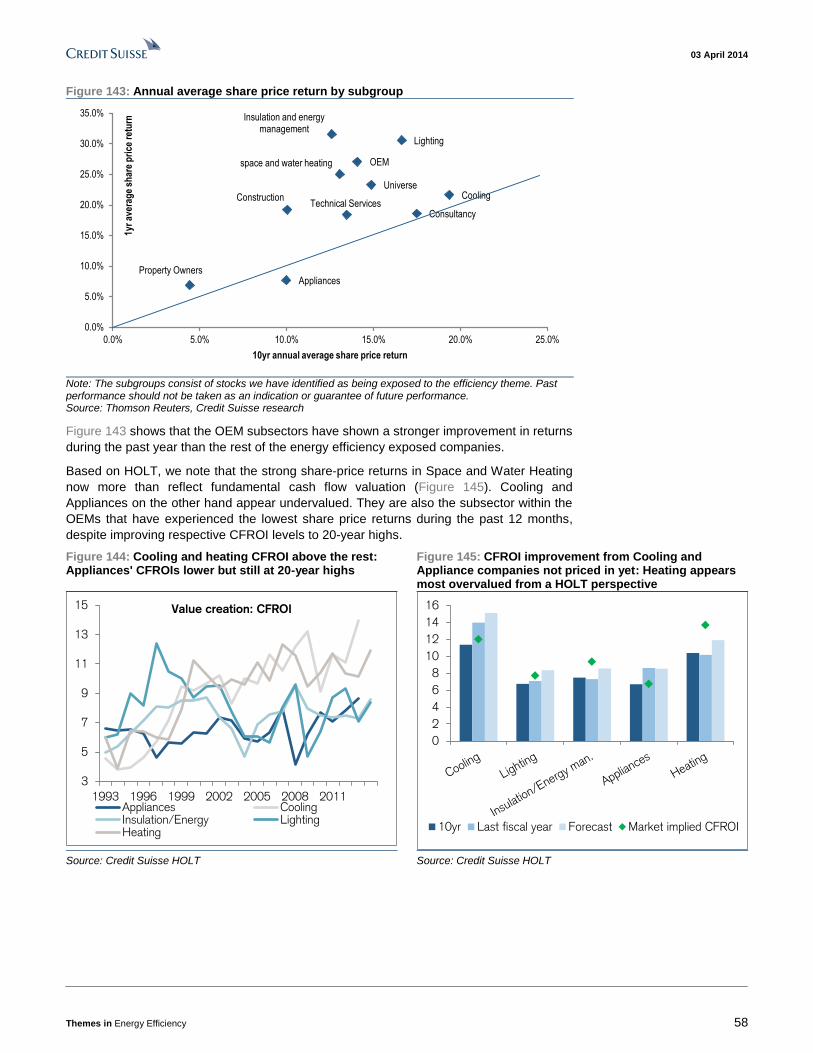
03 April 2014
Themes in Energy Efficiency 58
Figure 143: Annual average share price return by subgroup
Universe
Consultancy
ConstructionTechnical Services
OEM
Property Owners
Cooling
Lighting
Insulation and energy management
Appliances
space and water heating
0.0%
5.0%
10.0%
15.0%
20.0%
25.0%
30.0%
35.0%
0.0% 5.0% 10.0% 15.0% 20.0% 25.0%
1yr
aver
age
shar
e p
rice
ret
urn
10yr annual average share price return
Note: The subgroups consist of stocks we have identified as being exposed to the efficiency theme. Past performance should not be taken as an indication or guarantee of future performance. Source: Thomson Reuters, Credit Suisse research
Figure 143 shows that the OEM subsectors have shown a stronger improvement in returns
during the past year than the rest of the energy efficiency exposed companies.
Based on HOLT, we note that the strong share-price returns in Space and Water Heating
now more than reflect fundamental cash flow valuation (Figure 145). Cooling and
Appliances on the other hand appear undervalued. They are also the subsector within the
OEMs that have experienced the lowest share price returns during the past 12 months,
despite improving respective CFROI levels to 20-year highs.
Figure 144: Cooling and heating CFROI above the rest: Appliances' CFROIs lower but still at 20-year highs
Figure 145: CFROI improvement from Cooling and Appliance companies not priced in yet: Heating appears most overvalued from a HOLT perspective
3
5
7
9
11
13
15
1993 1996 1999 2002 2005 2008 2011
Value creation: CFROI
Appliances CoolingInsulation/Energy LightingHeating
0
2
4
6
8
10
12
14
16
10yr Last fiscal year Forecast Market implied CFROI
Source: Credit Suisse HOLT Source: Credit Suisse HOLT
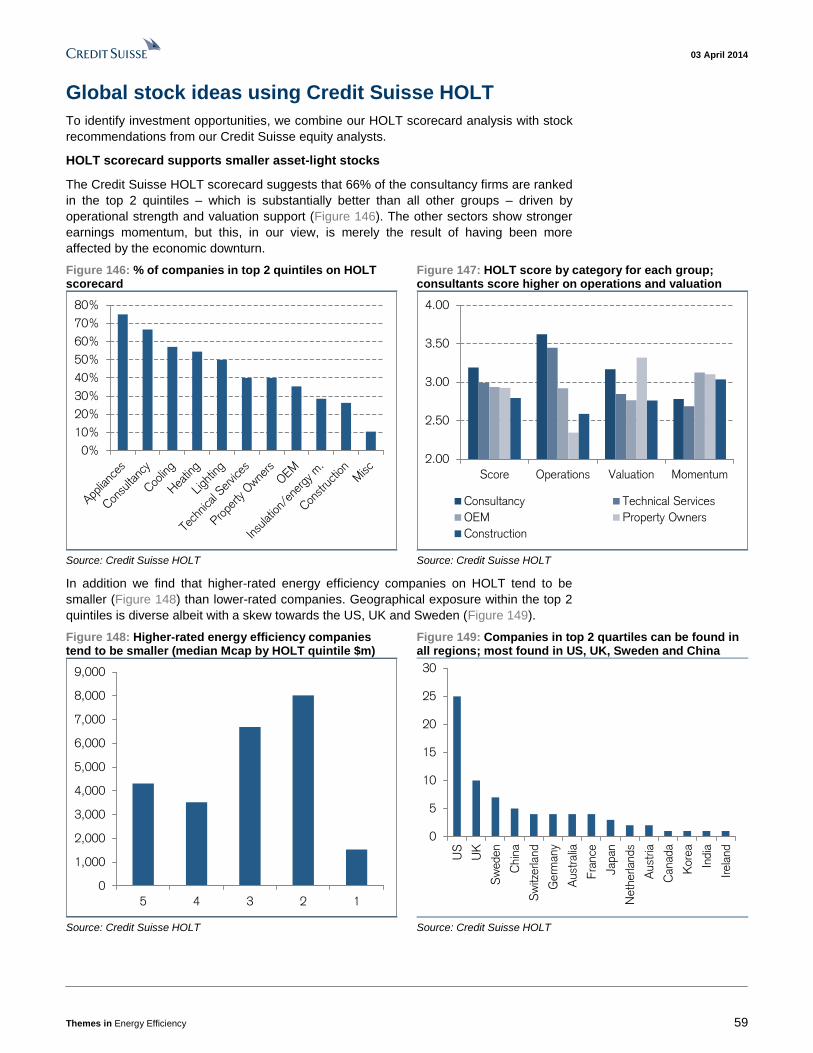
03 April 2014
Themes in Energy Efficiency 59
Global stock ideas using Credit Suisse HOLT
To identify investment opportunities, we combine our HOLT scorecard analysis with stock
recommendations from our Credit Suisse equity analysts.
HOLT scorecard supports smaller asset-light stocks
The Credit Suisse HOLT scorecard suggests that 66% of the consultancy firms are ranked
in the top 2 quintiles – which is substantially better than all other groups – driven by
operational strength and valuation support (Figure 146). The other sectors show stronger
earnings momentum, but this, in our view, is merely the result of having been more
affected by the economic downturn.
Figure 146: % of companies in top 2 quintiles on HOLT scorecard
Figure 147: HOLT score by category for each group; consultants score higher on operations and valuation
0%
10%
20%
30%
40%
50%
60%
70%
80%
2.00
2.50
3.00
3.50
4.00
Score Operations Valuation Momentum
Consultancy Technical Services
OEM Property Owners
Construction
Source: Credit Suisse HOLT Source: Credit Suisse HOLT
In addition we find that higher-rated energy efficiency companies on HOLT tend to be
smaller (Figure 148) than lower-rated companies. Geographical exposure within the top 2
quintiles is diverse albeit with a skew towards the US, UK and Sweden (Figure 149).
Figure 148: Higher-rated energy efficiency companies tend to be smaller (median Mcap by HOLT quintile $m)
Figure 149: Companies in top 2 quartiles can be found in all regions; most found in US, UK, Sweden and China
0
1,000
2,000
3,000
4,000
5,000
6,000
7,000
8,000
9,000
5 4 3 2 1
0
5
10
15
20
25
30
US
UK
Sw
eden
Chin
a
Sw
itzerland
Germ
any
Aust
ralia
Fra
nce
Japan
Neth
erlands
Aust
ria
Canada
Kore
a
India
Irela
nd
Source: Credit Suisse HOLT Source: Credit Suisse HOLT
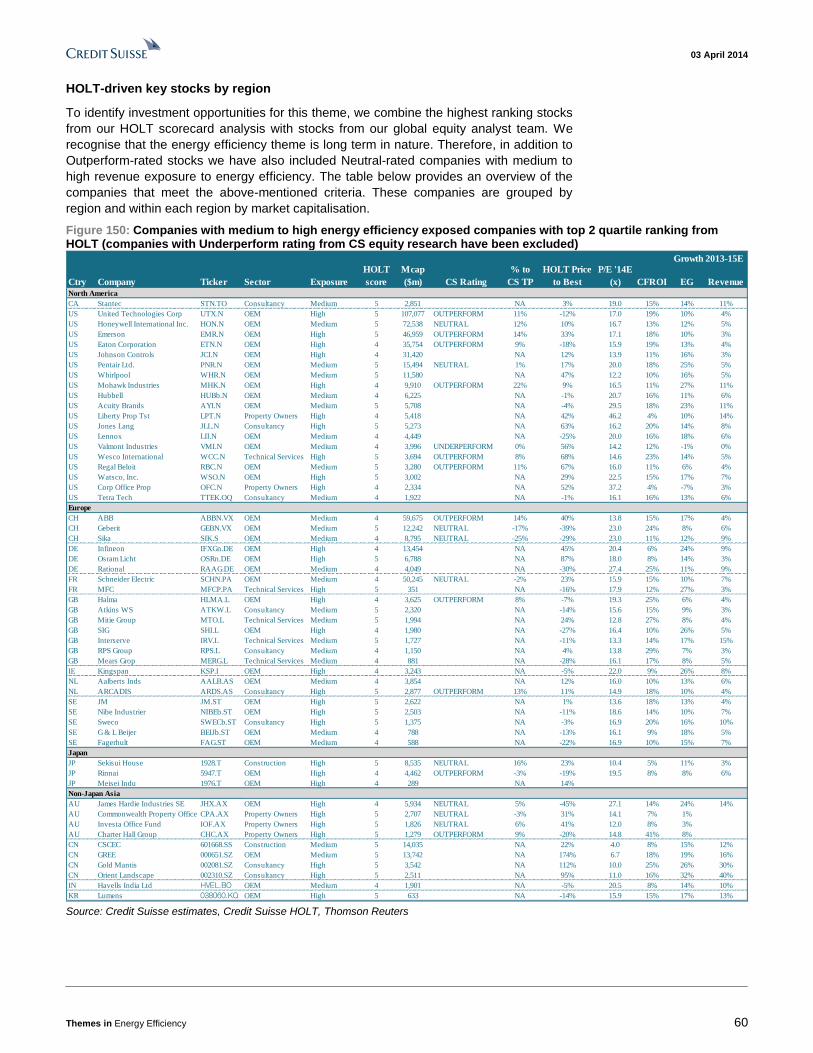
03 April 2014
Themes in Energy Efficiency 60
HOLT-driven key stocks by region
To identify investment opportunities for this theme, we combine the highest ranking stocks
from our HOLT scorecard analysis with stocks from our global equity analyst team. We
recognise that the energy efficiency theme is long term in nature. Therefore, in addition to
Outperform-rated stocks we have also included Neutral-rated companies with medium to
high revenue exposure to energy efficiency. The table below provides an overview of the
companies that meet the above-mentioned criteria. These companies are grouped by
region and within each region by market capitalisation.
Figure 150: Companies with medium to high energy efficiency exposed companies with top 2 quartile ranking from HOLT (companies with Underperform rating from CS equity research have been excluded)
Ctry Company Ticker Sector Exposure
HOLT
score
Mcap
($m) CS Rating
% to
CS TP
P/E '14E
(x) CFROI EG Revenue
North America
CA Stantec STN.TO Consultancy Medium 5 2,851 NA 3% 19.0 15% 14% 11%
US United Technologies Corp UTX.N OEM High 5 107,077 OUTPERFORM 11% -12% 17.0 19% 10% 4%
US Honeywell International Inc. HON.N OEM Medium 5 72,538 NEUTRAL 12% 10% 16.7 13% 12% 5%
US Emerson EMR.N OEM High 5 46,959 OUTPERFORM 14% 33% 17.1 18% 10% 3%
US Eaton Corporation ETN.N OEM High 4 35,754 OUTPERFORM 9% -18% 15.9 19% 13% 4%
US Johnson Controls JCI.N OEM High 4 31,420 NA 12% 13.9 11% 16% 3%
US Pentair Ltd. PNR.N OEM Medium 5 15,494 NEUTRAL 1% 17% 20.0 18% 25% 5%
US Whirlpool WHR.N OEM Medium 5 11,580 NA 47% 12.2 10% 16% 5%
US Mohawk Industries MHK.N OEM High 4 9,910 OUTPERFORM 22% 9% 16.5 11% 27% 11%
US Hubbell HUBb.N OEM Medium 4 6,225 NA -1% 20.7 16% 11% 6%
US Acuity Brands AYI.N OEM Medium 5 5,708 NA -4% 29.5 18% 23% 11%
US Liberty Prop Tst LPT.N Property Owners High 4 5,418 NA 42% 46.2 4% 10% 14%
US Jones Lang JLL.N Consultancy High 5 5,273 NA 63% 16.2 20% 14% 8%
US Lennox LII.N OEM Medium 4 4,449 NA -25% 20.0 16% 18% 6%
US Valmont Industries VMI.N OEM Medium 4 3,996 UNDERPERFORM 0% 56% 14.2 12% -1% 0%
US Wesco International WCC.N Technical Services High 5 3,694 OUTPERFORM 8% 68% 14.6 23% 14% 5%
US Regal Beloit RBC.N OEM Medium 5 3,280 OUTPERFORM 11% 67% 16.0 11% 6% 4%
US Watsco, Inc. WSO.N OEM High 5 3,002 NA 29% 22.5 15% 17% 7%
US Corp Office Prop OFC.N Property Owners High 4 2,334 NA 52% 37.2 4% -7% 3%
US Tetra Tech TTEK.OQ Consultancy Medium 4 1,922 NA -1% 16.1 16% 13% 6%
Europe
CH ABB ABBN.VX OEM Medium 4 59,675 OUTPERFORM 14% 40% 13.8 15% 17% 4%
CH Geberit GEBN.VX OEM Medium 5 12,242 NEUTRAL -17% -39% 23.0 24% 8% 6%
CH Sika SIK.S OEM Medium 4 8,795 NEUTRAL -25% -29% 23.0 11% 12% 9%
DE Infineon IFXGn.DE OEM High 4 13,454 NA 45% 20.4 6% 24% 9%
DE Osram Licht OSRn.DE OEM High 5 6,788 NA 87% 18.0 8% 14% 3%
DE Rational RAAG.DE OEM Medium 4 4,049 NA -30% 27.4 25% 11% 9%
FR Schneider Electric SCHN.PA OEM Medium 4 50,245 NEUTRAL -2% 23% 15.9 15% 10% 7%
FR MFC MFCP.PA Technical Services High 5 351 NA -16% 17.9 12% 27% 3%
GB Halma HLMA.L OEM High 4 3,625 OUTPERFORM 8% -7% 19.3 25% 6% 4%
GB Atkins WS ATKW.L Consultancy Medium 5 2,320 NA -14% 15.6 15% 9% 3%
GB Mitie Group MTO.L Technical Services Medium 5 1,994 NA 24% 12.8 27% 8% 4%
GB SIG SHI.L OEM High 4 1,980 NA -27% 16.4 10% 26% 5%
GB Interserve IRV.L Technical Services Medium 5 1,727 NA -11% 13.3 14% 17% 15%
GB RPS Group RPS.L Consultancy Medium 4 1,150 NA 4% 13.8 29% 7% 3%
GB Mears Grop MERG.L Technical Services Medium 4 881 NA -28% 16.1 17% 8% 5%
IE Kingspan KSP.I OEM High 4 3,243 NA -5% 22.0 9% 26% 8%
NL Aalberts Inds AALB.AS OEM Medium 4 3,854 NA 12% 16.0 10% 13% 6%
NL ARCADIS ARDS.AS Consultancy High 5 2,877 OUTPERFORM 13% 11% 14.9 18% 10% 4%
SE JM JM.ST OEM High 5 2,622 NA 1% 13.6 18% 13% 4%
SE Nibe Industrier NIBEb.ST OEM High 5 2,503 NA -11% 18.6 14% 10% 7%
SE Sweco SWECb.ST Consultancy High 5 1,375 NA -3% 16.9 20% 16% 10%
SE G & L Beijer BEIJb.ST OEM Medium 4 788 NA -13% 16.1 9% 18% 5%
SE Fagerhult FAG.ST OEM Medium 4 588 NA -22% 16.9 10% 15% 7%
Japan
JP Sekisui House 1928.T Construction High 5 8,535 NEUTRAL 16% 23% 10.4 5% 11% 3%
JP Rinnai 5947.T OEM High 4 4,462 OUTPERFORM -3% -19% 19.5 8% 8% 6%
JP Meisei Indu 1976.T OEM High 4 289 NA 14%
Non-Japan Asia
AU James Hardie Industries SE JHX.AX OEM High 4 5,934 NEUTRAL 5% -45% 27.1 14% 24% 14%
AU Commonwealth Property Office FundCPA.AX Property Owners High 5 2,707 NEUTRAL -3% 31% 14.1 7% 1%
AU Investa Office Fund IOF.AX Property Owners High 5 1,826 NEUTRAL 6% 41% 12.0 8% 3%
AU Charter Hall Group CHC.AX Property Owners High 5 1,279 OUTPERFORM 9% -20% 14.8 41% 8%
CN CSCEC 601668.SS Construction Medium 5 14,035 NA 22% 4.0 8% 15% 12%
CN GREE 000651.SZ OEM Medium 5 13,742 NA 174% 6.7 18% 19% 16%
CN Gold Mantis 002081.SZ Consultancy High 5 3,542 NA 112% 10.0 25% 26% 30%
CN Orient Landscape 002310.SZ Consultancy High 5 2,511 NA 95% 11.0 16% 32% 40%
IN Havells India Ltd HVEL.BO OEM Medium 4 1,901 NA -5% 20.5 8% 14% 10%
KR Lumens 038060.KQ OEM High 5 633 NA -14% 15.9 15% 17% 13%
HOLT Price
to Best
Growth 2013-15E
Source: Credit Suisse estimates, Credit Suisse HOLT, Thomson Reuters
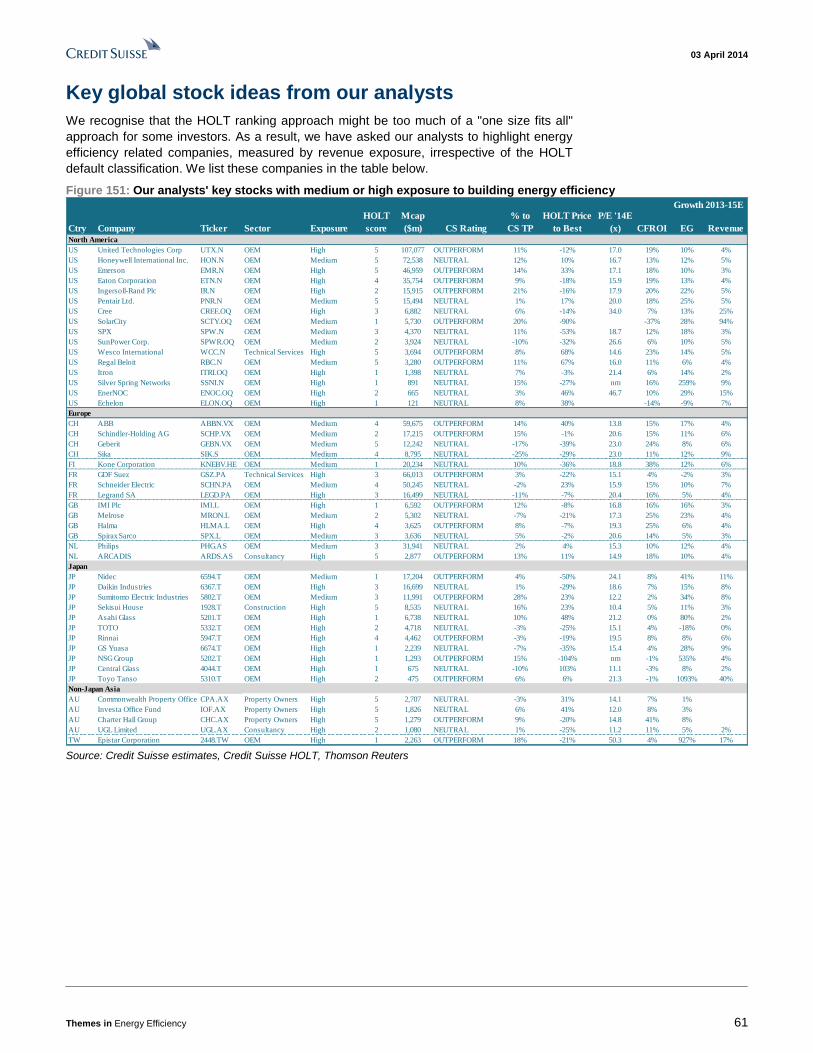
03 April 2014
Themes in Energy Efficiency 61
Key global stock ideas from our analysts
We recognise that the HOLT ranking approach might be too much of a "one size fits all"
approach for some investors. As a result, we have asked our analysts to highlight energy
efficiency related companies, measured by revenue exposure, irrespective of the HOLT
default classification. We list these companies in the table below.
Figure 151: Our analysts' key stocks with medium or high exposure to building energy efficiency
Ctry Company Ticker Sector Exposure
HOLT
score
Mcap
($m) CS Rating
% to
CS TP
P/E '14E
(x) CFROI EG Revenue
North America
US United Technologies Corp UTX.N OEM High 5 107,077 OUTPERFORM 11% -12% 17.0 19% 10% 4%
US Honeywell International Inc. HON.N OEM Medium 5 72,538 NEUTRAL 12% 10% 16.7 13% 12% 5%
US Emerson EMR.N OEM High 5 46,959 OUTPERFORM 14% 33% 17.1 18% 10% 3%
US Eaton Corporation ETN.N OEM High 4 35,754 OUTPERFORM 9% -18% 15.9 19% 13% 4%
US Ingersoll-Rand Plc IR.N OEM High 2 15,915 OUTPERFORM 21% -16% 17.9 20% 22% 5%
US Pentair Ltd. PNR.N OEM Medium 5 15,494 NEUTRAL 1% 17% 20.0 18% 25% 5%
US Cree CREE.OQ OEM High 3 6,882 NEUTRAL 6% -14% 34.0 7% 13% 25%
US SolarCity SCTY.OQ OEM Medium 1 5,730 OUTPERFORM 20% -90% -37% 28% 94%
US SPX SPW.N OEM Medium 3 4,370 NEUTRAL 11% -53% 18.7 12% 18% 3%
US SunPower Corp. SPWR.OQ OEM Medium 2 3,924 NEUTRAL -10% -32% 26.6 6% 10% 5%
US Wesco International WCC.N Technical Services High 5 3,694 OUTPERFORM 8% 68% 14.6 23% 14% 5%
US Regal Beloit RBC.N OEM Medium 5 3,280 OUTPERFORM 11% 67% 16.0 11% 6% 4%
US Itron ITRI.OQ OEM High 1 1,398 NEUTRAL 7% -3% 21.4 6% 14% 2%
US Silver Spring Networks SSNI.N OEM High 1 891 NEUTRAL 15% -27% nm 16% 259% 9%
US EnerNOC ENOC.OQ OEM High 2 665 NEUTRAL 3% 46% 46.7 10% 29% 15%
US Echelon ELON.OQ OEM High 1 121 NEUTRAL 8% 38% -14% -9% 7%
Europe
CH ABB ABBN.VX OEM Medium 4 59,675 OUTPERFORM 14% 40% 13.8 15% 17% 4%
CH Schindler-Holding AG SCHP.VX OEM Medium 2 17,215 OUTPERFORM 15% -1% 20.6 15% 11% 6%
CH Geberit GEBN.VX OEM Medium 5 12,242 NEUTRAL -17% -39% 23.0 24% 8% 6%
CH Sika SIK.S OEM Medium 4 8,795 NEUTRAL -25% -29% 23.0 11% 12% 9%
FI Kone Corporation KNEBV.HE OEM Medium 1 20,234 NEUTRAL 10% -36% 18.8 38% 12% 6%
FR GDF Suez GSZ.PA Technical Services High 3 66,013 OUTPERFORM 3% -22% 15.1 4% -2% 3%
FR Schneider Electric SCHN.PA OEM Medium 4 50,245 NEUTRAL -2% 23% 15.9 15% 10% 7%
FR Legrand SA LEGD.PA OEM High 3 16,499 NEUTRAL -11% -7% 20.4 16% 5% 4%
GB IMI Plc IMI.L OEM High 1 6,592 OUTPERFORM 12% -8% 16.8 16% 16% 3%
GB Melrose MRON.L OEM Medium 2 5,302 NEUTRAL -7% -21% 17.3 25% 23% 4%
GB Halma HLMA.L OEM High 4 3,625 OUTPERFORM 8% -7% 19.3 25% 6% 4%
GB Spirax Sarco SPX.L OEM Medium 3 3,636 NEUTRAL 5% -2% 20.6 14% 5% 3%
NL Philips PHG.AS OEM Medium 3 31,941 NEUTRAL 2% 4% 15.3 10% 12% 4%
NL ARCADIS ARDS.AS Consultancy High 5 2,877 OUTPERFORM 13% 11% 14.9 18% 10% 4%
Japan
JP Nidec 6594.T OEM Medium 1 17,204 OUTPERFORM 4% -50% 24.1 8% 41% 11%
JP Daikin Industries 6367.T OEM High 3 16,699 NEUTRAL 1% -29% 18.6 7% 15% 8%
JP Sumitomo Electric Industries 5802.T OEM Medium 3 11,991 OUTPERFORM 28% 23% 12.2 2% 34% 8%
JP Sekisui House 1928.T Construction High 5 8,535 NEUTRAL 16% 23% 10.4 5% 11% 3%
JP Asahi Glass 5201.T OEM High 1 6,738 NEUTRAL 10% 48% 21.2 0% 80% 2%
JP TOTO 5332.T OEM High 2 4,718 NEUTRAL -3% -25% 15.1 4% -18% 0%
JP Rinnai 5947.T OEM High 4 4,462 OUTPERFORM -3% -19% 19.5 8% 8% 6%
JP GS Yuasa 6674.T OEM High 1 2,239 NEUTRAL -7% -35% 15.4 4% 28% 9%
JP NSG Group 5202.T OEM High 1 1,293 OUTPERFORM 15% -104% nm -1% 535% 4%
JP Central Glass 4044.T OEM High 1 675 NEUTRAL -10% 103% 11.1 -3% 8% 2%
JP Toyo Tanso 5310.T OEM High 2 475 OUTPERFORM 6% 6% 21.3 -1% 1093% 40%
Non-Japan Asia
AU Commonwealth Property Office FundCPA.AX Property Owners High 5 2,707 NEUTRAL -3% 31% 14.1 7% 1%
AU Investa Office Fund IOF.AX Property Owners High 5 1,826 NEUTRAL 6% 41% 12.0 8% 3%
AU Charter Hall Group CHC.AX Property Owners High 5 1,279 OUTPERFORM 9% -20% 14.8 41% 8%
AU UGL Limited UGL.AX Consultancy High 2 1,080 NEUTRAL 1% -25% 11.2 11% 5% 2%
TW Epistar Corporation 2448.TW OEM High 1 2,263 OUTPERFORM 18% -21% 50.3 4% 927% 17%
HOLT Price
to Best
Growth 2013-15E
Source: Credit Suisse estimates, Credit Suisse HOLT, Thomson Reuters

03 April 2014
Themes in Energy Efficiency 62
Company profiles

03 April 2014
Themes in Energy Efficiency 63
Europe / Switzerland
Electrical Equipment
ABB (ABBN.VX)
Medium exposure
■ Company description: ABB is a global provider of Automation and Power
products for customers ranging from industrial to utilities. The company
operates in five divisions, namely: Discrete Automation, Process Automation,
Low Voltage Products, Power Products and Power Systems. The group has
operations in more than 100 countries, with Europe accounting for 34% of
total sales in 2013.
■ Investment case: We continue to favour the combination of 1) double digit
earnings growth from margin expansion in both Power businesses and
mainly Low Voltage and de-leveraging, 2) operational leverage potential if
short-cycle recovery is stronger, 3) balance sheet optionality, and 4)
attractive valuation.
■ Exposure to energy efficiency: ABB offers its customers products such as
motors, variable speed drives, network management products, traction
converters and flexible AC transmission systems which aim to enhance
reliability and to improve energy efficiency. Its energy management solutions
help customers reduce energy bills and carbon emissions by up to 20%.
■ Valuation: ABB is trading on 9.4x FY 2015E EV/EBITA, representing a 1%
discount to the electricals average. On our estimates the company's balance
sheet is going to be ungeared next year which potentially allows $8bn M&A
firepower if management levers up to 1x net debt to EBITDA, giving it among
the highest potential for inorganic growth in the European Capital Goods
universe.
Share price performance
15
20
25
Apr-12 Aug-12 Dec-12 Apr-13 Aug-13 Dec-13
Price Price relative
The price relative chart measures performance against the SMI
PRICE which closed at 8464.75 on 27/03/14
On 27/03/14 the spot exchange rate was SFr1.22/Eu 1. -
Eu .73/US$1
Performance Over 1M 3M 12M Absolute (%) -0.1 -5.0 3.8 Relative (%) 2.0 -6.3 -3.2
Financial and valuation metrics
Year 12/13A 12/14E 12/15E 12/16E Revenue (US$ m) 41,848.0 42,503.0 44,926.5 48,002.8 EBITDA (US$ m) 5,705.00 6,495.09 7,287.46 8,165.96 Adjusted Net Income (US$ m) 3,194.34 3,799.90 4,356.78 4,959.78 CS adj. EPS (US$) 1.39 1.65 1.89 2.15 Prev. EPS (US$) — — — — ROIC (%) 14.09 17.13 19.69 21.82 P/E (adj., x) 18.20 15.29 13.33 11.71 P/E rel. (%) 110.1 98.2 94.7 88.9 EV/EBITDA 10.8 9.2 7.9 6.8
Dividend (12/14E, US$) 0.83 IC (12/14E, US$ m) 21,954.81 Dividend yield (%) 3.3 EV/IC 2.7 Net debt (12/14E, US$ m) 1,169.2 Current WACC 9.00 Net debt/equity (12/14E, %) 5.6 Free float (%) 100.00 BV/share (12/14E, US$) 8.8 Number of shares (m) 2,314.74
Source: FTI, Company data, Thomson Reuters, Credit Suisse Securities (EUROPE) LTD. Estimates.
Rating OUTPERFORM* Price (28 Mar 14, SFr) 22.36 Target price (SFr) 26.00¹ Market cap. (SFr m) 51,757.66 Enterprise value (US$ m) 59,560.1
*Stock ratings are relative to the coverage universe in each
analyst's or each team's respective sector.
¹Target price is for 12 months.
Research Analysts
Simon Toennessen
44 20 7883 6893
Andre Kukhnin CFA
44 20 7888 0350
Max Yates
44 20 7883 8501
Jonathan Hurn, CFA
44 20 7883 4532
Tiantian Li
44 20 7883 1552

03 April 2014
Themes in Energy Efficiency 64
Europe / Netherlands
Business & Professional Services
ARCADIS (ARDS.AS)
High exposure
■ Company profile: Arcadis is one of the largest globally integrated
consultancy firms with a strong focus on sustainability. Revenues are
generated in four different activities: 30% of revenues are from buildings,
28% from environmental consultancy, 15% from water advisory and 27%
from infrastructure work. The geographical mix is well balanced with 35% of
EBITA from emerging markets, 48% from the US and the balance from work
done in Europe. Following acquisitions during the past few years, Arcadis is
now considered to be one of the leading asset-build consultancy firms
globally.
■ Investment case: Arcadis' risk profile is low owing to a revenue mix that is
heavily exposed to structural sustainability themes. In addition, we expect
cash flow generation to steadily increase as the company improves its
European margins following the completion of a European restructuring.
Earnings growth should reach double digits as a result, whereas gearing
should fall further from already moderate to low levels.
■ Exposure to energy efficiency: Arcadis has strong exposure to building
energy efficiency as 30% of revenues are from building-related consultancy
work. Through the acquisitions of EC Harris and Langdon and Seah a few
years ago, Arcadis has become one of the world's largest building
consultancy firms. The company provides a full life cycle offering from
planning and environmental impact studies to project management during
the construction phase, asset management consultancy during the operating
phase of a building and refurbishment with possible environmental
remediation work during the redevelopment phase.
■ Valuation: We use a combination of peer group multiple-comparison, Credit
Suisse HOLT and DCF modelling. This results in our target price of €31.6
per share. Coinciding with this building energy efficiency report, we upgrade
Arcadis to Outperform from Underperform and raise our target price from
€18.2 to €31.6 (see our note, ARCADIS - Upgrade on valuation review and
structural growth).
Share price performance
15
20
25
Apr-12 Aug-12 Dec-12 Apr-13 Aug-13 Dec-13
Price Price relative
The price relative chart measures performance against the
AMSTERDAM EXCHANGE INDEX which closed at 403.19 on
27/03/14
On 27/03/14 the spot exchange rate was €1./Eu 1. -
Eu .73/US$1
Performance Over 1M 3M 12M Absolute (%) -1.3 8.1 28.3 Relative (%) -0.7 8.7 13.2
Financial and valuation metrics
Year 12/13A 12/14E 12/15E 12/16E Revenue (Eu m) 2,515.9 2,597.8 2,738.7 2,903.2 EBITDA (Eu m) 222.90 244.74 252.19 279.44 Adjusted Net Income (Eu m) 123.37 137.06 150.31 170.43 CS adj. EPS (Eu) 1.71 1.88 2.06 2.33 Prev. EPS (Eu) — 1.93 2.08 2.28 ROIC (%) 14.86 16.96 17.04 19.52 P/E (adj., x) 15.99 14.56 13.28 11.71 P/E rel. (%) 99.6 109.2 112.6 109.2 EV/EBITDA 10.4 9.1 8.4 7.2
Dividend (12/14E, Eu) 0.69 IC (12/14E, Eu m) 853.91 Dividend yield (%) 2.5 EV/IC 2.6 Net debt (12/14E, Eu m) 179.8 Current WACC 8.30 Net debt/equity (12/14E, %) 26.7 Free float (%) 75.50 BV/share (12/14E, Eu) 9.2 Number of shares (m) 74.82
Source: FTI, Company data, Thomson Reuters, Credit Suisse Securities (EUROPE) LTD. Estimates.
Rating (from Underperform) OUTPERFORM* Price (27 Mar 14, Eu) 27.34 Target price (Eu) (from 18.20) 31.60¹ Market cap. (Eu m) 2,046.00 Enterprise value (Eu m) 2,225.8
*Stock ratings are relative to the coverage universe in each
analyst's or each team's respective sector.
¹Target price is for 12 months.
Research Analysts
Eugene Klerk
44 20 7883 4678
Andy Grobler, CFA
44 20 7883 5943
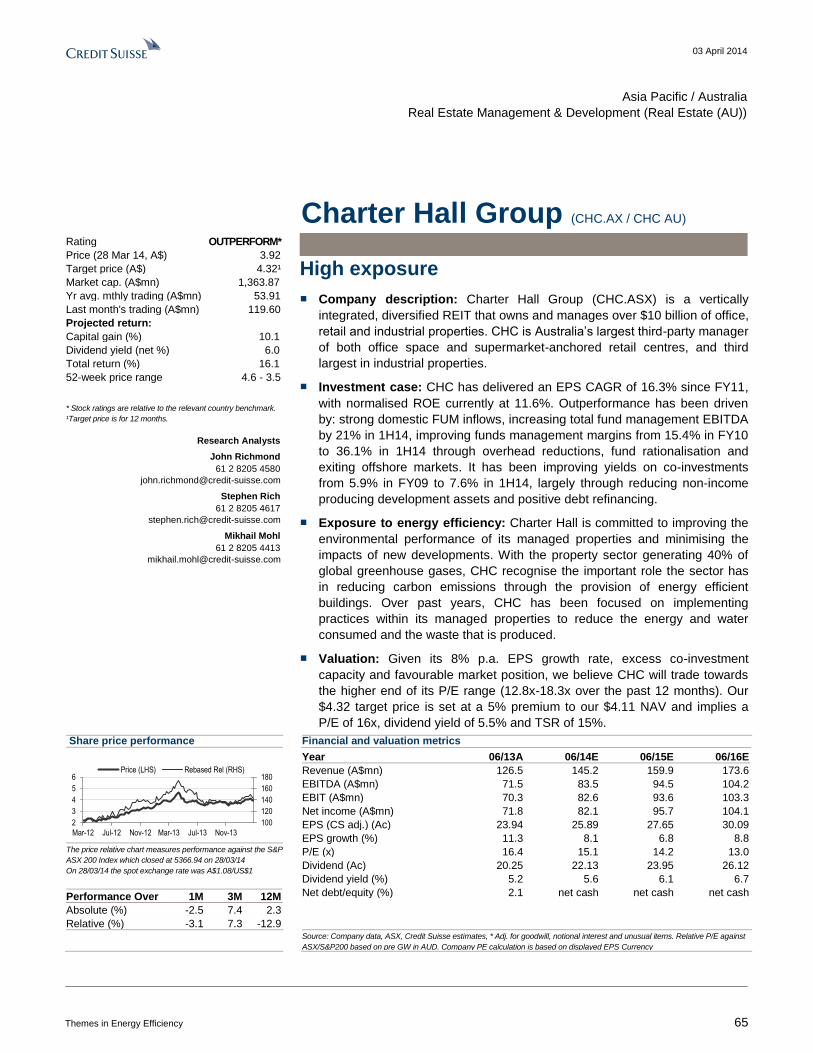
03 April 2014
Themes in Energy Efficiency 65
Asia Pacific / Australia
Real Estate Management & Development (Real Estate (AU))
Charter Hall Group (CHC.AX / CHC AU)
High exposure
■ Company description: Charter Hall Group (CHC.ASX) is a vertically
integrated, diversified REIT that owns and manages over $10 billion of office,
retail and industrial properties. CHC is Australia’s largest third-party manager
of both office space and supermarket-anchored retail centres, and third
largest in industrial properties.
■ Investment case: CHC has delivered an EPS CAGR of 16.3% since FY11,
with normalised ROE currently at 11.6%. Outperformance has been driven
by: strong domestic FUM inflows, increasing total fund management EBITDA
by 21% in 1H14, improving funds management margins from 15.4% in FY10
to 36.1% in 1H14 through overhead reductions, fund rationalisation and
exiting offshore markets. It has been improving yields on co-investments
from 5.9% in FY09 to 7.6% in 1H14, largely through reducing non-income
producing development assets and positive debt refinancing.
■ Exposure to energy efficiency: Charter Hall is committed to improving the
environmental performance of its managed properties and minimising the
impacts of new developments. With the property sector generating 40% of
global greenhouse gases, CHC recognise the important role the sector has
in reducing carbon emissions through the provision of energy efficient
buildings. Over past years, CHC has been focused on implementing
practices within its managed properties to reduce the energy and water
consumed and the waste that is produced.
■ Valuation: Given its 8% p.a. EPS growth rate, excess co-investment
capacity and favourable market position, we believe CHC will trade towards
the higher end of its P/E range (12.8x-18.3x over the past 12 months). Our
$4.32 target price is set at a 5% premium to our $4.11 NAV and implies a
P/E of 16x, dividend yield of 5.5% and TSR of 15%.
Share price performance
100
120
140
160
180
2
3
4
5
6
Mar-12 Jul-12 Nov-12 Mar-13 Jul-13 Nov-13
Price (LHS) Rebased Rel (RHS)
The price relative chart measures performance against the S&P
ASX 200 Index which closed at 5366.94 on 28/03/14
On 28/03/14 the spot exchange rate was A$1.08/US$1
Performance Over 1M 3M 12M
Absolute (%) -2.5 7.4 2.3
Relative (%) -3.1 7.3 -12.9
Financial and valuation metrics
Year 06/13A 06/14E 06/15E 06/16E
Revenue (A$mn) 126.5 145.2 159.9 173.6
EBITDA (A$mn) 71.5 83.5 94.5 104.2
EBIT (A$mn) 70.3 82.6 93.6 103.3
Net income (A$mn) 71.8 82.1 95.7 104.1
EPS (CS adj.) (Ac) 23.94 25.89 27.65 30.09
EPS growth (%) 11.3 8.1 6.8 8.8
P/E (x) 16.4 15.1 14.2 13.0
Dividend (Ac) 20.25 22.13 23.95 26.12
Dividend yield (%) 5.2 5.6 6.1 6.7
Net debt/equity (%) 2.1 net cash net cash net cash
Source: Company data, ASX, Credit Suisse estimates, * Adj. for goodwill, notional interest and unusual items. Relative P/E against
ASX/S&P200 based on pre GW in AUD. Company PE calculation is based on displayed EPS Currency
Rating OUTPERFORM*
Price (28 Mar 14, A$) 3.92
Target price (A$) 4.32¹
Market cap. (A$mn) 1,363.87
Yr avg. mthly trading (A$mn) 53.91
Last month's trading (A$mn) 119.60
Projected return:
Capital gain (%) 10.1
Dividend yield (net %) 6.0
Total return (%) 16.1
52-week price range 4.6 - 3.5
* Stock ratings are relative to the relevant country benchmark.
¹Target price is for 12 months.
Research Analysts
John Richmond
61 2 8205 4580
Stephen Rich
61 2 8205 4617
Mikhail Mohl
61 2 8205 4413
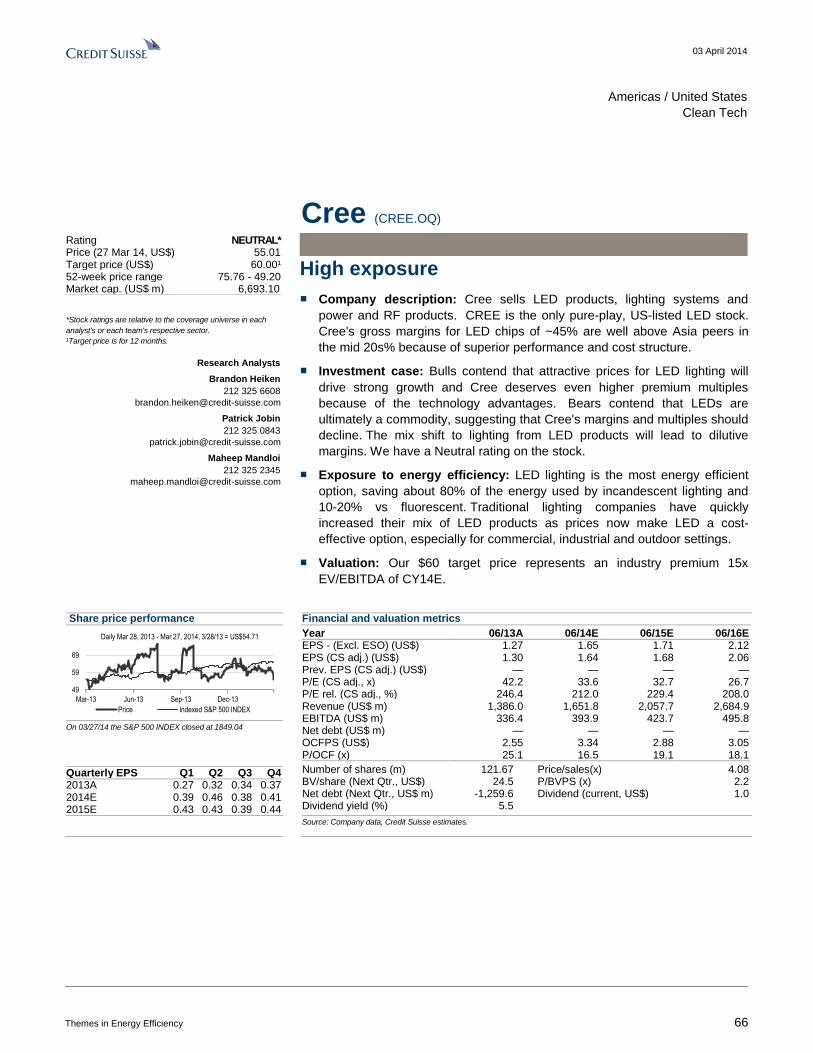
03 April 2014
Themes in Energy Efficiency 66
Americas / United States
Clean Tech
Cree (CREE.OQ)
High exposure
■ Company description: Cree sells LED products, lighting systems and
power and RF products. CREE is the only pure-play, US-listed LED stock.
Cree's gross margins for LED chips of ~45% are well above Asia peers in
the mid 20s% because of superior performance and cost structure.
■ Investment case: Bulls contend that attractive prices for LED lighting will
drive strong growth and Cree deserves even higher premium multiples
because of the technology advantages. Bears contend that LEDs are
ultimately a commodity, suggesting that Cree's margins and multiples should
decline. The mix shift to lighting from LED products will lead to dilutive
margins. We have a Neutral rating on the stock.
■ Exposure to energy efficiency: LED lighting is the most energy efficient
option, saving about 80% of the energy used by incandescent lighting and
10-20% vs fluorescent. Traditional lighting companies have quickly
increased their mix of LED products as prices now make LED a cost-
effective option, especially for commercial, industrial and outdoor settings.
■ Valuation: Our $60 target price represents an industry premium 15x
EV/EBITDA of CY14E.
Share price performance
49
59
69
Mar-13 Jun-13 Sep-13 Dec-13
Daily Mar 28, 2013 - Mar 27, 2014, 3/28/13 = US$54.71
Price Indexed S&P 500 INDEX
On 03/27/14 the S&P 500 INDEX closed at 1849.04
Quarterly EPS Q1 Q2 Q3 Q4 2013A 0.27 0.32 0.34 0.37 2014E 0.39 0.46 0.38 0.41 2015E 0.43 0.43 0.39 0.44
Financial and valuation metrics
Year 06/13A 06/14E 06/15E 06/16E EPS - (Excl. ESO) (US$) 1.27 1.65 1.71 2.12 EPS (CS adj.) (US$) 1.30 1.64 1.68 2.06 Prev. EPS (CS adj.) (US$) — — — — P/E (CS adj., x) 42.2 33.6 32.7 26.7 P/E rel. (CS adj., %) 246.4 212.0 229.4 208.0 Revenue (US$ m) 1,386.0 1,651.8 2,057.7 2,684.9 EBITDA (US$ m) 336.4 393.9 423.7 495.8 Net debt (US$ m) — — — — OCFPS (US$) 2.55 3.34 2.88 3.05 P/OCF (x) 25.1 16.5 19.1 18.1
Number of shares (m) 121.67 Price/sales(x) 4.08 BV/share (Next Qtr., US$) 24.5 P/BVPS (x) 2.2 Net debt (Next Qtr., US$ m) -1,259.6 Dividend (current, US$) 1.0 Dividend yield (%) 5.5
Source: Company data, Credit Suisse estimates.
Rating NEUTRAL* Price (27 Mar 14, US$) 55.01 Target price (US$) 60.00¹ 52-week price range 75.76 - 49.20 Market cap. (US$ m) 6,693.10
*Stock ratings are relative to the coverage universe in each
analyst's or each team's respective sector.
¹Target price is for 12 months.
Research Analysts
Brandon Heiken
212 325 6608
Patrick Jobin
212 325 0843
Maheep Mandloi
212 325 2345

03 April 2014
Themes in Energy Efficiency 67
Asia Pacific / Japan
Industrial Machinery (Machinery (Japan))
Daikin Industries (6367.T / 6367 JP)
High exposure ■ Company overview: Through its acquisition of US HVAC company
Goodman, Daikin is now the world’s largest HVAC maker, with ambitions to
expand its business further by boosting global market share. It plans to
achieve this by leveraging its energy efficient and inverter technologies and
by using its highly flexible production framework.
■ Investment case: Daikin is the industry’s leading specialist maker of HVAC
systems. It is the only company in the industry capable of manufacturing
HVAC systems in-house, including refrigerants and inverters. In Japan,
Europe, China and other markets in Asia, Daikin has created markets for
energy-efficient ductless air conditioners and built extensive distribution
networks. Using its acquisition of Goodman, the company plans to expand
sales of ductless air conditioners in North America, where ducted air
conditioning is still the most common technology. Daikin is also stepping up
its global growth strategy. Here it plans to overtake US rivals by offering
more efficient ducted air conditioners based on its energy efficient and
inverter technology. We see significant potential for growth over the longer
term, supported by rising awareness of environmental issues, growing
energy efficiency needs and a shift to automated home HVAC systems.
■ Exposure to energy efficiency: Daikin’s air conditioning business provides
89% of sales and 90% of OP, while the Chinese market accounts for 19% of
sales and 41% of OP. In China, urbanization, infrastructure investment and
rising uptake of inverter models are the factors driving demand, supporting
the company’s own marketing efforts. The US market, including sales from
acquired company Goodman, accounts for 22% of total sales and 16% of
OP. In North America, seasonal energy efficiency ratio (SEER) ratings are
gradually being tightened and awareness of variable refrigerant flow (VRF)
air conditioners is rising, two trends that are positive for Daikin. Tougher
environmental standards in Asia and Europe are also translating into
increased demand for the company’s products.
Share price performance
0
50
100
150
200
0
2000
4000
6000
8000
Mar-12 Jul-12 Nov-12 Mar-13 Jul-13 Nov-13
Price (LHS) Rebased Rel (RHS)
The price relative chart measures performance against the
TOPIX which closed at 1186.52 on 28/03/14
On 28/03/14 the spot exchange rate was ¥102.15/US$1
Performance Over 1M 3M 12M Absolute (%) -3.5 -12.9 53.4 Relative (%) -3.8 -13.3 35.6
Financial and valuation metrics
Year 3/13A 3/14E 3/15E 3/16E Revenue (¥ bn) 1,290.9 1,773.0 1,853.0 1,956.0 Operating profit (¥ bn) 88.6 153.0 168.0 186.0 Recurring profit (¥ bn) 94.1 152.0 167.0 185.0 Net income (¥ bn) 43.6 89.0 94.0 104.5 EPS (¥) 149.7 305.3 322.4 358.4 IBES Consensus EPS (¥) n.a. 292.9 335.6 378.6 EPS growth (%) 5.9 103.9 5.6 11.2 P/E (x) 24.6 18.5 17.5 15.8 Dividend yield (%) 1.0 0.9 1.2 1.4 EV/EBITDA(x) 13.3 11.5 9.6 8.5 P/B (x) 1.9 2.3 1.9 1.7 ROE(%) 7.8 12.4 11.0 11.0 Net debt/equity (%) 83.4 47.5 36.7 26.3
Source: Company data, Thomson Reuters, Credit Suisse estimates.
Rating NEUTRAL* Price (28 Mar 14, ¥) 5,654 Target price (¥) 6,000¹ Chg to TP (%) 6.1 Market cap. (¥ bn) 1,645.80 (US$ 16.11) Enterprise value (¥ bn) 2,030.93 Number of shares (mn) 291.09 Free float (%) 75.0
*Stock ratings are relative to the coverage universe in each
analyst's or each team's respective sector.
¹Target price is for 12 months.
Research Analysts
Shinji Kuroda
81 3 4550 9994
Yunchao Zhao
81 3 4550 9903
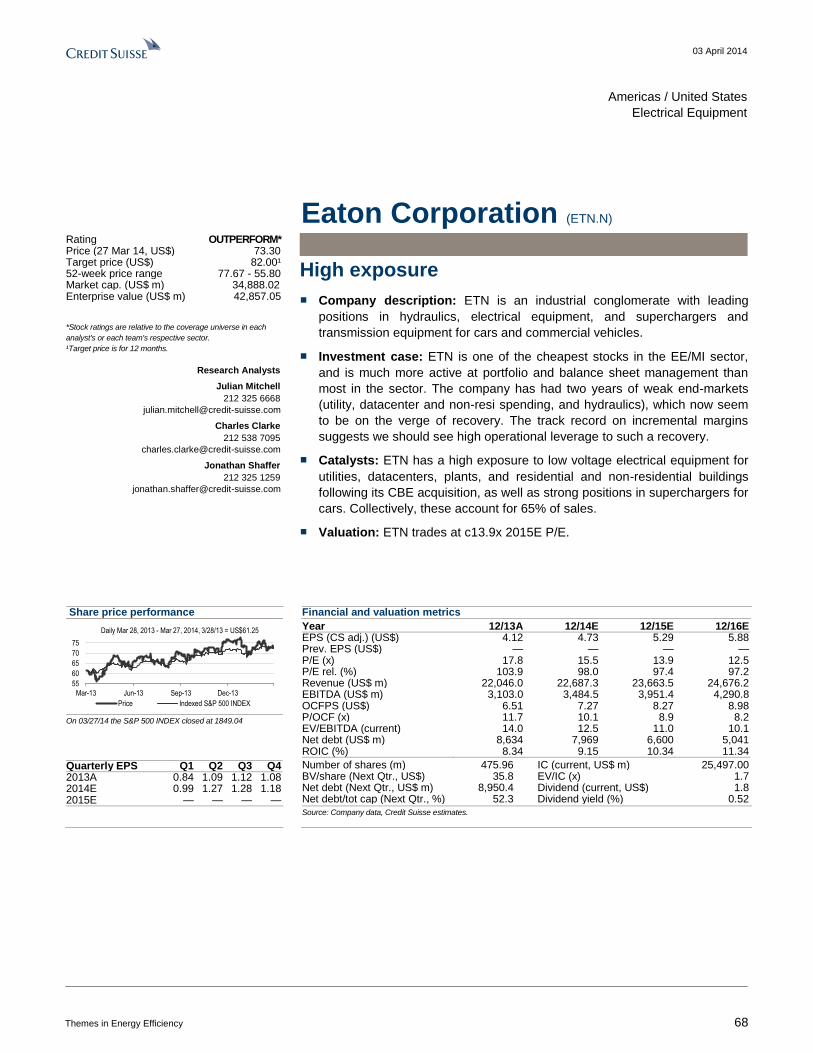
03 April 2014
Themes in Energy Efficiency 68
Americas / United States
Electrical Equipment
Eaton Corporation (ETN.N)
High exposure
■ Company description: ETN is an industrial conglomerate with leading
positions in hydraulics, electrical equipment, and superchargers and
transmission equipment for cars and commercial vehicles.
■ Investment case: ETN is one of the cheapest stocks in the EE/MI sector,
and is much more active at portfolio and balance sheet management than
most in the sector. The company has had two years of weak end-markets
(utility, datacenter and non-resi spending, and hydraulics), which now seem
to be on the verge of recovery. The track record on incremental margins
suggests we should see high operational leverage to such a recovery.
■ Catalysts: ETN has a high exposure to low voltage electrical equipment for
utilities, datacenters, plants, and residential and non-residential buildings
following its CBE acquisition, as well as strong positions in superchargers for
cars. Collectively, these account for 65% of sales.
■ Valuation: ETN trades at c13.9x 2015E P/E.
Share price performance
55
60
65
70
75
Mar-13 Jun-13 Sep-13 Dec-13
Daily Mar 28, 2013 - Mar 27, 2014, 3/28/13 = US$61.25
Price Indexed S&P 500 INDEX
On 03/27/14 the S&P 500 INDEX closed at 1849.04
Quarterly EPS Q1 Q2 Q3 Q4 2013A 0.84 1.09 1.12 1.08 2014E 0.99 1.27 1.28 1.18 2015E — — — —
Financial and valuation metrics
Year 12/13A 12/14E 12/15E 12/16E EPS (CS adj.) (US$) 4.12 4.73 5.29 5.88 Prev. EPS (US$) — — — — P/E (x) 17.8 15.5 13.9 12.5 P/E rel. (%) 103.9 98.0 97.4 97.2 Revenue (US$ m) 22,046.0 22,687.3 23,663.5 24,676.2 EBITDA (US$ m) 3,103.0 3,484.5 3,951.4 4,290.8 OCFPS (US$) 6.51 7.27 8.27 8.98 P/OCF (x) 11.7 10.1 8.9 8.2 EV/EBITDA (current) 14.0 12.5 11.0 10.1 Net debt (US$ m) 8,634 7,969 6,600 5,041 ROIC (%) 8.34 9.15 10.34 11.34
Number of shares (m) 475.96 IC (current, US$ m) 25,497.00 BV/share (Next Qtr., US$) 35.8 EV/IC (x) 1.7 Net debt (Next Qtr., US$ m) 8,950.4 Dividend (current, US$) 1.8 Net debt/tot cap (Next Qtr., %) 52.3 Dividend yield (%) 0.52
Source: Company data, Credit Suisse estimates.
Rating OUTPERFORM* Price (27 Mar 14, US$) 73.30 Target price (US$) 82.00¹ 52-week price range 77.67 - 55.80 Market cap. (US$ m) 34,888.02 Enterprise value (US$ m) 42,857.05
*Stock ratings are relative to the coverage universe in each
analyst's or each team's respective sector.
¹Target price is for 12 months.
Research Analysts
Julian Mitchell
212 325 6668
Charles Clarke
212 538 7095
Jonathan Shaffer
212 325 1259

03 April 2014
Themes in Energy Efficiency 69
Americas / United States
Electrical Equipment
Emerson (EMR.N)
High exposure
■ Company description: EMR is an industrial conglomerate with leading
positions in process automation, electrical equipment and residential
products.
■ Investment case: EMR has high exposure to a potential resurgence of US
downstream petrochemical spending via its leading process automation
franchise, as well as to an improvement in non-resi construction via its #1
position in scroll compressors for HVAC. Returns are consistently above the
sector average, and the valuation multiple has de-rated in recent years.
■ Exposure to energy efficiency: EMR has leading positions in electric
motors and drives, alternators for distributed power gen equipment, scroll
compressors for HVAC equipment, and UPS and precision cooling for
datacenters. Collectively these account for 40% of sales.
■ Valuation: EMR trades at c15x 2015E P/E.
Share price performance
53
58
63
68
Mar-13 Jun-13 Sep-13 Dec-13
Daily Mar 28, 2013 - Mar 27, 2014, 3/28/13 = US$55.87
Price Indexed S&P 500 INDEX
On 03/27/14 the S&P 500 INDEX closed at 1849.04
Quarterly EPS Q1 Q2 Q3 Q4 2013A 0.62 0.77 0.27 1.11 2014E 0.65 0.84 1.02 1.28 2015E — — — —
Financial and valuation metrics
Year 09/13A 09/14E 09/15E 09/16E EPS (CS adj.) (US$) 3.55 3.80 4.23 4.68 Prev. EPS (US$) — — — — P/E (x) 18.6 17.4 15.6 14.1 P/E rel. (%) 108.8 110.2 109.9 110.2 Revenue (US$ m) 24,669.0 24,561.7 25,769.8 27,180.7 EBITDA (US$ m) 5,123.0 5,217.5 5,590.5 5,949.7 OCFPS (US$) 4.96 4.33 5.28 5.72 P/OCF (x) 13.0 15.3 12.5 11.6 EV/EBITDA (current) 9.2 9.1 8.5 8.0 Net debt (US$ m) 2,367 2,104 1,190 95 ROIC (%) 25.08 24.10 25.67 27.39
Number of shares (m) 702.99 IC (current, US$ m) 13,085.00 BV/share (Next Qtr., US$) 15.5 EV/IC (x) 4.0 Net debt (Next Qtr., US$ m) 1,097.0 Dividend (current, US$) 1.6 Net debt/tot cap (Next Qtr., %) 10.1 Dividend yield (%) 0.63
Source: Company data, Credit Suisse estimates.
Rating OUTPERFORM* Price (27 Mar 14, US$) 66.20 Target price (US$) 76.00¹ 52-week price range 70.26 - 53.32 Market cap. (US$ m) 46,537.66 Enterprise value (US$ m) 48,641.24
*Stock ratings are relative to the coverage universe in each
analyst's or each team's respective sector.
¹Target price is for 12 months.
Research Analysts
Julian Mitchell
212 325 6668
Charles Clarke
212 538 7095
Jonathan Shaffer
212 325 1259
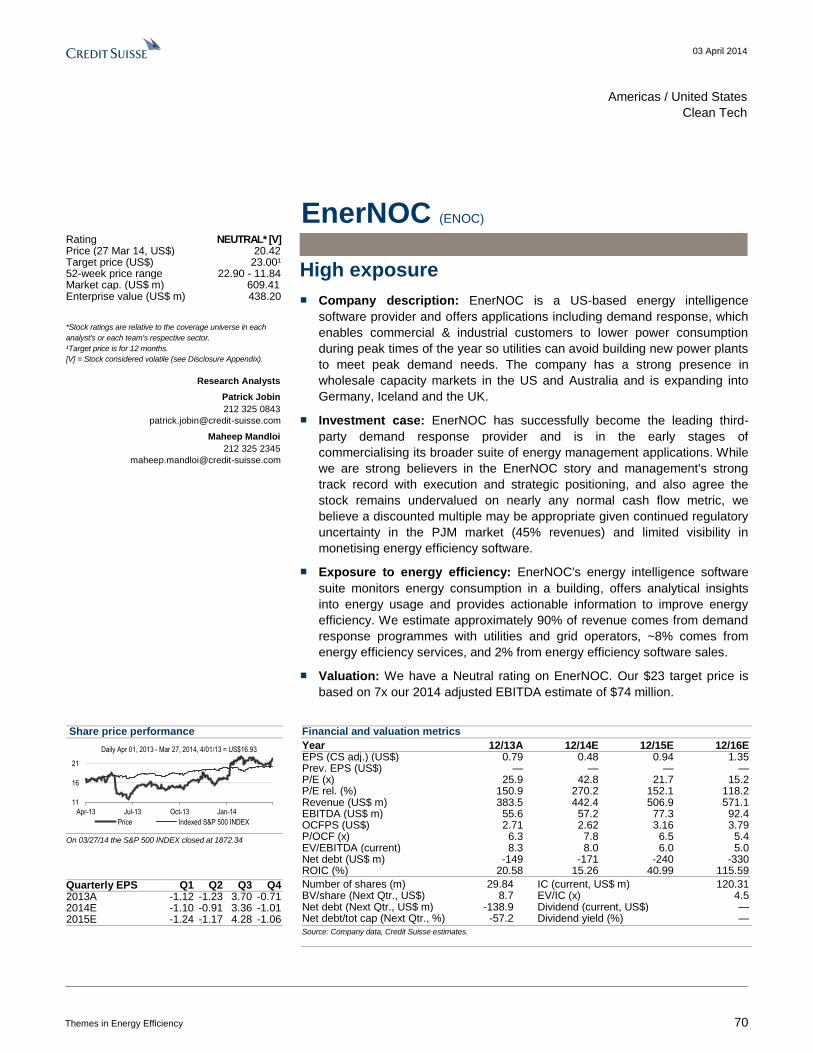
03 April 2014
Themes in Energy Efficiency 70
Americas / United States
Clean Tech
EnerNOC (ENOC)
High exposure
■ Company description: EnerNOC is a US-based energy intelligence
software provider and offers applications including demand response, which
enables commercial & industrial customers to lower power consumption
during peak times of the year so utilities can avoid building new power plants
to meet peak demand needs. The company has a strong presence in
wholesale capacity markets in the US and Australia and is expanding into
Germany, Iceland and the UK.
■ Investment case: EnerNOC has successfully become the leading third-
party demand response provider and is in the early stages of
commercialising its broader suite of energy management applications. While
we are strong believers in the EnerNOC story and management's strong
track record with execution and strategic positioning, and also agree the
stock remains undervalued on nearly any normal cash flow metric, we
believe a discounted multiple may be appropriate given continued regulatory
uncertainty in the PJM market (45% revenues) and limited visibility in
monetising energy efficiency software.
■ Exposure to energy efficiency: EnerNOC's energy intelligence software
suite monitors energy consumption in a building, offers analytical insights
into energy usage and provides actionable information to improve energy
efficiency. We estimate approximately 90% of revenue comes from demand
response programmes with utilities and grid operators, ~8% comes from
energy efficiency services, and 2% from energy efficiency software sales.
■ Valuation: We have a Neutral rating on EnerNOC. Our $23 target price is
based on 7x our 2014 adjusted EBITDA estimate of $74 million.
Share price performance
11
16
21
Apr-13 Jul-13 Oct-13 Jan-14
Daily Apr 01, 2013 - Mar 27, 2014, 4/01/13 = US$16.93
Price Indexed S&P 500 INDEX
On 03/27/14 the S&P 500 INDEX closed at 1872.34
Quarterly EPS Q1 Q2 Q3 Q4 2013A -1.12 -1.23 3.70 -0.71 2014E -1.10 -0.91 3.36 -1.01 2015E -1.24 -1.17 4.28 -1.06
Financial and valuation metrics
Year 12/13A 12/14E 12/15E 12/16E EPS (CS adj.) (US$) 0.79 0.48 0.94 1.35 Prev. EPS (US$) — — — — P/E (x) 25.9 42.8 21.7 15.2 P/E rel. (%) 150.9 270.2 152.1 118.2 Revenue (US$ m) 383.5 442.4 506.9 571.1 EBITDA (US$ m) 55.6 57.2 77.3 92.4 OCFPS (US$) 2.71 2.62 3.16 3.79 P/OCF (x) 6.3 7.8 6.5 5.4 EV/EBITDA (current) 8.3 8.0 6.0 5.0 Net debt (US$ m) -149 -171 -240 -330 ROIC (%) 20.58 15.26 40.99 115.59
Number of shares (m) 29.84 IC (current, US$ m) 120.31 BV/share (Next Qtr., US$) 8.7 EV/IC (x) 4.5 Net debt (Next Qtr., US$ m) -138.9 Dividend (current, US$) — Net debt/tot cap (Next Qtr., %) -57.2 Dividend yield (%) —
Source: Company data, Credit Suisse estimates.
Rating NEUTRAL* [V] Price (27 Mar 14, US$) 20.42 Target price (US$) 23.00¹ 52-week price range 22.90 - 11.84 Market cap. (US$ m) 609.41 Enterprise value (US$ m) 438.20
*Stock ratings are relative to the coverage universe in each
analyst's or each team's respective sector.
¹Target price is for 12 months.
[V] = Stock considered volatile (see Disclosure Appendix).
Research Analysts
Patrick Jobin
212 325 0843
Maheep Mandloi
212 325 2345
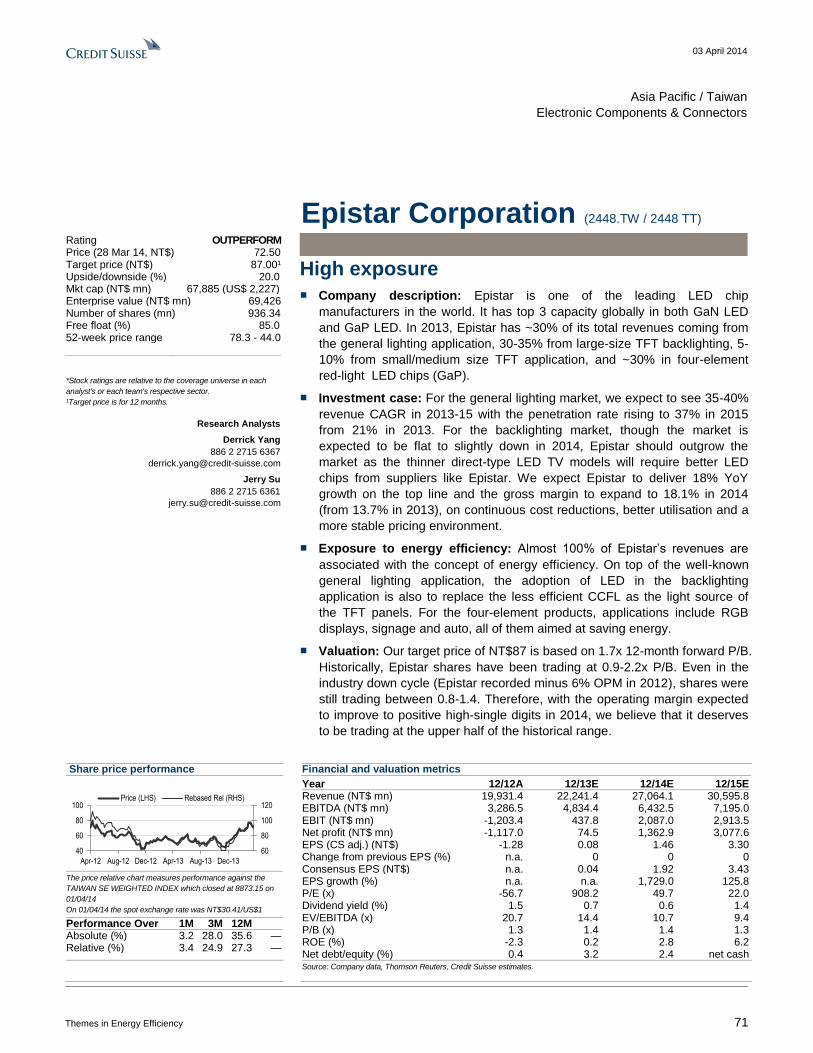
03 April 2014
Themes in Energy Efficiency 71
Asia Pacific / Taiwan
Electronic Components & Connectors
Epistar Corporation (2448.TW / 2448 TT)
High exposure
■ Company description: Epistar is one of the leading LED chip
manufacturers in the world. It has top 3 capacity globally in both GaN LED
and GaP LED. In 2013, Epistar has ~30% of its total revenues coming from
the general lighting application, 30-35% from large-size TFT backlighting, 5-
10% from small/medium size TFT application, and ~30% in four-element
red-light LED chips (GaP).
■ Investment case: For the general lighting market, we expect to see 35-40%
revenue CAGR in 2013-15 with the penetration rate rising to 37% in 2015
from 21% in 2013. For the backlighting market, though the market is
expected to be flat to slightly down in 2014, Epistar should outgrow the
market as the thinner direct-type LED TV models will require better LED
chips from suppliers like Epistar. We expect Epistar to deliver 18% YoY
growth on the top line and the gross margin to expand to 18.1% in 2014
(from 13.7% in 2013), on continuous cost reductions, better utilisation and a
more stable pricing environment.
■ Exposure to energy efficiency: Almost 100% of Epistar’s revenues are
associated with the concept of energy efficiency. On top of the well-known
general lighting application, the adoption of LED in the backlighting
application is also to replace the less efficient CCFL as the light source of
the TFT panels. For the four-element products, applications include RGB
displays, signage and auto, all of them aimed at saving energy.
■ Valuation: Our target price of NT$87 is based on 1.7x 12-month forward P/B.
Historically, Epistar shares have been trading at 0.9-2.2x P/B. Even in the
industry down cycle (Epistar recorded minus 6% OPM in 2012), shares were
still trading between 0.8-1.4. Therefore, with the operating margin expected
to improve to positive high-single digits in 2014, we believe that it deserves
to be trading at the upper half of the historical range.
Share price performance
60
80
100
120
40
60
80
100
Apr-12 Aug-12 Dec-12 Apr-13 Aug-13 Dec-13
Price (LHS) Rebased Rel (RHS)
The price relative chart measures performance against the
TAIWAN SE WEIGHTED INDEX which closed at 8873.15 on
01/04/14
On 01/04/14 the spot exchange rate was NT$30.41/US$1
Performance Over 1M 3M 12M Absolute (%) 3.2 28.0 35.6 — Relative (%) 3.4 24.9 27.3 —
Financial and valuation metrics
Year 12/12A 12/13E 12/14E 12/15E Revenue (NT$ mn) 19,931.4 22,241.4 27,064.1 30,595.8 EBITDA (NT$ mn) 3,286.5 4,834.4 6,432.5 7,195.0 EBIT (NT$ mn) -1,203.4 437.8 2,087.0 2,913.5 Net profit (NT$ mn) -1,117.0 74.5 1,362.9 3,077.6 EPS (CS adj.) (NT$) -1.28 0.08 1.46 3.30 Change from previous EPS (%) n.a. 0 0 0 Consensus EPS (NT$) n.a. 0.04 1.92 3.43 EPS growth (%) n.a. n.a. 1,729.0 125.8 P/E (x) -56.7 908.2 49.7 22.0 Dividend yield (%) 1.5 0.7 0.6 1.4 EV/EBITDA (x) 20.7 14.4 10.7 9.4 P/B (x) 1.3 1.4 1.4 1.3 ROE (%) -2.3 0.2 2.8 6.2 Net debt/equity (%) 0.4 3.2 2.4 net cash
Source: Company data, Thomson Reuters, Credit Suisse estimates.
Rating OUTPERFORM Price (28 Mar 14, NT$) 72.50 Target price (NT$) 87.00¹ Upside/downside (%) 20.0 Mkt cap (NT$ mn) 67,885 (US$ 2,227) Enterprise value (NT$ mn) 69,426 Number of shares (mn) 936.34 Free float (%) 85.0 52-week price range 78.3 - 44.0
*Stock ratings are relative to the coverage universe in each
analyst's or each team's respective sector.
¹Target price is for 12 months.
Research Analysts
Derrick Yang
886 2 2715 6367
Jerry Su
886 2 2715 6361
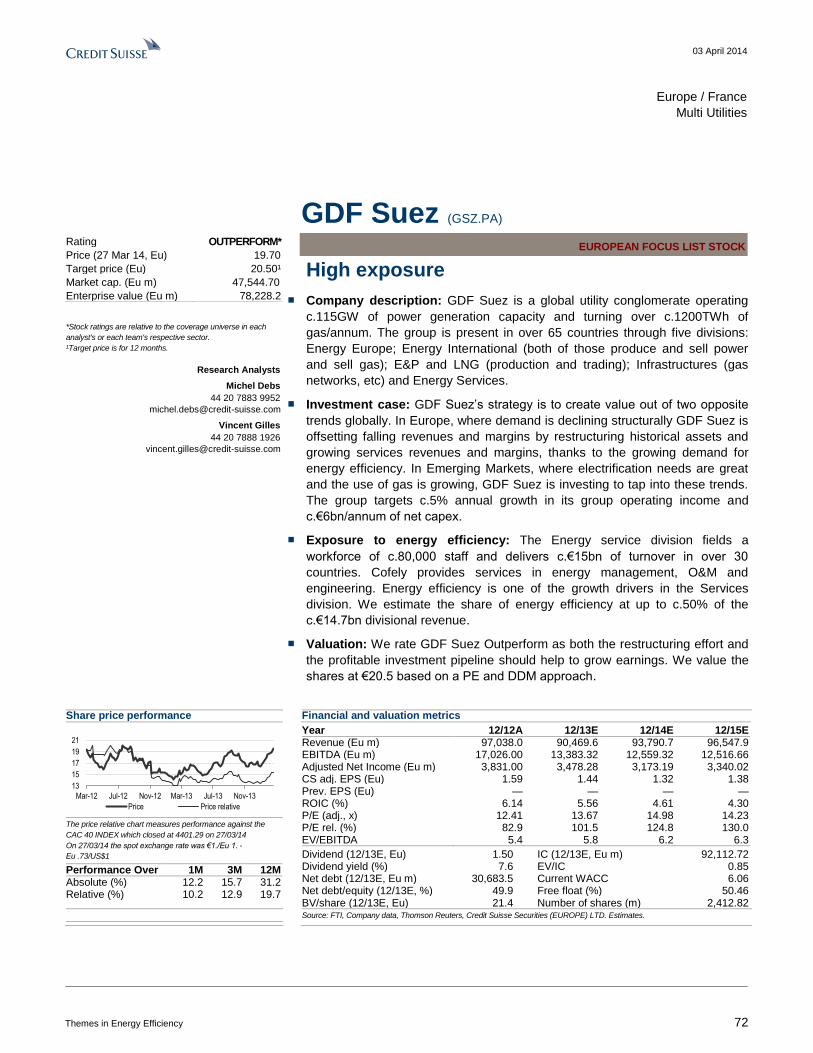
03 April 2014
Themes in Energy Efficiency 72
Europe / France
Multi Utilities
GDF Suez (GSZ.PA) EUROPEAN FOCUS LIST STOCK
High exposure
■ Company description: GDF Suez is a global utility conglomerate operating
c.115GW of power generation capacity and turning over c.1200TWh of
gas/annum. The group is present in over 65 countries through five divisions:
Energy Europe; Energy International (both of those produce and sell power
and sell gas); E&P and LNG (production and trading); Infrastructures (gas
networks, etc) and Energy Services.
■ Investment case: GDF Suez’s strategy is to create value out of two opposite
trends globally. In Europe, where demand is declining structurally GDF Suez is
offsetting falling revenues and margins by restructuring historical assets and
growing services revenues and margins, thanks to the growing demand for
energy efficiency. In Emerging Markets, where electrification needs are great
and the use of gas is growing, GDF Suez is investing to tap into these trends.
The group targets c.5% annual growth in its group operating income and
c.€6bn/annum of net capex.
■ Exposure to energy efficiency: The Energy service division fields a
workforce of c.80,000 staff and delivers c.€15bn of turnover in over 30
countries. Cofely provides services in energy management, O&M and
engineering. Energy efficiency is one of the growth drivers in the Services
division. We estimate the share of energy efficiency at up to c.50% of the
c.€14.7bn divisional revenue.
■ Valuation: We rate GDF Suez Outperform as both the restructuring effort and
the profitable investment pipeline should help to grow earnings. We value the
shares at €20.5 based on a PE and DDM approach.
Share price performance
13
15
17
19
21
Mar-12 Jul-12 Nov-12 Mar-13 Jul-13 Nov-13
Price Price relative
The price relative chart measures performance against the
CAC 40 INDEX which closed at 4401.29 on 27/03/14
On 27/03/14 the spot exchange rate was €1./Eu 1. -
Eu .73/US$1
Performance Over 1M 3M 12M Absolute (%) 12.2 15.7 31.2 Relative (%) 10.2 12.9 19.7
Financial and valuation metrics
Year 12/12A 12/13E 12/14E 12/15E Revenue (Eu m) 97,038.0 90,469.6 93,790.7 96,547.9 EBITDA (Eu m) 17,026.00 13,383.32 12,559.32 12,516.66 Adjusted Net Income (Eu m) 3,831.00 3,478.28 3,173.19 3,340.02 CS adj. EPS (Eu) 1.59 1.44 1.32 1.38 Prev. EPS (Eu) — — — — ROIC (%) 6.14 5.56 4.61 4.30 P/E (adj., x) 12.41 13.67 14.98 14.23 P/E rel. (%) 82.9 101.5 124.8 130.0 EV/EBITDA 5.4 5.8 6.2 6.3
Dividend (12/13E, Eu) 1.50 IC (12/13E, Eu m) 92,112.72 Dividend yield (%) 7.6 EV/IC 0.85 Net debt (12/13E, Eu m) 30,683.5 Current WACC 6.06 Net debt/equity (12/13E, %) 49.9 Free float (%) 50.46 BV/share (12/13E, Eu) 21.4 Number of shares (m) 2,412.82
Source: FTI, Company data, Thomson Reuters, Credit Suisse Securities (EUROPE) LTD. Estimates.
Rating OUTPERFORM*
Price (27 Mar 14, Eu) 19.70
Target price (Eu) 20.50¹
Market cap. (Eu m) 47,544.70
Enterprise value (Eu m) 78,228.2
*Stock ratings are relative to the coverage universe in each
analyst's or each team's respective sector.
¹Target price is for 12 months.
Research Analysts
Michel Debs
44 20 7883 9952
Vincent Gilles
44 20 7888 1926

03 April 2014
Themes in Energy Efficiency 73
Europe / Switzerland
Engineering & Construction
Geberit (GEBN.VX)
Medium exposure
■ Company description: Geberit is a leading provider of sanitary technology.
The company operates through two main product categories: Sanitary
systems (57% of group sales) and Piping systems (43%). Germany,
Switzerland and Italy are the key markets contributing c50% to total sales.
Construction is the main end market with exposure to both residential and
commercial sectors.
■ Investment Case: 1) Scope for organic growth acceleration driven by on-
going conversion of the sanitary product market to concealed cisterns and
improving construction markets in Europe. Asia and US are still untapped
markets which offer growth potential. 2) Scope for some margin
improvement in a better growth scenario. The company has enjoyed good
pricing power with annual price increases and ad hoc ones for raw materials
price spikes. 3) Cash generation. Geberit has a best in class cash
conversion profile, and we see scope for excess cash return to shareholders
over the next 12 months.
■ Exposure to Energy Efficiency: Geberit products are widely used in the
sanitary systems of residential and commercial buildings, which offers
energy-saving potential driven by technological innovation. Geberit's product
range (DeoFresh) for odour extraction is an energy-saving solution as
compared to ventilation through a window. The new AquaClean shower toilet
line introduced in April 2013 consumes 33% less energy in comparison to
older models.
■ Valuation: The stock is trading on a 2014E EV/EBITA of 18.6x and a 2015E
EV/EBITA of 17.0x, a premium of >50% to the Pan European sector which
we view as relatively expensive.
Share price performance
174
224
274
Apr-12 Aug-12 Dec-12 Apr-13 Aug-13 Dec-13
Price Price relative
The price relative chart measures performance against the SMI
PRICE which closed at 8464.75 on 31/03/14
On 31/03/14 the spot exchange rate was SFr1.22/Eu 1. -
Eu .73/US$1
Performance Over 1M 3M 12M Absolute (%) 4.5 5.7 23.3 Relative (%) 4.4 2.8 5.3
Financial and valuation metrics
Year 12/12A 12/13E 12/14E 12/15E Revenue (SFr m) 2,187.8 2,290.9 2,429.9 2,589.1 EBITDA (SFr m) 542.40 592.43 637.74 680.47 Adjusted Net Income (SFr m) 392.30 438.41 474.33 511.30 CS adj. EPS (SFr) 10.28 11.64 12.60 13.58 Prev. EPS (SFr) — — — — ROIC (%) 36.74 39.83 41.73 43.90 P/E (adj., x) 28.16 24.87 22.98 21.32 P/E rel. (%) 169.5 158.9 162.4 161.0 EV/EBITDA 19.2 17.4 15.9 14.7
Dividend (12/13E, SFr) 7.47 IC (12/13E, SFr m) 1,104.28 Dividend yield (%) 2.6 EV/IC 9.3 Net debt (12/13E, SFr m) -484.0 Current WACC 7.00 Net debt/equity (12/13E, %) -30.5 Free float (%) 87.00 BV/share (12/13E, SFr) 42.2 Number of shares (m) 37.40
Source: FTI, Company data, Thomson Reuters, Credit Suisse Securities (EUROPE) LTD. Estimates.
Rating NEUTRAL* Price (27 Mar 14, SFr) 288.10 Target price (SFr) 240.00¹ Market cap. (SFr m) 10,774.84 Enterprise value (SFr m) 10,290.8
*Stock ratings are relative to the coverage universe in each
analyst's or each team's respective sector.
¹Target price is for 12 months.
Research Analysts
Andre Kukhnin CFA
44 20 7888 0350
Patrick Laager
41 44 334 60 76
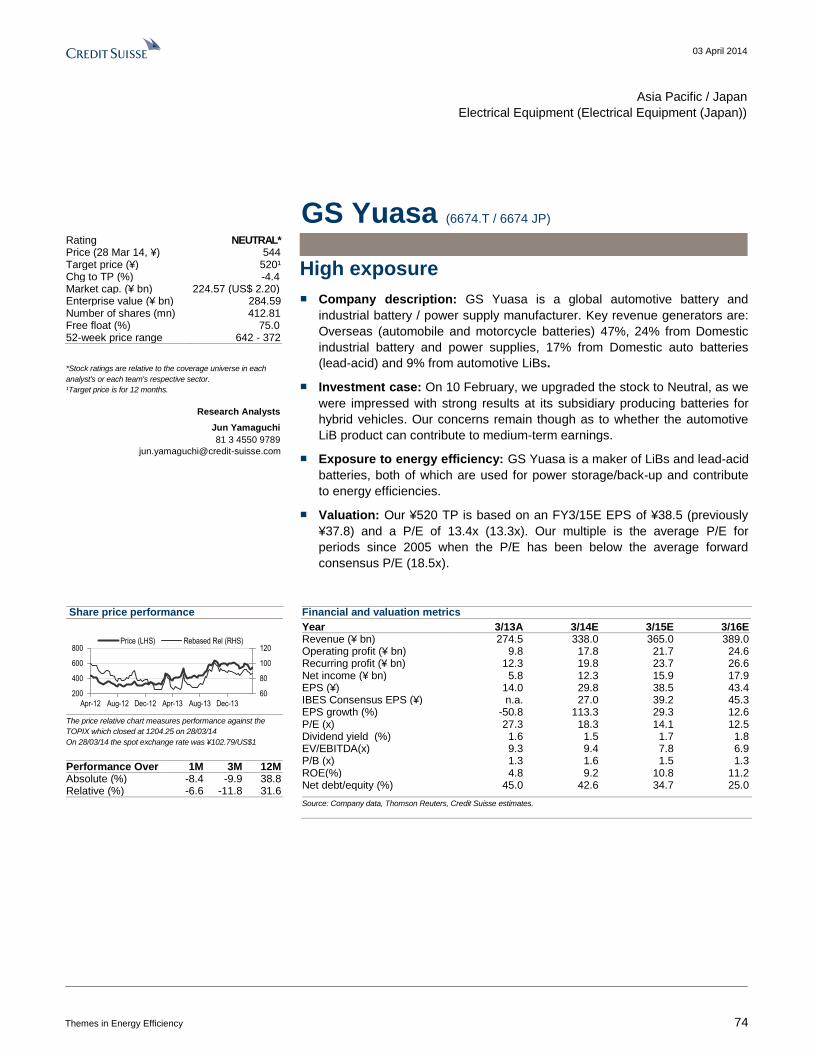
03 April 2014
Themes in Energy Efficiency 74
Asia Pacific / Japan
Electrical Equipment (Electrical Equipment (Japan))
GS Yuasa (6674.T / 6674 JP)
High exposure
■ Company description: GS Yuasa is a global automotive battery and
industrial battery / power supply manufacturer. Key revenue generators are:
Overseas (automobile and motorcycle batteries) 47%, 24% from Domestic
industrial battery and power supplies, 17% from Domestic auto batteries
(lead-acid) and 9% from automotive LiBs.
■ Investment case: On 10 February, we upgraded the stock to Neutral, as we
were impressed with strong results at its subsidiary producing batteries for
hybrid vehicles. Our concerns remain though as to whether the automotive
LiB product can contribute to medium-term earnings.
■ Exposure to energy efficiency: GS Yuasa is a maker of LiBs and lead-acid
batteries, both of which are used for power storage/back-up and contribute
to energy efficiencies.
■ Valuation: Our ¥520 TP is based on an FY3/15E EPS of ¥38.5 (previously
¥37.8) and a P/E of 13.4x (13.3x). Our multiple is the average P/E for
periods since 2005 when the P/E has been below the average forward
consensus P/E (18.5x).
Share price performance
60
80
100
120
200
400
600
800
Apr-12 Aug-12 Dec-12 Apr-13 Aug-13 Dec-13
Price (LHS) Rebased Rel (RHS)
The price relative chart measures performance against the
TOPIX which closed at 1204.25 on 28/03/14
On 28/03/14 the spot exchange rate was ¥102.79/US$1
Performance Over 1M 3M 12M Absolute (%) -8.4 -9.9 38.8 Relative (%) -6.6 -11.8 31.6
Financial and valuation metrics
Year 3/13A 3/14E 3/15E 3/16E Revenue (¥ bn) 274.5 338.0 365.0 389.0 Operating profit (¥ bn) 9.8 17.8 21.7 24.6 Recurring profit (¥ bn) 12.3 19.8 23.7 26.6 Net income (¥ bn) 5.8 12.3 15.9 17.9 EPS (¥) 14.0 29.8 38.5 43.4 IBES Consensus EPS (¥) n.a. 27.0 39.2 45.3 EPS growth (%) -50.8 113.3 29.3 12.6 P/E (x) 27.3 18.3 14.1 12.5 Dividend yield (%) 1.6 1.5 1.7 1.8 EV/EBITDA(x) 9.3 9.4 7.8 6.9 P/B (x) 1.3 1.6 1.5 1.3 ROE(%) 4.8 9.2 10.8 11.2 Net debt/equity (%) 45.0 42.6 34.7 25.0
Source: Company data, Thomson Reuters, Credit Suisse estimates.
Rating NEUTRAL* Price (28 Mar 14, ¥) 544 Target price (¥) 520¹ Chg to TP (%) -4.4 Market cap. (¥ bn) 224.57 (US$ 2.20) Enterprise value (¥ bn) 284.59 Number of shares (mn) 412.81 Free float (%) 75.0 52-week price range 642 - 372
*Stock ratings are relative to the coverage universe in each
analyst's or each team's respective sector.
¹Target price is for 12 months.
Research Analysts
Jun Yamaguchi
81 3 4550 9789
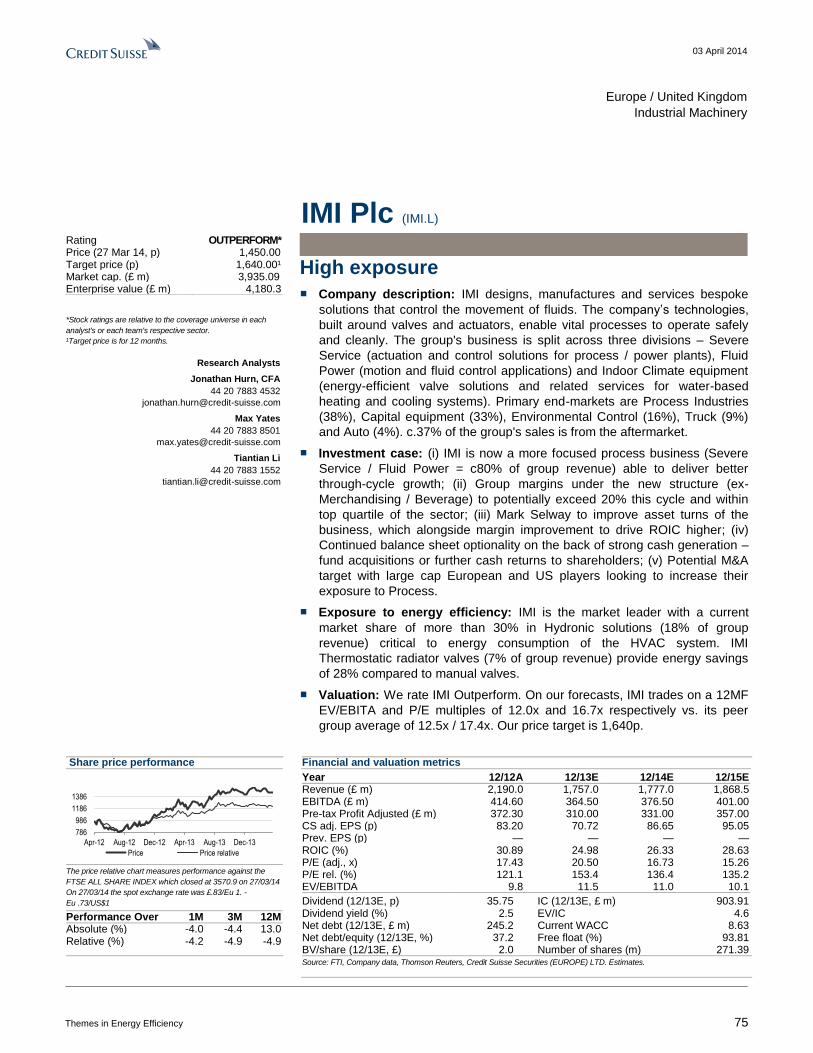
03 April 2014
Themes in Energy Efficiency 75
Europe / United Kingdom
Industrial Machinery
IMI Plc (IMI.L)
High exposure
■ Company description: IMI designs, manufactures and services bespoke
solutions that control the movement of fluids. The company’s technologies,
built around valves and actuators, enable vital processes to operate safely
and cleanly. The group's business is split across three divisions – Severe
Service (actuation and control solutions for process / power plants), Fluid
Power (motion and fluid control applications) and Indoor Climate equipment
(energy-efficient valve solutions and related services for water-based
heating and cooling systems). Primary end-markets are Process Industries
(38%), Capital equipment (33%), Environmental Control (16%), Truck (9%)
and Auto (4%). c.37% of the group's sales is from the aftermarket.
■ Investment case: (i) IMI is now a more focused process business (Severe
Service / Fluid Power = c80% of group revenue) able to deliver better
through-cycle growth; (ii) Group margins under the new structure (ex-
Merchandising / Beverage) to potentially exceed 20% this cycle and within
top quartile of the sector; (iii) Mark Selway to improve asset turns of the
business, which alongside margin improvement to drive ROIC higher; (iv)
Continued balance sheet optionality on the back of strong cash generation –
fund acquisitions or further cash returns to shareholders; (v) Potential M&A
target with large cap European and US players looking to increase their
exposure to Process.
■ Exposure to energy efficiency: IMI is the market leader with a current
market share of more than 30% in Hydronic solutions (18% of group
revenue) critical to energy consumption of the HVAC system. IMI
Thermostatic radiator valves (7% of group revenue) provide energy savings
of 28% compared to manual valves.
■ Valuation: We rate IMI Outperform. On our forecasts, IMI trades on a 12MF
EV/EBITA and P/E multiples of 12.0x and 16.7x respectively vs. its peer
group average of 12.5x / 17.4x. Our price target is 1,640p.
Share price performance
786
986
1186
1386
Apr-12 Aug-12 Dec-12 Apr-13 Aug-13 Dec-13
Price Price relative
The price relative chart measures performance against the
FTSE ALL SHARE INDEX which closed at 3570.9 on 27/03/14
On 27/03/14 the spot exchange rate was £.83/Eu 1. -
Eu .73/US$1
Performance Over 1M 3M 12M Absolute (%) -4.0 -4.4 13.0 Relative (%) -4.2 -4.9 -4.9
Financial and valuation metrics
Year 12/12A 12/13E 12/14E 12/15E Revenue (£ m) 2,190.0 1,757.0 1,777.0 1,868.5 EBITDA (£ m) 414.60 364.50 376.50 401.00 Pre-tax Profit Adjusted (£ m) 372.30 310.00 331.00 357.00 CS adj. EPS (p) 83.20 70.72 86.65 95.05 Prev. EPS (p) — — — — ROIC (%) 30.89 24.98 26.33 28.63 P/E (adj., x) 17.43 20.50 16.73 15.26 P/E rel. (%) 121.1 153.4 136.4 135.2 EV/EBITDA 9.8 11.5 11.0 10.1
Dividend (12/13E, p) 35.75 IC (12/13E, £ m) 903.91 Dividend yield (%) 2.5 EV/IC 4.6 Net debt (12/13E, £ m) 245.2 Current WACC 8.63 Net debt/equity (12/13E, %) 37.2 Free float (%) 93.81 BV/share (12/13E, £) 2.0 Number of shares (m) 271.39
Source: FTI, Company data, Thomson Reuters, Credit Suisse Securities (EUROPE) LTD. Estimates.
Rating OUTPERFORM* Price (27 Mar 14, p) 1,450.00 Target price (p) 1,640.00¹ Market cap. (£ m) 3,935.09 Enterprise value (£ m) 4,180.3
*Stock ratings are relative to the coverage universe in each
analyst's or each team's respective sector.
¹Target price is for 12 months.
Research Analysts
Jonathan Hurn, CFA
44 20 7883 4532
Max Yates
44 20 7883 8501
Tiantian Li
44 20 7883 1552

03 April 2014
Themes in Energy Efficiency 76
Americas / United States
Electrical Equipment
Ingersoll-Rand Plc (IR.N)
High exposure
■ Company description: IR has leading global positions in HVAC (brands
include Trane and Thermoking) and industrial (compressor) markets.
■ Investment case: IR is set to deliver above-average EPS growth driven by
100bps of annual operating margin expansion through cost-cutting and high
exposure to depressed end-markets (non-resi construction). Shareholder
capital returns are above-average due to consistent share buy-backs.
Portfolio change is above-average, with the spin-off of ALLE last year, and
possible future break-ups could occur.
■ Exposure to energy efficiency: IR has a strong position in non-resi, resi,
transport and refrigeration HVAC through its Trane, Thermoking and
Hussmann brands (latter is a JV). HVAC currently represent 75% of sales.
■ Valuation: We have an Outperform rating on the stock and a USD 69 TP. IR
trades at 14.0x 2015E P/E.
Share price performance
41
46
51
56
61
Apr-13 Jul-13 Oct-13 Jan-14
Daily Apr 01, 2013 - Mar 27, 2014, 4/01/13 = US$43.42
Price Indexed S&P 500 INDEX
On 03/27/14 the S&P 500 INDEX closed at 1872.34
Quarterly EPS Q1 Q2 Q3 Q4 2013A 0.22 0.93 0.91 0.61 2014E 0.26 1.05 1.02 0.85 2015E — — — —
Financial and valuation metrics
Year 12/13A 12/14E 12/15E 12/16E EPS (CS adj.) (US$) 2.67 3.20 3.96 4.90 Prev. EPS (US$) — — — — P/E (x) 20.9 17.4 14.0 11.4 P/E rel. (%) 121.7 109.9 98.7 88.6 Revenue (US$ m) 12,350.5 12,824.0 13,558.6 14,351.3 EBITDA (US$ m) 1,521.7 1,740.2 1,962.9 2,199.5 OCFPS (US$) 5.10 6.38 7.44 8.72 P/OCF (x) 12.1 8.7 7.5 6.4 EV/EBITDA (current) 11.1 9.7 8.6 7.7 Net debt (US$ m) 1,584 2,306 2,774 2,665 ROIC (%) 11.62 12.17 13.80 15.49
Number of shares (m) 278.04 IC (current, US$ m) 8,715.30 BV/share (Next Qtr., US$) 23.0 EV/IC (x) 2.0 Net debt (Next Qtr., US$ m) 2,070.9 Dividend (current, US$) 1.0 Net debt/tot cap (Next Qtr., %) 31.4 Dividend yield (%) 0.45
Source: Company data, Credit Suisse estimates.
Rating OUTPERFORM* Price (27 Mar 14, US$) 55.70 Target price (US$) 69.00¹ 52-week price range 62.88 - 41.68 Market cap. (US$ m) 15,486.59 Enterprise value (US$ m) 17,792.49
*Stock ratings are relative to the coverage universe in each
analyst's or each team's respective sector.
¹Target price is for 12 months.
Research Analysts
Julian Mitchell
212 325 6668
Charles Clarke
212 538 7095
Jonathan Shaffer
212 325 1259

03 April 2014
Themes in Energy Efficiency 77
Asia Pacific / Australia
Real Estate Management & Development (Real Estate (AU))
Investa Office Fund (IOF.AX / IOF AU)
High exposure ■ Company description: The fund is the owner of investment grade office
buildings and receives rental income from a tenant register comprising
predominantly government and blue chip tenants. IOF has total assets under
management of AU$2.8 billion, with investments located in core CBD
markets throughout Australia and select offshore markets in Europe.
■ Investment case: IOF has the largest exposure to secondary grade (21%)
of the major Australian office players. However, further asset recycling and
the completion of developments such as 567 Collins St, Melbourne
(premium) should see portfolio quality improve over time. IOF delivered a
strong result, delivering FFO of $84.5mn, up 8% on pcp (8.75¢). DPS was
9.25¢, up 5.7%, reflecting a payout ratio of 67%. Solid AUS NPI growth of
4.7% reflected (1) full period income from prior period acquisitions including
positive rent reversions 66 St Georges Terrace, (2) Comp NOI growth of 3%
(above AREIT average of 2.8%), and (3) stronger tenant retention of 82% up
from 54% at June, which saw IOF achieve record leasing during the period
(118k sq m leased or under H.O.A.). Despite this higher leasing velocity,
average. incentives were low at only 14%, below market (~30%) and below
peers DXS (17% average) and MGR (19% average).
■ Exposure to energy efficiency: Investa is internationally recognised in the
development and implementation of real estate sustainability initiatives, and
for more than 10 years has worked to establish best practice sustainability
procedures in the management of its Funds and properties. With a focus on
continual improvement, Investa has been able to demonstrate sustained
improvements in building quality and subsequent investment returns of the
properties it acquires and manages, with major improvements generally
being made in the first three years under management. IOF ranked in the
top quartile in 2013 ASX 200 Climate Disclosure Leadership Index (CDLI)
and achieved global recognition as a GRESB Green Star 2013.
■ Valuation: We have a Neutral rating and A$3.39 TP on Investa Office Fund.
Share price performance
80
90
100
110
120
2
3
4
5
6
Apr-12 Aug-12 Dec-12 Apr-13 Aug-13 Dec-13
Price (LHS) Rebased Rel (RHS)
The price relative chart measures performance against the S&P
ASX 200 Index which closed at 5389.17 on 28/03/14
On 28/03/14 the spot exchange rate was A$1.08/US$1
Performance Over 1M 3M 12M
Absolute (%) 0.9 3.5 4.9
Relative (%) 0.3 2.7 -13.5
Financial and valuation metrics
Year 06/13A 06/14E 06/15E 06/16E
Revenue (A$mn) 201.2 209.5 221.3 234.4
EBITDA (A$mn) 187.8 195.7 207.1 219.8
EBIT (A$mn) 190.6 197.1 207.1 219.8
Net income (A$mn) 153.5 162.2 165.0 171.3
EPS (CS adj.) (Ac) 25.00 26.41 26.87 27.90
EPS growth (%) 12.2 5.7 1.7 3.8
P/E (x) 12.8 12.2 11.9 11.5
Dividend (Ac) 17.75 19.02 19.35 20.09
Dividend yield (%) 5.5 5.9 6.0 6.3
Net debt/equity (%) 31.1 41.3 45.6 46.5
Source: Company data, ASX, Credit Suisse estimates, * Adj. for goodwill, notional interest and unusual items. Relative P/E against
ASX/S&P200 based on pre GW in AUD. Company PE calculation is based on displayed EPS Currency.
Rating NEUTRAL*
Price (28 Mar 14, A$) 3.21
Target price (A$) 3.39¹
Market cap. (A$mn) 1,971.09
Yr avg. mthly trading (A$mn) 132.74
Last month's trading (A$mn) 142.31
Projected return:
Capital gain (%) 5.7
Dividend yield (net %) 6.0
Total return (%) 11.7
52-week price range 3.4 - 2.8
* Stock ratings are relative to the relevant country benchmark.
¹Target price is for 12 months.
Research Analysts
John Richmond
61 2 8205 4580
Stephen Rich
61 2 8205 4617
Mikhail Mohl
61 2 8205 4413
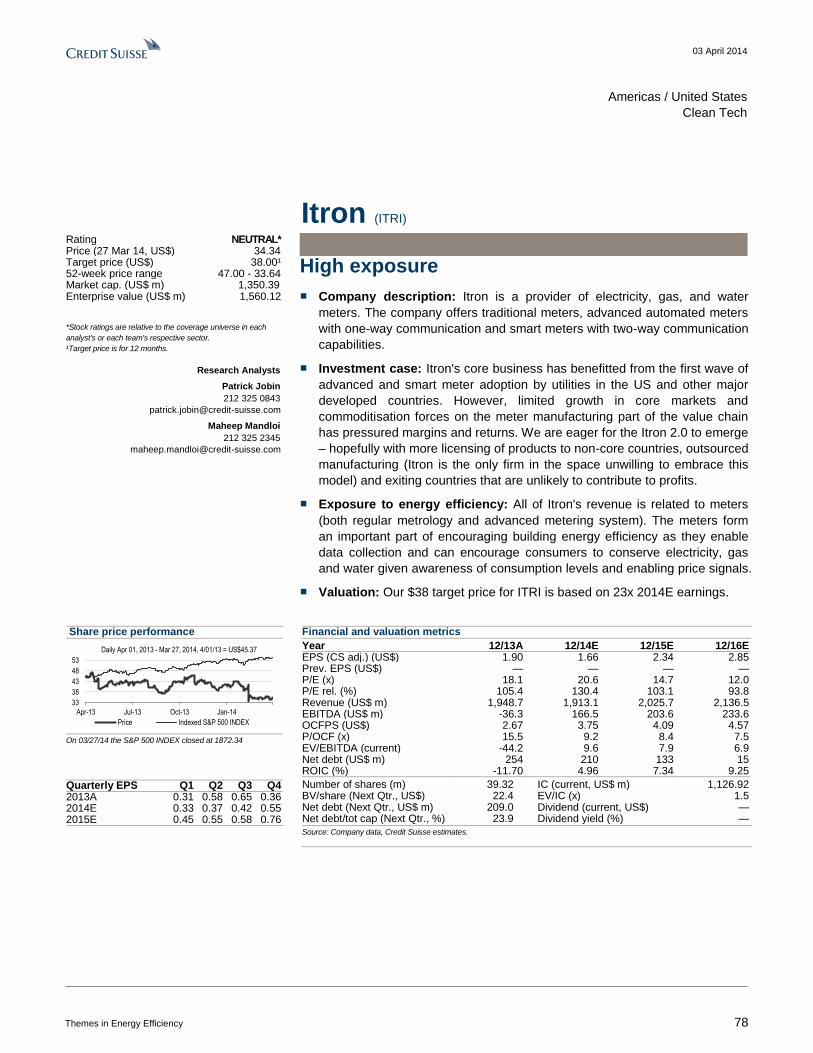
03 April 2014
Themes in Energy Efficiency 78
Americas / United States
Clean Tech
Itron (ITRI)
High exposure
■ Company description: Itron is a provider of electricity, gas, and water
meters. The company offers traditional meters, advanced automated meters
with one-way communication and smart meters with two-way communication
capabilities.
■ Investment case: Itron's core business has benefitted from the first wave of
advanced and smart meter adoption by utilities in the US and other major
developed countries. However, limited growth in core markets and
commoditisation forces on the meter manufacturing part of the value chain
has pressured margins and returns. We are eager for the Itron 2.0 to emerge
– hopefully with more licensing of products to non-core countries, outsourced
manufacturing (Itron is the only firm in the space unwilling to embrace this
model) and exiting countries that are unlikely to contribute to profits.
■ Exposure to energy efficiency: All of Itron's revenue is related to meters
(both regular metrology and advanced metering system). The meters form
an important part of encouraging building energy efficiency as they enable
data collection and can encourage consumers to conserve electricity, gas
and water given awareness of consumption levels and enabling price signals.
■ Valuation: Our $38 target price for ITRI is based on 23x 2014E earnings.
Share price performance
33
38
43
48
53
Apr-13 Jul-13 Oct-13 Jan-14
Daily Apr 01, 2013 - Mar 27, 2014, 4/01/13 = US$45.37
Price Indexed S&P 500 INDEX
On 03/27/14 the S&P 500 INDEX closed at 1872.34
Quarterly EPS Q1 Q2 Q3 Q4 2013A 0.31 0.58 0.65 0.36 2014E 0.33 0.37 0.42 0.55 2015E 0.45 0.55 0.58 0.76
Financial and valuation metrics
Year 12/13A 12/14E 12/15E 12/16E EPS (CS adj.) (US$) 1.90 1.66 2.34 2.85 Prev. EPS (US$) — — — — P/E (x) 18.1 20.6 14.7 12.0 P/E rel. (%) 105.4 130.4 103.1 93.8 Revenue (US$ m) 1,948.7 1,913.1 2,025.7 2,136.5 EBITDA (US$ m) -36.3 166.5 203.6 233.6 OCFPS (US$) 2.67 3.75 4.09 4.57 P/OCF (x) 15.5 9.2 8.4 7.5 EV/EBITDA (current) -44.2 9.6 7.9 6.9 Net debt (US$ m) 254 210 133 15 ROIC (%) -11.70 4.96 7.34 9.25
Number of shares (m) 39.32 IC (current, US$ m) 1,126.92 BV/share (Next Qtr., US$) 22.4 EV/IC (x) 1.5 Net debt (Next Qtr., US$ m) 209.0 Dividend (current, US$) — Net debt/tot cap (Next Qtr., %) 23.9 Dividend yield (%) —
Source: Company data, Credit Suisse estimates.
Rating NEUTRAL* Price (27 Mar 14, US$) 34.34 Target price (US$) 38.00¹ 52-week price range 47.00 - 33.64 Market cap. (US$ m) 1,350.39 Enterprise value (US$ m) 1,560.12
*Stock ratings are relative to the coverage universe in each
analyst's or each team's respective sector.
¹Target price is for 12 months.
Research Analysts
Patrick Jobin
212 325 0843
Maheep Mandloi
212 325 2345

03 April 2014
Themes in Energy Efficiency 79
Europe / Finland
Engineering & Construction
Kone Corporation (KNEBV.HE)
Medium exposure
■ Company description: Kone is one of the global leaders in the elevator and
escalator industry providing industry-leading elevators, escalators and
automatic building doors as well as solutions for modernisation and
maintenance. The group has about 250,000 customers spread across 50
countries.
■ Investment case: 1) Strongest positioning in China to capture the
maintenance market opportunity with 400 selling locations, providing
Kone with a significant advantage versus peers, especially given the new
regulation coming into force in 2014. 2) Scope for margin improvement
driven by efficiency improvements, rising density and developing China's
maintenance market. 3) Best-in-class returns and cash conversion
profile.
■ Exposure to Energy Efficiency: Kone manufactures elevators and
escalators, which contribute to energy consumption of the buildings. Design
innovation and application of smart technology can reduce energy
consumption of the building. Since 2008, Kone has reached a 70% reduction
in its energy consumptions for volume elevators in Europe, 60-75% in Asia
and 40% in the US. The company has recently launched UltraRopeTM,
which
consumes 15% lesser energy for an elevator ride of 500m height, which can
notch up to 45% for 800m.
■ Valuation: We have a Neutral rating on Kone and a €33.50 TP. With the
stock trading on EV/EBITA multiples of 13.3x in 2014E and 11.9x in 2015E,
at a c5% premium to the Pan European sector, we believe the market is
already discounting the above-mentioned growth and margin outlook.
Share price performance
20
25
30
35
Apr-12 Aug-12 Dec-12 Apr-13 Aug-13 Dec-13
Price Price relative
The price relative chart measures performance against the
HEX25 INDEX. which closed at 2843.44 on 27/03/14
On 27/03/14 the spot exchange rate was €1./Eu 1. -
Eu .73/US$1
Performance Over 1M 3M 12M Absolute (%) 1.0 -10.1 -2.7 Relative (%) 2.3 -10.9 -10.8
Financial and valuation metrics
Year 12/12A 12/13E 12/14E 12/15E Revenue (Eu m) 6,276.9 6,932.2 7,359.0 7,824.4 EBITDA (Eu m) 907.40 1,031.70 1,197.45 1,308.25 Adjusted Net Income (Eu m) 681.30 732.90 832.95 921.54 CS adj. EPS (Eu) 1.32 1.42 1.62 1.79 Prev. EPS (Eu) — — — — ROIC (%) 55.31 72.72 65.81 68.21 P/E (adj., x) 22.53 20.98 18.46 16.68 P/E rel. (%) 109.0 132.0 131.1 128.3 EV/EBITDA 15.0 13.2 11.4 10.3
Dividend (12/13E, Eu) 0.50 IC (12/13E, Eu m) 973.10 Dividend yield (%) 1.7 EV/IC 14.0 Net debt (12/13E, Eu m) -751.3 Current WACC 9.00 Net debt/equity (12/13E, %) -43.6 Free float (%) 75.00 BV/share (12/13E, Eu) 3.3 Number of shares (m) 482.53
Source: FTI, Company data, Thomson Reuters, Credit Suisse Securities (EUROPE) LTD. Estimates.
Rating NEUTRAL* Price (27 Mar 14, Eu) 29.85 Target price (Eu) 33.50¹ Market cap. (Eu m) 14,403.46 Enterprise value (Eu m) 13,652.2
*Stock ratings are relative to the coverage universe in each
analyst's or each team's respective sector.
¹Target price is for 12 months.
Research Analysts
Andre Kukhnin CFA
44 20 7888 0350
Max Yates
44 20 7883 8501
Tiantian Li
44 20 7883 1552
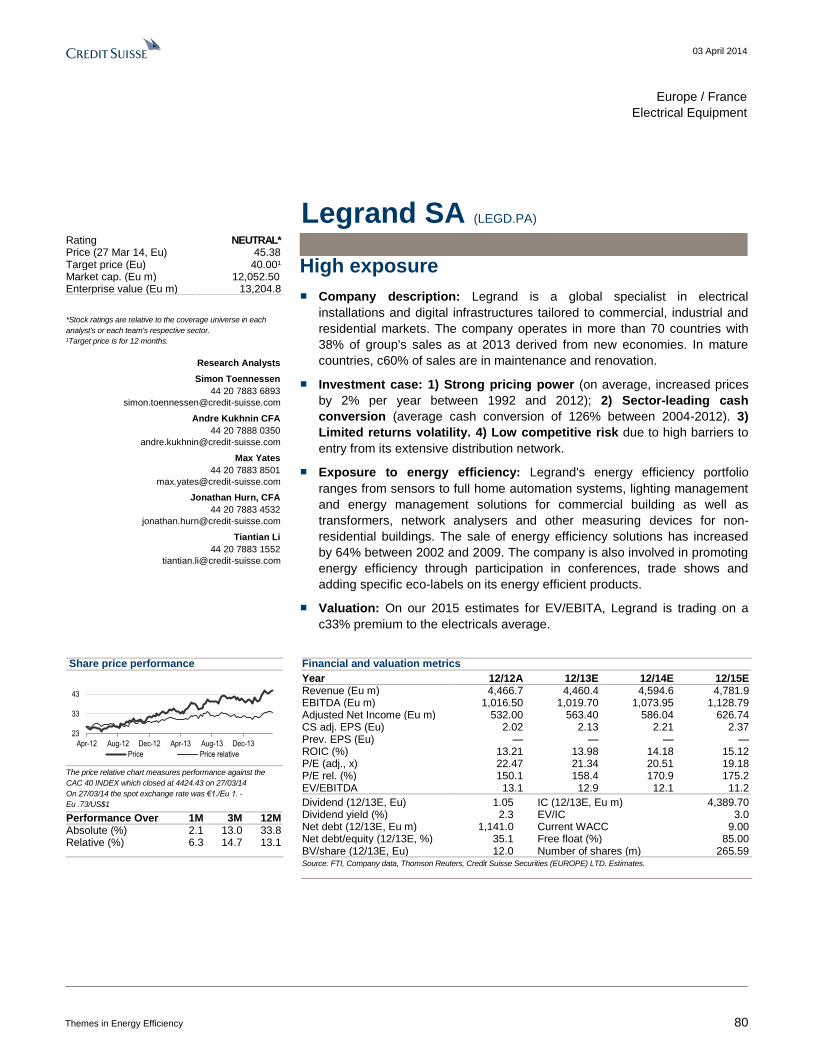
03 April 2014
Themes in Energy Efficiency 80
Europe / France
Electrical Equipment
Legrand SA (LEGD.PA)
High exposure
■ Company description: Legrand is a global specialist in electrical
installations and digital infrastructures tailored to commercial, industrial and
residential markets. The company operates in more than 70 countries with
38% of group's sales as at 2013 derived from new economies. In mature
countries, c60% of sales are in maintenance and renovation.
■ Investment case: 1) Strong pricing power (on average, increased prices
by 2% per year between 1992 and 2012); 2) Sector-leading cash
conversion (average cash conversion of 126% between 2004-2012). 3)
Limited returns volatility. 4) Low competitive risk due to high barriers to
entry from its extensive distribution network.
■ Exposure to energy efficiency: Legrand's energy efficiency portfolio
ranges from sensors to full home automation systems, lighting management
and energy management solutions for commercial building as well as
transformers, network analysers and other measuring devices for non-
residential buildings. The sale of energy efficiency solutions has increased
by 64% between 2002 and 2009. The company is also involved in promoting
energy efficiency through participation in conferences, trade shows and
adding specific eco-labels on its energy efficient products.
■ Valuation: On our 2015 estimates for EV/EBITA, Legrand is trading on a
c33% premium to the electricals average.
Share price performance
23
33
43
Apr-12 Aug-12 Dec-12 Apr-13 Aug-13 Dec-13
Price Price relative
The price relative chart measures performance against the
CAC 40 INDEX which closed at 4424.43 on 27/03/14
On 27/03/14 the spot exchange rate was €1./Eu 1. -
Eu .73/US$1
Performance Over 1M 3M 12M Absolute (%) 2.1 13.0 33.8 Relative (%) 6.3 14.7 13.1
Financial and valuation metrics
Year 12/12A 12/13E 12/14E 12/15E Revenue (Eu m) 4,466.7 4,460.4 4,594.6 4,781.9 EBITDA (Eu m) 1,016.50 1,019.70 1,073.95 1,128.79 Adjusted Net Income (Eu m) 532.00 563.40 586.04 626.74 CS adj. EPS (Eu) 2.02 2.13 2.21 2.37 Prev. EPS (Eu) — — — — ROIC (%) 13.21 13.98 14.18 15.12 P/E (adj., x) 22.47 21.34 20.51 19.18 P/E rel. (%) 150.1 158.4 170.9 175.2 EV/EBITDA 13.1 12.9 12.1 11.2
Dividend (12/13E, Eu) 1.05 IC (12/13E, Eu m) 4,389.70 Dividend yield (%) 2.3 EV/IC 3.0 Net debt (12/13E, Eu m) 1,141.0 Current WACC 9.00 Net debt/equity (12/13E, %) 35.1 Free float (%) 85.00 BV/share (12/13E, Eu) 12.0 Number of shares (m) 265.59
Source: FTI, Company data, Thomson Reuters, Credit Suisse Securities (EUROPE) LTD. Estimates.
Rating NEUTRAL* Price (27 Mar 14, Eu) 45.38 Target price (Eu) 40.00¹ Market cap. (Eu m) 12,052.50 Enterprise value (Eu m) 13,204.8
*Stock ratings are relative to the coverage universe in each
analyst's or each team's respective sector.
¹Target price is for 12 months.
Research Analysts
Simon Toennessen
44 20 7883 6893
Andre Kukhnin CFA
44 20 7888 0350
Max Yates
44 20 7883 8501
Jonathan Hurn, CFA
44 20 7883 4532
Tiantian Li
44 20 7883 1552
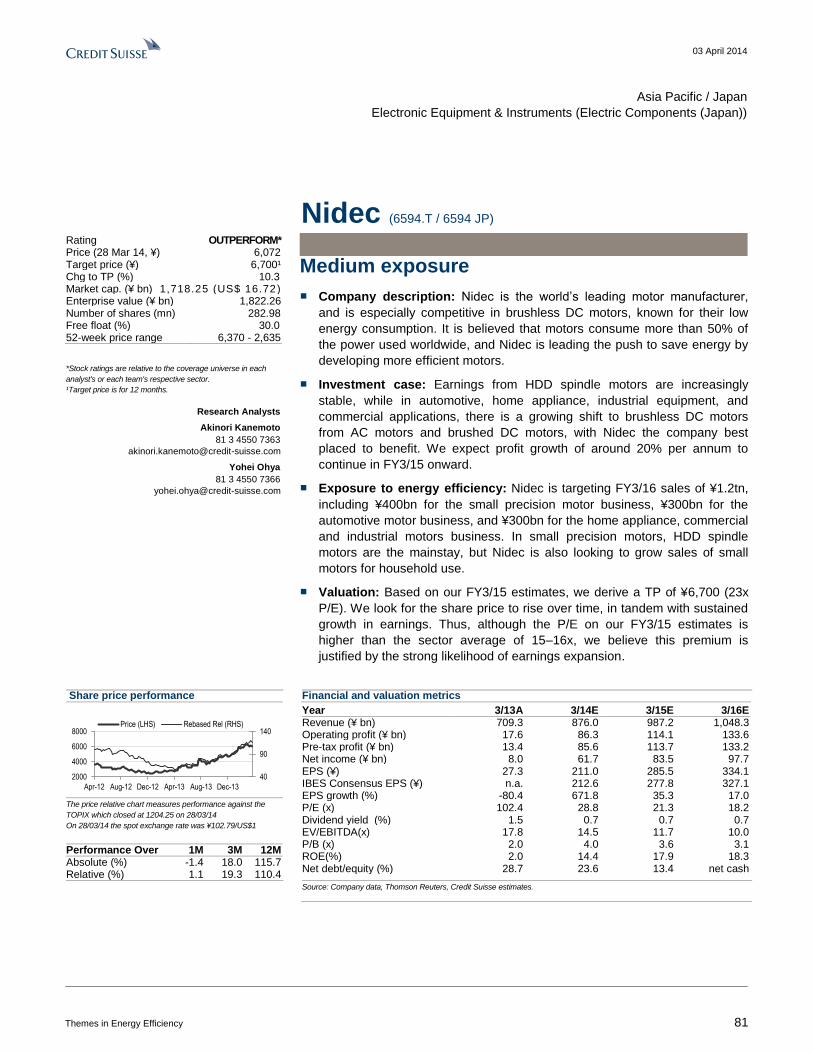
03 April 2014
Themes in Energy Efficiency 81
Asia Pacific / Japan
Electronic Equipment & Instruments (Electric Components (Japan))
Nidec (6594.T / 6594 JP)
Medium exposure
■ Company description: Nidec is the world’s leading motor manufacturer,
and is especially competitive in brushless DC motors, known for their low
energy consumption. It is believed that motors consume more than 50% of
the power used worldwide, and Nidec is leading the push to save energy by
developing more efficient motors.
■ Investment case: Earnings from HDD spindle motors are increasingly
stable, while in automotive, home appliance, industrial equipment, and
commercial applications, there is a growing shift to brushless DC motors
from AC motors and brushed DC motors, with Nidec the company best
placed to benefit. We expect profit growth of around 20% per annum to
continue in FY3/15 onward.
■ Exposure to energy efficiency: Nidec is targeting FY3/16 sales of ¥1.2tn,
including ¥400bn for the small precision motor business, ¥300bn for the
automotive motor business, and ¥300bn for the home appliance, commercial
and industrial motors business. In small precision motors, HDD spindle
motors are the mainstay, but Nidec is also looking to grow sales of small
motors for household use.
■ Valuation: Based on our FY3/15 estimates, we derive a TP of ¥6,700 (23x
P/E). We look for the share price to rise over time, in tandem with sustained
growth in earnings. Thus, although the P/E on our FY3/15 estimates is
higher than the sector average of 15–16x, we believe this premium is
justified by the strong likelihood of earnings expansion.
Share price performance
40
90
140
2000
4000
6000
8000
Apr-12 Aug-12 Dec-12 Apr-13 Aug-13 Dec-13
Price (LHS) Rebased Rel (RHS)
The price relative chart measures performance against the
TOPIX which closed at 1204.25 on 28/03/14
On 28/03/14 the spot exchange rate was ¥102.79/US$1
Performance Over 1M 3M 12M Absolute (%) -1.4 18.0 115.7 Relative (%) 1.1 19.3 110.4
Financial and valuation metrics
Year 3/13A 3/14E 3/15E 3/16E Revenue (¥ bn) 709.3 876.0 987.2 1,048.3 Operating profit (¥ bn) 17.6 86.3 114.1 133.6 Pre-tax profit (¥ bn) 13.4 85.6 113.7 133.2 Net income (¥ bn) 8.0 61.7 83.5 97.7 EPS (¥) 27.3 211.0 285.5 334.1 IBES Consensus EPS (¥) n.a. 212.6 277.8 327.1 EPS growth (%) -80.4 671.8 35.3 17.0 P/E (x) 102.4 28.8 21.3 18.2 Dividend yield (%) 1.5 0.7 0.7 0.7 EV/EBITDA(x) 17.8 14.5 11.7 10.0 P/B (x) 2.0 4.0 3.6 3.1 ROE(%) 2.0 14.4 17.9 18.3 Net debt/equity (%) 28.7 23.6 13.4 net cash
Source: Company data, Thomson Reuters, Credit Suisse estimates.
Rating OUTPERFORM* Price (28 Mar 14, ¥) 6,072 Target price (¥) 6,700¹ Chg to TP (%) 10.3 Market cap. (¥ bn) 1,718.25 (US$ 16.72) Enterprise value (¥ bn) 1,822.26 Number of shares (mn) 282.98 Free float (%) 30.0 52-week price range 6,370 - 2,635
*Stock ratings are relative to the coverage universe in each
analyst's or each team's respective sector.
¹Target price is for 12 months.
Research Analysts
Akinori Kanemoto
81 3 4550 7363
Yohei Ohya
81 3 4550 7366
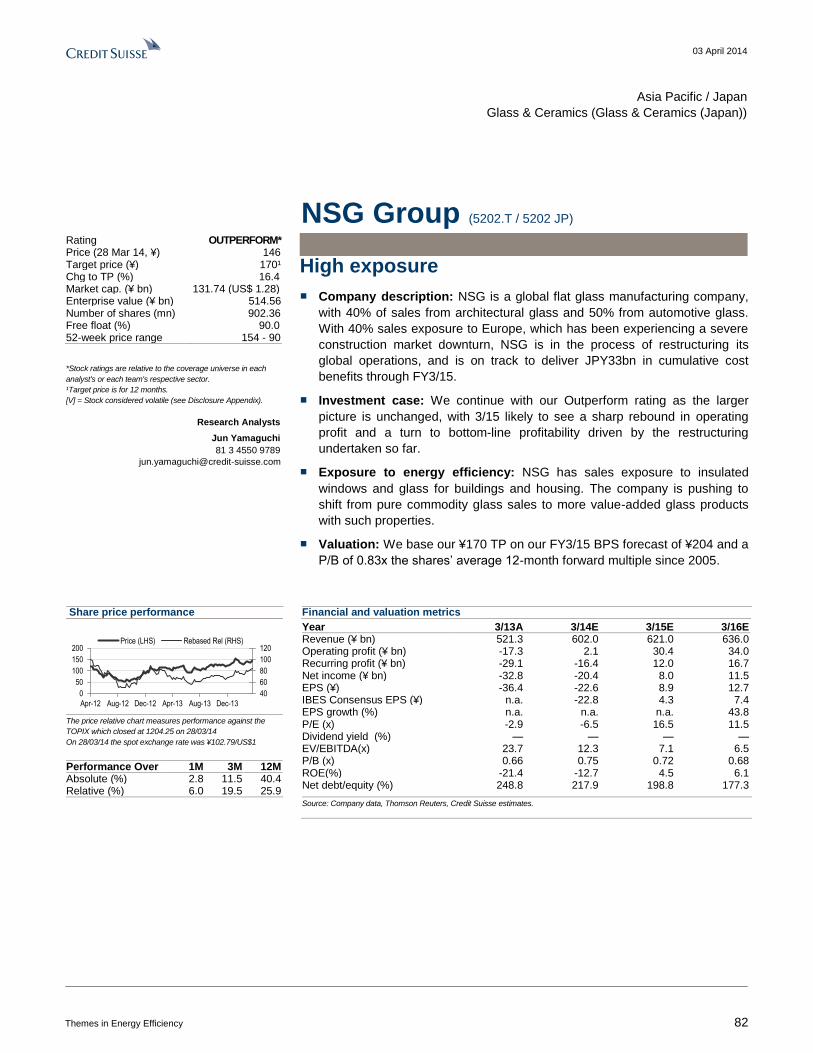
03 April 2014
Themes in Energy Efficiency 82
Asia Pacific / Japan
Glass & Ceramics (Glass & Ceramics (Japan))
NSG Group (5202.T / 5202 JP)
High exposure
■ Company description: NSG is a global flat glass manufacturing company,
with 40% of sales from architectural glass and 50% from automotive glass.
With 40% sales exposure to Europe, which has been experiencing a severe
construction market downturn, NSG is in the process of restructuring its
global operations, and is on track to deliver JPY33bn in cumulative cost
benefits through FY3/15.
■ Investment case: We continue with our Outperform rating as the larger
picture is unchanged, with 3/15 likely to see a sharp rebound in operating
profit and a turn to bottom-line profitability driven by the restructuring
undertaken so far.
■ Exposure to energy efficiency: NSG has sales exposure to insulated
windows and glass for buildings and housing. The company is pushing to
shift from pure commodity glass sales to more value-added glass products
with such properties.
■ Valuation: We base our ¥170 TP on our FY3/15 BPS forecast of ¥204 and a
P/B of 0.83x the shares’ average 12-month forward multiple since 2005.
Share price performance
40
60
80
100
120
0
50
100
150
200
Apr-12 Aug-12 Dec-12 Apr-13 Aug-13 Dec-13
Price (LHS) Rebased Rel (RHS)
The price relative chart measures performance against the
TOPIX which closed at 1204.25 on 28/03/14
On 28/03/14 the spot exchange rate was ¥102.79/US$1
Performance Over 1M 3M 12M Absolute (%) 2.8 11.5 40.4 Relative (%) 6.0 19.5 25.9
Financial and valuation metrics
Year 3/13A 3/14E 3/15E 3/16E Revenue (¥ bn) 521.3 602.0 621.0 636.0 Operating profit (¥ bn) -17.3 2.1 30.4 34.0 Recurring profit (¥ bn) -29.1 -16.4 12.0 16.7 Net income (¥ bn) -32.8 -20.4 8.0 11.5 EPS (¥) -36.4 -22.6 8.9 12.7 IBES Consensus EPS (¥) n.a. -22.8 4.3 7.4 EPS growth (%) n.a. n.a. n.a. 43.8 P/E (x) -2.9 -6.5 16.5 11.5 Dividend yield (%) — — — — EV/EBITDA(x) 23.7 12.3 7.1 6.5 P/B (x) 0.66 0.75 0.72 0.68 ROE(%) -21.4 -12.7 4.5 6.1 Net debt/equity (%) 248.8 217.9 198.8 177.3
Source: Company data, Thomson Reuters, Credit Suisse estimates.
Rating OUTPERFORM* Price (28 Mar 14, ¥) 146 Target price (¥) 170¹ Chg to TP (%) 16.4 Market cap. (¥ bn) 131.74 (US$ 1.28) Enterprise value (¥ bn) 514.56 Number of shares (mn) 902.36 Free float (%) 90.0 52-week price range 154 - 90
*Stock ratings are relative to the coverage universe in each
analyst's or each team's respective sector.
¹Target price is for 12 months.
[V] = Stock considered volatile (see Disclosure Appendix).
Research Analysts
Jun Yamaguchi
81 3 4550 9789
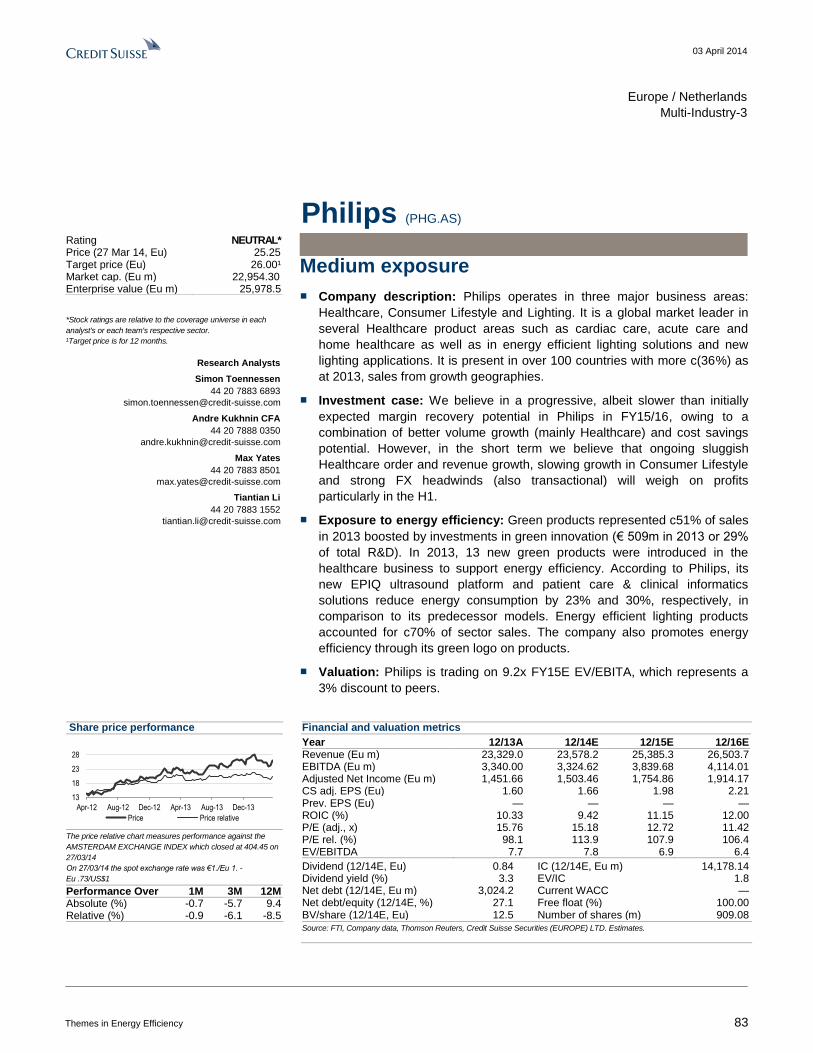
03 April 2014
Themes in Energy Efficiency 83
Europe / Netherlands
Multi-Industry-3
Philips (PHG.AS)
Medium exposure
■ Company description: Philips operates in three major business areas:
Healthcare, Consumer Lifestyle and Lighting. It is a global market leader in
several Healthcare product areas such as cardiac care, acute care and
home healthcare as well as in energy efficient lighting solutions and new
lighting applications. It is present in over 100 countries with more c(36%) as
at 2013, sales from growth geographies.
■ Investment case: We believe in a progressive, albeit slower than initially
expected margin recovery potential in Philips in FY15/16, owing to a
combination of better volume growth (mainly Healthcare) and cost savings
potential. However, in the short term we believe that ongoing sluggish
Healthcare order and revenue growth, slowing growth in Consumer Lifestyle
and strong FX headwinds (also transactional) will weigh on profits
particularly in the H1.
■ Exposure to energy efficiency: Green products represented c51% of sales
in 2013 boosted by investments in green innovation (€ 509m in 2013 or 29%
of total R&D). In 2013, 13 new green products were introduced in the
healthcare business to support energy efficiency. According to Philips, its
new EPIQ ultrasound platform and patient care & clinical informatics
solutions reduce energy consumption by 23% and 30%, respectively, in
comparison to its predecessor models. Energy efficient lighting products
accounted for c70% of sector sales. The company also promotes energy
efficiency through its green logo on products.
■ Valuation: Philips is trading on 9.2x FY15E EV/EBITA, which represents a
3% discount to peers.
Share price performance
13
18
23
28
Apr-12 Aug-12 Dec-12 Apr-13 Aug-13 Dec-13
Price Price relative
The price relative chart measures performance against the
AMSTERDAM EXCHANGE INDEX which closed at 404.45 on
27/03/14
On 27/03/14 the spot exchange rate was €1./Eu 1. -
Eu .73/US$1
Performance Over 1M 3M 12M Absolute (%) -0.7 -5.7 9.4 Relative (%) -0.9 -6.1 -8.5
Financial and valuation metrics
Year 12/13A 12/14E 12/15E 12/16E Revenue (Eu m) 23,329.0 23,578.2 25,385.3 26,503.7 EBITDA (Eu m) 3,340.00 3,324.62 3,839.68 4,114.01 Adjusted Net Income (Eu m) 1,451.66 1,503.46 1,754.86 1,914.17 CS adj. EPS (Eu) 1.60 1.66 1.98 2.21 Prev. EPS (Eu) — — — — ROIC (%) 10.33 9.42 11.15 12.00 P/E (adj., x) 15.76 15.18 12.72 11.42 P/E rel. (%) 98.1 113.9 107.9 106.4 EV/EBITDA 7.7 7.8 6.9 6.4
Dividend (12/14E, Eu) 0.84 IC (12/14E, Eu m) 14,178.14 Dividend yield (%) 3.3 EV/IC 1.8 Net debt (12/14E, Eu m) 3,024.2 Current WACC — Net debt/equity (12/14E, %) 27.1 Free float (%) 100.00 BV/share (12/14E, Eu) 12.5 Number of shares (m) 909.08
Source: FTI, Company data, Thomson Reuters, Credit Suisse Securities (EUROPE) LTD. Estimates.
Rating NEUTRAL* Price (27 Mar 14, Eu) 25.25 Target price (Eu) 26.00¹ Market cap. (Eu m) 22,954.30 Enterprise value (Eu m) 25,978.5
*Stock ratings are relative to the coverage universe in each
analyst's or each team's respective sector.
¹Target price is for 12 months.
Research Analysts
Simon Toennessen
44 20 7883 6893
Andre Kukhnin CFA
44 20 7888 0350
Max Yates
44 20 7883 8501
Tiantian Li
44 20 7883 1552
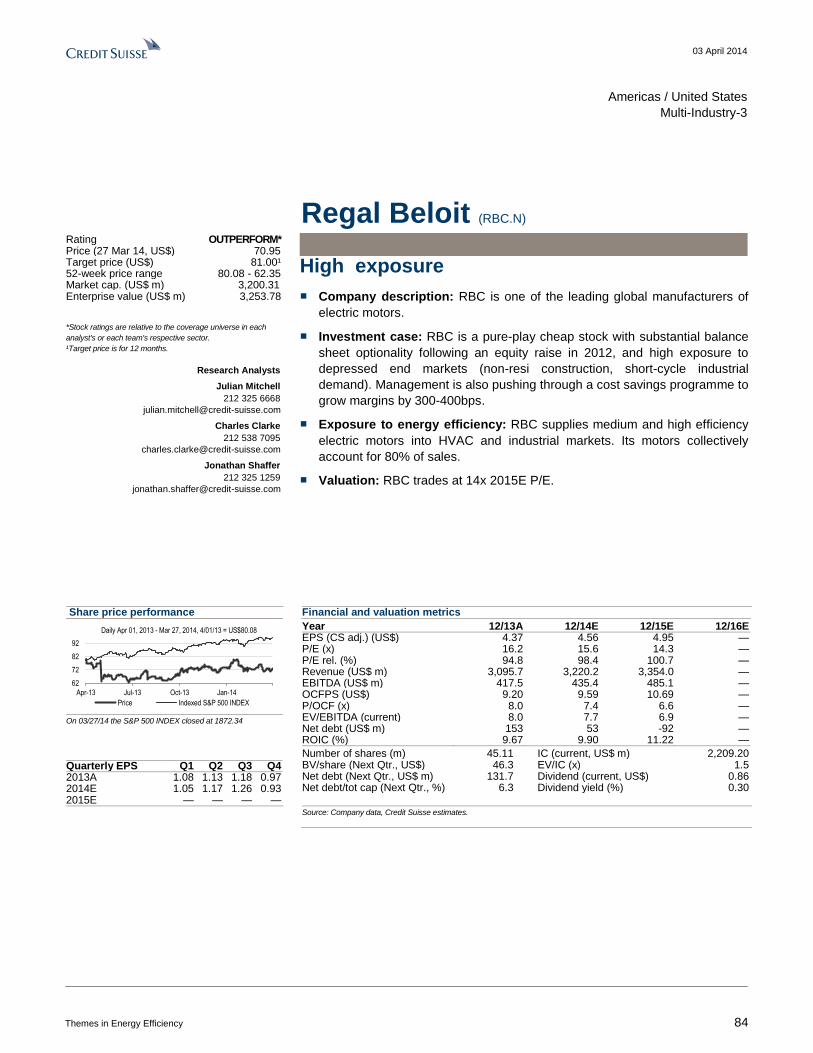
03 April 2014
Themes in Energy Efficiency 84
Americas / United States
Multi-Industry-3
Regal Beloit (RBC.N)
High exposure
■ Company description: RBC is one of the leading global manufacturers of
electric motors.
■ Investment case: RBC is a pure-play cheap stock with substantial balance
sheet optionality following an equity raise in 2012, and high exposure to
depressed end markets (non-resi construction, short-cycle industrial
demand). Management is also pushing through a cost savings programme to
grow margins by 300-400bps.
■ Exposure to energy efficiency: RBC supplies medium and high efficiency
electric motors into HVAC and industrial markets. Its motors collectively
account for 80% of sales.
■ Valuation: RBC trades at 14x 2015E P/E.
Share price performance
62
72
82
92
Apr-13 Jul-13 Oct-13 Jan-14
Daily Apr 01, 2013 - Mar 27, 2014, 4/01/13 = US$80.08
Price Indexed S&P 500 INDEX
On 03/27/14 the S&P 500 INDEX closed at 1872.34
Quarterly EPS Q1 Q2 Q3 Q4 2013A 1.08 1.13 1.18 0.97 2014E 1.05 1.17 1.26 0.93 2015E — — — —
Financial and valuation metrics
Year 12/13A 12/14E 12/15E 12/16E EPS (CS adj.) (US$) 4.37 4.56 4.95 — P/E (x) 16.2 15.6 14.3 — P/E rel. (%) 94.8 98.4 100.7 — Revenue (US$ m) 3,095.7 3,220.2 3,354.0 — EBITDA (US$ m) 417.5 435.4 485.1 — OCFPS (US$) 9.20 9.59 10.69 — P/OCF (x) 8.0 7.4 6.6 — EV/EBITDA (current) 8.0 7.7 6.9 — Net debt (US$ m) 153 53 -92 — ROIC (%) 9.67 9.90 11.22 —
Number of shares (m) 45.11 IC (current, US$ m) 2,209.20 BV/share (Next Qtr., US$) 46.3 EV/IC (x) 1.5 Net debt (Next Qtr., US$ m) 131.7 Dividend (current, US$) 0.86 Net debt/tot cap (Next Qtr., %) 6.3 Dividend yield (%) 0.30
Source: Company data, Credit Suisse estimates.
Rating OUTPERFORM* Price (27 Mar 14, US$) 70.95 Target price (US$) 81.00¹ 52-week price range 80.08 - 62.35 Market cap. (US$ m) 3,200.31 Enterprise value (US$ m) 3,253.78
*Stock ratings are relative to the coverage universe in each
analyst's or each team's respective sector.
¹Target price is for 12 months.
Research Analysts
Julian Mitchell
212 325 6668
Charles Clarke
212 538 7095
Jonathan Shaffer
212 325 1259
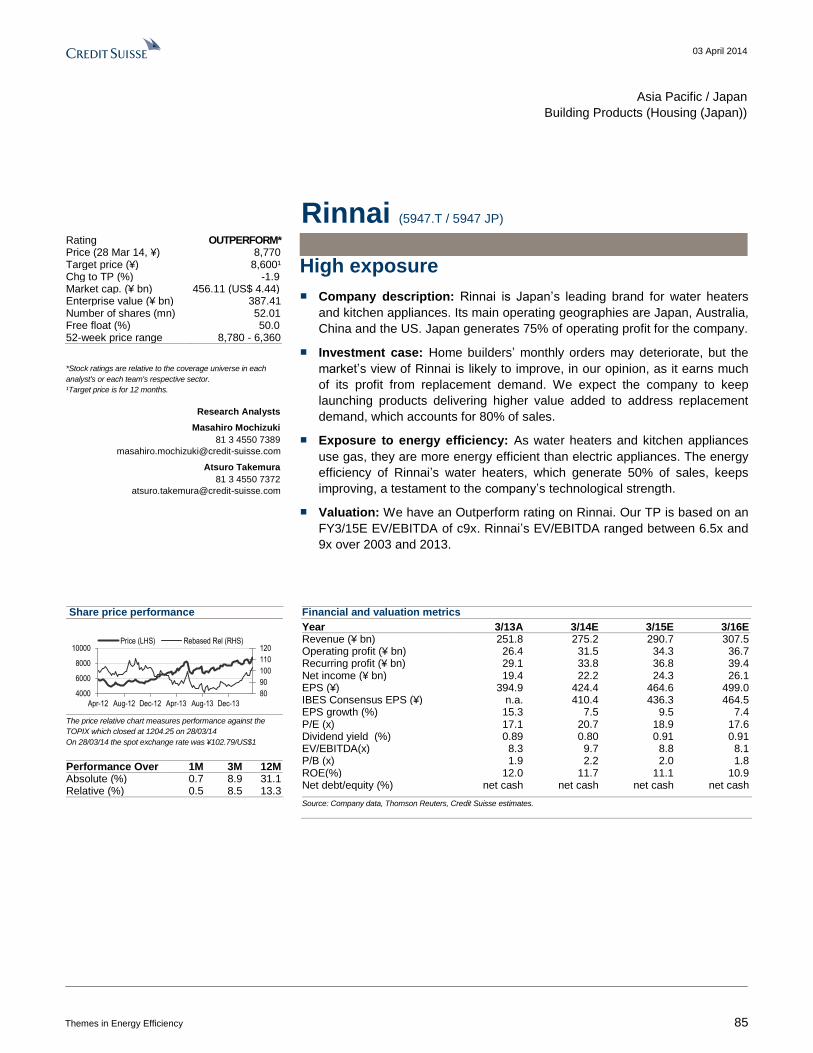
03 April 2014
Themes in Energy Efficiency 85
Asia Pacific / Japan
Building Products (Housing (Japan))
Rinnai (5947.T / 5947 JP)
High exposure
■ Company description: Rinnai is Japan’s leading brand for water heaters
and kitchen appliances. Its main operating geographies are Japan, Australia,
China and the US. Japan generates 75% of operating profit for the company.
■ Investment case: Home builders’ monthly orders may deteriorate, but the
market’s view of Rinnai is likely to improve, in our opinion, as it earns much
of its profit from replacement demand. We expect the company to keep
launching products delivering higher value added to address replacement
demand, which accounts for 80% of sales.
■ Exposure to energy efficiency: As water heaters and kitchen appliances
use gas, they are more energy efficient than electric appliances. The energy
efficiency of Rinnai’s water heaters, which generate 50% of sales, keeps
improving, a testament to the company’s technological strength.
■ Valuation: We have an Outperform rating on Rinnai. Our TP is based on an
FY3/15E EV/EBITDA of c9x. Rinnai’s EV/EBITDA ranged between 6.5x and
9x over 2003 and 2013.
Share price performance
80
90
100
110
120
4000
6000
8000
10000
Apr-12 Aug-12 Dec-12 Apr-13 Aug-13 Dec-13
Price (LHS) Rebased Rel (RHS)
The price relative chart measures performance against the
TOPIX which closed at 1204.25 on 28/03/14
On 28/03/14 the spot exchange rate was ¥102.79/US$1
Performance Over 1M 3M 12M Absolute (%) 0.7 8.9 31.1 Relative (%) 0.5 8.5 13.3
Financial and valuation metrics
Year 3/13A 3/14E 3/15E 3/16E Revenue (¥ bn) 251.8 275.2 290.7 307.5 Operating profit (¥ bn) 26.4 31.5 34.3 36.7 Recurring profit (¥ bn) 29.1 33.8 36.8 39.4 Net income (¥ bn) 19.4 22.2 24.3 26.1 EPS (¥) 394.9 424.4 464.6 499.0 IBES Consensus EPS (¥) n.a. 410.4 436.3 464.5 EPS growth (%) 15.3 7.5 9.5 7.4 P/E (x) 17.1 20.7 18.9 17.6 Dividend yield (%) 0.89 0.80 0.91 0.91 EV/EBITDA(x) 8.3 9.7 8.8 8.1 P/B (x) 1.9 2.2 2.0 1.8 ROE(%) 12.0 11.7 11.1 10.9 Net debt/equity (%) net cash net cash net cash net cash
Source: Company data, Thomson Reuters, Credit Suisse estimates.
Rating OUTPERFORM* Price (28 Mar 14, ¥) 8,770 Target price (¥) 8,600¹ Chg to TP (%) -1.9 Market cap. (¥ bn) 456.11 (US$ 4.44) Enterprise value (¥ bn) 387.41 Number of shares (mn) 52.01 Free float (%) 50.0 52-week price range 8,780 - 6,360
*Stock ratings are relative to the coverage universe in each
analyst's or each team's respective sector.
¹Target price is for 12 months.
Research Analysts
Masahiro Mochizuki
81 3 4550 7389
Atsuro Takemura
81 3 4550 7372
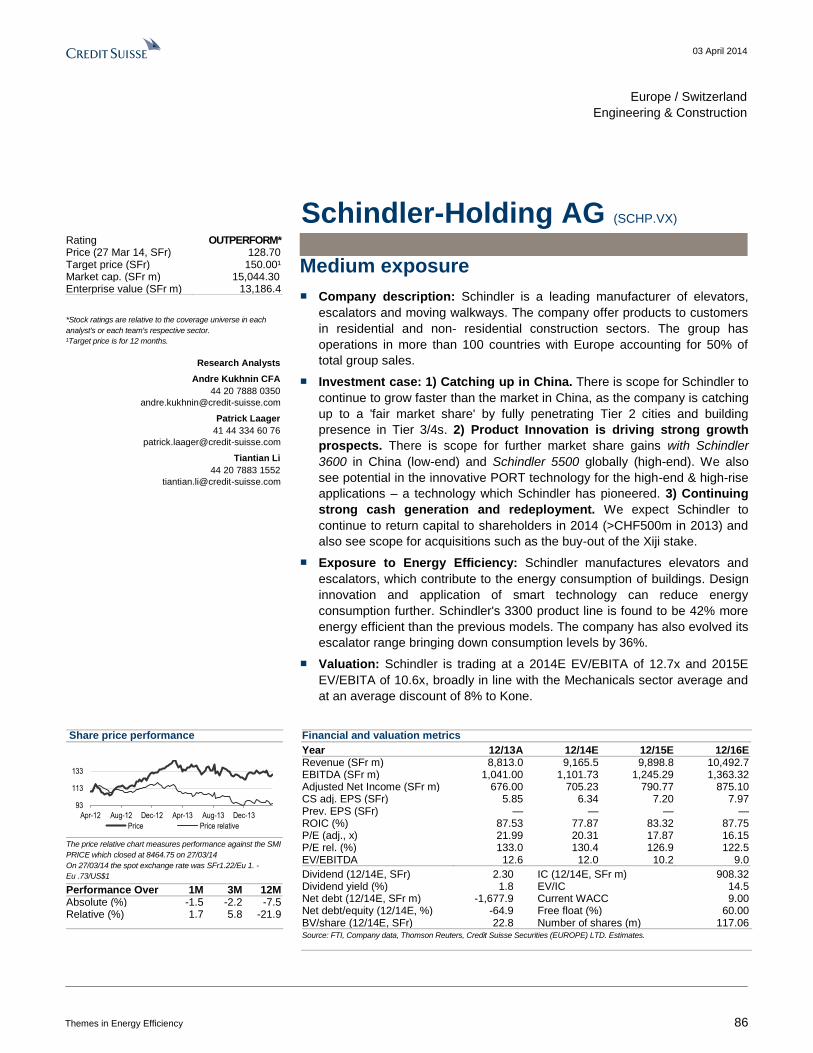
03 April 2014
Themes in Energy Efficiency 86
Europe / Switzerland
Engineering & Construction
Schindler-Holding AG (SCHP.VX)
Medium exposure
■ Company description: Schindler is a leading manufacturer of elevators,
escalators and moving walkways. The company offer products to customers
in residential and non- residential construction sectors. The group has
operations in more than 100 countries with Europe accounting for 50% of
total group sales.
■ Investment case: 1) Catching up in China. There is scope for Schindler to
continue to grow faster than the market in China, as the company is catching
up to a 'fair market share' by fully penetrating Tier 2 cities and building
presence in Tier 3/4s. 2) Product Innovation is driving strong growth
prospects. There is scope for further market share gains with Schindler
3600 in China (low-end) and Schindler 5500 globally (high-end). We also
see potential in the innovative PORT technology for the high-end & high-rise
applications – a technology which Schindler has pioneered. 3) Continuing
strong cash generation and redeployment. We expect Schindler to
continue to return capital to shareholders in 2014 (>CHF500m in 2013) and
also see scope for acquisitions such as the buy-out of the Xiji stake.
■ Exposure to Energy Efficiency: Schindler manufactures elevators and
escalators, which contribute to the energy consumption of buildings. Design
innovation and application of smart technology can reduce energy
consumption further. Schindler's 3300 product line is found to be 42% more
energy efficient than the previous models. The company has also evolved its
escalator range bringing down consumption levels by 36%.
■ Valuation: Schindler is trading at a 2014E EV/EBITA of 12.7x and 2015E
EV/EBITA of 10.6x, broadly in line with the Mechanicals sector average and
at an average discount of 8% to Kone.
Share price performance
93
113
133
Apr-12 Aug-12 Dec-12 Apr-13 Aug-13 Dec-13
Price Price relative
The price relative chart measures performance against the SMI
PRICE which closed at 8464.75 on 27/03/14
On 27/03/14 the spot exchange rate was SFr1.22/Eu 1. -
Eu .73/US$1
Performance Over 1M 3M 12M Absolute (%) -1.5 -2.2 -7.5 Relative (%) 1.7 5.8 -21.9
Financial and valuation metrics
Year 12/13A 12/14E 12/15E 12/16E Revenue (SFr m) 8,813.0 9,165.5 9,898.8 10,492.7 EBITDA (SFr m) 1,041.00 1,101.73 1,245.29 1,363.32 Adjusted Net Income (SFr m) 676.00 705.23 790.77 875.10 CS adj. EPS (SFr) 5.85 6.34 7.20 7.97 Prev. EPS (SFr) — — — — ROIC (%) 87.53 77.87 83.32 87.75 P/E (adj., x) 21.99 20.31 17.87 16.15 P/E rel. (%) 133.0 130.4 126.9 122.5 EV/EBITDA 12.6 12.0 10.2 9.0
Dividend (12/14E, SFr) 2.30 IC (12/14E, SFr m) 908.32 Dividend yield (%) 1.8 EV/IC 14.5 Net debt (12/14E, SFr m) -1,677.9 Current WACC 9.00 Net debt/equity (12/14E, %) -64.9 Free float (%) 60.00 BV/share (12/14E, SFr) 22.8 Number of shares (m) 117.06
Source: FTI, Company data, Thomson Reuters, Credit Suisse Securities (EUROPE) LTD. Estimates.
Rating OUTPERFORM* Price (27 Mar 14, SFr) 128.70 Target price (SFr) 150.00¹ Market cap. (SFr m) 15,044.30 Enterprise value (SFr m) 13,186.4
*Stock ratings are relative to the coverage universe in each
analyst's or each team's respective sector.
¹Target price is for 12 months.
Research Analysts
Andre Kukhnin CFA
44 20 7888 0350
Patrick Laager
41 44 334 60 76
Tiantian Li
44 20 7883 1552
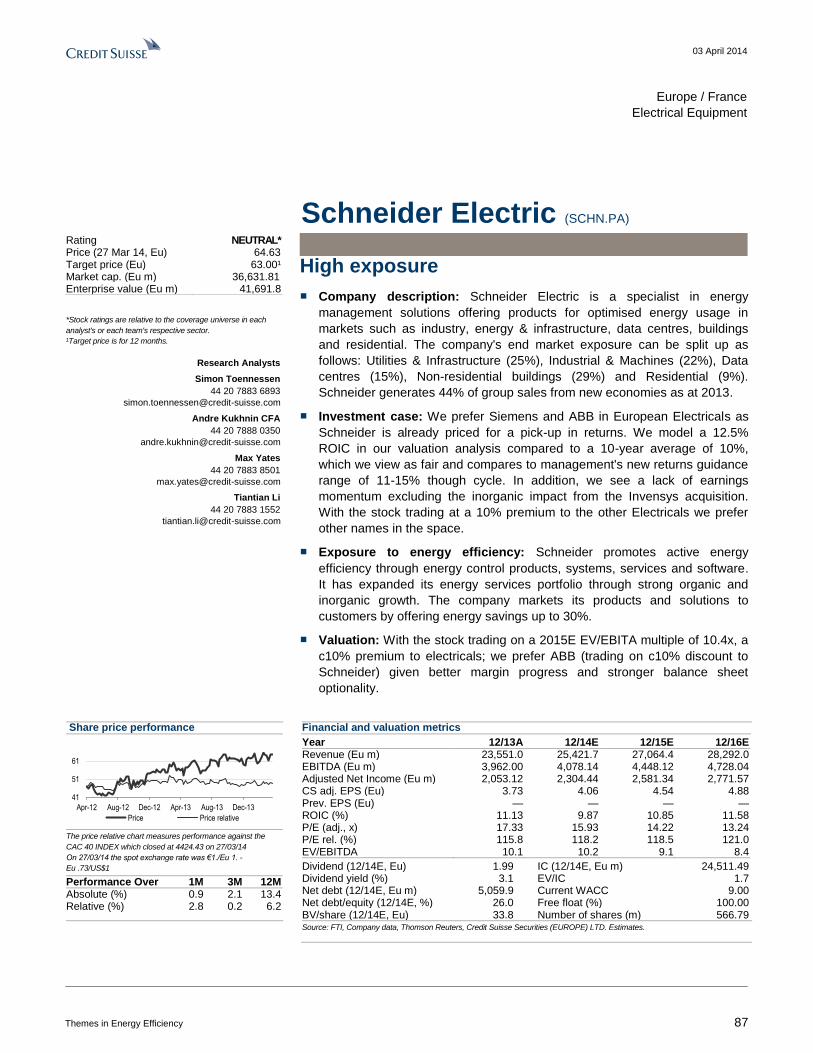
03 April 2014
Themes in Energy Efficiency 87
Europe / France
Electrical Equipment
Schneider Electric (SCHN.PA)
High exposure
■ Company description: Schneider Electric is a specialist in energy
management solutions offering products for optimised energy usage in
markets such as industry, energy & infrastructure, data centres, buildings
and residential. The company's end market exposure can be split up as
follows: Utilities & Infrastructure (25%), Industrial & Machines (22%), Data
centres (15%), Non-residential buildings (29%) and Residential (9%).
Schneider generates 44% of group sales from new economies as at 2013.
■ Investment case: We prefer Siemens and ABB in European Electricals as
Schneider is already priced for a pick-up in returns. We model a 12.5%
ROIC in our valuation analysis compared to a 10-year average of 10%,
which we view as fair and compares to management's new returns guidance
range of 11-15% though cycle. In addition, we see a lack of earnings
momentum excluding the inorganic impact from the Invensys acquisition.
With the stock trading at a 10% premium to the other Electricals we prefer
other names in the space.
■ Exposure to energy efficiency: Schneider promotes active energy
efficiency through energy control products, systems, services and software.
It has expanded its energy services portfolio through strong organic and
inorganic growth. The company markets its products and solutions to
customers by offering energy savings up to 30%.
■ Valuation: With the stock trading on a 2015E EV/EBITA multiple of 10.4x, a
c10% premium to electricals; we prefer ABB (trading on c10% discount to
Schneider) given better margin progress and stronger balance sheet
optionality.
Share price performance
41
51
61
Apr-12 Aug-12 Dec-12 Apr-13 Aug-13 Dec-13
Price Price relative
The price relative chart measures performance against the
CAC 40 INDEX which closed at 4424.43 on 27/03/14
On 27/03/14 the spot exchange rate was €1./Eu 1. -
Eu .73/US$1
Performance Over 1M 3M 12M Absolute (%) 0.9 2.1 13.4 Relative (%) 2.8 0.2 6.2
Financial and valuation metrics
Year 12/13A 12/14E 12/15E 12/16E Revenue (Eu m) 23,551.0 25,421.7 27,064.4 28,292.0 EBITDA (Eu m) 3,962.00 4,078.14 4,448.12 4,728.04 Adjusted Net Income (Eu m) 2,053.12 2,304.44 2,581.34 2,771.57 CS adj. EPS (Eu) 3.73 4.06 4.54 4.88 Prev. EPS (Eu) — — — — ROIC (%) 11.13 9.87 10.85 11.58 P/E (adj., x) 17.33 15.93 14.22 13.24 P/E rel. (%) 115.8 118.2 118.5 121.0 EV/EBITDA 10.1 10.2 9.1 8.4
Dividend (12/14E, Eu) 1.99 IC (12/14E, Eu m) 24,511.49 Dividend yield (%) 3.1 EV/IC 1.7 Net debt (12/14E, Eu m) 5,059.9 Current WACC 9.00 Net debt/equity (12/14E, %) 26.0 Free float (%) 100.00 BV/share (12/14E, Eu) 33.8 Number of shares (m) 566.79
Source: FTI, Company data, Thomson Reuters, Credit Suisse Securities (EUROPE) LTD. Estimates.
Rating NEUTRAL* Price (27 Mar 14, Eu) 64.63 Target price (Eu) 63.00¹ Market cap. (Eu m) 36,631.81 Enterprise value (Eu m) 41,691.8
*Stock ratings are relative to the coverage universe in each
analyst's or each team's respective sector.
¹Target price is for 12 months.
Research Analysts
Simon Toennessen
44 20 7883 6893
Andre Kukhnin CFA
44 20 7888 0350
Max Yates
44 20 7883 8501
Tiantian Li
44 20 7883 1552
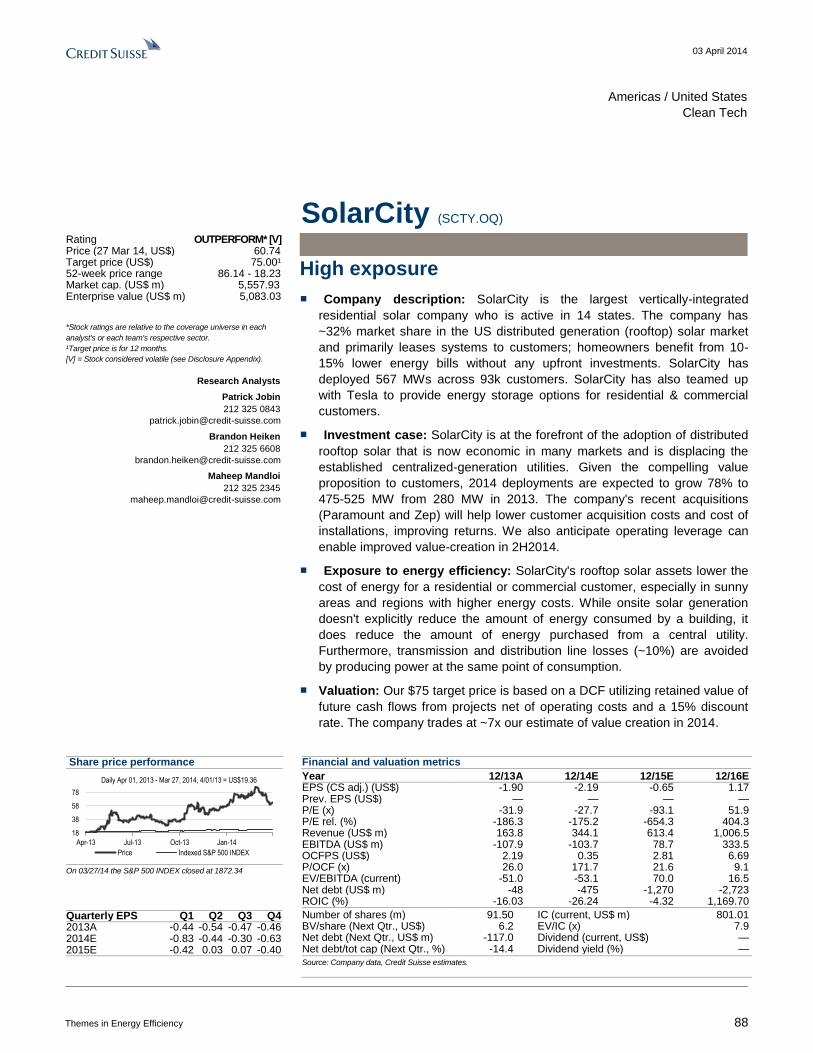
03 April 2014
Themes in Energy Efficiency 88
Americas / United States
Clean Tech
SolarCity (SCTY.OQ)
High exposure
■ Company description: SolarCity is the largest vertically-integrated
residential solar company who is active in 14 states. The company has
~32% market share in the US distributed generation (rooftop) solar market
and primarily leases systems to customers; homeowners benefit from 10-
15% lower energy bills without any upfront investments. SolarCity has
deployed 567 MWs across 93k customers. SolarCity has also teamed up
with Tesla to provide energy storage options for residential & commercial
customers.
■ Investment case: SolarCity is at the forefront of the adoption of distributed
rooftop solar that is now economic in many markets and is displacing the
established centralized-generation utilities. Given the compelling value
proposition to customers, 2014 deployments are expected to grow 78% to
475-525 MW from 280 MW in 2013. The company's recent acquisitions
(Paramount and Zep) will help lower customer acquisition costs and cost of
installations, improving returns. We also anticipate operating leverage can
enable improved value-creation in 2H2014.
■ Exposure to energy efficiency: SolarCity's rooftop solar assets lower the
cost of energy for a residential or commercial customer, especially in sunny
areas and regions with higher energy costs. While onsite solar generation
doesn't explicitly reduce the amount of energy consumed by a building, it
does reduce the amount of energy purchased from a central utility.
Furthermore, transmission and distribution line losses (~10%) are avoided
by producing power at the same point of consumption.
■ Valuation: Our $75 target price is based on a DCF utilizing retained value of
future cash flows from projects net of operating costs and a 15% discount
rate. The company trades at ~7x our estimate of value creation in 2014.
Share price performance
18
38
58
78
Apr-13 Jul-13 Oct-13 Jan-14
Daily Apr 01, 2013 - Mar 27, 2014, 4/01/13 = US$19.36
Price Indexed S&P 500 INDEX
On 03/27/14 the S&P 500 INDEX closed at 1872.34
Quarterly EPS Q1 Q2 Q3 Q4 2013A -0.44 -0.54 -0.47 -0.46 2014E -0.83 -0.44 -0.30 -0.63 2015E -0.42 0.03 0.07 -0.40
Financial and valuation metrics
Year 12/13A 12/14E 12/15E 12/16E EPS (CS adj.) (US$) -1.90 -2.19 -0.65 1.17 Prev. EPS (US$) — — — — P/E (x) -31.9 -27.7 -93.1 51.9 P/E rel. (%) -186.3 -175.2 -654.3 404.3 Revenue (US$ m) 163.8 344.1 613.4 1,006.5 EBITDA (US$ m) -107.9 -103.7 78.7 333.5 OCFPS (US$) 2.19 0.35 2.81 6.69 P/OCF (x) 26.0 171.7 21.6 9.1 EV/EBITDA (current) -51.0 -53.1 70.0 16.5 Net debt (US$ m) -48 -475 -1,270 -2,723 ROIC (%) -16.03 -26.24 -4.32 1,169.70
Number of shares (m) 91.50 IC (current, US$ m) 801.01 BV/share (Next Qtr., US$) 6.2 EV/IC (x) 7.9 Net debt (Next Qtr., US$ m) -117.0 Dividend (current, US$) — Net debt/tot cap (Next Qtr., %) -14.4 Dividend yield (%) —
Source: Company data, Credit Suisse estimates.
Rating OUTPERFORM* [V] Price (27 Mar 14, US$) 60.74 Target price (US$) 75.00¹ 52-week price range 86.14 - 18.23 Market cap. (US$ m) 5,557.93 Enterprise value (US$ m) 5,083.03
*Stock ratings are relative to the coverage universe in each
analyst's or each team's respective sector.
¹Target price is for 12 months.
[V] = Stock considered volatile (see Disclosure Appendix).
Research Analysts
Patrick Jobin
212 325 0843
Brandon Heiken
212 325 6608
Maheep Mandloi
212 325 2345
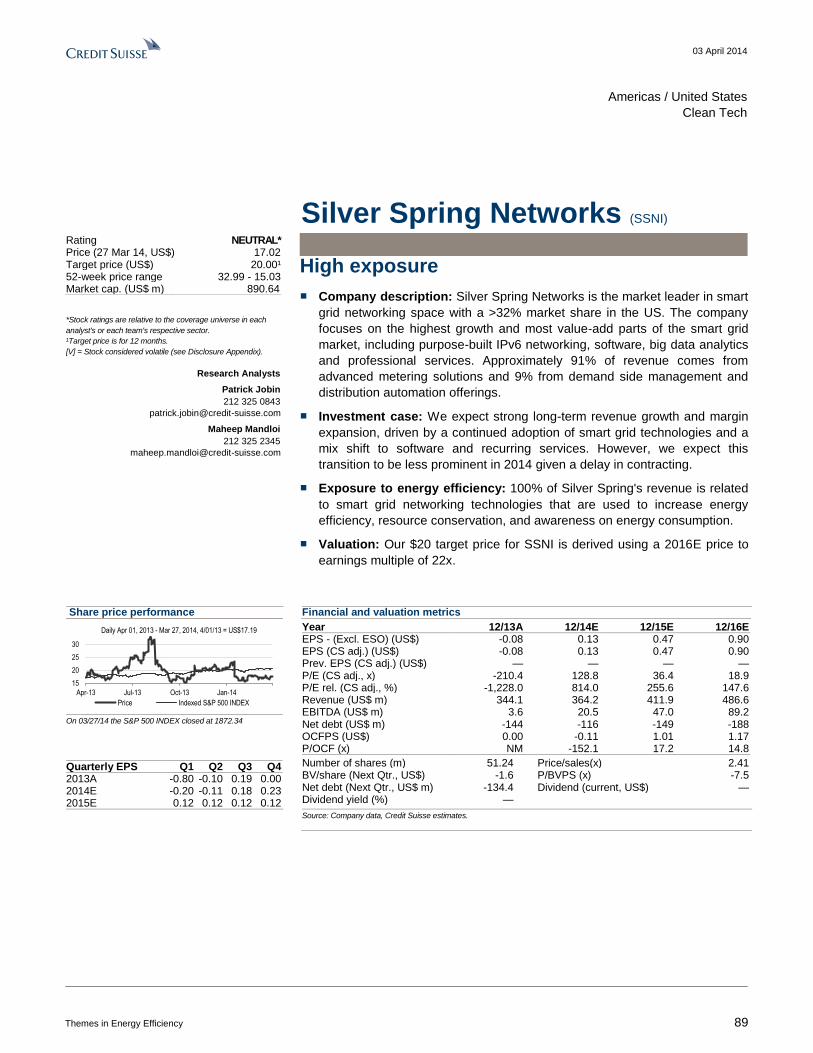
03 April 2014
Themes in Energy Efficiency 89
Americas / United States
Clean Tech
Silver Spring Networks (SSNI)
High exposure
■ Company description: Silver Spring Networks is the market leader in smart
grid networking space with a >32% market share in the US. The company
focuses on the highest growth and most value-add parts of the smart grid
market, including purpose-built IPv6 networking, software, big data analytics
and professional services. Approximately 91% of revenue comes from
advanced metering solutions and 9% from demand side management and
distribution automation offerings.
■ Investment case: We expect strong long-term revenue growth and margin
expansion, driven by a continued adoption of smart grid technologies and a
mix shift to software and recurring services. However, we expect this
transition to be less prominent in 2014 given a delay in contracting.
■ Exposure to energy efficiency: 100% of Silver Spring's revenue is related
to smart grid networking technologies that are used to increase energy
efficiency, resource conservation, and awareness on energy consumption.
■ Valuation: Our $20 target price for SSNI is derived using a 2016E price to
earnings multiple of 22x.
Share price performance
15
20
25
30
Apr-13 Jul-13 Oct-13 Jan-14
Daily Apr 01, 2013 - Mar 27, 2014, 4/01/13 = US$17.19
Price Indexed S&P 500 INDEX
On 03/27/14 the S&P 500 INDEX closed at 1872.34
Quarterly EPS Q1 Q2 Q3 Q4 2013A -0.80 -0.10 0.19 0.00 2014E -0.20 -0.11 0.18 0.23 2015E 0.12 0.12 0.12 0.12
Financial and valuation metrics
Year 12/13A 12/14E 12/15E 12/16E EPS - (Excl. ESO) (US$) -0.08 0.13 0.47 0.90 EPS (CS adj.) (US$) -0.08 0.13 0.47 0.90 Prev. EPS (CS adj.) (US$) — — — — P/E (CS adj., x) -210.4 128.8 36.4 18.9 P/E rel. (CS adj., %) -1,228.0 814.0 255.6 147.6 Revenue (US$ m) 344.1 364.2 411.9 486.6 EBITDA (US$ m) 3.6 20.5 47.0 89.2 Net debt (US$ m) -144 -116 -149 -188 OCFPS (US$) 0.00 -0.11 1.01 1.17 P/OCF (x) NM -152.1 17.2 14.8
Number of shares (m) 51.24 Price/sales(x) 2.41 BV/share (Next Qtr., US$) -1.6 P/BVPS (x) -7.5 Net debt (Next Qtr., US$ m) -134.4 Dividend (current, US$) — Dividend yield (%) —
Source: Company data, Credit Suisse estimates.
Rating NEUTRAL* Price (27 Mar 14, US$) 17.02 Target price (US$) 20.00¹ 52-week price range 32.99 - 15.03 Market cap. (US$ m) 890.64
*Stock ratings are relative to the coverage universe in each
analyst's or each team's respective sector.
¹Target price is for 12 months.
[V] = Stock considered volatile (see Disclosure Appendix).
Research Analysts
Patrick Jobin
212 325 0843
Maheep Mandloi
212 325 2345
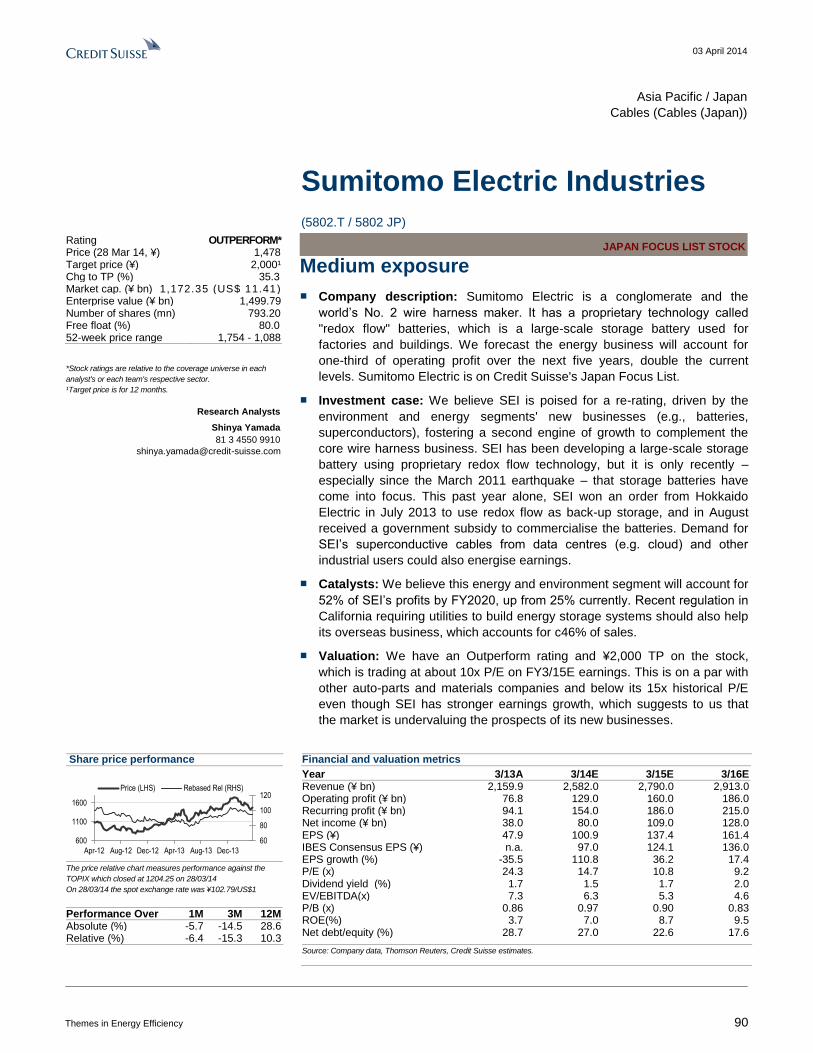
03 April 2014
Themes in Energy Efficiency 90
Asia Pacific / Japan
Cables (Cables (Japan))
Sumitomo Electric Industries
(5802.T / 5802 JP) JAPAN FOCUS LIST STOCK
Medium exposure
■ Company description: Sumitomo Electric is a conglomerate and the
world’s No. 2 wire harness maker. It has a proprietary technology called
"redox flow" batteries, which is a large-scale storage battery used for
factories and buildings. We forecast the energy business will account for
one-third of operating profit over the next five years, double the current
levels. Sumitomo Electric is on Credit Suisse's Japan Focus List.
■ Investment case: We believe SEI is poised for a re-rating, driven by the
environment and energy segments' new businesses (e.g., batteries,
superconductors), fostering a second engine of growth to complement the
core wire harness business. SEI has been developing a large-scale storage
battery using proprietary redox flow technology, but it is only recently –
especially since the March 2011 earthquake – that storage batteries have
come into focus. This past year alone, SEI won an order from Hokkaido
Electric in July 2013 to use redox flow as back-up storage, and in August
received a government subsidy to commercialise the batteries. Demand for
SEI’s superconductive cables from data centres (e.g. cloud) and other
industrial users could also energise earnings.
■ Catalysts: We believe this energy and environment segment will account for
52% of SEI’s profits by FY2020, up from 25% currently. Recent regulation in
California requiring utilities to build energy storage systems should also help
its overseas business, which accounts for c46% of sales.
■ Valuation: We have an Outperform rating and ¥2,000 TP on the stock,
which is trading at about 10x P/E on FY3/15E earnings. This is on a par with
other auto-parts and materials companies and below its 15x historical P/E
even though SEI has stronger earnings growth, which suggests to us that
the market is undervaluing the prospects of its new businesses.
Share price performance
60
80
100
120
600
1100
1600
Apr-12 Aug-12 Dec-12 Apr-13 Aug-13 Dec-13
Price (LHS) Rebased Rel (RHS)
The price relative chart measures performance against the
TOPIX which closed at 1204.25 on 28/03/14
On 28/03/14 the spot exchange rate was ¥102.79/US$1
Performance Over 1M 3M 12M Absolute (%) -5.7 -14.5 28.6 Relative (%) -6.4 -15.3 10.3
Financial and valuation metrics
Year 3/13A 3/14E 3/15E 3/16E Revenue (¥ bn) 2,159.9 2,582.0 2,790.0 2,913.0 Operating profit (¥ bn) 76.8 129.0 160.0 186.0 Recurring profit (¥ bn) 94.1 154.0 186.0 215.0 Net income (¥ bn) 38.0 80.0 109.0 128.0 EPS (¥) 47.9 100.9 137.4 161.4 IBES Consensus EPS (¥) n.a. 97.0 124.1 136.0 EPS growth (%) -35.5 110.8 36.2 17.4 P/E (x) 24.3 14.7 10.8 9.2 Dividend yield (%) 1.7 1.5 1.7 2.0 EV/EBITDA(x) 7.3 6.3 5.3 4.6 P/B (x) 0.86 0.97 0.90 0.83 ROE(%) 3.7 7.0 8.7 9.5 Net debt/equity (%) 28.7 27.0 22.6 17.6
Source: Company data, Thomson Reuters, Credit Suisse estimates.
Rating OUTPERFORM* Price (28 Mar 14, ¥) 1,478 Target price (¥) 2,000¹ Chg to TP (%) 35.3 Market cap. (¥ bn) 1,172.35 (US$ 11.41) Enterprise value (¥ bn) 1,499.79 Number of shares (mn) 793.20 Free float (%) 80.0 52-week price range 1,754 - 1,088
*Stock ratings are relative to the coverage universe in each
analyst's or each team's respective sector.
¹Target price is for 12 months.
Research Analysts
Shinya Yamada
81 3 4550 9910
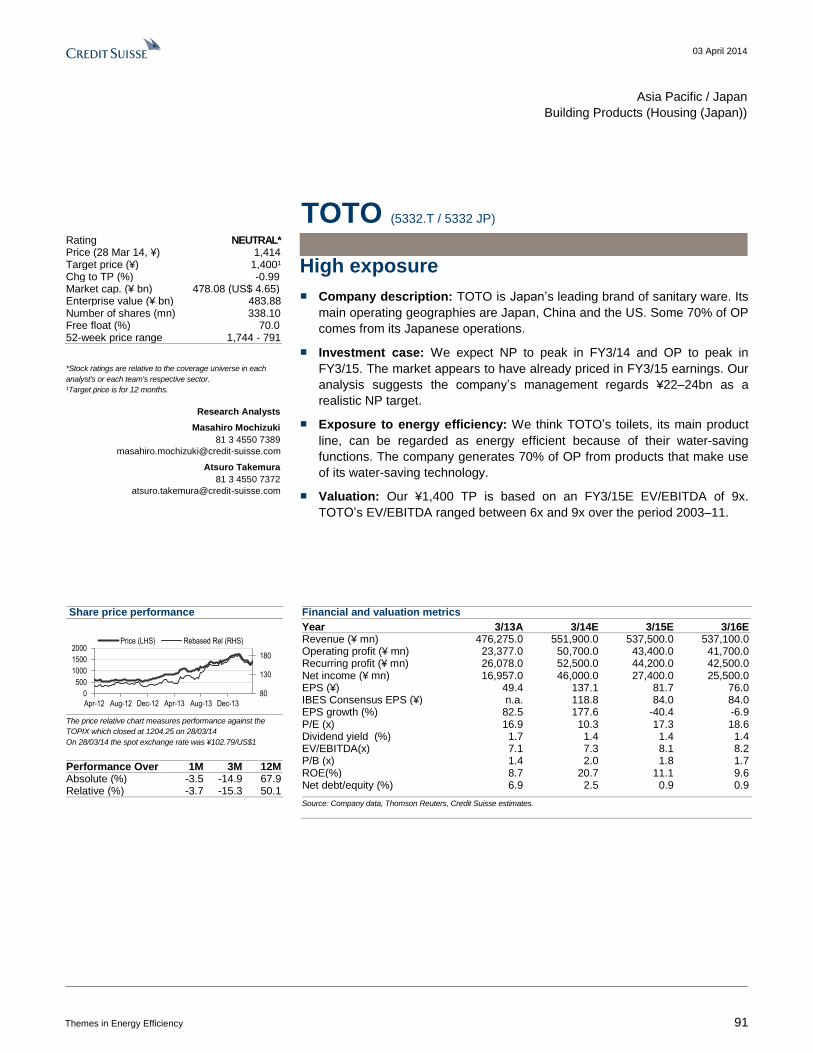
03 April 2014
Themes in Energy Efficiency 91
Asia Pacific / Japan
Building Products (Housing (Japan))
TOTO (5332.T / 5332 JP)
High exposure
■ Company description: TOTO is Japan’s leading brand of sanitary ware. Its
main operating geographies are Japan, China and the US. Some 70% of OP
comes from its Japanese operations.
■ Investment case: We expect NP to peak in FY3/14 and OP to peak in
FY3/15. The market appears to have already priced in FY3/15 earnings. Our
analysis suggests the company’s management regards ¥22–24bn as a
realistic NP target.
■ Exposure to energy efficiency: We think TOTO’s toilets, its main product
line, can be regarded as energy efficient because of their water-saving
functions. The company generates 70% of OP from products that make use
of its water-saving technology.
■ Valuation: Our ¥1,400 TP is based on an FY3/15E EV/EBITDA of 9x.
TOTO’s EV/EBITDA ranged between 6x and 9x over the period 2003–11.
Share price performance
80
130
180
0
500
1000
1500
2000
Apr-12 Aug-12 Dec-12 Apr-13 Aug-13 Dec-13
Price (LHS) Rebased Rel (RHS)
The price relative chart measures performance against the
TOPIX which closed at 1204.25 on 28/03/14
On 28/03/14 the spot exchange rate was ¥102.79/US$1
Performance Over 1M 3M 12M Absolute (%) -3.5 -14.9 67.9 Relative (%) -3.7 -15.3 50.1
Financial and valuation metrics
Year 3/13A 3/14E 3/15E 3/16E Revenue (¥ mn) 476,275.0 551,900.0 537,500.0 537,100.0 Operating profit (¥ mn) 23,377.0 50,700.0 43,400.0 41,700.0 Recurring profit (¥ mn) 26,078.0 52,500.0 44,200.0 42,500.0 Net income (¥ mn) 16,957.0 46,000.0 27,400.0 25,500.0 EPS (¥) 49.4 137.1 81.7 76.0 IBES Consensus EPS (¥) n.a. 118.8 84.0 84.0 EPS growth (%) 82.5 177.6 -40.4 -6.9 P/E (x) 16.9 10.3 17.3 18.6 Dividend yield (%) 1.7 1.4 1.4 1.4 EV/EBITDA(x) 7.1 7.3 8.1 8.2 P/B (x) 1.4 2.0 1.8 1.7 ROE(%) 8.7 20.7 11.1 9.6 Net debt/equity (%) 6.9 2.5 0.9 0.9
Source: Company data, Thomson Reuters, Credit Suisse estimates.
Rating NEUTRAL* Price (28 Mar 14, ¥) 1,414 Target price (¥) 1,400¹ Chg to TP (%) -0.99 Market cap. (¥ bn) 478.08 (US$ 4.65) Enterprise value (¥ bn) 483.88 Number of shares (mn) 338.10 Free float (%) 70.0 52-week price range 1,744 - 791
*Stock ratings are relative to the coverage universe in each
analyst's or each team's respective sector.
¹Target price is for 12 months.
Research Analysts
Masahiro Mochizuki
81 3 4550 7389
Atsuro Takemura
81 3 4550 7372

03 April 2014
Themes in Energy Efficiency 92
Asia Pacific / Japan
Glass & Ceramics (Glass & Ceramics (Japan))
Toyo Tanso (5310.T / 5310 JP)
High exposure
■ Company description: Toyo Tanso is a specialty carbon material
manufacturer, with sales for various client industries such as solar, LED and
general industrial applications.
■ Investment case: We rate it Outperform. Results for FY12/13, an irregular,
seven-month fiscal year, showed sustained growth for orders and the start of
an uptrend for sales of special carbon products for certain client industries.
■ Exposure to energy efficiency: We continue to believe the company’s
strengths are about to shine. We estimate marginal profit at better than 50%,
allowing robust earnings growth when sales are rising. Toyo Tanso is a
maker of specialty graphite products used as consumables in the production
of solar-use polycrystalline as well as LEDs.
■ Valuation: Our ¥2,500 TP uses FY12/14E BPS of ¥2,827 (¥2,795
previously) and P/B of 0.88x, the average since 2009 less one standard
deviation.
Share price performance
20
70
120
0
1000
2000
3000
4000
Apr-12 Aug-12 Dec-12 Apr-13 Aug-13 Dec-13
Price (LHS) Rebased Rel (RHS)
The price relative chart measures performance against the
TOPIX which closed at 1204.25 on 28/03/14
On 28/03/14 the spot exchange rate was ¥102.79/US$1
Performance Over 1M 3M 12M Absolute (%) 4.5 13.3 -1.5 Relative (%) 7.6 21.3 -15.9
Financial and valuation metrics
Year 12/13A 12/14E 12/15E 12/16E Revenue (¥ bn) 20.5 34.7 38.5 41.2 Operating profit (¥ bn) 1.0 3.7 4.9 6.3 Recurring profit (¥ bn) 1.3 3.5 4.7 6.1 Net income (¥ bn) -0.1 2.3 3.0 3.8 EPS (¥) -5.4 110.9 142.3 183.3 Change from previous EPS (%) n.a. 0 0 0 IBES Consensus EPS (¥) n.a. 79.6 114.5 142.3 EPS growth (%) n.a. n.a. 28.3 28.8 P/E (x) -371.3 20.5 15.9 12.4 Dividend yield (%) 0.6 1.0 1.1 1.4 EV/EBITDA(x) 12.5 6.1 5.1 3.9 P/B (x) 0.73 0.80 0.77 0.73 ROE(%) -0.2 4.0 4.9 6.1 Net debt/equity (%) net cash net cash net cash net cash
Source: Company data, Thomson Reuters, Credit Suisse estimates.
Rating OUTPERFORM* Price (28 Mar 14, ¥) 2,269 Target price (¥) 2,500¹ Chg to TP (%) 10.2 Market cap. (¥ bn) 47.05 (US$ 0.46) Enterprise value (¥ bn) 44.72 Number of shares (mn) 20.73 Free float (%) 50.0 52-week price range 2,397 - 1,457
*Stock ratings are relative to the coverage universe in each
analyst's or each team's respective sector.
¹Target price is for 12 months.
[V] = Stock considered volatile (see Disclosure Appendix).
Research Analysts
Jun Yamaguchi
81 3 4550 9789
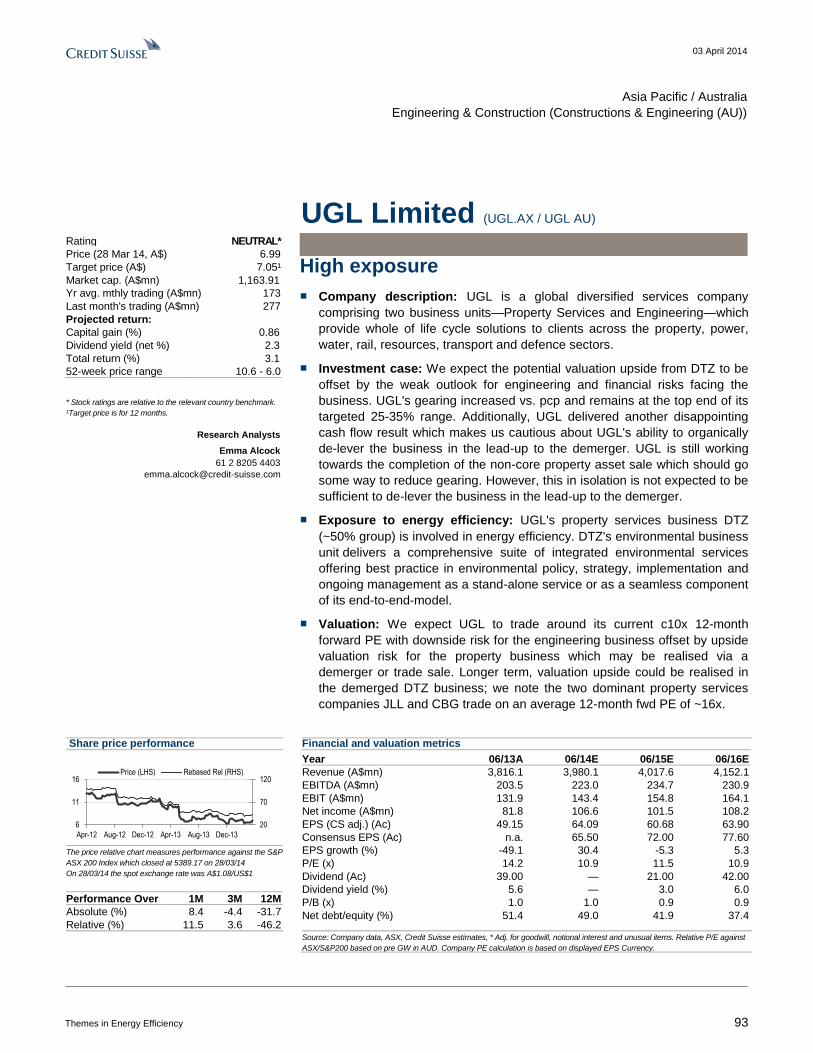
03 April 2014
Themes in Energy Efficiency 93
Asia Pacific / Australia
Engineering & Construction (Constructions & Engineering (AU))
UGL Limited (UGL.AX / UGL AU)
High exposure
■ Company description: UGL is a global diversified services company
comprising two business units—Property Services and Engineering—which
provide whole of life cycle solutions to clients across the property, power,
water, rail, resources, transport and defence sectors.
■ Investment case: We expect the potential valuation upside from DTZ to be
offset by the weak outlook for engineering and financial risks facing the
business. UGL's gearing increased vs. pcp and remains at the top end of its
targeted 25-35% range. Additionally, UGL delivered another disappointing
cash flow result which makes us cautious about UGL's ability to organically
de-lever the business in the lead-up to the demerger. UGL is still working
towards the completion of the non-core property asset sale which should go
some way to reduce gearing. However, this in isolation is not expected to be
sufficient to de-lever the business in the lead-up to the demerger.
■ Exposure to energy efficiency: UGL's property services business DTZ
(~50% group) is involved in energy efficiency. DTZ's environmental business
unit delivers a comprehensive suite of integrated environmental services
offering best practice in environmental policy, strategy, implementation and
ongoing management as a stand-alone service or as a seamless component
of its end-to-end-model.
■ Valuation: We expect UGL to trade around its current c10x 12-month
forward PE with downside risk for the engineering business offset by upside
valuation risk for the property business which may be realised via a
demerger or trade sale. Longer term, valuation upside could be realised in
the demerged DTZ business; we note the two dominant property services
companies JLL and CBG trade on an average 12-month fwd PE of ~16x.
Share price performance
20
70
120
6
11
16
Apr-12 Aug-12 Dec-12 Apr-13 Aug-13 Dec-13
Price (LHS) Rebased Rel (RHS)
The price relative chart measures performance against the S&P
ASX 200 Index which closed at 5389.17 on 28/03/14
On 28/03/14 the spot exchange rate was A$1.08/US$1
Performance Over 1M 3M 12M
Absolute (%) 8.4 -4.4 -31.7
Relative (%) 11.5 3.6 -46.2
Financial and valuation metrics
Year 06/13A 06/14E 06/15E 06/16E
Revenue (A$mn) 3,816.1 3,980.1 4,017.6 4,152.1
EBITDA (A$mn) 203.5 223.0 234.7 230.9
EBIT (A$mn) 131.9 143.4 154.8 164.1
Net income (A$mn) 81.8 106.6 101.5 108.2
EPS (CS adj.) (Ac) 49.15 64.09 60.68 63.90
Consensus EPS (Ac) n.a. 65.50 72.00 77.60
EPS growth (%) -49.1 30.4 -5.3 5.3
P/E (x) 14.2 10.9 11.5 10.9
Dividend (Ac) 39.00 — 21.00 42.00
Dividend yield (%) 5.6 — 3.0 6.0
P/B (x) 1.0 1.0 0.9 0.9
Net debt/equity (%) 51.4 49.0 41.9 37.4
Source: Company data, ASX, Credit Suisse estimates, * Adj. for goodwill, notional interest and unusual items. Relative P/E against
ASX/S&P200 based on pre GW in AUD. Company PE calculation is based on displayed EPS Currency.
Rating NEUTRAL*
Price (28 Mar 14, A$) 6.99
Target price (A$) 7.05¹
Market cap. (A$mn) 1,163.91
Yr avg. mthly trading (A$mn) 173
Last month's trading (A$mn) 277
Projected return:
Capital gain (%) 0.86
Dividend yield (net %) 2.3
Total return (%) 3.1
52-week price range 10.6 - 6.0
* Stock ratings are relative to the relevant country benchmark.
¹Target price is for 12 months.
Research Analysts
Emma Alcock
61 2 8205 4403
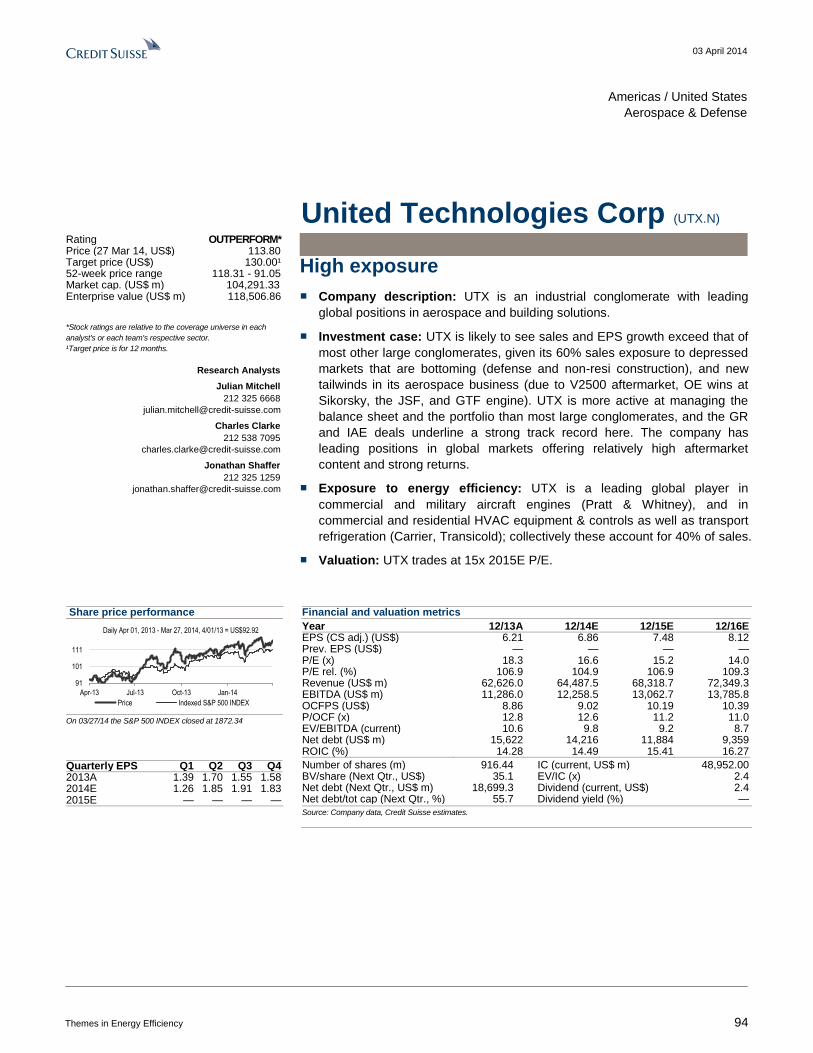
03 April 2014
Themes in Energy Efficiency 94
Americas / United States
Aerospace & Defense
United Technologies Corp (UTX.N)
High exposure
■ Company description: UTX is an industrial conglomerate with leading
global positions in aerospace and building solutions.
■ Investment case: UTX is likely to see sales and EPS growth exceed that of
most other large conglomerates, given its 60% sales exposure to depressed
markets that are bottoming (defense and non-resi construction), and new
tailwinds in its aerospace business (due to V2500 aftermarket, OE wins at
Sikorsky, the JSF, and GTF engine). UTX is more active at managing the
balance sheet and the portfolio than most large conglomerates, and the GR
and IAE deals underline a strong track record here. The company has
leading positions in global markets offering relatively high aftermarket
content and strong returns.
■ Exposure to energy efficiency: UTX is a leading global player in
commercial and military aircraft engines (Pratt & Whitney), and in
commercial and residential HVAC equipment & controls as well as transport
refrigeration (Carrier, Transicold); collectively these account for 40% of sales.
■ Valuation: UTX trades at 15x 2015E P/E.
Share price performance
91
101
111
Apr-13 Jul-13 Oct-13 Jan-14
Daily Apr 01, 2013 - Mar 27, 2014, 4/01/13 = US$92.92
Price Indexed S&P 500 INDEX
On 03/27/14 the S&P 500 INDEX closed at 1872.34
Quarterly EPS Q1 Q2 Q3 Q4 2013A 1.39 1.70 1.55 1.58 2014E 1.26 1.85 1.91 1.83 2015E — — — —
Financial and valuation metrics
Year 12/13A 12/14E 12/15E 12/16E EPS (CS adj.) (US$) 6.21 6.86 7.48 8.12 Prev. EPS (US$) — — — — P/E (x) 18.3 16.6 15.2 14.0 P/E rel. (%) 106.9 104.9 106.9 109.3 Revenue (US$ m) 62,626.0 64,487.5 68,318.7 72,349.3 EBITDA (US$ m) 11,286.0 12,258.5 13,062.7 13,785.8 OCFPS (US$) 8.86 9.02 10.19 10.39 P/OCF (x) 12.8 12.6 11.2 11.0 EV/EBITDA (current) 10.6 9.8 9.2 8.7 Net debt (US$ m) 15,622 14,216 11,884 9,359 ROIC (%) 14.28 14.49 15.41 16.27
Number of shares (m) 916.44 IC (current, US$ m) 48,952.00 BV/share (Next Qtr., US$) 35.1 EV/IC (x) 2.4 Net debt (Next Qtr., US$ m) 18,699.3 Dividend (current, US$) 2.4 Net debt/tot cap (Next Qtr., %) 55.7 Dividend yield (%) —
Source: Company data, Credit Suisse estimates.
Rating OUTPERFORM* Price (27 Mar 14, US$) 113.80 Target price (US$) 130.00¹ 52-week price range 118.31 - 91.05 Market cap. (US$ m) 104,291.33 Enterprise value (US$ m) 118,506.86
*Stock ratings are relative to the coverage universe in each
analyst's or each team's respective sector.
¹Target price is for 12 months.
Research Analysts
Julian Mitchell
212 325 6668
Charles Clarke
212 538 7095
Jonathan Shaffer
212 325 1259
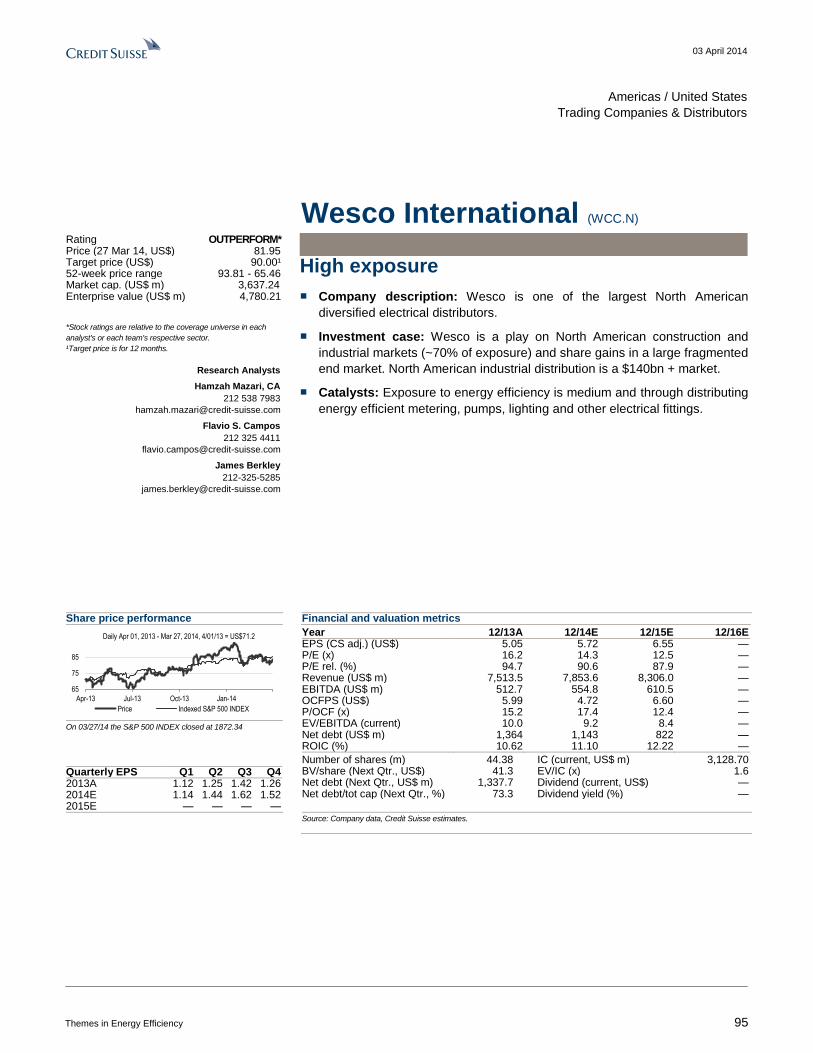
03 April 2014
Themes in Energy Efficiency 95
Americas / United States
Trading Companies & Distributors
Wesco International (WCC.N)
High exposure
■ Company description: Wesco is one of the largest North American
diversified electrical distributors.
■ Investment case: Wesco is a play on North American construction and
industrial markets (~70% of exposure) and share gains in a large fragmented
end market. North American industrial distribution is a $140bn + market.
■ Catalysts: Exposure to energy efficiency is medium and through distributing
energy efficient metering, pumps, lighting and other electrical fittings.
Share price performance
65
75
85
Apr-13 Jul-13 Oct-13 Jan-14
Daily Apr 01, 2013 - Mar 27, 2014, 4/01/13 = US$71.2
Price Indexed S&P 500 INDEX
On 03/27/14 the S&P 500 INDEX closed at 1872.34
Quarterly EPS Q1 Q2 Q3 Q4 2013A 1.12 1.25 1.42 1.26 2014E 1.14 1.44 1.62 1.52 2015E — — — —
Financial and valuation metrics
Year 12/13A 12/14E 12/15E 12/16E EPS (CS adj.) (US$) 5.05 5.72 6.55 — P/E (x) 16.2 14.3 12.5 — P/E rel. (%) 94.7 90.6 87.9 — Revenue (US$ m) 7,513.5 7,853.6 8,306.0 — EBITDA (US$ m) 512.7 554.8 610.5 — OCFPS (US$) 5.99 4.72 6.60 — P/OCF (x) 15.2 17.4 12.4 — EV/EBITDA (current) 10.0 9.2 8.4 — Net debt (US$ m) 1,364 1,143 822 — ROIC (%) 10.62 11.10 12.22 —
Number of shares (m) 44.38 IC (current, US$ m) 3,128.70 BV/share (Next Qtr., US$) 41.3 EV/IC (x) 1.6 Net debt (Next Qtr., US$ m) 1,337.7 Dividend (current, US$) — Net debt/tot cap (Next Qtr., %) 73.3 Dividend yield (%) —
Source: Company data, Credit Suisse estimates.
Rating OUTPERFORM* Price (27 Mar 14, US$) 81.95 Target price (US$) 90.00¹ 52-week price range 93.81 - 65.46 Market cap. (US$ m) 3,637.24 Enterprise value (US$ m) 4,780.21
*Stock ratings are relative to the coverage universe in each
analyst's or each team's respective sector.
¹Target price is for 12 months.
Research Analysts
Hamzah Mazari, CA
212 538 7983
Flavio S. Campos
212 325 4411
James Berkley
212-325-5285
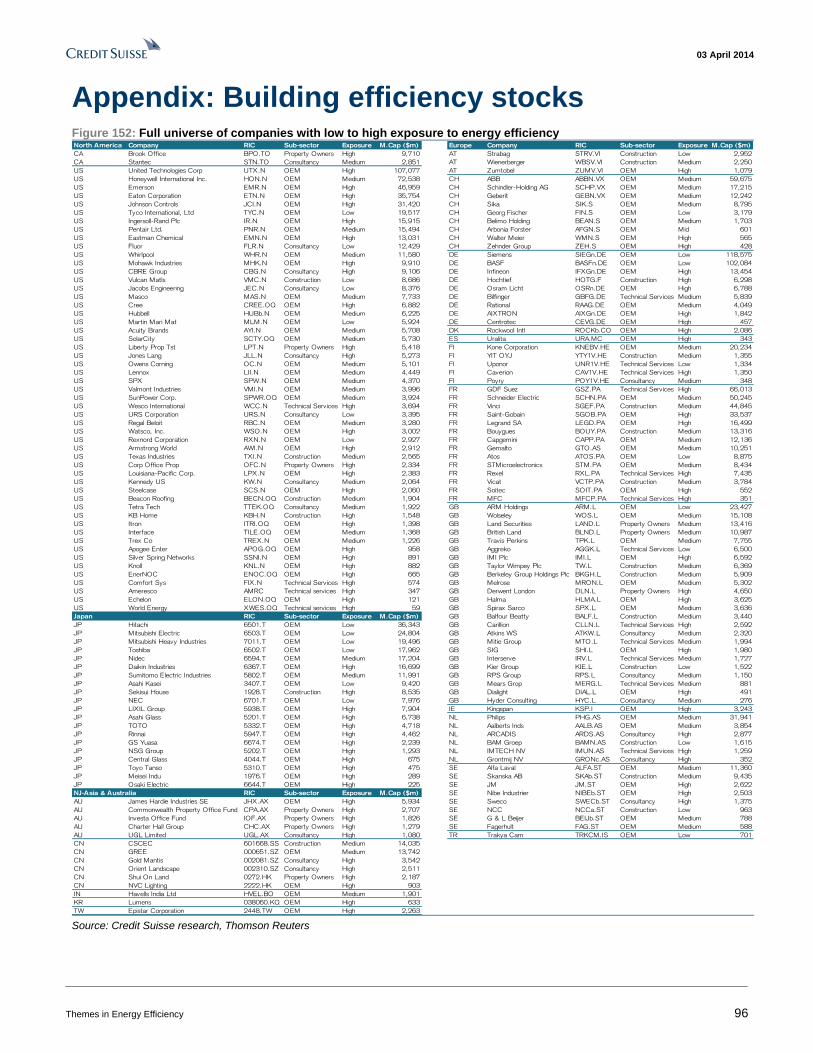
03 April 2014
Themes in Energy Efficiency 96
Appendix: Building efficiency stocks Figure 152: Full universe of companies with low to high exposure to energy efficiency North America Company RIC Sub-sector Exposure M.Cap ($m) Europe Company RIC Sub-sector Exposure M.Cap ($m)
CA Brook Office BPO.TO Property Owners High 9,710 AT Strabag STRV.VI Construction Low 2,952
CA Stantec STN.TO Consultancy Medium 2,851 AT Wienerberger WBSV.VI Construction Medium 2,250
US United Technologies Corp UTX.N OEM High 107,077 AT Zumtobel ZUMV.VI OEM High 1,079
US Honeywell International Inc. HON.N OEM Medium 72,538 CH ABB ABBN.VX OEM Medium 59,675
US Emerson EMR.N OEM High 46,959 CH Schindler-Holding AG SCHP.VX OEM Medium 17,215
US Eaton Corporation ETN.N OEM High 35,754 CH Geberit GEBN.VX OEM Medium 12,242
US Johnson Controls JCI.N OEM High 31,420 CH Sika SIK.S OEM Medium 8,795
US Tyco International, Ltd TYC.N OEM Low 19,517 CH Georg Fischer FIN.S OEM Low 3,179
US Ingersoll-Rand Plc IR.N OEM High 15,915 CH Belimo Holding BEAN.S OEM Medium 1,703
US Pentair Ltd. PNR.N OEM Medium 15,494 CH Arbonia Forster AFGN.S OEM Mid 601
US Eastman Chemical EMN.N OEM High 13,031 CH Walter Meier WMN.S OEM High 565
US Fluor FLR.N Consultancy Low 12,429 CH Zehnder Group ZEH.S OEM High 428
US Whirlpool WHR.N OEM Medium 11,580 DE Siemens SIEGn.DE OEM Low 118,575
US Mohawk Industries MHK.N OEM High 9,910 DE BASF BASFn.DE OEM Low 102,084
US CBRE Group CBG.N Consultancy High 9,106 DE Infineon IFXGn.DE OEM High 13,454
US Vulcan Matls VMC.N Construction Low 8,686 DE Hochtief HOTG.F Construction High 6,298
US Jacobs Engineering JEC.N Consultancy Low 8,376 DE Osram Licht OSRn.DE OEM High 6,788
US Masco MAS.N OEM Medium 7,733 DE Bilfinger GBFG.DE Technical Services Medium 5,839
US Cree CREE.OQ OEM High 6,882 DE Rational RAAG.DE OEM Medium 4,049
US Hubbell HUBb.N OEM Medium 6,225 DE AIXTRON AIXGn.DE OEM High 1,842
US Martin Mari Mat MLM.N OEM Low 5,924 DE Centrotec CEVG.DE OEM High 457
US Acuity Brands AYI.N OEM Medium 5,708 DK Rockwool Intl ROCKb.CO OEM High 2,086
US SolarCity SCTY.OQ OEM Medium 5,730 ES Uralita URA.MC OEM High 343
US Liberty Prop Tst LPT.N Property Owners High 5,418 FI Kone Corporation KNEBV.HE OEM Medium 20,234
US Jones Lang JLL.N Consultancy High 5,273 FI YIT OYJ YTY1V.HE Construction Medium 1,355
US Owens Corning OC.N OEM Medium 5,101 FI Uponor UNR1V.HE Technical Services Low 1,334
US Lennox LII.N OEM Medium 4,449 FI Caverion CAV1V.HE Technical Services High 1,350
US SPX SPW.N OEM Medium 4,370 FI Poyry POY1V.HE Consultancy Medium 348
US Valmont Industries VMI.N OEM Medium 3,996 FR GDF Suez GSZ.PA Technical Services High 66,013
US SunPower Corp. SPWR.OQ OEM Medium 3,924 FR Schneider Electric SCHN.PA OEM Medium 50,245
US Wesco International WCC.N Technical Services High 3,694 FR Vinci SGEF.PA Construction Medium 44,845
US URS Corporation URS.N Consultancy Low 3,395 FR Saint-Gobain SGOB.PA OEM High 33,537
US Regal Beloit RBC.N OEM Medium 3,280 FR Legrand SA LEGD.PA OEM High 16,499
US Watsco, Inc. WSO.N OEM High 3,002 FR Bouygues BOUY.PA Construction Medium 13,316
US Rexnord Corporation RXN.N OEM Low 2,927 FR Capgemini CAPP.PA OEM Medium 12,136
US Armstrong World AWI.N OEM High 2,912 FR Gemalto GTO.AS OEM Medium 10,251
US Texas Industries TXI.N Construction Medium 2,565 FR Atos ATOS.PA OEM Low 8,875
US Corp Office Prop OFC.N Property Owners High 2,334 FR STMicroelectronics STM.PA OEM Medium 8,434
US Louisiana-Pacific Corp. LPX.N OEM High 2,383 FR Rexel RXL.PA Technical Services High 7,435
US Kennedy US KW.N Consultancy Medium 2,064 FR Vicat VCTP.PA Construction Medium 3,784
US Steelcase SCS.N OEM High 2,060 FR Soitec SOIT.PA OEM High 552
US Beacon Roofing BECN.OQ Construction Medium 1,904 FR MFC MFCP.PA Technical Services High 351
US Tetra Tech TTEK.OQ Consultancy Medium 1,922 GB ARM Holdings ARM.L OEM Low 23,427
US KB Home KBH.N Construction High 1,548 GB Wolseley WOS.L OEM Medium 15,108
US Itron ITRI.OQ OEM High 1,398 GB Land Securities LAND.L Property Owners Medium 13,416
US Interface TILE.OQ OEM Medium 1,368 GB British Land BLND.L Property Owners Medium 10,987
US Trex Co TREX.N OEM Medium 1,226 GB Travis Perkins TPK.L OEM Medium 7,755
US Apogee Enter APOG.OQ OEM High 958 GB Aggreko AGGK.L Technical Services Low 6,500
US Silver Spring Networks SSNI.N OEM High 891 GB IMI Plc IMI.L OEM High 6,592
US Knoll KNL.N OEM High 882 GB Taylor Wimpey Plc TW.L Construction Medium 6,369
US EnerNOC ENOC.OQ OEM High 665 GB Berkeley Group Holdings Plc BKGH.L Construction Medium 5,909
US Comfort Sys FIX.N Technical Services High 574 GB Melrose MRON.L OEM Medium 5,302
US Ameresco AMRC Technical services High 347 GB Derwent London DLN.L Property Owners High 4,650
US Echelon ELON.OQ OEM High 121 GB Halma HLMA.L OEM High 3,625
US World Energy XWES.OQ Technical services High 59 GB Spirax Sarco SPX.L OEM Medium 3,636
Japan RIC Sub-sector Exposure M.Cap ($m) GB Balfour Beatty BALF.L Construction Medium 3,440
JP Hitachi 6501.T OEM Low 36,343 GB Carillion CLLN.L Technical Services High 2,592
JP Mitsubishi Electric 6503.T OEM Low 24,804 GB Atkins WS ATKW.L Consultancy Medium 2,320
JP Mitsubishi Heavy Industries 7011.T OEM Low 19,496 GB Mitie Group MTO.L Technical Services Medium 1,994
JP Toshiba 6502.T OEM Low 17,962 GB SIG SHI.L OEM High 1,980
JP Nidec 6594.T OEM Medium 17,204 GB Interserve IRV.L Technical Services Medium 1,727
JP Daikin Industries 6367.T OEM High 16,699 GB Kier Group KIE.L Construction Low 1,522
JP Sumitomo Electric Industries 5802.T OEM Medium 11,991 GB RPS Group RPS.L Consultancy Medium 1,150
JP Asahi Kasei 3407.T OEM Low 9,420 GB Mears Grop MERG.L Technical Services Medium 881
JP Sekisui House 1928.T Construction High 8,535 GB Dialight DIAL.L OEM High 491
JP NEC 6701.T OEM Low 7,976 GB Hyder Consulting HYC.L Consultancy Medium 276
JP LIXIL Group 5938.T OEM High 7,904 IE Kingspan KSP.I OEM High 3,243
JP Asahi Glass 5201.T OEM High 6,738 NL Philips PHG.AS OEM Medium 31,941
JP TOTO 5332.T OEM High 4,718 NL Aalberts Inds AALB.AS OEM Medium 3,854
JP Rinnai 5947.T OEM High 4,462 NL ARCADIS ARDS.AS Consultancy High 2,877
JP GS Yuasa 6674.T OEM High 2,239 NL BAM Groep BAMN.AS Construction Low 1,615
JP NSG Group 5202.T OEM High 1,293 NL IMTECH NV IMUN.AS Technical Services High 1,259
JP Central Glass 4044.T OEM High 675 NL Grontmij NV GRONc.AS Consultancy High 352
JP Toyo Tanso 5310.T OEM High 475 SE Alfa Laval ALFA.ST OEM Medium 11,360
JP Meisei Indu 1976.T OEM High 289 SE Skanska AB SKAb.ST Construction Medium 9,435
JP Osaki Electric 6644.T OEM High 225 SE JM JM.ST OEM High 2,622
NJ-Asia & Australia RIC Sub-sector Exposure M.Cap ($m) SE Nibe Industrier NIBEb.ST OEM High 2,503
AU James Hardie Industries SE JHX.AX OEM High 5,934 SE Sweco SWECb.ST Consultancy High 1,375
AU Commonwealth Property Office Fund CPA.AX Property Owners High 2,707 SE NCC NCCa.ST Construction Low 963
AU Investa Office Fund IOF.AX Property Owners High 1,826 SE G & L Beijer BEIJb.ST OEM Medium 788
AU Charter Hall Group CHC.AX Property Owners High 1,279 SE Fagerhult FAG.ST OEM Medium 588
AU UGL Limited UGL.AX Consultancy High 1,080 TR Trakya Cam TRKCM.IS OEM Low 701
CN CSCEC 601668.SS Construction Medium 14,035
CN GREE 000651.SZ OEM Medium 13,742
CN Gold Mantis 002081.SZ Consultancy High 3,542
CN Orient Landscape 002310.SZ Consultancy High 2,511
CN Shui On Land 0272.HK Property Owners High 2,187
CN NVC Lighting 2222.HK OEM High 903
IN Havells India Ltd HVEL.BO OEM Medium 1,901
KR Lumens 038060.KQ OEM High 633
TW Epistar Corporation 2448.TW OEM High 2,263 Source: Credit Suisse research, Thomson Reuters
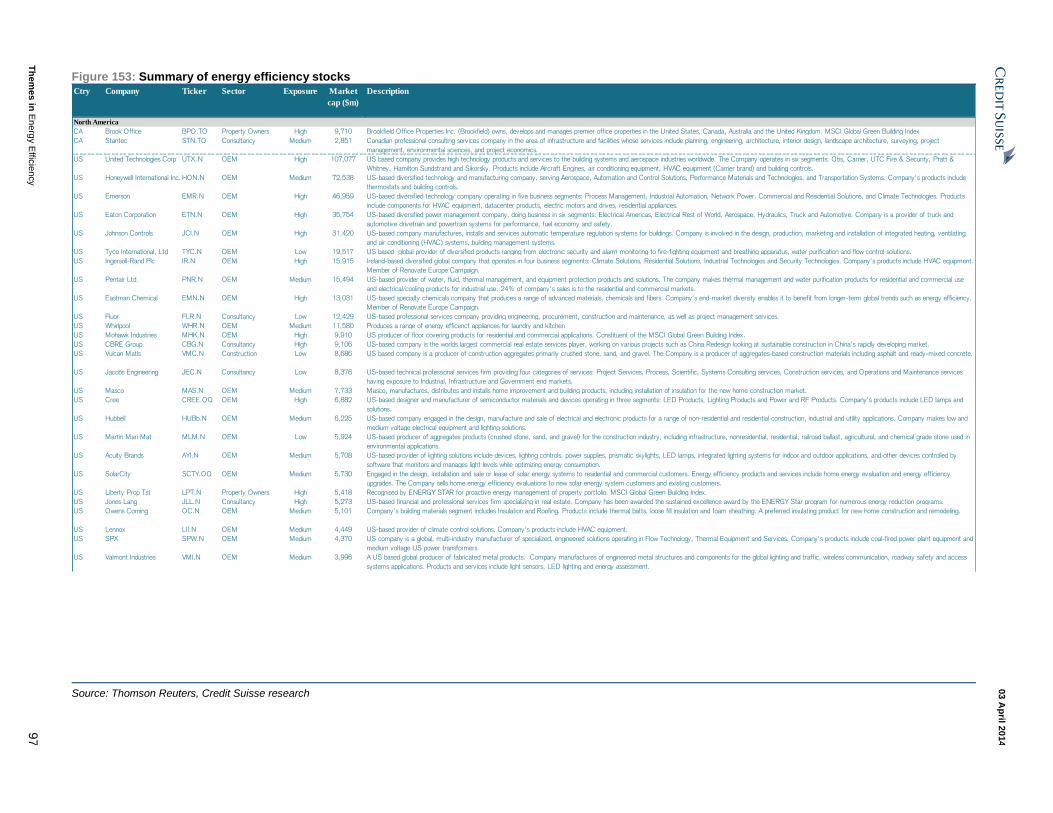
03 A
pril 2
014
Th
em
es
in E
nerg
y E
fficie
ncy
97
Figure 153: Summary of energy efficiency stocks Ctry Company Ticker Sector Exposure Market
cap ($m)
Description
North America
CA Brook Office BPO.TO Property Owners High 9,710 Brookfield Office Properties Inc. (Brookfield) owns, develops and manages premier office properties in the United States, Canada, Australia and the United Kingdom. MSCI Global Green Building Index
CA Stantec STN.TO Consultancy Medium 2,851 Canadian professional consulting services company in the area of infrastructure and facilities whose services include planning, engineering, architecture, interior design, landscape architecture, surveying, project
management, environmental sciences, and project economics.
US United Technologies Corp UTX.N OEM High 107,077 US based company provides high technology products and services to the building systems and aerospace industries worldwide. The Company operates in six segments: Otis, Carrier, UTC Fire & Security, Pratt &
Whitney, Hamilton Sundstrand and Sikorsky. Products include Aircraft Engines, air conditioning equipment, HVAC equipment (Carrier brand) and building controls.
US Honeywell International Inc. HON.N OEM Medium 72,538 US-based diversified technology and manufacturing company, serving Aerospace, Automation and Control Solutions, Performance Materials and Technologies, and Transportation Systems. Company's products include
thermostats and building controls.
US Emerson EMR.N OEM High 46,959 US-based diversified technology company operating in five business segments: Process Management, Industrial Automation, Network Power, Commercial and Residential Solutions, and Climate Technologies. Products
include components for HVAC equipment, datacenter products, electric motors and drives, residential appliances.
US Eaton Corporation ETN.N OEM High 35,754 US-based diversified power management company, doing business in six segments: Electrical Americas, Electrical Rest of World, Aerospace, Hydraulics, Truck and Automotive. Company is a provider of truck and
automotive drivetrain and powertrain systems for performance, fuel economy and safety.
US Johnson Controls JCI.N OEM High 31,420 US-based company manufactures, installs and services automatic temperature regulation systems for buildings. Company is involved in the design, production, marketing and installation of integrated heating, ventilating
and air conditioning (HVAC) systems, building management systems.
US Tyco International, Ltd TYC.N OEM Low 19,517 US based global provider of diversified products ranging from electronic security and alarm monitoring to fire-fighting equipment and breathing apparatus, water purification and flow control solutions.
US Ingersoll-Rand Plc IR.N OEM High 15,915 Ireland-based diversified global company that operates in four business segments: Climate Solutions, Residential Solutions, Industrial Technologies and Security Technologies. Company's products include HVAC equipment.
Member of Renovate Europe Campaign.
US Pentair Ltd. PNR.N OEM Medium 15,494 US-based provider of water, fluid, thermal management, and equipment protection products and solutions. The company makes thermal management and water purification products for residential and commercial use
and electrical/cooling products for industrial use. 24% of company's sales is to the residential and commercial markets.
US Eastman Chemical EMN.N OEM High 13,031 US-based specialty chemicals company that produces a range of advanced materials, chemicals and fibers. Company's end-market diversity enables it to benefit from longer-term global trends such as energy efficiency.
Member of Renovate Europe Campaign.
US Fluor FLR.N Consultancy Low 12,429 US-based professional services company providing engineering, procurement, construction and maintenance, as well as project management services.
US Whirlpool WHR.N OEM Medium 11,580 Produces a range of energy efficenct appliances for laundry and kitchen
US Mohawk Industries MHK.N OEM High 9,910 US producer of floor covering products for residential and commercial applications. Constituent of the MSCI Global Green Building Index.
US CBRE Group CBG.N Consultancy High 9,106 US-based company is the worlds largest commercial real estate services player, working on various projects such as China Redesign looking at sustainable construction in China's rapidly developing market.
US Vulcan Matls VMC.N Construction Low 8,686 US based company is a producer of construction aggregates primarily crushed stone, sand, and gravel. The Company is a producer of aggregates-based construction materials including asphalt and ready-mixed concrete.
US Jacobs Engineering JEC.N Consultancy Low 8,376 US-based technical professional services firm providing four categories of services: Project Services, Process, Scientific, Systems Consulting services, Construction services, and Operations and Maintenance services
having exposure to Industrial, Infrastructure and Government end markets.
US Masco MAS.N OEM Medium 7,733 Masco, manufactures, distributes and installs home improvement and building products, including installation of insulation for the new home construction market.
US Cree CREE.OQ OEM High 6,882 US-based designer and manufacturer of semiconductor materials and devices operating in three segments: LED Products, Lighting Products and Power and RF Products. Company's products include LED lamps and
solutions.
US Hubbell HUBb.N OEM Medium 6,225 US-based company engaged in the design, manufacture and sale of electrical and electronic products for a range of non-residential and residential construction, industrial and utility applications. Company makes low and
medium voltage electrical equipment and lighting solutions.
US Martin Mari Mat MLM.N OEM Low 5,924 US-based producer of aggregates products (crushed stone, sand, and gravel) for the construction industry, including infrastructure, nonresidential, residential, railroad ballast, agricultural, and chemical grade stone used in
environmental applications.
US Acuity Brands AYI.N OEM Medium 5,708 US-based provider of lighting solutions include devices, lighting controls, power supplies, prismatic skylights, LED lamps, integrated lighting systems for indoor and outdoor applications, and other devices controlled by
software that monitors and manages light levels while optimizing energy consumption.
US SolarCity SCTY.OQ OEM Medium 5,730 Engaged in the design, installation and sale or lease of solar energy systems to residential and commercial customers. Energy efficiency products and services include home energy evaluation and energy efficiency
upgrades. The Company sells home energy efficiency evaluations to new solar energy system customers and existing customers.
US Liberty Prop Tst LPT.N Property Owners High 5,418 Recognised by ENERGY STAR for proactive energy management of property portfolio. MSCI Global Green Building Index.
US Jones Lang JLL.N Consultancy High 5,273 US-based financial and professional services firm specializing in real estate. Company has been awarded the sustained excellence award by the ENERGY Star program for numerous energy reduction programs.
US Owens Corning OC.N OEM Medium 5,101 Company's building materials segment includes Insulation and Roofing. Products include thermal batts, loose fill insulation and foam sheathing. A preferred insulating product for new home construction and remodeling.
US Lennox LII.N OEM Medium 4,449 US-based provider of climate control solutions. Company's products include HVAC equipment.
US SPX SPW.N OEM Medium 4,370 US company is a global, multi-industry manufacturer of specialized, engineered solutions operating in Flow Technology, Thermal Equipment and Services. Company's products include coal-fired power plant equipment and
medium voltage US power transformers.
US Valmont Industries VMI.N OEM Medium 3,996 A US based global producer of fabricated metal products. Company manufactures of engineered metal structures and components for the global lighting and traffic, wireless communication, roadway safety and access
systems applications. Products and services include light sensors, LED lighting and energy assessment.
Source: Thomson Reuters, Credit Suisse research
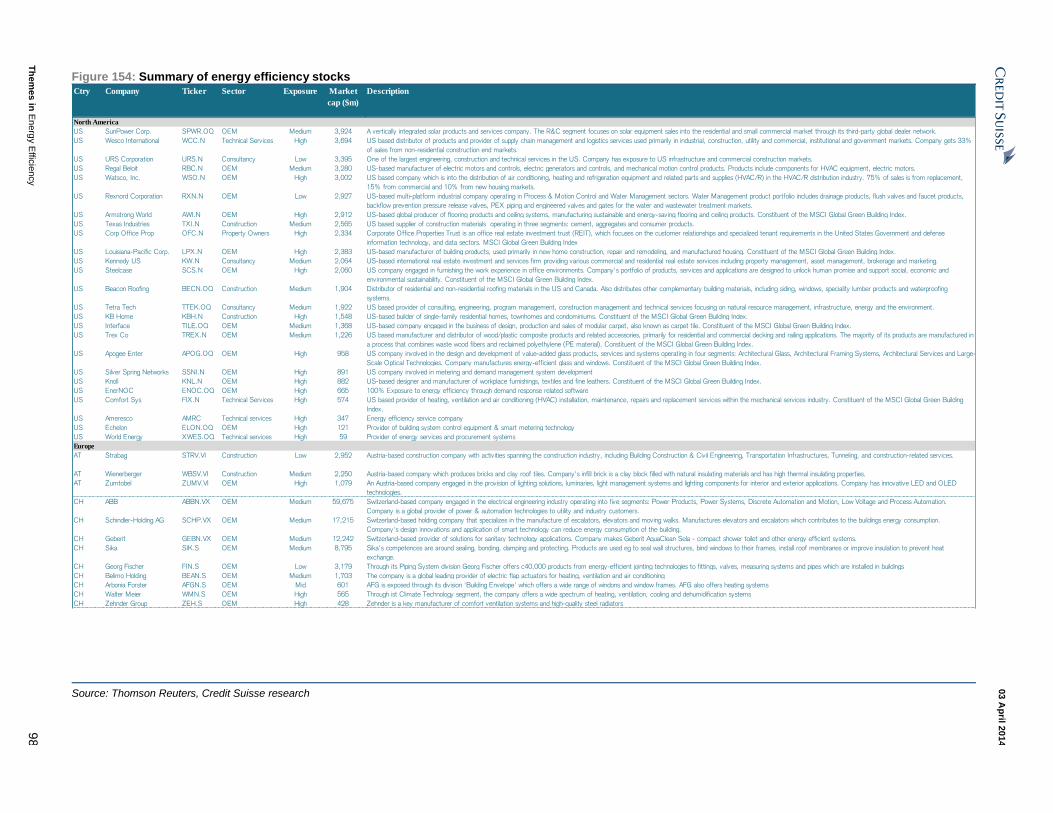
03 A
pril 2
014
Th
em
es
in E
nerg
y E
fficie
ncy
98
Figure 154: Summary of energy efficiency stocks Ctry Company Ticker Sector Exposure Market
cap ($m)
Description
North America
US SunPower Corp. SPWR.OQ OEM Medium 3,924 A vertically integrated solar products and services company. The R&C segment focuses on solar equipment sales into the residential and small commercial market through its third-party global dealer network.
US Wesco International WCC.N Technical Services High 3,694 US based distributor of products and provider of supply chain management and logistics services used primarily in industrial, construction, utility and commercial, institutional and government markets. Company gets 33%
of sales from non-residential construction end markets.
US URS Corporation URS.N Consultancy Low 3,395 One of the largest engineering, construction and technical services in the US. Company has exposure to US infrastructure and commercial construction markets.
US Regal Beloit RBC.N OEM Medium 3,280 US-based manufacturer of electric motors and controls, electric generators and controls, and mechanical motion control products. Products include components for HVAC equipment, electric motors.
US Watsco, Inc. WSO.N OEM High 3,002 US based company which is into the distribution of air conditioning, heating and refrigeration equipment and related parts and supplies (HVAC/R) in the HVAC/R distribution industry. 75% of sales is from replacement,
15% from commercial and 10% from new housing markets.
US Rexnord Corporation RXN.N OEM Low 2,927 US-based multi-platform industrial company operating in Process & Motion Control and Water Management sectors. Water Management product portfolio includes drainage products, flush valves and faucet products,
backflow prevention pressure release valves, PEX piping and engineered valves and gates for the water and wastewater treatment markets.
US Armstrong World AWI.N OEM High 2,912 US-based global producer of flooring products and ceiling systems, manufacturing sustainable and energy-saving flooring and ceiling products. Constituent of the MSCI Global Green Building Index.
US Texas Industries TXI.N Construction Medium 2,565 US based supplier of construction materials operating in three segments: cement, aggregates and consumer products.
US Corp Office Prop OFC.N Property Owners High 2,334 Corporate Office Properties Trust is an office real estate investment trust (REIT), which focuses on the customer relationships and specialized tenant requirements in the United States Government and defense
information technology, and data sectors. MSCI Global Green Building Index
US Louisiana-Pacific Corp. LPX.N OEM High 2,383 US-based manufacturer of building products, used primarily in new home construction, repair and remodeling, and manufactured housing. Constituent of the MSCI Global Green Building Index.
US Kennedy US KW.N Consultancy Medium 2,064 US-based international real estate investment and services firm providing various commercial and residential real estate services including property management, asset management, brokerage and marketing.
US Steelcase SCS.N OEM High 2,060 US company engaged in furnishing the work experience in office environments. Company's portfolio of products, services and applications are designed to unlock human promise and support social, economic and
environmental sustainability. Constituent of the MSCI Global Green Building Index.
US Beacon Roofing BECN.OQ Construction Medium 1,904 Distributor of residential and non-residential roofing materials in the US and Canada. Also distributes other complementary building materials, including siding, windows, speciality lumber products and waterproofing
systems.
US Tetra Tech TTEK.OQ Consultancy Medium 1,922 US based provider of consulting, engineering, program management, construction management and technical services focusing on natural resource management, infrastructure, energy and the environment.
US KB Home KBH.N Construction High 1,548 US-based builder of single-family residential homes, townhomes and condominiums. Constituent of the MSCI Global Green Building Index.
US Interface TILE.OQ OEM Medium 1,368 US-based company engaged in the business of design, production and sales of modular carpet, also known as carpet tile. Constituent of the MSCI Global Green Building Index.
US Trex Co TREX.N OEM Medium 1,226 US based manufacturer and distributor of wood/plastic composite products and related accessories, primarily for residential and commercial decking and railing applications. The majority of its products are manufactured in
a process that combines waste wood fibers and reclaimed polyethylene (PE material). Constituent of the MSCI Global Green Building Index.
US Apogee Enter APOG.OQ OEM High 958 US company involved in the design and development of value-added glass products, services and systems operating in four segments: Architectural Glass, Architectural Framing Systems, Architectural Services and Large-
Scale Optical Technologies. Company manufactures energy-efficient glass and windows. Constituent of the MSCI Global Green Building Index.
US Silver Spring Networks SSNI.N OEM High 891 US company involved in metering and demand management system development
US Knoll KNL.N OEM High 882 US-based designer and manufacturer of workplace furnishings, textiles and fine leathers. Constituent of the MSCI Global Green Building Index.
US EnerNOC ENOC.OQ OEM High 665 100% Exposure to energy efficiency through demand response related software
US Comfort Sys FIX.N Technical Services High 574 US based provider of heating, ventilation and air conditioning (HVAC) installation, maintenance, repairs and replacement services within the mechanical services industry. Constituent of the MSCI Global Green Building
Index.
US Ameresco AMRC Technical services High 347 Energy efficiency service company
US Echelon ELON.OQ OEM High 121 Provider of building system control equipment & smart metering technology
US World Energy XWES.OQ Technical services High 59 Provider of energy services and procurement systems
Europe
AT Strabag STRV.VI Construction Low 2,952 Austria-based construction company with activities spanning the construction industry, including Building Construction & Civil Engineering, Transportation Infrastructures, Tunneling, and construction-related services.
AT Wienerberger WBSV.VI Construction Medium 2,250 Austria-based company which produces bricks and clay roof tiles. Company's infill brick is a clay block filled with natural insulating materials and has high thermal insulating properties.
AT Zumtobel ZUMV.VI OEM High 1,079 An Austria-based company engaged in the provision of lighting solutions, luminaries, light management systems and lighting components for interior and exterior applications. Company has innovative LED and OLED
technologies.
CH ABB ABBN.VX OEM Medium 59,675 Switzerland-based company engaged in the electrical engineering industry operating into five segments: Power Products, Power Systems, Discrete Automation and Motion, Low Voltage and Process Automation.
Company is a global provider of power & automation technologies to utility and industry customers.
CH Schindler-Holding AG SCHP.VX OEM Medium 17,215 Switzerland-based holding company that specializes in the manufacture of escalators, elevators and moving walks. Manufactures elevators and escalators which contributes to the buildings energy consumption.
Company's design innovations and application of smart technology can reduce energy consumption of the building.
CH Geberit GEBN.VX OEM Medium 12,242 Switzerland-based provider of solutions for sanitary technology applications. Company makes Geberit AquaClean Sela - compact shower toilet and other energy efficient systems.
CH Sika SIK.S OEM Medium 8,795 Sika's competences are around sealing, bonding, damping and protecting. Products are used eg to seal wall structures, bind windows to their frames, install roof membranes or improve insulation to prevent heat
exchange.
CH Georg Fischer FIN.S OEM Low 3,179 Through its Piping System division Georg Fischer offers c40,000 products from energy-efficient jointing technologies to fittings, valves, measuring systems and pipes which are installed in buildings
CH Belimo Holding BEAN.S OEM Medium 1,703 The company is a global leading provider of electric flap actuators for heating, ventilation and air conditioning
CH Arbonia Forster AFGN.S OEM Mid 601 AFG is exposed through its division 'Building Envelope' which offers a wide range of windons and window frames. AFG also offers heating systems
CH Walter Meier WMN.S OEM High 565 Through ist Climate Technology segment, the company offers a wide spectrum of heating, ventilation, cooling and dehumidification systems
CH Zehnder Group ZEH.S OEM High 428 Zehnder is a key manufacturer of comfort ventilation systems and high-quality steel radiators
Source: Thomson Reuters, Credit Suisse research
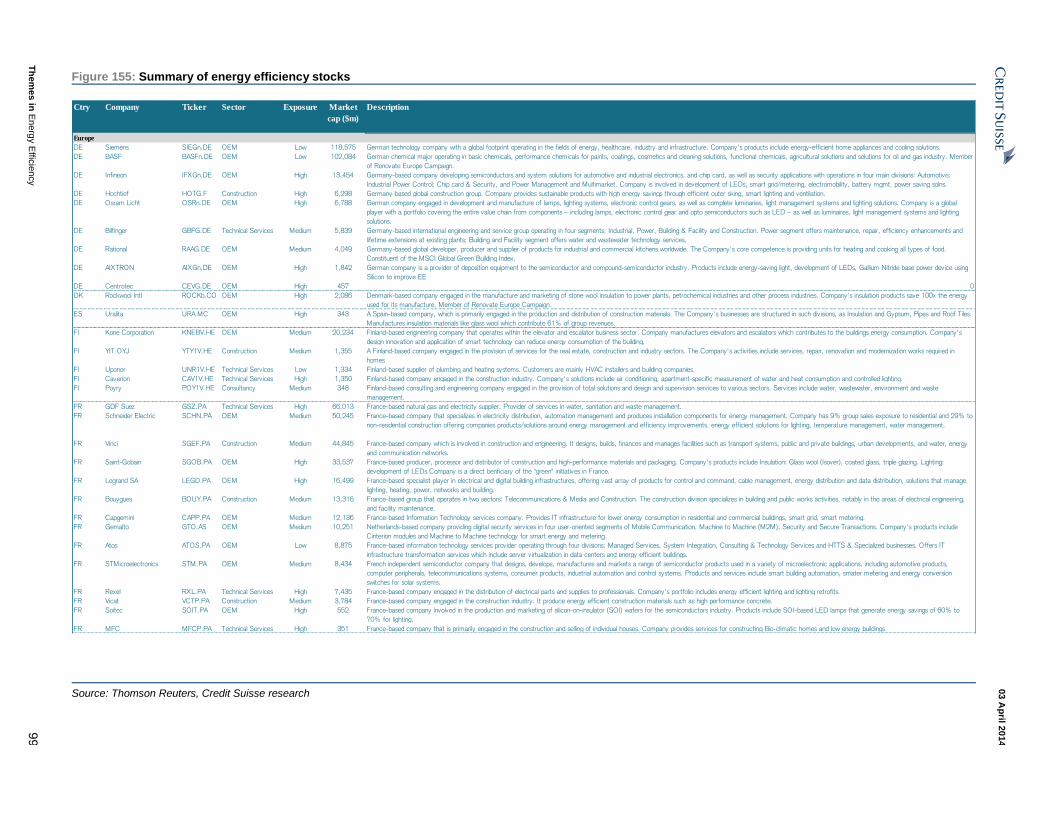
03 A
pril 2
014
Th
em
es
in E
nerg
y E
fficie
ncy
99
Figure 155: Summary of energy efficiency stocks
Ctry Company Ticker Sector Exposure Market
cap ($m)
Description
Europe
DE Siemens SIEGn.DE OEM Low 118,575 German technology company with a global footprint operating in the fields of energy, healthcare, industry and infrastructure. Company's products include energy-efficient home appliances and cooling solutions.
DE BASF BASFn.DE OEM Low 102,084 German chemical major operating in basic chemicals, performance chemicals for paints, coatings, cosmetics and cleaning solutions, functional chemicals, agricultural solutions and solutions for oil and gas industry. Member
of Renovate Europe Campaign.
DE Infineon IFXGn.DE OEM High 13,454 Germany-based company developing semiconductors and system solutions for automotive and industrial electronics, and chip card, as well as security applications with operations in four main divisions: Automotive;
Industrial Power Control; Chip card & Security, and Power Management and Multimarket. Company is involved in development of LEDs, smart grid/metering, electromobility, battery mgmt, power saving solns.
DE Hochtief HOTG.F Construction High 6,298 Germany-based global construction group. Company provides sustainable products with high energy savings through efficient outer sking, smart lighting and ventilation.
DE Osram Licht OSRn.DE OEM High 6,788 German company engaged in development and manufacture of lamps, lighting systems, electronic control gears, as well as complete luminaries, light management systems and lighting solutions. Company is a global
player with a portfolio covering the entire value chain from components – including lamps, electronic control gear and opto semiconductors such as LED – as well as luminaires, light management systems and lighting
solutions.
DE Bilfinger GBFG.DE Technical Services Medium 5,839 Germany-based international engineering and service group operating in four segments: Industrial, Power, Building & Facility and Construction. Power segment offers maintenance, repair, efficiency enhancements and
lifetime extensions at existing plants; Building and Facility segment offers water and wastewater technology services.
DE Rational RAAG.DE OEM Medium 4,049 Germany-based global developer, producer and supplier of products for industrial and commercial kitchens worldwide. The Company's core competence is providing units for heating and cooking all types of food.
Constituent of the MSCI Global Green Building Index.
DE AIXTRON AIXGn.DE OEM High 1,842 German company is a provider of deposition equipment to the semiconductor and compound-semiconductor industry. Products include energy-saving light, development of LEDs, Gallium Nitride base power device using
Silicon to improve EE
DE Centrotec CEVG.DE OEM High 457 0
DK Rockwool Intl ROCKb.CO OEM High 2,086 Denmark-based company engaged in the manufacture and marketing of stone wool insulation to power plants, petrochemical industries and other process industries. Company's insulation products save 100x the energy
used for its manufacture. Member of Renovate Europe Campaign.
ES Uralita URA.MC OEM High 343 A Spain-based company, which is primarily engaged in the production and distribution of construction materials. The Company's businesses are structured in such divisions, as Insulation and Gypsum, Pipes and Roof Tiles.
Manufactures insulation materials like glass wool which contribute 61% of group revenues.
FI Kone Corporation KNEBV.HE OEM Medium 20,234 Finland-based engineering company that operates within the elevator and escalator business sector. Company manufactures elevators and escalators which contributes to the buildings energy consumption. Company's
design innovation and application of smart technology can reduce energy consumption of the building.
FI YIT OYJ YTY1V.HE Construction Medium 1,355 A Finland-based company engaged in the provision of services for the real estate, construction and industry sectors. The Company's activities include services, repair, renovation and modernization works required in
homes
FI Uponor UNR1V.HE Technical Services Low 1,334 Finland-based supplier of plumbing and heating systems. Customers are mainly HVAC installers and building companies.
FI Caverion CAV1V.HE Technical Services High 1,350 Finland-based company engaged in the construction industry. Company's solutions include air conditioning, apartment-specific measurement of water and heat consumption and controlled lighting.
FI Poyry POY1V.HE Consultancy Medium 348 Finland-based consulting and engineering company engaged in the provision of total solutions and design and supervision services to various sectors. Services include water, wastewater, environment and waste
management.
FR GDF Suez GSZ.PA Technical Services High 66,013 France-based natural gas and electricity supplier. Provider of services in water, sanitation and waste management.
FR Schneider Electric SCHN.PA OEM Medium 50,245 France-based company that specializes in electricity distribution, automation management and produces installation components for energy management. Company has 9% group sales exposure to residential and 29% to
non-residential construction offering companies products/solutions around energy management and efficiency improvements. energy efficient solutions for lighting, temperature management, water management.
FR Vinci SGEF.PA Construction Medium 44,845 France-based company which is involved in construction and engineering. It designs, builds, finances and manages facilities such as transport systems, public and private buildings, urban developments, and water, energy
and communication networks.
FR Saint-Gobain SGOB.PA OEM High 33,537 France-based producer, processor and distributor of construction and high-performance materials and packaging. Company's products include Insulation: Glass wool (Isover), coated glass, triple glazing. Lighting:
development of LEDs.Company is a direct benficiary of the "green" initiatives in France.
FR Legrand SA LEGD.PA OEM High 16,499 France-based specialist player in electrical and digital building infrastructures, offering vast array of products for control and command, cable management, energy distribution and data distribution, solutions that manage
lighting, heating, power, networks and building.
FR Bouygues BOUY.PA Construction Medium 13,316 France-based group that operates in two sectors: Telecommunications & Media and Construction. The construction division specializes in building and public works activities, notably in the areas of electrical engineering,
and facility maintenance.
FR Capgemini CAPP.PA OEM Medium 12,136 France-based Information Technology services company. Provides IT infrastructure for lower energy consumption in residential and commercial buildings, smart grid, smart metering.
FR Gemalto GTO.AS OEM Medium 10,251 Netherlands-based company providing digital security services in four user-oriented segments of Mobile Communication, Machine to Machine (M2M), Security and Secure Transactions. Company's products include
Cinterion modules and Machine to Machine technology for smart energy and metering.
FR Atos ATOS.PA OEM Low 8,875 France-based information technology services provider operating through four divisions: Managed Services, System Integration, Consulting & Technology Services and HTTS & Specialized businesses. Offers IT
infrastructure transformation services which include server virtualization in data centers and energy efficient buildings.
FR STMicroelectronics STM.PA OEM Medium 8,434 French independent semiconductor company that designs, develops, manufactures and markets a range of semiconductor products used in a variety of microelectronic applications, including automotive products,
computer peripherals, telecommunications systems, consumer products, industrial automation and control systems. Products and services include smart building automation, smater metering and energy conversion
switches for solar systems.
FR Rexel RXL.PA Technical Services High 7,435 France-based company engaged in the distribution of electrical parts and supplies to professionals. Company's portfolio includes energy efficient lighting and lighting retrofits.
FR Vicat VCTP.PA Construction Medium 3,784 France-based company engaged in the construction industry. It produce energy efficient construction materials such as high performance concrete.
FR Soitec SOIT.PA OEM High 552 France-based company involved in the production and marketing of silicon-on-insulator (SOI) wafers for the semiconductors industry. Products include SOI-based LED lamps that generate energy savings of 60% to
70% for lighting.
FR MFC MFCP.PA Technical Services High 351 France-based company that is primarily engaged in the construction and selling of individual houses. Company provides services for constructing Bio-climatic homes and low energy buildings
Source: Thomson Reuters, Credit Suisse research
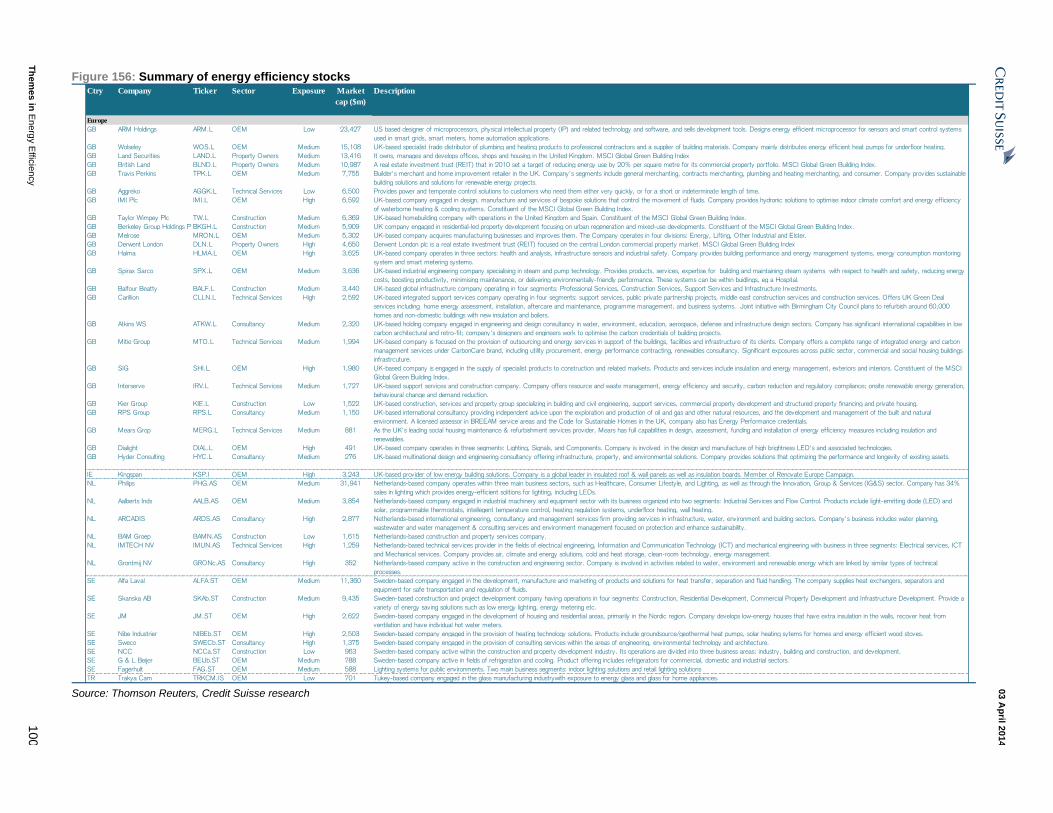
03 A
pril 2
014
Th
em
es
in E
nerg
y E
fficie
ncy
10
0
Figure 156: Summary of energy efficiency stocks
Ctry Company Ticker Sector Exposure Market
cap ($m)
Description
Europe
GB ARM Holdings ARM.L OEM Low 23,427 US based designer of microprocessors, physical intellectual property (IP) and related technology and software, and sells development tools. Designs energy efficient microprocessor for sensors and smart control systems
used in smart grids, smart meters, home automation applications.
GB Wolseley WOS.L OEM Medium 15,108 UK-based specialist trade distributor of plumbing and heating products to professional contractors and a supplier of building materials. Company mainly distributes energy efficient heat pumps for underfloor heating.
GB Land Securities LAND.L Property Owners Medium 13,416 It owns, manages and develops offices, shops and housing in the United Kingdom. MSCI Global Green Building Index
GB British Land BLND.L Property Owners Medium 10,987 A real estate investment trust (REIT) that in 2010 set a target of reducing energy use by 20% per square metre for its commercial property portfolio. MSCI Global Green Building Index.
GB Travis Perkins TPK.L OEM Medium 7,755 Builder's merchant and home improvement retailer in the UK. Company's segments include general merchanting, contracts merchanting, plumbing and heating merchanting, and consumer. Company provides sustainable
building solutions and solutions for renewable energy projects.
GB Aggreko AGGK.L Technical Services Low 6,500 Provides power and temperate control solutions to customers who need them either very quickly, or for a short or indeterminate length of time.
GB IMI Plc IMI.L OEM High 6,592 UK-based company engaged in design, manufacture and services of bespoke solutions that control the movement of fluids. Company provides hydronic solutions to optimise indoor climate comfort and energy efficiency
of waterborne heating & cooling systems. Constituent of the MSCI Global Green Building Index.
GB Taylor Wimpey Plc TW.L Construction Medium 6,369 UK-based homebuilding company with operations in the United Kingdom and Spain. Constituent of the MSCI Global Green Building Index.
GB Berkeley Group Holdings PlcBKGH.L Construction Medium 5,909 UK company engaged in residential-led property development focusing on urban regeneration and mixed-use developments. Constituent of the MSCI Global Green Building Index.
GB Melrose MRON.L OEM Medium 5,302 UK-based company acquires manufacturing businesses and improves them. The Company operates in four divisions: Energy, Lifting, Other Industrial and Elster.
GB Derwent London DLN.L Property Owners High 4,650 Derwent London plc is a real estate investment trust (REIT) focused on the central London commercial property market. MSCI Global Green Building Index
GB Halma HLMA.L OEM High 3,625 UK-based company operates in three sectors: health and analysis, infrastructure sensors and industrial safety. Company provides building performance and energy management systems, energy consumption monitoring
system and smart metering systems.
GB Spirax Sarco SPX.L OEM Medium 3,636 UK-based industrial engineering company specialising in steam and pump technology. Provides products, services, expertise for building and maintaining steam systems with respect to health and safety, reducing energy
costs, boosting productivity, minimising maintenance, or delivering environmentally-friendly performance. These systems can be within buidlings, eg a Hospital.
GB Balfour Beatty BALF.L Construction Medium 3,440 UK-based global infrastructure company operating in four segments: Professional Services, Construction Services, Support Services and Infrastructure Investments.
GB Carillion CLLN.L Technical Services High 2,592 UK-based integrated support services company operating in four segments: support services, public private partnership projects, middle east construction services and construction services. Offers UK Green Deal
services including home energy assessment, installation, aftercare and maintenance, programme management, and business systems. Joint initiative with Birmingham City Council plans to refurbish around 60,000
homes and non-domestic buildings with new insulation and boilers.
GB Atkins WS ATKW.L Consultancy Medium 2,320 UK-based holding company engaged in engineering and design consultancy in water, environment, education, aerospace, defense and infrastructure design sectors. Company has significant international capabilities in low
carbon architectural and retro-fit; company's designers and engineers work to optimise the carbon credentials of building projects.
GB Mitie Group MTO.L Technical Services Medium 1,994 UK-based company is focused on the provision of outsourcing and energy services in support of the buildings, facilities and infrastructure of its clients. Company offers a complete range of integrated energy and carbon
management services under CarbonCare brand, including utility procurement, energy performance contracting, renewables consultancy. Significant exposures across public sector, commercial and social housing buildings
infrastrcuture.
GB SIG SHI.L OEM High 1,980 UK-based company is engaged in the supply of specialist products to construction and related markets. Products and services include insulation and energy management, exteriors and interiors. Constituent of the MSCI
Global Green Building Index.
GB Interserve IRV.L Technical Services Medium 1,727 UK-based support services and construction company. Company offers resource and waste management, energy efficiency and security, carbon reduction and regulatory compliance; onsite renewable energy generation,
behavioural change and demand reduction.
GB Kier Group KIE.L Construction Low 1,522 UK-based construction, services and property group specializing in building and civil engineering, support services, commercial property development and structured property financing and private housing.
GB RPS Group RPS.L Consultancy Medium 1,150 UK-based international consultancy providing independent advice upon the exploration and production of oil and gas and other natural resources, and the development and management of the built and natural
environment. A licensed assessor in BREEAM service areas and the Code for Sustainable Homes in the UK, company also has Energy Performance credentials.
GB Mears Grop MERG.L Technical Services Medium 881 As the UK's leading social housing maintenance & refurbishment services provider, Mears has full capabilities in design, assessment, funding and installation of energy efficiency measures including insulation and
renewables.
GB Dialight DIAL.L OEM High 491 UK-based company operates in three segments: Lighting, Signals, and Components. Company is involved in the design and manufacture of high brightness LED's and associated technologies.
GB Hyder Consulting HYC.L Consultancy Medium 276 UK-based multinational design and engineering consultancy offering infrastructure, property, and environmental solutions. Company provides solutions that optimizing the performance and longevity of existing assets.
IE Kingspan KSP.I OEM High 3,243 UK-based provider of low energy building solutions. Company is a global leader in insulated roof & wall panels as well as insulation boards. Member of Renovate Europe Campaign.
NL Philips PHG.AS OEM Medium 31,941 Netherlands-based company operates within three main business sectors, such as Healthcare, Consumer Lifestyle, and Lighting, as well as through the Innovation, Group & Services (IG&S) sector. Company has 34%
sales in lighting which provides energy-efficient solitions for lighting, including LEDs.
NL Aalberts Inds AALB.AS OEM Medium 3,854 Netherlands-based company engaged in industrial machinery and equipment sector with its business organized into two segments: Industrial Services and Flow Control. Products include light-emitting diode (LED) and
solar, programmable thermostats, intellegent temperature control, heating regulation systems, underfloor heating, wall heating.
NL ARCADIS ARDS.AS Consultancy High 2,877 Netherlands-based international engineering, consultancy and management services firm providing services in infrastructure, water, environment and building sectors. Company's business includes water planning,
wastewater and water management & consulting services and environment management focused on protection and enhance sustainability.
NL BAM Groep BAMN.AS Construction Low 1,615 Netherlands-based construction and property services company.
NL IMTECH NV IMUN.AS Technical Services High 1,259 Netherlands-based technical services provider in the fields of electrical engineering, Information and Communication Technology (ICT) and mechanical engineering with business in three segments: Electrical services, ICT
and Mechanical services. Company provides air, climate and energy solutions, cold and heat storage, clean-room technology, energy management.
NL Grontmij NV GRONc.AS Consultancy High 352 Netherlands-based company active in the construction and engineering sector. Company is involved in activities related to water, environment and renewable energy which are linked by similar types of technical
processes.
SE Alfa Laval ALFA.ST OEM Medium 11,360 Sweden-based company engaged in the development, manufacture and marketing of products and solutions for heat transfer, separation and fluid handling. The company supplies heat exchangers, separators and
equipment for safe transportation and regulation of fluids.
SE Skanska AB SKAb.ST Construction Medium 9,435 Sweden-based construction and project development company having operations in four segments: Construction, Residential Development, Commercial Property Development and Infrastructure Development. Provide a
variety of energy saving solutions such as low energy lighting, energy metering etc.
SE JM JM.ST OEM High 2,622 Sweden-based company engaged in the development of housing and residential areas, primarily in the Nordic region. Company develops low-energy houses that have extra insulation in the walls, recover heat from
ventilation and have individual hot water meters.
SE Nibe Industrier NIBEb.ST OEM High 2,503 Sweden-based company engaged in the provision of heating technology solutions. Products include groundsource/geothermal heat pumps, solar heating sytems for homes and energy efficient wood stoves.
SE Sweco SWECb.ST Consultancy High 1,375 Sweden-based company engaged in the provision of consulting services within the areas of engineering, environmental technology and architecture.
SE NCC NCCa.ST Construction Low 963 Sweden-based company active within the construction and property development industry. Its operations are divided into three business areas: industry, building and construction, and development.
SE G & L Beijer BEIJb.ST OEM Medium 788 Sweden-based company active in fields of refrigeration and cooling. Product offering includes refrigerators for commercial, domestic and industrial sectors.
SE Fagerhult FAG.ST OEM Medium 588 Lighting systems for public environments. Two main business segments: indoor lighting solutions and retail lighting solutions
TR Trakya Cam TRKCM.IS OEM Low 701 Tukey-based company engaged in the glass manufacturing industrywith exposure to energy glass and glass for home appliances. Source: Thomson Reuters, Credit Suisse research

03 A
pril 2
014
Th
em
es
in E
nerg
y E
fficie
ncy
10
1
Figure 157: Summary of energy efficiency stocks Ctry Company Ticker Sector Exposure Market
cap ($m)
Description
Japan
JP Hitachi 6501.T OEM Low 36,343 Company is Japan's largest industrial electronics conglomerate with presence in Information and Telecommunication, Electricity, Social and Industrial, Electronic Device and System, Construction, High Functional
Material, Automotive, Component & Device, Digital Media & Consumer Product and Financial Services. Company has presence in elevators, escalators, A/C systems, lighting, smart meters and other aspects of energy
efficiency.JP Mitsubishi Electric 6503.T OEM Low 24,804 One of the industrial electronics conglomerate, the Japanese company is engaged in developing, manufacturing, sale and distribution of a range of electrical and electronic equipment. The company has a presence in
elevators, escalators, A/C systems, and other aspects of energy efficiency.
JP Mitsubishi Heavy Industries 7011.T OEM Low 19,496 Japanese diversified manufacturer operating in Marine Vessel & Ocean, Power Engine, Machinery & Steel Structure, Aviation & Space, General Machinery & Special Vehicle segments. Company's products include
exhaust fume treatment and waste treatment equipment.
JP Toshiba 6502.T OEM Low 17,962 One of Japan's largest manufacturers of elevators, escalators and building infrastructure. Their acquisition of Switzerland-based Landis+Gyr in 2011 also helped Toshiba gain a foothold in the smart-meter market as well.
Also has a presence in A/C systems and lighting.
JP Nidec 6594.T OEM Medium 17,204 World's largest maker of motors that go into pretty much everything that turns, the Japanese company has a strong presence in motors used in energy-efficient air conditioner inverters.
JP Daikin Industries 6367.T OEM High 16,699 Japan-based company is world's largest maker of A/C inverters and A/C units, the company has leading technology in energy efficiency. Company is engaged in the business of marine equipment and chemicals also.
JP Sumitomo Electric Industries5802.T OEM Medium 11,991 Japan-based manufacturing company operating in Automobile, Information Communications, Electronics, Cable, Equipment & Energy and Industrial Materials. SEI has a proprietary technology called "redox flow"
batteries (as we went into detail on in our Ideas Engine report on Jan. 16), which is a large-scale storage battery used for factories and buildings. We forecast the energy business will account for half of OP over the next
five years, double the current levels.
JP Asahi Kasei 3407.T OEM Low 9,420 Japanese company with a presence in Chemicals, Housing, Drug & Medical, Textiles, Electronics and Construction. Products include home insulation materials.
JP Sekisui House 1928.T Construction High 8,535 Japanese company is engaged in the design, construction and contract of prefabricated housing, the dealing, brokerage, leasing and management of real estate, as well as the provision of related services. Company's
Rethink green campaign focuses on roof sarking and ventilation. Constituent of the MSCI Global Green Building Index.
JP NEC 6701.T OEM Low 7,976 Japanese company's main business remains telecommunication equipment and IT system solutions, but has recently made inroads in energy management systems and lithium-ion storage batteries.
JP LIXIL Group 5938.T OEM High 7,904 Japan-based company operating in five segments: Metal Building Material, Plumbing Fixture, Other Building Material & Equipment, Distribution & Retail and Housing, Real Estate & Others. Company is a global leader in
window sashses, doors, toilets and other bath equipment. Leading technology in water and energy efficiency as well.
JP Asahi Glass 5201.T OEM High 6,738 Japanese manufacturer operating in three segments: Glass, Electronics and Chemical. Products include insulated windows and glass for buildings and housing.
JP TOTO 5332.T OEM High 4,718 Japanese company engaged in the manufacture and sale of restroom fixtures, bathroom fixtures, kitchen fixtures and others. Company is a global leader in toilets and other bath equipment and possesses leading
technology in water and energy efficiency.
JP Rinnai 5947.T OEM High 4,462 Japan-based company engaged in the manufacture and sale of heating appliances and components. Products include boilers and heating, mainly for kitchen and bath.
JP GS Yuasa 6674.T OEM High 2,239 Japan-based company engaged in the manufacture and sale of batteries and power supply devices. Maker of lithium ion batteries and lead-acid batteries, both used for power storage/backup.
JP NSG Group 5202.T OEM High 1,293 Japanese company mainly engaged in the manufacture and sale of glass products in Construction, Automobile, Functional and Other segments. Company is a maker of insulated windows and glass for buildings and
housing.
JP Central Glass 4044.T OEM High 675 Japanese manufacturer of glass and chemicals. Products include insulated windows and glass for buildings and housing.
JP Toyo Tanso 5310.T OEM High 475 Japan-based a company engaged in the manufacture, processing and sale of special graphite products, general carbon products, composite materials and others. Company is a maker of lithium ion batteries and lead-acid
batteries, both used for power storage/backup. Speciality graphite products made by the company are used as consumables in the production of solar-use polycrystalline as well as LEDs.
JP Meisei Indu 1976.T OEM High 289 Japanese company mainly engaged in the operation of construction business and boiler business. The construction work segment is engaged in the construction of thermal insulation works.
JP Osaki Electric 6644.T OEM High 225 Japan-based company mainly engaged in the manufacture and sale of measurement and control equipment. Company is a maker of metering devices for electricity, gas, and industrial uses.
Non Japan Asia & Australia
AU James Hardie Industries SEJHX.AX OEM High 5,934 US-based manufacturer of fiber cement products and systems for internal and external building construction applications. Constituent of the MSCI Global Green Building Index.
AU Commonwealth Property Office FundCPA.AX Property Owners High 2,707 The Fund owns and manages a diverse portfolio of office properties, located in major markets across Australia. MSCI Global Green Building Index
AU Investa Office Fund IOF.AX Property Owners High 1,826 The Fund is an owner of investment-grade office buildings and receives rental income from a tenant register consisting of predominantly Government and blue chip tenants. MSCI Global Green Building Index
AU Charter Hall Group CHC.AX Property Owners High 1,279 Charter Hall Group is engaged in three segments: Property investment, Property funds management and Development investment. MSCI Global Green Building Index
AU UGL Limited UGL.AX Consultancy High 1,080 An Australia basediversified services company. The Company consists of three complementary businesses: UGL Engineering, UGL Operations & Maintenance and DTZ Property. Company is engaged in providing
project delivery across rail, transport and technology systems, water, power, resources and defense with core capabilities in engineering, design, supply, project management and commissioning.
CN CSCEC 601668.SS Construction Medium 14,035 Specializes in building construction projects, real estate development and investment, infrastructure construction and investment, as well as design and surveying operations. Company is involved in water management &
environmental protection.
CN GREE 000651.SZ OEM Medium 13,742 Largest air conditioner enterprise that integrates R&D, manufacturing and services globally. Has the largest sales volume in the global residential air conditioner (RAC) market since 2005.
CN Gold Mantis 002081.SZ Consultancy High 3,542 China-based building decoration engineering company.
CN Orient Landscape 002310.SZ Consultancy High 2,511 Chinese company principally engaged in design of landscape and construction of landscaping projects.
CN Shui On Land 0272.HK Property Owners High 2,187 The Company and its subsidiaries are engaged in property development and provision of management services. MSCI Global Green Building Index
CN NVC Lighting 2222.HK OEM High 903 Chinese company engaged in the design, development, production, marketing and sale of a variety of lighting products. Company is a leading provider of energy-saving and other lighting products in china, with the
strongest domestic lighting brand.
IN Havells India Ltd HVEL.BO OEM Medium 1,901 India-based electrical and power distribution equipment manufacturer with products including compact fluorescent lamp (CFL) lamps.
KR Lumens 038060.KQ OEM High 633 Korea-based company mainly engaged in the manufacture of light emitting diode (LED) products. Constituent of the MSCI Global Green Building Index.
TW Epistar Corporation 2448.TW OEM High 2,263 Taiwan-based company engaged in the research, development, manufacture and distribution of light emitting diode (LED) wafers and chips. Company's products include LED lighting, LED backlighting, LED display and
LEDs for automotive applications.
Source: Thomson Reuters, Credit Suisse research

03 April 2014
Themes in Energy Efficiency 102
Appendix: Key technologies The array of products and services exposed to the theme of building energy efficiency is wide. The tables on the next two
pages summarise the key technologies exposed to this theme as well as an assessment of their potential cost savings
implications and barriers to implementation.
Figure 158: Key technological solutions aimed at improving building energy efficiency
Technology Potential savings
Cost
low,medium,
or high
Brief Description Barriers to broad implementation
Design
Integrated design & modeling
tools
L Software systems and IT that enable collaborative design Fragmented value chain – lack of collaboration;
lack of data to demonstrate viability
Favorable building siting L Orientation that favors shading and natural lighting
Natural and mixed-mode
ventilation
10% of HVAC energy use L Ventilation strategies that use outside air for cooling & ventilation, often in
combination w/HVAC; retrofitting not possible – new design only.
Complex design, climate limitations, potential fire
code concerns; no retrofits
Thermal mass and passive
solar heating
Can reduce cooling energy
by 8-18% depending on
climate
L-H Use of thermal mass (brick, concrete, stone) to moderate swings in building’s
indoor temperatures and take advantage of outdoor temperature differentials
between day and night: e.g., bring in cooler outdoor air at night to pre-cool the
building structure (night purge) – reduce cooling loads. The effectiveness of
thermal mass can be enhanced by use of solar heating to provide additional
heating during cooler months (reduce heating loads). Trombe walls – special
design.
Consumer and builder education; aesthetics;
better integration into traditional HVAC design
and construction; cost of more complex system;
specialized design
Materials
Building airtightness 10-40% of HVAC energy
use (depending on climate
and airtightness level)
L Reduce energy loss through unintentional air leakage through the building
envelope; retrofitting possible.
Lack of understanding (of cost and impact); poor
construction practices; limited code regulations
Cool roofing 6-16% of cooling energy
use (depending on climate)
L-M Coatings with high solar reflectance – reflect heat, transfer less heat to the
buildings
Residential: aesthetics – generally white
coatings; commercial: limited life cycle – degrade
properties within few years; limited code
regulations
Electrochromic windows 19-26% of cooling loads;
45-65% of lighting energy
H Adjust light transmission properties of the glazing to minimize solar heat gain and
maximize natural lighting
High first cost: incremental cost for
electrochromic windows are ~US$ 1,000/m2 of
glazing (US$ 93/ft2)
High performance windows 39% of heating and 32% of
cooling energy for HIT; 19%
of cooling energy for high
performance double-pane
low-e (Florida)
M New window technologies: 2nd gen low emmissivity (low-e) coatings; high
insulation technologies (HIT) with triple or quadruple panes, vacuum spaces and
aerogels
Low-e and double pane windows are standard;
HIT windows account for <1% in US due to cost
of US$ 30-50/m2 higher than standard; retrofitting
possible
Improved insulation 12% L Improved insulation products or practices to avoid loss of thermal insulation R-
value; thermal bridging and air leakage are major factors Lack of consumer and builder education and 3rd
party oversight; for retrofit adding sufficient
insulation and effective air sealing could be
expensive
Radiant barriers up to 10% of cooling
energy; much higher impact
when combined with
airtightnes
L Materials with high reflectivity (>0.9) and low emmissivity (< 0.1) – reflect heat
radiated by hot surfaces (e.g., keeps the heat out or in)
Lack of education: when combined with envelope
airtightness impact is significantly higher; adding
more insulation is considered more cost effective;
retrofits might be more attractive – insulation
harder to add
Phase change materials
(PCM)
can save 35% on the
energy used for air
conditioning;
H PCMs provide thermal mass to light structures, moderating temperature
fluctuations and reducing heating and cooling energy consumption. PCMs absorb
heat and slow down the temperature increase within a room, reducing peak
temperatures and delaying the peak loads. As temperatures drop, the absorbed
heat in the PCMs is released, warming the rooms and reducing the heating loads.
PCMs are generally incorporated in the building envelope as boards/panels or
other forms.
High first cost; unproven long-term performance;
new technology
Thermal energy storage
materials (TES)
10-20% of cooling energy H TES systems store a sizeable quantity of “cool” thermal energy at night to meet
cooling needs during the day. When the building requires cooling during the day,
water passes through the TES tank and circulates around the building. The
thermal storage media could be PCM materials or chilled water.
Technology commercialized, but very limited
market penetration; higher first cost and lower
efficiency for ice-based systems, space
constraints for water-based systems
Lighting
Compact Fluorescent lamps
(CFL)
Up to 80% of lighting energy L CFL lamps are smaller, consume 4 -5 times less energy to produce the same
amount of light and last approx. 10 times longer than conventional incandescent
lamps.
Higher first cost (CFLs ~ several dollars premium;
dimmable CFLs ~12 cost premium); more
common in Europe, less in US
Occupancy sensors for
lighting control
5-75% of lighting energy for
individual spaces
L Devices that automatically switch on/off lighting based on space occupancy. Payback uncertainty, commissioning challenges
and false triggering
Photosensor- based lighting
controls
Daylighting can save up to
30% in lighting energy
H Photo-sensor based devices that allow for continuous dimming (combine
daylighting with electric lighting) to adjust lighting output.
High cost, complex installation, commissioning ,
lack of evidence that technology works and
reduces energy use, limited retrofit opportunities Source: World Business Council for Sustainable Development
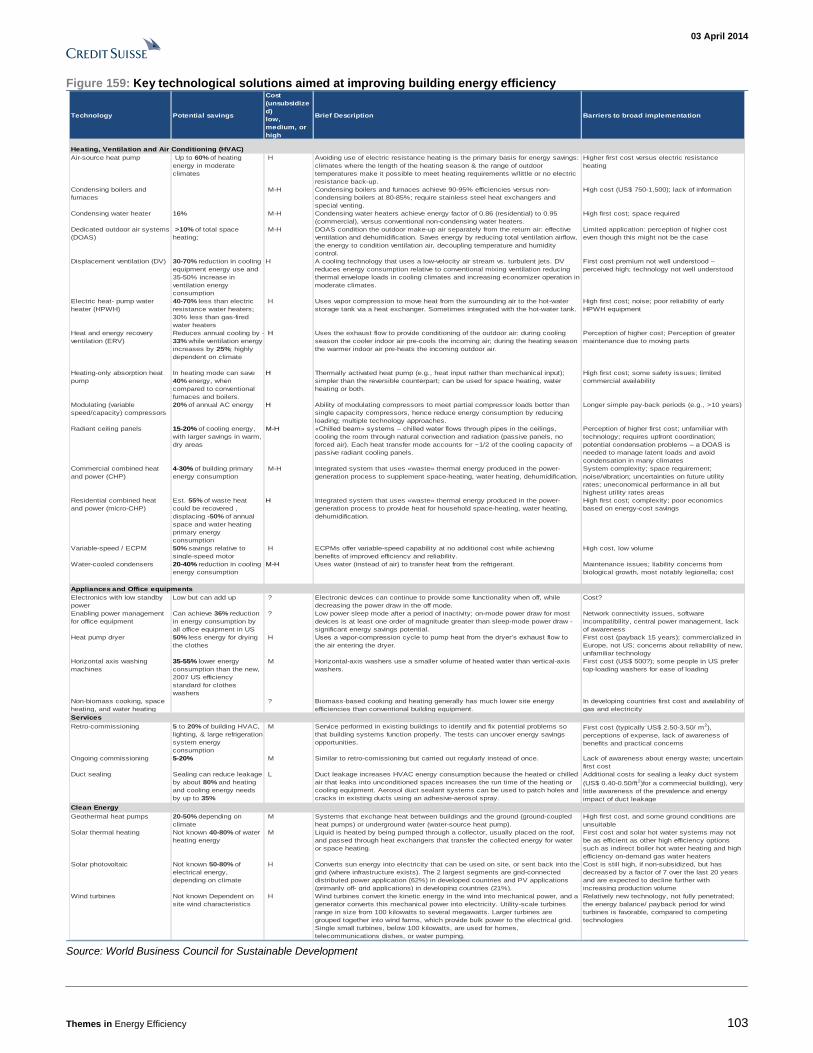
03 April 2014
Themes in Energy Efficiency 103
Figure 159: Key technological solutions aimed at improving building energy efficiency
Technology Potential savings
Cost
(unsubsidize
d)
low,
medium, or
high
Brief Description Barriers to broad implementation
Air-source heat pump Up to 60% of heating
energy in moderate
climates
H Avoiding use of electric resistance heating is the primary basis for energy savings:
climates where the length of the heating season & the range of outdoor
temperatures make it possible to meet heating requirements w/little or no electric
resistance back-up.
Higher first cost versus electric resistance
heating
Condensing boilers and
furnaces
M-H Condensing boilers and furnaces achieve 90-95% efficiencies versus non-
condensing boilers at 80-85%; require stainless steel heat exchangers and
special venting.
High cost (US$ 750-1,500); lack of information
Condensing water heater 16% M-H Condensing water heaters achieve energy factor of 0.86 (residential) to 0.95
(commercial), versus conventional non-condensing water heaters.
High first cost; space required
Dedicated outdoor air systems
(DOAS)
>10% of total space
heating;
M-H DOAS condition the outdoor make-up air separately from the return air: effective
ventilation and dehumidification. Saves energy by reducing total ventilation airflow,
the energy to condition ventilation air, decoupling temperature and humidity
control.
Limited application: perception of higher cost
even though this might not be the case
Displacement ventilation (DV) 30-70% reduction in cooling
equipment energy use and
35-50% increase in
ventilation energy
consumption
H A cooling technology that uses a low-velocity air stream vs. turbulent jets. DV
reduces energy consumption relative to conventional mixing ventilation reducing
thermal envelope loads in cooling climates and increasing economizer operation in
moderate climates.
First cost premium not well understood –
perceived high; technology not well understood
Electric heat- pump water
heater (HPWH)
40-70% less than electric
resistance water heaters;
30% less than gas-fired
water heaters
H Uses vapor compression to move heat from the surrounding air to the hot-water
storage tank via a heat exchanger. Sometimes integrated with the hot-water tank.
High first cost; noise; poor reliability of early
HPWH equipment
Heat and energy recovery
ventilation (ERV)
Reduces annual cooling by -
33% while ventilation energy
increases by 25%; highly
dependent on climate
H Uses the exhaust flow to provide conditioning of the outdoor air: during cooling
season the cooler indoor air pre-cools the incoming air; during the heating season
the warmer indoor air pre-heats the incoming outdoor air.
Perception of higher cost; Perception of greater
maintenance due to moving parts
Heating-only absorption heat
pump
In heating mode can save
40% energy, when
compared to conventional
furnaces and boilers.
H Thermally activated heat pump (e.g., heat input rather than mechanical input);
simpler than the reversible counterpart; can be used for space heating, water
heating or both.
High first cost; some safety issues; limited
commercial availability
Modulating (variable
speed/capacity) compressors
20% of annual AC energy H Ability of modulating compressors to meet partial compressor loads better than
single capacity compressors, hence reduce energy consumption by reducing
loading; multiple technology approaches.
Longer simple pay-back periods (e.g., >10 years)
Radiant ceiling panels 15-20% of cooling energy,
with larger savings in warm,
dry areas
M-H «Chilled beam» systems – chilled water flows through pipes in the ceilings,
cooling the room through natural convection and radiation (passive panels, no
forced air). Each heat transfer mode accounts for ~1/2 of the cooling capacity of
passive radiant cooling panels.
Perception of higher first cost; unfamiliar with
technology; requires upfront coordination;
potential condensation problems – a DOAS is
needed to manage latent loads and avoid
condensation in many climates
Commercial combined heat
and power (CHP)
4-30% of building primary
energy consumption
M-H Integrated system that uses «waste» thermal energy produced in the power-
generation process to supplement space-heating, water heating, dehumidification.
System complexity; space requirement;
noise/vibration; uncertainties on future utility
rates; uneconomical performance in all but
highest utility rates areas
Residential combined heat
and power (micro-CHP)
Est. 55% of waste heat
could be recovered ,
displacing -50% of annual
space and water heating
primary energy
consumption
H Integrated system that uses «waste» thermal energy produced in the power-
generation process to provide heat for household space-heating, water heating,
dehumidification.
High first cost; complexity; poor economics
based on energy-cost savings
Variable-speed / ECPM 50% savings relative to
single-speed motor
H ECPMs offer variable-speed capability at no additional cost while achieving
benefits of improved efficiency and reliability.
High cost, low volume
Water-cooled condensers 20-40% reduction in cooling
energy consumption
M-H Uses water (instead of air) to transfer heat from the refrigerant. Maintenance issues; liability concerns from
biological growth, most notably legionella; cost
Electronics with low standby
power
Low but can add up ? Electronic devices can continue to provide some functionality when off, while
decreasing the power draw in the off mode.
Cost?
Enabling power management
for office equipment
Can achieve 36% reduction
in energy consumption by
all office equipment in US
? Low power sleep mode after a period of inactivity; on-mode power draw for most
devices is at least one order of magnitude greater than sleep-mode power draw -
significant energy savings potential.
Network connectivity issues, software
incompatibility, central power management, lack
of awareness
Heat pump dryer 50% less energy for drying
the clothes
H Uses a vapor-compression cycle to pump heat from the dryer’s exhaust flow to
the air entering the dryer.
First cost (payback 15 years); commercialized in
Europe, not US; concerns about reliability of new,
unfamiliar technology
Horizontal axis washing
machines
35-55% lower energy
consumption than the new,
2007 US efficiency
standard for clothes
washers
M Horizontal-axis washers use a smaller volume of heated water than vertical-axis
washers.
First cost (US$ 500?); some people in US prefer
top-loading washers for ease of loading
Non-biomass cooking, space
heating, and water heating
? Biomass-based cooking and heating generally has much lower site energy
efficiencies than conventional building equipment.
In developing countries first cost and availability of
gas and electricity
Services
Retro-commissioning 5 to 20% of building HVAC,
lighting, & large refrigeration
system energy
consumption
M Service performed in existing buildings to identify and fix potential problems so
that building systems function properly. The tests can uncover energy savings
opportunities.
First cost (typically US$ 2.50-3.50/ m2),
perceptions of expense, lack of awareness of
benefits and practical concerns
Ongoing commissioning 5-20% M Similar to retro-comissioning but carried out regularly instead of once. Lack of awareness about energy waste; uncertain
first cost
Duct sealing Sealing can reduce leakage
by about 80% and heating
and cooling energy needs
by up to 35%
L Duct leakage increases HVAC energy consumption because the heated or chilled
air that leaks into unconditioned spaces increases the run time of the heating or
cooling equipment. Aerosol duct sealant systems can be used to patch holes and
cracks in existing ducts using an adhesive-aerosol spray.
Additional costs for sealing a leaky duct system
(US$ 0.40-0.50/ft2)for a commercial building), very
little awareness of the prevalence and energy
impact of duct leakage
Clean Energy
Geothermal heat pumps 20-50% depending on
climate
M Systems that exchange heat between buildings and the ground (ground-coupled
heat pumps) or underground water (water-source heat pump).
High first cost, and some ground conditions are
unsuitable
Solar thermal heating Not known 40-80% of water
heating energy
M Liquid is heated by being pumped through a collector, usually placed on the roof,
and passed through heat exchangers that transfer the collected energy for water
or space heating.
First cost and solar hot water systems may not
be as efficient as other high efficiency options
such as indirect boiler hot water heating and high
efficiency on-demand gas water heaters
Solar photovoltaic Not known 50-80% of
electrical energy,
depending on climate
H Converts sun energy into electricity that can be used on site, or sent back into the
grid (where infrastructure exists). The 2 largest segments are grid-connected
distributed power application (62%) in developed countries and PV applications
(primarily off- grid applications) in developing countries (21%).
Cost is still high, if non-subsidized, but has
decreased by a factor of 7 over the last 20 years
and are expected to decline further with
increasing production volume
Wind turbines Not known Dependent on
site wind characteristics
H Wind turbines convert the kinetic energy in the wind into mechanical power, and a
generator converts this mechanical power into electricity. Utility-scale turbines
range in size from 100 kilowatts to several megawatts. Larger turbines are
grouped together into wind farms, which provide bulk power to the electrical grid.
Single small turbines, below 100 kilowatts, are used for homes,
telecommunications dishes, or water pumping.
Relatively new technology, not fully penetrated;
the energy balance/ payback period for wind
turbines is favorable, compared to competing
technologies
Heating, Ventilation and Air Conditioning (HVAC)
Appliances and Office equipments
Source: World Business Council for Sustainable Development
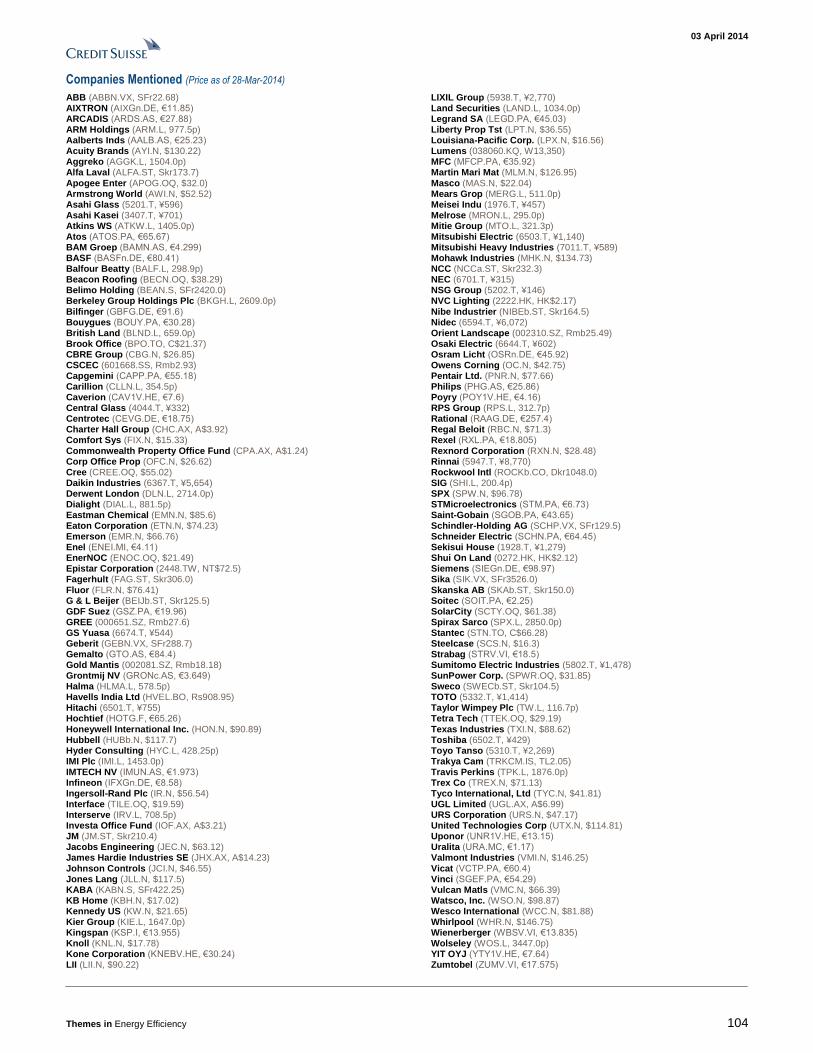
03 April 2014
Themes in Energy Efficiency 104
Companies Mentioned (Price as of 28-Mar-2014)
ABB (ABBN.VX, SFr22.68) AIXTRON (AIXGn.DE, €11.85) ARCADIS (ARDS.AS, €27.88) ARM Holdings (ARM.L, 977.5p) Aalberts Inds (AALB.AS, €25.23) Acuity Brands (AYI.N, $130.22) Aggreko (AGGK.L, 1504.0p) Alfa Laval (ALFA.ST, Skr173.7) Apogee Enter (APOG.OQ, $32.0) Armstrong World (AWI.N, $52.52) Asahi Glass (5201.T, ¥596) Asahi Kasei (3407.T, ¥701) Atkins WS (ATKW.L, 1405.0p) Atos (ATOS.PA, €65.67) BAM Groep (BAMN.AS, €4.299) BASF (BASFn.DE, €80.41) Balfour Beatty (BALF.L, 298.9p) Beacon Roofing (BECN.OQ, $38.29) Belimo Holding (BEAN.S, SFr2420.0) Berkeley Group Holdings Plc (BKGH.L, 2609.0p) Bilfinger (GBFG.DE, €91.6) Bouygues (BOUY.PA, €30.28) British Land (BLND.L, 659.0p) Brook Office (BPO.TO, C$21.37) CBRE Group (CBG.N, $26.85) CSCEC (601668.SS, Rmb2.93) Capgemini (CAPP.PA, €55.18) Carillion (CLLN.L, 354.5p) Caverion (CAV1V.HE, €7.6) Central Glass (4044.T, ¥332) Centrotec (CEVG.DE, €18.75) Charter Hall Group (CHC.AX, A$3.92) Comfort Sys (FIX.N, $15.33) Commonwealth Property Office Fund (CPA.AX, A$1.24) Corp Office Prop (OFC.N, $26.62) Cree (CREE.OQ, $55.02) Daikin Industries (6367.T, ¥5,654) Derwent London (DLN.L, 2714.0p) Dialight (DIAL.L, 881.5p) Eastman Chemical (EMN.N, $85.6) Eaton Corporation (ETN.N, $74.23) Emerson (EMR.N, $66.76) Enel (ENEI.MI, €4.11) EnerNOC (ENOC.OQ, $21.49) Epistar Corporation (2448.TW, NT$72.5) Fagerhult (FAG.ST, Skr306.0) Fluor (FLR.N, $76.41) G & L Beijer (BEIJb.ST, Skr125.5) GDF Suez (GSZ.PA, €19.96) GREE (000651.SZ, Rmb27.6) GS Yuasa (6674.T, ¥544) Geberit (GEBN.VX, SFr288.7) Gemalto (GTO.AS, €84.4) Gold Mantis (002081.SZ, Rmb18.18) Grontmij NV (GRONc.AS, €3.649) Halma (HLMA.L, 578.5p) Havells India Ltd (HVEL.BO, Rs908.95) Hitachi (6501.T, ¥755) Hochtief (HOTG.F, €65.26) Honeywell International Inc. (HON.N, $90.89) Hubbell (HUBb.N, $117.7) Hyder Consulting (HYC.L, 428.25p) IMI Plc (IMI.L, 1453.0p) IMTECH NV (IMUN.AS, €1.973) Infineon (IFXGn.DE, €8.58) Ingersoll-Rand Plc (IR.N, $56.54) Interface (TILE.OQ, $19.59) Interserve (IRV.L, 708.5p) Investa Office Fund (IOF.AX, A$3.21) JM (JM.ST, Skr210.4) Jacobs Engineering (JEC.N, $63.12) James Hardie Industries SE (JHX.AX, A$14.23) Johnson Controls (JCI.N, $46.55) Jones Lang (JLL.N, $117.5) KABA (KABN.S, SFr422.25) KB Home (KBH.N, $17.02) Kennedy US (KW.N, $21.65) Kier Group (KIE.L, 1647.0p) Kingspan (KSP.I, €13.955) Knoll (KNL.N, $17.78) Kone Corporation (KNEBV.HE, €30.24) LII (LII.N, $90.22)
LIXIL Group (5938.T, ¥2,770) Land Securities (LAND.L, 1034.0p) Legrand SA (LEGD.PA, €45.03) Liberty Prop Tst (LPT.N, $36.55) Louisiana-Pacific Corp. (LPX.N, $16.56) Lumens (038060.KQ, W13,350) MFC (MFCP.PA, €35.92) Martin Mari Mat (MLM.N, $126.95) Masco (MAS.N, $22.04) Mears Grop (MERG.L, 511.0p) Meisei Indu (1976.T, ¥457) Melrose (MRON.L, 295.0p) Mitie Group (MTO.L, 321.3p) Mitsubishi Electric (6503.T, ¥1,140) Mitsubishi Heavy Industries (7011.T, ¥589) Mohawk Industries (MHK.N, $134.73) NCC (NCCa.ST, Skr232.3) NEC (6701.T, ¥315) NSG Group (5202.T, ¥146) NVC Lighting (2222.HK, HK$2.17) Nibe Industrier (NIBEb.ST, Skr164.5) Nidec (6594.T, ¥6,072) Orient Landscape (002310.SZ, Rmb25.49) Osaki Electric (6644.T, ¥602) Osram Licht (OSRn.DE, €45.92) Owens Corning (OC.N, $42.75) Pentair Ltd. (PNR.N, $77.66) Philips (PHG.AS, €25.86) Poyry (POY1V.HE, €4.16) RPS Group (RPS.L, 312.7p) Rational (RAAG.DE, €257.4) Regal Beloit (RBC.N, $71.3) Rexel (RXL.PA, €18.805) Rexnord Corporation (RXN.N, $28.48) Rinnai (5947.T, ¥8,770) Rockwool Intl (ROCKb.CO, Dkr1048.0) SIG (SHI.L, 200.4p) SPX (SPW.N, $96.78) STMicroelectronics (STM.PA, €6.73) Saint-Gobain (SGOB.PA, €43.65) Schindler-Holding AG (SCHP.VX, SFr129.5) Schneider Electric (SCHN.PA, €64.45) Sekisui House (1928.T, ¥1,279) Shui On Land (0272.HK, HK$2.12) Siemens (SIEGn.DE, €98.97) Sika (SIK.VX, SFr3526.0) Skanska AB (SKAb.ST, Skr150.0) Soitec (SOIT.PA, €2.25) SolarCity (SCTY.OQ, $61.38) Spirax Sarco (SPX.L, 2850.0p) Stantec (STN.TO, C$66.28) Steelcase (SCS.N, $16.3) Strabag (STRV.VI, €18.5) Sumitomo Electric Industries (5802.T, ¥1,478) SunPower Corp. (SPWR.OQ, $31.85) Sweco (SWECb.ST, Skr104.5) TOTO (5332.T, ¥1,414) Taylor Wimpey Plc (TW.L, 116.7p) Tetra Tech (TTEK.OQ, $29.19) Texas Industries (TXI.N, $88.62) Toshiba (6502.T, ¥429) Toyo Tanso (5310.T, ¥2,269) Trakya Cam (TRKCM.IS, TL2.05) Travis Perkins (TPK.L, 1876.0p) Trex Co (TREX.N, $71.13) Tyco International, Ltd (TYC.N, $41.81) UGL Limited (UGL.AX, A$6.99) URS Corporation (URS.N, $47.17) United Technologies Corp (UTX.N, $114.81) Uponor (UNR1V.HE, €13.15) Uralita (URA.MC, €1.17) Valmont Industries (VMI.N, $146.25) Vicat (VCTP.PA, €60.4) Vinci (SGEF.PA, €54.29) Vulcan Matls (VMC.N, $66.39) Watsco, Inc. (WSO.N, $98.87) Wesco International (WCC.N, $81.88) Whirlpool (WHR.N, $146.75) Wienerberger (WBSV.VI, €13.835) Wolseley (WOS.L, 3447.0p) YIT OYJ (YTY1V.HE, €7.64) Zumtobel (ZUMV.VI, €17.575)
03 April 2014
Themes in Energy Efficiency 105
Disclosure Appendix
Important Global Disclosures
The analysts identified in this report each certify, with respect to the companies or securities that the individual analyzes, that (1) the views expressed in this report accurately reflect his or her personal views about all of the subject companies and securities and (2) no part of his or her compensation was, is or will be directly or indirectly related to the specific recommendations or views expressed in this report.
The analyst(s) responsible for preparing this research report received Compensation that is based upon various factors including Credit Suisse's total revenues, a portion of which are generated by Credit Suisse's investment banking activities
As of December 10, 2012 Analysts’ stock rating are defined as follows:
Outperform (O) : The stock’s total return is expected to outperform the relevant benchmark*over the next 12 months.
Neutral (N) : The stock’s total return is expected to be in line with the relevant benchmark* over the next 12 months.
Underperform (U) : The stock’s total return is expected to underperform the relevant benchmark* over the next 12 months.
*Relevant benchmark by region: As of 10th December 2012, Japanese ratings are based on a stock’s total return relative to the analyst's coverage universe which consists of all companies covered by the analyst within the relevant sector, with Outperforms representing the most attract ive, Neutrals the less attractive, and Underperforms the least attractive investment opportunities. As of 2nd October 2012, U.S. and Canadian as well as European ra tings are based on a stock’s total return relative to the analyst's coverage universe which consists of all companies covered by the analyst within the relevant sector, with Outperforms representing the most attractive, Neutrals the less attractive, and Underperforms the least attractive investment opportunities. For Latin Ame rican and non-Japan Asia stocks, ratings are based on a stock’s total return relative to the average total return of the relevant country or regional benchmark; Australia, New Zealand are, and prior to 2nd October 2012 U.S. and Canadian ratings were based on (1) a stock’s absolute total return potential to its current share price and (2) the relative attractiveness of a stock’s total return potential within an analyst’s coverage universe. For Australian and New Zealand stocks, 12 -month rolling yield is incorporated in the absolute total return calculation and a 15% and a 7.5% threshold replace the 10-15% level in the Outperform and Underperform stock rating definitions, respectively. The 15% and 7.5% thresholds replace the +10-15% and -10-15% levels in the Neutral stock rating definition, respectively. Prior to 10th December 2012, Japanese ratings were based on a stock’s total return relative to the average total return of the relevant country or regional benchmark.
Restricted (R) : In certain circumstances, Credit Suisse policy and/or applicable law and regulations preclude certain types of communications, including an investment recommendation, during the course of Credit Suisse's engagement in an investment banking transaction and in certain other circumstances.
Volatility Indicator [V] : A stock is defined as volatile if the stock price has moved up or down by 20% or more in a month in at least 8 of the past 24 months or the analyst expects significant volatility going forward.
Analysts’ sector weightings are distinct from analysts’ stock ratings and are based on the analyst’s expectations for the fundamentals and/or valuation of the sector* relative to the group’s historic fundamentals and/or valuation:
Overweight : The analyst’s expectation for the sector’s fundamentals and/or valuation is favorable over the next 12 months.
Market Weight : The analyst’s expectation for the sector’s fundamentals and/or valuation is neutral over the next 12 months.
Underweight : The analyst’s expectation for the sector’s fundamentals and/or valuation is cautious over the next 12 months.
*An analyst’s coverage sector consists of all companies covered by the analyst within the relevant sector. An analyst may cover multiple sectors.
Credit Suisse's distribution of stock ratings (and banking clients) is:
Global Ratings Distribution
Rating Versus universe (%) Of which banking clients (%)
Outperform/Buy* 43% (53% banking clients)
Neutral/Hold* 40% (50% banking clients)
Underperform/Sell* 14% (45% banking clients)
Restricted 2%
*For purposes of the NYSE and NASD ratings distribution disclosure requirements, our stock ratings of Outperform, Neutral, and Underperform mos t closely correspond to Buy, Hold, and Sell, respectively; however, the meanings are not the same, as our stock ratings are determined on a relative basis. (Please refer to definitions above.) An investor's decision to buy or sell a security should be based on investment objectives, current holdin gs, and other individual factors.
Credit Suisse’s policy is to update research reports as it deems appropriate, based on developments with the subject company, the sector or the market that may have a material impact on the research views or opinions stated herein.
Credit Suisse's policy is only to publish investment research that is impartial, independent, clear, fair and not misleading. For more detail please refer to Credit Suisse's Policies for Managing Conflicts of Interest in connection with Investment Research: http://www.csfb.com/research and analytics/disclaimer/managing_conflicts_disclaimer.html
Credit Suisse does not provide any tax advice. Any statement herein regarding any US federal tax is not intended or written to be used, and cannot be used, by any taxpayer for the purposes of avoiding any penalties.
03 April 2014
Themes in Energy Efficiency 106
Please refer to the firm's disclosure website at https://rave.credit-suisse.com/disclosures for the definitions of abbreviations typically used in the target price method and risk sections.
See the Companies Mentioned section for full company names
The subject company (STM.PA, VMI.N, HLMA.L, 6501.T, UTX.N, FLR.N, WHR.N, IFXGn.DE, HON.N, URS.N, RXN.N, ALFA.ST, WCC.N, BKGH.L, 5938.T, IMI.L, JEC.N, TPK.L, CPA.AX, ABBN.VX, SCHN.PA, BASFn.DE, EMR.N, 6701.T, WSO.N, SCTY.OQ, IR.N, CAPP.PA, SIEGn.DE, SGEF.PA, SPWR.OQ, TW.L, GSZ.PA, 2448.TW, 5802.T, SGOB.PA, CREE.OQ, IOF.AX, 6502.T, RBC.N, KBH.N, UGL.AX, GTO.AS, SPW.N, SIK.VX, ENEI.MI, ENOC.OQ) currently is, or was during the 12-month period preceding the date of distribution of this report, a client of Credit Suisse.
Credit Suisse provided investment banking services to the subject company (SCHP.VX, WHR.N, RXN.N, WCC.N, 5938.T, CPA.AX, ABBN.VX, BASFn.DE, 6701.T, SCTY.OQ, IR.N, SGEF.PA, SPWR.OQ, TW.L, SGOB.PA, RBC.N, KBH.N, SPW.N, SIK.VX, ENEI.MI) within the past 12 months.
Credit Suisse provided non-investment banking services to the subject company (STM.PA, VMI.N, 6501.T, WHR.N, IFXGn.DE, HON.N, BKGH.L, IMI.L, ABBN.VX, BASFn.DE, EMR.N, IR.N, CAPP.PA, SIEGn.DE, SPWR.OQ, GSZ.PA, 5802.T, IOF.AX, KBH.N, ENEI.MI) within the past 12 months
Credit Suisse has managed or co-managed a public offering of securities for the subject company (SCHP.VX, BASFn.DE, SCTY.OQ, IR.N, SPWR.OQ, KBH.N, SIK.VX, ENEI.MI) within the past 12 months.
Credit Suisse has received investment banking related compensation from the subject company (SCHP.VX, WHR.N, RXN.N, WCC.N, 5938.T, CPA.AX, ABBN.VX, BASFn.DE, 6701.T, SCTY.OQ, IR.N, SGEF.PA, SPWR.OQ, TW.L, SGOB.PA, RBC.N, KBH.N, SPW.N, SIK.VX, ENEI.MI) within the past 12 months
Credit Suisse expects to receive or intends to seek investment banking related compensation from the subject company (VMI.N, HLMA.L, 6501.T, UTX.N, FLR.N, WHR.N, IFXGn.DE, HON.N, URS.N, 6503.T, 6674.T, 5202.T, RXN.N, ALFA.ST, WCC.N, 7011.T, MAS.N, 5938.T, JEC.N, TPK.L, CPA.AX, ABBN.VX, SCHN.PA, BASFn.DE, EMR.N, 6701.T, WSO.N, SCTY.OQ, IR.N, CAPP.PA, 1928.T, SGEF.PA, SPWR.OQ, TW.L, 6367.T, GSZ.PA, BOUY.PA, 3407.T, 6594.T, 2448.TW, 5802.T, ATOS.PA, SGOB.PA, 5201.T, CREE.OQ, 6502.T, RBC.N, MHK.N, KBH.N, UGL.AX, GTO.AS, SPW.N, SIK.VX, ENEI.MI, ENOC.OQ) within the next 3 months.
Credit Suisse has received compensation for products and services other than investment banking services from the subject company (STM.PA, VMI.N, 6501.T, WHR.N, IFXGn.DE, HON.N, BKGH.L, IMI.L, ABBN.VX, BASFn.DE, EMR.N, IR.N, CAPP.PA, SIEGn.DE, SPWR.OQ, GSZ.PA, 5802.T, IOF.AX, KBH.N, ENEI.MI) within the past 12 months
As of the date of this report, Credit Suisse makes a market in the following subject companies (VMI.N, PNR.N, UTX.N, FLR.N, WHR.N, HON.N, URS.N, RXN.N, WCC.N, MAS.N, JEC.N, EMR.N, 6701.T, WSO.N, SCTY.OQ, IR.N, TYC.N, ETN.N, SPWR.OQ, CREE.OQ, 6502.T, RBC.N, MHK.N, KBH.N, SPW.N, ENOC.OQ).
As of the end of the preceding month, Credit Suisse beneficially own 1% or more of a class of common equity securities of (5202.T, ABBN.VX, SCTY.OQ, 1928.T, SIEGn.DE, TW.L, 2448.TW, ATOS.PA, ARM.L, PHG.AS, SIK.VX).
Credit Suisse has a material conflict of interest with the subject company (UTX.N) . Credit Suisse Securities (USA) LLC is acting as an advisor to Goodrich (GR) in a potential transaction with United Technologies Corp.
Credit Suisse has a material conflict of interest with the subject company (URS.N) . Credit Suisse Securities (Canada), Inc provided a Fairness Opinion and acted as financial advisor to Flint Energy Services Ltd. on the announced acquisition by URS Corporation.
Credit Suisse has a material conflict of interest with the subject company (RXN.N) . Credit Suisse served as co-managing bookrunner of Rexnord's Initial Public Offering
Credit Suisse has a material conflict of interest with the subject company (5938.T) . Credit Suisse is acting as financial advisor to TPG Capital and DLJ Merchant Banking Partners on the sale of their stake in Grohe S.A to to LIXIL Group and Development Bank of Japan.
Credit Suisse has a material conflict of interest with the subject company (6502.T) . Credit Suisse Securities (USA) LLC is acting as an advisor to Landis+Gyr on the announced acquisition by Toshiba Corporation. This acquisition remains subject to regulatory approvals and other customary closing conditions.
Credit Suisse has a material conflict of interest with the subject company (SPW.N) . Credit Suisse Securities USA LLC acted as financial advisor to SPX Corp in the sale of its Service Solutions business to Robert Bosch GmbBH.
Important Regional Disclosures
Singapore recipients should contact Credit Suisse AG, Singapore Branch for any matters arising from this research report.
The analyst(s) involved in the preparation of this report have not visited the material operations of the subject company (STM.PA, VMI.N, PNR.N, SCHP.VX, HLMA.L, 6501.T, UTX.N, AGGK.L, FLR.N, JHX.AX, CHC.AX, WOS.L, WHR.N, LEGD.PA, GEBN.VX, IFXGn.DE, HON.N, URS.N, 6503.T, 6674.T, 5332.T, 5202.T, RXN.N, ALFA.ST, YTY1V.HE, MRON.L, KNEBV.HE, ARDS.AS, WCC.N, BKGH.L, 7011.T, MAS.N, 5938.T, 4044.T, IMI.L, JEC.N, TPK.L, CPA.AX, ABBN.VX, 5310.T, SCHN.PA, BASFn.DE, EMR.N, 6701.T, WSO.N, SCTY.OQ, IR.N, CAPP.PA, TYC.N, 1928.T, SIEGn.DE, SGEF.PA, ETN.N, SPWR.OQ, TW.L, 6367.T, GSZ.PA, BOUY.PA, 3407.T, 2448.TW, 5802.T, ATOS.PA, 5947.T, SGOB.PA, ARM.L, 5201.T, PHG.AS, CREE.OQ, IOF.AX, 6502.T, RBC.N, SPX.L, UGL.AX, GTO.AS, SPW.N, SIK.VX, ENEI.MI, KABN.S, ENOC.OQ) within the past 12 months
An analyst involved in the preparation of this report has visited certain material operations of the subject company (6594.T, MHK.N, KBH.N) within the past 12 months

03 April 2014
Themes in Energy Efficiency 107
The travel expenses of the analyst in connection with such visits were not paid or reimbursed by the subject company, other than de minimus local travel expenses.
Restrictions on certain Canadian securities are indicated by the following abbreviations: NVS--Non-Voting shares; RVS--Restricted Voting Shares; SVS--Subordinate Voting Shares.
Individuals receiving this report from a Canadian investment dealer that is not affiliated with Credit Suisse should be advised that this report may not contain regulatory disclosures the non-affiliated Canadian investment dealer would be required to make if this were its own report.
For Credit Suisse Securities (Canada), Inc.'s policies and procedures regarding the dissemination of equity research, please visit http://www.csfb.com/legal_terms/canada_research_policy.shtml.
Credit Suisse Securities (Europe) Limited (Credit Suisse) acts as broker to (HLMA.L, TPK.L).
The following disclosed European company/ies have estimates that comply with IFRS: (HLMA.L, WOS.L, LEGD.PA, ALFA.ST, BKGH.L, IMI.L, TPK.L, ABBN.VX, SCHN.PA, BASFn.DE, 6701.T, CAPP.PA, SIEGn.DE, TW.L, GSZ.PA, BOUY.PA, 3407.T, ATOS.PA, SGOB.PA, PHG.AS, SPX.L, SIK.VX, ENEI.MI).
Credit Suisse has acted as lead manager or syndicate member in a public offering of securities for the subject company (SCHP.VX, FLR.N, URS.N, 5938.T, ABBN.VX, BASFn.DE, SCTY.OQ, IR.N, TYC.N, SIEGn.DE, ETN.N, SPWR.OQ, TW.L, PHG.AS, RBC.N, KBH.N, SIK.VX, ENEI.MI) within the past 3 years.
As of the end of the preceding month, Credit Suisse beneficially owned the following percentages of the voting rights of the subject companies: 1.0% or more of SCHP.VX, 1.0% or more of GEBN.VX
As of the date of this report, Credit Suisse acts as a market maker or liquidity provider in the equities securities that are the subject of this report.
Principal is not guaranteed in the case of equities because equity prices are variable.
Commission is the commission rate or the amount agreed with a customer when setting up an account or at any time after that.
Taiwanese Disclosures: This research report is for reference only. Investors should carefully consider their own investment risk. Investment results are the responsibility of the individual investor. Reports may not be reprinted without permission of CS. Reports written by Taiwan based analysts on non-Taiwan listed companies are not considered recommendations to buy or sell securities under Taiwan Stock Exchange Operational Regulations Governing Securities Firms Recommending Trades in Securities to Customers.
To the extent this is a report authored in whole or in part by a non-U.S. analyst and is made available in the U.S., the following are important disclosures regarding any non-U.S. analyst contributors: The non-U.S. research analysts listed below (if any) are not registered/qualified as research analysts with FINRA. The non-U.S. research analysts listed below may not be associated persons of CSSU and therefore may not be subject to the NASD Rule 2711 and NYSE Rule 472 restrictions on communications with a subject company, public appearances and trading securities held by a research analyst account.
Credit Suisse Securities (Japan) Limited .. Shinji Kuroda ; Yunchao Zhao ; Jun Yamaguchi ; Akinori Kanemoto ; Yohei Ohya ; Masahiro Mochizuki ; Atsuro Takemura
Credit Suisse Equities (Australia) Limited ....................................................................................... John Richmond ; Stephen Rich ; Mikhail Mohl
Credit Suisse Securities (Europe) Limited................ Eugene Klerk ; Michel Debs ; Vincent Gilles ; Andre Kukhnin CFA ; Patrick Laager ; Simon Toennessen ; Max Yates ; Jonathan Hurn, CFA ; Tiantian Li ; Ashlee Ramanathan ; Richard Kersley
Credit Suisse AG, Taipei Securities Branch ........................................................................................................................ Derrick Yang ; Jerry Su
Important Credit Suisse HOLT Disclosures
With respect to the analysis in this report based on the Credit Suisse HOLT methodology, Credit Suisse certifies that (1) the views expressed in this report accurately reflect the Credit Suisse HOLT methodology and (2) no part of the Firm’s compensation was, is, or will be directly related to the specific views disclosed in this report.
The Credit Suisse HOLT methodology does not assign ratings to a security. It is an analytical tool that involves use of a set of proprietary quantitative algorithms and warranted value calculations, collectively called the Credit Suisse HOLT valuation model, that are consistently applied to all the companies included in its database. Third-party data (including consensus earnings estimates) are systematically translated into a number of default algorithms available in the Credit Suisse HOLT valuation model. The source financial statement, pricing, and earnings data provided by outside data vendors are subject to quality control and may also be adjusted to more closely measure the underlying economics of firm performance. The adjustments provide consistency when analyzing a single company across time, or analyzing multiple companies across industries or national borders. The default scenario that is produced by the Credit Suisse HOLT valuation model establishes the baseline valuation for a security, and a user then may adjust the default variables to produce alternative scenarios, any of which could occur.
Additional information about the Credit Suisse HOLT methodology is available on request.
The Credit Suisse HOLT methodology does not assign a price target to a security. The default scenario that is produced by the Credit Suisse HOLT valuation model establishes a warranted price for a security, and as the third-party data are updated, the warranted price may also change. The default variable may also be adjusted to produce alternative warranted prices, any of which could occur.

03 April 2014
Themes in Energy Efficiency 108
CFROI®, HOLT, HOLTfolio, ValueSearch, AggreGator, Signal Flag and “Powered by HOLT” are trademarks or service marks or registered trademarks or registered service marks of Credit Suisse or its affiliates in the United States and other countries. HOLT is a corporate performance and valuation advisory service of Credit Suisse.
For Credit Suisse disclosure information on other companies mentioned in this report, please visit the website at https://rave.credit-suisse.com/disclosures or call +1 (877) 291-2683.

03 April 2014
Themes in Energy Efficiency 109

03 April 2014
Themes in Energy Efficiency 110

03 April 2014
Themes in Energy Efficiency 111
03 April 2014
Themes in Energy Efficiency 112
References in this report to Credit Suisse include all of the subsidiaries and affiliates of Credit Suisse operating under its investment banking division. For more information on our structure, please use the following link: https://www.credit-suisse.com/who_we_are/en/This report may contain material that is not directed to, or intended for distribution to or use by, any person or entity who is a citizen or resident of or located in any locality, state, country or other jurisdiction where such distribution, publication, availability or use would be contrary to law or regulation or which would subject Credit Suisse AG or its affiliates ("CS") to any registration or licensing requirement within such jurisdiction. All material presented in this report, unless specifically indicated otherwise, is under copyright to CS. None of the material, nor its content, nor any copy of it, may be altered in any way, transmitted to, copied or distributed to any other party, without the prior express written permission of CS. All trademarks, service marks and logos used in this report are trademarks or service marks or registered trademarks or service marks of CS or its affiliates. The information, tools and material presented in this report are provided to you for information purposes only and are not to be used or considered as an offer or the solicitation of an offer to sell or to buy or subscribe for securities or other financial instruments. CS may not have taken any steps to ensure that the securities referred to in this report are suitable for any particular investor. CS will not treat recipients of this report as its customers by virtue of their receiving this report. The investments and services contained or referred to in this report may not be suitable for you and it is recommended that you consult an independent investment advisor if you are in doubt about such investments or investment services. Nothing in this report constitutes investment, legal, accounting or tax advice, or a representation that any investment or strategy is suitable or appropriate to your individual circumstances, or otherwise constitutes a personal recommendation to you. CS does not advise on the tax consequences of investments and you are advised to contact an independent tax adviser. Please note in particular that the bases and levels of taxation may change. Information and opinions presented in this report have been obtained or derived from sources believed by CS to be reliable, but CS makes no representation as to their accuracy or completeness. CS accepts no liability for loss arising from the use of the material presented in this report, except that this exclusion of liability does not apply to the extent that such liability arises under specific statutes or regulations applicable to CS. This report is not to be relied upon in substitution for the exercise of independent judgment. CS may have issued, and may in the future issue, other communications that are inconsistent with, and reach different conclusions from, the information presented in this report. Those communications reflect the different assumptions, views and analytical methods of the analysts who prepared them and CS is under no obligation to ensure that such other communications are brought to the attention of any recipient of this report. CS may, to the extent permitted by law, participate or invest in financing transactions with the issuer(s) of the securities referred to in this report, perform services for or solicit business from such issuers, and/or have a position or holding, or other material interest, or effect transactions, in such securities or options thereon, or other investments related thereto. In addition, it may make markets in the securities mentioned in the material presented in this report. CS may have, within the last three years, served as manager or co-manager of a public offering of securities for, or currently may make a primary market in issues of, any or all of the entities mentioned in this report or may be providing, or have provided within the previous 12 months, significant advice or investment services in relation to the investment concerned or a related investment. Additional information is, subject to duties of confidentiality, available on request. Some investments referred to in this report will be offered solely by a single entity and in the case of some investments solely by CS, or an associate of CS or CS may be the only market maker in such investments. Past performance should not be taken as an indication or guarantee of future performance, and no representation or warranty, express or implied, is made regarding future performance. Information, opinions and estimates contained in this report reflect a judgment at its original date of publication by CS and are subject to change without notice. The price, value of and income from any of the securities or financial instruments mentioned in this report can fall as well as rise. The value of securities and financial instruments is subject to exchange rate fluctuation that may have a positive or adverse effect on the price or income of such securities or financial instruments. Investors in securities such as ADR's, the values of which are influenced by currency volatility, effectively assume this risk. Structured securities are complex instruments, typically involve a high degree of risk and are intended for sale only to sophisticated investors who are capable of understanding and assuming the risks involved. The market value of any structured security may be affected by changes in economic, financial and political factors (including, but not limited to, spot and forward interest and exchange rates), time to maturity, market conditions and volatility, and the credit quality of any issuer or reference issuer. Any investor interested in purchasing a structured product should conduct their own investigation and analysis of the product and consult with their own professional advisers as to the risks involved in making such a purchase. Some investments discussed in this report may have a high level of volatility. High volatility investments may experience sudden and large falls in their value causing losses when that investment is realised. Those losses may equal your original investment. Indeed, in the case of some investments the potential losses may exceed the amount of initial investment and, in such circumstances, you may be required to pay more money to support those losses. Income yields from investments may fluctuate and, in consequence, initial capital paid to make the investment may be used as part of that income yield. Some investments may not be readily realisable and it may be difficult to sell or realise those investments, similarly it may prove difficult for you to obtain reliable information about the value, or risks, to which such an investment is exposed. This report may provide the addresses of, or contain hyperlinks to, websites. Except to the extent to which the report refers to website material of CS, CS has not reviewed any such site and takes no responsibility for the content contained therein. Such address or hyperlink (including addresses or hyperlinks to CS's own website material) is provided solely for your convenience and information and the content of any such website does not in any way form part of this document. Accessing such website or following such link through this report or CS's website shall be at your own risk. This report is issued and distributed in Europe (except Switzerland) by Credit Suisse Securities (Europe) Limited, One Cabot Square, London E14 4QJ, England, which is authorised by the Prudential Regulation Authority and regulated by the Financial Conduct Authority and the Prudential Regulation Authority. This report is being distributed in Germany by Credit Suisse Securities (Europe) Limited Niederlassung Frankfurt am Main regulated by the Bundesanstalt fuer Finanzdienstleistungsaufsicht ("BaFin"). This report is being distributed in the United States and Canada by Credit Suisse Securities (USA) LLC; in Switzerland by Credit Suisse AG; in Brazil by Banco de Investimentos Credit Suisse (Brasil) S.A or its affiliates; in Mexico by Banco Credit Suisse (México), S.A. (transactions related to the securities mentioned in this report will only be effected in compliance with applicable regulation); in Japan by Credit Suisse Securities (Japan) Limited, Financial Instruments Firm, Director-General of Kanto Local Finance Bureau (Kinsho) No. 66, a member of Japan Securities Dealers Association, The Financial Futures Association of Japan, Japan Investment Advisers Association, Type II Financial Instruments Firms Association; elsewhere in Asia/ Pacific by whichever of the following is the appropriately authorised entity in the relevant jurisdiction: Credit Suisse (Hong Kong) Limited, Credit Suisse Equities (Australia) Limited, Credit Suisse Securities (Thailand) Limited, having registered address at 990 Abdulrahim Place, 27 Floor, Unit 2701, Rama IV Road, Silom, Bangrak, Bangkok 10500, Thailand, Tel. +66 2614 6000, Credit Suisse Securities (Malaysia) Sdn Bhd, Credit Suisse AG, Singapore Branch, Credit Suisse Securities (India) Private Limited regulated by the Securities and Exchange Board of India (registration Nos. INB230970637; INF230970637; INB010970631; INF010970631), having registered address at 9th Floor, Ceejay House, Dr.A.B. Road, Worli, Mumbai - 18, India, T- +91-22 6777 3777, Credit Suisse Securities (Europe) Limited, Seoul Branch, Credit Suisse AG, Taipei Securities Branch, PT Credit Suisse Securities Indonesia, Credit Suisse Securities (Philippines ) Inc., and elsewhere in the world by the relevant authorised affiliate of the above. Research on Taiwanese securities produced by Credit Suisse AG, Taipei Securities Branch has been prepared by a registered Senior Business Person. Research provided to residents of Malaysia is authorised by the Head of Research for Credit Suisse Securities (Malaysia) Sdn Bhd, to whom they should direct any queries on +603 2723 2020. This report has been prepared and issued for distribution in Singapore to institutional investors, accredited investors and expert investors (each as defined under the Financial Advisers Regulations) only, and is also distributed by Credit Suisse AG, Singapore branch to overseas investors (as defined under the Financial Advisers Regulations). By virtue of your status as an institutional investor, accredited investor, expert investor or overseas investor, Credit Suisse AG, Singapore branch is exempted from complying with certain compliance requirements under the Financial Advisers Act, Chapter 110 of Singapore (the "FAA"), the Financial Advisers Regulations and the relevant Notices and Guidelines issued thereunder, in respect of any financial advisory service which Credit Suisse AG, Singapore branch may provide to you. This research may not conform to Canadian disclosure requirements. In jurisdictions where CS is not already registered or licensed to trade in securities, transactions will only be effected in accordance with applicable securities legislation, which will vary from jurisdiction to jurisdiction and may require that the trade be made in accordance with applicable exemptions from registration or licensing requirements. Non-U.S. customers wishing to effect a transaction should contact a CS entity in their local jurisdiction unless governing law permits otherwise. U.S. customers wishing to effect a transaction should do so only by contacting a representative at Credit Suisse Securities (USA) LLC in the U.S. Please note that this research was originally prepared and issued by CS for distribution to their market professional and institutional investor customers. Recipients who are not market professional or institutional investor customers of CS should seek the advice of their independent financial advisor prior to taking any investment decision based on this report or for any necessary explanation of its contents. This research may relate to investments or services of a person outside of the UK or to other matters which are not authorised by the Prudential Regulation Authority and regulated by the Financial Conduct Authority and the Prudential Regulation Authority or in respect of which the protections of the Prudential Regulation Authority and Financial Conduct Authority for private customers and/or the UK compensation scheme may not be available, and further details as to where this may be the case are available upon request in respect of this report. CS may provide various services to US municipal entities or obligated persons ("municipalities"), including suggesting individual transactions or trades and entering into such transactions. Any services CS provides to municipalities are not viewed as "advice" within the meaning of Section 975 of the Dodd-Frank Wall Street Reform and Consumer Protection Act. CS is providing any such services and related information solely on an arm's length basis and not as an advisor or fiduciary to the municipality. In connection with the provision of the any such services, there is no agreement, direct or indirect, between any municipality (including the officials, management, employees or agents thereof) and CS for CS to provide advice to the municipality. Municipalities should consult with their financial, accounting and legal advisors regarding any such services provided by CS. In addition, CS is not acting for direct or indirect compensation to solicit the municipality on behalf of an unaffiliated broker, dealer, municipal securities dealer, municipal advisor, or investment adviser for the purpose of obtaining or retaining an engagement by the municipality for or in connection with Municipal Financial Products, the issuance of municipal securities, or of an investment adviser to provide investment advisory services to or on behalf of the municipality. If this report is being distributed by a financial institution other than Credit Suisse AG, or its affiliates, that financial institution is solely responsible for distribution. Clients of that institution should contact that institution to effect a transaction in the securities mentioned in this report or require further information. This report does not constitute investment advice by Credit Suisse to the clients of the distributing financial institution, and neither Credit Suisse AG, its affiliates, and their respective officers, directors and employees accept any liability whatsoever for any direct or consequential loss arising from their use of this report or its content. Principal is not guaranteed. Commission is the commission rate or the amount agreed with a customer when setting up an account or at any time after that.
Copyright © 2014 CREDIT SUISSE AG and/or its affiliates. All rights reserved.
Investment principal on bonds can be eroded depending on sale price or market price. In addition, there are bonds on which investment principal can be eroded due to changes in redemption amounts. Care is required when investing in such instruments. When you purchase non-listed Japanese fixed income securities (Japanese government bonds, Japanese municipal bonds, Japanese government guaranteed bonds, Japanese corporate bonds) from CS as a seller, you will be requested to pay the purchase price only.
XX6163EU.doc