Emerging Consumer Survey 2012 - Credit Suisse | PLUS
49
DISCLOSURE APPENDIX CONTAINS ANALYST CERTIFICATIONS AND THE STATUS OF NON-US ANALYSTS. FOR OTHER IMPORTANT DISCLOSURES, visit www.credit-suisse.com/ researchdisclosures or call +1 (877) 291-2683. U.S. Disclosure: Credit Suisse does and seeks to do business with companies covered in its research reports. As a result, investors should be aware that the Firm may have a conflict of interest that could affect the objectivity of this report. Investors should consider this report as only a single factor in making their investment decision. 16 January 2012 Emerging Consumer Survey 2012 Global Equities Research Credit Suisse, in conjunction with Nielsen, launch the second edition of the Emerging Market Consumer survey Credit Suisse Research Institute Thought leadership from Credit Suisse Research and the world’s foremost experts
-
Upload
khangminh22 -
Category
Documents
-
view
1 -
download
0
Transcript of Emerging Consumer Survey 2012 - Credit Suisse | PLUS

DISCLOSURE APPENDIX CONTAINS ANALYST CERTIFICATIONS AND THE STATUS OF NON-US ANALYSTS. FOR OTHER IMPORTANT DISCLOSURES, visit www.credit-suisse.com/ researchdisclosures or call +1 (877) 291-2683. U.S. Disclosure: Credit Suisse does and seeks to do business with companies covered in its research reports. As a result, investors should be aware that the Firm may have a conflict of interest that could affect the objectivity of this report. Investors should consider this report as only a single factor in making their investment decision.
16 January 2012
Emerging Consumer Survey 2012
Global Equities Research Credit Suisse, in conjunction with Nielsen, launch the second edition of the Emerging Market Consumer survey
Mary Curtis +44 20 7883 8885
Richard Kersley 44 20 7888 0313
Mujtaba Rana 44 20 7883 3773
Andrew Garthwaite 44 20 7883 6477
Credit Suisse Research Institute Thought leadership from Credit Suisse Research and the world’s foremost experts

16 January 2012
2
Table of contents Introduction 3 Executive Summary 4
Key Themes 4 Country Highlights 5
Stock Recommendations – Emerging Markets 7 Stock Recommendations – Developed Markets 9 The Credit Suisse emerging consumer survey map 11 The Emerging consumer in 2012 13
Optimism varies across the emerging world 13 Cyclical headwinds interrupt the shift towards discretionary spending 17 The appetite for technology 20 The role of brands 22
Brazil 28 China 30 Egypt 32 India 34 Indonesia 36 Russia 38 Saudi Arabia 40 Turkey 42 About the survey 44
Also published today in conjunction with our global analysts:
China Consumer Survey – “The best of youth” (Vincent Chan / Peggy Chan)
India Consumer Survey – “Building a strong base” (Neelkanth Mishra / Jatin Chawla)
Indonesia Consumer Survey (Teddy Oetomo / Ella Nusantoro / Agus Sandianto)
Consumer Survey – “Healthcare Conclusions” (Global Pharmaceuticals Team)
Consumer Survey – “Automotive Consumer Survey” (Ellinghorst / Hauser / Galliers)

16 January 2012
3
Introduction We are delighted to publish the second edition of the Credit Suisse Global Emerging Consumer Survey. The 2012 survey goes further than last year’s inaugural edition in extending our survey to eight countries – Brazil, China, Egypt, India, Indonesia, Russia, Saudi Arabia and Turkey. To undertake this project, the Credit Suisse Research Institute has again engaged the leading global market research firm AC Nielsen to conduct primary research on its behalf, this year interviewing over 14,000 consumers across countries that together account for 3.5 billion people.
At a time when investors are debating how sensitive emerging economies are to broader market and political turmoil, especially within Europe, this survey provides the investor a unique perspective on consumer behaviour at ground level. More broadly, the survey highlights the major income and demographic differences, and cultural and social drivers within the emerging world, a key consideration for spending preferences and also for the brand positioning of companies.
The analysis delivered in the report and the accompanying Databook provides insights not available from public sources of information. This underlines Credit Suisse’s commitment to provide our clients unique and proprietary insights to support their investment process. It also builds on prior detailed research of trends in emerging markets, notably the recent Credit Suisse Global Wealth Report that underlined the rapid wealth accumulation and consumption potential in the emerging world.
Analysts from across the breadth of Credit Suisse’s global research team have drawn out the key trends and investment conclusions for stocks both in the emerging and developed world. These are detailed in the pages that follow.
Research analyst Telephone Email
Mary Curtis +44 20 7883 8885 [email protected]
Richard Kersley +44 20 7888 0313 [email protected]
Mujtaba Rana +44 20 7883 3773 [email protected]
Jahanzeb Naseer +852 2101 6554 [email protected]
Istvan Mate-Toth +44 20 7888 1598 [email protected]
Daisuke Takato +81 3 4550 9671 [email protected] Michael Kassab +1 212 538 6307 [email protected] Ashley Van Der Waag +1 212 538 2908 [email protected] Andrew Garthwaite +44 20 7883 6477 [email protected] Sakhti Siva +65 6212 3027 [email protected] Alex Redman +44 20 7883 6896 [email protected] Contributors
Brazil Andrew Campbell +55 11 3841 6313 [email protected]
Daniel Federle +55 11 3841 6311 [email protected]
Gustavo Wigman +55 11 3841 6302 [email protected]
China Vincent Chan +852 2101 6568 [email protected]
Peggy Chan +852 2101 6305 [email protected]
Egypt Ahmed Badr +971 4 362 0223 [email protected]
Vincent Resillot +44 20 7883 5550 [email protected]
India Neelkanth Mishra +91 22 6777 3716 [email protected] Jatin Chawla +91 22 6777 3719 [email protected]
Indonesia Teddy Oetomo +62 21 255 37911 [email protected]
Ella Nusantoro +62 21 255 37917 [email protected]
Agus Sandianto +62 21 255 37916 [email protected]
Saudi Digvijay Singh +971 4 362 0311 [email protected]
Russia Victoria Petrova +7 495 967 8393 [email protected] Turkey Onur Muminoglu +90 212 349 0454 [email protected] Atinc Ozkan +90 212 349 0453 [email protected]
Stefano Natella Head of Global Equity Research

16 January 2012
4
Executive Summary Key Themes Greater emerging market consumption remains a key long-term trend for investors. It is a theme that has already been apparent for much of the past 10 years but one that we think investors need to continue to be positioned to exploit. Various similarities in pent-up demand from emerging consumers can be identified at a macro level. However, our survey highlights that this consumption is far from uniform in direction or scope and that important distinctions can be identified between both sectors, stocks and markets. From this year’s survey data, we highlight four key themes:
(1) Confidence still strong but not as strong as last year
Our survey suggests that confidence among emerging consumers is still reasonably strong. Of just over 14,000 adults included in the survey across eight markets, 35% thought their personal finances would improve over the next six months and 9% expected some deterioration. Optimism is highest in Brazil, India and China and lowest in Egypt, Turkey and Russia.
However, compared with last year, consumer confidence has slipped. This is particularly apparent for consumers that allocate a significant proportion of income towards food expenditure. The good news is that the inflation outlook is set to become significantly more supportive as the high food prices of H1 2011 lend a favourable base to H1 2012.
(2) Cyclical headwinds slow discretionary spending
The structural theme underpinning the outlook for the emerging consumer is a shift to a more discretionary bias that typifies spending in the developed world away from the basic essentials of life – a global rebalancing of consumption. However, this structural shift towards greater discretionary spending has stalled, on average, over the past year as slower growth and high food inflation has impacted confidence.
Consequently, when we compare the growth in spending rates between the latest survey and the year before, we can see that household consumption contracted for many of the more discretionary areas of expenditure over the year. This was particularly apparent in spending on sport shoes and fashion apparel, private healthcare and property ownership. However, certain sectors still delivered growth in consumer penetration rates despite the economic concerns. Examples here include mobile phones, smartphones, computers and internet access and education. Interestingly, a significant proportion of respondents in six out of seven markets said they had allocated more money to private education courses this year compared with last (Egypt was the only exception).
(3) The appetite for technology
The survey data indicate the strength of demand for technology varies according to income group as well as market. For example, the data show that the penetration of smartphones is greater in the low income groups in Saudi Arabia than it is for the high income groups in Brazil and Russia. The ownership of computers is higher for the mid-income brackets in China than it is for the high income brackets in Saudi Arabia, Russia or India. Possible explanations for this include (i) the strength and sophistication of the distribution network; (ii) relative prices and (iii) the relative development of broadband infrastructure.
Looking forward, the survey suggests growth in mobile phone penetration looks set to be relatively strong in Indonesia (still 29% of our survey sample said they did not own a mobile), India (6% in total had no mobile rising to 12% at the lower income brackets) and Brazil (where 11% of the lower income groups had no mobile).
16 January 2012
5
Momentum in smartphone penetration is likely to continue to be strong in Brazil and China. Saudi penetration rates also look likely to continue upwards. Supporting factors are (a) growth in real wages, (b) size and affluence of the mid-to-high income groups in each of these markets, (c) existing momentum (smartphone penetration increased by 22%, 11% and 5% for Saudi, Brazil and China respectively over the last year).
(4) The role of brands
In previous research, we have looked at the significance of the brands for investing in consumer related stocks (see Great Brands of Tomorrow, 25 February 2010). The survey continues along this theme and analyses the consumer perception of both unbranded and branded goods across a wide range of consumer products. Three specific topics are apparent from the data:
(i) The scope for greater M&A activity. Global consumer companies have already taken advantage of the growth opportunities in emerging vs. developed markets. It is the sectors, such as dairy and personal products which are more fragmented and where local brands proliferate that look most likely to benefit from greater M&A activity in the future.
(ii) “Trading up” opportunities as consumers shift from unbranded to branded products as incomes improve. Having a well-positioned brand for the improving living standards among low and middle income earners can be just as relevant for growth as the typical focus of investors on luxury brands. The survey identifies retailing, fashion and cosmetics brands that are well-positioned and locally-owned in India, Brazil and China.
(iii) The potential long-term winners. If the long-term story is about the emerging consumer incomes becoming ever more robust, investors need to be aware of the brands that are well-positioned among low and high income consumers. The survey illustrates brands that should succeed, as well as highlights brands that are vulnerable, to strong income improvements. Potential winners include Tsingtao, Natura and Li Ning which all enjoy strong brand acceptance among low and high income consumers within their respective markets. The global players look set to continue to dominate the luxury space but a question mark hangs over the global and Western technology companies, where, Apple aside, there are illustrations of diminishing brand traction. Emerging market technology brands could well become the global standard.
Country Highlights Pages 28 to 43 provide page-by-page findings for each country. Key highlights include:
Brazil: Living for today
The Brazilian consumer stands out as the most optimistic across our survey. This confidence is underpinned by expectations of one of the highest rates of income growth among the countries surveyed – nominal increases of over 10%. Given a consumer that typically spends not saves (barely 7% of income is registered as saved), it remains a market for momentum in discretionary spending (smartphones, technology, personal care). It seems real assets such as property command more interest than financial assets.
Key stock recommendations: AmBev, Brasil Foods, Natura, Diagnósticos da América, PDG, Multiplus, MercadoLibre, Procter & Gamble, Diageo, Yakult.
China: A savings culture
The outlook for the Chinese consumer is robust though expectations have softened in the last 12 months and optimism is lower than in Brazil and India. Food prices have provided a squeeze on a range of consumer staples as well as some more discretionary items. The strength of technology spending is a clear bull theme while a prioritisation of healthcare and education also stand out. Given the additional government spending plans in these latter areas, structural growth potential clearly exists.
Key stock recommendations: China Modern Dairy, Belle, 7 Days, BMW, Swatch, Wynn, Tencent.
16 January 2012
6
Egypt: Change but no change
Drawing definitive conclusions from our survey for Egypt this year is clearly challenging given a political backdrop that is fluid. The reality in the data, though, is less has changed than one might have hoped. Optimism is still the lowest in the survey. The structural bullish story that exists for the consumer in Egypt is that spending levels are so low. The key is finding the stability and impetus to unlock it. At present, and politics aside, ongoing real declines in income do not provide long term opportunities.
India: Going back to school
The Indian consumer in the survey remains the second most confident in his/her future personal finances. The survey points to spending activity in most consumer categories, particularly low ticket, well above those seen elsewhere in the emerging world. Additional distinguishing features of the Indian consumer is the appetite for extra investment in education and also a propensity to save. A major structural opportunity in technology spending exists with penetration rates still very low in keeping with limited internet rollout.
Key stock recommendations: Educomp, HDFC Bank, Hero, Sun Pharma, Prudential .
Indonesia: On a fast track
The Indonesian consumer displays strong structural growth potential. Its GDP per capita may be one of the lowest in the survey but its optimism is closer to the highest. The risk that always exists for the Indonesian consumer is the sensitivity of food prices as in any of the poorer economies. However, in the absence of this, there is considerable potential to unlock under-penetrated markets such as autos (cars and motor-bikes) and technology.
Key stock recommendations: Mitra Adiperkasa, Indofood CBP, XL Axiata, Daihatsu, BATs
Russia: The weakest BRIC in the wall
Optimism in Russia remains the lowest of the BRICs. The net balance of only 20% viewing an improved financial position in the six months ahead is only a third of that of Brazil. The simple explanation stems from poor income growth but it seems unlikely that this lid on optimism will be removed easily. The outlook for growth may be better in high ticket items due to the severe income inequality and under-penetration of luxury goods and technology.
Key stock recommendations: Magnit, Sberbank, Synergy, Philip Morris, Crown, JTI.
Saudi Arabia: The oil price hedge
Optimism is relatively high across a swathe of the Saudi population. The government’s spending plans and policy announcements have been highly supportive. Optimism goes hand in hand with perceived income growth - the highest in our survey. The upper end of earners expect their incomes to grow by 9% in real terms. The spending outlook should remain discretionary focused - smartphones, computers, property and cars.
Key stock recommendations: Almarai, Etihad Etisalat, Yum! Brands, Nokia, BMW, Apple
Turkey: Feeling the squeeze
Confidence among Turkish consumers is close to the weakest in the survey. Despite GDP per capita in keeping with the middle income bracket, Turkey’s spending patterns are more typical of the low income countries Food and housing costs are squeezing out discretionary spending and leaving limited funds for saving. With the outlook for real incomes still questionable, this does not look a market for high ticket spending.
Key stock recommendations: Efes, Arcelik, Tofas, Reckitt-Benckiser.
Custom Basket Alongside the specific stocks recommendations in this report, Credit Suisse prime financing offers a custom basket (CSGLEMDS Index [GO]) of 30 developed and emerging listed stocks that offer investors diversified exposure to the continued growth in emerging consumption, and remain attractive from a valuation perspective .

16 Jan
uary 2012
7
Stock Recommendations – Emerging Markets Figure 1: Plays on the emerging consumer
Stock Country Investment story
Current Price (local CCY)
Target Price (Local CCY)
EV / Ebitda (2012)
PE (2012)
P/B (2012)
ROE (2012)
3 year EPS
growth
3 year Revenue growth
Rating
Ambev Brazil Fourth largest brewer globally. Portfolio has desirable brands with high penetration across income categories. Revenues should have high resilience to the current low economic growth period in Brazil.
64.00 60.00 13.2x 20.5x 6.8x 33.3% 224% 42.2% Outperform
Brasil Foods Brazil Largest and most diversified Brazilian food company, a leading protein exporter, using global distribution network to access Middle-East, Asia and Europe/Russia.
35.00 38.50 8.4x 17.8x 2.0x 11.1% -38.5% 190% Outperform
Natura Brazil 30% share in the cosmetics and 11% share in the personal care markets. Operates in the Latin American market, selling premium HPC and middle prices cosmetics through its direct sales force.
37.84 42.50 10.8x 17.3x 12.1x 69.9% 185% 226% Neutral
Diagnósticos da América
Brazil Diagnósticos da América is the largest chain of clinical and imaging diagnostic testing laboratories in Latin America, operating in the Brazilian cities of Sao Paulo, Rio de Janeiro and Curitiba.
15.50 21.00 8.9x 18.3x 1.8x 9.6% 151% 237% Outperform
PDG
Brazil Largest homebuilder in Brazil and holding company for subsidiaries Goldfarb, CHL
and Agre. The company is geographically diversified and acts in both low and mid-high income housing.
6.45 10.00 9.1x 6.4x 1.0x 15.5% 140% 379% Outperform
Multiplus Brazil Engaged in the operation and management of customer loyalty programs, the main revenue driver is credit card usage.
33.96 41.00 11.5x 18.2x 20.7x 113.5% n.a. n.a. Outperform
China Modern Dairy
China Largest dairy farm company in China. Well positioned to benefit from fast-growing demand for quality milk and industry consolidation and modernisation. Sales CAGR of 51% for FY2010-15E.
1.74 3.25 11.4x 13.1x 1.3x 10.0% n.a. n.a. Outperform
7 Days Group
China Second largest economy hotel chain operator in China and fast growing; well positioned to benefit from the rapidly-growing domestic travel demand
82.28 153.44 6.3x 15.1x 2.3x 15.3% n.a. 492.9% Outperform
Belle China Belle is China's largest footwear retailer, with nearly 33% market share in China's mid- to high-end women's footwear segment, and China's second sportswear distributor, mainly selling Nike and Adidas.
11.86 14.5 10.8x 16.6x 3.5x 21.2% 64.0% 103.1% Outperform
Tencent China Largest SNS player in China. The company’s investment in new businesses i.e., Ecommerce, search, and payment is getting attention of internet users. Mobile internet is another key strength of Tencent, but not yet reflected in the consumer survey.
170.10 220.00 13.2x 21.1x 5.9x 28.5% 406.4% 414.2% Outperform
Educomp India Play on nascent education industry. Leader in technology-based interactive
learning; vocational training, on-line education potential. 217.95 275.00 5.1x 6.6x 0.9x 13.4% 339.1% 372.4% Neutral
HDFC Bank India Retail banking: rising ROE driven by stronger-than-industry credit growth and falling credit costs. Well placed for rising rates.
469.30 514.00 10.4x 22.1x 3.7x 17.4% 84.1% 102.4% Outperform

16 Jan
uary 2012
8
Stock Country Investment story
Current Price (local CCY)
Target Price (Local CCY)
EV / Ebitda (2012)
PE (2012)
P/B (2012)
ROE (2012)
3 year EPS
growth
3 year Revenue growth
Rating
Hero Motorcorp
India Market brand leader in two-wheeler market. Increased penetration in rural and female market. Among the cheaper plays on Indian consumer
1790.25 2238.00 8.6x 15.5x 10.6x 68.2% 115.7% 87.8% Outperform
Sun Pharma India Market leader in selling medicines for lifestyle diseases in India. We expect chronic drugs to outpace industry growth and grow at 18-20% CAGR over 5 years.
512.95 595.00 18.8x 23.6x 4.7x 20.1% 58.7% 83.1% Outperform
Mitra Adiperkasa
Indonesia Mid to high-end segment retailer, benefits from the rise of its target segments in Indonesia. Well positioned to benefit from the potential re-emergence of Java’s purchasing power.
5100.00 6000.00 8.8x 20.0x 4.0x 19.8% -29.0% 68.1% Outperform
Indofood CBP
Indonesia Leading instant-noodle and dairy producer, well positioned to benefit from the rise in country GDP/Capita. Indomie (instant noodle) is market leader.
5150.00 7300.00 6.8x 13.6x 2.6x 19.0% 2950% 89.4% Outperform
XL Axiata Indonesia Third largest cellular operator in Indonesia. Cost control record has been excellent, and this is being raised to a new level by the launch of a comprehensive network outsourcing deal.
5050.00 7200.00 4.8x 10.7x 2.6x 24.8% 860.8% 121.9% Outperform
Magnit
Russia
Play on food consumption and underpenetration of modern food retail format in Russia with high profitability, excellent track record, and strong organic growth.
$22.96 $25.00 12.1x 18.4x 4.0x 22.0% 128.3% 103.3% Outperform
Sberbank Russia
46% market share of retail deposits, due to its very large branch network. We expect Sberbank to generate a 20% ROTE over the next two years, in part due to high NIM. Major growth opportunity in under-developed Russian loan market.
85.69 129.14 n.a. 6.2x 1.2x 19.9% 66.4% 88.7% Outperform
Synergy Russia
Likely to improve profitability via different sales mix in alcohol segment. Longer term it could be a potential acquisition target for large international producers.
517.62 1060.43 3.5x 5.2x 0.6x 11.0% 41.4% 13.7% Outperform
Almarai Saudi Inequality of income means Middle East will see strong spending in both
essentials and discretionary. Stock offers growth via staples exposure. 99.00 113.00 11.0x 13.8x 2.8x 20.6% 49.7% 83.9% Outperform
Etihad Etisalat
Saudi Leading exponent on mobile data growth in GEM. One of the first operators in GEM to launch an LTE service driving strong growth in data revenues and helping it take further market share from STC in Saudi.
53.50 70.00 5.2x 7.1x 1.9x 26.0% 118.1% 89.7% Outperform
Efes Turkey Turkey’s largest brewer with 90% market share and set to become #2 player in Russia following the recently announced JV with SAB Miller. Very strong pricing power, a highly selective consumer base.
25.10 26.20 9.7x 17.9x 3.3x 18.6% 34.5% 37.6% Outperform
Arcelik Turkey 50% market share in white-goods appliances, powered by strong brand awareness, distribution power, R&D efforts.
7.08 7.70 5.1x 7.5x 1.2x 16.0% 227.8% 4.7% Outperform
Tofas Turkey Young product line-up continues to find new client base, evident from recently awarded export contracts from Opel, Vauxhall and Chrysler. Its export contracts are cost-plus and take-or-pay protected.
6.72 8.65 5.2x 6.5x 1.6x 24.6% 118.5% 75.2% Outperform
Source: Credit Suisse Emerging Market Consumer Survey, Credit Suisse estimates. NOTE: EM Sales exposures refer to 2010.

16 Jan
uary 2012
9
Stock Recommendations – Developed Markets Figure 2: Plays on the developed consumer
Stock Country Investment story
Current Price (local CCY)
Target Price (Local CCY)
EV / Ebitda (2012)
PE (2012)
P/B (2012)
ROE (2012)
3 year EPS
growth
3 year Revenue growth
Rating
Bayer Europe Unjustified decoupling from the pharma sector to the Dax should reverse in 2012 as
positive developments in pipeline and new launches add to the base pharma business which has minimal patent loss. EM accounts for 37% of group revenues.
52.82 56.00 6.0x 10.8x 2.1x 19.4% -72.5% 8.3% Outperform
BMW Europe Best auto play on EM exposure (c.30% of sales), particularly with respect to China, as it represents the closest play to a branded luxury good within the sector. Equity contribution from Chinese venture is expected to grow by 1.7% to €2.1bn in 2011E?.
58.04 76.00 1.2x 7.4x 0.9x 12.4% 14.0% 7.9% Outperform
BATs Europe Best margin visibility in coverage, underpinned by innovation-led premiumisation in emerging markets, untapped savings potential and over 50% EM sales exposure.
29.70 30.80 10.1x 14.1x 5.5x 39.3% 38.2% 52.7% Outperform
Diageo Europe New stretch targets are a welcome addition and a sign of management's confidence in the prospects. We think EM margins have reached an inflection point and should now start to trend up, restructuring in DM should help too. 35% EM sales exposure.
13.90 15.50 11.9x 15.3x 4.7x 31.0% 29.0% 22.8% Outperform
Nokia Europe Recovery story, timing right as last year spent putting the building blocks in place (partnership with Microsoft, integrating the new OS, taking significant cost out of the business, and developing stronger partnerships with carriers). 60% EM sales.
4.09 6.00 4.4x 16.6x 1.2x 7.0% -73.9% -17.3% Outperform
Prudential Europe Breadth and depth across Asia (53% of new business value from Asia). While US macro concerns appear to have come to fore in recent months, we believe that the sustained strength of the Asian franchise remains a key driver of the stock.
6.63 8.80 n.a. 10.4x 1.7x 16.5% 46.3% n.a. Outperform
Reckitt Benckiser
Europe Having been de-rated from 20x to 13.5x shares now fully reflect the slow down in the growth rates. Cheapest of the consumer staple majors. 30% EM sales exposure.
33.10 38.00 9.8x 13.5x 3.6x 26.5% 65.5% 60.4% Outperform
Swatch Europe Established brand awareness, best positioned players structurally and geographically in the luxury sector thanks to its portfolio. We estimate that the group’s current Greater China exposure accounts for about 35% of group sales.
372.10 480.00 8.5x 13.8x 2.1x 15.8% 10.6% 5.0% Outperform
Telenor Europe High exposure to smartphones becoming cheap in emerging markets and driving data growth. 40% of 2010 ebitda is from Asia.
96.50 114.00 5.2x 11.6x 1.6x 14.2% -25.3% 6.1% Outperform
Apple Inc United
States EM classes could add $70bn in sales and $17.50 in EPS. We estimate five countries will account for 63% of this potential –BRICS / Mexico, and with the upside being so focused, we believe that costs could also be manageable. 15% EM sales exposure .
$421.39 $500.00 9.4x 15.3x 5.1x 35.2% 285.5% 165.4% Outperform
Crown Holdings Inc.
United States
World's largest producer of metal packaging and the third largest producer of beverage cans. Nearly 30% of Crown's revenue is derived in emerging markets and the company is benefiting from rapid demand growth in these regions.
$34.40 $44.00 7.3x 12.3x n.a. n.a. n.a. n.a. Outperform
International Flavors & Fragrances
United States
IFF is the third largest player in the Flavor and Fragrance industry. Management is positioning the company’s top-line to benefit from increasing customer innovation despite recent raw material headwinds. Focus on project profitability and pricing.
$55.08 $66.00 9.7x 14.9x 3.6x 24.4% 26.6% 15.2% Outperform

16 Jan
uary 2012
10
Stock Country Investment story
Current Price (local CCY)
Target Price (Local CCY)
EV / Ebitda (2012)
PE (2012)
P/B (2012)
ROE (2012)
3 year EPS
growth
3 year Revenue growth
Rating
Las Vegas Sands Corp.
United States
Large global gaming operator with 90% of 2010A EBITDA generated from Macau and Singapore. LVS has a strong exposure to both VIP and Mass gaming segments
$45.23 $60.00 12.6x 22.4x 3.6x 17.7% 8.8% 132.3% Outperform
Mead Johnson Nutrition Co.
United States
#1 market share in the highly attractive infant formula category in China with exceptionally large profit margins and 10% annual top-line growth. .
$72.48 $82.00 16.9x 26.1x n.a. n.a. n.a. n.a. Outperform
Mercado Libre Inc.
United States
Operates the leading e-commerce marketplaces and online payments platforms which are set to benefit from the ongoing growth of internet penetration as well as online shopping. Brazil is largest operating region.
$86.51 $99.00 33.2x 49.4x 16.7x 33.8% 244.6% 151.9% Neutral
Philip Morris International
United States
Biggest tobacco company in the world. PMI owns what we regard the strongest cigarette brand portfolio in the industry (centred on Marlboro), being well positioned to capture untapped uptrading potential in EM (accounted for 50% of group profits).
$76.45 $79.00 10.6x 15.8x 61.0x 386.9% 38.3% 19.3% Outperform
Procter & Gamble Co.
United States
Global HPC company with 30%+ of sales in EM (5-6% in China). Given weak growth in developed markets, management is aggressively pursuing white space opportunities in growth markets by switching to country level planning.
$65.81 $70.00 11.6x 16.7x n.a. 17.8% 20.7% 3.2% Outperform
Wynn Resorts
United States
Premier global gaming brand catering to high-end, with properties in Las Vegas and Macau, with another Macau property in the pipeline for 2015. 70% China EBITDA.
$109.80 $167.00 9.2x 19.6x 4.4x 22.9% -28.3% 55.7% Outperform
Yum! Brands, Inc.
United States
EM are 58% of 2011E operating profits. Growth beneficiary from unit expansion opportunity and exposure to underdeveloped consumption patterns. >30% EM sales
$60.86 $64.00 11.7x 21.1x 14.2x 69.1% 50.8% 8.9% Outperform
Nissan Motor (7201)
Japan China accounts for 20% operating profit, continues to launch new products to gain market share and grow earnings. Expects China to be the biggest premium market in the future and relocated global headquarters for its premium brand, Infiniti, to HK
689.00 760.00 6.4x 11.0x 1.0x 8.9% -35.0% -18.9% Neutral
Daihatsu (7262)
Japan Operating profit contribution from Asia > 45%. Indonesia is the main driver, where it commands 15% share of sales and 50% of production.
1438.00 1680.00 3.9x 10.7x 1.4x 13.6% 50.6% -8.4% Outperform
Suzuki Motor (7269)
Japan Strong presence in India, poised to benefit from growing demand in the country. Subsidiary Maruti Suzuki is expanding supply of diesel products and production capacity. May be some long-term risk if preference shifts to higher-end cars.
1590.00 1860.00 4.4x 14.1x 0.9x 6.5% -54.7% -25.5% Neutral
Fast Retailing (9983)
Japan The operator of Uniqlo is aggressively expanding in Asia -- esp in China, South Korea, Malaysia, Thailand and Indonesia. The number of stores in China doubled to 105 (Nov ‘11) since mid-2010 and emerging markets account for about 5% of 2011E profits.
14610.00 13500.00 8.2x 21.6x 4.1x 18.8% 24.9% 39.9% Neutral
JT (2914) Japan Russia and CIS account for 30% of sales and is a key driver of profit growth. JT may struggle to increase sales volumes, but has room to raise prices in Russia.
394500 430000 7.3x 25.7x 2.3x 9.2% -39.2% -1.7% Outperform
Yakult (2267)
Japan Asia/Oceania and the Americas (mainly Brazil and Mexico) account for a fifth of the company's sales. China is the third-biggest market with sales growing at 30%+.
2402.00 2350.00 8.9x 30.2x 1.8x 5.9% -22.0% -3.6% Neutral
Shiseido (4911)
Japan With Asia accounting for 38% of operating profit and 18% of sales in 2011E, the region (led by China) has been a key driver of the company's FY3/13 profit growth and future.
1371.00 1660.00 9.3x 27.2x 1.7x 6.3% -63.0% -7.3% Outperform
Unicharm (8113)
Japan The company's focus on low-end baby diapers is contributing to sales growth and margin improvement. Main driver Asia accounts for 39% of OP and 31% of 2011E sales.
3865.00 4200.00 10.7x 22.1x 3.3x 14.8% 106.0% 11.9% Outperform
Source: Credit Suisse Emerging Market Consumer Survey, Credit Suisse estimates. NOTE: EM Sales exposures refer to 2010.

16 Jan
uary 2012
11
The Credit Suisse emerging consumer survey map Figure 3: Countries surveyed
Russia (11%*)GDP: $1,894.3 bn
Consumption: $945.3 bn (50%)GDP Growth (2011E): 4.29%
China (18%*)GDP: $6,476.2 bn
Consumption: $2085.3 bn (32%)GDP growth (2011E): 9.47%
India (18%*)GDP: $1,700 bn
Consumption: $827.9 bn (49%)GDP growth (2011E): 7.84%
Indonesia (11%*)GDP: $813.9 bn
Consumption: $454.2 bn (56%)GDP growth (2011E): 6.4%
Brazil (11%*)GDP: $2447.8 bn
Consumption: $1520.1 bn (62%)GDP growth (2011E): 3.77%
Egypt (11%*)GDP: $248.6 bn
Consumption: $174 bn (70%)GDP growth (2011E): 1.22%
Saudi Arabia (11%*)GDP: $580.7 bn
Consumption: $153.3 bn (26%)GDP growth (2011E): 6.47%
Note: 1.Total GDP for the country shown in nominal US $ (2011E).2.* % of survey sampled from this country3.Country GDP from IMF4.Consumption from UN data
2012 Credit Suisse Emerging Consumer Survey
Number of respondents : 14,232
Across 8 countries
70% in urban areas; 30% in rural areas
2012 Credit Suisse Emerging Consumer Survey
Number of respondents : 14,232
Across 8 countries
70% in urban areas; 30% in rural areas
Turkey (11%*)GDP: $846.5 bn
Consumption: $601 bn (71%)GDP growth (2011E): 6.59%
Source: Credit Suisse Emerging Market Consumer Survey, IMF, EIU, UN

16 January 2012
12
Figure 4: Credit Suisse Emerging Consumer related research
Asia Latin America / EMEA Global
Asian telecom sector. Smartphones - where are the best remaining Asian opportunities?
5 October 2011
2012 Outlook - Smartphones for everyone 6 December 2011
TMT The Emerging Apple 20 September 2011
Brazil Telecoms - Competitive sands are shifting; Vivo launches new initiatives
17 November 2011 2012 Outlook for Global Telecom Equipment 5 January 2012
China Healthcare Sector. 2012 outlook 5 January 2012
China Education Sector. OVERWEIGHT. K12 after-school tutoring market
29 November 2011 Healthcare / Education
India Pharmaceuticals Sector. Stay the course 19 October 2011
Brazilian Healthcare - Health care sector consolidation expected from the bottom up
21 March 2011
PharmaValues: Global analysis - Demographic exposure to ageing 14 September 2011
Global Proteins Industry - 2012: Another Year of Growing Demand 18 October 2011
Food / Beverages / HPC China Consumer Sector. Industry consolidation to
accelerate 20 October 2011 U.S. Protein - Elements in Place for Long-term Export
Growth 18 November 2011
Reloading the matrix - "The real world is not the Western world"
23 September 2011
Hong Kong Retail Sector. Rental cycle is catching up4 January 2012
Wealth Report Analysis - 2011 Wealth Report - Implications for Luxury
27th October 2011 Luxury / Retail / Leisure Macau gaming sector. Growth is normalizing, but not
collapsing 8 December, 2011
PCAR4: Blue Sky Over Cloudy Weather 3 October 2011 Global Hotel Sector - Assessing the GEM opportunity
23 March 2011
Brazilian Homebuilders and Real Estate Brokers - Attractive Valuation but Outlook Still Unclear
27 November 2011 Property
China Property Sector. Short-term gain? Long-term pain
5 December 2011 Russian homebuilders - Maintaining positive 2012 outlook
27 December 2011
Asia Transportation Sector. Captain's Log: Tough macro, but sector also a high beta recovery play
6 December 2011
Automotive - 2012: Two worlds in one sector 9 January 2012
Autos / Transport Asia Airline Sector. Enemies in the backyard
8 September 2011
LatAm Capital Goods Sector - A blend of conundrums and opportunities 1 December 2011 Travel & Leisure 2012 outlook - Rising above the
macro 9 December 2011
Themes Credit Suisse Research Institute: Global Wealth Report 2011,Credit Suisse Research Institute: The power of brand investing,Global Equity Strategy - 2012 Outlook
Source: Credit Suisse research

16 January 2012
13
The Emerging consumer in 2012 Our survey suggests that confidence among emerging market consumers is still reasonably strong. Of just over 14,000 adults included in the survey across eight markets, 35% thought their personal finances would improve over the next six months and 9% expected some deterioration. However, compared with last year, consumer confidence is not as strong as higher inflation and slower growth have taken their toll.
Optimism varies across the emerging world Optimism on the financial outlook is strongest in Brazil, India and China. In Brazil, 58% of respondents to the survey said they expected an improvement in their personal finances over the next six months. The Russian consumer is the most pessimistic of the BRIC countries.
At the other end of the scale, the greatest degree of pessimism in financial prospects was recorded in Egypt and Turkey. Despite the radical change in the political situation, Egyptian consumers remain the most downbeat among the countries included in our survey. Nearly as many Egyptians (24%) predicted a worse financial position as expected some improvement (25%) over the next six months. The picture in Turkey was not much better: 12% of respondents to the survey expected their financial position to worsen vs 16% who expected it to improve.
Figure 5: Do you think the state of your own personal finances over the next 6 months
will be better, worse or about the same?
58
43 40 36 3425 24
16
37
50 51 60 63
51
6772
7 9
24
8 12
0%
20%
40%
60%
80%
100%
Bra
zil
Indi
a
Chi
na
Sau
di
Indo
nesi
a
Egy
pt
Rus
sia
Tur
key
% o
f res
pond
ents
Better About the same Worse
Source: Credit Suisse Emerging Market Consumer Survey
When we compare the aggregate results in our latest survey with last year’s survey, we find that consumers, on average, are less optimistic. In Brazil, the balance of consumers expecting better rather than worse financial prospects over the next six months has fallen from 59% in 2010 to 53% in 2011. In China, the same statistic has slipped from 39% to 31% and in India it has fallen from 40% to 36%. The mood has improved in only two of the markets. In Indonesia, a net 31% now expect personal finances to improve over the next six months compared with 28% last year and in Egypt, the consumer is much more upbeat compared with last year but this is clearly off a very low base and still poor in absolute terms.

16 January 2012
14
Figure 6: Do you think the state of your own personal finances over the next 6 months
will be better, worse or about the same? 2011 vs 2010 results
53
3632 31 31
16
1
59
40
3239
28
17
-26-30
-20
-10
0
10
20
30
40
50
60
Bra
zil
Indi
a
Sau
di
Indo
nesi
a
Chi
na
Rus
sia
Egy
pt% e
xpec
ting
pers
onal
fina
nces
to b
e be
tter
min
us th
ose
expe
ctin
g it
to b
e w
orse
2011 2010
Source: Credit Suisse Emerging Market Consumer Survey
The rationale for the overall decline in optimism looks to be two-fold:
(1) On average, there has been a moderation in future wage expectations compared with last year. As we illustrate in Figure 7, wage expectations for the next 12 months, in the most recent survey compared with last year’s survey, have declined considerably in Brazil and have edged down in China. Wage expectations have picked up in Egypt, but, as with most indicators for Egypt, this comes from a very low base. The one market where there has, however, been a clear rise in wage expectations is Saudi Arabia. Arguably this reflects the increase in social spending programmes and rise in the minimum wage that the authorities have pursued in the wake of the political upheaval in other North African and Middle Eastern markets. This increase in optimism in Saudi Arabia is the obvious bright-spot in what is otherwise a somewhat more subdued consumer story on average.
Figure 7: % expecting better less worse household income in 2011 vs 2010
5855
47
3935
24 22
66
40
58
38 36
1822
0
10
20
30
40
50
60
70
Bra
zil
Sau
di
Indo
nesi
a
Indi
a
Chi
na
Egy
pt
Rus
sia
2011 2010
Source: Credit Suisse Emerging Market Consumer Survey

16 January 2012
15
(2) Food inflation has had a significant impact on consumer sentiment
When we compare the proportion of expenditure that is directed towards food against the optimism embodied in expectations on the state of personal finances, a clear pattern emerges. The least optimistic (consumers in Egypt) allocate over 40% of their total income towards food expenditure, the most optimistic (in Brazil) have the lowest relative expenditure on food.
Figure 8: Weight of food expenditure vs optimism on the outlook for personal finances
Saudi 2010
Russia 2010
Indonesia 2010
India 2010
Egypt 2010
China 2010
Brazil 2010
Turkey 2011
Saudi 2011
Russia 2011
Indonesia 2011India 2011
Egypt 2011
China 2011
Brazil 2011
-30
-20
-10
0
10
20
30
40
50
60
70
10% 15% 20% 25% 30% 35% 40% 45% 50%
Food expenditure as % total income
% re
spon
dent
s w
ith e
xpec
tatio
ns o
f bet
ter l
ess
wor
se
pers
onal
fina
nces
2010 survey 2011 survey
Source: Credit Suisse Emerging Market Consumer Survey
Clearly, food price inflation has negatively impacted consumer sentiment. The extent of the recent food price inflation felt across the emerging economies is illustrated in Figure 11. By our calculation, the annual rate of food price increases for the emerging markets in aggregate was running at 6.6% (in the 12 months ending September 2011) and this comes on top of 8.0% in the year before that. This puts food inflation for the last two years well above the 10-year average of 4.5%.
What next?
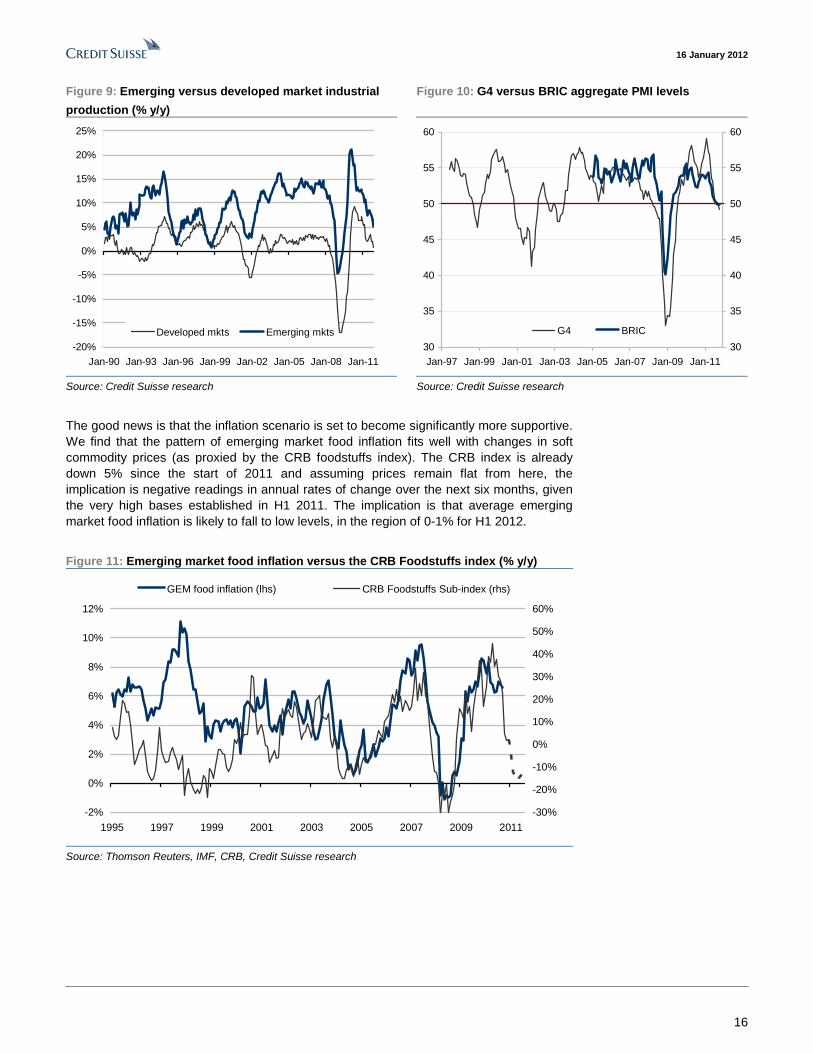
Economic momentum, on average, looks likely to continue to slow. Given that the export to GDP ratio for the emerging economies is a relatively high 35%, they are inevitably going to feel the headwinds of the slowdown and contraction in key developed markets. As we illustrate in Figure 9, emerging markets have consistently averaged higher growth rates in industrial production over the past decade but are clearly not independent of developed market trends. The most recent PMI readings are consistent with some contraction in industrial or manufacturing production for both the G4 and the BRIC economies in the months ahead. This suggests there is a risk of further slippage in nominal wage expectations over the next year across our survey markets and thus pressure remaining on confidence.
16 January 2012
16
Figure 9: Emerging versus developed market industrial
production (% y/y)
Figure 10: G4 versus BRIC aggregate PMI levels
-20%
-15%
-10%
-5%
0%
5%
10%
15%
20%
25%
Jan-90 Jan-93 Jan-96 Jan-99 Jan-02 Jan-05 Jan-08 Jan-11
Developed mkts Emerging mkts
30
35
40
45
50
55
60
Jan-97 Jan-99 Jan-01 Jan-03 Jan-05 Jan-07 Jan-09 Jan-1130
35
40
45
50
55
60
G4 BRIC
Source: Credit Suisse research Source: Credit Suisse research
The good news is that the inflation scenario is set to become significantly more supportive. We find that the pattern of emerging market food inflation fits well with changes in soft commodity prices (as proxied by the CRB foodstuffs index). The CRB index is already down 5% since the start of 2011 and assuming prices remain flat from here, the implication is negative readings in annual rates of change over the next six months, given the very high bases established in H1 2011. The implication is that average emerging market food inflation is likely to fall to low levels, in the region of 0-1% for H1 2012.
Figure 11: Emerging market food inflation versus the CRB Foodstuffs index (% y/y)
-2%
0%
2%
4%
6%
8%
10%
12%
1995 1997 1999 2001 2003 2005 2007 2009 2011-30%
-20%
-10%
0%
10%
20%
30%
40%
50%
60%
GEM food inflation (lhs) CRB Foodstuffs Sub-index (rhs)
Source: Thomson Reuters, IMF, CRB, Credit Suisse research

16 January 2012
17
Cyclical headwinds interrupt the shift towards discretionary spending The key structural theme that underpins the outlook for emerging markets is how income and demographic drivers could change the make-up of consumer spending in these economies. Consumer spending, which has been heavily focused around more essential areas of spending, is likely to continue to shift to the more discretionary bias that typifies the developed world. This is the pattern that has typically played out across the developed markets through the last century.
Aggregate emerging market GDP per capita now stands at US$7,600 (in PPP terms). Over the next five years, the IMF forecasts that this will increase to US$10,100. The US, France and Japan saw similar changes in the level of their GDP per capita in the 1930s, the 1950s and the 1960s, respectively. If we look back at the shifts in their spending patterns during this transition, it is clear that growth in spending on the more discretionary items was far stronger than the growth in expenditure on basic essentials.
We can see that growth in volume demand for “essential items” (such as food and beverages and utilities) was, on average, still positive, but it was not as strong as the growth in discretionary spending. Consumption of what we might describe as “useful items” (such as transportation, education, financial services or healthcare) proved to be much more sensitive to the rising income levels. We note that strong growth in household demand for communication services largely reflected the shift in technology that was taking place at the time as well as the substantial decline in prices that took place as the technology gained scale. Indeed, the fall in communication costs to date now means that the pattern of demand for basic mobile services is very much in line with that of other essential utilities.
Figure 12: Average* annual real growth in the volume of consumer expenditure as GDP
per capita rises from US$7,600 to US$10,100
4.6%
10.4%9.7%
7.2% 6.8%6.2% 6.2%
5.4%4.6% 4.3%
3.0%
0%
2%
4%
6%
8%
10%
12%
PC
E
Com
mun
icat
ion
Tra
nspo
rtat
ion
Edu
catio
n
Rec
reat
ion
Hou
sing
Fin
anci
al s
ervs
Hea
lthca
re
Hse
hld
& P
ers
Goo
ds Util
ities
Foo
d &
bevAve
rage
ann
ual g
row
th in
rea
l ter
ms
.
Source: BEA, INSEE, Ministry of Internal Affairs and Communications, Credit Suisse research
* Taking the average of growth in the components of real consumer expenditure in the US (1936 – 1940),
Japan (1961 – 1966) and France (1950 – 1959). These numbers are approximate to some extent:
differences in categorisation in expenditure by sector between these markets limits a more precise
calculation
We noted that the data from the survey last year confirmed that similar patterns of consumer expenditure were visible across the emerging economies. These trends are still clearly visible in the data from the recent survey.

16 January 2012
18
Demand for small-ticket, basic essentials (such as protein consumption or mobile phones) increases rapidly from very low income levels, but beyond average monthly household income of c. US$ 1,000 (PPP adjusted), consumption of essential goods and services tends to stagnate in favour of more discretionary items.
Figure 13: Mobile phone ownership Figure 14: Expenditure on entertainment
50
60
70
80
90
100
110
0 500 1000 1500 2000 2500 3000
Avg mthly household income (PPP, US$)
Brazil China Russia Egypt Indonesia
Mobile phone % ownership
0
100
200
300
400
500
0 1000 2000 3000 4000 5000 6000 7000 8000
Avg mthly household income (PPP, US$)
Brazil China Russia
Monthly spending on entertainment (PPP, US$)
Source: Credit Suisse Emerging Market Consumer Survey Source: Credit Suisse Emerging Market Consumer Survey
However, this long-term structural shift across the emerging economies towards greater discretionary spending has stalled, on average, over the past year as the slowdown in economic momentum and high food inflation has impacted confidence.
Consequently, when we compare the growth in spending rates between 2010 and 2011 for a range of goods and services, we can see that household consumption contracted for many of the more discretionary areas of expenditure over the course of the year. Figure 15 and Figure 16 serve to illustrate these changes. In these charts, we aggregate the survey results from all the markets to show how consumption or ownership of different types of goods and services changed this year compared with last year.
Figure 15: % of respondents that have bought various goods and services in 2011 and
the change vs 2010
Private healthcare
Extra education
Holidays
Perfume
Jewellery
Watches
Sports shoes
Fashion apparel
Cosmetics
Feminine hygiene
Tissues Dairy
Spirits
Bottled waterBeer Carbonated drinks
-8
-6
-4
-2
0
2
4
0 10 20 30 40 50 60 70 80 90 100
2011 % respondents that own or have bought each item
Cha
nge
vs 2
010
Source: Credit Suisse Emerging Market Consumer Survey

16 January 2012
19
Figure 16: % of respondents that own various goods/assets in 2011 and the change vs
2010
Ex Ch Internet accessEx Ch Smartphone Ex Ch Mobile phones
Ex Ch Computers
Ex Ch Cars
Ex Ch Property
Ch Internet access
Ch Smartphone
Ch Mobile phones
Ch Computers
Ch Cars Ch Property
-4
-3
-2
-1
0
1
2
3
4
5
6
7
0 20 40 60 80 100 120
2011 % respondents that own/have aecess to each item
Cha
nge
vs 2
010
Source: Credit Suisse Emerging Market Consumer Survey. NOTE: ‘Ex Ch’ – refers to data excluding China
We note the reduction over the course of the last year in average consumer exposure to:
- sport shoes and fashion apparel – these sectors have borne the brunt of the decline in consumer sentiment and higher average food prices. Both categories were down strongly across nearly all of our survey markets, including Saudi Arabia where consumer sentiment still appears to be relatively strong.
- private healthcare – four out of the seven markets (where we can compare the recent data against last year’s survey) recorded a decline in the number of households who allocated spending to private healthcare. Theoretically, this could simply reflect an improvement in state provision of healthcare services. However, in practice, since the detailed data show the decline was most obvious across the lowest income groups, it suggests that healthcare spend was forfeited to offset high food prices.
- property ownership also declined on aggregate in this survey versus the last survey. At the country level, the data show that ownership remained flat in China and Russia but declined slightly in India and Brazil. In a clear sign of the prevailing economic turmoil,, property ownership levels in Egypt were down significantly compared with last year.
Meanwhile, consumer penetration rates picked up on average for:
- mobile phones – this is predominantly driven by the rise in ownership across the lower income markets (India, Egypt, Indonesia and Brazil). Growth rates continue to hold the greatest potential in Indonesia (29% of our sample still do not have a mobile phone) followed by Egypt (15%) and Turkey (11%).
- smartphones – at the opposite extreme to the basic mobile, the higher income markets have been the key drivers of the rise in ownership of smartphones. Saudi Arabia tops the list with a penetration rate of 68% (a 22% increase on last year). The survey shows that smartphones have also proved popular in Brazil and China.
- computers and internet access – have also enjoyed strong growth in penetration rates over the year. Interestingly, this has not been driven by China (where computer ownership and internet access is already relatively high). Instead, the key drivers over the last year have been Brazil and Saudi Arabia.
- cosmetics – demand appears to have picked up marginally over the last year. Closer inspection of the data shows that the low income groups in Brazil were important drivers of this trend. This follows the well-established spending patterns of the higher income groups in Brazil. The country as a whole has one of the highest recorded spending rates on cosmetics and skincare (86% of our sample said they had spent on this item in the past three months) in contrast to China, with one of the lowest rates (only 43% of our Chinese sample said they had spent money on cosmetics over the same period).

16 January 2012
20
- education – a more significant proportion of respondents in six out of seven markets said they had allocated money to private education courses this year compared with last year. The exception was Egypt where the economic disruption has clearly undermined routines. But, Egypt aside, it is remarkable that the growth in education is so consistent across markets that differ so much in terms of consumer preference in so many other areas. And moreover, that education increased in prioritisation in a year that was far from supportive from a cyclical perspective. There is a substantial weight of historical evidence that suggests this strategy is highly likely to pay economic dividends and deliver sustainably higher GDP per capita in the long run. Thus, this is a strong underpin to the continued outperformance of emerging market economic growth.
The appetite for technology As noted above, the appetite for technology across our consumer universe appears to be very strong. However, we note that the strength of this demand varies according to income group as well as market. As an example, the data show that the penetration of smartphones is greater in the low income groups in Saudi Arabia than it is for the high income groups in Brazil and Russia. The ownership of computers is higher for the mid-income brackets in China than it is for the high income brackets in Saudi Arabia, Russia or India. Figure 17 and Figure 18 illustrate the point.
Figure 17: % of households (according to income bracket)
owning at least 1 computer
Figure 18: % of households (according to income bracket)
owning smartphones
0%
20%
40%
60%
80%
100%
120%
0 2000 4000 6000 8000 10000
Avg mthly household income (PPP, US$)
% h
ouse
hold
s w
ith c
ompu
ters
Brazil China India Russia Saudi Arabia
0%
10%
20%
30%
40%
50%
60%
70%
80%
90%
0 2000 4000 6000 8000 10000
Av g mthly household income (PPP, US$)
% h
ouse
hold
s w
ith a
Sna
rt ph
one
Brazil China India Russia Saudi Arabia
Source: Credit Suisse Emerging Market Consumer Survey Source: Credit Suisse Emerging Market Consumer Survey
The possible explanations for this are threefold:
(1) Strength and sophistication of the distribution network – the greater this is, the higher the penetration rate. Churn rates are one potential indicator of the scope and reach of the distribution network. Our survey data show that where mobile and smartphone penetration rates are highest, a mobile handset has a relatively short life (only 14 months on average in Saudi Arabia). In markets where phone penetration rates are lowest, the average length of time that a handset is owned is much longer (22 months on average in Russia and 24 months in India).
(2) Relative prices – are an obvious factor to explain relative penetration rates. The prevalence of low-cost smartphones in China and the competitive nature of that market has arguably boosted consumer access to the product.
(3) Relative development of broadband infrastructure – helps explain computer ownership. We find there is a clear correlation between broadband access and household computer penetration: where broadband access is low (notably Egypt, India and Indonesia) the average computer ownership is also low.
16 January 2012
21
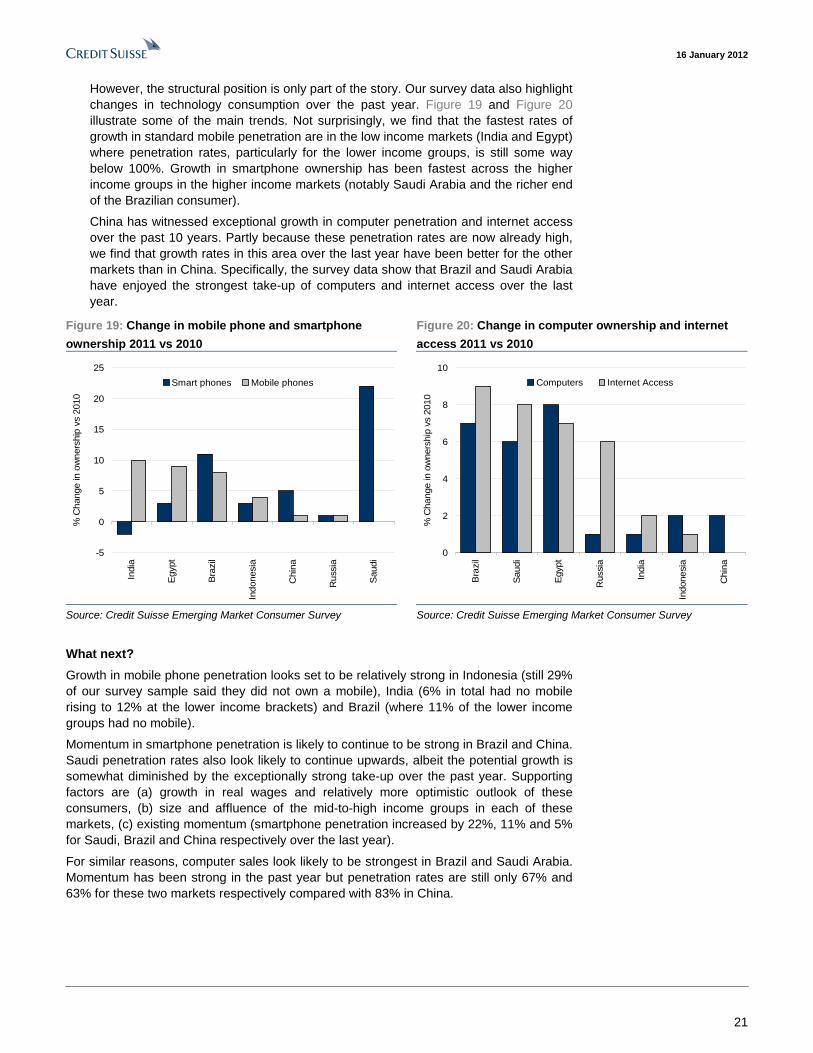
However, the structural position is only part of the story. Our survey data also highlight changes in technology consumption over the past year. Figure 19 and Figure 20 illustrate some of the main trends. Not surprisingly, we find that the fastest rates of growth in standard mobile penetration are in the low income markets (India and Egypt) where penetration rates, particularly for the lower income groups, is still some way below 100%. Growth in smartphone ownership has been fastest across the higher income groups in the higher income markets (notably Saudi Arabia and the richer end of the Brazilian consumer).
China has witnessed exceptional growth in computer penetration and internet access over the past 10 years. Partly because these penetration rates are now already high, we find that growth rates in this area over the last year have been better for the other markets than in China. Specifically, the survey data show that Brazil and Saudi Arabia have enjoyed the strongest take-up of computers and internet access over the last year.
Figure 19: Change in mobile phone and smartphone
ownership 2011 vs 2010
Figure 20: Change in computer ownership and internet
access 2011 vs 2010
-5
0
5
10
15
20
25
Indi
a
Egy
pt
Bra
zil
Indo
nesi
a
Chi
na
Rus
sia
Sau
di
% C
hang
e in
ow
ners
hip
vs 2
010
Smart phones Mobile phones
0
2
4
6
8
10
Bra
zil
Sau
di
Egy
pt
Rus
sia
Indi
a
Indo
nesi
a
Chi
na
% C
hang
e in
ow
ners
hip
vs 2
010
Computers Internet Access
Source: Credit Suisse Emerging Market Consumer Survey Source: Credit Suisse Emerging Market Consumer Survey
What next?
Growth in mobile phone penetration looks set to be relatively strong in Indonesia (still 29% of our survey sample said they did not own a mobile), India (6% in total had no mobile rising to 12% at the lower income brackets) and Brazil (where 11% of the lower income groups had no mobile).
Momentum in smartphone penetration is likely to continue to be strong in Brazil and China. Saudi penetration rates also look likely to continue upwards, albeit the potential growth is somewhat diminished by the exceptionally strong take-up over the past year. Supporting factors are (a) growth in real wages and relatively more optimistic outlook of these consumers, (b) size and affluence of the mid-to-high income groups in each of these markets, (c) existing momentum (smartphone penetration increased by 22%, 11% and 5% for Saudi, Brazil and China respectively over the last year).
For similar reasons, computer sales look likely to be strongest in Brazil and Saudi Arabia. Momentum has been strong in the past year but penetration rates are still only 67% and 63% for these two markets respectively compared with 83% in China.
16 January 2012
22
The role of brands Brands and income sensitivity
Running alongside the structural story of the transition of emerging market consumption from essential items towards discretionary spending, there are important implications for consumer brands. In last year’s survey, we flagged three specific themes which were very much apparent in the data.
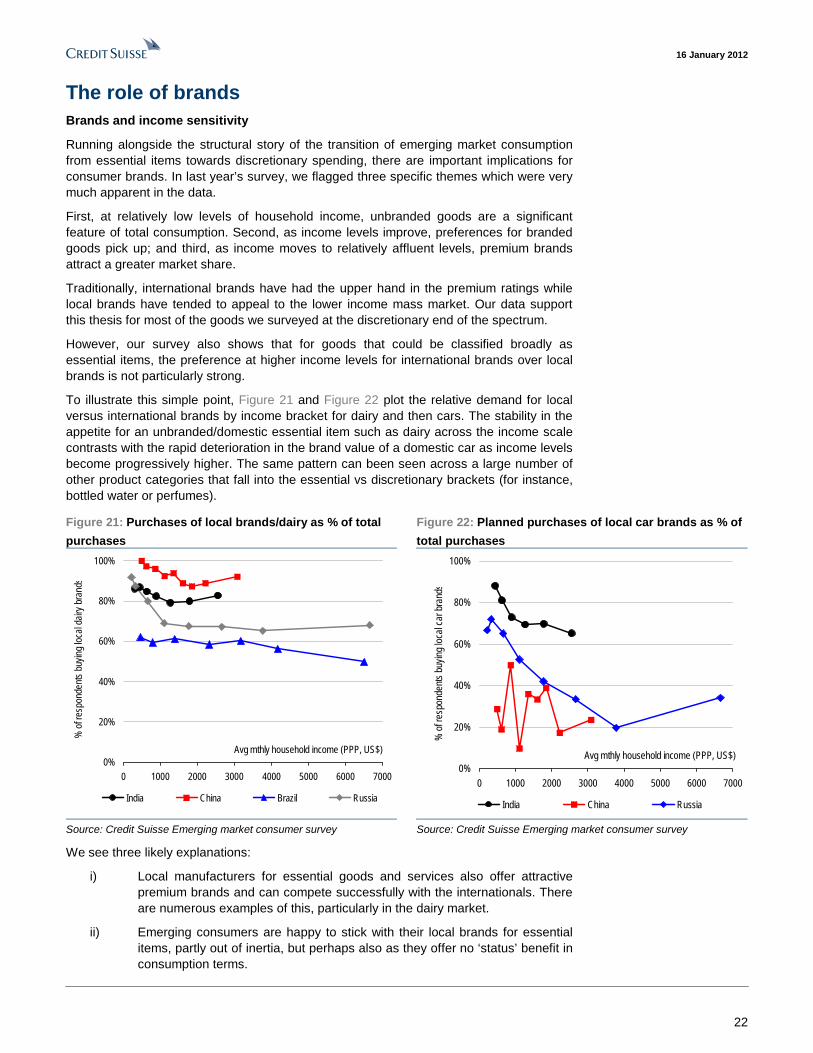
First, at relatively low levels of household income, unbranded goods are a significant feature of total consumption. Second, as income levels improve, preferences for branded goods pick up; and third, as income moves to relatively affluent levels, premium brands attract a greater market share.
Traditionally, international brands have had the upper hand in the premium ratings while local brands have tended to appeal to the lower income mass market. Our data support this thesis for most of the goods we surveyed at the discretionary end of the spectrum.
However, our survey also shows that for goods that could be classified broadly as essential items, the preference at higher income levels for international brands over local brands is not particularly strong.
To illustrate this simple point, Figure 21 and Figure 22 plot the relative demand for local versus international brands by income bracket for dairy and then cars. The stability in the appetite for an unbranded/domestic essential item such as dairy across the income scale contrasts with the rapid deterioration in the brand value of a domestic car as income levels become progressively higher. The same pattern can been seen across a large number of other product categories that fall into the essential vs discretionary brackets (for instance, bottled water or perfumes).
Figure 21: Purchases of local brands/dairy as % of total
purchases
Figure 22: Planned purchases of local car brands as % of
total purchases
0%
20%
40%
60%
80%
100%
0 1000 2000 3000 4000 5000 6000 7000
Avg mthly household income (PPP, US$)
% o
f res
pond
ents
buy
ing
loca
l dai
ry b
rand
s
India China Brazil Russia
0%
20%
40%
60%
80%
100%
0 1000 2000 3000 4000 5000 6000 7000
Avg mthly household income (PPP, US$)
% o
f res
pond
ents
buy
ing
loca
l car
bra
nds
India China Russia
Source: Credit Suisse Emerging market consumer survey Source: Credit Suisse Emerging market consumer survey
We see three likely explanations:
i) Local manufacturers for essential goods and services also offer attractive premium brands and can compete successfully with the internationals. There are numerous examples of this, particularly in the dairy market.
ii) Emerging consumers are happy to stick with their local brands for essential items, partly out of inertia, but perhaps also as they offer no ‘status’ benefit in consumption terms.

16 January 2012
23
iii) Brand power for essential items is not as strong as it is for discretionary items. Even international brands are often marketed on price and value.
The broad conclusion is that as incomes continue to improve, as we would expect in emerging economies, the growth outlook for local brands should be at least as good as international brands for essential goods and services. International brands offer greater growth potential than their local peers in the discretionary space. However, we would flag that, given the greater growth on offer in essential items in the emerging world, international companies may be moved—indeed in some cases have already been moved—to acquire these local brands.
Who are the winners?
If this is the broad picture, what are the specific illustrations of brand potential or vulnerability? The survey allows us to isolate specific brands at a very granular level by category of spending, by country and by the nature of the consumer concerned, whether by income or a wide range of demographics. The Credit Suisse Research Institute report Great Brands of Tomorrow underlined the significance for investors in understanding the drivers of brand development and positioning.
When taken to the micro level, we see three specific themes already at work and that might develop further:
(i) The scope for industry consolidation and M&A activity.
(ii) “Trading up” opportunities as consumers shift from unbranded to branded products as their incomes improve.
(iii) The potential structural global and local winning brands alongside those that may see their brand status challenged.
To explore these themes, Figure 24 and Figure 25 display a number of key country brands consumers highlighted in the survey. This is a small, but significant, sub-set of the data the hundreds of brands in the survey as a whole. The two tables split the brands by food and beverage, that would include some more lower ticket and essential items, and then the more highly discretionary areas of spending.
Each table shows the category of spending, a key country brand and its penetration in the lowest and highest income groups within the market. We have also shown which company owns the brand, which helps identify whether the brand is local or global in nature.
The brands selected fall into one of three categories and are colour coded accordingly – brands in the survey that see their market penetration among consumers increase as we move from low to high income (blue) that decrease as income rises (orange), and those that hold their own across the income scale (grey).
M&A
M&A is proving a major ongoing theme in emerging markets. Global consumer companies have taken advantage of the growth opportunities in emerging vs. developed markets and also the relaxation of regulatory constraints that permit it. It is the sectors which are more fragmented and where local brands proliferate that look most likely to benefit from greater M&A.
Taking the two tables together, the dairy and cosmetics space provide good illustrations of M&A potential, albeit for different reasons. As our earlier work suggested, global brands such as Nestle, Danone and Kraft gain limited traction in “essential” items. The dominance, and indeed resilience across the income scale, of companies like Mengnui and Yili in China illustrate the strength lies domestically. Unlisted companies and co-operatives (eg. Mother Dairy and Amul in India and Botavo in Brazil) also play a major role. Beyond the likes of the co-operatives, the ownership of local brands by major global companies is still low (in contrast to much of the beverages space). However, Pepsi‘s Wimm-Bill-Dann acquisition in Russia and its ownership of two dairy brands shows that

16 January 2012
24
this need not be the case. The global companies’ own brands meet with limited appetite; they may be better off buying the local brands and perhaps leveraging their superior capabilities in brand awareness and distribution to create value.
Cosmetics is a different story. Global players are present and income sensitivity does impact their attraction. However, as in dairy, there are well-positioned local brands that offer strong market position, growth potential and that are not already in the hands of the global players – Natura in Brazil, Parachute in India and Chistaya Linia in Russia to name a few.
Trading up: Unbranded to branded and beyond
While the process of how consumers shift from low-end brands to premium brands captures plenty of consideration; the reality is that many consumers across the emerging world still buy unbranded products in many categories. In the discretionary areas, this is at its extreme in low income earners but, as we have highlighted, can also be widespread in essential items. Being well-positioned to exploit the shift from unbranded to branded products offers sizeable potential gains for companies.
Figure 23 breaks down by country and by category the proportion of respondents suggesting they bought unbranded products. The relevance of unbranded purchases seems greatest among the discretionary areas and in essentials like dairy.
Figure 23: % of purchases by sector that are “unbranded” Brazil China Egypt India Indonesia Russia Saudi Turkey
Dairy 9 7 68 15 14 32 0 23
Soft drinks 6 1 1 2 2 16 0 4
Beer 1 4 N/A 5 N/A 20 N/A 7
Spirits 13 19 N/A 6 N/A 16 N/A 34
Cosmetics 6 13 38 8 68 14 7 15
Perfumes 9 23 72 45 81 32 31 66
Fashion 46 43 78 53 72 67 38 80
Leather goods 67 43 79 31 46 76 35 68
Sports shoes and wear
24 13 54 19 37 29 10 37
Source: Credit Suisse Emerging market consumer survey
If we consider a scenario where incomes improve at the low end and the appetite for branded products grow, there would be immediate benefits for those well positioned among the lowest income earners. Linking this into specific brands, Figure 24 and Figure 25 would suggest considerable potential in fashion/retailing for brands such as Bata in India, Hering and Marisa in Brazil; in cosmetics, again, for Natura and Parachute; in sportswear Action In India and Li Ning in China. Pepsi’s dairy acquisition in Russia would also look strategically well placed.
We have some scepticism of the quality of the low responses to the questions on unbranded alcohol. Buying unbranded alcohol may be deemed illegal in some areas. (Also note that the question was not asked in Indonesia, Saudi Arabia and Egypt for cultural reasons.) Even taking the data at face value, we can see a clear read through to the attraction of Baltika and Klinskoe in Russia. If you believe that the beer/spirits responses below under-estimate the local non-branded consumption, it is worth noting local brands dominating the low income brackets such as the likes of Snow in China and Skol in Brazil.
Many of these brands that play to the low income consumer, particularly beverages, have been acquired by the global consumer companies such as ABI and SAB Miller. Tsingtao in China is one notable that still rests outside of global ownership. Unilever owns strong low income local brands in India and Indonesia. However, none of the cosmetics and fashion brands is, as yet, owned by global companies.

16 January 2012
25
Structural winners and structurally challenged
While this potential positioning for a “low end” opportunity has an immediate relevance in some areas, the long-term theme in the survey is to consider a multi-year shift to discretionary spending that extends well beyond the lowest of income earners. Consumers who have moved from unbranded to effective low-end or value-branded products are not going to stop there if their incomes improve further. Brands that have critical mass at the low end but sustain it or grow it up the income scale could prove to be major structural winners.
As strong as the appetite may be for Snow and Skol at the low end, it tails off rapidly beyond the low income earners. Snow’s effective penetration halves between low and high income earners. In the cosmetics space in Russia, Oriflame sees its penetration fall from 61% to 20% between low and high income groups. As much as missing out on the potential structural shift up the income scale, they are very dependent on one income segment today. Oriflame has found this a painful experience in the last year given the pressure on the real incomes of low income Russian consumers – a fact borne out in our survey this year and last.
Many of the brands that display the ideal mix of being strong across the board stand within the portfolio of the global companies above – e.g. ABI’s soft drink brand Guarana Antarctica or beer brand Brahma. The global players owning brands such as these will generally continue to benefit. However, a number of the local brands we have mentioned above that stood out for their low income attractions and sitting in unconsolidated sectors emerge here as well.
For example, our survey shows that just as around a quarter of consumers purchase Tsingtao in the low income band, a quarter at the high end do likewise. Natura enjoy shares of 51% and 62% respectively between low and high income bands and Li Ning a stable 20% from top to bottom. Brands that do not enjoy the same income resilience would ultimately have to devise a “rebranding” or “reinvention” or run the risk of being left behind as incomes steadily improve beyond the most basic levels.
A final thought is to what extent can these local brands supplant the global players in the bigger ticket areas? High end luxury seems unlikely. Brands such as Burberry continue to grow apace. Technology though seems an area to watch. We have highlighted the structural growth the sector continues to see even in the currently less helpful cyclical environment. The Western brands are in many areas tiring. Brands such as Dell and HP have a declining appeal in India among higher earners while Lenovo dominates across the board in China. Nokia’s share is declining in most markets as Huawei establishes itself in a number of countries. Only Apple continues to sweep all before it and importantly its still lowly market shares suggests it has plenty of further potential yet. However, there seems every reason to believe that domestic brands can erode the brand value developed companies have enjoyed in this space. The ‘million-dollar’ question is, can these ultimately become the global not just local standard and fully turn the tables on their global counterparts?

16 January 2012
26
Figure 24: Food and Beverages: Brand market penetration according to income group
Sector Country / Brand% penetration at LOWER income
% penetration at HIGHER income
Difference
Parent Company (If applicable) Listed / Private
Juhaina (EGYPT) 35% 73% 38% Juhayna Food Industries JUFO EYDomik v Derevne (RUSSIA) 27% 50% 23% PepsiCo Inc. PEP US
Chudo (RUSSIA) 13% 29% 16% PepsiCo Inc. PEP USBatavo (BRAZIL) 30% 44% 13% Batavo Cooperativa Agroindustrial Prvate
Parmalat (BRAZIL) 39% 48% 9% AEP Investments, Ltd. PrivateNestle (INDIA) 2% 11% 9% Nestlé S.A. NESN VX
Danone (SAUDI) 7% 15% 8% Danone BN FPYili (CHINA) 55% 63% 8% Inner Mongolia Yili Industrial Group Co., Ltd. 600887 CH
Mengniu (CHINA) 63% 68% 4% China Mengniu Dairy Company Limited 2319 HKPinar (TURKEY) 41% 44% 3% Yasar Holding PrivateAnchor (SAUDI) 20% 21% 1% Fonterra Co-operative Group Limited Private
Mother Dairy (INDIA) 26% 25% -1% National Dairy Development Board PrivateKraft (SAUDI) 30% 28% -2% Kraft Foods Inc. KFT US
Thirumala (INDIA) 16% 7% -9% Tirumala Milk Products (P) L PrivateGuaraná Antarctica (BRAZIL) 46% 64% 18% Anheuser-Busch InBev NV ABI BBMirinda Pepsi-Cola (SAUDI) 41% 53% 12% PepsiCo Inc. PEP US
Coca-Cola (INDIA) 25% 33% 8% The Coca-Cola Company KO USLimca (INDIA) 29% 33% 4% The Coca-Cola Company KO US
Guozhiguole (CHINA) 10% 9% -1% China Huiyuan Juice Group Limited 1886 HKChernogolovka (RUSSIA) 10% 9% -1% OST Group Private
Dolly (BRAZIL) 19% 13% -6% Dolly PrivateBudweiser (TURKEY) 6% 23% 17% Anheuser-Busch InBev NV ABI BB
Carlsberg (INDIA) 0% 12% 12% Carlsberg Group CARLB DCHeineken (BRAZIL 0% 11% 11% Heineken HEIA NABrahma (BRAZIL) 12% 19% 7% Anheuser-Busch InBev NV ABI BBTsingtao (CHINA) 23% 26% 3% Tsingtao Brewery Company Limited 600600 CHYanjing (CHINA) 11% 13% 2% Yanjing Beer (Guilin Liquan) Co., Ltd. Private
Haywards (INDIA) 11% 12% 1% SAB Miller SAB LNKingfisher (INDIA) 42% 37% -5% UB Group PrivateBaltika (RUSSIA) 23% 18% -5% Carlsberg Group CARLB DC
Klinskoe (RUSSIA) 16% 10% -6% Anheuser-Busch InBev NV ABI BBSnow (CHINA) 30% 16% -14% SABMiller SAB LNSkol (BRAZIL) 45% 30% -15% Anheuser-Busch InBev NV ABI BB
Efes Pilsen (TURKEY) 85% 58% -26% Anadolu Efes AEFES.ISJohnnie Walker (BRAZIL) 5% 24% 19% Diageo plc DGE LN
Bacardi (BRAZIL) 9% 18% 9% Bacardi Limited PrivateNiulanshan (CHINA) 17% 24% 7% Beijing Shunxin Agriculture Co., Ltd 000860 CHSmirnoff (BRAZIL) 31% 38% 7% Diageo plc DGE LNRoyal Stag (INDIA) 11% 13% 2% Pernod Ricard RI FP5 Ozer (RUSSIA) 11% 11% 0% Alcohol Siberian Group, Inc Private
Bagpippers (INDIA) 14% 13% -1% UB Group PrivateJack Daniels (TURKEY) 22% 18% -4% Brown-Forman Corporation BF/B US
Xifeng (CHINA) 10% 3% -7% Shaanxi Xifeng Liquor Co., Ltd PrivateMc’Dowells No.1 (INDIA) 42% 27% -15% UB Group Private
Absolut (TURKEY) 35% 14% -21% Pernod Ricard RI FP
Dai
rySo
ft D
rinks
Bee
rSp
irits
Source: Credit Suisse Emerging market consumer survey
Colour code: brands increasing share from low to high income are in blue, brands maintaining share are in grey, and brands seeing decreases in
market share are in orange

16 January 2012
27
Figure 25: Discretionary spending: Brand market penetration according to income group
Sector Country / Brand% penetration at LOWER income
% penetration at HIGHER income
Difference
Parent Company (If applicable) Listed / Private
GM (CHINA) 8% 12% 4% General Motors Co GM USMaruti Suzuki (INDIA) 38% 41% 4% Maruti Suzuki India Limited MSIL IN
TATA (INDIA) 40% 41% 1% Tata Motors TTM USToyota (SAUDI) 23% 23% 0% Toyota Group 7203 JP
Lada / VAZ / Zhiguli (RUSSIA) 17% 11% -5% Renault SA RNO FPVolkswagen (CHINA) 22% 16% -6% Volkswagen AG VOW3 GY
Fiat (BRAZIL) 38% 22% -16% Fiat S.p.A. F IM
Boticário (BRAZIL) 15% 50% 35% O Boticário PrivateNivea (RUSSIA) 14% 31% 17% Beiersdorf AG BEI GR
Pond's (INDONESIA) 27% 43% 16% Unilever Indonesia UNVR JKNatura (BRAZIL) 51% 62% 11% Natura Cosmeticos SA NATU3 BZ
Parachute (INDIA) 33% 42% 8% Marico Limited MRCO INSantoor (INDIA) 14% 15% 1% Wipro Limited WPRO INL'Oreal (SAUDI) 10% 10% 0% L'Oreal SA OR FP
Chistaya Linia (RUSSIA) 19% 17% -3% Kalina KLNA RUFair & Lovely (INDIA) 46% 32% -14% Unilever UNA NAViva (INDONESIA) 26% 7% -19% SkinFood PrivateOriflame (RUSSIA) 61% 20% -42% Oriflame Cosmetics S.A. ORI SS
Chow Taifook (CHINA) 5% 28% 23% Chow Taifook Co. PrivateHering (BRAZIL) 4% 20% 16% Cia. Hering HGTX3 BZBurberry (SAUDI) 4% 16% 12% Burberry Group PLC BRBY LNZara (RUSSIA) 2% 13% 11% Industria de Diseno Textil, S.A. (Inditex) ITX SM
Fast Track (INDIA) 12% 22% 10% Titan Industries Ltd TTAN INAllen Solly (INDIA) 1% 11% 10% Aditya Birla Grasim GRASIM BORenner (BRAZIL) 21% 28% 8% Lojas Renner S.A. LREN3 BZOmega (CHINA) 4% 11% 7% Swatch Group UHR VXLVMH (CHINA) 1% 6% 5% LVMH S.A. MC FPZara (SAUDI) 16% 17% 1% Industria de Diseno Textil, S.A. (Inditex) ITX SM
Marisa (BRAZIL) 41% 33% -8% Maris Lojas SA AMAR3 SA
Adidas (RUSSIA) 27% 42% 15% Adidas AG ADS GYNike (SAUDI) 12% 14% 2% Nike, Inc. NKE US
Lining (CHINA) 20% 20% 0% Li Ning Company Limited 2331 HKAnta (CHINA) 12% 12% 0% Anta Sports Products Limited 2020 HK
X step (CHINA) 10% 4% -6% Xtep International Holdings Limited 1368 HK
Apple (CHINA) 13% 28% 15% Apple Inc. AAPL USApple (BRAZIL) 5% 17% 12% Apple Inc. AAPL US
Samsung (BRAZIL) 26% 33% 7% Samsung Group 005930 KSHuawei (INDONESIA) 10% 9% -1% Huawei Technologies Co. Ltd Private
LG (BRAZIL) 15% 12% -3% LG Corp. 066570 KSNokia (BRAZIL) 37% 28% -9% Nokia Corporation NOK1V FH
Sony (RUSSIA) 8% 30% 22% Sony Corp. 6758 JPApple (SAUDI) 11% 21% 10% Apple Inc. AAPL US
Tata Photon (INDIA) 13% 23% 10% Tata Teleservices Limited TTLS IN HCL Technologies (INDIA) 3% 12% 9% HCL HCLT IN
Airtel (INDIA) 11% 11% 0% Bharti Airtel Limited BHARTI INLenovo (CHINA) 29% 24% -5% Lenovo Group Limited 992 HK
Hewlett Packard (INDIA) 11% 6% -5% Hewlett-Packard Company HPQ USDell (INDIA) 19% 13% -6% Dell, Inc. DELL USAcer (INDIA) 17% 4% -13% Acer Incorporated 2353 TT
Aut
osC
osm
etic
sTV
/ Co
mpu
ters
/ In
tern
et /
Tele
com
s Fa
shio
nSp
orts
wea
rH
ands
ets
Source: Credit Suisse Emerging market consumer survey
16 January 2012
28
Brazil Living for today The Brazilian consumer continues to stand out as the most optimistic across our survey. The momentum of income growth provides an underpinning to discretionary spending as it has over the last year. The Brazilian typically spends not saves. There is an appetite for real assets such as property, if not financial assets.
At 58%, the weighted average balance of respondents are more positive in Brazil than in any other country. In addition, this measure of optimism has seen only a minor step down at the lower income end relative to last year’s survey. The general breadth of the optimism across the overall population looking ahead tends to set Brazil apart, notwithstanding the historical unequal income distribution.
Income expectations are underpinning this sense of optimism. On average, the Brazilian consumer is expecting one of the highest rates of household income growth among the countries surveyed, with the majority expecting increases in excess of 10%, or around 5% in real terms. Strong nominal income growth in the last year also shielded the consumer in Brazil from inflation better than in other countries.
The survey reveals that spending behaviour proved more robust in the last year than elsewhere including spending in the more discretionary areas. Sub-zero readings on the vertical axis in Figure 30 reflects the number of categories seeing lower readings in spending behaviour in this survey compared with 2010. It contains the fewest categories compared with other countries. This chart also highlights that tech penetration in Brazil is seeing strong positive readings. We also find the momentum behind the readings on holidays – backward and forward looking – is very strong.
Lastly, among the wealthier consumers in the survey (GDP per capita of $12,400), the savings behaviour is striking in that so little of income is saved. Barely 7% of household income is registered as saved and over a half of respondents suggest they have no extra cash for savings. Given the strength of projected real income growth, this is extraordinary. It is more typical of the countries where the consumer is being seriously squeezed than one where finances seem robust.
Perhaps an answer lies in perception of property as an asset. Property purchase intentions are higher here than for other countries and have increased over the year. Moreover, 73% of respondents expect house prices to rise – higher than any of the BRIC countries. Coupled with a history of high inflation, real assets perhaps command more of a structural attraction.
Figure 26: Key economic and demographic indicators GDP (2011) $1,894.3 bn
GDP per capita (2011) $13,543
Population (2011) 139.87 mn
Geographical area 17.09 mn km2
Number of cities (in excess of 2 million people) 2
Gini coefficient (2009) 37.5
Average inflation (2011E) 8.90%
Average inflation (2012E) 7.30%
Real GDP growth (2011E) 4.30%
Real GDP growth (2012E) 4.10%
Current account % of GDP (2011E) 5.50%
Current account % of GDP (2012E) 3.50%
Consumption as a % of GDP (2011) 49.90%
Source: Credit Suisse Research, IMF, EIU, UN

16 January 2012
29
Figure 27: State of personal finances over next 6 months Figure 28: Personal finances – 2011 vs 2010 (%)
0%
10%
20%
30%
40%
50%
60%
70%
80%
Total 500 800 1400 2400 4100 5600 7300 Morethan8200
Income (R$)
Balance better vs worse
30%
40%
50%
60%
70%
80%
90%
500 800 1400 2400 4100 5600 7300 Morethan8200
2011 2010 2011 average 2010 average
Income (R$)
Balance better vs worse
Source: Credit Suisse Emerging Market Consumer Survey Source: Credit Suisse Emerging Market Consumer Survey
Figure 29: Nominal growth in household income (%) Figure 30: Spending momentum and market penetration
-2.0
0.0
2.0
4.0
6.0
8.0
10.0
12.0
0 2000 4000 6000 8000
Income (R$)
Nominal growth in household income (%)
Last 12 months
Next 12 months
Cars Carbonated drinks
BeerSpirits
Dairy
Cosmetics
Fashion apparel
Sports shoes
Watches
Perfume
Computers
Mobile phonesSmartphone Internet
accessHolidays
Property
Extra education
Private healthcare
-20
-15
-10
-5
0
5
10
15
0 20 40 60 80 100
2011 % respondents that own or have bought each item
Re
cord
ed
spe
ndi
ng in
201
1 vs
20
10
Source: Credit Suisse Emerging Market Consumer Survey Source: Credit Suisse Emerging Market Consumer Survey
Figure 31: Monthly spending by category (%) Figure 32: Savings by distribution channel (%)
0%
5%
10%
15%
20%
25%
30%
35%
40%
45%
Hou
sing
+
Pub
lic U
tiliti
es
Foo
d
Ent
erta
inm
ent
Aut
os
Hea
lthca
re
Edu
catio
n
HP
C
Sav
ings
Mob
ile p
hone
Oth
er
0 10 20 30 40 50 60
Treasury bond
Stock market
Property
No extra savings
Mutual Fund
Life insurance
Gold / Jewellery
Collectables
Cash
Bank account
% of respondents saving by each method
Source: Credit Suisse Emerging Market Consumer Survey Source: Credit Suisse Emerging Market Consumer Survey

16 January 2012
30
China A savings culture The outlook for the Chinese consumer is robust though expectations have softened in the last 12 months. The expectations of the rich and poor remain a marked contrast, despite government policy initiatives aimed at addressing the imbalances. For now, the higher income consumers look likely to remain the preserve for discretionary spending and the acquisition of higher ticket items.
At 38%, the weighted balance of respondents expecting to see their financial positions improve is still robust – though we would note softening somewhat from last year and below that of Brazil and India. As Figure 35 shows, the step down has been uniform from rich to poor. In that respect, we would also note that nothing has changed to close the sizeable gap between the outlook of the rich and poor.
The implied patterns of spending over the last year reflected in Figure 38 are of lower spending on a range of staples such as dairy and beverages as well as more discretionary items such as fashion apparel, cosmetics and perfumes (which has by far the lowest implied usage than any of the other markets in the survey).
The areas of spending that have seen upward momentum are still relatively muted in their degree though the strength of technology spending is clearly apparent. However, the two categories that stand out are healthcare and education. The only country with comparable momentum in healthcare spending is Saudi Arabia. Only Saudi and India had stronger readings on extra educational spending. Given the government prioritisation on spending in both these areas in China, the growth in these segments looks well supported and structural in potential.
The savings behaviour of the Chinese consumer is also a notable feature. We highlighted last year, China’s high propensity to save. This remains unchanged. Any pressure on incomes has not been offset by a reduction in savings. At nearly 30% of monthly income, it is the highest in the survey. However, as Figure 39 illustrates there is plenty of scope to diversify into other savings channels.
Lastly, we note the interesting responses in China to some additional questions included in our latest survey. When asked about the importance of environmental protection relative to economic growth, a net 28% of respondents thought that the environment should take priority over growth, well above any other countries surveyed. The result was consistent across urban and rural areas. This profile suggests that wealth accumulation is also tempered by concerns about the common good and a degree of social conscience is emerging.
Figure 33: Key economic and demographic indicators GDP (2011) $6,476.2 bn
GDP per capita (2011) $4,833
Population (2011) 1.34 bn
Geographical area 9.59 mn km2
Number of cities (in excess of 2 million people) 25
Gini coefficient (2009) 41.5
Average inflation (2011E) 5.50%
Average inflation (2012E) 3.30%
Real GDP growth (2011E) 9.50%
Real GDP growth (2012E) 9.00%
Current account % of GDP (2011E) 5.20%
Current account % of GDP (2012E) 5.60%
Consumption as a % of GDP (2011) 32.20%
Source: Credit Suisse Research, IMF, EIU, UN

16 January 2012
31
Figure 34: State of personal finances over next 6 months Figure 35: Personal finances – 2011 vs 2010 (%)
0%
10%
20%
30%
40%
50%
Total Up to2500
3500 4500 5500 6500 7500 9000 Morethan
10000
Income (RMB)
Balance better vs worse
0%
10%
20%
30%
40%
50%
60%
Up to2500
3500 4500 5500 6500 7500 9000 Morethan
10000
2011 2010 2011 average 2010 average
Income (RMB)
Balance better vs worse
Source: Credit Suisse Emerging Market Consumer Survey Source: Credit Suisse Emerging Market Consumer Survey
Figure 36: Nominal growth in household income (%) Figure 37: Spending momentum and market penetration
-1
0
1
2
3
4
5
6
7
2000 4000 6000 8000 10000 12000
Income (RMB)
Nominal growth in household income (%)
Last 12 months
Next 12 months
Private
healthcare
Extra Education
Property
Holidays
Internet access
Smartphone
Mobile phonesComputers
Perfume
Watches
Sports shoes
Fashion apparel
Cosmetics
Dairy
Spirits
BeerCarbonated
drinks
Cars
-8
-6
-4
-2
0
2
4
6
8
10
0 20 40 60 80 100
2011 % respondents that own or have bought each item
Rec
ord
ed s
pen
din
g in
20
11 v
s 20
10
Source: Credit Suisse Emerging Market Consumer Survey Source: Credit Suisse Emerging Market Consumer Survey
Figure 38: Monthly spending by category (%) Figure 39: Savings by distribution channel (%)
0%
5%
10%
15%
20%
25%
30%
35%
Hou
sing
+
Pub
lic U
tiliti
es
Foo
d
Ent
erta
inm
ent
Aut
os
Hea
lthca
re
Edu
catio
n
HP
C
Sav
ings
Mob
ile p
hone
Oth
er
0 10 20 30 40 50 60 70 80 90
Treasury bond
Stock market
Property
No extra savings
Mutual Fund
Life insurance
Gold / Jewellery
Collectables
Cash
Bank account
% of respondents saving by each method
Source: Credit Suisse Emerging Market Consumer Survey Source: Credit Suisse Emerging Market Consumer Survey

16 January 2012
32
Egypt Change but no change Egypt notably stood out as by far the most negatively positioned in last year’s consumer survey. Drawing any definitive conclusions from our survey for Egypt this year is clearly challenging given a political backdrop that is fluid. However, we can illustrate what changes are visible in this year’s data. The reality is less has changed than one might have hoped. In fact, the prevailing household financial position looks worse than it did a year ago.
Last year’s survey for Egypt, which took place before the Arab Spring, generated by far the most negative readings of any country in the survey across every barometer of sentiment. An extreme inequality of income and a household budget consumed by ever more expensive food prices eroding its real value were hard datapoints. What’s changed?
The outlook of the consumer has improved with our weighted readings of optimism moving from –5% to +8%. However, this is still the lowest in the survey. How the readings have changed across income groups as shown in Figure 41 are noteworthy. The poorest and middle income earners have seen an improvement from the very negative perceptions a year ago while the rich have seen a corresponding decline having arguably been the greater beneficiaries of the old regime.
Current political events perhaps now call into question the durability of the improvement at the bottom end of the scale. There is also the ongoing red flag raised by exposure to food with its near 50% claim on the household income of Egyptian consumers. Ironically, plans to cut government spending on food subsidies to strengthen state finances, could in itself increase inflation and undermine consumer sentiment.
What we have seen during the period this survey catches has been a pick up in buying in the lower ticket discretionary items – eg. fashion, cosmetics. This is perhaps reflective of the improved confidence among low income earners. This contrasts with retrenchment in property. Property ownership has fallen by 13% this year to 57% on average. Also striking, and perhaps concerning, there has been major reductions in areas of healthcare and education provision by individuals.
The structural bullish story that exists for the consumer in Egypt is that spending levels are so low. Recorded activity in almost every category is lower than other countries. The key is finding the stability and impetus to unlock it. At present, and politics aside, ongoing real declines in income do not provide long-term opportunities.
Figure 40: Key economic and demographic indicators
GDP (2011) $248.6 bn
GDP per capita (2011) $2,892
Population (2011) 85.95 mn
Geographical area 1.00 mn km2
Number of cities (in excess of 2 million people) 3
Gini coefficient (2009) 32.1
Average inflation (2011E) 11.10%
Average inflation (2012E) 11.30%
Real GDP growth (2011E) 1.20%
Real GDP growth (2012E) 1.80%
Current account % of GDP (2011E) -1.90%
Current account % of GDP (2012E) -2.20%
Consumption as a % of GDP (2011) 69.70%
Source: Credit Suisse Research, IMF, EIU, UN

16 January 2012
33
Figure 41: State of personal finances over next 6 months Figure 42: Personal finances – 2011 vs 2010 (%)
-15%
-5%
5%
15%
Total 1000 1500 2500 3500 4500 5500 6000
Income (L.E.)
Balance better vs worse
-50%
-40%
-30%
-20%
-10%
0%
10%
20%
30%
1000 1500 2500 3500 4500 5500 6000
2011 2010 2011 average 2010 average
Income (L.E)Balance better vs worse
Source: Credit Suisse Emerging Market Consumer Survey Source: Credit Suisse Emerging Market Consumer Survey
Figure 43: Nominal growth in household income (%) Figure 44: Spending momentum and market penetration
0.0
1.0
2.0
3.0
4.0
5.0
6.0
7.0
8.0
500 1500 2500 3500 4500
Income (L.E.)
Nominal growth in household income (%)
Last 12 months
Next 12 months
Private healthcare
Extra education Property
Holidays
Internet access
Smartphone
Mobile phonesComputers
Perfume
Watches
Sports shoes
Fashion apparel
Cosmetics
Dairy
Carbonated drinks
Cars
-30
-25
-20
-15
-10
-5
0
5
10
15
20
0 20 40 60 80 100
2011 % respondents that own or have bought each item
Rec
orde
d sp
endi
ng in
201
1 vs
201
0
Source: Credit Suisse Emerging Market Consumer Survey Source: Credit Suisse Emerging Market Consumer Survey
Figure 45: Monthly spending by category (%) Figure 46: Savings by distribution channel (%)
-20%
-10%
0%
10%
20%
30%
40%
50%
Hou
sing
+
Pub
lic U
tiliti
es
Foo
d
Ent
erta
inm
ent
Aut
os
Hea
lthca
re
Edu
catio
n
HP
C
Sav
ings
Mob
ile p
hone
Oth
er
0 10 20 30 40 50 60 70 80
Treasury bond
Stock market
Property
No extra savings
Mutual Fund
Life insurance
Gold / Jewellery
Collectables
Cash
Bank account
Source: Credit Suisse Emerging Market Consumer Survey Source: Credit Suisse Emerging Market Consumer Survey
16 January 2012
34
India Going back to school Optimism among Indian consumers is only surpassed by that of Brazil. However, the spending priorities have been lower ticket. Distinguishing features of the Indian consumer is a continued appetite for extra educational expenditure and a propensity to save. There is a structural opportunity in technology spending.
The Indian consumer remains the second most confident in his/her personal finances looking forward (after Brazil). On a weighted basis, this has strengthened over the year but the detailed breakdown shows this shift was driven by the highest income earners.
The activity in the vast majority of categories we illustrate have shown increases above that seen elsewhere. They are tending to be lower ticket in nature – cosmetics, clothing, beverages, mobile phones (not smartphones) for example. In contrast to other countries, technology spending has been more muted (if still positive). However, a strong structural story exists in technology with ownership and recent purchases of technology still low compared with elsewhere.
70% of Indians say they have no computers in the home. Only 19% of respondents register having access to the internet. Both measures are the second lowest in the survey after Indonesia. If we begin to see a shift away from spending on essential items (housing and food make up around 35%), this should be one of the areas to benefit, particularly if we see increased infrastructure spending in telecoms.
We highlighted last year the high share of spending the consumer sets aside for education. At close to 10% of the household budget, this remains a feature. In fact spending on extra education is recorded at a greater rate in this survey compared with last, both in absolute terms and relative to other countries. 32% of children participate in education outside of typical schooling vs 23% last year. Adult participation in extra courses has risen from 3% to 12%. This micro story underpins a long-term bullish macro story for India.
Lastly, the savings culture we highlighted last year remains apparent. The survey registers the highest bank account penetration and the fewest number of people claiming they have no extra money for saving. The life insurance industry (via tax incentives) and real assets such as gold and property are the main non-cash homes for the rupee. This mix sets India apart from the other great saver – China.
Figure 47: Key economic and demographic indicators GDP (2011) $1,700 bn
GDP per capita (2011) $1,382
Population (2011) 1.23 bn
Geographical area 3.28 mn km2
Number of cities (in excess of 2 million people) 13
Gini coefficient (2009) 36.8
Average inflation (2011E) 10.60%
Average inflation (2012E) 8.60%
Real GDP growth (2011E) 7.80%
Real GDP growth (2012E) 7.50%
Current account % of GDP (2011E) -2.20%
Current account % of GDP (2012E) -2.20%
Consumption as a % of GDP (2011) 48.70%
Source: Credit Suisse Research, IMF, EIU, UN

16 January 2012
35
Figure 48: State of personal finances over next 6 months Figure 49: Personal finances – 2011 vs 2010 (%)
0%
10%
20%
30%
40%
50%
60%
70%
Total 5000 6250 8750 12500 17500 25000 35000 Morethan
40000
Income (Rs)
Balance better vs worse
20%
30%
40%
50%
60%
70%
6250 8750 12500 17500 25000 35000 Morethan
40000
2011 2010 2011 average 2010 average
Income (Rs)
Balance better vs worse
Source: Credit Suisse Emerging Market Consumer Survey Source: Credit Suisse Emerging Market Consumer Survey
Figure 50: Nominal growth in household income (%) Figure 51: Spending momentum and market penetration
0.0
1.0
2.0
3.0
4.0
5.0
6.0
0 5000 10000 15000 20000 25000 30000 35000 40000
Income (Rs)
Nominal growth in household income (%)
Last 12 months
Next 12 months
Private healthcare
Extra education
Property
HolidaysInternet access
Smartphone
Mobile phones
Computers
Perfume
Watches
Sports shoes
Fashion apparel
Cosmetics
Dairy
Spirits
BeerCarbonated
drinksCars
-25
-20
-15
-10
-5
0
5
10
15
0 20 40 60 80 100
2011 % respondents that own or have bought each item
Rec
orde
d sp
endi
ng in
201
1 vs
201
0
Source: Credit Suisse Emerging Market Consumer Survey Source: Credit Suisse Emerging Market Consumer Survey
Figure 52: Monthly spending by category (%) Figure 53: Savings by distribution channel (%)
0%
5%
10%
15%
20%
25%
Hou
sing
+
Pub
lic U
tiliti
es
Foo
d
Ent
erta
inm
ent
Aut
os
Hea
lthca
re
Edu
catio
n
HP
C
Sav
ings
Mob
ile p
hone
Oth
er
0 20 40 60 80 100
Treasury bond
Stock market
Property
No extra savings
Mutual Fund
Life insurance
Gold / Jewellery
Collectables
Cash
Bank account
% of respondents saving by each method
Source: Credit Suisse Emerging Market Consumer Survey Source: Credit Suisse Emerging Market Consumer Survey

16 January 2012
36
Indonesia On a fast track The Indonesian consumer offers a strong structural growth story. Its consumer has arguably more BRIC characteristics than the Russian. Its GDP per capita may be the third lowest in the survey but its optimism is the third highest. If food prices are removed as a hurdle, under-penetrated discretionary sectors offer considerable growth potential as incomes continue to grow.
Indonesia may rank as one of the poorer countries in the survey but it ranks among the most optimistic and also shows optimism that is rising year on year. Optimism in the region comes third highest in our survey (just below India and Brazil), with a weighted net 38% of respondents expecting their position to improve in the coming six months. This is up 4 percentage points from last year and has risen across every income category.
While the richer display the greatest confidence – close to the highest in the whole survey – the poorer end of the scale show robust levels of confidence in the 20-30% range. The driver of income is a supportive one. It may be an unequal one in terms of progression but again the expectations of the poorest levels in the income scale are improving more rapidly than elsewhere, albeit from an income level that is low in absolute terms.
The risk that always exists for the Indonesian consumer is the sensitivity of food prices. As in any of the poorer economies, food consumes a large proportion of the household budget. Our survey suggests it is close to a third. Hence, upward pressure on prices would threaten to crowd out other discretionary spending.
We can arguably see an element of this in comparing this survey to the last – a period when food prices have been an issue. Recorded spending activity is positive in a wide range of sectors but in a more modest fashion than other countries where optimism is recorded at a similarly high level. However, if food prices become less of an impediment, there is considerable potential to unlock under-penetrated markets such as autos (cars and motor-bikes) and technology.
As one would probably expect, the development of financial services is small. However, we have seen small rises in the number of respondents professing to owning a bank account and life insurance policies (39% and 3% respectively), though holding cash is still the main form of savings.
Figure 54: Key economic and demographic indicators GDP (2011) $813.9 bn
GDP per capita (2011) $3465
Population (2011) 234.9 mn
Geographical area 1.90 mn km2
Number of cities (in excess of 2 million people) 5
Gini coefficient (2009) 39.4
Average inflation (2011E) 5.70%
Average inflation (2012E) 6.50%
Real GDP growth (2011E) 6.40%
Real GDP growth (2012E) 6.30%
Current account % of GDP (2011E) 0.20%
Current account % of GDP (2012E) -0.40%
Consumption as a % of GDP (2011) 55.80%
Source: Credit Suisse Research, IMF, EIU, UN

16 January 2012
37
Figure 55: State of personal finances over next 6 months Figure 56: Personal finances – 2011 vs 2010 (%)
0%
10%
20%
30%
40%
50%
60%
70%
80%
Total 1000 1250 1750 2500 4000 6250 8750 Morethan
10000
Income (Rp '000)
Balance better vs worse
10%
15%
20%
25%
30%
35%
40%
45%
50%
55%
1000 1250 1750 2500 4000 6250
2011 2010 2011 average 2010 average
Income (Rp '000)
Balance better vs worse
Source: Credit Suisse Emerging Market Consumer Survey Source: Credit Suisse Emerging Market Consumer Survey
Figure 57: Nominal growth in household income (%) Figure 58: Spending momentum and market penetration
-1.0
1.0
3.0
5.0
7.0
9.0
11.0
1000000 3000000 5000000 7000000 9000000 11000000
Income (Rp)
Nominal growth in household income (%)
Last 12 months
Next 12 months
Cars
Carbonated drinks
Dairy
Cosmetics
Fashion apparel
Sports shoes
Watches
Perfume
Computers
Mobile phonesSmartphone
Internet access
Holidays Property
Extra education
Private healthcare
-30
-25
-20
-15
-10
-5
0
5
10
15
0 20 40 60 80 100
2011 % respondents that own or have bought each item
Rec
orde
d sp
endi
ng in
201
1 vs
201
0
Source: Credit Suisse Emerging Market Consumer Survey Source: Credit Suisse Emerging Market Consumer Survey
Figure 59: Monthly spending by category (%) Figure 60: Savings by distribution channel (%)
0%
5%
10%
15%
20%
25%
30%
35%
40%
Hou
sing
+
Pub
lic U
tiliti
es
Foo
d
Ent
erta
inm
ent
Aut
os
Hea
lthca
re
Edu
catio
n
HP
C
Sav
ings
Mob
ile p
hone
Oth
er
0 10 20 30 40 50
Treasury bond
Stock market
Property
No extra savings
Mutual Fund
Life insurance
Gold / Jewellery
Collectables
Cash
Bank account
% of respondents saving by each method
Source: Credit Suisse Emerging Market Consumer Survey Source: Credit Suisse Emerging Market Consumer Survey

16 January 2012
38
Russia The weakest BRIC in the wall Despite the structural support there has been for the Russian economy in recent years from commodity prices, there has not been a notable trickle down to the average consumer. Optimism remains the lowest of the BRICs. The inequality of income suggests that growth opportunities are played mainly at the high income end in Russia.
At a net weighted balance of only 20% viewing their financial position improving in the six months ahead, the reading in Russia is barely a third of the level seen in Brazil. In fact, only Turkey and Egypt rank lower in terms of financial optimism. The simple explanation stems from income growth – nominal and real. With the former very modest, the latter was very negative to the tune of -7% as inflation eroded nominal gains. With inflation forecast to remain at similar levels, this lid on optimism will not be removed easily.
The story becomes an equally familiar one when we note that 35% of household income is spent on food – another of the drivers of a pessimistic consumer across the survey. The level of negativity expressed by low end consumers is likely to reflect those consumers where the food impact has been felt the hardest.
Against this backdrop, it is interesting and perhaps surprising to note that we have seen increased positive readings of activity in some areas of discretionary spending, particularly high ticket items, including technology and luxury goods. We would offer two explanations. First, a severe inequality of income prevails in Russia and, at the high end, support remains for strong for large ticket purchases. The survey shows that intentions to buy cars among the highest earners has risen compared with last year. Second, higher ticket goods such as watches remain under-penetrated in Russia further supporting structural growth.
Russian consumption of alcoholic drinks is still one of the highest compared with the other markets. The penetration of beer (66% of our Russian respondents purchased beer in the last 3 months) is similar to China (67%) and Brazil (63%) but Russian consumption of spirits is by far the highest (49% bought spirits in the last three months compared with Brazil in second place at 33%). However, alcohol consumption has not grown over the past year, according to our survey data. The raft of measures aimed at curbing alcohol consumption introduced by Medvedev in 2011 are likely to lead to further declines.
The story of low banking penetration we highlighted in the last survey persists, with little improvement in bank account access. Less than a fifth of those surveyed reported having a bank account, and other channels of investment – life insurance, mutual funds, government bonds – again registered negligible overall uptake. Worryingly, the savings rate has also declined to 9% from 14%. Wealth accumulation is a story for the richest.
Figure 61: Key economic and demographic indicators GDP (2011) $1,894.3 bn
GDP per capita (2011) $13,543
Population (2011) 139.87 mn
Geographical area 17.09 mn km2
Number of cities (in excess of 2 million people) 2
Gini coefficient (2009) 37.5
Average inflation (2011E) 8.90%
Average inflation (2012E) 7.30%
Real GDP growth (2011E) 4.30%
Real GDP growth (2012E) 4.10%
Current account % of GDP (2011E) 5.50%
Current account % of GDP (2012E) 3.50%
Consumption as a % of GDP (2011) 49.90%
Source: Credit Suisse Research, IMF, EIU, UN

16 January 2012
39
Figure 62: State of personal finances over next 6 months Figure 63: Personal finances – 2011 vs 2010 (%)
-20%
-10%
0%
10%
20%
30%
40%
Total 5000 7500 15000 25000 40000 60000 85000 Morethan
100000
Income (RUB)
Balance better vs worse
-20%
-10%
0%
10%
20%
30%
40%
50%
5000 7500 15000 25000 40000 60000 85000 Morethan
100000
2011 2010 2011 average 2010 average
Income (RUB)
Balance better vs worse
Source: Credit Suisse Emerging Market Consumer Survey Source: Credit Suisse Emerging Market Consumer Survey
Figure 64: Nominal growth in household income (%) Figure 65: Spending momentum and market penetration
-2.0
-1.0
0.0
1.0
2.0
3.0
4.0
5.0
0 20000 40000 60000 80000 100000
Income (RUB)
Nominal growth in household income (%)
Last 12 months
Next 12 months
Cars
Carbonated drinks
BeerSpirits
Dairy
Cosmetics
Fashion apparel
Sports shoes
Watches
Perfume
Computers
Mobile phones
Smartphone
Internet access
Holidays
Property
Extra education
Private healthcare
-20
-15
-10
-5
0
5
10
0 20 40 60 80 100
2011 % respondents that own or have bought each item
Rec
orde
d sp
endi
ng in
201
1 vs
201
0
Source: Credit Suisse Emerging Market Consumer Survey Source: Credit Suisse Emerging Market Consumer Survey
Figure 66: Monthly spending by category (%) Figure 67: Savings by distribution channel (%)
0%
5%
10%
15%
20%
25%
30%
35%
40%
Hou
sing
+
Pub
lic U
tiliti
es
Foo
d
Ent
erta
inm
ent
Aut
os
Hea
lthca
re
Edu
catio
n
HP
C
Sav
ings
Mob
ile p
hone
Oth
er
0 10 20 30 40 50 60
Treasury bond
Stock market
Property
No extra savings
Mutual Fund
Life insurance
Gold / Jewellery
Collectables
Cash
Bank account
% of respondents saving by each method
Source: Credit Suisse Emerging Market Consumer Survey Source: Credit Suisse Emerging Market Consumer Survey

16 January 2012
40
Saudi Arabia The oil price hedge The strength of income expectations underpin the high level of optimism of the Saudi consumer in the survey. Oil prices that are a hindrance elsewhere are conversely a help here. The outlook for discretionary spending thus remains very strong after what has been a year of considerable momentum. However, there is also plenty of potential for a change in what is relatively unsophisticated savings behaviour.
With a weighted balance of respondents expecting to see their financial positions improve in the next six months at 37%, the Saudi consumer is among the most optimistic in the survey. While optimism is at its strongest among the highest earners, the level is relatively high across a broad swathe of the population.
Optimism goes hand-in-hand with income growth. Saudi real household income growth over the next 12 months is uniformly positive, and on average the highest in our survey. The upper end of earners expect their incomes to grow by 9% in real terms – a level unseen elsewhere. The picture has been, and is, less rosy for the lowest earners but again nominal and real incomes are expected to grow.
While inflation has been a negative in our emerging economies surveyed, including Saudi Arabia, there is a stabilising affect from government policy. Robust oil revenues (a driver of inflation for others) have provided government spending with the firepower to support public sector incomes and boost spending more generally. We have seen a government pledge to spend $130 billion on housing and job creation this year.
The spending momentum in the last year and the outlook is discretionary focused. Smartphones, computers, property, cars and holidays have all seen more robust trends in activity than elsewhere. Looking forward, 25% of respondents see now as an excellent time to make a big-ticket purchase with intentions to buy cars and property rising across the income scale. Away from shorter-term consumption decisions, healthcare and extra educational spending has also been stronger than elsewhere, with government spending to supplement this.
A structural opportunity remains in the financials services industry. The pool of savings is exceptionally large. High levels of income coincide with a high savings rate (15%). The Credit Suisse Global Wealth Report 2011 estimated that total wealth in Saudi Arabia increased from $0.4tr to $0.6tn in the last year. Financial wealth per capita increased 27.5%. Still the savings culture is far from sophisticated. Gold/jewellery command more of a focus than financial markets.
Figure 68: Key economic and demographic indicators GDP (2011) $580.7 bn
GDP per capita (2011) $21,685
Population (2011) 26.78 mn
Geographical area 2.15 mn km2
Number of cities (in excess of 2 million people) 2
Gini coefficient (2009) N.A.
Average inflation (2011E) 5.40%
Average inflation (2012E) 5.30%
Real GDP growth (2011E) 6.50%
Real GDP growth (2012E) 3.60%
Current account % of GDP (2011E) 20.60%
Current account % of GDP (2012E) 14.20%
Consumption as a % of GDP (2011) 26.40%
Source: Credit Suisse Research, IMF, EIU, UN

16 January 2012
41
Figure 69: State of personal finances over next 6 months Figure 70: Personal finances – 2011 vs 2010 (%)
0%
10%
20%
30%
40%
50%
60%
Total 5000 6250 8750 11250 13750 16250 18750 Morethan
20000
Income (SAR)
Balance better vs worse
10%
15%
20%
25%
30%
35%
40%
45%
50%
5000 6250 8750 11250 13750 16250 18750
2011 2010 2011 average 2010 average
Income (SAR)
Balance better vs worse
Source: Credit Suisse Emerging Market Consumer Survey Source: Credit Suisse Emerging Market Consumer Survey
Figure 71: Nominal growth in household income (%) Figure 72: Spending momentum and market penetration
4.0
6.0
8.0
10.0
12.0
14.0
16.0
2500 6500 10500 14500 18500 22500
Income (SAR)
Nominal growth in household income (%)
Last 12 months
Next 12 months
Cars
Carbonated drinks
DairyCosmetics
Fashion apparel
Sports shoes
Watches
Perfume
Computers
Mobile phones
Smartphone
Internet access
Holidays
Property
Extra education
Private healthcare
-20
-15
-10
-5
0
5
10
15
20
25
0 20 40 60 80 100
2011 % respondents that own or have bought each item
Rec
orde
d sp
endi
ng in
201
1 vs
201
0
Source: Credit Suisse Emerging Market Consumer Survey Source: Credit Suisse Emerging Market Consumer Survey
Figure 73: Monthly spending by category (%) Figure 74: Savings by distribution channel (%)
0%
5%
10%
15%
20%
25%
Hou
sing
+
Pub
lic U
tiliti
es
Foo
d
Ent
erta
inm
ent
Aut
os
Hea
lthca
re
Edu
catio
n
HP
C
Sav
ings
Mob
ile p
hone
Oth
er
0 10 20 30 40 50 60
Treasury bond
Stock market
Property
No extra savings
Mutual Fund
Life insurance
Gold / Jewellery
Collectables
Cash
Bank account
% of respondents saving by each method
Source: Credit Suisse Emerging Market Consumer Survey Source: Credit Suisse Emerging Market Consumer Survey

16 January 2012
42
Turkey Feeling the squeeze Turkey is a new edition to the Credit Suisse Emerging Consumer Survey for 2012. Unfortunately, it joins at a time when emerging market consumers have little confidence in their immediate outlook. Despite GDP per capita in keeping with the middle income bracket, its spending patterns are more typical of the low income countries with food and housing costs posing a severe constraint.
After Egypt, Turkey registers a low level of confidence in the survey with only 7% of respondents registering net positive prospects for the six months ahead. The pessimism is most acute in the low income areas though even at the high end optimism is well below that expressed by the high end of the income distribution elsewhere.
While Turkey is a new edition and we lack a 2010 survey, we would confidently suggest that 2011 has been a year of relative difficulty for the consumer. Nominal income growth has been meagre – less than 3% even at the high end. Inflation will have more than wiped this out at every income level. With consumers suggesting that nominal incomes will grow at a similar rate next year, real incomes look set to erode further.
Two categories dominate the spending patterns of the Turkish consumer – food and housing/utilities. Collectively spending on these items represent nearly half of total income. As we have shown elsewhere, the countries where food has posed a large claim on consumers’ income have been among the most depressed. Turkey is no different.
Housing is a more distinctive feature. Expenditure in this area (at an estimated 24%) is the highest of any country in the survey. This looks to be more out of a necessity than desire. The proportion of people registered as renting their property is among the highest in the survey. Turkish economic growth over the past decade, and the ensuing urbanisation, has led to high inflation in the housing sector.
Taken together with the food component, the most basic needs are arguably crowding out many other areas of spending. The survey data show that the ownership and implicit penetration of discretionary products in Turkey is much lower, across the board, when set against the survey average despite GDP per capita in the mid-range compared with the other survey markets.
Consumers have limited engagement with the financial sector. Bank account penetration is among the lowest in the survey, with only 14% having access to one. While this presents a structural opportunity, we would equally note that worryingly 73% of respondents claim they have no additional income to save.
Figure 75: Key economic and demographic indicators GDP (2011) $846.5 bn
GDP per capita (2011) $11,054
Population (2011) 76.58 mn
Geographical area 783,562 km2 Number of cities (in excess of 2 million people) 3
Gini coefficient (2009) 43.2
Average inflation (2011E) 6.00%
Average inflation (2012E) 6.90%
Real GDP growth (2011E) 6.60%
Real GDP growth (2012E) 2.20%
Current account % of GDP (2011E) -10.30%
Current account % of GDP (2012E) -7.40%
Consumption as a % of GDP (2011) 71%
Source: Credit Suisse Research, IMF, EIU, UN

16 January 2012
43
Figure 76: State of personal finances over next 6 months Figure 77: Ownership of mobiles/computers/smartphones
-5%
0%
5%
10%
15%
20%
25%
Total 1000 1500 2500 4000 6000 8500
Income (TL)
Balance better vs worse
Electronic Ownership (% of households)
Computers
Phones
Smart Phones
0%
20%
40%
60%
80%
100%
1000 1500 2500 4000 6000 8500
Income (TL)
Source: Credit Suisse Emerging Market Consumer Survey Source: Credit Suisse Emerging Market Consumer Survey
Figure 78: Nominal growth in household income (%) Figure 79: Major purchase intentions – 2011 (%)
-1.0
0.0
1.0
2.0
3.0
4.0
0 800 1600 2400 3200 4000 4800 5600
Income (TL)
Nominal growth in household income (%)
Last 12 months
Next 12 months
0%
5%
10%
15%
20%
25%
30%
500 1500 2500 4000 6000 More than7000
Property Purchase
Car purchase
% of respondents intention to buy
Income (TL)
Source: Credit Suisse Emerging Market Consumer Survey Source: Credit Suisse Emerging Market Consumer Survey
Figure 80: Monthly spending by category (%) Figure 81: Savings by distribution channel (%)
0%
5%
10%
15%
20%
25%
30%
Hou
sing
+
Pub
lic U
tiliti
es
Foo
d
Ent
erta
inm
ent
Aut
os
Hea
lthca
re
Edu
catio
n
HP
C
Sav
ings
Mob
ile p
hone
Oth
er
0 10 20 30 40 50 60 70 80
Treasury bond
Stock market
Property
No extra savings
Mutual Fund
Life insurance
Gold / Jewellery
Collectables
Cash
Bank account
% of respondents saving by each method
Source: Credit Suisse Emerging Market Consumer Survey Source: Credit Suisse Emerging Market Consumer Survey

16 January 2012
44
About the survey This report has been produced using market research gathered by Nielsen. This has given the Credit Suisse Research Institute the ability to conduct a consistent multi-region survey while also incorporating questions specific to the countries surveyed in the report.
Nielsen is a leader in data measurement and information across a wide range of industries and regions. Their expertise has complemented the analysis the Research Institute has conducted in this report. Nielsen’s input has helped develop a more complete view of the competitive consumer landscape across emerging markets.
Nielsen was founded in 1923 by Arthur C. Nielsen, Sr., who invented an approach to measuring competitive sales results that established the concept of “market share” as a practical management tool. For nearly 90 years, they have advanced the practice of market research and audience measurement for the benefits of their clients in a constantly evolving marketplace.
Nielsen has a presence in approximately 100 countries, and holds positions within established and emerging markets. Their operating model is grounded in a simple, open and integrated approach that delivers a broad portfolio of services and solutions for their clients.
The Credit Suisse Research Institute would like to thank Nielsen for their invaluable assistance in this project.

16 January 2012
45
Companies Mentioned (Price as of 13 Jan 11) 7 Days Group Holdings Ltd. (SVN.N, $22.42, OUTPERFORM [V], TP $24.30) Acer Group (2353.TW, NT$85.20, UNDERPERFORM, TP NT$26.00) Adidas AG (ADSGn.F, Eu47.78, OUTPERFORM, TP Eu57.00) Almarai Co (2280.SE, SRls114.25, OUTPERFORM, TP SRls113.00) AmBev SA (AMBV4, R$47.69, OUTPERFORM, TP R$60.00) Anadolu Efes (AEFES.IS, TRY23.00, OUTPERFORM, TP TRY26.20) Anheuser-Busch InBev (ABI.BR, Eu44.01) Anta Sports Products Limited (2020.HK, HK$13.24, UNDERPERFORM, TP HK$6.10) Apple Inc. (AAPL, $345.68, OUTPERFORM, TP $500.00) Arcelik (ARCLK.IS, TRY8.76, OUTPERFORM, TP TRY7.70) Bayer (BAYGn.DE, Eu55.52, OUTPERFORM, TP Eu56.00) Beiersdorf (BEIG.DE, Eu41.10, NEUTRAL, TP Eu40.00) Belle International Holdings Ltd (1880.HK, HK$14.02, OUTPERFORM, TP HK$14.50) Bharti Airtel Ltd (BRTI.BO, Rs346.05, NEUTRAL, TP Rs375.00) BMW (BMWG.F, Eu57.67, OUTPERFORM, TP Eu76.00) Brasil Foods S.A. (BRFS3, R$28.20, OUTPERFORM, TP R$38.50) British American Tobacco (BATS.L, 2325 p, OUTPERFORM, TP 3,080.00 p) Brown-Forman Corporation (BFB) Burberry Group (BRBY.L, 1080 p, NEUTRAL, TP 1,420.00 p) Carlsberg (CARLb.CO, DKr542.00) CEDC (CEDC.OQ, $25.55, UNDERPERFORM [V], TP $3.00) China Mengniu Dairy (2319.HK, HK$19.84, UNDERPERFORM, TP HK$18.00) China Modern Dairy Holdings Ltd (1117.HK, HK$2.65, OUTPERFORM, TP HK$3.25) Chow Tai Fook Jewellery Group Limited (1929.HK) CIA Hering S.A. (HGTX3, R$27.48) Colgate-Palmolive (CL, $78.31, NEUTRAL, TP $80.00) Crown Holdings Inc. (CCK, $33.34, OUTPERFORM, TP $44.00) Daihatsu Motor Co., Ltd (7262, ¥1,284, OUTPERFORM, TP ¥1,680, MARKET WEIGHT) Danone (DANO.PA, Eu45.69, UNDERPERFORM, TP Eu44.00) Dell Inc. (DELL, $14.17, UNDERPERFORM, TP $16.00) Diageo (DGE.L, 1224 p, OUTPERFORM, TP 1,550.00 p) Diagnosticos da America (DASA3, R$21.70, OUTPERFORM, TP R$21.00) Educomp Solutions Ltd (EDSO.BO, Rs517.35, NEUTRAL [V], TP Rs275.00) Etihad Etisalat (7020.SE, SRls54.50, OUTPERFORM, TP SRls70.00) Fast Retailing (9983, ¥12,120, NEUTRAL, TP ¥13,500, MARKET WEIGHT) Fiat (FIA.MI, Eu7.79, UNDERPERFORM [V], TP Eu4.00) General Motors Co. (GM, $38.27, OUTPERFORM, TP $32.00) HCL Technologies (HCLT.BO, Rs463.30, OUTPERFORM, TP Rs485.00) HDFC Bank (HDBK.BO, Rs428.43, OUTPERFORM, TP Rs514.00) Heineken (HEIN.AS, Eu37.22) Hero Motocorp Ltd (HROM.BO, Rs1,830.50, OUTPERFORM, TP Rs2,238.00) Hewlett-Packard (HPQ, $45.65, NEUTRAL, TP $30.00) Inditex (ITX.MC, Eu58.72, OUTPERFORM, TP Eu77.00) Indofood CBP (ICBP.JK, Rp4,575.00, OUTPERFORM, TP Rp7,300.00) Inner Mongolia Yili Industrial Group Company Ltd (600887.SS, Rmb17.78) International Flavors & Fragrances Inc. (IFF, $55.98, OUTPERFORM, TP $66.00) JT (2914, ¥320,000, OUTPERFORM, TP ¥430,000, MARKET WEIGHT) Kraft Foods, Inc. (KFT, $31.44, OUTPERFORM, TP $41.00) Las Vegas Sands (LVS, $47.21, OUTPERFORM [V], TP $60.00) Lenovo Group Ltd (0992.HK, HK$4.89, OUTPERFORM, TP HK$6.95) LG Corp (003550.KS, W86,600) Li Ning Co Ltd (2331.HK, HK$16.80) Lojas Renner (LREN3, R$53.10, OUTPERFORM, TP R$72.50) L'Oreal (OREP.PA, Eu83.27, UNDERPERFORM, TP Eu76.00) LVMH (LVMH.PA, Eu118.85, RESTRICTED) Magnit (MGNTq.L, $31.00, OUTPERFORM, TP $25.00) Marico Ltd (MRCO.BO, Rs122.65) Marisa Lojas S.A. (AMAR3, R$25.05, OUTPERFORM, TP R$31.00) Maruti Suzuki India Ltd (MRTI.BO, Rs1,313.10, UNDERPERFORM, TP Rs944.00) Mead Johnson Nutrition Co. (MJN, $62.93, OUTPERFORM, TP $82.00) MercadoLibre Inc. (MELI, $73.35, NEUTRAL, TP $99.00) Mitra Adiperkasa (MAPI.JK, Rp2,400.00, OUTPERFORM [V], TP Rp6,000.00) Multiplus SA (MPLU3, R$29.59, OUTPERFORM, TP R$41.00) Natura (NATU3, R$45.85, NEUTRAL, TP R$42.50)

16 January 2012
46
Nestle (NESN.VX, SFr52.05, NEUTRAL, TP SFr58.00) Nike Inc. (NKE, $82.56, NEUTRAL, TP $91.00) Nissan Motor Co. (7201, ¥858, NEUTRAL, TP ¥760, MARKET WEIGHT) Nokia (NOK1V.HE, Eu8.23, OUTPERFORM [V], TP Eu6.00) Oriflame (ORIsdb.ST, SKr311.30, NEUTRAL, TP SKr220.00) PDG Realty (PDGR3, R$10.45, OUTPERFORM, TP R$10.00) PepsiCo, Inc. (PEP, $66.91) Pernod-Ricard (PERP.PA, Eu70.51) Philip Morris International (PM, $56.50, OUTPERFORM, TP $79.00) Procter & Gamble Co. (PG, $65.48, OUTPERFORM, TP $70.00) Prudential (PRU.L, 694 p, OUTPERFORM, TP 880.00 p) Reckitt Benckiser (RB.L, 3425 p, OUTPERFORM, TP 3,800.00 p) Renault (RENA.PA, Eu48.25, NEUTRAL, TP Eu45.00) SAB Miller Plc (SAB.L, 2181 p) Samsung Electronics (005930.KS, W922,000, OUTPERFORM, TP W1,100,000) Sberbank (SBER.RTS, $3.59, OUTPERFORM [V], TP $4.20) Shiseido (4911, ¥1,781, OUTPERFORM, TP ¥1,660, MARKET WEIGHT) Sony (6758, ¥2,976, RESTRICTED) Sun Pharmaceuticals Industries Limited (SUN.BO, Rs482.75, OUTPERFORM, TP Rs595.00) Suzuki Motor Corp. (7269, ¥2,110, NEUTRAL, TP ¥1,860, MARKET WEIGHT) Swatch Group (UHR.VX, SFr404.00, OUTPERFORM, TP SFr480.00) Synergy Group (SYNG.RTS, $48.00, OUTPERFORM [V], TP $34.00) Tata Communications Ltd (TATA.BO, Rs256.85, OUTPERFORM, TP Rs375.00) Tata Motors Ltd. (TAMO.BO, Rs247.13, NEUTRAL, TP Rs190.00) Telenor (TEL.OL, NKr94.75, OUTPERFORM, TP NKr114.00) Tencent Holdings (0700.HK, HK$194.10, OUTPERFORM, TP HK$220.00) The Coca-Cola Company (KO, $63.40) Titan Industries (TITN.BO, Rs170.79) Tofas (TOASO.IS, TRY9.08, OUTPERFORM, TP TRY8.65) Toyota Motor Corp. (7203, ¥3,535, NEUTRAL, TP ¥2,980, MARKET WEIGHT) Tsingtao Brewery H (0168.HK, HK$39.00) Unicharm (8113, ¥3,310, OUTPERFORM, TP ¥4,200, MARKET WEIGHT) Unilever Indonesia (UNVR.JK, Rp15,900.00, UNDERPERFORM, TP Rp13,600.00) Unilever N V (UN, $30.35) Volkswagen (VOWG_p.F, Eu126.69, OUTPERFORM, TP Eu155.00) Wipro Ltd. (WIPR.BO, Rs455.00, NEUTRAL, TP Rs390.00) Wynn Resorts (WYNN, $116.72, OUTPERFORM, TP $167.00) XL Axiata Tbk (EXCL.JK, Rp5,500.00, OUTPERFORM [V], TP Rp7,200.00) Xtep (1368.HK, HK$5.43) Yakult Honsha (2267, ¥2,452, NEUTRAL, TP ¥2,350, MARKET WEIGHT) Yum! Brands, Inc. (YUM, $48.90, OUTPERFORM, TP $64.00)
Disclosure Appendix Important Global Disclosures The analysts identified in this report each certify, with respect to the companies or securities that the individual analyzes, that (1) the views expressed in this report accurately reflect his or her personal views about all of the subject companies and securities and (2) no part of his or her compensation was, is or will be directly or indirectly related to the specific recommendations or views expressed in this report. The analyst(s) responsible for preparing this research report received compensation that is based upon various factors including Credit Suisse's total revenues, a portion of which are generated by Credit Suisse's investment banking activities. Analysts’ stock ratings are defined as follows: Outperform (O): The stock’s total return is expected to outperform the relevant benchmark* by at least 10-15% (or more, depending on perceived risk) over the next 12 months. Neutral (N): The stock’s total return is expected to be in line with the relevant benchmark* (range of ±10-15%) over the next 12 months. Underperform (U): The stock’s total return is expected to underperform the relevant benchmark* by 10-15% or more over the next 12 months. *Relevant benchmark by region: As of 29th May 2009, Australia, New Zealand, U.S. and Canadian ratings are based on (1) a stock’s absolute total return potential to its current share price and (2) the relative attractiveness of a stock’s total return potential within an analyst’s coverage universe**, with Outperforms representing the most attractive, Neutrals the less attractive, and Underperforms the least attractive investment opportunities. Some U.S. and Canadian ratings may fall outside the absolute total return ranges defined above, depending on market conditions and industry factors. For Latin American, Japanese, and non-Japan Asia stocks, ratings are based on a stock’s total return relative to the average total return of the relevant country or regional benchmark; for European stocks, ratings are based on a stock’s total return relative to the analyst's coverage universe**. For Australian and New Zealand stocks, 12-month rolling yield is incorporated in the absolute total return calculation and a 15% and a

16 January 2012
47
7.5% threshold replace the 10-15% level in the Outperform and Underperform stock rating definitions, respectively. The 15% and 7.5% thresholds replace the +10-15% and -10-15% levels in the Neutral stock rating definition, respectively. **An analyst's coverage universe consists of all companies covered by the analyst within the relevant sector. Restricted (R): In certain circumstances, Credit Suisse policy and/or applicable law and regulations preclude certain types of communications, including an investment recommendation, during the course of Credit Suisse's engagement in an investment banking transaction and in certain other circumstances. Volatility Indicator [V]: A stock is defined as volatile if the stock price has moved up or down by 20% or more in a month in at least 8 of the past 24 months or the analyst expects significant volatility going forward.
Analysts’ coverage universe weightings are distinct from analysts’ stock ratings and are based on the expected performance of an analyst’s coverage universe* versus the relevant broad market benchmark**: Overweight: Industry expected to outperform the relevant broad market benchmark over the next 12 months. Market Weight: Industry expected to perform in-line with the relevant broad market benchmark over the next 12 months. Underweight: Industry expected to underperform the relevant broad market benchmark over the next 12 months. *An analyst’s coverage universe consists of all companies covered by the analyst within the relevant sector. **The broad market benchmark is based on the expected return of the local market index (e.g., the S&P 500 in the U.S.) over the next 12 months. Credit Suisse’s distribution of stock ratings (and banking clients) is:
Global Ratings Distribution Outperform/Buy* 47% (61% banking clients) Neutral/Hold* 41% (56% banking clients) Underperform/Sell* 10% (52% banking clients) Restricted 2%
*For purposes of the NYSE and NASD ratings distribution disclosure requirements, our stock ratings of Outperform, Neutral, and Underperform most closely correspond to Buy, Hold, and Sell, respectively; however, the meanings are not the same, as our stock ratings are determined on a relative basis. (Please refer to definitions above.) An investor's decision to buy or sell a security should be based on investment objectives, current holdings, and other individual factors.
Credit Suisse’s policy is to update research reports as it deems appropriate, based on developments with the subject company, the sector or the market that may have a material impact on the research views or opinions stated herein.
Credit Suisse's policy is only to publish investment research that is impartial, independent, clear, fair and not misleading. For more detail please refer to Credit Suisse's Policies for Managing Conflicts of Interest in connection with Investment Research: http://www.csfb.com/research-and-analytics/disclaimer/managing_conflicts_disclaimer.html
Credit Suisse does not provide any tax advice. Any statement herein regarding any US federal tax is not intended or written to be used, and cannot be used, by any taxpayer for the purposes of avoiding any penalties. Important Regional Disclosures Singapore recipients should contact a Singapore financial adviser for any matters arising from this research report.
Restrictions on certain Canadian securities are indicated by the following abbreviations: NVS--Non-Voting shares; RVS--Restricted Voting Shares; SVS--Subordinate Voting Shares. Individuals receiving this report from a Canadian investment dealer that is not affiliated with Credit Suisse should be advised that this report may not contain regulatory disclosures the non-affiliated Canadian investment dealer would be required to make if this were its own report. For Credit Suisse Securities (Canada), Inc.'s policies and procedures regarding the dissemination of equity research, please visit http://www.csfb.com/legal_terms/canada_research_policy.shtml.
Credit Suisse Securities (Europe) Limited acts as broker to DGE.L.
The following disclosed European company/ies have estimates that comply with IFRS: ADSGn.F, ABI.BR, BEIG.DE, BMWG.F, BATS.L, CARLb.CO, DANO.PA, DGE.L, FIA.MI, HEIN.AS, ITX.MC, OREP.PA, MGNTq.L, NESN.VX, 7201, NOK1V.HE, PERP.PA, PRU.L, RB.L, RENA.PA, SAB.L, SBER.RTS, UHR.VX, TEL.OL, VOWG_p.F.
As of the date of this report, Credit Suisse acts as a market maker or liquidity provider in the equities securities that are the subject of this report.
Principal is not guaranteed in the case of equities because equity prices are variable. Commission is the commission rate or the amount agreed with a customer when setting up an account or at anytime after that.
I, Mary Curtis, certify that (1) The views expressed in this report solely and exclusively reflect my personal opinions and have been prepared independently, including with respect to Banco de Investimentos Credit Suisse (Brasil) S.A. or its affiliates (“Credit Suisse”). (2) Part of my compensation is based on various factors, including the total revenues of Credit Suisse, but no part of my compensation has been, is, or will be related to the specific recommendations or views expressed in this report. In addition, Credit Suisse declares that: Credit Suisse has provided, and/or may in the future provide investment banking, brokerage, asset management, commercial banking and other financial services to the subject company/companies or its affiliates, for which they have received or may receive customary fees and commissions, and which constituted or may constitute relevant financial or commercial interests in relation to the subject company/companies or the subject securities.

16 January 2012
48
Taiwanese Disclosures: Reports written by Taiwan-based analysts on non-Taiwan listed companies are not considered recommendations to buy or sell securities under Taiwan Stock Exchange Operational Regulations Governing Securities Firms Recommending Trades in Securities to Customers. Please find the full reports, including disclosure information, on Credit Suisse's Research and Analytics Website (http://www.researchandanalytics.com) To the extent this is a report authored in whole or in part by a non-U.S. analyst and is made available in the U.S., the following are important disclosures regarding any non-U.S. analyst contributors: The non-U.S. research analysts listed below (if any) are not registered/qualified as research analysts with FINRA. The non-U.S. research analysts listed below may not be associated persons of CSSU and therefore may not be subject to the NASD Rule 2711 and NYSE Rule 472 restrictions on communications with a subject company, public appearances and trading securities held by a research analyst account. • Richard Kersley, non-U.S. analyst, is a research analyst employed by Credit Suisse Securities (Europe) Limited. • Mary Curtis, non-U.S. analyst, is a research analyst employed by Credit Suisse Securities (Europe) Limited. • Mujtaba Rana, non-U.S. analyst, is a research analyst employed by Credit Suisse Securities (Europe) Limited. • Jahanzeb Naseer, non-U.S. analyst, is a research analyst employed by Credit Suisse Securities (Hong Kong) Limited. • Istvan Mate-Toth, non-U.S. analyst, is a research analyst employed by Credit Suisse Securities (Europe) Limited. • Daisuke Takato, non-U.S. analyst, is a research analyst employed by Credit Suisse Securities (Japan) Limited. • Andrew Garthwaite, non-U.S. analyst, is a research analyst employed by Credit Suisse Securities (Europe) Limited. • Sakhti Siva, non-U.S. analyst, is a research analyst employed by Credit Suisse AG, Singapore Branch. • Alex Redman, non-U.S. analyst, is a research analyst employed by Credit Suisse Securities (Europe) Limited. For Credit Suisse disclosure information on other companies mentioned in this report, please visit the website at www.credit-suisse.com/researchdisclosures or call +1 (877) 291-2683. Disclaimers continue on next page.
16 January 2012
XX5175EU.doc
This report is not directed to, or intended for distribution to or use by, any person or entity who is a citizen or resident of or located in any locality, state, country or other jurisdiction where such distribution, publication, availability or use would be contrary to law or regulation or which would subject Credit Suisse AG, the Swiss bank, or its subsidiaries or its affiliates (“CS”) to any registration or licensing requirement within such jurisdiction. All material presented in this report, unless specifically indicated otherwise, is under copyright to CS. None of the material, nor its content, nor any copy of it, may be altered in any way, transmitted to, copied or distributed to any other party, without the prior express written permission of CS. All trademarks, service marks and logos used in this report are trademarks or service marks or registered trademarks or service marks of CS or its affiliates. The information, tools and material presented in this report are provided to you for information purposes only and are not to be used or considered as an offer or the solicitation of an offer to sell or to buy or subscribe for securities or other financial instruments. CS may not have taken any steps to ensure that the securities referred to in this report are suitable for any particular investor. CS will not treat recipients as its customers by virtue of their receiving the report. The investments or services contained or referred to in this report may not be suitable for you and it is recommended that you consult an independent investment advisor if you are in doubt about such investments or investment services. Nothing in this report constitutes investment, legal, accounting or tax advice or a representation that any investment or strategy is suitable or appropriate to your individual circumstances or otherwise constitutes a personal recommendation to you. CS does not offer advice on the tax consequences of investment and you are advised to contact an independent tax adviser. Please note in particular that the bases and levels of taxation may change. CS believes the information and opinions in the Disclosure Appendix of this report are accurate and complete. Information and opinions presented in the other sections of the report were obtained or derived from sources CS believes are reliable, but CS makes no representations as to their accuracy or completeness. Additional information is available upon request. CS accepts no liability for loss arising from the use of the material presented in this report, except that this exclusion of liability does not apply to the extent that liability arises under specific statutes or regulations applicable to CS. This report is not to be relied upon in substitution for the exercise of independent judgment. CS may have issued, and may in the future issue, a trading call regarding this security. Trading calls are short term trading opportunities based on market events and catalysts, while stock ratings reflect investment recommendations based on expected total return over a 12-month period as defined in the disclosure section. Because trading calls and stock ratings reflect different assumptions and analytical methods, trading calls may differ directionally from the stock rating. In addition, CS may have issued, and may in the future issue, other reports that are inconsistent with, and reach different conclusions from, the information presented in this report. Those reports reflect the different assumptions, views and analytical methods of the analysts who prepared them and CS is under no obligation to ensure that such other reports are brought to the attention of any recipient of this report. CS is involved in many businesses that relate to companies mentioned in this report. These businesses include specialized trading, risk arbitrage, market making, and other proprietary trading. Past performance should not be taken as an indication or guarantee of future performance, and no representation or warranty, express or implied, is made regarding future performance. Information, opinions and estimates contained in this report reflect a judgement at its original date of publication by CS and are subject to change without notice. The price, value of and income from any of the securities or financial instruments mentioned in this report can fall as well as rise. The value of securities and financial instruments is subject to exchange rate fluctuation that may have a positive or adverse effect on the price or income of such securities or financial instruments. Investors in securities such as ADR’s, the values of which are influenced by currency volatility, effectively assume this risk. Structured securities are complex instruments, typically involve a high degree of risk and are intended for sale only to sophisticated investors who are capable of understanding and assuming the risks involved. The market value of any structured security may be affected by changes in economic, financial and political factors (including, but not limited to, spot and forward interest and exchange rates), time to maturity, market conditions and volatility, and the credit quality of any issuer or reference issuer. Any investor interested in purchasing a structured product should conduct their own investigation and analysis of the product and consult with their own professional advisers as to the risks involved in making such a purchase. Some investments discussed in this report have a high level of volatility. High volatility investments may experience sudden and large falls in their value causing losses when that investment is realised. Those losses may equal your original investment. Indeed, in the case of some investments the potential losses may exceed the amount of initial investment, in such circumstances you may be required to pay more money to support those losses. Income yields from investments may fluctuate and, in consequence, initial capital paid to make the investment may be used as part of that income yield. Some investments may not be readily realisable and it may be difficult to sell or realise those investments, similarly it may prove difficult for you to obtain reliable information about the value, or risks, to which such an investment is exposed. This report may provide the addresses of, or contain hyperlinks to, websites. Except to the extent to which the report refers to website material of CS, CS has not reviewed the linked site and takes no responsibility for the content contained therein. Such address or hyperlink (including addresses or hyperlinks to CS’s own website material) is provided solely for your convenience and information and the content of the linked site does not in any way form part of this document. Accessing such website or following such link through this report or CS’s website shall be at your own risk. This report is issued and distributed in Europe (except Switzerland) by Credit Suisse Securities (Europe) Limited, One Cabot Square, London E14 4QJ, England, which is regulated in the United Kingdom by The Financial Services Authority (“FSA”). This report is being distributed in Germany by Credit Suisse Securities (Europe) Limited Niederlassung Frankfurt am Main regulated by the Bundesanstalt fuer Finanzdienstleistungsaufsicht ("BaFin"). This report is being distributed in the United States by Credit Suisse Securities (USA) LLC ; in Switzerland by Credit Suisse AG; in Canada by Credit Suisse Securities (Canada), Inc.; in Brazil by Banco de Investimentos Credit Suisse (Brasil) S.A. or its affiliates; in Mexico by Banco Credit Suisse (México), S.A. (transactions related to the securities mentioned in this report will only be effected in compliance with applicable regulation); in Japan by Credit Suisse Securities (Japan) Limited, Financial Instrument Firm, Director-General of Kanto Local Finance Bureau (Kinsho) No. 66, a member of Japan Securities Dealers Association, The Financial Futures Association of Japan, Japan Securities Investment Advisers Association, Type II Financial Instruments Firms Association; elsewhere in Asia/Pacific by whichever of the following is the appropriately authorised entity in the relevant jurisdiction: Credit Suisse (Hong Kong) Limited, Credit Suisse Equities (Australia) Limited , Credit Suisse Securities (Thailand) Limited, Credit Suisse Securities (Malaysia) Sdn Bhd, Credit Suisse AG, Singapore Branch, Credit Suisse Securities (India) Private Limited regulated by the Securities and Exchange Board of India (registration Nos. INB230970637; INF230970637; INB010970631; INF010970631), having registered address at 9th Floor, Ceejay House,Dr.A.B. Road, Worli, Mumbai - 18, India, T- +91-22 6777 3777, Credit Suisse Securities (Europe) Limited, Seoul Branch, Credit Suisse AG, Taipei Securities Branch, PT Credit Suisse Securities Indonesia, Credit Suisse Securities (Philippines ) Inc., and elsewhere in the world by the relevant authorised affiliate of the above. Research on Taiwanese securities produced by Credit Suisse AG, Taipei Securities Branch has been prepared by a registered Senior Business Person. Research provided to residents of Malaysia is authorised by the Head of Research for Credit Suisse Securities (Malaysia) Sdn. Bhd., to whom they should direct any queries on +603 2723 2020. In jurisdictions where CS is not already registered or licensed to trade in securities, transactions will only be effected in accordance with applicable securities legislation, which will vary from jurisdiction to jurisdiction and may require that the trade be made in accordance with applicable exemptions from registration or licensing requirements. Non-U.S. customers wishing to effect a transaction should contact a CS entity in their local jurisdiction unless governing law permits otherwise. U.S. customers wishing to effect a transaction should do so only by contacting a representative at Credit Suisse Securities (USA) LLC in the U.S. Please note that this report was originally prepared and issued by CS for distribution to their market professional and institutional investor customers. Recipients who are not market professional or institutional investor customers of CS should seek the advice of their independent financial advisor prior to taking any investment decision based on this report or for any necessary explanation of its contents. This research may relate to investments or services of a person outside of the UK or to other matters which are not regulated by the FSA or in respect of which the protections of the FSA for private customers and/or the UK compensation scheme may not be available, and further details as to where this may be the case are available upon request in respect of this report. Any Nielsen Media Research material contained in this report represents Nielsen Media Research's estimates and does not represent facts. NMR has neither reviewed nor approved this report and/or any of the statements made herein. If this report is being distributed by a financial institution other than Credit Suisse AG, or its affiliates, that financial institution is solely responsible for distribution. Clients of that institution should contact that institution to effect a transaction in the securities mentioned in this report or require further information. This report does not constitute investment advice by Credit Suisse to the clients of the distributing financial institution, and neither Credit Suisse AG, its affiliates, and their respective officers, directors and employees accept any liability whatsoever for any direct or consequential loss arising from their use of this report or its content. Copyright 2012 CREDIT SUISSE AG and/or its affiliates. All rights reserved.
CREDIT SUISSE SECURITIES (Europe) Limited Europe: +44 (20) 7888-8888