Astro Malaysia Holdings Bhd - Credit Suisse
46
DISCLOSURE APPENDIX CONTAINS ANALYST CERTIFICATIONS AND THE STATUS OF NON-US ANALYSTS. U.S. Disclosure: Credit Suisse does and seeks to do business with companies covered in its research reports. As a result, investors should be aware that the Firm may have a conflict of interest that could affect the objectivity of this report. Investors should consider this report as only a single factor in making their investment decision. CREDIT SUISSE SECURITIES RESEARCH & ANALYTICS BEYOND INFORMATION ™ Client-Driven Solutions, Insights, and Access 27 November 2012 Asia Pacific/Malaysia Equity Research Radio & TV Broadcasting Astro Malaysia Holdings Bhd (ASTR.KL / ASTRO MK) INITIATION A media powerhouse ■ Initiating coverage with an OUTPERFORM. Astro is the only satellite pay TV operator in Malaysia, with a subscriber base of over 3 mn. We expect Astro to grow its subscriber base as well as ARPU at the same time. We initiate coverage on Astro with an OUTPERFORM rating and a DCF-based target price of RM3.50, implying c.32% potential upside. ■ Proxy for rising Malay household income. We believe Astro is a potential beneficiary of Malaysia’s attractive demographics: a young and growing population, whereby a growing economy is driving income growth. Malay households, which account for 60% of Astro’s subscribers, have the highest income growth within the Malaysian population. Astro’s wide range of content is suited to Malaysia’s multi -lingual population, whereas free-to-air (FTA) TV has limited capacity to offer dedicated vernacular channels. ■ Growth drivers. Astro’s ARPU grew 8.5% from FY10A to FY12A. Potential ARPU drivers include high definition (30% take-up currently), personal video recorder (PVR), Super Pack and IPTV. We have baked in mid-single-digit ARPU growth for FY14-16E but if management delivers high single-digit ARPU growth, we estimate, 16% further potential upside to our target price. ■ Trading 11% below IPO price. We apply a mid-point 15% discount-to-DCF to arrive at our RM3.50 target price. Historically, Astro has traded at a 3%- 29% discount to DCF valuations—this suggests a share price range of RM2.90-4.00. Key risk factors, in our view, include content cost, satellite transponder capacity, technical/broadcast failure, competition, regulatory risks and currency. While FY13-14E EBITDA is dampened by significant costs related to a box swap, we expect profitability to rebound in FY15E when the bulk of Astro’s subscriber homes will be equipped with an HD-box. Share price performance 80 90 100 110 120 2 3 4 5 6 Oct-12 Price (LHS) Rebased Rel (RHS) The price relative chart measures performance against the FTSE BURSA MALAYSIA KLCI IDX which closed at 1614.32 on 23/11/12 On 23/11/12 the spot exchange rate was RM3.06/US$1 Performance over 1M 3M 12M Absolute (%) -7.0 — — Relative (%) -3.5 — — Financial and valuation metrics Year 1/12A 1/13E 1/14E 1/15E Revenue (RM mn) 3,888.8 4,317.5 4,701.9 5,065.7 EBITDA (RM mn) 1,414.7 1,366.3 1,467.8 1,730.1 EBIT (RM mn) 990.4 755.6 744.2 869.5 Net profit (RM mn) 624.1 420.7 415.4 489.8 EPS (CS adj.) (RM) 0.12 0.08 0.08 0.09 Change from previous EPS (%) n.a. EPS growth (%) -24.2 -32.6 -1.3 17.9 P/E (x) 22.2 32.9 33.3 28.2 Dividend yield (%) 0 1.1 2.3 2.7 EV/EBITDA (x) 12.1 11.3 10.4 8.9 P/B (x) 28.6 24.8 20.9 17.9 ROE (%) 258.5 80.8 68.1 68.3 Net debt/equity (%) 657.6 281.1 207.9 207.5 Source: Company data, Thomson Reuters, Credit Suisse estimates Rating OUTPERFORM* [V] Price (23 Nov 12, RM) 2.66 Target price (RM) 3.50¹ Upside/downside (%) 31.6 Mkt cap (RM mn) 13,827 (US$ 4,522) Enterprise value (RM mn) 15,432 Number of shares (mn) 5,198.30 Free float (%) 30.0 52-week price range 3.00 - 2.61 ADTO - 6M (US$ mn) 31.9 *Stock ratings are relative to the coverage universe in each analyst's or each team's respective sector. ¹Target price is for 12 months. [V] = Stock considered volatile (see Disclosure Appendix). Research Analysts Foong Wai Loke 60 3 2723 2082 [email protected] Regional Consumer Research Team Regional Head: Karim P. Salamatian, CFA Gabriel Chan, CFA Kevin Yin Sonia Kim Foong Wai Loke Ella Nusantoro Dian Haryokusumo Chung Hsu, CFA Arnab Mitra Chai Techakumpuch Vivian Zhao Thaniya Kevalee Isis Wong
-
Upload
khangminh22 -
Category
Documents
-
view
5 -
download
0
Transcript of Astro Malaysia Holdings Bhd - Credit Suisse

DISCLOSURE APPENDIX CONTAINS ANALYST CERTIFICATIONS AND THE STATUS OF NON-US ANALYSTS. U.S. Disclosure: Credit Suisse does and seeks to do business with companies covered in its research reports. As a result, investors should be aware that the Firm may have a conflict of interest that could affect the objectivity of this report. Investors should consider this report as only a single factor in making their investment decision.
CREDIT SUISSE SECURITIES RESEARCH & ANALYTICS BEYOND INFORMATION™
Client-Driven Solutions, Insights, and Access
27 November 2012
Asia Pacific/Malaysia
Equity Research
Radio & TV Broadcasting
Astro Malaysia Holdings Bhd
(ASTR.KL / ASTRO MK) INITIATION
A media powerhouse
■ Initiating coverage with an OUTPERFORM. Astro is the only satellite pay
TV operator in Malaysia, with a subscriber base of over 3 mn. We expect
Astro to grow its subscriber base as well as ARPU at the same time. We
initiate coverage on Astro with an OUTPERFORM rating and a DCF-based
target price of RM3.50, implying c.32% potential upside.
■ Proxy for rising Malay household income. We believe Astro is a potential
beneficiary of Malaysia’s attractive demographics: a young and growing
population, whereby a growing economy is driving income growth. Malay
households, which account for 60% of Astro’s subscribers, have the highest
income growth within the Malaysian population. Astro’s wide range of
content is suited to Malaysia’s multi-lingual population, whereas free-to-air
(FTA) TV has limited capacity to offer dedicated vernacular channels.
■ Growth drivers. Astro’s ARPU grew 8.5% from FY10A to FY12A. Potential
ARPU drivers include high definition (30% take-up currently), personal video
recorder (PVR), Super Pack and IPTV. We have baked in mid-single-digit
ARPU growth for FY14-16E but if management delivers high single-digit
ARPU growth, we estimate, 16% further potential upside to our target price.
■ Trading 11% below IPO price. We apply a mid-point 15% discount-to-DCF
to arrive at our RM3.50 target price. Historically, Astro has traded at a 3%-
29% discount to DCF valuations—this suggests a share price range of
RM2.90-4.00. Key risk factors, in our view, include content cost, satellite
transponder capacity, technical/broadcast failure, competition, regulatory
risks and currency. While FY13-14E EBITDA is dampened by significant
costs related to a box swap, we expect profitability to rebound in FY15E
when the bulk of Astro’s subscriber homes will be equipped with an HD-box.
Share price performance
80
90
100
110
120
2
3
4
5
6
Oct-12
Price (LHS) Rebased Rel (RHS)
The price relative chart measures performance against the
FTSE BURSA MALAYSIA KLCI IDX which closed at 1614.32
on 23/11/12
On 23/11/12 the spot exchange rate was RM3.06/US$1
Performance over 1M 3M 12M Absolute (%) -7.0 — — Relative (%) -3.5 — —
Financial and valuation metrics
Year 1/12A 1/13E 1/14E 1/15E Revenue (RM mn) 3,888.8 4,317.5 4,701.9 5,065.7 EBITDA (RM mn) 1,414.7 1,366.3 1,467.8 1,730.1 EBIT (RM mn) 990.4 755.6 744.2 869.5 Net profit (RM mn) 624.1 420.7 415.4 489.8 EPS (CS adj.) (RM) 0.12 0.08 0.08 0.09 Change from previous EPS (%) n.a. EPS growth (%) -24.2 -32.6 -1.3 17.9 P/E (x) 22.2 32.9 33.3 28.2 Dividend yield (%) 0 1.1 2.3 2.7 EV/EBITDA (x) 12.1 11.3 10.4 8.9 P/B (x) 28.6 24.8 20.9 17.9 ROE (%) 258.5 80.8 68.1 68.3 Net debt/equity (%) 657.6 281.1 207.9 207.5
Source: Company data, Thomson Reuters, Credit Suisse estimates
Rating OUTPERFORM* [V] Price (23 Nov 12, RM) 2.66 Target price (RM) 3.50¹ Upside/downside (%) 31.6 Mkt cap (RM mn) 13,827 (US$ 4,522) Enterprise value (RM mn) 15,432 Number of shares (mn) 5,198.30 Free float (%) 30.0 52-week price range 3.00 - 2.61 ADTO - 6M (US$ mn) 31.9
*Stock ratings are relative to the coverage universe in each
analyst's or each team's respective sector.
¹Target price is for 12 months.
[V] = Stock considered volatile (see Disclosure Appendix).
Research Analysts
Foong Wai Loke
60 3 2723 2082
Regional Consumer Research Team
Regional Head: Karim P. Salamatian, CFA
Gabriel Chan, CFA
Kevin Yin
Sonia Kim
Foong Wai Loke
Ella Nusantoro
Dian Haryokusumo
Chung Hsu, CFA
Arnab Mitra
Chai Techakumpuch
Vivian Zhao
Thaniya Kevalee
Isis Wong

27 November 2012
Astro Malaysia Holdings Bhd (ASTR.KL / ASTRO MK) 2
Focus charts Figure 1: FY12A revenue, by segment Figure 2: Monthly ARPU (USD)
TV93%
Radio5%
Others2%
0
10
20
30
40
50
60
70
80
90
100
DirecTV
Austa
r
DIS
H U
S
SK
Y N
Z
BS
kyB
Sta
rhub
Naspers
Astr
o
PC
CW
i-C
able
MN
C S
ky
KT S
kylif
e
DIS
H India
Source: Company data Source: Company data, Credit Suisse estimates
Figure 3: Astro subscriber base, by ethnic group Figure 4: Malay households have the fastest growing
incomes (%)
Malay, 28%
Malay, 60%
Chinese, 55%
Chinese, 22%
Indian, 13% Indian, 11%
Other, 4%Other, 7%
0%
10%
20%
30%
40%
50%
60%
70%
80%
90%
100%
2003 Current
Malay Chinese Indian Other
0.0%
1.0%
2.0%
3.0%
4.0%
5.0%
6.0%
7.0%
8.0%
Malay Indian Chinese
CAGR 07-09
Source: Company data Source: Economic Planning Unit
Figure 5: Global pay TV penetration rates Figure 6: Pay TV penetration trends
0%
20%
40%
60%
80%
100%
120%
140%
Kor
ea
Tai
wan
Hon
g K
ong
Indi
a
Sin
gapo
re
New
Zea
land
Mal
aysi
a
Chi
na
Aus
tral
ia
Japa
n
Vie
tnam
Tha
iland
Phi
lippi
nes
Indo
nesi
a
0%
10%
20%
30%
40%
50%
60%
70%
80%
90%
1965
1975
1981
1983
1985
1987
1989
1991
1993
1995
1997
1999
2001
2003
2005
2007
2009
2011
USA UK Australia
New Zealand Malaysia
Source: Media Partners Asia Source: Value Partners, Screen Digest, Credit Suisse estimates

27 November 2012
Astro Malaysia Holdings Bhd (ASTR.KL / ASTRO MK) 3
A media powerhouse We initiate coverage on Astro with an OUTPERFORM rating and a DCF-based target
price of RM3.50. Astro is the only DTH satellite pay TV operator in Malaysia, with a
subscriber base of over 3 mn. In addition to its leadership in pay TV, Astro is also the
leading radio operator in Malaysia, with 20 channels and a 52% share of radio advertising
expenditure (adex). While its FY13-14E EBITDA is dampened by significant costs related
to a box swap, we expect profitability to rebound in FY15 when the bulk of Astro’s
subscriber homes will be equipped with an HD-enabled box.
Proxy for rising Malay incomes
We expect Astro to grow subscribers and ARPU; it is well-positioned to tap Malaysia’s
attractive demographics: a young and growing population, whereby a growing economy is
driving income growth. The ethnic breakdown of Astro’s subscriber base is a close
reflection of Malaysia’s multi-cultural population (60% of its subscribers are Malays).
Hence, Astro is likely to be a prime beneficiary of rising income growth of the Malay
population, the highest growth for any race in Malaysia. Astro’s monthly ARPU accounts
for a tiny proportion of household incomes (1%-3%); this suggests affordability of its
services is relatively high. The company’s 3 mn-plus subscribers translate into a
household penetration rate of close to 50%, which is low compared to India’s 80% and
Singapore’s 70%; hence, there is potential for Malaysia to catch up, in our view.
Competition is limited
We believe Astro is in a strong competitive position as FTA TV is hampered by structural
issues while IPTV competitors lack scale. Print has historically dominated Malaysia’s adex
pie and this effectively serves to cap FTA TV revenues (effectively limiting its content
budgets). Astro offers 156 TV channels (of which 68 are Astro-created and branded)
compared to six channels for FTA (which are also aired on Astro’s platform) and 71 for
HyppTV (IPTV). As Astro’s subscriber base has grown and viewership has risen, pay TV
adex growth has outstripped FTA adex growth. Meanwhile, IPTV offerings by telcos are
relatively limited as FTH lacks scale (TM’s UniFi has 450,000 subscribers). We believe the
telcos are also keen to avoid margin erosion from overzealous spending on IPTV content
as they have significant dividend commitments to meet.
New growth drivers
HD, PVR, premium content and IPTV services are potential ARPU drivers for Astro in the
longer term. There’s also an opportunity for Astro to tap prepaid revenues via its NJOI
offering, which doesn’t incur any subscriber acquisition cost (the consumer pays for the set
top box and installation). Yet, NJOI could see long-term potential revenue upside if users
buy prepaid content.
Trading 11% below IPO price
We apply a mid-point 15% discount to DCF to arrive at our RM3.50 target price for Astro.
Historically, Astro has traded at a 3%-29% discount to DCF valuations, which suggests a
share price range of RM2.90-4.00 (which spells 9-50% upside from current levels). We
have baked in mid-single-digit ARPU growth for FY14-16E but if management delivers
high single-digit ARPU growth, there is 16% potential upside to our target price. In our
view, the key risk factors for Astro include content costs, satellite transponder capacity,
technical/broadcast failure, competition, regulatory risks and currency.
On the positive side, the senior management comprising CEO, COO, Chief Commercial
Officer and also the Chief Innovation Officer all bought Astro shares after the listing.
Initiating coverage on Astro
with a target price of
RM3.50, which spells 32%
potential upside from current
levels
Pay TV penetration is still
low in Malaysia, in our view
FTA TV has a limited
content budget because
Malaysia’s adex pie is
dominated by print
HD, PVR, premium content
and IPTV services are
potential ARPU drivers for
Astro
We have baked in mid-
single-digit ARPU growth for
FY14-16E but if
management delivers high
single-digit ARPU growth,
there is 16% potential
upside to our target price

27 November 2012
Astro Malaysia Holdings Bhd (ASTR.KL / ASTRO MK) 4
Astro Malaysia Holdings Bhd ASTR.KL / ASTRO MK Price (23 Nov 12): RM2.66, Rating: OUTPERFORM, Target Price: RM3.50, Analyst: Foong Wai Loke
Target price scenario
Scenario TP %Up/Dwn Assumptions Upside 3.90 46.62 5% Discount to DCF Central Case 3.50 31.58 15% Discount to DCF Downside 3.10 16.54 25% Discount to DCF
Key earnings drivers 1/12A 1/13E 1/14E 1/15E
Pay TV residential subs ('000)
3,067 3,257 3,424 3,561 Astro Household penetration (%)
47.4 49.3 51.1 52.3 Residential ARPU (RM/month)
89.0 95.0 99.0 103.0 Net adds ('000) 136.0 190.0 166.9 136.9 MAT Churn (%) 7.00 9.00 9.00 9.00
Income statement (RM mn) 1/12A 1/13E 1/14E 1/15E
Sales revenue 3,889 4,318 4,702 5,066 Cost of goods sold 2,237 2,770 3,069 3,237 SG&A — — — — Other operating exp./(inc.) 237.5 181.7 164.7 98.1 EBITDA 1,415 1,366 1,468 1,730 Depreciation & amortisation 424.3 610.7 723.6 860.6 EBIT 990.4 755.6 744.2 869.5 Net interest expense/(inc.) 126.0 165.3 161.6 183.6 Non-operating inc./(exp.) — — — — Associates/JV — — — — Recurring PBT 864.4 590.3 582.5 685.9 Exceptionals/extraordinaries — — — — Taxes 234.7 165.3 163.1 192.0 Profit after tax 629.7 425.0 419.4 493.9 Other after tax income (0.05) (0.05) (0.05) (0.05) Minority interests 5.5 4.3 4.0 4.0 Preferred dividends — — — — Reported net profit 624.1 420.7 415.4 489.8 Analyst adjustments — — — — Net profit (Credit Suisse) 624.1 420.7 415.4 489.8
Cash flow (RM mn) 1/12A 1/13E 1/14E 1/15E
EBIT 990.4 755.6 744.2 869.5 Net interest — — — — Tax paid (164.2) (165.3) (163.1) (192.0) Working capital (212.5) 336.7 362.0 241.1 Other cash & non-cash items 90.1 610.7 723.6 860.6 Operating cash flow 704 1,538 1,667 1,779 Capex (538.5) (452.0) (725.5) (745.9) Free cash flow to the firm 165 1,086 941 1,033 Disposals of fixed assets — — — — Acquisitions — — — — Divestments — — — — Associate investments — — — — Other investment/(outflows) (1,449) 86 86 73 Investing cash flow (1,988) (366) (639) (673) Equity raised — — — — Dividends paid (1,331) (147) (312) (380) Net borrowings 3,505 (500) (300) (200) Other financing cash flow (912.1) 604.1 (566.6) (587.8) Financing cash flow 1,262 (43) (1,178) (1,167) Total cash flow (22) 1,129 (151) (61) Adjustments — — — — Net change in cash (22) 1,129 (151) (61)
Balance sheet (RM mn) 1/12A 1/13E 1/14E 1/15E
Cash & cash equivalents 478 1,607 1,456 1,395 Current receivables 798.2 847.6 923.1 994.5 Inventories 13.3 22.8 25.2 26.6 Other current assets 116.3 116.3 116.3 116.3 Current assets 1,406 2,594 2,521 2,532 Property, plant & equip. 1,654 1,944 2,220 2,809 Investments 48.1 48.1 48.1 48.1 Intangibles 1,771 1,771 1,771 1,771 Other non-current assets 1,635 135 135 135 Total assets 6,514 6,491 6,694 7,295 Accounts payable 1,581 1,699 1,489 1,753 Short-term debt 43.5 43.5 43.5 43.5 Current provisions 86.5 86.5 86.5 86.5 Other current liabilities 66.2 66.2 66.2 66.2 Current liabilities 1,777 1,895 1,685 1,949 Long-term debt 3,666 3,168 2,824 2,997 Non-current provisions 323 600 1,250 1,300 Other non-current liab. 256.0 256.0 256.0 256.0 Total liabilities 6,022 5,920 6,016 6,502 Shareholders' equity 482.9 558.0 661.9 772.1 Minority interests 8.6 12.9 16.9 20.9 Total liabilities & equity 6,514 6,491 6,694 7,295
Per share data 1/12A 1/13E 1/14E 1/15E
Shares (wtd avg.) (mn) 5,198 5,198 5,198 5,198 EPS (Credit Suisse) (RM)
0.12 0.08 0.08 0.09 DPS (RM) — 0.03 0.06 0.07 BVPS (RM) 0.09 0.11 0.13 0.15 Operating CFPS (RM) 0.14 0.30 0.32 0.34
Key ratios and valuation
1/12A 1/13E 1/14E 1/15E
Growth(%) Sales revenue 6.1 11.0 8.9 7.7 EBIT (7.2) (23.7) (1.5) 16.8 Net profit (24.2) (32.6) (1.3) 17.9 EPS (24.2) (32.6) (1.3) 17.9 Margins (%) EBITDA 36.4 31.6 31.2 34.2 EBIT 25.5 17.5 15.8 17.2 Pre-tax profit 22.2 13.7 12.4 13.5 Net profit 16.0 9.7 8.8 9.7 Valuation metrics (x) P/E 22.2 32.9 33.3 28.2 P/B 28.6 24.8 20.9 17.9 Dividend yield (%) — 1.06 2.25 2.75 P/CF 19.6 9.0 8.3 7.8 EV/sales 4.39 3.57 3.24 3.05 EV/EBITDA 12.1 11.3 10.4 8.9 EV/EBIT 17.2 20.4 20.5 17.8 ROE analysis (%) ROE 258 81 68 68 ROIC 38.8 18.4 25.1 27.6 Asset turnover (x) 0.60 0.67 0.70 0.69 Interest burden (x) 0.87 0.78 0.78 0.79 Tax burden (x) 0.73 0.72 0.72 0.72 Financial leverage (x) 13.3 11.4 9.9 9.2 Credit ratios Net debt/equity (%) 658 281 208 208 Net debt/EBITDA (x) 2.28 1.17 0.96 0.95 Interest cover (x) 7.86 4.57 4.60 4.74
Source: IBES, Credit Suisse estimates

27 November 2012
Astro Malaysia Holdings Bhd (ASTR.KL / ASTRO MK) 5
Proxy for rising Malay incomes We initiate coverage on Astro with an OUTPERFORM rating and a DCF-based target
price of RM3.50. Astro is currently trading 11% below its 19 October, 2012 IPO price of
RM3.00. It is the only DTH pay TV operator in Malaysia, currently offering 156 channels
(of which 22 are HD). In addition to its leadership in pay TV, Astro is also the leading radio
operator in Malaysia, with 20 channels and 52% share of the radio advertising
expenditure.
Figure 7: FY12A revenue, by segment
TV93%
Radio5%
Others2%
Source: Company data
Figure 8: FY12A TV revenue breakdown
Subscription91%
Airtime Sales7%
Others2%
Source: Company data
Even if we were to exclude the FTA channels aired on its platform, Astro still offers a wider
range of TV channels (150) than the FTA (6) and IPTV players (64) combined.
According to Astro’s website, the most basic pack starts at RM37.95 and includes 41 basic
TV channels and 20 radio channels.

27 November 2012
Astro Malaysia Holdings Bhd (ASTR.KL / ASTRO MK) 6
Figure 9: Most popular TV content by language
Malay content Description
Maharaja Lawak Mega Comedy reality show across Malaysia, Indonesia and Singapore
Imam Muda Islamic reality show in search of the new Imam
Kilauan Emas Singing competition for senior citizens
Tanah Kubur Tales from grave-diggers
Chinese content Description
Astro Classic Golden Melody Singing competition for senior citizens
Hua Hee Everyday The first locally-produced Hokkien sitcom in Malaysia
Miss Astro Chinese International Pageant Beauty pageant, with its winner representing Malaysia to compete in the Miss Chinese International
Pageant.
My New Village Stories Documentary series of Chinese villages, cultures and heritage in Malaysia
Indian content Description
Vaanavil Super Star Singing competition
Aattam 100 Dance competition
Vagai Thigil Documentary on horror and supernatural stories in Malaysia
Viyarvai Documentary of community involved in dirty jobs such as cleaning toilets and rubbish for a living
Source: Company data
Exclusive channels include National Geographic, Disney channel, Discovery channel,
AXN, ESPN and Fox Movie Premium. Astro also offers key sporting content such as
Barclays Premier League, UEFA Champions League and FIFA World Cup.
Astro’s exclusivity for DTH transmission is due to expire in 2017 while its licence for DTH
transmission is due to expire in 2022. Given that the company has invested heavily in the
business in the past few decades, we expect it to seek a renewal of the exclusivity in due
time.
Astro operates on Ku-band DTH satellite which has the advantage of small dishes (as
opposed to much larger C-band dishes) but is susceptible to rain fade.
Astro is a multi-platform operator
Astro operates on various platforms:
■ DTH satellite,
■ IPTV, and
■ OTT (Astro-On-The-Go).
IPTV: In 2011, Astro launched Astro B.yond IPTV, delivered through fibre optics
broadband as a triple play offering, with high-speed broadband and telephony services.
This currently has an infrastructure tie-up with TIME dotCom which is in the midst of wiring
up multi-dwelling units (condominiums). On 30 August, Maxis announced that it has
entered into a JV for Astro to be its exclusive content service provider for Maxis’ IPTV on
its fibre broadband service for three years.
Astro-On-The-Go: This is an OTT online and mobile application service, offering 11 linear
TV channels and non-linear content.
Astro is part of the Ananda Krishnan group of companies, which include Maxis
(telecommunications) and Bumi Armada (oil & gas).
27 November 2012
Astro Malaysia Holdings Bhd (ASTR.KL / ASTRO MK) 7
Figure 10: Astro’s group structure
Astro Malaysia
TV Radio Content & Publishing Others
Source: Company data
Positive cash flow cycle
Astro’s subscriber acquisition strategy is supported by vendor financing. It enjoys vendor
financing ranging from 24-36 months for its set top boxes (STBs) at rates of 1%-5%. The
STB portion of the subscriber acquisition cost (SAC) is capitalised and depreciated over
three years while the remainder is expensed. We estimate that a new subscriber turns
cash flow positive for Astro within four months, assuming a new subscriber generates an
ARPU which is 25% lower than the average ARPU.
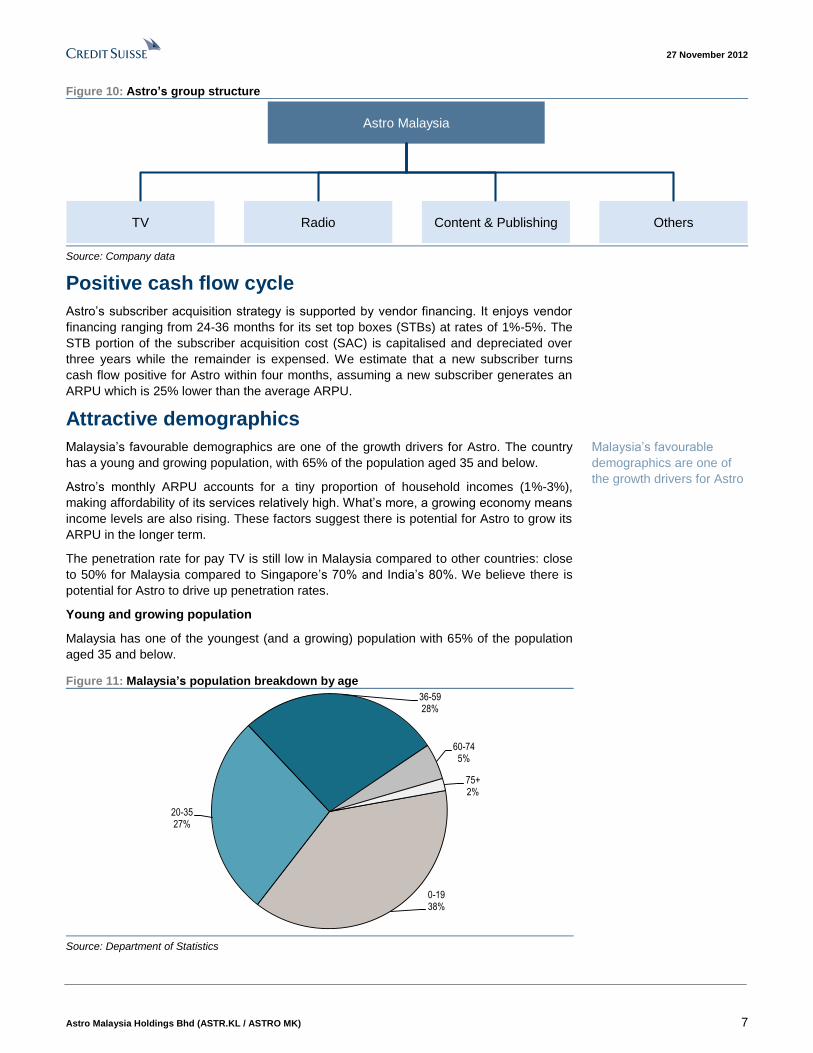
Attractive demographics
Malaysia’s favourable demographics are one of the growth drivers for Astro. The country
has a young and growing population, with 65% of the population aged 35 and below.
Astro’s monthly ARPU accounts for a tiny proportion of household incomes (1%-3%),
making affordability of its services relatively high. What’s more, a growing economy means
income levels are also rising. These factors suggest there is potential for Astro to grow its
ARPU in the longer term.
The penetration rate for pay TV is still low in Malaysia compared to other countries: close
to 50% for Malaysia compared to Singapore’s 70% and India’s 80%. We believe there is
potential for Astro to drive up penetration rates.
Young and growing population
Malaysia has one of the youngest (and a growing) population with 65% of the population
aged 35 and below.
Figure 11: Malaysia’s population breakdown by age
0-1938%
20-3527%
36-5928%
60-745%
75+2%
Source: Department of Statistics
Malaysia’s favourable
demographics are one of
the growth drivers for Astro

27 November 2012
Astro Malaysia Holdings Bhd (ASTR.KL / ASTRO MK) 8
Affordability is high and growing
Pay TV ARPU is growing, yet it accounts for a tiny proportion of household incomes. The
2Q FY13 monthly ARPU of RM92 is equivalent to 1-2 family visits to a cinema without a
meal (the cost of a cinema ticket ranges from RM12-60). Astro’s ARPU has grown as it
has added more channels and introduced premium services, such as HD, NVOD and PVR,
which indicates a willingness to pay for content.
We measured Astro’s FY12A average monthly ARPU as a proportion of average
household incomes across various parts of Malaysia. Astro’s FY12A average monthly
ARPU of RM89 accounted for less than 2.5% of household incomes in Malaysia (with the
exception of Perlis state where it accounted for 3.1% of income). Perlis accounts for 0.8%
of Malaysia’s total population).
Figure 12: Astro’s FY12A monthly ARPU as a percentage of household incomes
0.0
0.5
1.0
1.5
2.0
2.5
3.0
3.5
Joho
r
Ked
ah
Kel
anta
n
Mel
aka
N S
embi
lan
Pah
ang
Per
ak
Per
lis
Pen
ang
Sel
ango
r
Ter
engg
anu
KL
Put
raja
ya
Sab
ah
Labu
an
Sar
awak
2011 Malaysia average
Source: Company data, Economic Planning Unit, Credit Suisse estimates
Figure 13: Malaysia’s middle income population is growing
58%49%
33%
33%
36%
42%
10%15%
24%
-20%
0%
20%
40%
60%
80%
100%
1999 2002 2009
HH Annual Income < RM24,000 RM24,001-59,999 > RM60,000
Source: Department of Statistics
Pay TV ARPU is growing,
yet it accounts for a tiny
proportion of household
incomes

27 November 2012
Astro Malaysia Holdings Bhd (ASTR.KL / ASTRO MK) 9
Astro is aligned to rising Malay household incomes
Figure 14: Astro subscribers by race
Malay, 28%
Malay, 60%
Chinese, 55%
Chinese, 22%
Indian, 13% Indian, 11%
Other, 4%
Other, 7%
0%
10%
20%
30%
40%
50%
60%
70%
80%
90%
100%
2003 Current
Malay Chinese Indian Other
Source: Company data
The ethnic breakdown of Astro’s subscriber base is a close reflection of Malaysia’s multi-
racial population. Almost 60% of its subscribers are Malays. Hence, Astro is likely to be a
prime beneficiary of rising income growth of the Malay population, at 7%—the highest
growth for any ethnic group in Malaysia. Chinese and Indians account for 22% and 11% of
the company’s subscriber base, respectively.
Figure 15: Malay households have the fastest growing incomes (%)
0.0%
1.0%
2.0%
3.0%
4.0%
5.0%
6.0%
7.0%
8.0%
Malay Indian Chinese
CAGR 07-09
Source: Department of Statistics
Demographics are attractive: Malaysia has a fast-growing working population, which
suggests a positive household formation rate and this bodes well for Astro. A young
population means this trend will likely continue, in our view. In addition, the Malaysian
economy is growing: Credit Suisse expects 4.7%-4.8% GDP growth for 2012E-13E and
this is likely to translate into rising incomes. Average household incomes for Malaysia
grew at a CAGR of 5.4% over 2007-09.
Almost 60% of Astro’s
subscribers are Malays
27 November 2012
Astro Malaysia Holdings Bhd (ASTR.KL / ASTRO MK) 10
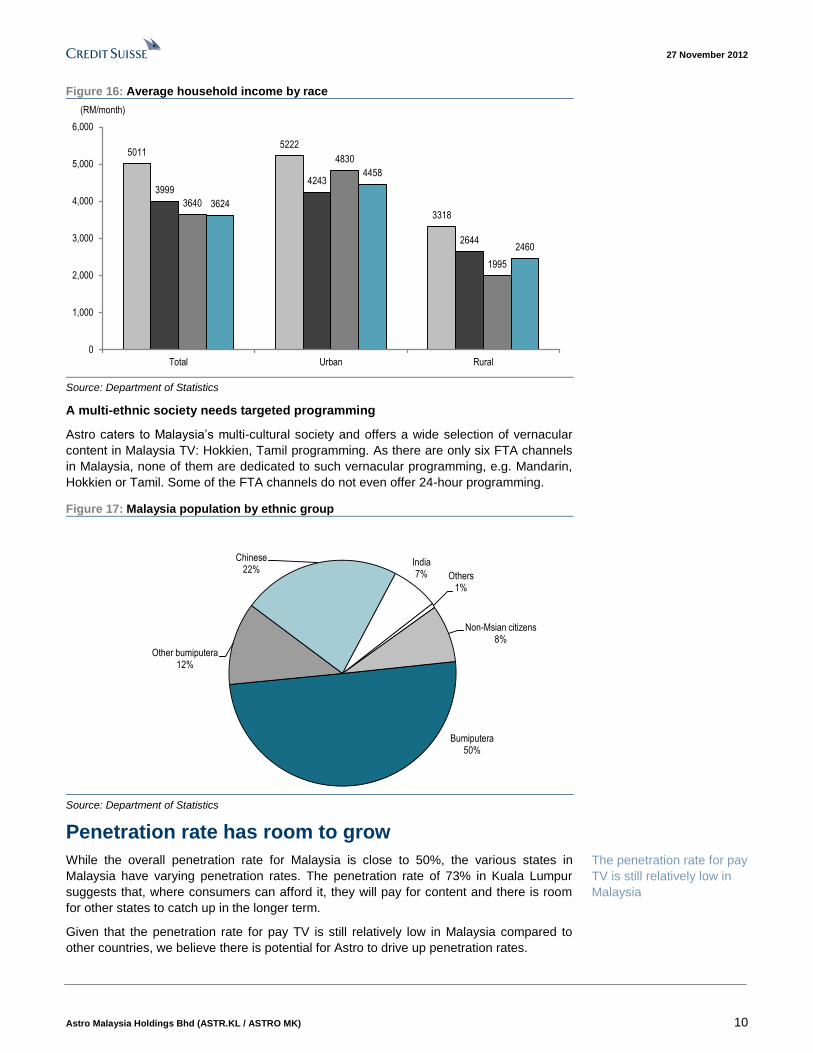
Figure 16: Average household income by race
50115222
3318
39994243
2644
3640
4830
1995
3624
4458
2460
0
1,000
2,000
3,000
4,000
5,000
6,000
Total Urban Rural
(RM/month)
Source: Department of Statistics
A multi-ethnic society needs targeted programming
Astro caters to Malaysia’s multi-cultural society and offers a wide selection of vernacular
content in Malaysia TV: Hokkien, Tamil programming. As there are only six FTA channels
in Malaysia, none of them are dedicated to such vernacular programming, e.g. Mandarin,
Hokkien or Tamil. Some of the FTA channels do not even offer 24-hour programming.
Figure 17: Malaysia population by ethnic group
Bumiputera50%
Other bumiputera12%
Chinese22%
India7% Others
1%
Non-Msian citizens8%
Source: Department of Statistics
Penetration rate has room to grow
While the overall penetration rate for Malaysia is close to 50%, the various states in
Malaysia have varying penetration rates. The penetration rate of 73% in Kuala Lumpur
suggests that, where consumers can afford it, they will pay for content and there is room
for other states to catch up in the longer term.
Given that the penetration rate for pay TV is still relatively low in Malaysia compared to
other countries, we believe there is potential for Astro to drive up penetration rates.
The penetration rate for pay
TV is still relatively low in
Malaysia

27 November 2012
Astro Malaysia Holdings Bhd (ASTR.KL / ASTRO MK) 11
Figure 18: Global pay TV penetration rates
0%
20%
40%
60%
80%
100%
120%
140%K
orea
Tai
wan
Hon
g K
ong
Indi
a
Sin
gapo
re
New
Zea
land
Mal
aysi
a
Chi
na
Aus
tral
ia
Japa
n
Vie
tnam
Tha
iland
Phi
lippi
nes
Indo
nesi
a
Source: Media Partners Asia
ARPU still low versus other markets
Astro’s ARPU of RM91 as of 1Q FY13A is still relatively low versus other markets and has
potential to grow, in our view.
Figure 19: Monthly ARPU (US$)
0
10
20
30
40
50
60
70
80
90
100
Dire
cTV
Aust
ar
DIS
H U
S
SK
Y N
Z
BS
kyB
Sta
rhub
Nas
pers
Ast
ro
PC
CW
i-C
able
MN
C S
ky
KT S
kyl
ife
DIS
H India
(US$/month)
Source: Company data, Credit Suisse estimates
Rising urbanisation
Urbanisation is on the rise in Malaysia, which points to rising income levels and hence,
greater potential to spend on leisure and entertainment.

27 November 2012
Astro Malaysia Holdings Bhd (ASTR.KL / ASTRO MK) 12
Figure 20: Rising urbanisation in Malaysia
0.0%
10.0%
20.0%
30.0%
40.0%
50.0%
60.0%
70.0%
80.0%
90.0%
0
5,000
10,000
15,000
20,000
25,000
30,000
1950 1955 1960 1965 1970 1975 1980 1985 1990 1995 2000 2005 2010 2015 2020
Rural population (thousands) Urban population (thousands) Percentage urban (%)
Urban (%)('000)
Source: United Nations
Piracy is not a problem
Pay TV piracy in Malaysia is very low compared to other countries. Piracy is estimated to
be 2% in the country compared to 23% in India, 61% in Thailand and 69% in Indonesia.
Figure 21: Piracy rates across Asia (illegal connections as a percentage of total)
68.9%
60.8%
33.7%30.4%
23.2%
10.1%
1.8% 1.1% 1.1% 0.8%
0%
10%
20%
30%
40%
50%
60%
70%
80%
Indonesia Thailand Vietnam Philippines India Taiwan Malaysia Australia Hong Kong Singapore
Source: Value Partners
In our view, Astro is likely to enjoy economies of scale benefits from its large subscriber
base which exceeds 3 mn (similar in absolute size to the postpaid subscriber base of top
cellular operator, Maxis). We believe this large subscriber base likely gives Astro better
negotiating power when purchasing content, STBs, etc.

27 November 2012
Astro Malaysia Holdings Bhd (ASTR.KL / ASTRO MK) 13
Competition is limited FTA TV is hampered by structural issues. Print has historically dominated Malaysia’s adex
pie and this effectively serves to cap FTA revenues. Astro currently offers 156 TV
channels compared to six channels for FTA (which are also aired on Astro’s platform) and
71 for HyppTV (IPTV). As Astro’s subscriber base has grown and viewership has risen,
pay TV adex growth has outstripped FTA adex growth. Meanwhile, IPTV offerings by
telcos are relatively limited as FTH (fibre-to-home) lacks scale. Fixed line incumbent, TM
(Telekom Malaysia), has 450,000-plus HSBB subscribers currently, whereby coverage is
limited to 1.3 mn premises unlike DTH coverage which is likely to be close to 100%.
Telcos are also keen to avoid margin erosion from overzealous spending on IPTV content
as they have significant dividend commitments to meet.
Structural issues
FTA is hampered by structural issues; Malaysia’s adex pie has historically been dominated
by print media. In recent years, pay TV has been eroding the market share of FTA. The
FTA offering is limited compared to Astro’s range of channels. Astro’s content is superior
to FTA, which has a limited purchasing power for content because Malaysia’s adex pie is
unusually dominated by print (50% market share). Within TV adex, pay TV is gaining
share at the expense of FTA. With only six FTA channels, we believe it is difficult for FTA
to fully cater to Malaysia’s multi-lingual population (there are no dedicated vernacular FTA
channels). MediaPrima’s TV revenues were just short of RM700 mn (primarily driven by
advertising) in 2011 versus RM3.6 bn (primarily driven by subscription fees) for Astro in
FYJan12.
Figure 22: Pay TV adex market share has been growing at the expense of FTA TV adex
0
5
10
15
20
25
30
35
2010 2011 9M12
Pay TV FTA TV
Source: Nielsen Media Research
According to Nielsen, pay TV adex grew 12.8% YoY in 2011 and 14% YoY in 9M12
whereas FTA TV adex fell 7% YoY in 2011 and 0.3% in 9M12. The market share for pay
TV adex has risen from 20.3% in 2010 to 24.3% in 9M12 whereas FTA TV’s adex market
share has fallen from 30.1% in 2010 to 27.6% in 9M12, according to Nielsen.
Print has historically
dominated Malaysia’s adex
pie and this effectively
serves to cap FTA revenues

27 November 2012
Astro Malaysia Holdings Bhd (ASTR.KL / ASTRO MK) 14
Other IPTV players lack scale
In the IPTV space, Astro presently has an infrastructure tie-up with TIME dotCom which is
in the process of wiring up multi-dwelling units (condominiums). We believe IPTV offers an
advantage over DTH satellite, e.g., rain fade doesn’t occur for IPTV whereas Ku-band
satellite signals are vulnerable to rain fade.
Maxis announced a much-awaited content tie-up with Astro on 30 August 2012. The ten-
year partnership makes Astro the exclusive content service provider to Maxis’s fibre
broadband service for three years. Maxis and Astro will jointly co-market the service via
their respective distribution channels. We believe this combined offering will be the best
IPTV offering in the market, exceeding TM’s HyppTV in terms of content breadth (number
of channels) while surpassing the Astro-TIME dotCom’s IPTV offering in terms of coverage
(Astro-Maxis’ current coverage will be 1.3 mn compared to 100,000 premises for Astro-
TIME dotCom). In comparison, TM’s UniFi service offers 71 TV channels (including FTA
and VOD channels but excluding interactive channels) and coverage of 1.3 mn premises.
Within the IPTV segment, Astro’s key competitor is HyppTV (owned by Telekom Malaysia),
where the basic channels are built into TM’s HSBB (fibre-to-home) service called UniFi.
UniFi currently has 450,000-plus subscribers (compared to Astro’s 3+mn subscriber base)
but coverage for TM’s HSBB is limited to 1.3 mn premises currently, unlike DTH coverage
which is likely to be close to 100% of Malaysia’s 6.7 mn households. According to TM,
about 20% of its UniFi subscribers subscribe for premium content. TM’s smaller subscriber
base doesn’t warrant significant content spend (we estimate <1% of its revenues) unlike
Astro’s content spend which amounts to 32%-35% of its TV segment revenues each year.
Maxis and Astro plan to roll out IPTV packages in the first quarter of 2013. We believe the
Astro-Maxis IPTV offering could be a credible threat to TM’s HSBB service, particularly
given that a rising proportion of UniFi subscribers will see their contracts mature in 2013.
Maxis currently offers similar coverage of 1.3 mn premises (as the bulk of its fibre
broadband services utilise TM’s HSBB pipe) which is significantly more than TIME
dotCom’s agreement with Astro (100,000 households covered currently).
Are the telcos a long-term threat?
We evaluate the possibility of the telcos becoming more aggressive in their IPTV offerings
but conclude that this is not likely in the next one-two years. The telcos have significant
dividend commitments; hence, we believe cash flow generation is of primary importance
and this could limit their budget for content. Also, relative to Astro’s 100% population
coverage for satellite transmission, TM’s HSBB coverage is relatively limited, at 1.3 mn
premises (for which there are 450,000+ subscribers currently) and about 20% of TM’s
HSBB subscribers pay for premium content currently. Hence, the economics may not
justify TM getting into a full blown war on content with Astro. Given TM’s relatively smaller
base of HSBB subscribers, we believe it may have to incur premium pricing on content,
which suggests significant ‘cash burn’ will become necessary if TM becomes more
ambitious in IPTV.
HyppTV (owned by Telekom Malaysia)
TM’s HyppTV currently offers 71 channels, including premium content costing
RM30/month for 30 channels. HyppTV is bundled together with TM’s HSBB service, UniFi.
Maxis announced a much-
awaited content tie-up with
Astro on 30 August 2012 for
IPTV

27 November 2012
Astro Malaysia Holdings Bhd (ASTR.KL / ASTRO MK) 15
Figure 23: HyppTV platinum pack channels (premium content)
News Kids
Aljazeera Nick Jr
Capital TV Cbeebies
Local & Asian selection Baby First
Star Chinese movies 2 Entertainment
Star Chinese channel Warner TV
TVB8 Universal channel HD
tvN HD Syfy HD
UTV Movies Fox Crime HD
Screen Red Lifestyle
Emas BBC Lifestyle
UTV Bindass Trace sports HD
Jayamax Channel V
MNC International Fashion tv
SETI i-concerts HD
Educational Nat Geo Music
BBC Knowledge MTV Live HD
Nat Geo Adventure MUTV
Source: Company data
Comparing Astro-TIME dotCom IPTV with UniFi:
■ Astro offers a greater range of channels.
■ UniFi has superior coverage currently, of 1.3 mn premises.
■ Astro’s IPTV tie-up with TIME dotCom currently covers 100,000 premises in major
Malaysian cities.
Comparing Astro-TIME dotCom IPTV with Astro DTH:
■ Unlike Astro’s DTH services, Astro IPTV is not susceptible to rain fade.
■ Astro IPTV allows users more interactive options such as VOD (video on demand).
■ Pricing for Astro IPTV is similar to the DTH service (stripping out the broadband cost)
but the Super Packs are slightly cheaper on the IPTV platform.
27 November 2012
Astro Malaysia Holdings Bhd (ASTR.KL / ASTRO MK) 16
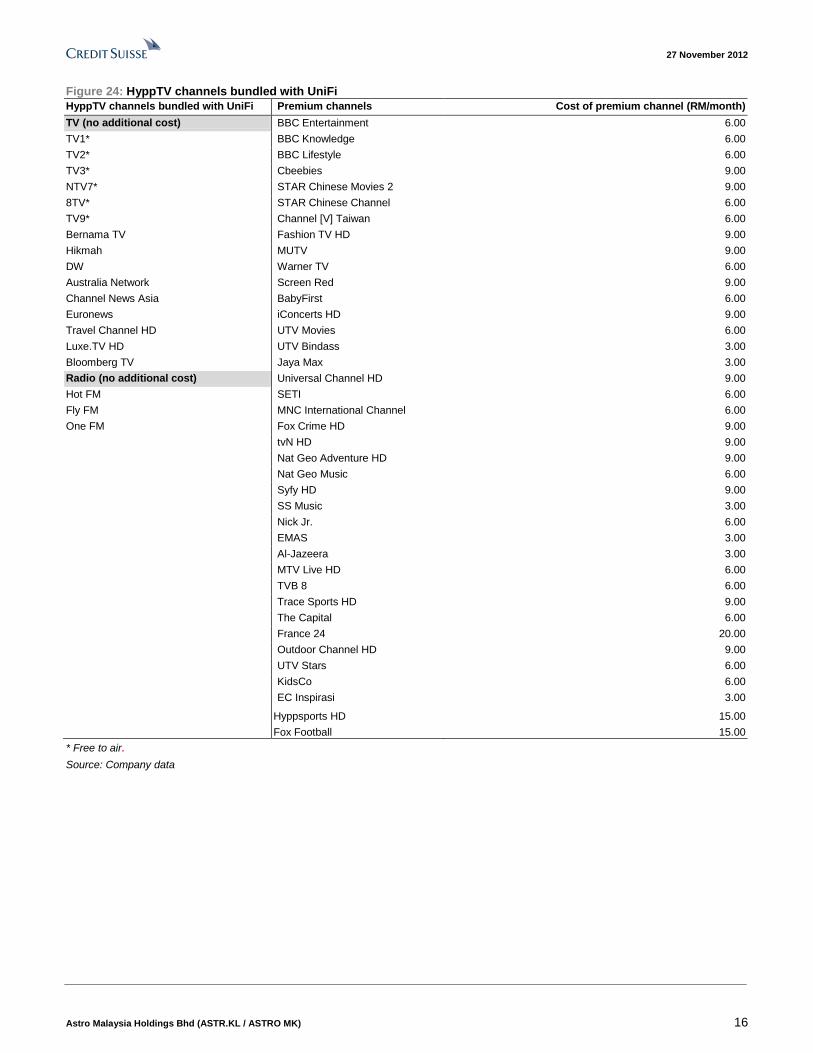
Figure 24: HyppTV channels bundled with UniFi
HyppTV channels bundled with UniFi Premium channels Cost of premium channel (RM/month)
TV (no additional cost) BBC Entertainment 6.00
TV1* BBC Knowledge 6.00
TV2* BBC Lifestyle 6.00
TV3* Cbeebies 9.00
NTV7* STAR Chinese Movies 2 9.00
8TV* STAR Chinese Channel 6.00
TV9* Channel [V] Taiwan 6.00
Bernama TV Fashion TV HD 9.00
Hikmah MUTV 9.00
DW Warner TV 6.00
Australia Network Screen Red 9.00
Channel News Asia BabyFirst 6.00
Euronews iConcerts HD 9.00
Travel Channel HD UTV Movies 6.00
Luxe.TV HD UTV Bindass 3.00
Bloomberg TV Jaya Max 3.00
Radio (no additional cost) Universal Channel HD 9.00
Hot FM SETI 6.00
Fly FM MNC International Channel 6.00
One FM Fox Crime HD 9.00
tvN HD 9.00
Nat Geo Adventure HD 9.00
Nat Geo Music 6.00
Syfy HD 9.00
SS Music 3.00
Nick Jr. 6.00
EMAS 3.00
Al-Jazeera 3.00
MTV Live HD 6.00
TVB 8 6.00
Trace Sports HD 9.00
The Capital 6.00
France 24 20.00
Outdoor Channel HD 9.00
UTV Stars 6.00
KidsCo 6.00
EC Inspirasi 3.00
Hyppsports HD 15.00
Fox Football 15.00
* Free to air.
Source: Company data
27 N
ov
em
ber 2
012
Astro
Mala
ysia
Ho
ldin
gs B
hd
(AS
TR
.KL
/ AS
TR
O M
K)
17
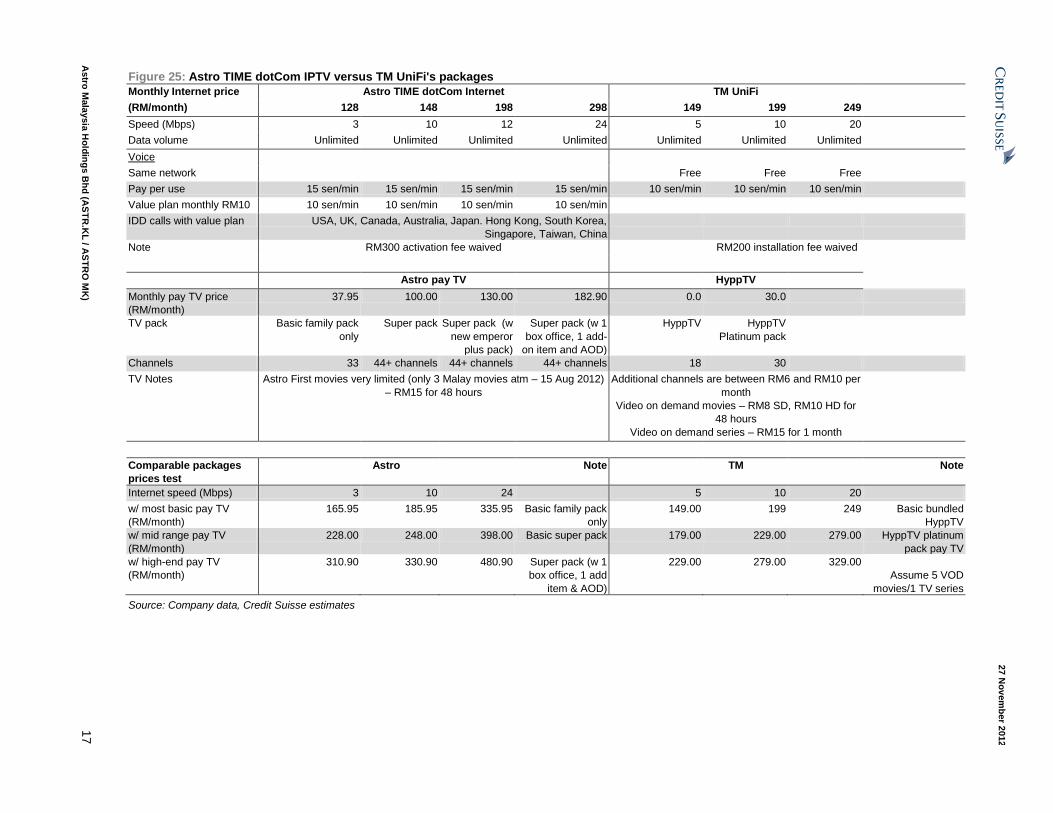
Figure 25: Astro TIME dotCom IPTV versus TM UniFi's packages
Monthly Internet price Astro TIME dotCom Internet TM UniFi
(RM/month) 128 148 198 298 149 199 249
Speed (Mbps) 3 10 12 24 5 10 20
Data volume Unlimited Unlimited Unlimited Unlimited Unlimited Unlimited Unlimited
Voice
Same network Free Free Free
Pay per use 15 sen/min 15 sen/min 15 sen/min 15 sen/min 10 sen/min 10 sen/min 10 sen/min
Value plan monthly RM10 10 sen/min 10 sen/min 10 sen/min 10 sen/min
IDD calls with value plan USA, UK, Canada, Australia, Japan. Hong Kong, South Korea,
Singapore, Taiwan, China
Note RM300 activation fee waived RM200 installation fee waived
Astro pay TV HyppTV
Monthly pay TV price
(RM/month)
37.95 100.00 130.00 182.90 0.0 30.0
TV pack Basic family pack
only
Super pack Super pack (w
new emperor
plus pack)
Super pack (w 1
box office, 1 add-
on item and AOD)
HyppTV HyppTV
Platinum pack
Channels 33 44+ channels 44+ channels 44+ channels 18 30
TV Notes Astro First movies very limited (only 3 Malay movies atm – 15 Aug 2012)
– RM15 for 48 hours
Additional channels are between RM6 and RM10 per
month
Video on demand movies – RM8 SD, RM10 HD for
48 hours
Video on demand series – RM15 for 1 month
Comparable packages
prices test
Astro Note TM Note
Internet speed (Mbps) 3 10 24 5 10 20
w/ most basic pay TV
(RM/month)
165.95 185.95 335.95 Basic family pack
only
149.00 199 249 Basic bundled
HyppTV
w/ mid range pay TV
(RM/month)
228.00 248.00 398.00 Basic super pack 179.00 229.00 279.00 HyppTV platinum
pack pay TV
w/ high-end pay TV
(RM/month)
310.90 330.90 480.90 Super pack (w 1
box office, 1 add
item & AOD)
229.00 279.00 329.00
Assume 5 VOD
movies/1 TV series
Source: Company data, Credit Suisse estimates
27 November 2012
Astro Malaysia Holdings Bhd (ASTR.KL / ASTRO MK) 18
Maxis (sister company to Astro)
Maxis is in the midst of ramping up its home fibre broadband division, while some of the
fibre is the company’s own, the bulk of its home fibre service rides off TM’s HSBB network.
On 30 August, Maxis announced that has entered into a JV for Astro to be its exclusive
content service provider for Maxis’s IPTV on its fibre broadband service for three years.
OTT: Astro-On-The-Go
Astro attempts to address the threat of OTT via Astro-On-The-Go, an authenticated
service accessible via smartphones, PCs and tablets.
Although OTT remains a long-term competitor for consumers’ attention, we believe it is not
likely to be a major issue for Astro for at least several more years because the majority of
the population doesn’t have HSBB (there are only 450,000-plus HSBB subscribers
currently). HSBB coverage is still limited to selected major urban areas whereby total
premises covered amounts to 1.3 mn (whereas total households amount to 6.7 mn). From
2013, TM is no longer bound to any coverage target by the government and the company
says that rollout will be determined by market demand.
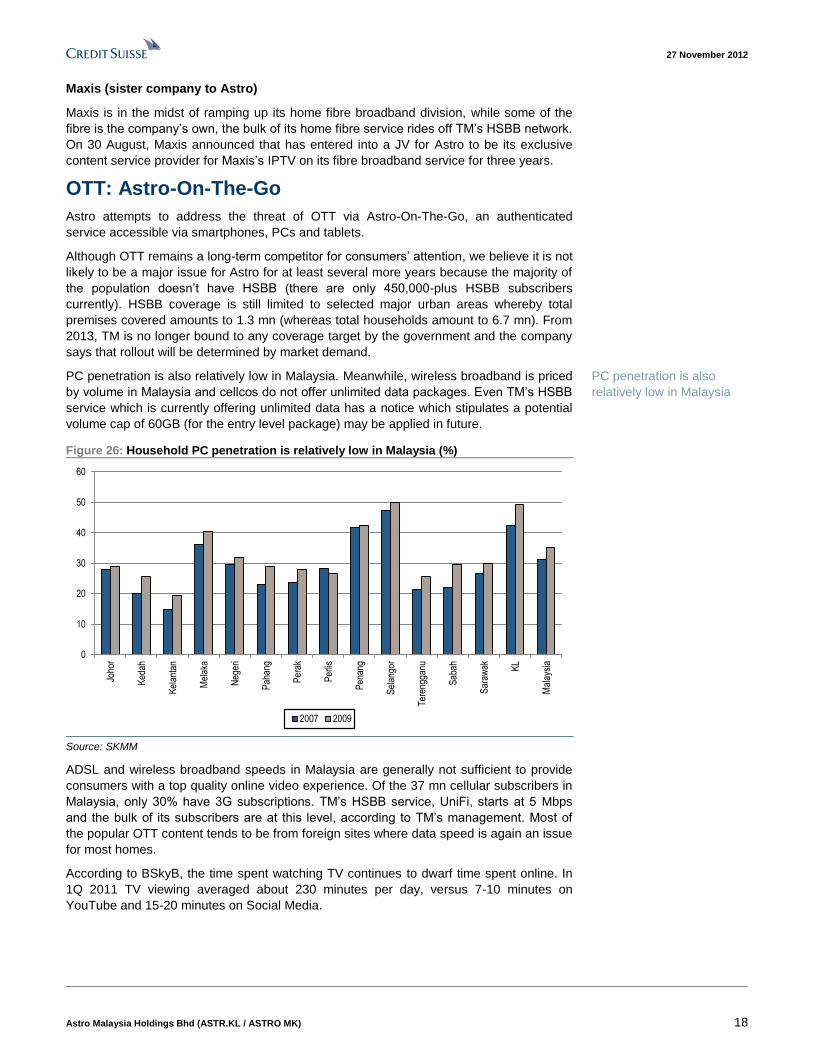
PC penetration is also relatively low in Malaysia. Meanwhile, wireless broadband is priced
by volume in Malaysia and cellcos do not offer unlimited data packages. Even TM’s HSBB
service which is currently offering unlimited data has a notice which stipulates a potential
volume cap of 60GB (for the entry level package) may be applied in future.
Figure 26: Household PC penetration is relatively low in Malaysia (%)
0
10
20
30
40
50
60
Joho
r
Ked
ah
Kel
anta
n
Mel
aka
Neg
eri
Pah
ang
Per
ak
Per
lis
Pen
ang
Sel
ango
r
Ter
engg
anu
Sab
ah
Sar
awak KL
Mal
aysi
a
2007 2009
Source: SKMM
ADSL and wireless broadband speeds in Malaysia are generally not sufficient to provide
consumers with a top quality online video experience. Of the 37 mn cellular subscribers in
Malaysia, only 30% have 3G subscriptions. TM’s HSBB service, UniFi, starts at 5 Mbps
and the bulk of its subscribers are at this level, according to TM’s management. Most of
the popular OTT content tends to be from foreign sites where data speed is again an issue
for most homes.
According to BSkyB, the time spent watching TV continues to dwarf time spent online. In
1Q 2011 TV viewing averaged about 230 minutes per day, versus 7-10 minutes on
YouTube and 15-20 minutes on Social Media.
PC penetration is also
relatively low in Malaysia

27 November 2012
Astro Malaysia Holdings Bhd (ASTR.KL / ASTRO MK) 19
Figure 27: Live TV is as important as ever
Note: Trademarked icons used.
Source: BSkyB, BARB TechEdge, ComScore, Sky Media research
Live TV still represents 85% of total viewing, according to BSkyB’s research of viewing in
BSkyB homes. BSkyB argued that investors should not underestimate how important
viewing of live TV still is in the UK.
Figure 28: On-The-Go services
Channels Selection of 11 linear TV channels across kids, news and entertainment
Live sports Selection of live sport matches and signature events or programmes
Pay per view Offering movies on demand and Astro First content
Catch up “Catch-up” and SVOD services for previously aired signature programmes
Note: 11 linear channels include: Astro AEC, Astro Awani, Astro Ria plus, Astro Shung Xing, Astro Warna,
Astro Xiao Tai Yang, CNN, Disney Channel, Disney Junior, One HD, Astro TVIQ.
Source: Company data
Low churn reflects weak competition
Astro has sustained a relatively low churn rate of 7%-11% for the past three years. The 1Q
FY13 churn rate stood at 8%. We believe Astro’s relatively low churn rate may be
attributable to strong affordability (monthly ARPU is just 1%-3% of household incomes)
and its content portfolio.
Astro has sustained a
relatively low churn rate of
7-11% for the past three
years

27 November 2012
Astro Malaysia Holdings Bhd (ASTR.KL / ASTRO MK) 20
New growth drivers We believe a rising take-up of HD, PVR, premium content and IPTV services bodes well
for Astro. In developed markets, we have seen HD take-up rates of 40%-57% (e.g., 43%
for BSkyB, 40% for DISH, 57% for DirecTV, etc). There’s also an opportunity for Astro to
tap prepaid revenues via its NJOI offering, which does not incur any subscriber acquisition
cost (consumer pays for STB and installation), yet could see potential upside if users buy
prepaid content.
Long-term drivers
We believe a rising take up of HD, PVR, premium content and IPTV services could bode
well for Astro.
HD migration
Having launched HD in 2010, Astro is in the midst of migrating its subscriber base over to
the HD-enabled B.Yond box and plans to have the bulk of its subscriber base fully
converted by FYJan2014. Thereafter, we expect the company to encourage these
subscribers to take up HD services, which entail an extra RM20 a month (a potential 21%
uplift to the current ARPU of RM91). Even though only 1.4 mn Astro subscribers have an
HD-enabled B.Yond box, Astro’s HD take-up rate currently stands at 30%, which is
equivalent to a 66% take-up rate if measured as a proportion of households with a B.Yond
box. This suggests it should see its take-up rate rise beyond 30% once the migration is
completed for its entire 3.1 mn subscriber base.
Figure 29: Astro’s HD channels
Basic HD Movies Variety Learning Sports Local / vernacular / others News
One Fox Premium Star World Discovery World Astro Supersport Astro Zhi Zun (Chinese) Sky News HD
Be HBO Disney XD National Geographic Astro Supersport 2 Astro Mustika
AXN Sundance History ESPN Astro First
FX Astro 'Signature'
KIX
Celestial
Food Network Asia
Life Inspired
Source: Company data
Russia’s largest satellite TV operator, Tricolor just launched HD services in July 2012 and
expects its ARPU to rise from R629 in 2011 to R1,200 next year. Austar in Australia which
launched PVR and HD in 2008-09 saw a 12% increase in ARPU in two years. HD is also
one of the key ARPU drivers for BSkyB in the UK.
We believe a rising take-up
of HD, PVR, premium
content and IPTV services
bodes well for Astro

27 November 2012
Astro Malaysia Holdings Bhd (ASTR.KL / ASTRO MK) 21
Figure 30: HD is a major ARPU growth driver for BSkyB (£)
25
27
29
31
33
35
37
39
41
43
2004 2005 2006 2007 2008 2009 2010 2011 2012E 2013E 2014E
Par TV ARPU excl HD HD ARPU
Source: Company data, Credit Suisse estimates
PVR
PVR allows for time-shifted viewing. PVR currently costs an additional RM10 a month for
Astro subscribers. Its Beyond PVR box is being rolled out across its subscriber base. In
the UK, we expect TiVo subscribers to make up a growing proportion of VMED’s total
subscribers, rising above 50% in 2015E.
Figure 31: TiVo accounts for a growing proportion of VMED’s TV customer base
1.3%4.3%
11.6%
17.9%
23.3%
27.3%29.9%
38.9%
46.1%
53.3%
60.5%
0%
10%
20%
30%
40%
50%
60%
70%
2Q11 3Q11 4Q11 1Q12 2Q12E 3Q12E 4Q12E 2013E 2014E 2015E 2016E
Source: Company data, Credit Suisse estimates
Premium packages
Astro also offers premium packages such as Super Pack. There are currently four Super
Packs available, targeting a different customer segment. Super Pack ARPUs are relatively
high, ranging from RM125 to RM255.
In the UK, TiVo subscribers
are projected to make up a
growing proportion of
VMED’s total subscribers,
rising above 50% in 2015E

27 November 2012
Astro Malaysia Holdings Bhd (ASTR.KL / ASTRO MK) 22
Figure 32: Astro Super Packs
Package Super Pack 1 Super Pack 2 Super Pack 3 Super Pack 4
Price (RM/month) 125 125 255 125
1 Basic Family package Basic Family package Basic Family package Basic Family package
2 Any 3 mini packages Any 3 mini packages Any 3 mini packages Any 3 mini packages
News News News News
Learning Learning Learning Learning
Variety Variety Variety Variety
Kids Kids Kids Kids
3 Prime Packages Prime Packages Prime Packages Prime Packages
Movies Movies Movies Movies
Sports Sports Sports Sports
Dynasty
4 Plus Package Plus Package Plus Package Plus Package
Mustika Maharaja New Emperor Metro
Celestial Movies
5 Astro box office Astro box office Astro box office Astro box office
Tayangan Hebat Thangathirai On Demand Dragon pack
6 HD service HD service HD service HD service
PVR PVR PVR PVR
Source: Company data
NJOI: A prepaid opportunity
Astro has a new pay TV business segment, NJOI, which incurs zero subscriber acquisition
cost, yet, offers long-term upside from prepaid content. While we have only modelled for
minor contributions from NJOI initially, a dominant prepaid telecommunications market
suggests it could become a major growth driver in the longer term. NJOI was launched in
February 2012.
Astro utilises basic set top boxes for the NJOI service. Subscribers pay for the box and
installation fees. In return, Astro provides 37 free TV and radio channels. The upside for
Astro lies with additional prepaid content which users may purchase.
Figure 33: NJOI channels
Entertainment Music Educational News
Astro Prima Tvi Astro Tutor TV SPM Astro Awani
Astro Oasis Astro Tutor TV UPSR CCTV4
Makkal TV Astro Tutor TV PMR Bernama TV
Jia Yu
TV1*
TV2*
Astro Vaanavil
i130
iView
Astro AEC
Source: Company data

27 November 2012
Astro Malaysia Holdings Bhd (ASTR.KL / ASTRO MK) 23
Figure 34: NJOI radio channels
Astro Radio's commercial stations Direct-to-user (DTU) radio stations
ERA India Beat
Sinar FM Golden Oldies
THR.fm Raaga Jazz
THR.fm Gegar Opus
MY FM Rock
Hitz.fm Melody
Mix FM Osai
Lite FM Bayu
XFM(3) Kenyalang
Musiq'a
Source: Company data
There are also some 50,000 NJOI set top boxes, provided free to lower-income
households via the government’s E-kasih programme. We believe NJOI will enable Astro
to widen its penetration of rural households and at the same time, limit the potential
downside risk via a prepaid model.
Experience in Russia: Tricolor
Tricolor (National Satellite Company, JSC) is Russia’s largest satellite TV operator with a
subscriber base in excess of 10 mn households (as of March 2012) of which 7.7 mn are
paying subscribers.
Tricolor began its services in 2005 with a package of 15 free Russian and regional
channels, where hardware was the only cost to subscribers. Subsequently, it launched 12
new pay channels in May 2007 via low-cost packages, by which time, its subscriber base
had reached 800,000. Tricolor has since expanded its portfolio: it currently offers 100
channels for an annual fee of R600 (equivalent to €15).
Pay TV: Malaysia versus global markets
Figure 35: Pay TV market dynamics
Malaysia UK US India
Penetration Low High High High
ARPU Low High High Very low
Competition Low High High High
Threat from IPTV & OTT Low Medium-high High Low
Source: Credit Suisse estimates
We believe the growth prospects for Astro are supported by positive market dynamics and
favourable demographics. In contrast, pay TV operators in developed markets are faced
with mature industry conditions (high penetration and slowing basic ARPU growth),
competition from IPTV and OTT, in our view. Within Asia, India is another market which
has a low penetration rate for pay TV and attractive demographics but competition is
strong and ARPU is very low (US$3).

27 November 2012
Astro Malaysia Holdings Bhd (ASTR.KL / ASTRO MK) 24
Figure 36: Global pay TV—competitive landscape by country
Country No. of operators Pay TV operators
UK 6 BSkyB, Youview, VirginMed, BT, Top up TV, Smallworld Cable
USA >5 Cable: Time Warner, Comcast, Cox communications, Charter communications, Cablevision; Satellite: DISH, DTV
South Korea >5 C&M co, KT Skylife, Tbroad Hanvit, Hyundai HCN, SK Broadband, LG Dacom, Hanaro Telecom
New Zealand 2 Sky Network, Telstra clear (most content offered on behalf of Sky)
India >10 APTV network, Shri Balaji cable, Hathway, Asianet, Dish TV, JAK communications, Barasat Cable TV
Singapore 3 Starhub, Singtel, M1
South Africa 5 Multichoice, Telkom Media, E-Sat, On Digital Media, Walking on Water
Hong Kong 2 PCCW, i-cable
Australia 3 Telstra, Foxtel, Yes Optus
Source: Company data.
Figure 37: Global pay TV penetration rates
0%
10%
20%
30%
40%
50%
60%
70%
80%
90%
1965
1970
1975
1980
1981
1982
1983
1984
1985
1986
1987
1988
1989
1990
1991
1992
1993
1994
1995
1996
1997
1998
1999
2000
2001
2002
2003
2004
2005
2006
2007
2008
2009
2010
2011
USA UK Australia New Zealand Malaysia
Source: Value Partners, Screen Digest, Credit Suisse estimates.
Pay TV penetration in the US reached about 84% in 4Q09/1Q10 and has been falling
since, causing major operators like DirecTV to focus on customer retention as opposed to
new customer acquisition.
Figure 38: Multi-channel video penetration of US households
79.5%
80.4%
81.0%
81.9%
82.5% 82.5%
83.5%
83.2%
82.4%82.5%
79.0%
79.5%
80.0%
80.5%
81.0%
81.5%
82.0%
82.5%
83.0%
83.5%
84.0%
2003 2004 2005 2006 2007 2008 2009 2010 2011 1Q12 HH data include occasional use, URE (usual residence elsewhere), and seasonal housing units.
Source: Company data, SNL Kagan, Credit Suisse estimates

27 November 2012
Astro Malaysia Holdings Bhd (ASTR.KL / ASTRO MK) 25
BSkyB in the UK has been facing more competition from the telcos, which are offering
triple-play services. Notably, BT will spend £700 mn for some Premier League matches in
the next season for its IPTV service, BT Vision. Meanwhile, TalkTalk has launched
YouView whose pricing is in between BSkyB (premium) and Freeview (no charge but no
interactive services offered).
Figure 39: BSkyB—net additions are running at substantially lower levels than historical
experience
0
50,000
100,000
150,000
200,000
250,000
300,000
Q1
2002
Q3
2002
Q1
2003
Q3
2003
Q1
2004
Q3
2004
Q1
2005
Q3
2005
Q1
2006
Q3
2006
Q1
2007
Q3
2007
Q1
2008
Q3
2008
Q1
2009
Q3
2009
Q1
2010
Q3
2010
Q1
2011
Q3
2011
Q1
2012
Q3
2012
net adds (subscribers)
Source: Company data.
The Malaysian economy is fine
Unlike its peers in developed markets, Astro is not grappling with weak economic
conditions. The Malaysian economy is growing and unemployment is low, resulting in
favourable indicators, e.g., consumer sentiment is robust and retail sales are growing.
Figure 40: Malaysia’s GDP growth is positive (% YoY) Figure 41: Consumer sentiment is robust
-3.0
-2.0
-1.0
0.0
1.0
2.0
3.0
4.0
5.0
6.0
7.0
8.0
2007 2008 2009 2010 2011F 2012F 2013F
(%
60
70
80
90
100
110
120
130
Mar-00 Apr-01 May-02 Jun-03 Jul-04 Aug-05 Sep-06 Oct-07 Nov-08 Dec-09 Jan-11 Feb-12
Source: Bank Negara, Credit Suisse estimates Source: MIER

27 November 2012
Astro Malaysia Holdings Bhd (ASTR.KL / ASTRO MK) 26
Figure 42: Unemployment is relatively low, at 3% Figure 43: Retail sales are growing (% YoY)
0%
1%
2%
3%
4%
5%
6%
7%
8%
1982
1984
1986
1988
1990
1993
1996
1998
2000
2002
2004
2006
2008
2010
YT
D 2
012
0%
2%
4%
6%
8%
10%
12%
14%
0
10
20
30
40
50
60
70
80
90
2002 2003 2004 2005 2006 2007 2008 2009 2010 2011
(RM bn)
Retail sales (RM mn) Retail sales YoY
Growth (%)
Source: Department of Statistics Source: Malaysia Retailers Association

27 November 2012
Astro Malaysia Holdings Bhd (ASTR.KL / ASTRO MK) 27
Trading 11% below the IPO price We use DCF as the primary valuation methodology for Astro as we believe it is most
suited to give a true representation of Astro's underlying cash flows, in our view. We apply
a mid-point 15% discount to DCF to arrive at our RM3.50 target price for Astro.
Historically, Astro has traded at a 3%-29% discount to DCF valuations, suggesting a share
price range of RM2.90-4.00.
Our key assumptions
Based on DCF valuation methodology, and applying a WACC of 8.4%, we derive an equity
valuation of RM21.5 bn for Astro.
In our view, P/E valuation is not suitable in this case because Astro's earnings will be
prone to fluctuating depreciation and amortisation of STBs, programme rights and satellite
transponder capacity. For example, while Astro is aggressively swapping out old STBs to
HD-enabled ones (which may generate higher ARPUs), we expect near-term net profits to
be depressed by exceptionally high depreciation charges.
Key drivers
Figure 44: Key assumptions
2010 2011 2012 2013E 2014E 2015E
Y/e pay TV subs (’000) 2930.0 2931.0 3067.0 3257.0 3423.9 3560.7
Subscriber growth (%) 0.0 4.6 6.2 5.1 4.0
Net adds (’000) 284.0 1.0 136.0 190.0 166.9 136.9
MAT churn (%) 11.0 10.0 7.0 9.0 9.0 9.0
Total JOI subs (excl NJOI) 2930.0 2931.0 3220.0 3415.0 3586.9 3728.7
Astro household penetration (%) 44.4 45.9 48.1 49.8 51.0
Total Malaysia households (’000) 6220.0 6605.0 6675.0 6775.1 6876.8 6979.9
Astro penetration of TV households (%) 45.7 47.4 49.3 51.1 52.3
Adex/TV revenues (%) 4.9 6.7 7.0 6.9 6.8 6.7
Adex growth (%) 56.6 8.5 10.0 8.0 7.5
Residential ARPU (RM) 82.0 85.0 89.0 95.0 99.0 103.0
ARPU growth (%) 3.7 4.7 6.7 4.2 4.0
Source: Company data, Credit Suisse estimates
Subscriber base: We have imputed 4%-7% growth in residential subscribers a year. This
suggests Astro's household penetration rate could rise to 51% by FY15E. If its FY14 net
adds are 50,000 more than we have assumed, this would imply 6.7% subscriber growth
(versus our forecast of 5%), and there could be 1% potential upside to our FY14E EBITDA
forecast.
ARPU: Over FY10-12, Astro’s ARPU rose from RM82 to RM89, and we have modelled for
it to rise to RM103 in FY15E. For an additional RM2 of ARPU above our current forecast
of RM99 for FY14E, there is 2.6% potential upside to EBITDA.
Content cost: Over FY10-12, Astro’s content cost was 32-35% of TV segment revenues.
We have allowed for content cost to be 32.5-35% of TV revenues from FY13-15E. If
content cost is 32% of TV revenues for FY13E instead of the 35% which we have built in,
there's 7.6% potential upside to EBITDA.
Administrative costs: Over FY10-12, administrative costs were about 8%-9% of revenues.
For FY13-15E, we have assumed administrative costs will be 9.0%-9.5% of revenues.
Marketing/distribution costs: Over FY10-12, distribution costs were 8%-9% of revenues.
For FY13-15E, we have assumed distribution costs will be stable at 10% of revenues.
Historically, Astro has
traded at a 3%-29%
discount to DCF valuations

27 November 2012
Astro Malaysia Holdings Bhd (ASTR.KL / ASTRO MK) 28
Figure 45: FY2012A TV revenue, by segment
Subscription91%
Airtime Sales7%
Others2%
Source: Company data
Figure 46: FY2012A revenue breakdown—subscription versus airtime sales
Subscription84%
Airtime Sales12%
Others4%
Source: Company data
DCF scenario analysis
Using DCF valuation methodology, applying a WACC of 8.4%, we derive an equity
valuation of RM21.5 bn for Astro. We apply a mid-point 15% discount to DCF to arrive at
our RM3.50 target price for Astro. Historically, Astro has traded at a 3%-29% discount to
DCF valuations, suggesting a share price range of RM2.90-4.00.
Our base case scenario is for ARPU growth of 4.0%-6.7% over FY13-16E and this leads
to our DCF-based target price of RM3.50. If Astro’s ARPU growth is high-single digit (from
6.4% to 8.4%) from FY13E to FY16E, we see 16% further potential upside to our target
price. However, if Astro’s ARPU growth is low single digit (from 2.0% to 3.4%) from FY13E
to FY16E, there is 9% potential downside to our target price.
We apply a mid-point 15%
discount to DCF to arrive at
our RM3.50 target price for
Astro.

27 November 2012
Astro Malaysia Holdings Bhd (ASTR.KL / ASTRO MK) 29
Figure 47: Target price range (RM) for Astro based on various ARPU growth rates (%)
and terminal growth rates (%)
Annual ARPU growth / terminal growth rates 2.5% 3.0% 3.5%
6-8% 3.80 4.07 4.39
4-6% 3.28 3.50 3.78
2-3% 2.96 3.16 3.41
Source: Credit Suisse estimates
Figure 48: Target price range (RM) for Astro based on various ARPU growth rates (%)
and WACC (%)
Annual ARPU growth / WACC 8.0% 8.4% 9%
6-8% 4.38 4.07 3.60
4-6% 3.77 3.50 3.10
2-3% 3.40 3.16 2.80
Source: Credit Suisse estimates
Figure 49: Key discount rate assumptions
Beta 0.9
Cost of equity 9.8%
Cost of debt 5.0%
Terminal growth 3.0%
WACC 8.4%
Source: Credit Suisse estimates
(1) Base case: Moderate ARPU growth
Our base case scenario is for ARPU growth of 4.0%-6.7% over FY13-16E; ARPU could
reach RM107 by FY16E, and this implies a DCF-based target price of RM3.50 (using a
mid-point 15% discount to DCF).
(2) High ARPU growth
If Astro’s ARPU growth is high-single digit (from 6.4% to 8.4%) over FY13-16E, ARPU
could reach RM117 by FY16E; this implies a DCF-based target price of RM4.07, 16%
above our current target price of RM3.50 (using a mid-point 15% discount to DCF).
(3) Low ARPU growth
If Astro’s ARPU growth is low-single digit (from 2.0% to 3.4%) over FY13-16E, ARPU
could reach RM98 by FY16E; this implies a DCF-based target price of RM3.17, 9.4%
below our current target price of RM3.50 (using a mid-point 15% discount to DCF).
Historical discount to DCF
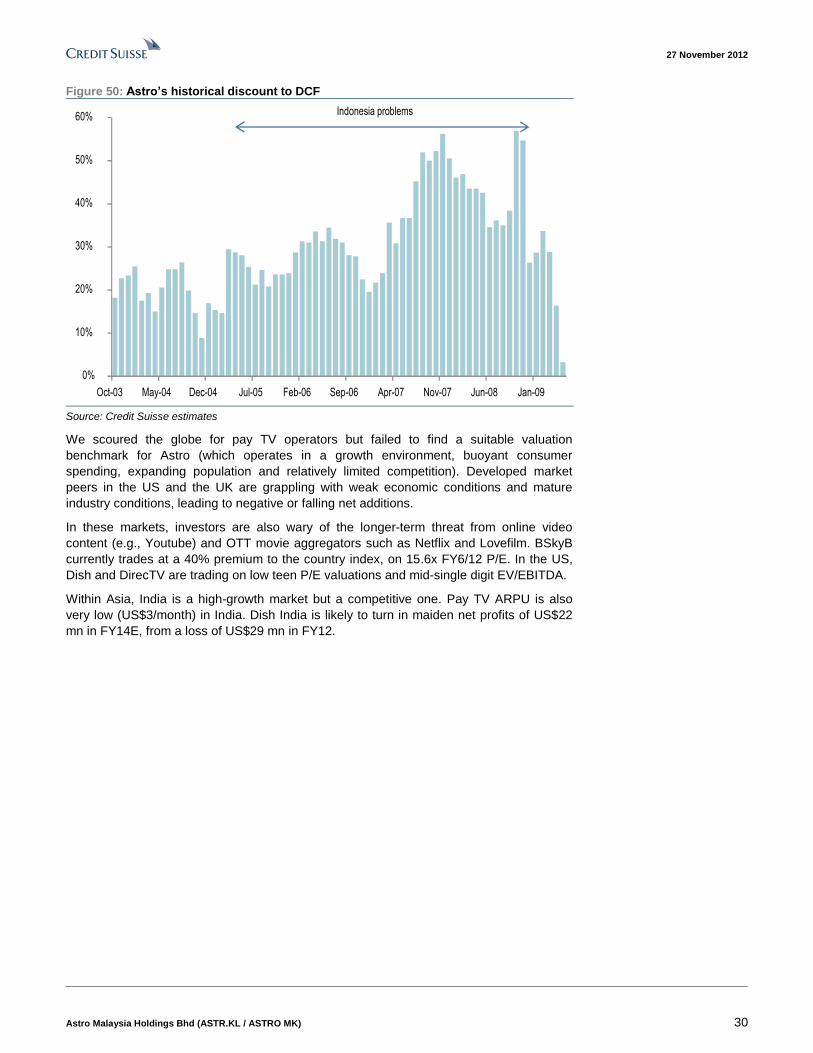
Historically, Astro has traded at a discount to its DCF valuations, ranging from 3%-29% .
(We have excluded the period during which there was a problematic Indonesian joint
venture in existence.)
If Astro’s ARPU growth is
high-single digit (from 6.4%
to 8.4%) from FY13E to
FY16E, there is 16%
potential upside to our target
price.
27 November 2012
Astro Malaysia Holdings Bhd (ASTR.KL / ASTRO MK) 30
Figure 50: Astro’s historical discount to DCF
0%
10%
20%
30%
40%
50%
60%
Oct-03 May-04 Dec-04 Jul-05 Feb-06 Sep-06 Apr-07 Nov-07 Jun-08 Jan-09
Indonesia problems
Source: Credit Suisse estimates
We scoured the globe for pay TV operators but failed to find a suitable valuation
benchmark for Astro (which operates in a growth environment, buoyant consumer
spending, expanding population and relatively limited competition). Developed market
peers in the US and the UK are grappling with weak economic conditions and mature
industry conditions, leading to negative or falling net additions.
In these markets, investors are also wary of the longer-term threat from online video
content (e.g., Youtube) and OTT movie aggregators such as Netflix and Lovefilm. BSkyB
currently trades at a 40% premium to the country index, on 15.6x FY6/12 P/E. In the US,
Dish and DirecTV are trading on low teen P/E valuations and mid-single digit EV/EBITDA.
Within Asia, India is a high-growth market but a competitive one. Pay TV ARPU is also
very low (US$3/month) in India. Dish India is likely to turn in maiden net profits of US$22
mn in FY14E, from a loss of US$29 mn in FY12.
27 N
ov
em
ber 2
012
Astro
Mala
ysia
Ho
ldin
gs B
hd
(AS
TR
.KL
/ AS
TR
O M
K)
31
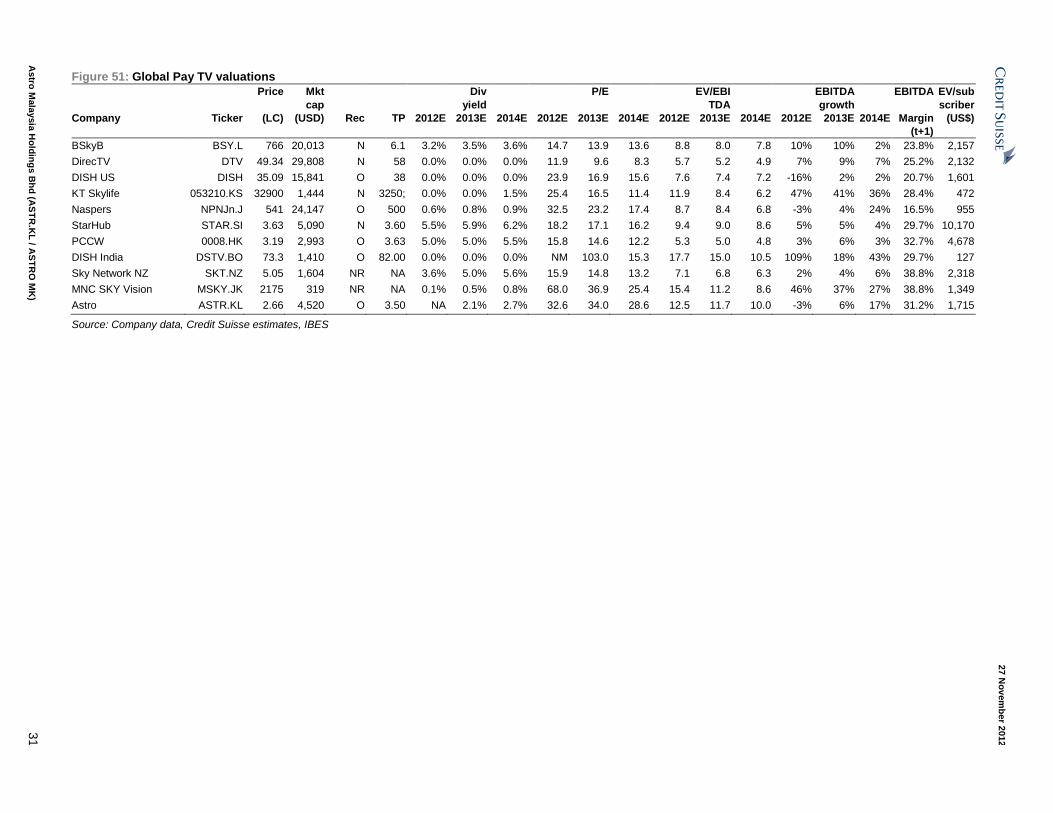
Figure 51: Global Pay TV valuations
Price Mkt
cap
Div
yield
P/E EV/EBI
TDA
EBITDA
growth
EBITDA EV/sub
scriber
Company Ticker (LC) (USD) Rec TP 2012E 2013E 2014E 2012E 2013E 2014E 2012E 2013E 2014E 2012E 2013E 2014E Margin
(t+1)
(US$)
BSkyB BSY.L 766 20,013 N 6.1 3.2% 3.5% 3.6% 14.7 13.9 13.6 8.8 8.0 7.8 10% 10% 2% 23.8% 2,157
DirecTV DTV 49.34 29,808 N 58 0.0% 0.0% 0.0% 11.9 9.6 8.3 5.7 5.2 4.9 7% 9% 7% 25.2% 2,132
DISH US DISH 35.09 15,841 O 38 0.0% 0.0% 0.0% 23.9 16.9 15.6 7.6 7.4 7.2 -16% 2% 2% 20.7% 1,601
KT Skylife 053210.KS 32900 1,444 N 3250; 0.0% 0.0% 1.5% 25.4 16.5 11.4 11.9 8.4 6.2 47% 41% 36% 28.4% 472
Naspers NPNJn.J 541 24,147 O 500 0.6% 0.8% 0.9% 32.5 23.2 17.4 8.7 8.4 6.8 -3% 4% 24% 16.5% 955
StarHub STAR.SI 3.63 5,090 N 3.60 5.5% 5.9% 6.2% 18.2 17.1 16.2 9.4 9.0 8.6 5% 5% 4% 29.7% 10,170
PCCW 0008.HK 3.19 2,993 O 3.63 5.0% 5.0% 5.5% 15.8 14.6 12.2 5.3 5.0 4.8 3% 6% 3% 32.7% 4,678
DISH India DSTV.BO 73.3 1,410 O 82.00 0.0% 0.0% 0.0% NM 103.0 15.3 17.7 15.0 10.5 109% 18% 43% 29.7% 127
Sky Network NZ SKT.NZ 5.05 1,604 NR NA 3.6% 5.0% 5.6% 15.9 14.8 13.2 7.1 6.8 6.3 2% 4% 6% 38.8% 2,318
MNC SKY Vision MSKY.JK 2175 319 NR NA 0.1% 0.5% 0.8% 68.0 36.9 25.4 15.4 11.2 8.6 46% 37% 27% 38.8% 1,349
Astro ASTR.KL 2.66 4,520 O 3.50 NA 2.1% 2.7% 32.6 34.0 28.6 12.5 11.7 10.0 -3% 6% 17% 31.2% 1,715
Source: Company data, Credit Suisse estimates, IBES
27 November 2012
Astro Malaysia Holdings Bhd (ASTR.KL / ASTRO MK) 32
Lack of comparables in Malaysia
There is a scarcity of large-cap and liquid consumption-related stocks in Malaysia. We
view Astro as a proxy for domestic consumption, particularly given its exposure to a
growing Malay middle class. In our view, the Malaysian telcos are not directly comparable
to Astro because the former are in a relatively mature phase compared to the latter.
Cellular penetration in Malaysia has reached 128.7% whereas Astro’s household
penetration is only approaching 50%.
Consumer stocks in Malaysia
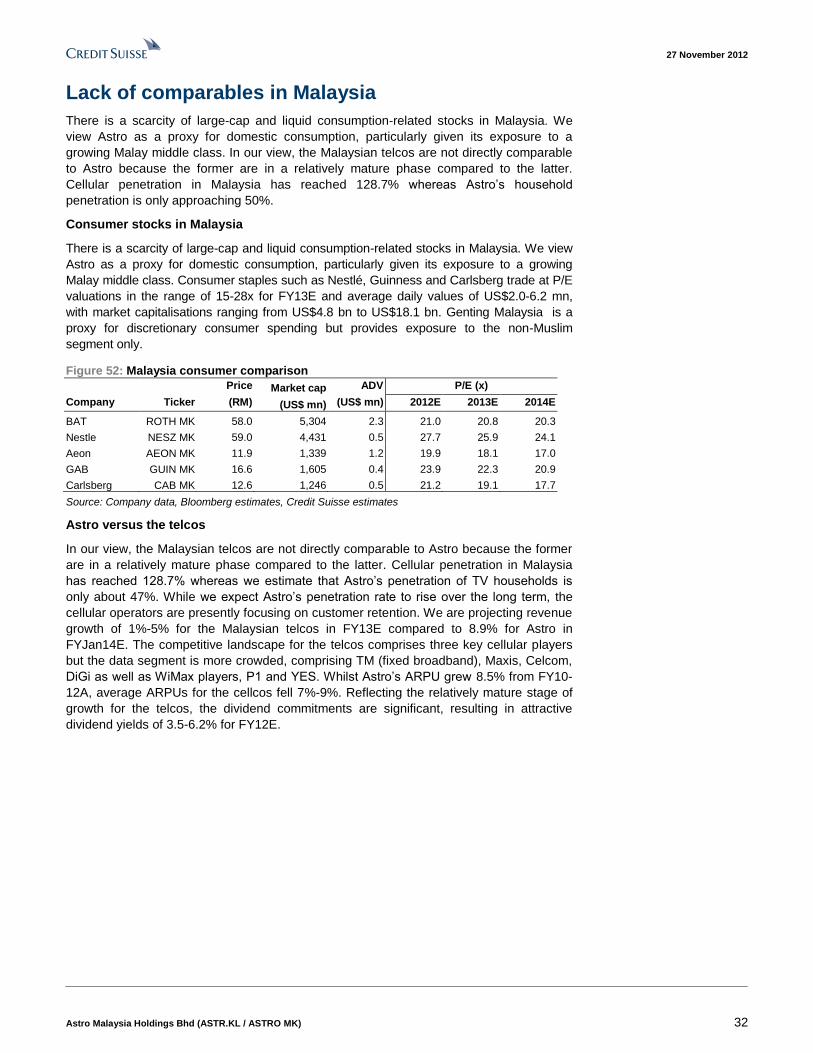
There is a scarcity of large-cap and liquid consumption-related stocks in Malaysia. We view
Astro as a proxy for domestic consumption, particularly given its exposure to a growing
Malay middle class. Consumer staples such as Nestlé, Guinness and Carlsberg trade at P/E
valuations in the range of 15-28x for FY13E and average daily values of US$2.0-6.2 mn,
with market capitalisations ranging from US$4.8 bn to US$18.1 bn. Genting Malaysia is a
proxy for discretionary consumer spending but provides exposure to the non-Muslim
segment only.
Figure 52: Malaysia consumer comparison
Price Market cap ADV P/E (x)
Company Ticker (RM) (US$ mn) (US$ mn) 2012E 2013E 2014E
BAT ROTH MK 58.0 5,304 2.3 21.0 20.8 20.3
Nestle NESZ MK 59.0 4,431 0.5 27.7 25.9 24.1
Aeon AEON MK 11.9 1,339 1.2 19.9 18.1 17.0
GAB GUIN MK 16.6 1,605 0.4 23.9 22.3 20.9
Carlsberg CAB MK 12.6 1,246 0.5 21.2 19.1 17.7
Source: Company data, Bloomberg estimates, Credit Suisse estimates
Astro versus the telcos
In our view, the Malaysian telcos are not directly comparable to Astro because the former
are in a relatively mature phase compared to the latter. Cellular penetration in Malaysia
has reached 128.7% whereas we estimate that Astro’s penetration of TV households is
only about 47%. While we expect Astro’s penetration rate to rise over the long term, the
cellular operators are presently focusing on customer retention. We are projecting revenue
growth of 1%-5% for the Malaysian telcos in FY13E compared to 8.9% for Astro in
FYJan14E. The competitive landscape for the telcos comprises three key cellular players
but the data segment is more crowded, comprising TM (fixed broadband), Maxis, Celcom,
DiGi as well as WiMax players, P1 and YES. Whilst Astro’s ARPU grew 8.5% from FY10-
12A, average ARPUs for the cellcos fell 7%-9%. Reflecting the relatively mature stage of
growth for the telcos, the dividend commitments are significant, resulting in attractive
dividend yields of 3.5-6.2% for FY12E.

27 November 2012
Astro Malaysia Holdings Bhd (ASTR.KL / ASTRO MK) 33
Figure 53: 2011A Astro versus Malaysia cellular penetration rates
47%
128%
0%
20%
40%
60%
80%
100%
120%
140%
Astro Cellular
Source: Company data, SKMM
Figure 54: CY13E revenue growth comparison
8.9%
4.7%
2.0%
0.9%
0%
1%
2%
3%
4%
5%
6%
7%
8%
9%
10%
Astro Digi Celcom Maxis
Source: Credit Suisse estimates

27 November 2012
Astro Malaysia Holdings Bhd (ASTR.KL / ASTRO MK) 34
Investment risks
Content cost
Content cost has accounted for a significant proportion of Astro’s costs and in the past
three years, amounting to 32%-35% of TV segment revenues. If content costs increase
significantly, this could negatively impact Astro's earnings. The Malaysian rights for live
Premier League football matches (for three seasons) have just been awarded to Astro for
the next three years for 2013/14 to 2015/16. If Astro fails to renew this contract in future,
there could be an impact on ARPU.
Satellite transponder capacity
Astro is currently utilising 17 transponders on two satellites, namely Measat 3 and Measat
3A. Another satellite, Measat 3B is currently scheduled for launch in 2014, which should
enable Astro to increase its channels to 180, from 156 currently. If Measat 3B is delayed,
Astro will not be able to expand the number of channels as planned and this could hamper
ARPU growth.
Technical/broadcast failure
In the past 16 years, Astro has not suffered any major outage or interruption to its service,
save for rain-fade. If either of the satellites were to suffer technical difficulties, Astro will not
be able to provide its full range of channels using the one remaining satellite. If there is
prolonged service interference, Astro could potentially lose subscribers.
Regulatory risk
Astro’s licences are subject to renewal and while it can apply to renew them, there is no
guarantee that it can secure the necessary approvals. Astro has a 25-year renewable
broadcasting licence with exclusivity on DTH satellite TV services till 2017 and non-
exclusivity until 2022.
According to the local media reports, the regulator could be contemplating potential
measures on content sharing which is deemed to be of national significance and this
includes international sports content. There has not been any official directive from the
regulator on this matter.
Online versus Astro
In developed markets, online content (OTT) and low-priced online video options are
deemed as a potential threat to pay TV operators, particularly as subscribers download
video content directly from the Internet.
Figure 55: Why people don’t subscribe to pay TV
50%
23% 23% 22%
16%14%
2%
0%
10%
20%
30%
40%
50%
60%
Too expensive Use Netflix/Hulu/Youtubeetc as substitute
Other reasons Don’t watch a lot of TV Just watch broadcast TVusing over the air signals
Don’t find the TV channels on PayTV
compelling
Don’t like the user interface
Source: Credit Suisse Future of Video Survey, 2011

27 November 2012
Astro Malaysia Holdings Bhd (ASTR.KL / ASTRO MK) 35
Piracy
Astro faces ongoing risk from content piracy as well as third party attempts to hack its
encryption technology.
Currency
Astro is exposed to foreign currency risk as it incurs significant costs in USD, e.g., for set
top boxes, international content and transponder lease payments. If the ringgit depreciates,
the cost of equipment and content for Astro will rise. Management has indicated that a
10% depreciation of the ringgit could cause a RM30mn increase in costs for Astro.
Competition
Astro is currently the largest pay TV operator in Malaysia. Local newspapers have
reported that Asian Broadcasting Network (ABN) has plans to offer a digital cable pay TV
service in Malaysia. ABN plans to launch 100 channels by end-2012 and to have 1.2 mn
premises covered. ABN has indicated that it could spend RM2 bn over the next five years.
It targets having 500,000 subscribers in the first year. The company had previously
indicated 2Q12 as a potential launch date in some key cities. We believe a key hurdle for
any potential cable TV operator in Malaysia would be the cost of laying cable as there is
no ready cable infrastructure in the ground.

27 November 2012
Astro Malaysia Holdings Bhd (ASTR.KL / ASTRO MK) 36
Appendix I: Key financials Figure 56: Profit and loss
YE 31Jan 2010 2011 2012 2013E 2014E 2015E
(RM mn)
Revenue 3242.3 3664.1 3888.8 4317.5 4701.9 5065.7
Cost of sales -1934.0 -2000.4 -2236.6 -2769.5 -3069.4 -3237.5
Gross profit 1308.4 1663.7 1652.2 1548.0 1632.5 1828.2
Other operating
income 22.9 27.4 27.2 28.0 28.5 29.1
Marketing and
distribution -282.7 -316.0 -323.0 -431.8 -470.2 -506.6
Administrative -244.5 -308.2 -366.1 -388.6 -446.7 -481.2
EBITDA 986.2 1369.8 1414.7 1366.3 1467.8 1730.1
EBITDA growth (%) 38.9 3.3 -3.4 7.4 17.9
EBITDA margin 30.4 37.4 36.4 31.6 31.2 34.2
Dep and Amortisation -182.1 -302.8 -424.3 -610.7 -723.6 -860.6
EBIT 804.1 1066.9 990.4 755.6 744.2 869.5
Finance income 69.1 119.4 68.7 86.2 86.1 72.8
Finance cost -70.9 -93.7 -194.7 -251.5 -247.7 -256.5
Share of post tax
results from
investments -1.0 -2.2 -0.1 -0.1 -0.1 -0.1
PBT 801.3 1090.5 864.3 590.3 582.5 685.8
Tax expense -187.4 -263.0 -234.7 -165.3 -163.1 -192.0
Profit after tax 613.9 827.5 629.6 425.0 419.4 493.8
Minorities 0.2 -4.0 -5.5 -4.3 -4.0 -4.0
Net profit 614.1 823.5 624.1 420.7 415.4 489.8
Source: Company data, Credit Suisse estimates
Figure 57: Cash flow summary
YE 31 Jan (RM mn) 2012 2013E 2014E 2015E
PBT 864.3 590.3 582.5 685.8
add:
Dep and Amortisation 424.3 610.7 723.6 860.6
Net finance cost 126.0 165.3 161.6 183.6
Others 318.7 0.0 0.0 0.0
WC changes -212.5 336.7 362.0 241.1
Taxation -164.2 -165.3 -163.1 -192.0
Operating cash flow 1022.4 1537.7 1666.7 1779.1
Purchase of PPE -476.7 -452.0 -725.5 -745.9
Cash flow from Investing -1984.5 -365.8 -639.4 -673.0
Cash flow from financing 1261.9 -43.1 -1178.2 -1167.4
Net (decrease)/increase in
cash 299.8 1128.8 -150.9 -61.3
Cash at beginning of year 678.5 478.2 1607.0 1456.1
Cash at year end 478.2 1607.0 1456.1 1394.7
Source: Company data, Credit Suisse estimates

27 November 2012
Astro Malaysia Holdings Bhd (ASTR.KL / ASTRO MK) 37
Figure 58: Balance sheet
YE 31 Jan (RM mn) 2012 2013E 2014E 2015E
Property, plant and
equipment 1654.2 1943.5 2219.9 2809.3
Other non-current assets 3453.6 1953.6 1953.6 1953.6
Non-current assets 5107.8 3897.1 4173.5 4762.9
Inventories 13.3 22.8 25.2 26.6
Receivables and
prepayments 798.2 847.6 923.1 994.5
Other current assets 116.3 116.3 116.3 116.3
Cash & equivalents 478.2 1607.0 1456.1 1394.7
Current Assets 1406.0 2593.7 2520.7 2532.2
Payables 1580.7 1699.3 1489.2 1753.1
ST borrowings 43.5 43.5 43.5 43.5
Other current liabilities 152.7 152.7 152.7 152.7
Current Liabilities 1776.9 1895.5 1685.4 1949.3
Payables 323.0 600.0 1250.0 1300.0
LT borrowings 3666.4 3168.4 2824.0 2996.8
Other LT liabilities 256.0 256.0 256.0 256.0
Non-current Liabilities 4245.5 4024.4 4330.1 4552.9
Shareholder funds 482.9 558.0 661.9 772.1
TOTAL EQUITY 491.4 570.9 678.7 792.9
Source: Company data, Credit Suisse estimates
Figure 59: Underlying assumptions
Key assumptions 2010 2011 2012 2013E 2014E 2015E
YE Pay TV subs (000) 2930.0 2931.0 3067.0 3257.0 3423.9 3560.7
Subscriber growth (%) 0.0 4.6 6.2 5.1 4.0
Net adds (000) 284.0 1.0 136.0 190.0 166.9 136.9
MAT Churn (%) 11.0 10.0 7.0 9.0 9.0 9.0
Total JOI subs (excl NJOI) 2930.0 2931.0 3220.0 3415.0 3586.9 3728.7
Astro household
penetration (%) 44.4 45.9 48.1 49.8 51.0
Total Malaysia households 6220.0 6605.0 6675.0 6775.1 6876.8 6979.9
Astro penetration of TV
households 45.7 47.4 49.3 51.1 52.3
Adex/TV revenues 4.9 6.7 7.0 6.9 6.8 6.7
Adex growth 56.6 8.5 10.0 8.0 7.5
Residential ARPU (RM) 82.0 85.0 89.0 95.0 99.0 103.0
ARPU growth (%) 3.7 4.7 6.7 4.2 4.0
Cost assumptions
Content as % TV revenues 34.6 32.0 32.0 34.5 34.0 34.0
Marketing/distribution as %
of revenues 8.7 8.6 8.3 10.0 10.0 10.0
Admin as % of revenues 7.5 8.4 9.4 9.0 9.5 9.5
Source: Company data, Credit Suisse estimates

27 November 2012
Astro Malaysia Holdings Bhd (ASTR.KL / ASTRO MK) 38
Appendix II: Astro channel packaging Figure 60: Astro—basic TV channels
Entertainment Music Movies Sports Educational News
TV1* Tvi Astro Vellithirai Astro Arena Astro Tutor TV SPM Bernama TV
TV2* Astro HITZ TV ESPNews Astro Tutor TV UPSR* CCTV News
TV3* Astro Tutor TV PMR CCTV4
NTV 7* Nat Geo Wild
TV9* Astro TVIQ
8TV* Astro Awani
Astro Ria Astro Ceria
Astro Prima
Astro Oasis
Zee Variasi
Arab Radio & TV Variety (ART)
TV AlHijrah
Astro Vaanavil
Makkal TV
Astro AEC
iView
Jia Yu
TNB Classic
KBS World
TVB Classic
Astro Xiao Tai Yang*
Asian Food Channel
AXN
TLC
DIVA Universal
i130
* FTA channels.
Source: Company data
Figure 61: Astro—radio channels
Astro radio's commercial stations Direct-to-user (DTU) radio stations
ERA India Beat
Sinar FM Golden Oldies
THR.fm Raaga Jazz
THR.fm Gegar Opus
MY FM Rock
Hitz.fm 103
Mix FM Osai
Lite FM Bayu
XFM(3) Kenyalang
Nasional FM
Sabah V FM
Wai FM
Source: Company data

27 November 2012
Astro Malaysia Holdings Bhd (ASTR.KL / ASTRO MK) 39
Appendix III: Management team Dato’ Rohana Binti Tan Sri Datuk Haji Rozhan, Chief Executive Officer
Rohana has been the CEO of Astro and its wholly-owned subsidiary, MBNS, since 2006.
Prior to being appointed as CEO, she was the group CFO of Astro All Asia Networks
(AAAN) and was instrumental in AAAN’s listing on the KLSE in 2003. She currently sits on
the boards of Media Innovations, Astro Overseas Limited and Malaysia Airlines.
Rohana holds a Bachelor of Arts (Honours) degree in Accounting and Economics from the
University of Kent and has completed the Advanced Management Programme at Harvard
Business School. She is a member of the Chartered Institute of Management Accountants
and the Malaysian Institute of Accountants.
Ahmad Fuaad Bin Mohd Kenali, Chief Financial Officer
Ahmad Fuaad joined Astro in August 2010 as the CFO. He has 18 years of experience in
accounting, assurance and finance. Prior to joining Astro, he was a partner at Ernst &
Young, Malaysia and served as the executive director finance in Petaling Garden Bhd.
He is a fellow of the Association of Chartered Certified Accountants, a member of the
Malaysian Institute of Accountants and a member of the Malaysian Institute of Certified
Public Accountants.
Henry Tan Poh Hock, Chief Operating Officer.
Henry is the COO and joined the group in May 2008. He is responsible for content,
marketing, branding and airtime sales. He has 24 years of experience in the media
industry and served as the CEO of GroupM, Malaysia and Singapore, a media investment
management company. Prior to that he was CEO of Mindshare Malaysia.
He holds a double degree in marketing and communications from Chisholm (now known
as Monash University), Australia.
Brian Wendell Lenz, Chief Innovation Officer
Brian joined the group in December 2011 as Chief Innovation Officer and is responsible for
the strategy, product and business development and technology infrastructure. He has 18
years of experience in product, technology, strategy and business development roles and
has spent the last nine years in pay TV and media. Prior to joining Astro, Brian worked at
BSkyB , Virgin Media, LEK Consulting and had a consultant position with Walt Disney on
broadband content strategy.
He holds a degree in industrial and operations engineering and an English literature
degree from the University of Michigan. He attended the London Business School and
received a Master’s in Business Administration with distinction.
Liew Swee Lin, Chief Commercial Officer
Swee Lin is the Chief Commercial Officer and joined the group in November 2010. She is
responsible for driving the customer franchise and top line growth to strengthen Astro’s
market position. She also oversees product management, sales, marketing, customer
management, service, operations and supply chain management.
Swee Lin has 22 years of management experience in the media and financial services
sectors and has worked at Alliance Financial Group, Standard Chartered Malaysia and
Ogilvy. She holds a Master of Science (MSc) in international marketing from University of
Strathclyde, UK, and is an accredited Certified Financial Planner (CFP, US).

27 November 2012
Astro Malaysia Holdings Bhd (ASTR.KL / ASTRO MK) 40
Appendix IV: Board of directors Tun Dato’ Seri Zaki Bin Tun Azmi, Independent Non-Executive Chairman
Tun Dato’ Seri Zaki Bin Tun Azmi had his early education in Malaysia before obtaining a
Barrister-at-Law qualification from the Lincoln’s Inn in 1969. He joined the Malaysian
judicial and legal services as a magistrate in 1970 and later transferred to the Attorney
General’s Chambers where he held several positions for 15 years before going into private
legal practice in 1985. While in practice, he was a director as well as chairman or member
of audit committees of the board of directors of several public listed companies including
Petroliam Nasional Berhad, Malaysia Airport Holdings Berhad and SP Setia Berhad.
He left legal practice in 2007 when he was appointed a Judge of the Federal Court of
Malaysia and shortly thereafter, he was appointed President of Court of Appeal of
Malaysia, the second highest judicial office. On 18 October 2008, he was appointed the
12th Chief Justice of Malaysia. He became the first chairman of the Judicial Appointment
Commission on 16 February 2009 until his retirement as Chief Justice in September 2011.
During his tenure as the Chief Justice of Malaysia, he reduced substantially the backlog of
cases pending at the Malaysian courts and also introduced technological and managerial
systems that enabled cases at the High Courts to be disposed of within nine months to
one year from the date of filing and within six months from the date of filing at the Sessions
Courts and Magistrates’ Courts.
Currently, he is the Chancellor of MAHSA University College and the Multimedia
University.
Augustus Ralph Marshall, Non-Independent Executive Deputy Chairman
Augustus Ralph Marshall has more than 30 years of experience in financial and general
management. He was admitted as a member of the Institute of Chartered Accountants in
England and Wales (“ICAEW”) in 1975. He started his career as an audit senior with Ernst
& Young in 1976 before joining Inchcape Malaysia Holdings Berhad in 1979 and in 1982,
was promoted to group finance director. In 1988, he joined UTSB where he currently
serves as an executive director.
He has been with the group since 1994 as a director of MBNS and was its Chief Executive
Officer from 1995 to 2006. He was later appointed a director of AAAN in July 2003 upon its
incorporation and became its deputy chairman and group chief executive officer in August
and September 2003, respectively prior to AAAN’s listing on the then Kuala Lumpur Stock
Exchange. Since the delisting of AAAN in June 2010, he was appointed Group Chief
Executive Officer of AHSB. He is also the Executive Deputy Chairman of ASTRO
Overseas Limited (“AOL”), a position he has held since April 2011.
He is currently an executive director of Tanjong Public Limited Company, Maxis (listed on
the Main Market), Maxis Communications Berhad (the holding company of Maxis) and
Johnston Press plc (listed on the London Stock Exchange plc), in which UTSB has
significant interests. In addition, he is also a director in an independent non-executive
capacity and the Chairman of the audit committee of KLCC Property Holdings Berhad
(“KLCCP”) (listed on the Main Market) and a non-executive director of MGB.
Chin Kwai Yoong, Independent Non-Executive Director.
After his tertiary education in Malaysia, Chin Kwai Yoong completed his articleship with
Middletons, a firm of chartered accountants in London and was admitted as a member of
the ICAEW in 1974.
He joined Price Waterhouse, London, as an audit assistant in 1974 and remained with the
firm until 1976. Subsequently, he took up a position as an audit senior with Price
Waterhouse, Kuala Lumpur, and was promoted to partner in 1982, a position he held until
his retirement in 2003. During his tenure as a partner, he was an executive director in
charge of the consumer and industrial products and services group. He also served as a
director of the audit and business advisory services division and the management
consulting services division.

27 November 2012
Astro Malaysia Holdings Bhd (ASTR.KL / ASTRO MK) 41
He has extensive experience in the audits of major companies in the banking, oil and gas
and automobile industries as well as in the heavy equipment, manufacturing, construction
and property development industries. He was also involved in corporate advisory services
covering investigations, mergers and acquisitions and share valuations.
He sits on the Board of Directors of Deleum Berhad and Genting Berhad (both listed on
the Main Market) and was also appointed as a director of BankNegara Malaysia in 2010.
Dato’ Mohamed Khadar Bin Merican, Independent Non-Executive Director.
Dato’ Mohamed Khadar Bin Merican has more than 30 years of experience in financial
and general management.
He began his career in 1983 when he joined Hanafiah Raslan & Mohamed, the then
member firm of Touch Ross International, as an auditor and consultant. In 1986, he joined
Kompleks Kewangan Malaysia Bhd, as the senior manager of financial planning, until
1988 when he joined Perbadanan Nasional Bhd, where his last position was as the senior
vice president of corporate services. In 1996, as a result of a reorganisation, he joined
Pernas International Holdings Bhd, a company listed on the Main Market, as the president
and chief operating officer. He resigned in 2003 to start his own financial consulting
business, which he manages currently.
He is a member of the ICAEW since 1983, and is also a chartered accountant of the
Malaysian Institute of Accountants. His other directorships in public companies include
RHB Capital Berhad (listed on the Main Market) and RHB Investment Bank Berhad where
he is the independent non-executive chairman of both companies, as well as AirAsia
Berhad (listed on the Main Market).
Bernard Anthony Cragg, Non-Independent Non-Executive Director.
Bernard Anthony Cragg is a chartered accountant by profession and was with Price
Waterhouse from 1976 to 1985. He graduated with a degree in mathematics from
Liverpool University, UK in 1976. He began his career with Price Waterhouse as a trainee
chartered accountant where he qualified and stayed until 1985 after which he joined
Carlton Communications plc (listed on the London Stock Exchange plc) initially as its
group financial controller. He held various senior management positions in Carlton
Communication plc including company secretary and group finance director. He has
previously served as the chairman of Datamonitor plc and i-Mate plc (both listed on the
London Stock Exchange plc) as well as a director of Arcadia Group plc and Bristol & West
Plc, a part of the Bank of Ireland (UK) Financial Services. Currently, he is also a director of
Workspace Group plc, Mothercare plc and Progressive Digital Media Group plc, all of
which are listed on the London Stock Exchange plc.
Lim Ghee Keong, Alternate Director to Augustus Ralph Marshall.
Lim Ghee Keong has more than 20 years of experience in treasury and credit
management. He has been with the UTSB Group since 1995 where he is currently the
Chief Financial Officer of UTSB. Prior to joining UTSB Group, he was attached to the
former Ban Hin Lee Bank in Malaysia from 1993 to 1995, initially as a senior credit officer
and later promoted to the position of branch head of credit. Between 1989 and 1993, he
was attached to General Electric Capital Corporation in the US where his last position was
as a credit analyst.
His other directorships include Bumi Armada Berhad, an offshore oil and gas service
provider (listed on Main Market) and Paxys Inc., a business process outsourcing company
listed on the (Philippines Stock Exchange). He is also a director of Yu Cai Foundation, a
charitable organisation and Bond Pricing Agency Malaysia Sdn Bhd, a bond pricing
agency registered with the SC.
He holds a Bachelor of Business Administration degree, majoring in finance, from the
University of Hawaii at Manoa, US, which he obtained in 1989.
Dato’ Rohana Binti Tan Sri Datuk Haji Rozhan also serves as an Executive Director

27 November 2012
Astro Malaysia Holdings Bhd (ASTR.KL / ASTRO MK) 42
Companies Mentioned (Price as of 23 Nov 12)
Astro Malaysia Holdings Bhd (ASTR.KL, RM2.66, OUTPERFORM, TP RM3.50) British Sky Broadcasting (BSY.L, 778p, NEUTRAL, TP 610.00p) DISH Network Corp. (DISH, $35.75, OUTPERFORM, TP $38.00) Dish TV India (DSTV.BO, Rs73.40, OUTPERFORM, TP Rs82.00) Hyundai HCN (126560.KS, W4710, NOT RATED) KT Skylife (053210.KS, W32,900, NEUTRAL [V], TP W32,500) LG Dacom (015940.KS, W17800, NOT RATED) Maxis Berhad (MXSC.KL, RM6.45, OUTPERFORM, TP RM8.00) Naspers (NPNJn.J, R539.85, OUTPERFORM, TP R500.00) PCCW (0008.HK, HK$3.19, OUTPERFORM, TP HK$3.63) PT MNC SKY Vision Tbk (MSKY.JK, Rp2175, NOT RATED) SK Broadband Co Ltd. (033630.KQ, W4,805, NEUTRAL, TP W3,200) Sky Network Television (SKT.NZ, NZ$5.07, NOT RATED) StarHub Ltd. (STAR.SI, S$3.63, NEUTRAL, TP S$3.60) TalkTalk (TALK.L, 211p, OUTPERFORM, TP 200.00p) Telekom Malaysia (TLMM.KL, RM5.37, UNDERPERFORM, TP RM3.94) The Directv Group, Inc. (DTV, $49.49, NEUTRAL, TP $58.00) Time dotCom Bhd (TCOM.KL, RM3.46, NOT RATED) i-Cable Communications (1097.HK, HK$.38) Singapore Telecom (STEL.SI, S$3.14, OUTPERFORM, TP S$3.58) M1 Ltd. (MONE.SI, S$2.68, OUTPERFORM, TP S$3.00) SK Broadband Co Ltd. (033630.KQ, W4,805, NEUTRAL, TP W3,200) Time Warner Cable (TWC, $93.55, OUTPERFORM, TP $92.00) Charter Communications (CHTR, $70.00, OUTPERFORM, TP $90.00) Cablevision (CVC, $13.98, NOT RATED) Virgin Media, Inc. (VMED, $34.01, OUTPERFORM, TP $38.00) BT Group (BT.L, 226.70p, OUTPERFORM, TP 300.00p) Telstra Corp. (TLS.AX, A$4.22, NEUTRAL, TP A$4.00) BAT Malaysia (BATO.KL, RM57.96, OUTPERFORM, TP RM72.00) Carlsberg Brewery (CAB MK, RM12.62, NOT RATED) Nestle (Malaysia) (NESZ MK, RM58.96, NOT RATED) Aeon Co (M) Bhd (AEON MK, RM11.90, NOT RATED) KLCC Property Holdings (KLCC MK, RM5.73, NOT RATED) SP Setia (SETI.KL, RM3.40, NEUTRAL, TP RM3.60) Malaysia Airports (MAHB.KL, RM5.48, OUTPERFORM, TP RM7.10) RHB Capital Berhad (RHBC.KL, RM7.40, RESTRICTED) Bumi Armada (BUAB.KL, RM3.88, NEUTRAL, TP RM3.30) Guinness Anchor Berhad (GUIN.KL, RM16.60, NOT RATED) Netflix, Inc. (NFLX, $82.95, OUTPERFORM [V], TP $80.00)
Disclosure Appendix Important Global Disclosures
I, Foong Wai Loke, certify that (1) the views expressed in this report accurately reflect my personal views about all of the subject companies and securities and (2) no part of my compensation was, is or will be directly or indirectly related to the specific recommendations or views expressed in this report.
See the Companies Mentioned section for full company names.

27 November 2012
Astro Malaysia Holdings Bhd (ASTR.KL / ASTRO MK) 43
3-Year Price, Target Price and Rating Change History Chart for ASTR.KL
ASTR.KL Closing
Price
Target
Price
Initiation/
Date (RM) (RM) Rating Assumption
0
0.5
1
1.5
2
2.5
3
Closing Price Target Price Initiation/Assumption Rating
RM
O=Outperform; N=Neutral; U=Underperform; R=Restricted; NR=Not Rated; NC=Not Covered
3-Year Price, Target Price and Rating Change History Chart for 053210.KS
053210.KS Closing
Price
Target
Price
Initiation/
Date (W) (W) Rating Assumption
22-Aug-11 24950 34400 O X
9-Dec-11 27450 32500
3-Oct-12 30500 N
34400
32500
22-Aug-11
O
N
17400
19400
21400
23400
25400
27400
29400
31400
33400
Closing Price Target Price Initiation/Assumption Rating
W
O=Outperform; N=Neutral; U=Underperform; R=Restricted; NR=Not Rated; NC=Not Covered
3-Year Price, Target Price and Rating Change History Chart for 033630.KQ
033630.KQ Closing
Price
Target
Price
Initiation/
Date (W) (W) Rating Assumption
10-May-10 5970 5200 U
2-May-11 4390 4800 N
3-Nov-11 3800 4200
8-May-12 3350 3750
1-Aug-12 2990 3200
5200
4800
4200
3750
3200
U
N
2805
3305
3805
4305
4805
5305
5805
6305
Closing Price Target Price Initiation/Assumption Rating
W
O=Outperform; N=Neutral; U=Underperform; R=Restricted; NR=Not Rated; NC=Not Covered
The analyst(s) responsible for preparing this research report received compensation that is based upon various factors including Credit Suisse's total revenues, a portion of which are generated by Credit Suisse's investment banking activities.
As of October, 2 2012 Analysts’ stock rating are defined as follows: Outperform (O): The stock’s total return is expected to outperform the relevant benchmark* by at least 10-15% or more, (depending on perceived risk) over the next 12 months. Neutral (N): The stock’s total return is expected to be in line with the relevant benchmark* (range of ±10-15%) over the next 12 months. Underperform (U): The stock’s total return is expected to underperform the relevant benchmark* by 10-15% or more over the next 12 months.

27 November 2012
Astro Malaysia Holdings Bhd (ASTR.KL / ASTRO MK) 44
*Relevant benchmark by region: As of 2nd October 2012, U.S. and Canadian as well as European ratings are based on a stock’s total return relative to the analyst's coverage universe which consists of all companies covered by the analyst within the relevant sector, with Outperforms representing the most attractive, Neutrals the less attractive, and Underperforms the least attractive investment opportunities. For Latin American, Japanese, and non-Japan Asia stocks, ratings are based on a stock’s total return relative to the average total return of the relevant country or regional benchmark; Australia, New Zealand are, and prior to 2nd October 2012 U.S. and Canadian ratings were based on (1) a stock’s absolute total return potential to its current share price and (2) the relative attractiveness of a stock’s total return potential within an analyst’s coverage universe. For Australian and New Zealand stocks, 12-month rolling yield is incorporated in the absolute total return calculation and a 15% and a 7.5% threshold replace the 10-15% level in the Outperform and Underperform stock rating definitions, respectively. The 15% and 7.5% thresholds replace the +10-15% and -10-15% levels in the Neutral stock rating definition, respectively. Restricted (R): In certain circumstances, Credit Suisse policy and/or applicable law and regulations preclude certain types of communications, including an investment recommendation, during the course of Credit Suisse's engagement in an investment banking transaction and in certain other circumstances.
Volatility Indicator [V]: A stock is defined as volatile if the stock price has moved up or down by 20% or more in a month in at least 8 of the past 24 months or the analyst expects significant volatility going forward.
Analysts’ sector weightings are distinct from analysts’ stock ratings and are based on the analyst’s expectations for the fundamentals and/or valuation of the sector* relative to the group’s historic fundamentals and/or valuation: Overweight: The analyst’s expectation for the sector’s fundamentals and/or valuation is favorable over the next 12 months. Market Weight: The analyst’s expectation for the sector’s fundamentals and/or valuation is neutral over the next 12 months. Underweight: The analyst’s expectation for the sector’s fundamentals and/or valuation is cautious over the next 12 months. *An analyst’s coverage sector consists of all companies covered by the analyst within the relevant sector. An analyst may cover multiple sectors.
Credit Suisse’s distribution of stock ratings (and banking clients) is: Global Ratings Distribution
Outperform/Buy* 42% (54% banking clients) Neutral/Hold* 40% (48% banking clients) Underperform/Sell* 15% (42% banking clients) Restricted 3%
*For purposes of the NYSE and NASD ratings distribution disclosure requirements, our stock ratings of Outperform, Neutral, and Underperform most closely correspond to Buy, Hold, and Sell, respectively; however, the meanings are not the same, as our stock ratings are determined on a relative basis. (Please refer to definitions above.) An investor's decision to buy or sell a security should be based on investment objectives, current holdings, and other individual factors.
Credit Suisse’s policy is to update research reports as it deems appropriate, based on developments with the subject company, the sector or the market that may have a material impact on the research views or opinions stated herein.
Credit Suisse's policy is only to publish investment research that is impartial, independent, clear, fair and not misleading. For more detail please refer to Credit Suisse's Policies for Managing Conflicts of Interest in connection with Investment Research: http://www.csfb.com/research-and-analytics/disclaimer/managing_conflicts_disclaimer.html
Credit Suisse does not provide any tax advice. Any statement herein regarding any US federal tax is not intended or written to be used, and cannot be used, by any taxpayer for the purposes of avoiding any penalties.
See the Companies Mentioned section for full company names. Price Target: (12 months) for (ASTR.KL) Method: We value Astro using discounted cashflow as we believe this methodology captures its true underlying cashflows. We believe PE valuations are not suitable as Astro's earnings are prone to large and fluctuating depreciation and amortization. We utilize a WACC of 8.4%, a beta of 0.9 and a mid-point discount-to-DCF of 15%to arrive at a target price of RM3.50. Risks: Key risk factors for Astro include Content cost, satellite transponder capacity, new competition, piracy and foreign currency. If content cost is greater than the 32-35% range guided by management, there could be potential downside to earnings. If ARPU growth is above our forecast of 4-6% for FY14-16E, there is potential upside to our forecasts. Price Target: (12 months) for (053210.KS) Method: Our target price of W32,500 is based on our DCF(Discounted Cash Flow) analysis with WACC(Weighted Average Cost of Capital) of 10.5% and implied 2020E EBITDA multiple of 4.5x. Risks: Potential risks to our target price of W32,500 are 1) potential regulation by KCC(Korea Communications Commission) imposing guidelines or limits to the marketing activities for the Pay TV operators, 2) market saturation for Pay TV, 3) Potential rise in the program usage fee from the contents providers. Price Target: (12 months) for (033630.KQ) Method: Our target price of W3,200 is based on 13E PBR of 0.8x from our previous target PBR of 1.0x. Given uncertainty over long-term earnings growth and 2013E ROE of 6.5%, we believe the company should trade at below its book value. For 2013, the market (KOSPI) trades at PBR of 1.06x with ROE of 16.0%. Risks: The following are risks to our W3,200 target price on SK Broadband: 1) the competitive environment in the broadband sector is still very fierce, with KT and LGT retaining its aggressive marketing strategy, which may force Hanaro to increase its marketing costs and even enter into a price war to hold off competition and 2) Slower than expected growth of its IPTV service.
Please refer to the firm's disclosure website at www.credit-suisse.com/researchdisclosures for the definitions of abbreviations typically used in the target price method and risk sections.

27 November 2012
Astro Malaysia Holdings Bhd (ASTR.KL / ASTRO MK) 45
See the Companies Mentioned section for full company names. The subject company (ASTR.KL, 053210.KS, 033630.KQ) currently is, or was during the 12-month period preceding the date of distribution of this report, a client of Credit Suisse. Credit Suisse provided investment banking services to the subject company (ASTR.KL, 053210.KS, 033630.KQ) within the past 12 months. Credit Suisse has managed or co-managed a public offering of securities for the subject company (ASTR.KL, 033630.KQ) within the past 12 months. Credit Suisse has received investment banking related compensation from the subject company (ASTR.KL, 053210.KS, 033630.KQ) within the past 12 months. Credit Suisse expects to receive or intends to seek investment banking related compensation from the subject company (ASTR.KL, 053210.KS, 033630.KQ) within the next 3 months.
Important Regional Disclosures
Singapore recipients should contact a Singapore financial adviser for any matters arising from this research report.
The analyst(s) involved in the preparation of this report have not visited the material operations of the subject company (ASTR.KL, 053210.KS, 033630.KQ) within the past 12 months.
Restrictions on certain Canadian securities are indicated by the following abbreviations: NVS--Non-Voting shares; RVS--Restricted Voting Shares; SVS--Subordinate Voting Shares. Individuals receiving this report from a Canadian investment dealer that is not affiliated with Credit Suisse should be advised that this report may not contain regulatory disclosures the non-affiliated Canadian investment dealer would be required to make if this were its own report. For Credit Suisse Securities (Canada), Inc.'s policies and procedures regarding the dissemination of equity research, please visit http://www.csfb.com/legal_terms/canada_research_policy.shtml.
Credit Suisse Securities (Europe) Limited acts as broker to TALK.L.
The following disclosed European company/ies have estimates that comply with IFRS: BSY.L, TALK.L, TLMM.KL.
As of the date of this report, Credit Suisse acts as a market maker or liquidity provider in the equities securities that are the subject of this report.
Principal is not guaranteed in the case of equities because equity prices are variable.
Commission is the commission rate or the amount agreed with a customer when setting up an account or at anytime after that. Taiwanese Disclosures: This research report is for reference only. Investors should carefully consider their own investment risk. Investment results are the responsibility of the individual investor. Reports may not be reprinted without permission of CS. Reports written by Taiwan-based analysts on non-Taiwan listed companies are not considered recommendations to buy or sell securities under Taiwan Stock Exchange Operational Regulations Governing Securities Firms Recommending Trades in Securities to Customers.
To the extent this is a report authored in whole or in part by a non-U.S. analyst and is made available in the U.S., the following are important disclosures regarding any non-U.S. analyst contributors: The non-U.S. research analysts listed below (if any) are not registered/qualified as research analysts with FINRA. The non-U.S. research analysts listed below may not be associated persons of CSSU and therefore may not be subject to the NASD Rule 2711 and NYSE Rule 472 restrictions on communications with a subject company, public appearances and trading securities held by a research analyst account. • Foong Wai Loke, non-U.S. analyst, is a research analyst employed by Credit Suisse Securities (Malaysia) Sdn Bhd..
For Credit Suisse disclosure information on other companies mentioned in this report, please visit the website at www.credit-suisse.com/researchdisclosures or call +1 (877) 291-2683. Disclaimers continue on next page.

27 November 2012
Asia Pacific
Equity Research
MD0197.doc
References in this report to Credit Suisse include all of the subsidiaries and affiliates of Credit Suisse operating under its investment banking division. For more information on our structure, please use the following link: https://www.credit-suisse.com/who_we_are/en/. This report may contain material that is not directed to, or intended for distribution to or use by, any person or entity who is a citizen or resident of or located in any locality, state, country or other jurisdiction where such distribution, publication, availability or use would be contrary to law or regulation or which would subject Credit Suisse AG or its affiliates ("CS") to any registration or licensing requirement within such jurisdiction. All material presented in this report, unless specifically indicated otherwise, is under copyright to CS. None of the material, nor its content, nor any copy of it, may be altered in any way, transmitted to, copied or distributed to any other party, without the prior express written permission of CS. All trademarks, service marks and logos used in this report are trademarks or service marks or registered trademarks or service marks of CS or its affiliates. The information, tools and material presented in this report are provided to you for information purposes only and are not to be used or considered as an offer or the solicitation of an offer to sell or to buy or subscribe for securities or other financial instruments. CS may not have taken any steps to ensure that the securities referred to in this report are suitable for any particular investor. CS will not treat recipients of this report as its customers by virtue of their receiving this report. The investments and services contained or referred to in this report may not be suitable for you and it is recommended that you consult an independent investment advisor if you are in doubt about such investments or investment services. Nothing in this report constitutes investment, legal, accounting or tax advice, or a representation that any investment or strategy is suitable or appropriate to your individual circumstances, or otherwise constitutes a personal recommendation to you. CS does not advise on the tax consequences of investments and you are advised to contact an independent tax adviser. Please note in particular that the bases and levels of taxation may change. Information and opinions presented in this report have been obtained or derived from sources believed by CS to be reliable, but CS makes no representation as to their accuracy or completeness. CS accepts no liability for loss arising from the use of the material presented in this report, except that this exclusion of liability does not apply to the extent that such liability arises under specific statutes or regulations applicable to CS. This report is not to be relied upon in substitution for the exercise of independent judgment. CS may have issued, and may in the future issue, other communications that are inconsistent with, and reach different conclusions from, the information presented in this report. Those communications reflect the different assumptions, views and analytical methods of the analysts who prepared them and CS is under no obligation to ensure that such other communications are brought to the attention of any recipient of this report. CS may, to the extent permitted by law, participate or invest in financing transactions with the issuer(s) of the securities referred to in this report, perform services for or solicit business from such issuers, and/or have a position or holding, or other material interest, or effect transactions, in such securities or options thereon, or other investments related thereto. In addition, it may make markets in the securities mentioned in the material presented in this report. CS may have, within the last three years, served as manager or co-manager of a public offering of securities for, or currently may make a primary market in issues of, any or all of the entities mentioned in this report or may be providing, or have provided within the previous 12 months, significant advice or investment services in relation to the investment concerned or a related investment. Additional information is, subject to duties of confidentiality, available on request. Some investments referred to in this report will be offered solely by a single entity and in the case of some investments solely by CS, or an associate of CS or CS may be the only market maker in such investments. Past performance should not be taken as an indication or guarantee of future performance, and no representation or warranty, express or implied, is made regarding future performance. Information, opinions and estimates contained in this report reflect a judgment at its original date of publication by CS and are subject to change without notice. The price, value of and income from any of the securities or financial instruments mentioned in this report can fall as well as rise. The value of securities and financial instruments is subject to exchange rate fluctuation that may have a positive or adverse effect on the price or income of such securities or financial instruments. Investors in securities such as ADR's, the values of which are influenced by currency volatility, effectively assume this risk. Structured securities are complex instruments, typically involve a high degree of risk and are intended for sale only to sophisticated investors who are capable of understanding and assuming the risks involved. The market value of any structured security may be affected by changes in economic, financial and political factors (including, but not limited to, spot and forward interest and exchange rates), time to maturity, market conditions and volatility, and the credit quality of any issuer or reference issuer. Any investor interested in purchasing a structured product should conduct their own investigation and analysis of the product and consult with their own professional advisers as to the risks involved in making such a purchase. Some investments discussed in this report may have a high level of volatility. High volatility investments may experience sudden and large falls in their value causing losses when that investment is realised. Those losses may equal your original investment. Indeed, in the case of some investments the potential losses may exceed the amount of initial investment and, in such circumstances, you may be required to pay more money to support those losses. Income yields from investments may fluctuate and, in consequence, initial capital paid to make the investment may be used as part of that income yield. Some investments may not be readily realisable and it may be difficult to sell or realise those investments, similarly it may prove difficult for you to obtain reliable information about the value, or risks, to which such an investment is exposed. This report may provide the addresses of, or contain hyperlinks to, websites. Except to the extent to which the report refers to website material of CS, CS has not reviewed any such site and takes no responsibility for the content contained therein. Such address or hyperlink (including addresses or hyperlinks to CS's own website material) is provided solely for your convenience and information and the content of any such website does not in any way form part of this document. Accessing such website or following such link through this report or CS's website shall be at your own risk. This report is issued and distributed in Europe (except Switzerland) by Credit Suisse Securities (Europe) Limited, One Cabot Square, London E14 4QJ, England, which is regulated in the United Kingdom by The Financial Services Authority ("FSA"). This report is being distributed in Germany by Credit Suisse Securities (Europe) Limited Niederlassung Frankfurt am Main regulated by the Bundesanstalt fuer Finanzdienstleistungsaufsicht ("BaFin"). This report is being distributed in the United States and Canada by Credit Suisse Securities (USA) LLC; in Switzerland by Credit Suisse AG; in Brazil by Banco de Investimentos Credit Suisse (Brasil) S.A or its affiliates; in Mexico by Banco Credit Suisse (México), S.A. (transactions related to the securities mentioned in this report will only be effected in compliance with applicable regulation); in Japan by Credit Suisse Securities (Japan) Limited, Financial Instruments Firm, Director-General of Kanto Local Finance Bureau (Kinsho) No. 66, a member of Japan Securities Dealers Association, The Financial Futures Association of Japan, Japan Investment Advisers Association, Type II Financial Instruments Firms Association; elsewhere in Asia/ Pacific by whichever of the following is the appropriately authorised entity in the relevant jurisdiction: Credit Suisse (Hong Kong) Limited, Credit Suisse Equities (Australia) Limited, Credit Suisse Securities (Thailand) Limited, Credit Suisse Securities (Malaysia) Sdn Bhd, Credit Suisse AG, Singapore Branch, Credit Suisse Securities (India) Private Limited regulated by the Securities and Exchange Board of India (registration Nos. INB230970637; INF230970637; INB010970631; INF010970631), having registered address at 9th Floor, Ceejay House,Dr.A.B. Road, Worli, Mumbai - 18, India, T- +91-22 6777 3777, Credit Suisse Securities (Europe) Limited, Seoul Branch, Credit Suisse AG, Taipei Securities Branch, PT Credit Suisse Securities Indonesia, Credit Suisse Securities (Philippines ) Inc., and elsewhere in the world by the relevant authorised affiliate of the above. Research on Taiwanese securities produced by Credit Suisse AG, Taipei Securities Branch has been prepared by a registered Senior Business Person. Research provided to residents of Malaysia is authorised by the Head of Research for Credit Suisse Securities (Malaysia) Sdn Bhd, to whom they should direct any queries on +603 2723 2020. This research may not conform to Canadian disclosure requirements. In jurisdictions where CS is not already registered or licensed to trade in securities, transactions will only be effected in accordance with applicable securities legislation, which will vary from jurisdiction to jurisdiction and may require that the trade be made in accordance with applicable exemptions from registration or licensing requirements. Non-U.S. customers wishing to effect a transaction should contact a CS entity in their local jurisdiction unless governing law permits otherwise. U.S. customers wishing to effect a transaction should do so only by contacting a representative at Credit Suisse Securities (USA) LLC in the U.S. Please note that this research was originally prepared and issued by CS for distribution to their market professional and institutional investor customers. Recipients who are not market professional or institutional investor customers of CS should seek the advice of their independent financial advisor prior to taking any investment decision based on this report or for any necessary explanation of its contents. This research may relate to investments or services of a person outside of the UK or to other matters which are not regulated by the FSA or in respect of which the protections of the FSA for private customers and/or the UK compensation scheme may not be available, and further details as to where this may be the case are available upon request in respect of this report. CS may provide various services to US municipal entities or obligated persons ("municipalities"), including suggesting individual transactions or trades and entering into such transactions. Any services CS provides to municipalities are not viewed as "advice" within the meaning of Section 975 of the Dodd-Frank Wall Street Reform and Consumer Protection Act. CS is providing any such services and related information solely on an arm's length basis and not as an advisor or fiduciary to the municipality. In connection with the provision of the any such services, there is no agreement, direct or indirect, between any municipality (including the officials, management, employees or agents thereof) and CS for CS to provide advice to the municipality. Municipalities should consult with their financial, accounting and legal advisors regarding any such services provided by CS. In addition, CS is not acting for direct or indirect compensation to solicit the municipality on behalf of an unaffiliated broker, dealer, municipal securities dealer, municipal advisor, or investment adviser for the purpose of obtaining or retaining an engagement by the municipality for or in connection with Municipal Financial Products, the issuance of municipal securities, or of an investment adviser to provide investment advisory services to or on behalf of the municipality. If this report is being distributed by a financial institution other than Credit Suisse AG, or its affiliates, that financial institution is solely responsible for distribution. Clients of that institution should contact that institution to effect a transaction in the securities mentioned in this report or require further information. This report does not constitute investment advice by Credit Suisse to the clients of the distributing financial institution, and neither Credit Suisse AG, its affiliates, and their respective officers, directors and employees accept any liability whatsoever for any direct or consequential loss arising from their use of this report or its content. Principal is not guaranteed. Commission is the commission rate or the amount agreed with a customer when setting up an account or at any time after that.
Copyright © 2012 CREDIT SUISSE AG and/or its affiliates. All rights reserved.
Investment principal on bonds can be eroded depending on sale price or market price. In addition, there are bonds on which investment principal can be eroded due to changes in redemption amounts. Care is required when investing in such instruments. When you purchase non-listed Japanese fixed income securities (Japanese government bonds, Japanese municipal bonds, Japanese government guaranteed bonds, Japanese corporate bonds) from CS as a seller, you will be requested to pay the purchase price only.