The Kroger Co. (KR) - Credit Suisse
49
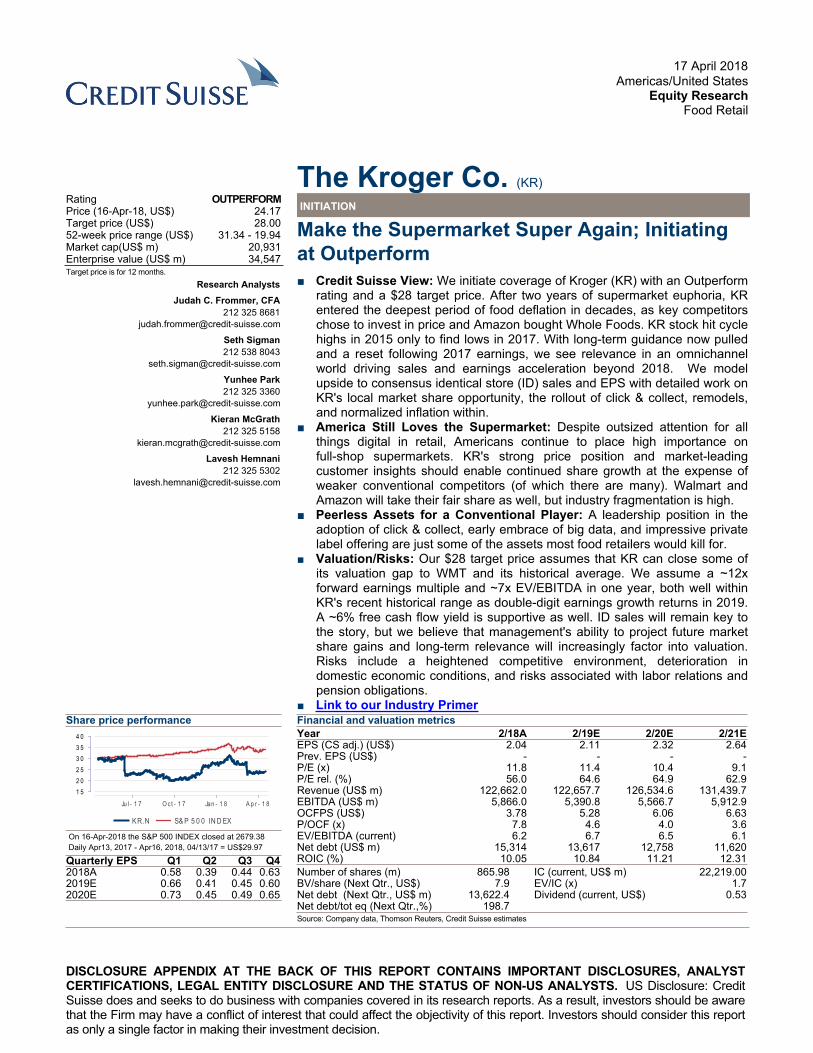
DISCLOSURE APPENDIX AT THE BACK OF THIS REPORT CONTAINS IMPORTANT DISCLOSURES, ANALYST CERTIFICATIONS, LEGAL ENTITY DISCLOSURE AND THE STATUS OF NON-US ANALYSTS. US Disclosure: Credit Suisse does and seeks to do business with companies covered in its research reports. As a result, investors should be aware that the Firm may have a conflict of interest that could affect the objectivity of this report. Investors should consider this report as only a single factor in making their investment decision. 17 April 2018 Americas/United States Equity Research Food Retail The Kroger Co. (KR) INITIATION Rating OUTPERFORM Price (16-Apr-18, US$) 24.17 Target price (US$) 28.00 52-week price range (US$) 31.34 - 19.94 Market cap(US$ m) 20,931 Enterprise value (US$ m) 34,547 Target price is for 12 months. Research Analysts Judah C. Frommer, CFA 212 325 8681 [email protected] Seth Sigman 212 538 8043 [email protected] Yunhee Park 212 325 3360 [email protected] Kieran McGrath 212 325 5158 [email protected] Lavesh Hemnani 212 325 5302 [email protected] Make the Supermarket Super Again; Initiating at Outperform ■ Credit Suisse View: We initiate coverage of Kroger (KR) with an Outperform rating and a $28 target price. After two years of supermarket euphoria, KR entered the deepest period of food deflation in decades, as key competitors chose to invest in price and Amazon bought Whole Foods. KR stock hit cycle highs in 2015 only to find lows in 2017. With long-term guidance now pulled and a reset following 2017 earnings, we see relevance in an omnichannel world driving sales and earnings acceleration beyond 2018. We model upside to consensus identical store (ID) sales and EPS with detailed work on KR's local market share opportunity, the rollout of click & collect, remodels, and normalized inflation within. ■ America Still Loves the Supermarket: Despite outsized attention for all things digital in retail, Americans continue to place high importance on full-shop supermarkets. KR's strong price position and market-leading customer insights should enable continued share growth at the expense of weaker conventional competitors (of which there are many). Walmart and Amazon will take their fair share as well, but industry fragmentation is high. ■ Peerless Assets for a Conventional Player: A leadership position in the adoption of click & collect, early embrace of big data, and impressive private label offering are just some of the assets most food retailers would kill for. ■ Valuation/Risks: Our $28 target price assumes that KR can close some of its valuation gap to WMT and its historical average. We assume a ~12x forward earnings multiple and ~7x EV/EBITDA in one year, both well within KR's recent historical range as double-digit earnings growth returns in 2019. A ~6% free cash flow yield is supportive as well. ID sales will remain key to the story, but we believe that management's ability to project future market share gains and long-term relevance will increasingly factor into valuation. Risks include a heightened competitive environment, deterioration in domestic economic conditions, and risks associated with labor relations and pension obligations. ■ Link to our Industry Primer Share price performance KR.N S&P 500 INDEX Ju l- 1 7 Oct-17 Jan - 1 8 Apr-18 15 20 25 30 35 40 On 16-Apr-2018 the S&P 500 INDEX closed at 2679.38 Daily Apr13, 2017 - Apr16, 2018, 04/13/17 = US$29.97 Quarterly EPS Q1 Q2 Q3 Q4 2018A 0.58 0.39 0.44 0.63 2019E 0.66 0.41 0.45 0.60 2020E 0.73 0.45 0.49 0.65 Financial and valuation metrics Year 2/18A 2/19E 2/20E 2/21E EPS (CS adj.) (US$) 2.04 2.11 2.32 2.64 Prev. EPS (US$) - - - - P/E (x) 11.8 11.4 10.4 9.1 P/E rel. (%) 56.0 64.6 64.9 62.9 Revenue (US$ m) 122,662.0 122,657.7 126,534.6 131,439.7 EBITDA (US$ m) 5,866.0 5,390.8 5,566.7 5,912.9 OCFPS (US$) 3.78 5.28 6.06 6.63 P/OCF (x) 7.8 4.6 4.0 3.6 EV/EBITDA (current) 6.2 6.7 6.5 6.1 Net debt (US$ m) 15,314 13,617 12,758 11,620 ROIC (%) 10.05 10.84 11.21 12.31 Number of shares (m) 865.98 IC (current, US$ m) 22,219.00 BV/share (Next Qtr., US$) 7.9 EV/IC (x) 1.7 Net debt (Next Qtr., US$ m) 13,622.4 Dividend (current, US$) 0.53 Net debt/tot eq (Next Qtr.,%) 198.7 Source: Company data, Thomson Reuters, Credit Suisse estimates
-
Upload
khangminh22 -
Category
Documents
-
view
3 -
download
0
Transcript of The Kroger Co. (KR) - Credit Suisse
DISCLOSURE APPENDIX AT THE BACK OF THIS REPORT CONTAINS IMPORTANT DISCLOSURES, ANALYST CERTIFICATIONS, LEGAL ENTITY DISCLOSURE AND THE STATUS OF NON-US ANALYSTS. US Disclosure: Credit Suisse does and seeks to do business with companies covered in its research reports. As a result, investors should be aware that the Firm may have a conflict of interest that could affect the objectivity of this report. Investors should consider this report as only a single factor in making their investment decision.
17 April 2018Americas/United States
Equity ResearchFood Retail
The Kroger Co. (KR)
INITIATION Rating OUTPERFORMPrice (16-Apr-18, US$) 24.17Target price (US$) 28.0052-week price range (US$) 31.34 - 19.94Market cap(US$ m) 20,931Enterprise value (US$ m) 34,547Target price is for 12 months.
Research AnalystsJudah C. Frommer, CFA
212 325 [email protected]
Seth Sigman212 538 8043
Yunhee Park212 325 3360
Kieran McGrath212 325 5158
Lavesh Hemnani212 325 5302
Make the Supermarket Super Again; Initiating at Outperform■ Credit Suisse View: We initiate coverage of Kroger (KR) with an Outperform
rating and a $28 target price. After two years of supermarket euphoria, KR entered the deepest period of food deflation in decades, as key competitors chose to invest in price and Amazon bought Whole Foods. KR stock hit cycle highs in 2015 only to find lows in 2017. With long-term guidance now pulled and a reset following 2017 earnings, we see relevance in an omnichannel world driving sales and earnings acceleration beyond 2018. We model upside to consensus identical store (ID) sales and EPS with detailed work on KR's local market share opportunity, the rollout of click & collect, remodels, and normalized inflation within.
■ America Still Loves the Supermarket: Despite outsized attention for all things digital in retail, Americans continue to place high importance on full-shop supermarkets. KR's strong price position and market-leading customer insights should enable continued share growth at the expense of weaker conventional competitors (of which there are many). Walmart and Amazon will take their fair share as well, but industry fragmentation is high.
■ Peerless Assets for a Conventional Player: A leadership position in the adoption of click & collect, early embrace of big data, and impressive private label offering are just some of the assets most food retailers would kill for.
■ Valuation/Risks: Our $28 target price assumes that KR can close some of its valuation gap to WMT and its historical average. We assume a ~12x forward earnings multiple and ~7x EV/EBITDA in one year, both well within KR's recent historical range as double-digit earnings growth returns in 2019. A ~6% free cash flow yield is supportive as well. ID sales will remain key to the story, but we believe that management's ability to project future market share gains and long-term relevance will increasingly factor into valuation. Risks include a heightened competitive environment, deterioration in domestic economic conditions, and risks associated with labor relations and pension obligations.
■ Link to our Industry Primer Share price performance
KR.N S& P 5 0 0 IN D EX
Ju l - 1 7 O ct - 1 7 Jan - 1 8 A p r - 1 81 52 02 53 03 54 0
On 16-Apr-2018 the S&P 500 INDEX closed at 2679.38Daily Apr13, 2017 - Apr16, 2018, 04/13/17 = US$29.97
Quarterly EPS Q1 Q2 Q3 Q42018A 0.58 0.39 0.44 0.632019E 0.66 0.41 0.45 0.602020E 0.73 0.45 0.49 0.65
Financial and valuation metricsYear 2/18A 2/19E 2/20E 2/21EEPS (CS adj.) (US$) 2.04 2.11 2.32 2.64Prev. EPS (US$) - - - -P/E (x) 11.8 11.4 10.4 9.1P/E rel. (%) 56.0 64.6 64.9 62.9Revenue (US$ m) 122,662.0 122,657.7 126,534.6 131,439.7EBITDA (US$ m) 5,866.0 5,390.8 5,566.7 5,912.9OCFPS (US$) 3.78 5.28 6.06 6.63P/OCF (x) 7.8 4.6 4.0 3.6EV/EBITDA (current) 6.2 6.7 6.5 6.1Net debt (US$ m) 15,314 13,617 12,758 11,620ROIC (%) 10.05 10.84 11.21 12.31
Number of shares (m) 865.98 IC (current, US$ m) 22,219.00BV/share (Next Qtr., US$) 7.9 EV/IC (x) 1.7Net debt (Next Qtr., US$ m) 13,622.4 Dividend (current, US$) 0.53Net debt/tot eq (Next Qtr.,%) 198.7Source: Company data, Thomson Reuters, Credit Suisse estimates

17 April 2018
The Kroger Co. (KR) 2
The Kroger Co. (KR)Price (16 Apr 2018): US$24.17; Rating: OUTPERFORM; Target Price: US$28.00; Analyst: Judah FrommerIncome Statement 2/18A 2/19E 2/20E 2/21ERevenue (US$ m) 122,662.0 122,657.7 126,534.6 131,439.7EBITDA 5,866 5,391 5,567 5,913Depr. & amort. (2,455) (2,565) (2,655) (2,748)EBIT (US$) 3,411 2,825 2,911 3,165Net interest exp (599) (558) (538) (535)PBT (US$) 2,812 2,267 2,373 2,630Income taxes (971) (499) (522) (579)Profit after tax 1,841 1,768 1,851 2,051Other NPAT adjustments 31 (17) (17) (17)Cash Flow 2/18A 2/19E 2/20E 2/21ECash flow from operations 3,413 4,457 4,876 5,188CAPEX (2,809) (3,000) (3,000) (3,000)Free cashflow to the firm 604 1,457 1,876 2,188Cash flow from investments (2,707) (805) (2,940) (2,940)Net share issue(/repurchase) 51 0 0 0Dividends paid (443) (455) (477) (510)Cashflow from financing activities (2,193) (1,955) (1,077) (1,110)Changes in Net Cash/Debt (1,487) 1,697 859 1,138Balance Sheet (US$) 2/18A 2/19E 2/20E 2/21ECash & cash equivalents 347 774 1,133 1,470Account receivables 1,637 1,621 1,671 1,723Total fixed assets 21,071 19,311 19,595 19,787Investment securities - - - -Total assets 37,228 35,553 36,345 37,029Total current liabilities 14,229 14,632 16,650 18,593Shareholder equity 6,905 6,718 7,492 8,433Total liabilities and equity 37,228 35,553 36,345 37,029Net debt 15,314 13,617 12,758 11,620Per share 2/18A 2/19E 2/20E 2/21ENo. of shares (wtd avg) 902 845 805 782CS adj. EPS 2.04 2.11 2.32 2.64Prev. EPS (US$)Dividend (US$) 0.49 0.54 0.59 0.65Free cash flow per share 0.67 1.73 2.33 2.80Earnings 2/18A 2/19E 2/20E 2/21ESales growth (%) 6.4 (0.0) 3.2 3.9EBIT growth (%) (3.6) (17.2) 3.0 8.7Net profit growth (%) (8.5) (3.9) 4.6 10.7EPS growth (%) (4.0) 3.6 9.9 13.9EBITDA margin (%) 4.8 4.4 4.4 4.5EBIT margin (%) 2.8 2.3 2.3 2.4Pretax margin (%) 2.3 1.8 1.9 2.0Net margin (%) 1.5 1.5 1.5 1.6Valuation 2/18A 2/19E 2/20E 2/21EEV/EBITDA (x) 6.2 6.7 6.5 6.1P/E (x) 11.8 11.4 10.4 9.1Returns 2/18A 2/19E 2/20E 2/21EROIC (%) 10.1 10.8 11.2 12.3Gearing 2/18A 2/19E 2/20E 2/21ENet debt/equity (%) 221.8 202.7 170.3 137.8Quarterly EPS Q1 Q2 Q3 Q42018A 0.58 0.39 0.44 0.632019E 0.66 0.41 0.45 0.602020E 0.73 0.45 0.49 0.65
Company BackgroundKroger is one of the world's largest food retailers. Kroger operates multiple banners with various store formats including grocery and multi-department stores, convenience, and jewelry stores. Kroger was founded in 1883 and headquartered in Cincinnati, OH
Blue/Grey Sky Scenario
Our Blue Sky Scenario (US$) 32.00Our $32 Blue Sky scenario for KR is based on improved top-line momentum through our modeling period with non-fuel IDs in the 3% range, offset to some extent by incremental gross margin pressure, which could translate to earnings and EBITDA upside of ~5% versus our base case in 2019. The improved earnings trajectory would likely garner a ~7.5x EBITDA multiple relative to the ~7x we use in our base case scenario.
Our Grey Sky Scenario (US$) 21.00Our $21 Grey Sky scenario for KR represents a ~6.5x multiple applied to reduced 2019 EBITDA that is ~6% below our base case. A return to ~2% non-fuel IDs, coupled with further operating expense deleverage would likely pressure both earnings and valuation.
Share price performance
KR.N S& P 5 0 0 IN D EX
Ju l - 1 7 O ct - 1 7 Jan - 1 8 A p r - 1 81 52 02 53 03 54 0
On 16-Apr-2018 the S&P 500 INDEX closed at 2679.38Daily Apr13, 2017 - Apr16, 2018, 04/13/17 = US$29.97
Source: Company data, Thomson Reuters, Credit Suisse estimates

17 April 2018
The Kroger Co. (KR) 3
Table of ContentsKey Charts 4
Investment Thesis 5
Groceries Aren't Books; Local Share Trumps All .....................................................5
Broad Toolbox Underappreciated ..........................................................................11
Kroger's Attempt at a Walmart Moment .................................................................19
Valuation 30
The Blue Sky Scenario...........................................................................................31
The Grey Sky Scenario ..........................................................................................31
Key Drivers and Credit Suisse Estimates ..............................................................33
HOLT® Analysis 34
Investment Risks 35
Company Overview 36
Management and Board of Directors 38
Appendix 40
PEERs....................................................................................................................41
Financial Models 42
Operating Results Summary & Financial Analysis.................................................42

17 April 2018
The Kroger Co. (KR) 4
Key ChartsFigure 1: Above-Consensus ID Sales Supported by Bottoms-Up Build
Figure 2: Bull Case on Market Share Gains Even More Compelling
0.0%
0.5%
1.0%
1.5%
2.0%
2.5%
3.0%
3.5%
2018E 2019E 2020E
KR ID Sales Composition
Gap to Total ID
Click & Collect
KR local B&M food channelshare gains of 10-20bps
Space Optimization
Inflation
Cons
0.0%
0.5%
1.0%
1.5%
2.0%
2.5%
3.0%
3.5%
2018E 2019E 2020E
KR ID Sales Composition: Market Share Bull Case
Gap to Total ID
Click & Collect
KR local B&M food channel sharegains of 40bps
Space Optimization
Inflation
Source: Company data, Credit Suisse estimates Source: Company data, Credit Suisse estimates
Figure 3: Plenty of Weaker Players Left to Donate Share
18.8% 20.0% 20.3% 20.7% 20.9% 20.9% 20.9% 20.9% 21.0% 20.9% 21.1%
8.2% 8.3% 8.3% 8.6% 9.1% 9.4% 9.4% 9.9% 9.8% 9.9% 10.3%3.2% 3.3% 3.4% 3.5% 3.7% 3.7% 3.6% 3.4% 3.4% 2.9% 2.8%4.2% 4.4% 4.4% 4.6% 4.7% 5.0% 5.1% 5.2% 4.8% 4.8% 4.9%4.8% 4.9% 5.0% 5.2% 5.3% 5.3% 5.2% 5.1% 4.9% 4.7% 4.5%2.3% 2.4% 2.2% 2.5% 2.7%3.0% 3.0%
19.3% 18.6% 18.2% 19.4% 19.1% 15.9% 17.4% 17.9% 16.7% 16.0% 16.1%
37.0% 35.6% 35.4% 33.3% 32.2% 34.3% 32.6% 30.9% 32.7% 33.5% 32.8%
0.0%
10.0%
20.0%
30.0%
40.0%
50.0%
60.0%
70.0%
80.0%
90.0%
100.0%
2007 2008 2009 2010 2011 2012 2013 2014 2015 2016 2017
Regionals, Independents & Other
Traditional (Ahold Delhaize, HEB,Publix, Meijer)Hard Discounting (ALDI, SAL)
Specialty Formats (WFM, SFM)
Dollar Stores (DG, DLTR)
Drugstores (Front-end)
Warehouse Clubs (COST, BJ's)
Discounters (TGT, Kmart)
Kroger
WMT (US+Sam's)
Source: Euromonitor, Supermarket News, Company data, Credit Suisse estimates.
Figure 4: KR Share Price Could Inflect With IDs… Figure 5: …Driven In Part by Improved Valuation
$10.0
$15.0
$20.0
$25.0
$30.0
$35.0
$40.0
$45.0
$50.0
-2.0%
-1.0%
0.0%
1.0%
2.0%
3.0%
4.0%
5.0%
6.0%
7.0%
1Q14
2Q14
3Q14
4Q14
1Q15
2Q15
3Q15
4Q15
1Q16
2Q16
3Q16
4Q16
1Q17
2Q17
3Q17
4Q17
1Q18
2Q18
3Q18
4Q18
1Q19
2Q19
3Q19
4Q19
1Q20
2Q20
3Q20
4Q20
Non-Fuel IDs Non-Fuel IDs CS Est Price
0.0x
5.0x
10.0x
15.0x
20.0x
25.0x
-2.0%
-1.0%
0.0%
1.0%
2.0%
3.0%
4.0%
5.0%
6.0%
7.0%
1Q14
2Q14
3Q14
4Q14
1Q15
2Q15
3Q15
4Q15
1Q16
2Q16
3Q16
4Q16
1Q17
2Q17
3Q17
4Q17
1Q18
2Q18
3Q18
4Q18
1Q19
2Q19
3Q19
4Q19
1Q20
2Q20
3Q20
4Q20
Non-Fuel IDs Non-Fuel IDs CS Est NTM Fwd PE
Source: Company data, Thomson Reuters, Credit Suisse estimates. Source: Company data, Thomson Reuters, Credit Suisse estimates.

17 April 2018
The Kroger Co. (KR) 5
Investment ThesisKroger is the second largest traditional food retailer in the United States, behind Walmart, but finds itself in the throes of a rapidly evolving consumer staples retail landscape. Supermarket stocks have long been trading vehicles, subject to cyclical pressures and tailwinds such as inflation, gas prices, and the overall macroeconomic environment. With valuation back in KR's historical reasonable range and an underappreciated stable of long-term market share building assets, we believe top-line drivers are evident and credit for the investment is due.
Well-managed supermarkets have a material market share growth opportunity as consumers likely look to consolidate trips toward those with the broadest offering and omnichannel options proliferate; why not buy as much as you can when potentially paying a fixed fee for pick-up or delivery? At the same time, weaker conventional players continue to fall by the wayside and those sales should disproportionately transfer to stronger, local traditional operators, we believe.
Figure 6: KR Stock Chart 2000–Present (04/16/2018)
$0.0
$5.0
$10.0
$15.0
$20.0
$25.0
$30.0
$35.0
$40.0
$45.0
2000
2001
2002
2003
2004
2005
2006
2007
2008
2009
2010
2011
2012
2013
2014
2015
2016
2017
2018
Source: Thomson Reuters, Company data, Credit Suisse estimates.
Groceries Aren't Books; Local Share Trumps AllAmazon's entry into the supermarket fray has diverted investor attention away from the importance of local market share in this industry. The high fixed cost structure of the grocery business and limited shelf life of fresh product benefits those can amortize expense across multiple locations. Advertising, promotion, distribution, and even labor costs can be leveraged by many or all stores in a given area.
Competition has increased over the past decade, as the United States has embraced Walmart, club stores, discounters, and small-format natural/organic players. These operators have attacked KR in its core markets, but KR has maintained top-tier share across the board (inclusive of acquired chains).
The supermarket channel still represents >30% of food at home spend in this country, per our estimates, and a well-run traditional supermarket still provides a compelling offering. We firmly believe that strong supermarkets will continue to play a meaningful role in U.S. food retail as shoppers look to consolidate trips to operators with full shopability - a broad SKU offering, prepared foods, online capabilities, and inviting stores.

17 April 2018
The Kroger Co. (KR) 6
Figure 7: Supermarkets Deliver Unparalleled In-Store Experience
Source: Temkin; n=10,000
Industry data support the supermarket's importance in the food channel, with 47% of Americans surveyed saying a supermarket is their primary grocery store format. This level has come down, even in recent years, but the full-service supermarket remains the most frequently visited format in the industry. As weaker players continue to close doors, we believe stronger traditional operators, of which KR is one, will benefit disproportionately.
Figure 8: Channels of Primary Store
67%
22%
7%2% 1% 1%
56%
27%
6%2%
7%2%
<1%
52%
23%
6%2% 4% 3%
9%
49%
25%
5%2%
7%3% 2%
7%
47%
24%
5% 3% 5%2%
5%8%
0%
10%
20%
30%
40%
50%
60%
70%
80%
Supermarket Supercenter Warehouse Discount Limited Assortment Organic/Specialty Other Channels No Primary Store
2005 2010 2015 2016 2017
Source: FMI, Credit Suisse estimates.

17 April 2018
The Kroger Co. (KR) 7
Americans continue to make multiple grocery shopping trips every week, despite the rising popularity of e-commerce options. Average spend per trip has been rising, which is consistent with commentary out of KR, and frequency of shop appears to have bottomed at ~1.5-1.6 trips per week.
Figure 9: Average Weekly Shopping Trips Figure 10: Average Weekly Spend on Grocery
2.22.1
1.9 1.92.0
2.1
1.7
2.2
1.71.6
1.51.6
1.2
1.4
1.6
1.8
2
2.2
2.4
2005 2006 2007 2008 2009 2010 2011 2012 2013 2014 2015 2016 2017
Average Weekly Shopping Trips to Grocery Store
93.2
97.8 98.499.9
97.3
104.9 105.5102.9
100.8
107.3109.7
$80.0
$85.0
$90.0
$95.0
$100.0
$105.0
$110.0
$115.0
2007 2008 2009 2010 2011 2012 2013 2014 2015 2016 2017
Weekly Spending on Grocery
Source: FMI, Credit Suisse estimates. Source: FMI, Credit Suisse estimates.
The Easy Way to Grow Market Share: Pick on the Weaklings
KR has had to contend with Walmart, clubs, discounters, specialty stores and the advent of online grocery over the past decade, but remains a top-three player in virtually all of its most stored areas. The share takers in most of these markets have been mass merchants, clubs, or specialty players, while primary share donors have been weaker conventional players - evidence of KR's ability to grow share among traditional supermarket players. KR must defend its market share against all grocery competition, but the rapidly evolving U.S. market is presenting a rare market share growth opportunity; simply take the share from weaker conventional operators.
Figure 11: KR’s Market Share Position Change 2016 vs. 2013Kroger Market Share Position Note Kroger Stores
MSA 2016 2013 ∆ Takers DonorsLos Angeles-Orange, CA 1 1 - WMT, WFM, TJ's, SFS COST, ABS, TGT, Stater Bro's
Atlanta, GA 3 3 - WMT, COST, Aldi Publix , Ingles, TGT, WFMHouston, TX 3 2 (1) WMT, HEB, COST, WFM ABS, TGTPhoenix , AZ 1 1 - WMT, SFM, TJ's ABS, Basha's, COST, TGT
Dallas-Fort Worth, TX 2 3 1 WMT, WFM, Aldi ABS, TGT, COSTDetroit, MI 1 1 - Meijer, WFM, TJ's WMT, COST, GFS
Seattle, WA 1 2 1 COST, WMT, TJ's ABS, WinCo, HaagenDenver, CO 1 1 - WMT, SFM, TJ's, NGVC ABS, COST, TGT
Cincinnati, OH 1 1 - COST, WFM,Houchen's WMT, Meijer, Remke, TGTColumbus, OH 1 1 - WMT, COST, WFM Meijer, TGT
Chicago, IL 3 4 1 WMT, WFM, TJ's ABS, SVT, TGTCharlotte, NC 2 1 (1) WMT, WFM, BJ's, TFM Southeastern, Ahold, TGT, COST
Milwaukee, WI 1 1 - WMT, COST, WFM Piggly Wiggly , Woodman's, TGTNashville, TN 2 2 - WMT, WFM, SFM Ahold, Publix , COST
Indianapolis-Carmel-Anderson, IN 1 2 1 Meijer, COST, WFM Marsh, TGT, GFSRiverside-San Bernardino, CA 4 3 (1) WMT, SFS, SFM Stater Bro's, ABS, Winco
Portland, OR-WA 2 2 - WMT, WFM, TJ's ABS, WinCo, COSTRaleigh-Cary, NC 1 2 1 COST, SFM WMT, Ahold, Lowe's
Memphis, TN 2 1 (1) WMT, WFM, TFM, Associated COST, TGT, S-A-LWashington, DC 5 6 1 WMT, Weis, WFM, Wegman's Ahold, ABSLas Vegas, NV 2 3 1 WMT, COST, TJ's, SFS, SFM ABS, TescoSan Diego, CA 3 3 - WMT, SFS, SFM, TJ's ABS, COST
Salt Lake City , UT 2 2 - COST, SFM, TJ's, ABS Harmon's, WinCo, Ream'sVirginia Beach-Norfolk-Newport News, VA 3 4 1 WMT, WFM, TFM Ahold, SVU,BJ's
Wichita, KS 2 2 - COST, Aldi, SFM, NGVC WMT, TGT, Leeker's FamDayton, OH 1 1 - COST, TJ's WMT, Meijer,GFS, MarshTucson, AZ 2 1 (1) WMT, SFM ABS, COST, Basha's
Little Rock, AR 2 2 - GES, WFM WMT, Harp's, Knight's
Source: Metro Market Studies 2017 & 2014, Credit Suisse estimates; note: ABS = Albertsons, TJ's = Trader Joe's, SAL = Save-A-Lot , GES= Edwards Food Giant, GFS = Gordon Food Service

17 April 2018
The Kroger Co. (KR) 8
The outlook for independent grocers being put forward by industry consultants is not pretty; Euromonitor sees this cohort as the only one ceding sales in the near-term and Willard Bishop is exceedingly negative on traditional supermarkets. Herein lies KR's continued opportunity to gain share. Channel checks indicate that shuttered supermarket sales are most often transferred to another full-shop format, namely another supermarket or WMT.
Figure 12: Historical and Projected Growth by Channel (2016-2021 CAGR)
Discounters$17B
Forecourt Retailer$143B
Hypermarket$316B
Convenience$27B
Supermarket$371B
Food/Drink/TobaccoSpec$68B
Independent Small Grocers
$73B
Other$5.3B
-1.0%
0.0%
1.0%
2.0%
3.0%
4.0%
5.0%
6.0%
7.0%
8.0%
9.0%
-1.0% 0.0% 1.0% 2.0% 3.0% 4.0% 5.0% 6.0%
2003
-20
16 C
AGR
2016 - 2021E CAGR
Source: Euromonitor, Credit Suisse estimates
Figure 13: Projected Annual Growth by Channel (2016-2021E Sales CAGR) Figure 14: Store Count by Channel 2016 vs. 2021E
8.0%
4.8% 4.5%
3.1% 3.0% 3.0% 2.6%2.0%
1.0% 0.9%-0.3%
-5.2%-6.0%
-4.0%
-2.0%
0.0%
2.0%
4.0%
6.0%
8.0%
10.0%
Limite
d Ass
ortm
ent
Fres
h For
mat
Supe
r war
ehou
se
Supe
rcente
r
Dolla
r
Who
lesale
Club
Othe
r sma
ll gro
cery
Conv
enien
ce S
tore
Drug
Millit
ary
Trad
itiona
l
Mass
2016 Store Counts 2021 Store Counts % ∆ in Store CountsTraditional Supermarkets 25,380 19,132 -24.6%Fresh Format 1,547 2,290 48.0%Limited Assortment 4,093 4,963 21.3%Super Warehouse 730 947 29.7%Other (Small Grocery) 8,748 8,878 1.5%Convenience (w/gas) 130,755 132,203 1.1%Convenience (w/o gas) 30,297 30,633 1.1%Wholesale club 1,472 1,613 9.6%Supercenter 4,106 4,560 11.1%Dollar 30,496 37,964 24.5%Drug 23,607 24,202 2.5%Mass 2,775 1,904 -31.4%Millitary 178 164 -7.9%
Source: Inmar Willard Bishop, Credit Suisse estimates Source: Inmar Willard Bishop, Credit Suisse estimates
Impressive Track Record of Local Market Share Gains Underlies Opportunity Take the recently announced bankruptcies of Tops Markets and Southeastern Grocers (Winn-Dixie parent), and even SVU's sale of its former Albertsons stores back to Albertsons; not to mention the shuttering of its Farm Fresh banner (with most stores going to KR) - stronger supermarkets are the winners when weaker competition closes. At its October 2017 Analyst Day, management cited $120 billion as the magnitude of competitors' brick-and-mortar food channel sales that KR could chip away at, roughly the size of total KR company sales today. There is also the $150 billion non-food channel opportunity that KR is increasingly focused on.

17 April 2018
The Kroger Co. (KR) 9
Figure 15: Very Long Runway for Local Market Share Growth for KR
KR Market Share Opportunity Within Local Markets (ex-fuel, Rx, most gen merch)
KR 2017 Sales ex-Fuel, Pharmacy, some GM
Non-Food Channel in KR Markets ($150bn)
Food Channel in KR Markets ($120bn)
Source: Company data, Credit Suisse estimates
Our bottom-up build of market share in U.S. food retail further underscores the market share opportunity available to stronger players, as weaker operators continue to cede share. Similar to the story shown in Figure 16, unconventional formats have grown store counts and share at the expense of traditional players over the past decade. Among traditional players, however, there are those top-tier operators that have maintained or grown share, and we estimate >20% of the market is still in the hands of longer-term share donors. A trip to a supermarket is most easily replaced by a trip to another supermarket, in our view.
Figure 16: Plenty of Weaker Players Left to Donate Share
18.8% 20.0% 20.3% 20.7% 20.9% 20.9% 20.9% 20.9% 21.0% 20.9% 21.1%
8.2% 8.3% 8.3% 8.6% 9.1% 9.4% 9.4% 9.9% 9.8% 9.9% 10.3%3.2% 3.3% 3.4% 3.5% 3.7% 3.7% 3.6% 3.4% 3.4% 2.9% 2.8%4.2% 4.4% 4.4% 4.6% 4.7% 5.0% 5.1% 5.2% 4.8% 4.8% 4.9%4.8% 4.9% 5.0% 5.2% 5.3% 5.3% 5.2% 5.1% 4.9% 4.7% 4.5%
2.3% 2.4% 2.2% 2.5% 2.7%3.0% 3.0%
19.3% 18.6% 18.2% 19.4% 19.1% 15.9% 17.4% 17.9% 16.7% 16.0% 16.1%
37.0% 35.6% 35.4% 33.3% 32.2% 34.3% 32.6% 30.9% 32.7% 33.5% 32.8%
0.0%
10.0%
20.0%
30.0%
40.0%
50.0%
60.0%
70.0%
80.0%
90.0%
100.0%
2007 2008 2009 2010 2011 2012 2013 2014 2015 2016 2017
Regionals, Independents & Other
Traditional (Ahold Delhaize, HEB,Publix, Meijer)
Hard Discounting (ALDI, SAL)
Specialty Formats (WFM, SFM)
Dollar Stores (DG, DLTR)
Drugstores (Front-end)
Warehouse Clubs (COST, BJ's)
Discounters (TGT, Kmart)
Kroger
WMT (US+Sam's)
Source: Euromonitor, Supermarket News, Company data, Credit Suisse estimates.

17 April 2018
The Kroger Co. (KR) 10
Figure 17: Food and Consumables Market Share, 2017
21.2%
10.3%
5.2% 4.3%2.9% 2.6% 2.2% 2.2% 1.9% 1.6% 1.6% 1.5% 1.5% 1.4% 1.3% 1.2% 1.1% 0.7% 0.5% 0.4% 0.4% 0.4%
0.0%
5.0%
10.0%
15.0%
20.0%
25.0%W
MT+
Sam'
s
Krog
er
Albe
rtson
s
Costc
o
Publi
x
Targ
et
Walg
reen
s
Ahold
(US)
HEB
Meije
r
CVS DG
Delha
ize (U
S)
ALDI
Who
le Fo
ods
Dolla
r Tre
e
Trad
er Jo
e's
Rite
Aid BJ
Save
-A-L
ot
Spro
uts
Supe
rvalu
Source: Euromonitor, Supermarket News, Company data, Credit Suisse estimates.
Figure 18: Food and Consumables Market Share, 2004–2017 Food Retailing Market Share 2004 2005 2006 2007 2008 2009 2010 2011 2012 2013 2014 2015 2016 2017
Total Grocery Market (CS Estimate) 722,981 768,561 809,392 859,258 913,148 928,538 950,752 988,717 1,029,525 1,051,209 1,095,100 1,124,815 1,164,781 1,187,643
Discounters 15.4% 16.1% 17.9% 18.8% 20.0% 20.5% 21.0% 21.3% 21.3% 21.1% 21.1% 21.2% 20.6% 20.7%Wal-Mart stores 12.7% 13.4% 14.8% 15.6% 16.7% 17.1% 17.5% 17.6% 17.6% 17.5% 17.6% 17.8% 17.7% 18.0%Target stores 1.8% 2.0% 2.4% 2.5% 2.6% 2.7% 2.9% 3.1% 3.2% 3.1% 3.1% 3.1% 2.6% 2.6%Kmart (4) 0.8% 0.7% 0.7% 0.7% 0.7% 0.7% 0.6% 0.6% 0.5% 0.5% 0.4% 0.3% 0.3% 0.2%
Warehouse Clubs 7.7% 7.8% 7.3% 7.4% 7.7% 7.7% 7.8% 7.9% 8.3% 8.4% 8.5% 8.1% 8.0% 8.1%Costco 3.9% 4.0% 3.5% 3.6% 3.7% 3.7% 3.8% 3.9% 4.3% 4.4% 4.5% 4.3% 4.2% 4.3%BJ 0.6% 0.6% 0.6% 0.6% 0.7% 0.7% 0.7% 0.7% 0.7% 0.7% 0.7% 0.6% 0.5% 0.5%Sam's Club 3.2% 3.2% 3.1% 3.1% 3.3% 3.2% 3.2% 3.3% 3.3% 3.3% 3.3% 3.2% 3.2% 3.2%
Drugstores (Front-end) 4.0% 4.1% 4.4% 4.8% 4.9% 5.0% 5.2% 5.3% 5.3% 5.2% 5.1% 4.9% 4.7% 4.5%CVS 1.3% 1.3% 1.5% 1.7% 1.7% 1.8% 1.9% 1.9% 1.9% 1.9% 1.8% 1.7% 1.6% 1.6%Walgreens 1.9% 2.0% 2.1% 2.2% 2.3% 2.4% 2.5% 2.6% 2.6% 2.5% 2.5% 2.4% 2.4% 2.2%Rite Aid 0.8% 0.8% 0.8% 0.9% 0.9% 0.9% 0.8% 0.8% 0.8% 0.8% 0.8% 0.7% 0.7% 0.7%
Dollar Stores 1.4% 1.5% 1.6% 1.6% 1.6% 1.8% 1.9% 2.1% 2.2% 2.3% 2.4% 2.2% 2.5% 2.7%Family Dollar (1) 0.6% 0.6% 0.6% 0.6% 0.6% 0.6% 0.6% 0.7% 0.7% 0.7% 0.7% Acq by DLTRDollar General (2) 0.7% 0.7% 0.7% 0.7% 0.8% 0.9% 1.0% 1.1% 1.2% 1.3% 1.3% 1.4% 1.4% 1.5%Dollar Tree (3) 0.2% 0.2% 0.2% 0.2% 0.2% 0.3% 0.3% 0.3% 0.4% 0.4% 0.4% 0.9% 1.1% 1.2%
Specialty Formats 1.1% 1.3% 1.4% 1.5% 1.7% 1.8% 1.9% 2.2% 2.4% 2.6% 2.8% 3.0% 3.0% 3.0%Whole Foods 0.5% 0.6% 0.7% 0.8% 0.9% 0.9% 0.9% 1.0% 1.1% 1.2% 1.3% 1.4% 1.3% 1.3%Trader Joe's (4) 0.4% 0.5% 0.5% 0.6% 0.6% 0.7% 0.7% 0.9% 0.9% 1.0% 1.1% 1.2% 1.1% 1.1%Sprouts -- -- -- -- 0.1% 0.1% 0.2% 0.2% 0.2% 0.2% 0.3% 0.3% 0.3% 0.4%The Fresh Market -- 0.1% 0.1% 0.1% 0.1% 0.1% 0.1% 0.1% 0.1% 0.1% 0.2% 0.2% 0.2% 0.1%
Hard Discounting 1.4% 1.4% 1.4% 1.4% 1.5% 1.4% 0.7% 0.7% 0.9% 0.8% 1.4% 1.5% 1.7% 1.9%ALDI (4) 0.6% 0.6% 0.6% 0.7% 0.7% 0.7% 0.7% 0.7% 0.8% 0.8% 0.9% 1.0% 1.2% 1.4%Save-A-Lot (4) 0.9% 0.8% 0.7% 0.7% 0.7% 0.6% 0.0% 0.0% 0.0% 0.0% 0.4% 0.4% 0.4% 0.4%
Total - Major Non-Traditional Retailers 31.0% 32.3% 34.0% 35.5% 37.4% 38.1% 38.6% 39.6% 40.4% 40.6% 41.3% 40.9% 40.6% 40.9%
Traditional - Big Three 19.0% 18.5% 17.6% 17.8% 17.5% 16.5% 16.4% 16.3% 13.6% 15.1% 16.2% 15.4% 15.4% 15.9%Kroger 7.8% 7.9% 8.2% 8.2% 8.3% 8.3% 8.6% 9.1% 9.4% 9.4% 9.9% 9.8% 9.9% 10.3%Supervalu 1.5% 1.4% 3.5% 4.0% 3.8% 3.4% 3.0% 2.4% 0.5% 0.4% 0.4% 0.4% 0.4% 0.4%Albertsons 4.8% 4.5% 1.0% 0.7% 0.5% 0.5% 0.4% 0.4% 0.4% 1.9% 2.5% 5.2% 5.1% 5.2%Safeway 5.0% 4.7% 5.0% 4.9% 4.8% 4.4% 4.3% 4.4% 3.4% 3.3% 3.3% Acq by ABS
Traditional - Other 10.3% 10.2% 9.7% 9.7% 9.5% 10.0% 11.7% 11.9% 11.7% 11.7% 11.6% 11.0% 10.5% 10.6%Ahold (US sales) 3.1% 2.9% 2.5% 2.4% 2.4% 2.5% 2.5% 2.5% 2.5% 2.5% 2.4% 2.3% 2.2% 2.2%Delhaize (US sales) 2.2% 2.2% 2.1% 2.1% 2.1% 2.0% 2.0% 1.9% 1.8% 1.6% 1.6% 1.5% 1.5% 1.5%Harris Teeter 0.4% 0.4% 0.4% 0.4% 0.4% 0.4% 0.5% 0.4% 0.4% 0.4% Acq by KRHEB 1.4% 1.4% 1.4% 1.4% 1.4% 1.4% 1.7% 1.8% 1.9% 2.0% 2.1% 2.0% 1.9% 1.9%Meijer 0.0% 0.0% 0.0% 0.0% 0.0% 0.0% 1.5% 1.5% 1.4% 1.4% 1.4% 1.5% 1.5% 1.6%Publix 2.6% 2.7% 2.7% 2.7% 2.6% 2.6% 2.7% 2.7% 2.7% 2.8% 2.8% 2.9% 2.9% 2.9%Roundy's -- -- -- -- -- 0.4% 0.4% 0.4% 0.4% 0.4% 0.4% 0.4% Acq by KRSpartan Stores 0.3% 0.3% 0.3% 0.3% 0.3% 0.3% 0.3% 0.3% 0.3% 0.3% 0.7% 0.2% 0.2% 0.2%Weis Markets 0.3% 0.3% 0.3% 0.3% 0.3% 0.3% 0.3% 0.3% 0.3% 0.3% 0.3% 0.3% 0.3% 0.3%
Total - Traditional Grocery 29.3% 28.6% 27.3% 27.4% 27.0% 26.5% 28.1% 28.2% 25.3% 26.8% 27.8% 26.4% 25.9% 26.4%Regionals, Independents & Other 39.7% 39.1% 38.7% 37.0% 35.6% 35.4% 33.3% 32.2% 34.3% 32.6% 30.9% 32.7% 33.5% 32.7%
Source: Euromonitor, Supermarket News, Company data, Credit Suisse estimates.
Market share data presented by KR underscores the company's consistent track record of taking market share, a trend we expect to continue and to support our above-consensus ID sales in 2019-2020. Assuming 15 bps of local market share gains annually (the low end of the trend over the last 3 years) within just the ~$120 billion brick-and-mortar food channel market opportunity gets KR within 40 bps of our total ex-fuel ID level. An upside scenario of 40 bps of market share gains (closer to the prior 3-year average) leaves just a 10 bps gap to the total ID. The gap can be closed by incremental delivery sales, non-food channel share gains (a $150 billion opportunity), improved merchandising, etc.

17 April 2018
The Kroger Co. (KR) 11
Figure 19: Conservative Market Share Gains Still Worth ~20 bps of ID Sales Growth
Figure 20: Market Share Gains Closer to 3-Yr Average Worth ~50 bps
0.0%
0.5%
1.0%
1.5%
2.0%
2.5%
3.0%
3.5%
2018E 2019E 2020E
KR ID Sales Composition
Gap to Total ID
Click & Collect
KR local B&M food channelshare gains of 10-20bps
Space Optimization
Inflation
Cons
0.0%
0.5%
1.0%
1.5%
2.0%
2.5%
3.0%
3.5%
2018E 2019E 2020E
KR ID Sales Composition: Market Share Bull Case
Gap to Total ID
Click & Collect
KR local B&M food channel sharegains of 40bps
Space Optimization
Inflation
Source: Company data, Credit Suisse estimates Source: Company data, Credit Suisse estimates
Figure 21: KR has Consistently Grown Market Share in its Local Markets
-2.0%
0.0%
2.0%
4.0%
6.0%
8.0%
0.0%
0.2%
0.4%
0.6%
0.8%
1.0%
Q1 Q2 Q3 Q4 Q1 Q2 Q3 Q4 Q1 Q2 Q3 Q4 Q1 Q2 Q3* Q4*
2014 2015 2016 2017
%
YoY Change in Market Share DollarsMarket Share (LHS) Non-Fuel IDs (RHS)
Source: Company data per IRI, Credit Suisse estimates | Q317 market share is KR estimates and Q417 market share is not available
Broad Toolbox UnderappreciatedKroger is often lumped in with other conventional or traditional supermarket players, a group that, as a whole, has been and will likely continue to be a long-term market share donor to competing retail concepts. At the same time, KR has a suite of assets and capabilities that nearly all brick-and-mortar retailers would envy. Click & collect capability is being rolled out rapidly, and learnings from Harris Teeter are a material advantage. Technology is the cornerstone of an industry-leading targeted promotion and rewards program that incorporates direct mail, digital offerings, and fuel rewards. KR's price gap to WMT is at the low end of supermarket players, but on-the-shelf pricing is often irrelevant at KR, as pricing and promotion can be tailored to loyal households.
Click & Collect Leads Digital Offering, but Delivery Offered As WellKroger is leaning into its physical assets and choosing click & collect as its primary online grocery offering. Delivery is an option in at least 45 markets, primarily via third-party services such as Instacart (KR handles delivery in Denver.) The Amazon-Whole Foods combination has further piqued investor interest in grocery delivery, but we see this as a legitimate two-horse race (delivery vs. click & collect) for at least the coming five to ten years. AMZN's decision to invest in physical stores and prune its AmazonFresh offering is telling, in our view.

17 April 2018
The Kroger Co. (KR) 12
Industry feedback implies that KR is going about its online investment the right way for the near term, as satisfaction scores are notably higher for click & collect offerings at WMT and KR than those for delivery services such as AmazonFresh and Peapod. The convenience of delivery is attractive, but delivery windows and damaged produce are often cited as offsets.
Figure 22: Overall Satisfaction with Online Grocery Service
69%75%
69%59% 62% 64%
23%20%
24%
29%31% 25%
0%
20%
40%
60%
80%
100%
Average ofall Services
Other
Extremely Satisfied Somewhat Satisfied Neutral Dissatisfed
Source: Kantar Consulting, Credit Suisse estimates.
Offering Delivery, but Owning Click & CollectWith KR's 2014 acquisition of Harris Teeter came a crash course in click & collect grocery retail. Harris Teeter launched its click & collect service, ExpressLane, in 2000 and touted its availability as a differentiator. Per company commentary, it was profitable as well. KR is now leaning into the buy-online-pick-up-in-store medium and choosing to leave delivery to third parties (for the most part). Across KR's store base of ~2,800 supermarkets, approximately 40% have ClickList or ExpressLane infrastructure in place today with plans to expand to the vast majority of stores.
Figure 23: Ramp in Click & Collect Locations
0
200
400
600
800
1,000
1,200
Dec 12 Aug 15 Oct 15 May16 Jun16 Aug16 Sep16 Nov16 Dec16 May17 Jun17 Sep17 Nov 17 Dec 17 Mar 18
ClickList ExpressLane (Harris Teeter)
Source: Company data, Credit Suisse estimates

17 April 2018
The Kroger Co. (KR) 13
Figure 24: Click & Collect Offerings at Competitors
1,200 1,100
115 80 4
+1,000
+500
+420
-
500
1,000
1,500
2,000
2,500
Walmart Kroger HEB Albertsons Loblaw's Smart & Final Publix
Number of Locations Today Plan for 2018
Source: Company data, Credit Suisse estimates
The ultimate impact of click & collect is difficult to calculate given little pointed commentary from industry participants. Our sense is that, if done well, this can be a comp, margin, and profit dollar driver, but the path to profitability is uncertain at best. The size of each click & collect basket, its product mix, and the particular trip that basket is cannibalizing are all fundamental variables that can determine ultimate returns. Key factors to consider include the following:
■ Base Basket: Average supermarket industry baskets are in the $30-40 range, and given KR's full shopability, we utilize $40. For gross margin, we assume a rate slightly higher than the company's prior three-year average, as the program is likely being rolled out at stores that can handle the investment first. Our assumption for direct store expenses is between the levels reported by Sprouts and Whole Foods historically.
■ Cannibalization: Industry commentary indicates that a click & collect basket is typically larger than one purchased in-store, but the question of where those incremental sales come from is more difficult. Our bear case assumes a click & collect basket cannibalizes a trip to KR, while our base and bull cases assume these incremental sales dollars are taken from other retailers.
■ Margin Impact: The incremental net cost for a click & collect basket must be considered as well. Key factors in this bucket include the service fee charged to the customer, the cost to pick the customer's order, incremental direct store expense (which we believe achieves some overall leverage despite related upfront capital investment), and the expense saved at the checkout. While others have pointed to improved gross margins on click & collect baskets, KR is not pushing this narrative.
It is easy to see how quickly click & collect can become materially dilutive to overall profitability, as is demonstrated in our bear case. That said, the company indicates there is little pushback to KR's current fee structure, a crucial element in achieving profitability, albeit at a lower margin, in the program at this time, despite WMT's decision to provide the service for free. Offsets to the fee, possibly with promotional dollars from vendors, are a likely avenue to go down as well.

17 April 2018
The Kroger Co. (KR) 14
Figure 25: Click & Collect Model Store EconomicsClick & Collect
Scenario Bear Case Base Case Bull Case
Standard Trip
Basket Size $40 $40 $40
Gross Margin Per Basket 24.5% 24.5% 24.5%
Picking Cost / Fee to 3rd Party 0.0% 0.0% 0.0%
Direct Store Expense 21.0% 21.0% 21.0%
Operating Profit Per Basket $1.40 $1.40 $1.40
Operating Profit % (ex-corporate) 3.5% 3.5% 3.5%
Impact from C&C / Delivery
Trip Cannibalization 2nd Trip to Same Store Discounter/Specialty Club/Warehouse
+ Bump in Basket Size 100.0% 200.0% 300.0%
- Impact from Lost Trip -50.0% -10.0% -10.0%
= Adjusted Basket Size $60 $116 $156
+ Fee Charged $0.0 $4.0 $6.0
Gross Margin Impact +0% +0% +0%
DSE on Incremental Sales 18.0% 18.0% 18.0%
Net Picking Cost / Fee to 3rd Party $8 $8 $10
Adj. Operating Profit Per Basket ($5.30) $2.34 $4.94
Operating Profit % -8.8% 2.0% 3.2%
Source: Company data, Credit Suisse estimates.
Add in a Little Inflation and Out-Year IDs Look Easily AchievableIn Figure 26 we demonstrate the achievability of our above-consensus ID sales estimates in 2019 and 2020. Based on historical achievement at Harris Teeter and anecdotal industry commentary that even the most productive click & collect stores do just a mid-single-digit percentage of their business this way, we estimate that the average comp impact to KR's 2018 IDs will be in the range of 10-30 basis points. The take-away here, however, is not near-term comp impact but the long-term build toward industry norms (and related sales growth) and relevance in what we anticipate will be a U.S. online grocery market that equitably splits share between delivery and pickup.
As click & collect locations ramp, and the service matures within each box toward the ~3% penetration range we believe Harris Teeter enjoys, we can very easily model a scenario where up to 20% of annual identical store sales are being fueled by the program (which we show in 2019-2020). A return to normalized inflation of ~2% would then require <100 bps ID sales generation from avenues other than click & collect or inflation over the next couple years. We see this as easily achievable from a combination of population growth, beating up on weaker competitors (discussed above), remodels, increased sales via delivery, etc. 2018 is likely lacks material inflation, but competitor closings (Southeastern Grocers and SVU's Farm Fresh, the latest) seem to be increasing.

17 April 2018
The Kroger Co. (KR) 15
Figure 26: Math on Click & Collect Impact Supports Acceleration in ID SalesImpact to 2018E KR IDs Impact to 2019E Impact to 2020E
Bear Case Base Case Bull Case Base Case Base Case
FY Est. Retail Sales ($M) $107,022 $107,022 $107,022 $110,886 $115,322
Total Stores 2,789 2,789 2,789 2,796 2,803
Total Stores w/ Click & Collect 1,600 1,600 1,600 2,100 2,400
Avg. Per Store Sales Penetration 0.8% 1.0% 1.2% 1.3% 1.6%
Total Click & Collect Sales ($M) $491 $614 $706 $1,083 $1,580
Incremental from Click & Collect ($M) 155 277 370 $469 $497
Est. ID Contribution from C&C 0.1% 0.3% 0.3% 0.4% 0.4%
Total ID Ex-Fuel (CS est.) 1.9% 1.9% 1.9% 2.7% 3.1%
Assumed Inflation 1.0% 1.0% 1.0% 1.7% 2.0%
Inflation Competed Away (0.2% ) (0.2% ) (0.2% ) (0.2% ) (0.2% )
Gap to Total ID 0.9% 0.8% 0.7% 0.8% 0.9%
Source: Company data, Credit Suisse estimates
Figure 27: Gap to Total ID Smaller When Consider Market Share Gains and Remodels
0.0%
0.5%
1.0%
1.5%
2.0%
2.5%
3.0%
3.5%
2018E 2019E 2020E
KR ID Sales Composition
Gap to Total ID
Click & Collect
KR local B&M food channelshare gains of 10-20bps
Space Optimization
Inflation
Cons
Source: Company data, Credit Suisse estimates
Delivery Is Instacart's ProblemWith Amazon firmly planted in the supermarket fray, rapidly expanding Whole Foods delivery, and even WMT expanding its delivery options, the likes of KR and Albertsons can ill-afford to stand still on grocery delivery to home. In the past few months, each has announced a partnership with Instacart, electing to let someone else worry about profiting from delivery. KR has offered delivery via owned vehicles in Denver for years but is not particularly pleased with returns there, calling the format "cumbersome to pull off." Tests with various service providers including Uber, Shipt, deliv, and Roadie have taken place as well. KR is building the tools to effectively compete in online grocery, but it is worth noting that overlaps with Whole Foods are toward the low end of companies within our coverage universe. Our base case assumption is that AMZN will lead grocery delivery, and insulation from its Whole Foods store base may be an advantage for KR.

17 April 2018
The Kroger Co. (KR) 16
Figure 28: KR and Other Retailers' Overlap with WFMOverlap with WFM
1 Mile 5 Mile 10 Mile
KR 4.0% 30.0% 51.1%
SFM 7.3% 44.6% 68.3%
SFS 7.0% 42.0% 60.8%
WMT 1.3% 13.8% 29.4%
TGT 7.3% 31.0% 53.6%
COST 6.4% 37.5% 63.3%
Source: Company data, Credit Suisse estimates.
Figure 29: Delivery Margin Lost in Third-Party FeesThird Party Delivery
Scenario Base Case
Standard TripBasket Size $40
Basket Size $40.0
Gross Margin Per Basket 24.5%
Picking Cost / Fee to 3rd Party 0.0%
Direct Store Expense 21.0%
Operating Profit Per Basket $1.40
Operating Profit % (ex-corporate) 3.5%
Impact from C&C / DeliveryTrip Cannibalization Discounter/Specialty
+ Bump in Basket Size 200.0%
- Impact from Lost Trip -10.0%
= Adjusted Basket Size $116
+ Fee Charged $0.0
Gross Margin Impact +0%
DSE on Incremental Sales 12.0%
Net Picking Cost / Fee to 3rd Party Mid-High Single Digit % of Sales
Picking Cost / Fee to 3rd Party 7%
Adj. Operating Profit Per Basket $2.78
Operating Profit % 2.4%
Source: Company data, Credit Suisse estimates.
We see this dual-pronged strategy for KR's online grocery offering as reasonable in the near to medium term, as it leverages existing infrastructure and avoids the investment and logistics headaches of delivery. KR could transition select locations to dark stores if the pick-up-in-store offering is proven highly successful. In many ways, this would represent a best-case scenario, as stores could be fully optimized for in-store shopping or pickup, with delivery services running out of both. If we assume that AMZN will establish itself as the market leader in grocery delivery, we see no reason why KR (and WMT) can't play the same role in click & collect. Car ownership levels, commute times, and population densities in the United States all point to grocery pickup playing a large role in the evolving food retail landscape.

17 April 2018
The Kroger Co. (KR) 17
Figure 30: Scorecard of Countries Ranks Global Markets for Online Grocery Delivery
CountryGDP per capita(Current US $)
% of Urban Population
Population of Top 5 Metro
Areas as % of Total Population
# Metro Areas >1m
# Metro Areas >3m
Population Density
(people per sq. km of land area)
Vehicle Ownership
(Vehicles per Capita
(/1000 inh.)
Smartphone Penetration
U.S. 1 2 4 2 2 5 5 3 Overall Rank
U.K. 3 1 1 3 3 1 3 1 U.S. 4
Germany 2 4 3 4 3 2 4 2 U.K. 1
France 4 3 2 4 3 4 2 4 Germany 2
China 5 5 5 1 1 3 1 5 France 3
China 5
Country% of Individuals
Using Internet
Fixed broadband subscriptions (per
100 people)
Wireless broadband
subscriptions (per 100 people)
# of B&M Channels with 25%+ Shares
Selling Sq Meter per 1 Million
Inhabitant
# of B&M Competitors with
10%+ Share
Online Share of Retail Spend
Online Share of Grocery Spend
U.S. 4 4 1 3 1 4 4 5
U.K. 1 2 2 3 4 2 2 1
Germany 2 3 4 1 2 1 3 4
France 3 1 3 1 3 2 5 3
China 5 5 5 3 5 5 1 2
Source: Company data, Credit Suisse estimates.
Online Sales Immaterial Today but Long-Term Potential is HUGEKR has multiple avenues for online sales, but we believe the relative contribution to sales is rapidly evolving. Press reports regarding conversations with Alibaba and Target (regarding Shipt) are likely 2-way, we believe, as KR has plenty of experience to bring to the table. Recent commentary indicates that digital sales grew 90% in 2017, but remain immaterial to total sales. We estimate that digital sales in 2017 were around $950 million based on prior disclosures as well as industry sources, but this is a ballpark range given little company commentary on hard dollars. We know that Vitacost represented ~$400 million in sales at its time of acquisition in 2014, but the other pie pieces are derived.
More important, however, is the potential for ClickList to grow to the levels enjoyed by Harris Teeter with ExpressLane, where we believe the best performing stores have high-single-digit sales penetration and the average is around 3%. 3% of non-fuel sales at KR today is >$3 billion. If we assume ClickList did <$200 million in sales in 2017, it would take 11+ years of 30% annualized click & collect growth to get this medium to the level of penetration Harris Teeter enjoys today, a meaningful ID tailwind for an extended period.
Figure 31: Road to 3% Penetration of Click & Collect Represents Very Long ID Sales Contribution Runway
Vitacost.com
Express Lane
ClickList, $175
Delivery & other
Estimated Breakdown of 2017 Digital SalesVitacost.com
ExpressLane
ClickList, $2,957
Delivery & other
2017 Digital Sales BreakdownPROFORMA
for Click & Collect Representing
3% of Total Co. Sales
Source: Company data, Credit Suisse estimates

17 April 2018
The Kroger Co. (KR) 18
Data WMT Would Die ForIn 2015, Kroger made the decision to dissolve a ten-year-old industry-exclusive joint venture with data science firm dunnhumby and effectively bring the majority of dunnhumby USA operations in house under the name 84.51°. This enabled Kroger the flexibility to apply the firm's proprietary analytics to other partners, whereas it had initially been restricted to working with dunnhumby alone. KR retains a perpetual license to use dunnhumby analytical tools.
Kroger and 84.51° work as cross-functional teams across operations and merchandizing with certain teams being co-located. 84.51° recently announced Kroger Precision Marketing, a cross-channel media solution focused on precise personalized communication to customers “at the right time with the right message in the right way.” This marketing program taps into purchase data from 60 million households to produce holistic targeted advertising and content campaigns across an expanded digital ecosystem. Loyal households are provided with a tailored digital experience online and by mobile as well as custom coupons and a print magazine (MyMagazine) that includes targeted product content and recipes.
Meal Kits and Restaurants Covered as WellManagement is increasingly using the term share of stomach for how it views KR's market share opportunity, a reasonable position with Food at Home and Food Away from Home sales approximately even in the United States today. Americans appear to be approaching indifference as to whether a meal is prepared at home or away, instead focusing more on how convenient, fresh, healthy, or local that food is.
Prepared foods are one of the fastest growing areas of KR's overall offering, a nod to the consumer's propensity to purchase high-quality food wherever it's available in a convenient format and at a competitive price point. There is no doubt AMZN recognized the strength of Whole Foods' prepared foods business and its mixed grocery store-restaurant, or Groceraunt, appeal. KR is focused on this theme as well, recognizing the importance of all things food to all people. Whereas Albertsons chose to acquire an established meal kit player in Plated, KR is going it alone with its Prep+Pared offering. These kits come at a notable discount to shipped offerings with a near-identical experience. Figure 32 represents management's long-term goal to compete across the entire fresh-prepared food spectrum.
Figure 32: Kroger’s Prepared Food/Meal Kit Offerings Run the Gamut
Source: Company data, Credit Suisse estimates.
Private Label Portfolio to Compete with DiscountersThe rising popularity of hard discounters with elevated private label sales mix in the U.S. points to the consumer's evolving relationship with large brands and the rising importance
17 April 2018
The Kroger Co. (KR) 19
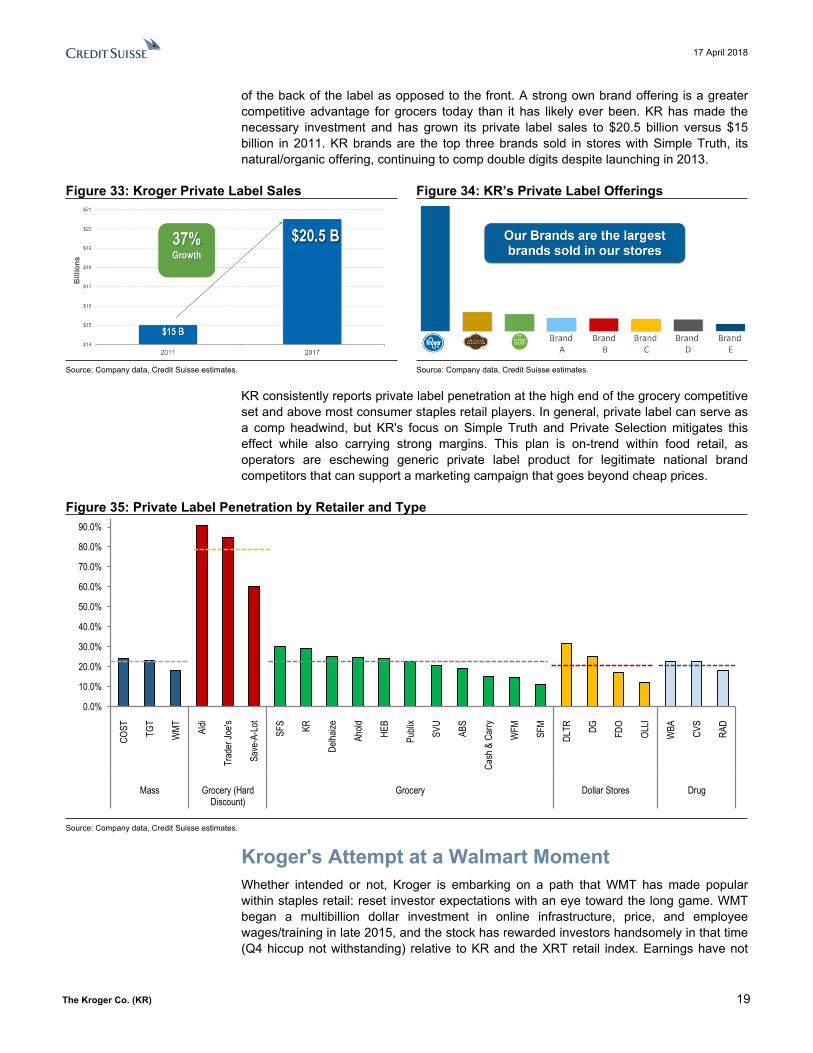
of the back of the label as opposed to the front. A strong own brand offering is a greater competitive advantage for grocers today than it has likely ever been. KR has made the necessary investment and has grown its private label sales to $20.5 billion versus $15 billion in 2011. KR brands are the top three brands sold in stores with Simple Truth, its natural/organic offering, continuing to comp double digits despite launching in 2013.
Figure 33: Kroger Private Label Sales Figure 34: KR’s Private Label Offerings
Source: Company data, Credit Suisse estimates. Source: Company data, Credit Suisse estimates.
KR consistently reports private label penetration at the high end of the grocery competitive set and above most consumer staples retail players. In general, private label can serve as a comp headwind, but KR's focus on Simple Truth and Private Selection mitigates this effect while also carrying strong margins. This plan is on-trend within food retail, as operators are eschewing generic private label product for legitimate national brand competitors that can support a marketing campaign that goes beyond cheap prices.
Figure 35: Private Label Penetration by Retailer and Type
0.0%
10.0%
20.0%
30.0%
40.0%
50.0%
60.0%
70.0%
80.0%
90.0%
100.0%
COST TG
T
WMT Al
di
Trad
er Jo
e's
Save
-A-L
ot
SFS KR
Delha
ize
Ahold HE
B
Publi
x
SVU
ABS
Cash
& C
arry
WFM SF
M
DLTR DG FDO
OLLI
WBA CV
S
RAD
Mass Grocery (HardDiscount)
Grocery Dollar Stores Drug
Source: Company data, Credit Suisse estimates.
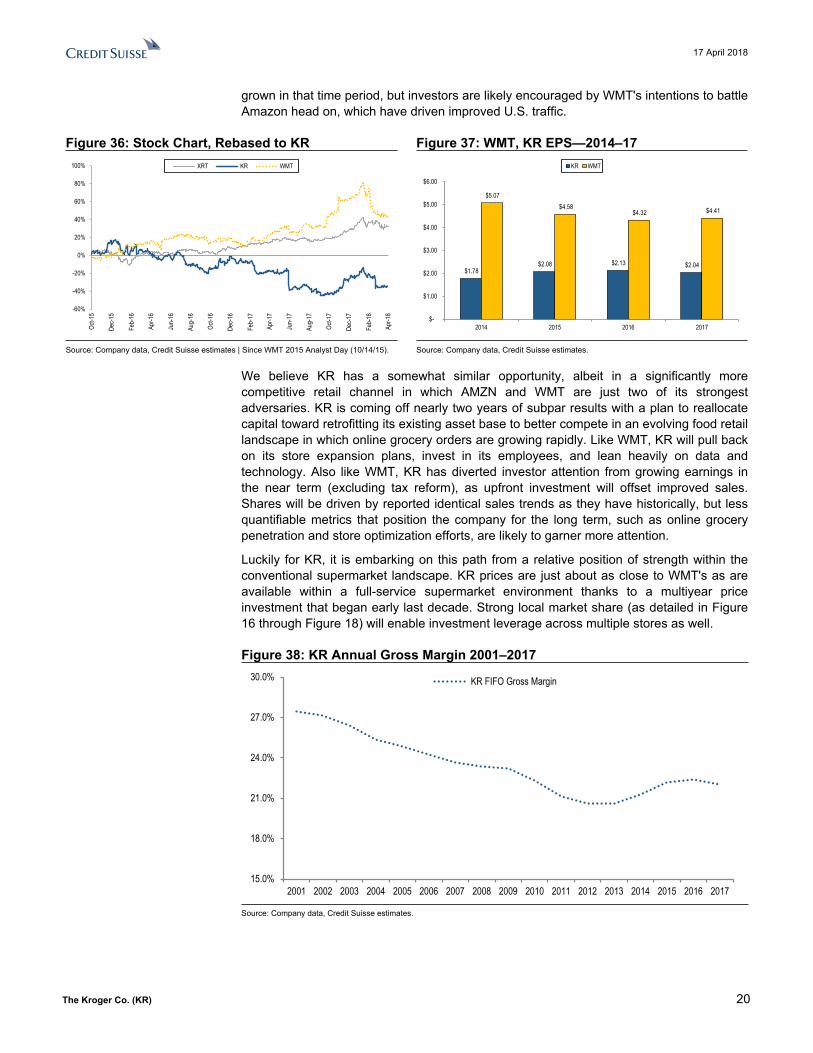
Kroger's Attempt at a Walmart MomentWhether intended or not, Kroger is embarking on a path that WMT has made popular within staples retail: reset investor expectations with an eye toward the long game. WMT began a multibillion dollar investment in online infrastructure, price, and employee wages/training in late 2015, and the stock has rewarded investors handsomely in that time (Q4 hiccup not withstanding) relative to KR and the XRT retail index. Earnings have not
17 April 2018
The Kroger Co. (KR) 20
grown in that time period, but investors are likely encouraged by WMT's intentions to battle Amazon head on, which have driven improved U.S. traffic.
Figure 36: Stock Chart, Rebased to KR Figure 37: WMT, KR EPS—2014–17
-60%
-40%
-20%
0%
20%
40%
60%
80%
100%
Oct-1
5
Dec-1
5
Feb-
16
Apr-1
6
Jun-
16
Aug-
16
Oct-1
6
Dec-1
6
Feb-
17
Apr-1
7
Jun-
17
Aug-
17
Oct-1
7
Dec-1
7
Feb-
18
Apr-1
8
XRT KR WMT
$1.78 $2.08 $2.13 $2.04
$5.07 $4.58
$4.32 $4.41
$-
$1.00
$2.00
$3.00
$4.00
$5.00
$6.00
2014 2015 2016 2017
KR WMT
Source: Company data, Credit Suisse estimates | Since WMT 2015 Analyst Day (10/14/15). Source: Company data, Credit Suisse estimates.
We believe KR has a somewhat similar opportunity, albeit in a significantly more competitive retail channel in which AMZN and WMT are just two of its strongest adversaries. KR is coming off nearly two years of subpar results with a plan to reallocate capital toward retrofitting its existing asset base to better compete in an evolving food retail landscape in which online grocery orders are growing rapidly. Like WMT, KR will pull back on its store expansion plans, invest in its employees, and lean heavily on data and technology. Also like WMT, KR has diverted investor attention from growing earnings in the near term (excluding tax reform), as upfront investment will offset improved sales. Shares will be driven by reported identical sales trends as they have historically, but less quantifiable metrics that position the company for the long term, such as online grocery penetration and store optimization efforts, are likely to garner more attention.
Luckily for KR, it is embarking on this path from a relative position of strength within the conventional supermarket landscape. KR prices are just about as close to WMT's as are available within a full-service supermarket environment thanks to a multiyear price investment that began early last decade. Strong local market share (as detailed in Figure 16 through Figure 18) will enable investment leverage across multiple stores as well.
Figure 38: KR Annual Gross Margin 2001–2017
15.0%
18.0%
21.0%
24.0%
27.0%
30.0%
2001 2002 2003 2004 2005 2006 2007 2008 2009 2010 2011 2012 2013 2014 2015 2016 2017
KR FIFO Gross Margin
Source: Company data, Credit Suisse estimates.

17 April 2018
The Kroger Co. (KR) 21
Figure 39: L.A. Pricing Survey: KR's Price Gap to WMT Relatively Low
-5.0%
0.0%
5.0%
10.0%
15.0%
20.0%
25.0%
30.0%
35.0%
40.0%
8/30/1
79/6
/179/1
3/17
9/20/1
79/2
7/17
10/4/
1710
/11/17
10/18
/1710
/25/17
11/1/
1711
/8/17
11/15
/1711
/22/17
11/29
/1712
/6/17
12/13
/1712
/20/17
12/27
/171/3
/181/1
0/18
1/17/1
81/2
4/18
1/31/1
82/7
/182/1
4/18
2/21/1
82/2
8/18
3/7/18
3/14/1
83/2
1/18
3/28/1
84/4
/18
Index
ed to
WMT
Survey Basket Price Gap to WMT
WFM
AMZN
ABSSWY
KR
SFM
SFS
Source: Company data, Credit Suisse estimates | In select Los Angeles Zip Codes.
Figure 40: KR Pricing Survey Against Competitors (Average of Periods 8/30/2017–4/5/2018) # Item Name Unit SFM WMT ABS/SWY Ralph's (Kroger) WFM SFS Amazon1 Bread White Bread 20 ounces $ 2.49 $ 2.33 $ 2.54 $ 2.72 $ 2.99 $ 2.58 $ 3.07 2 Cereal Kashi GOLEAN Cereal Original 13.1 ounces $ 3.80 $ 3.28 $ 4.01 $ 3.52 $ 3.71 $ 3.00 $ 3.77 3 Cereal bars Kind Healthy Grains Clusters 11 ounces $ 5.42 $ 4.53 $ 6.11 $ 5.25 $ 5.99 $ 4.45 $ 4.73 4 Oliv e Oil Pompeian Ex tra Virgin Oliv e Oil 16 ounces $ 5.99 $ 4.89 $ 5.86 $ 5.43 $ 5.99 $ 5.90 $ 5.07 5 Peanut Butter Jif Creamy Peanut Butter 16 ounces $ 2.75 $ 2.50 $ 4.29 $ 3.01 $ 2.49 $ 2.69 $ 2.67 6 Chips Stacy 's Pita Chips Simply Naked 7.33 ounces $ 3.52 $ 2.82 $ 3.73 $ 3.32 $ 3.29 $ 2.83 $ 2.67 7 Water Smartw ater 1 liter $ 2.38 $ 1.48 $ 2.21 $ 1.76 $ 2.19 $ 1.91 $ 1.61 8 Juice Orange juice - original 59 ounces $ 3.53 $ 3.59 $ 3.98 $ 3.94 $ 3.99 $ 3.63 $ 3.86 9 Pasta Sauce Marinara Pasta Sauce 24 ounces $ 3.49 $ 1.98 $ 2.80 $ 3.78 $ 3.49 $ 3.00 $ 2.76
Center of Store $ 33.35 $ 27.40 $ 35.52 $ 32.72 $ 34.13 $ 29.99 $ 30.22 10 Eggs Cage Free Eggs Grade A Large Brow n Eggs 1 dozen $ 3.95 $ 4.17 $ 5.18 $ 4.63 $ 3.50 $ 4.42 $ 3.41 11 Milk Horizon Organic Whole Milk 0.5 Gallon $ 4.45 $ 4.46 $ 5.30 $ 4.70 $ 5.63 $ 4.69 $ 4.61 12 Milk Almond Breeze Original Almond Milk 0.5 Gallon $ 3.30 $ 2.97 $ 3.12 $ 3.05 $ 3.49 $ 3.06 $ 3.13 13 Ice Cream Haagen Dazs Ice Cream - any flav or 14 ounces $ 5.25 $ 4.21 $ 4.45 $ 4.23 $ 4.99 $ 4.23 $ 4.35 14 Yogurt Fage Total Greek Strained Yogurt - any flav or 5.3 ounces $ 1.36 $ 1.26 $ 1.60 $ 1.18 $ 1.55 $ 1.38 $ 1.41 15 Butter Salted Butter 16 ounces $ 3.45 $ 4.26 $ 4.75 $ 3.94 $ 3.49 $ 3.58 $ 4.56
Dairy/Refrigerated $ 21.77 $ 21.33 $ 24.40 $ 21.73 $ 22.65 $ 21.36 $ 21.46 16 Straw berry Fresh Straw berries 1 lbs $ 2.45 $ 3.19 $ 3.94 $ 3.21 $ 2.94 $ 2.99 $ 3.45 17 Banana Yellow Banana 1 lbs $ 0.50 $ 0.53 $ 0.74 $ 0.59 $ 0.77 $ 0.57 $ 0.98 18 Apple Gala Apples 1 lbs $ 1.14 $ 1.04 $ 2.60 $ 1.79 $ 1.87 $ 1.28 $ 1.64 19 Apple Fuji Apples 1 lbs $ 1.31 $ 1.44 $ 1.98 $ 1.08 $ 2.49 $ 1.35 $ 1.42 20 Broccoli Broccoli Crow ns 1 lbs $ 1.70 $ 1.52 $ 2.03 $ 1.96 $ 2.35 $ 1.83 $ 2.05 21 Onions Yellow Onions 1 lbs $ 0.79 $ 0.65 $ 1.16 $ 0.65 $ 1.09 $ 0.99 $ 0.70 22 Tomato Roma Tomato 1 lbs $ 1.11 $ 0.98 $ 2.02 $ 1.15 $ 2.07 $ 1.78 $ 1.39 23 Orange Nav el Orange 1 each $ 1.29 $ 0.59 $ 0.99 $ 0.55 $ 0.44 $ 0.31 $ 0.81 24 Av ocado Large Hass Av ocado 1 each $ 2.33 $ 1.04 $ 1.67 $ 1.21 $ 1.73 $ 1.34 $ 1.84 25 Carrots Carrots 1 lbs $ 0.77 $ 0.74 $ 1.09 $ 0.85 $ 1.08 $ 0.69 $ 0.94
Fresh Produce $ 13.39 $ 11.71 $ 18.20 $ 13.03 $ 16.83 $ 13.14 $ 15.22 26 Chicken Whole Chicken 1 lbs $ 1.66 $ 1.07 $ 1.54 $ 1.49 $ 2.88 $ 1.44 $ 2.42 27 Salmon Atlantic Salmon Fillet 1 lbs $ 10.79 $ 11.16 $ 8.78 $ 9.23 $ 13.12 $ 8.67 $ 12.28 28 Pork Boneless Center Cut Thin Pork Chops 1 lbs $ 3.42 $ 4.45 $ 4.84 $ 4.36 $ 5.99 $ 3.89 $ 5.79 29 Beef Ground Beef ~80% Lean 1 lbs $ 4.80 $ 4.08 $ 3.76 $ 5.62 $ 6.48 $ 3.99 $ 4.51 30 Beef Beef Top Boneless Sirloin Steak 1 lbs $ 7.99 $ 6.46 $ 7.41 $ 9.31 $ 10.81 $ 6.99 $ 17.22
Protein $ 28.66 $ 27.23 $ 26.32 $ 30.01 $ 39.29 $ 24.98 $ 42.22 Total $ 97.17 $ 87.67 $ 104.45 $ 97.49 $ 112.90 $ 89.47 $ 109.13
Source: Company data, Credit Suisse estimates In Select Los Angeles Zip codes; *Substitute: SFM: Peanut Butter (Private Label), Bread (Market Corner); WMT: Salted butter (Darigold), ABS: Salted Butter (Lucern), WFM: Orange juice (Simply Beverages), Bread, Olive Oil, Peanut Butter, Eggs (Private Label). SFS: Olive Oil (Star) , AMZN: Bread (Oroweat).
Two Years of Feast Followed by Famine Prompt Restock Food retail is one of the least elastic areas of consumer demand available to investors, but stock prices are another story altogether. The year 2014 began an epic two-year run in Kroger shares fueled by strong IDs, cratering gas prices, the integration of Harris Teeter, and competitor bankruptcies, among other things. Management beat and raised EPS guidance in each of the first three quarters of 2014 and 2015, even electing to split its stock in July 2015, a move last made in 1999.
The year 2016 reversed the prior two-year trend, as an extended period of food deflation roiled the industry and KR began a string of guidance reductions. The first half of 2017 played out much the same way. At the company's Investor Day in October, management

17 April 2018
The Kroger Co. (KR) 22
voiced regret over the missed opportunity to further leverage expenses when IDs were running at the 5%+ level in 2014-15, a move that may have been able to pull forward some of the SG&A spend recorded in 2016-1H17.
Figure 41: KR Stock Chart, 1/1/2014–4/16/2018
$10.0
$15.0
$20.0
$25.0
$30.0
$35.0
$40.0
$45.0
Jan-
14
Apr-1
4
Jul-1
4
Oct-1
4
Jan-
15
Apr-1
5
Jul-1
5
Oct-1
5
Jan-
16
Apr-1
6
Jul-1
6
Oct-1
6
Jan-
17
Apr-1
7
Jul-1
7
Oct-1
7
Jan-
18
Apr-1
8
Source: Company data, Thomson Reuters, Credit Suisse estimates.
Removal of LT Guidance Evokes Pre-2012 Kroger ComparisonAt its October 2012 Investor Day, KR instituted long-term EPS guidance of 8-11%, effectively signaling to investors that stock performance was a real consideration for management. Prior to this move, KR was in the habit of periodically surprising on the gross margin line, as the company's product price gap versus competitors was top of mind. The year 2012 seemed to signal relative comfort with the company's overall price position and price perception, not to say that KR wouldn't remain vigilant on pricing.
With 2Q17 earnings, management removed its 8-11% EPS growth guidance, garnering greater leeway in its corporate planning process as the food landscape evolves. Whereas 2012-216 may have been a harvest period in which KR basked in the decision to invest in price long before other conventional supermarkets, management now finds itself back in investment mode, trying to ensure that it can skate to where the puck is going, not where it's been. Renewed focus on food at WMT, AMZN's purchase of Whole Foods, and constant price competition at the hands of discounters and others will require the freedom to invest accordingly.
Figure 42: SSS and EPS Surprise and Price Reaction
-25.00%
-20.00%
-15.00%
-10.00%
-5.00%
0.00%
5.00%
10.00%
-6.0%
-4.0%
-2.0%
0.0%
2.0%
4.0%
6.0%
8.0%
10.0%
12.0%
14.0%
16.0%
3Q10
4Q10
1Q11
2Q11
3Q11
4Q11
1Q12
2Q12
3Q12
4Q12
1Q13
2Q13
3Q13
4Q13
1Q14
2Q14
3Q14
4Q14
1Q15
2Q15
3Q15
4Q15
1Q16
2Q16
3Q16
4Q16
1Q17
2Q17
3Q17
4Q17
EPS Surprise (LHS) SSS (ex-fuel) Surprise (LHS) Price Reaction (RHS)
Source: Company data, Thomson Reuters, Credit Suisse estimates.
17 April 2018
The Kroger Co. (KR) 23
Figure 43: YoY Gross Margin Change in BPS and Price Reaction
-25.0%
-20.0%
-15.0%
-10.0%
-5.0%
0.0%
5.0%
10.0%
15.0%
-140
-120
-100
-80
-60
-40
-20
0
20
40
60
Sep-
05De
c-05
Mar-0
6Ju
n-06
Sep-
06De
c-06
Mar-0
7Ju
n-07
Sep-
07De
c-07
Mar-0
8Ju
n-08
Sep-
08De
c-08
Mar-0
9Ju
n-09
Sep-
09De
c-09
Mar-1
0Ju
n-10
Sep-
10De
c-10
Mar-1
1Ju
n-11
Sep-
11De
c-11
Mar-1
2Ju
n-12
Sep-
12De
c-12
Mar-1
3Ju
n-13
Sep-
13De
c-13
Mar-1
4Ju
n-14
Sep-
14De
c-14
Mar-1
5Ju
n-15
Sep-
15De
c-15
Mar-1
6Ju
n-16
Sep-
16De
c-16
Mar-1
7Ju
n-17
Sep-
17De
c-17
Mar-1
8
YoY
Chan
ge in
bps
FIFO Gross Margin Ex-Fuel (bps) Price Reaction +1D (%)
Source: Company data, Thomson Reuters, Credit Suisse estimates.
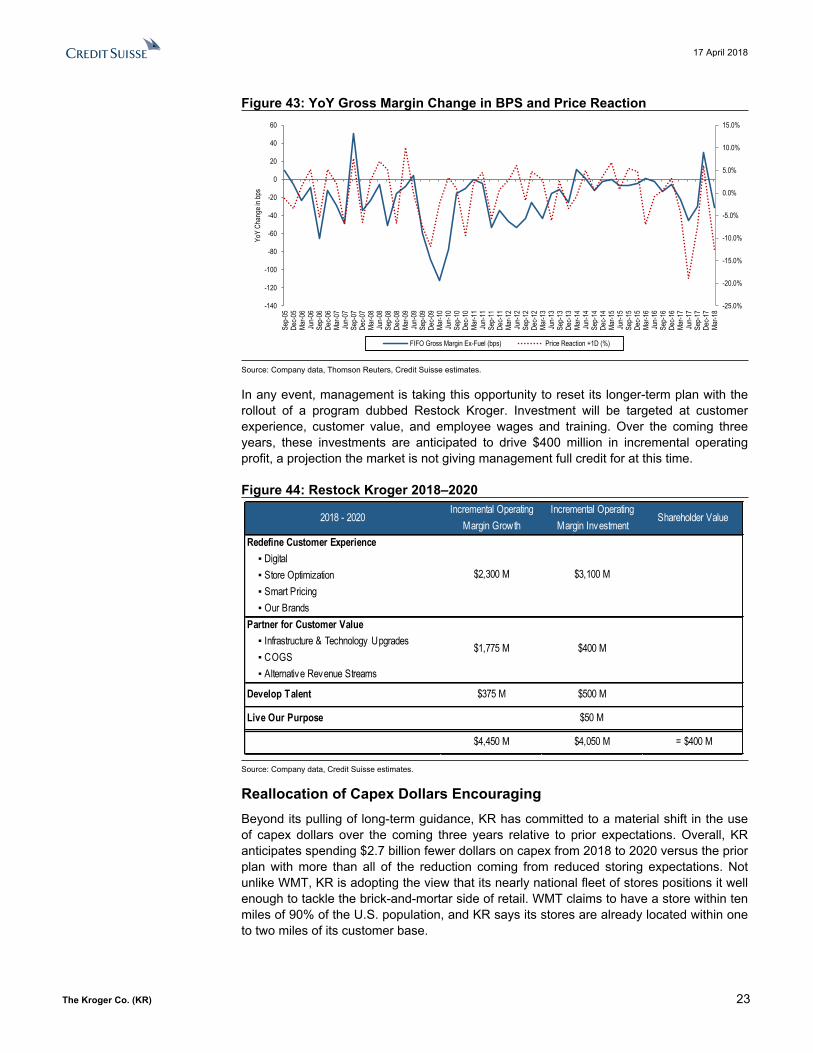
In any event, management is taking this opportunity to reset its longer-term plan with the rollout of a program dubbed Restock Kroger. Investment will be targeted at customer experience, customer value, and employee wages and training. Over the coming three years, these investments are anticipated to drive $400 million in incremental operating profit, a projection the market is not giving management full credit for at this time.
Figure 44: Restock Kroger 2018–2020
2018 - 2020Incremental Operating
Margin GrowthIncremental Operating
Margin InvestmentShareholder Value
Redefine Customer Experience▪ Digital▪ Store Optimization▪ Smart Pricing▪ Our Brands
Partner for Customer Value▪ Infrastructure & Technology Upgrades▪ COGS▪ Alternative Revenue Streams
Develop Talent $375 M $500 M
Live Our Purpose $50 M
$4,450 M $4,050 M = $400 M
$2,300 M $3,100 M
$1,775 M $400 M
Source: Company data, Credit Suisse estimates.
Reallocation of Capex Dollars Encouraging Beyond its pulling of long-term guidance, KR has committed to a material shift in the use of capex dollars over the coming three years relative to prior expectations. Overall, KR anticipates spending $2.7 billion fewer dollars on capex from 2018 to 2020 versus the prior plan with more than all of the reduction coming from reduced storing expectations. Not unlike WMT, KR is adopting the view that its nearly national fleet of stores positions it well enough to tackle the brick-and-mortar side of retail. WMT claims to have a store within ten miles of 90% of the U.S. population, and KR says its stores are already located within one to two miles of its customer base.

17 April 2018
The Kroger Co. (KR) 24
Management will focus on retrofitting its existing physical assets to better compete in the evolving food retail landscape. Major project counts, inclusive of remodels, will decline in favor of Space Optimization, a program informed by 84.51° analysis that will tailor individual store layouts to the needs and wants of the local customer base. If successful, this effort alone will demonstrate a competitive advantage for KR among traditional players, in our view.
Figure 45: Restock Kroger Current Expectation vs. Previous Expectation2018-2020E
Current Expectation Previous Expectation ∆Capital to Support Restock Plan $3,045 $1,700 $1,345Store Remodels $3,675 $3,800 ($125)Storing $1,150 $5,000 ($3,850)Major Project Counts 65-75 <300 (230)Infrastructure Maintenance $1,130 $1,200 ($70)Total $9,000 $11,700 ($2,700)$ in millions
Source: Company data, Credit Suisse estimates.
Get Used to the Term Space OptimizationThe store refresh program at KR has seen modest evolution over the past decade, but the utilization of 84.51° learnings could kick returns into overdrive. Historically, stores were bucketed by type (value, mainstream, and upscale), and a one-size-fits-most renovation was implemented at that location. Over the past year, approximately 6-7% of stores were touched using the bucket approach. Space Optimization will look at each store individually, analyzing internal store trends as well as specific competition affecting that store. The company believes this more targeted approach will allow for 20-30% of the 2018 store base to be touched under the new program.
Areas of focus will include expanded natural foods in the center store, expansion of high-growth categories (beverage, snacking, pet, etc.), and further implementation of fresh food elements such as grab-n-go items. Square footage will be reallocated toward ClickList, self-checkout, and other efficiency initiatives. Renovations and remodels should be more effective given projects will be tailored to each store. If a particular market over-indexes for carbonated soft drinks, that store could see expanded CSD square footage, a departure from conventional supermarket wisdom today. The pasta example in Figure 46 illustrates expanded private label shelf space, a decision driven by customer spend analytics and representative of how targeted these efforts are.
Figure 46: Pasta Shelf Optimization Example
Source: Company data, Credit Suisse estimates.
One could argue that Space Optimization is the holy grail of retail or the supermarket equivalent of money ball, a national chain with store-by-store offerings that differ according
17 April 2018
The Kroger Co. (KR) 25
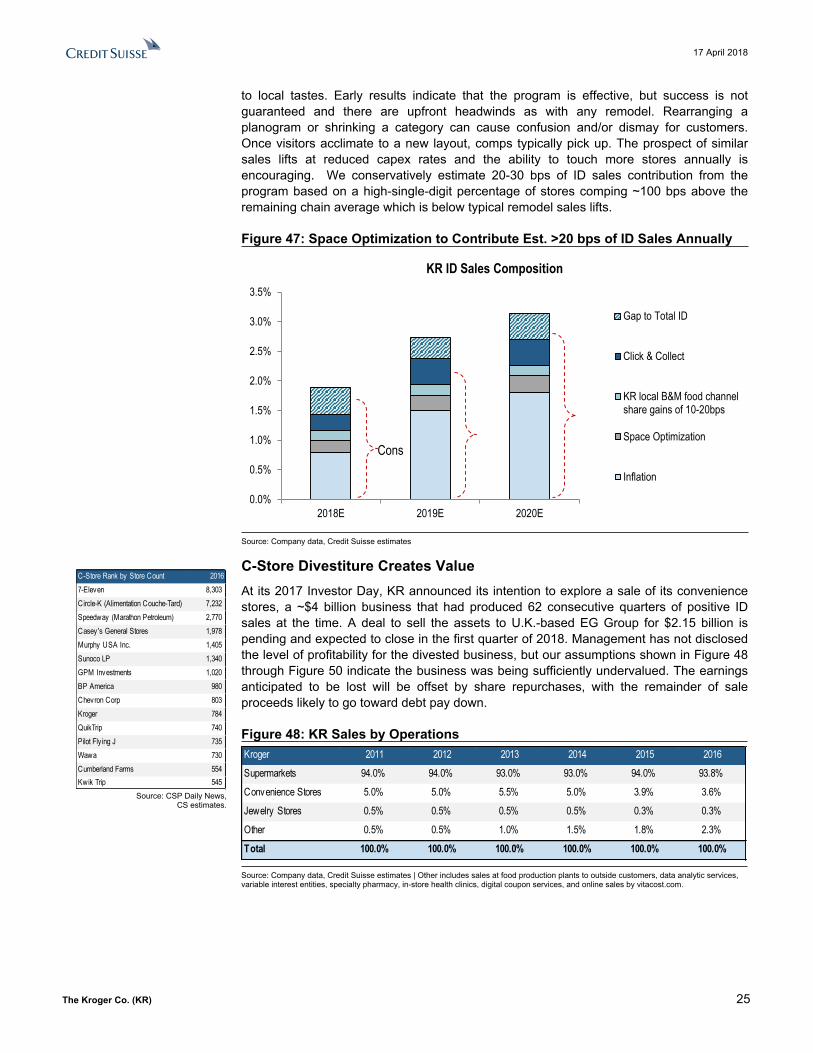
to local tastes. Early results indicate that the program is effective, but success is not guaranteed and there are upfront headwinds as with any remodel. Rearranging a planogram or shrinking a category can cause confusion and/or dismay for customers. Once visitors acclimate to a new layout, comps typically pick up. The prospect of similar sales lifts at reduced capex rates and the ability to touch more stores annually is encouraging. We conservatively estimate 20-30 bps of ID sales contribution from the program based on a high-single-digit percentage of stores comping ~100 bps above the remaining chain average which is below typical remodel sales lifts.
Figure 47: Space Optimization to Contribute Est. >20 bps of ID Sales Annually
0.0%
0.5%
1.0%
1.5%
2.0%
2.5%
3.0%
3.5%
2018E 2019E 2020E
KR ID Sales Composition
Gap to Total ID
Click & Collect
KR local B&M food channelshare gains of 10-20bps
Space Optimization
Inflation
Cons
Source: Company data, Credit Suisse estimates
C-Store Divestiture Creates ValueAt its 2017 Investor Day, KR announced its intention to explore a sale of its convenience stores, a ~$4 billion business that had produced 62 consecutive quarters of positive ID sales at the time. A deal to sell the assets to U.K.-based EG Group for $2.15 billion is pending and expected to close in the first quarter of 2018. Management has not disclosed the level of profitability for the divested business, but our assumptions shown in Figure 48 through Figure 50 indicate the business was being sufficiently undervalued. The earnings anticipated to be lost will be offset by share repurchases, with the remainder of sale proceeds likely to go toward debt pay down.
Figure 48: KR Sales by Operations Kroger 2011 2012 2013 2014 2015 2016
Supermarkets 94.0% 94.0% 93.0% 93.0% 94.0% 93.8%
Convenience Stores 5.0% 5.0% 5.5% 5.0% 3.9% 3.6%
Jewelry Stores 0.5% 0.5% 0.5% 0.5% 0.3% 0.3%
Other 0.5% 0.5% 1.0% 1.5% 1.8% 2.3%
Total 100.0% 100.0% 100.0% 100.0% 100.0% 100.0%
Source: Company data, Credit Suisse estimates | Other includes sales at food production plants to outside customers, data analytic services, variable interest entities, specialty pharmacy, in-store health clinics, digital coupon services, and online sales by vitacost.com.
C-Store Rank by Store Count 20167-Eleven 8,303Circle-K (Alimentation Couche-Tard) 7,232Speedway (Marathon Petroleum) 2,770Casey 's General Stores 1,978Murphy USA Inc. 1,405Sunoco LP 1,340GPM Investments 1,020BP America 980Chevron Corp 803Kroger 784QuikTrip 740Pilot Fly ing J 735Wawa 730Cumberland Farms 554Kwik Trip 545
Source: CSP Daily News, CS estimates.
17 April 2018
The Kroger Co. (KR) 26
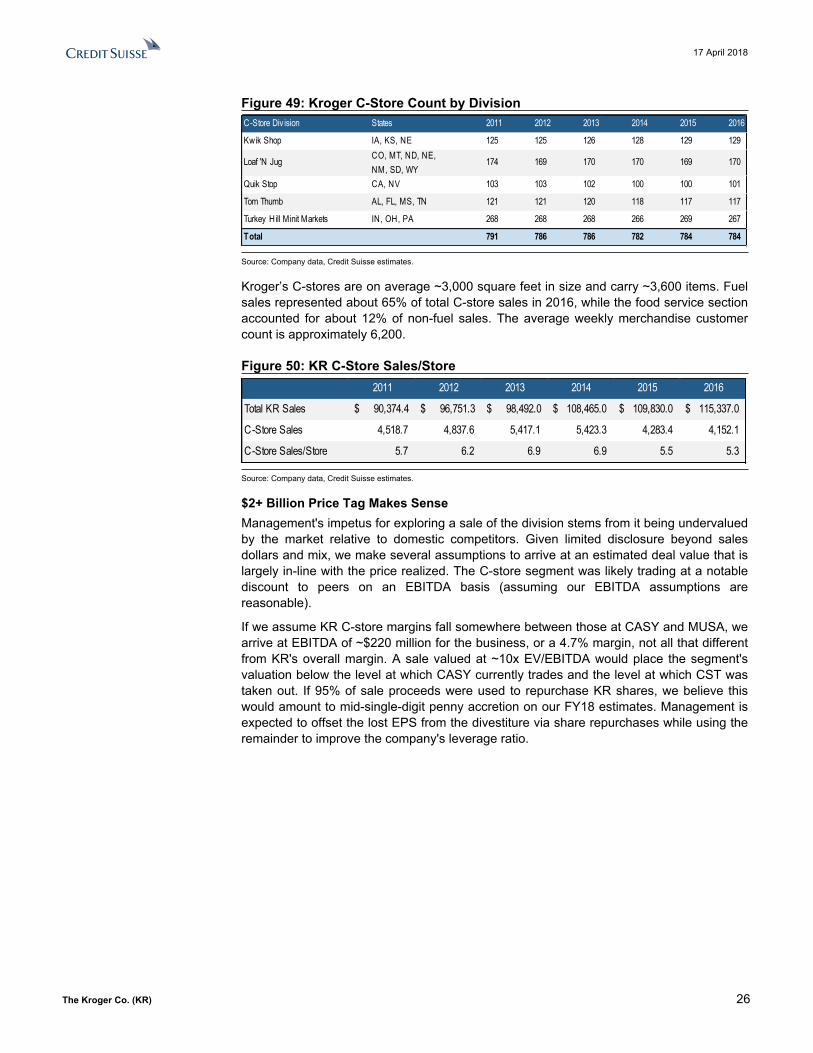
Figure 49: Kroger C-Store Count by Division C-Store Div ision States 2011 2012 2013 2014 2015 2016
Kwik Shop IA, KS, NE 125 125 126 128 129 129
Loaf 'N Jug CO, MT, ND, NE, NM, SD, WY
174 169 170 170 169 170
Quik Stop CA, NV 103 103 102 100 100 101
Tom Thumb AL, FL, MS, TN 121 121 120 118 117 117
Turkey Hill Minit Markets IN, OH, PA 268 268 268 266 269 267
Total 791 786 786 782 784 784
Source: Company data, Credit Suisse estimates.
Kroger’s C-stores are on average ~3,000 square feet in size and carry ~3,600 items. Fuel sales represented about 65% of total C-store sales in 2016, while the food service section accounted for about 12% of non-fuel sales. The average weekly merchandise customer count is approximately 6,200.
Figure 50: KR C-Store Sales/Store 2011 2012 2013 2014 2015 2016
Total KR Sales $ 90,374.4 $ 96,751.3 $ 98,492.0 $ 108,465.0 $ 109,830.0 $ 115,337.0
C-Store Sales 4,518.7 4,837.6 5,417.1 5,423.3 4,283.4 4,152.1
C-Store Sales/Store 5.7 6.2 6.9 6.9 5.5 5.3
Source: Company data, Credit Suisse estimates.
$2+ Billion Price Tag Makes SenseManagement's impetus for exploring a sale of the division stems from it being undervalued by the market relative to domestic competitors. Given limited disclosure beyond sales dollars and mix, we make several assumptions to arrive at an estimated deal value that is largely in-line with the price realized. The C-store segment was likely trading at a notable discount to peers on an EBITDA basis (assuming our EBITDA assumptions are reasonable).
If we assume KR C-store margins fall somewhere between those at CASY and MUSA, we arrive at EBITDA of ~$220 million for the business, or a 4.7% margin, not all that different from KR's overall margin. A sale valued at ~10x EV/EBITDA would place the segment's valuation below the level at which CASY currently trades and the level at which CST was taken out. If 95% of sale proceeds were used to repurchase KR shares, we believe this would amount to mid-single-digit penny accretion on our FY18 estimates. Management is expected to offset the lost EPS from the divestiture via share repurchases while using the remainder to improve the company's leverage ratio.

17 April 2018
The Kroger Co. (KR) 27
Figure 51: Sale Accretive Figure 52: $2Bn Seems Reasonable Assumptions Deal EV/Sales 0.5xConvenience Store Sales 3.6% Sales Proceeds ($M) $2,150Proceeds used for repo 95% Proceeds available for Repo 2,043EBITDA Margin 4.9% Implied EV/EBITDA 9.8xEV/Sales 0.5xRepo Price 24.00$ Impact to FY 18E
KR FY18E Net Income 1,768Net income C-Store Business 109.0PF Net Income $1,659PF EPS est. FY18 $1.96EPS Accretion/Dilution ($0.15)Current FY18E Shares Out 844.7Proceeds available for Repo 1,940Share Repo'd @ $24.00 81PF Shares Outstanding 764Current EPS est. FY18 $2.11PF EPS est. FY18 $2.17Accretion/Dilution post repo $0.06
Estimated C-Store Deal ProceedsEV/EBITDA
KR est↓
Casey↓
8.50x 8.75x 9.00x 9.25x 9.50x 9.75x 10.00x 10.25x 10.50x3.50% $1,314 $1,352 $1,391 $1,430 $1,468 $1,507 $1,546 $1,584 $1,623
Murphy→ 4.00% 1,501 1,546 1,590 1,634 1,678 1,722 1,766 1,810 1,8554.50% 1,689 1,739 1,788 1,838 1,888 1,937 1,987 2,037 2,0865.00% 1,877 1,932 1,987 2,042 2,098 2,153 2,208 2,263 2,3185.50% 2,064 2,125 2,186 2,247 2,307 2,368 2,429 2,489 2,5506.00% 2,252 2,318 2,385 2,451 2,517 2,583 2,649 2,716 2,7826.50% 2,440 2,512 2,583 2,655 2,727 2,799 2,870 2,942 3,014
Casey→ 7.00% 2,627 2,705 2,782 2,859 2,937 3,014 3,091 3,168 3,2467.50% 2,815 2,898 2,981 3,063 3,146 3,229 3,312 3,395 3,477
C-St
ore E
BITD
A Ma
rgin
KR est→
Murphy↓
Source: Company data, Credit Suisse estimates. Source: Company data, Credit Suisse estimates.
Figure 53: KR C-Store Business Was Garnering Valuation Below Peers
6.6x
0.3x
5.665.0%
10.2x
0.6x
4.1
58.8%
7.4x
0.2x
9.1
79.4%
10.0x
0.5x
5.4
76.8%
0.0x
2.0x
4.0x
6.0x
8.0x
10.0x
12.0x
EV/NTM EBITDA EV/ Sales C-Store Sales/Store Fuel Sales as % of TotalRevenue
KR C-Stores (est.) Casey's General Stores Murphy USA CST - Couche-Tard Deal
Source: Company data, Credit Suisse estimates.
Figure 54: How KR's C-Store Business Stacks Up
EV/NTM EBITDA EV/ Sales EBITDA
Margin (LTM) # of C-Stores Sales (LTM) in $M
C-Store Sales/Storein $M
Fuel Sales as % of Total Revenue
KR C-Stores currently (est.) 6.7x 0.3x 4.7% 784 4,292.7 5.5 65.0%Casey's General Stores 10.7x 0.7x 6.4% 1,978 7,863.9 4.0 58.8%Murphy USA 8.9x 0.3x 3.3% 1,405 12,502.8 8.9 79.4%
Deal EV to EBITDA
Deal EV to Sales
EBITDA Margin # of Stores Sales (LTM)
in $MC-Store Sales/Store
in $MFuel Sales as % of
Total Revenue
CST - Couche Tard Deal 10.0x 0.5x 4.8% 2,051 11,106.0 5.41 76.8%Murphy USA Spin-off 4.6x 0.1x 1.9% 1,179
Source: Company data, Credit Suisse estimates.

17 April 2018
The Kroger Co. (KR) 28
Recent Deals in the Space
On April 6, 2017, Seven & i Holdings Co, parent company of 7-Eleven convenience stores, agreed to buy ~1,100 Sunoco LP shops for a total E of ~$3.3 billion, or ~10x EBITDA. In January 2018, the deal was approved by the U.S. FTC with some conditions: 7-Eleven was mandated to sell 26 stores it owns to Sunoco, and Sunoco will retain 33 stores it would have sold to 7-Eleven.
On August 22, 2016, Alimentation Couche-Tard, the market leader in the Canadian convenience store industry and a parent company of the Circle K brand, announced a definitive agreement to acquire CST Brands in an all-cash transaction for $48.33 per share, with a total EV of ~$4.4 billion, or ~10x EBITDA. Couche-Tard acquired as part of the deal 1,146 CST brands c-stores primarily operating under the banners of Corner Store, Nice N Easy, and Flash Food. The deal was closed on June 28, 2017.
Flow-Through Incomplete, but Inflation Coming BackSupermarket sales demonstrate a fairly tight correlation to food inflation, as pricing is often passed on to the consumer. After 18 months of prolonged and painful deflation within the larger food retail landscape, inflation appears to be back, albeit at a modest level. Industry participants typically point to 2-3% inflation as an ideal level at which pricing can be fully passed onto the shelf. This rule of thumb is convenient but complex in that on-shelf pricing is going the way of the dodo bird as direct couponing gains traction across the industry.
Figure 55: KR ID Sales vs. CPI Food at Home Figure 56: Nielsen Supermarket Sales vs. CPI
-4.0%
-2.0%
0.0%
2.0%
4.0%
6.0%
8.0%
10.0%
Jul-0
5Ja
n-06
Jul-0
6Ja
n-07
Jul-0
7Ja
n-08
Jul-0
8Ja
n-09
Jul-0
9Ja
n-10
Jul-1
0Ja
n-11
Jul-1
1Ja
n-12
Jul-1
2Ja
n-13
Jul-1
3Ja
n-14
Jul-1
4Ja
n-15
Jul-1
5Ja
n-16
Jul-1
6Ja
n-17
Jul-1
7Ja
n-18
KR Non-Fuel IDs CPI Food At Home
-4.0%
-3.0%
-2.0%
-1.0%
0.0%
1.0%
2.0%
3.0%
4.0%
5.0%
Sep-14 Mar-15 Sep-15 Mar-16 Sep-16 Mar-17 Sep-17 Mar-18
Nielsen Sales (3 Mo. Rolling Avg.) CPI Food @ Home
Source: BLS, Credit Suisse estimates. Source: BLS, Credit Suisse estimates | Nielsen Food Channel.
Figure 57: KR Stock Price vs. Food at Home CPI Growth
$0
$5
$10
$15
$20
$25
$30
$35
$40
$45KR Price (RHS)
-4.5%
-3.5%
-2.5%
-1.5%
-0.5%
0.5%
1.5%
2.5%
3.5%
4.5%
Feb-
14Ap
r-14
Jun-
14Au
g-14
Oct-1
4De
c-14
Feb-
15Ap
r-15
Jun-
15Au
g-15
Oct-1
5De
c-15
Feb-
16Ap
r-16
Jun-
16Au
g-16
Oct-1
6De
c-16
Feb-
17Ap
r-17
Jun-
17Au
g-17
Oct-1
7De
c-17
Feb-
18Ap
r-18
CPI Food at Home (LHS)
Source: BLS, Credit Suisse estimates.

17 April 2018
The Kroger Co. (KR) 29
Beyond personalized couponing and promotions is the advent of online grocery and what it has done to comparability across stores. A quick search on Instacart for apples provides an instantaneous comparison shop across multiple retailers in a given market. Couple this with Amazon entering the space in a meaningful way via Whole Foods, the expansion of hard discounters in the United States, and WMT's concerted effort to remain a price leader, inflation becomes more and more difficult to fully pass through.
KR made this point effectively at its 2017 Investor Day with a rare glimpse into the delta between its cost inflation and retail inflation in recent quarters. Some of the controlled investment in price was due to an irrational competitive environment during a heightened period of deflation, but the current landscape feels similarly competitive. We believe that grocers will continue to fight for traffic as the battle for online dominance continues and that benefits from tax reform will be invested in price to some extent as well, as demonstrated by plans out of KR and WMT. That said, a return to even somewhat normal levels of inflation should drive an acceleration in ID sales over the coming years.
Figure 58: Kroger Cost Inflation vs. Retail Inflation
-3.00%
-2.50%
-2.00%
-1.50%
-1.00%
-0.50%
0.00%
0.50%
1.00%
1.50%
3Q15 4Q15 1Q16 2Q16 3Q16 4Q16 1Q17 2Q17
KR Cost Inflation Retail Inflation
Source: Company data, Credit Suisse estimates.
Figure 59: Expected Normalization in Inflation to Drive IDs
0.0%
0.5%
1.0%
1.5%
2.0%
2.5%
3.0%
3.5%
2018E 2019E 2020E
KR ID Sales Composition
Gap to Total ID
Click & Collect
KR local B&M food channelshare gains of 10-20bps
Space Optimization
Inflation
Cons
Source: Company data, Credit Suisse estimates

17 April 2018
The Kroger Co. (KR) 30
ValuationSupermarket valuations have historically been closely tied to same-store sales figures, as the leverage on incremental sales dollars through such a high fixed cost box is extremely powerful. That said, we believe that the rapidly evolving landscape within U.S. grocery will require investors to consider more than just quarterly comps and that ultimate market shares within a more pronounced online grocery environment will be key. Part of management teams' vital tasks over the coming years will likely be to project relevance over the long term. KR is on its way to crafting this narrative, but opportunity in this area remains.
Figure 60: KR Share Price and Same-Store Sales Figure 61: KR NTM Fwd P/E and Same-Store Sales
$10.0
$15.0
$20.0
$25.0
$30.0
$35.0
$40.0
$45.0
$50.0
-2.0%
-1.0%
0.0%
1.0%
2.0%
3.0%
4.0%
5.0%
6.0%
7.0%
1Q14
2Q14
3Q14
4Q14
1Q15
2Q15
3Q15
4Q15
1Q16
2Q16
3Q16
4Q16
1Q17
2Q17
3Q17
4Q17
1Q18
2Q18
3Q18
4Q18
1Q19
2Q19
3Q19
4Q19
1Q20
2Q20
3Q20
4Q20
Non-Fuel IDs Non-Fuel IDs CS Est Price
0.0x
5.0x
10.0x
15.0x
20.0x
25.0x
-2.0%
-1.0%
0.0%
1.0%
2.0%
3.0%
4.0%
5.0%
6.0%
7.0%
1Q14
2Q14
3Q14
4Q14
1Q15
2Q15
3Q15
4Q15
1Q16
2Q16
3Q16
4Q16
1Q17
2Q17
3Q17
4Q17
1Q18
2Q18
3Q18
4Q18
1Q19
2Q19
3Q19
4Q19
1Q20
2Q20
3Q20
4Q20
Non-Fuel IDs Non-Fuel IDs CS Est NTM Fwd PE
Source: Company data, Thomson Reuters, Credit Suisse estimates. Source: Company data, Thomson Reuters, Credit Suisse estimates.
On P/E and EV/EBITDA bases, KR has recovered from its lows, reached (unsurprisingly) during its weakest ID sales period in memory, but sits nowhere near the cycle highs achieved during the supermarket nirvana experienced in 2015. To frame valuation, we look at the stock's valuation discount to WMT for several reasons; WMT is the largest player in the grocery space, it is the bellwether staples retailer, and it is the natural foil for AMZN within the U.S. retail landscape.
After trading in-line or at a premium to WMT for much of the past five years, KR's valuation deficit widened as WMT gained traction in its U.S. business over the past year. Another important piece of the gap, we believe, has been WMT's ability to position itself as a legitimate long-term competitor to AMZN and overall omnichannel retailer with staying power. Our estimation that KR's multiple will expand over the coming 12 months is partially rooted in our expectation that KR can garner some of this premium as well. More tangibly, we see accelerating ID sales and EPS through 2019-2020 supporting improved valuation. A 6% FCF yield on our NTM estimates is supportive as well, relative to 4-5% historically.
Our $28 target price assumes KR stock can trade at ~7x EV to 2019 EBITDA over the coming year (and closer to 6.7x when MEPP-related debt is considered), in-line with the company's five-year historical average and a continued discount to WMT. On P/E, this translates to ~12x forward earnings in 12 months, both below the five-year average and WMT at ~17.5x, on what we believe will be double-digit EPS growth in 2019 and 2020. The discount to WMT is an opportunity if KR can convincingly demonstrate omnichannel sales growth and resumed EBITDA growth beyond 2018.
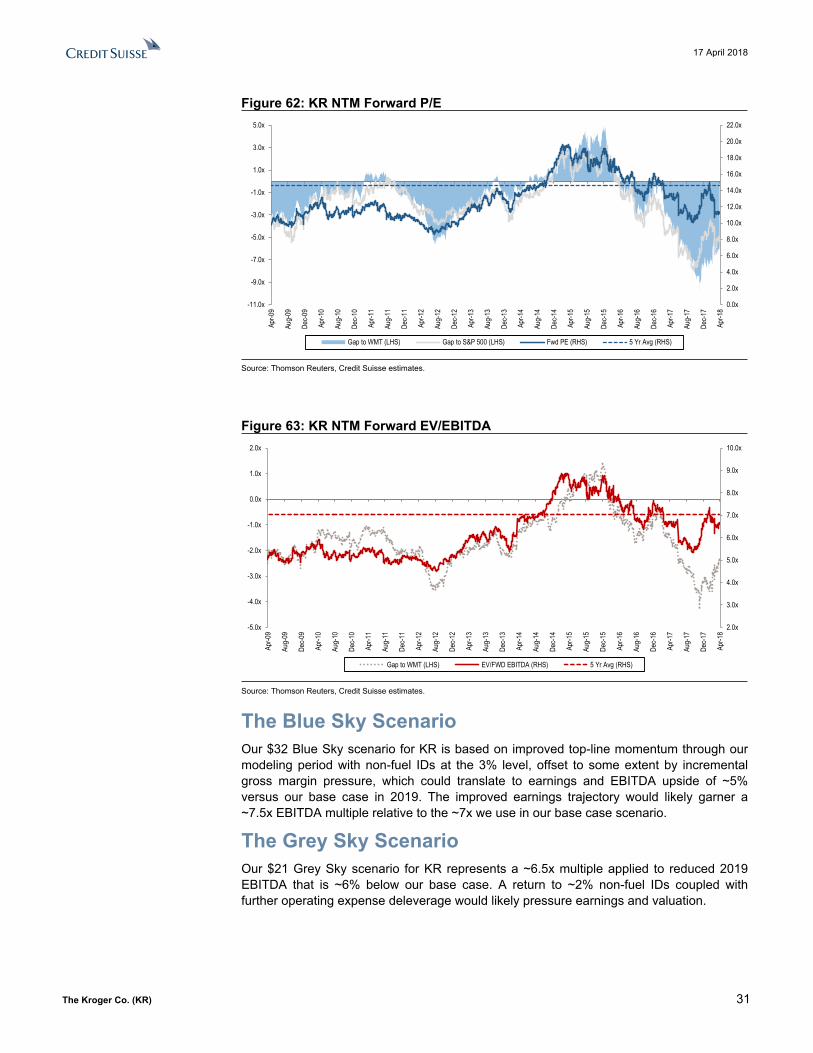
17 April 2018
The Kroger Co. (KR) 31
Figure 62: KR NTM Forward P/E
0.0x
2.0x
4.0x
6.0x
8.0x
10.0x
12.0x
14.0x
16.0x
18.0x
20.0x
22.0x
-11.0x
-9.0x
-7.0x
-5.0x
-3.0x
-1.0x
1.0x
3.0x
5.0x
Apr-0
9
Aug-
09
Dec-0
9
Apr-1
0
Aug-
10
Dec-1
0
Apr-1
1
Aug-
11
Dec-1
1
Apr-1
2
Aug-
12
Dec-1
2
Apr-1
3
Aug-
13
Dec-1
3
Apr-1
4
Aug-
14
Dec-1
4
Apr-1
5
Aug-
15
Dec-1
5
Apr-1
6
Aug-
16
Dec-1
6
Apr-1
7
Aug-
17
Dec-1
7
Apr-1
8
Gap to WMT (LHS) Gap to S&P 500 (LHS) Fwd PE (RHS) 5 Yr Avg (RHS)
Source: Thomson Reuters, Credit Suisse estimates.
Figure 63: KR NTM Forward EV/EBITDA
2.0x
3.0x
4.0x
5.0x
6.0x
7.0x
8.0x
9.0x
10.0x
-5.0x
-4.0x
-3.0x
-2.0x
-1.0x
0.0x
1.0x
2.0x
Apr-0
9
Aug-
09
Dec-0
9
Apr-1
0
Aug-
10
Dec-1
0
Apr-1
1
Aug-
11
Dec-1
1
Apr-1
2
Aug-
12
Dec-1
2
Apr-1
3
Aug-
13
Dec-1
3
Apr-1
4
Aug-
14
Dec-1
4
Apr-1
5
Aug-
15
Dec-1
5
Apr-1
6
Aug-
16
Dec-1
6
Apr-1
7
Aug-
17
Dec-1
7
Apr-1
8
Gap to WMT (LHS) EV/FWD EBITDA (RHS) 5 Yr Avg (RHS)
Source: Thomson Reuters, Credit Suisse estimates.
The Blue Sky ScenarioOur $32 Blue Sky scenario for KR is based on improved top-line momentum through our modeling period with non-fuel IDs at the 3% level, offset to some extent by incremental gross margin pressure, which could translate to earnings and EBITDA upside of ~5% versus our base case in 2019. The improved earnings trajectory would likely garner a ~7.5x EBITDA multiple relative to the ~7x we use in our base case scenario.
The Grey Sky ScenarioOur $21 Grey Sky scenario for KR represents a ~6.5x multiple applied to reduced 2019 EBITDA that is ~6% below our base case. A return to ~2% non-fuel IDs coupled with further operating expense deleverage would likely pressure earnings and valuation.

17 April 2018
The Kroger Co. (KR) 32
Figure 64: NTM P/E vs. Peers Figure 65: NTM EV/EBITDA vs. Peers
35.3 x
29.9 x
25.9 x
18.8 x 17.9 x 17.3 x 16.7 x 16.1 x 15.9 x 15.6 x13.6 x
11.5 x 11.4 x
6.1 x
0.0 x
5.0 x
10.0 x
15.0 x
20.0 x
25.0 x
30.0 x
35.0 x
40.0 x
OLLI FIVE COST SFM SYY WMT DLTR PFGC USFD DG TGT SFS KR SVU
NTM PE
22.1 x
17.3 x
13.7 x
11.5 x 10.8 x 10.4 x 10.3 x 10.0 x 9.8 x 9.0 x7.2 x 6.7 x
5.4 x 5.1 x
0.0 x
5.0 x
10.0 x
15.0 x
20.0 x
25.0 x
OLLI FIVE COST SYY DG SFM DLTR PFGC USFD WMT TGT KR SFS SVU
NTM EV/EBITDA
Source: Thomson Reuters, Company data, Credit Suisse estimates. Source: Thomson Reuters, Company data, Credit Suisse estimates.
Figure 66: KR Historical FCF Yield (NTM FCF / Daily Market Cap)
0.0%
2.0%
4.0%
6.0%
8.0%
10.0%
12.0%
Aug-
13
Dec-1
3
Apr-1
4
Aug-
14
Dec-1
4
Apr-1
5
Aug-
15
Dec-1
5
Apr-1
6
Aug-
16
Dec-1
6
Apr-1
7
Aug-
17
Dec-1
7
Apr-1
8
NTM FCF Yield Average
Source: Thomson Reuters, Company data, Credit Suisse estimates
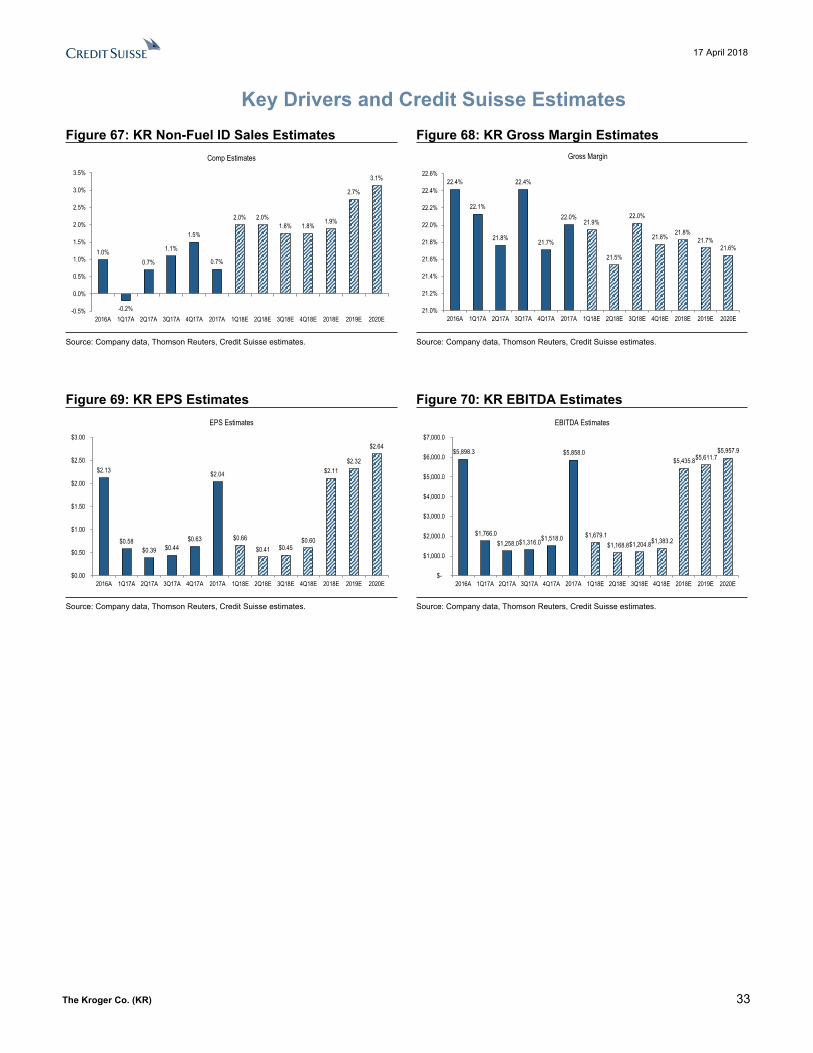
17 April 2018
The Kroger Co. (KR) 33
Key Drivers and Credit Suisse EstimatesFigure 67: KR Non-Fuel ID Sales Estimates Figure 68: KR Gross Margin Estimates
1.0%
-0.2%
0.7%
1.1%
1.5%
0.7%
2.0% 2.0%1.8% 1.8% 1.9%
2.7%
3.1%
-0.5%
0.0%
0.5%
1.0%
1.5%
2.0%
2.5%
3.0%
3.5%
2016A 1Q17A 2Q17A 3Q17A 4Q17A 2017A 1Q18E 2Q18E 3Q18E 4Q18E 2018E 2019E 2020E
Comp Estimates
22.4%
22.1%
21.8%
22.4%
21.7%
22.0%21.9%
21.5%
22.0%
21.8% 21.8%21.7%
21.6%
21.0%
21.2%
21.4%
21.6%
21.8%
22.0%
22.2%
22.4%
22.6%
2016A 1Q17A 2Q17A 3Q17A 4Q17A 2017A 1Q18E 2Q18E 3Q18E 4Q18E 2018E 2019E 2020E
Gross Margin
Source: Company data, Thomson Reuters, Credit Suisse estimates. Source: Company data, Thomson Reuters, Credit Suisse estimates.
Figure 69: KR EPS Estimates Figure 70: KR EBITDA Estimates
$2.13
$0.58 $0.39 $0.44
$0.63
$2.04
$0.66 $0.41 $0.45
$0.60
$2.11 $2.32
$2.64
$0.00
$0.50
$1.00
$1.50
$2.00
$2.50
$3.00
2016A 1Q17A 2Q17A 3Q17A 4Q17A 2017A 1Q18E 2Q18E 3Q18E 4Q18E 2018E 2019E 2020E
EPS Estimates
$5,898.3
$1,766.0 $1,258.0 $1,316.0 $1,518.0
$5,858.0
$1,679.1 $1,168.8 $1,204.8 $1,383.2
$5,435.8 $5,611.7 $5,957.9
$-
$1,000.0
$2,000.0
$3,000.0
$4,000.0
$5,000.0
$6,000.0
$7,000.0
2016A 1Q17A 2Q17A 3Q17A 4Q17A 2017A 1Q18E 2Q18E 3Q18E 4Q18E 2018E 2019E 2020E
EBITDA Estimates
Source: Company data, Thomson Reuters, Credit Suisse estimates. Source: Company data, Thomson Reuters, Credit Suisse estimates.

17 April 2018
The Kroger Co. (KR) 34
HOLT® AnalysisFigure 71: Kroger HOLT® Analysis
Current Price: USD 24.17 Warranted Price: USD 27.88 Valuation date: 17-Apr-18
HOLT perspective on operating projections implied by Target Price
Warranted price sensitivity to growth and marginsLong term sales growth
USD 5.2% 6.2% 7.2% 8.2% 9.2%Summary of CS Research projections and key operating drivers
Jan 17A Jan 18A Jan 19E Jan 20E Jan 21ESales Growth, % 5.0 6.4 0.0 3.2 3.9
EBITDA Mgn, % 5.1 4.8 4.4 4.4 4.5Asset Turns, x 1.91 1.9 2.0 2.0 2.0
CFROI®, % 6.4 6.3 6.5 6.4 6.7Disc Rate, % 4.8 5.2 5.7 5.7 5.7Asset Grth, % 6.6 1.7 -4.8 0.7 0.8
Value/Cost, x 1.5 1.3 1.2 1.1 1.1Economic PE, x 23.8 19.9 18.6 17.9 16.1Leverage, % 40.9 51.2 51.4 52.2 51.7
More than 10%
downsideWithin 10% More than
10% upside
Source: Credit Suisse HOLT®. CFROI and HOLTare trademarks or registered trademarks of Credit Suisse Group AG or its affiliates in the United States and other countries.
6.5% 47.42 51.13 55.11 59.40 64.02
5.5% 35.29 38.32 41.58 45.09 48.88
4.5% 23.01 25.35 27.88 30.62 33.57
2.03
3.5% 10.53 12.18 13.96 15.90 18.00
HO
LT
- C
redi
t Sui
sse
Ana
lyst
Sce
nari
o D
ata
KROGER CO (KR)
Long
term
EBI
TDA
mar
gins
2.5% -2.24 -1.32 -0.31 0.81
0
1
2
3
4
5
6
7
8
2013 2015 2017 2019 2021Historical Forecast based on Research projection
Long term estimates Discount Rate
CFROI & Discount Rate (in %)
0
1
2
3
4
5
6
2013 2015 2017 2019 2021Historical Forecast based on Research projection Long term estimates
EBITDA Margin (in %)
-2
0
2
4
6
8
10
12
2013 2015 2017 2019 2021Historical Forecast based on Research projection Implied by analyst target price
Sales Growth (in %)
0.0
0.5
1.0
1.5
2.0
2.5
2013 2015 2017 2019 2021Historical Forecast based on Research projection Long term estimates
Asset Turns (x)
-6-4-202468
101214
2013 2015 2017 2019 2021
Historical Forecast based on Research projection Long term estimates
Asset growth (inflation adjusted, in %)
Source: HOLT®, Company data, Credit Suisse estimates
About HOLT®
The HOLT® methodology goes beyond traditional accounting information to emphasize a company’s cash generating ability and overall potential for value creation. The cash flow return metric at the heart of HOLT® is a proprietary performance measure known as Cash Flow Return on Investment (CFROI®). HOLT®’s CFROI® is an adjusted return on capital metric that corrects for accounting distortions to capture true economic returns, allowing greater comparability across companies, time, industries and markets.
The HOLT® warranted value is based on a discounted cash flow framework with a number of distinguishing features defining free cash flow generated and method by which a firm’s cost of capital is estimated. HOLT® uses CFROI®, reinvestment rates and their expected pattern over time to forecast future cash flows. As opposed to a traditional perpetuity, HOLT® applies a long-term mean reversion of CFROI® towards its cost of capital thereby recognizing the economic realities of competition. Free cash flow is discounted by HOLT®’s unique, forward-looking, market derived discount rate.
Assumptions and Methodology:
We assume constant EBITDA Margin for 2020 and 2021 and arrive at 7.2% long-
term sales growth when solving for the
top-line growth required to arrive at
our target price within HOLT®’s DCF methodology.

17 April 2018
The Kroger Co. (KR) 35
Investment RisksRisks to our target price include deterioration in domestic economic conditions; increased competition from brick-and-mortar and online players, including heightened focus on price investments and increased promotional activities; and risks associated with Kroger’s labor relations and pension obligations.
Macroeconomic Slowdown and Volatility of Commodity PricesKroger’s results of operations could be largely affected by economic conditions of the domestic market, as the company’s operations and customers are located in the United States. Macroeconomic conditions including consumer confidence, employment levels, business conditions as well as consumers’ spending and eating habits can all significantly affect KR’s results.
In addition, KR is exposed to volatile inflationary and deflationary trends in certain commodities and also sells a significant amount of fuel. Thus the inability to pass through higher input costs onto consumers could hurt the company’s financial results.
Changes to the Competitive EnvironmentKroger operates in a highly competitive food retail industry with numerous national and regional players. Accelerated entry of nontraditional competitors and increased pricing and promotional activities from players in brick-and-mortar and online landscapes as well as a continued consolidation within the industry can negatively affect the company’s operating results and market share.
In particular, KR has been accelerating its offerings of online delivery and Click & Collect programs across its store base. These programs can be cannibalizing and materially dilutive to overall profitability in the near term, as they require incremental investments in capital and labor.
Labor Relations and Multiemployer Pension ObligationsA significant portion of Kroger’s employees is unionized and covered by collective bargaining agreements. Adverse relationships with these unions and an inability to manage and negotiate new contracts may result in increased operating costs and could have a material adverse impact on Kroger’s financial results.
Furthermore, Kroger contributes to a number of multiemployer pension plans based on obligations under collective bargaining agreements with unions and therefore bears on and off balance sheet pension liabilities. There is a risk that rating agencies could view Kroger’s underfunded pension liabilities as outstanding debt and unfavorably affect ratings on the company’s debt securities.

17 April 2018
The Kroger Co. (KR) 36
Company Overview Headquartered in Cincinnati, Ohio, Kroger is a grocery retail company that operates about 2,782 supermarket stores in 35 states under nearly two dozen banners. Kroger’s store formats include supermarkets (combination stores), multidepartment stores, marketplace stores, and price-impact warehouse stores. Of the 2,782 supermarkets under a variety of local banner names, ~2,268 had pharmacies and 1,489 had fuel centers. Kroger operated approximately 45% of its stores in company-owned facilities (including company-owned buildings on leased land).
In addition to supermarkets, Kroger operates ~782 convenience stores under six banners in 19 states and ~274 fine jewelry stores under names such as Fred Meyer Jewelers and Littman Jewelers.
Figure 72: Kroger Stores by Format Figure 73: KR Supermarket Store by Format, FY 16# of Stores % of Revenue
Supermarkets 2,782 97.0%Convenience Stores 782 3.6%*
Jewelry Stores 274 0.3%*Other NA 3.0%Total 3,838 100.0%
Store Formats # of Stores % of RevenueCombination Stores 2,381 85.0%
Multi-Department 132 5.0%Marketplace 153 5.0%
Price Impact Warehouse 130 5.0%Total 2,796 100.0%
Source: Company data, Credit Suisse estimates | *% of Revenue is as of FY 2016. Source: Company data, Credit Suisse estimates.
Approximately 75% of KR’s sales come from nonperishable and perishable products. The rest of sales come from its fuel, pharmacy, jewelry, and digital services.
− Nonperishable consists of grocery, general merchandise, health and beauty care, and natural foods.
− Perishable includes produce, floral, meat, seafood, deli, bakery, and fresh prepared foods
− Other consists of sales related to jewelry, stores, food production to outside customers, data analytics services, digital coupon services, etc.
Figure 74: KR Sales Mix, FY 2017
Non Perishable50.9%
Perishable23.8%
Fuel13.2%
Pharmacy8.8%
Other3.4%
Source: Company data, Credit Suisse estimates.

17 April 2018
The Kroger Co. (KR) 37
KR Geographic Footprint
Figure 75: KR Supermarkets Geographic Footprint
Source: Company data, Credit Suisse estimates.
Figure 76: KR M&A Activity M&A Date # of Stores (A) Location Banner Change
Buehler Food Markets Apr-06 1 Louisv ille, KY YesScott's Food & Pharmacy Apr-07 18 Fort Wayne, IN Yes
Farmer Jack Jun-07 20 Detroit, MI YesIndiv idual Stores 2007 2 Various YesIndiv idual Stores 2008 9 Various Yes
AWG Jan-10 7 Topeka & Wichita, KS YesBrookshires Mar-10 2 Jackson, MS YesAlbertsons Jun-10 1 Ft. Worth, TX Yes
Indiv idual Stores Apr-11 1 Bloomfield, IN YesSchnuck's (Supermarkets) Sep-11 8 Memphis, TN Yes
Schnuck's (C-Stores) Sep-11 7 Memphis, TN YesAxium Pharmacy Dec-12 Specialty Rx Lake Mary, FL N/A
Harris Teeter Jan-14 227 Multiple NoYOU Technology Feb-14 Technology San Francisco, CA N/A
Vitacost.com Aug-14 E-Comm Boca Raton, FL N/A84.51˚ Apr-15 Technology Cincinnati, OH N/AHiller's Jul-15 7 Detroit, MI Yes
Roundy 's (various banners) Dec-15 151 Wisconsin/Chicago NoMinyard Sun Fresh Jan-16 1 Plano, TX Yes
Market6 Aug-16 Technology Deerfield, IL N/AModernHEALTH Sep-16 Specialty Rx Orlando, FL N/AMurray 's Cheese Jan-17 2 New York City , NY No
* (A) Represents stores acquired. Kroger may not operate all
Source: Company data, Credit Suisse estimates.

17 April 2018
The Kroger Co. (KR) 38
Management and Board of DirectorsManagement TeamRodney McMullen was elected chairman of the board in January 2015 and chief executive officer in January 2014. Previously, he served in various leadership roles within the company, including president and chief operating officer from 2009 to 2013, vice chairman in 2003, executive vice president in 1999, and senior vice president in 1997. Mike Schlotman serves as executive vice president and chief financial officer of The Kroger Co. He joined Kroger in 1985 and has held a variety of leadership positions in accounting, including vice president and corporate controller.
Figure 77: KR Management ProfileEx ecutiv e Position Years at KR
W. Rodney McMullen Chairman and Chief Ex ecutiv e Officer 38
J. Michael Schlotman EVP and CFO 33
Michael J. Donnelly EVP of Merchandising 40
Christopher T. Hjelm EVP and CIO 13
Timonthy A. Massa Group VP, Human Resources & Labor Relations 8
Erin Sharp Group VP, Manufacturing 7
Alex Tosolini SVP, New Business Dev elopment 4
Mark Tuffin SVP 22
Christine S. Wheatley Group VP, Secretary and General Counsel 10
Jessica C. Adelman Group VP, Corporate Affairs 3
Mary Ellen Adcock Group VP, Retail Operations 19
Stuart Aitken Group VP 3
Robert W. Clark SVP, Merchandising 33
Calv in J. Kaufman SVP 24
Stephen M. McKinney SVP 37
Yael Cosset Group VP and Chief Digital Officer 2
Source: Company data, Credit Suisse estimates.
Management CompensationKroger management’s annual cash bonus plan is based on targets for ID Sales (30% weighting), Net Operating Profit (30% weighting), Customer 1st Strategy1 (30% weighting), Total Operating Costs as % of Sales, without Fuel (10% weighting). In addition, an extra 5% can be earned if KR achieves certain goals tied to ClickList expansion and operations.
Figure 78: KR Executive Compensation FY 2016
Name Position Salary Stock Awards Option AwardsNon-equity
incentive plan compensation
Change in Pension Value and
Nonqualified Deferred
Compensation Earnings
Other Total
W. Rodney McMullen Chairman and CEO $1,251,781 $5,125,034 $2,699,044 $719,945 $3,139,537 $282,051 $13,217,392J. Michael Schlotman EVP and CFO $850,360 $1,973,247 $1,040,436 $372,855 $1,436,752 $141,427 $5,815,077Michael J. Donnelly EVP of Merchandising $757,036 $1,480,011 $780,323 $341,308 $2,207,236 $188,569 $5,754,483Christopher T. Hjelm EVP and CIO $703,367 $1,480,011 $780,323 $326,280 $832 $104,505 $3,395,318
Frederick J. Morganthall II EVP and Retail Ops $691,487 $1,480,011 $780,323 $381,643 $852,235 $91,912 $4,277,611
Source: Company data, Credit Suisse estimates.
1 The “Four Keys” of Customer 1st Strategy: People, Products, Shopping Experience, and Price

17 April 2018
The Kroger Co. (KR) 39
Board of Directors
Figure 79: KR Board of DirectorsExecutive Background Joined Board Committees
Nora A. Aufreiter Director Emeritus of McKinsey & Company 2014Financial Policy
Public Responsibilites
Robert D. Beyer Chairman of Chaparal Investments LLC 1999Corporate Governance
Financial Policy
Anne Gates President of MGA Entertainment, Inc. 2015Audit
Public Responsibilities
Susan J. Kropf Former President and COO of Avon Products, Inc. 2007Compensation
Corporate Governance
W. Rodney McMullen Chairman and Chief Executive Officer of KR 2003 -
Jorge P. Montoya Former President of P&G Snacks & Beverages 2007Compensation
Public Responsibilities
Clyde R. Moore Former Chairman of First Serv ice Networks 1997Compensation
Corporate Governance
James A. RundeSpecial Advisor and a former Vice Chairman of
Morgan Stanley2006
CompensationFinancial Policy
Ronald L. Sargent Former Chairman and CEO of Staples, Inc. 2006Audit
Public Responsibilities
Bobby S. Schackouls Former Chairman of the Board of Burlington Resources 1999Audit
Corporate Governance
Mark S. Sutton Chairman and CEO of International Paper 2017Audit
Public Responsibilities
Source: Company data, Credit Suisse estimates.

17 April 2018
The Kroger Co. (KR) 40
AppendixFigure 80: Kroger Supermarket Banners by State
State Banners Y/E 2016 Y/E 2015California Food 4 Less Foods Co Ralphs 309 321
Ohio Kroger Kroger Marketplace Ruler Foods 212 212Texas Kroger Kroger Marketplace 211 209
Georgia Kroger Kroger Marketplace Harris Teeter 174 173North Carolina Kroger Harris Teeter 162 160
Indiana Kroger Kroger Marketplace Jay C Owen's Pay Less Super Markets Ruler Foods 152 151Colorado City Market King Soopers King Soopers Marketplace 146 144Michigan Kroger Kroger Marketplace 128 129Arizona Fry 's Food & Drug Fry 's Marketplace Smith's 127 123
Tennessee Kroger Kroger Marketplace 123 120Washington Fred Meyer QFC 119 118Wisconsin Pick 'n Save Copps Metro Market 115 116Kentucky Kroger Kroger Marketplace Ruler Foods 112 114Virginia Kroger Kroger Marketplace Harris Teeter 111 106Illinois Food 4 Less Kroger Marketplace Mariano's Ruler Foods 103 98
Kansas Dillons Food Stores Dillons Marketplace 62 64Oregon Fred Meyer QFC 57 56
Utah City Market Smith's Smith's Marketplace 54 52Nevada Smith's 44 44
West Virginia Kroger 42 42South Carolina Kroger Harris Teeter 36 35
Arkansas Kroger Kroger Marketplace 32 32Mississippi Kroger 31 31
New Mexico City Market Price Rite Smith's Smith's Marketplace 25 25Missouri Gerbes Super Markets Kroger Ruler Foods 17 15
Idaho Fred Meyer Smith's 15 15Mary land Harris Teeter 15 12Alaska Fred Meyer 11 11
Nebraska Baker's 11 11Alabama Kroger 11 11Wyoming City Market King Soopers Smith's 9 9Louisiana Kroger 9 8Montana Smith's 4 4
Washington, D.C. Harris Teeter 4 4Delaware Harris Teeter 2 2
Florida Harris Teeter 1 1Total 2,796 2,778
Source: Company data, Credit Suisse estimates.
Figure 81: Kroger Convenience Stores, FY 2016C-Store Div ision States Stores in 2016
Kwik Shop IA, KS, NE 129Loaf 'N Jug CO, MT, ND, NE, NM, SD, WY 170Quik Stop CA, NV 101
Tom Thumb AL, FL, MS, TN 117Turkey Hill Minit Markets IN, OH, PA 267
Total 784
Source: Company data, Credit Suisse estimates.

17 April 2018
The Kroger Co. (KR) 41
Figure 82: Kroger Fine Jewelry Stores by State, FY 2016State # Stores State # Stores
Washington 59 Tennessee 5Oregon 51 Georgia 5
Pennsylvania 25 Indiana 5Texas 18 Virginia 4Utah 16 Arkansas 4Ohio 14 California 4Idaho 12 Kansas 4
New Jersey 12 Wisconsin 2Alaska 11 Arizona 2
Mary land 11 Delaware 2New York 10 Illinois 2Michigan 8 Alabama 1Florida 7 Conneticut 1
Colorado 7 Nevada 1Kentucky 6 West Virginia 1
Source: Company data, Credit Suisse estimates.
PEERsFigure 83: KR Peer Group Analysis
Source: Company data, Credit Suisse PEERs database.
About Credit Suisse PEERs:
PEERs is a global database that captures unique information about companies within the Credit Suisse coverage universe based on their relationships with other companies – their customers, suppliers, and competitors. The database is built from our research analysts’ insight regarding these relationships. Credit Suisse covers over 3,000 companies globally. These companies form the core of the PEERs database, but it also includes relationships on stocks that are not under coverage.

17 April 2018
The Kroger Co. (KR) 42
Financial ModelsOperating Results Summary & Financial Analysis
Figure 84: KR Income StatementKroger Co. (KR) 2017A 2018E 2019E 2017A 2018E 2019E 2020E($ millions except per-share data) Q1A Q2A Q3A Q4A Q1E Q2E Q3E Q4E Q1E Q2E Q3E Q4E Jan Jan Jan JanIncome StatementTotal Sales 36,285.0 27,597.0 27,749.0 31,031.0 37,443.8 28,131.3 27,983.8 29,098.8 38,234.0 29,068.0 29,037.3 30,195.4 122,662 122,658 126,535 131,440Gross Profit 8,004.0 5,988.0 6,217.0 6,791.0 8,201.9 6,048.1 6,152.0 6,325.8 8,384.1 6,206.2 6,343.0 6,521.7 27,000 26,728 27,455 28,405SG&A Expense 5,993.0 4,523.0 4,708.0 4,999.0 6,259.8 4,657.6 4,755.3 4,742.9 6,384.3 4,773.3 4,897.4 4,884.2 20,223 20,416 20,939 21,515 Operating Income 1,005.0 678.0 740.0 988.0 894.9 571.5 596.0 762.9 917.3 586.4 617.9 789.8 3,411 2,825 2,911 3,165Interest Expense 177.0 138.0 136.0 148.0 172.0 129.9 128.8 127.7 162.7 124.7 125.3 125.5 599 558 538 535Other Expense (Income) 0.0 0.0 0.0 0.0 0.0 0.0 0.0 0.0 0.0 0.0 0.0 0.0 0 0 0 0 Pretax Income 828.0 540.0 604.0 840.0 722.9 441.6 467.2 635.2 754.6 461.7 492.7 664.4 2,812 2,267 2,373 2,630Net Inc. From Operations 540.0 351.0 389.0 561.0 563.9 344.4 364.4 495.5 588.6 360.1 384.3 518.2 1,841 1,768 1,851 2,051Net Inc. attrib. to non-controlling int. (6.0) (2.0) (8.0) (1.0) (6.0) (2.0) (8.0) (1.0) (6.0) (2.0) (8.0) (1.0) (17) (17) (17) (17)Net Inc. attributable to KR 546.0 353.0 397.0 562.0 569.9 346.4 372.4 496.5 594.6 362.1 392.3 519.2 1,858 1,785 1,868 2,068Earnings Per Share $0.58 $0.39 $0.44 $0.63 $0.66 $0.41 $0.45 $0.60 $0.73 $0.45 $0.49 $0.65 $2.04 $2.11 $2.32 $2.64Average Shares 925.0 905.0 893.0 884.0 869.0 851.1 835.3 823.6 813.9 805.3 801.1 798.2 902 845 805 782
EBITDA $1,766 $1,258 $1,316 $1,518 $1,679 $1,169 $1,205 $1,383 $1,728 $1,204 $1,248 $1,431 $5,858 $5,436 $5,612 $5,958
Margin AnalysisGross Margin 22.1% 21.8% 22.4% 21.7% 21.9% 21.5% 22.0% 21.8% 22.0% 21.4% 21.9% 21.6% 22.0% 21.8% 21.7% 21.6%SG&A Ratio 16.5% 16.4% 17.0% 16.1% 16.7% 16.6% 17.0% 16.3% 16.7% 16.4% 16.9% 16.2% 16.5% 16.6% 16.5% 16.4%Operating Margin 2.8% 2.5% 2.7% 3.2% 2.4% 2.0% 2.1% 2.6% 2.4% 2.0% 2.1% 2.6% 2.8% 2.3% 2.3% 2.4%Net Margin 1.5% 1.3% 1.4% 1.8% 1.5% 1.2% 1.3% 1.7% 1.5% 1.2% 1.3% 1.7% 1.5% 1.4% 1.5% 1.6%EBITDA Margin 4.9% 4.6% 4.7% 4.9% 4.5% 4.2% 4.3% 4.8% 4.5% 4.1% 4.3% 4.7% 4.8% 4.4% 4.4% 4.5%
Year-Over-Year GrowthIdentical Store Sales 1.6% 0.9% 2.4% 2.7% 3.1% 3.0% 1.8% 1.8% 2.5% 2.5% 3.0% 3.0% 1.9% 2.4% 2.8% 0.0%Identical Store Sales - Non-Fuel -0.2% 0.7% 1.1% 1.5% 2.0% 2.0% 1.8% 1.8% 2.5% 2.5% 3.0% 3.0% 0.7% 1.9% 2.7% 0.0%Square Footage Growth 2.5% 2.3% 1.2% 0.7% 0.6% 0.6% 0.9% 1.1% 1.1% 1.1% 1.1% 1.1% 0.7% 1.1% 1.1% 0.0%Total Sales 4.9% 3.9% 4.5% 12.4% 3.2% 1.9% 0.8% -6.2% 2.1% 3.3% 3.8% 3.8% 6.4% 0.0% 3.2% 0.0%Operating Income -16.3% -11.7% 3.8% 15.2% -11.0% -15.7% -19.5% -22.8% 2.5% 2.6% 3.7% 3.5% -3.6% -17.2% 3.0% 0.0%Earnings Per Share -17.0% -17.6% 8.4% 18.7% 12.2% 4.4% 0.3% -5.0% 11.4% 10.5% 9.8% 7.9% -4.0% 3.6% 9.9% 0.0%EBITDA -7.5% -3.6% 4.9% 6.1% -4.9% -7.1% -8.4% -8.9% 2.9% 3.0% 3.6% 3.5% -0.7% -7.2% 3.2% 0.0%
Key Operating StatisticsStore Count 2,792.0 2,793.0 2,790.0 2,782.0 2,782.0 2,787.0 2,788.0 2,789.0 2,789.0 2,794.0 2,795.0 2,796.0 2,782 2,789 2,796 2,803Total Sq. Ft (millions) 178.2 179.0 179.0 179.0 179.3 180.1 180.6 181.0 181.3 182.1 182.5 183.0 179.0 181.0 183.0 184.9LTM Sales/Avg. Sq. Ft $664.7 $667.1 $670.1 $687.6 $692.7 $692.5 $693.0 $681.5 $684.7 $686.8 $691.0 $695.4 $687.6 $681.5 $695.4 $714.6LTM Total Costs/Avg. Sq. Ft 645.7 648.7 651.6 668.4 674.2 674.8 676.1 665.8 668.9 671.0 675.1 679.4 668.4 665.8 679.4 697.4LTM EBITDA/Avg. Sq. Ft 32.7 32.3 32.4 32.8 32.3 31.6 31.0 30.2 30.4 30.5 30.6 30.8 32.8 30.2 30.8 32.4
Source: Company data, Credit Suisse estimates

17 April 2018
The Kroger Co. (KR) 43
Figure 85: KR Balance SheetKroger Co. (KR) 2017A 2018E 2019E 2017A 2018E 2019E 2020E
Q1A Q2A Q3A Q4A Q1E Q2E Q3E Q4E Q1E Q2E Q3E Q4E Jan Jan Jan JanBalance SheetCash and Equivalents 356.0 819.0 352.0 347.0 264.2 1,786.6 1,492.8 773.9 1,587.8 1,592.9 1,782.7 1,133.0 347.0 773.9 1,133.0 1,470.5Store Deposits in Transit 952.0 977.0 1,163.0 1,161.0 1,161.0 1,161.0 1,161.0 1,161.0 1,161.0 1,161.0 1,161.0 1,161.0 1,161.0 1,161.0 1,161.0 1,161.0Accounts Receivable, Net 1,394.0 1,536.0 1,452.0 1,637.0 1,403.2 1,526.6 1,428.2 1,621.1 1,424.6 1,567.6 1,473.3 1,671.5 1,637.0 1,621.1 1,671.5 1,723.3Inventories 6,359.0 6,363.0 6,917.0 6,533.0 6,241.4 6,291.2 6,637.4 6,298.6 6,168.6 6,305.7 6,665.8 6,345.2 6,533.0 6,298.6 6,345.2 6,393.7Other Current Assets 477.0 452.0 1,041.0 1,470.0 492.2 460.8 1,049.8 1,378.5 502.6 476.1 1,089.3 1,430.4 1,470.0 1,378.5 1,430.4 1,484.2Total Current Assets 9,538.0 10,147.0 10,925.0 11,148.0 9,562.0 11,226.1 11,769.2 11,233.0 10,844.6 11,103.3 12,172.2 11,741.1 11,148.0 11,233.0 11,741.1 12,232.8PP&E 21,133.0 21,308.0 20,966.0 21,071.0 21,186.9 19,149.6 19,235.8 19,310.5 19,399.5 19,476.6 19,541.9 19,595.3 21,071.0 19,310.5 19,595.3 19,787.1Goodwill and Intangibles 4,172.0 4,183.0 4,148.0 4,025.0 4,025.0 4,025.0 4,025.0 4,025.0 4,025.0 4,025.0 4,025.0 4,025.0 4,025.0 4,025.0 4,025.0 4,025.0Other Assets 956.0 962.0 989.0 984.0 984.0 984.0 984.0 984.0 984.0 984.0 984.0 984.0 984.0 984.0 984.0 984.0Total Assets 35,799.0 36,600.0 37,028.0 37,228.0 35,757.9 35,384.7 36,014.0 35,552.5 35,253.0 35,588.9 36,723.0 36,345.3 37,228.0 35,552.5 36,345.3 37,028.8
Total Current Liabilities 12,515 11,618 12,890 14,229 15,201 15,196 15,476 14,632 16,962 17,205 17,551 16,650 14,229 14,632 16,650 18,593Long-Term Debt 11,590 13,100 13,118 12,029 9,638 9,438 9,938 10,138 7,338 7,338 7,938 8,138 12,029 10,138 8,138 5,938Other Long-Term Liabilities 5,559 5,738 4,809 4,065 4,065 4,065 4,065 4,065 4,065 4,065 4,065 4,065 4,065 4,065 4,065 4,065Total Stockholders' Equity 6,135 6,144 6,211 6,905 6,854 6,686 6,536 6,718 6,888 6,982 7,170 7,492 6,905 6,718 7,492 8,433Total Liabilities & OE 35,799 36,600 37,028 37,228 35,758 35,385 36,014 35,553 35,253 35,589 36,723 36,345 37,228 35,553 36,345 37,029
Net Working Capital -2,431 -2,319 -1,751 -1,029 -2,883 -2,736 -2,179 -1,153 -3,285 -3,174 -2,641 -1,522 -1,029 -1,153 -1,522 -1,911Net Debt 13,088 13,229 14,495 15,242 13,554 11,832 12,626 13,545 11,331 11,426 11,836 12,686 15,242 13,545 12,686 11,548Common Equity 6,135 6,144 6,211 6,905 6,854 6,686 6,536 6,718 6,888 6,982 7,170 7,492 6,905 6,718 7,492 8,433Total Capital 19,223 19,373 20,706 22,147 20,409 18,518 19,162 20,263 18,219 18,407 19,006 20,178 22,147 20,263 20,178 19,981
Selected MeasuresNet Debt / Total Capital 68% 68% 70% 69% 66% 64% 66% 67% 62% 62% 62% 63% 69% 67% 63% 58%Common Equity / Total Capital 32% 32% 30% 31% 34% 36% 34% 33% 38% 38% 38% 37% 31% 33% 37% 42%Leverage Ratio (Net Debt/Equity) 2.1 2.2 2.3 2.2 2.0 1.8 1.9 2.0 1.6 1.6 1.7 1.7 2.2 2.0 1.7 1.4LTM EBIT / Interest (Coverage) 6.1x 5.3x 5.4x 5.7x 4.9x 4.9x 4.8x 5.1x 5.2x 5.2x 5.1x 5.4x 5.7x 5.1x 5.4x 5.9xLTM EBITDA / Interest 10.5x 9.6x 9.6x 9.8x 9.4x 9.4x 9.4x 9.7x 10.2x 10.2x 10.1x 10.4x 9.8x 9.7x 10.4x 11.1xNet Debt / LTM EBITDA 2.3x 2.3x 2.5x 2.6x 2.3x 2.1x 2.3x 2.5x 2.1x 2.1x 2.1x 2.3x 2.6x 2.5x 2.3x 1.9xCurrent Ratio 0.8 0.9 0.8 0.8 0.6 0.7 0.8 0.8 0.6 0.6 0.7 0.7 0.8 0.8 0.7 0.7Payables / Inventory 96% 94% 91% 90% 101% 99% 96% 94% 106% 105% 102% 99% 90% 94% 99% 104%Inventory Turns 14.7x 14.7x 13.7x 15.2x 15.2x 15.2x 14.2x 15.7x 15.7x 15.7x 14.7x 16.2x 14.6x 14.9x 15.7x 16.2xBook Value Per Share $6.63 $6.79 $6.96 $7.81 $7.89 $7.86 $7.82 $8.16 $8.46 $8.67 $8.95 $9.39 $7.66 $7.95 $9.31 $10.78
Source: Company data, Credit Suisse estimates

17 April 2018
The Kroger Co. (KR) 44
Figure 86: KR Statement of Cash FlowKroger Co. (KR) 2017A 2018E 2019E 2017A 2018E 2019E 2020E
Q1A Q2A Q3A Q4A Q1E Q2E Q3E Q4E Q1E Q2E Q3E Q4E Jan Jan Jan JanStatement of Cash FlowNet Income 297 351 388 853 564 344 364 495 589 360 384 518 1,889 1,768 1,851 2,051Depreciation & Amortization 736 563 572 565 769 587 599 610 796 608 620 632 2,436 2,565 2,655 2,748Other 69 336 99 (258) 0 0 0 0 0 0 0 0 246 0 0 0Changes in Working Capital 1,207 (235) (1,329) (801) 1,854 (147) (557) (1,026) 2,132 (111) (533) (1,119) (1,158) 124 370 388CFO 2,309 1,015 (270) 359 3,187 785 406 79 3,517 857 471 31 3,413 4,457 4,876 5,188
Capex (817) (705) (615) (672) (900) (700) (700) (700) (900) (700) (700) (700) (2,809) (3,000) (3,000) (3,000)Acquisitions 0 0 (16) 0 0 0 0 0 0 0 0 0 (16) 0 0 0Proceeds From Sale of P&E 83 11 26 18 15 2,150 15 15 15 15 15 15 138 2,195 60 60Other (10) (12) 20 (18) 0 0 0 0 0 0 0 0 (20) 0 0 0CFI (744) (706) (585) (672) (885) 1,450 (685) (685) (885) (685) (685) (685) (2,707) (805) (2,940) (2,940)
ST Debt (545) (880) 1,380 741 621 0 0 0 1,400 100 0 0 696 621 1,500 1,400Proceeds from Exercise of Stock Options 17 11 3 20 0 0 0 0 0 0 0 0 51 0 0 0LT Debt (83) 1,430 (613) 1 (2,391) (200) 500 200 (2,800) 0 600 200 735 (1,891) (2,000) (2,200)Payment of Div idends (111) (110) (112) (110) (115) (112) (115) (113) (118) (117) (121) (121) (443) (455) (477) (510)Share Repo (772) (258) (262) (341) (500) (400) (400) (200) (300) (150) (75) (75) (1,633) (1,500) (600) (600)Other (37) (40) (7) (3) 0 0 0 0 0 0 0 0 (87) 0 0 0CFF (1,531) 153 389 308 (2,385) (712) (15) (113) (1,818) (167) 404 4 (681) (3,226) (1,577) (1,910)
Increase (Decrease) in Cash 34 462 (466) (5) (83) 1,522 (294) (719) 814 5 190 (650) 25 427 359 338Cash at Beginning of Period 322 356 818 352 347 264 1,787 1,493 774 1,588 1,593 1,783 322 347 774 1,133Cash at End of Period 356 818 352 347 264 1,787 1,493 774 1,588 1,593 1,783 1,133 347 774 1,133 1,470
FCF AnalysisNet Income 297 351 388 853 564 344 364 495 589 360 384 518 1,889 1,768 1,851 2,051 + Depreciation & Amortization 736 563 572 565 769 587 599 610 796 608 620 632 2,436 2,565 2,655 2,748 -- Changes in Working Capital (1,207) 235 1,329 801 (1,854) 147 557 1,026 (2,132) 111 533 1,119 1,158 (124) (370) (388) -- Changes in Other Assets & Liabilities (69) (336) (99) 258 0 0 0 0 0 0 0 0 (246) 0 0 0 -- Capital Expenditures 817 705 615 672 900 700 700 700 900 700 700 700 2,809 3,000 3,000 3,000Free Cash Flow 1,492 310 (885) (313) 2,287 85 (294) (621) 2,617 157 (229) (669) $604 $1,457 $1,876 $2,188 Per Share $1.61 $0.34 ($0.99) ($0.35) $2.63 $0.10 ($0.35) ($0.75) $3.22 $0.20 ($0.29) ($0.84) $0.67 $1.73 $2.33 $2.80
Source: Company data, Credit Suisse estimates.

17 April 2018
The Kroger Co. (KR) 45
Companies Mentioned (Price as of 16-Apr-2018)7-Eleven Inc. (Unlisted)AB Inbev (BUD.N, $104.32)Ahold Delhaize (AD.AS, €18.95)Albertsons Cos (ABS.N, $18.95)Altria Group, Inc. (MO.N, $64.25)Amazon com Inc. (AMZN.OQ, $1441.5)BP (BP.L, 496.35p)Brambles (BXB.AX, A$9.66)CVS Health (CVS.N, $66.1)Cardinal Health (CAH.N, $62.29)Caseys General (CASY.OQ, $101.86)Chevron Corporation (CVX.N, $120.7)Church & Dwight (CHD.N, $50.1)Colgate (CL.N, $72.44)Conagra Brands (CAG.N, $37.21)Cooper Stand (CPS.N, $128.2)Costco Wholesale (COST.OQ, $194.58)Cott Corporation (COT.N, $14.58)Danone (DANO.PA, €65.29)Dean Foods Company (DF.N, $8.16)Diageo (DGE.L, 2459.0p)Dollar General Corporation (DG.N, $97.07)Dollar Tree Inc. (DLTR.OQ, $97.55)Dr Pepper Snapple Group (DPS.N, $121.04)General Mills (GIS.N, $45.24)Generali (GASI.MI, €16.17)Heineken (HEIN.AS, €88.64)Hormel Foods (HRL.N, $35.44)Johnson Controls Inc (JCI.N, $34.7)Kellogg Company (K.N, $63.83)Kimberly Clark (KMB.N, $106.81)Marathon Oil Corporation (MRO.N, $18.19)Mattel (MAT.OQ, $14.72)McCormick & Company (MKC.N, $107.26)Mondelez (MDLZ.OQ, $42.23)Nestle (NESN.S, SFr74.66)Novartis (NOVN.S, SFr77.82)Ollie’s Bargain Outlet Holdings, Inc. (OLLI.OQ, $61.8)Onex Corp (ONEX.TO, C$92.56)PepsiCo, Inc. (PEP.OQ, $109.92)Procter Gamble (PG.N, $78.61)Publix Super Mkt (PUSH.PK, $14.75)Reckitt Benckiser (RB.L, 5997.0p)Smart & Final Stores, Inc. (SFS.N, $5.15)Sprouts Farmers Market, Inc. (SFM.OQ, $24.59)Supervalu Inc. (SVU.N, $15.67)Target Corporation (TGT.N, $72.0)The Coca-Cola Company (KO.N, $44.68)The Hershey Company (HSY.N, $96.8)The Kroger Co. (KR.N, $24.17, OUTPERFORM, TP $28.0)Unilever (ULVR.L, 3908.5p)Unilever (UNc.AS, €46.18)Walgreens Boots Alliance (WBA.OQ, $66.22)Walmart Inc. (WMT.N, $86.84)
Disclosure AppendixAnalyst Certification The analysts identified in this report each certify, with respect to the companies or securities that the individual analyzes, that (1) the views expressed in this report accurately reflect his or her personal views about all of the subject companies and securities and (2) no part of his or her compensation was, is or will be directly or indirectly related to the specific recommendations or views expressed in this report.

17 April 2018
The Kroger Co. (KR) 46
3-Year Price and Rating History for The Kroger Co. (KR.N)
KR.N Closing Price Target Price Date (US$) (US$) Rating 18-Jun-15 36.77 36.50 N 11-Sep-15 37.29 37.00 03-Dec-15 39.91 40.00 22-Jan-16 37.12 36.00 12-May-16 34.89 34.00 07-Sep-16 31.32 29.00 19-Jan-17 34.26 33.00 02-Mar-17 30.67 30.00 05-Jun-17 30.09 NC * Asterisk signifies initiation or assumption of coverage.Effective July 3, 2016, NC denotes termination of coverage.
Target Price Closing Price KR.N
01- Jan- 2016 01- Jan- 2017 01- Jan- 201815
25
35
45
N EU T RA LN O T C O V ERED
The analyst(s) responsible for preparing this research report received Compensation that is based upon various factors including Credit Suisse's total revenues, a portion of which are generated by Credit Suisse's investment banking activitiesAs of December 10, 2012 Analysts’ stock rating are defined as follows:Outperform (O) : The stock’s total return is expected to outperform the relevant benchmark* over the next 12 months.Neutral (N) : The stock’s total return is expected to be in line with the relevant benchmark* over the next 12 months.Underperform (U) : The stock’s total return is expected to underperform the relevant benchmark* over the next 12 months. *Relevant benchmark by region: As of 10th December 2012, Japanese ratings are based on a stock’s total return relative to the analyst's coverage universe which consists of all companies covered by the analyst within the relevant sector, with Outperforms representing the most attractive, Neutrals the less attractive, and Underperforms the least attractive investment opportunities. As of 2nd October 2012, U.S. and Canadian as well as European ratings are based on a stock’s total return relative to the analyst's coverage universe which consists of all companies covered by the analyst within the relevant sector, with Outperforms representing the most attractive, Neutrals the less attractive, and Underperforms the least attractive investment opportunities. For Latin American and Asia stocks (excluding Japan and Australia), ratings are based on a stock’s total return relative to the average total return of the relevant country or regional benchmark (India - S&P BSE Sensex Index); prior to 2nd October 2012 U.S. and Canadian ratings were based on (1) a stock’s absolute total return potential to its current share price and (2) the relative attractiveness of a stock’s total return potential within an analyst’s coverage universe. For Australian and New Zealand stocks, the expected total return (ETR) calculation includes 12-month rolling dividend yield. An Outperform rating is assigned where an ETR is greater than or equal to 7.5%; Underperform where an ETR less than or equal to 5%. A Neutral may be assigned where the ETR is between -5% and 15%. The overlapping rating range allows analysts to assign a rating that puts ETR in the context of associated risks. Prior to 18 May 2015, ETR ranges for Outperform and Underperform ratings did not overlap with Neutral thresholds between 15% and 7.5%, which was in operation from 7 July 2011.Restricted (R) : In certain circumstances, Credit Suisse policy and/or applicable law and regulations preclude certain types of communications, including an investment recommendation, during the course of Credit Suisse's engagement in an investment banking transaction and in certain other circumstances.Not Rated (NR) : Credit Suisse Equity Research does not have an investment rating or view on the stock or any other securities related to the company at this time.Not Covered (NC) : Credit Suisse Equity Research does not provide ongoing coverage of the company or offer an investment rating or investment view on the equity security of the company or related products.Volatility Indicator [V] : A stock is defined as volatile if the stock price has moved up or down by 20% or more in a month in at least 8 of the past 24 months or the analyst expects significant volatility going forward.Analysts’ sector weightings are distinct from analysts’ stock ratings and are based on the analyst’s expectations for the fundamentals and/or valuation of the sector* relative to the group’s historic fundamentals and/or valuation:Overweight : The analyst’s expectation for the sector’s fundamentals and/or valuation is favorable over the next 12 months.Market Weight : The analyst’s expectation for the sector’s fundamentals and/or valuation is neutral over the next 12 months.Underweight : The analyst’s expectation for the sector’s fundamentals and/or valuation is cautious over the next 12 months. *An analyst’s coverage sector consists of all companies covered by the analyst within the relevant sector. An analyst may cover multiple sectors.
Credit Suisse's distribution of stock ratings (and banking clients) is:
Global Ratings DistributionRating Versus universe (%) Of which banking clients (%)Outperform/Buy* 48% (62% banking clients)Neutral/Hold* 37% (56% banking clients)Underperform/Sell* 13% (54% banking clients)Restricted 2%*For purposes of the NYSE and FINRA ratings distribution disclosure requirements, our stock ratings of Outperform, Neutral, and Underperform most closely correspond to Buy, Hold, and Sell, respectively; however, the meanings are not the same, as our stock ratings are determined on a relative basis. (Please refer to definitions above.) An investor's decision to buy or sell a security should be based on investment objectives, current holdings, and other individual factors.
Important Global Disclosures Credit Suisse’s research reports are made available to clients through our proprietary research portal on CS PLUS. Credit Suisse research products may also be made available through third-party vendors or alternate electronic means as a convenience. Certain research products are only made available through CS PLUS. The services provided by Credit Suisse’s analysts to clients may depend on a specific client’s preferences regarding the frequency and manner of receiving communications, the client’s risk profile and investment, the size and scope of the overall client relationship with

17 April 2018
The Kroger Co. (KR) 47
the Firm, as well as legal and regulatory constraints. To access all of Credit Suisse’s research that you are entitled to receive in the most timely manner, please contact your sales representative or go to https://plus.credit-suisse.com . Credit Suisse’s policy is to update research reports as it deems appropriate, based on developments with the subject company, the sector or the market that may have a material impact on the research views or opinions stated herein.Credit Suisse's policy is only to publish investment research that is impartial, independent, clear, fair and not misleading. For more detail please refer to Credit Suisse's Policies for Managing Conflicts of Interest in connection with Investment Research: https://www.credit-suisse.com/sites/disclaimers-ib/en/managing-conflicts.html . Credit Suisse does not provide any tax advice. Any statement herein regarding any US federal tax is not intended or written to be used, and cannot be used, by any taxpayer for the purposes of avoiding any penalties.Credit Suisse has decided not to enter into business relationships with companies that Credit Suisse has determined to be involved in the development, manufacture, or acquisition of anti-personnel mines and cluster munitions. For Credit Suisse's position on the issue, please see https://www.credit-suisse.com/media/assets/corporate/docs/about-us/responsibility/banking/policy-summaries-en.pdf .
Target Price and RatingValuation Methodology and Risks: (12 months) for The Kroger Co. (KR.N)
Method: Our $28 target price and Outperform rating assume KR stock can trade at ~7x EV to 2019 EBITDA over the coming year (and closer to 6.7x when MEPP-related debt is considered), in-line with the company's five-year historical average and a continued discount to WMT. On P/E, this translates to ~12x forward earnings in 12 months, both below the five-year average and WMT at ~17.5x, on what we believe will be double-digit EPS growth in 2019 and 2020. The discount to WMT is an opportunity if KR can convincingly demonstrate omnichannel sales growth and resumed EBITDA growth beyond 2018.
Risk: Risks to our target price of $28 and Outperform rating for KR include an already high competitive exposure to other non-traditional competitors, which is likely to increase, volatile investments in price, acceleration of product cost inflation or deflation, the macro environment weakening, and the potential distraction of integrating acquisitions.
Please refer to the firm's disclosure website at https://rave.credit-suisse.com/disclosures/view/selectArchive for the definitions of abbreviations typically used in the target price method and risk sections. See the Companies Mentioned section for full company names Credit Suisse currently has, or had within the past 12 months, the following as investment banking client(s): KR.N, WMT.N, TGT.N, WBA.OQ, CVS.N, DG.N, AMZN.OQ, SFM.OQ, SVU.N, SFS.N, OLLI.OQ, CVX.N, BP.L, MRO.N, CAH.N, BXB.AX, MDLZ.OQ, CHD.N, CAG.N, DANO.PA, DGE.L, GIS.N, GASI.MI, HEIN.AS, HRL.N, K.N, MKC.N, NESN.S, NOVN.S, RB.L, ULVR.L, HSY.N, PG.N, KMB.N, UNc.ASCredit Suisse provided investment banking services to the subject company (WMT.N, AMZN.OQ, SVU.N, SFS.N, BP.L, MRO.N, MDLZ.OQ, DGE.L, GIS.N, HEIN.AS, HRL.N, MKC.N, NESN.S, NOVN.S, PG.N, KMB.N) within the past 12 months.Credit Suisse currently has, or had within the past 12 months, the following issuer(s) as client(s), and the services provided were non-investment-banking, securities-related: WMT.N, AMZN.OQ, SFS.N, BP.L, MRO.N, MDLZ.OQ, DGE.L, GIS.N, GASI.MI, NESN.S, ULVR.L, PG.N, KMB.N, UNc.ASCredit Suisse has managed or co-managed a public offering of securities for the subject company (WMT.N, SFS.N, BP.L, MRO.N, DGE.L, GIS.N, HEIN.AS, MKC.N, NESN.S, KMB.N) within the past 12 months.Within the past 12 months, Credit Suisse has received compensation for investment banking services from the following issuer(s): WMT.N, AMZN.OQ, SVU.N, BP.L, MRO.N, MDLZ.OQ, DGE.L, GIS.N, HEIN.AS, HRL.N, MKC.N, NESN.S, NOVN.S, PG.N, KMB.NCredit Suisse expects to receive or intends to seek investment banking related compensation from the subject company (KR.N, WMT.N, COST.OQ, TGT.N, WBA.OQ, AD.AS, CVS.N, DG.N, AMZN.OQ, DLTR.OQ, SFM.OQ, SVU.N, SFS.N, OLLI.OQ, CVX.N, BP.L, MRO.N, CAH.N, BXB.AX, MDLZ.OQ, CHD.N, CL.N, CAG.N, DANO.PA, DF.N, DGE.L, GIS.N, GASI.MI, HEIN.AS, HRL.N, K.N, MKC.N, NESN.S, NOVN.S, RB.L, ULVR.L, HSY.N, PG.N, KMB.N, UNc.AS) within the next 3 months.Within the last 12 months, Credit Suisse has received compensation for non-investment banking services or products from the following issuer(s): WMT.N, AMZN.OQ, SFS.N, BP.L, MRO.N, MDLZ.OQ, DGE.L, GIS.N, GASI.MI, NESN.S, ULVR.L, PG.N, KMB.N, UNc.ASCredit Suisse or a member of the Credit Suisse Group is a market maker or liquidity provider in the securities of the following subject issuer(s): AD.AS, AMZN.OQ, BP.L, BXB.AX, CVS.N, CAH.N, CVX.N, CHD.N, CL.N, CAG.N, COST.OQ, DANO.PA, DF.N, DGE.L, DG.N, DLTR.OQ, GIS.N, GASI.MI, HEIN.AS, HRL.N, K.N, KMB.N, MRO.N, MKC.N, MDLZ.OQ, NESN.S, NOVN.S, OLLI.OQ, PG.N, RB.L, SFS.N, SFM.OQ, SVU.N, TGT.N, HSY.N, KR.N, ULVR.L, UNc.AS, WBA.OQ, WMT.NA member of the Credit Suisse Group is party to an agreement with, or may have provided services set out in sections A and B of Annex I of Directive 2014/65/EU of the European Parliament and Council ("MiFID Services") to, the subject issuer (WMT.N, WBA.OQ, CVS.N, DG.N, AMZN.OQ, DLTR.OQ, SFM.OQ, SVU.N, SFS.N, OLLI.OQ, CVX.N, BP.L, MRO.N, CAH.N, BXB.AX, MDLZ.OQ, CHD.N, DANO.PA, DF.N, DGE.L, GIS.N, HEIN.AS, HRL.N, MKC.N, NESN.S, NOVN.S, RB.L, ULVR.L, HSY.N, PG.N, KMB.N, UNc.AS) within the past 12 months.As of the end of the preceding month, Credit Suisse beneficially own 1% or more of a class of common equity securities of (NOVN.S).As of the end of the preceding month, Credit Suisse beneficially owned between 1% and 3% of the equity and related equity derivatives of (NESN.S).Credit Suisse has a material conflict of interest with the subject company (NESN.S) . Credit Suisse is acting as an agent in relation to Nestle’s (NESN.S) ongoing share buy-back program. Credit Suisse Securities is M&A Advisor to The Ferrero Group on their acquisition of Nestle SA's U.S. confectionary business.Credit Suisse has a material conflict of interest with the subject company (ULVR.L) . Credit Suisse is acting as advisor to KKR in relation to the announced acquisition of Unilever’s (UNc.AS/ ULVR.L) global Spreads division.Credit Suisse has a material conflict of interest with the subject company (UNc.AS) . Credit Suisse is acting as advisor to KKR in relation to the announced acquisition of Unilever’s (UNc.AS/ ULVR.L) global Spreads division.

17 April 2018
The Kroger Co. (KR) 48
For date and time of production, dissemination and history of recommendation for the subject company(ies) featured in this report, disseminated within the past 12 months, please refer to the link: https://rave.credit-suisse.com/disclosures/view/report?i=353239&v=1tl46yzk1y0ofii1hgbsf7coa . Important Regional Disclosures Singapore recipients should contact Credit Suisse AG, Singapore Branch for any matters arising from this research report.The analyst(s) involved in the preparation of this report may participate in events hosted by the subject company, including site visits. Credit Suisse does not accept or permit analysts to accept payment or reimbursement for travel expenses associated with these events.Restrictions on certain Canadian securities are indicated by the following abbreviations: NVS--Non-Voting shares; RVS--Restricted Voting Shares; SVS--Subordinate Voting Shares.Individuals receiving this report from a Canadian investment dealer that is not affiliated with Credit Suisse should be advised that this report may not contain regulatory disclosures the non-affiliated Canadian investment dealer would be required to make if this were its own report.For Credit Suisse Securities (Canada), Inc.'s policies and procedures regarding the dissemination of equity research, please visit https://www.credit-suisse.com/sites/disclaimers-ib/en/canada-research-policy.html.Principal is not guaranteed in the case of equities because equity prices are variable.Commission is the commission rate or the amount agreed with a customer when setting up an account or at any time after that.This research report is authored by:Credit Suisse Securities (USA) LLC ...........................................................................................................Judah C. Frommer, CFA ; Yunhee ParkImportant Credit Suisse HOLT Disclosures The HOLT methodology does not assign ratings or a target price to a security. It is an analytical tool that involves use of a set of proprietary quantitative algorithms and warranted value calculations, collectively called the HOLT valuation model, that are consistently applied to all the companies included in its database. Third-party data (including consensus earnings estimates) are systematically translated into a number of default variables and incorporated into the algorithms available in the HOLT valuation model. The source financial statement, pricing, and earnings data provided by outside data vendors are subject to quality control and may also be adjusted to more closely measure the underlying economics of firm performance. These adjustments provide consistency when analyzing a single company across time, or analyzing multiple companies across industries or national borders. The default scenario that is produced by the HOLT valuation model establishes a warranted price for a security, and as the third-party data are updated, the warranted price may also change. The default variables may also be adjusted to produce alternative warranted prices, any of which could occur. The warranted price is an algorithmic output applied systematically across all companies based on historical levels and volatility of returns. Additional information about the HOLT methodology is available on request.CFROI, CFROE, HOLT, HOLT Lens, HOLTfolio, "Clarity is Confidence" and "Powered by HOLT" are trademarks or registered trademarks of Credit Suisse Group AG or its affiliates in the United States and other countries.HOLT is a corporate performance and valuation advisory service of Credit Suisse.© 2018 Credit Suisse Group AG and its subsidiaries and affiliates. All rights reserved.Important disclosures regarding companies that are the subject of this report are available by calling +1 (877) 291-2683. The same important disclosures, with the exception of valuation methodology and risk discussions, are also available on Credit Suisse’s disclosure website at https://rave.credit-suisse.com/disclosures . For valuation methodology and risks associated with any recommendation, price target, or rating referenced in this report, please refer to the disclosures section of the most recent report regarding the subject company.

17 April 2018
The Kroger Co. (KR) 49
This report is produced by subsidiaries and affiliates of Credit Suisse operating under its Global Markets Division. For more information on our structure, please use the following link: https://www.credit-suisse.com/who-we-are This report may contain material that is not directed to, or intended for distribution to or use by, any person or entity who is a citizen or resident of or located in any locality, state, country or other jurisdiction where such distribution, publication, availability or use would be contrary to law or regulation or which would subject Credit Suisse or its affiliates ("CS") to any registration or licensing requirement within such jurisdiction. All material presented in this report, unless specifically indicated otherwise, is under copyright to CS. None of the material, nor its content, nor any copy of it, may be altered in any way, transmitted to, copied or distributed to any other party, without the prior express written permission of CS. All trademarks, service marks and logos used in this report are trademarks or service marks or registered trademarks or service marks of CS or its affiliates.The information, tools and material presented in this report are provided to you for information purposes only and are not to be used or considered as an offer or the solicitation of an offer to sell or to buy or subscribe for securities or other financial instruments. CS may not have taken any steps to ensure that the securities referred to in this report are suitable for any particular investor. CS will not treat recipients of this report as its customers by virtue of their receiving this report. The investments and services contained or referred to in this report may not be suitable for you and it is recommended that you consult an independent investment advisor if you are in doubt about such investments or investment services. Nothing in this report constitutes investment, legal, accounting or tax advice, or a representation that any investment or strategy is suitable or appropriate to your individual circumstances, or otherwise constitutes a personal recommendation to you. CS does not advise on the tax consequences of investments and you are advised to contact an independent tax adviser. Please note in particular that the bases and levels of taxation may change. Information and opinions presented in this report have been obtained or derived from sources believed by CS to be reliable, but CS makes no representation as to their accuracy or completeness. CS accepts no liability for loss arising from the use of the material presented in this report, except that this exclusion of liability does not apply to the extent that such liability arises under specific statutes or regulations applicable to CS. This report is not to be relied upon in substitution for the exercise of independent judgment. CS may have issued, and may in the future issue, other communications that are inconsistent with, and reach different conclusions from, the information presented in this report. Those communications reflect the different assumptions, views and analytical methods of the analysts who prepared them and CS is under no obligation to ensure that such other communications are brought to the attention of any recipient of this report. Some investments referred to in this report will be offered solely by a single entity and in the case of some investments solely by CS, or an associate of CS or CS may be the only market maker in such investments. Past performance should not be taken as an indication or guarantee of future performance, and no representation or warranty, express or implied, is made regarding future performance. Information, opinions and estimates contained in this report reflect a judgment at its original date of publication by CS and are subject to change without notice. The price, value of and income from any of the securities or financial instruments mentioned in this report can fall as well as rise. The value of securities and financial instruments is subject to exchange rate fluctuation that may have a positive or adverse effect on the price or income of such securities or financial instruments. Investors in securities such as ADR's, the values of which are influenced by currency volatility, effectively assume this risk. Structured securities are complex instruments, typically involve a high degree of risk and are intended for sale only to sophisticated investors who are capable of understanding and assuming the risks involved. The market value of any structured security may be affected by changes in economic, financial and political factors (including, but not limited to, spot and forward interest and exchange rates), time to maturity, market conditions and volatility, and the credit quality of any issuer or reference issuer. Any investor interested in purchasing a structured product should conduct their own investigation and analysis of the product and consult with their own professional advisers as to the risks involved in making such a purchase. Some investments discussed in this report may have a high level of volatility. High volatility investments may experience sudden and large falls in their value causing losses when that investment is realised. Those losses may equal your original investment. Indeed, in the case of some investments the potential losses may exceed the amount of initial investment and, in such circumstances, you may be required to pay more money to support those losses. Income yields from investments may fluctuate and, in consequence, initial capital paid to make the investment may be used as part of that income yield. Some investments may not be readily realisable and it may be difficult to sell or realise those investments, similarly it may prove difficult for you to obtain reliable information about the value, or risks, to which such an investment is exposed. This report may provide the addresses of, or contain hyperlinks to, websites. Except to the extent to which the report refers to website material of CS, CS has not reviewed any such site and takes no responsibility for the content contained therein. Such address or hyperlink (including addresses or hyperlinks to CS's own website material) is provided solely for your convenience and information and the content of any such website does not in any way form part of this document. Accessing such website or following such link through this report or CS's website shall be at your own risk.
This report is issued and distributed in European Union (except Switzerland): by Credit Suisse Securities (Europe) Limited, One Cabot Square, London E14 4QJ, England, which is authorised by the Prudential Regulation Authority and regulated by the Financial Conduct Authority and the Prudential Regulation Authority. Germany: Credit Suisse (Deutschland) Aktiengesellschaft regulated by the Bundesanstalt fuer Finanzdienstleistungsaufsicht ("BaFin"). United States and Canada: Credit Suisse Securities (USA) LLC; Switzerland: Credit Suisse AG; Brazil: Banco de Investimentos Credit Suisse (Brasil) S.A or its affiliates; Mexico: Banco Credit Suisse (México), S.A. (transactions related to the securities mentioned in this report will only be effected in compliance with applicable regulation); Japan: by Credit Suisse Securities (Japan) Limited, Financial Instruments Firm, Director-General of Kanto Local Finance Bureau ( Kinsho) No. 66, a member of Japan Securities Dealers Association, The Financial Futures Association of Japan, Japan Investment Advisers Association, Type II Financial Instruments Firms Association; Hong Kong: Credit Suisse (Hong Kong) Limited; Australia: Credit Suisse Equities (Australia) Limited; Thailand: Credit Suisse Securities (Thailand) Limited, regulated by the Office of the Securities and Exchange Commission, Thailand, having registered address at 990 Abdulrahim Place, 27th Floor, Unit 2701, Rama IV Road, Silom, Bangrak, Bangkok10500, Thailand, Tel. +66 2614 6000; Malaysia: Credit Suisse Securities (Malaysia) Sdn Bhd; Singapore: Credit Suisse AG, Singapore Branch; India: Credit Suisse Securities (India) Private Limited (CIN no.U67120MH1996PTC104392) regulated by the Securities and Exchange Board of India as Research Analyst (registration no. INH 000001030) and as Stock Broker (registration no. INB230970637; INF230970637; INB010970631; INF010970631), having registered address at 9th Floor, Ceejay House, Dr.A.B. Road, Worli, Mumbai - 18, India, T- +91-22 6777 3777; South Korea: Credit Suisse Securities (Europe) Limited, Seoul Branch; Taiwan: Credit Suisse AG Taipei Securities Branch; Indonesia: PT Credit Suisse Sekuritas Indonesia; Philippines:Credit Suisse Securities (Philippines ) Inc., and elsewhere in the world by the relevant authorised affiliate of the above.Additional Regional DisclaimersHong Kong: Credit Suisse (Hong Kong) Limited ("CSHK") is licensed and regulated by the Securities and Futures Commission of Hong Kong under the laws of Hong Kong, which differ from Australian laws. CSHKL does not hold an Australian financial services licence (AFSL) and is exempt from the requirement to hold an AFSL under the Corporations Act 2001 (the Act) under Class Order 03/1103 published by the ASIC in respect of financial services provided to Australian wholesale clients (within the meaning of section 761G of the Act). Research on Taiwanese securities produced by Credit Suisse AG, Taipei Securities Branch has been prepared by a registered Senior Business Person. Australia (to the extent services are offered in Australia): Credit Suisse Securities (Europe) Limited (“CSSEL”) and Credit Suisse International (“CSI”) are authorised by the Prudential Regulation Authority and regulated by the Financial Conduct Authority (“FCA”) and the Prudential Regulation Authority under UK laws, which differ from Australian Laws. CSSEL and CSI do not hold an Australian Financial Services Licence (“AFSL”) and are exempt from the requirement to hold an AFSL under the Corporations Act (Cth) 2001 (“Corporations Act”) under Class Order 03/1099 published by the Australian Securities and Investments Commission (“ASIC”), in respect of the financial services provided to Australian wholesale clients (within the meaning of section 761G of the Corporations Act). This material is not for distribution to retail clients and is directed exclusively at Credit Suisse's professional clients and eligible counterparties as defined by the FCA, and wholesale clients as defined under section 761G of the Corporations Act. Credit Suisse (Hong Kong) Limited (“CSHK”) is licensed and regulated by the Securities and Futures Commission of Hong Kong under the laws of Hong Kong, which differ from Australian laws. CSHKL does not hold an AFSL and is exempt from the requirement to hold an AFSL under the Corporations Act under Class Order 03/1103 published by the ASIC in respect of financial services provided to Australian wholesale clients (within the meaning of section 761G of the Corporations Act). Credit Suisse Securities (USA) LLC (CSSU) and Credit Suisse Asset Management LLC (CSAM LLC) are licensed and regulated by the Securities Exchange Commission of the United States under the laws of the United States, which differ from Australian laws. CSSU and CSAM LLC do not hold an AFSL and is exempt from the requirement to hold an AFSL under the Corporations Act under Class Order 03/1100 published by the ASIC in respect of financial services provided to Australian wholesale clients (within the meaning of section 761G of the Corporations Act). Malaysia: Research provided to residents of Malaysia is authorised by the Head of Research for Credit Suisse Securities (Malaysia) Sdn Bhd, to whom they should direct any queries on +603 2723 2020. Singapore: This report has been prepared and issued for distribution in Singapore to institutional investors, accredited investors and expert investors (each as defined under the Financial Advisers Regulations) only, and is also distributed by Credit Suisse AG, Singapore Branch to overseas investors (as defined under the Financial Advisers Regulations). Credit Suisse AG, Singapore Branch may distribute reports produced by its foreign entities or affiliates pursuant to an arrangement under Regulation 32C of the Financial Advisers Regulations. Singapore recipients should contact Credit Suisse AG, Singapore Branch at +65-6212-2000 for matters arising from, or in connection with, this report. By virtue of your status as an institutional investor, accredited investor, expert investor or overseas investor, Credit Suisse AG, Singapore Branch is exempted from complying with certain compliance requirements under the Financial Advisers Act, Chapter 110 of Singapore (the “FAA”), the Financial Advisers Regulations and the relevant Notices and Guidelines issued thereunder, in respect of any financial advisory service which Credit Suisse AG, Singapore Branch may provide to you. UAE: This information is being distributed by Credit Suisse AG (DIFC Branch), duly licensed and regulated by the Dubai Financial Services Authority (“DFSA”). Related financial services or products are only made available to Professional Clients or Market Counterparties, as defined by the DFSA, and are not intended for any other persons. Credit Suisse AG (DIFC Branch) is located on Level 9 East, The Gate Building, DIFC, Dubai, United Arab Emirates. EU: This report has been produced by subsidiaries and affiliates of Credit Suisse operating under its Global Markets Division In jurisdictions where CS is not already registered or licensed to trade in securities, transactions will only be effected in accordance with applicable securities legislation, which will vary from jurisdiction to jurisdiction and may require that the trade be made in accordance with applicable exemptions from registration or licensing requirements. This material is issued and distributed in the U.S. by CSSU, a member of NYSE, FINRA, SIPC and the NFA, and CSSU accepts responsibility for its contents. Clients should contact analysts and execute transactions through a Credit Suisse subsidiary or affiliate in their home jurisdiction unless governing law permits otherwise. Please note that this research was originally prepared and issued by CS for distribution to their market professional and institutional investor customers. Recipients who are not market professional or institutional investor customers of CS should seek the advice of their independent financial advisor prior to taking any investment decision based on this report or for any necessary explanation of its contents. This research may relate to investments or services of a person outside of the UK or to other matters which are not authorised by the Prudential Regulation Authority and regulated by the Financial Conduct Authority and the Prudential Regulation Authority or in respect of which the protections of the Prudential Regulation Authority and Financial Conduct Authority for private customers and/or the UK compensation scheme may not be available, and further details as to where this may be the case are available upon request in respect of this report. CS may provide various services to US municipal entities or obligated persons ("municipalities"), including suggesting individual transactions or trades and entering into such transactions. Any services CS provides to municipalities are not viewed as "advice" within the meaning of Section 975 of the Dodd-Frank Wall Street Reform and Consumer Protection Act. CS is providing any such services and related information solely on an arm's length basis and not as an advisor or fiduciary to the municipality. In connection with the provision of the any such services, there is no agreement, direct or indirect, between any municipality (including the officials,management, employees or agents thereof) and CS for CS to provide advice to the municipality. Municipalities should consult with their financial, accounting and legal advisors regarding any such services provided by CS. In addition, CS is not acting for direct or indirect compensation to solicit the municipality on behalf of an unaffiliated broker, dealer, municipal securities dealer, municipal advisor, or investment adviser for the purpose of obtaining or retaining an engagement by the municipality for or in connection with Municipal Financial Products, the issuance of municipal securities, or of an investment adviser to provide investment advisory services to or on behalf of the municipality. If this report is being distributed by a financial institution other than Credit Suisse AG, or its affiliates, that financial institution is solely responsible for distribution. Clients of that institution should contact that institution to effect a transaction in the securities mentioned in this report or require further information. This report does not constitute investment advice by Credit Suisse to the clients of the distributing financial institution, and neither Credit Suisse AG, its affiliates, and their respective officers, directors and employees accept any liability whatsoever for any direct or consequential loss arising from their use of this report or its content. Principal is not guaranteed. Commission is the commission rate or the amount agreed with a customer when setting up an account or at any time after that. No information or communication provided herein or otherwise is intended to be, or should be construed as, a recommendation within the meaning of the US Department of Labor’s final regulation defining "investment advice" for purposes of the Employee Retirement Income Security Act of 1974, as amended and Section 4975 of the Internal Revenue Code of 1986, as amended, and the information provided herein is intended to be general information, and should not be construed as, providing investment advice (impartial or otherwise). Copyright © 2018 CREDIT SUISSE AG and/or its affiliates. All rights reserved. Investment principal on bonds can be eroded depending on sale price or market price. In addition, there are bonds on which investment principal can be eroded due to changes in redemption amounts. Care is required when investing in such instruments.