Australian First Edition - Credit Suisse | PLUS
178
Note: If the rating of a company shown on the cover of First Edition is in bold type, a rating change has taken place CREDIT SUISSE SECURITIES RESEARCH & ANALYTICS BEYOND INFORMATION TM Client-Driven Solutions, Insights, and Access EQUITY RESEARCH CREDIT SUISSE EQUITIES (AUSTRALIA) LIMITED ABN 35 068 232 708 ACN 068 232 708 | Participating Organisation of the Australian Stock Exchange Australia & NZ Daily Research Monday, 17 February 2014 COMPANIES & SECTORS AHE Automotive Holdings Group NEUTRAL 13 Auto solid, cold storage needs to warm up FBU Fletcher Building NEUTRAL 19 .NZ Earnings recovery - not if but when HNZ Heartland New Zealand NEUTRAL 31 .NZ Diversifying its book and earnings JHX James Hardie Industries SE OUTPERFORM 35 Positive volume and price momentum MHI Michael Hill International OUTPERFORM 39 .NZ 1H14 result – steady as she goes NCM Newcrest Mining UNDERPERFORM 44 1H FY14 result spot on. Debt up on working capital and FX PRU Perseus Mining UNDERPERFORM 61 Low key 1H14 result, but a loss RIO Rio Tinto OUTPERFORM 66 Strong result, conservative guidance SGM Sims Metal Management UNDERPERFORM 77 Australia drives a better 1H; challenging outlook keeps management cautious TPI Transpacific Industries Group NEUTRAL 96 Shifting gears... VHP Vital Healthcare Property Trust NEUTRAL 99 .NZ Strong result - driven by one-off impacts WDC Westfield OUTPERFORM 106 Light at the end of the tunnel RESULT PREVIEW Australian Utilities Sector 118 1H14 results: Margin outlook and weather PNA PanAust OUTPERFORM 133 CY13 result preview: Key numbers known; reports on 20 Feb POT Port of Tauranga UNDERPERFORM 135 .NZ 1H14 result preview; reports on 20 Feb STU Steel & Tube Holdings UNDERPERFORM 137 .NZ 1H14 result preview; reports on 20 Feb STRATEGY & ECONOMICS Australian ESG/SRI - AGM series 139 GNC: 50% of the LTI opportunity converted to STI plan for FY14 NZ House Prices 151 REINZ House Prices (Jan) – Further easing in the rate of house price growth DISCLOSURE APPENDIX CONTAINS ANALYST CERTIFICATIONS AND THE STATUS OF NON-US ANALYSTS. FOR OTHER IMPORTANT DISCLOSURES, visit www.credit-suisse.com/ researchdisclosures or call +1 (877) 291-2683. U.S. Disclosure: Credit Suisse does and seeks to do business with companies covered in its research reports. As a result, investors should be aware that the Firm may have a conflict of interest that could affect the objectivity of this report. Investors should consider this report as only a single factor in making their investment decision. MARKET EVENTS Results, Australand 17 Feb Results, Ansell 17 Feb Results, APN News & Media 17 Feb Results, Aurizon 17 Feb UPCOMING CONFERENCES 2014 HOLT Conference 2014 – London 25 Feb 2014 5 th Annual DC Defense Conference – Washington 25 Feb For more scheduled conferences refer to page 2 TABLES Credit Suisse Ratings – Australia 154 Top 100 Earnings & Dividends 157 Small Caps Earnings & Dividends 160 Sector Aggregates 163 Weekly Market Calendar 164 Reporting Season Calendar 167 First NZ Capital Results Preview 172 March 24-28, Hong Kong
-
Upload
khangminh22 -
Category
Documents
-
view
2 -
download
0
Transcript of Australian First Edition - Credit Suisse | PLUS

Note: If the rating of a company shown on the cover of First Edition is in bold type, a rating change has taken place
CREDIT SUISSE SECURITIES RESEARCH & ANALYTICS BEYOND INFORMATIONTM
Client-Driven Solutions, Insights, and Access
EQUITY RESEARCH CREDIT SUISSE EQUITIES (AUSTRALIA) LIMITED ABN 35 068 232 708 ACN 068 232 708 | Participating Organisation of the Australian Stock Exchange
Australia & NZ Daily Research Monday, 17 February 2014
COMPANIES & SECTORS
AHE Automotive Holdings Group NEUTRAL 13 Auto solid, cold storage needs to warm up
FBU Fletcher Building NEUTRAL 19 .NZ Earnings recovery - not if but when
HNZ Heartland New Zealand NEUTRAL 31 .NZ Diversifying its book and earnings
JHX James Hardie Industries SE OUTPERFORM 35 Positive volume and price momentum
MHI Michael Hill International OUTPERFORM 39 .NZ 1H14 result – steady as she goes
NCM Newcrest Mining UNDERPERFORM 44 1H FY14 result spot on. Debt up on working
capital and FX
PRU Perseus Mining UNDERPERFORM 61 Low key 1H14 result, but a loss
RIO Rio Tinto OUTPERFORM 66 Strong result, conservative guidance
SGM Sims Metal Management UNDERPERFORM 77 Australia drives a better 1H; challenging outlook
keeps management cautious
TPI Transpacific Industries Group NEUTRAL 96 Shifting gears...
VHP Vital Healthcare Property Trust NEUTRAL 99 .NZ Strong result - driven by one-off impacts
WDC Westfield OUTPERFORM 106 Light at the end of the tunnel
RESULT PREVIEW
Australian Utilities Sector 118 1H14 results: Margin outlook and weather
PNA PanAust OUTPERFORM 133 CY13 result preview: Key numbers known;
reports on 20 Feb
POT Port of Tauranga UNDERPERFORM 135 .NZ 1H14 result preview; reports on 20 Feb
STU Steel & Tube Holdings UNDERPERFORM 137 .NZ 1H14 result preview; reports on 20 Feb
STRATEGY & ECONOMICS
Australian ESG/SRI - AGM series 139 GNC: 50% of the LTI opportunity converted to
STI plan for FY14
NZ House Prices 151 REINZ House Prices (Jan) – Further easing in
the rate of house price growth
DISCLOSURE APPENDIX CONTAINS ANALYST CERTIFICATIONS AND THE STATUS OF NON-US ANALYSTS. FOR OTHER IMPORTANT DISCLOSURES, visit www.credit-suisse.com/ researchdisclosures or call +1 (877) 291-2683. U.S. Disclosure: Credit Suisse does and seeks to do business with companies covered in its research reports. As a result, investors should be aware that the Firm may have a conflict of interest that could affect the objectivity of this report. Investors should consider this report as only a single factor in making their investment decision.
MARKET EVENTS
Results, Australand 17 Feb
Results, Ansell 17 Feb
Results, APN News & Media 17 Feb
Results, Aurizon 17 Feb
UPCOMING CONFERENCES
2014 HOLT Conference 2014 – London
25 Feb
2014 5th Annual DC Defense Conference – Washington
25 Feb
For more scheduled conferences refer to page 2
TABLES
Credit Suisse Ratings – Australia 154
Top 100 Earnings & Dividends 157
Small Caps Earnings & Dividends 160
Sector Aggregates 163
Weekly Market Calendar 164
Reporting Season Calendar 167
First NZ Capital Results Preview 172
March 24-28, Hong Kong

Australia and NZ First Edition 2
Australia & NZ Market Reports
Australia Index +/- %Day %Wk %Mth %YrRol
All Ordinaries 5366.9 48.2 0.9% 3.5% 2.1% 6.1% S&P/ASX 50 5522.8 44.8 0.8% 3.6% 2.1% 7.5% S&P/ASX 200 5356.3 48.2 0.9% 3.7% 2.1% 6.3% Financials 5834.9 44.2 0.8% 4.3% 1.1% 11.3% REITs 1016.3 6.7 0.7% 3.0% 1.2% 0.3% Industrials 3937.0 32.8 0.8% 3.2% 2.1% 0.9% Materials 10458.0 102.0 1.0% 4.4% 6.4% -6.9% Cons. Discreet 1806.8 20.1 1.1% 2.9% 0.5% 19.7%
NEW ZEALAND
NZX 50 4888.4 14.872 0.3% 1.0% -0.5% 15.3%
Currencies, Interest Rates & Gold
Index +/- %Day %Wk %Mth %YrRol
AUD/USD 0.899 0.001 0.1% 0.4% 0.8% -13.2% AUD/GBP 0.539 0.000 0.0% -1.2% -1.0% -19.4% EURAUD 1.523 0.000 0.0% 0.1% -0.2% 18.1% NZD/USD 0.834 0.000 0.0% 0.6% 0.0% -2.0% AUD/NZD 1.076 0.000 0.0% -0.3% 0.7% -11.6% TWI 0.687 -0.010 -1.4% -0.6% 0.0% -11.7% Aust 90Day 2.450 0.000 0.0% 0.0% 0.0% Aust 10Y 4.166 -0.078 -1.8% -0.1% -2.1% 15.7% NZ 90Day 3.220 NZ 10Y 4.620 -0.010 -0.2% 0.7% -1.9% 17.6% Gold Spot 1,302 11.660 0.9% 2.8% 4.9% -20.3%
Best Performers Worst Performers
Close % ‘000 Close % ‘000
Indophil Resourc 0.21 10.5 3152 Bathurst Resources 0.16 1033 Saracen Mineral 0.41 9.3 8248 Elemental 0.26 -5.5 68 Cudeco 1.66 7.8 859 iSelect Limited 1.22 -4.3 53 Alkane Resources 0.43 7.5 385 G.U.D. Holdings 5.96 -3.7 220 St Barbara 0.38 7.0 5814 Webjet 3.06 -3.2 364 Kingsgate Consol 1.39 6.9 2292 Astro JP 3.95 -3.2 124 PanAust 1.97 6.8 10393 OrotonGroup 3.91 -3.0 89 Sims Metal Mgmt 10.70 6.8 2079 Energy Wrld Corp 0.35 -2.8 1001 Sirius Resources 2.40 5.7 2816 Imdex 0.55 -2.7 268 Resolute Mining 0.66 5.6 4967 Neon Energy 0.04 -2.6 6937 Mount Gibson Iron 1.18 5.4 4929 Select Harvests 6.17 -2.4 240 Evolution Mining 0.83 5.1 4754 Ridly 0.81 -2.4 198
Source: ASX, Bloomberg, Reuters
Commodity Prices Spot* Forward Curve Credit Suisse Forecasts 3mth 15mth 1Q14 2014 2015
Bulks Iron Ore $/t 122.0 125.0 111.3 Coking Coal $/t 143.0 153.3 Thermal Coal $/t 76.8 85.0 85.0 Base Metals Aluminium USc/lb 77.1 78.4 83.5 77.1 82.2 Copper USc/lb 324.0 322.5 319.6 317.5 300.5 Nickel USc/lb 639.1 640.7 643.4 635.0 629.4 Zinc USc/lb 91.8 91.8 92.6 90.7 95.3 Lead USc/lb 95.4 96.1 96.6 99.8 103.2 Tin USc/lb 1025.2 1023.8 1043.3 1071.6
Precious Metals Gold US$/oz 1302.3 1160.0 1082.5 Silver US$/oz 20.5 18.7 18.2 Platinum US$/oz 1411.8 1380.0 1430.0
Energy Oil (Brent) US$/bbl 108.5 108.2 103.0 107.0 101.8 Oil (WTI) US$/bbl 100.4 99.3 90.2 94.0 91.8
*Fiscal year averages used, Steel prices are contract prices. Spot as of 10PM AEST.
VIX (S&P 500 Options Implied Volatility)
0.00
10.00
20.00
30.00
40.00
50.00
60.00
70.00
80.00
90.00
Jan
-96
Au
g-9
6
Ap
r-97
Dec-9
7
Au
g-9
8
Ap
r-99
Dec-9
9
Au
g-0
0
Ap
r-01
Dec-0
1
Au
g-0
2
Ap
r-03
Dec-0
3
Au
g-0
4
Ap
r-05
Dec-0
5
Au
g-0
6
Ap
r-07
Dec-0
7
Au
g-0
8
Ap
r-09
Dec-0
9
Au
g-1
0
Ap
r-11
Nov-1
1
Jul-1
2
Dec-1
2
Jun
-13
Dec-1
3
Daily VIX (S&P 500 Options Implied Volatility)
VIX Index Average -1 StDev +1 StDev
VIX – Current 1mth rol(avg) 3mth rol(avg) 6mth rol(avg) 14.14 15.84 14.30 14.51 Freight Spot 1 wk (avg) 1 mth (avg) 3 mth (avg) 6 mth (avg) 1 yr (avg)
Baltic Dry 1085.0 1091 1202 1635 1647 1280
Source: Bloomberg
Upcoming Credit Suisse Global Conferences New additions this week in bold.
February 2014 to November 2014
Feb-Mar 2014 Q1 Media Seminar – London
25 Feb 2014 HOLT Conference 2014 – London
25 Feb 2014 5th Annual DC Defense Conference – Washington
4-5 Mar 2014 Global Healthcare Conference – London
5 Mar 2014 Geneva Autos Show 2014 – Geneva
10-12 Mar 2014 Global Services Conference – Scottsdale, Arizona
11-12 Mar 2014 European Banks Conference 2014 – London
13 Mar 2014 Global Flagship event – London
13 Mar 2014 9th Annual European Cable and Telecoms Conf – London
13-16 Mar 2014 DCM Winter Conference 2014 – Silvaplana-Surlej
19-21 Mar 2014 Prime Services 2014 Hedge Fund Leadership Conf. – Florida
24 - 28 Mar 2014 Asian Investment Conference – Hong Kong
25 Mar 2014 Asian Hedge Fund Forum 2014 – Hong Kong
26-28 Mar 2014 Global Trading Forum 2014 – Miami
8 May 2014 Stockholm Consumer IR Day – Stockholm
14-15 May 2014 Chemicals & Ag Conference – London
May-Jun 2014 Q2 Media Seminar – London
3-4 Jun 2014 Energy Conference – London
5 Jun 2014 European Gaming Companies Conference – London
11 Jun 2014 Global Small & Midcap Conference – London
12 Jun 2014 European Buildings Conference – London
Jun 2014 Swiss Midcap Healthcare Conference – Zurich
Aug-Sep 2014 Q3 Media Seminar – London
10-12 Sep 2014 Asian Technology Conference – Taiwan
15-16 Sep European Telecoms 1:1 Conference – London
17-18 Sep Pan European Capital Goods Conference – London
24-25 Sep Global Steel & Mining Conference – London
3-4 Oct Paris Auto Conference – Paris
Oct-Nov Q4 Media Seminar – London
1 Nov Global Consumer IR Day – London
Nov Swiss Midcap Conference – Zurich
If you would like to attend any of the above conferences, please contact the Australian Corporate Access team: Cathy Kermond [email protected] or your Credit Suisse sales representative
Research Production
Adam Indikt – Supervisory Analyst 61 3 9280 1659 Patricia Rocis – Supervisory Analyst 61 3 9280 1678
Web Access Research Distribution [email protected] Email: [email protected]
Database Jason Swinbourne 612 8205 4591
Bottom Liners

17 February 2014
Australia and NZ First Edition 3
At a Glance Australia/NZ equities executive summary
COMPANIES & SECTORS
Auto solid, cold storage needs to warm up Automotive Holdings Group (AHE.AX)
Auto momentum continues, but TCS a drag and we still see risks around the disruption occurring within the industry: We believe the strong growth within the Automotive division from the annualisation of acquisitions, the continued growth of existing dealerships and scale benefits are likely to continue. However, Transport and Cold Storage (TCS) continues to be a drag on the group and while management expects an improved 2H result (on 2H13) it should still result in a decline on a full year basis (we forecast ~13% EBITDA decline in FY14). This combination means that short- to medium-term growth will likely be below the levels achieved recently. Further, we see additional risk from: (1) strong dollar weakening; (2) potential increases in unemployment; (3) the end of local manufacturing (disrupting the brands to which AHE is heavily exposed); and (4) broader economic uncertainly in AHE's two largest states (WA & Qld). While AHE is not trading at demanding levels (12.4x FY14 PE, ~20% discount to XSI), we believe that earnings risk is elevated and we retain our NEUTRAL rating. Key takeaways: (1) strong performance in the Automotive division continues with margin expansion across EBITDA, EBIT and PBT; (2) organic top line growth in automotive appears to be slowing and we believe the primary driver is discounting (due to excess inventory); (3) but the top line weakness in automotive is not flowing through to earnings as AHE continues to drive F&I, generate increased efficiency and we believe achieve greater manufacturer incentives; (4) TCS continues to be impacted by weak industry volumes and is carrying incremental costs—guidance for 2H14 to be above 2H13; (5) in the Other Logistics division, the mining downturn continues to impact COVS, but the other businesses performed well. Target price $3.90 (from $4.00): We derive our $3.90 target price for AHE by using an equally blended DCF and PE-relative based valuation.
Share Price 3.65 (AUD)
NEUTRAL
Target Price (from 4.00) 3.90 (AUD)
Chris Smith Research Analyst 61 2 8205 4210 This report is distributed in Australia by Credit Suisse Equities (Australia) Limited. Please see legal disclaimer and disclosure annex for further terms and information.
Prepared by Credit Suisse Emerging Companies (Australia) Pty Limited, a joint venture entered into between Credit Suisse and First NZ Capital.

17 February 2014
Australia and NZ First Edition 4
Earnings recovery - not if but when Fletcher Building (FBU.NZ)
Flagging upside risk to our forecasts: Our analysis of the historical relationship between FBU NZ and Australia earnings relative to the activity indicators we monitor (including currency impact on demand and product pricing dynamics) suggest upside risks to our 2H FY14and FY15 forecasts. The feedback we received from our recent FNZC sector conference also framed a more positive picture than we had expected. Accordingly, we have upgraded our FBU7 recommendation from Underperform to NEUTRAL with a revised NZ$10.25 target price (previously NZ$9.00). Balancing a positive three-year view vs. 12- month upside current level: FBU provides a good proxy for 1) the current and ongoing recovery in the NZ building market, 2) a pick-up in the Australian building sector, 3) a projected recovery in the US non-residential sector in 2014 and 2015 and 4) the potential upside in terms of cost savings from FBunite programme. We balance this positive three-year view against the magnitude of upside in the next 12 months relative to our DCF valuation, FBU’s peers and NZ equity market valuation. Residential building approvals in the coming months and 1H FY14 results: Our expectation is for a more positive trading outlook commentary since its AGM guidance four months ago. Our expectations are for EBIT of NZ$304mn (+12% vs pcp adjusted EBIT of NZ$272mn, reported of NZ$262mn) and NPAT of NZ$173mn (+19% vs pcp reported NPAT of NZ$146mn). Target price raised to NZ$10.25 (previously NZ$9.00): This is based on the midpoint of our valuation range between NZ$9.65 (12-forward DCF approach) and NZ$10.80 (with reference to NZ equity market and regional sector multiples).
Share Price 9.48 (NZD)
(from Underperform) NEUTRAL
Target Price (from 9.00) 10.25 (NZD)
Kar Yue Yeo Research Analyst +64 4 474 4462 This report is distributed in Australia by Credit Suisse Equities (Australia) Limited. Please see legal disclaimer and disclosure annex for further terms and information. Provided by First NZ Capital
Diversifying its book and earnings Heartland New Zealand (HNZ.NZ)
Event: HNZ announced the proposed acquisition of Home Equity Release (HER) mortgage businesses in NZ and Australia for $87mn (settlement 1 April 2014) to be funded by a ($58.7mn) capital raise to the vendor ($38.7mn), a $20mn placement and existing cash. Underlying NPAT contribution in the first full 12 months is expected to be $8mn-$9mn (implies initial acquisition P/E of 9.7x to 10.9x) but integration costs of $2mn (post tax) will weigh on HNZ’s FY14 (three months) and FY15 earnings contribution. Inclusive of the HER business, HNZ expects FY15 NPAT to be between $42mn and $44mn. At first glance the acquisition looks broadly neutral as it is priced on a similar P/E to what HNZ was trading prior to the announcement. However, we believe it is a strong strategic acquisition for HNZ that diversifies its earnings base (new market segment but also into Australia) and presents growth potential and a positive earnings story to HNZ over the next few years. We have preliminarily adjusted our forecasts to reflect the HER acquisition and guidance that HNZ’s existing business is trading slightly below our expectations in the near term. We will look for a full update when HNZ reports its 1H14 result on 25 February 2013. Investment case: HNZ should continue to re-rate as it improves its ROE and continues to grow and develop its business. HNZ remains on undemanding multiples. Catalysts: HNZ will release its 1H14 result on 25 February 2014. Valuation: We have upgraded our target price from $0.90 to $0.96 to reflect a heavier weight on higher FY15E earnings in our valuation approach (but retain a forward P/E of 11x) and an increase in the asset multiples used to set our target price to reflect the growth potential from the HER businesses.
Share Price 0.91 (NZD)
NEUTRAL
Target Price (from 0.90) 0.96 (NZD)
Greg Main Research Analyst 64 4 474 4061 Disclaimer: First NZ Capital is acting as underwriter to Heartland in its NZ$5m share purchase plan to shareholders
This report is distributed in Australia by Credit Suisse Equities (Australia) Limited. Please see legal disclaimer and disclosure annex for further terms and information. Provided by First NZ Capital

17 February 2014
Australia and NZ First Edition 5
Positive volume and price momentum James Hardie Industries SE (JHX.AX)
Louisiana Pacific (LP.US) reports 4Q: Louisiana Pacific, a key competitor of JHX in the US siding & trim market, reported its 4Q (Dec) 2013 result. The stock was up 5.5% on the back of this result. The read-through typically serves are a useful (albeit not precise) proxy for US fibre cement volume and price trends. The LP 4Q result (SmartSide division): A positive mix shift led prices up (+4%) and strong volume (+20%) was underpinned by growth in the R&R segment (single family and DIY also improving). This is despite weather disruptions (Polar Vortex) in the latter part of the qtr which continued into January 2014. Pleasingly, a number of distributors reported that January 2014 (weather impaired) activity was still better than the pcp. Pent-up demand is material and this should accelerate when the weather breaks. Read-though: JHX's US fibre cement volumes exhibiting a strong relationship to LP’s SmartSide volume with a 0.7 correlation through the cycle. Strong price growth (led by +ve mix shift) is also indicative of a change in consumer and homebuilder sentiment towards more higher priced and quality products. This plays right into the hands of JHX and was the key driver of JHX’s 4% price rise at the previous 2Q result. For JHX, we are increasingly confident that trend momentum will grow into FY14-15. Other points of interest: (1) US new home construction activity to
increase 20% in CY2014; (2) still significant pent-up demand; (3) first-time homebuyer is unlikely to participate until there is more job growth and an increased availability to financing; and (4) builders optimistic about 2014 activity, but concerned about labour shortages. Catalyst: JHX reports 3Q FY14 on 28 February 2014.
Share Price 13.19 (AUD)
OUTPERFORM
Target Price 13.50 (AUD)
Andrew Peros Research Analyst 61 2 8205 4013
1H14 result – steady as she goes Michael Hill International (MHI.NZ)
PBT, at A$28.5mn, compared with the pcp at A$27.0mn, up 5.1%, and was reasonably consistent with our estimate at A$28.7mn. MHI reported 1H14 reported earnings at A$16.2mn, down 26.3% compared with the pcp, and less than 30% compared with our 1H14 estimates. However, the result was impacted by a tax provision which has now been provided for in relation to the tax dispute with the Australian Taxation Office (ATO). We estimate the amount in the vicinity of A$7mn (based on our 1H14 tax estimate relative to the reported amount). Sales figures, and the composition thereof, had already been disclosed at the time of the 2H14 sales release, with the depreciation of the AUD relative to its respective regional currencies providing a meaningful tailwind with regards headline AUD revenues. EBIT margins held up reasonably well in the context of a challenging environment, but the inclusion of the high margin PCP was supportive of earnings. We expect MHI’s performance to be steady for a time. Key catalysts for performance include an improvement in the Australian economy (not expected any time soon), seeing the NZ management team get some meaningful traction (expected over next 12 months), with continued growth in the North American business considered a plus (but not a key valuation driver). We would also like to see the excess inventory issue resolved sooner rather than later. We retain our NZ$1.67 target price. We continue to believe that the business model is intact for MHI, but acknowledge that the stock may languish at around current levels until such a time as the issues addressed above (either macro or business specific) improve and/or are resolved.
Share Price 1.38 (NZD)
OUTPERFORM
Target Price 1.67 (NZD)
Sarndra Urlich Research Analyst +64 4 496 5363 This report is distributed in Australia by Credit Suisse Equities (Australia) Limited. Please see legal disclaimer and disclosure annex for further terms and information. Provided by First NZ Capital

17 February 2014
Australia and NZ First Edition 6
1H FY14 result spot on. Debt up on working capital and FX Newcrest Mining (NCM.AX)
Underlying NPAT $207mn (CS $206mn). Reported NPAT $40mn reflects previously advised $120mn tax expense and $47mn impairment of West Africa exploration assets. FY13 reported $5.8bn loss post $6.2bn write down. $228mn operating cash flow impacted by $200mn working capital movement and $70mn tax payment for prior R&D claims. 2H expected to see a ~$100m working capital release for a $370mn turnaround. No dividend. Operating cash flow less than the $421mn capex (Cadia East development), resulting in debt draw. 2H cash flow increase should exceed capex increase. No write down of Telfer despite reserves restated from 11.6moz to 6.3moz. Current mine plan consumes less than half the written down reserves. Group Reserves restated to 78moz from 87.7moz comprising: 3moz depletion, -5moz Telfer leaving 6.3Moz, -2.5moz at Lihir. Resource restated to 150moz from 161.2Moz. Reserve and RSC price assumptions unchanged. Net debt $4.5bn versus June 30 $4.14bn. $164mn attributable FX on USD denominated debt. Available liquidity A$1,250mn (FY13 A$958mn) in cash and undrawn facilities before additional liquidity of US$200mn in January. No change to FY14 production guidance or strategy. Each asset managed to be cash flow neutral or positive in FY14 at A$1,450/oz. TP unchanged at $8.20/share. Rating remains underperform.
Share Price 11.05 (AUD)
UNDERPERFORM
Target Price 8.20 (AUD)
Michael Slifirski Research Analyst 61 3 9280 1845
Low key 1H14 result, but a loss Perseus Mining (PRU.AX)
$4mn 1H14 loss, better than we forecast ($14mn loss) but largely explained by an $8.3mn FX gain we hadn’t accounted for. $16mn cash available and no debt, but this provides little comfort in the context of the 1H operating cash consumption of $1.8mn before investing cash consumption of $17.8mn. 1H cash consumption was minimised by drawing part of the mill feed from stockpile to avoid investing significant capital in pre-stripping to access higher grade ore. Liquidity outlook will depend on operation stability and gold price, with improved ore grades expected as mining progresses, lifting cash generation. Progress with Ghanaian government discussion has confirmed that at least a portion of the VAT refund will be achieved with 60mn Ghanaian cedi (~$23mn USD) agreed to be able to be used to offset future royalties/taxes, a benefit to cash flow. This is ~half of the VAT rebate that PRU believe they are entitled to but have not yet received. A cash component is expected in the final settlement and administration changes are hoped to stop the VAT receivable from increasing in future. Cost reduction initiatives implemented during the 1H reduced all-in site costs and are expected to have an increased full period benefit in the 2H. Management continue to project an all-in site cash cost of US$937/oz for 230koz/yr over 10 years to 2024. Valuation: A lot has to go right for Perseus to prosper. Our target price (unchanged) is undermined by punitive gold price assumptions, suggesting and unattractive risk-reward equation. Rating moves to Underperform given the recent share price strength.
Share Price 0.50 (AUD)
(from Outperform) UNDERPERFORM
Target Price 0.50 (AUD)
Michael Slifirski Research Analyst 61 3 9280 1845

17 February 2014
Australia and NZ First Edition 7
Strong result, conservative guidance Rio Tinto (RIO.AX)
Headline numbers, all positive: Underlying earnings beat - $10.2bn v CS $10.2bn and consensus $9.7bn, driven by savings in coal and aluminium. Cost cutting beat with $2.3bn of cost reductions, 15% ahead of the 2013 target. Dividend beat at 192cps or 15% increase, in-line with CS but well ahead of consensus expectation of 181cps (8%). Net debt much lower, $18.1bn v CS $18.3bn and consensus $21bn. Capex came in at $12.9bn in 2013 and RIO confirmed guidance for 2014 at <$11bn and 2015 of ~$8bn. Multiple impairment charges and one-offs for net earnings at $3.7bn: The interesting ones were a $696m charge to the Kitimat ali smelter on a capex overrun and restructuring costs of $367m (4000 staff reductions). Iron ore production guidance for 2014 is 295mt (global, 100% basis). This is below consensus at 305mt and CS at 311mt. Despite rainfall, we view the guidance as conservative - we expect that Rio will do a little better than guidance and assume 300mt production with 5mt of inventory sales. Other guidance also soft, with 570kt mined and 260kt refined copper below consensus at 615kt and 280kt. Guidance for 1.5mt TiO2 in FY14 is well below capacity at 1.8mt. Earnings and valuation, EPS down <1% as the 10mt lower iron ore production (~$400m NPAT) and 2% higher tax rate ($300m) are offset by cost savings in the coal and ali divisions. Our DCF increases to A$83.5/sh from A$78.5/sh on model roll forward ($2/sh), lower pension liabilities ($2/sh) and lower coal/ali costs ($1/sh). We raise our target price to A$80/sh (from A$75/sh) and £42/sh (from £40/sh) and retain our OUTPERFORM rating.
Share Price 67.83 (AUD)
OUTPERFORM
Target Price (from 75.00) 80.00 (AUD)
Paul McTaggart Research Analyst 61 2 8205 4698
Australia drives a better 1H; challenging outlook keeps management cautious
Sims Metal Management (SGM.AX)
Statutory 1H NPAT $9.3mn (CS $9mn). A$42.1mn underlying NPAT exceeded expectation. $113mn EBITDA exceeded our $86mn, driven by a very strong Australian result and the benefit of AUD depreciation on other regions. Australia underpinned by materially improving domestic scrap sector structure as competitors withdraw from the market. US now facing headwinds. SRS deteriorated further. No guidance. No interim dividend. Sales volumes increased by 3.3% to 6.1Mt in 1HY14 (5.927Mt pcp) in HY13, but down 6.2% from the strong 2H13 6.526Mt. Underlying EBITDA was A$128.5mn up 37.9% on pcp, again due to materially improved performance from recycling operations in Australia. At constant currency, underlying controllable costs were A$24.8mn lower in HY14 compared to HY13. Net debt as at 31 December 2013 was A$121.2mn, a decrease of A$32.6mn on FY13 $154mn. Operating cash flow $37.8mn plus $30.1mn cash from asset sales. Capex of $29.2mn is less than half the FY14 forecast $80mn and FY13 $149mn. 2H14 outlook described as challenging with export markets (Turkey) impacting demand for SGM's exports. New strategy to be delivered to the market by new MD Galdino Claro before the end of the half. No change to target price or rating.
Share Price 10.70 (AUD)
UNDERPERFORM
Target Price 10.00 (AUD)
Michael Slifirski Research Analyst 61 3 9280 1845

17 February 2014
Australia and NZ First Edition 8
Shifting gears... Transpacific Industries Group (TPI.AX)
TPI reported solid 1H14 underlying NPAT of $41.7mn, up 16.5% on pcp, driven by a $20mn improvement in Net Interest expense and lower D&A. Waste Management EBITDA of $189.3mn was down 0.5% on pcp and 1.5% ahead of CS forecast. Underlying operational outperformance of Cleanaway and NZ was offset by a weaker Industrial result. We have upgraded FY14 NPAT by 35% on upgraded NZD, inclusion of two months of commercial vehicles trading, lower D&A and revised interest guidance. Our FY15E NPAT is upgraded 15.6% and 6.3% in FY16. Brad Clibborn assumes coverage of TPI following a change in analyst responsibilities. NEUTRAL rating as TPI shifts gears: After a number of years of focus on restructuring and debt reduction, we now see TPI at a turning point. The management team has breathing room to focus on continuing operational efficiency gains and a new CEO to lead the business forward. Further, TPI will soon find itself with sufficient capital flexibility to explore strategic and growth options in Australia (assuming a successful sale of NZ in the next six months). With TPI trading on 18.7x FY15E P/E we believe the market has already priced in successful execution on the guided $50mn of first round cost-out (FY13–FY15) and de-risking of the balance sheet (ND/EBITDA now <2x). However, we believe TPI likely has further medium-term margin upside from operating efficiencies (route optimisation and further overhead reduction). In order to move positive on TPI from these levels we need to see a successful sale of NZ, greater clarity on next phase operating efficiencies and more from new CEO Robert Boucher on the strategic and growth opportunities for TPI in Australia. Catalysts: Update on sale of NZ business expected late FY14 or early FY15. Our target price increases to $1.27 from $1.00. We apply a DCF-based valuation to derive our target price employing a 9.9% WACC.
Share Price 1.16 (AUD)
NEUTRAL
Target Price (from 1.00) 1.27 (AUD)
Bradley Clibborn Research Analyst 61 2 8205 4465 This report is distributed in Australia by Credit Suisse Equities (Australia) Limited. Please see legal disclaimer and disclosure annex for further terms and information. Prepared by Credit Suisse Emerging Companies (Australia) Pty Limited, a joint venture entered into between Credit Suisse and First NZ Capital.

17 February 2014
Australia and NZ First Edition 9
Strong result – driven by one-off impacts Vital Healthcare Property Trust (VHP.NZ)
VHP's reported 1H14 distributable profit rose 48% on pcp and 44% on forecast as one-off items below the line contributed strongly to the result. Rental income was 2% up on pcp and in line with our forecast. Current tax was a credit of NZ$1.6mn which created a positive variance of NZ$4.7mn to our forecast which assumed a normalised tax charge in the period. Portfolio-structured rent review mechanism proving its worth. With minimal real rental growth being seen in the sector, VHP is likely to have one of the strongest rental growth prospects over the next 12 months (excluding currency impacts) from the majority structured review mechanism. In FY14, 81% of the total rent is subject to a review and with around half completed in the first half, VHP reported a 2.4% average rental increase. Portfolio metrics improved further. As announced in late 2013, management had been successful in the early negotiations of a new 30-year lease to Mercy Ascot Hospital in Auckland which made up circa 10% of the portfolio rent roll. This lease combined with several long-term extensions at some of their Australian assets saw the WALT extend from 11.8 years at year end to 14.9 years. Occupancy remained above 99% and the expiry profile appears to be very manageable through to FY17. With one of the two material lease expiries within the portfolio no longer of concern and gearing levels comfortably in the mid-30%, we have less concerns around the stock. The focus will now be on how management deals with the confirmed tenant departure at their Allamanda asset. We forecast VHP to have one of the higher rental growth and earnings profiles in the sector. Whilst our 12-month target price reduces 4cps to $1.35, the significant pull-back in the share price over the second half of 2013 means we upgrade our rating to NEUTRAL (from Underperform).
Share Price 1.29 (NZD)
(from Underperform) NEUTRAL
Target Price (from 1.39) 1.35 (NZD)
Stephen Reid Research Analyst +64 9 302 5543 This report is distributed in Australia by Credit Suisse Equities (Australia) Limited. Please see legal disclaimer and disclosure annex for further terms and information. Provided by First NZ Capital
Light at the end of the tunnel Westfield (WDC.AX)
Reality check: After running to $10.78 immediately after proposing the creation of Scentre Group, WDC has subsequently sold off 2.4% to $10.27 (vs Global REIT's 2.6% and Domestic Equities' +1.6%). Results have been de-risked with 2013 FFO guidance of 66.5c re-iterated in Dec. FY14 growth guidance was also struck, at 3.2% (68.6c). While dilutive sales pose some risk to growth, WDC would no doubt be ready to re-deploy capital into buying back their stock as it currently trades on an 11.3% discount to NAV. We lift our Target Price to $11.45 and upgrade rating to OUTPERFORM. Investment case: Westfield appears to have been dragged down by three key factors: 1) concerns re US pricing / comps, 2) concerns re growth outlook, and 3) liquidity drains on the A-REIT sector. Our CY14 NAV framework suggests the market is pricing WDC's "business" at $1.3bn or 5.2x FY14 EBIT - this excludes any value for the likely margin on the $1.5bn of balance sheet development currently underway. The headwind: We expect US non-core disposals to culminate shortly with six assets sold for $1.2bn, driving dilution in the order of 2.9% annualised (2.3% of FY14 FFO). Press speculation now suggests there may also be ~$1bn of UK asset sales – potentially ~1.8% dilutive (annualised). Yet, we stress, FY14 weakness could pull forward the long awaited growth by 2015. US cap rates offset FX: Our earnings (FY14 +0.8%) upgrades are driven purely by updated FX assumptions and share counts. The valuation uplift has been partially offset by applying 5bps higher cap rates to US NOI. Our valuation applies a blended average cap rate of 5.75% and an 11.1x multiple on active EBIT (& dev't value add) vs 10x on unallocated expenses.
Share Price 10.27 (AUD)
(from Neutral) OUTPERFORM
Target Price (from 11.27) 11.45 (AUD)
Stephen Rich Research Analyst 61 2 8205 4617

17 February 2014
Australia and NZ First Edition 10
RESULT PREVIEW
1H14 results: Margin outlook and weather Australian Utilities Sector
FY13 was bad for Integrated Utilities; FY14 starting off badly: We believe 1H14 will be a low for the Integrated Utilities as margins are impacted from discounting, churn, lower volumes and higher wholesale prices. While we expect a poor 1H14 for Integrated Utilities, the key to the results will likely be outlook and guidance statements for 2H14, as our proprietary survey indicates that discounting may already be at its nadir. In addition, we will be looking for commentary as to how the utilities managed the January heat wave in the South Eastern states. Marginally prefer ORG over AGK: We marginally prefer ORG to AGK coming into the 1H14 result. We do not expect ORG to provide formal guidance for FY14, instead providing outlook commentary, showing expectations of further discount tapering and a smaller relative impact from the January heat wave in SE Australia. For AGK, we will not be surprised if FY14 guidance will be tightened to the lower end of the $560mn to around $610mn, with the added possibility that any loss from Forge's issues at the Diamantina power station could be taken below the line. Few surprises expected for the Regulated Utilities: With guidance provided for each of regulated utilities (distribution or NPAT), we expect few surprises for the coming reporting season. For us, the key areas of focus will be any update on tax issues relating to SKI and commentary in relation to further growth opportunities in Western Australia following on from recent projects announced by DUE (potentially of benefit to both DUE and APA).
Sandra McCullagh Research Analyst 61 2 8205 4729
CY13 result preview: Key numbers known; reports on 20 Feb
PanAust (PNA.AX)
EBITDA of US$271mn is known, so uncertainty around unknown depreciation, corporate allocation, hedge accounting and tax drives a $10mn risk band around NPAT forecasting. We view our $81mn estimate as conservative with risk of being exceeded by lower depreciation and lower tax. 2H depreciation should be higher than 1H, reflecting operation of the Phu Kham enhanced recovery circuit. This is reflected in our higher 2H depreciation forecast. Consensus range of $81mn to $105mn could reflect variation in above assumptions or inclusion/exclusion of minorities. 31 Dec cash US$130.3mn and US$162mn debt already advised with the DecQ result in January. CY14 guidance provided: Phu Kham Cu 65-70kt, cash costs US$1.50-1.60/lb Cu; Ban Houayxai US$650-$700/oz. Consolidated gold forecast 160-165koz. CY14F EBITDA US$200– $225mn. No changes to these numbers expected. We hope for additional guidance on the capex profile, corporate overhead allocation and project expenditure. TP and rating unchanged.
Share Price 1.97 (AUD)
OUTPERFORM
Target Price 2.00 (AUD)
Michael Slifirski Research Analyst 61 3 9280 1845

17 February 2014
Australia and NZ First Edition 11
1H14 result preview; reports on 20 Feb Port of Tauranga (POT.NZ)
FNZC assumptions We anticipate POT's 1H14 NPAT at NZ$40.4mn. Management expects NPAT for FY14 in the range of NZ$77-81mn, which is consistent with our forecast of NZ$79.7mn. We assume EBITDA of NZ$67.5mn in 1H14 and NZ$122.8mn for FY14F. What to look for We are not anticipating any surprises in POT’s 1H14 result. Organic and inorganic growth in revenues is expected to be largely offset by a backflow of container volume to the Port of Auckland. A progress update on the expansion of existing facilities. Share price implications We expect a relatively muted response on the back of a flat underlying NPAT result when compared to the pcp. At current levels, valuation remains a hurdle. In order for us to upgrade our target price and rating for POT, we would require a positive surprise both in terms of the offset between increasing log volumes and the level of reduction in container volumes, and progress on the expansion in existing port facilities.
Share Price 13.95 (NZD)
UNDERPERFORM
Target Price 13.80 (NZD)
Kar Yue Yeo Research Analyst +64 4 474 4462 This report is distributed in Australia by Credit Suisse Equities (Australia) Limited. Please see legal disclaimer and disclosure annex for further terms and information. Provided by First NZ Capital
1H14 result preview; reports on 20 Feb Steel & Tube Holdings (STU.NZ)
FNZC Assumptions Our expectation is for 1H14 NPAT of NZ$7.5mn, translating into NZ$17.3mn for FY14. We anticipate 1H14 EBIT of NZ$11.0mn, translating into NZ$25.1mn for FY14. What to look for We look for evidence of STU’s ability to capitalise on the NZ building and construction sector recovery translating into higher steel demand. Increased activity in both residential and non-residential building consents in Auckland and Christchurch are the key drivers here. Importantly, increased demand should translate into an improvement in margins. Share price implications To be more bullish on the stock, we would require improvement in margins and an anticipation that these improvements can be sustained going forward through the remainder of FY14F.
Share Price 3.00 (NZD)
UNDERPERFORM
Target Price 3.10 (NZD)
Kar Yue Yeo Research Analyst +64 4 474 4462 This report is distributed in Australia by Credit Suisse Equities (Australia) Limited. Please see legal disclaimer and disclosure annex for further terms and information. Provided by First NZ Capital
STRATEGY & ECONOMICS
GNC: 50% of the LTI opportunity converted to STI plan for FY14
Australian ESG/SRI - AGM series
We have reviewed the Grain Corp (GNC.AX) Remuneration Report for the Annual General Meeting on 25
th February 2014.
The CEO earns a base salary of $1.15mn, up 21.5% on FY12. Market capitalisation increased from $1.2bn to $1.8bn during the 2012 remuneration review period, which was cited as the reason for the base salary increase. Market cap is currently ~$1.78bn, therefore benchmarking may still be relevant. FY13 LTI will be cash-based, rather than rights, but will be subject to same hurdles and vesting period. 50% of the FY14 LTI opportunity has been converted to the STI plan due to share price volatility following the failed take-over attempt. This results in an additional $0.60mn in STI opportunity in lieu of the LTI plan for the CEO. CEO termination benefit composition unclear: The former CEO departed on 13 January 2014 and collected $0.939mn in termination benefits, including contractual pro-rata STI for ~3 months. The Board has discretion on payout of STI but we are unable to determine if any of the converted LTI for FY14 was paid out as part of termination.
Sandra McCullagh Research Analyst 61 2 8205 4729

17 February 2014
Australia and NZ First Edition 12
REINZ House Prices (Jan) – Further easing in the rate of house price growth
NZ House Prices
The REINZ house price index (stratified) rose by 7.7% YoY in January 2014, down from the 9.2% YoY increase recorded over the previous month. The national stratified house price index continued to ease back from its November 2013 peak of NZ$437,700, recording a price of NZ$423,150 over January. While the rise in national house prices continued to be underpinned by robust increases in both the Auckland and Canterbury regions, there were further signs of a softening in the rate of growth in annual house price inflation. In particular, annual house price inflation turned modestly negative in the Wellington region (down 1.1%), while that past three months has seen declines in the annual pace of growth in both Auckland and Christchurch house prices. In addition to the softening in the rate of growth in national house prices, REINZ estimates that the number of house sales declined by 1.1% MoM in January. While it still remains a little early to be definitive regarding the impact of the recently introduced high LVR mortgage restrictions, the RBNZ is likely to take comfort from these data showing further signs of a softening in the rate of growth in house prices. Moreover, despite the current elevated level of consumer confidence and continued rise in migrant inflows, the heightened prospect of the RBNZ raising interest rate settings in March 2014 is also increasingly likely to be a factor dampening housing market activity.
Chris Green Research Analyst 64 9 302 5509
This report is distributed in Australia by Credit Suisse Equities (Australia) Limited. Please see legal disclaimer and disclosure annex for further terms and information. Provided by First NZ Capital

Australia and NZ First Edition 13
17 February 2014
Asia Pacific/Australia
Equity Research
Small Cap Companies
Automotive Holdings Group
(AHE.AX / AHE AU) RESULTS
Auto solid, cold storage needs to warm up ■ Auto momentum continues, but TCS a drag and we still see risks
around the disruption occurring within the industry: We believe the
strong growth within the Automotive division from the annualisation of
acquisitions, the continued growth of existing dealerships and scale benefits
are likely to continue. However, Transport and Cold Storage (TCS)
continues to be a drag on the group and while management expects an
improved 2H result (on 2H13) it should still result in a decline on a full year
basis (we forecast ~13% EBITDA decline in FY14). This combination means
that short- to medium-term growth will likely be below the levels achieved
recently. Further, we see additional risk from: (1) strong dollar weakening;
(2) potential increases in unemployment; (3) the end of local manufacturing
(disrupting the brands to which AHE is heavily exposed); and (4) broader
economic uncertainly in AHE's two largest states (WA & Qld). While AHE is
not trading at demanding levels (12.4x FY14 PE, ~20% discount to XSI), we
believe that earnings risk is elevated and we retain our NEUTRAL rating.
■ Key takeaways: (1) strong performance in the Automotive division
continues with margin expansion across EBITDA, EBIT and PBT; (2) organic
top line growth in automotive appears to be slowing and we believe the
primary driver is discounting (due to excess inventory); (3) but the top line
weakness in automotive is not flowing through to earnings as AHE continues
to drive F&I, generate increased efficiency and we believe achieve greater
manufacturer incentives; (4) TCS continues to be impacted by weak industry
volumes and is carrying incremental costs—guidance for 2H14 to be above
2H13; (5) in the Other Logistics division, the mining downturn continues to
impact COVS, but the other businesses performed well.
■ Target price $3.90 (from $4.00): We derive our $3.90 target price for AHE
by using an equally blended DCF and PE-relative based valuation.
Total return forecast in perspective
Mean^CSEC tgt^
Sh Prc
-30%
-20%
-10%
0%
10%
20%
30%
40%
50%
12mth Volatility* 52wk Hi-Lo IBES Consensustarget return^
Performance over 1M 3M 12M
Absolute (%) -1.9 -2.7 -7.6
Relative (%) -4.0 -1.8 -13.9
Financial and valuation metrics
Year 06/13A 06/14E 06/15E 06/16E
Revenue (A$mn) 4,271.7 4,549.3 4,687.7 4,830.3
EBITDA (A$mn) 165.3 171.6 181.0 188.5
EBIT (A$mn) 136.9 143.7 151.9 158.3
Net income (A$mn) 72.7 76.9 81.4 86.3
EPS (CS adj.) (Ac) 27.88 29.48 31.23 33.09
Change from previous EPS (%) n.a. -1.6 -2.2 -0.9
Consensus EPS (Ac) n.a. 30.30 33.00 35.10
EPS growth (%) 13.3 5.7 5.9 6.0
P/E (x) 13.1 12.4 11.7 11.0
Dividend (Ac) 20.00 21.07 22.23 23.56
Dividend yield (%) 5.5 5.8 6.1 6.5
P/B (x) 2.0 1.9 1.8 1.7
Net debt/equity (%) 138.0 139.6 132.1 123.6
Relative performance versus S&P ASX 200. See Reference Appendix for a description of the chart. Source: CSEC estimates, * Consensus, mean range from Thomson Reuters.
Source: Company data, ASX, CSEC estimates, * Adj. for goodwill, notional interest and unusual items. Relative P/E against
ASX/S&P200 based on pre GW in AUD. Company PE calculation is based on displayed EPS Currency
Rating NEUTRAL*
Price (14 Feb 14, A$) 3.65
Target price (A$) (from 4.00) 3.90¹
Market cap. (A$mn) 951.12
Yr avg. mthly trading (A$mn) 44
Last month's trading (A$mn) 33
Projected return:
Capital gain (%) 6.8
Dividend yield (net %) 6.0
Total return (%) 12.8
52-week price range 4.3 - 3.1
* Stock ratings are relative to the relevant country
benchmark.
¹Target price is for 12 months.
Research Analysts
Chris Smith
61 2 8205 4210
Paul Buys
61 2 8205 4538
Bradley Clibborn
61 2 8205 4465
Sarah Mann
61 2 8205 4610
This report is distributed in Australia by Credit
Suisse Equities (Australia) Limited. Please see legal disclaimer and
disclosure annex for further terms and information.
Prepared by Credit Suisse Emerging Companies (Australia) Pty Limited,
a joint venture entered into between Credit Suisse and First NZ Capital.

17 February 2014
Australia and NZ First Edition 14
Figure 1: Financial summary
Automotive Holdings Group Ltd (AHE) Year ending 30 Jun In AUDmn, unless otherwise stated2012 2013 2014 2015 2016 2012 2013 2014 2015 2016
Share Price: A$3.65 Earnings 06/12A 06/13A 06/14E 06/15E 06/16ERating c_EPS_SHARESEquiv. FPO (period avg.) mn 260.7 260.8 260.7 260.7 260.7
Target Price A$ 3.90 c_EPS*100EPS (Normalised) c 24.6 27.9 29.5 31.2 33.1
vs Share price % 6.85 EPS_GROWTH*100EPS Growth % 13.3 5.7 5.9 6.0
DCF A$ 4.12 c_EBITDA_MARGIN*100EBITDA Margin % 3.9 3.9 3.8 3.9 3.9
c_DPS*100DPS c 18.0 20.0 21.1 22.2 23.6
c_PAYOUT*100Payout % 73.1 71.7 71.5 71.2 71.2
FRANKING*100Franking % 100.0 100.0 100.0 100.0 100.0
c_FCF_PS*100Free CFPS c 17.2 9.9 17.7 28.0 31.9
Profit & Loss 06/12A 06/13A 06/14E 06/15E 06/16E c_TAX_RATE*100Effective tax rate % 30.4 29.5 30.0 30.0 30.0
Sales revenue 3,914.7 4,271.7 4,549.3 4,687.7 4,830.3 ValuationEBITDA 153.5 165.3 171.6 181.0 188.5 c_PE P/E x 14.8 13.1 12.4 11.7 11.0
Depr. & Amort. (26.5) (28.4) (27.8) (29.1) (30.1) c_EBIT_MULTIPLE_CURREV/EBIT x 12.0 11.8 11.6 10.9 10.5
EBIT 127.0 136.9 143.7 151.9 158.3 c_EBITDA_MULTIPLE_CUEV/EBITDA x 9.9 9.8 9.7 9.2 8.8
Associates 0.0 0.0 0.0 0.0 0.0 c_DIV_YIELD*100Dividend Yield % 4.9 5.5 5.8 6.1 6.5
Net interest Exp. (30.7) (29.4) (27.6) (29.7) (28.9) c_FCF_YIELD*100FCF Yield % 4.7 2.7 4.8 7.7 8.8
Other 0.0 0.0 0.0 0.0 0.0 c_PB Price to Book x 2.1 2.0 1.9 1.8 1.7
Profit before tax 96.3 107.6 116.2 122.2 129.4 ReturnsIncome tax (29.2) (31.7) (34.8) (36.6) (38.8) c_ROE*100Return on Equity % 14.1 15.2 15.4 15.5 15.7
Profit after tax 67.1 75.9 81.3 85.5 90.6 c_I_NPAT/c_I_SALES*100Profit Margin % 1.6 1.7 1.7 1.7 1.8
Minorities 0.0 0.0 0.0 0.0 0.0 c_I_SALES/c_B_TOT_ASSAsset Turnover x 2.8 2.7 2.7 2.7 2.7
Preferred dividends 0.0 0.0 0.0 0.0 0.0 c_ASSETS/c_EQ_COMMONEquity Multiplier x 3.1 3.3 3.4 3.3 3.3
Associates & Other (2.9) (3.1) (4.5) (4.1) (4.4) c_ROA*100Return on Assets % 4.6 4.6 4.6 4.7 4.8
Normalised NPAT 64.2 72.7 76.9 81.4 86.3 c_ROIC*100Return on Invested Cap. % 8.6 8.3 8.2 8.5 8.7
Unusual item after tax (13.5) (6.0) (0.8) 0.0 0.0 GearingReported NPAT 50.6 66.8 76.0 81.4 86.3 c_GEARING*100Net Debt to Net debt + Equity % 55.6 58.0 58.3 56.9 55.3
c_NET_DEBT/c_I_EBITDANet Debt to EBITDA x 3.7 4.1 4.1 3.9 3.7
Balance Sheet 06/12A 06/13A 06/14E 06/15E 06/16E c_I_EBITDA/ c_I_NET_INTERESTInt Cover (EBITDA/Net Int.) x 5.0 5.6 6.2 6.1 6.5
Cash & equivalents 81.4 97.4 107.0 123.2 147.2 c_I_EBIT/ c_I_NET_INTERESTInt Cover (EBIT/Net Int.) x 4.1 4.7 5.2 5.1 5.5
Inventories 584.2 691.0 735.5 757.3 780.0 (c_C_CAPEX/c_I_SALES)*-100Capex to Sales % 1.1 1.6 1.3 0.8 0.7
Receivables 248.8 300.3 293.8 302.8 312.0 (c_C_CAPEX/c_I_DEPR)*-100Capex to Depreciation % 224.7 323.6 303.2 171.5 145.4
Other current assets 82.9 18.3 21.5 21.5 21.5
Current assets 997.2 1,107.0 1,157.8 1,204.8 1,260.6 MSCI IVA (ESG) Rating BBProperty, plant & equip. 137.3 186.4 224.5 239.5 249.5 TP ESG Risk (%): 0
Intangibles 211.8 249.0 259.0 250.8 242.7
Other non-current assets 52.1 38.5 44.1 44.1 44.1
Non-current assets 401.2 474.0 527.6 534.4 536.3
Total assets 1,398.4 1,581.0 1,685.4 1,739.2 1,796.9
Payables 195.1 251.3 269.8 277.7 286.1
Interest bearing debt 654.0 768.8 818.3 834.7 851.7
Other liabilities 91.5 74.4 87.6 88.3 89.3 MSCI IVA Risk: Positive
Total liabilities 940.5 1,094.5 1,175.7 1,200.7 1,227.1
Net assets 457.9 486.5 509.7 538.5 569.8
Ordinary equity 454.1 477.6 499.1 523.8 550.7
Minority interests 3.8 8.9 10.6 14.7 19.1
Preferred capital 0.0 0.0 0.0 0.0 0.0
Total shareholder funds 457.9 486.5 509.7 538.5 569.8
Net debt 572.6 671.4 711.3 711.4 704.5 Source: MSCI ESG Research
Cashflow 06/12A 06/13A 06/14E 06/15E 06/16E Share Price Performance
EBIT 127.0 136.9 143.7 151.9 158.3
Net interest -31.1 -29.4 -30.7 -29.7 -28.9
Depr & Amort 26.5 28.4 27.8 29.1 30.1
Tax paid -28.3 -32.1 -28.6 -36.0 -37.7
Working capital 0.0 0.0 19.9 -6.4 -6.6
Other -7.2 -11.1 -26.3 0.0 0.0
Operating cashflow 86.9 92.7 105.9 108.9 115.3
Capex -42.1 -67.0 -59.7 -36.0 -32.0
Capex - expansionary 0.0 0.0 0.0 0.0 0.0
Capex - maintenance -42.1 -67.0 -59.7 -36.0 -32.0
Acquisitions & Invest -60.3 -45.7 -10.6 0.0 0.0
Asset sale proceeds -2.3 64.7 0.3 0.0 0.0
Other 0.0 -4.6 0.2 0.0 0.0
Investing cashflow -104.7 -52.5 -69.8 -36.0 -32.0
Dividends paid -46.5 -52.1 -56.2 -56.7 -59.4
Equity raised 0.5 0.0 0.0 0.0 0.0
Net borrowings 15.2 28.0 29.6 0.0 0.0
Other 0.0 0.0 0.0 0.0 0.0 1 Month 3 Month 12 Month
Financing cashflow -30.8 -24.1 -26.5 -56.7 -59.4 Absolute -2.7% -7.6%
Total cashflow -48.6 16.1 9.5 16.2 23.9 Relative -1.4% -0.3% -10.3%
Adjustments 0.0 0.0 0.0 0.0 0.0
Net change in cash -48.6 16.1 9.5 16.2 23.9 Source: Reuters 52 week trading range: 3.13-4.33
MSCI IVA Risk Comment: We believe the MSCI rating for AHE is not
appropriate since it highlights labour-related work stoppages and customer
dissatisfaction as key ESG risks. AHE has a strong focus on training and
motivating staff sales through training and development programs for
Dealer Principals and salesmen. Furthermore AHE have demonstrated a
dedication to building customer relationships. This was highlighted through
their development program dedicated to Customer Service and Retention
which provides significant training to customer-facing staff.
14/02/2014 19:28
Automotive Holdings Group Limited (AHE) is a diversified automotive retailing and logistics
group with operations in every Australian and New Zealand. AHE has three segments:
automotive retail, other logistics and property.
CSEC View
TP Risk Comment: For AHE, outside of the retail ESG risk factors we do
not include any ESG impact in our base valuation. We highlight AHE's
dedication to training and motivating its sales staff through established
leadership and training programs as a positive ESG factor. We highlight a
potential corporate governance issue with two long standing board
members sitting on the board for over 10 years and so can no longer be
considered independent as a key ESG risk.
NEUTRAL
3.00
3.20
3.40
3.60
3.80
4.00
4.20
4.40
4/02/2013 4/04/2013 4/06/2013 4/08/2013 4/10/2013 4/12/2013 4/02/2014
AHE.AX XSI
2.3
3.3
4.3
5.3
6.3
7.3
8.3
9.3
10.3
Environment Social Governance
Stock Local Sector
Country Global Sector
Source: Company data, CSEC estimates

17 February 2014
Australia and NZ First Edition 15
Key takeaways
■ Solid 1H14 result: AHE delivered a solid 1H14 result with underlying NPAT up 2.0%
to $39.3mn, behind CSEC $42mn estimate. The Automotive Retail division grew
strongly through both organic and acquisitive initiatives, delivering revenue growth of
8% and PBT growth of 20%. Transport and Cold Storage was again impacted by the
continued investment in facilities, as well as lower freight volumes in the half with PBT
decreasing 28.9%. Other Logistics continued to be mixed (EBITDA +5.6%, PBT –1%),
with COVS impacted by lower demand from the mining sector, but KTM, AMCAP and
GTB/VSE performing well.
AHE declared an interim dividend of 8.5cps (1H13 8.0cps).
Automotive Retailing
■ Automotive Retailing – softening growth supported by acquisitions: Revenue
increased 8% to $1,916mn, EBITDA increased 11.5% to $64mn and EBITDA, EBIT
and PBT margins all increased. Continued scale benefits, as well as increased
efficiency and the annualisation of acquisitions increased the operating EBITDA
margin to 3.3% (from 3.2% in 1H13, FY13 3.4%).
■ Reversion risk of industry growth drivers: After a long period of near ‘perfect storm’
conditions, we believe the industry will find it increasingly challenging to replicate
historical growth levels. Put simply, we believe that while industry demand drivers
remain supportive at the moment, there is increased risk around their reversion
(increased unemployment, falling vehicle affordability, lower consumer confidence)
and that growth in vehicle sales is likely to moderate towards the longer-term trend of
~3% (over the past ten years).
Figure 2: Automotive Retailing
A$mn, unless stated FY09 FY10 FY11 FY12 1H13 2H13 FY13 1H14 2H14F FY14F FY15F
Revenue 2691.2 2857.7 2923.8 3207.5 1774.7 1766.7 3541.4 1916.1 1887.8 3803.9 3916.1
…growth (%) -11.1% 6.2% 2.3% 9.7% 15.4% 5.8% 10.4% 8.0% 6.9% 7.4% 2.9%
EBITDA (operating) 54.9 88.8 93.3 106.3 57.4 61.4 118.8 64.0 64.8 128.8 132.7
…growth (%) -43% 62% 5% 14% 15% 9% 12% 12% 6% 8% 3%
…margin (%) 2.0% 3.1% 3.2% 3.3% 3.2% 3.5% 3.4% 3.3% 3.4% 3.4% 3.4%
EBIT (operating) 44.7 78.3 81.8 92.9 50.4 54.2 104.6 56.4 57.3 113.6 116.8
…growth (%) -48% 75% 4% 14% 16% 9% 13% 12% 6% 9% 3%
…margin (%) 1.7% 2.7% 2.8% 2.9% 2.8% 3.1% 3.0% 2.9% 3.0% 3.0% 3.0%
PBT (operating) 23.6 62.9 62.0 71.6 38.7 43.7 82.3 46.4 47.3 93.8 95.4
…growth (%) -64% 166% -1% 15% 16% 14% 15% 20% 8% 14% 2%
…margin (%) 0.9% 2.2% 2.1% 2.2% 2.2% 2.5% 2.3% 2.4% 2.5% 2.5% 2.4%
Non-operating adjustments 18.6 0.0 -7.4 -10.4 -1.9 -0.4 -2.3 -1.2 0.0 -1.2 0.0
PBT (reported) 42.2 62.9 54.6 61.2 36.8 43.3 80.1 45.2 47.3 92.6 95.4
…growth (%) -28.2% 48.9% -13.2% 12.1% 11.7% 53.3% 30.9% 22.9% 9.4% 15.6% 3.0%
…margin (%) 1.6% 2.2% 1.9% 1.9% 2.1% 2.4% 2.3% 2.4% 2.5% 2.4% 2.4%
Source: Company data, CSEC estimates
■ Excess inventory seems to be impacting the top line growth in Automotive
Retailing, but finance and insurance (F&I) and manufacturer incentives appear
to be supporting margins: Backing out our estimated revenue from recent
acquisitions in the Automotive Retailing division we believe that the growth in the
underlying dealerships was at low single digit levels in 1H14. We believe this
compares to mid-single digit underlying growth that AHE has delivered over recent
history. We attribute this decline in headline revenue to the increased discounting of
new vehicles following the FBT disruption that led to increased inventory levels across
the industry. We believe this is likely to remain a headwind in 2H14. Positively and
ahead of our expectations, AHE continues to be able to utilise its scale, drive

17 February 2014
Australia and NZ First Edition 16
efficiency, increase the penetration of the high margin F&I and we believe
negotiate/receive beneficial incentives from the car manufacturers as they use AHE's
scale to clear excess inventory.
AHE remains well positioned to continue to benefit from acquisitions and supportive
industry drivers (low interest rates, low unemployment and record vehicle affordability).
However, in addition to the risk around the reversion of the positive demand drivers
experienced over the past two years we believe excess inventory volumes within the
industry are creating headlines for top line growth (ex acquisitions). Backing out the
annualisation of recent acquisitions from the 1H14 result we believe the top line
generated low single-digit growth. Positively, this weakness does not seem to be
flowing through to earnings as we believe AHE continues to drive F&I, efficiency
improvements and achieve preferential manufacturer incentives.
■ Reversion risk of the positive industry growth drivers: After a long period of highly
supportive conditions, we believe the industry will find it increasingly challenging to
replicate historical growth levels. We believe that while the industry demand drivers
are currently supportive, there is increased risk around their reversion (increased
unemployment, falling vehicle affordability, lower consumer confidence) and that
growth in vehicle sales is likely to moderate towards the longer-term trend of ~3%.
Transport and Cold Storage
■ Transport and Cold Storage – continued investment and weak volumes: Revenue
was weak (-0.7% to $210mn) from a combination of: (1) softer volumes across the
industry (lower peak demand and lower frozen and freshfood volumes); and (2) the
seasonal impact from the 2013 floods in NSW and Queensland that have reduced
supply in 1H14. EBITDA fell 23.4% to $15.4mn, but included $2mn of "one-off" costs
from the investment in new facilities in WA and SA. The EBITDA margin declined to
7.3% on a reported basis and 8.3% on an underlying basis, from 9.5% in 1H13.
The Transport and Cold Storage result was materially below our expectations at both
the revenue (CSECf $218.8mn) and EBITDA level ($20.8mn), with an underlying
EBITDA margin of 8.3% below our forecast for it to be broadly flat on 1H13.
Management expects 2H14 performance in Rand to improve on the pcp (2H13
$11.8mn). We have tempered our margin expectations for the division in the near
term, but we continue to believe that as AHE internalises the Toll pallets and utilisation
within the pallet storage business returns towards normalised levels that margins will
trend towards at least the historically generated levels (+9% EBITDA).
Figure 3: Transport and cold storage
A$mn, unless stated FY09 FY10 FY11 FY12 1H13 2H13 FY13 1H14 2H14F FY14F FY15F
Revenue 155.3 167.1 201.6 325.2 211.5 178.6 390.0 210.0 181.0 391.0 404.6
…growth (%) 7.6% 20.6% 61.3% 25.4% 14.1% 19.9% -0.7% 1.4% 0.3% 3.5%
EBITDA (operating) 13.3 15.0 19.8 29.8 20.1 11.8 31.9 15.4 12.1 27.5 32.1
…growth (%) 13% 32% 51% 5% 11% 7% -23% 3% -14% 17%
…margin (%) 8.6% 9.0% 9.8% 9.2% 9.5% 6.6% 8.2% 7.3% 6.7% 7.0% 7.9%
EBIT (operating) 10.1 10.4 13.8 19.1 14.2 6.0 20.2 10.5 7.4 17.9 22.0
…growth (%) 3% 33% 39% 6% 4% 6% -26% 23% -11% 23%
…margin (%) 6.5% 6.2% 6.8% 5.9% 6.7% 3.3% 5.2% 5.0% 4.1% 4.6% 5.4%
PBT (operating) 8.6 8.4 11.4 14.6 12.2 4.0 16.1 8.7 5.5 14.2 18.0
…growth (%) -2% 36% 28% 11% 9% 11% -29% 39% -12% 27%
…margin (%) 5.5% 5.0% 5.7% 4.5% 5.8% 2.2% 4.1% 4.1% 3.0% 3.6% 4.5%
Non-operating adjustments 0.0 0.0 0.0 -1.8 -1.1 -1.1 -2.3 -0.1 0.0 -0.1 0.0
PBT (reported) 8.6 8.4 11.4 12.8 11.0 2.8 13.9 8.6 5.5 14.1 18.0
…growth (%) -2.0% 36.2% 12.0% 14.5% -9.7% 8.6% -22.6% 94.2% 1.3% 28.2%
…margin (%) 5.5% 5.0% 5.7% 3.9% 5.2% 1.6% 3.6% 4.1% 3.0% 3.6% 4.5%
Source: Company data, CSEC estimates

17 February 2014
Australia and NZ First Edition 17
Other Logistics
■ Other Logistics – still mixed: Continuing business (excluding Zupps from pcp)
revenue increased 3.6% to $189.9, EBITDA was up solidly (+5.6%) to $9.8mn, with
the EBITDA margin expanding to 5.2% (from 5.1%). Due to higher D&A ($1.5mn vs
$1.1mn) and lower interest income ($0.3mn vs $0.5mn), PBT decreased 1% to
$8.6mn. The result was mixed with the mining downturn impacting COVS, but KTM
delivered record unit sales that more than offset the weaker AUD, and AMCAP and
GTB/VSE both performed well.
Figure 4: Other logistics
Other Logistics FY09 FY10 FY11 FY12 1H13 2H13 FY13 1H14 2H14F FY14F FY15F
Revenue 226.6 215.1 210.4 386.9 183.2 162.4 345.6 189.9 166.5 356.4 366.5
…growth (%) -41.2% -5.1% -2.2% 83.9% -10.1% -11.3% -10.7% 3.6% 2.5% 3.1% 2.8%
EBITDA (operating) 14.3 12.2 9.2 16.5 9.3 7.2 16.6 9.8 8.2 18.1 18.6
…growth (%) -46% -15% -25% 79% 17% -15% 1% 6% 14% 9% 3%
…margin (%) 6.3% 5.7% 4.4% 4.3% 5.1% 4.4% 4.8% 5.2% 4.9% 5.1% 5.1%
EBIT (operating) 12.8 10.4 7.5 14.3 8.2 5.8 14.1 8.3 6.7 15.1 15.5
…growth (%) -43% -18% -28% 90% 18% -20% -2% 1% 15% 7% 3%
…margin (%) 5.6% 4.8% 3.6% 3.7% 4.5% 3.6% 4.1% 4.4% 4.0% 4.2% 4.2%
PBT (operating) 10.7 8.2 6.5 14.9 8.7 6.3 15.0 8.6 7.0 15.6 16.1
…growth (%) -13% -23% -21% 130% 22% -19% 1% -1% 12% 4% 3%
…margin (%) 4.7% 3.8% 3.1% 3.8% 4.8% 3.9% 4.3% 4.5% 4.2% 4.4% 4.4%
Non-operating adjustments 0.0 0.0 -14.4 -3.0 -2.7 -5.1 -7.7 -0.1 0.0 -0.1 0.0
PBT (reported) 10.7 8.2 -7.9 11.9 6.0 1.2 7.3 8.5 7.0 15.6 16.1
…growth (%) -12.8% -23.3% -196.9% -249.6% 9.6% -81.0% -39.0% 41.4% 478.5% 114.5% 3.4%
…margin (%) 4.7% 3.8% -3.8% 3.1% 3.3% 0.7% 2.1% 4.5% 4.2% 4.4% 4.4%
Source: Company data, CSEC estimates
Earnings changes, investment case and target price
■ Earnings changes: We have made minor revisions to our forecasts over the forecast
period (-3% to -4%). We continue to forecast solid growth in the Automotive Retailing
division from a combination of internal initiatives and the annualisation of acquisitions.
We believe that excess inventory is likely to continue to temper the top line (driven by
discounting) and see annualisation of acquisitions as being the primary driver of
growth. We forecast a recovery in industry volumes in Transport and Cold Storage and
assume margin uplift from the internationalisation of Toll pallet storage business and
increased utilisation. In Other Logistics we forecast continued solid growth for KTM,
AMCAP, and GTB/VSE. We have reduced our forecasts for COVS and assume it
continues to be negatively impacted by the mining downturn.
Investment case: We continue to believe that the strong growth drivers present over
the last two years (low unemployment, low interest rates, manufacturer incentives and
record levels of vehicle affordability) remain supportive. However, we believe there is
both increased uncertainty in the short term from: (1) the impact on new vehicle pricing
from the excess inventory within the system; (2) the potential for positive growth drivers
to revert; and (3) the brand disruption from the announced closure of the Australian
manufacturers. We see AHE as likely to continue to supplement its organic growth
through acquisitions, but see the reversion of growth drivers and broader industry
disruption as heightening earnings risk in the short term. NEUTRAL rating retained.
■ Target price: We derive our $3.90 target price for AHE by using a blended valuation
methodology, applying equal weights to our DCF and P/E-relative based valuations. At
our target price AHE would be trading at 12.8x 12-month forward earnings and a
~10% discount to the XSI.

17 February 2014
Australia and NZ First Edition 18
Our P/E relative valuation assumes that AHE trades at a 15% discount to the XSI on a
12-month forward basis. The key assumptions for our DCF are a WACC of 11.1%,
beta of 1.1x, risk free rate of 5.3% and terminal growth rate of 3.0%.
Figure 5: AHE P/E absolute Figure 6: AHE P/E relative to XSI
0.0x
2.0x
4.0x
6.0x
8.0x
10.0x
12.0x
14.0x
16.0x
18.0x
May-07
Nov-07
May-08
Nov-08
May-09
Nov-09
May-10
Nov-10
May-11
Nov-11
May-12
Nov-12
May-13
Nov-13
AHE.AX Mean +SD -SD
0%
20%
40%
60%
80%
100%
120%
140%
Jul-07
Jan-08
Jul-08
Jan-09
Jul-09
Jan-10
Jul-10
Jan-11
Jul-11
Jan-12
Jul-12
Jan-13
Jul-13
Jan-14
AHE EV/EBIT relative (to XSI) Mean +SD -SD
Source: IBES consensus data Source: IBES consensus data
Figure 7: AHE EV/EBITDA absolute Figure 8: AHE EV/EBITDA relative to the XSI
0.0x
2.0x
4.0x
6.0x
8.0x
10.0x
12.0x
Jul-07
Jan-08
Jul-08
Jan-09
Jul-09
Jan-10
Jul-10
Jan-11
Jul-11
Jan-12
Jul-12
Jan-13
Jul-13
Jan-14
AHE.AX Mean +SD -SD
0%
20%
40%
60%
80%
100%
120%
140%
Jul-07
Jan-08
Jul-08
Jan-09
Jul-09
Jan-10
Jul-10
Jan-11
Jul-11
Jan-12
Jul-12
Jan-13
Jul-13
Jan-14
AHE EV/EBITDA relative (to XSI) Mean +SD -SD
Source: IBES consensus data Source: IBES consensus data

Australia and NZ First Edition 19
17 February 2014
Asia Pacific/New Zealand
Equity Research
Construction & Engineering (Industrials)
■
Fletcher Building (FBU.NZ / FBU NZ) UPGRADE RATING
Earnings recovery - not if but when
■ Flagging upside risk to our forecasts: Our analysis of the historical
relationship between FBU NZ and Australia earnings relative to the activity
indicators we monitor (including currency impact on demand and product
pricing dynamics) suggest upside risks to our 2H FY14and FY15 forecasts.
The feedback we received from our recent FNZC sector conference also
framed a more positive picture than we had expected. Accordingly, we have
upgraded our FBU7 recommendation from Underperform to NEUTRAL with a
revised NZ$10.25 target price (previously NZ$9.00).
■ Balancing a positive three-year view vs. 12- month upside current
level: FBU provides a good proxy for 1) the current and ongoing recovery in
the NZ building market, 2) a pick-up in the Australian building sector, 3) a
projected recovery in the US non-residential sector in 2014 and 2015 and 4)
the potential upside in terms of cost savings from FBunite programme. We
balance this positive three-year view against the magnitude of upside in the
next 12 months relative to our DCF valuation, FBU’s peers and NZ equity
market valuation.
■ Residential building approvals in the coming months and 1H FY14 results:
Our expectation is for a more positive trading outlook commentary since its
AGM guidance four months ago. Our expectations are for EBIT of NZ$304mn
(+12% vs pcp adjusted EBIT of NZ$272mn, reported of NZ$262mn) and NPAT
of NZ$173mn (+19% vs pcp reported NPAT of NZ$146mn).
■ Target price raised to NZ$10.25 (previously NZ$9.00): This is based on
the midpoint of our valuation range between NZ$9.65 (12-forward DCF
approach) and NZ$10.80 (with reference to NZ equity market and regional
sector multiples).
Share price performance
80.0
87.5
95.0
102.5
110.0
8.00
8.50
9.00
9.50
10.00
Feb-13 Mar-13 Apr-13 May-13 Jun-13 Jul-13 Aug-13 Sep-13 Oct-13 Nov-13 Dec-13 Jan-14 Feb-14
Fletcher Building Limited LHS Relative to NZX50 (RHS)
The price relative chart measures performance against the
NZX50 index which closed at 4873.5 on 13 Feb 14 .
The spot exchange rate was NZ$1.199/US$1 on 14 Feb 14.
Performance over 1M 3M 12M
Absolute(%) 5.8 -2.6 8.7
Rel-NZX50(%) 5.7 -1.5 -6.3
Year to 30 Jun 2012A 2013A 2014F 2015F 2016F
Adjusted Earnings NZ$m 314 337 368 431 514
EPS Adjusted NZc. 46.2 49.2 53.8 62.9 75.0
EPS Grow th % -16.0 6.5 9.3 17.0 19.2
P/E x 20.5 19.3 17.6 15.1 12.6
CPS NZc. 79.9 81.3 85.6 95.0 108
P/CF x 11.9 11.7 11.1 10.0 8.8
EV/EBITDA x 10.9 10.6 9.8 8.7 7.7
Net DPS NZc. 34.0 34.0 35.0 39.0 44.0
Imputation % 50.0 50.0 50.0 50.0 50.0
Net Yield % 3.6 3.6 3.7 4.1 4.6
Gross Yield % 4.3 4.3 4.4 4.9 5.5
Financial and valuation metrics
Source: Company data, NZX, First NZ Capital estimates
Rating (from Underperform) NEUTRAL* Price (14 Feb 2014, NZ$) 9.48 Target price (NZ$) (from 9.00) 10.25¹ Market cap. (NZ$mn) 6,520.86 Projected return: 0 Capital gain (%) 8.1 Dividend yield (net %) 4.0 Total return (%) 12.1 52-week price range (NZ$) 8.03-9.99
* Stock ratings are relative to the relevant country
benchmark.
¹Target price is for 12 months.
Research Analysts
Kar Yue Yeo
+64 4 474 4462
Andrew Peros
61 2 8205 4013
This report is distributed in Australia by Credit Suisse
Equities (Australia) Limited. Please see legal disclaimer and
disclosure annex for further terms and information
Provided by First NZ Capital

17 February 2014
Australia and NZ First Edition 20
Figure 1: Fletcher Building financial summary
Sector: Capital Goods NZX Code: FBU
PROFIT & LOSS ($m) BALANCE SHEET ($m)Year to 30 Jun 2012A 2013A 2014F 2015F 2016F Year to 30 Jun 2012A 2013A 2014F 2015F 2016F
Operating Rev enue 8,871 8,521 8,634 9,137 9,922 Cash & Equiv alents 168 123 123 123 123
Operating Ex penses -8,091 -7,718 -7,779 -8,182 -8,844 Debtors & Inv entories 2,894 2,699 2,694 2,851 3,095
Operating EBITDA 781 803 855 955 1,078 Other Current Assets 28.0 30.0 30.0 30.0 30.0
Depreciation -229 -220 -218 -220 -224 Current Assets 3,090 2,852 2,847 3,004 3,248
Amortisation 0.0 0.0 0.0 0.0 0.0 Fix ed Assets 2,348 2,261 2,323 2,378 2,406
Operating EBIT 552 583 637 735 853 Inv estments 224 251 251 251 251
Other Income 0.0 0.0 0.0 0.0 0.0 Intangibles 1,762 1,729 1,729 1,729 1,729
Abnormals -149 -10.0 0.0 0.0 0.0 Other Non-Current Ass. 0.0 0.0 0.0 0.0 0.0
Reported EBIT 403 573 637 735 853 Total Assets 7,424 7,093 7,150 7,361 7,635
Net Interest -152 -147 -138 -133 -129
Pretax Profit 251 426 499 602 725 Interest Bearing Debt 2,207 2,019 1,919 1,874 1,795
Tax -57.4 -85.3 -116 -155 -189 Other Liabilities 1,614 1,520 1,533 1,609 1,727
Minority Interests -8.0 -11.0 -14.9 -16.6 -22.0 Total Liabilities 3,821 3,539 3,452 3,483 3,522
Equity Accounted Profit 0.0 0.0 0.0 0.0 0.0 Minorities 32.0 35.0 49.9 66.5 88.5
Reported NPAT 185 330 368 431 514 Conv ertible Capital 0.0 0.0 0.0 0.0 0.0
Abnormals (net of tax ) -128 -7.3 0.0 0.0 0.0 Ordinary Equity 3,571 3,519 3,648 3,812 4,024
Adjusted Earnings 314 337 368 431 514 Total Funds Emp. 7,424 7,093 7,150 7,361 7,635
RATIOS AND CAPITAL STRUCTURE CASH FLOW ($m)Year to 30 Jun 2012A 2013A 2014F 2015F 2016F Year to 30 Jun 2012A 2013A 2014F 2015F 2016F
Profitability & Growth
EBITDA/Op Rev % 8.8 9.4 9.9 10.5 10.9 Operating EBITDA 781 803 855 955 1,078
EBIT/Op Rev % 6.2 6.8 7.4 8.0 8.6 Other Cash Income 0.0 0.0 0.0 0.0 0.0
Effectiv e Tax Rate % 22.9 20.0 23.2 25.7 26.1 Interest Paid -152 -149 -138 -133 -129
Return On Equity % 8.7 9.5 10.3 11.6 13.1 Tax Paid -79.0 -60.0 -116 -155 -189
ROCE % 9.8 10.5 11.6 13.2 15.0 Working Capital / Other -102 -27.2 18.5 -81.3 -127
EPS Adjusted c. 46.2 49.2 53.8 62.9 75.0 Operating Cash Flow 448 567 619 586 634
EPS Grow th % -16.0 6.5 9.3 17.0 19.2
Net DPS c. 34.0 34.0 35.0 39.0 44.0 Total Capex -344 -233 -280 -274 -253
Div idend Cov er x 1.4 1.4 1.5 1.6 1.7 Acquisitions -48.0 -13.0 0.0 0.0 0.0
Asset Backing & Capital Structure Div estments 0.0 91.0 0.0 0.0 0.0
Net Cash (Debt) $m -2,039 -1,896 -1,796 -1,751 -1,672 Div idends -201 -208 -240 -267 -301
NTA / Share $ 2.7 2.6 2.8 3.0 3.4 Equity Raised 0.0 0.0 0.0 0.0 0.0
Equity / Tot Assets % 48.5 50.1 51.7 52.7 53.9 Other 0.0 0.0 0.0 0.0 0.0
Net Debt / EBITDA x 2.6 2.4 2.1 1.8 1.6 Change in Net Debt -145 204 99.9 44.9 79.1
Interest Cov er x 3.6 4.0 4.6 5.5 6.6
Shares on Issue Capex /Depn % 150 106 129 125 113
Ordinary m 679 685 685 685 685 Capex /Rev % 3.9 2.7 3.2 3.0 2.6
Fully Diluted m 679 685 685 685 685
KEY DRIVERS DIVISIONAL EBIT ($m)Year to 30 Jun 2012A 2013A 2014F 2015F 2016F Year to 30 Jun 2012A 2013A 2014F 2015F 2016F
NZD:AUD 0.78 0.80 0.87 0.88 0.87 Construction 49.8 90.9 103 131 131
NZD:USD 0.81 0.82 0.78 0.76 0.75 Infrastructure 209 222 243 273 316
Res Consents (NZ) 15000 18800 20000 21000 23000 Building Products 105 126 136 149 169
Infrastructure ($m, real) 3530.11 3759.57 3928.75 4105.54 4208.18 Distribution 65.0 49.7 63.1 78.5 107
Non-res WPP ($m, real) 2947.69 3050.86 3203.4 3539.76 3805.24 Laminates & Panels 139 126 132 145 171
Resid. Comms. (000s, AUS)157.3 170.6 165 167.78 167.48
Source: Company data, NZX, First NZ Capital estimates

17 February 2014
Australia and NZ First Edition 21
Summary ■ Overall FNZC sector conference feedback frames a more positive picture of the
sector than we had expected – NZ housing work volume continues its recovery with
some signs of activity spreading beyond Auckland and Christchurch. NZ non-
residential market volume recovery is also underway. The NZ infrastructure market has
bottomed and on-site work volume should begin to turn up in late 2014 or early 2015.
There are expectations that the total rebuild cost in Canterbury will exceed Treasury’s
last estimate of NZ$40bn. Those operators with Australian exposure suggested a
strong recovery in NSW housing work volume and infrastructure work (ex-mining) is
projected to bottom in 2014 and should begin its recovery in 2015.
■ Lead activity indicators in NZ – Both new houses and apartments building consents
issued have continued to lift driven by Christchurch, Auckland and to a less degree the
other regions in NZ. Recovery in NZ net migration has been a factor and will likely to
continue to support higher housing formation rate. NZ stratified median house price
peaked at 10% YoY in October 2013 and has moderated to c7.7% YoY in January
2014. We note the increase in NZ new residential building consents issued YoY growth
rate has lifted from 23% in 1H 2013 to 27% in 2H 2013. The consent data in 2013
suggests NZ non-residential sector is recovering albeit less consistent than in housing.
■ Lead activity indicators in Australia – The recovery in approvals for apartments has
been the major driver of Australian total building approval levels rising by 23% YoY in
2H 2013 from 8% YoY in 1H 2013. That said, detached house building approvals have
also recorded significant improvement rising by 13% YoY in 2H 2013 from 7% YoY in
1H 2013. This recent acceleration in value of residential work approved promises
considerable pent-up growth in the next 12 months. Similarly, the recent value of non-
residential work approved also points to growth in the next 12 months.
■ Earnings revision risks: The current activity indicators we monitor (including currency
impact on demand and product pricing dynamics) point to upside risks to our 2H
FY14F forecast and likely FY15F. These analyses are outlined in Figure 4, Figure 7,
Figure 8, Figure 9). We await FBU’s pending result on 20 February to finalise changes
in our FBU’s earnings.
■ What to do with the stock? Based on our recent findings, we are upgrading FBU from
Underperform to NEUTRAL to signal a further business recovery in the sector and as
positive earnings revision risks to our FBU forecasts. We have also revised our target
price from NZ$9.00 to NZ$10.25. This is based on our valuation range of between
NZ$9.65 (12-forward DCF approach) and NZ$10.80 (using NZ FY16F core market P/E
and regional sector multiples, specifically Boral’s current FY16F P/E, for relativity).

17 February 2014
Australia and NZ First Edition 22
Key points from FNZC sector conference
Overall feedback painted a constructive view of the NZ sector – Positive outlook
expressed by presenters on the NZ sector – good volume recovery in residential, stable to
recovering volume of work in non-residential and prospects for a recovery in infrastructure.
Treasury’s Christchurch re-build cost estimate of NZ$40bn may be light – Feedback
from the presenters at our forum suggest this will likely be exceeded, though none of our
presenters ventured to offer an estimate. It would not surprise us the next estimate
reaches NZ$45bn-NZ$50bn. From the feedback we received, we concluded that 2014, by
and large, will be a planning and consenting phase for city centre redevelopment with one
or possibly two major anchor projects to commence in mid-to-late 2014.
Divergence in competition and price across difference regions observed – 1) The
average per tonne NZD steel price has declined from a peak of NZ$2,300 in late 2012 to
currently NZ$1,800 due in part to higher NZDUSD. This has also caused some
inconsistent price behaviour among the distributors. Overall dollar margin per tonne has
lifted in the industry. 2) Product price divergence is occurring due to regional differences in
demand dynamics for certain building products and construction material. 3) A lid remains
on construction margin due to keen competition in the sector with new overseas entrants.
NZ residential – This segment is likely to remain strong across Christchurch, as well as
Auckland with shortening of development and environmental consenting process for those
that qualifies under Special Housing Accord. Auckland City Council aims to lift its seven-
year residential pipeline of visible/likely projects from currently 20,000 dwellings to
100,000. This is equivalent to 14,000 new dwellings pa vs currently 5,000 consents new
dwellings consented in Auckland.
NZ non-residential – This segment is beginning to experience a significant volume lift in
recent weeks (e.g. steel) in Auckland and certain regional markets. There has also been a
strong lift in request-for-pricing activity among NZ steel fabricators. This suggests potential
lift in the pipeline of work.
NZ Infrastructure – Workflow is projected to climb in NZ across Auckland and
Christchurch as well as in irrigation schemes and roads of national significance. As an
example, the infrastructure spend in Auckland is currently at NZ$1.8bn pa and is projected
to peak at NZ$2.5bn in 2018. Auckland Infrastructure spend is forecast to deliver NZ$16bn
capex over the next seven years (an average of NZ$2.3bn pa).
Figure 2: FBU FY13a EBIT composition by geography Figure 3: In NZ, residential sector provides the best proxy
for FBU’s NZ-sourced earnings
NZ, 50%
Australia, 36%
US, 7%
Asia, 7%Europe, -1%
Others, 1%
NZ- Res, 25%
NZ-Non-Res, 13%
NZ-Other, 13%
Australia, 36%
US, 7%
Asia, 7%EU, -1%Others, 1%
Source: Company data, FNZC estimates
Source: Company data, FNZC estimates

17 February 2014
Australia and NZ First Edition 23
Figure 4: Ongoing recovery in NZ housing points to
upside risks in our forecasts for FBU NZ operation
Figure 5: Contribution from FBU’s EQR contract
0
2000
4000
6000
8000
10000
12000
14000
16000
18000
0
50
100
150
200
250
300
1H
05a
2H
05a
1H
06a
2H
06a
1H
07a
2H
07a
1H
08a
2H
08a
1H
09a
2H
09a
1H
10a
2H
10a
1H
11a
2H
11a
1H
12a
2H
12a
1H
13a
2H
13a
1H
14F
2H
14F
NZ
six
mo
nth
ly n
ew
re
sid
en
tia
l bu
ildin
g
co
nse
nts
issu
ed
FB
U h
alf-y
ea
r N
Z E
BIT
(N
Z$
mn
)
NZ EBIT (ex-EQR) NZ New Res consents advanced by six months
Excludes gain on sale of quarry
0
2
4
6
8
10
12
14
16
18
1H
05a
2H
05a
1H
06a
2H
06a
1H
07a
2H
07a
1H
08a
2H
08a
1H
09a
2H
09a
1H
10a
2H
10a
1H
11a
2H
11a
1H
12a
2H
12a
1H
13a
2H
13a
1H
14F
2H
14F
1H
15F
2H
15F
EB
IT c
on
trib
utio
n fro
m E
QR
co
nstr
act
(NZ
$m
n)
Source: Company data, Stats NZ, FNZC estimates
Source: Company data, FNZC estimates
Figure 6: In Australia, residential sector remains the most
important contributor to earnings
Figure 7: The sharp turn in Australia 2H 2013 total
building approvals suggest upside risk for FBU 2H FY14F
earnings
NZ, 50%
Aust-Res, 20%
Aust-Non-Res, 11%
Aust-Others, 5%
US, 7%
Asia, 7%Europe, -1%Others, 1%
0
20000
40000
60000
80000
100000
120000
0
20
40
60
80
100
120
140
1H
06a
2H
06a
1H
07a
2H
07a
1H
08a
2H
08a
1H
09a
2H
09a
1H
10a
2H
10a
1H
11a
2H
11a
1H
12a
2H
12a
1H
13a
2H
13a
1H
14F
2H
14F A
ustr
alia
six
mo
nth
ly b
uild
ing
ap
pro
va
ls
FB
U h
alf-y
ea
r A
ustr
alia
EB
IT (
A$
mn
)
Australia EBIT (ex-insulation subsidy, A$mn)
Aust building approvals (advanced by six months)
Acquisitions & Rocla's rail contract (non-building)
Source: Company data, FNZC estimates
Source: ABS, company data, FNZC estimates
Figure 8: Even excluding apartments, the upturn in
Australia 2H 2013 detached houses building approvals
also points to upside risk in FBU 2H FY14F earnings
Figure 9: AUDUSD weakness should provide tailwind for
domestic demand and pricing power in FY15F
0
10000
20000
30000
40000
50000
60000
70000
0
20
40
60
80
100
120
140
1H
06a
2H
06a
1H
07a
2H
07a
1H
08a
2H
08a
1H
09a
2H
09a
1H
10a
2H
10a
1H
11a
2H
11a
1H
12a
2H
12a
1H
13a
2H
13a
1H
14F
2H
14F A
ustr
alia
six
mo
nth
ly b
uild
ing
ap
pro
va
ls
FB
U h
alf-y
ea
r A
ustr
alia
EB
IT (
A$
mn
)
Australia EBIT (ex-insulation subsidy, A$mn)
Aust building approvals (houses, advanced six months)
Acquisitions & Rocla's rail contract (non-building)
Source: ABS, company data, FNZC estimates
Source: Bloomberg, company data, FNZC estimates

17 February 2014
Australia and NZ First Edition 24
Figure 10: Trajectory for FBU North America earnings Figure 11: Trajectory for FBU Asia earnings
80
90
100
110
120
130
140
150
160
170
180
-5
0
5
10
15
20
251
H0
6a
2H
06a
1H
07a
2H
07a
1H
08a
2H
08a
1H
09a
2H
09a
1H
10a
2H
10a
1H
11a
2H
11a
1H
12a
2H
12a
1H
13a
2H
13a
1H
14F
2H
14F
FB
U h
alf y
ea
r N
ort
h A
m r
eve
nu
e (
US
$m
n)
FB
U h
alf-y
ea
r N
ort
h A
m E
BIT
(U
S$
mn
)
North America EBIT (US$mn) US revenue (US$mn)
0
20
40
60
80
100
120
0
2
4
6
8
10
12
14
16
18
20
1H
06a
2H
06a
1H
07a
2H
07a
1H
08a
2H
08a
1H
09a
2H
09a
1H
10a
2H
10a
1H
11a
2H
11a
1H
12a
2H
12a
1H
13a
2H
13a
1H
14F
2H
14F
FB
U h
alf y
ea
r A
sia
re
ve
nu
e (
US
$m
n)
FB
U h
alf-y
ea
r A
sia
EB
IT (
US
$m
n)
Asia EBIT (US$mn) Asia revenue (US$mn)
Source: Company data, FNZC estimates
Source: Company data, FNZC estimates
Figure 12: Trajectory for FBU other earnings
80
90
100
110
120
130
140
150
160
-8
-6
-4
-2
0
2
4
6
8
10
12
1H
06a
2H
06a
1H
07a
2H
07a
1H
08a
2H
08a
1H
09a
2H
09a
1H
10a
2H
10a
1H
11a
2H
11a
1H
12a
2H
12a
1H
13a
2H
13a
1H
14F
2H
14F
FB
U h
alf y
ea
r E
U r
eve
nu
e (
US
$m
n)
FB
U h
alf-y
ea
r E
U E
BIT
(U
S$
mn
)
EU EBIT (US$mn) EU revenue (US$mn)
Source: Company data, FNZC estimates

17 February 2014
Australia and NZ First Edition 25
NZ activity indicators
Figure 13: NZ home sales vs monthly total new residential
consents issued
Figure 14: NZ home sales vs monthly new residential (ex-
aptmts) consents issued
700
1,000
1,300
1,600
1,900
2,200
2,500
2,800
3,100
3,400
3,000
4,000
5,000
6,000
7,000
8,000
9,000
10,000
11,000
12,000
Jan
-95
Jan
-96
Jan
-97
Jan
-98
Jan
-99
Jan
-00
Jan
-01
Jan
-02
Jan
-03
Jan
-04
Jan
-05
Jan
-06
Jan
-07
Jan
-08
Jan
-09
Jan
-10
Jan
-11
Jan
-12
Jan
-13
Jan
-14
Mo
nth
ly c
on
se
nts
issu
ed
in
cl-
ap
mt
Mo
nth
ly h
ou
se
sa
les
Monthly House Sales Volume s.a. (LHS)
Monthly Consents Issued incl apmts. s.a. (RHS)
House sales is advanced 4 months in this chart
New residential approvals
continue its recovery in NZ
700
1,000
1,300
1,600
1,900
2,200
2,500
3,000
4,000
5,000
6,000
7,000
8,000
9,000
10,000
11,000
12,000
Jan
-95
Jan
-96
Jan
-97
Jan
-98
Jan
-99
Jan
-00
Jan
-01
Jan
-02
Jan
-03
Jan
-04
Jan
-05
Jan
-06
Jan
-07
Jan
-08
Jan
-09
Jan
-10
Jan
-11
Jan
-12
Jan
-13
Jan
-14
Mo
nth
ly c
on
se
nts
issu
ed
ex-a
pm
t
Mo
nth
ly h
ou
se
sa
les
Monthly House Sales Volume s.a. (LHS)
Monthly Consents Issued ex aptmt. s.a. (RHS)
House sales is advanced 4 months in this chart
New residential approvals continue its recovery in NZ
Source: Stats NZ, REINZ, FNZC estimates
Source: Stats NZ, REINZ, FNZC estimates
Figure 15: Auckland home sales volume appears to have
reached an intermediate peak
Figure 16: Canterbury new residential building consents
issued (ex-apmts) remain at elevated levels
0
100
200
300
400
500
600
700
800
900
0
500
1,000
1,500
2,000
2,500
3,000
3,500
4,000
4,500
Jan
-95
Jan
-96
Jan
-97
Jan
-98
Jan
-99
Jan
-00
Jan
-01
Jan
-02
Jan
-03
Jan
-04
Jan
-05
Jan
-06
Jan
-07
Jan
-08
Jan
-09
Jan-1
0
Jan
-11
Jan
-12
Jan
-13
Jan
-14
Mo
nth
ly c
on
se
nts
issu
ed
ex-a
pm
t
Mo
nth
ly h
ou
se
sa
les (
Au
ckla
nd
)
Auckland house sales s.a.
Consents Issued ex aptmt. Auckland s.a.
House sales is advanced by 4 months in this chart
0
100
200
300
400
500
0
200
400
600
800
1,000
1,200
1,400
1,600
1,800
2,000
Jan
-95
Jan
-96
Jan
-97
Jan
-98
Jan
-99
Jan
-00
Jan
-01
Jan
-02
Jan
-03
Jan
-04
Jan
-05
Jan
-06
Jan
-07
Jan
-08
Jan
-09
Jan
-10
Jan
-11
Jan
-12
Jan
-13
Jan
-14
Mo
nth
ly c
on
se
nts
issu
ed
ex-a
pm
t
Mo
nth
ly h
ou
se
sa
les
(Can
terb
ury
/Westla
nd)
House Sales Volume (Canterbury) s.a.
Consents Issued ex aptmt. Canterbury s.a.
House sales is advanced by 4 months in this chart
Source: Stats NZ, REINZ, FNZC estimates
Source: Stats NZ, REINZ, FNZC estimates
Figure 17: In other NZ regions, the recovery in new
residential building consents remains modest
Figure 18: The strength of in-house price growth reflects
ongoing strong Auckland housing demand
0
300
600
900
1,200
1,500
1,800
0
1,000
2,000
3,000
4,000
5,000
6,000
7,000
Jan
-95
Jan
-96
Jan
-97
Jan
-98
Jan
-99
Jan
-00
Jan
-01
Jan
-02
Jan
-03
Jan
-04
Jan
-05
Jan
-06
Jan
-07
Jan
-08
Jan
-09
Jan
-10
Jan
-11
Jan
-12
Jan
-13
Jan
-14
Mo
nth
ly c
on
se
nts
issu
ed
ex-a
pm
t
Mo
nth
ly h
ou
se
sa
les (
ex-A
uckla
nd
-C
an
terb
ury
/Westla
nd)
House Sales Volume (ex- Auckland & Canterbury) s.a.
Consents Issued ex aptmt. Ex Auckland & Canterbury s.a.
House sales is advanced by 4 months in this chart
-10.0%
-5.0%
0.0%
5.0%
10.0%
15.0%
20.0%
25.0%
Jan
-11
Ap
r-11
Jul-
11
Oct-
11
Jan
-12
Ap
r-12
Jul-
12
Oct-
12
Jan
-13
Ap
r-13
Jul-
13
Oct-
13
Jan
-14
Ap
r-14
Jul-
14
Oct-
14Y
oY
Sta
rte
fie
d m
ed
ian
ho
use
pri
ce
ch
na
ge
(%
)
Auckland Christchurch Wellington
Other North Island Other South Island
Auckland
Other regions
Christchurch
Source: Stats NZ, REINZ, FNZC estimates
Source: REINZ

17 February 2014
Australia and NZ First Edition 26
Figure 19: Housing loan approvals suggest RBNZ’s
lending limits have had some impact on demand
Figure 20: The value of NZ non-residential building
consents has slowed to +2.8% YoY in 2H 2013 vs +9.3%
YoY in 1H 2013
0
1,000
2,000
3,000
4,000
5,000
6,000
7,000
8,000
9,000
1 5 9 13 17 21 25 29 33 37 41 45 49 53
Nu
mb
er
of
mo
rta
ge a
pp
rova
ls
Calendar week-ending
2012 2013 2014
0
100
200
300
400
500
600
Ap
r-9
0
Ap
r-9
1
Ap
r-9
2
Ap
r-9
3
Ap
r-9
4
Ap
r-9
5
Apr-
96
Ap
r-9
7
Ap
r-9
8
Ap
r-9
9
Ap
r-0
0
Ap
r-0
1
Ap
r-0
2
Apr-
03
Ap
r-0
4
Ap
r-0
5
Ap
r-0
6
Ap
r-0
7
Ap
r-0
8
Ap
r-0
9
Apr-
10
Ap
r-1
1
Ap
r-1
2
Ap
r-1
3
Ap
r-1
4To
tal n
on-r
esid
en
tia
l b
uild
ing a
pp
rova
l (N
Z$
mn
)
Total monthly non-residential buildings
Total monthly non-residential building approval (3 monthly average)
Source: RBNZ
Source: Stats NZ
Figure 21: 2013 data suggest NZ non-residential sector is
recovering albeit less consistent than in housing
0
50
100
150
200
250
300
350
400
450
500
Jan Feb Mar Apr May Jun Jul Aug Sep Oct Nov Dec
Mo
nth
;y N
on
-re
sid
en
tial b
uild
ing
co
nse
nts
(N
Z$
mn
)
2011 2012 2013
Source: Stats NZ
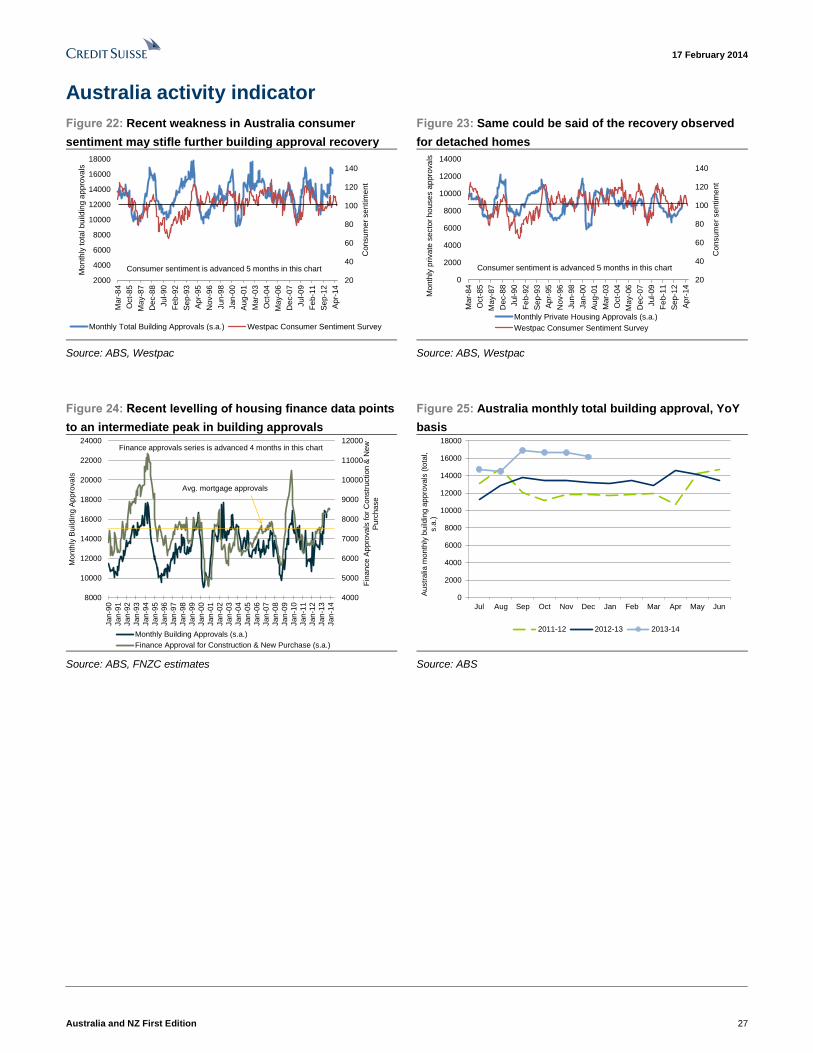
17 February 2014
Australia and NZ First Edition 27
Australia activity indicator
Figure 22: Recent weakness in Australia consumer
sentiment may stifle further building approval recovery
Figure 23: Same could be said of the recovery observed
for detached homes
20
40
60
80
100
120
140
2000
4000
6000
8000
10000
12000
14000
16000
18000
Ma
r-8
4
Oct-
85
Ma
y-8
7
Dec-8
8
Jul-
90
Fe
b-9
2
Se
p-9
3
Ap
r-95
Nov-9
6
Jun
-98
Jan
-00
Au
g-0
1
Ma
r-0
3
Oct-
04
Ma
y-0
6
Dec-0
7
Jul-
09
Fe
b-1
1
Se
p-1
2
Ap
r-14
Co
nsu
me
r se
ntim
en
t
Mo
nth
ly t
ota
l b
uild
ing
ap
pro
va
ls
Monthly Total Building Approvals (s.a.) Westpac Consumer Sentiment Survey
Consumer sentiment is advanced 5 months in this chart
20
40
60
80
100
120
140
0
2000
4000
6000
8000
10000
12000
14000
Ma
r-8
4
Oct-
85
Ma
y-8
7
De
c-8
8
Jul-
90
Fe
b-9
2
Se
p-9
3
Ap
r-95
No
v-9
6
Jun
-98
Jan
-00
Au
g-0
1
Ma
r-0
3
Oct-
04
Ma
y-0
6
De
c-0
7
Jul-
09
Fe
b-1
1
Se
p-1
2
Ap
r-14
Co
nsu
me
r se
ntim
en
t
Mo
nth
ly p
riva
te s
ecto
r h
ou
se
s a
pp
rova
ls
Monthly Private Housing Approvals (s.a.)
Westpac Consumer Sentiment Survey
Consumer sentiment is advanced 5 months in this chart
Source: ABS, Westpac
Source: ABS, Westpac
Figure 24: Recent levelling of housing finance data points
to an intermediate peak in building approvals
Figure 25: Australia monthly total building approval, YoY
basis
4000
5000
6000
7000
8000
9000
10000
11000
12000
8000
10000
12000
14000
16000
18000
20000
22000
24000
Jan
-90
Jan
-91
Jan
-92
Jan
-93
Jan
-94
Jan
-95
Jan
-96
Jan
-97
Jan
-98
Jan
-99
Jan
-00
Jan
-01
Jan
-02
Jan
-03
Jan
-04
Jan
-05
Jan
-06
Jan
-07
Jan
-08
Jan
-09
Jan
-10
Jan
-11
Jan
-12
Jan
-13
Jan
-14
Fin
an
ce
Ap
pro
va
ls fo
r C
on
str
uctio
n &
Ne
w
Pu
rch
ase
Mo
nth
ly B
uild
ing
Ap
pro
va
ls
Monthly Building Approvals (s.a.)
Finance Approval for Construction & New Purchase (s.a.)
Finance approvals series is advanced 4 months in this chart
Avg. mortgage approvals
0
2000
4000
6000
8000
10000
12000
14000
16000
18000
Jul Aug Sep Oct Nov Dec Jan Feb Mar Apr May Jun
Au
str
alia
mo
nth
ly b
uild
ing
ap
pro
va
ls (
tota
l,
s.a
.)
2011-12 2012-13 2013-14
Source: ABS, FNZC estimates
Source: ABS

17 February 2014
Australia and NZ First Edition 28
Figure 26: Australia monthly detached house building
approval – YoY basis
Figure 27: Recent value of residential work approved
promises pent-up growth in the next 12 months
0
1000
2000
3000
4000
5000
6000
7000
8000
9000
10000
Jul Aug Sep Oct Nov Dec Jan Feb Mar Apr May Jun
Austr
alia
mon
thly
bu
ildin
g a
ppro
vals
(fo
r h
ou
se
s, s.a
.)
2011-12 2012-13 2013-14
0.0
50.0
100.0
150.0
200.0
250.0
300.0
350.0
400.0
Jun
-86
Jun
-88
Jun
-90
Jun
-92
Jun-9
4
Jun
-96
Jun
-98
Jun
-00
Jun
-02
Jun
-04
Jun
-06
Jun
-08
Jun
-10
Jun-1
2
Jun
-14Q
trly
re
sid
en
tia
l bu
ildin
g v
olu
me
in
de
x
(Ju
n 1
98
6=
10
0)
Qtrly residential building approval (s.a., constant price)
Qtrly value of residential building work done (constant price, s.a.)
Source: ABS
Source: ABS, FNZC estimates
Figure 28: Australia monthly non-residential building
approval continues to recover – YoY basis
Figure 29: Recent value of non-residential work approved
points to growth in the next 12 months
0.0
1.0
2.0
3.0
4.0
5.0
6.0
Jul Aug Sep Oct Nov Dec Jan Feb Mar Apr May Jun
Va
lue
of n
on
-re
sid
en
tial b
uild
ing
a
pp
rova
ls (
s.a
., A
$b
n)
2011-12 2012-13 2013-14
0.0
50.0
100.0
150.0
200.0
250.0
300.0
350.0
Jun
-86
Jun
-88
Jun
-90
Jun
-92
Jun
-94
Jun
-96
Jun
-98
Jun
-00
Jun
-02
Jun
-04
Jun
-06
Jun
-08
Jun
-10
Jun
-12
Jun
-14
Qtr
ly n
on
-re
sid
en
tial b
uild
ing
vo
lum
e
ind
ex (
Ju
n 1
98
6=
10
0)
Qtrly non-residential building approval (s.a., constant price)
Qtrly value of non-residential building work done (constant price, s.a.)
Source: ABS, FNZC estimates
Source: ABS, FNZC estimates

17 February 2014
Australia and NZ First Edition 29
Expectations for 1H FY14F
Figure 30: Our current 1H and 2H YoY EBIT growth estimates for FBU vs lead activity
indicators suggest upside revision risks to our forecasts
1H14F 1H13A % change 2H14F 2H13A % change
Construction 630 613 3% 612 580 6%
Infrastructure Products 1030 1052 -2% 1057 1043 1%
Building Products 700 701 0% 631 649 -3%
Distribution 1100 1133 -3% 1086 1008 8%
Laminates & Panels 900 881 2% 888 857 4%
Corporate
0
0 0
Total Revenue 4360 4380 0% 4274 4137 3%
EBIT pre-abnormal
Construction 47 37 27% 56 50 13%
Infrastructure Products 119 102 17% 124 120 3%
Building Products 67 60 12% 69 66 4%
Distribution 29 26 12% 34 24 42%
Laminates & Panels 62 57 9% 70 69 1%
Corporate -20 -10 100% -20 -22 -9%
Total 304 272 12% 333 307 8%
0
Net interest 70 75 -7% 68 72 -6%
PBT 234 197 19% 265 235 13%
Tax 55 39
61 49
less minorties 6 5
9 6
NPAT pre-abnormal 173 153 13% 195 180 8%
Abnormal 0 -7
0 0
Gain on property sales 0 0
0 0
Reported NPAT 173 146 19% 195 180
EBIT margin
Construction 7.5% 6.0% 1.4% 9.2% 8.6% 0.6%
Infrastructure Products 11.6% 9.7% 1.9% 11.7% 11.5% 0.2%
Building Products 9.6% 8.6% 1.0% 10.9% 10.2% 0.7%
Distribution 2.6% 2.3% 0.3% 3.1% 2.4% 0.8%
Laminates & Panels 6.9% 6.5% 0.4% 7.9% 8.1% -0.2%
Group (ex-abnormal) 7.0% 6.2% 0.8% 7.8% 7.4% 0.4%
EBIT margin ex-Steel
Tax rate 24% 20%
23.0% 21%
Operating cash flow 288 204 41% 331 355 -7%
Free cash flow (pre-acqn) 148 110 35% 192 241 -21%
Average Issued shares (mn) 688 685
688 685
Net debt (incl pension liab) 1814.0 1995.0
-16.7 1860.0
EPS 25.2 22.3 13% 28.4 26.3 8%
DPS 17.0 17.0 0% 18.0 17.0 6%
Source: Company data, FNZC estimates
Valuation comparisons
There are virtually no genuinely comparable building material companies in the region for
FBU because of differences in products, market structure and geographic composition of
revenue and earnings. That said, Boral (BLD) probably comes closest to as a multi-
building and construction materials and geographically diversified company.
Using BLD’s current FY16F multiple as benchmark, this would value FBU at NZ$10.50ps.
If we assumed NZ core equity market P/E of 15.0x for FBU, this would imply a valuation of
NZ$10.80.
In adopting the NZ$10.25 midpoint of our NZ$9.65 (12-month DCF) to NZ$10.80ps (P/E
multiple base) valuation range, we took into account that FBU has historically traded an
average 0.85x P/E relative (to NZ core equity market multiple) and less of a discount to the
market in a cyclical upturn phase.

17 February 2014
Australia and NZ First Edition 30
Figure 31: Multiples for Australia and NZ building and construction material companies
Company Name FY14 PE FY15 PE FY16 PE
FY14 EV /
EBIT
FY15 EV /
EBIT
FY16 EV /
EBIT
EPS
CAGR 14-
16F
EBIT
CAGR 14-
16F
FY14 Div
Yield
Fletcher Building 17.4 14.9 12.5 13.1 11.3 9.8 11.7% 10.2% 3.7%
CSR 23.0 16.8 12.3 14.9 11.2 8.2 23.2% 22.0% 3.6%
Adelaide Brighton 17.4 16.9 16.3 14.8 14.6 14.7 2.2% 0.2% 4.4%
Boral 24.4 19.1 14.6 21.5 20.1 15.8 18.8% 10.9% 3.1%
James Hardie
Industries SE 27.8 21.8 18.3 20.2 15.1 12.4 15.0% 17.7% 4.4%
NZ core market 17.6 15.4 15.0 13.7 12.6 12.7 na na 4.0%
FBU @ NZ$10.00 18.7x 16.0x 13.9x
FBU @ NZ$10.50 19.6x 16.8x 14.6x
FBU @ NZ$10.80 20.2x 17.2x 15.0x
Source: Credit Suisse, FNZC estimates

Australia and NZ First Edition 31
17 February 2014
Asia Pacific/New Zealand
Equity Research
Diversified Financial Services (Financials)
Heartland New Zealand
(HNZ.NZ) INCREASE TARGET PRICE
Diversifying its book and earnings
■ Event: HNZ announced the proposed acquisition of Home Equity
Release (HER) mortgage businesses in NZ and Australia for $87mn
(settlement 1 April 2014) to be funded by a ($58.7mn) capital raise to the
vendor ($38.7mn), a $20mn placement and existing cash. Underlying NPAT
contribution in the first full 12 months is expected to be $8mn-$9mn (implies
initial acquisition P/E of 9.7x to 10.9x) but integration costs of $2mn (post
tax) will weigh on HNZ’s FY14 (three months) and FY15 earnings
contribution. Inclusive of the HER business, HNZ expects FY15 NPAT to be
between $42mn and $44mn. At first glance the acquisition looks broadly
neutral as it is priced on a similar P/E to what HNZ was trading prior to the
announcement. However, we believe it is a strong strategic acquisition for
HNZ that diversifies its earnings base (new market segment but also into
Australia) and presents growth potential and a positive earnings story to
HNZ over the next few years. We have preliminarily adjusted our forecasts
to reflect the HER acquisition and guidance that HNZ’s existing business is
trading slightly below our expectations in the near term. We will look for a full
update when HNZ reports its 1H14 result on 25 February 2013.
■ Investment case: HNZ should continue to re-rate as it improves its ROE
and continues to grow and develop its business. HNZ remains on
undemanding multiples.
■ Catalysts: HNZ will release its 1H14 result on 25 February 2014.
■ Valuation: We have upgraded our target price from $0.90 to $0.96 to reflect
a heavier weight on higher FY15E earnings in our valuation approach (but
retain a forward P/E of 11x) and an increase in the asset multiples used to
set our target price to reflect the growth potential from the HER businesses.
Share price performance
90.0
97.5
105.0
112.5
120.0
0.00
0.25
0.50
0.75
1.00
Feb-13 Mar-13 Apr-13 May-13 Jun-13 Jul-13 Aug-13 Sep-13 Oct-13 Nov-13 Dec-13 Jan-14 Feb-14
Heartland New Zealand Limited LHS Relative to NZX50 (RHS)
The price relative chart measures performance against the
NZX50 index which closed at 4873.5 on 13 Feb 14
The spot exchange rate was NZ$1.199/US$1 on 14 Feb 14
Performance Over 1M 3M 12M
Absolute (%) 4.7 3.5 30.7
Rel-NZX50(%) 4.5 4.6 15.7
Year to 30 Jun 2012A 2013A 2014F 2015F 2016F
Adjusted Earnings NZ$m 40.3 6.9 35.2 42.0 46.2
EPS Adjusted NZc. 10.4 1.8 8.6 9.1 9.9
EPS Grow th % 341 -82.8 384 5.1 8.7
P/E x 8.8 51.1 10.6 10.0 9.2
CPS NZc. 10.6 2.0 8.8 9.2 10.0
P/CF x 8.6 46.4 10.3 9.9 9.1
EV/EBITDA x 104 198 50.1 47.7 44.7
Net DPS NZc. 0.0 3.5 6.0 6.5 7.0
Imputation % 100 100 100 100 100
Net Yield % 0.0 3.8 6.6 7.1 7.7
Gross Yield % 0.0 5.3 9.2 9.9 10.7
Financial and valuation metrics
Source: Company data, NZX, First NZ Capital estimates
Rating NEUTRAL* Price (14 Feb 2014, NZ$) 0.91 Target price (NZ$) (from 0.90) 0.96¹ Market cap. (NZ$mn) 357.22 Projected return: 0 Capital gain (%) -1.1 Dividend yield (net %) 6.9 Total return (%) 5.8 52-week price range (NZ$) 0.71-0.92
* Stock ratings are relative to the relevant country
benchmark.
¹Target price is for 12 months.
Research Analysts
Greg Main CFA
64 4 474 4061
Disclaimer:
First NZ Capital is acting as underwriter to
Heartland in its NZ$5m share purchase plan to
shareholders
This report is distributed in Australia by Credit Suisse
Equities (Australia) Limited. Please see legal disclaimer and
disclosure annex for further terms and information
Provided by First NZ Capital

17 February 2014
Australia and NZ First Edition 32
Figure 1: Heartland New Zealand financial summary
Sector: Diversified Financials NZX Code: HNZ
PROFIT & LOSS ($m) BALANCE SHEET ($m)Year to 30 Jun 2012A 2013A 2014F 2015F 2016F Year to 30 Jun 2012A 2013A 2014F 2015F 2016F
Operating Rev enue 92.9 107 121 136 138 Cash & Equiv alents 89.7 174 150 150 150
Operating Ex penses -73.3 -96.0 -70.1 -75.4 -71.1 Debtors & Inv entories 2,113 2,043 2,770 2,861 2,980
Operating EBITDA 19.6 10.9 51.1 60.6 66.6 Other Current Assets 21.4 10.1 10.1 10.1 10.1
Depreciation -0.8 -0.7 -0.8 -0.8 -0.8 Current Assets 2,224 2,227 2,930 3,021 3,140
Amortisation -1.1 -1.2 -1.4 -1.4 -1.4 Fix ed Assets 10.1 10.3 10.3 10.3 10.3
Operating EBIT 17.8 8.9 48.9 58.4 64.4 Inv estments 83.0 228 187 178 172
Other Income 0.0 0.0 0.0 0.0 0.0 Intangibles 23.0 23.0 23.0 23.0 23.0
Abnormals 9.6 0.0 0.0 0.0 0.0 Other Non-Current Ass. 8.1 16.4 16.4 16.4 16.4
Reported EBIT 27.4 8.9 48.9 58.4 64.4 Total Assets 2,348 2,505 3,166 3,248 3,361
Net Interest 0.0 0.0 0.0 0.0 0.0
Pretax Profit 27.4 8.9 48.9 58.4 64.4 Interest Bearing Debt 1,939 2,098 2,679 2,745 2,838
Tax 3.3 -2.5 -14.2 -17.0 -18.7 Other Liabilities 33.8 36.5 36.5 36.5 36.5
Minority Interests 0.0 0.0 0.0 0.0 0.0 Total Liabilities 1,973 2,134 2,716 2,781 2,875
Equity Accounted Profit 0.0 0.5 0.5 0.5 0.5 Minorities 0.0 0.0 0.0 0.0 0.0
Reported NPAT 30.7 6.9 35.2 42.0 46.2 Conv ertible Capital 0.0 0.0 0.0 0.0 0.0
Abnormals (net of tax ) -9.6 0.0 0.0 0.0 0.0 Ordinary Equity 375 371 450 467 486
Adjusted Earnings 40.3 6.9 35.2 42.0 46.2 Total Funds Emp. 2,348 2,505 3,166 3,248 3,361
RATIOS AND CAPITAL STRUCTURE CASH FLOW ($m)Year to 30 Jun 2012A 2013A 2014F 2015F 2016F Year to 30 Jun 2012A 2013A 2014F 2015F 2016F
Profitability & Growth
EBITDA/Op Rev % 21.1 10.2 42.2 44.6 48.4 Operating EBITDA 19.6 10.9 51.1 60.6 66.6
EBIT/Op Rev % 19.2 8.3 40.3 43.0 46.8 Other Cash Income 0.0 0.0 0.0 0.0 0.0
Effectiv e Tax Rate % -12.0 28.1 29.0 29.0 29.0 Interest Paid 0.0 0.0 0.0 0.0 0.0
Return On Equity % 12.0 1.9 8.6 9.2 9.7 Tax Paid 0.0 0.0 -22.4 -25.2 -26.9
ROCE % 0.9 0.4 1.9 2.0 2.1 Working Capital / Other -18.7 59.6 -711 -71.4 -103
EPS Adjusted c. 10.4 1.8 8.6 9.1 9.9 Operating Cash Flow 0.9 70.5 -683 -35.9 -63.0
EPS Grow th % 341 -82.8 384 5.1 8.7
Net DPS c. 0.0 3.5 6.0 6.5 7.0 Total Capex -3.2 -2.3 -2.2 -2.2 -2.2
Div idend Cov er x 0.5 1.4 1.4 1.4 Acquisitions -32.3 -131 -87.0 0.0 0.0
Asset Backing & Capital Structure Div estments 0.8 3.2 0.0 0.0 0.0
Net Cash (Debt) $m -1,850 -1,923 -2,529 -2,595 -2,688 Div idends 0.0 -13.6 -27.7 -30.3 -33.0
NTA / Share $ 0.9 0.9 0.9 1.0 1.1 Equity Raised 55.0 0.0 65.1 5.3 5.8
Equity / Tot Assets % 16.0 14.8 14.2 14.4 14.5 Other 0.0 0.0 0.0 0.0 0.0
Net Debt / EBITDA x 94.2 177 49.5 42.8 40.4 Change in Net Debt 21.2 -73.6 -734 -63.1 -92.5
Interest Cov er x
Shares on Issue Capex /Depn % 420 318 278 278 278
Ordinary m 389 389 461 466 472 Capex /Rev % 3.4 2.1 1.8 1.6 1.6
Fully Diluted m 389 389 461 466 429
KEY ASSUMPTIONSYear to 30 Jun 2012A 2013A 2014F 2015F 2016F
Profitability Ratios:
Net Interest Spread (%) 3.29 1.12 0.64 0.48 0.46
Op cost to income ratio (%) 70.6 65.8 53.1 52.0 49.1
Bad Debt Charge:
BD chrg % of av g fin rec (%) 0.45 1.09 0.28 0.24 0.19
Provisioning:
Collectiv e prov ision % 0.38 0.77 0.46 0.32 0.23
Specific prov ision % 0.92 1.68 0.92 0.48 0.21
Total prov ision % 1.30 2.45 1.37 0.80 0.44
Credit Growth
Sy stem Credit Grow th % 1.3 3.5 4.0 4.1 4.5
Finance Receiv ables Grow th %-2.3 -2.1 34.7 2.7 3.8
Residential12%
Consumer30%
Leases2%
Rural29%
Business23%
Non-Core Property
Book
4%
Loan Book Split
Source: Company data, NZX, First NZ Capital estimates

17 February 2014
Australia and NZ First Edition 33
Diversifying the earnings base
HNZ has entered into a Sale and Purchase Agreement with Seniors Money International
Limited for the acquisition of its NZ and Australian Home Equity Release (HER) mortgage
businesses. Consideration is $87mn and settlement is 1 April 2014. Underlying NPAT
contribution in the first full 12 months is expected to be $8mn-$9mn (implies initial
acquisition P/E of 9.7x to 10.9x) but integration costs of $2mn (post tax) will weigh on the
earnings contribution in HNZ’s FY14 (3 months) and FY15 financial years. Inclusive of the
HER business HNZ expects FY15 NPAT to be between $42mn and $44mn.
HNZ is funding the acquisition via:
■ $20mn capital raising via a $15mn institutional placement and $5mn share purchase
plan.
■ $38.7mn placemen to the Vendor at $0.90 per share (43mn shares representing circa
14% of post deal shares on issue). All shares issued to the Vendor are subject to a
minimum 12-month lock-up. Presumably this implies some overhang post the escrow
period.
■ The balance ($28.3mn) is being funded via cash reserves.
From a valuation perspective, at first glance the acquisition looks broadly neutral as it is
being priced on a similar P/E to what HNZ was trading at prior to the announcement.
However, we see it as being a strong strategic acquisition for HNZ that diversifies its
earnings base (new market segment but also into Australia) and presents some attractive
underlying growth potential that should see the HER business help provide a positive
earnings story to HNZ over the next few years.
Figure 2: Pro forma HNZ balance sheet expansion
Source: Company data, FNZC estimates
One slightly disappointing aspect of the announcement, but not a total surprise, is that
HNZ expects its existing business (i.e., excluding the HER acquisitions) to only increase
NPAT by circa 5% in FY15 over FY14. Our previous forecasts were for NPAT to increase
from $34.8mn to $39.2mn (+12.6%). HNZ will release its 1H14 result on 25 February 2014
and said it expects 1H14 NPAT to be circa $16.5mn (our forecast $17.5mn). HNZ has
retained its guidance for FY14 NPAT of $34mn to $37mn but it obviously now includes one
quarter's contribution from the HER businesses, albeit there will be some integration and
other upfront costs likely.
We suspect part of the issue has been the impact the LVR restrictions have had with the
main trading banks looking to replace lost earnings in other areas and this has impacted
HNZ. In addition, credit growth has probably tracked a bit weaker than we had expected

17 February 2014
Australia and NZ First Edition 34
and it could also relate to the timing of expected cost efficiencies. We will get more details
at the result. However, we have preliminarily adjusted our forecasts to reflect the lower
core business forecasts and for the acquisition of the HER businesses. We have
maintained our DPS forecast at 6cps for FY14 and have set a DPS of 6.5cps for FY15
(previous 6.8cps). Although we still have to discuss with HNZ how the acquisition will
impact its prudential capital requirements, we expect HNZ to still be relatively well
capitalised implying some potential further bolt-on acquisitions going forward.
We have elected to increase our target price from $0.90ps to $0.96. The increased target
price reflects greater weight on FY15 EPS forecast since our last note (even though we
have lowered our FY15 EPS forecast) and we have increased the asset based multiples
we use to set our target price to reflect the greater growth prospects of the MER business.
We note that based on FY15E P/E outlook, HNZ continues to trade at a discount to its
Australian peers (average 12.6x vs 10.0x for HNZ) and at a higher dividend yield.
Figure 3: Preliminary revised forecasts
NZ$mn FY14F FY15F
Was Now %Ch Was Now %Ch
Net Interest Income 108.6 109.9 1.1% 116.0 125.4 8.1%
Net Operating Income 119.2 121.1 1.6% 125.8 136.0 8.1%
Operating expenses 60.6 62.2 2.7% 60.7 68.5 12.9%
Impaired asset expense 8.4 7.9
8.7 6.9
Operating profit before taxation 48.8 49.4 1.2% 55.0 58.9 7.2%
Taxation (14.0) (14.2) 1.2% (15.8) (16.9) 7.2%
Net profit after taxation 34.8 35.2 1.2% 39.2 42.0 7.1%
Less Abnormals 0.0 0.0 N/A 0.0 0.0 N/A
Adjusted NPAT 34.8 35.2 1.2% 39.2 42.0 7.1%
EPS (cents) 8.9 8.6 -3.7% 10.1 9.1 -10.1%
EPS adj. (cents) 8.9 8.6 -3.7% 10.1 9.1 -10.1%
DPS (cents) 6.0 6.0 -0.5% 6.8 6.5 -4.2%
Source: Company data, FNZC estimates
Highlights of the businesses to be acquired
Sentinel is the number one HER provider in NZ with approximately 80% market share.
AFS is the largest non-bank HER loan provider in Australia, with approximately 20%
market share.
Commonwealth Bank of Australia (CBA) has agreed to continue to provide committed
facilities to HNZ to fund the Sentinel and AFS portfolios for a term of five and a half years,
on similar terms to those currently in place.
Figure 4: Key metrics of businesses acquired
NZ Australia
Sentinel AFS
Established 2003 2004
Approximate market share 80% 20%
Portfolio size NZ$340m A$380m
Number of loans 4,048 4,245
Average loan - current NZ$84.2k A$89.8k
Average loan at origination NZ$39.5k A$45.1k
Average property value NZ$324.7k A$344.3k
Weighted average age 77.8 years 76.2 years
Weighted average current LVR 32.7% 31.8%
Weighted average original LVR 15.6% 17.1%
Source: Company data, FNZC estimates

Australia and NZ First Edition 35
17 February 2014
Asia Pacific/Australia
Equity Research
Building Materials & Construction (Building Materials (AU))
James Hardie Industries SE
(JHX.AX / JHX AU) COMPANY UPDATE
Positive volume and price momentum
■ Louisiana Pacific (LP.US) reports 4Q: Louisiana Pacific, a key competitor
of JHX in the US siding & trim market, reported its 4Q (Dec) 2013 result. The
stock was up 5.5% on the back of this result. The read-through typically
serves are a useful (albeit not precise) proxy for US fibre cement volume
and price trends.
■ The LP 4Q result (SmartSide division): A positive mix shift led prices up
(+4%) and strong volume (+20%) was underpinned by growth in the R&R
segment (single family and DIY also improving). This is despite weather
disruptions (Polar Vortex) in the latter part of the qtr which continued into
January 2014. Pleasingly, a number of distributors reported that January
2014 (weather impaired) activity was still better than the pcp. Pent-up
demand is material and this should accelerate when the weather breaks.
■ Read-though: JHX's US fibre cement volumes exhibiting a strong
relationship to LP’s SmartSide volume with a 0.7 correlation through the
cycle. Strong price growth (led by +ve mix shift) is also indicative of a
change in consumer and homebuilder sentiment towards more higher priced
and quality products. This plays right into the hands of JHX and was the key
driver of JHX’s 4% price rise at the previous 2Q result. For JHX, we are
increasingly confident that trend momentum will grow into FY14-15.
■ Other points of interest: (1) US new home construction activity to increase
20% in CY2014; (2) still significant pent-up demand; (3) first-time homebuyer
is unlikely to participate until there is more job growth and an increased
availability to financing; and (4) builders optimistic about 2014 activity, but
concerned about labour shortages.
■ Catalyst: JHX reports 3Q FY14 on 28 February 2014.
Total return forecast in perspective
Mean^CSEC tgt^
Sh Prc
-40%
-30%
-20%
-10%
0%
10%
20%
30%
40%
12mth Volatility* 52wk Hi-Lo IBES Consensustarget return^
Performance over 1M 3M 12M
Absolute (%) 1.1 8.4 39.9
Relative (%) -0.1 10.1 34.6
Financial and valuation metrics
Year 03/13A 03/14E 03/15E 03/16E
Revenue (US$mn) 1,321.3 1,480.5 1,716.4 1,987.2
EBITDA (US$mn) 242.2 324.4 417.1 498.3
EBIT (US$mn) 181.0 257.9 344.7 420.0
Net income (US$mn) 140.8 193.2 246.0 293.4
EPS (CS adj.) (USc) 32.06 43.59 55.51 66.22
Change from previous EPS (%) n.a. — — —
Consensus EPS (USc) n.a. 41.30 53.10 66.40
EPS growth (%) -0.4 36.0 27.3 19.3
P/E (x) 37.0 27.2 21.4 17.9
Dividend (USc) 18.00 53.00 61.00 68.00
Dividend yield (%) 1.5 4.5 5.1 5.7
P/B (x) 287.0 -223.7 -109.9 -94.3
Net debt/equity (%) net cash net cash net cash net cash
Relative performance versus S&P ASX 200.See Reference
Appendix for a description of the chart. Source: Credit Suisse
estimates, * Consensus, mean range from Thomson Reuters
Source: Company data, ASX, Credit Suisse estimates, * Adj. for goodwill, notional interest and unusual items. Relative P/E
against ASX/S&P200 based on pre GW in AUD. Company PE calculation is based on displayed EPS Currency
Rating OUTPERFORM*
Price (13 Feb 14, A$) 13.19
Target price (A$) 13.50¹
Market cap. (A$mn) 5,850.30
Yr avg. mthly trading (A$mn) 307
Last month's trading (A$mn) 352
Projected return:
Capital gain (%) 2.4
Dividend yield (net %) 5.1
Total return (%) 7.4
52-week price range 13.8 - 8.9
* Stock ratings are relative to the relevant country
benchmark.
¹Target price is for 12 months.
Research Analysts
Andrew Peros
61 2 8205 4013

17 February 2014
Australia and NZ First Edition 36
Figure 1: Financial Summary
James Hardie Industries SE (JHX) Year ending 31 Mar In USDmn, unless otherwise stated2012 2013 2014 2015 2016 2012 2013 2014 2015 2016
Share Price: A$13.19 Earnings 03/12A 03/13A 03/14E 03/15E 03/16ERating OUTPERFORM c_EPS_SHARESEquiv. FPO (period avg.) mn 436.2 439.2 443.1 443.1 443.1
Target Price A$ 13.50 c_EPS*100EPS (Normalised) c 32.2 32.1 43.6 55.5 66.2
vs Share price % 2.35 EPS_GROWTH*100EPS Growth % -0.4 36.0 27.3 19.3
DCF A$ 14.22 c_EBITDA_MARGIN*100EBITDA Margin % 20.5 18.3 21.9 24.3 25.1
c_DPS*100DPS c 42.0 18.0 53.0 61.0 68.0
c_PAYOUT*100Payout % 130.5 56.1 121.6 109.9 102.7
FRANKING*100Franking % 0.0 0.0 0.0 0.0 0.0
c_FCF_PS*100Free CFPS c 80.6 11.0 29.4 30.7 59.9
Profit & Loss 03/12A 03/13A 03/14E 03/15E 03/16E c_TAX_RATE*100Effective tax rate % 22.4 23.2 24.6 25.5 25.4
Sales revenue 1,237.5 1,321.3 1,480.5 1,716.4 1,987.2 ValuationEBITDA 253.6 242.2 324.4 417.1 498.3 c_PEP/E x 36.8 37.0 27.2 21.4 17.9
Depr. & Amort. (65.2) (61.2) (66.5) (72.4) (78.3) c_EBIT_MULTIPLE_CURREV/EBIT x 26.5 28.2 20.6 16.1 13.4
EBIT 188.4 181.0 257.9 344.7 420.0 c_EBITDA_MULTIPLE_CUEV/EBITDA x 19.7 21.1 16.4 13.3 11.3
Associates 0.0 0.0 0.0 0.0 0.0 c_DIV_YIELD*100Dividend Yield % 3.5 1.5 4.5 4.6 5.2
Net interest Exp. (7.4) 2.4 (1.6) (14.5) (26.5) c_FCF_YIELD*100FCF Yield % 6.8 0.9 2.5 2.6 5.1
Other 0.0 0.0 0.0 0.0 0.0 c_PBPrice to Book x 41.1 287.0 -223.7 -109.9 -94.3
Profit before tax 181.0 183.4 256.2 330.2 393.5 ReturnsIncome tax (40.6) (42.6) (63.1) (84.2) (100.0) c_ROE*100Return on Equity % 111.1 773.6 -822.4 -514.4 -527.0
Profit after tax 140.4 140.8 193.2 246.0 293.4 c_I_NPAT/c_I_SALES*100Profit Margin % 11.3 10.7 13.0 14.3 14.8
Minorities (0.0) (0.0) (0.0) (0.0) (0.0) c_I_SALES/c_B_TOT_ASSAsset Turnover x 0.5 0.6 0.6 0.7 0.8
Preferred dividends 0.0 0.0 0.0 0.0 0.0 c_ASSETS/c_EQ_COMMONEquity Multiplier x 18.3 115.8 -98.7 -52.2 -46.3
Associates & Other (0.0) 0.0 0.0 0.0 0.0 c_ROA*100Return on Assets % 6.1 6.7 8.3 9.9 11.4
Normalised NPAT 140.4 140.8 193.2 246.0 293.4 c_ROIC*100Return on Invested Cap. % -105.1 -102.6 719.3 107.5 96.6
Unusual item after tax 463.9 (95.3) 0.0 0.0 0.0 GearingReported NPAT 604.3 45.5 193.2 246.0 293.4 c_GEARING*100Net Debt to Net debt + Equity % Net Cash Net Cash 186.9 120.0 117.2
c_NET_DEBT/c_I_EBITDANet Debt to EBITDA x Net Cash Net Cash 0.2 0.7 0.8
Balance Sheet 03/12A 03/13A 03/14E 03/15E 03/16E c_I_EBITDA/ c_I_NET_INTERESTInt Cover (EBITDA/Net Int.) x 34.3 -100.9 200.9 28.7 18.8
Cash & equivalents 265.4 153.7 153.7 153.7 153.7 c_I_EBIT/ c_I_NET_INTERESTInt Cover (EBIT/Net Int.) x 25.5 -75.4 159.7 23.7 15.8
Inventories 189.0 172.1 220.1 292.9 327.1 (c_C_CAPEX/c_I_SALES)*-100Capex to Sales % 2.9 4.6 10.1 8.6 5.4
Receivables 343.1 272.3 350.0 381.2 397.4 (c_C_CAPEX/c_I_DEPR)*-100Capex to Depreciation % 54.9 99.8 225.8 204.5 136.8
Other current assets 78.1 92.9 92.9 92.9 92.9
Current assets 875.6 691.0 816.7 920.7 971.0 MSCI IVA (ESG) Rating BBProperty, plant & equip. 665.5 658.9 742.6 818.3 847.1 TP ESG Risk (%): -18
Intangibles 0.0 0.0 0.0 0.0 0.0
Other non-current assets 768.9 757.7 757.7 757.7 757.7
Non-current assets 1,434.4 1,416.6 1,500.3 1,576.0 1,604.8
Total assets 2,310.0 2,107.6 2,317.0 2,496.7 2,575.8
Payables 92.6 98.1 153.0 176.3 225.4
Interest bearing debt 0.0 0.0 204.2 440.3 533.7
Other liabilities 2,091.0 1,991.3 1,983.2 1,927.9 1,872.4 MSCI IVA Risk: Neutral
Total liabilities 2,183.6 2,089.4 2,340.5 2,544.5 2,631.5
Net assets 126.4 18.2 -23.5 -47.8 -55.7
Ordinary equity 126.4 18.2 -23.5 -47.8 -55.7
Minority interests 0.0 0.0 0.0 0.0 0.0
Preferred capital 0.0 0.0 0.0 0.0 0.0
Total shareholder funds 126.4 18.2 -23.5 -47.8 -55.7
Net debt -265.4 -153.7 50.5 286.6 380.0 Source: MSCI IVA Rating
Cashflow 03/12A 03/13A 03/14E 03/15E 03/16E Share Price Performance
EBIT 188.4 181.0 257.9 344.7 420.0
Net interest -11.2 -0.1 -1.6 -14.5 -26.5
Depr & Amort 65.2 61.2 66.5 72.4 78.3
Tax paid 267.2 -83.3 -53.3 -78.9 -96.1
Working capital 0.0 -34.0 -68.6 -78.5 1.0
Other -122.4 -15.5 -20.0 -62.9 -61.7
Operating cashflow 387.2 109.3 180.9 182.3 315.1
Capex -35.8 -61.1 -150.2 -148.1 -107.1
Capex - expansionary 0.0 0.0 -99.5 -102.0 -57.5
Capex - maintenance -35.8 -61.1 -50.7 -46.1 -49.6
Acquisitions & Invest 0.0 0.0 0.0 0.0 0.0
Asset sale proceeds 0.0 1.4 0.0 0.0 0.0
Other -14.1 0.0 0.0 0.0 0.0
Investing cashflow -49.9 -59.7 -150.2 -148.1 -107.1
Dividends paid -17.4 -188.5 -234.8 -270.3 -301.3
Equity raised -8.0 26.3 0.0 0.0 0.0
Net borrowings -59.0 0.0 204.2 236.1 93.4
Other 0.0 3.5 0.0 0.0 0.0 1 Month 3 Month 12 Month
Financing cashflow -84.4 -158.7 -30.6 -34.2 -207.9 Absolute 1.1% 8.4% 39.9%
Total cashflow 252.9 -109.1 0.0 0.0 0.0 Relative -0.1% 10.1% 34.6%
Adjustments -6.1 -2.6 0.0 0.0 0.0
Net change in cash 246.8 -111.7 0.0 0.0 0.0 Source: Reuters 52 week trading range: 8.90-13.80
MSCI IVA Risk Comment: JHX has appropriately provided for the
asbestos liability on its B/S and cash payments (35% op CF) are
made into the asbestos fund. A reduction in the projected future
number of asbestos claims to be reported for a number of disease
types implies the liability is appropriately provided for.
James Hardie Industries SE (JHX). is an international building materials company focused on
fibre cement products. JHX is the dominant manufacturer of fibre cement in the US, Australia,
New Zealand and the Philippines.
Credit Suisse View
TP Risk Comment: Our JHX val'v is reduced by A$1.42/share
(18.0%) due to the asbestos liability. Our valuation captures a
nominal impact from carbon (>1%) effective 1 July 2012. MSCI
ascribes a 33% weighting to carbon which we believe is
overstated.
4.00
6.00
8.00
10.00
12.00
14.00
16.00
Feb 13 Apr 13 Jun 13 Aug 13 Oct 13 Dec 13 Feb 14
JHX.AX XJO
1.8
2.8
3.8
4.8
5.8
6.8
Environment Social Governance
Stock Local Sector
Country Global Sector
Source: Company data, Credit Suisse estimates

17 February 2014
Australia and NZ First Edition 37
The following information has been extracted from LP presentation slides and the
post 4Q result conference call.
LP.US 4Q 2013 read-through
■ For the quarter, SmartSide average sale price (most relevant division for JHX) was up
4%, and volume increased a meaningful 20%. This was driven by continued
penetration in several key focus markets, including repair & remodel along with new
housing markets.
■ Prices in the SmartSide siding product line primarily increased due to changes in
product mix.
■ Of lesser importance, CanExel divisional volume declined 9%, but these are very
lumpy given distributors stocking methods. CanExel prices were flat for the quarter.
End-market comments
■ Repair and remodel (R&R) was a strong growth segment, while new single-family
construction and retail (DIY) saw solid volume improvements.
■ Housing is forecast to increase 20% in 2014.
■ The single-family segment is still focused on more affluent buyers, as evidenced by
the average square footage being the highest ever.
■ A sustained recovery requires the first homebuyer to participate in activity.
■ Despite weather challenges in many parts of the country in January, many of LP’s
channel partners had a better January this year than they did in January of last year,
and they all say there's pent-up demand that will accelerate activity when the weather
does break.
■ Builders are optimistic about 2014, with the number of exhibitors at the International
Builders Show was up about 20%. Attendance was probably 30% to 35% higher than
last year.
Other points of interest
Comments/feedback from the Policy Advisory Board of the Harvard Joint Center for
Housing Studies.
■ The general mood on the market was upbeat, and lots of comments on pent-up
demand.
■ Consensus estimates from this group were also in that 1.1 million start range for 2014.
■ There's still a strong belief that the first-time homebuyer is unlikely to participate, until
there is more job growth and an increased availability to financing.
■ There was a general feeling that the price increases experienced across the country in
2013 will moderate, in all but the best markets.
■ Builders continue to be concerned about labor shortages, both skilled and unskilled
workers, and most participants were calling for immigration reform as a means to ease
some of this tension.
■ There does not appear to be much confidence that Congress will pass any reform on
the government-sponsored entities (Freddie Mac and Fannie Mae) that back
mortgages.

17 February 2014
Australia and NZ First Edition 38
Focus charts
Figure 2: JHX volume vs LP volume (YoY chg%)
-45%
-30%
-15%
0%
15%
30%
45%
2002
2003
2004
2005
2006
2007
2008
2009
2010
2011
2012
2013
2014
2015
James Hardie (Fibre Cement) Louisiana Pacific (SmartSide)
Volume YoY
Source: Company data, Credit Suisse estimates
Figure 3: JHX price vs LP price (YoY chg%)
-6%
-4%
-2%
0%
2%
4%
6%
8%
10%
12%
14%
2002
2003
2004
2005
2006
2007
2008
2009
2010
2011
2012
2013
2014
2015
James Hardie (Fibre Cement) Louisiana Pacific (SmartSide)
Price YoY
Source: Company data, Credit Suisse estimates

Australia and NZ First Edition 39
17 February 2014
Asia Pacific/New Zealand
Equity Research
Specialty Retail (Consumer Discretionary)
■
■
Michael Hill International
(MHI.NZ / MHI NZ) RESULTS
1H14 result – steady as she goes ■ PBT, at A$28.5mn, compared with the pcp at A$27.0mn, up 5.1%, and
was reasonably consistent with our estimate at A$28.7mn. MHI reported
1H14 reported earnings at A$16.2mn, down 26.3% compared with the pcp,
and less than 30% compared with our 1H14 estimates. However, the result
was impacted by a tax provision which has now been provided for in relation
to the tax dispute with the Australian Taxation Office (ATO). We estimate the
amount in the vicinity of A$7mn (based on our 1H14 tax estimate relative to
the reported amount).
■ Sales figures, and the composition thereof, had already been disclosed
at the time of the 2H14 sales release, with the depreciation of the AUD
relative to its respective regional currencies providing a meaningful
tailwind with regards headline AUD revenues. EBIT margins held up
reasonably well in the context of a challenging environment, but the
inclusion of the high margin PCP was supportive of earnings.
■ We expect MHI’s performance to be steady for a time. Key catalysts for
performance include an improvement in the Australian economy (not
expected any time soon), seeing the NZ management team get some
meaningful traction (expected over next 12 months), with continued growth
in the North American business considered a plus (but not a key valuation
driver). We would also like to see the excess inventory issue resolved
sooner rather than later.
■ We retain our NZ$1.67 target price. We continue to believe that the
business model is intact for MHI, but acknowledge that the stock may
languish at around current levels until such a time as the issues
addressed above (either macro or business specific) improve and/or
are resolved.
Share price performance
90.0
105.0
120.0
135.0
150.0
1.00
1.25
1.50
1.75
2.00
Feb-13 Mar-13 Apr-13 May-13 Jun-13 Jul-13 Aug-13 Sep-13 Oct-13 Nov-13 Dec-13 Jan-14 Feb-14
Michael Hill International Limited LHS Relative to NZX50 (RHS)
The price relative chart measures performance against the
NZX50 index which closed at 4873.5 on 13 Feb 14
The spot exchange rate was NZ$1.202/US$1 on 13 Feb 14
Performance over 1M 3M 12M
Absolute (%) -2.8 -11.4 21.1
Rel-NZX50(%) -2.9 -10.3 6.2
Year to 30 Jun 2012A 2013A 2014F 2015F 2016F
Adjusted Earnings NZ$m 36.5 39.7 39.6 45.3 41.6
EPS Adjusted NZc. 9.5 10.4 10.4 11.8 10.9
EPS Grow th % 5.9 8.8 -0.3 14.3 -8.2
P/E x 14.7 13.5 13.5 11.8 12.9
CPS NZc. 12.8 13.8 14.3 16.3 15.7
P/CF x 11.0 10.2 9.8 8.6 8.9
EV/EBITDA x 9.7 8.9 8.8 7.6 7.0
Net DPS NZc. 5.5 6.5 6.5 7.5 6.8
Imputation % 0.0 0.0 0.0 0.0 0.0
Net Yield % 3.9 4.6 4.7 5.3 4.9
Gross Yield % 3.9 4.6 4.7 5.3 4.9
Financial and valuation metrics
Source: Company data, NZX, First NZ Capital estimates
Rating OUTPERFORM* Price (14 Feb 2014, NZ$) 1.38 Target price (NZ$) 1.67¹ Market cap. (NZ$mn) 536.26 Projected return: 0 Capital gain (%) 19.3 Dividend yield (net %) 5.1 Total return (%) 24.4 52-week price range (NZ$) 1.22-1.60
* Stock ratings are relative to the relevant country
benchmark.
¹Target price is for 12 months.
Research Analysts
Sarndra Urlich
64 4 496 5363
This report is distributed in Australia by Credit Suisse
Equities (Australia) Limited. Please see legal disclaimer and
disclosure annex for further terms and information
Provided by First NZ Capital

17 February 2014
Australia and NZ First Edition 40
Figure 1: Michael Hill International financial summary
Sector: Retailing NZX Code: MHIPROFIT & LOSS ($m) BALANCE SHEET ($m)
Year to 30 Jun 2012A 2013A 2014F 2015F 2016F Year to 30 Jun 2012A 2013A 2014F 2015F 2016F
Operating Rev enue 513 550 539 580 618 Cash & Equiv alents 12.1 12.5 12.5 12.5 12.5
Operating Ex penses -455 -487 -476 -509 -541 Debtors & Inv entories 199 202 195 209 222
Operating EBITDA 58.2 62.9 62.7 71.2 77.1 Other Current Assets 0.0 0.0 0.0 0.0 0.0
Depreciation -12.3 -13.0 -15.3 -17.0 -18.5 Current Assets 211 215 207 222 235
Amortisation 0.0 0.0 0.0 0.0 0.0 Fix ed Assets 47.1 60.1 74.4 83.2 89.6
Operating EBIT 45.9 49.8 47.4 54.2 58.5 Inv estments 0.0 0.0 0.0 0.0 0.0
Other Income 0.0 0.0 0.0 0.0 0.0 Intangibles 0.0 0.0 0.0 0.0 0.0
Abnormals 0.0 0.0 0.0 0.0 0.0 Other Non-Current Ass. 65.6 73.2 73.2 73.2 73.2
Reported EBIT 45.9 49.8 47.4 54.2 58.5 Total Assets 324 348 355 378 398
Net Interest -3.9 -3.1 -2.0 -1.0 -0.8
Pretax Profit 42.0 46.7 45.3 53.2 57.7 Interest Bearing Debt 33.1 33.4 19.2 18.6 17.4
Tax -5.5 -7.0 -5.7 -7.9 -16.2 Other Liabilities 96.2 108 114 121 127
Minority Interests 0.0 0.0 0.0 0.0 0.0 Total Liabilities 129 141 133 140 144
Equity Accounted Profit 0.0 0.0 0.0 0.0 0.0 Minorities 0.0 0.0 0.0 0.0 0.0
Reported NPAT 36.5 39.7 39.6 45.3 41.6 Conv ertible Capital 0.0 0.0 0.0 0.0 0.0
Abnormals (net of tax ) 0.0 0.0 0.0 0.0 0.0 Ordinary Equity 194 207 222 238 254
Adjusted Earnings 36.5 39.7 39.6 45.3 41.6 Total Funds Emp. 324 348 355 378 398
RATIOS AND CAPITAL STRUCTURE CASH FLOW ($m)
Year to 30 Jun 2012A 2013A 2014F 2015F 2016F Year to 30 Jun 2012A 2013A 2014F 2015F 2016F
Profitability & Growth
EBITDA/Op Rev % 11.3 11.4 11.6 12.3 12.5 Operating EBITDA 58.2 62.9 62.7 71.2 77.1
EBIT/Op Rev % 8.9 9.1 8.8 9.3 9.5 Other Cash Income 0.5 9.8 6.5 5.2 4.1
Effectiv e Tax Rate % 13.2 15.0 12.6 14.8 28.0 Interest Paid -3.9 -2.7 -2.0 -1.0 -0.8
Return On Equity % 19.6 19.8 18.5 19.7 16.9 Tax Paid -1.4 -11.9 -5.7 -7.9 -16.2
ROCE % 21.3 22.5 20.8 22.9 23.3 Working Capital / Other -1.3 -5.7 5.8 -10.9 -10.0
EPS Adjusted c. 9.5 10.4 10.4 11.8 10.9 Operating Cash Flow 52.2 52.5 67.2 56.6 54.2
EPS Grow th % 5.9 8.8 -0.3 14.3 -8.2
Net DPS c. 5.5 6.5 6.5 7.5 6.8 Total Capex -17.9 -28.6 -28.0 -27.5 -26.9
Div idend Cov er x 1.7 1.6 1.6 1.6 1.6 Acquisitions 0.0 0.0 0.0 0.0 0.0
Asset Backing & Capital Structure Div estments 0.0 0.0 0.0 0.0 0.0
Net Cash (Debt) $m -21.0 -20.9 -6.7 -6.1 -5.0 Div idends -19.1 -23.0 -25.0 -28.6 -26.2
NTA / Share $ 0.5 0.5 0.6 0.6 0.7 Equity Raised 0.0 0.0 0.0 0.0 0.0
Equity / Tot Assets % 60.1 59.4 62.4 63.0 63.8 Other 0.0 -2.9 0.0 0.0 0.0
Net Debt / EBITDA x 0.4 0.3 0.1 0.1 0.1 Change in Net Debt 15.1 -2.0 14.2 0.6 1.2
Interest Cov er x 11.9 16.1 23.2 57.0 71.4
Shares on Issue Capex /Depn % 145 219 184 162 145
Ordinary m 383 383 383 383 383 Capex /Rev % 3.5 5.2 5.2 4.7 4.4
Fully Diluted m 383 383 383 383 383
KEY ASSUMPTIONS
Year to 30 Jun 2012A 2013A 2014F 2015F 2016F
Sales by Region
Australia 333.17 361.24 340.5 361.45 378.98
NZ 109.11 111.36 106.16 110.91 115.26
Canada 55.12 64.14 80.74 96.38 112.32
US 12 12.47 10.97 11.08 11.19
Other 2.09 0.41 0.41 0.41 0.41
EBIT by Region
Australia 47.51 52.74 49.71 52.77 55.33
NZ 21.55 22.13 21.34 22.29 23.17
Canada 0.71 1.36 1.71 2.04 2.37
US -3.32 -2.87 -1.1 -1.11 0
Unallocated Ex penses -8.26 -10.48 -9.01 -4.82 -3.81
Australia61%
NZ19%
Canada17%
US3%
Stores by Region FY13A
Source: Company data, NZX, First NZ Capital estimates

17 February 2014
Australia and NZ First Edition 41
1H14 result – tax and inventories a bit of a dampener
Summary
MHI reported 1H14 reported earnings at A$16.2mn, down 26.3% compared with the pcp,
and less than 30% compared with our 1H14 estimates.
However, the result was impacted by a tax provision which has now been provided for in
relation to the tax dispute with the ATO. We estimate the amount in the vicinity of A$7mn
(based on our 1H14 tax estimate relative to the reported amount).
PBT, at A$28.5mn, compared with the pcp at A$27.0mn, up 5.1%, and was reasonably
consistent with our estimate at A$28.7mn.
Although the GP margin at 64.6% exceeded our estimate by 100bp (and the pcp by 71bp),
we underestimated SG&A costs by A$2.8mn, and the pcp by A$14.9mn. This is clearly
telling regarding a lack of operating leverage during the key Xmas/holiday season.
Sales figures, and the composition thereof, had already been disclosed at the time of the
2H14 sales release, with the depreciation of the AUD relative to its respective regional
currencies providing a meaningful tailwind with regards to headline AUD revenues.
Figure 2: 1H14 earnings summary (A$mn)
1H14a 1H13a Change 1H14e 1H14a/1H14e
Trading revenue 262.4 242.7 8.1% 262.4 0%
PCP 8.3 4.0 108.7% 8.3 0%
Other revenue 0.3 0.1 113.3% 0.2 71%
Total operating revenue 271.1 246.8 9.8% 270.8 0%
COGS -95.9 -89.1 7.7% -98.6 -3%
GP 175.2 157.7 11.1% 172.3 2%
Employee benefits -69.0 -60.2 14.6% -67.6 2%
Occupancy costs -23.0 -20.3 13.2% -22.5 2%
Selling & marketing -29.8 -28.4 5.0% -29.2 2%
Other expenses -17.2 -15.2 13.4% -16.9 2%
S,G&A -139.0 -124.1 12.0% -136.2 2%
EBITDA 36.1 33.7 7.4% 36.0 0%
D&A -6.2 -5.0 23.0% -6.0 3%
EBIT 29.9 28.6 4.6% 30.0 0%
Interest -1.5 -1.5 -4.0% -1.3 12%
PBT 28.5 27.1 5.1% 28.7 -1%
Tax -12.2 -5.1 141.7% -5.5 124%
NPAT 16.2 22.0 -26.3% 23.2 -30%
Margins/ratios 1H14a 1H13a ∆ bp 1H14e
COGS 35.4% 36.1% -71.0 36.4%
GP 64.6% 63.9% +71.0 63.6%
Employee benefits 25.4% 22.2% +324.3 25.0%
Occupancy costs 8.5% 7.5% +99.2 8.3%
Selling & marketing 11.0% 10.5% +52.9 10.8%
Other expenses 6.4% 5.6% +74.9 6.2%
S,G&A/revenues 51.3% 50.3% +101.2 50.3%
EBITDA 13.3% 13.6% -30.2 13.3%
EBIT 11.0% 11.6% -54.8 11.1%
PCP revenue brought to income 8.3 4.0 109% 8.3
PCP revenue collected 17.6 14.3 23% 17.6
Metrics 1H14a 1H13a
1H14e
eps cps 4.2 5.8
6.1
dps cps 2.5 2.5
2.2
payout ratio 58.9% 43.4%
36.2%
Total stores #'s 279 263 +16
Source: MHI

17 February 2014
Australia and NZ First Edition 42
Divisional breakdown
Figures 3 through 6 summarise the divisional results from MHI’s respective geographies.
Figure 3: Segment result Australian operations
Australia 1H14a 1H13a chg
Sales $Amn 171.7 162.7 5.5%
Sales $NZmn 192.3 206.4 -6.8%
Segment result $Amn 29.0 28.0 3.6%
Segment result $NZmn 32.5 35.4 -8.3%
Margin 16.9% 17.1% -25.7
NZD/AUD 0.89 0.79 13.3%
Stores 166 160 +6
Sales/store $Amn 1.03 1.02 1.7%
sss 1.4% 3.8%
Ratio total sales 63% 66% -2.6%
Source: MHI
Figure 4: Segment result NZ operations
New Zealand 1H14a 1H13a chg
Sales $Amn 54.3 49.8 9.1%
Sales $NZmn 60.8 63.1 -3.7%
Segment result $Amn 11.1 10.2 8.3%
Segment result $NZmn 12.4 13.0 -4.4%
Margin 20.4% 20.5% -0.5%
stores 53 52 +1
sales/stores (cc) 1.15 1.21 -5.5%
sss -4.1% 3.0%
Ratio total sales 20.0% 20.2% -0.1%
Source: MHI
Figure 5: Segment result Canadian operations
Canada 1H14a 1H13a chg
Sales $Amn 39.4 28.5 38.0%
Sales $CADmn 37.9 29.5 28.5%
Segment result $Amn 2.98 1.49 100.4%
Segment result $CADmn 2.86 1.53 86.7%
Margin 7.6% 5.3% 228.2
AUD/CAD 1.04 0.97 7.4%
Stores 52 42 +10
Sales/store $CADmn 0.73 0.70 3.8%
sss 7.9% 3.8%
Ratio total sales 14.5% 11.6% 3.0%
Source: MHI
Figure 6: Segment result US operations
USD 1H14a 1H13a chg
Sales $Amn 5.5 5.3 3.8%
Sales $USmn 5.0 5.5 -8.4%
Segment result $Amn -0.6 -1.2 -51.2%
Segment result $USmn -0.5 -1.3 -57.0%
Margin -10.9% -23.1% -53.0%
AUD/USD 1.09 0.96 13.4%
Stores 8 9 -1
Sales/store $USmn 0.6 0.6 3.0%
Ratio total sales 2.0% 2.1% -0.1%
Source: MHI

17 February 2014
Australia and NZ First Edition 43
What’s the story
Key themes from MHI’s respective geographies are as follows:
■ Australia: Australia saw lower SSS growth than the pcp, although these were at least
in [small] positive territory. This was largely reflective of a sluggish retail landscape, a
scenario that we do not see changing in the near term. Margins held up reasonably
well, but the disproportionately high PCP margins supported this. Australia now
comprises 63% total sales, down from 66%.
■ New Zealand: As discussed at the time of the 1H14 sales result, a combination of
sluggish underlying trends and disruptive changes to its management team had a
disproportionate negative impact on sales (down 4.1%, compared with +3.0% at the
pcp). Margins held steady compared with those in 1H13, again supported by the PCP
contribution.
■ Canada: Canada was the shining light of this result, with SSS growth at +7.9%, and
margins up from 5.3% to 7.6%. MHI attributed this, in part, to economies of scale
associated with a critical mass of stores at 52 (up from 42 at 1H13).
■ US: Sales remain small in the context of MHI’s portfolio, although reassuringly 1H14
saw a lessening of losses compared to the pcp.
Asset backing, capital structure, and ratios
Figure 7 profiles MHI’s OCF, gearing and cover ratios. The key point to note is the
deterioration in OCF compared to the pcp. This is a function of significant inventory being
deployed in North America as part of MHI’s new bridal range strategy. MHI is targeting a
correction of the excess inventory during 2H14 as it can be utilised across the group (i.e.,
merchandise is not obsolete).
Figure 7: Asset backing, capital structure and ratios (A$mn)
1H14a 1H13a Change $
OCF -2.3 22.2 -24.4
Capex 11.3 10.9 0.4
NIBD 46.1 16.4 29.8
Gearing 19.1% 9.9%
Interest cover (x) 20.6 18.9
Fixed charge cover (x) 1.8 1.8
Stock turn (x) 1.3 1.5
Source: MHI
PCP data
PCP data is summarised in Figure 8.
Figure 8: PCP data (A$mn)
PCP data 1H14a 1H13a
Revenue collected 17.6 14.2
Revenue brought to income 8.3 4.0
Deferred revenue carried forward to balance sheet 49.4 35.2
Source: MHI

Australia and NZ First Edition 44
17 February 2014
Asia Pacific/Australia
Equity Research
Precious Metals (Gold (AU))
Newcrest Mining
(NCM.AX / NCM AU) RESULTS
1H FY14 result spot on. Debt up on working
capital and FX
■ Underlying NPAT $207mn (CS $206mn). Reported NPAT $40mn reflects
previously advised $120mn tax expense and $47mn impairment of West
Africa exploration assets. FY13 reported $5.8bn loss post $6.2bn write
down.
■ $228mn operating cash flow impacted by $200mn working capital movement
and $70mn tax payment for prior R&D claims. 2H expected to see a ~$100m
working capital release for a $370mn turnaround. No dividend.
■ Operating cash flow less than the $421mn capex (Cadia East development),
resulting in debt draw. 2H cash flow increase should exceed capex increase.
■ No write down of Telfer despite reserves restated from 11.6moz to 6.3moz.
Current mine plan consumes less than half the written down reserves.
■ Group Reserves restated to 78moz from 87.7moz comprising: 3moz
depletion, -5moz Telfer leaving 6.3Moz, -2.5moz at Lihir. Resource restated
to 150moz from 161.2Moz. Reserve and RSC price assumptions
unchanged.
■ Net debt $4.5bn versus June 30 $4.14bn. $164mn attributable FX on USD
denominated debt. Available liquidity A$1,250mn (FY13 A$958mn) in cash
and undrawn facilities before additional liquidity of US$200mn in January.
■ No change to FY14 production guidance or strategy. Each asset managed to
be cash flow neutral or positive in FY14 at A$1,450/oz.
■ TP unchanged at $8.20/share. Rating remains underperform.
Total return forecast in perspective
Mean^
CS tgt^
Sh Prc
-40%
10%
60%
110%
12mth Volatility* 52wk Hi-Lo IBES Consensustarget return^
Performance over 1M 3M 12M
Absolute (%) 29.5 15.1 -52.7
Relative (%) 27.4 15.9 -59.0
Financial and valuation metrics
Year 06/13A 06/14E 06/15E 06/16E
Revenue (A$mn) 3,775.0 3,825.4 4,223.1 4,229.5
EBITDA (A$mn) 1,367.0 1,234.5 1,627.6 1,738.5
EBIT (A$mn) 756.0 657.9 1,032.4 1,119.5
Net income (A$mn) 451.0 295.8 530.6 605.7
EPS (CS adj.) (Ac) 58.89 38.63 69.27 79.07
Change from previous EPS (%) n.a. 1.5 -1.8 -1.6
Consensus EPS (Ac) n.a. 39.00 55.90 74.50
EPS growth (%) -58.4 -34.4 79.3 14.2
P/E (x) 18.8 28.6 16.0 14.0
Dividend (Ac) 12.00 — — 20.00
Dividend yield (%) 1.1 — — 1.8
P/B (x) 0.85 0.80 0.76 0.72
Net debt/equity (%) 41.1 37.9 31.2 24.7
Relative performance versus S&P ASX 200.See Reference
Appendix for a description of the chart. Source: Credit Suisse
estimates, * Consensus, mean range from Thomson Reuters
Source: Company data, ASX, Credit Suisse estimates, * Adj. for goodwill, notional interest and unusual items. Relative P/E
against ASX/S&P200 based on pre GW in AUD. Company PE calculation is based on displayed EPS Currency
Rating UNDERPERFORM* [V]
Price (14 Feb 14, A$) 11.05
Target price (A$) 8.20¹
Market cap. (A$mn) 8,469.95
Yr avg. mthly trading (A$mn) 1,515
Last month's trading (A$mn) 1,330
Projected return:
Capital gain (%) -25.8
Dividend yield (net %) —
Total return (%) -25.8
52-week price range 23.4 - 7.0
* Stock ratings are relative to the relevant country
benchmark.
¹Target price is for 12 months.
[V] = Stock considered volatile (see Disclosure Appendix).
Research Analysts
Michael Slifirski
61 3 9280 1845
Sam Webb
61 3 9280 1716

17 February 2014
Australia and NZ First Edition 45
Figure 1: NCM Financial Summary
Newcrest Mining (NCM) Year ending 30 Jun In AUDmn, unless otherwise stated2012 2013 2014 2015 2016 2012 2013 2014 2015 2016
Share Price: A$11.05 Earnings 06/12A 06/13A 06/14E 06/15E 06/16ERating UNDERPERFORM c_EPS_SHARESEquiv. FPO (period avg.) mn 765.9 765.8 765.8 766.0 766.0
Target Price A$ 8.20 c_EPS*100EPS (Normalised) c 141.5 58.9 38.1 70.5 80.4
vs Share price % -25.79 EPS_GROWTH*100EPS Growth % -58.4 -34.4 79.3 14.2
DCF A$ 8.08 c_EBITDA_MARGIN*100EBITDA Margin % 48.7 36.2 32.3 38.5 41.1
c_DPS*100DPS c 35.0 12.0 0.0 0.0 20.0
c_PAYOUT*100Payout % 24.7 20.4 0.0 0.0 25.3
FRANKING*100Franking % 15.0 0.0 0.0 0.0 0.0
c_FCF_PS*100Free CFPS c 52.4 10.9 36.1 135.7 145.8
Profit & Loss 06/12A 06/13A 06/14E 06/15E 06/16E c_TAX_RATE*100Effective tax rate % 26.2 25.5 31.0 29.8 29.8
Sales revenue 4,416.0 3,775.0 3,825.4 4,223.1 4,229.5 ValuationEBITDA 2,151.0 1,367.0 1,234.5 1,627.6 1,738.5 c_PEP/E x 7.8 18.8 28.6 16.0 14.0
Depr. & Amort. (561.0) (611.0) (576.6) (595.2) (619.0) c_EBIT_MULTIPLE_CURREV/EBIT x 6.7 16.7 19.1 11.6 10.2
EBIT 1,590.0 756.0 657.9 1,032.4 1,119.5 c_EBITDA_MULTIPLE_CUEV/EBITDA x 4.9 9.2 10.2 7.4 6.6
Associates 0.0 0.0 0.0 0.0 0.0 c_DIV_YIELD*100Dividend Yield % 3.2 1.1 0.0 0.0 1.8
Net interest Exp. (41.0) (109.0) (199.7) (239.7) (222.4) c_FCF_YIELD*100FCF Yield % 4.7 1.0 3.3 12.3 13.2
Other 0.0 0.0 0.0 0.0 0.0 c_PBPrice to Book x 0.6 0.9 0.8 0.8 0.7
Profit before tax 1,549.0 647.0 458.2 792.7 897.0 ReturnsIncome tax (406.1) (165.0) (142.0) (236.3) (267.6) c_ROE*100Return on Equity % 7.2 4.5 2.8 4.7 5.2
Profit after tax 1,142.9 482.0 316.2 556.4 629.4 c_I_NPAT/c_I_SALES*100Profit Margin % 24.5 11.9 7.7 12.6 14.3
Minorities (58.9) (31.0) (20.4) (25.8) (23.7) c_I_SALES/c_B_TOT_ASSAsset Turnover x 0.2 0.2 0.2 0.2 0.2
Preferred dividends 0.0 0.0 0.0 0.0 0.0 c_ASSETS/c_EQ_COMMONEquity Multiplier x 1.4 1.7 1.7 1.7 1.6
Associates & Other 0.0 (0.0) 0.0 0.0 0.0 c_ROA*100Return on Assets % 5.3 2.6 1.7 2.9 3.2
Normalised NPAT 1,084.0 451.0 295.8 530.6 605.7 c_ROIC*100Return on Invested Cap. % 6.8 4.0 3.0 4.9 5.3
Unusual item after tax 33.0 (6,229.0) (191.1) (8.2) (1.6) GearingReported NPAT 1,117.1 (5,778.0) 104.7 522.4 604.1 c_GEARING*100Net Debt to Net debt + Equity % 12.5 29.1 27.5 23.8 19.8
c_NET_DEBT/c_I_EBITDANet Debt to EBITDA x 1.0 3.0 3.3 2.2 1.7
Balance Sheet 06/12A 06/13A 06/14E 06/15E 06/16E c_I_EBITDA/ c_I_NET_INTERESTInt Cover (EBITDA/Net Int.) x 52.5 12.5 6.2 6.8 7.8
Cash & equivalents 242.0 69.0 231.7 659.9 1,142.7 c_I_EBIT/ c_I_NET_INTERESTInt Cover (EBIT/Net Int.) x 38.8 6.9 3.3 4.3 5.0
Inventories 748.0 946.0 723.7 656.3 678.6 (c_C_CAPEX/c_I_SALES)*-100Capex to Sales % 57.9 51.5 21.5 18.2 15.6
Receivables 251.0 178.0 217.1 397.0 410.4 (c_C_CAPEX/c_I_DEPR)*-100Capex to Depreciation % 511.9 357.5 160.1 148.3 121.7
Other current assets 223.0 232.0 194.1 199.0 207.1
Current assets 1,464.0 1,425.0 1,366.7 1,912.1 2,438.8 MSCI IVA (ESG) Rating BBProperty, plant & equip. 4,364.0 5,544.0 5,943.5 6,194.3 6,312.1 TP ESG Risk (%): 0
Intangibles 3,852.0 550.0 546.1 536.9 528.6
Other non-current assets 10,829.0 9,666.0 9,897.2 9,911.1 9,902.5
Non-current assets 19,045.0 15,760.0 16,386.8 16,642.3 16,743.2
Total assets 20,509.0 17,185.0 17,753.5 18,554.5 19,182.0
Payables 482.0 620.0 361.9 587.5 607.4
Interest bearing debt 2,408.0 4,211.0 4,324.6 4,202.6 4,085.0
Other liabilities 2,525.0 2,269.0 2,264.0 2,405.1 2,577.5 MSCI IVA Risk: Neutral
Total liabilities 5,415.0 7,100.0 6,950.5 7,195.2 7,269.9
Net assets 15,094.0 10,085.0 10,803.0 11,359.3 11,912.1
Ordinary equity 14,975.0 9,945.0 10,643.5 11,174.1 11,703.1
Minority interests 119.0 140.0 159.4 185.2 209.0
Preferred capital 0.0 0.0 0.0 0.0 0.0
Total shareholder funds 15,094.0 10,085.0 10,803.0 11,359.3 11,912.1
Net debt 2,166.0 4,142.0 4,092.9 3,542.7 2,942.3 Source: MSCI IVA Rating
Cashflow 06/12A 06/13A 06/14E 06/15E 06/16E Share Price Performance
EBIT 1,590.0 756.0 657.9 1,032.4 1,119.5
Net interest -31.0 -97.0 -190.9 -244.6 -230.6
Depr & Amort 561.0 611.0 576.6 595.2 619.0
Tax paid -219.0 -162.0 -151.9 -95.2 -95.2
Working capital 183.0 13.0 -75.0 113.2 -15.8
Other -358.0 -414.0 -153.1 -26.6 55.0
Operating cashflow 1,726.0 707.0 663.6 1,374.4 1,451.8
Capex -2,556.0 -1,946.0 -822.0 -770.2 -660.8
Capex - expansionary -1,231.7 -1,322.6 -435.1 -435.2 -325.4
Capex - maintenance -1,324.3 -623.4 -387.0 -335.0 -335.0
Acquisitions & Invest -158.0 -152.0 -72.3 -54.0 -114.0
Asset sale proceeds 0.0 0.0 0.0 0.0 0.0
Other -41.0 -26.0 0.0 0.0 0.0
Investing cashflow -2,755.0 -2,124.0 -894.3 -824.2 -774.8
Dividends paid -405.0 -256.0 0.0 0.0 -76.6
Equity raised 0.0 0.0 0.0 0.0 0.0
Net borrowings 1,543.0 1,379.0 399.4 -122.1 -117.6
Other -48.0 113.0 -7.0 0.0 0.0 1 Month 3 Month 12 Month
Financing cashflow 1,090.0 1,236.0 392.4 -122.1 -194.2 Absolute 29.5% 15.1% -52.7%
Total cashflow 61.0 -181.0 161.7 428.2 482.8 Relative 27.4% 15.9% -59.0%
Adjustments -4.0 8.0 1.0 0.0 0.0
Net change in cash 57.0 -173.0 162.7 428.2 482.8 Source: Reuters 52 week trading range: 6.99-23.10
MSCI IVA Risk Comment: Given performance and rating
provided, feel change in rating in near-term may be unlikely.
14/02/2014 19:36
Newcrest Mining Limited (NCM) is engaged in the exploration, mine development, operations
and the sale of gold and gold/copper concentrate. NCM has exploration and production
operations in Australia, Indonesia, Cote d’Ivoire, Papua New Guinea and Fiji.
Credit Suisse View
TP Risk Comment: No additional ESG downside risk
incorporated into our Target Price outside of already assumed
cost pressure from labour in our modelled assumptions.
0.00
5.00
10.00
15.00
20.00
25.00
30.00
4/02/2013 4/04/2013 4/06/2013 4/08/2013 4/10/2013 4/12/2013 4/02/2014
NCM.AX XJO
1.8
2.8
3.8
4.8
5.8
6.8
Environment Social Governance
Stock Local Sector Country Global Sector
Source: Company data, Credit Suisse estimates

17 February 2014
Australia and NZ First Edition 46
No great surprise in 1H14 result
After a very satisfactory DecQ and 1H operating performance, Newcrest has delivered an
in-line profit result, but a higher debt outcome.
While optically disappointing, the one off unfavourable $200mn working capital increase
and $70mn cash tax payment for prior periods, accounts entirely for the need for the debt
draw for the half. The magnitude of the net debt increase exceeds debt draw, due to FX
re-statement. Gearing is less impacted due to $8bmn of Newcrest's assets being offshore
and USD denominated.
Management indicated the working capital will be more balanced over the year, with an
expectation of a $100mn release in 2H14. The net impact relative to the 1H is potentially a
$370mn turn around. This more than exceeds the expected higher capital expenditure in
2H14 so should deliver a lower year end net debt outcome, subject to metal prices and
production outcome being delivered on plan.
Reserve and resource restatement was significantly more benign than we had expected,
leading to a reduced impairment compared to what might have been if adjustments were
more significant. We had expected Telfer's reserves to be written down to match the
articulated 4-5 year production plan, or to ~3moz from prior 11.6moz. The 4.6moz
adjustment to 6.3moz (reduction of open pit reserves) leaves more than twice the planned
production, suggesting room for a future adjustment or for an extension to the current plan.
It could also be a deferral of the decision to a future period to assist with the optics of
gearing, avoiding a ~$700mn write down of the asset.
The small adjustment to Lihir's reserves of 2.5moz to a still robust 29moz reflects an
increase in the cut-off grade from 0.75g/t to 1g/t which will lead to a reduced stockpile
build and lower grade material tipped as waste. This makes sense, with a recoverable
value of US$32/oz at U$$1,250/oz compared to a future recovery and processing cost of
perhaps $40/t at current operating cost. Clearly management expect costs to decline
further during the stockpile recovery phase, probably from a material reduction in the
admin overhead when mining ceases.
Management sounded materially more relaxed on the call than on prior recent calls,
suggesting a greater level of comfort with the business. This also appeared to be
expressed through comments around the balance sheet, suggesting a "progressive
reduction in gearing over time subject to market and operating conditions". This resonates
with our analysis that indicates that free cash generating increases materially after next
year when the $400mn annual capital investment in Cadia East falls to $100mn and cash
generation from Cadia East rises.
■ Operational NPAT of $207mn, (CS $206mn, 2H13A $131mn, 1H13A $320mn), spot
on our expectations.
■ Statutory profit $40mn after $120mn R&D tax hit and $47mn exploration impairment.
■ Net debt up as expected to $4.5bn, from A$4.143bn (1H $3,106mn), $164mn
attributable FX on USD denominated debt. Available liquidity A$1,250mn (FY13
A$958mn) in cash and undrawn facilities before additional liquidity of US$200mn in
January. This is a good outcome given:
o One off $70mn tax cost
o One off $200mn working capital hit
o Constrained cash generation during ramp up
o Elevated capex while Cadia East development and Lihir remediation capital is
spend.

17 February 2014
Australia and NZ First Edition 47
■ However, we note that the 2H will see higher capital expenditure but more than offset
by higher expected operating cash flow.
■ We also note that 1H net debt could have been worse if projected growth and
sustaining capital had been evenly spread across the year, not skewed to the 2H.
■ Cost cutting evident in reductions in:
o Corporate overheads falling to $40mn (annualised below guidance) from FY13
$132mn (2H $66mn, 1H $66mn). Guidance was that 2H12 should be annualised
for FY13. FY14 guided to be lower at $85-$95m reflecting cost saving initiatives,
office closures and redundancies. FY13 corporate overheads include underlying
$102mn, $22mn depreciation and $8mn equity payments.
o Exploration expenditure and expenses falling to $36mn and $12mn respectively.
■ Weak operating cash flow of $228mnn from (2H13 $482mn, 1H13 $225mn) down on
FY12 $1.726bn and FY11 $1.729bn, reflecting subdued production from the Cadia
Valley and Lihir operations, undermined by weaker metal prices, reduced by increased
capitalised stripping and adverse working capital movements and the tax payment.
Adjusting for working capital and tax, operating cash flow was a robust $498mn.
■ Tax paid $78mn including the adverse $70mn R&D claim reversal (2H $44mn,
1HFY13 $118mn, FY12 $219mn, $107mn in FY11). No longer protected by Australian
tax losses but with on-going R&D deductions reducing the tax rate, but full tax paid in
Indonesia from Gosowong. No Australian tax forecast to be paid this year.
■ Abating capital re-investment of $457mn (FY13 $1,946mn, 2H13 $824mn, 1H 13
$1,122mn including exploration).
■ No dividend as per expectation.
■ The heavy capital investment phase has another year to run at Cadia East in FY15 to
complete panel cave #2. The Lihir remediation, included in sustaining capital, is
completed this year.
Operations profit review
Lihir Island – no visibility of FY15 strategy but expect less stockpile?
The 8Mt of stockpiled ore carries a $55mn accounting charge in addition to a $2/t cost of
handling. This is included in the $675-$735mn cash cost.

17 February 2014
Australia and NZ First Edition 48
Figure 2: Lihir FY14
Milling Stockpile recovery: 80% Mine:
11.5Mtpa 8Mt @ 2.3g/t 3.5Mt @ 2.9g/t
592koz contained 326koz contained
90% recovery
Float 8Mt @ 2.3g/t
8Mtpa 90% recovery 88% recovery
40% mass pull
88% recovery
Autoclave 3.2Mt @ 5.18g/t 3.5Mt @ 2.9g/t
10Mtpa capacity but 6.7Mt utilised 88% recovery 88% recovery
recover 469koz recover 287koz
CIL 756koz
Source: Company data, Credit Suisse estimates
■ $192mn EBITDA (FY13 $540mn EBITDA), 24.4% of group total but on 57.9% group
net operating assets.
■ No additional asset write-down with only trivial adjustment to end of mine life reserves
now excluded from future stockpiles by a higher cut-off grade assumption.
■ FY13 A$3,492mn, US$3,240mn write down of US$3,643mn goodwill based on a
5.25% favourable discount rate (5.5%) but unfavourable reduction in gold multiple
from 1.4 to 1.0x.
■ 1H14 $121mn capex of FY14F $290mn - $320mn (comprising A$140mn-$155mn
stripping Minifie and $150-$165mn in sustaining capital inclusive of the old plant
refurbishment capital). Project capital declines to only $2-5mn.
■ Still no clarity around Kapit/Kapit North East until studies are completed and the cost
and scope of the sea wall are defined. This project will be deferred as long as possible
– possibly by >10 years.
■ 5 year outlook for production and capital not provided but does not include Kapit but
does include additional flotation capital.
■ Site costs up on MOPU plant ramp up and increased mining activity to $391mn in
1H14 (JunQ13 $217mn, MarQ13 $166mn, DecQ12 $144mn, SepQ12 $124mn).
■ 1H depreciation of $263/oz above guided ~$200/oz (FY13 A$206/oz, JunQ $215/oz).
■ 1H14 all in sustaining cost of $1,201/oz on 398,669oz or $479mn at the bottom end of
the FY14F all in sustaining cost of production of A$965-$1,060mn to produce 700-
800koz, an implied cash cost range of $1,206 - $1,514/oz.
■ 1H sustaining capital $37mn.
■ 1H project capex of $6mn excludes the old plant remediation capital carried within
sustaining capex.

17 February 2014
Australia and NZ First Edition 49
Cadia – ramping up as expected – small change to guidance as stockpiles cut
Cadia guidance was marginally reduced with the DecQ with the elimination of low grade
stockpiled tonnes from the production plan. These appeared to remain cash flow positive
to us and this has been confirmed by them remaining in reserves. Initially an implied 8-
10Mt of capacity was available for the treatment of very low grade stockpiles. 1H
stockpiles treated totalled 3.429Mt before cessation of this ore source.
Management has been clear that stockpiles will only be processed where they are cash
flow positive. The Cadia mills will no longer be fully utilised in FY14.
■ $341mn EBITDA, 43.3% of group total or 27.5% group net operating assets.
■ Cadia East on schedule. Commercial production was from 1 January 2013 resulting in
previously capitalised interest now being expensed.
■ Cadia East capex forecast unchanged at $349-$380mn of total site capital of $405-
$445mn, down on FY13 $525mn and A$1,108mn capital spent in FY12.
■ Very confident on ramp up profile with progress ahead of schedule but with cessation
of low grade stockpile treatment, 2H production expected to be a little below 1H
305.5moz of a FY14 guidance figure of 480-530koz.
■ 5 year targeted production of 800koz. No change to plan.
■ On-going development capex of $100mn/yr after $1.3bn of cave development capital
over the next 5 years plus 11 additional $100mn crushers required over balance of
mine life.
■ 1H14 sustaining capital $21.7mn of FY14F site sustaining capital of $50-60mn/yr.
■ 1H14 depreciation of $309/oz, flat on $313/oz in FY13, materially up on FY12 $240/oz
reflecting higher Cadia East capital base and lower FY13F production from low grade
stockpiles.
■ Trivial exploration budget of $1-2mn.
■ 1H14 AISC of $90mn of FY14F all in sustaining cost of production guidance of A$265-
$300mn (after by-product credits) to produce 480-530koz, an implied cash cost range
of $500 - $625/oz.
■ 1H sustaining capital $21mn.
■ Site project capital of $340-$380mn is the only group capital not included in all in
sustaining capital. 1H14 Capex of $141mn is at the low end of capex guidance,
suggesting an elevated 2H.
Bonikro
■ $8mn EBITDA, 1% of group total on 3.2% group net operating assets.
■ Additional $47mn exploration write off on top of the FY13 $480mn write-down
including all of the US$188mn goodwill.
■ Targeted mill expansion from current 2Mtpa to 3.5Mtpa to increase production from
current 100koz/yr to ~225koz/yr at a cash cost of ~US$600-650/oz remains deferred
indefinitely from prior FY16 targeted for expanded production rate, following a year of
ramp up.
■ $120mn capex in FY13 declines to $25-30mn in FY14 including $15-20m stripping (in
all in sustaining costs). 1H capex zero.
■ 1H sustaining capital $2mn.

17 February 2014
Australia and NZ First Edition 50
■ 1H AISC of $63mn at the high end of FY14F for All in sustaining cost of A$105-125mn
to produce 80-95koz suggest a cost range of A$1,147/oz to $1,563/oz.
Telfer – stripping largely complete
■ $135mn EBITDA, 17.1% of group total but on 5.4% group net operating assets.
■ No additional write down of Telfer, despite reserves written down for 11.6moz to
6.3moz after adjustment for depletion. FY13 saw $1,175mn write down reflect a loss of
shareholder funds on a project that failed to deliver on feasibility projections. This book
value reflects real dollars invested in the project that are not expected to be recovered.
■ Production guidance of 400-450koz in FY14 from 525.5koz in FY13.
■ Mine life potentially limited to 4-5 years unless further significant deployment of capital.
Capital is required to produce more than half the written down reserve.
■ Underground production sustainable for 5 years after which a contribution from the
emerging VSC or West Dome Deep is require. Drilling is progressing but the capital
hurdle makes such an investment unlikely.
■ FY14 Capital expenditure of $80-90mn includes $20-25mn for the last of stage 4
stripping included in all in sustaining cost. Zero 1H project capital.
■ 1H sustaining capital $26mn.
■ 1H14 AISC of $291mn at the bottom end of FY14F All in sustaining cost of A$590-
660mn after by-product credits to produce 400-450koz - suggest a cost range of
A$1,311 - 1,475/oz.
■ No guidance granularity on production make up. We have guessed contributions of
underground, open pit and stockpiles.
Gosowong – past its best years
■ $105mn EBITDA, 13.3% of group total but on only 3.6% group net operating assets.
■ Weak FY14 guidance of only 260-320koz but with a stronger 2H on grade expectation.
1H 149koz already above mid-point of guidance and a stronger 2H still forecast.
■ Depreciation rising to 1H14 $335/oz reflecting capex on access to new shoots and
plant debottlenecking.
■ 1H14 $91.77mn site costs, in line with historic run rate (JunQ $51.66mn, MarQ
$46.5mn, DecQ $43.64mn up on lower SepQ $39.6mn, JunQ $42.5mn, MarQ $40mn).
■ FY13 site cost $181.3mn (forecast was $175-$185mn), above FY12 $166mn. JunQ
annualised is 10% above FY13 total.
■ 1HFY14 AISC $151.7mn at the top end of FY14 all in sustaining cost guidance of
$265-290mn to produce 260-320koz, an implied all in cash cost of $828/oz -
$1,115/oz.
■ 1H sustaining capital $37mn.
■ $1mn project capital in 1H14.

17 February 2014
Australia and NZ First Edition 51
Hidden Valley – an amazing turn around
■ $7mn (POSITIVE!) EBITDA, 0.9% of group total, on 2.4% group net operating assets.
■ No additional write down of the FY13 US$380mn write down which confirmed the
deep operational challenges compared with feasibility expectations.
■ Appalling performance continued with a delay to completion of the conveyor head end
crusher. This meant lower production and higher costs until the conveyor can be fully
utilised.
■ Management indicate in June 2013 that their cash subsidy tolerance is~$10mn before
considering care and maintenance. The operation reported a materially better DecQ
AISC of $1,343/oz, being cash flow positive for the Q but cash consuming for the half
with an AISC of $1,627/oz.
■ 1H production of 49.7koz, comfortably in production guidance forecast of 80-105koz
(up 10% on FY13) but remains constrained.
■ The sites issues are not confined to the ore haulage challenges. Grades and
recoveries as also fallen short of feasibility expectations.
■ Depreciation of $323/oz remains high due to constrained production and remedial
capital.
■ Future expansion no longer in plans.
■ 1H14 site costs improved to $82.3mn from JunQ $50.6mn (MarQ $46.7mn, DecQ
$44.1mn, SepQ $40.5mn, JunQ $42.5mn, MarQ $37mn). Costs up on lower
production.
■ FY13 site costs of $182mn exceeded forecast of $155-$165mn. Costs remained
elevated by: poor conveyor performance requiring supplementation by expensive
trucking; poor road conditions, high tyre wear, mining interrupted by rain and fog and
the remoteness of the site.
■ 1H14 AISC of $79.4mn, at the bottom end of FY14F all in sustaining cost of A$160-
$180mn to produce 80-105koz, an implied all in cash cost of $1,523 – $2,250/oz
suggesting very little change of achieving a cash flow neutral outcome relative to
assumed A$1,450/oz. However, this cost guidance includes treatment of stockpiled
ore with a P&L cost in the cash cost guidance. The reduction in guidance granularity
makes it impossible to guess between cash and non-cash in the guidance.
■ 1H sustaining capital $7mn.

17 February 2014
Australia and NZ First Edition 52
Figure 3: Operational EBITDA
0
100
200
300
400
500
600
700
8001Q
09
2Q09
3Q09
4Q09
1Q10
2Q10
3Q10
4Q10
1Q11
2Q11
3Q11
4Q11
1Q12
2Q12
3Q12
4Q12
1Q13
2Q13
3Q13
4Q13
1Q14
2Q14
A$m
n
EBITDA contribution - operations
Cracow ( 70%) Gosowong ( 82.5%) Hidden Valley ( 50%) Telfer ( 100%)Cadia ( 100%) Ridgeway ( 100%) Lihir Island (100%) Mt Rawdon (100%)Bonikro (90%) Wafi Golpu (35%) Namosi (69.94%)
Source: Company data, Credit Suisse estimates

17 February 2014
Australia and NZ First Edition 53
1H14 result detail Profit and loss – as expected
■ 1H14 underlying profit of $207mn (CS $206mn). Statutory profit of $40mn after
$120mn R&D tax smack and $47mn Bonikro exploration impairment.
■ FY13 underlying profit of $451mn (1H $320mn) in line with CS $434mn forecasts.
FY13 statutory loss of $5,778mn as per $6,229mn write down guidance.
■ Favourable tax rate not maintained (FY13 26%, 1H 23%). However, $120mn R&D tax
claim restatement taken in 1H14 with a $70mn cash tax payment.
■ Revenue was 84.7% (FY13 83%, 1H13 85.5%) gold and silver (FY12 86%, 1H 85%),
confirming Newcrest’s position as predominantly a gold company, although there now
appears to be little differentiation between gold and copper companies.
■ Profit reported was clear of any hedge influence.
■ $788mn (FY13 $1,611mn, 1H $843mn) operating EBITDA dominated by:
o Lihir (24.4%) or $192mn (FY13 33.5% at $540mn, 1H $285mn, 34%, FY12
$594mn),
o Cadia Valley (43.3%) or $341mn (FY13 30.5 or $492mn, 1H $198mn, 23%, FY12
$551mn),
o Gosowong (13.3%) or $105mn (FY13 17.3%, $278mn, 1H $166mn, 20%, FY12
$504mn).
o Telfer (17.1%) or $135mn (FY13 16.2%, $261mn, 1H $160mn, 19%, FY12
$409mn).
■ Bonikro and Hidden Valley contribution $8mn (1%) and $7mn (0.9%) respectively.
■ $12mn exploration expensed of $36mn expenditure. FY14 exploration budget of $80-
90mn from FY14 $152mn. In 2HFY13 42% or $64mn of exploration expenditure of
$84mn expensed. (1H13 43% or $33mn of exploration expenditure of $84mn
expensed). FY12 50% or $80mn of exploration expenditure of $158mn expensed.
1H12 50% or $33mn of exploration expenditure of $66mn expensed.
■ Earnings period reflects sub-normal production and cost from Cadia, Hidden Valley
and Lihir.
■ 1H14 corporate overheads $40mn, excluding $14mn corporate depreciation and $4mn
equity based settlements. Corporate overheads reduced significantly to a FY14F of
$85-$90mn from FY13 A$102mn/$132mn (1H $66mn, FY12 $140mn, 1H $66mn, from
FY11 $93mn , FY10 $78mn. FY13 of $132mn Corporate includes $22mn corporate
depreciation and $8mn equity settled share payments.
■ Corporate overheads for the period totalled $40/oz down from FY13 $62/oz (FY12
$61/oz, 1H $57/oz, FY10 $51/oz, 1H10 $44.6/oz, FY09 $42.8/oz).
■ Depreciation $314mn (FY13 $589mn, 1H13 $259mn, FY12 $542mn, 1H $267mn,
FY11 $501mn, FY09 $262mn and FY08 $274mn) reflecting the increasing capital
intensity as new mines replace lower capital intensity old mines and the high capital
intensity of the Lihir assets.
■ Depreciation down to $260/oz from FY13 $290/oz (1H13 $259/oz, 1H $259/oz. FY12
$236/oz, 1H $220/oz) produced, up on FY11 $204/oz from FY10 $175/oz.

17 February 2014
Australia and NZ First Edition 54
Figure 4: EBITDA Margin
39%
32%34%
43%41%
51% 50% 49%
41%
32%
36% 36%
0%
10%
20%
30%
40%
50%
60%
2005 2006 2007 2008 2009 2010 2011 2012 1H'13 2H'13 2013 1H'14
(%)
EBITDA Margin
Source: Company data, Credit Suisse estimates
Figure 5: EBIT Margin
26%
19%21%
31% 31%
40%
38%36%
26%
14%
20% 20%
0%
5%
10%
15%
20%
25%
30%
35%
40%
45%
2005 2006 2007 2008 2009 2010 2011 2012 1H'13 2H'13 2013 1H'14
(%)
EBIT Margin
Source: Company data, Credit Suisse estimates
Cash flow statement – weak cash generation
requires debt draw to fully fund growth and
unforeseen tax payment
■ Operating cash flow of only $228mn (FY13 $707mn, 1H 13 $225mn, FY12 $1,726mn,
1H $1,009mn, FY11 $1,729mn, 1H $922mn).
■ Tax payments of $102mn (FY13 $162mn, 1H13 $118mn, FY12 $219mn, FY11
$107mn, FY10 $74.1mn). Tax payments include the $70mn tax paid for reassessed
R&D claims for past periods.

17 February 2014
Australia and NZ First Edition 55
■ Investing capex down very materially to $457mn dominated by Cadia East panel cave
#2 development.
o Cadia East $141mn
o Lihir $6mn
o Wafi Golpu $14mn
■ FY13 $2,098mn (1H13 $1,038mn, FY12 $2,556mn, 1H $1,329mn).
■ Sustaining capital subset of investing capital of $136mn. Low 1H14 sustaining capital
suggests a significant rise in 2H sustaining capital to reach guidance of $355-$410mn.
o Telfer $26mn
o Cadia Valley $21mn
o Lihir $37mn
o Gosowong $37mn
o Bonikro $2mn
o Hidden Valley $7mn
■ Production stripping consumed $120mn (FY13 $346mn)
o Telfer $24mn
o Lihir $78mn
o Bonikro 9$9mn
o Hidden Valley $9mn
■ Exploration expenditure of $36mn (FY13 $152mn, 1H13 $84mn, FY13 budget $150-
$160mn, FY12 $158mn, 2H12 $92mn, 1H $66mn, FY11 $126mn reflects only 4
months of LGL ownership, FY10 $101.1mn).
■ Zero cash dividends paid versus FY13 $256mn (1H $150mn).
■ Cash short fall funded by $287mn debt draw. FY13 debt draw $1,803mn (1H13
$837mn, FY12 $1,543mn, 1H $744mn debt draw).
Balance sheet – CY15 re-financing dictating
operating strategy?
Focus continues to be largely on Newcrest's balance sheet given June 30 elevated
gearing of 29.1% increased to 30.5% and a gold price that remains below Newcrest's
planning price for a cash neutral outcome (just).
Management have indicated that despite the $70mn tax payment and 1H $200mn working
capital consumption, the year is still expected to be cash neutral and this can be achieved
at a lower gold price than the previously stated A$1,450/oz. Management stress that
costs, production and capex will continue to be actively managed for no worse than a cash
neutral outcome. There is ample evidence that this is occurring:
■ Marginal Cadia East stockpile production has been cut;
■ $68mn sustaining capital in the DecQ and $136mn in the half is well below full year
guidance of $355-$410mn, suggesting a significant 2H sustaining capital expenditure
that perhaps also has production implications;
■ AISC guidance range of $2,450-$2,730mn has been re-guided toward the bottom of
the range, a $140mn saving compared to mid-range; and

17 February 2014
Australia and NZ First Edition 56
■ Production guidance has been guided to the top end of guidance, 150koz above the
mid-point.
It is clear that further changes in operating plans and corporate overheads could be
implemented and are expected (by the market) to be implemented by Sandeep, if not
sooner. These could include:
■ Additional cuts to corporate overheads – we could suggest a few high cost individuals
not critical to near term sustainability
■ Additional cuts to exploration
■ Increased treatment of Lihir stockpiles and reduced mining activity on cut back 9
■ Elimination of other low grade stockpiles that are currently cash positive
■ Cessation of Telfer open pit production and halving of mill capacity
We do not see significant opportunities for reducing growth capital. Growth capital is
dominated by Cadia panel cave 2 development which has a significant positive benefit to
future cash generation.
Separate announcements of the increase of US$450mn (October 17) and US$200mn (Jan
14) in bilateral loan facilities despite the challenging environment, adds significant head
room and demonstrates that lenders appear to have greater confidence in Newcrest’s
balance sheet outlook than the equity market. The equity market was concerned about
Newcrest’s ability to extend existing facilities maturing in Sep 15 and Sep 17 yet NCM has
done better, increasing available facilities.
Management have confirmed that there are no ratings triggers or gearing covenants in any
of Newcrest's debt facilities. All debt costs are fixed or have fixed points relative to libor so
any rating change impacts only the cost of future debt, not existing facilities. Most of
Newcrest’s debt is long term other than $1.2bn which is due in September 2015 and
September 2017. As evidenced by today's new facility, we expect that this debt will be
renegotiated as it has been in the past, albeit at a potentially higher cost reflecting both
higher prevailing rates and the balance sheet deterioration.
A new MD however is a troubling sign for those not inclined to a capital raising, with
perhaps the beginning of his tenure (or that of the Chairman) an opportunity to address the
$4.2bn debt balance. We are always cautious of management changes, as all too often
they have signalled material changes to operations, balance sheet and/or investor
sentiment. We don't propose this is necessarily one of these occasions, but highlight the
risk nonetheless. A new MD and new Chairman who is also new to the board can readily
distance themselves from previous statements made on balance sheet management.
■ Cash balance of $121mn (FY13 $69mn, 1H $97mn, FY12 $242mn, H $265mn) but
debt up to $4,211mn (1H $3,203mn, FY12 $2,408mn,1H $1,601mn).
■ Net debt of $4,517mn (FY13 $4,142mn) but impacted by unfavourable FX restatement
of USD debt ($164mn) plus incremental debt draw ($287mn).
■ Undrawn US$1,210mn facilities available (FY13 US$825mn of US$2.5bn US bilateral
facilities, FY12 US$780mn, 1H US$1,730mn) available with a holding cost/facility fee
estimated to be ~0.75%.
■ All debt is US dollar denominated.
■ Gearing now 30.5% with AUD debt up and assets also up, despite the West African $47mn
impairments. FY13 29.1% (1H 16.9%) up on FY12 12.5%.
■ Gearing target is below 15% and long term target is 10%.

17 February 2014
Australia and NZ First Edition 57
■ Under our more punitive gold and copper price assumptions than prevailing spot,
NCM continues to consume cash (FCF – operating cash flow less capex) in FY14.
This is consistent with 7 June guidance of being FCF neutral given the fall in the gold
price subsequent to this date.
Investment phase end in sight
With the heavy capital reinvestment phase (Lihir expansion and refurbishment, Telfer cut
back and Cadia East development) now largely complete (or deferred), Newcrest moves
naturally to a phase of reduced capital expenditure with no major capital projects other
than completion of:
■ The 5Mtpa Lihir flotation expansion ($300mn) is now complete and in commissioning
phase with commissioning costs in the operating budget
■ The old plant refurbishment ($200mn) with ~$50mn in FY14 within the sustaining
capital forecast of $150-$165mn and $40mn assumed in FY15
■ Cadia East lift 2 development, $340-$380mn in FY14
Discussion on all management calls since the MarQ has made it abundantly clear that any
new capital committed to any Newcrest projects would only be on the basis of sound
returns. This hinted broadly at significant revisions to the August 2012, 5 year plan to be
updated in August 2013. We expected little change from Cadia other than potential
exclusion of some stockpiled ore, but saw potential for further revision of the Lihir plan
compared to the prior plan.
We remain concerned about the sustainability of Telfer in its current form but do see the
potential for extensions beyond our currently assumed 5 year life, but perhaps with the mill
capacity halved using only one of the two parallel mill trains. West Dome Deeps drilling,
while early stage, is to date unconvincing in both grade and width of intersection,
particularly the material capital required to access a potential future resource.
Management has re-affirmed that FY14 total capex will be ~$895mn - $1025mn, down
from ~$2bn in FY13, with Cadia East the only development capital project.

17 February 2014
Australia and NZ First Edition 58
Figure 6: Production forecast and actual
FY11
Actual
FY12
Original
Guidance
FY12A FY13
Guidance
FY13 #1
revised
Guidance
FY13 #2
revised
Guidance
FY13A FY14
Guidance
Gold Production koz koz koz koz koz koz koz koz koz
Cadia Valley 515 550 – 580 473,195 400 - 500 450 - 470 no change 447 480 530
Lihir 791 815 – 850 604,336 700 - 900 726 - 746 620 - 680 649 700 800
Telfer 621 575 – 610 540,115 500 - 600 549 - 559 no change 526 400 450
Gosowong 463 455 – 465 439,384 375 - 425 351-361 300 - 325 313 260 320
Hidden Valley 100 115 – 135 88,801 100 - 120 88-98 80 - 90 85 80 105
Bonikro 50 95 – 105 92,102 100 - 110 104 - 114 no change 90 80 95
Cracow 71 70 – 75 divested divested divested divested divested divested divested
Mt Rawdon 90 100 – 105 divested divested divested divested divested divested divested
Total Gold Production 2,702 2,775 –
2,925
2,286 2,300 -
2,500
2,268 -
2,378
2,000 -
2124
2109.784 2000 2300
Copper Production kt kt kt kt kt kt kt kt kt
Cadia Valley 44 45 – 50 45 53 - 58 53 - 58 54 - 58 54 60
Telfer 32 30 – 35 31 22 - 27 22 - 27 23 - 27 26 20
Total Copper Production 76 75 - 85 76.015 75 - 85 75 - 85 76 - 85 80 75 85
Silver Production 1,921 koz 2,500 –
2,750 koz
1,997.25 2,380 -
2,630
2,380 -
2,630
2,380 -
2,631
1,932 1,200 1,500
Source: Company data, Credit Suisse estimates

17 February 2014
Australia and NZ First Edition 59
Earnings changes Figure 7: Earnings changes
FY15
Old 1H14 2H14 New % change Old New % change Old New % change
Total Revenue A$mn 3,869 2,016 1,809 3,825 -1% 4,223 4,223 0% 4,229 4,229 0%
Cracow EBIT A$mn - - - - - - - - - - -
Gosowong EBIT A$mn 131 57 68 125 -5% 169 152 -10% 155 134 -14%
Hidden Valley EBIT A$mn 21- 10- 10- 20- 3% 22- 22- 0% 21- 21- 0%
Telfer EBIT A$mn 105 99 7 106 1% 74 70 -5% 55 49 -11%
Cadia EBIT A$mn 145 86 60 146 1% 488 488 0% 811 811 0%
Ridgeway EBIT A$mn 259 146 114 260 0% 193 193 0% - - -
Wafi - Golpu Revenue - - - - - - - - - - -
Lihir Island EBIT A$mn 188 109 83 192 2% 283 283 0% 281 281 0%
Mt Rawdon EBIT A$mn - - - - - - - - - - -
Bonikro EBIT A$mn 18- 10- 7- 18- 2% 11- 11- 0% 3 3 0%
Other EBIT A$mn 11- 18- 5- 23- -104% 10- 9- 9% 9- 8- 9%
Corporate A$mn 89- 44- 44- 88- 1% 95- 95- 0% 95- 95- 0%
Exploration A$mn 25- 12- 12- 24- 5% 16- 16- 0% 34- 34- 0%
EBITDA A$mn 1,223 731 504 1,235 1% 1,628 1,628 0% 1,738 1,738 0%
Depreciation & Amortisation A$mn 559- 327- 250- 577- -3% 575- 595- -4% 593- 619- -4%
EBIT A$mn 664 404 254 658 -1% 1,053 1,032 -2% 1,146 1,119 -2%
Net Interest A$mn 219- 88- 112- 200- 9% 242- 240- 1% 230- 222- 3%
NPBT A$mn 445 316 142 458 3% 811 793 -2% 916 897 -2%
Taxation A$mn 132- 100- 42- 142- -7% 242- 236- 2% 273- 268- 2%
Minorities A$mn 22- 9- 11- 20- 6% 29- 26- 11% 27- 24- 13%
NPAT (operating) A$mn 291 207 89 296 1% 540 531 -2% 615 606 -2%
EPS (operating) A¢ 38 27 12 39 1% 71 69 -2% 80 79 -2%
FY16FY14
Source: Company data, Credit Suisse estimates
Our earnings forecasts continue to be driven by a spot scenario using US$1,230/oz gold,
US$3.30/lb Cu and 0.90 AUDUSD. This is reviewed typically on a quarterly basis.

17 February 2014
Australia and NZ First Edition 60
Figure 8: Key data summary - NCM Market Data P&L (A$mn) FY12 A FY13 E FY14 E FY15 E FY16 E
Ticker NCM.AX Total revenues 4416 3775 3825 4223 4229
Share price 16-Jul-13 A$ 11.05 Total operating expenses -2265 -2408 -2591 -2596 -2491
Target price A$ 8.20 EBITDA 2151 1367 1235 1628 1738
Rating UNDERPERFORM Depreciation and amortisation -561 -611 -577 -595 -619
Return to target price % -26% EBIT 1590 756 658 1032 1119
Market cap mn 8,470 Finance cost -41 -109 -200 -240 -222
Shares on issue mn 767 Profit before tax 1549 647 458 793 897
Year end 30-Jun Tax -406 -165 -142 -236 -268
Outside equity interest -59 -31 -20 -26 -24
Company Background Underlying NPAT 1084 451 296 531 606
Net significant items (post tax) 33 -6229 -191 -8 -2
Reported NPAT 1117 -5778 105 522 604
Valuation Data A$m A$/sh Balance Sheet (A$mn) FY12 A FY13 A FY14 E FY15 E FY16 E
Bonikro 56 0.07 Cash 242 69 232 660 1143
Cadia 6281 8.20 Receviables 251 178 217 397 410
Gosowong 552 0.72 Inventories 748 946 724 656 679
Hidden Valley 0 0.00 Other current assets 223 232 194 199 207
Lihir Island 2081 2.72 Current Assets 1464 1425 1367 1912 2439
Namosi 0 0.00 Plant & Equipments 4364 5544 5944 6194 6312
Ridgeway 289 0.38 Intangibles 3852 550 546 537 529
Telfer 94 0.12 Other non current assets 0 0 0 0 0
Wafi-Golpu 636 0.83 Total Assets 20509 17185 17753 18554 19182
O'Callaghans 50 0.07 Payables 482 620 362 588 607
Evolution stake 194 0.25 Borrowings 2408 4211 4325 4203 4085
Lihir end of life capitalised rsvs 1,100 1.44 Other liabilities 2525 2269 2264 2405 2577
Net Debt Dec 31, 2013 -4,517 -5.90 Total Liabilities 5415 7100 6950 7195 7270
Corporate -629 -0.82 Net Assets 15094 10085 10803 11359 11912
Total 6,187 8.08 Net Tangible Assets 11242 9535 10257 10822 11383
P/NPV 1.37x
Cash Flow (A$mn) FY12 A FY13 A FY14 E FY15 E FY16 E
Assumptions FY12 A FY13 A FY14 E FY15 E FY16 E
Operating Cash Flow 1726 707 664 1374 1452
Copper (Cu) US$/lb 3.70 3.42 3.27 3.30 3.30 Maintenance Capex -1324 -623 -387 -335 -335
Gold (Au) US$/oz 1,673 1,609 1,269 1,230 1,230 Free Cash Flow 402 84 277 1039 1117
Silver (Ag) US$/oz 34.2 30.3 20.8 20.0 20.0 Expansion Capex -1232 -1323 -435 -435 -325
AUDUSD x 1.03 1.02 0.91 0.90 0.90 Exporation Expenditure -158 -152 -72 -54 -114
Other investing cash flow -41 -26 0 0 0
Production Profile FY12 A FY13 A FY14 E FY15 E FY16 E Investing Cash Flow -2755 -2124 -894 -824 -775
Financing Cash Flow 1090 1236 392 -122 -194
Reserves - P&P (contained gold) Net change in cash -1263 -804 -225 93 148
Bonikro koz 1014 1301 1442 1348 1258
Cadia koz 24251 23980 26520 25933 25063 Ratios FY12 A FY13 A FY14 E FY15 E FY16 E
Gosowong koz 1340 950 772 454 135
Hidden Valley koz 3408 3470 3276 3056 2836 Per share ratios
Lihir Island koz 30731 32004 28587 28227 27880 Dividends per share cps 35.0 12.0 0.0 0.0 20.0
Ridgeway koz 2332 2004 1723 1472 1472 Underlying EPS - Basic cps 141.7 58.9 38.6 69.3 79.1
Telfer koz 11373 11236 6085 5513 4962 Underlying EPS - Diluted cps 141.5 58.9 38.6 69.3 79.1
Resources - M&I (contained gold) Reported EPS - Basic cps 146.0 -754.5 13.7 68.2 78.9
Bonikro koz 1795 1867 1942 1849 1759 Reported EPS - Diluted cps 145.8 -754.5 13.7 68.2 78.9
Cadia koz 35575 37965 37913 37326 36457 NAV per share ps 19.7 13.2 14.1 14.8 15.6
Gosowong koz 1626 1327 1006 688 369 NTA per share ps 14.7 12.5 13.4 14.1 14.9
Hidden Valley koz 5433 6023 5256 5036 4817
Lihir Island koz 51881 53990 51172 50282 49380 Price ratios
Ridgeway koz 2793 2664 2295 2044 2044 Payout Ratio % 25% 20% 0% 0% 25%
Telfer koz 18877 17947 12831 12260 11709 Dividend yield % 3.2% 1.1% 0.0% 0.0% 1.8%
Production - (attributable gold) P/BV x 0.6 x 0.8 x 0.8 x 0.7 x 0.7 x
Bonikro koz 92 90 82 88 86 P/NTA x 0.8 x 0.9 x 0.8 x 0.8 x 0.7 x
Cadia koz 250 185 231 527 778
Gosowong koz 439 313 297 302 302 Profitability ratios
Hidden Valley koz 89 85 99 95 95 EBITDA margin % 49% 36% 32% 39% 41%
Lihir Island koz 604 649 757 858 869 EBIT margin % 36% 20% 17% 24% 26%
Ridgeway koz 223 262 299 203 0 NPAT margin % 25% 12% 8% 13% 14%
Telfer koz 540 526 504 419 403 Tax rate % 26% 26% 31% 30% 30%
Total koz 2,238 2,110 2,270 2,492 2,533 EBITDA growth (pcp) % 5% -36% -10% 32% 7%
Total Cash Cost (incl. royalties) EBIT growth (pcp) % 3% -52% -13% 57% 8%
Bonikro US$/oz 925 1,005 1,044 937 964 NPAT growth (pcp) % 23% -617% -102% 399% 16%
Cadia US$/oz 482 386 405 127 21 EPS Growth % -4% -58% -34% 79% 14%
Gosowong US$/oz 417 635 640 534 549
Hidden Valley US$/oz 1,294 1,643 1,174 1,188 1,167 Gearing ratios
Lihir Island US$/oz 575 700 843 747 754 Net Debt (cash) A$m 2166 4142 4093 3543 2942
Ridgeway US$/oz 393 455 177 149 0 Net Debt / Equity % 14% 41% 38% 31% 25%
Telfer US$/oz 806 1,045 931 970 1,001 Net Debt / (Equity+Net Debt) % 13% 29% 27% 24% 20%
Group Cash Cost US$/oz 634 768 725 602 566
Source: Company Data, Rave, Bloomberg
Newcrest Mining Limited (NCM) is engaged in the exploration, mine development, operations and the sale of gold
and gold/copper concentrate. NCM has exploration and production operations in Australia, Indonesia, Cote
d’Ivoire, Papua New Guinea and Fiji.
Source: Company data, Credit Suisse estimates

Australia and NZ First Edition 61
17 February 2014
Asia Pacific/Australia
Equity Research
Diversified Metals & Mining (Gold (AU))
Perseus Mining
(PRU.AX / PRU AU) DOWNGRADE RATING
Low key 1H14 result, but a loss
■ $4mn 1H14 loss, better than we forecast ($14mn loss) but largely explained
by an $8.3mn FX gain we hadn’t accounted for.
■ $16mn cash available and no debt, but this provides little comfort in the
context of the 1H operating cash consumption of $1.8mn before investing
cash consumption of $17.8mn. 1H cash consumption was minimised by
drawing part of the mill feed from stockpile to avoid investing significant
capital in pre-stripping to access higher grade ore.
■ Liquidity outlook will depend on operation stability and gold price, with
improved ore grades expected as mining progresses, lifting cash generation.
Progress with Ghanaian government discussion has confirmed that at least
a portion of the VAT refund will be achieved with 60mn Ghanaian cedi
(~$23mn USD) agreed to be able to be used to offset future royalties/taxes,
a benefit to cash flow. This is ~half of the VAT rebate that PRU believe they
are entitled to but have not yet received. A cash component is expected in
the final settlement and administration changes are hoped to stop the VAT
receivable from increasing in future.
■ Cost reduction initiatives implemented during the 1H reduced all-in site costs
and are expected to have an increased full period benefit in the 2H.
Management continue to project an all-in site cash cost of US$937/oz for
230koz/yr over 10 years to 2024.
■ Valuation: A lot has to go right for Perseus to prosper. Our target price
(unchanged) is undermined by punitive gold price assumptions, suggesting
and unattractive risk-reward equation. Rating moves to Underperform given
the recent share price strength.
Total return forecast in perspective
Mean^CSEC tgt^
Sh Prc
-80%
-30%
20%
70%
120%
170%
220%
270%
320%
12mth Volatility* 52wk Hi-Lo IBES Consensustarget return^
Performance over 1M 3M 12M
Absolute (%) 38.4 29.5 -71.9
Relative (%) 36.2 30.3 -78.2
Financial and valuation metrics
Year 06/13A 06/14E 06/15E 06/16E
Revenue (A$mn) 293.6 279.9 320.7 342.6
EBITDA (A$mn) 86.8 41.7 52.8 48.9
EBIT (A$mn) 66.5 4.5 16.2 7.2
Net income (A$mn) 38.4 2.2 9.8 2.4
EPS (CS adj.) (Ac) 8.38 0.48 2.15 0.52
Change from previous EPS (%) n.a. n.m n.m -3.5
Consensus EPS (Ac) n.a. -0.90 4.70 3.90
EPS growth (%) -20.8 -94.3 348.6 -75.6
P/E (x) 6.0 105.6 23.5 96.6
Dividend (Ac) — — — —
Dividend yield (%) — — — —
P/B (x) 0.49 0.48 0.47 0.47
Net debt/equity (%) net cash net cash net cash net cash
Relative performance versus S&P ASX 200. See Reference Appendix for a description of the chart. Source: Credit Suisse estimates, * Consensus, mean range from Thomson Reuters.
Source: Company data, ASX, Credit Suisse estimates, * Adj. for goodwill, notional interest and unusual items. Relative P/E
against ASX/S&P200 based on pre GW in AUD. Company PE calculation is based on displayed EPS Currency
Rating (from Outperform) UNDERPERFORM* [V]
Price (14 Feb 14, A$) 0.50
Target price (A$) 0.50¹
Market cap. (A$mn) 231.27
Yr avg. mthly trading (A$mn) 75
Last month's trading (A$mn) 73
Projected return:
Capital gain (%) -0.99
Dividend yield (net %) —
Total return (%) -0.99
52-week price range 1.92 - 0.22
* Stock ratings are relative to the relevant country
benchmark.
¹Target price is for 12 months.
[V] = Stock considered volatile (see Disclosure Appendix).
Research Analysts
Michael Slifirski
61 3 9280 1845
Sam Webb
61 3 9280 1716

17 February 2014
Australia and NZ First Edition 62
Figure 1: PRU Financial Summary
Perseus Mining (PRU) Year ending 30 Jun In AUDmn, unless otherwise stated2012 2013 2014 2015 2016 2012 2013 2014 2015 2016
Share Price: A$0.51 Earnings 06/12A 06/13A 06/14E 06/15E 06/16ERating UNDERPERFORM c_EPS_SHARESEquiv. FPO (period avg.) mn 448.3 458.0 458.0 458.0 458.0
Target Price A$ 0.50 c_EPS*100EPS (Normalised) c 10.6 8.4 0.5 2.1 0.5
vs Share price % -0.99 EPS_GROWTH*100EPS Growth % -20.8 -94.3 348.6 -75.6
DCF A$ 0.62 c_EBITDA_MARGIN*100EBITDA Margin % 46.6 29.6 14.9 16.5 14.3
c_DPS*100DPS c 0.0 0.0 0.0 0.0 0.0
c_PAYOUT*100Payout % 0.0 0.0 0.0 0.0 0.0
FRANKING*100Franking % 0.0 0.0 0.0 0.0 0.0
c_FCF_PS*100Free CFPS c 8.9 5.6 0.3 5.5 2.2
Profit & Loss 06/12A 06/13A 06/14E 06/15E 06/16E c_TAX_RATE*100Effective tax rate % 12.7 32.7 21.5 35.0 50.3
Sales revenue 155.3 293.6 279.9 320.7 342.6 ValuationEBITDA 72.3 86.8 41.7 52.8 48.9 c_PEP/E x 4.8 6.0 105.6 23.5 96.6
Depr. & Amort. (10.2) (20.2) (37.1) (36.6) (41.7) c_EBIT_MULTIPLE_CURREV/EBIT x 3.0 2.9 45.9 11.7 26.1
EBIT 62.2 66.5 4.5 16.2 7.2 c_EBITDA_MULTIPLE_CUEV/EBITDA x 2.6 2.3 5.0 3.6 3.9
Associates 0.0 0.0 0.0 0.0 0.0 c_DIV_YIELD*100Dividend Yield % 0.0 0.0 0.0 0.0 0.0
Net interest Exp. (1.1) (2.9) (0.7) 0.5 0.8 c_FCF_YIELD*100FCF Yield % 17.7 11.1 0.7 11.0 4.4
Other 0.0 0.0 0.0 0.0 0.0 c_PBPrice to Book x 0.6 0.5 0.5 0.5 0.5
Profit before tax 61.1 63.6 3.8 16.7 8.0 ReturnsIncome tax (7.8) (20.8) (0.8) (5.8) (4.0) c_ROE*100Return on Equity % 13.2 8.1 0.5 2.0 0.5
Profit after tax 53.3 42.8 3.0 10.8 4.0 c_I_NPAT/c_I_SALES*100Profit Margin % 30.5 13.1 0.8 3.1 0.7
Minorities (5.3) (3.1) (0.8) (1.0) (1.6) c_I_SALES/c_B_TOT_ASSAsset Turnover x 0.3 0.5 0.5 0.5 0.6
Preferred dividends 0.0 0.0 0.0 0.0 0.0 c_ASSETS/c_EQ_COMMONEquity Multiplier x 1.5 1.2 1.2 1.3 1.3
Associates & Other (0.6) (1.4) 0.0 0.0 0.0 c_ROA*100Return on Assets % 9.0 6.5 0.4 1.6 0.4
Normalised NPAT 47.4 38.4 2.2 9.8 2.4 c_ROIC*100Return on Invested Cap. % 17.3 10.0 0.8 2.3 0.8
Unusual item after tax (0.3) 0.1 0.0 0.0 0.0 GearingReported NPAT 47.2 38.4 2.2 9.8 2.4 c_GEARING*100Net Debt to Net debt + Equity % Net Cash Net Cash Net Cash Net Cash Net Cash
c_NET_DEBT/c_I_EBITDANet Debt to EBITDA x Net Cash Net Cash Net Cash Net Cash Net Cash
Balance Sheet 06/12A 06/13A 06/14E 06/15E 06/16E c_I_EBITDA/ c_I_NET_INTERESTInt Cover (EBITDA/Net Int.) x 66.8 29.5 59.1 -109.7 -63.3
Cash & equivalents 105.5 35.5 22.7 42.3 42.5 c_I_EBIT/ c_I_NET_INTERESTInt Cover (EBIT/Net Int.) x 57.4 22.6 6.5 -33.7 -9.4
Inventories 37.3 30.7 17.2 16.4 23.0 (c_C_CAPEX/c_I_SALES)*-100Capex to Sales % 82.2 13.1 7.7 5.6 5.5
Receivables 10.5 8.2 11.5 11.5 19.7 (c_C_CAPEX/c_I_DEPR)*-100Capex to Depreciation % 1,256.0 189.8 58.1 48.8 45.5
Other current assets 5.6 12.9 11.6 10.0 10.1
Current assets 159.0 87.3 63.0 80.2 95.3 MSCI IVA (ESG) Rating Property, plant & equip. 287.8 367.4 391.2 372.5 349.8 TP ESG Risk (%): 0
Intangibles 0.0 0.0 0.0 0.0 0.0
Other non-current assets 82.2 135.0 141.6 165.0 175.0
Non-current assets 370.0 502.4 532.8 537.5 524.8
Total assets 529.0 589.6 595.8 617.7 620.1
Payables 31.7 53.1 45.9 52.4 49.2
Interest bearing debt 60.3 0.0 0.0 0.0 0.0
Other liabilities 77.1 55.2 56.9 61.4 62.9 MSCI IVA Risk: Positive
Total liabilities 169.1 108.3 102.7 113.8 112.1
Net assets 359.9 481.3 493.1 503.9 507.9
Ordinary equity 360.5 472.3 483.0 492.9 495.3
Minority interests -0.6 9.1 10.1 11.1 12.7
Preferred capital 0.0 0.0 0.0 0.0 0.0
Total shareholder funds 359.9 481.3 493.1 503.9 507.9
Net debt -45.2 -35.5 -22.7 -42.3 -42.5 Source: MSCI IVA Rating
Cashflow 06/12A 06/13A 06/14E 06/15E 06/16E Share Price Performance
EBIT 62.2 66.5 4.5 16.2 7.2
Net interest -0.8 -2.8 -0.2 0.4 0.7
Depr & Amort 10.2 20.2 37.1 36.6 41.7
Tax paid 0.0 0.0 0.0 -1.3 -9.9
Working capital -35.8 30.3 3.0 7.4 -18.0
Other 7.3 -67.6 -25.5 -15.9 7.4
Operating cashflow 43.1 46.7 18.9 43.2 29.1
Capex -127.7 -38.4 -21.5 -17.8 -19.0
Capex - expansionary -124.6 -17.4 -4.2 0.0 0.0
Capex - maintenance -3.1 -21.1 -17.3 -17.8 -19.0
Acquisitions & Invest -29.4 -13.4 -10.2 -5.8 -10.0
Asset sale proceeds 0.0 0.0 0.1 0.0 0.0
Other 54.0 -6.9 -0.2 0.0 0.0
Investing cashflow -103.1 -58.7 -31.8 -23.6 -29.0
Dividends paid 0.0 0.0 0.0 0.0 0.0
Equity raised 89.1 0.0 0.0 0.0 0.0
Net borrowings -21.2 -60.6 0.0 0.0 0.0
Other 0.6 0.0 0.0 0.0 0.0 1 Month 3 Month 12 Month
Financing cashflow 68.5 -60.6 0.0 0.0 0.0 Absolute 38.4% 29.5% -71.9%
Total cashflow 8.4 -72.6 -12.9 19.6 0.1 Relative 36.2% 30.3% -78.2%
Adjustments 0.6 2.6 0.1 0.0 0.0
Net change in cash 9.0 -70.0 -12.8 19.6 0.1 Source: Reuters 52 week trading range: 0.22-1.92
MSCI IVA Risk Comment: Recent downgrrade to 'B' rating reflects
poor biodiversity and land use, health & safety scores. Given the
project is in early stages, as production ramps up at Edikan in
Ghana, we expect an increased focus by management on
addressing these issues in future.
11/02/2014 17:52
Perseus Mining Limited (PRU) focuses on exploration and operating gold deposits in West
Africa. PRU’s sole operating asset, the Edikan Gold Mine in Ghana, reached commercial
production on 1 January, 2012.
Credit Suisse View
TP Risk Comment: No incorporation of ESG concerns outside
sector-wide cost inflation (current and forecast) in our current
Target Price. Forecasts include conservative cost assumptions to
somewhat account for perceived (actual or otherwise) geopolitical
risk of West African operators.
0.00
0.50
1.00
1.50
2.00
2.50
4/02/2013 4/04/2013 4/06/2013 4/08/2013 4/10/2013 4/12/2013 4/02/2014
PRU.AX XJO
1.8
2.8
3.8
4.8
5.8
6.8
Environment Social Governance
Stock Local Sector Country Global Sector
Source: Company data, Credit Suisse estimates

17 February 2014
Australia and NZ First Edition 63
View
PRU has delivered an earnings loss, as expected, but less than we had forecast. The
main difference between our projected loss and the smaller loss delivered was an FX
benefit that we are unable to forecast.
PRU's 1H struggled with higher costs and downgraded production (FY14 unchanged).
Both line items should improve in the second half, delivering a higher 2H EBITDA to offset
depreciation, but we've said this before. It is clear that underlying losses (the first since
FY11) need to be rectified but a sticky cost base remains. In fact 1H14 USD cash costs
were actually flat on 2H FY13 (~US$115mn).
Management continue to be frustrated by the challenge of removing costs from the
operation and achieving operational reliability and stability. Certainly operational
performance appears to have improved and now cost achievement should be less of a
challenge. Removing costs when fighting to maintain production has been a challenge. It
is difficult to forecast the pace at which costs abate.
Given the existing cost base, it is difficult to have a compelling positive view on PRU under
our punitive gold price assumptions. CS official house forecasts are indicating gold to fall
under US$1,000/oz in the DecQ this year. Under this scenario, Edikan in unviable. We
(Australian Gold research team) don't entertain the same belief for the trajectory of the
gold price, but the breakeven status of the operation is no doubt a concern and
compresses our cash flow generation modelling.
One of the challenges is that the ounces just aren't coming out of the operation that was
once projected.
■ 8.1Mtpa processing rate, now 7.5Mtpa (although 8Mtpa is still believed achievable)
■ 90%-92% recoveries, now (DecQ) 84.4% and best quarter only 87.7% (SepQ12)
■ Head grade for years 1-3 previously expected to be >1.2g/t, now (DecQ) 1g/t
The operation has failed to deliver the grade or recovery projected and Ghanaian
operating costs and labour productivity have not met expectation. This has been
exacerbated by the unforeseen cash flow impost of the un-rebated (to date) VAT.
Result commentary
■ 1H14 underlying NLAT $4.024mn, a better outcome than our forecast for a loss of
$14mn. This was the first half delivering an underlying earnings loss since 2H FY11.
■ Adjusted result was largely in line with our estimates
o FX gain of $8.3mn (not modelled but recognised as a variable risk to our number).
■ Forecasting of FX gains remains difficult. No detailed guidance is provided despite this
being our largest missed forecast item across many reporting periods.
■ A$ cash available cash $16.016mn. In addition, $10.634mn supports environmental
performance guarantees.
■ 8,984oz of bullion (A$13mnm) on account at the refinery but not yet in reflected in
cash.

17 February 2014
Australia and NZ First Edition 64
■ DecQ gold production of 48.36koz, up on the SepQ 45.83koz and met DecH guidance
of 91-101koz. Production forecast for 2H FY14 unchanged at 99-109koz at an all-in
site cost of US$1,050-1,250/oz for an unchanged full year forecast of 190-210koz at
US$1,000-1,250oz. This excludes any VAT charge that may or may not be rebated,
off site exploration and corporate overheads ($18mn/yr).
■ Australian dollar cash (and bullion) balance up $0.9mn on SepQ to $28.2mn, but
helped by period end currency being 4c more favourable versus SepQ end. US$ cash
and bullion actually fell slightly quarter on quarter.
■ Group cash flow generation remains constrained by elevated costs. However, good
progress has been made on unit costs: Mining declined to $3.71 ($4.16/t), and
processing to $10.77/t ($11.61/t). G&A at $1.62/month ($1.63) is below the $2/month
plan.
■ SepQ result flipped the 1H v 2H production guidance, so the 2H should deliver
stronger production numbers and this should drive dollar per ounce cash costs down.
Group FY14 all-in site cash cost guidance of US$1,050-$1,250/oz unchanged, but
revised up US$50/oz at SepQ result versus previous guidance.
■ 44,617oz gold sold less than 48,360oz production. Average price achieved of
US$1,318/oz exceeded spot $1,271/oz, benefiting from hedging.
■ Gold hedging covers 124,000oz at an average price of US$1,463/oz, in the money by
US$31.6mn.
VAT progress
VAT rebate discussions with the Ghanaian government are reported as making progress
on the ~US$39mn receivable.
The Government is to issue US$25.4mn of Treasury credit notes and are discussing a
cash component in the final settlement mix. In addition, discussions progressing aimed at
ensuring that the VAT receivable does not increase in future. VAT has been charged on
the mining contract at a rate of $8-10mn/q and is not reflected in the quoted c1 cash cost.
We note that the VAT receivable increased in the DecQ from a closing balance at the end
of the SepQ of from SepQ GHC 86.4mn (US$39.2mn) to a marginal increase at the end of
the DecQ of GHC 93mn (US$39.4mn).
The proposed Treasury Credit Notes are to apply to any liability that is due and payable to
the government, i.e. royalties as well as taxes. This instrument is expected to have a cash
flow impact of US$5-6M per quarter, when implemented. Over and above this instrument,
a final cash settlement is being negotiated for the GHC30M outstanding.
PRU now expect to recover the full amount of the VAT and do not expect to see the VAT
receivable build in future, permanently improving cash flow.
PRU's operating costs are expressed ex-VAT so have not been included other than as an
unfavourable movement in working capital (to date). This should reverse. The VAT
receivable had been growing at GHC10mm/q.

17 February 2014
Australia and NZ First Edition 65
1H14 by numbers
■ 1H14 NPAT a loss of $4.024mn.
o FY13 NPAT (attributable) $38.37mn (1H13 $28.2mn) reported NPAT
(attributable).
■ $5.164mn exploration expenditure.
■ Net operating cash flow consumption of $1.782mn (1H13 $31.8mn, FY14 $46.7mn).
■ Total cash consumption $19.593mn.
■ No debt.
■ $16mn available cash.
■ $13mn bullion awaiting sale.
■ $31.6mn positive marked to market hedge book.
■ $39.4mn VAT receivable.
Earnings changes
Figure 2: Earnings changes
Old 1H14 2H14 New % chg. Old New % chg. Old New % chg.
Edikan revenue A$mn 275 133 143 277 0% 305 305 0% 328 328 0%
Tengrela revenue A$mn - - - - - - - - - - -
Other revenue (includes hedging gain/loss) A$mn 1- 2 1 3 563% 16 16 0% 14 14 0%
Total Revenue A$mn 275 135 145 280 2% 321 321 0% 343 343 0%
Edikan EBITDA A$mn 41 10 32 42 3% 55 55 0% 53 53 0%
Tengrela EBITDA A$mn - - - - - - - - - - -
Other EBITDA A$mn 1- 28 1 29 4155% 16 16 0% 14 14 0%
Corporate & other expenses/ income A$mn 18- 21- 9- 30- -66% 18- 18- 0% 18- 18- 0%
Exploration A$mn - - - - - - - - - - -
EBITDA A$mn 22 17 25 42 87% 53 53 0% 49 49 0%
Depreciation & Amortisation A$mn 30- 21- 16- 37- -22% 37- 37- 0% 42- 42- 0%
EBIT A$mn 8- 4- 8 5 157% 16 16 0% 7 7 0%
Net Interest A$mn 1 1- 0 1- -228% 1 0 -11% 1 1 -12%
NPBT A$mn 7- 5- 8 4 151% 17 17 0% 8 8 -1%
Taxation A$mn - 1 1- 1- - 3- 6- -80% 4- 4- 0%
Minorities A$mn 1- 0 1- 1- -12% 1- 1- 0% 2- 2- 0%
Share of net profit from associate A$mn - - - - - - - - - - -
NPAT (operating) A$mn 8- 4- 6 2 127% 12 10 -21% 2 2 -4%
EPS (operating) A$/sh 0.02- 0.01- 0.01 0.00 127% 0.03 0.02 -21% 0.01 0.01 -4%
FY15 FY16FY14
Source: Company data, Credit Suisse estimates

Australia and NZ First Edition 66
17 February 2014
Asia Pacific/Australia
Equity Research
Diversified Metals & Mining (Diversified Resources (AU))
Rio Tinto (RIO.AX / RIO AU) INCREASE TARGET PRICE
Strong result, conservative guidance
■ Headline numbers, all positive: Underlying earnings beat - $10.2bn v CS
$10.2bn and consensus $9.7bn, driven by savings in coal and aluminium.
Cost cutting beat with $2.3bn of cost reductions, 15% ahead of the 2013
target. Dividend beat at 192cps or 15% increase, in-line with CS but well
ahead of consensus expectation of 181cps (8%). Net debt much lower,
$18.1bn v CS $18.3bn and consensus $21bn. Capex came in at $12.9bn in
2013 and RIO confirmed guidance for 2014 at <$11bn and 2015 of ~$8bn.
■ Multiple impairment charges and one-offs for net earnings at $3.7bn:
The interesting ones were a $696m charge to the Kitimat ali smelter on a
capex overrun and restructuring costs of $367m (4000 staff reductions).
■ Iron ore production guidance for 2014 is 295mt (global, 100% basis).
This is below consensus at 305mt and CS at 311mt. Despite rainfall, we
view the guidance as conservative - we expect that Rio will do a little better
than guidance and assume 300mt production with 5mt of inventory sales.
Other guidance also soft, with 570kt mined and 260kt refined copper below
consensus at 615kt and 280kt. Guidance for 1.5mt TiO2 in FY14 is well
below capacity at 1.8mt.
■ Earnings and valuation, EPS down <1% as the 10mt lower iron ore
production (~$400m NPAT) and 2% higher tax rate ($300m) are offset by cost
savings in the coal and ali divisions. Our DCF increases to A$83.5/sh from
A$78.5/sh on model roll forward ($2/sh), lower pension liabilities ($2/sh) and
lower coal/ali costs ($1/sh). We raise our target price to A$80/sh (from
A$75/sh) and £42/sh (from £40/sh) and retain our OUTPERFORM rating.
Total return forecast in perspective
Mean^CS tgt^
Sh Prc
-30%
-20%
-10%
0%
10%
20%
30%
40%
12mth Volatility* 52wk Hi-Lo IBES Consensustarget return^
Performance over 1M 3M 12M
Absolute (%) 7.1 3.5 -3.7
Relative (%) 5.2 5.3 -9.8
Financial and valuation metrics
Year 12/12A 12/13E 12/14E 12/15E
Revenue (US$mn) 50,942.0 51,171.0 49,689.3 51,489.5
EBITDA (US$mn) 19,125.0 21,509.0 21,439.0 21,720.8
EBIT (US$mn) 14,684.0 15,457.0 15,724.7 15,894.2
Net income (US$mn) 9,269.0 10,217.0 11,054.3 11,529.0
EPS (CS adj.) (USc) 501.27 553.12 598.40 624.10
Change from previous EPS (%) n.a. 0.35 -0.12 -0.81
Consensus EPS (USc) n.a. 521.70 579.30 615.30
EPS growth (%) -37.6 10.3 8.2 4.3
P/E (x) 12.1 11.0 10.1 9.7
Dividend (USc) 167.00 192.05 211.26 232.38
Dividend yield (%) 2.8 3.2 3.5 3.8
P/B (x) 2.4 2.4 2.1 1.8
Net debt/equity (%) 34.1 34.3 20.3 9.2
Relative performance versus S&P ASX 200. See Reference
Appendix for a description of the chart. Source: Credit Suisse
estimates, * Consensus, mean range from Thomson Reuters.
Source: Company data, ASX, Credit Suisse estimates, * Adj. for goodwill, notional interest and unusual items. Relative P/E
against ASX/S&P200 based on pre GW in AUD. Company PE calculation is based on displayed EPS Currency
Rating OUTPERFORM*
Price (13 Feb 14, A$) 67.83
Target price (A$) (from 75.00) 80.00¹
Market cap. (A$mn) 121,448.48
Yr avg. mthly trading (A$mn) 3,217
Last month's trading (A$mn) 3,101
Projected return:
Capital gain (%) 17.9
Dividend yield (net %) 3.5
Total return (%) 21.5
52-week price range 72.1 - 50.2
* Stock ratings are relative to the relevant country
benchmark.
¹Target price is for 12 months.
Research Analysts
Paul McTaggart
61 2 8205 4698
James Gurry
44 20 7883 7083
Martin Kronborg
61 2 8205 4369
Justin Teo
61 2 8205 4426

17 February 2014
Australia and NZ First Edition 67
Rio Tinto delivers – debt down, dividends up
Rio delivered a strong FY13 result in Sam Walsh's first full year as CEO and in-line with
his agenda to restore value and show a much stronger commitment to shareholder value.
■ UNDERLYING EARNINGS - at US$10.2bn, in line with CS at $10.2bn and 5% ahead
of consensus $9.7bn, driven by exceeding cost targets and improved aluminium result.
■ DIVIDEND - 192cps or 15% increase, in-line with CS at 192cps but well ahead (8%) of
consensus expectation of 181cps. Pay-out ratio now 35% (but still low!).
■ NET DEBT - better than expected at $18.1bn (ND:ND+E of 25%) v CS $18.3bn and
consensus at $21bn. Cash flow from operations was up 22% to $20.1bn. Capex was
$12.9bn. Targeting sustainable net debt levels in mid-teen billions.
■ COST CUTTING - beat targets with $2.3bn of cost reductions, 15% ahead of the 2013
target (we thought a 10% beat was possible). 2014 target remains unchanged at $3bn
but after exceeding targets in 2013, we think RIO can again surprise. Headcount
reduced by 4,000 across the group.
■ EFFECTIVE TAX RATE – on underlying earnings (and excluding equity accounted
units) was a high 35% given utilisation of MRRT deferred tax asset. Guidance for
2014 is 30-35%, we assume 32%.
■ ONE OFFS:
o Impairments $3.4bn (Oyu Tolgoi $1.6bn, Kitimat ali smelter $696m, Gove alumina
refinery $555m) and non-cash FX losses $2.9bn.
o Restructuring costs of $367m were taken.
o FX losses on debt and derivatives mark-to-market of $2.7bn.
o Gains: disposal of assets netted $847m including $596m from Constellium and
$396m from Northparkes.
■ NET EARNINGS - $3.7bn after taking into account the one off -items.
Figure 1: Rio FY13 reconciliation of underlying and reported earnings
Source: Company data, Credit Suisse estimates

17 February 2014
Australia and NZ First Edition 68
Key divisions:
■ Iron ore: net earnings IN-LINE at $9.9bn v consensus at $9.9bn. Disappointingly,
iron ore production guidance for 2014 is 295mt (global, 100% basis) with the
Pilbara 290 ramp up to be complete before the end of 1H14. On the call, management
noted that guidance was conservative and there had been rain in the Pilbara lately.
Rio has 14mt of excess iron ore inventory in Australia which will be drawn down
progressively over the next 3 years. This guidance will be lower than many expected,
with consensus of 305mt (CS had been forecasting 311mt). We have revised our
forecasts down to 300mt, in the belief that RIO in being extremely conservative.
■ Copper: AHEAD at $821bn net earnings v CS $813m and consensus at $735m.
Guidance of 570kt mined and 260kt refined copper is below consensus at 615kt and
280kt (though ahead of CS).
■ Aluminium: AHEAD net earnings at $557m v expectations (CS and consensus) of
breakeven. This is partially offset by a charge of $281m in "other" which includes Gove
expenses – this was not included in the divisional Alu breakdown.
■ Energy: IN-LINE with net earnings at $33m v consensus at a loss $35m.
■ Minerals: IN-LINE at $350m net earnings. Guidance for 1.5mt TiO2 in FY14 is well
below capacity at 1.8mt.
■ Offset by slightly higher intersegment transactions, interest costs and "other" for an in-
line result with CS.
Rio is positive on global growth and flow-on impact for China exports. Despite talk of
liquidity and solvency issues in China, Rio has not seen any impact on letters of credit or
iron ore orders.
Capex inline and guidance confirmed – came in at $12.9bn in 2013, reconfirm guidance
for 2014 at <$11bn and 2015 of ~$8bn. Group sustaining capex reduced by $1.9bn to
~$4.5bn.
Post balance net date debt moved lower – net declined further in January with inflows
of $1.2bn from TRQ minority shareholders rights issue participation. The Clermont coal
sale ($1bn) should complete in 1H 2014. Pension provisions reduced from $6.2bn to
$3.6bn.
Oyu Tolgoi Mongolia Update – recently production has been impacted by post-
commissioning issues including failure of rake blades in tailings thickeners. The
associated repair works will see only one line in the mill operating for 6-8 weeks. Despite
this issue 2014 production guidance remains unchanged at 150-175kt copper in
concentrate and 700-750k oz gold in concentrate. An option to restart the underground
development by March when lender commitments are due to expire has been proposed.
However this will be delayed if the outstanding shareholder issues and permits are not
resolved.
Cash flow boosted by lower exploration/evaluation, tax payments – the former
reduced to $948m and reduced by $1bn against a targeted reduction of $750m. Rio stated
that exploration/evaluations spend will remain around this level. Tax payments in 2013
were $2.1bn lower than in 2012. Rio says that increased tax outflows in Australia are
expected in 2014 following a transition to monthly tax payments and that Rio will pay 14
months of Australian tax in 2014 (a timing impact – last quarter in 2013 plus 11 months in
2014).
Cost cutting – group unit cash costs reduced by 10% versus 2012 with Kennecott costs
down by $1,500/t, primary aluminium (North America) costs down by $300/t and Rio Tinto
Coal down by $30/t. Aluminium and Energy cost saves were, respectively, $574m and
$646m in 2013. A low AUD also had a $1bn net impact on earnings.

17 February 2014
Australia and NZ First Edition 69
Figure 2: Rio P&L vs CS vs Consensus
Rio P&L (US$mn) 1H13 2H13 FY13
Jun-13 Dec-13 Dec-13
Summary - Actuals vs CS vs Consensus Actuals Actuals Actuals CS Var Consensus Var
Revenue 24,511 26,660 51,171 50,044 2%
Operating expenses 14,912 14,750 29,662 29,309 1%
EBITDA Underlying 9,599 11,910 21,509 20,735 4% 20,763 4%
Depreciation of assets -3,512 -2,540 -6,052 -6,342 -5%
EBIT 6,087 9,370 15,457 14,393 7%
Net interest -344 -81 -425 -739 -43% -503
Other -353 -272 -625 -353 77%
Profit before tax 5,390 9,017 14,407 13,300 8%
Tax -1,526 -776 -2,302 -4,057 -43%
Share of net profits of associates (after tax) 330 368 698 903 -23%
Net profit after tax (pre OEI) 4,194 8,609 12,803 10,146 26%
Minorities (OEI) 35 -2,621 -2,586 35 -7489%
Underlying NPAT (post OEI) 4,229 5,988 10,217 10,181 0%
Significant items -2,509 -4,043 -6,552 -2,509 161%
Reported NPAT 1,720 1,945 3,665 7,672 -52%
Underlying EPS (USc/sh) 229 324 553 551 0%
DPS (USc/sh) 84 109 192 192 0% 181 6%
Underlying Earnings
Iron Ore 4,273 5,585 9,858 9,994 -1% 9,861 0%
Aluminium 123 434 557 5 nm -2
Copper 348 473 821 866 -5% 735 12%
Energy -52 85 33 -289 nm -35
Minerals (and Diamonds) 192 158 350 348 1% 412 -15%
Total Divisional 4,884 6,735 11,619 10,924 6% 10,970 6%
Margins
Revenue / Opex (x) 1.64x 1.81x 1.73x 1.71x 1%
EBITDA margin (%) 39% 45% 42% 41% 1%
EBIT margin (%) 25% 35% 30% 29% 5%
NPAT margin (%) - underlying 17% 22% 20% 20% -2% Source: Company data, Credit Suisse estimates, Vuma Consensus
Iron Ore
■ Iron ore earnings of $9.86bn was in line with consensus and marginally below CS at
$10bn.
■ EBITDA of $17.4bn was ahead of consensus and CS at $17bn, despite revenue of
$26bn being largely in line at $26bn. A beat on costs.
■ Rio saw cost savings of $351m ($240m post-tax), which compares to the target
savings of $400m by end 2014. A weaker currency also contributed while higher
royalty and MRRT payments were a partial offset.
■ The key point of contention is the 295mt global production guidance for FY14. This is
significantly below consensus and CS at app. 305/311mt. With "330mt Pilbara
production in 2015" guidance still maintained, would require ~55mt growth YoY in
2015. We expect that RIO will do a little better than its guidance and assume 300mt
production with 5mt of inventory sales.

17 February 2014
Australia and NZ First Edition 70
■ We are uncertainty on how the 330mt guidance for 2015 will be reached and have
pulled back our estimates to 325mt.
Figure 3: Iron ore summary
Iron Ore 1H11 2H11 1H12 2H12 1H13 2H13 1H14F 2H14F
Units Jun-11 Dec-11 Jun-12 Dec-12 Jun-13 Dec-13 Jun-14 Dec-14
Production Rio share ('000 tonnes)
Total Australia mt 87 97 91 100 96 104 104 118
Other (IOC, Simandou) mt 3 4 4 5 4 5 6 7
Total iron ore (Rio share) mt 91 101 94 105 100 109 110 125
Total Australia iron ore (100% basis) mt 110 122 114 125 120 131 133 147
Summary financials - Iron Ore
Iron Ore - Fines CFR China (62%) US$/t $177 $159 $141 $115 $137 $134 $120 $103
Australian revenue US$mn 12,425 14,430 11,273 10,912 10,807 12,929 11,627 11,168
Total Revenue US$mn 13,494 15,832 12,194 11,963 11,797 14,197 13,171 12,699
Costs US$mn 3,853 4,552 4,203 4,271 4,162 4,461 4,600 5,103
EBITDA US$mn 9,641 11,280 7,991 7,692 7,635 9,736 8,571 7,596
D&A US$mn 562 607 697 791 757 884 1,001 1,086
EBIT US$mn 9,079 10,673 7,294 6,901 6,878 8,852 7,570 6,510
Total Underlying Earnings US$mn 6,095 7,185 4,755 4,487 4,273 5,542 5,151 4,449
Total CAPEX US$mn 2,068 2,636 3,037 4,829 3,519 3,568 2,585 2,932
…growth US$mn 201 1,252 2,220 2,375 2,694 2,790 1,785 2,034
…maintenance US$mn 1,867 1,384 817 2,454 825 778 800 897
Operating assets US$mn 14,207 13,115 18,251 21,619 22,309 21,870 23,443 25,289
ROE % 47% 53% 30% 23% 19% 25% 23% 18%
Per tonne analysis
Realised price per tonne (Australia) US$/t 142 149 124 109 113 124 112 95
Realised price per tonne (Total) US$/t 149 157 129 114 118 130 120 102
Costs per tonne US$/t 42 45 45 41 42 41 42 41
EBITDA per tonne US$/t 106 112 85 74 76 89 78 61
D+A US$/t 6 6 7 8 8 8 9 9
EBIT per tonne US$/t 100 106 77 66 69 81 69 52
Interest, tax and other US$/t 34 36 29 25 28 32 24 18
Operating earnings per tonne US$/t 66 70 49 41 41 49 45 34
Capex per tonne US$/t 23 26 32 46 35 33 24 24
Sustaining capex per tonne US$/t 21 14 9 23 8 7 7 7
Margins
Realised price / costs per tonne x 3.50x 3.48x 2.90x 2.80x 2.83x 3.18x 2.86x 2.49x
EBITDA margin % 71% 71% 66% 64% 65% 69% 65% 60%
EBIT margin % 67% 67% 60% 58% 58% 62% 57% 51%
NPAT margin - underlying % 45% 45% 39% 38% 36% 39% 39% 35% Source: Company data, Credit Suisse estimates
Aluminium
■ Big positive surprise with underlying earnings of $557m against consensus
expectations of break even. This is up $54m in 2013, despite 9% lower LME prices.
■ Higher physical premia and cost reductions have turned the business around into
profitability (though undoubtedly, some of the $367m restructuring charges not
included in underlying earnings were taking in the ali. division).
■ Impairment charge of $696m on Kitimat is a negative. The cause is a capex overrun,
although the exact amount has not yet been determined. The project was on the go-
slow, overruns are not unusual in those situations.

17 February 2014
Australia and NZ First Edition 71
■ FY14 Guidance of 41mt bauxite (42mt consensus), 8.1mt alumina (9.2mt) and 3.4mt
aluminium (3.6mt) was below expectations and CS. On-going streamlining and cost-
outs has probably meant lower production. This is not a major concern as the
business is profitable again.
■ Primary Metal North America costs reduced by $300/t.
Copper
■ Earnings of $821m marginally ahead of consensus at $734m.
■ Rio still has 254mlb copper sales that have been provisionally priced at $3.33/lb. At
current prices of $3.22/lb that would equates to a negative $32m impact.
■ An option to restart the underground development at OT, subject to certain conditions
being met, has been proposed. However, outstanding issues, such as project finance,
still need to be resolved.
■ Recovery work at Kennecott is expected to last until end 2015. An impairment charge
of $283m was taken to write off deferred stripping assets and damaged equipment,
which compares to the initial $340m charge taken (a reversal in 2H14?).
■ Guidance of 570kt mined and 260kt refined copper is below consensus expectations
at 615kt and 280kt (though ahead of CS). Rio notes that there will be planned smelter
maintenance at Kennecott Utah in the year ahead.

17 February 2014
Australia and NZ First Edition 72
Figure 4: Copper summary Copper 1H11 2H11 1H12 2H12 1H13 2H13 1H14F 2H14F
Units Jun-11 Dec-11 Jun-12 Dec-12 Jun-13 Dec-13 Jun-14 Dec-14
Production (Rio share) ('000 tonnes)
Copper - mine production 000 t 274 246 253 296 297 335 284 286
Copper - refined production 000 t 185 149 123 156 151 149 129 129
Molybdenum (Bingham Canyon) 000 t 8 6 6 4 3 3 10 10
Silver mined 000 oz 2,578 2,345 1,812 1,846 2,006 2,758 2,764 2,784
Silver - refined (Kennecott) 000 oz 1,771 1,418 1,284 1,167 1,129 1,028 1,893 1,893
Gold mined 000 oz 316 324 154 141 130 212 174 174
Gold refined 000 oz 204 175 155 124 104 88 210 210
Prices
Copper US$/lb 4.25 3.80 3.67 3.56 3.44 3.21 3.12 2.89
Copper price US$/t 9,367 8,375 8,092 7,845 7,577 7,072 6,873 6,373
Gold US$/oz 1,448 1,694 1,652 1,686 1,525 1,308 1,140 1,025
Summary financials
Gross revenue US$mn 4,148 3,407 3,170 3,350 3,121 2,795 2,977 2,557
Costs US$mn 1,948 2,213 2,343 2,441 2,225 1,941 1,726 1,658
EBITDA US$mn 2,200 1,194 827 909 896 854 1,251 899
D+A US$mn 265 252 269 333 464 498 344 375
EBIT US$mn 1,935 942 558 576 432 356 907 524
Net earnings US$mn 1,392 847 556 780 348 473 593 299
CAPEX - total US$mn 719 1,312 1,360 2,706 1,580 1,233 1,075 927
Operating assets US$mn 5,153 6,001 6,898 13,812 12,873 12,070 15,897 16,422
ROE % 31% 15% 9% 8% 3% 4% 4% 2%
Per tonne analysis (per tonne of mined Copper)
Realised price per tonne US$/t 15,163 13,835 12,535 11,323 10,526 8,341 10,471 8,933
Costs per tonne US$/t 7,121 8,986 9,265 8,251 7,504 5,792 6,071 5,793
EBITDA per tonne US$/t 8,042 4,848 3,270 3,072 3,022 2,548 4,401 3,140
D+A US$/t 969 1,023 1,064 1,126 1,565 1,486 1,212 1,311
EBIT per tonne US$/t 7,073 3,825 2,206 1,947 1,457 1,062 3,189 1,829
Net earnings per tonne US$/t 5,088 3,439 2,198 2,636 1,174 1,412 2,088 1,044
Capex per tonne US$/t 2,630 5,328 5,378 9,146 5,329 3,679 3,780 3,238
Margins
Realised price / costs per tonne x 2.13x 1.54x 1.35x 1.37x 1.40x 1.44x 1.72x 1.54x
EBITDA margin % 53% 35% 26% 27% 29% 31% 42% 35%
EBIT margin % 47% 28% 18% 17% 14% 13% 30% 20%
NPAT margin - underlying % 34% 25% 18% 23% 11% 17% 20% 12% Source: Company data, Credit Suisse estimates
Energy
■ Earnings of $33m compared to consensus expecting a loss of $35m. Rio reported a
$258m gain on divestment of exploration projects.
■ Cost savings of $646m pre-tax were achieved, $442m post tax. Rio Tinto Coal
Australia costs were down an impressive $30/t.
■ ERA and Rossing still struggling following issues following leach tank failures. Still
awaiting approvals for recommencing operations at ERA while at Rossing some
operations were restarted in January 2014, to be gradually restored over 1Q14.
■ Guidance of 8.5mt semi-soft coking coal, 3mt HCC and 16.5mt thermal is a little below
expectations on all counts.

17 February 2014
Australia and NZ First Edition 73
Figure 5: Energy summary
Energy 1H11 2H11 1H12 2H12 1H13 2H13 1H14F 2H14F
Units Jun-11 Dec-11 Jun-12 Dec-12 Jun-13 Dec-13 Jun-14 Dec-14
Production (Rio share)
Total hard coking 000 t 3,403 5,412 3,704 4,339 3,552 4,663 4,430 4,430
Total thermal 000 t 8,780 9,011 8,914 11,736 11,032 11,945 8,276 8,500
Uranium 000 lbs 2,468 4,590 3,796 5,964 4,701 3,293 3,082 3,768
Prices
Coking Coal-high grade US$/t 278 300 223 198 169 149 147 160
Semi-soft coking US$/t 264 285 201 157 137 125 125 136
Steaming Coal US$/t 110 119 114 115 105 95 92 88
Uranium price US$/lb 60 53 52 46 42 36 38 45
Summary financials - Energy
Gross revenue US$mn 3,156 4,165 2,860 2,916 2,592 2,862 2,529 2,192
Costs US$mn 2,367 2,722 2,088 2,427 2,190 2,358 1,852 1,913
EBITDA US$mn 789 1,443 772 489 402 504 677 279
Underlying earnings US$mn 375 699 307 11 -52 85 308 -11
Capex US$mn 531 796 934 971 510 222 226 176
Coal - (excludes uranium divisions within Energy)
Gross revenue US$mn 2,686 3,510 2,533 2,475 2,313 2,493 2,381 1,972
Costs US$mn 1,828 2,050 2,028 2,014 1,980 2,031 1,659 1,666
EBITDA US$mn 858 1,460 505 461 333 462 721 306
Underlying earnings US$mn 433 807 196 114 -2 126 346 15
Capex US$mn 444 572 787 849 410 169 203 153
Operating assets US$mn 3,703 7,356 8,062 6,186 6,221 4,653 4,653 4,583
ROE % 13% 15% 3% 2% 0% 2% 7% 0%
Coal - Per tonne analysis
Realised price per tonne US$/t 220 243 201 154 159 150 187 153
Costs per tonne US$/t 150 142 161 125 136 122 131 129
EBITDA per tonne US$/t 70 101 40 29 23 28 57 24
Underlying earnings per tonne US$/t 36 56 16 7 0 8 27 1
Capex per tonne US$/t 36 40 62 53 28 10 16 12
Coal - Margins
Realised price / costs per tonne x 1.47x 1.71x 1.25x 1.23x 1.17x 1.23x 1.43x 1.18x
EBITDA margin % 32% 42% 20% 19% 14% 19% 30% 16%
NPAT margin - underlying % 16% 23% 8% 5% 0% 5% 15% 1% Source: Company data, Credit Suisse estimates
Diamonds and minerals
■ Earnings came in at $350m, slightly below consensus at $412m but in line with CS.
■ Not much news, Rio noted that pigment producers are believed to have absorbed a
large amount of inventories in 2013 but that an overhang remains on the feed stocks
side. Rio remains committed to the minerals sands business and Walsh says he is still
happy to have bought BHP's share of RBM.
■ Guidance of 1.5mt TiO2 - Rio operations will continue to operate well below capacity
of 1.8mt and expectations of 1.7mt.

17 February 2014
Australia and NZ First Edition 74
Earnings and valuation
EPS down <1% as the 10mt lower iron ore production (~$400m NPAT) and 2% higher tax
rate ($300m) are offset by cost savings in the coal and ali divisions.
Figure 6: Earnings changes Earnings FY13F FY14F FY15F
revisions Old New Ch % Old New Ch % Old New Ch %
Sales revenue ($mn) 50,044 51,171 2.3% 50,224 49,689 -1.1% 50,635 51,489 1.7%
EBITDA ($mn) 20,735 21,509 3.7% 21,490 21,439 -0.2% 21,761 21,721 -0.2%
EBIT ($mn) 14,393 15,457 7.4% 15,267 15,725 3.0% 15,583 15,894 2.0%
Underlying NPAT ($mn) 10,181 10,217 0.4% 11,068 11,054 -0.1% 11,623 11,529 -0.8%
Reported NPAT ($mn) 7,672 3,665 -52.2% 11,313 11,299 -0.1% 11,623 11,529 -0.8%
EPS Pre-GW (¢) 551 553 0.4% 599 598 -0.1% 629 624 -0.8%
DPS (¢) 192 192 0.0% 211 211 0.0% 232 232 0.0%
Operating cashflow 14,642 15,078 3.0% 17,223 18,442 7.1% 18,321 18,122 -1.1%
Capex total -13,245 -13,001 -1.8% -10,360 -10,734 3.6% -7,546 -7,444 -1.3% Source: Credit Suisse estimates
Our DCF increases to A$83.5/sh from A$78.5/sh on model roll forward ($2/sh), lower
pension liabilities ($2/sh) and lower coal/ali costs ($1/sh). We raise our target price to
A$80/sh (from A$75/sh) and £42/sh (from £40/sh) and retain our OUTPERFORM rating.
Figure 7: Rio DCF based SoTP valuation
NPV USD $/share AUD $A/share GBP/share %
Rio Tinto Alcan 8,024 4.3 9,499 5.1 2.6 5.2%
Pacific Aluminium 2,549 1.4 3,000 1.6 0.8 1.7%
Total Aluminium 10,573 5.7 12,498 6.8 3.4 6.9%
Hamersley Iron 95,005 51.4 111,456 60.3 31.0 62.0%
Robe River 9,571 5.2 11,207 6.1 3.1 6.2%
Iron Ore Company of Canada 2,624 1.4 3,067 1.7 0.9 1.7%
Simandou 1,128 0.6 1,333 0.7 0.4 0.7%
Iron ore 108,327 58.6 127,063 68.8 35.3 70.7%
Kennecott Utah Copper 5,919 3.2 6,959 3.8 1.9 3.9%
Escondida 7,019 3.8 8,250 4.5 2.3 4.6%
Grasberg joint venture 3,400 1.8 4,012 2.2 1.1 2.2%
Northparkes (sold) 0 0.0 0 0.0 0.0 0.0%
Oyu Tolgoi 1,269 0.7 1,492 0.8 0.4 0.8%
Resolution 1,000 0.5 1,176 0.6 0.3 0.7%
Northern Dynasty (shareholding) 68 0.0 77 0.0 0.0 0.0%
Turquise Hill other assets 1,000 0.5 1,000 0.5 0.3 0.7%
Copper 19,676 10.7 22,967 12.4 6.4 12.8%
Rio Tinto Iron & Titanium 5,018 2.7 5,897 3.2 1.6 3.3%
Rio Tinto Minerals 1,261 0.7 1,476 0.8 0.4 0.8%
Diamonds 1,055 0.6 1,245 0.7 0.3 0.7%
Minerals (and Diamonds) 7,334 4.0 8,618 4.7 2.4 4.8%
Rio Tinto Coal Australia 5,978 3.2 7,008 3.8 1.9 3.9%
Mozambique 390 0.2 457 0.2 0.1 0.3%
Rössing 408 0.2 483 0.3 0.1 0.3%
Energy Resources of Australia 531 0.3 531 0.3 0.2 0.3%
Energy 7,307 4.0 8,479 4.6 2.4 4.8%
Total operations 153,217 82.9 179,625 97.2 49.9 100%
Net debt 17,625 9.5 20,735 11.2 5.7
Unfunded pension 3,600 1.9 4,235 2.3 1.2
Net debt and other 21,225 11.5 24,971 13.5 6.9
Net valuation 131,992 71.5 154,654 83.7 43.0 Source: Credit Suisse estimates

17 February 2014
Australia and NZ First Edition 75
Rio financial summary
Figure 8: RIO financial summary Market data RIO (Total) plc Ltd NPV USD $/sh A$/sh GB/sh
Ticker $US RIO.L RIO.AX Aluminium 10,573 5.7 6.8 3.4
Share prices (local) (GB£ / A$) 35.1 67.8 Iron ore 108,327 58.6 68.8 35.3
Share price $US equivalent 58.9 58.3 60.6 Copper 19,676 10.7 12.4 6.4
plc / Ltd Premium/(discount) -4% 4% Mineral/Diamond 7,334 4.0 4.7 2.4
Market cap (US$'mn) 108,721 82,312 26,409 Energy 7,307 4.0 4.6 2.4
Market cap (%) 100% 76% 24% Total operations 153,217 82.9 97.2 49.9
Market cap (local) (GB£ / A$) (million) 49,544 29,560 Net debt & other 21,225 11.5 13.5 6.9
Shares on issue (mn) 1,847 1,412 436 Net valuation 131,992 71.5 83.7 43.0
Shares (%) 100% 76% 24% Shares on issue 1,847 FX 0.89 1.66
Enterprise value (EV) ($US'mn) 129,946
F'cast->
Commodity assumptions FY12 FY13F FY14F FY15F FY16F FY17F FY18F FY19F FY20F
Iron Ore - Fines CFR China (62%) 128 135 111 95 95 95 95 95 95
Iron Ore - Lump CFR China (64%) 135 146 131 107 103 103 103 103 103
Iron ore Pellets (US$/t) 182 174 163 139 135 136 136 137 138
Freight cost Aust-China (US$/t) 8.8 8.1 10.0 10.0 10.0 10.0 10.0 10.0 10.0
Hard Coking Coal (US$/t) FOB Queensland 210.0 158.5 153.3 167.5 175.0 175.0 175.0 175.0 175.1
Semi soft coking coal (US$/t) FOB Queensland 178.7 130.8 130.2 142.8 149.2 149.2 148.4 147.3 146.1
PCI coal (US$/t) FOB Queensland 153.1 125.4 123.0 132.0 138.0 138.0 137.3 136.3 135.2
Thermal coal (US$/t) FOB Newcastle 114.5 100.0 89.8 91.8 98.0 100.0 100.1 100.3 100.4
Aluminium (US$/lb) 0.92 0.86 0.82 0.91 0.95 1.00 1.01 1.03 1.04
Alumina (US$/t) 319.0 329.8 330.0 340.0 350.0 380.0 385.6 394.5 403.4
Alumina (contract linkage) (US$/t) 317.7 314.0 290.4 312.0 336.0 348.0 355.8 361.8 367.8
Copper (US$/lb) 3.62 3.32 3.01 3.06 3.29 3.52 3.47 3.41 3.34
Uranium (US$/lb) 48.8 38.5 41.8 55.3 60.0 70.0 69.9 69.7 69.5
Gold (US$/oz) 1,669 1,416 1,083 990 1,000 1,000 1,041 1,106 1,171
Zircon bulk from Australia FOB 2,173 1,151 1,108 1,250 1,400 1,600 1,599 1,597 1,596
TiO2 basket price 1,783 748 776 1,038 958 859 857 855 852
TCRC: Copper, USc/lb, contract 19.2 19.2 19.2 19.2 19.2 19.2 19.2 19.2 19.2
AUD:USD 1.04 0.97 0.89 0.86 0.85 0.85 0.85 0.85 0.85
Production schedule (attributable) FY12 FY13F FY14F FY15F FY16F FY17F FY18F FY19F FY20F
Alumina ('000 tonnes) 10,041 9,309 8,090 7,840 7,840 7,840 7,840 7,840 3,920.00
Aluminium ('000 tonnes) 3,220 3,553 3,434 3,448 3,521 3,522 3,522 3,522 1,761.15
Bauxite ('000 tonnes) 39,363 43,204 41,000 41,200 41,200 41,200 41,200 41,200 20,600.00
Coal - Coking ('000 tonnes) 8,043 8,215 8,860 9,670 10,558 11,286 11,286 11,286 5,643.00
Coal - Semi soft ('000 tonnes) 3,286 3,858 3,028 3,484 3,712 3,969 3,969 3,969 1,984.49
Coal - Thermal ('000 tonnes) 20,378 22,977 16,775 17,687 18,183 18,871 21,005 22,205 11,702.42
Copper - mined ('000 tonnes) 549 632 570 670 654 645 689 755 403.36
Copper - refined ('000 tonnes) 279 300 258 281 289 295 295 295 147.60
Iron ore ('000 tonnes) 198,870 208,966 234,245 280,206 290,706 299,106 307,294 314,846 161,199.36
Pilbara capacity guidance (100%), end year 240,000 261,510 293,000 335,000 345,000 355,000 360,000 360,000 360,000
Pilbara production 100% 239,381 250,584 279,000 330,000 342,500 352,500 360,000 360,000 180,000
Global iron ore production at 100% 253,460 265,951 300,500 353,000 365,500 375,500 388,000 408,000 214,000.00
Titanium dioxide feedstock ('000 tonnes) 1,595 1,622 1,500 1,650 1,850 1,900 1,900 1,900 950.00
Uranium ('000 lbs) 9,760 7,994 6,850 8,042 6,813 6,813 6,813 6,813 3,406.51
Gold - mined ('000 ozs) 296 342 349 516 474 420 427 434 216.14
Gold - refined ('000 ozs) 279 192 420 453 453 453 453 453 226.30
Revenue, mt Fe - IO equivalent 465 488 479 528 543 553 565 571 576
...Growth - IO equivalent 8% 5% -2% 10% 3% 2% 2% 1% 1%
Expenses per tonne of IO equivalent 68 61 59 56 56 56 55 54 55
P&L ($US'mn) FY12 FY13F FY14F FY15F FY16F FY17F FY18F FY19F FY20F
Revenue 50,942 51,171 49,689 51,489 52,947 54,424 55,350 56,084 57,583
Expenses 31,817 29,662 28,250 29,769 30,231 30,873 31,270 31,096 31,570
EBITDA 19,125 21,509 21,439 21,721 22,716 23,550 24,080 24,988 26,013
Depreciation & amortisation 4,441 6,052 5,714 5,827 5,955 5,903 5,938 6,055 6,223
EBIT 14,684 15,457 15,725 15,894 16,761 17,647 18,142 18,933 19,790
Net interest + other 2,682 1,050 549 387 194 -79 -375 -772 -1,208
Profit before tax 12,002 14,407 15,175 15,507 16,567 17,726 18,516 19,704 20,998
Associates after tax 1,056 698 938 1,010 1,049 974 993 1,086 1,041
Tax -3,788 -2,302 -4,856 -4,652 -4,970 -5,318 -5,555 -5,911 -6,299
OEI -1 -2,586 -203 -336 -332 -325 -382 -410 -497
Underlying NPAT 9,269 10,217 11,054 11,529 12,314 13,058 13,573 14,469 15,243
Net significant items (post tax) -12,297 -6,552 245 - - - - - -
Reported NPAT -3,028 3,665 11,299 11,529 12,314 13,058 13,573 14,469 15,243
EPS - basic (underlying) (US cents) 501 553 598 624 667 707 735 783 825
DPS (US cents) 167 192 211 232 256 281 309 340 374
Payout ratio 33% 35% 35% 37% 38% 40% 42% 43% 45%
Dividend growth (%) 15% 15% 10% 10% 10% 10% 10% 10% 10%
Business unit earnings (post tax pre interest) FY12 FY13F FY14F FY15F FY16F FY17F FY18F FY19F FY20F
Iron Ore 9,242 9,858 9,600 8,729 8,878 9,199 9,610 10,103 10,594
Aluminium 3 557 621 846 953 1,172 1,186 1,293 1,399
Copper 1,092 821 892 1,060 1,224 1,224 1,339 1,453 1,591
Energy 283 33 297 213 450 610 610 613 617
Minerals (and Diamonds) 119 350 298 919 931 825 827 826 826
Other (interest, exploration, other ops) -1,470 -1,402 -654 -239 -122 27 2 181 215
Underlying NPAT 9,269 10,217 11,054 11,529 12,314 13,058 13,573 14,469 15,243 Source: Company data, Credit Suisse estimates

17 February 2014
Australia and NZ First Edition 76
Figure 9: Rio financial summary (continued) Cashflows ($US'mn) FY12 FY13F FY14F FY15F FY16F FY17F FY18F FY19F FY20F
Operating cashflows 9,430 15,078 18,442 18,122 19,290 19,855 20,636 21,706 22,763
Capex - sustaining -3,000 -3,000 -3,300 -3,630 -3,775 -3,926 -4,083 -4,247 -4,416
FCF- pre growth capex 6,430 12,078 15,142 14,492 15,515 15,929 16,552 17,460 18,347
Capex - growth -14,615 -10,001 -7,434 -3,814 -3,860 -3,749 -1,015 -42 -
Free cash flow after all capex -8,185 2,077 7,709 10,678 11,654 12,180 15,538 17,418 18,347
Total capex spend -17,615 -13,001 -10,734 -7,444 -7,635 -7,675 -5,098 -4,288 -4,416
Exploration and other -628 2,055 600 -400 -400 -400 -600 -600 -600
Share buy-back -1,471 - - - - - - - -
Dividend payments -3,038 -3,322 -3,779 -4,080 -4,488 -4,937 -5,430 -5,973 -6,571
Other cashflows 10,833 2,388 1,200 -0 -0 0 - -0 -
Net increase in cash -2,489 3,198 5,730 6,198 6,767 6,843 9,507 10,844 11,176
Cash at end of period 7,272 10,209 15,939 22,136 28,903 35,746 45,253 56,098 67,274
Net debt 19,233 17,625 11,902 5,705 -1,062 -7,905 -17,412 -28,257 -39,433 #N/A #N/A #N/A #N/A
Balance Sheet ($US'm) FY12 FY13F FY14F FY15F FY16F FY17F FY18F FY19F FY20F
Cash 7,135 10,216 15,939 22,136 28,903 35,746 45,253 56,098 67,274
Receivables 5,341 4,667 4,667 4,667 4,667 4,667 4,667 4,667 4,667
Inventories 6,375 5,737 5,737 5,737 5,737 5,737 5,737 5,737 5,737
Plant & equipment 76,985 70,827 74,853 76,471 78,152 79,924 79,084 77,316 75,510
Deferred tax assets 3,476 3,555 3,555 3,555 3,555 3,555 3,555 3,555 3,555
Other assets & intangibles 19,125 16,023 16,023 16,023 16,023 16,023 16,023 16,023 16,023
Assets 118,437 111,025 120,774 128,589 137,037 145,652 154,319 163,396 172,766
Payables 9,420 8,400 8,400 8,400 8,400 8,400 8,400 8,400 8,400
Provisions 17,394 14,081 14,081 14,081 14,081 14,081 14,081 14,081 14,081
Tax liabilities 823 1,126 2,197 2,227 2,516 2,686 2,828 2,999 3,200
Borrowings 26,904 28,551 28,551 28,551 28,551 28,551 28,551 28,551 28,551
Other liabilities 6,156 5,365 5,365 5,365 5,365 5,365 5,365 5,365 5,365
Liabilities 60,697 57,523 58,594 58,624 58,913 59,083 59,225 59,396 59,597
Net Assets 57,740 53,502 62,180 69,965 78,123 86,570 95,094 104,000 113,169
Valuation metrics (31-DecYE) FY12 FY13F FY14F FY15F FY16F FY17F FY18F FY19F FY20F
Underlying EPS - diluted (US cents) 501 553 598 624 667 707 735 783 825
EPS growth (underlying - diluted) -38% 10% 8% 4% 7% 6% 4% 7% 5%
Cash EPS 76 526 921 940 989 1,026 1,056 1,111 1,162
PE - plc 11.6x 10.5x 9.7x 9.3x 8.7x 8.2x 7.9x 7.4x 7.1x
PE - Ltd 12.1x 11.0x 10.1x 9.7x 9.1x 8.6x 8.2x 7.7x 7.3x
PE - ltd (CS FX Forward Curve) 14.0x 11.9x 10.0x 9.3x 8.6x 8.2x 7.8x 7.4x 7.0x
Share price / cash EPS - plc 76.3x 11.1x 6.3x 6.2x 5.9x 5.7x 5.5x 5.2x 5.0x
Share price / cash EPS - Ltd 79.3x 11.5x 6.6x 6.5x 6.1x 5.9x 5.7x 5.5x 5.2x
Div Yield Plc 2.9% 3.3% 3.6% 4.0% 4.4% 4.8% 5.3% 5.8% 6.4%
Div Yield Ltd 2.8% 3.2% 3.5% 3.8% 4.2% 4.6% 5.1% 5.6% 6.2%
EV / EBITDA (fixed) 7.4x 6.4x 6.4x 6.3x 6.1x 5.8x 5.7x 5.5x 5.3x
EV / EBITDA (floating) 7.3x 6.2x 6.0x 5.6x 5.1x 4.6x 4.1x 3.5x 3.0x
FCF / share, USD, all capex -4.43 1.12 4.17 5.78 6.31 6.59 8.41 9.43 9.93
FCF yield all capex Plc -7.6% 1.9% 7.2% 9.9% 10.8% 11.3% 14.4% 16.2% 17.0%
FCF yield all capex Ltd -7.3% 1.9% 6.9% 9.5% 10.4% 10.9% 13.9% 15.6% 16.4%
Price / cash earnings Ltd 79.3x 11.5x 6.6x 6.5x 6.1x 5.9x 5.7x 5.5x 5.2x
Price / cash earnings Plc 76.3x 11.1x 6.3x 6.2x 5.9x 5.7x 5.5x 5.2x 5.0x
Price / Book Plc 2.3x 2.4x 2.0x 1.8x 1.6x 1.4x 1.3x 1.2x 1.1x
Cash PE - ltd (CS FX Forward Curve) 92.0x 12.5x 6.5x 6.2x 5.8x 5.6x 5.5x 5.2x 5.0x
ROE 18.7% 27.7% 22.4% 20.3% 19.0% 17.9% 16.8% 16.2% 15.6%
ROIC 13.1% 18.3% 14.4% 14.7% 15.2% 15.7% 16.3% 17.5% 18.8%
Gearing and debt metrics FY12 FY13F FY14F FY15F FY16F FY17F FY18F FY19F FY20F
Net Debt (net cash) 19,233 17,625 11,902 5,705 -1,062 -7,905 -17,412 -28,257 -39,433
Net Debt / (Net Debt + Equity) (%) 26% 26% 17% 8% 0% -9% -21% -36% -52%
Net Debt / Equity (%) 34% 34% 20% 9% 0% -8% -18% -26% -34%
Interest cover (x) (EBIT) 83.0x 36.4x 28.6x 41.0x 86.4x -223.4x -48.4x -24.5x -16.4x
Margins FY12 FY13F FY14F FY15F FY16F FY17F FY18F FY19F FY20F
EBITDA margin 38% 42% 43% 42% 43% 43% 44% 45% 45%
EBIT margin 29% 30% 32% 31% 32% 32% 33% 34% 34%
NPAT margin 18% 20% 22% 22% 23% 24% 25% 26% 26%
Income tax rate 32% 16% 32% 30% 30% 30% 30% 30% 30%
Valuation metrics FY12 FY13F FY14F FY15F FY16F FY17F FY18F FY19F FY20F
PER weighted average 11.7x 10.6x 9.8x 9.4x 8.8x 8.3x 8.0x 7.5x 7.1x
NPAT growth (%) -152% -221% 208% 2% 7% 6% 4% 7% 5%
EV (floating) (US$mn) 128,490 127,056 121,333 115,136 108,369 101,526 92,019 81,174 69,998
NTA per share (US$) 26.0 25.3 30.0 34.2 38.6 43.2 47.8 52.6 57.6
ROTE (%) 30% 34% 33% 29% 27% 25% 23% 22% 21%
P / NTA (x) 2.3x 2.4x 2.0x 1.8x 1.6x 1.4x 1.3x 1.2x 1.1x
FCF/sh -sustaining CAPEX (US$) 3.48 6.54 8.20 7.84 8.40 8.62 8.96 9.45 9.93
FCF/sh - total CAPEX -4.43 1.12 4.17 5.78 6.31 6.59 8.41 9.43 9.93 Source: Company data, Credit Suisse estimates

Australia and NZ First Edition 77
17 February 2014
Asia Pacific/Australia
Equity Research
Diversified Metals & Mining (Steel (AU))
Sims Metal Management
(SGM.AX / SGM AU) RESULTS
Australia drives a better 1H; challenging
outlook keeps management cautious
■ Statutory 1H NPAT $9.3mn (CS $9mn). A$42.1mn underlying NPAT
exceeded expectation. $113mn EBITDA exceeded our $86mn, driven by a
very strong Australian result and the benefit of AUD depreciation on other
regions. Australia underpinned by materially improving domestic scrap
sector structure as competitors withdraw from the market. US now facing
headwinds. SRS deteriorated further. No guidance. No interim dividend.
■ Sales volumes increased by 3.3% to 6.1Mt in 1HY14 (5.927Mt pcp) in
HY13, but down 6.2% from the strong 2H13 6.526Mt.
■ Underlying EBITDA was A$128.5mn up 37.9% on pcp, again due to
materially improved performance from recycling operations in Australia.
■ At constant currency, underlying controllable costs were A$24.8mn lower in
HY14 compared to HY13.
■ Net debt as at 31 December 2013 was A$121.2mn, a decrease of
A$32.6mn on FY13 $154mn. Operating cash flow $37.8mn plus $30.1mn
cash from asset sales. Capex of $29.2mn is less than half the FY14
forecast $80mn and FY13 $149mn.
■ 2H14 outlook described as challenging with export markets (Turkey)
impacting demand for SGM's exports.
■ New strategy to be delivered to the market by new MD Galdino Claro before
the end of the half. No change to target price or rating.
Total return forecast in perspective
Mean^
CS tgt^Sh Prc
-40%
-30%
-20%
-10%
0%
10%
20%
30%
40%
12mth Volatility* 52wk Hi-Lo IBES Consensustarget return^
Performance over 1M 3M 12M
Absolute (%) 3.2 2.4 -2.4
Relative (%) 1.1 3.2 -8.7
Financial and valuation metrics
Year 06/13A 06/14E 06/15E 06/16E
Revenue (A$mn) 7,245.6 7,199.5 7,321.5 7,832.0
EBITDA (A$mn) 191.4 240.6 318.8 379.9
EBIT (A$mn) 67.9 118.7 192.3 251.1
Net income (A$mn) 17.1 73.3 126.3 168.7
EPS (CS adj.) (Ac) 8.37 35.89 61.76 82.50
Change from previous EPS (%) n.a. 71.1 -0.7 0.2
Consensus EPS (Ac) n.a. 49.10 80.90 103.50
EPS growth (%) -76.7 328.9 72.1 33.6
P/E (x) 127.9 29.8 17.3 13.0
Dividend (Ac) — — 30.88 41.25
Dividend yield (%) — — 2.9 3.9
P/B (x) 1.1 1.2 1.2 1.1
Net debt/equity (%) 8.0 10.9 5.2 1.3
Relative performance versus S&P ASX 200.See Reference
Appendix for a description of the chart. Source: Credit Suisse
estimates, * Consensus, mean range from Thomson Reuters
Source: Company data, ASX, Credit Suisse estimates, * Adj. for goodwill, notional interest and unusual items. Relative P/E
against ASX/S&P200 based on pre GW in AUD. Company PE calculation is based on displayed EPS Currency
Rating UNDERPERFORM*
Price (14 Feb 14, A$) 10.70
Target price (A$) 10.00¹
Market cap. (A$mn) 2,187.50
Yr avg. mthly trading (A$mn) 215
Last month's trading (A$mn) 151
Projected return:
Capital gain (%) -6.5
Dividend yield (net %) 1.8
Total return (%) -4.7
52-week price range 11.2 - 8.3
* Stock ratings are relative to the relevant country
benchmark.
¹Target price is for 12 months.
Research Analysts
Michael Slifirski
61 3 9280 1845
Sam Webb
61 3 9280 1716

17 February 2014
Australia and NZ First Edition 78
Figure 1: SGM Financial Summary
Sims Metal Management (SGM) Year ending 30 Jun In AUDmn, unless otherwise stated2012 2013 2014 2015 2016 2012 2013 2014 2015 2016
Share Price: A$10.70 Earnings 06/12A 06/13A 06/14E 06/15E 06/16ERating UNDERPERFORM c_EPS_SHARESEquiv. FPO (period avg.) mn 205.8 204.4 204.4 204.4 204.4
Target Price A$ 10.00 c_EPS*100EPS (Normalised) c 36.0 8.4 35.9 61.8 82.5
vs Share price % -6.54 EPS_GROWTH*100EPS Growth % -76.7 328.9 72.1 33.6
DCF A$ 10.04 c_EBITDA_MARGIN*100EBITDA Margin % 2.8 2.6 3.3 4.4 4.9
c_DPS*100DPS c 20.0 0.0 0.0 30.9 41.2
c_PAYOUT*100Payout % 55.6 0.0 0.0 50.0 50.0
FRANKING*100Franking % 0.0 0.0 0.0 40.0 40.0
c_FCF_PS*100Free CFPS c 77.6 77.4 15.8 71.8 90.6
Profit & Loss 06/12A 06/13A 06/14E 06/15E 06/16E c_TAX_RATE*100Effective tax rate % 27.5 66.0 29.6 30.0 30.0
Sales revenue 9,123.2 7,245.6 7,199.5 7,321.5 7,832.0 ValuationEBITDA 253.2 191.4 240.6 318.8 379.9 c_PEP/E x 29.8 127.9 29.8 17.3 13.0
Depr. & Amort. (129.9) (123.5) (121.8) (126.5) (128.8) c_EBIT_MULTIPLE_CURREV/EBIT x 20.1 34.5 20.1 11.9 8.8
EBIT 123.3 67.9 118.7 192.3 251.1 c_EBITDA_MULTIPLE_CUEV/EBITDA x 9.8 12.2 9.9 7.2 5.8
Associates 0.0 0.0 0.0 0.0 0.0 c_DIV_YIELD*100Dividend Yield % 1.9 0.0 0.0 2.9 3.9
Net interest Exp. (21.2) (17.6) (14.6) (11.9) (10.2) c_FCF_YIELD*100FCF Yield % 7.3 7.2 1.5 6.7 8.5
Other 0.0 0.0 0.0 0.0 0.0 c_PBPrice to Book x 0.9 1.1 1.2 1.2 1.1
Profit before tax 102.1 50.3 104.1 180.4 240.9 ReturnsIncome tax (28.1) (33.2) (30.8) (54.1) (72.3) c_ROE*100Return on Equity % 3.1 0.9 4.1 6.6 8.4
Profit after tax 74.0 17.1 73.3 126.3 168.7 c_I_NPAT/c_I_SALES*100Profit Margin % 0.8 0.2 1.0 1.7 2.2
Minorities 0.0 0.0 0.0 0.0 0.0 c_I_SALES/c_B_TOT_ASSAsset Turnover x 2.5 2.5 2.6 2.6 2.6
Preferred dividends 0.0 0.0 0.0 0.0 0.0 c_ASSETS/c_EQ_COMMONEquity Multiplier x 1.5 1.5 1.5 1.5 1.5
Associates & Other (0.0) (0.0) 0.0 0.0 0.0 c_ROA*100Return on Assets % 2.0 0.6 2.7 4.4 5.6
Normalised NPAT 74.0 17.1 73.3 126.3 168.7 c_ROIC*100Return on Invested Cap. % 3.3 1.1 4.2 6.7 8.7
Unusual item after tax (696.5) (483.2) (32.8) 0.0 0.0 GearingReported NPAT (622.5) (466.1) 40.5 126.3 168.7 c_GEARING*100Net Debt to Net debt + Equity % 10.9 7.4 9.8 4.9 1.3
c_NET_DEBT/c_I_EBITDANet Debt to EBITDA x 1.2 0.8 0.8 0.3 0.1
Balance Sheet 06/12A 06/13A 06/14E 06/15E 06/16E c_I_EBITDA/ c_I_NET_INTERESTInt Cover (EBITDA/Net Int.) x 11.9 10.9 16.5 26.8 37.2
Cash & equivalents 51.4 46.9 5.9 102.6 174.6 c_I_EBIT/ c_I_NET_INTERESTInt Cover (EBIT/Net Int.) x 5.8 3.9 8.1 16.2 24.6
Inventories 890.0 574.9 431.3 439.3 469.9 (c_C_CAPEX/c_I_SALES)*-100Capex to Sales % 1.8 2.1 1.3 1.7 1.6
Receivables 513.4 455.4 503.2 512.5 548.2 (c_C_CAPEX/c_I_DEPR)*-100Capex to Depreciation % 156.3 147.4 88.4 119.9 119.9
Other current assets 29.4 82.2 82.2 82.2 82.2
Current assets 1,484.2 1,159.4 1,022.5 1,136.6 1,275.0 MSCI IVA (ESG) Rating AAAProperty, plant & equip. 977.1 992.2 960.4 960.4 960.4 TP ESG Risk (%): 0
Intangibles 634.0 263.9 263.9 263.9 263.9
Other non-current assets 524.7 501.3 501.3 501.3 501.3
Non-current assets 2,135.8 1,757.4 1,725.6 1,725.6 1,725.6
Total assets 3,620.0 2,916.8 2,748.1 2,862.2 3,000.6
Payables 672.1 585.2 556.7 560.2 596.2
Interest bearing debt 343.6 200.7 200.7 200.7 200.7
Other liabilities 209.9 202.1 202.1 202.1 202.1 MSCI IVA Risk: Neutral
Total liabilities 1,225.6 988.0 959.5 963.0 999.0
Net assets 2,394.4 1,928.8 1,788.6 1,899.2 2,001.6
Ordinary equity 2,394.4 1,928.8 1,788.6 1,899.2 2,001.6
Minority interests 0.0 0.0 0.0 0.0 0.0
Preferred capital 0.0 0.0 0.0 0.0 0.0
Total shareholder funds 2,394.4 1,928.8 1,788.6 1,899.2 2,001.6
Net debt 292.2 153.8 194.8 98.1 26.1 Source: MSCI IVA Rating
Cashflow 06/12A 06/13A 06/14E 06/15E 06/16E Share Price Performance
EBIT 123.3 67.9 118.7 192.3 251.1
Net interest -20.0 -16.7 -16.7 -14.7 -11.9
Depr & Amort 129.9 123.5 121.8 126.5 128.8
Tax paid -64.8 -9.4 -27.5 -30.8 -54.1
Working capital 106.6 286.2 67.4 -13.8 -30.4
Other 14.6 -154.2 -141.5 13.8 30.4
Operating cashflow 289.6 297.3 122.3 273.3 313.9
Capex -161.1 -149.0 -90.0 -126.5 -128.8
Capex - expansionary -31.2 -10.0 0.0 0.0 0.0
Capex - maintenance -129.9 -139.1 -90.0 -126.5 -128.8
Acquisitions & Invest -75.6 28.9 -50.0 -50.0 -50.0
Asset sale proceeds 0.0 0.0 0.0 0.0 0.0
Other -105.9 1.3 2.4 0.0 0.0
Investing cashflow -342.6 -118.8 -137.6 -176.5 -178.8
Dividends paid -69.3 -20.4 0.0 0.0 -63.1
Equity raised -37.0 -8.8 0.0 0.0 0.0
Net borrowings 40.9 -157.3 -28.6 0.0 0.0
Other 0.0 0.0 0.0 0.0 0.0 1 Month 3 Month 12 Month
Financing cashflow -65.4 -186.5 -28.6 0.0 -63.1 Absolute 3.2% 2.4% -2.4%
Total cashflow -118.4 -8.0 -43.9 96.8 72.0 Relative 1.1% 3.2% -8.7%
Adjustments 4.3 3.5 2.9 0.0 0.0
Net change in cash -114.1 -4.5 -41.0 96.8 72.0 Source: Reuters 52 week trading range: 8.26-11.24
MSCI IVA Risk Comment: As SGM is not involved in production of
steel or Iron Ore, and is not anticipated too, we expect low risk of
a MSCI rating downgrade
11/02/2014 17:52
Sims Metal Management Limited is a metals recycling company. Its core businesses include
ferrous recycling; non-ferrous recycling; and recycling solutions.
Credit Suisse View
TP Risk Comment: No ESG risk factored into our TP, consistent
with MSCI 'AAA' rating.
0.00
2.00
4.00
6.00
8.00
10.00
12.00
4/02/2013 4/04/2013 4/06/2013 4/08/2013 4/10/2013 4/12/2013 4/02/2014
SGM.AX XJO
1.8
2.8
3.8
4.8
5.8
6.8
Environment Social Governance
Stock Local Sector Country Global Sector
Source: Company data, Credit Suisse estimates

17 February 2014
Australia and NZ First Edition 79
Stronger 1H than we expected, but 2H appears
challenged as tailwind becomes a headwind
Undoubtedly a better result than we had envisaged driven by a strong result from Australia
but helped by accounting definitions more than true underlying recovery in performance, in
our view. Underlying earnings of $42.1mn, up on pcp $9.4mn. $9.3mn statutory/reported
earnings result was in line with our forecasts.
Much of the gap between the 'underlying' figure and the reported figure could be debated,
6 of the 11 'significant items' occurring in 1H13 and the major difference, a deferred tax
asset write-off of $17.6mn, impossible for us to estimate. That said, the headline figure
was pleasing, even if driven only by Australia on 1.015Mt and unlikely to be replicated by
the larger volume, 4.364Mt US business.
The outlook, however, is somewhat more subdued and ultimately the 2H may indeed
prove more difficult from:
■ Turkey market disruptions seen aggressively since January;
■ Export destined tonnage now competing with US domestic markets for a buyer;
■ Continued low levels of scrap generation in the US and now reduction in competition;
■ No turnaround visible in the SRS business (new management placed in 1 July 2013),
indeed a further deterioration;
■ Excess processing capacity (ongoing structural issue) in the US market;
■ Severe winters in the US and Europe impacting 2H scrap flows;
■ Collapsing half to date prices globally for scrap.
In line with our preview, SGM’s 1H results exceeded our forecast, driven, as we had
forewarned, by a stronger Australasia result than we were modelling.
We recognised two risks to our Australian forecast – that of the materially improved
domestic structure following significant capacity idling and competition abatement and the
benefit of the rapidly rising scrap price in November and December, and of course the
declining AUD.
Only one prong of this three-pronged boost remains in the current half, that of the
improved and seemingly sustainable industry structure in Australia. FX may have
stabilised and it is difficult to see a significant rise in the ferrous scrap price during the
current half. The June half will see downward pressure from improved US scrap flows as
the northern hemisphere winter abates and is unlikely to see the 1H leg-up from a rising
iron ore price. Iron ore prices appear stable and well supported, but unlikely to rise
materially in the half, therefore holding scrap at parity.
SGM’s US operations also saw the benefit of strong November and December price
momentum, almost certainly assisting margins during that period. The US still struggles
with chronic over-capacity and a vastly inferior market structure to Australia. We do not
see this overcapacity/low utilisation/overbidding for scrap abating any time soon. SGM's
management is unable to quantify the magnitude of the capacity challenge, other than to
say that it varies by region. This much we already assumed. However, incremental
positive signs of volume growth are emerging, but seemingly of a trivial magnitude
compared to the extent of the overcapacity.
US margins appear likely to be static for some time, with any improvement delivered by
SGM’s ability to cut its cost base more aggressively than its unlisted, and generally more
nimble, smaller peers. We do see the potential for SGM to become relatively more nimble,

17 February 2014
Australia and NZ First Edition 80
with significantly deeper cuts possible than can be executed by the already hand-to-mouth
buy-price setting peer group.
While management suggests that margin improvement was delivered by internal action
(cost cutting and efficiency), not market, we suspect that the strongly rising price in
November and December nevertheless contributed significantly. Certainly SGM’s peers
suggest that their weak November quarters would have been materially worse had it not
been for a strong November.
New MD Galdino Claro suggests that there is a layer of business improvement identified to
be extracted through further internal improvements, suggesting improved cost efficiency
has and will continue to improve peer relative position. He believes that the business will
migrate from volume-focused to margin-focused, with more emphasis on cost control and
margin extraction. His focus is the entire supply chain seeking to improve cost of in bound,
conversion and shipping costs, to maximise profit on every tonne.
No guidance has been provided for the 2H, not even directionally. However, it is
abundantly clear that the market is currently deeply challenged and does not have the 1H
external support factors. Indeed the 1H tailwinds that boosted earnings have reversed to
2H headwinds with scrap falling materially and export markets currently in disarray now
impacting US domestic scrap market as “refugee scrap” previously destined for the Turkey
market seeks an already supplied interim market destination.
In our view, the strong 1H Australasian result may struggle to be replicated in the 2H, and
the US market will need to see a material improvement from its current dislocation. At this
point, a weaker US scrap outlook is probable.
While not wishing to deflect or diminish the stronger-than-expected 1H result, we were
quite disappointed by the further deterioration in the SRS business. We had expected the
half to be a period of stabilistion, with remedial actions lifting margins. Disappointingly, the
SRS business deteriorated further and significant further restructuring of the business has
been identified as necessary.
Despite SGM’s return to profitability, strong balance sheet and likely working capital
release likely as scrap collapses, the board is still not confident to resume dividends. This
says clearly that it is not confident that profitability has been sustainably restored and that
further restructuring work and market activity is required to restore this confidence.
Management proudly presents its delivery of $110mn annualised controllable cost
reduction since 2H FY12 exceeding target $100mn. However, this has been almost
entirely eroded by currency impact in AUD terms. This same FX movement has of course
assisted translation of reported EBIT which has not improved proportionally.
Australia clearly the stand out, but we question its sustainability
Strong result from Australia delivering 71% of group underlying operating EBIT, despite
higher costs (on higher volumes) but reflective of exiting competition in the market.
■ Stronger sales volumes of 0.975Mt, up 8.5% pcp and 12.7% HoH.
■ Strongest intake volumes of 1.015Mt, up 18.2% pcp and 12.9% HoH. Highest intake
volumes for at least five years.
■ Some risk to medium-term outlook as manufacturing continues to reduce suggesting
less prompt scrap availability.
■ Stronger sales revenues of $596.9mn up 4.1% versus pcp and 17% HoH.
■ Margins the key driver to the improved EBITDA on the back of improved intake and
market consolidation.

17 February 2014
Australia and NZ First Edition 81
■ New WA shredder to be operational in 2H FY15, to replace two smaller existing
shredders – a decision possible post ARI's exit from the WA market (a failed Smorgon
strategy).
While no doubt a pleasing result, 1H result, we note, was largely Australia driven. We
remain cautious on the outlook given the margin pressure we continue to see where cost
outs are largely consumed by buy price pressure. Fundamentally, margins have not
returned at the pace of volumes, despite aggressive cost cutting, improved non-ferrous
contributions and yard and shredder optimisation. This continues to influence our long-
term view.
We recognise that when volumes are ultimately restored, fixed cost coverage should
improve, reducing unit operating cost but, to date, material achievements with reducing
operating costs have not flowed to materially improving earnings. We are cautious on not
calling a turnaround when comparing numbers to what was a very weak FY13, and what
remains a very poor result on the asset deployed.
Ferrous scrap prices retreating
The past two weeks have seen the return of some scrap demand from Turkey with several
mills reported as resuming deep-sea cargoes for February-March shipment from American
and Baltic suppliers, after an exceptionally quiet January.
Pricing is ~$370/mt CFR Turkish ports for heavy melting scrap (80:20 blend), a $31/t lower
price than at the start of 2014.
Turkey is the world's largest export market for scrap, but has declined year or year with
CY13 scrap imports declining to 19.4Mt, down 13.4% YoY. Turkey’s scrap imports account
for > 20% of total global scrap trade and approximately equivalent to the US total scrap
exports. The US is the largest global exporter.
Turkey can import scrap from the US, EU, the UK or Russia or it can buy semi-finished
steel (billets, blooms and slabs) from Russia. Importing semi's has been cheaper and has
reduced need for scrap.
Turkey produced 35Mt of steel in CY13, 70% of which was in electric arc furnaces fed
largely by imported scrap. This compares to EAF's production globally being well below
40% of total steel production. The collapse of the Turkish Lira against the US$ has
favoured Eurozone exports slightly in recently relative to US exports, with UK exports
being the most expensive.
The Middle East and North Africa account for 54% of Turkish finished steel exports.
Instability in Turkey’s largest export market is not helpful to its steel producers and impacts
its scrap requirements.
Turkish scrap imports softened in December, increasing US domestic scrap market
liquidity and capping year-end domestic scrap price increases. Simplistically, this suggests
scrap prices must decline to a point where export pricing becomes attractive again,
obviously exacerbated by the Lira. Semi-finished steel exports from Russia to Turkey are
additionally impacted Turkey's by demand for scrap imports.
US East Coast scrap traders, sell mainly to Europe and the Middle East, so are more
impacted by weaker Turkish demand than West Coast scrapyards, which sell mainly to
Asia. For SGM, its East Coast operations have historically been less competitive and more
profitable than its intensely competitive West Coast operations.
SGM's East Coast peer, Schnitzer Steel Industries Inc. reported that exports accounted for
67% of overall sales in its latest quarter, down from 71%, a year earlier.
Steel Dynamics Inc scrap subsidiary, OmniSource, suggests that reduced scrap buying
from Turkey will offset US cold weather scrap supply issues and lead to declining US
ferrous scrap prices in February, and potentially the rest of the first quarter.

17 February 2014
Australia and NZ First Edition 82
Most recently, the differential between scrap and billet has narrowed to ~$122/t,
suggesting that there is less economic advantage for a Turkish EAF to purchase and re-
roll billet (and other semis) over importing scrap and converting it to billet.
Figure 2: Global scrap prices – falling
250
300
350
400
450
500
10
-Feb
-12
10
-Mar
-12
10
-Ap
r-1
2
10
-May
-12
10
-Ju
n-1
2
10
-Ju
l-1
2
10
-Au
g-1
2
10
-Sep
-12
10
-Oct
-12
10
-No
v-1
2
10
-Dec
-12
10
-Jan
-13
10
-Feb
-13
10
-Mar
-13
10
-Ap
r-1
3
10
-May
-13
10
-Ju
n-1
3
10
-Ju
l-1
3
10
-Au
g-1
3
10
-Sep
-13
10
-Oct
-13
10
-No
v-1
3
10
-Dec
-13
10
-Jan
-14
10
-Feb
-14
$/t Scrap Prices
HMS 1/2 80:20 / East Asia import CFR $/t HMS 1/2 / N.America domestic Del. Mill $/l.ton
HMS 1/2 80:20 / Turkish port import CFR $/t HMS Europe export FOB
Shred Scrp US Midwest Source: SBB, Credit Suisse
Margins up, but still historically weak
It has long been our thesis that historical ferrous margins of >US$30/t will not return to
scrap markets given the structural and dynamic changes the industry has undergone over
the past 3-4 years. This thesis continues to hold, but even the extent of the continued
margin compression has surprised us in its severity. With each half of reporting, we
become even more confident in our view. Our $15/t 'mid-cycle' margin assumption may
indeed be too optimistic.
Figure 3: Margins still under pressure
1H06
2H061H07
2H07
1H08
2H08
1H09
2H09
1H10
2H10
1H05
2H05
1H04
2H04
1H11
2H11
1H12
2H121H132H13
1H14
-
10
20
30
40
50
60
70
80
90
200 250 300 350 400 450 500 550 600
EB
IT m
argi
n (U
S$/
t)
Average Ferrous price realised (US$/t)
Ferrous Processing margins
Source: Company data, Credit Suisse estimates

17 February 2014
Australia and NZ First Edition 83
P&L
■ 1H14 underlying NPAT $42mn (2H13 underlying NPAT $7mn, 1H13 $10mn).
■ Interest cost of $126mn (2H13 $12.9mn, 1H13 $12mn) on closing debt of $184.1mn
(2H13 $200mn, 1H13 $364mn).
■ Fourth straight half where no dividend has been paid. Last dividend was 2H FY12
(10cps unfranked, a payout of 66% of ¢15.1 EPS). We continue to forecast ~50%
payout ratio which we continue to use to forecast future dividend payouts. Despite no
change to guidance policy of 45–55%, we remain unsure when dividends will re-
commence. We assume FY15.
■ We note the Board's reluctance to restore dividends is consistent with our cautious
view of SGM's recovery trajectory. While ferrous volumes are improving, they are not
delivering the improved margins that should be expected.
■ Underlying EBIT again heavily weighted to Australia as expected:
o Australia $47.6mn (2H13 $42.2mn, 1H13 $19.5mn)
o Europe $11.1mn (2H13 UK impacted $31.5mn loss, 1H13 at $12.3mn)
o North America $6.8mn (2H13 $34.8mn, 1H13 small $1.9mn).
■ Depreciation and amortisation flat at $60.9mn (2H13 $61.3mn, 1H13 $62.2mn).
■ Effective tax rate 29.2%, or $17.4mn. 2H13 $20.7mn tax on $27.8mn PBT (74%),
1H13 $12.5mn on $22.5mn PBT (56%). We continue to model a flat 30% rate.
■ Corporate overheads, as stated, total $61.1mn.
Figure 4: EBIT
(100)
-
100
200
300
400
500
600
1H06 2H06 1H07 2H07 1H08 2H08 1H09 2H09 1H10 2H10 1H11 2H11 1H12 2H12 1H13 2H13 1H14
A$m
n
Group EBIT contributions
Australia, NZ & Asia North America Europe Group
Source: Company data, Credit Suisse estimates

17 February 2014
Australia and NZ First Edition 84
Balance sheet remains strong
■ Period end net debt improved again to $121.2mn. 30 June 2013 net debt $153.8mn,
31 December 2012 net debt $292.8mn. Strength of balance sheet continues.
■ Gearing 5.7% (7.4% June 30, 2013). Maintaining low gearing remains a focus.
■ Inventory up in AUD at $651.2mn but broadly flat after 2H13 restatement to $574.9mn.
■ No material write-downs outside a $17.6mn write-off of deferred tax asset balance.
■ Goodwill $174.5mn (2H13 $166.5mn, 2H12 $507.4mn, 2H11 $988.7mn, 2H10
$1,151.7mn!).
■ Unfortunately a smaller than usual release of financials means no disclosure on the
split of goodwill between geographies.
■ We note the possibility of a 2H14 working capital released on the strong reversal of
scrap prices, particularly if this is sustained over the half.
Figure 5: Gearing
(500)
(400)
(300)
(200)
(100)
-
100
200
300
1H06 2H06 1H07 2H07 1H08 2H08 1H09 2H09 1H10 2H10 1H11 2H11 1H12 2H12 1H13 2H13 1H14
A$m
n
Net cash / (debt)
Cash & Equivalents Debt Net cash / (debt)
Source: Company data, Credit Suisse estimates

17 February 2014
Australia and NZ First Edition 85
Cash flow
■ Operating cash flow of $37.8mn, down on 2H13 $220.9mn and on pcp 1H13 $76.4mn.
SGM typically have far higher operating cash flows in each 2H.
■ No dividends paid since 1H13.
■ Net borrowings ~$28mn. Gross debt has been gradually reducing since 2H FY12.
Figure 6: Cash flow summary
(600)
(400)
(200)
-
200
400
600
1H06 2H06 1H07 2H07 1H08 2H08 1H09 2H09 1H10 2H10 1H11 2H11 1H12 2H12 1H13 2H13 1H14
A$m
n
Cash Flow Summary
Operating Cashflows Investing Cashflows Financing Cashflows Net cash
Source: Company data, Credit Suisse estimates

17 February 2014
Australia and NZ First Edition 86
Operational review Australia (and NZ consolidated) – the shining light
■ 1H FY14 statutory EBIT $48.3mn (2H13 $4mn, 1H13 EBIT $15mn).
■ 1H13 EBIT margin of $49.5/t (2H13 $4.5, 1H13 $16.6t, $70/t in 2H12 and $44/t in 1H12).
■ Scrap sales of 0.975Mt (2H13 0.865Mt, 1H13 0.899Mt, 2H12 0.88Mt, 1H12 0.0.89Mt).
■ Intake volumes 1.015Mt (2H13 0.899Mt, 1H13 0.859Mt).
■ Australia remains (by far) the best business in the portfolio
■ Employees now being added.
■ $8mn additional costs explained by greater intake volumes vs sales.
Figure 7: Australasia financial summary
Australia, NZ & Asia 2H11 2011 1H12 2H12 2012 1H13 2H13 2013 1H14 hoh (%) pcp (%)
Sales Revenue A$mn 690 1,369 639 589 1,228 574 510 1,083 597 17% 4%
EBITDA (statutory) A$mn 73 109 54 77 131 28 17 45 63 262% 128%
EBITA (statutory) A$mn 62 87 42 65 106 15 4 20 49 1009% 219%
EBIT (pre-amortisation of
intangibles, statutory)
A$mn 62 87 38 64 102 15 4 19 48 1138% 224%
Assets $ 633 633 650 733 733 709 671 671 695 4% -2%
Employees 942 942 960 1,006 1,006 968 984 984 1,013 3% 5%
Sales tonnes $/t 884 1,774 855 917 1,772 899 865 1,764 975 13% 8%
EBITDA/t $/t 82.6 61.3 62.8 83.8 73.6 30.6 20.0 25.4 64.2 221% 110%
EBITA/t % 70.2 49.2 48.9 70.4 60.0 17.0 5.1 11.2 50.1 884% 194%
EBIT/t % 70.0 49.0 44.2 70.0 57.6 16.6 4.5 10.7 49.5 999% 199%
EBITDA / Sales A$ 10.6% 7.9% 8.4% 13.0% 10.6% 4.8% 3.4% 4.1% 10.5% 209% 119%
EBITDA / Assets % 23.1% 17.2% 16.5% 21.0% 17.8% 7.8% 5.2% 6.7% 18.0% 250% 132%
EBITDA / Employee % 154,989 115,393 111,875 152,684 129,722 56,818 35,163 45,528 123,593 251% 118%
EBIT / Sales A$/t 9.0% 6.4% 5.9% 10.9% 8.3% 2.6% 0.8% 1.7% 8.1% 957% 212%
Source: Company data, Credit Suisse estimates
Figure 8: Australia – EBIT, revenue and margin
0.0%
2.0%
4.0%
6.0%
8.0%
10.0%
12.0%
14.0%
16.0%
-
100
200
300
400
500
600
700
800
900
1,000
1H06 2H06 1H07 2H07 1H08 2H08 1H09 2H09 1H10 2H10 1H11 2H11 1H12 2H12 1H13 2H13 1H14
A$m
n
Australia, NZ & Asia
Sales Revenue EBIT EBIT / Sales
Source: Company data, Credit Suisse estimates

17 F
eb
ruary
201
4
Au
stra
lia a
nd
NZ
Firs
t Ed
ition
87
Figure 9: Assets Figure 10: Regional EBIT contributions
0
500
1,000
1,500
2,000
2,500
3,000
3,500
4,000
1H07 2H07 1H08 2H08 1H09 2H09 1H10 2H10 1H11 2H11 1H12 2H12 1H13 2H13 1H14
A$m
n
Assets
North America Australia, NZ & Asia Europe
(100)
-
100
200
300
400
500
600
1H06 2H06 1H07 2H07 1H08 2H08 1H09 2H09 1H10 2H10 1H11 2H11 1H12 2H12 1H13 2H13 1H14
A$m
n
Group EBIT contributions
Australia, NZ & Asia North America Europe Group
Source: Company data, Credit Suisse estimates Source: Company data, Credit Suisse estimates
Figure 11: EBITDA by region Figure 12: EBITDA return on assets
-5%
0%
5%
10%
15%
20%
1H07 2H07 1H08 2H08 1H09 2H09 1H10 2H10 1H11 2H11 1H12 2H12 1H13 2H13 1H14
EBITDA margin by region
North America Australia, NZ & Asia Europe
-5%
0%
5%
10%
15%
20%
25%
30%
35%
40%
45%
1H07 2H07 1H08 2H08 1H09 2H09 1H10 2H10 1H11 2H11 1H12 2H12 1H13 2H13 1H14
A$m
n
EBITDA return on assets
North America Australia, NZ & Asia Europe
Source: Company data, Credit Suisse estimates Source: Company data, Credit Suisse estimates

17 February 2014
Australia and NZ First Edition 88
North America – still struggling
■ 1H14 statutory EBIT -$1mn loss (2H13 $4.8mn and impairment impacted 1H13
$320.1mn loss).
■ $36mn of margin enhancement ($7mn volume, $24mn cost out and $5mn FX) was not
delivered to margins, with a weaker SRS contribution blamed.
■ EBIT/t again very weak, just under breakeven and only $1.6/t on underlying EBIT.
■ Volumes (sales and intake) weaker than 2H13, but up marginally on pcp. 4.364Mt
intake and 4.342Mt sales volumes.
■ Margin restoration remains elusive.
■ $44mn articulated cost reductions but no material improvement or flow through to
earnings.
■ New England expansion completed.
■ ~200 less employees than at June 30.
■ $7.8mn difference between statutory and "underlying" earnings
Figure 13: North America financial summary
North America 2H11 2011 1H12 2H12 2012 1H13 2H13 2013 1H14 hoh (%) pcp (%)
Sales Revenue A$mn 3,418 5,993 3,044 2,983 6,027 2,043 2,491 4,535 2,182 -12% 7%
EBITDA (statutory) A$mn 132 197 25 2 27 -1 46 46 33 -28% -5650%
EBITA (statutory) A$mn 105 141 -2 -24 -26 -26 23 -3 8 -65% -132%
EBIT (pre-amortisation of intangibles, statutory)
A$mn 96 118 3 -6 -3 2 5 -315 -1 -121% -100%
Assets 2,656 2,656 2,157 2,066 2,066 1,670 1,660 1,660 1,650 -1% -1%
Employees Mt 3,503 3,503 3,804 3,692 3,692 3,744 3,618 3,618 3,417 -6% -9%
Sales tonnes $/t 6,024 10,964 5,488 5,592 11,080 4,233 5,144 9,377 4,342 -16% 3%
EBITDA/t $/t 21.9 18.0 4.5 0.4 2.4 -0.1 9.0 4.9 7.7 -14% -5511%
EBITA/t % 17.4 12.8 -0.3 -4.3 -2.3 -6.1 4.5 -0.3 1.9 -58% -131%
EBIT/t % 15.9 10.8 0.5 -1.0 -0.3 0.5 0.9 -33.6 -0.2 -125% -100%
EBITDA / Sales A$/t 3.9% 3.3% 0.8% 0.1% 0.4% 0.0% 1.9% 1.0% 1.5% -18% -5297%
EBITDA / Assets % 10.0% 7.4% 2.3% 0.2% 1.3% -0.1% 5.6% 2.7% 4.0% -27% -5716%
EBITDA / Employee % 75,478 56,352 12,881 1,246 7,259 -267 25,484 12,576 19,491 -24% -6181%
EBIT / Sales A$/t 2.8% 2.0% 0.1% -0.2% 0.0% 0.1% 0.2% -7.0% 0.0% -124% -100%
Source: Company data, Credit Suisse estimates

17 February 2014
Australia and NZ First Edition 89
Figure 14: US reporting segment
-25.0%
-20.0%
-15.0%
-10.0%
-5.0%
0.0%
5.0%
10.0%
15.0%
(500)
-
500
1,000
1,500
2,000
2,500
3,000
3,500
4,000
4,500
1H06 2H06 1H07 2H07 1H08 2H08 1H09 2H09 1H10 2H10 1H11 2H11 1H12 2H12 1H13 2H13 1H14
A$m
n
North America
Sales Revenue EBIT EBIT / Sales
Source: Company data, Credit Suisse estimates
Europe
■ 1H14 statutory EBIT $3.3mn (2H13 EBIT -$144.7mn loss, 1H13 EBIT -$5.9mn, both
impacted by UK write downs).
■ EBIT/t $4.1/t, or $13.8/t on underlying EBIT ($11.1mn).
■ $19mn cost reductions and $2mn volume growth more than consumed, with a $1.2mn
lower underlying EBIT (pcp) on roughly the same tonnage. Like North America, cost
outs are still failing to fall to the bottom line, but again attributable to SRS
performance,
■ Scrap sales of 0.795Mt (2H 0.843Mt, 1H12 0.852Mt, 2H11 803kt, 1H 682kt, flat on
2H10 686kt but down on 1H10 714kt).
■ ~100 employees removed HoH.
Figure 15: European financial summary
Europe 2H11 2011 1H12 2H12 2012 1H13 2H13 2013 1H14 hoh (%) pcp (%)
Sales Revenue A$mn 789 1,485 901 880 1,781 812 764 1,575 814 7% 0%
EBITDA (statutory) A$mn 77 126 22 8 30 8 -125 -118 16 -112% 101%
EBITA (statutory) A$mn 64 102 9 -5 4 -5 -140 -145 4 -103% -170%
EBIT (pre-amortisation of intangibles, statutory)
A$mn 63 100 -92.3 -8.4 -100.7 -5.9 -144.7 -150.6 3.3 -102% -156%
Assets 891 891 726 710 710 699 585 585 649 11% -7%
Employees 1,727 1,727 1,846 1,900 1,900 1,845 1,718 1,718 1,616 -6% -12%
Sales tonnes $/t 766 1,466 808 843 1,651 795 850 1,645 807 -5% 2%
EBITDA/t $/t 100.7 86.2 27.2 9.6 18.2 9.7 -147.3 -71.4 19.2 -113% 98%
EBITA/t % 84.1 69.8 11.3 -5.9 2.5 -6.3 -164.7 -88.1 4.3 -103% -169%
EBIT/t % 82.6 68.3 -114.2 -10.0 -61.0 -7.4 -170.2 -91.6 4.1 -102% -155%
EBITDA / Sales A$/t 3.9% 3.3% 0.8% 0.1% 0.4% 0.0% 1.9% 1.0% 1.5% -18% -5297%
EBITDA / Assets % 10.0% 7.4% 2.3% 0.2% 1.3% -0.1% 5.6% 2.7% 4.0% -27% -5716%
EBITDA / Employee % 75,478 56,352 12,881 1,246 7,257 -321 25,484 12,576 19,491 -24% -6181%
EBIT / Sales A$/t 8.0% 6.7% -10.2% -1.0% -5.7% -0.7% -18.9% -9.6% 0.4% -102% -156%
Source: Company data, Credit Suisse estimates

17 February 2014
Australia and NZ First Edition 90
Figure 16: Europe revenue and earnings
-20.0%
-15.0%
-10.0%
-5.0%
0.0%
5.0%
10.0%
(200)
(100)
-
100
200
300
400
500
600
700
800
900
1,000
1H08 2H08 1H09 2H09 1H10 2H10 1H11 2H11 1H12 2H12 1H13 2H13 1H14
A$m
n
Europe
Sales Revenue EBIT EBIT / Sales
Source: Company data, Credit Suisse estimates
Figure 17: Raw material expenses Figure 18: Freight expenses
0
100
200
300
400
500
600
0
500
1,000
1,500
2,000
2,500
3,000
3,500
4,000
4,500
1H06 2H06 1H07 2H07 1H08 2H08 1H09 2H09 1H10 2H10 1H11 2H11 1H12 2H12 1H13 2H13 1H14
US
$/t
US
$mn
Raw materials and changes in inventories of finished goods
Raw materials and changes in inventories of finished goods
Raw materials and changes in inventories of finished goods US$/tonne
0
10
20
30
40
50
60
70
80
0
100
200
300
400
500
600
1H06 2H06 1H07 2H07 1H08 2H08 1H09 2H09 1H10 2H10 1H11 2H11 1H12 2H12 1H13 2H13 1H14
US
$/t
US
$mn
Freight expenses
Freight expenses Freight expenses US$/tonne
Source: Company data, Credit Suisse estimates Source: Company data, Credit Suisse estimates
Figure 19: Employee benefits expense Figure 20: Depreciation and amortisation expense
0
5
10
15
20
25
30
35
40
45
0
50
100
150
200
250
300
350
1H06 2H06 1H07 2H07 1H08 2H08 1H09 2H09 1H10 2H10 1H11 2H11 1H12 2H12 1H13 2H13 1H14
US
$/t
US
$mn
Employee benefits expense
Employee benefits expense Employee benefits expense US$/tonne
0
2
4
6
8
10
12
0
10
20
30
40
50
60
70
80
1H07 2H07 1H08 2H08 1H09 2H09 1H10 2H10 1H11 2H11 1H12 2H12 1H13 2H13
US
$/t
US
$mn
Depreciation and amortisation expense
Depreciation and amoritisation expense
Depreciation and amoritisation expense US$/tonne
Source: Company data, Credit Suisse estimates Source: Company data, Credit Suisse estimates

17 February 2014
Australia and NZ First Edition 91
Figure 21: Repairs and maintenance expense Figure 22: ‘Other’ expenses
0
2
4
6
8
10
12
0
10
20
30
40
50
60
70
80
90
1H06 2H06 1H07 2H07 1H08 2H08 1H09 2H09 1H10 2H10 1H11 2H11 1H12 2H12 1H13 2H13 1H14
US
$/t
US
$mn
Repairs and maintenance expense
Repairs and maintenance expense Repairs and maintenance expense US$/tonne
0
10
20
30
40
50
60
0
50
100
150
200
250
300
350
1H07 2H07 1H08 2H08 1H09 2H09 1H10 2H10 1H11 2H11 1H12 2H12 1H13 2H13
US
$/t
US
$mn
Other expenses from ordinary activities expense
Other expenses from ordinary activities Other expenses from ordinary activities US$/t
Source: Company data, Credit Suisse estimates Source: Company data, Credit Suisse estimates

17 February 2014
Australia and NZ First Edition 92
Business segments Ferrous shredded and processed including NFSR
Figure 23: Ferrous processing margins
0%
2%
4%
6%
8%
10%
12%
14%
16%
18%
-
10
20
30
40
50
60
70
80
90
1H06
2H06
1H07
2H07
1H08
2H08
1H09
2H09
1H10
2H10
1H11
2H11
1H12
2H12
1H13
2H13
1H14
EB
IT m
argi
n (%
)
EB
IT m
argi
n ($
/t)
Ferrous Processing margins
EBIT/t US$/t EBIT/t A$/t EBIT margin %
Source: Company data, Credit Suisse estimates
Ferrous shredded and processed including NFSR
■ Ferrous sales volumes down to 4.327Mt vs pcp 4.398Mt. and 4.602Mt in prior half
■ Ferrous EBITDA $71.8mn (2H13 $31.5mn, 1H13 $12.9mn, 2H12 $4.5mn).
■ Australian operations remain robust and high margin, however Nov/Dec scrap price
rises likely helped margin expansion.
■ Margins remain materially below those achieved in 1H09 when EBIT/t was $51.42/t,
but achieved on a more favourable FX translation.
Ferrous brokerage – materially weaker margins
■ 1H14 brokerage tonnage 1.519Mt, down HoH (1.577Mt) but up on very weak 1H13
1.263Mt. Sales tonnage has averaged 1.68Mt since FY08 (inclusive).
■ 1H14 EBITA $4.7mn (2H13 $4.9mn, 1H13 $8.8mn).
■ 1H14 EBITA/t $3.1/t (flat on 2H13 $3.1/t, 1H13 $7/t)
■ Ferrous brokerage is normally a $5/t to $10/t business and has averaged a margin on
$6.7/t since FY08 (inclusive).
■ The business is a low-margin, consistent business, with very little capital deployed.

17 February 2014
Australia and NZ First Edition 93
Figure 24: Ferrous brokerage margins
0%
1%
1%
2%
2%
3%
3%
4%
4%
0
2
4
6
8
10
12
14
16
1H06
2H06
1H07
2H07
1H08
2H08
1H09
2H09
1H10
2H10
1H11
2H11
1H12
2H12
1H13
2H13
1H14
EB
IT m
argi
n (%
)
EB
IT m
argi
n ($
/t)
Ferrous Brokerage margins
EBIT/t US$/t EBIT/t A$/t EBIT margin %
Source: Company data, Credit Suisse estimates
Non-ferrous trading and brokerage
■ Flat 1H14 tonnage of 275kt (2H13 274kt, 1H13 282kt) and in line with average
volumes since 2008.
■ 1H14 EBITA $24.8mn, (2H13 $23.8mn, 1H13 $18.3mn, 2H12 $42.9mn, 1H12
$29.5mn).
■ 1H14 EBITA/t $89/t (2H13 $84/t, 1H13 EBIT/t $69/t, 2H12 $144/t, 1H12 $102/t).
Manufacturing, distribution and JVs
■ 1H14 $20.1mn (2H13 $33.9mn loss, 1H13 $5.2mn).
■ This segment now is dominated by JVs,
■ The JVs are dominated by the SA recycling JV which generate the majority of JV
contribution. Thie $20.1m result is very material.
■ This material turn around was not discussed by management, but was a significant
trend change consolidated in the weaker North American result.

17 February 2014
Australia and NZ First Edition 94
Figure 25: Non-ferrous margins
-10.0%
-5.0%
0.0%
5.0%
10.0%
15.0%
20.0%
(200)
(150)
(100)
(50)
-
50
100
150
200
250
300
350
4001H
04
2H04
1H05
2H05
1H06
2H06
1H07
2H07
1H08
2H08
1H09
2H09
1H10
2H10
1H12
2H12
1H13
2H13
1H14
EB
IT m
argi
n (%
)
EB
IT m
argi
n ($
/t)
Non-Ferrous margins
EBIT/t US$/t EBIT/t A$/t EBIT margin
Source: Company data, Credit Suisse estimates
Earnings changes
Figure 26: Earnings changes
Old 1H14 2H14 New % chg Old New % chg Old New % chg
Revenues
Ferrous Trading & NFSR A$mn 3,572 1,871 1,791 3,662 3% 3,790 3,662 -3% 3,898 3,766 -3%
Ferrous Brokerage A$mn 1,099 589 578 1,168 6% 1,103 1,109 1% 1,240 1,240 0%
Non-Ferrous A$mn 1,421 663 732 1,394 -2% 1,644 1,589 -3% 1,840 1,858 1%
Manufacturing / JVs A$mn 60 30 30 60 0% 66 66 0% 72 72 0%
Recycling Solutions A$mn 1,000 440 456 896 -10% 1,000 896 -10% 1,000 896 -10%
Total Revenue A$mn 7,152 3,613 3,587 7,200 1% 7,602 7,322 -4% 8,050 7,832 -3%
EBIT
Ferrous Trading & NFSR A$mn 85 72 58 130 54% 144 139 -3% 174 168 -3%
Ferrous Brokerage A$mn 16 5 6 10 -38% 19 19 1% 23 23 0%
Non-Ferrous A$mn 59 25 28 53 -10% 74 71 -3% 83 84 1%
Manufacturing / JVs A$mn 20 20 20 40 100% 20 20 0% 21 21 0%
Recycling Solutions A$mn 50 2 10 12 -75% 80 80 0% 81 81 0%
Operational EBIT A$mn 230 124 122 245 7% 336 329 -2% 382 377 -1%
Non operational EBIT A$mn 157- 72- 71- 142- 9% 144- 137- 5% 133- 126- 5%
Total EBIT A$mn 73 68 51 119 62% 192 192 0% 249 251 1%
EBITDA A$mn 203 129 112 241 18% 327 319 -3% 387 380 -2%
Depreciation A$mn 108- 51- 51- 102- 5% 112- 106- 5% 114- 107- 6%
GW Amoritsation A$mn 23- 10- 10- 20- 11% 24- 21- 11% 24- 21- 11%
EBIT A$mn 73 68 51 119 62% 192 192 0% 249 251 1%
Net Interest A$mn 12- 8- 6- 15- -22% 11- 12- -12% 9- 10- -13%
NPBT A$mn 61 60 45 104 70% 182 180 -1% 240 241 0%
Taxation A$mn 18- 17- 13- 31- -68% 54- 54- 1% 72- 72- 0%
NPAT (operating) A$mn 43 42 31 73 71% 127 126 -1% 168 169 0%
EPS (operating) Acps 21 21 15.3 36 71% 62 62 -1% 82 82 0%
FY15 FY16FY14
Source: Company data, Credit Suisse estimates

17 February 2014
Australia and NZ First Edition 95
Valuation
Figure 27: DCF based sum-of-the-parts
Operational
A$mn
(t = 1-3 yrs)
A$mn
(terminal) (2)A$mn A$/sh (1)
Ferrous Trading & Ferrous Other 224 1,160 1,384 6.77
Ferrous Brokerage 29 171 200 0.98
Non-Ferrous 112 634 746 3.65
Manufacturing/JVs/Sims Steel 39 143 181 0.89
Recycling Solutions 103 552 656 3.21Growth Capex (3)
-32 -146 -178 -0.87
Sub-Total 475 2,514 2,989 14.62
Non-Operational
Net Cash / (debt) -121 0 -121 -0.59
Corporate -175 -640 -814 -3.98
Sub-Total -296 -640 -936 -4.58
Total 179 1,875 2,054 10.04
Notes & assumptions
1) Shares on issue 204.4 mn
2) Terminal growth rate 2.0 %
3) Excluding sustaining capex which is incl in operational DCFs
Target price 10.00
NAV
Source: Company data, Credit Suisse estimates

Australia and NZ First Edition 96
17 February 2014
Asia Pacific/Australia
Equity Research
Diversified Commercial Services
Transpacific Industries Group
(TPI.AX / TPI AU) ASSUMING COVERAGE
Shifting gears... ■ TPI reported solid 1H14 underlying NPAT of $41.7mn, up 16.5% on pcp,
driven by a $20mn improvement in Net Interest expense and lower D&A.
Waste Management EBITDA of $189.3mn was down 0.5% on pcp and 1.5%
ahead of CS forecast. Underlying operational outperformance of Cleanaway
and NZ was offset by a weaker Industrial result. We have upgraded FY14
NPAT by 35% on upgraded NZD, inclusion of two months of commercial
vehicles trading, lower D&A and revised interest guidance. Our FY15E
NPAT is upgraded 15.6% and 6.3% in FY16. Brad Clibborn assumes
coverage of TPI following a change in analyst responsibilities.
■ NEUTRAL rating as TPI shifts gears: After a number of years of focus on
restructuring and debt reduction, we now see TPI at a turning point. The
management team has breathing room to focus on continuing operational
efficiency gains and a new CEO to lead the business forward. Further, TPI
will soon find itself with sufficient capital flexibility to explore strategic and
growth options in Australia (assuming a successful sale of NZ in the next six
months). With TPI trading on 18.7x FY15E P/E we believe the market has
already priced in successful execution on the guided $50mn of first round
cost-out (FY13–FY15) and de-risking of the balance sheet (ND/EBITDA now
<2x). However, we believe TPI likely has further medium-term margin upside
from operating efficiencies (route optimisation and further overhead
reduction). In order to move positive on TPI from these levels we need to
see a successful sale of NZ, greater clarity on next phase operating
efficiencies and more from new CEO Robert Boucher on the strategic and
growth opportunities for TPI in Australia.
■ Catalysts: Update on sale of NZ business expected late FY14 or early
FY15.
■ Our target price increases to $1.27 from $1.00. We apply a DCF-based
valuation to derive our target price employing a 9.9% WACC.
Total return forecast in perspective
Mean^
CSEC tgt^
Sh Prc
-40%
-30%
-20%
-10%
0%
10%
20%
30%
40%
12mth Volatility* 52wk Hi-Lo IBES Consensustarget return^
Performance over 1M 3M 12M
Absolute (%) 3.1 0.4 40.4
Relative (%) 1.0 1.3 34.0
Financial and valuation metrics
Year 06/13A 06/14E 06/15E 06/16E
Revenue (A$mn) 2,282.7 1,919.7 1,892.1 1,931.3
EBITDA (A$mn) 406.7 382.7 399.6 412.8
EBIT (A$mn) 221.0 204.4 214.2 228.0
Net income (A$mn) 67.9 84.0 98.1 111.7
EPS (CS adj.) (Ac) 4.30 5.32 6.22 7.08
Change from previous EPS (%) n.a. 35.4 15.7 6.4
Consensus EPS (Ac) n.a. 4.70 6.30 7.60
EPS growth (%) 0.3 23.7 16.9 13.9
P/E (x) 27.1 21.9 18.7 16.5
Dividend (Ac) — — 1.55 3.54
Dividend yield (%) — — 1.3 3.0
P/B (x) 1.1 0.9 0.9 0.8
Net debt/equity (%) 48.7 31.8 26.9 23.1
Relative performance versus S&P ASX 200.See Reference
Appendix for a description of the chart. Source: CSEC
estimates, * Consensus, mean range from Thomson Reuters
Source: Company data, ASX, CSEC estimates, * Adj. for goodwill, notional interest and unusual items. Relative P/E against
ASX/S&P200 based on pre GW in AUD. Company PE calculation is based on displayed EPS Currency
Rating NEUTRAL*
Price (14 Feb 14, A$) 1.16
Target price (A$) (from 1.00) 1.27¹
Market cap. (A$mn) 1,839.29
Yr avg. mthly trading (A$mn) 74
Last month's trading (A$mn) 77
Projected return:
Capital gain (%) 9.0
Dividend yield (net %) 0.84
Total return (%) 9.8
52-week price range 1.18 - 0.73
* Stock ratings are relative to the relevant country
benchmark.
¹Target price is for 12 months.
Research Analysts
Bradley Clibborn
61 2 8205 4465
Paul Buys
61 2 8205 4538
Chris Smith
61 2 8205 4210
Sarah Mann
61 2 8205 4610
This report is distributed in Australia by Credit
Suisse Equities (Australia) Limited. Please see legal disclaimer and disclosure annex for further terms
and information.
Prepared by Credit Suisse Emerging Companies
(Australia) Pty Limited, a joint venture entered into between
Credit Suisse and First NZ Capital.

17 February 2014
Australia and NZ First Edition 97
Figure 1: Financial summary
Transpacific Industries Group (TPI) Year ending 30 Jun In AUDmn, unless otherwise stated2012 2013 2014 2015 2016 2012 2013 2014 2015 2016
Share Price: A$1.17 Earnings 06/12A 06/13A 06/14E 06/15E 06/16ERating c_EPS_SHARESEquiv. FPO (period avg.) mn 1,352.3 1,578.8 1,578.6 1,578.6 1,578.6
Target Price A$ 1.27 c_EPS*100EPS (Normalised) c 4.3 4.3 5.3 6.2 7.1
vs Share price % 9.01 EPS_GROWTH*100EPS Growth % 0.3 23.7 16.9 13.9
c_EBITDA_MARGIN*100EBITDA Margin % 19.3 17.8 19.9 21.1 21.4
c_DPS*100DPS c 0.0 0.0 0.0 1.6 3.5
c_PAYOUT*100Payout % 0.0 0.0 0.0 25.0 50.0
FRANKING*100Franking % 100.0 100.0 100.0 100.0 100.0
c_FCF_PS*100Free CFPS c 6.6 5.5 3.1 6.4 7.2
Profit & Loss 06/12A 06/13A 06/14E 06/15E 06/16E c_TAX_RATE*100Effective tax rate % 26.7 25.8 27.9 27.8 28.2
Sales revenue 2,267.2 2,282.7 1,919.7 1,892.1 1,931.3 ValuationEBITDA 437.3 406.7 382.7 399.6 412.8 c_PE P/E x 27.2 27.1 21.9 18.7 16.5
Depr. & Amort. (188.0) (185.7) (178.3) (185.4) (184.8) c_EBIT_MULTIPLE_CURREV/EBIT x 11.6 12.7 12.5 11.5 10.5
EBIT 249.3 221.0 204.4 214.2 228.0 c_EBITDA_MULTIPLE_CUEV/EBITDA x 6.6 6.9 6.7 6.2 5.8
Associates 2.9 5.5 9.0 9.0 9.0 c_DIV_YIELD*100Dividend Yield % 0.0 0.0 0.0 1.3 3.0
Net interest Exp. (168.8) (133.4) (95.6) (85.6) (79.5) c_FCF_YIELD*100FCF Yield % 5.7 4.7 2.7 5.5 6.2
Other 0.0 0.0 0.0 0.0 0.0 c_PB Price to Book x 1.0 1.1 0.9 0.9 0.8
Profit before tax 83.4 93.1 117.9 137.6 157.5 ReturnsIncome tax (22.3) (24.0) (32.9) (38.3) (44.4) c_ROE*100Return on Equity % 3.1 3.9 4.2 4.7 5.2
Profit after tax 61.1 69.1 85.0 99.3 113.1 c_I_NPAT/c_I_SALES*100Profit Margin % 2.6 3.0 4.4 5.2 5.8
Minorities (3.1) (1.2) (1.0) (1.2) (1.3) c_I_SALES/c_B_TOT_ASSAsset Turnover x 0.6 0.6 0.5 0.5 0.5
Preferred dividends 0.0 0.0 0.0 0.0 0.0 c_ASSETS/c_EQ_COMMONEquity Multiplier x 2.0 2.1 1.8 1.7 1.6
Associates & Other 0.0 0.0 0.0 0.0 0.0 c_ROA*100Return on Assets % 1.5 1.9 2.4 2.8 3.1
Normalised NPAT 58.0 67.9 84.0 98.1 111.7 c_ROIC*100Return on Invested Cap. % 5.7 5.5 4.9 5.2 5.5
Unusual item after tax (45.5) (286.6) 114.0 (2.9) (2.9) GearingReported NPAT 12.5 (218.7) 197.9 95.2 108.8 c_GEARING*100Net Debt to Net debt + Equity % 32.8 32.7 24.1 21.2 18.8
c_NET_DEBT/c_I_EBITDANet Debt to EBITDA x 2.4 2.4 1.9 1.6 1.4
Balance Sheet 06/12A 06/13A 06/14E 06/15E 06/16E c_I_EBITDA/ c_I_NET_INTERESTInt Cover (EBITDA/Net Int.) x 2.6 3.0 4.0 4.7 5.2
Cash & equivalents 77.9 76.2 72.6 82.1 75.6 c_I_EBIT/ c_I_NET_INTERESTInt Cover (EBIT/Net Int.) x 1.5 1.7 2.1 2.5 2.9
Inventories 175.2 165.2 20.2 20.5 20.9 (c_C_CAPEX/c_I_SALES)*-100Capex to Sales % 7.9 8.6 9.4 9.5 9.1
Receivables 305.6 282.6 291.0 292.0 297.7 (c_C_CAPEX/c_I_DEPR)*-100Capex to Depreciation % 105.0 107.9 103.1 99.1 97.4
Other current assets 18.7 28.0 22.7 22.7 22.7
Current assets 577.4 552.0 406.4 417.3 416.9 MSCI IVA (ESG) Rating BProperty, plant & equip. 1,035.7 1,084.4 1,095.3 1,093.6 1,088.9 TP ESG Risk (%): 0
Intangibles 2,047.2 1,862.8 1,909.3 1,901.6 1,893.9
Other non-current assets 99.3 137.2 131.7 140.7 149.7
Non-current assets 3,182.2 3,084.4 3,136.2 3,135.8 3,132.4
Total assets 3,759.6 3,636.4 3,542.6 3,553.2 3,549.3
Payables 290.7 264.9 186.2 189.5 192.6
Interest bearing debt 1,128.5 1,053.7 795.6 715.6 635.6
Other liabilities 189.1 310.5 289.9 292.8 295.7 MSCI IVA Risk: Neutral
Total liabilities 1,608.3 1,629.1 1,271.7 1,197.9 1,123.9
Net assets 2,151.3 2,007.3 2,270.9 2,355.3 2,425.4
Ordinary equity 1,896.1 1,750.9 2,013.5 2,096.7 2,165.5
Minority interests 5.4 6.6 7.6 8.8 10.1
Preferred capital 249.8 249.8 249.8 249.8 249.8
Total shareholder funds 2,151.3 2,007.3 2,270.9 2,355.3 2,425.4
Net debt 1,050.6 977.5 723.0 633.5 560.0 Source: MSCI ESG Research
Cashflow 06/12A 06/13A 06/14E 06/15E 06/16E Share Price Performance
EBIT 249.3 221.0 204.4 214.2 228.0
Net interest -135.2 -103.0 -83.1 -85.6 -79.5
Depr & Amort 188.0 185.7 178.3 185.4 184.8
Tax paid 8.1 -5.5 -20.8 -34.4 -40.4
Working capital 12.2 0.0 -1.1 1.9 -3.0
Other -52.4 -15.8 -48.6 0.0 0.0
Operating cashflow 270.0 282.4 229.1 281.5 290.0
Capex -180.1 -196.3 -180.0 -180.0 -176.4
Capex - expansionary 0.0 0.0 0.0 0.0 0.0
Capex - maintenance -180.1 -196.3 -180.0 -180.0 -176.4
Acquisitions & Invest 14.3 28.2 9.1 0.0 0.0
Asset sale proceeds 0.0 0.0 235.3 0.0 0.0
Other 16.6 4.1 5.1 0.0 0.0
Investing cashflow -149.2 -164.0 69.5 -180.0 -176.4
Dividends paid 0.0 0.0 0.0 -12.0 -40.1
Equity raised 260.7 1.2 0.0 0.0 0.0
Net borrowings -348.1 28.2 -283.1 -80.0 -80.0
Other -44.5 -150.3 -20.8 0.0 0.0 1 Month 3 Month 12 Month
Financing cashflow -131.9 -120.9 -303.9 -92.0 -120.1 Absolute 3.1% 0.4% 40.4%
Total cashflow -11.1 -2.5 -5.3 9.5 -6.5 Relative 1.0% 1.3% 34.0%
Adjustments 0.3 0.8 1.7 0.0 0.0
Net change in cash -10.8 -1.7 -3.6 9.5 -6.5 Source: Reuters 52 week trading range: 0.73-1.18
MSCI IVA Risk Comment: We belive the MSCI rating is
appropriate given TPI's recent environmental performance in
relation to specific occurences and management of its carbon
footprint.
14/02/2014 18:08
Transpacific Industries Group Ltd is an Australia-based company. It operates in three core
segments across the waste collection and management areas: Cleanaway, Transpacific
Industrials and New Zealand.
Credit Suisse View
TP Risk Comment: For TPI, outside of the corporate services
ESG risk factors we do not include any ESG impact in our base
valuation. We highlight the key ESG risk areas for TPI as 1) the
Tullamarine site remediation and cap; and 2) environmental
concerns surrounding site remediation, waste management and
the capture/sequestration of greenhouse gases from its waste
facilities.
NEUTRAL
0.00
0.20
0.40
0.60
0.80
1.00
1.20
1.40
4/02/2013 4/04/2013 4/06/2013 4/08/2013 4/10/2013 4/12/2013 4/02/2014
TPI.AX XJO
2.7
3.7
4.7
5.7
6.7
7.7
Environment Social Governance
Stock Local Sector
Country Global Sector
Source: Company data, CSEC estimates

17 February 2014
Australia and NZ First Edition 98
Figure 2: Earnings Changes
Consolidated P&L (A$mn) FY14F FY15F FY16F
Old New % chg Old New % chg Old New % chg
Cleanaway 826.0 928.6 12.4% 851.9 959.7 12.7% 881.7 995.5 12.9%
Industrials 504.9 496.3 -1.7% 519.8 501.4 -3.6% 538.0 505.3 -6.1%
New Zealand 333.2 412.0 23.7% 342.7 431.1 25.8% 353.0 430.5 21.9%
CVM 23.6 82.8 250.1% 24.4 - -100.0% 25.0 - -100.0%
Other operating income - - - - - -
Total sales revenue 1,687.7 1,919.7 13.7% 1,738.8 1,892.1 8.8% 1,797.6 1,931.3 7.4%
Non operating revenues 8.7 12.9 47.5% 8.7 12.9 47.5% 8.7 12.9 47.5%
Total revenues 1,696.4 1,932.6 13.9% 1,747.5 1,905.0 9.0% 1,806.4 1,944.2 7.6%
Operating expenses 1,327.4 1,549.9 16.8% 1,357.8 1,505.4 10.9% 1,395.1 1,531.4 9.8%
Cleanaway 196.9 196.9 0.0% 205.7 208.2 1.2% 216.7 220.4 1.7%
Industrials 94.0 90.8 -3.4% 100.4 96.2 -4.2% 106.4 97.2 -8.6%
New Zealand 86.1 97.2 12.9% 88.5 103.5 16.9% 92.3 103.7 12.3%
CVM -2.3 5.8 -348.8% 0.9 - -100.0% 1.9 - -100.0%
Commercial vehicles -5.6 -8.0 42.0% -5.8 -8.2 42.0% -6.0 -8.5 42.0%
EBITDA 369.1 382.7 3.7% 389.7 399.6 2.5% 411.3 412.8 0.4%
TPI EBITDA (incl. associate) 377.5 391.7 3.8% 398.1 408.6 2.6% 419.7 421.8 0.5%
Depreciation of assets -183.3 -174.6 -4.8% -185.2 -181.7 -1.9% -186.1 -181.1 -2.7%
Amortisation other -3.7 -3.7 0.0% -3.7 -3.7 0.0% -3.7 -3.7 0.0%
EBIT 182.0 204.4 12.3% 200.8 214.2 6.7% 221.5 228.0 3.0%
TPI EBIT (incl. associate) 190.4 213.4 12.1% 209.2 223.2 6.7% 229.9 237.0 3.1%
Interest charges (Bank, USPP, conv notes, leases)-91.3 -82.0 -10.2% -78.4 -71.8 -8.4% -70.4 -65.8 -6.6%
Interest on Step up prefs -16.2 -16.0 -1.2% -16.2 -16.0 -1.2% -16.2 -16.0 -1.2%
Interest received 1.8 2.4 31.9% 1.2 2.2 74.5% 0.6 2.3 266.3%
Share of net profits of associates 8.4 9.0 7.1% 8.4 9.0 7.1% 8.4 9.0 7.1%
Profit before tax 84.7 117.9 39.1% 115.9 137.6 18.8% 143.9 157.5 9.5%
Tax -21.7 -32.9 51.3% -29.7 -38.3 29.1% -37.2 -44.4 19.5%
OEI -1.0 -1.0 4.2% -1.3 -1.2 -11.0% -1.6 -1.3 -18.1%
Normalised NPAT 62.0 84.0 35.4% 84.9 98.1 15.6% 105.1 111.7 6.3%
Significant items (net of tax) 59.1 114.0 92.9% -6.1 -2.9 -51.6% -6.0 -2.9 -51.7%
Reported NPAT 121.1 197.9 63.5% 78.8 95.2 20.8% 99.0 108.8 9.9%
Normalised EPS (cps) 3.9 5.3 35.4% 5.4 6.2 15.6% 6.7 7.1 6.3%
DPS (cps) - - nm 1.3 1.6 15.7% 3.3 3.5 6.4%
Tax rate % 26% 28% 26% 28% 26% 28% Source: Company data, CSEC estimates

Australia and NZ First Edition 99
17 February 2014
Asia Pacific/New Zealand
Equity Research
Real Estate Investment Trusts (REITs) (Financials)
■
■
Vital Healthcare Property Trust
(VHP.NZ / VHP NZ) UPGRADE RATING
Strong result – driven by one-off impacts ■ VHP's reported 1H14 distributable profit rose 48% on pcp and 44% on
forecast as one-off items below the line contributed strongly to the result.
Rental income was 2% up on pcp and in line with our forecast. Current tax
was a credit of NZ$1.6mn which created a positive variance of NZ$4.7mn to
our forecast which assumed a normalised tax charge in the period.
■ Portfolio-structured rent review mechanism proving its worth. With
minimal real rental growth being seen in the sector, VHP is likely to have
one of the strongest rental growth prospects over the next 12 months
(excluding currency impacts) from the majority structured review
mechanism. In FY14, 81% of the total rent is subject to a review and with
around half completed in the first half, VHP reported a 2.4% average rental
increase.
■ Portfolio metrics improved further. As announced in late 2013,
management had been successful in the early negotiations of a new 30-year
lease to Mercy Ascot Hospital in Auckland which made up circa 10% of the
portfolio rent roll. This lease combined with several long-term extensions at
some of their Australian assets saw the WALT extend from 11.8 years at
year end to 14.9 years. Occupancy remained above 99% and the expiry
profile appears to be very manageable through to FY17.
■ With one of the two material lease expiries within the portfolio no longer of
concern and gearing levels comfortably in the mid-30%, we have less
concerns around the stock. The focus will now be on how management
deals with the confirmed tenant departure at their Allamanda asset. We
forecast VHP to have one of the higher rental growth and earnings profiles in
the sector. Whilst our 12-month target price reduces 4cps to $1.35, the
significant pull-back in the share price over the second half of 2013 means
we upgrade our rating to NEUTRAL (from Underperform).
Share price performance
90.0
95.0
100.0
105.0
110.0
1.00
1.25
1.50
1.75
2.00
Feb-13 Mar-13 Apr-13 May-13 Jun-13 Jul-13 Aug-13 Sep-13 Oct-13 Nov-13 Dec-13 Jan-14 Feb-14
Vital Healthcare Property Trust LHS Relative to NZX50 (RHS)
The price relative chart measures performance against the
NZX50 index which closed at 4873.5 on 13 Feb 14
The spot exchange rate was NZ$1.199/US$1 on 14 Feb 14
Performance over 1M 3M 12M
Absolute(%) -0.4 -0.4 7.3
Rel-NZX50(%) -0.6 0.7 -7.7
Rel-NZPTY(%) -0.8 -0.3 5.7
Year to 30 Jun 2012A 2013A 2014F 2015F 2016F
Adjusted Earnings NZ$m 22.7 27.9 32.4 29.3 30.0
EPS Adjusted NZc. 7.8 9.3 9.7 8.6 8.7
EPS Grow th % 6.4 19.3 4.6 -11.9 1.9
P/E x 16.6 13.9 13.3 15.1 14.8
CPS NZc. 7.8 9.3 9.7 8.6 8.7
P/CF x 16.6 13.9 13.3 15.1 14.8
EV/EBITDA x 15.9 13.6 13.5 12.7 12.4
Net DPS NZc. 7.7 7.9 7.9 8.1 8.3
Imputation % 19.0 46.0 47.0 48.0 48.0
Net Yield % 6.0 6.1 6.1 6.3 6.4
Gross Yield % 8.9 9.1 9.2 9.4 9.6
Financial and valuation metrics
Source: Company data, NZX, First NZ Capital estimates
Rating (from Underperform) NEUTRAL* Price (14 Feb 2014, NZ$) 1.29 Target price (NZ$) (from 1.39) 1.35¹ Market cap. (NZ$mn) 436.98 Projected return: 0 Capital gain (%) 4.7 Dividend yield (net %) 6.2 Total return (%) 10.9 52-week price range (NZ$) 1.23-1.44
* Stock ratings are relative to the relevant country
benchmark.
¹Target price is for 12 months.
Research Analysts
Stephen Reid
+64 9 302 5543
This report is distributed in Australia by Credit Suisse
Equities (Australia) Limited. Please see legal disclaimer and
disclosure annex for further terms and information
Provided by First NZ Capital

17 February 2014
Australia and NZ First Edition 100
Figure 1: Vital Healthcare Property Trust—Financial summary
PROFIT & LOSS ($m) BALANCE SHEET ($m)Year to 30 Jun 2012A 2013A 2014F 2015F 2016F Year to 30 Jun 2012A 2013A 2014F 2015F 2016F
Operating Rev enue 48.0 57.9 58.5 61.0 63.4 Cash & Equiv alents 1.3 1.4 1.4 1.4 1.4
Operating Ex penses -7.1 -7.2 -7.3 -7.4 -7.6 Debtors & Inv entories 0.0 0.0 0.0 0.0 0.0
Operating EBITDA 40.9 50.6 51.1 53.7 55.8 Other Current Assets 3.2 7.5 7.5 7.5 7.5
Depreciation 0.0 0.0 0.0 0.0 0.0 Current Assets 4.5 8.8 8.8 8.8 8.8
Amortisation 0.0 0.0 0.0 0.0 0.0 Fix ed Assets 575 619 640 660 664
Operating EBIT 40.9 50.6 51.1 53.7 55.8 Inv estments 0.0 0.0 0.0 0.0 0.0
Other Income 0.0 0.0 0.0 0.0 0.0 Intangibles 0.0 0.0 0.0 0.0 0.0
Abnormals 0.0 0.0 0.0 0.0 0.0 Other Non-Current Ass. 0.8 1.9 1.9 1.9 1.9
Reported EBIT 40.9 50.6 51.1 53.7 55.8 Total Assets 581 629 651 670 675
Net Interest -16.1 -17.4 -17.1 -17.9 -19.0
Pretax Profit 24.8 33.3 34.1 35.8 36.8 Interest Bearing Debt 244 266 239 254 254
Tax -2.1 -5.4 -1.7 -6.5 -6.8 Other Liabilities 48.9 54.4 54.4 54.4 54.4
Minority Interests 0.0 0.0 0.0 0.0 0.0 Total Liabilities 293 320 294 309 308
Equity Accounted Profit 0.0 0.0 0.0 0.0 0.0 Minorities 0.0 0.0 0.0 0.0 0.0
Reported NPAT 22.7 27.9 32.4 29.3 30.0 Conv ertible Capital 0.0 0.0 0.0 0.0 0.0
Abnormals (net of tax ) 0.0 0.0 0.0 0.0 0.0 Ordinary Equity 287 309 357 362 367
Adjusted Earnings 22.7 27.9 32.4 29.3 30.0 Total Funds Emp. 581 629 651 670 675
RATIOS AND CAPITAL STRUCTURE CASH FLOW ($m)Year to 30 Jun 2012A 2013A 2014F 2015F 2016F Year to 30 Jun 2012A 2013A 2014F 2015F 2016F
Profitability & Growth
EBITDA/Op Rev % 85.2 87.5 87.5 87.9 88.0 Operating EBITDA 40.9 50.6 51.1 53.7 55.8
EBIT/Op Rev % 85.2 87.5 87.5 87.9 88.0 Other Cash Income 0.0 0.0 0.0 0.0 0.0
Effectiv e Tax Rate % 8.5 16.3 4.9 18.3 18.4 Interest Paid -17.2 -17.6 -17.1 -17.9 -19.0
Return On Equity % 7.7 9.3 9.7 8.1 8.2 Tax Paid -0.6 -2.1 -1.7 -6.5 -6.8
ROCE % 8.1 9.2 8.8 8.9 9.0 Working Capital / Other 0.5 1.2 0.0 0.0 0.0
EPS Adjusted c. 7.8 9.3 9.7 8.6 8.7 Operating Cash Flow 23.7 32.1 32.4 29.3 30.0
EPS Grow th % 6.4 19.3 4.6 -11.9 1.9
Net DPS c. 7.7 7.9 7.9 8.1 8.3 Total Capex -36.4 -41.7 -21.3 -19.7 -4.3
Div idend Cov er x 1.0 1.2 1.2 1.1 1.1 Acquisitions -34.1 -40.4 0.0 0.0 0.0
Asset Backing & Capital Structure Div estments 14.4 12.8 0.0 0.0 0.0
Net Cash (Debt) $m -243 -265 -238 -253 -252 Div idends -19.0 -17.5 -23.4 -24.5 -25.1
NTA / Share $ 1.0 1.0 1.0 1.1 1.1 Equity Raised 0.0 0.0 39.2 0.0 0.0
Equity / Tot Assets % 49.5 49.1 54.9 54.0 54.4 Other 2.3 0.0 0.0 0.0 0.0
Net Debt / EBITDA x 5.9 5.2 4.7 4.7 4.5 Change in Net Debt -49.1 -54.7 26.9 -15.0 0.6
Interest Cov er x 2.5 2.9 3.0 3.0 2.9
Shares on Issue Capex /Depn %
Ordinary m 293 307 341 343 346 Capex /Rev % 75.9 72.1 36.4 32.3 6.8
Fully Diluted m 293 307 341 343 346
Auckland21%
Other2%Hawkes Bay
2%
Australia75%
GEOGRAPHIC SPLIT BY VALUE
0.50
0.70
0.90
1.10
1.30
1.50
1.70
Sep
-99
Sep
-00
Sep
-01
Sep
-02
Sep
-03
Sep
-04
Sep
-05
Sep
-06
Sep
-07
Sep
-08
Sep
-09
Sep
-10
Sep
-11
Sep
-12
Sep
-13
MOVING PRICE TO NTA
Source: Company data, NZX, First NZ Capital estimates

17 February 2014
Australia and NZ First Edition 101
The result
On 14 February 2014, Vital Healthcare Property Trust (VHP) reported their results for the
six months to 31 December 2013.
Figure 2: VHP financials for the six months ended 31 December 2013 (NZ$mn)
1H14A 1H13A % Chg FNZC % Chg vs f/c
Net rental revenue 28.9 28.3 2% 29.1 -1%
Administration expenses (including management fee - base) (2.6) (2.9) -8% (2.4) 9%
Other indirect expenses (0.5) (0.6) -12% (1.0) -47%
EBIT 25.7 24.9 3% 25.7 0%
Net interest expense (7.8) (8.4) -7% (8.3) -6%
Operating profit before taxation 18.0 16.5 8% 17.4 3%
Taxation expense 1.6 (2.6) -161% (3.1) -152%
Operating profit (FNZC) 19.5 13.9 40% 14.3 36%
Tax expense/(benefit) from foreign exchange gains/(losses) 1.1 -
Distributable profit (VHP) 20.6 13.9 48% 14.3 44%
Less distributable profit adjustments (1.1) -
Unrealised loss on foreign exchange (6.4) -
Receipts under transaction hedging foreign exchange contracts 1.1 0.1
Fair value gain/(Loss) on foreign exchange derivatives 0.3 0.1
Fair value gain/(Losses) on interest rate derivatives 3.1 1.0
Deferred tax (0.9) (0.5)
Profit/(Loss) after income tax 16.6 14.6
Movement in foreign currency translation reserve (27.7) (3.1)
Realised foreign exchange loss on hedges 18.2 3.9
Unrealised foreign exchange loss on hedges (6.3) 1.7
Fair value gain on net investment hedges 18.2 (3.2)
Income tax expense relating to other comprehensive income - current (5.1) (1.1)
Income tax expense relating to other comprehensive income - deferred (3.3) 0.4
Comprehensive income (loss) after tax 10.6 13.2
EPU operating profit before current taxation (NZc) 5.5 5.6 -2.2% 5.2 4.7%
EPU operating profit FNZC (NZc) 5.9 4.7 26.4% 4.3 38.3%
EPU distributable profit VHP (NZc) 6.3 4.7 n/a
DPU Gross (NZc) 4.1 4.3 -5.4% 4.9 -15.7%
DPU Net (NZc) 4.0 3.9 2.6% 3.9 0.1%
FNZC payout % 66% 82% 92%
VHP payout % 63% 82% n/a
Imputation % 8% 26% 48%
NTA/Unit $1.05 $0.99
NIBD/Total assets 34% 44%
Source: Company data, FNZC estimates
The 1H14 result was significantly ahead of forecast although it was driven by one-off items
relating to taxation and foreign exchange. Net rental revenue rose 2% on the prior period
although the Trust reported gross rental up 3.8% which was offset by the stronger NZ
dollar over the period. We had forecast a NZ$3.1mn tax expense in 1H14 (reflecting an
effective tax rate of 18%) but the result was a NZ$1.6mn credit due to a combination of an
unrealised forex loss tax deduction and also a write-back of current tax paid under
FIF rules.
In Figure 3 below, we try and analyse the underlying business performance by stripping
out the one-off impacts in 1H14 which shows a 10.6% increase in FNZC gross
distributable profit. VHP operates foreign exchange contracts (FEC) whereby they hedge
the forecast quarterly remittances from their Australian operation that are used to pay their
quarterly distributions (in NZD). VHP currently brings this gain/loss through distributable
profit as part of its ‘normal business’. As this is likely to fluctuate year to year we show this
separately below for comparison purposes. In 1H14 this produced a circa NZ$1.0mn gain.

17 February 2014
Australia and NZ First Edition 102
Figure 3: Distributable profit analysis
$NZ’000
Reported gross distributable profit 1H12 13,891
Rental increase 593
Reduction in overhead costs 293
Reduction in net finance costs 592
Operating performance
1,478
FNZC gross distributable profit 1H13 15,369
10.6%
Receipts under forex contracts
1,017
One-off taxation variance
4,202
Reported gross distributable profit 1H13
20,588
Source: Company data, FNZC estimates
VHP’s gearing was 33.9% and its weighted average interest rate was 6.58% at period end.
Net tangible assets were $1.05 per unit at 31 December 2013, up 4 cents from $1.01 per
unit at 30 June 2013. VHP benefits from the natural hedge of 75% of its assets in AUD
and 100% of its debt in AUD although in times of rising NZD the unhedged portion will
result in a reducing NTA as the portfolio value reduces greater than the debt value. The
rights issue completed above NTA was the main driver of the increased NTA as the
portfolio value actually reduced by around NZ$20mn when translated into NZD.

17 February 2014
Australia and NZ First Edition 103
Portfolio metrics
Figure 4: WALT (years) Figure 5: Occupancy (%)
8.0
9.0
10.0
11.0
12.0
13.0
14.0
15.0
2009 2010 2011 2012 2013
Full-Year Half-Year
97.0%
97.5%
98.0%
98.5%
99.0%
99.5%
100.0%
2009 2010 2011 2012 2013
Full-Year Half-Year
Source: Company data
Source: Company data
■ The already high WALT has jumped to 14.9 years on the back of securing of a new
30-year lease late last year with Mercy Ascot Hospital in Auckland (circa 10% of rent
roll) and four 10-year lease extensions in Australia.
■ Occupancy remains above 99%.
Figure 6: Lease expiry profile
0%
2%
4%
6%
8%
10%
12%
14%
16%
18%
2014 2015 2016 2017 2018 2019 2020 2021 2022 2023
Lease Expiry Profile 30-Jun-13 Lease Expiry Profile 31-Dec-13
Source: Company data
■ The completion of the new lease to Mercy Ascot Hospital has seen the 2019 lease
expiries reduce significantly to circa 5% (from 13%). The 2018 expiries are still
dominated by the Allamanda Hospital expiry in November 2017 which currently makes
up 12.5% of the total rent roll.

17 February 2014
Australia and NZ First Edition 104
Forecasts
We have made some changes to our forecasts incorporating the following:
■ Committed redevelopment works in Australia.
■ Minor changes to rental track on the back of current rent review run-rate.
■ Normalisation of current tax to 18% in 2H14.
Figure 7: Forecasts ($NZmn)
FY14 FY15 FY16
Was Now Chg. Was Now Chg. Was Now Chg.
($m) ($m) (%) ($m) ($m) (%) ($m) ($m) (%)
Net Rental Revenue 59.1 58.5 -1% 60.6 61.0 1% 61.8 63.4 3%
Base Management Fee (5.1) (5.1)
(5.1) (5.2)
(5.2) (5.3)
Other Indirect Expenses (2.2) (2.2)
(2.2) (2.2)
(2.2) (2.3)
EBIT 51.8 51.1 -1% 53.3 53.6 1% 54.4 55.8 3%
Net Interest Expense (16.6) (17.2)
(15.8) (17.9)
(16.4) (19.0)
Income Tax Expense (6.5) (1.6)
(7.2) (6.5)
(7.3) (6.7)
Operating Profit 28.7 32.3 13% 30.3 29.2 -4% 30.7 29.7 -2%
EPU (cents) 8.6 9.7 13% 8.9 8.6 -4% 8.9 8.7 -2%
Net DPU (cents) 7.9 7.9 0% 8.4 8.1 -4% 8.5 8.3 -2%
Payout ratio 92% 82%
95% 95%
95% 95%
Source: Company data, FNZC estimates
The reduction in EPS forecast in FY15 and FY16 is almost solely attributable to higher
interest costs through a combination of increased gearing through the various
redevelopment works and forecast increases in interest costs.
We have lowered our forecast pay-out ratio to 95% resulting in a 2-4% reduction in DPS in
FY15 and FY16. Guidance for cash DPU in FY14 was reaffirmed at 7.9cps and we expect
a pay-out ratio of around 82% due to the one-off tax adjustments. .
Allamanda lease expiry
The tenant Healthescope has now confirmed that it will be relocating services to a new
private hospital on the Gold Coast. This lease expires in November 2017 and makes up
12.5% of the total portfolio rent roll.
At this stage we have not assumed a lower rent or any capex for potential conversion
given the expiry is some 3.5 years away and management are not in a position to detail
any alternatives. However, if we make a broad assumption of a year’s rent-free and
NZ$10mn of redevelopment capex on expiry our DCF would drop by 4cps or 3%.

17 February 2014
Australia and NZ First Edition 105
Valuation and investment view
VHP continues to maintain it’s near full occupancy and long WALT (now extended out to
14.9 years). With around 80% of their portfolio leases being under a structured or fixed
review mechanism we expect VHP will produce one of the strongest rental growths in the
sector over the next 12 months, excluding any negative foreign exchange outcomes.
Management continues to organically grow the rental streams through careful brownfield
redevelopments forecast to yield around 10% on completion.
With a forecast FY14 cash distribution of 7.9cps Vital is trading on a 6.1% cash yield,
above the sector average, but still some 23% above NTA. We see little downside risk to
this distribution amount through a combination of positive earnings momentum and an
unstressed pay-out ratio. We have a lower risk view on the stock with gearing now under
control and the Mercy Ascot lease extended. The biggest risk remains the lease expiry
and departure of the tenant at their Allamanda property. Although still 3.5 years away, it
will need to be carefully managed given this one lease makes up circa 12.5% of the total
rent roll.
Our 12-month target price has reduced by 4cps (or 3%) to $1.35 mainly on the back of
slightly slower forecast earnings growth. With the significant pull-back in the share price
over the second half of 2013, we upgrade our rating to NEUTRAL (from
Underperform).

Australia and NZ First Edition 106
17 February 2014
Asia Pacific/Australia
Equity Research
REITs (Real Estate (AU))
Westfield
(WDC.AX / WDC AU) UPGRADE RATING
Light at the end of the tunnel
■ Reality check: After running to $10.78 immediately after proposing the
creation of Scentre Group, WDC has subsequently sold off 2.4% to $10.27
(vs Global REIT's 2.6% and Domestic Equities' +1.6%). Results have been
de-risked with 2013 FFO guidance of 66.5c re-iterated in Dec. FY14 growth
guidance was also struck, at 3.2% (68.6c). While dilutive sales pose some
risk to growth, WDC would no doubt be ready to re-deploy capital into
buying back their stock as it currently trades on an 11.3% discount to NAV.
We lift our Target Price to $11.45 and upgrade rating to OUTPERFORM.
■ Investment case: Westfield appears to have been dragged down by three
key factors: 1) concerns re US pricing / comps, 2) concerns re growth
outlook, and 3) liquidity drains on the A-REIT sector. Our CY14 NAV
framework suggests the market is pricing WDC's "business" at $1.3bn or
5.2x FY14 EBIT - this excludes any value for the likely margin on the $1.5bn
of balance sheet development currently underway.
■ The headwind: We expect US non-core disposals to culminate shortly with
six assets sold for $1.2bn, driving dilution in the order of 2.9% annualised
(2.3% of FY14 FFO). Press speculation now suggests there may also be
~$1bn of UK asset sales – potentially ~1.8% dilutive (annualised). Yet, we
stress, FY14 weakness could pull forward the long awaited growth by 2015.
■ US cap rates offset FX: Our earnings (FY14 +0.8%) upgrades are driven
purely by updated FX assumptions and share counts. The valuation uplift
has been partially offset by applying 5bps higher cap rates to US NOI. Our
valuation applies a blended average cap rate of 5.75% and an 11.1x multiple
on active EBIT (& dev't value add) vs 10x on unallocated expenses.
Total return forecast in perspective
Mean^CS tgt^
Sh Prc
-20%
-10%
0%
10%
20%
30%
40%
12mth Volatility* 52wk Hi-Lo IBES Consensustarget return^
Performance over 1M 3M 12M
Absolute (%) 1.6 -5.9 -6.7
Relative (%) -0.5 -5.0 -13.1
Financial and valuation metrics
Year 12/12A 12/13E 12/14E 12/15E
Revenue (A$mn) 2,254.6 2,242.4 2,321.1 2,439.8
EBITDA (A$mn) 2,142.4 2,132.7 2,209.8 2,322.0
EBIT (A$mn) 2,142.4 2,132.7 2,209.8 2,322.0
Net income (A$mn) 1,437.0 — — —
EPS (CS adj.) (Ac) 65.01 66.53 68.60 70.54
Change from previous EPS (%) n.a. 0.02 0.83 0.42
EPS growth (%) 0.3 2.3 3.1 2.8
P/E (x) 15.8 15.4 15.0 14.6
Dividend (Ac) 49.50 51.00 52.22 55.02
Dividend yield (%) 4.8 5.0 5.1 5.4
Net debt/equity (%) 63.9 64.0 70.0 77.2
Relative performance versus S&P ASX 200.See Reference
Appendix for a description of the chart. Source: Credit Suisse
estimates, * Consensus, mean range from Thomson Reuters
Source: Company data, ASX, Credit Suisse estimates, * Adj. for goodwill, notional interest and unusual items. Relative P/E
against ASX/S&P200 based on pre GW in AUD. Company PE calculation is based on displayed EPS Currency
Rating (from Neutral) OUTPERFORM*
Price (14 Feb 14, A$) 10.27
Target price (A$) (from 11.27) 11.45¹
Market cap. (A$mn) 21,705.66
Yr avg. mthly trading (A$mn) 1,487.60
Last month's trading (A$mn) 1,295.81
Projected return:
Capital gain (%) 11.5
Dividend yield (net %) 5.1
Total return (%) 16.6
52-week price range 12.3 - 9.7
* Stock ratings are relative to the relevant country
benchmark.
¹Target price is for 12 months.
Research Analysts
Stephen Rich
61 2 8205 4617
John Richmond
61 2 8205 4580
Mikhail Mohl
61 2 8205 4413
Specialist sales: Bhupen Master
61 2 8205 4792

17 February 2014
Australia and NZ First Edition 107
Figure 1: Westfield Group financial summary
Westfield ######## ######## ######## ######## ########
In AUDmn unless otherwise stated Year ending 31 Dec Share Price: A$10.2712-month target price: A$#ERR: Label not found: 'ESTIM_PP'
2011 2012 2013 2014 2015 2011 2012 2013 2014 2015
Profit & Loss 2011A 2012A 2013F 2014F 2015F Financial Summary 2011A 2012A 2013F 2014F 2015F
Net property income 1,947 1,941 1,929 1,997 2,107 Core Earnings 1,492.4 1,473.7 1,438.8 1,424.1 1,464.4
Investment Income Core Earnings Growth -1.3% -2.4% -1.0% 2.8%
Management EBIT 108 123 129 140 145 EPS (CS underlying) 64.8 65.0 66.5 68.6 70.5
Development EBIT 43 87 102 113 111 EPS growth 0.3% 2.3% 3.1% 2.8%
Other Active EBIT P/E 15.85 15.80 15.44 14.97 14.56
Trading Profits (/loss) Dividends (cents per share) 48.4 49.5 51.0 52.2 55.0
Other income 5 24 13 - - Dividend Yield 4.7% 4.8% 5.0% 5.1% 5.4%
Unallocated expenses -37 -33 -41 -40 -41 AFFO (cents per share) 73.4 68.0 62.0 63.7 65.4
EBITDA 2,064 2,142 2,133 2,210 2,322 P/AFFO 14.0 15.1 16.6 16.1 15.7
Depreciation & Amortisation EV/EBITDA 14.3 14.9 14.7 14.6 14.6
EBIT 2,064 2,142 2,133 2,210 2,322
Net Interest 445 552 589 676 745 Profitability Ratios
PBT 1,619 1,591 1,544 1,534 1,577 Development ROC 13.5% 13.5% 13.5% 13.5% 13.5%
Tax -110 -95 -95 -99 -101 ROE (%) 8.77% 9.35% 7.87% 7.59% 7.62%
Minorities -17 -22 -11 -11 -11 Payout Ratio (Dist / Op Earnings) 75% 76% 77% 76% 78%
NPAT (post minorities) 1,492 1,474 1,439 1,424 1,464 Offshore Assets 44% 45% 59% 59% 59%
Balance Sheet 2011A 2012A 2013F 2014F 2015F Financial Ratios 2011A 2012A 2013F 2014F 2015F
Cash & equivalents 191 1,099 991 1,049 1,008 Balance Sheet Ratios
Receivables 1,535 244 481 481 481 Interest cover 4.0 3.4 3.6 3.3 3.1
Derivatives 188 146 134 134 134 Debt/EBITDA 8.0 5.8 5.9 6.4 6.8
Other current assets 167 204 626 626 626 Net Debt / Investment Properties 44.1% 39.4% 59.9% 63.0% 69.2%
Current assets 2,080 1,692 2,233 2,290 2,249 Total Liabilities/ Total Assets 53.8% 53.7% 52.1% 53.3% 54.6%
Investment Properties 23,108 17,956 19,524 20,852 21,457 Share Items
Investments 9,990 12,947 14,844 15,457 16,995 EFPOWA 2,303.1 2,267.0 2,162.6 2,076.0 2,076.0
Intangible assets - - - - - Units on Issue 2,303.1 2,238.6 2,121.4 2,076.0 2,076.0
Other non-current assets 1,675 1,460 1,556 1,578 1,613 Target Price ESG Risk Due to ESG 0.0%
Non-current assets 34,778 32,382 35,942 37,906 40,084 MSCI IVA Risk Neutral
Total assets 36,858 34,074 38,175 40,196 42,333 MSCI IVA Comment
Derivatives 495 451 242 242 242
Interest bearing debt 13,886 11,178 12,683 14,193 15,858
Other liabilities 5,457 6,681 6,974 6,988 7,007
Total liabilities 19,837 18,310 19,899 21,423 23,107
Net assets 17,021 15,764 18,275 18,773 19,225
Ordinary equity 17,021 15,764 18,275 18,773 19,225
Minorities / prefered capital 273 435 225 225 225 Share Price Performance 52 week range: $9.70 - $12.34
Net Tangible Assets per share 7.4 7.0 8.6 9.0 9.3
Cashflow 2011A 2012A 2013F 2014F 2015F
Net Property Income 1,947 1,941 1,929 1,997 2,107
Other operating cashflow -140 -431 -803 2 -868
Operating cashflow 1,807 1,510 1,126 1,999 1,240
Disposals (/acquisitions) of property
Specific Capex -797 -974 -786 -1,428 -1,452
Maintenance Capex -6 -62 -73 -75 -81
Net investment in JV's & associates
Other Investing Cashflows -269 3,950 2,474 - -
Investing cashflow -1,073 2,914 1,614 -1,503 -1,533
Proceeds from Equity Issuance -7 -776 -1,644 - -
Dividend Re-investment Plan
Dividends paid -1,284 -1,125 -1,103 -1,067 -1,123
Net borrowings 1,091 -1,660 -105 1,413 1,375
Other -525 44 8 - -
Financing cashflow -726 -3,516 -2,845 346 252
Net cashflow 8 907 -105 842 -41
We agree with MSCI's rating as a number of WDC
retail property owning peers have started to
demonstrate more proactive efforts to achieve green
certifications across their portfolios, and while
Westfield continues to adopt green certifications at a
slow rate and demonstrates little evidence of
improvement in portfolio-wide energy and water
efficiency
9.5
10.0
10.5
11.0
11.5
12.0
12.5
13.0
Feb
-13
Mar
-13
Apr
-13
May
-13
Jun-
13
Jul-1
3
Aug
-13
Sep
-13
Oct
-13
Nov
-13
Dec
-13
Jan-
14
Feb
-14
WDC.AX S&P/ASX 200 S&P/ASX 200 Property
Source: Company data, Credit Suisse estimates

17 February 2014
Australia and NZ First Edition 108
Investment thesis Since popping to $10.78 on announcement of the Scentre Group proposal, Westfield has
fallen 2.4% (vs the broader markets' +1.6%, A-REITs' +0.9% and Global REITs' 2.6%) on
a dividend adjusted basis. Implied value would appear to have emerged when we consider
the following metrics:
■ NAV: Using our NAV framework, market pricing reflects: a 6.14% forward NOI yield
(vs 5.9% book) and a 10.4x multiple (vs CSe 11.1x) on active earnings and value
creation (i.e., including estimated value uplift on balance sheet devt).
■ Dividend: Yield of 5.1% is not compelling relative to a historical average of 7%,
however, the 2013 pay-out ratio of 77% is considerably lower than the 92% average.
■ Multiples: WDC's 15.0x FFO multiple reflects a PE Rel of 1.04 is in line with the
historical average, but with history of trading 15% expensive when growth emerges,
However, market concerns seem focused on three key factors:
■ Deal transparency: We estimate a 21x pre-eliminations EBIT multiple if we assume
WRT consideration is truly worth NTA, despite historically trading at a 14.8% discount,
■ US pricing / comps: Post proposal, WDC has de-rated by 11% relative to US peers
on a price to FFO multiple basis, more than compensating for lower short-term growth,
■ Liquidity drains on the A-REIT sector: $1.9bn of 4Q13 REIT capital raised, and…
… lack of confidence in growth!!!
Market data shows second-year growth expectations (12 to 24mth forward) has averaged
4.9% since the merger, in-line with management comments of ~5% trend EPS growth.
However, Westfield's growth since the merger of 2004 has consistently underwhelmed.
Compound Annual Growth on post GFC re-capitalised FY11 earnings stands at just 3.5%
pa to 2013 (Figure 2) and is expected to grow just 3.2% into 2014.
Figure 2: WDC growth historically underwhelming Figure 3: When hopes breach 5.5% PErel +1 s.d.
-40%
-30%
-20%
-10%
0%
10%
20%
2005 2006 2007 2008 2009 2010 2011 2012 2013 2014 2015
EPS DPS Forecast Growth into Forward 'Year 2'
Source: Company data, Credit Suisse estimates Source: Company data, Credit Suisse estimates
The risk creates the opportunity
We note the risks to FY14 FFO associated with dilutive disposals including:
■ US: 2.3% dilution from selling six assets with a book value of US$1.2bn
■ UK: 1.4% dilution from selling stakes in Merry Hill and Derby.
However, depressing FY14 earnings may see FY15 growth more achievable. 3-4% EPS
dilution could be offset by a potentially greater re-rate. With comfort in 5.5% growth, could
WDC trade back to 1 standard deviation expensive? That’s where our TP stands.
Concerns remain, but value
has emerged – Upgrade to
OUTPERFORM
Lower yield with lower
payout -> even more need
to generate growth!
Dilution as a "growth
slingshot?"
Our $11.45 target price is
NAV driven. Yet, we note, it
reflects 16.69x 2014 FFO –
1.16x PE Rel, or <1 sd
above the historical average

17 February 2014
Australia and NZ First Edition 109
The disposals The potential for dilutive asset sales are the primary drag on confidence. While US sales
have been well flagged since April 2011, we now read of the potential for UK sales also.
United States
Westfield December 2013 Group Restructure presentation highlighted that six US assets
with a total book value of US$1.2bn and average productivity of US$325 psft were
considered non-core.
Figure 4: Credit Suisse depiction of potential suspects highlights ~7% yield
Asset Market 31 Dec, 2013
Book Value
2012 Specialty
Sales (US$ psft)
Estimated Yield
31 Dec, 12
Meriden Connecticut 136 313 7.01%
Vancouver Washington 141 331 6.05%
Hawthorn Illinois/Indiana 183 300 7.00%
Fox Valley Illinois/Indiana 209 314 7.24%
Connecticut Post Connecticut 237 343 7.00%
Wheaton Maryland 272 352 7.26%
1,177 328 6.99%
Source: Company data, Credit Suisse estimates
US dilutive sales impact
Unsure of relative denominations of debt, if we were to assume this portfolio were sold at a
5% discount to book, settling on 1 April, paying down debt at a group average interest
expense of 4%, the FFO hit would be 2.3% (growing to 2.9% annualised).
Superficial analysis could overstate the dilution
As highlighted in September's note, "Are We There Yet?" there are a few factors that can
reduce dilution:
■ Property Level (/Mortgage) Debt: If assets are sold with property level debt that can
be assumed by the buyer, this will reduce the group's average cost of debt,
■ Co-investment: Retaining some stake in the disposal assets appears to be prudent
from a tax perspective. If the stake is held in a highly levered, floating debt structure,
WDC's dividend income can partially offset the dilution.
Full analysis is reproduced in Appendix 1.
United Kingdom
In addition to US sales, the AFR has recently reported that Westfield is also negotiating to
sell interests in its UK assets Derby and Merry Hill.
■ Derby: Shifted from 100% consolidated to 66.7% Equity Accounted at June. At 31
December 2012, the 100% stake was valued at £394.3m, on a yield of 6.5%. Westfield
holds a 50% direct interest and 16.7% through its one-third stake in the UK Shopping
Centre Fund – the income from which would also reduce on disposal.
■ Merry Hill: At 31 December 2012, the 33.3% stake was valued at £254.9m, on a yield
of 5.7%. Westfield holds a 25% direct interest and 8.3% through its one-third stake in
the UK Shopping Centre Fund – the income from which would also reduce on
disposal.
If sold at book, the combined receipts would reach ~£518m or ~A$950m.
US sales: 2.3% dilutive to
2014 FFO – pre-structuring
~$1bn of UK disposals to
improve portfolio quality
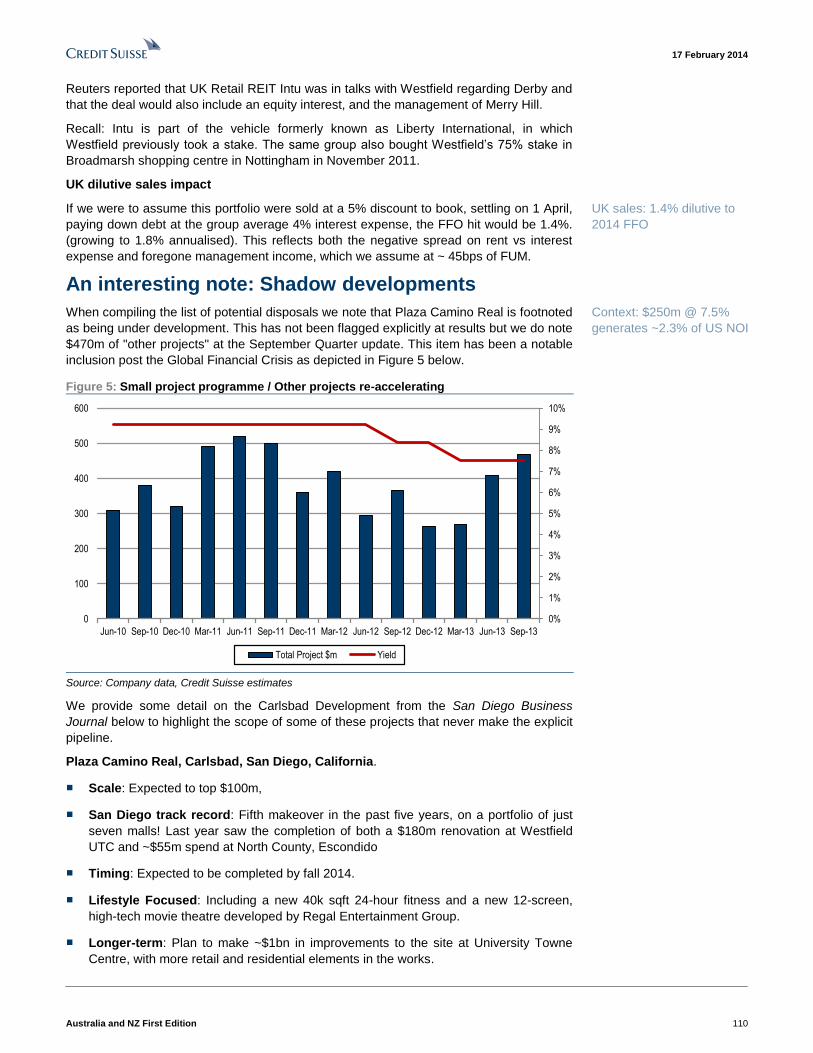
17 February 2014
Australia and NZ First Edition 110
Reuters reported that UK Retail REIT Intu was in talks with Westfield regarding Derby and
that the deal would also include an equity interest, and the management of Merry Hill.
Recall: Intu is part of the vehicle formerly known as Liberty International, in which
Westfield previously took a stake. The same group also bought Westfield’s 75% stake in
Broadmarsh shopping centre in Nottingham in November 2011.
UK dilutive sales impact
If we were to assume this portfolio were sold at a 5% discount to book, settling on 1 April,
paying down debt at the group average 4% interest expense, the FFO hit would be 1.4%.
(growing to 1.8% annualised). This reflects both the negative spread on rent vs interest
expense and foregone management income, which we assume at ~ 45bps of FUM.
An interesting note: Shadow developments
When compiling the list of potential disposals we note that Plaza Camino Real is footnoted
as being under development. This has not been flagged explicitly at results but we do note
$470m of "other projects" at the September Quarter update. This item has been a notable
inclusion post the Global Financial Crisis as depicted in Figure 5 below.
Figure 5: Small project programme / Other projects re-accelerating
0%
1%
2%
3%
4%
5%
6%
7%
8%
9%
10%
0
100
200
300
400
500
600
Jun-10 Sep-10 Dec-10 Mar-11 Jun-11 Sep-11 Dec-11 Mar-12 Jun-12 Sep-12 Dec-12 Mar-13 Jun-13 Sep-13
Total Project $m Yield
Source: Company data, Credit Suisse estimates
We provide some detail on the Carlsbad Development from the San Diego Business
Journal below to highlight the scope of some of these projects that never make the explicit
pipeline.
Plaza Camino Real, Carlsbad, San Diego, California.
■ Scale: Expected to top $100m,
■ San Diego track record: Fifth makeover in the past five years, on a portfolio of just
seven malls! Last year saw the completion of both a $180m renovation at Westfield
UTC and ~$55m spend at North County, Escondido
■ Timing: Expected to be completed by fall 2014.
■ Lifestyle Focused: Including a new 40k sqft 24-hour fitness and a new 12-screen,
high-tech movie theatre developed by Regal Entertainment Group.
■ Longer-term: Plan to make ~$1bn in improvements to the site at University Towne
Centre, with more retail and residential elements in the works.
UK sales: 1.4% dilutive to
2014 FFO
Context: $250m @ 7.5%
generates ~2.3% of US NOI

17 February 2014
Australia and NZ First Edition 111
Base case FFO adjustments At this point we have yet to include either: non-core disposals or Scentre Group spin-off.
We have, however, adjusted our base case earnings forecasts for two key factors:
■ Buyback: WDC bought back 91.5m shares with an average timing of 4 October at an
average price of $11.01, and
■ Foreign Exchange: The AUDUSD finished the period at 89.2, with a 2H13 average of
~92.1.
Figure 6: Buyback activity aggressive while on Figure 7: Australian dollar weaker
0%
10%
20%
30%
40%
50%
60%
70%
80%
10.60
10.70
10.80
10.90
11.00
11.10
11.20
11.30
11.40
Avg Price Mkt Share
0.78
0.8
0.82
0.84
0.86
0.88
0.9
0.92
0.94
Spot FY14 FY15 FY16
AUDUSD @ 16 Sept AUDUSD Today
Source: Company data, Credit Suisse estimates Source: Company data, Credit Suisse estimates
Forward looking / impact
Currency
The spot AUDUSD has fallen 3.4% since our last model update for FX, from 93.2 to 90.
More importantly our house FY14 AUD/USD forecast has shifted 1.2%, as have future
years.
All else being equal, the currency moves drive a:
■ 1.6% upgrade to our WDC NAV, and
■ 1.3% upgrade to FY14 earnings
We note: when Westfield provided a forecast for 2014 FFO in early December, they used
a cross rate of 0.91. This would be 1.3% dilutive to our FY14 estimate.
Share count
We had assumed 45m shares would be bought back this half at an average price of
$11.05 (at an average date of 31 October) and a further 45m in the half to June 2014 at
$11.30.
Applying the 2H13 actual figures (as above) and removing 1H14 buyback activity drives
minimal FY14 accretion (~0.2%).
FFO falls ~1c if we apply
WDC's 0.91 AUDUSD

17 February 2014
Australia and NZ First Edition 112
Valuation
Two key factors impacting Westfield’s valuation right now include:
■ Perceived US valuation: Concerns re: 1) a multiple de-rate due to lower growth and
2) unwillingness of offshore investors to ascribe much of a multiple to active earnings,
not helped by…
■ Transparency: Significant confusion / frustration around the pricing of the Scentre
Group proposal.
Multiple confusion
Westfield Retail Trust holders have been vocal in their disapproval of the merger ratios
applied in the creation of Scentre Group.
While it would appear tough for both parties to the merger to feel hard done by (?!?), the
lack of transparency has clearly frustrated both groups of investors.
The Economics
We believe Scentre Group's Proforma FFO forecasts (Figure 8) understate the economics
of the earnings streams in play. With only 25% of real estate externally owned on Day 1,
75% of earnings will be eliminated / not charged.
In a world awash with capital seeking real estate investments and given the quality of the
portfolio, we would expect Scentre group to increase external holdings rapidly. Further, the
earnings stream being sold, was generating earnings from 62.5% external ownership.
Figure 8: Eliminations reduce Scentre Group earnings Figure 9: Considering pre-eliminations FFO
Proforma ($m) CY14WDC (Aus/NZ)
and WRTAdj Proforma
Property NOI
WRT 836 836
WDC 942 55 997
Total NOI 1,779 55 1,834
Property Management Income 103 (55) 48
Project Income 92 (15) 77
Overheads (107) 9 (98)
EBIT 1,867 (6) 1,860
Interest (557) 11 (546)
Tax (98) 19 (78)
Minorities (96) (96)
FFO 1,116 25 1,140
Securities on issue (post) 5,311
FFO per security (cents) 21.5
Source: Company data, Credit Suisse estimates Source: Company data, Credit Suisse estimates
In Figure 10 below we consider one scenario under which Westfield Group's comments re
a 16.6x multiple hold (i.e., the inverse of a property cap rate), based on pre-eliminations
earnings.
After all, Property Management Fees are charged to the tenant and the equivalent of
"internally generated project earnings" is simply development upside – a capital
release.

17 February 2014
Australia and NZ First Edition 113
Figure 10: One way to backsolve to Westfield Group's 16.6x multiple
Theoretical Income Analysis Assumptions Earnings Multiple Comments
Assets 37,900
Net Property Income 6.2% 2,347
Gross Property Income 1.35 3,168
Property Management Revenue 5.0% 158
A) Property Management Income 100% 158 16.15x Inverse of 6 cap
Development pa 48 2.1%
Spend pa 790
B) Project 'Earnings' 13.5% 107 17.18x Solved for
C) Overheads -0.26% -98 9.00x Scalability
Earnings / Valuation 167 3,507 A + B + C
Blended average pre cost multiple 265 16.6x Just A & B
Source: Company data, Credit Suisse estimates
We see this as a stretch from three perspectives and consider some sensitivities:
1) 100% scalability of property management income: We allocate 80% of
property management revenue to our EBIT line, and eliminate the associated
costs from the "unallocated overhead" line.
2) Project "Earnings" multiple: We believe a 13x EBIT multiple would be more
palatable given the lack of transparency that comes with limited external
ownership and visibility on the future pipeline and trajectory, and
3) Overheads: Proforma $98m seems reasonable with reference to the Westfield
Group's 1H13 overheads of $95m, and reflects just 26bps of Assets Under
Management, However, we are reluctant to reward scalability by ascribing the
relatively low ~9x multiple we would typically ascribe to a Real Estate business's
unallocated overheads without more transparency on the composition of trajectory
of costs. We lift the multiple to 10x.
Figure 11 below highlights the implications for the valuation of the business.
Figure 11: Three adjustment sensitivities see valuation fall 21%
Theoretical Income Analysis Assumptions Earnings Multiple Comments
Assets 37,900
Net Property Income 6.2% 2,347
Gross Property Income 1.35 3,168
Property Management Revenue 5.0% 158
A) Property Management Income 80% 127 16.15x Inverse of 6 cap
Development pa 48 2.1%
Spend pa 790
B) Project 'Earnings' 13.5% 107 13.0x Solved for
C) Overheads -0.17% -66 10.00x Scalability
Earnings / Valuation 167 2,769 A + B + C
Blended average pre-cost multiple 233 14.7x Just A & B
Source: Company data, Credit Suisse estimates
The sensitivity valuation implies:
■ A valuation of $2.77bn (vs $3.5bn)
■ A pre-cost EBIT multiple of 14.7x (from 16.6x), and
■ An EBIT multiple of 16.6x (from 21x)
We stress this is not an attempt at a conclusive valuation but an estimate of three
key adjustments we believe should be made.

17 February 2014
Australia and NZ First Edition 114
Considerations for valuation
We are increasingly warming to Westfield’s argument re property management fees
warranting a comparable multiple to rental income.
Further, with Simon Property Group set to receive property management income from
SpinCo, we note WDC will have a vocal and respected partner likely to be lobbying the
investment community to value this stream “fairly”.
However, we would note that the “Management” EBIT line in Figure 11 also includes funds
management fees. We believe it would be wise for Scentre Group management to provide
significantly greater transparency re: the composition, margins and growth trajectory of
various earnings streams to facilitate a more robust valuation analysis. This would benefit
the market pricing of both entities.
US REIT comparison
For the year to June 2013 US Regional Mall REIT's traded on an average 18.6x forward
FFO multiple. However they have subsequently de-rated substantially in line with most
yield asset classes globally, to now trade at 16.3x on average (Figure 12).
Figure 12: US regional mall REITs' FFO multiple de-rating Figure 13: Shifting growth picture? But once bitten…
17.2 16.7 16.7
16.4
14.7
0%
1%
2%
3%
4%
5%
6%
7%
8%
9%
10%
13.5
14.0
14.5
15.0
15.5
16.0
16.5
17.0
17.5
TCO.N MAC.N GGP.N SPG.N WDC.AX
2014 FFO Multiple 2yr FFO CAGR (to '16) FFO G (1Yr)
Source: Company data, Credit Suisse estimates Source: Company data, Credit Suisse estimates
While WDC's forecast 2014 FFO growth of 3.2% is underwhelming with a shift in focus to
2014 multiples, we should consider growth into 2015.
Our FFO growth forecasts remain depressed into 2015 (+2.8%), but a two year forward
CAGR of 4.7% becomes interesting – standing close the peer group's 5%.
Further, if WDC were to announce dilutive transactions early this year and/or re-
structure the debt book (for a full year impact in 2015), growth into FY15 could pop.
WDC has traded to a 13% multiple discount to US peers – vs 2% on Proposal of the
Scentre Group - as the market fixates on WDC's lacklustre 2015 growth.
Figure 14: Westfield Group's EPS and DPS track record Figure 15: Achieved vs forecast "Year 2" growth
0
20
40
60
80
100
120
2005 2006 2007 2008 2009 2010 2011 2012 2013 2014 2015
EPS Growth DPS Growth
-40%
-30%
-20%
-10%
0%
10%
20%
2005 2006 2007 2008 2009 2010 2011 2012 2013 2014 2015
EPS DPS Forecast Growth into Forward 'Year 2'
Source: Company data, Credit Suisse estimates Source: Company data, Credit Suisse estimates
For now we leave our
domestic multiples
unchanged.
Punished for historical
disappointment?

17 February 2014
Australia and NZ First Edition 115
Net asset valuation Our Net Asset Valuation is largely unchanged, up 1.6% to $11.45.
Key Changes include:
■ Rolling Valuation to December 14 from June 14,
■ Updating Foreign Exchange assumptions (+1.6%),
■ Increasing US cap rates by 5bps to reflect potential disposals.
Figure 16: Westfield Group NAV
Westfield Group NAV Local Income AUD Income Cap Rate Gross value
Assets (Local $) ($Am) (% / x) (A$m)
Australia 817 817 5.70% 14,330
New Zealand 107 98 7.50% 1,311
UK 131 242 5.60% 4,313
US 666 751 5.65% 13,303
Income Producing Assets 5.76% 33,257
Other Hard Assets 3,513
Tangible Assets 36,770
Active Earnings Streams 253 10.7 2,701
Development Pipeline 85 12.5 1,060
Other Net Assets - excl tax items 958
Gross Enterprise Value 41,490
Liabilities
Debt by denomination
AUD&NZD -3,702 -3,702 -3,702
USD -7,012 -7,908 -7,908
UK&EUR -2,045 -3,758 -3,758
Debt -15,368
Corporate Overheads -40 10 -400
OEI's, PLN's and Converts -1,953
Equity Value 23,769
Number of Shares 2,076
Value per share 11.45
Source: Company data, Credit Suisse estimates
What will the spin-off do?
The true focus for US comparison should be the post spin off Westfield Corporation.
While there has been no medium term EPS growth guidance provided key points to note
for the new vehicle (at Dec presentation FX rates) include:
■ ROE lifts from 11.6% to ~12%
■ The book Equity Base reduces by $6.9bn to $10.5bn,
■ Gearing falls from 35.5% to 33.6%
We expect Westfield Group to Report Full Year Results in late February. This should
provide a better basis for forecasting, valuation and analysis of the new entity. As will the
Independent Experts Reports to be released with the Explanatory Memorandum in April.
See Appendix 2 for indicative timetable.
Superficial indications in
advance of April's
Explanatory Memorandum

17 February 2014
Australia and NZ First Edition 116
Appendix 1: US dilution softeners Figure 17: CSe 6.8% passing yield on June 13 valuations – assuming no NOI growth
Assets 31 Dec Valuation Yield Income Productivity
Mid-West Belden Village 211 6.41% 14 441
Franklin Park 318 6.89% 22 412
Great Northern 145 6.80% 10 353
Southlake 280 6.22% 17 410
West Coast Capital 187 6.66% 12 355
Parkway 294 6.36% 19 337
West Covina 328 5.62% 18 366
31-Dec-12 1763 6.37% 112 383
30-Jun-13 1643 6.83% 112
Source: Company data, Credit Suisse estimates
Joint venture yield
As highlighted in Figure 18, by gearing up the disposal assets at ~55%, Westfield should
be able to generate a ~9.1% yield out of its ~US$73.1m investment – decreasing dilution.
Figure 18: WDC juiced up return from remaining 10% stake
Assets 1% 1,623.6
Debt 55% 893.0
WDC Equity 10% 73.1
Net Property Income Yield 6.83% 112.1
Mgmt Fee to Starwood 0.45% -7.3
Cost of Debt 4.25% -38.0
JV Profit 66.8
WDC Return 10% 6.7
WDC Yield 9.1%
Source: Company data, Credit Suisse estimates
Westfield Group impact
Figure 19 below highlights how you could estimate 4.5cps dilution from this transaction.
However, as highlighted by our comments, this is far from the impact we’ve modelled.
Figure 19: Reconciling the guided impact
WDC Impact Assumption Impact Comment
Headline (US$m) 1640
WDC Sales (US$m) 1% 1623.6
Yield (US$m) 6.83% -111.0 As per Figure 2 above
Investment (US$m) 10% 73.1
Investment Yield (US$m) 9.1% 6.7
Debt Reduction 1,550.5
Int Exp Reduction 1.0% 15.5 Low relative to CSe
Net Impact (US$m) -88.8
Net Impact (A$m) 0.920 -96.5 93.3 at time of writing…
Per Share (m / cps) 2,162 -4.5 At spot vs CSe 2014 Average: 2,124m
Part Period 13% -0.6 Assumes 15 Nov settlement
Source: Company data, Credit Suisse estimates
Further, we also understand there was ~US$175m of debt against these assets which we
assume was paying ~4.5%.
If we also consider floating cost of debt closer to 1.5%, the blended cost of debt paid-off
would be closer to 1.85% and dilution on this deal, closer to 3.8cps.
Starwood Disposal Portfolio
– September, 2013
We estimate FY dilution of
~3.8c

17 February 2014
Australia and NZ First Edition 117
Appendix 2: Timetable Figure 20: Indicative timetable provided on proposal announcement – 4 December 2013
February 2014 WRT and WDC full-year 2013 results announcement
WRT and WDC distribution paid for H2 2013
April 2014 First court hearing
Explanatory Memorandum and meeting documents sent to WDC and WRT securityholders
May 2014 WRT and WDC AGM and securityholder meetings to approval proposal
Second court hearing
June 2014 WRT and WDC 1H 2014 distribution
Full implementation and commencement of separate listings
Source: Company data, Credit Suisse estimates

Australia and NZ First Edition 118
17 February 2014
Asia Pacific/Australia
Equity Research
Utilities
Australian Utilities Sector PRE RESULTS COMMENT
1H14 results: Margin outlook and weather
■ FY13 was bad for Integrated Utilities; FY14 starting off badly: We
believe 1H14 will be a low for the Integrated Utilities as margins are
impacted from discounting, churn, lower volumes and higher wholesale
prices. While we expect a poor 1H14 for Integrated Utilities, the key to the
results will likely be outlook and guidance statements for 2H14, as our
proprietary survey indicates that discounting may already be at its nadir. In
addition, we will be looking for commentary as to how the utilities managed
the January heat wave in the South Eastern states.
■ Marginally prefer ORG over AGK: We marginally prefer ORG to AGK
coming into the 1H14 result. We do not expect ORG to provide formal
guidance for FY14, instead providing outlook commentary, showing
expectations of further discount tapering and a smaller relative impact from
the January heat wave in SE Australia. For AGK, we will not be surprised if
FY14 guidance will be tightened to the lower end of the $560mn to around
$610mn, with the added possibility that any loss from Forge's issues at the
Diamantina power station could be taken below the line.
■ Few surprises expected for the Regulated Utilities: With guidance
provided for each of regulated utilities (distribution or NPAT), we expect few
surprises for the coming reporting season. For us, the key areas of focus will
be any update on tax issues relating to SKI and commentary in relation to
further growth opportunities in Western Australia following on from recent
projects announced by DUE (potentially of benefit to both DUE and APA).
Figure 1: Discount tapering extends beyond NSW into 2H14
10%
12%
6%
11%
7%
13%
7%
10%9%
16%
7%
12%
8%
16%
7%
12%
8%
15%
7%
12%
0%
2%
4%
6%
8%
10%
12%
14%
16%
18%
NSW VIC QLD SA
June July September October January
Source: Company data, Credit Suisse estimates
Research Analysts
Sandra McCullagh
61 2 8205 4729
David Bailey
61 2 8205 4739
Nicholas Markiewicz
61 2 8205 4107

17 February 2014
Australia and NZ First Edition 119
Utilities reporting season When are they reporting?
Figure 2: Dial-in details for utilities reporting season
Company Date and Time Australian no. International no. Password / ID
AGK 26 February 2014
10:30am (AEST) 1800 801 825 +61 2 8524 5042 AGL
APA 19 February 2014
11:00am (AEST) 1800 558 698 +612 9007 3187 730151
DUE 21 February 2014
11:00am (AEST) 1800 801 825 +612 8254 5042 1620160
ENV 20 February 2014
1:00pm (AEST) 1800 123 296 +61 2 8038 5221 3560 9827
ORG 20 February 2014
10:00am (AEST) 1800 064 350 +61 3 8605 4954 N/A
SKI 24 February 2014
10:30am (AEST) 1800 558 698 +61 2 9007 3187 729 092
ENE 25 February 2014 NA NA NA
Source: Company data, Credit Suisse estimates

17 February 2014
Australia and NZ First Edition 120
Forecasts and consensus
■ Energy developments is the only Integrated Utility to provide 1H14 guidance, at
$82mn to $86mn EBITDA.
■ ORG and AGK offer no 1H guidance with impacts of discounting still unknown:
Both AGK and ORG have not offered 1H14 guidance, with only AGK offering FY14
guidance of $560mn–$610mn NPAT.
■ Few surprises expected from the regulated utilities: DUE, APA and SKI have
provided 1H14 distribution guidance for the reporting period, with ENV providing NPAT
guidance for 1H14 of ~$85mn (CS: $87mn). With both APA and ENV upgrading full-
year guidance in mid-December and DUE re-iterating in mid-January, we see limited
scope for updates/variation to be provided during this reporting season.
Figure 3: February 2014 reporting season – Credit Suisse estimates, company guidance
Company Period EBITDA EBIT NPAT EPS DPS Company guidance
$mn $mn $mn cps cps
Origin Energy 1H14 1,204.0 821.4 408.3 37.0 25.0 No guidance.
AGL 1H14 700.5 537.6 305.2 54.9 31.0 No 1H14 guidance. FY14 NPAT guidance remains $560mn to $610mn.
Energy Developments 1H14 82.9 48.1 24.1 14.9 9.7 EBITDA guidance of $82mn - $86mn.
Duet 1H14 411.2 277.8 52.8 4.5 8.5 1H14 distribution 8.5cps; FY14 distribution guidance of 17cps.
APA Group 1H14 380.1 312.3 115.9 13.9 17.5 1H14 distribution 17.5cps; FY14 EBITDA guidance of $730-740mn, net
interest cost $315-325mn.
Envestra 1H14 223.8 192.8 87.0 4.8 3.2 1H14 NPAT guidance of ~$85mn; FY14 NPAT guidance of ~$145mn.
Spark Infrastructure FY13 317.8 317.8 161.5 12.2 11.0 FY13 distribution guidance of 11cps; 3-5% growth for 2014-2015.
Source: Company data, Credit Suisse estimates
■ Credit Suisse forecasts imply seasonality in line with historic averages.
Figure 4: Historic 1H EBITDA seasonality, Credit Suisse 1H14 estimates
EBITDA ($mn) Seasonality
1H11 FY11 1H12 FY12 1H13 FY13 1H14F FY14F 1H11 1H12 1H13 1H14F
Origin Energy 818 1782 1157 2257 1055 2181 1204 2343 46% 51% 48% 51%
AGL 416 805 439 904 650 1336 701 1397 52% 49% 49% 50%
Energy Developments 64 119 62 132 84 175 83 176 53% 47% 48% 47%
Duet 371 755 379 736 405 799 411 804 49% 51% 51% 51%
APA Group 254 490 289 535 324 667 380 734 52% 54% 49% 52%
Envestra 165 297 174 334 198 360 224 409 55% 52% 55% 55%
Source: Company data, Credit Suisse estimates
■ For Integrates Utilities, minor variation exists between Credit Suisse forecasts
and consensus estimates. Among regulated utilities, variance exists for DUE (albeit
noting a very wide consensus range; likely a mix of proportionate and statutory) while
for SKI, we have included a non-cash tax item relating to SAPN.
Figure 5: Summary of consensus, Credit Suisse estimates
EBITDA ($mn) NPAT ($mn) DPS (cps)
Consensus CS % Var Consensus CS % Var Consensus CS % Var
Origin Energy FY14 2,278.0 2,343.3 2.9% 772.2 791.2 2.5% 50.0 50.0 0.0%
AGL FY14 1,358.0 1,397.5 2.9% 597.7 603.7 1.0% 65.0 65.0 0.0%
Energy Developments FY14 181.5 175.9 -3.1% 55.9 55.8 -0.2% 19.6 22.5 14.8%
Duet FY14 816.3 803.6 -1.6% 115.9 85.9 -25.9% 17.0 17.0 0.0%
APA Group FY14 736.3 733.8 -0.3% 198.8 201.4 1.3% 36.4 36.0 -1.1%
Envestra FY14 391.0 409.4 4.7% 145.3 145.2 -0.1% 6.4 6.4 0.0%
Spark Infrastructure FY13 329.3 317.8 -3.5% 199.0 161.5 -18.8% 11.0 11.0 0.0%
Source: Bloomberg, Credit Suisse estimates

17 February 2014
Australia and NZ First Edition 121
Industry wide trends and themes
■ What is the near-term outlook for discounting conditions? Management point to
evidence that discounting conditions may be abating, particularly with the cessation of
door knocking campaigns. We have seen some evidence of this in our proprietary
discounting survey data for NSW (Figure 6), with deepest average discounts falling to
8% from 10% in June 2013. In Victoria, discounting has abated for the first time in
January 2014 to 15% but still above the 12% levels of June 2013. South Australia, at
an average of 12%, is still above the 11% average deepest discounts of June 2013,
and similarly Queensland's discount level of 7% is still above the 6% of June 2013.
Figure 6: Average deepest discounting remains elevated – though improving
10%
12%
6%
11%
7%
13%
7%
10%9%
16%
7%
12%
8%
16%
7%
12%
8%
15%
7%
12%
0%
2%
4%
6%
8%
10%
12%
14%
16%
18%
NSW VIC QLD SA
June July September October January
Source: Company data, Credit Suisse estimates
■ How are discounts impacting margins? With discounts appearing to ease, 1H14
could very well be the low point for retail margins. For FY14 we have assumed retail
margins are largely flat on FY13 with a recovery thereafter. We expect that much of
the 1H14 result will lie in ORG's guidance and any forward looking commentary from
management.
Figure 7: EBITDA margin at the deepest discount by State
6.7% 6.4%
18.5%
6.6%
0.0%
2.0%
4.0%
6.0%
8.0%
10.0%
12.0%
14.0%
16.0%
18.0%
20.0%
South Australia New SouthWales
Victoria Queensland
Source: Company data, Credit Suisse estimates

17 February 2014
Australia and NZ First Edition 122
Issues / key questions AGL Energy (AGK, NEUTRAL, TP $15.80)
■ Margins: AGK has the benefit of reporting almost a week after ORG and thus can see
their results, guidance and shape its own messages. CLP's subsidiary,
EnergyAustralia, will report a day after AGK on 27/02/14. We expect 1H14 net Retail
EBIT margins of 6.8% (down from 7.2% in FY13 but up on 5.4% in 1H13). Price
discounting, higher wholesale prices and weak demand are all expected to impact on
1H14 margins.
■ South Eastern Australia heat wave impact: We understand AGK experienced
issues with both Loy Yang (one unit) and with Torrens Island generators during the
heat wave in South Eastern Australia. We expect AGK will likely have some protection
from weather derivatives from the high temperatures but the loss of some upside from
Loy Yang and Torrens Island is no doubt disappointing. The upsurge in demand may
however mitigate the impact from the temporary generation loss.
■ Customer growth: We expect to see muted customer growth as door knocking was
wound back in the half. This is supported by the recent normalisation of electricity
retail churn data.
■ AGK gas sales: We will be looking for information on sales of the announced 40PJa
gas book for FY15–17 that AGK identified at the FY13 result. We believe a small
portion of this gas (~10PJ) may have been sold to IPL.
■ AGK gas contract renewal: AGK has gas contracts expiring after the end 2016, with
the need to replace up to 130PJa of gas. Given the constrained domgas market and
announcements in the past six months by both ORG and ORI on domgas purchases,
we are keen to understand when AGK expects to announce replacement gas
contracts. Without certainty on gas supply past mid-2017, AGK risks further gas
customer losses amongst its commercial and industrial customers.
■ Forge impact: We understand that AGK may suffer some impact of $5mn–$10mn
from the collapse of Forge (FGE) who was constructing the Diamantina Power station.
This could also result in a delay of a few months on the delivery of the power station.
The power station is due to be fully operational in 1H 2014.
■ Guidance: AGK has guided to FY14 NPAT range of $560mn–$610mn. If the company
has suffered downside from the weather conditions, we can expect that guidance may
be firmed towards the lower end of guidance. However, AGK may wait until June to
firm up the guidance range.
Origin Energy (ORG, NEUTRAL, TP $15.30)
■ Margins: We expect to see energy EBIT margins (all products) marginally up at 9.0%
for 1H14 from 8.6% at FY13 and 8.4% at 1H13. We expect a small increase in
blended margins, driven primarily by a flat retail business and marginally more positive
upstream.
■ South Eastern Australia heat wave impact: With Origin short generation in South
Eastern states, we will be looking for commentary as to how the business fared during
the most recent heat wave, which would impact on 2H14 results.
■ Customer losses expected to be reversed: With ORG now focussed on retaining
customers, we expect a net add of up 19,000 customers, predominantly gas
customers. ORG added 7,000 net customers in 2H13, turning around a net loss of
23,000 customers in 1H13.

17 February 2014
Australia and NZ First Edition 123
■ Guidance: All eyes will be on whether ORG provides any FY14 guidance for NPAT
and EBITDA. Having provided no FY14 guidance at the FY13 result, or at the AGM,
we do not expect ORG to provide guidance now. Consensus has FY14 growth only
1.6% above FY13.
Energy Developments (ENE, OUTPERFORM, TP $6.44):
■ Tight guidance range: Management has already delivered a 1H14 EBITDA guidance
range of $82mn to $86mn and FY14 EBITDA to $175mn to $185mn.
■ Earnings composition a key focus: Given the tight guidance range, the earnings
composition and quality will be a key focus. Given historical operating issues, we will
believe management needs to demonstrate tight cost control at Remote Energy sites.
■ Free cash-flow should start to ramp up: With the McArthur River expansion already
funded, and in the absence of any growth opportunities announced in FY14, we believe
we should start to see the emergence of an impressive free cash flow yield in 1H14.
■ More about outlook and growth opportunities: With over 400MW of growth
opportunities previously identified as well a tight guidance range, we believe the 1H14
result will be as much about outlook commentary as the result itself. We expect
management to talk positively to prospective growth opportunities, though actual
announcements on the expansion of the RE and WCMG businesses will likely be
more forthcoming in the coming months as opposed to the result itself.
APA Group (APA, UNDERPERFORM, TP $6.05)
■ Net impact from changing face of East Coast gas market: We look for further
commentary on organic growth opportunities, on both the East and West Coast. We
have previously written on the potential for demand destruction in line with our
expectations for higher East Coast gas prices and contract expiry on the Moomba–
Sydney pipeline. Since FY13 results, we have seen ORG, Lumo, and EnergyAustralia
sign contracts for gas transportation from Victoria into NSW with APA, and ORI sign
contracts for gas from Victoria into NSW, bypassing APA's pipelines. We will be
looking for commentary from APA on the net margin impact of these changes.
■ Commentary on the increased ENV bid: While the increased offer was in line with
our expectations for a deal to be acceptable to ENV, we continue to see limited
strategic rationale for the bid given limited synergy benefits and depressed returns
within the regulated space.
■ We expect few surprises from the result: With FY14 guidance upgraded in mid-
December, we expect few surprises from an operational perspective. Our FY14
forecasts sit in line with company guidance (EBITDA $730mn–$740mn, net interest
costs of $315mn–$325mn) and consensus estimates.
DUET Group (DUE, OUTPERFORM, TP $2.30)
■ DDG growth opportunities: Following on from the recently announced expansion
projects in WA (Wheatstone, Solomon Hub), look for any further commentary in
relation to near-term opportunities in Western Australia. With current projects
generating equity IRRs of 13%+, additional opportunities with similar return profiles
would provide further incremental earnings accretion.
■ DBP Standard Shipping Contracts renewal: A key catalyst for DUE is the tariff
outlook for the DBP. In 2016, the Standard Shipping Contracts (70% of capacity)
revert from a contracted to a regulated tariff. In our view, risk free rates will determine
the extent of the downside of such a move (risk free rates are slightly above those set
for the current regulatory period). However, renegotiation for a continuation of the
current contracted rate would alleviate the risk. Look for any commentary as to the
potential timing and progress for re-contracting.

17 February 2014
Australia and NZ First Edition 124
■ DRP cap: Funds raised from the recent $30mn SPP are expected to be allocated
towards capex for UED and Multinet. Look for any commentary in relation to DRP
caps on a forward looking basis (recently capped at 20%).
Spark Infrastructure (SKI, OUTPERFORM, TP $1.78)
■ Focus continues to be on tax: For us the key issue in this result season is likely to
be what happens with tax. While incremental detail has been released to the market,
we could expect a more comprehensive overview/update to be provided. We will be
looking for a timeline for any potential future decisions as well as any update of the
potential magnitude of an adverse decision. On a "worst case" outcome, we estimate
that tax loss carry forwards would be depleted with both entities moving to a cash-tax
paying position. However, we see management as having the capacity to maintain the
current distribution profile, with the parent entity as having sufficient capacity to
provide additional funds through either undrawn debt facilities or a DRP.
■ Expect a relatively straight forward result: Outside of tax, we expect SKI to report
fairly reliable numbers (limited dispersion at the EBITDA level). We are looking for
proportionate EBITDA of $775mn or $699mn excluding customer contributions.
■ Distribution guidance: FY13 distribution guidance is for 11cps. We forecast 11.5cps
in FY14, an increase of 4.5% and at the upper end of management's 3%–5% guided
range to 2015.
Envestra (ENV, NEUTRAL, TP $1.22)
■ Guidance well flagged: ENV provided updated guidance for both the half and full
year in mid-December 2013 (NPAT of $85mn and $145mn, respectively); our 1H14
forecasts sits marginally ahead at $87mn.
■ Capital management: Look for any change to FY14 FFO/interest, FFO/debt targets
(2.7x and 10%, respectively) as well as any commentary relating to a take-over clause
and any potential requirements for debt financing.

17 F
eb
ruary
201
4
Au
stra
lia a
nd
NZ
Firs
t Ed
ition
125
Figure 8: Financial summary
Source: Company data, Credit Suisse estimates

17 February 2014
Australia and NZ First Edition 126
Figure 9: ORG financial summary
Origin Energy (ORG) Year ending 30 Jun In AUDmn, unless otherwise stated2012 2013 2014 2015 2016 2012 2013 2014 2015 2016
Share Price: A$14.76 Earnings 06/12A 06/13A 06/14E 06/15E 06/16ERating c_EPS_SHARESEquiv. FPO (period avg.) mn 1,084.1 1,098.3 1,100.0 1,104.4 1,108.6
Target Price A$ 15.30 c_EPS*100EPS (Normalised) c 82.4 69.2 71.9 91.0 104.6
vs Share price % 3.66 EPS_GROWTH*100EPS Growth % -16.0 3.9 26.6 14.9
DCF A$ 16.57 c_EBITDA_MARGIN*100EBITDA Margin % 17.4 14.9 15.1 17.5 20.9
c_DPS*100DPS c 50.0 50.0 50.0 50.0 50.0
c_PAYOUT*100Payout % 60.7 72.3 69.5 54.9 47.8
FRANKING*100Franking % 100.0 50.0 50.0 50.0 50.0
c_FCF_PS*100Free CFPS c 116.4 85.5 104.6 112.4 92.8
Profit & Loss 06/12A 06/13A 06/14E 06/15E 06/16E c_TAX_RATE*100Effective tax rate % 30.1 28.7 28.7 28.7 28.7
Sales revenue 12,935.0 14,619.0 15,545.0 15,519.3 16,182.4 ValuationEBITDA 2,257.0 2,181.0 2,343.3 2,719.5 3,383.8 c_PE P/E x 17.9 21.3 20.5 16.2 14.1
Depr. & Amort. (659.0) (743.0) (757.7) (863.5) (1,110.6) c_EBIT_MULTIPLE_CURREV/EBIT x 13.6 16.0 16.0 14.2 11.4
EBIT 1,598.0 1,438.0 1,585.6 1,855.9 2,273.3 c_EBITDA_MULTIPLE_CUEV/EBITDA x 9.6 10.6 10.8 9.7 7.6
Associates 0.0 0.0 0.0 0.0 0.0 c_DIV_YIELD*100Dividend Yield % 3.4 3.4 3.4 3.4 3.4
Net interest Exp. (217.0) (255.0) (314.9) (280.0) (507.5) c_FCF_YIELD*100FCF Yield % 7.9 5.8 7.1 7.6 6.3
Other 0.0 0.0 0.0 0.0 0.0 c_PB Price to Book x 1.2 1.2 1.2 1.2 1.1
Profit before tax 1,381.0 1,183.0 1,270.8 1,575.9 1,765.8 ReturnsIncome tax (415.0) (339.0) (364.1) (451.6) (506.0) c_ROE*100Return on Equity % 6.8 5.7 5.8 7.2 8.0
Profit after tax 966.0 844.0 906.6 1,124.3 1,259.8 c_I_NPAT/c_I_SALES*100Profit Margin % 6.9 5.2 5.1 6.5 7.2
Minorities (73.0) (84.0) (115.4) (119.1) (100.0) c_I_SALES/c_B_TOT_ASSAsset Turnover x 0.5 0.5 0.5 0.5 0.5
Preferred dividends 0.0 0.0 0.0 0.0 0.0 c_ASSETS/c_EQ_COMMONEquity Multiplier x 2.1 2.2 2.4 2.4 2.3
Associates & Other 0.0 0.0 0.0 (0.0) 0.0 c_ROA*100Return on Assets % 3.2 2.6 2.4 3.0 3.4
Normalised NPAT 893.0 760.0 791.2 1,005.2 1,159.8 c_ROIC*100Return on Invested Cap. % 5.6 4.7 4.6 5.2 6.3
Unusual item after tax 87.0 (382.0) (166.0) (277.1) (157.3) GearingReported NPAT 980.0 378.0 625.1 728.1 1,002.5 c_GEARING*100Net Debt to Net debt + Equity % 27.6 31.5 37.3 39.3 37.5
c_NET_DEBT/c_I_EBITDANet Debt to EBITDA x 2.4 3.1 3.9 3.7 2.8
Balance Sheet 06/12A 06/13A 06/14E 06/15E 06/16E c_I_EBITDA/ c_I_NET_INTERESTInt Cover (EBITDA/Net Int.) x 10.4 8.6 7.4 9.7 6.7
Cash & equivalents 357.0 307.0 183.0 195.4 139.7 c_I_EBIT/ c_I_NET_INTERESTInt Cover (EBIT/Net Int.) x 7.4 5.6 5.0 6.6 4.5
Inventories 259.0 231.0 245.6 245.2 255.7 (c_C_CAPEX/c_I_SALES)*-100Capex to Sales % 11.6 7.1 4.4 3.3 1.6
Receivables 2,306.0 2,705.0 2,876.3 2,871.6 2,994.3 (c_C_CAPEX/c_I_DEPR)*-100Capex to Depreciation % 228.1 140.1 89.6 58.7 23.9
Other current assets 1,017.0 718.0 718.0 718.0 718.0
Current assets 3,939.0 3,961.0 4,023.0 4,030.2 4,107.7 MSCI IVA (ESG) Rating AProperty, plant & equip. 11,733.0 12,161.0 12,175.1 11,974.9 11,496.9 TP ESG Risk (%): -1.6
Intangibles 5,966.0 6,113.0 6,113.0 6,113.0 6,113.0
Other non-current assets 6,343.0 7,351.0 10,096.8 11,611.5 11,963.3
Non-current assets 24,042.0 25,625.0 28,384.8 29,699.4 29,573.2
Total assets 27,981.0 29,586.0 32,407.8 33,729.5 33,680.9
Payables 2,063.0 2,120.0 2,248.5 2,211.3 2,287.1
Interest bearing debt 5,879.0 7,116.0 9,266.0 10,266.0 9,766.0
Other liabilities 5,581.0 5,556.0 5,628.8 5,719.1 5,576.6 MSCI IVA Risk: Negative
Total liabilities 13,523.0 14,792.0 17,143.3 18,196.4 17,629.6
Net assets 14,458.0 14,794.0 15,264.5 15,533.1 16,051.2
Ordinary equity 13,094.0 13,283.0 13,713.9 13,947.0 14,452.6
Minority interests 1,364.0 1,511.0 1,550.6 1,586.1 1,598.6
Preferred capital 0.0 0.0 0.0 0.0 0.0
Total shareholder funds 14,458.0 14,794.0 15,264.5 15,533.1 16,051.2
Net debt 5,522.0 6,809.0 9,083.0 10,070.6 9,626.3 Source: MSCI ESG Research
Cashflow 06/12A 06/13A 06/14E 06/15E 06/16E Share Price Performance
EBIT 1,598.0 1,438.0 1,585.6 1,855.9 2,273.3
Net interest -366.0 -436.0 -582.6 -703.3 -762.9
Depr & Amort 659.0 743.0 757.7 863.5 1,110.6
Tax paid -39.0 -275.0 -224.6 -250.0 -442.8
Working capital -334.0 -213.0 -57.5 -32.1 -57.4
Other -62.0 -51.0 -53.8 -236.3 -826.9
Operating cashflow 1,456.0 1,206.0 1,424.8 1,497.8 1,293.8
Capex -1,503.0 -1,041.0 -678.7 -506.8 -265.1
Capex - expansionary -1,309.0 -774.0 -405.0 -250.0 0.0
Capex - maintenance -194.0 -267.0 -273.7 -256.8 -265.1
Acquisitions & Invest 0.0 0.0 0.0 0.0 0.0
Asset sale proceeds 75.0 0.0 0.0 0.0 0.0
Other -1,235.0 -486.0 -2,450.0 -1,400.0 0.0
Investing cashflow -2,663.0 -1,527.0 -3,128.7 -1,906.8 -265.1
Dividends paid -377.0 -459.0 -549.2 -550.0 -552.2
Equity raised 155.0 9.0 54.9 55.0 55.2
Net borrowings 1,093.0 754.0 2,150.0 1,000.0 -500.0
Other -34.0 -44.0 -75.8 -83.7 -87.5 1 Month 3 Month 12 Month
Financing cashflow 837.0 260.0 1,579.9 421.3 -1,084.4 Absolute 9.3% 1.6% 21.8%
Total cashflow -370.0 -61.0 -124.0 12.3 -55.7 Relative 8.1% 3.3% 16.4%
Adjustments 3.0 11.0 0.0 0.0 0.0
Net change in cash -367.0 -50.0 -124.0 12.3 -55.7 Source: Reuters 52 week trading range: 11.33-14.86
MSCI IVA Risk Comment: ORG could suffer a rating downgrade
on increased risk from increased scrutiny over fugitive gas
emissions from its upstream coal seam gas operations.
14/02/2014 11:42
Origin Energy is engaged in the operation of energy businesses, including exploration and
production of oil and gas; electricity generation, and wholesale and retail sale of electricity and
gas.
Credit Suisse View
TP Risk Comment: We have included the impact of lowering the
carbon price to $12/t in our target price due to expectec changes
in carbon tax legislation.
NEUTRAL
0.30
2.30
4.30
6.30
8.30
10.30
12.30
14.30
16.30
4/02/2013 4/04/2013 4/06/2013 4/08/2013 4/10/2013 4/12/2013 4/02/2014
ORG.AX XJO
2.7
3.7
4.7
5.7
6.7
7.7
Environment Social Governance
Stock Local Sector
Country Global Sector
Source: Company data, Credit Suisse estimates

17 February 2014
Australia and NZ First Edition 127
Figure 10: AGK financial summary
AGL Energy (AGK) Year ending 30 Jun In AUDmn, unless otherwise stated2012 2013 2014 2015 2016 2012 2013 2014 2015 2016
Share Price: A$15.71 Earnings 06/12A 06/13A 06/14E 06/15E 06/16ERating c_EPS_SHARESEquiv. FPO (period avg.) mn 482.3 550.5 558.3 566.5 574.9
Target Price A$ 15.80 c_EPS*100EPS (Normalised) c 99.9 108.7 108.1 124.3 135.4
vs Share price % 0.57 EPS_GROWTH*100EPS Growth % 8.8 -0.5 15.0 8.9
c_EBITDA_MARGIN*100EBITDA Margin % 12.1 13.8 13.7 14.9 15.6
c_DPS*100DPS c 61.0 63.0 65.0 66.6 68.3
c_PAYOUT*100Payout % 61.0 58.0 60.1 53.6 50.4
FRANKING*100Franking % 100.0 100.0 100.0 100.0 100.0
c_FCF_PS*100Free CFPS c 76.0 76.1 131.0 164.5 180.6
Profit & Loss 06/12A 06/13A 06/14E 06/15E 06/16E c_TAX_RATE*100Effective tax rate % 29.0 29.1 29.1 29.1 29.1
Sales revenue 7,455.6 9,715.7 10,177.2 10,386.7 10,650.5 ValuationEBITDA 904.3 1,336.4 1,397.5 1,552.5 1,663.9 c_PE P/E x 15.7 14.5 14.5 12.6 11.6
Depr. & Amort. (173.9) (287.1) (331.6) (344.3) (357.7) c_EBIT_MULTIPLE_CURREV/EBIT x 15.4 11.1 10.7 9.1 7.9
EBIT 730.4 1,049.3 1,065.8 1,208.2 1,306.2 c_EBITDA_MULTIPLE_CUEV/EBITDA x 12.5 8.7 8.2 7.1 6.2
Associates 0.0 0.0 0.0 0.0 0.0 c_DIV_YIELD*100Dividend Yield % 3.9 4.0 4.1 4.2 4.3
Net interest Exp. (51.2) (205.5) (214.4) (215.0) (208.5) c_FCF_YIELD*100FCF Yield % 4.8 4.8 8.3 10.5 11.5
Other 0.0 0.0 0.0 0.0 0.0 c_PB Price to Book x 1.2 1.2 1.1 1.1 1.0
Profit before tax 679.2 843.8 851.4 993.2 1,097.7 ReturnsIncome tax (197.2) (245.5) (247.7) (289.0) (319.4) c_ROE*100Return on Equity % 6.8 8.2 7.8 8.6 8.9
Profit after tax 482.0 598.3 603.7 704.2 778.4 c_I_NPAT/c_I_SALES*100Profit Margin % 6.5 6.2 5.9 6.8 7.3
Minorities 0.0 0.0 0.0 0.0 0.0 c_I_SALES/c_B_TOT_ASSAsset Turnover x 0.5 0.7 0.7 0.7 0.7
Preferred dividends 0.0 0.0 0.0 0.0 0.0 c_ASSETS/c_EQ_COMMONEquity Multiplier x 2.1 1.8 1.8 1.8 1.7
Associates & Other 0.0 0.0 0.0 0.0 0.0 c_ROA*100Return on Assets % 3.3 4.5 4.3 4.8 5.1
Normalised NPAT 482.0 598.3 603.7 704.2 778.4 c_ROIC*100Return on Invested Cap. % 5.4 7.3 7.3 8.2 9.0
Unusual item after tax (367.1) (209.6) (46.0) 0.0 0.0 GearingReported NPAT 114.9 388.7 557.7 704.2 778.4 c_GEARING*100Net Debt to Net debt + Equity % 25.9 27.8 25.7 21.7 15.1
c_NET_DEBT/c_I_EBITDANet Debt to EBITDA x 2.8 2.1 1.9 1.5 0.9
Balance Sheet 06/12A 06/13A 06/14E 06/15E 06/16E c_I_EBITDA/ c_I_NET_INTERESTInt Cover (EBITDA/Net Int.) x 17.7 6.5 6.5 7.2 8.0
Cash & equivalents 1,812.9 281.0 490.6 888.7 1,610.1 c_I_EBIT/ c_I_NET_INTERESTInt Cover (EBIT/Net Int.) x 14.3 5.1 5.0 5.6 6.3
Inventories 185.4 133.0 157.7 160.9 165.0 (c_C_CAPEX/c_I_SALES)*-100Capex to Sales % 10.2 5.9 5.3 5.0 3.0
Receivables 1,531.4 1,844.0 1,931.6 1,971.4 2,021.4 (c_C_CAPEX/c_I_DEPR)*-100Capex to Depreciation % 437.3 198.7 163.8 151.6 89.6
Other current assets 602.2 578.0 578.0 578.0 578.0
Current assets 4,131.9 2,836.0 3,157.8 3,599.0 4,374.5 MSCI IVA (ESG) Rating BBBProperty, plant & equip. 6,323.5 6,175.7 6,480.8 6,628.0 6,538.9 TP ESG Risk (%): -1
Intangibles 3,172.0 3,149.4 3,149.4 3,149.4 3,149.4
Other non-current assets 1,111.0 1,204.7 1,204.7 1,204.7 1,204.7
Non-current assets 10,606.5 10,529.8 10,834.9 10,982.1 10,893.0
Total assets 14,738.4 13,365.8 13,992.7 14,581.0 15,267.6
Payables 1,158.4 1,444.0 1,513.0 1,522.6 1,549.0
Interest bearing debt 4,312.0 3,109.0 3,164.0 3,164.0 3,164.0
Other liabilities 2,135.1 1,473.8 1,593.4 1,698.6 1,820.4 MSCI IVA Risk: Neutral
Total liabilities 7,605.5 6,026.8 6,270.4 6,385.3 6,533.5
Net assets 7,132.9 7,339.0 7,722.3 8,195.8 8,734.1
Ordinary equity 7,132.9 7,339.0 7,722.3 8,195.8 8,734.1
Minority interests 0.0 0.0 0.0 0.0 0.0
Preferred capital 0.0 0.0 0.0 0.0 0.0
Total shareholder funds 7,132.9 7,339.0 7,722.3 8,195.8 8,734.1
Net debt 2,499.1 2,828.0 2,673.4 2,275.3 1,553.9 Source: MSCI ESG Research
Cashflow 06/12A 06/13A 06/14E 06/15E 06/16E Share Price Performance
EBIT 730.4 1,049.3 1,065.8 1,208.2 1,306.2
Net interest -98.0 -214.2 -186.5 -185.7 -177.8
Depr & Amort 173.9 287.1 331.6 344.3 357.7
Tax paid -180.8 -71.1 -128.1 -183.7 -197.6
Working capital -185.7 -473.8 -43.2 -33.4 -27.7
Other 26.7 24.5 0.0 0.0 0.0
Operating cashflow 466.5 601.8 1,039.6 1,149.6 1,260.8
Capex -760.4 -570.4 -543.0 -521.8 -320.6
Capex - expansionary -660.5 -387.4 -234.5 -304.2 -98.3
Capex - maintenance -99.9 -183.0 -308.5 -217.6 -222.3
Acquisitions & Invest 143.2 4.2 -103.0 0.0 0.0
Asset sale proceeds 217.5 -33.1 0.0 0.0 0.0
Other -131.6 49.8 -18.5 1.1 21.3
Investing cashflow -531.3 -549.5 -664.6 -520.7 -299.4
Dividends paid -185.8 -213.9 -346.8 -362.9 -377.4
Equity raised 879.4 -6.1 126.3 132.1 137.4
Net borrowings 431.0 -1,258.9 55.0 0.0 0.0
Other 0.0 -105.2 0.0 0.0 0.0 1 Month 3 Month 12 Month
Financing cashflow 1,124.6 -1,584.1 -165.5 -230.7 -240.0 Absolute 4.7% 3.5% 4.2%
Total cashflow 1,059.8 -1,531.8 209.5 398.1 721.4 Relative 3.5% 5.2% -1.1%
Adjustments 0.0 0.0 0.0 0.0 0.0
Net change in cash 1,059.8 -1,531.8 209.5 398.1 721.4 Source: Reuters 52 week trading range: 13.89-16.60
MSCI IVA Risk Comment: As expected, MSCI has downgraded its
IVA rating for AGK from A to BBB due to LYA emissions. We now
agree with MSCI's IVA rating and have a Neutral rating outlook.
14/02/2014 11:42
AGL Energy is an Australian based integrated energy retailer. It owns generation (coal, gas,
hydro and renewables) and a large electricity and gas retail customer base across Eastern
Australian. It has a small portfolio of coal seam gas assets.
Credit Suisse View
TP Risk Comment: We have included the impact of lowering the
carbon price to $12/t in our target price due to expectec changes
in carbon tax legislation.
NEUTRAL
0.30
2.30
4.30
6.30
8.30
10.30
12.30
14.30
16.30
18.30
4/02/2013 4/04/2013 4/06/2013 4/08/2013 4/10/2013 4/12/2013 4/02/2014
AGK.AX XJO
2.7
3.7
4.7
5.7
6.7
7.7
Environment Social Governance
Stock Local Sector
Country Global Sector
Source: Company data, Credit Suisse estimates

17 February 2014
Australia and NZ First Edition 128
Figure 11: APA financial summary
APA Group (APA) Year ending 30 Jun In AUDmn, unless otherwise stated2012 2013 2014 2015 2016 2012 2013 2014 2015 2016
Share Price: A$6.21 Earnings 06/12A 06/13A 06/14E 06/15E 06/16ERating c_EPS_SHARESEquiv. FPO (period avg.) mn 639.7 772.3 835.8 835.8 835.8
Target Price A$ 6.05 c_EPS*100EPS (Normalised) c 21.9 23.1 24.1 28.8 32.3
vs Share price % -2.58 EPS_GROWTH*100EPS Growth % 5.5 4.1 19.4 12.1
DCF A$ 6.12 c_EBITDA_MARGIN*100EBITDA Margin % 50.8 52.9 55.3 56.7 57.4
c_DPS*100DPS c 35.0 35.5 36.0 36.9 37.8
c_PAYOUT*100Payout % 159.6 153.4 149.4 128.2 117.2
FRANKING*100Franking % 0.0 0.0 0.0 0.0 0.0
c_FCF_PS*100Free CFPS c 48.6 52.8 43.4 55.6 57.1
Profit & Loss 06/12A 06/13A 06/14E 06/15E 06/16E c_TAX_RATE*100Effective tax rate % 26.4 25.7 27.0 27.0 27.0
Sales revenue 1,054.3 1,260.6 1,327.8 1,426.2 1,483.4 ValuationEBITDA 535.5 667.1 733.8 808.5 852.0 c_PE P/E x 28.3 26.8 25.8 21.6 19.2
Depr. & Amort. (110.4) (130.5) (137.2) (142.8) (143.9) c_EBIT_MULTIPLE_CURREV/EBIT x 18.4 17.8 16.6 14.9 13.8
EBIT 425.1 536.7 596.6 665.7 708.0 c_EBITDA_MULTIPLE_CUEV/EBITDA x 14.6 14.3 13.5 12.3 11.5
Associates 0.0 0.0 0.0 0.0 0.0 c_DIV_YIELD*100Dividend Yield % 5.6 5.7 5.8 5.9 6.1
Net interest Exp. (234.3) (299.7) (320.8) (336.2) (338.6) c_FCF_YIELD*100FCF Yield % 7.8 8.5 7.0 9.0 9.2
Other 0.0 0.0 0.0 0.0 0.0 c_PB Price to Book x 3.3 2.7 2.8 2.9 3.0
Profit before tax 190.8 237.0 275.8 329.5 369.4 ReturnsIncome tax (50.4) (61.0) (74.5) (89.0) (99.7) c_ROE*100Return on Equity % 11.4 9.3 11.0 13.6 15.7
Profit after tax 140.4 176.0 201.4 240.5 269.7 c_I_NPAT/c_I_SALES*100Profit Margin % 13.3 14.2 15.2 16.9 18.2
Minorities (0.1) 2.8 0.0 0.0 0.1 c_I_SALES/c_B_TOT_ASSAsset Turnover x 0.2 0.2 0.2 0.2 0.2
Preferred dividends 0.0 0.0 0.0 0.0 0.0 c_ASSETS/c_EQ_COMMONEquity Multiplier x 4.5 4.0 4.4 4.6 4.8
Associates & Other 0.0 0.0 0.0 0.0 0.0 c_ROA*100Return on Assets % 2.6 2.3 2.5 3.0 3.3
Normalised NPAT 140.3 178.8 201.4 240.6 269.7 c_ROIC*100Return on Invested Cap. % 7.4 5.8 6.1 6.8 7.5
Unusual item after tax (9.7) 120.0 0.0 0.0 0.0 GearingReported NPAT 130.6 298.8 201.4 240.6 269.7 c_GEARING*100Net Debt to Net debt + Equity % 62.0 63.4 66.1 66.8 66.5
c_NET_DEBT/c_I_EBITDANet Debt to EBITDA x 4.9 6.5 6.4 5.9 5.4
Balance Sheet 06/12A 06/13A 06/14E 06/15E 06/16E c_I_EBITDA/ c_I_NET_INTERESTInt Cover (EBITDA/Net Int.) x 2.3 2.2 2.3 2.4 2.5
Cash & equivalents 329.9 81.0 44.9 77.5 250.9 c_I_EBIT/ c_I_NET_INTERESTInt Cover (EBIT/Net Int.) x 1.8 1.8 1.9 2.0 2.1
Inventories 11.5 12.7 12.7 12.7 12.7 (c_C_CAPEX/c_I_SALES)*-100Capex to Sales % 23.6 31.5 35.0 15.8 3.1
Receivables 238.5 164.6 153.3 164.5 171.1 (c_C_CAPEX/c_I_DEPR)*-100Capex to Depreciation % 238.5 318.5 353.4 164.4 33.0
Other current assets 4.6 22.1 22.1 22.1 22.1
Current assets 584.5 280.4 233.0 276.9 456.8 MSCI IVA (ESG) Rating AProperty, plant & equip. 3,472.2 5,280.4 5,613.7 5,702.1 5,609.5 TP ESG Risk (%): -0.16
Intangibles 595.5 1,327.5 1,321.8 1,316.2 1,310.5
Other non-current assets 843.8 810.6 808.3 805.1 801.8
Non-current assets 4,911.5 7,418.5 7,743.9 7,823.4 7,721.8
Total assets 5,496.1 7,698.9 7,976.9 8,100.2 8,178.6
Payables 175.0 190.1 139.3 155.2 158.6
Interest bearing debt 2,965.3 4,440.5 4,765.9 4,833.6 4,856.4
Other liabilities 741.7 556.0 645.5 749.5 844.2 MSCI IVA Risk: Neutral
Total liabilities 3,882.0 5,186.6 5,550.8 5,738.2 5,859.2
Net assets 1,614.0 2,512.3 2,426.1 2,362.0 2,319.4
Ordinary equity 1,227.1 1,913.6 1,827.5 1,763.4 1,720.8
Minority interests 386.9 598.7 598.7 598.6 598.6
Preferred capital 0.0 0.0 0.0 0.0 0.0
Total shareholder funds 1,614.0 2,512.3 2,426.1 2,362.0 2,319.4
Net debt 2,635.3 4,359.6 4,721.0 4,756.1 4,605.5 Source: MSCI ESG Research
Cashflow 06/12A 06/13A 06/14E 06/15E 06/16E Share Price Performance
EBIT 425.1 536.7 596.6 665.7 708.0
Net interest -218.2 -270.6 -305.8 -321.2 -323.6
Depr & Amort 110.4 130.5 137.2 142.8 143.9
Tax paid 0.0 -0.1 0.0 0.0 -19.9
Working capital -53.9 87.8 -39.4 4.6 -3.2
Other 72.1 -51.5 2.3 3.2 3.3
Operating cashflow 335.6 432.6 390.9 495.1 508.5
Capex -249.1 -397.5 -464.9 -225.5 -45.7
Capex - expansionary -224.7 -372.8 -436.2 -195.1 -14.1
Capex - maintenance -24.4 -24.7 -28.6 -30.4 -31.5
Acquisitions & Invest -17.4 -323.6 0.0 0.0 0.0
Asset sale proceeds 476.0 412.0 0.0 0.0 0.0
Other -29.0 -66.6 0.0 0.0 0.0
Investing cashflow 180.6 -375.6 -464.9 -225.5 -45.7
Dividends paid -208.5 -269.9 -287.5 -304.7 -312.3
Equity raised 44.5 74.4 0.0 0.0 0.0
Net borrowings -103.8 -49.8 325.4 67.6 22.8
Other -13.8 -60.8 0.0 0.0 0.0 1 Month 3 Month 12 Month
Financing cashflow -281.6 -306.0 37.9 -237.0 -289.4 Absolute 2.6% 2.5% 8.6%
Total cashflow 234.6 -249.0 -36.1 32.6 173.4 Relative 1.4% 4.2% 3.2%
Adjustments 0.0 0.0 0.0 0.0 0.0
Net change in cash 234.6 -249.0 -36.1 32.6 173.4 Source: Reuters 52 week trading range: 5.73-6.95
MSCI IVA Risk Comment: We have a Neutral outlook given APA's
solid performance on ESG matters.
14/02/2014 15:00
APA Group consists of Australian Pipeline Trust (APT) and APT Investment Trust (APTIT).
APA is principally engaged in the ownership and operation of energy infrastructure, including
gas and transmission and distribution businesses.
Credit Suisse View
TP Risk Comment: We value the fall in the debt margin post the
next regulatory decisions based on community concerns with
rising energy prices. This affects primarily the Gasnet assets
UNDERPERFORM
5.20
5.70
6.20
6.70
7.20
4/02/2013 4/04/2013 4/06/2013 4/08/2013 4/10/2013 4/12/2013 4/02/2014
APA.AX XJO
2.7
3.7
4.7
5.7
6.7
7.7
8.7
Environment Social Governance
Stock Local Sector
Country Global Sector
Source: Company data, Credit Suisse estimates

17 February 2014
Australia and NZ First Edition 129
Figure 12: DUE financial summary
DUET Group (DUE) Year ending 30 Jun In AUDmn, unless otherwise stated2012 2013 2014 2015 2016 2012 2013 2014 2015 2016
Share Price: A$2.10 Earnings 06/12A 06/13A 06/14E 06/15E 06/16ERating c_EPS_SHARESEquiv. FPO (period avg.) mn 1,070.5 1,143.9 1,246.9 1,295.9 1,295.9
Target Price A$ 2.30 c_EPS*100EPS (Normalised) c 5.8 5.9 6.9 9.8 12.5
vs Share price % 9.79 EPS_GROWTH*100EPS Growth % 2.1 15.9 42.9 26.7
c_EBITDA_MARGIN*100EBITDA Margin % 61.2 63.5 63.5 64.9 65.9
c_DPS*100DPS c 16.0 16.5 17.0 17.5 18.0
c_PAYOUT*100Payout % 274.8 277.7 246.8 177.9 144.6
FRANKING*100Franking % 0.0 0.0 0.0 0.0 0.0
c_FCF_PS*100Free CFPS c 71.3 60.9 65.4 68.5 73.3
Profit & Loss 06/12A 06/13A 06/14E 06/15E 06/16E c_TAX_RATE*100Effective tax rate % 3.8 27.0 0.0 0.0 0.0
Sales revenue 1,201.9 1,257.9 1,265.5 1,355.8 1,430.1 ValuationEBITDA 735.8 799.4 803.6 880.0 942.3 c_PE P/E x 36.0 35.3 30.4 21.3 16.8
Depr. & Amort. (233.9) (253.9) (264.8) (272.1) (278.2) c_EBIT_MULTIPLE_CURREV/EBIT x 15.1 14.6 14.7 13.4 12.3
EBIT 501.9 545.5 538.8 607.9 664.1 c_EBITDA_MULTIPLE_CUEV/EBITDA x 10.3 10.0 9.9 9.2 8.7
Associates 6.8 0.0 0.0 0.0 0.0 c_DIV_YIELD*100Dividend Yield % 7.6 7.9 8.1 8.4 8.6
Net interest Exp. (447.6) (433.5) (450.2) (465.1) (477.2) c_FCF_YIELD*100FCF Yield % 34.0 29.1 31.2 32.7 35.0
Other 0.0 0.0 0.0 0.0 0.0 c_PB Price to Book x 1.7 1.8 1.9 2.0 2.1
Profit before tax 61.1 112.0 88.5 142.8 187.0 ReturnsIncome tax (2.3) (30.3) (0.0) (0.0) (0.0) c_ROE*100Return on Equity % 4.5 5.1 5.9 9.3 12.5
Profit after tax 58.8 81.7 88.5 142.8 187.0 c_I_NPAT/c_I_SALES*100Profit Margin % 5.2 5.4 6.8 9.4 11.3
Minorities 3.6 (13.8) (2.7) (15.3) (25.3) c_I_SALES/c_B_TOT_ASSAsset Turnover x 0.1 0.1 0.1 0.2 0.2
Preferred dividends 0.0 0.0 0.0 0.0 0.0 c_ASSETS/c_EQ_COMMONEquity Multiplier x 5.9 6.4 5.8 6.2 6.6
Associates & Other (0.0) 0.0 0.0 0.0 0.0 c_ROA*100Return on Assets % 0.8 0.8 1.0 1.5 1.9
Normalised NPAT 62.3 68.0 85.9 127.5 161.6 c_ROIC*100Return on Invested Cap. % 7.5 5.9 7.8 8.8 9.6
Unusual item after tax (14.8) (62.1) 0.0 0.0 0.0 GearingReported NPAT 47.5 5.9 85.9 127.5 161.6 c_GEARING*100Net Debt to Net debt + Equity % 75.7 77.6 76.2 78.2 79.5
c_NET_DEBT/c_I_EBITDANet Debt to EBITDA x 6.6 6.6 6.5 6.2 5.8
Balance Sheet 06/12A 06/13A 06/14E 06/15E 06/16E c_I_EBITDA/ c_I_NET_INTERESTInt Cover (EBITDA/Net Int.) x 1.6 1.8 1.8 1.9 2.0
Cash & equivalents 243.6 402.2 358.8 259.0 277.1 c_I_EBIT/ c_I_NET_INTERESTInt Cover (EBIT/Net Int.) x 1.1 1.3 1.2 1.3 1.4
Inventories 19.6 22.1 22.1 22.1 22.1 (c_C_CAPEX/c_I_SALES)*-100Capex to Sales % 0.0 0.0 0.0 0.0 0.0
Receivables 68.0 79.7 79.7 79.7 79.7 (c_C_CAPEX/c_I_DEPR)*-100Capex to Depreciation % 0.0 0.0 0.0 0.0 0.0
Other current assets 79.5 108.5 108.5 108.5 108.5
Current assets 410.8 612.5 569.1 469.4 487.4 MSCI IVA (ESG) Rating BBProperty, plant & equip. 5,473.2 5,613.7 5,701.5 5,762.1 5,725.3 TP ESG Risk (%): -2.6
Intangibles 2,094.3 2,087.4 2,087.4 2,087.4 2,087.4
Other non-current assets 140.4 191.7 191.7 191.7 191.7
Non-current assets 7,707.9 7,892.9 7,980.7 8,041.3 8,004.5
Total assets 8,118.7 8,505.4 8,549.8 8,510.7 8,491.9
Payables 285.1 235.4 235.4 235.4 235.4
Interest bearing debt 5,125.1 5,671.9 5,598.2 5,687.0 5,763.8
Other liabilities 1,139.7 1,076.1 1,076.1 1,076.1 1,076.1 MSCI IVA Risk: Positive
Total liabilities 6,550.0 6,983.4 6,909.7 6,998.5 7,075.3
Net assets 1,568.7 1,522.0 1,640.1 1,512.2 1,416.6
Ordinary equity 1,376.9 1,332.5 1,464.8 1,365.4 1,293.4
Minority interests 191.8 189.5 175.3 146.8 123.2
Preferred capital 0.0 0.0 0.0 0.0 0.0
Total shareholder funds 1,568.7 1,522.0 1,640.1 1,512.2 1,416.6
Net debt 4,881.5 5,269.7 5,239.5 5,428.0 5,486.7 Source: MSCI ESG Research
Cashflow 06/12A 06/13A 06/14E 06/15E 06/16E Share Price Performance
EBIT 501.9 545.5 538.8 607.9 664.1
Net interest 19.6 7.2 11.5 7.4 7.3
Depr & Amort 233.9 253.9 264.8 272.1 278.2
Tax paid -50.3 -38.7 0.0 0.0 0.0
Working capital 352.3 -63.9 0.0 0.0 0.0
Other -293.9 -7.5 0.0 0.0 0.0
Operating cashflow 763.4 696.5 815.1 887.3 949.5
Capex 0.0 0.0 0.0 0.0 0.0
Capex - expansionary
Capex - maintenance
Acquisitions & Invest
Asset sale proceeds 0.1 0.0 0.0 0.0 0.0
Other -41.0 -391.4 -352.6 -332.6 -241.4
Investing cashflow -40.9 -391.4 -352.6 -332.6 -241.4
Dividends paid -145.7 -147.2 -211.9 -226.9 -233.7
Equity raised 266.4 0.0 258.3 0.0 0.0
Net borrowings
Other -1,145.6 0.7 -552.3 -427.6 -456.5 1 Month 3 Month 12 Month
Financing cashflow -1,024.9 -146.4 -505.9 -654.4 -690.1 Absolute 1.7% -3.0% -1.6%
Total cashflow -302.4 158.7 -43.4 -99.7 18.0 Relative 0.5% -1.3% -7.0%
Adjustments 2.5 -0.1 0.0 0.0 0.0
Net change in cash -299.9 158.6 -43.4 -99.7 18.0 Source: Reuters 52 week trading range: 1.99-2.52
MSCI IVA Risk Comment: DUE has recently been downgraded
from BBB to BB, with a lack of disclosure on environmental issues
such as biodiversity and land use, and Social issues such as
Employee benefits and programs. We believe as DUE moves to
internalise management and acts more as an integrated company
rather than as a manager of asset companies, disclosure will
improve.
14/02/2014 11:43
DUET Group is an investor in energy infrastructure assets. DUE's portfolio comprises three
assets DBP (80%), UED (66%) and MGH (100%). DBP is a gas transmission pipeline in
Western Australia, with primarily contracted revenues.
Credit Suisse View
TP Risk Comment: We value the fall in the debt margin post the
next regulatory decisions based on community concerns with
rising energy prices
OUTPERFORM
0.30
0.80
1.30
1.80
2.30
2.80
4/02/2013 4/04/2013 4/06/2013 4/08/2013 4/10/2013 4/12/2013 4/02/2014
DUE.AX XJO
2.7
3.7
4.7
5.7
6.7
7.7
Environment Social Governance
Stock Local Sector
Country Global Sector
Source: Company data, Credit Suisse estimates

17 February 2014
Australia and NZ First Edition 130
Figure 13: SKI financial summary
Spark Infrastructure Group (SKI) Year ending 31 Dec In AUDmn, unless otherwise stated2011 2012 2013 2014 2015 2011 2012 2013 2014 2015
Share Price: A$1.72 Earnings 12/11A 12/12A 12/13E 12/14E 12/15ERating c_EPS_SHARESEquiv. FPO (period avg.) mn 1,326.7 1,326.7 1,326.7 1,326.7 1,326.7
Target Price A$ 1.78 c_EPS*100EPS (Normalised) c 12.6 13.1 13.4 15.9 16.1
vs Share price % 3.41 EPS_GROWTH*100EPS Growth % 4.1 2.1 18.7 1.6
c_EBITDA_MARGIN*100EBITDA Margin % 96.4 96.4 96.6 96.9 96.8
c_DPS*100DPS c 10.0 10.5 11.0 11.5 12.0
c_PAYOUT*100Payout % 79.5 80.1 82.2 72.4 74.4
FRANKING*100Franking % 0.0 0.0 0.0 0.0 0.0
c_FCF_PS*100Free CFPS c 14.2 13.4 14.2 16.1 16.8
Profit & Loss 12/11A 12/12A 12/13E 12/14E 12/15E c_TAX_RATE*100Effective tax rate % 5.0 5.1 20.0 20.0 20.0
Sales revenue 287.7 298.0 328.9 368.0 369.2 ValuationEBITDA 277.3 287.1 317.8 356.6 357.5 c_PE P/E x 13.7 13.1 12.9 10.8 10.7
Depr. & Amort. (0.0) (0.0) (0.0) (0.0) (0.0) c_EBIT_MULTIPLE_CURREV/EBIT x 8.4 8.0 7.1 6.1 6.0
EBIT 277.3 287.1 317.8 356.6 357.5 c_EBITDA_MULTIPLE_CUEV/EBITDA x 8.4 8.0 7.1 6.1 6.0
Associates 0.0 0.0 0.0 0.0 0.0 c_DIV_YIELD*100Dividend Yield % 5.8 6.1 6.4 6.7 7.0
Net interest Exp. (101.7) (103.9) (95.9) (93.2) (89.9) c_FCF_YIELD*100FCF Yield % 8.3 7.8 8.3 9.4 9.8
Other 0.0 0.0 0.0 0.0 0.0 c_PB Price to Book x 1.7 1.5 1.5 1.3 1.2
Profit before tax 175.7 183.3 221.9 263.4 267.6 ReturnsIncome tax (8.7) (9.4) (44.4) (52.7) (53.5) c_ROE*100Return on Equity % 12.5 11.8 11.4 12.3 11.5
Profit after tax 166.9 173.9 177.5 210.7 214.0 c_I_NPAT/c_I_SALES*100Profit Margin % 58.0 58.3 54.0 57.3 58.0
Minorities (0.0) (0.0) (0.0) (0.0) (0.0) c_I_SALES/c_B_TOT_ASSAsset Turnover x 0.1 0.1 0.1 0.1 0.1
Preferred dividends 0.0 0.0 0.0 0.0 0.0 c_ASSETS/c_EQ_COMMONEquity Multiplier x 1.7 1.7 1.7 1.7 1.6
Associates & Other 0.0 0.0 0.0 0.0 0.0 c_ROA*100Return on Assets % 7.2 7.1 6.8 7.4 7.1
Normalised NPAT 166.9 173.9 177.5 210.7 214.0 c_ROIC*100Return on Invested Cap. % 19.0 18.3 16.6 17.6 16.8
Unusual item after tax (84.4) 0.0 (16.0) 0.0 0.0 GearingReported NPAT 82.6 173.9 161.5 210.7 214.0 c_GEARING*100Net Debt to Net debt + Equity % 3.6 0.9 Net Cash Net Cash Net Cash
c_NET_DEBT/c_I_EBITDANet Debt to EBITDA x 0.2 0.0 Net Cash Net Cash Net Cash
Balance Sheet 12/11A 12/12A 12/13E 12/14E 12/15E c_I_EBITDA/ c_I_NET_INTERESTInt Cover (EBITDA/Net Int.) x 2.7 2.8 3.3 3.8 4.0
Cash & equivalents 32.9 42.0 104.3 165.2 228.5 c_I_EBIT/ c_I_NET_INTERESTInt Cover (EBIT/Net Int.) x 2.7 2.8 3.3 3.8 4.0
Inventories 0.0 0.0 0.0 0.0 0.0 (c_C_CAPEX/c_I_SALES)*-100Capex to Sales % 0.0 0.0 0.0 0.0 0.0
Receivables 11.2 11.4 11.4 11.4 11.4 (c_C_CAPEX/c_I_DEPR)*-100Capex to Depreciation %
Other current assets 0.6 0.6 0.6 0.6 0.6
Current assets 44.8 54.0 116.4 177.3 240.6 MSCI IVA (ESG) Rating AProperty, plant & equip. 0.0 0.0 0.0 0.0 0.0 TP ESG Risk (%): -6.12
Intangibles 0.0 0.0 0.0 0.0 0.0
Other non-current assets 2,271.4 2,384.7 2,511.8 2,655.2 2,793.8
Non-current assets 2,271.4 2,384.7 2,511.8 2,655.2 2,793.8
Total assets 2,316.1 2,438.6 2,628.2 2,832.4 3,034.4
Payables 50.8 49.0 49.0 49.0 49.0
Interest bearing debt 82.9 55.7 75.7 75.7 75.7
Other liabilities 848.6 857.0 943.0 995.7 1,049.2 MSCI IVA Risk: Neutral
Total liabilities 982.3 961.7 1,067.6 1,120.3 1,173.8
Net assets 1,333.8 1,477.0 1,560.5 1,712.1 1,860.6
Ordinary equity 1,333.8 1,473.5 1,557.0 1,708.6 1,857.1
Minority interests 0.0 0.0 0.0 0.0 0.0
Preferred capital 0.0 0.0 0.0 0.0 0.0
Total shareholder funds 1,333.8 1,473.5 1,557.0 1,708.6 1,857.1
Net debt 50.0 13.7 -28.7 -89.6 -152.9 Source: MSCI ESG Research
Cashflow 12/11A 12/12A 12/13E 12/14E 12/15E Share Price Performance
EBIT 277.3 287.1 317.8 356.6 357.5
Net interest -7.1 -9.0 -2.3 0.3 3.6
Depr & Amort 0.0 0.0 319.2 387.2 477.2
Tax paid -11.2 0.0 0.0 0.0 0.0
Working capital -30.8 -2.0 51.4 74.3 80.2
Other -39.4 -97.7 -497.7 -604.9 -696.1
Operating cashflow 189.0 178.4 188.3 213.5 222.5
Capex 0.0 0.0 0.0 0.0 0.0
Capex - expansionary 0.0 0.0 0.0 0.0 0.0
Capex - maintenance 0.0 0.0 0.0 0.0 0.0
Acquisitions & Invest 0.0 0.0 0.0 0.0 0.0
Asset sale proceeds 0.0 0.0 0.0 0.0 0.0
Other -51.8 0.0 0.0 0.0 0.0
Investing cashflow -51.8 0.0 0.0 0.0 0.0
Dividends paid -153.5 -139.3 -145.9 -152.6 -159.2
Equity raised 0.0 0.0 0.0 0.0 0.0
Net borrowings -40.0 -30.0 20.0 0.0 0.0
Other 0.0 0.0 0.0 0.0 0.0 1 Month 3 Month 12 Month
Financing cashflow -193.5 -169.3 -125.9 -152.6 -159.2 Absolute 4.6% 4.9% 4.9%
Total cashflow -56.4 9.1 62.4 60.9 63.3 Relative 3.4% 6.6% -0.5%
Adjustments 0.0 0.0 0.0 0.0 0.0
Net change in cash -56.4 9.1 62.4 60.9 63.3 Source: Reuters 52 week trading range: 1.55-1.85
MSCI IVA Risk Comment: No current concerns
14/02/2014 11:45
Spark Infrastructure is an Australia-based company. It is engaged in the investment in
electricity distribution businesses in Victoria and South Australia. It operates under two
segements: CHEDHA Holdings and ETSA Utilities.
Credit Suisse View
TP Risk Comment: We value the fall in the debt margin post the
next regulatory decision based on community concerns with rising
energy prices
OUTPERFORM
0.30
0.50
0.70
0.90
1.10
1.30
1.50
1.70
1.90
2.10
4/02/2013 4/04/2013 4/06/2013 4/08/2013 4/10/2013 4/12/2013 4/02/2014
SKI.AX XJO
2.7
3.7
4.7
5.7
6.7
7.7
Environment Social Governance
Stock Local Sector
Country Global Sector
Source: Company data, Credit Suisse estimates

17 February 2014
Australia and NZ First Edition 131
Figure 14: ENV financial summary
Envestra (ENV) Year ending 30 Jun In AUDmn, unless otherwise stated2012 2013 2014 2015 2016 2012 2013 2014 2015 2016
Share Price: A$1.18 Earnings 06/12A 06/13A 06/14E 06/15E 06/16ERating c_EPS_SHARESEquiv. FPO (period avg.) mn 1,524.0 1,629.1 1,796.8 1,796.8 1,796.8
Target Price A$ 1.22 c_EPS*100EPS (Normalised) c 4.9 6.6 8.1 8.2 8.3
vs Share price % 3.13 EPS_GROWTH*100EPS Growth % 35.2 22.1 1.1 2.2
DCF A$ 1.13 c_EBITDA_MARGIN*100EBITDA Margin % 71.3 71.0 72.9 73.0 72.5
c_DPS*100DPS c 5.8 5.9 6.4 6.6 7.0
c_PAYOUT*100Payout % 118.5 89.2 79.2 81.3 83.6
FRANKING*100Franking % 0.0 0.0 0.0 0.0 0.0
c_FCF_PS*100Free CFPS c 10.2 13.1 13.7 14.5 14.9
Profit & Loss 06/12A 06/13A 06/14E 06/15E 06/16E c_TAX_RATE*100Effective tax rate % 29.9 29.9 30.0 30.0 30.0
Sales revenue 468.6 507.5 561.6 578.9 600.0 ValuationEBITDA 334.1 360.3 409.4 422.8 434.9 c_PE P/E x 24.1 17.9 14.6 14.5 14.2
Depr. & Amort. (56.5) (58.6) (63.4) (68.6) (72.1) c_EBIT_MULTIPLE_CURREV/EBIT x 15.3 13.7 12.3 12.1 12.1
EBIT 277.6 301.7 346.0 354.2 362.8 c_EBITDA_MULTIPLE_CUEV/EBITDA x 12.7 11.5 10.4 10.2 10.1
Associates 0.0 0.0 0.0 0.0 0.0 c_DIV_YIELD*100Dividend Yield % 4.9 5.0 5.4 5.6 5.9
Net interest Exp. (171.2) (147.9) (138.6) (144.6) (148.5) c_FCF_YIELD*100FCF Yield % 8.6 11.1 11.6 12.3 12.6
Other 0.0 0.0 0.0 0.0 0.0 c_PB Price to Book x 3.2 2.5 2.4 2.3 2.3
Profit before tax 106.4 153.8 207.4 209.7 214.3 ReturnsIncome tax (31.8) (46.0) (62.2) (62.9) (64.3) c_ROE*100Return on Equity % 12.7 12.8 16.4 16.1 15.9
Profit after tax 74.6 107.8 145.2 146.8 150.0 c_I_NPAT/c_I_SALES*100Profit Margin % 15.9 21.2 25.9 25.4 25.0
Minorities (0.0) (0.0) (0.0) (0.0) (0.0) c_I_SALES/c_B_TOT_ASSAsset Turnover x 0.2 0.2 0.2 0.2 0.2
Preferred dividends 0.0 0.0 0.0 0.0 0.0 c_ASSETS/c_EQ_COMMONEquity Multiplier x 5.2 3.8 3.9 3.9 4.0
Associates & Other 0.0 0.0 0.0 0.0 0.0 c_ROA*100Return on Assets % 2.4 3.3 4.2 4.1 4.0
Normalised NPAT 74.6 107.8 145.2 146.8 150.0 c_ROIC*100Return on Invested Cap. % 7.2 7.4 8.0 8.0 8.0
Unusual item after tax (0.7) 0.0 0.0 0.0 0.0 GearingReported NPAT 73.9 107.8 145.2 146.8 150.0 c_GEARING*100Net Debt to Net debt + Equity % 78.4 70.6 70.7 70.5 70.5
c_NET_DEBT/c_I_EBITDANet Debt to EBITDA x 6.4 5.6 5.2 5.2 5.2
Balance Sheet 06/12A 06/13A 06/14E 06/15E 06/16E c_I_EBITDA/ c_I_NET_INTERESTInt Cover (EBITDA/Net Int.) x 2.0 2.4 3.0 2.9 2.9
Cash & equivalents 1.0 1.0 4.0 1.6 4.8 c_I_EBIT/ c_I_NET_INTERESTInt Cover (EBIT/Net Int.) x 1.6 2.0 2.5 2.5 2.4
Inventories 0.0 0.0 0.0 0.0 0.0 (c_C_CAPEX/c_I_SALES)*-100Capex to Sales % 37.6 42.8 47.5 36.2 39.2
Receivables 72.9 82.7 91.8 94.6 98.6 (c_C_CAPEX/c_I_DEPR)*-100Capex to Depreciation % 311.7 371.0 420.9 305.2 326.2
Other current assets 5.0 2.5 2.6 2.6 2.7
Current assets 78.9 86.2 98.3 98.9 106.1 MSCI IVA (ESG) Rating BBBProperty, plant & equip. 2,341.7 2,497.0 2,700.4 2,841.2 3,004.4 TP ESG Risk (%): -3.94
Intangibles 606.0 606.0 606.0 606.0 606.0
Other non-current assets 32.0 47.7 47.7 47.7 47.7
Non-current assets 2,979.7 3,150.7 3,354.1 3,494.9 3,658.1
Total assets 3,058.6 3,236.9 3,452.4 3,593.8 3,764.2
Payables 49.4 47.2 47.3 48.5 51.4
Interest bearing debt 2,124.9 2,022.5 2,134.6 2,181.5 2,257.1
Other liabilities 297.9 325.4 387.6 450.5 514.8 MSCI IVA Risk: Positive
Total liabilities 2,472.2 2,395.1 2,569.6 2,680.6 2,823.3
Net assets 586.4 841.8 882.9 913.2 940.9
Ordinary equity 586.4 841.8 882.9 913.2 940.9
Minority interests 0.0 0.0 0.0 0.0 0.0
Preferred capital 0.0 0.0 0.0 0.0 0.0
Total shareholder funds 586.4 841.8 882.9 913.2 940.9
Net debt 2,123.9 2,021.5 2,130.6 2,179.9 2,252.3 Source: MSCI ESG Research
Cashflow 06/12A 06/13A 06/14E 06/15E 06/16E Share Price Performance
EBIT 277.6 301.7 346.0 354.2 362.8
Net interest -142.8 -143.8 -133.6 -139.6 -143.5
Depr & Amort 56.5 58.6 2,621.0 2,702.3 2,821.9
Tax paid 0.0 0.0 0.0 0.0 0.0
Working capital 5.1 -12.0 -9.0 -1.7 -1.2
Other -24.6 29.3 -2,557.7 -2,633.7 -2,749.8
Operating cashflow 171.8 233.8 266.8 281.5 290.2
Capex -176.1 -217.4 -266.8 -209.4 -235.3
Capex - expansionary -159.9 -196.6 -245.8 -188.1 -212.1
Capex - maintenance -16.2 -20.8 -21.1 -21.3 -23.2
Acquisitions & Invest 0.0 0.0 0.0 0.0 0.0
Asset sale proceeds 0.1 0.9 0.0 0.0 0.0
Other -0.6 -8.9 0.0 0.0 0.0
Investing cashflow -176.6 -225.4 -266.8 -209.4 -235.3
Dividends paid -87.5 -93.7 -104.1 -116.4 -122.3
Equity raised 69.6 219.0 0.0 0.0 0.0
Net borrowings 19.4 -129.3 107.1 41.9 70.6
Other -3.0 -4.4 0.0 0.0 0.0 1 Month 3 Month 12 Month
Financing cashflow -1.5 -8.4 3.0 -74.6 -51.7 Absolute 2.8% 9.4% 18.2%
Total cashflow -6.3 0.0 3.0 -2.4 3.2 Relative 1.6% 11.2% 12.8%
Adjustments 0.0 0.0 0.0 0.0 0.0
Net change in cash -6.3 0.0 3.0 -2.4 3.2 Source: Reuters 52 week trading range: 0.93-1.18
MSCI IVA Risk Comment: We note that ENV was recently
downgraded on issues on carbon and envirnmental management.
We expect that with clearer disclosure on network replacment
programs and the carbon reduction impact of this that there is
upside risk to the MSCI IVA rating.
14/02/2014 11:45
ENV owns and invests in gas transportation infrastructure across the Australian market.
Headquartered in South Australia, ENV's primarily assets are gas distribution networks in
Queensland, Victoria and South Australia.
Credit Suisse View
TP Risk Comment: We value the fall in the debt margin post the
next regulatory decisions based on community concerns with
rising energy prices
NEUTRAL
0.30
0.40
0.50
0.60
0.70
0.80
0.90
1.00
1.10
1.20
1.30
4/02/2013 4/04/2013 4/06/2013 4/08/2013 4/10/2013 4/12/2013 4/02/2014
ENV.AX XJO
2.7
3.7
4.7
5.7
6.7
7.7
Environment Social Governance
Stock Local Sector
Country Global Sector
Source: Company data, Credit Suisse estimates

17 February 2014
Australia and NZ First Edition 132
Figure 15: ENE financial summary
Energy Developments Limited (ENE) Year ending 30 Jun In AUDmn, unless otherwise stated2012 2013 2014 2015 2016 2012 2013 2014 2015 2016
Share Price: A$6.00 Earnings 06/12A 06/13A 06/14E 06/15E 06/16ERating c_EPS_SHARESEquiv. FPO (period avg.) mn 168.2 163.2 161.2 161.2 161.2
Target Price A$ 6.44 c_EPS*100EPS (Normalised) c 5.5 33.7 34.5 37.0 31.7
vs Share price % 7.28 EPS_GROWTH*100EPS Growth % 512.9 2.4 7.2 -14.4
c_EBITDA_MARGIN*100EBITDA Margin % 41.3 43.5 41.8 40.6 42.1
c_DPS*100DPS c 0.0 22.0 22.4 24.0 20.6
c_PAYOUT*100Payout % 0.0 65.3 65.0 65.0 65.0
FRANKING*100Franking % 0.0 0.0 0.0 0.0 0.0
c_FCF_PS*100Free CFPS c 41.9 21.9 65.3 63.3 52.3
Profit & Loss 06/12A 06/13A 06/14E 06/15E 06/16E c_TAX_RATE*100Effective tax rate % 121.9 17.2 30.1 30.3 30.3
Sales revenue 319.4 400.9 420.5 442.9 392.5 ValuationEBITDA 132.0 174.6 175.9 179.7 165.3 c_PE P/E x 109.1 17.8 17.4 16.2 18.9
Depr. & Amort. (59.6) (69.4) (69.7) (70.1) (70.4) c_EBIT_MULTIPLE_CURREV/EBIT x 19.4 13.2 12.6 11.6 12.9
EBIT 72.4 105.2 106.2 109.6 95.0 c_EBITDA_MULTIPLE_CUEV/EBITDA x 10.6 8.0 7.6 7.1 7.4
Associates 0.0 0.0 0.0 0.0 0.0 c_DIV_YIELD*100Dividend Yield % 0.0 3.7 3.7 4.0 3.4
Net interest Exp. (38.0) (41.8) (31.7) (29.4) (27.6) c_FCF_YIELD*100FCF Yield % 7.0 3.6 10.9 10.6 8.7
Other (26.2) 0.0 0.0 0.0 0.0 c_PB Price to Book x 3.8 3.1 3.0 2.8 2.7
Profit before tax 8.2 63.4 74.4 80.2 67.4 ReturnsIncome tax (2.1) (10.9) (22.4) (24.3) (20.5) c_ROE*100Return on Equity % 3.5 17.3 17.1 17.2 14.0
Profit after tax 6.1 52.5 52.0 55.8 46.9 c_I_NPAT/c_I_SALES*100Profit Margin % 2.9 13.7 13.2 13.5 13.0
Minorities 0.0 0.0 0.0 0.0 0.0 c_I_SALES/c_B_TOT_ASSAsset Turnover x 0.4 0.4 0.4 0.5 0.4
Preferred dividends 0.0 0.0 0.0 0.0 0.0 c_ASSETS/c_EQ_COMMONEquity Multiplier x 3.2 3.0 2.9 2.8 2.7
Associates & Other 3.2 2.4 3.6 3.8 4.1 c_ROA*100Return on Assets % 1.1 5.9 5.9 6.2 5.2
Normalised NPAT 9.2 55.0 55.6 59.6 51.1 c_ROIC*100Return on Invested Cap. % 7.6 11.7 10.6 11.7 10.6
Unusual item after tax (7.9) 0.0 0.0 0.0 0.0 GearingReported NPAT 1.4 55.0 55.6 59.6 51.1 c_GEARING*100Net Debt to Net debt + Equity % 62.2 57.3 53.3 47.1 41.4
c_NET_DEBT/c_I_EBITDANet Debt to EBITDA x 3.3 2.4 2.1 1.7 1.6
Balance Sheet 06/12A 06/13A 06/14E 06/15E 06/16E c_I_EBITDA/ c_I_NET_INTERESTInt Cover (EBITDA/Net Int.) x 3.5 4.2 5.5 6.1 6.0
Cash & equivalents 42.8 42.3 96.1 159.5 210.5 c_I_EBIT/ c_I_NET_INTERESTInt Cover (EBIT/Net Int.) x 1.9 2.5 3.3 3.7 3.4
Inventories 15.4 13.5 13.5 13.7 14.0 (c_C_CAPEX/c_I_SALES)*-100Capex to Sales % 0.0 23.2 7.9 6.5 7.7
Receivables 46.9 51.1 47.4 50.1 47.3 (c_C_CAPEX/c_I_DEPR)*-100Capex to Depreciation % 0.0 134.2 47.6 41.2 42.9
Other current assets 11.5 32.3 32.3 32.3 32.3
Current assets 116.6 139.2 189.3 255.6 304.1 MSCI IVA (ESG) Rating Property, plant & equip. 643.7 698.0 661.5 619.7 578.5 TP ESG Risk (%): -19.55
Intangibles 52.6 50.3 50.3 50.3 50.3
Other non-current assets 44.3 48.0 45.4 43.6 42.4
Non-current assets 740.6 796.3 757.1 713.6 671.1
Total assets 857.2 935.5 946.5 969.2 975.2
Payables 29.1 58.6 64.0 67.9 58.1
Interest bearing debt 480.6 468.0 468.0 468.0 468.0
Other liabilities 80.9 91.8 89.2 87.1 85.1 MSCI IVA Risk:
Total liabilities 590.6 618.4 621.2 623.1 611.2
Net assets 266.6 317.1 325.3 346.1 364.0
Ordinary equity 266.6 317.1 325.3 346.1 364.0
Minority interests 0.0 0.0 0.0 0.0 0.0
Preferred capital 0.0 0.0 0.0 0.0 0.0
Total shareholder funds 266.6 317.1 325.3 346.1 364.0
Net debt 437.9 425.7 371.9 308.6 257.5 Source: MSCI ESG Research
Cashflow 06/12A 06/13A 06/14E 06/15E 06/16E Share Price Performance
EBIT 72.4 105.2 106.2 109.6 95.0
Net interest -36.5 -36.4 -31.7 -29.4 -27.6
Depr & Amort -59.6 -69.4 -69.7 -70.1 -70.4
Tax paid 0.0 0.0 -22.4 -24.3 -20.5
Working capital 0.0 0.0 9.1 1.3 -7.0
Other 94.2 129.3 143.0 143.9 144.8
Operating cashflow 70.5 128.8 134.4 131.0 114.4
Capex 0.0 -93.1 -33.2 -28.9 -30.2
Capex - expansionary -4.0 0.0 0.0
Capex - maintenance -29.2 -28.9 -30.2
Acquisitions & Invest
Asset sale proceeds 0.0 0.0 0.0 0.0 0.0
Other -185.4 4.2 0.0 0.0 0.0
Investing cashflow -185.4 -88.9 -33.2 -28.9 -30.2
Dividends paid 0.0 0.0 -36.2 -38.8 -33.2
Equity raised 26.1 -17.0 -11.3 0.0 0.0
Net borrowings 93.3 -25.1 0.0 0.0 0.0
Other -32.3 -1.0 0.0 0.0 0.0 1 Month 3 Month 12 Month
Financing cashflow 87.0 -43.1 -47.5 -38.8 -33.2 Absolute 0.0% 5.3% 82.4%
Total cashflow -27.9 -3.2 53.8 63.3 51.0 Relative -1.2% 7.0% 77.0%
Adjustments 0.0 0.0 0.0 0.0 0.0
Net change in cash -27.9 -3.2 53.8 63.3 51.0 Source: Reuters 52 week trading range: 3.03-6.45
MSCI IVA Risk Comment:
14/02/2014 11:46
Energy Developments owns a portfolio of remote power generation supplying electricity to
remote mines and town, as well and a portfolio of clean energy generation, including
generation from landfill gas and coal mine waste gas.
Credit Suisse View
TP Risk Comment: Our ESG impact is the value of $24 carbon
into perpetuity, which represents $1.56 further upside not currently
captured in our valuation. The high ESG sensitivity reflects the
material contribution from Green Revenue to group earnings.
OUTPERFORM
0.30
1.30
2.30
3.30
4.30
5.30
6.30
7.30
4/02/2013 4/04/2013 4/06/2013 4/08/2013 4/10/2013 4/12/2013 4/02/2014
ENE.AX XJO
2.7
3.7
4.7
5.7
6.7
7.7
Environment Social Governance
Stock Local Sector
Country Global Sector
Source: Company data, Credit Suisse estimates

Australia and NZ First Edition 133
17 February 2014
Asia Pacific/Australia
Equity Research
Diversified Metals & Mining (Copper (AU))
PanAust
(PNA.AX / PNADA AU) PRE RESULTS COMMENT
CY13 result preview: Key numbers known;
reports on 20 Feb
Date: Thursday, 20 February Time: Pre-market
Period: Final Earnings Risk: Low
Credit Suisse estimates Briefing and dial-in details
NPAT: US$80.8mn (consensus $70mn-105mn) 11am (ADST)
Dial in: 1800 558 698 (Aust). +612
9007 3187 (Int.). ID: 729144.
EPS: 13.56cps
DPS: 4cps
■ EBITDA of US$271mn is known, so uncertainty around unknown depreciation,
corporate allocation, hedge accounting and tax drives a $10mn risk band around
NPAT forecasting. We view our $81mn estimate as conservative with risk of
being exceeded by lower depreciation and lower tax. 2H depreciation should be
higher than 1H, reflecting operation of the Phu Kham enhanced recovery circuit.
This is reflected in our higher 2H depreciation forecast.
■ Consensus range of $81mn to $105mn could reflect variation in above
assumptions or inclusion/exclusion of minorities.
■ 31 Dec cash US$130.3mn and US$162mn debt already advised with the
DecQ result in January.
■ CY14 guidance provided: Phu Kham Cu 65-70kt, cash costs US$1.50-1.60/lb
Cu; Ban Houayxai US$650-$700/oz. Consolidated gold forecast 160-165koz.
CY14F EBITDA US$200– $225mn. No changes to these numbers expected.
■ We hope for additional guidance on the capex profile, corporate overhead
allocation and project expenditure.
■ TP and rating unchanged.
Total return forecast in perspective
Mean^CS tgt^ Sh Prc
-50%
-30%
-10%
10%
30%
50%
70%
90%
12mth Volatility* 52wk Hi-Lo IBES Consensustarget return^
Performance over 1M 3M 12M
Absolute (%) 6.5 11.6 -38.6
Relative (%) 4.4 12.5 -45.0
Financial and valuation metrics
Year 12/12A 12/13E 12/14E 12/15E
Revenue (US$mn) 705.3 733.4 635.3 648.4
EBITDA (US$mn) 319.3 271.0 171.7 178.5
EBIT (US$mn) 230.8 150.2 70.3 70.4
Net income (US$mn) 142.3 80.8 31.0 23.1
EPS (CS adj.) (USc) 23.91 13.56 5.19 3.88
Change from previous EPS (%) n.a. — — —
Consensus EPS (USc) n.a. 14.80 8.80 11.60
EPS growth (%) 3.0 -43.3 -61.7 -25.3
P/E (x) 7.4 13.1 34.1 45.7
Dividend (USc) 7.00 7.00 7.00 7.00
Dividend yield (%) 4.0 4.0 4.0 4.0
P/B (x) 1.1 1.1 1.1 1.1
Net debt/equity (%) 3.9 9.8 18.0 62.8
Relative performance versus S&P ASX 200.See Reference
Appendix for a description of the chart. Source: Credit Suisse
estimates, * Consensus, mean range from Thomson Reuters
Source: Company data, ASX, Credit Suisse estimates, * Adj. for goodwill, notional interest and unusual items. Relative P/E
against ASX/S&P200 based on pre GW in AUD. Company PE calculation is based on displayed EPS Currency
Rating OUTPERFORM* [V]
Price (14 Feb 14, A$) 1.97
Target price (A$) 2.00¹
Market cap. (A$mn) 1,222.83
Yr avg. mthly trading (A$mn) 165
Last month's trading (A$mn) 176
Projected return:
Capital gain (%) 1.5
Dividend yield (net %) 4.0
Total return (%) 5.5
52-week price range 3.2 - 1.4
* Stock ratings are relative to the relevant country
benchmark.
¹Target price is for 12 months.
[V] = Stock considered volatile (see Disclosure Appendix).
Research Analysts
Michael Slifirski
61 3 9280 1845
Sam Webb
61 3 9280 1716

17 February 2014
Australia and NZ First Edition 134
Figure 1: PNA Financial Summary
PanAust (PNA) Year ending 31 Dec In USDmn, unless otherwise stated2011 2012 2013 2014 2015 2011 2012 2013 2014 2015
Share Price: A$1.97 Earnings 12/11A 12/12A 12/13E 12/14E 12/15ERating OUTPERFORM c_EPS_SHARESEquiv. FPO (period avg.) mn 593.0 594.9 596.2 597.1 597.1
Target Price A$ 2.00 c_EPS*100EPS (Normalised) c 23.2 23.9 13.6 5.2 3.9
vs Share price % 1.52 EPS_GROWTH*100EPS Growth % 3.0 -43.3 -61.7 -25.3
DCF US$ 1.94 c_EBITDA_MARGIN*100EBITDA Margin % 47.6 45.3 37.0 27.0 27.5
c_DPS*100DPS c 0.0 7.0 7.0 7.0 7.0
c_PAYOUT*100Payout % 0.0 29.3 51.6 135.0 180.6
FRANKING*100Franking % 0.0 0.0 0.0 0.0 0.0
c_FCF_PS*100Free CFPS c 30.3 21.6 9.0 24.1 19.1
Profit & Loss 12/11A 12/12A 12/13E 12/14E 12/15E c_TAX_RATE*100Effective tax rate % 27.3 25.3 27.2 25.0 25.0
Sales revenue 596.6 705.3 733.4 635.3 648.4 ValuationEBITDA 284.2 319.3 271.0 171.7 178.5 c_PEP/E x 7.6 7.4 13.1 34.1 45.7
Depr. & Amort. (59.5) (88.4) (120.8) (101.4) (108.1) c_EBIT_MULTIPLE_CURREV/EBIT x 4.7 4.9 8.0 18.4 25.0
EBIT 224.7 230.8 150.2 70.3 70.4 c_EBITDA_MULTIPLE_CUEV/EBITDA x 3.7 3.6 4.4 7.5 9.9
Associates 0.0 0.0 0.0 0.0 0.0 c_DIV_YIELD*100Dividend Yield % 0.0 4.0 4.0 4.0 4.0
Net interest Exp. (12.4) (16.6) (21.1) (17.9) (28.7) c_FCF_YIELD*100FCF Yield % 17.1 12.2 5.1 13.6 10.8
Other (3.0) (1.9) (1.0) (1.2) 0.0 c_PBPrice to Book x 1.3 1.1 1.1 1.1 1.1
Profit before tax 209.3 212.4 128.1 51.2 41.7 ReturnsIncome tax (57.3) (53.7) (34.9) (12.8) (10.4) c_ROE*100Return on Equity % 17.7 15.5 8.5 3.3 2.5
Profit after tax 152.1 158.7 93.2 38.4 31.3 c_I_NPAT/c_I_SALES*100Profit Margin % 23.1 20.2 11.0 4.9 3.6
Minorities (14.4) (16.4) (12.4) (7.5) (8.1) c_I_SALES/c_B_TOT_ASSAsset Turnover x 0.5 0.5 0.5 0.4 0.3
Preferred dividends 0.0 0.0 0.0 0.0 0.0 c_ASSETS/c_EQ_COMMONEquity Multiplier x 1.5 1.5 1.6 1.6 2.1
Associates & Other 0.0 0.0 0.0 0.0 0.0 c_ROA*100Return on Assets % 11.5 10.1 5.4 2.1 1.2
Normalised NPAT 137.7 142.3 80.8 31.0 23.1 c_ROIC*100Return on Invested Cap. % 19.3 16.2 9.3 4.2 3.1
Unusual item after tax (5.5) 0.0 0.0 0.0 0.0 GearingReported NPAT 132.1 142.3 80.8 31.0 23.1 c_GEARING*100Net Debt to Net debt + Equity % Net Cash 3.7 8.9 15.2 38.6
c_NET_DEBT/c_I_EBITDANet Debt to EBITDA x Net Cash 0.1 0.4 1.1 3.7
Balance Sheet 12/11A 12/12A 12/13E 12/14E 12/15E c_I_EBITDA/ c_I_NET_INTERESTInt Cover (EBITDA/Net Int.) x 22.9 19.2 12.8 9.6 6.2
Cash & equivalents 155.5 125.0 129.4 42.4 22.3 c_I_EBIT/ c_I_NET_INTERESTInt Cover (EBIT/Net Int.) x 18.1 13.9 7.1 3.9 2.5
Inventories 56.3 111.9 173.6 131.3 144.3 (c_C_CAPEX/c_I_SALES)*-100Capex to Sales % 38.9 28.9 13.2 27.5 76.9
Receivables 15.7 20.1 22.0 16.6 18.3 (c_C_CAPEX/c_I_DEPR)*-100Capex to Depreciation % 390.0 230.5 82.2 172.2 461.4
Other current assets 4.2 0.5 8.3 22.1 22.1
Current assets 231.7 257.5 333.3 212.4 206.9 MSCI IVA (ESG) Rating AAProperty, plant & equip. 525.3 903.9 877.1 975.3 1,416.1 TP ESG Risk (%): 0
Intangibles 14.0 14.0 14.0 14.0 14.0
Other non-current assets 421.9 228.4 269.0 280.3 289.3
Non-current assets 961.1 1,146.3 1,160.1 1,269.6 1,719.3
Total assets 1,192.9 1,403.8 1,493.4 1,482.0 1,926.2
Payables 84.5 88.0 91.8 83.5 85.1
Interest bearing debt 107.0 164.7 233.8 233.8 683.8
Other liabilities 107.4 127.0 101.1 101.1 104.2 MSCI IVA Risk: Neutral
Total liabilities 298.9 379.7 426.6 418.4 873.0
Net assets 894.0 1,024.1 1,066.8 1,063.6 1,053.2
Ordinary equity 777.7 915.5 949.6 938.9 920.4
Minority interests 116.3 108.6 117.2 124.6 132.8
Preferred capital 0.0 0.0 0.0 0.0 0.0
Total shareholder funds 894.0 1,024.1 1,066.8 1,063.6 1,053.2
Net debt -48.5 39.7 104.4 191.3 661.5 Source: MSCI IVA Rating
Cashflow 12/11A 12/12A 12/13E 12/14E 12/15E Share Price Performance
EBIT 224.7 230.8 150.2 70.3 70.4
Net interest -17.1 -18.0 -18.6 -17.9 -28.7
Depr & Amort 59.5 88.4 120.8 101.4 108.1
Tax paid -36.5 -53.9 -52.1 -26.5 -7.3
Working capital 38.1 -56.6 -59.8 39.5 -13.1
Other -29.6 7.6 -16.0 2.6 3.0
Operating cashflow 239.1 198.4 124.5 169.3 132.3
Capex -232.2 -203.8 -96.5 -174.6 -498.8
Capex - expansionary -173.0 -134.1 -25.9 -149.4 -480.8
Capex - maintenance -59.2 -69.6 -70.6 -25.2 -18.0
Acquisitions & Invest -69.1 -67.9 -47.9 -40.0 -62.0
Asset sale proceeds 0.0 0.0 0.0 0.0 0.0
Other -0.7 -8.3 -5.1 0.0 0.0
Investing cashflow -302.0 -279.9 -149.5 -214.6 -560.8
Dividends paid 0.0 -16.9 -39.4 -41.7 -41.7
Equity raised 1.4 3.7 2.3 0.0 0.0
Net borrowings 43.3 56.5 59.6 0.0 450.0
Other -10.5 7.2 8.7 0.0 0.0 1 Month 3 Month 12 Month
Financing cashflow 34.2 50.5 31.3 -41.7 408.3 Absolute 6.5% 11.6% -38.6%
Total cashflow -28.6 -31.0 6.3 -87.0 -20.2 Relative 4.4% 12.5% -45.0%
Adjustments -0.6 0.5 -1.9 0.0 0.0
Net change in cash -29.2 -30.5 4.4 -87.0 -20.2 Source: Reuters 52 week trading range: 1.45-3.20
MSCI IVA Risk Comment: Rating upgraded to 'AA' (from 'A') on
17 Dec 13. The recent upgrade was pleasing however main
operations in Laos/Thailand continue to place perceived
geopolitical risk on PNA.
11/02/2014 17:52
PanAust Limited (PanAust) is a copper and gold producer in Laos, Southeast Asia, and has a
portfolio of organic growth projects. PanAust’s portfolio of development and exploration assets
are located primarily in Laos and Chile.
Credit Suisse View
TP Risk Comment: Despite low carbon tax exposure and
operations in Laos/Thailand, we do not attribute any ESG risk to
our share price.
0.00
0.50
1.00
1.50
2.00
2.50
3.00
3.50
4.00
4/02/2013 4/04/2013 4/06/2013 4/08/2013 4/10/2013 4/12/2013 4/02/2014
PNA.AX XJO
1.8
2.8
3.8
4.8
5.8
6.8
Environment Social Governance
Stock Local Sector Country Global Sector
Source: Company data, Credit Suisse estimates

Australia and NZ First Edition 135
17 February 2014
Asia Pacific/New Zealand
Equity Research
Transportation Infrastructure (Industrials)
Port of Tauranga (POT.NZ / POT NZ) PRE RESULTS COMMENT
1H14 result preview; reports on 20 Feb
Date: 20/02/14 Time: 10:30am
Period: 1H14 Earnings Risk: n/a
FNZC estimates Briefing and dial-in details
NPAT: $40.4mn Time: 1.00pm
Dial: 0800 450 585
Confirmation code: 1391003
EPS: 30.1¢
DPS: 20.0¢
FNZC assumptions
■ We anticipate POT's 1H14 NPAT at NZ$40.4mn. Management expects
NPAT for FY14 in the range of NZ$77-81mn, which is consistent with our
forecast of NZ$79.7mn.
■ We assume EBITDA of NZ$67.5mn in 1H14 and NZ$122.8mn for FY14F.
What to look for
■ We are not anticipating any surprises in POT’s 1H14 result. Organic and
inorganic growth in revenues is expected to be largely offset by a backflow
of container volume to the Port of Auckland.
■ A progress update on the expansion of existing facilities.
Share price implications
■ We expect a relatively muted response on the back of a flat underlying NPAT
result when compared to the pcp. At current levels, valuation remains a hurdle.
■ In order for us to upgrade our target price and rating for POT, we would
require a positive surprise both in terms of the offset between increasing log
volumes and the level of reduction in container volumes, and progress on
the expansion in existing port facilities.
Share price performance
80.0
87.5
95.0
102.5
110.0
13.00
13.75
14.50
15.25
16.00
Feb-13 Mar-13 Apr-13 May-13 Jun-13 Jul-13 Aug-13 Sep-13 Oct-13 Nov-13 Dec-13 Jan-14 Feb-14
Port of Tauranga Limited (ns) LHS Relative to NZX50 (RHS)
The price relative chart measures performance against the
NZX50 index which closed at 4873.5 on 13 Feb 14.
The spot exchange rate was NZ$1.199/US$1 on 14 Feb 14.
Performance over 1M 3M 12M
Absolute(%) -4.7 3.8 4.5
Rel-NZX50(%) -4.9 4.9 -10.4
Year to 30 Jun 2012A 2013A 2014F 2015F 2016F
Adjusted Earnings NZ$m 73.9 77.3 79.7 84.5 89.2
EPS Adjusted NZc. 55.1 57.6 59.4 63.0 66.5
EPS Grow th % 27.6 4.4 3.2 6.1 5.5
P/E x 25.4 24.3 23.5 22.2 21.0
CPS NZc. 65.8 69.3 72.3 78.4 84.2
P/CF x 21.3 20.2 19.3 17.8 16.6
EV/EBITDA x 16.0 15.2 14.8 13.9 12.9
Net DPS NZc. 39.0 46.0 46.0 46.0 48.0
Imputation % 100 100 100 100 100
Net Yield % 2.8 3.3 3.3 3.3 3.4
Gross Yield % 3.9 4.6 4.6 4.6 4.8
Financial and valuation metrics
Source: Company data, NZX, First NZ Capital estimates
Rating UNDERPERFORM* Price (14 Feb 2014, NZ$) 13.95 Target price (NZ$) 13.80¹ Market cap. (NZ$mn) 1,874.95 Projected return: 0 Capital gain (%) -1.3 Dividend yield (net %) 3.3 Total return (%) 2.0 52-week price range (NZ$) 13.15-15.70
* Stock ratings are relative to the relevant country
benchmark.
¹Target price is for 12 months.
Research Analysts
Kar Yue Yeo
+64 4 474 4462
This report is distributed in Australia by Credit Suisse
Equities (Australia) Limited. Please see legal disclaimer and
disclosure annex for further terms and information
Provided by First NZ Capital

17 February 2014
Australia and NZ First Edition 136
Figure 1: Port of Tauranga—Financial summary
Sector: Transportation NZX Code: POT
PROFIT & LOSS ($m) BALANCE SHEET ($m)Year to 30 Jun 2012A 2013A 2014F 2015F 2016F Year to 30 Jun 2012A 2013A 2014F 2015F 2016F
Operating Rev enue 226 244 262 281 302 Cash & Equiv alents 9.2 37.2 37.2 37.2 37.2
Operating Ex penses -113 -121 -129 -136 -145 Debtors & Inv entories 33.8 34.0 36.3 38.6 41.2
Operating EBITDA 113 123 133 145 157 Other Current Assets 1.1 0.0 0.0 -0.2 -0.2
Depreciation -14.2 -15.8 -17.3 -20.6 -23.7 Current Assets 44.0 71.3 73.5 75.7 78.3
Amortisation -2.7 -2.8 -2.8 -2.8 -2.8 Fix ed Assets 889 947 1,045 1,076 1,080
Operating EBIT 96.4 105 113 122 131 Inv estments 78.6 46.5 68.8 70.3 71.8
Other Income 2.9 2.1 0.8 0.3 0.0 Intangibles 16.9 42.6 41.5 40.4 39.3
Abnormals -0.3 33.7 0.0 0.0 0.0 Other Non-Current Ass. 5.3 5.3 5.3 5.3 5.3
Reported EBIT 99.0 140 114 122 131 Total Assets 1,034 1,113 1,234 1,268 1,275
Net Interest -13.8 -13.4 -15.1 -18.8 -21.5
Pretax Profit 85.2 127 98.4 103 109 Interest Bearing Debt 196 226 329 336 316
Tax -23.8 -25.1 -27.7 -29.0 -30.7 Other Liabilities 104 92.6 93.1 95.6 98.3
Minority Interests 0.0 0.0 0.0 0.0 0.0 Total Liabilities 300 319 422 432 414
Equity Accounted Profit 12.3 10.4 8.9 10.2 10.7 Minorities 0.0 0.0 0.0 0.0 0.0
Reported NPAT 73.7 112 79.7 84.5 89.2 Conv ertible Capital 0.0 0.0 0.0 0.0 0.0
Abnormals (net of tax ) -0.3 34.9 0.0 0.0 0.0 Ordinary Equity 734 794 812 836 861
Adjusted Earnings 73.9 77.3 79.7 84.5 89.2 Total Funds Emp. 1,034 1,113 1,234 1,268 1,275
RATIOS AND CAPITAL STRUCTURE CASH FLOW ($m)Year to 30 Jun 2012A 2013A 2014F 2015F 2016F Year to 30 Jun 2012A 2013A 2014F 2015F 2016F
Profitability & Growth
EBITDA/Op Rev % 50.1 50.4 50.6 51.7 52.0 Operating EBITDA 113 123 133 145 157
EBIT/Op Rev % 42.6 42.8 43.0 43.4 43.3 Other Cash Income 0.0 0.0 0.0 0.0 0.0
Effectiv e Tax Rate % 27.9 19.8 28.1 28.1 28.1 Interest Paid -12.3 -16.9 -14.3 -18.6 -21.5
Return On Equity % 10.3 10.1 9.9 10.3 10.5 Tax Paid -24.0 -26.9 -27.7 -29.0 -30.7
ROCE % 12.3 12.3 11.7 11.8 12.4 Working Capital / Other -2.5 4.2 -1.8 0.1 0.1
EPS Adjusted c. 55.1 57.6 59.4 63.0 66.5 Operating Cash Flow 74.5 83.4 89.0 97.8 105
EPS Grow th % 27.6 4.4 3.2 6.1 5.5
Net DPS c. 39.0 46.0 46.0 46.0 48.0 Total Capex -39.1 -97.3 -117 -53.0 -29.6
Div idend Cov er x 1.4 1.3 1.3 1.4 1.4 Acquisitions -4.0 -2.0 -21.6 0.0 0.0
Asset Backing & Capital Structure Div estments 1.0 70.5 0.0 0.0 0.0
Net Cash (Debt) $m -187 -189 -292 -299 -278 Div idends -44.3 -63.0 -61.7 -60.7 -63.7
NTA / Share $ 5.3 5.6 5.7 5.9 6.1 Equity Raised 0.0 0.0 0.0 0.0 0.0
Equity / Tot Assets % 71.0 71.3 65.8 65.9 67.6 Other 3.9 4.3 0.0 0.0 0.0
Net Debt / EBITDA x 1.6 1.5 2.2 2.1 1.8 Change in Net Debt -8.1 -4.1 -111 -15.9 11.8
Interest Cov er x 7.0 7.8 7.5 6.5 6.1
Shares on Issue Capex /Depn % 275 616 679 257 125
Ordinary m 134 134 134 134 134 Capex /Rev % 17.3 39.9 44.7 18.9 9.8
Fully Diluted m 134 134 134 134 134
CARGO VOLUMES (000 tonnes) REVENUE BREAKDOWNYear to 30 Jun 2012A 2013A 2014F 2015F 2016F Year to 30 Jun 2012A 2013A 2014F 2015F 2016F
Logs 4,919 5,601 6,161 6,408 6,664 Revenue
Other Forest Products 2,404 2,229 2,274 2,365 2,459 Port Serv ice Rev enue 184.7 191.0 206.9 219.4 232.4
Primary Ex ports 2,520 2,849 2,906 3,051 3,204 Quality Marshalling 0 9.96 9.96 12.95 19.42
Other Ex ports 1,898 1,937 1,956 2,074 2,177 Property Lease Rentals 18.8 19.9 21.3 23.7 24.2
Total Exports 12,262 13,056 13,746 14,355 14,971 Tapper Transport 22.7 23.2 24.1 25.1 26.1
Oil Products 1,230 1,242 1,267 1,292 1,318 Total 226.2 244.01 262.27 281.13 302.02
Fertiliser Bases 520 382 390 397 405
Coal 31.0 63.0 50.0 50.0 50.0
Other Imports 4,409 4,322 4,402 4,545 4,684
Total Imports 6,190 6,009 6,109 6,284 6,457
Total Volume 18,452 19,065 19,854 20,639 21,428
Containers (000 teus) 796 848 831 881 917
Source: Company data, NZX, First NZ Capital estimates

Australia and NZ First Edition 137
17 February 2014
Asia Pacific/New Zealand
Equity Research
Construction & Engineering (Industrials)
Steel & Tube Holdings (STU.NZ / STU NZ) PRE RESULTS COMMENT
1H14 result preview; reports on 20 Feb
Date: 20/02/14 Time: 9:00am
Period: 1H14 Earnings Risk: n/a
FNZC estimates Briefing and dial-in details
NPAT: $7.5mn n/a
EPS: 8.5¢
DPS: 6.5¢
FNZC Assumptions
■ Our expectation is for 1H14 NPAT of NZ$7.5mn, translating into NZ$17.3mn
for FY14.
■ We anticipate 1H14 EBIT of NZ$11.0mn, translating into NZ$25.1mn for
FY14.
What to look for
■ We look for evidence of STU’s ability to capitalise on the NZ building and
construction sector recovery translating into higher steel demand. Increased
activity in both residential and non-residential building consents in Auckland
and Christchurch are the key drivers here. Importantly, increased demand
should translate into an improvement in margins.
Share price implications
■ To be more bullish on the stock, we would require improvement in margins
and an anticipation that these improvements can be sustained going forward
through the remainder of FY14F.
Share price performance
80.0
90.0
100.0
110.0
120.0
2.00
2.50
3.00
3.50
4.00
Feb-13 Mar-13 Apr-13 May-13 Jun-13 Jul-13 Aug-13 Sep-13 Oct-13 Nov-13 Dec-13 Jan-14 Feb-14
Steel & Tube Holdings Limited LHS Relative to NZX50 (RHS)
The price relative chart measures performance against the
NZX50 index which closed at 4873.5 on 13 Feb 14.
The spot exchange rate was NZ$1.199/US$1 on 14 Feb 14.
Performance over 1M 3M 12M
Absolute(%) 0.3 -1.6 27.2
Rel-NZX50(%) 0.2 -0.5 12.3
Year to 30 Jun 2012A 2013A 2014F 2015F 2016F
Adjusted Earnings NZ$m 13.1 14.6 17.3 21.6 25.3
EPS Adjusted NZc. 14.9 16.6 19.6 24.4 28.6
EPS Grow th % -24.1 11.6 18.3 24.5 17.1
P/E x 20.6 18.4 15.6 12.5 10.7
CPS NZc. 21.9 22.7 24.8 29.6 33.8
P/CF x 14.0 13.5 12.3 10.3 9.1
EV/EBITDA x 11.8 11.2 10.0 8.3 7.2
Net DPS NZc. 12.0 15.0 15.5 19.0 24.0
Imputation % 100 100 100 100 100
Net Yield % 3.9 4.9 5.1 6.2 7.8
Gross Yield % 5.4 6.8 7.0 8.6 10.9
Financial and valuation metrics
Source: Company data, NZX, First NZ Capital estimates
Rating UNDERPERFORM* Price (14 Feb 2014, NZ$) 3.00 Target price (NZ$) 3.10¹ Market cap. (NZ$mn) 265.33 Projected return: 0 Capital gain (%) 3.3 Dividend yield (net %) 5.9 Total return (%) 9.2 52-week price range (NZ$) 2.32-3.20
* Stock ratings are relative to the relevant country
benchmark.
¹Target price is for 12 months.
Research Analysts
Kar Yue Yeo
+64 4 474 4462
This report is distributed in Australia by Credit Suisse
Equities (Australia) Limited. Please see legal disclaimer and
disclosure annex for further terms and information
Provided by First NZ Capital

17 February 2014
Australia and NZ First Edition 138
Figure 1: Steel & Tube Holdings financial summary
Sector: Capital Goods NZX Code: STU
PROFIT & LOSS ($m) BALANCE SHEET ($m)Year to 30 Jun 2012A 2013A 2014F 2015F 2016F Year to 30 Jun 2012A 2013A 2014F 2015F 2016F
Operating Rev enue 405 393 421 465 489 Cash & Equiv alents 3.7 3.5 3.5 3.5 3.5
Operating Ex penses -379 -366 -392 -429 -447 Debtors & Inv entories 157 150 160 172 178
Operating EBITDA 26.1 27.0 29.7 35.8 41.1 Other Current Assets 0.6 0.7 0.7 0.7 0.7
Depreciation -6.2 -5.4 -4.6 -4.6 -4.6 Current Assets 161 154 164 176 182
Amortisation 0.0 0.0 0.0 0.0 0.0 Fix ed Assets 48.2 46.5 46.5 46.5 46.5
Operating EBIT 19.9 21.6 25.1 31.2 36.6 Inv estments 0.0 0.0 0.0 0.0 0.0
Other Income 0.0 0.0 0.0 0.0 0.0 Intangibles 20.9 21.5 21.5 21.5 21.5
Abnormals 0.0 0.9 0.0 0.0 0.0 Other Non-Current Ass. 0.0 0.0 0.0 0.0 0.0
Reported EBIT 19.9 22.6 25.1 31.2 36.6 Total Assets 230 222 232 244 250
Net Interest -1.7 -1.4 -1.1 -1.3 -1.5
Pretax Profit 18.3 21.2 24.0 29.9 35.1 Interest Bearing Debt 40.5 27.3 29.5 30.3 26.2
Tax -5.1 -5.6 -6.7 -8.4 -9.8 Other Liabilities 37.2 37.9 40.4 44.4 46.5
Minority Interests 0.0 0.0 0.0 0.0 0.0 Total Liabilities 77.7 65.2 70.0 74.7 72.7
Equity Accounted Profit 0.0 0.0 0.0 0.0 0.0 Minorities 0.0 0.0 0.0 0.0 0.0
Reported NPAT 13.1 15.6 17.3 21.6 25.3 Conv ertible Capital 0.0 0.0 0.0 0.0 0.0
Abnormals (net of tax ) 0.0 0.9 0.0 0.0 0.0 Ordinary Equity 153 157 162 169 177
Adjusted Earnings 13.1 14.6 17.3 21.6 25.3 Total Funds Emp. 230 222 232 244 250
RATIOS AND CAPITAL STRUCTURE CASH FLOW ($m)Year to 30 Jun 2012A 2013A 2014F 2015F 2016F Year to 30 Jun 2012A 2013A 2014F 2015F 2016F
Profitability & Growth
EBITDA/Op Rev % 6.4 6.9 7.0 7.7 8.4 Operating EBITDA 26.1 27.0 29.7 35.8 41.1
EBIT/Op Rev % 4.9 5.5 6.0 6.7 7.5 Other Cash Income 0.0 0.9 0.0 0.0 0.0
Effectiv e Tax Rate % 28.1 26.5 28.0 28.0 28.0 Interest Paid -1.7 -1.2 -1.1 -1.3 -1.5
Return On Equity % 8.6 9.4 10.8 13.0 14.6 Tax Paid -4.9 -5.3 -6.7 -8.4 -9.8
ROCE % 10.5 11.7 13.6 16.3 18.5 Working Capital / Other -1.0 7.2 -7.0 -7.9 -4.1
EPS Adjusted c. 14.9 16.6 19.6 24.4 28.6 Operating Cash Flow 18.5 28.6 14.9 18.3 25.8
EPS Grow th % -24.1 11.6 18.3 24.5 17.1
Net DPS c. 12.0 15.0 15.5 19.0 24.0 Total Capex -4.3 -2.8 -4.6 -4.6 -4.6
Div idend Cov er x 1.2 1.1 1.3 1.3 1.2 Acquisitions 0.0 0.0 0.0 0.0 0.0
Asset Backing & Capital Structure Div estments 0.0 0.0 0.0 0.0 0.0
Net Cash (Debt) $m -36.8 -23.8 -26.0 -26.8 -22.7 Div idends -12.8 -11.4 -12.6 -14.5 -17.1
NTA / Share $ 1.5 1.5 1.6 1.7 1.8 Equity Raised 0.0 0.0 0.0 0.0 0.0
Equity / Tot Assets % 66.3 70.7 69.8 69.3 70.9 Other 0.0 0.0 0.0 0.0 0.0
Net Debt / EBITDA x 1.4 0.9 0.9 0.7 0.6 Change in Net Debt 1.5 14.4 -2.3 -0.8 4.1
Interest Cov er x 11.9 15.8 23.5 24.2 24.7
Shares on Issue Capex /Depn % 69.6 51.8 100 100 100
Ordinary m 88.2 88.2 88.2 88.2 88.2 Capex /Rev % 1.1 0.7 1.1 1.0 0.9
Fully Diluted m 88.2 88.2 88.2 88.2 88.2
Distribution47%
Piping Sy stems
3%
Hurricane10%
Fasteners13%
Reinf orcing11%
Roof ing16%
EST REVENUE BREAKDOWN
Distribution28%
Piping Systems
5%
Hurricane10%
Fasteners14%
Reinforcing18%
Roofing25%
EST EBITDA BREAKDOWN
Source: Company data, NZX, First NZ Capital estimates

Australia and NZ First Edition 139
17 February 2014
Asia Pacific/Australia
Equity Research
Macro
Australian ESG/SRI - AGM series
SOCIALLY RESPONSIBLE INVESTING
GNC: 50% of the LTI opportunity converted to
STI plan for FY14
■ We have reviewed the Grain Corp (GNC.AX) Remuneration Report for
the Annual General Meeting on 25th
February 2014.
■ The CEO earns a base salary of $1.15mn, up 21.5% on FY12.
■ Market capitalisation increased from $1.2bn to $1.8bn during the 2012
remuneration review period, which was cited as the reason for the base
salary increase. Market cap is currently ~$1.78bn, therefore benchmarking
may still be relevant.
■ FY13 LTI will be cash-based, rather than rights, but will be subject to same
hurdles and vesting period.
■ 50% of the FY14 LTI opportunity has been converted to the STI plan
due to share price volatility following the failed take-over attempt. This
results in an additional $0.60mn in STI opportunity in lieu of the LTI plan for
the CEO.
■ CEO termination benefit composition unclear: The former CEO departed
on 13 January 2014 and collected $0.939mn in termination benefits,
including contractual pro-rata STI for ~3 months. The Board has discretion
on payout of STI but we are unable to determine if any of the converted LTI
for FY14 was paid out as part of termination.
Figure 1: Summary of remuneration issues
GNC.AX AGM: 25 Feb
Long-term incentives
FY13 LTI: Converted to a cash performance award rather than performance rights but subject to same hurdles and vesting. FY14 LTI: Converted to a cash STI award at 50% of maximum LTI award, subject to STI hurdles and vesting (including one- and two-year deferral).
Short-term incentives
CEO termination: Board exercised discretion for pro-rata STI payment for part of FY14, but not clear if this included pro-rata of converted STI.
Fixed pay Remuneration benchmarking based on market capitalization increase in 2012 resulted in a 21.5% increase in base pay and a 39.8% increase in maximum pay from FY12.
Remuneration vote
Strong support for Remuneration Report (1% against vote in FY12 and FY11).
Source: Company data, Credit Suisse estimates
Research Analysts
Sandra McCullagh
61 2 8205 4729
Chris Parks
61 2 8205 4400

17 February 2014
Australia and NZ First Edition 140
Summary ■ We have reviewed the Grain Corp (GNC.AX) Remuneration Report for the Annual
General Meeting on 25 February 2014.
Figure 2: Summary of remuneration issues
GNC.AX AGM: 25 Feb
Long term incentives
FY13 LTI: Converted to a cash performance award rather than performance rights but subject to same hurdles and vesting. FY14 LTI: Converted to a cash STI award at 50% of maximum LTI award, subject to STI hurdles and vesting (including one- and two-year deferral).
Short term incentives
CEO termination: Board exercised discretion for pro-rata STI payment for part of FY14, but not clear if this included pro-rata of converted STI.
Fixed pay Remuneration benchmarking based on market capitalisation increase in 2012 resulted in a 21.5% increase in base pay and a 39.8% increase in maximum pay from FY12.
Remuneration vote
Strong support for Remuneration Report (1% against vote in FY12 and FY11).
Source: Company data, Credit Suisse estimates
■ The CEO earns a base salary of $1.15mn (21.5% increase from FY12).
■ The CEO can earn up to $4.8mn, with STI contributing up to 200% of base salary (up
from 150% in FY12). We assume the LTI can comprise up to 100% of base salary
(does not specify maximum, 100% is target). We estimate the total maximum salary
has increased by 39.8% compared to FY12.
■ Market capitalisation increased from $1.2bn to $1.8bn during remuneration
review period in 2012 conducted by EY, which was cited as the reason for the base
salary increase. Market capitalisation is currently ~$1.78bn, therefore benchmarking
may still be relevant.
■ The CEO earned an STI of $0.732mn, which was 64% of the base and target, and
32% of the maximum STI available.
■ Disclosure could improve for STI: Specific hurdles for calculating STI are generally
not disclosed. Two notable exceptions are safety (LTIFR reduction of 32%) and
employee engagement (engagement survey result of 62.5%), both of which were
missed.
■ FY13 LTI award granted in cash equivalents not performance rights due to
volatility during the takeover attempt. LTI opportunity remains 100% of base salary with
the same timing, vesting and performance conditions.
■ 50% of the LTI opportunity has been converted to the STI plan for FY14 due to
share price volatility following the failed take-over attempt. This results in an additional
$0.60mn in STI opportunity in lieu of LTI plan for the CEO.
■ CEO termination benefit composition unclear: The former CEO departed on 13
January 2014 and collected $0.939mn in termination benefits, including contractual
pro-rata STI for ~3 months. The Board has discretion on payout of STI but we are
unable to determine if any of the converted LTI for FY14 was paid out as part of the
termination.
■ No incentive structure for acting CEO. The Chairman has stepped in as the acting
CEO while continuing in the role of Chairman of the Board and being remunerated
separately for both roles (Chairman:$0.33mn, CEO:$0.60mn), though is not taking part
in LTI and STI plans. We note the board has set performance criteria for the interim
CEO.

17 February 2014
Australia and NZ First Edition 141
Remuneration report Salary structure
Figure 3: Comparison of FY12 and FY13 pay structures for CEO
Item FY12 FY13
Base pay $0.99mn $1.15mn (21.5% increase)
Short-term incentive 150% of base salary possible 200% of base salary possible
Long-term incentive 100% of base salary 100% of base salary
Mix (Base: STI: LTI) Base 29%: STI 43%: LTI 29% Base 25%: STI 50%: LTI 25%
Maximum possible salary $3.46mn $4.80mn (39.8% increase)
Remuneration advisor EY EY
Auditor PWC PWC
Source: Company data, Credit Suisse estimates
■ The CEO earns a base salary of $1.15mn (21.5% increase from FY12).
■ The CEO can earn up to $4.8mn, with STI contributing up to 200% of base salary (up
from 150% in FY12). We assume the LTI can comprise up to 100% of base salary
(does not specify maximum, 100% is target). We estimate the total maximum salary
has increased by 39.8% compared to FY12.
■ Market capitalisation increase from $1.2bn to $1.8bn during the remuneration
review period in 2012 conducted by EY cited as reason for the base salary increase.
Market capitalisation is currently ~$1.78bn, therefore benchmarking may still be
relevant.
■ CEO termination benefit composition unclear: The former CEO departed on 13
January 2014 and collected $0.939mn in termination benefits, including contractual
pro-rata STI for ~3 months. The Board has discretion on payout of STI but we are
unable to determine if any of the converted LTI for FY14 (refer to the FY14
Performance section) was paid out as part of the termination.
■ No incentive structure for acting CEO. The Chairman has stepped in as the acting
CEO while continuing in the role of Chairman of the Board and being remunerated
separately for both roles (Chairman:$0.33mn, CEO:$0.60mn), though is not taking part
in LTI and STI plans. We note the board has set performance criteria for the interim
CEO.

17 February 2014
Australia and NZ First Edition 142
Short-term incentives
Figure 4: FY13 short-term performance incentives for CEO
Item FY13 Comment
CEO achieved $0.732mn 50% is deferred, with 25% vesting after one year;
25% vesting after two years
Performance hurdles
Financial; NOPAT Safety; Injury rates
Customer; Improve supply chain People; Engagement and talent
Strategic; Asset optimisation and efficiency Regulation & External; Investor and regulatory
relationships
Disclosure on hurdles Some hurdles are disclosed in arrears
% of maximum awarded 32%
Exclusions None
Disclosure on performance Discussion on each area provided though generally not
quantitative. Employee engagement and safety performances
below target
Source: Company data, Credit Suisse estimates
■ The CEO earned an STI of $0.732mn, which was 64% of the base, and 32% of the
maximum STI available.
■ Deferral of 50%: 50% of the STI is deferred; 25% of the STI earned is vested after one
year, and 25% after two years.
■ Disclosure could improve: Specific measurable hurdles for calculating STI are
generally not disclosed. Two notable exceptions are safety (LTIFR reduction of 32%)
and employee engagement (engagement survey result of 62.5%), both of which were
missed.

17 February 2014
Australia and NZ First Edition 143
Long-term incentives
Figure 5: FY13 long-term incentives for CEO
Item FY13 Comment
Number of performance
rights/cash $1.15mn
Deferred cash grants under the same terms and
conditions of the performances rights were granted
due to share price volatility
How calculated cash
Basis of calculation 100% of base salary
Performance hurdle 1 Relative TSR - 50% Comparative group comprises of 50 companies
immediately above and below GNC by market cap
Vesting for performance hurdle 1
50th percentile: 0% vesting
75th percentile:100% vesting (straight line basis)
Rewards second quartile performance
Performance hurdle 2
ROE - 50%
Targets are not disclosed until results available
Vesting for performance hurdle 2
At minimum target: 50% At maximum target: 100%
(straight line) Full vesting possible within target range
Testing period Three years
Retesting No
Hedging allowed? No
Source: Company data, Credit Suisse estimates
■ FY13 LTI award granted in cash equivalents not performance rights due to
volatility during the takeover attempt. LTI opportunity remains 100% of base salary with
the same timing, vesting and performance conditions.
■ Use of VWAP to calculate awards, which is positive: GNC calculates rights based
awards on 20-day VWAP and does not apply discounts reflecting the probability of
vesting which we view as a better indicator of "remuneration at risk", rather than
compensating for that risk. Due to the use of cash-based awards in FY13 and FY14,
this does not apply but is worthy of mention.

17 February 2014
Australia and NZ First Edition 144
Voting on remuneration report
■ Strong vote for the Remuneration Report at 2012 and 2011 AGMs: The Against
vote in FY13 was 1% (1% in FY12).
Figure 6: Comparison of FY11 and FY12 AGM Remuneration Reports voting
FY12 FY13
For resolution 99% 99%
Against resolution 1% 1%
Source: Company data

17 February 2014
Australia and NZ First Edition 145
FY14 performance rights Figure7: Comparison of FY13 and FY14 LTI share performance grants
Item FY13 FY14 Comment
Number of performance rights/cash
$1.15mn $600,000 for CEO FY14 grant may return back to FY12
conditions for the CEO
How calculated cash 50% of the value of the LTI opportunity
converted into the STI plan
Basis of calculation
100% of base salary 50% of LTI opportunity (LTI opportunity
is 100% of base salary)
Performance hurdle 1
Relative TSR – 50% Uses the short-term incentive targets:
(see STI)
Vesting for performance hurdle 1
50
th percentile:0% vesting
75th percentile:100% vesting (straight line basis)
Performance hurdle 2
ROE – 50%
Vesting for performance hurdle 2
At minimum target:50% At maximum target:100%
(straight line)
Testing period Three years
Retesting No
Source: Company data, Credit Suisse estimates
■ No resolution at AGM to award FY14 performance shares.
■ 50% of the LTI opportunity has been converted to the STI plan for FY14 due to
share price volatility following the failed take-over attempt. This results in an additional
$0.60mn in STI opportunity in lieu of the LTI plan for the CEO.
■ It is not clear if the CEO termination package, which included pro-rata STI,
contained any of the converted LTI. The former CEO departed on 13 January 2014
and collected $0.939mn. We are unable to reconcile this figure based on the
information provided and determine the proportion of STI, converted LTI or other
components paid upon departure.
■ We forecast declining ROE in FY14 of 6.7% (FY13:9.9%). As a result we expect
lower ROE hurdles for GNC as maximum and minimum targets have generally been
in-line with consensus (Figure 8). We note our ROE historics differ from those of GNC.
Figure 8: GNC.AX ROE
ROE
GNC.AX FY11A FY12A FY13A FY14F FY15F FY16F
ROE 12.5% 13.3% 9.9% 6.7% 7.8% 9.9%
Reference to grant year FY11 FY12 FY13 FY14 Source: Company data, Credit Suisse estimates

17 February 2014
Australia and NZ First Edition 146
ESG metrics MSCI ESG
■ MSCI ESG rates GNC BB. Our analyst has a Neutral outlook on that rating.
Target Price Impacts from ESG
■ Our analyst has included no downside risk for ESG issues in the Target Price for
GNC.
Figure 9: MSCI and CS Analyst Views
MSCI IVA (ESG) Rating BB
TP ESG Risk (%): 0
MSCI IVA Risk: Neutral
MSCI IVA Risk Comment: Graincorp was recently upgraded to
a 'BB' rating from 'B' following the initiation of programs to
improve energy consumption efficiency. We retain a Neutral
outlook for GNC's MSCI rating on the grounds that its most
significant ESG detriments are now being addressed. GNC's
rating is being dragged by relatively weak carbon emission
and water stress programs however these are offset by a
strong presence of operations in developed economies
reducing its exposure to poor labour standard risks.
Credit Suisse View
Our analysis has found no downside material ESG risk
1.4
2.4
3.4
4.4
5.4
6.4
7.4
8.4
9.4
10.4
Environment Social Governance
Stock Local Sector
Country Global Sector
Source: Company data, Credit Suisse estimates

17 February 2014
Australia and NZ First Edition 147
Australian ESG/SRI – AGM series
■ We plan to publish the Remuneration reports for the upcoming AGM season for mainly
ASX100 companies (excluding REITS). We have published for the following
companies:
■ Australian ESG/SRI – ALL: Discounted fair value results in 94% higher LTI grant
for FY13 – 7 February
■ Australian ESG/SRI – AGK: clawback positive but hurdle too low – 2 October
■ Australian ESG/SRI – AMC: LTI hurdle below current performance – 9 October
■ Australian ESG/SRI – ANN: EPS growth hurdle appears 'in the money' – 2
October
■ Australian ESG/SRI – ANZ: 157% higher LTI grant – 10 December
■ Australian ESG/SRI – APA: Greater disclosure needed for ASX50 company; no
remuneration vote – 1 October
■ Australian ESG/SRI – ARI: FY13, FY14 LTI EPS hurdles look achievable– 6
November
■ Australian ESG/SRI – ARP: Minimalist Remuneration Report – 12 September
■ Australian ESG/SRI – ASX: LTI EPS hurdle well above consensus – 5 September
■ Australian ESG/SRI – AZJ: FY13 LTI targets appear achievable, FY14 some
challenges – 28 October
■ Australian ESG/SRI – BEN: LTI can vest on lower cash earnings – 11 October
■ Australian ESG/SRI – BHP: relativity with Board adjustments – 21 October
■ Australian ESG/SRI – BLD: 40% more LTI awards for FY14 – 15 October
■ Australian ESG/SRI – BOQ: Use of cash NPAT in STI – 11 November
■ Australian ESG/SRI – BSL: maximum STI in FY13 – 4 November
■ Australian ESG/SRI – BXB – High quality remuneration structure, though STI
disclosure could be improved – 9 October
■ Australian ESG/SRI – CBA: Fair value results in 67% more LTI – 22 October
■ Australian ESG/SRI – COH: recalibration of CEO's remuneration mix – 1 October
■ Australian ESG/SRI – CPU: 110% average STI over four years; LTI does not meet
EPS hurdle – 5 November
■ Australian ESG/SRI – CSL: EPS hurdle in the money – 24 September
■ Australian ESG/SRI – CRZ: low base salary, double digit LTI growth – 10 October
■ Australian ESG/SRI –CWN: Refreshing in design – 11 October
■ Australian ESG/SRI –DJS, MYR: Similarities, different outcomes – 12 November
■ Australian ESG/SRI –DOW: LTI EPS hurdles difficult to achieve – 22 October
■ Australian ESG/SRI –DUE: First look at Remuneration – 6 November
■ Australian ESG/SRI –FLT: one of a kind – 17 October

17 February 2014
Australia and NZ First Edition 148
■ Australian ESG/SRI –FMG: ROE LTI hurdle appears achievable – 29 October
■ Australian ESG/SRI –FXJ: new incentive plan – 23 October
■ Australian ESG/SRI –HVN: modest salary and incentives – 11 November
■ Australian ESG/SRI – IAG: LTI ROE hurdle could be higher – 11 September
■ Australian ESG/SRI – IPL: FY13 LTI EPS hurdle 'out of the money' – 11 December
■ Australian ESG/SRI: NAB: LTI award 145% higher than under VWAP – 10
December
■ Australian ESG/SRI: NCM: ROCE hurdle out of the money – 9 October
■ Australian ESG/SRI – ORG: Board slashes approved FY13 LTI grant – 2 October
■ Australian ESG/SRI – ORI: EPS LTI hurdle tough – 20 Jan
■ Australian ESG/SRI – PPT: LTI EPS hurdle appears achievable – 14 October
■ Australian ESG/SRI – RHC: FY14 LTI grant at 378% of base salary – 4 November
■ Australian ESG/SRI – REA: Estimate 25% LTI EPS growth but hurdles not
disclosed – 4 November
■ Australian ESG/SRI – SEK: Tailored to company needs – 14 November
■ Australian ESG/SRI – SGM: Board discretion on STI, LTI grant valued at 450% of
base – 4 November
■ Australian ESG/SRI – SHL: LTI hurdle of CAGR in ROIC appears difficult – 11
November
■ Australian ESG/SRI – SUN adjustments to underlying profits need disclosure – 3
October
■ Australian ESG/SRI – TAH: Prefer VWAP for calculating executive incentives –
15 October
■ Australian ESG/SRI – TLS: Hurdle lowered for FCF ROI on NBN payment timing
– 23 September
■ Australian ESG/SRI – TOL: FY14 LTI now ROC focussed – 2 October
■ Australian ESG/SRI – TTS: Lower CEO pay, no performance based LTI – 17
October
■ Australian ESG/SRI – TWE: Board shows discipline – 2 October
■ Australian ESG/SRI – UGL: No LTI expected for the CEO – 14 October
■ Australian ESG/SRI – WBC: 'Fair value' results in 92% higher LTI – 4 December
■ Australian ESG/SRI – WES: LTI all about relativity – 9 October
■ Australian ESG/SRI – WHC: reworked remuneration for the new CEO – 17
October
■ Australian ESG/SRI – WOR: currency a key to LTI EPS hurdle – 9 September

17 February 2014
Australia and NZ First Edition 149
Recent Australian ESG research:
■ Australian ESG/SRI – MSCI ESG rating changes – WPL makes AAA; healthcare
stocks down two notches – 13 August
■ Australian ESG/SRI – TWE: Executive remuneration may contribute to share
price overhang – 16 July
■ Australian ESG/SRI - LEI appoints new independent directors – an analysis of
LEI's latest Board composition – 21 Jun 2013.
■ Australian ESG/SRI - Too late to stop; Too late to start: winners and losers
from CSG – our views on the ESG issues associated with current and prospective
CSG projects – 10 Apr 2013.
■ Australian ESG/SRI - An update on safety – 28 Feb 2013.
■ Australian ESG/SRI - Water handling increases LNG capex – 25 Feb 2013.
■ Australian ESG/SRI - Impact of NSW policy on AGK CSG carrying value – 25
Feb 2013.
■ Australian ESG/SRI - MSCI SPN upgrade changes Utilities outlook – our views
on ESG issues in the Utilities sector in Australia – 13 Feb 2013.
■ Australian ESG/SRI - ESG issues to watch in 2013 – our key ESG issues for
2013 – 31 Jan 2013.
■ Australian ESG/SRI - Banks down, REITS up, RIO down to BB – an update on
key ESG stock calls, MSCI IVA rating changes and ESG Target Price impact changes
– 21 January 2013.
■ Australian ESG/SRI - ESG in the Media Sector – our views on ESG issues in the
Media sector in Australia – 27 November.
■ ESG changes in stocks calls and analyst views – an update on key ESG stock
calls, MSCI IVA rating changes and ESG Target Price impact changes – 24 October
2012.
■ “ESG overlay on key stock calls”- our view on the analysts’ outlook for MSCI IVA
ratings on 27 September 2012.
■ “$21.4bn in ESG concerns on Australian stocks” - our first view of the impact on
analysts’ Target Prices - 2 July 2012.
Recent Global ESG Research
■ Credit Suisse ESG Spotlight – weekly update from the global ESG team –29
January 2014
■ Credit Suisse ESG Spotlight – weekly update from the global ESG team – 23
January 2014
■ Credit Suisse ESG Spotlight – weekly update from the global ESG team – 15
January 2014

17 February 2014
Australia and NZ First Edition 150
MSCI Disclaimer

Australia and NZ First Edition 151
17 February 2014
Asia Pacific/New Zealand
Equity Research
Economics
■
NZ House Prices ECONOMICS
REINZ House Prices (Jan) – Further easing in
the rate of house price growth
■ The REINZ house price index (stratified) rose by 7.7% YoY in January
2014, down from the 9.2% YoY increase recorded over the previous
month. The national stratified house price index continued to ease back
from its November 2013 peak of NZ$437,700, recording a price of
NZ$423,150 over January.
■ While the rise in national house prices continued to be underpinned by robust
increases in both the Auckland and Canterbury regions, there were further
signs of a softening in the rate of growth in annual house price inflation.
In particular, annual house price inflation turned modestly negative in the
Wellington region (down 1.1%), while that past three months has seen declines
in the annual pace of growth in both Auckland and Christchurch house prices.
■ In addition to the softening in the rate of growth in national house prices, REINZ
estimates that the number of house sales declined by 1.1% MoM in January.
■ While it still remains a little early to be definitive regarding the impact
of the recently introduced high LVR mortgage restrictions, the RBNZ is
likely to take comfort from these data showing further signs of a
softening in the rate of growth in house prices. Moreover, despite the
current elevated level of consumer confidence and continued rise in migrant
inflows, the heightened prospect of the RBNZ raising interest rate settings in
March 2014 is also increasingly likely to be a factor dampening housing
market activity.
Figure 1: REINZ House Prices – January
YoY %
-10
-5
0
5
10
15
20
25
Jan-95 Jan-98 Jan-01 Jan-04 Jan-07 Jan-10 Jan-13
YoY% 3mth/YoY% Average
Source: REINZ, First NZ Capital
Research Analysts
Chris Green
64 9 302 5509
This report is distributed in Australia by Credit Suisse
Equities (Australia) Limited. Please see legal disclaimer and
disclosure annex for further terms and information
Provided by First NZ Capital

17 February 2014
Australia and NZ First Edition 152
NZ House Prices Figure 2: House price inflation continues to be dominated
by the Auckland and Canterbury regions YoY %
Figure 3: Further signs of some pricing pressures easing
in the robust Auckland region YoY% - 3-month average
7.7
14.0
-1.1
10.0
2.9
5.2
-5
0
5
10
15
NZ AKL WNG CCH Other NI Other SI
-10
0
10
20
30
Jan-93 Jan-97 Jan-01 Jan-05 Jan-09 Jan-13
Total NZ Auckland Region Canterbury Region
Source: REINZ, First NZ Capital
Source: REINZ, First NZ Capital
Figure 4: National house prices in stratified terms moved
back from recent historic highs NZ$ - Stratified house prices
Figure 5: The ratio of Auckland to national house prices
stabilises after reaching a historic peak Ratio of regional house prices to national average
$200,000
$300,000
$400,000
$500,000
$600,000
$700,000
Jan-07 Jan-08 Jan-09 Jan-10 Jan-11 Jan-12 Jan-13 Jan-14
NZ Auckland Wellington
Christchurch Other NI Other SI
0.6
0.8
1.0
1.2
1.4
1.6
Jan-92 Jan-96 Jan-00 Jan-04 Jan-08 Jan-12
Auckland Wellington Christchurch
Other NI Other SI
Source: REINZ, First NZ Capital
Source: REINZ, First NZ Capital
Figure 6: Further signs of a softening in house sales
Number (12M moving avg.) - lhs, YoY % (3M average) - rhs
Figure 7: REINZ house price inflation table
YoY %
-10
-5
0
5
10
15
20
25
4,000
5,000
6,000
7,000
8,000
9,000
10,000
11,000
Jan-95 Jan-99 Jan-03 Jan-07 Jan-11
House Sales - lhs House Prices - rhs
Long-term
YoY % Nov-13 Dec-13 Jan-14 Average
NZ 9.6 9.2 7.7 6.5
Auckland 14.9 14.4 14.0 7.7
Wellington 6.2 2.0 -1.1 6.1
Christchurch 12.2 7.2 10.0 6.3
Other North Island 3.8 8.4 2.9 5.9
Other South Island 5.2 6.7 5.2 6.3
Source: REINZ, First NZ Capital
Source: REINZ, First NZ Capital

17 February 2014
Australia and NZ First Edition 153
NZ House Prices Figure 8: Annual house sales ease back slightly below
their long-term “average” levels Number
Figure 9: Number of days to sell shows a seasonal
increase over January Monthly sales - lhs, Days to sell (inverted) - rhs
50,000
70,000
90,000
110,000
130,000
Jan-90 Jan-95 Jan-00 Jan-05 Jan-10
Annual Sales Annual Average
20
30
40
50
60
702,000
4,000
6,000
8,000
10,000
12,000
Jan-95 Jan-98 Jan-01 Jan-04 Jan-07 Jan-10 Jan-13
Number of sales - lhs Number of days to sell - rhs
Source: REINZ, First NZ Capital
Source: REINZ, First NZ Capital
Figure 10: Sharp rise in residential dwelling consents
over December contrasts with flattening sales growth Number (12-month moving average) - lhs, Number (s.a.) - rhs
Figure 11: Rising net migration inflows continue to
support housing market activity Annual total – lhs, YoY % - rhs
800
1,000
1,200
1,400
1,600
1,800
2,000
2,200
2,400
2,600
4,000
5,000
6,000
7,000
8,000
9,000
10,000
11,000
Jan-95 Jan-99 Jan-03 Jan-07 Jan-11
House Sales - lhs Consents ex apart. - rhs
-10
-5
0
5
10
15
20
25
-20,000
-10,000
0
10,000
20,000
30,000
40,000
50,000
Jan-93 Jan-97 Jan-01 Jan-05 Jan-09 Jan-13
Net Migration - lhs House Prices - rhs
Source: Statistics NZ, REINZ, First NZ Capital
Source: Statistics NZ, REINZ, First NZ Capital
Figure 12: Auckland (nominal) house prices now around
23% above their previous peak levels NZ$
Figure 13: RBNZ projects annual house price inflation
peaking around the current 10% level NZ$ - lhs, YoY % - rhs
$350,000
$450,000
$550,000
$650,000
$750,000
Jan-05 Jan-07 Jan-09 Jan-11 Jan-13
Auckland House Price
Auckland house prices now23% above previous peak
-10
-5
0
5
10
15
20
$250,000
$300,000
$350,000
$400,000
$450,000
Jan-05 Jan-07 Jan-09 Jan-11 Jan-13
House Prices (NZ$) - lhs House Prices (YoY %) - rhs
Source: REINZ, First NZ Capital
Source: REINZ, First NZ Capital

Australia and NZ First Edition 154
17 February 2014
Asia Pacific/Australia
Equity Research
Credit Suisse Ratings – Australia
Research Analysts
Adam Indikt
61 3 9280 1659
RATINGS
As of Friday, 14 February 2014
Figure 1: Credit Suisse stock ratings – distribution
UNDERPERFORM 22%
NEUTRAL 44%
OUTPERFORM 34%
0% 5% 10% 15% 20% 25% 30% 35% 40% 45% 50%
See Figure 3 for ratings on each stock covered by Credit Suisse, ranked by expected total return.
Source: Credit Suisse estimates
Stock ratings
Individual stock ratings are determined by the projected total return on a stock
relative to absolute return benchmarks.
Analysts project a 12-month target share price for each stock. The capital gain
or loss implied by the 12-month target share price, along with the analyst’s
projected prospective dividend yield, generates the analyst’s projected total
return for a given stock.
The absolute return required to achieve an Outperform rating is greater than or
equal to 15%, and to achieve an Underperform rating is less than 7.5%. A
Neutral rating requires a projected total return within this range.

17 February 2014
Australia and NZ First Edition 155
Figure 2: Stock ratings definitions Stock rating Projected total return
Outperform ≥ 15 % Neutral 7.5% to < 15% Underperform < 7.5% Source: Credit Suisse
Credit Suisse applies a volatility cushion of 2.5% to the 7.5% and 15% total return
benchmarks so as to minimise rating changes caused by short-lived stock price
movements. Accordingly, a stock must trade for more than four consecutive trading days
above 10% or below 12.5% total return before an automatic rating change to Neutral from
either Underperform or Outperform, respectively, is considered appropriate.
Given the dynamic nature of share prices and as expectations regarding earnings
performance are adjusted for new information, it is possible these ratings could change
with some frequency.

17 February 2014
Australia and NZ First Edition 156
Figure 3: Ranking by projected total return Code Share Price Target Price Total Return** Rating^
KGD.AX
$0.10 $0.35 250% OUTPERFORM BSE.AX
$0.44 $0.90 107% OUTPERFORM AQZ.AX
$1.23 $2.15 82% OUTPERFORM * MDL.AX
$2.20 $4.00 82% OUTPERFORM SYR.AX
$2.75 $4.90 78% OUTPERFORM WHC.AX
$1.57 $2.75 76% OUTPERFORM MCS.AX
$1.10 $1.75 64% OUTPERFORM * NWT.AX
$0.47 $0.74 58% OUTPERFORM * TIG.AX $0.16 $0.25 56% OUTPERFORM ISU.AX $1.22 $1.90 56% OUTPERFORM * TSE.AX $0.82 $1.20 46% OUTPERFORM * AOH.AX
$0.18 $0.26 44% OUTPERFORM MSB.AX
$5.77 $7.95 38% OUTPERFORM GRY.AX
$0.19 $0.25 35% OUTPERFORM FMG.AX
$5.70 $7.50 35% OUTPERFORM MRM.AX
$2.94 $3.80 34% OUTPERFORM * BND.AX
$0.15 $0.20 33% NEUTRAL JBH.AX $18.27 $23.06 31% OUTPERFORM TGA.AX
$2.02 $2.53 31% NEUTRAL * TRS.AX
$10.91 $13.50 29% NEUTRAL FLT.AX $46.67 $58.00 28% OUTPERFORM FXL.AX $4.07 $5.00 27% OUTPERFORM * ERA.AX
$1.19 $1.50 27% OUTPERFORM PMV.AX
$7.91 $9.50 27% OUTPERFORM ORL.AX
$3.91 $4.65 25% OUTPERFORM SWM.AX
$2.18 $2.60 25% OUTPERFORM SAI.AX $3.83 $4.57 24% OUTPERFORM * PAN.AX
$0.24 $0.29 23% NEUTRAL QBE.AX
$11.43 $13.65 23% OUTPERFORM PRG.AX
$2.71 $3.15 23% NEUTRAL * CTX.AX
$19.93 $23.80 22% OUTPERFORM WRT.AX
$3.06 $3.51 21% OUTPERFORM AGO.AX
$1.10 $1.30 21% OUTPERFORM SFH.AX
$0.84 $1.00 21% OUTPERFORM RIO.AX $67.90 $80.00 21% OUTPERFORM BKN.AX
$4.51 $5.15 21% OUTPERFORM * GDI.AX $0.89 $1.01 20% OUTPERFORM SKE.AX
$3.07 $3.50 20% OUTPERFORM * ANZ.AX
$31.34 $35.80 20% OUTPERFORM TWR.AX
$1.49 $1.66 20% NEUTRAL UXC.AX
$1.06 $1.20 20% OUTPERFORM * MQG.AX
$55.36 $63.00 19% OUTPERFORM NAB.AX
$34.12 $38.00 18% OUTPERFORM PRT.AX
$1.00 $1.10 18% NEUTRAL OSH.AX
$8.32 $9.70 17% OUTPERFORM DUE.AX
$2.11 $2.30 17% OUTPERFORM MYR.AX
$2.49 $2.70 17% NEUTRAL CQR.AX
$3.66 $3.99 17% NEUTRAL PGH.AX
$3.45 $3.85 16% OUTPERFORM API.AX $0.58 $0.64 16% OUTPERFORM UGL.AX
$7.08 $7.75 16% NEUTRAL PRY.AX
$4.65 $5.15 16% NEUTRAL AHE.AX
$3.65 $4.00 16% NEUTRAL * AMP.AX
$4.52 $4.96 15% NEUTRAL TLS.AX $5.20 $5.70 15% OUTPERFORM GPT.AX
$3.66 $4.00 15% OUTPERFORM DXS.AX
$1.07 $1.16 15% OUTPERFORM LLC.AX $11.33 $12.54 15% OUTPERFORM SXY.AX
$0.74 $0.85 15% OUTPERFORM WDC.AX
$10.27 $11.27 15% NEUTRAL CGF.AX
$6.30 $7.00 15% OUTPERFORM IAG.AX $5.47 $6.00 15% NEUTRAL SLM.AX
$2.05 $2.20 15% NEUTRAL * SGP.AX
$3.90 $4.23 15% NEUTRAL WOR.AX
$15.69 $17.10 14% NEUTRAL NHC.AX
$3.39 $3.70 14% NEUTRAL IIN.AX $7.38 $8.10 14% OUTPERFORM * IOF.AX $3.10 $3.33 13% NEUTRAL MMS.AX
$11.34 $12.25 13% UNDERPERFORM * WTF.AX
$2.73 $2.90 13% UNDERPERFORM * RWH.AX
$3.25 $3.55 13% OUTPERFORM * MGR.AX
$1.74 $1.87 13% OUTPERFORM IVC.AX $10.61 $11.60 13% NEUTRAL * NUF.AX
$4.14 $4.55 13% NEUTRAL RMD.AX
$5.09 $5.60 13% NEUTRAL EHL.AX $0.26 $0.28 12% NEUTRAL * CSL.AX $67.69 $74.55 12% OUTPERFORM CFX.AX
$1.95 $2.04 12% NEUTRAL WOW.AX
$35.50 $38.25 12% OUTPERFORM SGN.AX
$1.47 $1.55 12% NEUTRAL AMX.AX
$0.17 $0.19 12% NEUTRAL AIO.AX $5.72 $6.20 12% OUTPERFORM BLD.AX $5.48 $5.90 11% NEUTRAL ANN.AX
$19.29 $21.00 11% NEUTRAL SUL.AX $10.76 $11.50 11% NEUTRAL DOW.AX
$4.90 $5.20 11% NEUTRAL ENE.AX
$6.00 $6.44 11% OUTPERFORM WEB.AX
$3.06 $3.25 11% NEUTRAL * AMM.AX
$2.02 $2.17 11% NEUTRAL * SIP.AX $0.64 $0.66 11% NEUTRAL BOQ.AX
$11.89 $12.50 11% NEUTRAL HVN.AX
$3.17 $3.40 11% NEUTRAL ARP.AX
$10.70 $11.50 10% UNDERPERFORM * ILU.AX $9.24 $10.00 10% NEUTRAL ALQ.AX
$8.31 $8.75 10% UNDERPERFORM GNC.AX
$7.85 $8.36 10% UNDERPERFORM PPT.AX $48.34 $51.00 10% NEUTRAL VAH.AX
$0.35 $0.38 10% NEUTRAL TPI.AX $1.17 $1.27 10% NEUTRAL *
Source: ASX, Credit Suisse estimates, CSEC estimates. Correct as of 9PM AET on 14 February 2014. * Please note these companies are covered by Credit Suisse Emerging Companies (CSEC), a joint venture between Credit Suisse and First NZ Capital. **Projected capital gain or loss plus gross dividend yield.
Figure3: Ranking by projected total return (continued) Code Share Price Target Price Total Return** Rating^
SKI.AX $1.73 $1.78 10% OUTPERFORM BEN.AX
$11.72 $12.20 10% NEUTRAL MTS.AX
$2.99 $3.10 10% UNDERPERFORM TTS.AX $3.04 $3.16 10% NEUTRAL SMX.AX
$4.20 $4.40 10% NEUTRAL * BXB.AX
$8.79 $9.29 9% NEUTRAL FDC.AX
$2.37 $2.43 9% NEUTRAL QUB.AX
$2.07 $2.20 9% NEUTRAL AMC.AX
$10.72 $11.20 9% NEUTRAL ORA.AX
$1.35 $1.40 8% OUTPERFORM PBG.AX
$0.75 $0.75 8% NEUTRAL CPU.AX
$11.93 $12.60 8% NEUTRAL ENV.AX
$1.19 $1.22 8% NEUTRAL WBC.AX
$32.75 $33.50 8% UNDERPERFORM WES.AX
$43.84 $45.00 7% NEUTRAL SEK.AX
$13.19 $13.78 7% NEUTRAL GMG.AX
$4.81 $4.95 7% NEUTRAL NWS.AX
$19.20 $20.25 7% NEUTRAL DMP.AX
$19.51 $20.50 7% NEUTRAL * IPL.AX $3.02 $3.10 7% OUTPERFORM HGG.AX
$4.34 $4.45 7% NEUTRAL ORG.AX
$14.80 $15.30 7% NEUTRAL NVT.AX
$7.09 $7.35 7% OUTPERFORM * DJS.AX $3.10 $3.14 7% NEUTRAL NEC.AX
$2.23 $2.30 6% OUTPERFORM SPN.AX
$1.28 $1.27 6% NEUTRAL IRE.AX $9.41 $9.60 6% NEUTRAL * TAH.AX
$3.60 $3.65 6% NEUTRAL IFL.AX $9.34 $9.35 6% NEUTRAL PNA.AX
$1.97 $2.00 5% OUTPERFORM SUN.AX
$12.54 $12.36 5% UNDERPERFORM CBA.AX
$75.99 $76.00 5% UNDERPERFORM BRG.AX
$8.07 $8.20 5% NEUTRAL * EGP.AX
$2.45 $2.50 5% OUTPERFORM JHX.AX $13.50 $13.50 5% OUTPERFORM BHP.AX
$37.71 $38.00 5% NEUTRAL TME.AX
$3.70 $3.70 5% UNDERPERFORM APE.AX
$5.01 $5.00 4% NEUTRAL * GUD.AX
$5.96 $5.77 4% NEUTRAL * NWH.AX
$1.36 $1.30 4% NEUTRAL * APA.AX
$6.20 $6.05 3% UNDERPERFORM AGK.AX
$15.92 $15.80 3% NEUTRAL FAN.AX
$1.99 $2.00 3% UNDERPERFORM CAB.AX
$4.12 $4.00 3% UNDERPERFORM * ALZ.AX $3.91 $3.81 3% NEUTRAL CHC.AX
$3.89 $3.78 3% NEUTRAL QAN.AX
$1.22 $1.21 3% NEUTRAL BPT.AX $1.54 $1.55 3% NEUTRAL SHL.AX $16.85 $16.50 2% NEUTRAL TOL.AX $5.67 $5.49 2% NEUTRAL AWC.AX
$1.30 $1.30 2% OUTPERFORM CPA.AX
$1.26 $1.21 2% NEUTRAL OZL.AX $3.93 $3.80 2% UNDERPERFORM REA.AX
$47.62 $47.50 1% NEUTRAL CCL.AX
$11.79 $11.30 1% UNDERPERFORM ASX.AX
$36.80 $35.20 1% UNDERPERFORM MYX.AX
$0.87 $0.86 0% NEUTRAL ORI.AX $24.19 $23.10 0% NEUTRAL RRL.AX
$3.09 $2.90 0% NEUTRAL PRU.AX
$0.51 $0.50 -1% UNDERPERFORM CSR.AX
$3.06 $2.90 -1% OUTPERFORM AUB.AX
$10.95 $10.41 -1% UNDERPERFORM LEI.AX $16.34 $15.20 -2% UNDERPERFORM STO.AX
$14.06 $13.40 -2% UNDERPERFORM RHC.AX
$43.53 $41.50 -3% NEUTRAL WPL.AX
$38.36 $35.00 -3% UNDERPERFORM BSL.AX $5.93 $5.70 -3% OUTPERFORM COH.AX
$55.47 $51.10 -3% UNDERPERFORM CRZ.AX
$10.61 $9.80 -4% NEUTRAL SGM.AX
$10.70 $10.00 -5% UNDERPERFORM ALL.AX $4.94 $4.50 -5% UNDERPERFORM YAL.AX $0.70 $0.65 -5% UNDERPERFORM AQA.AX
$2.75 $2.60 -5% OUTPERFORM TPM.AX
$5.41 $5.00 -6% NEUTRAL * CWN.AX
$17.40 $15.90 -6% UNDERPERFORM SXL.AX $1.63 $1.40 -8% UNDERPERFORM SFR.AX
$6.55 $5.75 -9% UNDERPERFORM BLY.AX $0.44 $0.40 -9% UNDERPERFORM * MGX.AX
$1.18 $1.05 -9% UNDERPERFORM ARI.AX $1.71 $1.43 -10% UNDERPERFORM IGO.AX $4.25 $3.70 -10% OUTPERFORM SDF.AX
$1.58 $1.36 -11% UNDERPERFORM PTM.AX
$7.09 $6.00 -11% UNDERPERFORM ABC.AX
$4.06 $3.40 -12% UNDERPERFORM TWE.AX
$3.75 $3.15 -12% UNDERPERFORM TEN.AX
$0.34 $0.29 -13% NEUTRAL GFF.AX
$0.61 $0.50 -13% UNDERPERFORM VOC.AX
$3.29 $2.82 -14% OUTPERFORM * WSA.AX
$3.19 $2.75 -14% NEUTRAL BTT.AX $6.30 $5.15 -14% NEUTRAL FWD.AX
$2.97 $2.40 -14% NEUTRAL * OKN.AX
$1.63 $1.25 -17% NEUTRAL * OGC.AX
$2.49 $2.00 -20% UNDERPERFORM AQG.AX
$2.82 $2.25 -20% UNDERPERFORM EVN.AX
$0.83 $0.64 -21% UNDERPERFORM NCM.AX
$11.05 $8.20 -26% UNDERPERFORM FXJ.AX $0.72 $0.50 -28% UNDERPERFORM APN.AX
$0.45 $0.30 -31% UNDERPERFORM GBG.AX
$0.10 $0.06 -41% UNDERPERFORM
Source: ASX, Credit Suisse estimates CSEC estimates. Correct as of 9PM AET on 14 February 2014. * Please note these companies are covered by Credit Suisse Emerging Companies (CSEC), a joint venture between Credit Suisse and First NZ Capital. **Projected capital gain or loss plus gross dividend yield.

17 F
eb
ruary
201
4
Au
stra
lia a
nd
NZ
Firs
t Ed
ition
157
Top 100 Earnings & Dividends Research Analyst
Jason Swinbourne
612 8205 4591
As at 14 February 2014 Year Rating Share 12M Mkt NPAT PE Relative PE Dividend Dividend Yield EBITDA Multiple F'kg
to Price Tgt Cap 2013 2014F 2015F 2013 2014F 2015F 2013 2014F 2015F 2013 2014F 2015F 2013 2014F 2015F 2013 2014F 2015F 2013 2014F 2015F 2014F
$ $ $m $m $m $m ¢ ¢ ¢ x x x % % % ¢ ¢ ¢ % % % x x x %
Energy
Aurora Oil & Gas 31-Dec RSTR 4.13 1,666 124.5 288.7 266.8 27.2 63.0 58.3 13.7 5.9 6.4 81.6 41.3 47.5 0.0 0.0 0.0 0.0 0.0 0.0 6.5 3.4 3.0 0
Beach Energy 30-Jun NTRL 1.54 1.55 1,962 140.8 264.2 235.9 10.5 19.5 17.2 14.7 7.9 8.9 87.7 55.4 66.5 2.8 2.8 2.8 1.8 1.8 1.8 5.3 3.4 3.9 100
Caltex Australia 31-Dec OPFM 19.93 23.80 5,381 320.3 433.6 475.5 118.6 160.6 176.1 16.8 12.4 11.3 100.4 87.1 84.4 40.0 48.2 105.7 2.0 2.4 5.3 8.7 6.9 6.5 100
Origin Energy 30-Jun NTRL 14.80 15.30 16,298 760.0 791.2 1,005.2 69.2 71.9 91.0 21.4 20.6 16.3 127.8 144.5 121.3 50.0 50.0 50.0 3.4 3.4 3.4 10.6 10.8 9.7 50
Oil Search 31-Dec OPFM 8.32 9.70 10,047 209.0 328.0 907.5 15.6 24.3 67.0 48.1 30.7 11.2 287.2 215.6 83.2 4.0 4.0 26.8 0.5 0.5 3.6 30.7 17.6 7.4 0
Santos Ltd 31-Dec UPFM 14.06 13.40 13,642 558.7 558.3 1,002.3 57.8 57.2 101.7 24.3 24.6 13.8 145.2 172.5 103.2 30.0 30.0 50.8 2.1 2.1 3.6 9.9 9.5 6.6 100
WorleyParsons 30-Jun NTRL 15.69 17.10 3,820 322.1 261.9 276.6 130.8 106.2 112.2 12.0 14.8 14.0 71.7 103.7 104.3 92.5 84.0 78.0 5.9 5.4 5.0 7.5 8.6 8.4 75
Woodside Petroleum 31-Dec UPFM 38.36 35.00 28,410 1,717.9 2,068.9 2,257.9 208.5 251.1 274.0 16.5 13.7 12.6 98.8 96.4 93.9 250.4 200.9 219.2 7.3 5.8 6.4 8.2 6.6 6.1 100
Sector Aggregate 20.3 16.2 12.4 4.0 3.7 4.7 10.0 7.9 6.6
Materials - Chemicals
Incitec Pivot Ltd. 30-Sep OPFM 3.02 3.10 4,968 298.4 350.9 477.7 18.3 21.5 29.3 16.5 14.0 10.3 98.5 98.4 76.8 9.2 11.9 16.1 3.0 3.9 5.3 9.8 8.0 6.2 50
Orica 30-Sep NTRL 24.19 23.10 8,956 601.6 626.7 693.6 165.2 171.8 189.6 14.6 14.1 12.8 87.5 98.8 95.2 94.0 98.0 107.0 3.9 4.1 4.4 9.1 9.1 8.0 50
Sector Aggregate 15.3 14.1 11.8 3.6 4.0 4.7 9.4 8.7 7.3
Materials - Construction Materials
Adelaide Brighton 31-Dec UPFM 4.06 3.40 2,592 148.6 153.0 158.4 23.1 23.8 24.6 17.6 17.1 16.5 105.0 119.8 123.0 17.5 18.0 18.0 4.3 4.4 4.4 10.9 10.6 10.4 100
Boral 30-Jun NTRL 5.48 5.90 4,267 104.4 174.0 224.0 13.5 22.5 28.8 40.6 24.3 19.0 242.4 170.6 141.9 11.0 17.0 23.0 2.0 3.1 4.2 11.6 9.4 9.2 80
James Hardie Industries SE 31-Mar OPFM 13.50 13.50 5,382 140.8 193.2 246.0 32.1 43.6 55.5 37.9 27.8 21.9 226.1 195.4 163.1 18.0 53.0 61.0 1.5 4.4 5.0 21.6 16.7 13.6 0
Sector Aggregate 32.9 24.2 19.9 2.1 3.9 4.6 15.2 12.4 11.3
Materials - Containers & Packaging
Amcor 30-Jun NTRL 10.72 11.20 12,936 689.5 722.8 806.1 56.3 59.0 65.8 19.0 18.2 16.3 113.8 127.5 121.5 40.0 41.3 46.7 3.7 3.9 4.4 10.5 9.9 9.3 0
Orora 30-Jun OPFM 1.35 1.40 1,629 - 98.5 112.7 8.2 9.3 n.m 16.5 14.5 116.2 107.8 5.8 6.5 4.3 4.8 n.m 8.0 7.3 0
Materials - Metals & Mining
Arrium 30-Jun UPFM 1.71 1.43 2,321 168.3 362.7 246.9 12.5 26.7 18.2 13.6 6.4 9.4 81.4 44.8 69.9 5.0 12.0 9.1 2.9 7.0 5.3 7.5 4.2 5.0 0
Alumina Limited 31-Dec OPFM 1.30 1.30 3,267 17.0 40.2 170.6 0.6 1.4 6.1 n.m 81.3 19.2 n.m 570.9 142.9 0.0 1.0 7.0 0.0 0.9 6.0 n.m n.m n.m 100
BHP Billiton 30-Jun NTRL 37.71 38.00 174,644 11,223.0 13,643.8 12,445.5 210.2 254.3 231.9 16.1 13.3 14.6 96.4 93.6 109.0 116.0 127.0 140.0 3.4 3.7 4.1 7.2 6.3 6.6 100
BlueScope Steel 30-Jun OPFM 5.93 5.70 3,313 29.7 67.8 160.1 5.2 12.1 28.7 n.m 48.8 20.7 680.0 342.7 154.3 0.0 0.0 8.8 0.0 0.0 1.5 8.3 6.6 4.9 100
Fortescue Metals Group Ltd 30-Jun OPFM 5.70 7.50 15,954 1,706.4 3,279.9 2,841.9 54.8 105.3 91.3 9.4 4.9 5.6 55.9 34.1 41.9 10.0 10.0 21.0 2.0 2.0 4.1 8.0 3.5 3.5 100
Iluka Resources 31-Dec NTRL 9.24 10.00 3,869 59.0 96.0 337.7 14.1 22.9 80.7 65.5 40.3 11.5 391.5 282.9 85.5 10.0 19.0 30.0 1.1 2.1 3.2 15.2 12.4 6.1 100
Newcrest Mining 30-Jun UPFM 11.05 8.20 8,470 451.0 295.8 530.6 58.9 38.6 69.3 18.8 28.6 16.0 112.1 200.8 119.0 12.0 0.0 0.0 1.1 0.0 0.0 9.2 10.2 7.4 0
OZ Minerals 31-Dec UPFM 3.93 3.80 1,193 62.5- 24.5- 82.2- -20.6 -8.1 -27.1 n.m n.m n.m n.m n.m n.m 20.0 20.0 20.0 5.1 5.1 5.1 7.2 6.3 6.4 0
Rio Tinto 31-Dec OPFM 67.90 80.00 108,845 10,217.0 11,054.3 11,529.0 553.1 598.4 624.1 11.0 10.2 9.8 65.9 71.6 73.0 192.1 211.3 232.4 3.1 3.5 3.8 5.9 5.7 5.3 100
Regis Resources Limited 30-Jun NTRL 3.09 2.90 1,539 145.7 112.7 179.6 30.1 22.5 35.9 10.3 13.7 8.6 61.3 96.3 64.2 15.0 11.3 21.5 4.9 3.6 7.0 6.0 7.3 4.6 0
Sims Metal Management 30-Jun UPFM 10.70 10.00 2,187 17.1 42.9 127.1 8.4 21.0 62.2 n.m 51.0 17.2 764.0 358.1 128.3 0.0 10.5 31.1 0.0 1.0 2.9 12.2 11.4 6.8 40
Sector Aggregate 15.5 11.6 11.4 2.8 3.4 4.0 7.6 6.0 5.7
Industrials - Capital Goods
Leighton Holdings 31-Dec UPFM 16.34 15.20 5,510 521.5 502.1 503.8 154.7 149.0 149.5 10.6 11.0 10.9 63.1 77.0 81.6 99.0 89.4 89.7 6.1 5.5 5.5 3.3 3.2 3.1 55
UGL Limited 30-Jun NTRL 7.08 7.75 1,179 81.8 117.7 119.5 49.1 70.8 71.4 14.4 10.0 9.9 86.1 70.2 73.9 39.0 46.0 47.0 5.5 6.5 6.6 8.6 6.7 6.4 100
Sector Aggregate 11.1 10.8 10.7 6.0 5.7 5.7 3.7 3.5 3.4
Industrials - Commercial & Professional Services
ALS Limited 31-Mar UPFM 8.31 8.75 3,276 237.9 191.5 226.2 69.4 53.4 61.3 12.0 15.6 13.6 71.5 109.3 101.2 48.0 36.6 42.9 5.8 4.4 5.2 9.1 11.0 9.1 50
Brambles Limited 30-Jun NTRL 8.79 9.29 12,341 585.1 629.5 698.3 37.7 40.5 45.0 21.0 19.5 17.6 125.3 136.9 131.1 27.0 30.0 32.0 3.5 3.4 3.6 10.5 9.8 9.1 25
Downer EDI 30-Jun NTRL 4.90 5.20 2,130 215.4 214.9 224.6 50.1 49.1 50.4 9.8 10.0 9.7 58.4 70.0 72.5 21.0 25.0 25.0 4.3 5.1 5.1 3.5 3.4 2.9 100
Seek 30-Jun NTRL 13.19 13.78 4,474 141.0 164.4 202.9 41.5 48.4 59.7 31.8 27.2 22.1 189.9 191.3 164.7 22.0 33.9 41.8 1.7 2.6 3.2 19.9 15.6 13.2 100
Sector Aggregate 19.6 18.4 16.1 3.3 3.5 3.9 10.1 9.1 8.0
Industrials - Transportation
Asciano Group 30-Jun OPFM 5.72 6.20 5,579 358.4 360.7 415.6 36.7 37.0 42.6 15.6 15.5 13.4 93.0 108.6 100.2 11.1 14.8 21.3 1.9 2.6 3.7 8.7 8.2 7.4 100
Aurizon 30-Jun RSTR 5.10 10,900 487.4 519.0 643.3 21.6 24.3 30.1 23.6 21.0 16.9 141.1 147.4 126.4 16.0 17.0 21.1 3.1 3.3 4.1 10.6 10.0 8.5 20
Qantas Airways 30-Jun NTRL 1.22 1.21 2,669 133.4 382.3- 197.1- 6.0 -17.0 -8.8 20.4 n.m n.m 122.0 n.m n.m 0.0 1.5 5.5 0.0 1.2 4.5 3.2 5.2 4.4 100
Toll Holdings 30-Jun NTRL 5.67 5.49 4,066 288.0 285.7 307.2 40.2 40.1 42.8 14.1 14.1 13.2 84.3 99.3 98.7 26.0 29.5 32.0 4.6 5.2 5.6 7.6 7.2 6.8 100
Sector Aggregate 18.7 29.3 19.8 2.7 3.2 4.3 7.7 8.1 7.2
* Please note these companies are covered by Credit Suisse Emerging Companies (CSEC), a joint venture between Credit Suisse and First NZ Capital.
EPS
Source: Company data, Credit Suisse estimates, CSEC estimates

Au
stra
lia a
nd
NZ
Firs
t Ed
ition
158
17 F
eb
ruary
201
4
Top 100 Earnings & Dividends (continued) As at 14 February 2014 Year Rating Share 12M Mkt NPAT PE Relative PE Dividend Dividend Yield EBITDA Multiple F'kg
to Price Tgt Cap 2013 2014F 2015F 2013 2014F 2015F 2013 2014F 2015F 2013 2014F 2015F 2013 2014F 2015F 2013 2014F 2015F 2013 2014F 2015F 2014F
$ $ $m $m $m $m ¢ ¢ ¢ x x x % % % ¢ ¢ ¢ % % % x x x %
Consumer Discretionary - Consumer Durables & Apparel
Consumer Discretionary - Consumer Services
Aristocrat Leisure 30-Sep UPFM 4.94 4.50 2,724 107.2 130.5 144.5 19.4 23.6 26.1 25.5 21.0 18.9 152.3 147.3 141.2 14.5 16.5 20.0 2.9 3.3 4.0 15.6 12.4 11.0 0
Crown 30-Jun UPFM 17.40 15.90 12,674 472.8 614.2 663.3 64.9 84.3 91.1 26.8 20.6 19.1 160.1 144.9 142.5 37.0 37.0 37.0 2.1 2.1 2.1 18.8 18.1 18.3 60
Echo Entertainment 30-Jun OPFM 2.45 2.50 2,023 123.3 126.4 133.6 14.9 15.3 16.1 16.4 16.0 15.2 98.2 112.5 113.5 6.0 6.0 8.0 2.4 2.4 3.3 7.0 6.7 6.4 100
Flight Centre 30-Jun OPFM 46.67 58.00 4,692 240.8 272.3 307.3 239.0 270.2 305.0 19.5 17.3 15.3 116.7 121.3 114.2 137.0 160.5 190.5 2.9 3.4 4.1 9.0 7.3 6.2 100
Navitas Ltd * 30-Jun OPFM 7.09 7.35 2,662 74.6 82.6 108.1 19.9 22.0 28.8 35.7 32.2 24.6 213.2 226.3 183.7 19.5 19.5 23.0 2.8 2.7 3.2 21.2 18.8 14.9 90
Tabcorp Holdings 30-Jun NTRL 3.60 3.65 2,715 139.1 144.7 162.0 18.8 19.2 21.4 19.1 18.8 16.8 114.1 131.8 125.7 19.0 15.3 17.1 5.3 4.3 4.8 8.3 8.0 7.5 100
Tatts Group 30-Jun NTRL 3.04 3.16 4,308 227.4 243.0 250.2 16.4 17.2 17.4 18.5 17.7 17.4 110.5 124.2 130.0 15.5 17.0 17.0 5.1 5.6 5.6 11.8 10.6 10.4 100
Sector Aggregate 22.8 19.7 18.0 3.1 3.1 3.4 12.8 11.6 10.7
Consumer Discretionary - Media
Sector Aggregate n.m n.m n.m n.m n.m n.m
Consumer Discretionary - Retailing
David Jones 26-Jul NTRL 3.10 3.14 1,665 101.6 92.1 107.5 19.1 17.2 20.1 16.2 18.0 15.4 96.8 126.3 115.0 17.0 15.1 17.4 5.5 4.9 5.6 8.5 8.9 7.9 100
Harvey Norman 30-Jun NTRL 3.17 3.40 3,368 183.4 216.8 243.1 17.3 20.4 22.9 18.4 15.5 13.9 109.7 109.0 103.3 9.0 10.1 11.3 2.8 3.2 3.6 11.5 8.9 8.0 100
Myer Holdings 27-Jul NTRL 2.49 2.70 1,458 127.2 125.1 149.5 21.6 21.4 25.6 11.5 11.6 9.7 68.9 81.8 72.5 18.0 18.2 22.4 7.2 7.3 9.0 5.9 6.1 5.3 100
Sector Aggregate 15.7 14.9 13.0 4.5 4.6 5.3 8.8 8.0 7.2
Consumer Staples - Food & Drug Retailing
Metcash 30-Apr UPFM 2.99 3.10 2,656 268.1 254.1 215.5 31.1 28.9 24.5 9.6 10.4 12.2 57.5 72.8 91.2 28.0 20.8 17.1 9.4 7.0 5.7 6.8 7.4 8.0 100
Wesfarmers 30-Jun NTRL 43.84 45.00 50,121 2,261.0 2,340.9 2,686.6 195.6 204.8 239.7 22.4 21.4 18.3 133.9 150.3 136.4 180.0 195.4 223.0 4.1 4.5 5.1 11.6 11.4 10.3 100
Woolworths 30-Jun OPFM 35.50 38.25 44,539 2,355.7 2,524.7 2,703.9 189.5 200.4 213.3 18.7 17.7 16.6 111.9 124.3 124.2 133.0 139.7 149.0 3.7 3.9 4.2 10.4 10.0 9.3 100
Sector Aggregate 19.9 19.0 17.3 4.1 4.3 4.7 10.8 10.6 9.8
Consumer Staples - Food Beverage & Tobacco
Coca-Cola Amatil 31-Dec UPFM 11.79 11.30 9,003 508.8 515.5 522.9 66.7 67.4 68.3 17.7 17.5 17.3 105.6 122.8 128.7 59.5 61.0 58.0 5.0 5.2 4.9 10.2 10.0 9.8 70
Graincorp 30-Sep UPFM 7.85 8.36 1,797 174.5 121.1 146.7 76.2 52.2 64.1 10.3 15.0 12.2 61.5 105.6 91.4 40.0 27.6 33.6 5.1 3.5 4.3 6.2 6.8 6.2 100
Treasury Wine 30-Jun UPFM 3.75 3.15 2,427 136.8 162.4 196.4 20.7 25.0 30.2 18.2 15.0 12.4 108.4 105.4 92.6 13.0 12.0 15.0 3.5 3.2 4.0 9.3 10.2 8.2 0
Sector Aggregate 16.2 16.6 15.3 4.8 4.6 4.7 9.2 9.5 8.8
Health Care
Ansell Limited 30-Jun NTRL 19.29 21.00 2,649 139.2 161.9 194.4 106.0 111.9 125.6 16.4 15.5 13.8 97.7 108.8 103.0 38.0 40.7 46.5 2.2 2.3 2.7 14.5 12.6 10.1 0
Cochlear 30-Jun UPFM 55.47 51.10 3,165 132.6 108.0 150.5 232.4 189.2 261.7 23.9 29.3 21.2 142.6 205.9 158.1 252.0 254.0 254.0 4.5 4.6 4.6 16.1 19.6 14.2 0
CSL Ltd 30-Jun OPFM 67.69 74.55 29,457 1,216.3 1,342.3 1,425.6 243.1 276.6 296.8 25.0 22.0 20.5 149.5 154.4 153.0 102.0 113.1 125.3 1.7 1.9 2.1 18.0 15.9 14.8 0
Primary Health Care 30-Jun NTRL 4.65 5.15 2,348 150.1 167.8 188.6 29.9 33.3 37.1 15.6 14.0 12.5 93.0 98.2 93.4 17.5 22.0 24.0 3.8 4.7 5.2 8.8 8.4 7.9 100
Ramsay Health Care 30-Jun NTRL 43.53 41.50 8,797 275.4 323.1 373.0 148.0 170.3 195.4 29.4 25.6 22.3 175.7 179.5 166.2 70.5 82.7 94.9 1.6 1.9 2.2 15.6 13.8 12.2 100
ResMed Inc. 30-Jun NTRL 5.09 5.60 6,478 307.2 364.3 403.7 21.0 25.1 27.7 21.8 18.3 16.5 130.4 128.2 123.2 7.6 10.5 12.5 1.7 2.3 2.7 13.6 11.6 10.5 0
Sonic Healthcare 30-Jun NTRL 16.85 16.50 6,753 335.0 403.8 441.1 84.3 100.4 108.5 20.0 16.8 15.5 119.5 117.8 115.9 62.0 72.9 78.8 3.7 4.3 4.7 13.1 11.0 10.0 45
Sector Aggregate 25.5 20.7 18.4 2.0 2.4 2.7 16.9 13.9 12.3
Financials - Banks
ANZ Banking Group 30-Sep OPFM 31.34 35.80 86,000 6,446.0 7,036.2 7,450.6 229.6 247.8 261.9 13.6 12.6 12.0 81.5 88.8 89.2 164.0 176.0 187.0 5.2 5.6 6.0 4.8 4.1 3.6 100
Bendigo and Adelaide Bank 30-Jun NTRL 11.72 12.20 4,805 348.0 378.3 397.4 78.4 84.3 87.7 15.0 13.9 13.4 89.3 97.6 99.7 61.0 64.0 67.0 5.2 5.5 5.7 8.2 7.5 7.1 100
Bank of Queensland 31-Aug NTRL 11.89 12.50 3,835 248.2 291.3 328.1 75.8 86.5 95.7 15.7 13.7 12.4 93.8 96.5 92.7 58.0 66.0 73.0 4.9 5.6 6.1 9.7 8.6 7.7 100
Commonwealth Bank Australia 30-Jun UPFM 75.99 76.00 122,490 7,720.0 8,458.1 8,535.6 468.5 511.3 511.2 16.2 14.9 14.9 96.9 104.3 110.9 364.0 393.0 397.0 4.8 5.2 5.2 9.0 7.3 7.1 100
National Australia Bank 30-Sep OPFM 34.12 38.00 80,231 5,958.0 6,569.2 6,910.8 251.6 275.3 289.1 13.6 12.4 11.8 81.0 87.0 88.0 190.0 209.0 220.0 5.6 6.1 6.4 4.9 4.3 3.9 100
Westpac 30-Sep UPFM 32.75 33.50 101,821 7,097.0 7,307.1 7,538.8 223.0 228.2 234.9 14.7 14.4 13.9 87.7 100.8 104.0 174.0 182.0 190.0 5.3 5.6 5.8 8.2 7.9 7.6 100
Sector Aggregate 14.6 13.7 13.2 5.2 5.6 5.8 6.5 5.7 5.2
* Please note these companies are covered by Credit Suisse Emerging Companies (CSEC), a joint venture between Credit Suisse and First NZ Capital.
EPS
Source: Company data, Credit Suisse estimates, CSEC estimates

Au
stra
lia a
nd
NZ
Firs
t Ed
ition
159
17 F
eb
ruary
201
4
Top 100 Earnings & Dividends (continued) As at 14 February 2014 Year Rating Share 12M Mkt NPAT PE Relative PE Dividend Dividend Yield EBITDA Multiple F'kg
to Price Tgt Cap 2013 2014F 2015F 2013 2014F 2015F 2013 2014F 2015F 2013 2014F 2015F 2013 2014F 2015F 2013 2014F 2015F 2013 2014F 2015F 2014F
$ $ $m $m $m $m ¢ ¢ ¢ x x x % % % ¢ ¢ ¢ % % % x x x %
Financials - Diversified Financials
ASX 30-Jun UPFM 36.80 35.20 7,124 348.2 380.4 407.8 195.5 196.9 210.7 18.8 18.7 17.5 112.4 131.2 130.3 170.2 177.0 189.7 4.6 4.8 5.2 8.3 8.2 7.6 100
Challenger Limited 30-Jun OPFM 6.30 7.00 3,344 308.5 327.8 310.5 58.6 64.0 62.1 10.7 9.8 10.1 64.2 69.1 75.7 20.0 23.0 23.0 3.2 3.7 3.7 8.7 7.6 6.9 23
Henderson Group PLC 31-Dec NTRL 4.34 4.45 1,556 161.9 172.5 192.6 14.6 15.5 17.3 16.1 15.1 13.5 96.1 106.0 100.9 8.5 9.8 11.0 3.6 4.2 4.7 7.4 6.3 5.3 0
Macquarie Group 31-Mar OPFM 55.36 63.00 17,774 851.0 1,262.3 1,267.4 246.1 363.4 381.4 22.5 15.2 14.5 134.4 107.0 108.3 200.0 269.5 302.0 3.6 4.9 5.5 9.4 6.9 7.0 40
Perpetual Limited 30-Jun NTRL 48.34 51.00 2,249 75.9 110.9 141.0 185.1 254.0 305.3 26.1 19.0 15.8 156.0 133.6 118.1 130.0 200.0 250.0 2.7 4.1 5.2 17.6 12.8 10.0 100
Sector Aggregate 19.4 15.2 14.4 3.7 4.6 5.1 9.2 7.4 7.0
Financials - Insurance
AMP 31-Dec NTRL 4.52 4.96 13,369 646.6 827.3 969.5 25.1 31.6 34.5 18.0 14.3 13.1 107.6 100.5 97.9 24.0 25.5 28.0 5.3 5.6 6.2 25.0 20.4 18.6 65
Insurance Australia Group 30-Jun NTRL 5.47 6.00 12,809 1,063.0 1,038.9 869.0 48.7 44.6 35.3 11.2 12.3 15.5 67.0 86.1 115.7 36.0 29.0 27.0 6.6 5.3 4.9 8.5 8.4 9.5 100
QBE Insurance Group 31-Dec OPFM 11.43 13.65 12,830 249.6- 970.9 1,194.9 -19.0 73.1 89.5 n.m 14.1 11.5 n.m 98.7 85.7 34.0 41.0 50.0 3.2 3.6 4.2 22.0 11.7 9.8 70
Suncorp Group Limited 30-Jun UPFM 12.54 12.36 16,134 502.6 1,163.6 1,361.7 41.1 91.0 106.6 30.5 13.8 11.8 182.5 96.7 87.8 75.0 78.0 90.0 6.0 6.2 7.2 26.6 12.6 10.9 100
Sector Aggregate 26.1 13.6 12.6 5.2 5.2 5.7 17.4 12.1 11.2
Financials - Real Estate
CFS Retail Property Trust 30-Jun NTRL 1.95 2.04 5,885 384.6 386.7 401.7 13.6 13.7 14.2 14.3 14.3 13.7 85.7 100.1 102.4 13.6 13.7 14.2 7.0 7.0 7.3 16.9 16.2 15.5 0
Commonwealth Property Office Fund 30-Jun NTRL 1.26 1.21 2,945 204.3 206.9 207.5 8.7 8.8 8.8 14.4 14.2 14.2 86.1 99.9 105.9 6.6 6.7 6.9 5.2 5.3 5.5 15.8 15.3 15.4 0
Dexus Property Group 30-Jun OPFM 1.07 1.16 5,107 365.4 384.5 398.3 7.7 8.3 8.6 13.8 12.9 12.4 82.2 90.2 92.3 6.0 6.2 6.4 5.6 5.9 6.0 15.2 14.9 14.3 0
Federation Centres 30-Jun NTRL 2.37 2.43 3,384 224.4 237.1 249.5 15.8 16.6 17.5 15.0 14.3 13.6 89.6 100.2 101.1 13.8 14.6 15.4 5.8 6.2 6.5 14.0 14.9 15.1 0
Goodman Group 30-Jun NTRL 4.81 4.95 8,267 544.1 603.5 635.4 32.4 35.0 36.7 14.8 13.7 13.1 88.6 96.4 97.8 19.5 20.8 22.1 4.1 4.3 4.6 16.1 15.2 14.6 0
GPT Group 31-Dec OPFM 3.66 4.00 6,203 446.8 442.0 454.7 25.7 26.5 27.4 14.2 13.8 13.3 85.1 96.8 99.6 20.4 21.2 21.9 5.6 5.8 6.0 14.4 14.5 14.0 0
Investa Office Fund 30-Jun NTRL 3.10 3.33 1,904 137.5 139.8 145.0 22.4 22.8 23.6 13.8 13.6 13.1 82.7 95.6 97.9 17.7 18.5 19.0 5.7 6.0 6.1 14.7 15.0 14.9 0
Lend Lease 30-Jun OPFM 11.33 12.54 6,534 553.0 545.8 597.4 96.3 94.5 102.9 11.8 12.0 11.0 70.3 84.1 82.1 42.0 45.4 51.5 3.7 4.0 4.5 9.4 8.7 8.1 0
Mirvac Group 30-Jun OPFM 1.74 1.87 6,377 377.6 437.4 447.6 10.9 12.0 12.2 15.9 14.6 14.2 95.1 102.2 106.1 8.8 9.0 9.2 5.1 5.2 5.3 19.1 15.5 15.5 0
Stockland 30-Jun NTRL 3.90 4.23 8,992 494.8 550.0 596.5 22.4 23.8 25.6 17.4 16.4 15.2 104.2 114.9 113.5 24.0 24.0 24.0 6.2 6.2 6.2 22.3 20.4 18.7 0
Westfield 31-Dec NTRL 10.27 11.27 21,706 1,448.1 1,420.8 1,459.3 66.5 68.0 70.2 15.4 15.1 14.6 92.2 106.0 109.1 51.0 52.1 54.8 5.0 5.1 5.3 15.3 15.9 15.8 0
Westfield Retail Trust 31-Dec OPFM 3.06 3.51 9,116 605.3 619.7 641.2 20.0 20.7 21.5 15.3 14.8 14.3 91.6 103.6 106.4 19.9 20.7 21.4 6.5 6.8 7.0 15.5 15.4 15.0 0
Sector Aggregate 14.9 14.3 13.7 5.4 5.5 5.7 15.3 14.9 14.5
Information Technology
Computershare 30-Jun NTRL 11.93 12.60 5,965 304.8 335.0 376.4 54.8 60.2 67.7 19.6 17.8 15.8 116.8 125.0 118.2 28.0 28.0 31.0 2.7 2.4 2.5 14.2 12.9 11.0 20
Telecommunication Services
Telstra Corporation 30-Jun OPFM 5.20 5.70 64,704 3,866.0 4,094.0 4,265.2 31.1 32.9 34.3 16.7 15.8 15.2 100.0 110.9 113.2 28.0 29.0 30.0 5.4 5.6 5.8 7.2 7.0 6.9 100
Utilities
AGL Energy 30-Jun NTRL 15.92 15.80 8,889 598.3 603.7 704.2 108.7 108.1 124.3 14.6 14.7 12.8 87.5 103.3 95.5 63.0 65.0 66.6 4.0 4.1 4.2 8.8 8.3 7.2 100
APA Group 30-Jun UPFM 6.20 6.05 5,182 178.8 201.4 240.6 23.1 24.1 28.8 26.8 25.7 21.5 160.0 180.6 160.7 35.5 36.0 36.9 5.7 5.8 6.0 14.3 13.5 12.3 0
DUET Group 30-Jun OPFM 2.11 2.30 2,714 68.0 85.9 127.5 5.9 6.9 9.8 35.5 30.6 21.4 212.2 215.1 160.0 16.5 17.0 17.5 7.8 8.1 8.3 10.0 9.9 9.3 0
Spark Infrastructure Group 31-Dec OPFM 1.73 1.78 2,289 177.5 210.7 214.0 13.4 15.9 16.1 12.9 10.9 10.7 77.0 76.3 79.8 11.0 11.5 12.0 6.4 6.7 7.0 7.1 6.2 6.0 0
SP AusNet 31-Mar NTRL 1.28 1.27 4,318 279.1 295.4 333.5 8.5 8.7 9.5 14.9 14.7 13.4 89.2 103.4 99.8 8.2 8.4 8.5 6.4 6.6 6.7 9.3 9.2 8.9 33
Sector Aggregate 17.4 16.7 14.6 5.5 5.6 5.8 9.6 9.1 8.3
Report Average 16.7 14.2 13.4 4.1 4.4 4.9 8.4 7.2 6.7
* Please note these companies are covered by Credit Suisse Emerging Companies (CSEC), a joint venture between Credit Suisse and First NZ Capital.
EPS
Source: Company data, Credit Suisse estimates, CSEC estimates

17 F
eb
ruary
201
4
Au
stra
lia a
nd
NZ
Firs
t Ed
ition
160
Small Caps Earnings & Dividends
Research Analyst
Jason Swinbourne
612 8205 4591
As at 14 February 2014 Year Rating Share 12M Mkt NPAT PE Relative PE Dividend Dividend Yield EBITDA Multiple F'kg
to Price Tgt Cap 2013 2014F 2015F 2013 2014F 2015F 2013 2014F 2015F 2013 2014F 2015F 2013 2014F 2015F 2013 2014F 2015F 2013 2014F 2015F 2014F
$ $ $m $m $m $m ¢ ¢ ¢ x x x % % % ¢ ¢ ¢ % % % x x x %
Energy
Aquila Resources 30-Jun OPFM 2.75 2.60 1,132 173.4- 15.1- 19.3- -42.1 -3.7 -4.7 n.m n.m n.m n.m n.m n.m 0.0 0.0 0.0 0.0 0.0 0.0 n.m n.m n.m 100
Bandanna Energy Limited 30-Jun NTRL 0.15 0.20 79 7.6- 13.3- 14.4- -1.4 -2.5 -2.7 n.m n.m n.m n.m n.m n.m 0.0 0.0 0.0 0.0 0.0 0.0 n.m 3.4 n.m 0
Cockatoo Coal 30-Jun RSTR 0.04 181 21.8- 19.1- 13.7 -1.3 -1.1 0.8 n.m n.m 5.3 n.m n.m 31.6 0.0 0.0 0.0 0.0 0.0 0.0 58.3 21.2 4.4 100
Energy Resources of Australia 31-Dec OPFM 1.19 1.50 614 142.4- 135.8- 142.5- -27.5 -26.2 -27.5 n.m n.m n.m n.m n.m n.m 0.0 0.0 0.0 0.0 0.0 0.0 2.2 4.0 n.m 100
New Hope Corporation 31-Jul NTRL 3.39 3.70 2,817 124.4 113.7 134.1 15.0 13.7 16.1 22.6 24.8 21.0 95.3 120.4 125.3 16.0 13.7 16.1 4.7 4.0 4.8 9.7 12.4 11.4 100
Senex Energy Limited 30-Jun OPFM 0.74 0.85 847 61.0 64.7 79.0 5.3 5.6 6.9 13.9 13.2 10.8 58.5 64.1 64.4 0.0 0.0 0.0 0.0 0.0 0.0 9.2 8.6 6.8 100
Whitehaven Coal 30-Jun OPFM 1.57 2.75 1,610 60.7- 16.3- 57.8 -6.2 -1.6 5.6 n.m n.m 27.9 n.m n.m 166.2 0.0 0.0 2.5 0.0 0.0 1.6 199.5 23.4 9.8 100
Yancoal Australia 31-Dec UPFM 0.70 0.65 691 6.1 24.0- 150.0 0.6 -2.4 15.1 n.m n.m 4.6 473.3 n.m 27.5 0.0 0.3 3.8 0.0 0.5 5.4 23.3 8.4 5.6 100
Sector Aggregate n.m n.m 28.6 1.7 1.5 2.5 24.0 13.3 15.6
Materials - Chemicals
Nufarm 31-Jul NTRL 4.14 4.55 1,092 69.2 78.4 98.9 26.4 29.8 37.4 15.7 13.9 11.1 66.1 67.7 66.0 8.0 8.9 13.1 1.9 2.2 3.2 6.6 6.2 5.3 31
Materials - Construction Materials
CSR 31-Mar OPFM 3.06 2.90 1,548 32.7 67.0 91.7 6.5 13.2 18.1 47.4 23.1 16.9 199.2 112.3 100.8 5.1 11.0 13.0 1.7 3.6 4.2 10.3 8.2 7.0 0
Materials - Containers & Packaging
Pact Group Holdings 30-Jun OPFM 3.45 3.85 1,015 131.1 81.9 88.8 44.6 27.8 30.2 7.7 12.4 11.4 32.6 60.3 68.2 0.0 9.5 20.2 0.0 2.8 5.9 8.6 8.1 7.5 65
Materials - Metals & Mining
Atlas Iron 30-Jun OPFM 1.10 1.30 1,002 13.7 117.8 67.9 1.5 11.1 6.4 72.4 9.9 17.2 304.4 47.9 102.8 3.0 3.0 3.0 2.7 2.7 2.7 7.1 2.5 4.0 0
Ampella Mining Limited 31-Dec NTRL 0.17 0.19 42 19.6- 18.8- 19.8- -7.9 -7.6 -8.0 n.m n.m n.m n.m n.m n.m 0.0 0.0 0.0 0.0 0.0 0.0 n.m n.m n.m 0
Altona Mining Limited 30-Jun OPFM 0.18 0.26 96 12.6 13.8 11.6 2.4 2.6 2.2 7.6 7.0 8.3 32.1 34.1 49.8 0.0 0.0 0.0 0.0 0.0 0.0 8.3 3.8 5.4 0
Alacer Gold Corp. 31-Dec UPFM 2.82 2.25 736 110.3 52.3 0.9 38.2 18.1 0.3 6.6 14.0 n.m 27.9 68.2 n.m 0.0 0.0 0.0 0.0 0.0 0.0 2.0 3.1 9.9 0
Base Resources Ltd 30-Jun OPFM 0.44 0.90 244 5.7- 20.9- 88.3 -1.0 -3.7 15.7 n.m n.m 2.8 n.m n.m 16.5 0.0 0.0 0.0 0.0 0.0 0.0 n.m n.m 2.4 100
Evolution Mining Limited 30-Jun UPFM 0.83 0.64 588 44.4 47.4 38.6 6.3 6.7 5.4 13.2 12.4 15.2 55.6 60.3 91.0 1.0 1.7 1.6 1.2 2.0 1.9 3.3 3.2 3.5 0
Gindalbie Metals Ltd 30-Jun UPFM 0.10 0.06 148 138.9- 5.5- 19.9- -10.3 -0.4 -1.3 n.m n.m n.m n.m n.m n.m 0.0 0.0 0.3 0.0 0.0 2.9 n.m n.m n.m 0
Gryphon Minerals Limited 30-Jun OPFM 0.19 0.25 74 4.1- 3.0- 7.5- -1.1 -0.8 -1.9 n.m n.m n.m n.m n.m n.m 0.0 0.0 0.0 0.0 0.0 0.0 n.m n.m n.m 0
Independence Group NL 30-Jun OPFM 4.25 3.70 992 18.3 52.6 74.8 7.8 22.6 32.1 54.6 18.8 13.3 229.6 91.5 79.1 2.0 9.0 12.8 0.5 2.1 3.0 19.4 8.0 5.7 100
Kula Gold 31-Dec OPFM 0.10 0.35 13 2.1- 5.5- 32.2 -0.8 -1.3 7.8 n.m n.m 1.3 n.m n.m 7.6 0.0 0.0 0.0 0.0 0.0 0.0 15.3 n.m 0.9 0
Mineral Deposits Ltd. 31-Dec OPFM 2.20 4.00 205 1.6 2.0 70.9 1.7 2.0 68.5 n.m n.m 2.9 490.7 493.0 17.2 0.0 0.0 0.0 0.0 0.0 0.0 n.m n.m n.m 100
Mount Gibson Iron 30-Jun UPFM 1.18 1.05 1,287 92.9 247.6 99.6 8.5 22.7 9.1 13.8 5.2 12.9 58.2 25.3 77.1 4.0 2.0 2.0 3.4 1.7 1.7 6.0 2.7 4.1 100
OceanaGold Corporation 31-Dec UPFM 2.49 2.00 672 76.4 77.1 66.7 25.7 25.7 22.2 8.7 8.7 10.1 36.6 42.4 60.1 0.0 0.0 0.0 0.0 0.0 0.0 3.4 3.3 2.9 0
Panoramic Resources 30-Jun NTRL 0.24 0.29 76 26.1- 16.3- 3.4- -10.3 -5.3 -1.0 n.m n.m n.m n.m n.m n.m 1.0 0.0 0.0 4.3 0.0 0.0 4.0 1.3 0.4 100
PanAust 31-Dec OPFM 1.97 2.00 1,099 80.8 31.0 23.1 13.6 5.2 3.9 13.1 34.1 45.7 55.0 166.0 272.7 7.0 7.0 7.0 4.0 4.0 4.0 4.4 7.5 9.9 0
Perseus Mining 30-Jun UPFM 0.51 0.50 231 38.4 2.2 9.8 8.4 0.5 2.1 6.0 n.m 23.5 25.4 513.3 140.5 0.0 0.0 0.0 0.0 0.0 0.0 2.3 5.0 3.6 0
Sandfire Resources NL 30-Jun UPFM 6.55 5.75 1,019 88.0 103.5 116.4 57.4 65.4 73.1 11.4 10.0 9.0 48.0 48.7 53.5 0.0 0.0 36.6 0.0 0.0 5.6 4.6 4.2 3.6 0
Syrah Resources 30-Jun OPFM 2.75 4.90 447 4.8- 5.3- 8.1- -3.5 -3.6 -5.5 n.m n.m n.m n.m n.m n.m 0.0 0.0 0.0 0.0 0.0 0.0 n.m n.m n.m 0
Tigers Realm Coal 31-Dec OPFM 0.16 0.25 84 17.4- 6.1- 29.8- -3.2 -0.8 -3.3 n.m n.m n.m n.m n.m n.m 0.0 0.0 0.0 0.0 0.0 0.0 n.m n.m n.m 0
Western Areas 30-Jun NTRL 3.19 2.75 628 5.6 8.1 0.4 2.8 4.1 0.2 n.m 77.4 n.m 472.6 376.2 n.m 2.0 0.0 0.0 0.6 0.0 0.0 6.2 7.0 7.7 100
Sector Aggregate 27.8 14.6 16.2 1.4 1.3 2.0 5.6 4.4 4.8
Materials - Paper & Forest Products
Sector Aggregate n.m n.m n.m
Industrials - Capital Goods
Bradken Limited * 30-Jun OPFM 4.51 5.15 763 96.2 63.8 79.5 56.2 36.9 45.1 8.0 12.2 10.0 33.8 59.4 59.7 38.0 28.7 31.0 8.4 6.4 6.9 5.6 6.3 5.6 100
Boart Longyear Group * 31-Dec UPFM 0.44 0.40 182 125.7- 76.4- 48.0- -27.6 -16.8 -10.6 n.m n.m n.m n.m n.m n.m 0.0 0.0 0.0 0.0 0.0 0.0 6.9 6.7 5.9 35
Emeco Holdings * 30-Jun NTRL 0.26 0.28 153 23.8 14.8- 6.2 4.1 -2.4 1.0 6.3 n.m 25.0 26.5 n.m 149.0 2.5 0.0 1.0 9.8 0.0 3.9 3.2 4.9 3.3 100
NRW Holdings Limited * 30-Jun NTRL 1.36 1.30 379 74.1 59.0 61.6 26.5 21.1 22.1 5.1 6.4 6.2 21.6 31.3 36.7 13.0 10.9 11.1 9.6 8.0 8.2 2.8 2.8 2.4 100
Sector Aggregate 24.3 77.5 17.1 7.7 5.3 6.0 4.3 4.7 4.0
* Please note these companies are covered by Credit Suisse Emerging Companies (CSEC), a joint venture between Credit Suisse and First NZ Capital.
EPS
Source: Company data, Credit Suisse estimates, CSEC estimates

Au
stra
lia a
nd
NZ
Firs
t Ed
ition
161
17 F
eb
ruary
201
4
Small Caps Earnings & Dividends (continued) As at 14 February 2014 Year Rating Share 12M Mkt NPAT PE Relative PE Dividend Dividend Yield EBITDA Multiple F'kg
to Price Tgt Cap 2013 2014F 2015F 2013 2014F 2015F 2013 2014F 2015F 2013 2014F 2015F 2013 2014F 2015F 2013 2014F 2015F 2013 2014F 2015F 2014F
$ $ $m $m $m $m ¢ ¢ ¢ x x x % % % ¢ ¢ ¢ % % % x x x %
Industrials - Commercial & Professional Services
Cabcharge Australia * 30-Jun UPFM 4.12 4.00 496 66.5 66.9 55.1 55.2 55.6 45.8 7.5 7.4 9.0 31.4 36.0 53.7 30.0 28.9 23.7 7.3 7.0 5.7 7.6 7.3 8.5 100
McMillan Shakespeare * 30-Jun UPFM 11.34 12.25 845 63.1 59.6 79.3 82.9 77.9 103.7 13.7 14.6 10.9 57.6 70.8 65.3 52.0 49.1 65.0 4.6 4.3 5.7 5.9 5.5 4.4 100
Programmed Maintenance Services * 31-Mar NTRL 2.71 3.15 320 34.6 34.9 39.7 28.6 28.7 32.6 9.5 9.5 8.3 39.9 46.0 49.6 15.0 17.0 17.5 5.5 6.3 6.4 5.8 5.3 4.7 100
Royal Wolf Holdings * 30-Jun OPFM 3.25 3.55 326 19.1 20.7 23.8 19.0 20.6 23.7 17.1 15.7 13.7 72.0 76.6 81.8 9.5 11.1 12.8 2.9 3.4 3.9 10.0 9.2 8.4 0
SAI Global * 30-Jun OPFM 3.83 4.57 807 43.2 43.3 51.4 20.9 20.7 24.6 18.4 18.5 15.6 77.3 90.0 93.1 15.0 14.5 17.2 3.9 3.8 4.5 9.8 9.2 8.3 100
Skilled Group Limited * 30-Jun OPFM 3.07 3.50 718 58.4 58.1 66.9 24.2 24.3 27.9 12.7 12.6 11.0 53.4 61.5 65.7 16.0 17.4 19.0 5.2 5.7 6.2 8.5 8.4 7.2 100
Salmat * 30-Jun NTRL 2.05 2.20 328 17.5 14.9 21.8 11.0 9.4 13.6 18.6 21.9 15.0 78.3 106.6 89.8 24.0 15.0 15.0 11.7 7.3 7.3 6.6 8.7 6.7 100
Transpacific Industries Group * 30-Jun NTRL 1.17 1.27 1,839 67.9 84.0 98.1 4.3 5.3 6.2 27.1 21.9 18.7 114.0 106.5 111.9 0.0 0.0 1.6 0.0 0.0 1.3 6.9 6.7 6.2 100
Transfield Services Ltd * 30-Jun OPFM 0.82 1.20 420 45.5 55.8 68.9 8.9 10.9 13.4 9.2 7.5 6.1 38.9 36.6 36.4 5.0 0.0 0.0 6.1 0.0 0.0 6.5 5.4 4.7 40
Sector Aggregate 14.8 14.0 12.2 3.9 3.2 3.9 7.2 6.9 6.2
Industrials - Transportation
Alliance Aviation Services Limited * 30-Jun OPFM 1.23 2.15 130 21.7 22.8 25.3 21.7 21.5 23.9 5.7 5.7 5.1 23.8 27.8 30.7 10.4 8.6 9.6 8.5 7.0 7.8 3.7 3.4 3.1 100
McAleese Group * 30-Jun OPFM 1.10 1.75 326 58.7 44.2 43.1 20.4 15.4 15.0 5.4 7.2 7.3 22.6 34.8 43.7 0.0 4.3 6.8 0.0 3.9 6.1 4.3 4.3 4.2 100
Mermaid Marine Australia * 30-Jun OPFM 2.94 3.80 684 60.3 60.1 66.6 26.5 25.7 28.3 11.1 11.4 10.4 46.7 55.6 62.0 13.5 13.3 14.3 4.6 4.5 4.9 6.4 5.7 5.2 100
Qube Logistics 30-Jun NTRL 2.07 2.20 1,928 86.3 84.9 96.4 9.4 9.2 10.5 22.1 22.5 19.8 93.0 109.2 118.1 5.2 5.0 5.4 2.5 2.4 2.6 13.2 11.6 10.4 100
Virgin Australia 30-Jun NTRL 0.35 0.38 1,213 58.4- 119.7- 60.7- -2.4 -4.9 -2.5 n.m n.m n.m n.m n.m n.m 0.0 0.0 0.0 0.0 0.0 0.0 12.5 10.7 8.9 100
Sector Aggregate 28.9 n.m 29.4 2.1 2.3 2.7 9.3 8.4 7.5
Consumer Discretionary - Automobiles & Components
ARB Corp * 30-Jun UPFM 10.70 11.50 776 42.4 42.6 50.1 58.4 58.8 69.1 18.3 18.2 15.5 77.0 88.5 92.5 28.0 28.7 33.6 2.6 2.7 3.1 11.6 11.2 9.4 100
Consumer Discretionary - Consumer Durables & Apparel
Fleetwood Corporation * 30-Jun NTRL 2.97 2.40 180 16.6 13.3 19.6 27.6 22.3 32.7 10.7 13.3 9.1 45.2 64.9 54.3 30.0 6.9 19.6 10.1 2.3 6.6 5.2 5.7 4.5 100
G.U.D. Holdings * 30-Jun NTRL 5.96 5.77 425 36.8 28.2 35.6 51.5 39.3 49.6 11.6 15.1 12.0 48.7 73.7 71.8 72.0 36.0 44.6 12.1 6.0 7.5 6.9 8.6 7.2 100
Sector Aggregate 11.3 14.6 11.0 11.5 4.9 7.2 6.3 7.5 6.1
Consumer Discretionary - Consumer Services
Domino's Pizza * 30-Jun NTRL 19.51 20.50 1,676 30.4 43.7 54.7 43.0 52.0 63.1 45.4 37.5 30.9 191.1 182.3 184.4 30.9 36.9 44.6 1.6 1.9 2.3 31.0 19.5 16.1 100
iSelect Limited * 30-Jun OPFM 1.22 1.90 318 14.4 21.0 25.3 7.1 7.8 9.4 17.2 15.6 12.9 72.5 75.8 77.2 0.0 0.0 0.0 0.0 0.0 0.0 8.8 7.5 6.3 100
Invocare Group * 31-Dec NTRL 10.61 11.60 1,167 45.5 50.7 55.5 41.6 46.3 50.7 25.5 22.9 20.9 107.3 111.4 124.8 35.8 37.2 40.8 3.4 3.5 3.8 14.3 13.3 12.4 100
Sector Aggregate 31.3 27.2 23.5 2.1 2.3 2.6 18.4 14.6 12.7
Consumer Discretionary - Media
APN News & Media 30-Dec UPFM 0.45 0.30 294 49.4 50.3 55.6 7.5 7.6 8.4 6.0 5.9 5.3 25.0 28.5 31.8 0.0 0.0 5.0 0.0 0.0 11.2 4.6 3.8 3.3 33
Fairfax Media 30-Jun UPFM 0.72 0.50 1,693 128.0 111.2 106.6 5.4 4.7 4.5 13.2 15.2 15.9 55.7 74.1 94.8 2.0 2.0 2.0 2.8 2.8 2.8 4.9 6.4 6.6 100
Nine Entertainment 30-Jun OPFM 2.23 2.30 2,097 136.7 150.7 160.2 14.5 16.0 17.0 15.3 13.9 13.1 64.5 67.7 78.1 0.0 4.1 9.4 0.0 1.8 4.2 9.1 8.4 7.8 100
Prime Media Group 30-Jun NTRL 1.00 1.10 364 35.4 32.3 34.5 9.7 8.8 9.4 10.3 11.3 10.6 43.3 54.9 63.1 7.3 6.6 7.1 7.3 6.6 7.1 7.4 7.3 6.9 30
REA Group 30-Jun NTRL 47.62 47.50 6,272 109.7 145.1 177.0 83.3 110.1 134.4 57.2 43.2 35.4 240.5 210.2 211.5 41.5 56.0 67.5 0.9 1.2 1.4 36.8 26.9 22.1 100
STW Communications Group 31-Dec NTRL 1.47 1.55 592 49.5 52.6 55.5 12.3 13.1 13.8 11.9 11.2 10.6 50.0 54.3 63.2 8.6 8.8 9.3 5.9 6.0 6.3 8.7 7.9 7.3 100
Seven West Media Ltd 30-Jun OPFM 2.18 2.60 2,178 225.2 256.8 273.8 19.8 22.7 24.2 11.0 9.6 9.0 46.4 46.7 53.7 12.0 12.0 12.1 5.5 5.5 5.6 7.4 6.7 6.2 100
Southern Cross Media Group 30-Jun UPFM 1.63 1.40 1,146 90.8 103.4 108.5 12.9 14.7 15.4 12.6 11.1 10.6 53.1 53.8 63.0 9.0 10.0 10.0 5.5 6.2 6.2 8.3 8.0 7.6 100
Ten Network Holdings 31-Aug NTRL 0.34 0.29 894 5.0- 5.4- 51.8 -0.2 -0.2 2.0 n.m n.m 17.0 n.m n.m 101.4 0.0 0.0 1.3 0.0 0.0 3.8 22.0 26.5 7.6 0
Sector Aggregate 19.6 17.9 15.6 2.2 2.6 3.5 11.1 10.7 9.4
Consumer Discretionary - Retailing
Automotive Holdings Group Ltd * 30-Jun NTRL 3.65 4.00 951 72.7 78.1 83.2 27.9 30.0 31.9 13.1 12.2 11.4 55.1 59.2 68.2 20.0 21.0 22.4 5.5 5.8 6.1 9.8 9.3 8.8 100
AP Eagers Limited * 31-Dec NTRL 5.01 5.00 885 62.6 61.9 63.8 34.9 34.1 35.2 14.3 14.7 14.2 60.3 71.4 84.9 21.1 20.7 21.4 4.2 4.1 4.3 11.6 11.3 11.0 100
Breville Group * 30-Jun NTRL 8.07 8.20 1,050 49.7 49.6 55.8 38.2 38.1 42.9 21.1 21.2 18.8 88.8 103.0 112.3 26.0 26.5 29.8 3.2 3.3 3.7 12.8 12.7 11.3 83
Fantastic Holdings 30-Jun UPFM 1.99 2.00 205 13.5 5.4 10.2 13.1 5.3 10.0 15.1 37.8 19.9 63.5 183.7 118.9 15.0 3.2 6.2 7.6 1.6 3.1 8.3 13.2 8.9 100
JB Hi-Fi 30-Jun OPFM 18.27 23.06 1,832 116.4 131.9 149.5 117.0 129.3 147.1 15.6 14.1 12.4 65.7 68.7 74.1 72.0 81.0 97.7 3.9 4.4 5.3 9.0 8.2 7.1 100
OrotonGroup 27-Jul OPFM 3.91 4.65 160 23.4 9.6 12.4 57.3 23.5 30.3 6.8 16.6 12.9 28.7 80.9 76.9 50.0 22.0 26.0 12.8 5.6 6.6 3.2 8.5 6.6 100
Pacific Brands 30-Jun NTRL 0.75 0.75 680 73.8 69.8 68.2 8.1 7.6 7.4 9.2 9.8 10.1 38.8 47.7 60.3 5.0 5.3 5.9 6.7 7.2 7.9 6.1 6.3 6.3 100
Premier Investments Ltd 27-Jul OPFM 7.91 9.50 1,229 69.3 86.4 95.5 44.1 55.0 60.8 17.9 14.4 13.0 75.5 69.9 77.6 38.0 47.8 53.0 4.8 6.0 6.7 9.7 8.5 7.5 100
Specialty Fashion Group 30-Jun OPFM 0.84 1.00 161 13.0 10.0 17.7 6.7 5.2 9.2 12.5 16.2 9.1 52.7 78.6 54.5 2.0 2.0 2.0 2.4 2.4 2.4 3.0 3.5 2.3 100
Super Retail Group 30-Jun NTRL 10.76 11.50 2,117 114.1 117.6 142.4 57.7 59.4 72.0 18.7 18.1 15.0 78.5 88.0 89.2 38.0 41.7 50.5 3.5 3.9 4.7 16.5 16.4 14.4 100
Thorn Group * 31-Mar NTRL 2.02 2.53 302 28.0 29.3 32.1 19.1 19.7 21.4 10.6 10.2 9.4 44.5 49.8 56.2 10.5 11.0 11.3 5.2 5.5 5.6 7.1 6.9 6.6 100
Trade Me Group Ltd 30-Jun UPFM 3.70 3.70 1,582 78.6 85.9 96.5 19.8 21.7 24.3 20.1 18.4 16.4 84.6 89.5 97.8 15.8 17.3 19.5 4.0 4.3 4.9 13.8 12.5 11.1 0
The Reject Shop 30-Jun NTRL 10.91 13.50 314 17.4 17.5 23.3 64.0 65.5 87.2 17.1 16.6 12.5 71.8 81.0 74.7 37.0 50.5 67.2 3.4 4.6 6.2 7.8 7.9 6.2 100
Webjet * 30-Jun NTRL 3.06 3.25 243 12.0 16.0 18.9 15.8 19.2 21.8 19.4 15.9 14.1 81.7 77.5 83.9 13.0 13.5 15.2 4.2 4.4 5.0 9.9 8.9 7.1 100
Wotif.com Holdings * 30-Jun UPFM 2.73 2.90 578 53.3 45.7 47.6 25.0 21.5 22.2 10.9 12.7 12.3 45.9 61.9 73.3 23.0 18.5 19.1 8.4 6.8 7.0 5.8 6.0 5.6 100
Sector Aggregate 15.6 15.2 13.6 4.5 4.7 5.3 9.7 9.6 8.5
* Please note these companies are covered by Credit Suisse Emerging Companies (CSEC), a joint venture between Credit Suisse and First NZ Capital.
EPS
Source: Company data, Credit Suisse estimates, CSEC estimates

Au
stra
lia a
nd
NZ
Firs
t Ed
ition
162
17 F
eb
ruary
201
4
Small Caps Earnings & Dividends (continued) As at 14 February 2014 Year Rating Share 12M Mkt NPAT PE Relative PE Dividend Dividend Yield EBITDA Multiple F'kg
to Price Tgt Cap 2013 2014F 2015F 2013 2014F 2015F 2013 2014F 2015F 2013 2014F 2015F 2013 2014F 2015F 2013 2014F 2015F 2013 2014F 2015F 2014F
$ $ $m $m $m $m ¢ ¢ ¢ x x x % % % ¢ ¢ ¢ % % % x x x %
Consumer Staples - Food Beverage & Tobacco
Goodman Fielder 30-Jun UPFM 0.61 0.50 1,193 66.2 63.2 86.1 3.4 3.2 4.4 18.1 19.0 14.0 76.4 92.5 83.3 3.0 2.4 3.0 4.9 3.9 4.9 6.9 7.2 6.3 10
Health Care
Australian Pharmaceutical Ind 31-Aug OPFM 0.58 0.64 281 24.3 26.2 27.0 5.0 5.4 5.5 11.6 10.7 10.4 48.6 52.0 62.0 3.3 3.3 3.3 5.7 5.7 5.7 5.2 5.3 4.4 100
Mesoblast 30-Jun OPFM 5.77 7.95 1,853 61.7- 81.7- 93.6- -20.3 -25.0 -28.1 n.m n.m n.m n.m n.m n.m 0.0 0.0 0.0 0.0 0.0 0.0 n.m n.m n.m 0
Mayne Pharma 30-Jun NTRL 0.87 0.86 490 6.2 18.4 26.7 1.4 3.1 4.5 60.7 27.9 19.3 255.5 135.7 114.9 0.0 0.0 1.4 0.0 0.0 1.6 29.4 13.1 9.2 10
Sigma Pharmaceuticals 31-Jan NTRL 0.64 0.66 715 53.6 49.8 51.0 4.5 4.3 4.6 14.0 14.9 13.8 59.0 72.3 82.7 4.0 4.5 4.5 6.3 7.1 7.1 8.1 8.7 8.5 100
Sector Aggregate n.m n.m n.m 1.8 2.0 2.2 44.7 49.6 35.9
Financials - Diversified Financials
BT Investment Management 30-Sep NTRL 6.30 5.15 1,781 61.9 88.3 103.4 20.9 29.4 34.5 30.1 21.4 18.3 126.8 104.1 109.1 18.0 26.0 30.0 2.9 4.1 4.8 20.9 14.6 12.4 100
FlexiGroup Limited * 30-Jun OPFM 4.07 5.00 1,238 72.1 86.0 95.5 24.9 28.2 31.2 16.4 14.4 13.1 68.8 70.1 78.0 14.5 17.0 18.0 3.6 4.2 4.4 12.2 12.0 11.0 100
IOOF Holdings 30-Jun NTRL 9.34 9.35 2,168 108.8 126.3 140.2 46.9 54.4 60.4 19.9 17.2 15.5 83.9 83.5 92.3 42.0 49.0 54.0 4.5 5.2 5.8 14.6 12.4 11.1 100
Platinum Asset Management 30-Jun UPFM 7.09 6.00 4,103 129.1 176.7 197.0 22.6 30.1 33.6 31.4 23.5 21.1 132.1 114.4 126.0 22.0 29.0 33.0 3.1 4.1 4.7 22.2 16.0 14.3 100
Sector Aggregate 24.8 19.8 17.6 3.4 4.4 4.9 17.8 14.1 12.6
Financials - Insurance
Austbrokers 30-Jun UPFM 10.95 10.41 653 28.9 32.6 35.6 50.2 55.5 60.6 21.8 19.7 18.1 91.8 95.9 107.9 35.5 39.0 42.0 3.2 3.6 3.8 16.1 13.6 12.2 100
Steadfast 30-Jun UPFM 1.58 1.36 789 35.8 38.5 40.8 7.1 7.7 8.1 22.1 20.5 19.4 92.9 99.9 115.6 0.0 4.6 5.0 0.0 2.9 3.1 21.8 21.3 20.3 100
Tower Limited 30-Sep NTRL 1.49 1.66 286 34.4 28.0 29.4 16.6 13.5 14.2 9.7 11.9 11.3 40.7 57.8 67.5 11.0 12.8 13.5 6.8 8.0 8.4 n.m 0.9 0.8 0Sector Aggregate 19.0 18.4 17.3 2.2 3.9 4.1 35.4 6.7 6.3
Financials - Real Estate
Australand 31-Dec NTRL 3.91 3.81 2,261 146.7 156.1 168.0 25.4 27.0 29.1 15.4 14.5 13.5 64.8 70.4 80.3 21.5 21.6 23.2 5.5 5.5 5.9 13.8 13.3 12.6 0
Charter Hall Group 30-Jun NTRL 3.89 3.78 1,203 71.8 74.8 81.2 23.9 24.5 26.0 16.2 15.9 15.0 68.4 77.3 89.4 20.3 22.0 23.4 5.2 5.7 6.0 17.0 15.7 14.7 0
Charter Hall Retail REIT 30-Jun NTRL 3.66 3.99 1,328 96.4 104.4 107.1 29.8 30.5 30.7 12.3 12.0 11.9 51.7 58.4 71.2 26.8 27.5 27.9 7.3 7.5 7.6 14.8 13.9 13.4 0
GDI Property Group 30-Jun OPFM 0.89 1.01 505 - 21.6 45.1 3.8 8.0 n.m 23.4 11.2 113.8 66.8 3.5 7.5 3.9 8.4 n.m 25.9 12.6 0
Sector Aggregate 14.6 14.6 13.1 5.9 5.9 6.6 14.8 14.6 13.2
Information Technology
IRESS * 31-Dec NTRL 9.41 9.60 1,492 55.0 76.6 91.6 38.9 47.8 56.4 24.2 19.7 16.7 101.7 95.8 99.5 32.5 39.2 46.3 3.5 4.2 4.9 18.3 13.4 11.4 90
Oakton * 30-Jun NTRL 1.63 1.25 147 9.2 10.1 11.9 10.0 11.2 13.1 16.4 14.6 12.4 68.9 71.0 74.2 9.5 9.6 10.5 5.8 5.9 6.4 9.6 9.2 7.9 100
SMS Management & Technology * 30-Jun NTRL 4.20 4.40 294 21.1 16.0 20.8 30.1 22.5 29.3 14.0 18.6 14.3 58.7 90.6 85.6 25.5 18.0 21.1 6.1 4.3 5.0 8.7 11.5 8.9 100
UXC Limited * 30-Jun OPFM 1.06 1.20 338 20.5 22.0 27.4 6.5 6.9 8.5 16.2 15.2 12.4 68.2 74.1 74.1 5.8 5.7 6.4 5.5 5.4 6.1 8.5 8.3 6.8 100
Sector Aggregate 20.2 18.4 15.2 4.2 4.5 5.2 13.4 11.7 9.8
Telecommunication Services
Amcom Telecommunications * 30-Jun NTRL 2.02 2.17 494 20.8 23.7 29.6 8.4 9.7 12.1 24.1 20.8 16.7 101.5 101.4 99.7 5.5 6.3 7.9 2.7 3.1 3.9 12.6 10.8 8.9 100
iiNet * 30-Jun OPFM 7.38 8.10 1,190 56.1 67.0 82.2 34.6 41.6 51.0 21.3 17.8 14.5 89.7 86.3 86.4 19.0 23.7 30.6 2.6 3.2 4.1 8.3 7.5 6.5 100
NewSat Limited * 30-Jun OPFM 0.47 0.74 276 1.8 0.2- 5.2 0.5 0.0 0.7 97.0 n.m 63.4 408.1 n.m 378.2 0.0 0.0 0.0 0.0 0.0 0.0 57.9 n.m 94.0 100
TPG Telecom * 31-Jul NTRL 5.41 5.00 4,295 139.2 161.2 220.0 17.5 20.3 27.7 30.9 26.6 19.5 129.8 129.5 116.5 7.5 9.3 12.8 1.4 1.7 2.4 15.2 14.2 10.2 100
Vocus Communications * 30-Jun OPFM 3.29 2.82 266 8.2 10.9 16.1 10.6 13.5 19.6 31.1 24.4 16.8 131.0 118.5 100.3 1.0 1.5 2.2 0.3 0.4 0.7 15.0 11.2 8.2 0
Sector Aggregate 28.7 24.8 18.5 1.6 2.0 2.6 13.4 12.3 9.4
Utilities
Energy Developments Limited 30-Jun OPFM 6.00 6.44 965 55.0 55.6 59.6 33.7 34.5 37.0 17.8 17.4 16.2 74.9 84.5 96.8 22.0 22.4 24.0 3.7 3.7 4.0 8.0 7.6 7.1 0
Envestra 30-Jun NTRL 1.19 1.22 2,138 107.8 145.2 146.8 6.6 8.1 8.2 18.0 14.7 14.6 75.7 71.6 87.0 5.9 6.4 6.6 5.0 5.4 5.6 11.5 10.4 10.2 0
Sector Aggregate 17.9 15.5 15.0 4.6 4.9 5.1 10.1 9.3 9.0
Report Average 23.8 20.6 16.8 3.0 3.2 3.9 10.5 9.2 8.5
* Please note these companies are covered by Credit Suisse Emerging Companies (CSEC), a joint venture between Credit Suisse and First NZ Capital.
EPS
Source: Company data, Credit Suisse estimates, CSEC estimates

17 F
eb
ruary
201
4
Au
stra
lia a
nd
NZ
Firs
t Ed
ition
163
Sector Aggregates
Research Analyst
Jason Swinbourne
612 8205 4591
As at 14 February 2014 PE Rel vs ASX 200(1)
EPS Growth % (1)
Div Yield % (1)
EBIT Multiple (1)
EBITDA Multiple (1)
2013 2014 2015 2013 2014 2015 2013 2014 2015 2013 2014 2015 2013 2014 2015 2013 2014 2015 2013 2014 2015 Top 200 Top 300
Energy (2) 22.0 16.7 12.7 14.8 13.2 11.3 1.3 1.1 0.9 -15.7 31.6 31.9 3.8 3.5 4.6 16.2 11.9 9.3 10.4 8.2 6.7 5.28% 5.17%
Materials (2) 15.9 12.0 11.8 17.6 15.3 14.8 0.9 0.8 0.8 -20 32 2 2.8 3.4 4.1 11.0 8.6 8.4 7.8 6.2 5.9 24.29% 23.78%
Chemicals (2) 15.3 14.0 11.7 15.7 14.0 11.1 0.9 0.9 0.8 -19 9 20 3.5 3.9 4.6 12.1 11.4 9.3 9.1 8.4 7.1 0.89% 0.87%
Construction Materials (2) 34.0 24.1 19.5 42.0 23.7 18.0 2.0 1.6 1.4 -13 41 23 2.1 3.8 4.5 25.2 18.4 15.6 14.4 11.7 10.6 0.85% 0.83%
Containers & Packaging (2) 19.0 18.0 16.1 19.0 17.4 15.4 1.1 1.2 1.1 9 5 12 3.7 3.9 4.4 16.8 13.2 12.2 10.5 9.6 9.0 0.86% 0.84%
Metals & Mining (2) 15.5 11.6 11.5 14.1 13.6 14.3 0.9 0.8 0.8 -21 34 0 2.8 3.4 4.0 10.6 8.2 8.1 7.5 5.9 5.7 21.70% 21.23%
Paper & Forest Products (2) 15.3 14.0 11.7 15.7 14.0 11.1 0.9 0.9 0.8 -19 9 20 3.5 3.9 4.6 12.1 11.4 9.3 9.1 8.4 7.1 0.89% 0.87%
Industrials (2) 17.6 20.1 16.3 13.7 12.6 10.9 1.0 1.3 1.2 12 -13 23 3.4 3.6 4.2 13.3 13.3 11.4 7.5 7.3 6.5 3.76% 3.68%
Capital Goods (2) 10.1 10.6 10.3 9.3 10.5 10.0 0.6 0.7 0.7 -4 -4 3 6.4 5.8 5.9 7.5 7.3 6.8 3.8 3.6 3.4 0.46% 0.45%
Commercial Services & Supplies (2) 18.6 17.4 15.3 13.2 15.1 12.3 1.1 1.2 1.1 5 7 14 3.3 3.4 3.8 14.3 13.2 11.5 9.4 8.6 7.6 1.70% 1.66%
Transportation (2) 20.7 35.3 21.6 15.6 14.1 13.2 1.2 2.3 1.5 35 -41 63 2.6 3.1 4.0 15.6 17.7 14.1 8.0 8.3 7.3 1.60% 1.56%
Consumer Discretionary (2) 21.9 20.4 18.0 17.9 16.6 15.3 1.3 1.4 1.3 -12 7 14 2.8 3.1 3.6 16.4 15.4 13.4 11.6 10.7 9.5 4.48% 4.39%
Automobiles & Components (2) >100 >100 >100 >100 >100 >100
Consumer Durables & Apparel (2) 11.6 15.1 12.0 11.6 15.1 12.0 0.7 1.0 0.9 -18 -24 26 12.1 6.0 7.5 8.7 11.4 9.1 6.9 8.6 7.2 0.03% 0.02%
Hotels Restaurants & Leisure (2) 23.5 20.3 18.5 25.5 20.6 18.9 1.4 1.4 1.3 -14 16 10 3.0 3.1 3.4 18.0 15.6 14.2 13.3 11.8 10.9 2.05% 2.00%
Media (2) 26.4 27.6 22.6 12.6 11.2 15.9 1.5 1.8 1.6 -20 -4 22 1.3 2.1 2.6 18.9 19.8 15.9 11.1 10.5 9.1 1.42% 1.39%
Retailing (2) 16.0 15.1 13.4 16.6 15.0 12.8 0.9 1.0 1.0 1 6 13 4.4 4.7 5.4 12.2 11.4 10.0 9.7 9.1 8.1 0.99% 0.97%
Consumer Staples (2) 19.4 18.7 17.0 18.1 17.5 14.0 1.1 1.2 1.2 3 3 10 4.2 4.3 4.7 13.5 13.4 12.3 10.5 10.4 9.6 6.60% 6.46%
Food & Drug Retailing (2) 19.9 19.0 17.3 18.7 17.7 16.6 1.1 1.3 1.2 6 5 10 4.1 4.3 4.7 13.8 13.5 12.4 10.8 10.6 9.8 5.75% 5.63%
Food Beverage & Tobacco (2) 16.3 16.8 15.2 17.9 16.3 13.2 0.9 1.1 1.1 -10 -3 11 4.8 4.5 4.7 12.0 12.8 11.6 9.0 9.2 8.5 0.85% 0.83%
Health Care (2) 26.6 21.8 19.3 20.0 16.8 15.5 1.5 1.5 1.4 18 22 13 2.0 2.4 2.7 21.1 17.2 15.1 17.6 14.6 12.8 3.93% 3.85%
Financials (2) 15.6 13.9 13.3 15.3 14.3 13.5 0.9 0.9 1.0 5 13 4 5.1 5.5 5.7 8.6 7.3 6.7 7.9 6.8 6.3 34.73% 33.99%
Banks (2) 14.6 13.7 13.2 14.8 13.8 12.9 0.8 0.9 0.9 8 7 3 5.2 5.6 5.8 7.0 6.1 5.6 6.5 5.7 5.2 23.59% 23.08%
Diversified Financials (2) 20.1 15.8 14.9 19.4 16.2 15.0 1.2 1.1 1.1 12 27 6 3.7 4.6 5.1 11.8 9.3 8.8 10.1 8.1 7.6 2.42% 2.36%
Insurance (2) 26.1 13.6 12.6 14.6 13.9 12.4 1.5 0.9 0.9 -26 93 8 5.2 5.2 5.7 26.7 12.9 12.1 17.4 12.1 11.2 3.34% 3.27%
Real Estate (2) 14.8 14.3 13.7 14.8 14.3 13.6 0.9 1.0 1.0 3 4 4 5.4 5.6 5.8 15.5 15.1 14.6 15.3 14.9 14.4 5.39% 5.27%
Information Technology (2) 23.6 19.7 16.9 23.2 19.2 16.1 1.4 1.3 1.2 7 20 16 2.7 2.8 3.2 18.3 14.9 12.5 17.0 14.0 11.8 0.65% 0.63%
Telecommunication Services (2) 17.3 16.2 15.4 21.3 17.8 15.2 1.0 1.1 1.1 10 6 6 5.1 5.3 5.5 12.2 11.4 11.1 7.5 7.2 7.1 4.15% 4.06%
Utilities (2) 17.5 16.5 14.6 16.5 14.7 14.0 1.0 1.1 1.0 8 6 13 5.4 5.6 5.8 12.4 11.7 10.6 9.7 9.2 8.4 1.51% 1.48%
20 Leaders 16.5 13.9 13.4 18.0 14.9 14.5 1.0 0.9 0.95 -7 18 4 4.2 4.6 5.0 9.7 8.2 7.7 7.8 6.7 6.3 na na
50 Leaders 16.5 14.1 13.3 17.1 14.8 14.0 1.0 0.9 1.0 -5 17 6 4.1 4.5 4.9 10.3 8.6 8.0 8.2 7.0 6.5 na na
ASX 100 17.2 14.9 13.9 17.1 15.1 13.9 1.0 1.0 1.0 -3 15 7 4.2 4.6 5.0 10.5 8.9 8.2 8.6 7.4 6.8 na na
MidCap 50 19.0 16.3 14.7 16.6 15.5 13.6 1.1 1.1 1.1 4 17 11 3.6 4.0 4.6 14.2 11.8 10.5 10.0 8.7 7.8 na na
S&P/ASX 200 - Industrials 17.1 15.5 14.4 16.4 15.1 14.2 1.0 1.0 1.0 4 10 7 4.5 4.8 5.2 10.2 9.0 8.2 8.6 7.7 7.1 na na
S&P/ASX 200 - Resources 18.3 13.5 12.5 14.7 13.4 13.2 1.1 0.9 0.9 -27 36 7 3.0 3.3 4.1 12.5 9.4 8.8 8.5 6.6 6.2 na na
S&P/ASX 200 - Ind excl BIP 19.5 18.4 16.3 18.2 16.5 14.6 1.1 1.2 1.2 3.9 6.1 12.7 3.7 4.0 4.4 14.1 13.1 11.8 10.1 9.5 8.7 na na
S&P/ASX 200 17.3 15.0 14.0 16.2 14.9 13.9 17.3 15.0 14.0 -4 15 7 4.2 4.5 4.9 10.7 9.0 8.3 8.6 7.4 6.9 na na
S&P/ASX 300 - Industrials 19.7 18.4 16.4 16.9 15.5 14.2 1.1 1.2 1.2 1 7 12 3.7 4.0 4.4 15.2 14.1 12.8 10.3 9.7 8.9 na na
S&P/ASX 300 - Resources 18.5 13.5 12.6 13.9 12.8 11.8 1.1 0.9 0.9 -27 37 8 3.0 3.3 4.1 12.7 9.5 8.9 8.5 6.6 6.2 na na
S&P/ASX 300 - Ind excl BIP 19.7 18.4 16.4 16.9 15.5 14.2 1.1 1.2 1.2 0.7 7.0 12.4 3.7 4.0 4.4 15.2 14.1 12.8 10.3 9.7 8.9 na na
S&P/ASX 300 17.4 15.1 14.0 15.9 14.8 13.8 1.0 1.0 1.0 -4 15 7 4.2 4.5 4.9 10.7 9.1 8.4 8.6 7.4 6.9 na na
Small Companies (4) 21.7 18.4 15.9 14.0 14.4 13.2 1.3 1.2 1.1 24- 18 16 3.3 3.4 4.0 14.9 13.0 11.7 9.4 8.6 7.9 na na
Small Industrials 19.2 17.8 15.7 15.4 14.7 13.5 1.1 1.2 1.1 -4 8 13 3.9 4.1 4.6 17.0 15.7 14.0 11.8 10.8 9.8 na na
Small Resources 77.7 19.7 19.7 9.4 9.9 12.9 4.5 1.3 1.4 -76 294 0 1.1 1.2 1.9 35.4 13.2 16.4 7.0 5.4 5.8 na na
(1) Includes all companies covered by Credit Suisse analysts (3) No weighting applicable
(2) All sectors are based on S&P/ASX200.Companies on restricted list are not included in aggregates (4) Small companies are all companies covered by Credit Suisse analysts excluding top 100 stocks.
Sector Weight PE (1)
Median PE (1)(3)

Au
stra
lia a
nd
NZ
Firs
t Ed
ition
164
17 F
eb
ruary
201
4
Weekly Market Calendar Research Analyst
Adam Indikt
61 3 9280 1659 [email protected]
Market estimates are preliminary and subject to change. Information correct as at 13 February 2014. NZ company comment and valuation provided by First NZ Capital. Source: ASX, Bloomberg, IRESS, Reuters and Credit Suisse estimates, CSEC estimates
Monday, 17 February 2014 Tuesday, 18 February 2014 Wednesday, 19 February 2014 Thursday, 20 February 2014 Friday, 21 February 2014
Results (estimates) Australand 1H14F NPAT $146.7mn, DPS 10.9cps Ansell 1H14F NPAT $64.3mn, DPS 17.4cps APN News & Media 1H14F NPAT $46.0mn, DPS 0.0 Aurizon 1H14F Bendigo and Adelaide Bank 1H14F NPAT $192.0mn, DPS 32.0cps *Fleetwood Corp 1H14F NPAT $5.0mn, DPS 0.0cps UGL 1H14F NPAT 46.3mn, DPS 22.0cps Western Areas 1H14F NPAT $6.3mn, DPS 0.0cps
Ex Div (div¢@fkg% pay date) BKN (0.0543) 15 0 21-Mar-14 CBA (8.4906)183 100 3-Apr-14 COO 0.5 0 5-Mar-14 GXL (0.049) 5.5 100 14-Mar-14 RKN 4.75 90 6-Mar-14 SCC 5 100 27-Feb-14
Results (estimates) Asciano Group 1H14F DPS 3.0cps Amcor 1H14F NPAT $5,233.1mn, DPS 18.5cps *Amcom Telecommunications 1H14F NPAT $11.3mn, DPS 2.3cps Arrium 1H14F NPAT $0.0mn, DPS 6.0cps BHP Billiton 1H14F NPAT US$7,072.3mn, DPS 62.0cps Coca-Cola Amatil 1H14F NPAT $499.6mn, DPS 35.5cps CFS Retail Property Trust 1H14F NPAT $191.9mn, DPS 6.8cps Challenger Limited 1H14F NPAT $200.9mn, DPS 10.0cps Commonwealth Property Office Fund 1H14F NPAT $105.7mn, DPS 3.4cps Mount Gibson Iron 1H14F NPAT $141.6mn, DPS 0.0cps *McMillan Shakespeare 1H14F NPAT $22.1mn, DPS 17.9cps *Oakton 1H14F NPAT $4.6mn, DPS 4.5cps Orora 1H14F NPAT $1,551.6mn, DPS 3.0cps Pacific Brands 1H14 *SAI Global 1H14 Sonic Healthcare 1H14F NPAT $172.2mn, DPS 27.9cps Ex Div (div¢@fkg% pay date) BLD (0.2962) 7 100 24-Mar-14 CPU (0.4467) 14 20 18-Mar-14 DMP (0.1124) 17.7 100 11-Mar-14 ETSMSF 13.3 0 27-Mar-14 ITD 0.5 100 3-Mar-14 MCR (0.0081) 2 100 21-Mar-14
Results (estimates) APA Group 1H14F NPAT $0.0mn, DPS 17.3cps APN News & Media 1H14 *ARB Corp 1H14F NPAT $19.5mn, DPS 12.0cps Brambles Limited 1H14F DPS 14.1cps Fortescue Metals Group 1H14F NPAT US$1,646.6mn, DPS 5.0cps Seek 1H14 *SMS Management & Technology 1H14F NPAT $6.8mn, DPS 7.0cps Suncorp Group Limited 1H14F NPAT $560.3mn, DPS 33.0cps Toll Holdings 1H14F DPS 15.0cps TradeMe 1H14 Wesfarmers FY13F NPAT $1,364.4mn, DPS 84.7cps Woodside Petroleum 1H14F NPAT US$1,763.9mn, DPS 104.4cps AGM Aristocrat Leisure 10 Macquarie Street, Sydney, 10:00
Results (estimates) Adelaide Brighton 1H14F DPS 8.0cps *Alliance Aviation Services 1H14 AMP 1H14F NPAT $646.6mn, DPS 12.5cps *Breville Group 1H14F NPAT $49.7mn, DPS 12.0cps *Emeco Holdings FY13F NPAT -$12.3mn, DPS 0.0cps Envestra FY13F NPAT $87.0mn, DPS 3.2cps Fairfax Media 1H14 Federation Centres 1H14F NPAT $115.8mn, DPS 7.1cps *iiNet 1H14F NPAT $31.7mn, DPS 9.0cps Investa Office Fund 1H14F NPAT $69.3mn, DPS 9.3cps Leighton Holdings 1H14F NPAT $556.4mn, DPS 54.0cps Mirvac Group 1H14F NPAT $210.0mn, DPS 4.3cps Myer 1H14 Origin Energy 1H14F PanAust 1H14F NPAT $80.8mn, DPS 4.0cps Platinum Asset Management 1H14F NPAT $88.5mn, DPS 11.0cps Super Retail Group 1H14F NPAT $60.7mn, DPS 18.5cps Tatts Group 1H14F NPAT $114.3mn, DPS 0.0cps Treasury Wine 1H14F DPS 6.0cps
Ex Div (div¢@fkg% pay date) ETSGEL 10.36 0 9-May-14 KOV 26 100 12-Mar-14
Results (estimates) Crown 1H14F DUET Group 1H14F Evolution Mining Limited 1H14F NPAT $28.6mn, DPS 0.9cps Insurance Australia Group 1H14F NPAT $570.4mn, DPS 16.0cps Iluka Resources FY13F NPAT $18.0mn, DPS 5.0cps Qube Logistics 1H14 Sandfire Resources NL 1H14F NPAT $31.7mn Santos Ltd 1H14F NPAT $469.5mn

17 F
eb
ruary
201
4
Au
stra
lia a
nd
NZ
Firs
t Ed
ition
165
Market estimates are preliminary and subject to change. Information correct as at 13 February 2014. NZ company comment and valuation provided by First NZ Capital. Source: ASX, Bloomberg, IRESS, Reuters and Credit Suisse estimates, CSEC estimates
Monday, 17 February 2014 Tuesday, 18 February 2014 Wednesday, 19 February 2014 Thursday, 20 February 2014 Friday, 21 February 2014 Economics AUSTRALIA New Motor Vehicle Sales MoM (Jan) (Prev 1.70%) New Motor Vehicle Sales YoY (Jan) (Prev 0.10%) NEW ZEALAND Performance Services Index (Jan) (Prev 57.5) Retail Sales Ex Inflation QoQ (4Q) (Mkt 1.90%, Prev 0.30%)
Economics UNITED STATES Revisions of the Consumer Price Index Empire Manufacturing (Feb) (Mkt 9.7, Prev 12.5) Net Long-term TIC Flows (Dec) (Prev -$29.3bn) NAHB Housing Market Index (Feb) (Mkt 56, Prev 56)
Economics AUSTRALIA Conf. Board Leading Index MoM (Dec) (Prev 0.20%) Skilled Vacancies MoM (Jan) (Prev -0.60%) Bloomberg Feb Australia Economic Survey Wage Cost Index QoQ (4Q) (Prev 0.50%) Wage Cost Index YoY (4Q) (Prev 2.70%) CHINA MNI February Business Indicator UNITED STATES PPI (Jan)- Will reflect a significant redefinition (Prev 0.4%) - Core PPI (Prev 0.3%) Housing Starts (Jan) (CS 945K, Mkt 950K, Prev 999K) - Building Permits (Mkt 975K, Prev 991K) Atlanta Fed’s Lockhart speaks on the economic outlook at Mercer University (Non-Voter) St. Louis Fed’s Bullard speaks on the US economy and monetary policy (Non-Voter) FOMC Minutes from the January 28-29 meeting San Francisco Fed’s Williams speaks in NY on the outlook and monetary policy (Non-Voter)
Economics AUSTRALIA RBA FX Trans. Mkt (Jan) (Prev 884M) RBA FX Transactions Government (Jan) (Prev -906M) RBA FX Transactions Other (Jan) (Prev 31M) CHINA HSBC/Markit Flash Mfg PMI (Feb) (Mkt 49.6, Prev 49.5) Bloomberg Feb. China Economic Survey UNITED STATES Initial Jobless Claims (wk ended Feb 15) (CS 340K, Mkt 330K, Prev 339K) CPI (Jan) MoM (YoY) (CS 0.1%(1.5%), Mkt 0.1%(1.6%), Prev 0.3%(1.5%)) -.Core CPI (CS 0.2%(1.6%), Mkt 0.1%(1.6%), Prev 0.1%(1.7%)) CPI NSA Index (CS 233.770, Prev 233.049) Markit US PMI (Feb-Prelim) (Mkt 53.7, Prev 53.7 (Jan-Fin)) Philadelphia Fed (Feb) (Mkt 10.0, Prev 9.4) Leading Indicators (Jan) (Mkt 0.4%, Prev 0.1%) UST 2-Year Floating Rate Note Announcement (Reopening) UST 2, 5 & 7-Year Note Announcements UST 30-Year TIPS Auction NEW ZEALAND ANZ Job Advertisements MoM (Jan) (Prev -0.70%) PPI Input QoQ (4Q) (Prev 2.20%) PPI Output QoQ (4Q) (Prev 2.40%) ANZ Consumer Confidence Index (Feb) (Prev 135.8) ANZ Consumer Confidence MoM (Feb) (Prev 4.90%)
Economics UNITED STATES Revisions of Existing Home Sales Existing Home Sales (Jan) (CS 4.70mn, Mkt 4.70mn, Prev 4.87mn) St. Louis Fed’s Bullard speaks to the St. Louis Forum (Non-Voter) NEW ZEALAND Food Prices MoM Jan, (Prev -0.10%) Non Resident Bond Holdings Jan, (Prev 65.10%)

17 F
eb
ruary
201
4
Au
stra
lia a
nd
NZ
Firs
t Ed
ition
166
Companies that have reported over the past week ANZ Banking Group1H14 NPAT $3,405mn, EPS $1.27, DPS 80cps Macquarie Group 1H14 NPAT $501mn, EPS $1.50, DPS $1.00 Boral 1H14 NPAT -$27mn, EPS 11.6cps, DPS 7.0cps carsales.com.au 1H14 NPAT $44mn, EPS 18.5cps, DPS 14.7cps Commonwealth Bank of Australia 1H14 co def NPAT $4,268mn, EPS $2.64, DPS $1.83 Computershare 1H14 norm. NPAT US$164mn, EPS 26.9cps, DPS 14.0cps CSL 1H14 rep. NPAT $645.7mn, EPS 133cps, DPS 53cps Dexus Property Group 1H14 NPAT $189.8mn, EPS 4.08cps, DPS 3.07cps *Domino's Pizza 1H14 NPAT $20.2mn, EPS 25cps, DPS 17.7cps Goodman Fielder 1H14 pre sig. NPAT $14.6mn, EPS -3.3cps, DPS 1.0cps OZ Minerals CY13 NPAT -$62.5mn, EPS -20.60cps, DPS (final) 10.0cps Newcrest Mining 1H14 underlying NPAT $207mn Sims Metal Management 1H14 underlying NPAT $42.1mn Perseus Mining 1H14 NPAT -$4.024mn, EPS -0.84cps Rating Changes over the past week *iiNet from Neutral to OUTPERFORM Goodman Fielder from Neutral to UNDERPERFORM OZ Minerals from Neutral to UNDERPERFORM *Skilled Group from Neutral to UNDERPERFORM
ASX code change over the past week (WAG) WAG to (EPA) Ephraim Resources
Companies that have reported over the past week Primary Healthcare 1H14 reported NPAT $75.5mn, EPS 0.15cps, DPS 9.0cps *Skilled Group 1H14 NPAT $26.0mn, EPS 9.00cps, DPS 7.5cps ASX 1H14 underlying NPAT $189.6mn, DPS 88.2cps Goodman Group 1H14 NPAT $306.8mn, EPS 17.2cps, DPS 13.50cps Stockland 1H14 NPAT $267.0mn, EPS 11.6cps, DPS 12cps STW Communications FY13 NPAT $49.5mn, EPS 12.3cps, DPS 8.6cps Telstra 1H14 NPAT $1,93bn, EPS 15.5cps, DPS 14.5cps *Webjet 1H14 NPAT $9.17mn, EPS 11.55cps, DPS 6.25cps Bradken 1H14 NPAT $38.1mn, EPS 22.5cps, DPS 15cps Cochlear 1H14 NPAT $21mn, EPS 37cps, DPS 127cps Rio Tinto FY13 underlying NPAT $10.2bn, DPS 192cps GPT Group FY13 NPAT $471.8mn, EPS 25.7cps, DPS (final) 10.3cps *Automotive 1H14 NPAT $37.9mn, EPS 15.1cps Charter Hall Retail REIT 1H14 stat NPAT $20.6mn, DPU 13.65cpu *TransPacific Industries 1H14 NPAT $158.6mn, EPS 10cps
Market estimates are preliminary and subject to change. Information correct as at 13 February 2014. NZ company comment and valuation provided by First NZ Capital. Source: ASX, Bloomberg, IRESS, Reuters and Credit Suisse estimates, CSEC estimates

17 F
eb
ruary
201
4
Au
stra
lia a
nd
NZ
Firs
t Ed
ition
167
Credit Suisse’s Reporting Season Calendar Research Analyst
Adam Indikt 61 3 9280 1659
Price 12M NPAT pre-unusual** Reported NPAT** DPS (c)
Code Company Currency (A$) Tgt. Rtg Date Report Curr PCP Chg % Curr PCP Chg % Curr PCP Chg % Credit Suisse analyst comment
ALZ Australand A$ 3.9 3.8 N 17-Feb Final 146.7 142.0 3.3 146.7 142.0 3.3 10.9 11.0 -0.5
ANN Ansell Limited US$ 19.3 21.0 N 17-Feb Interim 64.3 57.1 12.6 64.3 57.1 12.6 17.4 16.0 8.9
AZJ Aurizon A$ 5.1 R 17-Feb Interim 0.0 0.0 0.0 0.0 450.0 410.0 9.8 Expect 1Q14 above rail volumes and qualitative outlook commentary, though nothing formal. Outlook commentary likely to be relatively positive given the reasonable organic volume growth in the space.
BEN Bendigo and Adelaide Bank
A$ 11.7 12.2 N 17-Feb Interim 192.0 169.7 13.1 192.0 169.7 13.1 32.0 30.0 6.7 We would look for: Some relief emerging for net interest margins (TD spread pressures easing, the re-pricing of parts of the Community Bank portfolio); Accelerating operating costs; Rural Bank asset quality; Update on medium term issues, such as the progress of the Great Southern litigation and the Basel advanced accreditation program.
FWD Fleetwood Corporation*
A$ 3.0 2.4 N 17-Feb Interim 5.0 8.9 -43.5 5.0 5.2 -4.3 0.0 30.0 -100.0
UGL UGL Limited A$ 7.1 7.8 N 17-Feb Interim 51.1 51.0 0.2 46.3 26.0 77.8 22.0 34.0 -35.3 We expect UGL to report 1H14 underlying NPAT of $51mn and to reiterate FY14 guidance of $120-130mn underlying NPAT. We expect a solid result for the property business to be overshadowed by weakness in the engineering division.
WSA Western Areas A$ 3.2 2.8 N 17-Feb Interim 6.3 6.5 -2.9 6.3 2.1 196.5 0.0 2.0 -100.0 Reporting date is an estimate.
AIO Asciano Group A$ 5.7 6.2 O 18-Feb Interim 0.0 0.0 0.0 0.0 3.0 3.0 0.0 Quarterly volumes will be released at AGM. We have a good read-through from Port and Coal stats so don't expect any material surprises. Data is showing a recovery in port volumes and continued underlying growth of 5-6% of coal. Expect outlook commentary though no formal guidance likely. Management may reiterate progress towards 10-15% EPS growth targets and WACC goals.
AMC Amcor A$ 10.7 11.2 N 18-Feb Interim 5,233.1 322.0 1,525.2 5,233.1 238.3 2,096.0 18.5 19.0 -2.6
AMM Amcom Telecommunications*
A$ 2.0 2.2 N 18-Feb Interim 11.3 10.0 13.9 11.3 10.0 13.9 2.3 2.0 14.6 FY14 earnings guidance for "double digit NPAT growth" expected to be maintained. Any momentum from sales here forward will be a driver for FY15 earnings. Could see announcement of first wins on CISCO HCS product. Potentially positive catalyst
ARI Arrium A$ 1.7 1.4 U 18-Feb Interim 0.0 0.0 0.0 0.0 6.0 2.0 200.0 1H FY14 quantitative guidance may be provided. We will also focus on domestic demand commentary and Iron Ore segment likely continued strong performance. First AGM for new MD Andrew Roberts.
BHP BHP Billiton US$ 37.7 38.0 N 18-Feb Interim 6,912.3 4,433.0 55.9 7,072.3 2,988.0 136.7 62.0 57.0 8.7
CCL Coca-Cola Amatil A$ 11.8 11.3 U 18-Feb Final 508.8 558.4 -8.9 499.6 459.9 8.6 35.5 -17.0 308.8
CFX CFS Retail Property Trust
A$ 2.0 2.0 N 18-Feb Interim 191.9 0.0 191.9 0.0 6.8 0.0 Australia dial in 1800 801 825. International dial in 61 2 8524 5042. Conference ID 3227176
CGF Challenger Limited A$ 6.3 7.0 O 18-Feb Interim 164.5 148.7 10.6 200.9 222.0 -9.5 10.0 9.5 5.3
CPA Commonwealth Property Office Fund
A$ 1.3 1.2 N 18-Feb Interim 105.7 103.3 2.3 105.7 103.3 2.3 3.4 3.2 4.7 Australia dial in 1800 801 825. International dial in 61 2 8524 5042. Conference ID 8287329.
MGX Mount Gibson Iron A$ 1.2 1.1 U 18-Feb Interim 141.6 37.1 281.7 141.6 37.1 281.7 0.0 2.0 -100.0 Reporting date is an estimate
MMS McMillan Shakespeare*
A$ 11.3 12.3 U 18-Feb Interim 23.0 29.7 -22.7 23.0 29.7 -22.7 18.4 24.0 -23.5
OKN Oakton* A$ 1.6 1.3 N 18-Feb Interim 4.6 4.5 1.6 4.6 4.5 1.6 4.5 4.8 -4.6
* Please note these companies are covered by Credit Suisse Emerging Companies (CSEC), a joint venture between Credit Suisse and First NZ Capital.
** In A$mn, unless otherwise stated. Final DPS is 2H dividend. O = Outperform, N = Neutral, U = Underperform, R = Restricted. Source: Company data, Credit Suisse estimates, CSEC estimates

17 F
eb
ruary
201
4
Au
stra
lia a
nd
NZ
Firs
t Ed
ition
168
Currency Price 12M NPAT pre-unusual** Reported NPAT** DPS (c)
Code Company (A$) Tgt. Rtg Date Report Curr PCP Chg % Curr PCP Chg % Curr PCP Chg % Credit Suisse analyst comment
ORA Orora A$ 1.4 1.4 O 18-Feb Interim 1,551.6 0.0 1,551.6 0.0 3.0 0.0 November trading update, AMC/Orora indicated trading was favorable: Earnings higher than last year across Australasia and Packaging Distribution. Full year earnings expected to be significantly higher, cost savings will be skewed toward 2H14.
PBG Pacific Brands A$ 0.7 0.8 N 18-Feb Interim 34.4 38.9 -11.5 42.1 38.9 8.3 2.3 2.5 -9.8 PBG indicated at its AGM in October that its 1H14 EBIT and NPAT pre SI would be 'materially down' on pcp.
SHL Sonic Healthcare A$ 16.9 16.5 N 18-Feb Interim 172.2 150.6 14.3 172.2 150.6 14.3 27.9 25.0 11.5
SWM Seven West Media Ltd
A$ 2.2 2.6 O 18-Feb Interim 165.3 142.3 16.2 165.3 -109.3 251.1 6.0 6.0 0.0 SWM could surprise on the upside with stronger TV revenues towards the end of the period and potentially a better result on cost-out. Cautiously optimistic near-to-medium term trading outlook likely.
APA APA Group A$ 6.2 6.1 U 19-Feb Interim 0.0 0.0 0.0 0.0 17.5 17.0 2.9
APN APN News & Media A$ 0.4 0.3 U 19-Feb Final 49.4 54.4 -9.1 46.0 -455.8 110.1 0.0 0.0 APN may surprise on the upside with strong radio results and a strengthening NZ economy and exchange rate.
ARP ARB Corp* A$ 10.7 11.5 U 19-Feb Interim 19.5 20.9 -6.6 19.5 20.9 -6.6 12.0 12.5 -4.0
BXB Brambles Limited US$ 8.8 9.3 N 19-Feb Interim 0.0 0.0 0.0 0.0 13.6 13.9 -1.9 1Q14 sales and outlook commentary expected ahead of the AGM. Potential for BXB's mgmt to narrow guidance within the stated band. Given the recent negative read-through into the US retail sales from Wal-Mart, there is a chance that guidance could be narrowed to the lower end of the range. CS is currently at the top end.
FMG Fortescue Metals Group Ltd
US$ 5.7 7.5 O 19-Feb Interim 1,594.5 367.4 334.0 1,646.6 478.0 244.5 5.0 0.0
SEK Seek A$ 13.2 13.8 N 19-Feb Interim 72.9 67.5 8.0 72.9 67.5 8.0 12.9 10.0 29.0 Expect an update to the guidance given at the AGM. Currency will provide tailwind while core domestic employment business appears to be bottoming out - commentary and outlook likely to be key to share price reaction.
SMX SMS Management & Technology*
A$ 4.2 4.4 N 19-Feb Interim 6.8 12.7 -46.3 6.8 12.9 -47.1 7.0 13.5 -48.0
SUN Suncorp Group A$ 12.5 12.4 U 19-Feb Interim 560.3 574.0 -2.4 560.3 574.0 -2.4 33.0 25.0 32.0
SXL Southern Cross Media Group
A$ 1.6 1.4 U 19-Feb Interim 54.3 47.6 14.1 54.3 45.1 20.4 5.0 4.5 11.1 SXL is likely to report a mixed result, with radio ad spend more subdued towards the end of the period and SXL continuing to lose market share, offset by a potentially stronger result from regional TV.
TME Trade Me Group Ltd NZ$ 3.7 3.7 U 19-Feb Interim 40.9 37.4 9.4 40.9 37.4 9.4 8.3 7.5 10.1 TME indicated at its FY13 result that the rate of growth across the business would slow in FY14. The market is forecasting 9% EBITDA growth versus FY guidance for less than 12%.
TOL Toll Holdings A$ 5.7 5.5 N 19-Feb Interim 0.0 0.0 0.0 0.0 15.0 12.5 20.0 Qualitative and informal outlook commentary likely. Expect the tone of outlook to be reserved, in line with commentary at FY14 result.
TRS The Reject Shop A$ 10.9 13.5 N 19-Feb Interim 16.7 18.0 -7.1 16.7 20.0 -16.4 22.7 24.0 -5.6 TRS issued a trading update on 24 January that was 30% below market expectations and indicated 1H14 NPAT would be ~7% below pcp.
WES Wesfarmers A$ 43.8 45.0 N 19-Feb Interim 1,297.9 1,285.0 1.0 1,364.4 1,285.0 6.2 84.7 77.0 9.9
WPL Woodside Petroleum US$ 38.4 35.0 U 19-Feb Final 1,717.9 2,086.5 -17.7 1,763.9 2,983.0 -40.9 104.4 0.0 FY13 results and final dividend announcement.
ABC Adelaide Brighton A$ 4.1 3.4 U 20-Feb Interim 0.0 0.0 0.0 0.0 8.0 7.5 6.7
AMP AMP A$ 4.5 5.0 N 20-Feb Final 646.6 703.6 -8.1 646.6 703.6 -8.1 12.5 12.5 0.0
BRG Breville Group* A$ 8.1 8.2 N 20-Feb Final 49.7 46.0 8.2 49.7 46.0 8.2 12.0 11.5 4.3
EHL Emeco Holdings* A$ 0.3 0.3 N 20-Feb Interim -12.3 25.1 -148.8 -12.3 22.5 -154.4 0.0 2.5 -100.0
ENV Envestra A$ 1.2 1.2 N 20-Feb Interim 87.0 59.1 47.1 87.0 59.1 47.1 3.2 3.0 6.7
FDC Federation Centres A$ 2.4 2.4 N 20-Feb Interim 115.8 106.2 9.0 115.8 106.2 9.0 7.1 6.6 8.2
FXJ Fairfax Media A$ 0.7 0.5 U 20-Feb Interim 68.9 83.0 -17.1 68.9 386.3 -82.2 1.0 1.0 0.0 FXJ is likely to report a deceleration in the rate of decline in profit, primarily driven by cost-out. We are forecasting a $79mn cost reduction in 1H14 out of the $100-120mn cost-out flagged for FY. The revenue run-rate decline is also expected to decelerate.
IIN iiNet* A$ 7.4 8.1 O 20-Feb Interim 31.7 26.3 20.5 31.7 31.9 -0.9 9.0 8.0 12.5 Expect a strong subscriber net adds result (best for several years). Also expect to see the cost discipline from 2H13 continued with further cost out from synergies and reduction in employee costs. IIN does not provide guidance. CS is above consensus in FY14 by 3%
IOF Investa Office Fund A$ 3.1 3.3 N 20-Feb Interim 69.3 69.3 0.0 69.3 69.3 0.0 9.3 0.0
LEI Leighton Holdings A$ 16.3 15.2 U 20-Feb Final 521.5 442.5 17.9 556.4 444.7 25.1 54.0 60.0 -9.9
* Please note these companies are covered by Credit Suisse Emerging Companies (CSEC), a joint venture between Credit Suisse and First NZ Capital.
** In A$mn, unless otherwise stated. Final DPS is 2H dividend. O = Outperform, N = Neutral, U = Underperform, R = Restricted. Source: Company data, Credit Suisse estimates, CSEC estimates

17 F
eb
ruary
201
4
Au
stra
lia a
nd
NZ
Firs
t Ed
ition
169
Currency Price 12M NPAT pre-unusual** Reported NPAT** DPS (c)
Code Company (A$) Tgt. Rtg Date Report Curr PCP Chg % Curr PCP Chg % Curr PCP Chg % Credit Suisse analyst comment
MGR Mirvac Group A$ 1.7 1.9 O 20-Feb Interim 210.0 194.2 8.1 210.0 194.2 8.1 4.3 4.2 2.7 Australia dial in 1800 801 825. International dial in 612 8524 5042. Conference ID 2526682.
ORG Origin Energy A$ 14.8 15.3 N 20-Feb Interim 0.0 0.0 0.0 0.0 0.0 0.0
PNA PanAust US$ 2.0 2.0 O 20-Feb Final 80.8 142.3 -43.2 80.8 142.3 -43.2 4.0 4.0 0.0 Reporting date is an estimate
PTM Platinum Asset Management
A$ 7.1 6.0 U 20-Feb Interim 88.5 62.4 41.8 88.5 62.4 41.8 11.0 8.0 37.5
SUL Super Retail Group A$ 10.8 11.5 N 20-Feb Interim 60.7 60.6 0.1 60.7 60.6 0.1 18.5 17.0 9.0
TTS Tatts Group A$ 3.0 3.2 N 20-Feb Interim 114.3 109.7 4.2 114.3 129.3 -11.6 0.0 0.0
TWE Treasury Wine A$ 3.8 3.2 U 20-Feb Interim 0.0 0.0 6.0 6.0 0.0
CWN Crown A$ 17.4 15.9 U 21-Feb Interim 0.0 0.0 0.0 0.0 0.0 0.0
DUE DUET Group A$ 2.1 2.3 O 21-Feb Interim 0.0 0.0 0.0 0.0 0.0 0.0
EVN Evolution Mining A$ 0.8 0.6 U 21-Feb Interim 28.6 40.7 -29.7 28.6 40.7 -29.7 0.9 0.0 No material updates are expected.
FAN Fantastic Holdings A$ 2.0 2.0 U 21-Feb Interim 4.1 7.7 -47.1 4.1 7.7 -47.1 2.4 7.5 -68.4 FAN issued a trading update on 3 December that was ~50% below market expectations and indicated 1H14 NPAT would be 35-61% below pcp.
IAG Insurance Australia Group
A$ 5.5 6.0 N 21-Feb Interim 570.4 643.0 -11.3 570.4 461.0 23.7 16.0 11.0 45.5
ILU Iluka Resources A$ 9.2 10.0 N 21-Feb Final 59.0 363.2 -83.7 18.0 363.2 -95.0 5.0 10.0 -50.0 Dividend announcement.
SFR Sandfire Resources NL A$ 6.6 5.8 U 21-Feb Interim 31.7 79.1 -59.9 31.7 79.1 -59.9 0.0 0.0 No material updates are expected.
STO Santos Ltd A$ 14.1 13.4 U 21-Feb Final 558.7 606.0 -7.8 469.5 519.0 -9.5 0.0 0.0
AGO Atlas Iron A$ 1.1 1.3 O 24-Feb Interim 69.5 1.0 6,839.9 69.5 -256.0 127.2 0.0 0.0 Estimated date.
AQA Aquila Resources A$ 2.8 2.6 O 24-Feb Interim -7.8 -112.0 93.1 -7.8 408.9 -101.9 0.0 0.0 reporting date is an estimate
BLY Boart Longyear Group*
US$ 0.4 0.4 U 24-Feb Final -125.7 114.0 -210.3 -410.4 68.2 -702.1 0.1 1.0 -94.5 Update given in December following clarification on Canadian tax issues. However, by mid-Feb should have an idea of conversation with Northern Hemisphere customers for 2014 budgets. Guidance unlikely to be provided. We expect conditions to remains challenging given weak gold price. Focus needs to be on reducing costs and releasing working capital to manage the balance sheet.
BPT Beach Energy A$ 1.5 1.6 N 24-Feb Interim 161.3 62.2 159.2 161.3 45.1 257.8 0.8 0.8 0.0
BSL BlueScope Steel A$ 5.9 5.7 O 24-Feb Interim 0.0 0.0 0.0 0.0 0.0 0.0 Quantitative guidance change unlikely. Our focus will be on qualitative
commentary around domestic conditions and demand.
CTX Caltex Australia A$ 19.9 23.8 O 24-Feb Final 320.3 458.0 -30.1 344.5 56.8 506.7 17.0 23.0 -26.1 FY13 results, dividend announced
IGO Independence Group NL
A$ 4.3 3.7 O 24-Feb Interim 21.3 16.5 29.1 21.3 16.5 29.1 3.7 1.0 265.4 Estimated reporting week.
MCS McAleese Group* A$ 1.1 1.8 O 24-Feb Interim 23.4 28.6 -17.9 15.5 27.6 -43.7 0.0 0.0 Maiden result for McAleese. Focus will be on pro forma trading results for the first 6 months to Dec-13. Stat results likely to be messy given Nov-13 listing. No surprise expected given recent prospectus forecasts given in Nov-13
MDL Mineral Deposits Ltd. US$ 2.2 4.0 O 24-Feb Final 1.6 20.1 -91.9 -11.6 16.3 -171.7 0.0 0.0 Reporting date is an estimate
PAN Panoramic Resources
A$ 0.2 0.3 N 24-Feb Interim -9.1 -13.0 29.6 -9.1 -13.0 29.6 0.0 1.0 -100.0 Reporting date is an estimate
RRL Regis Resources Limited
A$ 3.1 2.9 N 24-Feb Interim 61.0 66.1 -7.6 61.0 66.1 -7.6 0.0 0.0 No material update expected.
SKI Spark Infrastructure Group
A$ 1.7 1.8 O 24-Feb Final 177.5 173.9 2.1 177.5 173.9 2.1 5.5 5.3 4.7
SXY Senex Energy A$ 0.7 0.9 O 24-Feb Interim 27.3 23.4 17.1 27.3 23.4 17.1 0.0 0.0 Reporting date is an estimate
TIG Tigers Realm Coal A$ 0.2 0.3 O 24-Feb Final -17.4 -18.8 7.2 -17.4 -18.8 7.2 0.0 0.0 Reporting date is an estimate
YAL Yancoal Australia A$ 0.7 0.7 U 24-Feb Final 6.1 30.5 -79.9 -721.8 403.1 -279.0 0.0 0.0 reporting date is an estimate
CAB Cabcharge Australia* A$ 4.1 4.0 U 25-Feb Interim 34.1 33.3 2.2 34.1 33.3 2.2 17.6 18.0 -2.0
CHC Charter Hall Group A$ 3.9 3.8 N 25-Feb Interim 37.1 33.4 11.4 37.1 33.4 11.4 11.0 9.8 12.2
ENE Energy Developments A$ 6.0 6.4 O 25-Feb Interim 24.0 29.5 -18.5 24.0 29.5 -18.5 9.7 0.0
FLT Flight Centre A$ 46.7 58.0 O 25-Feb Interim 105.8 91.8 15.3 105.8 91.8 15.3 52.5 46.0 14.1
IFL IOOF Holdings A$ 9.3 9.4 N 25-Feb Interim 61.8 50.9 21.2 49.2 33.2 48.1 24.0 19.5 23.1
MRM Mermaid Marine Australia*
A$ 2.9 3.8 O 25-Feb Final 60.3 51.0 18.1 60.3 51.0 18.1 7.0 6.0 16.7
* Please note these companies are covered by Credit Suisse Emerging Companies (CSEC), a joint venture between Credit Suisse and First NZ Capital.
** In A$mn, unless otherwise stated. Final DPS is 2H dividend. O = Outperform, N = Neutral, U = Underperform, R = Restricted. Source: Company data, Credit Suisse estimates, CSEC estimates

17 F
eb
ruary
201
4
Au
stra
lia a
nd
NZ
Firs
t Ed
ition
170
Currency Price 12M NPAT pre-unusual** Reported NPAT** DPS (c)
Code Company (A$) Tgt. Rtg Date Report Curr PCP Chg % Curr PCP Chg % Curr PCP Chg % Credit Suisse analyst comment
OSH Oil Search US$ 8.3 9.7 O 25-Feb Final 209.0 154.5 35.3 209.3 175.8 19.0 2.0 2.0 0.0
QBE QBE Insurance Grp US$ 11.4 13.7 O 25-Feb Final -249.6 761.0 -132.8 -249.6 761.0 -132.8 13.0 10.4 25.1
RHC Ramsay Health Care A$ 43.5 41.5 N 25-Feb Interim 159.1 140.0 13.7 149.2 130.1 14.7 33.1 29.0 14.0
SFH Specialty Fashion Group
A$ 0.8 1.0 O 25-Feb Interim 12.6 18.0 -29.7 12.6 18.0 -29.7 2.0 2.0 0.0 SFH is likely to report a material decline in 1H profit in line with broader retail downgrades. The Rivers acquisition is unlikely to be positively contributing. We are 30% below market.
SLM Salmat* A$ 2.1 2.2 N 25-Feb Interim 7.4 9.8 -24.5 6.8 41.5 -83.6 7.5 25.0 -70.0
AGK AGL Energy A$ 15.9 15.8 N 26-Feb Interim 0.0 0.0 0.0 0.0 31.0 30.0 3.3
HGG Henderson Grp PLC £ 4.3 4.5 N 26-Feb Final 161.9 126.8 27.7 118.9 99.7 19.2 6.3 5.1 25.1
IRE IRESS* A$ 9.4 9.6 N 26-Feb Final 55.0 54.4 1.1 55.0 54.4 1.1 19.0 24.5 -22.4
LLC Lend Lease A$ 11.3 12.5 O 26-Feb Interim 253.7 302.3 -16.1 253.7 302.3 -16.1 0.0 0.0 Australia dial in 1800 354 715. Conference ID 15797117.
MYX Mayne Pharma A$ 0.9 0.9 N 26-Feb Interim 9.5 1.6 489.4 8.8 -2.5 446.4 0.0 0.0
PGH Pact Group Holdings A$ 3.5 3.9 O 26-Feb Interim 0.0 0.0 0.0 0.0 0.0 0.0
PRT Prime Media Group A$ 1.0 1.1 N 26-Feb Interim 16.4 19.4 -15.2 16.4 4.6 255.6 3.4 4.0 -15.0 PRT provided an update at its AGM in November that was 10% below market expectations and indicated FY14 core NPAT would be ~8% below pcp.
WHC Whitehaven Coal A$ 1.6 2.8 O 26-Feb Interim -19.0 -27.6 31.1 -19.0 -47.1 59.6 0.0 0.0
WOR Worley Parsons A$ 15.7 17.1 N 26-Feb Interim 92.2 155.1 -40.6 92.2 155.1 -40.6 42.0 41.5 1.2 We expect WOR to report 1H14 underlying NPAT of $92mn, at the bottom end of 1H14 guidance ($90-110mn). We also expect WOR to reiterate FY14 guidance of $260-300mn.
WTF Wotif.com Holdings* A$ 2.7 2.9 U 26-Feb Interim 22.2 27.5 -19.4 22.2 27.5 -19.4 8.3 11.5 -27.6 AGM: We are not expecting quantified guidance, but we believe that qualitative outlook commentary is a strong possibility. We are looking for updated commentary surrounding the strategies announced at the strategic review in May. Specifically, we would be looking for more detail on the marketing plans for Asia and for a further explanation of the strategy.
GBG Gindalbie Metals Ltd A$ 0.1 0.1 U 27-Feb Interim -7.6 -18.8 59.6 -7.6 -18.8 59.6 0.0 0.0
ISU iSelect Limited* A$ 1.2 1.9 O 27-Feb Interim 5.0 0.2 2,359.5 5.0 0.2 2,359.5 0.0 0.0
NEC Nine Entertainment A$ 2.2 2.3 O 27-Feb Interim 0.0 0.0 0.0 0.0 0.0 0.0 Although NEC did not release any prospectus forecasts for the first half we expect upgrades post-1H14 result to full year numbers due to improved ad market conditions and strong performance of Nine Network over summer.
NWH NRW Holdings Limited*
A$ 1.4 1.3 N 27-Feb Interim 25.7 48.6 -47.0 25.7 48.6 -47.0 4.3 8.0 -45.8 Update expected on revenue guidance of $1 - $1.2bn. Now have Roy Hill contract awarded, hence should give mgmt more visibility. Roy Hill should be mostly mobilized and changes to RIO work schedule should also be understood.
PPT Perpetual Limited A$ 48.3 51.0 N 27-Feb Interim 46.9 35.7 31.2 40.8 28.0 45.6 110.0 50.0 120.0
QAN Qantas Airways A$ 1.2 1.2 N 27-Feb Interim 0.0 0.0 0.0 0.0 0.0 0.0 No formal guidance, but qualitative outlook commentary likely to be offered. Alan Joyce will likely reiterate the airline is still on track for profitability in International by FY15
TSE Transfield Services Ltd*
A$ 0.8 1.2 O 27-Feb Interim 0.0 0.0 0.0 0.0 0.0 5.0 -100.0 Expect re-iteration of guidance for $65 - $70mn NPAT consistent with December update. key focus will be on balance sheet where ND expected to peak at ~$680mn. Also expect to see TIMEC (North America) turn to positive profit contribution (major milestone). This will be the first result showing the margin improvement from major cost out initiatives. So all eyes will be on margin trends.
UXC UXC Limited* A$ 1.1 1.2 O 27-Feb Interim 6.4 7.5 -15.5 6.4 8.4 -24.1 1.5 1.8 -13.1
VOC Vocus Communications*
A$ 3.3 2.8 O 27-Feb Interim 5.1 3.9 31.2 5.1 4.2 21.1 0.7 0.4 72.9 Focus will be on: (1) growth in fibre customers and fibre revenue; (2) capex and FY14 capex guidance; (3) continuing to win market share in Internet? and (4) cost control. We expect a very strong result.
WDC Westfield A$ 10.3 11.3 N 27-Feb Final 1,448.1 1,473.7 -1.7 1,448.1 1,473.7 -1.7 25.5 24.8 3.0
WRT Westfield Retail Trust A$ 3.1 3.5 O 27-Feb Final 605.3 572.6 5.7 605.3 572.6 5.7 9.9 9.5 4.5
AOH Altona Mining Limited A$ 0.2 0.3 O 28-Feb Interim 8.5 14.2 -39.7 8.5 14.2 -39.7 0.0 0.0
AUT Aurora Oil & Gas US$ 4.1 R 28-Feb Final 124.5 55.2 125.7 124.5 55.2 125.7 0.0 0.0 Conference call.
BSE Base Resources Ltd A$ 0.4 0.9 O 28-Feb Interim -30.0 -2.0 -1,371.4 -30.0 -2.0 -1,371.4 0.0 0.0 Reporting date is an estimate
HVN Harvey Norman A$ 3.2 3.4 N 28-Feb Interim 119.5 113.4 5.4 119.5 81.9 45.9 5.1 4.5 12.5
NWT NewSat Limited* A$ 0.5 0.7 O 28-Feb Interim 0.1 1.3 -90.6 0.1 1.3 -90.6 0.0 0.0 Result not particularly meaningful. Key focus needs to be on delivery of sales contract for Jabiru1 satellite launching mid-2015.
* Please note these companies are covered by Credit Suisse Emerging Companies (CSEC), a joint venture between Credit Suisse and First NZ Capital.
** In A$mn, unless otherwise stated. Final DPS is 2H dividend. O = Outperform, N = Neutral, U = Underperform, R = Restricted. Source: Company data, Credit Suisse estimates, CSEC estimates

17 F
eb
ruary
201
4
Au
stra
lia a
nd
NZ
Firs
t Ed
ition
171
Currency Price 12M NPAT pre-unusual** Reported NPAT** DPS (c)
Code Company (A$) Tgt. Rtg Date Report Curr PCP Chg % Curr PCP Chg % Curr PCP Chg % Credit Suisse analyst comment
VAH Virgin Australia A$ 0.3 0.4 N 28-Feb Interim 0.0 0.0 0.0 0.0 0.0 0.0 Tentative date
WOW Woolworths A$ 35.5 38.3 O 28-Feb Interim 1,344.2 1,247.2 7.8 1,344.2 1,154.8 16.4 64.5 62.0 4.1
GRY Gryphon Minerals Limited
A$ 0.2 0.3 O 3-Mar Interim -1.5 -1.1 -31.3 -1.5 -1.1 -31.3 0.0 0.0
ORL OrotonGroup A$ 3.9 4.7 O 11-Mar Interim 5.8 16.4 -64.5 5.8 16.4 -64.5 10.0 22.0 -54.5 ORL provided a trading update in Feb 2014 that was below expectations. 1H14 EBIT from continuing businesses is expected to be $8mn, representing a 24% decline from continuing businesses on pcp. FY14 guidance was revised down to the 'lower end' of $13-15mn EBIT.
ORL OrotonGroup A$ 3.9 4.7 O 11-Mar Interim 5.8 16.4 -64.5 5.8 16.4 -64.5 10.0 22.0 -54.5 ORL provided a trading update in Feb 2014 that was below expectations. 1H14 EBIT from continuing businesses is expected to be $8mn, representing a 24% decline from continuing businesses on pcp. FY14 guidance was revised down to the 'lower end' of $13-15mn EBIT.
PMV Premier Investments Ltd
A$ 7.9 9.5 O 19-Mar Interim 52.3 46.5 12.6 52.3 46.5 12.6 23.6 19.0 24.2
MYR Myer Holdings A$ 2.5 2.7 N 20-Mar Interim 77.0 87.9 -12.5 77.0 87.9 -12.5 10.0 10.0 0.0
TPM TPG Telecom* A$ 5.4 5.0 N 24-Mar Interim 75.3 71.3 5.6 75.3 78.3 -3.8 4.6 3.5 30.1 Guidance expected to be re-iterated for $290 - $300mn EBITDA (excluding AAPT acquisition). Key focus will be on progress with FTTb project
TEN Ten Network Holdings
A$ 0.3 0.3 N 10-Apr Interim 6.6 6.8 -3.2 6.6 -243.3 102.7 0.0 0.0 Weak result expected. Investor focus likely to be centred on programming strategy for 2014, in particular areas of investment.
BOQ Bank of Queensland A$ 11.9 12.5 N 11-Apr Interim 140.5 119.9 17.2 140.5 119.9 17.2 32.0 28.0 14.3
MSB Mesoblast A$ 5.8 8.0 O TBA Interim -36.5 -27.8 -31.4 -36.5 -27.8 -31.4 0.0 0.0
* Please note these companies are covered by Credit Suisse Emerging Companies (CSEC), a joint venture between Credit Suisse and First NZ Capital.
** In A$mn, unless otherwise stated. Final DPS is 2H dividend. O = Outperform, N = Neutral, U = Underperform, R = Restricted. Source: Company data, Credit Suisse estimates, CSEC estimates

17 F
eb
ruary
201
4
Au
stra
lia a
nd
NZ
Firs
t Ed
ition
172
First NZ Capital Results Preview Research Analyst
Robert Bode 64 9 302 5555
Price Tgt Est NPAT rptd (NZ$m) EPS adjusted (NZ¢) DPS (NZ¢)
Code Company (NZ$) (NZ$) Rtg Date Report Curr PCP Chg Curr PCP Chg Curr PCP FNZC Analyst Comment
PFI Property for Industry 1.27 1.35 U 17-Feb FY 22.6 13.7 65% 7.2 6.2 15% 7.0 6.6 PFI will report for the first time post the DPF merger although comparatives will be of little use due to the merger occurring on 1 July 2013. PFI has already announced a small positive revaluation over its portfolio of 2.4%. We expect further muted comments on the outlook for rental growth and are looking for guidance that confirms the talked about benefits of the DPF merger. Gearing remains close to the board imposed limit of 40%.
CEN Contact Energy 5.18 5.75 O 18-Feb 1H 79.7 88.0 -9% 10.9 12.6 -13% 11.0 11.0 1H14 earnings expected to be slightly below pcp. We forecast stronger 2H14F due to Te Mihi EBITDAF uplift and reduced fuel costs. Our FY14F NPAT forecast currently lies 3% above pcp, but will be sensitive to initial level of Te Mihi depreciation.
PCT Precinct Properties 1.025 1.08 N 18-Feb 1H 30.9 26.2 18% 2.9 2.6 12% 2.7 2.6 1H14 should see the start of rental and earnings momentum, particularly out of their Auckland prime office portfolio where vacancy is effectively nil and tenant demand is firm. This reporting period will also show the benefits of their debt fuelled acquisitions over the last 18 or so months consolidating their Auckland downtown precinct with a large expected jump in headline NPAT although less on a per share basis.
TME Trade Me 4.00 4.23 U 19-Feb 1H 40.9 37.4 9% 10.3 9.4 9% 17.3 15.8 We expect TME to maintain its FY14 guidance for revenue and EBITDA growth to be lower than FY13 (i.e., lower than 15% revenue growth and 12% EBITDA growth). Market forecasting 9% EBITDA growth.
EBO EBOS Group 9.72 11.25 O 19-Feb 1H 48.7 15.0 320% 33.0 29.0 14% 19.5 17.5 EBO 1H14 is not comparable on a pcp basis, given the acquisition of Symbion in June 2013. Points of interest will include the impact of the AUD (PFI 1H14 guidance issued at 0.82), and any comments around market dynamics in Australia (particularly around PBS policy and guidelines).
MEL Meridian Energy 1.025 1.70 O 19-Feb 1H 62.7 173.4 -64% 2.5 3.5 -29% 4.2 0 Large fall in 1H14 NPAT, due mainly to introduction of lower NZAS sale price from July 2013, and some reduction in Retail FPVV average sale price. Our 2H14 earnings forecast remains consistent with MEL meeting PFI forecasts for FY14. Any cost saving in underlying business would be upside.
STU Steel & Tube 3.00 3.10 U 20-Feb 1H 7.5 7.3 3% 8.5 7.5 13% 6.5 6.5 The rebuild in Canterbury as well as housing and investment recovery in Auckland should deliver growth for STU. The extent to which this captured by STU will be subject to price discipline in the market.
POT Port of Tauranga 13.95 13.80 U 20-Feb 1H 40.4 39.2 3% 30.1 29.2 3% 20.0 20.0 A projected decline in POT’s container volume handled is likely to be more than offset by log volume in 1H, driven by ongoing strong demand for logs from Asia. We expect POT to maintain its NZ$77mn-NZ$81mn NPAT guidance range.
FBU Fletcher Building 9.48 9.00 U 20-Feb 1H 173.0 146.0 19% 25.2 22.3 13% 17.0 17.0 NZ earnings should continue to respond to the pick-up in Auckland housing and ongoing repair and rebuild in Canterbury. Australia performance will likely have remained flat but outlook statement should be more encouraging in light of recovery displayed by lead activity indicators in the sector. We expect FBU to maintain it NZ$610mn-NZ$650mn EBIT guidance range.
AIA Auckland Intl Airport 3.58 3.45 N 20-Feb 1H 86.3 76.1 13% 6.5 5.8 13% 0.0 5.75 Revenue is forecast to lift +7.8% to $239.4mn following a 4.3% increase in international pax and a 3.8% lift in aircraft tonnes landed. EBITDA (excl. associates) is forecast to increase 7.9% to $178.0mn. Due to the announcement of a $454mn capital return AIA will not pay an interim dividend.
NPX Nuplex 3.36 3.73 N 20-Feb 1H 27.0 24.5 10% 13.6 12.4 10% 10.0 10.0 We assume $3.3m restructuring charges in 1H14. Look for European and Asian trading conditions commentary. Impact of strong NZ dollar may weigh on company outlook.
TEL Telecom 2.46 2.50 N 21-Feb 1H 172.0 156.0 10% 9.4 8.4 12% 8.0 8.0 Can TEL surprise on the cost out benefits it has received and outline a plan for further reductions greater than the market anticipates? Operationally, we expect mobile to be the star performer. Look for an update on content strategy and capital structure post AAPT sale.
*Ratings: O = Outperform, U = Underperform, N = Neutral, R = Restricted
Source: Company data, FNZC estimates

17 F
eb
ruary
201
4
Au
stra
lia a
nd
NZ
Firs
t Ed
ition
173
Price Tgt Est NPAT rptd (NZ$m) EPS adjusted (NZ¢) DPS (NZ¢)
Code Company (NZ$) (NZ$) Rtg Date Report Curr PCP Chg Curr PCP Chg Curr PCP FNZC Analyst Comment
NZX NZX 1.24 1.26 U 21-Feb FY 14.0 9.9 41% 5.9 4.8 23% 5.6 5.1 A strong 2013 market will flow through to results. Key question remains around the rebasing of operating costs to meet service levels and if the momentum in other areas can offset a weaker capital raising environment.
VCT Vector 2.32 2.55 U 21-Feb 1H 85.9 116.7 -26% 8.6 11.7 -27% 6.8 7.3 Look for impact of regulated price reset for gas transmission and distribution and claw back for electricity. Key issue remains what return VCT can earn on its network at the 2015 electricity rest given interest rate risk and potential for the Comcom to change its WACC methodology.
CNU Chorus 1.445 1.56 N 24-Feb 1H 80.5 83.6 -4% 20.7 21.7 -5% 0.0 10.0 Key driver is CFH discussions near term but we don’t expect much of an update on this at the result. Operationally probably too early to be talking major cost cutting until CNU know if they can renegotiate CFH contract or not.
FRE Freightways 4.55 4.50 N 24- Feb 1H 21.4 21.0 2% 13.4 12.9 4% 10.0 9.0 Express parcel volume is projected to be c2% YoY driven by a recovery in the NZ economy but earnings growth will likely be contained to mid-single digit due to ongoing shift in volume growth toward the higher unit cost to serve B2C market. We expect FRE to maintain c6% NPAT growth in FY14F before adjusting for recent document destruction and information management businesses
SKT Sky Television 5.78 5.70 U 24-Feb 1H 74.1 68.2 9% 19.1 17.5 9% 13.5 12.0 Another solid result expected. The key focus is subscriber growth and mix following the DSO and whether there have been some expenses associated with a high level of promotional activity and the lower price of Igloo boxes in the period. This will help contextualise the FY14 earnings guidance SKT gave at its ASM in October.
GPG Guinness Peat Group 0.66 0.59 N 25-Feb FY Besides pensions for GPG key focus will be on the impact of weaker Brazil and emerging markets and slower growth in China on Coats’ performance. Our 2H13 revenue for Industrials may be too optimistic.
PGW PGG Wrightson 0.42 0.52 O 25-Feb 1H 9.3 4.8 93% 1.2 1.1 12% 2.2 2.2 Our expectations are for merchandising to deliver NZ$20.4mn EBITDA (+14% YoY) driven by relatively broad-based recovery. Outlook remains encouraging based on current farmgate prices and returns.
HNZ Heartland New Zealand 0.91 0.90 N 25-Feb 1H 17.5 10.7 64% 4.5 2.8 61% 2.5 2.0 Key question is whether the LVR restrictions have flowed through to competition in rural thus impacting HNZ. Look for update on whether there are any acquisition opportunities.
SUM Summerset 3.28 3.55 O 25-Feb FY 24.9 14.8 68% 11.7 7.0 67% 3.5 2.5 Confident around estimates for strong growth in FY13; however, growth rate should ebb in FY14 as SUM cycles a tougher comp and as overheads ramp-up before build rate matches.
ATM A2 Corporation 0.96 0.73 U 26-Feb 1H 1.6 1.2 33% 25.0 9.0 278% 0.0 0.0 We await an update on progress in A2’s most recent initiatives in China with infant formula and the UK where the company has recently taken full ownership of its previous fresh milk JV with Muller-Wiseman. We also anticipate news on further ventures into new markets – most likely the US.
MRP Mighty River Power 1.975 2.30 N 26-Feb 1H 100.9 75.5 34% 7.2 9.5 -24% 5.5 4.8 We forecast 3% uplift vs pcp for 1H14 EBITDAF. Due to large one-off Overseas JV net uplift in pcp 1H14 NPAT expected to be lower. Our current 1H14 forecast is consistent with MRP hitting EBITDAF $500m FY14 guidance.
AIR Air New Zealand 1.695 1.66 N 27 Feb 1H 130 100 30% 11.8 9.0 30% 4.5 3.0 Passenger revenue is forecast to increase 0.4% to $1,937mn with short-haul revenue growth of 1.6% offset by a 1.8% decline in long-haul. We expect lower hedged jet fuel price, a stronger NZ$ and ongoing fuel efficiency improvements to drive lower fuel costs which will in turn deliver around 20% growth in1H14 EBIT that AIR guided to in December.
NZR New Zealand Refining 1.97 2.78 O 27-Feb FY 29.3 32.6 -10% 10.5 11.7 -10% 6.0 7.0 A very weak end to FY13 for margins means downside revisions are likely to our/consensus numbers. Meanwhile, FY14 appears to have started poorly for margins.
HBY Hellaby Holdings 3.15 3.90 O 27-Feb 1H 9.3 6.2 50% 9.9 6.6 50% 7.5 5.0 Despite the changed composition of the investment portfolio, with the acquisition of Contract Resources, we are forecasting a 1H / 2H split consistent with that of last year (that being 1/3 and 2/3 respectively). This is due the contract nature of the oil and gas business.
*Ratings: O = Outperform, U = Underperform, N = Neutral, R = Restricted
Source: Company data, FNZC estimates

17 February 2014
Australia and NZ First Edition 174
Companies Mentioned (Price as of 14 Feb 2014)
Adelaide Brighton (ABC.AU, AU$4.06, UNDERPERFORM, TP AU$3.40) BHP Billiton (BLT.L, 1871.0p) Boral (BLD.AU, AU$5.48, NEUTRAL, TP AU$5.90) CLP Holdings Limited (0002.HK, HK$59.45) Commonwealth Bank Australia (CBA.AU, AU$75.99, UNDERPERFORM, TP AU$76.00) CSR (CSR.AU, AU$3.06, OUTPERFORM, TP AU$2.90) *Fletcher Building (FBU.NZ, NZ$9.48, NEUTRAL, TP NZ$10.25) *Heartland New Zealand (HNZ.NZ, NZ$0.91, NEUTRAL, TP NZ$0.96) James Hardie Industries SE (JHX.AU, AU$13.50, OUTPERFORM, TP AU$13.50) Louisiana-Pacific Corp. (LPX.N, $18.07) *Michael Hill International (MHI.NZ, NZ$1.38, OUTPERFORM, TP NZ$1.67) *Port of Tauranga (POT.NZ, NZ$13.95, UNDERPERFORM, TP NZ$13.80) Rio Tinto (RIO.L, 3497.5p, OUTPERFORM, TP 4200.0p) Simon Property Group, Inc. (SPG.N, $158.73) Singapore Telecom (SGT.AX, A$3.59, NEUTRAL, TP S$3.9) Singapore Telecom (STEL.SI, S$3.58, NEUTRAL, TP S$3.9) *Steel & Tube Holdings (STU.NZ, NZ$3.00, UNDERPERFORM, TP NZ$3.10) *Vital Healthcare Property Trust (VHP.NZ, NZ$1.29, NEUTRAL, TP NZ$1.35)
*Denotes a First NZ Capital covered company. For details of Australian companies covered by Credit Suisse refer to the Top 100 and Small Caps earnings & dividends sheets.
CSEC Disclosure Appendix
Important Global Disclosures
The analysts identified in this report each certify, with respect to the companies or securities that the individual analyzes, that (1) the views expressed in this report accurately reflect his or her personal views about all of the subject companies and securities and (2) no part of his or her compensation was, is or will be directly or indirectly related to the specific recommendations or views expressed in this report.
The analyst(s) responsible for preparing this research report received Compensation that is based upon various factors including CSEC’s revenues, a portion of which is generated by Credit Suisse and CSEC’s investment banking activities. CSEC Analysts involved in the preparation of this report may be co-located with Credit Suisse analysts.
The analyst(s) responsible for preparing this research report received compensation that is based upon various factors including CSEC's total revenues, a portion of which are generated by CSEC's investment banking activities.
Analysts’ sector weightings are distinct from analysts’ stock ratings and are based on the analyst’s expectations for the fundamentals and/or valuation of the sector* relative to the group’s historic fundamentals and/or valuation:
Overweight : The analyst’s expectation for the sector’s fundamentals and/or valuation is favorable over the next 12 months.
Market Weight : The analyst’s expectation for the sector’s fundamentals and/or valuation is neutral over the next 12 months.
Underweight : The analyst’s expectation for the sector’s fundamentals and/or valuation is cautious over the next 12 months.
*An analyst’s coverage sector consists of all companies covered by the analyst within the relevant sector. An analyst may cover multiple sectors.
As of December 10, 2012 Analysts’ stock rating are defined as follows:
Outperform (O) : The stock’s total return is expected to outperform the relevant benchmark*over the next 12 months.
Neutral (N) : The stock’s total return is expected to be in line with the relevant benchmark* over the next 12 months.
Underperform (U) : The stock’s total return is expected to underperform the relevant benchmark* over the next 12 months.
*Relevant benchmark by region: As of 10th December 2012, Japanese ratings are based on a stock’s total return relative to the analyst's coverage universe which consists of all companies covered by the analyst within the relevant sector, with Outperforms representing the most attractiv e, Neutrals the less attractive, and Underperforms the least attractive investment opportunities. As of 2nd October 2012, U.S. and Canadian as well as European ratings are based on a stock’ s total return relative to the analyst's coverage universe which consists of all companies covered by the analyst within the releva nt sector, with Outperforms representing the most attractive, Neutrals the less attractive, and Underperforms the least attractive investment opportunities. For Latin Ame rican and non-Japan Asia stocks, ratings are based on a stock’s total return relative to the average total return of the relevant country or regional benchmark; Australia, New Zealand are, and prior to 2nd October 2012 U.S. and Canadian ratings were based on (1) a stock’s absolute total return potential to its current share price and (2) the relative attractiveness of a stock’s total return potential within an analyst’s coverage universe. For Australian and New Zealand stocks, 12 -month rolling yield is incorporated in the absolute total return calculation and a 15% and a 7.5% threshold replace the 10-15% level in the Outperform and Underperform stock rating definitions, respectively. The 15% and 7.5% thresholds replace the +10-15% and -10-15% levels in the Neutral stock rating definition, respectively. Prior to 10th December 2012, Japanese ra tings were based on a stock’s total return relative to the average total return of the relevant country or regional benchmark.
Restricted (R) : In certain circumstances, CSEC policy and/or applicable law and regulations preclude certain types of communications, including an investment recommendation, during the course of CSEC's engagement in an investment banking transaction and in certain other circumstances.

17 February 2014
Australia and NZ First Edition 175
Volatility Indicator [V] : A stock is defined as volatile if the stock price has moved up or down by 20% or more in a month in at least 8 of the past 24 months or the analyst expects significant volatility going forward.
CSEC's distribution of stock ratings (and banking clients) is:
Global Ratings Distribution
Rating Versus universe (%) Of which banking clients (%)
Outperform/Buy* 39% (0% banking clients)
Neutral/Hold* 48% (0% banking clients)
Underperform/Sell* 13% (0% banking clients)
Restricted 0%
*For purposes of the NYSE and NASD ratings distribution disclosure requirements, our stock rating s of Outperform, Neutral, and Underperform most closely correspond to Buy, Hold, and Sell, respectively; however, the meanings are not the same, as our stock ratings are determined on a relative basis. (Please refer to definitions above.) An investor's decision to buy or sell a security should be based on investment objectives, current holdings, and other individual factors.
CSEC’s policy is to update research reports as it deems appropriate, based on developments with the subject company, the sector or the market that may have a material impact on the research views or opinions stated herein.
CSEC's policy is only to publish investment research that is impartial, independent, clear, fair and not misleading. For more detail on CSEC's Policies for Managing Conflicts of Interest in connection with Investment Research please contact (+612) 8205 4381.
CSEC does not provide any tax advice. Any statement herein regarding any US federal tax is not intended or written to be used, and cannot be used, by any taxpayer for the purposes of avoiding any penalties.
Credit Suisse Disclosure Appendix
As of December 10, 2012 Analysts’ stock rating are defined as follows:
Outperform (O) : The stock’s total return is expected to outperform the relevant benchmark*over the next 12 months.
Neutral (N) : The stock’s total return is expected to be in line with the relevant benchmark* over the next 12 months.
Underperform (U) : The stock’s total return is expected to underperform the relevant benchmark* over the next 12 months.
*Relevant benchmark by region: As of 10th December 2012, Japanese ratings are based on a stock’s total return relative to the ana lyst's coverage universe which consists of all companies covered by the analyst within the relevant sector, with Outperforms representing the most attractive, Neutrals the less attractive, and Underperforms the least attractive investment opportunities. As of 2nd October 2012, U.S. and Canadian as well as European ra tings are based on a stock’s total return relative to the analyst's coverage universe which consists of all companies covered by the analyst within the relevant sector, with Outperforms represen ting the most attractive, Neutrals the less attractive, and Underperforms the least attractive investment opportunities. For Latin American and non-Japan Asia stocks, ratings are based on a stock’s total return relative to the average total return of the relevant country or regional benchmark; Australia, New Zealand are, and prior to 2nd October 2012 U.S. and Canadian ratings were based on (1) a stock’s absolute total return potential to its current share price and (2) the relative attractiveness of a stock’s total return potential within an analyst’s coverage universe. For Australian and New Zealand stocks, 12 -month rolling yield is incorporated in the absolute total return calculation and a 15% and a 7.5% threshold replace the 10-15% level in the Outperform and Underperform stock rating definitions, respectively. The 15% and 7.5% thresholds replace the +10-15% and -10-15% levels in the Neutral stock rating definition, respectively. Prior to 10th December 2012, Japanese ratings were based on a stock’s total return relative to the average total return of the relevant country or regional benchmark.
Restricted (R) : In certain circumstances, Credit Suisse policy and/or applicable law and regulations preclude certain types of communications, including an investment recommendation, during the course of Credit Suisse's engagement in an investment banking transaction and in certain other circumstances.
Volatility Indicator [V] : A stock is defined as volatile if the stock price has moved up or down by 20% or more in a month in at least 8 of the past 24 months or the analyst expects significant volatility going forward.
Analysts’ sector weightings are distinct from analysts’ stock ratings and are based on the analyst’s expectations for the fundamentals and/or valuation of the sector* relative to the group’s historic fundamentals and/or valuation:
Overweight : The analyst’s expectation for the sector’s fundamentals and/or valuation is favorable over the next 12 months.
Market Weight : The analyst’s expectation for the sector’s fundamentals and/or valuation is neutral over the next 12 months.
Underweight : The analyst’s expectation for the sector’s fundamentals and/or valuation is cautious over the next 12 months.
*An analyst’s coverage sector consists of all companies covered by the analyst within the relevant sector. An analyst may cover multiple sectors.

17 February 2014
Australia and NZ First Edition 176
Credit Suisse's distribution of stock ratings (and banking clients) is:
Global Ratings Distribution
Rating Versus universe (%) Of which banking clients (%)
Outperform/Buy* 43% (54% banking clients)
Neutral/Hold* 40% (49% banking clients)
Underperform/Sell* 15% (44% banking clients)
Restricted 2%
*For purposes of the NYSE and NASD ratings distribution disclosure requirements, our stock ratings of Outperform, Neutral, an d Underperform most closely correspond to Buy, Hold, and Sell, respectively; however, the meanings are not the same, as our stock ratings are determined on a relative basis. (Please refer to definitions above.) An investor's decision to buy or sell a security should be based on investment objectives, current holdin gs, and other individual factors.
Credit Suisse’s policy is to update research reports as it deems appropriate, based on developments with the subject company, the sector or the market that may have a material impact on the research views or opinions stated herein.
Credit Suisse's policy is only to publish investment research that is impartial, independent, clear, fair and not misleading. For more detail please refer to Credit Suisse's Policies for Managing Conflicts of Interest in connection with Investment Research: http://www.csfb.com/research and analytics/disclaimer/managing_conflicts_disclaimer.html
Credit Suisse does not provide any tax advice. Any statement herein regarding any US federal tax is not intended or written to be used, and cannot be used, by any taxpayer for the purposes of avoiding any penalties.
Please refer to the firm's disclosure website at https://rave.credit-suisse.com/disclosures for the definitions of abbreviations typically used in the target price method and risk sections.
Important Regional Disclosures
Singapore recipients should contact Credit Suisse AG, Singapore Branch for any matters arising from this research report.
Restrictions on certain Canadian securities are indicated by the following abbreviations: NVS--Non-Voting shares; RVS--Restricted Voting Shares; SVS--Subordinate Voting Shares.
Individuals receiving this report from a Canadian investment dealer that is not affiliated with Credit Suisse should be advised that this report may not contain regulatory disclosures the non-affiliated Canadian investment dealer would be required to make if this were its own report.
For Credit Suisse Securities (Canada), Inc.'s policies and procedures regarding the dissemination of equity research, please visit http://www.csfb.com/legal_terms/canada_research_policy.shtml.
As of the date of this report, Credit Suisse acts as a market maker or liquidity provider in the equities securities that are the subject of this report.
Principal is not guaranteed in the case of equities because equity prices are variable.
Commission is the commission rate or the amount agreed with a customer when setting up an account or at any time after that.
Credit Suisse Emerging Companies (Australia) Pty Limited ("CSEC") is the research report provider in relation to this report. Credit Suisse has disclosed its conflicts of interest also in this report as Credit Suisse is a material shareholder in CSEC; the distributor of this research; and has re-branded this document. Despite the foregoing, Credit Suisse is not liable or responsible for the content of this research report and provides it as distributor for informational purposes only
Credit Suisse Emerging Companies (Australia) Pty Limited ("CSEC") is an incorporated joint venture entered into between Credit Suisse and First NZ Capital. Pursuant to this arrangement, Credit Suisse makes available to its clients certain research produced by CSEC. CSEC is not an affiliate or related body corporate of Credit Suisse. Credit Suisse is not liable or responsible for the content of such research and provides such research as its distributor for informational purposes only
Important MSCI Disclosures
The MSCI sourced information is the exclusive property of Morgan Stanley Capital International Inc. (MSCI). Without prior written permission of MSCI, this information and any other MSCI intellectual property may not be reproduced, re-disseminated or used to create and financial products, including any indices. This information is provided on an "as is" basis. The user assumes the entire risk of any use made of this information. MSCI, its affiliates and any third party involved in, or related to, computing or compiling the information hereby expressly disclaim all warranties of originality, accuracy, completeness, merchantability or fitness for a particular purpose with respect to any of this information. Without limiting any of the foregoing, in no event shall MSCI, any of its affiliates or any third party involved in, or related to, computing or compiling the information have any liability for any damages of any kind. MSCI, Morgan Stanley Capital International and the MSCI indexes are services marks of MSCI and its affiliates.
The Global Industry Classification Standard (GICS) was developed by and is the exclusive property of Morgan Stanley Capital International Inc. and Standard & Poor’s. GICS is a service mark of MSCI and S&P and has been licensed for use by Credit Suisse.
For Credit Suisse disclosure information on other companies mentioned in this report, please visit the website at https://rave.credit-suisse.com/disclosures or call +1 (877) 291-2683.

23 J
an
uary
201
4
EQUITIES
Nick Selvaratnam 612 8205 4105 Head of Equities
Adam Indikt 613 9280 1659 Head of Client Relationship Management
RESEARCH
Adnan Kucukalic 612 8205 4427 Paul McTaggart 612 8205 4698 Co-Heads of Research
Resources
Energy (Oil & Gas) Mark Samter 612 8205 4537 David Hewitt 65 6212 3064 Justin Teo 612 8205 4426
Diversified Resources, Coal, Iron Ore, Nickel Paul McTaggart 612 8205 4698 Matthew Hope 612 8205 4669 Martin Kronborg 612 8205 4369
Copper, Gold, Steel Michael Slifirski 613 9280 1845 Sam Webb 613 9280 1716
Industrials
Food & Beverage, Packaging, Agriculture, Casinos & Gaming Larry Gandler 613 9280 1855 Ben Levin 613 9280 1766
Media & Telecoms Fraser McLeish 612 8205 4069 Lucas Goode 612 8205 4431
Retail Grant Saligari 613 9280 1720 Samantha Carleton 612 8205 4148 James O’Brien 613 9280 1669
Health Care Saul Hadassin 612 8205 4679 William Dunlop 612 8205 4405
Utilities & Infrastructure Sandra McCullagh 612 8205 4729 David Bailey 612 8205 4739 Nicholas Markiewicz 612 8205 4107
Transport Nicholas Markiewicz 612 8205 4107
Building Materials, Chemicals Andrew Peros 612 8205 4013
Developers & Contractors Emma Alcock 612 8205 4403
email: [email protected]
Financials
Banks Jarrod Martin 612 8205 4334 James Ellis 612 8205 4531 James Cordukes 612 8205 4858
Insurance & Diversified Financials Andrew Adams 612 8205 4106 James Ellis 612 8205 4531
Real Estate Stephen Rich 612 8205 4617 John Richmond 612 8205 4580 Mikhail Mohl 612 8205 4413
Macro
Investment Strategy Hasan Tevfik 612 8205 4284 Damien Boey 612 8205 4615
ESG Sandra McCullagh 612 8205 4729 Chris Parks 612 8205 4577
Quantitative Analysis Richard Hitchens 612 8205 4467
Research Database Jason Swinbourne 612 8205 4591
Emerging Companies
Credit Suisse Emerging Companies (Australia) Limited Research Paul Buys 612 8205 4538 Bradley Clibborn 612 8205 4465 Chris Smith 612 8205 4210 Sarah Mann 612 8205 4610
Specialist Sales Michael Bassett 612 8205 4326 Craig Haskins 612 8205 4160
CORPORATE ACCESS Cathy Kermond 612 8205 4488
EQUITY CAPITAL MARKETS Ian Arnold 612 8205 4415 Head of Syndication
Credit Suisse HOLT®
Scott Chessum 613 9280 1662 Head of Australia
Peter Jabour 613 9280 1702
SALES AND TRADING
SYDNEY – Research Sales Chris Mayne 612 8205 4363 Head of Sales & SalesTrading
John Ayoub 612 8205 4636 John Fessey 612 8205 4417 Simon Footit 612 8205 4173 Michael van Elst 612 8205 4419 Tom McDonald 612 8205 4874
Sales Trading James Hogan 612 8205 4043 Jim Bromley 612 8205 4715 David Robb 612 8205 4820
Facilitation Ron Rossettin 612 8205 4479 Jason Cooper 612 8205 4364
OTC Derivatives Phil McLean 612 8205 4775
Derivative Sales Chris Mayne 612 8205 4363
Portfolio & Quant Sales Andrew Bruce 612 8205 4474
AES Sales David Broadfield 612 8205 4708
Hedge Fund Sales Peter van Beek 612 8205 4172 William Allen 612 8205 4131
Real Estate Specialist Sales Jason Cooper 612 8205 4364 Bhupen Master 612 8205 4792
MELBOURNE – Research Sales
Tom Wilson 613 9280 1727 Sales Trading
John Ryan 613 9280 1644 Joe Zhang 613 9280 1691
UK/EUROPE Edward Delany 4420 7888 0841 Head of International Sales
Sophie Rose 4420 7888 5648
USA Nicholas Humphries 1 212 325 6998 Jonathan Chow 1 415 836 8686
ASIA Rowan Parchi 852 2101 6763 Head of Asian Sales
Dominic Smith 852 2101 7503
EXECUTION Paul Marosa 612 8205 4425 Head DTR
Paul Bugeja 613 9280 1788 Rohan Congues 612 8205 4728
PRIME SERVICES Graeme Anderson 612 8205 4647 James Persson 612 8205 4938 Callum Gordon 612 8205 4831 Warren Goward 612 8205 4453 Nathan Trute 612 8205 4333 Stephen Morgans 612 8205 4333 Nigel Watts 612 8205 4845 Chad Heinsen 612 8205 4581 Damien Jenkins 612 8205 4864 Sophie Rasmussen 612 8205 4955
Research & Sales Responsibilities

References in this report to Credit Suisse include all of the subsidiaries and affiliates of Credit Suisse operating under its investment banking division. For more information on our structure, please use the following link: https://www.credit-suisse.com/who_we_are/en/.This report may contain material that is not directed to, or intended for distribution to or use by, any person or entity who is a citizen or resident of or located in any locality, state, country or other jurisdiction where such distribution, publication, availability or use would be contrary to law or regulation or which would subject Credit Suisse AG or its affiliates ("CS") to any registration or licensing requirement within such jurisdiction. All material presented in this report, unless specifically indicated otherwise, is under copyright to CS. None of the material, nor its content, nor any copy of it, may be altered in any way, transmitted to, copied or distributed to any other party, without the prior express written permission of CS. All trademarks, service marks and logos used in this report are trademarks or service marks or registered trademarks or service marks of CS or its affiliates. The information, tools and material presented in this report are provided to you for information purposes only and are not to be used or considered as an offer or the solicitation of an offer to sell or to buy or subscribe for securities or other financial instruments. CS may not have taken any steps to ensure that the securities referred to in this report are suitable for any particular investor. CS will not treat recipients of this report as its customers by virtue of their receiving this report. The investments and services contained or referred to in this report may not be suitable for you and it is recommended that you consult an independent investment advisor if you are in doubt about such investments or investment services. Nothing in this report constitutes investment, legal, accounting or tax advice, or a representation that any investment or strategy is suitable or appropriate to your individual circumstances, or otherwise constitutes a personal recommendation to you. CS does not advise on the tax consequences of investments and you are advised to contact an independent tax adviser. Please note in particular that the bases and levels of taxation may change. Information and opinions presented in this report have been obtained or derived from sources believed by CS to be reliable, but CS makes no representation as to their accuracy or completeness. CS accepts no liability for loss arising from the use of the material presented in this report, except that this exclusion of liability does not apply to the extent that such liability arises under specific statutes or regulations applicable to CS. This report is not to be relied upon in substitution for the exercise of independent judgment. CS may have issued, and may in the future issue, other communications that are inconsistent with, and reach different conclusions from, the information presented in this report. Those communications reflect the different assumptions, views and analytical methods of the analysts who prepared them and CS is under no obligation to ensure that such other communications are brought to the attention of any recipient of this report. CS may, to the extent permitted by law, participate or invest in financing transactions with the issuer(s) of the securities referred to in this report, perform services for or solicit business from such issuers, and/or have a position or holding, or other material interest, or effect transactions, in such securities or options thereon, or other investments related thereto. In addition, it may make markets in the securities mentioned in the material presented in this report. CS may have, within the last three years, served as manager or co-manager of a public offering of securities for, or currently may make a primary market in issues of, any or all of the entities mentioned in this report or may be providing, or have provided within the previous 12 months, significant advice or investment services in relation to the investment concerned or a related investment. Additional information is, subject to duties of confidentiality, available on request. Some investments referred to in this report will be offered solely by a single entity and in the case of some investments solely by CS, or an associate of CS or CS may be the only market maker in such investments. Past performance should not be taken as an indication or guarantee of future performance, and no representation or warranty, express or implied, is made regarding future performance. Information, opinions and estimates contained in this report reflect a judgment at its original date of publication by CS and are subject to change without notice. The price, value of and income from any of the securities or financial instruments mentioned in this report can fall as well as rise. The value of securities and financial instruments is subject to exchange rate fluctuation that may have a positive or adverse effect on the price or income of such securities or financial instruments. Investors in securities such as ADR's, the values of which are influenced by currency volatility, effectively assume this risk. Structured securities are complex instruments, typically involve a high degree of risk and are intended for sale only to sophisticated investors who are capable of understanding and assuming the risks involved. The market value of any structured security may be affected by changes in economic, financial and political factors (including, but not limited to, spot and forward interest and exchange rates), time to maturity, market conditions and volatility, and the credit quality of any issuer or reference issuer. Any investor interested in purchasing a structured product should conduct their own investigation and analysis of the product and consult with their own professional advisers as to the risks involved in making such a purchase. Some investments discussed in this report may have a high level of volatility. High volatility investments may experience sudden and large falls in their value causing losses when that investment is realised. Those losses may equal your original investment. Indeed, in the case of some investments the potential losses may exceed the amount of initial investment and, in such circumstances, you may be required to pay more money to support those losses. Income yields from investments may fluctuate and, in consequence, initial capital paid to make the investment may be used as part of that income yield. Some investments may not be readily realisable and it may be difficult to sell or realise those investments, similarly it may prove difficult for you to obtain reliable information about the value, or risks, to which such an investment is exposed. This report may provide the addresses of, or contain hyperlinks to, websites. Except to the extent to which the report refers to website material of CS, CS has not reviewed any such site and takes no responsibility for the content contained therein. Such address or hyperlink (including addresses or hyperlinks to CS's own website material) is provided solely for your convenience and information and the content of any such website does not in any way form part of this document. Accessing such website or following such link through this report or CS's website shall be at your own risk. This report is issued and distributed in Europe (except Switzerland) by Credit Suisse Securities (Europe) Limited, One Cabot Square, London E14 4QJ, England, which is regulated in the United Kingdom by The Financial Services Authority ("FSA"). This report is being distributed in Germany by Credit Suisse Securities (Europe) This report is being distributed in the United States and Canada by Credit Suisse Securities (USA) LLC; in Switzerland by Credit Suisse AG; in Brazil by Banco de Investimentos Credit Suisse (Brasil) S.A or its affiliates; in Mexico by Banco Credit Suisse (México), S.A. (transactions related to the securities mentioned in this report will only be effected in compliance with applicable regulation); in Japan by Credit Suisse Securities (Japan) Limited, Financial Instruments Firm, Director-General of Kanto Local Finance Bureau (Kinsho) No. 66, a member of Japan Securities Dealers Association, The Financial Futures Association of Japan, Japan Investment Advisers Association, Type II Financial Instruments Firms Association; elsewhere in Asia/ Pacific by whichever of the following is the appropriately authorised entity in the relevant jurisdiction: Credit Suisse (Hong Kong) Limited, Credit Suisse Equities (Australia) Limited, Credit Suisse Securities (Thailand) Limited, Credit Suisse Securities (Malaysia) Sdn Bhd, Credit Suisse AG, Singapore Branch, Credit Suisse Securities (India) Private Limited regulated by the Securities and Exchange Board of India (registration Nos. INB230970637; INF230970637; INB010970631; INF010970631), having registered address at 9th Floor, Ceejay House,Dr.A.B. Road, Worli, Mumbai - 18, India, T- +91-22 6777 3777, Credit Suisse Securities (Europe) Limited, Seoul Branch, Credit Suisse AG, Taipei Securities Branch, PT Credit Suisse Securities Indonesia, Credit Suisse Securities (Philippines ) Inc., and elsewhere in the world by the relevant authorised affiliate of the above. Research on Taiwanese securities produced by Credit Suisse AG, Taipei Securities Branch has been prepared by a registered Senior Business Person. Research provided to residents of Malaysia is authorised by the Head of Research for Credit Suisse Securities (Malaysia) Sdn Bhd, to whom they should direct any queries on +603 2723 2020. This research may not conform to Canadian disclosure requirements. In jurisdictions where CS is not already registered or licensed to trade in securities, transactions will only be effected in accordance with applicable securities legislation, which will vary from jurisdiction to jurisdiction and may require that the trade be made in accordance with applicable exemptions from registration or licensing requirements. Non-U.S. customers wishing to effect a transaction should contact a CS entity in their local jurisdiction unless governing law permits otherwise. U.S. customers wishing to effect a transaction should do so only by contacting a representative at Credit Suisse Securities (USA) LLC in the U.S. Please note that this research was originally prepared and issued by CS for distribution to their market professional and institutional investor customers. Recipients who are not market professional or institutional investor customers of CS should seek the advice of their independent financial advisor prior to taking any investment decision based on this report or for any necessary explanation of its contents. This research may relate to investments or services of a person outside of the UK or to other matters which are not regulated by the FSA or in respect of which the protections of the FSA for private customers and/or the UK compensation scheme may not be available, and further details as to where this may be the case are available upon request in respect of this report. CS may provide various services to US municipal entities or obligated persons ("municipalities"), including suggesting individual transactions or trades and entering into such transactions. Any services CS provides to municipalities are not viewed as "advice" within the meaning of Section 975 of the Dodd-Frank Wall Street Reform and Consumer Protection Act. CS is providing any such services and related information solely on an arm's length basis and not as an advisor or fiduciary to the municipality. In connection with the provision of the any such services, there is no agreement, direct or indirect, between any municipality (including the officials, management, employees or agents thereof) and CS for CS to provide advice to the municipality. Municipalities should consult with their financial, accounting and legal advisors regarding any such services provided by CS. In addition, CS is not acting for direct or indirect compensation to solicit the municipality on behalf of an unaffiliated broker, dealer, municipal securities dealer, municipal advisor, or investment adviser for the purpose of obtaining or retaining an engagement by the municipality for or in connection with Municipal Financial Products, the issuance of municipal securities, or of an investment adviser to provide investment advisory services to or on behalf of the municipality. If this report is being distributed by a financial institution other than Credit Suisse AG, or its affiliates, that financial institution is solely responsible for distribution. Clients of that institution should contact that institution to effect a transaction in the securities mentioned in this report or require further information. This report does not constitute investment advice by Credit Suisse to the clients of the distributing financial institution, and neither Credit Suisse AG, its affiliates, and their respective officers, directors and employees accept any liability whatsoever for any direct or consequential loss arising from their use of this report or its content. Principal is not guaranteed. Commission is the commission rate or the amount agreed with a customer when setting up an account or at any time after that.
Copyright © 2014 CREDIT SUISSE AG and/or its affiliates. All rights reserved.
Investment principal on bonds can be eroded depending on sale price or market price. In addition, there are bonds on which investment principal can be eroded due to changes in redemption amounts. Care is required when investing in such instruments.
When you purchase non-listed Japanese fixed income securities (Japanese government bonds, Japanese municipal bonds, Japanese government guaranteed bonds, Japanese corporate bonds) from CS as a seller, you will be requested to pay the purchase price only.