Dominos Pizza (ASX:DMP) - Bell Direct
57
Domino’s Pizza Enterprises Limited 1/485 Kingsford Smith Drive Hamilton, QLD, Australia 4007 ACN: 010 489 326 www.dominos.com.au 17 February 2021 The Manager Market Announcements Office Australian Securities Exchange 4 th Floor, 20 Bridge Street SYDNEY NSW 2000 Dear Sir Market presentation for the half-year ended 27 December 2020 Please find attached for immediate release the market presentation in relation to the financial results for the Company for the half-year ended 27 December 2020. For further information, contact Nathan Scholz, Head of Investor Relations at [email protected] or on +61-419-243-517. Authorised for lodgement by the Board. Craig Ryan Company Secretary END
-
Upload
khangminh22 -
Category
Documents
-
view
1 -
download
0
Transcript of Dominos Pizza (ASX:DMP) - Bell Direct

Domino’s Pizza Enterprises Limited 1/485 Kingsford Smith Drive
Hamilton, QLD, Australia 4007 ACN: 010 489 326
www.dominos.com.au
17 February 2021
The Manager
Market Announcements Office
Australian Securities Exchange
4th Floor, 20 Bridge Street
SYDNEY NSW 2000
Dear Sir
Market presentation for the half-year ended 27 December 2020
Please find attached for immediate release the market presentation in relation to the financial results
for the Company for the half-year ended 27 December 2020.
For further information, contact Nathan Scholz, Head of Investor Relations at
[email protected] or on +61-419-243-517.
Authorised for lodgement by the Board.
Craig Ryan
Company Secretary
END

1

2
3
Management is prepared for a medium-term future living with COVID-19; Domino’s will rise to the challenge
Likelihood of a mix of above-trend sales, temporary closures and short-term investments are not possible to quantify
DPE is however well placed to respond: our strategy, store footprint, and franchisees are right for this time.
What delivered us to now, allows us to build a confident future
Domino’s outlook for new store openings and Same Store Sales growth remains unchanged
In all regions we intend to put people first, and grow market share:▪ To prioritise the safety of our customers and team members▪ To invest in ‘distressed’ media▪ To seek out growth opportunities▪ To be agile▪ To strengthen our franchisee base▪ To refine operations, to grow carry-out and delivery▪ To prepare for more value-focused customers
Management outlined the following at our Full Year Presentation, on 19 August 2020:See DPE FY20 Market Presentation, “Living With COVID-19” slide 40
4
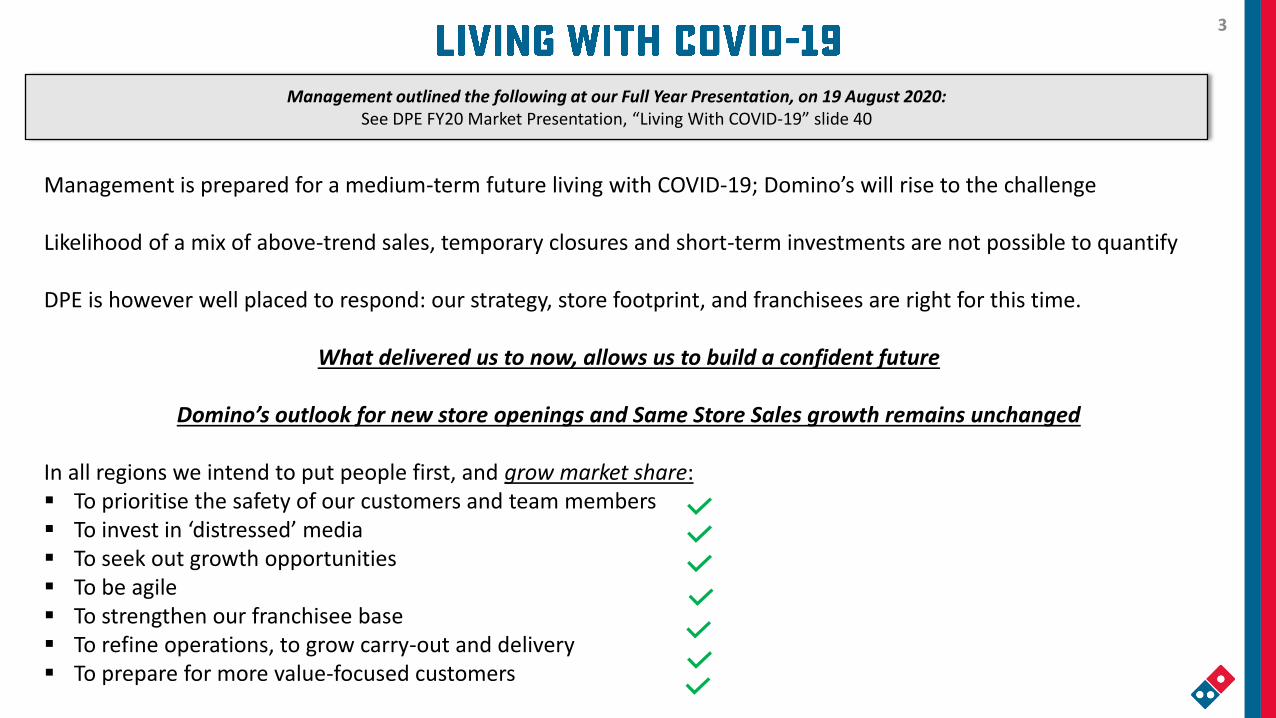
1) H121 underlying compared to H120 underlying including AASB162) Net CAPEX excludes acquisition payments – see slide 15 for further details
H121
Actual
Half-on-Half
Growth
Half-on-Half
% Growth
Network Sales $1,843.0m +$260.8m +16.5%
Online Sales $1,417.0m +$286.6m +25.4%
Same Store Sales Growth +8.5%
Network Store Count 2,795 stores +131 stores
EBITDA(1) $218.7m +$42.0m +23.8%
EBIT(1) $153.0m +$37.4m +32.3%
NPAT (after Minority Interest)(1) $96.2m +$23.7m +32.8%
EPS(1) 111.1 cps +26.8 cps +31.7%
Dividend 88.4 cps +21.7 cps +32.5%
Net CAPEX(2) $36.9m -$12.2m -24.9%
Free Cash Flow $124.4m +$41.7m +50.3%

5
▪ Very strong Network Sales growth and store openings continued across all regions for the first 7 weeks of H221
▪ In the prior corresponding period, SSS was +6.3%, with +11 new stores opened during the first 7 weeks of trade(2)
1) Network Sales and SSS growth during the first 6 weeks of trade (28 December 2020 – 14 February 2021); new organic store additions during the first 7 weeks of trade (28 December 2020 – 17 February 2021)2) SSS growth during the first 7 weeks of trade (30 December 2019 – 16 February 2020); new organic stores additions during the first 7 weeks of trade (30 December 2019 – 19 February 2020)
(1)
H121 H221
Actual Trading Update(1)
Network Sales Growth +16.5% +20.9%
Same Store Sales Growth +8.5% +10.1%
New Organic Store Additions +131 stores +11 stores
6
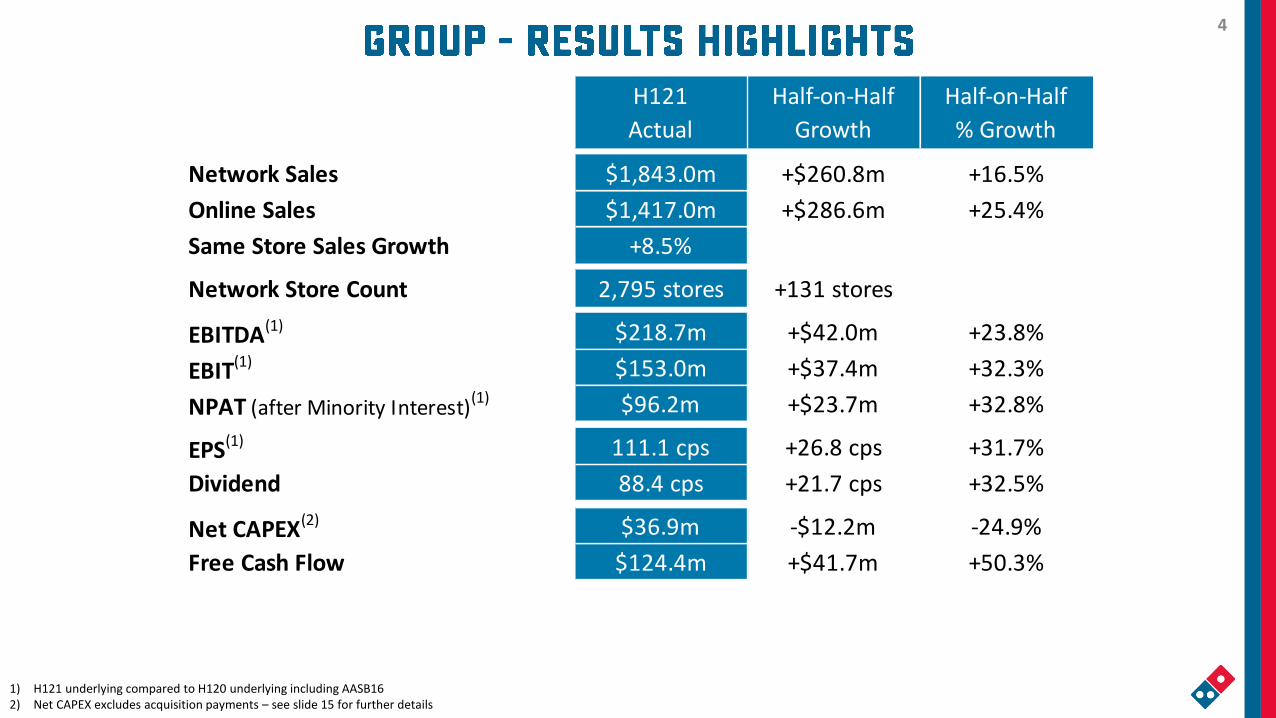
1) 3-5 Year Outlook as provided to the Market on 19 August 2020 2) Excluding capital expenditure relating to acquisitions of $1.0m
(3)
▪ Pleasing Group-wide performance with strong SSS and new store openings in H121; Japan and Germany are ongoing highlights for the Group
▪ Changes in trading conditions, and the Company’s agile response to these changes, has lifted expectations for FY21 performance to be above the 3-5 Year Outlook, in all the above measures
▪ The likelihood of a mix of above-trend sales and temporary regional lockdowns continues
▪ Japan will also be cycling exceptional sales comps in Q4 (due to peak COVID State of Emergency in 2020), where we gained significant leverage in our Corporate stores
▪ The medium term outlook for the business (post COVID-19) remains unchanged
3-5 Year H121
Outlook(1) Actual
Same Store Sales Growth +3-6% +8.5%
New Organic Store Additions +7-9% of network+131 stores
+5.0% of network
Net CAPEX(2) $60-100m $36.9m
7
(1)
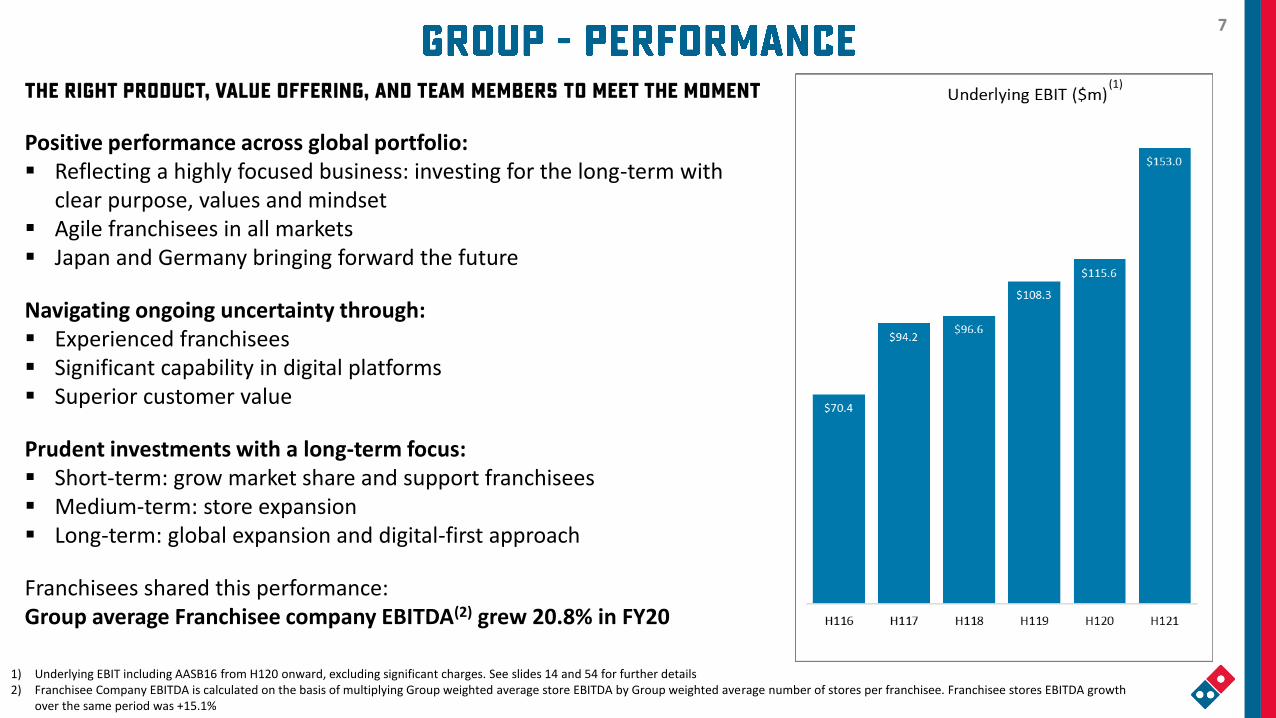
Positive performance across global portfolio:▪ Reflecting a highly focused business: investing for the long-term with
clear purpose, values and mindset▪ Agile franchisees in all markets▪ Japan and Germany bringing forward the future
Navigating ongoing uncertainty through:▪ Experienced franchisees▪ Significant capability in digital platforms▪ Superior customer value
Prudent investments with a long-term focus:▪ Short-term: grow market share and support franchisees▪ Medium-term: store expansion▪ Long-term: global expansion and digital-first approach
Franchisees shared this performance:Group average Franchisee company EBITDA(2) grew 20.8% in FY20
1) Underlying EBIT including AASB16 from H120 onward, excluding significant charges. See slides 14 and 54 for further details 2) Franchisee Company EBITDA is calculated on the basis of multiplying Group weighted average store EBITDA by Group weighted average number of stores per franchisee. Franchisee stores EBITDA growth
over the same period was +15.1%

8
1) Total Network Sales growth using Half Year average FX rates, as reported during the respective periods2) SSS is calculated in constant currency3) Including sales via aggregator platforms, now including Japan aggregator sales for H121 of $38.2m and for H120 of $32.7m4) Group Online Sales percentage calculated as total Online Sales divided by total Network Sales (including acquisitions)5) Due to rapid store expansion in Japan, less than 30% of the total store network in Japan is included as same-store
▪ Network Sales growth +16.5%, (+17.0% in constant currency), SSS +8.5%▪ Group Online Sales growth +25.4%
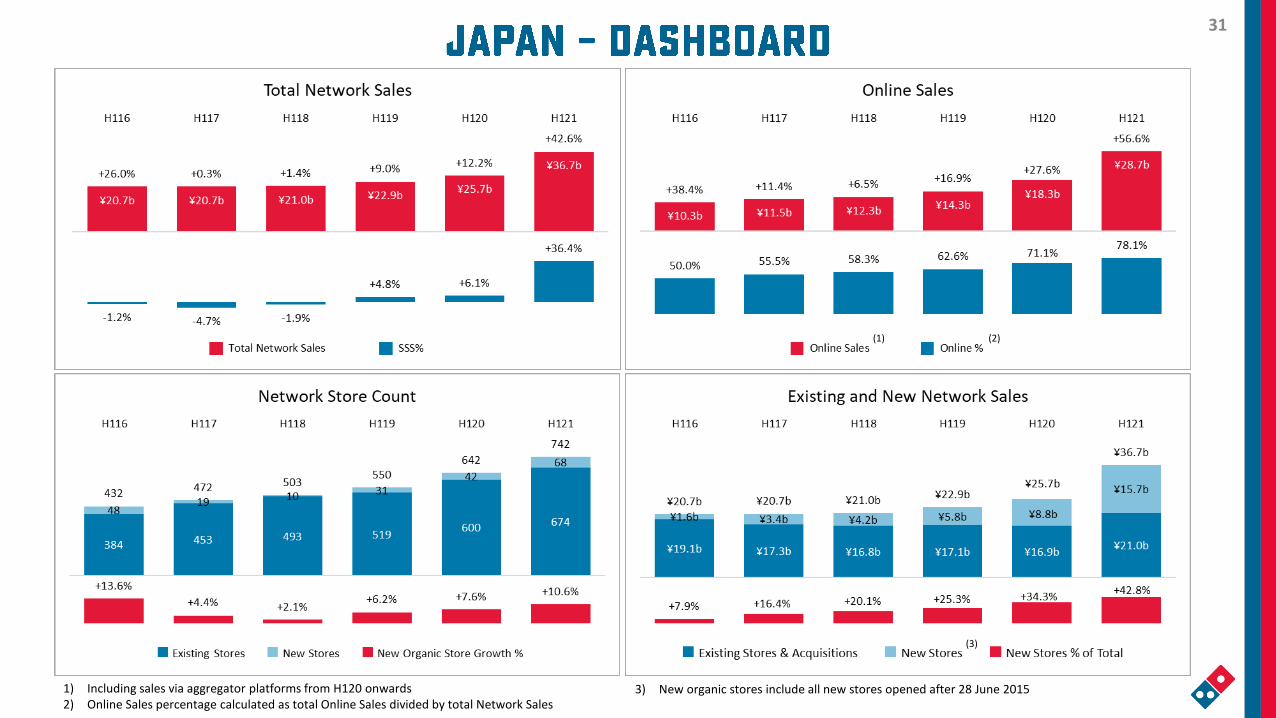
▪ Japan: Online Sales growth +56.6%, Network Sales growth +42.6%, SSS +36.4%(5)
▪ Germany: Surpasses initial expectations with highest average weekly unit sales in Europe
(3) (4)(1) (2)

9
1) Including acquisitions in France (FY16) and Germany (FY16 and FY18)2) New organic stores include all new stores opened after 28 June 2015
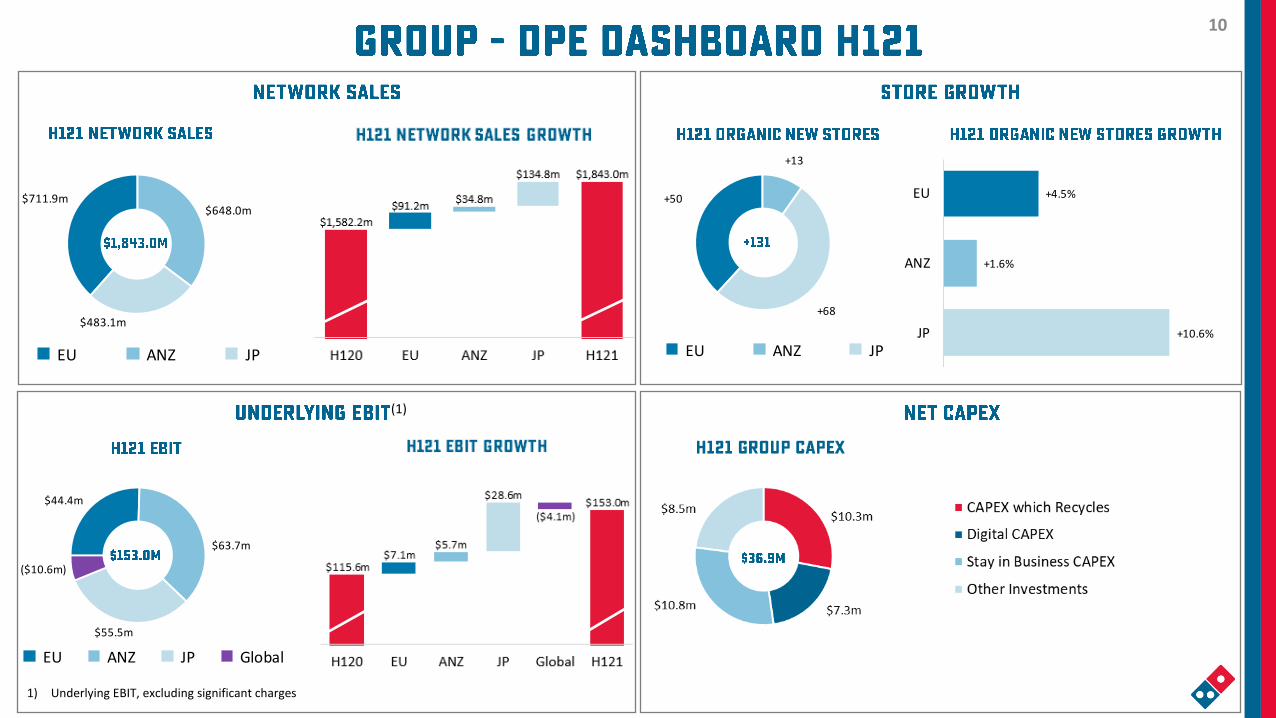
▪ Significant Network Sales growth, from both new and existing stores
▪ Group: +131 new stores added to the network
▪ Europe: +50 new stores▪ ANZ: +13 new stores▪ Japan: +68 new stores
▪ See slide 49 for further details
(1) (2)(1)
10
+50
+13
+68
EU ANZ JP+10.6%
+1.6%
+4.5%
JP
ANZ
EU
$44.4m
$63.7m
$55.5m
($10.6m)
EU ANZ JP Global
$711.9m$648.0m
$483.1m
EU ANZ JP
(1)
1) Underlying EBIT, excluding significant charges

11 11

12
1) H121 underlying compared to H120 underlying, including AASB16, excluding significant charges - see slides 14 and 54 for further details on significant charges
▪ Network Sales growth across the Group (+$260.8m)
▪ Revenue growth benefitted from extraordinary Corporate store sales growth in Japan
▪ Underlying NPAT growth +$23.7m, +32.8% (Statutory growth +37.9%)
▪ EPS growth +31.7%▪ Half Year dividend up +32.5% (50% franked)
▪ Increase in Minority Interest (MI) due to higher profits in Germany
H120 H121
Underlying Underlying
$ mil $ mil %
Network Sales 1,582.2 1,843.0 16.5%
Revenue 905.8 1,095.1 20.9%
EBITDA 176.7 218.7 23.8%
Depreciation & Amortisation (61.0) (65.6) (7.5%)
EBIT 115.6 153.0 32.3%
EBIT Margin 12.8% 14.0%
Interest (7.3) (7.2) 2.1%
NPBT 108.3 145.8 34.7%
Tax Expense (33.3) (45.0) (34.9%)
NPAT before Minority Interest 74.9 100.9 34.6%
Minority Interest (2.5) (4.7) (86.6%)
NPAT 72.4 96.2 32.8%
Performance Indicators
EPS (basic) 84.3 cps 111.1 cps 31.7%
Dividend per Share 66.7 cps 88.4 cps 32.5%
Same Store Sales % 4.1% 8.5%
+/(-) H120
Underlying(1)
13
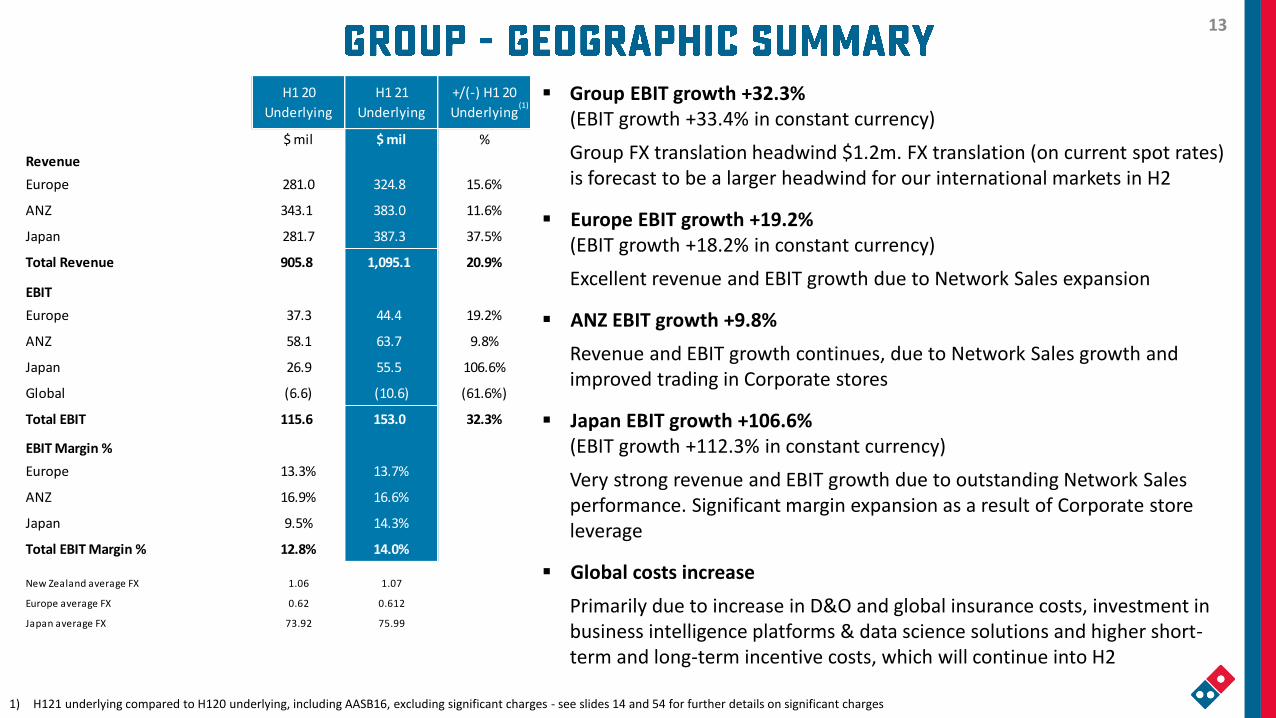
(1)▪ Group EBIT growth +32.3%
(EBIT growth +33.4% in constant currency)
Group FX translation headwind $1.2m. FX translation (on current spot rates) is forecast to be a larger headwind for our international markets in H2
▪ Europe EBIT growth +19.2%(EBIT growth +18.2% in constant currency)
Excellent revenue and EBIT growth due to Network Sales expansion
▪ ANZ EBIT growth +9.8%
Revenue and EBIT growth continues, due to Network Sales growth and improved trading in Corporate stores
▪ Japan EBIT growth +106.6%(EBIT growth +112.3% in constant currency)
Very strong revenue and EBIT growth due to outstanding Network Sales performance. Significant margin expansion as a result of Corporate store leverage
▪ Global costs increase
Primarily due to increase in D&O and global insurance costs, investment in business intelligence platforms & data science solutions and higher short-term and long-term incentive costs, which will continue into H2
H1 20
Underlying
H1 21
Underlying
+/(-) H1 20
Underlying
$ mil $ mil %
Revenue
Europe 281.0 324.8 15.6%
ANZ 343.1 383.0 11.6%
Japan 281.7 387.3 37.5%
Total Revenue 905.8 1,095.1 20.9%
EBIT
Europe 37.3 44.4 19.2%
ANZ 58.1 63.7 9.8%
Japan 26.9 55.5 106.6%
Global (6.6) (10.6) (61.6%)
Total EBIT 115.6 153.0 32.3%
EBIT Margin %
Europe 13.3% 13.7%
ANZ 16.9% 16.6%
Japan 9.5% 14.3%
Total EBIT Margin % 12.8% 14.0%
New Zealand average FX 1.06 1.07
Europe average FX 0.62 0.612
Japan average FX 73.92 75.99
1) H121 underlying compared to H120 underlying, including AASB16, excluding significant charges - see slides 14 and 54 for further details on significant charges
(1)

14
1) H121 underlying compared to H120 underlying, including AASB16, excluding significant charges 2) See slide 54 for further details on Significant Charges3) As outlined in the H120 Market Presentation on 19 February 2020 – see slides 12 and 14
▪ H121 Significant Charges relate to legal defence fees associated with ANZ Fast Food Industry Award class action case(2)
▪ H120 Significant Charges relate to conversion of stores to Domino’s in Europe, legal dispute and resolution costs in France and legal defence costs associated with ANZ Fast Food Industry Class action case(3)
H120 H120 H120 H121 H121 H121
StatutorySignificant
ChargesUnderlying Statutory
Significant
ChargesUnderlying
$ mil $ mil $ mil $ mil $ mil $ mil %
Network Sales 1,582.2 1,582.2 1,843.0 1,843.0 16.5%
Revenue 905.8 905.8 1,095.1 1,095.1 20.9%
EBITDA 171.0 5.7 176.7 217.7 1.0 218.7 23.8%
Depreciation & Amortisation (61.0) (61.0) (65.6) (65.6) (7.5%)
EBIT 110.0 5.7 115.6 152.0 1.0 153.0 32.3%
EBIT Margin 12.1% 12.8% 13.9% 14.0%
Interest (7.3) (7.3) (7.2) (7.2) 2.1%
NPBT 102.6 5.7 108.3 144.8 1.0 145.8 34.7%
Tax Expense (31.6) (1.7) (33.3) (44.7) (0.3) (45.0) (34.9%)
NPAT before Minority Interest 71.0 4.0 74.9 100.2 0.7 100.9 34.6%
Minority Interest (1.8) (0.8) (2.5) (4.7) 0.0 (4.7) (86.6%)
NPAT 69.2 3.2 72.4 95.4 0.7 96.2 32.8%
Performance Indicators
EPS (basic) 80.6 cps 3.7 cps 84.3 cps 110.4 cps 0.7 cps 111.1 cps 31.7%
Dividend per Share 66.7 cps 66.7 cps 88.4 cps 88.4 cps 32.5%
Same Store Sales % 4.1% 4.1% 8.5% 8.5%
+/(-) H120
Underlying(1)
15
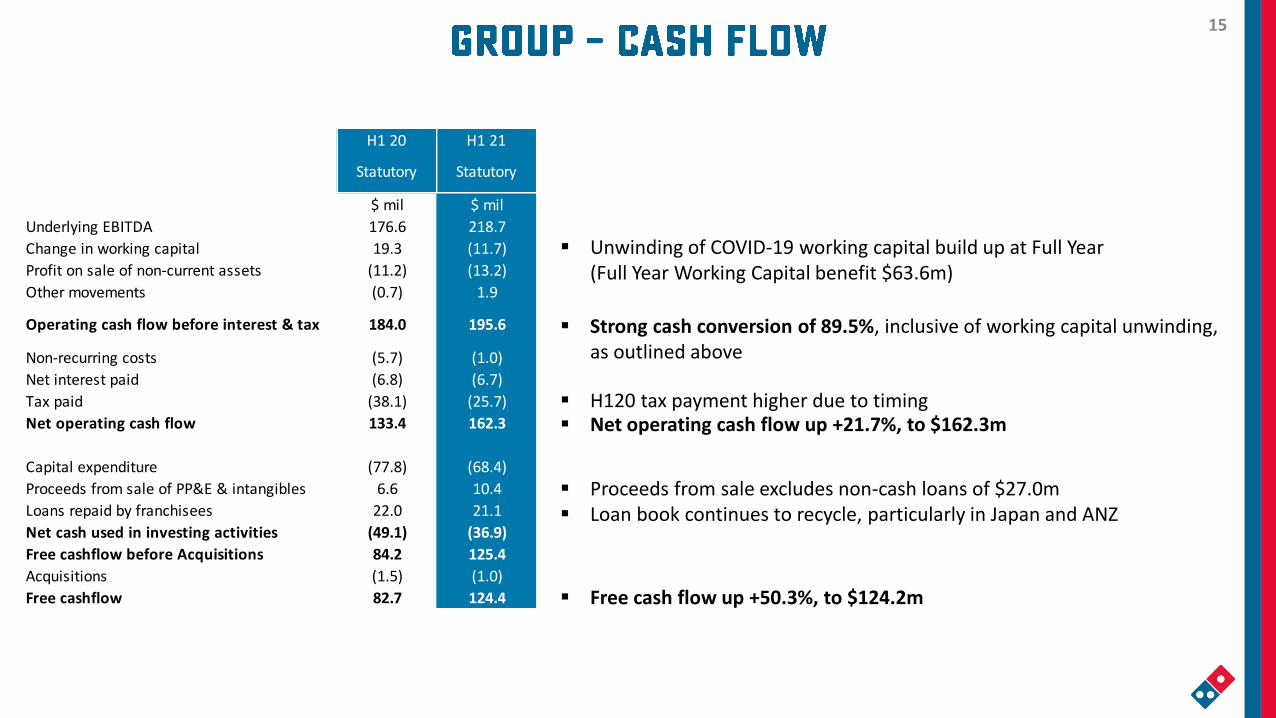
▪ Unwinding of COVID-19 working capital build up at Full Year (Full Year Working Capital benefit $63.6m)
▪ H120 tax payment higher due to timing
▪ Proceeds from sale excludes non-cash loans of $27.0m ▪ Loan book continues to recycle, particularly in Japan and ANZ
▪ Free cash flow up +50.3%, to $124.2m
▪ Net operating cash flow up +21.7%, to $162.3m
▪ Strong cash conversion of 89.5%, inclusive of working capital unwinding, as outlined above
H1 20 H1 21
EBITDA BASED CASHFLOWStatutory Statutory
$ mil $ mil
Underlying EBITDA 176.6 218.7
Change in working capital 19.3 (11.7)
Profit on sale of non-current assets (11.2) (13.2)
Other movements (0.7) 1.9
Operating cash flow before interest & tax 184.0 195.6
Non-recurring costs (5.7) (1.0)
Net interest paid (6.8) (6.7)
Tax paid (38.1) (25.7)
Net operating cash flow 133.4 162.3
Capital expenditure (77.8) (68.4)
Proceeds from sale of PP&E & intangibles 6.6 10.4
Loans repaid by franchisees 22.0 21.1
Net cash used in investing activities (49.1) (36.9)
Free cashflow before Acquisitions 84.2 125.4
Acquisitions (1.5) (1.0)
Free cashflow 82.7 124.4
16
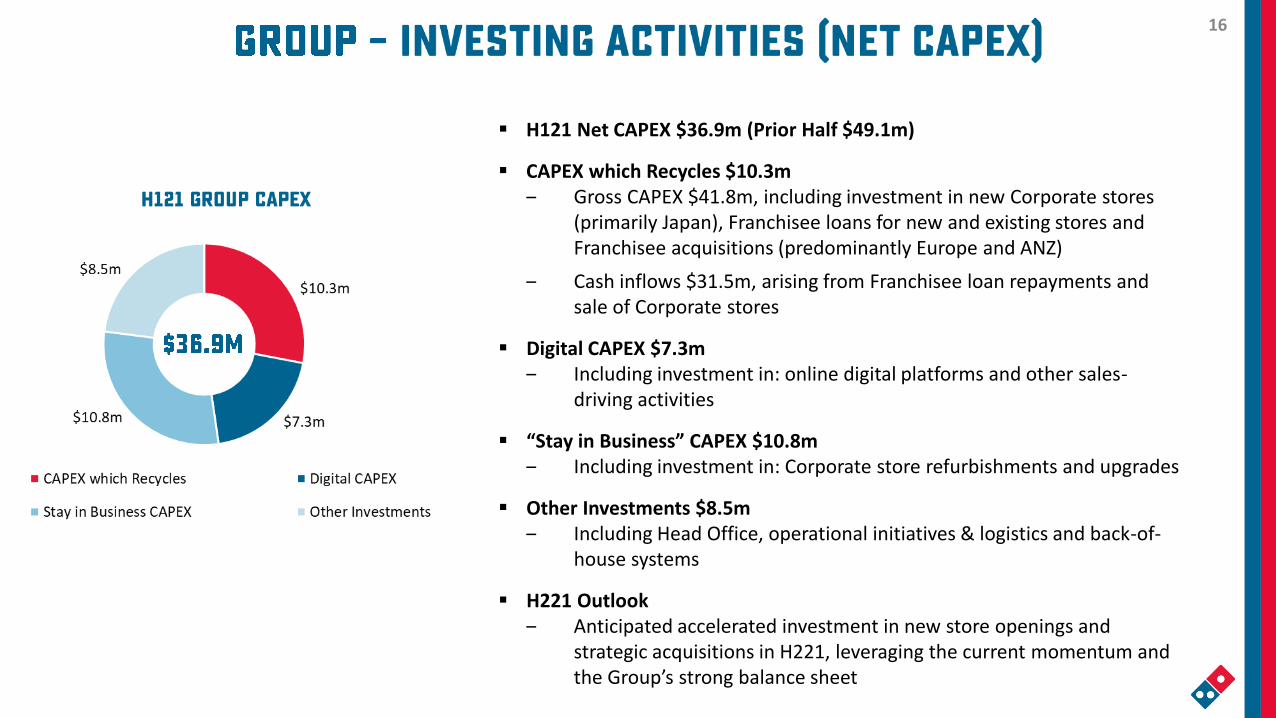
▪ H121 Net CAPEX $36.9m (Prior Half $49.1m)
▪ CAPEX which Recycles $10.3m‒ Gross CAPEX $41.8m, including investment in new Corporate stores
(primarily Japan), Franchisee loans for new and existing stores and Franchisee acquisitions (predominantly Europe and ANZ)
‒ Cash inflows $31.5m, arising from Franchisee loan repayments and sale of Corporate stores
▪ Digital CAPEX $7.3m‒ Including investment in: online digital platforms and other sales-
driving activities
▪ “Stay in Business” CAPEX $10.8m‒ Including investment in: Corporate store refurbishments and upgrades
▪ Other Investments $8.5m‒ Including Head Office, operational initiatives & logistics and back-of-
house systems
▪ H221 Outlook‒ Anticipated accelerated investment in new store openings and
strategic acquisitions in H221, leveraging the current momentum and the Group’s strong balance sheet

17
▪ Net debt reduced $70.6m vs. Full Year and $102.5m vs. H120, noting partial unwinding of Full Year Working Capital position of $63.6m, as outlined in the Cash Flow slide 15
▪ Other Current and Non-current liabilities increased, primarily due to revaluation of Germany put option and market assess right, as a result of out-performance in Germany ($54.9m)
1) Balance Sheet includes impact relating to AASB16
FY20 H121
Statutory Statutory
$ mil $ mil $ mil
Cash & cash equivalents 245.7 177.3 (68.3)
Trade and other receivables 146.5 177.8 31.3
Other current assets 130.3 138.7 8.4
Total Current Assets 522.4 493.8 (28.6)
Property, plant & equipment 272.8 269.6 (3.2)
Other non-current assets 1,675.9 1,670.3 (5.5)
Total Non-current Assets 1,948.7 1,940.0 (8.8)
Total Assets 2,471.1 2,433.7 (37.4)
Trade & other payables 323.6 346.1 22.5
Current tax liabilities 19.1 27.5 8.4
Borrowings 50.2 16.1 (34.1)
Other current liabilities 142.7 154.2 11.4
Total Current Liabilities 535.7 543.9 8.3
Borrowings 657.2 546.1 (111.1)
Lease liabilities 663.0 665.4 2.3
Other non-current liabilities 221.8 271.2 49.4
Total Non-current Liabilities 1,542.1 1,482.6 (59.4)
Total Liabilities 2,077.7 2,026.6 (51.1)
Net Assets 393.4 407.2 13.8
+/(-)
H120
Statutory
(1)
18
1) DPE key financial ratios, including AASB16 – see slides 50-51 for further details2) Banking Covenant Debt Ratios excluding AASB16 – see slide 52 for further details
(2)
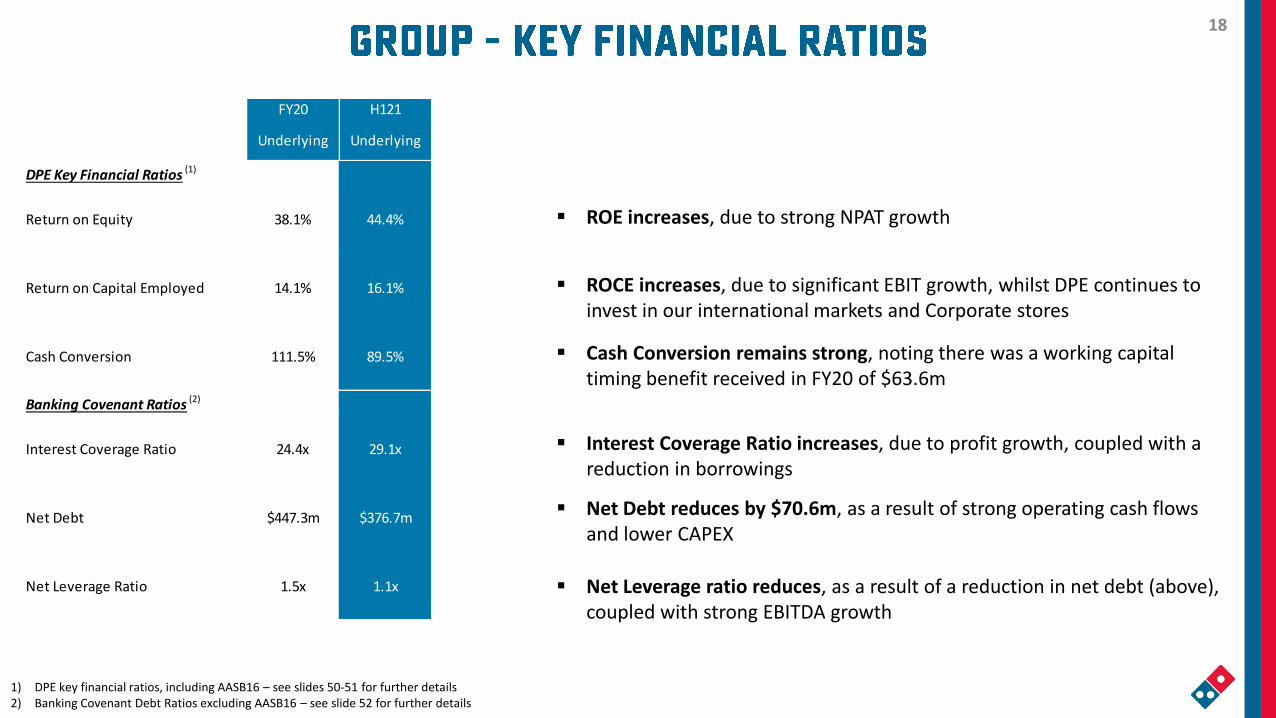
▪ Net Debt reduces by $70.6m, as a result of strong operating cash flows and lower CAPEX
▪ Net Leverage ratio reduces, as a result of a reduction in net debt (above), coupled with strong EBITDA growth
▪ Cash Conversion remains strong, noting there was a working capital timing benefit received in FY20 of $63.6m
▪ ROE increases, due to strong NPAT growth
▪ ROCE increases, due to significant EBIT growth, whilst DPE continues to invest in our international markets and Corporate stores
▪ Interest Coverage Ratio increases, due to profit growth, coupled with a reduction in borrowings
FY20 H121
Underlying Underlying
DPE Key Financial Ratios (1)
Return on Equity 38.1% 44.4%
Return on Capital Employed 14.1% 16.1%
Cash Conversion 111.5% 89.5%
Banking Covenant Ratios (2)
Interest Coverage Ratio 24.4x 29.1x
Net Debt $447.3m $376.7m
Net Leverage Ratio 1.5x 1.1x

19
Committed Debt Weighted Average Maturity 1.6 years
Strong Balance Sheet Position:
▪ Overall significant reduction in net debt, due to strong operating cash flows and lower capital expenditure
▪ Total available cash and cash equivalents $177.3m
▪ Undrawn debt facilities of $268.3m, of which $228.5m is committed
▪ Weighted average maturity of committed facilities 1.6 years
▪ Net Leverage Ratio is significantly below our 3.0x covenant requirement
1) The above are reported on an underlying basis excluding Significant Charges and the impact of AASB16 Leases. See slide 52 for further details
2) Interest coverage is calculated on a 12-month rolling basis, in line with banking covenant requirements
(1)
H120 FY20 H121
12 Month Rolling EBITDA (ex AASB16) $296.2m $303.0m $342.8m
Total Debt $606.1m $693.0m $554.0m
Total Cash and Cash Equivalents $126.9m $245.7m $177.3m
Net Debt $479.2m $447.3m $376.7m
Interest Coverage Ratio 21.7x 24.4x 29.1x
Net Leverage Ratio 1.6x 1.5x 1.1x
(2)
20
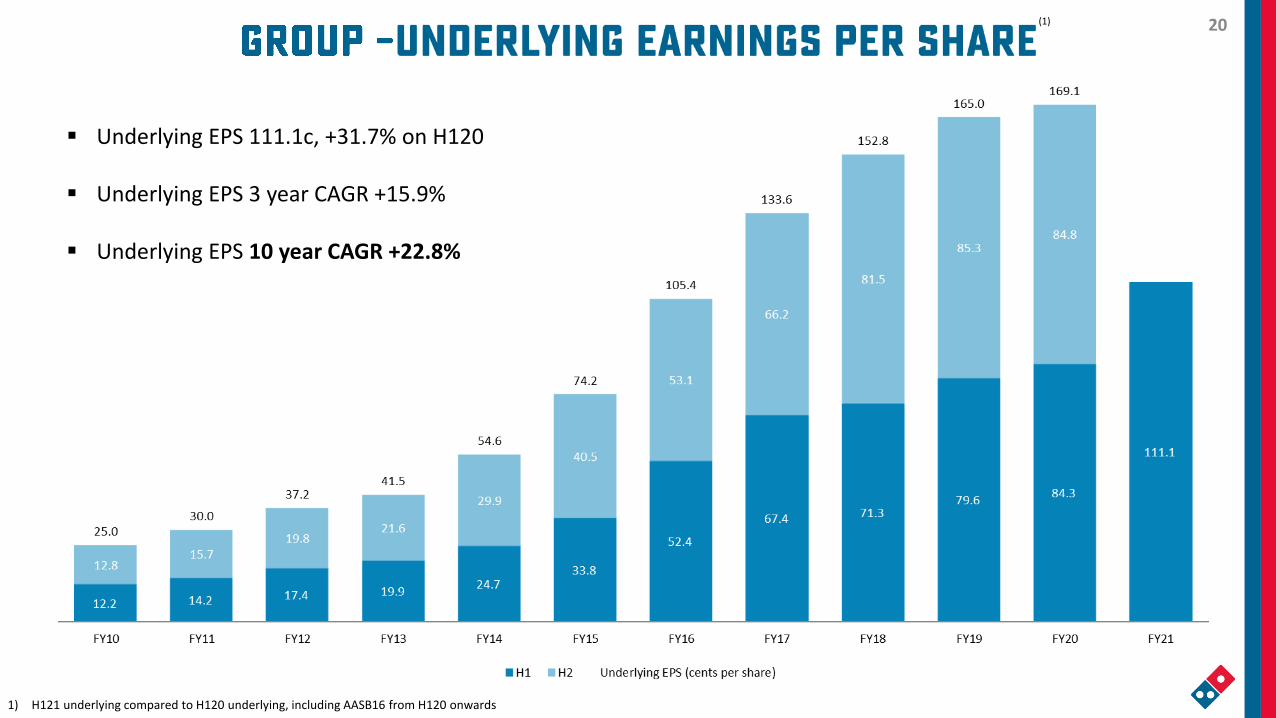
▪ Underlying EPS 111.1c, +31.7% on H120
▪ Underlying EPS 3 year CAGR +15.9%
▪ Underlying EPS 10 year CAGR +22.8%
(1)
1) H121 underlying compared to H120 underlying, including AASB16 from H120 onwards

21 21
22
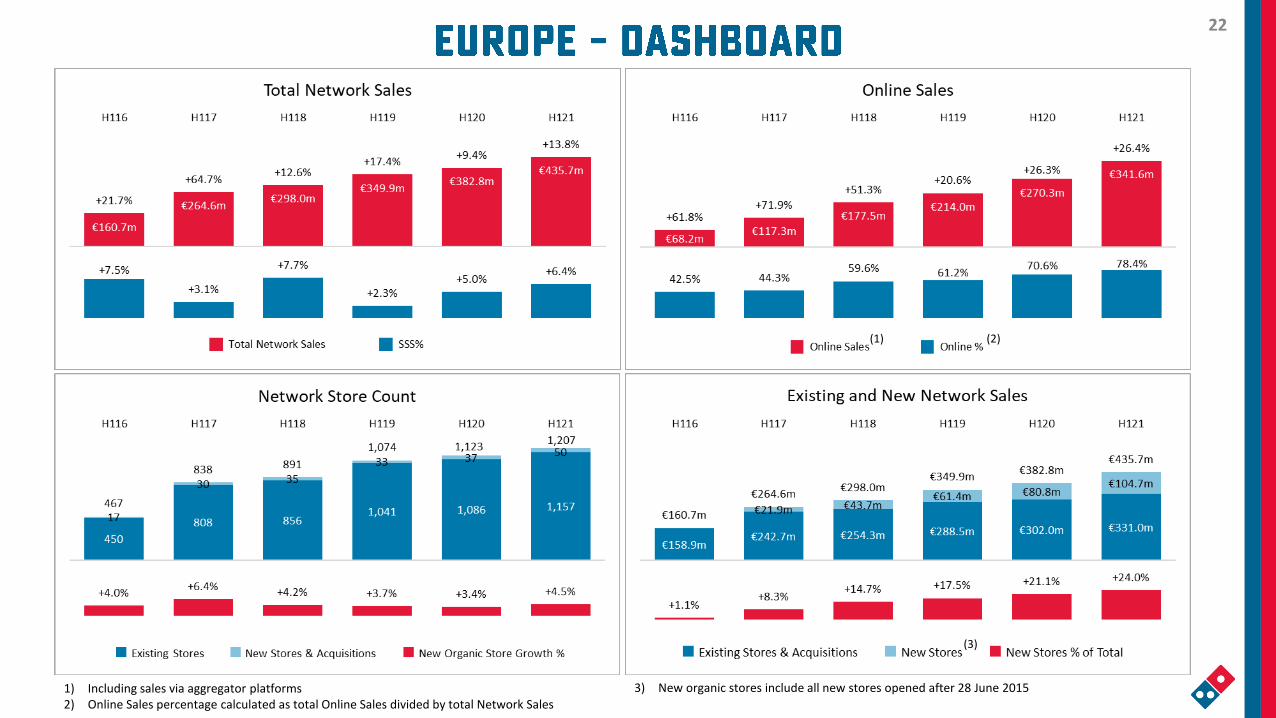
3) New organic stores include all new stores opened after 28 June 2015
(1)
1) Including sales via aggregator platforms2) Online Sales percentage calculated as total Online Sales divided by total Network Sales
(2)
(3)
23
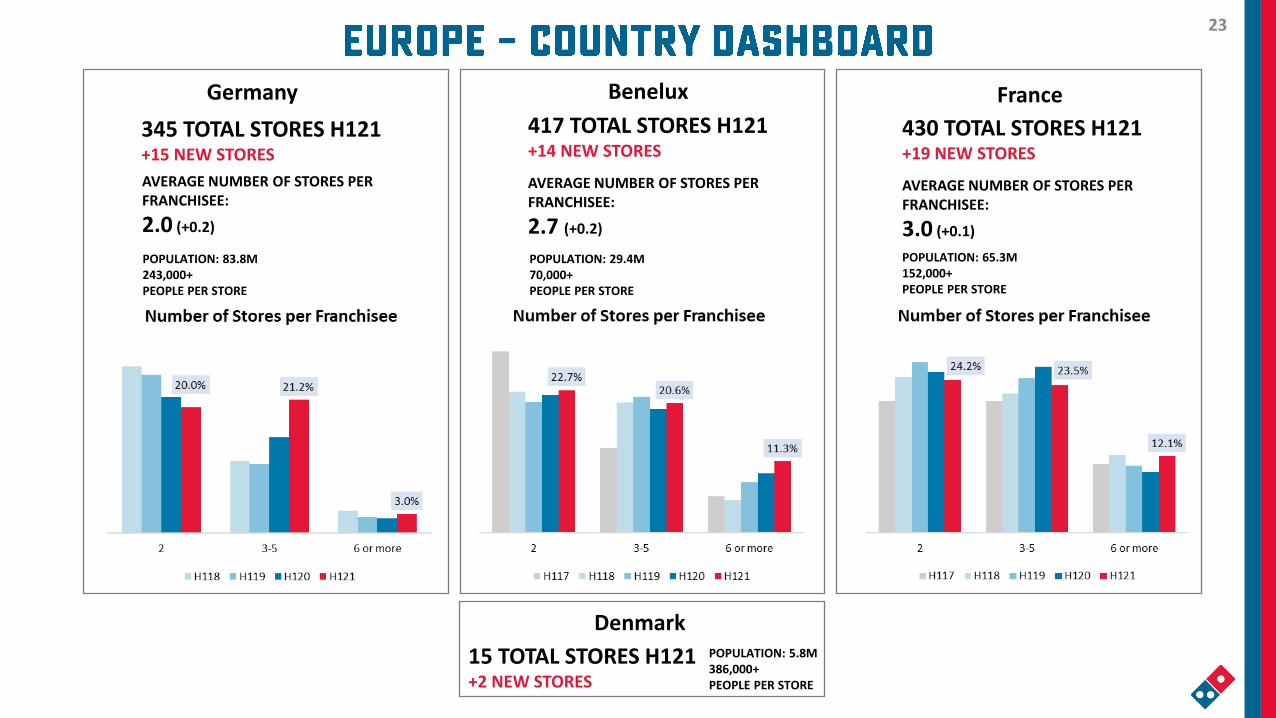
AVERAGE NUMBER OF STORES PER FRANCHISEE:
2.0 (+0.2)
345 TOTAL STORES H121+15 NEW STORES
Germany
15 TOTAL STORES H121+2 NEW STORES
Denmark
AVERAGE NUMBER OF STORES PER FRANCHISEE:
3.0 (+0.1)
430 TOTAL STORES H121+19 NEW STORES
France
AVERAGE NUMBER OF STORES PER FRANCHISEE:
2.7 (+0.2)
417 TOTAL STORES H121+14 NEW STORES
Benelux
POPULATION: 5.8M386,000+PEOPLE PER STORE
POPULATION: 83.8M243,000+PEOPLE PER STORE
POPULATION: 29.4M70,000+PEOPLE PER STORE
POPULATION: 65.3M152,000+PEOPLE PER STORE

24
Network Sales and store openings grew in all countries including significant expansion in Germany
▪ As a result of the above, marketing reach has grown including increased national television in major markets
▪ Delivery order growth has also been very strong, partly offset by challenges in carry-out
▪ Carry-out continues to reflect local COVID-19 conditions including societal restrictions (such as curfews)
▪ Market-leading execution, including initiatives such as Project 3TEN, is returning new delivery customers
▪ Unit economics and resulting franchisee profitability is continuing to grow – at record levels in Germany and France
▪ Franchisee profitability and engagement has accelerated store openings – record store openings in Germany and France

25 25

26
(1) (2)
(3)
3) New organic stores include all new stores opened after 28 June 20151) Including sales via aggregator platforms2) Online Sales percentage calculated as total Online Sales divided by total Network Sales
27
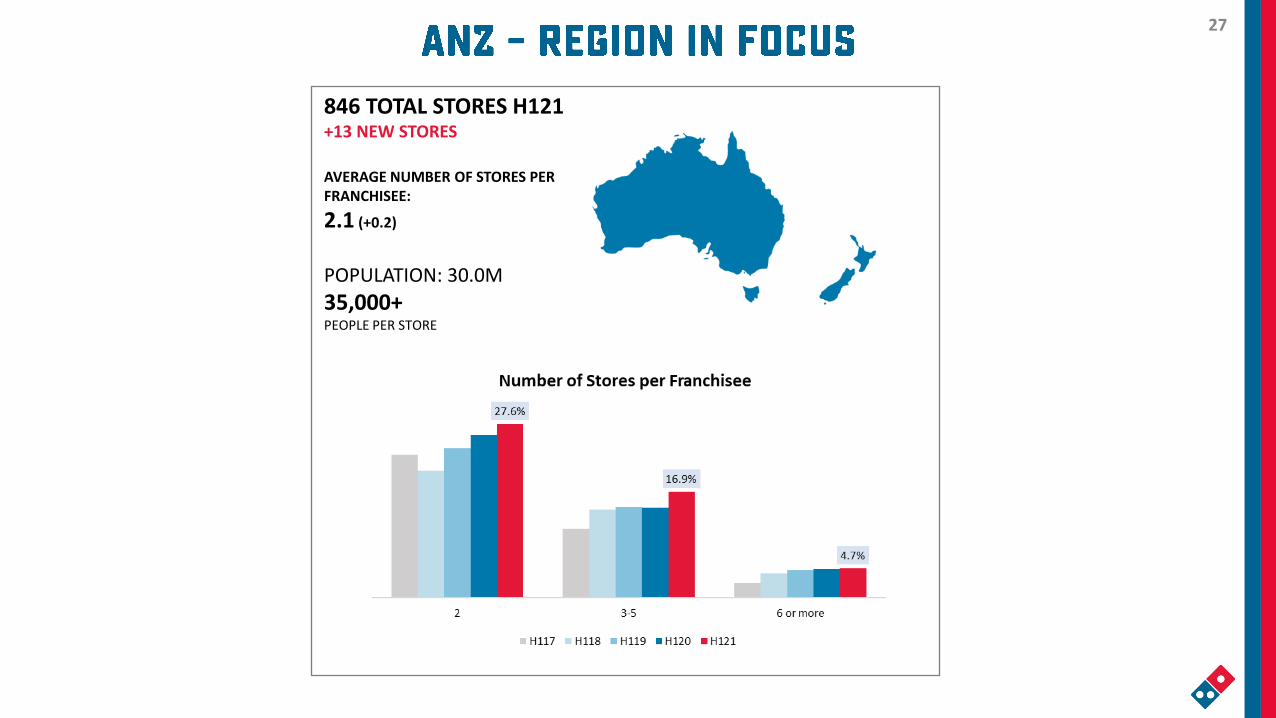
POPULATION: 30.0M
35,000+PEOPLE PER STORE
AVERAGE NUMBER OF STORES PER FRANCHISEE:
2.1 (+0.2)
846 TOTAL STORES H121+13 NEW STORES
28
Franchisee company EBITDA strong through organic openings, refranchising and high level of unit profitability
▪ Delivery growth in Australia and New Zealand remains strong: online ordering outpacing offline
▪ Carry-out sales remain affected in some regions – focus continues on returning carry-out; including Car Park Delivery
▪ ‘App-first’ approach, lifting customer engagement and providing greater insights for customer retention
Multi-year program to strengthen the franchisee base continues to improve performance during rapidly changing times
▪ Improved DPE margins through refranchising corporate stores, leverage, and reduced COVID-19 specific support to stores
▪ Domino’s is not accepting government support in FY21: and $792,000 JobKeeper assistance received in FY20 in Australia has been returned to the ATO
29
▪ The Australian Government has issued a response to the Parliamentary Joint Committee on Corporations and Financial Services inquiry into the operation and effectiveness of the Franchising Code of Conduct: the Fairness in Franchising report
▪ In response the Australian Government will implement a range of measures to reform how franchising is regulated, to restore confidence in the industry
▪ Domino’s supported the recommendations and had already taken proactive steps to be best practice in franchising
▪ Mandating legal and financial advice for sub-franchisees prior to joining the Domino’s system▪ Moving from annual to quarterly AdFund statements▪ Substantially increasing the required training for prospective franchisees▪ As has always been the case, franchisees have the right to purchase like products from any supplier – DPE aims to
be the lowest cost provider
▪ The majority of organic new stores and refranchising of corporate stores is to internal candidates (existing Domino’s franchisees or experienced store managers).
▪ Franchising is a key component of Domino’s success and management is committed to continued improvement.
1) Fairness in Franchising report: https://www.industry.gov.au/sites/default/files/2020-08/government-response-to-the-fairness-in-franchising-report.pdf
30 30
31
3) New organic stores include all new stores opened after 28 June 20151) Including sales via aggregator platforms from H120 onwards2) Online Sales percentage calculated as total Online Sales divided by total Network Sales
(1) (2)
(3)
32
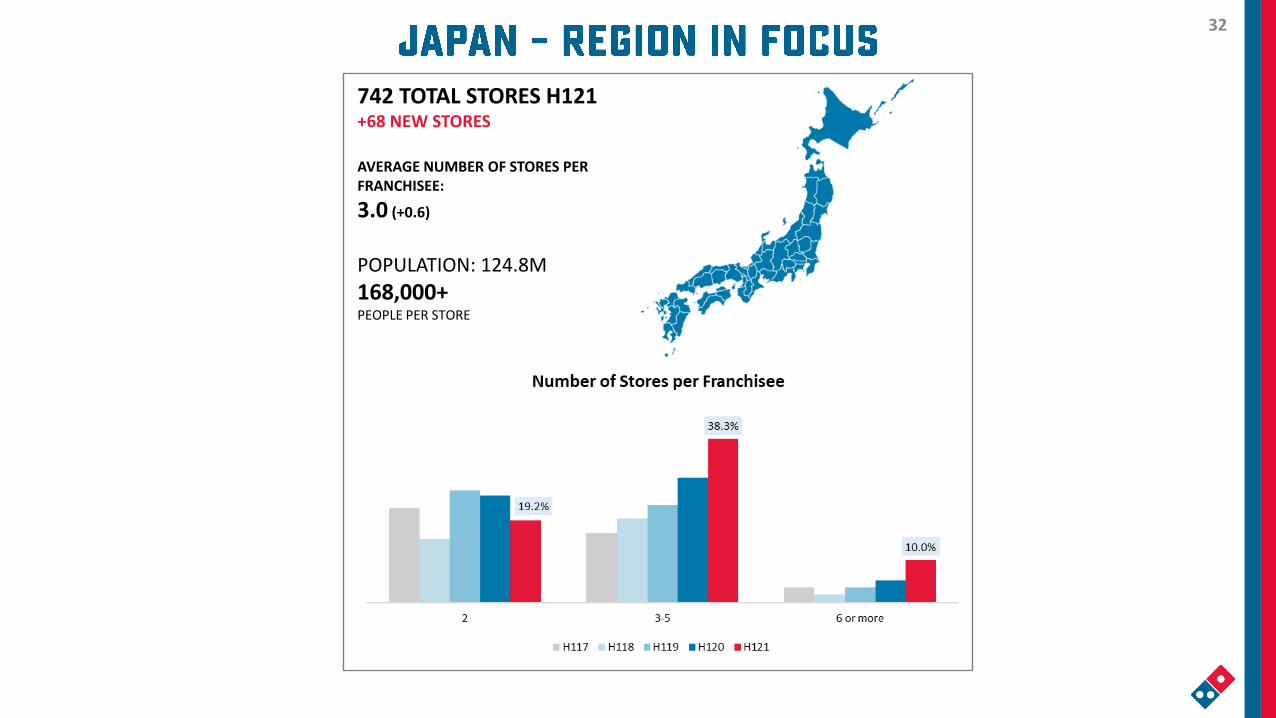
POPULATION: 124.8M
168,000+PEOPLE PER STORE
AVERAGE NUMBER OF STORES PER FRANCHISEE:
3.0 (+0.6)
742 TOTAL STORES H121+68 NEW STORES
33
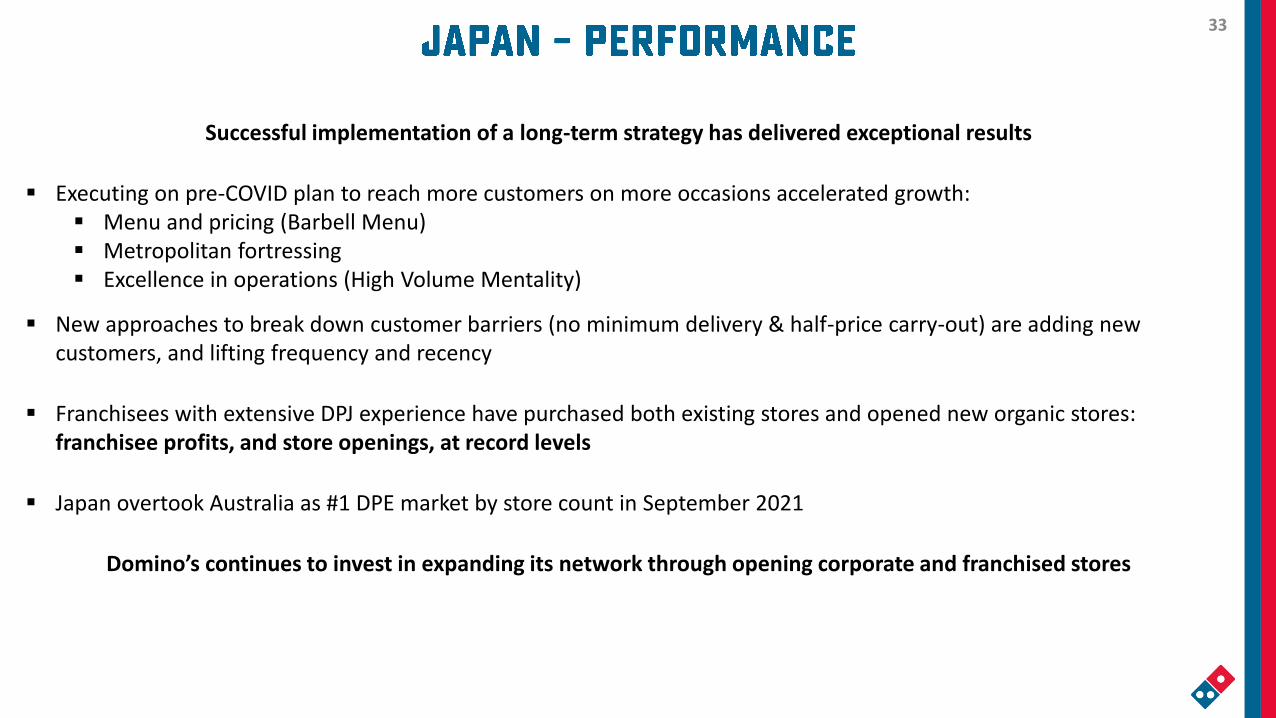
Successful implementation of a long-term strategy has delivered exceptional results
▪ Executing on pre-COVID plan to reach more customers on more occasions accelerated growth:▪ Menu and pricing (Barbell Menu)▪ Metropolitan fortressing▪ Excellence in operations (High Volume Mentality)
▪ New approaches to break down customer barriers (no minimum delivery & half-price carry-out) are adding new customers, and lifting frequency and recency
▪ Franchisees with extensive DPJ experience have purchased both existing stores and opened new organic stores: franchisee profits, and store openings, at record levels
▪ Japan overtook Australia as #1 DPE market by store count in September 2021
Domino’s continues to invest in expanding its network through opening corporate and franchised stores

34 34
34
35
▪ We are pleased to welcome our first Chief ESG Officer, Marika Stegmeijer, to the Global Leadership Team
New initiatives continue to launch under Domino’s for Good’s five pillars:
Our Food:
▪ From April 2021, all EU markets will use UTZ sustainable chocolate in all lava cakes
Our Environment:
▪ New programs in France are reducing the amount of plastic and cardboard in our business: reconfiguring pizza boxes is delivering savings of more than 265 tonnes of paper annually
Our Community:
▪ Community giving programs are expanding in each region including: $750,000 on a 3-year partnership with Lifeline(through Domino’s Australia’s registered charity Give for Good); 150,000 pizzas in Japan have been donated since the start of the pandemic; €38k donated to help those in need at Christmas (Germany)

36
Domino’s is committed to continuous improvement through “Domino’s for Good”
▪ A global working group including representatives from all markets was established in H121
▪ Domino’s will this year start modelling and measuring carbon emissions across all regions, in order to set science-based carbon reduction targets
Management intends to set measurable goals for each of the Domino’s for Good Pillars:
▪ By 2030, Domino’s intends to reach gender diversity at the Board, Global Leadership and Country Leadership levels with at least 40 percent female representation.
▪ We will reduce our European Supply Chain Centre fleet emissions by 20% by 2025▪ A 5.6% reduction in supply chain emissions per store was achieved in FY20
through route optimisation and upgrading to the first Compressed Natural Gas (CNG) Truck
25%
29%
0%
14%
50%
0% 10% 20% 30% 40% 50%
ANZ LT
EUROPE LT
JAPAN LT
GLOBAL LT
NON EXECUTIVE DIRECTORS
Feb-21 Feb-20
FY19(Benchmark)
FY20
CO2e emissions
3.61 tonnes CO2e per store
3.41 tonnes CO2e per store
The European Supply Chain Centre fleet services commissaries in France and the Netherlands

37 37
- Domino’s Pizza Enterprises Ltd Purpose

38
The clear principles that have delivered Domino’s success, before and during COVID-19, will guide this next phase:
▪ Putting people first – prioritising the safety of our customers and team members▪ Partnership, with an even stronger franchisee base▪ Long-term decisions and investments benefiting all partners▪ ‘Domino’s only’: expansion through new Domino’s territories and building out existing Domino’s markets▪ Growing market share through Product, Service and Image
Domino’s is prepared for ongoing uncertainty into calendar year 2022▪ Societal restrictions will continue to affect all markets differently▪ Digital delivery growth is strong – COVID-19 has brought forward the ‘Age of Delivery’▪ Carry-out orders remain challenging in most regions – and present an opportunity post COVID-19▪ All regions seek growth opportunities, including distressed marketing and real estate▪ Management has not observed an anticipated shift to austerity
“Aligning our business with a single purpose and being relentlessly focused on this purpose, will give the best opportunity of delivering.” – AGM, 2019
39
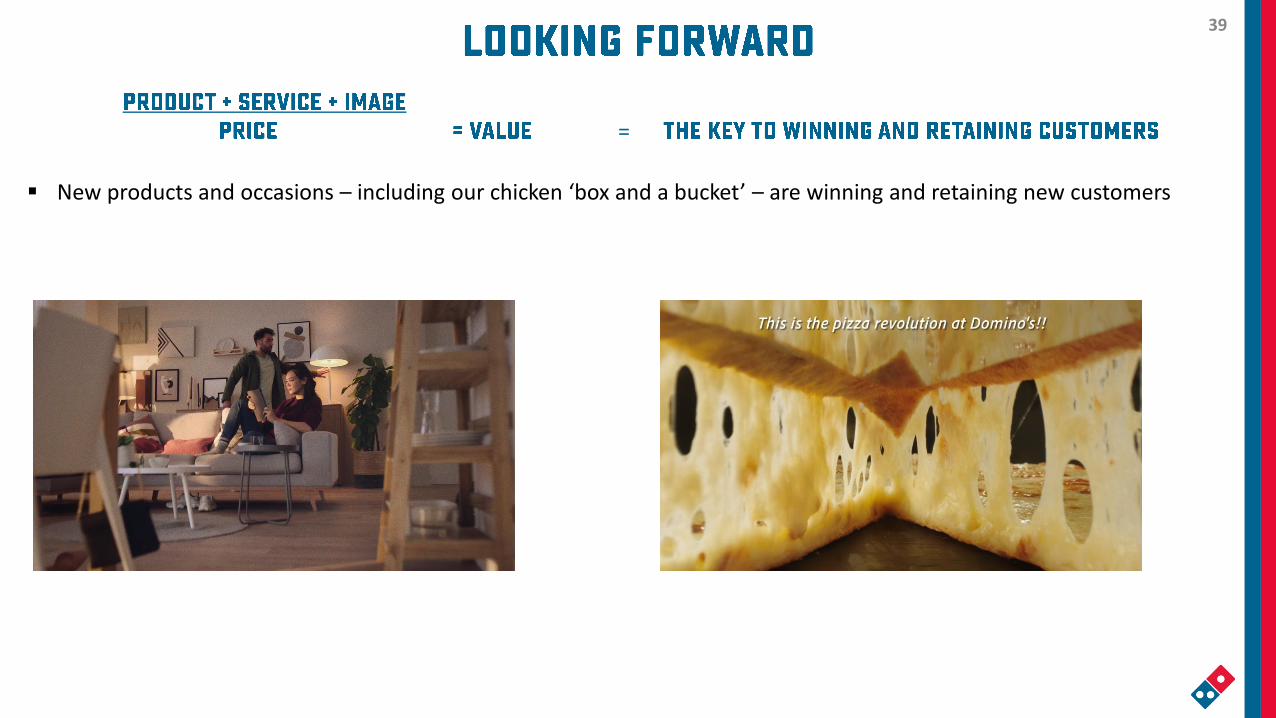
=
▪ New products and occasions – including our chicken ‘box and a bucket’ – are winning and retaining new customers

40
Domino’s expects to open a record number of new stores in Europe in FY21
▪ Franchisees have risen to the challenge: engagement and profitability is very strong, lead by Germany
▪ All markets maximising the opportunity to grow delivery; aiming to rebuild carry-out orders when restrictions ease
▪ Continuing high levels of COVID-19 in European markets, coupled with social restrictions, will affect short-term carry-out
Germany▪ Strong sales, profitability and store roll-out give management and franchisees heightened optimism over medium-term▪ Germany has been trading extremely well; margin partially offset by DPI royalty step-up in H2
France▪ Positive franchisee alignment will lift new store openings in H221 – Network Sales growth will reflect market closure in pcp
Benelux▪ Franchisees have traded well despite difficult conditions and will target carry-out opportunity as restrictions allow
Denmark▪ Short-term losses continue, as anticipated, as we repair the brand and invest in new stores to build-out the market▪ Customers are embracing the ‘real' Domino's brand and continued reputational improvement is ongoing, as expected
41
Management is confident in franchisees’ capability to navigate the ongoing effects of COVID-19
▪ All stores are well-placed for delivery growth and rebuilding carry-out (which remains challenged, including in NZ)
▪ ANZ short-term soft commodity headwinds anticipated in H221, which are expected to moderate in H122
▪ Digital delivery has been strong – Domino’s will retain new customers with additional menu options and Project 3TEN
▪ Technology development, focused on lifting already high levels of delivery performance (including Call on Arrival)
Operations 360 continues to lift franchisee performance and is an ongoing feature of ANZ operations
▪ Improved insights have delivered new fortressing opportunities and positive performance in newly opened stores
▪ Continued improvement in franchisee capability and store performance will deliver network expansion:
Organic new store openings will accelerate in H221 and refranchising of corporate stores will continue
42
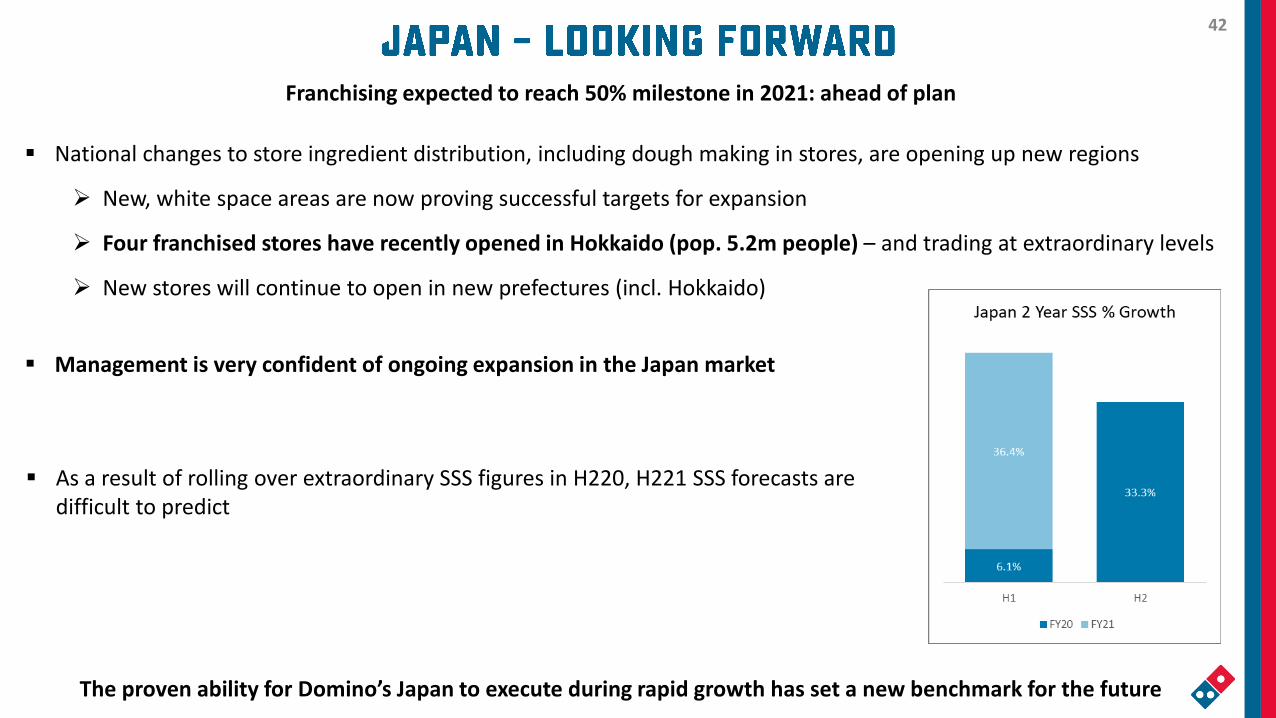
Franchising expected to reach 50% milestone in 2021: ahead of plan
▪ National changes to store ingredient distribution, including dough making in stores, are opening up new regions
➢ New, white space areas are now proving successful targets for expansion
➢ Four franchised stores have recently opened in Hokkaido (pop. 5.2m people) – and trading at extraordinary levels
➢ New stores will continue to open in new prefectures (incl. Hokkaido)
▪ Management is very confident of ongoing expansion in the Japan market
▪ As a result of rolling over extraordinary SSS figures in H220, H221 SSS forecasts are difficult to predict
The proven ability for Domino’s Japan to execute during rapid growth has set a new benchmark for the future
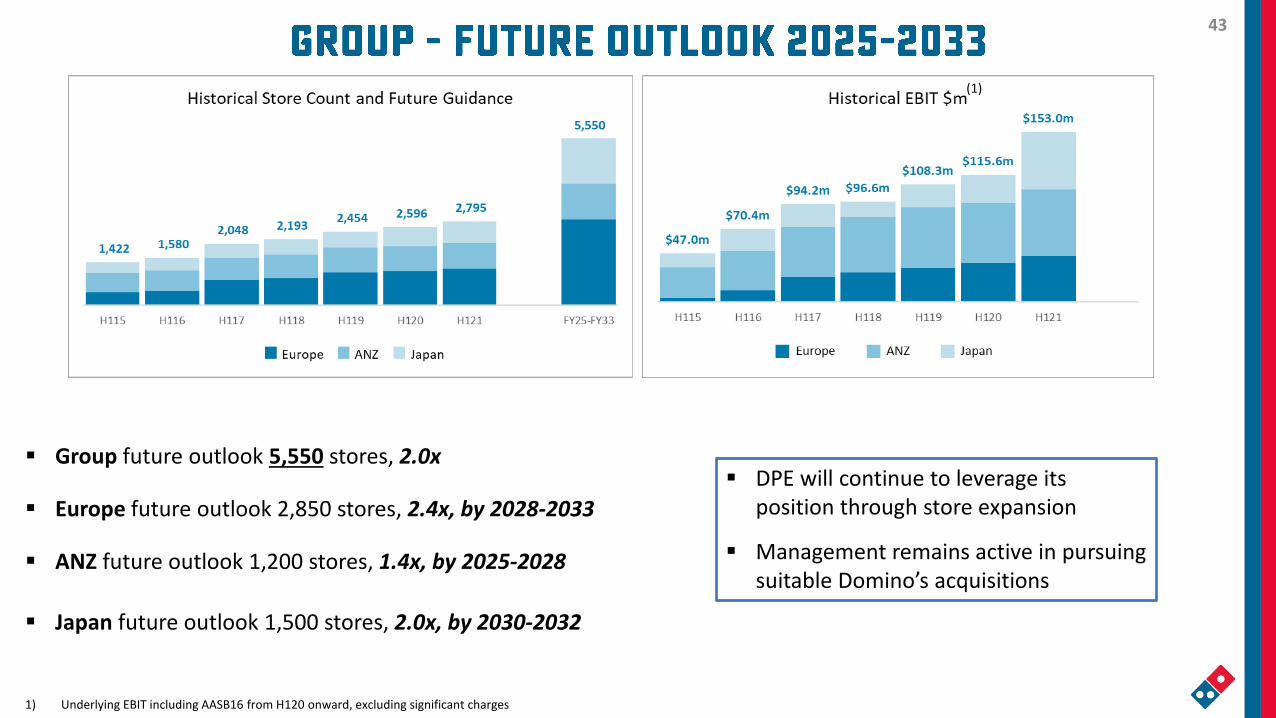
43
▪ Group future outlook 5,550 stores, 2.0x
▪ Europe future outlook 2,850 stores, 2.4x, by 2028-2033
▪ ANZ future outlook 1,200 stores, 1.4x, by 2025-2028
▪ Japan future outlook 1,500 stores, 2.0x, by 2030-2032
▪ DPE will continue to leverage its position through store expansion
▪ Management remains active in pursuing suitable Domino’s acquisitions
(1)
1) Underlying EBIT including AASB16 from H120 onward, excluding significant charges

44
1) Excluding capital expenditure relating to acquisitions
▪ 3-5 Year Outlook unchanged
▪ Management Outlook provides an illustration of our medium-term annual growth expectations, but does not constitute specific earnings guidance
3-5 Year
Outlook
Annual Same Store Sales Growth +3-6%
Annual Organic New Store Additions +7-9%
Annual Net CAPEX(1) $60-100m
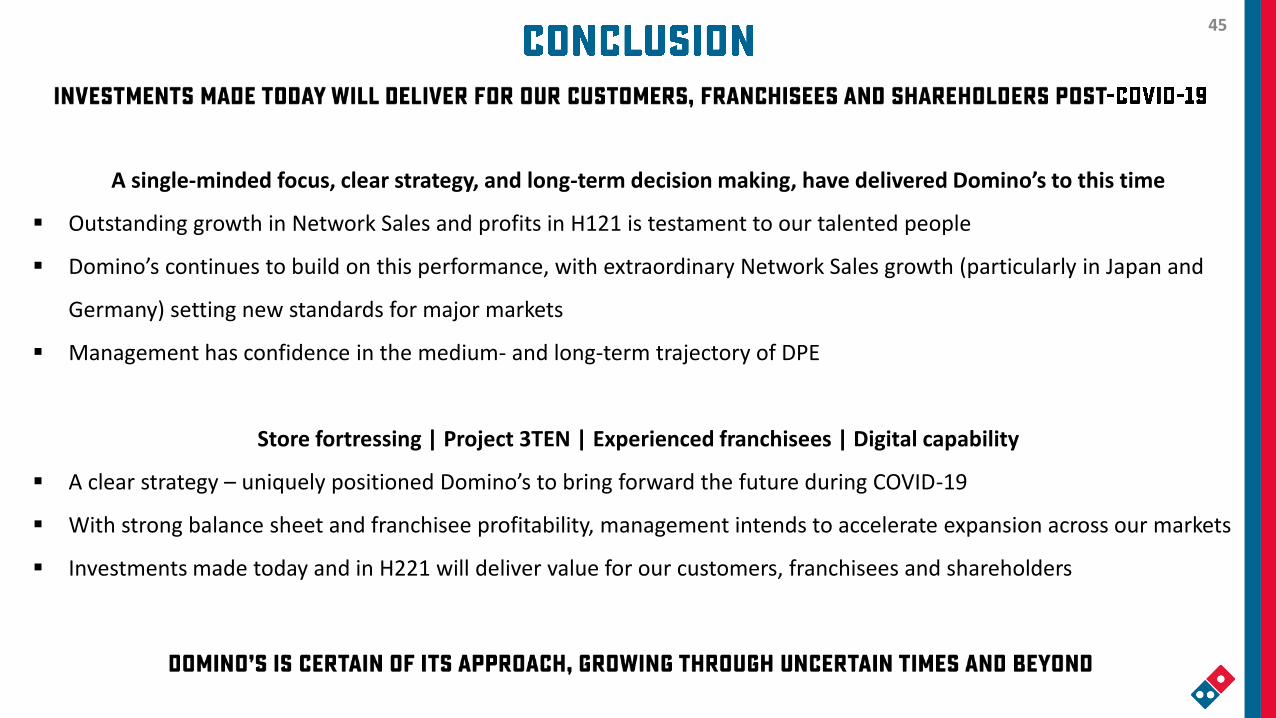
45
A single-minded focus, clear strategy, and long-term decision making, have delivered Domino’s to this time
▪ Outstanding growth in Network Sales and profits in H121 is testament to our talented people
▪ Domino’s continues to build on this performance, with extraordinary Network Sales growth (particularly in Japan and
Germany) setting new standards for major markets
▪ Management has confidence in the medium- and long-term trajectory of DPE
Store fortressing | Project 3TEN | Experienced franchisees | Digital capability
▪ A clear strategy – uniquely positioned Domino’s to bring forward the future during COVID-19
▪ With strong balance sheet and franchisee profitability, management intends to accelerate expansion across our markets
▪ Investments made today and in H221 will deliver value for our customers, franchisees and shareholders

46 46

47 47
47

48
▪ 24 February, 2021 – Dividend record date
▪ 11 March, 2021 – Dividend payment date
▪ May, 2021 – CEOs webcast
▪ 1 June, 2021 – Blackout period commences

49
▪ Group – 131 new store additions
▪ Europe – 46 new store additions, noting 4 store closures, including closure of final 2 Sprint stores in France as planned
▪ ANZ – 13 new store additions
▪ Japan – 68 new store additions
H1 19 FY 19 H1 20 FY 20 H1 21
European stores
Franchised stores 1,012 1,028 1,042 1,060 1,105
Corporate stores 62 69 81 101 102
European Network Stores 1,074 1,097 1,123 1,161 1,207
Net stores added in period 20 43 26 64 46
ANZ stores
Franchised stores 738 716 713 714 736
Corporate stores 92 109 118 119 110
ANZ Network Stores 830 825 831 833 846Stadium outlets incl. in above 8 0 0 0 0
Net stores added in period 11 6 6 8 13
Japan stores
Franchised stores 236 254 275 308 357
Corporate stores 314 346 367 366 385
Japanese Network Stores 550 600 642 674 742
Net stores added in period 30 80 42 74 68
Consolidated number of stores
Franchised stores 1,986 1,998 2,030 2,082 2,198
Corporate stores 468 524 566 586 597
Total Network Stores 2,454 2,522 2,596 2,668 2,795
Corporate store % 19% 21% 22% 22% 21%
Net stores added in period 61 129 74 146 127
Europe as % of tota l s tores 44% 43% 43% 44% 43%
Japan as % of tota l s tores 22% 24% 25% 25% 27%
50
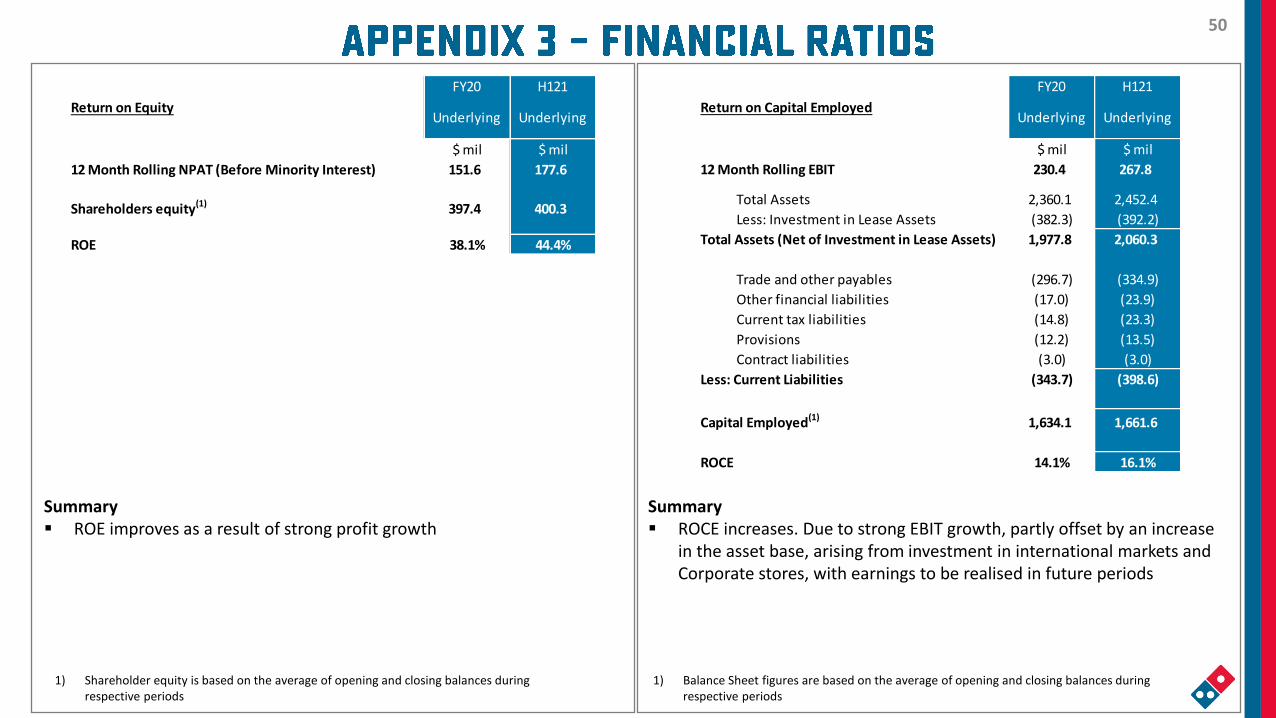
Summary▪ ROCE increases. Due to strong EBIT growth, partly offset by an increase
in the asset base, arising from investment in international markets and Corporate stores, with earnings to be realised in future periods
Summary▪ ROE improves as a result of strong profit growth
1) Balance Sheet figures are based on the average of opening and closing balances during respective periods
1) Shareholder equity is based on the average of opening and closing balances during respective periods
FY20 H121
Underlying Underlying
$ mil $ mil
12 Month Rolling NPAT (Before Minority Interest) 151.6 177.6
Shareholders equity(1) 397.4 400.3
ROE 38.1% 44.4%
Return on Equity
FY20 H121
Underlying Underlying
$ mil $ mil
12 Month Rolling EBIT 230.4 267.8
Total Assets 2,360.1 2,452.4
Less: Investment in Lease Assets (382.3) (392.2)
Total Assets (Net of Investment in Lease Assets) 1,977.8 2,060.3
Trade and other payables (296.7) (334.9)
Other financial liabilities (17.0) (23.9)
Current tax liabilities (14.8) (23.3)
Provisions (12.2) (13.5)
Contract liabilities (3.0) (3.0)
Less: Current Liabilities (343.7) (398.6)
Capital Employed(1) 1,634.1 1,661.6
ROCE 14.1% 16.1%
Return on Capital Employed

51
Summary▪ Strong Cash Conversion through:
‒ Continued strong operating performance‒ Partly offset by timing benefit in working capital in prior periods
FY20 H121
Underlying Underlying
Operating cash flow before interest & tax396.7 195.6
EBITDA 355.9 218.7
Cash conversion 111.5% 89.5%
Cash Conversion
52
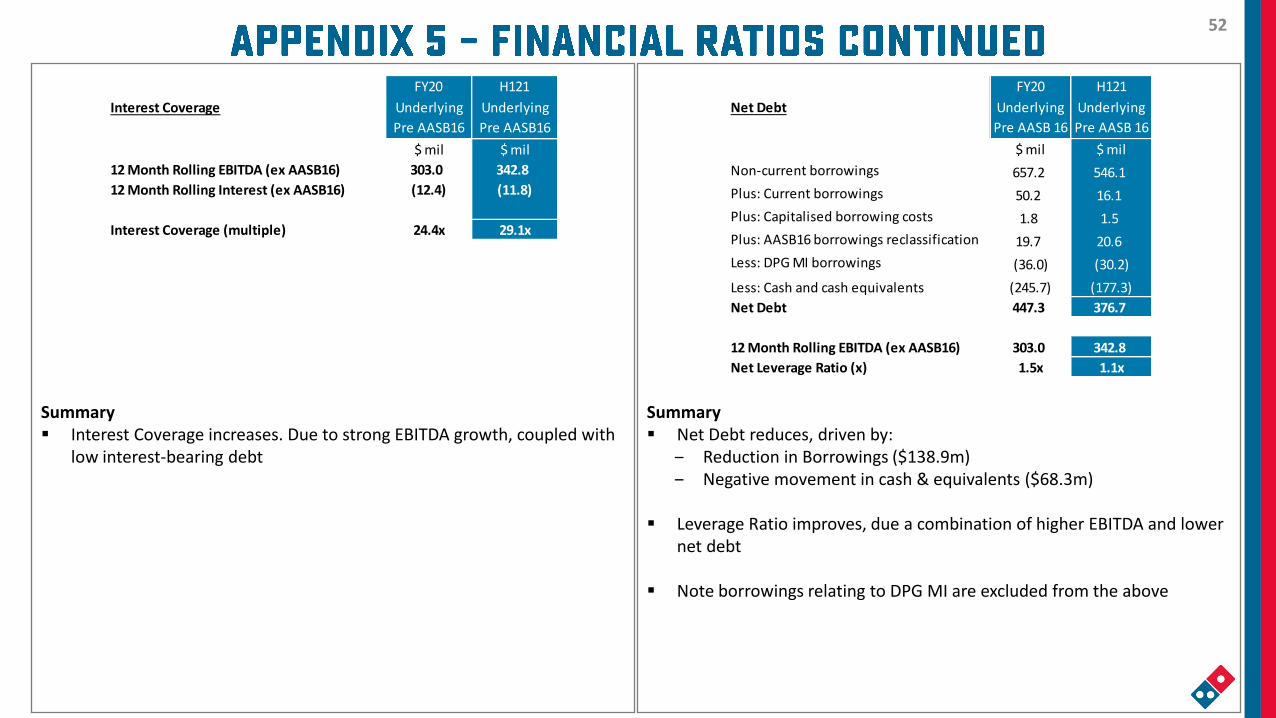
Summary▪ Net Debt reduces, driven by:
‒ Reduction in Borrowings ($138.9m)‒ Negative movement in cash & equivalents ($68.3m)
▪ Leverage Ratio improves, due a combination of higher EBITDA and lower net debt
▪ Note borrowings relating to DPG MI are excluded from the above
Summary▪ Interest Coverage increases. Due to strong EBITDA growth, coupled with
low interest-bearing debt
FY20 H121
Underlying
Pre AASB16
Underlying
Pre AASB16
$ mil $ mil
12 Month Rolling EBITDA (ex AASB16) 303.0 342.8
12 Month Rolling Interest (ex AASB16) (12.4) (11.8)
Interest Coverage (multiple) 24.4x 29.1x
Interest Coverage
FY20 H121
Underlying
Pre AASB 16
Underlying
Pre AASB 16
$ mil $ mil
Non-current borrowings 657.2 546.1
Plus: Current borrowings 50.2 16.1
Plus: Capitalised borrowing costs 1.8 1.5
Plus: AASB16 borrowings reclassification 19.7 20.6
Less: DPG MI borrowings (36.0) (30.2)
Less: Cash and cash equivalents (245.7) (177.3)
Net Debt 447.3 376.7
12 Month Rolling EBITDA (ex AASB16) 303.0 342.8
Net Leverage Ratio (x) 1.5x 1.1x
Net Debt

53
1) H121 vs. H120 growth, excluding AASB16 and significant Charges
H120 H120 H120 H121 H121 H121
Underlying
Pre AASB16
AASB 16
Adjustments
Underlying
Post AASB16
Underlying
Pre AASB16
AASB 16
Adjustments
Underlying
Post AASB16
$ mil $ mil $ mil $ mil %
Network Sales 1,582.2 1,582.2 1,843.0 1,843.0 16.5%
Revenue 905.8 0.0 905.8 1,109.7 (14.6) 1,095.1 22.5%
EBITDA 151.0 25.7 176.7 190.7 27.9 218.7 26.3%
Depreciation & Amortisation (36.1) (24.9) (61.0) (39.0) (26.6) (65.6) (8.0%)
EBIT 114.9 0.8 115.6 151.7 1.3 153.0 32.1%
EBIT Margin 12.7% 0.1% 12.8% 13.7% 0.3% 14.0%
Interest (6.3) (1.0) (7.3) (5.7) (1.5) (7.2) 10.0%
NPBT 108.5 (0.3) 108.3 146.1 (0.2) 145.8 34.6%
Tax Expense (33.4) 0.1 (33.3) (45.0) 0.1 (45.0) (34.7%)
NPAT before Minority Interest 75.1 (0.2) 74.9 101.0 (0.1) 100.9 34.5%
Minority Interest (2.5) 0.0 (2.5) (4.7) 0.0 (4.7) (87.4%)
NPAT 72.6 (0.2) 72.4 96.3 (0.1) 96.2 32.7%
Performance Indicators
EPS (basic) 84.5 cps -0.2 cps 84.3 cps 111.2 cps -0.1 cps 111.1 cps 31.6%
Dividend per Share 66.7 cps 66.7 cps 88.4 cps 88.4 cps 32.5%
Same Store Sales % 4.1% 4.1% 8.5% 8.5%
+/(-) H120
Underlying(1)
Pre AASB16

54
CLASS ACTION
• The Company rejects the allegations and has been defending the action vigorously. A defence denying the allegations has been filed and an application to have the statement of claim (or parts thereof) struck out was heard on 9 June 2020
• A decision on the strike out application is yet to be handed down
• The statement of claim does not quantify any loss by the lead applicant or the alleged group and, to date, the applicant’s solicitors have not indicated how many members form part of the alleged group
• Accordingly, the Company remains unable to determine any potential obligation or financial impact arising from the alleged damages claimed in the proceeding
SPEED RABBIT PIZZA
• Domino's Pizza France is involved in eight separate proceedings. One has been resolved finally in favour of DPF. One has not yet been heard at first instance. In the other six proceedings, the Court has ruled in favour of DPF at first instance but those decisions are in various stages of appeal. DPE denies all claims made and is vigorously defending the proceedings brought against it. DPE is confident of its legal position
PIZZA SPRINT
• Multiple separate proceedings have been brought in relation to matters which occurred before the Company's ownership of the France market. In one proceeding, the Court's decision did not result in any fine or financial charges but is being appealed by the plaintiffs. In other proceedings, DPF was ordered to pay a total of €3 million. DPF is appealing these decisions
55
▪ Same Store Sales are calculated weekly, measured in local currency
▪ Same Store Sales is the process of comparing year-on-year growth of existing mature stores
▪ Stores are included after two years of trading (either two years of DPE, or one year pre-acquisition plus one year of DPE)
▪ Where a delivery territory is fortressed with the opening of a new store, both the existing and new store(s) are excluded until two years of like-for-like trading data is collected
▪ During COVID-19 – stores that were closed for greater than a week are not included in Same Store Sales calculations for the period of their closure
▪ The above provides a normalised estimate of performance from a like-for-like group of stores that continued to trade at a point in time
▪ Network Sales are calculated in both local currency and AUD
▪ Network Sales growth includes sales for all stores
▪ Stores are included from the first day of trading
▪ Where a delivery territory is fortressed, the Network Sales from both stores are included at all times
▪ During COVID-19 – closed stores have zero Network Sales
56
▪ Domino’s Pizza Enterprises Limited (Domino’s) advises that the information in this presentation contains forward looking statements which may be subject to significant uncertainties outside of Domino’s control
▪ Domino’s does not undertake any obligation to provide recipients of this presentation with further information to either update this presentation or correct any inaccuracies
▪ While due care has been taken in preparing these statements, no representation or warranty is made or given as to the accuracy, reliability or completeness of forecasts or the assumptions on which they are based
▪ Actual future events may vary from these forecasts and you are advised not to place undue reliance on any forward looking statement
▪ A number of figures in the tables and charts in this presentation pack have been rounded to one decimal place. Percentages (%) and variances have been calculated on actual figures
Statutory Profit and Underlying Profit:▪ Statutory profit is prepared in accordance with the Corporations Act 2001 and Australian Accounting Standards (AASB), which comply
with International Financial Reporting Standards (IFRS)
▪ Underlying profit is the Statutory profit contained in Appendix 4D of the Domino’s Financial Report, adjusted for significant items specific to the period. Comparisons to prior periods in financial statements are generally made on an underlying basis, rather than statutory. Where highlighted in this document, Statutory results have been adjusted for significant items (as shown in previous Market Presentations)
▪ Underlying Profit after tax is reported to give information to shareholders that provides a greater understanding of the performance of the Company's operations. DPE believes Underlying Profit after tax is useful as it removes significant items thereby facilitating a more representative comparison of financial performance between financial periods. Underlying Profit is a non-IFRS measure which is not subject to audit or review