TPG Telecom HY20 Presentation - Bell Direct
45
TPG Telecom Investor Presentation Results for the half-year ended 30 June 2020 (‘1H20’)
-
Upload
khangminh22 -
Category
Documents
-
view
0 -
download
0
Transcript of TPG Telecom HY20 Presentation - Bell Direct

TPG Telecom Investor PresentationResults for the half-year ended 30 June 2020 (‘1H20’)

Better together as a leading full service telco challenger
TPG Corporation Limited (formerly TPG Telecom Limited
(“TPM”))
TPG Telecom Limited (formerly Vodafone Hutchison Australia Limited
(“VHA”))
TPG Telecom Group
In this presentation: ▪ TPG Telecom Limited (formerly Vodafone Hutchison Australia Limited) is referred to as “TPG Telecom” and “VHA”. ▪ TPG Corporation Limited (formerly TPG Telecom Limited) is referred to as “TPG Corporation”, “TPG Corp” and “TPM”. ▪ The merged group is referred to as the “TPG Telecom Group”.
2

Agenda
Merger update
TPG Telecom Group pro forma 1H20 results
TPG Telecom (VHA) standalone 1H20 results
TPG Corporation (TPM) standalone 1H20 results
TPG Telecom Group look ahead
Q&A
3

Merger update
4

Merger implementation timeline
30 August 2018Merger announced
8 May 2019ACCC opposedproposed merger
13 February 2020Federal Court
approved merger
5 March 2020ACCC announced no
appeal of Federal Court decision
19 May 2020TPG Corporation Scheme Booklet registered with
ASIC
24 June 2020TPG Corporation shareholders
voted in favour of Scheme
26 June 2020Merger approved by
NSW Supreme Court. Merger effective for accounting purposes
30 June 2020TPG Telecom admitted to the ASX under ticker code ‘TPG’.Shares commence trading on
deferred settlement basis
29 June 2020Scheme effective date
13 July 2020Implementation of Scheme
of Arrangement
14 July 2020TPG Telecom shares
commence trading on ordinary settlement
basis
Integration activities
5

TPG Telecom Group pro forma 1H20 results
• The merger of TPG Telecom Limited (formerly VHA) and TPG Corporation Limited (formerly TPG Telecom Limited) became effective for accounting purposes following court approval on 26 June 2020.
• The merger implementation date was 13 July 2020.
• The Group’s statutory income statement for 1H20 includes a full six months results of the company formerly known as VHA but only four days from TPG Corporation (the company formerly known as TPG Telecom).
• The Group’s statutory balance sheet at 30 June 2020 includes TPG Corporation’s assets and liabilities but is not fully reflective of the Group’s balance sheet upon merger implementation due to significant restructuring steps that occurred between 30 June 2020 and the merger implementation date.
6

TPG Telecom Group 1H20 financial highlights
$m Reported Pro forma** Note
Revenue 1,540 2,712
EBITDA 531 918 1
NPAT 83 140
Net Debt* 8,748 4,557 2
*Net Debt defined as borrowings less cash.** Refer to pro forma income statement on slide 13 and pro forma balance sheet on slide 9.
Note 1
• The merger of TPG Telecom Limited (formerly VHA) and TPG Corporation Limited (formerly TPG Telecom Limited) became effective for accounting purposes following court approval on 26 June 2020.
• The Group’s statutory income statement for 1H20 includes a full six months’ results of the company formerly known as VHA but only four days from TPG Corporation (the company formerly known as TPG Telecom).
• Therefore, alongside the statutory ‘reported’ results, pro forma results are also provided to simulate what the Group’s 1H20 results would have been if the merger had taken effect from the start of the half-year.
• A reconciliation of the reported to pro forma income statement is set out on slides 10 to 13.
Note 2
• As key pre-merger implementation steps, including debt restructuring, were not completed until 13 July 2020, a pro forma balance sheet is also provided to simulate what the Group’s 30 June 2020 balance sheet (and particularly its net debt) would have been if the merger implementation steps had been completed by 30 June 2020.
• A reconciliation of the reported to pro forma balance sheet is set out on slide 9.
7

Notes
1. ‘Shares to be issued’ comprises:
• $4,475m in respect of shares issued in July to VHA pre-merger shareholders relating to debt restructure, creating a corresponding ‘debt restructuring receivable’ as at 30 June 2020.
• $7,877m in respect of shares issued in July to TPG Corporation shareholders upon merger implementation.
2. Tuas Limited (TPG Singapore) net assets held for distribution at 30 June 2020, and distributed on 13 July 2020. Corresponding liability for TPG Corporation’s in-specie dividend of Tuas Limited shares.
3. Borrowings balance as at 30 June 2020 included $4,475m of debt that was removed from the Group by 13 July 2020 as part of pre-merger implementation debt restructure.
4. TPG Corporation special cash dividend, paid on 13 July 2020.
TPG Telecom Group 30 June 2020 summary reported balance sheet
$mReported
30 June 2020 Notes
Current Assets
Cash and cash equivalents 470
Debt restructuring receivable 4,475 1
Assets classified as held for distribution 512 2
Other current assets 837
Total Current Assets 6,294
Total Non-current Assets 17,659
Total Assets 23,953
Current Liabilities
Borrowings 9,218 3
TPG Corp special dividend payable 479 4
TPG Corp in-specie dividend payable 512 2
Other current liabilities 1,340
Total Current Liabilities 11,549
Non-current Liabilities
Borrowings -
Other non-current liabilities 1,164
Total Non-current Liabilities 1,164
Total Liabilities 12,713
Net Assets 11,240
Contributed equity 6,047
Shares to be issued 12,352 1
Other reserves (7,166)
Equity attributable to owners of the Company 11,233
Non-controlling interests 7
Total Equity 11,240
8

TPG Telecom Group 30 June 2020 pro forma balance sheet
Break out equity
Merger implementation steps
$mReported
30 June 2020Payment by TPG Corp
of Tuas dividendPayment by TPG Corp
of special cash dividendTPG Telecom debt
restructure
Issuance of TPG Telecom shares to TPG Corp
shareholders
Pro forma30 June 2020
Current Assets
Cash and cash equivalents 470 (18) (229) 223
Debt restructuring receivable 4,475 (4,475) -
Assets classified as held for distribution 512 (512) -
Other current assets 837 (232) 605
Total Current Assets 6,294 (512) (18) (4,936) 828
Total Non-current Assets 17,659 - - - 17,659
Total Assets 23,953 (512) (18) (4,936) 18,487
Current Liabilities
Borrowings 9,218 461 (9,679) -
TPG Corp special dividend payable 479 (479) -
TPG Corp in-specie dividend payable 512 (512) -
Other current liabilities 1,340 (36) 1,304
Total Current Liabilities 11,549 (512) (18) (9,715) 1,304
Non-current Liabilities
Borrowings - 4,780 4,780
Other non-current liabilities 1,164 1,164
Total Non-current Liabilities 1,164 - - 4,780 5,944
Total Liabilities 12,713 (512) (18) (4,935) 7,248
Net Assets 11,240 - - (1) 11,239
Contributed equity 6,047 4,475 7,877 18,399
Shares to be issued 12,352 (4,475) (7,877) -
Accumulated losses and other reserves (7,166) (1) (7,167)
Equity attributable to owners of the Company 11,233 - - (1) 11,232
Non-controlling interests 7 7
Total Equity 11,240 - - (1) 11,239
9

TPG Telecom Group 1H20 reported income statement
$mGroup 1H20
ReportedNotes
Revenue 1,540
Other income 6
Cost of provision of telco services (367)
Cost of handsets sold (368)
Employee benefits expense (112)
Other operating expenses (168) 1
EBITDA 531
Depreciation and amortisation (479)
Results from operations 52
Net financing costs (195) 1,2
Loss before tax (143)
Income tax benefit 226 3
Profit after tax 83
EBITDA (pre AASB16) 461
Notes
The Group’s consolidated income statement for 1H20 includes only 4 days’ contribution from TPG Corporation.
1. ‘Other operating expenses’ and ‘Net financing costs’ include one-off merger related costs of $24m and $6m respectively.
2. Net financing costs for the period reflects interest and fees on the elevated level of debt held throughout the period prior to the debt restructuring that occurred in July 2020.
3. One-off, non-cash, credit to income tax expense reflecting the recognition of a deferred tax asset for temporary differences.
10

Reconciliation from Group 1H20 reported income statement
to underlying TPG Telecom (VHA) standalone income statement
$mGroup 1H20
income statement Reported
Less: 4 days contribution from
TPG Corp
TPG Telecom standalone
Add back: TPG Telecom merger related expenses
Less: one-off TPG Telecom income tax
credit
Underlying 1H20 TPG Telecom
standalone
Revenue 1,540 (27) 1,513 1,513
Other income 6 6 6
Cost of provision of telco services (367) 15 (352) (352)
Cost of handsets sold (368) (368) (368)
Employee benefits expense (112) 2 (110) (110)
Other operating expenses (168) 1 (167) 24 (143)
EBITDA 531 (9) 522 24 546
Depreciation and amortisation (479) 4 (475) (475)
Results from operations 52 (5) 47 24 71
Net financing costs (195) 1 (194) 6 (188)
Loss before tax (143) (4) (147) 30 (117)
Income tax benefit/(expense) 226 0 226 (226) 0
Profit/(Loss) after tax 83 (4) 79 30 (226) (117)
EBITDA (pre AASB16) 461 (9) 452 24 476
11

TPG Corporation (TPM) pre-merger income statement
$mUnderlying
1H20
Revenue 1,248
Cost of provision of telco services (672)
Employee benefits expense (116)
Other operating expenses (69)
EBITDA 391
Depreciation and amortisation (166)
Results from operations 225
Net financing costs (35)
Profit before tax 190
Income tax expense (52)
Profit after tax 138
EBITDA (pre AASB16) 379
Notes1H20 represents the six months ended 30 June 2020.Underlying EBITDA of $391m excludes Tuas Limited (TPG Singapore) and merger related expenses of $47m.
12

Notes1. Reflects elimination of all intra-group transactions (primarily dark fibre and MVNO contracts)2. Additional depreciation and amortisation relating to identified tangible and intangible assets which may arise as a result of the purchase price allocation exercise that the Group will undertake during 2H20 are not reflected in the pro forma income statement.
TPG Telecom Group 1H20 pro forma income statement
$mUnderlying
TPG Telecom 1H20(from slide 11)
Underlying TPG Corp 1H20(from slide 12)
Eliminate intra-group transactions1
Reflect post-merger debt structure
OtherPro forma
TPG Telecom Group 1H20
Revenue 1,513 1,248 (53) 4 2,712
Other income 6 6
Cost of provision of telco services (352) (672) 23 4 (997)
Cost of handsets sold (368) (368)
Employee benefits expense (110) (116) 3 (223)
Other operating expenses (143) (69) (212)
EBITDA 546 391 (30) 11 918
Depreciation and amortisation (475) (166) 20 (11) (632)
Results from operations 71 225 (10) 0 286
Net financing costs (188) (35) 17 112 (94)
(Loss)/Profit before income tax (117) 190 7 112 0 192
Income tax expense 0 (52) (52)
(Loss)/Profit after tax (117) 138 7 112 0 140
EBITDA (pre AASB 16) 476 379 (30) 11 836
13

TPG Telecom Group 1H20 reported cash flow
$mGroup 1H20
ReportedNotes
Operating cash flow 318 1
Tax paid -
Mobile spectrum payments (204) 2
Other capital expenditure (267)
AASB16 lease payments (including interest) (113)
Merger costs (14) 3
Net financing costs (80)
Net Cash flow before loan movements (360) 1
Excluding spectrum (156) 1
Notes
The Group’s consolidated cash flow statement for 1H20 includes only 4 days’ contribution from TPG Corporation.
1. 1H20 operating cash flow materially impacted by negative working capital movement in the period principally due to timing of supplier payments. Operating cash flow for 2H19 was $875m.
2. Spectrum payments comprise $132m for 3.6 GHz spectrum and $72m for 700 MHz spectrum (final instalment).
3. Merger related costs paid in the period.
14

TPG Telecom Group 1H20 pro forma cash flow
$mGroup1H20
Reported
Less: 4 days contribution
from TPG Corp
TPG Telecomstandalone
1H20
TPG Corp standalone
1H20
Eliminate intra-group transactions
Reflect post-merger debt
structure
Add back merger
transaction costs
Pro forma TPG Telecom
Group 1H20
Operating cash flow 318 (15) 303 420 (30) 693
Tax paid - - (56) (56)
Mobile spectrum payments (204) (204) (484) (688)
Other capital expenditure (267) 1 (266) (88) (354)
AASB16 lease payments (including interest) (113) (113) (13) 30 (96)
Merger costs (14) (14) (40) 54 0
Net financing costs (80) 3 (77) (121) 144 (54)
Net Cash flow before loan movements (360) (11) (371) (382) - 144 54 (555)
Excluding spectrum (156) (11) (167) 102 - 144 54 133
15

TPG Telecom Group debt facility
New facility $5,250 million
Total drawn on merger implementation $4,780 million
Undrawn on merger implementation $470 million
Overview of new facility
• Maturity of 3 to 5 years
• Interest rate calculated as BBSY plus margin on drawn balance
• Funding provided by 14 domestic and international banks
Pro Forma Leverage Ratio1,2
(Net debt / EBITDA)2.7x
Notes1. Net debt of $4,557m calculated as borrowings of $4,780m less cash of $223m per pro forma balance sheet. EBITDA is pre AASB16 EBITDA of $836m per
pro forma income statement annualised.2. Financial covenants tested on a 12 month rolling basis. First testing period 30 June 2021.
16

TPG Telecom Limited (VHA) standalone 1H20 results
17

TPG Telecom (VHA) standalone underlying income statement
$mUnderlying
TPG Telecom1H20
Underlying TPG Telecom
1H19Movement
Revenue 1,513 1,723 (210)
Other income 6 5 1
Cost of provision of telecommunication services (352) (342) (10)
Cost of handsets sold (368) (539) 171
Employee benefits expense (110) (116) 6
Other operating expenses (143) (139) (4)
EBITDA 546 592 (46)
Depreciation and amortisation (475) (506) 31
Results from operations 71 86 (15)
Net financing costs (188) (230) 42
Loss before tax (117) (144) 27
Income tax - - -
Loss after tax (117) (144) 27
NotesThe differences between the reported and underlying 1H20 income statement are as set out on Slide 11.The only difference between the reported and underlying 1H19 income statement is that $9m of merger related cost have been excluded from other operating expenses.
18

TPG Telecom (VHA) underlying EBITDA bridge
NotesEBITDA is presented on a post AASB16 basis.
1H20 EBITDA • Adversely impacted by mobile
subscriber and ARPU movements (refer slides 23-24) and COVID (refer slides 20-21)
Other growth • Driven by opex savings,
improved device margin and fixed broadband growth
19

20
COVID: Vodafone helping customers stay connected
Suspension of late payment fees, collection activities
$10 Stay Connected Cap Plan
Two months’ free mobile service for registered health practitioners
Substantial reduction in data overage charges
Bonus data for customers
Free unlimited national calls and sms

Affected Areas Impact to-date Outlook
Roaming (inbound + outbound)~80% reduction in margin contribution from April to June compared with prior year
Anticipate impact to continue for at least the rest of the year
Connections~30% lower prepaid and ~20% lower postpaidconnections due to decline in international visitors from April to June
Anticipate impact to continue for at least the rest of the year
Contact centresSignificantly reduced operations in March and April due to India lockdown, leading to reduced service availability and sales
Full service resumed but anticipate modest increase in operating costs while pandemic is ongoing
Retail storesOne third of stores temporarily closed from April to June impacting sales
Stores re-opened but lower retail traffic anticipated. Further temporary store closures also likely in response to the evolving situation
Customer support initiatives Reduced ARPU due to extra data, free national voice calls & SMS, and the $10 ‘Stay Connected’ financial hardship plan
$10 financial hardship plan continues to be available to customers experiencing financial difficulties during pandemic
Suspension of late payment fees and collection activities
100% of late payments fees paused from April to June
Special assistance continues to be available to customers experiencing financial difficulties
TPG Telecom (VHA) COVID impacts
21

TPG Telecom (VHA) underlying results analysis
Revenue $mMobile
PostpaidMobilePrepaid
Fixed & Other Service revenue
Hardware revenue
Total
1H20 861 199 80 373 1,513
1H19 920 219 54 530 1,723
Movement (59) (20) 26 (157) (210)
EBITDA $m Total
1H20 546
1H19 592
Movement (46)
EBITDA % Total
1H20 36%
1H19 34%
Revenue• 75% of decrease attributable
to lower handset sales
• Other revenue movements driven by subscriber and ARPU movements (refer slides 23 and 24)
EBITDA• Increase in EBITDA margin %
22

9 337 114
150
Jun-18 Dec-18 Jun-19 Dec-19 Jun-20
Subsc
ribers
(‘0
00
)
Fixed Broadband
TPG Telecom (VHA) subscribers
NotesMobile - Prepaid subscribers measured based upon having usage in the last 3 months.
3,432 3,454 3,445 3,416 3,354
2,209 2,209 2,196 2,018 1,818
337 356 349 310 297
5,978 6,019 5,990 5,744 5,469
Jun-18 Dec-18 Jun-19 Dec-19 Jun-20
Subsc
ribers
(‘0
00
)
Mobile - Postpaid Mobile - Prepaid Mobile - MVNOMobile subscribers• Prepaid declined by 200k in
1H20
• Postpaid declined by 62k in 1H20
• Includes impact of COVID
MVNO subscribers• Includes 242k TPG
Corporation mobile subscribers at 30 June 2020
NBN subscribers• Increased by 36k in 1H20
23

TPG Telecom (VHA) ARPU
NotesMobile ARPU represents a rolling 12 month average of net service revenue (excl. GST) per user per month excluding MVNOs. Mobile - Prepaid includes Kogan and Lebara brands. Fixed broadband ARPU represents a 12 month average of net service revenue (excl. GST) per user per month including Kogan.
44.3
17.2
59.4
43.1
16.7
58.6
41.9
17.0
59.8
Mobile - Postpaid Mobile - Prepaid Fixed broadband
ARPU ($/month)
1H19 2H19 1H20
Postpaid ARPU • Decrease of $1.2 compared to
2H19. Includes COVID impacts
Prepaid ARPU • $0.3 increase compared to
2H19
Fixed broadband (NBN) ARPU• Increased by $1.2 compared to
2H19
24

TPG Telecom (VHA) 1H20 cash flow
1H20 1H19
Operating cash flow 303 402
Tax paid - -
Mobile spectrum payments (204) (76)
Other capital expenditure (266) (309)
AASB16 lease payments (including interest) (113) (118)
Operating cash flow less capex (280) (101)
Excluding spectrum (76) (25)
• 1H20 operating cash flow materially impacted by negative working capital movement in the period principally due to timing of supplier payments. Operating cashflow for 2H19 was $875m
• Mobile spectrum paymentscomprise $132m for 3.6 GHz and $72m for 700 MHz (final instalment)
• Capital expenditure includes payments for property, plant and equipment plus intangible assets
• One-off merger transactioncosts excluded from the analysis
25

TPG Corporation Limited (TPM) standalone 1H20 results
26

NotesFor purposes of comparison with the ‘BAU’ EBITDA guidance provided by TPG Corporation on 5 March 2020, the underlying income statement for the 11 months to 30 June 2020 is presented in a manner consistent with that guidance in that it (a) excludes any contribution from Tuas Limited (TPG Singapore), (b) excludes any Australian mobile network opex and (c) excludes merger related expenses. One minor difference in the presentation of the underlying results for the 6 months to 30 June 2020 (1H20) is that Australian mobile opex ($3.1m for the 6 months) has not been excluded as it will form part of the ordinary business of the Group post merger.EBITDA for 1H20 and 1H19 is presented on a post AASB16 basis (1H19 re-stated for comparative purposes as if AASB16 had been adopted for that period).1H20 represents the six months ended 30 June 2020. 1H19 represents the six months ended 31 July 2019 (i.e. the 2nd half of TPG Corporation’s FY19 financial year).EBITDA for all periods excludes Tuas Limited (TPG Singapore) and merger related expenses.
$mUnderlying
11 months from 1 Aug 2019 to 30 June 2020
Underlying TPG Corporation
1H20
Underlying TPG Corporation
1H19Movement
Revenue 2,287 1,248 1,241 7
Cost of provision of telco services (1,211) (672) (642) (30)
Employee benefits expense (206) (116) (114) (2)
Other operating expenses (130) (69) (78) 9
EBITDA 740 391 407 (16)
Depreciation and amortisation (303) (166) (171) 5
Results from operations 437 225 236 (11)
Net financing costs (61) (35) (38) 3
Profit before tax 376 190 198 (8)
Income tax (107) (52) (56) 4
Profit after tax 269 138 142 (4)
EBITDA (pre AASB16) 720 379 396 (17)
TPG Corporation (TPM) standalone underlying income statement
27

TPG Corporation (TPM) underlying EBITDA bridge
Notes1H20 represents the six months ended 30 June 2020. 1H19 represents the six months ended 31 July 2019 (i.e. the 2nd half of TPG Corporation’s FY19 financial year).EBITDA for both periods is presented on a post AASB16 basis (1H19 re-stated for comparative purposes as if AASB16 had been adopted for that period).EBITDA for both periods excludes Tuas Limited (TPG Singapore) and merger related expenses.
NBN headwinds
• Headwinds continue from migration of DSL customers to less profitable NBN services
• ‘Other growth’ driven by opex savings as well as Corporate Division and FTTB growth
• No material financial impact to-date from COVID on fixed broadband business
28

TPG Corporation (TPM) segment analysis
Revenue $m Consumer Corporate Aust mobile Total
1H20 879 369 - 1,248
1H19 866 375 - 1,241
Movement 13 (6) - 7
EBITDA $m Consumer Corporate Aust mobile Total
1H20 198 196 (3) 391
1H19 220 190 (3) 407
Movement (22) 6 - (16)
EBITDA % Consumer Corporate Aust mobile Total
1H20 23% 53% - 31%
1H19 25% 51% - 33%
Notes1H20 represents the six months ended 30 June 2020. 1H19 represents the six months ended 31 July 2019 (ie the 2nd half of TPG Corporation’s FY19 financial year).EBITDA for both periods is presented on a post AASB16 basis (1H19 re-stated for comparative purposes as if AASB16 had been adopted for that period).
Consumer Division • Profit decline attributable to
ongoing NBN headwinds
Corporate Division• Continued margin improvement
29

TPG Corporation (TPM) consumer segment product analysis
$m Broadband Fixed Voice Mobile Other Total
1H20
Revenue 771 15 48 45 879
Gross Profit 275 5 11 26 317
Gross Profit % 36% 33% 23% 58% 36%
Overheads (119)
Overheads % 14%
EBITDA 198
EBITDA % 23%
1H19
Revenue 736 30 54 46 866
Gross Profit 299 9 12 26 346
Gross Profit % 41% 30% 22% 57% 40%
Overheads (126)
Overheads % 15%
EBITDA 220
EBITDA % 25%
Notes1H20 represents the six months ended 30 June 2020. 1H19 represents the six months ended 31 July 2019 (i.e. the 2nd half of TPG Corporation’s FY19 financial year).EBITDA for both periods is presented on a post AASB16 basis (1H19 re-stated for comparative purposes as if AASB16 had been adopted for that period).
• Broadband revenue increase driven by subscriber growth but offset by NBN margin erosion
• Further decrease in Consumer Division overheads
30

TPG Corporation (TPM) corporate & wholesale segment
Revenue $m Data/Internet Voice Legacy iiNet Total
1H20 293 58 18 369
1H19 294 57 24 375
Movement (1) 1 (6) (6)
$m Corporate Segment EBITDA
1H20 196
1H19 190
Movement 6
Notes1H20 represents the six months ended 30 June 2020. 1H19 represents the six months ended 31 July 2019 (ie the 2nd half of TPG Corporation’s FY19 financial year).EBITDA for both periods is presented on a post AASB16 basis (1H19 re-stated for comparative purposes as if AASB16 had been adopted for that period).
31

TPG Corporation (TPM) cash flow
Notes1H20 represents the six months ended 30 June 2020. 1H19 represents the six months ended 31 July 2019 (i.e. the 2nd half of TPG Corporation’s FY19 financial year).Cash flow excludes Tuas Limited (TPG Singapore).
$m 1H20 1H19
Operating cash flow 420 427
Tax paid (56) (51)
Mobile spectrum payments (484) -
Other capital expenditure (88) (120)
AASB16 lease payments (including interest) (13) (3)
Operating cash flow less capex (221) 253
Excluding spectrum 263 253
• 1H20 operating cashflow exceeds EBITDA
• Mobile spectrum paymentscomprise $131m for 3.6 GHz and $352m for 700 MHz (final instalment)
• Capital expenditure includes payments for property, plant and equipment plus intangible assets
• One-off merger transaction costs excluded from the analysis
32

TPG Corporation (TPM) broadband subscribers
• 31k net subscriber growth in 5 months to 30 June 2020
• 185k net NBN subscriber growth in 5 months to 30 June 2020
• 12% of subscriber base remaining on DSL at 30 June 2020
861 9881,220
1,4031,588
107112
117
123
127
840725
516355
208100 74 52 39 2923 23 21 20 19
1,931 1,922 1,9261,940 1,971
Jul-18 Jan-19 Jul-19 Jan-20 Jun-20
Subsc
ribers
(‘0
00
)
NBN On-net FTTB/HFC/VDSL On-net ADSL Off-net ADSL Other Off-net
33

TPG Corporation (TPM) mobile subscribers
422 430 410367 357
Jul-18 Jan-19 Jul-19 Jan-20 Jun-20
Subsc
ribers
(‘0
00
) TPG Corporation mobile subscribers at 30 June 2020:
• TPG brand 252k
• iiNet brand 105k
242k of the TPG brand subscribers are also included in TPG Telecom (VHA) MVNO subscriber numbers at 30 June 2020
34
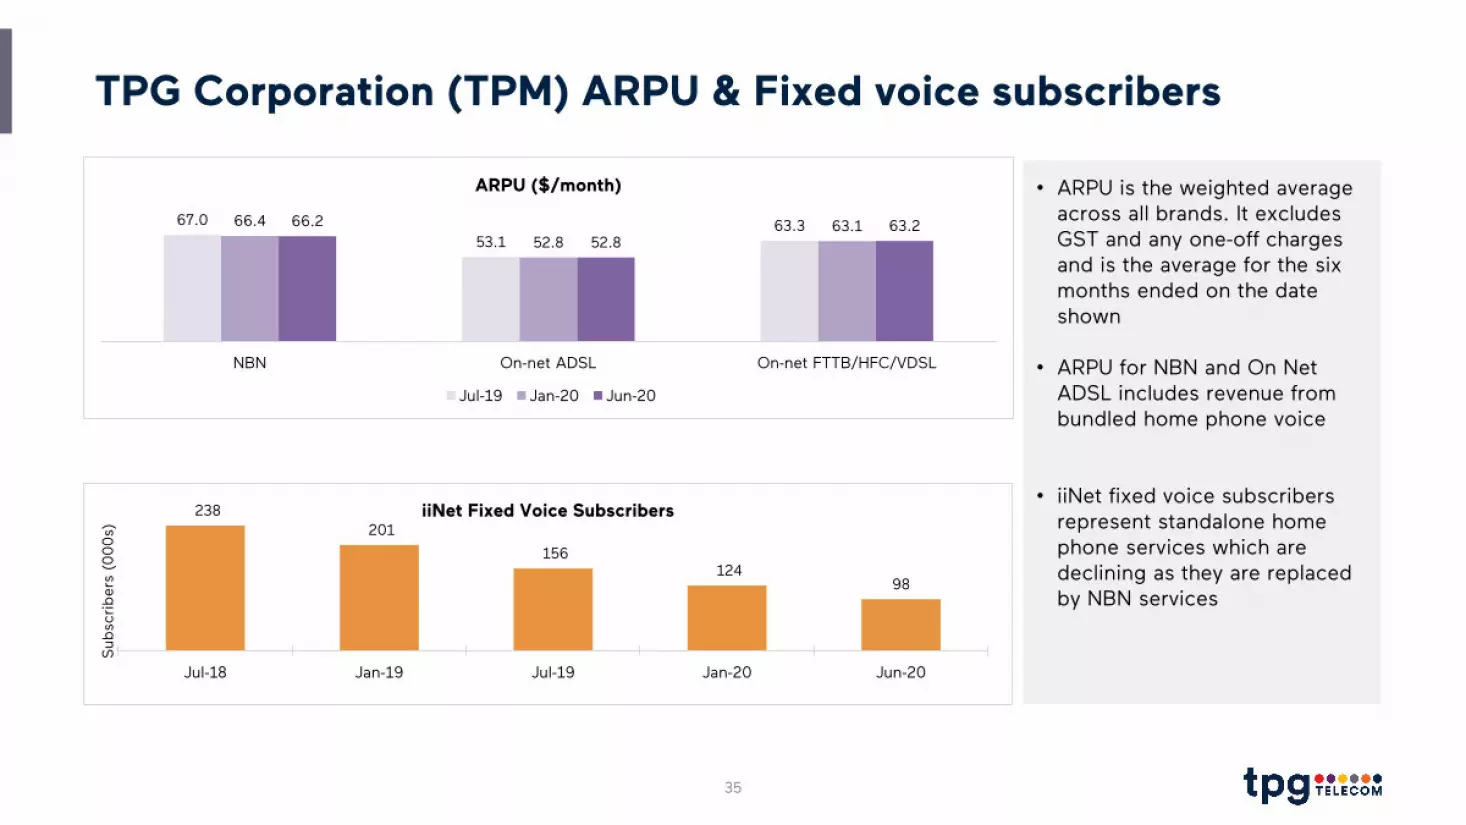
TPG Corporation (TPM) ARPU & Fixed voice subscribers
• ARPU is the weighted average across all brands. It excludes GST and any one-off charges and is the average for the six months ended on the date shown
• ARPU for NBN and On Net ADSL includes revenue from bundled home phone voice
• iiNet fixed voice subscribers represent standalone home phone services which are declining as they are replaced by NBN services
238
201
156 124
98
Jul-18 Jan-19 Jul-19 Jan-20 Jun-20
Subsc
ribers
(0
00
s)
iiNet Fixed Voice Subscribers
67.0
53.163.366.4
52.863.166.2
52.863.2
NBN On-net ADSL On-net FTTB/HFC/VDSL
ARPU ($/month)
Jul-19 Jan-20 Jun-20
35

TPG Telecom Group look ahead
36

Additional fibre rollout for 700 Vodafone
mobile sites
Merger synergies being realised and on track
Key merger synergy realised by integration of
network assets
455 mobile site upgrades since merger, including:
Addition of 700 MHz, 3.6 GHz, 1800 MHz and 2600 MHz spectrum holdings
Deployment of small cells in Sydney and Melbourne
Network
iiNet launches mobile plans with 50% off
for 6 months
iiNet base to be migrated to Vodafone mobile
network
Vodafone launches home bundle as start to converged
products
Commercial
5G network build
Extended Optus eJV for 5G
Nokia deployment to accelerate
37

Management team in place to drive delivery of further synergies
Align and transform organisation
Reduce mobile transmission third party costs leveraging existing fibre assets
Cross sell FTTB / Fixed wireless into Fixed NBN base
Leverage mobile and fixed customer bases to increase converged households
Increase Enterprise market share and build wholesale business
Improve cost efficiencies across technology, infrastructure, logistics and property
38

5G rollout gaining momentum
• More than 1,200 sites currently in planning mainly in Sydney, Melbourne, Brisbane, Adelaide, Perth and Canberra
• 5G standalone network capability being developed
• Targeting over 85% population coverage in the top 6 cities by end of 2021 with delivery of 5G standalone network and site rollout program
Note 5G standalone network accessible by 5G standalone capable devices
39

Group priorities
ConvergenceGrow share of household spend
5G mobile networkAccelerate 5G rollout
Integration activitiesIntegration and optimisation of the two organisations
EnterpriseDevelop corporate and government unit
On-net broadband opportunitiesBring more customers onto FTTB, Fast Fibre & Fixed Wireless
Merger synergiesLeverage combined infrastructure, rationalise costs and realise cross-sell opportunities
40

Our major brands: Vodafone
41

Our major brands: TPG
42

Our major brands: iiNet
43

Q&A
44

This presentation contains certain forward-looking and unaudited information. Such information is based on estimates and assumptions that, whilst considered reasonable by TPG Telecom at the date of preparation, are subject to risks and uncertainties. Actual results and achievements could be significantly different from those expressed in or implied by this information.
COVID is likely to continue affecting parts of TPG Telecom’s business. However, the dynamic nature and continuing uncertainty surrounding COVID makes it impossible to accurately predict or forecast the extent of the impact on TPG’s business or future financial or other performance.
Disclaimer
45