Case Study: British Telecom - CiteSeerX
32
1 Case Study: British Telecom: Searching for a winning strategy Tuomo Summanen Michael Pollitt Judge Institute of Management November 2002 1. Introduction The development of the telecommunications market in the United Kingdom and the corporate strategy and development of the incumbent, British Telecom, represents an interesting object of analysis for several reasons. First, the UK telecommunications market was - along with the U.S. market - among the first telecommunications market that was deregulated in the early 1980s. Also some regulatory innovations, such as price cap regulation, were developed, and first implemented in telecommunications in the UK. Second, British Telecom was the first large incumbent in telecommunications that was privatised in the early 1980s. Third, competition in the UK telecommunications started gradually about ten years earlier than in most of the other European countries, and for a long period the UK market was, in number of competing companies at least, well ahead other European countries. However, competition evolved gradually, and had some country specific features that have affected the development of the telecommunications market, and particularly British Telecom.
-
Upload
khangminh22 -
Category
Documents
-
view
1 -
download
0
Transcript of Case Study: British Telecom - CiteSeerX

1
Case Study:
British Telecom: Searching for a winning strategy
Tuomo Summanen
Michael Pollitt
Judge Institute of Management
November 2002
1. Introduction
The development of the telecommunications market in the United Kingdom and the
corporate strategy and development of the incumbent, British Telecom, represents an
interesting object of analysis for several reasons. First, the UK telecommunications
market was - along with the U.S. market - among the first telecommunications market
that was deregulated in the early 1980s. Also some regulatory innovations, such as
price cap regulation, were developed, and first implemented in telecommunications in
the UK. Second, British Telecom was the first large incumbent in telecommunications
that was privatised in the early 1980s. Third, competition in the UK
telecommunications started gradually about ten years earlier than in most of the other
European countries, and for a long period the UK market was, in number of
competing companies at least, well ahead other European countries. However,
competition evolved gradually, and had some country specific features that have
affected the development of the telecommunications market, and particularly British
Telecom.

2
The main question to be explored in this paper is how the incumbent, British
Telecom, in its strategies utilised the early mover advantage in the deregulated
market? First, the development of telecommunications market in the UK after
deregulation will be reviewed, and second, the development of corporate strategies of
British Telecom will be described.
2. Telecommunications market in the United Kingdom
2.1 The History of liberalisation
Before its 1984 privatisation British Telecom had a legal monopoly over fixed line
network operations (local, long-distance, international) and the supply of network
services, most apparatus supply, and value added network services. In the beginning
of 1980s the agenda was not to privatise British Telecom, but rather to clarify the
financial and operational routines and tighten financial control on the company. In
1981 the Beesley report recommended liberalisation of the resale of leased circuits. In
the same year the British Telecommunications Act split BT from the Post Office
and begins liberalisation. As a result in 1982, Mercury, a subsidiary of Cable and
Wireless, was licensed as a national fixed line network operator in competition with
BT. In 1982 White Paper announced the government’s intention to privatise BT. In
1983 the government announced its “duopoly policy”, which meant that for next
seven years there will be only two operators, BT and Mercury, for nation-wide fixed
line networks. This duopoly policy also prevented cable television companies from
providing telecommunications services in their own right. In 1984 British Telecom
was privatised: 50.2% of its shares were sold. Two possible models of privatisation of
3
BT were considered: to privatise it as an integrated company, or to follow the recent
model of restructuring of AT&T in the USA, and break up BT, for instance by
separating off local services, long-distance services and apparatus supply services.
The former model, which also BT’s management strongly supported, was chosen. BT
was also forbidden from carrying television services on its network.
The liberalisation of the telecommunications market in the UK can be divided into
two periods: first, the period of duopoly 1984-1990, and the period of more liberalised
market after 1991.
The duopoly policy ended in 1991 following the publication of a White Paper. Earlier
in 1989 further liberalisation had taken place: domestic, but not international yet,
simple resale was permitted and the duopoly policy in the mobile telecommunications
– until 1989 only two operators, namely Vodafone and BT’s Cellnet were licensed as
network operators – expired. White Paper allowed cable TV companies to start to
offer telecommunications services in their own right through their cable networks. At
the same time national public telecommunications companies were not permitted to
carry TV services on their networks for a further decade.
Armstrong, Cowan and Vickers (1994) describe the first period of liberalisation in the
UK telecommunications as a decade of lost opportunities. Competition in the market
grew very slowly, e.g. only in 1986, four years after its license was granted, could
Mercury could get access to BT’s local loop. And due to weak competition there was
no need for BT to restructure itself: major restructuring of the company only started at
the beginning of the 1990s.
The essential developments are listed below:
- Gradualism
4
Although deregulation of the market and the privatisation of BT were the first major
liberalisation decisions and were at that time radical political decisions, which started
a new period world-wide in the network industries, the liberalisation policy itself
during the 1980s tried to ensure a soft transition to a more competitive market.
- Duopoly
In the duopoly policy the gradual, the planned transition to the competitive market
can be seen perhaps most clearly. In the literature (e.g. Laffont and Tirole, 2000) it
has been pointed out that market forces would have done a better job at selecting
worthy competitors to BT than did regulators, and that Mercury might have not been
the optimal choice.
- Growth of the role of regulation
It is difficult to believe that the aim of the lawmakers was to increase gradually the
role of regulatory bodies in developing the competitive market.
At privatisation about half of BT’s business was subject to price control, but in mid
1990s around 70% of its business (by revenue) was under price control. The duopoly
between BT and Mercury might have created the illusion of possibility of effective
regulation by bargaining with Oftel and with final referee of the MMC. To regulate
hundreds of companies is a different kind of task.
- Regulation by bargaining
There were three regulatory bodies in the UK – the Department of Trade and Industry
(DTI), Oftel and the Monopolies and Mergers Commission (MMC). The regulatory
authority of Oftel can be extended beyond the powers and duties of the 1984
Telecommunications Act because it can always employ the threat of a reference to the
MMC to seek regulatory change. In fact regulation has involved what seems like
5
bargaining between Oftel and BT. This is in quite sharp contrast to rather legalistic
type of regulation in the USA, and to very weak regulation in the Nordic countries.
- Cherry picking
New entrants, such as Mercury during the duopoly and others after 1994, concentrate
upon the high-value-added parts of the network, comprising major cities and
especially the City of London, and upon the relatively profitable long-distance and
international markets.
- Competitive mobile telecommunications
The duopoly policy was applied also to mobile telecommunications, and initially in
1980’s only two operators were licensed, namely Cellnet and Vodafone. However,
after cancellation of the duopoly policy the licences were granted for two more
operators. At the moment all four operators have almost similar market share. Oftel’s
recent benchmarking work, reflecting prices in August 2001 shows that UK mobile
prices are slightly below average when compared to major European economies.
- Slow restructuring of BT
The duopoly period, 1984 – 1990, created for BT a soft landing into competition.
Although BT sold its manufacturing businesses soon after privatisation it employed
more people in 1990 than it did in 1984. The restructuring of the company started
only in the beginning of 1990s.
Although competition emerged after 1991, the telecommunications market in the UK
in 1990s still had very typical problems coming from 1980s, e.g. the low level of
competition in the local, especially residential, market. This is by no means only a
British phenomenon. This is crucial in the U.S. telecommunications market and also
in the EU telecommunications market as a recent declaration of the European
6
Commission on the slow development of competition in the local telephone markets
shows.
2.2 The market structure
The Office for National Statistics (ONS) estimates that there are over 7,000
businesses in the U.K. whose primary businesses can be considered
telecommunications. This estimate includes a large number of companies such as
those involved in consultancy or hardware and network installations, most of which
are outside the scope of regulation. Data used in this chapter is based on Oftel’s
Market Information 2000/2001 survey that collected data from 82 licensed telecom
operators in the U.K. ONS estimates that the turnover of the UK telecommunications
industry was £41.4 billion in the year to March 2001.
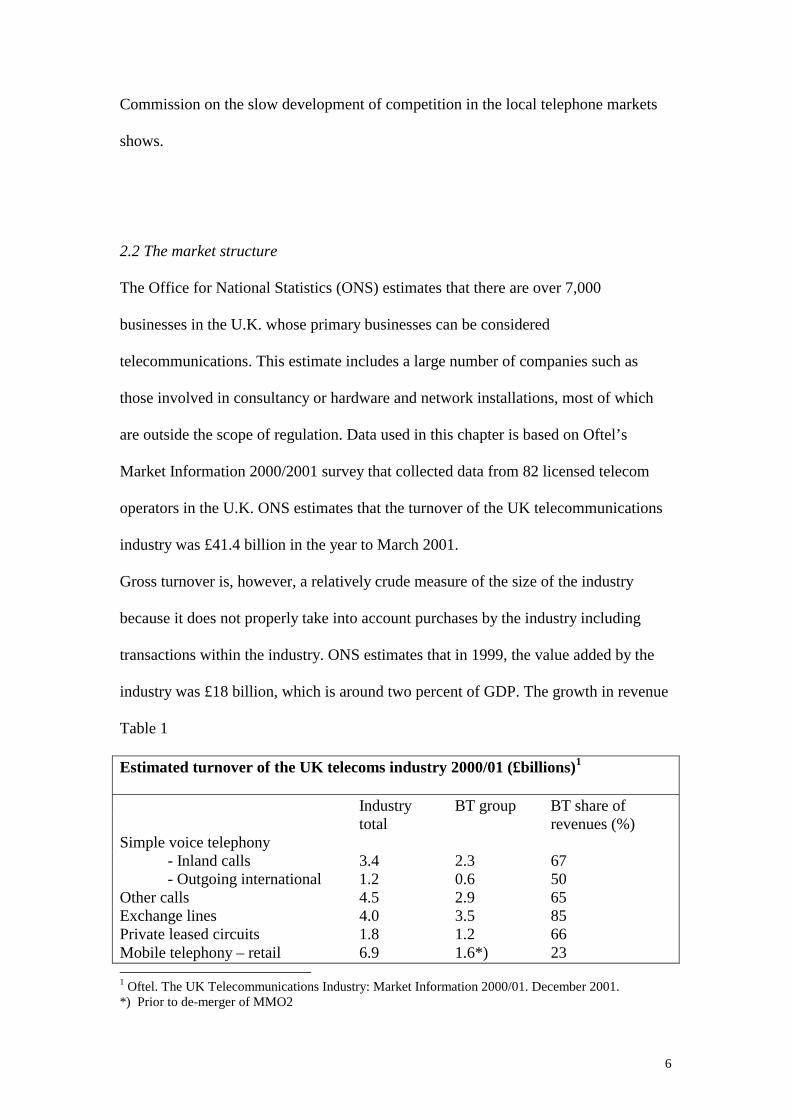
Gross turnover is, however, a relatively crude measure of the size of the industry
because it does not properly take into account purchases by the industry including
transactions within the industry. ONS estimates that in 1999, the value added by the
industry was £18 billion, which is around two percent of GDP. The growth in revenue
Table 1
Estimated turnover of the UK telecoms industry 2000/01 (£billions)1
Industry BT group BT share of total revenues (%) Simple voice telephony - Inland calls 3.4 2.3 67 - Outgoing international 1.2 0.6 50 Other calls 4.5 2.9 65 Exchange lines 4.0 3.5 85 Private leased circuits 1.8 1.2 66 Mobile telephony – retail 6.9 1.6*) 23 1 Oftel. The UK Telecommunications Industry: Market Information 2000/01. December 2001. *) Prior to de-merger of MMO2

7
Interconnect 6.5 2.5 38 Other revenues reported to Oftel 1.7 0.4 32 Estimate of other licensed operator turnover **) 5.6 5.6 Turnover from other telecoms } 32 activity **) 5.9 Total turnover **) 41.4 20.4 49
has been mainly in newer services such as mobile and Internet but also through
interconnect revenue as a result of increased competition. During 2000 the number of
mobile subscribers exceeded the number of fixed lines for the first time in the UK. In
1996/1997 there were 30,678 thousand fixed lines and 7,109 thousand mobile
subscribers but in 2000/01 there were 34,766 thousand fixed lines and 43,452 mobile
subscribers in the UK. Growth in fixed call volumes is almost entirely driven by the
internet. In 2000/01 it is estimated that around 40 percent of all call minutes
originating on the PSTN were to Internet service providers.2
The fixed lines market
In March 2001 there were 35 million exchange line numbers that is one million higher
than a year earlier. Growth was primarily in the number of business access lines. Call
volumes from fixed telephones increased by 25 per cent. This was driven mainly by
Table 2
Fixed operators: summary of all operators’ volumes3
Volumes Volumes 2001/02 Q4 2000/01 Q4 C.A.G.R 2000/01 1996/97 C.A.G.R. (per cent) (per cent) Call minutes (millions) Local calls 18,810 19,802 -5.0 79,496 86,280 -2.0 National calls 13,645 14,115 -3.3 52,847 29,512 15.7 International calls 1,976 2,114 -6.5 7,750 2,116 38.3 Calls to mobiles 3,456 3,317 4.2 12,096 2,864 43.4
**) May include some non-UK turnover 2 Oftel. The UK Telecommunications Industry… p. 6. 3 Oftel. The UK Telecommunications Market…p30; Oftel. Market Information, Fixed Update August 2002.

8
Others calls 47,077 34,141 37.9 111,110 5,032 116.8 All calls 84,965 73,490 15.6 263,30 125,803 20.3 Lines at year end (thousands) Connections 1,214 1,406 -13.6 5,380 4,299 5.8 Lines at year end 35,290 35,047 0.7 34,766 30,678 3.2
huge growth in dial-up Internet usage. Local and national calls were stable while
fixed to mobile call volumes and international call volumes increased.
BT’s share of the total fixed line telephone market continued to decrease to 65 per
cent in March 2001.
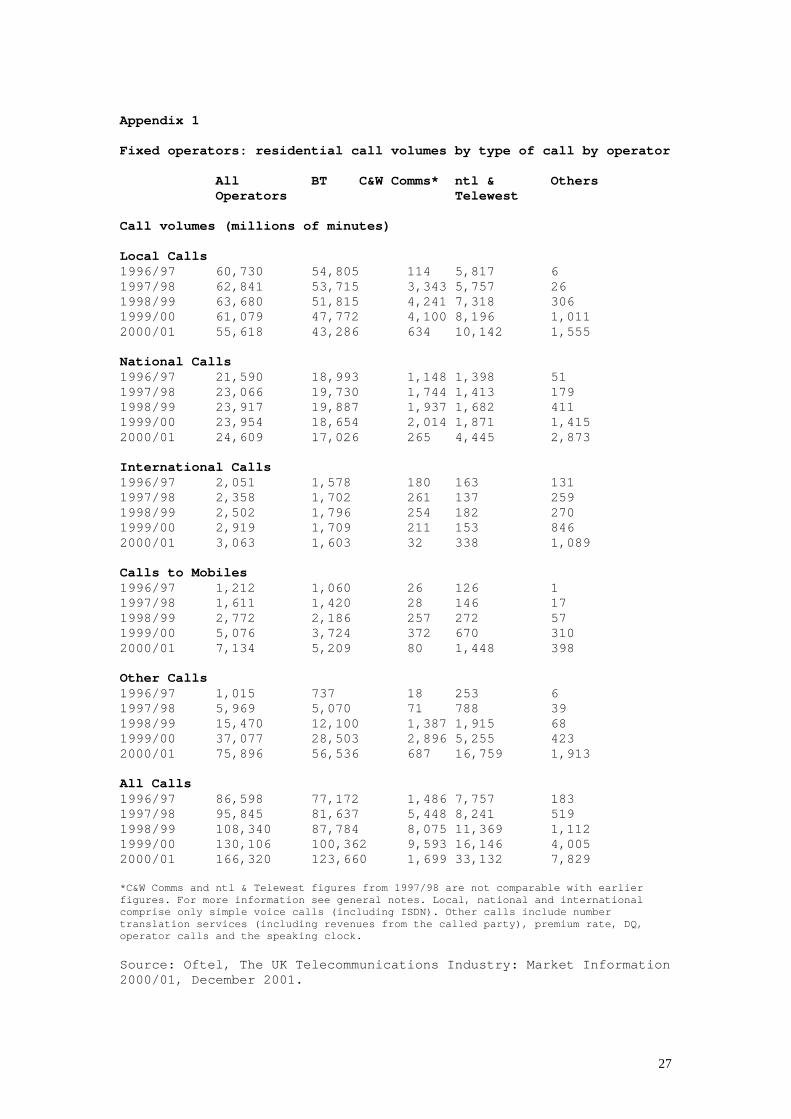
Residential fixed line telephone market
In March 2001 there were 24,6 million residential exchange line numbers. The annual
decrease was 100,000. Residential fixed telephone volumes have increased from
86,598 million minutes in 1996/97 to 166,320 million minutes in 2000/01.
Residential local call volume has decreased, and national and international call
volumes have increased. Calls to mobiles have increased substantially.
(See appendix 1, Fixed operators: residential call volumes by type of call by
operator).
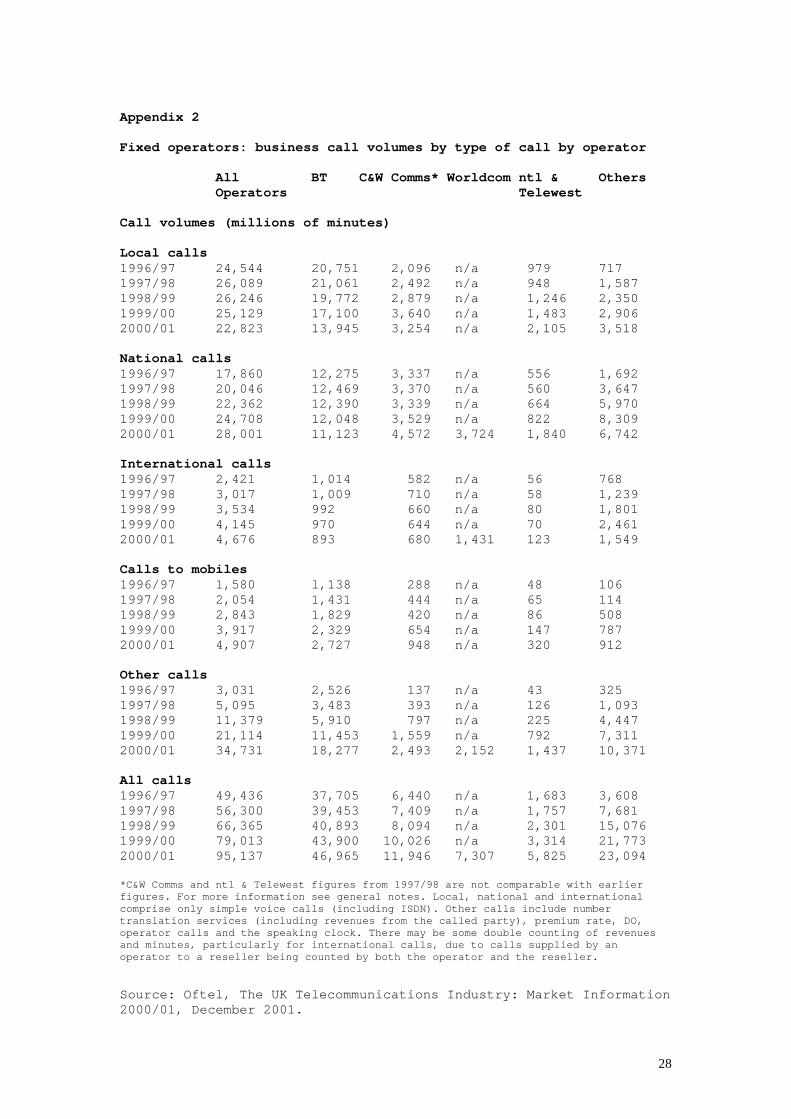
Business fixed line telephone market
Business fixed telephone call volumes increased from 49,436 million minutes in
1996/97 to 95,137 million minutes in 2000/01. Local call volumes slightly fell while
national, international and calls to mobiles increased substantially. (See appendix 2,
Fixed operators: business call volumes by type of call by operator).
The market shares
9
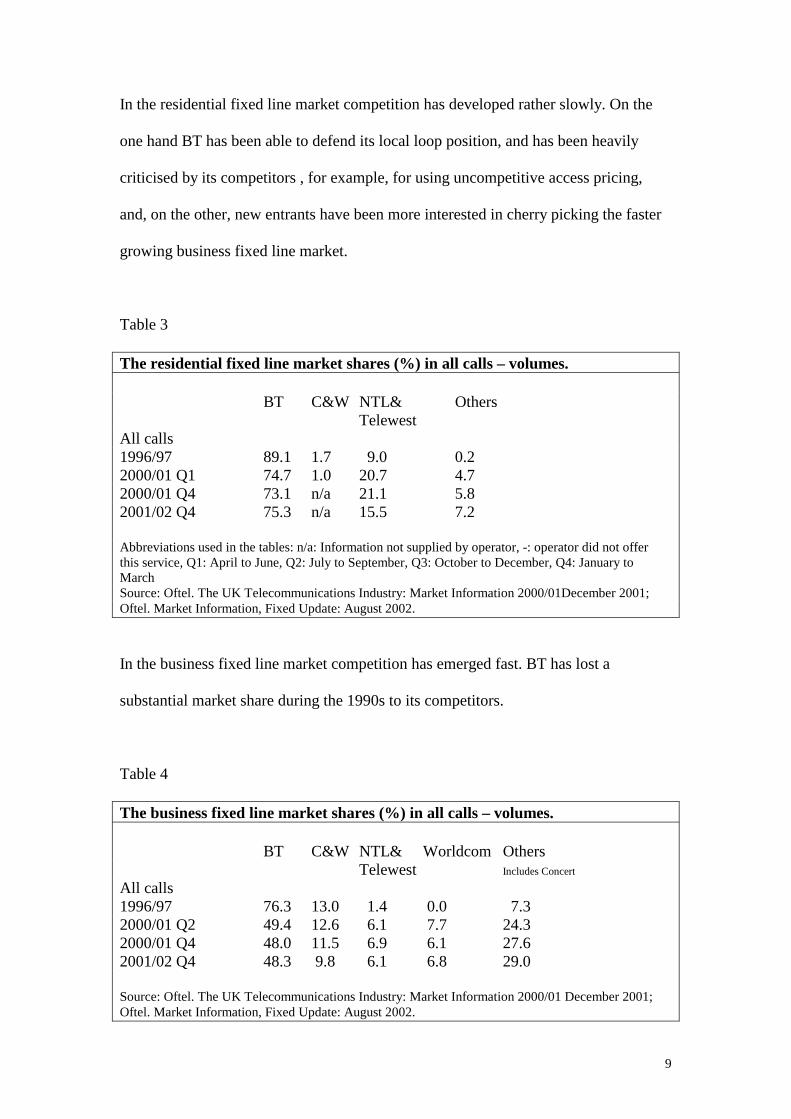
In the residential fixed line market competition has developed rather slowly. On the
one hand BT has been able to defend its local loop position, and has been heavily
criticised by its competitors , for example, for using uncompetitive access pricing,
and, on the other, new entrants have been more interested in cherry picking the faster
growing business fixed line market.
Table 3
The residential fixed line market shares (%) in all calls – volumes. BT C&W NTL& Others Telewest All calls 1996/97 89.1 1.7 9.0 0.2 2000/01 Q1 74.7 1.0 20.7 4.7 2000/01 Q4 73.1 n/a 21.1 5.8 2001/02 Q4 75.3 n/a 15.5 7.2
Abbreviations used in the tables: n/a: Information not supplied by operator, -: operator did not offer this service, Q1: April to June, Q2: July to September, Q3: October to December, Q4: January to March Source: Oftel. The UK Telecommunications Industry: Market Information 2000/01December 2001; Oftel. Market Information, Fixed Update: August 2002. In the business fixed line market competition has emerged fast. BT has lost a
substantial market share during the 1990s to its competitors.
Table 4
The business fixed line market shares (%) in all calls – volumes. BT C&W NTL& Worldcom Others Telewest Includes Concert
All calls 1996/97 76.3 13.0 1.4 0.0 7.3 2000/01 Q2 49.4 12.6 6.1 7.7 24.3 2000/01 Q4 48.0 11.5 6.9 6.1 27.6 2001/02 Q4 48.3 9.8 6.1 6.8 29.0 Source: Oftel. The UK Telecommunications Industry: Market Information 2000/01 December 2001; Oftel. Market Information, Fixed Update: August 2002.
10
However, it seems that the almost inevitable trend of BT losing its residential and
business fixed line market shares has stopped during 2001 and 2002. Partly this might
be the result of strategic change in the company, and partly the result of heavy
financial problems of BT’s competitors.
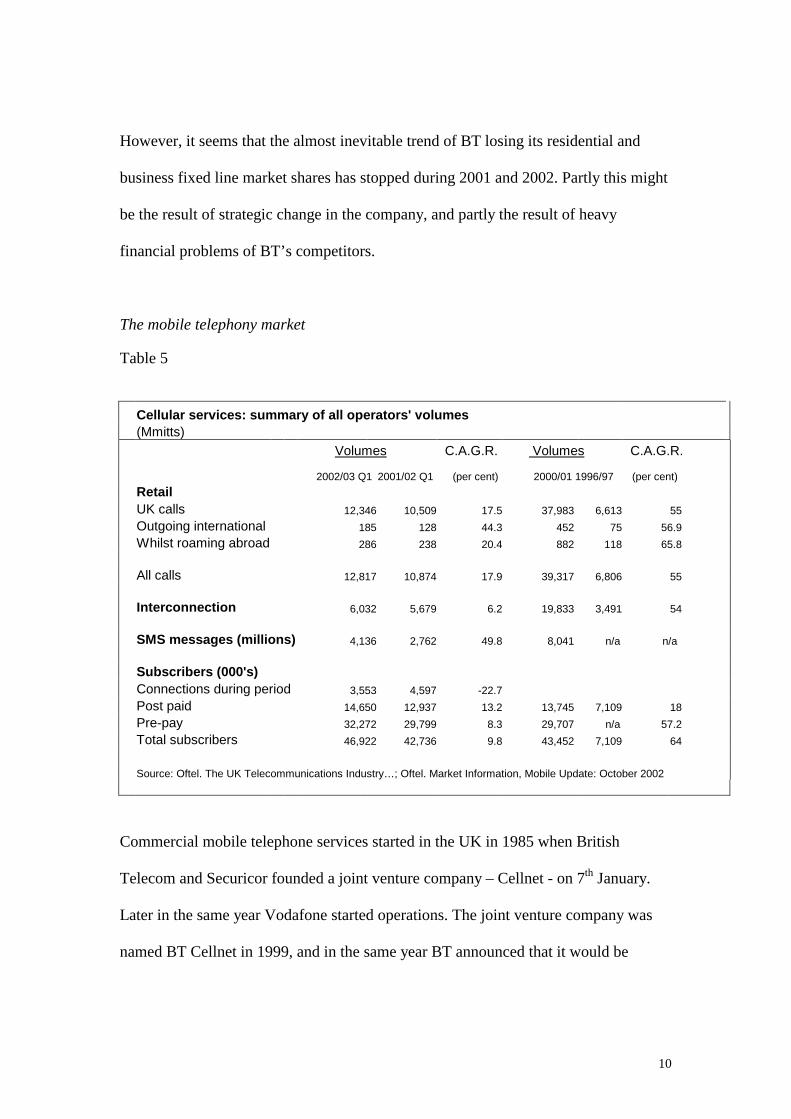
The mobile telephony market Table 5
Cellular services: summary of all operators' volumes (Mmitts) Volumes C.A.G.R. Volumes C.A.G.R.
2002/03 Q1 2001/02 Q1 (per cent) 2000/01 1996/97 (per cent)
Retail UK calls 12,346 10,509 17.5 37,983 6,613 55 Outgoing international 185 128 44.3 452 75 56.9 Whilst roaming abroad 286 238 20.4 882 118 65.8 All calls 12,817 10,874 17.9 39,317 6,806 55 Interconnection 6,032 5,679 6.2 19,833 3,491 54 SMS messages (millions) 4,136 2,762 49.8 8,041 n/a n/a Subscribers (000's) Connections during period 3,553 4,597 -22.7 Post paid 14,650 12,937 13.2 13,745 7,109 18 Pre-pay 32,272 29,799 8.3 29,707 n/a 57.2 Total subscribers 46,922 42,736 9.8 43,452 7,109 64 Source: Oftel. The UK Telecommunications Industry…; Oftel. Market Information, Mobile Update: October 2002
Commercial mobile telephone services started in the UK in 1985 when British
Telecom and Securicor founded a joint venture company – Cellnet - on 7th January.
Later in the same year Vodafone started operations. The joint venture company was
named BT Cellnet in 1999, and in the same year BT announced that it would be

11
acquiring Securicor’s minority stake in the joint venture. In 1993 Mercury
Communications launched its One 2 One mobile telephone service.
Table 6
Mobile market shares 2000/01 in the UK
Subscribers R etail revenues C all volum es % % %
O range 27 .8 23 .4 26 .2O ne 2 O ne 22 .1 17 .0 21 .0BT C ellnet 25 .5 23 .4 23.6Vodafone 24 .7 36 .2 29.3
Source: Oftel. The UK Telecommunications Industry…December 2001
The mobile telephone market in the UK has developed rapidly and market shares of
the operators have changed substantially. The fourth and the latest entrant in this
market – Orange, entered the market in April 1994 – is at the moment the biggest
mobile operator by number of subscribers. (See more detailed information about the
development of market shares in the appendix 3, Cellular services: subscribers.
Connections, stocks, and net changes by operator). In October 1999 Orange was
acquired by Mannesman. In February 2000 Vodafone acquired Mannesman and
undertook according the conditions set by the regulator to sell Orange. In May 2000
Orange announced an agreed acquisition by France Telecom. In 2001 BT demerged,
as a part of its financial rescue plan, BT Cellnet, which was named mmO2. In the
same year One 2 One was re-named by Deutsche Telekom as T-Mobile.
3. Development and corporate strategies of British Telecom

12
BT’s origins date back as far as to the introduction of the first commercial telegraph
services in the early nineteenth century. The survivors of these companies were
transferred to state control under the Post Office. Thus as in many other developed
countries in the early days of telephony telephone services in the United Kingdom
were provided by the Post Office in competition with private telephone companies.
However, in 1912 the Post Office became the monopoly supplier of telephone
services except in a few municipalities. Post Office was a state department until 1969,
when under the Post Office Act it was transferred into a public corporation. The
British Telecommunications Act, 1981, separated postal and telecommunications
activities and created British Telecom as a distinct public corporation. In the
beginning of the 1980s the process of opening up the telecommunications market to
competition started. The Telecommunications Act, 1984, confirmed the privatisation
of British Telecom. In 1984 50.2 per cent of British Telecom shares were sold to the
public. In December 1991 the government sold half of its remaining holding of 47.6
per cent of shares, and all the remaining government shares were sold in July 1993.
The outcome of the 1984 Act was that British Telecom finally lost its monopoly in
running telecommunications network in the UK. The Act, by creating Oftel,
completed the separation of regulatory and operational functions that had started in
1981.
A Government White Paper “Competition and Choice: Telecommunications Policy
for the 1990s”, issued on 5 March 1991, cancelled the duopoly and opened the market
for competition. The first major restructuring of BT as an integrated
telecommunications company was done in the beginning of 1990s. In April 1991 BT
unveiled a new organisation structure, which was the result of twelve months of

13
reorganisation. BT’s new organisation focused on specific market sectors to meet
better the needs of different customers – the individual, the small business, and the
multinational corporations. For the first time after privatisation BT started to cut jobs.
The object of becoming a leading global telecommunications operator was set during
that time. The main strategic approach for this goal was to expand rapidly into
overseas using strategic alliances with telecommunications companies. Earlier, in
1990, British Telecom sold its telephone manufacturing businesses. At its largest the
Post Office/British Telecom manufacturing division consisted of eight factories
around the country (three in London, three in Birmingham, one in Edinburgh and one
in Cwmcarn) and employed 4,000 people. In the same year British Telecom sold also
its holdings in cable operating companies: Thames Valley Cable, Ulster Cable,
Aberdeen Cable Services Ltd., Swindon Cable and Coventry Cable as a part of its
general strategy of concentrating on providing network-related products and services
to customers all around the world.
In 1987 Sir George Jefferson resigned as Chairman of British Telecom, and the CEO
Iain Vallance became also the chairman of the company. Sir Iain Vallance had joined
the Post Office in 1966. He was appointed a director of British Telecom in 1984, and
served as CEO from 1986. In 1993 BT and MCI, the second largest carrier of long
distance telecommunications services in the USA, announced a joint global alliance
through a new joint venture company Concert Communications. This new company
was planned to play the main role in transforming BT into a leading global
telecommunications operator. During the next few years in order to create a global
network around Concert to serve multinational corporate clients BT acquired stakes or
founded several joint venture companies overseas: e.g. in 1995 Albacom – a joint
venture company in Italy with BNL, Viag InterKom KG – joint venture company in
14
Germany, Telenordia in Sweden with TeleDanmark and Telenor; in 1996 BT
acquired Bell Canada’s 25% stake in Clear Communications, New Zealand’s second
largest telecommunications company and a joint venture company in Korea with
Dacom, a joint venture company Telfort B.V. in the Netherlands.
In 1996 at the annual shareholding meeting the chairman Iain Vallance formulated
BT’s corporate strategy in the following way. “We have a clear strategy…that has
been in place for some time now.” “First, we will continue to defend market share in
the UK… Second, we will expand our overseas presence and our interests,
particularly in partnership with others. Third, we will develop the market for
advanced, interactive and multimedia services”. BT’s overseas activity targets were
set in three parts of the world: North America – in partnership with MCI; mainland
Europe defined as BT’s extended home markets, and the Asia-Pacific region. As
Vallance put it: “Your company already has a significant presence in most of the
major European markets and we are looking forward to the time when we can
compete head-to-head with the incumbent operators. We have 12 years experience of
competition, they have none.” BT also aimed to develop advanced services and with
trials of interactive services from video-on-demand to home shopping.
In January 1996 Sir Peter Bonfield, the former chairman of ICL, joined BT as Chief
Executive. Sir Iain Vallance continued as Chairman of BT. The general strategy was
to transform BT into a global telecommunications player. The major role in this was
planned to be taken by Concert Communications, a one billion joint venture with MCI
Communications. In June 1996 BT and MCI announce that they are close to
completing the world’s largest Internet network. Later in November in the same year
15
BT and MCI announce that they have entered into a merger agreement. However, the
management of BT underestimated Worldcom’s CEO Bernie Ebbern. The bid battle
between BT and Worldcom for MCI finally came to the end in November 1997 when
Worldcom offered $37 billion for MCI. This left BT in need of a global partner.
In July 1998 BT and AT&T agreed to pool their international operations into a joint
venture. In January 2000 Concert, a global joint venture between BT and AT&T
formally comes into existence. However, its estimation of $7 billion in revenues in
2000 is about $3 billion less than originally predicted. Soon Concert with the end of
telecommunications boom becomes a heavy burden for both of the companies. Finally
in October 2001 BT and AT&T announce the close of Concert. This mean a £1.2
billion charge for BT and charges of $5.3 billion for AT&T.
4. Aftermath of abandonment of global player strategy
Rapidly changed market conditions in 2000 forced BT, and many other incumbents
too, to concentrate all efforts to secure the financial stability of the company. Now the
debt issue was on the agenda of every meeting of the senior management, and every
management decision was constrained by the serious financial problems of the
company.
After the third generation mobile phone licence auctions BT, just like other European
telecommunications companies who won licences, became heavily indebted. At the
start of 2000 it was expected that in the UK each licence would cost £500 million - £1
billion. The result was £4.5 billion per licence. In addition it is estimated that each
16
licence winner must invest around £3 billion - £4 billion in the physical network. BT
won licences in the UK, Germany, and in the Netherlands. During 2001 the financing
of the massive debt of BT became the key issue driving the rescue strategy of the
company. European telecommunications companies spent around Eu128 billion on
3G licences. However, the massive debt of European telecommunications companies
results not only from the 3G licence payments, although they certainly are the largest
single debt item. In early 2001 the total debt of France Telecom, Deutsche Telekom,
BT, Telefonica, KPN, Telecom Italia, and Sonera – to mention some of the most
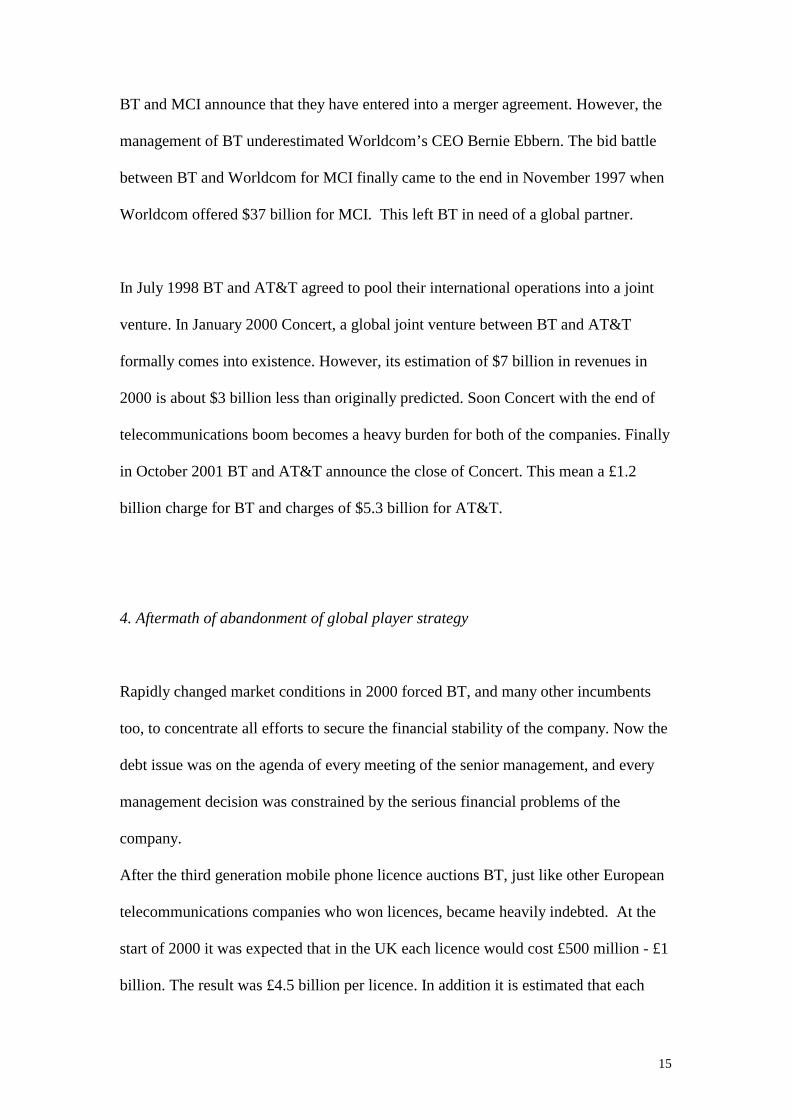
indebted European incumbents – was Euro 233 billion. The very high licence fees
were part of a strategy of the aggressive growth that was based on optimism and faith
in a sort of
Table 7
Telecom debt Projected 2001 Debt/ earnings net debt (€bn) ratio France Telecom 62 5.0 Deutsche Telekom 56 4.3 BT (before restructuring) 45 4.5 Telefonica 24 1.9 KPN 22 5.9 Telecom Italia 19 1.3 Sonera 5.7 3.8 Source: Financial Times
technological determinism that would create high and growing consumer demand for
new services. The fact that most new entrants in telecommunications services on the
both sides of Atlantic are now in serious financial problems although even if they did
not pay high licence fees tells us something. On the one hand, it suggests the growth
optimism and confused strategies of these companies, and on the other how easy it
was to raise funds for future investment projects. The change in market conditions has

17
exposed these companies shortcomings. Until spring 2000 non-incumbent companies
like Atlantic Telecom, Colt, Viatel could easily raise hundreds of millions of pounds
to fund ambitious expansion plans. A representative of Viatel, a Nasdaq-listed
company, which has 4,000 corporate clients in the UK after buying AT&T’s business
in the UK, says: “We have been a victim of circumstances, which is the change in
market conditions. The investment houses that were preparing to provide money for
the purpose of building this network are the same investment houses that are
punishing us for carrying so much debt”.4
Business Week in April, 2001, writes that “The saga of BT is full of lost changes”
The journal argues that while trying to create a global BT through partnerships with
the US telecommunications companies – with MCI and later with AT&T - the
management of BT missed what was happening in Europe. Later BT tried to
compensate this by “an 18-month buying binge in mid-1999”. However, BT, unlike
Vodafone, spent billions to acquire mainly minority stakes in second-tier mobile
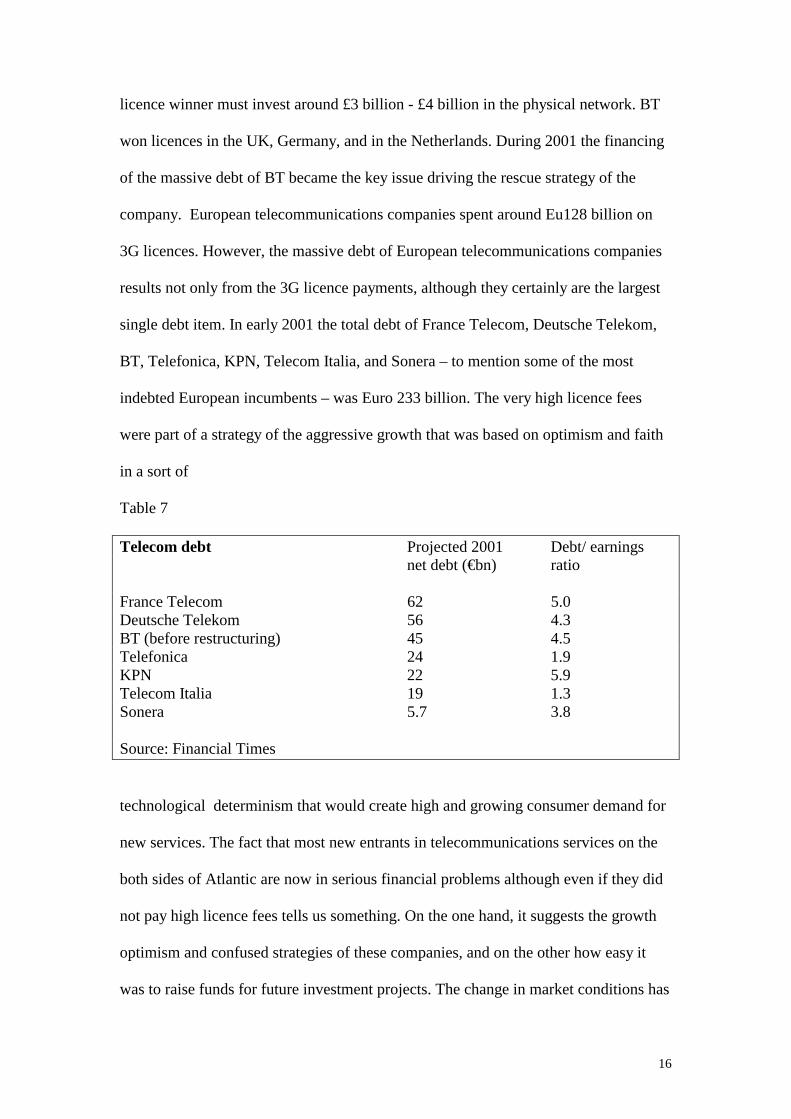
telephone companies. In the spring 2001 BT faced all the problems of high debt. If
the company was not able to pay off at least $15 billion of its debt by spring 2002, its
credit rating would fall to the lowest investment grade, triple B.5 This would raise
the cost of BT’s interest payments by as much as $300 million annually.
Table 8
Projected 2001 Required debt reduction net debt Triple-B Single-A rating rating (Euro bn) (Euro bn) (Euro bn)
4 The Sunday Times, March 18, 2001 5 Standard and Poor’s investment grades are AAA, AA, A, and BBB. Ratings BB, B, CCC, CC, and C are regarded as having significant speculative characteristics. Source: www.standardandpoors.com
18
France Telecom 62.0 18.3 30.8 Deutsche Telekom 56.0 10.5 23.5 BT 45.0 10.1 20.1 KPN 22.0 9.1 12.8 Sonera 5.7 2.9 3.7 Source: Financial Times March 16, 2001
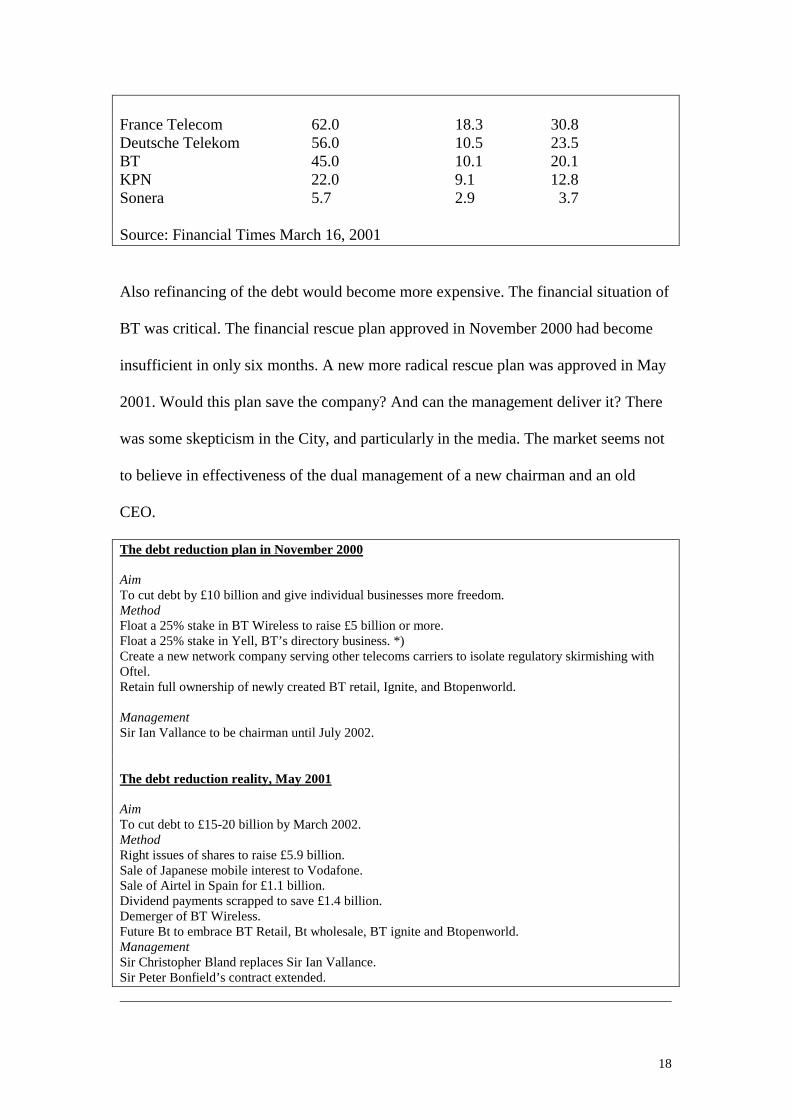
Also refinancing of the debt would become more expensive. The financial situation of
BT was critical. The financial rescue plan approved in November 2000 had become
insufficient in only six months. A new more radical rescue plan was approved in May
2001. Would this plan save the company? And can the management deliver it? There
was some skepticism in the City, and particularly in the media. The market seems not
to believe in effectiveness of the dual management of a new chairman and an old
CEO.
The debt reduction plan in November 2000
Aim To cut debt by £10 billion and give individual businesses more freedom. Method Float a 25% stake in BT Wireless to raise £5 billion or more. Float a 25% stake in Yell, BT’s directory business. *) Create a new network company serving other telecoms carriers to isolate regulatory skirmishing with Oftel. Retain full ownership of newly created BT retail, Ignite, and Btopenworld. Management Sir Ian Vallance to be chairman until July 2002. The debt reduction reality, May 2001 Aim To cut debt to £15-20 billion by March 2002. Method Right issues of shares to raise £5.9 billion. Sale of Japanese mobile interest to Vodafone. Sale of Airtel in Spain for £1.1 billion. Dividend payments scrapped to save £1.4 billion. Demerger of BT Wireless. Future Bt to embrace BT Retail, Bt wholesale, BT ignite and Btopenworld. Management Sir Christopher Bland replaces Sir Ian Vallance. Sir Peter Bonfield’s contract extended.
19
*) Yell was sold in June 2001 for £2.14m to a partnership of venture capitalists, Apax Partners Ltd and Hicks, Muse, Tate and Furst. ____________ The Sunday Times, May 13, 2001
Rebuilding credibility
The changing market conditions forced BT, like other telecommunications
incumbents and new entrants, to reformulate their strategies. In November 2000 BT
announced a radical restructuring that would break the business into five separate
public companies. In the spring 2001 the management of BT with new chairman Sir
Christopher Bland announced that BT’s strategy was to concentrate on the voice and
data markets in the UK and elsewhere in Europe. This was a major change from the
previous strategy of the global leadership in telecommunications. A substantial part of
this strategy is the reorganisation of the company. Two separately quoted companies
were to be created: BT Wireless (later MMO2) and Future BT (later BT Group plc).
BT Group plc was the listed holding company for the BT group companies. BT Group
plc represented the group as a whole to external audience such as shareholders,
financial analysts and the media. Under this structure British Telecommunications plc
was a wholly owned subsidiary of BT Group plc. British Telecommunications plc was
to own separately managed businesses comprising:
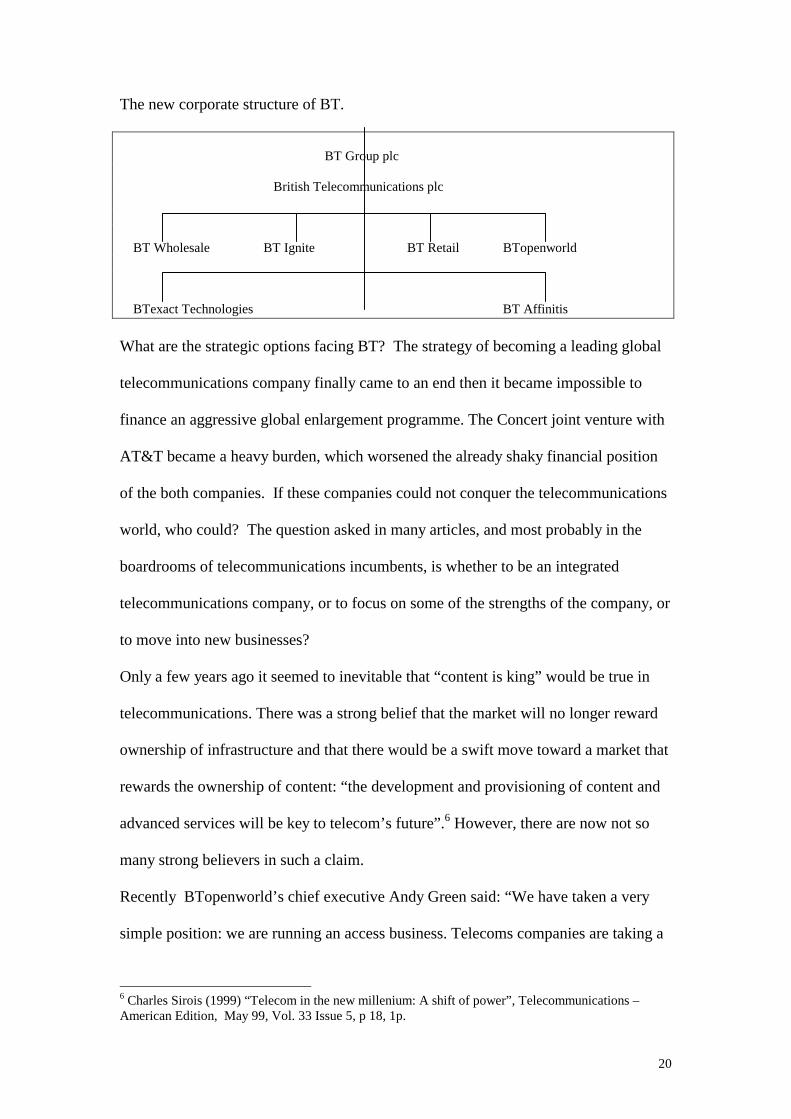
BT Ignite – an international broadband business network business focused primarily
on corporate and wholesale markets; BTopenworld – an international mass-market
Internet business; BT Retail – serving end-business and residential customers;
BT Wholesale – which sells network capacity and call terminations to other carriers;
BTexact Technologies – engineering and technology R&D activities; BT Affinitis – a
business offering services, which can be, bought stand alone or in integrated
offerings.
20
The new corporate structure of BT.
BT Group plc British Telecommunications plc BT Wholesale BT Ignite BT Retail BTopenworld BTexact Technologies BT Affinitis What are the strategic options facing BT? The strategy of becoming a leading global
telecommunications company finally came to an end then it became impossible to
finance an aggressive global enlargement programme. The Concert joint venture with
AT&T became a heavy burden, which worsened the already shaky financial position
of the both companies. If these companies could not conquer the telecommunications
world, who could? The question asked in many articles, and most probably in the
boardrooms of telecommunications incumbents, is whether to be an integrated
telecommunications company, or to focus on some of the strengths of the company, or
to move into new businesses?
Only a few years ago it seemed to inevitable that “content is king” would be true in
telecommunications. There was a strong belief that the market will no longer reward
ownership of infrastructure and that there would be a swift move toward a market that
rewards the ownership of content: “the development and provisioning of content and
advanced services will be key to telecom’s future”.6 However, there are now not so
many strong believers in such a claim.
Recently BTopenworld’s chief executive Andy Green said: “We have taken a very
simple position: we are running an access business. Telecoms companies are taking a
6 Charles Sirois (1999) “Telecom in the new millenium: A shift of power”, Telecommunications – American Edition, May 99, Vol. 33 Issue 5, p 18, 1p.
21
huge risk already by investing in infrastructure, other people have got to think about
providing attractive broadband content” (Financial Times, September 18, 2001).
However, only a few months later the chairman Sir Christopher Bland said that BT
could become a fully-fledged broadcaster within two years. The chairman even
highlighted more ambitious possibility of BT producing its own content. (Financial
Times January 8, 2002). However, Sir Christopher took a few steps back a few days
later on 9th January and pointed out that BT would eventually use its network for
television but would not enter directly into the media and entertainment business.
These announcements illustrate the complexity and uncertainty facing strategists in
the changing environment of telecommunications, media, and information
technology.
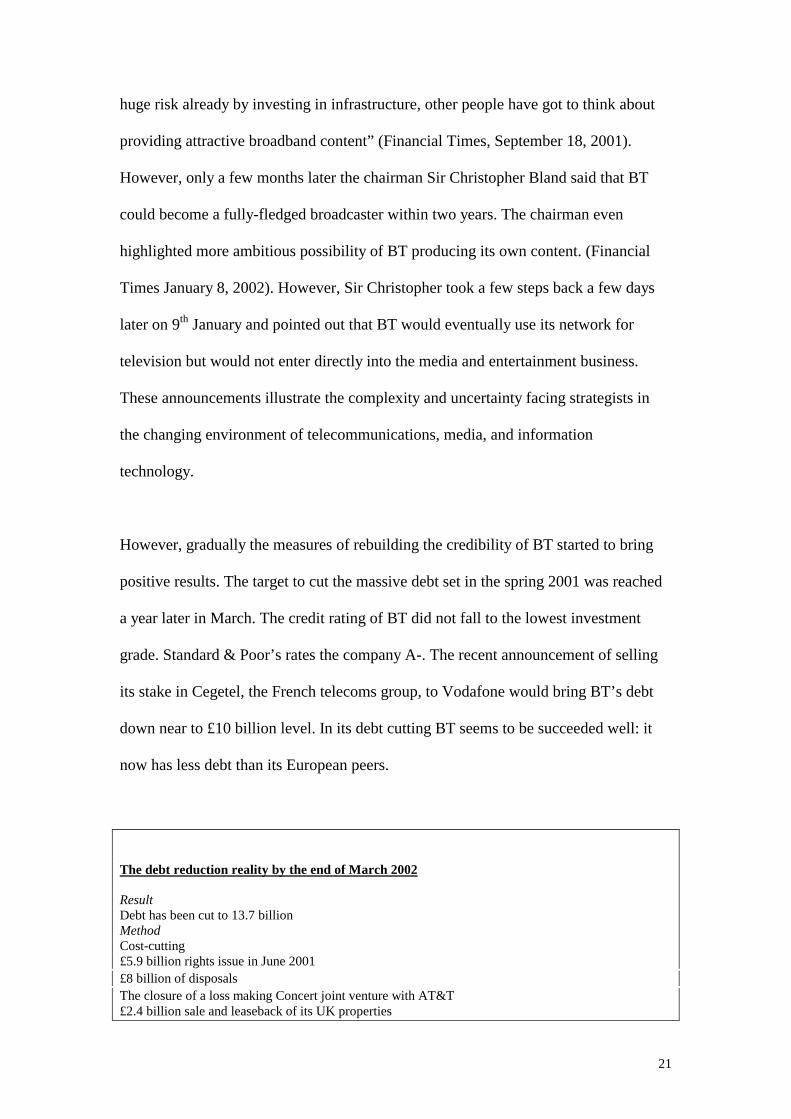
However, gradually the measures of rebuilding the credibility of BT started to bring
positive results. The target to cut the massive debt set in the spring 2001 was reached
a year later in March. The credit rating of BT did not fall to the lowest investment
grade. Standard & Poor’s rates the company A-. The recent announcement of selling
its stake in Cegetel, the French telecoms group, to Vodafone would bring BT’s debt
down near to £10 billion level. In its debt cutting BT seems to be succeeded well: it
now has less debt than its European peers.
The debt reduction reality by the end of March 2002
Result Debt has been cut to 13.7 billion Method Cost-cutting £5.9 billion rights issue in June 2001 £8 billion of disposals The closure of a loss making Concert joint venture with AT&T £2.4 billion sale and leaseback of its UK properties

22
Floating off wireless activities into mmO2 Management Sir Christopher Bland replaced Sir Ian Vallance in April 2001 Ben Verwaagen replaced Sir Peter Bonfield in December 2001 Senior executive team reduced from 16 to 5 The heads of BT’s three main business - retail, wholesale and international network business – placed on the board -------- The Birmingham Post, May 17, 2002; The Guardian, April 08, 2002, and July 25, 2002
The City welcomed the annual results, April 2001 – March 2002, of BT Group under
Ben Verwaayen, its new chief executive. The turnover of the group rose 8 per cent to
£18.4 billion, and earnings before interest, tax, depreciation and amortisation
(EBITDA) were £5.7 billion, which were in line with the previous year.The numbers
in the first quarter of 2002 show that BT’s wholesale and retail businesses combined
grew 1.5 per cent.
However, while some analysts are still skeptical about the depth of the cultural
change in the company, most agree that the chaos in telecommunications, and
particularly the situation with alternative telecom companies creates an opportunity
for BT.
Table 9
Telecom debt (at calendar year end)
Total debt Debt to revenue ratio 2001 2001 2000 1999 Euro (bn) BT Group* 30.1 0.9 1.5 0.5 Cable&Wireless* 4.8 0.4 0.6 0.7 Colt Telecom Group 2.2 1.5 2.1 3 Energis** 1.9 1.5 2.1 1.4 Telewest 9.4 4.5 4.5 4.5 NTL 19.4 4.6 5.3 5.1 France Telecom 63.2 1.5 1.1 0.6 Deutsche Telekom 67 1.4 1.5 1.2 Telefonica 27.7 0.9 0.9 0.8 Sonera 2.8 1.3 2.8 0.7
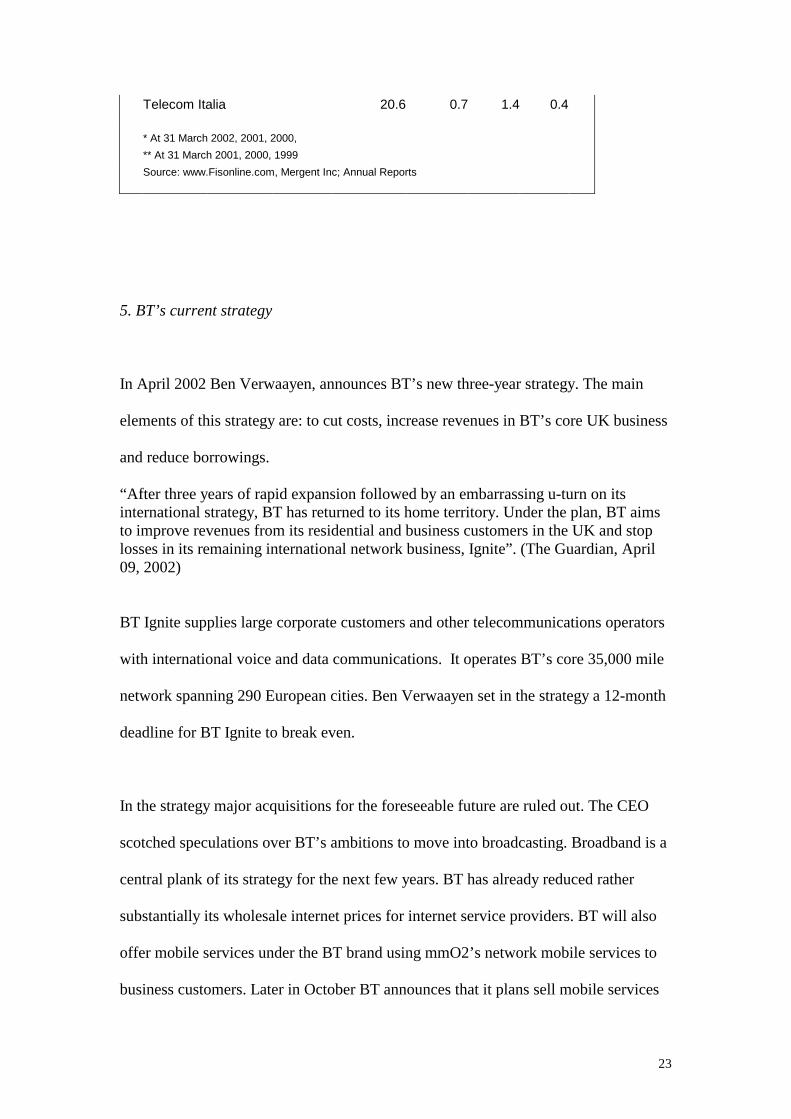
23
Telecom Italia 20.6 0.7 1.4 0.4 * At 31 March 2002, 2001, 2000, ** At 31 March 2001, 2000, 1999 Source: www.Fisonline.com, Mergent Inc; Annual Reports 5. BT’s current strategy
In April 2002 Ben Verwaayen, announces BT’s new three-year strategy. The main
elements of this strategy are: to cut costs, increase revenues in BT’s core UK business
and reduce borrowings.
“After three years of rapid expansion followed by an embarrassing u-turn on its international strategy, BT has returned to its home territory. Under the plan, BT aims to improve revenues from its residential and business customers in the UK and stop losses in its remaining international network business, Ignite”. (The Guardian, April 09, 2002)
BT Ignite supplies large corporate customers and other telecommunications operators
with international voice and data communications. It operates BT’s core 35,000 mile
network spanning 290 European cities. Ben Verwaayen set in the strategy a 12-month
deadline for BT Ignite to break even.
In the strategy major acquisitions for the foreseeable future are ruled out. The CEO
scotched speculations over BT’s ambitions to move into broadcasting. Broadband is a
central plank of its strategy for the next few years. BT has already reduced rather
substantially its wholesale internet prices for internet service providers. BT will also
offer mobile services under the BT brand using mmO2’s network mobile services to
business customers. Later in October BT announces that it plans sell mobile services

24
to customers using the mmO2 network under the brand Mobile Sense also to
consumer market.
The strategy also illustrates the changes in the management style of the company.
BT’s senior executive team was reduced from 16 to 5 in an effort to speed up decision
making within the group. Sir Christopher Bland had already earlier noticed that BT’s
divisional heads focused on independence rather than cooperation. This accelerated
particularly when the stockmarket took off in the late 1990s. “That caused some
disruptive patterns of behaviour”, admits Sir Christopher. One of the first things to do
was to place the heads of the group’s three main businesses – retail, wholesale, and
the international network business, Ignite – on the board. “It has had quite a unifying
effect,” says Sir Christopher. (The Guardian, July, 25, 2002).
In the strategy Mr Verwaayen set targets for each of the company’s four businesses –
ranging from 3% annual revenue growth at BT Retail to 35% revenue growth at
Openworld. Overall the company plans to attain 25% compound annual growth in
earnings per share, and 6% to 8% organic revenue growth.
The focus in the UK core business, however, does not mean that BT would have
forgotten lucrative opportunities of broadcasting , and in general opportunities of
convergence of media and telecommunications. In July this year BT announces a new
approach to broadcasting, but now in the framework of the new strategy. BT Group
and BSkyB announced a broadband interactive TV alliance. The deal gives Sky
customers the option to upgrade their interactive TV facility to a faster BT broadband
connection. Sky hopes that this will boost demand for its interactive TV services such
as betting and shopping.

25
BT plans to use its DSL network to enhance communications experience to the PC
through video and multimedia. BT will focus on new applications in the
communications / PC area that linking PC, telephone, sound system and TV will
provide. BT announced that its network strategy includes the principle of multimedia
capable network intelligence offering a customer-centric open architecture with
opportunities for third party applications. The company plans to exploit new
technology and partnerships to extend broadband reach to a wider customer base.
November 6th BT announces with Microsoft an alliance in collaborating on how to
bring dynamic broadband applications to the market for residential and business
customers. Ben Verwaayen, chief executive of BT Group, said:
'BT has accelerated on all fronts during the past two years to make broadband as
attractive as possible to potential customers, residential and business, by giving them
the compelling applications that will deliver a superb online experience that meets
their needs and aspirations. That's where this alliance comes in.'
The alliance focuses on five key programmes, developing applications for multimedia
home computing, increasing the productivity and flexibility of large organisations, the
new generation of mobile computing, Net and web services, and portals.
Bibliography Mark Armstrong, Simon Cowan and John Vickers (1994) Regulatory Reform: Economic Analysis and British Experience, London, Chapter 7 Telecommunications, pp. 195-244. BTGroup: www.bt.com
26
Sylvia Chan-Olmstedt and Mark Jamison (2001) “Rivalry Through Alliances: Competitive Strategy in the Global Telecommunications Market”, European Management Journal, Vol 19, No. 3, pp. 317-331, 2001. Peter Curwen (2001) “Rivalry Through Alliances: Competitive Strategy in the Global Telecommunications Market – A Rejoinder to Chan-Olmstedt and Jamison”, European Management Journal, Vol 19, No. 6, pp. 678-681, December 2001. Peter Curwen (1997) Restructuring Telecommunications, A Study of Europe in a Global Context, MacMillan Press Ltd, London, Chapter 11 The UK: A Case Study, pp. 129-160. Ernst & Young (2001) Business Redefined: Connecting Content, Applications, and Customers, Ernst & young LLP and Cap Gemini Ernst & Young Joint publication. Federal Communications Commission (FCC): www.fcc.gov Financial Times: www.ft.com Arnoldo C. Hax and Dean L. Wilde II (1999) “The Delta Model: Adaptive Management for a Changing World”, Sloan Mananagement Review, 1999 40 (2), pp. 11-28. Jean-Jacques Laffont and Jean Tirole (2000) Competition in telecommunications, Cambridge, Mass.; London: MIT Press, 2000. David M. Newbery (1999) Privatization, Restructuring, and Regulation of Network Utilities, The MIT Press, Cambridge Massachusetts, London, England, Chapter 7 Liberalizing Telecommunications Industry, pp. 291-340. Oftel. Office of Telecommunications. The UK Telecommunications Industry: Market Information 2000/2001, December 2001. Oftel: www.oftel.gov.uk Michael E. Porter (1995) “Toward a dynamic theory of strategy” in Rumelt, Richard P., Schendel Dan E. and Teece David J. (eds) Fundamental Issues in Strategy – A Research Agenda, Harvard University Press, pp. 423-461. Bernard W. Wirtz (2001) “Reconfiguration of Value Chains in Converging Media and Communications Markets”, Long Range Planning, 34 (2001), pp. 489-506 .
27
Appendix 1
Fixed operators: residential call volumes by type of call by operator
All BT C&W Comms* ntl & OthersOperators Telewest
Call volumes (millions of minutes)
Local Calls1996/97 60,730 54,805 114 5,817 61997/98 62,841 53,715 3,343 5,757 261998/99 63,680 51,815 4,241 7,318 3061999/00 61,079 47,772 4,100 8,196 1,0112000/01 55,618 43,286 634 10,142 1,555
National Calls1996/97 21,590 18,993 1,148 1,398 511997/98 23,066 19,730 1,744 1,413 1791998/99 23,917 19,887 1,937 1,682 4111999/00 23,954 18,654 2,014 1,871 1,4152000/01 24,609 17,026 265 4,445 2,873
International Calls1996/97 2,051 1,578 180 163 1311997/98 2,358 1,702 261 137 2591998/99 2,502 1,796 254 182 2701999/00 2,919 1,709 211 153 8462000/01 3,063 1,603 32 338 1,089
Calls to Mobiles1996/97 1,212 1,060 26 126 11997/98 1,611 1,420 28 146 171998/99 2,772 2,186 257 272 571999/00 5,076 3,724 372 670 3102000/01 7,134 5,209 80 1,448 398
Other Calls1996/97 1,015 737 18 253 61997/98 5,969 5,070 71 788 391998/99 15,470 12,100 1,387 1,915 681999/00 37,077 28,503 2,896 5,255 4232000/01 75,896 56,536 687 16,759 1,913
All Calls1996/97 86,598 77,172 1,486 7,757 1831997/98 95,845 81,637 5,448 8,241 5191998/99 108,340 87,784 8,075 11,369 1,1121999/00 130,106 100,362 9,593 16,146 4,0052000/01 166,320 123,660 1,699 33,132 7,829
*C&W Comms and ntl & Telewest figures from 1997/98 are not comparable with earlierfigures. For more information see general notes. Local, national and internationalcomprise only simple voice calls (including ISDN). Other calls include numbertranslation services (including revenues from the called party), premium rate, DQ,operator calls and the speaking clock.
Source: Oftel, The UK Telecommunications Industry: Market Information2000/01, December 2001.
28
Appendix 2
Fixed operators: business call volumes by type of call by operator
All BT C&W Comms* Worldcom ntl & OthersOperators Telewest
Call volumes (millions of minutes)
Local calls1996/97 24,544 20,751 2,096 n/a 979 7171997/98 26,089 21,061 2,492 n/a 948 1,5871998/99 26,246 19,772 2,879 n/a 1,246 2,3501999/00 25,129 17,100 3,640 n/a 1,483 2,9062000/01 22,823 13,945 3,254 n/a 2,105 3,518
National calls1996/97 17,860 12,275 3,337 n/a 556 1,6921997/98 20,046 12,469 3,370 n/a 560 3,6471998/99 22,362 12,390 3,339 n/a 664 5,9701999/00 24,708 12,048 3,529 n/a 822 8,3092000/01 28,001 11,123 4,572 3,724 1,840 6,742
International calls1996/97 2,421 1,014 582 n/a 56 7681997/98 3,017 1,009 710 n/a 58 1,2391998/99 3,534 992 660 n/a 80 1,8011999/00 4,145 970 644 n/a 70 2,4612000/01 4,676 893 680 1,431 123 1,549
Calls to mobiles1996/97 1,580 l,138 288 n/a 48 1061997/98 2,054 1,431 444 n/a 65 1141998/99 2,843 1,829 420 n/a 86 5081999/00 3,917 2,329 654 n/a 147 7872000/01 4,907 2,727 948 n/a 320 912
Other calls1996/97 3,031 2,526 137 n/a 43 3251997/98 5,095 3,483 393 n/a 126 1,0931998/99 11,379 5,910 797 n/a 225 4,4471999/00 21,114 11,453 1,559 n/a 792 7,3112000/01 34,731 18,277 2,493 2,152 1,437 10,371
All calls1996/97 49,436 37,705 6,440 n/a 1,683 3,6081997/98 56,300 39,453 7,409 n/a 1,757 7,6811998/99 66,365 40,893 8,094 n/a 2,301 15,0761999/00 79,013 43,900 10,026 n/a 3,314 21,7732000/01 95,137 46,965 11,946 7,307 5,825 23,094
*C&W Comms and ntl & Telewest figures from 1997/98 are not comparable with earlierfigures. For more information see general notes. Local, national and internationalcomprise only simple voice calls (including ISDN). Other calls include numbertranslation services (including revenues from the called party), premium rate, DO,operator calls and the speaking clock. There may be some double counting of revenuesand minutes, particularly for international calls, due to calls supplied by anoperator to a reseller being counted by both the operator and the reseller.
Source: Oftel, The UK Telecommunications Industry: Market Information2000/01, December 2001.

29
Appendix 3
Cellular services: subscribersConnections, stocks and net changes by operator
All Vodafone BT Cellnet One 2 One OrangeOperators
Connections duringyear (0OOs)1996/97 3,324 1,152 1,245 389 5381997/98 4,728 1,668 1,567 834 6591998/99 9,002 3,479 2,288 1,534 1,7021999/00 18,124 5,454 4,793 3,577 4,3002000/01 24,189 6,423 6,464 5,324 5,978
Subscribers atyear end (O00s)Post paidMarch 1997 7,109 2,867 2,728 620 894March 1998 8,556 3,232 3,077 1,021 1,227March 1999 10,439 3,728 3,613 1,297 1,801March 2000 12,164 3,712 3,813 2,094 2,545March 2001 13,745 4,293 3,455 2,715 3,281* June 2001 14,030 4,360 3,435 2,755 3,480
Pre-payMarch 1997 - - - - -March 1998 467 198 - 177 92March 1999 4,438 1,847 909 951 731March 2000 15,021 5,079 3,591 2,924 3,426March 2001 29,707 7,985 7,705 6,266 7,751* June 2001 28,689 6,180 7,455 6,673 8,381
TotalMarch 1997 7,109 2,867 2,728 620 894March 1998 9,023 3,430 3,077 1,198 1,319March 1999 14,878 5,575 4,522 2,249 2,532March 2000 27,185 8,791 7,404 5,018 5,972March2001 43,452 12,279 11,160 8,981 11,032* June 2001 42,719 10,540 10,890 9,428 11,861
Net change during year1996/97 1,374 423 337 209 4051997/98 1,914 563 349 577 4251998/99 5,854 2,144 1,445 1,051 1,2131999/00 12,307 3,216 2,882 2,769 3,4402000/01 16,267 3,487 3,756 3,963 5,060
*Subscriber data for June 2001 shows revised Vodafone & BT Cellnetdata. See notes for more details.
Source: Oftel, The UK Telecommunications Industry: Market Information2000/01, December 2001.
30
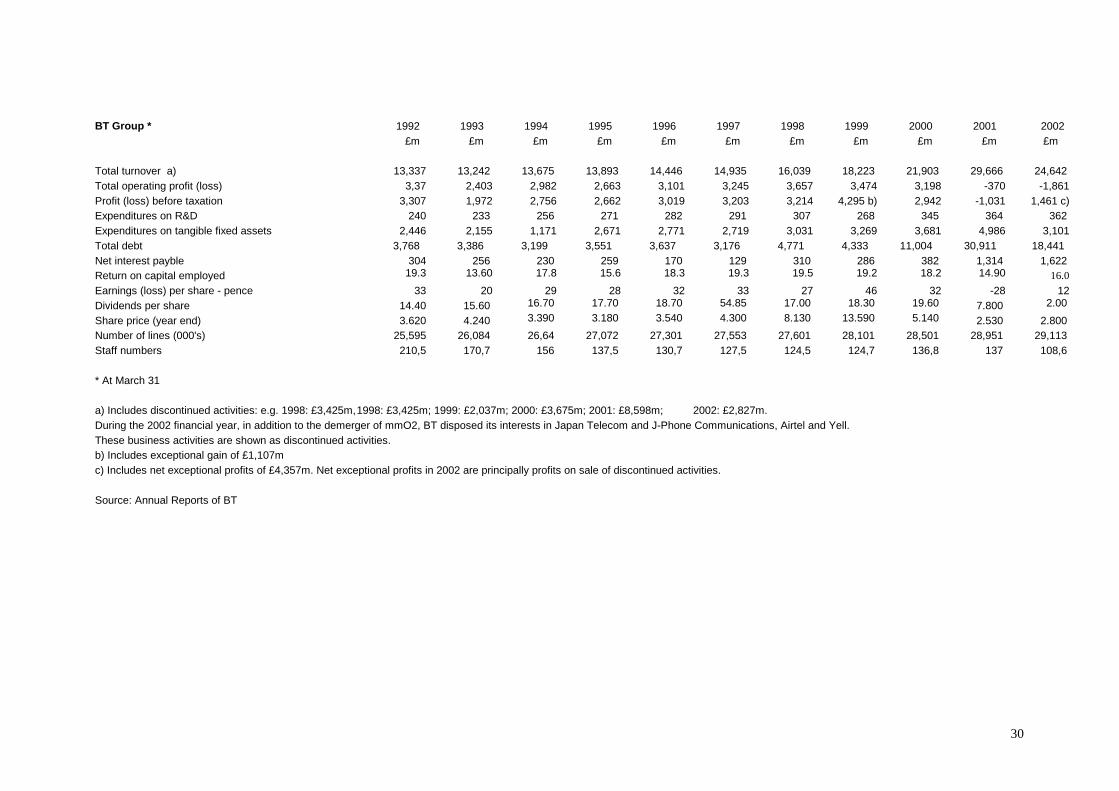
BT Group * 1992 1993 1994 1995 1996 1997 1998 1999 2000 2001 2002 £m £m £m £m £m £m £m £m £m £m £m Total turnover a) 13,337 13,242 13,675 13,893 14,446 14,935 16,039 18,223 21,903 29,666 24,642 Total operating profit (loss) 3,37 2,403 2,982 2,663 3,101 3,245 3,657 3,474 3,198 -370 -1,861 Profit (loss) before taxation 3,307 1,972 2,756 2,662 3,019 3,203 3,214 4,295 b) 2,942 -1,031 1,461 c) Expenditures on R&D 240 233 256 271 282 291 307 268 345 364 362 Expenditures on tangible fixed assets 2,446 2,155 1,171 2,671 2,771 2,719 3,031 3,269 3,681 4,986 3,101 Total debt 3,768 3,386 3,199 3,551 3,637 3,176 4,771 4,333 11,004 30,911 18,441 Net interest payble 304 256 230 259 170 129 310 286 382 1,314 1,622 Return on capital employed 19.3 13.60 17.8 15.6 18.3 19.3 19.5 19.2 18.2 14.90 16.0 Earnings (loss) per share - pence 33 20 29 28 32 33 27 46 32 -28 12 Dividends per share 14.40 15.60 16.70 17.70 18.70 54.85 17.00 18.30 19.60 7.800 2.00 Share price (year end) 3.620 4.240 3.390 3.180 3.540 4.300 8.130 13.590 5.140 2.530 2.800 Number of lines (000's) 25,595 26,084 26,64 27,072 27,301 27,553 27,601 28,101 28,501 28,951 29,113 Staff numbers 210,5 170,7 156 137,5 130,7 127,5 124,5 124,7 136,8 137 108,6 * At March 31 a) Includes discontinued activities: e.g. 1998: £3,425m,1998: £3,425m; 1999: £2,037m; 2000: £3,675m; 2001: £8,598m; 2002: £2,827m. During the 2002 financial year, in addition to the demerger of mmO2, BT disposed its interests in Japan Telecom and J-Phone Communications, Airtel and Yell. These business activities are shown as discontinued activities. b) Includes exceptional gain of £1,107m c) Includes net exceptional profits of £4,357m. Net exceptional profits in 2002 are principally profits on sale of discontinued activities. Source: Annual Reports of BT

31
BT Group 1991 1992 1993 1994 1995 1996 1997 1998 1999 2000 2001 2002Selected Operational Statistics UK exchange line connections ('000) 25.488 25.595 26.084 26.64 27.072 27.299 27.553 27.599 28.099 28.499 28.949 29,07Business (000) 5,859 5,947 6,129 6,459 6,798 7,16 7,521 7,982 8,45 8,91 9,03% growth over previous period 1.5 3.1 5.4 5.2 5.3 5.0 6.1 5.9 5.4 1.3Residential (000) 19,729 20,114 20,471 20,613 20,5 20,393 20,13 20,067 20,04 19,97 20,027% growth over previous period 2.0 1.8 0.7 (0.5) (0.5) (1.3) (0.3) (0.1) (0.3) 0.3Service providers (000) 90 70 56% growth over previous period 22.20 20.00 Source: Annual Reports of BT
32
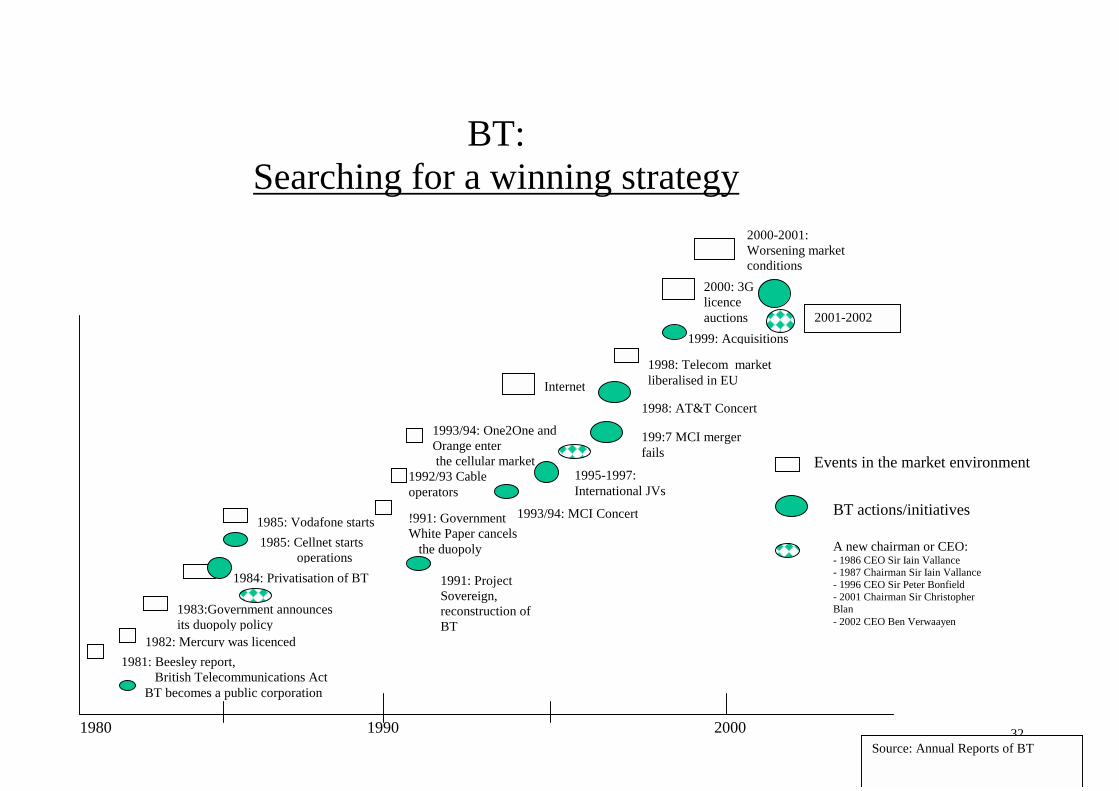
BT: Searching for a winning strategy
Events in the market environment
BT actions/initiatives
1980 1990 2000
1981: Beesley report, British Telecommunications Act BT becomes a public corporation
1982: Mercury was licenced
1983:Government announcesits duopoly policy
1984: Privatisation of BT
1985: Cellnet starts operations
!991: Government White Paper cancels the duopoly
1991: Project Sovereign, reconstruction of BT
1992/93 Cable operators
1993/94: One2One and Orange enter the cellular market
1993/94: MCI Concert
1995-1997: International JVs
199:7 MCI mergerfails
1985: Vodafone starts
Internet1998: AT&T Concert
1998: Telecom marketliberalised in EU
1999: Acquisitions
2000: 3G licence auctions
2000-2001: Worsening market conditions
A new chairman or CEO: - 1986 CEO Sir Iain Vallance - 1987 Chairman Sir Iain Vallance - 1996 CEO Sir Peter Bonfield - 2001 Chairman Sir Christopher Blan - 2002 CEO Ben Verwaayen
2001-2002
Source: Annual Reports of BT