Quality, Safety, and Efficacy of Herbal Products through Regulatory Harmonization
Upload
khangminh22Category
view
5download
0
Assessment of Customer perception of Service and UP (E) SERVICE AREA Implementation and Effectiveness of Telecom Consumers Protection and Redressal of Grievances Regulations
© 441, (Basement), Jangpura, Mathura Road, New Delhi – 110014, India
Email: [email protected], URL: www.consumer-voice
1
QUALITY OF SERVICE ASSESSMENT
Report of Survey for Basic Service (Wireline), Cellular Mobile (Wireless) and Broadband
for
UP (East) Service Area
Assessment of: (i) Customer Perception of Service and
(ii) Implementation and Effectiveness of Telecom Consumers Protection and Redressal of Grievances Regulations, 2007
September 2008 Report Prepared for: TRAI
By:
VOICE 441, Jangpura, Mathura Road,
Tel: (011) – 24379078 – 80 Fax: (011) – 24379081
E-mail: [email protected]
New Delhi – 110014
URL: www.consumer-voice.org

Assessment of Customer perception of Service and UP (E) SERVICE AREA Implementation and Effectiveness of Telecom Consumers Protection and Redressal of Grievances Regulations
© 441, (Basement), Jangpura, Mathura Road, New Delhi – 110014, India
Email: [email protected], URL: www.consumer-voice
2
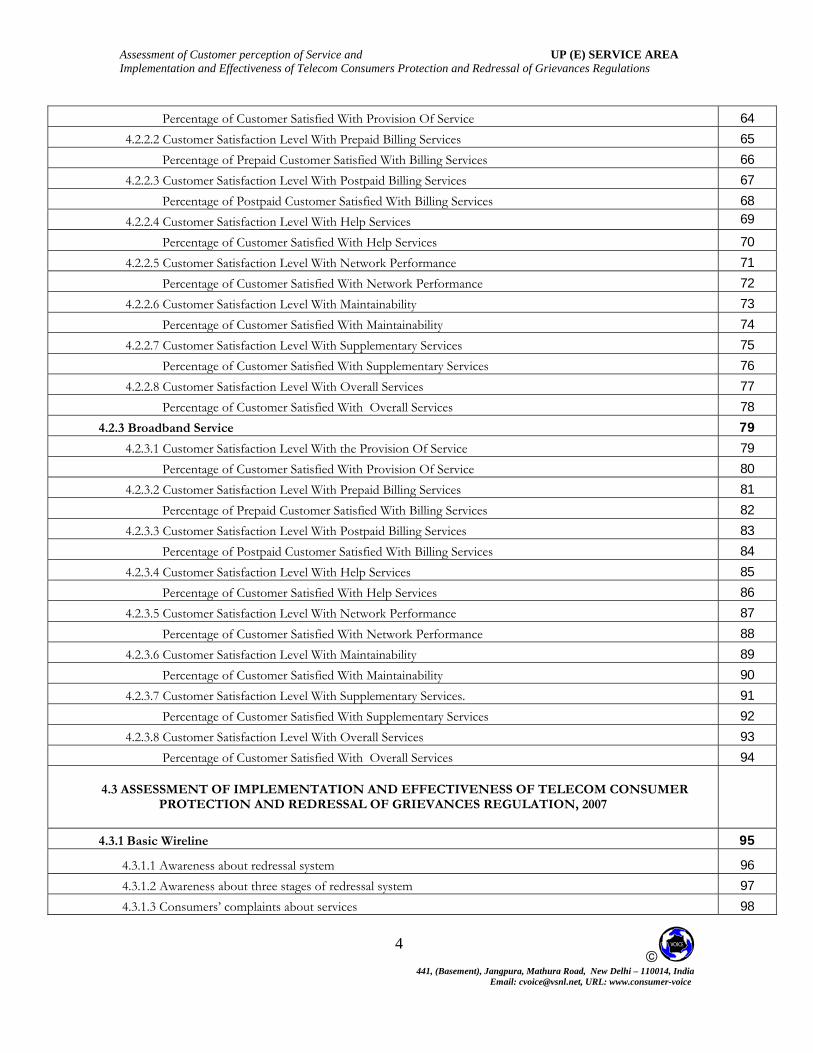
Index of Contents
1.1 Preface 11 1.2 Questionnaire Building Process 13 1.2.1 Basic Service (Wireline) 13
1.2.2 Basic Service (Wireless) and Cellular Mobile Telephone Service 14
1.2.3 Broadband Service 14
1.3 Methodology To Calculate Customer Satisfaction on Broadband Parameters 15 1.3.1 Methodology for Calculation of Customer Satisfaction Level 15
1.3.2 Methodology for Calculation of Percentage of Customer Satisfied 16
1.3.3 Comparison with the Benchmarking 16
2.1 Introduction 17 2.2 Sampling Methodology 17 2.2.1 Basic Wireline 17 2.2.1.1 Mode Of Interview 20
2.2.1.2 Typewise Sample Distribution 21
2.2.2 Cellular Mobile 22 2.2.2.1 District wise Sample Distribution 23
2.2.2.2 Area wise Sample Distribution 24
2.2.2.3 Mode Of Interview 25
2.2.2.4 Typewise Sample Distribution 26
2.2.3 Broadband 27 2.2.3.1 Area Wise Distribution 28
2.2.3.2 Mode Of Interview 29
3.1 Executive Summary 30 3.1.1 Customer Satisfaction Survey(Basic Wireline) 30 3.1.1.1 Overall Customer Satisfaction Level 30
3.1.1.2 Network Performance 30
3.1.1.3 Billing 30
3.1.1.4 Maintainability 31
3.1.1.5 Help Services/ Customer Care 31
3.1.1.6 Consumers Protection and Redressal of Grievances 31
3.1.2 Customer Satisfaction Survey (Cellular Mobile) 32 3.1.2.1 Overall Customer Satisfaction Level 32
3.1.2.2 Network Performance 32
3.1.2.3 Billing 33
3.1.2.4 Maintainability 33
3.1.2.5 Help Services/ Customer Care 33

Assessment of Customer perception of Service and UP (E) SERVICE AREA Implementation and Effectiveness of Telecom Consumers Protection and Redressal of Grievances Regulations
© 441, (Basement), Jangpura, Mathura Road, New Delhi – 110014, India
Email: [email protected], URL: www.consumer-voice
3
3.1.2.6 Consumers Protection and Redressal of Grievances 34
3.1.3 Customer Satisfaction Survey (Broadband) 35 3.1.3.1 Overall Customer Satisfaction Level 35
3.1.3.2 Network Performance 35
3.1.3.3 Billing 35
3.1.3.4 Maintainability 36
3.1.3.5 Help Services/ Customer Care 36
3.1.3.6 Consumers Protection and Redressal of Grievances 36
4. Detail Report 38 4.1 Performance Compliance 39 4.1.1 Basic Wireline 40 4.1.1.1 Consumer Satisfaction Level On Various Service Parameters 40
4.1.1.2 Percentage Of Consumer Satisfied On Various Service Parameters 41
4.1.2 Cellular Mobile 42 4.1.2.1 Consumer Satisfaction Level On Various Service Parameters 42
4.1.2.2 Percentage Of Consumer Satisfied On Various Service Parameters 43
4.1.3 Broadband 44 4.1.3.1 Consumer Satisfaction Level On Various Service Parameters 44
4.1.3.2 Percentage Of Consumer Satisfied On Various Service Parameters 45
4.2 Graphical Presentation 46 4.2.1 Basic Wireline 47 4.2.1.1 Customer Satisfaction Level With the Provision Of Service 47
Percentage of Customer Satisfied With Provision Of Service 48
4.2.1.2 Customer Satisfaction Level With Prepaid Billing Services 49
Percentage of Prepaid Customer Satisfied With Billing Services 50
4.2.1.3 Customer Satisfaction Level With Postpaid Billing Services 51
Percentage of Postpaid Customer Satisfied With Billing Services 52
4.2.1.4 Customer Satisfaction Level With Help Services 53
Percentage of Customer Satisfied With Help Services 54
4.2.1.5 Customer Satisfaction Level With Network Performance 55
Percentage of Customer Satisfied With Network Performance 56
4.2.1.6 Customer Satisfaction Level With Maintainability 57
Percentage of Customer Satisfied With Maintainability 58
4.2.1.7 Customer Satisfaction Level With Supplementary Services 59
Percentage of Customer Satisfied With Supplementary Services 60
4.2.1.8 Customer Satisfaction Level With Overall Services 61
Percentage of Customer Satisfied With Overall Services 62
4.2.2 Cellular Service 63 4.2.2.1 Customer Satisfaction Level With the Provision Of Service 63
Assessment of Customer perception of Service and UP (E) SERVICE AREA Implementation and Effectiveness of Telecom Consumers Protection and Redressal of Grievances Regulations
© 441, (Basement), Jangpura, Mathura Road, New Delhi – 110014, India
Email: [email protected], URL: www.consumer-voice
4
Percentage of Customer Satisfied With Provision Of Service 64
4.2.2.2 Customer Satisfaction Level With Prepaid Billing Services 65
Percentage of Prepaid Customer Satisfied With Billing Services 66
4.2.2.3 Customer Satisfaction Level With Postpaid Billing Services 67
Percentage of Postpaid Customer Satisfied With Billing Services 68
4.2.2.4 Customer Satisfaction Level With Help Services 69
Percentage of Customer Satisfied With Help Services 70
4.2.2.5 Customer Satisfaction Level With Network Performance 71
Percentage of Customer Satisfied With Network Performance 72
4.2.2.6 Customer Satisfaction Level With Maintainability 73
Percentage of Customer Satisfied With Maintainability 74
4.2.2.7 Customer Satisfaction Level With Supplementary Services 75
Percentage of Customer Satisfied With Supplementary Services 76
4.2.2.8 Customer Satisfaction Level With Overall Services 77
Percentage of Customer Satisfied With Overall Services 78
4.2.3 Broadband Service 79 4.2.3.1 Customer Satisfaction Level With the Provision Of Service 79
Percentage of Customer Satisfied With Provision Of Service 80
4.2.3.2 Customer Satisfaction Level With Prepaid Billing Services 81
Percentage of Prepaid Customer Satisfied With Billing Services 82
4.2.3.3 Customer Satisfaction Level With Postpaid Billing Services 83
Percentage of Postpaid Customer Satisfied With Billing Services 84
4.2.3.4 Customer Satisfaction Level With Help Services 85
Percentage of Customer Satisfied With Help Services 86
4.2.3.5 Customer Satisfaction Level With Network Performance 87
Percentage of Customer Satisfied With Network Performance 88
4.2.3.6 Customer Satisfaction Level With Maintainability 89
Percentage of Customer Satisfied With Maintainability 90
4.2.3.7 Customer Satisfaction Level With Supplementary Services. 91
Percentage of Customer Satisfied With Supplementary Services 92
4.2.3.8 Customer Satisfaction Level With Overall Services 93
Percentage of Customer Satisfied With Overall Services 94
4.3 ASSESSMENT OF IMPLEMENTATION AND EFFECTIVENESS OF TELECOM CONSUMER PROTECTION AND REDRESSAL OF GRIEVANCES REGULATION, 2007
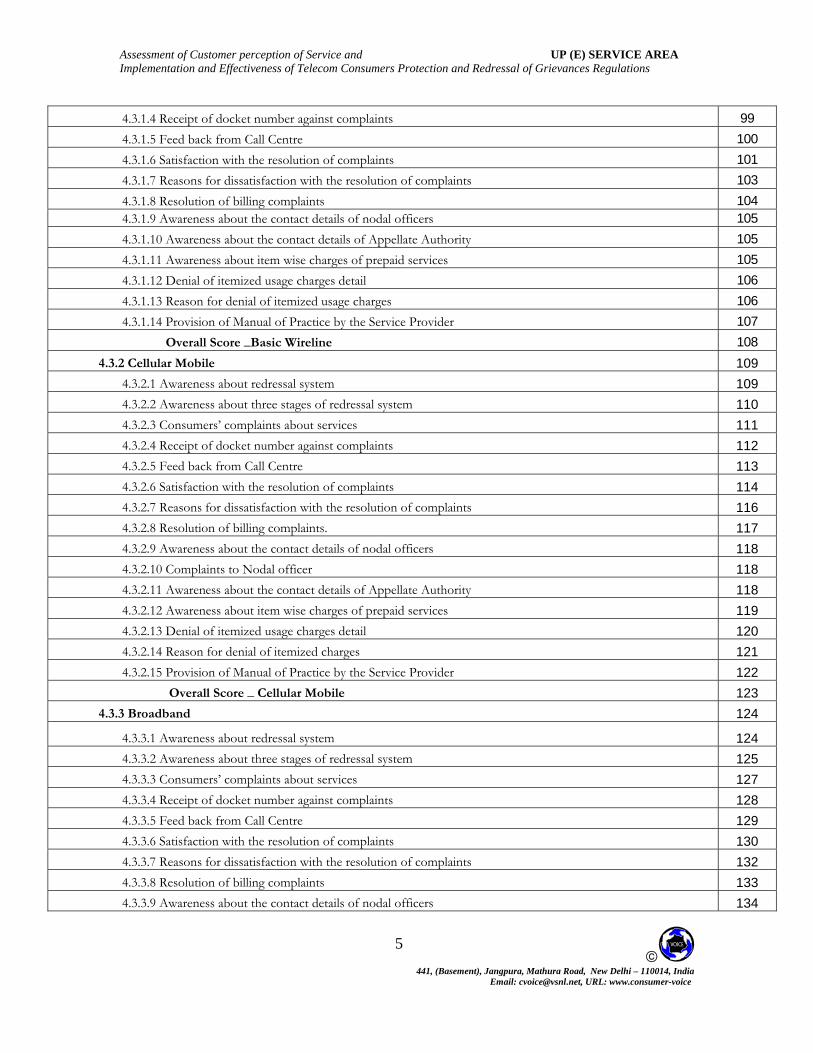
4.3.1 Basic Wireline 95
4.3.1.1 Awareness about redressal system 96
4.3.1.2 Awareness about three stages of redressal system 97
4.3.1.3 Consumers’ complaints about services 98
Assessment of Customer perception of Service and UP (E) SERVICE AREA Implementation and Effectiveness of Telecom Consumers Protection and Redressal of Grievances Regulations
© 441, (Basement), Jangpura, Mathura Road, New Delhi – 110014, India
Email: [email protected], URL: www.consumer-voice
5
4.3.1.4 Receipt of docket number against complaints 99
4.3.1.5 Feed back from Call Centre 100
4.3.1.6 Satisfaction with the resolution of complaints 101
4.3.1.7 Reasons for dissatisfaction with the resolution of complaints 103
4.3.1.8 Resolution of billing complaints 104 4.3.1.9 Awareness about the contact details of nodal officers 105
4.3.1.10 Awareness about the contact details of Appellate Authority 105
4.3.1.11 Awareness about item wise charges of prepaid services 105
4.3.1.12 Denial of itemized usage charges detail 106
4.3.1.13 Reason for denial of itemized usage charges 106
4.3.1.14 Provision of Manual of Practice by the Service Provider 107
Overall Score _Basic Wireline 108
4.3.2 Cellular Mobile 109 4.3.2.1 Awareness about redressal system 109 4.3.2.2 Awareness about three stages of redressal system 110 4.3.2.3 Consumers’ complaints about services 111 4.3.2.4 Receipt of docket number against complaints 112 4.3.2.5 Feed back from Call Centre 113 4.3.2.6 Satisfaction with the resolution of complaints 114 4.3.2.7 Reasons for dissatisfaction with the resolution of complaints 116 4.3.2.8 Resolution of billing complaints. 117 4.3.2.9 Awareness about the contact details of nodal officers 118 4.3.2.10 Complaints to Nodal officer 118 4.3.2.11 Awareness about the contact details of Appellate Authority 118 4.3.2.12 Awareness about item wise charges of prepaid services 119 4.3.2.13 Denial of itemized usage charges detail 120 4.3.2.14 Reason for denial of itemized charges 121 4.3.2.15 Provision of Manual of Practice by the Service Provider 122 Overall Score _ Cellular Mobile 123 4.3.3 Broadband 124
4.3.3.1 Awareness about redressal system 124 4.3.3.2 Awareness about three stages of redressal system 125 4.3.3.3 Consumers’ complaints about services 127 4.3.3.4 Receipt of docket number against complaints 128 4.3.3.5 Feed back from Call Centre 129 4.3.3.6 Satisfaction with the resolution of complaints 130 4.3.3.7 Reasons for dissatisfaction with the resolution of complaints 132 4.3.3.8 Resolution of billing complaints 133 4.3.3.9 Awareness about the contact details of nodal officers 134

Assessment of Customer perception of Service and UP (E) SERVICE AREA Implementation and Effectiveness of Telecom Consumers Protection and Redressal of Grievances Regulations
© 441, (Basement), Jangpura, Mathura Road, New Delhi – 110014, India
Email: [email protected], URL: www.consumer-voice
6
4.3.3.10 Complaints to Nodal officer 135 4.3.3.11 Awareness about the contact details of Appellate Authority 135 4.3.3.12 Awareness about item wise charges of prepaid services 136 4.3.3.13 Denial of itemized usage charges detail 137 4.3.3.14 Reason for denial of itemized usage charges 137 4.3.3.15 Provision of Manual of Practice by the Service Provider 137 Overall Score _ Broadband 138 5. Conclusion and Recommendations 139 6. Annexure - Tables 144 7. Annexure - Questionnaires 190

Assessment of Customer perception of Service and UP (E) SERVICE AREA Implementation and Effectiveness of Telecom Consumers Protection and Redressal of Grievances Regulations
© 441, (Basement), Jangpura, Mathura Road, New Delhi – 110014, India
Email: [email protected], URL: www.consumer-voice
7
ANNEXURE - TABLES 6.1 Basic Wire line 145
6.1.1-Service Provision 145 6.1.1.1 When did you last apply for a phone connection? 145
6.1.1.2 How much time was taken to get the telephone connection installed and activated after you applied for it; Service Provider Wise 145
6.1.1.3 How satisfied are you with time taken to provide working phone connection: Service Provider Wise 145
6.1.1.4 How satisfied are you with time taken for shifting of telephone, in case you had sought shifting of telephone in the last six months: Service Provider Wise 146
6.1.1.5 In case your connection was temporarily suspended due to non-payment of bills, are you satisfied with the time taken to reactivate service after you made the payment? 146
6.1.2-A-Billing Related (only for postpaid customers) 147 6.1.2.1 How satisfied are you with the timely delivery if bills? 147 6.1.2.2 How satisfied are you with the accuracy of the bills? 147 6.1.2.3 Please specify the reason(s) for your dissatisfaction. 147 6.1.2.4 Have you made any billing related complaints in last 12 months? 148 6.1.2.5 How satisfied are you with the process of resolution of billing complaints? 148
6.1.2.6 How satisfied are you with the clarity of the bills sent by your service provider in terms of transparency & understandability? 148
6.1.2.7 Please specify the reason(s) for your dissatisfaction; Service Provider Wise 1496.1.2-B-Billing Related (only for prepaid customers) 149 6.1.2.8 How satisfied are you with the accuracy of charges i.e. amount deducted on every usage? 1496.1.3- Help Service/Customer Care 150
6.1.3.1 Did you make a complain or make a query in the last 12 months to the customer care / helpline/call center toll free number of your service provider? : Service provider wise 150
6.1.3.2 How satisfied are you with the ease of access of call center/customer care or helpline? 150 6.1.3.3 How satisfied are you with the response time taken to answer your call by a customer care executive? 150 6.1.3.4 How satisfied are you with the problem solving ability of the customer care executive(s)? 151
6.1.3.5 How satisfied are you with the time taken by a Call centre/customer care/helpline to resolve your complaint? 151
6.1.4-Network Performance, Reliability & Availability 152 6.1.4.1 How satisfied are you with the availability of working telephone (dial tone)? 152 6.1.4.2 How satisfied are you with the ability to make or receive calls easily? 152 6.1.4.3 How satisfied are you with the voice quality? 1526.1.5-Maintainability 153 6.1.5.1 Have you experienced fault in your telephone connection in the last 12 months? 153 6.1.5.2 How many time your telephone became faulty in the last one month? 153 6.1.5.3 How long did it take generally for repairing the fault after lodging complaint? 153 6.1.5.4 How satisfied are you with the fault repair service? 1546.1.6-Supplementary Services 154 6.1.6.1 Do you use services like call waiting, call forwarding, voice mail or any other supplementary services? 154 6.1.6.2 How satisfied are you with the quality of the supplementary services provided? 154

Assessment of Customer perception of Service and UP (E) SERVICE AREA Implementation and Effectiveness of Telecom Consumers Protection and Redressal of Grievances Regulations
© 441, (Basement), Jangpura, Mathura Road, New Delhi – 110014, India
Email: [email protected], URL: www.consumer-voice
8
6.1.7-Overall Satisfaction 155 6.1.7.1 How satisfied are you with the overall quality of your telephone service? 1556.1.8-General Information 155
6.1.8.1 Have you been informed in writing at the time of subscription of service or within a week of activation of service the complete details of your tariff plan? 155
6.1.8.2 Have you terminated your mobile phone connection in last 12 months? 155 6.1.8.3 If yes, Please name your previous service provider? 156 6.1.8.4 How many days were taken by previous service provider for termination of your phone
connection? 156 6.1.8.5 Did your service provider adjust your security deposit in the bill raised after you requested for
termination? 156 6.1.8.6 Have you registered your telephone number for do not call (DNC) registry with your service
provider so that you do not receive unsolicited commercial calls / SMS? 157 6.1.8.7 Do you still receive unsolicited calls/SMS and whether there is any change in the frequency of
such calls/SMS? 157 6.1.8.8 Have you made any complaint to your service provider on getting such unsolicited calls/SMS
after registering for national Do Not Call registry? 1576.2 Cellular Mobile 158
6.2.1-Service Provision 158 6.2.1.1 When did you last apply for a phone connection? 158
6.2.1.2 How much time was taken to get the telephone connection activated after you applied & Completed all formalities; Service Provider Wise 158
6.2.1.3 How satisfied are you with time taken to activate the mobile connection, after you applied and completed all formalities; Service Provider Wise 159
6.2.1.4 In case your connection was temporarily suspended due to non-payment of bills, are you satisfied with the time taken to reactivate service after you made the payment? 159
6.2.2-A-Billing Related (only for prepaid customers) 160 6.2.2.1 How satisfied are you with the accuracy of charges ,i.e. amount deducted on every usage? 160 6.2.2.2 Please specify the reason(s) for your dissatisfaction. 1606.2.2-B-Billing Related (only for postpaid customers) 161 6.2.2.3 How satisfied are you with the timely delivery of bills; Service Provider Wise 161 6.2.2.4 How satisfied are you with the accuracy of the bills; Service Provider Wise 161 6.2.2.5 Have you made any billing related complaints in last 12 months; Service Provider Wise 162
6.2.2.6 How satisfied are you with the process of resolution of billing complaints;Service Provider Wise162
6.2.2.7 How satisfied are you with the clarity of the bills sent by your service provider in terms of transparency and understandability; Service Provider Wise 163
6.2.2.8 Please specify the reason(s) for your dissatisfaction; Service Provider Wise 1636.2.3- Help Service/Customer Care 164
6.2.3.1 Did you make a complain or make a query in the last 12 months to the customer care / helpline/call center toll free number of your service provider? : Service provider wise 164
6.2.3.2 How satisfied are you with the ease of access of call center/customer care or helpline? 164 6.2.3.3 How satisfied are you with the response time taken to answer your call by a customer care
executive? 165 6.2.3.4 How satisfied are you with the problem solving ability of the customer care executive(s)? 165 6.2.3.5 How satisfied are you with the time taken by a Call centre/customer care/helpline to resolve your 166

Assessment of Customer perception of Service and UP (E) SERVICE AREA Implementation and Effectiveness of Telecom Consumers Protection and Redressal of Grievances Regulations
© 441, (Basement), Jangpura, Mathura Road, New Delhi – 110014, India
Email: [email protected], URL: www.consumer-voice
9
complaint? 6.2.4-Network Performance, Reliability & Availability 166 6.2.4.1 How satisfied are you with the availability of signal of your service provider in your locality? 166 6.2.4.2 How satisfied are you with the ability to make or receive calls easily? 167 6.2.4.3 How often does your call drops during conversation? 167 6.2.4.4 How satisfied are you with the voice quality? 1686.2.5-Maintainability 168 6.2.5.1 How often your mobile handsets faces problem of signal? 168 6.2.5.2 How satisfied are you with the availability of network signal? 169 6.2.5.3 Are you satisfied with the restoration of network (signal) problems? 1696.2.6-Supplementary Services 170 6.2.6.1 Do you use value added services like roaming, ring tone, GPRS, e-mail, voice mail or any other
such services? 170 6.2.6.2 Did the service provider have your explicit consent before providing the chargeable value
added service such as ring tone, emails/ GPRS, voice mail etc. 170 6.2.6.3 How satisfied are you with the quality of supplementary/ value added services provided? 1716.2.7-Overall Satisfaction 172 6.2.7.1 How satisfied are you with the overall quality of your mobile service; Service provider wise 172 6.2.7.1 Please specify the reason for your dissatisfaction 1726.2.8-General Information 173
6.2.8.1 Have you been informed in writing at the time of subscription of service or within a week of activation of service the complete details of your tariff plan? 173
6.2.8.2 Have you terminated your mobile phone connection in last 12 months? 173 6.2.8.3 If yes, Please name your previous service provider? 174 6.2.8.4 How many days were taken by previous service provider for termination of your mobile phone
connection? 174 6.2.8.5 Did your service provider adjust your security deposit in the bill raised after you requested for
termination? 175 6.2.8.6 Have you registered your telephone number for do not call (DNC) registry with your service
provider so that you do not receive unsolicited commercial calls / SMS? 175 6.2.8.7 Do you still receive unsolicited calls/SMS and whether there is any change in the frequency of
such calls/SMS? 176 6.2.8.8 Have you made any complaint to your service provider on getting such unsolicited calls/ SMS
after registering for NDNC registry? 176 6.2.8.9 Do you still receive unsolicited calls/SMS and whether there is any change in the frequency of
such calls/SMS? 1776.3 Broadband 178
6.3.1-Service Provision 178 6.3.1.1 After registration and payment of initial deposit by you within how many working days did the
Broadband connection get activated? 178 6.3.1.2 How satisfied are you with the time taken in the provision of the Broadband connection after
registration and payment of initial deposit by you? 178 6.3.1.3 In case your connection was temporarily suspended due to non-payment of bills, are you
satisfied with the time taken to reactivate service after you made the payment? 1796.3.2-A-Billing Related (only for postpaid customers) 179 6.3.2.1 How satisfied are you with the timely delivery if bills? 179

Assessment of Customer perception of Service and UP (E) SERVICE AREA Implementation and Effectiveness of Telecom Consumers Protection and Redressal of Grievances Regulations
© 441, (Basement), Jangpura, Mathura Road, New Delhi – 110014, India
Email: [email protected], URL: www.consumer-voice
10
6.3.2.2 How satisfied are you with the accuracy of the bills? 179 6.3.2.3 Please specify the reason(s) for your dissatisfaction. 180 6.3.2.4 Have you made any billing related complaints in last 12 months? 180 6.3.2.5 How satisfied are you with the process of resolution of billing complaints? 180 6.3.2.6 How satisfied are you with the clarity of the bills sent by your service provider in terms of transparency
& understandability? 181 6.3.2.7 Please specify the reason(s) for your dissatisfaction; Service Provider Wise 1816.3.2-B-Billing Related (only for prepaid customers) 182 6.3.2.8 How satisfied are you with the accuracy of charges i.e. amount deducted on every usage? 182 6.3.3.2 Please specify the reason(s) for your dissatisfaction 1826.3.3- Help Service/Customer Care 183
6.3.3.1 Did you make a complain or make a query in the last 12 months to the customer care / helpline/call center toll free number of your service provider? : Service provider wise 183
6.3.3.2 How satisfied are you with the ease of access of call center/customer care or helpline? 183 6.3.3.3 How satisfied are you with the response time taken to answer your call by a customer care executive? 184 6.3.3.4 How satisfied are you with the problem solving ability of the customer care executive(s)? 184 6.3.3.5 How satisfied are you with the time taken by a Call centre/customer care/helpline to resolve your
complaint? 1846.3.4-Network Performance, Reliability & Availability 185 6.3.4.1 How satisfied are you with the speed of the broadband connection? 185 6.3.4.2 How satisfied are you with the amount of time for which service is up and working? 1856.3.5-Maintainability 186 6.3.5.1 How often do you face a problem with your Broadband connection? 186 6.3.5.2 What was the broadband connection problem face by you in last twelve month related to please specify? 186 6.3.5.3 How satisfied are you with the time taken for restoration of broadband? 1876.3.6-Supplementary Services 187 6.3.6.1 Do you use any value added services or supplementary services such as static/fixed IP addresses-mail, IDs etc? 187 6.3.6.2 How satisfied are you with the quality of the supplementary services provided? 1876.3.7-Overall Satisfaction 188 6.3.7.1 How satisfied are you with the overall quality of your telephone service? 188 6.3.7.2 Please specify the reason(s) for your dissatisfaction; Service Provider Wise 1886.1.8-General Information 189
6.3.8.1 Are you aware of the facility for measuring the broadband connection speed provided by your service provider? 189

Assessment of Customer perception of Service and UP (E) SERVICE AREA Implementation and Effectiveness of Telecom Consumers Protection and Redressal of Grievances Regulations
© 441, (Basement), Jangpura, Mathura Road, New Delhi – 110014, India
Email: [email protected], URL: www.consumer-voice
11
1.1 PREFACE
Provision of world class telecommunication infrastructure and information is the key to rapid economic and social development of the country. While expansion in number of subscribers and growth of tele-density are important quantitative goals in this sector, it is important to pay attention to the Quality of Service to consumers through regulatory mechanism. The Telecom Regulatory Authority of India was established in 1997 through an Act of Parliament namely, the Telecom Regulatory Authority of India Act 1997 as amended by TRAI (Amendment) Act 2000. The Framework for consumer protection is to “Lay down the standards of quality of service to be provided by the service providers and ensure the quality of service and conduct the periodical survey of such service provided by the service providers so as to protect interest of the consumers of telecommunication service”1.⁵ While the TRAI is the regulatory body under the Act, TDSAT is the body responsible for settlement of telecom disputes. However, individual consumer complaints do not come under the purview of either TRAI or TDSAT. Considering the fact that individual consumers can not seek redressal from TRAI or TDSAT, TRAI has taken number of steps to issue various directions, regulations and orders as measures to protect the interest of the consumers. In this concern, TRAI initiates study to assess the quality of telecom services every year. The study covers the whole India comprising four metros and three circles for Basic Wireline and Cellular services. The main aim is to assess the quality of Basic service (wireline) and Cellular Mobile services as per the Quality of Service of Basic and Cellular Mobile Telephone Services, 2005 dated 1st July 2005. In May 2007, TRAI further passed a regulation titled, “Telecom Protection and Redressal of Grievances Regulation, 2007”. The main objective of this regulation is to lay down the norms for the service providers of Basic service (Wireline), Cellular Mobile and Broadband services in order to handle the complaints of aggrieved consumers. The salient feature of this regulation is listed below: I. Each Telecom Service Provider would be required:
1. To set up 24x7 Toll Free Call Centre 2. To appoint one or more Nodal Officer in each licensed service area 3. To appoint one or more Appellate Authority in each licensed service area.
1 www.trai.gov.in

Assessment of Customer perception of Service and UP (E) SERVICE AREA Implementation and Effectiveness of Telecom Consumers Protection and Redressal of Grievances Regulations
© 441, (Basement), Jangpura, Mathura Road, New Delhi – 110014, India
Email: [email protected], URL: www.consumer-voice
12
II. The information as above and also contact details of Nodal Officers and Appellate Authority to be widely publicized in national and local newspaper, sales outlets, web-site and back side of their Invoice/ Bills being sent to consumers. III. Each Service Provider will be required to publish abridged version of “Manual of Practices” for their customers and also make available the same on their web-sites. !V. The call centre, Nodal Officers and Appellate Authorities would follow the time lines as given in TRAI regulations for redressal of the complaints. For the year 2008, TRAI invited tenders from the reputed market agencies to carry out Customer Satisfaction Survey
1. To assess the Implementation and Effectiveness of Telecom Consumers Protection and Redressal of Grievances Regulations, 2007
2. To Assess Customer perception of Service as defined in Regulations on quality of service of Basic and Cellular dated 1st July 2005 and Broadband Service dated 6th October 2006.
The interested market research agencies were required to submit separate tender for each of the four zones. Each of the zone comprised of the following Telecom Circle/ Metro Service Areas.
North Zone: Delhi, Jammu & Kashmir, Himachal Pradesh, Punjab, Haryana, Rajasthan, Uttar Pradesh –East and Uttar Pradesh - West (including Uttrakhand). For the cellular mobile telephone service the service area of Delhi includes Ghaziabad, Faridabad, Noida and Gurgaon. South Zone: Chennai, Andhra Pradesh, Karnataka, Tamilnadu, (excluding Chennai) and Kerala. West Zone: Mumbai, Maharashtra (including Goa and excluding Mumbai), Gujarat and Madhya Pradesh (including Chattisgarh). East Zone: Kolkata, West Bengal (including Andman & Nicobar, Sikkim and excluding Kolkata), Bihar (inclding Jharkhand), Orissa, Assam and North East which includes Arunachal Pradesh, Meghalaya, Mizoram, Nagaland, Manipur and Tripura. As per the tender document, TRAI evaluated the technical bidding of the bidders and subsequently financial bids were opened in the presence of successful technical bidders.

Assessment of Customer perception of Service and UP (E) SERVICE AREA Implementation and Effectiveness of Telecom Consumers Protection and Redressal of Grievances Regulations
© 441, (Basement), Jangpura, Mathura Road, New Delhi – 110014, India
Email: [email protected], URL: www.consumer-voice
13
Voluntary Organization in the interest of Consumer Education (VOICE), with registered office at, 441, Jangpura, Mathura Road, New Delhi was awarded the contract for the North Zone comprising eight states – Delhi, Haryana, Punjab, UP (E), UP (W), Rajasthan, Himachal Pradesh and Jammu & Kashmir by Telecom Regulatory Authority of India (TRAI) on 7th January 2008.
1.2 QUESTIONNAIRE BUILDING PROCESS
VOICE with other successful bidders – IMRB for East and South Zone and Market Pulse for West Zone – submitted their draft questionnaires to TRAI in the month of January 2008. TRAI oganised a round table consultation with all the successful bidders and three sets of questionnaires were finalized as per the parameters laid down in the tender documents. The Basic service (Wireline) and Cellular mobile questionnaires (see Annexure 1.1) were based on 7 broad parameters and 33 questions related to consumer perception on quality of services and other 22 questions were related to consumer perception on Assessment of Implementation and Effectiveness of Telecom Consumers Protection and Redressal of Grievances Regulations, 2007. In the case of Broadband, questionnaire was based on 7 broad parameters and 22 questions related to consumer perception on quality of service. Whereas, in the case of perception on Assessment of Implementation and Effectiveness of Telecom Consumers Protection and Redressal of Grievances Regulations, 2007, broadband questionnaire had same number of questions as in Basic service (Wireline) and Cellular Mobile. Broad parameters to assess the customer perception on quality of Basic service (Wireline), Cellular Mobile and Broadband services are listed below: 1.2.1 Basic Service (Wireline) Customer perception of service Benchmark
(i) % satisfied with provision of services >95%
(ii) % satisfied with billing performance >90%
(iii) % satisfied with help services >90%
(iv) % satisfied with network performance, reliability and availability
>95%
(v) % satisfied with maintainability >95%
(vi) Overall customer satisfaction >95%
(vii) Customer satisfaction with offered supplementary services % satisfied
>95%

Assessment of Customer perception of Service and UP (E) SERVICE AREA Implementation and Effectiveness of Telecom Consumers Protection and Redressal of Grievances Regulations
© 441, (Basement), Jangpura, Mathura Road, New Delhi – 110014, India
Email: [email protected], URL: www.consumer-voice
14
1.2.2 Basic services (wireless) and Cellular Mobile Telephone Service Customer perception of service Benchmark
(i) % satisfied with provision of services >95%
(ii) % satisfied with billing performance >90%
(iii) % satisfied with help services >90%
(iv) % satisfied with network performance, reliability and availability
>95%
(v) % satisfied with maintainability >95%
(vi) Overall customer satisfaction >95%
(vii) Customer satisfaction with offered supplementary services % satisfied
>95%
1.2.3 Broadband Service Customer perception of service Benchmark
(i) % satisfied with provision of services >90%
(ii) % satisfied with billing performance >90%
(iii) % satisfied with help services >90%
(iv) % satisfied with network performance, reliability and availability
>85%
(v) % satisfied with maintainability >85%
(vi) % satisfied Overall customer satisfaction >85%
(vii) Customer satisfaction with offered supplementary services such as allocation of static / fixed IP addresses, email Ids etc.
>95%

Assessment of Customer perception of Service and UP (E) SERVICE AREA Implementation and Effectiveness of Telecom Consumers Protection and Redressal of Grievances Regulations
© 441, (Basement), Jangpura, Mathura Road, New Delhi – 110014, India
Email: [email protected], URL: www.consumer-voice
15
1.3 METHODOLOGY TO CALCULATE CUSTOMER SATISFACTION ON BROAD PARAMETERS. Customers perception of satisfaction level were calculated using two types of measures. 1.3.1 Calculation of Consumer satisfaction level 1.3.2 Calculation of percentage of Consumers satisfied. 1.3.1 Methodology for calculation of consumer satisfaction level
To measure the satisfaction across various QoS parameters a four-point Likert scale of “Very Satisfied”, “Satisfied”, “Dissatisfied” and “Very Dissatisfied” was used. Weights are assigned to all the four responses with “Very Satisfied” being assigned 4 and “Very Dissatisfied” being assigned 1. Weighting is done in order to adequately account for the satisfaction levels of various consumers. Weighting is done according to the standard market research practices followed across the world. The overall satisfaction score is ascertained using the following formula(s): Mean Score = A / N Where: A = (No. of subscribers who have given a rating of “very satisfied” * 4 + No. of subscribers who have given a rating of “satisfied” * 3 + No. of subscribers who have given a rating of “dissatisfied” * 2 + No. of subscribers who have given a rating of “very dissatisfied” * 1) N = Total sample size achieved Now, overall weighted satisfaction score is calculated using the formula: Overall weighted satisfaction score = {(Mean Score – 1) / 3} * 100 This implies that if all the customers are “Very Satisfied”, the operator can get a rating of 100%. On the other hand, if all the customers are “Very Dissatisfied”, the operator gets a score of 0%. Thus, the scale has been calibrated to range between 0% and 100%.

Assessment of Customer perception of Service and UP (E) SERVICE AREA Implementation and Effectiveness of Telecom Consumers Protection and Redressal of Grievances Regulations
© 441, (Basement), Jangpura, Mathura Road, New Delhi – 110014, India
Email: [email protected], URL: www.consumer-voice
16
1.3.2 Methodology for Calculation of percentage of Consumer satisfied. To measure the percentage of consumers satisfied on various QoS parameters a simple addition method were applied by taking in to account the sum of consumer who were either “Very satisfied” or “Satisfied” on particular parameter. Therefore, the proportion of sum total of “Very Satisfied” and “Satisfied” consumers were taken out from the total number of valid responses on the all questions of each of the broad parameter. % of satisfied consumers is ascertained using the following formula(s): CS = (A / N) *100 Where: CS = % of satisfied consumers A = (sum total of no. of subscribers who were “very satisfied” on each of the broad parameter + sum total of no. of subscribers who were “satisfied” on each of the broad parameter N = Total sample size achieved This implies that if all the customers are either “Very Satisfied” or “Satisfied” the operator can get a rating of 100%. On the other hand, if all the customers are “Dissatisfied” or “Very Dissatisfied”, the operator gets a score of 0%. 1.3.3 Comparison with the Benchmarking. As per the tender document TRAI has fixed the benchmarks on broad parameters for Basic Service (Wirline), Basic (wireless) and Cellular Mobile and Broadband services. In the case of Basic Service (Wireline) and Basic (Wireless) & Cellular Mobile services, benchmark on all the broad parameter has been fixed relatively high at > 90%. Whereas, in the case of Broadband services, the benchmarks on three parameters – provision of services, billing performance and help services – has been fixed at >90%. In the case of other four parameters – network performance, maintainability, overall satisfaction and supplementary services – the benchmark has been set at >85%. During the consultation with the TRAI, it was agreed that comparison with the benchmarks will be done on the basis of consumer satisfaction level as described in section 1.3.1. Therefore, no comparison with the benchmark will be done on the bais of % of consumer satisfied as described in the section 1.3.2.

Assessment of Customer perception of Service and UP (E) SERVICE AREA Implementation and Effectiveness of Telecom Consumers Protection and Redressal of Grievances Regulations
© 441, (Basement), Jangpura, Mathura Road, New Delhi – 110014, India
Email: [email protected], URL: www.consumer-voice
17
2.1 INTRODUCTION It was decided to complete the survey of three Service Areas of Haryana, Punjab and UP (E) in the second quarter of 2008. Accordingly, the survey was carried out in Haryana, Punjab and UP (E) during the months of May – July 2008 for Basic Wireline, Cellular Mobile Telephone and Broadband services. The present report, deals with Uttar Pradesh (East) (UP (E)) only. 2.2 SAMPLING METHODOLOGY 2.2.1 Basic Wireline As per the tender document, survey agencies were supposed to cover a total sample of 1176 subscribers, to be divided among the two service providers. This is shown in the table below. Name of the service providers Sample
Airtel (Bharti Airtel Limited) 576 BSNL (Bharat Sanchar Nigam Limited) 600 Total 1176
The above sample represents the total operator wise subscribers in UP (E) Service Area with 95% confidence level and 4% interval. As per the tender document, survey agencies were supposed to cover a total sample of 5% of exchanges of each BSO in the circle, covering a sample of 1,176 subscribers. These 5% of exchanges should be evenly spread over 10% of SDCA with each BSO. For the purpose of selecting exchange areas to be covered, BSNL exchanges were considered as the base. In UP (E) there are 1,226 total BSNL exchanges and 164 SDCA. Therefore altogether 62 exchanges (5% of total exchanges) to be spread among 17 SDCAs (5% of total SDCAs ) were selected for purpose of canvassing the questionnaire. The names of the 6 selected SDAs are as follows:

Assessment of Customer perception of Service and UP (E) SERVICE AREA Implementation and Effectiveness of Telecom Consumers Protection and Redressal of Grievances Regulations
© 441, (Basement), Jangpura, Mathura Road, New Delhi – 110014, India
Email: [email protected], URL: www.consumer-voice
18
The list below also gives the list of exchanges under each of the selected SDCAs.
UP (E) Service Area: Name of SDCAs & Exchanges covered.
Name of selected exchanges SDCA
URBAN RURAL
1 ALLAHABAD SUBEDARGANJ-1 SUBEDARGANJ-2 COLONALGANG
BARA
2 BALLIA SIKANDARPUR RATSAR, PHEPHNA
3 JAUNPUR SHAHGANJ CHANDWAK
4 JHANSI BIJAULI CHIRGAON KATERA
5 KANPUR BITHOOR
GHATAMPUR KALYANPUR
DERAPUR, KAKWAN
6 LUCKNOW ALAMBAGH DALIGANJ
GOMTI NAGAR MALIHABAD, KAKORI
7 MAINPURI BEWAR NABIGANJ, SULTANGANJ
8 MIRZAPUR KACHHAWA MARIHAN BARAUNDHA, HALLIA
9 RAIBARELI LALGANJ NASIRAHBAD, SHIVGARH
10 SULTANPUR AMETHI CHANDA, JAGDISHPUR
11 UNNAO PURWA SAFIPUR BARA, HILAULI, MAGRAYAR
12 VARANASI BHADOHI MUGHALSARAI
CHOLAPUR, MIRZAMURAD, PHOOLPUR
13 GAZIPUR GAZIPUR BIRNON, GAHAMAR
14 GORAKHPUR GORAKHPUR PIPRAICH KAURIRAM, KUSAMI, PALI
15 Khushinagar PADRAUNA FAZIL NAGAR, BODARWAR
16 Gonda GONDA WAZEERGANJ, DHANEPUR
17 Basti BASTI WAZEERGANJ, DHANEPUR
TOTAL EXCHANGES COVERED 28 34

Assessment of Customer perception of Service and UP (E) SERVICE AREA Implementation and Effectiveness of Telecom Consumers Protection and Redressal of Grievances Regulations
© 441, (Basement), Jangpura, Mathura Road, New Delhi – 110014, India
Email: [email protected], URL: www.consumer-voice
19
It should be noted here that selection of exchange areas was done on the basis of BSNL exchange structure. At the time of survey, the field team could not find the required number of subscribers of other private service provider – Bharti. Therefore, some re-adjustment in the area selection was done in order to complete the required sample. Sample distribution in to SDCAs The provider wise sample was distributed among the SDCAs based on the proportionate population of the district, where these SDCAs fall. Therefore, the following table shows the provider wise SDCA/ district wise target sample distribution.
UP (E) Service Area: Basic (Wireline): Target Sample distribution in to districts and providers.
S.No. District Population Percentage % BSNL Bharti ALL Total
1 Allahabad 4936105 9.40% 55 55 110 2 Jaunpur 3911679 7.45% 45 43 88 3 Ballia 2761620 5.26% 32 30 62 4 Jhansi 1744931 3.32% 20 19 39 5 Gorakhpur 3769456 7.18% 43 41 84 6 Kanpur 5731335 10.92% 66 63 129 7 Gazipur 3037582 5.79% 35 33 68 8 Lucknow 3647834 6.95% 42 40 82 9 Mirzapur 2116042 4.03% 24 23 47 10 Sultanpur 3214832 6.13% 37 35 72 11 Rae Bareily 2872335 5.47% 33 32 65 12 Varanasi 3138671 5.98% 36 34 70 13 Unnao 2700324 5.14% 30 30 60 14 Mainpuri 1596718 3.04% 18 18 36 15 Basti 2750764 5.24% 31 30 61 16 Khushinagar 2235505 4.26% 26 25 51 17 Gonda 2321000 4.42% 27 25 52
Total: 52486733 100.00% 600 576 1176 Note: Population Source: Census of India 2001

Assessment of Customer perception of Service and UP (E) SERVICE AREA Implementation and Effectiveness of Telecom Consumers Protection and Redressal of Grievances Regulations
© 441, (Basement), Jangpura, Mathura Road, New Delhi – 110014, India
Email: [email protected], URL: www.consumer-voice
20
2.2.1.1 Mode of interview Two modes of interview were selected to cover the entire sample. 75% of operator sample was covered through in-depth interview with the consumers’ and rest 25% of sample was covered through telephonic interview using the technique of Computer Assisted Telephonic Interview (CATI). The sample breakup with the modes of interviews is shown below:
UP (E) Service Area: Operator wise sample distribution with mode of interview
Service Provider Telephonic In-Person Total
Count 156 420 576 Bharti
%age 27.1% 72.9% 100.0%
Count 126 474 600 BSNL
%age 21.0% 79.0% 100.0%
Count 282 894 1176 Total
%age 24.0% 76.0% 100.0%

Assessment of Customer perception of Service and UP (E) SERVICE AREA Implementation and Effectiveness of Telecom Consumers Protection and Redressal of Grievances Regulations
© 441, (Basement), Jangpura, Mathura Road, New Delhi – 110014, India
Email: [email protected], URL: www.consumer-voice
21
2.2.1.2 Type wise sample distribution
• The operator wise sample was further divided in to pre-paid and post paid segment. The following table shows the operator wise pre-paid and post-paid division of sample achieved during the survey.
UP (E) Service Area: Operator wise and user type wise sample distribution
Service Provider Prepaid Postpaid Total
Count 74 502 576 Bharti
%age 12.8% 87.2% 100.0%
Count 78 522 600 BSNL
%age 13.0% 87.0% 100.0%
Count 152 1024 1176 Total
%age 12.9% 87.1% 100.0%
Assessment of Customer perception of Service and UP (E) SERVICE AREA Implementation and Effectiveness of Telecom Consumers Protection and Redressal of Grievances Regulations
© 441, (Basement), Jangpura, Mathura Road, New Delhi – 110014, India
Email: [email protected], URL: www.consumer-voice
22
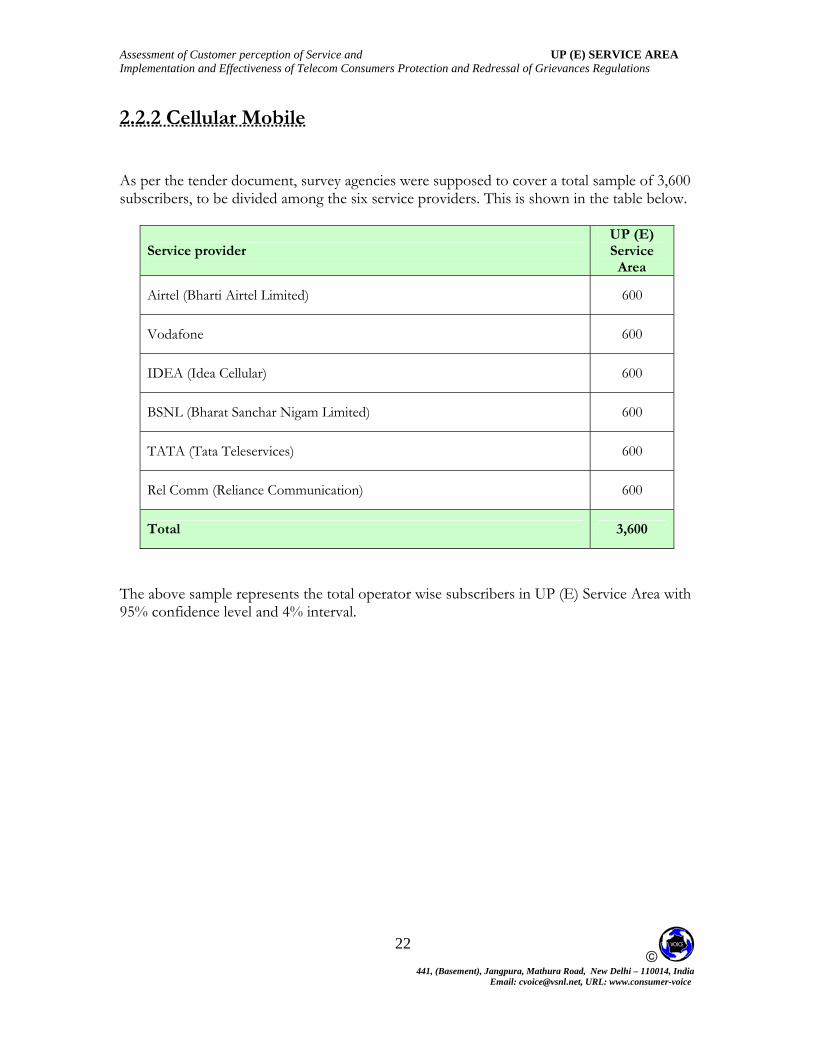
2.2.2 Cellular Mobile As per the tender document, survey agencies were supposed to cover a total sample of 3,600 subscribers, to be divided among the six service providers. This is shown in the table below.
Service provider UP (E) Service
Area
Airtel (Bharti Airtel Limited) 600
Vodafone 600
IDEA (Idea Cellular) 600
BSNL (Bharat Sanchar Nigam Limited) 600
TATA (Tata Teleservices) 600
Rel Comm (Reliance Communication) 600
Total 3,600
The above sample represents the total operator wise subscribers in UP (E) Service Area with 95% confidence level and 4% interval.

Assessment of Customer perception of Service and UP (E) SERVICE AREA Implementation and Effectiveness of Telecom Consumers Protection and Redressal of Grievances Regulations
© 441, (Basement), Jangpura, Mathura Road, New Delhi – 110014, India
Email: [email protected], URL: www.consumer-voice
23
2.2.2.1 District wise sample distribution As per the tender document the sample for cellular mobile telephone service subscribers shall be evenly spread in over 10% of district headquarters of a service area where services are commissioned. In UP (E) there are altogether 34 districts. Therefore 4 districts – Allahabad, Jhansi, Kanpur and Lucknow were selected. Sample was distributed in these four districts on the basis of their proportionate population. The following table shows the district wise and provider wise target sample distribution.
UP (E) Service Area: Cellular Mobile : Target sample distribution in to districts/area and service provider
Districts/ area
Population Population
%
Total sample
size Bharti Vodafone
Idea Cellular
Rel Com
Tata Tele-
services BSNL
Allahabad 4,941,510 40.76% 1470 245 245 245 245 245 245
Jhansi 504,292 4.16% 150 25 25 25 25 25 25
Kanpur 4,137,489 34.13% 1230 205 205 205 205 205 205
Lucknow 2,541,101 20.96% 750 126 126 126 126 126 126
Total 12,124,392 100.00% 3600 600 600 600 600 600 600
Note: Population Source: Census of India 2001

Assessment of Customer perception of Service and UP (E) SERVICE AREA Implementation and Effectiveness of Telecom Consumers Protection and Redressal of Grievances Regulations
© 441, (Basement), Jangpura, Mathura Road, New Delhi – 110014, India
Email: [email protected], URL: www.consumer-voice
24
2.2.2.2 Area wise sample distribution
In order to make the sample wide spread in all the selected district headquarters, the area was divided in to four to five quadrants and the localities were selected from each of the quadrants for administering the face to face interviews with the consumers. The following table shows the district wise area covered for administering the cellular mobile survey.
UP(E) Service Area: Cellular Mobile: Coverage Area
District Headquarter Areas Covered (Localities)
Allahabad Nawada, Nayakatra, Tagore Town, Rani Mandi, Allahapur, Allenaganj, Rambagh, Malviya Nagar, Rajapur, Railway Colony, Bharana, Bans Mandi.
Lucknow
Daulatganj, Daliganj, Wazirbagh, Shahganj, Tilaknagar, Aminabad, Nishantganj, Mukharimnagar, Gopalnagar Colony, Singar Nagar, Alambagh, Sadar Bajar, Moti Nagar.
Kanpur
Nawabganj, Generalganj, Sadar Bajar, Rail Bajar, Colonal Ganj, Navin Market, Guptarghat, Sismau, Chakri, City Centre, Cantt, Gandhi Nagar, Govind Nagar, Kalyanpur
Jhansi BHEL, Ranipur, Manik Chowk, Sipri Bajar, Talpura, Cantt, Samtha

Assessment of Customer perception of Service and UP (E) SERVICE AREA Implementation and Effectiveness of Telecom Consumers Protection and Redressal of Grievances Regulations
© 441, (Basement), Jangpura, Mathura Road, New Delhi – 110014, India
Email: [email protected], URL: www.consumer-voice
25
2.2.2.3 Mode of interview
• Two modes of interview were selected to cover the entire sample. 75% of operator
sample was covered through in-depth interview with the consumers and rest 25% of sample was covered through telephonic interview using the technique of Computer Assisted Telephonic interview (CATI). The following table shows the operator wise sample covered during the survey, using both the modes of interview.
UP (E) Service Area: Operator wise sample distribution with mode of interview
Telephonic (CATI) In-Person Total
Count 197 403 600 Bharti
%age 32.8% 67.2% 100.0%
Count 263 337 600 Vodafone
%age 43.8% 56.2% 100.0%
Count 64 536 600 Idea Cellular
%age 10.7% 89.3% 100.0%
Count 114 486 600 BSNL
%age 19.0% 81.0% 100.0%
Count 108 492 600 Rel Comm
%age 18.0% 82.0% 100.0%
Count 121 479 600 Tata Teleservices %age 20.2% 79.8% 100.0%
Count 867 2733 3600 Total
%age 24.1% 75.9% 100.0%
Assessment of Customer perception of Service and UP (E) SERVICE AREA Implementation and Effectiveness of Telecom Consumers Protection and Redressal of Grievances Regulations
© 441, (Basement), Jangpura, Mathura Road, New Delhi – 110014, India
Email: [email protected], URL: www.consumer-voice
26
2.2.2.4 Type wise sample distribution
• The operator wise sample was further divided in to pre-paid and post paid segment. The operator wise ratio of pre paid and post paid subscriber base was organized with the help of nodal officer appointed for each provider. The following table shows the operator wise pre-paid and post-paid division of sample.
UP(E) Service Area: Operator wise and user type wise sample distribution
Service provider Prepaid Postpaid Total
Count 588 12 600 Bharti
%age 98.0% 2.0% 100.0%
Count 582 18 600 Vodafone
%age 97.0% 3.0% 100.0%
Count 588 12 600 Idea Cellular
%age 98.0% 2.0% 100.0%
Count 577 23 600 BSNL
%age 96.2% 3.8% 100.0%
Count 540 60 600 Rel Comm
%age 90.0% 10.0% 100.0%
Count 564 36 600 Tata Teleservices
%age 94.0% 6.0% 100.0%
Count 3439 161 3600 Total
%age 95.5% 4.5% 100.0%

Assessment of Customer perception of Service and UP (E) SERVICE AREA Implementation and Effectiveness of Telecom Consumers Protection and Redressal of Grievances Regulations
© 441, (Basement), Jangpura, Mathura Road, New Delhi – 110014, India
Email: [email protected], URL: www.consumer-voice
27
2.2.3 Broadband In the case of Broadband, Survey agencies were required to obtain from Broadband Service Provider’s Central ISP Node total number of subscribers in each circle and then work out the sample to be covered. VOICE contacted the broadband service providers to ascertain their number POPs (Point of Presence) in UPE. It was found that only three providers – Bharti ,BSNL and Rel Comm. – had substantial numbers of consumers in UPE.. As per the tender document requirement, 10% of POPs of Bharti , BSNL and Rel Comm. were selected to carry out the survey. The following table shows the service provider wise sample covered in UP (E) Service area.
Operator Total
Bharti 590
BSNL 597
Rel Comm 482
Total 1669
The operator wise sample achieved represents the total operator wise subscribers in the UP (E) with 95% confidence level and 4% confidence interval.

Assessment of Customer perception of Service and UP (E) SERVICE AREA Implementation and Effectiveness of Telecom Consumers Protection and Redressal of Grievances Regulations
© 441, (Basement), Jangpura, Mathura Road, New Delhi – 110014, India
Email: [email protected], URL: www.consumer-voice
28
2.2.3.1 Area wise distribution: Altogether seventeen districts were selected for the broadband survey, where the providers had their PoPs. However, Bharti had the presence only in Lucknow and Rel Comm had presence in Kanpur only. The following table shows the district wise and provider wise sample which was covered during the survey.
UP(E) Service Area: Broadband: District wise and provider wise actual sample covered
Districts BSNL Bharti Rel Comm ALLAHABAD 65 - -
BALLIA 26 - -
JAUNPUR 37 - -
JHANSI 38 - -
KANPUR 67 - 482
LUCKNOW 58 590 -
MAINPURI 22 - -
MIRZAPUR 42 - -
RAIBARELI 35 - -
SULTANPUR 46 - -
UNNAO 37 - -
VARANASI 49 - -
GAZIPUR 10 - -
GORAKHPUR 10 - -
KHUSHINAGAR 18 - -
GONDA 21 - -
BASTI 16 - -
TOTAL 598 590 482

Assessment of Customer perception of Service and UP (E) SERVICE AREA Implementation and Effectiveness of Telecom Consumers Protection and Redressal of Grievances Regulations
© 441, (Basement), Jangpura, Mathura Road, New Delhi – 110014, India
Email: [email protected], URL: www.consumer-voice
29
2.2.3.1 Mode of Interview As per the tender document, at least 50% of the observations/ interviews shall be based on personal interview basis and up to 50% through email or by developing web based applications. VOICE, accordingly developed a web based application and this was put on web site of VOICE in the month of February 2008. In order to publicize about the web based application, VOICE sent email to the data base received from few service providers and also the VOICE internal data base so that consumers can log on and fill the questionnaire. However, the number of responses to the email sent was abysmally low. The following table show the actual service provider wise sample covered with the mode of interview.
UP (E) Service Area: Operator wise sample distribution with mode of interviews
Service Provider In-Person Web/ Online Total
Count 561 29 590 Bharti
%age 95.1% 4.9% 100.0%
Count 583 14 597 BSNL
%age 97.7% 2.3% 100.0%
Count 466 16 482 Rel Comm
%age 96.7% 3.3% 100.0%
Count 1610 59 1669 Total
%age 96.5% 3.5% 100.0%
• The table above shows that out of the total sample of 1669, only 59 (3.5%) responses could be collected through web based online mechanism.
• The possible reason, for such a low responses could be that the data base of email addresses were either non functional or not valid.
• Therefore, VOICE decided to meet the entire sample through In-person interview. Accordingly 96.5% of the total sample was covered using In-person interview techniques.

Assessment of Customer perception of Service and UP (E) SERVICE AREA Implementation and Effectiveness of Telecom Consumers Protection and Redressal of Grievances Regulations
© 441, (Basement), Jangpura, Mathura Road, New Delhi – 110014, India
Email: [email protected], URL: www.consumer-voice
30
3.1 EXECUTIVE SUMMARY 3.1.1 Customer Satisfaction Survey -Basic Service (Wireline) Subscribers’ perception of Basic (wireline) service was assesses for “7” defined parameters through 33 questions and Implementation and Effectiveness of Telecom Consumers Protection and Redressal of Grievances Regulations, 2007 through 22 questions. As regard to the UP (E) Service Area performance of operators, none of the operator is meeting the prescribed parameters’ benchmark with respect to quality of service. The findings with respect to major parameters on quality of service are as follows:
3.1.1.1: Overall Customer Satisfaction Level (Benchmark >95%)
The customer perception of overall satisfaction level is poor in UP (E) Service Area as out of 2 operators none of them meet the benchmark of 95%.
• In terms of customer satisfaction level, the achievement level of the operators ranged from 65.2% to 69.3%.
• The highest overall satisfaction level was achieved by BSNL with 69.3%. • The lowest overall satisfaction level was achieved by Bharti with 65.2%
3.1.1.2: Network Performance (Benchmark >95%) The customer perception of the parameter network performance is poor in UP (E) Service Area as out of 2 operators none of them meet the benchmark of 95%.
• In terms of customer satisfaction level with the network performance, the achievement level of the operators ranged from 70.9% to 71.1%.
• The highest satisfaction level with the network performance was scored by Bharti with 71.1%.
• The lowest customer satisfaction level on network performance was achieved by BSNL with 70.9%.
3.1.1.3: Billing (Benchmark >95%) The survey was conducted separately for post-paid and pre-paid customers. In the case of pre-paid segment, none of the 2 operators meet the benchmark of 90%. Similar situation was found in post-paid segment where none of the 2 operators meet the benchmark of 90%
• In terms of customer satisfaction level, the achievement level of the operators, in the case of pre-paid segment, ranged from 81.2% to 86.5%. Whereas in the case of post-paid, it ranged from 63.9% to 64.8%
• The highest consumer satisfaction level with billing services, in pre-paid segment was achieved by Bharti with 86.5%. In the case of post paid segment the highest consumer satisfaction level was attained by BSNL with 64.8%.
• The lowest consumer satisfaction level with billing service in the pre-paid segment was achieved by BSNL with 81.2%. In the case of post-paid segment the lowest consumer satisfaction level was attained by Bharti with 63.9%.

Assessment of Customer perception of Service and UP (E) SERVICE AREA Implementation and Effectiveness of Telecom Consumers Protection and Redressal of Grievances Regulations
© 441, (Basement), Jangpura, Mathura Road, New Delhi – 110014, India
Email: [email protected], URL: www.consumer-voice
31
3.1.3.4: Maintainability (Benchmark >85%)
The customer perception of the parameter maintainability is poor in UP (E) Service Area as out of 2 operators none of them meets the benchmark of 95%.
• In terms of customer satisfaction level, the achievement level of the operators ranged from 63.9% to 64.6%.
• The highest customer satisfaction level on maintainability was achieved by Bharti with 64.6%.
• The lowest customer satisfaction level on maintainability was achieved by BSNL with 63.9%.
3.1.1.5: Help Services/ Customer Care (Benchmark >90%) The customer perception of the parameter help service/ customer care is significantly poor in UP (E) Service Area as out of 2 operators none of them meets the benchmark of 90%.
• In terms of customer satisfaction level, the achievement level of the operators ranged from 63.8% to 69.0%.
• The highest customer satisfaction level on help service/ customer care was achieved by BSNL with 69.0%.
• The lowest customer satisfaction level on help services/ customer care was achieved by Bharti with 63.8%.
3.1.1.6: Consumers Protection and Redressal of Grievances
• Awareness about all the three stages of grievance redressal mechanism set up by their service providers was found to be comparatively higher as this was reported by over 36% of consumers surveyed. The higher percentage of aware subscribers were found in the case of BSNL (43%) as compared to Bharti (29.5%).
• Awareness level was found high in the case of call centre/ customer care help line numbers as this was reported by all the consumers (100%) surveyed. However, awareness about the nodal officer and Appellate authority was reported by only 0.6% and 1.2% of consumers respectively.
• Higher number of complaints to the call centre, within last six months, was made by BSNL subscribers (70.5%) as compared to the percentage of Bharti subscribers (64.1%).
• Almost 9 out of 10 complainants (92.6%) confirmed that they received the docket number of most of their complaints. This was reported higher in the case of BSNL (93.9%) as compared to Bharti (91.1%).
• In the case of both the providers, more than 95% of complainants were satisfied (very satisfied and satisfied) with the resolution of complaints by call centre.
• Out of 7 (0.6%) respondents who were aware of nodal officers, none of them knew (were aware) about the contact details of Nodal Officers.

Assessment of Customer perception of Service and UP (E) SERVICE AREA Implementation and Effectiveness of Telecom Consumers Protection and Redressal of Grievances Regulations
© 441, (Basement), Jangpura, Mathura Road, New Delhi – 110014, India
Email: [email protected], URL: www.consumer-voice
32
3.1.2 Customer Satisfaction Survey (Cellular Mobile) Subscribers’ perception of cellular service was assesses for “7” defined parameters through 33 questions and Implementation and Effectiveness of Telecom Consumers Protection and Redressal of Grievances Regulations, 2007 through 22 questions. As regard to the UP (E) Service Area performance of operators, none of the operators are meeting the prescribed parameters’ benchmark with respect to quality of service. The findings with respect to major parameters on quality of service are as follows:
3.1.2.1: Overall Customer Satisfaction Level (Benchmark >95%)
The customer perception of overall satisfaction level is poor in UP (E) Service Area as out of 6 operators none of them meet the benchmark of 95%.
• In terms of customer satisfaction level, the achievement level of the operators ranged from 71.4% to 74.6%.
• The highest overall satisfaction level was achieved by Rel Comm at 74.6%, followed by Tata Teleservices (73.3%) and Bharti (72.5%).
• The lowest overall satisfaction level was achieved by Vodafone at 71.4%, followed by BSNL (71.6%) and Idea Cellular (71.9%).
3.1.2.2: Network Performance (Benchmark >95%)
The customer perception of the parameter network performance is poor in UP (E) Service Area as out of 6 operators none of them meet the benchmark of 95%.
• In terms of customer satisfaction level, the achievement level of the operators ranged from 74% to 80.1%.
• The highest consumer satisfaction level on network performance was attained by Rel Comm with 80.1%, closely followed by Idea Cellular with 80%, Tata Teleservices (79.8%) and Bharti (79%).
• The lowest consumer satisfaction level on network performance was achieved by Vodafone (74%), followed by BSNL (75.3%).

Assessment of Customer perception of Service and UP (E) SERVICE AREA Implementation and Effectiveness of Telecom Consumers Protection and Redressal of Grievances Regulations
© 441, (Basement), Jangpura, Mathura Road, New Delhi – 110014, India
Email: [email protected], URL: www.consumer-voice
33
3.1.2.3: Billing (Benchmark >90%)
The survey was conducted separately for post-paid and pre-paid customers.
In the case of pre-paid segment, none of the 6 operators meet the benchmark of 90%. Similar situation was found in post-paid segment where none of the 6 operators meet the benchmark of 90%
• In terms of customer satisfaction level, the achievement level of the operators, in the case pre-paid segment, ranged from 66.6% to 71.1%. Whereas in the case of post-paid, it ranged from 68.3% to 82.5%
• The highest consumer satisfaction level with billing services, in pre-paid segment was achieved by Bharti with 71.1%, closely followed by Rel Comm (70.5%) and Idea cellular and Tata Teleservices (69.8% each). In the case of post paid segment the highest consumer satisfaction level was attained by Idea Cellular with 82.5%, followed by Vodafone (76.7%) and Rel Comm (74%).
• The lowest consumer satisfaction level with billing service in the pre-paid segment was achieved by Vodafone with 66.6%, followed by BSNL (68.1%). In the case of post-paid segment the lowest consumer satisfaction level was attained by Bharti with 68.3%, followed by Tata Teleservices (68.5%) and BSNL (72.5%).
3.1.2.4: Maintainability (Benchmark >95%)
The customer perception of the parameter maintainability is poor in UP (E) Service Area as out of 6 operators none of them meet the benchmark of 95%.
• In terms of customer satisfaction level, the achievement level of the operators ranged from 73.8% to 78.6%.
• The highest consumer satisfaction level on maintainability was achieved by Rel Comm with 78.6%, followed by Idea Cellular (77.8%) and Bharti (77.2%) and Tata Teleservices (76.1%).
• The lowest consumer satisfaction level on maintainability was achieved by Vodafone with 73.8%, followed by BSNL (74.8%).
3.1.2.5: Help Services/ Customer Care (Benchmark >90%) The customer perception of the parameter help service/ customer care is significantly poor in UP (E) Service Area as out of 6 operators none of them meet the benchmark of 90%.
• In terms of customer satisfaction level, the achievement level of the operators ranged from 64.7% to 74.4%.
• The highest consumer satisfaction level on help service/ customer care was achieved by Idea Cellular with 74.4%, closely followed by Bharti (74.3%), Tata Teleservices (69%) and Rel Comm (68.9%).

Assessment of Customer perception of Service and UP (E) SERVICE AREA Implementation and Effectiveness of Telecom Consumers Protection and Redressal of Grievances Regulations
© 441, (Basement), Jangpura, Mathura Road, New Delhi – 110014, India
Email: [email protected], URL: www.consumer-voice
34
• The lowest consumer satisfaction level on help services/ customer care was shared by BSNL and Vodafone with 64.7% each.
• 3.1.2.6: Consumers Protection and Redressal of Grievances
• In the case of cellular mobile service, awareness about the three stages of
grievance redressal mechanism set up by their service providers was found be low as this was reported by only 15.7% of consumers surveyed. The highest percentage of aware subscribers were found in the case of Vodafone (21.5%), followed by Tata Teleservices (21.2%), Rel Comm (18%) and Idea Cellular (17.3%). Whereas, the lowest percentage of aware subscribers were reported from BSNL with 8%, closely followed by Bharti (8.2%).
• Awareness level was found high in the case of call centre/ customer care help line numbers as this was reported by 93.6% of consumers surveyed. Awareness about the Nodal Officers and Appellate Authority was reported by only 0.3% and 0.2% of consumers respectively.
• Relatively low numbers of complaints were made by the respondents surveyed. Altogether only 195 (5.4%) reported that they had made complaints within last six months. This was reported mainly by Vodafone subscribers (9%) followed by the subscribers of BSNL (7.7%), Rel Comm (6%) and Idea Cellular (5%). The lowest number of complaints to the call centre, within last six months were made by the subscribers of Bharti (1.7%) and Tata Teleservices (3.2%).
• Overall 51.8% confirmed that they received the docket number for most of their complaints. This was reported highest in the case of Tata Teleservices (63.2%), followed by BSNL (60.9%), Rel Comm (58.3%), Idea Cellular (53.3%), Bharti (50%) and Vodafone (35.2%).
• In the case of Rel Com and Vodafone all the consumers were satisfied (Very Satisfied and Satisfied) with the resolution of complaints by call centre. Whereas in the case of other four providers, percentages of satisfied complainants ranged from 89.5% to 95.7%.
• Out of 10 respondents who were aware of Nodal Officers, only 3 respondents confirmed that they knew (were aware) about the contact details of nodal officers.

Assessment of Customer perception of Service and UP (E) SERVICE AREA Implementation and Effectiveness of Telecom Consumers Protection and Redressal of Grievances Regulations
© 441, (Basement), Jangpura, Mathura Road, New Delhi – 110014, India
Email: [email protected], URL: www.consumer-voice
35
3.1.3 Customer Satisfaction Survey (Broadband) Subscribers’ perception of broadband service was assessed for “7” defined parameters through 23 questions and Implementation and Effectiveness of Telecom Consumers Protection and Redressal of Grievances Regulations, 2007 through 22 questions. As regard to the UP (E) Service Area performance of operators, none of the operators are meeting the prescribed parameter’s benchmark with respect to quality of service. The findings with respect to major parameters on quality of service are as follows: 3.1.3.1: Overall Customer Satisfaction Level (Benchmark 85%)
The customer perception of overall satisfaction level, in the case of broadband, is poor in UP (E) Service Area as out of 3 operators none of them meets the benchmark of 85%.
• In terms of customer satisfaction level, the achievement level of the operators ranged from 63.8% to 66.7%.
• The highest overall satisfaction level was achieved by BSNL with 66.7%, closely follwed by Bharti (66.2%).
• The lowest overall satisfaction level was achieved by Rel Com with 63.8%. 3.1.3.2: Network Performance (Benchmark >85%)
The customer perception of the parameter network performance is poor in UP (E) Service Area as out of 2 operators none of them meet the benchmark of 85%.
• In terms of customer satisfaction level with the network performance, the achievement level of the operators ranged from 59.2% to 62.2 %.
• The highest satisfaction level with the network performance was scored by BSNL with 62.2%, followed by Bharti (61.1%).
• The lowest customer satisfaction level on network performance was achieved by Rel Com with 59.2%.
3.1.3.3: Billing (Benchmark >90%) The survey was conducted separately for post-paid and pre-paid customers.
In the case of pre-paid segment, none of the 3 operators meet the benchmark of 90%. Similar situation was found in post-paid segment where none of the 2 operators meet the benchmark of 90%
• In terms of customer satisfaction level, the achievement level of the operators, in the case of pre-paid segment, ranged from 59.5% to 64.4%. Whereas in the case of post-paid, it ranged from 66.5% to 70.9%
• The highest customer satisfaction level with billing services, in pre-paid segment was achieved by Bharti with 64.4% followed by BSNL (61.4%). In the

Assessment of Customer perception of Service and UP (E) SERVICE AREA Implementation and Effectiveness of Telecom Consumers Protection and Redressal of Grievances Regulations
© 441, (Basement), Jangpura, Mathura Road, New Delhi – 110014, India
Email: [email protected], URL: www.consumer-voice
36
case of post paid segment the highest customer satisfaction level was attained by BSNL with 70.9% followed by Rel Comm (69.3%).
• The lowest customer satisfaction level with billing services, in pre-paid segment was achieved by Rel Comm with 59.5%. In the case of post paid segment the lowest customer satisfaction level was attained by Bharti with 66.5%.
3.1.3.4: Maintainability (Benchmark >85%)
The customer perception of the parameter maintainability is poor in UP (E) Service Area as out of 3 operators none of them meets the benchmark of 85%.
• In terms of customer satisfaction level, the achievement level of the operators ranged from 68.4% to 73.7%.
• The highest customer satisfaction level on maintainability was achieved by Rel Comm with 73.7%.
• The lowest customer satisfaction level on maintainability was achieved by BSNL (68.4%) followed by Bharti (68.6%).
3.1.3.5: Help Services/ Customer Care (Benchmark >90%) The customer perception of the parameter help service/ customer care is significantly poor in UP (E) Service Area as out of 3 operators none of them meets the benchmark of 90%.
• In terms of customer satisfaction level, the achievement level of the operators ranged from 61.9% to 66.6%.
• The highest customer satisfaction level on help service/ customer care was achieved by BSNL with 66.6%, followed by Bharti (64%).
• The lowest customer satisfaction level on help services/ customer care was achieved by Rel Comm with 61.9%.
3.1.3.6: Consumers Protection and Redressal of Grievances
• Awareness about all the three stages of grievance redressal mechanism set up by their service providers was found to be low as this was reported by only 7.4% of consumers surveyed. The higher percentage of aware subscribers was found in the case of Rel Com (8.9%), closely followed by Bharti (8.3%). Whereas, in the case of BSNL, only 5.4% consumers were found to be aware.
• Awareness level was found high in the case of call centre/ customer care help line numbers as this was reported by 99.7% of consumers surveyed. Awareness about the Nodal Officer and Appellate Authority was reported by 5.5% and 3.2% of consumers respectively.
• Higher numbers of complaints to the call centre, within last six months, were made by Rel Comm subscribers (44.4%), followed by BSNL (31.7%) and Bharti (27.5%).

Assessment of Customer perception of Service and UP (E) SERVICE AREA Implementation and Effectiveness of Telecom Consumers Protection and Redressal of Grievances Regulations
© 441, (Basement), Jangpura, Mathura Road, New Delhi – 110014, India
Email: [email protected], URL: www.consumer-voice
37
• Overall 80.9% confirmed that they received the docket number of most of their complaints. This was reported higher in the case of Bharti (87.7%) as compared to Rel Comm (79%) and BSNL (77.2%).
• Higher percentage of satisfied customers (Very satisfied and Satisfied) with the resolution of complaints by call centre was found in the case of Rel Comm (85.9%) as compared to BSNL (68.3%) and Bharti (66.7%).
• Out of 55 (5.5%) respondents who were aware of nodal officers, only 7 (12.7%) respondent confirmed that they knew (were aware) about the contact details of Nodal Officers.

Assessment of Customer perception of Service and UP (E) SERVICE AREA Implementation and Effectiveness of Telecom Consumers Protection and Redressal of Grievances Regulations
© 441, (Basement), Jangpura, Mathura Road, New Delhi – 110014, India
Email: [email protected], URL: www.consumer-voice
38
4 DETAIL REPORT

Assessment of Customer perception of Service and UP (E) SERVICE AREA Implementation and Effectiveness of Telecom Consumers Protection and Redressal of Grievances Regulations
© 441, (Basement), Jangpura, Mathura Road, New Delhi – 110014, India
Email: [email protected], URL: www.consumer-voice
39
4.1 PERFORMANCE COMPLIANCE As discussed in the Chapter 1 that the comparison with the benchmarking, set up by the
TRAI for service provisions will be done on the basis of consumer satisfaction level as
described in the methodology section 1.3.1. Accordingly the benchmarking on various
service provisions of all the service providers was done, using the same criteria. This has
been shown below separately for all the three services – Basic Wireline, Cellular mobile and
Broadband.
However, the calculation of percentage of satisfied consumer on various service provisions
as described in methodology section 1.3.2 was also carried out in order to understand the
service providers wise total percentage of satisfied consumers on various service provisions.
The analysis for all three services – Basic Wireline, Cellular Mobile and Broadband – has
been shown separately. In this analysis, the outcome has not been compared with the
benchmarking set up by the TRAI for various service provisions.
Assessment of Customer perception of Service and UP (E) SERVICE AREA Implementation and Effectiveness of Telecom Consumers Protection and Redressal of Grievances Regulations
© 441, (Basement), Jangpura, Mathura Road, New Delhi – 110014, India
Email: [email protected], URL: www.consumer-voice
40
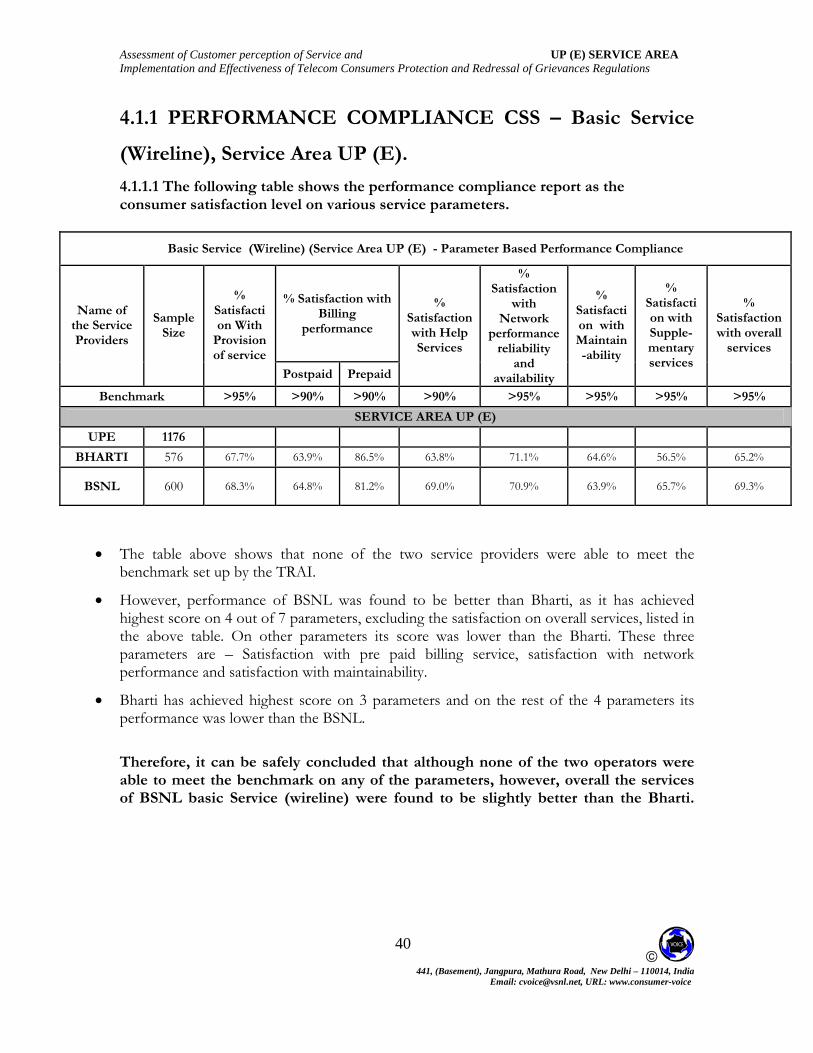
4.1.1 PERFORMANCE COMPLIANCE CSS – Basic Service
(Wireline), Service Area UP (E).
4.1.1.1 The following table shows the performance compliance report as the consumer satisfaction level on various service parameters.
Basic Service (Wireline) (Service Area UP (E) - Parameter Based Performance Compliance
% Satisfaction with Billing
performance
Name of the Service Providers
Sample Size
% Satisfaction With
Provision of service
Postpaid Prepaid
% Satisfaction with Help Services
% Satisfaction
with Network
performance reliability
and availability
% Satisfaction with Maintain-ability
% Satisfaction with Supple-mentary services
% Satisfaction with overall
services
Benchmark >95% >90% >90% >90% >95% >95% >95% >95%
SERVICE AREA UP (E)
UPE 1176 BHARTI 576 67.7% 63.9% 86.5% 63.8% 71.1% 64.6% 56.5% 65.2%
BSNL 600 68.3% 64.8% 81.2% 69.0% 70.9% 63.9% 65.7% 69.3%
• The table above shows that none of the two service providers were able to meet the benchmark set up by the TRAI.
• However, performance of BSNL was found to be better than Bharti, as it has achieved highest score on 4 out of 7 parameters, excluding the satisfaction on overall services, listed in the above table. On other parameters its score was lower than the Bharti. These three parameters are – Satisfaction with pre paid billing service, satisfaction with network performance and satisfaction with maintainability.
• Bharti has achieved highest score on 3 parameters and on the rest of the 4 parameters its performance was lower than the BSNL.
Therefore, it can be safely concluded that although none of the two operators were able to meet the benchmark on any of the parameters, however, overall the services of BSNL basic Service (wireline) were found to be slightly better than the Bharti.

Assessment of Customer perception of Service and UP (E) SERVICE AREA Implementation and Effectiveness of Telecom Consumers Protection and Redressal of Grievances Regulations
© 441, (Basement), Jangpura, Mathura Road, New Delhi – 110014, India
Email: [email protected], URL: www.consumer-voice
41
4.1.1.2 The following table shows the percentage of consumers satisfied on various service parameters. This has been calculated by taking in to account the total number of “Very satisfied” and “Satisfied” consumers out of the total sample on all the parameters.
Basic Service (Wireline) (Service Area UP (E)) - Parameter Based Performance Compliance
% of Satisfied customers with
Billing performance
Name of the Service
Providers
Sample Size
% of Satisfied
customers With
Provision of service
Postpaid Prepaid
% of Satisfied
customers with Help Services
% of Satisfied
customers with
Network performance
reliability and
availability
% of Satisfied
customers with
Maintain-ability
% of Satisfied
customers with
Supple-mentary services
% of Satisfied
customers with
overall services
SERVICE AREA UP (E)
UPE 1176
BHARTI 576 95.5% 87.9% 87.8% 89.3% 96.7% 87.9% 68.1% 90.5%
BSNL 600 97.8% 89.6% 85.9% 99.6% 98.9% 89.3% 95.2% 99.3%
• The analysis reveal that in terms of satisfied customers, BSNL achieved the highest
score on 6 out of 7 parameters; it has attained highest percentage of satisfied consumers, and in rest of the 1 of the parameter – satisfaction with pre paid billing performance - it has lower percentage of satisfied consumers than Bharti.
• Bharti could achieve highest percentages of satisfied consumers on only parameter and on the rest of the 6 parameters, its percentages were lower than BSNL. The percentage was quite low in the case of performance on supplementary services and help services.
The analysis reveals that in terms of percentage of satisfied consumers, BSNL’s performance was better than the other provider – Bharti. However, the above analysis calculates the percentage of satisfied consumers by taking in to account the consumers who were “very satisfied” and “satisfied” on various parameters. Therefore, it does not show the level of Customer satisfaction.

Assessment of Customer perception of Service and UP (E) SERVICE AREA Implementation and Effectiveness of Telecom Consumers Protection and Redressal of Grievances Regulations
© 441, (Basement), Jangpura, Mathura Road, New Delhi – 110014, India
Email: [email protected], URL: www.consumer-voice
42
4.1.2 PERFORMANCE COMPLIANCE CSS – Cellular Mobile, UP (East) Service Area 4.1.2.1 The following table shows the performance compliance report as the consumer satisfaction level on various service parameters.
Cellular Mobile, Service Area - UP (E) - Parameter Based Performance Compliance
% Satisfaction with Billing Performance Name of the
Service Provider
Sample
Size
% Satisfaction
with Provision of
service
% Satisfaction with Network Performance,
Reliability and Availability
% Satisfaction with
Maintainability
% Satisfactio
n with Supplementary service
% Satisfactio
n with overall
services
% Satisfaction with Help
Service
Postpaid Prepaid
Benchmark >95% >90% >90% >90% >95% >95% >95% >95%
SERVICE AREA – UP (E)
UP(E) 3600 Bharti 600 72.3% 68.3% 71.1% 74.3% 79.0% 77.2% 66.7% 72.5%
Vodafone 600 70.7% 76.7% 66.6% 64.7% 74.0% 73.8% 67.8% 71.4%
Idea Cellular 600 73.5% 82.5% 69.8% 74.4% 80.0% 77.8% 67.3% 71.9% BSNL 600 70.9% 72.5% 68.1% 64.7% 75.3% 74.8% 66.9% 71.6%
Rel Comm 600 75.3% 74.0% 70.5% 68.9% 80.1% 78.6% 66.4% 74.6% Tata
Teleservices 600 74.0% 68.5% 69.8% 69.0% 79.8% 76.1% 65.2% 73.3%
• The table above shows that none of the service providers were able to meet the benchmark on any of the parameter, set up by the TRAI.
• However, performance of Idea Cellular was found to be better than others, as it has achieved highest score on 2 out of 7 parameters, excluding the satisfaction on overall services, listed in the above table. Similarly, it has achieved second highest on 3 out of 7 parameters and third highest on other 2 out of 7 parameters.
• Idea Cellular was followed by Rel Comm as it has also achieved highest score on 2 parameters, but the second highest on 1 parameter. It also attained third and fourth highest on 1 parameter each. However, it also scored second lowest on other 1 parameter.
• Bharti achieved highest score on 1 out of 7 parameters and second and third highest on 1 parameter each, fourth highest on 3 parameters. However, it also achieved lowest score on one of the parameter – post paid billing service.
• Performance of other three providers – Tata Teleservices, BSNL and Vodafone were below the other three providers. Although Vodafone was able to achieve highest secore on one of the parameter, its performance score on other 4 of the 7 parameters were the lowest. Whereas, Tata Teleservices was able to score second highest on only 1 of the parameter and on rest it scored average or below average scores. Similarly performance of BSNL was average on one of the parameters and on rest of the 6 parameters its performance was below average. In fact BSNL achieved lowest score on supplementary services. Therefore, it can be safely concluded that although none of the operators were able to meet the benchmark on any of the parameters, however, overall the services of Idea Cellular mobile were found to be relatively better than the other service providers.

Assessment of Customer perception of Service and UP (E) SERVICE AREA Implementation and Effectiveness of Telecom Consumers Protection and Redressal of Grievances Regulations
© 441, (Basement), Jangpura, Mathura Road, New Delhi – 110014, India
Email: [email protected], URL: www.consumer-voice
43
4.1.2.2 The following table shows the percentage of consumers satisfied on various service parameters. This has been calculated by taking in to account the total number of “Very satisfied” and “Satisfied” consumers out of the total sample on all the parameters.
Cellular Mobile, Service Area - UP (E) - Parameter Based Performance Compliance
% of Satisfied customers with
Billing performance
Name of the Service
Providers
Sample Size
% of Satisfied customer
s With Provision of service
Postpaid Prepaid
% of Satisfie
d customers with
Help Services
% of Satisfied
customers with Network performance reliability and
availability
% of Satisfied
customers with
Maintain-ability
% of Satisfied
customers with
Supple-mentary services
% of Satisfied
customers with overall
services
SERVICE AREA – UP (E)
UP(E) 3600
Bharti 600 99.9% 80.0% 99.1% 89.5% 99.2% 99.8% 92.5% 99.7%
Vodafone 600 97.4% 95.2% 86.1% 84.5% 96.8% 98.0% 94.7% 99.3%
Idea Cellular 600 100.0% 97.6% 97.1% 95.1% 98.6% 98.2% 93.9% 99.2%
BSNL 600 98.8% 96.5% 90.1% 81.3% 95.7% 97.3% 89.8% 99.0%
Rel Comm 600 100.0% 97.2% 93.0% 86.5% 98.3% 97.6% 91.4% 98.3% Tata
Teleservices 600 99.1% 90.5% 96.5% 93.9% 98.5% 98.6% 90.1% 99.5%
• The analysis reveals that in terms of satisfied customers, Idea Cellular had the highest
percentages of satisfied consumers on 3 out of 7 parameters. On other 3 parameters it has achieved second highest percentage and on other 1 parameter it has third highest percentage of satisfied consumers.
• Idea Cellular is followed by Bharti. It has also achieved highest percentage of satisfied consumers on 3 parameters and third highest percentage on other 3 parameter. However on post paid billing service it achieved lowest percentages of satisfied consumers.
• Although Tata Teleservices could not achieve highest percentages on any of the parameter, it could achieve second and third highest percentage of satisfied consumers on each of the 2 parameters. On rest of the 2 parameters, it achieved below average percentages.
• Rel Comm could not achieve highest percentage of satisfied consumers on any of the parameters. However, on 2 of the parameters it had second highest percentage. On rest of the parameters it had below average percentages.
• In the case of other two providers –Vodafone and BSNL – the achievement level, with regard to percentage of satisfied consumers – was relatively low. However, Vodafone was able to achieve highest percentages of satisfied consumers on supplementary services. The performance of BSNL was lowest on 4 of the 7 parameters.
The analysis reveals that in terms of percentage of satisfied consumers, Idea Cellular emerged as the number one service providers, followed by Bharti and Rel Com. However, the above analysis calculates the percentage of satisfied consumers by taking in to account the consumers who were “very satisfied” and “satisfied” on various parameters. Therefore, it does not show the level of customer satisfaction.

Assessment of Customer perception of Service and UP (E) SERVICE AREA Implementation and Effectiveness of Telecom Consumers Protection and Redressal of Grievances Regulations
© 441, (Basement), Jangpura, Mathura Road, New Delhi – 110014, India
Email: [email protected], URL: www.consumer-voice
44
4.1.3: PERFORMANCE COMPLIANCE CSS – Broadband, UP (E)SERVICE AREA 4.1.3.1: The following table shows the performance compliance report as the consumer satisfaction level on various service parameters.
Broadband (SERVICE AREA – UP(E)) - Parameter Based Performance Compliance
% Satisfaction with Billing performance
Name of the
Service Providers
Sample Size
% Satisfaction With
Provision of service
Postpaid Prepaid
% Satisfactio
n with Help
Services
% Satisfaction
with Network
performance reliability
and availability
% Satisfaction with
Maintain-ability
% Satisfaction with Supple-mentary services
% Satisfactio
n with overall
services
Benchmark >90% >90% >90% >90% >85% >85% >85% >85%
SERVICE AREA - UP (E)
UPE 1669 Bharti 590 63.9% 66.5% 64.4% 64.0% 61.1% 68.6% 67.7% 66.2% BSNL 597 69.8% 70.9% 61.4% 66.6% 62.2% 68.4% 58.5% 66.7%
Rel Comm 482 71.7% 69.3% 59.5% 61.9% 59.2% 73.7% 61.5% 63.8%
• The table above shows that none of the service providers were able to meet the benchmark on any of the parameter, set up by the TRAI.
• However, performance of BSNL was found to be better than others, as it has achieved higher score on 4 out of 7 parameters, excluding the satisfaction on overall services, listed in the above table. It has, however, achieved lowest score on only 2 of the parameters – maintainability and supplementary services.
• BSNL is followed by Bharti which attained highest score on 2 of the parameters. Second highest on other 3 parameters but lowest on rest of the 2 parameters – provision of services and post paid billing service.
• Rel comm also achieved highest score on 2 of the parameter and second highest on other two. However, its score on 3 parameters were the lowest..
• Therefore, the analysis reveals that broadband service provided by BSNL in UP (E) Service Area is comparatively better than Bharti and Rel Com.

Assessment of Customer perception of Service and UP (E) SERVICE AREA Implementation and Effectiveness of Telecom Consumers Protection and Redressal of Grievances Regulations
© 441, (Basement), Jangpura, Mathura Road, New Delhi – 110014, India
Email: [email protected], URL: www.consumer-voice
45
4.1.3.2: The following table shows the percentage of consumers satisfied on various service parameters. This has been calculated by taking in to account the total number of “Very satisfied” and “Satisfied” consumers out of the total sample on all the parameters
Broadband (SERVICE AREA – UP (E)) - Parameter Based Performance Compliance
% of atisfied customers with
Billing performance
Name of the
Service Providers
Sample Size
% of Satisfied customer
s With Provision of service
Postpaid
Prepaid
% of Satisfied customer
s with Help
Services
% of Satisfied
customers with
Network performance
reliability and
availability
% of Satisfied customers with Maintain-ability
% of Satisfied customer
s with Supple-mentary services
% of Satisfie
d customers with overall
services
SERVICE AREA - UP (E)
UPE 1669 Bharti 590 85.9% 94.0% 90.0% 87.7% 85.9% 94.1% 95.5% 98.3% BSNL 597 95.2% 98.2% 73.7% 91.9% 88.4% 95.7% 74.5% 98.8%
Rel Comm 482 100.0% 97.5% 78.6% 83.2% 79.5% 88.2% 83.1% 90.0%
• The analysis reveals that in terms of satisfied customers also, the performance of
BSNL was better than Bharti and Rel Comm. BSNL achieved the highest percentage of satisfied consumers on 4 out of 7 parameters and second highest on 1 parameter. However, it achieved lowest percentage of satisfied consumers on 2 of the parameters – prepaid billing service and supplementary services.
• The performance of Bharti and Rel Com were at par with each other but lowe than BSNL.
• Bharti had highest percentage of satisfied consumers on 2 of the parameters, second highest on other two but lowest on other 3 parameters.
• Reliance, on the other hand, attained highest percentage on only 1 parameter but second highest on other four. It achieved lowest score on only 2 of the parameter.
The analysis reveals that in terms of percentage of satisfied consumers, BSNL had the higher percentage of satisfied consumers as compared to Bharti and Rel Comm. Whereas, performance of Bharti and Rel Com were found to be similar. However, the above analysis calculates the percentage of satisfied consumers by taking in to account the consumers who were “very satisfied” and “satisfied” on various parameters. Therefore, it does not show the level of Customer satisfaction.

Assessment of Customer perception of Service and UP (E) SERVICE AREA Implementation and Effectiveness of Telecom Consumers Protection and Redressal of Grievances Regulations
© 441, (Basement), Jangpura, Mathura Road, New Delhi – 110014, India
Email: [email protected], URL: www.consumer-voice
46
4.2 Graphical Presentation

Assessment of Customer perception of Service and UP (E) SERVICE AREA Implementation and Effectiveness of Telecom Consumers Protection and Redressal of Grievances Regulations
© 441, (Basement), Jangpura, Mathura Road, New Delhi – 110014, India
Email: [email protected], URL: www.consumer-voice
47
4.2.1 BASIC SERVICES (WIRE LINE) – UP (E) Service Area 4.2.1.1 SATISFIED WITH PROVISION OF SERVICES Consumer satisfaction level The following graph shows the consumer satisfaction level with the provision of service.
67.7
%
68.3
%
0.0%
10.0%
20.0%
30.0%
40.0%
50.0%
60.0%
70.0%
80.0%
90.0%
100.0
BHARTI BSNL
%
Customers' Satisfaction Level Benchmark
• Audit conducted for 2 operators providing services in UP (E) Service Area.
• None of the operators were found meeting the benchmark of >95%.
• Higher level of satisfaction was found by the consumers of BSNL (68.3%) as compare to Bharti (67.7%).
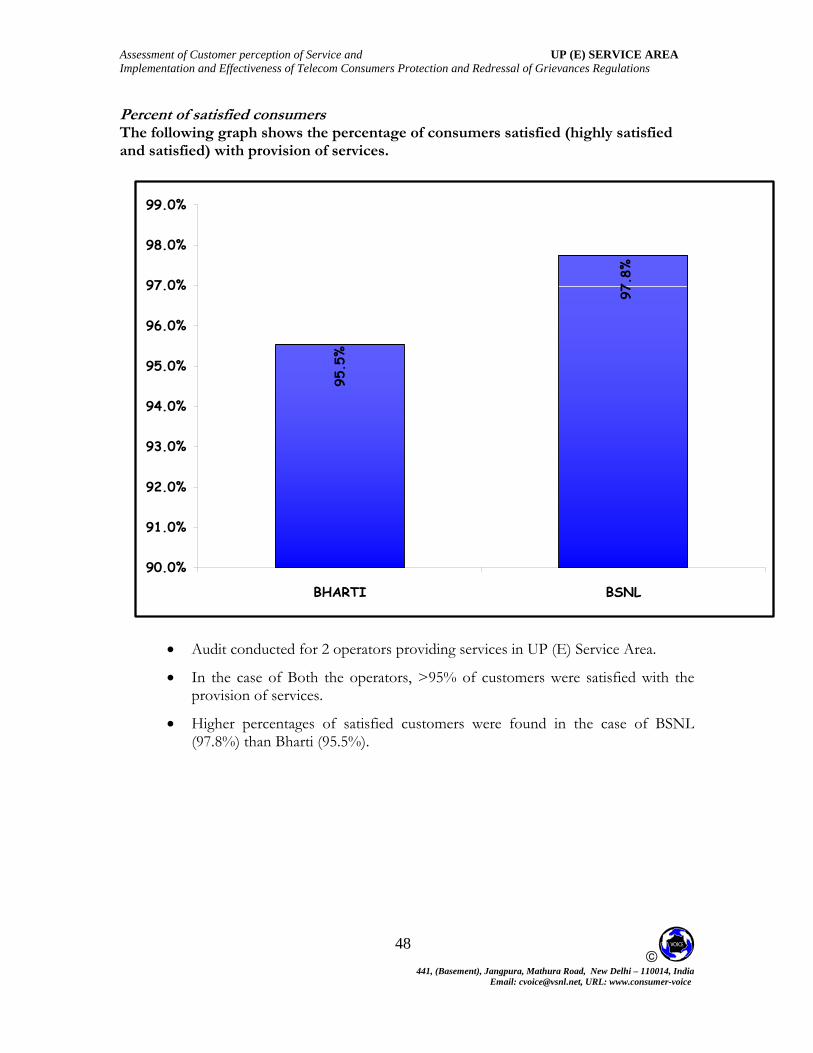
Assessment of Customer perception of Service and UP (E) SERVICE AREA Implementation and Effectiveness of Telecom Consumers Protection and Redressal of Grievances Regulations
© 441, (Basement), Jangpura, Mathura Road, New Delhi – 110014, India
Email: [email protected], URL: www.consumer-voice
48
Percent of satisfied consumers The following graph shows the percentage of consumers satisfied (highly satisfied and satisfied) with provision of services.
95.5
%
97.8
%
90.0%
91.0%
92.0%
93.0%
94.0%
95.0%
96.0%
97.0%
98.0%
99.0%
BHARTI BSNL
• Audit conducted for 2 operators providing services in UP (E) Service Area.
• In the case of Both the operators, >95% of customers were satisfied with the provision of services.
• Higher percentages of satisfied customers were found in the case of BSNL (97.8%) than Bharti (95.5%).

Assessment of Customer perception of Service and UP (E) SERVICE AREA Implementation and Effectiveness of Telecom Consumers Protection and Redressal of Grievances Regulations
© 441, (Basement), Jangpura, Mathura Road, New Delhi – 110014, India
Email: [email protected], URL: www.consumer-voice
49
4.2.1.2 SATISFIED WITH PREPAID BILLING SERVICES Consumer satisfaction level The following graph shows the consumer satisfaction level with the prepaid billing services.
81.2
%
86.5
%
60.0%
75.0%
80.0%
85.0%
90.0%
95.0%
BHARTI BSNL
70.0%
65.0%
Customers' Satisfaction Level Benchmark
• Audit conducted for 2 operators providing services in UP (E) Service Area.
• None of the operators were found meeting the benchmark of >90%.
• Higher level of satisfaction was found by the consumers of Bharti (86.5%) as compare to BSNL (81.2%).

Assessment of Customer perception of Service and UP (E) SERVICE AREA Implementation and Effectiveness of Telecom Consumers Protection and Redressal of Grievances Regulations
© 441, (Basement), Jangpura, Mathura Road, New Delhi – 110014, India
Email: [email protected], URL: www.consumer-voice
50
Percent of satisfied consumers The following graph shows the percentage of prepaid consumers satisfied (highly satisfied and satisfied) with billing services.
85.9
%
87.8
%
75.0%
77.0%
79.0%
81.0%
83.0%
85.0%
87.0%
89.0%
BHARTI BSNL
• rs providing services in UP (E) Service Area.
• In the case of both the operators, >90% of customers were satisfied with the billing service, in the pre paid segment.
• Higher percentages of satisfied customers were found in the case of Bharti (87.8%) than BSNL (85.9%).
Audit conducted for 2 operato

Assessment of Customer perception of Service and UP (E) SERVICE AREA Implementation and Effectiveness of Telecom Consumers Protection and Redressal of Grievances Regulations
© 441, (Basement), Jangpura, Mathura Road, New Delhi – 110014, India
Email: [email protected], URL: www.consumer-voice
51
4.2.1.3 SATISFIED WITH POSTPAID BILLING SERVICES
Consumer satisfaction level The following graph shows the consumer satisfaction level with the post-paid billing services.
64.8
%
63.9
%
0.0%
10.0%
20.0%
30.0%
40.0%
50.0%
60.0%
70.0%
80.0%
90.0%
100.0
BHARTI BSNL
%
Customers' Satisfaction Level Benchmark
• Audit conducted for 2 operators providing services in UP (E) Service Area.
• None of the operators were found meeting the benchmark of >90%.
• Higher level of satisfaction was found by the consumers of BSNL (64.8%) as compare to Bharti (63.9%).

Assessment of Customer perception of Service and UP (E) SERVICE AREA Implementation and Effectiveness of Telecom Consumers Protection and Redressal of Grievances Regulations
© 441, (Basement), Jangpura, Mathura Road, New Delhi – 110014, India
Email: [email protected], URL: www.consumer-voice
52
Percent of satisfied consumers The following graph shows the percentage of postpaid consumers satisfied (highly satisfied and satisfied) with billing services.
87.9
% 89.6
%
77.0%
79.0%
81.0%
83.0%
85.0%
87.0%
89.0%
91.0%
75.0%
BHARTI BSNL
• rs providing services in UP (E) Service Area.
• In the case of both the operators, >90% of customers were not satisfied with the billing service, in the post-paid segment.
• Higher percentages of satisfied customers were found in the case of BSNL (89.6%) than Bharti (87.9%).
Audit conducted for 2 operato

Assessment of Customer perception of Service and UP (E) SERVICE AREA Implementation and Effectiveness of Telecom Consumers Protection and Redressal of Grievances Regulations
© 441, (Basement), Jangpura, Mathura Road, New Delhi – 110014, India
Email: [email protected], URL: www.consumer-voice
53
4.2.1.4 SATISFIED WITH HELP SERVICES
onsuThe fo
C mer satisfaction level
llowing graph shows the consumer satisfaction level with the help service.
69.0
%
Customers' Satisfaction Level Benchma
63.8
%
50.0%
0.0%
10.0%
20.0%
30.0%
40.0%
70.0%
80.0%
90.0%
100.0%
BHARTI BSNL
60.0%
rk
• Audit conducted for 2 operators providing services in UP (E) Service Area.
• None of the operators were found meeting the benchmark of >90%.
• Higher level of satisfaction was found by the consumers of BSNL (69.0%) of Bharti (63.8%).

Assessment of Customer perception of Service and UP (E) SERVICE AREA Implementation and Effectiveness of Telecom Consumers Protection and Redressal of Grievances Regulations
© 441, (Basement), Jangpura, Mathura Road, New Delhi – 110014, India
Email: [email protected], URL: www.consumer-voice
54
Percent of satisfied consumers The following graph shows the percentage of consumers satisfied (highly satisfied and satisfied) with help services.
89.3
%
99.6
%
50.0
55.0%
60.0%
65.0%
70.0%
75.0%
80.0%
85.0%
90.0%
95.0%
100.0%
%
BHARTI BSNL
• rs providing services in UP (E) Service Area.
• In the case of 1 of 2 operators, >90% of customers were satisfied with the help service.
• Higher percentages of satisfied customers were found in the case of BSNL (99.6%) than Bharti (89.3%).
Audit conducted for 2 operato

Assessment of Customer perception of Service and UP (E) SERVICE AREA Implementation and Effectiveness of Telecom Consumers Protection and Redressal of Grievances Regulations
© 441, (Basement), Jangpura, Mathura Road, New Delhi – 110014, India
Email: [email protected], URL: www.consumer-voice
55
4.2.1.5 SATISFIED WITH NETWORK PERFORMANCE Consumer satisfaction level The following graph shows the consumer satisfaction level with network performance.
70.9
%
71.1
%
0.0%
10.0%
Customers' Satisfac on Levelti
20.0%
30.0%
40.0%
50.0%
60.0%
80.0%
90.0
100.0
BHARTI BSNL
%
%
70.0%
Benchmark
• Audit conducted for 2 operators providing services in UP (E) Service Area.
• None of the operators were found meeting the benchmark of >95%.
• Higher level of satisfaction was found by the consumers of BSNL (70.9%) as compare to Bharti (71.1%).
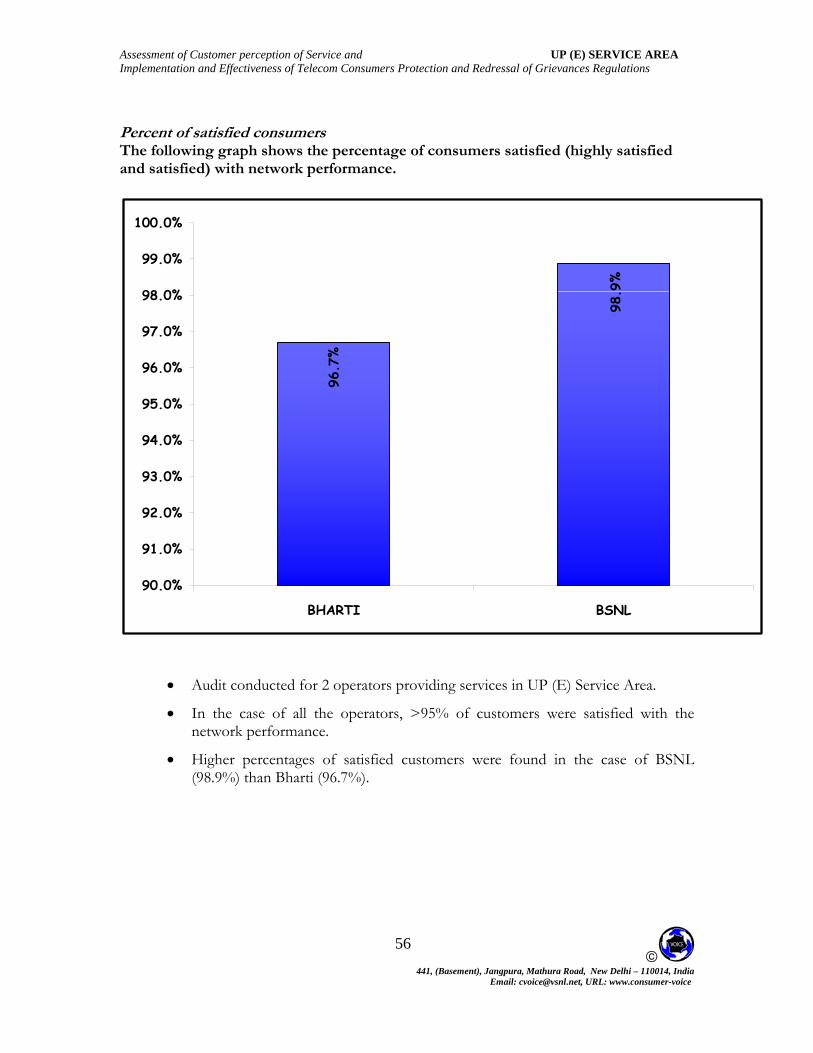
Assessment of Customer perception of Service and UP (E) SERVICE AREA Implementation and Effectiveness of Telecom Consumers Protection and Redressal of Grievances Regulations
© 441, (Basement), Jangpura, Mathura Road, New Delhi – 110014, India
Email: [email protected], URL: www.consumer-voice
56
Percent of satisfied consumers The following graph shows the percentage of consumers satisfied (highly satisfied and satisfied) with network performance.
98.9
%
96.7
%
90.0
91.0%
92.0%
93.0%
94.0%
95.0%
96.0%
97.0%
98.0%
99.0%
100.0%
%
BHARTI BSNL
• rs providing services in UP (E) Service Area.
• In the case of all the operators, >95% of customers were satisfied with the network performance.
• Higher percentages of satisfied customers were found in the case of BSNL (98.9%) than Bharti (96.7%).
Audit conducted for 2 operato

Assessment of Customer perception of Service and UP (E) SERVICE AREA Implementation and Effectiveness of Telecom Consumers Protection and Redressal of Grievances Regulations
© 441, (Basement), Jangpura, Mathura Road, New Delhi – 110014, India
Email: [email protected], URL: www.consumer-voice
57
4.2.1.6 SATISFIED WITH MAINTAINABILITY
Consumer satisfaction level The following graph shows the consumer satisfaction level with maintainability
64.6
%
63.9
%0.0%
10.0%
20.0%
30.0%
40.0%
50.0%
60.0%
70.0%
80.0%
90.0
100.0
BHARTI BSNL
%
%
Customers' Satisfaction Level Benchmark
• Audit conducted for 2 operators providing services in UP (E)Service Area.
• None of the operators were found meeting the benchmark of >95%.
• Higher level of satisfaction was found by the consumers of Bharti (64.6%) as compare to BSNL (63.9%).

Assessment of Customer perception of Service and UP (E) SERVICE AREA Implementation and Effectiveness of Telecom Consumers Protection and Redressal of Grievances Regulations
© 441, (Basement), Jangpura, Mathura Road, New Delhi – 110014, India
Email: [email protected], URL: www.consumer-voice
58
Percent of satisfied consumers The following graph shows the percentage of consumers satisfied (highly satisfied and satisfied) with maintainability.
87.9
% 89.3
%
75.0%
77.0%
79.0%
81.0%
83.0%
85.0%
87.0%
89.0%
91.0%
BHARTI BSNL
• rs providing services in UP (E) Service Area.
• In the case of both the operators, >95% of customers were satisfied with the maintainability.
• Higher percentages of satisfied customers were found in the case of BSNL (89.3%) than Bharti (87.9%).
Audit conducted for 2 operato

Assessment of Customer perception of Service and UP (E) SERVICE AREA Implementation and Effectiveness of Telecom Consumers Protection and Redressal of Grievances Regulations
© 441, (Basement), Jangpura, Mathura Road, New Delhi – 110014, India
Email: [email protected], URL: www.consumer-voice
59
4.2.1.7 SATISFIED WITH SUPPLEMENTRY SERVICES Consumer satisfaction level The following graph shows the consumer satisfaction level with Supplementary services.
65.7
%
56.5
%
0.0%
10.0%
20.0%
30.0%
40.0%
50.0%
60.0%
70.0%
80.0%
90.0%
100.0%
BHARTI BSNL
Customers' Satisfaction Level Benchmark
• Audit conducted for 2 operators providing services in UP (E) Service Area.
• None of the operators were found meeting the benchmark of >95%.
• Higher level of satisfaction was found by the consumers of BSNL (65.7%) as compared to Bharti (56.5%)

Assessment of Customer perception of Service and UP (E) SERVICE AREA Implementation and Effectiveness of Telecom Consumers Protection and Redressal of Grievances Regulations
© 441, (Basement), Jangpura, Mathura Road, New Delhi – 110014, India
Email: [email protected], URL: www.consumer-voice
60
Percent of satisfied consumers The following graph shows the percentage of consumers satisfied (highly satisfied and satisfied) with supplementary services.
95.2
%
68.1
%
0.0%
10.0%
20.0%
30.0%
40.0%
50.0%
60.0%
70.0%
80.0%
90.0%
100.0%
BHARTI BSNL
• Audit conducted for 2 operators providing services in Bharti (56.5%) Service Area.
• In the case 1 of 2 operators, >95% of customers were satisfied with the Supplementary services.
• Higher percentages of satisfied customers were found in the case of BSNL (95.2%) than Bharti (68.1%).
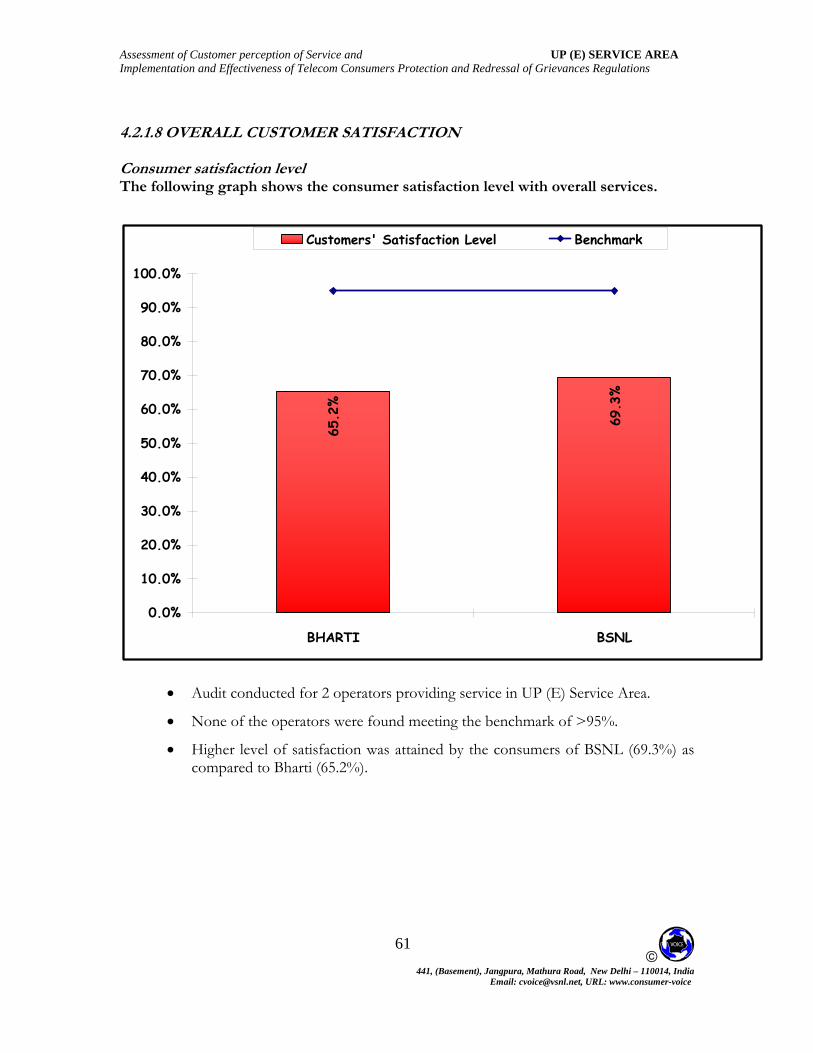
Assessment of Customer perception of Service and UP (E) SERVICE AREA Implementation and Effectiveness of Telecom Consumers Protection and Redressal of Grievances Regulations
© 441, (Basement), Jangpura, Mathura Road, New Delhi – 110014, India
Email: [email protected], URL: www.consumer-voice
61
4.2.1.8 OVERALL CUSTOMER SATISFACTION Consumer satisfaction level The following graph shows the consumer satisfaction level with overall services.
69.3
%
65.2
%
0.0%
10.0%
20.0%
30.0%
40.0%
50.0%
60.0%
70.0%
80.0%
90.0
100.0
BHARTI BSNL
%
%
Customers' Satisfaction Level Benchmark
• Audit conducted for 2 operators providing service in UP (E) Service Area.
• None of the operators were found meeting the benchmark of >95%.
• Higher level of satisfaction was attained by the consumers of BSNL (69.3%) as compared to Bharti (65.2%).

Assessment of Customer perception of Service and UP (E) SERVICE AREA Implementation and Effectiveness of Telecom Consumers Protection and Redressal of Grievances Regulations
© 441, (Basement), Jangpura, Mathura Road, New Delhi – 110014, India
Email: [email protected], URL: www.consumer-voice
62
Percent of satisfied consumers The following graph shows the percentage of consumers satisfied (highly satisfied and satisfied) with overall services.
99.3
%
90.5
%
75.0
80.0%
85.0%
90.0%
95.0%
100.0%
105.0%
%
BHARTI BSNL
• rs providing services in UP (E) Service Area.
• In the case 1 of 2 operators, >95% of customers were satisfied with the overall services.
• Higher percentages of satisfied customers were found in the case of BSNL (99.3%) than Bharti (90.5%).
Audit conducted for 2 operato

Assessment of Customer perception of Service and UP (E) SERVICE AREA Implementation and Effectiveness of Telecom Consumers Protection and Redressal of Grievances Regulations
© 441, (Basement), Jangpura, Mathura Road, New Delhi – 110014, India
Email: [email protected], URL: www.consumer-voice
63
4.2.2 CELLULAR SERVICES – UP (E) SERVICE AREA
4.2.2.1 SATISFIED WITH PROVISION OF SERVICES The following graph shows the consumers’ satisfaction level with provision of services.
74.
Consumers' satisfaction level with provision of services Be
0%.3%
%
73.5
%
70.7
%
72.3
%
%
75
70.9
0.0%
10.0%
20.0%
30.0%
40.0%
50.0%
60.0%
70.0
80.0
90.0%
100.0
Bharti Vodafone Idea Cellular BSNL Rel Comm TataTeleservices
%
%
nchmark
• Audit conducted for 6 operators providing services in UP(E) Service Area. • None of the operators were found meeting the benchmark of >95%. • Customer satisfaction level with the provision of services attained by all the 6
operators ranged from 70.7% to 75.3%. • Highest level of satisfaction was found by the consumers of Rel Comm (75.3%),
followed by Tata Teleservices (74.0%),Idea Cellular (73.5%) and Bharti (72.3%). • The lowest level of satisfaction was attained by the consumers of Vodafone
(70.7%) followed by BSNL (70.9%).

Assessment of Customer perception of Service and UP (E) SERVICE AREA Implementation and Effectiveness of Telecom Consumers Protection and Redressal of Grievances Regulations
© 441, (Basement), Jangpura, Mathura Road, New Delhi – 110014, India
Email: [email protected], URL: www.consumer-voice
64
Percent of Satisfied Customers The following graph shows the percentage of consumers satisfied (highly satisfied and satisfied) with provision of services.
99.1
%
100.
0%
98.8
%
100.
0%
97.4
%
99.9
%
96.0%
96.5%
97.0%
97.5%
98.0%
98.5%
99.0%
99.5%
100.0%
100.5%
Bharti Vodafone Idea Cellular BSNL Rel Comm TataTeleservices
• Audit conducted for 6 operators providing services in UP(E) Service Area. • In the case of all operators, more than 95% of consumers were satisfied with
provision of services. • Highest percentage of satisfied customers was found in the case of Rel Comm &
Idea Cellular (100.0% each), closely followed by Bharti (99.9%) and Tata Teleservices (99.1%).
• Whereas the lowest percentages of satisfied customers were in the case of Vodafone (97.4%) followed by BSNL (98.8%).

Assessment of Customer perception of Service and UP (E) SERVICE AREA Implementation and Effectiveness of Telecom Consumers Protection and Redressal of Grievances Regulations
© 441, (Basement), Jangpura, Mathura Road, New Delhi – 110014, India
Email: [email protected], URL: www.consumer-voice
65
4.2.2.2 SATISFIED WITH PREPAID BILLING SERVICES Consumer satisfaction level The following graph shows the prepaid consumers’ satisfaction level with the prepaid billing services.
71.1
%
.8% % .5%
66.6
%
69 68. 70 69%
1 .8%
0.0%
10.0%
20.0%
30.0%
40.0%
50.0%
60.0
70.0%
80.0%
90.0
100.0
Bharti Vodafone Idea Cellular BSNL Rel Comm TataTeleservices
% Consumers' satisfaction level with billing services - Prepaid
%
Benchmark
• Audit conducted for 6 operators providing services in UP (E) Service Area. • None of the operators were found meeting the benchmark of >90%. • For Customer satisfaction level with billing service, in the pre-paid segment,
achievement level of all the 6 operators ranged from 66.6% to 71.1% .
• Highest level of satisfaction was found by the consumers of Bharti (71.1%) followed by Rel Comm (70.5%), Idea cellular & Tata Teleservices ( 69.8% each).
• The lowest level of satisfaction was attained by the consumers of Vodafone (66.6%) followed by BSNL (68.1%).

Assessment of Customer perception of Service and UP (E) SERVICE AREA Implementation and Effectiveness of Telecom Consumers Protection and Redressal of Grievances Regulations
© 441, (Basement), Jangpura, Mathura Road, New Delhi – 110014, India
Email: [email protected], URL: www.consumer-voice
66
Percent of satisfied consumers The following graph shows the percentage of prepaid consumers satisfied (highly satisfied and satisfied) with billing services.
96.5
%
93.0
%
90.1
%
97.1
%
86.1
%
99.1
%
75.0%
80.0%
85.0%
90.0%
95.0%
100.0%
105.0%
Bharti Vodafone Idea Cellular BSNL Rel Comm TataTeleservices
• Audit conducted for 6 operators providing services in UP (E) Service Area. • In the case of 5 operators >90% of prepaid subscribers were satisfied with billing
services. • Highest percentage of satisfied customers were found in the case of Bharti
(99.1%) followed by Idea Cellular (97.1%) and Tata Teleservices (96.5%).
• Whereas, the lowest percentage of satisfied customers were in the case of Vodafone (86.1%) followed by BSNL (90.1%) and Rel Comm (93.0%).

Assessment of Customer perception of Service and UP (E) SERVICE AREA Implementation and Effectiveness of Telecom Consumers Protection and Redressal of Grievances Regulations
© 441, (Basement), Jangpura, Mathura Road, New Delhi – 110014, India
Email: [email protected], URL: www.consumer-voice
67
4.2.2.3 SATISFIED WITH POSTPAID BILLING SERVICES Consumer satisfaction level The following graph shows the postpaid consumers’ satisfaction level with billing services.
68.
68.3%
5%
0.0%
10.0%
40.0%
50.0%
60.0
70.0%
80.0%
90.0
100.0
Bharti Vodafone Idea Cellular BSNL Rel Comm TataTeleservices
% Consumers' satisfaction level with billing services - Postpaid Benc
%
74.0
%
72.5
%82.5
%
76.7
%
%
30.0%
20.0%
hmark
• Audit conducted for 6 operators providing services in UP(E) Service Area. • None of the operators were found meeting the benchmark of >90%. • For customer satisfaction level with billing service, in the postpaid segment,
achievement level of all the 6 operators ranged from 68.3% to 82.5%.
• Highest level of satisfaction was found by the consumers of Idea Cellular (82.5%) followed by Vodafone (76.7%), Rel Comm (74.0%) and BSNL (72.5%).
• The lowest level of satisfaction was attained by the consumers of Bharti (68.3%) closely followed by Tata Teleservices (68.5%).

Assessment of Customer perception of Service and UP (E) SERVICE AREA Implementation and Effectiveness of Telecom Consumers Protection and Redressal of Grievances Regulations
© 441, (Basement), Jangpura, Mathura Road, New Delhi – 110014, India
Email: [email protected], URL: www.consumer-voice
68
Percent of satisfied consumers The following graph shows the percentage of postpaid consumers satisfied (highly satisfied and satisfied) with billing services.
90.5
%97.2
%
96.5
%
97.6
%
95.2
%
80.0
%
0.0%
20.0%
40.0%
60.0%
80.0%
100.0%
120.0%
Bharti Vodafone Idea Cellular BSNL Rel Comm TatarvicesTelese
• • se of 5 operators >90% of postpaid subscribers were satisfied with
), BSNL (96.5%) and Vodafone (95.2%).
• Whereas, the lowest percentage of satisfied customers were in the case of Bharti (80.0%) followed by Tata Teleservices (90.5%).
Audit conducted for 6 operators providing service in UP(E) Service Area. In the cabilling services.
• Highest percentage of satisfied customers were found in the case Idea cellular (97.6%) closely followed by Rel Comm (97.2%
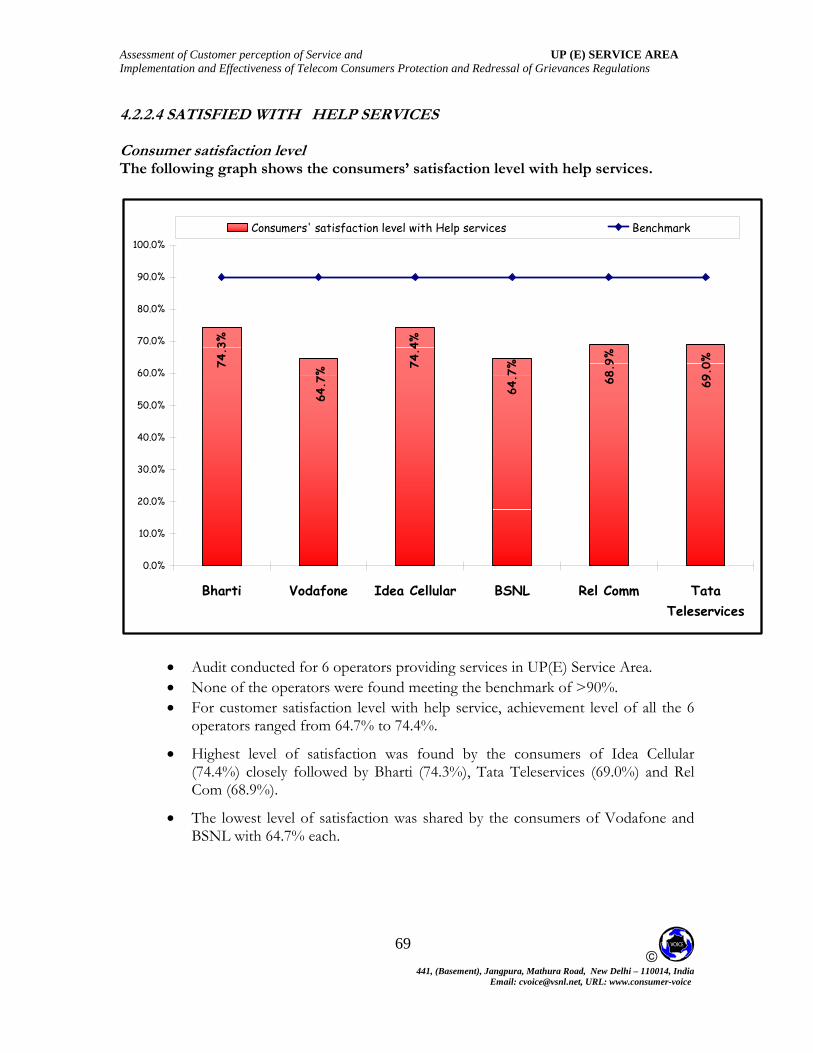
Assessment of Customer perception of Service and UP (E) SERVICE AREA Implementation and Effectiveness of Telecom Consumers Protection and Redressal of Grievances Regulations
© 441, (Basement), Jangpura, Mathura Road, New Delhi – 110014, India
Email: [email protected], URL: www.consumer-voice
69
4.2.2.4 SATISFIED WITH HELP SERVICES Consumer satisfaction level The following graph shows the consumers’ satisfaction level with help services.
69.0
%
68.9
%.4%
74.3
%
6464.7
% .7%74
0.0%
10.0%
20.0%
30.0%
40.0%
50.0%
60.0%
70.0%
80.0%
90.0%
100.0%
Bharti Vodafone Idea Cellular BSNL Rel Comm TataTeleservices
Consumers' satisfaction level with Help services Benchmark
• Audit conducted for 6 operators providing services in UP(E) Service Area. • None of the operators were found meeting the benchmark of >90%. • For customer satisfaction level with help service, achievement level of all the 6
operators ranged from 64.7% to 74.4%.
• Highest level of satisfaction was found by the consumers of Idea Cellular (74.4%) closely followed by Bharti (74.3%), Tata Teleservices (69.0%) and Rel Com (68.9%).
• The lowest level of satisfaction was shared by the consumers of Vodafone and BSNL with 64.7% each.

Assessment of Customer perception of Service and UP (E) SERVICE AREA Implementation and Effectiveness of Telecom Consumers Protection and Redressal of Grievances Regulations
© 441, (Basement), Jangpura, Mathura Road, New Delhi – 110014, India
Email: [email protected], URL: www.consumer-voice
70
Percent of satisfied consumers The following graph shows the percentage of consumers satisfied (highly satisfied and satisfied) with help services.
93.9
%
86.5
%
81.3
%
95.1
%
84.5
%
89.5
%
70.0%
75.0%
80.0%
85.0%
90.0%
95.0%
100.0%
Bharti Vodafone Idea Cellular BSNL Rel Comm TataTeleservices
• Audit conducted for 6 operators providing services in UP(E) Service Area. • In the case of 2 operators >90% of subscribers were satisfied with help services • Highest percentage of satisfied customers were found in the case of Idea Cellular
(95.1%) followed by Tata Teleservices (93.9%) and Bharti (89.5%).
• Whereas, the lowest percentage of satisfied customers were in the case of BSNL (81.3%) followed by Vodafone (84.5%) and Rel Comm (86.5%).

Assessment of Customer perception of Service and UP (E) SERVICE AREA Implementation and Effectiveness of Telecom Consumers Protection and Redressal of Grievances Regulations
© 441, (Basement), Jangpura, Mathura Road, New Delhi – 110014, India
Email: [email protected], URL: www.consumer-voice
71
4.2.2.5 SATISFIED WITH NETWORK PERFORMANCE Consumer satisfaction level The following graph shows the consumers’ satisfaction level with network performance.
79.0
74.0
% 80.0
75.3
%
80.1
%
79.8
%% %
0.0%
10.0%
20.0%
30.0%
40.0%
50.0%
60.0%
70.0%
80.0%
90.0%
100.0%
Bharti Vodafone Idea Cellular BSNL Rel Comm TataTeleservices
Consumers' satisfaction level w th Network performancei Benchmark
• Audit conducted for 6 operators providing services in UP(E) Service Area. • None of the operators were found meeting the benchmark of >95%. • For customer satisfaction level with network performance, achievement level of
all the 6 operators ranged from 74.0% to 80.1%.
• Highest level of satisfaction was attained by the consumers of Rel Comm (80.1%) closely followed by Idea Cellular (80.0%),Tata Teleservices (79.8%) and Bharti (79.0%).
• The lowest level of satisfaction was attained by the consumers of Vodafone (74.0%) followed by BSNL (75.3%).

Assessment of Customer perception of Service and UP (E) SERVICE AREA Implementation and Effectiveness of Telecom Consumers Protection and Redressal of Grievances Regulations
© 441, (Basement), Jangpura, Mathura Road, New Delhi – 110014, India
Email: [email protected], URL: www.consumer-voice
72
Percent of satisfied consumers The following graph shows the percentage of consumers satisfied (highly satisfied and satisfied) with network performance.
98.5
%
98.3
%
95.7
%
98.6
%
96.8
%
99.2
%
93.0%
94.0%
95.0%
96.0%
97.0%
98.0%
99.0%
100.0%
Bharti Vodafone Idea Cellular BSNL Rel Comm TataTeleservices
• Audit conducted for 6 operators providing service in UP(E) Service Area. • In the case of all operators >95% of subscribers were satisfied with network
performance • Highest percentage of satisfied customers were found in the case of Bharti (99.2%)
followed by Idea cellular (98.6%) Tata teleservices (98.5%) and Rel Comm (98.3%).
• Whereas, the lowest percentage of satisfied customers were in the case of BSNL (95.7%) followed by Vodafone (96.8%).

Assessment of Customer perception of Service and UP (E) SERVICE AREA Implementation and Effectiveness of Telecom Consumers Protection and Redressal of Grievances Regulations
© 441, (Basement), Jangpura, Mathura Road, New Delhi – 110014, India
Email: [email protected], URL: www.consumer-voice
73
4.2.2.6 SATISFIED WITH MAINTAINABILITY Consumer satisfaction level The following graph shows the consumers’ satisfaction level with Maintainability.
76.1
%
78.6
%
74.8
%
77.8
%
73.8
%
77.2
%
0.0%
0.0%
10.0%
20.0%
30.0%
40.0%
50.
6
7
8
9
0
Bharti Vodafone Idea Cellular BSNL Rel Comm TataTeleservices
1 0.0%Consumers' satisfaction level with Maintainability
0.0%
0.0%
0%
0.0%
Benchmark
• Audit conducted for 6 operators providing service in UP(E) Service Area. • None of the operators were found meeting the benchmark of >95%. • For customer satisfaction level with maintainability, achievement level of all the 6
operators ranged from 73.8% to 78.6%.
• Highest level of satisfaction was found by the consumers of Rel Comm (78.6%) followed by Idea Cellular (77.8%) Bharti (77.2%) and Tata Teleservices (76.1%).
• The lowest level of satisfaction was attained by the consumers of Vodafone (73.8%) followed by BSNL (74.8%).

Assessment of Customer perception of Service and UP (E) SERVICE AREA Implementation and Effectiveness of Telecom Consumers Protection and Redressal of Grievances Regulations
© 441, (Basement), Jangpura, Mathura Road, New Delhi – 110014, India
Email: [email protected], URL: www.consumer-voice
74
Percent of satisfied consumers The following graph shows the percentage of consumers satisfied (highly satisfied and satisfied) with maintainability.
98.6
%
97.6
%
97.3
%
98.2
%
98.0
%
99.8
%
90.0%
92.0%
94.0%
96.0%
98.0%
100.0%
102.0%
Bharti Vodafone Idea Cellular BSNL Rel Comm TataTeleservices
• Audit conducted for 6 operators providing service in UP(E) Service Area. • In the case of all operator >95% of subscribers were satisfied with maintainability. • Highest percentage of satisfied customers were found in the case of Bharti (99.8%)
followed by Tata Teleservices (98.6%), Idea Cellular (98.2%) and Vodafone (98.0%).
• Whereas, the lowest percentage of satisfied customers were found in the case of BSNL (97.3%) followed by Rel Comm (97.6%).

Assessment of Customer perception of Service and UP (E) SERVICE AREA Implementation and Effectiveness of Telecom Consumers Protection and Redressal of Grievances Regulations
© 441, (Basement), Jangpura, Mathura Road, New Delhi – 110014, India
Email: [email protected], URL: www.consumer-voice
75
4.2.2.7 SATISFIED WITH SUPPLEMENTRY SERVICES Consumer satisfaction level The following graph shows the consumers’ satisfaction level with supplementary services.
65.2
66.4
66.
67.
66.7 %93
0.0%
10.0%
20.0%
30.0%
40.0%
50.0%
60.0%
70.0%
80.0%
90.0%
100.0%
Bharti Vodafone Idea Cellular BSNL Rel Comm TataTeleservices%%%
67.8
%%
Consumers' satisfaction level with Supplementary services Benchmark
• Audit conducted for 6 operators providing service in UP(E) Service Area. • None of the operators were found meeting the benchmark of >95%. • For customer satisfaction level with supplementary service, achievement level of
all the 6 operators ranged from 66.4% to 67.8%.
• Highest level of satisfaction was found by the consumers of Vodafone (67.8%) closely followed by Idea cellular (67.3%),BSNL (66.9%) and Bharti (66.7%).
• The lowest level of satisfaction was attained by the consumers of Tata Teleservices (65.2%) followed by Rel Comm (66.4%).

Assessment of Customer perception of Service and UP (E) SERVICE AREA Implementation and Effectiveness of Telecom Consumers Protection and Redressal of Grievances Regulations
© 441, (Basement), Jangpura, Mathura Road, New Delhi – 110014, India
Email: [email protected], URL: www.consumer-voice
76
• Percent of satisfied consumers
The following graph shows the percentage of consumers satisfied (highly satisfied and satisfied) with supplementary services.
90.1
%
91.4
%
89.8
%
93.9
%94.7
%
92.5
%
87.0%
88.0%
89.0%
90.0%
91.0%
92.0%
93.0%
94.0%
95.0%
96.0%
Bharti Vodafone Idea Cellular BSNL Rel Comm TataTeleservices
• Audit conducted for 6 operators providing service in UP (E) Service Area. • In none of the operator >95% of subscribers were satisfied with supplementary
services. • Highest percentage of satisfied customers were found in the case of Vodafone
(94.7%) followed by Idea Cellular (93.9%), Bharti (92.5%) and Rel Comm (91.4%).
• Whereas, the lowest percentages of satisfied customers were found in the case of BSNL (89.8%) followed by Tata Teleservices (90.1%).
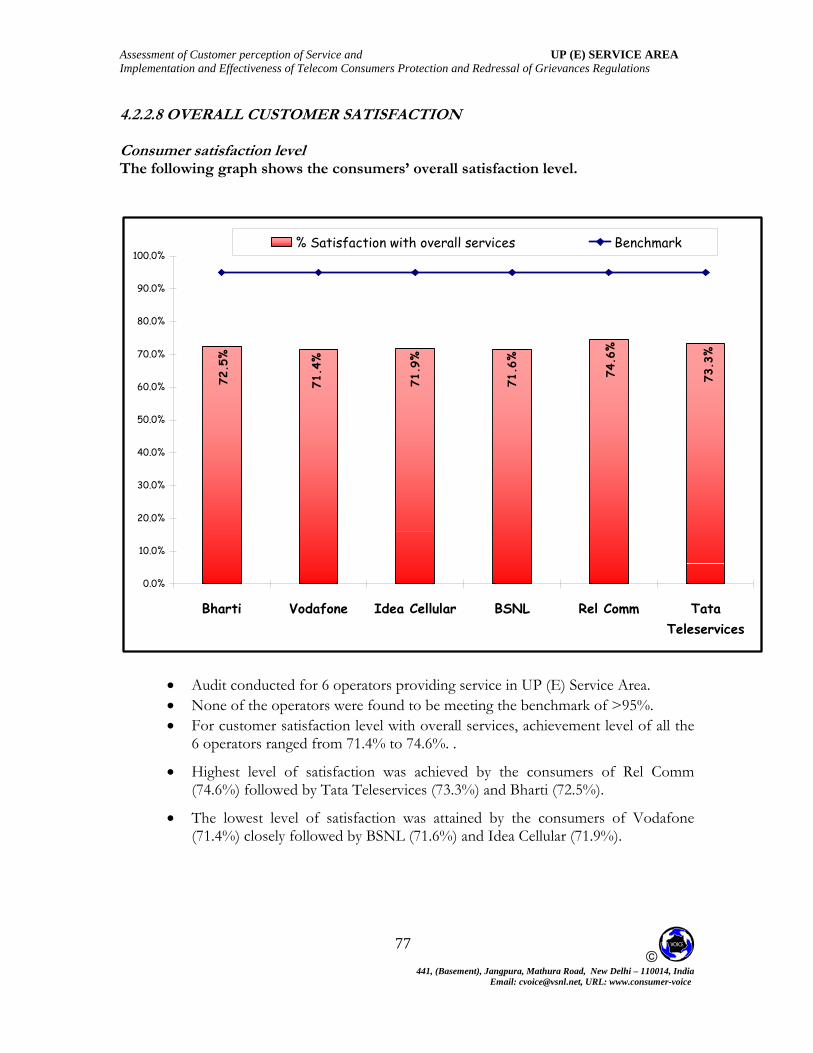
Assessment of Customer perception of Service and UP (E) SERVICE AREA Implementation and Effectiveness of Telecom Consumers Protection and Redressal of Grievances Regulations
© 441, (Basement), Jangpura, Mathura Road, New Delhi – 110014, India
Email: [email protected], URL: www.consumer-voice
77
4.2.2.8 OVERALL CUSTOMER SATISFACTION Consumer satisfaction level The following graph shows the consumers’ overall satisfaction level.
73.3
%
74.6
%
.6%
.9%
.4%
72.5
%
7171 71
0.0%
10.0%
20.0%
30.0%
40.0%
50.0%
60.0%
70.0%
80.0%
90.0%
100.0%
Bharti Vodafone Idea Cellular BSNL Rel Comm TataTeleservices
% Satisfaction with overall services Benchmark
• Audit conducted for 6 operators providing service in UP (E) Service Area. • None of the operators were found to be meeting the benchmark of >95%. • For customer satisfaction level with overall services, achievement level of all the
6 operators ranged from 71.4% to 74.6%. .
• Highest level of satisfaction was achieved by the consumers of Rel Comm (74.6%) followed by Tata Teleservices (73.3%) and Bharti (72.5%).
• The lowest level of satisfaction was attained by the consumers of Vodafone (71.4%) closely followed by BSNL (71.6%) and Idea Cellular (71.9%).

Assessment of Customer perception of Service and UP (E) SERVICE AREA Implementation and Effectiveness of Telecom Consumers Protection and Redressal of Grievances Regulations
© 441, (Basement), Jangpura, Mathura Road, New Delhi – 110014, India
Email: [email protected], URL: www.consumer-voice
78
Percent of satisfied consumers The following graph shows the percentage of overall satisfied (highly satisfied and satisfied) consumers.
99.5
%
98.3
%
99.0
%
99.2
%
99.3
%99.7
%
95.0%
95.5%
96.0%
96.5%
97.0%
97.5%
98.0%
98.5%
99.0%
99.5%
100.0%
Bharti Vodafone Idea Cellular BSNL Rel Comm TataTeleservices
• Audit conducted for 6 operators providing service in UP(E) Service Area. • In case of all the operators >95% of subscribers were overall satisfied with
services. • Highest percentage of satisfied customers were found in the case of Bharti
(99.7%) followed by Tata Teleservices (99.5%), Vodafone (99.3%) and Idea Cellular (99.2%).
• Whereas, the lowest percentage of satisfied customers were found in the case of Rel Comm (98.3%) followed by BSNL (99.0%).

Assessment of Customer perception of Service and UP (E) SERVICE AREA Implementation and Effectiveness of Telecom Consumers Protection and Redressal of Grievances Regulations
© 441, (Basement), Jangpura, Mathura Road, New Delhi – 110014, India
Email: [email protected], URL: www.consumer-voice
79
4.2.3 Broadband services – UP (E) SERVICE AREA 4.2.3.1 SATISFIED WITH PROVISION OF SERVICES Consumer Satisfaction level The following graph shows the consumer satisfaction level with the provision of services.
71.7
69.8
9%%
%%
63.
0.0%
10.0%
20.0%
30.0
40.0%
50.0
60.0
70.0%
80.0%
90.0
100.0
Bharti BSNL Rel Comm
%
%
%
%
Consumer satisfaction level Benchmark
• Audit conducted for 3 operators providing services in UP (E) Service Area. • None of the operators were found meeting the benchmark of >90%. • For customer satisfaction level with the provision of services attained by all the 3
operators ranged from 63.9% to 71.7%
• Highest level of satisfaction was found by the consumers of Rel Comm (71.7%), followed by BSNL (69.8%).
• The lowest level of satisfaction was attained by the consumers of Bharti (63.9%)

Assessment of Customer perception of Service and UP (E) SERVICE AREA Implementation and Effectiveness of Telecom Consumers Protection and Redressal of Grievances Regulations
© 441, (Basement), Jangpura, Mathura Road, New Delhi – 110014, India
Email: [email protected], URL: www.consumer-voice
80
Percent of satisfied consumers The following graph shows the percentage of consumers satisfied (highly satisfied and satisfied) with provision of services.
100.
0%
95.2
%
85.9
%
50.0
55.0%
60.0%
65.0%
70.0%
75.0%
80.0%
85.0%
90.0%
95.0%
100.0%
%
Bharti BSNL Rel Comm
•
Highest percentage of satisfied customers were found in the case of Rel comm. (100.0%) followed by BSNL (95.2%).
Whereas, the lowest percentage of satisfied customers were found in the case of Bharti (85.9%).
Audit conducted for 3 operators providing services in UP (E) Service Area. • In the case of 2 operators >90% of consumers were satisfied with provision of
services. •
•

Assessment of Customer perception of Service and UP (E) SERVICE AREA Implementation and Effectiveness of Telecom Consumers Protection and Redressal of Grievances Regulations
© 441, (Basement), Jangpura, Mathura Road, New Delhi – 110014, India
Email: [email protected], URL: www.consumer-voice
81
TISFIED WITH PREPAID BILLING SERVICES
Consumer Satisfaction level he following graph shows the consumer satisfaction level with the prepaid billing
serv e
4.2.3.2 SA
Tic s.
59.5
%
61.4
%
Consumer satisfaction level Benchmark
64.4
%
0.0%
10.0%
20.0%
30.0%
50.0%
60.0%
70.0%
8 %
90.0%
100.0%
Bharti BSNL Rel Comm
0.0
40.0%
• Audit conducted for 3operators providing services in UP (E) Service Area. • None of the operators were found meeting the benchmark of >90%. • For customer satisfaction level with billing service, in the pre-paid segment,
achievement level of all the 3 operators ranged from 59.5% to 64.4%.
• Highest level of satisfaction was found by the consumers of Bharti (64.4%) followed by BSNL (61.4%).
• The lowest level of satisfaction was attained by the consumers of Rel Comm (59.5%).

Assessment of Customer perception of Service and UP (E) SERVICE AREA Implementation and Effectiveness of Telecom Consumers Protection and Redressal of Grievances Regulations
© 441, (Basement), Jangpura, Mathura Road, New Delhi – 110014, India
Email: [email protected], URL: www.consumer-voice
82
Percent of satisfied consumers The following graph shows the percentage of prepaid consumers satisfied (highly satisfied and satisfied) with billing services.
78.6
%
73.7
%
90.0
%
0. %0
10.0%
20.0%
30.0%
40.0%
50.0%
60.0%
70.0%
80.0%
90.0%
100.0%
Bharti BSNL Rel Comm
% of satisfied consumers with Billing Prepaid
•
• Highest percentages of satisfied customers were found in the case of Bharti (90.0%) followed by Rel Comm (78.6%).
• Whereas, the lowest percentage of satisfied customers were found in the case of BSNL (73.7%).
Audit conducted for 3 operators providing services in UP (E) Service Area. • In the case of 1 operator, 90% of prepaid subscribers were satisfied with billing
services.

Assessment of Customer perception of Service and UP (E) SERVICE AREA Implementation and Effectiveness of Telecom Consumers Protection and Redressal of Grievances Regulations
© 441, (Basement), Jangpura, Mathura Road, New Delhi – 110014, India
Email: [email protected], URL: www.consumer-voice
83
POSTPAID BILLING SERVICES
Th billing ser e
4.2.3.3 SATISFIED WITH
Consumer Satisfaction level e following graph shows the consumer satisfaction level with the postpaidvic s.
69.3
%
70.9
%
Consumer satisfaction level
66.5
%
0.0%
10.0%
20.0%
30.0%
50.0%
60.0%
70.0%
80.0%
0
1
Bharti BSNL Rel Comm
00.0%
90. %
40.0%
Benchmark
• Audit conducted for 3 operators providing services in UP (E) Service Area. • None of the operators were found meeting the benchmark of >90%. • For customer satisfaction level with billing service, in the postpaid segment,
achievement level of all the 3 operators ranged from 66.5% to 70.9%.
• Highest level of satisfaction was found by the consumers of BSNL (70.9%) followed by Rel Comm (69.3%).
• The lowest level of satisfaction was attained by the consumers of Bharti (66.5%).

Assessment of Customer perception of Service and UP (E) SERVICE AREA Implementation and Effectiveness of Telecom Consumers Protection and Redressal of Grievances Regulations
© 441, (Basement), Jangpura, Mathura Road, New Delhi – 110014, India
Email: [email protected], URL: www.consumer-voice
84
Percent of satisfied consumers The following graph shows the percentage of postpaid consumers satisfied (highly satisfied and satisfied) with billing services.
94.0
%
98.2
%
97.5
%
90
91.0%
92.0%
93.0%
94.0%
95.0%
96.0%
97.0%
98.0%
99.0%
.0%
Bharti BSNL Rel Comm
% of satisfied consumers with Billing_Postpaid
• rs >90% of postpaid subscribers were satisfied with billing services. • Highest percentage of satisfied customers were found in the case of BSNL (98.2%)
followed by Rel Comm (97.5%)
• Whereas, the lowest percentages of satisfied customers were found in the case of Bharti (94.0%).
• Audit conducted for 3operators providing services in UP (E) Service Area.
In all the operato

Assessment of Customer perception of Service and UP (E) SERVICE AREA Implementation and Effectiveness of Telecom Consumers Protection and Redressal of Grievances Regulations
© 441, (Basement), Jangpura, Mathura Road, New Delhi – 110014, India
Email: [email protected], URL: www.consumer-voice
85
4.2.3.4 SATISFIED WITH HELP SERVICES Consumer Satisfaction level The following graph shows the consumer satisfaction level with the help services.
61.9
%
66.6
%
64.0
%
0.0%
30.0%
40.0%
50.0%
60.0%
70.0%
80.0%
90.0%
100.0%
Bharti BSNL Rel Comm
20.0%
10.0%
Consumer satisfaction level Benchmark
• Audit conducted for 3 operators providing services in UP (E) Service Area. • None of the operators were found meeting the benchmark of >90%. • For customer satisfaction level with help service, achievement level of all the
3 operators ranged from 61.9% to 66.6%.
• Highest level of satisfaction was found by the consumers of BSNL (66.6%) followed by Bharti (64.0%).
• The lowest level of satisfaction was attained by the consumers of Rel Comm (61.9%).

Assessment of Customer perception of Service and UP (E) SERVICE AREA Implementation and Effectiveness of Telecom Consumers Protection and Redressal of Grievances Regulations
© 441, (Basement), Jangpura, Mathura Road, New Delhi – 110014, India
Email: [email protected], URL: www.consumer-voice
86
Percent of satisfied consumers The following graph shows the percentage of consumers satisfied (highly satisfied and satisfied) with help services.
83.2
%
91.9
%
87.7
%
55.0%
60.0%
65.0%
70.0%
75.0%
80.0%
85.0%
90.0%
95.0%
50.0%
Bharti BSNL Rel Comm
% of satisfied consumers with Helpline Services
• iding services in UP (E) Service Area.
• atisfied customers were found in the case of BSNL (91.9%) followed by Bharti (87.7%).
• Whereas, the lowest percentage of satisfied customers were found in the case of Rel Comm (83.2%).
Audit conducted for 3 operators prov
• In the case of 1 operator >90% of subscribers were satisfied with help services Highest percentage of s
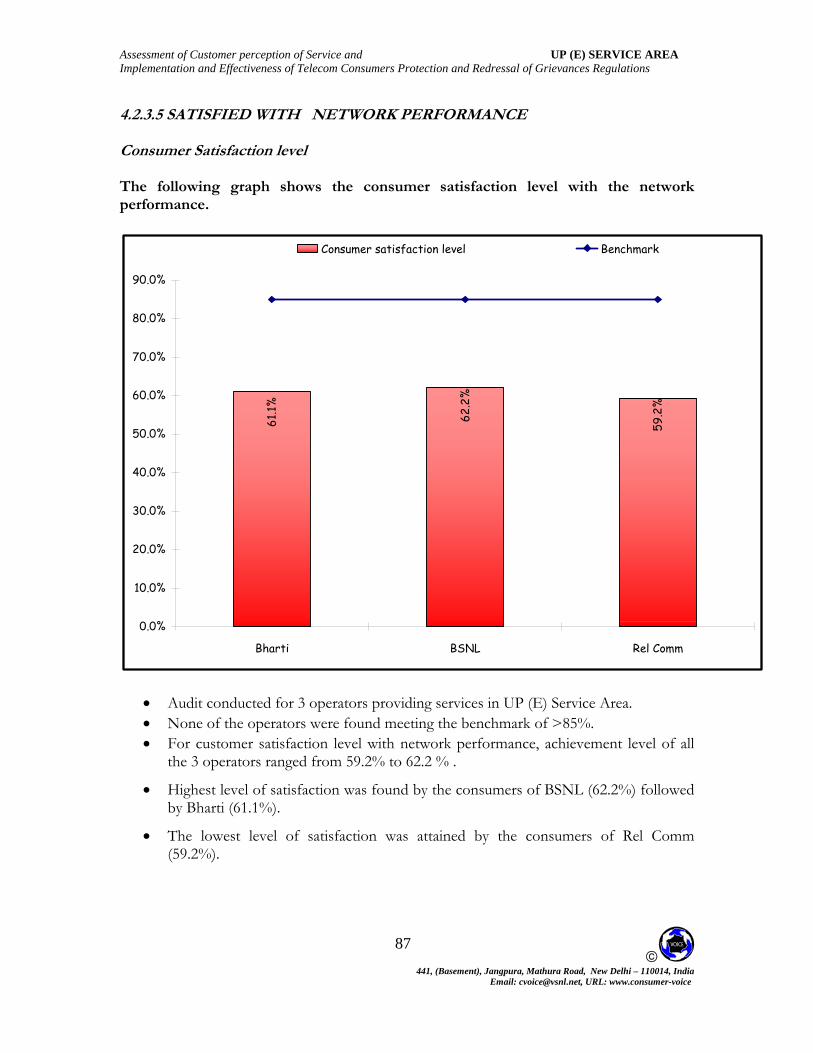
Assessment of Customer perception of Service and UP (E) SERVICE AREA Implementation and Effectiveness of Telecom Consumers Protection and Redressal of Grievances Regulations
© 441, (Basement), Jangpura, Mathura Road, New Delhi – 110014, India
Email: [email protected], URL: www.consumer-voice
87
4.2.3.5 SATISFIED WITH NETWORK PERFORMANCE Consumer Satisfaction level The following graph shows the consumer satisfaction level with the network performance.
59.2
%
62.2
61.1%
%
0.0%
20.0%
30.0%
40.0%
50.0%
60.0%
70
80
90
Bharti BSNL Rel Comm
.0%
.0%
.0%
10.0%
Consumer satisfaction level Benchmark
• Audit conducted for 3 operators providing services in UP (E) Service Area. • None of the operators were found meeting the benchmark of >85%. • For customer satisfaction level with network performance, achievement level of all
the 3 operators ranged from 59.2% to 62.2 % .
• Highest level of satisfaction was found by the consumers of BSNL (62.2%) followed by Bharti (61.1%).
• The lowest level of satisfaction was attained by the consumers of Rel Comm (59.2%).
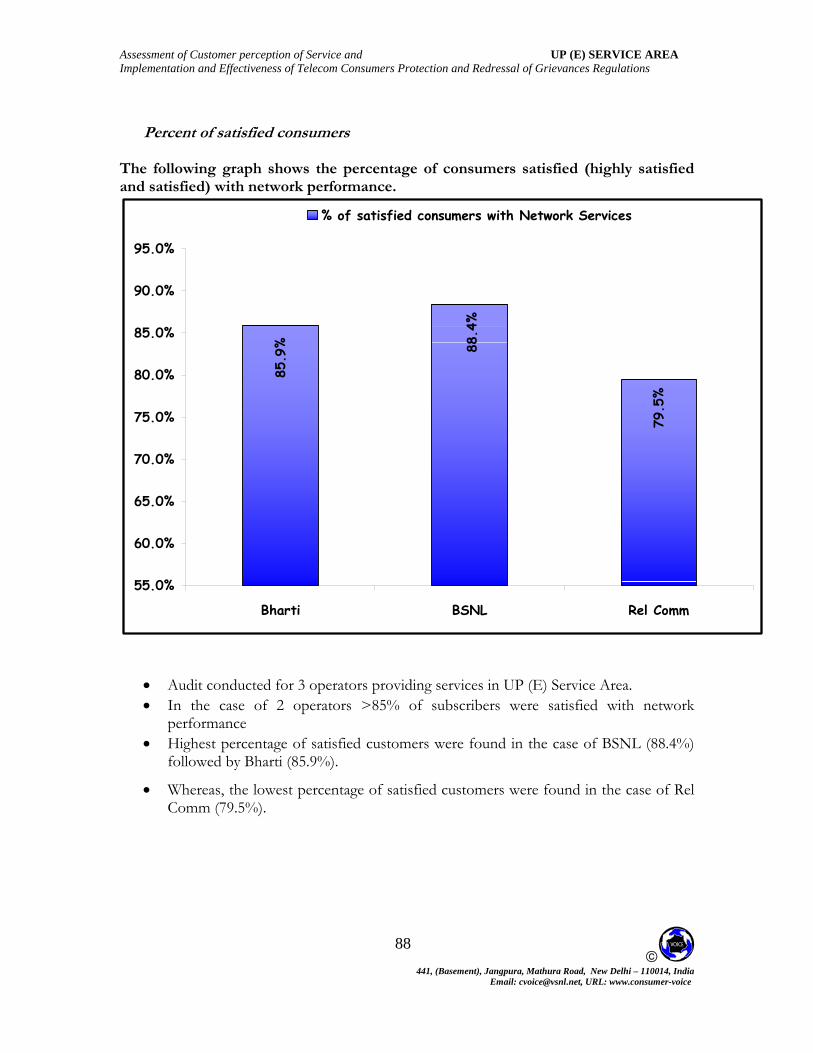
Assessment of Customer perception of Service and UP (E) SERVICE AREA Implementation and Effectiveness of Telecom Consumers Protection and Redressal of Grievances Regulations
© 441, (Basement), Jangpura, Mathura Road, New Delhi – 110014, India
Email: [email protected], URL: www.consumer-voice
88
Percent of satisfied consumers
The following graph shows the percentage of consumers satisfied (highly satisfied and satisfied) with network performance.
79.5
%
88.4
%
85.9
%
55
60.0%
65.0%
70.0%
75.0%
80.0%
85.0%
90.0%
95.0%
.0%
Bharti BSNL Rel Comm
% of satisfied consumers with Network Services
•
• Highest percentage of satisfied customers were found in the case of BSNL (88.4%) followed by Bharti (85.9%).
• Whereas, the lowest percentage of satisfied customers were found in the case of Rel Comm (79.5%).
Audit conducted for 3 operators providing services in UP (E) Service Area.
• In the case of 2 operators >85% of subscribers were satisfied with network performance

Assessment of Customer perception of Service and UP (E) SERVICE AREA Implementation and Effectiveness of Telecom Consumers Protection and Redressal of Grievances Regulations
© 441, (Basement), Jangpura, Mathura Road, New Delhi – 110014, India
Email: [email protected], URL: www.consumer-voice
89
4.2.3.6 SATISFIED WITH MAINTAINABILITY Consumer satisfaction level The following graph shows the consumer satisfaction level with maintainability
73.7
%
68.
68. 4%6%
0.0%
30.0%
40.0%
50.0%
60.0%
70.0%
80.0%
90.0%
Bharti BSNL Rel Comm
20.0%
10.0%
Consumer satisfaction level Benchmark
• Audit conducted for 3 operators providing services in UP (E) Service Area. • None of the operators were found meeting the benchmark of >85%. • For customer satisfaction level with maintainability, achievement level of all
the 3 operators ranged from 68.4% to 73.7%.
• Highest level of satisfaction was found by the consumers of Rel Comm with 73.7%.
• The lowest level of satisfaction was attained by the consumers of BSNL (68.4%) followed by Bharti (68.6%).

Assessment of Customer perception of Service and UP (E) SERVICE AREA Implementation and Effectiveness of Telecom Consumers Protection and Redressal of Grievances Regulations
© 441, (Basement), Jangpura, Mathura Road, New Delhi – 110014, India
Email: [email protected], URL: www.consumer-voice
90
Percent of satisfied consumers The following graph shows the percentage of consumers satisfied (highly satisfied and satisfied) with maintainability.
88.2
%
95.7
%
94.1
%
55.0
60.0%
65.0%
70.0%
75.0%
80.0%
85.0%
90.0%
95.0%
100.0%
%
Bharti BSNL Rel Comm
% of satisfied consumers with Maintainability
• 85% of subscribers were satisfied with maintainability. • Highest percentage of satisfied customers were found in the case of BSNL
(95.7%) followed by Bharti (94.1%).
• Whereas, the lowest percentage of satisfied customers were found in the case of Rel Comm (88.2%).
• Audit conducted for 3 operators providing services in UP (E) Service Area. In all the operators >

Assessment of Customer perception of Service and UP (E) SERVICE AREA Implementation and Effectiveness of Telecom Consumers Protection and Redressal of Grievances Regulations
© 441, (Basement), Jangpura, Mathura Road, New Delhi – 110014, India
Email: [email protected], URL: www.consumer-voice
91
4.2.3.7 SATISFIED WITH SUPPLEMENTRY SERVICES Consumer satisfaction level The following graph shows the consumer satisfaction level with Supplementary services.
61.5
%
58.5
%67.7
%
0.0%
10.0%
20.0%
30.0%
40.0%
50.0%
60.0%
70.0
80.0
90.0
Bharti BSNL Rel Comm
%
%
%
Consumer satisfaction level Benchmark
• Audit conducted for 3 operators providing services in UP (E) Service Area. • None of the operators were found meeting the benchmark of >95%. • For Customer satisfaction level with supplementary services, achievement level
of all the 3 operators ranged from 58.5% to 67.7%.
• Highest level of satisfaction was found by the consumers of Bharti (67.7%) followed by Rel Comm (61.5%).
• Whereas, lowest level of satisfaction was attained by the consumers of BSNL (58.5%).

Assessment of Customer perception of Service and UP (E) SERVICE AREA Implementation and Effectiveness of Telecom Consumers Protection and Redressal of Grievances Regulations
© 441, (Basement), Jangpura, Mathura Road, New Delhi – 110014, India
Email: [email protected], URL: www.consumer-voice
92
Percent of satisfied consumers The following graph shows the percentage of consumers satisfied (highly satisfied and satisfied) with supplementary services.
83.1
%
74.5
%
95.5
%
50.0%
55.0%
60.0%
65.0%
70.0%
75.0%
80.0%
85.0%
90.0%
95.0%
100.0%
Bharti BSNL Rel Comm
% of satisfied consumers with Supplementary Services
• Audit conducted for 3 operators providing services in UP (E) Service Area. • In the case of 1 operator >95% of subscribers were satisfied with supplementary
services. • Highest percentage of satisfied customers were found in the case of Bharti
(95.5%) followed by Rel Comm (83.1%).
• Whereas, the lowest percentage of satisfied customers were found in the case of BSNL (74.5%).

Assessment of Customer perception of Service and UP (E) SERVICE AREA Implementation and Effectiveness of Telecom Consumers Protection and Redressal of Grievances Regulations
© 441, (Basement), Jangpura, Mathura Road, New Delhi – 110014, India
Email: [email protected], URL: www.consumer-voice
93
4.2.3.8 OVERALL CUSTOMER SATISFACTION Consumer satisfaction level The following graph shows the consumer satisfaction level with overall services.
63.66
.
66 8%
7%
0.0%
20.0%
30.0%
40.0%
50.0%
60.0%
70.0%
80.0%
90.0%
Bharti BSNL Rel Comm
.2%
10.0%
Consumer satisfaction level Benchmark
• Audit conducted for 3 operators providing services in UP (E) Service Area. • None of the operator was found meeting the benchmark of >85%. • For Customer satisfaction level with overall services, achievement level of all the
3 operators ranged from 63.8% to 66.7%.
• Highest level of satisfaction was obtained by the consumers of BSNL (66.7%) followed by Bharti (66.2%).
• The lowest level of satisfaction was attained by the consumers of Rel Comm (63.8%).

Assessment of Customer perception of Service and UP (E) SERVICE AREA Implementation and Effectiveness of Telecom Consumers Protection and Redressal of Grievances Regulations
© 441, (Basement), Jangpura, Mathura Road, New Delhi – 110014, India
Email: [email protected], URL: www.consumer-voice
94
Percent of satisfied consumers The following graph shows the percentage of consumers satisfied (highly satisfied and satisfied) with overall services.
90.0
%
98.8
%
98.3
%
70.0%
75.0%
80.0%
85.0%
90.0%
95.0%
100.0%
Bharti BSNL Rel Comm
% of satisfied consumers with Overall Services
•
• of satisfied customers were found in the case of BSNL (98.8%) followed by Bharti (98.3%).
• Whereas, the lowest percentage of satisfied customers were found in the case of Rel Comm (90.0%).
Audit conducted for 3 operators providing services in UP (E) Service Area. • In all the operators >85% of subscribers were satisfied with overall services
Highest percentage

Assessment of Customer perception of Service and UP (E) SERVICE AREA Implementation and Effectiveness of Telecom Consumers Protection and Redressal of Grievances Regulations
4.3 ASSESSMENT OF IMPLEMENTATION AND EFFECTIVENESS OF TELECOM CONSUMER
PROTECTION AND REDRESSAL OF GRIEVANCES REGULATION, 2007.
© 441, (Basement), Jangpura, Mathura Road, New Delhi – 110014, India
Email: [email protected], URL: www.consumer-voice
95

Assessment of Customer perception of Service and UP (E) SERVICE AREA Implementation and Effectiveness of Telecom Consumers Protection and Redressal of Grievances Regulations
© 441, (Basement), Jangpura, Mathura Road, New Delhi – 110014, India
Email: [email protected], URL: www.consumer-voice
96
4.3.1 BASIC SERVICE WIRELINE - UP (East) Service Area 4.3.1.1: Awareness about redressal system: In the Basic services (wireline), altogether 1176 consumers of 2 service providers were interviewed. Among them 428 (36.4%) were aware of three stages of grievance redressal mechanism set up by their service providers. Higher percentage of aware subscribers was found in the case of BSNL (43.0%) as compared to Bharti (29.5%).
Table 4.3.1.1: Are you aware of the three stage grievance redressal mechanism set up by your telecom service provider based on the regulations of TRAI for redressal of your grievances?
Service Provider No Yes Total
Count 406 170 576 BHARTI
%age 70.5% 29.5% 100.0%
Count 342 258 600 BSNL
%age 57.0% 43.0% 100.0%
Count 748 428 1176 Total
%age 63.6% 36.4% 100.0%
Graphical representation: The graph below shows the percentage of respondents who were aware about three stages of grievance redressal mechanism.
29.5%
43.0%
BHARTI
BSNL

Assessment of Customer perception of Service and UP (E) SERVICE AREA Implementation and Effectiveness of Telecom Consumers Protection and Redressal of Grievances Regulations
© 441, (Basement), Jangpura, Mathura Road, New Delhi – 110014, India
Email: [email protected], URL: www.consumer-voice
97
4.3 :asked about the three stages of redressal mechanism by naming them – call centre, Nodal officers and Appellate authority. The followingresp t
.1.2 Awareness about three stages of redressal system: The respondents were also
table shows their awareness level with ec to each of the stage mentioned above.
Table 4.3.1.2. Which all stages of the three stage grievance mechanism process set up by your telecom service provider for redressal of grievances of telecom consumers are you aware of?
Service Provider
CALL CENTER
NODAL OFFICER
APPELLATE AUTHORITY
NONE OF
THESE Total
Count 576 2 7 0 576 BHARTI
%age 100.0% 0.3% 1.2% 0.0% 100.0%
Count 600 5 7 0 600 BSNL
%age 100.0% 0.8% 1.2% 0.0% 100.0%
Count 1176 7 14 0 1176 Total
%age 100.0% 0.6% 1.2% 0.0% 100.0% *Multi Responded
• Out of 1176 respondents targeted, all (100.0%) were aware of call centers of their service provider.
• Only 0.6% of respondents were aware about the Nodal officers. This was found to be higher in the case of BSNL (0.8%) as compared to Bharti (0.3%).
• 14 respondents (1.2%) were about Appellate Authority, 7 each of Bharti and BSNL.
Graphical representation: The graph below shows the percentage of respondents who were aware about call center/Nodal officer/Appellate Authority.
1.2%
1.2%
100.0%100.0%
0.8%
0.3%
Bharti BSNL
CALL CENTER NODAL OFFICER APPELLATE AUTHORITY

Assessment of Customer perception of Service and UP (E) SERVICE AREA Implementation and Effectiveness of Telecom Consumers Protection and Redressal of Grievances Regulations
© 441, (Basement), Jangpura, Mathura Road, New Delhi – 110014, India
Email: [email protected], URL: www.consumer-voice
98
4.3.1.3: Consumers’ complaints about services: Respondents were asked if they had made any complaints within last six months to call centre/ helpline number. The table below shows that out of 1176 respondents, 792 (67.3%) had made complaints within last six months. The highest percentage of respondents, who had made complaints, was from BSNL (70.5%) as compared to Bharti (64.1%). Table 4.3.1.3 Have you made any complaint within last 6 months to the toll free call centre/customer
care/ helpline telephone number?
Service Provider Yes No Total
Count 369 207 576 BHARTI
%age 64.1% 35.9% 100.0%
Count 423 177 600 BSNL
%age 70.5% 29.5% 100.0%
Count 792 384 1176 Total
%age 67.3% 32.7% 100.0%
Graphical representation: The following graph shows provider wise percentages of respondents who had made any complaint within last 6 months to the toll free call centre/customer care/helpline telephone number.
64.1%
70.5%
Bharti
BSNL

Assessment of Customer perception of Service and UP (E) SERVICE AREA Implementation and Effectiveness of Telecom Consumers Protection and Redressal of Grievances Regulations
© 441, (Basement), Jangpura, Mathura Road, New Delhi – 110014, India
Email: [email protected], URL: www.consumer-voice
99
4.3.1.4: Receipt of docket number against complaints: Respondents those who made complaints to call centre/ helpline numbers were asked whether they received docket numbers. Out of 792 respondents who had made a complaint, 92.6% confirmed that they received docket number for most of the complaints. Only 4 % indicated that they didn’t receive any docket number for most of the complaints. The table also shows 3.4% of respondents also reported that docket number was not given for their complaints even on request. Table 4.3.1.4. Redressal of grievances mechanism provides for allotting docket number to consumers on his making the complaint. Please specify which of these applied the most to you?
Service Provider
no docket number
received even on request
no docket number
received for most of the complaints
docket number received for most of the complaints
Total
Count 13 20 336 369 BHARTI
%age 3.5% 5.4% 91.1% 100.0%
Count 14 12 397 423 BSNL
%age 3.3% 2.8% 93.9% 100.0%
Count 27 32 733 792 Total
%age 3.4% 4.0% 92.6% 100.0%
Graphical representation: The graph below shows that highest number of respondents who reported that they received docket number came from BSNL (93.9%) as compared to Bharti (91.1%).
3.3%3.5%5.4% 2.8%
93.9%91.1%
Bharti BSNL
DOCKET NUMBER RECEIVED FOR MOST OF THE COMPLAINTS
NO DOCKET NUMBER RECEIVED FOR MOST OF THE COMPLAINTS
NO DOCKET NUMBER RECEIVED EVEN ON REQUEST

Assessment of Customer perception of Service and UP (E) SERVICE AREA Implementation and Effectiveness of Telecom Consumers Protection and Redressal of Grievances Regulations
© 441, (Basement), Jangpura, Mathura Road, New Delhi – 110014, India
Email: [email protected], URL: www.consumer-voice
100
4.3.1.5: Feed back from Call Centre: The respondents who made complaints to call centre/ helpline numbers were also asked whether call centre informed them about the action taken on complaints. Out of 792 respondents, 90.5% had reported that they were informed by call center for the action taken on their complaints. BSNL has the higher customers (94.8%), who reported that they were informed about the action taken on their complaints as compared to Bharti (85.6%).
Table 4.3.1.5. Did the call centre inform you the action taken on your complaint?
Service Provider Yes No Total
Count 316 53 369 BHARTI
%age 85.6% 14.4% 100.0%
Count 401 22 423 BSNL
%age 94.8% 5.2% 100.0%
Count 717 75 792 Total
%age 90.5% 9.5% 100.0%
Graphical representation: The graph shows the provider wise percentage of respondents who confirmed that they were informed by the call centre of the action taken on their complaints.
85.6%
94.8%
Bharti
BSNL

Assessment of Customer perception of Service and UP (E) SERVICE AREA Implementation and Effectiveness of Telecom Consumers Protection and Redressal of Grievances Regulations
© 441, (Basement), Jangpura, Mathura Road, New Delhi – 110014, India
Email: [email protected], URL: www.consumer-voice
101
4.3 :respons esolution of complaints by call centre/ customer care/ helpline.
Table 4.3.1.6. w helpline?
.1.6 Satisfaction with the resolution of complaints: The following table shows the es of respondents in terms of level of satisfaction on r
Ho satisfied are you with the system of resolving of your complaints by call centre/customer care/
Service Provider
very dissatisfied
+ dissatisfied
very dissatisfied dissatisfied very satisfied +
satisfied satisfied
very satisfied
Total
Count 16 11 5 353 347 6 369 BHARTI %age 4.3% 3.0% 1.4% 95.7% 94.0% 1.6% 100.0%
Count 20 12 8 403 396 7 423 BSNL
%age 4.7% 2.8% 1.9% 95.3% 93.6% 1.7% 100.0%
Count 36 23 13 756 743 13 792 Total
%age 4.5% 2.9% 1.6% 95.5% 93.8% 1.6% 100.0%
• Maximum percentage of satisfied consumers (very satisfied and satisfied) came
from Bharti (95.7%) as compared to BSNL (95.3%).
• The percentage of very satisfied consumers were more or less same in the case of both the providers.
• As far dissatisfaction (very dissatisfied and dissatisfied) is concerned the highest percentage of respondents were reported from BSNL (4.7%). However, Bharti has had the higher percentage of very dissatisfied consumers (3%) as compared to Bharti (2.8%)..

Assessment of Customer perception of Service and UP (E) SERVICE AREA Implementation and Effectiveness of Telecom Consumers Protection and Redressal of Grievances Regulations
© 441, (Basement), Jangpura, Mathura Road, New Delhi – 110014, India
Email: [email protected], URL: www.consumer-voice
102
Graphical representation: The graph below shows the provider wise percentage of satisfied (very satisfied and satisfied) and dissatisfied (very dissatisfied and dissatisfied) consumers with the resolution of complains by call centre/ customer care.
95.7%
95.3%
4.3%
4.7%
Bharti
BSNL
VERY SATISFIED+SATISFIED VERY DISSATISFIED+DISSATISFIED

Assessment of Customer perception of Service and UP (E) SERVICE AREA Implementation and Effectiveness of Telecom Consumers Protection and Redressal of Grievances Regulations
© 441, (Basement), Jangpura, Mathura Road, New Delhi – 110014, India
Email: [email protected], URL: www.consumer-voice
103
4.3.1.7: Reasons for dissatisfaction with the resolution of complaints: Respondents who were dissatisfied or very dissatisfied (Question No. 29) were asked to specify the reasons for their dissatisfaction.
Table 4.3.1.7 Please specify the reason(s) for your dissatisfaction
Service Provider
difficult to connect to
the call center
exicutive
customer care
executive not polite/
courteouas
customer care
executive not equipped
with adequate
information
time taken by call
center for redressal of complaint is too long
customer care
executive was unable
to understand the problem
Total
Count 6 3 5 8 4 BHARTI
%age 37.5% 18.8% 31.3% 50.0% 25.0% 16
Count 11 4 9 8 5 BSNL
%age 55.0% 20.0% 45.0% 40.0% 25.0% 20
Count 17 7 14 16 9 Total
%age 47.2% 19.4% 38.9% 44.4% 25.0% 36
• Out of 36 dissatisfied respondents most of them (47.2%) cited the reasons as “Difficult to connect to the call center executive.” This was cited by higher percentage of consumers in the case of BSNL (55%) as compared to Bharti (37.5%).
• The other reasons cited include “Time taken by call centre for redressal of
complaint is long” reported by over 4 out of 10 respondents or complainants (44.4%). This too was found higher in the case of Bharti (50%), as compared with BSNL (40%).
• “Customer care executive are not equipped with adequate information” cited
by 38.9%, was other reason for dissatisfaction. This was reported higher in the case of BSNL (45%) as compared to Bharti (31.3%).
• “Customer care executive was unable to understand the problem” was also
reported by 25% of respondents. This was reported equally by the respondents of both the service providers BSNL as well as Bharti (25% each).
• “Customer care executive not polite/ Courteous” was cited by 19.4% of respondents. This was reported higher in the case of BSNL (20%) as compared to Bharti (18.8%).

Assessment of Customer perception of Service and UP (E) SERVICE AREA Implementation and Effectiveness of Telecom Consumers Protection and Redressal of Grievances Regulations
© 441, (Basement), Jangpura, Mathura Road, New Delhi – 110014, India
Email: [email protected], URL: www.consumer-voice
104
4.3.1.8 Resolution of billing complaints: The following table shows that out of 792 respondents who had complained to call center/customer care, 341 had billing related complaints. Out of these 266 (78%) had confirmed that their complaint was satisfactorily resolved by call centre/ customer care within four week after lodging the complaint. This was found to be higher in the case of Bharti (81.2%) as compared to BSNL (65.7%). Therefore altogether almost 22% reported that it was not resolved satisfactorily within the specified time. The percentage was high in the case of BSNL (34.3%) as compared to Bharti (18.8%).
Table 4.3.1.8. Was your billing complaint resolved satisfactorily by call centre/customer care within four weeks after lodging of the complaint?
Service Provider Yes No Total
Count 220 51 271 BHARTI
%age 81.2% 18.8% 100.0%
Count 46 24 70 BSNL
%age 65.7% 34.3% 100.0%
Count 266 75 341 Total
%age 78.0% 22.0% 100.0%
Graphical representation: The graphs below shows the provider wise percentage of respondents who confirmed that their billing complaint were resolved satisfactorily by call centre/ customer cared within four weeks after lodging the complaint. BSNL had the highest number of unsatisfied complainants (34.3%) as compared to Bharti (18.8%).
65.70%
81.20%
34.30%
18.80%
BSNL
BHARTI
Yes No

Assessment of Customer perception of Service and UP (E) SERVICE AREA Implementation and Effectiveness of Telecom Consumers Protection and Redressal of Grievances Regulations
© 441, (Basement), Jangpura, Mathura Road, New Delhi – 110014, India
Email: [email protected], URL: www.consumer-voice
105
4.3 1.9.: Awareness about the contact details of nodal officers: The respondents were asked about their awareness about three stages of redressal mechanism (Question No. 25.). 7 respondents had reported that they were aware about Nodal officers. Out of these 7 respondents, no one was aware about the contact detail of Nodal officer. Table 4.3.1.10: Awareness about the contact details of Appellate Authority: As regard to the awareness about the contact details of the Appellate Authority, 14 respondents reported that they were aware about Appellate Authority; out of these again no one was aware about the contact detail of the same. 4.3.1.11: Awareness about item wise charges of prepaid services: All the prepaid customers were asked whether they were aware that a consumer can get item wise usage charges details, on request. Out of 152 prepaid customers of 2 providers targeted, 85 (55.9%) reported that they were aware of this facility. The highest percentage was reported from the prepaid subscribers of BSNL (56.4%) as compared to Bharti (55.4%). Table 4.3.1.11. Are you aware that the prepaid customer can get item-wise usage charge details, on request?
Operators Yes No Total Count 41 33 74
BHARTI %age 55.4% 44.6% 100.0% Count 44 34 78
BSNL %age 56.4% 43.6% 100.0% Count 85 67 152
Total %age 55.9% 44.1% 100.0%
*Only for Prepaid customer Graphical representation: The graphs below shows the provider wise percentage of consumers who were aware that they can get item-wise usage charge details, on request?
55.4%
56.4%
Bharti
BSNL
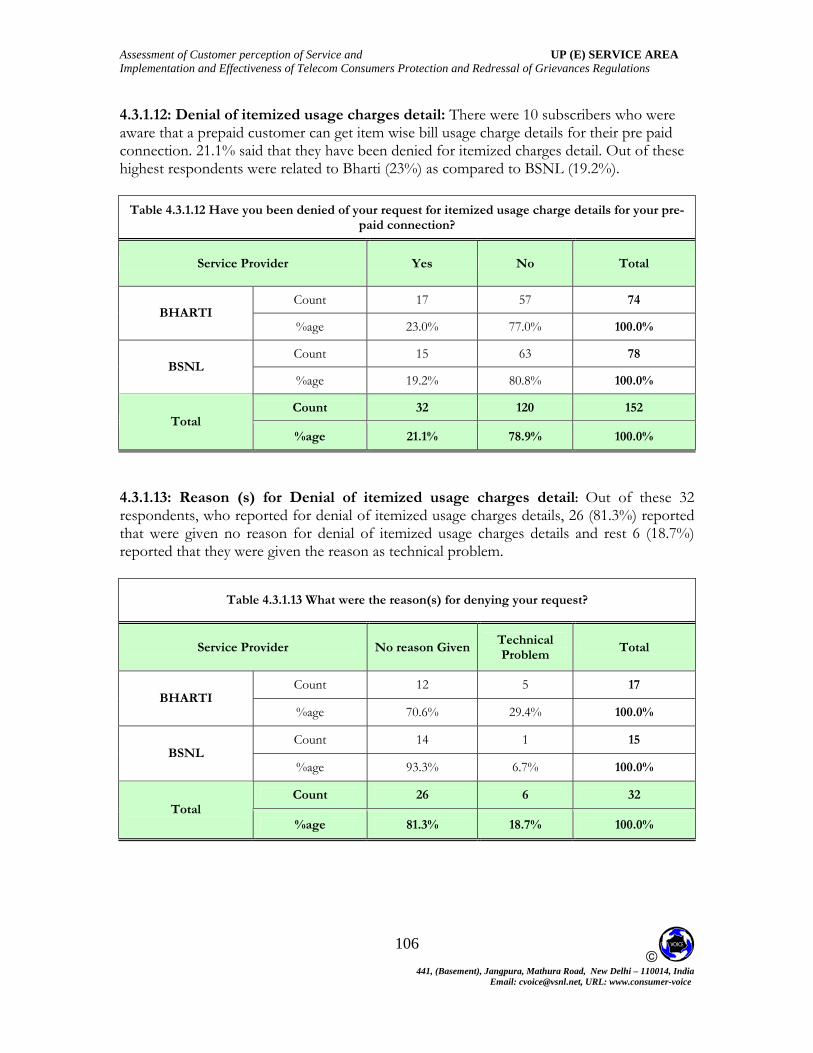
Assessment of Customer perception of Service and UP (E) SERVICE AREA Implementation and Effectiveness of Telecom Consumers Protection and Redressal of Grievances Regulations
© 441, (Basement), Jangpura, Mathura Road, New Delhi – 110014, India
Email: [email protected], URL: www.consumer-voice
106
4.3.1.12: Denial of itemized usage charges detail: There were 10 subscribers who were aware that a prepaid customer can get item wise bill usage charge details for their pre paid connection. 21.1% said that they have been denied for itemized charges detail. Out of these highest respondents were related to Bharti (23%) as compared to BSNL (19.2%).
Table 4.3.1.12 Have you been denied of your request for itemized usage charge details for your pre-paid connection?
Service Provider Yes No Total
Count 17 57 74 BHARTI
%age 23.0% 77.0% 100.0%
Count 15 63 78 BSNL
%age 19.2% 80.8% 100.0%
Count 32 120 152 Total
%age 21.1% 78.9% 100.0%
4.3.1.13: Reason (s) for Denial of itemized usage charges detail: Out of these 32 respondents, who reported for denial of itemized usage charges details, 26 (81.3%) reported that were given no reason for denial of itemized usage charges details and rest 6 (18.7%) reported that they were given the reason as technical problem.
Table 4.3.1.13 What were the reason(s) for denying your request?
Service Provider No reason GivenTechnical Problem
Total
Count 12 5 17 BHARTI
%age 70.6% 29.4% 100.0%
Count 14 1 15 BSNL
%age 93.3% 6.7% 100.0%
Count 26 6 32 Total
%age 81.3% 18.7% 100.0%

Assessment of Customer perception of Service and UP (E) SERVICE AREA Implementation and Effectiveness of Telecom Consumers Protection and Redressal of Grievances Regulations
© 441, (Basement), Jangpura, Mathura Road, New Delhi – 110014, India
Email: [email protected], URL: www.consumer-voice
107
4.3.3.14: Provision of Manual of Practice by the Service Provider: TRAI has suggested to all the service providers to provide manual of practice to the new customers. Out of 861 new customers (Subscribed in last 6 months), 260 (30.2%) indicated that they have not been provided the manual of practice containing the term and condition of service, grievances redressal mechanism while taking the connection. 69.8% confirmed of receiving the manual. This was reported to be higher in the case of Bharti (71.3%) who confirmed to have received the manual as compared to 253 (67.8%) in the case of BSNL.
Table 4.3.1.14.Have you been provided the Manual of Practice containing the terms and conditions of service, grievance redressal mechanism etc. while taking the connection?
Operator Yes No Total
Count 348 140 488 BHARTI
%age 71.3% 28.7% 100.0%
Count 253 120 373 BSNL
%age 67.8% 32.2% 100.0%
Count 601 260 861 Total
%age 69.8% 30.2% 100.0%
Graphical representation: The graph shows provider wise subscribers who confirmed that they received the manual of practice at the time of connection.
67.8%
71.3%
BSNL
Bharti

Assessment of Customer perception of Service and UP (E) SERVICE AREA Implementation and Effectiveness of Telecom Consumers Protection and Redressal of Grievances Regulations
© 441, (Basement), Jangpura, Mathura Road, New Delhi – 110014, India
Email: [email protected], URL: www.consumer-voice
108
Overall Score – Telecom Consumer Protection and Redressal of Grievances
BASIC SERVICES-WIRELINE The following table shows the provider wise score on various provisions of the Telecom Consumer Protection and Redressal of Grievances Act.
S.N. Sub Parameter Bharti BSNL
1 Awareness of three stage grievance mechanism 29.5% 43.0%
2 For pre-paid customers awareness about item-wise usage charge details on request 55.4% 56.4%
3 If aware (for pre-paid customers )ever denied of item wise usage charge details for pre paid connection
23.0% 19.2%
4 For new customers provisioning of "Manual of practice while taking the new connection
71.3% 67.8%
5 Awareness of call center for redressing grievances 100.0% 100.0%
6 Penetration of consumers made any complaint to the toll free number within last six months
64.1% 70.5%
7 Call center informing about the action taken on complaint 85.6% 94.8%
8 Resolution of complaint by customer care with in 4 weeks of lodging complaint
81.2% 65.7%
9 Percentage satisfied with complaint resolution by call center 95.7% 95.3%
10 Awareness of nodal officer for redressing grievances 0.3% 0.8%
11 Awareness of appellate authority for redressing grievances 1.2% 1.2%
• Awareness level on the three stages of consumer grievances redressal mechanism was found to be low and it ranged from 29.5% to 43.0%. The highest percentage of aware subscribers was found in the case of BSNL (43.0%). The lowest percentage of aware consumers was found in the case of Bharti (29.5%).
• Awareness level was found high in the case of call centre/ customer care help line numbers. This was found to be 100.0% in both the cases.
• Awareness about the Nodal Officer was found to be abysmally low and ranged from 0.3% (Bharti) to 0.8% (BSNL).
• Similarly, the awareness was also found to be low in the case of Appellate Authority, which was 1.2% in both the cases.
• Highest number of complaints to the call centre, within last six months, was made by the subscribers of BSNL (70.5%) and lowest number of complaints to the call centre was made by the subscribers of Bharti (64.1%).
• Awareness about item wise usage charges in the case of pre paid services was reported to be highest in the case of BSNL (56.4%) and in the case of Bharti, it was reported to be 55.4%.

Assessment of Customer perception of Service and UP (E) SERVICE AREA Implementation and Effectiveness of Telecom Consumers Protection and Redressal of Grievances Regulations
© 441, (Basement), Jangpura, Mathura Road, New Delhi – 110014, India
Email: [email protected], URL: www.consumer-voice
109
4.3.2: CELLULAR MOBILE – UP (East) Service Area 4.3.2.1: Awareness about redressal system: In the Cellular Mobile Service, altogether 3600 consumers were interviewed for Service Area. Overall 15.7 % respondents reported that they were aware of the three stage grievance redressal mechanism set up by their service provider. And among the all, Vodafone (21.5%) and Tata Tele Services (21.2%) have the highest percentage of aware consumers of three stage grievance redressal mechanism set up by their service provider based on the regulation of TRAI for redressal of grievances. This is shown in the table below: Table 4.3.1.1: Are you aware of the three stage grievance redressal mechanism set up by your telecom service provider based on the regulations of TRAI for redressal of your grievances?
Service provider Yes No Total Count 49 551 600
Bharti %age 8.2% 91.8% 100.0% Count 129 471 600
Vodafone %age 21.5% 78.5% 100.0% Count 104 496 600
Idea Cellular %age 17.3% 82.7% 100.0% Count 48 552 600
BSNL %age 8.0% 92.0% 100.0% Count 108 492 600
Rel Comm %age 18.0% 82.0% 100.0% Count 127 473 600
Tata Teleservices %age 21.2% 78.8% 100.0% Count 565 3035 3600
Total %age 15.7% 84.3% 100.0%
Graphical representation: The following graph shows the percentage of respondents who were aware about three stages of grievance redressal mechanism.
8.0%
8.2%
17.3%
18.0%
21.2%
21.5%
BSNL
Bharti
Idea Cellular
Rel Comm
Tata Teleservices
Vodafone

Assessment of Customer perception of Service and UP (E) SERVICE AREA Implementation and Effectiveness of Telecom Consumers Protection and Redressal of Grievances Regulations
© 441, (Basement), Jangpura, Mathura Road, New Delhi – 110014, India
Email: [email protected], URL: www.consumer-voice
110
4.3.2.2: Awareness about three stages of redressal system: The respondents were also asked about the three stages of redressal mechanism by naming them – Call centre, Nodal officers and Appellate authority. The following table shows their awareness level with respect to each of the stage mentioned above. Out of 3600 respondents, 93.7% respondents indicated that they were aware of call center. Whereas, only 0.2 % were aware of Nodal Officer and 0.7% on the Appellate Authority. However, 1% of respondents also indicated that they were not aware of any of the stage. Table 4.3.1.2. Which all stages of the three stage grievance mechanism process set up by your telecom service provider for redressal of grievances of telecom consumers are you aware of?
Service provider Call CentreNodal Officer
Appellate Authority
None of these
Total
Count 581 0 0 1 Bharti %age 96.8% 0.0% 0.0% 0.2% 600
Count 547 2 1 3 Vodafone %age 91.2% 0.3% 0.2% 0.5% 600
Count 573 1 0 6 Idea Cellular %age 95.5% 0.2% 0.0% 1.0% 600
Count 563 0 0 5 BSNL %age 93.8% 0.0% 0.0% 0.8% 600
Count 562 1 4 6 Rel Comm %age 93.7% 0.2% 0.7% 1.0% 600
Count 543 6 1 1 Tata Teleservices %age 90.5% 1.0% 0.2% 0.2% 600
Count 3369 10 6 22 Total
%age 93.6% 0.3% 0.2% 0.6% 3600
*Multi Responded Graphical representation: The following graph shows the percentage of respondents who were aware about Call Centre, Nodal Officers and Appellate Authority.
90.5%
93.7%9
Call Centre Nodal Officer Appellate Authority
96.8%
0.2%
0.2%0.7%
94.0%
95.0%
96.0%
97.0%
98.0%
3.8%
95.5%
91.2%
1.0%0.2%
87.0%
88.0%
89.0%
90.0%
93.0%
Vodafo a Cell BSNL Rel Comm arvices
0.3%
0.2%
91.0%
92.0%
Bharti ne Ide ular TatTelese

Assessment of Customer perception of Service and UP (E) SERVICE AREA Implementation and Effectiveness of Telecom Consumers Protection and Redressal of Grievances Regulations
© 441, (Basement), Jangpura, Mathura Road, New Delhi – 110014, India
Email: [email protected], URL: www.consumer-voice
111
4.3.1.3: Consumers’ complaints about services: The table below shows that out of 3600 respondent 5.4% of res nts ha call cen elp line tele numbers for complaints in the last six months. Vodafone (9%) had the highest percentages of complain wed by BS 7.7%) el Comm , who used rvice for comp six m The m um perce e of consume ho made complaints were found in the case of Bharti (1.7%), followed by Tata Teleservices (3.2%). Table 4.3.1.3 Have you made an laint w ast 6 mon e toll free Ca
s, only ponde d used tre / h phone
ants, follo NL ( and R (6%) this selaint within last onths. inim ntag rs w
y comp ithin l ths to th ll Centre/customer care/Helpline telephone number; Service provider wise
Service provider Yes No Total Count 10 590 600
Bharti %age 1.7% 98.3% 100.0% Count 54 546 600
Vodafone %age 9.0% 91.0% 100.0% Count 30 570 600
Idea Cellular %age 5.0% 95.0% 100.0% Count 46 554 600
BSNL %age 7.7% 92.3% 100.0% Count 36 564 600
Rel Comm %age 6.0% 94.0% 100.0% Count 19 581 600
Tata Teleservices %age 3.2% 96.8% 100.0%
Count 195 3405 3600 Total
%age 5.4% 94.6% 100.0%
raphical representation: The graph below shows the percentage of respondents who had
the toll free call centre/customer care/ Helpline telephone number of their service provider.
Gmade any complaint within last 6 months to
1.7%
3.2%
5.0%
6.0%
7.7%
9.0%
Bharti
Tata Teleservices
Idea Cellular
Rel Comm
BSNL
Vodafone

Assessment of Customer perception of Service and UP (E) SERVICE AREA Implementation and Effectiveness of Telecom Consumers Protection and Redressal of Grievances Regulations
© 441, (Basement), Jangpura, Mathura Road, New Delhi – 110014, India
Email: [email protected], URL: www.consumer-voice
112
4.3.2.4: Receipt of docket number against complaints: Respondents those who made complaints to call centre/ helpline numbers were asked whether they had received docket numbers for their complaints. Out of 195 respondents who had made a complaint, 51.8% confirmed that they had received docket number for most of their complaints. However 34.9% indicated that they didn’t receive any docket number for most of their complaints. The table also shows 13.3% of respondents did not receive docket numbers even on request. Table 4.3.1.4 Redressal of grievances mechanism provides for alloting docket number to consumers on his making the complaint. Please specify which of these applied the most to you.
Service provider
No docket number
received even on request
No docket number
received for most of the complaints
Docket number
received for most of the complaints
Total
Count 3 2 5 10 Bharti %age 30.0% 20.0% 50.0% 100.0%
Count 9 26 19 54 Vodafone %age 16.7% 48.1% 35.2% 100.0%
Count 8 6 16 30 Idea Cellular %age 26.7% 20.0% 53.3% 100.0%
Count 4 14 28 46 BSNL %age 8.7% 30.4% 60.9% 100.0%
Count 0 15 21 36 Rel Comm %age 0.0% 41.7% 58.3% 100.0%
Count 2 5 12 19 Tata Teleservices %age 10.5% 26.3% 63.2% 100.0%
Count 26 68 101 195 Total
%age 13.3% 34.9% 51.8% 100.0%
Graphical representation: The graphs show that highest number of respondents who had reported that they received docket number came from Tata Teleservices (63.2%) followed by BSNL (60.9%), Rel Comm (58.3%) , Idea Cellular (53.3%) and Bharti (50 %).
30.0%
16.7%
26.7%
8.7% 10.5%
20.0%
48.1%
20.0%
30.4%
41.7%
26.3%
50.0%
35.2%
53.3%
60.9%
58.3% 63
.2%
Bharti Vodafone Idea Cellular BSNL Rel Comm TataTeleservices
NO DUCKET NUMBER RECEIVED EVEN ON REQUEST
NO DOCKET NUMBER RECEIVED FOR MOST OF THE COMPLAINTS
DOCKET NUMBER RECEIVED FOR MOST OF THE COMPLAINTS

Assessment of Customer perception of Service and UP (E) SERVICE AREA Implementation and Effectiveness of Telecom Consumers Protection and Redressal of Grievances Regulations
© 441, (Basement), Jangpura, Mathura Road, New Delhi – 110014, India
Email: [email protected], URL: www.consumer-voice
113
4.3.2.5: Feed back from Call Centre: The respondents who had made complaints to call centre/ helpline numbers were also asked whether call centre informed them about the action taken on complaints. Out of 195 respondents, 45.6% had reported that they were informed by call center for the action taken on their complaints. This was found to be highest in the case of Rel Comm (72.2%), followed by BSNL (58.7%), Idea Cellular (43.3%), Vodafone (33.3%) and Bharti (30.0%). In the case Tata Teleservices only 10.5% complainants confirmed that got the feed back from call centre. Table 4.3.1.5. Did the call centre inform you the action taken on your complaint?
Service provider Yes No Total
Count 3 7 10 Bharti %age 30.0% 70.0% 100.0%
Count 18 36 54 Vodafone %age 33.3% 66.7% 100.0%
Count 13 17 30 Idea Cellular %age 43.3% 56.7% 100.0%
Count 27 19 46 BSNL %age 58.7% 41.3% 100.0%
Count 26 10 36 Rel Comm %age 72.2% 27.8% 100.0%
Count 2 17 19 Tata Teleservices %age 10.5% 89.5% 100.0%
Count 89 106 195 Total
%age 45.6% 54.4% 100.0% Graphical representation: The graph below shows the provider wise percentage of respondents who confirmed that they were informed by the call centre of the action taken on their complaints.
10.5%
30.0%
33.3%
43.3%
58.7%
72.2%
Tata Teleservices
Bharti
Vodafone
Idea Cellular
BSNL
Rel Comm

Assessment of Customer perception of Service and UP (E) SERVICE AREA Implementation and Effectiveness of Telecom Consumers Protection and Redressal of Grievances Regulations
© 441, (Basement), Jangpura, Mathura Road, New Delhi – 110014, India
Email: [email protected], URL: www.consumer-voice
114
4.3.2.6: Satisfaction with the resolution of complaints: The following table shows the responses of respondents in terms of level of satisfaction with the resolution of complaints by call centre/ customer care/ helpline.
Table 4.3.1.6. How satisfied are you with the system of resolving of your complaints by call centre/customer care/helpline?
Service provider Total
Very Satisfied
+ Satisfied
Very Satisfied
Satisfied
Very Dissatisfied +
Dissatisfied
Dissatisfied
Very Dissatisfied
Count 10 9 5 4 1 1 0 Bharti
%age 100.0% 90.0% 50.0% 40.0% 10.0% 10.0% 0.0% Count 54 54 13 41 0 0 0
Vodafone %age 100.0% 100.0% 24.1% 75.9% 0.0% 0.0% 0.0% Count 30 28 10 18 2 2 0
Idea Cellular %age 100.0% 93.3% 33.3% 60.0% 6.7% 6.7% 0.0% Count 46 44 9 35 2 2 0
BSNL %age 100.0% 95.7% 19.6% 76.1% 4.3% 4.3% 0.0% Count 36 36 9 27 0 0 0
Rel Comm %age 100.0% 100.0% 25.0% 75.0% 0.0% 0.0% 0.0% Count 19 17 3 14 2 2 0
Tata Teleservices %age 100.0% 89.5% 15.8% 73.7% 10.5% 10.5% 0.0%
Count 195 188 49 139 7 7 0 Total
%age 100.0% 96.4% 25.1% 71.3% 3.6% 3.6% 0.0%
• Maximum percentage of satisfied consumers (very satisfied and satisfied) were reported in the case of Vodafone and Rel Comm (100%), followed by BSNL (95.7%) and Idea (93.3%).Whereas the lowest were in the case of Tata Teleservices (89.5%), closely followed by Bharti (90.0%).
• The highest percentage of very satisfied consumers was found in the case of Bharti (50%), which was followed by Idea (33.3%) and Rel Comm (25.0%).
• As far as dissatisfaction (very dissatisfied and dissatisfied) is concerned the highest percentage of respondents were reported from Tata Teleservices (10.5%) followed by Bharti (10.0%). None of the customers reported that they were very dissatisfied with the resolution of their complaints.

Assessment of Customer perception of Service and UP (E) SERVICE AREA Implementation and Effectiveness of Telecom Consumers Protection and Redressal of Grievances Regulations
© 441, (Basement), Jangpura, Mathura Road, New Delhi – 110014, India
Email: [email protected], URL: www.consumer-voice
115
Graphical representation: The graph below shows the provider wise percentage of satisfied and dissatisfied consumers with resolution of their complaints by the call centre. .
89.5%
90.0%
93.3%
95.7%
100.0%
100.0%
10.5%
10.0%
6.7%
4.3%
Tata Teleservices
Bharti
Idea Cellular
BSNL
Vodafone
Rel Comm
Very Satisfied + Satisfied Very Dissatisfied + Dissatisfied

Assessment of Customer perception of Service and UP (E) SERVICE AREA Implementation and Effectiveness of Telecom Consumers Protection and Redressal of Grievances Regulations
© 441, (Basement), Jangpura, Mathura Road, New Delhi – 110014, India
Email: [email protected], URL: www.consumer-voice
116
4.3.2.7: Reasons for dissatisfaction with the resolution of complaints: Respondents who were dissatisfied or very dissatisfied (Question No. 39) were asked to specify the reasons for their dissatisfaction. Various reasons were specified by the consumers. Among them “Customer Care executive was unable to understand the problem” was cited as the main reason. This was cited by 57.1% of dissatisfied consumers. The two other important reasons were cited as “time taken by call center for redressal of complaint is too long” and “difficult to connect to the call centre executive”. – reported by around 43% of dissatisfied consumers.
Table 4.3.2.7 Please specify the reason(s) for your dissatisfaction with resolution of complaint by call centre/ customer care executive/ helpline
Service provider
Difficult to connect to the call
centre executive
Customer care executive not
polite/courteous
Customer care
executive not
equipped with
adequate information
Time taken by
call centre for
redressal of complaint is too long
Customer care
executive was unable
to understand the problem
Total
Count 1 1 0 0 1 Bharti
%age 100.0% 100.0% 0.0% 0.0% 100.0% 1
Count 0 0 0 0 1 2 Idea Cellular %age 0.0% 0.0% 0.0% 0.0% 50.0% Count 0 0 2 1 1 2 BSNL %age 0.0% 0.0% 100.0% 50.0% 50.0% Count 2 0 0 2 1 Tata
Teleservices %age 100.0% 0.0% 0.0% 100.0% 50.0% 2
Count
3 1 2 3 4 Total
%age 42.9% 14.3% 28.6% 42.9% 57.1% 7
Note: sum may not add because of multiple response

Assessment of Customer perception of Service and UP (E) SERVICE AREA Implementation and Effectiveness of Telecom Consumers Protection and Redressal of Grievances Regulations
© 441, (Basement), Jangpura, Mathura Road, New Delhi – 110014, India
Email: [email protected], URL: www.consumer-voice
117
4.3.2.8: Resolution of billing complaints: The following table shows that out of 195 respondents who had complained to call center/customer care, 158 had billing related complaints. Out of these 135, 85.4% had confirmed that their complaint was satisfactorily resolved by call centre/ customer care within four weeks after lodging the complaint. This was found to be highest in the case of Bharti and Rel Comm (100% each) followed by BSNL (97.7%) and Vodafone (77.6%). In the case of Idea Cellular this was confirmed by only 66.7% of customers followed by Tata Teleservices (54.5%).
Table 4.3.2.8. Was your billing complaint resolved satisfactorily by call centre/customer care within four weeks after lodging of the complaint?
Service provider Yes No Total applicable
Count 4 0 4 Bharti %age 100.0% 0.0% 100.0%
Count 38 11 49 Vodafone %age 77.6% 22.4% 100.0%
Count 12 6 18 Idea Cellular %age 66.7% 33.3% 100.0%
Count 42 1 43 BSNL %age 97.7% 2.3% 100.0%
Count 33 0 33 Rel Comm %age 100.0% 0.0% 100.0%
Count 6 5 11 Tata Teleservices %age 54.5% 45.5% 100.0%
Count 135 23 158 Total
%age 85.4% 14.6% 100.0% Graphical representation: The percentage of respondents who confirmed that their billing complaints were resolved satisfactorily by call centre/ customer cared with four weeks after lodging the complaint.
54.50%
66.70%
77.60%
97.70%
100.00%
100.00%
Tata Teleservices
Idea Cellular
Vodafone
BSNL
Bharti
Rel Comm

Assessment of Customer perception of Service and UP (E) SERVICE AREA Implementation and Effectiveness of Telecom Consumers Protection and Redressal of Grievances Regulations
© 441, (Basement), Jangpura, Mathura Road, New Delhi – 110014, India
Email: [email protected], URL: www.consumer-voice
118
4.3.2.9: Awareness about the contact details of nodal officers: The respondents were asked about their awareness about three stages of redressal mechanism (Question No. 35.).10 (0.3%) respondents had reported that they were aware about Nodal officers. However, awareness about the contact details of nodal officers was found to be abysmally low. Only 3 knew about their contact details.
4.3.1.9. Are you aware of the contact details of the Nodal Officer?
Service provider Yes No Total
Count 1 1 2 Vodafone
%age 50.0% 50.0% 100.0% Count 0 1 1
Idea %age 0.0% 100.0% 100.0% Count 0 1 1
Rel Comm %age 0.0% 100.0% 100.0% Count 2 4 6 Tata
Teleservices %age 33.3% 66.7% 100.0% Count 3 7 10
Total %age 30.0% 70.0% 100.0%
4.3.2.10 Complaints to Nodal officer: None of the customers who were aware of the contact details of nodal officer had made any complaint to Nodal Officers, which were not resolved or unsatisfactorily resolved by customer care executive/ call centre. Therefore, the analysis of redressal mechanism with the Nodal Officer could not be ascertained. 4.3.2.11: Awareness about the contact details of Appellate Authority:
As regard to the awareness about the contact details of the Appellate Authority out of 19 respondents who had reported that they were aware about Appellate Authority, none of them were aware about their contact details for filing of appeals on complaints which were not resolved or unsatisfactorily resolved by Nodal officer. Therefore, the analysis of redressal mechanism with the Appellate Authority could not be ascertained.
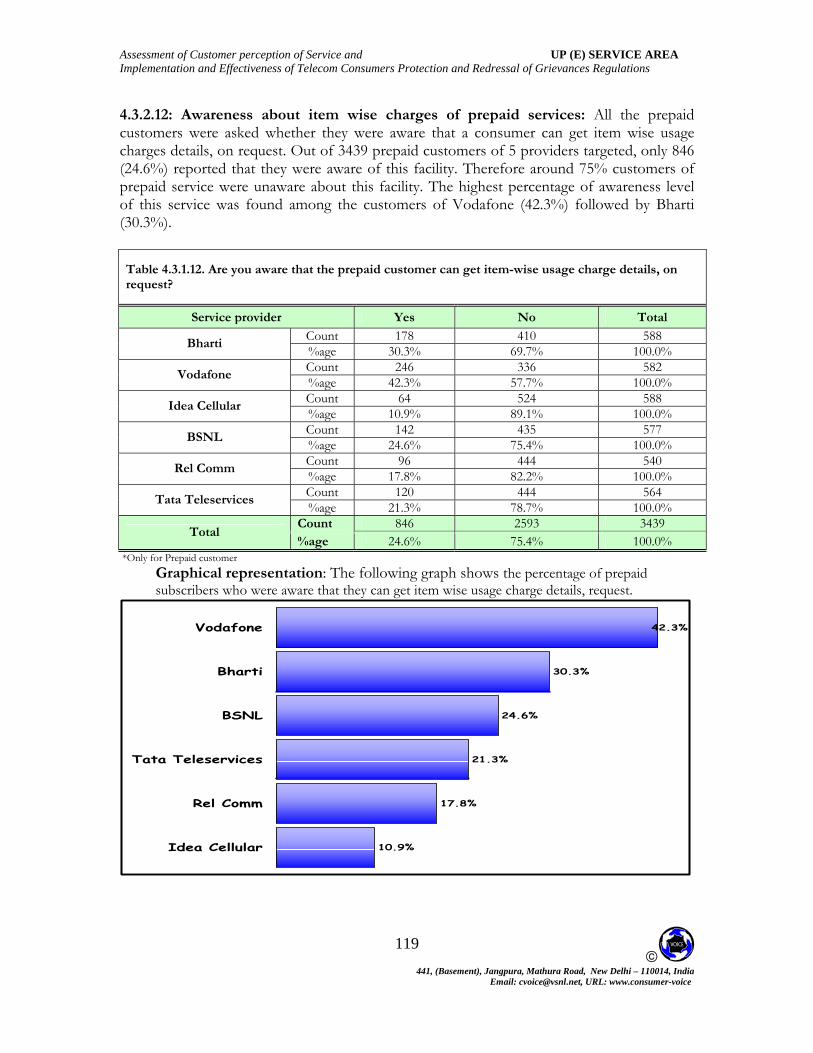
Assessment of Customer perception of Service and UP (E) SERVICE AREA Implementation and Effectiveness of Telecom Consumers Protection and Redressal of Grievances Regulations
© 441, (Basement), Jangpura, Mathura Road, New Delhi – 110014, India
Email: [email protected], URL: www.consumer-voice
119
4.3.2.12: Awareness about item wise charges of prepaid services: All the prepaid customers were asked whether they were aware that a consumer can get item wise usage charges details, on request. Out of 3439 prepaid customers of 5 providers targeted, only 846 (24.6%) reported that they were aware of this facility. Therefore around 75% customers of prepaid service were unaware about this facility. The highest percentage of awareness level of this service was found among the customers of Vodafone (42.3%) followed by Bharti (30.3%).
Table 4.3.1.12. Are you aware that the prepaid customer can get item-wise usage charge details, on request?
Service provider Yes No Total
Count 178 410 588 Bharti %age 30.3% 69.7% 100.0%
Count 246 336 582 Vodafone %age 42.3% 57.7% 100.0%
Count 64 524 588 Idea Cellular %age 10.9% 89.1% 100.0%
Count 142 435 577 BSNL %age 24.6% 75.4% 100.0%
Count 96 444 540 Rel Comm %age 17.8% 82.2% 100.0%
Count 120 444 564 Tata Teleservices %age 21.3% 78.7% 100.0%
Count 846 2593 3439 Total
%age 24.6% 75.4% 100.0% *Only for Prepaid customer
Graphical representation: The following graph shows the percentage of prepaid subscribers who were aware that they can get item wise usage charge details, request.
10.9%
17.8%
21.3%
24.6%
30.3%
42.3%
Idea Cellular
Rel Comm
Tata Teleservices
BSNL
Bharti
Vodafone
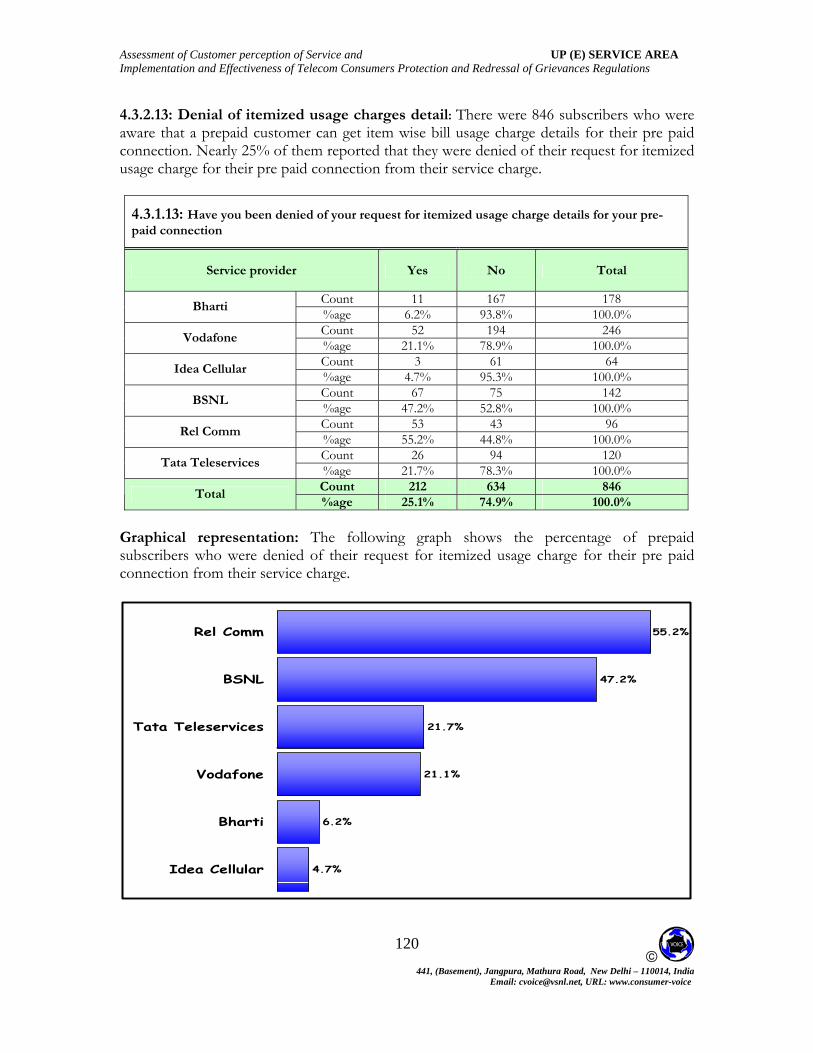
Assessment of Customer perception of Service and UP (E) SERVICE AREA Implementation and Effectiveness of Telecom Consumers Protection and Redressal of Grievances Regulations
© 441, (Basement), Jangpura, Mathura Road, New Delhi – 110014, India
Email: [email protected], URL: www.consumer-voice
120
4.3.2.13: Denial of itemized usage charges detail: There were 846 subscribers who were aware that a prepaid customer can get item wise bill usage charge details for their pre paid connection. Nearly 25% of them reported that they were denied of their request for itemized usage charge for their pre paid connection from their service charge.
4.3.1.13: Have you been denied of your request for itemized usage charge details for your pre-paid connection
Service provider Yes No Total
Count 11 167 178 Bharti %age 6.2% 93.8% 100.0%
Count 52 194 246 Vodafone %age 21.1% 78.9% 100.0%
Count 3 61 64 Idea Cellular %age 4.7% 95.3% 100.0%
Count 67 75 142 BSNL %age 47.2% 52.8% 100.0%
Count 53 43 96 Rel Comm %age 55.2% 44.8% 100.0%
Count 26 94 120 Tata Teleservices %age 21.7% 78.3% 100.0%
Count 212 634 846 Total
%age 25.1% 74.9% 100.0% Graphical representation: The following graph shows the percentage of prepaid subscribers who were denied of their request for itemized usage charge for their pre paid connection from their service charge.
4.7%
6.2%
21.1%
21.7%
47.2%
55.2%
Idea Cellular
Bharti
Vodafone
Tata Teleservices
BSNL
Rel Comm

Assessment of Customer perception of Service and UP (E) SERVICE AREA Implementation and Effectiveness of Telecom Consumers Protection and Redressal of Grievances Regulations
© 441, (Basement), Jangpura, Mathura Road, New Delhi – 110014, India
Email: [email protected], URL: www.consumer-voice
121
4.3.2.14: Reason (s) for Denial of itemized usage charges detail: Out of these 212 respondents, who reported about denial of itemized usage charges details, 143 (67.5%) reported that they were given the reason as technical problem while the rest 69 (32.5%) reported that they were given no reason for denial of itemized usage charges details
Table 4.3.1.14: What were the reason(s) for denying your request?
Service provider No reason
given Technical Problem
Total
Count 0 11 11 Bharti
%age 0.0% 100.0% 100.0%
Count 17 35 52 Vodafone
%age 32.7% 67.3% 100.0%
Count 0 3 3 Idea Cellular
%age 0.0% 100.0% 100.0%
Count 27 40 67 BSNL
%age 40.3% 59.7% 100.0%
Count 15 38 53 Rel Comm
%age 28.3% 71.7% 100.0%
Count 10 16 26 Tata Teleservices
%age 38.5% 61.5% 100.0%
Count 69 143 212 Total
%age 32.5% 67.5% 100.0%

Assessment of Customer perception of Service and UP (E) SERVICE AREA Implementation and Effectiveness of Telecom Consumers Protection and Redressal of Grievances Regulations
© 441, (Basement), Jangpura, Mathura Road, New Delhi – 110014, India
Email: [email protected], URL: www.consumer-voice
122
4.3.2.15: Provision of Manual of Practice by the Service Provider: TRAI has suggested to all the service providers to provide manual of practice to the new customers. Out of 964 new respondents, who had subscribed in last 6 months, 578 (60%) indicated that they have not been provided the manual of practice containing the terms and condition of service, grievances redressal mechanism while taking the connection. Among the 386 respondents who got the manual of practice, BSNL topped with 46.8% followed by Tata Teleservices (46.1%), Vodafone(40.4%) Idea Cellular (38.1%), Rel Comm (33.7%) and Bharti (27.9%).
Table 4.3.1.14: Have you been provided the Manual of Practice containing the terms and conditions of service, grievance redressal mechanism etc. while taking the connection?
Service provider Yes No Total Count 31 80 111
Bharti %age 27.9% 72.1% 100.0% Count 80 118 198
Vodafone %age 40.4% 59.6% 100.0% Count 80 130 210
Idea Cellular %age 38.1% 61.9% 100.0% Count 65 74 139
BSNL %age 46.8% 53.2% 100.0% Count 30 59 89
Rel Comm %age 33.7% 66.3% 100.0% Count 100 117 217
Tata Teleservices %age 46.1% 53.9% 100.0% Count 386 578 964
Total %age 40.0% 60.0% 100.0%
Graphical representation: The graph below shows provider wise subscribers who confirmed that they received the manual of practice at the time of connection.
27.9%
33.7%
4%
.8%
38.1%
40.
46BSNL
46.1%Tata Teleservices
Bharti
Rel Comm
Idea Cellular
Vodafone

Assessment of Customer perception of Service and UP (E) SERVICE AREA Implementation and Effectiveness of Telecom Consumers Protection and Redressal of Grievances Regulations
© 441, (Basement), Jangpura, Mathura Road, New Delhi – 110014, India
Email: [email protected], URL: www.consumer-voice
123
Con er Prote and Re al of anceCELLULAR MOBILE
vider ore on provis e Te Consction and Redressal of Grievances
S.N. Sub Vodafone Cellular
RTeleservices
Overall Score – Telecom sum ction dress Griev s
The following table shows the proProte
wise sc Act.
various ions of th lecom umer
Parameter Bharti Idea
BSNL el CommTata
1 Awareness of three stage grievance mechanism 8.2% 21.5% 17.3% 8.0% 18.0% 21.2%
2 For pre-paid customers awareness about itwise usage c
em-harge details on request 30.3% 42.3% 10.9% 24.6% 17.8% 21.3%
3 denied
rge details for pre paid connection
6.2% 21.1% 4.7% 47.2% 55.2% 21.7% If aware (for pre-paid customers )everof item wise usage cha
4 For new customeof practice while t 46.1% rs provisioning of "Manual
aking the new connection 27.9% 40.4% 38.1% 46.8% 33.7%
5 Awareness of callgrievances 90.5% center for redressing 96.8% 91.2% 95.5% 93.8% 93.7%
6 Penetration o oto the toll free nu 3.2% f c nsumers made any complaint
mber within last six months 1.7% 9.0% 5.0% 7.7% 6.0%
7 Call center informon complaint 10.5% ing about the action taken 30.0% 33.3% 43.30% 58.7% 72.2%
8 Resolution of mwith in 4 wee o 54.5% co plaint by customer care
ks f lodging complaint 100.0% 77.6% 66.7% 97.7% 100.0%
9 Percentage sa fiby call center 89.5% tis 90.0% 100.0% 93.3% 95.7% 100.0% ed with complaint resolution
10 Awareness of nodgrievances 1.0% al officer for redressing 0.0% 0.3% 0.2% 0.0% 0.2%
11 Awareness of appredressing grievan 0.2% ellate authority for
ces 0.0% 0.2% 0.0% 0.0% 0.7%
• Awareness level on the three stages of consumer grievances redressal mechanism was found to be low and it ranged from 8.0% to 21.5%. The highest percentage of aware subscribers were found in the case of Vodafone (21.5%) followed by Tata Teleservices (21.2%), Rel Comm (18.0%), Idea Cellular (17.3%), Bharti (8.2%) and the lowest percentage of aware consumers was found in the case of BSNL (8.0%).
• Awareness level was found high in the case of call centre/ customer care help line numbers. This was found in the range of 90.5% to 96.8%. This was found to be highest in the case of Bharti (96.8%) followed by Idea Cellular (95.5%), BSNL (93.8%), Rel Comm (93.7%), Vodafone (91.2%) & Tata Teleservices (90.5%).
• Awareness about the Nodal Officer was found to be abysmally low and ranged from 0.0% (Bhariti & BSNL each) to 1.0% (Tata Teleservices).
• Similarly, the awareness was also found to be low in the case of Appellate Authority, which ranged from 0.0% (Bharti, Idea Cellular & BSNL) to 0.7% (Rel Comm).
• Highest number of complaints to the call centre, within last six months, were made by the subscribers of Vodafone (9.0%), closely followed by BSNL (7.7%), Rel Comm (6.0%), Idea Cellular (5.0%), Tata Teleservices (3.2%) and Bharti (1.7%).
• Awareness about item wise usage charges in the case of pre paid services was reported to be highest in the case of Vodafone (42.3%) followed by Bharti (30.3%), BSNL (24.6%), Tata Teleservices (21.3%), Rel Comm (17.8%) and Idea Cellular (10.9%).
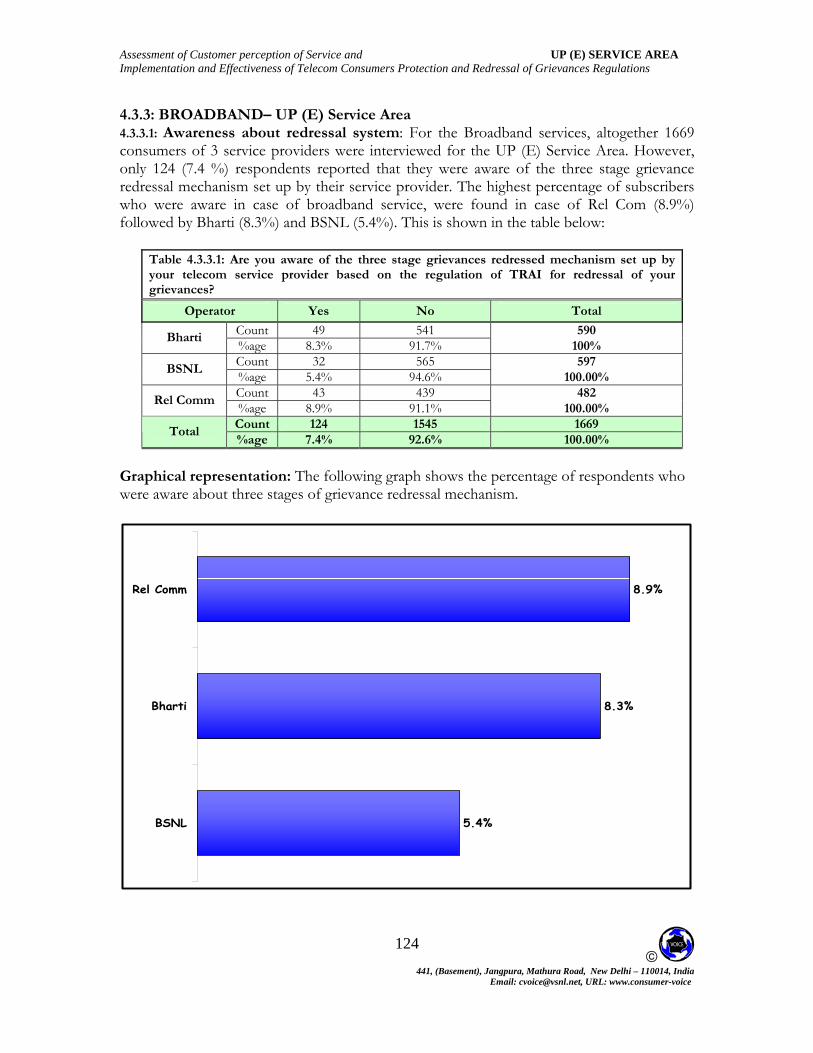
Assessment of Customer perception of Service and UP (E) SERVICE AREA Implementation and Effectiveness of Telecom Consumers Protection and Redressal of Grievances Regulations
© 441, (Basement), Jangpura, Mathura Road, New Delhi – 110014, India
Email: [email protected], URL: www.consumer-voice
124
4.3.3: BROADBAND– UP (E) Service Area 4.3.3.1: Awareness about redressal system: For the Broadband services, altogether 1669 consumers of 3 service providers were interviewed for the UP (E) Service Area. However, only 124 (7.4 %) respondents reported that they were aware of the three stage grievance redressal mechanism set up by their service provider. The highest percentage of subscribers who were aware in case of broadband service, were found in case of Rel Com (8.9%) followed by Bharti (8.3%) and BSNL (5.4%). This is shown in the table below:
Table 4.3.3.1: Are you aware of the three stage grievances redressed mechanism set up by your telecom service provider based on the regulation of TRAI for redressal of your grievances?
Operator Yes No Total
Count 49 541 590 Bharti %age 8.3% 91.7% 100% Count 32 565 597
BSNL %age 5.4% 94.6% 100.00% Count 43 439 482
Rel Comm %age 8.9% 91.1% 100.00% Count 124 1545 1669
Total %age 7.4% 92.6% 100.00%
Graphical representation: The following graph shows the percentage of respondents who were aware about three stages of grievance redressal mechanism.
5.4%
8.3%
8.9%
BSNL
Bharti
Rel Comm

Assessment of Customer perception of Service and UP (E) SERVICE AREA Implementation and Effectiveness of Telecom Consumers Protection and Redressal of Grievances Regulations
© 441, (Basement), Jangpura, Mathura Road, New Delhi – 110014, India
Email: [email protected], URL: www.consumer-voice
125
4.3.3.2: Awareness about three stages of redressal system: The respondents were also asked about the three stages of redressal mechanism by naming them – Call centre, Nodal officers and Appellate authority. The following table shows their awareness level with respect to each of the stage mentioned above.
Table 4.3.3.2 Which all stages of the three stage mechanism process set up by your telecom service provider for redressal of grievances of telecom consumers are you aware of?
Operator Call
centre Nodal Officer
Appellate Authority
None of these
Total
Count 532 41 4 32
Bharti %age 99.3% 16.3% 4.8% 17.0% 590
Count 570 9 6 21
Rel Com %age 100.0% 3.3% 3.8% 10.8% 597
Count 461 5 5 21
BSNL %age 2.2% 482
100.0% 1.0% 6.0%
Count 1563 55 15 74
Total %age 99.7% 5.5% 3.2% 10.1% 1669
*Multiple response therefore sum may not add
• Out of 1669 respondents targeted, 1563 (99.7%) were aware of call centers of their providers. In the case of BSNL Rel Comm, all the customers reported to be aware of call center facility.
• Only 5.5% of respondents were aware about the Nodal officers. This was found to be highest in case of Bharti (16.3%) followed by Rel Com (3.3%). BSNL subscribers were least aware about the Nodal Officers (1.0%).
• Only 15 subscribers (3.2%) were aware about Appellate Authority. This was reported to be lowest in the case of BSNL subscribers (2.2%).
• 74 (10.1%) respondents had also reported that they were not aware of any of the
three stages. Out of these maximum customers belonged to Bharti (17.0%).

Assessment of Customer perception of Service and UP (E) SERVICE AREA Implementation and Effectiveness of Telecom Consumers Protection and Redressal of Grievances Regulations
© 441, (Basement), Jangpura, Mathura Road, New Delhi – 110014, India
Email: [email protected], URL: www.consumer-voice
126
Graphical representation: The following graph shows the percentage of respondents who were aware about Call Centre, Nodal Officers and Appellate Authority.
99.3% 100.0% 100.0%
3.3%16.3%
1.0%
4.8%
2.2%3.8%
Bharti BSNL Rel Com
Call centre Nodal Officer Appellate Authority

Assessment of Customer perception of Service and UP (E) SERVICE AREA Implementation and Effectiveness of Telecom Consumers Protection and Redressal of Grievances Regulations
© 441, (Basement), Jangpura, Mathura Road, New Delhi – 110014, India
Email: [email protected], URL: www.consumer-voice
127
4.3.3.3: Consumers’ complaints about services: The Respondents were asked if they had made any complaints within last six months to call centre/helpline number. The table below shows that out of 1669 respondents, only 565 (33.9%) respondents had used this facility. The highest number of respondents who had made complaints were from Rel Comm (44.4%) followed by BSNL (31.7%).Whereas; the lowest number of complaints were made by the customers of Bharti (27.5%).
Table 4.3.3.3. Have you made any complain within 6 month to the toll free call center/customer care /helpline telephone number?
Operator Yes No Total Count 162 428
Bharti %age 27.5% 72.5% 590 Count 189 408
BSNL %age 31.7% 68.3% 597 Count 214 268
Rel Com %age 44.4% 55.6% 482 Count 565 1104
Total %age 33.9% 66.1% 1669
Graphical representation: The graph below shows the percentage of respondents who had made any complaint within last 6 months to the toll free call centre/customer care/ Helpline telephone number of their service provider.
27.5%
31.7%
44.4%
Bharti
BSNL
Rel Comm

Assessment of Customer perception of Service and UP (E) SERVICE AREA Implementation and Effectiveness of Telecom Consumers Protection and Redressal of Grievances Regulations
© 441, (Basement), Jangpura, Mathura Road, New Delhi – 110014, India
Email: [email protected], URL: www.consumer-voice
128
4.3.3.4: Receipt of docket number against complaints: Respondents those who made complaints to call centre/ helpline numbers were asked whether they had received docket numbers for their complaints. Out of 565 respondents who had made a complaint, 80.9% confirmed that they had received docket number for most of their complaints. However 19.1 % indicated that they didn’t receive any docket number for most of their complaints. Table 4.3.3.4. Redressal of grievances mechanism provide for allotting docket number to consumers on his making the complaint. Please specify which of these applied the most to you?
Operator
No docket number
received even on request
No docket number received for most of
the complaints
Docket number received for most of
the complaints Total
Count 0 20 142 Bharti %age 0.0% 12.3% 87.7%
162
Count 0 43 146 BSNL %age 0.0% 22.8% 77.2% 189
Count 0 45 169 Rel Com %age 0.0% 21.0% 79.0% 214
Count 0 108 457 Total %age 0.0% 19.1% 80.9%
565
Graphical representation: The graphs show that highest number of respondents who had reported that they received docket number came from Bharti (87.7%) followed by Rel Comm (79.0%) and BSNL (77.2%)
12.3%
21.0% 22.8%
87.7%
77.2% 79.0%
Bharti BSNL Rel Comm
No docket number received for most of the complaints
Docket number received for most of the complaints

Assessment of Customer perception of Service and UP (E) SERVICE AREA Implementation and Effectiveness of Telecom Consumers Protection and Redressal of Grievances Regulations
© 441, (Basement), Jangpura, Mathura Road, New Delhi – 110014, India
Email: [email protected], URL: www.consumer-voice
129
4.3.3.5: Feed back from Call Centre: The respondents who had made complaints to call centre/ helpline numbers were also asked whether call centre informed them about the action taken on complaints. Out of 565 respondents, 30.8 % had reported that they were informed by call center for the action taken on their complaints. This was found to be highest in the case of Bharti (43.2 %), followed by BSNL (33.3%) and Rel Comm (19.2%)
Table 4.3.3.5. Did the call centre inform you the action taken on your complaint?
Operator Yes No Total
Count 70 92 Bharti %age 43.2% 56.8% 162
Count 63 126 BSNL %age 33.3% 66.7% 189
Count 41 173 Rel Com %age 19.2% 80.8% 214
Count 174 391
Total %age 30.8% 69.2% 565
Graphical representation: The graph below shows the provider wise percentage of respondents who confirmed that they were informed by the call centre of the action taken on their complaints.
19.2%
33.3%
43.2%
Rel Com
BSNL
Bharti

Assessment of Customer perception of Service and UP (E) SERVICE AREA Implementation and Effectiveness of Telecom Consumers Protection and Redressal of Grievances Regulations
© 441, (Basement), Jangpura, Mathura Road, New Delhi – 110014, India
Email: [email protected], URL: www.consumer-voice
130
4.3.3.6: Satisfaction with the resolution of complaints: The following table shows the responses of respondents in terms of level of satisfaction with the resolution of complaints by call centre/ customer care/ helpline.
Table 4.3.3.6. How satisfied are you with the system of resolving of your complaints by call centre/customer care/helpline?
Operator Very
Dissatisfied Dissatisfied
Very Dissatisfied +Dissatisfied
Satisfied Very
Satisfied
Very Satisfied + Satisfied
Total
Count 0 54 54 105 3 108 311 Bharti
33.3% Row% 0.0% 33.3% 64.8% 1.9% 66.7% 100.0%
Count 0 60 60 128 1 129 311 BSNL
Row% 0.0% 31.7% 31.7% 67.8% 0.5% 68.3% 100.0%
Count 0 30 30 179 5 184 360 Rel Comm
Row% 0.0% 14.0% 14.0% 83.4% 2.3% 86.0% 100.0%
Count 0 144 144 412 9 421 671 Total
Row% 0.0% 25.5% 25.5% 72.9% 1.6% 74.5% 100.0%
• Maximum percentage of satisfied consumers (very satisfied and satisfied) were
reported in the case of Rel Comm (86%), followed by BSNL (68.3%).Whereas the lowest were in the case of Bharti (66.7%).
• The overall percentage of very satisfied customers was very low (1.6%).The highest percentage of very satisfied consumers was found in the case of Rel Comm (2.3%), followed by Bharti (1.9%) and BSNL (0.5%).
• As far as dissatisfaction (very dissatisfied and dissatisfied) is concerned the highest percentage of respondents were reported from Bharti (33.3%) followed by BSNL (31.7%).None of the customers reported that they were very dissatisfied with the resolution of their complaints.
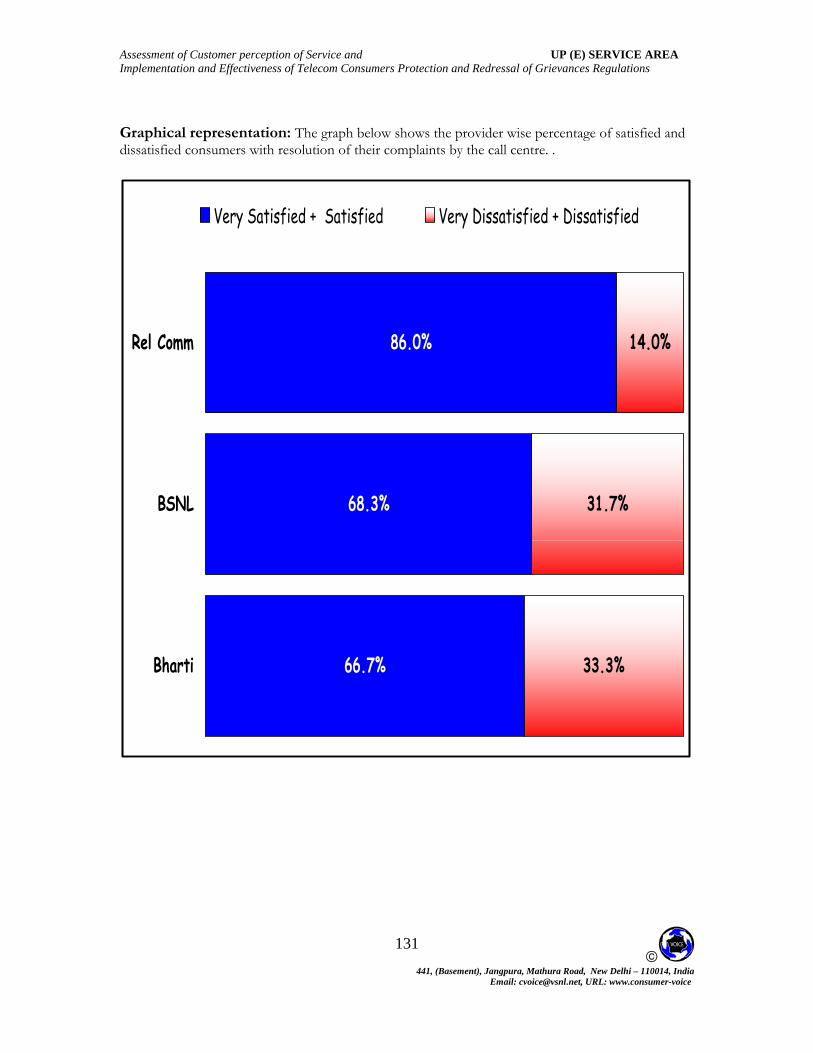
Assessment of Customer perception of Service and UP (E) SERVICE AREA Implementation and Effectiveness of Telecom Consumers Protection and Redressal of Grievances Regulations
© 441, (Basement), Jangpura, Mathura Road, New Delhi – 110014, India
Email: [email protected], URL: www.consumer-voice
131
Graphical representation: The graph below shows the provider wise percentage of satisfied and dissatisfied consumers with resolution of their complaints by the call centre. .
66.7%
68.3%
86.0%
33.3%
31.7%
14.0%
Bharti
BSNL
Rel Comm
Very Satisfied + Satisfied Very Dissatisfied + Dissatisfied

Assessment of Customer perception of Service and UP (E) SERVICE AREA Implementation and Effectiveness of Telecom Consumers Protection and Redressal of Grievances Regulations
© 441, (Basement), Jangpura, Mathura Road, New Delhi – 110014, India
Email: [email protected], URL: www.consumer-voice
132
4.3.3.7: Reasons for dissatisfaction with the resolution of complaints: Respondents who were dissatisfied or very dissatisfied (Question No. 29) were asked to specify the reasons for their dissatisfaction.
Table 4.3.3.7. Please specify the reason(s) for your dissatisfaction with the resolution of complaints
Operator
Difficult to connect to the
call center executive
customer care executive not polite\courte
ous
customer care executive not equipped with
adequate information
Time taken by call centre for redressal of complaint is
long
Customer care
executive was unable
to understand the problem
Total
Count 34 14 11 3 9 Bharti %age 63.0% 25.9% 20.4% 5.6% 16.7% 54
Count 29 11 17 21 10 BSNL %age 48.3% 18.3% 28.3% 35.0% 16.7% 60
Count 14 9 9 11 5 Rel Comm %age 46.7% 30.0% 30.0% 36.7% 16.7% 30
Count 77 34 37 35 24 Total %age 53.5% 23.6% 25.7% 24.3% 16.7% 144
Note: sum may not add because of multiple response
• Various reasons were specified by the consumers. Among them “Difficult to connect to the call centre executive” was cited as the main reason. This was cited by 53.5% of dis-satisfied consumers. This was cited maximum in the case of Bharti (63%), followed by BSNL (48.3%) and Rel Comm (46.7%).
• The other reason “Customer care executive not equipped with adequate
information” was cited by 25.7% of the respondents. This was reported highest in the case of Rel Comm (30.0%), followed by BSNL (28.3%) and Bharti (20.4%).
• Another important reason cited by 24.3% of the respondents was “time taken by
call center for redressal of complaint is too long”. This was found highest in the case of Rel Comm (36.7%) followed by BSNL (35.0%) and Bharti (5.6%).
• “Customer care executive not polite/courteous” was also reported by 23.6% of
the respondents. This was found highest in the case of Rel Com (30%), followed by Bharti (25.9%) and BSNL (18.3%).
• Similarly, “Customer care executive was unable to understand the problem”
was also cited by 14 (16.7%) of complainants. This was reported by 9-10 complaints from each of the service provider covered in UP (E)

Assessment of Customer perception of Service and UP (E) SERVICE AREA Implementation and Effectiveness of Telecom Consumers Protection and Redressal of Grievances Regulations
© 441, (Basement), Jangpura, Mathura Road, New Delhi – 110014, India
Email: [email protected], URL: www.consumer-voice
133
4.3.3.8: Resolution of billing complaints: The following table shows that out of 565 respondents who had complained to call center/customer care, 268 had billing related complaints. Out of these 268, only 36.6% had confirmed that their complaint was satisfactorily resolved by call centre/ customer care within four weeks after lodging of the complaint. This was found to be highest in the case of Rel Comm (44%) followed by BSNL (41%) and Bharti (22.4%) Table 4.3.3.8 Was your billing resolved satisfactorily by call center/customer care within four weeks after lodging of the complaint?
Operator Yes No Total
Count 17 59 Bharti
%age 22.4% 77.6% 76
Count 48 69 BSNL
%age 41.0% 59.0% 117
Count 33 42 Rel Comm
%age 44.0% 56.0% 75
Count 98 170 Total
%age 36.6% 63.4% 268
Graphical representation: The percentage of respondents who confirmed that their billing complaints were resolved satisfactorily by call centre/ customer cared with four weeks after lodging the complaint.
22.4%
41.0%
44.0%
Bharti
BSNL
Rel Comm
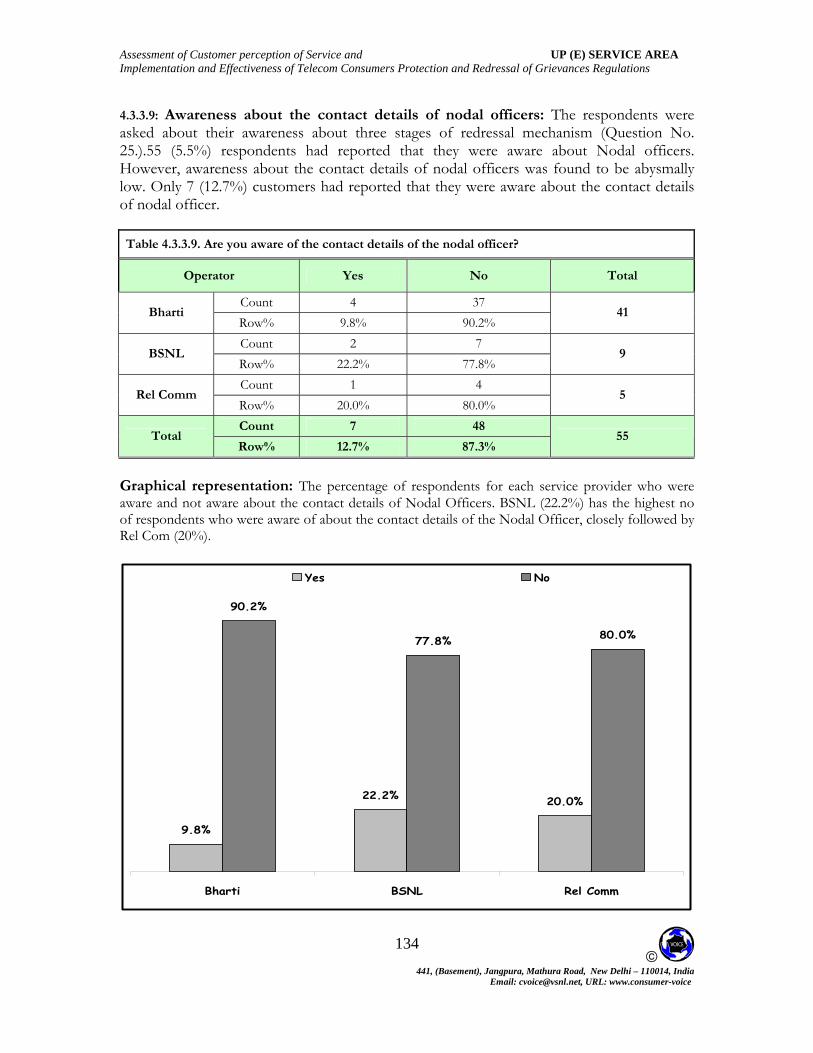
Assessment of Customer perception of Service and UP (E) SERVICE AREA Implementation and Effectiveness of Telecom Consumers Protection and Redressal of Grievances Regulations
© 441, (Basement), Jangpura, Mathura Road, New Delhi – 110014, India
Email: [email protected], URL: www.consumer-voice
134
4.3.3.9: Awareness about the contact details of nodal officers: The respondents were asked about their awareness about three stages of redressal mechanism (Question No. 25.).55 (5.5%) respondents had reported that they were aware about Nodal officers. However, awareness about the contact details of nodal officers was found to be abysmally low. Only 7 (12.7%) customers had reported that they were aware about the contact details of nodal officer.
Table 4.3.3.9. Are you aware of the contact details of the nodal officer?
Operator Yes No Total
Count 4 37 Bharti
Row% 9.8% 90.2% 41
Count 2 7 BSNL
Row% 22.2% 77.8% 9
Count 1 4 Rel Comm
Row% 20.0% 80.0% 5
Count 7 48 Total
Row% 12.7% 87.3% 55
Graphical representation: The percentage of respondents for each service provider who were aware and not aware about the contact details of Nodal Officers. BSNL (22.2%) has the highest no of respondents who were aware of about the contact details of the Nodal Officer, closely followed by Rel Com (20%).
90.2%
77.8% 80.0%
9.8%
22.2% 20.0%
Bharti BSNL Rel Comm
Yes No

Assessment of Customer perception of Service and UP (E) SERVICE AREA Implementation and Effectiveness of Telecom Consumers Protection and Redressal of Grievances Regulations
© 441, (Basement), Jangpura, Mathura Road, New Delhi – 110014, India
Email: [email protected], URL: www.consumer-voice
135
.3.3.10 Complaints to Nodal officer:
one of the customers who were aware of the contact details of nodal officer had made any omplaint to Nodal officers, which were not resolved or unsatisfactorily resolved by call entre/ customer care executive. Therefore, the analysis of redressal mechanism with the odal officer could not be ascertained.
.3.3.11: Awareness about the contact details of Appellate Authority:
s regard to the awareness about the contact details of the Appellate Authority. Out of 15 spondents who had reported that they were aware about Appellate Authority, none of em were aware about their contact details for filing of appeals on complaints which were
ot resolved or unsatisfactorily resolved by Nodal officer. Therefore, the analysis of redressal echanism with the Appellate Authority could not be ascertained
4 NccN
4
Arethnm
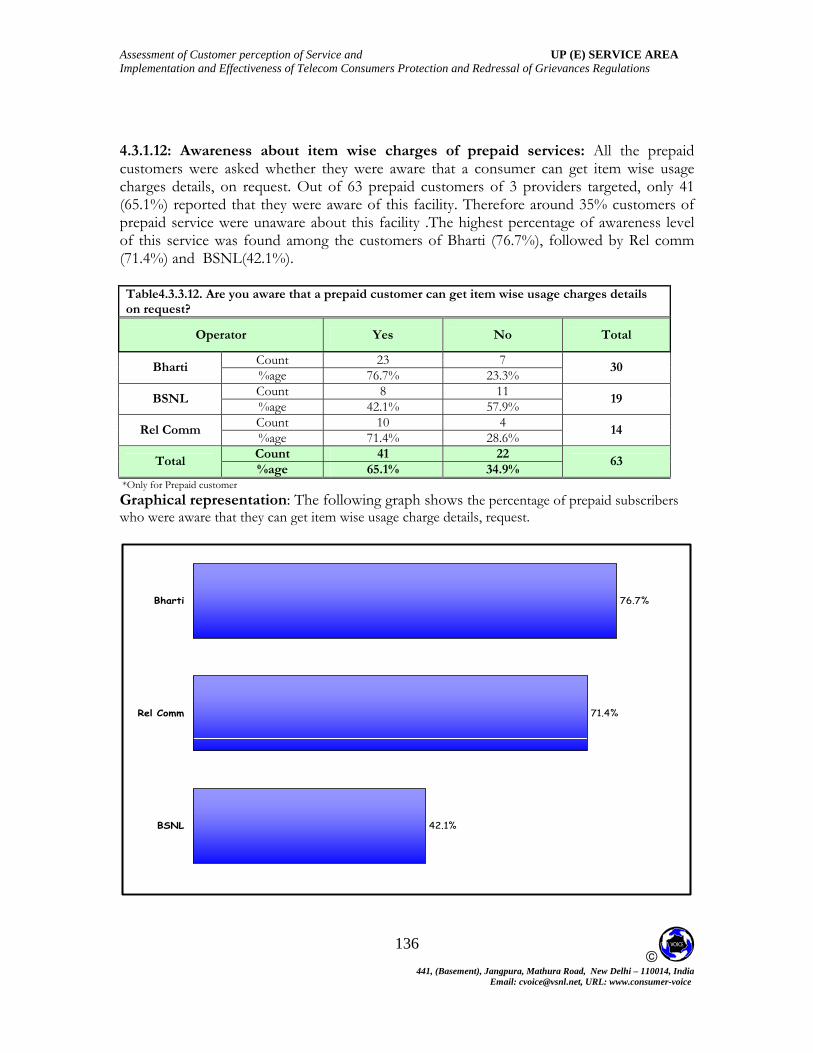
Assessment of Customer perception of Service and UP (E) SERVICE AREA Implementation and Effectiveness of Telecom Consumers Protection and Redressal of Grievances Regulations
© 441, (Basement), Jangpura, Mathura Road, New Delhi – 110014, India
Email: [email protected], URL: www.consumer-voice
136
e oviders targeted, only 41
are of this facility. Therefore around 35% customers of prepaid service were unaware about this facility .The highest percentage of awareness level of this service was found among the customers of Bharti (76.7%), followed by Rel comm (71.4%) and BSNL(42.1%). Table4.3.3.12. Are you aware that a prepaid customer can get item wise usage charges details on request?
4.3.1.12: Awareness about item wise charges of prepaid services: All the prepaid customers were asked whether they were aware that a consumer can get item wise usagharges details, on request. Out of 63 prepaid customers of 3 prc
(65.1%) reported that they were aw
Operator Yes No Total
Count 23 7 Bharti %age 76.7% 23.3% 30
Count 8 11 BSNL %age 42.1% 57.9% 19
Count 10 4 Rel Comm %age 71.4% 28.6% 14
Count 41 22 Total
%age 65.1% 34.9% 63
*Only for Prepaid customer Graphical representation: The following graph shows the percentage of prepaid subscribers who were aware that they can get item wise usage charge details, request.
42.1%
71.4%
76.7%
BSNL
Rel Comm
Bharti

Assessment of Customer perception of Service and UP (E) SERVICE AREA Implementation and Effectiveness of Telecom Consumers Protection and Redressal of Grievances Regulations
© 441, (Basement), Jangpura, Mathura Road, New Delhi – 110014, India
Email: [email protected], URL: www.consumer-voice
137
4.3.3.13: Denial of itemized usage charges detail: There were 41 subscribers who were aware that a prepaid customer can get item wise bill usage charge details for their pre paid connection. However, none of the customers reported that they were denied their request for itemized usage charge for their pre paid connection from their service charge. 4.3.3.14: Reason (s) for Denial of itemized usage charges detail: Since none of the customers reported that they were denied a detailed report of itemized usage the analysis for reasons of such denial could not be ascertained. 4.3.3.15: Provision of Manual of Practice by the Service Provider: TRAI has suggested to all the service providers to provide manual of practice to the new customers. Out of 713 new respondents, who had subscribed in last 6 months, 616 (86.4%) indicated that they have not been provided the manual of practice containing the terms and condition of service, grievances redressal mechanism while taking the connection. Among the 97(13.6%) respondents who got the manual of practice, BSNL topped with 23.7% followed by Rel Comm (10.3%) and Bharti (7.3%).
Table4.3.3.16. Have you been provided the manual of practice containing the terms and condition of service, grievance redressal mechanism etc. while taking the connection?
Operator Yes No Total
Count 13 165 Bharti %age 7.3% 92.7% 178
Count 51 164 BSNL %age 23.7% 76.3% 215
Count 33 287 Rel Comm %age 10.3% 89.7% 320
Count 97 616 Total
%age 13.6% 86.4% 713
Graphical representation: The graph below shows provider wise subscribers who confirmed that they received the manual of practice at the time of connection.
7.3%
10.3%
23.7%
Bharti
Rel Comm
BSNL

Assessment of Customer perception of Service and UP (E) SERVICE AREA Implementation and Effectiveness of Telecom Consumers Protection and Redressal of Grievances Regulations
© 441, (Basement), Jangpura, Mathura Road, New Delhi – 110014, India
Email: [email protected], URL: www.consumer-voice
138
BROADBAND The following table shows the provider wise score on various provisions of the Telecom Consumer Protection and Redressal of Grievances Act.
Rel Comm
Overall Score – Telecom Consumer Protection and Redressal of Grievances
S.N. Sub Parameter Bharti BSNL
1 Awareness of three stage grievance mechanism 8.3% 8.9% 5.4%
2 For pre-paid customers awareness about item-wise usage charge details on request
76.7% 71.4% 42.1%
3
If aware (for pre-paid customers )ever denied of item wise usage charge details for pre paid connection
0.0% 0.0% 0.0%
4 For new customers provisioning of "Manual of practice while taking the new connection
7.3% 10.3% 23.7%
5 Awareness of call center for redressing grievances 99.3% 100.0% 100.0%
6 Penetration of consumers made any complaint to the toll free number within last six months
27.5% 44.4% 31.7%
7 Call center informing about the action taken on complaint 43.2% 19.2% 33.3%
8 Resolution of complaint by customer care with in 4 weeks of lodging complaint
22.4% 44.0% 41.0%
9 Percentage satisfied with complaint resolution by call center
66.7% 86.0% 68.3%
10 Awareness of nodal officer for redressing grievances 16.3% 3.3% 1.0%
11 Awareness of appellate authority for redressing grievances 4.8% 3.8% 2.2%
• Awareness level on the three stages of consumer grievances redressal mechanism was found to be low and it ranged from 5.4% to 8.9%. The highest percentage of aware subscribers was found in the case of Rel Comm (8.9%) followed by Bharti (8.3%) & the lowest percentage of aware consumers was found in the case of BSNL (5.4%).
• Awareness level was found high in the case of call centre/ customer care help line numbers. This was found in the range of 99.3% to 100.0%. This was found to be highest in the case of BSNL & Rel Comm (100%) and lowest in the case of Bharti (99.3%).
• Awareness about the Nodal Officer was found to be abysmally low and ranged from 1.0% (BSNL) to 16.3% (Bharti).
• Similarly, the awareness was also found to be low in the case of Appellate Authority & ranged from 2.2% (BSNL) to 4.8% (Bharti).
• Highest number of complaints to the call centre, within last six months, were made by the subscribers of Rel Comm (44.4%) followed by BSNL (31.7%) and Bharti (27.5%).
• Awareness about item wise usage charges in the case of pre paid services was reported to be highest in the case of Bharti (76.7%) followed by Rel Comm (71.4%) and BSNL (42.1%).

Assessment of Customer perception of Service and UP (E) SERVICE AREA Implementation and Effectiveness of Telecom Consumers Protection and Redressal of Grievances Regulations
© 441, (Basement), Jangpura, Mathura Road, New Delhi – 110014, India
Email: [email protected], URL: www.consumer-voice
139
3.
4.
Overall weighted satisfaction score = {(Mean Score – 1) / 3} * 100
5. Conclusion and Recommendations
As discussed in Chapter 1 of the report, the main objective of the study was to:
To assess the Implementation and Effectiveness of Telecom Consumers Protection and Redressal of Grievances Regulations, 2007 To Assess Customer perception of Service as defined in Regulations on quality of service of Basic and Cellular dated 1st July 2005 and Broadband Service dated 6th October 2006.
Therefore, the present report deals with the subject matter as listed above of the three services – Basic Wireline, Cellular Mobile and Broadband – in UP (E) Service Area. Altogether 7 parameters were considered to assess the customer perception of services. The consumers were asked to rank the services on the defined parameter on a likert scale of 1 to 4, where, 4 = Very satisfied, 3 = satisfied, 2 = dissatisfied and 1 = very dissatisfied. The satisfaction level was measured by using these weights and calculating the mean score. Therefore overall satisfaction was calculated using the following formula:
The analysis revealed that none of the services providers operating in UP (E) Service Area of all the three services – Basic Wireline, Cellular Mobile and Broadband – were able to meet the benchmarks as set up the TRAI for the defined parameter. This has been briefly explained in the section below. 5.1 Key Takeout 5.1.1 Basic Wireline:
1. Only 2 service providers – Bharti and BSNL – are providing their Basic service in UP (E) and none of them were able to meet the benchmark on any of the 7 parameters set up the TRAI.
2. The performance of BSNL could be considered better than Bharti as it scored high on 4 of the 7 parameters. However, its performance on pre paid billing service, network and maintainability was rated slightly lower as compared to Bharti.
3. In the case of Bharti, the performance rating was better than BSNL on 3 of the 7 parameters – pre paid billing service, network and maintainability. The performance was found to be lower than BSNL on all the other 4 parameters.
4. With regard to the implementation and effectiveness of grievance redressal mechanism, the performance level of both the providers were found to be relatively higher as overall 36.4% of consumers were aware about the three stages of redressal mechanism set up by the service providers. However, with regard to Nodal Officers
Assessment of Customer perception of Service and UP (E) SERVICE AREA Implementation and Effectiveness of Telecom Consumers Protection and Redressal of Grievances Regulations
© 441, (Basement), Jangpura, Mathura Road, New Delhi – 110014, India
Email: [email protected], URL: www.consumer-voice
140
4) In the case of Bharti, its performance on pre paid billing service was found to be higher than other cellular providers in UP (E) Service Area. Its performance on help services was also better than at least other 5 providers. However, its performance on the post-paid billing service was lowest and also its performances on provision of service, network and supplementary services were relatively low as compared to most of the other providers.
and Appellate Authority, the awareness level was abysmally low. Most of the consumers know about only one stage – call centre or customer care facility set up by their respective service providers. As per the TRAI regulations, the contact details of Nodal officers should be clearly mentioned on bills and service providers should widely publicize these details.
5.1.2 Cellular Mobile
1) None of the service providers were able to meet the benchmark on any of the 7 parameters set up by the TRAI.
2) The performance of Idea Cellular was found to be better than others as it scored relatively higher on 2 out of the 7 parameters. However, its performance on provision of service and pre paid billing service was found to be average.
3) The performance of Rel Com was relatively better than 4 of the service providers covered in the study. They are – Bharti, Tata Teleservices, BSNL and Vodafone. Its performance was found to be highest on network and maintainability. However, its performance on supplementary services and help services was found to be slightly lower.
5) The performance of Tata Teleservices was found to be better in the case of service provisioning. However, its performance on supplementary services was found be lowest as compared to other providers. Similarly its performance on billing service (both post-paid and pre-paid), maintainability were found to be below average.
6) In the case of BSNL, its performance was average on supplementary services. However, the performance level was found to be critical in the area of help services also prepaid billing services. The services which were ranked below average also included post-paid billing service.
7) The performance of Vodafone in UP (E) service area is the cause of concern on most of the parameters. It could achieve highest rating on supplementary services. However, its performance on provision on service, prepaid billing service, network and maintainability was found to be critical as it achieved lowest score on these parameters. It even achieved below average score on help services.
8) With regard to the implementation and effectiveness of grievance redressal mechanism, the performance level of all the service providers were considered to

Assessment of Customer perception of Service and UP (E) SERVICE AREA Implementation and Effectiveness of Telecom Consumers Protection and Redressal of Grievances Regulations
© 441, (Basement), Jangpura, Mathura Road, New Delhi – 110014, India
Email: [email protected], URL: www.consumer-voice
141
9) The performance of Vodafone was found to be lower than other providers on most of the parameters. The possible reason could be the feed back mechanism set up for the resolution of complaint. TRAI has made it mandatory to the service providers to issue the docket number for customers’ complaints. However, over 1 out 2 customers contacted during the survey reported that they have not received the docket number on most of the complaints they had registered with the customer care centre of their service providers. Nearly half of Vodafone consumers reported that they did not get docket number for most of their complaints. Nearly two-third also reported that they never received feed back from the call centre about the action taken on their complaints.
be low as overall only 565 (15.7%) of consumers were aware about the three stages of redressal mechanism set up by the service providers. In the case of Vodafone and Tata Teleservices this was reported by 1 out of 5 customers contacted during the survey. Most of the consumers know about only one stage – call centre or customer care facility set up by their respective service providers. The awareness level about the nodal officers could be gauged from the fact that only 10 respondents were aware about the nodal officers and out of these only 3 knew about their contact details. As per the TRAI regulations, the contact details of Nodal officers should be clearly mentioned on bills and service providers should widely publicize these details.
5.1.3 Broadband
1. Only 3 service providers – BSNL, Bharti and Rel Com – are providing their service in Haryana and none of them were able to meet the benchmark on any of the 7 parameters set up the TRAI.
2. The performance of BSNL could be considered better than others as it scored highest on 4 of the 7 parameters. However, its performance on maintainability and supplementary services was rated slightly lower as compared to Bharti and Rel Com.
3. In the case of Bharti, the performance rating was better than BSNL and Rel Comm on 2 of the 7 parameters – pre paid billing services and supplementary services. However, the performance on provision of services and post paid billing services was lower than other 2 providers.
4. Rel Com was also able to achieve highest score on 2 of the 7 parameters. However, its performance on pre paid billing service, help services and network was the lowest.
5. With regard to the implementation and effectiveness of grievance redressal mechanism, the performance level of all the providers were considered to be low as overall only 7.4% of consumers were aware about the three stages of redressal mechanism set up by the service providers. Most of the consumers know about only one stage – call centre or customer care facility set up by their respective service providers. However, the awareness level about the Nodal Officers and Appellate Authority was reported by only 5.5% and 3.2% of the consumers surveyed. Secondly out of 55 (5.5%) consumers, who were aware about the nodal officers, only 7

Assessment of Customer perception of Service and UP (E) SERVICE AREA Implementation and Effectiveness of Telecom Consumers Protection and Redressal of Grievances Regulations
© 441, (Basement), Jangpura, Mathura Road, New Delhi – 110014, India
Email: [email protected], URL: www.consumer-voice
142
5.2.2 Cellular Mobile
(12.7%) were aware about their contact details. As per the TRAI regulations, the contact details of Nodal officers should be clearly mentioned on bills and service providers should widely publicize these details.
6. The performance of BSNL was found to be better on various parameters. But the most important aspect is of having lowest percentage of complaints as compared to Bharti and Rel Comm.
5.2 Recommendations 5.2. 1 Basic Wireline:
1) BSNL should improve its service on pre paid billing service, network and maintainability. Setting up the instruments and getting it activated is the only half of the service provided. The operator should regularly maintain the line so that consumer could avail the services on regular basis with minimum interruption. Trained manpower to maintain the lines and continuous feed back from the consumer on line quality should be done on periodic basis. Secondly, to improve the network performance, BSNL should enhance the infrastructure facility.
2) Bharti should enhance its performance on supplementary services such as call waiting, call forwarding, voice mail etc. At present customers find it bit complicated therefore the rating score is found to be lower than BSNL. The operator should also improve its services for post paid customers. Delivering bills on time and transparency should be adopted so that consumers are aware about the charges they are paying.
1) Idea Cellular, though rated higher on most of the parameters, should enhance its pre
paid billing service and provision of service. The accounting system related to charges should be made more transparent so that customer could avail the itemized usage charges.
2) BSNL, Tata Teleservices and Vodafone should improve provisioning of services.
3) BSNL, Tata Teleservices and Bharti should address the grievances of post paid billing complaints. Although, the share of post paid subscribers were found to be low as compared to pre paid, it requires a separate mechanism to redress their grievances. BSNL and Tata Teleservices should also improve the pre paid billing services which required to be addressed through a transparent mechanism for calculation the charges for call made.
4) BSNL and Vodafone should concentrate in improving their help services by putting up more equipment so that customers could reach the call centre by spending lesser

Assessment of Customer perception of Service and UP (E) SERVICE AREA Implementation and Effectiveness of Telecom Consumers Protection and Redressal of Grievances Regulations
© 441, (Basement), Jangpura, Mathura Road, New Delhi – 110014, India
Email: [email protected], URL: www.consumer-voice
143
3) Rel Com should focus more on the infrastructure for the help services and maintainability. Decentralized call centers with skilled manpower who can better understand the problems of their consumers in different regions are some of the points which were suggested by the consumers.
time. The operator is also required to enhance the skill of call centre executive so that they can better understand the consumers’ problem. Both these providers should also improve their network infrastructure in order to reduce the call drop problem. Their performance on maintainability was also found to be low. Setting up the instruments and getting it activated is the only half of the service provided. The operator should regularly maintain the line so that consumer could avail the services on regular basis with minimum interruption. Trained manpower to maintain the lines and continuous feed back from the consumer on line quality should be done on periodic basis.
5.2.2.3 Broadband
1) BSNL should concentrate in improving its performance on maintainability and supplementary services. Continuous maintenance of the line and provision of better equipments such as modems, wires and adapters used for modems are some of the suggestions given by few of the complainants.
2) Bharti is aggressively pursuing its marketing strategy. It has to put more effort on service provision and transparent bill mechanism in order to reduce the grievances of its consumers.

Assessment of Customer perception of Service and UP (E) SERVICE AREA Implementation and Effectiveness of Telecom Consumers Protection and Redressal of Grievances Regulations
© 441, (Basement), Jangpura, Mathura Road, New Delhi – 110014, India
Email: [email protected], URL: www.consumer-voice
144
6. ANNEXURE -TABLES

Assessment of Customer perception of Service and UP (E) SERVICE AREA Implementation and Effectiveness of Telecom Consumers Protection and Redressal of Grievances Regulations
© 441, (Basement), Jangpura, Mathura Road, New Delhi – 110014, India
Email: [email protected], URL: www.consumer-voice
145
6.1 Basic Service (Wireline)
6.1.1-Service Provision 6.1.1.1 When did you last apply for a phone connection?
Operators Less than 6months
6-12 months
More than 12 Months
Total
Count 68 80 428 576 BHARTI
%age 11.8% 13.9% 74.3% 100.0%
Count 48 42 510 600 BSNL
%age 8.0% 7.0% 85.0% 100.0%
Count 116 122 938 1176
Total %age
9.9% 10.4% 79.8% 100.0%
6.1.1.2 How much time was taken to get the telephone connection installed and activated after you applied for it; Service Provider Wise
Operators 7-15 days Less than 7
Days Total
Count 53 95 148 BHARTI
%age 35.8% 64.2% 100.0%
Count 19 71 90 BSNL
%age 21.1% 78.9% 100.0%
Count 72 166
238 Total
%age 30.3% 69.7%
100.0%
6.1.1.3 How satisfied are you with time taken to provide working phone connection: Service Provider Wise
Operators Very
Dissatisfied Dissatisfied Satisfied
Very Satisfied
Total
Count 0 14 100 34 148 BHARTI
%age 0.0% 9.5% 67.6% 23.0% 100.0%
Count 0 4 66 20 90 BSNL
%age 0.0% 4.4% 73.3% 22.2% 100.0%
Count 0 18 166 54 238 Total
%age 0.0% 7.6% 69.7% 22.7% 100.0%

Assessment of Customer perception of Service and UP (E) SERVICE AREA Implementation and Effectiveness of Telecom Consumers Protection and Redressal of Grievances Regulations
© 441, (Basement), Jangpura, Mathura Road, New Delhi – 110014, India
Email: [email protected], URL: www.consumer-voice
146
6.1.1.4 How satisfied are you with time taken for shifting of telephone, in case you had sought shifting of telephone in the last six months: Service Provider
Wise
Operators Very
DissatisfiedDissatisfied Satisfied
Very Satisfied
Total sample
Count 0 12 509 55 576 BHARTI
%age 0.0% 2.1% 88.4% 9.5% 100.0%
Count 0 5 542 53 600 BSNL
%age 0.0% 0.8% 90.3% 8.8% 100.0%
Count 0 17 1051 108 1176 Total
%age 0.0% 1.4% 89.4% 9.2% 100.0%
6.1.1.5 In case your connection was temporarily suspended due to non-payment of bills, are you satisfied with the time taken to reactivate service after you made the
payment?
Operators Very
Dissatisfied Dissatisfied Satisfied Very
Satisfied Total
Count 0 32 534 10 576 BHARTI
%age 0.0% 5.6% 92.7% 1.7% 100.0%
Count 0 20 562 18 600 BSNL
%age 0.0% 3.3% 93.7% 3.0% 100.0%
Count 0 52 1096 28 1176 Total
%age 0.0% 4.4% 93.2% 2.4% 100.0%

Assessment of Customer perception of Service and UP (E) SERVICE AREA Implementation and Effectiveness of Telecom Consumers Protection and Redressal of Grievances Regulations
© 441, (Basement), Jangpura, Mathura Road, New Delhi – 110014, India
Email: [email protected], URL: www.consumer-voice
147
6.1.2.1 How satisfied are you with the timely delivery if bills?
6.1.2-A-Billing Related (only for postpaid customers)
Operators VERY
DISSATISFIEDDISSATISFIED SATISFIED
VERY SATISFIED
Total
Count 0 26 445 31 502 Bharti
% age 0.0% 5.2% 88.6% 6.2% 100.0%
Count 0 19 456 47 522 BSNL
% age 0.0% 3.6% 87.4% 9.0% 100.0%
Count 0 45 901 78 1024 Total
% age 0.0% 4.4% 88.0% 7.6% 100.0%
6.1.2.2 How satisfied are you with the accuracy of the bills?
Operators VERY DISSATISFIED
DISSATISFIED SATISFIEDVERY
SATISFIED Total
Count 6 79 410 7 502 Bharti
% age 1.2% 15.7% 81.7% 1.4% 100.0%
Count 0 116 393 13 522 BSNL
% age 0.0% 22.2% 75.3% 2.5% 100.0%
Count 6 195 803 20 1024 Total
% age 0.6% 19.0% 78.4% 2.0% 100.0%
6.1.2.3 Please specify the reason(s) for your dissatisfaction.
Operators
CHARGES NOT AS PER
TARIFF PLAN
SUBSCRIBED
TARIFF PLAN CHANGED WITHOUT
INFORMATION
CHARGED FOR VALUE
ADDED SERVICE
NOT REQUESTED
CHARGED FOR
Call/services not
made/used
Total
Count 26 17 44 10 85 Bharti
% age 30.6% 20.0% 51.8% 11.8% 100.0%
Count 51 12 31 42 116 BSNL
% age 44.0% 10.3% 26.7% 36.2% 100.0%
Count 77 29 75 52 201 Total
% age 38.3% 14.4% 37.3% 25.9% 100.0%

Assessment of Customer perception of Service and UP (E) SERVICE AREA Implementation and Effectiveness of Telecom Consumers Protection and Redressal of Grievances Regulations
© 441, (Basement), Jangpura, Mathura Road, New Delhi – 110014, India
Email: [email protected], URL: www.consumer-voice
148
6.1.2.4 Have you made any billing related complaints in last 12 months?
Operators Yes No Total
Count 308 194 502 Bharti
% age 61.4% 38.6% 100.0%
Count 351 171 522 BSNL
% age 67.2% 32.8% 100.0%
Count 659 365 1024 Total
% age 64.4% 35.6% 100.0%
6.1.2.5 How satisfied are you with the process of resolution of billing complaints?
Operators VERY
DISSATISFIED DISSATISFIED SATISFIEDVERY
SATISFIED Total
Count 0 14 274 20 308 Bharti
% age 0.0% 89.0% 4.5% 6.5% 100.0%
Count 0 0 334 17 351 BSNL
% age 0.0% 0.0% 95.2% 4.8% 100.0%
Count 0 14 608 37 659 Total
% age 0.0% 2.1% 92.3% 5.6% 100.0%
6.1.2.6 How satisfied are you with the clarity of the bills sent by your service provider in terms of transparency & understandability?
Operators VERY
DISSATISFIED DISSATISFIED SATISFIEDVERY
SATISFIED Total
Count 4 91 387 20 502 Bharti
% age 0.8% 18.1% 77.1% 4.0% 100.0%
Count 5 60 437 20 522 BSNL
% age 1.0% 11.5% 83.7% 3.8% 100.0%
Count 9 151 824 40 1024 Total
% age 0.9% 14.7% 80.5% 3.9% 100.0%
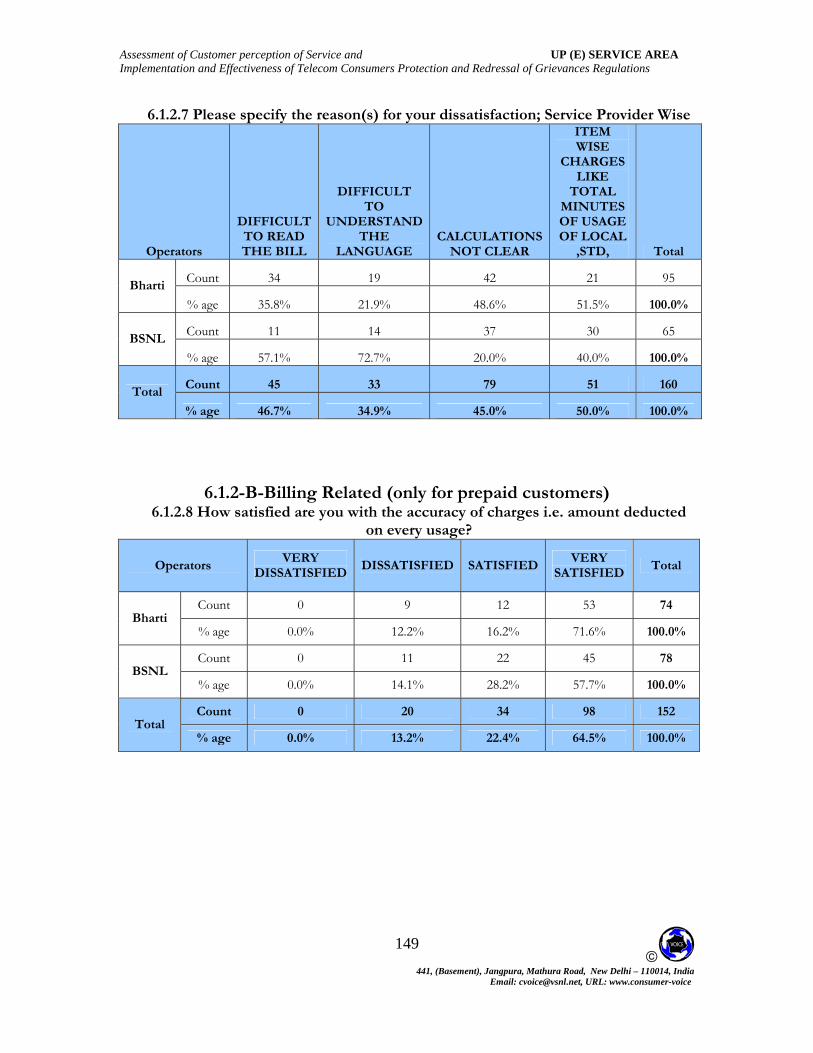
Assessment of Customer perception of Service and UP (E) SERVICE AREA Implementation and Effectiveness of Telecom Consumers Protection and Redressal of Grievances Regulations
© 441, (Basement), Jangpura, Mathura Road, New Delhi – 110014, India
Email: [email protected], URL: www.consumer-voice
149
6.1.2.7 Please specify the reason(s) for your dissatisfaction; Service Provider Wise
Operators
DIFFICULT TO READ THE BILL
DIFFICULT TO
UNDERSTAND THE
LANGUAGE CALCULATIONS
NOT CLEAR
ITEM WISE
CHARGES LIKE
TOTAL MINUTES OF USAGE OF LOCAL
,STD, Total
Count 34 19 42 21 95 Bharti
% age 35.8% 21.9% 48.6% 51.5% 100.0%
Count 11 14 37 30 65 BSNL
% age 57.1% 72.7% 20.0% 40.0% 100.0%
Count 45 33 79 51 160 Total
% age 46.7% 34.9% 45.0% 50.0% 100.0%
6.1.2-B-Billing Related (only for prepaid customers) 6.1.2.8 How satisfied are you with the accuracy of charges i.e. amount deducted
on every usage?
Operators VERY
DISSATISFIEDDISSATISFIED SATISFIED
VERY SATISFIED
Total
Count 0 9 12 53 74 Bharti
% age 0.0% 12.2% 16.2% 71.6% 100.0%
Count 0 11 22 45 78 BSNL
% age 0.0% 14.1% 28.2% 57.7% 100.0%
Count 0 20 34 98 152 Total
% age 0.0% 13.2% 22.4% 64.5% 100.0%

Assessment of Customer perception of Service and UP (E) SERVICE AREA Implementation and Effectiveness of Telecom Consumers Protection and Redressal of Grievances Regulations
© 441, (Basement), Jangpura, Mathura Road, New Delhi – 110014, India
Email: [email protected], URL: www.consumer-voice
150
6.1.3- Help Service/Customer Care 6.1.3.1 Did you make a complain or make a query in the last 12 months to the
customer care / helpline/call center toll free number of your service provider? : Service provider wise
Operators Yes No Total
Count 328 246 574 BHARTI
% age 57.1% 42.9% 100.0%
Count 447 152 599 BSNL
% age 74.6% 25.4% 100.0%
Count 775 398 1173 Total
% age 66.1% 33.9% 100.0%
6.1.3.2 How satisfied are you with the ease of access of call center/customer care or helpline?
Operators VERY
DISSATISFIED DISSATISFIED SATISFIEDVERY
SATISFIED Total
Count 0 47 269 12 328 BHARTI
% age 0.0% 14.3% 82.0% 3.7% 100.0%
Count 0 5 409 33 447 BSNL
% age 0.0% 1.1% 91.5% 7.4% 100.0%
Count 0 52 678 45 775 Total
% age 0.0% 6.7% 87.5% 5.8% 100.0%
6.1.3.3 How satisfied are you with the response time taken to answer your call by a customer care executive?
Operators VERY
DISSATISFIED DISSATISFIED SATISFIEDVERY
SATISFIED Total
Count 0 37 285 6 328 BHARTI
% age 0.0% 11.3% 86.9% 1.8% 100.0%
Count 0 2 409 36 447 BSNL
% age 0.0% 0.4% 91.5% 8.1% 100.0%
Count 0 39 694 42 775 Total
% age 0.0% 5.0% 89.5% 5.4% 100.0%

Assessment of Customer perception of Service and UP (E) SERVICE AREA Implementation and Effectiveness of Telecom Consumers Protection and Redressal of Grievances Regulations
© 441, (Basement), Jangpura, Mathura Road, New Delhi – 110014, India
Email: [email protected], URL: www.consumer-voice
151
6.1.3.4 How satisfied are you with the problem solving ability of the customer care executive(s)?
Opeartors VERY
DISSATISFIED DISSATISFIED SATISFIEDVERY
SATISFIED Total
Count 7 22 293 6 328 BHARTI
% age 2.1% 6.7% 89.3% 1.8% 100.0%
Count 0 1 425 21 447 BSNL
% age 0.0% 0.2% 95.1% 4.7% 100.0%
Count 7 23 718 27 775 Total
% age 0.9% 3.0% 92.6% 3.5% 100.0%
6.1.3.5 How satisfied are you with the time taken by a Call centre/customer care/helpline to resolve your complaint?
Operators VERY
DISSATISFIEDDISSATISFIED SATISFIED
VERY SATISFIED
Total
Count 0 28 287 13 328 BHARTI
% age 0.0% 8.5% 87.5% 4.0% 100.0%
Count 0 0 405 42 447 BSNL
% age 0.0% 0.0% 90.6% 9.4% 100.0%
Count 0 28 692 55 775 Total
% age 0.0% 3.6% 89.3% 7.1% 100.0%
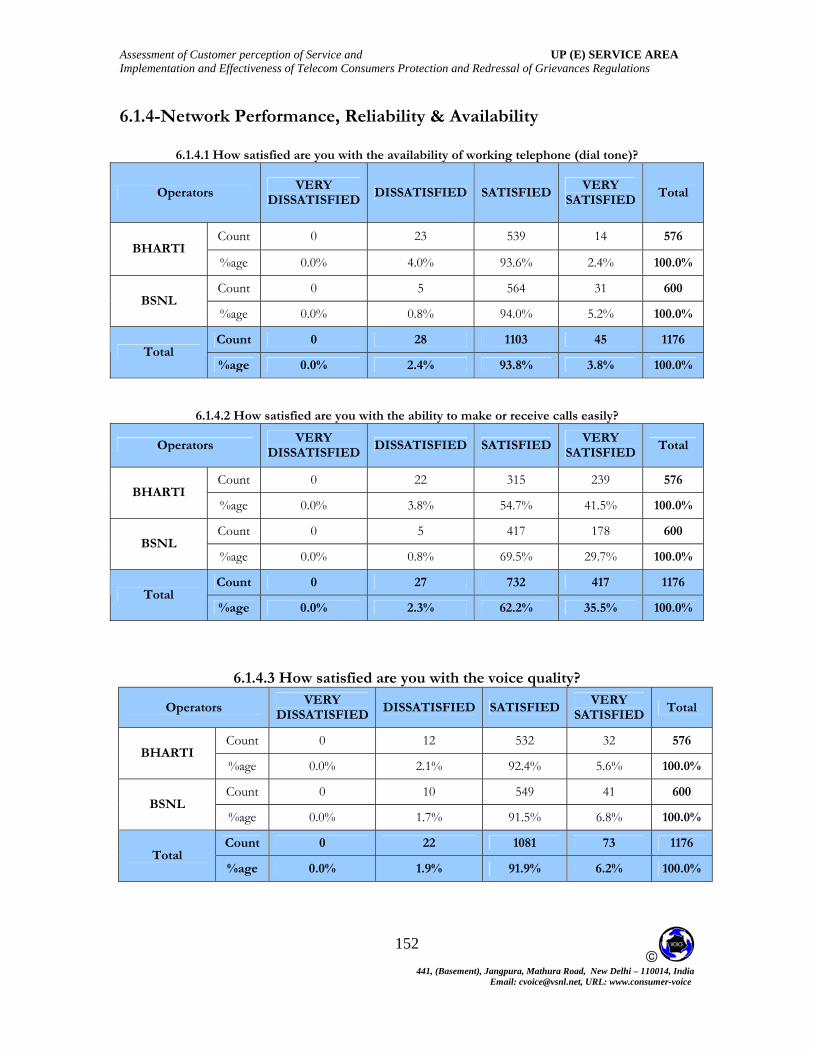
Assessment of Customer perception of Service and UP (E) SERVICE AREA Implementation and Effectiveness of Telecom Consumers Protection and Redressal of Grievances Regulations
© 441, (Basement), Jangpura, Mathura Road, New Delhi – 110014, India
Email: [email protected], URL: www.consumer-voice
152
6.1.4-Network Performance, Reliability & Availability
6.1.4.1 How satisfied are you with the availability of working telephone (dial tone)?
Operators VERY
DISSATISFIEDDISSATISFIED SATISFIED
VERY SATISFIED
Total
Count 0 23 539 14 576 BHARTI
%age 0.0% 4.0% 93.6% 2.4% 100.0%
Count 0 5 564 31 600 BSNL
%age 0.0% 0.8% 94.0% 5.2% 100.0%
Count 0 28 1103 45 1176 Total
%age 0.0% 2.4% 93.8% 3.8% 100.0%
6.1.4.2 How satisfied are you with the ability to make or receive calls easily?
Operators VERY
DISSATISFIEDDISSATISFIED SATISFIED
VERY SATISFIED
Total
Count 0 22 315 239 576 BHARTI
%age 0.0% 3.8% 54.7% 41.5% 100.0%
Count 0 5 417 178 600 BSNL
%age 0.0% 0.8% 69.5% 29.7% 100.0%
Count 0 27 732 417 1176 Total
%age 0.0% 2.3% 62.2% 35.5% 100.0%
6.1.4.3 How satisfied are you with the voice quality?
Operators VERY
DISSATISFIEDDISSATISFIED SATISFIED
VERY SATISFIED
Total
Count 0 12 532 32 576 BHARTI
%age 0.0% 2.1% 92.4% 5.6% 100.0%
Count 0 10 549 41 600 BSNL
%age 0.0% 1.7% 91.5% 6.8% 100.0%
Count 0 22 1081 73 1176 Total
%age 0.0% 1.9% 91.9% 6.2% 100.0%
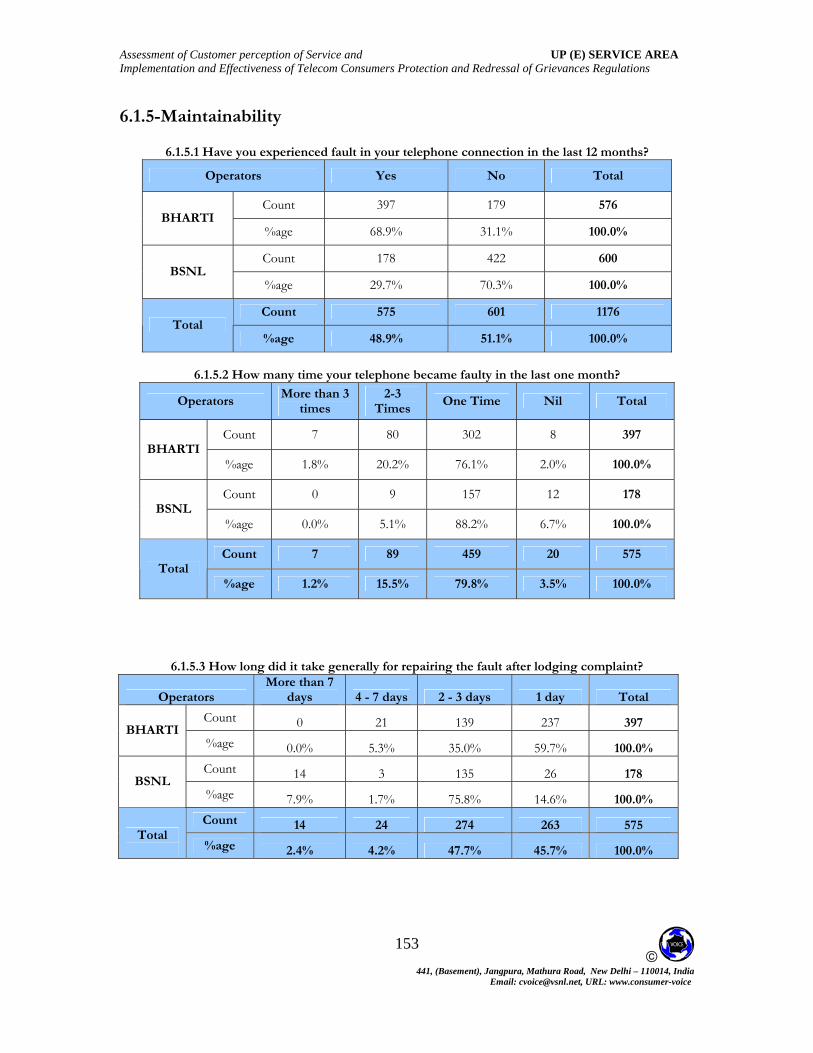
Assessment of Customer perception of Service and UP (E) SERVICE AREA Implementation and Effectiveness of Telecom Consumers Protection and Redressal of Grievances Regulations
© 441, (Basement), Jangpura, Mathura Road, New Delhi – 110014, India
Email: [email protected], URL: www.consumer-voice
153
6.1.5-Maintainability 6.1.5.1 Have you experienced fault in your telephone connection in the last 12 months?
Operators Yes No Total
Count 397 179 576 BHARTI
%age 68.9% 31.1% 100.0%
Count 178 422 600 BSNL
%age 29.7% 70.3% 100.0%
Count 575 601 1176 Total
%age 48.9% 51.1% 100.0%
6.1.5.2 How many time your telephone became faulty in the last one month?
Operators More than 3
times 2-3
Times One Time Nil Total
Count 7 80 302 8 397 BHARTI
%age 1.8% 20.2% 76.1% 2.0% 100.0%
Count 0 9 157 12 178 BSNL
%age 0.0% 5.1% 88.2% 6.7% 100.0%
Count 7 89 459 20 575 Total
%age 1.2% 15.5% 79.8% 3.5% 100.0%
6.1.5.3 How long did it take generally for repairing the fault after lodging complaint?
Operators More than 7
days 4 - 7 days 2 - 3 days 1 day Total
Count 0 21 139 237 397 BHARTI
%age 0.0% 5.3% 35.0% 59.7% 100.0%
Count 14 3 135 26 178 BSNL
%age 7.9% 1.7% 75.8% 14.6% 100.0%
Count 14 24 274 263 575 Total
%age 2.4% 4.2% 47.7% 45.7% 100.0%

Assessment of Customer perception of Service and UP (E) SERVICE AREA Implementation and Effectiveness of Telecom Consumers Protection and Redressal of Grievances Regulations
© 441, (Basement), Jangpura, Mathura Road, New Delhi – 110014, India
Email: [email protected], URL: www.consumer-voice
154
6.1.5.4 How satisfied are you with the fault repair service?
Operators VERY
DISSATISFIEDDISSATISFIED SATISFIED
VERY SATISFIED
Total
Count 0 48 326 23 397 BHARTI
%age 0.0% 12.1% 82.1% 5.8% 100.0%
Count 0 19 155 4 178 BSNL
%age 0.0% 10.7% 87.1% 2.2% 100.0%
Count 0 67 481 27 575 Total %age 0.0% 11.7% 83.7% 4.7% 100.0%
6.1.6-Supplementary Services
6.1.6.1 Do you use services like call waiting, call forwarding, voice mail or any other supplementary services?
Operators Yes No Total
Count 69 507 576 BHARTI
% age 12.0% 88.0% 100.0%
Count 353 247 600 BSNL
% age 58.8% 41.2% 100.0%
Count 422 754 1176
Total % age 35.9% 64.1% 100.0%
6.1.6.2 How satisfied are you with the quality of the supplementary services provided?
Operators Very
Dissatisfied Dissatisfied Satisfied Very Satisfied Total
Count 0 22 46 1 69 BHARTI
% age 0.0% 31.9% 66.7% 1.4% 100.0%
Count 0 17 329 7 353 BSNL
% age 0.0% 4.8% 93.2% 2.0% 100.0%
Count 0 39 375 8 422
Total % age 0.0% 9.2% 88.9% 1.9% 100.0%

Assessment of Customer perception of Service and UP (E) SERVICE AREA Implementation and Effectiveness of Telecom Consumers Protection and Redressal of Grievances Regulations
© 441, (Basement), Jangpura, Mathura Road, New Delhi – 110014, India
Email: [email protected], URL: www.consumer-voice
155
6.1.7-Overall Satisfaction
6.1.7.1 How satisfied are you with the overall quality of your telephone service?
Operators VERY
DISSATISFIED DISSATISFIED SATISFIED VERY
SATISFIED Total
Count 7 48 485 36 576 BHARTI
% age 1.2% 8.3% 84.2% 6.3% 100.0%
Count 0 4 545 51 600 BSNL
% age 0.0% 0.7% 90.8% 8.5% 100.0%
Count 7 52 1030 87 1176 Total
% age 0.6% 4.4% 87.6% 7.4% 100.0%
6.1.8-General Information
6.1.8.1 Have you been informed in writing at the time of subscription of service or within a week of activation of service the complete details of your tariff plan?
Operators Yes No Total
Count 112 135 247 BHARTI
%age 45.3% 54.7% 100.0%
Count 111 152 263 BSNL
%age 42.2% 57.8% 100.0%
Count 223 287 510 Total %age 43.7% 56.3% 100.0%
6.1.8.2 Have you terminated your mobile phone connection in last 12 months?
Operators Yes No Total
Count 17 559 576 BHARTI
%age 3.0% 97.0% 100.0%
Count 13 587 600 BSNL
%age 2.2% 97.8% 100.0%
Count 30 1146 1176 Total %age 2.6% 97.4% 100.0%

Assessment of Customer perception of Service and UP (E) SERVICE AREA Implementation and Effectiveness of Telecom Consumers Protection and Redressal of Grievances Regulations
© 441, (Basement), Jangpura, Mathura Road, New Delhi – 110014, India
Email: [email protected], URL: www.consumer-voice
156
6.1.8.3 If yes, Please name your previous service provider?
Operators BHARTI BSNL Total
Count 0 17 17 BHARTI
%age 0.0% 100.0% 100.0%
Count 13 0 13 BSNL
%age 100.0% 0.0% 100.0%
Count 13 17 30 Total %age 43.3% 56.7% 100.0%
6.1.8.4 How many days were taken by previous service provider for termination of your mobile phone connection?
Operators More than
7 days 4-7 days 2-3 days 1 day Total
Count 7 8 2 0 17 BHARTI
%age 41.2% 47.1% 11.8% 0.0% 100.0%
Count 7 4 2 0 13 BSNL
%age 53.8% 30.8% 15.4% 0.0% 100.0%
Count 14 12 4 0 30 Total
%age 46.7% 40.0% 13.3% 0.0% 100.0%
6.1.8.5 Did your service provider adjust your security deposit in the bill raised after
you requested for termination?
Operators Yes No Total
Count 12 5 17 BHARTI
%age 70.6% 29.4% 100.0%
Count 10 3 13 BSNL
%age 76.9% 23.1% 100.0%
Count 22 8 30 Total %age 73.3% 26.7% 100.0%

Assessment of Customer perception of Service and UP (E) SERVICE AREA Implementation and Effectiveness of Telecom Consumers Protection and Redressal of Grievances Regulations
© 441, (Basement), Jangpura, Mathura Road, New Delhi – 110014, India
Email: [email protected], URL: www.consumer-voice
157
6.1.8.6 Have you registered your telephone number for do not call (DNC) registry
with your service provider so that you do not receive unsolicited commercial calls / SMS?
Opeartors Do not mind
receiving such calls/SMS
Yes No Total
Count 148 6 422 576 BHARTI
%age 25.7% 1.0% 73.3% 100.0%
Count 330 4 266 600 BSNL
%age 55.0% 0.7% 44.3% 100.0%
Count 478 10 688 1176 Total
%age 40.6% 0.9% 58.5% 100.0%
6.1.8.7 Do you still receive unsolicited calls/SMS and whether there is any change in the frequency of
such calls/SMS?
Service Provider Continued receiving
Slight Decrease
Considerable Decrease
Stop receiving
Total
Count 0 2 2 2 6 BHARTI
%age 0.0% 33.3% 33.3% 33.3% 100.0%
Count 0 0 2 2 4 BSNL
%age 0.0% 0.0% 50.0% 50.0% 100.0%
Count 3 2 4 4 10 Total %age 12.5% 20.0% 40.0% 40.0% 100.0%
6.1.8.8. Have you made any complaint to your service provider on getting such unsolicited calls/SMS
after registering for national Do Not Call registry? Operator No Total
Count 6 6 Bharti
100.0% %age 100.0% Count 4 4
BSNL %age 100.0% 100.0%
Count 10 10 Total
%age 100.00% 100.00%
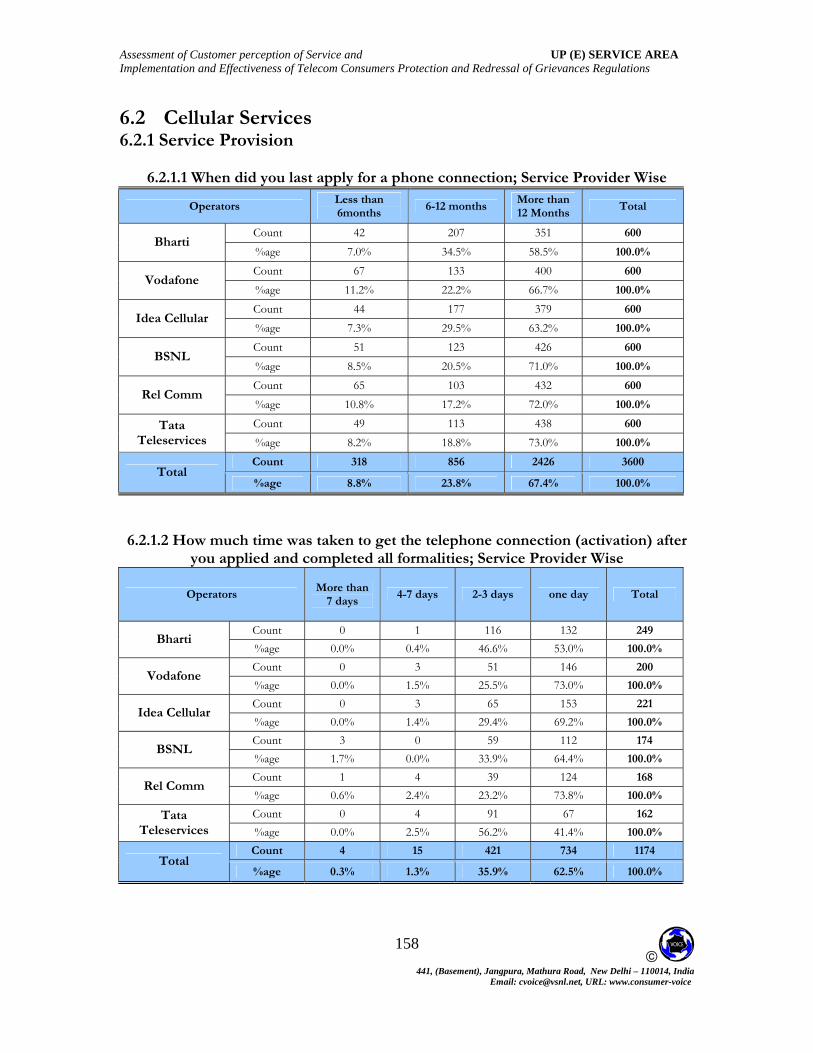
Assessment of Customer perception of Service and UP (E) SERVICE AREA Implementation and Effectiveness of Telecom Consumers Protection and Redressal of Grievances Regulations
© 441, (Basement), Jangpura, Mathura Road, New Delhi – 110014, India
Email: [email protected], URL: www.consumer-voice
158
6.2 Cellular Services 6.2.1 Service Provision
6.2.1.1 When did you last apply for a phone connection; Service Provider Wise
Operators Less than 6months
6-12 months More than 12 Months
Total
Count 42 207 351 600 Bharti
%age 7.0% 34.5% 58.5% 100.0%
Count 67 133 400 600 Vodafone
%age 11.2% 22.2% 66.7% 100.0%
Count 44 177 379 600 Idea Cellular
%age 7.3% 29.5% 63.2% 100.0%
Count 51 123 426 600 BSNL
%age 8.5% 20.5% 71.0% 100.0%
Count 65 103 432 600 Rel Comm
%age 10.8% 17.2% 72.0% 100.0%
Count 49 113 438 600 Tata Teleservices %age 8.2% 18.8% 73.0% 100.0%
Count 318 856 2426 3600 Total
%age 8.8% 23.8% 67.4% 100.0%
6.2.1.2 How much time was taken to get the telephone connection (activation) after
you applied and completed all formalities; Service Provider Wise
Operators More than
7 days 4-7 days 2-3 days one day Total
Count 0 1 116 132 249 Bharti
%age 0.0% 0.4% 46.6% 53.0% 100.0%
Count 0 3 51 146 200 Vodafone
%age 0.0% 1.5% 25.5% 73.0% 100.0%
Count 0 3 65 153 221 Idea Cellular
%age 0.0% 1.4% 29.4% 69.2% 100.0%
Count 3 0 59 112 174 BSNL
%age 1.7% 0.0% 33.9% 64.4% 100.0%
Count 1 4 39 124 168 Rel Comm
%age 0.6% 2.4% 23.2% 73.8% 100.0%
Count 0 4 91 67 162 Tata Teleservices %age 0.0% 2.5% 56.2% 41.4% 100.0%
Count 4 15 421 734 1174 Total
%age 0.3% 1.3% 35.9% 62.5% 100.0%
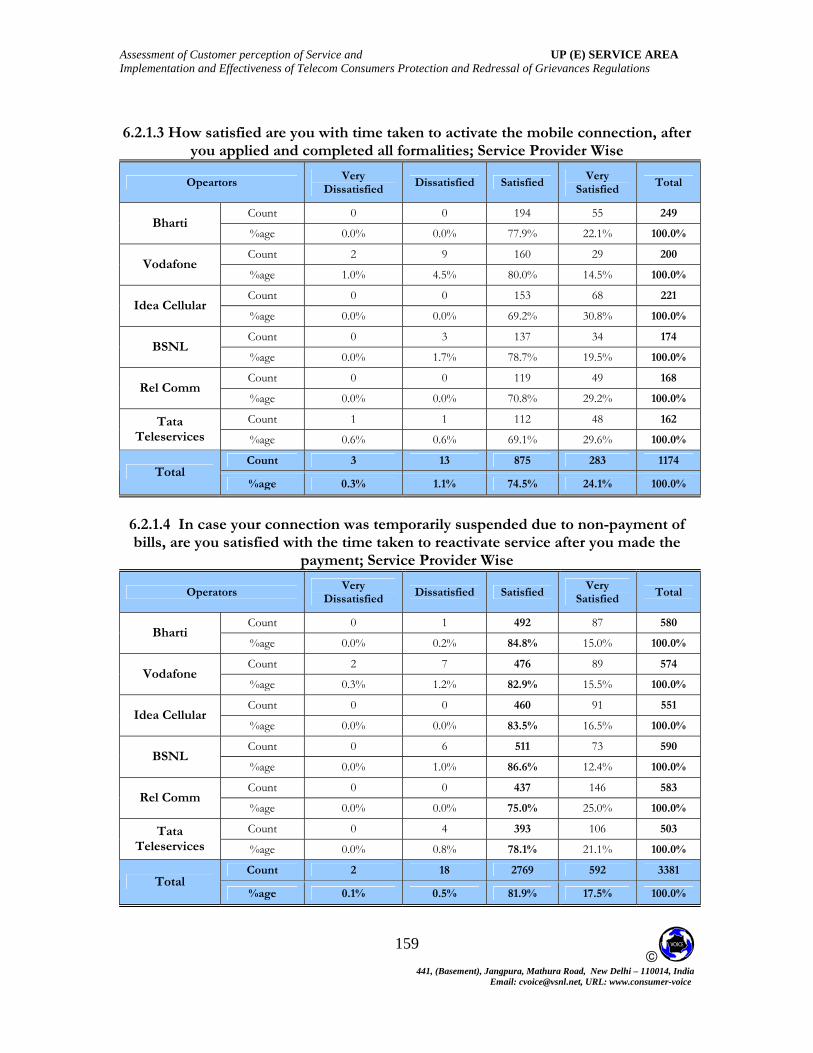
Assessment of Customer perception of Service and UP (E) SERVICE AREA Implementation and Effectiveness of Telecom Consumers Protection and Redressal of Grievances Regulations
© 441, (Basement), Jangpura, Mathura Road, New Delhi – 110014, India
Email: [email protected], URL: www.consumer-voice
159
6.2.1.3 How satisfied are you with time taken to activate the mobile connection, after
you applied and completed all formalities; Service Provider Wise
Opeartors Very
Dissatisfied Dissatisfied Satisfied
Very Satisfied
Total
Count 0 0 194 55 249 Bharti
%age 0.0% 0.0% 77.9% 22.1% 100.0%
Count 2 9 160 29 200 Vodafone
%age 1.0% 4.5% 80.0% 14.5% 100.0%
Count 0 0 153 68 221 Idea Cellular
69.2% %age 0.0% 0.0% 30.8% 100.0%
Count 0 3 137 34 174 BSNL
%age 0.0% 1.7% 78.7% 19.5% 100.0%
Count 0 0 119 49 168 Rel Comm
%age 0.0% 0.0% 70.8% 29.2% 100.0%
Count 1 1 112 48 162 Tata Teleservices %age 0.6% 0.6% 69.1% 29.6% 100.0%
Count 3 13 875 283 1174 Total
%age 0.3% 1.1% 74.5% 24.1% 100.0%
6.2.1.4 In case your connection was temporarily suspended due to non-payment of bills, are you satisfied with the time taken to reactivate service after you made the
payment; Service Provider Wise
Operators Very
Dissatisfied Dissatisfied Satisfied
Very Satisfied
Total
Count 0 1 492 87 580 Bharti
%age 0.0% 0.2% 84.8% 15.0% 100.0%
Count 2 7 476 89 574 Vodafone
%age 0.3% 1.2% 82.9% 15.5% 100.0%
Count 0 0 460 91 551 Idea Cellular
%age 0.0% 0.0% 83.5% 16.5% 100.0%
Count 0 6 511 73 590 BSNL
%age 0.0% 1.0% 86.6% 12.4% 100.0%
Count 0 0 437 146 583 Rel Comm
%age 0.0% 0.0% 75.0% 25.0% 100.0%
Count 0 4 393 106 503 Tata Teleservices %age 0.0% 0.8% 78.1% 21.1% 100.0%
Count 2 18 2769 592 3381 Total
%age 0.1% 0.5% 81.9% 17.5% 100.0%

Assessment of Customer perception of Service and UP (E) SERVICE AREA Implementation and Effectiveness of Telecom Consumers Protection and Redressal of Grievances Regulations
© 441, (Basement), Jangpura, Mathura Road, New Delhi – 110014, India
Email: [email protected], URL: www.consumer-voice
160
6.2.2- Billing related - Prepaid Customers 6.2.2.1 How satisfied are you with the accuracy of charges, i.e. amount deducted
on every usage?
Operators Very
Dissatisfied Dissatisfied Satisfied
Very Satisfied
Total
Count 1 4 499 84 588 Bharti
%age 0.2% 100.0% 0.7% 84.9% 14.3%
Count 4 77 417 84 582 Vodafone
%age 0.7% 13.2% 71.6% 14.4% 100.0%
Count 3 14 495 76 588 Idea Cellular
%age 0.5% 2.4% 84.2% 12.9% 100.0%
Count 0 57 439 81 577 BSNL
%age 0.0% 9.9% 76.1% 14.0% 100.0%
Count 0 38 402 100 540 Rel Comm
%age 0.0% 7.0% 74.4% 18.5% 100.0%
Count 0 20 471 73 564 Tata Teleservices %age 0.0% 3.5% 83.5% 12.9% 100.0%
Count 8 210 2723 498 3439 Total
%age 0.2% 6.1% 79.2% 14.5% 100.0%
6.2.2.2 Please specify the reason(s) for your dissatisfaction.
Operators
Charges Not as per tariff plan
subscribed
Tariff plan changed without
information
charges for value added services not requested
Charged for calls/services
not made/used Total
Count 3 5 1 1 Bharti
20.0% %age 60.0% 100.0% 20.0% 5
Count 15 24 16 33 Vodafone
%age 18.5% 29.6% 19.8% 40.7% 81
Count 8 11 4 2 Idea Cellular
%age 47.1% 64.7% 23.5% 11.8% 17
Count 19 22 7 17 BSNL
%age 33.3% 38.6% 12.3% 29.8% 57
Count 8 9 14 9 Rel Comm
%age 21.1% 23.7% 36.8% 23.7% 38
Count 4 9 5 11 Tata Teleservices %age 20.0% 45.0% 25.0% 55.0%
20
Count 57 80 47 73 Total
%age 26.1% 36.7% 21.6% 33.5% 218

Assessment of Customer perception of Service and UP (E) SERVICE AREA Implementation and Effectiveness of Telecom Consumers Protection and Redressal of Grievances Regulations
© 441, (Basement), Jangpura, Mathura Road, New Delhi – 110014, India
Email: [email protected], URL: www.consumer-voice
161
6.2.2-B- BILLING RELATED –Postpaid
6.2.2.3 How satisfied are you with the timely delivery of bills; Service Provider Wise
Operators Very
Dissatisfied Dissatisfied Satisfied Very
Satisfied Total Count 0 1 7 4 12
Bharti %age 0.0% 8.3% 58.3% 33.3% 100.0% Count 0 0 10 8 18
Vodafone %age 0.0% 0.0% 55.6% 44.4% 100.0% Count 0 0 3 9 12
Idea Cellular %age 0.0% 0.0% 25.0% 75.0% 100.0% Count 0 0 18 5 23
BSNL %age 0.0% 0.0% 78.3% 21.7% 100.0% Count 2 1 49 8 60
Rel Comm %age 3.3% 1.7% 81.7% 13.3% 100.0% Count 0 36 3 31 2
Tata Teleservices %age 0.0% 8.3% 86.1% 5.6% 100.0%
Count 2 5 118 36 161 Total
%age 1.2% 3.1% 73.3% 22.4% 100.0%
6.2.2.4 How satisfied are you with the accuracy of the bills; Service Provider Wise
Operators
Very Dissatisfied
(a) Dissatisfied
(b) Satisfied Very
Satisfied Total
Count 0 1 6 5 12 Bharti
%age 0.0% 8.3% 50.0% 41.7% 100.0%
Count 1 0 9 8 18 Vodafone
%age 5.6% 0.0% 50.0% 44.4% 100.0%
Count 0 0 0 12 12 Idea Cellular
%age 0.0% 0.0% 0.0% 100.0% 100.0%
Count 0 1 16 6 23 BSNL
%age 0.0% 4.3% 69.6% 26.1% 100.0%
Count 1 3 27 29 60 Rel Comm
%age 1.7% 5.0% 45.0% 48.3% 100.0%
Count 0 4 15 17 36 Tata Teleservices
%age 0.0% 11.1% 41.7% 47.2% 100.0%
Count 2 9 73 77 161 Total
%age 1.2% 5.6% 45.3% 47.8% 100.0%

Assessment of Customer perception of Service and UP (E) SERVICE AREA Implementation and Effectiveness of Telecom Consumers Protection and Redressal of Grievances Regulations
© 441, (Basement), Jangpura, Mathura Road, New Delhi – 110014, India
Email: [email protected], URL: www.consumer-voice
162
6.2.2.5 Have you made any billing related complaints in last 12 months; Service Provider Wise
Operators Yes No Total
Count 4 8 12 Bharti
%age 33.3% 66.7% 100.0% Count 9 9 18
Vodafone %age 50.0% 50.0% 100.0% Count 5 7 12
Idea Cellular %age 41.7% 58.3% 100.0% Count 17 6 23
BSNL %age 73.9% 26.1% 100.0% Count 41 19 60
Rel Comm %age 68.3% 31.7% 100.0% Count 15 21 36
Tata Teleservices %age 41.7% 58.3% 100.0%
Count 91 70 161 Total
%age 56.5% 43.5% 100.0%
6.2.2.6How satisfied are you with the process of resolution of billing complaints; Service Provider Wise
Operators
Very Dissatisfied
(a) Dissatisfied
(b) Satisfied Very
Satisfied Total Count 0 3 1 0 4
Bharti %age 0.0% 75.0% 25.0% 0.0% 100.0% Count 0 1 8 0 9
Vodafone %age 0.0% 11.1% 88.9% 0.0% 100.0% Count 0 0 5 0 5
Idea Cellular %age 0.0% 0.0% 100.0% 0.0% 100.0% Count 0 1 15 1 17
BSNL %age 0.0% 5.9% 88.2% 5.9% 100.0% Count 0 0 36 5 41
Rel Comm %age 0.0% 0.0% 87.8% 12.2% 100.0% Count 0 1 11 3 15
Tata Teleservices %age 0.0% 6.7% 73.3% 20.0% 100.0%
Count 0 6 76 9 91 Total
%age 0.0% 6.6% 83.5% 9.9% 100.0%

Assessment of Customer perception of Service and UP (E) SERVICE AREA Implementation and Effectiveness of Telecom Consumers Protection and Redressal of Grievances Regulations
© 441, (Basement), Jangpura, Mathura Road, New Delhi – 110014, India
Email: [email protected], URL: www.consumer-voice
163
6.2.2.7 How satisfied are you with the clarity of the bills sent by your service provider
in terms of transparency and understandability; Service Provider Wise
Operators Very
Dissatisfied Dissatisfied Satisfied Very
Satisfied Total Count 0 3 8 1 12
Bharti %age 0.0% 25.0% 66.7% 8.3% 100.0% Count 0 1 10 7 18
Vodafone %age 0.0% 5.6% 55.6% 38.9% 100.0% Count 0 0 10 2 12
Idea Cellular %age 0.0% 0.0% 83.3% 16.7% 100.0% Count 0 1 16 6 23
BSNL %age 0.0% 4.3% 69.6% 26.1% 100.0% Count 0 2 49 9 60
Rel Comm %age 0.0% 3.3% 81.7% 15.0% 100.0% Count 0 1 32 3 36
Tata Teleservices %age 0.0% 2.8% 88.9% 8.3% 100.0%
Count 0 8 125 28 161 Total
%age 0.0% 5.0% 77.6% 17.4% 100.0%
6.2.2.8 Please specify the reason(s) for your dissatisfaction; Service Provider Wise
Operators Difficult to read the bill
Difficult to understand
the language
Calculations not clear
Item-wise charges like
total minutes of usage of
local, STD,ISD calls and charges
thereon not given
Total
Count 0 3 2 2 3 Bharti
%age 0.0% 100.0% 66.7% 66.7% 100.0% Count 3 0 1 1 1
Vodafone %age 100.0% 0.0% 100.0% 100.0% 100.0% Count 1 1 1 0 1
BSNL %age 33.3% 100.0% 100.0% 0.0% 100.0% Count 2 1 1 1 2
Rel Comm %age 66.7% 50.0% 50.0% 50.0% 100.0% Count 0 1 1 1 1
Tata Teleservices %age 0.0% 100.0% 100.0% 100.0% 100.0%
Count 6 6 6 5 8 Total
%age 75.0% 75.0% 75.0% 62.5% 100.0%

Assessment of Customer perception of Service and UP (E) SERVICE AREA Implementation and Effectiveness of Telecom Consumers Protection and Redressal of Grievances Regulations
© 441, (Basement), Jangpura, Mathura Road, New Delhi – 110014, India
Email: [email protected], URL: www.consumer-voice
164
6.2.3 Help Services/ Customer Care 6.2.3.1 Did you make a complain or make a query in the last 12 months to the
customer care / helpline/call center toll free number of your service provider? : Service provider wise
Operators YES NO Total
Count 110 490 600 Bharti
%age 18.3% 81.7% 100.0% Count 296 304 600
Vodafone %age 49.3% 50.7% 100.0% Count 123 477 600
Idea Cellular %age 20.5% 79.5% 100.0% Count 252 348 600
BSNL %age 42.0% 58.0% 100.0% Count 198 402 600
Rel Comm %age 33.0% 67.0% 100.0% Count 161 439 600
Tata Teleservices %age 26.8% 73.2% 100.0%
Count 1140 2460 3600 Total
%age 31.7% 68.3% 100.0%
6.2.3.2 How satisfied are you with the ease of access of call center/customer care or helpline?
Opeartors
Very Dissatisfied
(a) Dissatisfied
(b) Satisfied Very Satisfied Total
Count 0 10 74 26 110 Bharti
%age 0.0% 9.1% 67.3% 23.6% 100.0%
Count 2 44 218 32 296 Vodafone
%age 0.7% 14.9% 73.6% 10.8% 100.0%
Count 0 4 101 18 123 Idea Cellular
%age 0.0% 3.3% 82.1% 14.6% 100.0%
Count 1 50 170 31 252 BSNL
%age 0.4% 19.8% 67.5% 12.3% 100.0%
Count 1 24 135 38 198 Rel Comm
%age 0.5% 12.1% 68.2% 19.2% 100.0%
Count 0 10 139 12 161 Tata Teleservices
%age 0.0% 6.2% 86.3% 7.5% 100.0%
Count 4 142 837 157 1140 Total
%age 0.4% 12.5% 73.4% 13.8% 100.0%

Assessment of Customer perception of Service and UP (E) SERVICE AREA Implementation and Effectiveness of Telecom Consumers Protection and Redressal of Grievances Regulations
© 441, (Basement), Jangpura, Mathura Road, New Delhi – 110014, India
Email: [email protected], URL: www.consumer-voice
165
6.2.3.3 How satisfied are you with the response time taken to answer your call by a customer care executive?
Operators
Very Dissatisfied
(a) Dissatisfied
(b) Satisfied Very Satisfied Total
Count 0 10 54 46 110 Bharti
%age 0.0% 9.1% 49.1% 41.8% 100.0% Count 3 43 222 28 296
Vodafone %age 1.0% 14.5% 75.0% 9.5% 100.0% Count 0 9 63 51 123
Idea Cellular %age 0.0% 7.3% 51.2% 41.5% 100.0% Count 3 44 167 38 252
BSNL %age 1.2% 17.5% 66.3% 15.1% 100.0% Count 1 26 129 42 198
Rel Comm %age 0.5% 13.1% 65.2% 21.2% 100.0% Count 0 11 120 30 161 Tata
Teleservices %age 0.0% 6.8% 74.5% 18.6% 100.0% Count 7 143 755 235 1140
Total %age 0.6% 12.5% 66.2% 20.6% 100.0%
6.2.3.4 How satisfied are you with the problem solving ability of the customer care
executive(s)?
Operators
Very Dissatisfied
(a) Dissatisfied
(b) Satisfied Very Satisfied Total
Count 0 13 71 26 110 Bharti
%age 0.0% 11.8% 64.5% 23.6% 100.0%
Count 4 41 215 36 296 Vodafone
%age 1.4% 13.9% 72.6% 12.2% 100.0%
Count 0 5 99 19 123 Idea Cellular
%age 0.0% 4.1% 80.5% 15.4% 100.0%
Count 0 44 182 26 252 BSNL
%age 0.0% 17.5% 72.2% 10.3% 100.0%
Count 1 27 131 39 198 Rel Comm
%age 0.5% 13.6% 66.2% 19.7% 100.0%
Count 0 9 139 13 161 Tata Teleservices
%age 0.0% 5.6% 86.3% 8.1% 100.0%
Count 5 139 837 159 1140 Total
%age 0.4% 12.2% 73.4% 13.9% 100.0%

Assessment of Customer perception of Service and UP (E) SERVICE AREA Implementation and Effectiveness of Telecom Consumers Protection and Redressal of Grievances Regulations
© 441, (Basement), Jangpura, Mathura Road, New Delhi – 110014, India
Email: [email protected], URL: www.consumer-voice
166
6.2.3.5 How satisfied are you with the time taken by a Call centre/customer care/helpline to resolve your complaint?
Operators
Very Dissatisfied
(a) Dissatisfied
(b) Satisfied Very Satisfied Total
Count 0 13 48 49 110 Bharti
%age 0.0% 11.8% 43.6% 44.5% 100.0% Count 2 45 220 29 296
Vodafone %age 0.7% 15.2% 74.3% 9.8% 100.0% Count 0 6 67 50 123
Idea Cellular %age 0.0% 4.9% 54.5% 40.7% 100.0% Count 0 47 167 38 252
BSNL %age 0.0% 18.7% 66.3% 15.1% 100.0% Count 1 26 125 46 198
Rel Comm %age 0.5% 13.1% 63.1% 23.2% 100.0% Count 0 9 122 30 161 Tata
Teleservices %age 0.0% 5.6% 75.8% 18.6% 100.0% Count 3 146 749 242 1140
Total %age 0.3% 12.8% 65.7% 21.2% 100.0%
6.2.4 Network Performance, Reliability and Availability 6.2.4.1 How satisfied are you with the availability of signal of your service provider in
your locality?
Operators
Very Dissatisfied
(a) Dissatisfied
(b) Satisfied Very
Satisfied Total Count 0 5 500 95 600
Bharti %age 0.0% 0.8% 83.3% 15.8% 100.0% Count 0 40 486 74 600
Vodafone %age 0.0% 6.7% 81.0% 12.3% 100.0% Count 0 13 499 88 600
Idea Cellular %age 0.0% 2.2% 83.2% 14.7% 100.0% Count 0 43 479 78 600
BSNL %age 0.0% 7.2% 79.8% 13.0% 100.0% Count 0 21 453 126 600
Rel Comm %age 0.0% 3.5% 75.5% 21.0% 100.0% Count 0 19 540 41 600 Tata
Teleservices 90.0% 6.8% %age 0.0% 3.2% 100.0% Count 0 141 2957 502 3600
Total %age 0.0% 3.9% 82.1% 13.9% 100.0%

Assessment of Customer perception of Service and UP (E) SERVICE AREA Implementation and Effectiveness of Telecom Consumers Protection and Redressal of Grievances Regulations
© 441, (Basement), Jangpura, Mathura Road, New Delhi – 110014, India
Email: [email protected], URL: www.consumer-voice
167
6.2.4.2 How satisfied are you with the ability to make or receive calls easily?
Operators Very
Dissatisfied (a)
Dissatisfied (b)
SatisfiedVery
Satisfied Total
Count 0 9 259 332 600 Bharti
%age 0.0% 55.3% 1.5% 43.2% 100.0%
Count 0 6 388 206 600 Vodafone
64.7% 34.3% %age 0.0% 1.0% 100.0%
Count 0 6 247 347 600 Idea Cellular
%age 0.0% 1.0% 100.0% 41.2% 57.8%
Count 0 21 338 241 600 BSNL
%age 0.0% 3.5% 56.3% 40.2% 100.0%
Count 0 2 250 348 600 Rel Comm
%age 0.0% 0.3% 41.7% 58.0% 100.0%
Count 0 7 221 372 600 Tata Teleservices %age 0.0% 1.2% 36.8% 62.0% 100.0%
Count 0 51 1703 1846 3600 Total
%age 0.0% 1.4% 47.3% 51.3% 100.0%
6.2.4.3 How often does your call drops during conversation?
Operators Very
frequently Frequently Occasionally Never Total
Count 0 340 81 179 600 Bharti
0.0% %age 13.5% 56.7% 29.8% 100.0%
Count 0 19 200 381 600 Vodafone
%age 0.0% 3.2% 33.3% 63.5% 100.0%
Count 3 14 419 164 600 Idea Cellular %age 0.5% 2.3% 69.8% 27.3% 100.0%
Count 1 22 249 328 600 BSNL
%age 0.2% 3.7% 41.5% 54.7% 100.0%
Count 0 42 227 331 600 Rel Comm
%age 0.0% 7.0% 37.8% 55.2% 100.0%
Count 2 16 368 214 600 Tata Teleservices %age 0.3% 2.7% 61.3% 35.7% 100.0%
Count 6 194 1803 1597 3600 Total
%age 0.2% 5.4% 50.1% 44.4% 100.0%

Assessment of Customer perception of Service and UP (E) SERVICE AREA Implementation and Effectiveness of Telecom Consumers Protection and Redressal of Grievances Regulations
© 441, (Basement), Jangpura, Mathura Road, New Delhi – 110014, India
Email: [email protected], URL: www.consumer-voice
168
6.2.4.4 How satisfied are you with the voice quality?
Operators
Very Dissatisfied
Dissatisfied SatisfiedVery
Satisfied Total
Count 0 1 347 252 600 Bharti
%age 0.0% 0.2% 57.8% 42.0% 100.0%
Count 0 12 412 176 600 Vodafone
%age 0.0% 2.0% 68.7% 29.3% 100.0%
Count 0 6 286 308 600 Idea Cellular
%age 0.0% 1.0% 47.7% 51.3% 100.0%
Count 3 11 226 360 600 BSNL
%age 0.5% 1.8% 60.0% 37.7% 100.0%
Count 1 7 306 286 600 Rel Comm
%age 0.2% 1.2% 51.0% 47.7% 100.0%
Count 0 1 277 322 600 Tata Teleservices %age 0.0% 0.2% 46.2% 53.7% 100.0%
Count 4 38 1988 1570 3600 Total
%age 0.1% 1.1% 55.2% 43.6% 100.0%
6.2.5.1 How often your mobile handsets faces problem of signal?
6.2.5 Maintainability
Operators Very
Frequently Frequently Occassionally Never Total
Count 1 89 227 283 600 Bharti
%age 0.2% 14.8% 37.8% 47.2% 100.0%
Count 2 12 138 448 600 Vodafone
%age 0.3% 2.0% 23.0% 74.7% 100.0%
Count 6 15 241 338 600 Idea Cellular
%age 1.0% 2.5% 40.2% 56.3% 100.0%
Count 1 5 167 427 600 BSNL
%age 0.2% 0.8% 27.8% 71.2% 100.0%
Count 1 32 163 404 600 Rel Comm
%age 0.2% 5.3% 27.2% 67.3% 100.0%
Count 3 9 261 327 600 Tata Teleservices %age 0.5% 1.5% 43.5% 54.5% 100.0%
Count 14 162 1197 2227 3600 Total
%age 0.4% 4.5% 33.3% 61.9% 100.0%
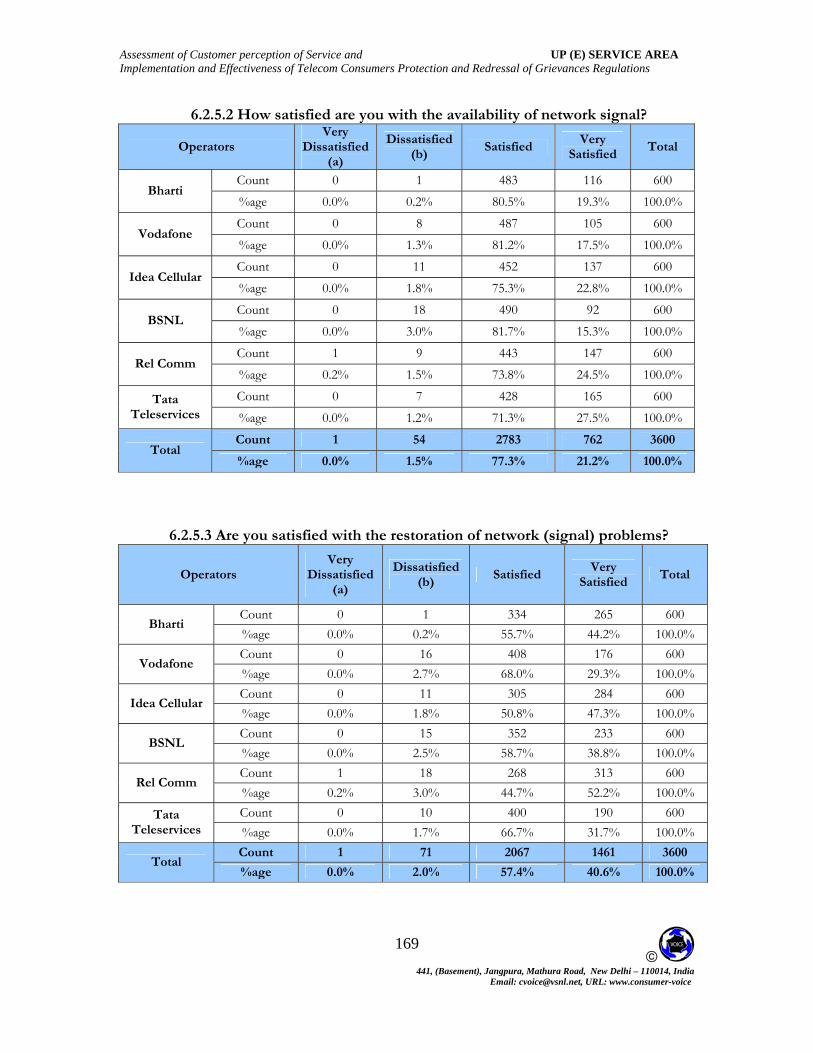
Assessment of Customer perception of Service and UP (E) SERVICE AREA Implementation and Effectiveness of Telecom Consumers Protection and Redressal of Grievances Regulations
© 441, (Basement), Jangpura, Mathura Road, New Delhi – 110014, India
Email: [email protected], URL: www.consumer-voice
169
6.2.5.2 How satisfied are you with the availability of network signal?
Operators Very
Dissatisfied (a)
Dissatisfied (b)
Satisfied Very
Satisfied Total
Count 0 1 483 116 600 Bharti
%age 0.0% 0.2% 80.5% 19.3% 100.0%
Count 0 8 487 105 600 Vodafone
%age 0.0% 1.3% 81.2% 17.5% 100.0%
Count 0 11 452 137 600 Idea Cellular
%age 0.0% 1.8% 75.3% 22.8% 100.0%
Count 0 18 490 92 600 BSNL
%age 0.0% 3.0% 81.7% 15.3% 100.0%
Count 1 9 443 147 600 Rel Comm
%age 0.2% 1.5% 73.8% 24.5% 100.0%
Count 0 7 428 165 600 Tata Teleservices %age 0.0% 1.2% 71.3% 27.5% 100.0%
Count 1 54 2783 762 3600 Total
%age 0.0% 1.5% 77.3% 21.2% 100.0%
6.2.5.3 Are you satisfied with the restoration of network (signal) problems?
Operators Very
Dissatisfied (a)
Dissatisfied (b)
Satisfied Very
Satisfied Total
Count 0 1 334 265 600 Bharti
%age 0.0% 0.2% 55.7% 44.2% 100.0% Count 0 16 408 176 600
Vodafone %age 0.0% 2.7% 68.0% 29.3% 100.0% Count 0 600 11 305 284
Idea Cellular %age 0.0% 1.8% 50.8% 47.3% 100.0% Count 0 15 352 233 600
BSNL %age 0.0% 100.0% 2.5% 58.7% 38.8% Count 1 18 268 313 600
Rel Comm %age 0.2% 3.0% 44.7% 52.2% 100.0% Count 0 10 400 190 600 Tata
Teleservices %age 0.0% 1.7% 66.7% 31.7% 100.0% Count 1 71 2067 1461 3600
Total %age 0.0% 2.0% 57.4% 40.6% 100.0%

Assessment of Customer perception of Service and UP (E) SERVICE AREA Implementation and Effectiveness of Telecom Consumers Protection and Redressal of Grievances Regulations
© 441, (Basement), Jangpura, Mathura Road, New Delhi – 110014, India
Email: [email protected], URL: www.consumer-voice
170
6.2.6 Supplementary services/ Value Added services
6.2.6.1 Do you use value added services like roaming, ring tone, GPRS, e-mail, voice mail or any other such services?
Operators Yes No Total
Count 18 582 600 Bharti
%age 3.0% 97.0% 100.0% Count 127 473 600
Vodafone %age 21.2% 78.8% 100.0% Count 26 574 600
Idea Cellular %age 4.3% 95.7% 100.0% Count 146 454 600
BSNL %age 24.3% 75.7% 100.0% Count 50 550 600
Rel Comm %age 8.3% 91.7% 100.0% Count 76 524 600
Tata Teleservices %age 12.7% 87.3% 100.0%
Count 443 3157 3600 Total
%age 12.3% 87.7% 100.0%
6.2.6.2 Did the service provider have your explicit consent before providing the chargeable value added service such as ring tone, emails/ GPRS, voice mail etc.
Operators Yes No Total
Count 13 5 18 Bharti
%age 72.2% 27.8% 100.0% Count 71 56 127
Vodafone %age 55.9% 44.1% 100.0% Count 20 6 26
Idea Cellular %age 76.9% 23.1% 100.0% Count 120 26 146
BSNL %age 82.2% 17.8% 100.0% Count 38 12 50
Rel Comm %age 76.0% 24.0% 100.0% Count 42 34 76
Tata Teleservices %age 55.30% 44.70% 100.00%
Count 304 139 443 Total
%age 68.6% 31.4% 100.0%

Assessment of Customer perception of Service and UP (E) SERVICE AREA Implementation and Effectiveness of Telecom Consumers Protection and Redressal of Grievances Regulations
© 441, (Basement), Jangpura, Mathura Road, New Delhi – 110014, India
Email: [email protected], URL: www.consumer-voice
171
6.2.6.3 How satisfied are you with the quality of supplementary/ value added services provided?
Operators Very
Dissatisfied (a)
Dissatisfied (b)
Satisfied Very
Satisfied Total
Count 0 0 13 5 18 Bharti
72.2% %age 0.0% 0.0% 27.8% 100.0%
Count 1 2 104 20 127 Vodafone
%age 0.8% 1.6% 81.9% 15.7% 100.0%
Count 0 1 17 8 26 Idea Cellular
%age 0.0% 3.8% 65.4% 30.8% 100.0%
Count 0 0 123 23 146 BSNL
%age 0.0% 0.0% 84.2% 15.8% 100.0%
Count 0 0 40 10 50 Rel Comm
%age 0.0% 0.0% 80.0% 20.0% 100.0%
Count 0 2 71 3 76 Tata Teleservices %age 0.0% 2.6% 93.4% 3.9% 100.0%
Count 1 5 368 69 443 Total
%age 0.2% 1.1% 83.1% 15.6% 100.0%
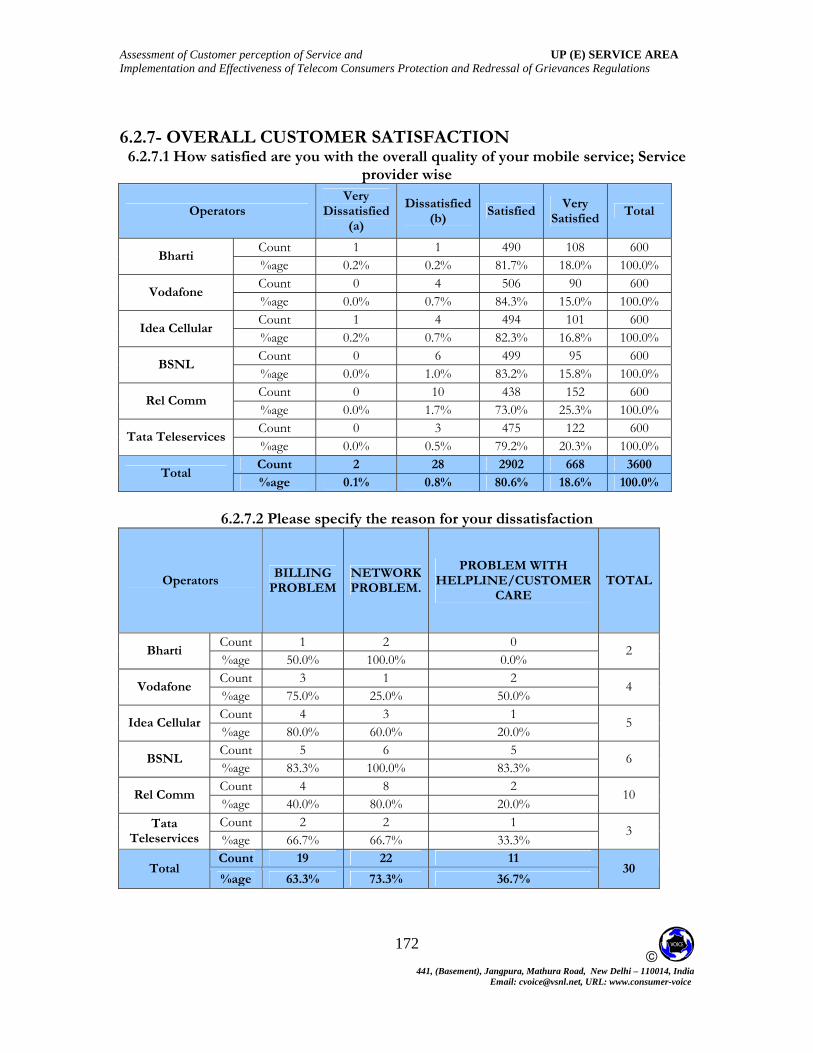
Assessment of Customer perception of Service and UP (E) SERVICE AREA Implementation and Effectiveness of Telecom Consumers Protection and Redressal of Grievances Regulations
© 441, (Basement), Jangpura, Mathura Road, New Delhi – 110014, India
Email: [email protected], URL: www.consumer-voice
172
6.2.7- OVERALL CUSTOMER SATISFACTION
6.2.7.1 How satisfied are you with the overall quality of your mobile service; Service provider wise
Operators Very
Dissatisfied (a)
Dissatisfied (b)
SatisfiedVery
Satisfied Total
Count 1 1 490 108 600 Bharti
%age 0.2% 0.2% 81.7% 18.0% 100.0% Count 0 4 506 90 600
Vodafone %age 0.0% 0.7% 84.3% 15.0% 100.0% Count 1 4 494 101 600
Idea Cellular %age 0.2% 0.7% 82.3% 16.8% 100.0% Count 0 6 499 95 600
BSNL %age 0.0% 1.0% 83.2% 15.8% 100.0% Count 0 10 438 152 600
Rel Comm %age 0.0% 1.7% 73.0% 25.3% 100.0% Count 0 3 475 122 600
Tata Teleservices %age 0.0% 0.5% 79.2% 20.3% 100.0%
Count 2 28 2902 668 3600 Total
%age 0.1% 0.8% 80.6% 18.6% 100.0%
6.2.7.2 Please specify the reason for your dissatisfaction
Operators BILLING
PROBLEMNETWORK PROBLEM.
PROBLEM WITH HELPLINE/CUSTOMER
CARE TOTAL
Count 1 2 0 Bharti
%age 50.0% 100.0% 0.0% 2
Count 3 1 2 Vodafone 4
%age 75.0% 25.0% 50.0% Count 4 3 1
Idea Cellular %age 80.0% 60.0% 20.0%
5
Count 5 6 5 BSNL
%age 83.3% 100.0% 83.3% 6
Count 4 8 2 Rel Comm
%age 40.0% 80.0% 20.0% 10
Count 2 2 1 Tata Teleservices %age 66.7% 66.7% 33.3%
3
Count 19 22 11 Total
%age 63.3% 73.3% 36.7% 30
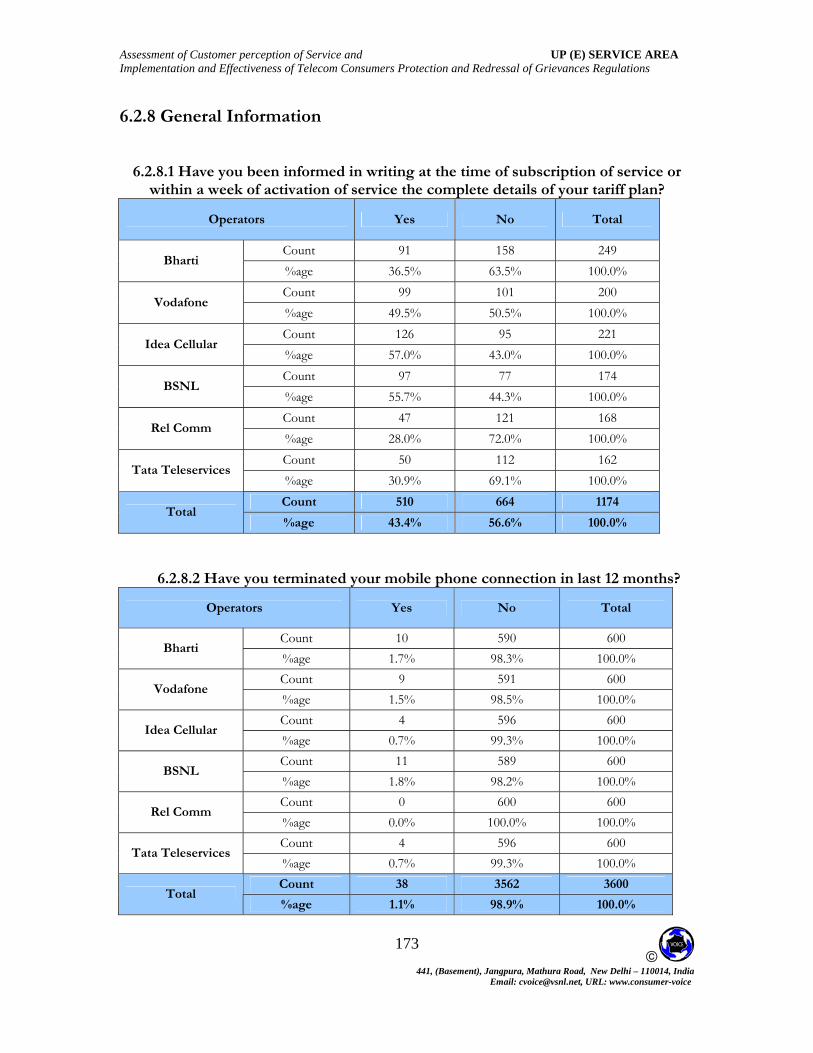
Assessment of Customer perception of Service and UP (E) SERVICE AREA Implementation and Effectiveness of Telecom Consumers Protection and Redressal of Grievances Regulations
© 441, (Basement), Jangpura, Mathura Road, New Delhi – 110014, India
Email: [email protected], URL: www.consumer-voice
173
6.2.8 General Information
6.2.8.1 Have you been informed in writing at the time of subscription of service or within a week of activation of service the complete details of your tariff plan?
Operators Yes No Total
Count 91 158 249 Bharti
%age 36.5% 63.5% 100.0% Count 99 101 200
Vodafone %age 49.5% 50.5% 100.0% Count 126 95 221
Idea Cellular %age 57.0% 43.0% 100.0% Count 97 77 174
BSNL %age 55.7% 44.3% 100.0% Count 47 121 168
Rel Comm %age 28.0% 72.0% 100.0% Count 50 112 162
Tata Teleservices %age 30.9% 69.1% 100.0%
Count 510 664 1174 Total
%age 43.4% 56.6% 100.0%
6.2.8.2 Have you terminated your mobile phone connection in last 12 months?
Operators Yes No Total
Count 10 590 600 Bharti
%age 1.7% 98.3% 100.0% Count 9 591 600
Vodafone %age 1.5% 98.5% 100.0% Count 4 596 600
Idea Cellular %age 0.7% 99.3% 100.0% Count 11 589 600
BSNL %age 1.8% 98.2% 100.0% Count 0 600 600
Rel Comm %age 0.0% 100.0% 100.0% Count 4 596 600
Tata Teleservices %age 0.7% 99.3% 100.0%
Count 38 3562 3600 Total
%age 1.1% 98.9% 100.0%

Assessment of Customer perception of Service and UP (E) SERVICE AREA Implementation and Effectiveness of Telecom Consumers Protection and Redressal of Grievances Regulations
© 441, (Basement), Jangpura, Mathura Road, New Delhi – 110014, India
Email: [email protected], URL: www.consumer-voice
174
6.2.8.3 If yes, Please name your previous service provider?
Operators Bharti Vodafone Idea
Cellular BSNL
Tata Teleservices
Total
Count 0 1 0 9 0 10 Bharti
%age 0.0% 10.0% 0.0% 90.0% 0.0% 100.0%
Count 1 0 2 4 2 9 Vodafone
%age 11.1% 0.0% 22.2% 44.4% 22.2% 100.0%
Count 3 0 0 0 1 4 Idea Cellular
%age 75.0% 0.0% 0.0% 0.0% 25.0% 100.0%
Count 6 3 2 0 0 11 BSNL
%age 54.5% 27.3% 18.2 0.0% 0.0% 100.0%
Count 2 0 0 2 0 4 Tata Teleservices %age 50.0% 0.0% 0.0% 50.0% 0.0% 100.0%
Count 12 4 4 15 3 38 Total
%age 31.6% 10.5% 10.5% 39.5% 7.9% 100.0%
6.2.8.4 How many days were taken by previous service provider for termination of
your mobile phone connection?
Operators 4-7 days 2-3 days one day Total
Count 0 10 0 10 Bharti
%age 0.0% 100.0% 0.0% 100.0% Count 0 4 5 9
Vodafone %age 0.0% 44.4% 55.6% 100.0% Count 0 0 4 4
Idea Cellular %age 0.0% 0.0% 100.0% 100.0% Count 2 5 4 11
BSNL %age 18.2% 45.5% 36.4% 100.0% Count 0 4 0 4
Tata Teleservices %age 0.0% 100.0% 0.0% 100.0%
Count 2 23 13 38 Total
%age 5.3% 60.5% 34.2% 100.0%

Assessment of Customer perception of Service and UP (E) SERVICE AREA Implementation and Effectiveness of Telecom Consumers Protection and Redressal of Grievances Regulations
© 441, (Basement), Jangpura, Mathura Road, New Delhi – 110014, India
Email: [email protected], URL: www.consumer-voice
175
6.2.8.5 Did your service provider adjust your security deposit in the bill raised after you requested for termination?
Operators Yes No Total
Count 9 1 10 Bharti
%age 90.0% 10.0% 100.0% Count 7 2 9
Vodafone %age 77.8% 22.2% 100.0% Count 4 0 4
Idea Cellular %age 100.0% 0.0% 100.0% Count 8 3 11
BSNL %age 72.7% 27.3% 100.0% Count 4 0 4
Tata Teleservices %age 100.0% 0.0% 100.0%
Count 32 6 38 Total
%age 84.2% 15.8% 100.0%
6.2.8.6 Have you registered your telephone number for do not call (DNC) registry with your service provider so that you do not receive unsolicited commercial calls
/ SMS?
Operators Do not mind
receiving such calls/SMS
Yes No Total
Count 9 70 521 600 Bharti
%age 1.5% 11.7% 86.8% 100.0% Count 3 68 529 600
Vodafone %age 0.5% 11.3% 88.2% 100.0% Count 5 99 496 600
Idea Cellular %age 0.8% 16.5% 82.7% 100.0% Count 1 36 563 600
BSNL %age 0.2% 6.0% 93.8% 100.0% Count 2 115 483 600
Rel Comm %age 0.3% 19.2% 80.5% 100.0% Count 13 134 453 600 Tata
Teleservices %age 2.2% 22.3% 75.5% 100.0% Count 33 522 3045 3600
Total %age 0.9% 14.5% 84.6% 100.0%

Assessment of Customer perception of Service and UP (E) SERVICE AREA Implementation and Effectiveness of Telecom Consumers Protection and Redressal of Grievances Regulations
© 441, (Basement), Jangpura, Mathura Road, New Delhi – 110014, India
Email: [email protected], URL: www.consumer-voice
176
6.2.8.7 Do you still receive unsolicited calls/ SMS and whether there is any change in the frequency of such calls/SMS?
Operators Continued receiving
Slight decrease
Considerable decrease
Stopped receiving
Total
Count 3 64 1 2 70 Bharti
%age 4% 91% 1% 3% 100% Count 0 62 2 4 68
Vodafone %age 0% 91% 3% 6% 100% Count 0 90 4 5 99
Idea Cellular %age 0% 91% 4% 5% 100% Count 0 31 1 4 36
BSNL %age 0% 86% 3% 11% 100% Count 0 107 0 8 115
Rel Comm %age 0% 93% 0% 7% 100% Count 0 124 9 1 134 Tata
Teleservices %age 0% 93% 7% 1% 100% Count 3 478 17 24 522
Total %age 1% 92% 3% 5% 100%
6.2.8.8. Have you made any complaint to your service provider on getting such unsolocited calls/
SMS after registering for NDNC registry?
Operators Yes No Total
Count 2 68 70 Bharti
%age 2.9% 97.1% 100.0% Count 0 68 68
Vodafone %age 0.0% 100.0% 100.0% Count 3 96 99
Idea Cellular %age 3.0% 97.0% 100.0% Count 2 34 36
BSNL %age 5.6% 94.4% 100.0% Count 1 114 115
Rel Comm %age 0.9% 99.1% 100.0% Count 2 132 134
Tata Teleservices %age 1.5% 98.5% 100.0%
Count 10 512 522 Total
%age 1.9% 98.1% 100.0%

Assessment of Customer perception of Service and UP (E) SERVICE AREA Implementation and Effectiveness of Telecom Consumers Protection and Redressal of Grievances Regulations
© 441, (Basement), Jangpura, Mathura Road, New Delhi – 110014, India
Email: [email protected], URL: www.consumer-voice
177
6.2.8.9 If yes, please indicate the following.
Operators
Yes, Complaint was registered by the service
provider. Total
Count 2 Bharti
%age 100.0% 2
Count 3 Idea Cellular
%age 100.0% 3
Count 2 BSNL
%age 100.0% 2
Count 1 Rel Comm
%age 200.0% 1
Count 2 Tata Teleservices
%age 100.0% 2
Count 10 Total
%age 100.0% 10
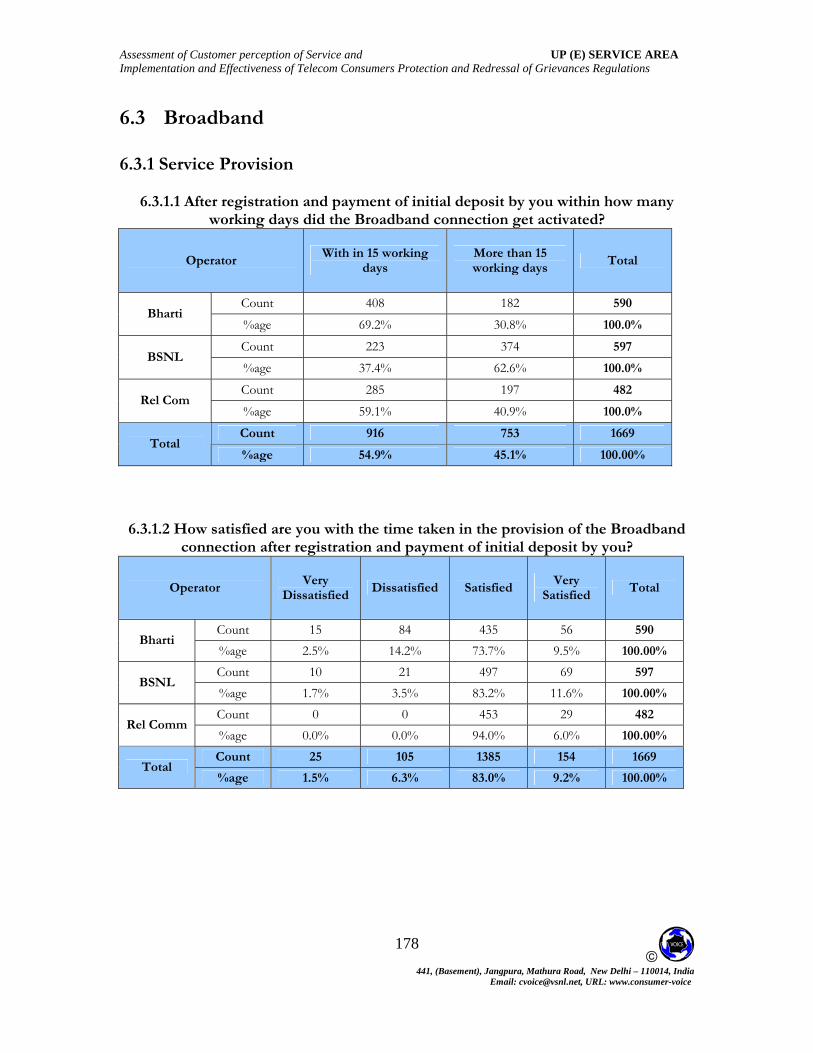
Assessment of Customer perception of Service and UP (E) SERVICE AREA Implementation and Effectiveness of Telecom Consumers Protection and Redressal of Grievances Regulations
© 441, (Basement), Jangpura, Mathura Road, New Delhi – 110014, India
Email: [email protected], URL: www.consumer-voice
178
6.3 Broadband
6.3.1 Service Provision
6.3.1.1 After registration and payment of initial deposit by you within how many working days did the Broadband connection get activated?
Operator With in 15 working
days More than 15 working days
Total
Count 408 182 590 Bharti
%age 69.2% 30.8% 100.0%
Count 223 374 597 BSNL
%age 37.4% 62.6% 100.0%
Count 285 197 482 Rel Com
%age 59.1% 40.9% 100.0%
Count 916 753 1669 Total
%age 54.9% 45.1% 100.00%
6.3.1.2 How satisfied are you with the time taken in the provision of the Broadband connection after registration and payment of initial deposit by you?
Operator Very
Dissatisfied Dissatisfied Satisfied
Very Satisfied
Total
Count 15 84 435 56 590 Bharti
%age 2.5% 14.2% 73.7% 9.5% 100.00%
Count 10 21 497 69 597 BSNL
%age 1.7% 3.5% 83.2% 11.6% 100.00%
Count 0 0 453 29 482 Rel Comm
%age 0.0% 0.0% 94.0% 6.0% 100.00%
Count 25 105 1385 154 1669 Total
%age 1.5% 6.3% 83.0% 9.2% 100.00%

Assessment of Customer perception of Service and UP (E) SERVICE AREA Implementation and Effectiveness of Telecom Consumers Protection and Redressal of Grievances Regulations
© 441, (Basement), Jangpura, Mathura Road, New Delhi – 110014, India
Email: [email protected], URL: www.consumer-voice
179
6.3.1.3 In case your connection was temporarily suspended due to non-payment of bills how satisfied are you with the time taken to reactivate service after you made
the payment?
Operator Very
Dissatisfied Dissatisfied Satisfied
Very Satisfied
Total
Count 0 20 223 9 252 Bharti
%age 0.0% 7.9% 88.5% 3.6% 100.00%
Count 0 9 162 59 230 BSNL
%age 0.0% 3.9% 70.4% 25.7% 100.00%
Count 0 0 366 115 481 Rel Comm
%age 0.0% 0.0% 76.1% 23.9% 100.00%
Count 0 29 751 183 963 Total
%age 0.0% 3.0% 78.0% 19.0% 100.00%
6.3.2-A-Billing Related (only for postpaid customers)
6.3.2.1 How satisfied with the timely delivery of bills?
Operator Very
Dissatisfied Dissatisfied Satisfied
Very Satisfied
Total
Count 0 17 500 43 560 Bharti
%age 0.0% 3.0% 89.3% 7.7% 100.00%
Count 0 11 493 74 578 BSNL
85.3% %age 0.0% 1.9% 12.8% 100.00%
Count 0 11 430 27 468 Rel Comm
%age 0.0% 2.4% 91.9% 5.8% 100.00%
Count 0 39 1423 144 1606 Total
%age 0.0% 2.4% 88.6% 9.0% 100.00%
6.3.2.2 How satisfied are you with the accuracy of the bills?
Operator Very
Dissatisfied Dissatisfied Satisfied
Very Satisfied
Total
Count 7 29 493 31 560 Bharti
88.0% %age 1.3% 5.2% 5.5% 100.00%
Count 0 5 486 87 578 BSNL
%age 0.0% 0.9% 84.1% 15.1% 100.00%
Count 0 14 382 72 468 Rel Comm
%age 0.0% 15.4% 3.0% 81.6% 100.00%
Count 7 48 1361 190 1606 Total
%age 0.4% 3.0% 84.7% 11.8% 100.00%

Assessment of Customer perception of Service and UP (E) SERVICE AREA Implementation and Effectiveness of Telecom Consumers Protection and Redressal of Grievances Regulations
© 441, (Basement), Jangpura, Mathura Road, New Delhi – 110014, India
Email: [email protected], URL: www.consumer-voice
180
6.3.2.3 Please specify the reason(s) for your dissatisfaction?
Operator
Charges not as per the tariff
plan subscribed
Tariff plan changed without
information
Charges for value added
services not requested
Charged for calls\services
not made\used
Total
Count 3 8 11 16 Bharti
%age 8.3% 22.2% 30.6% 44.4% 36
Count 5 4 1 2 BSNL
%age 100.0% 80.0% 20.0% 40.0% 5
Count 4 7 4 6 Rel Comm
%age 28.6% 50.0% 28.6% 42.9% 14
Count 12 19 16 24
Total %age 21.8% 34.5% 29.1% 43.6% 55
6.3.2.4 Have you made any billing related complaints in last 12 months?
Operator Yes No Total
Count 80 480 560 Bharti
%age 14.3% 100.0% 85.7%
Count 156 422 578 BSNL
%age 27.0% 73.0% 100.0%
Count 85 383 468 Rel Comm
%age 18.2% 81.8% 100.0%
Count 321 1285 1606 Total
%age 20.0% 80.0% 100.0%
6.3.2.5 How satisfied are you with the process of resolution of billing complaints?
Operator Very
Dissatisfied Dissatisfied Satisfied
Very Satisfied
Total
Count 2 10 67 1 80 Bharti
%age 2.5% 12.5% 83.8% 1.3% 100.00%
Count 0 3 126 27 156 BSNL
%age 0.0% 1.9% 80.8% 17.3% 100.00%
Count 0 1 74 10 85 Rel Comm
%age 0.0% 1.2% 87.1% 11.8% 100.00%
Count 2 14 267 38 321 Total
%age 0.6% 4.4% 83.2% 11.8% 100.00%

Assessment of Customer perception of Service and UP (E) SERVICE AREA Implementation and Effectiveness of Telecom Consumers Protection and Redressal of Grievances Regulations
© 441, (Basement), Jangpura, Mathura Road, New Delhi – 110014, India
Email: [email protected], URL: www.consumer-voice
181
6.3.2.6 How satisfied are you with the clarity of the bills issued by your service provider in term of transparency and understandability?
Operator Very
Dissatisfied Dissatisfied Satisfied
Very Satisfied
Total
Count 0 12 63 5 80 Bharti
%age 0.0% 15.0% 78.8% 6.3% 100.00%
Count 0 8 123 25 156 BSNL
%age 0.0% 5.1% 78.8% 16.0% 100.00%
Count 0 2 75 8 85 Rel Comm
%age 0.0% 2.4% 88.2% 9.4% 100.00%
Count 0 22 261 38 321 Total
%age 0.0% 6.9% 81.3% 11.8% 100.00%
6.3.2.7 Please specify the reason(s) for your dissatisfaction
Operator Difficult to read the bill
Difficult to understand
the language
calculation not clear
Item wise charges not
given Total
Count 2 1 6 4 Bharti
%age 16.7% 8.3% 50.0% 33.3% 12
Count 4 3 1 2 BSNL
%age 50.0% 37.5% 12.5% 25.0% 8
Count 1 0 2 2 Rel Comm
%age 50.0% 2 0.0% 100.0% 100.0%
Count 7 4 9 8
Total %age 31.8% 18.2% 40.9% 36.4% 22

Assessment of Customer perception of Service and UP (E) SERVICE AREA Implementation and Effectiveness of Telecom Consumers Protection and Redressal of Grievances Regulations
© 441, (Basement), Jangpura, Mathura Road, New Delhi – 110014, India
Email: [email protected], URL: www.consumer-voice
182
6.3.2-B-Billing Related (only for prepaid customers)
6.3.2.8 How satisfied are you with the accuracy of charges i.e. amount deducted on
every usage?
Operator Very
Dissatisfied Dissatisfied Satisfied
Very Satisfied
Total
Count 0 3 26 1 30 Bharti
%age 0.0% 10.0% 86.7% 3.3% 100.00%
Count 0 5 12 2 19 BSNL
%age 0.0% 26.3% 63.2% 10.5% 100.00%
Count 0 3 11 0 14 Rel Comm
%age 0.0% 21.4% 78.6% 0.0% 100.00%
Count 0 11 49 3 63 Total
%age 0.0% 17.5% 77.8% 4.8% 100.00%
6.3.2.9 Please specify the reason(s) for your dissatisfaction
Operator
Charges not as per tariff
plan subscribed
Tariff plan changed without
information
charged for value added services not requested
Tariff plan changed without
information
Total
Count 2 2 1 1 Bharti
66.7% % age 66.7% 33.3% 33.3% 3
Count 3 1 3 2 BSNL
% age 60.0% 20.0% 60.0% 40.0% 5
Count 2 0 3 0 Rel Comm % age 66.7% 0.0% 100.0% 0.0% 3
Count 10 6 11 6
Total % age 90.9% 54.5% 100.0% 54.5% 11

Assessment of Customer perception of Service and UP (E) SERVICE AREA Implementation and Effectiveness of Telecom Consumers Protection and Redressal of Grievances Regulations
© 441, (Basement), Jangpura, Mathura Road, New Delhi – 110014, India
Email: [email protected], URL: www.consumer-voice
183
6.3.3Help services / Customer Care
6.3.3.1 Did you complain or make a query in the last 12 month to the customer
care/helpdesk/call center toll free number of your operator?
Operator Yes No Total
Count 308 282 590 Bharti
%age 52.2% 47.8% 100.00%
Count 385 212 597 BSNL
%age 64.5% 35.5% 100.00%
Count 192 290 482 Rel Comm
%age 39.8% 60.2% 100.00%
Count 885 784 1669 Total
%age 53.0% 47.0% 100.00%
6.3.3.2 How satisfied are you with the ease of access of customer care or help desk toll free number?
Operator Very
DissatisfiedDissatisfied Satisfied
Very Satisfied
Total
Count 0 12 285 11 308 Bharti
%age 0.0% 3.9% 92.5% 3.6% 100.00%
Count 1 9 347 28 385 BSNL
%age 0.3% 2.3% 90.1% 7.3% 100.00%
Count 1 25 163 3 192 Rel Comm
%age 0.5% 13.0% 84.9% 1.6% 100.00%
Count 2 46 795 42 885 Total
%age 0.2% 5.2% 89.8% 4.7% 100.00%

Assessment of Customer perception of Service and UP (E) SERVICE AREA Implementation and Effectiveness of Telecom Consumers Protection and Redressal of Grievances Regulations
© 441, (Basement), Jangpura, Mathura Road, New Delhi – 110014, India
Email: [email protected], URL: www.consumer-voice
184
6.3.3.3 How satisfied are you with the response time taken to answer your call by a customer care executive?
Operator Very
DissatisfiedDissatisfied Satisfied
Very Satisfied
Total
Count 4 35 250 19 308 Bharti
%age 1.3% 11.4% 81.2% 6.2% 100.00%
Count 1 20 302 62 385 BSNL
%age 0.3% 5.2% 78.4% 16.1% 100.00%
Count 1 38 135 18 192 Rel Comm
%age 0.5% 19.8% 70.3% 9.4% 100.00%
Count 6 93 687 99 885 Total
%age 0.7% 10.5% 77.6% 11.2% 100.00%
6.3.3.4 How satisfied are you with the problem solving ability of the customer care
executive (s)?
Operator Very
DissatisfiedDissatisfied Satisfied
Very Satisfied
Total
Count 0 58 227 23 308 Bharti
%age 0.0% 18.8% 73.7% 7.5% 100.00%
Count 1 52 300 32 385 BSNL
%age 0.3% 13.5% 77.9% 8.3% 100.00%
Count 1 32 156 3 192 Rel Comm
%age 0.5% 16.7% 81.3% 1.6% 100.00%
Count 2 142 683 58 885 Total
%age 0.2% 16.0% 77.2% 6.6% 100.00%
6.3.3.5 How satisfied are you with the time taken by the call center /customer care
/helpdesk to resolve your complain?
Operator Very
DissatisfiedDissatisfied Satisfied
Very Satisfied
Total
Count 0 43 260 5 308 Bharti
%age 0.0% 14.0% 84.4% 1.6% 100.00%
Count 1 39 342 3 385 BSNL
%age 0.3% 10.1% 88.8% 0.8% 100.00%
Count 1 30 161 0 192 Rel Comm
%age 0.5% 100.00% 15.6% 83.9% 0.0% Count 2 112 763 8 885
Total %age 0.2% 12.7% 86.2% 0.9% 100.00%

Assessment of Customer perception of Service and UP (E) SERVICE AREA Implementation and Effectiveness of Telecom Consumers Protection and Redressal of Grievances Regulations
© 441, (Basement), Jangpura, Mathura Road, New Delhi – 110014, India
Email: [email protected], URL: www.consumer-voice
185
6.3.4 Network Performance, Reliability, Availability
6.3.4.1 How satisfied are you with the speed of the broadband connection?
Operator Very
Dissatisfied Dissatisfied Satisfied
Very Satisfied
Total
Count 0 62 524 4 590 Bharti
%age 0.0% 10.5% 88.8% 0.7% 100.00%
Count 0 41 555 1 597 BSNL
%age 0.0% 6.9% 93.0% 0.2% 100.00%
Count 0 43 439 0 482 Rel Comm
%age 0.0% 8.9% 91.1% 0.0% 100.00%
Count 0 146 1518 5 1669 Total
%age 0.0% 8.7% 91.0% 0.3% 100.00%
6.3.4.2 How satisfied are you with the amount of time for which service is up and working?
Operator Very
Dissatisfied Dissatisfied Satisfied
Very Satisfied
Total
Count 34 70 486 0 Bharti
%age 5.8% 11.9% 82.4% 0.0% 590
Count 22 76 499 0 BSNL
%age 3.7% 12.7% 83.6% 0.0% 597
Count 17 138 327 0 Rel Comm
%age 3.5% 28.6% 67.8% 0.0% 482
Count 73 284 1312 0 Total
%age 4.4% 17.0% 78.6% 0.0% 1669

Assessment of Customer perception of Service and UP (E) SERVICE AREA Implementation and Effectiveness of Telecom Consumers Protection and Redressal of Grievances Regulations
© 441, (Basement), Jangpura, Mathura Road, New Delhi – 110014, India
Email: [email protected], URL: www.consumer-voice
186
6.3.5 Maintainability
6.3.5.1 How often do you face a problem with your Broadband connection?
Operator Very
Frequently Frequently Occasionally Never Total
Count 31 26 387 146 590 Bharti
%age 5.3% 4.4% 65.6% 24.7% 100.00%
Count 19 18 498 62 597 BSNL
%age 3.2% 3.0% 83.4% 10.4% 100.00%
Count 14 18 396 54 482 Rel Comm
%age 2.9% 3.7% 82.2% 11.2% 100.00%
Count 64 62 1281 262 1669 Total
%age 3.8% 3.7% 76.8% 15.7% 100.00%
6.3.5.2 What was the broadband connection problem face by you in last twelve month related to please specify?
Operator Problem was related
to computer hardware,software
problem was related to the broadband
connection\modem Total
Count 42 55 Bharti
Row% 73.7% 96.5% 57
Count 22 21 BSNL
Row% 59.5% 56.8% 37
Count 15 17 Rel Comm
Row% 46.9% 53.1% 32
Count 79 93 Total
Row% 62.7% 73.8% 126

Assessment of Customer perception of Service and UP (E) SERVICE AREA Implementation and Effectiveness of Telecom Consumers Protection and Redressal of Grievances Regulations
© 441, (Basement), Jangpura, Mathura Road, New Delhi – 110014, India
Email: [email protected], URL: www.consumer-voice
187
6.3.5.3 How satisfied are you with the time taken for restoration of broadband?
Operator Very
DissatisfiedDissatisfied Satisfied
Very Satisfied
Total
Count 0 35 485 70 590 Bharti
%age 0.0% 5.9% 82.2% 11.9% 100.00%
Count 2 24 514 59 597 BSNL
%age 0.3% 4.0% 86.1% 9.9% 100.00%
Count 3 54 266 162 482 Rel Comm
%age 0.7% 11.2% 55.2% 33.6% 100.00%
Count 5 113 1265 291 1669 Total
%age 0.2% 6.8% 75.8% 17.4% 100.00%
6.3.6 Supplementary Services
6.3.6.1 Do you use any value added services or supplementary services such as satic/fixed IP addresses-mail, IDs etc?
Operator Yes No Total
Count 66 524 590 Bharti
%age 11.2% 88.8% 100.00%
Count 98 499 597 BSNL
%age 16.4% 83.6% 100.00%
Count 65 417 482 Rel Comm
%age 13.5% 86.5% 100.00%
Count 229 1440 1669
Total %age 13.7% 86.3% 100.00%
6.3.6.2 How satisfied are you with the quality of such supplementary services provided?
Operator Very
Dissatisfied Dissatisfied Satisfied
Very Satisfied
Total
Count 0 3 58 5 66 Bharti
%age 0.0% 4.5% 87.9% 7.6% 100.00%
Count 4 21 68 5 98 BSNL
69.4% %age 4.1% 21.4% 5.1% 100.00%
Count 0 11 53 1 65 Rel Comm
%age 0.0% 16.9% 81.5% 1.5% 100.00%
Count 4 35 179 11 229 Total
%age 1.7% 15.3% 78.2% 4.8% 100.00%

Assessment of Customer perception of Service and UP (E) SERVICE AREA Implementation and Effectiveness of Telecom Consumers Protection and Redressal of Grievances Regulations
© 441, (Basement), Jangpura, Mathura Road, New Delhi – 110014, India
Email: [email protected], URL: www.consumer-voice
188
6.3.7 Overall Satisfaction
6.3.7.1 How satisfied are you with the overall quality of your Broadband service?
Operator Very
Dissatisfied Dissatisfied Satisfied
Very Satisfied
Total
Count 0 10 578 2 590 Bharti
%age 0.0% 1.7% 98.0% 0.3% 100.00%
Count 0 7 582 597 8 BSNL
%age 0.0% 1.2% 97.5% 1.3% 100.00%
Count 0 48 427 7 482 Rel Comm
%age 0.0% 10.0% 88.6% 1.5% 100.00%
Count 0 65 1587 17 1669 Total
%age 0.0% 3.9% 95.1% 1.0% 100.00%
6.3.7.2 Please specify the reason(s) for your dissatisfaction
Operator
Billing related
problem
Help service related
problem
Network performance
related problem
Problem with Supplementary
services Total
Count 3 2 4 3 Bharti
%age 30.0% 20.0% 40.0% 30.0% 10
Count 2 2 5 3 BSNL
%age 28.6% 28.6% 71.4% 42.9% 7
Count 18 11 16 5 Rel Comm %age 37.5% 22.9% 33.3% 10.4% 48
Count 23 15 25 11 Total
%age 35.4% 23.1% 38.5% 16.9% 65

Assessment of Customer perception of Service and UP (E) SERVICE AREA Implementation and Effectiveness of Telecom Consumers Protection and Redressal of Grievances Regulations
© 441, (Basement), Jangpura, Mathura Road, New Delhi – 110014, India
Email: [email protected], URL: www.consumer-voice
189
6.3.8 General Information
6.3.8.1 Are you aware of the facility for measuring the broadband connection speed
provided by your service provider?
Operator Yes No Total
Count 109 481 590 Bharti
%age 18.4% 81.6% 100.00%
Count 80 517 597 BSNL
%age 13.4% 86.6% 100.00%
Count 160 322 482 Rel Comm
%age 33.2% 66.8% 100.00%
Count 349 1320 1669 Total
%age 20.9% 79.1% 100.00%

Assessment of Customer perception of Service and UP (E) SERVICE AREA Implementation and Effectiveness of Telecom Consumers Protection and Redressal of Grievances Regulations
© 441, (Basement), Jangpura, Mathura Road, New Delhi – 110014, India
Email: [email protected], URL: www.consumer-voice
190
ANNEXURE - QUESTIONNAIRES
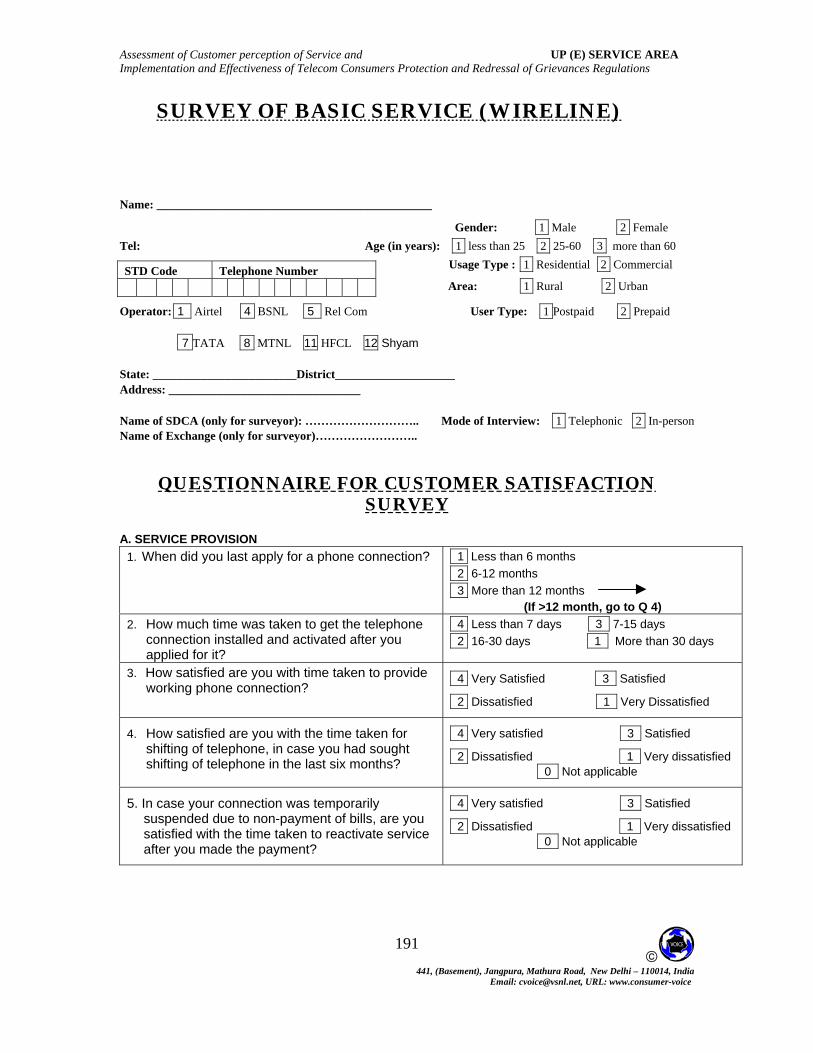
Assessment of Customer perception of Service and UP (E) SERVICE AREA Implementation and Effectiveness of Telecom Consumers Protection and Redressal of Grievances Regulations
© 441, (Basement), Jangpura, Mathura Road, New Delhi – 110014, India
Email: [email protected], URL: www.consumer-voice
191
Name: ______________________________________________
SURVEY OF BASIC SERVICE (WIRELINE)
Gender: 1 Male 2 Female Tel: Age (in years): 1 less than 25 2 25-60 3 more than 60
Usage Type : 1 Residential 2 Commercial
Area: 1 Rural 2 Urban
Operator: 1 Airtel 4 BSNL 5 Rel Com User Type: 1 Postpaid 2 Prepaid 7 TATA 8 MTNL 11 HFCL 12 Shyam
State: ________________________District____________________ Address: ________________________________ Name of SDCA (only for surveyor): ……………………….. Mode of Interview: 1 Telephonic 2 In-person Name of Exchange (only for surveyor)……………………..
QUESTIONNAIRE FOR CUSTOMER SATISFACTION SURVEY
A. SERVICE PROVISION
1. When did you last apply for a phone connection? 11 Less than 6 months 22 6-12 months 33 More than 12 months (If >12 month, go to Q 4)
STD Code Telephone Number
2. How much time was taken to get the telephone connection installed and activated after you applied for it?
14 Less than 7 days 23 7-15 days 32 16-30 days 414 More than 30 days
3. How satisfied are you with time taken to provide working phone connection?
14 Very Satisfied 23 Satisfied
32 Dissatisfied 414 Very Dissatisfied
4. How satisfied are you with the time taken for shifting of telephone, in case you had sought shifting of telephone in the last six months?
14 Very satisfied 23 Satisfied
32 Dissatisfied 414 Very dissatisfied 40 Not applicable
5. In case your connection was temporarily suspended due to non-payment of bills, are you satisfied with the time taken to reactivate service after you made the payment?
14 Very satisfied 23 Satisfied
32 Dissatisfied 414 Very dissatisfied 40 Not applicable

Assessment of Customer perception of Service and UP (E) SERVICE AREA Implementation and Effectiveness of Telecom Consumers Protection and Redressal of Grievances Regulations
© 441, (Basement), Jangpura, Mathura Road, New Delhi – 110014, India
Email: [email protected], URL: www.consumer-voice
192
B. BILLING RELATED (only for postpaid customers) (for pre-paid customer go to Question 11)
6. How satisfied are you with the timely delivery of bills?
14 Very Satisfied 23 Satisfied
32 Dissatisfied 414 Very Dissatisfied
7(a). How satisfied are you with the accuracy of the bills?
14 Very Satisfied 23 Satisfied
32 Dissatisfied 414 Very Dissatisfied
(Ask this question only if 1 OR 2 is coded in Q7(a))
7(b) Please specify the reason(s) for your dissatisfaction
11 Charges not as per tariff plan subscribed
2 Tariff plan changed without information
33 Charged for value added services not subscribed
444 Charged for calls/services not made/used
454 Others (please specify) ____________________
_______________________________________
8. Have you made any billing related complaints in last 12 months?
11 Yes
22 No (If no, go to Q 10 (a))
9. How satisfied are you with the process of resolution of billing complaints?
14 Very Satisfied 23 Satisfied
32 Dissatisfied 414 Very Dissatisfied
10(a). How satisfied are you with the clarity of the bills sent by your service provider in terms of transparency and understandability?
14 Very Satisfied 23 Satisfied
32 Dissatisfied 414 Very Dissatisfied
(Ask this question only if 1 OR 2 is coded in Q10(a))
10(b) Please specify the reason(s) for your dissatisfaction
11 Difficult to read the bill
22 Difficult to understand the language
33 Calculations not clear
444 Item-wise charges like total minutes of usage of local, STD, ISD calls and charges thereon not given
454 Others (please specify)_____________________
_______________________________________
For Prepaid Customers only
11. How satisfied are you with the accuracy of charges i.e. amount deducted on every usage?
14 Very Satisfied 23 Satisfied
32 Dissatisfied 414 Very Dissatisfied

Assessment of Customer perception of Service and UP (E) SERVICE AREA Implementation and Effectiveness of Telecom Consumers Protection and Redressal of Grievances Regulations
© 441, (Basement), Jangpura, Mathura Road, New Delhi – 110014, India
Email: [email protected], URL: www.consumer-voice
193
C. HELP SERVICES/CUSTOMER CARE
12. Did you complain or make a query in the last 12 months to the customer care/helpline/ call centre toll free number of your service provider?
1 Yes
2 No (If no, go to Q 17)
13. How satisfied are you with the ease of access of call centre/customer care or helpline?
14 Very Satisfied 23 Satisfied
32 Dissatisfied 414 Very Dissatisfied
14. How satisfied are you with the response time taken to answer your call by a customer care executive?
14 Very Satisfied 23 Satisfied
32 Dissatisfied 414 Very Dissatisfied
15. How satisfied are you with the problem solving ability of the customer care executive(s)?
14 Very Satisfied 23 Satisfied
32 Dissatisfied 414 Very Dissatisfied
16. How satisfied are you with the time taken by call centre/customer care /helpline to resolve your complaint?
14 Very Satisfied 23 Satisfied
32 Dissatisfied 414 Very Dissatisfied
D. NETWORK PERFORMANCE, RELIABILITY AND AVAILABILITY
17. How satisfied are you with the availability of working telephone (dial tone)?
14 Very Satisfied 23 Satisfied
32 Dissatisfied 414 Very Dissatisfied
18. How satisfied are you with the ability to make or receive calls easily?
14 Very Satisfied 23 Satisfied
32 Dissatisfied 414 Very Dissatisfied
19. How satisfied are you with the voice quality? 14 Very Satisfied 23 Satisfied
32 Dissatisfied 414 Very Dissatisfied
E. MAINTAINABILITY (FAULT REPAIR)
20. Have you experienced fault in your telephone connection in the last 12 months?
11 Yes
22 No (If no, go to Q 24)
21. How many time your telephone became faulty in the last one month.
14 Nil 23 One time
32 2-3 times 414 More than 3 times
22. How long did it take generally for repairing the fault after lodging complaint?
14 1 day 23 2-3 days
32 4 - 7 days 414 more than 7 days
23. How satisfied are you with the fault repair service?
14 Very Satisfied 23 Satisfied

Assessment of Customer perception of Service and UP (E) SERVICE AREA Implementation and Effectiveness of Telecom Consumers Protection and Redressal of Grievances Regulations
© 441, (Basement), Jangpura, Mathura Road, New Delhi – 110014, India
Email: [email protected], URL: www.consumer-voice
194
32 Dissatisfied 414 Very Dissatisfied
F. SUPPLEMENTARY SERVICES
24. Do you use services like call waiting, call forwarding, voice mail or any other supplementary services
11 Yes
22 No (If no, go to Q 26(a))
25. How satisfied are you with the quality of the supplementary services provided?
14 Very Satisfied 23 Satisfied
32 Dissatisfied 414 Very Dissatisfied
G. OVERALL CUSTOMER SATISFACTION
26(a). How satisfied are you with the overall quality of your telephone service?
14 Very Satisfied 23 Satisfied
32 Dissatisfied 414 Very Dissatisfied
(Ask this question only if 1 OR 2 is coded in Q26(a))
26(b) Please specify the reason(s) for your dissatisfaction
1. _______________________________________
_______________________________________
2. _______________________________________
_______________________________________
3. _______________________________________
H. GENERAL INFORMATION
(Ask this question only if 1 OR 2 is coded in Q1)
27. Have you been informed in writing, at the time of subscription of service or within a week of activation of service the complete details of your tariff plan?
12 Yes
21 No
28. Have you terminated a Telephone Phone connection that you had in the last 12 months
11 Yes
22 No (If no, go to Q 32)
29. If yes, please name your previous service provider?
1 Airtel 4 BSNL 5 Rel Com
7 TATA 8 MTNL 11 HFCL 12 Shyam
30. How many days were taken for termination of your connection?
14 1 day 23 2-3 days
32 4 - 7 days 414 more than 7 days
31. Did your service provider adjust your security deposit in the bill raised after you requested for termination?
11 Yes
22 No
32. Have you registered your telephone number for Do Not Call (DNC) registry with your service
11 Yes
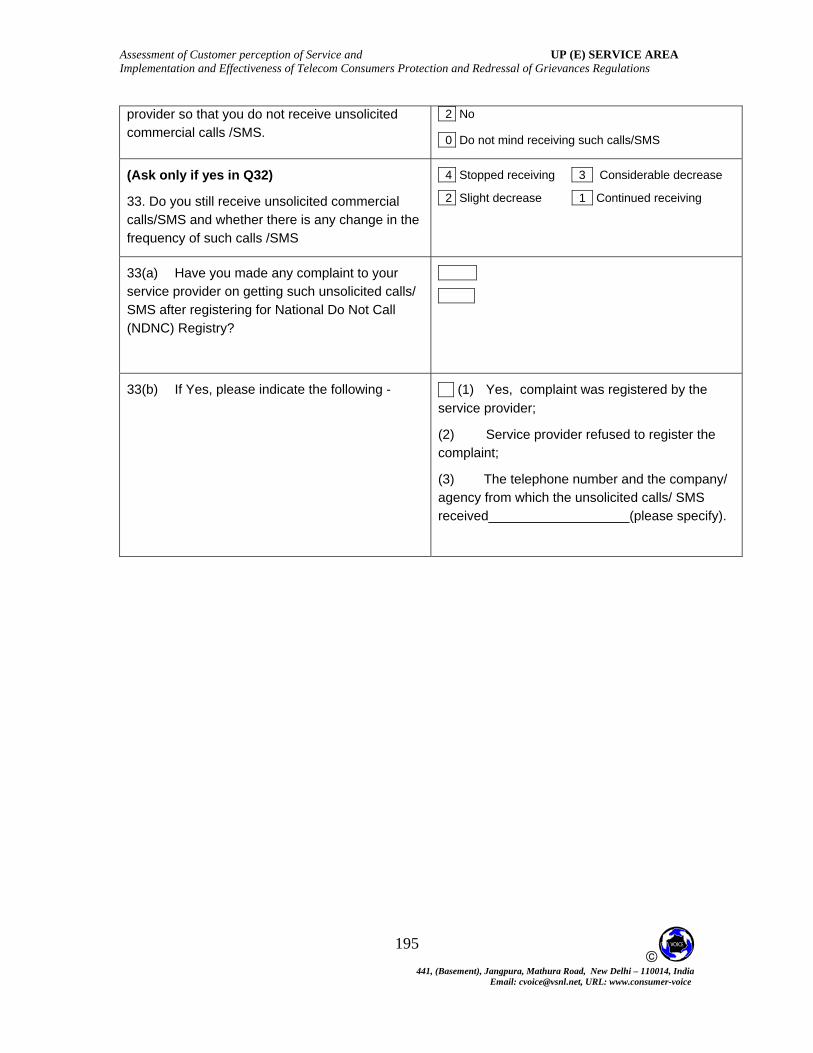
Assessment of Customer perception of Service and UP (E) SERVICE AREA Implementation and Effectiveness of Telecom Consumers Protection and Redressal of Grievances Regulations
© 441, (Basement), Jangpura, Mathura Road, New Delhi – 110014, India
Email: [email protected], URL: www.consumer-voice
195
provider so that you do not receive unsolicited commercial calls /SMS.
22 No
20 Do not mind receiving such calls/SMS
(Ask only if yes in Q32)
33. Do you still receive unsolicited commercial calls/SMS and whether there is any change in the frequency of such calls /SMS
14 Stopped receiving 23 Considerable decrease
32 Slight decrease 414 Continued receiving
33(a) Have you made any complaint to your service provider on getting such unsolicited calls/ SMS after registering for National Do Not Call (NDNC) Registry?
1 Yes
2 No
33(b) If Yes, please indicate the following -
(1) (1) Yes, complaint was registered by the service provider;
(2) Service provider refused to register the complaint;
(3) The telephone number and the company/ agency from which the unsolicited calls/ SMS received___________________(please specify).
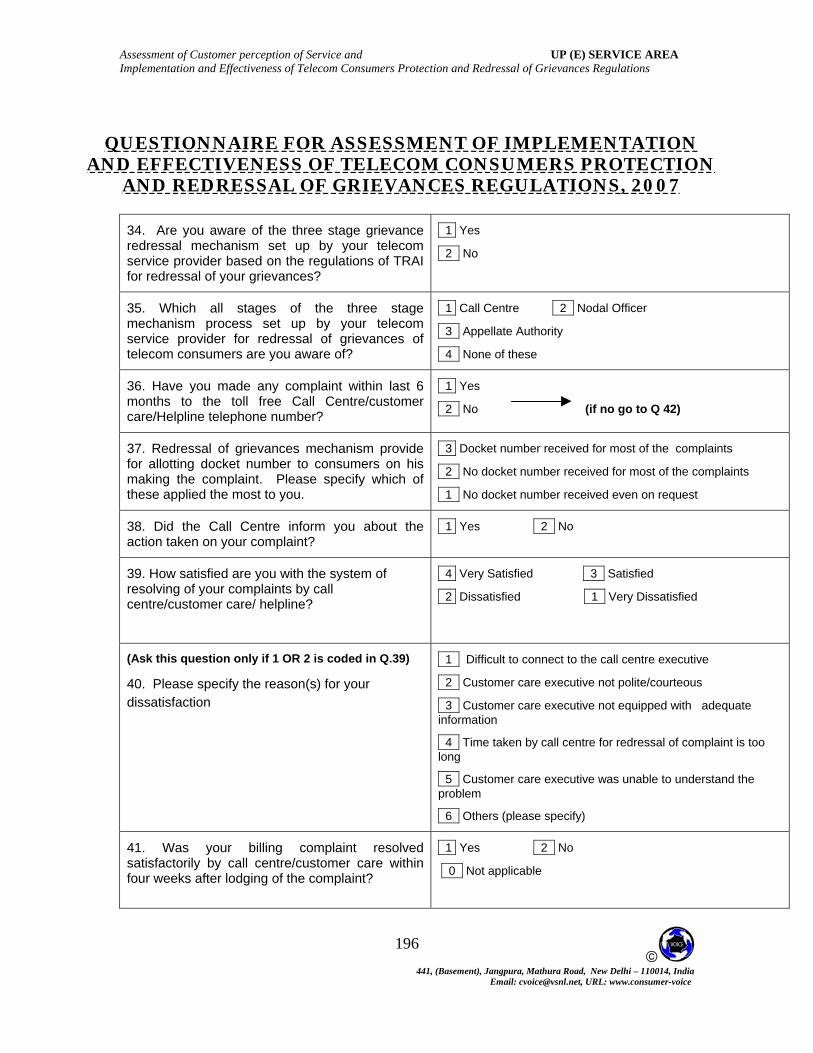
Assessment of Customer perception of Service and UP (E) SERVICE AREA Implementation and Effectiveness of Telecom Consumers Protection and Redressal of Grievances Regulations
© 441, (Basement), Jangpura, Mathura Road, New Delhi – 110014, India
Email: [email protected], URL: www.consumer-voice
196
QUESTIONNAIRE FOR ASSESSMENT OF IMPLEMENTATION AND EFFECTIVENESS OF TELECOM CONSUMERS PROTECTION
AND REDRESSAL OF GRIEVANCES REGULATIONS, 2007
34. Are you aware of the three stage grievance redressal mechanism set up by your telecom service provider based on the regulations of TRAI for redressal of your grievances?
11 Yes
22 No
35. Which all stages of the three stage mechanism process set up by your telecom service provider for redressal of grievances of telecom consumers are you aware of?
11 Call Centre 22 Nodal Officer
23 Appellate Authority
24 None of these
36. Have you made any complaint within last 6 months to the toll free Call Centre/customer care/Helpline telephone number?
11 Yes
22 No (if no go to Q 42)
37. Redressal of grievances mechanism provide for allotting docket number to consumers on his making the complaint. Please specify which of these applied the most to you.
23 Docket number received for most of the complaints
32 No docket number received for most of the complaints
31 No docket number received even on request
38. Did the Call Centre inform you about the action taken on your complaint?
11 Yes 22 No
39. How satisfied are you with the system of resolving of your complaints by call centre/customer care/ helpline?
14 Very Satisfied 23 Satisfied
32 Dissatisfied 414 Very Dissatisfied
(Ask this question only if 1 OR 2 is coded in Q.39)
40. Please specify the reason(s) for your dissatisfaction
11 Difficult to connect to the call centre executive
22 Customer care executive not polite/courteous
33 Customer care executive not equipped with adequate information
444 Time taken by call centre for redressal of complaint is too long
454 Customer care executive was unable to understand the problem
464 Others (please specify)
41. Was your billing complaint resolved satisfactorily by call centre/customer care within four weeks after lodging of the complaint?
11 Yes 22 No
20 Not applicable

Assessment of Customer perception of Service and UP (E) SERVICE AREA Implementation and Effectiveness of Telecom Consumers Protection and Redressal of Grievances Regulations
© 441, (Basement), Jangpura, Mathura Road, New Delhi – 110014, India
Email: [email protected], URL: www.consumer-voice
197
42. Are you aware of the contact details of the Nodal Officer?
11 yes
22 No (if no go to Q 48)
43. Have you ever made a complaint to the nodal officer regarding your complaints not resolved or unsatisfactorily resolved by the call center/customer care?
11 yes
22 No (if no go to Q 48)
44. Can you approach your Nodal Officer easily? 11 Yes 22 No
45. Did the Nodal Officer intimate you about the decision taken on your complaint?
11 Yes 22 No
46. How satisfied are you with the redressal of the complaint by the Nodal Officer?
14 Very Satisfied 23 Satisfied
32 Dissatisfied 414 Very Dissatisfied
(Ask this question only if 1 OR 2 is coded in Q46)
47. Please specify the reason(s) for your dissatisfaction
11 Difficult to connect to the Nodal Officer
22 Nodal Officer not polite/courteous
33 Nodal Officer not equipped with adequate information
44 time taken by Nodal Officer for redressal of complaint is too long
454 Nodal Officer was unable to understand the problem
464 Others (please specify)
48. Are you aware of the contact details of the appellate authority for filing of appeals on complaints not resolved or unsatisfactorily resolved by Nodal Officer?
11 Yes
22 No (if no go to Q 52)
49. Have you filed any appeal in the prescribed form in last 6 month?
11 Yes
22 No (if no go to Q 52)
50. Did you receive any acknowledgement? 11 Yes 22 No
51. Did the appellate authority take a decision upon your appeal within 3 months of filing the appeal?
11 Yes 22 No
23 Appeal filed only recently
(Q52 to Q54 are for prepaid customers only)
52. Are you aware that a prepaid customer can get item-wise usage charge details, on request?
11 Yes 22 No

Assessment of Customer perception of Service and UP (E) SERVICE AREA Implementation and Effectiveness of Telecom Consumers Protection and Redressal of Grievances Regulations
© 441, (Basement), Jangpura, Mathura Road, New Delhi – 110014, India
Email: [email protected], URL: www.consumer-voice
198
53. Have you been denied of your request for item-wise usage charge details for your pre-paid connection?
11 Yes 22 No (if no go to Q 55)
54. What were the reason(s) for denying your request?
11 No reason given
22 technical problem
33 Others (please specify)
For new customers only(Subscribed in last 6 months)
55. Have you been provided the Manual of Practice containing the terms and conditions of service, grievance redressal mechanism etc. while taking the connection?
11 Yes 22 No
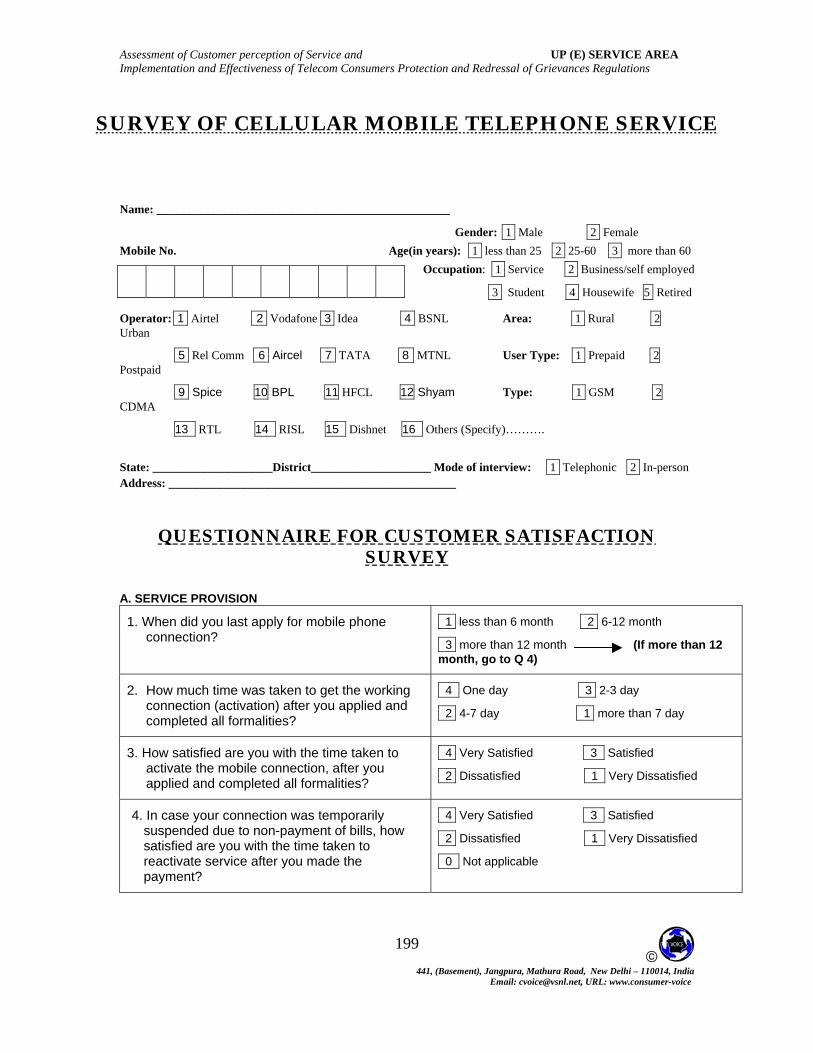
Assessment of Customer perception of Service and UP (E) SERVICE AREA Implementation and Effectiveness of Telecom Consumers Protection and Redressal of Grievances Regulations
© 441, (Basement), Jangpura, Mathura Road, New Delhi – 110014, India
Email: [email protected], URL: www.consumer-voice
199
SURVEY OF CELLULAR MOBILE TELEPHONE SERVICE Name: _________________________________________________
Gender: 1 Male 2 Female Mobile No. Age(in years): 1 less than 25 2 25-60 3 more than 60
Occupation: 1 Service 2 Business/self employed
3 Student 4 Housewife 5 Retired
Operator: 1 Airtel 2 Vodafone 3 Idea 4 BSNL Area: 1 Rural 2 Urban
5 Rel Comm 6 Aircel 7 TATA 8 MTNL User Type: 1 Prepaid 2 Postpaid
9 Spice 10 BPL 11 HFCL 12 Shyam Type: 1 GSM 2 CDMA
13 RTL 14 RISL 15 Dishnet 16 Others (Specify)……….
State: ____________________District____________________ Mode of interview: 1 Telephonic 2 In-person Address: ________________________________________________
QUESTIONNAIRE FOR CUSTOMER SATISFACTION SURVEY
A. SERVICE PROVISION
1. When did you last apply for mobile phone connection?
11 less than 6 month 22 6-12 month
33 more than 12 month (If more than 12 month, go to Q 4)
2. How much time was taken to get the working connection (activation) after you applied and completed all formalities?
444 One day 33 2-3 day
22 4-7 day 1 more than 7 day
3. How satisfied are you with the time taken to activate the mobile connection, after you applied and completed all formalities?
14 Very Satisfied 23 Satisfied
32 Dissatisfied 414 Very Dissatisfied
4. In case your connection was temporarily suspended due to non-payment of bills, how satisfied are you with the time taken to reactivate service after you made the payment?
14 Very Satisfied 23 Satisfied
32 Dissatisfied 414 Very Dissatisfied
404 Not applicable
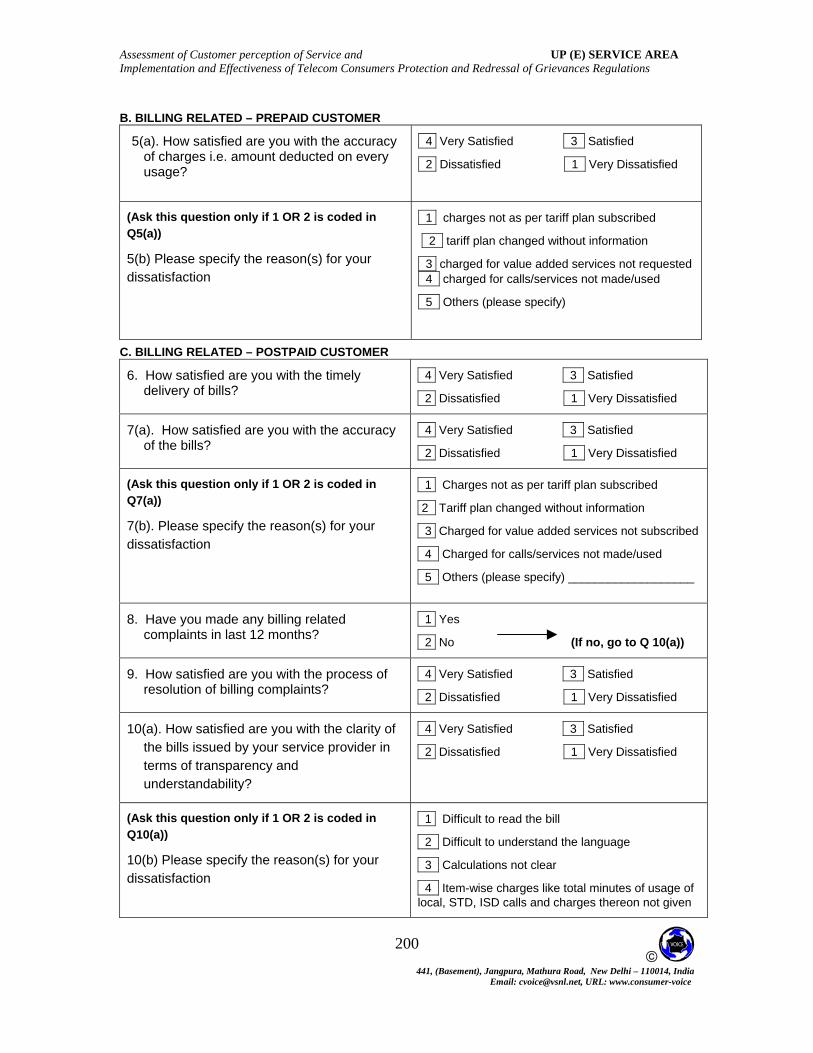
Assessment of Customer perception of Service and UP (E) SERVICE AREA Implementation and Effectiveness of Telecom Consumers Protection and Redressal of Grievances Regulations
© 441, (Basement), Jangpura, Mathura Road, New Delhi – 110014, India
Email: [email protected], URL: www.consumer-voice
200
B. BILLING RELATED – PREPAID CUSTOMER
5(a). How satisfied are you with the accuracy of charges i.e. amount deducted on every usage?
14 Very Satisfied 23 Satisfied
32 Dissatisfied 414 Very Dissatisfied
(Ask this question only if 1 OR 2 is coded in Q5(a))
5(b) Please specify the reason(s) for your dissatisfaction
11 charges not as per tariff plan subscribed
22 tariff plan changed without information
33 charged for value added services not requested 444 charged for calls/services not made/used
454 Others (please specify)
C. BILLING RELATED – POSTPAID CUSTOMER
6. How satisfied are you with the timely delivery of bills?
14 Very Satisfied 23 Satisfied
32 Dissatisfied 414 Very Dissatisfied
7(a). How satisfied are you with the accuracy of the bills?
14 Very Satisfied 23 Satisfied
32 Dissatisfied 414 Very Dissatisfied
(Ask this question only if 1 OR 2 is coded in Q7(a))
7(b). Please specify the reason(s) for your dissatisfaction
11 Charges not as per tariff plan subscribed
2 Tariff plan changed without information
33 Charged for value added services not subscribed
444 Charged for calls/services not made/used
454 Others (please specify) ___________________
8. Have you made any billing related complaints in last 12 months?
11 Yes
22 No (If no, go to Q 10(a))
9. How satisfied are you with the process of resolution of billing complaints?
14 Very Satisfied 23 Satisfied
32 Dissatisfied 414 Very Dissatisfied
10(a). How satisfied are you with the clarity of the bills issued by your service provider in terms of transparency and understandability?
14 Very Satisfied 23 Satisfied
32 Dissatisfied 414 Very Dissatisfied
(Ask this question only if 1 OR 2 is coded in Q10(a))
10(b) Please specify the reason(s) for your dissatisfaction
11 Difficult to read the bill
22 Difficult to understand the language
33 Calculations not clear
444 Item-wise charges like total minutes of usage of local, STD, ISD calls and charges thereon not given
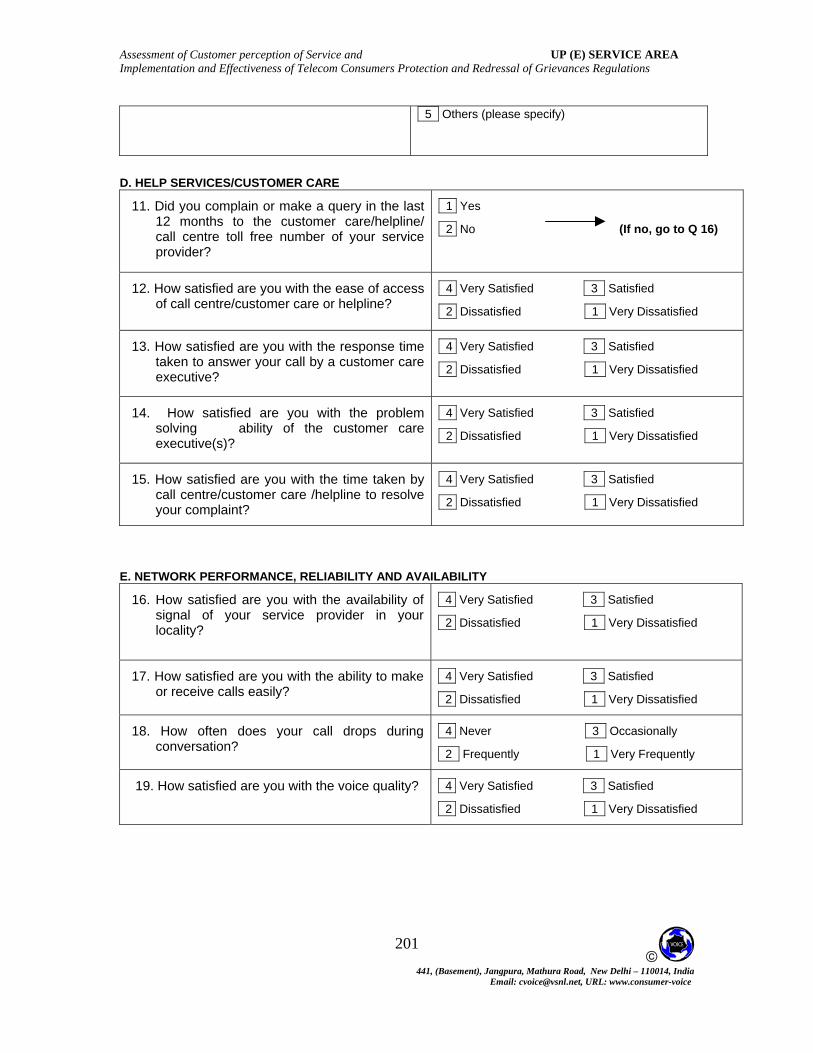
Assessment of Customer perception of Service and UP (E) SERVICE AREA Implementation and Effectiveness of Telecom Consumers Protection and Redressal of Grievances Regulations
© 441, (Basement), Jangpura, Mathura Road, New Delhi – 110014, India
Email: [email protected], URL: www.consumer-voice
201
454 Others (please specify)
D. HELP SERVICES/CUSTOMER CARE
11. Did you complain or make a query in the last 12 months to the customer care/helpline/ call centre toll free number of your service provider?
11 Yes
22 No (If no, go to Q 16)
12. How satisfied are you with the ease of access of call centre/customer care or helpline?
14 Very Satisfied 23 Satisfied
32 Dissatisfied 414 Very Dissatisfied
13. How satisfied are you with the response time taken to answer your call by a customer care executive?
14 Very Satisfied 23 Satisfied
32 Dissatisfied 414 Very Dissatisfied
14. How satisfied are you with the problem solving ability of the customer care executive(s)?
14 Very Satisfied 23 Satisfied
32 Dissatisfied 414 Very Dissatisfied
15. How satisfied are you with the time taken by call centre/customer care /helpline to resolve your complaint?
14 Very Satisfied 23 Satisfied
32 Dissatisfied 414 Very Dissatisfied
E. NETWORK PERFORMANCE, RELIABILITY AND AVAILABILITY
16. How satisfied are you with the availability of signal of your service provider in your locality?
14 Very Satisfied 23 Satisfied
32 Dissatisfied 414 Very Dissatisfied
17. How satisfied are you with the ability to make or receive calls easily?
14 Very Satisfied 23 Satisfied
32 Dissatisfied 414 Very Dissatisfied
18. How often does your call drops during conversation?
14 Never 33 Occasionally
22 Frequently 11 Very Frequently
19. How satisfied are you with the voice quality? 14 Very Satisfied 23 Satisfied
32 Dissatisfied 414 Very Dissatisfied

Assessment of Customer perception of Service and UP (E) SERVICE AREA Implementation and Effectiveness of Telecom Consumers Protection and Redressal of Grievances Regulations
© 441, (Basement), Jangpura, Mathura Road, New Delhi – 110014, India
Email: [email protected], URL: www.consumer-voice
202
F. MAINTAINABILITY
20. How often your mobile handset faces problem of signal?
14 Never 33 Occasionally
22 Frequently 11 Very Frequently
21. How satisfied are you with the availability of network (signal)?
14 Very Satisfied 23 Satisfied
32 Dissatisfied 414 Very Dissatisfied
22. Are you satisfied with the restoration of network (signal) problems?
14 Very satisfied 23 Satisfied
32 Dissatisfied 414 Very dissatisfied
G. SUPPLEMENTARY SERVICES/VALUE ADDED SERVICES
23. Do you use value added services like roaming, ring tone, GPRS, e-mail, voice mail or any other such services
11 Yes
22 No (If no, go to Q 26(a))
24. Did the service provider have your explicit consent before providing the chargeable value added service such as ring tone, e-mail/GPRS, voice mail etc.
11 Yes
22 No
25. How satisfied are you with the quality of the supplementary / value added services provided?
14 Very Satisfied 23 Satisfied
32 Dissatisfied 414 Very Dissatisfied
G. OVERALL CUSTOMER SATISFACTION
26(a). How satisfied are you with the overall quality of your mobile service?
14 Very Satisfied 23 Satisfied
32 Dissatisfied 414 Very Dissatisfied
(Ask this question only if 1 OR 2 is coded in Q26(a))
26(b) Please specify the reason(s) for your dissatisfaction
1. _______________________________________
_______________________________________
2. _______________________________________
_______________________________________
3. _______________________________________
_______________________________________

Assessment of Customer perception of Service and UP (E) SERVICE AREA Implementation and Effectiveness of Telecom Consumers Protection and Redressal of Grievances Regulations
© 441, (Basement), Jangpura, Mathura Road, New Delhi – 110014, India
Email: [email protected], URL: www.consumer-voice
203
H. GENERAL INFORMATION (Ask this question only if 1 OR 2 is coded in Q1) 27. Have you been informed in writing, at the time of subscription of service or within a week of activation of service the complete details of your tariff plan?
1 Yes
2 No
28. Have you terminated your Mobile Phone connection in the last 12 months
1 Yes
2 No (If no, go to Q 32)
29. If Yes, please name your previous service provider? 1 Airtel 2 Vodafone 3 Idea 4 BSNL
5 Rel Comm 6 Aircel 7 TATA 8 MTNL
9 Spice 10 BPL 11 HFCL 12 Shyam
13 RTL 14 RISL 15 Dishnet
16 Others (Specify)________________________________
30. How many days were taken by previous service provider for termination of your Mobile Phone connection?
4 1 day 3 2-3 days
2 4 - 7 days 1 more than 7 days
31. Did your service provider adjust your security deposit in the bill raised after you requested for termination?
1 Yes
2 No
32. Have you registered your telephone number for Do Not Call (DNC) registry with your service provider so that you do not receive unsolicited commercial calls /SMS.
1 Yes
2 No
0 Do not mind receiving such calls/SMS
(Ask only if yes in Q32) 33. Do you still receive unsolicited commercial calls/SMS and whether there is any change in the frequency of such calls /SMS
4 Stopped receiving 3 Considerable decrease
2 Slight decrease 1 Continued receiving
(Ask only if yes in Q32) 33. Do you still receive unsolicited commercial calls/SMS and whether there is any change in the frequency of such calls /SMS
4 Stopped receiving 3 Considerable decrease
2 Slight decrease 1 Continued receiving
33(a) Have you made any complaint to your service provider on getting such unsolicited calls/ SMS after registering for National Do Not Call (NDNC) Registry?
1 Yes
2 No
33(b) If Yes, please indicate the following -
(1) Yes, complaint was registered by the service provider;
(2) Service provider refused to register the complaint;
(3) The telephone number and the company/ agency from which the unsolicited calls/ SMS

Assessment of Customer perception of Service and UP (E) SERVICE AREA Implementation and Effectiveness of Telecom Consumers Protection and Redressal of Grievances Regulations
© 441, (Basement), Jangpura, Mathura Road, New Delhi – 110014, India
Email: [email protected], URL: www.consumer-voice
204
received___________________(please specify).
QUESTIONNAIRE FORASSESSMENT OF IMPLEMENTATION AND EFFECTIVENESS OF TELECOM CONSUMERS PROTECTION
AND REDRESSAL OF GRIEVANCES REGULATIONS, 2007
34. Are you aware of the three stage grievance redressal mechanism set up by your telecom service provider based on the regulations of TRAI for redressal of your grievances?
11 Yes
22 No
35. Which all stages of the three stage mechanism process set up by your telecom service provider for redressal of grievances of telecom consumers are you aware of?
11 Call Centre 22 Nodal Officer
23 Appellate Authority
24 None of these
36. Have you made any complaint within last 6 months to the toll free Call Centre/customer care/Helpline telephone number?
11 Yes
22 No (if no go to Q 42)
37. Redressal of grievances mechanism provide for allotting docket number to consumers on his making the complaint. Please specify which of these applied the most to you.
23 Docket number received for most of the complaints
32 No docket number received for most of the complaints
31 No docket number received even on request
38. Did the Call Centre inform you about the action taken on your complaint?
11 Yes 22 No
39. How satisfied are you with the system of resolving of your complaints by call centre/customer care/ helpline?
14 Very Satisfied 23 Satisfied
32 Dissatisfied 414 Very Dissatisfied
(Ask this question only if 1 OR 2 is coded in Q.39)
40. Please specify the reason(s) for your dissatisfaction
11 Difficult to connect to the call centre executive
22 Customer care executive not polite/courteous
33 Customer care executive not equipped with adequate information
444 Time taken by call centre for redressal of complaint is too long
454 Customer care executive was unable to understand the problem

Assessment of Customer perception of Service and UP (E) SERVICE AREA Implementation and Effectiveness of Telecom Consumers Protection and Redressal of Grievances Regulations
© 441, (Basement), Jangpura, Mathura Road, New Delhi – 110014, India
Email: [email protected], URL: www.consumer-voice
205
464 Others (please specify)
41. Was your billing complaint resolved satisfactorily by call centre/customer care within four weeks after lodging of the complaint?
11 Yes 22 No
20 Not applicable
42. Are you aware of the contact details of the Nodal Officer?
11 yes
22 No (if no go to Q 48)
43. Have you ever made a complaint to the nodal officer regarding your complaints not resolved or unsatisfactorily resolved by the call center/customer care?
11 yes
22 No (if no go to Q48)
44. Can you approach your Nodal Officer easily? 11 Yes 22 No
45. Did the Nodal Officer intimate you about the decision taken on your complaint?
11 Yes 22 No
46. How satisfied are you with the redressal of the complaint by the Nodal Officer?
14 Very Satisfied 23 Satisfied
32 Dissatisfied 414 Very Dissatisfied
(Ask this question only if 1 OR 2 is coded in Q46)
47. Please specify the reason(s) for your dissatisfaction
11 Difficult to connect to the Nodal Officer
22 Nodal Officer not polite/courteous
33 Nodal Officer not equipped with adequate information
44 time taken by Nodal Officer for redressal of complaint is too long
454 Nodal Officer was unable to understand the problem
464 Others (please specify)
48. Are you aware of the contact details of the appellate authority for filing of appeals on complaints not resolved or unsatisfactorily resolved by Nodal Officer?
11 Yes
22 No (if no go to Q 52)
49. Have you filed any appeal in the prescribed form in last 6 month?
11 Yes
22 No (if no go to Q 52)
50. Did you receive any acknowledgement? 11 Yes 22 No
51. Did the appellate authority take a decision upon your appeal within 3 months of filing the appeal?
11 Yes 22 No
23 Appeal filed only recently
(Q52 to Q54 are for prepaid customers only)

Assessment of Customer perception of Service and UP (E) SERVICE AREA Implementation and Effectiveness of Telecom Consumers Protection and Redressal of Grievances Regulations
© 441, (Basement), Jangpura, Mathura Road, New Delhi – 110014, India
Email: [email protected], URL: www.consumer-voice
206
n 1 Yes 22 No 52. Are you aware that a prepaid customer caget item-wise usage charge details, on request?
1
53. Have you been denied of your request for item-wise usage charge details for your pre-paid
11 Yes 22 No (if no go to Q 55)
connection?
54. What were the reason(s) for denying your request?
11 No reason given
22 technical problem
33 Others (please specify)
For new customers only(Subscribed in last 6 months)
ontaining the terms and conditions of 1 Yes 22 No 55. Have you been provided the Manual of
Practice cservice, grievance redressal mechanism etc. while taking the connection?
1

Assessment of Customer perception of Service and UP (E) SERVICE AREA Implementation and Effectiveness of Telecom Consumers Protection and Redressal of Grievances Regulations
© 441, (Basement), Jangpura, Mathura Road, New Delhi – 110014, India
Email: [email protected], URL: www.consumer-voice
207
BROADBAND SERVICE Name: _________________________________________________ Gender: 1 Male 2 Female Tel: Age Age (in years): 1 less than 25 2 25-60 3
more than 60 Usage Type : 1 Residential 2 Commercial
E-mail ID
Operator: 1 Airtel 4 BSNL 5 Rel Com 8 MTNL Area: 1 Rural 2 Urban
11 HFCL 21 VSNL 22 Sify 23 Asianet User Type: 1 Prepaid 2 Postpaid
24 Ortel 25 You Telcom 26 Hathway 27 Others_____
State: ____________________District________________________ Mode of interview: 1 Telephonic 2 In-person
Address: _____________________________________________ 3 e-mail 4 Web/online
Name of SDCA (only for surveyor): ……………………….. Name of POP (only for surveyor)……………………..
QUESTIONNAIRE FOR CUSTOMER SATISFACTION SURVEY
A. SERVICE PROVISION
1. After registration and payment of initial deposit by you within how many working days did the broadband connection get activated?
11 Within 15 working days
22 More than 15 working Days
2. How satisfied are you with the time taken in the provision of the Broadband connection after registration and payment of initial deposit by you?
14 Very Satisfied 23 Satisfied
32 Dissatisfied 414 Very Dissatisfied
3. In case your connection was temporarily suspended due to non-payment of bills, how satisfied are you with the time taken to reactivate service after you made the payment?
14 Very Satisfied 23 Satisfied
32 Dissatisfied 414 Very Dissatisfied
04 Not applicable

Assessment of Customer perception of Service and UP (E) SERVICE AREA Implementation and Effectiveness of Telecom Consumers Protection and Redressal of Grievances Regulations
© 441, (Basement), Jangpura, Mathura Road, New Delhi – 110014, India
Email: [email protected], URL: www.consumer-voice
208
14 Very Satisfied 23 Satisfied
B. BILLING RELATED - POSTPAID CUSTOMER
4. How satisfied are you with the timely delivery of bills? 32 Dissatisfied 414 Very Dissatisfied
5(a). How satisfied are you with the accuracy of the bills?
14 Very Satisfied 23 Satisfied
32 Dissatisfied 414 Very Dissatisfied
(Ask this question only if 1 OR 2 is coded in Q5(a))
5(b) Please specify the reason(s) for your dissatisfaction
11 Charges not as per tariff plan subscribed
22 Tariff plan changed without information
33 Charged for value added services not requested
444 Charged for calls/services not made/used
454 Others (please specify)
6. Have you made any billing related complaints in last 12 months?
11 Yes
22 No (If no, go to Q 8(a))
7. How satisfied are you with the process of resolution of billing complaints?
14 Very Satisfied 23 Satisfied
32 Dissatisfied 414 Very Dissatisfied
8(a). How satisfied are you with the clarity of the bills issued by your service provider in terms of transparency and understandability?
14 Very Satisfied 23 Satisfied
32 Dissatisfied 414 Very Dissatisfied
(Ask this question only if 1 OR 2 is coded in Q8(a))
8(b) Please specify the reason(s) for your dissatisfaction
11 Difficult to read the bill
22 Difficult to understand the language
33 Calculations not clear
44 Item-wise charges like total minutes of usage of local, STD, ISD calls and charges thereon not given
5 Others (please specify)
C. BILLING RELATED - FOR PREPAID CUSTOMER ONLY
9(a). How satisfied are you with the accuracy of charges i.e. amount deducted on every usage?
14 Very Satisfied 23 Satisfied
32 Dissatisfied 414 Very Dissatisfied
(Ask this question only if 1 OR 2 is coded in Q9(a))
9(b) Please specify the reason(s) for your dissatisfaction
11 charges not as per tariff plan subscribed
22 tariff plan changed without information
33 charged for value added services not requested 444 charged for calls/services not made/used
454 Others (please specify) _____________________

Assessment of Customer perception of Service and UP (E) SERVICE AREA Implementation and Effectiveness of Telecom Consumers Protection and Redressal of Grievances Regulations
© 441, (Basement), Jangpura, Mathura Road, New Delhi – 110014, India
Email: [email protected], URL: www.consumer-voice
209
10. Did you complain or make a query in the last 12 months to the customer care/ helpdesk/ call centre toll free number of your operator?
D. HELP SERVICE
11 Yes
22 No (If no, go to Q 15)
11. How satisfied are you with the ease of access of customer care or helpdesk/toll free number?
14 Very Satisfied 23 Satisfied
32 Dissatisfied 414 Very Dissatisfied
12. How satisfied are you with the response time taken to answer your call by a customer care executive?
14 Very Satisfied 23 Satisfied
32 Dissatisfied 414 Very Dissatisfied
13. How satisfied are you with the problem solving ability of the customer care executive(s)?
14 Very Satisfied 23 Satisfied
32 Dissatisfied 414 Very Dissatisfied
14. How satisfied are you with the time taken by call centre/customer care /helpdesk to resolve your complaint?
14 Very Satisfied 23 Satisfied
32 Dissatisfied 414 Very Dissatisfied
E. NETWORK PERFORMANCE, RELIABILITY AND AVAILABILITY
15. How satisfied are you with the speed of Broadband connection?
14 Very Satisfied 23 Satisfied
32 Dissatisfied 414 Very Dissatisfied
16. How satisfied are you with the amount of time for which service is up and working?
14 Very Satisfied 23 Satisfied
32 Dissatisfied 414 Very Dissatisfied
F. MAINTAINABILITY
17. How often do you face a problem with your Broadband connection?
14 Never 23 Occasionally
32 Frequently 14 Very Frequently
(Ask if response to Q17 is Frequently/Very Frequently)
18. What was the broadband connection problem faced by you in last twelve months related to, please specify
11 Problem was related to my computer hardware/ software
22 Problem was related to the broadband connection
and modem provided by the service provider.
19. How satisfied are you with the time taken for restoration of Broadband connection?
14 Very Satisfied 23 Satisfied
32 Dissatisfied 414 Very Dissatisfied

Assessment of Customer perception of Service and UP (E) SERVICE AREA Implementation and Effectiveness of Telecom Consumers Protection and Redressal of Grievances Regulations
© 441, (Basement), Jangpura, Mathura Road, New Delhi – 110014, India
Email: [email protected], URL: www.consumer-voice
210
20.Do you use any value added services or supplementary services such as static/ fixed IP addresses, e-mail IDs etc.
G. SUPPLEMENTARY SERVICES
11 Yes
22 No (If no, go to Q 22(a)
21. How satisfied are you with the quality of such supplementary services provided?
14 Very Satisfied 23 Satisfied
32 Dissatisfied 414 Very Dissatisfied
G. OVERALL CUSTOMER SATISFACTION 22(a). How satisfied are you with the overall quality of your Broadband service?
14 Very Satisfied 23 Satisfied
32 Dissatisfied 414 Very Dissatisfied
(Ask this question only if 1 OR 2 is coded in Q22(a))
22(b) Please specify the reason(s) for your dissatisfaction
1. _______________________________________
_______________________________________
2. _______________________________________
_______________________________________
3. _______________________________________
_______________________________________
H. GENERAL 23. Are you aware of the facility for measuring the broadband connection speed provided by your service provider?
11 Yes
22 No

Assessment of Customer perception of Service and UP (E) SERVICE AREA Implementation and Effectiveness of Telecom Consumers Protection and Redressal of Grievances Regulations
© 441, (Basement), Jangpura, Mathura Road, New Delhi – 110014, India
Email: [email protected], URL: www.consumer-voice
211
11 Yes
Questionnaire for Assessment of Implementation and Effectiveness of Telecom
Consumers Protection and Redressal of Grievances Regulations, 2007
24. Are you aware of the three stage grievance redressal mechanism set up by your telecom service provider based on the regulations of TRAI for redressal of your grievances?
22 No
25. Which all stages of the three stage mechanism process set up by your telecom service provider for redressal of grievances of telecom consumers are you aware of?
11 Call Centre 22 Nodal Officer
23 Appellate Authority
24 None of these
26. Have you made any complaint within last 6 months to the toll free Call Centre/customer care/Helpline telephone number?
11 Yes
22 No (if no go to Q 32)
27. Redressal of grievances mechanism provide for allotting docket number to consumers on his making the complaint. Please specify which of these applied the most to you.
23 Docket number received for most of the complaints
32 No docket number received for most of the complaints
31 No docket number received even on request
28. Did the Call Centre inform you about the action taken on your complaint?
11 Yes 22 No
29. How satisfied are you with the system of resolving of your complaints by call centre/customer care/ helpline?
14 Very Satisfied 23 Satisfied
32 Dissatisfied 414 Very Dissatisfied
(Ask this question only if 1 OR 2 is coded in Q.29)
30. Please specify the reason(s) for your dissatisfaction
11 Difficult to connect to the call centre executive
22 Customer care executive not polite/courteous
33 Customer care executive not equipped with adequate information
444 Time taken by call centre for redressal of complaint is too long
454 Customer care executive was unable to understand the problem
464 Others (please specify)
31. Was your billing complaint resolved satisfactorily by call centre/customer care within four weeks after lodging
11 Yes 22 No

Assessment of Customer perception of Service and UP (E) SERVICE AREA Implementation and Effectiveness of Telecom Consumers Protection and Redressal of Grievances Regulations
© 441, (Basement), Jangpura, Mathura Road, New Delhi – 110014, India
Email: [email protected], URL: www.consumer-voice
212
of the complaint? 20 Not applicable
32. Are you aware of the contact details of the Nodal Officer?
11 yes
22 No (if no go to Q 38)
33. Have you ever made a complaint to the nodal officer regarding your complaints not resolved or unsatisfactorily resolved by the call center/customer care?
11 yes
22 No (if no go to Q38)
34. Can you approach your Nodal Officer easily? 11 Yes 22 No
35. Did the Nodal Officer intimate you about the decision taken on your complaint?
11 Yes 22 No
36. How satisfied are you with the redressal of the complaint by the Nodal Officer?
14 Very Satisfied 23 Satisfied
32 Dissatisfied 414 Very Dissatisfied
(Ask this question only if 1 OR 2 is coded in Q36)
37. Please specify the reason(s) for your dissatisfaction
11 Difficult to connect to the Nodal Officer
22 Nodal Officer not polite/courteous
33 Nodal Officer not equipped with adequate information
44 time taken by Nodal Officer for redressal of complaint is too long
454 Nodal Officer was unable to understand the problem
464 Others (please specify)
38. Are you aware of the contact details of the appellate authority for filing of appeals on complaints not resolved or unsatisfactorily resolved by Nodal Officer?
11 Yes
22 No (if no go to Q 42)
39. Have you filed any appeal in the prescribed form in last 6 month?
11 Yes
22 No (if no go to Q 42)
40. Did you receive any acknowledgement? 11 Yes 22 No
41. Did the appellate authority take a decision upon your appeal within 3 months of filing the appeal?
11 Yes 22 No
23 Appeal filed only recently
(Q42 to Q44 are for prepaid customers only)
42. Are you aware that a prepaid customer can get item-wise usage charge details on request?
11 Yes 22 No
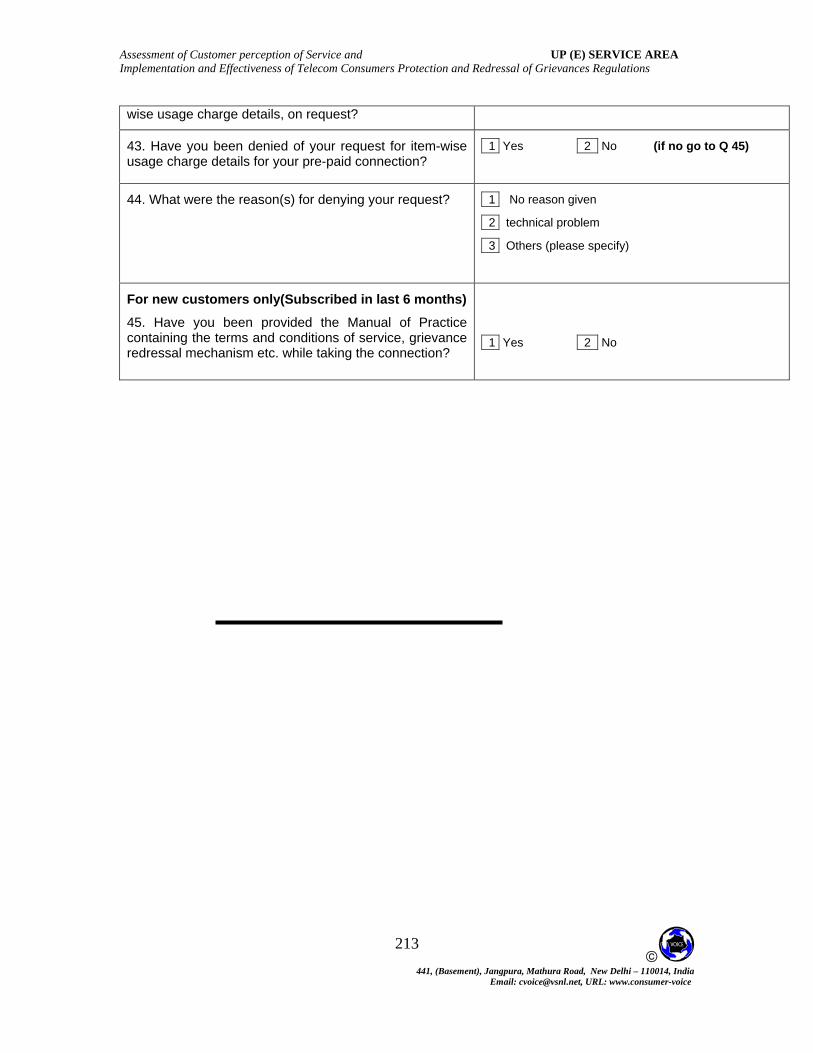
Assessment of Customer perception of Service and UP (E) SERVICE AREA Implementation and Effectiveness of Telecom Consumers Protection and Redressal of Grievances Regulations
© 441, (Basement), Jangpura, Mathura Road, New Delhi – 110014, India
Email: [email protected], URL: www.consumer-voice
213
wise usage charge details, on request?
43. Have you been denied of your request for item-wise usage charge details for your pre-paid connection?
11 Yes 22 No (if no go to Q 45)
44. What were the reason(s) for denying your request? 11 No reason given
22 technical problem
33 Others (please specify)
For new customers only(Subscribed in last 6 months)
45. Have you been provided the Manual of Practice containing the terms and conditions of service, grievance redressal mechanism etc. while taking the connection?
11 Yes 22 No
Copyright © 2022 FDOKUMEN