Title: A System Dynamics Regulatory Tool for the Telecom Sector Discipline: Information Systems,...
56
1 1 st International Workshop on System Dynamics, Nairobi, Kenya, 2015 Title: A System Dynamics Regulatory Tool for the Telecom Sector Discipline: Information Systems, Decision Support Systems (Telecommunication Policy) J. WALUBENGO, T. Waema, D. Williams [email protected], Jan 2015
-
Upload
independent -
Category
Documents
-
view
3 -
download
0
Transcript of Title: A System Dynamics Regulatory Tool for the Telecom Sector Discipline: Information Systems,...
1
1st International Workshop on System Dynamics, Nairobi, Kenya, 2015
Title: A System Dynamics Regulatory Tool for the Telecom Sector
Discipline: Information Systems, Decision Support Systems (Telecommunication Policy)
J. WALUBENGO, T. Waema, D. [email protected],
Jan 2015
2
Chapter 1: Introduction
Chapter 1:-Intro Summary
Background
Problem Definition
Research Aim+Objectives
Research Questions/Dynamic Hypothesis
Scope of Study
Significance of Study
3
1.1 Background(a)
Cost of Telco (Internet Access) Prices remains high despite the landing of the submarine cables, liberalization.
Internet Price “NOT Affordable” based on the fact that monthly internet rates i.e. cost of 1Mbs of Internet Access per month is 44% of Average incomes (ITU, 2014)
It is 2.5%, 2.8%, 6.0%, 17.4%, 32% for Egypt,, S.A,Bostwana, Nigeria & UG. respectively (ITU, 2014)
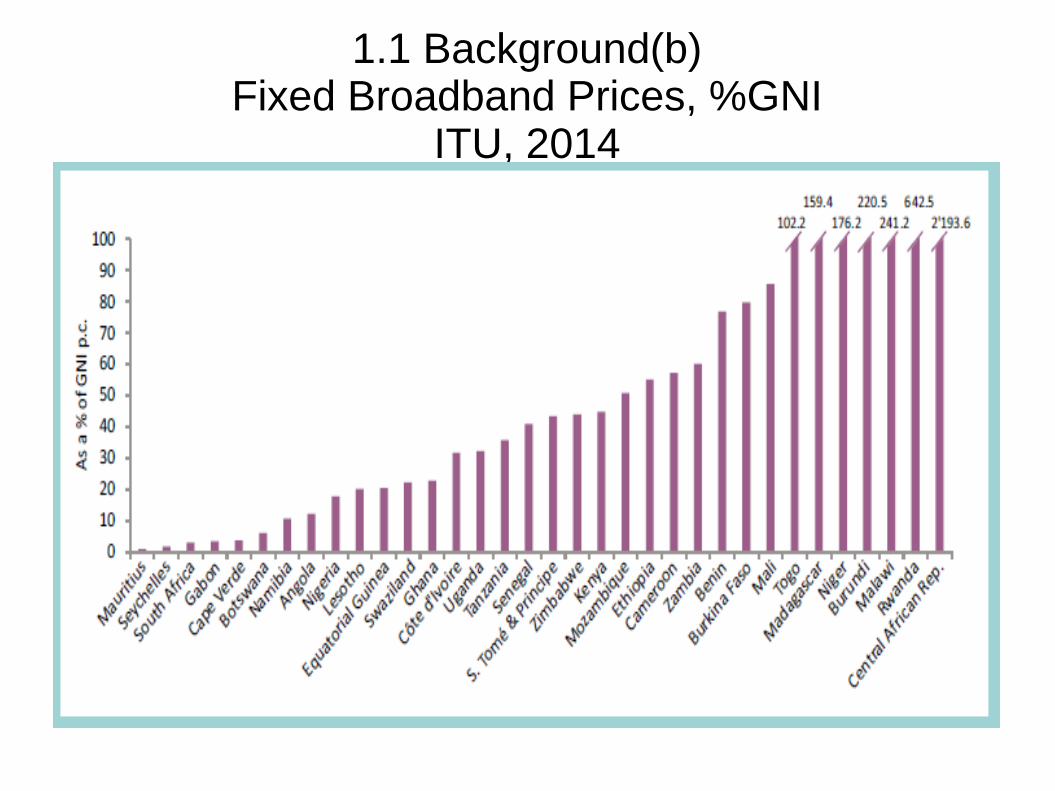
1.1 Background(b)Fixed Broadband Prices, %GNI
ITU, 2014
5
1.2 Problem Definition
The eventual Price of Telco/Internet Access is determined by various parameters including but not limited to, Suppliers, Market Size, Domestic Infrastructure, Regulation etc (Dutta & Roy 2004)
Whereas factors affecting Telco/Internet Pricing are known, less is known about how this price holistically impacts the rest of the Telco sector over time.
Problem Area: IS/Decision Support
6
1.3 Research Aim+Objectives(a)
Aim: To develop a Telco Regulatory tool to manage the Telco/Internet Sector.
Objectives
1. To identify, describe and estimate the relationships between the factors influencing Telco/Internet Price in Kenya (Causal Loop Diag)
2. To identify the dominant/key feedback loops in the above relationships in order to determine critical points for policy and strategic intervention with respect to Telco/Internet Prices.
7
1.3 Research Aim+Objectives(b)
3. To provide a time-based Model describing the dynamic interplay between the various factors that Influence Internet/Telco Pricing in Kenya (SFD).
4. To Simulate and Test the Proposed Model (Conceptional Test, Data Test and Validity Test as by (Martis 2006),
5. To automate the Proposed Model in order to provide a "What-If-Analysis" tool for Stakeholders (Policy Shapers, Operators, Regulators, Consumers)
8
1.4 Research Q/Hypothesis (a) RQ: What are the Structures behind the
Dynamic Behaviour of the Internet Price Variables in Kenya? What are the dominant loops and time-delays?
Proposed Dynamic Hypothesis for testing & validation is based on the following:
High prices depresses Demand
High prices (Revenue) attracts more Suppliers/Operators
Increased Supply (Competition) drives down prices
Reduced prices increase uptake but increase Congestion
Congestion drives away Consumers/Customers
9
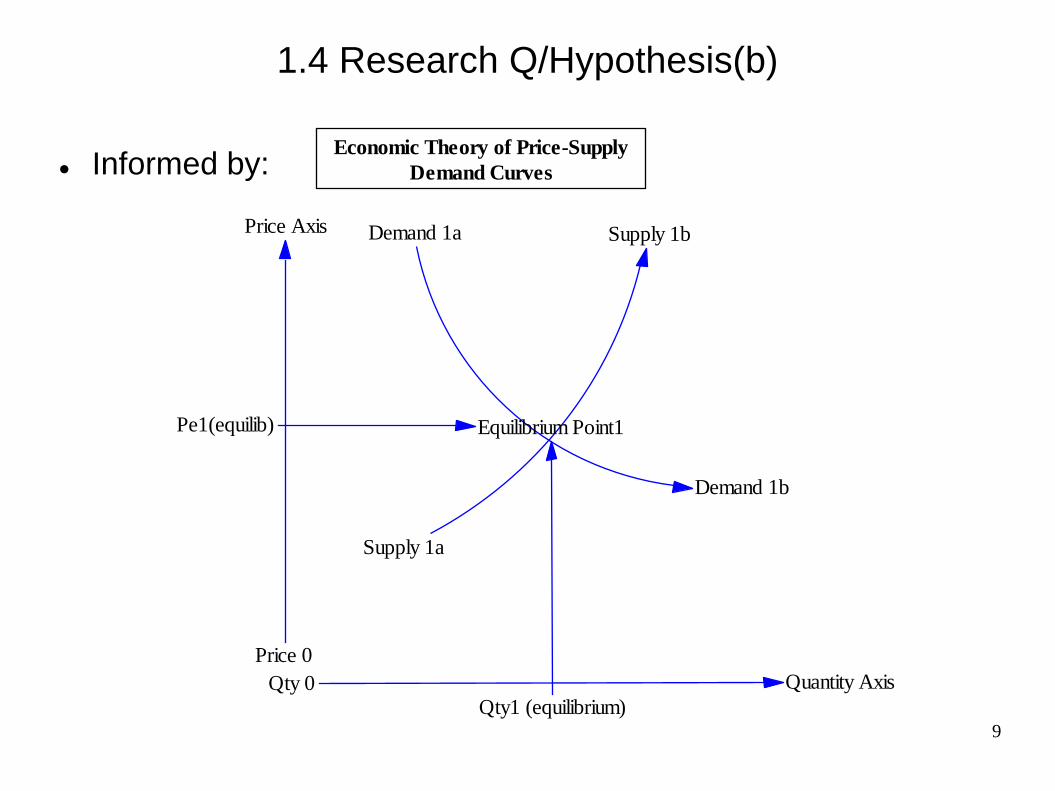
1.4 Research Q/Hypothesis(b)
Demand 1a
Demand 1b
Supply 1a
Supply 1bPrice Axis
Price 0
Qty 0 Quantity Axis
Pe1(equilib) Equilibrium Point1
Qty1 (equilibrium)
Economic Theory of Price-Supply
Demand Curves Informed by:
10
1.5 Scope
Regulatory role ensures sustainable equilibrium between Competition, Usage and Investment in Telco sector
Limited to Variables of Regulatory Interest
Key Regulatory parameters/indicators Include Price(Affordability), Revenues, Competition, Network Capacity, Quality of Service(QoS), Market Penetration.
Key stakeholder Includes:-Operators, Regulators, Users, Govt
11
1.6 Significance
Expected Model would provide regulators with new insights on the dynamics of Telco/internet market with Pricing as the key driver.
Model would provide a cheaper mechanism for stakeholders to experiment (Forrester 1991) by subjecting different parameters and policies to the model and viewing the impact in a “lab” environment
12
Chapter 2: Literature Review
Chapter 2:-Summary
Background
Exisiting Models Reviewed
Dutta (2001),
Jain(2003),
Dutta(2004)),
Walrand(2008),
Rouskas(2009),
ITU (2014)
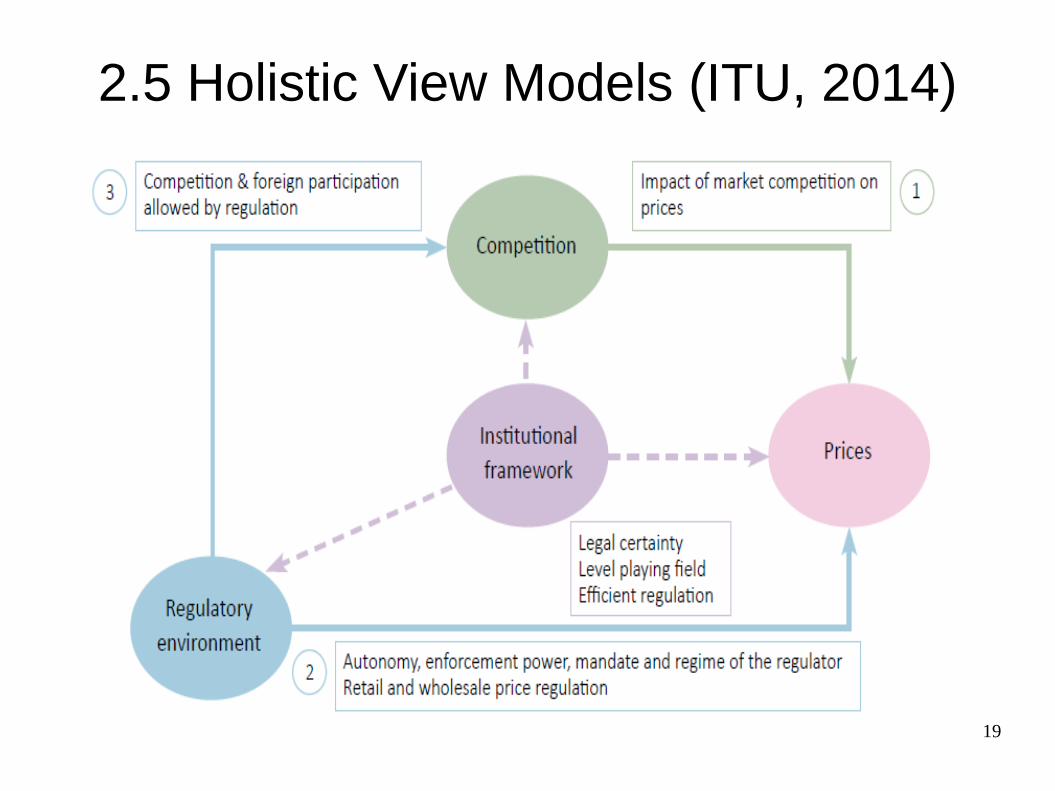
2.0 Background
• Most economies moved from Monopolistic Telco environments to Liberalized environments
• Regulators have to manage different stakeholders often with diverse and conflicting interest.
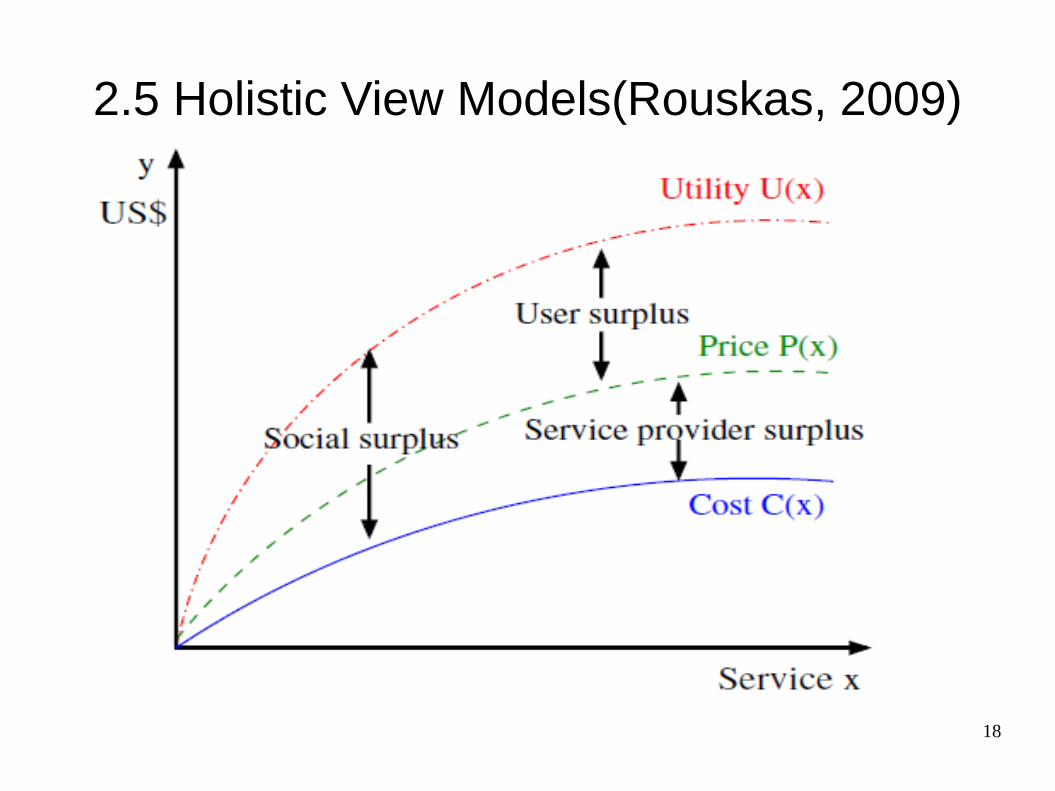
• Operators want to maximize Profits(Operator Surplus), Users want to maximize Utility(User Surplus)
• Regulator must sustain both interests by maximizing the Social Surplus(Operator+User).
• Literature shows Price is the key denominator for each stakeholder
• Several pricing methods (LRIC, Ramsey, etc) exist but not focused on holistic impact of pricing in the Telco sector
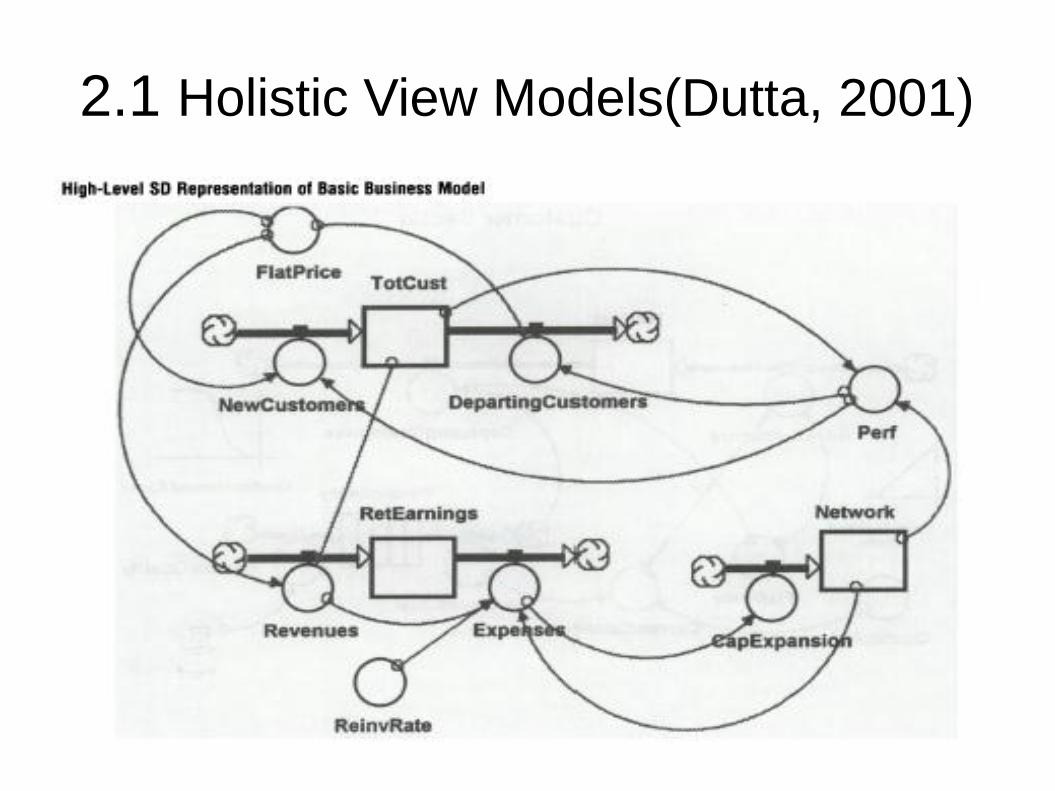
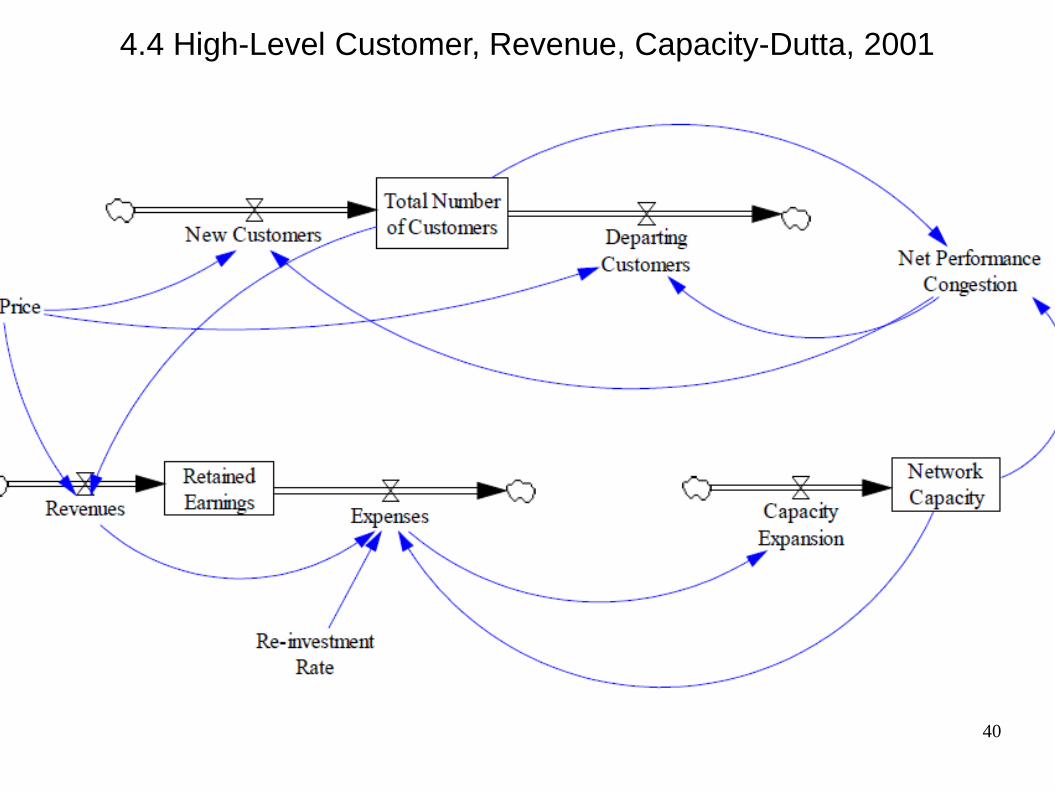
2.1 Holistic View Models(Dutta, 2001)
15
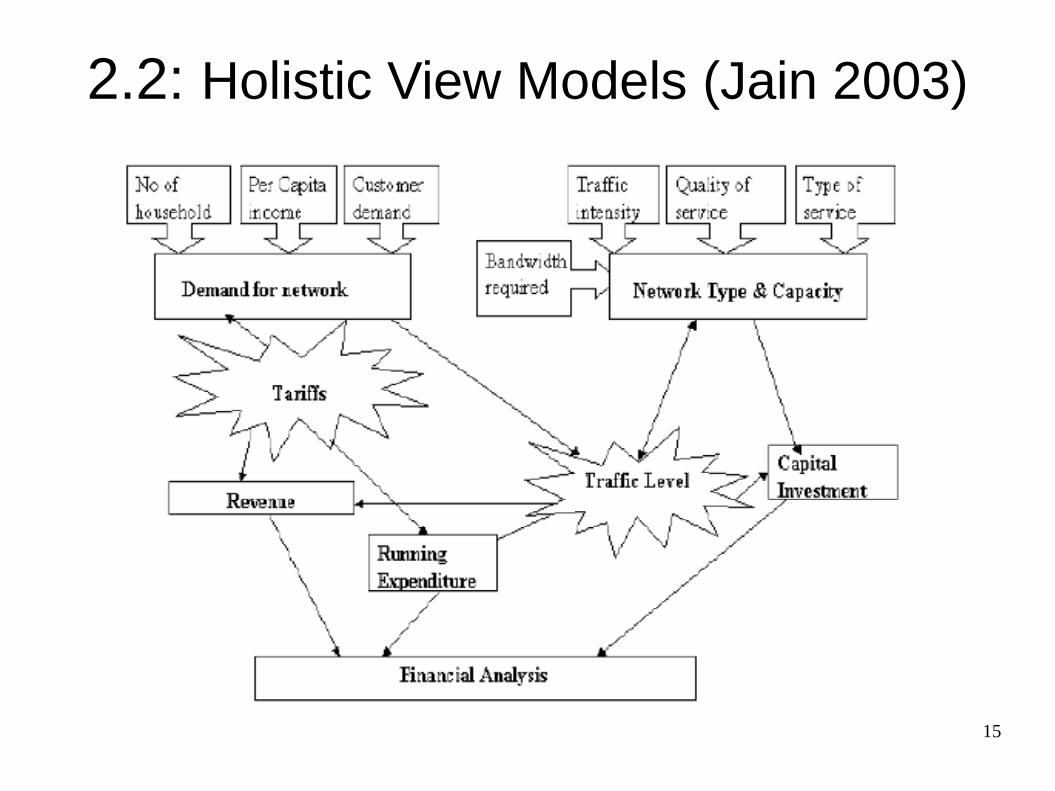
2.2: Holistic View Models (Jain 2003)
16
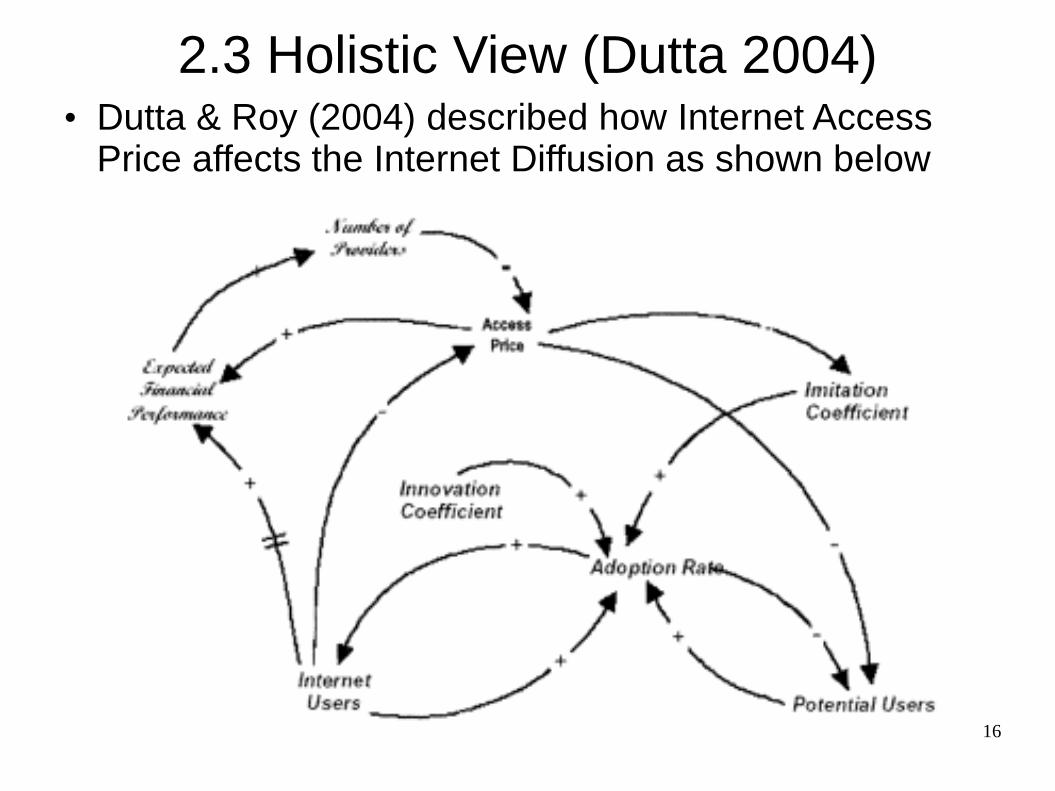
2.3 Holistic View (Dutta 2004)• Dutta & Roy (2004) described how Internet Access
Price affects the Internet Diffusion as shown below
17
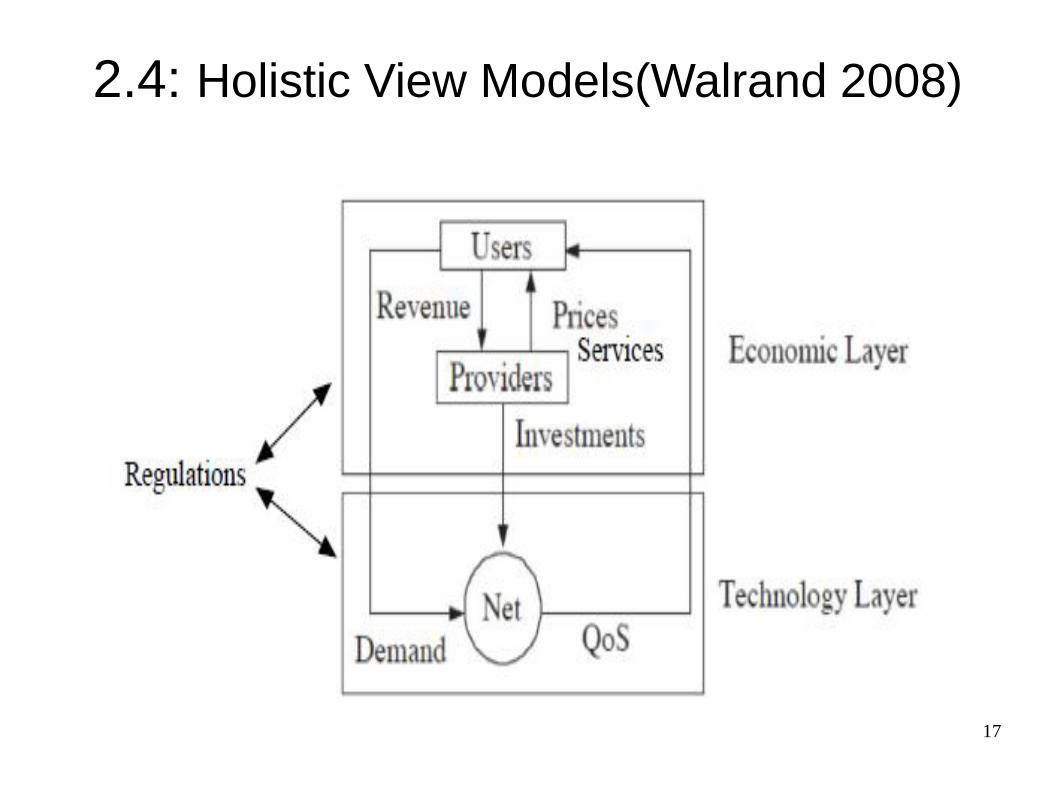
2.4: Holistic View Models(Walrand 2008)
18
2.5 Holistic View Models(Rouskas, 2009)
19
2.5 Holistic View Models (ITU, 2014)
20
Chapter 3: Research Methodology
Chapter 3:-RM
The System Dynamic Approach
What is System Dynamics(SD)
What are SD benefits
What are SD components
What are SD key archetypes and behaviour
What archetype suits Internet Price behaviour
Where has SD been applied in Internet Studies
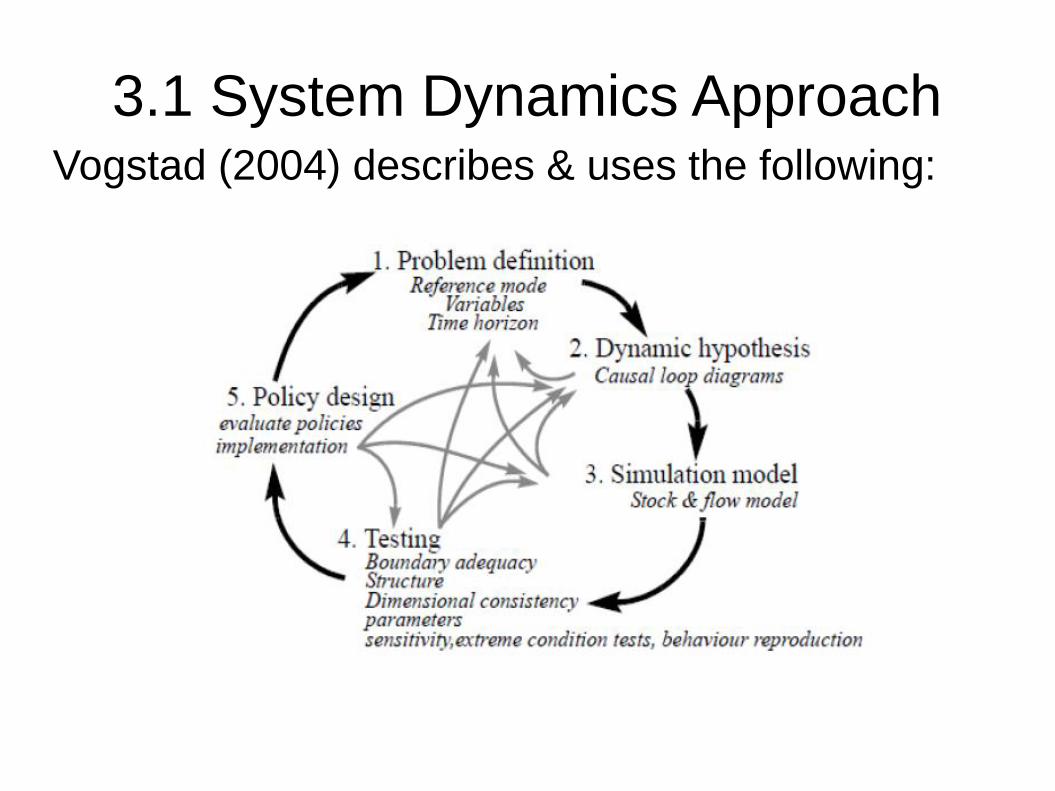
3.1 System Dynamics ApproachVogstad (2004) describes & uses the following:
22
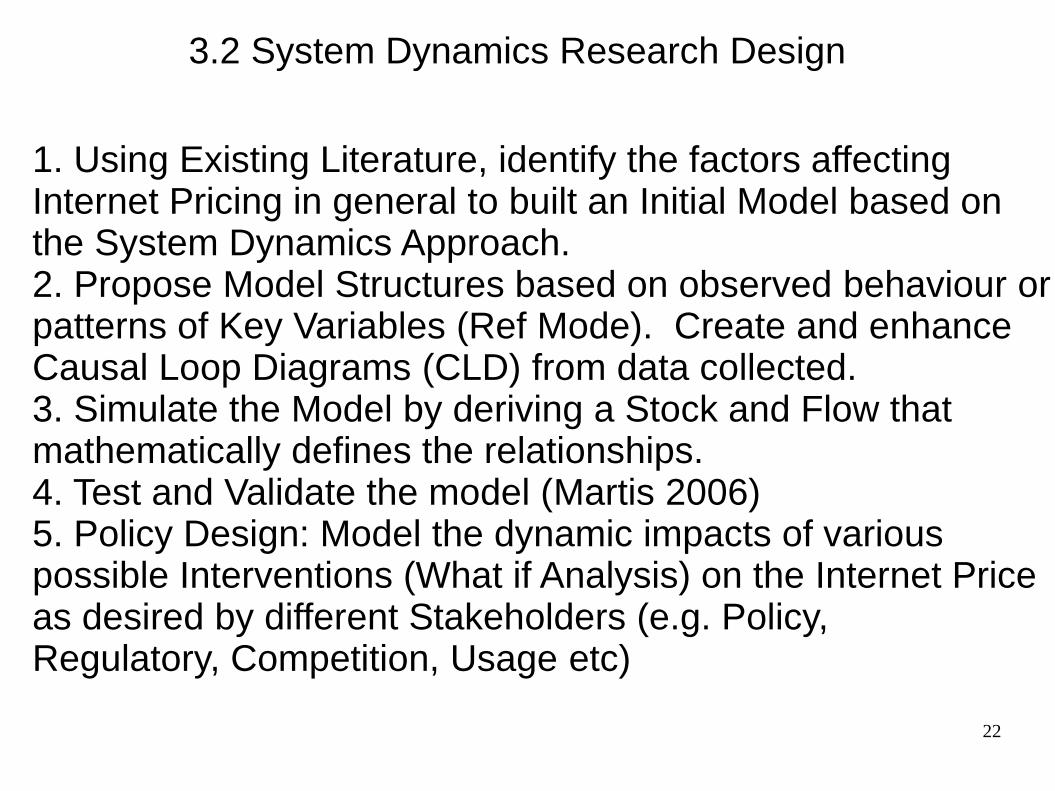
3.2 System Dynamics Research Design
1. Using Existing Literature, identify the factors affecting Internet Pricing in general to built an Initial Model based on the System Dynamics Approach.2. Propose Model Structures based on observed behaviour or patterns of Key Variables (Ref Mode). Create and enhance Causal Loop Diagrams (CLD) from data collected.3. Simulate the Model by deriving a Stock and Flow that mathematically defines the relationships.4. Test and Validate the model (Martis 2006)5. Policy Design: Model the dynamic impacts of various possible Interventions (What if Analysis) on the Internet Price as desired by different Stakeholders (e.g. Policy,Regulatory, Competition, Usage etc)

23
3.3
Dyn
am
ic S
ynth
esis
Resea
rch
Meth
odo
logy(W
illia
ms,
20
02
)
24
3.4 What is System Dynamics
System dynamics is a powerful methodology and computer simulation modeling technique for framing, understanding, and discussing complex issues and problems.
It applies to dynamic problems arising in complex social, managerial, economic, or ecological systems -- literally any dynamic systems characterized by interdependence, mutual interaction, information feedback, and circular causality. (System Dynamics Society)
25
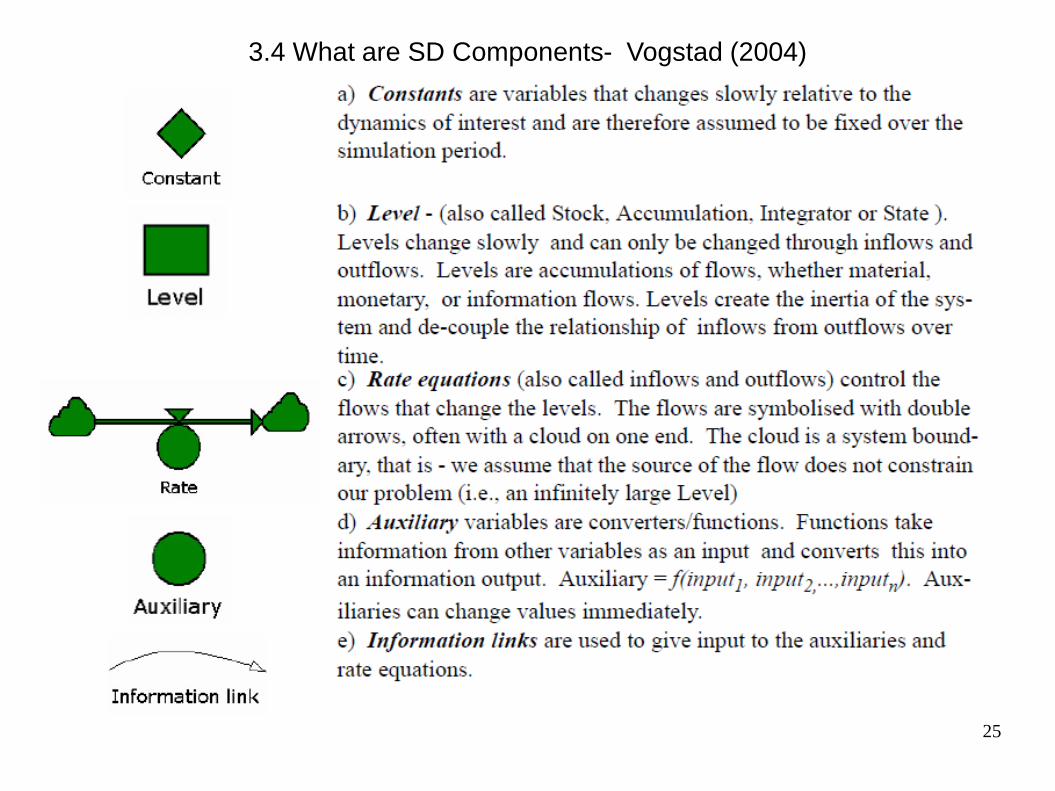
3.4 What are SD Components- Vogstad (2004)
26
3.4 Characteristics of Dynamic Systems(1) Cause and effect are separated by a lot more time and
distance than you think. Time delays greatly complicate the effort to firmly connect cause with effect - particularly when there are multiple causes and multiple effects.
The more you try to improve the system, the stronger the resistance to change. This is the result of "balancing loops" - forces that counteract changes.
There are unintended consequences and indirect effects. Sometimes the most obvious solution makes a problem worse.
27
3.4 Characteristics of Dynamic Systems(2)
Things can get worse before they get better.
Reinforcing Loops amplify small changes into big changes.
SD stresses that there is no single right answer/model. There are often trade-offs that require choices. (Sterman 2002)
28
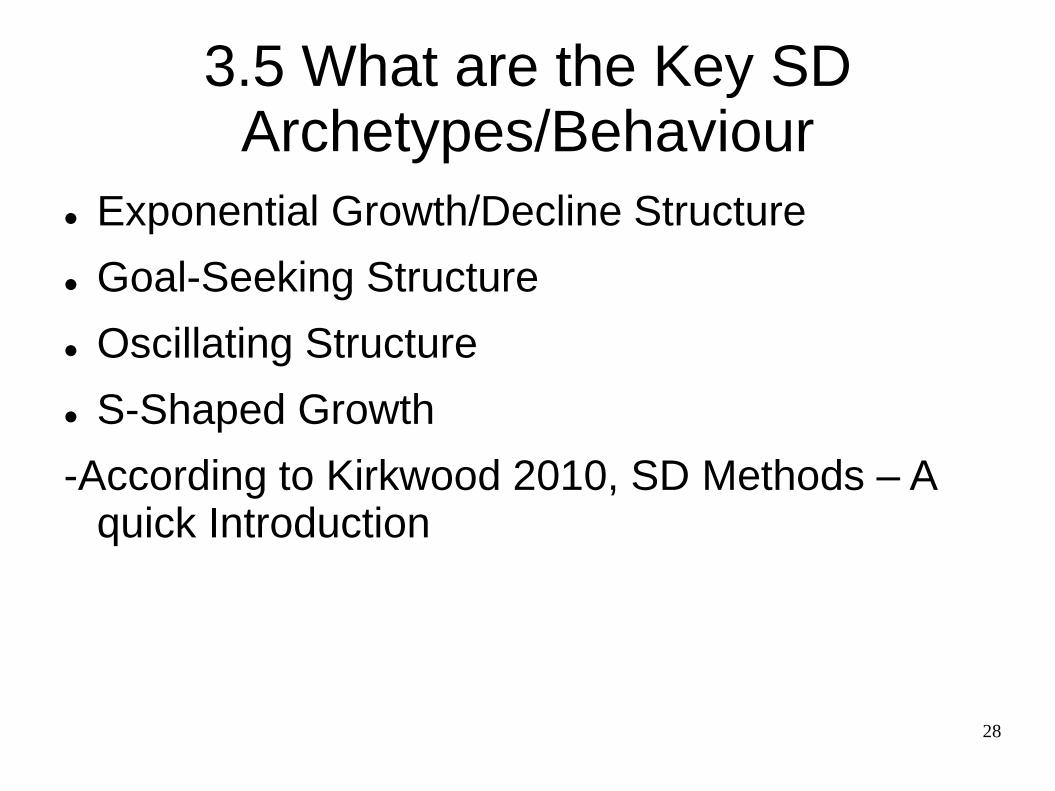
3.5 What are the Key SD Archetypes/Behaviour
Exponential Growth/Decline Structure
Goal-Seeking Structure
Oscillating Structure
S-Shaped Growth
-According to Kirkwood 2010, SD Methods – A quick Introduction
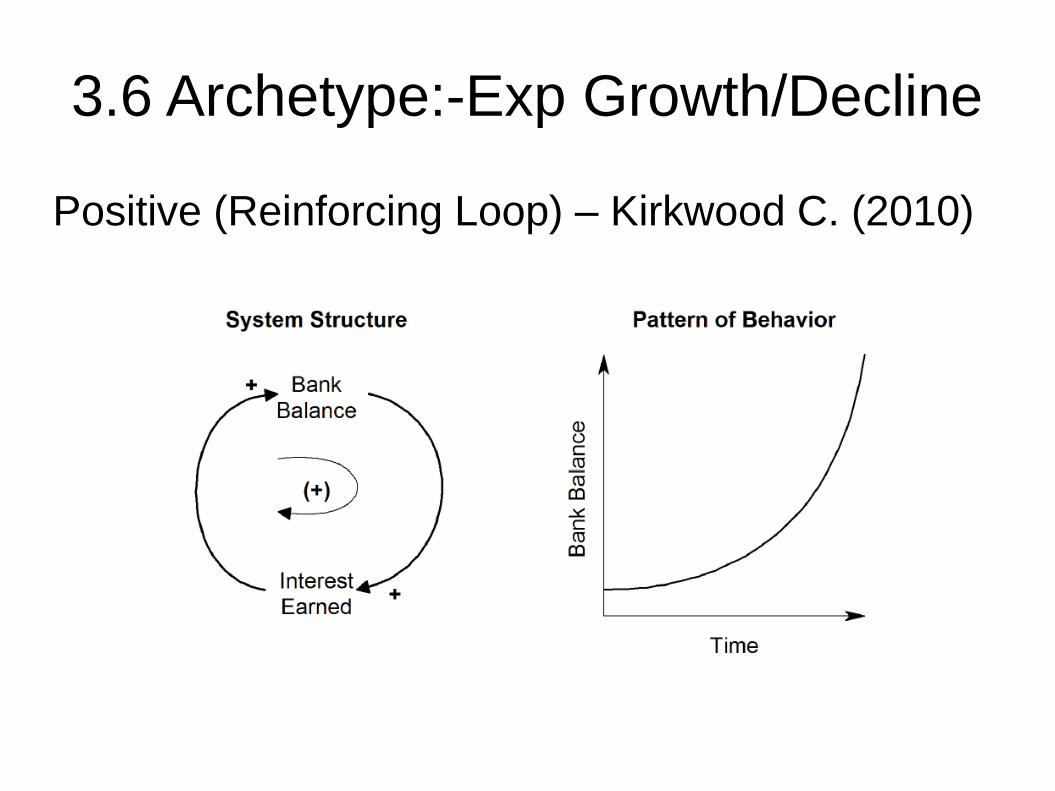
3.6 Archetype:-Exp Growth/Decline
Positive (Reinforcing Loop) – Kirkwood C. (2010)
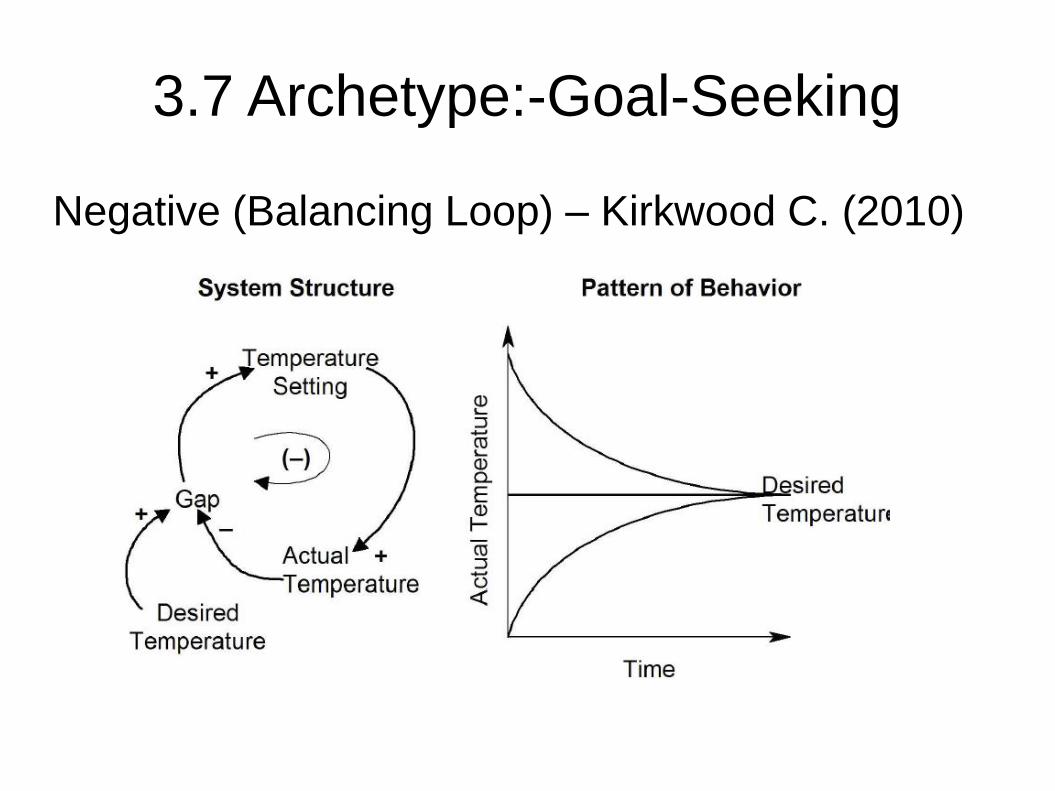
3.7 Archetype:-Goal-Seeking
Negative (Balancing Loop) – Kirkwood C. (2010)
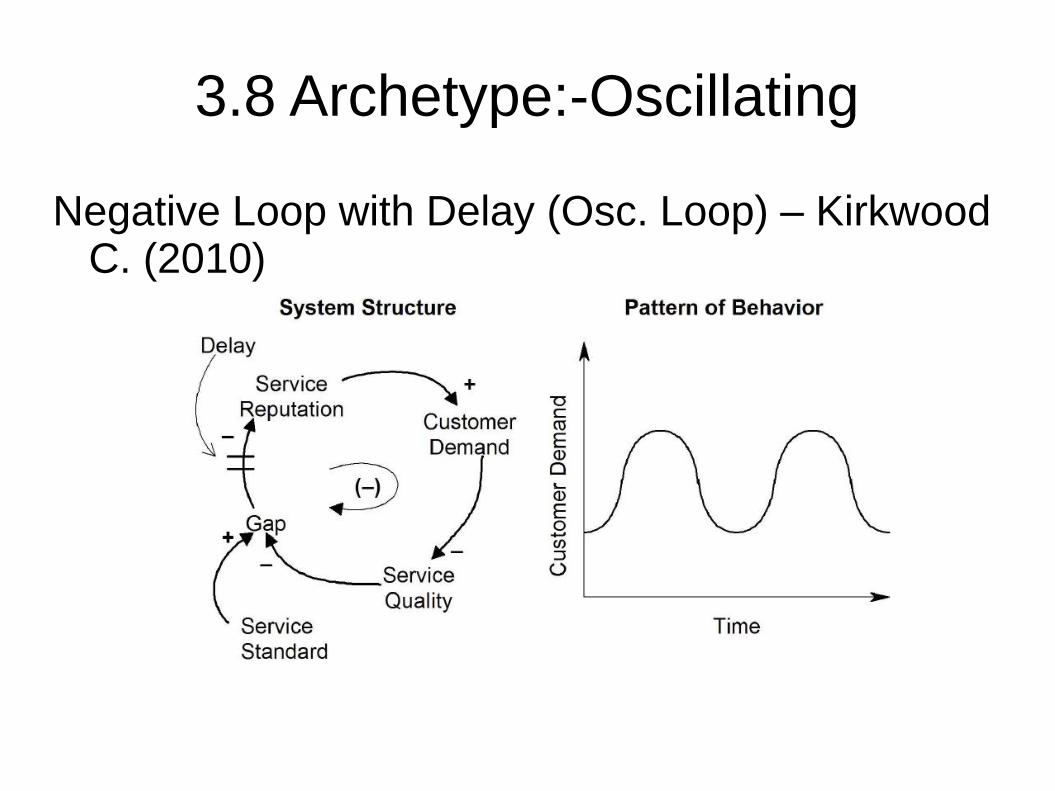
3.8 Archetype:-Oscillating
Negative Loop with Delay (Osc. Loop) – Kirkwood C. (2010)
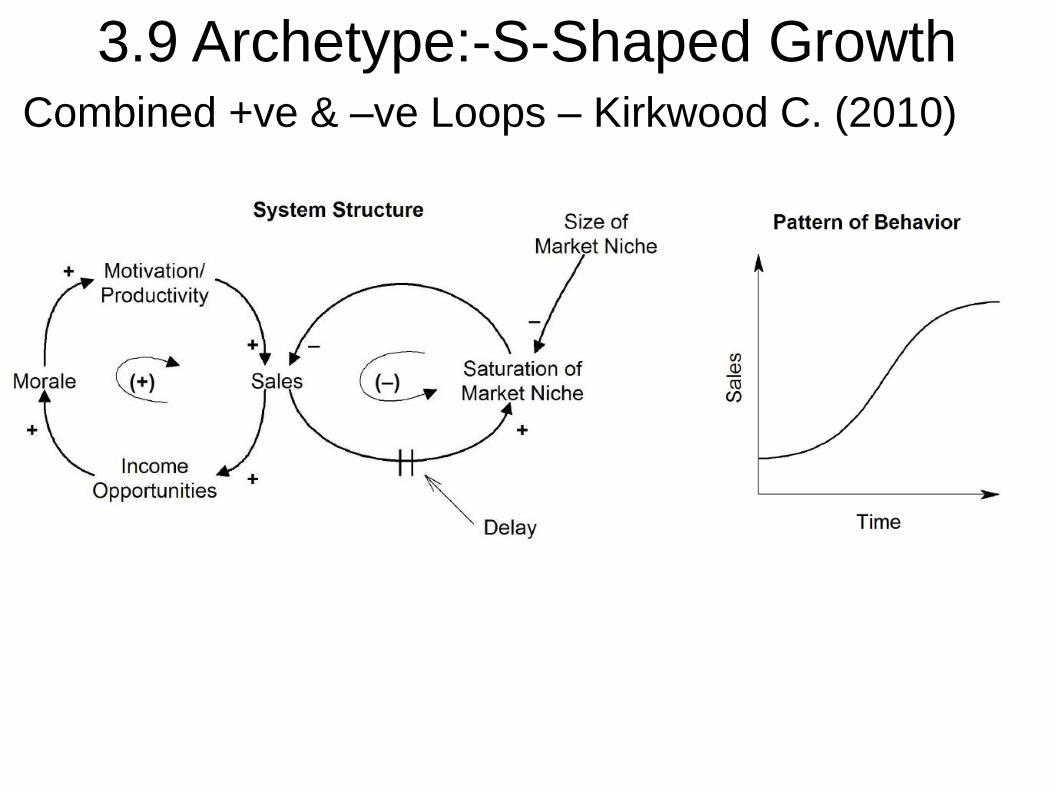
3.9 Archetype:-S-Shaped GrowthCombined +ve & –ve Loops – Kirkwood C. (2010)
33
3.10 What Archetype suits the Internet Price behavior?
Since the Internet Prices are dropping, they imply a Goal-Seeking behaviour and that is what will be used to create the initial draft model for Internet Price dynamics
Internet Price Pattern could also signify the reverse S-Shaped behaviour that can also be explored further.
34
4.0 Proposed Model
Trends in Internet Pricing(Reference Mode)
Dynamic Hypothesis
Key Loops
Stock Flow Diag(SFD):Customer, Finance & Network View – Dutta (2001)
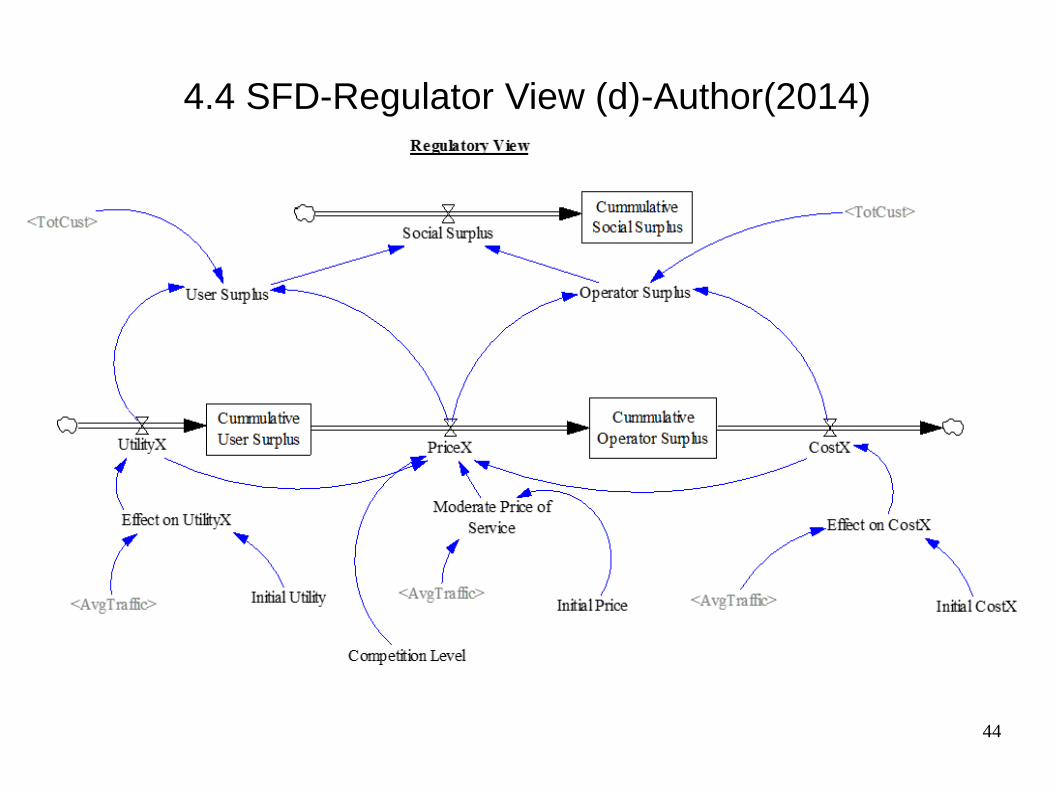
Regulatory view – Rouskas et al(2009)
SD Regulatory view –Author (2014)
35
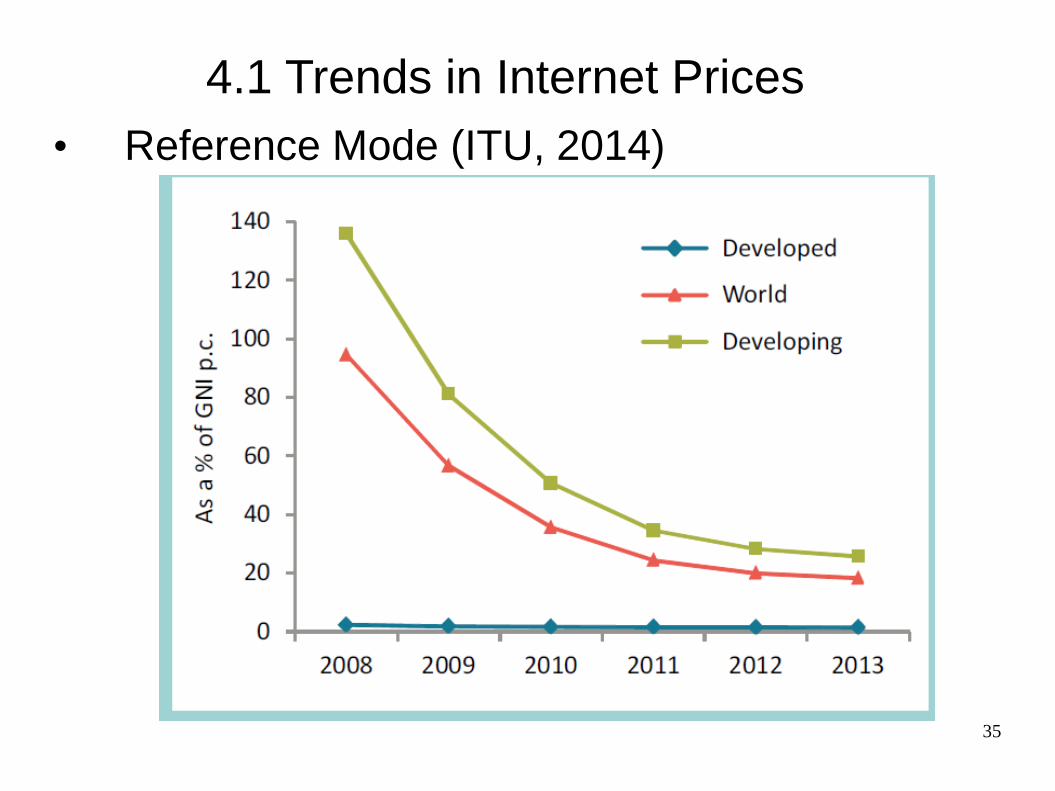
4.1 Trends in Internet Prices
• Reference Mode (ITU, 2014)
36
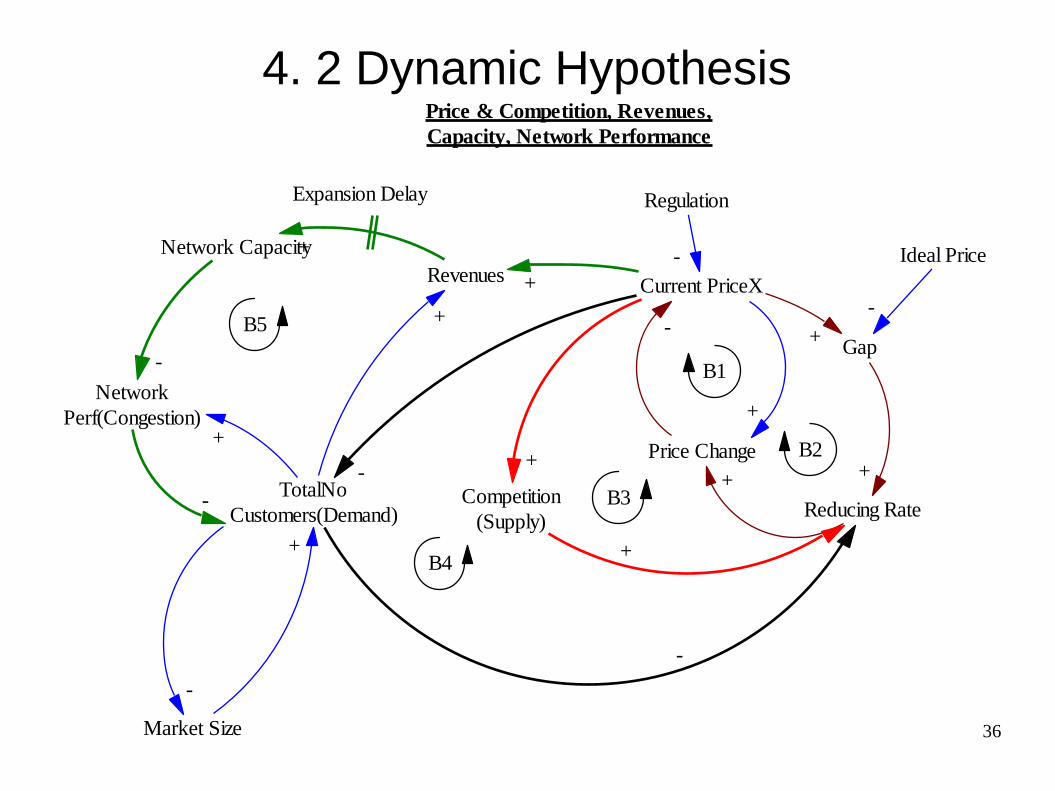
4. 2 Dynamic Hypothesis
Current PriceX
Price Change
+
-
Ideal Price
Gap
Reducing Rate
-
+
++Competition
(Supply)
TotalNo
Customers(Demand)
Market Size
Network
Perf(Congestion)
+
+
-
-
Revenues +
Network Capacity+
-
-
-
+
+
Regulation
-
+
Price & Competition, Revenues,
Capacity, Network Performance
B1
B2
B3
B4
B5
Expansion Delay
37
4.3a Dynamic Hypothesis-Key Loops
Loop Number 1 (Balancing Loop1, B1): Current PriceX -> Price Change
An increase in the Current Price for telecommunication service, potentially provides an opportunity to change the price in equal measure. A high price is awaiting reduction as soon as sufficient competition builds up.
Loop Number 2 (Balancing Loop2, B2): Current PriceX->Gap->Reducing Rate -> Price Change
The Ideal Price from a regulatory point of view is one that is affordable (%of GNI) to the consumers. The difference between the Current Price and the Ideal Price creates a Gap. The size of the Gap dictates the rate of reduction required to bring the Current Price towards the Ideal Price.
38
4.3b Dynamic Hypothesis-Key LoopsLoop Number 3 (Balancing Loop3, B3): Current PriceX-> Competition(Supply)-> Reducing Rate ->Price Change
The balancing loop3, B3 describe the supply side of the telecommunication sector. An increase in the telecommunication prices attracts more competitors into the market, thus increasing suppliers and competition. According to the classic supply curve, Competition puts pressure on the prices, pushing them down towards the Ideal Price.
Loop Number 4 (Balancing Loop4, B4): Current PriceX-> TotalNoCustomers(Demand) ->Reducing Rate -> Price Change
The balancing loop4, B4, describes the demand side of the telecommunication sector. An increase in the telecommunication prices depresses demand leading to reducing number of users or customers. However, since the high price attracts more players(competition), the current price is eventually moved downwards towards the ideal price.
39
4.3c Dynamic Hypothesis-Key Loops
Loop Number 5 (Balancing Loop5, B5): Current PriceX ->Revenues -> Network Capacity -> Network Perf(Congestion) -> TotalNoCustomers(Demand) ->Reducing Rate -> Price Change
The balancing loop5, B5, describes the Network Performance (Congestion) side of the telecommunication sector. Specifically, the regulator is concerned about the quality of service(QoS) the operators are providing in the market. Essentially, higher prices fetch better revenues, enabling operators to improve capacity and QoS of their networks. Better Network performance leads to a higher number of customers (demand) which eventually overloads or congests the network.
40
4.4 High-Level Customer, Revenue, Capacity-Dutta, 2001
41
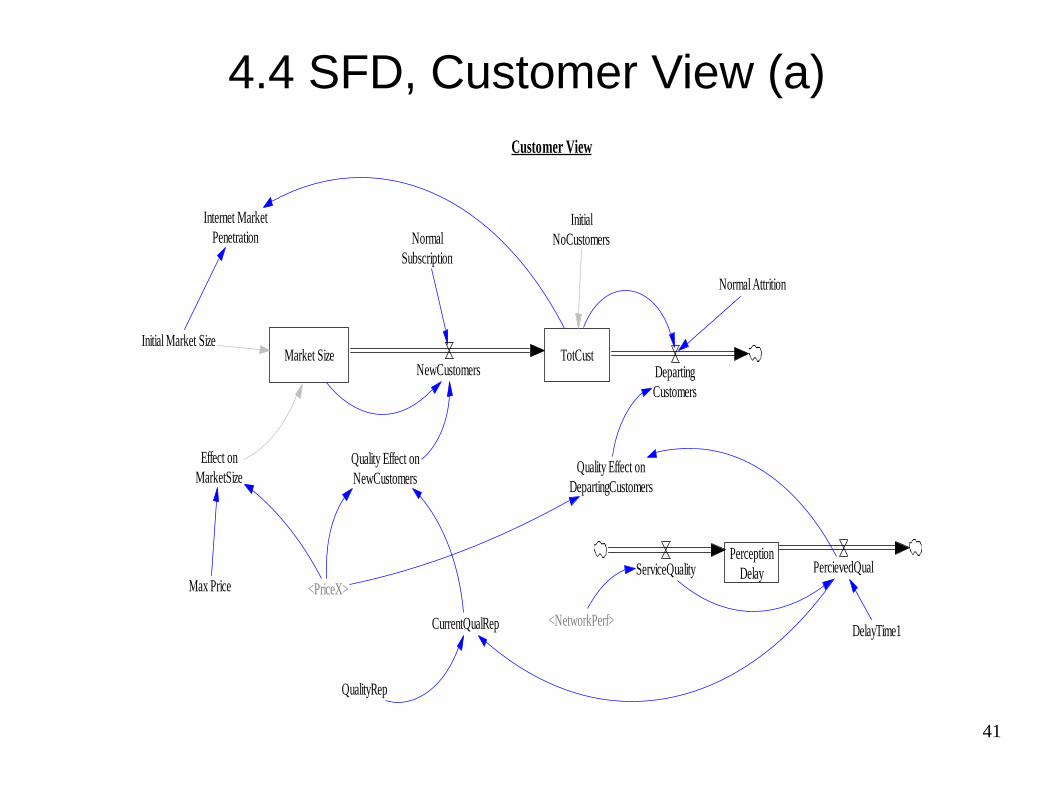
4.4 SFD, Customer View (a)
Customer View
TotCustDeparting
Customers
CurrentQualRep
QualityRep
Perception
Delay PercievedQual
DelayTime1<NetworkPerf>
ServiceQuality
Quality Effect on
NewCustomersQuality Effect on
DepartingCustomers
Initial
NoCustomers
Normal Attrition
Normal
Subscription
<PriceX>
Market SizeNewCustomers
Max Price
Effect on
MarketSize
Internet Market
Penetration
Initial Market Size
42
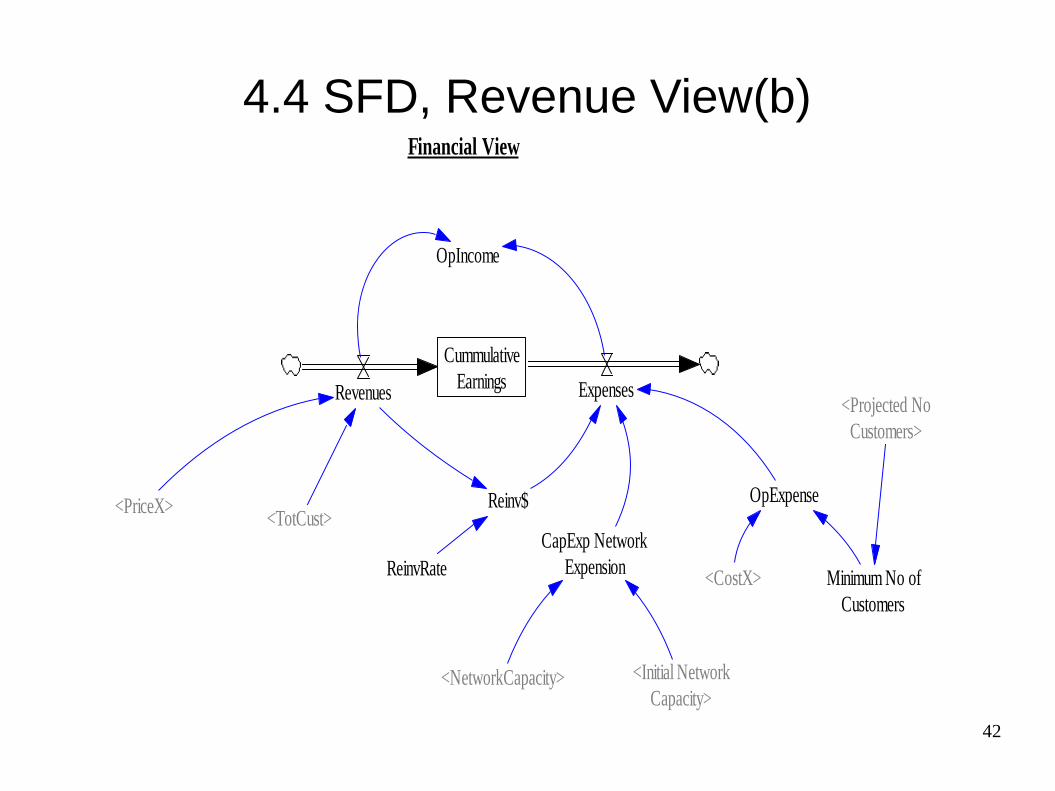
4.4 SFD, Revenue View(b)Financial View
Cummulative
EarningsRevenues Expenses
Reinv$
ReinvRate
OpExpense
OpIncome
<TotCust>
<NetworkCapacity>
CapExp Network
Expension
<Initial Network
Capacity>
<PriceX>
<CostX>
<Projected No
Customers>
Minimum No of
Customers
43
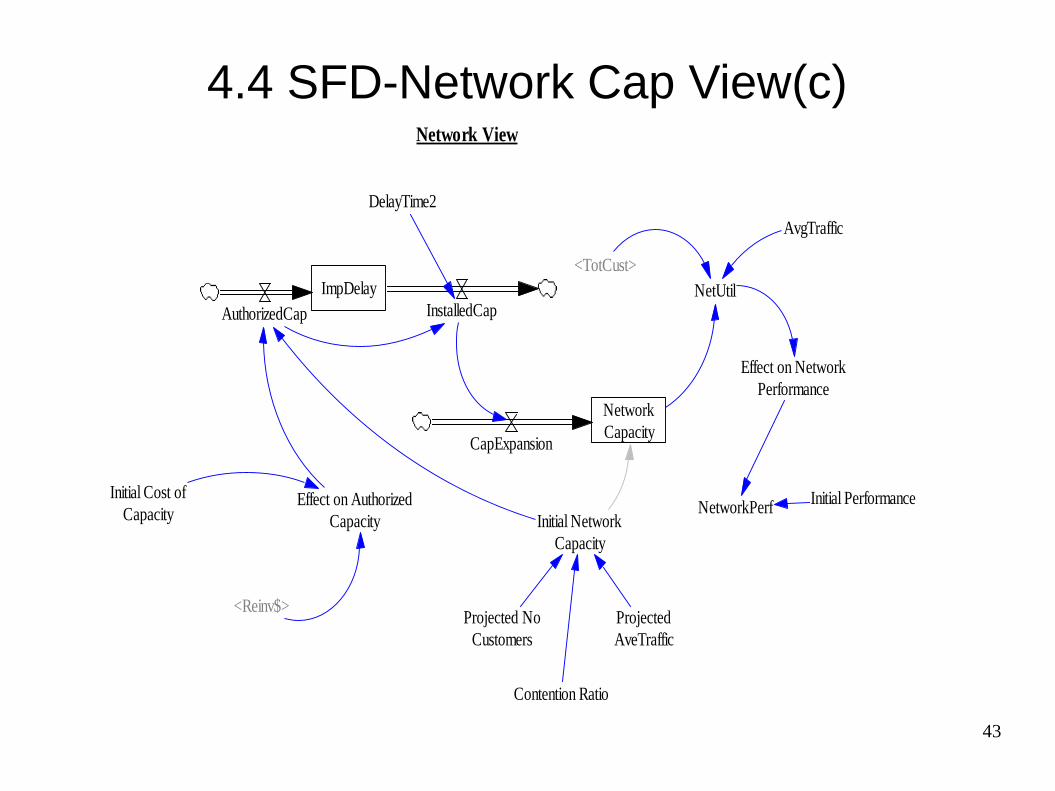
4.4 SFD-Network Cap View(c) Network View
Network
CapacityCapExpansion
ImpDelay
AuthorizedCap InstalledCapNetUtil
AvgTraffic
NetworkPerf
<Reinv$>
<TotCust>
Initial Performance
Effect on Network
Performance
Effect on Authorized
Capacity
Initial Cost of
Capacity
DelayTime2
Initial Network
Capacity
Projected No
Customers
Projected
AveTraffic
Contention Ratio
44
4.4 SFD-Regulator View (d)-Author(2014)
5.0 Simulated Results/Discussion
• Policy Test: Regulator wishes to appreciate long term impact of Low, Moderate and High Telco/Internet prices.
• Selected Market Scenario: The telecommunication market is assumed to be moderately competitive and without any investing in network capacity expansion.
• Regulatory Indicators: The performance of selected regulatory indicators of (Market Penetration, Network Performance (QoS) and Operational Income for the Provider) are observed over time for simulated
Internet price levels (Lower, Base and Higher).
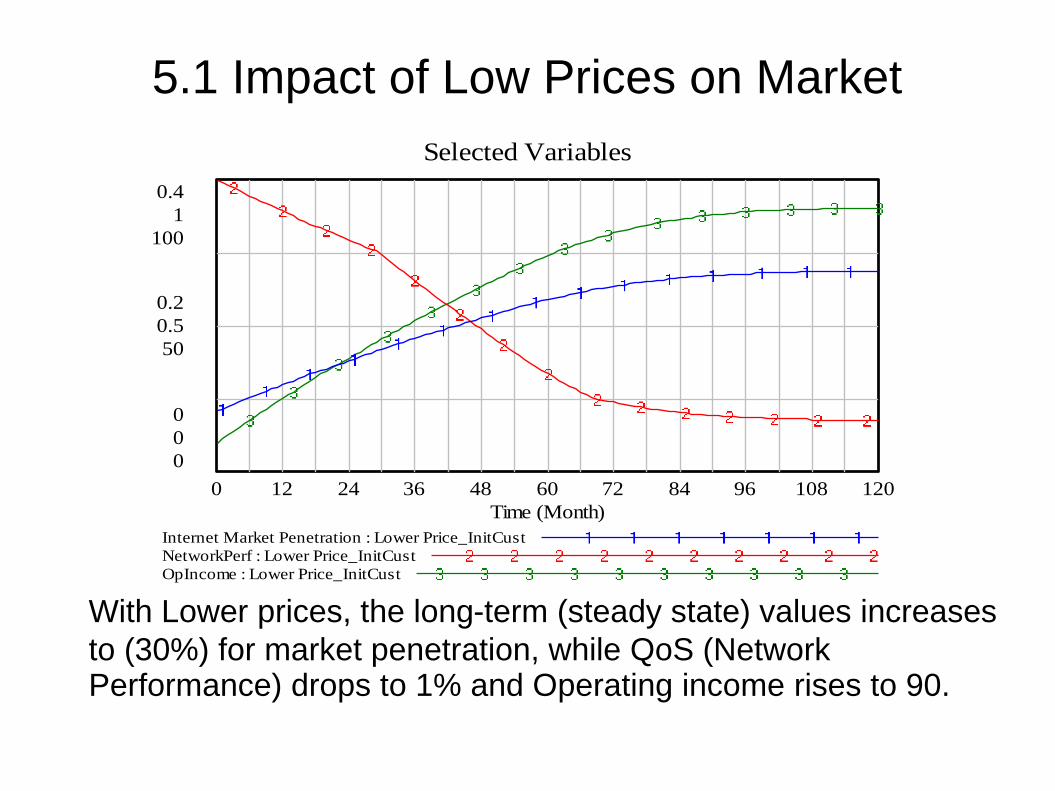
5.1 Impact of Low Prices on Market
With Lower prices, the long-term (steady state) values increases
to (30%) for market penetration, while QoS (Network Performance) drops to 1% and Operating income rises to 90.
Selected Variables
0.4
1
100
0.2
0.5
50
0
0
0
0 12 24 36 48 60 72 84 96 108 120
Time (Month)
Internet Market Penetration : Lower Price_InitCust
NetworkPerf : Lower Price_InitCust
OpIncome : Lower Price_InitCust
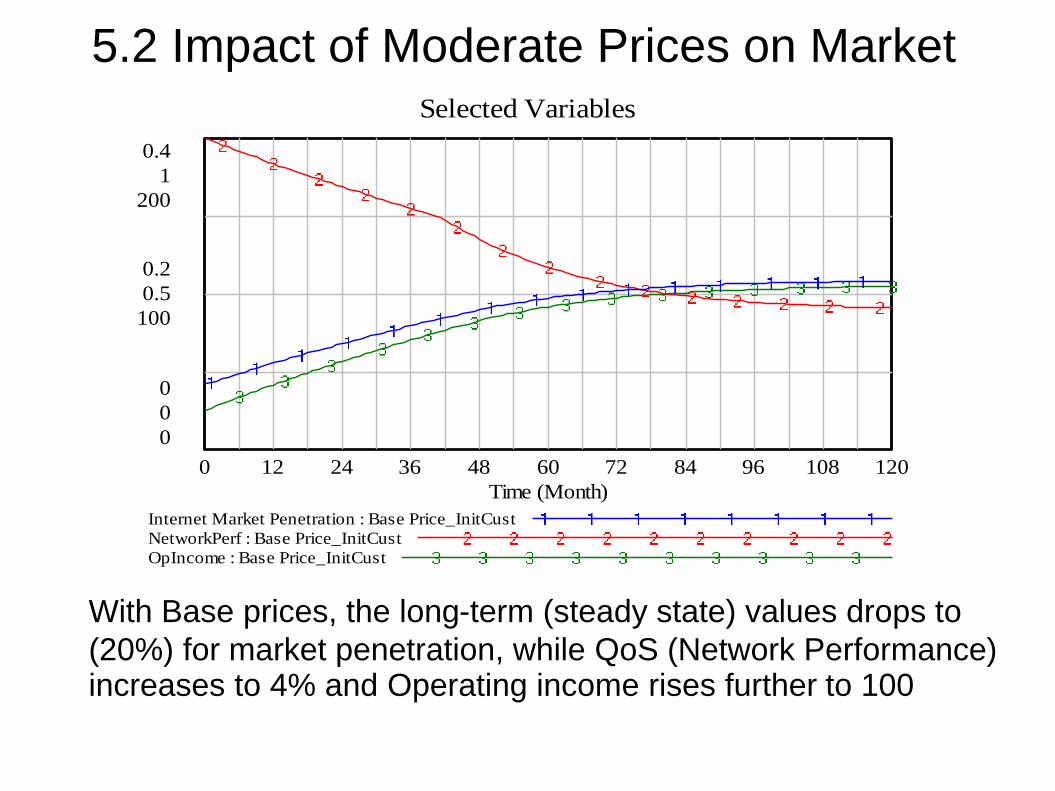
5.2 Impact of Moderate Prices on Market
With Base prices, the long-term (steady state) values drops to
(20%) for market penetration, while QoS (Network Performance) increases to 4% and Operating income rises further to 100
Selected Variables
0.4
1
200
0.2
0.5
100
0
0
0
0 12 24 36 48 60 72 84 96 108 120
Time (Month)
Internet Market Penetration : Base Price_InitCust
NetworkPerf : Base Price_InitCust
OpIncome : Base Price_InitCust
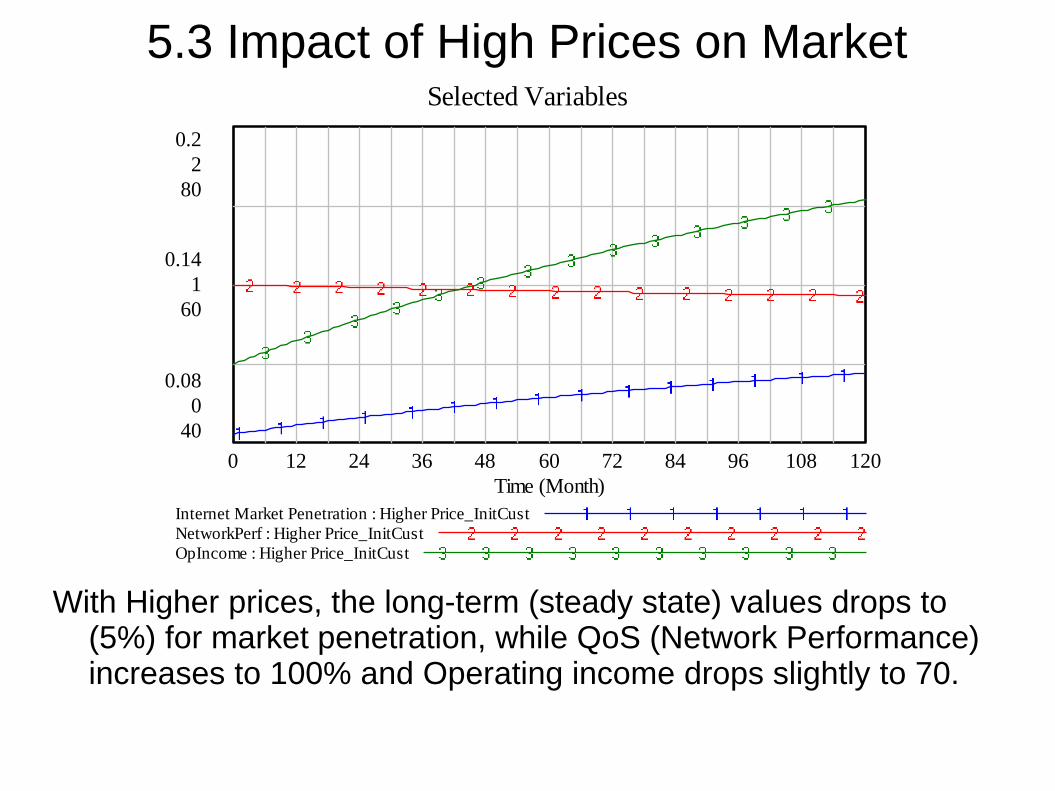
5.3 Impact of High Prices on Market
With Higher prices, the long-term (steady state) values drops to (5%) for market penetration, while QoS (Network Performance) increases to 100% and Operating income drops slightly to 70.
Selected Variables
0.2
2
80
0.14
1
60
0.08
0
40
0 12 24 36 48 60 72 84 96 108 120
Time (Month)
Internet Market Penetration : Higher Price_InitCust
NetworkPerf : Higher Price_InitCust
OpIncome : Higher Price_InitCust
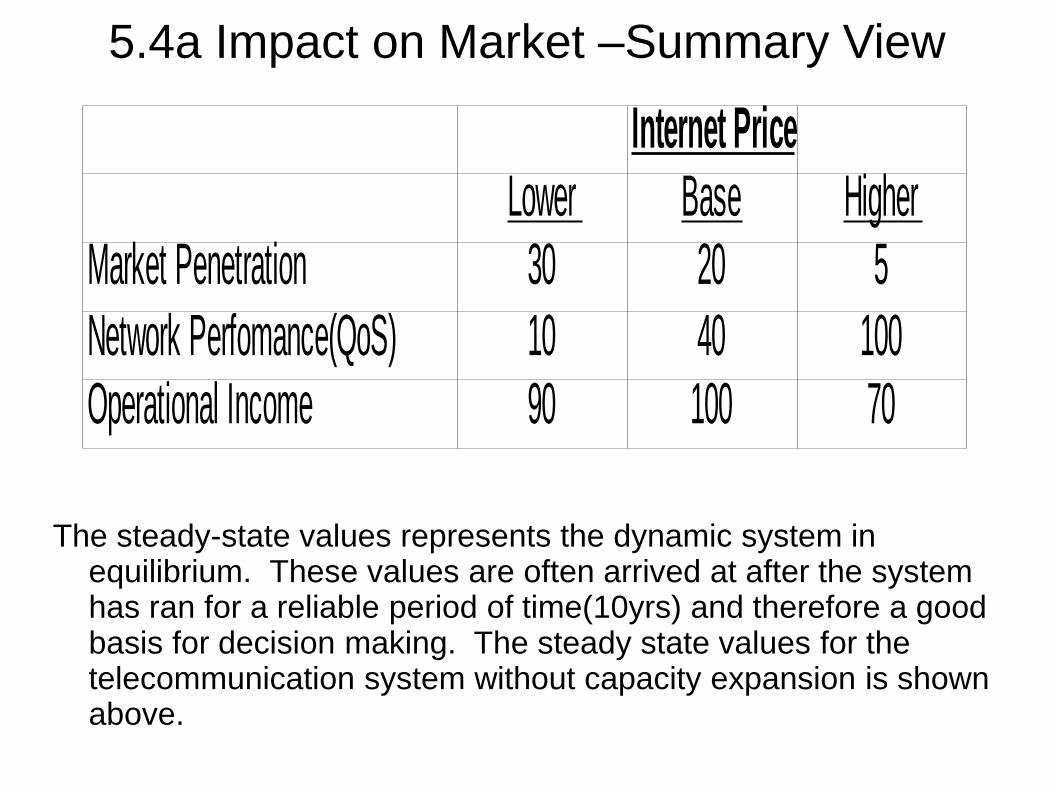
5.4a Impact on Market –Summary View
The steady-state values represents the dynamic system in equilibrium. These values are often arrived at after the system has ran for a reliable period of time(10yrs) and therefore a good basis for decision making. The steady state values for the telecommunication system without capacity expansion is shown above.
Internet PriceLower Base Higher
Market Penetration 30 20 5
Network Perfomance(QoS) 10 40 100Operational Income 90 100 70
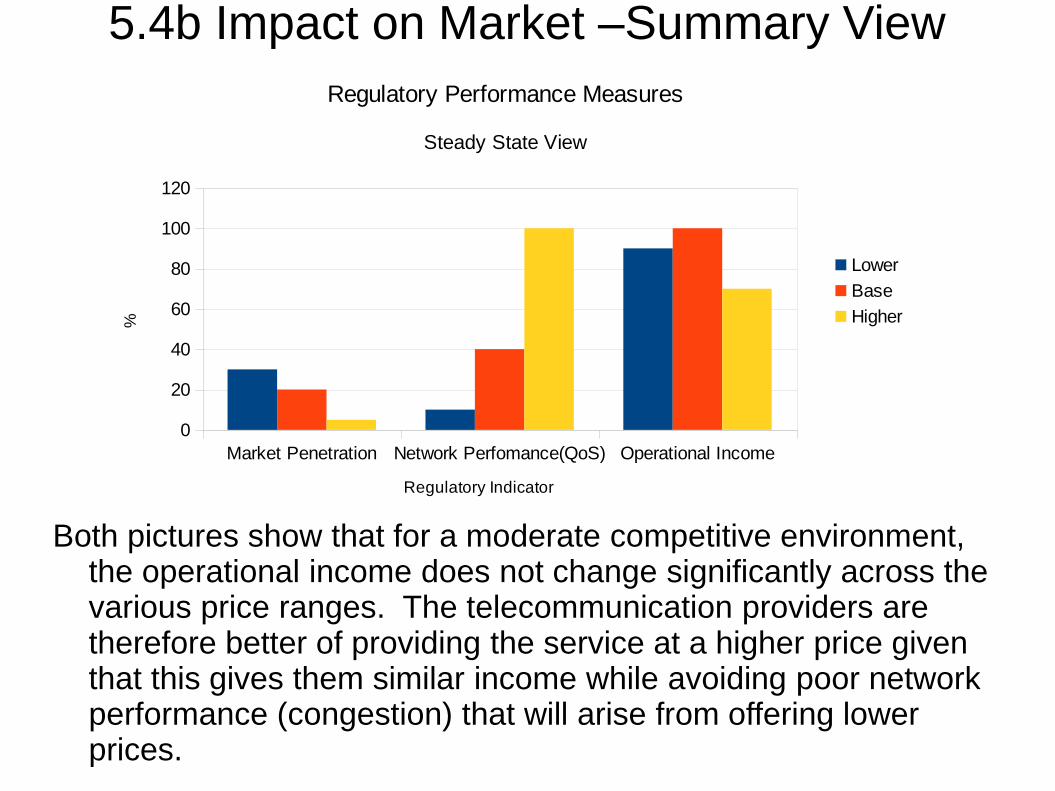
5.4b Impact on Market –Summary View
Both pictures show that for a moderate competitive environment, the operational income does not change significantly across the various price ranges. The telecommunication providers are therefore better of providing the service at a higher price given that this gives them similar income while avoiding poor network performance (congestion) that will arise from offering lower prices.
Market Penetration Network Perfomance(QoS) Operational Income
0
20
40
60
80
100
120
Regulatory Performance Measures
Steady State View
Lower
Base
Higher
Regulatory Indicator
%
5.5 Conclusion
Based on “steady-state” (long-term) simulated values for the selected regulatory indicators (Internet Penetration, Network Performance (QoS), & Operational Income), it is demonstrated that lowering prices for internet services has a significant impact on the uptake meaning that Internet services have a high price elasticity of demand. It is however demonstrated that the Operational Income for the Telecom provider is not significantly different across the different price ranges (Low, Base & High).
This means that the Telecoms provider would rather maintain higher prices since they fetch similar incomes compared to lower prices but without the network congestion that comes with lower prices.
These are however preliminary results since the proposed model is yet to be validated by the operators and regulators.
52
5.6 Future Work
A potential area of improvement would be to use the Bass Diffusion model to fine tune the internet market adoption/penetration aspect of the proposed model. Potential policies that can be tested in future include whether or not sharing telecommunications infrastructure will lead to a better market outcome.
Either way, the paper demonstrates the way in which the regulators can improve their policy decisions by subjecting them through the model and seeing the futuristic impacts within a virtual, simulated environment.
53
6a. References
Casier, Koen, Sofie Verbrugge, Jan Van Ooteghem, Didier Colle, Mario Pickavet, and Piet Demeester. 2009. “Using Cost Based Price Calculations in a Converged Network.” Info 11 (3): 6–18. doi:10.1108/14636690910954944.
Davies, Gareth, Michael Hardt, and Frank Kelly. 2004. “Come the Revolution—network Dimensioning, Service Costing and Pricing in a Packet Switched Environment.” Telecommunications Policy 28 (5): 391–412.
Dutta, Amitava. 2001. “Business Planning for Network Services: A Systems Thinking Approach.” Information Systems Research 12 (3): 260–83.
Dutta, A. & Roy, R., 2004. The Mechanics of Internet Growth: A Developing-Country Perspective. International Journal of Electronic Commerce, 9(2), pp.143-165. Available at: http://www.jstor.org/stable/27751145 [Accessed February 4, 2011].
Kirkwood, C.W, 2010 , System Dynamics Methods, A Quick Introduction, Arizona University Publication
Forrester, J.W., 1991. System dynamics and the lessons of 35 years. the Systemic Basis of Policy Making in the 1990s, 29.
Frederiksen, John. 2011. “Broadband Access, Regulatory Issues and Profitability Analyses.” Info 13 (5): 19–28. doi:10.1108/14636691111160617.
Jain, Piyush, and Varadharajan Sridhar. 2003. “Analysis of Competition and Market Structure of Basic Telecommunication Services in India.” Communications & Strategies 52 (4): 271–93.
Martis, M.S., 2006. Validation of simulation based models: a theoretical outlook.Electronic Journal of Business Research Methods, 4(1), pp.39–46.
54
6b. ReferencesMayoka, Kituyi, Moya Musa, Agnes S. Rwashana, and Angnes Rwashana. 2012. “A System
Dynamics Pricing Model for Stabilizing Prices for Telecommunication Products and Services in Uganda.” http://www.crownjournal.org/Geoffrey%20et%20al.pdf.
.ITU 2014, Measuring the Information Society, ITU Publication
Qi, Jiayin, Ling Li, and Hua Ai. 2009. “A System Dynamics Approach to Competitive Strategy in Mobile Telecommunication Industry.” Systems Research and Behavioral Science 26 (2): 155–68. doi:10.1002/sres.966.
Rouskas, George N., and Qian Lv. 2009. “An Economic Model for Pricing Tiered Network Services.” Annals of Telecommunications - Annales Des Télécommunications 65 (3-4): 147–61. doi:10.1007/s12243-009-0149-3.
Sterman, J.D., 2002. All models are wrong: reflections on becoming a systems scientist. System Dynamics Review, 18(4), pp.501-531. Available at: http://doi.wiley.com/10.1002/sdr.261 [Accessed April 25, 2011].
Sun, Li-hui, Chong Feng, Yan-qiu Zhang, and Li-ru Wang. 2011. “Price Discrimination Game of Duopoly Telecommunication Operators Based on System Dynamics.” In Industrial Engineering and Engineering Management (IE&EM), 2011 IEEE 18Th International Conference on, 1728–31. IEEE. http://ieeexplore.ieee.org/xpls/abs_all.jsp?arnumber=6035498.
Vogstad, K.O., 2004. A system dynamics analysis of the Nor-dic electricity market: The transi-tionfrom fossil fuelled toward a renewable supply within a liberal-ised electricity market. Diss., Norwegian University of Science and Technology, Department of Electrical Power Engineering. Trondheim.
Walrand, Jean. 2008. “Economic Models of Communication Networks.” In Performance Modeling and Engineering, 57–89. Springer. http://link.springer.com/chapter/10.1007/978-0-387-79361-0_3.
Williams, D.2002, Integrating System Dynamics Modelling and Case.
7. AppendixSystem Dynamics Equations for the Model
56
Q&A
End