Telecom Regulatory Authority of India
121
Telecom Regulatory Authority of India Yearly Performance Indicators Indian Telecom Sector (Fifth Edition) 2020 New Delhi, India Mahanagar Doorsanchar Bhawan, Jawahar Lal Nehru Marg, New Delhi-110002 Tel: +91-11- 23230752, Fax: +91-11- 23236650 Website: www.trai.gov.in
-
Upload
khangminh22 -
Category
Documents
-
view
2 -
download
0
Transcript of Telecom Regulatory Authority of India
Telecom Regulatory Authority of India
Yearly Performance Indicators
Indian Telecom Sector (Fifth Edition)
2020
New Delhi, India
Mahanagar Doorsanchar Bhawan, Jawahar Lal Nehru Marg, New Delhi-110002
Tel: +91-11- 23230752, Fax: +91-11- 23236650 Website: www.trai.gov.in
Table of Contents
Snapshot ......................................................................................................... 1
Introduction .................................................................................................... 3
Chapter 1 : Subscription Data .......................................................................... 4
Section A : Access Service - An Overview .......................................................... 5
Section B : Wireless Service ........................................................................... 13
Section C : Wireline Service ........................................................................... 21
Section D : Internet Service ............................................................................ 33
Section E : Other Value Added Services - Public Mobile Radio Trunk Services
(PMRTS) and Very Small Aperture Terminals (VSAT) ………………......47
Chapter 2 : Wireless Revenue and Usage ........................................................ 50
Chapter 3 : Wireless Data Services ................................................................. 60
Chapter 4 : Financial Data of Telecom Service Sector .................................... 68
Chapter 5 : Performance of Cable TV, Direct-to-Home (DTH) and Radio
Broadcasting Services.. .................................................................................. 76
Annexures ..................................................................................................... 83
Annexure 1.1: Wireless Subscriber Base ......................................................... 84
Annexure 1.2: Wireline Subscriber Base ......................................................... 85
Annexure 1.3: Service Area and Operator wise details of Public Call Offices
(PCOs) ..................................................................................... 86
Annexure 1.4: Service area wise details of Village Public Telephones (VPTs) .... 88
Annexure 1.5: Internet Service Provider(ISP) wise Internet Subscriber base…...89
Annexure 1.6: List of Service Providers which reported IP Telephony Minutes 99
Annexure 1.7: Service Area wise PMRTS subscriber Base ............................ .100
Annexure 5.1: MRP (in Rs.) of pay channels, offered by broadcasters to
subscriber as reported to TRAI (as per New Regulatory
Framework) ........................................................................... 102
Annexure 5.2: List of Pay DTH (Direct-to-Home) Operators ........................... 114
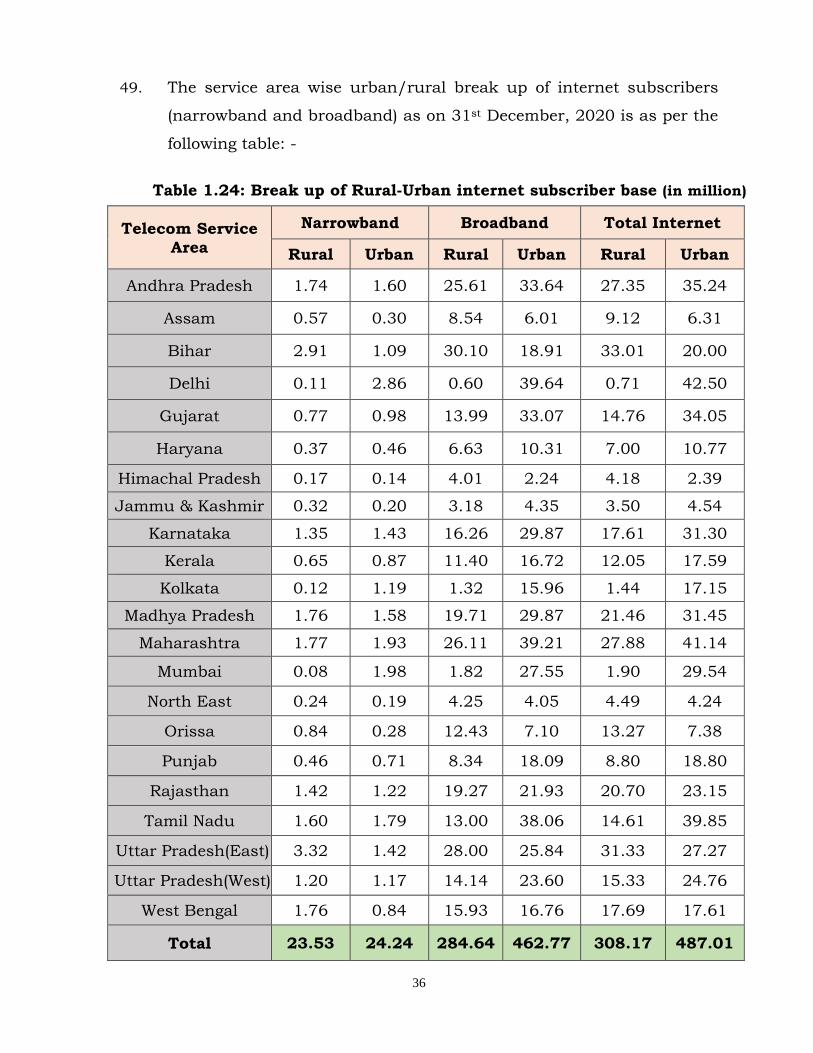
Annexure 5.3: List of existing cities with operational FM Radio Channels in India
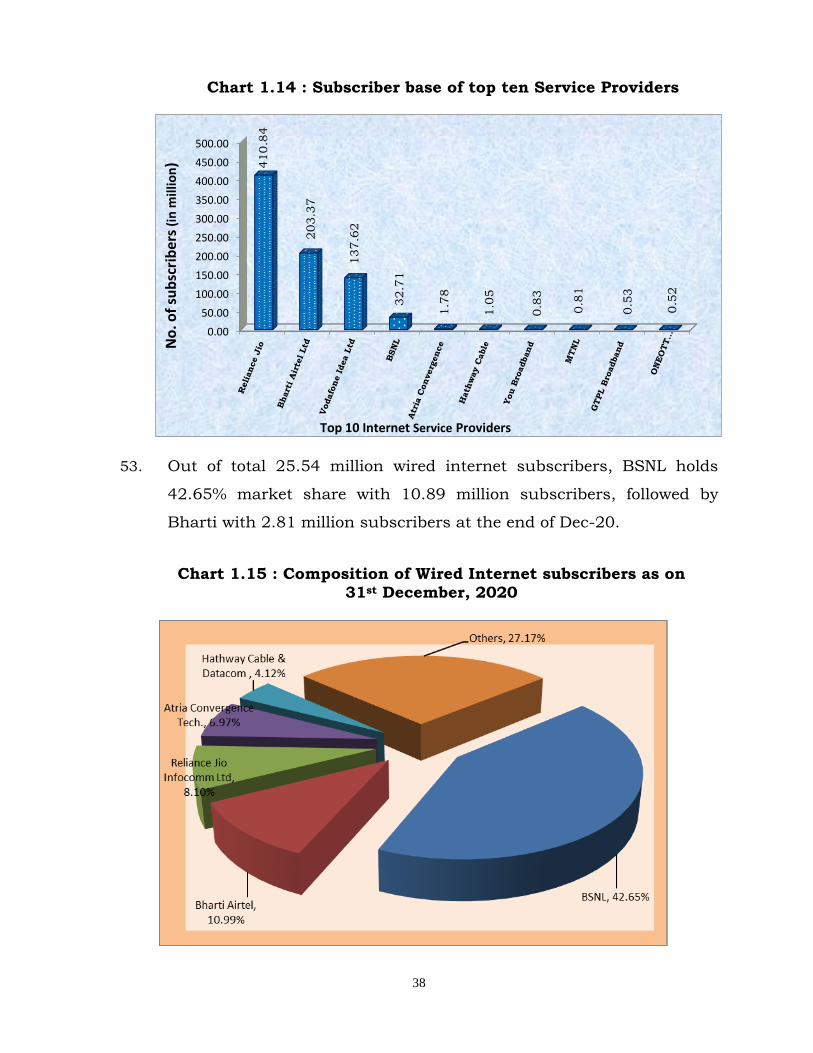
............................................................................................. 115

1
Snapshot
(Data As on 31st December, 2020)
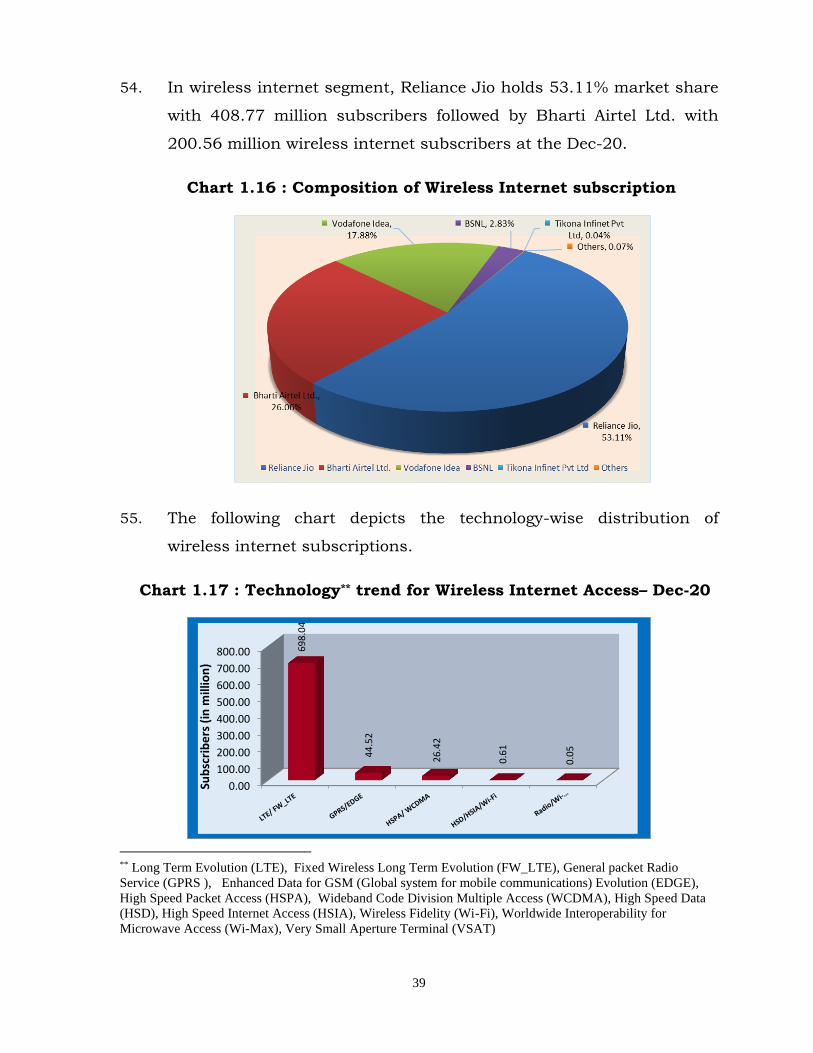
Telecom Subscribers (Wireless+Wireline)
Total Subscribers 1,173.83 Million
% change over the previous year 0.12%
Urban Subscribers 647.91 Million
Rural Subscribers 525.92 Million
Market share of Private Operators 88.74%
Market share of PSU Operators 11.26%
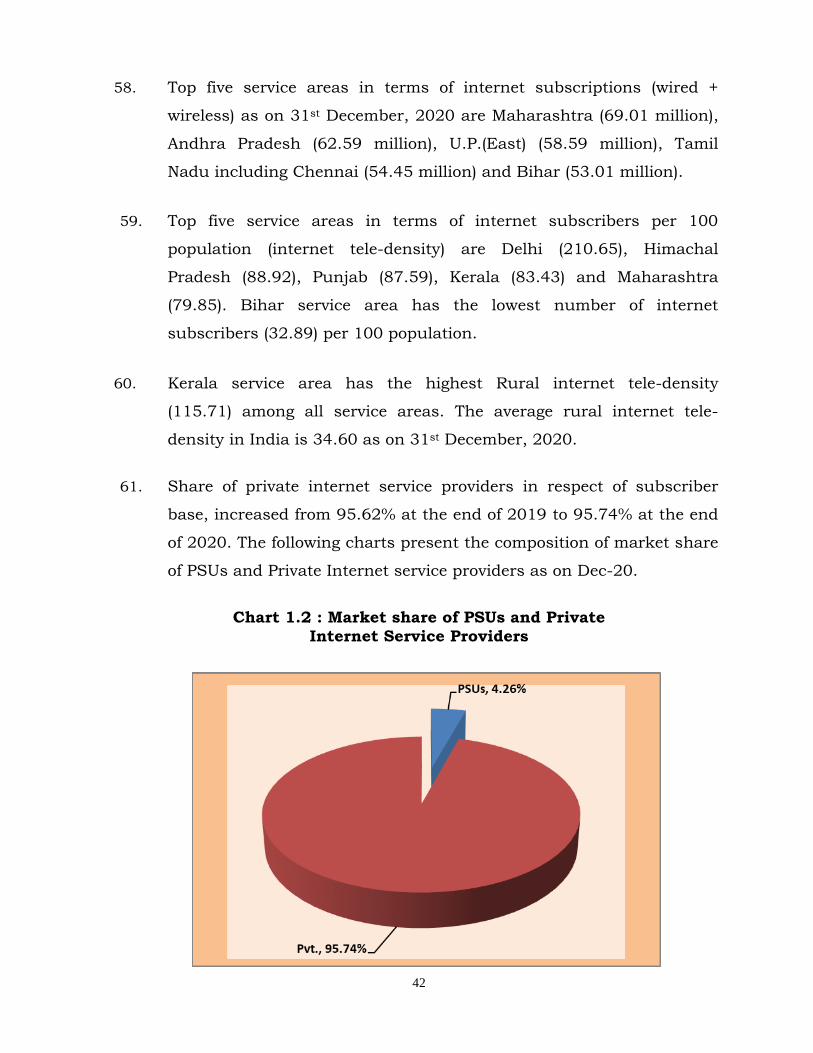
Tele-density 86.38%
Urban Tele-density 138.34%
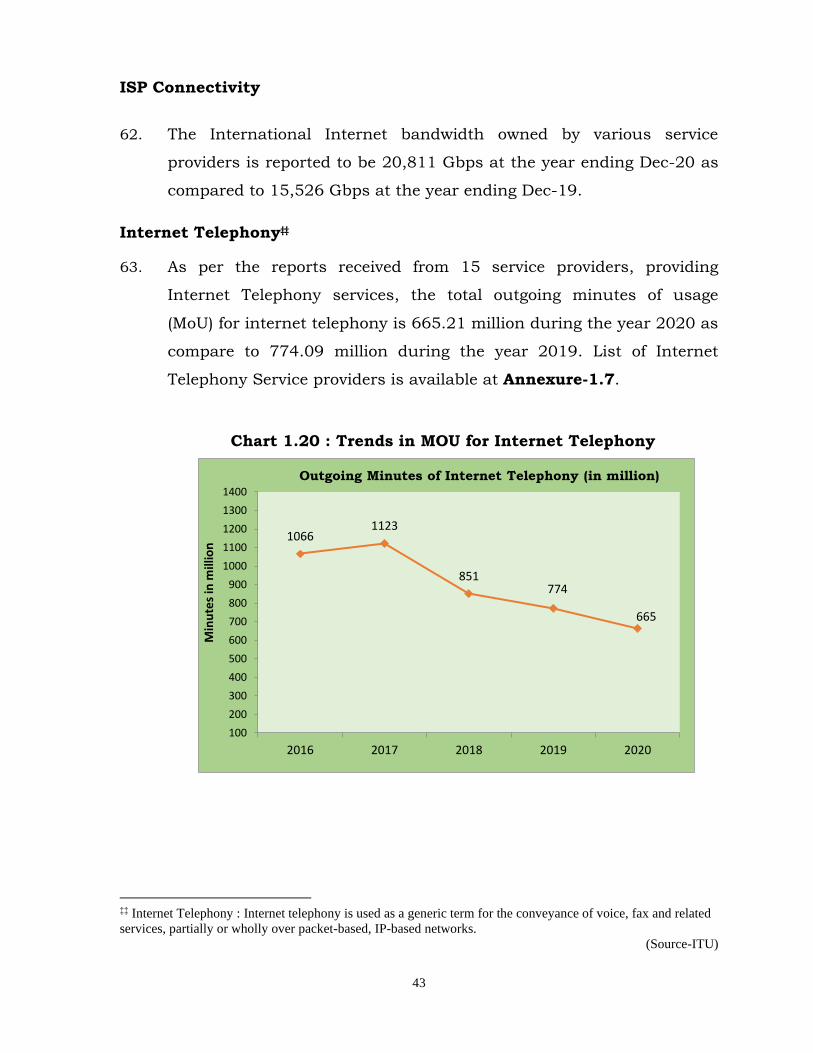
Rural Tele-density 59.05%
Wireless Subscribers
Total Wireless Subscribers 1,153.77 Million
% change over the previous year 2.34%
Urban Subscribers 629.67 Million
Rural Subscribers 524.11 Million
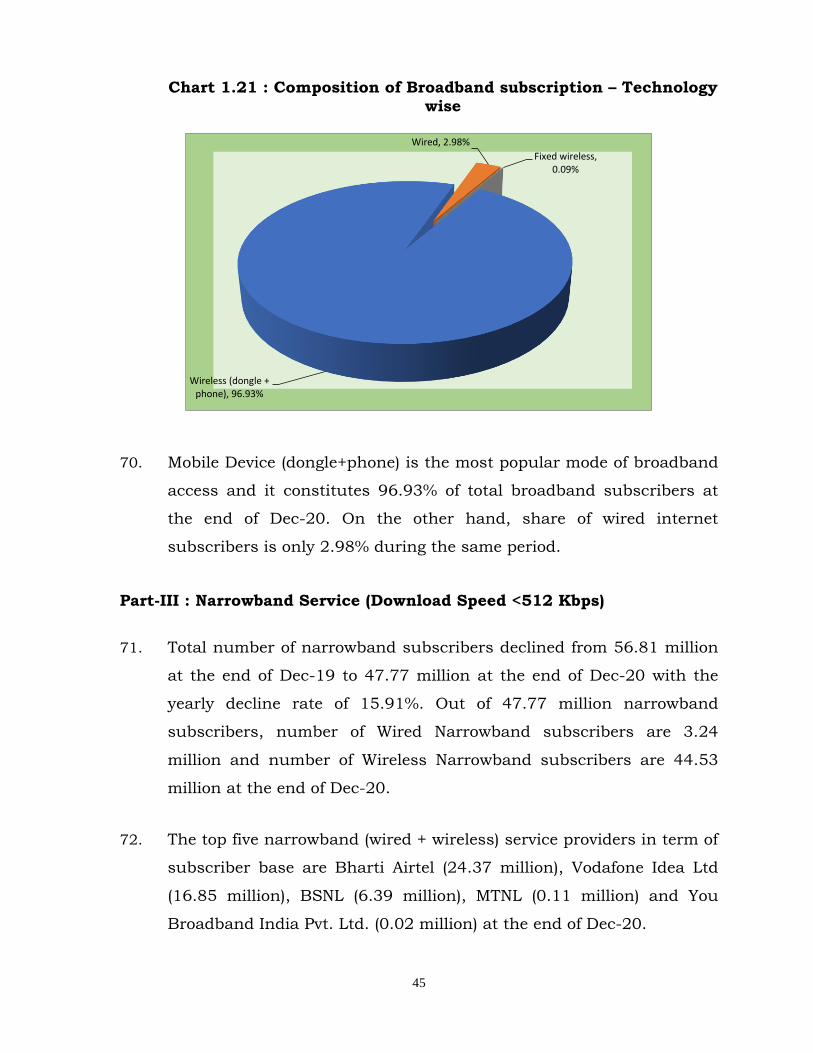
Market share of Private Sector Operators 89.42%
Market share of Public Sector Operators 10.58%
Tele-density 84.90%
Urban Tele-density 134.34%
Rural Tele-density 58.85%
No. of total Public Mobile Radio Trunk Services (PMRTS) 63,205
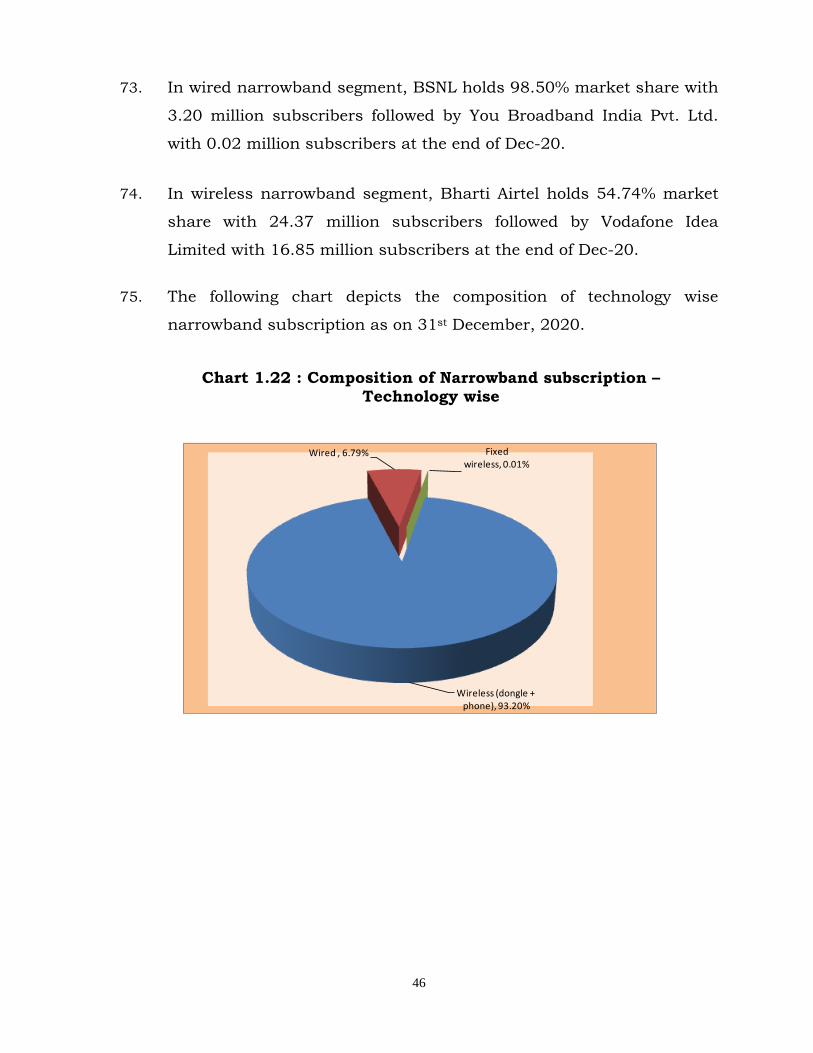
No. of Very Small Aperture Terminals (VSAT) 2,96,079
Wireline Subscribers
Total Wireline Subscribers 20.05 Million
% change over the previous year -4.53%
Urban Subscribers 18.24 Million
Rural Subscribers 1.81 Million
Market share of Private Operators 49.49%
Market share of PSU Operators 50.51%
Tele-density 1.48%
Urban Tele-density 3.89%
Rural Tele-density 0.20%
No. of Village Public Telephones (VPT) 68,606
No. of Public Call Office (PCO) 1,40,546
2
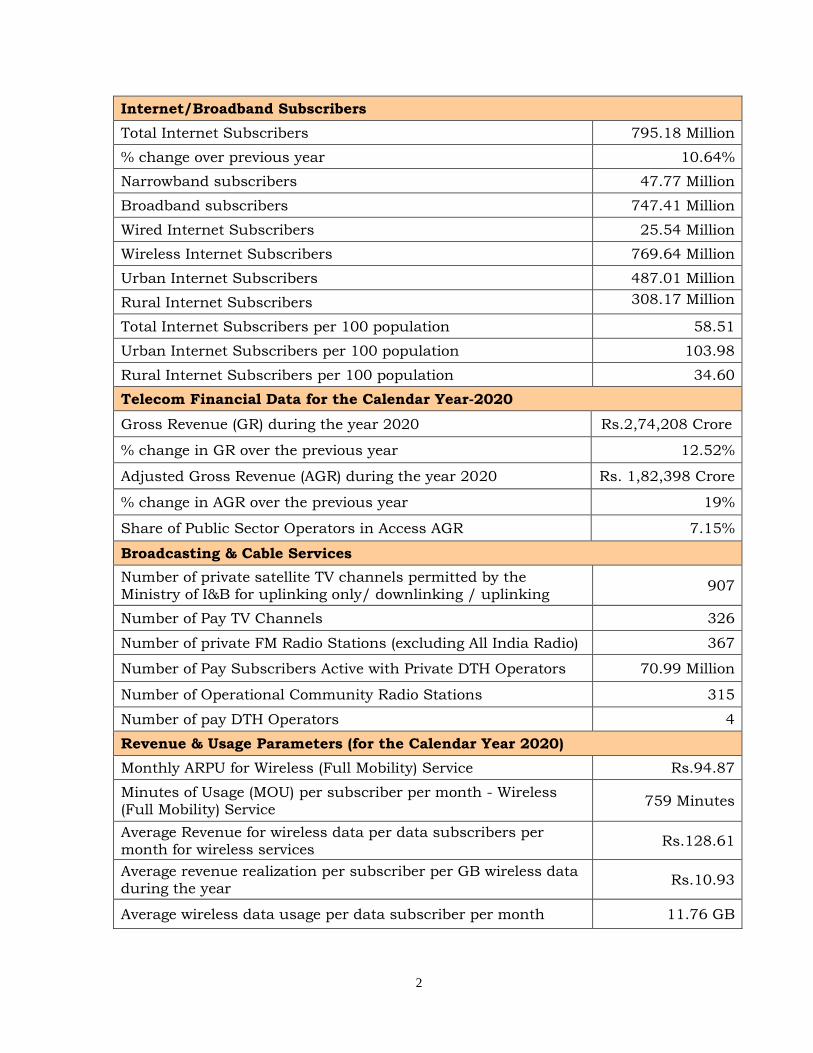
Internet/Broadband Subscribers
Total Internet Subscribers 795.18 Million
% change over previous year 10.64%
Narrowband subscribers 47.77 Million
Broadband subscribers 747.41 Million
Wired Internet Subscribers 25.54 Million
Wireless Internet Subscribers 769.64 Million
Urban Internet Subscribers 487.01 Million
Rural Internet Subscribers 308.17 Million
M Total Internet Subscribers per 100 population 58.51
Urban Internet Subscribers per 100 population 103.98
Rural Internet Subscribers per 100 population 34.60
Telecom Financial Data for the Calendar Year-2020
Gross Revenue (GR) during the year 2020 Rs.2,74,208 Crore
% change in GR over the previous year 12.52%
Adjusted Gross Revenue (AGR) during the year 2020 Rs. 1,82,398 Crore
% change in AGR over the previous year 19%
Share of Public Sector Operators in Access AGR 7.15%
Broadcasting & Cable Services
Number of private satellite TV channels permitted by the Ministry of I&B for uplinking only/ downlinking / uplinking
907
Number of Pay TV Channels 326
Number of private FM Radio Stations (excluding All India Radio) 367
Number of Pay Subscribers Active with Private DTH Operators 70.99 Million
Number of Operational Community Radio Stations 315
Number of pay DTH Operators 4
Revenue & Usage Parameters (for the Calendar Year 2020)
Monthly ARPU for Wireless (Full Mobility) Service Rs.94.87
Minutes of Usage (MOU) per subscriber per month - Wireless (Full Mobility) Service
759 Minutes
Average Revenue for wireless data per data subscribers per month for wireless services
Rs.128.61
Average revenue realization per subscriber per GB wireless data during the year
Rs.10.93
Average wireless data usage per data subscriber per month 11.76 GB
3
Introduction
This Report presents the Key Parameters and growth trends for the Telecom Services in India for the calendar year 2020. To provide a broad
perspective on the Telecom Services and to serve as a reference document for various stakeholders, research agencies and analysts. Chapter-1 depicts the growth pattern, in terms of Subscriber base and Tele-density of Wireline,
Wireless, Internet and Value Added Services (VAS). Chapter-2 covers the key revenue and usage parameters of Wireless services. Chapter-3 provides the
analysis relating to the wireless data service and revenue from wireless data. Chapter-4 gives the financial data. The information relating to Cable TV, DTH & Radio Broadcast services is provided in Chapter-5.
2. Key indicators of the report are as follows: -
i. The total number of telephone subscribers increased from 1,172.44
million at the end of Dec-2019 to 1,173.83 million at the end of Dec-2020
ii. Total internet subscribers increased from 718.74 million in the end of Dec-2019 to 795.18 million at the end of Dec-2020. During the
same period Broadband subscriber base has also increased from 661.94 million to 747.41 million.
iii. ARPU per month increased from Rs.74.88 in the year 2019 to
Rs.94.87 in the year 2020 and MoU per subscriber per month also increased from 701 minutes to 759 minutes during the same period.
iv. Number of total active subscribers with pay DTH operators is reported as 70.99 million at the end of Dec-2020.
v. Total Gross Revenue of telecom sector increased from Rs.2,43,705/- crore in Dec-2019 to Rs. 2,74,208/- crore in year 2020.
3. The Report has been prepared based on the information furnished by the Service Providers. It is also available on TRAI’s website (www.trai.gov.in
under the link http://www.trai.gov.in/release-publication/reports/ performance-indicators-reports). For any suggestion or clarification
pertaining to this report, the following persons may be contacted: 1. Dr. M.P. Tangirala, Pr. Advisor (F&EA), TRAI
Tel. : +91-11-23221856, Fax.: +91-11-23235249 e-mail: [email protected]
2. Shri Amit Sharma, Advisor (F&EA), TRAI Tele. : +91-11-23234367
e-mail : [email protected]
4
----------------------------------------------------------------------------------------------------------------
• Tele-density figures are derived from the subscriber data provided by the operators and the
projection of population. With effect from 1st January, 2020, the projection of population is based on the ‘Report of the Technical Group on Population Projections for India and States 2011 – 2036’, which is available under the link https://main.mohfw.gov.in/sites/default/files/Population%20Projection%20Report%202011-
2036%20-%20upload_ compressed_0.pdf Prior to that population projection was based on census data, 2001-2026, published by the Office of Registrar General & Census Commissioner of India.
• The Report has been prepared based on the information furnished by the Service Providers.
Chapter 1: Subscription
Data
5
Section A : Access Service – An overview
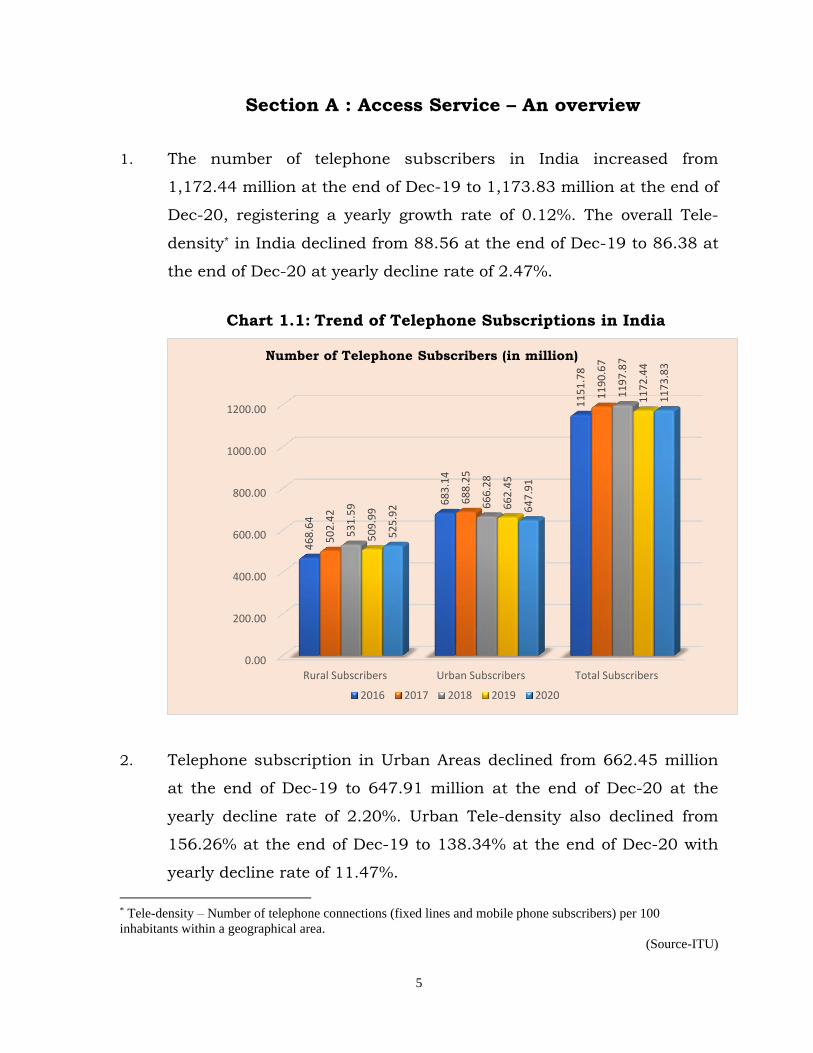
1. The number of telephone subscribers in India increased from
1,172.44 million at the end of Dec-19 to 1,173.83 million at the end of
Dec-20, registering a yearly growth rate of 0.12%. The overall Tele-
density* in India declined from 88.56 at the end of Dec-19 to 86.38 at
the end of Dec-20 at yearly decline rate of 2.47%.
Chart 1.1: Trend of Telephone Subscriptions in India
2. Telephone subscription in Urban Areas declined from 662.45 million
at the end of Dec-19 to 647.91 million at the end of Dec-20 at the
yearly decline rate of 2.20%. Urban Tele-density also declined from
156.26% at the end of Dec-19 to 138.34% at the end of Dec-20 with
yearly decline rate of 11.47%.
* Tele-density – Number of telephone connections (fixed lines and mobile phone subscribers) per 100
inhabitants within a geographical area.
(Source-ITU)
0.00
200.00
400.00
600.00
800.00
1000.00
1200.00
Rural Subscribers Urban Subscribers Total Subscribers
46
8.6
4
68
3.1
4
11
51
.78
50
2.4
2
68
8.2
5
11
90
.67
53
1.5
9 66
6.2
8
11
97
.87
50
9.9
9 66
2.4
5
11
72
.44
52
5.9
2 64
7.9
1
11
73
.83
2016 2017 2018 2019 2020
Number of Telephone Subscribers (in million)
6
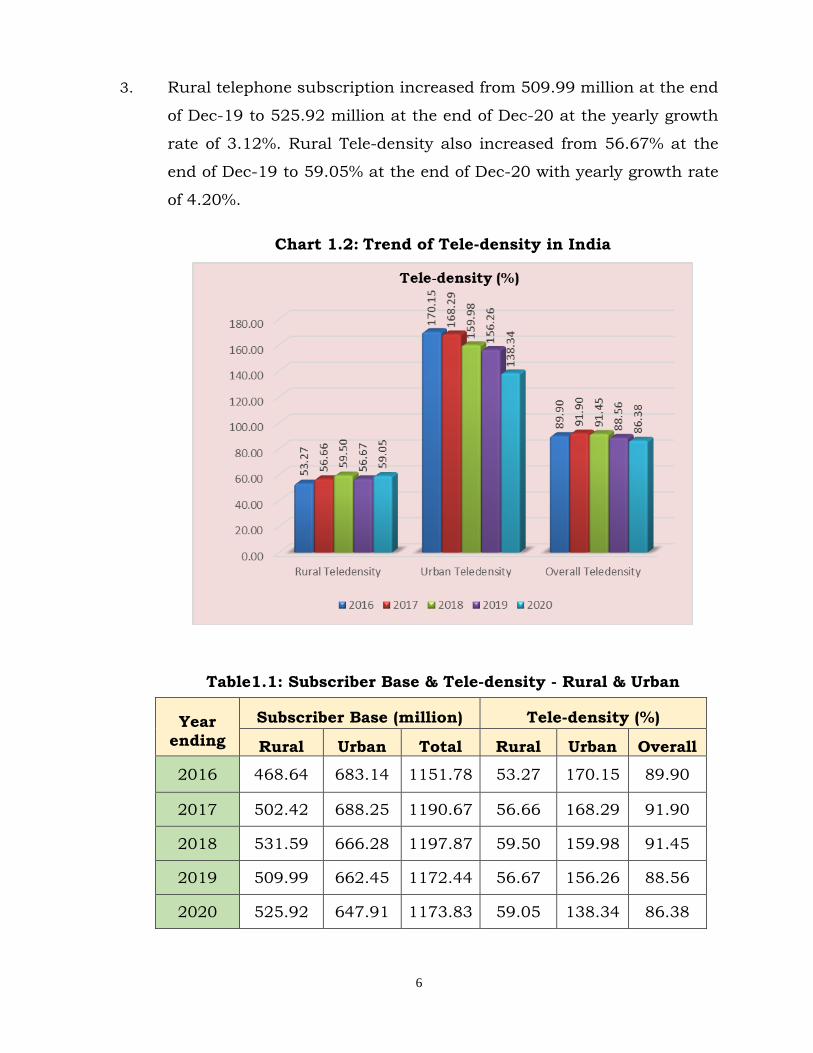
3. Rural telephone subscription increased from 509.99 million at the end
of Dec-19 to 525.92 million at the end of Dec-20 at the yearly growth
rate of 3.12%. Rural Tele-density also increased from 56.67% at the
end of Dec-19 to 59.05% at the end of Dec-20 with yearly growth rate
of 4.20%.
Chart 1.2: Trend of Tele-density in India
Table1.1: Subscriber Base & Tele-density - Rural & Urban
Year
ending
Subscriber Base (million) Tele-density (%)
Rural Urban Total Rural Urban Overall
2016 468.64 683.14 1151.78 53.27 170.15 89.90
2017 502.42 688.25 1190.67 56.66 168.29 91.90
2018 531.59 666.28 1197.87 59.50 159.98 91.45
2019 509.99 662.45 1172.44 56.67 156.26 88.56
2020 525.92 647.91 1173.83 59.05 138.34 86.38
7
4. Out of the total telephone subscription, the shares of Rural telephone
subscription increased from 43.50% at the end of Dec-19 to 44.80%
at the end of Dec-20. However, share of Urban telephone subscription
in total telephone subscription, decreased from 56.50% at the end of
Dec-19 to 55.20% at the end of Dec-20. The following chart depicts
the rural-urban market share of telephone subscribers at the end of
Dec-20.
Table 1.2 : Composition of Telephone Subscribers
Network Type Share (%)
Urban Wireless 53.64%
Rural Wireless 44.65%
Urban Wireline 1.55%
Rural Wireline 0.15%
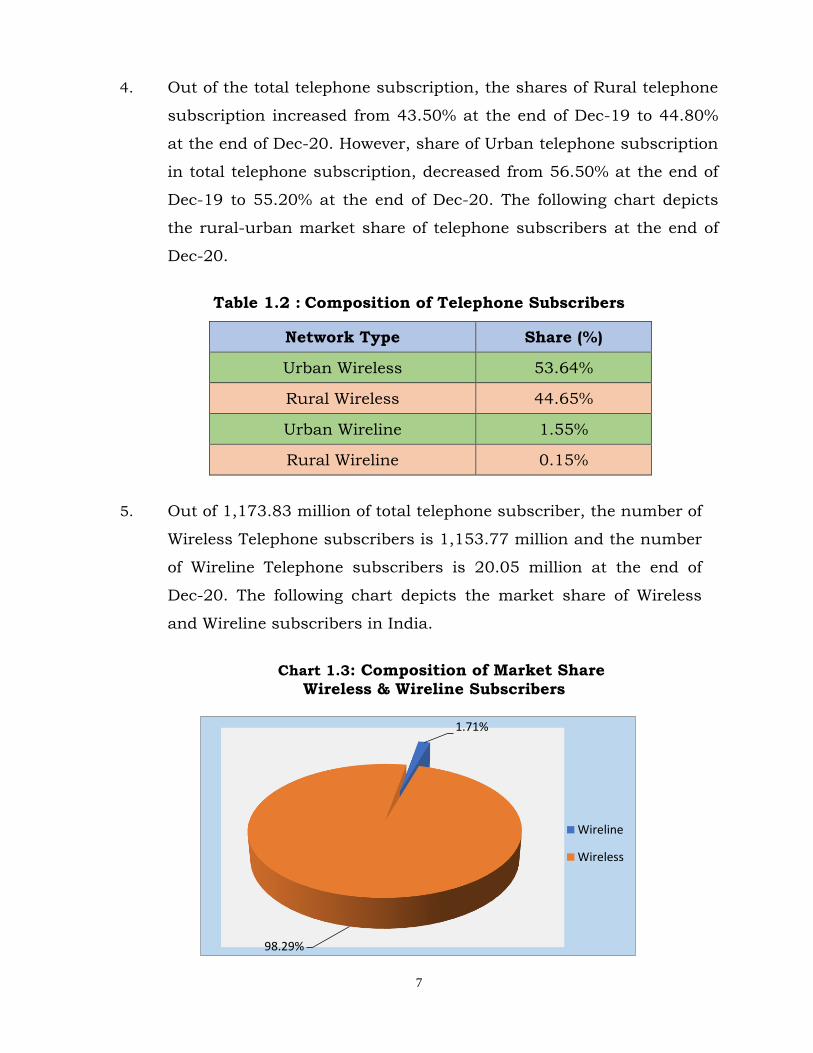
5. Out of 1,173.83 million of total telephone subscriber, the number of
Wireless Telephone subscribers is 1,153.77 million and the number
of Wireline Telephone subscribers is 20.05 million at the end of
Dec-20. The following chart depicts the market share of Wireless
and Wireline subscribers in India.
Chart 1.3: Composition of Market Share
Wireless & Wireline Subscribers
1.71%
98.29%
Wireline
Wireless

8
Table 1.3: Service Area wise Access (Wireless+Wireline) Subscriber base
Service Area Subscribers (million)
Dec-19 Dec-20 Yearly Net Additions
Rate of Yearly
Growth (%)
Andhra Pradesh 88.38 89.00 0.62 0.70
Assam 23.72 24.17 0.45 1.91
Bihar 84.50 85.10 0.60 0.71
Delhi 56.22 55.90 -0.31 -0.56
Gujarat 68.64 68.75 0.11 0.15
Haryana 28.07 27.44 -0.63 -2.23
Himachal Pradesh 10.70 11.14 0.44 4.14
Jammu & Kashmir 10.45 11.96 1.51 14.41
Karnataka 69.51 69.41 -0.10 -0.15
Kerala 45.23 45.98 0.75 1.66
Madhya Pradesh 75.74 76.20 0.46 0.60
Maharashtra 94.01 94.54 0.52 0.55
Mumbai 41.17 38.01 -3.16 -7.67
North East 12.21 12.31 0.10 0.84
Orissa 33.23 33.72 0.49 1.48
Punjab 39.83 38.42 -1.42 -3.56
Rajasthan 65.84 65.63 -0.22 -0.33
Tamil Nadu 83.87 82.39 -1.49 -1.77
U.P.(E) 96.12 98.98 2.86 2.98
U.P.(W) 63.22 62.80 -0.42 -0.66
Kolkata 26.32 26.83 0.51 1.95
West Bengal 55.46 55.15 -0.31 -0.55
All India 1,172.44 1,173.83 1.39 0.12
6. During the year 2020, Jammu & Kashmir service area has recorded
the highest growth rate of 14.41% followed by Himachal Pradesh
service area (4.14%). On the other hand, Mumbai service area showed
maximum decline rate of 7.67% during the year 2020.
9
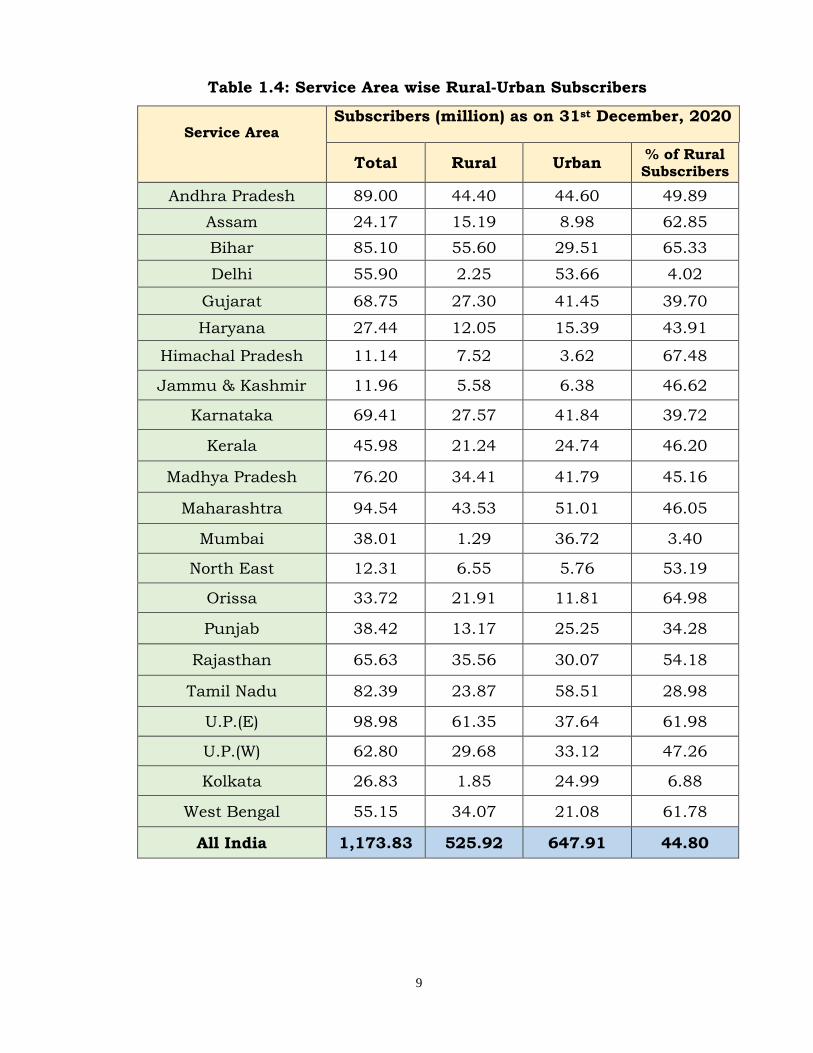
Table 1.4: Service Area wise Rural-Urban Subscribers
Service Area
Subscribers (million) as on 31st December, 2020
Total Rural Urban % of Rural Subscribers
Andhra Pradesh 89.00 44.40 44.60 49.89
Assam 24.17 15.19 8.98 62.85
Bihar 85.10 55.60 29.51 65.33
Delhi 55.90 2.25 53.66 4.02
Gujarat 68.75 27.30 41.45 39.70
Haryana 27.44 12.05 15.39 43.91
Himachal Pradesh 11.14 7.52 3.62 67.48
Jammu & Kashmir 11.96 5.58 6.38 46.62
Karnataka 69.41 27.57 41.84 39.72
Kerala 45.98 21.24 24.74 46.20
Madhya Pradesh 76.20 34.41 41.79 45.16
Maharashtra 94.54 43.53 51.01 46.05
Mumbai 38.01 1.29 36.72 3.40
North East 12.31 6.55 5.76 53.19
Orissa 33.72 21.91 11.81 64.98
Punjab 38.42 13.17 25.25 34.28
Rajasthan 65.63 35.56 30.07 54.18
Tamil Nadu 82.39 23.87 58.51 28.98
U.P.(E) 98.98 61.35 37.64 61.98
U.P.(W) 62.80 29.68 33.12 47.26
Kolkata 26.83 1.85 24.99 6.88
West Bengal 55.15 34.07 21.08 61.78
All India 1,173.83 525.92 647.91 44.80
10
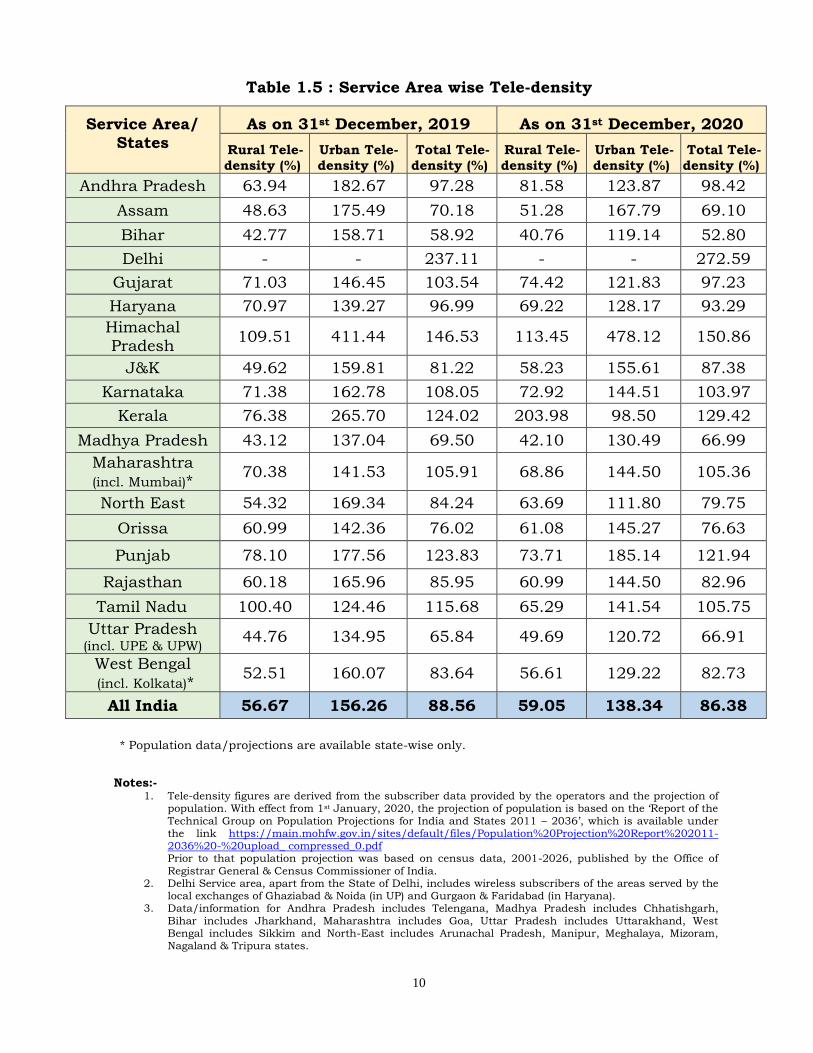
Table 1.5 : Service Area wise Tele-density
Service Area/ States
As on 31st December, 2019 As on 31st December, 2020
Rural Tele-
density (%)
Urban Tele-
density (%)
Total Tele-
density (%)
Rural Tele-
density (%)
Urban Tele-
density (%)
Total Tele-
density (%)
Andhra Pradesh 63.94 182.67 97.28 81.58 123.87 98.42
Assam 48.63 175.49 70.18 51.28 167.79 69.10
Bihar 42.77 158.71 58.92 40.76 119.14 52.80
Delhi - - 237.11 - - 272.59
Gujarat 71.03 146.45 103.54 74.42 121.83 97.23
Haryana 70.97 139.27 96.99 69.22 128.17 93.29
Himachal Pradesh
109.51 411.44 146.53 113.45 478.12 150.86
J&K 49.62 159.81 81.22 58.23 155.61 87.38
Karnataka 71.38 162.78 108.05 72.92 144.51 103.97
Kerala 76.38 265.70 124.02 203.98 98.50 129.42
Madhya Pradesh 43.12 137.04 69.50 42.10 130.49 66.99
Maharashtra (incl. Mumbai)*
70.38 141.53 105.91 68.86 144.50 105.36
North East 54.32 169.34 84.24 63.69 111.80 79.75
Orissa 60.99 142.36 76.02 61.08 145.27 76.63
Punjab 78.10 177.56 123.83 73.71 185.14 121.94
Rajasthan 60.18 165.96 85.95 60.99 144.50 82.96
Tamil Nadu 100.40 124.46 115.68 65.29 141.54 105.75
Uttar Pradesh (incl. UPE & UPW)
44.76 134.95 65.84 49.69 120.72 66.91
West Bengal
(incl. Kolkata)* 52.51 160.07 83.64 56.61 129.22 82.73
All India 56.67 156.26 88.56 59.05 138.34 86.38
* Population data/projections are available state-wise only.
Notes:- 1. Tele-density figures are derived from the subscriber data provided by the operators and the projection of
population. With effect from 1st January, 2020, the projection of population is based on the ‘Report of the
Technical Group on Population Projections for India and States 2011 – 2036’, which is available under the link https://main.mohfw.gov.in/sites/default/files/Population%20Projection%20Report%202011-2036%20-%20upload_ compressed_0.pdf Prior to that population projection was based on census data, 2001-2026, published by the Office of
Registrar General & Census Commissioner of India. 2. Delhi Service area, apart from the State of Delhi, includes wireless subscribers of the areas served by the
local exchanges of Ghaziabad & Noida (in UP) and Gurgaon & Faridabad (in Haryana). 3. Data/information for Andhra Pradesh includes Telengana, Madhya Pradesh includes Chhatishgarh,
Bihar includes Jharkhand, Maharashtra includes Goa, Uttar Pradesh includes Uttarakhand, West Bengal includes Sikkim and North-East includes Arunachal Pradesh, Manipur, Meghalaya, Mizoram, Nagaland & Tripura states.
11
7. Kerala service area has the highest Rural Tele-density of 203.98
followed by Himachal Pradesh service area (113.45) at the end of
Dec-20. On the other hand, Bihar service area have the lowest Rural
Tele-density of 40.76 in the same period.
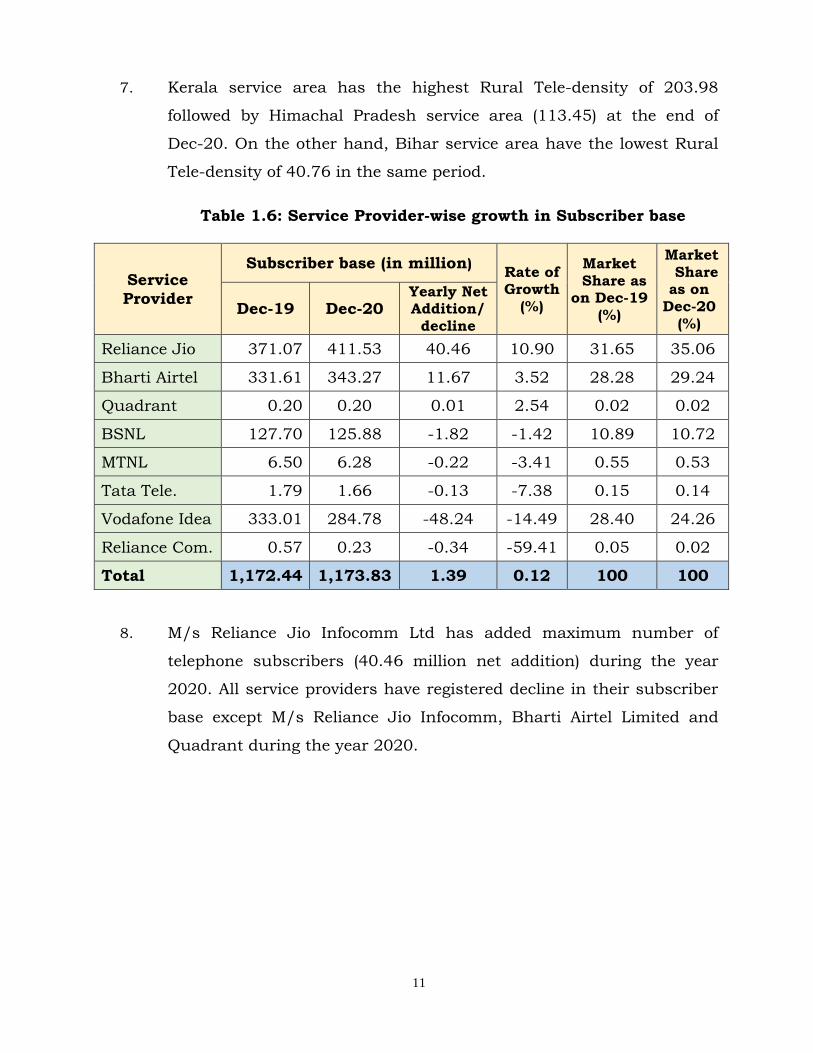
Table 1.6: Service Provider-wise growth in Subscriber base
Service
Provider
Subscriber base (in million) Rate of Growth
(%)
Market Share as on Dec-19
(%)
Market Share as on
Dec-20
(%) Dec-19 Dec-20
Yearly Net Addition/
decline
Reliance Jio 371.07 411.53 40.46 10.90 31.65 35.06
Bharti Airtel 331.61 343.27 11.67 3.52 28.28 29.24
Quadrant 0.20 0.20 0.01 2.54 0.02 0.02
BSNL 127.70 125.88 -1.82 -1.42 10.89 10.72
MTNL 6.50 6.28 -0.22 -3.41 0.55 0.53
Tata Tele. 1.79 1.66 -0.13 -7.38 0.15 0.14
Vodafone Idea 333.01 284.78 -48.24 -14.49 28.40 24.26
Reliance Com. 0.57 0.23 -0.34 -59.41 0.05 0.02
Total 1,172.44 1,173.83 1.39 0.12 100 100
8. M/s Reliance Jio Infocomm Ltd has added maximum number of
telephone subscribers (40.46 million net addition) during the year
2020. All service providers have registered decline in their subscriber
base except M/s Reliance Jio Infocomm, Bharti Airtel Limited and
Quadrant during the year 2020.

12
Table 1.7 : Service provider-wise Market Share of rural subscribers in their total subscribers – as on 31st December, 2020
Service Provider
No. of Total Subscribers (in millions)
No. of Rural Subscribers (in millions)
Percentage of Rural
subscribers
Market share of Rural
subscribers (%)
Reliance Jio 411.53 172.82 41.99 32.86
Bharti 343.27 160.40 46.73 30.50
Vodafone Idea Ltd
284.78 152.98 53.72 29.09
BSNL 125.88 39.61 31.47 7.53
Tata 1.66 0.04 2.48 0.01
Quadrant 0.20 0.03 14.54 0.01
MTNL 6.28 0.05 0.72 0.01
Reliance Comm.
0.23 - 0.00 0.00
Total 1,173.83 525.92 44.80 100
9. M/s Vodafone Idea Ltd is the service provider with highest proportion
of rural subscribers (53.72%), followed by Bharti Airtel (46.73%) to
their total number of telephone subscribers at the end of Dec-20.
13
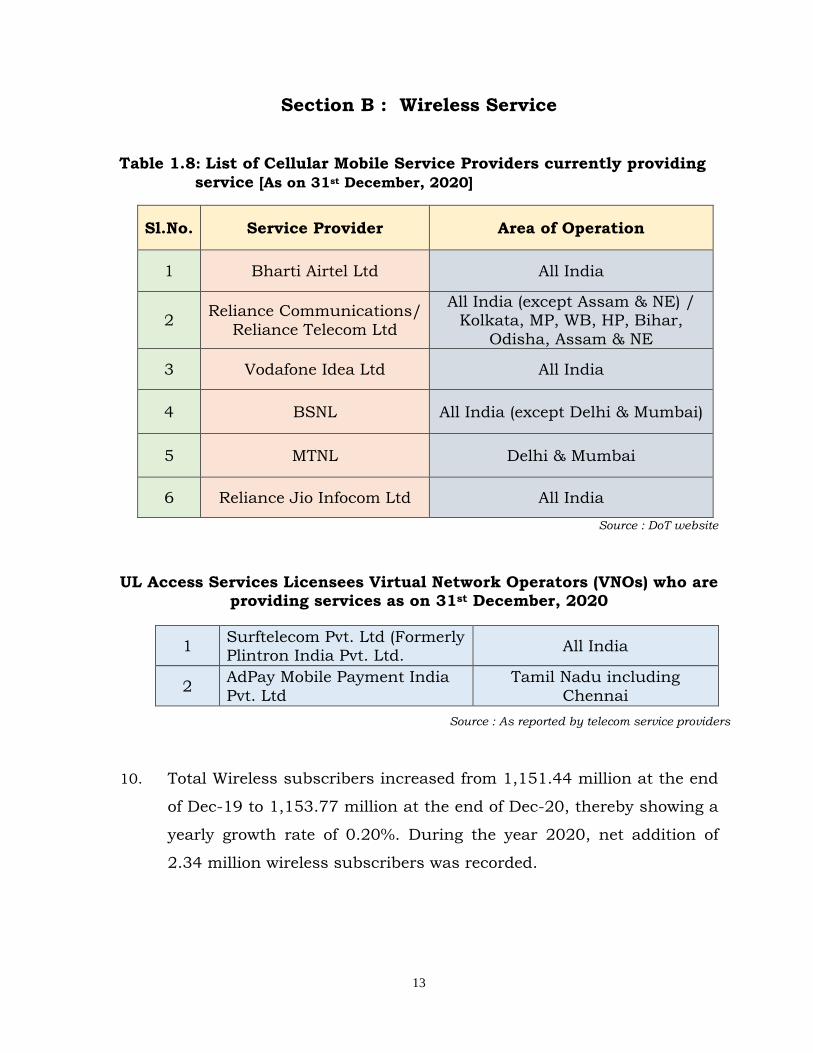
Section B : Wireless Service
Table 1.8: List of Cellular Mobile Service Providers currently providing
service [As on 31st December, 2020]
Sl.No. Service Provider Area of Operation
1 Bharti Airtel Ltd All India
2 Reliance Communications/
Reliance Telecom Ltd
All India (except Assam & NE) / Kolkata, MP, WB, HP, Bihar,
Odisha, Assam & NE
3 Vodafone Idea Ltd All India
4 BSNL All India (except Delhi & Mumbai)
5 MTNL Delhi & Mumbai
6 Reliance Jio Infocom Ltd All India
Source : DoT website
UL Access Services Licensees Virtual Network Operators (VNOs) who are providing services as on 31st December, 2020
1 Surftelecom Pvt. Ltd (Formerly Plintron India Pvt. Ltd.
All India
2 AdPay Mobile Payment India
Pvt. Ltd
Tamil Nadu including
Chennai
Source : As reported by telecom service providers
10. Total Wireless subscribers increased from 1,151.44 million at the end
of Dec-19 to 1,153.77 million at the end of Dec-20, thereby showing a
yearly growth rate of 0.20%. During the year 2020, net addition of
2.34 million wireless subscribers was recorded.

14
11. The Rural Wireless subscribers increased from 507.46 million at the
end of Dec-19 to 524.11 million at the end of Dec-20 with yearly
growth rate of 3.28%
12. The urban wireless subscribers declined from 643.97 million at the
end of Dec-19 to 629.67 million at the end of Dec-20 with yearly
decline rate of 2.22%.
13. The following chart and table depict the trend of total, rural and
urban wireless subscribers during last five years.
Chart 1.4: Trend of Wireless Subscriber Base
Table 1.9: Wireless Subscriber Base & Tele-density - Rural & Urban
Year ending
Subscriber Base (million) Tele-density (%)
Rural Urban Total Rural Urban Overall
Dec-16 464.78 662.60 1127.37 52.84 165.04 88.00
Dec-17 499.00 668.44 1167.44 56.28 163.44 90.11
Dec-18 528.48 647.52 1176.00 59.15 155.48 89.78
Dec-19 507.46 643.97 1151.44 56.39 151.90 86.98
Dec-20 524.11 629.67 1153.77 58.85 134.44 84.90
0.00
200.00
400.00
600.00
800.00
1000.00
1200.00
1400.00
Rural Urban Total
464.7
8 662.6
0
1127.3
7
499.0
0
668.4
4
1167.4
4
528.4
8
647.5
2
1176.0
0
507.4
6
643.9
7
1151.4
4
524.1
1
629.6
7
1153.7
7
2016 2017 2018 2019 2020
Wireless Subscriber Base (in Million)
15
14. Overall Wireless Teledensity declined from 86.98 at the end of Dec-19
to 84.90 at the end of Dec-20. Rural wireless Teledensity increased
from 56.39 to 58.85, however Urban wireless Teledensity declined
from 151.90 to 134.44 at the end of Dec-20.
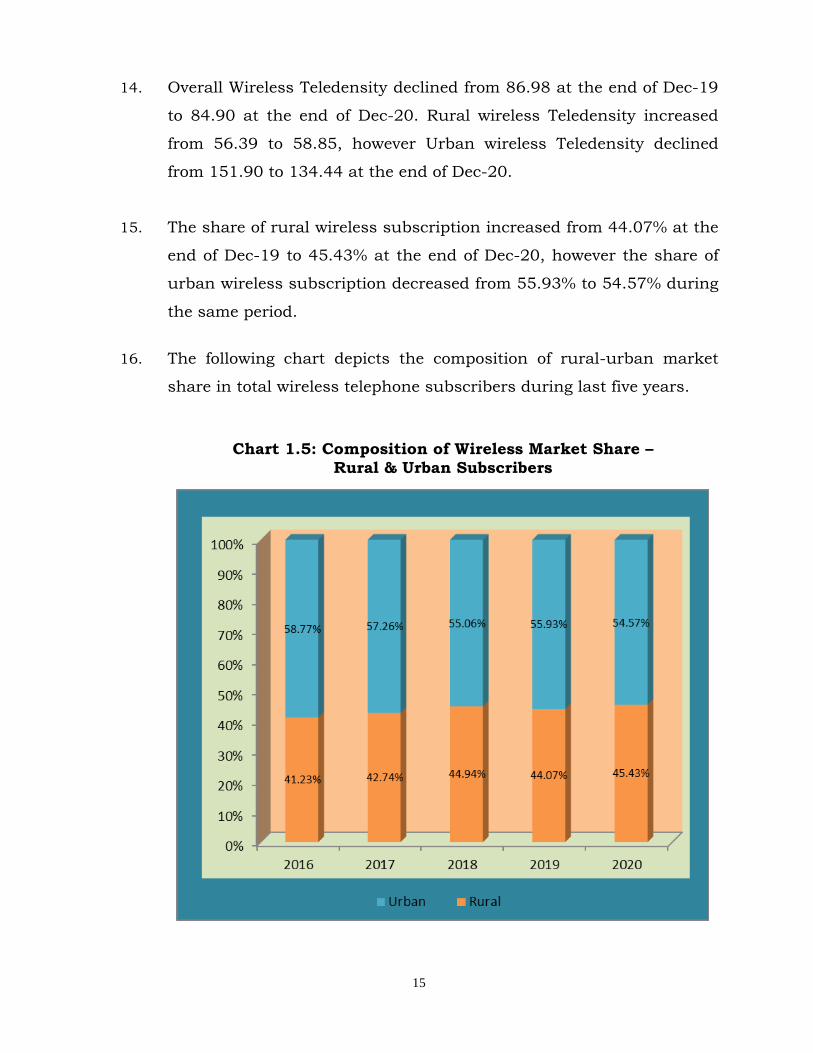
15. The share of rural wireless subscription increased from 44.07% at the
end of Dec-19 to 45.43% at the end of Dec-20, however the share of
urban wireless subscription decreased from 55.93% to 54.57% during
the same period.
16. The following chart depicts the composition of rural-urban market
share in total wireless telephone subscribers during last five years.
Chart 1.5: Composition of Wireless Market Share –
Rural & Urban Subscribers
16
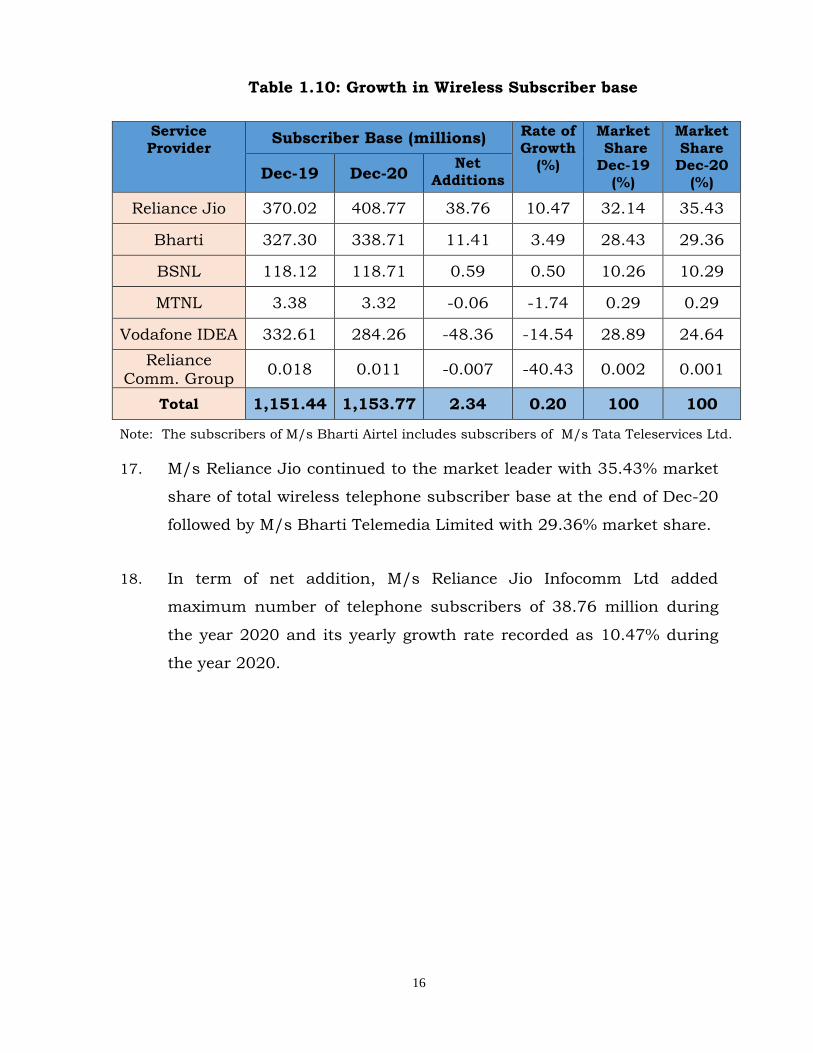
Table 1.10: Growth in Wireless Subscriber base
Service Provider
Subscriber Base (millions) Rate of Growth
(%)
Market Share Dec-19
(%)
Market Share Dec-20
(%) Dec-19 Dec-20
Net Additions
Reliance Jio 370.02 408.77 38.76 10.47 32.14 35.43
Bharti 327.30 338.71 11.41 3.49 28.43 29.36
BSNL 118.12 118.71 0.59 0.50 10.26 10.29
MTNL 3.38 3.32 -0.06 -1.74 0.29 0.29
Vodafone IDEA 332.61 284.26 -48.36 -14.54 28.89 24.64
Reliance Comm. Group
0.018 0.011 -0.007 -40.43 0.002 0.001
Total 1,151.44 1,153.77 2.34 0.20 100 100
Note: The subscribers of M/s Bharti Airtel includes subscribers of M/s Tata Teleservices Ltd.
17. M/s Reliance Jio continued to the market leader with 35.43% market
share of total wireless telephone subscriber base at the end of Dec-20
followed by M/s Bharti Telemedia Limited with 29.36% market share.
18. In term of net addition, M/s Reliance Jio Infocomm Ltd added
maximum number of telephone subscribers of 38.76 million during
the year 2020 and its yearly growth rate recorded as 10.47% during
the year 2020.
17
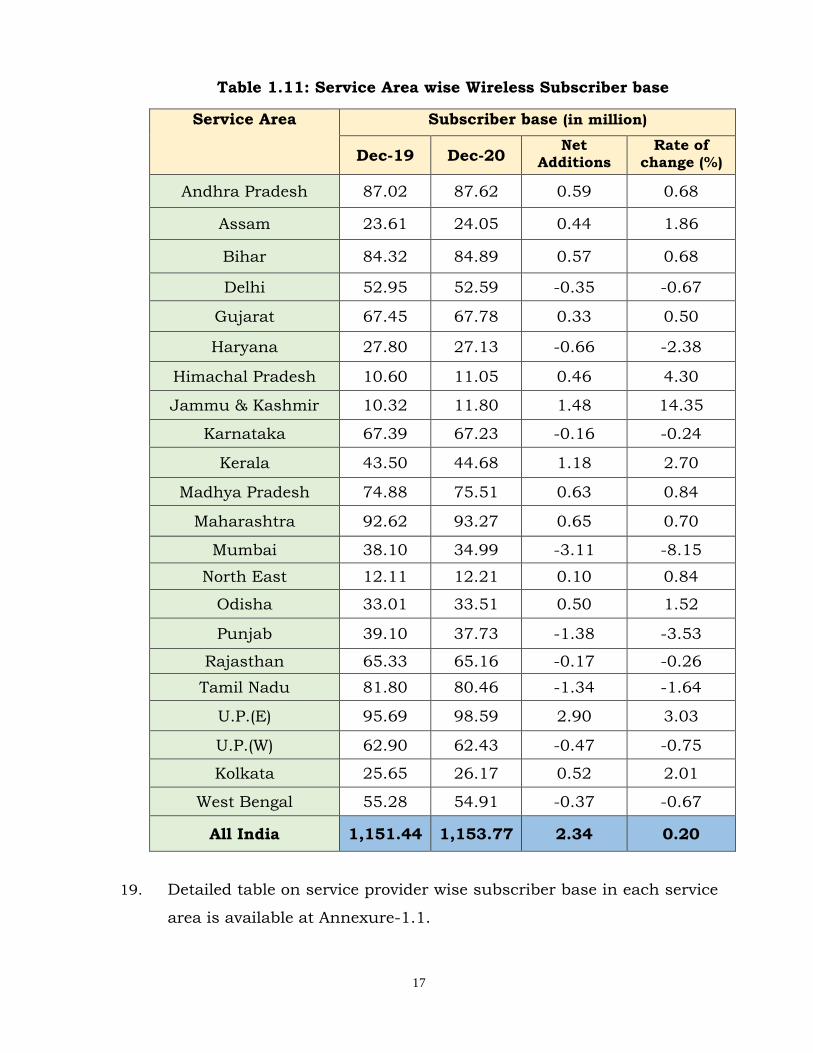
Table 1.11: Service Area wise Wireless Subscriber base
Service Area Subscriber base (in million)
Dec-19 Dec-20 Net
Additions Rate of
change (%)
Andhra Pradesh 87.02 87.62 0.59 0.68
Assam 23.61 24.05 0.44 1.86
Bihar 84.32 84.89 0.57 0.68
Delhi 52.95 52.59 -0.35 -0.67
Gujarat 67.45 67.78 0.33 0.50
Haryana 27.80 27.13 -0.66 -2.38
Himachal Pradesh 10.60 11.05 0.46 4.30
Jammu & Kashmir 10.32 11.80 1.48 14.35
Karnataka 67.39 67.23 -0.16 -0.24
Kerala 43.50 44.68 1.18 2.70
Madhya Pradesh 74.88 75.51 0.63 0.84
Maharashtra 92.62 93.27 0.65 0.70
Mumbai 38.10 34.99 -3.11 -8.15
North East 12.11 12.21 0.10 0.84
Odisha 33.01 33.51 0.50 1.52
Punjab 39.10 37.73 -1.38 -3.53
Rajasthan 65.33 65.16 -0.17 -0.26
Tamil Nadu 81.80 80.46 -1.34 -1.64
U.P.(E) 95.69 98.59 2.90 3.03
U.P.(W) 62.90 62.43 -0.47 -0.75
Kolkata 25.65 26.17 0.52 2.01
West Bengal 55.28 54.91 -0.37 -0.67
All India 1,151.44 1,153.77 2.34 0.20
19. Detailed table on service provider wise subscriber base in each service
area is available at Annexure-1.1.

18
Table 1.12: Service Area wise Wireless Rural-Urban Subscriber base
Service Area Subscriber base (in million) – Dec-20
Total Rural Urban % of Rural Subscribers
Andhra Pradesh 87.62 44.28 43.33 50.54
Assam 24.05 15.18 8.87 63.12
Bihar 84.89 55.57 29.32 65.46
Delhi 52.59 2.25 50.35 4.27
Gujarat 67.78 27.23 40.56 40.17
Haryana 27.13 12.02 15.12 44.28
Himachal Pradesh 11.05 7.47 3.58 67.60
Jammu & Kashmir 11.80 5.57 6.24 47.16
Karnataka 67.23 27.48 39.75 40.88
Kerala 44.68 20.53 24.14 45.96
Madhya Pradesh 75.51 34.39 41.12 45.55
Maharashtra 93.27 43.37 49.90 46.49
Mumbai 34.99 1.29 33.70 3.70
North East 12.21 6.54 5.68 53.53
Odisha 33.51 21.88 11.64 65.28
Punjab 37.73 13.07 24.66 34.63
Rajasthan 65.16 35.53 29.64 54.52
Tamil Nadu 80.46 23.65 56.81 29.40
U.P.(E) 98.59 61.31 37.28 62.19
U.P.(W) 62.43 29.66 32.77 47.51
Kolkata 26.17 1.85 24.32 7.06
West Bengal 54.91 34.00 20.91 61.92
All India 1,153.77 524.11 629.67 45.43
19
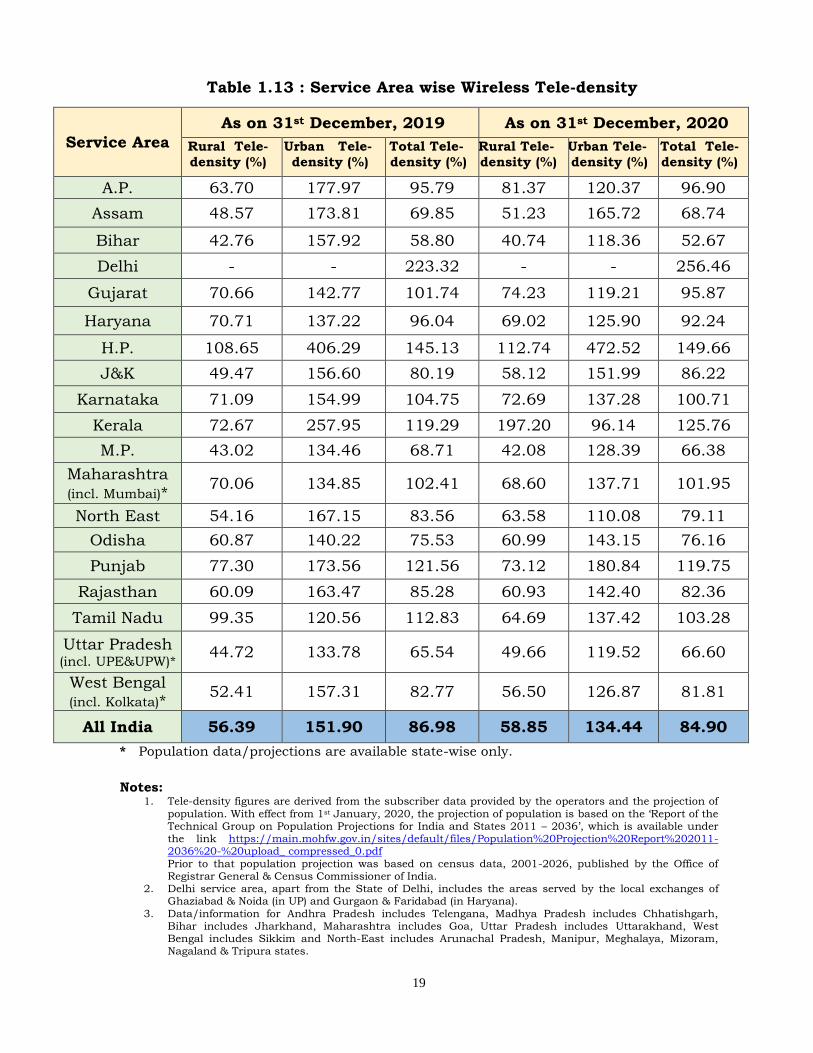
Table 1.13 : Service Area wise Wireless Tele-density
Service Area
As on 31st December, 2019 As on 31st December, 2020
Rural Tele-
density (%)
Urban Tele-
density (%)
Total Tele-
density (%)
Rural Tele-
density (%)
Urban Tele-
density (%)
Total Tele-
density (%)
A.P. 63.70 177.97 95.79 81.37 120.37 96.90
Assam 48.57 173.81 69.85 51.23 165.72 68.74
Bihar 42.76 157.92 58.80 40.74 118.36 52.67
Delhi - - 223.32 - - 256.46
Gujarat 70.66 142.77 101.74 74.23 119.21 95.87
Haryana 70.71 137.22 96.04 69.02 125.90 92.24
H.P. 108.65 406.29 145.13 112.74 472.52 149.66
J&K 49.47 156.60 80.19 58.12 151.99 86.22
Karnataka 71.09 154.99 104.75 72.69 137.28 100.71
Kerala 72.67 257.95 119.29 197.20 96.14 125.76
M.P. 43.02 134.46 68.71 42.08 128.39 66.38
Maharashtra
(incl. Mumbai)* 70.06 134.85 102.41 68.60 137.71 101.95
North East 54.16 167.15 83.56 63.58 110.08 79.11
Odisha 60.87 140.22 75.53 60.99 143.15 76.16
Punjab 77.30 173.56 121.56 73.12 180.84 119.75
Rajasthan 60.09 163.47 85.28 60.93 142.40 82.36
Tamil Nadu 99.35 120.56 112.83 64.69 137.42 103.28
Uttar Pradesh (incl. UPE&UPW)*
44.72 133.78 65.54 49.66 119.52 66.60
West Bengal (incl. Kolkata)*
52.41 157.31 82.77 56.50 126.87 81.81
All India 56.39 151.90 86.98 58.85 134.44 84.90
* Population data/projections are available state-wise only.
Notes:
1. Tele-density figures are derived from the subscriber data provided by the operators and the projection of
population. With effect from 1st January, 2020, the projection of population is based on the ‘Report of the Technical Group on Population Projections for India and States 2011 – 2036’, which is available under the link https://main.mohfw.gov.in/sites/default/files/Population%20Projection%20Report%202011-2036%20-%20upload_ compressed_0.pdf
Prior to that population projection was based on census data, 2001-2026, published by the Office of Registrar General & Census Commissioner of India.
2. Delhi service area, apart from the State of Delhi, includes the areas served by the local exchanges of Ghaziabad & Noida (in UP) and Gurgaon & Faridabad (in Haryana).
3. Data/information for Andhra Pradesh includes Telengana, Madhya Pradesh includes Chhatishgarh, Bihar includes Jharkhand, Maharashtra includes Goa, Uttar Pradesh includes Uttarakhand, West Bengal includes Sikkim and North-East includes Arunachal Pradesh, Manipur, Meghalaya, Mizoram, Nagaland & Tripura states.
20
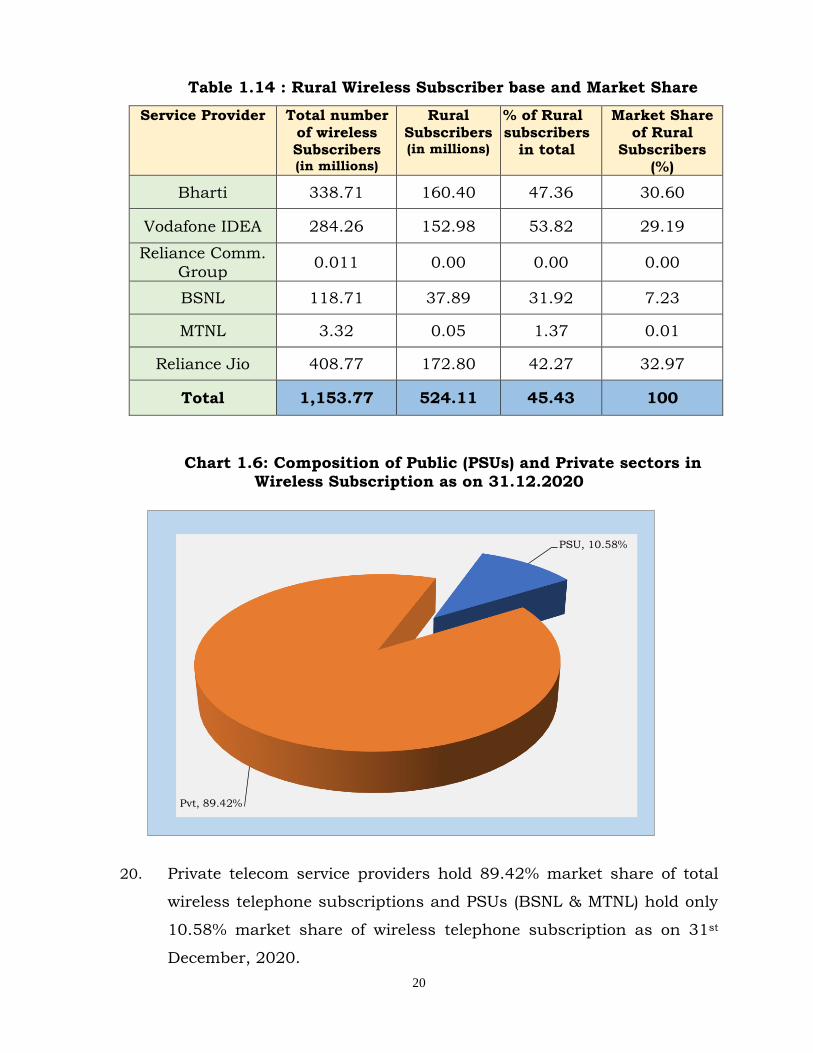
Table 1.14 : Rural Wireless Subscriber base and Market Share
Service Provider
Total number of wireless Subscribers (in millions)
Rural Subscribers (in millions)
% of Rural subscribers
in total
Market Share of Rural
Subscribers (%)
Bharti 338.71 160.40 47.36 30.60
Vodafone IDEA 284.26 152.98 53.82 29.19
Reliance Comm.
Group 0.011 0.00 0.00 0.00
BSNL 118.71 37.89 31.92 7.23
MTNL 3.32 0.05 1.37 0.01
Reliance Jio 408.77 172.80 42.27 32.97
Total 1,153.77 524.11 45.43 100
Chart 1.6: Composition of Public (PSUs) and Private sectors in Wireless Subscription as on 31.12.2020
20. Private telecom service providers hold 89.42% market share of total
wireless telephone subscriptions and PSUs (BSNL & MTNL) hold only
10.58% market share of wireless telephone subscription as on 31st
December, 2020.
PSU, 10.58%
Pvt, 89.42%
21
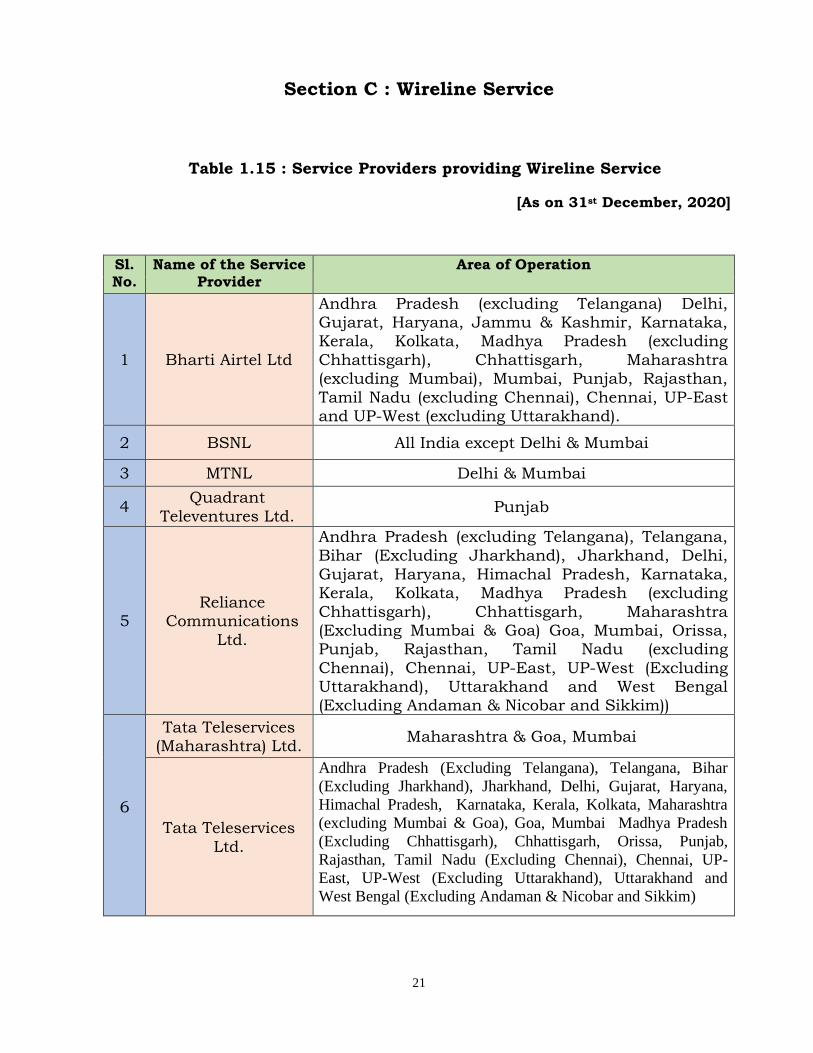
Section C : Wireline Service
Table 1.15 : Service Providers providing Wireline Service
[As on 31st December, 2020]
Sl. No.
Name of the Service Provider
Area of Operation
1 Bharti Airtel Ltd
Andhra Pradesh (excluding Telangana) Delhi, Gujarat, Haryana, Jammu & Kashmir, Karnataka, Kerala, Kolkata, Madhya Pradesh (excluding
Chhattisgarh), Chhattisgarh, Maharashtra (excluding Mumbai), Mumbai, Punjab, Rajasthan,
Tamil Nadu (excluding Chennai), Chennai, UP-East and UP-West (excluding Uttarakhand).
2 BSNL All India except Delhi & Mumbai
3 MTNL Delhi & Mumbai
4 Quadrant
Televentures Ltd. Punjab
5
Reliance Communications
Ltd.
Andhra Pradesh (excluding Telangana), Telangana, Bihar (Excluding Jharkhand), Jharkhand, Delhi,
Gujarat, Haryana, Himachal Pradesh, Karnataka, Kerala, Kolkata, Madhya Pradesh (excluding
Chhattisgarh), Chhattisgarh, Maharashtra (Excluding Mumbai & Goa) Goa, Mumbai, Orissa, Punjab, Rajasthan, Tamil Nadu (excluding
Chennai), Chennai, UP-East, UP-West (Excluding Uttarakhand), Uttarakhand and West Bengal (Excluding Andaman & Nicobar and Sikkim))
6
Tata Teleservices (Maharashtra) Ltd.
Maharashtra & Goa, Mumbai
Tata Teleservices
Ltd.
Andhra Pradesh (Excluding Telangana), Telangana, Bihar
(Excluding Jharkhand), Jharkhand, Delhi, Gujarat, Haryana,
Himachal Pradesh, Karnataka, Kerala, Kolkata, Maharashtra
(excluding Mumbai & Goa), Goa, Mumbai Madhya Pradesh
(Excluding Chhattisgarh), Chhattisgarh, Orissa, Punjab,
Rajasthan, Tamil Nadu (Excluding Chennai), Chennai, UP-
East, UP-West (Excluding Uttarakhand), Uttarakhand and
West Bengal (Excluding Andaman & Nicobar and Sikkim)
22
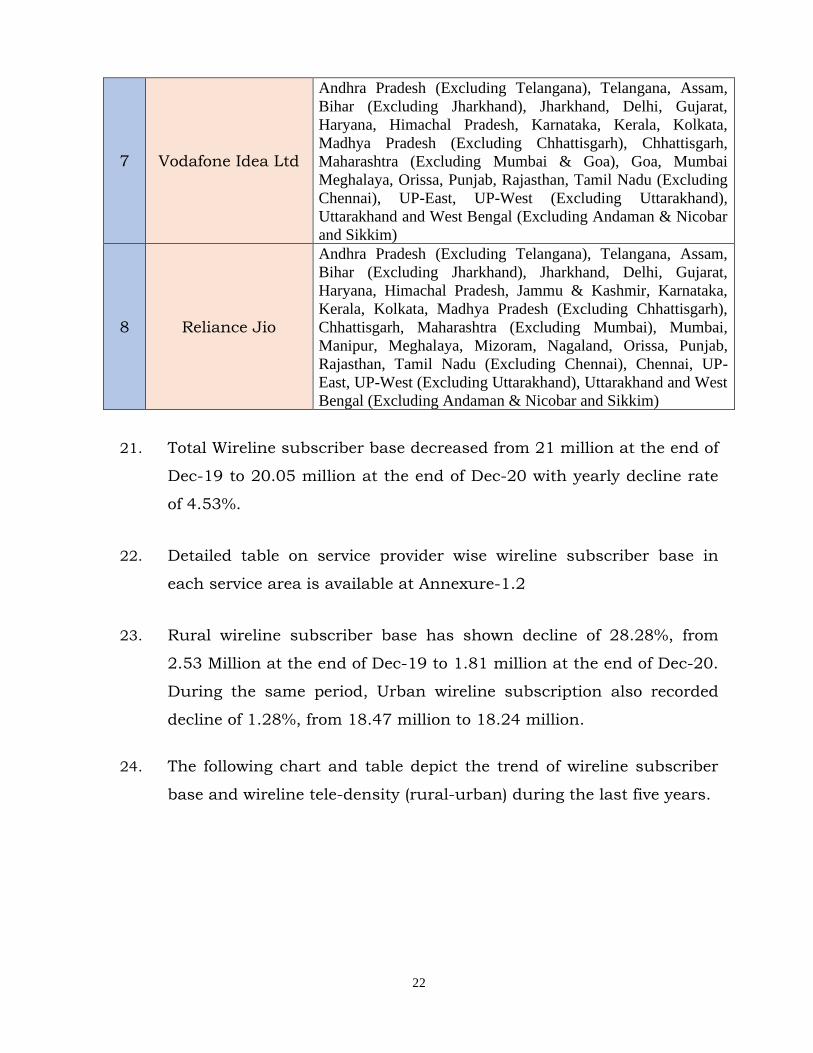
7 Vodafone Idea Ltd
Andhra Pradesh (Excluding Telangana), Telangana, Assam,
Bihar (Excluding Jharkhand), Jharkhand, Delhi, Gujarat,
Haryana, Himachal Pradesh, Karnataka, Kerala, Kolkata,
Madhya Pradesh (Excluding Chhattisgarh), Chhattisgarh,
Maharashtra (Excluding Mumbai & Goa), Goa, Mumbai
Meghalaya, Orissa, Punjab, Rajasthan, Tamil Nadu (Excluding
Chennai), UP-East, UP-West (Excluding Uttarakhand),
Uttarakhand and West Bengal (Excluding Andaman & Nicobar
and Sikkim)
8 Reliance Jio
Andhra Pradesh (Excluding Telangana), Telangana, Assam,
Bihar (Excluding Jharkhand), Jharkhand, Delhi, Gujarat,
Haryana, Himachal Pradesh, Jammu & Kashmir, Karnataka,
Kerala, Kolkata, Madhya Pradesh (Excluding Chhattisgarh),
Chhattisgarh, Maharashtra (Excluding Mumbai), Mumbai,
Manipur, Meghalaya, Mizoram, Nagaland, Orissa, Punjab,
Rajasthan, Tamil Nadu (Excluding Chennai), Chennai, UP-
East, UP-West (Excluding Uttarakhand), Uttarakhand and West
Bengal (Excluding Andaman & Nicobar and Sikkim)
21. Total Wireline subscriber base decreased from 21 million at the end of
Dec-19 to 20.05 million at the end of Dec-20 with yearly decline rate
of 4.53%.
22. Detailed table on service provider wise wireline subscriber base in
each service area is available at Annexure-1.2
23. Rural wireline subscriber base has shown decline of 28.28%, from
2.53 Million at the end of Dec-19 to 1.81 million at the end of Dec-20.
During the same period, Urban wireline subscription also recorded
decline of 1.28%, from 18.47 million to 18.24 million.
24. The following chart and table depict the trend of wireline subscriber
base and wireline tele-density (rural-urban) during the last five years.
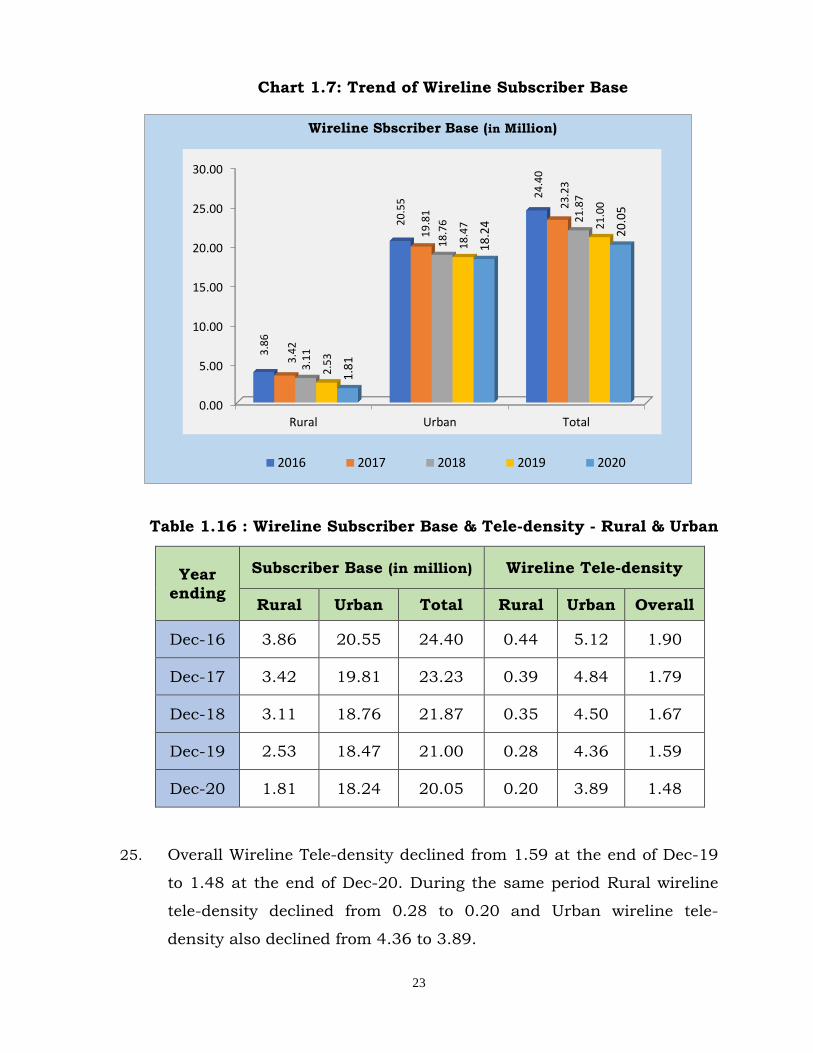
23
Chart 1.7: Trend of Wireline Subscriber Base
Table 1.16 : Wireline Subscriber Base & Tele-density - Rural & Urban
Year
ending
Subscriber Base (in million) Wireline Tele-density
Rural Urban Total Rural Urban Overall
Dec-16 3.86 20.55 24.40 0.44 5.12 1.90
Dec-17 3.42 19.81 23.23 0.39 4.84 1.79
Dec-18 3.11 18.76 21.87 0.35 4.50 1.67
Dec-19 2.53 18.47 21.00 0.28 4.36 1.59
Dec-20 1.81 18.24 20.05 0.20 3.89 1.48
25. Overall Wireline Tele-density declined from 1.59 at the end of Dec-19
to 1.48 at the end of Dec-20. During the same period Rural wireline
tele-density declined from 0.28 to 0.20 and Urban wireline tele-
density also declined from 4.36 to 3.89.
0.00
5.00
10.00
15.00
20.00
25.00
30.00
Rural Urban Total
3.8
6
20
.55
24
.40
3.4
2
19
.81
23
.23
3.1
1
18
.76 2
1.8
7
2.5
3
18
.47 21
.00
1.8
1
18
.24
20
.05
2016 2017 2018 2019 2020
Wireline Sbscriber Base (in Million)
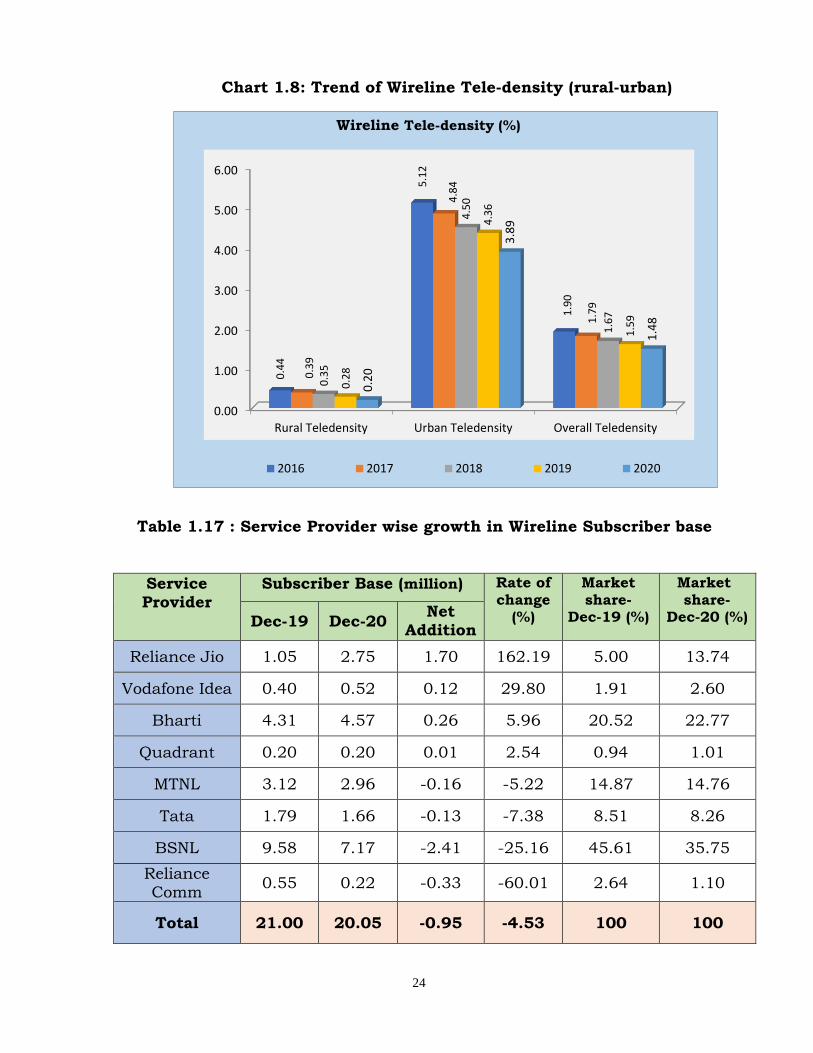
24
Chart 1.8: Trend of Wireline Tele-density (rural-urban)
Table 1.17 : Service Provider wise growth in Wireline Subscriber base
Service Provider
Subscriber Base (million) Rate of change
(%)
Market share-
Dec-19 (%)
Market share-
Dec-20 (%) Dec-19 Dec-20 Net
Addition
Reliance Jio 1.05 2.75 1.70 162.19 5.00 13.74
Vodafone Idea 0.40 0.52 0.12 29.80 1.91 2.60
Bharti 4.31 4.57 0.26 5.96 20.52 22.77
Quadrant 0.20 0.20 0.01 2.54 0.94 1.01
MTNL 3.12 2.96 -0.16 -5.22 14.87 14.76
Tata 1.79 1.66 -0.13 -7.38 8.51 8.26
BSNL 9.58 7.17 -2.41 -25.16 45.61 35.75
Reliance Comm
0.55 0.22 -0.33 -60.01 2.64 1.10
Total 21.00 20.05 -0.95 -4.53 100 100
0.00
1.00
2.00
3.00
4.00
5.00
6.00
Rural Teledensity Urban Teledensity Overall Teledensity
0.4
4
5.1
2
1.9
0
0.3
9
4.8
4
1.7
9
0.3
5
4.5
0
1.6
7
0.2
8
4.3
6
1.5
9
0.2
0
3.8
9
1.4
8
2016 2017 2018 2019 2020
Wireline Tele-density (%)

25
26. M/s BSNL is the leading operator in wireline service with 7.17 million
subscriber at the end of Dec-20 followed by Bharti with 4.57 million
subscribers.
27. In term of net addition, only four service providers namely M/s
Reliance Jio, M/s Vodafone Idea Limited, M/s Bharti Airtel Limited
and M/s Quadrant showed positive growth with net additions 1.70,
0.12, 0.26, 0.01 million respectively during the year 2020. All other
service providers showed decline in their wireline subscriber base
during the year 2020.
28. In total wireline subscriber base, PSUs hold 50.51% of market share
at the end of Dec-20 as against 60.47% at the end of Dec-19. Both
PSUs, BSNL and MTNL showed decline in their wireline subscriber
base during the year 2020.
Table 1.18 : Service Provider wise Subscriber base (Rural - Urban)
Service Provider
Subscriber Base (million) Dec-20 Share of Rural subscription
(%) Rural Urban Total
BSNL 1.73 5.44 7.17 24.10
Bharti -- 4.57 4.57 -
MTNL -- 2.96 2.96 -
Tata 0.04 1.62 1.66 2.48
Reliance 0.00 0.22 0.22 0.00
Quadrant 0.03 0.17 0.20 14.54
Vodafone -- 0.52 0.52 -
Reliance Jio 0.02 2.74 2.75 0.61
Total 1.81 18.24 20.05 9.05
26
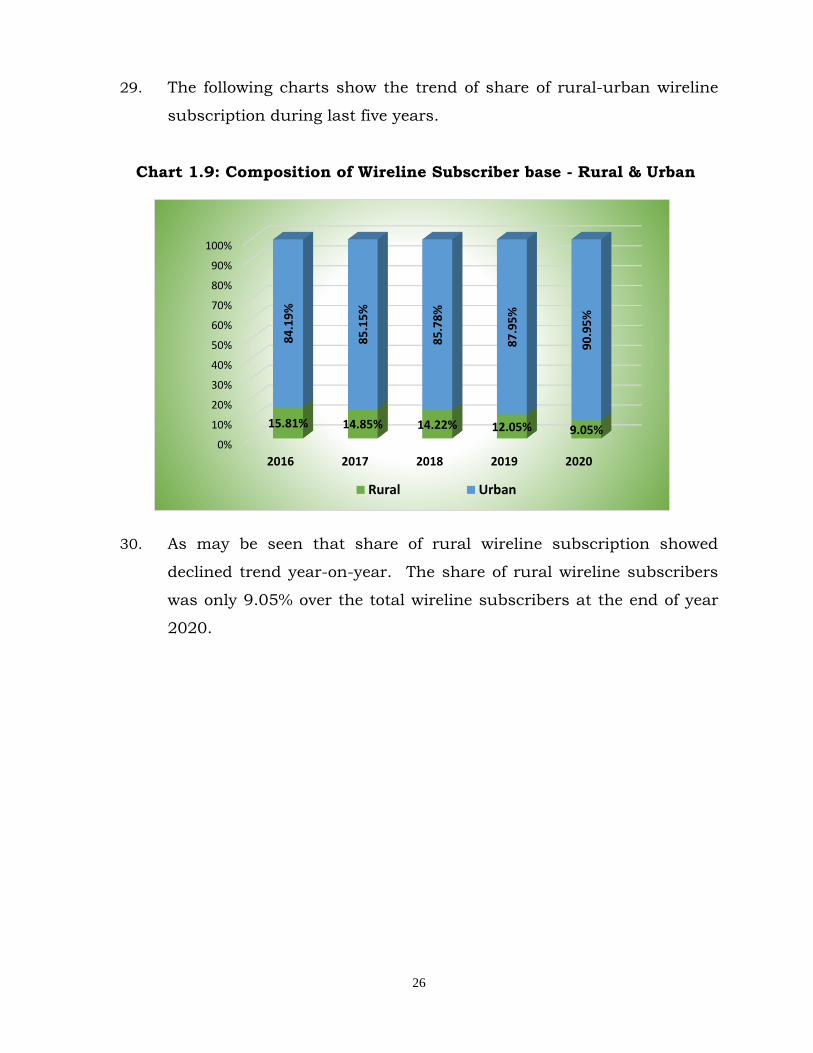
29. The following charts show the trend of share of rural-urban wireline
subscription during last five years.
Chart 1.9: Composition of Wireline Subscriber base - Rural & Urban
30. As may be seen that share of rural wireline subscription showed
declined trend year-on-year. The share of rural wireline subscribers
was only 9.05% over the total wireline subscribers at the end of year
2020.
0%
10%
20%
30%
40%
50%
60%
70%
80%
90%
100%
2016 2017 2018 2019 2020
15.81% 14.85% 14.22% 12.05% 9.05%
84
.19
%
85
.15
%
85
.78
%
87
.95
%
90
.95
%
Rural Urban
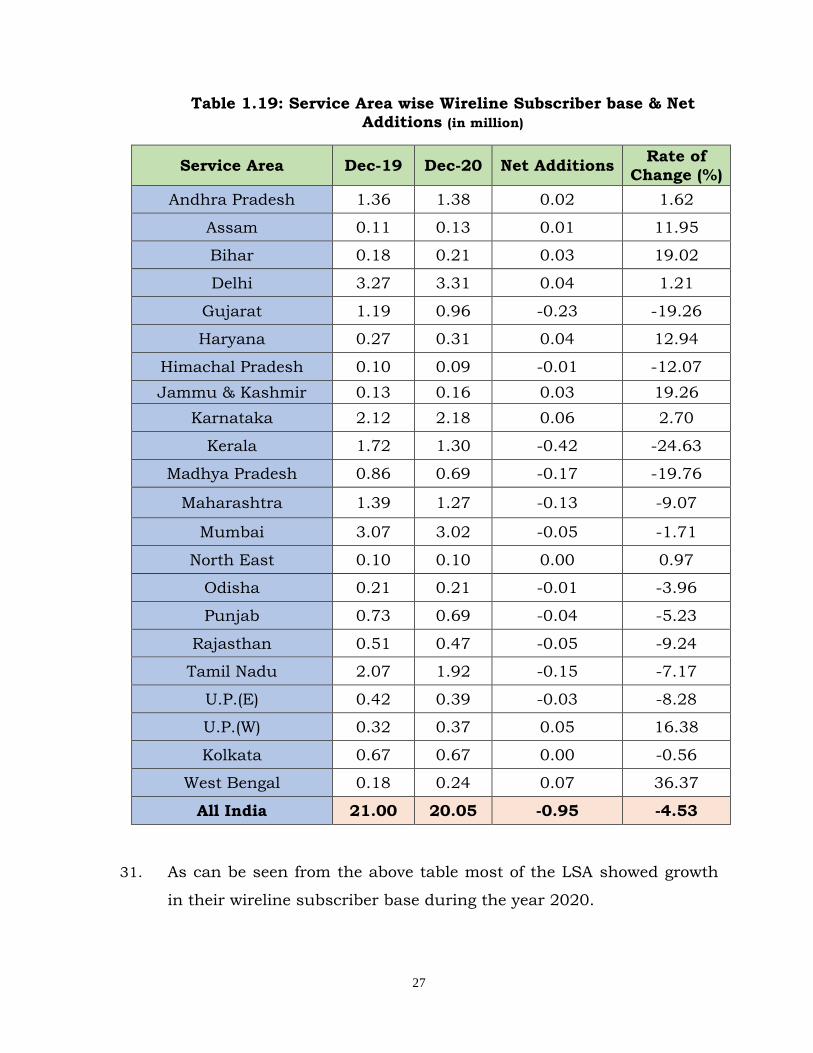
27
Table 1.19: Service Area wise Wireline Subscriber base & Net Additions (in million)
Service Area Dec-19 Dec-20 Net Additions Rate of
Change (%)
Andhra Pradesh 1.36 1.38 0.02 1.62
Assam 0.11 0.13 0.01 11.95
Bihar 0.18 0.21 0.03 19.02
Delhi 3.27 3.31 0.04 1.21
Gujarat 1.19 0.96 -0.23 -19.26
Haryana 0.27 0.31 0.04 12.94
Himachal Pradesh 0.10 0.09 -0.01 -12.07
Jammu & Kashmir 0.13 0.16 0.03 19.26
Karnataka 2.12 2.18 0.06 2.70
Kerala 1.72 1.30 -0.42 -24.63
Madhya Pradesh 0.86 0.69 -0.17 -19.76
Maharashtra 1.39 1.27 -0.13 -9.07
Mumbai 3.07 3.02 -0.05 -1.71
North East 0.10 0.10 0.00 0.97
Odisha 0.21 0.21 -0.01 -3.96
Punjab 0.73 0.69 -0.04 -5.23
Rajasthan 0.51 0.47 -0.05 -9.24
Tamil Nadu 2.07 1.92 -0.15 -7.17
U.P.(E) 0.42 0.39 -0.03 -8.28
U.P.(W) 0.32 0.37 0.05 16.38
Kolkata 0.67 0.67 0.00 -0.56
West Bengal 0.18 0.24 0.07 36.37
All India 21.00 20.05 -0.95 -4.53
31. As can be seen from the above table most of the LSA showed growth
in their wireline subscriber base during the year 2020.
28
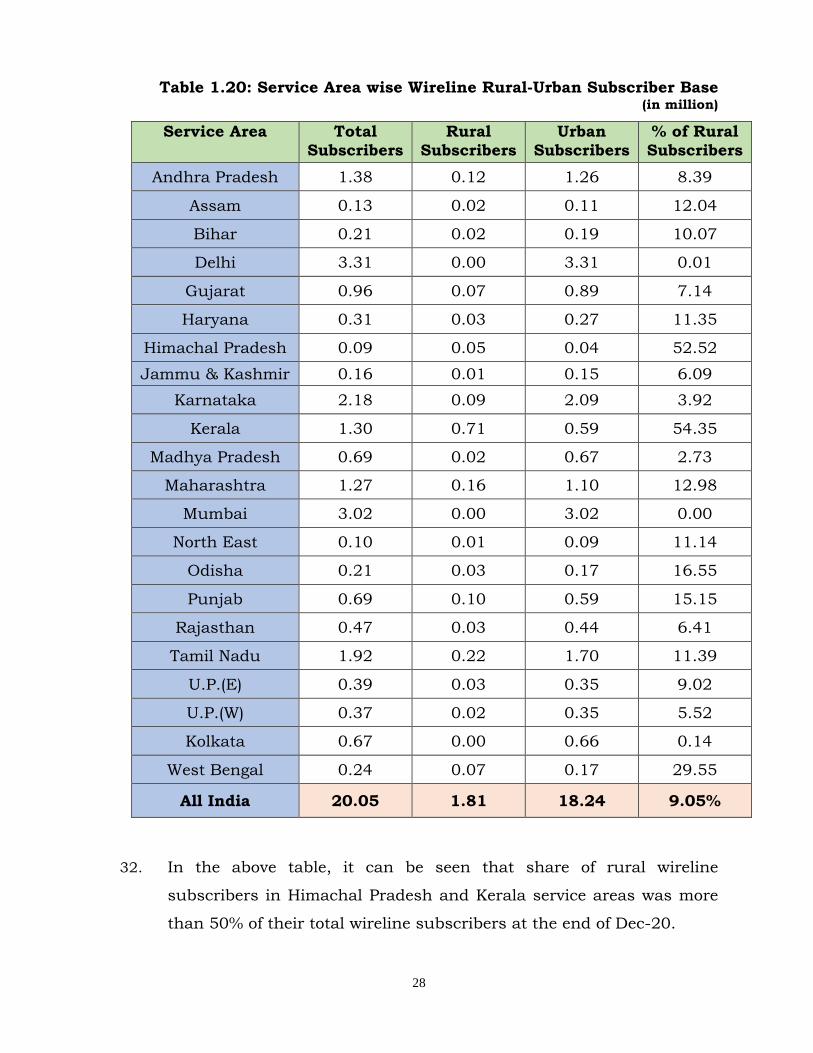
Table 1.20: Service Area wise Wireline Rural-Urban Subscriber Base (in million)
Service Area Total
Subscribers
Rural
Subscribers
Urban
Subscribers
% of Rural
Subscribers
Andhra Pradesh 1.38 0.12 1.26 8.39
Assam 0.13 0.02 0.11 12.04
Bihar 0.21 0.02 0.19 10.07
Delhi 3.31 0.00 3.31 0.01
Gujarat 0.96 0.07 0.89 7.14
Haryana 0.31 0.03 0.27 11.35
Himachal Pradesh 0.09 0.05 0.04 52.52
Jammu & Kashmir 0.16 0.01 0.15 6.09
Karnataka 2.18 0.09 2.09 3.92
Kerala 1.30 0.71 0.59 54.35
Madhya Pradesh 0.69 0.02 0.67 2.73
Maharashtra 1.27 0.16 1.10 12.98
Mumbai 3.02 0.00 3.02 0.00
North East 0.10 0.01 0.09 11.14
Odisha 0.21 0.03 0.17 16.55
Punjab 0.69 0.10 0.59 15.15
Rajasthan 0.47 0.03 0.44 6.41
Tamil Nadu 1.92 0.22 1.70 11.39
U.P.(E) 0.39 0.03 0.35 9.02
U.P.(W) 0.37 0.02 0.35 5.52
Kolkata 0.67 0.00 0.66 0.14
West Bengal 0.24 0.07 0.17 29.55
All India 20.05 1.81 18.24 9.05%
32. In the above table, it can be seen that share of rural wireline
subscribers in Himachal Pradesh and Kerala service areas was more
than 50% of their total wireline subscribers at the end of Dec-20.
29
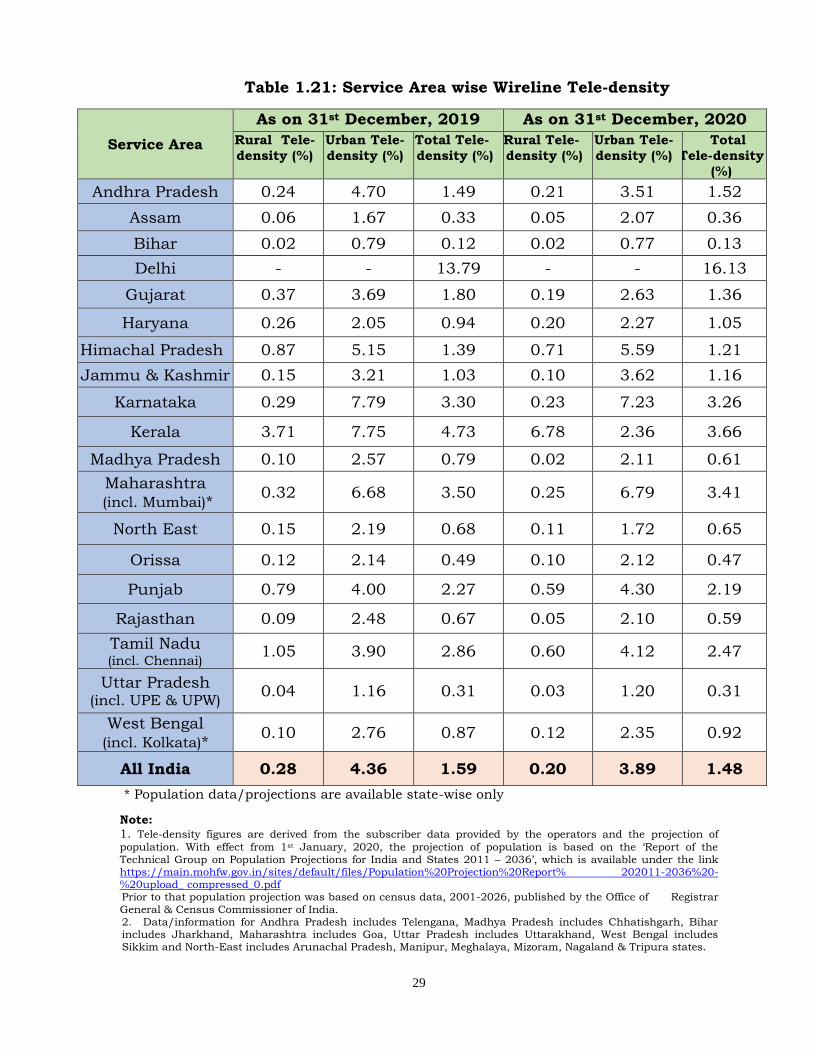
Table 1.21: Service Area wise Wireline Tele-density
Service Area
As on 31st December, 2019 As on 31st December, 2020
Rural Tele-
density (%)
Urban Tele-
density (%)
Total Tele-
density (%)
Rural Tele-
density (%)
Urban Tele-
density (%)
Total
Tele-density
(%)
Andhra Pradesh 0.24 4.70 1.49 0.21 3.51 1.52
Assam 0.06 1.67 0.33 0.05 2.07 0.36
Bihar 0.02 0.79 0.12 0.02 0.77 0.13
Delhi - - 13.79 - - 16.13
Gujarat 0.37 3.69 1.80 0.19 2.63 1.36
Haryana 0.26 2.05 0.94 0.20 2.27 1.05
Himachal Pradesh 0.87 5.15 1.39 0.71 5.59 1.21
Jammu & Kashmir 0.15 3.21 1.03 0.10 3.62 1.16
Karnataka 0.29 7.79 3.30 0.23 7.23 3.26
Kerala 3.71 7.75 4.73 6.78 2.36 3.66
Madhya Pradesh 0.10 2.57 0.79 0.02 2.11 0.61
Maharashtra (incl. Mumbai)*
0.32 6.68 3.50 0.25 6.79 3.41
North East 0.15 2.19 0.68 0.11 1.72 0.65
Orissa 0.12 2.14 0.49 0.10 2.12 0.47
Punjab 0.79 4.00 2.27 0.59 4.30 2.19
Rajasthan 0.09 2.48 0.67 0.05 2.10 0.59
Tamil Nadu
(incl. Chennai) 1.05 3.90 2.86 0.60 4.12 2.47
Uttar Pradesh (incl. UPE & UPW)
0.04 1.16 0.31 0.03 1.20 0.31
West Bengal
(incl. Kolkata)* 0.10 2.76 0.87 0.12 2.35 0.92
All India 0.28 4.36 1.59 0.20 3.89 1.48
* Population data/projections are available state-wise only
Note: 1. Tele-density figures are derived from the subscriber data provided by the operators and the projection of
population. With effect from 1st January, 2020, the projection of population is based on the ‘Report of the
Technical Group on Population Projections for India and States 2011 – 2036’, which is available under the link https://main.mohfw.gov.in/sites/default/files/Population%20Projection%20Report% 202011-2036%20-%20upload_ compressed_0.pdf Prior to that population projection was based on census data, 2001-2026, published by the Office of Registrar
General & Census Commissioner of India. 2. Data/information for Andhra Pradesh includes Telengana, Madhya Pradesh includes Chhatishgarh, Bihar includes Jharkhand, Maharashtra includes Goa, Uttar Pradesh includes Uttarakhand, West Bengal includes Sikkim and North-East includes Arunachal Pradesh, Manipur, Meghalaya, Mizoram, Nagaland & Tripura states.
30
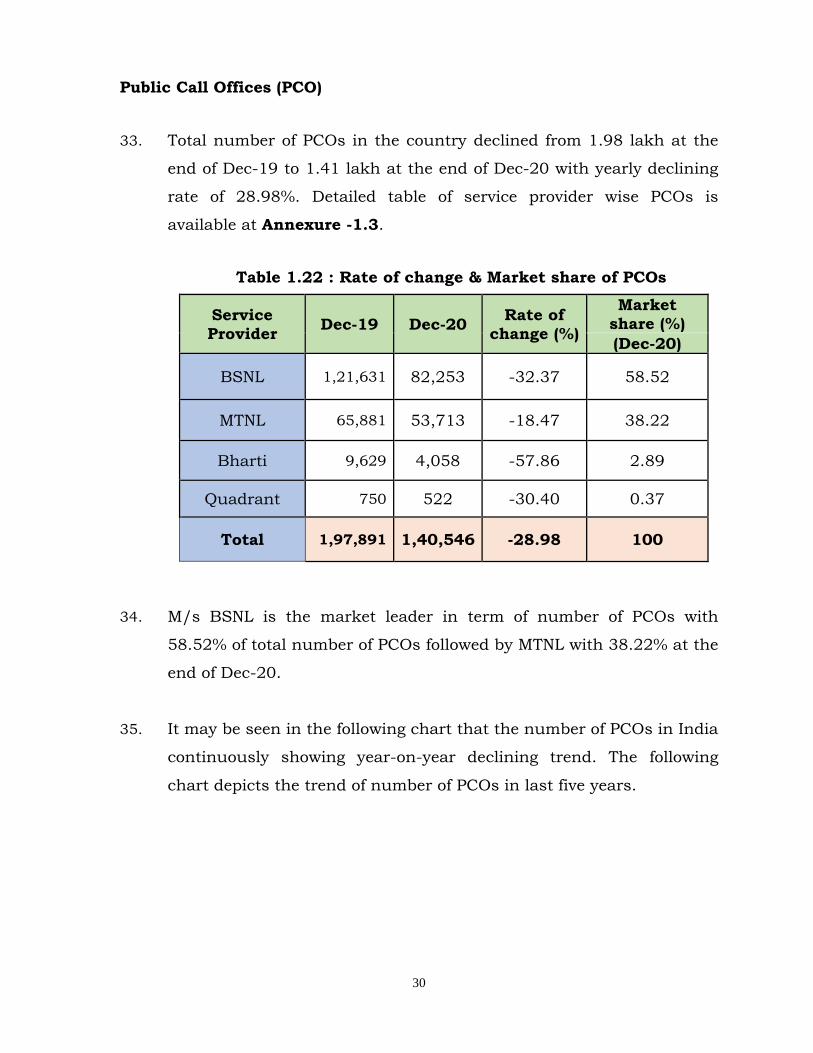
Public Call Offices (PCO)
33. Total number of PCOs in the country declined from 1.98 lakh at the
end of Dec-19 to 1.41 lakh at the end of Dec-20 with yearly declining
rate of 28.98%. Detailed table of service provider wise PCOs is
available at Annexure -1.3.
Table 1.22 : Rate of change & Market share of PCOs
Service
Provider Dec-19 Dec-20
Rate of
change (%)
Market
share (%)
(Dec-20)
BSNL 1,21,631 82,253 -32.37 58.52
MTNL 65,881 53,713 -18.47 38.22
Bharti 9,629 4,058 -57.86 2.89
Quadrant 750 522 -30.40 0.37
Total 1,97,891 1,40,546 -28.98 100
34. M/s BSNL is the market leader in term of number of PCOs with
58.52% of total number of PCOs followed by MTNL with 38.22% at the
end of Dec-20.
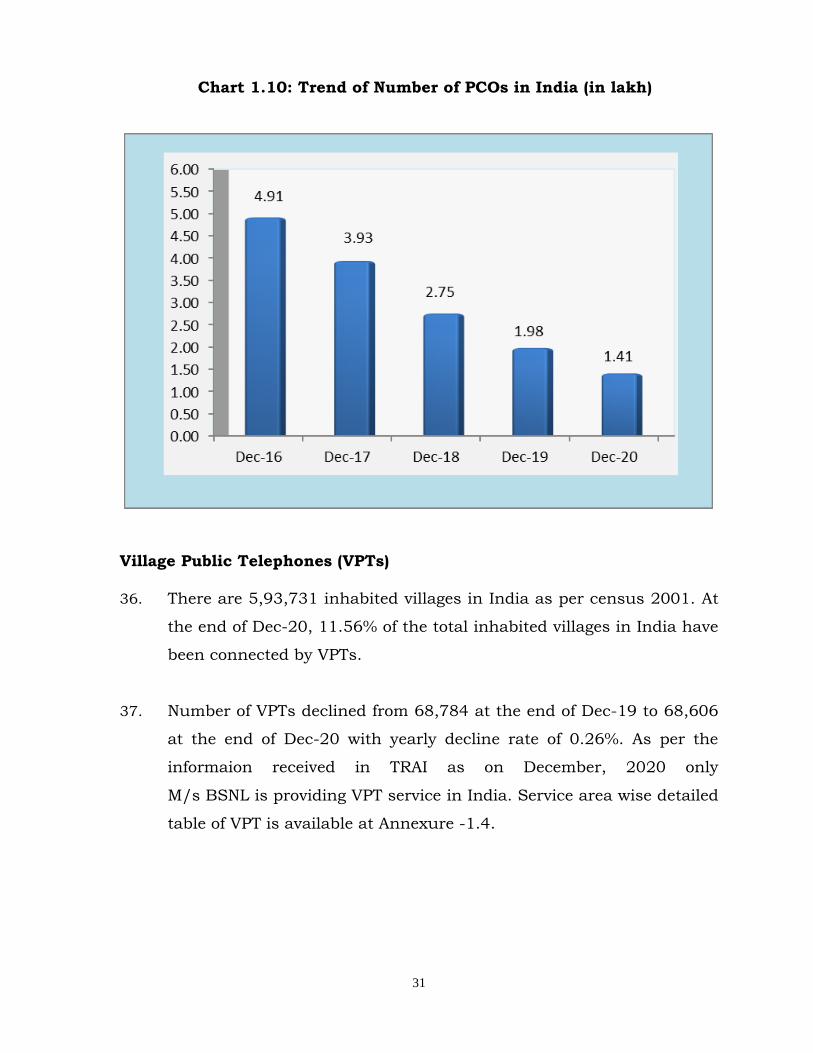
35. It may be seen in the following chart that the number of PCOs in India
continuously showing year-on-year declining trend. The following
chart depicts the trend of number of PCOs in last five years.
31
Chart 1.10: Trend of Number of PCOs in India (in lakh)
Village Public Telephones (VPTs)
36. There are 5,93,731 inhabited villages in India as per census 2001. At
the end of Dec-20, 11.56% of the total inhabited villages in India have
been connected by VPTs.
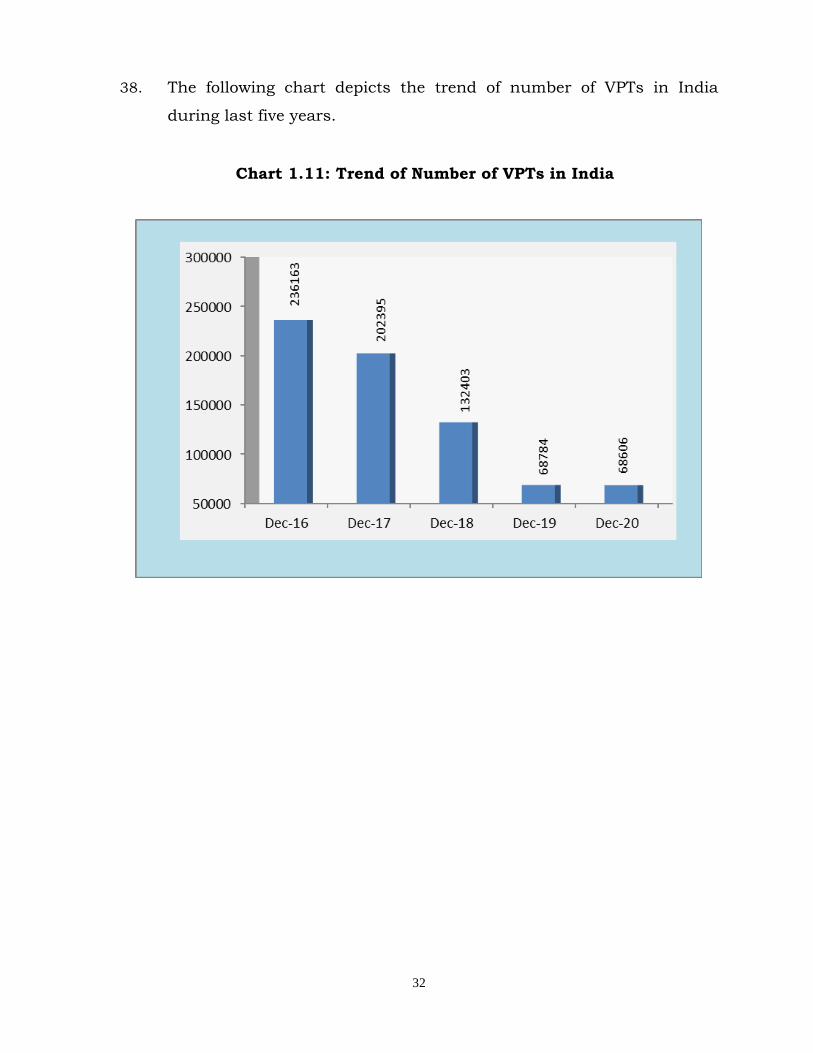
37. Number of VPTs declined from 68,784 at the end of Dec-19 to 68,606
at the end of Dec-20 with yearly decline rate of 0.26%. As per the
informaion received in TRAI as on December, 2020 only
M/s BSNL is providing VPT service in India. Service area wise detailed
table of VPT is available at Annexure -1.4.
32
38. The following chart depicts the trend of number of VPTs in India
during last five years.
Chart 1.11: Trend of Number of VPTs in India
33
Section D : Internet Service
39. This section summarizes information submitted by 396 operators for
the year ending 2020. Part-I consists of information of Internet
services (both narrowband and broadband), Part-II consists of
broadband services and Part-III covers narrowband services.
Part-I : Internet† Service (broadband‡ + narrowband§)
40. As per reports received from operators, total number of internet
subscribers increased from 718.74 million at the end of Dec-19 to
795.18 million at the end of Dec-20 with yearly growth rate of
10.64%. Out of total 795.18 million internet subscribers, number of
broadband subscribers is 747.41 million and number of narrowband
subscribers is 47.77 million at the end of Dec-20.
41. Wireless Internet subscribers increased from 696.36 million at the
end of Dec-19 to 769.64 million at the end of Dec-20 with yearly
growth rate of 10.52%. Wired Internet subscribers increased from
22.39 million at the end of Dec-19 to 25.54 million at the end of Dec-
20 with yearly growth rate of 14.07%.
42. Number of Broadband subscribers increased from 661.94 million at
the end of Dec-19 to 747.41 million at the end of Dec-20 with yearly
growth rate of 12.91%. However, the number of Narrowband
subscribers declined from 56.81 million at the end of Dec-19 to 47.77
million at the end of Dec-20 with yearly declining rate of 15.91%.
† Internet: Interconnected global networks that use the internet protocol. ‡ Broadband: Internet access with a minimum capacity of greater or equal 512 Kbit/s in one or both directions. § Narrowband: Internet access with a capacity of less than 512 Kbit/s in one or both directions.
(Source-ITU)
34
Table 1.23 : Trend of Internet subscriber base
Segment
Mode of Access
Total
Subscribers (in million)
Wired
Subscribers (in million)
Wireless Subscribers (in million)
Fixed Wireless (Wi-Fi, Wi-Max,
Radio & VSAT)
Mobile
Wireless (Phone + Dongle)
Total Wireless
Dec-19 Dec-20 Dec-19 Dec-20 Dec-19 Dec-20 Dec-19 Dec-20 Dec-19 Dec-20
Broadband 19.14 22.29 0.61 0.65 642.19 724.46 642.80 725.12 661.94 747.41
Narrowband 3.25 3.24 0.01 0.004 53.55 44.52 53.56 44.53 56.81 47.77
Total 22.39 25.54 0.62 0.66 695.74 768.99 696.36 769.64 718.74 795.18
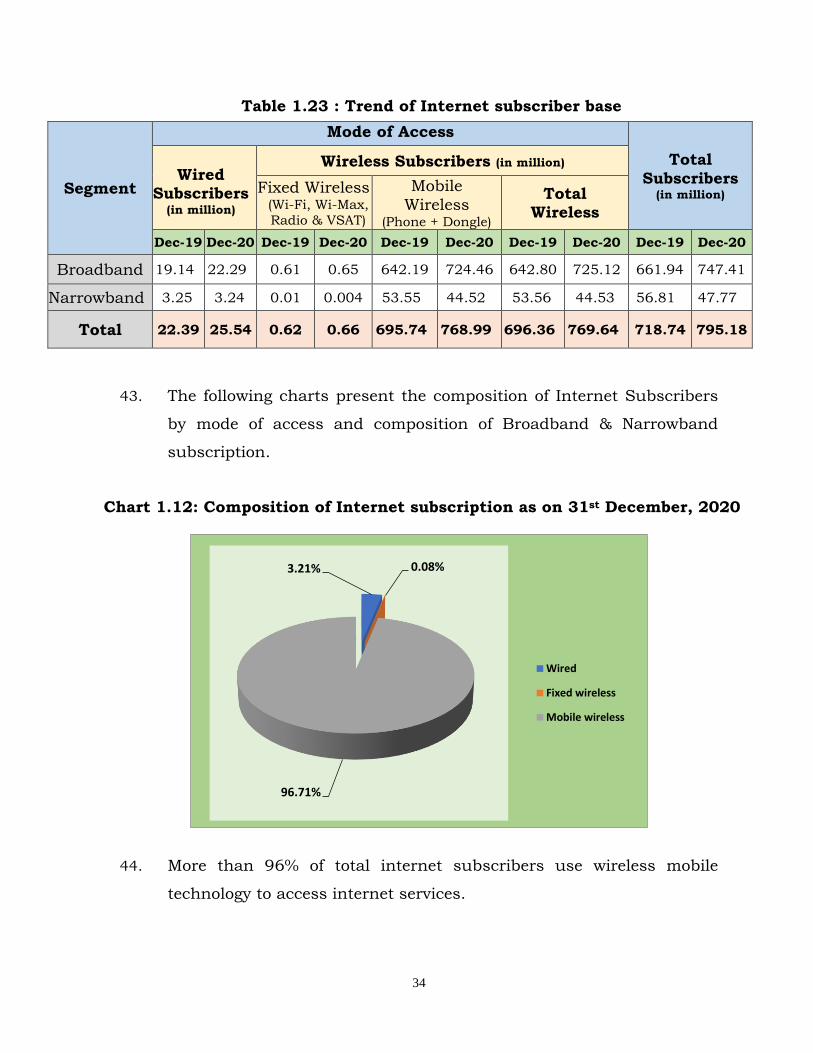
43. The following charts present the composition of Internet Subscribers
by mode of access and composition of Broadband & Narrowband
subscription.
Chart 1.12: Composition of Internet subscription as on 31st December, 2020
44. More than 96% of total internet subscribers use wireless mobile
technology to access internet services.
3.21% 0.08%
96.71%
Wired
Fixed wireless
Mobile wireless
35
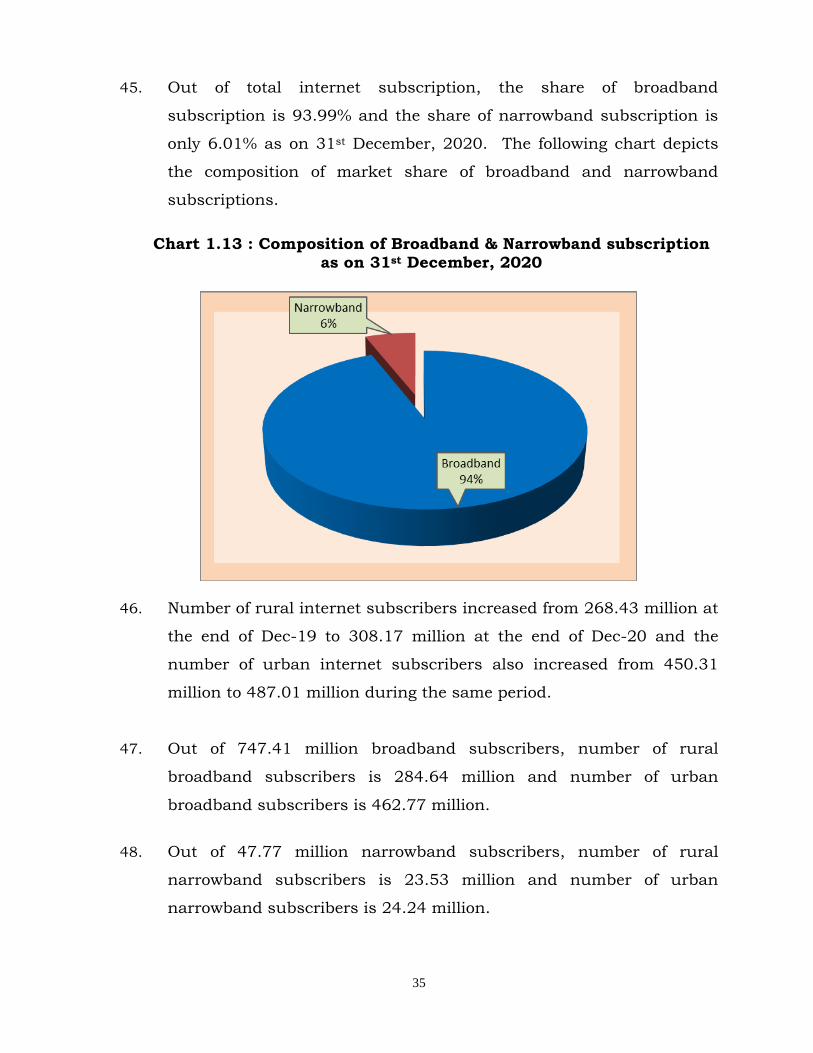
45. Out of total internet subscription, the share of broadband
subscription is 93.99% and the share of narrowband subscription is
only 6.01% as on 31st December, 2020. The following chart depicts
the composition of market share of broadband and narrowband
subscriptions.
Chart 1.13 : Composition of Broadband & Narrowband subscription as on 31st December, 2020
46. Number of rural internet subscribers increased from 268.43 million at
the end of Dec-19 to 308.17 million at the end of Dec-20 and the
number of urban internet subscribers also increased from 450.31
million to 487.01 million during the same period.
47. Out of 747.41 million broadband subscribers, number of rural
broadband subscribers is 284.64 million and number of urban
broadband subscribers is 462.77 million.
48. Out of 47.77 million narrowband subscribers, number of rural
narrowband subscribers is 23.53 million and number of urban
narrowband subscribers is 24.24 million.
36
49. The service area wise urban/rural break up of internet subscribers
(narrowband and broadband) as on 31st December, 2020 is as per the
following table: -
Table 1.24: Break up of Rural-Urban internet subscriber base (in million)
Telecom Service
Area
Narrowband Broadband Total Internet
Rural Urban Rural Urban Rural Urban
Andhra Pradesh 1.74 1.60 25.61 33.64 27.35 35.24
Assam 0.57 0.30 8.54 6.01 9.12 6.31
Bihar 2.91 1.09 30.10 18.91 33.01 20.00
Delhi 0.11 2.86 0.60 39.64 0.71 42.50
Gujarat 0.77 0.98 13.99 33.07 14.76 34.05
Haryana 0.37 0.46 6.63 10.31 7.00 10.77
Himachal Pradesh 0.17 0.14 4.01 2.24 4.18 2.39
Jammu & Kashmir 0.32 0.20 3.18 4.35 3.50 4.54
Karnataka 1.35 1.43 16.26 29.87 17.61 31.30
Kerala 0.65 0.87 11.40 16.72 12.05 17.59
Kolkata 0.12 1.19 1.32 15.96 1.44 17.15
Madhya Pradesh 1.76 1.58 19.71 29.87 21.46 31.45
Maharashtra 1.77 1.93 26.11 39.21 27.88 41.14
Mumbai 0.08 1.98 1.82 27.55 1.90 29.54
North East 0.24 0.19 4.25 4.05 4.49 4.24
Orissa 0.84 0.28 12.43 7.10 13.27 7.38
Punjab 0.46 0.71 8.34 18.09 8.80 18.80
Rajasthan 1.42 1.22 19.27 21.93 20.70 23.15
Tamil Nadu 1.60 1.79 13.00 38.06 14.61 39.85
Uttar Pradesh(East) 3.32 1.42 28.00 25.84 31.33 27.27
Uttar Pradesh(West) 1.20 1.17 14.14 23.60 15.33 24.76
West Bengal 1.76 0.84 15.93 16.76 17.69 17.61
Total 23.53 24.24 284.64 462.77 308.17 487.01

37
50. The following table depicts the number of internet subscribers of top
ten service providers and their market share as on 31st December,
2020: -
Table 1.25: Internet Subscriber Base and Market Share of top 10
Service Providers – Dec-20
S.No Service Providers No. of Internet
Subscribers
Share
(%)
1 Reliance Jio Infocomm Ltd 410.84 51.67
2 Bharti Airtel Ltd. 203.37 25.58
3 Vodafone Idea Limited 137.62 17.31
4 Bharat Sanchar Nigam Ltd. 32.71 4.11
5 Atria Convergence Technologies Pvt. Ltd.
1.78 0.22
6 Hathway Cable & Datacom Pvt. Ltd.
1.05 0.13
7 You Broadband India Pvt. Ltd. 0.83 0.10
8 Mahanagar Telephone Nigam Ltd. 0.81 0.10
9 GTPL Broadband Pvt. Ltd. 0.53 0.07
10 ONEOTT iNTERTAINMENT LTD 0.52 0.06
Total of Top 10 ISPs 790.06 99.36
Others 5.12 0.64
Grand Total 795.18 100
51. M/s Reliance Jio Infocomm Ltd holds the top position with 51.67%
market share of total internet subscribers followed by Bharti Airtel
Ltd. with 25.28%. Top 10 Service Providers together hold 99.36%
share of total internet subscriber base at the end of Dec-20.
52. Detailed table of number of subscriber base (Broadband &
Narrowband subscribers) of all the service providers is available at
Annexure-1.5.
38
Chart 1.14 : Subscriber base of top ten Service Providers
53. Out of total 25.54 million wired internet subscribers, BSNL holds
42.65% market share with 10.89 million subscribers, followed by
Bharti with 2.81 million subscribers at the end of Dec-20.
Chart 1.15 : Composition of Wired Internet subscribers as on 31st December, 2020
0.00
50.00
100.00
150.00
200.00
250.00
300.00
350.00
400.00
450.00
500.00
410.8
4
203.3
7
137.6
2
32.7
1
1.7
8
1.0
5
0.8
3
0.8
1
0.5
3
0.5
2
No
. of
sub
scri
ber
s (i
n m
illio
n)
Top 10 Internet Service Providers
39
54. In wireless internet segment, Reliance Jio holds 53.11% market share
with 408.77 million subscribers followed by Bharti Airtel Ltd. with
200.56 million wireless internet subscribers at the Dec-20.
Chart 1.16 : Composition of Wireless Internet subscription
55. The following chart depicts the technology-wise distribution of
wireless internet subscriptions.
Chart 1.17 : Technology** trend for Wireless Internet Access– Dec-20
** Long Term Evolution (LTE), Fixed Wireless Long Term Evolution (FW_LTE), General packet Radio
Service (GPRS ), Enhanced Data for GSM (Global system for mobile communications) Evolution (EDGE),
High Speed Packet Access (HSPA), Wideband Code Division Multiple Access (WCDMA), High Speed Data
(HSD), High Speed Internet Access (HSIA), Wireless Fidelity (Wi-Fi), Worldwide Interoperability for
Microwave Access (Wi-Max), Very Small Aperture Terminal (VSAT)
0.00
100.00
200.00
300.00
400.00
500.00
600.00
700.00
800.00 69
8.0
4
44
.52
26
.42
0.6
1
0.0
5
Sub
scri
be
rs (
in m
illio
n)

40
56. The following chart depicts the technology-wise distribution of wired
internet subscriptions.
Chart 1.18 : Technology†† trend for Wired Internet Access – Dec-20
57. Number of internet subscribers per 100 populations (internet tele-
density) increased from 54.29 as on 31st December, 2019 to 58.51 as
on 31st December, 2020. Rural internet tele-density increased from
29.83 to 34.60 and urban internet tele-density decreased from 106.22
to 103.98 from Dec-19 to Dec-20.
Table1.26 : Subscriber Base & Tele-density - Rural & Urban
Year ending
Internet Subscribers (million) Internet tele-density (%)
Rural Urban Total Rural Urban Overall
2016 115.06 276.44 391.50 13.08 68.86 30.56
2017 132.03 313.92 445.96 14.89 76.76 34.42
2018 213.30 390.91 604.21 23.87 93.86 46.13
2019 268.43 450.31 718.74 29.83 106.22 54.29
2020 308.17 487.01 795.18 34.60 103.98 58.51
†† DSL – Digital Subscriber Line, LAN – Local Area Network

41
Table 1.27: Service Area wise number of Internet Subscribers per 100 population at the end of Dec-20
Service Area
Internet Subscribers (in million)
Internet subscribers per 100 population
Rural Urban Total Rural Urban Total
Andhra Pradesh 27.35 35.24 62.59 50.26 97.90 69.22
Assam 9.12 6.31 15.43 30.77 117.93 44.11
Bihar 33.01 20.00 53.01 24.20 80.75 32.89
Delhi 0.71 42.50 43.20 - - 210.65
Gujarat 14.76 34.05 48.81 40.25 100.07 69.04
Haryana 7.00 10.77 17.77 40.22 89.71 60.42
Himachal Pradesh 4.18 2.39 6.57 63.09 314.81 88.92
Jammu & Kashmir 3.50 4.54 8.04 36.54 110.71 58.75
Karnataka 17.61 31.30 48.91 46.58 108.10 73.26
Kerala 12.05 17.59 29.64 115.71 70.05 83.43
Madhya Pradesh 21.46 31.45 52.91 26.26 98.21 46.52
Maharashtra 27.88 41.14 69.01 45.75 116.42 79.85
Mumbai 1.90 29.54 31.44
North East 4.49 4.24 8.73 43.68 82.17 56.53
Orissa 13.27 7.38 20.65 36.99 90.78 46.92
Punjab 8.80 18.80 27.59 49.23 137.86 87.59
Rajasthan 20.70 23.15 43.85 35.50 111.24 55.42
Tamil Nadu 14.61 39.85 54.45 39.94 96.39 69.89
UP (East) 31.33 27.27 58.59 25.47 88.77 40.82
UP (West) 15.33 24.76 40.09
Kolkata 1.44 17.15 18.59 30.14 97.50 54.37
West Bengal 17.69 17.61 35.30
Total 308.17 487.01 795.18 34.60 103.98 58.51
* Population data/projections are available state-wise only. Notes:
1. The projection of population. With effect from 1st January, 2020, the projection of population is based on the ‘Report of the Technical Group on Population Projections for India and States 2011 – 2036’, which is available under the link https://main.mohfw.gov.in/sites/default/files/Population%20Projection%20Report%202011-2036%20-
%20upload_ compressed_0.pdf Prior to that population projection was based on census data, 2001-2026, published by the Office of Registrar General & Census Commissioner of India.
2. No. of total internet subscribers per 100 population is derived from from the subscriber data provided by the operators and projection of population from the ‘Report of the Technical Group on Population Projections for India and States 2011 – 2036’, which is available under the link https://main.mohfw.gov.in/sites/default/files/ Population%20Projection%20Report %202011-2036%20-
%20upload_compressed_0.pdf
3. Data/information for Andhra Pradesh includes Telengana, Madhya Pradesh includes Chhatishgarh,
Bihar includes Jharkhand, Maharashtra includes Goa, Uttar Pradesh includes Uttarakhand, West
Bengal includes Sikkim and North-East includes Arunachal Pradesh, Manipur, Meghalaya, Mizoram,
Nagaland & Tripura states.
42
58. Top five service areas in terms of internet subscriptions (wired +
wireless) as on 31st December, 2020 are Maharashtra (69.01 million),
Andhra Pradesh (62.59 million), U.P.(East) (58.59 million), Tamil
Nadu including Chennai (54.45 million) and Bihar (53.01 million).
59. Top five service areas in terms of internet subscribers per 100
population (internet tele-density) are Delhi (210.65), Himachal
Pradesh (88.92), Punjab (87.59), Kerala (83.43) and Maharashtra
(79.85). Bihar service area has the lowest number of internet
subscribers (32.89) per 100 population.
60. Kerala service area has the highest Rural internet tele-density
(115.71) among all service areas. The average rural internet tele-
density in India is 34.60 as on 31st December, 2020.
61. Share of private internet service providers in respect of subscriber
base, increased from 95.62% at the end of 2019 to 95.74% at the end
of 2020. The following charts present the composition of market share
of PSUs and Private Internet service providers as on Dec-20.
Chart 1.2 : Market share of PSUs and Private
Internet Service Providers
43
ISP Connectivity
62. The International Internet bandwidth owned by various service
providers is reported to be 20,811 Gbps at the year ending Dec-20 as
compared to 15,526 Gbps at the year ending Dec-19.
Internet Telephony‡‡
63. As per the reports received from 15 service providers, providing
Internet Telephony services, the total outgoing minutes of usage
(MoU) for internet telephony is 665.21 million during the year 2020 as
compare to 774.09 million during the year 2019. List of Internet
Telephony Service providers is available at Annexure-1.7.
Chart 1.20 : Trends in MOU for Internet Telephony
‡‡ Internet Telephony : Internet telephony is used as a generic term for the conveyance of voice, fax and related
services, partially or wholly over packet-based, IP-based networks.
(Source-ITU)
10661123
851774
665
100
200
300
400
500
600
700
800
900
1000
1100
1200
1300
1400
2016 2017 2018 2019 2020
Min
ute
s in
mill
ion
Outgoing Minutes of Internet Telephony (in million)
44
Part-II : Broadband Service (Download Speed >=512 Kbps)
64. The total number of broadband subscribers increased from 661.94
million at the end of Dec-19 to 747.41 million at the end of Dec-20
with yearly growth rate of 12.91%. Out of total number of broadband
subscribers, number of wired broadband subscribers are 22.29
million and number of wireless broadband subscribers are 725.12
million at the end of Dec-20.
65. Top five broadband (wired+wireless) service providers in term of
subscribers as on 31st December, 2020 are Reliance Jio (410.84
million), Bharti Airtel (179 million), Vodafone Idea Ltd (120.77
million), BSNL (26.32 million) and Atria Convergence Technologies
Pvt. Ltd. (1.78 million).
66. In wired broadband segment, BSNL holds 34.53% market share with
7.70 million subscribers followed by Bharti with 2.81 million
subscribers at the end of Dec-20.
67. In wireless broadband segment, Reliance Jio holds 56.37% market
share with 408.77 million subscribers followed by Bharti Airtel Ltd.
(24.30%) with 176.19 million subscribers at the end of Dec-20.
68. Top five service areas in respect of broadband subscriptions at Q.E.
Dec-20 are Maharashtra (65.32 million), Andhra Pradesh including
Telengana (59.26 million), U.P.-East (53.85 million), Tamil Nadu
(51.06 million) and Madhya Pradesh (49.58 million).
69. The following chart depicts the composition of technology wise
broadband subscriptions as on 31st December, 2020.
45
Chart 1.21 : Composition of Broadband subscription – Technology wise
70. Mobile Device (dongle+phone) is the most popular mode of broadband
access and it constitutes 96.93% of total broadband subscribers at
the end of Dec-20. On the other hand, share of wired internet
subscribers is only 2.98% during the same period.
Part-III : Narrowband Service (Download Speed <512 Kbps)
71. Total number of narrowband subscribers declined from 56.81 million
at the end of Dec-19 to 47.77 million at the end of Dec-20 with the
yearly decline rate of 15.91%. Out of 47.77 million narrowband
subscribers, number of Wired Narrowband subscribers are 3.24
million and number of Wireless Narrowband subscribers are 44.53
million at the end of Dec-20.
72. The top five narrowband (wired + wireless) service providers in term of
subscriber base are Bharti Airtel (24.37 million), Vodafone Idea Ltd
(16.85 million), BSNL (6.39 million), MTNL (0.11 million) and You
Broadband India Pvt. Ltd. (0.02 million) at the end of Dec-20.
Wireless (dongle + phone), 96.93%
Wired, 2.98%
Fixed wireless, 0.09%
46
73. In wired narrowband segment, BSNL holds 98.50% market share with
3.20 million subscribers followed by You Broadband India Pvt. Ltd.
with 0.02 million subscribers at the end of Dec-20.
74. In wireless narrowband segment, Bharti Airtel holds 54.74% market
share with 24.37 million subscribers followed by Vodafone Idea
Limited with 16.85 million subscribers at the end of Dec-20.
75. The following chart depicts the composition of technology wise
narrowband subscription as on 31st December, 2020.
Chart 1.22 : Composition of Narrowband subscription –
Technology wise
Wireless (dongle + phone), 93.20%
Wired , 6.79% Fixed wireless, 0.01%
47
Section E : Other Value Added Services - PMRTS & VSAT
Public Mobile Radio Trunk Services (PMRTS)
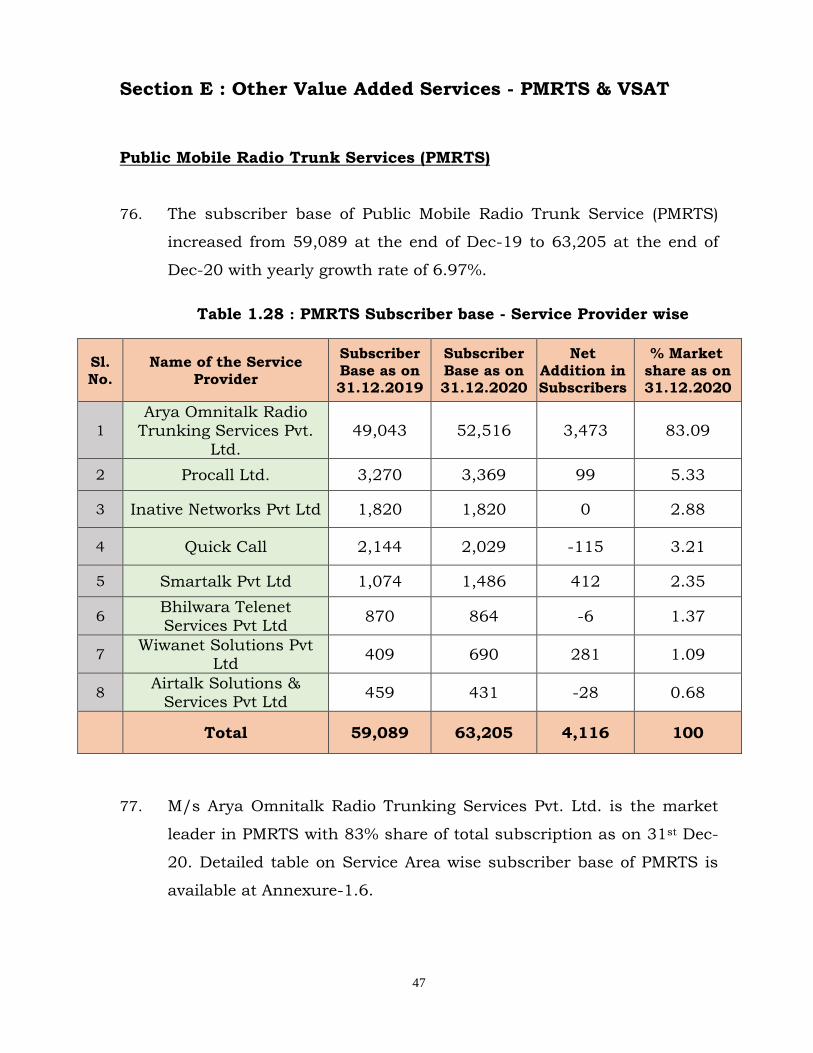
76. The subscriber base of Public Mobile Radio Trunk Service (PMRTS)
increased from 59,089 at the end of Dec-19 to 63,205 at the end of
Dec-20 with yearly growth rate of 6.97%.
Table 1.28 : PMRTS Subscriber base - Service Provider wise
Sl. No.
Name of the Service Provider
Subscriber Base as on 31.12.2019
Subscriber Base as on 31.12.2020
Net Addition in Subscribers
% Market share as on 31.12.2020
1
Arya Omnitalk Radio Trunking Services Pvt.
Ltd.
49,043 52,516 3,473 83.09
2 Procall Ltd. 3,270 3,369 99 5.33
3 Inative Networks Pvt Ltd 1,820 1,820 0 2.88
4 Quick Call 2,144 2,029 -115 3.21
5 Smartalk Pvt Ltd 1,074 1,486 412 2.35
6 Bhilwara Telenet Services Pvt Ltd
870 864 -6 1.37
7 Wiwanet Solutions Pvt
Ltd 409 690 281 1.09
8 Airtalk Solutions &
Services Pvt Ltd 459 431 -28 0.68
Total 59,089 63,205 4,116 100
77. M/s Arya Omnitalk Radio Trunking Services Pvt. Ltd. is the market
leader in PMRTS with 83% share of total subscription as on 31st Dec-
20. Detailed table on Service Area wise subscriber base of PMRTS is
available at Annexure-1.6.
48
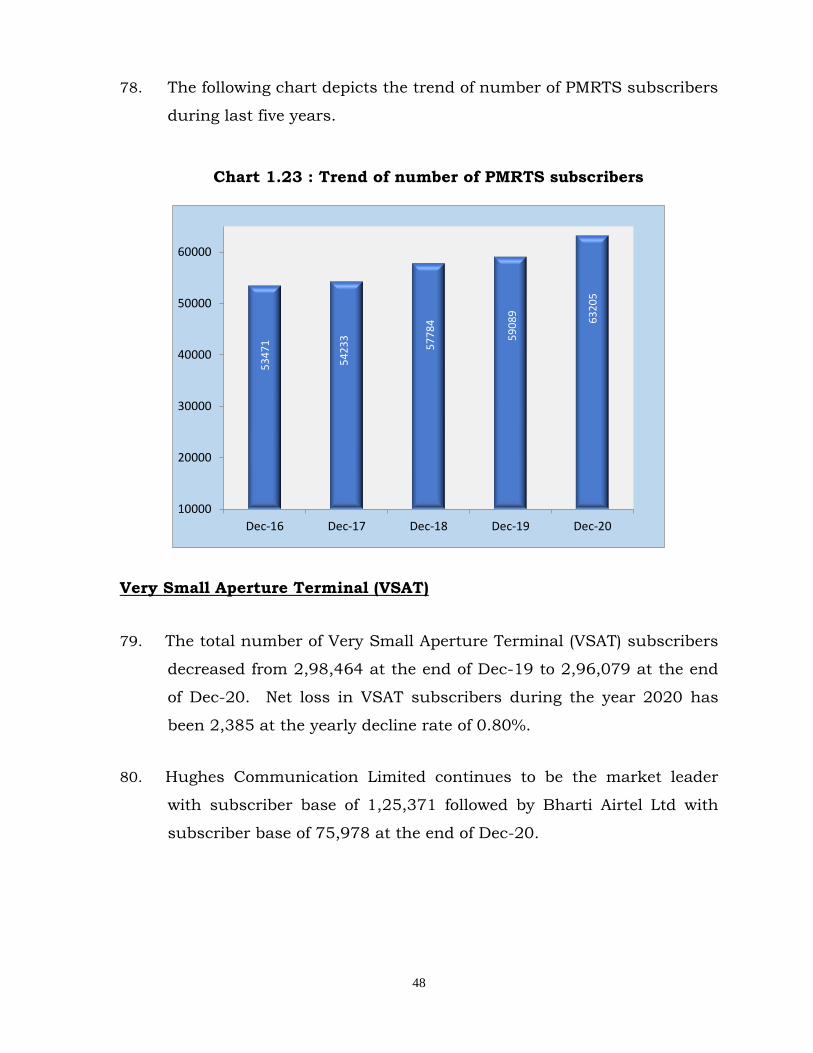
78. The following chart depicts the trend of number of PMRTS subscribers
during last five years.
Chart 1.23 : Trend of number of PMRTS subscribers
Very Small Aperture Terminal (VSAT)
79. The total number of Very Small Aperture Terminal (VSAT) subscribers
decreased from 2,98,464 at the end of Dec-19 to 2,96,079 at the end
of Dec-20. Net loss in VSAT subscribers during the year 2020 has
been 2,385 at the yearly decline rate of 0.80%.
80. Hughes Communication Limited continues to be the market leader
with subscriber base of 1,25,371 followed by Bharti Airtel Ltd with
subscriber base of 75,978 at the end of Dec-20.
53
47
1
54
23
3
57
78
4
59
08
9
63
20
5
10000
20000
30000
40000
50000
60000
Dec-16 Dec-17 Dec-18 Dec-19 Dec-20
49
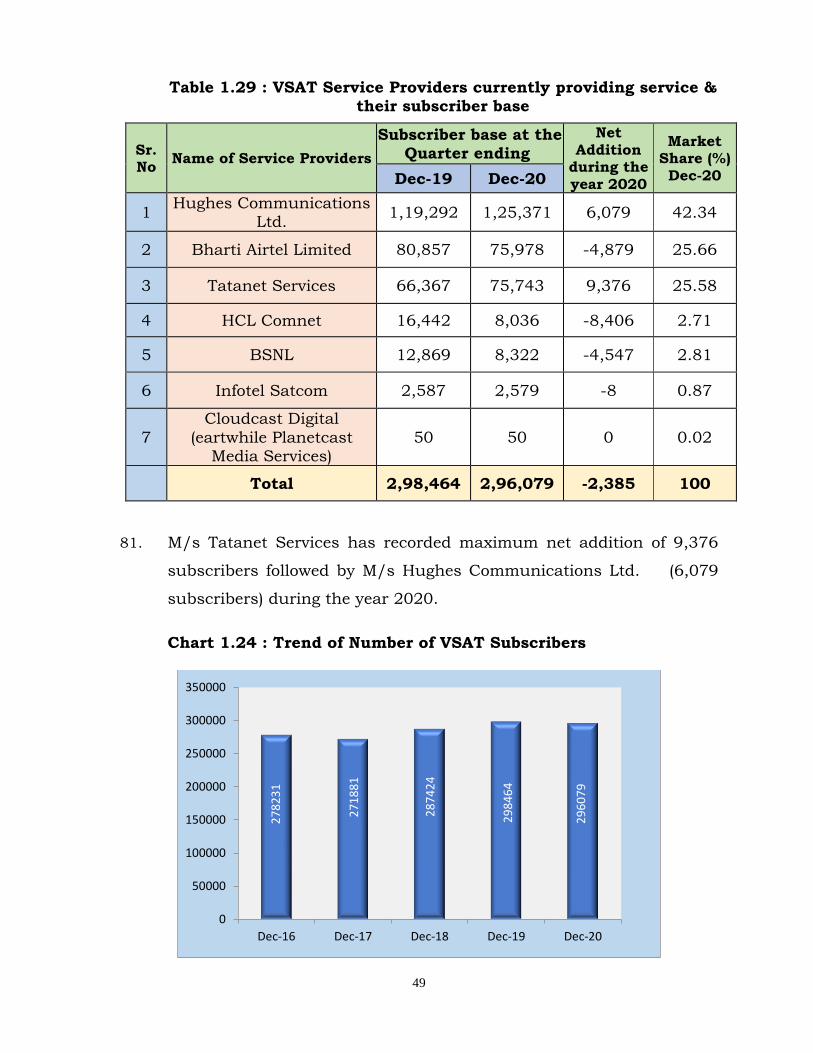
Table 1.29 : VSAT Service Providers currently providing service & their subscriber base
Sr. No
Name of Service Providers
Subscriber base at the Quarter ending
Net Addition
during the year 2020
Market Share (%) Dec-20 Dec-19 Dec-20
1 Hughes Communications
Ltd. 1,19,292 1,25,371 6,079 42.34
2 Bharti Airtel Limited 80,857 75,978 -4,879 25.66
3 Tatanet Services 66,367 75,743 9,376 25.58
4 HCL Comnet 16,442 8,036 -8,406 2.71
5 BSNL 12,869 8,322 -4,547 2.81
6 Infotel Satcom 2,587 2,579 -8 0.87
7
Cloudcast Digital
(eartwhile Planetcast Media Services)
50 50 0 0.02
Total 2,98,464 2,96,079 -2,385 100
81. M/s Tatanet Services has recorded maximum net addition of 9,376
subscribers followed by M/s Hughes Communications Ltd. (6,079
subscribers) during the year 2020.
Chart 1.24 : Trend of Number of VSAT Subscribers
27
82
31
27
18
81
28
74
24
29
84
64
29
60
79
0
50000
100000
150000
200000
250000
300000
350000
Dec-16 Dec-17 Dec-18 Dec-19 Dec-20

50
:
------------------------------------------------------------------------------------------------------------ • For all the parameters, Metros indicate data for Delhi, Mumbai & Kolkata. Data for
Chennai service area has been included in Circle A, as part of TN.
• ARPU arrived after adjusting interconnect usage charges and roaming settlement
charges.
• The data contained in the section A & B covers the licensees, who have been
providing service during the entire period from 1st January, 2020 to 31st December, 2020 in the various service areas.
Chapter 2: Revenue and
Usage Wireless
Services
51
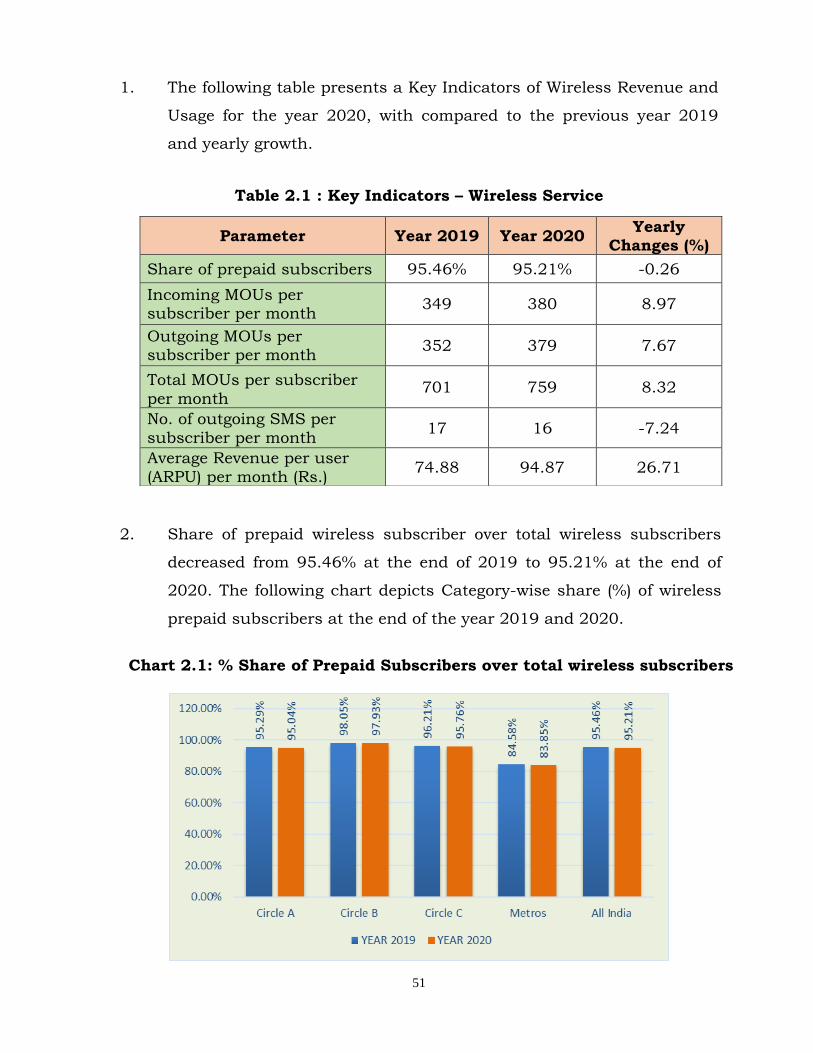
1. The following table presents a Key Indicators of Wireless Revenue and
Usage for the year 2020, with compared to the previous year 2019
and yearly growth.
Table 2.1 : Key Indicators – Wireless Service
2. Share of prepaid wireless subscriber over total wireless subscribers
decreased from 95.46% at the end of 2019 to 95.21% at the end of
2020. The following chart depicts Category-wise share (%) of wireless
prepaid subscribers at the end of the year 2019 and 2020.
Chart 2.1: % Share of Prepaid Subscribers over total wireless subscribers
Parameter Year 2019 Year 2020 Yearly
Changes (%)
Share of prepaid subscribers 95.46% 95.21% -0.26
Incoming MOUs per subscriber per month
349 380 8.97
Outgoing MOUs per subscriber per month
352 379 7.67
Total MOUs per subscriber
per month 701 759 8.32
No. of outgoing SMS per
subscriber per month 17 16 -7.24
Average Revenue per user
(ARPU) per month (Rs.) 74.88 94.87 26.71
52
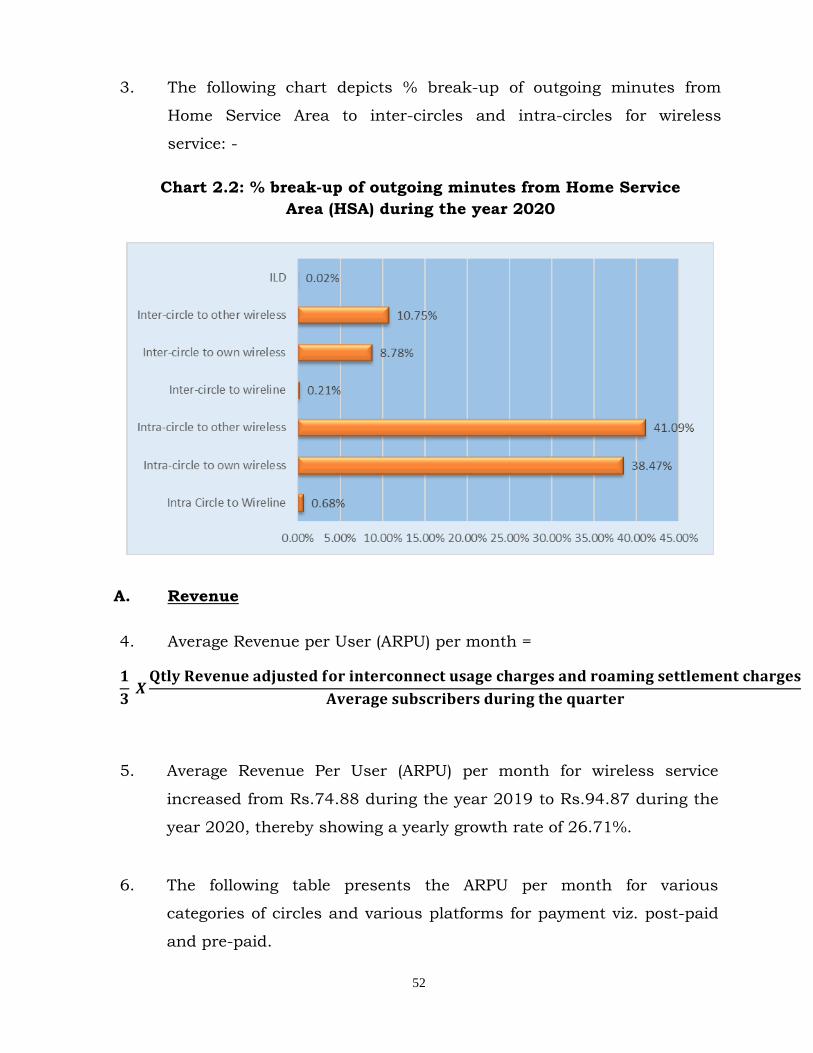
3. The following chart depicts % break-up of outgoing minutes from
Home Service Area to inter-circles and intra-circles for wireless
service: -
Chart 2.2: % break-up of outgoing minutes from Home Service
Area (HSA) during the year 2020
A. Revenue
4. Average Revenue per User (ARPU) per month =
𝟏
𝟑 𝑿
𝐐𝐭𝐥𝐲 𝐑𝐞𝐯𝐞𝐧𝐮𝐞 𝐚𝐝𝐣𝐮𝐬𝐭𝐞𝐝 𝐟𝐨𝐫 𝐢𝐧𝐭𝐞𝐫𝐜𝐨𝐧𝐧𝐞𝐜𝐭 𝐮𝐬𝐚𝐠𝐞 𝐜𝐡𝐚𝐫𝐠𝐞𝐬 𝐚𝐧𝐝 𝐫𝐨𝐚𝐦𝐢𝐧𝐠 𝐬𝐞𝐭𝐭𝐥𝐞𝐦𝐞𝐧𝐭 𝐜𝐡𝐚𝐫𝐠𝐞𝐬
𝐀𝐯𝐞𝐫𝐚𝐠𝐞 𝐬𝐮𝐛𝐬𝐜𝐫𝐢𝐛𝐞𝐫𝐬 𝐝𝐮𝐫𝐢𝐧𝐠 𝐭𝐡𝐞 𝐪𝐮𝐚𝐫𝐭𝐞𝐫
5. Average Revenue Per User (ARPU) per month for wireless service
increased from Rs.74.88 during the year 2019 to Rs.94.87 during the
year 2020, thereby showing a yearly growth rate of 26.71%.
6. The following table presents the ARPU per month for various
categories of circles and various platforms for payment viz. post-paid
and pre-paid.
53
Table 2.2 : Average Revenue Per User (ARPU) per month (Rs.)
7. Average Revenue Per User (ARPU) per month for postpaid service
declined from Rs.259.02 during the year 2019 to Rs.226.83 during the
year 2020. ARPU per month for prepaid service increased from
Rs.66.48 during the year 2019 to Rs.88.37 during the year 2020.
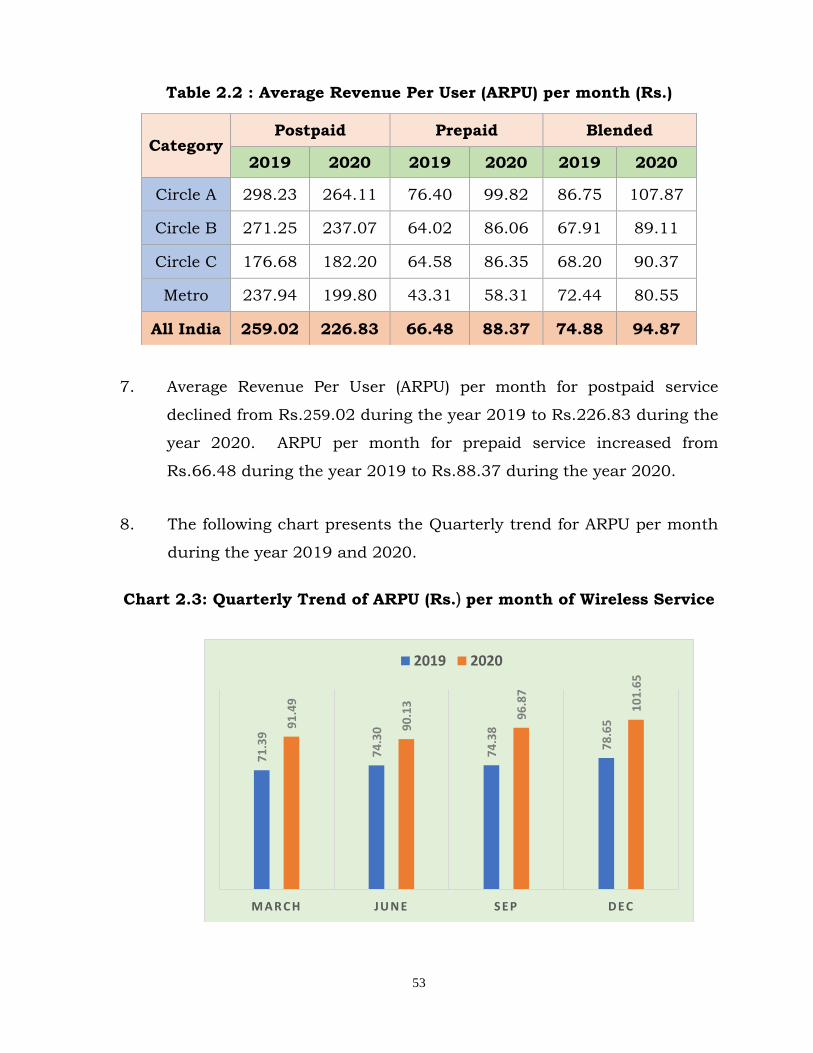
8. The following chart presents the Quarterly trend for ARPU per month
during the year 2019 and 2020.
Chart 2.3: Quarterly Trend of ARPU (Rs.) per month of Wireless Service
71
.39
74
.30
74
.38
78
.6591
.49
90
.13
96
.87
10
1.6
5
M A R C H J U N E S EP D EC
2019 2020
Category Postpaid Prepaid Blended
2019 2020 2019 2020 2019 2020
Circle A 298.23 264.11 76.40 99.82 86.75 107.87
Circle B 271.25 237.07 64.02 86.06 67.91 89.11
Circle C 176.68 182.20 64.58 86.35 68.20 90.37
Metro 237.94 199.80 43.31 58.31 72.44 80.55
All India 259.02 226.83 66.48 88.37 74.88 94.87
54
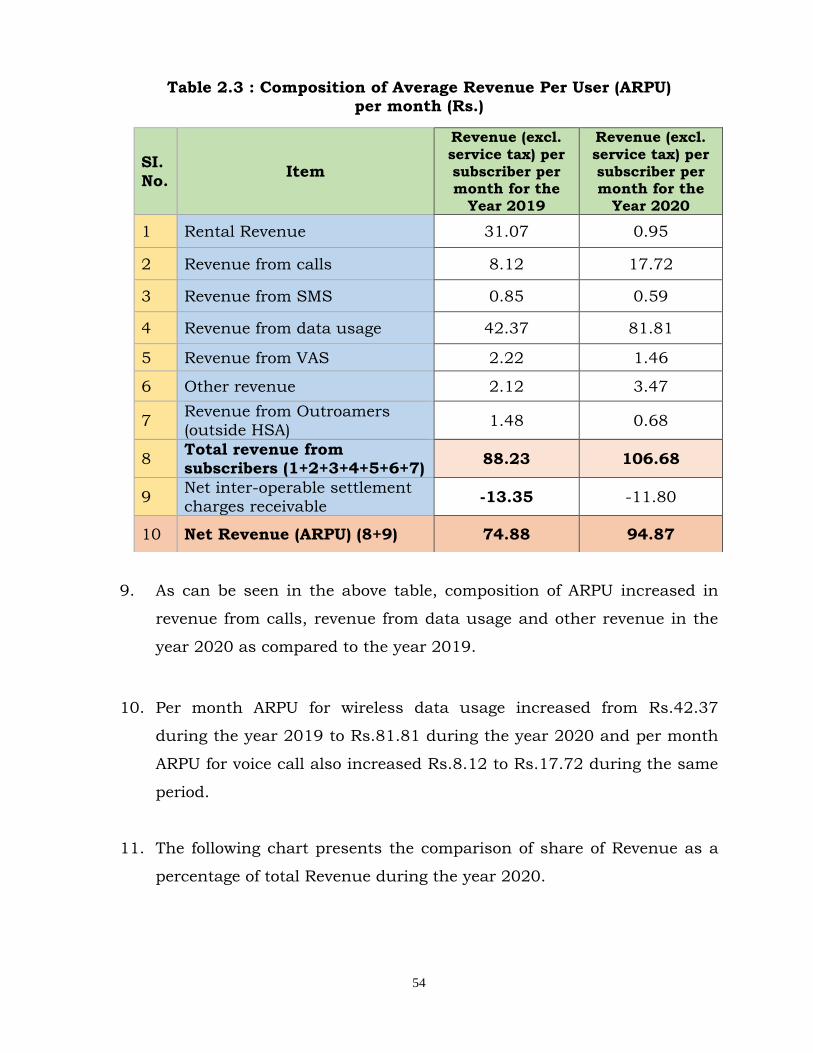
Table 2.3 : Composition of Average Revenue Per User (ARPU) per month (Rs.)
9. As can be seen in the above table, composition of ARPU increased in
revenue from calls, revenue from data usage and other revenue in the
year 2020 as compared to the year 2019.
10. Per month ARPU for wireless data usage increased from Rs.42.37
during the year 2019 to Rs.81.81 during the year 2020 and per month
ARPU for voice call also increased Rs.8.12 to Rs.17.72 during the same
period.
11. The following chart presents the comparison of share of Revenue as a
percentage of total Revenue during the year 2020.
SI.
No. Item
Revenue (excl. service tax) per subscriber per month for the
Year 2019
Revenue (excl. service tax) per subscriber per month for the
Year 2020
1 Rental Revenue 31.07 0.95
2 Revenue from calls 8.12 17.72
3 Revenue from SMS 0.85 0.59
4 Revenue from data usage 42.37 81.81
5 Revenue from VAS 2.22 1.46
6 Other revenue 2.12 3.47
7 Revenue from Outroamers
(outside HSA) 1.48 0.68
8 Total revenue from
subscribers (1+2+3+4+5+6+7) 88.23 106.68
9 Net inter-operable settlement
charges receivable -13.35 -11.80
10 Net Revenue (ARPU) (8+9) 74.88 94.87
55
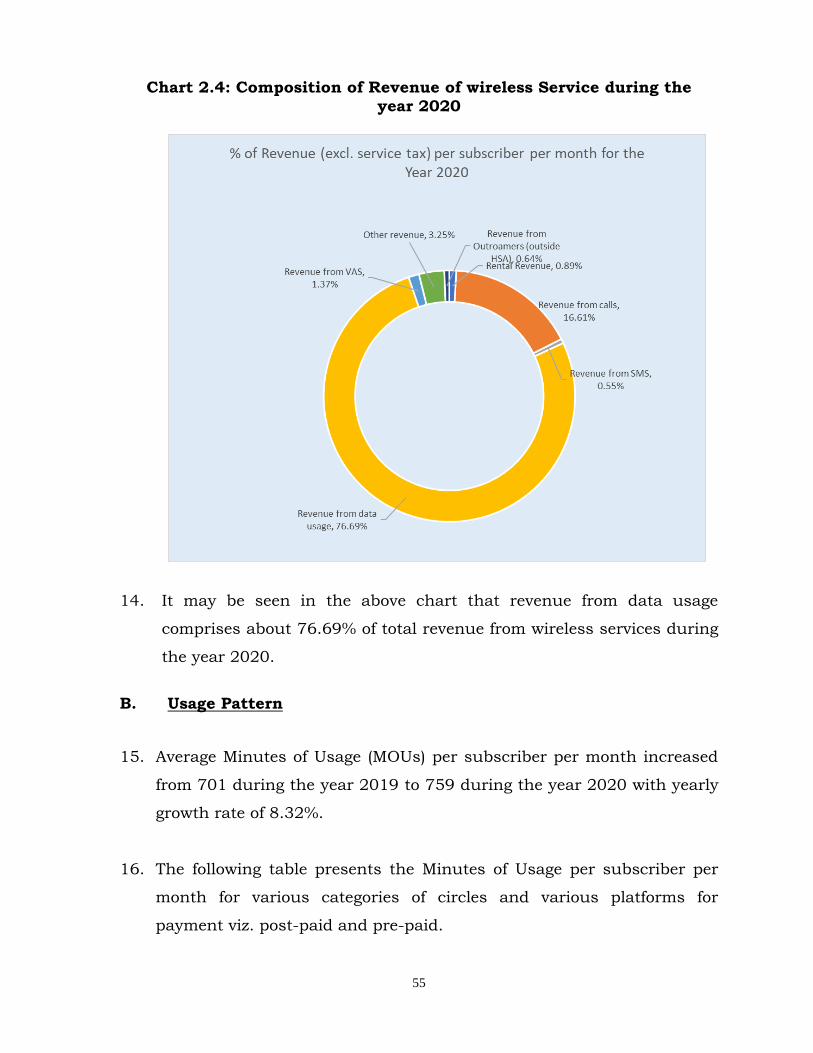
Chart 2.4: Composition of Revenue of wireless Service during the year 2020
14. It may be seen in the above chart that revenue from data usage
comprises about 76.69% of total revenue from wireless services during
the year 2020.
B. Usage Pattern
15. Average Minutes of Usage (MOUs) per subscriber per month increased
from 701 during the year 2019 to 759 during the year 2020 with yearly
growth rate of 8.32%.
16. The following table presents the Minutes of Usage per subscriber per
month for various categories of circles and various platforms for
payment viz. post-paid and pre-paid.

56
Table 2.4: - Category-wise Minutes of Usages (MOUs) per subscriber per
month
17. Minutes of Usage (MOUs) per subscriber per month for postpaid
services declined from 637 during the year 2019 to 628 during the year
2020 however, MoUs for prepaid services increased from 703 to 765
during the same period.
18. Outgoing MoUs per subscriber per month increased from 352 during
the year 2019 to 379 during the year 2020 and Incoming MoUs per
subscriber per month also increased from 349 to 380 during the same
period.
Segment MOUs Year Circle A Circle B Circle C Metros All India
Postpaid
Outgoing
MOU
2019 344.10 368.20 422.67 284.43 336.34
2020 348.80 338.54 387.94 287.67 332.02
Incoming MOU
2019 316.73 352.31 356.63 240.21 300.80
2020 309.96 314.14 394.20 231.07 295.93
Total MOU 2019 660.83 720.50 779.30 524.65 637.14
2020 658.75 652.67 782.14 518.75 627.95
Prepaid
Outgoing
MOU
2019 315.10 347.60 409.42 419.34 352.38
2020 346.59 372.57 443.02 445.51 380.95
Incoming MOU
2019 297.74 360.17 452.31 340.17 351.09
2020 337.44 384.20 476.17 406.69 384.36
Total MOU 2019 612.84 707.77 861.74 759.52 703.47
2020 684.03 756.77 919.19 852.19 765.31
Blended
Outgoing MOU
2019 316.45 347.99 409.85 399.15 351.68
2020 346.70 371.88 440.71 420.70 378.65
Incoming
MOU
2019 298.62 360.03 449.23 325.21 348.89
2020 336.10 382.79 472.74 379.08 380.21
Total MOU 2019 615.08 708.01 859.08 724.36 700.58
2020 682.79 754.67 913.46 799.78 758.86
57
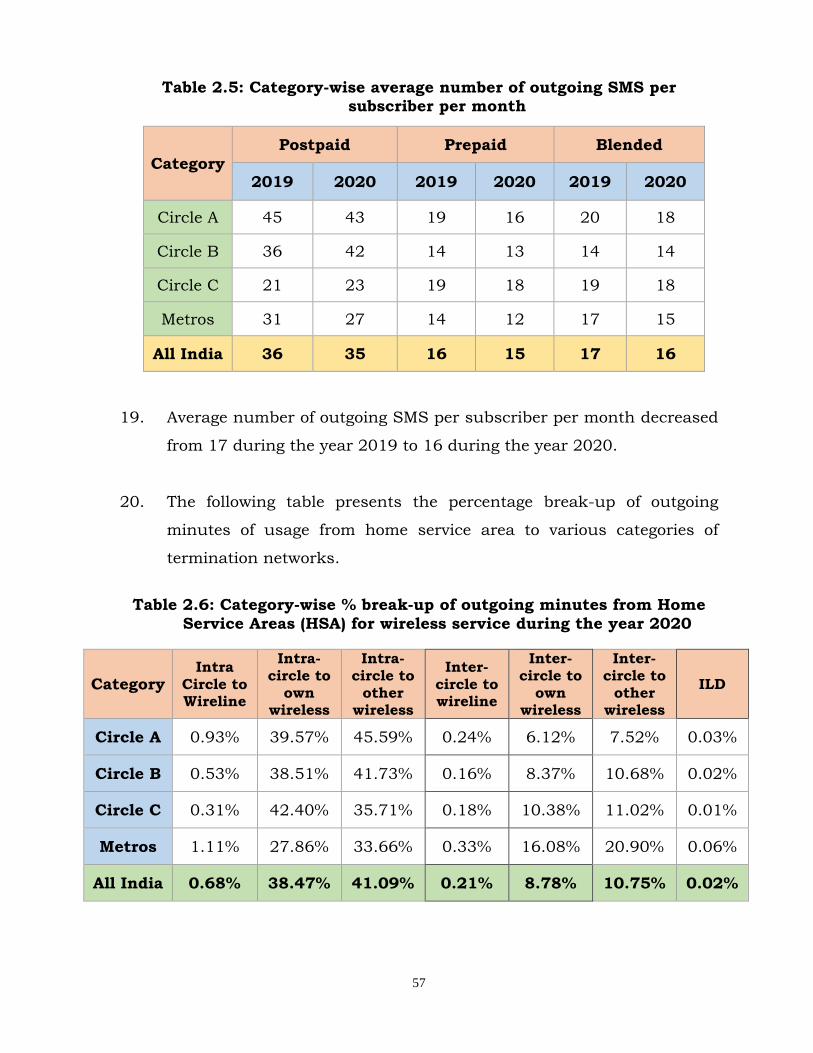
Table 2.5: Category-wise average number of outgoing SMS per subscriber per month
Category
Postpaid Prepaid Blended
2019 2020 2019 2020 2019 2020
Circle A 45 43 19 16 20 18
Circle B 36 42 14 13 14 14
Circle C 21 23 19 18 19 18
Metros 31 27 14 12 17 15
All India 36 35 16 15 17 16
19. Average number of outgoing SMS per subscriber per month decreased
from 17 during the year 2019 to 16 during the year 2020.
20. The following table presents the percentage break-up of outgoing
minutes of usage from home service area to various categories of
termination networks.
Table 2.6: Category-wise % break-up of outgoing minutes from Home
Service Areas (HSA) for wireless service during the year 2020
Category Intra
Circle to Wireline
Intra-circle to
own wireless
Intra-circle to
other wireless
Inter-circle to wireline
Inter-circle to
own wireless
Inter-circle to
other wireless
ILD
Circle A 0.93% 39.57% 45.59% 0.24% 6.12% 7.52% 0.03%
Circle B 0.53% 38.51% 41.73% 0.16% 8.37% 10.68% 0.02%
Circle C 0.31% 42.40% 35.71% 0.18% 10.38% 11.02% 0.01%
Metros 1.11% 27.86% 33.66% 0.33% 16.08% 20.90% 0.06%
All India 0.68% 38.47% 41.09% 0.21% 8.78% 10.75% 0.02%

58
21. Out of total number of wireless subscribers, about 16.20% wireless
subscribers availed roaming service during the year 2020. The chart
given below presents the share of wireless subscribers who availed
roaming service during the year 2020.
Chart 2.5: Share of subscribers who availed roaming service during the
year 2020
22. The chart given below presents the composition of roaming MoUs of
outroamers (who had availed roaming services) during the year 2020.
Chart 2.6: Composition of roaming MoUs of outroamers during
the year 2020

59
C. Average revenue per outgoing minute for usage from Home
Service Area (HSA)
23. The tariff plans are of bundled nature and the trade-off is generally
between monthly fixed charges and variable (call) charges. Therefore,
average revenue per outgoing minute for usage from Home Service
Area (HSA) as defined below would be a realistic indicator of average
tariff levels.
24. Average Revenue per Outgoing Minute for usage from HSA
=Rental revenue + revenue from outgoing calls from HSA
No.of outgoing minutes from HSA
25. The table below provides the Average Revenue per Outgoing Minute
for usage from HSA during the year 2020.
Table 2.7: Average Revenue per Outgoing Minute for usage from HSA
(in Rs. per minute) during the year 2020
Category Postpaid Prepaid Blended
2019 2020 2019 2020 2019 2020
Circle A 0.56 0.14 0.12 0.05 0.14 0.06
Circle B 0.45 0.14 0.11 0.05 0.11 0.05
Circle C 0.23 0.10 0.10 0.05 0.10 0.05
Metros 0.56 0.13 0.10 0.04 0.15 0.05
All India 0.49 0.13 0.11 0.05 0.12 0.05
26. Average subscriber revenue per outgoing minute for wireless service
from home service area declined from Rs.0.12 during the year 2019 to
Rs.0.05 during the year 2020.
60
Chapter 3: Wireless Data
Service
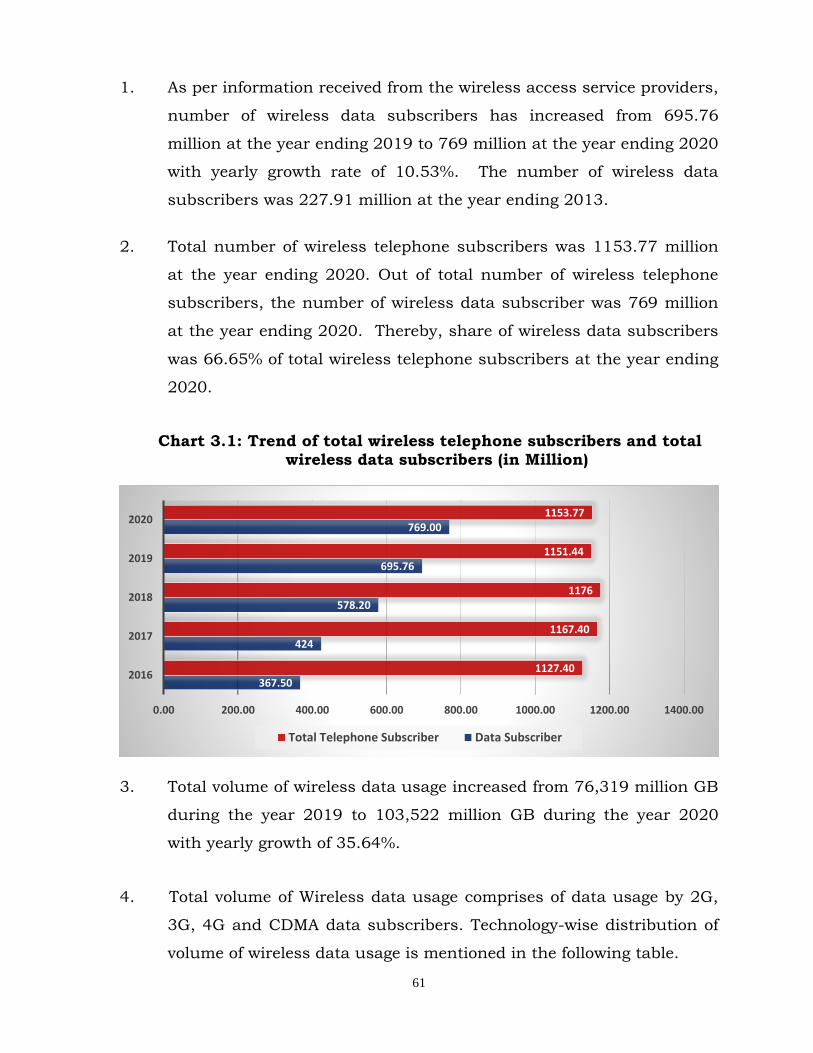
61
1. As per information received from the wireless access service providers,
number of wireless data subscribers has increased from 695.76
million at the year ending 2019 to 769 million at the year ending 2020
with yearly growth rate of 10.53%. The number of wireless data
subscribers was 227.91 million at the year ending 2013.
2. Total number of wireless telephone subscribers was 1153.77 million
at the year ending 2020. Out of total number of wireless telephone
subscribers, the number of wireless data subscriber was 769 million
at the year ending 2020. Thereby, share of wireless data subscribers
was 66.65% of total wireless telephone subscribers at the year ending
2020.
Chart 3.1: Trend of total wireless telephone subscribers and total
wireless data subscribers (in Million)
3. Total volume of wireless data usage increased from 76,319 million GB
during the year 2019 to 103,522 million GB during the year 2020
with yearly growth of 35.64%.
4. Total volume of Wireless data usage comprises of data usage by 2G,
3G, 4G and CDMA data subscribers. Technology-wise distribution of
volume of wireless data usage is mentioned in the following table.
367.50
424
578.20
695.76
769.00
1127.40
1167.40
1176
1151.44
1153.77
0.00 200.00 400.00 600.00 800.00 1000.00 1200.00 1400.00
2016
2017
2018
2019
2020
Total Telephone Subscriber Data Subscriber
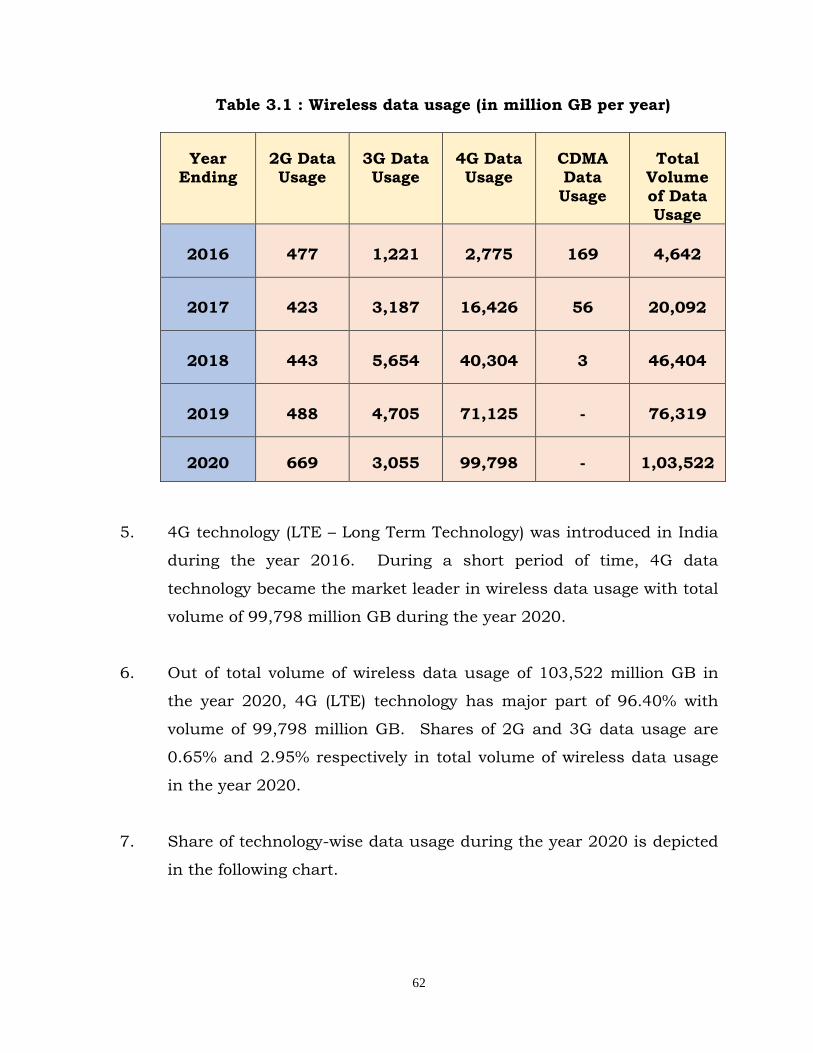
62
Table 3.1 : Wireless data usage (in million GB per year)
Year Ending
2G Data Usage
3G Data Usage
4G Data Usage
CDMA Data
Usage
Total Volume
of Data Usage
2016 477 1,221 2,775 169 4,642
2017 423 3,187 16,426 56 20,092
2018 443 5,654 40,304 3 46,404
2019 488 4,705 71,125 - 76,319
2020 669 3,055 99,798 - 1,03,522
5. 4G technology (LTE – Long Term Technology) was introduced in India
during the year 2016. During a short period of time, 4G data
technology became the market leader in wireless data usage with total
volume of 99,798 million GB during the year 2020.
6. Out of total volume of wireless data usage of 103,522 million GB in
the year 2020, 4G (LTE) technology has major part of 96.40% with
volume of 99,798 million GB. Shares of 2G and 3G data usage are
0.65% and 2.95% respectively in total volume of wireless data usage
in the year 2020.
7. Share of technology-wise data usage during the year 2020 is depicted
in the following chart.
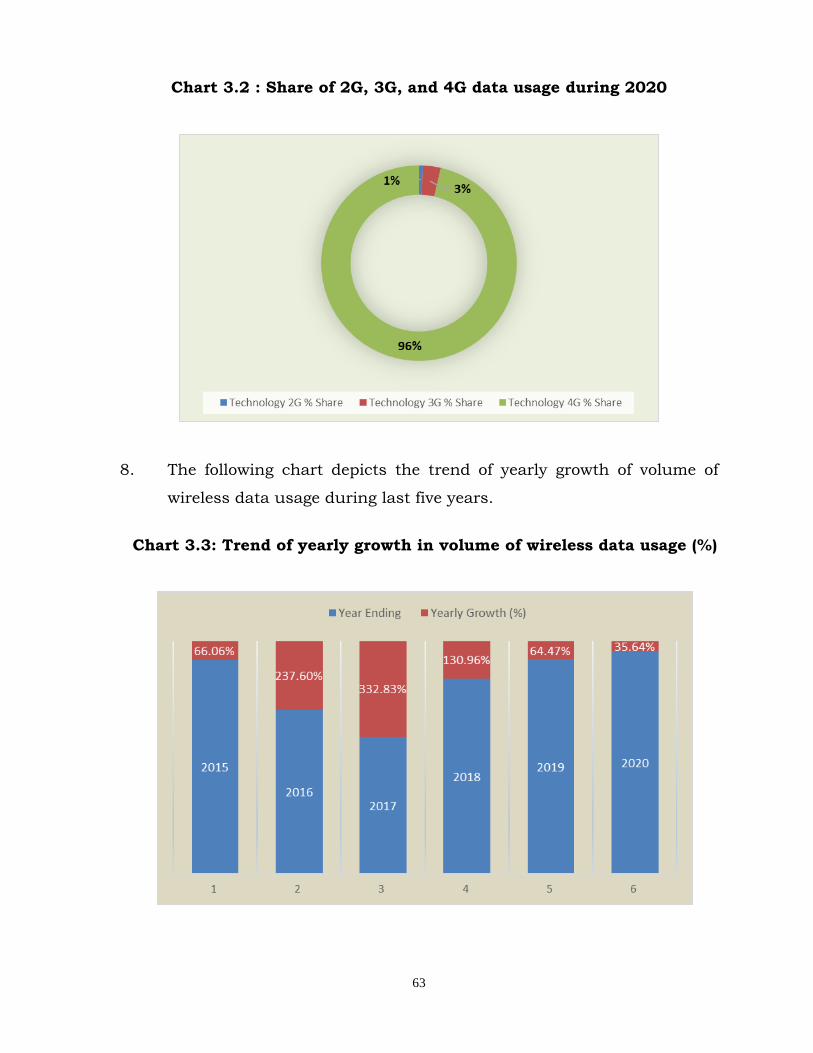
63
Chart 3.2 : Share of 2G, 3G, and 4G data usage during 2020
8. The following chart depicts the trend of yearly growth of volume of
wireless data usage during last five years.
Chart 3.3: Trend of yearly growth in volume of wireless data usage (%)

64
9. Total volume of wireless data usage increased by 35.64% in the year
2020 over previous year, as compared to the yearly growth rate of
64.47% in the year 2019. However, the growth rate in volume of
wireless data usage were recorded 332.83% and 130.96% in the
years 2017 and 2018 over previous year.
10. Total revenue from wireless data usage increased from Rs. 59,334
crore in the year 2019 to Rs. 113,156 crore in the year 2020 with
yearly growth rate of 90.71%. The total revenue from wireless data
usages was Rs. 22,265 crore in the year 2014.
Chart 3.4 : Trend of Wireless Data Revenue (in crore Rs.) per year
Year Total Wireless Data Revenue
YoY Growth
2014 22,265 -
2015 31,120 39.77%
2016 35,079 12.72%
2017 38,882 10.84%
2018 54,671 40.61%
2019 59,334 8.53%
2020 113,156 90.71%
11. Average Revenue for wireless data usage (Data ARPU) per data
subscriber per month increased from Rs. 76.59 in the year 2019 to
Rs. 128.61 in the year 2020.
12. Average revenue for data services has been derived on dividing of total
yearly revenue of wireless data services by the average number of
wireless data subscribers during the year. The following table and
chart show the trend of Average Revenue Per Data User (data ARPU)
per month for wireless data usage during the year 2014 to 2020.
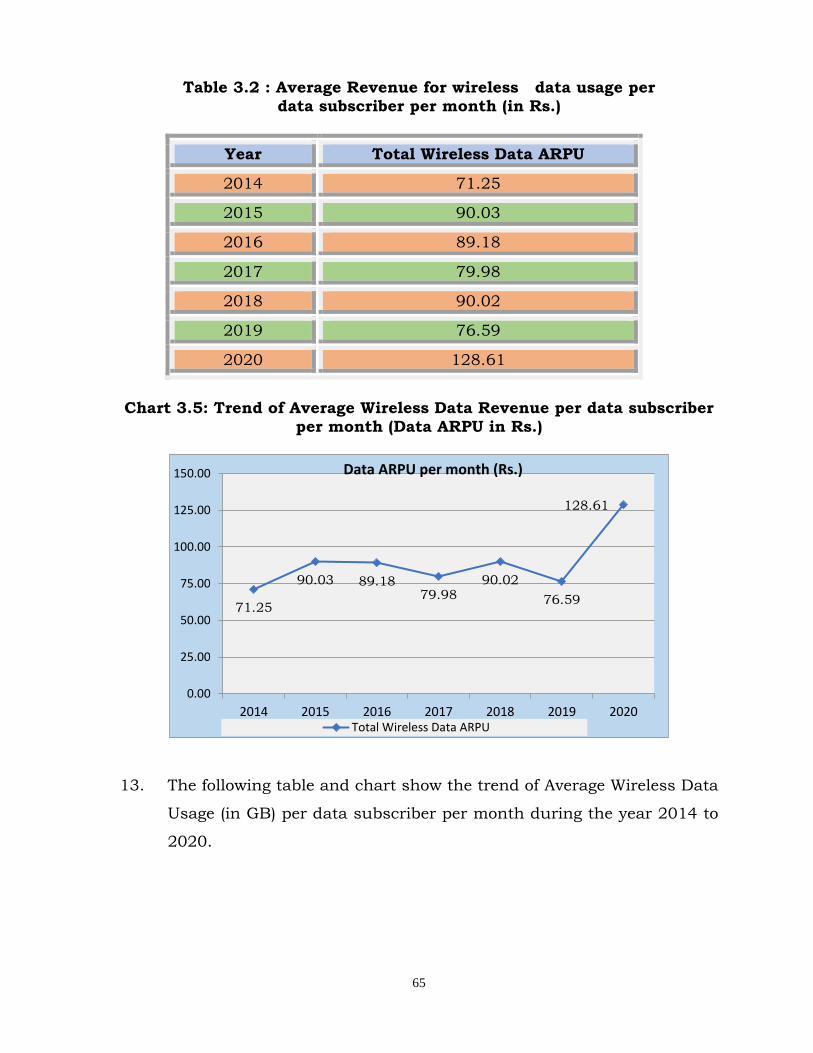
65
Table 3.2 : Average Revenue for wireless data usage per data subscriber per month (in Rs.)
Year Total Wireless Data ARPU
2014 71.25
2015 90.03
2016 89.18
2017 79.98
2018 90.02
2019 76.59
2020 128.61
Chart 3.5: Trend of Average Wireless Data Revenue per data subscriber
per month (Data ARPU in Rs.)
13. The following table and chart show the trend of Average Wireless Data
Usage (in GB) per data subscriber per month during the year 2014 to
2020.
71.25
90.03 89.1879.98
90.02
76.59
128.61
0.00
25.00
50.00
75.00
100.00
125.00
150.00
2014 2015 2016 2017 2018 2019 2020Total Wireless Data ARPU
Data ARPU per month (Rs.)

66
Table 3.3 : Average Wireless Data Usage (in GB) per data user per month
Year
Ending
2G Data
Usage
3G Data
Usage
4G Data
Usage
CDMA
Data Usage
GSM
Data Usage
Total
Wireless Data
Usage
2014 0.14 0.62 1.72 0.23 0.27
2015 0.20 0.75 2.53 0.35 0.41
2016 0.23 0.79 12.42 2.31 1.16 1.14
2017 0.30 2.29 7.95 3.67 4.13 4.11
2018 0.54 5.26 9.73 2.15 7.69 7.60
2019 0.64 7.05 11.26 0.00 9.85 9.85
2020 1.16 8.26 12.71 0.00 11.77 11.76
14. Average wireless data usage per wireless data subscriber per month
increased from 9.85 GB during the year 2019 to 11.76 GB during the
year 2020. The average wireless data usage per wireless data
subscribers per month was 0.27 GB per month in the year 2014.
Chart 3.6 : Trend of Average Wireless Data Usage (in GB) per active
data user per month
15. The following table depicts the average revenue realization per
subscriber for per GB wireless data usage.
0.27 0.411.14
4.11
7.69
9.85
11.76
0.00
2.00
4.00
6.00
8.00
10.00
12.00
14.00
2014 2015 2016 2017 2018 2019 2020
Total wireless data usage
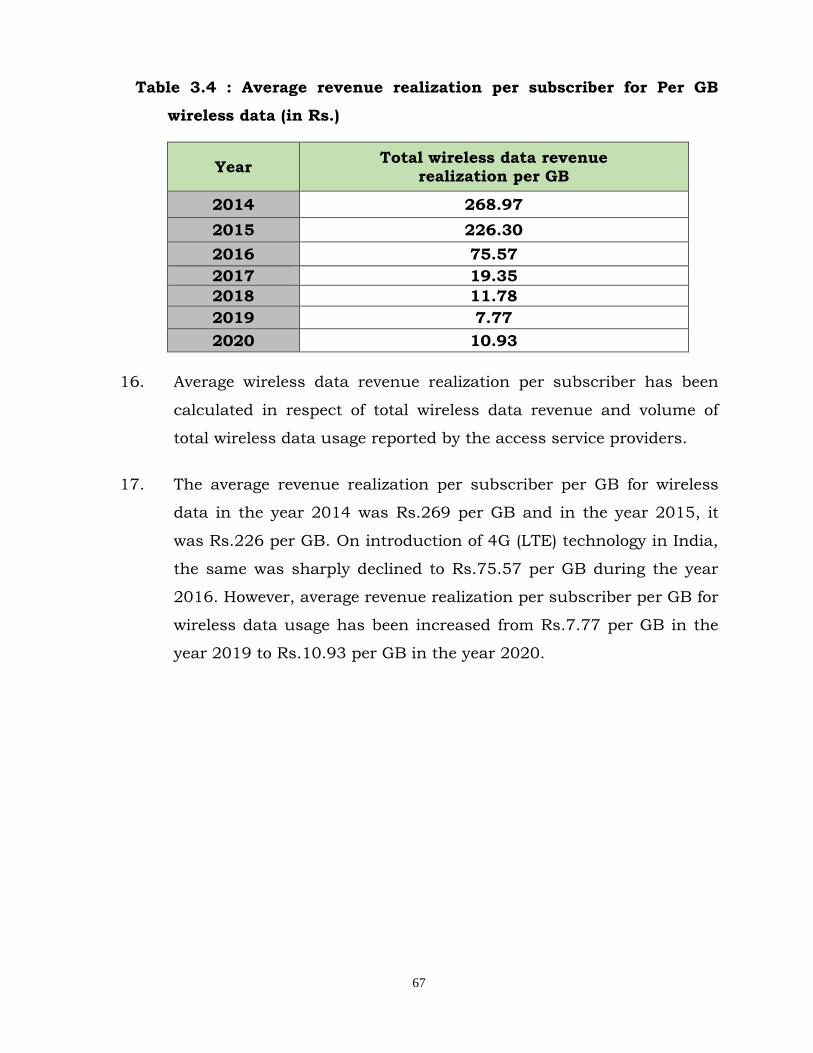
67
Table 3.4 : Average revenue realization per subscriber for Per GB
wireless data (in Rs.)
Year Total wireless data revenue
realization per GB
2014 268.97
2015 226.30
2016 75.57
2017 19.35
2018 11.78
2019 7.77
2020 10.93
16. Average wireless data revenue realization per subscriber has been
calculated in respect of total wireless data revenue and volume of
total wireless data usage reported by the access service providers.
17. The average revenue realization per subscriber per GB for wireless
data in the year 2014 was Rs.269 per GB and in the year 2015, it
was Rs.226 per GB. On introduction of 4G (LTE) technology in India,
the same was sharply declined to Rs.75.57 per GB during the year
2016. However, average revenue realization per subscriber per GB for
wireless data usage has been increased from Rs.7.77 per GB in the
year 2019 to Rs.10.93 per GB in the year 2020.
68
Chapter 4:
Financial Data of Telecom Service
Sector
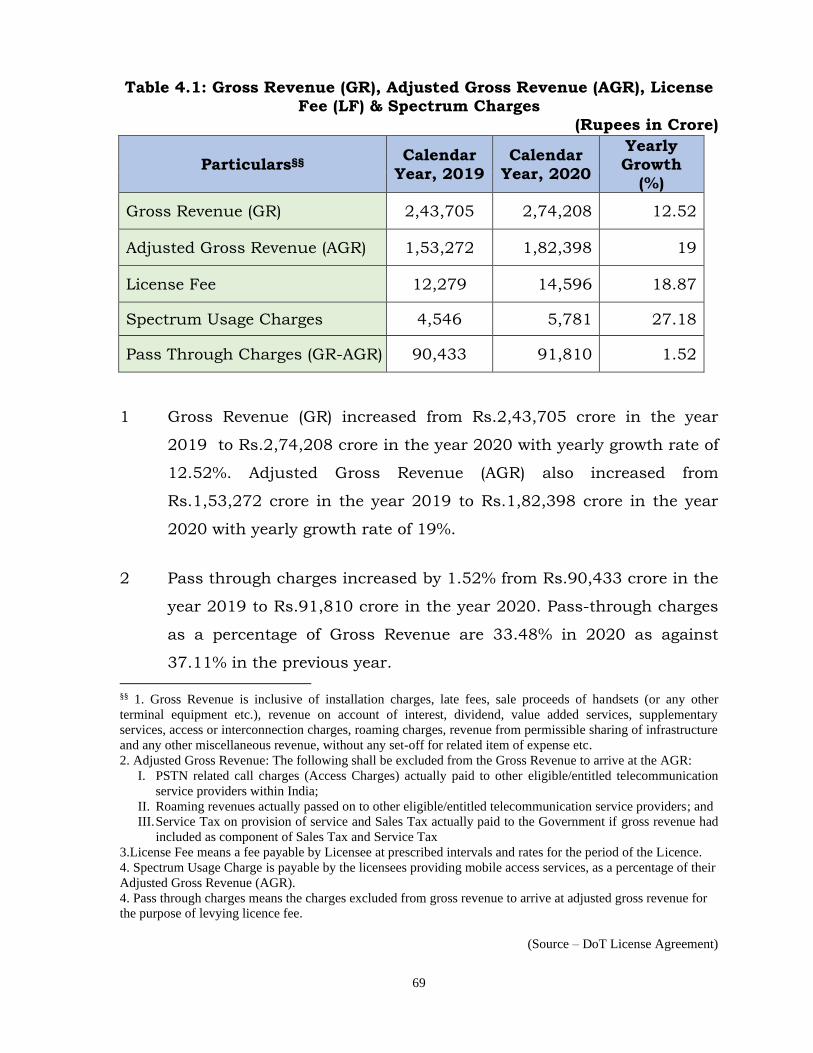
69
Table 4.1: Gross Revenue (GR), Adjusted Gross Revenue (AGR), License Fee (LF) & Spectrum Charges
(Rupees in Crore)
Particulars§§ Calendar
Year, 2019
Calendar
Year, 2020
Yearly Growth
(%)
Gross Revenue (GR) 2,43,705 2,74,208 12.52
Adjusted Gross Revenue (AGR) 1,53,272 1,82,398 19
License Fee 12,279 14,596 18.87
Spectrum Usage Charges 4,546 5,781 27.18
Pass Through Charges (GR-AGR) 90,433 91,810 1.52
1 Gross Revenue (GR) increased from Rs.2,43,705 crore in the year
2019 to Rs.2,74,208 crore in the year 2020 with yearly growth rate of
12.52%. Adjusted Gross Revenue (AGR) also increased from
Rs.1,53,272 crore in the year 2019 to Rs.1,82,398 crore in the year
2020 with yearly growth rate of 19%.
2 Pass through charges increased by 1.52% from Rs.90,433 crore in the
year 2019 to Rs.91,810 crore in the year 2020. Pass-through charges
as a percentage of Gross Revenue are 33.48% in 2020 as against
37.11% in the previous year.
§§ 1. Gross Revenue is inclusive of installation charges, late fees, sale proceeds of handsets (or any other
terminal equipment etc.), revenue on account of interest, dividend, value added services, supplementary
services, access or interconnection charges, roaming charges, revenue from permissible sharing of infrastructure
and any other miscellaneous revenue, without any set-off for related item of expense etc.
2. Adjusted Gross Revenue: The following shall be excluded from the Gross Revenue to arrive at the AGR:
I. PSTN related call charges (Access Charges) actually paid to other eligible/entitled telecommunication
service providers within India;
II. Roaming revenues actually passed on to other eligible/entitled telecommunication service providers; and
III. Service Tax on provision of service and Sales Tax actually paid to the Government if gross revenue had
included as component of Sales Tax and Service Tax
3.License Fee means a fee payable by Licensee at prescribed intervals and rates for the period of the Licence.
4. Spectrum Usage Charge is payable by the licensees providing mobile access services, as a percentage of their
Adjusted Gross Revenue (AGR).
4. Pass through charges means the charges excluded from gross revenue to arrive at adjusted gross revenue for
the purpose of levying licence fee.
(Source – DoT License Agreement)
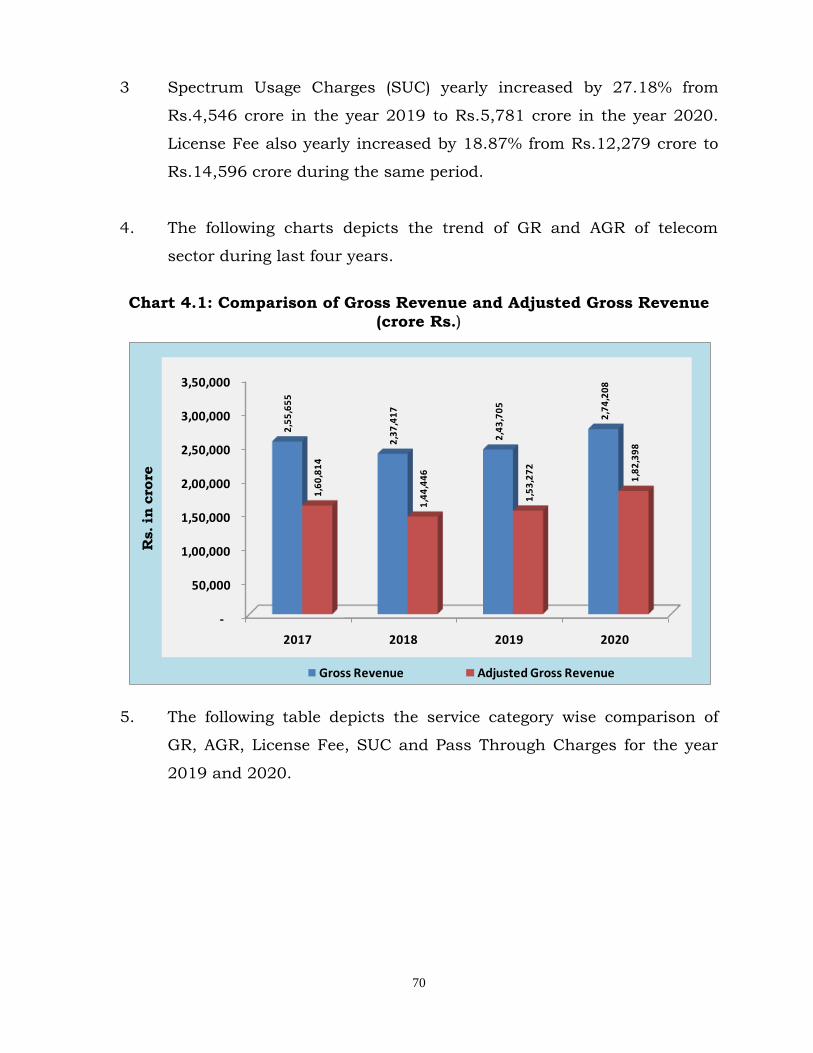
70
3 Spectrum Usage Charges (SUC) yearly increased by 27.18% from
Rs.4,546 crore in the year 2019 to Rs.5,781 crore in the year 2020.
License Fee also yearly increased by 18.87% from Rs.12,279 crore to
Rs.14,596 crore during the same period.
4. The following charts depicts the trend of GR and AGR of telecom
sector during last four years.
Chart 4.1: Comparison of Gross Revenue and Adjusted Gross Revenue
(crore Rs.)
5. The following table depicts the service category wise comparison of
GR, AGR, License Fee, SUC and Pass Through Charges for the year
2019 and 2020.
-
50,000
1,00,000
1,50,000
2,00,000
2,50,000
3,00,000
3,50,000
2017 2018 2019 2020
2,5
5,6
55
2,3
7,4
17
2,4
3,7
05
2,7
4,2
08
1,6
0,8
14
1,4
4,4
46
1,5
3,2
72
1,8
2,3
98
Gross Revenue Adjusted Gross Revenue
Rs. in
cro
re
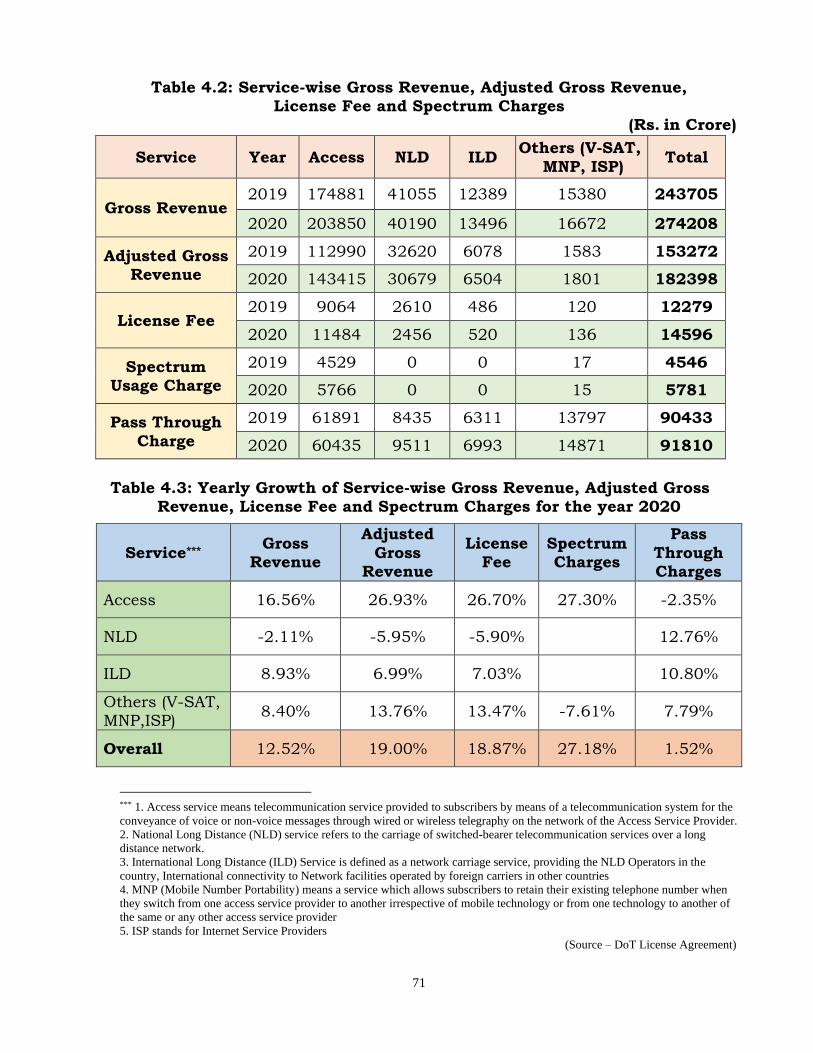
71
Table 4.2: Service-wise Gross Revenue, Adjusted Gross Revenue, License Fee and Spectrum Charges (Rs. in Crore)
Service Year Access NLD ILD Others (V-SAT,
MNP, ISP) Total
Gross Revenue 2019 174881 41055 12389 15380 243705
2020 203850 40190 13496 16672 274208
Adjusted Gross Revenue
2019 112990 32620 6078 1583 153272
2020 143415 30679 6504 1801 182398
License Fee 2019 9064 2610 486 120 12279
2020 11484 2456 520 136 14596
Spectrum Usage Charge
2019 4529 0 0 17 4546
2020 5766 0 0 15 5781
Pass Through
Charge
2019 61891 8435 6311 13797 90433
2020 60435 9511 6993 14871 91810
Table 4.3: Yearly Growth of Service-wise Gross Revenue, Adjusted Gross Revenue, License Fee and Spectrum Charges for the year 2020
Service*** Gross
Revenue
Adjusted
Gross Revenue
License Fee
Spectrum Charges
Pass
Through Charges
Access 16.56% 26.93% 26.70% 27.30% -2.35%
NLD -2.11% -5.95% -5.90% 12.76%
ILD 8.93% 6.99% 7.03% 10.80%
Others (V-SAT, MNP,ISP)
8.40% 13.76% 13.47% -7.61% 7.79%
Overall 12.52% 19.00% 18.87% 27.18% 1.52%
*** 1. Access service means telecommunication service provided to subscribers by means of a telecommunication system for the
conveyance of voice or non-voice messages through wired or wireless telegraphy on the network of the Access Service Provider.
2. National Long Distance (NLD) service refers to the carriage of switched-bearer telecommunication services over a long
distance network.
3. International Long Distance (ILD) Service is defined as a network carriage service, providing the NLD Operators in the
country, International connectivity to Network facilities operated by foreign carriers in other countries
4. MNP (Mobile Number Portability) means a service which allows subscribers to retain their existing telephone number when
they switch from one access service provider to another irrespective of mobile technology or from one technology to another of
the same or any other access service provider 5. ISP stands for Internet Service Providers
(Source – DoT License Agreement)

72
Chart 4.2: Service wise composition of Adjusted Gross Revenue for the year 2020
6 Access services contributed 78.63% of the total Adjusted Gross
Revenue of telecom services. In Access services, Gross Revenue (GR),
Adjusted Gross Revenue (AGR), License Fee and Spectrum Usage
Charges (SUC) increased by 16.56%, 26.93%, 26.70% and 27.30%
respectively in the year 2020 over the year 2019. However, Pass
Through Charges declined by 2.35% during the same period.
Table 4.4: Access Service – Service Provider wise Adjusted Gross Revenue
(Rs. in Crore)
Sl.No. Access Service Provider
Calendar Year 2019
Calendar Year 2020
Yearly Growth (%)
1 Reliance Jio 44,800 61,785 37.91
2 Bharti 28,827 41,931 45.45
3 Vodafone 26,625 26,756 0.49
4 BSNL 8,392 8,735 4.09
5 Tata 2,137 2,372 10.99
6 MTNL 1,738 1,525 -12.24
7 Reliance 457 302 -33.90
8 Quadrant 11 -1 -104.82
9 V-Con Mobile & Infra Pvt. Ltd.
1 9 557.86
Grand Total (Access) 112,991 1,43,415 26.93
Access, 78.63%
NLD, 16.82%
ILD, 3.57% Others , 0.99%
Access NLD ILD Others
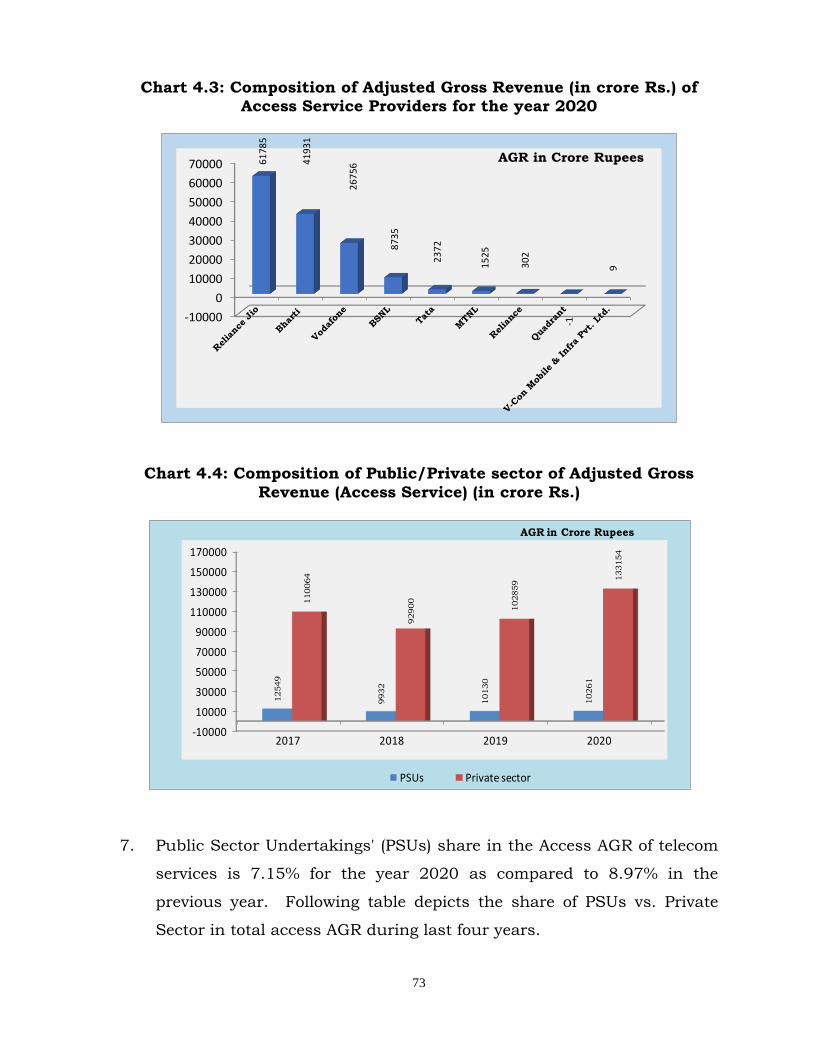
73
Chart 4.3: Composition of Adjusted Gross Revenue (in crore Rs.) of Access Service Providers for the year 2020
Chart 4.4: Composition of Public/Private sector of Adjusted Gross
Revenue (Access Service) (in crore Rs.)
7. Public Sector Undertakings' (PSUs) share in the Access AGR of telecom
services is 7.15% for the year 2020 as compared to 8.97% in the
previous year. Following table depicts the share of PSUs vs. Private
Sector in total access AGR during last four years.
-10000
0
10000
20000
30000
40000
50000
60000
70000 61
78
5
41
93
1
26
75
6
87
35
23
72
15
25
30
2
-1
9
AGR in Crore Rupees
-10000
10000
30000
50000
70000
90000
110000
130000
150000
170000
2017 2018 2019 2020
12549
9932
10130
10261
110064
92900
102859
133154
PSUs Private sector
AGR in Crore Rupees
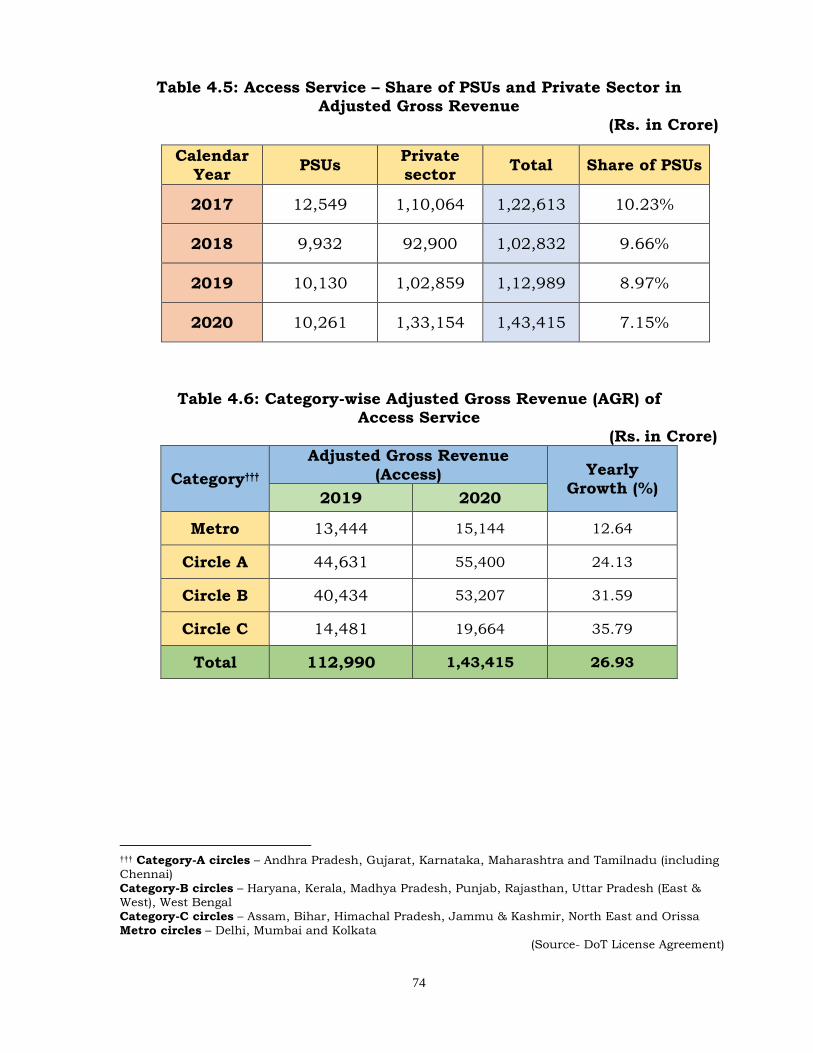
74
Table 4.5: Access Service – Share of PSUs and Private Sector in Adjusted Gross Revenue
(Rs. in Crore)
Calendar
Year PSUs
Private
sector Total Share of PSUs
2017 12,549 1,10,064 1,22,613 10.23%
2018 9,932 92,900 1,02,832 9.66%
2019 10,130 1,02,859 1,12,989 8.97%
2020 10,261 1,33,154 1,43,415 7.15%
Table 4.6: Category-wise Adjusted Gross Revenue (AGR) of
Access Service
(Rs. in Crore)
Category†††
Adjusted Gross Revenue
(Access) Yearly
Growth (%) 2019 2020
Metro 13,444 15,144 12.64
Circle A 44,631 55,400 24.13
Circle B 40,434 53,207 31.59
Circle C 14,481 19,664 35.79
Total 112,990 1,43,415 26.93
††† Category-A circles – Andhra Pradesh, Gujarat, Karnataka, Maharashtra and Tamilnadu (including Chennai) Category-B circles – Haryana, Kerala, Madhya Pradesh, Punjab, Rajasthan, Uttar Pradesh (East & West), West Bengal Category-C circles – Assam, Bihar, Himachal Pradesh, Jammu & Kashmir, North East and Orissa Metro circles – Delhi, Mumbai and Kolkata
(Source- DoT License Agreement)
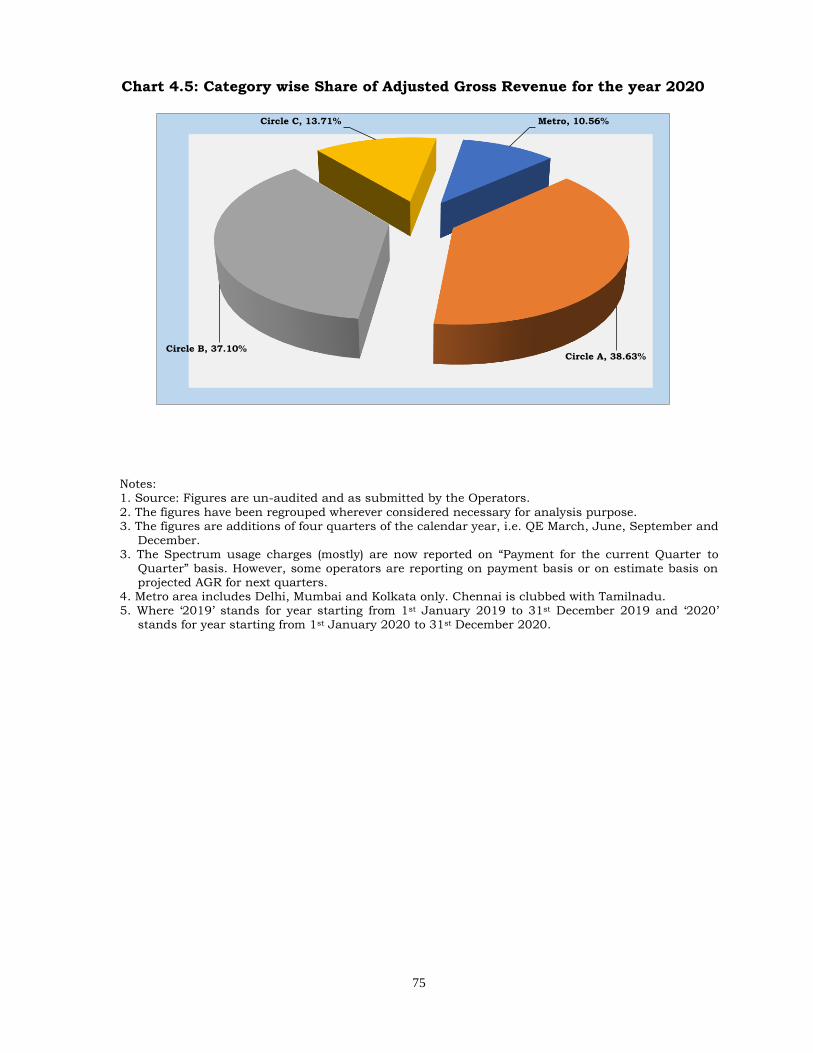
75
Chart 4.5: Category wise Share of Adjusted Gross Revenue for the year 2020
Notes: 1. Source: Figures are un-audited and as submitted by the Operators.
2. The figures have been regrouped wherever considered necessary for analysis purpose. 3. The figures are additions of four quarters of the calendar year, i.e. QE March, June, September and
December. 3. The Spectrum usage charges (mostly) are now reported on “Payment for the current Quarter to
Quarter” basis. However, some operators are reporting on payment basis or on estimate basis on projected AGR for next quarters.
4. Metro area includes Delhi, Mumbai and Kolkata only. Chennai is clubbed with Tamilnadu. 5. Where ‘2019’ stands for year starting from 1st January 2019 to 31st December 2019 and ‘2020’
stands for year starting from 1st January 2020 to 31st December 2020.
Metro, 10.56%
Circle A, 38.63%Circle B, 37.10%
Circle C, 13.71%
76
Chapter 5:
Performance of
Cable TV, DTH and Radio Broadcasting
Services
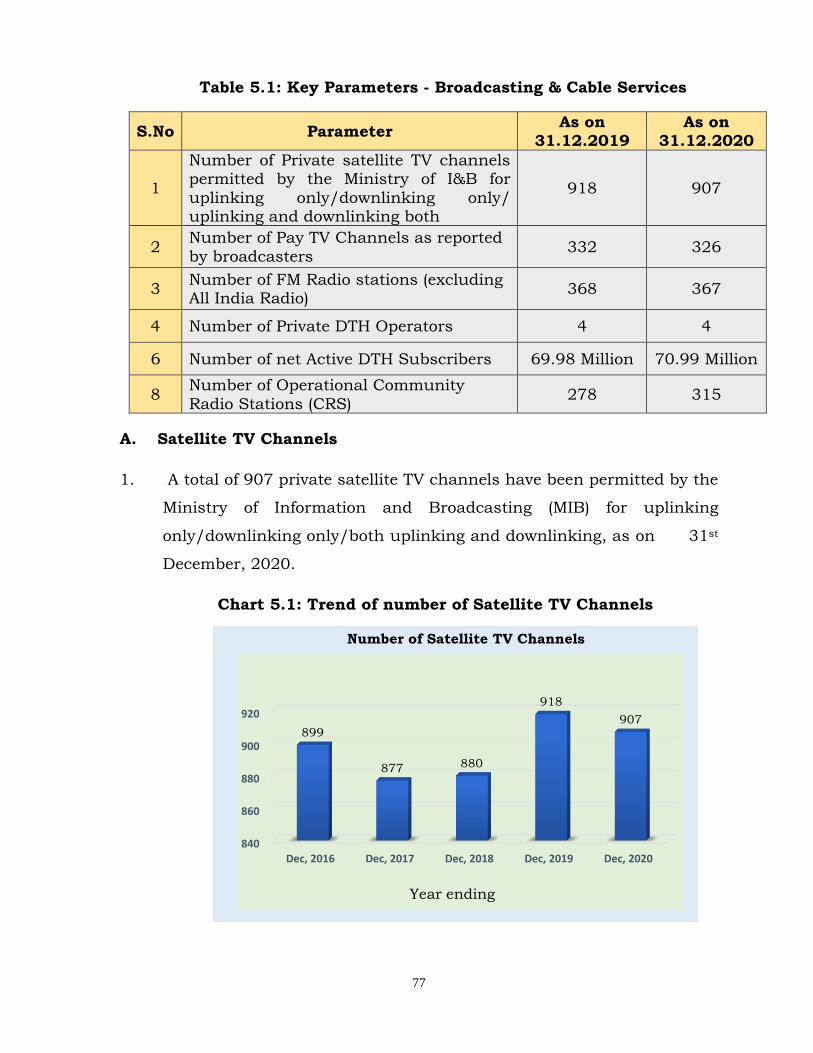
77
Table 5.1: Key Parameters - Broadcasting & Cable Services
S.No Parameter As on
31.12.2019 As on
31.12.2020
1
Number of Private satellite TV channels permitted by the Ministry of I&B for
uplinking only/downlinking only/ uplinking and downlinking both
918 907
2 Number of Pay TV Channels as reported
by broadcasters 332 326
3 Number of FM Radio stations (excluding All India Radio)
368 367
4 Number of Private DTH Operators 4 4
6 Number of net Active DTH Subscribers 69.98 Million 70.99 Million
8 Number of Operational Community
Radio Stations (CRS) 278 315
A. Satellite TV Channels
1. A total of 907 private satellite TV channels have been permitted by the
Ministry of Information and Broadcasting (MIB) for uplinking
only/downlinking only/both uplinking and downlinking, as on 31st
December, 2020.
Chart 5.1: Trend of number of Satellite TV Channels
840
860
880
900
920
Dec, 2016 Dec, 2017 Dec, 2018 Dec, 2019 Dec, 2020
899
877 880
918
907
Number of Satellite TV Channels
Year ending
78
B. Pay TV Channels
2. Telecom Regulatory Authority of India (TRAI), in March, 2017, notified
the new regulatory framework for Broadcasting and Cable services.
The framework comprises of Tariff Order 2017, Interconnection
Regulations 2017 and Quality of Service & Consumer Protection
Regulations 2017. The framework was duly notified vide press release
no.71/2018 dated 3rd July 2018 with revised timelines for
implementation. All the timelines prescribed in the above-mentioned
framework commenced from 3rd July 2018. The new regulatory
framework has come into effect on 29th December 2018.
3. As per the Telecommunication (Broadcasting and Cable) Services
(Eighth) (Addressable Systems) Tariff Order, 2017 dated 3rd March
2017 as amended, every broadcaster has to offer all its channels on a-
la-carte basis to all distributors of television channels and declare
maximum retail price, per month, payable by a subscriber for each of
its pay channel offered on a-la-carte basis. Further, it is also
permissible for a broadcaster to offer its pay channels in the form of
bouquet and declare the maximum retail price, per month, of such
bouquet payable by a subscriber.
4. As per the reporting done by broadcasters in pursuance of the Tariff
Order dated 3rd March 2017, as amended, there are 326 pay TV
channels, as on 31st December 2020, which includes 233 SD pay TV
channels and 93 HD Pay TV channels. Apart from these pay channels
reported to TRAI, all other channels permitted by MIB may be
considered as Free to Air (FTA) channels. A list of pay TV channels
offered by broadcasters for subscribers as reported to TRAI is attached
as Annexure-5.1.
79
C. Cable TV Sector 5. Digitization, with addressability, of cable TV sector has been
completed. The country achieved 100% digitization of Cable TV
network. This is a stupendous achievement making India as the only
large country where 100% digital cable has been achieved through
mandatory regulations.
D. Direct-to-Home (DTH) Sector
6. Since its introduction in the year 2003, Indian DTH service has
displayed a phenomenal growth. During the period ending 31st
December, 2020, there were 4 pay DTH service providers in India.
List and details of pay DTH service providers is placed at Annexure-
5.2.
7. Pay DTH has attained net pay active subscriber base of around 70.99
million with 4 pay DTH service providers as on 31st December, 2020
as compared to 69.98 million subscribers with 4 pay DTH service
providers as on 31st December, 2019. This is in addition to the
subscribers of the free DTH services of Doordarshan. Yearly increase
rate of 1.44% has been recorded in pay active subscriber base in the
year 2020 as compared to the previous year.
8. The following chart depict the yearly trend of number of pay active
subscribers of pay DTH service during last five years.
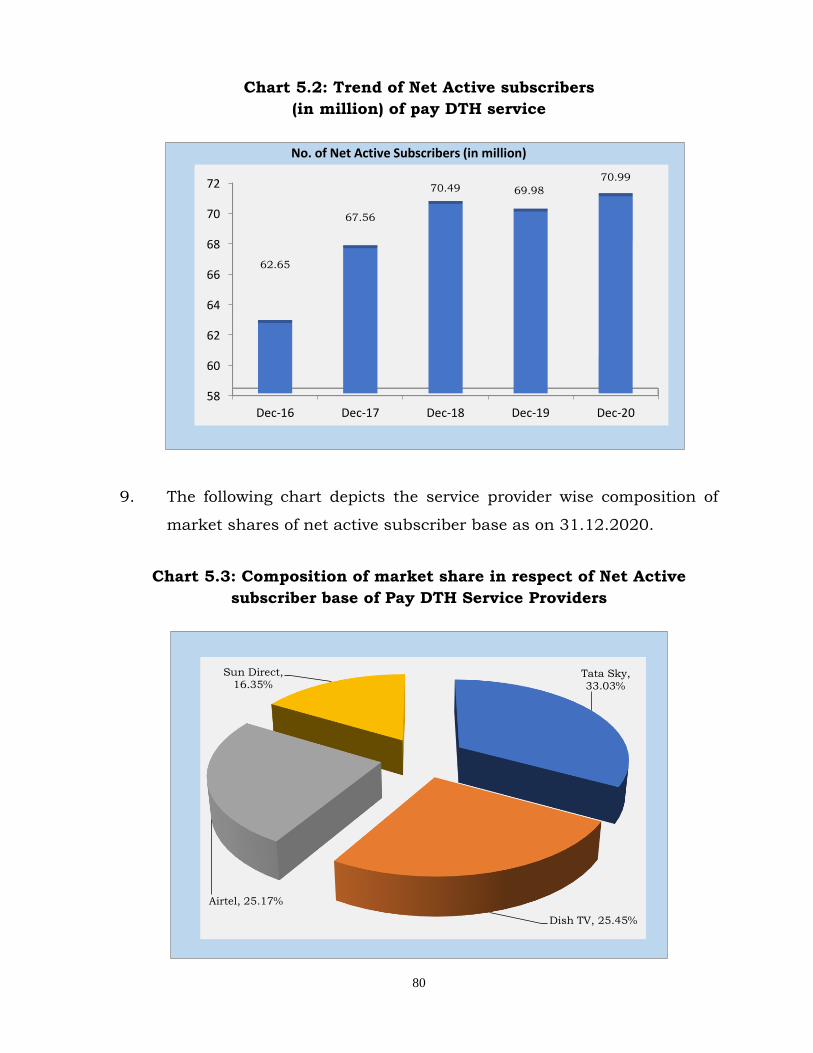
80
Chart 5.2: Trend of Net Active subscribers
(in million) of pay DTH service
9. The following chart depicts the service provider wise composition of
market shares of net active subscriber base as on 31.12.2020.
Chart 5.3: Composition of market share in respect of Net Active
subscriber base of Pay DTH Service Providers
58
60
62
64
66
68
70
72
Dec-16 Dec-17 Dec-18 Dec-19 Dec-20
62.65
67.56
70.49 69.98
70.99
No. of Net Active Subscribers (in million)
Tata Sky, 33.03%
Dish TV, 25.45%
Airtel, 25.17%
Sun Direct, 16.35%
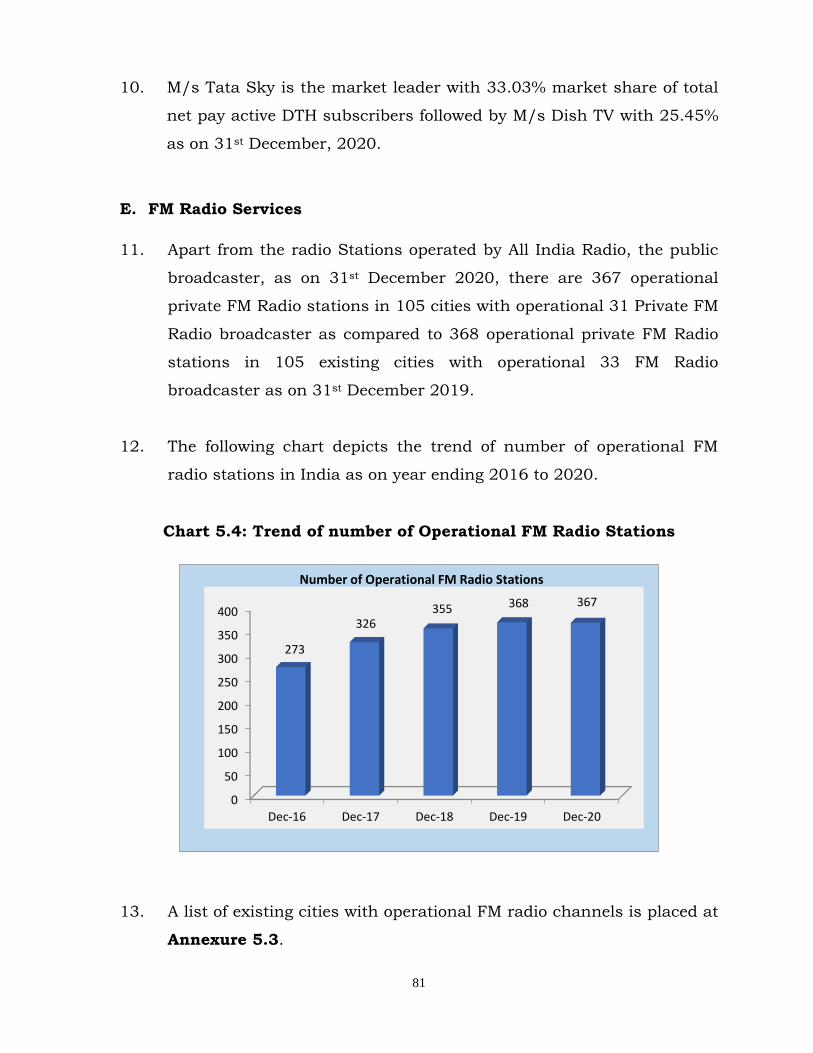
81
10. M/s Tata Sky is the market leader with 33.03% market share of total
net pay active DTH subscribers followed by M/s Dish TV with 25.45%
as on 31st December, 2020.
E. FM Radio Services
11. Apart from the radio Stations operated by All India Radio, the public
broadcaster, as on 31st December 2020, there are 367 operational
private FM Radio stations in 105 cities with operational 31 Private FM
Radio broadcaster as compared to 368 operational private FM Radio
stations in 105 existing cities with operational 33 FM Radio
broadcaster as on 31st December 2019.
12. The following chart depicts the trend of number of operational FM
radio stations in India as on year ending 2016 to 2020.
Chart 5.4: Trend of number of Operational FM Radio Stations
13. A list of existing cities with operational FM radio channels is placed at
Annexure 5.3.
0
50
100
150
200
250
300
350
400
Dec-16 Dec-17 Dec-18 Dec-19 Dec-20
273
326355 368 367
Number of Operational FM Radio Stations
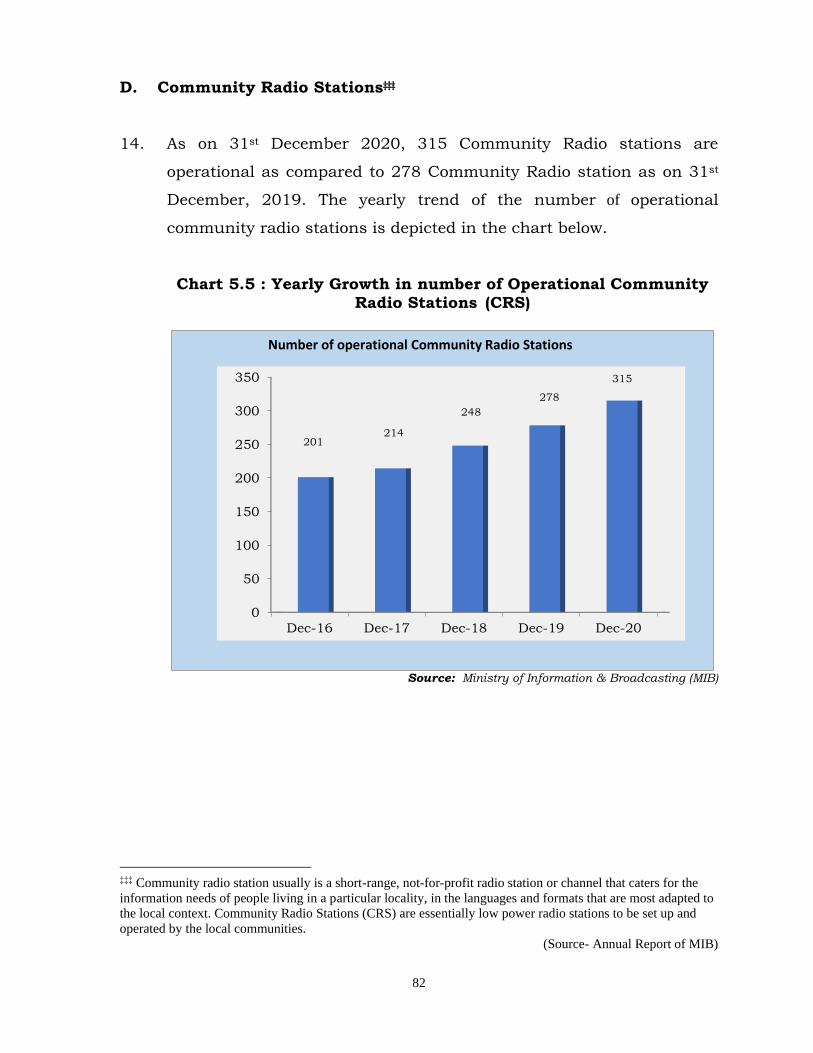
82
D. Community Radio Stations‡‡‡
14. As on 31st December 2020, 315 Community Radio stations are
operational as compared to 278 Community Radio station as on 31st
December, 2019. The yearly trend of the number of operational
community radio stations is depicted in the chart below.
Chart 5.5 : Yearly Growth in number of Operational Community Radio Stations (CRS)
Source: Ministry of Information & Broadcasting (MIB)
‡‡‡ Community radio station usually is a short-range, not-for-profit radio station or channel that caters for the
information needs of people living in a particular locality, in the languages and formats that are most adapted to
the local context. Community Radio Stations (CRS) are essentially low power radio stations to be set up and
operated by the local communities.
(Source- Annual Report of MIB)
0
50
100
150
200
250
300
350
Dec-16 Dec-17 Dec-18 Dec-19 Dec-20
201214
248
278
315
Number of operational Community Radio Stations

83
Annexures
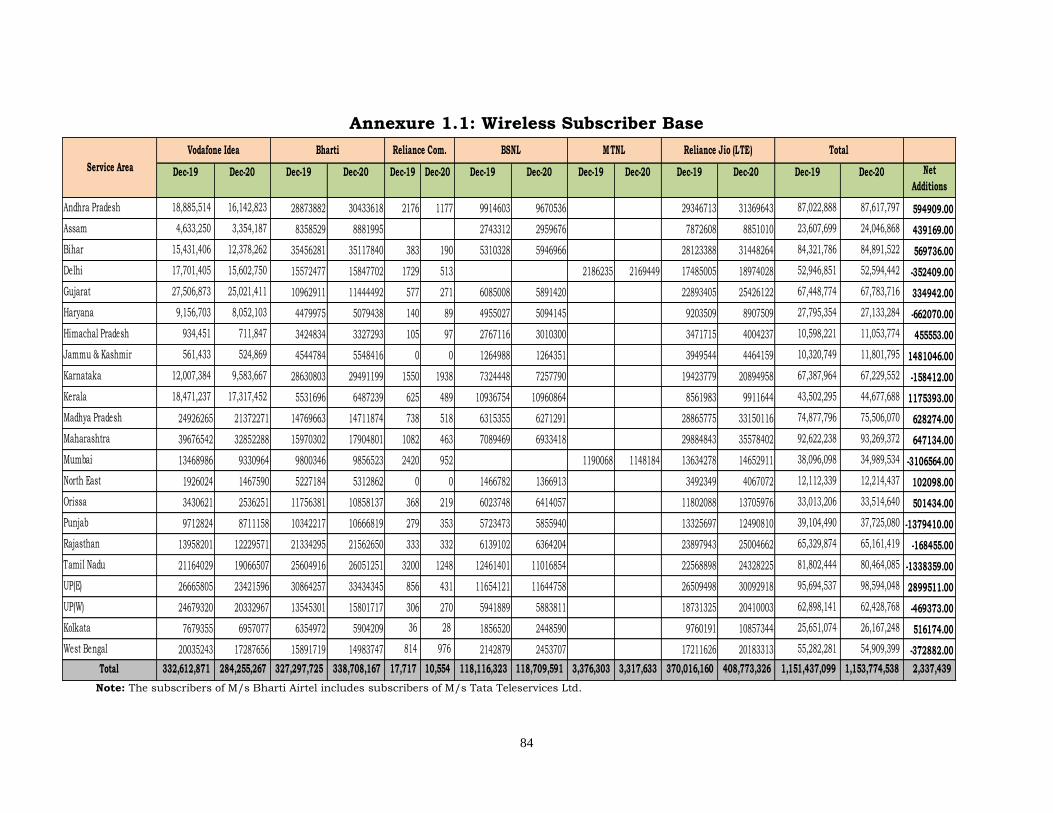
84
Annexure 1.1: Wireless Subscriber Base
Note: The subscribers of M/s Bharti Airtel includes subscribers of M/s Tata Teleservices Ltd.
Dec-19 Dec-20 Dec-19 Dec-20 Dec-19 Dec-20 Dec-19 Dec-20 Dec-19 Dec-20 Dec-19 Dec-20 Dec-19 Dec-20 Net
Additions
Andhra Pradesh 18,885,514 16,142,823 28873882 30433618 2176 1177 9914603 9670536 29346713 31369643 87,022,888 87,617,797 594909.00
Assam 4,633,250 3,354,187 8358529 8881995 2743312 2959676 7872608 8851010 23,607,699 24,046,868 439169.00
Bihar 15,431,406 12,378,262 35456281 35117840 383 190 5310328 5946966 28123388 31448264 84,321,786 84,891,522 569736.00
Delhi 17,701,405 15,602,750 15572477 15847702 1729 513 2186235 2169449 17485005 18974028 52,946,851 52,594,442 -352409.00
Gujarat 27,506,873 25,021,411 10962911 11444492 577 271 6085008 5891420 22893405 25426122 67,448,774 67,783,716 334942.00
Haryana 9,156,703 8,052,103 4479975 5079438 140 89 4955027 5094145 9203509 8907509 27,795,354 27,133,284 -662070.00
Himachal Pradesh 934,451 711,847 3424834 3327293 105 97 2767116 3010300 3471715 4004237 10,598,221 11,053,774 455553.00
Jammu & Kashmir 561,433 524,869 4544784 5548416 0 0 1264988 1264351 3949544 4464159 10,320,749 11,801,795 1481046.00
Karnataka 12,007,384 9,583,667 28630803 29491199 1550 1938 7324448 7257790 19423779 20894958 67,387,964 67,229,552 -158412.00
Kerala 18,471,237 17,317,452 5531696 6487239 625 489 10936754 10960864 8561983 9911644 43,502,295 44,677,688 1175393.00
Madhya Pradesh 24926265 21372271 14769663 14711874 738 518 6315355 6271291 28865775 33150116 74,877,796 75,506,070 628274.00
Maharashtra 39676542 32852288 15970302 17904801 1082 463 7089469 6933418 29884843 35578402 92,622,238 93,269,372 647134.00
Mumbai 13468986 9330964 9800346 9856523 2420 952 1190068 1148184 13634278 14652911 38,096,098 34,989,534 -3106564.00
North East 1926024 1467590 5227184 5312862 0 0 1466782 1366913 3492349 4067072 12,112,339 12,214,437 102098.00
Orissa 3430621 2536251 11756381 10858137 368 219 6023748 6414057 11802088 13705976 33,013,206 33,514,640 501434.00
Punjab 9712824 8711158 10342217 10666819 279 353 5723473 5855940 13325697 12490810 39,104,490 37,725,080 -1379410.00
Rajasthan 13958201 12229571 21334295 21562650 333 332 6139102 6364204 23897943 25004662 65,329,874 65,161,419 -168455.00
Tamil Nadu 21164029 19066507 25604916 26051251 3200 1248 12461401 11016854 22568898 24328225 81,802,444 80,464,085 -1338359.00
UP(E) 26665805 23421596 30864257 33434345 856 431 11654121 11644758 26509498 30092918 95,694,537 98,594,048 2899511.00
UP(W) 24679320 20332967 13545301 15801717 306 270 5941889 5883811 18731325 20410003 62,898,141 62,428,768 -469373.00
Kolkata 7679355 6957077 6354972 5904209 36 28 1856520 2448590 9760191 10857344 25,651,074 26,167,248 516174.00
West Bengal 20035243 17287656 15891719 14983747 814 976 2142879 2453707 17211626 20183313 55,282,281 54,909,399 -372882.00
Total 332,612,871 284,255,267 327,297,725 338,708,167 17,717 10,554 118,116,323 118,709,591 3,376,303 3,317,633 370,016,160 408,773,326 1,151,437,099 1,153,774,538 2,337,439
Service Area
Vodafone Idea Bharti Reliance Com. TotalBSNL MTNL Reliance Jio (LTE)
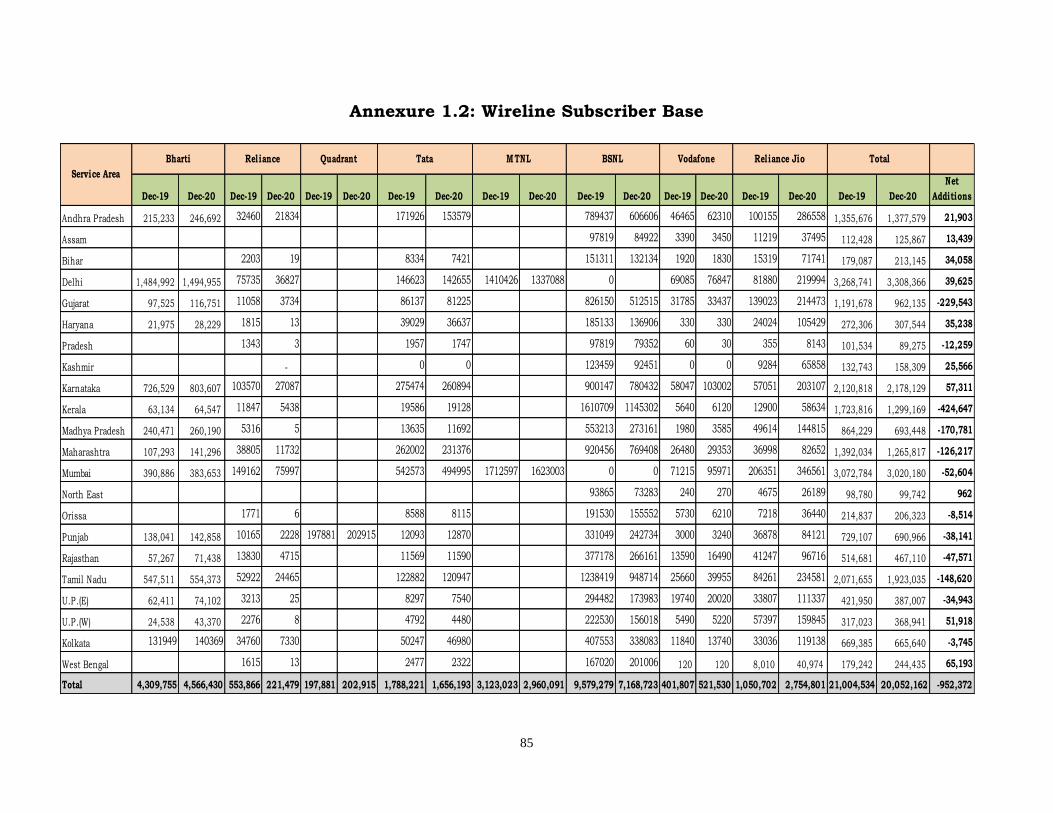
85
Annexure 1.2: Wireline Subscriber Base
Dec-19 Dec-20 Dec-19 Dec-20 Dec-19 Dec-20 Dec-19 Dec-20 Dec-19 Dec-20 Dec-19 Dec-20 Dec-19 Dec-20 Dec-19 Dec-20 Dec-19 Dec-20
Net
Additions
Andhra Pradesh 215,233 246,692 32460 21834 171926 153579 789437 606606 46465 62310 100155 286558 1,355,676 1,377,579 21,903
Assam 97819 84922 3390 3450 11219 37495 112,428 125,867 13,439
Bihar 2203 19 8334 7421 151311 132134 1920 1830 15319 71741 179,087 213,145 34,058
Delhi 1,484,992 1,494,955 75735 36827 146623 142655 1410426 1337088 0 69085 76847 81880 219994 3,268,741 3,308,366 39,625
Gujarat 97,525 116,751 11058 3734 86137 81225 826150 512515 31785 33437 139023 214473 1,191,678 962,135 -229,543
Haryana 21,975 28,229 1815 13 39029 36637 185133 136906 330 330 24024 105429 272,306 307,544 35,238Himachal
Pradesh 1343 3 1957 1747 97819 79352 60 30 355 8143 101,534 89,275 -12,259Jammu &
Kashmir - 0 0 123459 92451 0 0 9284 65858 132,743 158,309 25,566
Karnataka 726,529 803,607 103570 27087 275474 260894 900147 780432 58047 103002 57051 203107 2,120,818 2,178,129 57,311
Kerala 63,134 64,547 11847 5438 19586 19128 1610709 1145302 5640 6120 12900 58634 1,723,816 1,299,169 -424,647
Madhya Pradesh 240,471 260,190 5316 5 13635 11692 553213 273161 1980 3585 49614 144815 864,229 693,448 -170,781
Maharashtra 107,293 141,296 38805 11732 262002 231376 920456 769408 26480 29353 36998 82652 1,392,034 1,265,817 -126,217
Mumbai 390,886 383,653 149162 75997 542573 494995 1712597 1623003 0 0 71215 95971 206351 346561 3,072,784 3,020,180 -52,604
North East 93865 73283 240 270 4675 26189 98,780 99,742 962
Orissa 1771 6 8588 8115 191530 155552 5730 6210 7218 36440 214,837 206,323 -8,514
Punjab 138,041 142,858 10165 2228 197881 202915 12093 12870 331049 242734 3000 3240 36878 84121 729,107 690,966 -38,141
Rajasthan 57,267 71,438 13830 4715 11569 11590 377178 266161 13590 16490 41247 96716 514,681 467,110 -47,571
Tamil Nadu 547,511 554,373 52922 24465 122882 120947 1238419 948714 25660 39955 84261 234581 2,071,655 1,923,035 -148,620
U.P.(E) 62,411 74,102 3213 25 8297 7540 294482 173983 19740 20020 33807 111337 421,950 387,007 -34,943
U.P.(W) 24,538 43,370 2276 8 4792 4480 222530 156018 5490 5220 57397 159845 317,023 368,941 51,918
Kolkata 131949 140369 34760 7330 50247 46980 407553 338083 11840 13740 33036 119138 669,385 665,640 -3,745
West Bengal 1615 13 2477 2322 167020 201006 120 120 8,010 40,974 179,242 244,435 65,193
Total 4,309,755 4,566,430 553,866 221,479 197,881 202,915 1,788,221 1,656,193 3,123,023 2,960,091 9,579,279 7,168,723 401,807 521,530 1,050,702 2,754,801 21,004,534 20,052,162 -952,372
Reliance Jio TotalBharti Reliance Quadrant Tata MTNL BSNL Vodafone
Service Area

86
Annexure 1.3: Service Area and Operator wise details of PCOs
Name of the Circle/Service
Area Service Provider
Number of PCOs as on 31.12.2019
Number of PCOs as on 31.12.2020
Andhra Pradesh (Excluding Telangana)
Bharat Sanchar Nigam Ltd. 4,912 3,616
Bharti Group 184 0
Telangana Bharat Sanchar Nigam Ltd. 4097 3,993
Bharti Group 181
Assam Bharat Sanchar Nigam Ltd. 915 624
Bihar (excluding Jharkhand)
Bharat Sanchar Nigam Ltd. 822 591
Jharkhand Bharat Sanchar Nigam Ltd. 2,441 2,410
Delhi Bharti Group 330 330
Mahanagar Telephone Nigam Ltd./MTNL
45,694 38,936
Gujarat Bharat Sanchar Nigam Ltd. 7,509 4,680
Bharti Group 14 16
Haryana Bharat Sanchar Nigam Ltd. 789 415
Bharti Group 138 134
Himachal Pradesh Bharat Sanchar Nigam Ltd. 730 618
Jammu & Kashmir Bharat Sanchar Nigam Ltd. 973 372
Karnataka Bharat Sanchar Nigam Ltd. 13,348 8,752
Bharti Group 3,036 2,713
Kerala
Bharat Sanchar Nigam Ltd. 12,585 10,326
Bharti Group 397 382
Kolkata Bharat Sanchar Nigam Ltd. 2,189 1,884
Bharti Group 37 26
Madhya Pradesh (excluding Chhattisgarh)
Bharat Sanchar Nigam Ltd. 8,865 5,476
Bharti Group 1,338 0
Chhatisgarh Bharat Sanchar Nigam Ltd. 925 182
Maharashtra & Goa Bharat Sanchar Nigam Ltd. 16,209 6,910
Mumbai Bharti Group 50 50
Mahanagar Telephone Nigam Ltd./MTNL
20,187 14,777
Arunachal Pradesh Bharat Sanchar Nigam Ltd. 1,352 9
Manipur Bharat Sanchar Nigam Ltd. 772 772
Meghalaya Bharat Sanchar Nigam Ltd. 255 94
Mizoram Bharat Sanchar Nigam Ltd. 115 105
Nagaland Bharat Sanchar Nigam Ltd. 0 0
Tripura Bharat Sanchar Nigam Ltd. 483 472
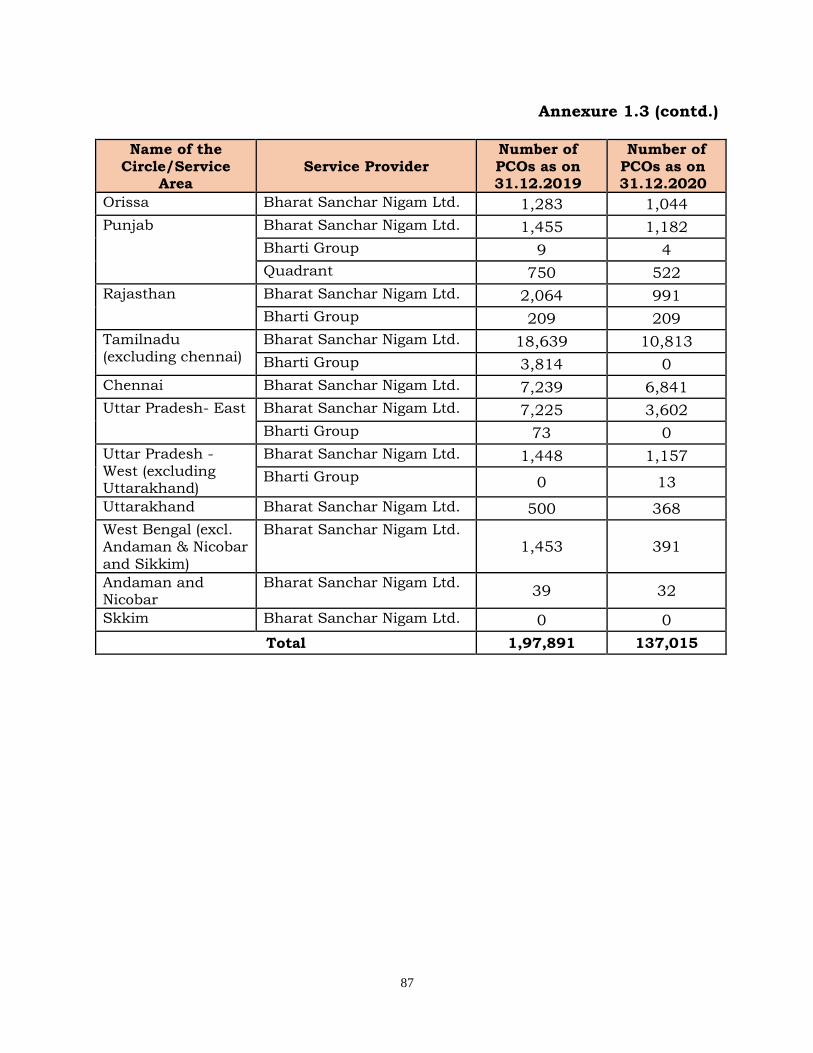
87
Annexure 1.3 (contd.)
Name of the Circle/Service
Area Service Provider
Number of PCOs as on 31.12.2019
Number of PCOs as on 31.12.2020
Orissa Bharat Sanchar Nigam Ltd. 1,283 1,044
Punjab Bharat Sanchar Nigam Ltd. 1,455 1,182
Bharti Group 9 4
Quadrant 750 522
Rajasthan Bharat Sanchar Nigam Ltd. 2,064 991
Bharti Group 209 209
Tamilnadu (excluding chennai)
Bharat Sanchar Nigam Ltd. 18,639 10,813
Bharti Group 3,814 0
Chennai Bharat Sanchar Nigam Ltd. 7,239 6,841
Uttar Pradesh- East Bharat Sanchar Nigam Ltd. 7,225 3,602
Bharti Group 73 0
Uttar Pradesh - West (excluding Uttarakhand)
Bharat Sanchar Nigam Ltd. 1,448 1,157
Bharti Group 0 13
Uttarakhand Bharat Sanchar Nigam Ltd. 500 368
West Bengal (excl. Andaman & Nicobar and Sikkim)
Bharat Sanchar Nigam Ltd.
1,453 391
Andaman and Nicobar
Bharat Sanchar Nigam Ltd. 39 32
Skkim Bharat Sanchar Nigam Ltd. 0 0
Total 1,97,891 137,015
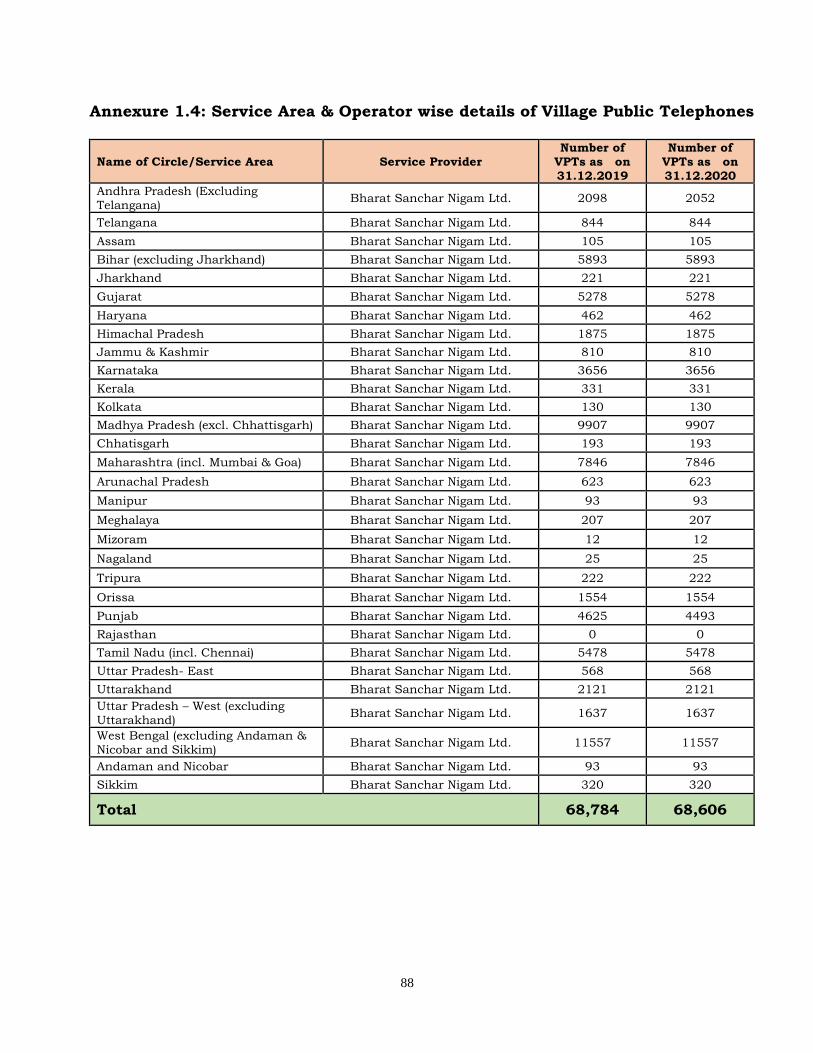
88
Annexure 1.4: Service Area & Operator wise details of Village Public Telephones
Name of Circle/Service Area Service Provider Number of
VPTs as on 31.12.2019
Number of VPTs as on 31.12.2020
Andhra Pradesh (Excluding Telangana)
Bharat Sanchar Nigam Ltd. 2098 2052
Telangana Bharat Sanchar Nigam Ltd. 844 844
Assam Bharat Sanchar Nigam Ltd. 105 105
Bihar (excluding Jharkhand) Bharat Sanchar Nigam Ltd. 5893 5893
Jharkhand Bharat Sanchar Nigam Ltd. 221 221
Gujarat Bharat Sanchar Nigam Ltd. 5278 5278
Haryana Bharat Sanchar Nigam Ltd. 462 462
Himachal Pradesh Bharat Sanchar Nigam Ltd. 1875 1875
Jammu & Kashmir Bharat Sanchar Nigam Ltd. 810 810
Karnataka Bharat Sanchar Nigam Ltd. 3656 3656
Kerala Bharat Sanchar Nigam Ltd. 331 331
Kolkata Bharat Sanchar Nigam Ltd. 130 130
Madhya Pradesh (excl. Chhattisgarh) Bharat Sanchar Nigam Ltd. 9907 9907
Chhatisgarh Bharat Sanchar Nigam Ltd. 193 193
Maharashtra (incl. Mumbai & Goa) Bharat Sanchar Nigam Ltd. 7846 7846
Arunachal Pradesh Bharat Sanchar Nigam Ltd. 623 623
Manipur Bharat Sanchar Nigam Ltd. 93 93
Meghalaya Bharat Sanchar Nigam Ltd. 207 207
Mizoram Bharat Sanchar Nigam Ltd. 12 12
Nagaland Bharat Sanchar Nigam Ltd. 25 25
Tripura Bharat Sanchar Nigam Ltd. 222 222
Orissa Bharat Sanchar Nigam Ltd. 1554 1554
Punjab Bharat Sanchar Nigam Ltd. 4625 4493
Rajasthan Bharat Sanchar Nigam Ltd. 0 0
Tamil Nadu (incl. Chennai) Bharat Sanchar Nigam Ltd. 5478 5478
Uttar Pradesh- East Bharat Sanchar Nigam Ltd. 568 568
Uttarakhand Bharat Sanchar Nigam Ltd. 2121 2121
Uttar Pradesh – West (excluding Uttarakhand)
Bharat Sanchar Nigam Ltd. 1637 1637
West Bengal (excluding Andaman & Nicobar and Sikkim)
Bharat Sanchar Nigam Ltd. 11557 11557
Andaman and Nicobar Bharat Sanchar Nigam Ltd. 93 93
Sikkim Bharat Sanchar Nigam Ltd. 320 320
Total 68,784 68,606
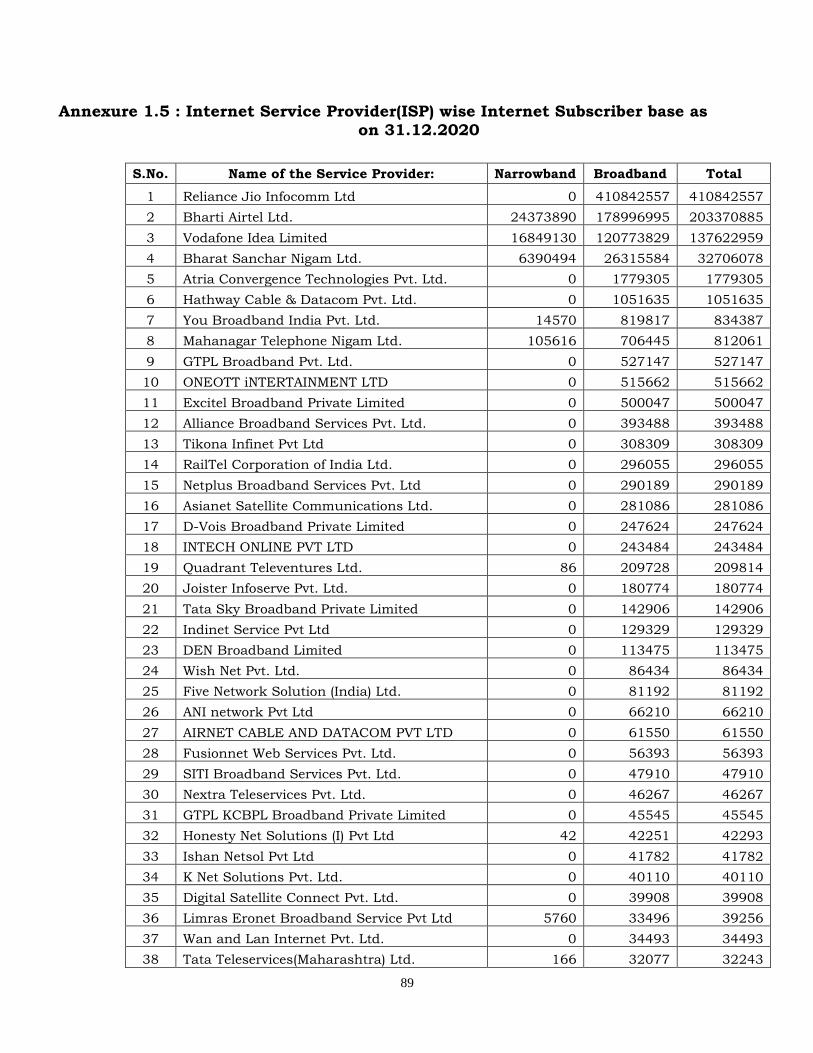
89
Annexure 1.5 : Internet Service Provider(ISP) wise Internet Subscriber base as on 31.12.2020
S.No. Name of the Service Provider: Narrowband Broadband Total
1 Reliance Jio Infocomm Ltd 0 410842557 410842557
2 Bharti Airtel Ltd. 24373890 178996995 203370885
3 Vodafone Idea Limited 16849130 120773829 137622959
4 Bharat Sanchar Nigam Ltd. 6390494 26315584 32706078
5 Atria Convergence Technologies Pvt. Ltd. 0 1779305 1779305
6 Hathway Cable & Datacom Pvt. Ltd. 0 1051635 1051635
7 You Broadband India Pvt. Ltd. 14570 819817 834387
8 Mahanagar Telephone Nigam Ltd. 105616 706445 812061
9 GTPL Broadband Pvt. Ltd. 0 527147 527147
10 ONEOTT iNTERTAINMENT LTD 0 515662 515662
11 Excitel Broadband Private Limited 0 500047 500047
12 Alliance Broadband Services Pvt. Ltd. 0 393488 393488
13 Tikona Infinet Pvt Ltd 0 308309 308309
14 RailTel Corporation of India Ltd. 0 296055 296055
15 Netplus Broadband Services Pvt. Ltd 0 290189 290189
16 Asianet Satellite Communications Ltd. 0 281086 281086
17 D-Vois Broadband Private Limited 0 247624 247624
18 INTECH ONLINE PVT LTD 0 243484 243484
19 Quadrant Televentures Ltd. 86 209728 209814
20 Joister Infoserve Pvt. Ltd. 0 180774 180774
21 Tata Sky Broadband Private Limited 0 142906 142906
22 Indinet Service Pvt Ltd 0 129329 129329
23 DEN Broadband Limited 0 113475 113475
24 Wish Net Pvt. Ltd. 0 86434 86434
25 Five Network Solution (India) Ltd. 0 81192 81192
26 ANI network Pvt Ltd 0 66210 66210
27 AIRNET CABLE AND DATACOM PVT LTD 0 61550 61550
28 Fusionnet Web Services Pvt. Ltd. 0 56393 56393
29 SITI Broadband Services Pvt. Ltd. 0 47910 47910
30 Nextra Teleservices Pvt. Ltd. 0 46267 46267
31 GTPL KCBPL Broadband Private Limited 0 45545 45545
32 Honesty Net Solutions (I) Pvt Ltd 42 42251 42293
33 Ishan Netsol Pvt Ltd 0 41782 41782
34 K Net Solutions Pvt. Ltd. 0 40110 40110
35 Digital Satellite Connect Pvt. Ltd. 0 39908 39908
36 Limras Eronet Broadband Service Pvt Ltd 5760 33496 39256
37 Wan and Lan Internet Pvt. Ltd. 0 34493 34493
38 Tata Teleservices(Maharashtra) Ltd. 166 32077 32243
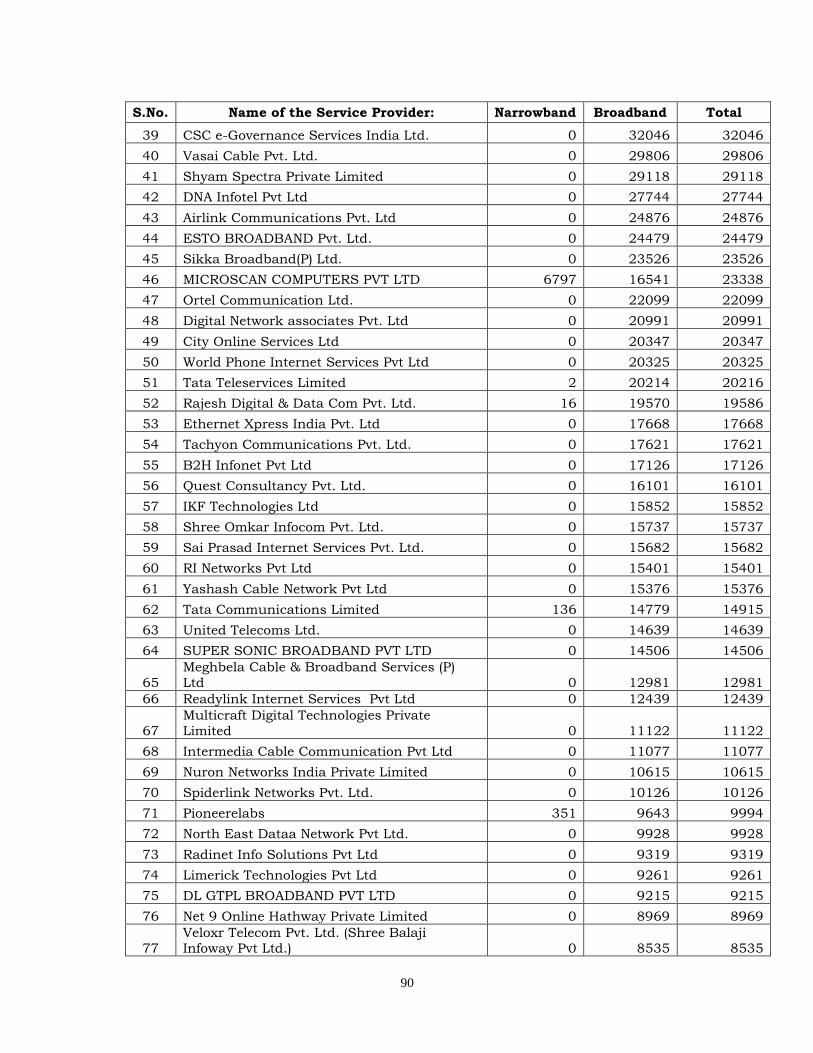
90
S.No. Name of the Service Provider: Narrowband Broadband Total
39 CSC e-Governance Services India Ltd. 0 32046 32046
40 Vasai Cable Pvt. Ltd. 0 29806 29806
41 Shyam Spectra Private Limited 0 29118 29118
42 DNA Infotel Pvt Ltd 0 27744 27744
43 Airlink Communications Pvt. Ltd 0 24876 24876
44 ESTO BROADBAND Pvt. Ltd. 0 24479 24479
45 Sikka Broadband(P) Ltd. 0 23526 23526
46 MICROSCAN COMPUTERS PVT LTD 6797 16541 23338
47 Ortel Communication Ltd. 0 22099 22099
48 Digital Network associates Pvt. Ltd 0 20991 20991
49 City Online Services Ltd 0 20347 20347
50 World Phone Internet Services Pvt Ltd 0 20325 20325
51 Tata Teleservices Limited 2 20214 20216
52 Rajesh Digital & Data Com Pvt. Ltd. 16 19570 19586
53 Ethernet Xpress India Pvt. Ltd 0 17668 17668
54 Tachyon Communications Pvt. Ltd. 0 17621 17621
55 B2H Infonet Pvt Ltd 0 17126 17126
56 Quest Consultancy Pvt. Ltd. 0 16101 16101
57 IKF Technologies Ltd 0 15852 15852
58 Shree Omkar Infocom Pvt. Ltd. 0 15737 15737
59 Sai Prasad Internet Services Pvt. Ltd. 0 15682 15682
60 RI Networks Pvt Ltd 0 15401 15401
61 Yashash Cable Network Pvt Ltd 0 15376 15376
62 Tata Communications Limited 136 14779 14915
63 United Telecoms Ltd. 0 14639 14639
64 SUPER SONIC BROADBAND PVT LTD 0 14506 14506
65
Meghbela Cable & Broadband Services (P)
Ltd 0 12981 12981
66 Readylink Internet Services Pvt Ltd 0 12439 12439
67
Multicraft Digital Technologies Private
Limited 0 11122 11122
68 Intermedia Cable Communication Pvt Ltd 0 11077 11077
69 Nuron Networks India Private Limited 0 10615 10615
70 Spiderlink Networks Pvt. Ltd. 0 10126 10126
71 Pioneerelabs 351 9643 9994
72 North East Dataa Network Pvt Ltd. 0 9928 9928
73 Radinet Info Solutions Pvt Ltd 0 9319 9319
74 Limerick Technologies Pvt Ltd 0 9261 9261
75 DL GTPL BROADBAND PVT LTD 0 9215 9215
76 Net 9 Online Hathway Private Limited 0 8969 8969
77
Veloxr Telecom Pvt. Ltd. (Shree Balaji
Infoway Pvt Ltd.) 0 8535 8535
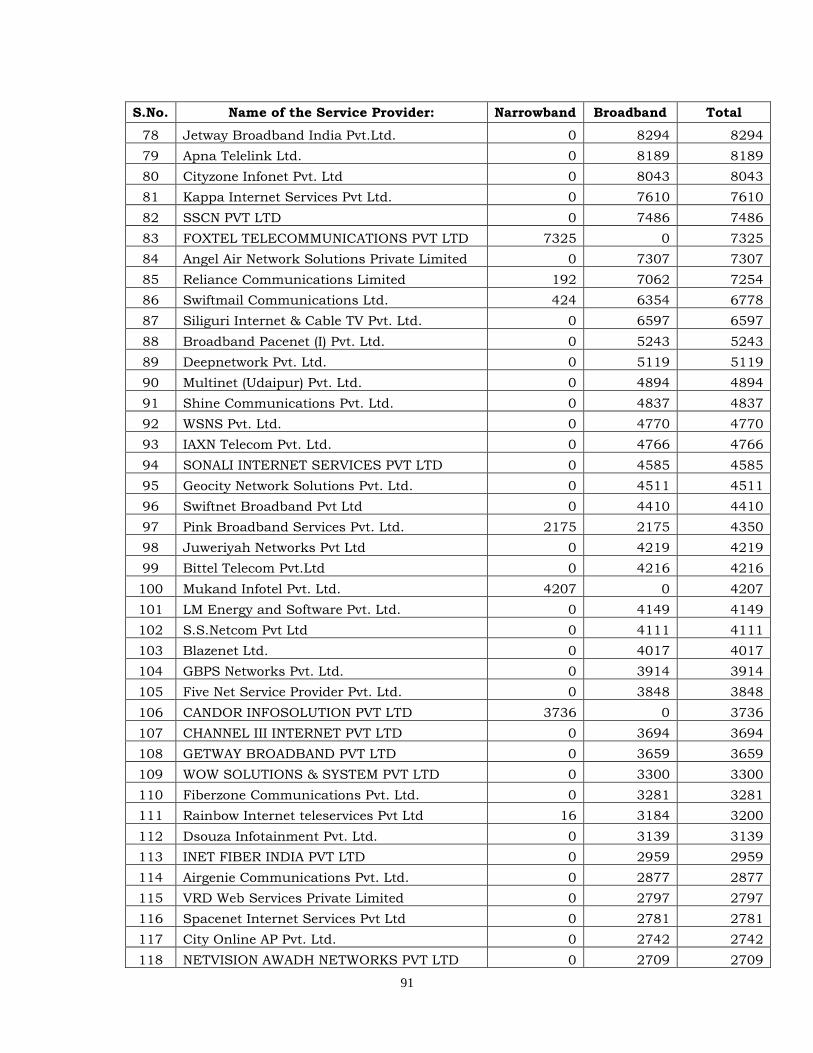
91
S.No. Name of the Service Provider: Narrowband Broadband Total
78 Jetway Broadband India Pvt.Ltd. 0 8294 8294
79 Apna Telelink Ltd. 0 8189 8189
80 Cityzone Infonet Pvt. Ltd 0 8043 8043
81 Kappa Internet Services Pvt Ltd. 0 7610 7610
82 SSCN PVT LTD 0 7486 7486
83 FOXTEL TELECOMMUNICATIONS PVT LTD 7325 0 7325
84 Angel Air Network Solutions Private Limited 0 7307 7307
85 Reliance Communications Limited 192 7062 7254
86 Swiftmail Communications Ltd. 424 6354 6778
87 Siliguri Internet & Cable TV Pvt. Ltd. 0 6597 6597
88 Broadband Pacenet (I) Pvt. Ltd. 0 5243 5243
89 Deepnetwork Pvt. Ltd. 0 5119 5119
90 Multinet (Udaipur) Pvt. Ltd. 0 4894 4894
91 Shine Communications Pvt. Ltd. 0 4837 4837
92 WSNS Pvt. Ltd. 0 4770 4770
93 IAXN Telecom Pvt. Ltd. 0 4766 4766
94 SONALI INTERNET SERVICES PVT LTD 0 4585 4585
95 Geocity Network Solutions Pvt. Ltd. 0 4511 4511
96 Swiftnet Broadband Pvt Ltd 0 4410 4410
97 Pink Broadband Services Pvt. Ltd. 2175 2175 4350
98 Juweriyah Networks Pvt Ltd 0 4219 4219
99 Bittel Telecom Pvt.Ltd 0 4216 4216
100 Mukand Infotel Pvt. Ltd. 4207 0 4207
101 LM Energy and Software Pvt. Ltd. 0 4149 4149
102 S.S.Netcom Pvt Ltd 0 4111 4111
103 Blazenet Ltd. 0 4017 4017
104 GBPS Networks Pvt. Ltd. 0 3914 3914
105 Five Net Service Provider Pvt. Ltd. 0 3848 3848
106 CANDOR INFOSOLUTION PVT LTD 3736 0 3736
107 CHANNEL III INTERNET PVT LTD 0 3694 3694
108 GETWAY BROADBAND PVT LTD 0 3659 3659
109 WOW SOLUTIONS & SYSTEM PVT LTD 0 3300 3300
110 Fiberzone Communications Pvt. Ltd. 0 3281 3281
111 Rainbow Internet teleservices Pvt Ltd 16 3184 3200
112 Dsouza Infotainment Pvt. Ltd. 0 3139 3139
113 INET FIBER INDIA PVT LTD 0 2959 2959
114 Airgenie Communications Pvt. Ltd. 0 2877 2877
115 VRD Web Services Private Limited 0 2797 2797
116 Spacenet Internet Services Pvt Ltd 0 2781 2781
117 City Online AP Pvt. Ltd. 0 2742 2742
118 NETVISION AWADH NETWORKS PVT LTD 0 2709 2709
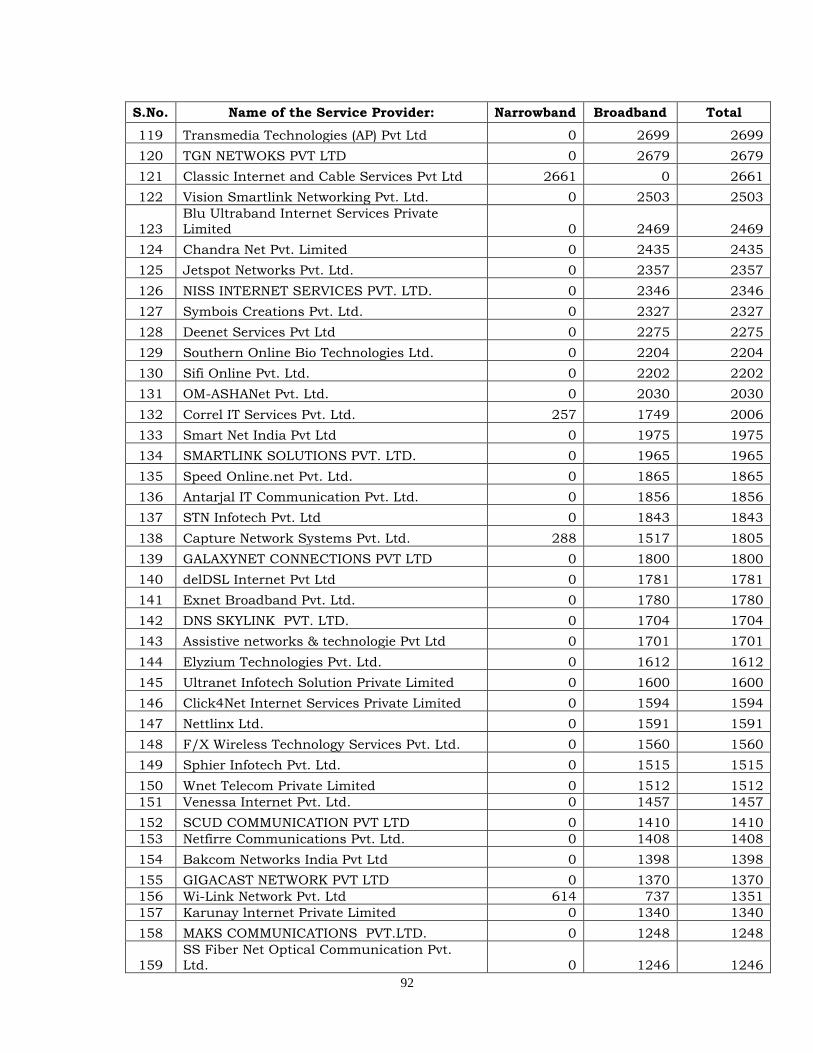
92
S.No. Name of the Service Provider: Narrowband Broadband Total
119 Transmedia Technologies (AP) Pvt Ltd 0 2699 2699
120 TGN NETWOKS PVT LTD 0 2679 2679
121 Classic Internet and Cable Services Pvt Ltd 2661 0 2661
122 Vision Smartlink Networking Pvt. Ltd. 0 2503 2503
123
Blu Ultraband Internet Services Private
Limited 0 2469 2469
124 Chandra Net Pvt. Limited 0 2435 2435
125 Jetspot Networks Pvt. Ltd. 0 2357 2357
126 NISS INTERNET SERVICES PVT. LTD. 0 2346 2346
127 Symbois Creations Pvt. Ltd. 0 2327 2327
128 Deenet Services Pvt Ltd 0 2275 2275
129 Southern Online Bio Technologies Ltd. 0 2204 2204
130 Sifi Online Pvt. Ltd. 0 2202 2202
131 OM-ASHANet Pvt. Ltd. 0 2030 2030
132 Correl IT Services Pvt. Ltd. 257 1749 2006
133 Smart Net India Pvt Ltd 0 1975 1975
134 SMARTLINK SOLUTIONS PVT. LTD. 0 1965 1965
135 Speed Online.net Pvt. Ltd. 0 1865 1865
136 Antarjal IT Communication Pvt. Ltd. 0 1856 1856
137 STN Infotech Pvt. Ltd 0 1843 1843
138 Capture Network Systems Pvt. Ltd. 288 1517 1805
139 GALAXYNET CONNECTIONS PVT LTD 0 1800 1800
140 delDSL Internet Pvt Ltd 0 1781 1781
141 Exnet Broadband Pvt. Ltd. 0 1780 1780
142 DNS SKYLINK PVT. LTD. 0 1704 1704
143 Assistive networks & technologie Pvt Ltd 0 1701 1701
144 Elyzium Technologies Pvt. Ltd. 0 1612 1612
145 Ultranet Infotech Solution Private Limited 0 1600 1600
146 Click4Net Internet Services Private Limited 0 1594 1594
147 Nettlinx Ltd. 0 1591 1591
148 F/X Wireless Technology Services Pvt. Ltd. 0 1560 1560
149 Sphier Infotech Pvt. Ltd. 0 1515 1515
150 Wnet Telecom Private Limited 0 1512 1512
151 Venessa Internet Pvt. Ltd. 0 1457 1457
152 SCUD COMMUNICATION PVT LTD 0 1410 1410
153 Netfirre Communications Pvt. Ltd. 0 1408 1408
154 Bakcom Networks India Pvt Ltd 0 1398 1398
155 GIGACAST NETWORK PVT LTD 0 1370 1370
156 Wi-Link Network Pvt. Ltd 614 737 1351
157 Karunay lnternet Private Limited 0 1340 1340
158 MAKS COMMUNICATIONS PVT.LTD. 0 1248 1248
159
SS Fiber Net Optical Communication Pvt.
Ltd. 0 1246 1246
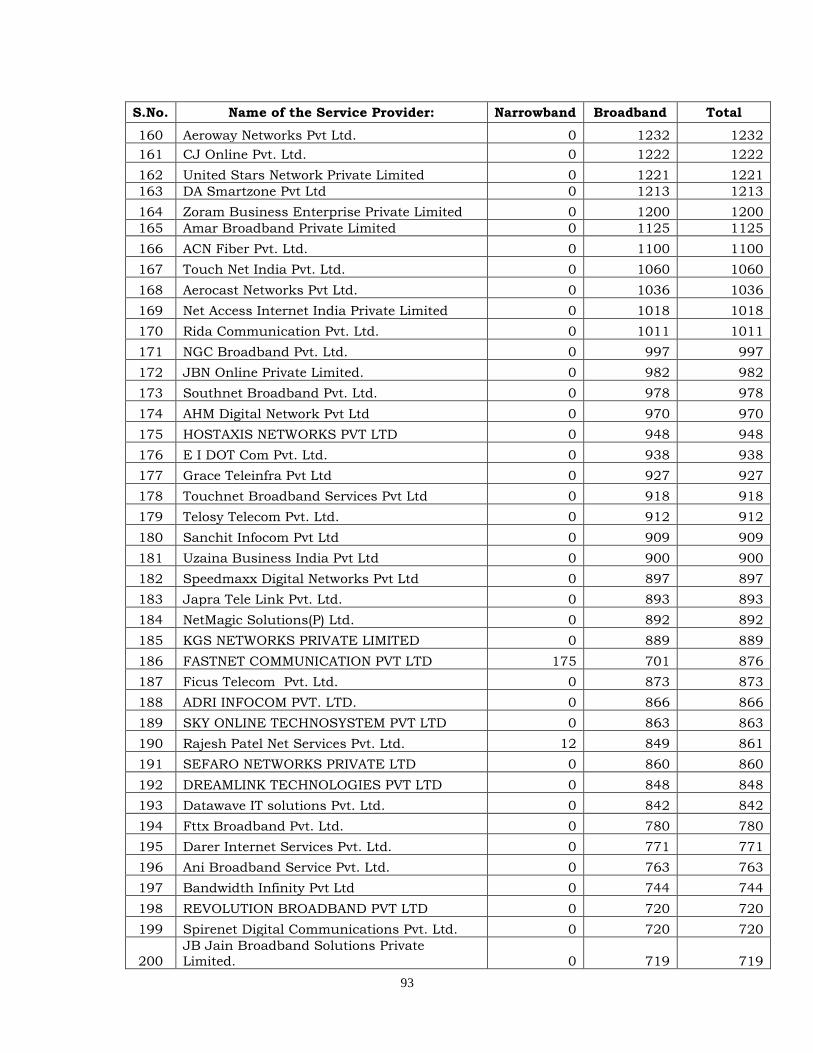
93
S.No. Name of the Service Provider: Narrowband Broadband Total
160 Aeroway Networks Pvt Ltd. 0 1232 1232
161 CJ Online Pvt. Ltd. 0 1222 1222
162 United Stars Network Private Limited 0 1221 1221
163 DA Smartzone Pvt Ltd 0 1213 1213
164 Zoram Business Enterprise Private Limited 0 1200 1200
165 Amar Broadband Private Limited 0 1125 1125
166 ACN Fiber Pvt. Ltd. 0 1100 1100
167 Touch Net India Pvt. Ltd. 0 1060 1060
168 Aerocast Networks Pvt Ltd. 0 1036 1036
169 Net Access Internet India Private Limited 0 1018 1018
170 Rida Communication Pvt. Ltd. 0 1011 1011
171 NGC Broadband Pvt. Ltd. 0 997 997
172 JBN Online Private Limited. 0 982 982
173 Southnet Broadband Pvt. Ltd. 0 978 978
174 AHM Digital Network Pvt Ltd 0 970 970
175 HOSTAXIS NETWORKS PVT LTD 0 948 948
176 E I DOT Com Pvt. Ltd. 0 938 938
177 Grace Teleinfra Pvt Ltd 0 927 927
178 Touchnet Broadband Services Pvt Ltd 0 918 918
179 Telosy Telecom Pvt. Ltd. 0 912 912
180 Sanchit Infocom Pvt Ltd 0 909 909
181 Uzaina Business India Pvt Ltd 0 900 900
182 Speedmaxx Digital Networks Pvt Ltd 0 897 897
183 Japra Tele Link Pvt. Ltd. 0 893 893
184 NetMagic Solutions(P) Ltd. 0 892 892
185 KGS NETWORKS PRIVATE LIMITED 0 889 889
186 FASTNET COMMUNICATION PVT LTD 175 701 876
187 Ficus Telecom Pvt. Ltd. 0 873 873
188 ADRI INFOCOM PVT. LTD. 0 866 866
189 SKY ONLINE TECHNOSYSTEM PVT LTD 0 863 863
190 Rajesh Patel Net Services Pvt. Ltd. 12 849 861
191 SEFARO NETWORKS PRIVATE LTD 0 860 860
192 DREAMLINK TECHNOLOGIES PVT LTD 0 848 848
193 Datawave IT solutions Pvt. Ltd. 0 842 842
194 Fttx Broadband Pvt. Ltd. 0 780 780
195 Darer Internet Services Pvt. Ltd. 0 771 771
196 Ani Broadband Service Pvt. Ltd. 0 763 763
197 Bandwidth Infinity Pvt Ltd 0 744 744
198 REVOLUTION BROADBAND PVT LTD 0 720 720
199 Spirenet Digital Communications Pvt. Ltd. 0 720 720
200
JB Jain Broadband Solutions Private
Limited. 0 719 719
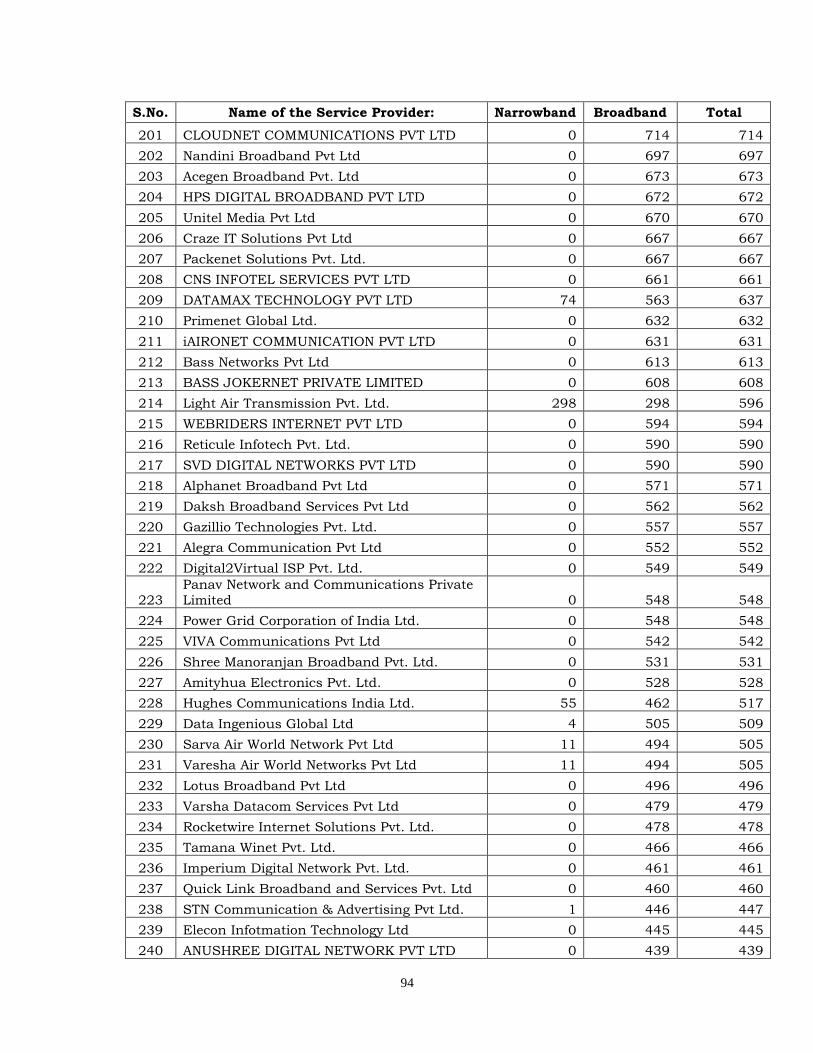
94
S.No. Name of the Service Provider: Narrowband Broadband Total
201 CLOUDNET COMMUNICATIONS PVT LTD 0 714 714
202 Nandini Broadband Pvt Ltd 0 697 697
203 Acegen Broadband Pvt. Ltd 0 673 673
204 HPS DIGITAL BROADBAND PVT LTD 0 672 672
205 Unitel Media Pvt Ltd 0 670 670
206 Craze IT Solutions Pvt Ltd 0 667 667
207 Packenet Solutions Pvt. Ltd. 0 667 667
208 CNS INFOTEL SERVICES PVT LTD 0 661 661
209 DATAMAX TECHNOLOGY PVT LTD 74 563 637
210 Primenet Global Ltd. 0 632 632
211 iAIRONET COMMUNICATION PVT LTD 0 631 631
212 Bass Networks Pvt Ltd 0 613 613
213 BASS JOKERNET PRIVATE LIMITED 0 608 608
214 Light Air Transmission Pvt. Ltd. 298 298 596
215 WEBRIDERS INTERNET PVT LTD 0 594 594
216 Reticule Infotech Pvt. Ltd. 0 590 590
217 SVD DIGITAL NETWORKS PVT LTD 0 590 590
218 Alphanet Broadband Pvt Ltd 0 571 571
219 Daksh Broadband Services Pvt Ltd 0 562 562
220 Gazillio Technologies Pvt. Ltd. 0 557 557
221 Alegra Communication Pvt Ltd 0 552 552
222 Digital2Virtual ISP Pvt. Ltd. 0 549 549
223
Panav Network and Communications Private
Limited 0 548 548
224 Power Grid Corporation of India Ltd. 0 548 548
225 VIVA Communications Pvt Ltd 0 542 542
226 Shree Manoranjan Broadband Pvt. Ltd. 0 531 531
227 Amityhua Electronics Pvt. Ltd. 0 528 528
228 Hughes Communications India Ltd. 55 462 517
229 Data Ingenious Global Ltd 4 505 509
230 Sarva Air World Network Pvt Ltd 11 494 505
231 Varesha Air World Networks Pvt Ltd 11 494 505
232 Lotus Broadband Pvt Ltd 0 496 496
233 Varsha Datacom Services Pvt Ltd 0 479 479
234 Rocketwire Internet Solutions Pvt. Ltd. 0 478 478
235 Tamana Winet Pvt. Ltd. 0 466 466
236 Imperium Digital Network Pvt. Ltd. 0 461 461
237 Quick Link Broadband and Services Pvt. Ltd 0 460 460
238 STN Communication & Advertising Pvt Ltd. 1 446 447
239 Elecon Infotmation Technology Ltd 0 445 445
240 ANUSHREE DIGITAL NETWORK PVT LTD 0 439 439
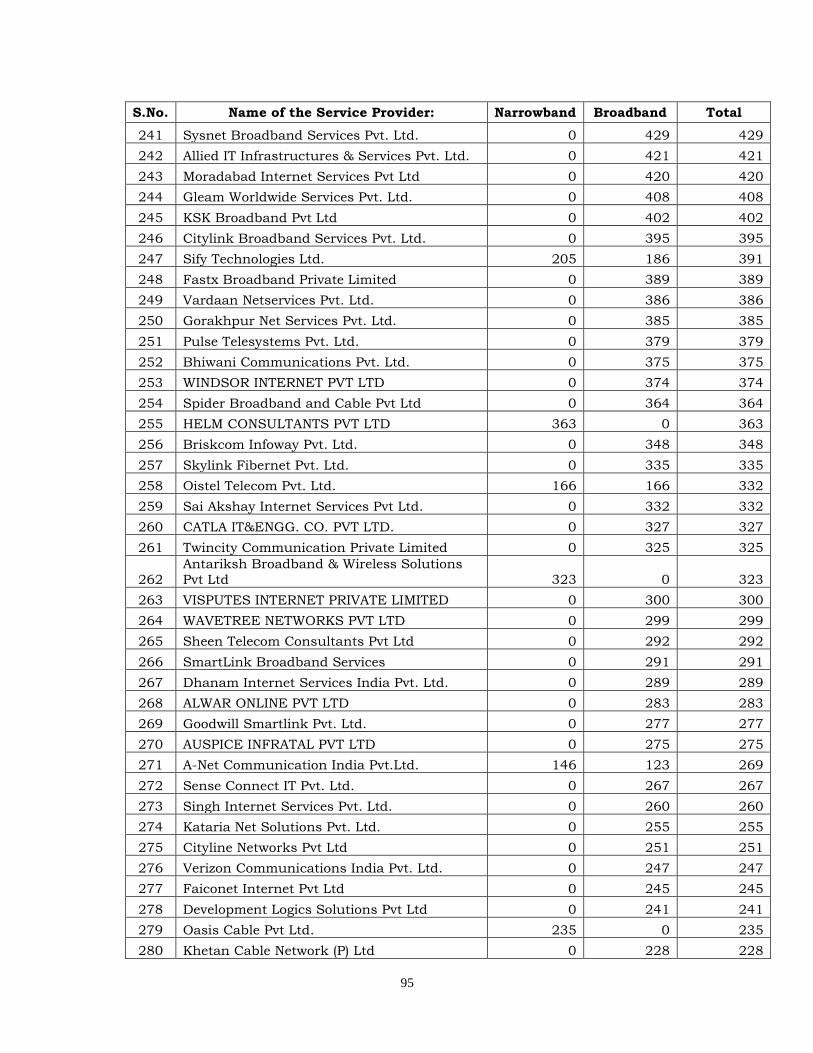
95
S.No. Name of the Service Provider: Narrowband Broadband Total
241 Sysnet Broadband Services Pvt. Ltd. 0 429 429
242 Allied IT Infrastructures & Services Pvt. Ltd. 0 421 421
243 Moradabad Internet Services Pvt Ltd 0 420 420
244 Gleam Worldwide Services Pvt. Ltd. 0 408 408
245 KSK Broadband Pvt Ltd 0 402 402
246 Citylink Broadband Services Pvt. Ltd. 0 395 395
247 Sify Technologies Ltd. 205 186 391
248 Fastx Broadband Private Limited 0 389 389
249 Vardaan Netservices Pvt. Ltd. 0 386 386
250 Gorakhpur Net Services Pvt. Ltd. 0 385 385
251 Pulse Telesystems Pvt. Ltd. 0 379 379
252 Bhiwani Communications Pvt. Ltd. 0 375 375
253 WINDSOR INTERNET PVT LTD 0 374 374
254 Spider Broadband and Cable Pvt Ltd 0 364 364
255 HELM CONSULTANTS PVT LTD 363 0 363
256 Briskcom Infoway Pvt. Ltd. 0 348 348
257 Skylink Fibernet Pvt. Ltd. 0 335 335
258 Oistel Telecom Pvt. Ltd. 166 166 332
259 Sai Akshay Internet Services Pvt Ltd. 0 332 332
260 CATLA IT&ENGG. CO. PVT LTD. 0 327 327
261 Twincity Communication Private Limited 0 325 325
262
Antariksh Broadband & Wireless Solutions
Pvt Ltd 323 0 323
263 VISPUTES INTERNET PRIVATE LIMITED 0 300 300
264 WAVETREE NETWORKS PVT LTD 0 299 299
265 Sheen Telecom Consultants Pvt Ltd 0 292 292
266 SmartLink Broadband Services 0 291 291
267 Dhanam Internet Services India Pvt. Ltd. 0 289 289
268 ALWAR ONLINE PVT LTD 0 283 283
269 Goodwill Smartlink Pvt. Ltd. 0 277 277
270 AUSPICE INFRATAL PVT LTD 0 275 275
271 A-Net Communication India Pvt.Ltd. 146 123 269
272 Sense Connect IT Pvt. Ltd. 0 267 267
273 Singh Internet Services Pvt. Ltd. 0 260 260
274 Kataria Net Solutions Pvt. Ltd. 0 255 255
275 Cityline Networks Pvt Ltd 0 251 251
276 Verizon Communications India Pvt. Ltd. 0 247 247
277 Faiconet Internet Pvt Ltd 0 245 245
278 Development Logics Solutions Pvt Ltd 0 241 241
279 Oasis Cable Pvt Ltd. 235 0 235
280 Khetan Cable Network (P) Ltd 0 228 228
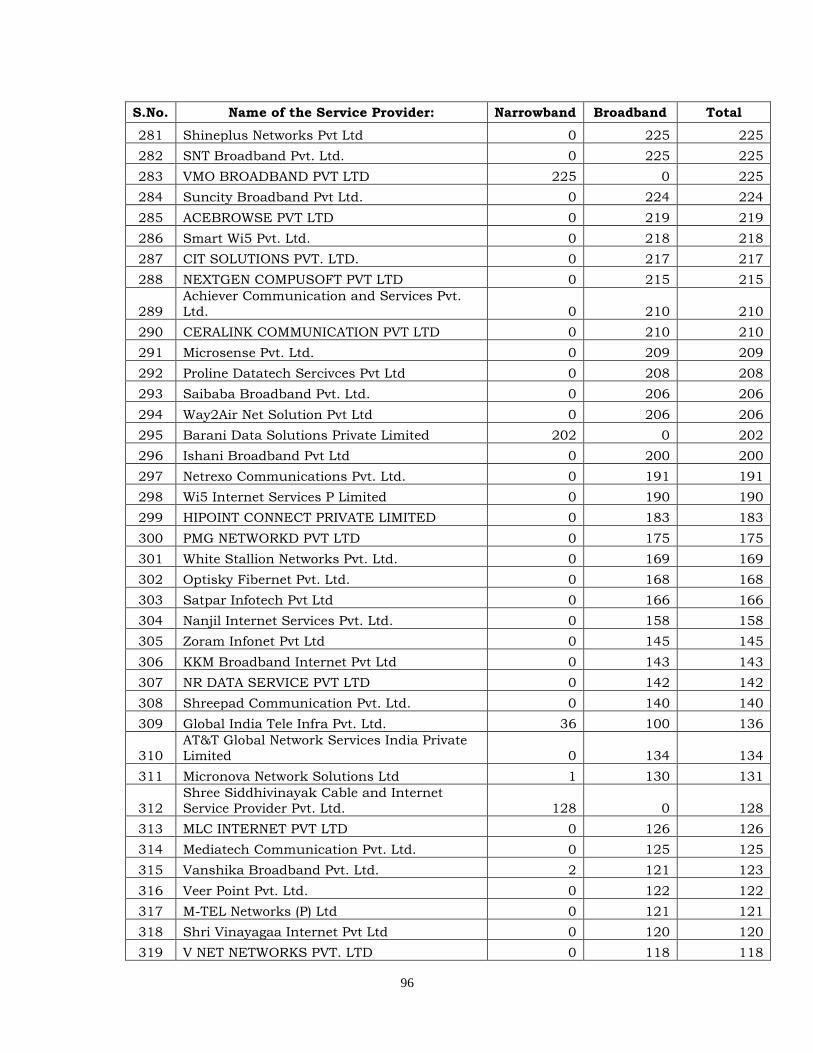
96
S.No. Name of the Service Provider: Narrowband Broadband Total
281 Shineplus Networks Pvt Ltd 0 225 225
282 SNT Broadband Pvt. Ltd. 0 225 225
283 VMO BROADBAND PVT LTD 225 0 225
284 Suncity Broadband Pvt Ltd. 0 224 224
285 ACEBROWSE PVT LTD 0 219 219
286 Smart Wi5 Pvt. Ltd. 0 218 218
287 CIT SOLUTIONS PVT. LTD. 0 217 217
288 NEXTGEN COMPUSOFT PVT LTD 0 215 215
289
Achiever Communication and Services Pvt.
Ltd. 0 210 210
290 CERALINK COMMUNICATION PVT LTD 0 210 210
291 Microsense Pvt. Ltd. 0 209 209
292 Proline Datatech Sercivces Pvt Ltd 0 208 208
293 Saibaba Broadband Pvt. Ltd. 0 206 206
294 Way2Air Net Solution Pvt Ltd 0 206 206
295 Barani Data Solutions Private Limited 202 0 202
296 Ishani Broadband Pvt Ltd 0 200 200
297 Netrexo Communications Pvt. Ltd. 0 191 191
298 Wi5 Internet Services P Limited 0 190 190
299 HIPOINT CONNECT PRIVATE LIMITED 0 183 183
300 PMG NETWORKD PVT LTD 0 175 175
301 White Stallion Networks Pvt. Ltd. 0 169 169
302 Optisky Fibernet Pvt. Ltd. 0 168 168
303 Satpar Infotech Pvt Ltd 0 166 166
304 Nanjil Internet Services Pvt. Ltd. 0 158 158
305 Zoram Infonet Pvt Ltd 0 145 145
306 KKM Broadband Internet Pvt Ltd 0 143 143
307 NR DATA SERVICE PVT LTD 0 142 142
308 Shreepad Communication Pvt. Ltd. 0 140 140
309 Global India Tele Infra Pvt. Ltd. 36 100 136
310
AT&T Global Network Services India Private
Limited 0 134 134
311 Micronova Network Solutions Ltd 1 130 131
312
Shree Siddhivinayak Cable and Internet
Service Provider Pvt. Ltd. 128 0 128
313 MLC INTERNET PVT LTD 0 126 126
314 Mediatech Communication Pvt. Ltd. 0 125 125
315 Vanshika Broadband Pvt. Ltd. 2 121 123
316 Veer Point Pvt. Ltd. 0 122 122
317 M-TEL Networks (P) Ltd 0 121 121
318 Shri Vinayagaa Internet Pvt Ltd 0 120 120
319 V NET NETWORKS PVT. LTD 0 118 118
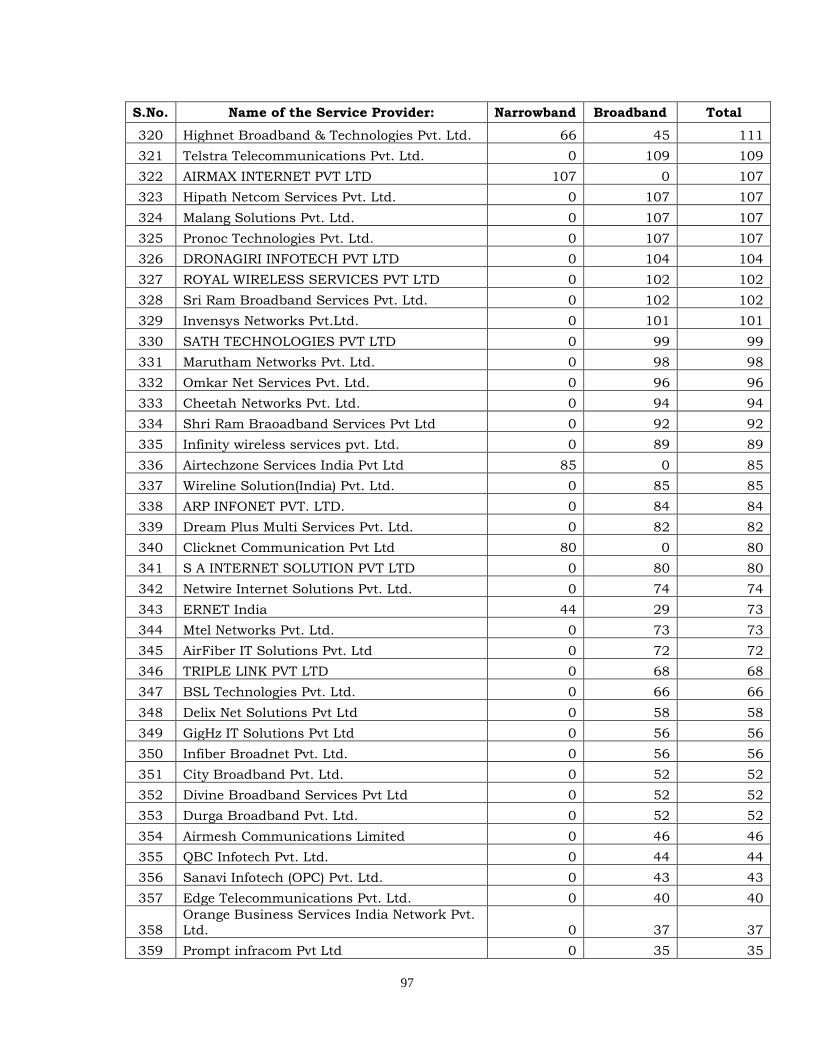
97
S.No. Name of the Service Provider: Narrowband Broadband Total
320 Highnet Broadband & Technologies Pvt. Ltd. 66 45 111
321 Telstra Telecommunications Pvt. Ltd. 0 109 109
322 AIRMAX INTERNET PVT LTD 107 0 107
323 Hipath Netcom Services Pvt. Ltd. 0 107 107
324 Malang Solutions Pvt. Ltd. 0 107 107
325 Pronoc Technologies Pvt. Ltd. 0 107 107
326 DRONAGIRI INFOTECH PVT LTD 0 104 104
327 ROYAL WIRELESS SERVICES PVT LTD 0 102 102
328 Sri Ram Broadband Services Pvt. Ltd. 0 102 102
329 Invensys Networks Pvt.Ltd. 0 101 101
330 SATH TECHNOLOGIES PVT LTD 0 99 99
331 Marutham Networks Pvt. Ltd. 0 98 98
332 Omkar Net Services Pvt. Ltd. 0 96 96
333 Cheetah Networks Pvt. Ltd. 0 94 94
334 Shri Ram Braoadband Services Pvt Ltd 0 92 92
335 Infinity wireless services pvt. Ltd. 0 89 89
336 Airtechzone Services India Pvt Ltd 85 0 85
337 Wireline Solution(India) Pvt. Ltd. 0 85 85
338 ARP INFONET PVT. LTD. 0 84 84
339 Dream Plus Multi Services Pvt. Ltd. 0 82 82
340 Clicknet Communication Pvt Ltd 80 0 80
341 S A INTERNET SOLUTION PVT LTD 0 80 80
342 Netwire Internet Solutions Pvt. Ltd. 0 74 74
343 ERNET India 44 29 73
344 Mtel Networks Pvt. Ltd. 0 73 73
345 AirFiber IT Solutions Pvt. Ltd 0 72 72
346 TRIPLE LINK PVT LTD 0 68 68
347 BSL Technologies Pvt. Ltd. 0 66 66
348 Delix Net Solutions Pvt Ltd 0 58 58
349 GigHz IT Solutions Pvt Ltd 0 56 56
350 Infiber Broadnet Pvt. Ltd. 0 56 56
351 City Broadband Pvt. Ltd. 0 52 52
352 Divine Broadband Services Pvt Ltd 0 52 52
353 Durga Broadband Pvt. Ltd. 0 52 52
354 Airmesh Communications Limited 0 46 46
355 QBC Infotech Pvt. Ltd. 0 44 44
356 Sanavi Infotech (OPC) Pvt. Ltd. 0 43 43
357 Edge Telecommunications Pvt. Ltd. 0 40 40
358
Orange Business Services India Network Pvt.
Ltd. 0 37 37
359 Prompt infracom Pvt Ltd 0 35 35
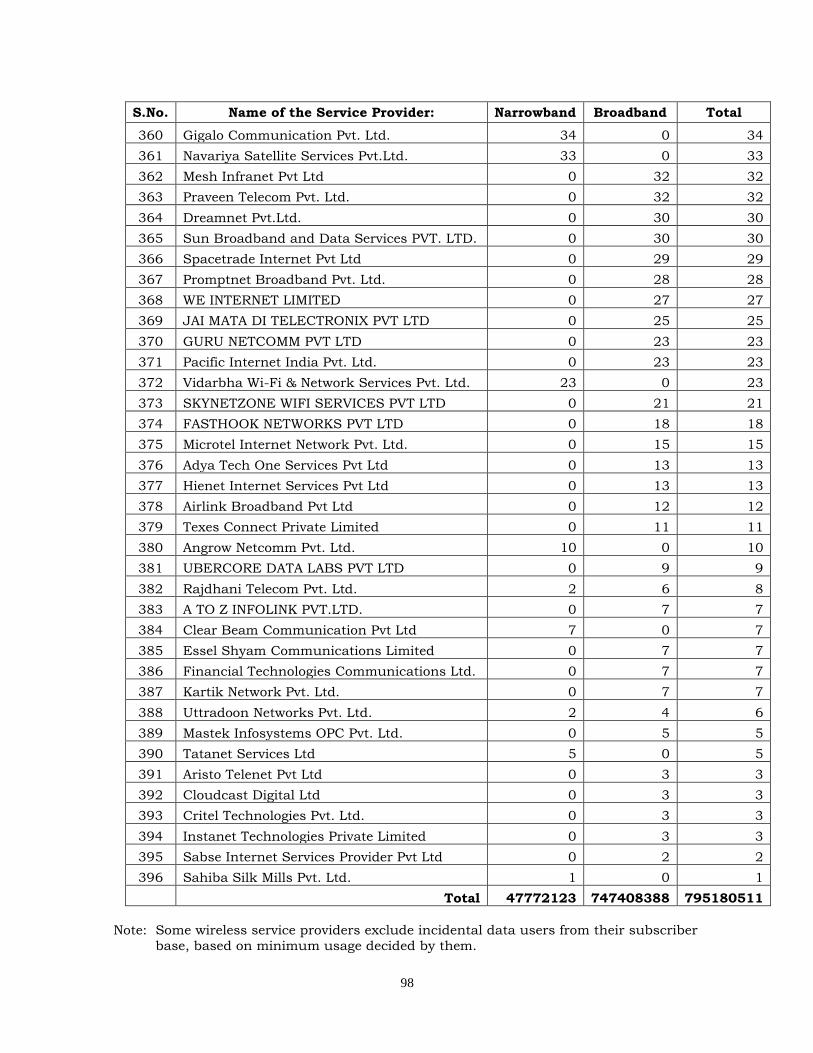
98
S.No. Name of the Service Provider: Narrowband Broadband Total
360 Gigalo Communication Pvt. Ltd. 34 0 34
361 Navariya Satellite Services Pvt.Ltd. 33 0 33
362 Mesh Infranet Pvt Ltd 0 32 32
363 Praveen Telecom Pvt. Ltd. 0 32 32
364 Dreamnet Pvt.Ltd. 0 30 30
365 Sun Broadband and Data Services PVT. LTD. 0 30 30
366 Spacetrade Internet Pvt Ltd 0 29 29
367 Promptnet Broadband Pvt. Ltd. 0 28 28
368 WE INTERNET LIMITED 0 27 27
369 JAI MATA DI TELECTRONIX PVT LTD 0 25 25
370 GURU NETCOMM PVT LTD 0 23 23
371 Pacific Internet India Pvt. Ltd. 0 23 23
372 Vidarbha Wi-Fi & Network Services Pvt. Ltd. 23 0 23
373 SKYNETZONE WIFI SERVICES PVT LTD 0 21 21
374 FASTHOOK NETWORKS PVT LTD 0 18 18
375 Microtel Internet Network Pvt. Ltd. 0 15 15
376 Adya Tech One Services Pvt Ltd 0 13 13
377 Hienet Internet Services Pvt Ltd 0 13 13
378 Airlink Broadband Pvt Ltd 0 12 12
379 Texes Connect Private Limited 0 11 11
380 Angrow Netcomm Pvt. Ltd. 10 0 10
381 UBERCORE DATA LABS PVT LTD 0 9 9
382 Rajdhani Telecom Pvt. Ltd. 2 6 8
383 A TO Z INFOLINK PVT.LTD. 0 7 7
384 Clear Beam Communication Pvt Ltd 7 0 7
385 Essel Shyam Communications Limited 0 7 7
386 Financial Technologies Communications Ltd. 0 7 7
387 Kartik Network Pvt. Ltd. 0 7 7
388 Uttradoon Networks Pvt. Ltd. 2 4 6
389 Mastek Infosystems OPC Pvt. Ltd. 0 5 5
390 Tatanet Services Ltd 5 0 5
391 Aristo Telenet Pvt Ltd 0 3 3
392 Cloudcast Digital Ltd 0 3 3
393 Critel Technologies Pvt. Ltd. 0 3 3
394 Instanet Technologies Private Limited 0 3 3
395 Sabse Internet Services Provider Pvt Ltd 0 2 2
396 Sahiba Silk Mills Pvt. Ltd. 1 0 1
Total 47772123 747408388 795180511
Note: Some wireless service providers exclude incidental data users from their subscriber
base, based on minimum usage decided by them.
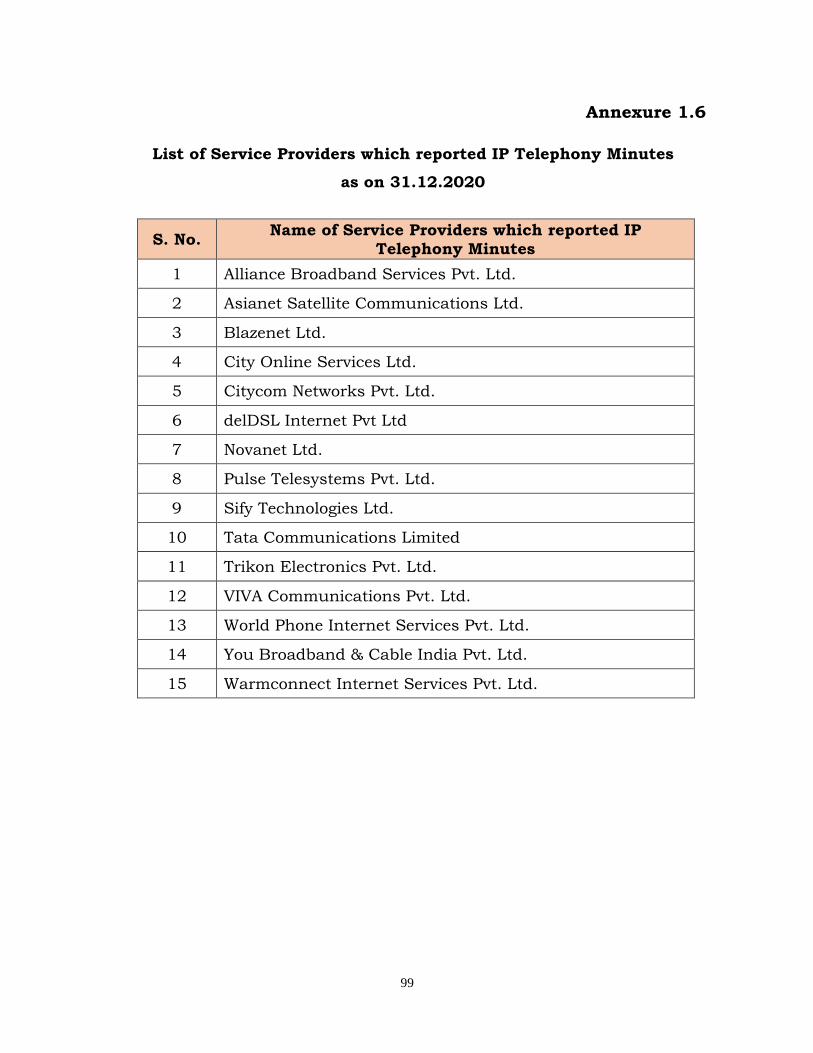
99
Annexure 1.6
List of Service Providers which reported IP Telephony Minutes
as on 31.12.2020
S. No. Name of Service Providers which reported IP
Telephony Minutes
1 Alliance Broadband Services Pvt. Ltd.
2 Asianet Satellite Communications Ltd.
3 Blazenet Ltd.
4 City Online Services Ltd.
5 Citycom Networks Pvt. Ltd.
6 delDSL Internet Pvt Ltd
7 Novanet Ltd.
8 Pulse Telesystems Pvt. Ltd.
9 Sify Technologies Ltd.
10 Tata Communications Limited
11 Trikon Electronics Pvt. Ltd.
12 VIVA Communications Pvt. Ltd.
13 World Phone Internet Services Pvt. Ltd.
14 You Broadband & Cable India Pvt. Ltd.
15 Warmconnect Internet Services Pvt. Ltd.
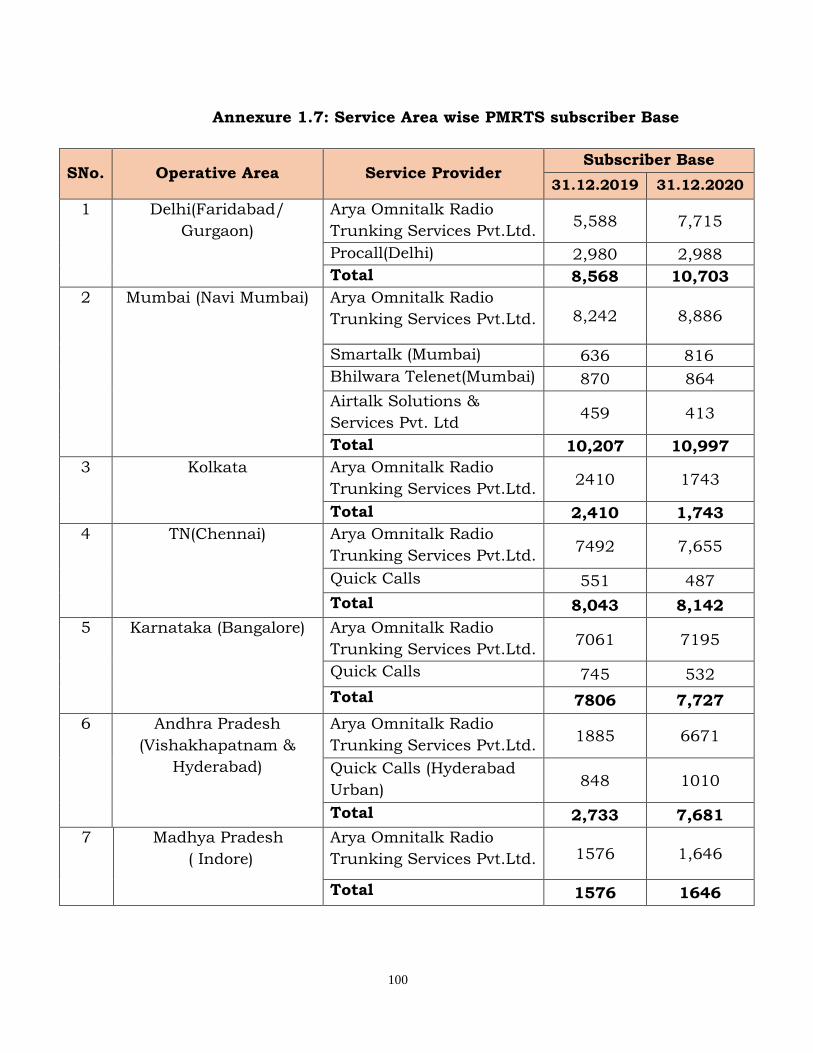
100
Annexure 1.7: Service Area wise PMRTS subscriber Base
SNo. Operative Area Service Provider
Subscriber Base
31.12.2019 31.12.2020
1 Delhi(Faridabad/
Gurgaon)
Arya Omnitalk Radio
Trunking Services Pvt.Ltd. 5,588 7,715
Procall(Delhi) 2,980 2,988
Total 8,568 10,703
2 Mumbai (Navi Mumbai) Arya Omnitalk Radio
Trunking Services Pvt.Ltd. 8,242
8,886
Smartalk (Mumbai) 636 816
Bhilwara Telenet(Mumbai) 870 864
Airtalk Solutions &
Services Pvt. Ltd 459 413
Total 10,207 10,997
3 Kolkata Arya Omnitalk Radio
Trunking Services Pvt.Ltd. 2410 1743
Total 2,410 1,743
4 TN(Chennai) Arya Omnitalk Radio
Trunking Services Pvt.Ltd. 7492 7,655
Quick Calls 551 487
Total 8,043 8,142
5 Karnataka (Bangalore) Arya Omnitalk Radio
Trunking Services Pvt.Ltd. 7061 7195
Quick Calls 745 532
Total 7806 7,727
6 Andhra Pradesh
(Vishakhapatnam &
Hyderabad)
Arya Omnitalk Radio
Trunking Services Pvt.Ltd. 1885 6671
Quick Calls (Hyderabad
Urban) 848 1010
Total 2,733 7,681
7 Madhya Pradesh
( Indore)
Arya Omnitalk Radio
Trunking Services Pvt.Ltd. 1576 1,646
Total 1576 1646
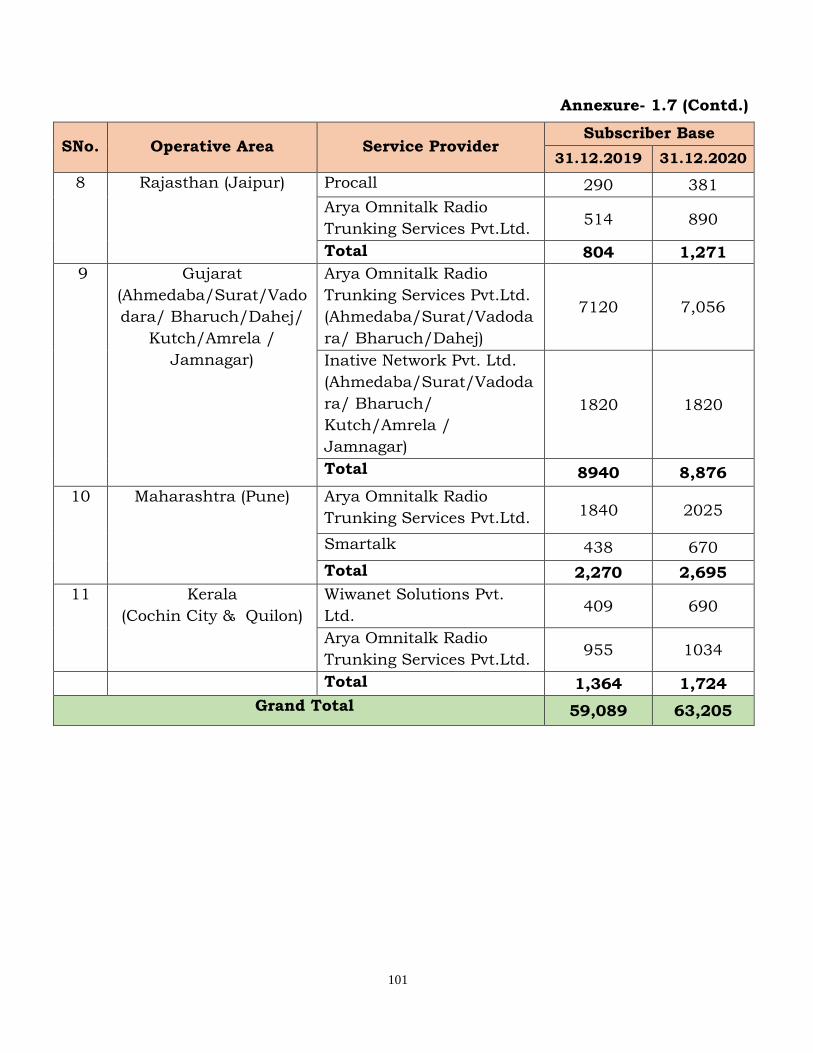
101
Annexure- 1.7 (Contd.)
SNo. Operative Area Service Provider
Subscriber Base
31.12.2019 31.12.2020
8 Rajasthan (Jaipur)
Procall 290 381
Arya Omnitalk Radio
Trunking Services Pvt.Ltd. 514 890
Total 804 1,271
9 Gujarat
(Ahmedaba/Surat/Vado
dara/ Bharuch/Dahej/
Kutch/Amrela /
Jamnagar)
Arya Omnitalk Radio
Trunking Services Pvt.Ltd.
(Ahmedaba/Surat/Vadoda
ra/ Bharuch/Dahej)
7120 7,056
Inative Network Pvt. Ltd.
(Ahmedaba/Surat/Vadoda
ra/ Bharuch/
Kutch/Amrela /
Jamnagar)
1820 1820
Total 8940 8,876
10 Maharashtra (Pune) Arya Omnitalk Radio
Trunking Services Pvt.Ltd. 1840 2025
Smartalk 438 670
Total 2,270 2,695
11 Kerala
(Cochin City & Quilon)
Wiwanet Solutions Pvt.
Ltd. 409 690
Arya Omnitalk Radio
Trunking Services Pvt.Ltd. 955 1034
Total 1,364 1,724
Grand Total 59,089 63,205
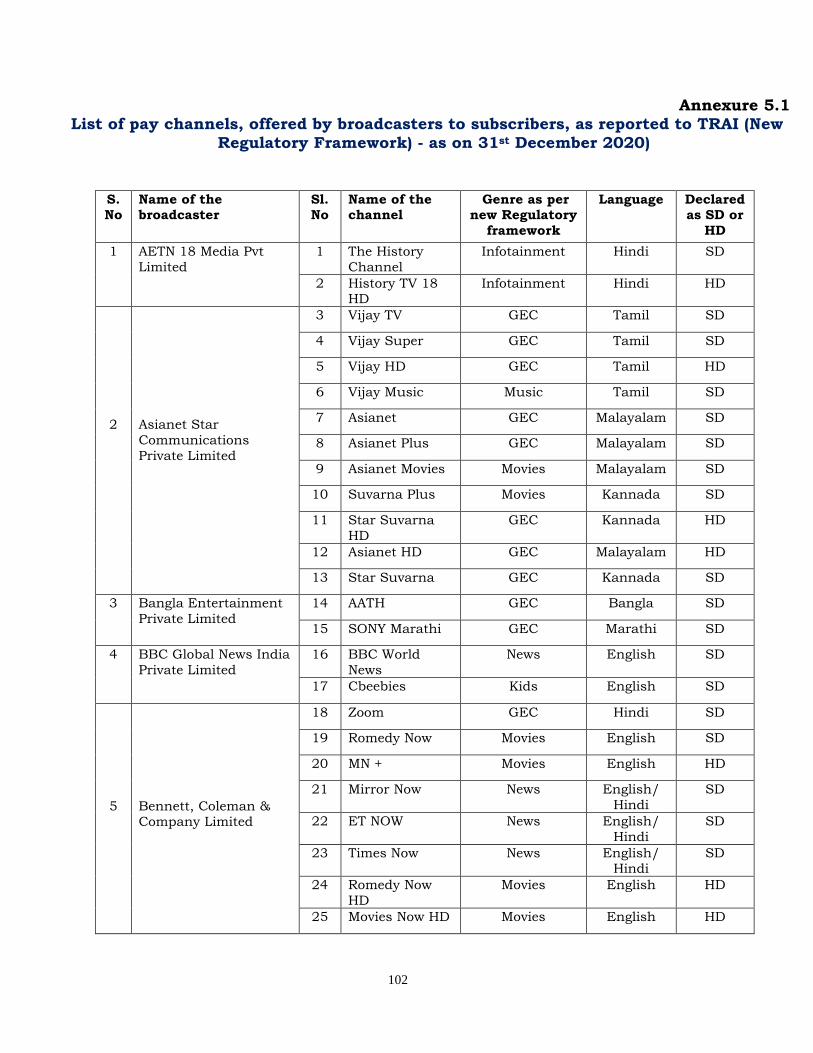
102
Annexure 5.1 List of pay channels, offered by broadcasters to subscribers, as reported to TRAI (New
Regulatory Framework) - as on 31st December 2020)
S. No
Name of the broadcaster
Sl. No
Name of the channel
Genre as per new Regulatory
framework
Language Declared as SD or
HD
1 AETN 18 Media Pvt
Limited
1 The History
Channel
Infotainment Hindi SD
2 History TV 18 HD
Infotainment Hindi HD
2
Asianet Star
Communications
Private Limited
3 Vijay TV GEC Tamil SD
4 Vijay Super GEC Tamil SD
5 Vijay HD GEC Tamil HD
6 Vijay Music Music Tamil SD
7 Asianet GEC Malayalam SD
8 Asianet Plus GEC Malayalam SD
9 Asianet Movies Movies Malayalam SD
10 Suvarna Plus Movies Kannada SD
11 Star Suvarna
HD
GEC Kannada HD
12 Asianet HD GEC Malayalam HD
13 Star Suvarna GEC Kannada SD
3 Bangla Entertainment
Private Limited
14 AATH GEC Bangla SD
15 SONY Marathi GEC Marathi SD
4 BBC Global News India
Private Limited
16 BBC World
News
News English SD
17 Cbeebies Kids English SD
5
Bennett, Coleman & Company Limited
18 Zoom GEC Hindi SD
19 Romedy Now Movies English SD
20 MN + Movies English HD
21 Mirror Now News English/
Hindi
SD
22 ET NOW News English/
Hindi
SD
23 Times Now News English/ Hindi
SD
24 Romedy Now
HD
Movies English HD
25 Movies Now HD Movies English HD
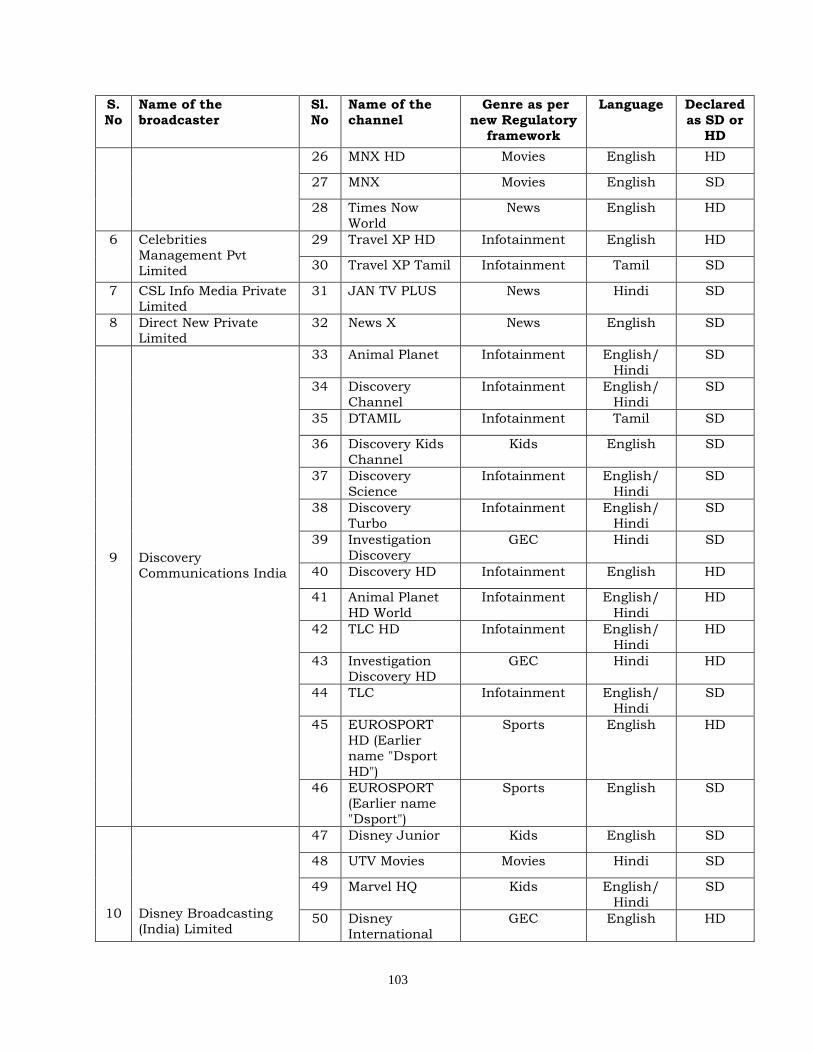
103
S.
No
Name of the
broadcaster
Sl.
No
Name of the
channel
Genre as per
new Regulatory
framework
Language Declared
as SD or
HD
26 MNX HD Movies English HD
27 MNX Movies English SD
28 Times Now
World
News English HD
6 Celebrities
Management Pvt
Limited
29 Travel XP HD Infotainment English HD
30 Travel XP Tamil Infotainment Tamil SD
7 CSL Info Media Private
Limited
31 JAN TV PLUS News Hindi SD
8 Direct New Private Limited
32 News X News English SD
9
Discovery
Communications India
33 Animal Planet Infotainment English/
Hindi
SD
34 Discovery
Channel
Infotainment English/
Hindi
SD
35 DTAMIL Infotainment Tamil SD
36 Discovery Kids
Channel
Kids English SD
37 Discovery
Science
Infotainment English/
Hindi
SD
38 Discovery
Turbo
Infotainment English/
Hindi
SD
39 Investigation
Discovery
GEC Hindi SD
40 Discovery HD Infotainment English HD
41 Animal Planet
HD World
Infotainment English/
Hindi
HD
42 TLC HD Infotainment English/
Hindi
HD
43 Investigation Discovery HD
GEC Hindi HD
44 TLC Infotainment English/
Hindi
SD
45 EUROSPORT
HD (Earlier
name "Dsport
HD")
Sports English HD
46 EUROSPORT (Earlier name
"Dsport")
Sports English SD
10
Disney Broadcasting
(India) Limited
47 Disney Junior Kids English SD
48 UTV Movies Movies Hindi SD
49 Marvel HQ Kids English/
Hindi
SD
50 Disney
International
GEC English HD
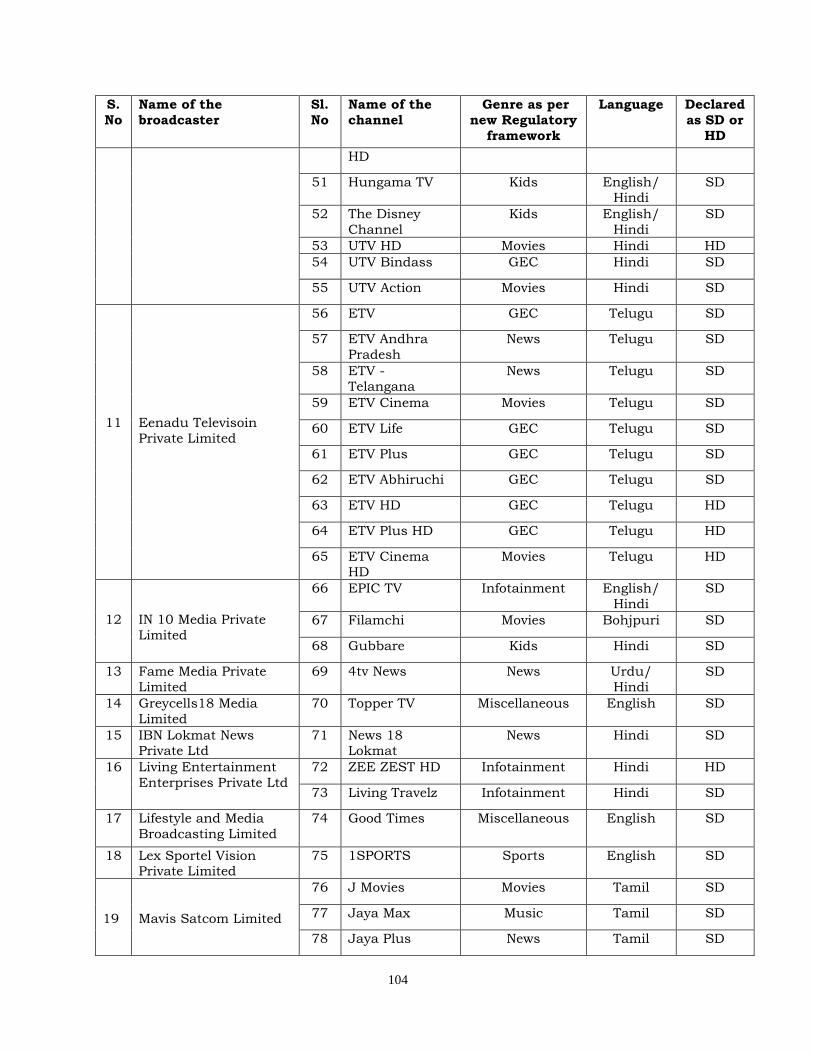
104
S.
No
Name of the
broadcaster
Sl.
No
Name of the
channel
Genre as per
new Regulatory
framework
Language Declared
as SD or
HD
HD
51 Hungama TV Kids English/ Hindi
SD
52 The Disney
Channel
Kids English/
Hindi
SD
53 UTV HD Movies Hindi HD
54 UTV Bindass GEC Hindi SD
55 UTV Action Movies Hindi SD
11
Eenadu Televisoin
Private Limited
56 ETV GEC Telugu SD
57 ETV Andhra
Pradesh
News Telugu SD
58 ETV -
Telangana
News Telugu SD
59 ETV Cinema Movies Telugu SD
60 ETV Life GEC Telugu SD
61 ETV Plus GEC Telugu SD
62 ETV Abhiruchi GEC Telugu SD
63 ETV HD GEC Telugu HD
64 ETV Plus HD GEC Telugu HD
65 ETV Cinema HD
Movies Telugu HD
12
IN 10 Media Private
Limited
66 EPIC TV Infotainment English/
Hindi
SD
67 Filamchi Movies Bohjpuri SD
68 Gubbare Kids Hindi SD
13 Fame Media Private
Limited
69 4tv News News Urdu/
Hindi
SD
14 Greycells18 Media
Limited
70 Topper TV Miscellaneous English SD
15 IBN Lokmat News Private Ltd
71 News 18 Lokmat
News Hindi SD
16 Living Entertainment
Enterprises Private Ltd
72 ZEE ZEST HD Infotainment Hindi HD
73 Living Travelz Infotainment Hindi SD
17 Lifestyle and Media
Broadcasting Limited
74 Good Times Miscellaneous English SD
18 Lex Sportel Vision Private Limited
75 1SPORTS Sports English SD
19
Mavis Satcom Limited
76 J Movies Movies Tamil SD
77 Jaya Max Music Tamil SD
78 Jaya Plus News Tamil SD

105
S.
No
Name of the
broadcaster
Sl.
No
Name of the
channel
Genre as per
new Regulatory
framework
Language Declared
as SD or
HD
79 Jaya TV HD GEC Tamil HD
20 MSM World Wide Factual Media Private
Limited
80 SONY BBC EARTH
Infotainment English/ Hindi
SD
81 SONY BBC
EARTH HD
Infotainment English/
Hindi
HD
21 Media World Wide
Limited
82 Travel XP Infotainment English SD
22 New Delhi Television
Limited
83 NDTV 24*7 News English SD
84 NDTV India News Hindi SD
85 NDTV Profit News English SD
23
NGC Network (India)
Pvt Limited
86 Fox Life Infotainment English/
Hindi
SD
87 National
Geographic
Channel (NGC)
Infotainment English/
Hindi
SD
88 Fox Life HD Infotainment English/
Hindi
HD
89 Nat Geo Wild Infotainment English/ Hindi
SD
90 National
Geographic HD
Infotainment English/
Hindi
HD
91 Nat Geo Wild
HD
Infotainment English/
Hindi
HD
92 Baby TV HD Kids English/
Hindi
HD
24 NOIDA Software
Technology Park Limited
93 NHK World
Premium (HD Distribution)
Infotainment Japanese HD
25
Odisha Television
Limited
94 Prarthana Devotional Odia SD
95 Tarang GEC Odia SD
96 Tarang Music Music Odia SD
97 Alankar Movies Odia SD
26 Parshavnath Media
Private Limited
98 Dangal
Kannada
GEC Kannada SD
27
Raj Television Network Limited
99 Raj Digital Plus Movies Tamil SD
100 Raj Musix Music Tamil SD
101 Raj News News Tamil SD
102 Raj TV GEC Tamil SD
28 Silverstar Communications
Limited
103 Mega 24 GEC Tamil SD
104 Mega Musiq Music Tamil SD
105 Mega TV GEC Tamil SD
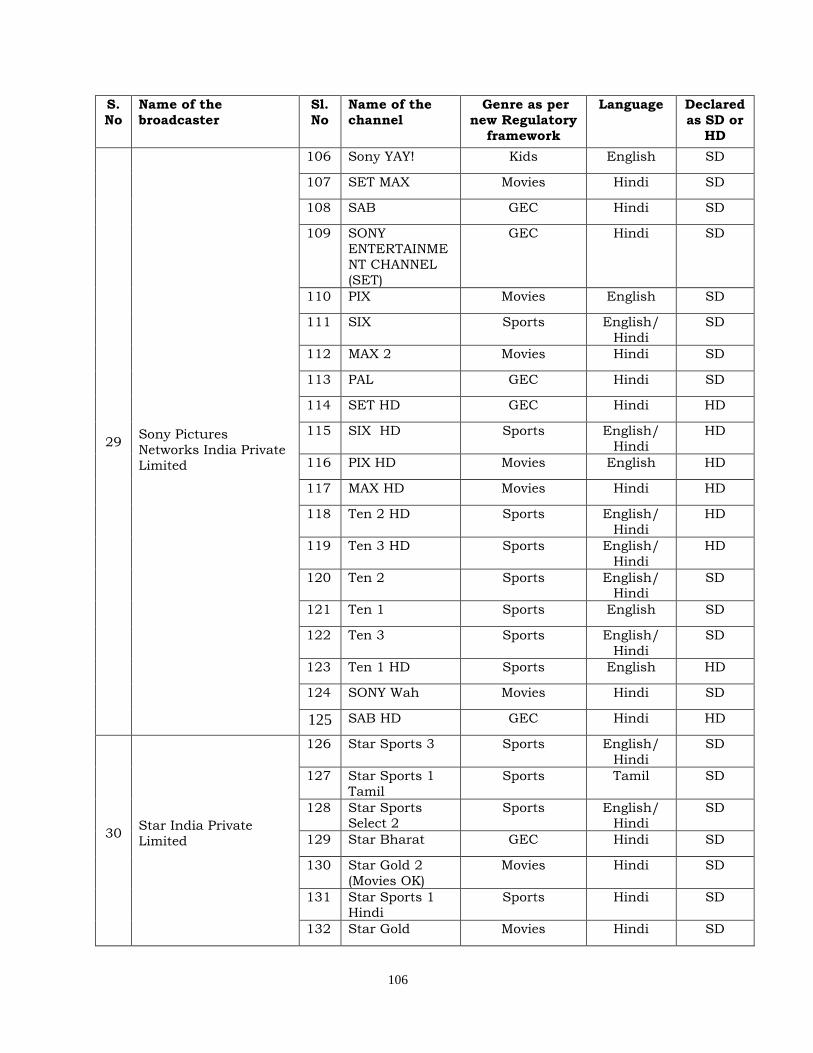
106
S.
No
Name of the
broadcaster
Sl.
No
Name of the
channel
Genre as per
new Regulatory
framework
Language Declared
as SD or
HD
29
Sony Pictures
Networks India Private
Limited
106 Sony YAY! Kids English SD
107 SET MAX Movies Hindi SD
108 SAB GEC Hindi SD
109 SONY
ENTERTAINME
NT CHANNEL
(SET)
GEC Hindi SD
110 PIX Movies English SD
111 SIX Sports English/
Hindi
SD
112 MAX 2 Movies Hindi SD
113 PAL GEC Hindi SD
114 SET HD GEC Hindi HD
115 SIX HD Sports English/
Hindi
HD
116 PIX HD Movies English HD
117 MAX HD Movies Hindi HD
118 Ten 2 HD Sports English/
Hindi
HD
119 Ten 3 HD Sports English/
Hindi
HD
120 Ten 2 Sports English/ Hindi
SD
121 Ten 1 Sports English SD
122 Ten 3 Sports English/
Hindi
SD
123 Ten 1 HD Sports English HD
124 SONY Wah Movies Hindi SD
125 SAB HD GEC Hindi HD
30
Star India Private
Limited
126 Star Sports 3 Sports English/
Hindi
SD
127 Star Sports 1
Tamil
Sports Tamil SD
128 Star Sports Select 2
Sports English/ Hindi
SD
129 Star Bharat GEC Hindi SD
130 Star Gold 2
(Movies OK)
Movies Hindi SD
131 Star Sports 1 Hindi
Sports Hindi SD
132 Star Gold Movies Hindi SD
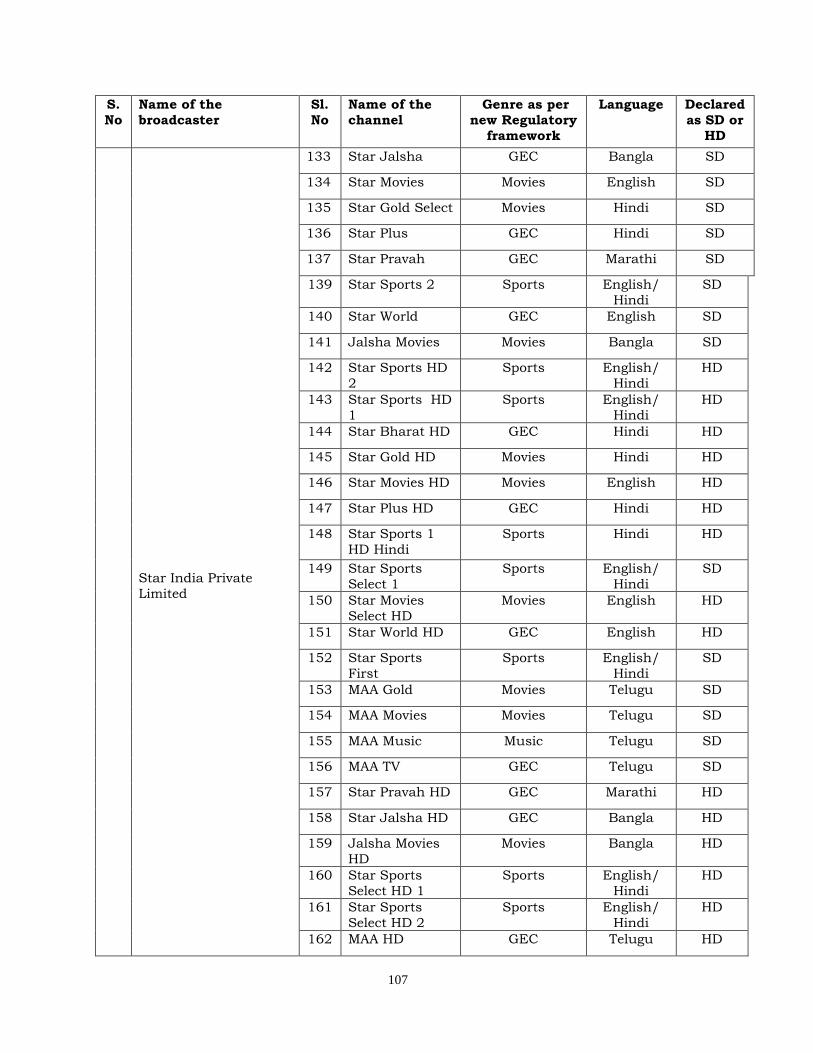
107
S.
No
Name of the
broadcaster
Sl.
No
Name of the
channel
Genre as per
new Regulatory
framework
Language Declared
as SD or
HD
Star India Private
Limited
133 Star Jalsha GEC Bangla SD
134 Star Movies Movies English SD
135 Star Gold Select Movies Hindi SD
136 Star Plus GEC Hindi SD
137 Star Pravah GEC Marathi SD
139 Star Sports 2 Sports English/
Hindi
SD
140 Star World GEC English SD
141 Jalsha Movies Movies Bangla SD
142 Star Sports HD
2
Sports English/
Hindi
HD
143 Star Sports HD
1
Sports English/
Hindi
HD
144 Star Bharat HD GEC Hindi HD
145 Star Gold HD Movies Hindi HD
146 Star Movies HD Movies English HD
147 Star Plus HD GEC Hindi HD
148 Star Sports 1
HD Hindi
Sports Hindi HD
149 Star Sports
Select 1
Sports English/
Hindi
SD
150 Star Movies
Select HD
Movies English HD
151 Star World HD GEC English HD
152 Star Sports
First
Sports English/
Hindi
SD
153 MAA Gold Movies Telugu SD
154 MAA Movies Movies Telugu SD
155 MAA Music Music Telugu SD
156 MAA TV GEC Telugu SD
157 Star Pravah HD GEC Marathi HD
158 Star Jalsha HD GEC Bangla HD
159 Jalsha Movies
HD
Movies Bangla HD
160 Star Sports
Select HD 1
Sports English/
Hindi
HD
161 Star Sports
Select HD 2
Sports English/
Hindi
HD
162 MAA HD GEC Telugu HD

108
S.
No
Name of the
broadcaster
Sl.
No
Name of the
channel
Genre as per
new Regulatory
framework
Language Declared
as SD or
HD
163 Star Gold Select
HD
Movies Hindi HD
164 MAA Movies HD Movies Telugu HD
165 Star World
Prmiere HD
GEC English HD
166 Star Sport 1
Telugu
Sports Telugu SD
167 Star Sport 1
Kannada
Sports Kannada SD
168 Star Sports 1
Bangla
Sports Bangla SD
169 Star Utsav GEC Hindi SD
170 Star Sports 1
Marathi
Sports Marathi SD
171 Star Utsav
Movies
Movies Hindi SD
31
SUN TV Network
Limited
172 Adithya TV GEC Tamil SD
173 Chintu TV Kids Kannada SD
174 Chutti TV Kids Tamil SD
175 Gemini Comedy GEC Telugu SD
176 Gemini Life GEC Telugu SD
177 Gemini Movies GEC Telugu SD
178 Gemini Music Music Telugu SD
179 Gemini TV GEC Telugu SD
180 KTV GEC Tamil SD
181 Surya Movies GEC Malayalam SD
182 Kushi TV Kids Telugu SD
183 SUN Life GEC Tamil SD
184 Sun Music Music Tamil SD
185 Sun News News Tamil SD
186 Surya Music Music Malayalam SD
187 SUN TV GEC Tamil SD
188 Surya Comedy GEC Malayalam SD
189 Surya TV GEC Malayalam SD
190 Udaya Comedy GEC Kannada SD
191 Udaya Movies GEC Kannada SD
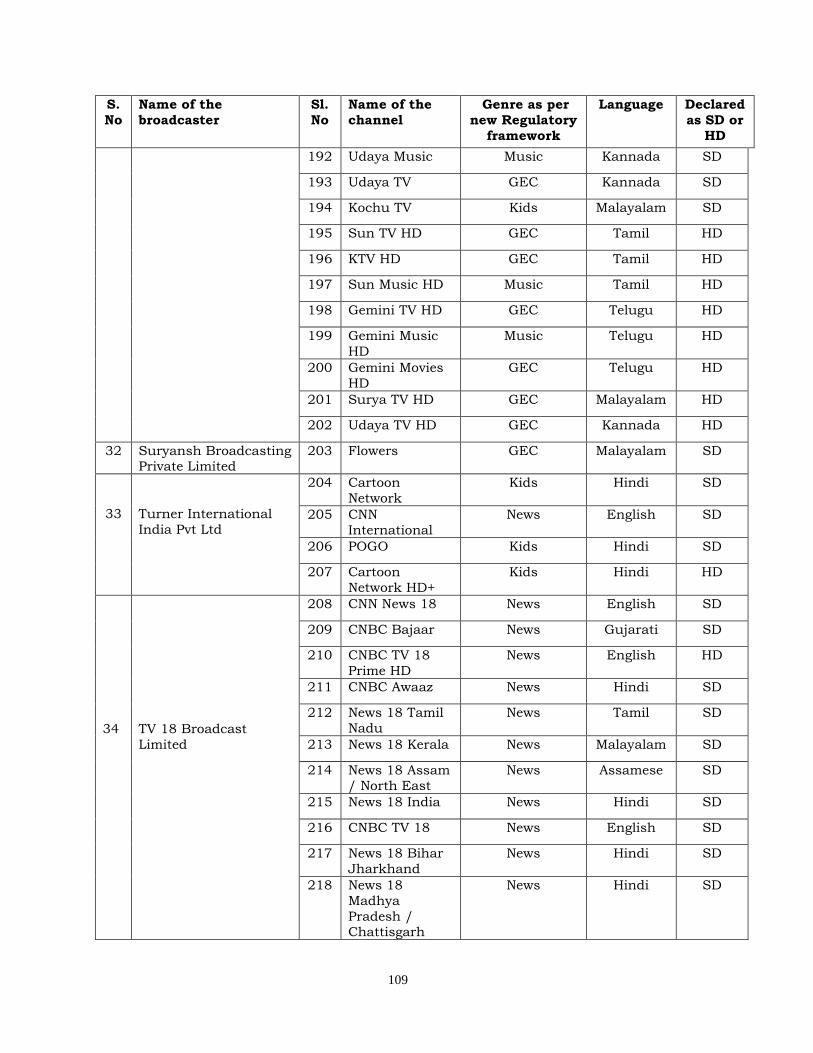
109
S.
No
Name of the
broadcaster
Sl.
No
Name of the
channel
Genre as per
new Regulatory
framework
Language Declared
as SD or
HD
192 Udaya Music Music Kannada SD
193 Udaya TV GEC Kannada SD
194 Kochu TV Kids Malayalam SD
195 Sun TV HD GEC Tamil HD
196 KTV HD GEC Tamil HD
197 Sun Music HD Music Tamil HD
198 Gemini TV HD GEC Telugu HD
199 Gemini Music
HD
Music Telugu HD
200 Gemini Movies
HD
GEC Telugu HD
201 Surya TV HD GEC Malayalam HD
202 Udaya TV HD GEC Kannada HD
32 Suryansh Broadcasting Private Limited
203 Flowers GEC Malayalam SD
33
Turner International
India Pvt Ltd
204 Cartoon
Network
Kids Hindi SD
205 CNN
International
News English SD
206 POGO Kids Hindi SD
207 Cartoon
Network HD+
Kids Hindi HD
34
TV 18 Broadcast
Limited
208 CNN News 18 News English SD
209 CNBC Bajaar News Gujarati SD
210 CNBC TV 18
Prime HD
News English HD
211 CNBC Awaaz News Hindi SD
212 News 18 Tamil
Nadu
News Tamil SD
213 News 18 Kerala News Malayalam SD
214 News 18 Assam / North East
News Assamese SD
215 News 18 India News Hindi SD
216 CNBC TV 18 News English SD
217 News 18 Bihar
Jharkhand
News Hindi SD
218 News 18
Madhya
Pradesh / Chattisgarh
News Hindi SD
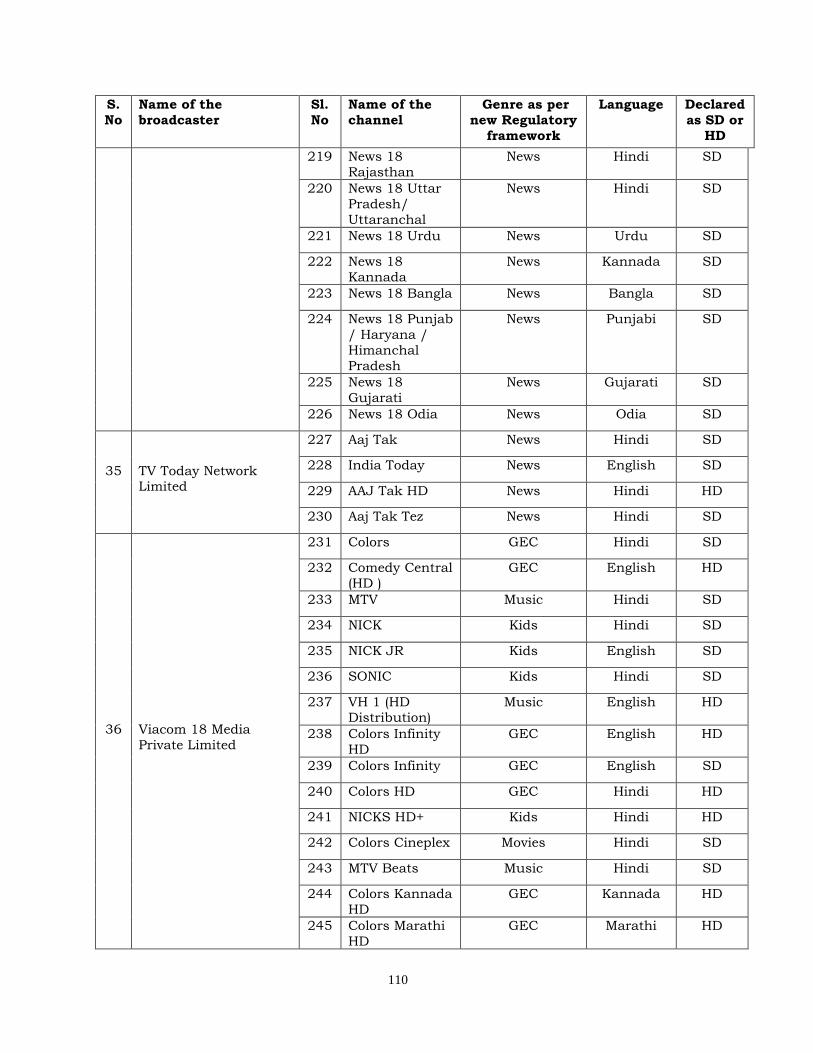
110
S.
No
Name of the
broadcaster
Sl.
No
Name of the
channel
Genre as per
new Regulatory
framework
Language Declared
as SD or
HD
219 News 18
Rajasthan
News Hindi SD
220 News 18 Uttar
Pradesh/
Uttaranchal
News Hindi SD
221 News 18 Urdu News Urdu SD
222 News 18
Kannada
News Kannada SD
223 News 18 Bangla News Bangla SD
224 News 18 Punjab
/ Haryana /
Himanchal
Pradesh
News Punjabi SD
225 News 18
Gujarati
News Gujarati SD
226 News 18 Odia News Odia SD
35
TV Today Network Limited
227 Aaj Tak News Hindi SD
228 India Today News English SD
229 AAJ Tak HD News Hindi HD
230 Aaj Tak Tez News Hindi SD
36
Viacom 18 Media
Private Limited
231 Colors GEC Hindi SD
232 Comedy Central
(HD )
GEC English HD
233 MTV Music Hindi SD
234 NICK Kids Hindi SD
235 NICK JR Kids English SD
236 SONIC Kids Hindi SD
237 VH 1 (HD Distribution)
Music English HD
238 Colors Infinity
HD
GEC English HD
239 Colors Infinity GEC English SD
240 Colors HD GEC Hindi HD
241 NICKS HD+ Kids Hindi HD
242 Colors Cineplex Movies Hindi SD
243 MTV Beats Music Hindi SD
244 Colors Kannada
HD
GEC Kannada HD
245 Colors Marathi
HD
GEC Marathi HD
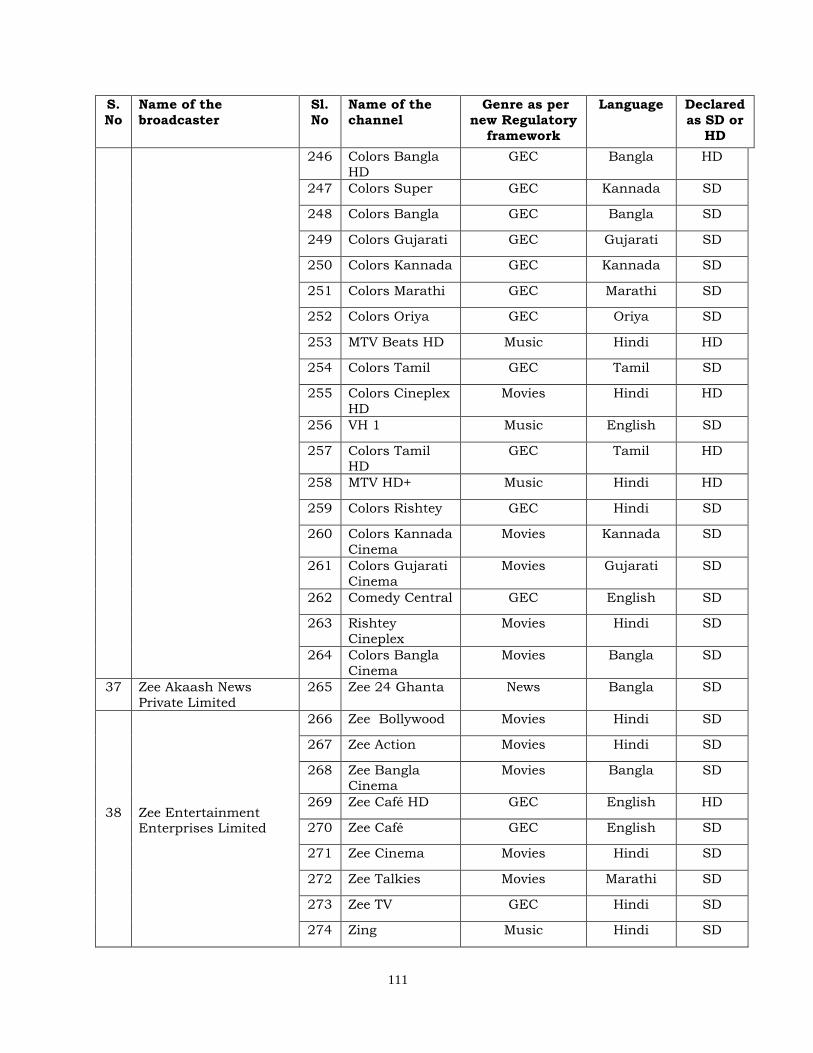
111
S.
No
Name of the
broadcaster
Sl.
No
Name of the
channel
Genre as per
new Regulatory
framework
Language Declared
as SD or
HD
246 Colors Bangla
HD
GEC Bangla HD
247 Colors Super GEC Kannada SD
248 Colors Bangla GEC Bangla SD
249 Colors Gujarati GEC Gujarati SD
250 Colors Kannada GEC Kannada SD
251 Colors Marathi GEC Marathi SD
252 Colors Oriya GEC Oriya SD
253 MTV Beats HD Music Hindi HD
254 Colors Tamil GEC Tamil SD
255 Colors Cineplex
HD
Movies Hindi HD
256 VH 1 Music English SD
257 Colors Tamil HD
GEC Tamil HD
258 MTV HD+ Music Hindi HD
259 Colors Rishtey GEC Hindi SD
260 Colors Kannada
Cinema
Movies Kannada SD
261 Colors Gujarati
Cinema
Movies Gujarati SD
262 Comedy Central GEC English SD
263 Rishtey
Cineplex
Movies Hindi SD
264 Colors Bangla
Cinema
Movies Bangla SD
37 Zee Akaash News
Private Limited
265 Zee 24 Ghanta News Bangla SD
38
Zee Entertainment Enterprises Limited
266 Zee Bollywood Movies Hindi SD
267 Zee Action Movies Hindi SD
268 Zee Bangla Cinema
Movies Bangla SD
269 Zee Café HD GEC English HD
270 Zee Café GEC English SD
271 Zee Cinema Movies Hindi SD
272 Zee Talkies Movies Marathi SD
273 Zee TV GEC Hindi SD
274 Zing Music Hindi SD

112
S.
No
Name of the
broadcaster
Sl.
No
Name of the
channel
Genre as per
new Regulatory
framework
Language Declared
as SD or
HD
Zee Entertainment
Enterprises Limited
275 & Picture Movies Hindi SD
276 Zee Bangla GEC Bangla SD
277 Zee Marathi GEC Marathi SD
278 Zee Zest Infotainment English/
Hindi
SD
279 Zee TV HD GEC Hindi HD
280 Zee Cinema HD Movies Hindi HD
281 & TV GEC Hindi SD
282 & TV HD GEC Hindi HD
283 Zee Kannada GEC Kannada SD
284 Zee Telugu GEC Telugu SD
285 & Pictures HD Movies English/
Hindi
HD
286 Zee Cinemalu Movies Telugu SD
287 Zee Yuva GEC Marathi SD
288 Zee Marathi HD GEC Marathi HD
289 & Prive HD Movies English HD
290 Zee Bangla HD GEC Bangla HD
291 Zee Tamil HD GEC Tamil HD
292 Zee Cinemalu
HD
Movies Telugu HD
293 Zee Telugu HD GEC Telugu HD
294 Zee Tamil GEC Tamil SD
295 Zee Kannada
HD
GEC Kannada HD
296 Zee Anmol Cinema
Movies Hindi SD
297 & Flix HD Movies English HD
298 & Flix Movies English SD
299 Zee Keralam
HD
GEC Malayalam HD
300 Zee Keralam GEC Malayalam SD
301 Zee Vajwa Music Hindi SD
302 Zee Anmol GEC Hindi SD
303 Big Magic GEC Hindi SD
304 Big Ganga GEC Bhojpuri SD
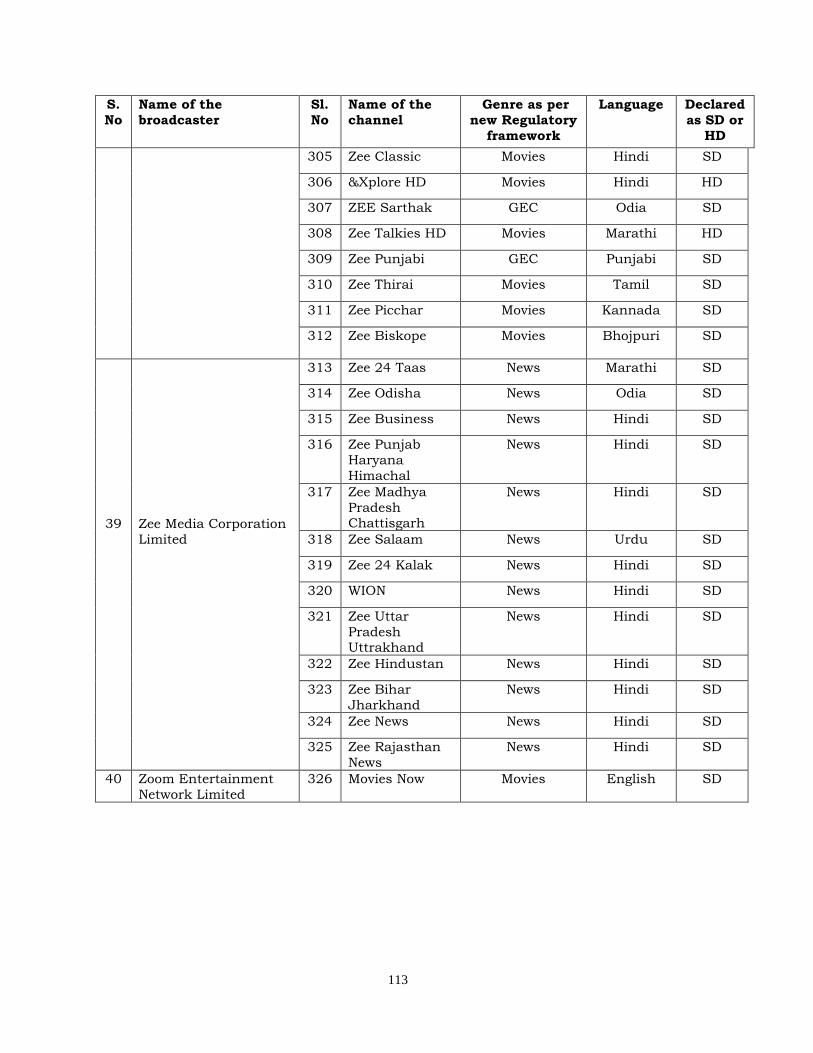
113
S.
No
Name of the
broadcaster
Sl.
No
Name of the
channel
Genre as per
new Regulatory
framework
Language Declared
as SD or
HD
305 Zee Classic Movies Hindi SD
306 &Xplore HD Movies Hindi HD
307 ZEE Sarthak GEC Odia SD
308 Zee Talkies HD Movies Marathi HD
309 Zee Punjabi GEC Punjabi SD
310 Zee Thirai Movies Tamil SD
311 Zee Picchar Movies Kannada SD
312 Zee Biskope Movies Bhojpuri SD
39
Zee Media Corporation
Limited
313 Zee 24 Taas News Marathi SD
314 Zee Odisha News Odia SD
315 Zee Business News Hindi SD
316 Zee Punjab
Haryana
Himachal
News Hindi SD
317 Zee Madhya
Pradesh Chattisgarh
News Hindi SD
318 Zee Salaam News Urdu SD
319 Zee 24 Kalak News Hindi SD
320 WION News Hindi SD
321 Zee Uttar
Pradesh Uttrakhand
News Hindi SD
322 Zee Hindustan News Hindi SD
323 Zee Bihar
Jharkhand
News Hindi SD
324 Zee News News Hindi SD
325 Zee Rajasthan
News
News Hindi SD
40 Zoom Entertainment
Network Limited
326 Movies Now Movies English SD

114
Annexure 5.2
List of Pay DTH Operators
1. M/s. Tata Sky Ltd., Tata Communications Complex,
Mandi Road, PO Chattarpur, New Delhi – 110 074
Tel: 011-6616 3000 Fax-022-6616 3030 Website : www.tatasky.com
Toll Free No. 18002086633 2. M/s Dish TV India Ltd.
FC-19, Sector-16A, Film City, Noida-201301
Tel: 91-120-2467005 / 2467000 Fax: 91-120-4357082 Toll Free No. 18002583474 (Dish), 1800212212 (d2h)
Website : www.dishtv.in
3. SUN Direct TV(P) Ltd. Murasoli Maran Towers, 73, MRC Nagar,
Main Road, MRC Nagar, Chennai – 28 PH: 044-44676767, Fax No 044-40679191 Website : www.sundirect.in
Toll Free No. 18001037575
4. Bharti Telemedia Ltd. Airtel Centre, Plot No 16, Udyog Vihar Phase IV,
Gurgaon – 122 015 Ph: 0124-4222222 Fax : 0124-4248063
Website : www.airtel.in Toll Free No. 18001036065
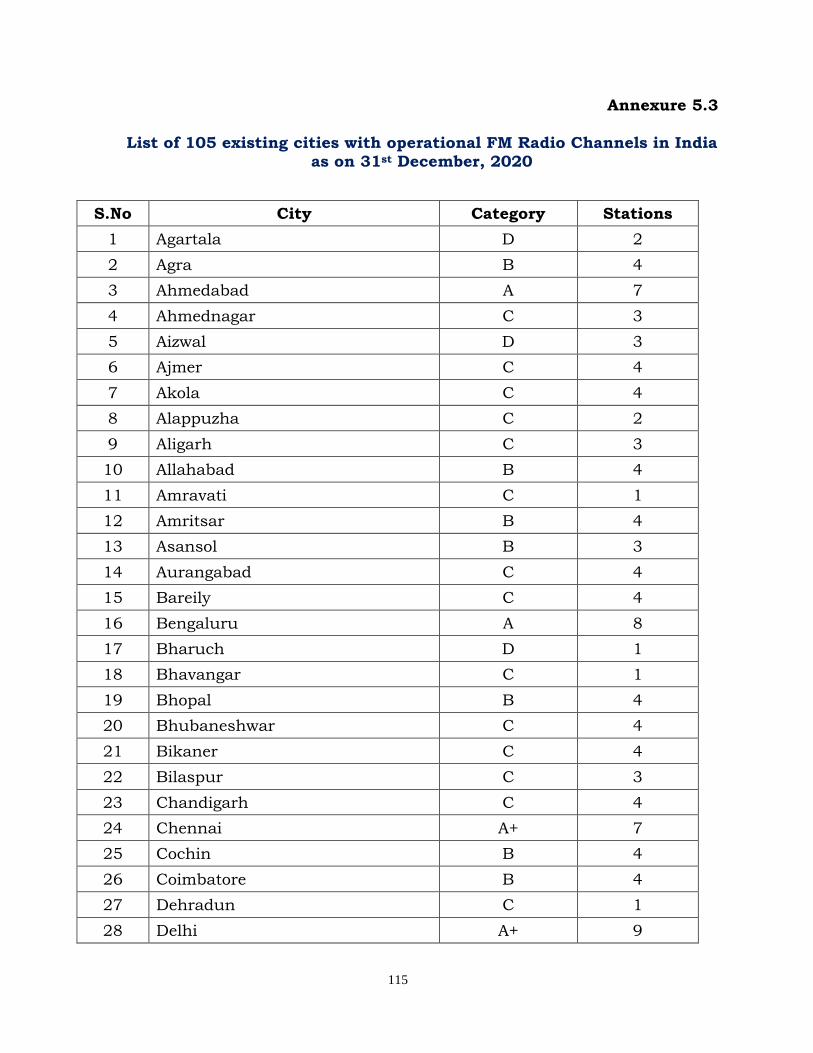
115
Annexure 5.3
List of 105 existing cities with operational FM Radio Channels in India as on 31st December, 2020
S.No City Category Stations
1 Agartala D 2
2 Agra B 4
3 Ahmedabad A 7
4 Ahmednagar C 3
5 Aizwal D 3
6 Ajmer C 4
7 Akola C 4
8 Alappuzha C 2
9 Aligarh C 3
10 Allahabad B 4
11 Amravati C 1
12 Amritsar B 4
13 Asansol B 3
14 Aurangabad C 4
15 Bareily C 4
16 Bengaluru A 8
17 Bharuch D 1
18 Bhavangar C 1
19 Bhopal B 4
20 Bhubaneshwar C 4
21 Bikaner C 4
22 Bilaspur C 3
23 Chandigarh C 4
24 Chennai A+ 7
25 Cochin B 4
26 Coimbatore B 4
27 Dehradun C 1
28 Delhi A+ 9
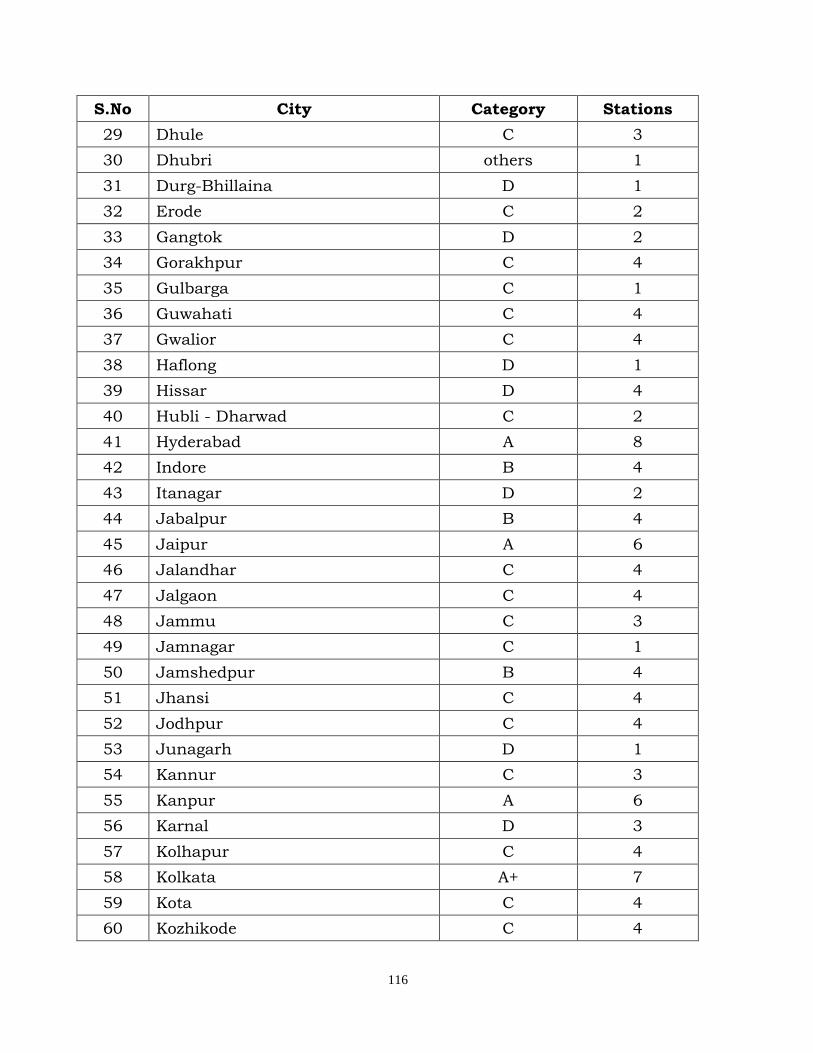
116
S.No City Category Stations
29 Dhule C 3
30 Dhubri others 1
31 Durg-Bhillaina D 1
32 Erode C 2
33 Gangtok D 2
34 Gorakhpur C 4
35 Gulbarga C 1
36 Guwahati C 4
37 Gwalior C 4
38 Haflong D 1
39 Hissar D 4
40 Hubli - Dharwad C 2
41 Hyderabad A 8
42 Indore B 4
43 Itanagar D 2
44 Jabalpur B 4
45 Jaipur A 6
46 Jalandhar C 4
47 Jalgaon C 4
48 Jammu C 3
49 Jamnagar C 1
50 Jamshedpur B 4
51 Jhansi C 4
52 Jodhpur C 4
53 Junagarh D 1
54 Kannur C 3
55 Kanpur A 6
56 Karnal D 3
57 Kolhapur C 4
58 Kolkata A+ 7
59 Kota C 4
60 Kozhikode C 4
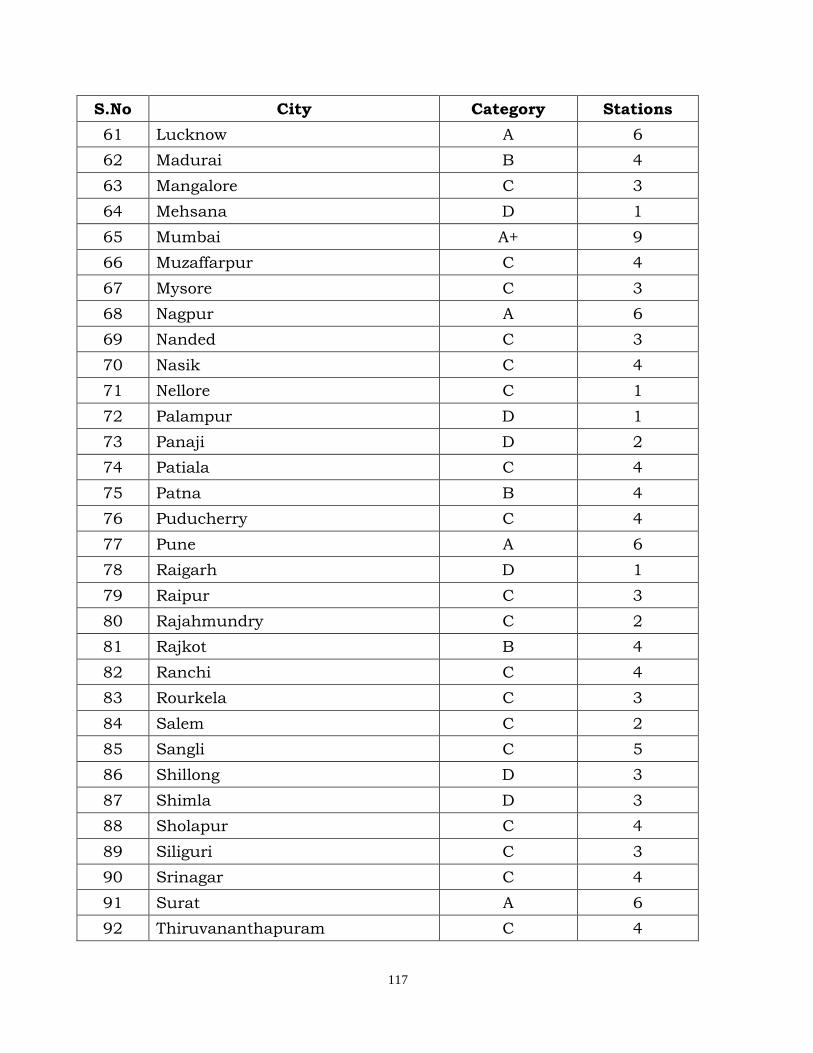
117
S.No City Category Stations
61 Lucknow A 6
62 Madurai B 4
63 Mangalore C 3
64 Mehsana D 1
65 Mumbai A+ 9
66 Muzaffarpur C 4
67 Mysore C 3
68 Nagpur A 6
69 Nanded C 3
70 Nasik C 4
71 Nellore C 1
72 Palampur D 1
73 Panaji D 2
74 Patiala C 4
75 Patna B 4
76 Puducherry C 4
77 Pune A 6
78 Raigarh D 1
79 Raipur C 3
80 Rajahmundry C 2
81 Rajkot B 4
82 Ranchi C 4
83 Rourkela C 3
84 Salem C 2
85 Sangli C 5
86 Shillong D 3
87 Shimla D 3
88 Sholapur C 4
89 Siliguri C 3
90 Srinagar C 4
91 Surat A 6
92 Thiruvananthapuram C 4
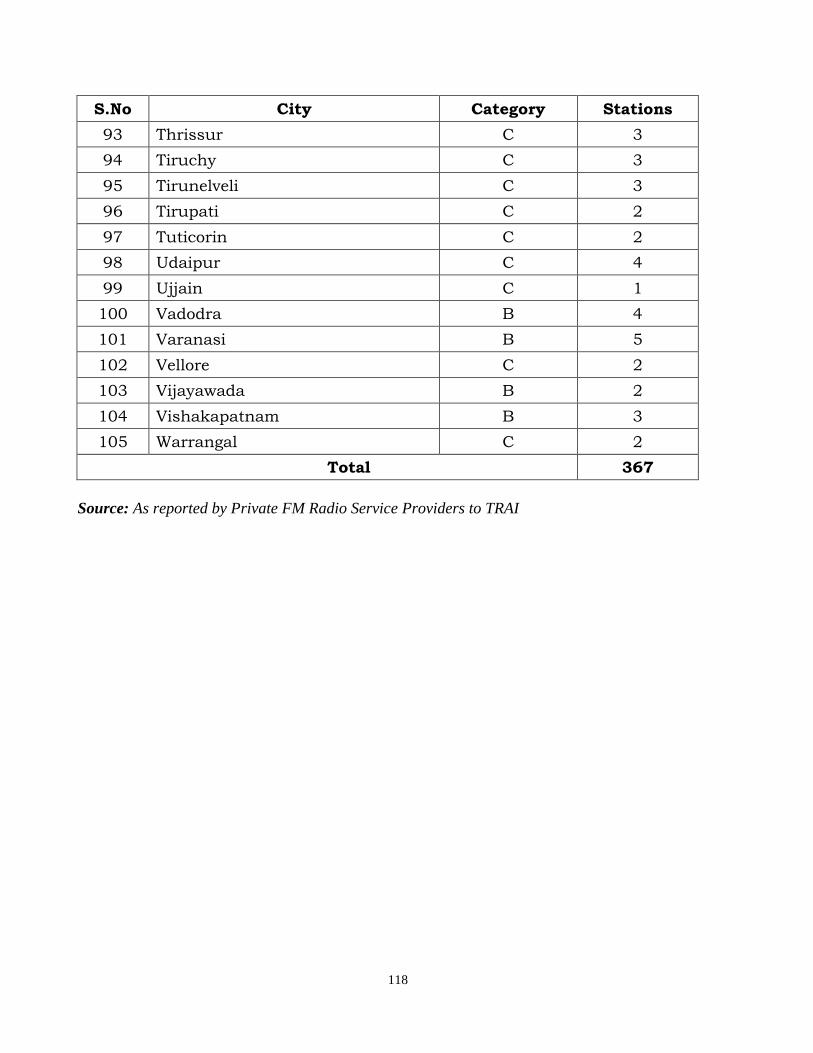
118
S.No City Category Stations
93 Thrissur C 3
94 Tiruchy C 3
95 Tirunelveli C 3
96 Tirupati C 2
97 Tuticorin C 2
98 Udaipur C 4
99 Ujjain C 1
100 Vadodra B 4
101 Varanasi B 5
102 Vellore C 2
103 Vijayawada B 2
104 Vishakapatnam B 3
105 Warrangal C 2
Total 367
Source: As reported by Private FM Radio Service Providers to TRAI

119
Disclaimer
The Information and Statistics contained in this report are derived from variety of
sources but are mainly reliant on data obtained from Service Providers. This
report does not constitute commercial or other advice. No warranty,
representation or undertaking of any kind, express or implied, is given in relation
to the information and statistics contained in this report.