VALUATION OF CELLNEX TELECOM - Repositorio Comillas
71
1 Facultad de Ciencias Económicas y Empresariales VALUATION OF CELLNEX TELECOM Autora: Fátima de San Román de Simón Tutor: Manuel Federico Goudie Pujals MADRID | June 2020
-
Upload
khangminh22 -
Category
Documents
-
view
0 -
download
0
Transcript of VALUATION OF CELLNEX TELECOM - Repositorio Comillas

1
Facultad de Ciencias Económicas y Empresariales
VALUATION OF CELLNEX TELECOM
Autora: Fátima de San Román de Simón Tutor: Manuel Federico Goudie Pujals
MADRID | June 2020

2
ABSTRACT
1. INTRODUCTION .................................................................................................. 7
2. TELECOMMUNICATIONS SECTOR ANALYSIS .......................................... 8
2.1 Telecommunications sector in Spain ................................................................ 8
2.2 Market trends in the sector ............................................................................... 8
2.3 Key growth drivers ......................................................................................... 10
3. TOWER INDUSTRY. SUBSECTOR ................................................................. 12
3.1. Introduction .................................................................................................... 12
3.2. Tower Industry in Europe. .............................................................................. 16
3.3. Business Model ............................................................................................... 17
3.4. Competitiveness in the European market ....................................................... 22
4. CELLNEX ............................................................................................................. 25
4.1. Introduction .................................................................................................... 25
4.2. Main milestones .............................................................................................. 26
4.3. Business Lines ................................................................................................ 29
4.3.1. Telecom Infrastructure Services ................................................................. 29
4.3.2. Broadcasting networks ............................................................................... 30
4.3.3. DAS & Small Cells ..................................................................................... 30
4.3.4. Fibre Optic .................................................................................................. 31
4.4. Growth Opportunities ..................................................................................... 32
4.5. Financial Analysis .......................................................................................... 35
4.6. Coronavirus Impact ........................................................................................ 39
5. VALUATION METHODS .................................................................................. 40
5.1. Precedent Transactions ................................................................................... 40
5.2. Comparable Trading Companies .................................................................... 41
5.3. Discounted Cash Flow .................................................................................... 41
6. CELLNEX VALUATION ................................................................................... 45
3
6.1. Precedent Transactions ................................................................................... 45
6.2. Comparables ................................................................................................... 47
6.3. Discounted Cash Flow .................................................................................... 50
6.3.1. Projections .................................................................................................. 50
6.3.2. Weighted Average Cost of Capital (WACC) ............................................. 59
6.3.3. Valuation with DCF .................................................................................... 61
6.3.4. Sensitivity Analysis .................................................................................... 62
6.3.5. Football Field .............................................................................................. 63
7. CONCLUSION ..................................................................................................... 65
8. BIBLIOGRAPHY ................................................................................................. 67
9. APPENDIX ............................................................................................................ 70
9.1. Balance Sheet 2015-2019 ............................................................................... 70
9.2. Profit & Loss account 2015-2019 ................................................................... 70
9.3. Cash Flow Statement 2015-2019 .................................................................... 71
4
VOCABULARY
MNO Mobile Network Operator
BTS Build to Suit
DAS Distributed Antenna System
PoP Point of Presence
TowerCos Tower Companies
Tenancy The right to use land or live in a building in exchange for rent
MSA Master Service Agreement
CAGR Compound Annual Growth Rate
WACC Weighted Average Cost of Capital
Capex Capital Expenditure
FCF Free Cash Flow
EBITDA Earnings Before Interest Taxes Depreciation and Amortization
INDEX OF GRAPHS Graph 1: Revenue from the Digital Ecosystem (in billion euros) .................................. 10
Graph 2: Global Consumer IP Traffic (EB/month) ........................................................ 11
Graph 3: Global Consumer Internet Traffic ................................................................... 12
Graph 4: Telecom Tower Ownership ............................................................................. 16
Graph 5: Europe's main telecom and broadcast TowerCos ............................................ 17
Graph 6: Cost per Additional Point of Presence for MNOs vs. TowerCos .................... 22
Graph 7: Tower ownership in the UK ............................................................................ 23
Graph 8: Tower Ownership in Spain .............................................................................. 25
Graph 9: Shareholder Structure ...................................................................................... 26
Graph 10: Cellnex's main milestones ............................................................................. 27
Graph 11: Tower ownership in France ........................................................................... 34
Graph 12: Revenues by Country and Business Line in 2019 ......................................... 36
Graph 13: Financials evolution ....................................................................................... 38
Graph 14: Cellnex’s precedent transactions ................................................................... 46
Graph 15: Other players’ precedent transactions ........................................................... 46
Graph 16: Football Field (Equity Value) ........................................................................ 64
5
INDEX OF FIGURES
Figure 1: TowerCo's role in infrastructure sharing ......................................................... 14
Figure 2: IFRS 16 impact ............................................................................................... 19
Figure 3: IFRS implications for clients .......................................................................... 19
Figure 4: IFRS 16 implications for Cellnex ................................................................... 20
Figure 5: How TowerCos facilitate infrastructure sharing ............................................. 21
Figure 6: Presence of Deutsche Telekom in Europe ...................................................... 24
Figure 7: Total number of sites ....................................................................................... 30
Figure 8: Fixed and Mobile Transport Fiber Network ................................................... 31
Figure 9: Vodafone TowerCo footprint .......................................................................... 33
Figure 10: Evolution of Cellnex shares during 2019 ...................................................... 39
Figure 11: Revenues projection ...................................................................................... 51
Figure 12: M&A growth assumption .............................................................................. 52
Figure 13: Build to Suit assumption ............................................................................... 53
Figure 14: Tenancy ratio estimates ................................................................................. 53
Figure 15: Fee per PoP estimates ................................................................................... 54
Figure 16: Weighted inflation assumption ..................................................................... 55
Figure 17: Operating Expenses projection ..................................................................... 55
Figure 18: Capital Expenditure projection ..................................................................... 56
Figure 19: BTS assumption ............................................................................................ 57
Figure 20: Depreciation and Amortization projection .................................................... 58
Figure 21: Spread ............................................................................................................ 60
Figure 22: Weighted Tax Rate ........................................................................................ 60
Figure 23: Weighted Average Cost of Capital ............................................................... 61
Figure 24: Sensitivity Analysis ....................................................................................... 63
INDEX OF TABLES
Table 1: Highlights in the European market ................................................................... 23
Table 3: Recurring Levered FCF .................................................................................... 37
Table 4: Comparables financial data .................................................... 48
Table 5: Comparable Companies multiple ..................................................................... 49
Table 6: Share Price with Multiples ............................................................................... 49
Table 7: Share Price with Discounted Cash Flow .......................................................... 62
6
ABSTRACT The present investigation seeks to perform a fundamental analysis about Cellnex
Telecom, a Spanish listed company which operates as Europe’s leading operator of
wireless telecommunications and broadcasting infrastructures. This analysis will be
conducted in order to conclude if Cellnex current market value is overvalued or
undervalued by comparing it with the implied value. In order to do so, a literature
review about the telecommunication sector and the theoretical framework of the
company has been assessed. Furthermore, a review of the main methods of valuation of
companies has been carried out, such as the discounted cash flow or comparable trading
companies’ valuation. In addition, the main financials of the company have been
analyzed, as well as its strategic expansion plans and its growth opportunities in the
European market. The aim of the investigation is to issue a recommendation on whether
or not to maintain, buy or sell the stock of Cellnex Telecom in a given portfolio.
Key words: Company valuation, Telecommunications, DCF, Multiple, Value, Share Price

7
1. INTRODUCTION
In order to carry out the valuation of a company as accurate as possible, there are
several steps that must be taken during the process. It is necessary to make an in-depth
analysis both of the theoretical framework of the company and of the best indicators for
determining the growth and the future expansion strategy expectations. This should be
done through an adequate monitoring of the company performance and its
macroeconomic environment, which will have a direct influence on the expectations
mentioned above. This will be very important when making assumptions for the
valuation analysis.
When making assumptions to project the future cash flows of a company, a deep
understanding of the sector in which your company is operating and of the company’s
evolution during the past years in terms of growth, strategy and financials and the
growth opportunities within the market is needed.
In addition, it will be easier to achieve a more accurate result if more than one method is
used by comparing all of them at the end. The analysis includes a review of the different
valuation methods, especially focusing on three of them: Precedent Transactions,
Comparable Trading Companies, and Discounted Cash Flow as these have been used to
reach Cellnex Telecom’s implied value. However, the most accurate method and the
one on which my conclusion mainly relies is the Discounted Cash Flow.
In this valuation assessment, I have tried to go through all the possible aspects that need
to be taken into consideration to make the most precise assumptions and estimates. First
of all, I have done a telecommunications sector analysis to gain knowledge of the key
elements that drive this sector such as the current market trends. However, I wanted to
go deeper into Cellnex main operating field, which is the tower industry. Therefore, a
more detailed explanation of Cellnex’s growth drivers and its infrastructure functioning
have been included.
Cellnex Telecom is Europe’s leading operator of wireless telecommunications and
broadcasting infrastructures with a portfolio of 58,000 sites including forecast roll-outs
up to 2027. Cellnex operates in multiple countries across Europe, specifically in Spain,

8
Italy, Netherlands, France, Switzerland, the United Kingdom, Ireland and Portugal. It
provides Telecom Infrastructure Services and Broadcasting Services, in addition to
other Network services. It is listed on the IBEX 35 index and trades at 50.05 euros as of
April 22nd, 2020.
2. TELECOMMUNICATIONS SECTOR ANALYSIS
2.1 Telecommunications sector in Spain
Spain’s telecommunication market is one of the largest in Europe, but it has taken time
to achieve this position. Until the 80s there was a predominance of traditional services
such as the telegraphy and the basic telephony. Some experts place in 1979, with the
celebration of the World Telecommunications Exhibitions (TELECOM’79), the turning
point for the establishment of this new technology.
Deloitte’s report “Impacto de 20 años de liberalización de las telecomunicaciones en
España 1998-2018” considers that for the last two decades, the Spanish telecom sector
has undergone an important transformation due to the technology development and due
to its clients’ consumption evolution. This evolution is caused by the change of fixed
telephony to mobile telephony, the high increase in the use of smartphones and the
growth in the consumption of mobile data.
At the beginnings of this new era, there was a monopoly of the sector in Spain led by
‘Compañía Telefónica Nacional de España’, founded in 1924. Telefónica was the
responsible for the development and operation of the telephone service in Spain, and it
was not until 1945, when Telefónica converted into a public company as Franco’s
government nationalized it by taking control of the company with the 79,6% of the
shares. However, the biggest change was in the 90s decade with the privatizations. In
1996, it started the liberalization process of the telecommunications sector with
companies such as Airtel or Orange entering the scene.
2.2 Market trends in the sector
The main market trends within the telecommunication sector in 2019 which are driving
the companies’ strategy are: Artificial Intelligence (AI), implementation of 5G, Cloud
9
computing, Internet of Things (IoT) and its applications and, Edge Computing among
others.
Nowadays, telecommunication companies are using AI to analyze and process the vast
amounts of data collected over the years through their customer bases. They use all the
Big Data to provide better services, improve operations and increase revenue through
new products and services.
TechSee/Liad Churchill publication on “4 areas where AI is Transforming the Telecom
Industry in 2019” mentions the following statements about AI. Communication service
providers (CSPs) are using Artificial Intelligence to optimize network quality based on
traffic information by region and time zone. It helps them to find patterns within the
data in order to detect and predict network anomalies and future results based on
historical data. To conclude, TechSee states “International Data Corporation (IDC)
indicates that 63.5% of operators are investing in AI systems to improve their
infrastructure”. (Churchill, 2020)
This is one of the most important factors that is determining the strategy of the
telecommunication companies. It will imply changes in the use of networks and the new
services’ forms for clients and companies.
Andalucia Es Digital provides some data we should take into account to understand the
changes that 5G will bring to this sector and the world are: 5G will reduce the latency
period (the time from when its transmitted by a mobile terminal to when it arrives at its
destination). It will allow the interconnexion of 50,000 million of connected objects
(Internet of Things). Moreover, 5G will generate energy savings of 90% on the current
consumption according to the EU.
Cloud Computing allows the remote access to software, storage and processing of the
cloud data. It is the alternative to the physic storage. Masvoz identifies the following
benefits from Cloud Computing. The advantages of this trend are the cost savings,
higher efficiency, agility, growth opportunities and innovation among others. Some data
information that reinforces the relevance of this trend within this industry is: 83% of
Enterprise workloads will be in the cloud in 2020. In 2019, the public cloud services
10
have grown 18% accounting for more than 215 billion dollars in comparison with the
180 billion dollars of 2018 in the world.
Furthermore, the World Economic Forum foresees an annual investment in IoT, at a
worldwide level, of billions of dollars in the following two years. Therefore, the
implementation of this technology is one of the main trends in telecommunications in
2020.
2.3 Key growth drivers
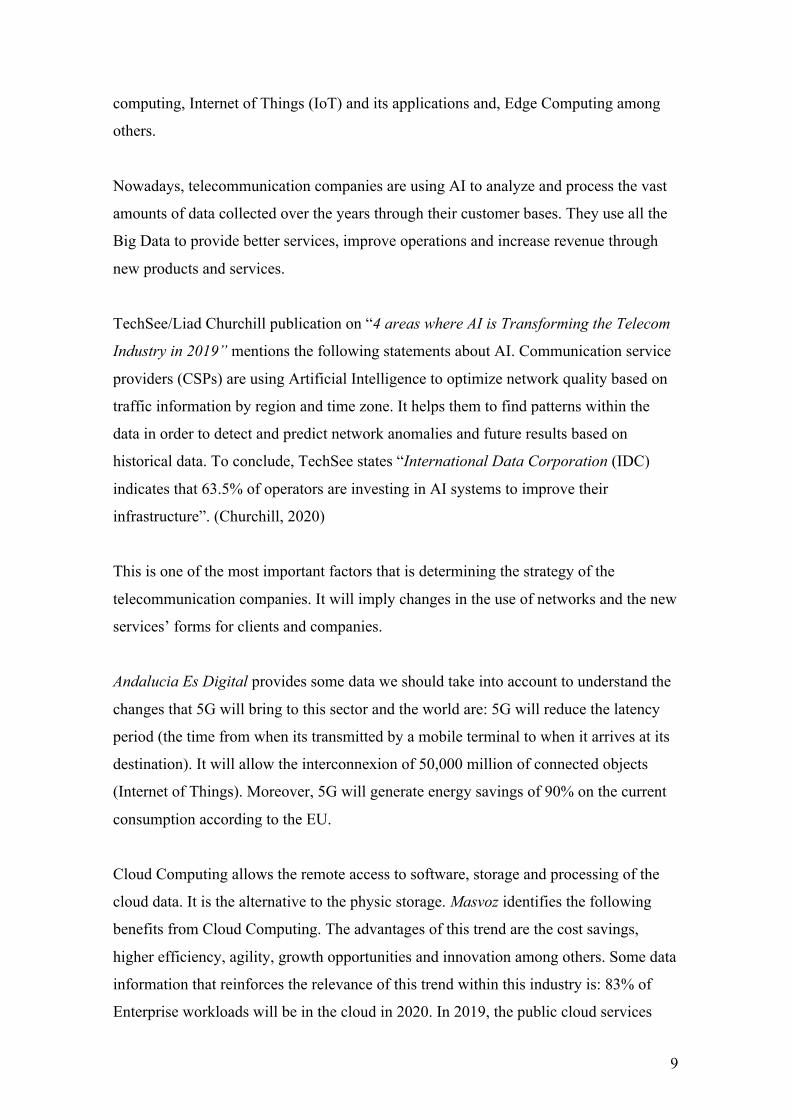
Telecom operators, device manufacturers, and internet players have driven the world
ecosystem’s growth over 2011-2016. In the graph below, we can appreciate the
evolution of revenues from the Digital Ecosystem during the 2007-2016 period. These
revenues are generated by the following divisions: Telecom operators, Devices,
Information Technology and Software, Telecom equipment, Internet and Content. They
are ordered in terms of contribution to revenues, the former representing 34% of total
revenues in 2016. Furthermore, Internet division is the one which represents the highest
Compound Annual Growth Rate with a 22% during the period.
Graph 1: Revenue from the Digital Ecosystem (in billion euros)
Source: Own development with Statista data
855 910 932 962 1031 1080 1149 1212 1280 1328
761 834 842 969 1060 1169 1215 1266 1331 1249316
347 335358
404434 442
464478 487
7281 90
113148
188232
282335 427
250266 242
258263
262256
250253 261
180179 162
171169
167158
160169 188
2007 2008 2009 2010 2011 2012 2013 2014 2015 2016
Telecom operators Devices IT and software services Internet Content Telecom equipment
11
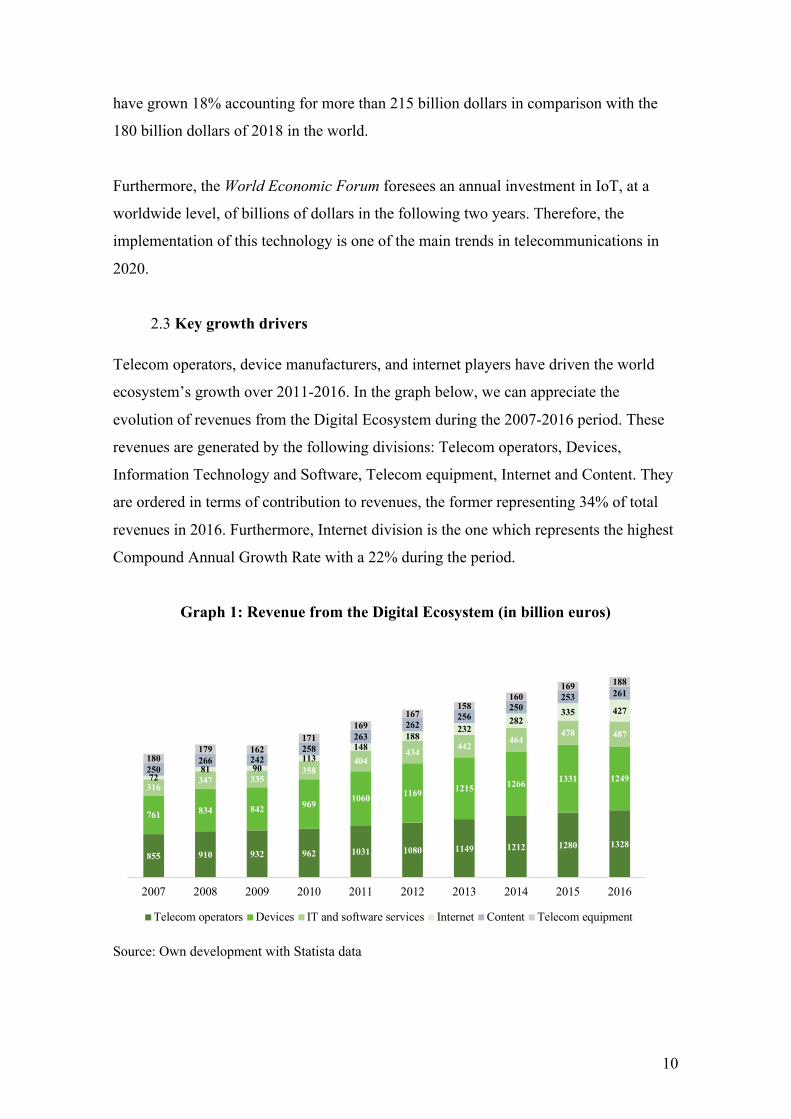
Regarding global consumer traffic, it is expected to grow at a 27.2% CAGR during the
2017-2022 period. Mobile Data and Internet will experience an important growth in the
coming years, driving Global Consumer IP Traffic. The following graph shows the
consumer traffic tendency during this period as well as its growth. It is measured in
exabytes per month.
Graph 2: Global Consumer IP Traffic (EB/month)
Source: Own development with Statista data
According to Cisco, globally, consumer IP traffic will reach 332.7 exabytes per month
by 2022. An exabyte is a measurement unit of data storage. In 2017, global consumer IP
traffics grew 31%.
Internet Traffic, both fixed and mobile, are expected to increase in all continents, with
an expected CAGR of 27.1%, and 22.3% in Western Europe during the 2017-2022
period. Global consumer internet traffic was 63% of total IP traffic in 2017 and it will
be 74% of total IP traffic by 2022. Moreover, Asia Pacific is the region that consumes
most Internet, covering 44% of the total global Internet consumption by 2022 and
growing at a CAGR of 33.24%. North America will follow Asia with the 27% of the
consumption, however, by looking at the graph below we can notice that it will lose
coverage throughout the years. Moreover, Western Europe is expected to consume 12%
of the total Internet. The rest of the Internet consumption, the 16%, will be consumed by
67 86110
142179
223
2327
32
36
40
40
1015
25
36
51
67
2017 2018 2019 2020 2021 2022
Internet Managed IP Mobile Data

12
other regions which include Central and Eastern Europe, Middle East and Africa, and
Latin America.
Graph 3: Global Consumer Internet Traffic
Source: Own development with Statista data
Once the main telecommunication sector trends and the drivers of this industry
expansion and growth have been explained, we need to understand in greater depth the
industry in which Cellnex is specialized. Indeed, it generates 67% of its revenues from
this business. Therefore, it is necessary to understand the main elements that build this
subsector. In addition, the telecommunications sector comprises a wide range of
services and companies such as Telefonica, MásMóvil or Cellnex. Therefore, mobile
network operators would not be considered as comparable companies to Cellnex.
3. TOWER INDUSTRY. SUBSECTOR
3.1. Introduction
In order to later understand Cellnex valuation, including its process and how figures
have been projected, we should firstly understand the functioning of this subsector,
along with the following concepts:
35 49 6789
116147
3543
53
64
76
90
1518
22
27
33
41
15
18
24
32
42
54
2017 2018 2019 2020 2021 2022
Asia and Pacific North America Western Europe Others
13
• Build-to-suit (BTS): Towers that are built to meet the need of the customer. It is
like a customized building, an investment option specially adjusted to a
company’s needs and its productive process. You can find it in two ways:
o Sale-leaseback: In this process, a tenant will acquire the land, assume the
liability of financing, and hire a general contractor to plan and construct
the building. The tenant may then sell the property to an investor and
lease the property back.
o Using a Developer: Based on the company specifications, a tenant will
hire a commercial developer. The developer will acquire, take
ownership, and manage the risk of construction of the property. The
tenant will then lease the property from the developer/owner.
The property is typically leased for a predetermined length of time and typically longer
term, due to the fact the building is designed specifically for the tenant.
• Distributed Antenna System (DAS): “DAS is a network of spatially distributed
antennas connected to a common source, thus providing wireless service within
a specific geographic area”.
• Point of Presence (PoP): “An artificial demarcation point, access point, or
physical location at which two or more networks or communication devices
share a connection”. (Isberto, 2019). Each tenant on a given site is considered a
PoP. It is a site where a mobile network operator is “present” and provides a
network signal. If an MNO provides multiple networks (e.g., 2G, 3G and 4G)
from the same site, this presence is still counted as one PoP. The co-location (or
tenancy) ratio for a single tower is defined as the number of PoPs hosted on that
tower. Therefore, one tower can have multiple PoPs

14
Figure 1: TowerCo's role in infrastructure sharing
Source: Ersnt & Young
• Tenancy ratio: It refers to the number of tenants, or operators, who have put up
their antenna and other active infrastructure on the towers. It is expressed as a
fraction of total number of operators sharing towers over the total number of
towers present. For the company, in this case Cellnex, it represents to how many
operators does it rent each of its towers. They are usually rented to MNOs. We
could also define it as the number of PoPs hosted on that tower. This ratio is also
known as co-location ratio.
• Mobile Network Operator (MNO): It is a wireless communications services
provider. In Spain, some examples of MNOs would be Vodafone, Movistar or
Orange.
During the last 20 years, the tower industry has boosted thanks to the creation of
independent telecom tower companies (TowerCos). This new industry delivers a
number of benefits both to MNOs and consumers as a result of outsourcing wireless
network infrastructure to independent TowerCos. Reduced overall cost for mobile
operators, improvement of coverage and reduction of consumer prices are some of the
benefits caused by sharing towers with multiple tenants. According to Ernst & Young “a
point of presence managed by a TowerCo is circa 40% more efficient than one managed
by a mobile operator, resulting in economic savings of 31 billion euros across Europe
by 2029”. Moreover, independent TowerCos are playing a key role in enabling 5G
rollouts as MNOs are reinvesting in their networks, which involves an improvement of
mobile network coverage and the acceleration of 5G rollouts.

15
Ernst & Young claims that there is a difference between owning a tower when you are a
mobile network operator and when you are an independent telecom tower. On the
former’s balance sheet, a tower, is a depreciating asset built to serve the needs of a
single owner. Whereas a tower on a TowerCo’s balance sheet is a potential source of
long-term, recurring revenue from multiple credit worthy tenants. As a result, investors
consider that TowerCos have long-term cash flows. Hence, MNOs typically trade at 4-
7x, while towercos typically trade at 10-25x.
There is a great diversity in TowerCo’s business models. On one hand we can find
pureplay businesses who own and operate towers such as American Tower, Crown
Castle, SBA Communications and Cellnex. The “pureplay independent TowerCos”
trace their origins back to the phenomenon where privately-owned tower builders
started retaining and acquiring assets in the U.S. in the mid-1990s. They are public or
privately owned TowerCos with little or no residual equity retained by MNOs.
TowerCos typically either build the infrastructure or acquire it from a mobile operator
in sale and lease back transactions.
On the other hand, there are operator-led TowerCos. They are independent tower
companies in which 51% or more of the equity is retained by parent MNOs such as
China Tower Corporation, Vodafone’s TowerCo, Deutsche Funkturm, Telxius and
Inwit.
Furthermore, there is another variant known as JV infracos (joint venture infrastructure
companies). These are entities in which the towers of two or more mobile operator
networks have been grouped, this encompasses firms which have their own separate
balance sheet and those on which the towers remain on MNO balance sheets. For
instance, CTIL is a British company created between Telefónica and Vodafone.
Nevertheless, in Europe is taking longer for TowerCos to dominate the market as the
outsourcing of telecom operators’ infrastructure to independent tower companies is still
in its infancy. In the following section, Europe’s tower market will be analyzed.

16
3.2. Tower Industry in Europe.
An increase in the demand for tower infrastructure is directly linked to the increase of
consumer appetite for mobile data capacity. In Europe, mobile network operators
consider passive infrastructure as a key competitive differentiator, and this is why many
MNOs have been hesitant to outsource their mobile towers to TowerCos. Consequently,
Joint Venture infrastructure companies and operator led TowerCos by MNOs have been
created.
North America market is far more advanced on this industry than Europe. According to
TowerXchange, 11% of Europe’s towers are owned or operated by JV infracos. In
addition, the pureplay independent TowerCo sector has been experiencing growth,
mostly caused by Cellnex and American Tower expansion, representing 12% of
Europe’s towers. Moreover, the operator led TowerCo sector represents 19% with
Telxius and Inwit boosting its growth. This leaves Mobile Network Operators with
around 58% of Europe’s towers. TowerXchange forecasts that 64.9% of Europe’s
towers will be owned by independent telecom tower companies by the fourth quarter of
2021. Contrarily, American independent TowerCos have been able to take over the
majority of U.S. and Canadian towers owning 66% of these infrastructures. The rest is
owned by MNOs with 27% of these towers and 7% by operator led TowerCos.
Graph 4: Telecom Tower Ownership
§ MNO Captive
Source: Own development with TowerXchange data
12,0%
19,0%
11,0%
58,0%
Europe
66,0%7,0%
27,0%
US & Canada
§ Pureplay independent § Operator-led § JV Infracos
17
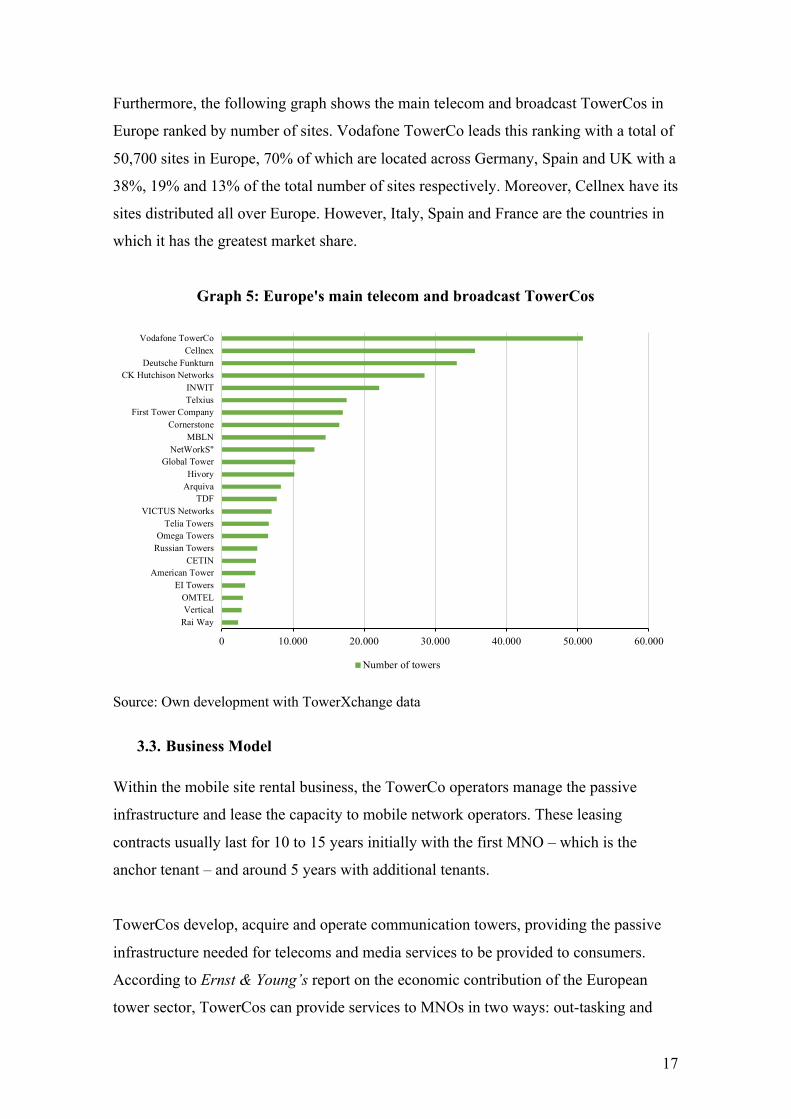
Furthermore, the following graph shows the main telecom and broadcast TowerCos in
Europe ranked by number of sites. Vodafone TowerCo leads this ranking with a total of
50,700 sites in Europe, 70% of which are located across Germany, Spain and UK with a
38%, 19% and 13% of the total number of sites respectively. Moreover, Cellnex have its
sites distributed all over Europe. However, Italy, Spain and France are the countries in
which it has the greatest market share.
Graph 5: Europe's main telecom and broadcast TowerCos
Source: Own development with TowerXchange data
3.3. Business Model
Within the mobile site rental business, the TowerCo operators manage the passive
infrastructure and lease the capacity to mobile network operators. These leasing
contracts usually last for 10 to 15 years initially with the first MNO – which is the
anchor tenant – and around 5 years with additional tenants.
TowerCos develop, acquire and operate communication towers, providing the passive
infrastructure needed for telecoms and media services to be provided to consumers.
According to Ernst & Young’s report on the economic contribution of the European
tower sector, TowerCos can provide services to MNOs in two ways: out-tasking and
0 10.000 20.000 30.000 40.000 50.000 60.000
Rai WayVerticalOMTEL
EI TowersAmerican Tower
CETINRussian TowersOmega Towers
Telia TowersVICTUS Networks
TDFArquivaHivory
Global TowerNetWorkS"
MBLNCornerstone
First Tower CompanyTelxiusINWIT
CK Hutchison NetworksDeutsche Funkturn
CellnexVodafone TowerCo
Number of towers

18
out-sourcing. When they out-task, network operators outsource the operation of towers
to TowerCos while retaining ownership for the infrastructure.
On the other hand, network operators can transfer functional responsibilities to
TowerCos. Then, they use their own resources to develop, operate, maintain and
optimize the network or its elements. Ownership of the tower can either be retained with
the MNO or transfer to the TowerCo (with leaseback agreements). Either way, the
management of the tower is assigned to the TowerCo, which can then share the
infrastructure with multiple network customers.
The provision of tower infrastructure by TowerCos provides an alternative to Network
Operators from managing their own passive infrastructure. Among the multiple
economic benefits, it is an effective way to gain access to liquidity as outsourcing
infrastructure means a source of cash for MNOs which they could use to invest in
network upgrades and expansion. Ernst & Young estimated that, if Europe outsourced to
the same level as the US, an additional 27 billion euros of capital would be released in
the European tower sector, as well as a discounted net benefit of 23 billion euros to the
European economy over the next decade.
A further potential benefit to consumers from outsourcing infrastructure is that it can
improve the quality of service for customers. As a result of having higher infrastructure
sharing rates, the numbers of available points of presence for MNOs would be increased
because of the more efficient use of existing infrastructure.
In terms of regulation, IFRS 16 forces TowerCos to capitalize leasings, increasing its
Debt. The IFRS 16 has the effect of increasing the company’s net debt (as future lease
obligations are now recognized as a liability) but also increases EBITDA as annual
lease costs are expensed as interest and depreciation.
IFRS 16 is a new accounting standard that defines the differences between a lease and a
service agreement and requires the lessee to recognize an asset and a liability for all
leases. Regarding the implications for its clients, we should know what a Master Service
Agreement (MSA) is. It is a contract reached between parties, in which the parties agree
to most of the terms that will govern future transactions or future agreements.
19
Cellnex’s MSA does not fall under IFRS 16 due to the following industrial reasons:
• The Network is considered Cellnex’s “unit of account”, not individual sites
• Their MSA consists of the reservation of a technical footprint
• Cellnex has the right to relocate equipment within the site and to another site
(Network Optimisation)
• Their clients (MNOs) can control Cellnex’s quality of service through Service
Level Agreements (SLAs) and extensive Key Performance Indicators (KPIs)
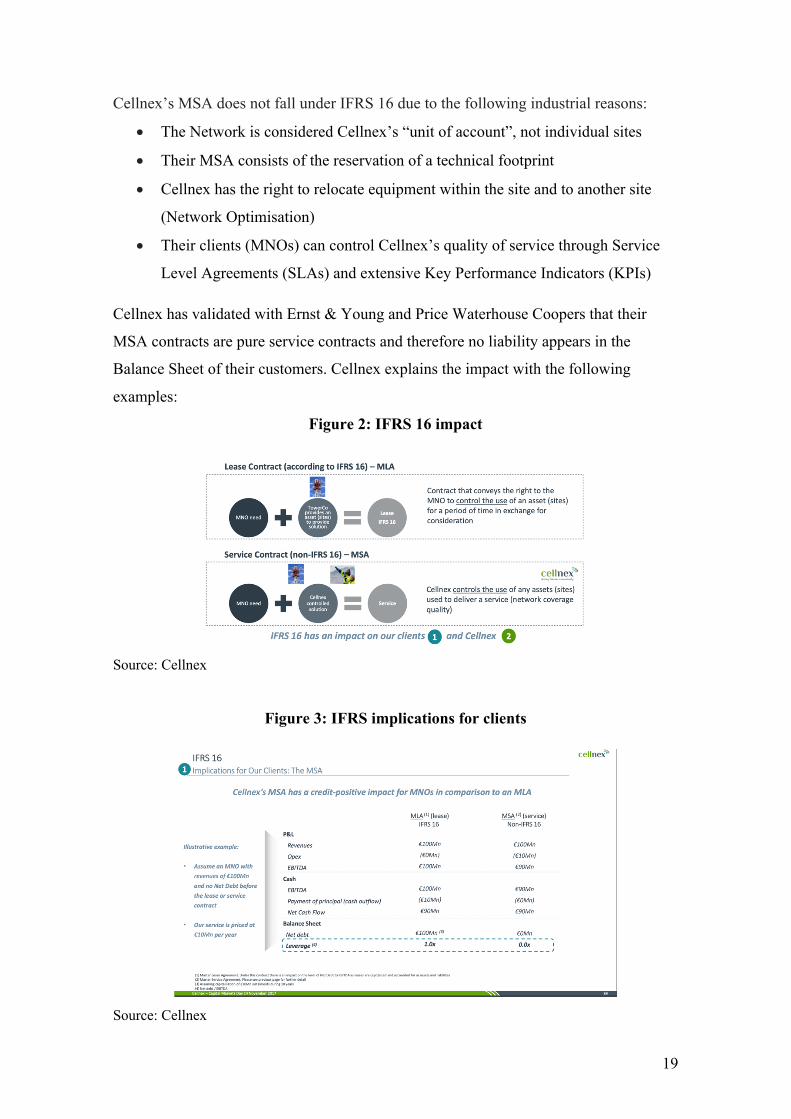
Cellnex has validated with Ernst & Young and Price Waterhouse Coopers that their
MSA contracts are pure service contracts and therefore no liability appears in the
Balance Sheet of their customers. Cellnex explains the impact with the following
examples:
Figure 2: IFRS 16 impact
Source: Cellnex
Figure 3: IFRS implications for clients
Source: Cellnex
20
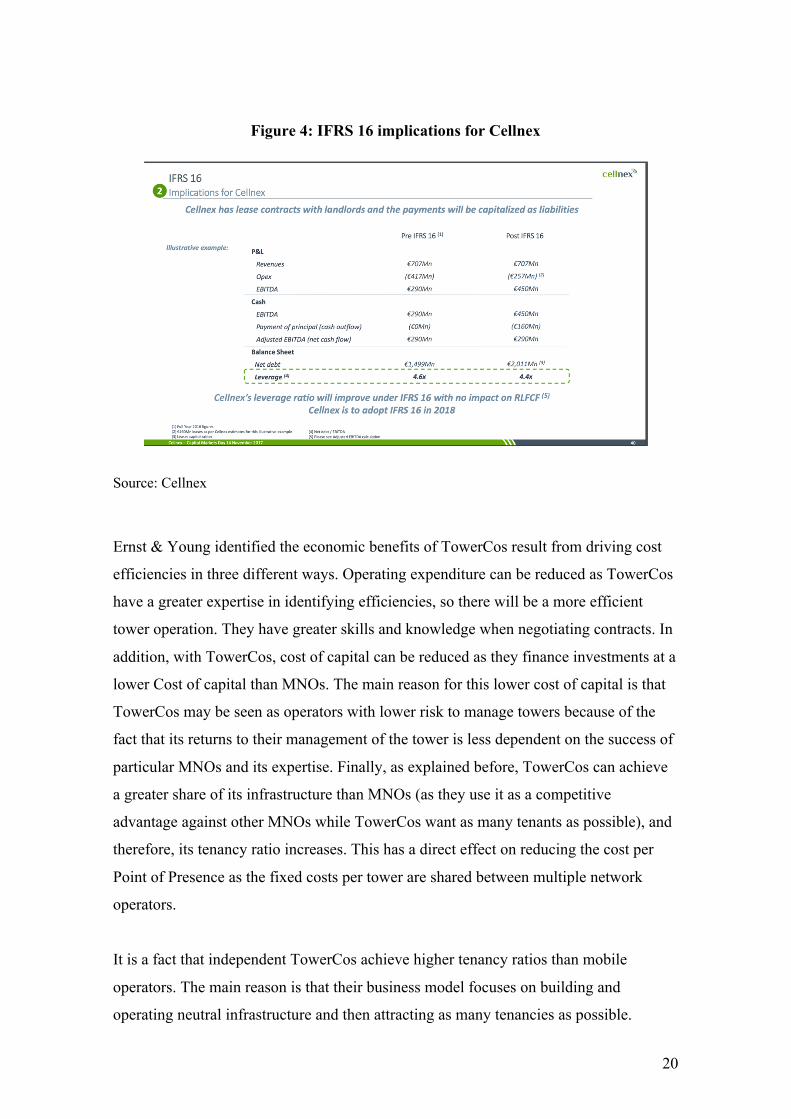
Figure 4: IFRS 16 implications for Cellnex
Source: Cellnex
Ernst & Young identified the economic benefits of TowerCos result from driving cost
efficiencies in three different ways. Operating expenditure can be reduced as TowerCos
have a greater expertise in identifying efficiencies, so there will be a more efficient
tower operation. They have greater skills and knowledge when negotiating contracts. In
addition, with TowerCos, cost of capital can be reduced as they finance investments at a
lower Cost of capital than MNOs. The main reason for this lower cost of capital is that
TowerCos may be seen as operators with lower risk to manage towers because of the
fact that its returns to their management of the tower is less dependent on the success of
particular MNOs and its expertise. Finally, as explained before, TowerCos can achieve
a greater share of its infrastructure than MNOs (as they use it as a competitive
advantage against other MNOs while TowerCos want as many tenants as possible), and
therefore, its tenancy ratio increases. This has a direct effect on reducing the cost per
Point of Presence as the fixed costs per tower are shared between multiple network
operators.
It is a fact that independent TowerCos achieve higher tenancy ratios than mobile
operators. The main reason is that their business model focuses on building and
operating neutral infrastructure and then attracting as many tenancies as possible.

21
Therefore, the use of passive infrastructure for TowerCos is central to their profitability
and they see it as a core business activity. In contrast, MNOs focus on increasing their
network differentiation against their direct competitors by prioritizing their sharing of
active infrastructure. They see infrastructure as a competitive advantage as they
compete on the quality of their service coverage with other MNOs. They aren’t that
incentivized in finding additional customers. Therefore, independent TowerCos
management is more efficient than the management of points of presence by a mobile
network operator as they can share among more operators and effectively give some of
the discount back to consumers. The provision of tower infrastructure by TowerCos
provides an alternative to the Network Operator managing their own passive
infrastructure, as represented below:
Figure 5: How TowerCos facilitate infrastructure sharing
Source: Ernst & Young
Furthermore, Ernst & Young estimated the cost of providing a Point of Presence
depending on who managed the tower, either the TowerCo or the MNO. In this analysis,
they forecasted that when a TowerCo manages a typical Point of Presence it is 40%
more efficient that one managed by an MNO. The differences in efficiency are driven
by assumptions regarding co-location (tenancy) ratio, cost of capital and operating
expenditure. Nevertheless, the main driver is the higher tenancy ratio that a TowerCo is
able to achieve in comparison with an MNO, so the reduction comes basically from

22
spreading its fixed among many “customers”. The following graph provided by EY
shows the differences.
Graph 6: Cost per Additional Point of Presence for MNOs vs. TowerCos
Source: Ernst & Young
In Europe tenancy ratios are growing. European mobile operators are seeking to share
capex given the poor returns of the industry and the growing need for densification of
networks. As reported by Credit Suisse, industry returns in European telecoms sector
have been below the cost of capital for nearly a decade. As a result, telecommunication
companies have reconsidered the need for owning their entire infrastructure.
3.4. Competitiveness in the European market
In Europe, the majority of challengers have sold towers now. The remaining towers are
owned by Incumbents or Vodafone, who are pursuing paths to create value by
increasing utilization and reducing cost themselves.
In recent years, Italy has become one of the most developed tower markets. The
potential opportunities left in the Italian market include EI Towers’ telecom towers,
wind Tre’s remaining towers and some smaller independent TowerCos.
60,0%
100,0%
-1,5% -1,5%
-37,0%
MNO Cost Opex Efficiency Cost of Capital Saving Increased Co-Location TowerCo Cost
23
Vodafone and Orange’s agreement has a major impact on the Spanish telecom sector as
it will imply better financial conditions, therefore, greater speed for the roll out of 5G
for both operators and it will put pressure on Telefónica and MásMóvil.
Table 1: Highlights in the European market
Country Highlights
Vodafone and Inwit (Telecom Italia) merger à “Vodafone Towers” to deploy
5G in partnership
Initial Public Offering (IPO) of Inwit in 2015
Sale of Wind Tre’s 7,337 towers to Cellnex
Spain Vodafone and Orange à Extension of network sharing agreement from 5.6k
to 14.8k
Vodafone and O2 (Telefónica) agreement à Building a 5G joint network.
Cellnex acquisition of Arqiva à 7,400 towers
Portugal Altice’s sale of €1.57bn stake of its wholesale fibre operation to Morgan
Stanley. Vodafone owns 4k sites Source: Own development
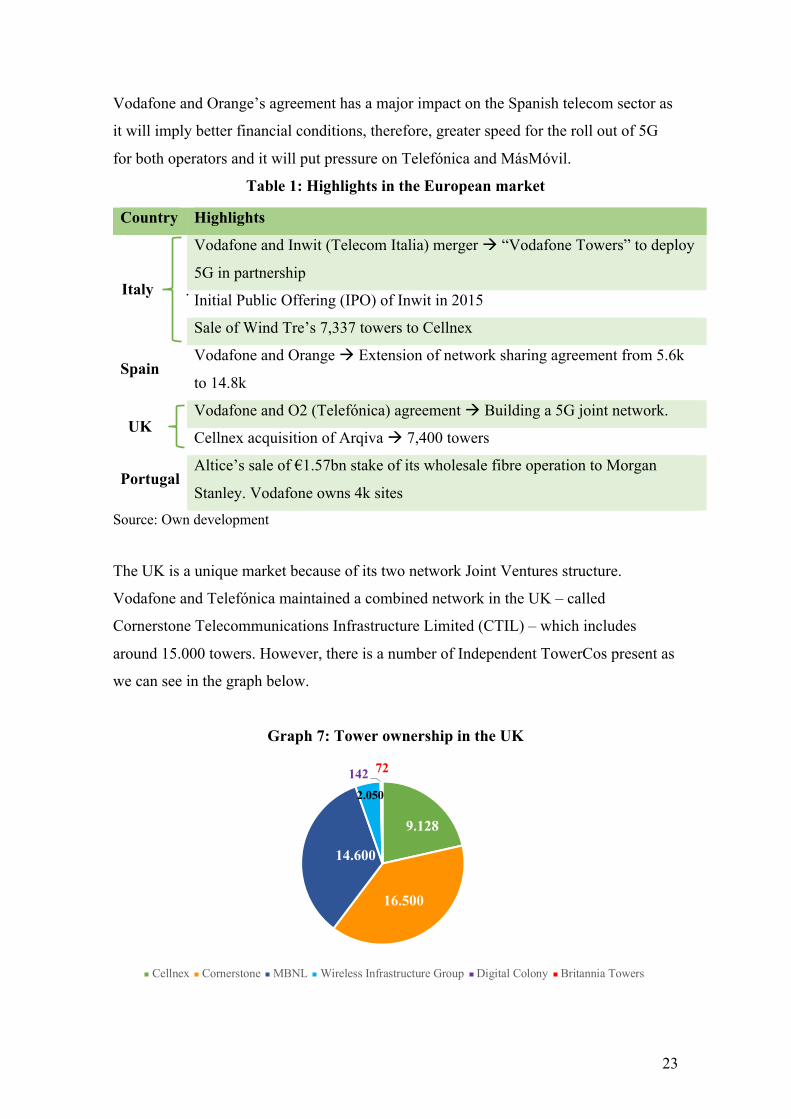
The UK is a unique market because of its two network Joint Ventures structure.
Vodafone and Telefónica maintained a combined network in the UK – called
Cornerstone Telecommunications Infrastructure Limited (CTIL) – which includes
around 15.000 towers. However, there is a number of Independent TowerCos present as
we can see in the graph below.
Graph 7: Tower ownership in the UK
9.128
16.500
14.600
2.050
142 72
Cellnex Cornerstone MBNL Wireless Infrastructure Group Digital Colony Britannia Towers
. Italy
UK
24
Source: Own development with TowerXchange data
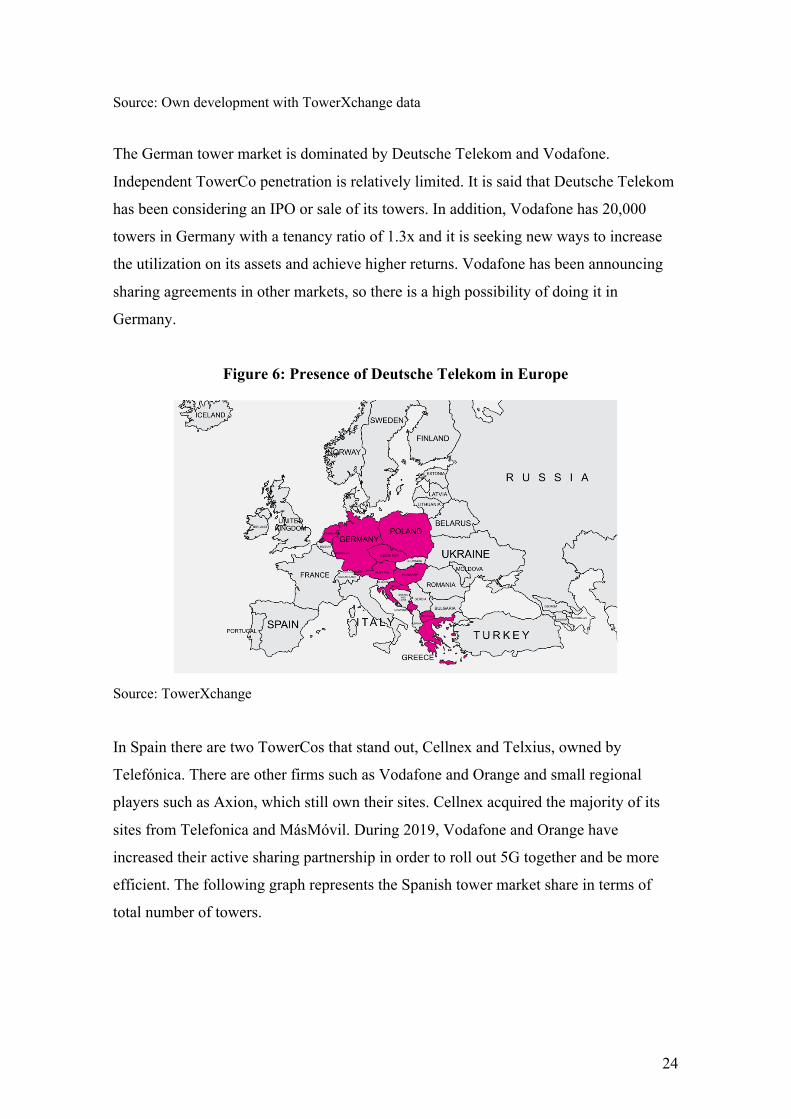
The German tower market is dominated by Deutsche Telekom and Vodafone.
Independent TowerCo penetration is relatively limited. It is said that Deutsche Telekom
has been considering an IPO or sale of its towers. In addition, Vodafone has 20,000
towers in Germany with a tenancy ratio of 1.3x and it is seeking new ways to increase
the utilization on its assets and achieve higher returns. Vodafone has been announcing
sharing agreements in other markets, so there is a high possibility of doing it in
Germany.
Figure 6: Presence of Deutsche Telekom in Europe
Source: TowerXchange
In Spain there are two TowerCos that stand out, Cellnex and Telxius, owned by
Telefónica. There are other firms such as Vodafone and Orange and small regional
players such as Axion, which still own their sites. Cellnex acquired the majority of its
sites from Telefonica and MásMóvil. During 2019, Vodafone and Orange have
increased their active sharing partnership in order to roll out 5G together and be more
efficient. The following graph represents the Spanish tower market share in terms of
total number of towers.

25
Graph 8: Tower Ownership in Spain
Source: TowerXchange
Moreover, the Netherlands has a mature independent TowerCo market with tenancy
ratios typically high. It could be the next market with activity regarding the telecom
sector.
Cellnex stands out in France, Italy and Switzerland with multiple agreements in each of
these countries which will be mentioned when analyzing Cellnex. In addition, Cellnex
plans to increase the number of sites through a BTS program running between 2020-
2027.
4. CELLNEX
4.1. Introduction
Cellnex Telecom is the leading infrastructure operator for wireless telecommunication
in Europe. It was founded in 2000 as Abertis Telecom and renamed Cellnex in 2015, the
same year it become a publicly listed company. It is part of the IBEX35, Eurostoxx 600
and MSCI Europe index, being one of the listed companies with more liquidity in the
Spanish Stock Exchange Interconnection System (SIBE). Cellnex’s CEO is Tobías
Marínez Gimeno who joined the Abertis Group in 2000, and it is headquartered in
Madrid.
29%
26%16%
27%
2%
Telxius Vodafone Orange Cellnex Axion
26
It provides services in Italy, Netherlands, United Kingdom, France, Switzerland,
Ireland, Portugal and Spain as a result of its investment effort to boost its transformation
and internationalization. Cellnex offers to its customers a range of services to guarantee
the conditions for reliable and high-quality transmission of voice, data and audiovisual
contents. Moreover, it develops solutions in the field of “Smart City” projects that
optimize services to the citizen via networks and services that facilitate municipal
management.
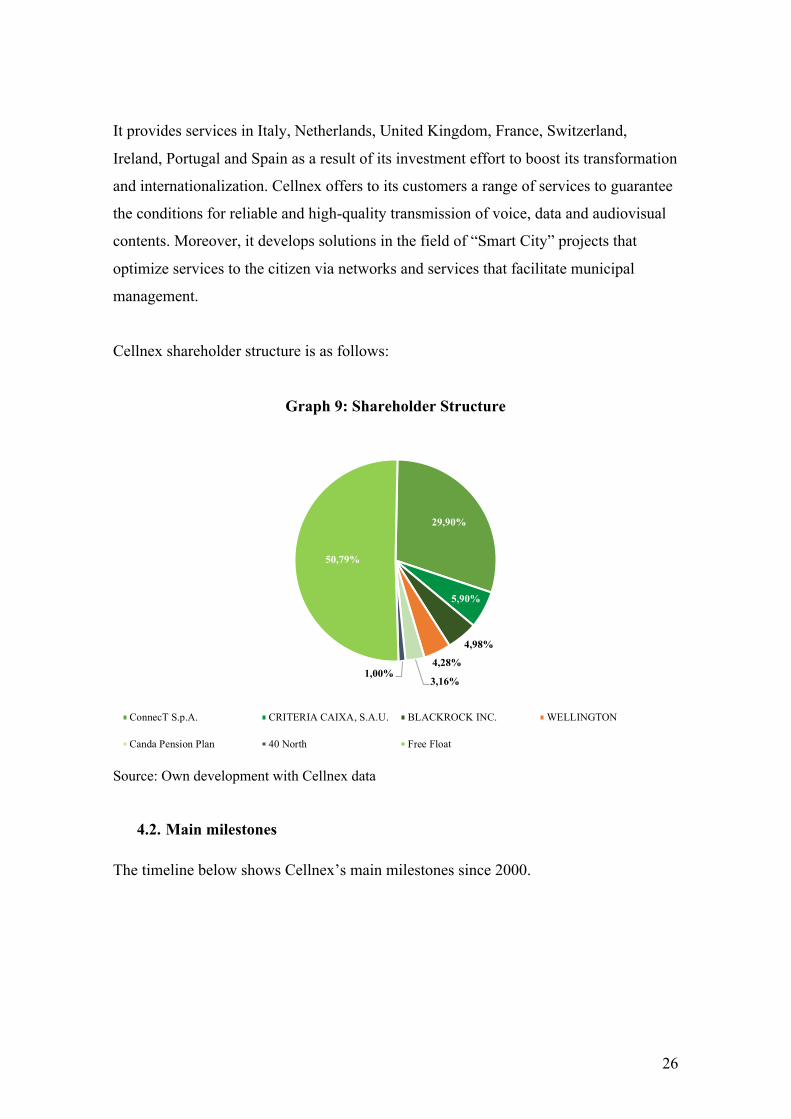
Cellnex shareholder structure is as follows:
Graph 9: Shareholder Structure
Source: Own development with Cellnex data
4.2. Main milestones
The timeline below shows Cellnex’s main milestones since 2000.
29,90%
5,90%
4,98%
4,28%
3,16%1,00%
50,79%
ConnecT S.p.A. CRITERIA CAIXA, S.A.U. BLACKROCK INC. WELLINGTON
Canda Pension Plan 40 North Free Float

27
Graph 10: Cellnex's main milestones
Source: Own development
In 2016 it starts Cellnex relationship with Bouygues Telecom with the acquisition of
270 towers in France and with Shere Group by acquiring 261 towers in the Netherlands
consolidating presence in Netherlands and starting activity in France. However, the
most outstanding event in 2016 was its entrance to the IBEX 35 index.
In 2017, three strategic and very important decisions for Cellnex enlargement were
made. Firstly, it strengthened its position in the Netherlands by acquiring Alticom, a
company which operates high capacity telecommunications towers and sites for
broadcasting services. Moreover, it acquired 100% of Swiss Towers AG which operated
2,239 sites in Switzerland. Lastly, it reached an agreement with Bouygues Telecom
adding 3,000 sites to its current French portfolio of 500. The relationship between
Acesa Telecom acquires 52%
Tradia
Abertis provides coverage for 80%
Spain
Joined the STOXX Europe 600
Purchase of 7,337 towers from Wind
Purchase 3,000 towers from Bouygues
Acquires Alticom and Swiss Towers
Agreement with Bouygues for the roll out
of 5G
Acquires 1,500 sites from Orange
Agreement with Arqiva in the UK
Acquires Omtel and NOS in Portugal
2000 2005 2015 2016
Agreement with Bouygues Telecom and
Shere Group.
Cellnex joins IBEX-35 index
2017 2018 2019
Agreement with Illiad and Salt and acquires
Cignal in Ireland
2020

28
Cellnex and Bouygues continued in 2018, rolling out up to 88 new strategic
telecommunications centers.
2019 has been a very active year in terms of acquisitions for Cellnex. Among all
operations carried out, the following ones are particularly worthy of mention. It
acquired 1,500 sites from Orange Spain for 260 million euros and the
telecommunications division of English company Arquiva which involved the purchase
of 7,400 sites in the United Kingdom. Moreover, it acquired the Irish towers and
telecommunications operator Cignal for 210 million euros. Finally, it executed a
Europe-wide agreement with Illiad – in France and Italy – and with Salt in Switzerland.
So far this year, Cellnex has equipped Manchester City’s Etihad Stadium with a multi-
operator Distributed Antenna System (DAS) and it has focused on increasing its market
share in Portugal with the acquisition of Omtel (3,000 sites), the main
telecommunications infrastructure operator in the country, and the Portuguese mobile
operator NOS (2,000 sites).
Besides all the high-quality services and successful management performance Cellnex
has proved to have, there are other aspects that have boosted Cellnex’s businesses and
have led them to be the leading wireless telecommunications infrastructure company in
Europe.
Cellnex identified at the right time the major problems that mobile network operators
were facing and knew how to take advantage of them by looking at them as
opportunities. These issues encompass the high amount of debt on the MNOs’ balance
sheet (along with a lot of pressure to get rid of towers in order to reduce debt), the need
of reinventing themselves, and the burning of cash flow. The tower business is a
business which requires the burning of cash flow on the part of the MNOs mainly due to
the maintenance Capex they have to pay each year, worsening debt problems.
Finally, Cellnex has shown to have a great management team who has taken advantage
of the expansion opportunities within the market. It has been able to change the tower
business model within the European market, following that of the American tower
companies. It had the business models of its American peers, such as Crown Castle and
29
American Tower, and used them as a reference to build its own business plan following
their approaches.
4.3. Business Lines
Cellnex has three main business lines in which they are specialized and through which
they provide services. If we take a look at Cellnex revenues breakdown we can see the
three divisions which bring revenues to the company, which are: Telecom Infrastructure
(67%), Broadcasting (23%) and Network Services & Others (11%).
4.3.1. Telecom Infrastructure Services
First of all, they offer telecom infrastructure services to its customers. The objective of
this division relies on making sure the transmission of voice, data and audiovisual
contents are reliable and high-quality services. It has more than 8,000 sites in Spain
which contribute to Cellnex’s commitment of the development of 5G.
They allow mobile carriers to install their telecommunications and wireless radio
broadcast equipment in their infrastructure offering co-location services. Multiple
infrastructure’s properties such as an appropriate climate control, assisted power supply
systems and automatic alarm detection systems are some of the outstanding features that
allow Cellnex to provide a service with a high level of quality, availability and network
stability.
Regarding Cellnex’s total number of sites, its network comprises currently more than
thirty-six thousand sites. The following figure shows the total number of sites including
those which haven’t been transferred or build yet (but the M&A contract has already
been signed and closed), that is to say assuming that all sites to be transferred or built
under our M&A contracts are actually transferred or built by each relevant date.

30
Figure 7: Total number of sites
Source: Cellnex
4.3.2. Broadcasting networks
The aim of this service is to ensure distribution and broadcasting of digital television,
radio or multi-screen environment content. They achieve this thanks to the more than
3000 emitter centers they own and its lengthy experience in network operation and
radio-electric spectrum management.
Regarding the part that contributes to the broadcasting of television, Cellnex
spearheaded the implementation of DTT (digital terrestrial television) in Spain. It has a
network of installations which broadcast at more than 3200 sites.
Broadcasting services also include internet media. It provides innovative content
distribution and management services via the Internet through online multi-screen
solutions, online business support solutions and content delivery network (CDN) which
reduces latency and increase bandwidth.
4.3.3. DAS & Small Cells
In addition to towers, Cellnex also develops Distributed antenna solutions (DAS) which
provide wireless service within a geographic area or structure. The DAS and Small

31
Cells systems are one of the core infrastructures from which the new 5G communication
standard will be deployed.
By using the Distributed Antenna System, Cellnex ensures good mobile connectivity in
crowded and difficult-to-reach places such as stadiums and airports. Cellnex manages
approximately 1,500 multi-system and multi-operator nodes in the main high-traffic
areas. Some of these establishments stand out among Cellnex’s portfolio such as The
Wanda Metropolitan and the Juventus Stadium, the Milan Subway or the Malpensa
Airport. Cellnex’s services also include the provision of the infrastructure required to
build and develop Smart Cities, Internet of Things and Security.
4.3.4. Fibre Optic
Cellnex strives to continue growing and it is open for other opportunities the market
may present. Its investment policy is based on reinvesting as long as there are growth
opportunities. Today, Cellnex is a diversified company which operates in multiple
countries such as Italy, France, Netherlands and Ireland and in which 51% of its
revenues are generated outside Spain.
Furthermore, Cellnex’s latest investment is on fibre. It has decided to enter the fibre
optic market and it has already started to negotiate and sign long-term agreements to
deploy this new network which adds to its vast amount of installations and services.
Cellnex provides the following schematic of its fibre plans:
Figure 8: Fixed and Mobile Transport Fiber Network
Source: Cellnex FY 2019 Results presentation

32
On February 2020, it announced a new agreement with Bouygues Telecom which
involves investing a thousand million euros during the following seven years and
creating a new company controlled by the Spanish firm that aims deploying a national
fibre optic network in France.
The new joint subsidiary Cellnex-Bouygues will deploy from scratch a network of up to
31,500 kilometers, interconnecting the towers used by Bouygues – 5000 of which are
Cellnex property – with the network called metropolitan offices, that is to say, the
centers that receive the servers of the Edge Computing systems, and with the small
cells, in other words, the small size antennas that will be indispensable to use high
frequencies used by a part of 5G.
Cellnex’s growth within this market contributes to its “Network Services & Others”
revenues, which will be helpful for the assumptions taken when projecting these
revenues.
4.4. Growth Opportunities
Cellnex has not finished its consolidation goal in Europe and it is still interest on
carrying out M&A Activity across Europe, especially in those countries with higher
growth opportunities. Although during the last couple of years there has been various
transactions involving towers, there are still towers which could potentially be sold in
the future.
Cellnex is very keen on acquiring more assets from the big European MNO players.
TowerXchange says that, recently, Vodafone has been examining the idea of selling
many of their approximately 55,000 European towers. Vodafone’s increased willingness
to share and monetize their towers is already reflected in an agreement to merge
Vodafone Italy’s 11,000 towers with TIM’s TowerCo INWIT. Additionally, The MNOs
Orange and Telenor could be interest on selling too.
33
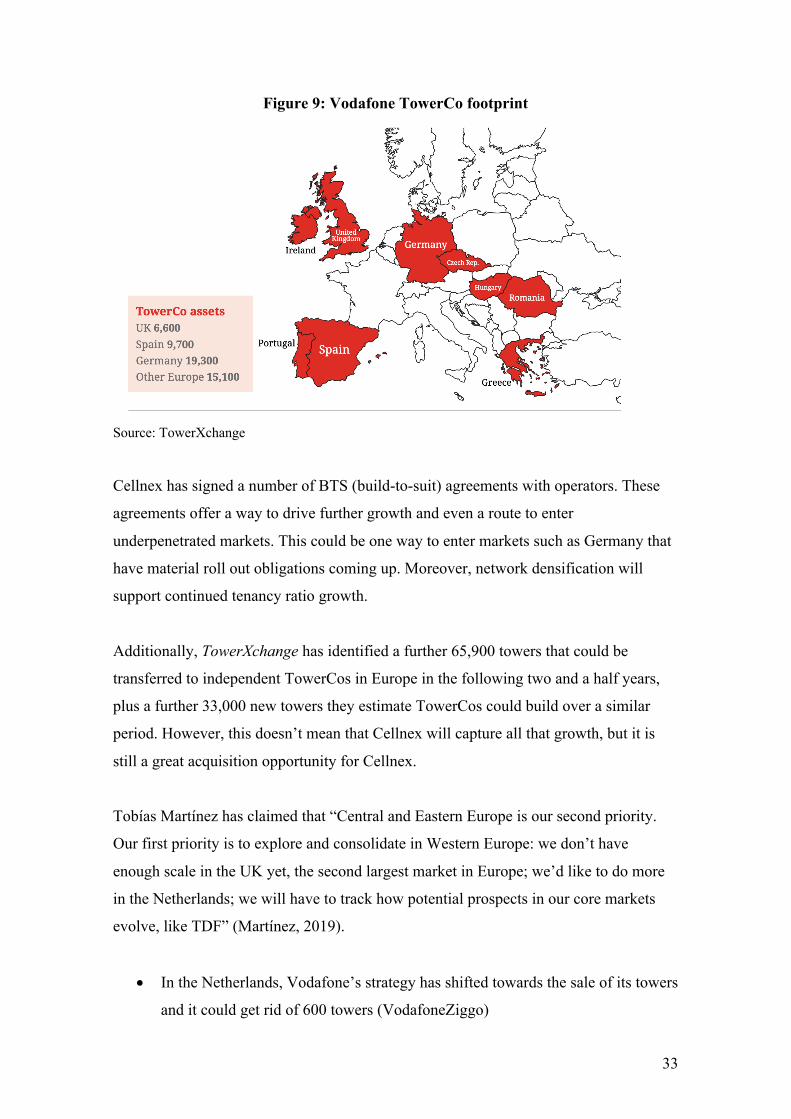
Figure 9: Vodafone TowerCo footprint
Source: TowerXchange
Cellnex has signed a number of BTS (build-to-suit) agreements with operators. These
agreements offer a way to drive further growth and even a route to enter
underpenetrated markets. This could be one way to enter markets such as Germany that
have material roll out obligations coming up. Moreover, network densification will
support continued tenancy ratio growth.
Additionally, TowerXchange has identified a further 65,900 towers that could be
transferred to independent TowerCos in Europe in the following two and a half years,
plus a further 33,000 new towers they estimate TowerCos could build over a similar
period. However, this doesn’t mean that Cellnex will capture all that growth, but it is
still a great acquisition opportunity for Cellnex.
Tobías Martínez has claimed that “Central and Eastern Europe is our second priority.
Our first priority is to explore and consolidate in Western Europe: we don’t have
enough scale in the UK yet, the second largest market in Europe; we’d like to do more
in the Netherlands; we will have to track how potential prospects in our core markets
evolve, like TDF” (Martínez, 2019).
• In the Netherlands, Vodafone’s strategy has shifted towards the sale of its towers
and it could get rid of 600 towers (VodafoneZiggo)

34
• In the UK, Vodafone and Telefónica are exploring options to monetize part of
its stake in Cornerstone (CTIL) which owns around 16,000 towers.
• In Italy, WindTre is willing to put 7,000 towers on the market.
• In France, the market is dominated by Orange, who remains France’s largest
tower owner with around 15,000 sites However, Cellnex has been consolidating
its business during the past years carrying out important and high-scale deals
such as the acquisition of 5,700 Iliad towers and all its past agreements with
Bouygues, thus building up its status as the largest independent tower operator
in France, with around 9,000 sites. France is one of the more developed tower
markets in Europe.
Graph 11: Tower ownership in France
Source: Own development with TowerXchange data
• In Switzerland, Cellnex has more than doubled its size in terms of towers going
from 2,327 towers in 2018 to 5,270 towers in 2019. In addition to the 2,339
towers coming from its deal with Sunrise in 2017, Cellnex has signed an
agreement with Salt in 2019 aggregating 2,900 towers, representing 46.6% of
the country’s current tower stock, with the balance retained by market leaders
Swisscom, which is the only operator that owns any towers in Switzerland, and
they haven’t considered the sale of its assets.
15.000
10.198
7.7283.250
9.192
2.504
500 10.400
Orange Hivory TDF Bouygues captive
Cellnex American Tower Towercast Others
35
• Finally, Cellnex has entered Portugal with the acquisition of 3k sites of Omtel
and has continued with the acquisition of 2k sites of NOS, carrying out both
transactions in 2020. In addition, it stands out over Portugal Telecom as a long-
term strategic partner.
As a conclusion, I would say the markets where Cellnex have the highest opportunities
to expand and buy more towers are the UK and Portugal.
4.5. Financial Analysis
Looking at Cellnex’s balance (included in the Appendix) over the last 5 years, we can
appreciate an average annual increase in assets of 36.55%. Its net worth has increased at
an average annual rate of 38.84%. This could be an indicator of value created for the
shareholder; however, we should contrast it with its share book value. Finally, regarding
Cellnex’s debt level, there is an increase of 30.82%. This figure should be monitor as it
would cause a problem if its increase is made at a higher rate than the increase in the
assets. An increase in debt often includes a decrease in the company’s solvency and an
increase in the financial risk.
Cellnex has increased the number of sites in all countries, with an important
consolidation in some countries across Europe. Apart from the strong position in Spain
and Italy – especially in the latter country where the number of sites has gone from 321
to 10,121 since 2014 – Cellnex has been able to consolidate in France, from 0 to 9,192
sites, and in Switzerland, from 0 to 5,277 sites. Moreover, tenancy ratios have remained
stable in terms of Cellnex Group Figures. Cellnex’s average tenancy ratio from 2015 to
2019 is 1.54.
Furthermore, points of presence have increased at a CAGR of 24.6% mainly due to
inorganic growth, meaning all the M&A activity. In 2015 there were 20,740 PoPs and it
has increased to 50,057 PoPs in 2019.
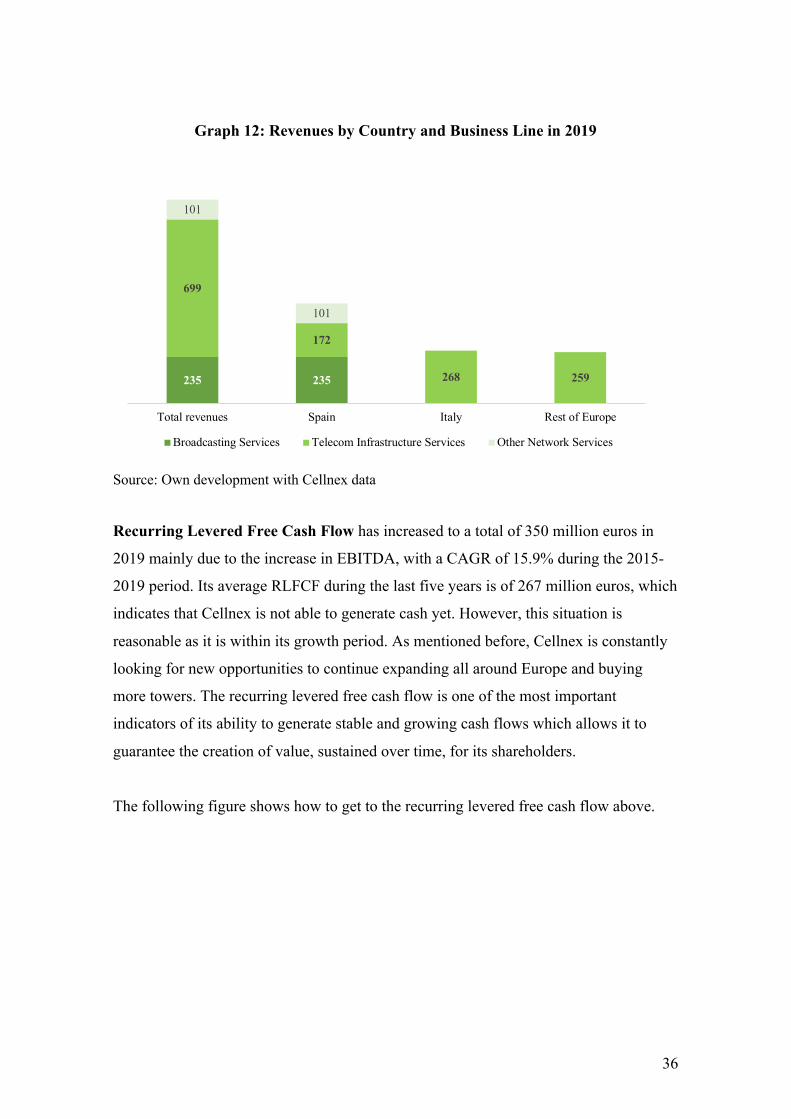
Cellnex invoiced €1,035 MM in 2019, approximately 15% more than in 2018. Its
business segments are divided in Telecom Infrastructure services, Broadcasting and
other services, which amount to 67%, 23% and 10%, respectively, of the total business.
36
Graph 12: Revenues by Country and Business Line in 2019
Source: Own development with Cellnex data
Recurring Levered Free Cash Flow has increased to a total of 350 million euros in
2019 mainly due to the increase in EBITDA, with a CAGR of 15.9% during the 2015-
2019 period. Its average RLFCF during the last five years is of 267 million euros, which
indicates that Cellnex is not able to generate cash yet. However, this situation is
reasonable as it is within its growth period. As mentioned before, Cellnex is constantly
looking for new opportunities to continue expanding all around Europe and buying
more towers. The recurring levered free cash flow is one of the most important
indicators of its ability to generate stable and growing cash flows which allows it to
guarantee the creation of value, sustained over time, for its shareholders.
The following figure shows how to get to the recurring levered free cash flow above.
235 235
699
172
268 259
101
101
Total revenues Spain Italy Rest of Europe
Broadcasting Services Telecom Infrastructure Services Other Network Services
37
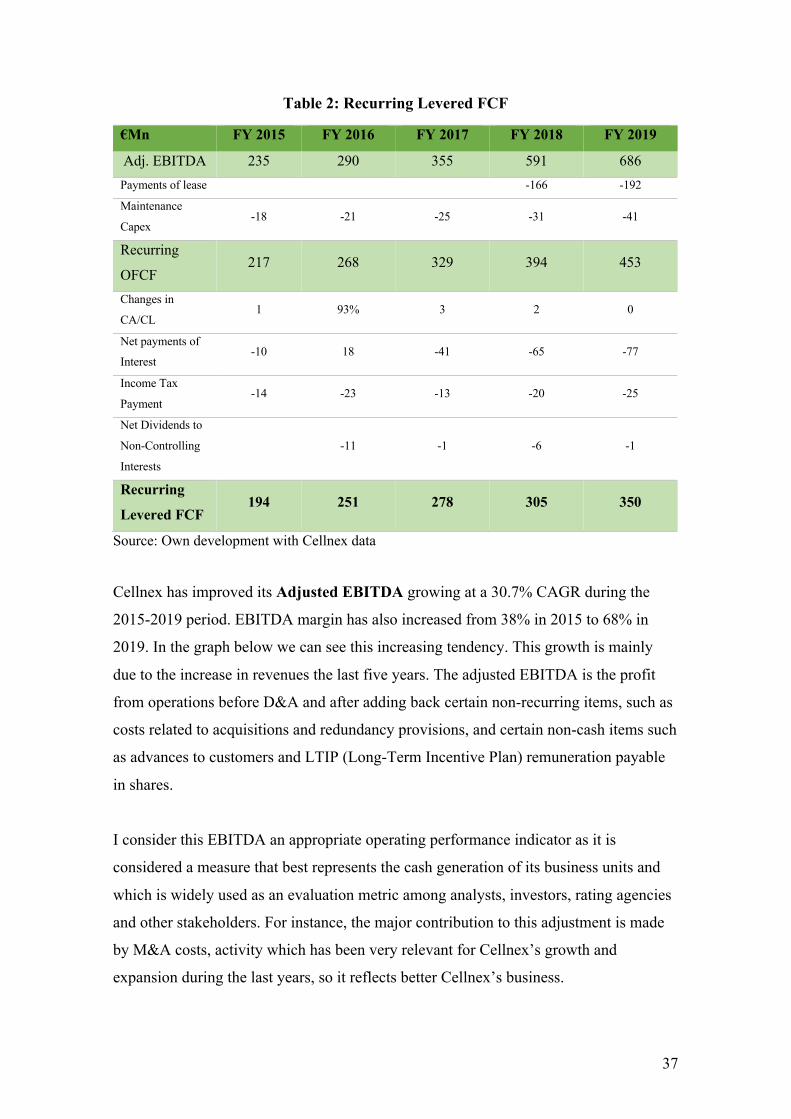
Table 2: Recurring Levered FCF
€Mn FY 2015 FY 2016 FY 2017 FY 2018 FY 2019
Adj. EBITDA 235 290 355 591 686 Payments of lease -166 -192
Maintenance
Capex -18 -21 -25 -31 -41
Recurring
OFCF 217 268 329 394 453
Changes in
CA/CL 1 93% 3 2 0
Net payments of
Interest -10 18 -41 -65 -77
Income Tax
Payment -14 -23 -13 -20 -25
Net Dividends to
Non-Controlling
Interests
-11 -1 -6 -1
Recurring
Levered FCF 194 251 278 305 350
Source: Own development with Cellnex data
Cellnex has improved its Adjusted EBITDA growing at a 30.7% CAGR during the
2015-2019 period. EBITDA margin has also increased from 38% in 2015 to 68% in
2019. In the graph below we can see this increasing tendency. This growth is mainly
due to the increase in revenues the last five years. The adjusted EBITDA is the profit
from operations before D&A and after adding back certain non-recurring items, such as
costs related to acquisitions and redundancy provisions, and certain non-cash items such
as advances to customers and LTIP (Long-Term Incentive Plan) remuneration payable
in shares.
I consider this EBITDA an appropriate operating performance indicator as it is
considered a measure that best represents the cash generation of its business units and
which is widely used as an evaluation metric among analysts, investors, rating agencies
and other stakeholders. For instance, the major contribution to this adjustment is made
by M&A costs, activity which has been very relevant for Cellnex’s growth and
expansion during the last years, so it reflects better Cellnex’s business.

38
Furthermore, Cellnex Net Debt has increased at a CAGR of 43.57% during the 2015-
2019 period as a result of the intensive M&A activity during the last years. In addition,
its Net debt/ EBITDA multiple has increased from 1.8 in 2014 to 5.7 in 2019,
registering its peak in 2017 with a 7.5 ratio, having a very levered capital structure.
Its capital expenditure has increased at a CAGR of 50.4% with an M&A capex of
1,258 million euros, on average, during the 2015-2019 period. Taking a deeper look at
this figure, we realize that the average capital expenditure during the 2014-2018 period
was 590 million euros versus a 1,444 during the 2015-2019 period. The main reason of
this huge difference from one period to another is 2019’s M&A Capex figure, which
amounts to 3,659 million euros.
Additionally, Cellnex’s revenues growth is not perfectly in line with asset expansion (as
seen within its financial statements in the appendix) specially because Cellnex’s Capex
fluctuates every year.
Graph 13: Financials evolution
Source: Own development with Cellnex data.
As of 31 December 2019, Cellnex’s share capital increased by 38,411 thousand euros
to 96,332 thousand euros. Cellnex’s share price experienced a 94% increase during
2019, closing at 30.2 euros per share. One of the most outstanding aspects has been
Cellnex’s increase regarding its market capitalization, which stood at 14,784 million
0
500
1000
1500
2000
2500
3000
3500
4000
4500
Adj EBITDA Recurring OFCF Recurring LFCF Net debt Capex
2015 2019
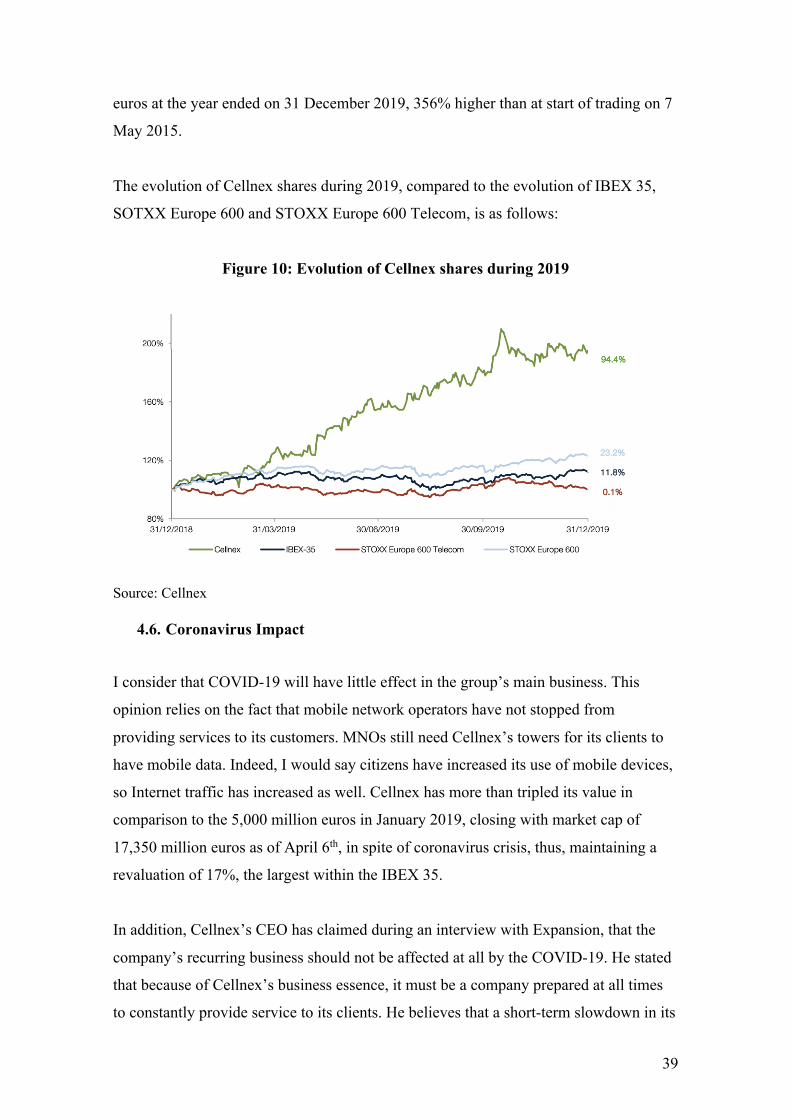
39
euros at the year ended on 31 December 2019, 356% higher than at start of trading on 7
May 2015.
The evolution of Cellnex shares during 2019, compared to the evolution of IBEX 35,
SOTXX Europe 600 and STOXX Europe 600 Telecom, is as follows:
Figure 10: Evolution of Cellnex shares during 2019
Source: Cellnex
4.6. Coronavirus Impact
I consider that COVID-19 will have little effect in the group’s main business. This
opinion relies on the fact that mobile network operators have not stopped from
providing services to its customers. MNOs still need Cellnex’s towers for its clients to
have mobile data. Indeed, I would say citizens have increased its use of mobile devices,
so Internet traffic has increased as well. Cellnex has more than tripled its value in
comparison to the 5,000 million euros in January 2019, closing with market cap of
17,350 million euros as of April 6th, in spite of coronavirus crisis, thus, maintaining a
revaluation of 17%, the largest within the IBEX 35.
In addition, Cellnex’s CEO has claimed during an interview with Expansion, that the
company’s recurring business should not be affected at all by the COVID-19. He stated
that because of Cellnex’s business essence, it must be a company prepared at all times
to constantly provide service to its clients. He believes that a short-term slowdown in its

40
business organic growth could be expected, but not in its provision of services growth,
which are not subject to the supply and demand fluctuations in the short term and it has
a recurring nature. Furthermore, he still expects an EBITDA increase of more than 40%
for 2020, but lower than the 55% that was previously estimated.
As a matter of fact, I would say that coronavirus might even be an opportunity for
Cellnex. The reason for this is that if mobile operators were to become more financially
stretched from the recessionary environment, they would be more inclined to sell towers
to TowerCos such as Cellnex to protect their balance sheets.
5. VALUATION METHODS
There are many methods to value a company. The type of method used for each
company depends on many factors such as the type of company, whether if the
company is an early-stage company or a mature company, its sector/ industry, main core
business, etc.
In addition, we should take into account which process and in which moment we want
to value the company as throughout its life there exists different occasions to value the
processes. These include: the merger and acquisition operations of the company, an
initial public offering (IPO), liquidation of the company, taxes imposed, assets and
intangibles, identify the best sources of added value and leverages.
In this case, I will only explain the methods used within my analysis which are:
Precedent transactions, Comparable Trading Companies, and the Discounted Cash
Flow. However, there are many more valuation methods such as the book value, the
leveraged buy-out, or the dividend discount model.
5.1. Precedent Transactions
This method consists on looking at past transactions that your company or similar
companies have made and do the average of these transactions. This way you can see
what price a company paid for another one, so it is based on real data.

41
As with the multiples method, you should look for transactions within the same sector,
geography, size and you should also take into consideration time, meaning that the
transactions you look for should be one or two years ago. The main difference with
Comparable Public Companies method is that the calculation of valuation multiples is
based on what acquirers have paid to acquire other companies. Then, an average price,
which will represent the company’s value, is calculated.
However, this data tends to be less consistent because companies get acquired for very
different reasons. Often, the multiples produced by Precedent Transactions are higher
than those from Public Comps because of the control premium built into M&A deals.
5.2. Comparable Trading Companies
This method is based on using multiples to value your company. It is a shorthand for
valuation, and it is based on finding similar listed companies to the one you are
evaluating. After finding the most adequate comparable companies, a calculation of
their multiples is needed. There are different factors you should take into account to
choose these comparable companies such as industry, size, geography, growth rates or
stage of the company. Among all the multiples, the most common ones are: AV/Sales,
AV/EBITDA, AV/EBIT, P/E, Net Debt/EBITDA, P/BV and LFCF yield.
The multiples used during this method vary depending on the company’s industry and
the company itself as there are some multiples which are useless for specific sectors.
Once all the multiples have been gathered, an average of each multiple is calculated.
This figure will be the one used to value the company concerned. In addition, depending
on the type of multiple used, you can arrive to the Enterprise or the Equity value.
5.3. Discounted Cash Flow
This method estimates the value of a company or investment based on its future cash
flows generated. It is the value of a company today, based on projections of how much
money it will generate in the future. In order to know its present value, it uses a discount
rate that varies depending on the risk associated to those future cash flows. It takes into
account the time value of money assuming, for instance, that a dollar today is worth
42
more than a dollar tomorrow. It consists of two periods: the explicit forecast period and
the terminal period or mature stage.
Firstly, we have to understand the difference between Enterprise Value and Equity
Value. The former one is the value of the company’s core business operations (i.e., only
the assets related to its core business), but to all investors (equity, debt, preferred, and
possibly others). On the other hand, the equity value represents the value of everything
a company has (all its assets), but only to equity investors (i.e., common shareholders).
If the company is publicly traded, then its Current Equity Value is its Market
Capitalization.
To calculate this value, we need to project a company’s cash flows with much detail as
possible in the near term, the next 5, 10 or 15 years. These projections belong to the
explicit forecast period. Then, within the Terminal Period or growing perpetuity stage
we assume that its Cash Flow Growth Rate and Discount rate remain constant.
The items we should project to obtain the future cash flows are: Revenue, COGS and
Operating Expenses, Taxes, Depreciation and Amortization, the Change in Working
Capital and Capital Expenditures. For all these projections we need to make
assumptions for the growth rates that each item will follow. In addition, we should
consider that a company’s FCF growth eventually slows down and starts growing at
about the same rate – the Terminal Growth Rate – into perpetuity. The FCF is
calculated the following way:
𝐹𝐶𝐹 = 𝐸𝐵𝐼𝑇 × (1 − 𝑇𝑎𝑥) + 𝑁𝑜𝑛𝐶𝑎𝑠ℎ𝐸𝑥𝑝𝑒𝑛𝑠𝑒𝑠 − 𝐶𝑎𝑝𝑒𝑥
± 𝐶ℎ𝑎𝑛𝑔𝑒𝑖𝑛𝑁𝑒𝑡𝑊𝑜𝑟𝑘𝑖𝑛𝑔𝐶𝑎𝑝𝑖𝑡𝑎𝑙
The assumptions made depend on the type of company which is being assessed. For this
reason, a detailed sector and company analysis must be carried out. For instance, a
software and services company would be far less dependent on CapEx than an asset-
intensive company.
Regarding the growth rate assumption, it will vary by company’s operating stage. For
example, small firms grow faster than the mature firms so you will use a higher growth
43
rate. Another aspect to take into consideration is historical revenue growth, growth rate
of the industry and GDP.
The Discount Rate is the rate of return used to discount future cash flows back to their
present value. A higher Discount Rate means the risk and potential returns are both
higher whereas a lower Discount Rate implies lower risk and potential returns.
Furthermore, there are two different discount rates we can use that are Weighted
Average Cost of Capital (WACC) and Cost of Equity, the former being the most
common one. Nevertheless, it depends on what value you want to obtain. If the final
value you want to get is the Enterprise Value, you will use Unlevered Free Cash Flows
discounting them at the WACC. Because they both represent all the investors in a
company. On the other hand, if you want to get the Equity value you will use Levered
Free Cash Flows using Cost of Equity as the discount rate.
WACC is the cost of capital, the return that equity and debt holders expect the company
to deliver on their investment on the company. For the company, it is the cost of
funding with all its resources (both equity and debt). The following formula represents
the cost of capital for a company (without taking into account preferred shares):
𝑊𝐴𝐶𝐶 = A𝐶𝑜𝑠𝑡𝑜𝑓𝑒𝑞𝑢𝑖𝑡𝑦 ×𝐸𝑞𝑢𝑖𝑡𝑦
𝐸𝑞𝑢𝑖𝑡𝑦 + 𝐷𝑒𝑏𝑡H
+ I𝐶𝑜𝑠𝑡𝑜𝑓𝑑𝑒𝑏𝑡 ×𝐷𝑒𝑏𝑡
𝐸𝑞𝑢𝑖𝑡𝑦 + 𝐷𝑒𝑏𝑡 ×(1 − 𝑇𝑎𝑥)K
Moreover, the cost of equity reflects the return that shareholders expect the company to
deliver on their investment in the company. It tells you how much a company’s stock
“should” return, on average, over the long term, also factoring in dividends and stock
repurchases. There are different approaches for calculating it, including un-levering and
re-levering Beta from peer companies or using the company’s historical Beta. The most
common method to calculate cost of equity is Capital Asset Pricing Model (CAPM)
which is defined by the following formula:

44
𝐶𝑜𝑠𝑡𝑜𝑓𝑒𝑞𝑢𝑖𝑡𝑦 = 𝑅𝑓 + 𝛽𝑙𝑒𝑣𝑒𝑟𝑒𝑑 ×(𝑅𝑚 − 𝑅𝑓)
Rf stands for risk free rate. The coupon rate on government bonds in the country. It is
what you could earn on “safe” government bonds denominated in the same currency as
this company’s cash flows.
Beta is the volatility of the company’s shares over volatility of the market index.
Levered beta tells you how volatile the company’s stock is relative to the market as a
whole, factoring in both the intrinsic business risk and the risk introduced by leverage.
(Rm-Rf) represents the risk premium. The Equity Risk Premium represents the
percentage the stock market will return each year, on average, above and beyond the
rate on “safe” government bonds. No one agrees on the appropriate Equity Risk
Premium.
The Cost of Debt represent the rate the company would pay if it issued additional debt.
You don’t know in advance what this rate will be, but you could make a rough
approximation by using the current coupon rates on the company’s Debt. Another
option would be to take a look at the Yield to Maturity on the Debt or take the risk-free
rate and add a “default spread” based on the company’s credit rating.
With regards to the capital structure, you may use the company’s current capital
structure or the targeted capital structure. Once you have calculated the Discount Rate,
you discount the Cash Flows.
To calculate the Terminal Value, you can use two different methods, Gordon Growth
Model and Multiples. The most common method is Gordon Growth Model, which
assumes a constant growth rate for this period, and we calculate the Terminal Value
with the following formula:
𝑇𝑉 =𝐹𝐶𝐹! × (1 + 𝑔)𝑊𝐴𝐶𝐶 − 𝑔
45
The Terminal FCF Growth Rate should be low – below the GDP growth rate of the
country, and in-line with the rate of inflation. Even if a company grows at a higher rate
initially, growth always slows down over time.
On the other hand, you can also calculate the Terminal Value using Multiples Method.
You might base the Terminal Multiple on multiples of publicly traded peer companies.
However, if there are no truly comparable peer companies, the Multiples Method is
useless. But if the country concerned long-term GDP growth is highly uncertain, or its
government is unstable, the Gordon Growth Method might not work so well. Therefore,
the best solution is to use each method to cross-check your work.
Then, we have to discount this Terminal Value to get the Present Value. We sum this
value to the present value of the future cash flows of the explicit forecast period and we
will get the Enterprise Value/ Equity Value of the company. In an Unlevered DCF,
adding these two terms together gives you the company’s implied Enterprise Value.
Often, if the company is public, you move from this value to Equity Value and divide it
by the company’s diluted share count to calculate its Implied Share Price which you
compare it to its Current Share Price and conclude by analyzing it and seeing if your
company is overvalued or undervalued.
6. CELLNEX VALUATION
6.1. Precedent Transactions
The aim of this method is to find the price of acquisition paid by companies in order to
make a rough estimate of Cellnex value. This way we get a more realistic view of how
much is a company willing to pay for other companies in the telecom sector. However,
it is not a very useful method within the tower industry field. The implied share price
doesn’t represent Cellnex’s real value as it only takes into account the purchase of
towers (asset acquisition) but not a company’s acquisition, resulting in a price much
lower than the reality.
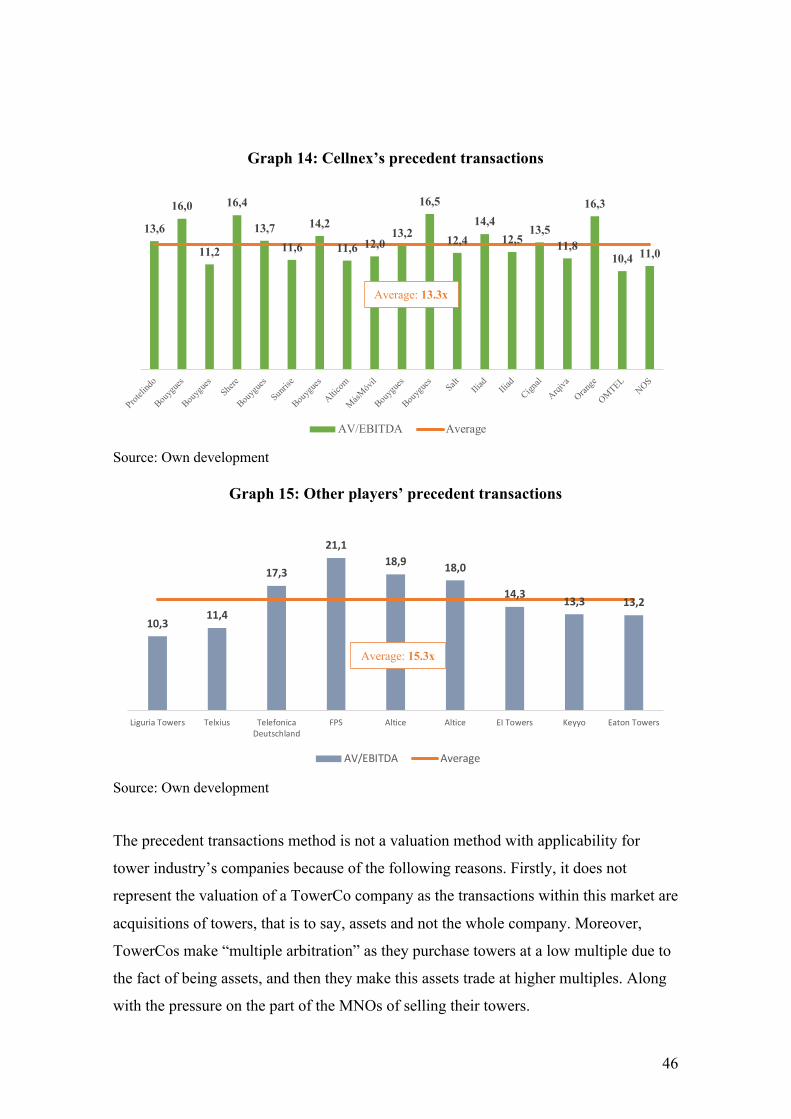
46
Graph 14: Cellnex’s precedent transactions
Source: Own development
Graph 15: Other players’ precedent transactions
Source: Own development The precedent transactions method is not a valuation method with applicability for
tower industry’s companies because of the following reasons. Firstly, it does not
represent the valuation of a TowerCo company as the transactions within this market are
acquisitions of towers, that is to say, assets and not the whole company. Moreover,
TowerCos make “multiple arbitration” as they purchase towers at a low multiple due to
the fact of being assets, and then they make this assets trade at higher multiples. Along
with the pressure on the part of the MNOs of selling their towers.
13,6
16,0
11,2
16,4
13,711,6
14,2
11,6 12,013,2
16,5
12,414,4
12,513,5
11,8
16,3
10,4 11,0
Proteli
ndo
Bouyg
ues
Bouyg
ues Shere
Bouyg
ues
Sunris
e
Bouyg
ues
Alticom
MásMóv
il
Bouyg
ues
Bouyg
ues Salt Iliad
Iliad
Cignal
Arqiva
Orange
OMTELNOS
AV/EBITDA Average
10,311,4
17,3
21,118,9 18,0
14,3 13,3 13,2
Liguria Towers Telxius TelefonicaDeutschland
FPS Altice Altice EI Towers Keyyo Eaton Towers
AV/EBITDA Average
Average: 13.3x
Average: 15.3x
47
Although not being useful for Cellnex’s valuation, I have used it when projecting the
M&A Capex as I had to take into account the company’s past deals to assume a
purchase price for the future sites.
6.2. Comparables
Rai Way
It is one of the leading providers of network infrastructure and services for broadcasters,
telecommunications operations, private companies and public administrative bodies in
Italy. They provide the following services: broadcasting, transmission, tower rental and
network services. It offers terrestrial radio-television broadcasting through a network
capable of achieving a 99% coverage of the population.
Inwit
It is the main tower operator in Italy, it works in the field of passive infrastructure for
mobile phone technology, broadcasting, radio, other wireless services and private
mobile networks. Currently, it is Italy’s major Tower Operator providing widespread
coverage throughout the country. It plays an important role in delivering wireless
mobile coverage within Italy’s territory and it is adding new infrastructure to its
portfolio as technology evolves such as 5G. It owns approximately eleven thousand
sites.
American Tower
It was founded in 1995 and it is one of the largest global Real Estate Investment Trusts
(REITs). Currently, it is a leading independent owner, operator and developer of
wireless and broadcast communications real estate. They provide the real estate
necessary for today’s wireless communications networks. American Tower’s portfolio
includes approximately 180,000 communications sites. ATC’s segments include U.S.
property, Asia property, EMEA property, Latin America property, Services and Other.
Crown Castle
It is a real estate investment trust (REIT) and the largest provider of shared
communications infrastructure in the United States. Crown Castle’s clients in the United
States are considered the top mobile operators. Some of their tenants are AT&T, T-
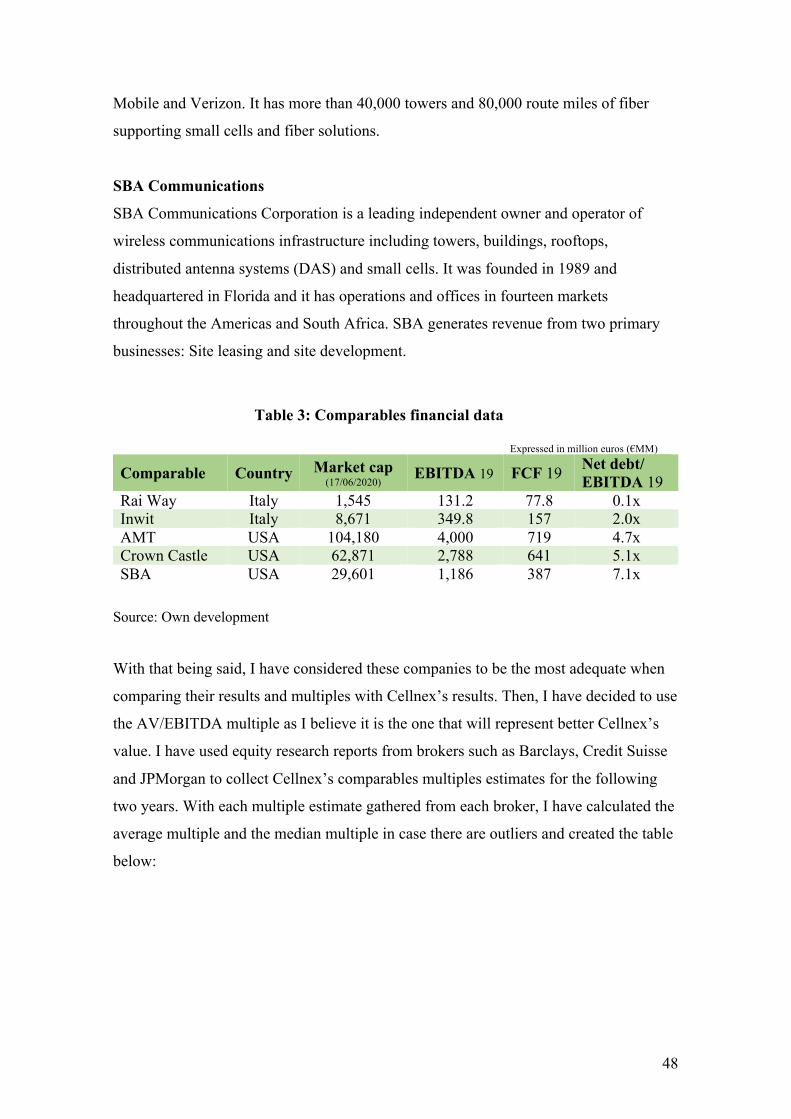
48
Mobile and Verizon. It has more than 40,000 towers and 80,000 route miles of fiber
supporting small cells and fiber solutions.
SBA Communications
SBA Communications Corporation is a leading independent owner and operator of
wireless communications infrastructure including towers, buildings, rooftops,
distributed antenna systems (DAS) and small cells. It was founded in 1989 and
headquartered in Florida and it has operations and offices in fourteen markets
throughout the Americas and South Africa. SBA generates revenue from two primary
businesses: Site leasing and site development.
Table 3: Comparables financial data
Expressed in million euros (€MM) Comparable Country Market cap
(17/06/2020) EBITDA 19 FCF 19 Net debt/ EBITDA 19
Rai Way Italy 1,545 131.2 77.8 0.1x Inwit Italy 8,671 349.8 157 2.0x AMT USA 104,180 4,000 719 4.7x Crown Castle USA 62,871 2,788 641 5.1x SBA USA 29,601 1,186 387 7.1x
Source: Own development
With that being said, I have considered these companies to be the most adequate when
comparing their results and multiples with Cellnex’s results. Then, I have decided to use
the AV/EBITDA multiple as I believe it is the one that will represent better Cellnex’s
value. I have used equity research reports from brokers such as Barclays, Credit Suisse
and JPMorgan to collect Cellnex’s comparables multiples estimates for the following
two years. With each multiple estimate gathered from each broker, I have calculated the
average multiple and the median multiple in case there are outliers and created the table
below:

49
Table 4: Comparable Companies multiple
Comparable Country 2020 E 2021 E
Rai Way Italy 19.4x 10.9x
Inwit Italy 19.4x 17.7x
American Tower United States 24.1x 22.4x
Crown Castle United States 22.8x 22.2x
SBA Communic. United States 25.6x 23.8x
Cellnex Spain 24.2x 20.4x
Average multiple 21.2x 19.6x
Median 23.5x 21.3x
Source: Own development
As we can see, American companies and Cellnex trade at higher multiples than the
Italian TowerCos. This is probably because in Italy there are lower tenancy ratios (1.5x
in Italy vs 2.0x in Spain at year ended 2019), and they still have room to grow more.
The process to get to the equity value is the same as with the Precedent Transactions
multiples except for the EBITDA. This time, the EBITDA I have used is the estimated
EBITDA for 2020 and for 2021. However, the net debt and minorities used to get the
Equity Value is the one corresponding to 2019.
Table 5: Share Price with Multiples
Source: Own development
Average 2020 E
Average 2021 E
Median 2020 E
Median 2021 E
AV/EBITDA 21.2 19.6 23.5 21.3 EBITDA 775 979 775 979 AV 16,439 19,145 18,167 20,820 Net Debt 3,938 3,938 3,938 3,938 Minorities 890 890 890 890 Equity value 11,599 14,305 13,327 15,980 # Shares 385 Share Price 30.16 37.19 34.65 41.54

50
As we can see, I have obtained greater values (and more similar to the current value)
using the median AV/EBITDA multiple. Most of the times, the average includes
outliers which don’t represent the true value and can affect our conclusions and results.
Nevertheless, all of Cellnex’s share prices calculated through the comparable method
are below its current value (52.94€ as of 19/06/2020). Therefore, I would say that
Cellnex’s market value is overpriced and the recommendation would be selling
Cellnex’s shares. However, I will give my final recommendation once the discounted
cash flow method is done. The DCF is a more accurate method and could tell us a
different thing, or at least, be closer to the current market value.
6.3. Discounted Cash Flow
Finally, I have carried out a Discount Cash Flow Analysis to get a more accurate
valuation of Cellnex. Indeed, it is the most precise method and my conclusions will be
in major part influenced by this analysis. As mentioned before, it is based on projecting
future cash flows of the company. To do so, it is necessary to make estimates of
multiple items included on a company’s financial statements.
The following is a more detailed explanation of how I got to the enterprise value going
through each of the steps and projections I have taken. The aim of this method is the
same as the one of the two methods explained above, get an Implied Share price and
compare it with the market value.
6.3.1. Projections
Revenues
First and foremost, I have started this financial analysis by analyzing revenues, which
have been broken-down by type of business, and in the case of the Telecom division, by
country. Each division requires to make different assumptions depending on the
business. As explained before, Cellnex’s revenues come from Telecom Infrastructure
Services, Broadcasting Services and, Network and other services, which account for
67%, 23% and 10% of Cellnex’s total revenues respectively. Therefore, the projection
of the former one needs a deeper and more detailed analysis.
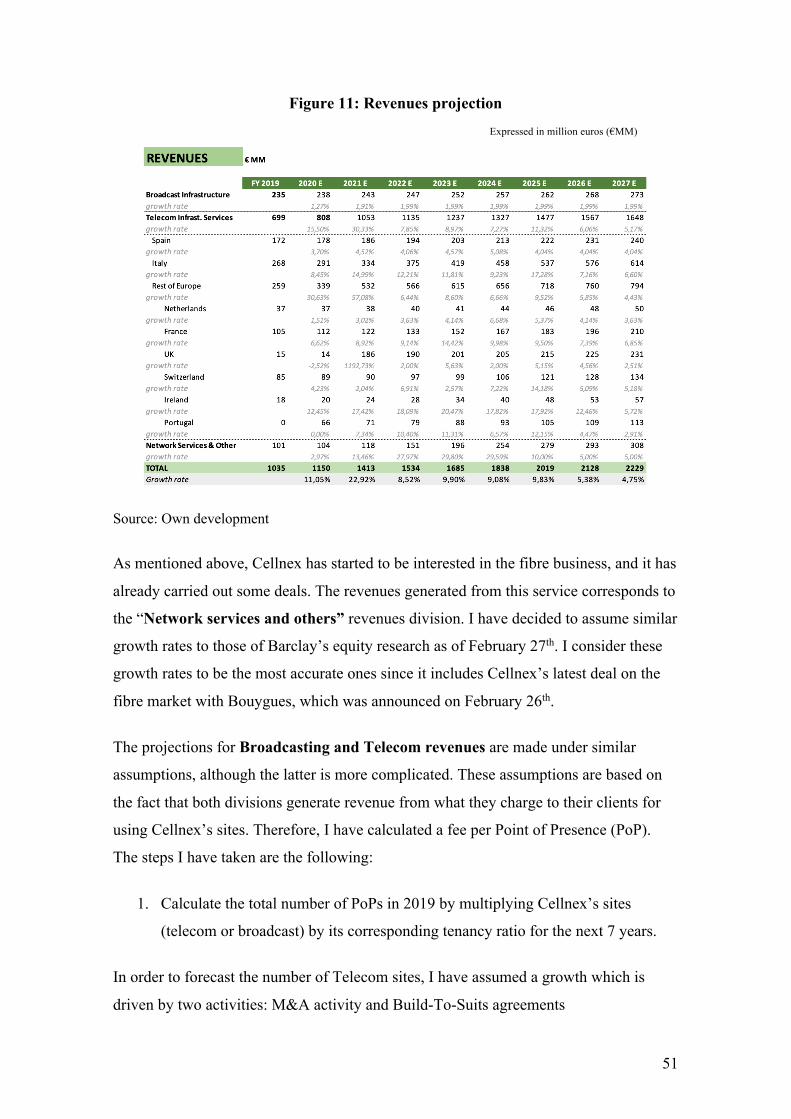
51
Figure 11: Revenues projection
Expressed in million euros (€MM)
Source: Own development
As mentioned above, Cellnex has started to be interested in the fibre business, and it has
already carried out some deals. The revenues generated from this service corresponds to
the “Network services and others” revenues division. I have decided to assume similar
growth rates to those of Barclay’s equity research as of February 27th. I consider these
growth rates to be the most accurate ones since it includes Cellnex’s latest deal on the
fibre market with Bouygues, which was announced on February 26th.
The projections for Broadcasting and Telecom revenues are made under similar
assumptions, although the latter is more complicated. These assumptions are based on
the fact that both divisions generate revenue from what they charge to their clients for
using Cellnex’s sites. Therefore, I have calculated a fee per Point of Presence (PoP).
The steps I have taken are the following:
1. Calculate the total number of PoPs in 2019 by multiplying Cellnex’s sites
(telecom or broadcast) by its corresponding tenancy ratio for the next 7 years.
In order to forecast the number of Telecom sites, I have assumed a growth which is
driven by two activities: M&A activity and Build-To-Suits agreements

52
Figure 12: M&A growth assumption
Source: Own development
The most remarkable figure is that of United Kingdom in 2021 as I have assumed a
1,217% growth rate. This is because of Cellnex’s deal with Arqiva which involves the
acquisition of 7,400 sites which I assumed to be integrated in 2021. Another thing to be
highlighted is the entry in the Portuguese market in the last months in 2020. We can
appreciate these events in the difference in the total number of sites between the years
2020 and 2021 and the rest of the years.
On the other hand, we have to add the BTS programs that may appear on Cellnex’s
contracts. So far, Cellnex has a total of 9,050 towers which will be built between 2020
and 2027 across Europe. This 9,050 towers figure is provided by Cellnex within its
2019 results presentation. However, I got to this figure by myself as when I was
carrying out the precedent transactions’ method, I had to go through each deal where
you can find this information (how many BTS included the agreement). In addition, the
sum of the total number of BTS that comes from each deal is 9,050 as we can see in the
figure below. To distribute the sites coming from BTS programs for each country, I
have assumed different percentages of sites build each year.
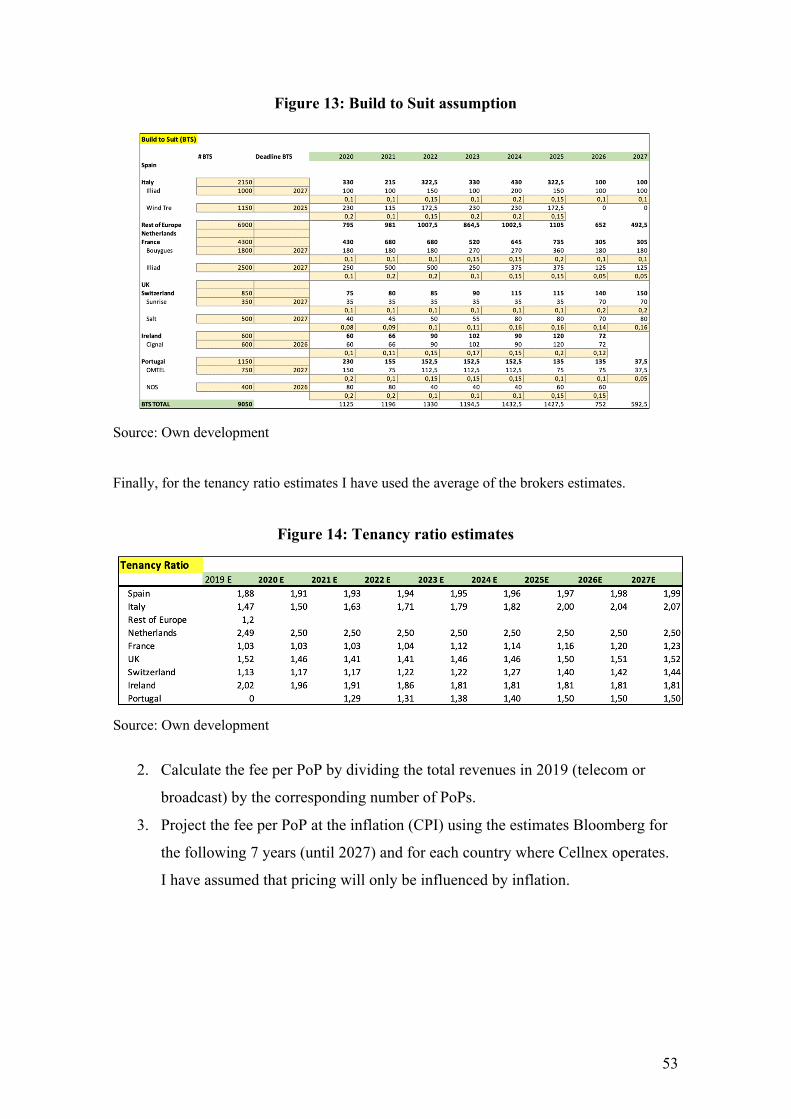
53
Figure 13: Build to Suit assumption
Source: Own development
Finally, for the tenancy ratio estimates I have used the average of the brokers estimates.
Figure 14: Tenancy ratio estimates
Source: Own development
2. Calculate the fee per PoP by dividing the total revenues in 2019 (telecom or
broadcast) by the corresponding number of PoPs.
3. Project the fee per PoP at the inflation (CPI) using the estimates Bloomberg for
the following 7 years (until 2027) and for each country where Cellnex operates.
I have assumed that pricing will only be influenced by inflation.

54
Figure 15: Fee per PoP estimates
Expressed in euros
Source: Own development
4. Calculate the revenues’ estimates by multiplying the fee per PoP by the total
number of PoPs for each year.
Operating Expenses
The next item that needs to be projected are operating expenses. Depending on its
nature – fixed or variable - I have used two different rates to project them. The variable
expenses are those that change depending on sales, therefore, they have been estimated
at the sales growth; while the fixed expenses have been projected at the inflation rate.
Therefore, I have considered variable the expenses coming from Staff Costs, Leases,
and Utilities, and fixed the expenses originated by Repair and Maintenance, and
General and other services.
These projections haven’t been broken down by country, thus representing the total
amount of operating costs for Cellnex. Therefore, the inflation used as a growth rate for
the fixed expenses is a weighted inflation.
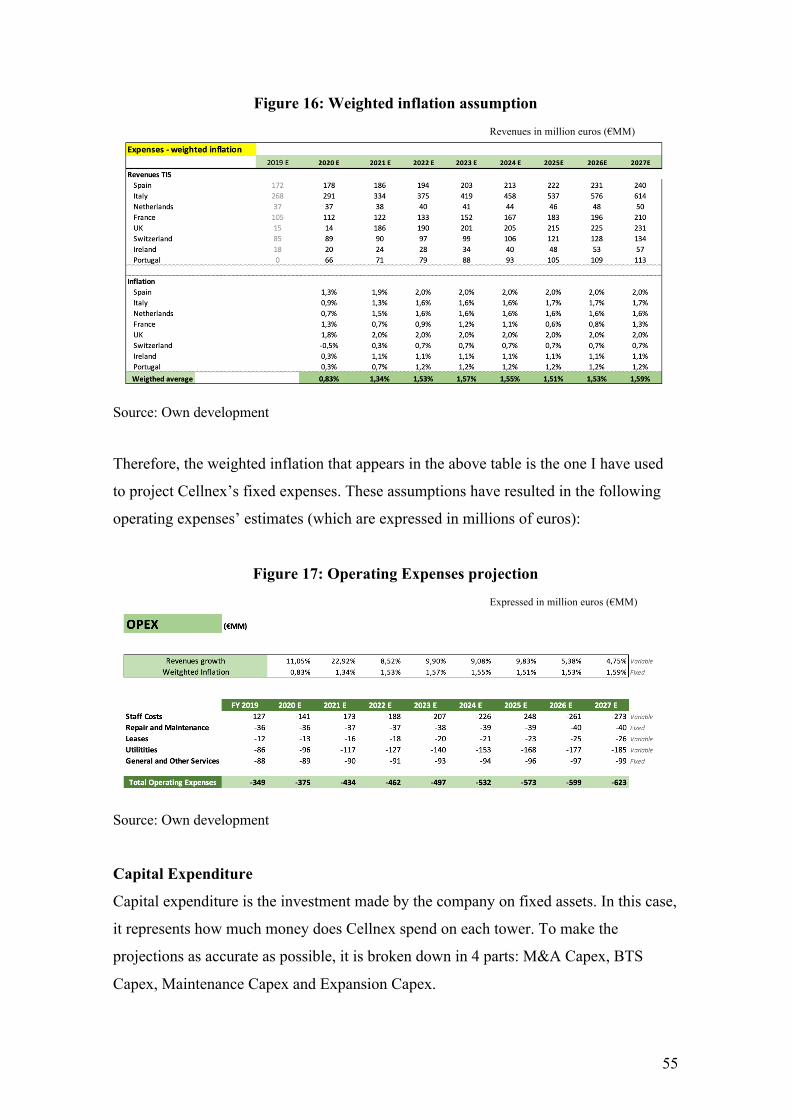
55
Figure 16: Weighted inflation assumption
Revenues in million euros (€MM)
Source: Own development
Therefore, the weighted inflation that appears in the above table is the one I have used
to project Cellnex’s fixed expenses. These assumptions have resulted in the following
operating expenses’ estimates (which are expressed in millions of euros):
Figure 17: Operating Expenses projection
Expressed in million euros (€MM)
Source: Own development
Capital Expenditure
Capital expenditure is the investment made by the company on fixed assets. In this case,
it represents how much money does Cellnex spend on each tower. To make the
projections as accurate as possible, it is broken down in 4 parts: M&A Capex, BTS
Capex, Maintenance Capex and Expansion Capex.

56
Figure 18: Capital Expenditure projection
Expressed in million euros (€MM)
Source: Own development
To calculate the capital expenditure that belongs to the merger and acquisition activity
I have assumed an average cost per tower using the data of the last M&A deals made by
Cellnex which were carried out either in 2020 or 2019. This cost, calculated through the
precedent transactions’ method, has been used for all the towers I assumed to be created
through M&A Activity.
As may be seen in the figure above, the estimates for 2020 and 2021 are much higher in
comparison with those of the following years due to the M&A growth assumptions. In
the figure that shows my assumptions on inorganic growth, we can observe that the total
number of sites created in 2020 and 2021 are 5,472 and 8,086 respectively. As
mentioned before, in 2020 Cellnex has acquired 5,000 towers from two Portuguese
companies, and 2021 is the year assumed for the transfer of Arqiva’s sites which
amounts to 7,400 sites (an increase of 1,217%). Nevertheless, the estimates between
2022 and 2027 are around 800 towers. Therefore, when multiplying the average cost per
tower by the total amount of towers created through M&A it will result on the
difference seen above.

57
Then, I calculated the cost per tower of each specific BTS deal and allocate it to their
corresponding towers (they are comparable as they are the same type of tower).
Figure 19: BTS assumption
Source: Own development
Finally, both maintenance and expansion Capex have been calculated as a percentage of
Cellnex’s revenues. I have assumed a 2% and 5%, respectively, of total revenues in line
with its historical evolution as the maintenance Capex has been around 2% for the last 5
years and the expansion Capex has been between 5% and 10%, stabilizing around 5%
during the last years.
Depreciation and Amortization
Total depreciation and amortization have been calculated by depreciating three different
assets. The first one corresponds to the depreciation of the property, plant and
equipment account, the second one corresponds to the amortization of intangible assets,
and the last one has been calculated by amortizing the capex estimated for the following
years. For each of them I have assumed that they amortize in 22 years as Cellnex,
within its annual accounts, includes a range of years between 15 and 25 of useful life for
depreciation.
When depreciating the PPE, I have used the Gross PPE:
𝐺𝑟𝑜𝑠𝑠𝑃𝑃𝐸 = 𝑁𝑒𝑡𝑃𝑃𝐸 − 𝐶𝑎𝑝𝑒𝑥 + 𝐴𝑐𝑐𝑢𝑚𝑢𝑙𝑎𝑡𝑒𝑑𝐷𝑒𝑝𝑟𝑒𝑐𝑖𝑎𝑡𝑖𝑜𝑛

58
The Net PPE account is shown within Cellnex’s balance sheet, the Capex within the
Cash Flow statement and the accumulated depreciation within the annual accounts.
For the capex I have projected the depreciation corresponding to each year, therefore
adding each year a new depreciation item. This being said, the depreciation and
amortization estimates look like within the following table:
Figure 20: Depreciation and Amortization projection
Expressed in million euros (€MM)
Source: Own development
Change in Net Working Capital
In this case, the variation in net working capital could be assumed to be 0 as it is low
and not very relevant. To calculate the working capital, I have used the figures from
Cellnex’s balance sheet which are: current assets without taking into account the cash
and short-term deposits (trade and other receivables) and on the liability side the trade
and other payables figure. Then I have increased the change in working capital at the
revenues growth rate. When calculating the free cash flow, I have added this variation
as it has a negative sign.

59
Free Cash Flow
Having forecasted all these P&L items, I have continued the analysis with the
calculation of Cellnex’s future free cash flows. As mentioned in the Valuation Methods
topic, the formula to calculate the free cash flow is:
𝐹𝐶𝐹 = 𝐸𝐵𝐼𝑇(1 − 𝑇𝑎𝑥) + 𝑁𝑜𝑛𝐶𝑎𝑠ℎ𝐸𝑥𝑝𝑒𝑛𝑠𝑒𝑠 − 𝐶𝑎𝑝𝑒𝑥 ± ∆𝑛𝑒𝑡𝑤𝑜𝑟𝑘𝑖𝑛𝑔𝑐𝑎𝑝𝑖𝑡𝑎𝑙
All the items above have been projected and explained except for the EBIT, which has
been calculated by subtracting the depreciation and amortization to the EBITDA. This
EBITDA has been calculated with my revenues and operating expenses projections.
6.3.2. Weighted Average Cost of Capital (WACC)
The next step is calculating the appropriate Weighted Average Cost of Capital used to
discount the future cash flows. As previously indicated, the WACC consists of two
parts: Cost of equity and cost of debt.
In order to calculate the cost of equity, I have used the Capital Asset Pricing Model. For
the risk-free rate, I have used a weighted risk-free rate with the 30-year bond yields of
the countries where Cellnex operates, and I have got a 1.54% rate. Moreover, I assumed
a weighted Equity Risk Premium of 6.01% provided by Damodaran for a mature equity
market. Although I first calculated a weighted equity risk premium, the results was very
high for Cellnex (8.62%). Finally, the 5-year 0.49 Beta has been obtained from Yahoo
Finance which indicates that Cellnex shares are less volatile than the market. The cost
of equity which resulted from introducing this data into de CAPM formula is 4.49%.
For the cost of debt, I have used the weighted risk-free rate (1.54%) used for the cost of
equity and a spread of 5.33%. This spread is provided by Factset as of June 17, 2020
and represents a 10-year spread over the risk-free rate for a company which is rated with
a 𝐵𝐵" as Cellnex’s case.

60
Figure 21: Spread
Source: Factset
Then I applied a weighted tax rate (24%) to obtain the after-tax cost of debt which is
5.19%. The weighted tax rate has been calculated the same way as the weighted risk-
free rate, with Damodaran’s data which tell us the spread and the corporate tax for each
country.
Figure 22: Weighted Tax Rate
Source: Own development with Damodaran’s data.
One more step needs to be taken before calculating the WACC, which is to determine
the capital structure required for this formula. I have decided to use Cellnex’s market
values for the capital structure, being 83% of the total capital equity versus the 17% of

61
capital from debt. The equity is the market capital, and the debt is Cellnex’s net
financial debt. Finally, the WACC I got with all these assumptions and figures is 5.67%.
Figure 23: Weighted Average Cost of Capital
Source: Own development
For the calculation of the perpetuity growth rate, I have used the brokers’ average which
was between 1,5% and 3%, obtaining an average growth rate of 1.96%. I think this
growth rate is very appropriated as it is assumed from 2027. In this year, I expect
Cellnex to be very consolidated across Europe, but still carrying out some acquisitions
to still grow and expand.
6.3.3. Valuation with DCF
With all this information, I have performed a discounted cash flow analysis to estimate
the value of Cellnex. I have arrived at an enterprise value of €23,341 MM, which after
deducting net debt and minorities, results in an equity value of €18,500 MM. The share
price obtained is 51.00€ which implies a potential downside of 3.8% with respect to the
current price of 52.94€ (as of 19/06/2020).

62
Table 6: Share Price with Discounted Cash Flow
Expressed in million euros (€MM)
2020E 2021E 2022E 2023E 2024E 2025E 2026E 2027E
EBIT 89 189 202 285 370 473 523 573
D&A 686 790 870 903 936 973 1,005 1,032
EBITDA 775 979 1,072 1,188 1,306 1,445 1,528 1,605
CAPEX 1,857 2,719 806 664 784 813 628 551
D NWC -4 -9 -4 -5 -5 -6 -4 -4
Tax rate 24% 24% 24% 24% 24% 24% 24% 24%
FOCF -1,100 -1,777 220 460 437 523 776 917
TV 35,311
TOTAL
PV 24,480
Enterprise Value 24,480
Net financial Debt 3,938
Minorities 890
Equity Value 19,652
Number of Shares 385
Share Price 51.00
Source: Own development
6.3.4. Sensitivity Analysis
“A sensitivity analysis determines how different values of an independent variable
affect a particular dependent variable under a given set of assumptions. In other words,
sensitivity analyses study how various sources of uncertainty in a mathematical model
contribute to the model's overall uncertainty. This technique is used within specific
boundaries that depend on one or more input variables” (Kenton, 2020).
The figure below represents the multiple options we can get depending on the WACC
or growth rate used. As we can see, 1% of variation in both rates involves a huge
decrease or increase in the share price. The growth rate affects the terminal value, which
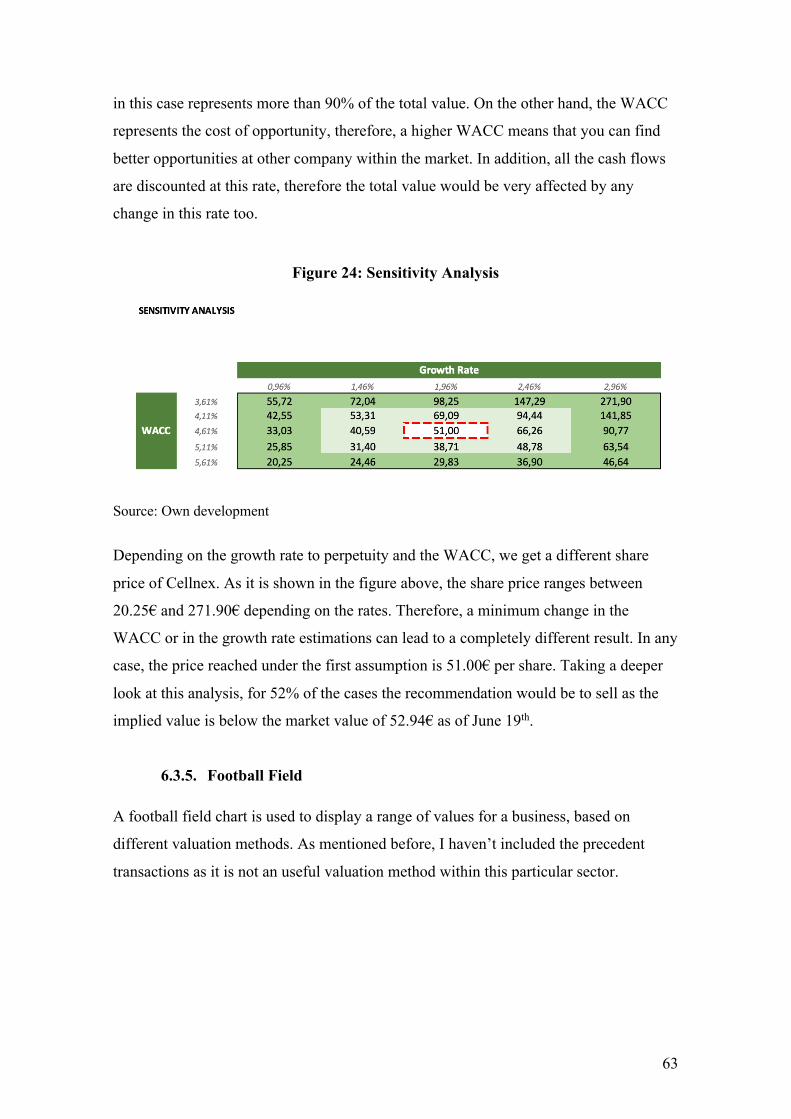
63
in this case represents more than 90% of the total value. On the other hand, the WACC
represents the cost of opportunity, therefore, a higher WACC means that you can find
better opportunities at other company within the market. In addition, all the cash flows
are discounted at this rate, therefore the total value would be very affected by any
change in this rate too.
Figure 24: Sensitivity Analysis
Source: Own development
Depending on the growth rate to perpetuity and the WACC, we get a different share
price of Cellnex. As it is shown in the figure above, the share price ranges between
20.25€ and 271.90€ depending on the rates. Therefore, a minimum change in the
WACC or in the growth rate estimations can lead to a completely different result. In any
case, the price reached under the first assumption is 51.00€ per share. Taking a deeper
look at this analysis, for 52% of the cases the recommendation would be to sell as the
implied value is below the market value of 52.94€ as of June 19th.
6.3.5. Football Field
A football field chart is used to display a range of values for a business, based on
different valuation methods. As mentioned before, I haven’t included the precedent
transactions as it is not an useful valuation method within this particular sector.
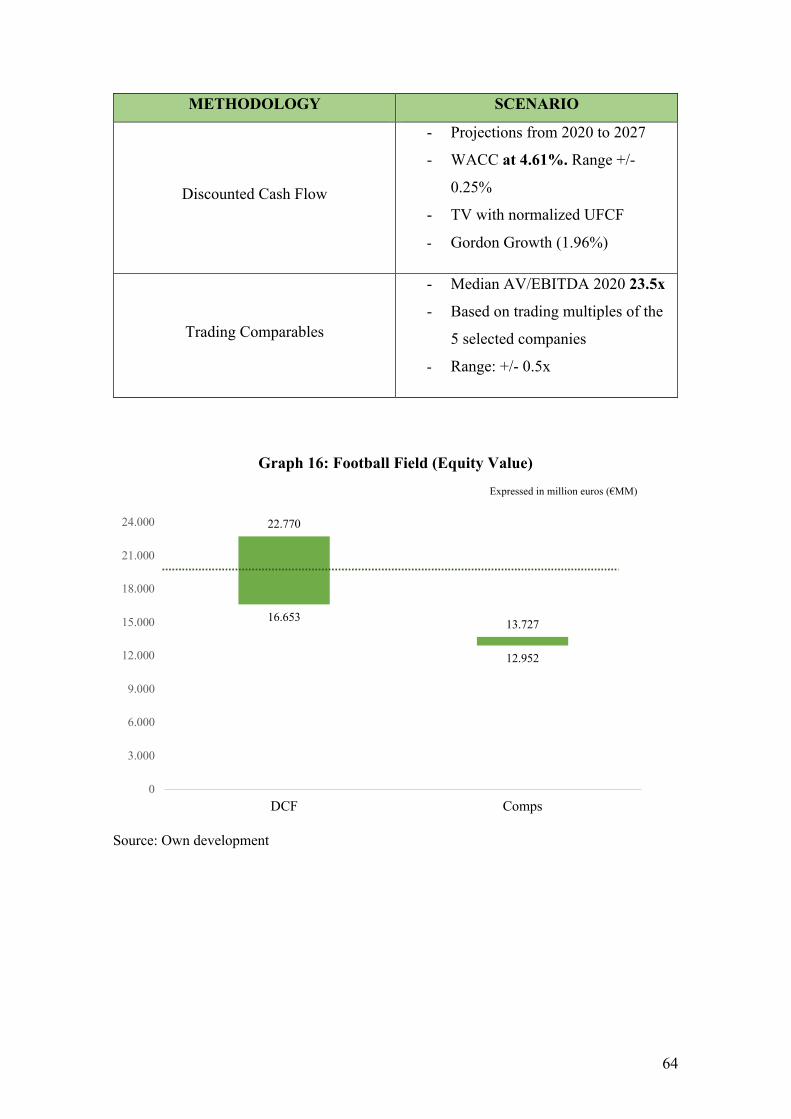
64
METHODOLOGY SCENARIO
Discounted Cash Flow
- Projections from 2020 to 2027
- WACC at 4.61%. Range +/-
0.25%
- TV with normalized UFCF
- Gordon Growth (1.96%)
Trading Comparables
- Median AV/EBITDA 2020 23.5x
- Based on trading multiples of the
5 selected companies
- Range: +/- 0.5x
Graph 16: Football Field (Equity Value)
Expressed in million euros (€MM)
Source: Own development
16.653
12.952
22.770
13.727
0
3.000
6.000
9.000
12.000
15.000
18.000
21.000
24.000
DCF Comps
65
7. CONCLUSION
The aim of this study was to deeply analyze Cellnex and reach a conclusion in which I
express my recommendation regarding the purchase, sale or maintenance of Cellnex’s
shares. This recommendation requires to gain knowledge of all the fields related to
Cellnex, going from the business plan of the company and its growth opportunities to
the telecommunication sector evolution and situation in Spain and across the countries
within Europe where Cellnex operates. Therefore, the valuation of a company does not
only rely on a single figure calculated from a valuation method, but also on all the
context and situation that surrounds Cellnex.
The conclusions that I drew from the company and the sector analysis are the
followings.
• The main market trends are gaining many relevance and importance across the
world, with the 5G revolutionizing the IT services world. Cellnex has showed a
tremendous growth during the last year reaching the top 3 within the Ibex 35 in
terms of appreciation of the share price.
• The merger and acquisition transactions has driven Cellnex’s strategy during the
last years achieving a strong consolidation in countries such as Italy or Spain.
Additionally, its CEO has stated more than once its willingness to continue with
the enlargement of the company.
• They are diversifying its portfolio by banking on the fibre market with multiple
transactions such as the most recent one with Bouygues in France.
Regarding the type of valuation method used, we can see how each of them has arrived
at different values.
• The precedent transactions couldn’t be used in this case as the implied share
price is very low due to the fact of being asset (towers) acquisitions and not
company acquisitions.
• Although the share price resulting from the multiples method may be low due to
the comparability with some of the peer companies, we should take into account
that Cellnex’s share price has increased by approximately 63% since last year’s

66
share price of 29.5€ as of June 10th, 2019. Therefore, the share price resulting
from the multiples method is also reasonable given that at year ended 2019
Cellnex’s share price was 38.37€, and some assumptions and figures of these
methodologies weren’t taking into account Cellnex improvement since 2020.
• The DCF has involved a much more detailed work and I consider this method to
have a smaller error range.
Furthermore, I would focus on the DCF result to conclude this report. Cellnex’s closing
stock price on the last days, June 18th and June 19th, has been 52.04€ and 52.94€
respectively, and as of today (June 25th) it has already reached 54€. Therefore, having
arrived at a 51.00€ per share, strengthens my determination to sell Cellnex’s shares. The
main reason for this is Cellnex’s recent statements regarding its future growth published
in El Confidencial. Cellnex has warned its investors that the expansion process is
increasingly difficult due to the growing competition within the sector posing a risk to
fulfilment of its return objectives. Additionally, Cellnex has claimed that “some
competitors are larger, and they could have greater financial sources (as KKR), while
others can apply investment criteria with lower return” than Cellnex’s investors required
return. Furthermore, Cellnex faces competition from its American peers such as
American Tower or Crown Castle which have much more expertise. For all these
potential difficulties on its future growth, in addition to having arrived at an
undervalued price, I recommend selling Cellnex’s shares.
67
8. BIBLIOGRAPHY
Cellnex Results 2018 (Rep.). (2020). Retrieved from
https://www.cellnextelecom.com/content/uploads/2020/02/Cellnex-Resultados-
T4-2019.pdf
Churchill, L. (2020, february 10). 4 Areas where AI Is Transforming the Telecom
Industry in 2019. Retrieved from https://techsee.me/blog/artificial-intelligence-in-
telecommunications-industry/
Cisco (2018). VNI Complete Forecast Highlights. Retrieved from
https://www.cisco.com/c/dam/m/en_us/solutions/service-provider/vni-forecast-
highlights/pdf/Global_Device_Growth_Traffic_Profiles.pdf
Company Valuation Methods. Balance Sheet-Based Methods (Shareholders' Equity)
(Part 2). (2017, November 9). Helicopter View. Retrieved from http://helicopter-
view.com/blog/company-valuation-methods-balance-sheet-based-methods-
shareholders-equity-part-2
Del Castillo, I. (2020). Tobías Martínez (Cellnex): "Habrá un freno a corto plazo en el
despliegue de torres por la crisis". Expansion. Retrieved from
https://www.expansion.com/empresas/tecnologia/2020/04/07/5e8ba2f0468aeb1442
8b460c.html
Deloitte. (s. f.). Impacto de 20 años de liberalización de las telecomunicaciones en
España 1998-2018. Retrieved from
https://www2.deloitte.com/es/es/pages/technology-media-and-
telecommunications/articles/impacto-sector-telecomunicaciones-clientes.html
INWIT. (2020). Inwit: Board of Directors examines and approves the annual financial
report at 31 december 2019. Retrieved from
https://www.inwit.it/sites/default/files/SDIR_CS ENG CDA INWIT DEFINITIVO
con allegati.pdf
68
Isberto, M. (2019, September 24). What is Point of Presence (POP)? Retrieved from
https://www.colocationamerica.com/blog/point-of-presence?amp
Kenton, W. (2020, May 28). Sensitivity Analysis. Retrieved June 09, 2020, from
https://www.investopedia.com/terms/s/sensitivityanalysis.asp
TowerXchange. (2018). New horizons for tower companies opportunities in fibre-fed
small cells and edge computing. Retrieved from
https://www.towerxchange.com/publications/
TowerXchange’s 2019 European market review (Rep.). (2019). Retrieved from
https://www.towerxchange.com/wpcontent/uploads/2019/12/TX_EuropeReport_2
019.pdf
Wolf, O., Corkery, M., Prichard, J., & Tricot, A. (2015). European Wireless
Infrastructure Association Report. Ernst & Young. Retrieved from
https://ewia.org/wp-content/uploads/2017/10/EU-Tower-Sector_EY-White-
Paper.pdf
Wolf, O., Coulson, D., & Loever, U. (2019). The economic contribution of the
European tower sector. Ernst & Young. Retrieved from
https://www.parthenon.ey.com/Publication/vwLUAssets/ey-the-economic-
contribution-of-the-european-tower-sector/$FILE/ey-the-economic-contribution-of-
the-european-tower-sector.pdf
World Economic Forum (Ed.). (2019). Annual Report. Retrieved from
http://www3.weforum.org/docs/WEF_Annual_Report_18-19.pdf
(2020, February 25). Retrieved from https://www.americantower.com/investor-
relations/press-releases/
(2020, March 11). Retrieved from http://www.raiway.it/en_GB/web/guest/comunicati-
finanziari?p_p_id=101_INSTANCE_MRT5ZAyHUUJM&p_p_lifecycle=2&p_p_s
tate=normal&p_p_mode=view&p_p_cacheability=cacheLevelPage&p_p_col_id=c
olumn2&p_p_col_pos=2&p_p_col_count=3&_101_INSTANCE_MRT5ZAyHUUJ
M_struts_action=/asset_publisher/get_workflowasset_resource_2&_101_INSTAN
69
CE_MRT5ZAyHUUJM_resource=attachment&_101_INSTANCE_MRT5ZAyHU
UJM_attachmentId=181724
(2020, February 26). Retrieved from https://investor.crowncastle.com/static-
files/143ec304-92cb-4b2b-9c00-2edba444d383
5G la transformación digital hacia un mundo hiperconectado. (2019, March 12).
Retrieved from https://www.blog.andaluciaesdigital.es/que-es-el-5g/
7 tendencias principales sobre el Cloud Computing para 2020. (2019, November 7).
Retrieved from https://www.masvoz.es/blog/7-tendencias-principales-sobre-el-
cloud-computing-para-2020/
(n.d.). Retrieved June 12, 2020, from https://www.cellnextelecom.com/quienes-somos/
(n.d.). Retrieved June 12, 2020, from https://www.cellnextelecom.com/en/das-distributed-antenna-systems/

70
9. APPENDIX
9.1. Balance Sheet 2015-2019
9.2. Profit & Loss account 2015-2019
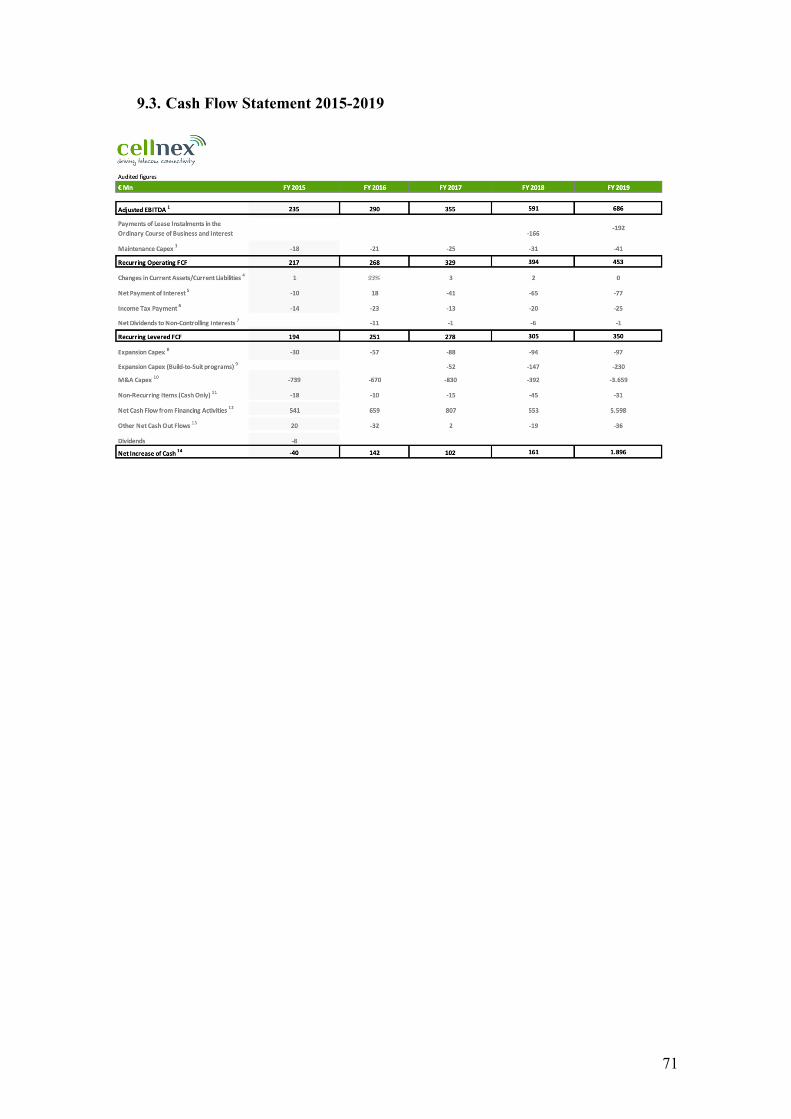
71
9.3. Cash Flow Statement 2015-2019