cf-cuadra_ll.pdf - Repositorio Académico - Universidad de Chile

Corporate FinanceGhassan Yacoub
HOW TO VALUE A COMPANY?
Valuation Tutorial Session
Case Study: Project Arkon
Copyright © Ghassan Yacoub###

Football FieldIntrinsic 1) DCFReflecting Market Volatili2) Trading ComparisonReflecting Market Volatili3) Precedent Transactions( it's the high value because of premiu
EV:
Net Debt __>TD-CashEquity Value

CONFIDENTIAL
Enterprise Value0_____________100
3) Precedent Transactions( it's the high value because of premiu

PROJECT ARKON - OPERATING MODEL
INCOME STATEMENT YE Dec 2009Historicals
REVENUE 252,577 % Growth N/A
COGS 232,543 % Growth N/A % Margin 92.1%
GROSS PROFIT 20,034 % Growth N/A % Margin 7.9%
SG&A (16,474)% Growth N/A % Margin 6.5%
FX Gains (Losses) 113 % Growth N/A % Margin (0.0%)
EBITDA 3,673 % Growth N/A % Margin 1.5%
D&A capital exp, property plant Equip (438)% Growth N/A % Beginning PP&E N/A
EBIT 3,235 % Growth N/A % Margin 1.3%
Interest Expense (764)% Growth N/A % Margin 0.3%
EBT 2,471

% Growth N/A % Margin 1.0%
Income Taxes (485)% Growth N/A % EBIT 15.0%
NET INCOME 1,986 % Growth N/A % Margin 0.8%
BALANCE SHEET YE Dec 2009Historicals
Cash & Cash Equivalents 7,480 Accounts Receivables 41,678 Other Accounts Receivables 4,804 Inventory 23,276 Prepaid Expenses 1,057 CURRENT ASSETS 78,295
PP&E 988 Intercompany Receivables 2,842 Investments 363 Miscellaneous 82 NON CURRENT ASSETS 4,275
TOTAL ASSETS 82,570
Short Term Borrowings 6,010 Accounts Payable 55,548 Accruals 5,975 Other Current Liabilities - CURRENT LIABILITIES 67,533
Long Term Debt 7,894 Intercompany Payables 79 EOSB( Pension) - LONG-TERM LIABILITIES 7,973
TOTAL LIABILITIES 75,506
Share Capital 5,701

Reserves (paid in excess over par) 1,418 Capital Reserves 19 Retained Earnings (75)
TOTAL EQUITY 7,063
Check A=L+E 1
BALANCE SHEET CALCULATIONS YE Dec 2009Historicals
Accounts Receivables 41,678 % Sales 16.5% DSO ( days sales 60
Other Accounts Receivables 4,804 % Sales 1.9% DSO 7
Inventories 23,276 % COGS 10.0% Inventory Days 37
Prepaid Expenses 1,057 % SG&A (6.4%)
Accounts Payable 55,548 % COGS 23.9% DPO 87
Accruals 5,975 % SG&A (36.3%)
Other Current Liabilities - % COGS 0.0%
EOSB - % SG&A 0.0%
DEBT SCHEDULE INTEREST - ON BALANCE SHEET YE Dec 2009Historicals
Short Term Borrowings

Interest rate 12.0%
Opening BalancePaid InterestClosing Balance
Long Term Borrowings
Interest rate 7.0% Facility 6,500
Opening BalancePaid InterestClosing Balance
Total Interest Expense
CASH FLOW YE Dec 2009Historicals
Net Income 1,986 Depreciation 438 EOSB ( inflow-outflow) - Miscellaneous ( outflow-inflow) because it's an asset (82)
(Increase)/Decrease in Accounts Receivable (41,678) (Increase)/Decrease in Other Accounts Receivable (4,804) (Increase)/Decrease in Inventories (23,276) (Increase)/Decrease in Prepaid Expenses (1,057) (Increase)/Decrease in Intercompany Receivables (2,842) Increase/(Decrease) in Accounts Payables 55,548 Increase/(Decrease) in Accruals 5,975 Increase/(Decrease) in Other Current Liabilities - Increase/(Decrease) in Intercompany Payables 79 Change in Working Capital (12,055)
Cash Flow from Operations (9,713)
Capital Expenditures (331)% of Depreciation 75.6%
Investments (363)

Cash Flow from Investing (694)
Short Term Borrowings 6,010 Long Term Debt 7,894
Cash Flow from Financing 13,904
TOTAL CASH FLOW 3,497

YE Dec 2010 YE Dec 2011 YE Dec 2012 YE Dec 2013 YE Dec 2014Historicals Forecasts
294,451 353,899 411,252 454,999 504,168 16.6% 20.2% 16.2% 10.6% 10.8%
272,671 328,262 380,041 419,693 463,365 17.3% 20.4% 15.8% 10.4% 10.4% 92.6% 92.8% 92.4% 92.2% 91.9%
21,780 25,637 31,212 35,307 40,802 8.7% 17.7% 21.7% 13.1% 15.6% 7.4% 7.2% 7.6% 7.8% 8.1%
(17,025) (19,969) (22,728) (25,935) (28,738)3.3% 17.3% 13.8% 14.1% 10.8% 5.8% 5.6% 5.5% 5.7% 5.7%
30 149 (45) (50) (56)(73.5%) 395.3% (130.6%) 10.6% 10.8%
(0.0%) (0.0%) 0.0% 0.0% 0.0%
4,785 5,816 8,438 9,321 12,009 30.3% 21.5% 45.1% 10.5% 28.8%
1.6% 1.6% 2.1% 2.0% 2.4%
(422) (361) (402) (430) (460)(3.6%) (14.3%) 11.2% 7.0% 7.0% 42.7% 36.0% 35.0% 35.0% 35.0%
4,363 5,454 8,037 8,891 11,549 34.9% 25.0% 47.3% 10.6% 29.9%
1.5% 1.5% 2.0% 2.0% 2.3%
(1,162) (990) (1,248) (834) (834)52.0% (14.8%) 26.1% (33.2%) 0.0%
0.4% 0.3% 0.3% 0.2% 0.2%
3,201 4,465 6,789 8,057 10,715
29.5% 39.5% 52.1% 18.7% 33.0% 1.1% 1.3% 1.7% 1.8% 2.1%
(654) (818) (1,205) (1,334) (1,732)34.9% 25.0% 47.3% 10.7% 29.9% 15.0% 15.0% 15.0% 15.0% 15.0%
2,547 3,646 5,584 6,724 8,983 28.2% 43.2% 53.1% 20.4% 33.6%
0.9% 1.0% 1.4% 1.5% 1.8%
YE Dec 2010 YE Dec 2011 YE Dec 2012 YE Dec 2013 YE Dec 2014Historicals Forecasts
11,594 12,852 10,863 8,645 11,671 44,656 57,214 63,360 71,055 78,733 4,926 6,680 7,814 8,726 9,669
26,582 38,163 49,479 55,192 60,936 664 998 1,136 1,297 1,437
88,422 115,907 132,653 144,914 162,446
1,003 1,148 1,228 1,314 1,406 - - - - -
402 - - - - 97 99 99 99 99
1,502 1,247 1,327 1,413 1,505
89,924 117,154 133,980 146,328 163,951
4,281 2,228 3,158 3,158 3,158 63,393 84,686 93,215 101,186 109,176 4,836 6,222 6,818 7,780 8,621 1,186 2,029 1,900 2,098 2,317
73,696 95,165 105,092 114,223 123,273
4,910 6,387 6,500 6,500 6,500 11 - - - -
1,176 1,356 1,545 (1,764) (1,954)6,097 7,743 8,045 4,736 4,546
79,793 102,908 113,137 118,960 127,818
5,701 5,701 5,701 5,701 5,701

1,418 1,418 1,418 1,418 1,418 (304) (314) (314) (314) (314)3,314 7,441 14,038 20,762 29,744
10,129 14,246 20,843 27,567 36,549
2 - - (198) (417)
YE Dec 2010 YE Dec 2011 YE Dec 2012 YE Dec 2013 YE Dec 2014Historicals Forecasts
44,656 57,214 63,360 71,055 78,733 15.2% 16.2% 15.4% 15.6% 15.6%
55 59 56 57 57
4,926 6,680 7,814 8,726 9,669 1.7% 1.9% 1.9% 1.9% 1.9%
6 7 7 7 7
26,582 38,163 49,479 55,192 60,936 9.7% 11.6% 13.0% 13.2% 13.2%
36 42 48 48 48
664 998 1,136 1,297 1,437 (3.9%) (5.0%) (5.0%) (5.0%) (5.0%)
63,393 84,686 93,215 101,186 109,176 23.2% 25.8% 24.5% 24.1% 23.6%
85 94 90 88 86
4,836 6,222 6,818 7,780 8,621 (28.4%) (31.2%) (30.0%) (30.0%) (30.0%)
1,186 2,029 1,900 2,098 2,317 0.4% 0.6% 0.5% 0.5% 0.5%
1,176 1,356 1,545 (1,764) (1,954)(6.9%) (6.8%) (6.8%) 6.8% 6.8%
YE Dec 2010 YE Dec 2011 YE Dec 2012 YE Dec 2013 YE Dec 2014Historicals Forecasts

3,158 3,158 378.96 378.963,158 3,158
6,500 6,500 455 455
6,500 6,500
834 834
YE Dec 2010 YE Dec 2011 YE Dec 2012 YE Dec 2013 YE Dec 2014Historicals Forecasts
2,547 3,646 5,584 6,724 8,983 422 361 402 430 460
1,176 180 189 (3,309) (191)(15) (2) - - -
(2,978) (12,558) (6,146) (7,694) (7,678)(122) (1,754) (1,134) (912) (943)
(3,306) (11,581) (11,316) (5,714) (5,743)393 (334) (138) (160) (140)
2,842 - - - - 7,845 21,293 8,529 7,971 7,990
(1,139) 1,386 596 962 841 (68) (11) - - - (68) (11) - - -
3,399 (3,570) (9,609) (5,547) (5,674)
7,529 616 (3,434) (1,703) 3,579
(455) (492) (482) (516) (552)107.8% 136.1% 120.0% 120.0% 120.0% (39) 402 - - -

(494) (90) (482) (516) (552)
(1,729) (2,053) 930 - - (2,984) 1,477 113 - -
(4,713) (576) 1,043 - -
2,322 (50) (2,873) (2,219) 3,027

YE Dec 2015 YE Dec 2016 YE Dec 2017Forecasts
559,187 621,895 693,174 10.9% 11.2% 11.5%
511,058 565,826 629,210 10.3% 10.7% 11.2% 91.4% 91.0% 90.8%
48,129 56,069 63,964 18.0% 16.5% 14.1%
8.6% 9.0% 9.2%
(31,874) (35,448) (39,511)10.9% 11.2% 11.5%
5.7% 5.7% 5.7%
(62) (69) (77)10.9% 11.2% 11.5%
0.0% 0.0% 0.0%
16,194 20,552 24,376 34.8% 26.9% 18.6%
2.9% 3.3% 3.5%
(492) (527) (564)7.0% 7.0% 7.0%
35.0% 35.0% 35.0%
15,702 20,025 23,813 36.0% 27.5% 18.9%
2.8% 3.2% 3.4%
(834) (834) (834)0.0% 0.0% 0.0% 0.1% 0.1% 0.1%
14,868 19,191 22,979

38.8% 29.1% 19.7% 2.7% 3.1% 3.3%
(2,355) (3,004) (3,572)36.0% 27.5% 18.9% 15.0% 15.0% 15.0%
12,512 16,187 19,407 39.3% 29.4% 19.9%
2.2% 2.6% 2.8%
YE Dec 2015 YE Dec 2016 YE Dec 2017Forecasts
17,174 26,763 38,652 87,325 97,118 108,249 10,724 11,927 13,294 67,208 74,410 82,745 1,594 1,772 1,976
184,024 211,990 244,916
1,505 1,610 1,723 - - - - - -
99 99 99 1,604 1,709 1,822
185,628 213,699 246,738
3,158 3,158 3,158 117,613 128,667 141,357
9,562 10,634 11,853 2,555 2,829 3,146
132,889 145,289 159,514
6,500 6,500 6,500 - - -
(2,167) (2,410) (2,687)4,333 4,090 3,813
137,221 149,378 163,327
5,701 5,701 5,701

1,418 1,418 1,418 (314) (314) (314)
42,257 58,444 77,851
49,062 65,249 84,656
(655) (929) (1,246)
YE Dec 2015 YE Dec 2016 YE Dec 2017Forecasts
87,325 97,118 108,249 15.6% 15.6% 15.6% CCC=AR+Inv days-Payable days
57 57 57
10,724 11,927 13,294 1.9% 1.9% 1.9%
7 7 7
67,208 74,410 82,745 13.2% 13.2% 13.2%
48 48 48
1,594 1,772 1,976 (5.0%) (5.0%) (5.0%)
117,613 128,667 141,357 23.0% 22.7% 22.5%
84 83 82
9,562 10,634 11,853 (30.0%) (30.0%) (30.0%)
2,555 2,829 3,146 0.5% 0.5% 0.5%
(2,167) (2,410) (2,687)6.8% 6.8% 6.8%
YE Dec 2015 YE Dec 2016 YE Dec 2017Forecasts

3,158 3,158 3,158 378.96 378.96 378.963,158 3,158 3,158
6,500 6,500 6,500 455 455 455
6,500 6,500 6,500
834 834 834
YE Dec 2015 YE Dec 2016 YE Dec 2017Forecasts
12,512 16,187 19,407 492 527 564
(213) (243) (276)- - -
(8,592) (9,793) (11,131)(1,055) (1,203) (1,367)(6,272) (7,202) (8,335)(157) (179) (203)
- - - 8,437 11,054 12,689 941 1,072 1,219 - - - - - -
(6,698) (6,250) (7,128)
6,093 10,221 12,566
(591) (632) (676)120.0% 120.0% 120.0%
- - -

(591) (632) (676)
- - - - - -
- - -
5,502 9,589 11,890

CCC=AR+Inv days-Payable days

2012 EBITDA 8,438 2013 EBITDA 9,321 Multiple Range 2012 NI 5,584 2013 NI 6,724 Low High
TRADING COMPARABLES
2012 EV/EBITDA IT Distributors 5.5x 6.0x
2013 EV/EBITDA IT Distributors 5.0x 5.5x
2012 P/E IT Distributors 9.0x 9.5x
2013 P/E IT Distributors 8.0x 8.5x
PRECEDENT TRANSACTIONS
Mean/Median Range Precedent Transactions 7.0x 7.5x 2012 EV/EBITDA
DISCOUNTED CASH FLOW ANALYSIS
Case : WACC Range: 13%-15% 9.3x 12.6x Multiple Range: 4.5x - 5.5x
- 20,000 40,000 60,000 80,000 100,000 120,000 140,000
-
59,068
54,130
50,593
46,607
46,411
-
63,287
57,492
53,385
51,267
50,630

Enterprise Value Ranges
- 20,000 40,000 60,000 80,000 100,000 120,000 140,000
-
59,068
54,130
50,593
46,607
46,411
-
63,287
57,492
53,385
51,267
50,630

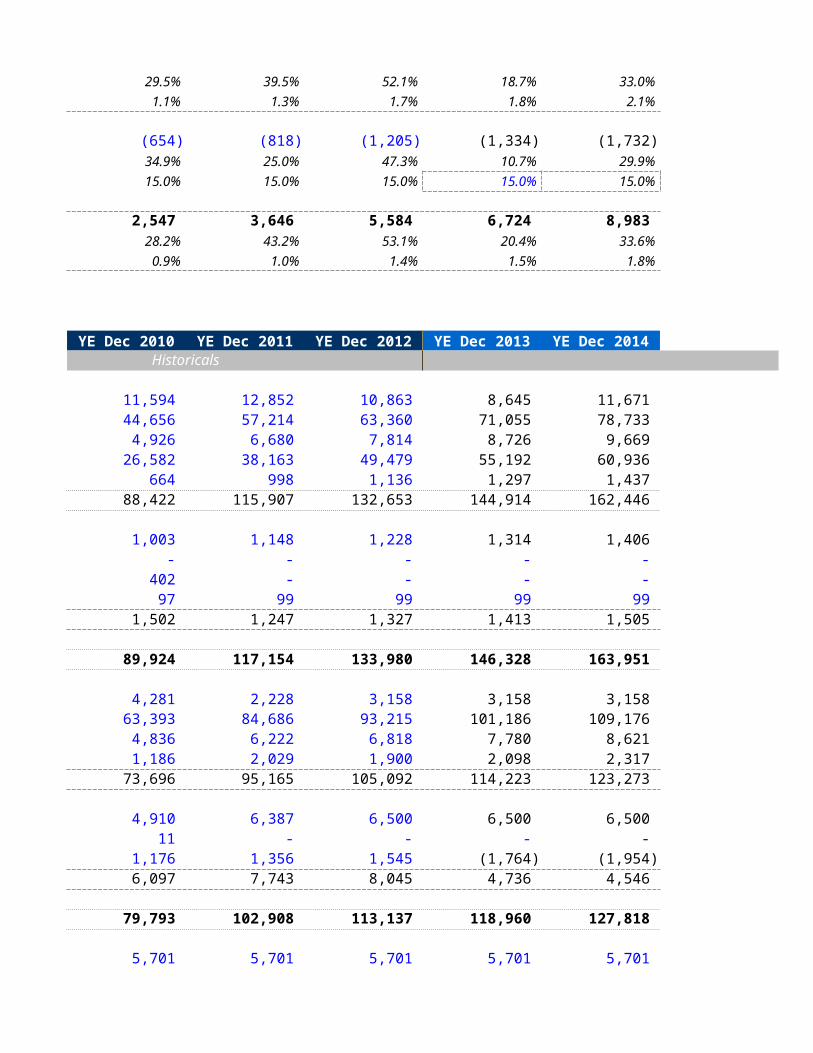
Enterprise Value RangesEV Low EV Difference EV High
IT Distributors 46,411 4,219 50,630
IT Distributors 46,607 4,661 51,267
IT Distributors 50,593 2,792 53,385
IT Distributors 54,130 3,362 57,492
Precedent Transactions 59,068 4,219 63,287
Base Case -
- 20,000 40,000 60,000 80,000 100,000 120,000 140,000
-
59,068
54,130
50,593
46,607
46,411
-
63,287
57,492
53,385
51,267
50,630
EV Low EV Difference EV High
Base Case - - -
Precedent Tran 59,068 4,219 63,287
IT Distributor 54,130 3,362 57,492 IT Distributor 50,593 2,792 53,385 IT Distributor 46,607 4,661 51,267 IT Distributor 46,411 4,219 50,630

DISCOUNTED CASH FLOW ANALYSIS
Transaction Date: 1/1/2013
SUMMARY FINANCIALS
EBITDA
NOPAT
CHANGE IN WORKING CAPITAL
CAPITAL EXPENDITURES
DEPRECIATION
UNLEVERED FREE CASH FLOW
MULTIPLE METHODOLOGY (Better)
WACC 13.0%
PV of UFCF 24,475
Terminal Value Multiple 4.0x
PV of Terminal Value 56,257 % of Total Value 69.7%
Enterprise Value 80,732 2013 EBITDA Multiple 8.7x
Net Debt 340
Equity Value 81,072

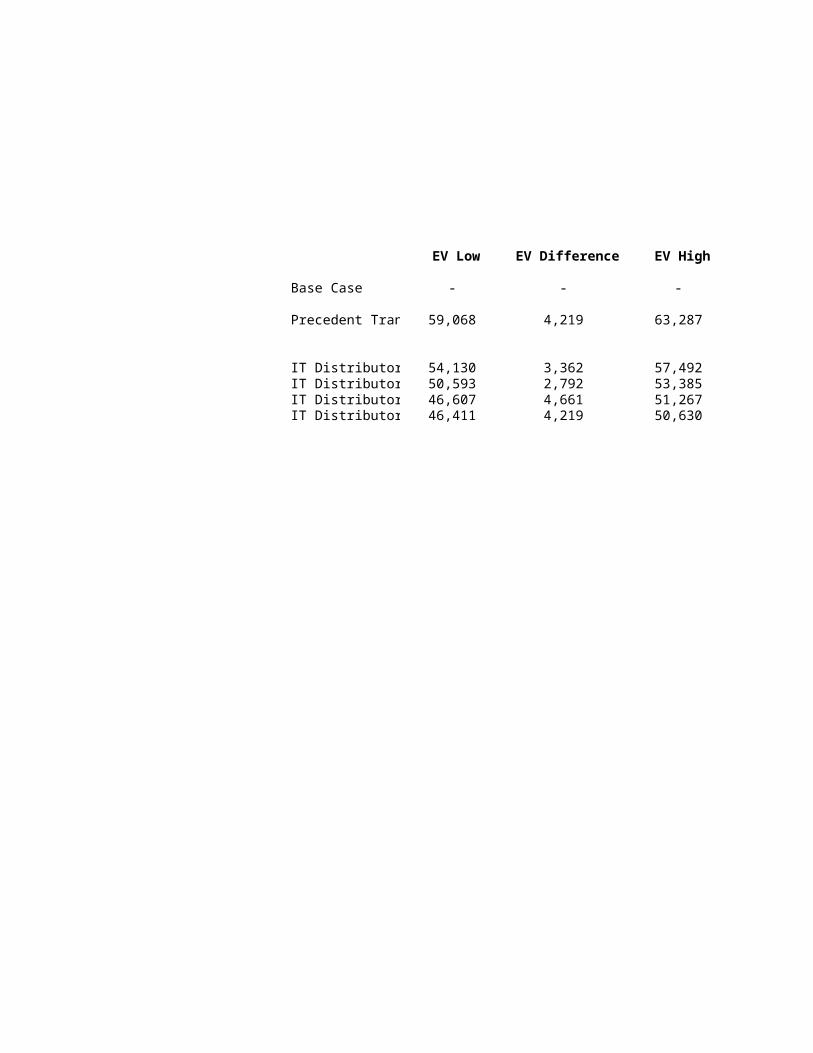
YE Dec-12 YE Dec-13
8,438 9,321
6,832 7,558
(9,609) (5,547)
(482) (516)
402 430
(2,858) 1,924
PERPETUITY GROWTH METHODOLOGY
13.0% WACC
24,475 24,475 PV of UFCF
5.0x 6.0x Perpetuity Growth Rate
70,321 84,386 PV of Terminal Value74.2% 77.5% % of Total Value
94,796 108,860 Enterprise Value10.2x 11.7x 2013 EBITDA Multiple
340 340 Net Debt
95,136 109,200 Equity Value

TV Multiple WACC80,732 12.0% 13.0% 14.0%
4.0x4.5x5.0x5.5x6.0x
Perp. Growth WACC82,170 12.0% 13.0% 14.0%
1.0% 1.5% 2.0% 2.5% 3.0%

YE Dec-14 YE Dec-15 YE Dec-16 YE Dec-17
12,009 16,194 20,552 24,376
9,817 13,346 17,021 20,241
(5,674) (6,698) (6,250) (7,128)
(552) (591) (632) (676)
460 492 527 564
4,051 6,550 10,666 13,000
PERPETUITY GROWTH METHODOLOGY
13.0%
24,475 24,475 24,475
Perpetuity Growth Rate 0.0% 1.0% 2.0%
PV of Terminal Value 57,695 63,128 69,549 70.2% 72.1% 74.0%
Enterprise Value 82,170 87,603 94,024 2013 EBITDA Multiple 8.8x 9.4x 10.1x
340 340 340
82,510 87,943 94,364

WACC15.0% 16.0%
WACC15.0% 16.0%

TRADING COMPARABLES
CONTROL BOX
Date: 9/30/2012Currency: USD
Scale 6 1st Historic FY FY 2008
Equity EnterpriseCom pany Geography Value Value Sales EBITDA Net Incom e Growth Valuation
LTM Sales LTM EBITDA LTM % LTM NI NI % Revenue Enterprise Value / EBITDA P/E2YR-H 2YR-F LTM FY 2013 LTM FY 2013
Arrow Electronics, Inc. United States 3,668 5,266 20,443 936 4.6% 506 2.5% 20.7% 3.4% 5.6x 5.1x 6.9x 6.7x
Avnet, Inc. United States 4,075 5,381 25,152 979 3.9% 528 2.1% 14.6% 5.8% 5.5x 5.2x 7.7x 7.1x
Com puage Infocom Ltd. India 8 43 313 6 1.9% 2 0.6% 12.9% N/A 7.2x N/A 3.8x N/A
Digital China Holdings Lim ited Hong Kong 1,742 2,009 9,490 186 2.0% 170 1.8% 18.4% N/A 10.8x N/A 10.1x N/A
ECS Holdings Ltd. Singapore 142 305 2,891 38 1.3% 26 0.9% N/A N/A 8.1x 8.0x 5.5x 4.5x
Indeks Bilgisayar Sistem leri M ühendislik Sanayii ve Ticaret A.S.Turkey 98 95 794 21 2.7% 11 1.3% (0.2%) N/A 4.5x N/A 9.2x N/A
Ingram M icro Inc. United States 2,286 1,852 36,400 548 1.5% 309 0.9% 2.6% N/A 3.4x 3.1x 7.7x 7.4x
Raya Holding Com pany for Technology and Com m unication (S.A.E)Egypt 69 69 483 28 5.9% 4 0.8% 4.8% 6.2% 2.4x 2.1x N/A 6.5x
Redington (India) Ltd. India 591 952 4,212 125 3.0% 58 1.4% 17.2% 10.8% 7.6x 7.2x 10.2x 9.0x
Tech Data Corp. United States 1,708 1,550 24,744 376 1.5% 181 0.7% 9.5% 2.6% 4.1x 4.0x 9.6x 8.5x
M edian 2.3% 1.1% 12.9% 5.8% 5.6x 5.1x 7.7x 7.1x

Source: Capital IQ
Equity EnterpriseCom pany Geography Value Value Sales EBITDA Net Incom e Growth Valuation
LTM Sales LTM EBITDA LTM % LTM NI NI % Revenue Enterprise Value / EBITDA P/E2YR-H 2YR-F LTM FY 2013 LTM FY 2013
Arrow Electronics, Inc. United States 3,668 5,266 20,443 936 4.6% 506 2.5% 20.7% 3.4% 5.6x 5.1x 6.9x 6.7x
Avnet, Inc. United States 4,075 5,381 25,152 979 3.9% 528 2.1% 14.6% 5.8% 5.5x 5.2x 7.7x 7.1x
Com puage Infocom Ltd. India 8 43 313 6 1.9% 2 0.6% 12.9% N/A 7.2x N/A 3.8x N/A
Digital China Holdings Lim ited Hong Kong 1,742 2,009 9,490 186 2.0% 170 1.8% 18.4% N/A 10.8x N/A 10.1x N/A
ECS Holdings Ltd. Singapore 142 305 2,891 38 1.3% 26 0.9% N/A N/A 8.1x 8.0x 5.5x 4.5x
Indeks Bilgisayar Sistem leri M ühendislik Sanayii ve Ticaret A.S.Turkey 98 95 794 21 2.7% 11 1.3% (0.2%) N/A 4.5x N/A 9.2x N/A
Ingram M icro Inc. United States 2,286 1,852 36,400 548 1.5% 309 0.9% 2.6% N/A 3.4x 3.1x 7.7x 7.4x
Raya Holding Com pany for Technology and Com m unication (S.A.E)Egypt 69 69 483 28 5.9% 4 0.8% 4.8% 6.2% 2.4x 2.1x N/A 6.5x
Redington (India) Ltd. India 591 952 4,212 125 3.0% 58 1.4% 17.2% 10.8% 7.6x 7.2x 10.2x 9.0x
Tech Data Corp. United States 1,708 1,550 24,744 376 1.5% 181 0.7% 9.5% 2.6% 4.1x 4.0x 9.6x 8.5x
M edian 2.3% 1.1% 12.9% 5.8% 5.6x 5.1x 7.7x 7.1x
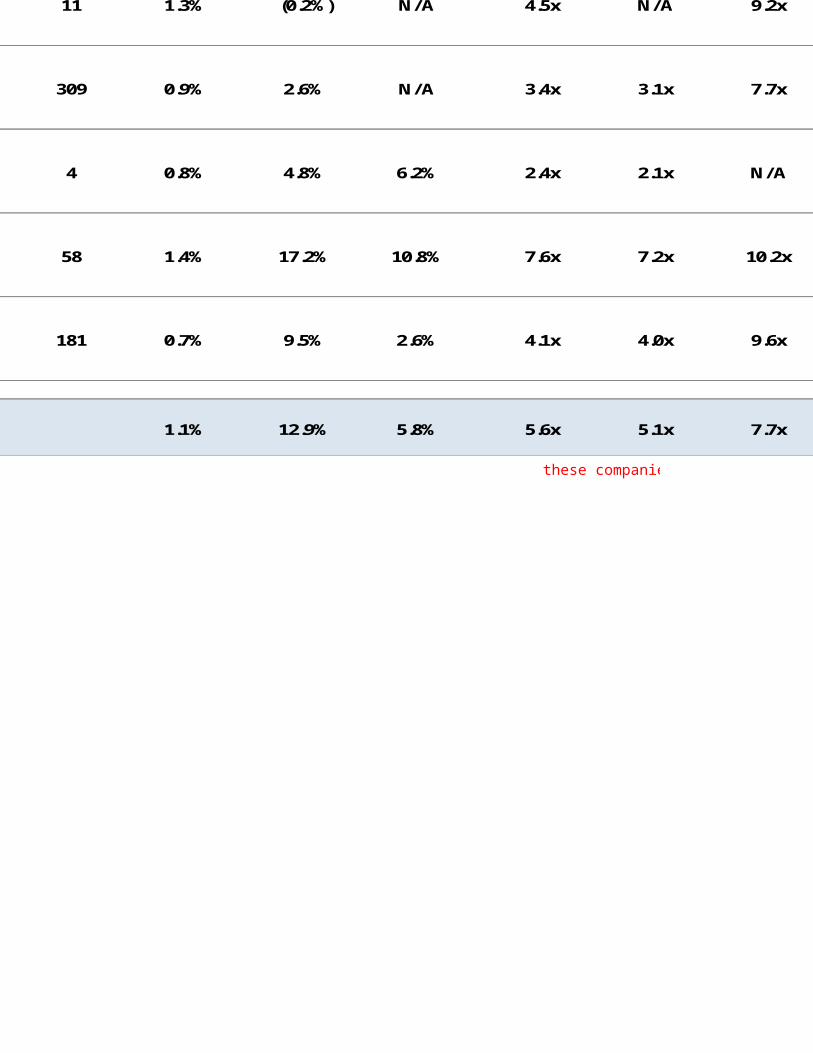
these companies are trading X times their EBITDA
Equity EnterpriseCom pany Geography Value Value Sales EBITDA Net Incom e Growth Valuation
LTM Sales LTM EBITDA LTM % LTM NI NI % Revenue Enterprise Value / EBITDA P/E2YR-H 2YR-F LTM FY 2013 LTM FY 2013
Arrow Electronics, Inc. United States 3,668 5,266 20,443 936 4.6% 506 2.5% 20.7% 3.4% 5.6x 5.1x 6.9x 6.7x
Avnet, Inc. United States 4,075 5,381 25,152 979 3.9% 528 2.1% 14.6% 5.8% 5.5x 5.2x 7.7x 7.1x
Com puage Infocom Ltd. India 8 43 313 6 1.9% 2 0.6% 12.9% N/A 7.2x N/A 3.8x N/A
Digital China Holdings Lim ited Hong Kong 1,742 2,009 9,490 186 2.0% 170 1.8% 18.4% N/A 10.8x N/A 10.1x N/A
ECS Holdings Ltd. Singapore 142 305 2,891 38 1.3% 26 0.9% N/A N/A 8.1x 8.0x 5.5x 4.5x
Indeks Bilgisayar Sistem leri M ühendislik Sanayii ve Ticaret A.S.Turkey 98 95 794 21 2.7% 11 1.3% (0.2%) N/A 4.5x N/A 9.2x N/A
Ingram M icro Inc. United States 2,286 1,852 36,400 548 1.5% 309 0.9% 2.6% N/A 3.4x 3.1x 7.7x 7.4x
Raya Holding Com pany for Technology and Com m unication (S.A.E)Egypt 69 69 483 28 5.9% 4 0.8% 4.8% 6.2% 2.4x 2.1x N/A 6.5x
Redington (India) Ltd. India 591 952 4,212 125 3.0% 58 1.4% 17.2% 10.8% 7.6x 7.2x 10.2x 9.0x
Tech Data Corp. United States 1,708 1,550 24,744 376 1.5% 181 0.7% 9.5% 2.6% 4.1x 4.0x 9.6x 8.5x
M edian 2.3% 1.1% 12.9% 5.8% 5.6x 5.1x 7.7x 7.1x

2 metrics:EV/EBITDA (my companies value is euqual X times my EBITDA)P/E
LTM( last 12 months)
Equity EnterpriseCom pany Geography Value Value Sales EBITDA Net Incom e Growth Valuation
LTM Sales LTM EBITDA LTM % LTM NI NI % Revenue Enterprise Value / EBITDA P/E2YR-H 2YR-F LTM FY 2013 LTM FY 2013
Arrow Electronics, Inc. United States 3,668 5,266 20,443 936 4.6% 506 2.5% 20.7% 3.4% 5.6x 5.1x 6.9x 6.7x
Avnet, Inc. United States 4,075 5,381 25,152 979 3.9% 528 2.1% 14.6% 5.8% 5.5x 5.2x 7.7x 7.1x
Com puage Infocom Ltd. India 8 43 313 6 1.9% 2 0.6% 12.9% N/A 7.2x N/A 3.8x N/A
Digital China Holdings Lim ited Hong Kong 1,742 2,009 9,490 186 2.0% 170 1.8% 18.4% N/A 10.8x N/A 10.1x N/A
ECS Holdings Ltd. Singapore 142 305 2,891 38 1.3% 26 0.9% N/A N/A 8.1x 8.0x 5.5x 4.5x
Indeks Bilgisayar Sistem leri M ühendislik Sanayii ve Ticaret A.S.Turkey 98 95 794 21 2.7% 11 1.3% (0.2%) N/A 4.5x N/A 9.2x N/A
Ingram M icro Inc. United States 2,286 1,852 36,400 548 1.5% 309 0.9% 2.6% N/A 3.4x 3.1x 7.7x 7.4x
Raya Holding Com pany for Technology and Com m unication (S.A.E)Egypt 69 69 483 28 5.9% 4 0.8% 4.8% 6.2% 2.4x 2.1x N/A 6.5x
Redington (India) Ltd. India 591 952 4,212 125 3.0% 58 1.4% 17.2% 10.8% 7.6x 7.2x 10.2x 9.0x
Tech Data Corp. United States 1,708 1,550 24,744 376 1.5% 181 0.7% 9.5% 2.6% 4.1x 4.0x 9.6x 8.5x
M edian 2.3% 1.1% 12.9% 5.8% 5.6x 5.1x 7.7x 7.1x

these companies are trading X times their EBITDA
Equity EnterpriseCom pany Geography Value Value Sales EBITDA Net Incom e Growth Valuation
LTM Sales LTM EBITDA LTM % LTM NI NI % Revenue Enterprise Value / EBITDA P/E2YR-H 2YR-F LTM FY 2013 LTM FY 2013
Arrow Electronics, Inc. United States 3,668 5,266 20,443 936 4.6% 506 2.5% 20.7% 3.4% 5.6x 5.1x 6.9x 6.7x
Avnet, Inc. United States 4,075 5,381 25,152 979 3.9% 528 2.1% 14.6% 5.8% 5.5x 5.2x 7.7x 7.1x
Com puage Infocom Ltd. India 8 43 313 6 1.9% 2 0.6% 12.9% N/A 7.2x N/A 3.8x N/A
Digital China Holdings Lim ited Hong Kong 1,742 2,009 9,490 186 2.0% 170 1.8% 18.4% N/A 10.8x N/A 10.1x N/A
ECS Holdings Ltd. Singapore 142 305 2,891 38 1.3% 26 0.9% N/A N/A 8.1x 8.0x 5.5x 4.5x
Indeks Bilgisayar Sistem leri M ühendislik Sanayii ve Ticaret A.S.Turkey 98 95 794 21 2.7% 11 1.3% (0.2%) N/A 4.5x N/A 9.2x N/A
Ingram M icro Inc. United States 2,286 1,852 36,400 548 1.5% 309 0.9% 2.6% N/A 3.4x 3.1x 7.7x 7.4x
Raya Holding Com pany for Technology and Com m unication (S.A.E)Egypt 69 69 483 28 5.9% 4 0.8% 4.8% 6.2% 2.4x 2.1x N/A 6.5x
Redington (India) Ltd. India 591 952 4,212 125 3.0% 58 1.4% 17.2% 10.8% 7.6x 7.2x 10.2x 9.0x
Tech Data Corp. United States 1,708 1,550 24,744 376 1.5% 181 0.7% 9.5% 2.6% 4.1x 4.0x 9.6x 8.5x
M edian 2.3% 1.1% 12.9% 5.8% 5.6x 5.1x 7.7x 7.1x

EV/EBITDA (my companies value is euqual X times my EBITDA)

PRECEDENT TRANSACTIONS
Source: Capital IQ


two types of investors:Strategic, Financialsynergy, exit

CONSOLIDATED REVENUE AND GP - DRIVERS
MANAGEMENT PROJECTIONS
INCOME STATEMENT
3COM% Growth
3M% Growth
ACER% Growth
Allied Telesis% Growth
ALTair% Growth
APC% Growth
Apsec% Growth
Avaya% Growth
Avocent% Growth
Benq% Growth
Business Objects% Growth
Cisco% Growth
Cisco CIS% Growth
Cisco UCS% Growth
Components% Growth
Computer Associates% Growth
Dell % Growth
Digi-Link% Growth
D-LINK

% GrowthFujitsu - Siemens
% GrowthHP - ESG (Servers)
% Growth HP - ESG Value
% GrowthHP - PNB (Networks)
% GrowthIBM
% GrowthIBM - ISS
% GrowthIT - Service
% GrowthLexmark
% GrowthLinksys
% GrowthLiteon
% GrowthLogitec & Labtec
% GrowthMcAfee
% GrowthMicrosoft FPP+OLP
% GrowthMicrosoft OEM
% GrowthMicrosoft VAD
% GrowthNet
% GrowthNetApps
% GrowthOracle HW
% GrowthOracle SW
% GrowthPace
% GrowthPCI
% GrowthPoint Of View
% GrowthRiverbed
% GrowthSMC

% GrowthSymantec
% GrowthTandberg
% GrowthVeeam
% GrowthVmware
% GrowthWyse
% GrowthOthers 1
% GrowthOthers 2
% GrowthOthers 3
% GrowthOthers 4
% GrowthOthers 5
% GrowthOthers 6
% GrowthStock Provision
% GrowthSub Total IT
% GrowthMob
% GrowthSubTotal Distribution
% GrowthATS - Cisco
% GrowthATS - Dell
% GrowthATS - McAfee
% GrowthATS - Microsoft VAD
% GrowthATS - Mission Critical
% GrowthATS - Net App
% GrowthATS - Riverbed
% GrowthATS - RSA
% GrowthATS - Symantec

% GrowthATS - Vmware
% GrowthOthers 1
% GrowthALS
% GrowthLogistics - 3rd party
% Growth
DISCONTINUED
Adobe % Growth
AKS - Kiosk% Growth
Belkin% Growth
Dynamic% Growth
HP - PSG (PCs)% Growth
Nortel% Growth
Seagate% Growth
SUN% Growth
US Robotics% Growth
Western Digital% Growth
Procurve% Growth
Others% Growth
ATS Revenue% Growth
Intercompany% Growth
SALES - % Growth N/A
3COM -

3M -
ACER -
Allied Telesis -
ALTair -
APC -
Apsec -
Avaya -
Avocent -
Benq -
Business Objects -
Cisco -
Cisco CIS -
Cisco UCS -
Components -
Computer Associates -
Dell -
Digi-Link -
D-LINK -
Fujitsu - Siemens -
HP - ESG (Servers) -
HP - ESG Value -
HP - PNB (Networks) -
IBM -
IBM - ISS -

IT - Service -
Lexmark -
Linksys -
Liteon -
Logitec & Labtec -
McAfee -
Microsoft FPP+OLP -
Microsoft OEM -
Microsoft VAD -
Net -
NetApps -
Oracle HW -
Oracle SW -
Pace -
PCI -
Point Of View -
Riverbed -
SMC -
Symantec -
Tandberg -
Veeam -
Vmware -
Wyse -
Others 1 -

Others 2 -
Others 3 -
Others 4 -
Others 5 -
Others 6 -
Stock Provision -
Sub Total IT -
Mob -
SubTotal Distribution -
ATS - Cisco -
ATS - Dell -
ATS - McAfee -
ATS - Microsoft VAD -
ATS - Mission Critical -
ATS - Net App -
ATS - Riverbed -
ATS - RSA -
ATS - Symantec -
ATS - Vmware -
Others 1 -
ALS -
Logistics - 3rd party -
DISCONTINUED

Adobe -
AKS - Kiosk -
Belkin -
Dynamic -
HP - PSG (PCs) -
Nortel -
Seagate -
SUN -
US Robotics -
Western Digital -
Procurve -
Others -
ATS Revenue -
Intercompany -
TOTAL COGS - % Growth N/A % Margin N/A
3COM% Growth
3M% Growth
ACER% Growth
Allied Telesis% Growth
ALTair% Growth
APC% Growth
Apsec

% GrowthAvaya
% GrowthAvocent
% GrowthBenq
% GrowthBusiness Objects
% GrowthCisco
% GrowthCisco CIS
% GrowthCisco UCS
% GrowthComponents
% GrowthComputer Associates
% GrowthDell
% GrowthDigi-Link
% GrowthD-LINK
% GrowthFujitsu - Siemens
% GrowthHP - ESG (Servers)
% GrowthHP - ESG Value
% GrowthHP - PNB (Networks)
% GrowthIBM
% GrowthIBM - ISS
% GrowthIT - Service
% GrowthLexmark
% GrowthLinksys
% GrowthLiteon
% GrowthLogitec & Labtec
% GrowthMcAfee

% GrowthMicrosoft FPP+OLP
% GrowthMicrosoft OEM
% GrowthMicrosoft VAD
% GrowthNet
% GrowthNetApps
% GrowthOracle HW
% GrowthOracle SW
% GrowthPace
% GrowthPCI
% GrowthPoint Of View
% GrowthRiverbed
% GrowthSMC
% GrowthSymantec
% GrowthTandberg
% GrowthVeeam
% GrowthVmware
% GrowthWyse
% GrowthOthers 1
% GrowthOthers 2
% GrowthOthers 3
% GrowthOthers 4
% GrowthOthers 5
% GrowthOthers 6
% GrowthStock Provision

% GrowthSub Total IT
% GrowthMob
% GrowthSubTotal Distribution
% GrowthATS - Cisco
% GrowthATS - Dell
% GrowthATS - McAfee
% GrowthATS - Microsoft VAD
% GrowthATS - Mission Critical
% GrowthATS - Net App
% GrowthATS - Riverbed
% GrowthATS - RSA
% GrowthATS - Symantec
% GrowthATS - Vmware
% GrowthOthers 1
% GrowthALS
% GrowthLogistics - 3rd party
% Growth
DISCONTINUED
Adobe % Growth
AKS - Kiosk% Growth
Belkin% Growth
Dynamic% Growth
HP - PSG (PCs)% Growth

Nortel% Growth
Seagate% Growth
SUN% Growth
US Robotics% Growth
Western Digital% Growth
Procurve% Growth
Others% Growth
ATS Revenue% Growth
Intercompany% Growth
TOTAL GROSS PROFIT - % Growth N/A % Margin N/A

YE Dec 2009 YE Dec 2010 YE Dec 2011 YE Dec 2012Historicals
6,289.5 4,386.3 323.1 - (30.3%) (92.6%) (100.0%)
2,488.2 3,530.6 6,192.2 11,083.5 41.9% 75.4% 79.0%
19,384.5 9,283.7 2,756.0 - (52.1%) (70.3%) (100.0%)
- - 228.3 - NA NA (100.0%)
- - 6.4 - NA NA (100.0%)
18,377.9 17,785.1 22,394.0 24,264.5 (3.2%) 25.9% 8.4%
- - - - NA NA NA
3,783.0 5,695.3 7,266.8 8,695.7 50.6% 27.6% 19.7%
- - 2.3 - NA NA (100.0%)
3,657.3 2,879.2 693.7 - (21.3%) (75.9%) (100.0%)
135.5 160.5 104.8 316.2 18.4% (34.7%) 201.6%
28,066.0 41,532.9 62,232.4 71,951.3 48.0% 49.8% 15.6%
- - - - NA NA NA
- - - - NA NA NA
332.0 4,818.0 4,399.0 - 1351.2% (8.7%) (100.0%)
820.8 658.5 640.6 725.0 (19.8%) (2.7%) 13.2%
11,063.0 35,662.2 45,149.5 49,271.7 222.4% 26.6% 9.1%
742.3 1,352.2 202.5 815.2 82.2% (85.0%) 302.6%
11,600.3 8,971.6 10,158.3 10,831.5

(22.7%) 13.2% 6.6% 3,123.0 3,391.0 1,652.0 3,000.0
8.6% (51.3%) 81.6% 7,403.0 7,982.0 8,422.0 10,934.2
7.8% 5.5% 29.8% 19,081.8 18,276.9 26,654.4 25,091.0
(4.2%) 45.8% (5.9%)5,765.2 5,412.7 8,318.6 10,389.4
(6.1%) 53.7% 24.9% 1,217.1 1,781.2 4,000.1 4,755.4
46.3% 124.6% 18.9% 6,402.9 3,082.6 3,127.1 6,140.0
(51.9%) 1.4% 96.4% 471.2 422.0 351.2 480.0
(10.4%) (16.8%) 36.7% 2,375.4 2,512.0 2,506.7 -
5.7% (0.2%) (100.0%)7,134.0 5,924.3 5,726.3 5,611.3
(17.0%) (3.3%) (2.0%)776.4 8.0 - -
(99.0%) (100.0%) NA 184.2 84.0 5.1 -
(54.4%) (94.0%) (100.0%)7,103.8 5,856.5 6,346.9 8,887.5
(17.6%) 8.4% 40.0% 24,948.8 39,362.5 44,864.0 45,104.7
57.8% 14.0% 0.5% 9,648.3 10,772.5 9,878.1 10,939.9
11.7% (8.3%) 10.7% - - 405.7 2,948.9
NA NA 626.8% - - 592.7 1,018.2
NA NA 71.8% 7,273.2 5,413.0 8,451.0 10,648.0
(25.6%) 56.1% 26.0% - - 3,395.8 10,014.8
NA NA 194.9% 6,596.0 4,844.5 6,666.7 6,869.0
(26.6%) 37.6% 3.0% 304.9 281.3 27.8 -
(7.8%) (90.1%) (100.0%)4.7 1.0 - -
(78.9%) (100.0%) NA 437.0 86.0 11.0 -
(80.3%) (87.2%) (100.0%)- 972.8 2,233.0 3,416.4
NA 129.5% 53.0% 301.0 142.1 6.9 -

(52.8%) (95.1%) (100.0%)19,627.2 25,974.2 27,625.3 35,369.9
32.3% 6.4% 28.0% - - 72.8 -
NA NA (100.0%)- 138.4 834.4 1,213.3
NA 502.8% 45.4% 7,539.7 7,495.0 15,299.9 22,707.4
(0.6%) 104.1% 48.4% - - 125.7 467.6
NA NA 272.1% - - 34.8 1,494.6
NA NA 4191.4% - - 0.6 -
NA NA (100.0%)- - 36.0 -
NA NA (100.0%)- - - -
NA NA NA - - - -
NA NA NA - - - -
NA NA NA - - - -
NA NA NA - - - -
NA NA NA 2,060.0 2,343.0 1,873.9 2,160.0
13.7% (20.0%) 15.3% - - - -
NA NA NA - 980.4 263.0 -
NA (73.2%) (100.0%)- 176.3 57.4 141.0
NA (67.5%) 145.9% - - - -
NA NA NA - - 5.2 184.3
NA NA 3479.6% - - - 120.0
NA NA NA - 52.9 89.7 123.5
NA 69.7% 37.6% - - - 500.0
NA NA NA - - 222.0 463.6
NA NA 108.8% - 707.1 732.5 1,004.8

NA 3.6% 37.2% - 102.2 76.0 584.5
NA (25.7%) 669.1% - - - 154.3
NA NA NA - - - -
NA NA NA - 190.3 156.2 360.0
NA (17.9%) 130.4%
5,891.7 2,065.6 - - (64.9%) (100.0%) NA
46.0 22.4 - - (51.3%) (100.0%) NA
3,740.3 87.8 - - (97.7%) (100.0%) NA
249.0 32.0 - - (87.1%) (100.0%) NA
10.0 - - - (100.0%) NA NA
174.0 16.0 - - (90.8%) (100.0%) NA
2,214.0 - - - (100.0%) NA NA
1,121.4 52.1 - - (95.4%) (100.0%) NA
- - - - NA NA NA
364.0 - - - (100.0%) NA NA
- 658.0 - - NA (100.0%) NA
294.8 32.3 - - (89.0%) (100.0%) NA
2,913.0 - - - (100.0%) NA NA
(10,960.0) - - - (100.0%) NA NA
252,577 294,451 353,899 411,252 N/A 16.6% 20.2% 16.2%
5,643.5 4,245.9 323.1 -

2,076.7 3,032.4 5,200.9 9,778.7
18,722.9 8,905.8 2,693.4 -
- - 209.6 -
- - 4.0 -
17,262.2 16,686.1 20,762.2 22,670.6
- - - -
3,149.8 4,804.0 6,130.7 7,652.2
- - 2.2 -
3,534.3 2,832.1 678.0 -
119.5 138.9 81.1 286.8
26,206.6 38,776.6 58,466.6 67,251.0
- - - -
- - - -
281.0 4,561.0 4,264.0 -
711.8 581.5 544.6 623.5
10,390.0 33,676.6 42,403.4 46,518.8
644.8 1,296.5 183.9 741.8
10,627.8 8,175.9 9,175.9 9,975.0
2,900.0 3,174.0 1,556.0 2,790.0
6,913.0 7,453.0 7,910.0 10,442.6
18,162.0 17,348.0 25,721.7 23,585.5
5,407.7 5,126.3 7,833.4 9,635.2
1,112.1 1,611.0 3,648.6 4,470.1
5,845.9 2,495.6 2,698.3 5,350.1

311.4 151.0 278.5 336.0
2,211.4 2,354.3 2,363.2 -
6,691.0 5,567.3 5,329.5 5,245.8
742.4 8.0 - -
199.4 77.0 9.3 -
6,390.9 5,115.9 5,547.2 7,774.6
23,886.0 37,583.3 42,630.6 42,965.0
9,273.9 10,284.0 9,365.7 10,395.2
- - 374.9 2,692.8
- - 515.7 921.0
6,721.9 4,764.1 7,388.1 9,666.1
- - 3,107.9 9,377.5
5,964.5 4,288.7 6,015.8 6,325.4
280.4 263.5 24.8 -
4.7 3.0 - -
411.0 86.0 12.0 -
- 860.0 2,020.9 3,095.8
288.0 135.0 6.5 -
17,205.7 23,056.3 24,833.4 31,225.6
- - 60.3 -
- 98.4 675.3 1,035.9
6,938.0 6,757.1 13,686.5 20,390.3
- - 109.3 420.8
- - (63.9) 1,404.9

- - 0.6 -
- - 36.0 -
- - - -
- - - -
- - - -
581.4 411.0 1,037.3 1,481.0
- - - -
823.0 1,636.0 1,184.3 1,279.0
- - - -
- 775.4 266.0 -
- 133.3 27.4 63.7
- - 2.0 -
- - 36.2 115.9
- - - 110.0
- 26.9 65.7 112.1
- - - 300.0
- - 138.0 300.6
- 576.1 614.2 718.9
- 68.2 71.0 405.7
- - - 108.9
- - - -
- 0.3 0.2 -

5,245.5 1,830.1 - -
45.0 14.8 - -
3,555.8 84.4 - -
266.1 45.0 - -
10.0 - - -
159.4 17.2 - -
2,099.0 - - -
1,069.2 50.6 - -
(7.0) - - -
350.0 - - -
- 598.0 - -
49.2 29.3 - -
2,024.0 - - -
(10,960.0) - - -
232,543 272,671 328,262 380,041 N/A 17.3% 20.4% 15.8%
(92.1%) (92.6%) (92.8%) (92.4%)
646.0 140.4 - - (78.3%) (100.0%) NA
411.5 498.3 991.3 1,304.8 21.1% 99.0% 31.6%
661.6 377.9 62.6 - (42.9%) (83.4%) (100.0%)
- - 18.7 - NA NA (100.0%)
- - 2.4 - NA NA (100.0%)
1,115.7 1,099.0 1,631.8 1,593.8 (1.5%) 48.5% (2.3%)
- - - -
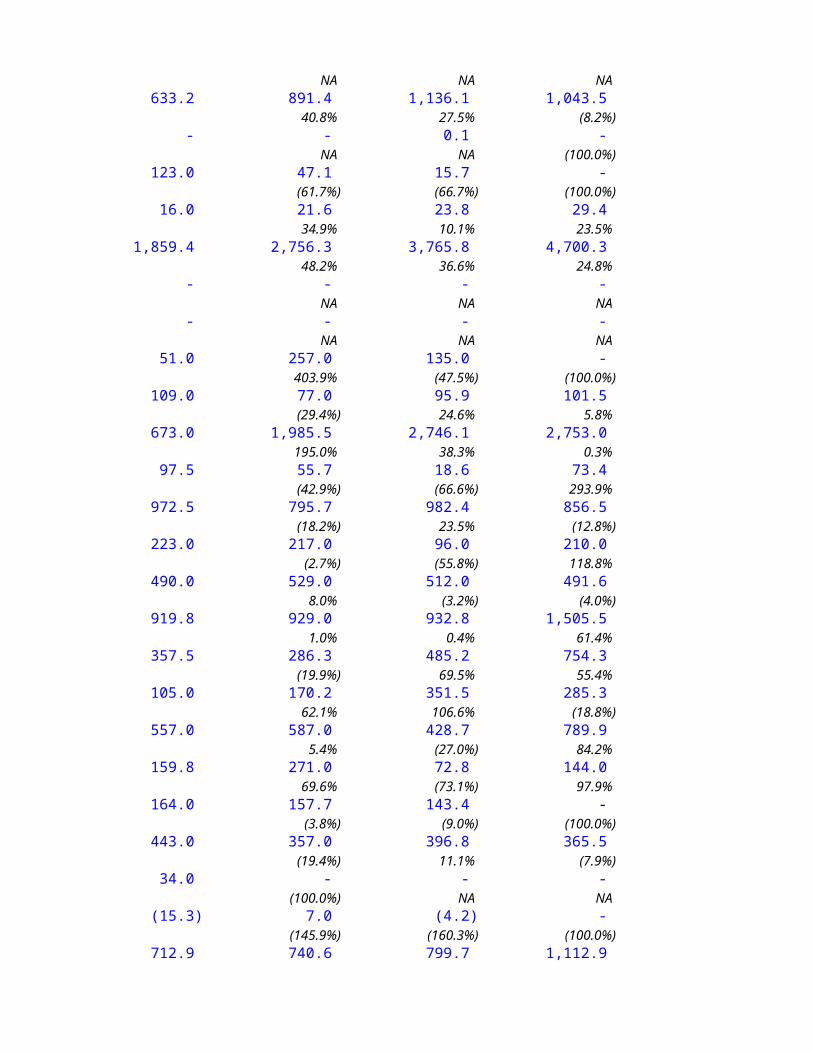
NA NA NA 633.2 891.4 1,136.1 1,043.5
40.8% 27.5% (8.2%)- - 0.1 -
NA NA (100.0%)123.0 47.1 15.7 -
(61.7%) (66.7%) (100.0%)16.0 21.6 23.8 29.4
34.9% 10.1% 23.5% 1,859.4 2,756.3 3,765.8 4,700.3
48.2% 36.6% 24.8% - - - -
NA NA NA - - - -
NA NA NA 51.0 257.0 135.0 -
403.9% (47.5%) (100.0%)109.0 77.0 95.9 101.5
(29.4%) 24.6% 5.8% 673.0 1,985.5 2,746.1 2,753.0
195.0% 38.3% 0.3% 97.5 55.7 18.6 73.4
(42.9%) (66.6%) 293.9% 972.5 795.7 982.4 856.5
(18.2%) 23.5% (12.8%)223.0 217.0 96.0 210.0
(2.7%) (55.8%) 118.8% 490.0 529.0 512.0 491.6
8.0% (3.2%) (4.0%)919.8 929.0 932.8 1,505.5
1.0% 0.4% 61.4% 357.5 286.3 485.2 754.3
(19.9%) 69.5% 55.4% 105.0 170.2 351.5 285.3
62.1% 106.6% (18.8%)557.0 587.0 428.7 789.9
5.4% (27.0%) 84.2% 159.8 271.0 72.8 144.0
69.6% (73.1%) 97.9% 164.0 157.7 143.4 -
(3.8%) (9.0%) (100.0%)443.0 357.0 396.8 365.5
(19.4%) 11.1% (7.9%)34.0 - - -
(100.0%) NA NA (15.3) 7.0 (4.2) -
(145.9%) (160.3%) (100.0%)712.9 740.6 799.7 1,112.9

3.9% 8.0% 39.2% 1,062.8 1,779.2 2,233.5 2,139.7
67.4% 25.5% (4.2%)374.4 488.5 512.4 544.6
30.5% 4.9% 6.3% - - 30.9 256.1
NA NA 729.4% - - 77.0 97.2
NA NA 26.2% 551.3 648.9 1,062.9 981.9
17.7% 63.8% (7.6%)- - 287.9 637.2
NA NA 121.4% 631.5 555.9 650.9 543.6
(12.0%) 17.1% (16.5%)24.5 17.8 3.0 -
(27.3%) (83.1%) (100.0%)- (2.0) - -
NA (100.0%) NA 26.0 - (1.0) -
(100.0%) NA (100.0%)- 112.8 212.1 320.6
NA 88.0% 51.2% 13.0 7.1 0.4 -
(45.3%) (94.1%) (100.0%)2,421.5 2,917.8 2,791.8 4,144.3
20.5% (4.3%) 48.4% - - 12.5 -
NA NA (100.0%)- 40.0 159.2 177.3
NA 297.9% 11.4% 601.6 737.8 1,613.4 2,317.1
22.6% 118.7% 43.6% - - 16.3 46.8
NA NA 186.2% - - 98.7 89.7
NA NA (9.1%)- - 0.0 -
NA NA (100.0%)- - - -
NA NA NA - - - -
NA NA NA - - - -
NA NA NA - - - -
NA NA NA (581.4) (411.0) (1,037.3) (1,481.0)

(29.3%) 152.4% 42.8% - - - -
NA NA NA 1,237.0 707.0 689.6 881.0
(42.8%) (2.5%) 27.8% - - - -
NA NA NA - 205.0 (3.0) -
NA (101.5%) (100.0%)- 43.0 30.0 77.3
NA (30.2%) 157.6% - - (2.0) -
NA NA (100.0%)- - (31.0) 68.4
NA NA (320.8%)- - - 10.0
NA NA NA - 26.0 24.0 11.4
NA (7.5%) (52.5%)- - - 200.0
NA NA NA - - 84.0 163.0
NA NA 94.0% - 131.0 118.4 285.9
NA (9.7%) 141.5% - 34.0 5.0 178.9
NA (85.3%) 3477.2% - - - 45.4
NA NA NA - - - -
NA NA NA - 190.0 156.0 360.0
NA (17.9%) 130.8%
646.2 235.5 - - (63.6%) (100.0%) NA
1.0 7.6 - - 656.0% (100.0%) NA
184.5 3.4 - - (98.1%) (100.0%) NA
(17.1) (13.0) - - (23.8%) (100.0%) NA
- - - - NA NA NA

14.6 (1.2) - - (108.2%) (100.0%) NA
115.0 - - - (100.0%) NA NA
52.2 1.5 - - (97.2%) (100.0%) NA
7.0 - - - (100.0%) NA NA
14.0 - - - (100.0%) NA NA
- 60.0 - - NA (100.0%) NA
245.6 3.0 - - (98.8%) (100.0%) NA
889.0 - - - (100.0%) NA NA
- - - - NA NA NA
20,034 21,780 25,637 31,212 N/A 8.7% 17.7% 21.7%
7.9% 7.4% 7.2% 7.6%

YE Dec 2013 YE Dec 2014 YE Dec 2015 YE Dec 2016Forecasts
- - - - 0% 0% 0% 0%
11,638 12,220 12,831 13,472 5% 5% 5% 5%- - - - 0% 0% 0% 0%- - - - 0% 0% 0% 0%- - - - 0% 0% 0% 0%
25,720 27,264 28,899 30,633 6% 6% 6% 6%- - - - 0% 0% 0% 0%
9,043 9,405 9,781 10,173 4% 4% 4% 4%- - - - 0% 0% 0% 0%- - - - 0% 0% 0% 0%
351 390 436 489 11% 11% 12% 12%
75,549 79,326 83,293 87,457 5% 5% 5% 5%- - - - 0% 0% 0% 0%- - - - 0% 0% 0% 0%- - - - 0% 0% 0% 0%
819 926 1,046 1,182 13% 13% 13% 13%
53,706 58,540 63,808 69,551 9% 9% 9% 9%
848 882 917 954 4% 4% 4% 4%
11,373 11,942 12,539 13,166

5% 5% 5% 5%3,255 3,532 3,832 4,158
9% 9% 9% 9%11,918 12,991 14,160 15,435
9% 9% 9% 9%27,349 29,811 32,494 35,418
9% 9% 9% 9%11,013 11,674 12,374 13,116
6% 6% 6% 6%5,207 5,702 6,244 6,837
9.5% 9.5% 9.5% 9.5%7,675 9,594 11,992 14,990
25% 25% 25% 25%528 581 639 703 10% 10% 10% 10%- - - - 0% 0% 0% 0%
5,836 6,069 6,312 6,564 4% 4% 4% 4%- - - - 0% 0% 0% 0%- - - - 0% 0% 0% 0%
10,132 11,550 13,167 15,011 14% 14% 14% 14%
51,419 58,618 66,825 76,180 14% 14% 14% 14%
13,675 15,726 17,928 20,258 25% 15% 14% 13%
3,362 3,832 4,369 4,981 14% 14% 14% 14%
1,069 1,123 1,179 1,238 5% 5% 5% 5%
11,926 13,357 14,960 16,755 12% 12% 12% 12%
11,016 12,118 13,330 14,663 10% 10% 10% 10%
7,831 8,927 10,177 11,602 14% 14% 14% 14%- - - - 0% 0% 0% 0%- - - - 0% 0% 0% 0%- - - - 0% 0% 0% 0%
3,587 3,767 3,955 4,153 5% 5% 5% 5%- - - -

0% 0% 0% 0%39,968 45,164 51,035 57,670
13% 13% 13% 13%- - - - 0% 0% 0% 0%
1,371 1,549 1,751 1,978 13% 13% 13% 13%
28,384 35,480 44,350 55,438 25% 25% 25% 25%
524 587 657 736 12% 12% 12% 12%
1,629 1,776 1,936 2,110 9% 9% 9% 9%- - - - 0% 0% 0% 0%- - - - 0% 0% 0% 0%- - - - 0% 0% 0% 0%- - - - 0% 0% 0% 0%- - - - 0% 0% 0% 0%- - - - 0% 0% 0% 0%- - - - 0% 0% 0% 0%
2,268 2,381 2,500 2,625 5% 5% 5% 5%- - - - 0% 0% 0% 0%- - - - 0% 0% 0% 0%
157 174 193 214 11% 11% 11% 11%- - - - 0% 0% 0% 0%
203 223 245 270 10% 10% 10% 10%
133 148 164 182 11% 11% 11% 11%
136 149 164 181 10% 10% 10% 10%
600 720 864 1,037 20% 20% 20% 20%
510 561 617 679 10% 10% 10% 10%
1,115 1,238 1,374 1,525

11% 11% 11% 11%649 720 799 887 11% 11% 11% 11%
247 284 327 376 60% 15% 15% 15%- - - - 0% 0% 0% 0%
1,260 3,150 4,725 6,851 250% 150% 50% 45%
- - - - 0% 0% 0% 0%- - - - 0% 0% 0% 0%- - - - 0% 0% 0% 0%- - - - 0% 0% 0% 0%- - - - 0% 0% 0% 0%- - - - 0% 0% 0% 0%- - - - 0% 0% 0% 0%- - - - 0% 0% 0% 0%- - - - 0% 0% 0% 0%- - - - 0% 0% 0% 0%- - - - 0% 0% 0% 0%- - - - 0% 0% 0% 0%- - - - 0% 0% 0% 0%- - - - 0% 0% 0% 0%
454,999 504,168 559,187 621,895 10.6% 10.8% 10.9% 11.2%
- - - -

10,267.6 10,781.0 11,320.0 11,886.0
- - - -
- - - -
- - - -
24,030.9 25,472.7 26,983.2 28,583.0
- - - -
7,958.3 8,276.6 8,607.7 8,952.0
- - - -
- - - -
318.1 352.7 395.0 442.4
70,613.5 74,144.2 77,851.4 81,744.0
- - - -
- - - -
- - - -
704.6 796.1 899.6 1,016.6
50,733.0 55,328.7 60,308.2 65,736.0
771.5 802.4 834.5 867.9
10,473.8 10,997.4 11,547.3 12,124.7
3,024.0 3,277.6 3,552.4 3,850.1
11,382.5 12,406.9 13,523.5 14,740.6
25,723.3 28,054.7 30,597.1 33,369.8
10,213.3 10,826.1 11,475.6 12,164.2
4,896.2 5,362.9 5,874.1 6,433.9
6,703.4 8,398.7 10,510.4 13,152.8

369.6 406.6 447.2 491.9
- - - -
5,455.7 5,673.9 5,900.8 6,136.9
- - - -
- - - -
8,863.1 10,103.9 11,518.4 13,131.0
48,980.2 55,837.4 63,654.6 72,566.2
13,064.8 15,042.9 17,162.5 19,401.3
3,072.3 3,505.3 3,999.4 4,563.0
967.1 1,015.4 1,066.2 1,119.5
10,826.1 12,125.2 13,580.2 15,209.8
10,321.7 11,353.8 12,489.2 13,738.1
7,211.0 8,220.5 9,371.4 10,683.3
- - - -
- - - -
- - - -
3,250.6 3,413.1 3,583.8 3,763.0
- - - -
35,243.5 39,777.9 44,895.1 50,670.1
- - - -
1,170.6 1,322.8 1,494.7 1,689.1
25,487.8 31,859.8 39,824.7 49,780.9
471.3 527.9 591.3 662.2
1,531.3 1,669.2 1,819.4 1,983.1

- - - -
- - - -
- - - -
- - - -
- - - -
1,703.2 1,958.6 2,252.4 2,590.3
- - - -
1,343.0 1,410.1 1,480.6 1,554.6
- - - -
- - - -
70.7 78.5 87.2 96.7
- - - -
127.5 140.3 154.3 169.7
122.1 135.5 150.4 167.0
123.3 135.6 149.2 164.1
360.0 432.0 518.4 622.1
330.7 363.8 400.1 440.2
800.9 892.1 993.7 1,106.8
450.3 499.8 554.8 615.8
160.6 184.7 212.4 244.3
- - - -
- - (1,575.0) (2,598.8)

- - - -
- - - -
- - - -
- - - -
- - - -
- - - -
- - - -
- - - -
- - - -
- - - -
- - - -
- - - -
- - - -
- - - -
419,693 463,365 511,058 565,826 10.4% 10.4% 10.3% 10.7%
(92.2%) (91.9%) (91.4%) (91.0%)
- - - - 0% 0% 0% 0%
1,370 1,439 1,510 1,586 5% 5% 5% 5%- - - - 0% 0% 0% 0%- - - - 0% 0% 0% 0%- - - - 0% 0% 0% 0%
1,689 1,791 1,916 2,050 6% 6% 7% 7%- - - -

0% 0% 0% 0%1,085 1,129 1,174 1,221
4% 4% 4% 4%- - - - 0% 0% 0% 0%- - - - 0% 0% 0% 0%
33 37 41 46 12% 12% 12% 12%
4,935 5,182 5,441 5,713 5% 5% 5% 5%- - - - 0% 0% 0% 0%- - - - 0% 0% 0% 0%- - - - 0% 0% 0% 0%
115 130 146 165 13% 13% 13% 13%
2,973 3,211 3,500 3,815 8% 8% 9% 9%
76 79 83 86 4% 4% 4% 4%
899 944 992 1,041 5% 5% 5% 5%
231 254 280 307 10% 10% 10% 10%
536 584 637 694 9% 9% 9% 9%
1,626 1,756 1,896 2,048 8% 8% 8% 8%
800 847 898 952 6% 6% 6% 6%
311 339 370 403 9% 9% 9% 9%
972 1,195 1,482 1,837 23% 23% 24% 24%
158 174 192 211 10% 10% 10% 10%- - - - 0% 0% 0% 0%
380 395 411 428 4% 4% 4% 4%- - - - 0% 0% 0% 0%- - - - 0% 0% 0% 0%
1,269 1,446 1,649 1,880

14% 14% 14% 14%2,439 2,781 3,170 3,614
14% 14% 14% 14%610 683 765 857 12% 12% 12% 12%
289 327 370 418 13% 13% 13% 13%
102 107 112 118 5% 5% 5% 5%
1,100 1,232 1,380 1,545 12% 12% 12% 12%
695 764 840 924 9% 10% 10% 10%
620 707 805 918 14% 14% 14% 14%- - - - 0% 0% 0% 0%- - - - 0% 0% 0% 0%- - - - 0% 0% 0% 0%
337 354 371 390 5% 5% 5% 5%- - - - 0% 0% 0% 0%
4,725 5,386 6,140 7,000 14% 14% 14% 14%- - - - 0% 0% 0% 0%
200 226 256 289 13% 13% 13% 13%
2,896 3,621 4,526 5,657 25% 25% 25% 25%52 59 66 74 12% 12% 12% 12%98 107 116 127 9% 9% 9% 9%- - - - 0% 0% 0% 0%- - - - 0% 0% 0% 0%- - - - 0% 0% 0% 0%- - - - 0% 0% 0% 0%- - - - 0% 0% 0% 0%
(1,703) (1,959) (2,252) (2,590)

15% 15% 15% 15%- - - - 0% 0% 0% 0%
925 971 1,020 1,071 5% 5% 5% 5%- - - - 0% 0% 0% 0%- - - - 0% 0% 0% 0%
86 95 106 117 11% 11% 11% 11%- - - - 0% 0% 0% 0%
75 83 91 100 10% 10% 10% 10%11 12 14 15 11% 11% 11% 11%13 14 15 17 10% 10% 10% 10%
240 288 346 415 20% 20% 20% 20%
179 197 217 239 10% 10% 10% 10%
314 346 380 419 10% 10% 10% 10%
199 220 245 272 11% 11% 11% 11%86 99 114 131 90% 15% 15% 15%- - - - 0% 0% 0% 0%
1,260 3,150 6,300 9,450 250% 150% 100% 50%
- - - - 0% 0% 0% 0%- - - - 0% 0% 0% 0%- - - - 0% 0% 0% 0%- - - - 0% 0% 0% 0%- - - - 0% 0% 0% 0%

- - - - 0% 0% 0% 0%- - - - 0% 0% 0% 0%- - - - 0% 0% 0% 0%- - - - 0% 0% 0% 0%- - - - 0% 0% 0% 0%- - - - 0% 0% 0% 0%- - - - 0% 0% 0% 0%- - - - 0% 0% 0% 0%- - - - 0% 0% 0% 0%
35,307 40,802 48,129 56,069 13.1% 15.6% 18.0% 16.5%
7.8% 8.1% 8.6% 9.0%

YE Dec 2017Forecasts
- 0%
14,146 5%- 0%- 0%- 0%
32,471 6%- 0%
10,580 4%- 0%- 0%
547 12%
91,830 5%- 0%- 0%- 0%
1,336 13%
75,811 9%
992 4%
13,824

5%4,511
9%16,824
9%38,606
9%13,903
6%7,486
9.5%18,738
25%773 10%- 0%
6,827 4%- 0%- 0%
17,112 14%
86,845 14%
22,689 12%
5,678 14%
1,299 5%
18,765 12%
16,129 10%
13,226 14%- 0%- 0%- 0%
4,360 5%-

0%65,167
13%- 0%
2,235 13%
69,297 25%
824 12%
2,300 9%- 0%- 0%- 0%- 0%- 0%- 0%- 0%
2,757 5%- 0%- 0%
238 11%- 0%
297 10%
202 11%
199 10%
1,244 20%
747 10%
1,693

11%985 11%
432 15%- 0%
9,249 35%
- 0%- 0%- 0%- 0%- 0%- 0%- 0%- 0%- 0%- 0%- 0%- 0%- 0%- 0%
693,174 11.5%
-

12,480.3
-
-
-
30,257.0
-
9,310.0
-
-
495.5
85,831.2
-
-
-
1,148.8
71,652.2
902.6
12,730.9
4,172.8
16,067.3
36,393.6
12,894.0
7,047.2
16,459.3

541.1
-
6,382.3
-
-
14,969.4
82,725.5
21,729.5
5,206.0
1,175.5
17,035.0
15,112.0
12,179.0
-
-
-
3,951.1
-
57,187.2
-
1,908.6
62,226.2
741.7
2,161.6

-
-
-
-
-
2,978.8
-
1,632.4
-
-
107.4
-
186.7
185.4
180.5
746.5
484.2
1,232.8
683.6
280.9
-
(2,563.3)

-
-
-
-
-
-
-
-
-
-
-
-
-
-
629,210 11.2%
(90.8%)
- 0%
1,665 5%- 0%- 0%- 0%
2,214 8%-

0%1,270
4%- 0%- 0%
52 12%
5,999 5%- 0%- 0%- 0%
187 13%
4,158 9%
89 4%
1,093 5%
338 10%
756 9%
2,212 8%
1,009 6%
439 9%
2,278 24%
232 10%- 0%
445 4%- 0%- 0%
2,143

14%4,120
14%960 12%
472 13%
124 5%
1,730 12%
1,017 10%
1,047 14%- 0%- 0%- 0%
409 5%- 0%
7,980 14%- 0%
327 13%
7,071 25%82 12%
138 9%- 0%- 0%- 0%- 0%- 0%
(2,979)

15%- 0%
1,124 5%- 0%- 0%
130 11%- 0%
110 10%17 11%18 10%
498 20%
263 10%
460 10%
301 11%
151 15%- 0%
11,813 25%
- 0%- 0%- 0%- 0%- 0%
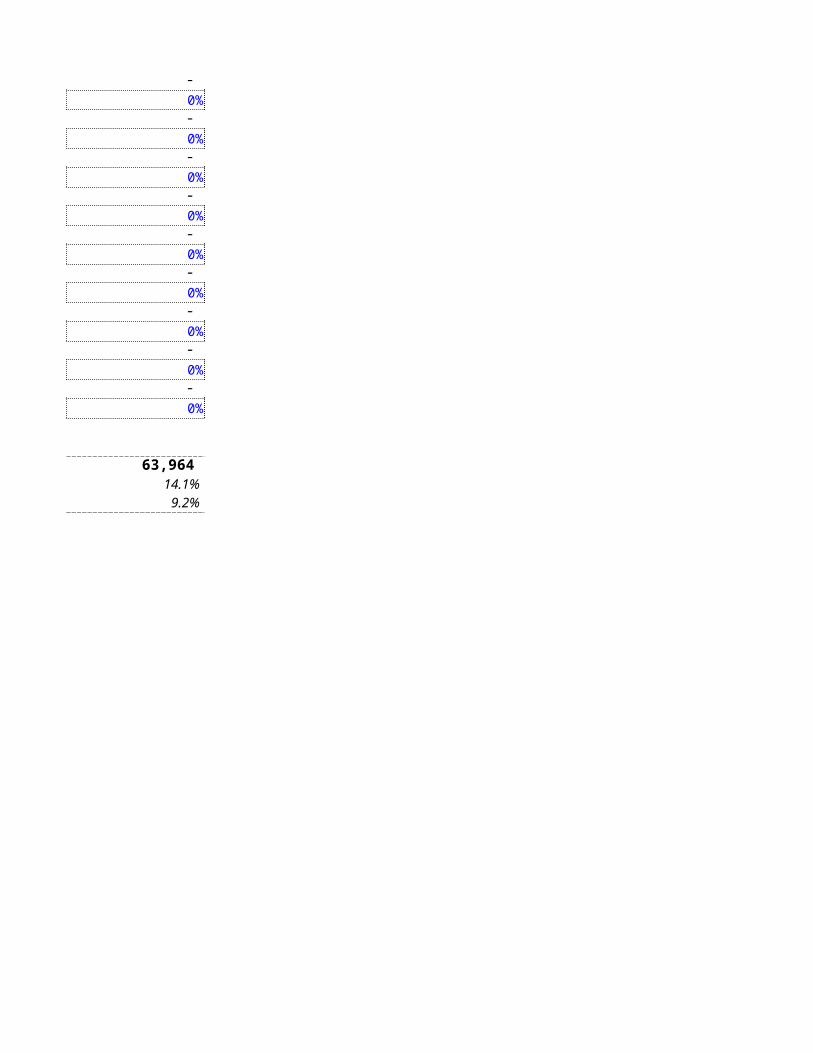
- 0%- 0%- 0%- 0%- 0%- 0%- 0%- 0%- 0%
63,964 14.1%
9.2%
Copyright © 2022 FDOKUMEN


![#@cf}+jflif{s k|ltj]bg @)&%–)&^](https://static.fdokumen.com/doc/165x107/6331ac16ba79697da50fe7f4/cfjflifs-kltjbg-.jpg)