Equity Valuation - IMPRESA
84
CATÓLICA LISBON - SCHOOL OF BUSINESS & ECONOMICS Equity Valuation - IMPRESA Sofia Sá Gonçalves 152110104 Advisor: José Tudela Martins “Dissertation submitted in partial fulfillment of requirements for the degree of MSc in Business Administration, at the Universidade Católica Portuguesa, date 2012”.
-
Upload
khangminh22 -
Category
Documents
-
view
1 -
download
0
Transcript of Equity Valuation - IMPRESA

CATÓLICA LISBON -
SCHOOL OF BUSINESS & ECONOMICS
Equity Valuation - IMPRESA
Sofia Sá Gonçalves
152110104
Advisor: José Tudela Martins
“Dissertation submitted in partial fulfillment of requirements for the degree of MSc in Business
Administration, at the Universidade Católica Portuguesa, date 2012”.

Equity Valuation IMPRESA
1
Abstract:
The purpose of this dissertation is to perform an equity valuation about a listed company in
Euronext Lisbon Stock Exchange namely Impresa SGPS, which is one of the main players of the
media industry in Portugal.
The valuation is based on a research about the media sector, the company and current
challenges in the industry and the dissertation concludes with the price per share of Impresa.
These results will be compared with the Millenniumbpc Investment Bank Report.

Equity Valuation IMPRESA
2
1. Table of Contents
2. Acknowledgements ............................................................................................................... 5
3. Preface................................................................................................................................... 6
4. Executive Summary ............................................................................................................... 7
5. Literature Review .................................................................................................................. 8
5.1. Valuation Overview ....................................................................................................... 8
5.2. Valuation Approaches ................................................................................................... 9
5.2.1. Discounted Cash Flow Approach (DCF) ................................................................. 9
5.2.2. Free Cash Flow to Firm (FCFF) ............................................................................. 10
5.2.3. Free Cash Flow to Equity (FCFE) .......................................................................... 15
5.2.4. Dividend Discount Model (DDM) ........................................................................ 15
5.2.5. Adjusted Present Value (APV) ............................................................................. 17
5.3. Relative Valuation- Multiples ...................................................................................... 20
5.4. Return Based Approaches ........................................................................................... 22
5.4.1. Economic Value Added........................................................................................ 23
5.4.2. Dynamic ROE ....................................................................................................... 24
5.5. Option Theory ............................................................................................................. 24
5.6. Cross Border Valuation Overview ............................................................................... 25
6. Macro Economic Analysis .................................................................................................... 27
6.1. Macro-Economic Analysis in the World ...................................................................... 27
6.2. Macro-Economic Analysis in Portugal ......................................................................... 29
6.2.1. Television ............................................................................................................. 29
6.2.2. Press .................................................................................................................... 30
6.2.3. Digital .................................................................................................................. 31
7. Defining the Media Sector in Portugal ................................................................................ 31
7.1. Definition ..................................................................................................................... 31
7.2. External Factors ........................................................................................................... 32
7.3. Consequences ............................................................................................................. 33

Equity Valuation IMPRESA
3
8. Future trends for Media ...................................................................................................... 34
9. Company Analysis ............................................................................................................... 38
9.1. Describing Impresa ...................................................................................................... 38
9.2. Shareholder Structure ................................................................................................. 39
9.3. Impresa Performance .................................................................................................. 39
9.3.1. Stock Performance .............................................................................................. 39
9.3.2. Company Performance ........................................................................................ 40
9.4. Main Competitors ....................................................................................................... 46
10. Valuation ......................................................................................................................... 47
10.1. Valuation Approaches ............................................................................................. 47
10.2. Assumptions ............................................................................................................ 47
10.2.1. Television Segment ............................................................................................. 48
10.2.2. Publishing Segment ............................................................................................. 52
10.2.3. Digital Segment ....................................................................................................... 54
10.2.4. Others & Inter Segment ...................................................................................... 56
10.2.5. EBITDA ................................................................................................................. 57
10.2.6. NWC..................................................................................................................... 57
10.2.7. Investments ......................................................................................................... 58
10.2.8. Debt ..................................................................................................................... 59
11. Valuation ......................................................................................................................... 60
11.1. Unlevered Value of Firm ......................................................................................... 60
11.2. Present Value of Tax Shields ................................................................................... 61
11.3. Present Value of Bankruptcy Costs ......................................................................... 61
11.4. Value of Impresa per Share ..................................................................................... 61
11.5. Financial Indicators.................................................................................................. 63
11.6. Sensibility Analysis .................................................................................................. 63
11.7. Relative Valuation ................................................................................................... 65
11.7.1. Peer Group Selection........................................................................................... 65

Equity Valuation IMPRESA
4
11.7.2. Valuation ............................................................................................................. 67
12. Comparison of the valuation with Millenniumbcp ......................................................... 69
13. Conclusion ....................................................................................................................... 71
14. Exhibits ............................................................................................................................ 72
14.1. Literature Review .................................................................................................... 72
14.1.1. Exhibit: Limitations of Discounted Cash Flow ..................................................... 72
14.1.2. Exhibit: Alternative Beta estimates ..................................................................... 73
14.1.3. Exhibit: Real options by sector ............................................................................ 73
14.2. Industry ................................................................................................................... 74
14.2.1. Exhibit: SWOT Analyzes ....................................................................................... 74
14.3. Company ................................................................................................................. 74
14.3.1. Exhibit: Resume of IMPRESA main events: ........................................................ 74
14.4. Valuation ................................................................................................................. 76
14.4.1. Exhibit: Bankruptcy Costs Calculations ............................................................... 76
14.4.2. Exhibit: Portugal Rating History .......................................................................... 76
14.4.3. Exhibit: Impresa Regression with PSI20 .............................................................. 76
14.4.4. Exhibit: Historical Consolidated Balance Sheet (M €) ......................................... 77
14.4.5. Exhibit: Forecast Consolidated Balance Sheet (M €)........................................... 78
14.4.6. Exhibit: Historical- Consolidated Income Statement (M €) ................................. 79
14.4.7. Exhibit: Forecast- Consolidated Income Statement (M €) .................................. 80
15. References ....................................................................................................................... 80
15.1. Literature Review .................................................................................................... 80
15.2. Industry Analysis ..................................................................................................... 82
15.3. Company ................................................................................................................. 82
15.4. Valuation ................................................................................................................. 83

Equity Valuation IMPRESA
5
2. Acknowledgements
I am very grateful to a group of people that were exceptional in supporting me during this time period. First of all, I must express my gratitude to my Master Thesis´ advisor José Tudela Martins for his permanent availability and the clarification of all my doubts. As well to the support provided by Prof. Luís Janeiro in the last part of my assignment. Additionally, I am grateful for the constant support that I had from Investment Bank analysts - Helena Barbosa from Caixa BI and João Flores from Millenniumbcp. I am also extremely thankful for their initial guidelines and their availability to clarify all my doubts along this process and also for giving me key data and reports for my analysis. The support provided by José Freire- Impresa Investor Relation was also very important to achieve the most reliable assumptions. Last but not least, I appreciate all the support provided by my family, Augusto, Rute, Daniel and Cristiana which was very important for me to be successful in one more step of my life.

Equity Valuation IMPRESA
6
3. Preface
In order to complete my Master degree in Business Administration in Católica Lisbon, I decided
to do an equity valuation as it is a framework that gives us enormous knowledge about
different components of a company. It is used by analysts to make recommendations about
equity investments and it is also important when we analyze possible M&As or Joint Ventures.
I chose for that purpose to evaluate Impresa, a Portuguese company that is the leader in the
media industry. It is very challenging because Impresa has three segments (Television,
Publishing and Digital) which are facing different challenges and trends.
In order to get all the information for my valuation, I had access to several reports and papers,
talked with the Investor Relations of Impresa that clarified all my doubts and with Investment
Banking analysts that supported me with important guidelines.
I started by describing in the Literature Review the main valuation models and in which
circumstances they should be applied, highlighting advantages/ disadvantages. Then, I pointed
out the media trends around the world by segments and countries. After that I described the
media industry referring to the external factors and challenges that it is facing, concluding by
enumerating some solutions. After describing the sector, I started to portray the company,
focusing on the most important sources of revenues, costs and events and comparing with
their competitors’ performances. Finally, I based my forecasts on assumptions which I
gathered from different sources, and compared my end results with an analyst of
Millenniumbcp.

Equity Valuation IMPRESA
7
4. Executive Summary
The Portuguese group Impresa SGPS is one of the main players in the media industry which
manages different companies in that industry. It operates in three segments: television,
publishing and digital.
The group is facing several challenges. On the one hand the economic crisis and the austerity
measures directly influence the available income of costumers/ companies. Apart from that,
companies have difficulties in accessing credits and the advertising revenues are decreasing.
On the other hand the possible privatization of RTP1 leads to an increase of the competition
among FTA Channels. Finally, the significance of the publishing sector is negatively impacted by
the digital migration.
APV is the model used to value the Impresa group since it is a cyclical company and its capital
structure will change in the future. This is due to the fact that currently the group is highly
leveraged but a gradual reduction is expected in the coming years.
Following from my analysis I concluded a price per share of 0.31€, which means a potential
loss of around 26% when compared to their current price per share.
The major reasons for this price are the cut of the Portuguese long-term government bond
which increases the Country Risk Premium used in Ra and the weak forecasts for Media
companies. Lastly, the negative EBIT in 2011 led Impresa to a Rating of D which is definitely the
main cause since its bankruptcy costs are huge.

Equity Valuation IMPRESA
8
5. Literature Review
5.1. Valuation Overview
“Valuation can be considered the heart of finance.” (Damodaran, 2006)
“The first step is to recognize that virtually every popular valuation approach is simply a
different way of expressing the same underlying model.” (All roads lead to Rome, 1999)
The main goal of performing a valuation is to estimate the potential value of a stock through
its Intrinsic Value, even when the priced stock shows a different value. It means evaluating the
stocks separately from the market. Therefore, it represents an important tool to look for M&A
opportunities, but also to show if a company is creating or destroying value. 1
When a company is being valued, we should use just a single model (DCF or DDM or APV, for
example) because the more models are used, the weaker the message becomes.
There are four concepts that analysts must take into consideration when valuing a firm2:
Consistency- The assumptions used for determining one valuation model must be valid
for other models. Thus, at the end the goal is to achieve the same valuation result.
Comparison- It is possible to make comparisons between different valuations models
about a firm. Thus, it is crucial to understand which assumptions cause that difference.
Uniqueness- It should exist just one fair value for the price of the company.
Consistency without uniformity- Different analysts can adopt different methods to
evaluate a particular company.
As we can see in the following figure, there are four types of valuations which differ from
valuing in the equity perspective (when the value of the company shows the money for the
equity holders) or in the enterprise value perspective (for the company as a whole).
Note: There are more types of valuation approaches, but I described the ones that are more
commonly used nowadays.
1 (Fernández, 2007)
2 All roads lead to Rome ( Goldman Sachs, September 1999)

Equity Valuation IMPRESA
9
Source: Goldman Sachs- “All roads lead to Rome”
5.2. Valuation Approaches
5.2.1. Discounted Cash Flow Approach (DCF)
One of the most used valuation approaches, which is since then called Discounted CF,
appeared in 1970. It allows the calculation of the intrinsic value of an asset through the
present value of the expected CF of that asset discounted by the WACC (Weighted-Average
Cost of Capital) that reflects the risk of those CF. Nevertheless, this method is becoming
obsolete and there are other methods appearing, which are even better models, such as the
APV. Some experts predict that in the upcoming years analysts will use more valuation models
to compare their results, in order to get more accurate results, improving efficiency in their
decisions.3
There are two ways of computing the DCF, both leading to the same result: the first one aims
at valuing the whole business (enterprise value or assets) and discounts the Free Cash Flow of
the Firm by the opportunity cost (WACC). The second one values the part that belongs to the
shareholders (equity), discounting the Free Cash Flow to Equity by Ke (cost of equity).
Figure 1: Differences between APV model and DCF using WACC
Source: Sebastian Ootjers BSC, 26 September 2007
3 Luerhman (1997) – What´s it Worth?
Enterprise DCF Model APV Model
Cash Flow FCFF FCFF
Discount Rate WACC Ku or Kd
Cost of Equity Levered Unlevered
Cost of debt Credit rating based Credit Rating Based
Capital structure Constant leverage ratio Constant leverage ratio or variable debt
Probability of default Not explicity taken ito account Separate term in the valuation
Cost of financial distress Not explicity taken ito account Separate term in the valuation
Equity Values Enterprise Values
Cash Flows App.
Return Based App.
Multiples
Contingent Claim
App.
- Dividend Discount Model, FCFE -Discounted Cash Flow, APV,
Capital CF -Dynamic ROE - Economic Value Added
-PER, PBV, DY -FCF Yield, EV/EBITDA
- Option Theory
Valuation Approaches
-

Equity Valuation IMPRESA
10
5.2.2. Free Cash Flow to Firm (FCFF)
Free Cash Flow to Firm is the cash that is available for investors and is generated through
company´s operations minus all the reinvestment in the business, not taking into account the
financial debt.4
Damodaran (2002) states that “The value of the firm is the value of all investors who have
claims on the firm… it includes the lenders and bond holders who have fixed claims and equity
investors who have residual claims”. It can be calculated by the following formulas:
In order to transform FCFF into FCFE we must add the non-operating assets (e. g. cash and
marketable securities, minorities) and subtract non-equity claims (e.g. Debt, capitalized leases,
unfunded pension plans and health care obligations).
The value of the firm is computed by the present value of adding the steady state, as we
can see in the following formula:
Damodaran (2006) explains the different ways to estimate the Terminal Value and the best
option - “Using multiples to estimate terminal value, when those multiples are estimated for
comparable firms, results in a dangerous mix of relative and discounted cash flow valuation.
The only consistent way of estimating the Terminal Value in a Discounted Cash Flow Model is
to use either the liquidation value or to use a Stable Growth Model.”
In my valuation I will consider the last model since it reflects the changes in company
characteristics, from high growth rates in the Explicit Period to the Terminal Value which
shows stable rates. Stable growth rates characterize companies by having higher debt ratios,
null/ lower excess returns, lower reinvestment rates, less exposure to market risks (lower
betas- closer to 1 which is the average of the market). Thus, a stable growth rate must be
lower or equal to the economic growth rate.
4 Sebastian Ootjers BSC, 26 September 2007

Equity Valuation IMPRESA
11
WACC
The WACC is the opportunity cost that an investor has when he invests in a project because he
could have invested in another one with similar risk. Riskier projects have higher opportunity
cost due to the implicit risk. The three main components of WACC are: the Ke (cost of equity
calculated through CAPM or APT); the Kd (cost of debt before tax) and the company’s capital
structure (Debt/V - leverage of the firm) as we can see in the next formula: Damodaran (2006)
E= Market value of equity; D= Market value of debt
D/ (E+D)= Debt structure; E/ V= Equity capital structure
Kd= Cost of debt; Ke= Cost of equity
Tc= Tax rate;
This method takes into account the Tax shield effect looking at the debt structure of a
company, as well as at the cost of financing and the risk of the company.
Cost of Equity
When an investor does an investment in a company he requires a rate of return, called cost of
equity.
Fernández (2007) explains that there are two ways for computing the Ke:
I. Gordon Constant Growth Valuation Model:
G=dividend growth rate ; Po= current share price
II. The Capital Asset Pricing Model (CAPM)
Rf= Risk free rate for investments (treasury bonds)
Rm= Expected market return

Equity Valuation IMPRESA
12
Rm-Rf= Market risk premium or equity premium
= Systematic risk/Market risk of an asset; The higher the beta, the greater the return of a
security because it measures the incremental risk for an investor.
According to Rosenberg and Rudd (1982), if we assume that investors are well diversified it
means they would be mean-variance optimizers: “it is not the isolated equity risk of the
individual corporation that counts, but rather its contribution to the risk of a diversified equity
portfolio.”
CAPM
The CAPM is an explanatory model about the exposition of a stock to the capital market,
where the return will be proportional to the risk involved. This risk is called non-diversified risk,
which comes from the exposure of a stock to the market.
Several tests were done to test CAPM and experts found out that there are other variables
besides beta that help to explain the expected returns, such as: 5
- The effect of a small firm (Kleim, 1981)
- The effect of book-to- market (Stattman, 1980; Rosenberg, 1985)
- The momentum effect: Past winners are a good strategy to create money in the future
(Jegadeesh &Titman, 1993)
Fama & French (1992) developed an explanatory model which is composed by 3 factors: SMB
(Small minus Big) gives the “return on small capitalization firms in excess of large cap firms”;
HML (High minus Low: Book-to-Market= Book Value of Equity / Market Value of Equity) that
measures the growth of a stock; and finally the MKT (“aggregate market index”). In order to
test beta’s accuracy, F&F performed tests with new variables: Size and market beta. They
found out that those variables explain the stock returns (cross-sectional variation) as opposed
to beta, where they said: “Beta is dead”.
Champbell & Vuolteenabo (2004) studied CAPM with the existence of two betas: the good one
(“with market discount-rate news”) and the bad one (“with the market cash flow shocks”).
The main arguments against CAPM are due to its unrealistic assumptions, such as: no taxes or
transaction costs, investors’ financing and borrowing money at a risk-free rate, all investors
5 Empirical Finance: Católica Lisbon University- Prof. José Faias

Equity Valuation IMPRESA
13
hold a diversified portfolio and are risk averse, there is no information asymmetry, all
securities are well priced, etc.
Despite these arguments, it is a simple model that has been used for more than 40 years and it
is recognized as having been the best estimator for Ke, comparing to other models. Chan &
Mendelson learnt that between the periods of 1926-1991 the only year that beta had a
negative relation with the expected return was in 1982. Therefore, I will use this model in my
valuation for Ra because I believe beta is a good risk measure.
Cost of Debt
It is the cost paid by a company that is funded through debt. This value is a measure of how
risky this is and it depends on three factors:
- The default premium
- The tax rate of the firm
- Interest rates
Risk Free rate
The risk free rate of an asset represents the rate of return of an investment without risk. There
are two conditions that must be fulfilled in order to achieve a risk free rate: no probability of
default and no uncertainty about reinvestment rates, which means “it is a zero coupon
security with the same maturity as the cash flow being analyzed. “ (Damodaran, 2006 )
The duration of an investment will influence the duration of the T-Bill chosen.
Beta
Beta measures the market’s sensitivity and the risk added to a diversified portfolio. Thus, when
it indicates that an asset has more risk than the average investments.
In order to choose the right model to calculate beta we must understand which characteristics
define the firm, as we can see in Exhibit 14.1.2.
The next formulas show the most common ways to estimate beta, one way is through a
regression where Rj is the stock return; Rm the market return; “a” is the interception and “b” is
the slope (beta). In the second formula, beta is estimated through the covariance between the
company’s rate of return and the market return divided by the variance of the market return.

Equity Valuation IMPRESA
14
Or
The following factors influence :6
- Type of business: Varies with the sensitivity of the demand for certain products/
services and the macroeconomic environment. Cyclical companies have higher betas than non
ciclycal companies, because beta is influenced by macroeconomic factors that affect the whole
economy.
- Companies with higher operating/financial leverage have superior betas because the
greater the exposure to fixed costs (interest payments), the higher will be the exposure to
market risk. The companies that are Smaller/ Younger / Growth firms should also have higher
betas due to earnings volatility.
Regarding the following costs, the higher they are, the greater will be the operational
costs.
; relates to the proportion on fixed and
variable costs.
; relates to
the change of EBIT when the other variables change.
Where the leverage will be :
Country Risk Premium
When investing in a riskier country we should include this Country’s Risk Premium in the cost
of equity if it is not included yet in the estimated CF, since the political and economical
environment that a country is facing will influence the company’s performance in the future.
However there are some experts that criticize this idea because they defend “The Country risk
is diversifiable”; “A Global Capital Asset Pricing Model” or “Country Risk is better reflected in
the cash flows”.7
Despite this, I will include the country risk in Ra since Portugal is exposed to a harsh
environment and to austerity measures, factors that will influence the performance of
6 (Damodaran, 2011) 7 (Damodaran, 2011)

Equity Valuation IMPRESA
15
Impresa. For this reason, I will use a spreadsheet of Damodaran which gives us the Portugal
rating (through Moody´s Site) and then the corresponding CRP.
5.2.3. Free Cash Flow to Equity (FCFE)
The Free Cash Flow to Equity is the CF after-taxes that is available to equity holders of a firm,
as we can see in the next formula: (Damodaran, 2006)
This method is used as an alternative to the Dividend Discount Model but some experts
recommend the use of FCFF (although the FCFF and FCFE must achieve the same result if
consistently used). Comparing to the DDM, one of the following conditions must be fulfilled in
order to come to the same result: the value of dividends must be equal to or lower than the
FCFE. This difference, namely excess cash, must be invested in “fairly priced assets”.8
Although this model is much more intuitive than FCFF since the only CF that shareholders
receive is dividends, I will use APV as FCFE is recommended for firms with stable leverage.
5.2.4. Dividend Discount Model (DDM)
The Dividend Discount Model is a special scenario of equity valuation. Any investor that buys a
certain stock expects to receive cash flows from the dividend distribution during the holding
period, as well as the expected price in the end of this period. Thus, the value of any stock is
computed by the present value of the expected dividends until infinity. This simple model
assumes a stable company.
It has to be highlighted that the dividend growth rate must be equal to or lower than the
economic growth rate (where that company is inserted) and the dividend growth rate
influences directly the growth performance indicators in the same proportion.9
8 (Damodaran, 2006)
9 (Damodaran, 2006)

Equity Valuation IMPRESA
16
= Expected dividends per share; Ke= Cost of equity
This model allows us to understand about the stock’s growth stagnation and why this occurs.
The companies which have a higher dividend payout ratio evoke growth stagnation in stock
prices since they abdicate to reinvest in new projects.
There are several variations of the DDM which assume different growth rates to meet the
limitation of the “steady state”, but I will only focus on the most popular ones namely the
Gordon Growth Model and the H-Model (Two-stage model for growth).
Two-Stage Growth Model
The Two-Stage Growth model is characterized by one period of growth, where for instance the
dividend growth rate could be higher than the earnings rate. Then, the equity value is
computed through the present value of the steady state dividends plus the expected value of
the dividends in the non-stable phase.
g= is the stable growth rate
H-Model
The H-Model model has two phases, the first one is characterized by a non-stable growth
where the “earnings growth rate starts at a high initial rate (ga)” and the second one “declines
linearly over time to reach the stable growth rate in the steady state.”
DPS= Dividend per share; gn= Stable growth rate
This model is very useful for companies that are growing quickly in current years but are
expected to smoothly decrease growth rates over the upcoming ones as they become more
mature.

Equity Valuation IMPRESA
17
Despite all the advantages about the DDM, it can be used only in three situations:10
I. “Firms that have Cash Flow to Equity that exceed dividends”
II. “In sectors where Cash Flow estimation is difficult or impossible, dividends are the only
cash flows that can be estimated with any degree of precision.”
III. “It yields realistic estimates of value per share for firms that do pay out their Free Cash
Flow to Equity as dividends, at least on average over time.”
5.2.5. Adjusted Present Value (APV)
The APV estimates the enterprise value based on three components: analyzing the value of the
firm without debt (unlevered firm); then include the debt and all inherent costs taking into
account the tax shields effects (“interest expenses are tax deductible”); and then the
bankruptcy costs.11
This approach was developed by Miller&Modigliani (1963). They focused on the importance of
the present value of tax shield savings in perpetuity using for that Kd (cost of debt) as a
discount rate. The version of the APV that is used nowadays was improved by Myers (1974)
and adds the relation between the investments and the financial decisions.
The APV method is known for its transparency, because we can easily identify the components
that destroy/create value and the corresponding reasons. It starts to replace the WACC more
and more often due to its fewer limitations. Some WACC limitations: it comprises a reduced
number of assumptions which could imply that a lower WACC increases the value of the cash
flow.
It also only works well when applied to companies that have stable capital structures,
otherwise it must be adjusted year after year in the following rubrics: Tax shields; issue costs;
subsidies; hedges; exotic debt securities and adjusting to a dynamic capital structure in order
to reduce the errors.
The main advantages of the APV are the flexibility, versatility, reliability. It always can be
applied and is very informative about its components.
10
(Damodaran, 2006) 11
(Damodaran, 2006)

Equity Valuation IMPRESA
18
Unlevered Firm
The first step is to calculate the value of the company without debt financing. Where Vu=
Equity when Debt=0: The FCFF is the CF that is available after taxes to all investors (equity or
debt holders). Thus, CF is the difference between the cash inflows (from operational
investment and financing activities) and the cash outflows (investment and expenses).
;
Ru= Unleverage cost of equity from firms´s point of view = Ka (is the minimum required rate of
return on the operating activity of a company), when D=0
TV= Terminal value assuming an expected growth of “g”
FCFF n= Free Cash Flow to Firm in time n
; the Ke can derives from CAPM
Value of Tax Shields
The second step is to calculate the present value of the interest tax shields regarding a certain
debt level, where the VL (Value of the firm with leverage)=Vu+ PVTS:
;
Where (when debt is in equilibrium)- M&M
Where ) – M&E
There are different points of view in regards to the choise of the PV TS´ discount rate. Brealey
& Myers 2003 and Cooper & Nyborg 2006 are four of many authors that defend the calculation
of VL as the sum of the PV TS discounted by Kd agreeing with the founders M&M and M&E. The
difference between M&M and M&E is the assumption of a contant D/V of the first one as
opposed to the last one. However, Koller 2005 deepens this thought creating two scenarios: if
we are convinced that a firm has a stable capital structure during the following years, the tax
shields and the operating assets will tend to have the same risk where ku=ka. Nevertheless, if
the ratio D/V will vary, the risk of interest tax shields will be more similar to the “value of
forecasted debt” instead of the operating assets.
Although there is no consensus among the authors, the best course of action is to be
consistent using the right assumptions according to the model chosen. I will use Rd as a

Equity Valuation IMPRESA
19
discount rate, since I believe that Impresa is likely to incorporate growth opportunities and has
different capital structures over time.
Value of Bankrupcy Costs
At the end, we must subtract all the disadvantages of the leveraging. Indeed, according to
Damodaran (2002) it is one limitation of the APV model given that it is very complicated to
quantify the PV of expected bankruptcy cost:”This component of the Adjusted Present Value
approach posses the most significant estimation problems, since neither the probability of
bankruptcy nor the bankruptcy cost can be estimated directly”.
When companies default, it means that they cannot pay easily and on time the debt payments
and hence they have two options: liquidation or reorganization of their activities. This situation
depends on the company’s´ capability to generate CFs from operations and to face financial
obligations. Damodaran (2002) explains this relation: - “Companies which generate high Cash
Flows relatively to their financial obligation have lower default risk than firms which generate
low Cash Flows relative to their obligations.” – “the more stability there is in Cash Flows, the
lower is the default risk in the company. Companies which operate in predictable and stable
businesses will have lower default risk than similar companies which operate in cyclical and/or
volatile businesses.”
The bankruptcy costs can be direct or indirect. The direct costs are the ones inherent to the
bankruptcy process namely administrative, legal and the liquidation process to sell some
assets at a lower price. The indirect costs affect the operational activity of the company, for
example the decrease in demand, the suppliers starting to refuse selling products without an
immediate payment, the increase in production costs due to the reduction/elimination of
economies of scale and the management team that has to solve all those difficulties resulting
in high opportunity cost. Regarding Warner (1977) and Weiss (1990), the indirect bankruptcy
costs vary between 5%- 15% and the direct bankruptcy costs can go up to 5%. Both of them
are calculated as a percentage of Value unlevered of the firm (Vu).
There are several models that help to measure the probability of default but I only will explain
the one used in my equity valuation:

Equity Valuation IMPRESA
20
- Altman´s Z-score
- Ohlson´s O-sore
- Contingent- claims models
- Bond Ratings: I chose this model because it is a simple framework and is commonly
used by Standard & Poor's, Moody's and Damodaran. There are several ratios that measure
the default risk (Operating Income/Sales; Long Term Debt/ Capital; Interest Coverage Ratio
etc). In this case, I calculated the Interest Coverage ratio based on the debt level of Impresa,
figured out the corresponding credit rating, and finally determined the probability of default
matching that rating.
5.3. Relative Valuation- Multiples
“A m m m .”
(Marc Goedhart, Timothy Koller and David Wessels)
The Relative Valuation estimates the value of an asset that derives from the price of similar
company´s assets through the market judgment of that asset value.
Figure 2: Valuation Approach by Multiples
Source: Goldman Sachs- “All roads lead to Rome”
In general, authors prefer using EV/EBITDA since it is less likely to be manipulated as changes
in capital structure will not affect directly this ratio (only if the capital structure influences the
decrease of cost of capital, increasing the value of the multiple and vice-versa).
The Multiples analysis between similar companies can be a useful tool. If Multiples are
carefully aligned with the DCF, they will help companies in: 12
Stress- Test its CF´s forecasts.
Understanding the mismatches between its performance and its competitors.
12
The Right Role for Multiples in Valuation- Mckinsey &Company
Equity Values Enterprise Values (Equity + Debt)
Dividend Yield Free Cash Flow Yield
Price to Earnings Ratio (PER) EV/Sales
Price to Book Value (PBV) EV/ Capital
Price to Cash Flow (PCF) EV/EBIT
Price to Sales (P/S) EV/EBITDA
Multiples

Equity Valuation IMPRESA
21
To be strategically positioned in order to create more value than its competitors.
Understanding the key factors that are creating/destroying value in a company.
In order to achieve the right Multiples there are four principles that most be followed
(Goedhart, Koller and Wessels):
I. Use firms that have similar ROIC and growth perspectives.
II. Use forward Multiples, always based in future values instead of historical ones,
because forward Multiples are more accurate to predict the value of an asset.
III. Use enterprise value Multiples.
IV. Adjust the EV/ EBITDA for non-operating items in order to avoid misleading results.
The most frequent adjustments are the following: exclude the excess cash non-operating
assets from EV; add to EBITDA the implied interest expense and the value of leased assets of
the equity and debt market value; add to EBITDA the present value of all employees grants and
subtract the new employee option grant and pension adjustments.
Regarding Damodaran,13 the advantages of using Multiples comparing to DCF valuation are:
the use of few assumptions; its simplicity in understanding the results/ calculations and the
quick estimation of asset values when there are many similar firms being traded in financial
markets. Finally, he defends that in relative valuation the probability to catch the current
mood of the market is higher since it does not measure the intrinsic value but the relative one,
hence, in general the yield value will be even closer to market prices.
On the other hand, there are some weaknesses regarding the use of Relative Valuation
because it is too simplistic about assumptions and captures a snapshot of a specific point in
time despite of the dynamic evolution of its competitors and the business.
Often, there are firms that are not easily comparable and the peer group increases noise
because the companies are much bigger/smaller comparing to the company concerned. In the
case of media companies, the cyclicality increases the dispersion within companies which
implies that the multiples will not explain correctly the price of a company. Another
disadvantage occurs when the market prices an asset too low or too high as the multiple will
then be undervalued/overvalued respectively, directly influencing the firm’s comparison.
Additionally, there are multiples that are easily manipulated due to their composition
(example: depreciations, provisions). Therefore, the use of Multiples might increase the errors.
13
Relative Multiples - (Damodaran, 2008)

Equity Valuation IMPRESA
22
Thereby, the main point is to get a peer group with similar characteristics, such as: risk;
potential growth rate; expected CF; size; D/E and profitability. After choosing the driver, it
must be multiplied by the corresponding Multiple. Damodaran adds that there are multiples
that cannot be computed for all types of firms, thus, it is essential to answer the following
questions in order to avoid biases: “What are the fundamentals that determine at what
multiple a firm should trade? How do changes in the fundamentals affect the multiple?”
Finding comparable firms is hard, especially when there are few companies in a sector.
However there is a trade-off, when the number of comparable firms increases by too much the
peer group gets too dispersed.
According to Damoradan14 there are three techniques to smooth the dispersion within firms:
I. The analysts do subjective adjustments (analyzing the companies that compose the
peer group and the multiples that must be chosen).
II. Modified multiples. These tools are difficult to implement.
III. Statistical techniques: The point is to perform a market regression which has several
advantages, such as: it includes the risk and growth within companies, analyses all
firms in the market and identifies the undervalued/overvalued firms in an industry (but
is not necessarily true that the highest Multiple explains better the asset price).
This topic will be further developed since I will consider it in my analysis due to all inherent
advantages.
5.4. Return Based Approaches
The main purpose of the model of Return Based Approaches is to measure the excess return of
the valuation, which either could be a negative or a positive value. The excess return is
reached by calculating the difference of the normal return CF (cost of capital or equity) minus
the return of that capital. 15
m
14 Valuation Approaches and Metrics: A Survey of the Theory and Evidence (Damoradan, November
2006) 15
(Damodaran, 2006)

Equity Valuation IMPRESA
23
m
An investment in a company only creates value if the ROIC is higher than the WACC, thus it has
a positive NPV and there is value creation.
5.4.1. Economic Value Added
The Economic Value Added approach was created by Stern Stewart & Co. in the 90s with the
purpose of measuring the “true financial performance of a company” and this method
“correctly takes into account value creation or destruction in a company”. (Stewart, 1991)
“EVA is a measure of the surplus value created by an investment or a portfolio of
investments.” (Damodaran 2006)
A A A m A
The EVA derives from the NPV approach, thus is also related to the value of a firm and can be
calculated as the following formula shows:
There are variants of the EVA approach that are measures of excess returns but are computed
in a different way.16
Economic Profit: It is based on net income rather than on after-tax operating income.
CF Return on Investment (CFROI): It has two differences compared to EVA, “The first is
that the return earned on investments is computed not based on accounting earnings but on
16
(Damodaran, 2006)

Equity Valuation IMPRESA
24
after-tax cash flow. The second is that both returns and the cost of capital are computed in
real terms rather than nominal terms.”
Concluding, this method allows the alignment between the shareholder value creation and the
financial decision, maximizing the shareholder management and debt holder’s interests. A
project must be accepted when having a positive EVA. If the assumptions (reinvestment and
growth) are reliable, the EVA must coincide with the DCF valuation, nevertheless Penman and
Sourgiannis (1998) found out that the EVA for a ten-year period shows better performance
(lower errors) than the DCF because earnings explain better the model than CFs. Francis, Olson
and Oswald (1999) found the same result comparing to DDM for Terminal Value calculations.
5.4.2. Dynamic ROE
This method allows measuring the excess return, giving information about whether a company
is creating or destroying value on the equity side, as opposed to EVA (Enterprise Values). A
company creates value if the ROE is higher than Ke (cost of equity).
One of the main advantages of the dynamic ROE occurs when calculating the TV because this
result is lower compared to the one using the DCF model. However, in order to surpass some
difficulties (as well in the EVA) the use of Comprehensive Income rather than Net Income (“all
changes in Equity less those related with owners”) is recommended in the calculations. 17
However, I will not use any of these approaches in my valuation since I will use the APV.
5.5. Option Theory
“ z m w
understand whether and when to proceed with the later phases of projects that have already
, w .” ( m . . K ,
1998)
17
(José Tudela Martins, 2011)-Católica Lisbon University

Equity Valuation IMPRESA
25
The purpose of the Option Model is to evaluate future projects that involve higher levels of
uncertainty and opportunities. Investors should therefore not ignore it otherwise they could
be under-valuing good opportunities. Thus, the higher the uncertainty around an asset/
investment, the higher the CF probabilities will be and hence the real option will value more.
The Exhibit 14.1.3. shows examples of Real Options by sectors.
The basic meaning beyond the Option Theory is that an investor has the right to buy or sell an
asset at a determined date and price. If exercised it generates a CF and another option for
another possible investment, resulting in many stages of investments (compounded option).
When an investor analyzes the option tree, he observes which tree has the highest CF which
then is the one that must be chosen. Thus, it is very helpful to look at different stages of the
projects’ lifecycles and draw conclusions from that, because projects that are undervalued can
sometimes show investment growth opportunities.
There are two approaches to compute options which are the binomial model and the Black-
Scholes model. According to Luehrman 18 there are three factors that must be considered
regarding future opportunities: CF, risk and time.
Despite being considered a promising valuation method since the 1970s, there are some
factors such as: “… active competitors, uncertainties that do not fit near probability
distributions, and the sheer number of relevant variables” that make the use of the Option
Theory not generally applicable. “Option pricing has not yet been widely used as a tool for
valuing opportunities…this tool is costlier.” (Luehrman, 1997)
For this reason I will not consider it in my valuation.
5.6. Cross Border Valuation Overview
This method allows the valuation of a company that invests outside a country, namely of
multinational firms. However, there are some aspects that the analyst must pay attention to
when evaluating this type of companies: (Koler, Goedhart, Wessels, 2005)
I. International accounting differences
II. International taxation
III. Translation of foreign-currency financial statements
18
What it worth? (Luehrman, May- June 1997)

Equity Valuation IMPRESA
26
IV. Forecasting cash flows in foreign and domestic currency
V. Estimating the cost of capital in foreign currency
VI. Incorporating foreign-currency risk in valuations
Thus, the risks that an investor faces when investing in a foreign market are the following: 19
These risks led investors to include them in their valuations since there is a possibility of loss.
Therefore, it is very complicated to quantify it and understand the impact that it will have in
their business.
Nick Patel suggests evaluating multinational companies using Discounted Cash Flow with an
appropriate discount rate that incorporates the potential risk. Kester and Morley (1997) on the
other hand, recommend the APV. Regarding the first method, risk is incorporated through the
constructions of macroeconomic scenarios (inflation rate, growth of the products, interest
rates and foreign-exchange rates) as well as by the use of global CAPM instead of local CAPM
when assuming a well diversified investor:
*Ka
= Rf of T-Bond + (Asset Beta relative to MSCI Index x Global Market Risk Premium)
Some authors defend that we never should add the risk premium to the cost of capital.
Considering long term periods, the WACC should not incorporate the country risk premium
19
(Nick Patel, 2005) *(Nick Patel, 2005)
Type of Risk Description
I. Currency risk
Happens when investors make investments in a foreign currency but there is a risk of
a potential loss when convert it to their home currency. Among all the risks, this is
the easiest to minimize, since the financial markets can do the hedging of the
currency.
II. Expropriation risk
Occurs when the local government owns the “foreign owned asset” forcibly without
the proper adjustments. However, there is a lower probability for this to occur
because the local government does not have the right knowledge and expertise to
manage efficiently the project.
III. Repatriation risk
Some local governments lower the appeal of having capital abroad and impose for
that purpose measures that would makes it impracticable. Example: Heavy taxes on
Cash Flows.
IV. Regulatory risk
The local government can take several measures which directly impact the foreign
business, such as: limiting the ownership of the company to a certain stake, avoiding
monopoly power; giving incentives/subsidies that affect the competitiveness of
foreign firm; and the state takes the control of that company and chooses the right
moment to leave the project. Thus, the state can takes several measures to protect
the local economy.

Equity Valuation IMPRESA
27
because “it is more likely to experience some economic distress and the risk will already be
reflected in the data for the local assets undervalued and in the historical business results.“20
Impresa does not operate outside Portugal and I will therefore not further develop this
method.
6. Macro Economic Analysis
6.1. Macro-Economic Analysis in the World
According to Caixa Investment Banking, the majority of companies in the media sector
presented in the first quarter of 2011 very positive results, when analyzing the advertising
growth. Nevertheless, the last months have shown a negative discrepancy of that growth
between companies, countries and sub-segments.
This tendency did not occur in the same way among Europe. TV Advertising in the Netherlands
and in France showed organic revenue growth rates when comparing to the benchmark while
Germany, Scandinavia and Southern Europe performed below the forecasts. The negative
expectations are explained by a decrease of market consumption, pricing pressure and the
transition of advertising from publishing to internet.
The companies that maintain or increase their advertising budgets (examples: FMCG-Fast
Moving Consumer Goods and retail companies) will transfer a part of those investments from
Europe to the US and Latin America.
In general, Caixa BI expects an increase in a low single digit of the European advertising
market. Finally, Caixa BI maintains a neutral rating for the media sector favoring companies
that are related to emerging markets and digital media because those companies have more
growth opportunities and benefits from the internet.
Goldman Sachs21 states “While the scale of the changes varies depending on the cyclical or
defensive nature of the companies and stocks, more important is the fact that structural
20
(Mimi James and Timothy M. Koller, 2000) 21
Goldman Sachs Global Investment Research- “Europe-Media”

Equity Valuation IMPRESA
28
change accelerates during difficult times; poorly positioned companies are affected more
severely than well-positioned ones”.
This means that dispersion increases with higher uncertainty environment, geographically we
observe that Southern Europe has the weaker outlook; Northern Europe and the USA have
greater dispersion as opposed to emerging markets that have higher growth rates. The key of
industry positioning is the geographic exposure, where the weaker positions are hit hardly by
the economic conjuncture (example of Spain, Italy and other Western companies).
Regarding the media segments Goldman Sachs found out that an uncertain outlook
accelerates the decline of newspapers/magazines as opposed to Pay- TV that shows the
strongest position, despite of few future growth opportunities caused by a tough environment.
Internet has shown a great advertising growth. While in Spain it ranks 2nd place after TV,
experts believe that it is an irreversible trend that will negatively impact the publishing
segment and they expect that this trend gets to Portugal in 2013. Therefore, the most secure
areas are Pay TV, outdoor and internet.
Figure 3: “Newspapers will lose share of advertising spend going forward;
Newspapers advertising as % of total”
Source: Zenith Optimedia, Goldman Sachs Research estimates

Equity Valuation IMPRESA
29
Figure 4 : “Pay TV penetration has increased in most markets and is around 50% in the UK and 15% in Germany;
Pay TV penetration as a % of TV homes”
Source: Screen Digest, Informa Telecoms & Media, Goldman Sachs
For 2012, it is considered important to incorporate, the slowdown of forecasts in companies’
valuations. Examples of these forecasts are the organic revenue growth that will be between
4% a 5% for digital and emerging markets and an advertising growth of 1% to 2% for
developed markets and the USA and Europe and of 3% to 4% for Spain and Italy.
6.2. Macro-Economic Analysis in Portugal 6.2.1. Television
Regarding a study conducted by the University of Porto22, the regulation mechanisms of the
media sector were subject to reformulation in 2006, where the Media High Authority for the
Social Communication gave place to the Communication Regulatory Authority (financed by the
companies in that sector) and new legal restrictions were created.
According to a report by the Millenniumbcp bank 23 and Anacom (the media watchdog), the
analog television will be substituted by digital television and the switch-off will take place
between the 12th of January 2012 and the 26th of April 2012.
Portugal Telecom which won the bid to operate the DTT (Digital Terrestrial TV) in Portugal
offered the service already in April 2011, but only for testing purposes. The operator expects
to reach 80% of the Portuguese population by the end of the year. Although the European
Commission set 2012 as the upper limit migration, several experts warned against the
technological, economic, legislative and social difficulties that exist. They speculate how
22
Paulo Faustino- “Gestão, Tendências e Estratégias no Mercado dos Media em Portugal”. 23
Millennium Investment Banking “Media Update”

Equity Valuation IMPRESA
30
difficult it is for Portugal to implement this new system 100%, while the United Kingdom that
began in 1998 still did not implement it completely.
However, Millenniumbcp believes PT withdrew its Pay-DTT license due to several reasons, such
as: the huge competition from Triple Paid operators has reduced the attractiveness of Pay-
DTT; unsuccessful implementation of this project in Europe which started before it started
Portugal; finally, it is becoming more complicated to attract clients from FTA channels.
The project for the new FTA channel (5th channel) was defended by PS- José Socrates but was
postponed due the rejection of two bids licenses to operate in Portugal. The ERC (Portuguese
media watchdog) rejected the first bid done by Zon Multimédia because the project was based
on outsourcing and cost reductions, which would expect to capture less than 10% of the
market share (and would therefore not even become a competitor for the existing channels).
The second offer failed due the lack of financial viability: despite the project target of 22-25%
of audience in just 3 years, it was an “in-house production” involving about 300 people.
In a report done by a consultant24 they analyze the impact of the economic crisis in companies’
revenues and segments. Advertising is in the following way positively correlated to the
fluctuations of the economy: When the GDP decreases, the investment in advertising
decreases even more and vice versa. Hence, the trends in advertising investments can be seen
as an indicator of the confidence level of advertising companies. In fact, the difficult financial
situation of the companies and the austerity measures to reduce the Portuguese debt will have
a negative impact on the national economic growth, implying a reduction on advertising
budget of companies. 25
6.2.2. Press
The most affected segment is the press because it is the one that suffered most from the
digital migration and the change of the reading habits, thus, it will have a slower recovery. As
opposed to that, television is the one that will have the faster recuperation because it had
suffered less from the digital migration and it also is a stable segment. Therefore, it will be the
first segment to take advantage of the recovery in advertising investments after the crisis
scenario. The following figure shows the recovery per segment after this crisis.
24
Deloitte – Report on ERC “Estudo das receitas dos media em Portugal”. 25
Millennium Investment Banking “Media Update”

Equity Valuation IMPRESA
31
Figure 5: Digital Impact and Speed of traditional Media recovery after the Crisis
Source: Deloitte- "Modelos de Negócio, Sector Media, Análise Deloitte”
6.2.3. Digital
Returning to the Deloitte study, it was found that the economic crisis accelerates the digital
migration, expanding those effects into the Portuguese environment. In other words, in the
last years we have seen media prices/time for advertising decreasing, due to the competitive
environment in the media industry. Recently the advertisers realized that they could have the
same advertising space for a lower price, which led to a migration from traditional to new
media.
7. Defining the Media Sector in Portugal
7.1. Definition
“Media are the storage and transmission channels or tools used to store and deliver
information or data. Content is information and experiences that may provide value for an
end-user in specific contexts”.26
There are three separate segments for the traditional media: the publishing sector,
newspapers and entertainment (television, radio, etc). The new media segment is called-
internet.
According to Kelly´s principals –“free or fee” there is a law of generosity that says that for
anything that can be replicated, the price will tend to be around zero or it will be free. Thus,
the main point is that in the past years the content had low-quality and customers therefore
26
Internet Marketing; Católica Lisbon University- Prof Fernando Machado

Equity Valuation IMPRESA
32
expected free content. Now, the contents have high quality and it is therefore possible to
charge successfully (fee business models). Examples are iTunes and some newspapers that
charge for premium content.
7.2. External Factors
There are many aspects that are forcing managers to re-orient their business models (Exhibit
14.2.1- SWOT Analysis). During the last years we observed the pressure on companies to
proceed in many and successive restructurations, with the aim of reducing the weight of
advertising dependence as well as of readjusting business structures towards greater
flexibility.
Overall, this sector is characterized by external factors that influence directly the revenues and
the costs structure, limit the growth of those companies, decrease their profitability and
enhance the dependence on technology. Examples are: the cyclicality of the media sector; the
economic crisis of 2008 that brought other issues (for example: difficulty of companies in
accessing credit, increasing financial costs, a zero/ low growth rate in the Portuguese market,
decreasing of advertising revenues and austerity measures that reduce the available income of
costumers/companies).
Another factor is the increase of competition with the emergence of new internet TV (Google
TV and Apple TV)- with low impact on the advertising market but directly influencing Triple-
Play (Zon and Meo). Appearing new technologies (HD and 3D) benefits cable channels (Pay TV).
Finally, we have observed in the last years an increase of the bargaining power of customers
and new customers’ habits (stagnation of reading habits, pay for high quality content) that
brought a new problem: “How to charge online content”. Costumers have low WTP for paid
contents knowing that they are available for free anywhere. The new media generation
enables users to have access to different information in real time depending on their own
preferences and WTP.
On the other hand, those threats if aligned with the internet could be transformed into
opportunities, for which the companies in the media sector must have the right business
model, understanding the costumers’ shopping habits and their WTP, investing in new

Equity Valuation IMPRESA
33
technologies in order to offer innovative products and, finally, having a contingency plan to
face the downturn cycles.
7.3. Consequences
Deloitte27 found out that the main sources of revenues of media companies are from
advertising and content sales. Those were directly influenced by the economic crisis and the
digital migration which influences the competitive context of media companies, hence, the
main changes in media are:
I. Increased number of competitors.
II. Increased offer of contents to costumers which potentiated the redefinition of the
value chain for Media companies.
III. Decreased value of the publicity in the market.
Advertising was the most affected source of revenues especially for press and television and it
will continue to be in the future, as opposed to pay television and internet that resisted the
economic crisis, growing in 2009/10. Therefore, the recuperation will be different within these
segments and the internet will be the key to connect two different value chains: media and
telecommunications. The press is emerging in digital formats (iPad, Tablets, Smartphones) and
is no longer associated with support (the place where it is possible to buy it - store) but it starts
getting associated with the content because in this new “era” the costumers value more the
content and its richness looking for their preferences on the internet.
According to Millenniumbcp28 the second and third players in press (newspapers and
magazines), are facing a tough environment, examples of that are the “Grupo Lena” that had
held the daily newspaper “i” (sales of 6500 copies daily) and was forced to sell its sub-holding
due cost reductions measures. According to banks and press, “Grupo Lena” was forced to
reorient its strategy adjusting its business model to the current environment. Controlinvest is
another case which is facing a decrease of audience/ sales in “Diário de Notícias” and “24
Horas”, which shows that this situation is even worse for non-leaders.
27
Deloitte – Report on ERC “Estudo das receitas dos media em Portugal”. 28
Millennium Investment Banking “Media Update”

Equity Valuation IMPRESA
34
8. Future trends for Media
Following Millenniumbcp,29 the media companies are going through a difficult phase, where
the stagnation of the economic growth directly limits the advertising budget for several
companies. They state “… the best option in the near future to Media players will be keeping
capital spending at low levels while focused on costs control, since increasing risk premium on
Portuguese Bonds led to credit restrictions”.
In the next figure we can see the trend for each media segment:
Figure 6: Trends for Revenues/ Costs regarding the Media sector
Source: Obercom –“Barometro 2009/2010”
In order to face the challenges, media companies should re-define their business models in
order to exploit the internet advantages and updating constantly the new technologies as a
way to increase their revenues and maintain/increase market share.
iPad and tablets: Could they be another Source of Revenue?
The goal for media companies is to reduce their interdependence to the cyclical movements
that has been affecting their revenues model and advertising investments. One way to do this
is to sell paid media content on the internet, expanding their revenues model as it was done by
two English newspapers: “Sunday Times” and “The Times” lost two thirds of their site readers,
when they started to charge the on-line access to sites news”. 30
In Portugal the way media contents are being charged on the internet does not work out,
hence experts think that the new trend (iPad) could bring success to this new business model.
29
Millennium Investment Banking “Media Update” 30
Millenniumbcp

Equity Valuation IMPRESA
35
A prove of this is the result of a poll done by “El País” where they state “34% of the readers are
available to read “El País” newspapers on an iPad out of which 64% could pay contents”.
Impresa launched in the first trimester of 2011 several editions on iPad formats such as “Caras,
Expresso and Exame” which had a good acceptance from readers and advertisers. However,
the availability of those contents on iPad potentiates the decrease of print circulation.31
Will Free-to-Air TV coexist with Internet?
Internet has been growing exponentially day by day so it is an important tool to target the
right consumers, through click stream data (a tool that allows to understand the purchase
behavior and the navigation history for which transaction logs and cookies& bugs are used)
and panel data (which is helpful to understand the attitudes towards the online shopping and
customer satisfaction surveys). 32
As we observe that the major internet revenues stem from advertising, Internet and TV should
complement each other in the way that TV is a good tool to target a mass audience and
internet a “niche” that at the end captures a lower quantity than FTA TV. Example:” A popular
show may capture a million viewers when it first airs on TV, yet fetch only thousands viewers
when it runs online the next day”.33
Addressable advertising
This strategy aims at targeting the right households, at the right place and time. The
responsible entity identifies the gender, the items that were purchased and the income of the
subscriber data, in order to understand the right target. Then, the information is kept on the
household´s Direct TV box. Thus, when an ad is aired on TV the commercial that best fits in
that household will be chosen.
Regarding Millenniumbcp the effects of Direct TV when subscribed to addressable ads “will
allow advertisers to reach almost 10 million homes with targeted commercials”. The results of
a test done by Comcast and Startcom in 2009 showed that “60.000 households revealed that
those who receive targeted ads switched channels 32% less often than homes receiving
regular commercials”.
31
Annual Report 2011 of Impresa- “Informação trimestral” 32
Internet Marketing- Católica University 33
Millennium Investment Banking “Media Update”

Equity Valuation IMPRESA
36
This service soon should arrive in Portugal and could re-launch TV Advertising increasing
revenues of advertisers since it has particular characteristics of the internet. Although this
service will target a limit household and there are similar ways that are already being used to
advertise in TV (example: Panda channel runs advertises related to children). Another problem
of this service is the fact that the scale could not be large enough to achieve mass potential
customers and the data for these addressable ads must come from authorized/well known
third-parties.
Media Industry Challenges

Equity Valuation IMPRESA
37
Source: Millenniumbcp investment Bank- “Media Update” – 8 July 2011
Source: Millenniumbcp investment Bank- “Media Update” – 27 July 2011
Solutions for Media Industry
I. To reinforce Contingency plans (Cost savings)
II. Deleveraging
III. Bet on international markets with different exposure: Brazil & Angola
IV. Merger Cofina & Impresa- Reasons:
1- Cyclical companies are "increasing downside risks".
2- Will benefit from synergies and scale economies.
3- "Excellent opportunity for Impresa to adopt a more efficient cost policy".
4-" Advertising Market in FTA TV is back to levels reached 10 years ago".
Main Assumption:
1- Cofina must sell all magazines in order to guarantee the merger approval from
the Portuguese Anti-Trust Authority.
Main Problems:
1- Conflicts between CEO´s
2- Cofina is mainly in press segment, since it is one of the most affected areas
might not be a good investment.

Equity Valuation IMPRESA
38
9. Company Analysis
9.1. Describing Impresa
Impresa SGPS (“Sociedade Gestora de Participações Sociais”) was founded on the 18th of
October 1990. Impresa SGPS is one of the main players in the media industry that aims at
managing its participations in other companies of that sector. It invests in three segments:
Television, Publishing and Digital. Others & Inter Segments includes participations in
associated companies.
This diversified portfolio allows for synergy effects. Impresa also has different sources of
revenues investing out of Portugal (Example of “Olhares”- internalization to France, Spain and
Brazil).
The Exhibit 14.3.1 shows a summary of the main events that characterize Impresa.
Actually, the group structure of this holding is shown in the following picture:
Figure 7: Impresa´ Group Structure
Source: Impresa Site (25 October 2011)

Equity Valuation IMPRESA
39
52%
23%
4%
4%
4%0% 13%
Impreger- SGPS
RS Holding *
BPI
Credite Suisse
Madre-SGPS
Own Shares
Free- Float
9.2. Shareholder Structure
On the 14th of January 2011, Impresa had the following shareholder structure with a total
amount of 168 million shares.
* Includes Ongoing Stake; Source: Company data;
Millennium Investment Banking
9.3. Impresa Performance
9.3.1. Stock Performance
Impresa entered the Lisbon Stock Exchange in June 2000, and the following years were
characterized by a huge expansion period that facilitated the stabilization of its strategy and
consolidation of investments. In 2009, Impresa left Psi-20 and started being traded in Psi-Geral
due to a decrease of the free-float that creates a reduction of shares liquidity.
As we can see below, the financial crisis which started in 2007 had the highest impact on
Impresa shares ever, with a decrease of almost 51% of the stock price in June of 2007. Since
that moment Impresa never was able to retake those values and the worst impact was seen in
2011, reaching its lowest record (0.43€ per share).
This negative trend in 2011 was influenced by the external factors already mentioned where
the worldwide financial crisis showed the highest impact. Thus, the market is penalizing all the
Portuguese companies in general but these factors affect even more Impresa due to all the
challenges faced by the sector, the exposure to cycle periods, the austerity measures and a
large drop of advertising investments (the main source of revenue).

Equity Valuation IMPRESA
40
9.3.2. Company Performance
The main source of revenues comes from Television following Publishing segment. Despite
this, internet is gaining weight.
In 2008, Impresa faced a huge decrease in the EBITDA margin because of the following several
investments to face 2009 challenges: In the SIC reorganization (exclusive contracts with TV
Globo until 2012), investments in MEO, in the portal AEIOU, in the platform Mobile TV and
finally in a new management team.
The year of 2009 was characterized by the largest decrease of the advertising market, where
television revenues decreased 15% and publishing revenues dropped 19%, Impresa
nevertheless managed to increase its margin.
Figure 8: Impresa- Revenues per Segment and Margin EBITDA (%)
Source: Impresa Annual Reports
0
1
2
3
4
5
6
01
-01
-07
01
-03
-07
01
-05
-07
01
-07
-07
01
-09
-07
01
-11
-07
01
-01
-08
01
-03
-08
01
-05
-08
01
-07
-08
01
-09
-08
01
-11
-08
01
-01
-09
01
-03
-09
01
-05
-09
01
-07
-09
01
-09
-09
01
-11
-09
01
-01
-10
01
-03
-10
01
-05
-10
01
-07
-10
01
-09
-10
01
-11
-10
01
-01
-11
01
-03
-11
01
-05
-11
01
-07
-11
01
-09
-11
Shar
e P
rice Impresa ́
share price 7-Out-2011
164185
172155 173
9392
96 92 93
47
67
16,5 18,1
7,1
13,112,4
0
5
10
15
20
0
50
100
150
200
250
300
2006 2007 2008 2009 2010
Television Publishing Digital Margem EBITDA
0
0,2
0,4
0,6
0,8
1
1,2
1,4
07-10-10 07-12-10 07-02-11 07-04-11 07-06-11 07-08-11 07-10-11

Equity Valuation IMPRESA
41
9.3.2.1. Television
This segment includes SIC TV and thematic channels (SIC Notícias, SIC Mulher, SIC Radical, SIC
Internacional and SIC K). The figure below shows the sources of revenue comparing to cost,
where it is visible that advertising is the main source of revenues and the rubric “Others” that
includes revenues from multimedia (Call TV programs) has the lowest weight.
Figure 9: Television- Revenues comparing to total Cost (Values 000)
Source: Impresa Annual Reports
The next figures show SIC competitors and their positioning regarding audience share and
advertising investments.
Source: Marktest
In 2010, SIC was the channel that had the second highest advertising investments. ZON/MEO
channels were the leaders relatively to advertising duration which is quite obvious since it
includes countless channels.
The advertising revenues are influenced by the duration (more advertising minutes, more
revenues) and the amount of investments (the higher the investments in advertising the higher
will be the revenues). What happens is that the advertising investments in the last five years
0
40
80
120
160
200
2007 2008 2009 2010
Revenues SIC TV advertising Revenues Thematic channels
Revenues Others Total Cash Costs
Total Revenues

Equity Valuation IMPRESA
42
(2007-11) dropped by 30%, thus, if “Others” continue to gain power Impresa will face an even
worse situation in the future.34
Figure 10: Audience share per channel (%)
Source: Marktest: "Anuário de Media & Publicidade de 2010"
In the past years TVI has been the leader in the share of audience, whereas the second place
keeps changing between SIC and RTP1. Indeed, Cable/Others is the channel that showed a
higher improvement in the last years, increasing 41% in the share of audience, while SIC
dropped 11%.
9.3.2.2. Publishing
This segment is characterized by one weekly newspaper (Expresso) and 17 magazines that vary
between weekly and monthly, plus one magazine (Rumo) launched in 2011 in Angola.
The main source of revenues is from advertising, but as years passed, this result tends to
become closer to sales of publications due to the advertising migration to the internet.
There are several events which are considered strategic for the growth of this segment, such
as the Conference for a Sustainable Future, The Portugal in Review Conference, and the Primus
Inter Pares Award.
The figure below shows the annual evolution of revenues and cost regarding the press
segment.
34
Francisco Balsemão Conferência: “Futuro dos Media”
0%
10%
20%
30%
40%
2007 2008 2009 2010TVI SIC RTP1 RTP2 OTHER CHANNELS

Equity Valuation IMPRESA
43
Figure 11: Publishing- Revenues comparing to total Costs (values 000)
Source: Marktest
The next figure summarizes the publishing portfolio of Impresa in the last years, where the
main publications since 2007 are Expresso, Visão and Caras. The growth of Visão Júnior is
explained through the contract assigned in 2009 where this magazine is integrated in “Plano
Nacional de Leitura”. 35
Figure 12: Average of Audiences for Type of Publications; Annual Evolution (%)
Source: Marktest, Millenniumbcp Investment Bank and Impresa site
35
Example of Average Audience: If a weekly newspaper has a 15% average audience in a given period means that, on average, each number was contacted by 15% of the universe or target. "- Obercom
0
20
40
60
80
100
2007 2008 2009 2010
Advertising revenues Sales of publications Other Revenues
Total Revenues Cash Costs
7,4 8,1 7,7 7,6
8 7,5 7,3 6,9
6,2 5,6 5,8 5,7
3,9 3,3 3,3 3,3
33,2 3,1 3,1
2,7 2,9 2,9 3,1
2,5 2,3 2,7 3,1
2,32,2 3,1 2,9
2,22,1
2,2 2,3
1,61,6
1,8 2,21,1
11,3 1,5
1,61,4
1,4 1,411,1
1,4 1,41,31,1
1,3 1,11,2
1 10,8 0,9 11,1
1,3
0,8
2007 2008 2009 2010
Volante
Visão vida e viagens
Visão Júnior
Courrier
Autosport
Blitz
Casa Claúdia
Casa Claúdia Ideias
Arquitectura e Construção
Caras Decoração
Exame
Activa
Exame Informática
Telenovelas
Tv Mais
Caras
Visão
Expresso

Equity Valuation IMPRESA
44
9.3.2.3. Digital
In 2007 the digital segment which offers content and technology, formed by different activities
and projects, such as: Digital Guest Services, My Games, AEIOU, Info Portugal and ITL,
appeared.
Nowadays this segment integrates other companies:
Source: Impresa Annual Reports
The first year of activity for this segment was in 2008, thus only from 2009 the revenues were
higher than costs due to all the investments that were needed to start this project.
The main source of revenue has been changing, at the beginning it came from DGSM but now
AEIOU has more impact (increase in revenues 237% since 2008), as a result of the new strategy
that was implemented in 2009 which allows for sustainable growth in the following years. On
the other hand, even though DGSM has been affected by the decrease of occupancy rates in
hotels and the suspension of new hotel constructions, the investor relation defends that it will
reach the expected return from 2013.
Figure 13: Digital- Revenues comparing to total Costs (Values 000)
Source: Impresa Annual Reports
2,5 3,02,2
1,4 1,5 1,30,9 1,1
3,21,8
0,80,2
6,7
6,46,8
8,6
6,0
6,7
2008 2009 2010
DGSM Revenues InfoPortugal Reveneus AEIOU Revenues
Others Revenues Total Revenues Total Cash Costs

Equity Valuation IMPRESA
45
In order to take advantage of new challenges, Impresa provided online content for Expresso
and the main magazines which already have a considerable number of readers and growth
prospects. The next figure matches online websites with their target.
Source: Impresa Site
The next figure shows the positioning of Impresa regarding online press comparing to its
competitors. Impresa is the leader with 3240 thousands of users.
Figure 14: Users per Media Groups Internet in 2010; Values 000
Source: Marktest
9.3.2.4. Other & Inter-Segment
This segment includes the holdings (Impresa, Mediazoom , Solo, etc), operations from Impresa
Services, revenues from external costumers and a correction of the transactions between
Inter- Segments, which turn the EBITDA negative.
Activa Female Exame Informática Tech
AEIOU Portal Expresso L&S Leisure
Auto Guia Auto Guia do estudante News
Autosport Auto Jornal de Letras -
Bla Chat kitchenet Culinary
Blitz Music My games Entertainment
bpi expresso imobiliário Buy/Rent Houses Olhares Photography
Caras Female Priberam Services
Email Marketing - Relvado Football
Escape Leisure Tube AEIOU Video
Expresso News Visão News
Expresso Emprego Employment Visão júnior News
Exame Expresso News Visão Viagens Leisure
Website / Segment
1882
2960 3119
1345
176
32402984
16541301
23372051
1252 1344
A B
ola
Co
fin
a
Co
ntr
oli
nve
st
Eco
nó
mic
a
Imp
ala
Imp
resa
Me
dia
Cap
ital
Mo
tor p
ress
Re
nas
cen
ça
RTP
Son
ae.c
om
Ion
lin
e
Sol

Equity Valuation IMPRESA
46
Digital Segment
Group
Controlinveste
Media Capital
Cofina
Sonae.com
RTP
Figure 15: Revenues, Costs and EBITDA Analysis (M €)
Source: Impresa Annual Reports
9.4. Main Competitors
Source: Companys´Site
Source: Companies´ sites
-1,62
-0,73-0,53
-2,14
-0,11
0,76 0,90
-0,54
-1,5
-1,5 -1,4 -1,6
2007 2008 2009 2010
Revenues Cash Costs EBITDA
Company Description of the business
TVI
"Televisão Independente" (TVI) is the second private channel that
appeared in 1993. Owned by Media Capital which belongs to the PRISA
group; Has three channels ( TVI, TVI 24, TVI Internacional and TVI Direct-
only in Meo); 12 minutes of paid advertising per hour.
RTP
"Rádio e Televisão de Portugal" (RTP) is a public channel. Since 2004 this
group integrated radio and television but the last one appeared in 1957;
This group has several channels (RTP1, RTP2, RTP Memória, RTP Noticías,
RTP Internacional etc);
The main channel is RTP1 that has 6 minutes of paid advsertising per
hour. RTP 2 has free advertising.
Other ChannelsA pack that includes 3 paid services- phone, internet and television. It
includes several channels from TVI, SIC, RTP and others.
Television Segment
Company Business Area
Controlinveste
It is present in 7 newspapers ( "Jornal de Noticías, Diário de Notcías"
etc), 2 magazines, 1 radio station and 6 TV channels (Sport TV). Also bets
on new media.
Euro Impala
Operates in hotels, books and magazines ("Focus, VIP, Gente, Ana"). It is
not traded in the stock exchange but it also is a competitor. Also bets on
new media.
Cofina
It is the 3rd largest company operating in the media sector, being the
leader in the press sector with six newspapers (" Correio da Manhã")
and 11 magazines (" Sábado, Record, Destak"). It has one portal (XL).
Also bets on new media.
Sonae.com
This subholding of PT operates in different areas: Telecommunications
(Optimus), Software and systems information and Media (Newspaper-
"Público"). Also bets on new media.
Publishing Segment

Equity Valuation IMPRESA
47
10. Valuation
10.1. Valuation Approaches
The main valuation model used in my valuation is the APV, although I used the Multiples
approach as well to complete my analysis.
I chose the APV to evaluate Impresa because of all the advantages already mentioned that
surpasses other valuation models, but mainly because Impresa is a cyclical company and the
capital structure will change along time as it happened in the past. Exhibit 14.1.1 shows the
limitations of the use of DCF.
10.2. Assumptions
In order to achieve the most accurate forecast possible, many factors were considered in this
analysis, such as: historical data because in the majority of the cases the past is a good
predictor of future forecasts; understanding through several reports what will be the future
trends for each segment and why; analyzing the external factors that may condition this
industry and understand how Impresa is facing those challenges; positioning Impresa in the
market comparing its performance with their competitors; considering the last report of
Impresa (3rd trimester) as well as information given by the Investor Relation and finally data
projections about GDP and inflation in Portugal.
In general revenues are directly tied to the GDP due to purchasing power parity and cyclicality,
although this does not happen as often with inflation, so I only will consider it in my valuation
when using the terminal value because Impresa does not have a defined price policy (where
the prices are constantly adjusted to changes in inflation).
Figure 16: GDP and Inflation in Portugal (%)
Source: IMF Site in 2 November 2011.
My explicit period is from 2011 to 2019 and the Terminal Value from 2020 onwards. This
period was chosen considering that it is a cyclical company, so I have to capture all the
economic cycle.
2011 E 2012E 2013E 2014E 2015E 2016E 2017E 2018E 2019E
Gross Domestic Product (GDP), Constant Prices
(%)-2,16% -1,84% 1,19% 2,45% 2,22% 2,00% 2,00% 2,00% 2,00%
Inflation, Average Consumer Prices (% change) 3,44% 2,11% 1,46% 1,53% 1,55% 1,63% 1,63% 1,63% 1,63%

Equity Valuation IMPRESA
48
The growth rates estimated for 2011 regarding the four segments were based on the 3rd
trimester Report of Impresa and the remainder of the quarter adjusted to the last homolog
quarter’s evolution.
The next figure shows the advertising expenditure forecasts for Western Europe by segment,
which will be used as an indicator for my forecasts.
Figure 19: Advertising Expenditure by Segment for Western Europe (%)
Source: Zenith Optimedia
10.2.1. Television Segment
10.2.1.1. Revenues
The next two figures are a summary of television revenues forecasts, the first in a percentage
and the other in absolute values.
Figure 16: Growth Rates of Television Revenues (%)
Source: Thesis Excel
-10%
0%
10%
2010 2011 E 2012 E 2013 E
Newspapers Magazines Television Internet
Growth Rates of Revenues 2011 E 2012 E 2013 E 2014 E 2015 E 2016 E 2017 E 2018 E 2019 E CAGR 2010-
2013
CAGR 2014-
2019
SIC TV advertising -4,00% -7,00% -1,60% 4,91% 5,01% 5,12% 5,22% 5,32% 3,63% -4,23% 4,86%
Thematic channels 5,60% 5,33% 3,11% 2,75% 2,99% 2,75% 1,97% 2,75% 3,63% 4,67% 2,82%
Multimedia -19,60% -7,00% 1,19% 2,45% 2,22% 2,00% 2,00% 2,00% 3,63% -8,88% 2,37%
Others + Merchandising -3,60% -1,84% 1,19% 2,45% 2,22% 2,00% 2,00% 2,00% 3,63% -1,44% 2,37%
Total Television Revenues -3,28% -3,52% 0,11% 3,95% 4,07% 4,05% 3,90% 4,21% 3,63% -2,24% 3,97%

Equity Valuation IMPRESA
49
Figure 17: Historic Revenues and Forecast for Television (M €)
Source: Thesis Excel
As we can see, advertising is the main source of revenue following thematic channels. The last
one can be seen as the amount that ZON and Meo pay to SIC due the incorporation of SIC
thematic channels in their service, varying with the number of subscriptions. Thus, this rubric
shows a positive and solid growth because Pay-TV is going to be the leader in the future,
therefore an increase of customers in the following years is expected. Hence, if SIC channels
are seen by more people there is an increasing trend to raise their advertising revenues.
Despite the positive development of this source of revenues, it cannot compensate the losses
in SIC advertising.
Hence, thematic channels will follow the growth of “Other Channels” adding the fact that SIC
has three channels in the top eleven shares of audience among all channels, which supports
my assumption. Additionally, if we sum all shares of audience for SIC channels in the “Other
Channels” universe they have about 25.7%, which represents a higher value when comparing
to some competitors.
The following figure shows the forecasts done through a linear function for the share
of audience per channel, where the three main Pay TV channels are converging to the same
audience share and “Other Channels” are getting an enormous advantage.
115,8109,2
92,7105,9 101,7
94,6 93,1 97,6 102,5 107,8 113,4 119,4 123,8
32,9 38,1 42,5 42,1 44,4 46,8 48,3 49,6 51,1 52,5 53,5 55,0 57,0
185,2
171,5155,4
173,0167,3 161,4 161,6 168,0
174,8 181,9189,0 196,9 204,1
149,4
154,7 132,8148,0
138,5 133,1 133,7 138,3143,2
148,2 153,3 159,0 164,2
2007 2008 2009 2010 2011 E 2012 E 2013 E 2014 E 2015 E 2016 E 2017 E 2018 E 2019 E
SIC TV advertising Thematic channels Multimedia
Others + Merchandising Total Revenues Total Operational Costs

Equity Valuation IMPRESA
50
Figure 18: Share of Audience per Channel (%)
Source: Millenniumbcp and Thesis Excel
These forecasts will favor the advertising growth for “Other Channels”, increasing the
competition among FTA channels.
With respect to TV advertising, Pinto Balsemão said in a conference that between the years
2007-2011 this sector will face a decrease of 30% and in 2012 it will decrease by 5%-10%. In
my analysis I integrate these thoughts, as well as the forecast for 2013 by Zenith and from
2014 onwards this rubric will be affected by the GDP multiplier effect.
In order to measure the performance of revenues regarding its market share, analysts use the
power ratio, which is calculated by market share in total advertising divided by market share in
cable audiences. Until 2013 TVI and SIC have the highest power ratio, although in the next
years there will be a convergence of the three main players, which will affect their
competitiveness. It means that these two FTA channels are losing efficiency with the years
passing, capturing at the end the same % of advertising of RPT1.
The remaining rubrics represent a small dimension among all television revenues, which
consists of non-current revenues that vary with the acceptance of the programs and the
purchasing parity power of customers, so in my analysis this rubric will be tied to the GDP.
10.2.1.2. Operational Costs
The forecasts for operational costs are the following, the first one in (%) and the second one in
absolute values.
0%
5%
10%
15%
20%
25%
30%
35%
40%
45%
2007 2008 2009 2010 2011 E 2012 E 2013 E 2014 E 2015 E 2016 E 2017 E 2018 E 2019 E
TVI
SIC
RTP1
RTP2
OTHER CHANNELS
Linear (TVI)
Linear (SIC)
Linear (RTP1)

Equity Valuation IMPRESA
51
Figure 17: Growth Rates of Operational Costs for Television (%)
Source: Thesis Excel
Figure 18: Historical Cost and Forecast for Television (M €)
Source: Thesis Excel
As can be seen Impresa pursues a cost reduction program focusing on personnel costs and
programming costs.
The main sources of costs are from programming costs followed by other costs. Programming
costs have represented an average of around 45% of the revenues, a percentage that I
assumed to be constant in the future, because my research about Impresa allowed me to
understand that this cost will be related to the television revenues.
Other costs include mainly external supplies and services and other operating costs, both
associated with television revenues. Both show a constant percentage. However, the first one
is with 19% a percentage of total television revenues whereas the latter is with 33% a
percentage of multimedia and other revenue.
Regarding personnel costs Impresa expressed the intention to reduce the salary of the board
of directors by 10% (2011). However this is very difficult to quantify. They also plan to reduce
10% in the number of employees at least until 2012 and the average salaries in the company
will follow the inflation.
Growth Rates of Operational
Costs2011 E 2012 E 2013 E 2014 E 2015 E 2016 E 2017 E 2018 E 2019 E
CAGR 2010-
2013
CAGR 2014-
2019
Personnel costs -10,00% -5,04% 1,46% 1,53% 1,55% 1,63% 1,63% 1,63% 1,63% -4,64% 1,61%
Programming Costs -1,13% -3,52% 0,11% 3,95% 4,07% 4,05% 3,90% 4,21% 3,63% -1,52% 3,97%
Other Costs -9,97% -3,86% 0,30% 3,69% 3,75% 3,69% 3,57% 3,84% 3,63% -4,60% 3,70%
ESS -13,54% -3,52% 0,11% 3,95% 4,07% 4,05% 3,90% 4,21% 3,63%
Other Operating Cost 11,1% -5,4% 1,2% 2,5% 2,2% 2,0% 2,0% 2,0% 3,6%
Total Operational Costs -6,40% -3,88% 0,40% 3,45% 3,54% 3,53% 3,43% 3,68% 3,31% -3,34% 3,50%
76,2 80,2 74,6 76,1 75,2 72,6 72,7 75,5 78,6 81,8 85,0 88,6 91,8
42 4431,5
43 38,7 37,2 37,3 38,7 40,2 41,6 43,1 44,8 46,4
149,4
154,7
132,8
148,0138,5
133,1
133,7138,3 143,2 148,2 153,3 159,0 164,2
2007 2008 2009 2010 2011 E 2012 E 2013 E 2014 E 2015 E 2016 E 2017 E 2018 E 2019 E
Personnel costs Programming Costs Other Costs Cash Costs (*)

Equity Valuation IMPRESA
52
With the economic recovery around 2015, an investment in human resources is expected since
they might need more labor force to face their increase in revenues.
Concluding, this segment is the main source of revenues for Impresa and will as such continue
in the future, however there is a deceleration in growth rates in the first years that tend to be
recovered in the future.
10.2.2. Publishing Segment
10.2.2.1. Revenues
I must highlight the fact that Expresso has been very well positioned and is reinforcing its
market share. Nevertheless, Impresa holds more magazines which are facing even a worse
environment since they are not an essential good and are more expensive than newspapers.
Therefore, regarding advertising revenues I try to manage the forecasts done for Western
European companies adjusting some values so that this rubric reflects a more negative impact
relatively to television. From 2014 onwards this rubric as well as the remaining sources of
publishing revenues will follow the GDP. The reason that sustains this thought is due to the
weak trend for this segment to grow, so it is not very probable that it will have a higher growth
than the GDP.
Figure 19: Growth Rates of Publishing Revenues (%)
Source: Thesis Excel
Publishing Advertising Revenues are reducing their weight in total revenues due to the
challenges of the internet. In the next years, this rubric and the sales of publications tend to
converge.
Growth Rate of Revenues 2011 E 2012 E 2013 E 2014 E 2015 E 2016 E 2017 E 2018 E 2019 E
CAGR
2010-
2013
CAGR
2014-
2019
Advertising revenues -10,00% -12,00% -2,26% 2,45% 2,22% 2,00% 2,00% 2,00% 2,00% -8,18% 2,04%
Sales of publications -7,50% -1,84% 1,19% 2,45% 2,22% 2,00% 2,00% 2,00% 2,00% -2,79% 2,04%
Other Revenues -10,0% -1,8% 1,2% 2,5% 2,2% 2,0% 2,0% 2,0% 2,0% -3,67% 2,04%
Total Revenues -9,00% -6,62% -0,34% 2,45% 2,22% 2,00% 2,00% 2,00% 2,00% -5,39% 2,04%

Equity Valuation IMPRESA
53
Figure 20: Historic and Forecast for Publishing (M €)
Source: Thesis Excel
This segment will lose some margin because revenues are increasing in a lower rate than costs.
10.2.2.2. Costs
The cost reduction policy is well illustrated in the following table, where the main reductions
concern cost of sales and other costs.
Figure 21: Growth Rates of Publishing Costs (%)
Source: Thesis Excel
Figure 22: Historical and Forecast Publishing Costs (M €)
Source: Thesis Excel
53,5 55,5
44,8 44,439,9
35,1 34,4 35,2 36,0 36,7 37,4 38,2 38,9
11,37,7
12,6 11,6 10,4 10,2 10,4 10,6 10,9 11,1 11,3 11,5 11,8
91,795,6 91,9 93,4
85,079,4 79,1 81,1 82,9 84,5 86,2 87,9 89,7
78,2 89,780,2 83,3 77,5
70,5 70,1 71,9 73,7 75,4 77,1 78,9 80,7
2007 2008 2009 2010 2011 E 2012 E 2013 E 2014 E 2015 E 2016 E 2017 E 2018 E 2019 E
Advertising revenues Sales of publications Other Revenues Total Revenues Total Costs
Growth Rates of
Operational Costs
2011 E 2012 E 2013 E 2014 E 2015 E 2016 E 2017 E 2018 E 2019 E
CAGR
2010-
2013
CAGR
2014-
2019
Personnel costs -6,9% -5,0% -1,6% 1,5% 1,6% 1,6% 1,6% 1,6% 1,6% -4,54% 2,02%
Cost of sales -9,9% -8,3% 0,8% 5,0% 4,5% 4,0% 4,0% 4,0% 4,0% -5,90% 4,13%
Other Costs -11,0% -6,6% -0,3% 2,5% 2,2% 2,0% 2,0% 2,0% 2,0% -6,10% 2,04%
Total Costs -7,00% -9,08% -0,51% 2,64% 2,45% 2,28% 2,29% 2,30% 2,31% -5,60% 2,32%
23,1 23,6 24,7 24,7 23,0 21,8 21,5 21,8 22,2 22,5 22,9 23,3 23,616,1 16,3 15,5 15,6 14,1 12,9 13,0 13,6 14,3 14,8 15,4 16,1 16,7
39
49,8
40 4338,3 35,7 35,6 36,5 37,3 38,0 38,8 39,6 40,4
78,2 89,7 80,283,3
77,570,5 70,1 71,9 73,7 75,4 77,1 78,9 80,7
2007 2008 2009 2010 2011 E 2012 E 2013 E 2014 E 2015 E 2016 E 2017 E 2018 E 2019 E
Personnel costs Cost of sales Other Costs Total Costs

Equity Valuation IMPRESA
54
According to Impresa this segment shows more capacity to reduce personnel costs which will
lead to a cut of 100 employees in three years.
Source: Thesis Excel
Regarding the composition of the remaining costs, cost of sales represent 19% of publishing
revenues and other costs are mainly formed by external suppliers and services. Their
calculations are directly related with revenues.
This segment shows the highest decline in Impresa´ portfolio, since it is the one that is most
affected by the economic turmoil and the challenges from internet. There is a decline in the
EBITDA from 2015 on since the revenues are growing in a lower rate comparing to the costs.
10.2.3. Digital Segment
10.2.3.1. Revenues
The following figures represent the expected revenue growth rates and their evolution.
Figure 23: Growth Rates of Digital Revenues (%)
Source: Thesis Excel
DGSM is a business that provides software for hotels, which is directly related to the
economical environment since in an expansion period there are more new hotels that could
adopt this software and therefore the forecasts will be tied to the GDP. Regardless, in this type
of business higher growth rates could be expected in an expansion period when comparing to
the GDP, but there is not sufficient information in the market to determine those values with
precision. Impresa considers that this company has not reached the expected return yet, but it
is expected to occur in 2013.
2007 2008 2009 2010 2011 E 2012E 2013E 2014E 2015E 2016E 2017E 2018E 2019EPersonnel Costs For Publishing 23,1 23,6 24,7 24,7 23,00 21,84 21,49 21,82 22,16 22,52 22,88 23,26 23,64
Number of employees 620 682 608 526 473 440 427 427 427 427 427 427 427
Average Salary 0,04 0,03 0,04 0,05 0,05 0,05 0,05 0,05 0,05 0,05 0,05 0,05 0,06
D number of employees -10% -7% -3%
Growth Rates of
Revenues2011 E 2012 E 2013 E 2014 E 2015 E 2016 E 2017 E 2018 E 2019 E
CAGR
2010-
2013
CAGR
2014-
2019
DGSM -0,70% -1,84% 1,19% 2,45% 2,22% 2,00% 2,00% 2,00% 3,63% -0,46% 2,37%
InfoPortugal 6,25% 2,00% 1,19% 2,45% 2,22% 2,00% 2,00% 2,00% 3,63% 3,12% 2,37%
AEIOU 3,19% 7,47% 5,60% 6,75% 6,81% 6,88% 6,95% 7,02% 8,65% 6,22% 7,26%
Olhares 1,59% 3,73% 2,80% 3,37% 3,41% 3,44% 3,48% 3,51% 4,32% 2,71% 3,63%
Total Revenues 3,59% 3,43% 3,39% 4,62% 4,59% 4,58% 4,67% 4,77% 6,44% 3,47% 5,01%

Equity Valuation IMPRESA
55
Info Portugal is characterized by Impresa as a very profitable company. There is little available
information about this company, so for the same reason as DGSM this rubric will be linked to
GDP.
Figure 24: Historical Revenues and Forecast for Digital (M €)
Source: Thesis Excel
As we can see the main source of revenues comes from AEIOU because we have seen that the
digital subscriptions shows higher growth rates when compared to traditional publishing,
where the newspaper “Expresso” is the Portuguese edition leader in online sales.
The trend for this rubric keeps increasing their variety in subscription products and also their
advertising revenues since Impresa gains new subscribers on a daily basis. This rubric will
follow the growth forecast for the internet in Western Europe until 2013 and will then increase
each year with a multiplier effect.
The rubric “Olhares” (a photograph site) follows the same behavior given that it has been very
successful in the last years but this site does not have the same dimension of online
newspapers and magazines, accordingly I assume that it will capture half of the growth rate of
AEIOU.
10.2.3.2. Costs
The digital costs will be a percentage of sales in each year, which is shown in the following
figure.
6,7
6,4 6,8 7,1 7,3 7,57,9 8,3 8,6
9,0 9,510,1
8,57
6,036,68
6,135,62 5,14 5,38 5,63
5,89 6,16 6,466,87
0
2
4
6
8
10
12
2008 2009 2010 2011 E 2012 E 2013 E 2014 E 2015 E 2016 E 2017 E 2018 E 2019 E
DGSM InfoPortugal AEIOU Olhares Total Revenues Costs

Equity Valuation IMPRESA
56
Figure 25: Growth Rates of Operational Costs for Digital (%)
Source: Thesis Excel
Firstly I calculated a percentage of costs in total revenues, then the variation in growth
followed by an average of these values. Taking into consideration that this segment had
started its activities in 2008, I expect a gradual decrease in weight of the total costs in total
revenues because it is a sector that reveals high growth propensity and economies of scale.
Therefore, I assume that this segment will achieve a reasonable weight until 2013 and will
stabilize afterwards.
This segment reveals high levels of profitability for Impresa with an EBITDA margin of around
30%, being definitely a segment to bet on.
10.2.4. Others & Inter Segment
Impresa does not provide enough information about this rubric which mainly consists of
adjustments between segments, so both forecasts will be tied to the GDP because it is the best
way to capture the economic environment.
Figure 26: Growth Rates of Others & Inter Segment (%)
Source: Thesis Excel
Growth Rates of
Operational Costs2011 E 2012 E 2013 E 2014 E 2015 E 2016 E 2017 E 2018 E 2019 E
CAGR
2010-
2013
CAGR
2014-
2019
% of Costs in Revenues 87% 77% 68% 68% 68% 68% 68% 68% 68%
Average last 2 years -11% -11% -11%
Costs 6,13 5,62 5,14 5,38 5,63 5,89 6,16 6,46 6,87 -8,35% 5,01%
Growth Rate Revenues 2011 E 2012 E 2013 E 2014 E 2015 E 2016 E 2017 E 2018 E 2019 E
CAGR
2010-
2013
CAGR
2014-
2019
Revenues -2,16% -1,84% 1,19% 2,45% 2,22% 2,00% 2,00% 2,00% 3,63% -0,95% 2,37%
Costs -2,16% -1,84% 1,19% 2,45% 2,22% 2,00% 2,00% 2,00% 3,63% -0,95% 2,37%

Equity Valuation IMPRESA
57
Figure 27: Historical and Forecasted Others & Inter Segments M (€)
Source: Thesis Excel
It is distinctive that revenues could take a negative value, nonetheless it is mainly due to
adjustments between segments and the reduction of revenues from external clients.
10.2.5. EBITDA
As we could expect, the television segment is the one with the highest earnings before
adjustments followed by the publishing segment. However the last one is losing impact and
digital is improving its performance.
Figure 28: EBITDA per Segment (M €)
Source: Thesis Excel
10.2.6. NWC
The net working capital is a measure that allows us to understand the operational efficiency
and financial health of a certain company in the short-term. NWC is used to invest in the
growth and development of a business. Thus, when it increases, the FCFF of that period will
decrease, which means we are investing. When there is a positive change in NWC it means
that the assets increase comparing to liabilities and vice-versa.
-1,62
-0,73-0,53
-2,14 -2,09 -2,05 -2,07 -2,13 -2,17 -2,22 -2,26 -2,31 -2,39
-0,11
0,76 0,90
-0,54 -0,53 -0,52 -0,53 -0,54 -0,55 -0,56 -0,58 -0,59 -0,61
2007 2008 2009 2010 2011 E 2012 E 2013 E 2014 E 2015 E 2016 E 2017 E 2018 E 2019 E
Revenues Costs
13,5
9,0
35,839,9
-1,5-1,8
-1,9 3,2
-5
0
5
10
15
20
25
30
35
40
45
2007 2008 2009 2010 2011 E 2012 E 2013 E 2014 E 2015 E 2016 E 2017 E 2018 E 2019 E
EBITDA Publishing EBITDA Television EBITDA Others & Inter Segment EBITDA Digital

Equity Valuation IMPRESA
58
In order to compute the NWC, first we need to understand its historical performance as well as
the goals of the company for the future. The following rubrics will influence the operational
liquidity of Impresa: Inventories, Trade & Other Receivables, Trade & Other Payables and
State. In the following, there are some formulas for those computations:
The cash conversion cycle (DSI+DSO-DPO) is the length of time that a company has to sell its
inventories, to receive money from its clients and to manage paying its expenses to suppliers.
There is a reduction in the CCC in coming years, which means that Impresa can turn its
“inputs” into cash in fewer days.
Source: Thesis Excel
According to Impresa this trend will continue in the future, however it is not clear when this
trend will stabilize and at the same time it is also not sustainable forever, so I assume a
stabilization of the CCC in 2015.
10.2.7. Investments
Capital Expenditure is the investment made by a company when acquiring/ upgrading their
assets (tangible or intangible) in order to maintain or increase the company´s performance.
The forecasts for the Capex were computed for tangible and intangible assets separately, as a
percentage of the historical values of the Capex in the total revenues for each year. The
average of that percentages in the last four years was used as an assumption for the coming
years, with exception of the terminal value where I assumed that the amount of Capex will be
equal to the amortizations, since in a steady state period the investments made focus on
Days 2007 2008 2009 2010 2011 E 2012 E 2013 E 2014 E 2015 E 2016 E 2017 E 2018 E 2019 E
DSI 80 81 51 59 57 55 53 52 51 51 51 51 51
DSO 64 60 57 43 42 41 41 40 39 39 39 39 39
DPO 80 59 81 55 56 56 57 58 60 60 60 60 60
CCC 64 82 27 48 44 40 37 34 30 30 30 30 30

Equity Valuation IMPRESA
59
substitution investments to maintain the productivity level of the company. Regarding the
Caixa Investment Bank the Capex of this industry is on average 3%-4% of revenues which is
quite the same as my analysis.
Amortizations for each year are computed in the same way as Capex, which we can see in the
following figure.
Source: Thesis Excel
The investments made for Capex and Amortization regarding each segment, were calculated
by the weight of the revenues of each segment in the total revenues.
The amount of net assets was computed separately for tangibles and intangibles. It was
calculated for each year as the value of the year before plus Capex less amortizations. The
tangible assets have a higher weight to Impresa due the acquisition of “Machinery &
Equipment” and “Buildings & Others constructions”.
10.2.8. Debt
Regarding Impresa “The target Net Debt is 150 M, however with the actual economic
conjecture this amount only is possible to set at least three years from now.”- José Freire.
Regarding the existing Debt, Impresa has a D/V of 75% in market values and the types of debt
are mainly bank loans and commercial papers (a reduced %). The amortization plan of the
existing debt will end in 2018.
In order to compute the total debt for Impresa, I first computed the amortization plan and
interests for the existing debt, and then because the target level of Impresa could not be
achieved in 2011 I did the cash flow statement. The main point is to understand the money
that is available for equity holders and if there is debt needs. So, using the expected cash flows
for each year (FCFF) to pay current expenses, will always lead to a negative value, which means
that Impresa will need to contract more debt in order to face its responsibilities.
Capex & Amortization of the year 2011 E 2012 E 2013 E 2014 E 2015 E 2016 E 2017 E 2018 E 2019 E
Amortizations of the year 8,21 7,96 7,96 8,24 8,53 8,82 9,12 9,44 9,74
Capex of the year 9,85 9,55 9,55 9,89 10,23 10,59 10,94 11,33 9,74
% Capex in Revenues 3,84% 3,84% 3,84% 3,84% 3,84% 3,84% 3,84% 3,84% 3,20%

Equity Valuation IMPRESA
60
The debt being paid in the next year will be considered as current debt and the type of debt
contracted is in the form of bank loans as it was observed in the past. The Kd for new debt was
estimated through a spreadsheet available in Damodaran Site, where first of all I calculated the
interest coverage ratio assuming just the old debt which then gives us the correspondent Kd for
the company rating. This approach was the most reliable for me since this type of information
is not available in Bloomberg.
The following figure discriminates the value of the net debt for each year, where it is
observable that Impresa can achieve their target debt in 2014.
Source: Thesis Excel
11. Valuation
11.1. Unlevered Value of Firm
The value of the firm unlevered was computed as indicated in the literature review and the
main components will be explained in the following paragraphs.
In order to calculate beta, firstly I performed a regression of monthly data for the last 4 years,
where beta was achieved through the slope of the Impresa return with the PSI Geral return
where the was of 65%, a reasonable explanatory model for beta. The Index PSI Geral was
chosen after the bad performance from the regression of beta with PSI 20 (Exhibit 14.4.3).
Thus, the main problems of the regression model are that “the market index can be dominated
by a few stocks, the beta estimate can be noisy and the firm itself might have changed during
the course of the regression.”36 Therefore, there are fewer companies for which regression
betas are a good measure.
Then, when looking for a more reliable framework, I decided not to use the beta of the peer
group since there are no similar companies for the digital segment so it would not be accurate
selecting the beta from different authors. Therefore, I chose the beta for each segment from
36
Damodaran- Estimating Risk Parameters
Net Debt 2007 2008 2009 2010 2011 E 2012 E 2013 E 2014 E 2015 E 2016 E 2017 E 2018 E 2019 E
Short Term Debt (+) 32,0 58,2 49,3 61,6 58,8 63,9 76,2 76,6 70,9 60,1 47,8 33,8 61,3
Long Term Debt (+) 182,3 192,4 187,1 158,7 153,5 138,3 112,7 96,7 84,6 75,1 65,6 56,1 0,0
Cash & Equivalents (-) 32,2 9,5 5,1 6,9 12,5 19,7 20,4 21,5 23,3 21,9 20,8 19,9 19,5
Total (=) 182,1 241,1 231,3 213,3 199,8 182,5 168,5 151,7 132,3 113,3 92,6 69,9 41,8

Equity Valuation IMPRESA
61
the Damodaran Site for European countries, due to their similarities. The beta of Other & Inter
Segment is an average of beta for the reminiscent segments.
The risk-free rate is computed for a 10-Years German Government Bond of 2.25%, assuming a
diversified investor.37 The tax rate used for future computations was 29% since it is commonly
used in this industry.
Since Portugal is exposed to political and economical risks, the country risk premium must be
included in Ra. It was computed through Moody’s rating for Portugal of Ba2 (last change was
on the 5th of July in 2011) and the corresponding risk premium is 4.13% as suggested by
Damodaran.
The last component to be computed is the equity premium that is the excess return of an asset
over a risk-free rate due to the extra risk incurred. The historical values for the US/German
market of 5% were used.
11.2. Present Value of Tax Shields
The second step is to estimate the tax benefits that debt brings along. This positive effect is
computed multiplying the total debt of Impresa by the tax rate and the cost of debt (average
cost of the total debt), then discounting by Rd in order to get the PV of tax shields.
11.3. Present Value of Bankruptcy Costs
The last step was to compute the negative effect of the debt. Using a framework given by
Damodaran, the interest coverage ratio (EBIT / interest expenses) was first computed, then
this rating was matched with the default probability for small cap firms. After that, we must
multiply it with the bankruptcy costs (20% of Vu for each year) and discount it by the cost of
debt. Exhibit 14.4.1.
The high probability of default in 2011 led to a company rating of D, which is one of the main
causes of the reduced price per share.
11.4. Value of Impresa per Share
After explaining each step, it is time to incorporate the following inputs in my model in order
to arrive to the price per share of Impresa.
37
Bloomberg 14-Nov-2011

Equity Valuation IMPRESA
62
Source: Thesis Excel
The following table explains how the value of equity was achieved: From the total enterprise
value the net debt was deducted and then the minority interests were added arriving at the
end at a price per share of 0.31€, which means a potential loss of around 26%. values in (M €)
Source: Thesis Excel
Source: Thesis Excel
APV Inputs Television Publishing Digital Others & Inter Segment
Risk Free Rate 2,25% 2,25% 2,25% 2,25%
Country Risk Premium 4,13% 4,13% 4,13% 4,13%
Market Premium 5% 5% 5% 5%
Unleverage Beta 0,65 0,77 0,84 0,75
Ra 9,63% 10,23% 10,58% 10,15%
Terminal Growth 2% 1,50% 2,50% 2%
Tax Rate 29% 29% 29% 29%
Vu 284,2
PV of Tax Shields 31,1
PV of expected Bankruptcy Costs 63,3
Total EV 252,0
Cash & Equivalents (31/12/2011) 12,5
Debt (31/12/2011) 212,3
Minority Interests (31/12/2011) -0,25
Equity 52,0
# Shares outstanding 168
Equity value per share= P0 0,31
Current P0 (8-11-2011) 0,42 €
Potential Gain /Loss -26%
Impresa- APV Valuation
284,2
31,1
63,3
252,0
12,5
212,3
52,0
Vu
PV of Tax Shields
PV of expected Bankruptcy Costs
Total EV
Cash & Equivalents (31/12/2011)
Debt (31/12/2011)
Minority Interests (31/12/2011)
Equity

Equity Valuation IMPRESA
63
11.5. Financial Indicators
Source: Thesis Excel
These financial indicators of Impresa show us different perspectives: To begin with, the
segment that corresponds to the highest EBITDA margins in the forecast period is digital,
followed by television.
The harsh times that we are living had a huge impact on the net income, which reaches a
negative value in 2011. However, it reveals a good recovery until the steady state.
Finally, the financial structure of Impresa in the first forecasted years reveals high debt levels,
although this trend will be reverted in the next years where the group reaches a Rating of AAA.
Regarding the dividend policy, it is quite obvious that Impresa will not distribute any earnings
since it does not generate enough CFs.
11.6. Sensibility Analysis
After concluding my valuation, I tried to understand which variables influence mostly the price
per share and why. Thus, I found out that the country risk premium is the one that causes a
higher impact in the Ra calculation. When the CRP increases, the Ra will increase as well and
thus the price per share will be lower. As can be seen in the following table, the highest drop in
the Portugal Rating took place in 2011.
Financial Indicators 2007 2008 2009 2010 2011 E 2012 E 2013 E 2014 E 2015 E 2016 E 2017 E 2018 E 2019 E
EBITDA 46 19 33 31 36 37 38 40 42 44 46 48 50
EBITDA Margin (%) 18,1% 7,1% 13,1% 12,4% 13,9% 15,2% 15,4% 15,6% 15,9% 16,1% 16,3% 16,5% 16,7%
Television 19,3% 9,8% 14,6% 14,5% 17,2% 17,5% 17,3% 17,7% 18,1% 18,5% 18,9% 19,3% 19,5%
Publishing 14,7% 6,2% 12,8% 10,8% 8,9% 11,3% 11,4% 11,3% 11,1% 10,8% 10,6% 10,3% 10,0%
Digital -37,9% -28,9% 5,7% 2,0% 13,2% 23,1% 31,9% 31,9% 31,9% 31,9% 31,9% 31,9% 31,9%
EBIT 38,75 -4,95 23,87 23,36 -2,05 29,50 29,94 31,61 33,38 35,16 36,94 38,98 40,64
EBIT Margin (%) 13,8% -1,8% 9,4% 8,6% -0,8% 12,0% 12,2% 12,4% 12,7% 12,9% 13,1% 13,3% 13,5%
Net Income 18,1 -26,9 7,8 7,9 -7,6 16,8 17,2 18,8 20,5 22,4 24,2 26,2 27,9
Book Debt Ratio 43% 48% 47% 45% 46% 44% 41% 37% 33% 29% 24% 19% 13%
NET Debt 182 241 231 213 200 183 169 152 132 113 93 70 42
Net Debt/Equity (x) 1,1 1,7 1,6 1,3 1,3 1,1 0,9 0,7 0,6 0,5 0,3 0,2 0,1
Net Debt/EBITDA (x) 3,9 12,5 6,9 6,8 5,6 4,9 4,5 3,8 3,2 2,6 2,0 1,4 0,8
Rating of Impresa B+ D B B D A- A- A- A A+ AA AAA AAA
EBITDA-Capex 33 1 29 25 26 28 28 30 32 33 35 37 41
ROC 5,5% -0,7% 3,4% 3,4% -0,3% 4,5% 4,6% 4,8% 5,0% 5,3% 5,5% 5,8% 6,0%
ROE 11% -19% 5% 5% -5% 10% 9% 9% 9% 9% 9% 9% 9%
Operating Margin (%) 6% -10% 3% 3% -3% 7% 7% 7% 8% 8% 9% 9% 9%
Asset Turnover (%) 56% 53% 50% 56% 56% 53% 53% 54% 56% 58% 59% 61% 63%
Leverage Effect (%) 292% 358% 338% 305% 307% 277% 252% 231% 211% 193% 176% 161% 148%
Payout Ratio 0% 0% 0% 0% 0% 0% 0% 0% 0% 0% 0% 0% 0%

Equity Valuation IMPRESA
64
Figure 29: Ra Estimation for Sensitivity Analysis- Portugal
Source: Thesis Excel
* Country Risk Premium- Exhibit 14.4.2.
On the other hand, the Terminal Value growth rate has also a great impact on the final price as
it is shown in the next figure.
Figure 30: Sensibility Analysis to Ra and TV Growth Rate
Source: Thesis Excel
The stock price is maximized at the highest TV growth rate with the lowest Ra.
Another variable that negatively influences the price is the bankruptcy cost in 2011, thus a
rating of B is enough to turn the PV of tax shields higher than the PV bankruptcy costs which
led to a stock price of 0.53€.
Lastly, regarding the television segment, there is the possibility of a state-owned channel
privatization in the near future. There is no defined date yet for this event to occur, however
Pedro Passos Coelho ensures that this operation will take place only when it reaches a stable
economy.
This occurrence increases the advertising space by 6 minutes/hour which penalizes SIC and TVI
in the coming years.
Francisco Pinto Balsemão who contested this privatization said in an interview that this
occurrence goes against some agreements done with the government, since everyone knows
that the impact in the other media players will be catastrophic for their margins.
Data Rating Country Risk Premium Television Ra Publishing Ra Digital Ra Others Ra Average Ra
13 July 2010 A1 1,28% 6,8% 7,4% 7,7% 7,3% 7,3%
15 March 2011 A3 1,73% 7,2% 7,8% 8,2% 7,7% 7,7%
5 April 2011 Baa1 2,25% 7,8% 8,4% 8,7% 8,3% 8,3%
5 July 2011 Ba2 4,13% 9,6% 10,2% 10,6% 10,1% 10,1%
1,0% 1,5% 2,0% 2,5% 3,6%
7,3% 0,98 1,12 1,29 1,49 2,15
7,7% 0,82 0,93 1,07 1,23 1,76
8,3% 0,65 0,74 0,86 0,99 1,40
10,1% 0,20 0,25 0,31 0,38 0,58
11,0% 0,05 0,10 0,14 0,20 0,35
11,5% -0,02 0,02 0,06 0,10 0,23
TV Growth Rate
Average
Ra

Equity Valuation IMPRESA
65
Therefore, I analyzed this possible occurrence, estimating for that purpose the impact on SIC
advertising revenues and on its share price.
Figure 31: RTP1 Privatization- Increase # Advertising Minutes
Source: Caixa BI and Thesis Excel
In 2010, the total amount spent in television advertising was around 305 M/€ in Portugal and
upon this value SIC captured 34.7%. The RTP1 privatization is estimated for 2012, therefore
this year will reflect an increase of advertising minutes/hour about 20%, which makes SIC
capturing only 80% out of 34.7% ending up with a final result of 27%.
I assumed that the amount spent in television advertising is tied to the advertising growth rate
which was already explained.
Concluding, incorporating those forecasts in my valuation, the resulting price per share is
0.07€.
11.7. Relative Valuation
11.7.1. Peer Group Selection
As enumerated in the literature review the goal is to find similar firms with Impresa. Since it is
a group that invests in three different segments, I decided to analyze separately the peer
group for each one. The reason is mainly the existence of few firms that operate at the same
time in these segments, which would give me a wrong peer group increasing the bias of my
analysis.
Understanding the importance of arriving to a comparable peer group, I started looking for
similar television companies. Initially, I knew that Impresa would have a much lower market
capitalization, sales and EBITDA comparing to their competitors. Nevertheless, there were
other aspects that I needed to consider, such as growth opportunities and EV/EBITDA since the
last one is the main comparable indicator for the Media companies. Thus, after taking these
aspects into consideration, I focused on countries from Western Europe since they are
generally exposed to an identical environment. The next step was to focus on the core
2011 E 2012 E 2013 E 2014 E 2015 E 2016 E 2017 E 2018 E 2019 E
Amount of Money Spent in Television Adv. (M €) 292,8 272,3 267,9 281,1 295,2 310,3 326,5 343,9 356,3
Advertising Growth Rate -4,0% -7,0% -1,6% 4,9% 5,0% 5,1% 5,2% 5,3% 3,6%
% Captured by SIC 34,7% 27,8% 27,8% 27,8% 27,8% 27,8% 27,8% 27,8% 27,8%
Audience Share of SIC (%) 23,0% 22,5% 22,1% 21,7% 21,3% 20,9% 20,5% 20,1% 18,5%
Power Ratio 1,51 1,24 1,26 1,28 1,31 1,33 1,36 1,38 1,50
Advertising Revenues SIC (M €) 101,6 75,7 74,5 78,1 82,1 86,3 90,8 95,6 99,1

Equity Valuation IMPRESA
66
business of each company, from a list provided by Morgan Stanley about European companies
for the television sector. After excluding in this analysis companies that mainly include sports
channels, music, series and radio stations, I ended up with the following information about the
peer group:
Figure 32: Peer Group Description of each Company- Television
Source: Morgan Stanley, Millenniumbcp and Thesis Excel *By Market Capitalization
Figure 33: Peer Group Main Indicators- Television
Source: Morgan Stanley, Millenniumbcp and Thesis Excel
As can be observed, the data from Impresa is more different when compared to its peer group
as we could expect, however it shows a huge similarity with media capital. Therefore, this
aspect could represent a limitation for the use of Multiples.
I used the same reasoning for publishing achieving the following results:
Country Description of the Company Weighted Average *
Mediaset Italy
"Lukewarm growth perspective, solid multichannel strategy, attractive yield" -
Morgan Stanley
Core Business: FTA Channels and television production
36%
ITV United
kingdom
" Good cost control, low valuation, slowing advertising momentum; uncertainty over
new CEO strategy and a merger among competitors."- Morgan Stanley
Main Public Television Channel
28%
Telecinco Spain"High recovery potential, weak momentum."- Morgan Stanley
It is owned by Mediaset Spain; Generalist Channel.24%
Antena 3 Spain "High cyclical and operational gearing. Cheapest broadcasters" - Morgan Stanley 11%
Media Capital Portugal FTA channel 1%
2011
Sales EBITDA PBT EPSMarket
Cap.
Impresa 173 25 26 0,06 72
Mediaset 4292 985 600 0,38 3698
ITV 2065 436 321 6,35 2859
Telecinco 855 228 37 0,50 2524
Antena 3 808 157 132 0,54 1165
Media Capital 159 40 22 0,05 106
Companies
2010 Indicators

Equity Valuation IMPRESA
67
Source: Millenniumbcp and Thesis Excel
According to Fernández (2007) the multiples that are more used to evaluate internet
companies are: Price/Sales, Price/Subscriber, Price/Pages Visited and Price/Inhabitant. I did
not use multiples to value the digital segment because I did not have enough information to be
accurate, since Impresa recently started investing in digital platforms.
11.7.2. Valuation
The next figure reveals close results of Impresa with the weighted-average Multiples of the
peer group. As indicated in the literature review, we should use forward multiples in order to
get more accurate results because the differences among multiples will be lower and the firms
are more comparable, being reflected in the final price. Thus, I will base my final results on
those values.
Figure 34: Peer Group Multiples- Television
Source: Morgan Stanley, Milenniumbcp and Thesis Excel
In order to arrive at the price per share of Impresa, each Multiple was multiplied by the
corresponding driver, achieving the following results:
Figure 35: Multiples Valuation- Television
Source: Thesis Excel
Publishing CountryWeighted Average Market
Cap.
Editoriale Lexpresso Italy 21%
Grupo Prisa Spain 42%
Telegraaf Netherlands 17%
Mondadori Italy 18%
Cofina Portugal 1%
EV/EBITDA
(x)EV/Sales (x) P/E (x)
FCF Yield
(%)
EV/EBITDA
(x)EV/Sales (x) P/E (x)
FCF Yield
(%)
EV/EBITDA
(x)
EV/Sales
(x)P/E (x)
FCF
Yield
(%)
Mediaset 7,4 1,6 8,6 15% 8,2 1,5 11,2 14% 7,4 1,4 10,1 17%
ITV 8,0 1,7 11,6 13% 7,8 1,7 11,0 6% 7,6 1,7 10,5 8%
Telecinco 9,0 2,4 12,3 8% 10,2 1,9 14,1 5% 8,9 1,8 13,1 6%
Antena 3 8,1 1,6 10,7 16% 8,3 1,6 10,6 7% 7,3 1,5 9,3 7%
Media Capital 11,5 1,8 10,4 13% 4,9 1,7 8,3 6% 4,1 0,9 9,4 0%
Impresa 10,1 1,5 9,7 9% 8,8 1,6 7,4 5% 8,9 1,6 8,3 8%
Weighted average 8,1 1,8 10,6 13% 8,6 1,7 11,8 9% 7,8 1,6 10,8 11%
2011 20122010
Television
Impresa' Share Price by
Multiples- Television2010 2011 E 2012 E
EV/ EBITDA 1,38 1,47 1,31
EV/ Sales 1,82 1,66 1,52
PER -0,48 -0,53 1,08

Equity Valuation IMPRESA
68
The P/E shows some limitations because it can be easily manipulated and it is affected by a
change of the capital structure.
The Enterprise Value Multiples are more commonly used for media companies, which is why I
chose them to compare them with my valuation. Both valuations are very similar, which could
indicate that it might be considered a good peer group.
Figure 36: Comparison- Multiples with APV
Source: Thesis Excel
For the Publishing segment the same reasoning was applied:
Figure 37: Peer Group Multiples- Publishing
Source: Morgan Stanley, Millenniumbcp and Thesis Excel
Figure 38: Multiples Valuation- Publishing
Source: Thesis Excel
The EV/EBITDA is the one that shows a similar value in 2011. This multiple allows making
comparisons with other countries since it uses earnings before taxes, not including the
different existing taxes.
Although having some similarities in the final result, I think that the Multiples valuation shoul
not be used alone to value Impresa, since it only captures a snapshot in a determined time
which may lead to a bias because it fails to capture other aspects that can create value for
Impresa.
EV/ Sales 2011 2012
Methods
Valuation 246,1 251,1
Multiples 278,8 256,1
Television
EV/ EBITDA 2011 2012
Methods
Valuation 246,1 251,1
Multiples 246,3 219,9
Television
2011
Market Cap
(M €) EV/EBITDA (x) EV/Sales P/E
EV/EBITDA
(x)EV/Sales P/CF P/E
Editoriale Lexpresso 677 4,8 0,9 10,8 4,3 0,9 6,1 9,2
Grupo Prisa 1383 7,9 1,7 11,1 6,7 1,6 2,7 6,8
Telegraaf 571 7 0,9 9,9 6,5 0,9 5,7 8,4
Mondadori 602 6,1 0,6 9,3 5,7 0,6 5,7 8,2
Cofina 46 10,3 1,4 14,1 8,4 1,4 2,4 3,5
Weighted average 3279,0 6,81 1,19 10,54 6,01 1,15 4,47 7,8
Publishing
2010 2011
EV Publishing by Multiples 2010 2011
EV/ EBITDA 51,23 45,24
EV/ SALES 101,12 97,53
Vu- Valuation 44,73

Equity Valuation IMPRESA
69
12. Comparison of the valuation with Millenniumbcp
Given that the valuation model already was explained, I will compare my model with the
model done by Millenniumbcp Investment Bank on the 18th of October 2011, in order to
understand the main differences that cause a different price per share.
First of all, Milleniumbcp used an explicit period of 2011-2021 and a Terminal Value in 2022,
whereas I assumed that Impresa will reach a steady state in 2020. Also the valuation model
selected was different, they used the DCF discounted to WACC and I used the APV. If I had
used the same assumptions with the same model I should have achieved the same result, but I
will show that there are more differences which explain such a difference in stock price.
Milleniumbcp also adopted the new segment structure of Impresa done in the 3rd trimester of
2011, where the Television Segment remained intact but the rubrics “AEIOU” and “Olhares”
were added to the publishing segment. The sub-holdings of Impresa started to be computed in
digital segment. Again, it is a question of organization, thus the value of the model should be
the same if other assumptions are equal. I did not choose to do this update since there is just
one report with consolidated accounts, which easily could commit errors since I did not feel so
comfortable with it. João Flores told me that he knew with the years going by those errors
would be corrected, which confirms my expectations that some errors will arise.
Regarding the Television segment they consider the impact of RTP1 in their analysis starting in
2012, but I will only consider it in my sensibility analysis since it is not decided yet.
Source: Millennium Investment Bank (18 October 2011)

Equity Valuation IMPRESA
70
In order to evaluate the Digital segment, Milleniumbcp does not use DCFs but uses
. They computed all the investments in associated companies in real values, using
then a multiple they multiplied by 2 assuming an appreciation.
They assume that Impresa is maximizing their WACC using an optimal D/V of 20% in their
assumptions from 2011 onwards. In my point of view, it does not make any sense to assume
that the company is incorporating their optimal target debt since this would not generate
enough CFs to pay their expenses in the end of the year, which means that they will need to be
financed with more debt to face their financial obligations. This difference will affect also the
PV of bankruptcy costs and the PV of tax shields, because when incorporating the real value of
debt in the valuation it starts with a company rating of D and finishes in the steady state with a
Rating of AAA.
The growth rates in certain rubrics are different, so it depends on the expected evolution for
each segment. I based my forecasts on some Reports that were mentioned several times,
which gave me resources to analyze diverse trends and information about the evolution for
each segment.
Regarding the assumptions done, Millenniumbcp assumed a German 10-year bond risk-free
rate of 3% explaining why: “its current value is 2%, however we prefer not to change our
valuation since we believe it could be a temporary overreaction: flight-to-quality move to
German Bonds”.
Source: Millennium Investment Bank (18 October 2011)

Equity Valuation IMPRESA
71
Another different result comes from the CRP where Millenniumbcp calculates through the
“difference between the Local Sovereign Yield and the German 10-year Government Bond
Yield multiplied by a volatility factor (ratio that relates equity with bonds volatility). “ The main
difference is in TV since they assume that the German bond will converge “to respective last
10- year averages”.
Finally, the last two differences come from the Terminal Value growth rate where they assume
3% and I assume a different growth rate for each Segment: Television 2%, Publishing 1.5% and
Digital 2.5%. The other difference concerns beta because they compute the Bottom-up beta
which includes the debt effects, calculated through a matrix where they include several factors
that affect the company, such as: the quality of the management team, the financial risk, the
capital structure, the size of the company etc. Therefore, it is obvious that their beta will be
higher since they want to include a higher risk, due to their initial assumption of a D/V of 20%
that is too low.
Thereby, I am sure that all those differences contribute to different valuations.
13. Conclusion
After understanding all the challenges that Impresa is facing, I end up with a price per share of
0.31€.
This price reflects the financial situation of Impresa characterized by high values of leverage,
where in the year 2011 the group shows a rating of D incorporating huge bankruptcy costs.
However, over the years the group´s rating is forecasted to increase gradually reaching AAA in
2018.
The weak estimate for media growth rates caused by this harsh environment decreases the
expected CFs. The most affected segments are publishing and television, but the last one will
have a great recovery in an expansion cycle. The digital is the most profitable segment showing
higher EBITDA margins which help Impresa diversifying its sources of revenues. At the same
time, Impresa is betting on a cost reduction policy as a way to face those challenges.
Taking into consideration all those aspects, it is not the best time to invest in this company,
maybe it would be reasonable to bet on it when it starts to show some recovery (2014/2015).
Nevertheless one must be aware of the possible privatization of RTP1, which lowers the value
of Impresa even more.

Equity Valuation IMPRESA
72
14. Exhibits
14.1. Literature Review 14.1.1. Exhibit: Limitations of Discounted Cash Flow
Source: Damodaran
· Financially distressed firms
Generally this type of firms are characterized by negative CFs and
earnings, with a high probability to go bankrupt. Therefore, the
estimations for DCF might show a negative value for the firm.
However, the price of each stock cannot be negative, so DCF does not
work in this situation.
· Cyclical companies
Firms whose CFs and earnings follow the economic cycle, meaning that
in an economic boom the cash flows will rise and will fall in a recession
period. Using DCF in this type of companies, means a lower expected
CF. Although the analysts try to predict the economic cycles adjusting
certain rubrics, which will certaintly incur forecasting errors. Therefore,
it is not a good valuation model in this case.
· Firms with unutilized
assets
The DCF only includes the assets that produce cash flows, so if a firm
has unutilized assets, they will not be incorporated in the company
valuation. However, they can be added separatly if traded in secondary
markets.
· Firms with patents or
product options
Again, patents are an asset that do not produce any type of CF. They are
very useful to protect the brand, but DCF does not incorporate those
assets in the company valuation, undervaluing the company. But as
unutilized assets they can be estimated through option models.
· Private firms
These companies are not traded in the stock market and for DCF
purposes the use of risk parameters is necessary. Without access to
that information it is impossible to estimate the value of that company.
However, there are two possible solutions:
- Look at comparable firms that are traded;
- Use the measure of risk regarding accounting variables for that private
company.
· Firms involved in
acquisitions
For merger purposes there are two issues that we must pay attention
to when we use DCF:
- Will there be any synergies? If yes, how can we compute the effect on
future CFs
- If the management team changes, this must be incorporated in future
CFs and WACC.
However, they are very hard to estimate.
· Firms in restructuring
processes
In this type of firms there are many aspects changing: capital structure,
assets, WACC, future revenues, dividend structure and maybe the
onwership structure. Since those factors will affect the expected cash
flows, they must reflect all those changes.
Limitations of DCF

Equity Valuation IMPRESA
73
14.1.2. Exhibit: Alternative Beta estimates
Source: Damodaran
14.1.3. Exhibit: Real options by sector
Source: The Mckinsey Quarterly 1998 Number 3
Approach Description
Regression Company has changed significantly
Modified Regression Used MSCI as market Index
Enhanced Beta Fundamental regression has low R^2
Accounting Beta Few observations
Proxy Variable Uses Market cap. And book/market
Bottom-up Beta Reflects current business and financial mix
Aerospace and defense Consumer/ packaged goods Pharmaceuticals and medical products
Valuing options in customer
contracts
Learning options for new product
R&D and test marketing
Esrablishing priorities among prospective
R&D projects
Assembly and machinery Electronics Pulp and paper
Timing of investment in new
factories
Entry or exist options in the PC
assembly businesTiming of forest harvesting
Automotive Energy Retail
Valuing decisions to modify new
car designs well into product
development cycles
Learning options in timing the
development of oil and gas fieldTiming of expansion into foreign markets
Banking and securities Insurance Tekecommunications
Valuing real estate leasesValuing such contingency features as
loans against value of policiesM&A programs for geographic expansion
Chemicals Media and Entertainment Transportation
Timing of investment in new
factoriesPlanning new product launches
The option to extend or contract routing
structures

Equity Valuation IMPRESA
74
14.2. Industry
14.2.1. Exhibit: SWOT Analyzes
Source: Impresa Annual Report and Investment Banks Equity Research
14.3. Company 14.3.1. Exhibit: Resume of IMPRESA main events:
- 1972: Francisco Pinto Balsemão creates Sojornal, a group that has the weekly newspaper
Expresso. He believes that despite the censorship and all the constrainsts of that time, it
would be possible to create a higher quality journal that could serve as a reference.
- 1988: Formation of Controljornal, the holding company of the media group, which is
managed by Francisco Pinto Balsemão who consolidates all the participations in the
group.
- 1989: Through a joint-Venture with a Brazilian group the first magazine called Exame
appeared.
STRENGTHS WEAKNESSES
· Diversified investments in three main areas. · Decrease of advertising revenues.
· Contingency plan to react to the economic crisis (mainly in costs
savings). Ex: Impresa ceased the publication of several Magazines. · Stagnation of the business models.
· Anti-Takeover policies (A family company). · Strong dependency on new technologies.
· Diversification of their activities on internet. · Low investments in technologies.
· At the end of 2011, Impresa wants to have all their publications available
on IPAD.·Downward trend for press segments (magazines and newspapers).
· Impresa strategy is not focused on being the leader in share of audience,
but on increasing operational numbers and reducing the debt.
OPPORTUNITIES THREATS
· Digital TV. · Internet.
· Bid Takeover from Cofina ( Growth through M&A).·The possible emergence of a 5th FTA TV Channel would increase the
competition. However, ERC rejected the two bids.
· Exploiting all potentials of the internet and smartphones, since they are
the most powerful motors of growth. Ex: IPAD
Those multiple platforms decrease the dependence on the advertsing on
economic cycles
·Increased competition between the operators from Triple- Paid (ZON,
MEO). The development of new technologies (HD, 3D) will benefit the
cable channels .
· The reduction of the number of consumers in the media market forced
those companies to look for opportunities in international markets. Ex:
Africa and Brasil, due to their similarities in culture and geography.
·New habits of consumers (stagnation of reading habits; new generation
of media) and the lower WTP of consumers for paid contents when they
know that they are available elsewhere.
· Addressable ads will arrive soon in Portugal.
· Consumers value differently the contents, which severly influences the
creation of a new business model due to the problem of "How to charge
the content ?".
·Costumers as the producers of their own products: It is healpful to
decrease costs.· Emergence of new channels on the internet.
·new technologies to measure the share of audience (the end of
Marktest). More accurate results.
· Economic crisis and the austerity measures (estimated low organic
growth rates).
· The new governmental regulation has a negative impact on media
revenues because this legislation may condicionate future strategies.
· Football rights assigned by competitors (RTP1, TVI).
· Media industry is a cyclical sector.
· Increase of the barganing power of consumers.

Equity Valuation IMPRESA
75
- 1991: A press holding is created when the social capital of Controljornal is open to foreign
investors. This group was one of the founders of SIC (“Sociedade Independente de
Comunicação”).
- 1992: Creation of the first private TV channel in Portugal namely SIC, which becomes the
leader in 1995.
- 1999: Impresa increases its participations in SIC.
- 2000: Impresa goes public on the Lisbon stock exchange.
- 2001: Expansion cycle of Impresa where it has diversified its activities. SIC owns 3
thematic channels (where SIC Noticías shows more relevancy).
- 2005: Impresa acquires 100% of SIC.
- 2007: Creation of Impresa Digital, a new business area, that has several participations in
different companies related to internet and technologies, which becomes a strength. It
produces/ distributes digital content for multiple platforms.
- 2008: Merger of newspapers and magazines in the segment- Impresa Publishing, being
one of the main players in this sector with more than 30 publications. The three main
segments of Impresa are: SIC, Publishing and Digital.
- 2009: Impresa won 7 awards from “Meios & Publicidade 2009” that include SIC Notícias,
Expresso, Visão, Caras, Caras Decoração and FHM.
This year was characterized by a contract with MEO until 2012 and with ZON until 2013.
Alienation of diverse participations and reinforcement in other participations: AEIOU and
Lisboa TV (owner of SIC Notícias).
- 2010: Television segment reaches an internalization of thematic channels in 10 countries:
France, Switzerland, USA, Canada, Brazil, Cape Verde, Angola, Mozambique, South Africa
and Australia.
Launches a new Channel in MEO namely SIC K.
Discontinuity of the magazines: Cosmopolitan and Surf Portugal that were sold, and other
digital activities.
- 2011: Creates a new magazine in Angola- Rumo and re-launches Expresso (increasing the
number of newspapers sold) and the site Escape.
The restructuration of Television and Digital segments implied an increase of costs.
Source: Impresa Site

Equity Valuation IMPRESA
76
14.4. Valuation
14.4.1. Exhibit: Bankruptcy Costs Calculations
Source: Damodaran Site
14.4.2. Exhibit: Portugal Rating History
Source: Moody´s Site
14.4.3. Exhibit: Impresa Regression with PSI20
Source: Bloomberg
> ≤ to Rating is Spread is Default Probability
12.5 100000 AAA 0,50% 0,07%
9.5 12,499999 AA 0,65% 0,51%
7.5 9,499999 A+ 0,85% 0,60%
6 7,499999 A 1,00% 0,66%
4.5 5,999999 A- 1,10% 2,50%
4 4,499999 BBB 1,60% 7,54%
3.5 3,9999999 BB+ 3,00% 10,00%
3 3,499999 BB 3,35% 16,63%
2.5 2,999999 B+ 3,75% 25,00%
2 2,499999 B 5,00% 36,80%
1.5 1,999999 B- 5,25% 45,00%
1.25 1,499999 CCC 8,00% 59,01%
0.8 1,249999 CC 10,00% 70,00%
0.5 0.799999 C 12,00% 85,00%
-100000 0.499999 D 15,00% 100,00%
Small-cap firms ($100 million–$1 billion market cap)
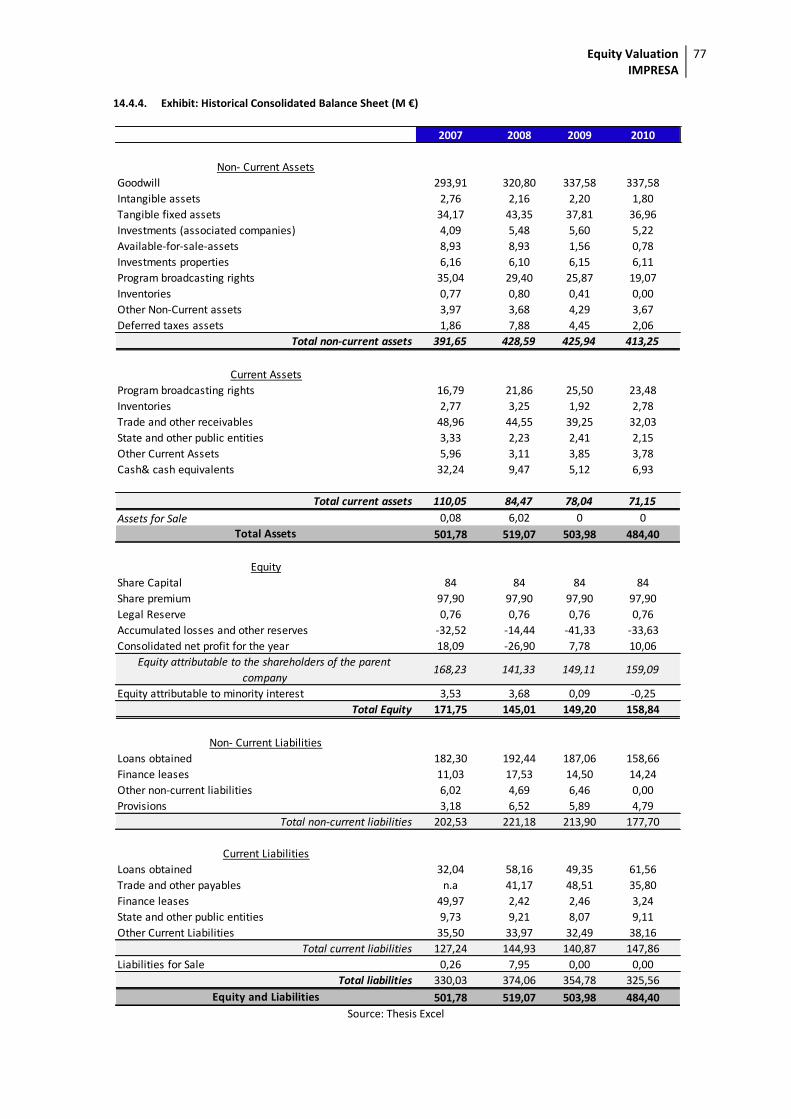
Equity Valuation IMPRESA
77
14.4.4. Exhibit: Historical Consolidated Balance Sheet (M €)
Source: Thesis Excel
2007 2008 2009 2010
Non- Current Assets
Goodwill 293,91 320,80 337,58 337,58
Intangible assets 2,76 2,16 2,20 1,80
Tangible fixed assets 34,17 43,35 37,81 36,96
Investments (associated companies) 4,09 5,48 5,60 5,22
Available-for-sale-assets 8,93 8,93 1,56 0,78
Investments properties 6,16 6,10 6,15 6,11
Program broadcasting rights 35,04 29,40 25,87 19,07
Inventories 0,77 0,80 0,41 0,00
Other Non-Current assets 3,97 3,68 4,29 3,67
Deferred taxes assets 1,86 7,88 4,45 2,06
Total non-current assets 391,65 428,59 425,94 413,25
Current Assets
Program broadcasting rights 16,79 21,86 25,50 23,48
Inventories 2,77 3,25 1,92 2,78
Trade and other receivables 48,96 44,55 39,25 32,03
State and other public entities 3,33 2,23 2,41 2,15
Other Current Assets 5,96 3,11 3,85 3,78
Cash& cash equivalents 32,24 9,47 5,12 6,93
Total current assets 110,05 84,47 78,04 71,15
Assets for Sale 0,08 6,02 0 0
Total Assets 501,78 519,07 503,98 484,40
Equity
Share Capital 84 84 84 84
Share premium 97,90 97,90 97,90 97,90
Legal Reserve 0,76 0,76 0,76 0,76
Accumulated losses and other reserves -32,52 -14,44 -41,33 -33,63
Consolidated net profit for the year 18,09 -26,90 7,78 10,06
Equity attributable to the shareholders of the parent
company168,23 141,33 149,11 159,09
Equity attributable to minority interest 3,53 3,68 0,09 -0,25
Total Equity 171,75 145,01 149,20 158,84
Non- Current Liabilities
Loans obtained 182,30 192,44 187,06 158,66
Finance leases 11,03 17,53 14,50 14,24
Other non-current liabilities 6,02 4,69 6,46 0,00
Provisions 3,18 6,52 5,89 4,79
Total non-current liabilities 202,53 221,18 213,90 177,70
Current Liabilities
Loans obtained 32,04 58,16 49,35 61,56
Trade and other payables n.a 41,17 48,51 35,80
Finance leases 49,97 2,42 2,46 3,24
State and other public entities 9,73 9,21 8,07 9,11
Other Current Liabilities 35,50 33,97 32,49 38,16
Total current liabilities 127,24 144,93 140,87 147,86
Liabilities for Sale 0,26 7,95 0,00 0,00
Total liabilities 330,03 374,06 354,78 325,56
Equity and Liabilities 501,78 519,07 503,98 484,40

Equity Valuation IMPRESA
78
14.4.5. Exhibit: Forecast Consolidated Balance Sheet (M €)
2011 E 2012 E 2013 E 2014 E 2015 E 2016 E 2017 E 2018 E 2019 E
Non- Current Assets
Goodwill 308,08 308,08 308,08 308,08 308,08 308,08 308,08 308,08 308,08
Intangible assets 2,05 2,29 2,53 2,77 3,03 3,29 3,57 3,85 3,85
Tangible fixed assets 37,68 39,02 40,35 41,74 43,17 44,65 46,18 47,77 47,77
Investments (associated companies) 5,22 5,22 5,22 5,22 5,22 5,22 5,22 5,22 5,22
Available-for-sale-assets 0,00 0,00 0,00 0,00 0,00 0,00 0,00 0,00 0,00
Investments properties 6,11 6,11 6,11 6,11 6,11 6,11 6,11 6,11 6,11
Program broadcasting rights 19,07 19,07 19,07 19,07 19,07 19,07 19,07 19,07 19,07
Inventories 0,29 0,26 0,25 0,26 0,27 0,28 0,30 0,31 0,33
Other Non-Current assets 3,67 3,67 3,67 3,67 3,67 3,67 3,67 3,67 3,67
Deferred taxes assets 2,06 0,18 0,18 0,18 0,18 0,18 0,18 0,18 0,18
Total non-current assets 384,23 383,89 385,46 387,10 388,80 390,56 392,38 394,27 394,28
Current Assets
Program broadcasting rights 23,48 23,48 23,48 23,48 23,48 23,48 23,48 23,48 23,48
Inventories 2,22 1,97 1,91 1,98 2,07 2,17 2,28 2,40 2,52
Trade and other receivables 29,79 27,92 27,37 27,77 28,17 29,14 30,11 31,19 32,19
State and other public entities 5,67 2,18 2,18 2,25 2,33 2,41 2,49 2,58 2,67
Other Current Assets 3,78 3,78 3,78 3,78 3,78 3,78 3,78 3,78 3,78
Cash& cash equivalents 12,49 19,75 20,42 21,49 23,30 21,92 20,81 19,94 19,49
Total current assets 77,42 79,07 79,14 80,75 83,13 82,90 82,96 83,37 84,13
Assets for Sale 0,00 0,00 0,00 0,00 0,00 0,00 0,00 0,00 0,00
Total Assets 461,65 462,97 464,60 467,86 471,93 473,47 475,34 477,63 478,42
Equity
Share Capital 84 84 84 84 84 84 84 84 84
Share premium 97,90 97,90 97,90 97,90 97,90 97,90 97,90 97,90 97,90
Legal Reserve 0,76 0,76 0,76 0,76 0,76 0,76 0,76 0,76 0,76
Accumulated losses and other reserves -24,67 -32,30 -15,53 1,69 20,51 41,05 63,43 87,61 113,83
Consolidated net profit for the year -7,63 16,77 17,22 18,82 20,54 22,39 24,18 26,21 27,87
Equity attributable to the shareholders of
the parent company150,36 167,13 184,35 203,17 223,71 246,10 270,28 296,49 324,35
Equity attributable to minority interest -0,28 -0,28 -0,28 -0,28 -0,28 -0,28 -0,28 -0,28 -0,28
Total Equity 150,08 166,85 184,07 202,89 223,43 245,82 270,00 296,21 324,08
Non- Current Liabilities
Loans obtained 153,50 138,34 112,73 96,66 84,62 75,11 65,61 56,10 0,00
Finance leases 11,06 8,57 6,62 5,23 4,33 2,88 1,44 0,00 0,00
Other non-current liabilities 0,00 0,00 0,00 0,00 0,00 0,00 0,00 0,00 0,00
Provisions 4,79 4,79 4,79 4,79 4,79 4,79 4,79 4,79 4,79
Total non-current liabilities 169,35 151,70 124,14 106,69 93,74 82,79 71,84 60,89 4,79
Current Liabilities
Loans obtained 58,80 63,91 76,17 76,55 70,94 60,11 47,81 33,77 61,33
Trade and other payables 33,74 32,09 32,37 34,07 36,22 37,36 38,51 39,77 40,99
Finance leases 3,19 2,47 1,91 1,51 1,25 0,83 0,42 0,00 0,00
State and other public entities 8,33 7,79 7,78 7,98 8,19 8,40 8,61 8,84 9,07
Other Current Liabilities 38,16 38,16 38,16 38,16 38,16 38,16 38,16 38,16 38,16
Total current liabilities 142,22 144,42 156,38 158,28 154,76 144,86 133,51 120,53 149,54
Liabilities for Sale 0,00 0,00 0,00 0,00 0,00 0,00 0,00 0,00 0,00
Total liabilities 311,57 296,12 280,53 264,96 248,50 227,65 205,35 181,42 154,34
Equity and Liabilities 461,65 462,97 464,60 467,86 471,93 473,47 475,34 477,63 478,42

Equity Valuation IMPRESA
79
14.4.6. Exhibit: Historical- Consolidated Income Statement (M €)
Source: Thesis Excel and Impresa Annual Report
2007 2008 2009 2010
Television Revenues 185,18 171,55 155,45 173,00
Publishing Revenues 92,40 95,62 91,91 93,47
Digital Revenues 4,16 6,65 6,39 6,82
Other & Inter Segments -1,62 -0,73 -0,53 -2,14
(+) Consolidated Revenues 280,12 273,08 253,22 271,15
Television Costs 149,40 154,70 132,79 148,00
Publising Costs 78,20 89,70 80,20 83,32
Digital Costs 5,74 8,57 6,03 6,68
Other & Inter Segments -0,11 0,76 0,90 -0,54
(-) Total Operational Costs 233,89 253,73 219,92 237,46
(-) Operational Costs (With Reestruturation) 2,244673 - - 2,2
Validation (=) EBITDA 48,47 19,36 33,30 31,49
(=) EBITDA 46,22 19,355 33,30 31,49
Margem EBITDA 18,09% 7,10% 13,10% 12,40%
EBITDA Television 35,77 16,86 22,65 25,00
EBITDA Publishing 13,54 5,91 11,66 10,15
EBITDA Digital -1,58 -1,92 0,41 0,13
EBITDA Other & Inter Segments -1,51 -1,49 -1,43 -1,59
(-) Depreciations 7,47 10,16 9,37 8,13
Impairements - 0,142 0,423(=) EBIT 38,75 -4,95 23,87 23,36
EBIT Margin 13,83% -1,81% 9,43% 8,62%
(-) Total Financial Expenses -14,21 -17,00 -13,0 -11,6
(+) Financial Income 1,29 0,50 0,6 -0,3
(=) Financial Results (Net financials) 12,31 16,50 12,39 11,85(=) Res. bef.Taxes & Minorities (EBT) 26,44 -21,45 11,48 11,51
(-) Taxes (IRC) 7,61 -3,61 3,83 3,77
(=) EBM 18,83 -17,84 7,65 7,74
(-) Descontinued Activities 0,26 7,59 0,00 0,00
(-) Minority Interests 0,72 1,48 -0,13 -0,12(=) Consolidated Net Income 18,09 -26,90 7,78 7,86

Equity Valuation IMPRESA
80
14.4.7. Exhibit: Forecast- Consolidated Income Statement (M €)
Source: Theis Excel
15. References
15.1. Literature Review
Courteau, L., J. Kao and G.D. Richardson, 2001, The Equivalence of Dividend, Cash Flow and
Residual Earnings Approaches to Equity Valuation Employing Ideal Terminal Value Calculations,
Contemporary Accounting Research, v18 ,625–661.
Cooper, I.A. and K.G. Nyborg, 2006, The value of tax shields is equal to the present value of the
tax shields, Journal of Financial Economics, v81, 215-225.
Damodaran, A., (1994), Damodaran on Valuation, John Wiley, New York
Damodaran, A. (2002) Investment Valuation: Tools and Techniques for Determining the Value
of Any Asset, New York: John Wiley & Sons, Inc.
2011 E 2012 E 2013 E 2014 E 2015 E 2016 E 2017 E 2018 E 2019 E
Television Revenues 167,32 161,42 161,61 168,00 174,83 181,91 189,00 196,95 204,09
Publishing Revenues 85,02 79,39 79,13 81,07 82,87 84,52 86,21 87,94 89,70
Digital Revenues 7,06 7,30 7,55 7,90 8,26 8,64 9,04 9,47 10,08
Other & Inter Segments -2,09 -2,05 -2,07 -2,13 -2,17 -2,22 -2,26 -2,31 -2,39
(+) Consolidated Revenues 257,30 246,07 246,21 254,83 263,79 272,85 281,99 292,05 301,48
Television Costs 138,52 133,14 133,68 138,29 143,19 148,25 153,33 158,97 164,22
Publising Costs 77,49 70,45 70,09 71,94 73,70 75,38 77,11 78,88 80,70
Digital Costs 6,13 5,62 5,14 5,38 5,63 5,89 6,16 6,46 6,87
Other & Inter Segments -0,53 -0,52 -0,53 -0,54 -0,55 -0,56 -0,58 -0,59 -0,61
(-) Total Operational Costs 221,61 208,69 208,38 215,07 221,96 228,96 236,03 243,72 251,19
(=) EBITDA 35,69 37,38 37,82 39,77 41,82 43,90 45,97 48,33 50,30
Margem EBITDA 13,87% 15,19% 15,36% 15,60% 15,85% 16,09% 16,30% 16,55% 16,68%
EBITDA Television 28,79 28,28 27,93 29,71 31,65 33,66 35,67 37,98 39,87
EBITDA Publishing 7,53 8,94 9,03 9,13 9,16 9,14 9,10 9,05 9,00
EBITDA Digital 0,93 1,69 2,41 2,52 2,63 2,75 2,88 3,02 3,21
EBITDA Other & Inter Segments -1,56 -1,53 -1,55 -1,58 -1,62 -1,65 -1,68 -1,72 -1,78
(-) Depreciations 8,24 7,88 7,88 8,16 8,45 8,74 9,03 9,35 9,65
Impairements -29,5(=) EBIT -2,05 29,50 29,94 31,61 33,38 35,16 36,94 38,98 40,64
EBIT Margin -0,80% 11,99% 12,16% 12,40% 12,65% 12,89% 13,10% 13,35% 13,48%
(-) Total Financial Expenses 8,92 6,84 6,63 6,05 5,40 4,58 3,83 3,01 2,35
(+) Financial Income 0,95 0,95 0,95 0,95 0,95 0,95 0,95 0,95 0,95
(=) Financial Results (Net financials) 8,74 5,89 5,68 5,10 4,45 3,63 2,88 2,06 1,39(=) Res. bef.Taxes & Minorities (EBT) -10,79 23,61 24,26 26,51 28,93 31,53 34,06 36,92 39,25
(-) Taxes (IRC) 3,13 -6,85 -7,03 -7,69 -8,39 -9,14 -9,88 -10,71 -11,38
(=) EBM -7,66 16,77 17,22 18,82 20,54 22,39 24,18 26,21 27,87
(-) Descontinued Activities 0,00 0,00 0,00 0,00 0,00 0,00 0,00 0,00 0,00
(-) Minority Interests -0,03 0,00 0,00 0,00 0,00 0,00 0,00 0,00 0,00(=) Consolidated Net Income -7,63 16,77 17,22 18,82 20,54 22,39 24,18 26,21 27,87

Equity Valuation IMPRESA
81
Damodaran, A. (2006), Valuation Approaches and Metrics: a Survey of the Theory and
Evidence, Stern School of Business.
Damodaran, A. Estimating Risk Parameters (New York, NY 10012)
Damodaran Site
Fernández (2001), EVA and Cash value added do NOT measure shareholder value creation
Fernández (2002), The value of Tax shields is not equal to the present value of tax shields.
Fernández (2005), Financial literature about discounted cash flow valuation.
Fernández (2007), Company valuation methods. The most common errors in valuations
Francis, J., P. Olsson, and D. Oswald. 2000. Comparing the Accuracy and Explainability of
Dividend, Free Cash Flow and Abnormal Earnings Equity Value Estimates. Journal of Accounting
Research, v38, 45- 70.
Jaime Sabal, “The Discount Rate in Emerging Markets: A Guide,” Journal of Applied Corporate
Finance 16 (Spring/Summer 2004): 159.
Modigliani, F., and Miller, M. (1958), The Cost of Capital, Corporate Finance and the Theory of
Investment, American Economic Review, Vol. 48, No. 3: 261-297.
Modigliani, F., and Miller, M. (1963), Corporate Income Taxes and the Cost of Capital: A
Correction, American Economic Review, Vol. 53, No. 3: 433-443.
Myers, S.C. (1974), “Interactions of Corporate Financing and Investment Decisions –
Implications for Capital Budgeting”, Journal of Finance (March), pp. 1-25.
Luehrman, T., (1997), Using APV a better tool for valuing operations, Harvard Business Review
Luehrman, T., (1997), What’s it worth?, Harvard Business Review
Luis Pereiro, Valuation of Companies in Emerging Markets: A Practical Approach (New York,
NY: John Wiley & Sons, 2002), p. 111.
Penman, S. and T. Sougiannis. 1998. A Comparison of Dividend, Cash Flow, and Earnings
Approaches to Equity Valuation, Contemporary Accounting Research, v15, 343-383.

Equity Valuation IMPRESA
82
Pereiro, Valuation of Companies in Emerging Markets: A Practical Approach, p. 127.
Young, M., et al. (1999), All Roads Lead to Rome: an integrated approach to valuation
methods, Goldman Sachs Investment Research.
UBS Warburg, Valuation Multiples: A Primer November 2001
15.2. Industry Analysis
Paper: “Gestão, Tendências e Estratégias no Mercado dos Media em Portugal”- (Paulo
Faustino, Universidade do Porto, 2010)
Report ERC: “Estudo das receitas dos media em Portugal” – (Deloitte, May 2010)
“Television´s “Super Media“status strengthens”- (Deloitte, 2011)
“Anuário de Media & Publicidade 2010”- (Grupo Marktest, 2010)
“Internet Marketing- Católica Lisbon University”- (Professor Fernando Machado, 2011)
http://stateofthemedia.org/ (Last Assess: 23 September 2011)
15.3. Company
Marktest
Impresa- www.impresa.pt
Cofina- www.cofina.pt (Last Assess: 10 October 2011)
Impala- www.euroimpala.pt (Last Assess: 10 October 2011)
Controlinveste- www.controlinveste.pt (Last Assess: 10 October 2011)
AEIOU- www.aeiuo.pt (Last Assess: 10 October 2011)
Info Portugal www.infoportugal.pt (Last Assess: 10 October 2011)
Olhares- www.olhares.com (Last Assess: 10 October 2011)
TVI- www.tvi.pt (Last Assess: 10 October 2011)
ZON- www.zon.pt (Last Assess: 10 October 2011)

Equity Valuation IMPRESA
83
MEO-www.meo.pt (Last Assess: 10 October 2011)
15.4. Valuation
“Anuário da Comunicação 2009/2010” (Obercom, 2010)
Bloomberg Terminal and www.bloomberg.com
Damodaran Site: “Valuation: Intrinsic, Relative and Contingent Claim Valuation
“http://www.stern.nyu.edu/~adamodar (Last Access in 23 November 2011)
Equity Research: “Europe-Media” (Goldman Sachs Global Investment Research, September 15,
2011)
“Europe Media”: Equity Research (Goldman Sachs, 15 September 2011)
Investment Research- “Portugal-Media” (Caixa BI, 16 December 2010)
“Media & Internet”: “Back from the brink” (Morgan Stanley, 5 July 2011)
“Media Update” (Millennium Investment Banking, 11 February 2011)
“Media Update” (Millennium Investment Banking, 8 July 2011)
“Media: M&A scenario “(Millennium investment bank, 27 July 2011)
“Media & Internet”: The Favored Five (Morgan Stanley, 9 August 2011)
Millenniumbcp Investment Banking- Media M&A Scenario(28 July 2011)
“Steady recovery in global ad expenditure to continue for at least three years” (ZenithOptimedia Group, 6 December 2010)