
Valuation Insights - Motilal Oswal
56
Thematic Study | November 2018 TOP 10 WEALTH CREATORS (2013-2018) Raamdeo Agrawal ([email protected]) / Shrinath Mithanthaya ([email protected]) We thank Mr Dhruv Mehta ([email protected]), Investment Consultant, for his invaluable contribution to this report. Investors are advised to refer through important disclosures made at the end of the Research Report. THE BIGGEST THE FASTEST THE MOST CONSISTENT Wealth 5-Year Appeared 10-Year Rank Company Created Company Price Company in WC Price (INR b) CAGR (%) Study (x) CAGR (%) 1 HDFC Bank 3,247 Indiabulls Ventures 97 Titan Company 10 33 2 Reliance Industries 3,094 Dalmia Bharat 81 Godrej Consumer 10 33 3 TCS 2,532 TVS Motor 80 Shree Cement 10 31 4 Maruti Suzuki 2,308 HEG 79 Pidilite Industries 10 30 5 Hindustan Unilever 1,883 Sterlite Technologies 75 Maruti Suzuki 10 27 6 HDFC 1,640 Bajaj Finance 73 Marico 10 26 7 Kotak Mahindra Bank 1,345 Motilal Oswal 67 Asian Paints 10 25 8 IOC 1,008 IIFL Holdings 64 HDFC Bank 10 22 9 Larsen & Toubro 990 NBCC 64 Kotak Mahindra Bank 10 21 10 Bajaj Finance 902 Eicher Motors 62 Dabur India 10 20 23RD ANNUAL WEALTH CREATION STUDY (2013-2018) HIGHLIGHTS The two key drivers of Intrinsic Value are Return on Equity (RoE) and Earnings growth Companies create Intrinsic Value only when they earn RoE higher than Cost of Equity Low RoE companies must focus on increasing RoE, high RoE companies on increasing growth Both high RoE and high Earnings growth are difficult to sustain PEG (P/E to Growth ratio) less than 1x is a near-infallible formula for healthy outperformance Current market valuations imply robust earnings growth, which remains elusive. Hence, expect market to remain soft "In the Bible, it says that love covers a multitude of sins. Well, in the investing field, price covers a multitude of mistakes. For human beings, there is no substitute for love. For investing, there is no substitute for paying the right price - absolutely none." – Arnold Van Den Berg, Outstanding Investor Digest, April 2004 What works, What doesn't Valuation Insights
-
Upload
khangminh22 -
Category
Documents
-
view
5 -
download
0
Transcript of Valuation Insights - Motilal Oswal

1
Thematic Study | November 2018
TOP 10 WEALTH CREATORS (2013-2018)
Raamdeo Agrawal ([email protected]) / Shrinath Mithanthaya ([email protected])
We thank Mr Dhruv Mehta ([email protected]), Investment Consultant, for his invaluable contribution to this report.
Investors are advised to refer through important disclosures made at the end of the Research Report.
THE BIGGEST THE FASTEST THE MOST CONSISTENT
Wealth 5-Year Appeared 10-YearRank Company Created Company Price Company in WC Price
(INR b) CAGR (%) Study (x) CAGR (%)
1 HDFC Bank 3,247 Indiabulls Ventures 97 Titan Company 10 33
2 Reliance Industries 3,094 Dalmia Bharat 81 Godrej Consumer 10 33
3 TCS 2,532 TVS Motor 80 Shree Cement 10 31
4 Maruti Suzuki 2,308 HEG 79 Pidilite Industries 10 30
5 Hindustan Unilever 1,883 Sterlite Technologies 75 Maruti Suzuki 10 27
6 HDFC 1,640 Bajaj Finance 73 Marico 10 26
7 Kotak Mahindra Bank 1,345 Motilal Oswal 67 Asian Paints 10 25
8 IOC 1,008 IIFL Holdings 64 HDFC Bank 10 22
9 Larsen & Toubro 990 NBCC 64 Kotak Mahindra Bank 10 21
10 Bajaj Finance 902 Eicher Motors 62 Dabur India 10 20
23RD ANNUAL WEALTH CREATION STUDY(2013-2018)
HIGHLIGHTS
The two key drivers of Intrinsic Value are Return on Equity (RoE) and Earnings growth
Companies create Intrinsic Value only when they earn RoE higher than Cost of Equity
Low RoE companies must focus on increasing RoE, high RoE companies on increasing
growth
Both high RoE and high Earnings growth are difficult to sustain
PEG (P/E to Growth ratio) less than 1x is a near-infallible formula for healthy
outperformance
Current market valuations imply robust earnings growth, which remains elusive. Hence,
expect market to remain soft
"In the Bible, it says that love covers a multitude of sins. Well, in the investing field, price
covers a multitude of mistakes. For human beings, there is no substitute for love. For investing,
there is no substitute for paying the right price - absolutely none."
– Arnold Van Den Berg, Outstanding Investor Digest, April 2004
What works, What doesn't
Valuation Insights

23rd Annual Wealth Creation Study (2013-2018)
Motilal Oswal 23rd Annual Wealth Creation Study
Page
Wealth Creation Study: Objective, Concept & Methodology ....................... 1
Wealth Creation 2013-18: Highlights .......................................................... 2-3
Theme 2018: Valuation Insights – What works, what doesn’t................. 4-31
Wealth Creation 2013-18: Detailed Findings ......................................... 32-47
Appendix 1: MOSL 100 – Biggest Wealth Creators ................................ 48-49
Appendix 2: MOSL 100 – Fastest Wealth Creators ................................ 50-51
Appendix 3: MOSL 100 – Wealth Creators (alphabetical) .......................... 52
Abbreviations and Terms used in this report Abbreviation / Term Description
2008, 2013, 2018, etc Reference to years for India are financial year ending March, unless otherwise stated
Avg Average
CAGR Compound Annual Growth Rate
L to P / P to L Loss to Profit / Profit to Loss. In such cases, calculation of PAT CAGR is not possible
INR b Indian Rupees in billion
Price CAGR In the case of aggregates, Price CAGR refers to Market Cap CAGR
WC Wealth Created
Wealth Created Increase in Market Capitalization over the last 5 years, duly adjusted for corporate
events such as fresh equity issuance, mergers, demergers, share buybacks, etc.
Note: Capitaline database has been used for this study. Source of all exhibits is MOSL analysis, unless otherwise stated

1 November 2018 1
23rd Annual Wealth Creation Study (2013-2018)
Wealth Creation Study Objective, Concept & Methodology
Objective The foundation of Wealth Creation is to buy businesses at a price substantially lower than their
“intrinsic value” or “expected value”. The lower the market value compared to the intrinsic value,
the higher is the margin of safety. Every year, as in the past 23 years, we endeavor to cull out the
characteristics of businesses that create value for their shareholders.
As Phil Fisher says, “It seems logical that even before thinking of buying any common stock, the
first step is to see how money has been most successfully made in the past.” Our Wealth Creation
Studies are attempts to study the past as a guide to the future, and gain insights into the various
dynamics of stock market investing.
Concept & Methodology Wealth Creation is the process by which a company enhances the market value of the capital
entrusted to it by its shareholders. It is a basic measure of success for any commercial venture.
For listed companies, we define Wealth Created as the difference in market capitalization over a
period of last five years, duly adjusted for corporate events such as fresh equity issuance,
mergers, demergers, share buybacks, etc.
We rank the top 100 companies in descending order of absolute Wealth Created, subject to the
company’s stock price at least outperforming the benchmark index (BSE Sensex in our case).
These top 100 Wealth Creators are also ranked according to speed (i.e. price CAGR during the
period under study).
Report structure We present the 2013-2018 Wealth Creation Study highlights in pages 2-3. The detailed findings
are presented in pages 32-47. Appendix 1 (pages 48-49) ranks the top 100 Wealth Creators by
size, and Appendix 2 (pages 50-51) ranks the same 100 Wealth Creators by speed.
This year’s theme study titled “Valuation Insights – What works, what doesn’t” is featured in
pages 4-31.

1 November 2018 2
23rd Annual Wealth Creation Study (2013-2018)
Wealth Creation 2013-2018 Highlights
HDFC Bank is the Biggest Wealth Creator for the first time ever
After consistently hugging the second and third rank for the last 6 studies, HDFC Bank has
finally broken through to emerge the biggest Wealth Creator over 2013-18.
Exhibit 1 Top 10 Biggest Wealth Creators (2013-18)
Rank Company Wealth Created CAGR (%) P/E (x) RoE (%)
INR b % share Price PAT 2018 2013 2018 2013
1 HDFC Bank 3,247 7.2 25 22 27 22 17 19
2 Reliance Inds 3,094 6.9 18 13 15 13 12 11
3 TCS 2,532 5.6 13 13 21 22 30 36
4 Maruti Suzuki 2,308 5.1 47 25 41 17 15 11
5 Hind. Unilever 1,883 4.2 23 10 55 31 72 113
6 HDFC 1,640 3.7 17 16 22 19 16 21
7 Kotak Mah. Bank 1,345 3.0 26 23 32 22 12 14
8 IOC 1,008 2.2 20 38 8 15 19 7
9 Larsen & Toubro 990 2.2 17 14 21 18 16 13
10 Bajaj Finance 902 2.0 73 35 38 10 16 18
Total of Top 10 18,948 42 21 18 21 18 17 15
Total of Top 100 44,883 100 24 19 22 18 16 14
Indiabulls Ventures is the Fastest Wealth Creator
Indiabulls Ventures has emerged the Fastest Wealth Creator, with 2013-18 stock price
multiplier of 30x (97% CAGR).
INR 100,000 invested equally in 2013 in top 10 Fastest Wealth Creators would have grown to
almost INR 1.7 million in 2018, delivering a return CAGR of 75%. Over the same period, INR
100,000 invested in the Sensex would have grown to only INR 175,000 (12% return CAGR).
Exhibit 2 Top 10 Fastest Wealth Creators (2013-18)
Rank Company Price Appn. CAGR (%) Mkt Cap (INR b) P/E (x)
(x) Price PAT 2018 2013 2018 2013
1 Indiabulls Ventures 30 97 30 127 2 54 3
2 Dalmia Bharat 19 81 23 257 12 48 6
3 TVS Motor 19 80 40 293 15 44 12
4 HEG 19 79 48 127 7 12 4
5 Sterlite Technologies 17 75 67 125 9 37 35
6 Bajaj Finance 15 73 35 1,023 57 38 10
7 Motilal Oswal 13 67 42 146 11 26 11
8 IIFL Holdings 12 64 27 224 18 25 7
9 NBCC 12 64 11 171 15 48 7
10 Eicher Motors 11 62 45 772 69 39 23
Titan Company is the Most Consistent Wealth Creator
Titan Company has emerged the Most Consistent Wealth Creator by virtue of –
1. Appearing among top 100 Wealth Creators in each of the last 10 studies; and
2. Recording the highest Price CAGR of 33% over the 10-year period 2008 to 2018,
fractionally ahead of Godrej Consumer.
All the top 10 Consistent Wealth Creators are consumer-facing companies (Exhibit 3).

1 November 2018 3
23rd Annual Wealth Creation Study (2013-2018)
Exhibit 3 Top 10 Most Consistent Wealth Creators (2008-18)
Appeared in 10-yr Price 10-yr PAT P/E (x) RoE (%)
Rank Company WC Study (x) CAGR (%) CAGR (%) 2018 2008 2018 2008
1 Titan Company 10 33 22 73 30 22 35
2 Godrej Consumer 10 33 25 51 20 24 93
3 Shree Cement 10 31 17 42 13 15 42
4 Pidilite Inds. 10 30 19 49 20 27 28
5 Maruti Suzuki 10 27 14 41 14 15 20
6 Marico 10 26 17 54 26 31 51
7 Asian Paints 10 25 17 54 28 24 42
8 HDFC Bank 10 22 28 27 29 17 14
9 Kotak Mah. Bank 10 21 20 32 22 12 17
10 Dabur India 10 20 15 42 29 24 53
Financials is the biggest Wealth Creating sector for the second consecutive year
Financials has emerged as India’s biggest Wealth Creating sector over 2013-18 for the second
consecutive year.
In this study period, the Financials sector has the unusual distinction of being the biggest
Wealth Creator (thanks to private banks and NBFCs) and the biggest Wealth Destroyer
(thanks to state-owned banks).
PEG < 1x is also a solid formula for superior returns
For the purposes of this section, PEG (P/E to Growth ratio) is obtained by dividing trailing 12-
month P/E by future 5-year earnings CAGR.
We have used perfect foresight of 5 years’ earnings to calculate PEG. Thus, if a stock’s P/E in
2013 was 20x, and its 2013-18 PAT CAGR is 25%, its 2013 PEG works out to 0.8x (20 ÷ 25).
Clearly, lower the PEG, higher the likely return.
Our theme study this year (see pages 4 to 31) has almost conclusively established that stocks
with PEG less than 1x tend to significantly outperform the market.
As tabled below, the story was no different for the 2018 Wealth Creators. Nearly half the
Wealth Creators were trading at PEG of less than 1x in 2013, and delivered the highest return.
Exhibit 4 PEG < 1x is a solid formula for high returns PEG Range No. of WC % Share CAGR (%) RoE (%)
in 2013 (x) Cos. (INR b) of WC Price PAT 2018 2013
<0.5 23 7,427 17 38 34 19 10
0.5-1 26 17,803 40 28 17 15 14
1-1.5 11 5,093 11 20 13 18 18
1.5-2 11 4,952 11 16 13 25 26
2-3 9 2,091 5 22 10 11 16
>3 14 5,365 12 20 6 18 23
L to P 3 682 2 24 L to P 13 -20
PAT decline 3 1,470 3 19 -17 3 16
Total 100 44,883 100 24 19 16 14
Note: PEG here is calculated as P/E of March 2013 divided by 2013-18 PAT CAGR
For detailed findings of 2013-18 Wealth Creation Study, please see pages 32-47.

1 November 2018 4
23rd Annual Wealth Creation Study (2013-2018)
Theme 2018

1 November 2018 5
23rd Annual Wealth Creation Study (2013-2018)
Valuation Insights What works, what doesn’t
“In the Bible, it says that love covers a multitude of sins. Well, in the investing field, price covers
a multitude of mistakes. For human beings, there is no substitute for love. For investing, there
is no substitute for paying the right price – absolutely none.“
— Arnold Van Den Berg, Outstanding Investor Digest, April 2004
1. Introduction Towards understanding reasonable Price
The essence of equity investing is – buying (and staying invested in) only those stocks where there
is a significant Value-Price gap. As Warren Buffett has said, ‘Price is what we pay. Value is what
we get.” Thus, the equity investing process may be simply reduced to –
Assessing value of stocks
Comparing the value with the prevailing price and
Buying them only if there is adequate Margin of Safety i.e. the price should be meaningfully
lower than the assessed value to account for potential risks in investing.
At Motilal Oswal, we call our approach to equity investing “QGLP” – Quality, Growth, Longevity,
reasonable Price. QGL is the Value component which is then juxtaposed with P i.e. reasonable
Price. In our recent past Wealth Creation Studies*, we have probed into various aspects of QGL.
In this Study, we attempt to gain some insights into what constitutes reasonable Price.
Exhibit 1 Motilal Oswal’s QGLP investment philosophy – At a glance
QGLP – Quality, Growth, Longevity, reasonable Price
* For all our Wealth Creation Studies, visit www.motilaloswal.com
Quality of business x Quality of management
• Stable business, preferably consumer facing
• Huge business opportunity
• Sustainable competitive advantage
• Competent management team
• Healthy financials & ratios
Growth in earnings
• Volume growth
• Price growth
• Mix change
• Operating leverage
• Financial leverage
Price
• Reasonable valuation, relative to
quality and growth prospects
• High margin of safety
Longevity of Quality & Growth
• Long-term relevance of business
• Extending competitive advantage
period
• Sustenance of growth momentum
QGLP

1 November 2018 6
23rd Annual Wealth Creation Study (2013-2018)
The key numerical triad of QGLP is –
1. RoE (Return on Equity) – this reflects the Quality of Business and Quality of Management
2. PAT Growth – the G of QGLP
3. P/E (Price-to-Earnings) – this helps determine reasonable price.
Exhibit 2 The numerical triad of QGLP
Hitherto, we assessed these three variables somewhat independently. We now find that a
simplified version of the Discounted Free Cash Flow to Equity (DFCFE) model offers an intelligent
integration of the RoE-Growth-PE triad, leading to some interesting insights on valuation which
we discuss in this Study. Besides, we also present some insights based on few pricing heuristics –
P/E (both absolute and relative to market), PEG (P/E to Growth ratio) and Payback Ratio.
The final message is loud and clear, especially in the context of current richly valued Indian market
– Overpaying doesn’t pay!
2. Evolution of valuation From book value to cash flows and beyond
Equity valuation is a continuously evolving practice. In his book Investing – The Last Liberal Art,
Robert Hagstrom traces out five phases of valuation –
Exhibit 3 How equity valuation has evolved
1930’s & 1940’s Discount to hard book value, first proposed by Benjamin Graham and David Dodd
1950’s Dividend yield
1960’s Earnings and earnings growth
1980’s Return on Equity and Cash flow, strongly advocated by the likes of Warren Buffett
Emerging Cash return on invested capital
What the above means is that there is unlikely to ever be a final word about valuation. Even as
new tools and techniques evolve, practitioners will adapt and adopt what best works for them.
RoE
P/EPAT
growth
Quality
PriceGrowth

1 November 2018 7
23rd Annual Wealth Creation Study (2013-2018)
3. What is Value Present value of lifetime cash flows
Investopedia defines Intrinsic Value as, “the perceived or calculated value of a company,
including tangible and intangible factors, using fundamental analysis. The intrinsic value may or
may not be the same as the current market value.”
The key word here is “perceived”. As is humorously said, “In the stock market, most people know
the price of everything but the value of nothing.” Price is universal to all, but value lies in the
minds of individual investors. In fact, the very reason stock trades happen is because at the same
price, some investors think the stock is below their perceived value (hence they buy), whereas
some others think it is beyond their perceived value (hence they sell). Those investors get
rewarded whose perception of value is closer to that which the market majority eventually
converges to.
The most irrefutable definition of Intrinsic Value for any asset is – present value of its lifetime
cash flows. This is most easily depicted in valuing fixed income instruments.
3.1 Intrinsic Value of fixed income instruments
Exhibit 4 depicts the cash flow and Intrinsic Value calculation for a bond with face value of INR
1,000 and 8% coupon. The annual interest inflows will be INR 80. In the 10th year, the principal of
INR 1,000 will also be repaid.
Now, these cash flows need to be discounted by the return that an investor desires. Thus, if an
investor desires 10% return, their present value of Year 1 interest inflow of INR 80 is INR 73
(80÷1.1), that of the Year 2 interest inflow is INR 66 (80÷1.21), and so on. This way, the total
present value of the interest and principal repayment inflows is INR 877, which is the bond’s
Intrinsic Value for this particular investor.
If another investor desires a return of 12%, their Intrinsic Value would work out to INR 774.
Exhibit 4 Intrinsic Value calculation for a bond with face value of INR 1,000 and 8% coupon if an investor desires 10% return
Year 1 2 3 4 5 6 7 8 9 10
Interest @ 8% of 1,000 (A) 80 80 80 80 80 80 80 80 80 80
Principal repayment (B) - - - - - - - - - 1,000
Total Cash flow I=(A)+(B) 80 80 80 80 80 80 80 80 80 1,080
Discount factor @ 10% (D) 1.10 1.21 1.33 1.46 1.61 1.77 1.95 2.14 2.36 2.59
(1.1) (1.12) (1.13) (1.14) (1.15) (1.16) (1.17) (1.18) (1.19) (1.110)
Present Value I=I÷(D) 73 66 60 55 50 45 41 37 34 416
TOTAL PRESENT VALUE 877

1 November 2018 8
23rd Annual Wealth Creation Study (2013-2018)
3.2 The challenge of Intrinsic Value for equity stocks
The above approach of discounting cash flow is increasingly being adopted to value equity stocks.
However, there are key challenges –
No fixed coupon: Unlike fixed income securities, equity stocks do not offer a fixed annual
coupon. Strictly speaking, the equity equivalent of a coupon is dividend. However, dividends
are dependent on the profits that companies earn and the dividend payout policy which they
choose to follow. Many times, even after earning healthy profits, companies may not declare
any dividends for a particular year(s) if they decide to conserve resources for expansion
and/or acquisitions.
No fixed tenure and terminal value: Unlike fixed income securities, equity stocks have no
fixed tenure and hence terminal value.
The challenge of required return i.e. discount rate: Intrinsic Value is very sensitive to the
required return or the discount rate. In the stock market, every investor will have their own
required return, and hence may arrive at their own Intrinsic Value. In equities, the key to
success is to accurately assess what value the broad market is likely to assign to a particular
company. Hence, choosing an appropriate discount rate is crucial in arriving at Intrinsic Value.
Even as the art and science of equity valuation continues to rapidly evolve, the current state-of-
art approach is what is called the DCF (Discounted Cash Flow) Model. We proceed to discuss
insights from one simplified version of the same.
4. Two key drivers of equity value Return on Equity and Earnings growth
A detailed discussion on DCF is beyond the scope of this report. We would refer readers to
valuation classics like Damodaran on Valuation by Professor Aswath Damodaran and Valuation:
Measuring and Managing the Value of Companies by Tim Koller, Marc Goedhart and David
Wessels. The latter book presents an interesting perspective that the DCF Model – hence value –
is essentially driven by two factors: (1) RoIC (Return on Invested Capital) and (2) Sales growth.
We have adapted a simplified version of the same using RoE (Return on Equity) as proxy for RoIC
and PAT (Profit After Tax) growth as proxy for Sales growth. We present the model and its key
elements in Exhibit 6 on page 9. We discuss below our key valuation insights from the same.
Exhibit 5 Return on Equity and Earnings growth drive value
Return on Equity
PAT Growth
Free Cash flow
Cost of Equity
VALUE

1 November 2018 9
23rd Annual Wealth Creation Study (2013-2018)
Exh
ibit
6 S
imp
lifi
ed
Dis
cou
nte
d F
ree
Ca
sh F
low
to
Eq
uit
y M
od
el
KE
Y V
AR
IAB
LES
-
Ass
um
ed
va
lue
s
Ear
nin
gs g
row
th r
ate
20
%
Ro
E
2
5%
Co
nti
nu
ing
gro
wth
rat
e
8
%
Co
st o
f E
qu
ity
1
3%
Yea
r 0
1
2
3
4
5
6
7
8
9
1
0
11
1
2
13
1
4
15
1
6
PA
T
83
1
00
1
20
1
44
1
73
2
07
2
46
2
90
3
39
3
91
4
47
5
06
5
68
6
30
6
93
7
56
8
16
YoY
20
%
20
%
20
%
20
%
20
%
19
%
18
%
17
%
16
%
14
%
13
%
12
%
11
%
10
%
9%
8
%
De
lta
PA
T
0
2
0
24
2
9
35
3
9
44
4
8
52
5
6
59
6
1
62
6
3
62
6
0
Inve
stm
en
t
80
9
6
11
5
13
8
15
7
17
5
19
3
21
0
22
5
23
7
24
6
25
0
25
2
25
0
24
2
FCFE
20
2
4
29
3
5
51
7
1
97
1
29
1
66
2
10
2
61
3
18
3
78
4
44
5
14
Co
nti
nu
ing
Val
ue
11
,10
0
To
tal C
ash
Flo
w
2
0
24
2
9
35
5
1
71
9
7
12
9
16
6
21
0
26
1
31
8
37
8
44
4
11
,61
4
Dis
cou
nt
Fact
or
1
.13
1
.28
1
.44
1
.63
1
.84
2
.08
2
.35
2
.66
3
.00
3
.39
3
.84
4
.33
4
.90
5
.53
6
.25
DC
FE
1
8
19
2
0
21
2
8
34
4
1
48
5
5
62
6
8
73
7
7
80
1
,85
7
Intr
insi
c V
alu
e
2,5
00
2,7
81
3
,09
3
3,4
41
3
,82
7
4,2
57
4
,73
6
5,2
68
5
,86
0
6,5
18
7
,25
0
8,0
65
8
,97
1
9,9
79
1
1,1
00
Intr
insi
c P
/E
30
2
5
23
2
1
20
1
8
17
1
6
16
1
5
15
1
4
14
1
4
14
1
5
Ke
y e
lem
en
ts e
xpla
ine
d:
Earn
ings
gro
wth
ra
te:
Th
is is
th
e g
row
th in
PA
T as
sum
ed
to
su
stai
n in
th
e f
irst
fiv
e
year
s. P
ost
th
at t
he
gro
wth
is t
ape
red
to
th
e c
on
tin
uin
g gr
ow
th r
ate
of
8%
.
Co
nti
nu
ing
gro
wth
ra
te:
Th
is is
th
e r
ate
at
wh
ich
PA
T an
d c
ash
flo
w a
re e
xpe
cte
d
to g
row
be
yon
d t
he
exp
licit
fo
reca
st p
eri
od
of
15
ye
ars.
Th
eo
ry s
ugg
est
s th
is
sho
uld
be
exp
ect
ed
no
min
al G
DP
gro
wth
rat
e t
o p
erp
etu
ity.
Co
st o
f Eq
uit
y: T
his
is t
he
ma
rke
t’s
retu
rn e
xpe
ctat
ion
on
a p
arti
cula
r st
ock
. In
ou
r
mo
de
l, w
e h
ave
co
nsi
de
red
Co
st o
f E
qu
ity
at 1
3%
, th
e lo
ng-
pe
rio
d r
etu
rn o
f In
dia
’s
be
nch
mar
k st
ock
ind
ice
s. A
no
the
r al
tern
ativ
e a
pp
roac
h is
ris
k-fr
ee
rat
e (
8%
) p
lus
5%
ris
k p
rem
ium
, wh
ich
als
o w
ork
s o
ut
to 1
3%
.
De
lta
PA
T:
Th
is is
th
e in
cre
me
nta
l PA
T o
ver
pre
vio
us
year
.
Inve
stm
en
t: T
his
is t
he
inve
stm
en
t re
qu
ire
d e
ach
ye
ar t
o g
en
era
te t
he
De
lta
PA
T
ne
xt y
ear
. Th
is is
de
pe
nd
en
t o
n R
oE
, an
d is
de
term
ine
d b
y D
elt
a P
AT
÷ R
oE
. Th
us,
to g
en
era
te D
elt
a P
AT
of
20
in Y
ear
2, t
he
fir
m h
ere
ne
ed
s to
inve
st 8
0 (
20
÷2
5%
) in
Year
1.
FCFE
: F
ree
Ca
sh F
low
to
Eq
uit
y is
PA
T le
ss In
vest
me
nt
ne
ed
ed
.
Co
nti
nu
ing
Va
lue
: T
his
is t
he
val
ue
of
the
fir
m b
eyo
nd
th
e e
xplic
it f
ore
cast
pe
rio
d.
It is
cal
cula
ted
usi
ng
the
pre
sen
t va
lue
fo
rmu
la o
f a
gro
win
g an
nu
ity
i.e.
Year
15
FCFE
x (
1+
Co
nti
nu
ing
gro
wth
rat
e)
÷ (
Co
st o
f e
qu
ity
– C
on
tin
uin
g gr
ow
th r
ate
).
Dis
cou
nt
Fact
or:
Th
is is
(1
+C
ost
of
Eq
uit
y)n, w
he
re n
in t
he
nu
mb
er
of
year
.
DFC
FE:
Dis
cou
nte
d F
ree
Cas
h F
low
to
Eq
uit
y; t
his
is a
rriv
ed
at
as
Tota
l Cas
h F
low
÷ D
isco
un
t Fa
cto
r.
Intr
insi
c V
alu
e:
Th
is is
th
e s
um
to
tal o
f al
l 15
-ye
ars’
DFC
FE.
Intr
insi
c P
/E:
Th
is is
cal
cula
ted
as
Intr
insi
c V
alu
e ÷
PA
T (o
f re
spe
ctiv
e y
ear
).
Mo
de
l lim
ita
tio
n:
This
is a
sim
plif
ied
ve
rsio
n w
ith
a f
ew
ass
um
pti
on
s –
An
nu
al d
ep
reci
atio
n t
ake
s ca
re o
f in
vest
me
nts
re
qu
ire
d t
o m
ain
cu
rre
nt
pro
fits
.
The
co
mp
any
is c
urr
en
tly
op
era
tin
g at
fu
ll ca
pac
ity
i.e. f
urt
he
r gr
ow
th is
po
ssib
le
on
ly t
hro
ugh
fu
rth
er
inve
stm
en
t.
The
re is
no
maj
or
chan
ge in
th
e c
om
pan
y’s
de
bt
po
siti
on
.

1 November 2018 10
23rd Annual Wealth Creation Study (2013-2018)
4.1.1 Balance Sheet RoE versus Business RoE
A key issue in valuing a company is which RoE figure to consider – the balance sheet RoE or the core
business RoE. Over time, many Indian companies have resorted to holding cash on their balance
sheets in excess of their immediate business requirements. Such excess cash barely earns 5% post-tax
yield. This causes reported RoE to be muted.
In some cases, the market is efficient enough to compute the core RoE and value companies
accordingly. However, in some others, the market fears capital misallocation and hence keeps
valuations low. We are convinced companies can improve their valuations by bridging the gap
between balance sheet RoE and business RoE through a combination of higher dividend payout and
share buyback. From Exhibit 7 below, the top candidates for potential re-rating are: Hindustan Zinc,
Bajaj Auto, Hero Motocorp and Infosys.
Exhibit 7 Leading companies with significant gap between Balance Sheet RoE and Business RoE
Net Worth Cash Equivalents Return on Equity (%) Current
Company (INR bn) (INR bn) % of NW Bal. Sheet Business P/E (x)
Hindustan Unilever 73 53 73 75 221 64
Hindustan Zinc 359 222 62 27 123 14
Bajaj Auto 204 171 84 22 92 16
Eicher Motors 70 50 72 32 87 28
Hero Motocorp 120 67 56 32 64 15
Maruti Suzuki 426 342 80 16 58 31
TCS 852 431 51 30 58 24
Infosys 649 262 40 23 37 17
ITC 525 209 40 22 34 32
Bosch 100 64 64 15 32 40
OUR METHODOLOGY
We calculated the cash equivalents for all the companies.
In cases where cash equivalents exceeds debt, we deducted 4.5% post-tax yield on the cash from
the companies’ reported PAT to arrive at their core Business PAT.
We deducted the cash equivalents from the Net Worth to arrive at the core Business Net Worth.
We calculated core Business RoE as Business PAT divided by Business Net Worth.
Exhibit 7 features the top 10 Business RoE companies with excess cash of at least INR 50 billion.
4.1 Interplay of RoE and growth determines free cash flow
In business, growth is a choice. Companies can choose whether or not they wish to grow, and if
yes, at what rate. Having chosen a growth rate, the level of investment required to achieve the
same depends on their RoE. As shown in Exhibit 6, consider a company with PAT of INR 100 in
Year 1. It chooses to grow 20% next year i.e. earn additional PAT of INR 20 in Year 2. Now, if it
enjoys RoE of 25%, to earn the incremental INR 20 in Year 2, it will need to invest INR 80 (20÷25%)
in Year 1 itself. This leaves Year 1 free cash flow of INR 20 (100-80).
If, however, the company enjoyed RoE of 20%, to earn additional PAT of INR 20, it would need to
invest INR 100 (20÷20%) in Year 1. This would leave free cash flow of zero (100-100). Likewise, if
RoE was 15%, the additional PAT of INR 20 would entail investment of INR 133 (20÷15%), implying
Year 1 free cash flow of INR -33 (100-133), which means the company would have to infuse fresh
equity of INR 33 to grow by 20%. Thus, if a company’s RoE is well above its growth rate, it does
not need additional fund raising.

1 November 2018 11
23rd Annual Wealth Creation Study (2013-2018)
4.2 All growth is not necessarily good The stock markets are gripped by Earnings growth. In the short- and medium term, all companies
with high earnings growth tend to get rewarded by investors by way of rising stock prices and
market value. However, our model suggests that all growth is not good –
If a company’s RoE remains below Cost of Equity for long, then high growth actually detracts
firm value, as the company has to raise significant levels of capital from its equity holders to
fund its growth (the 10% RoE column in Exhibit 8 and 9).
If a company’s RoE is exactly equal to its Cost of Equity, then no amount of growth adds any
value whatsoever (the 13% RoE column in Exhibit 8 and 9). The P/E in such case works out to
1÷Cost of Equity, here, 1÷13% = 7.7x.
Growth adds positive value only when RoE is higher than Cost of Equity.
Note that at 0% growth, value of a company is the same irrespective of RoE. The P/E in such
case again works out to 1÷Cost of Equity, here, 1÷13% = 7.7x.
Exhibit 8 Firm value for various combinations of RoE and Growth
RoE
670 10% 13% 15% 20% 25% 30% 40% 50% 100%
0% 770 770 770 770 770 770 770 770 770
10% 280 770 990 1,340 1,550 1,700 1,870 1,980 2,190
Growth (see note)
15% 10 770 1,110 1,650 1,980 2,200 2,480 2,640 2,970
20% -310 770 1,250 2,030 2,500 2,820 3,210 3,440 3,910
25% -740 770 1,440 2,530 3,180 3,620 4,160 4,490 5,140
30% -1,290 770 1,680 3,170 4,060 4,660 5,400 5,850 6,740
40% -2,900 770 2,400 5,060 6,650 7,710 9,040 9,830 11,420
Note: Growth rate is for first 5 years; other variables are based on Exhibit 6 on page 9
Exhibit 9 1-year forward P/E multiples for various combinations of RoE and Growth
RoE
670 10% 13% 15% 20% 25% 30% 40% 50% 100%
0% 8 8 8 8 8 8 8 8 8
10% 3 8 10 13 16 17 19 20 22
Growth (see note)
15% 0 8 11 17 20 22 25 26 30
20% -3 8 13 20 25 28 32 34 39
25% -7 8 14 25 32 36 42 45 51
30% -13 8 17 32 41 47 54 59 67
40% -29 8 24 51 67 77 90 98 114
Note: Growth rate is for first 5 years; other variables are based on Exhibit 6 on page 9
4.3 Beyond a point, growth adds more value than RoE
Iterations in our DFCFE Model suggest that beyond a certain high level of RoE, further increase in
RoE adds commensurately less value. Thus, as Exhibit 10 shows, beyond 40-50%, rise in RoE
results in much lower rise in P/E. So, once RoEs are comfortably higher than Cost of Equity,
investors (and even company managers) should seek Earnings growth to drive value, rather than
expanding RoE. At the other end of the spectrum, low RoE companies add much higher value by
raising RoE than growth (Exhibit 11).

1 November 2018 12
23rd Annual Wealth Creation Study (2013-2018)
Exhibit 10 For a given level of growth, PE flattens out beyond a high level of RoE, say, 40-50%
Exhibit 11 If RoE is high, delta growth adds higher value; if RoE is low, delta RoE adds higher value
% change in value Company A Company B
30% RoE | 20% Growth 16% RoE | 20% Growth
1% higher RoE 2% 12%
1% higher growth 5% 3%
4.4 Earnings growth and valuation are exponentially correlated
For any given level of RoE above Cost of Equity, P/E rises exponentially relative to Earnings
growth. Thus, as Exhibit 12 shows, at 25% RoE, a 5-year hyper earnings growth of 40% merits a
one-year forward P/E of 67x whereas, growth of 50%, merits a much higher P/E of 108x.
Exhibit 12 For a given RoE above Cost of Equity, P/E is exponentially correlated to earnings growth
Having determined that RoE and Earnings growth are the key drivers of value, it is relevant to
know what drives each of them. We discuss this in an Annexure 1 on page 24.
0
10
20
30
40
50
13% 20% 25% 30% 40% 50% 60% 70% 80% 90% 100% 150% 200%
1-y
ear
fo
rwar
d P
/E
RoE
1-year forward P/E for different RoEs for 20% growth rate
0
20
40
60
80
100
120
0% 10% 15% 20% 25% 30% 40% 50%
1-y
ear
fo
rwar
d P
/E
Earnings growth
1-year forward P/E for different growth rates for 25% RoE

1 November 2018 13
23rd Annual Wealth Creation Study (2013-2018)
5. RoE, Earnings growth & Stock returns The Indian experience
We processed 20-year data of RoE, Earnings growth and Stock returns of today’s top 1,500 listed
companies. We list some of the findings here.
5.1 High RoE is rare On average, 52% of India Inc has RoE lower than 13%. Only 19% of companies manage RoE of
over 25%.
Exhibit 13 High RoE is rare in India Inc
5.2 Sustaining RoE above Cost of Equity is a challenge
To consider only meaningful companies, we started with 188 companies with PAT above INR 200
mn in 1998. Of these, a fairly high 136 companies had RoE greater than 13%. However, that figure
dropped quite steeply in the initial 7-8 years and more gradually later, all the way down to a mere
22 by 2018.
Exhibit 14 Only 22 companies managed to sustain RoE above 13% every year over the last 20 years
56
%
63
%
58
%
62
%
66
%
59
%
49
%
43
%
38
%
35
%
39
% 51
%
43
%
44
% 54
%
56
%
58
%
59
%
58
%
57
%
55
%
31
%
24
%
27
%
26
%
21
%
25
%
27
%
27
%
30
%
32
%
31
% 29
%
32
%
34
% 30
%
30
%
29
%
29
%
30
%
29
%
33
%
13
%
13
%
15
%
12
%
13
%
16
%
24
%
29
%
32
%
33
%
30
% 20
%
25
%
21
%
16
%
14
%
13
%
12
%
12
%
14
%
12
%
19
98
19
99
20
00
20
01
20
02
20
03
20
04
20
05
20
06
20
07
20
08
20
09
20
10
20
11
20
12
20
13
20
14
20
15
20
16
20
17
20
18
RoE distribution < 13% 13-25% >=25%
136
107
88
7462
56 5346 41 40 39 36 35 34 33 33 30 27 23 23 22
19
98
19
99
20
00
20
01
20
02
20
03
20
04
20
05
20
06
20
07
20
08
20
09
20
10
20
11
20
12
20
13
20
14
20
15
20
16
20
17
20
18
Companies which sustained RoE > 13% every year

1 November 2018 14
23rd Annual Wealth Creation Study (2013-2018)
5.3 Like high RoE, high Earnings growth is also not easy to come by
On average, over 60% of companies in India are likely to clock 5-year PAT CAGR of less than 15%.
The balance 40% are almost equally divided between 15-25% PAT CAGR and 25%+.
Exhibit 15 High Earnings growth is also not easy to come by in India
5.4 Hyper Earnings growth is rarely sustained beyond 5-6 years
Sustaining hyper Earnings growth beyond 5-6 years is a low probability event. As seen in Exhibit
16, in 1998, 188 companies had PAT above INR 200 mn. Of these, 28 clocked PAT CAGR of 25%+
in the first 5-year period i.e. 1998 to 2003. Of these 28, only 8 sustained 25%+ growth in the
second 5-year period (2003-08), and just 1 in the third (2008-13).
Likewise, in 2003, of the 283 companies with PAT above INR 200 mn, as many as 103 clocked PAT
CAGR of 25%+ in the first 5-year period i.e. 2003 to 2008. Once again, this figure collapsed to 13
in the second 5-year period (2008-13) and to zero in the third (2013-18).
The above phenomenon can be seen even in 3-year growth periods, when the numbers in the
third round are just single digits.
Exhibit 16 High Earnings growth is rarely sustained beyond 5-6 years
Year
Companies with PAT
Cos. With PAT CAGR >= 25% in 5-year period
Cos. With PAT CAGR >= 25% in 3-year period
>= INR 200 mn 1st 2nd 3rd 1st 2nd 3rd 4th
1998 188 28 8 1 35 18 8 2
1999 197 50 14 2 39 17 8 3
2000 221 52 12 2 50 17 10 2
2001 241 69 22 1 83 28 8 2
2002 236 91 16 0 92 34 11 1
2003 283 103 13 0 111 40 8 2
5.5 Implications for stock investing
Stock markets tend to extrapolate recent earnings performance into the future. If a company is
currently in the hyper growth mode, the market is likely to end up extrapolating this too far into
the future, bidding up valuations. The above data that hyper growth rarely lasts beyond 5-6 years
38
%
31
%
29
%
20
%
13
%
17
%
25
%
20
%
22
% 35
%
42
%
44
%
47
%
45
%
37
%
32
%
29
%
26
%
29
%
28
%
25
% 26
% 28
%
26
%
23
%
29
% 26
%
24
%
26
%
30
%
32
%
35
%
18
%
17
%
19
%
23
%
24
%
20
% 18
%
20
%
23
%
18
% 18
%
15
% 19
%
15
%
15
%
17
%
15
%
25
%
24
%
29
%
39
%
36
%
29
%
35
%
32
% 18
%
13
%
17
% 8%
11
%
16
%
16
%
19
98
19
99
20
00
20
01
20
02
20
03
20
04
20
05
20
06
20
07
20
08
20
09
20
10
20
11
20
12
20
13
5-year PAT CAGR beginning
PAT Growth distribution < 0 0-15% 15-25% >= 25%

1 November 2018 15
23rd Annual Wealth Creation Study (2013-2018)
will prevent smart investors from buying into such stocks based on unrealistic growth
expectations. Further, investors already holding stocks of companies in the hyper growth mode
must seriously consider exiting if valuations hit exuberant levels. (As Section 6 suggests, 2x
Market P/E or 3x PEG whichever is higher may be deemed to be exuberant levels.)
5.6 What works – prefer High-RoE-High-Growth stocks
It is possible to classify all stocks on the basis of 10-year average RoE into High (above 15%) and
Low (below 15%). Likewise, stocks can also be classified based on 10-year Earnings CAGR into
High (above 15%) and Low (below 15%).
Exhibit 17 captures the performance of the four resultant investment strategies for rolling 10-
year periods between 1998 and 2018. Exhibit 18 maps the final average performance on to our
Quality-Growth Matrix.
Exhibit 17 Performance of four investment strategies based on RoE and Earnings growth
98-08 99-09 00-10 01-11 02-12 03-13 04-14 05-15 06-16 07-17 08-18 Average
Sensex Return 15% 10% 13% 18% 18% 20% 15% 16% 8% 9% 8% 14%
Strategy Returns –
High RoE, High Growth 27% 22% 28% 33% 32% 33% 25% 28% 22% 26% 29% 27%
Low RoE, High Growth 33% 16% 22% 30% 28% 29% 19% 16% 14% 15% 14% 21%
High RoE, Low Growth 11% 7% 12% 19% 18% 19% 14% 15% 9% 14% 17% 14%
Low RoE, Low Growth 10% 2% 8% 12% 9% 11% 7% 4% 0% 4% 3% 6%
No. of cos. With PAT of at least INR 200 mn
135 139 186 195 191 239 297 355 427 502 558
Note: For all the periods, we have considered only companies with PAT of at least INR 200 mn
Key observations –
The High-RoE-High-Growth strategy has handsomely outperformed the benchmark in all
eleven 10-year periods.
The High-RoE-High-Growth strategy has also outperformed all the other four strategies,
except in 1998 to 2008 when a handful of 10 Low-RoE-High-Growth stocks outperformed.
This clearly is an aberration.
We believe the bedrock of high RoE (i.e. High Quality) lends stability to the portfolio.
The above findings reiterate our belief in our Quality-Growth matrix payoff (Exhibit 18).
We continue to prefer High-Quality-High-Growth stocks, but with a very strong emphasis on
reasonable price. Section 8 covers what constitutes a reasonable price.

1 November 2018 16
23rd Annual Wealth Creation Study (2013-2018)
Exhibit 18 Quality-Growth Matrix
Performance Expectation Actual Average Returns (see note below)
Note: Actual Average Returns is the “Average” column of Exhibit 17, plotted on the Quality-Growth Matrix.
The comparable Sensex performance is 14%.
6. Reasonable Price What works, what doesn’t
Having gleaned some insights on valuation, we proceed to explore some potential pricing
strategies. What’s the difference between valuation and pricing of any asset, in our case stocks?
As stated earlier, valuation essentially is a fundamental assessment of a stock’s intrinsic value,
based on the expected cash flows arising from the same. In contrast, pricing is more empirical
and heuristic. The basis of such pricing is usually based on applying appropriate multiples – P/E,
Price/Book, Price/Sales, EV/EBITDA, etc. Pricing is also likely to be relative rather than absolute
i.e. depending on what comparable stocks or benchmark is priced.
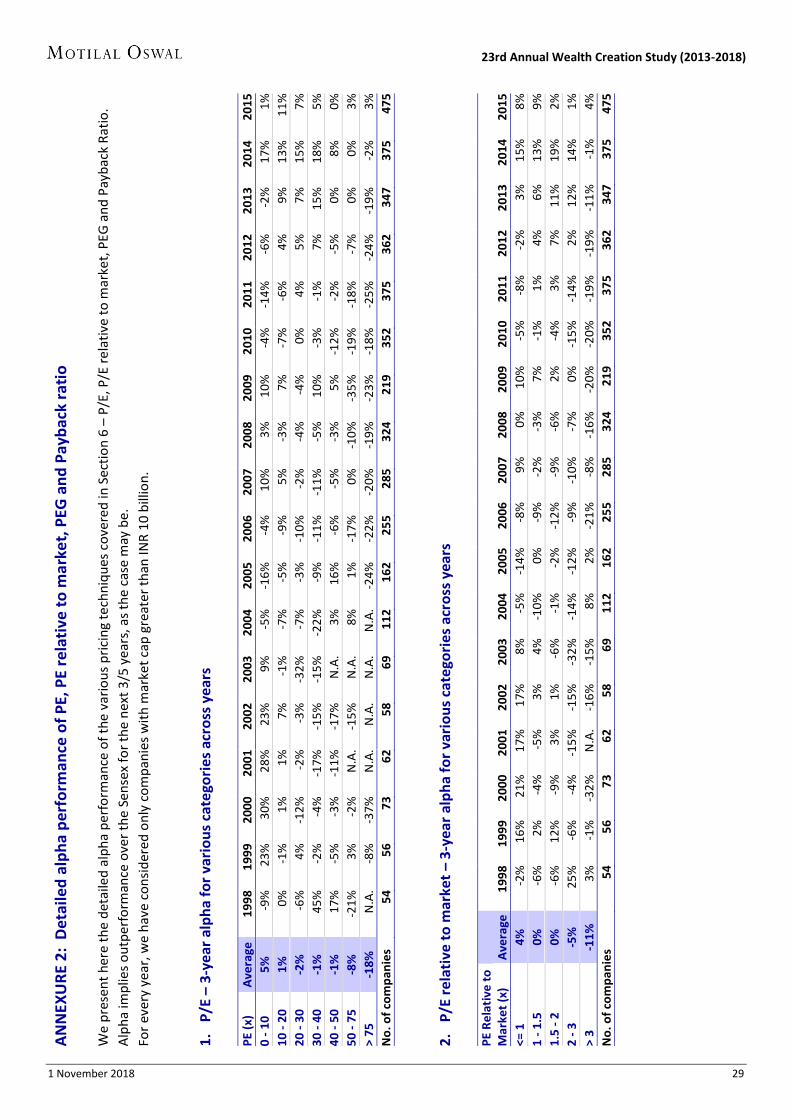
We studied the alpha track record over 20 years (1998 to 2018) of four pricing techniques – P/E,
P/E relative to market, PEG and Payback Ratio. Based on the same, we arrive at some idea of
what potentially works and what doesn’t.
Our methodology for P/E, P/E relative to market and PEG –
3-year alpha implies outperformance over the Sensex for the next 3 years. Thus, for 1998, alpha would
be outperformance over 1998 to 2001, for 1999, outperformance over 1999 to 2002, and so on till
outperformance over 2015 to 2018 for alpha in 2015.
For each year from 1998 to 2015, we started off with stocks which had market capitalization of at least
INR 10 bn.
For each year, we observed the alpha under each category (e.g. P/E 0-10x, 10-20x, and so on).
Finally, we averaged the performance of the 18 observation years, 1998 to 2015.
The observations for each year are presented in Annexure 2, pages 29 & 30.
GROWTH TRAPS TRUE WEALTH CREATORSHigh Transitory Enduring
Multi-baggers Multi-baggers
GROWTH
WEALTH DESTROYERS QUALITY TRAPSLow Permanent capital loss Underperformers
Low High
QUALITY
High
GROWTH
Low
Low High
QUALITY
21% 27%
14%6%
1 November 2018 17
23rd Annual Wealth Creation Study (2013-2018)
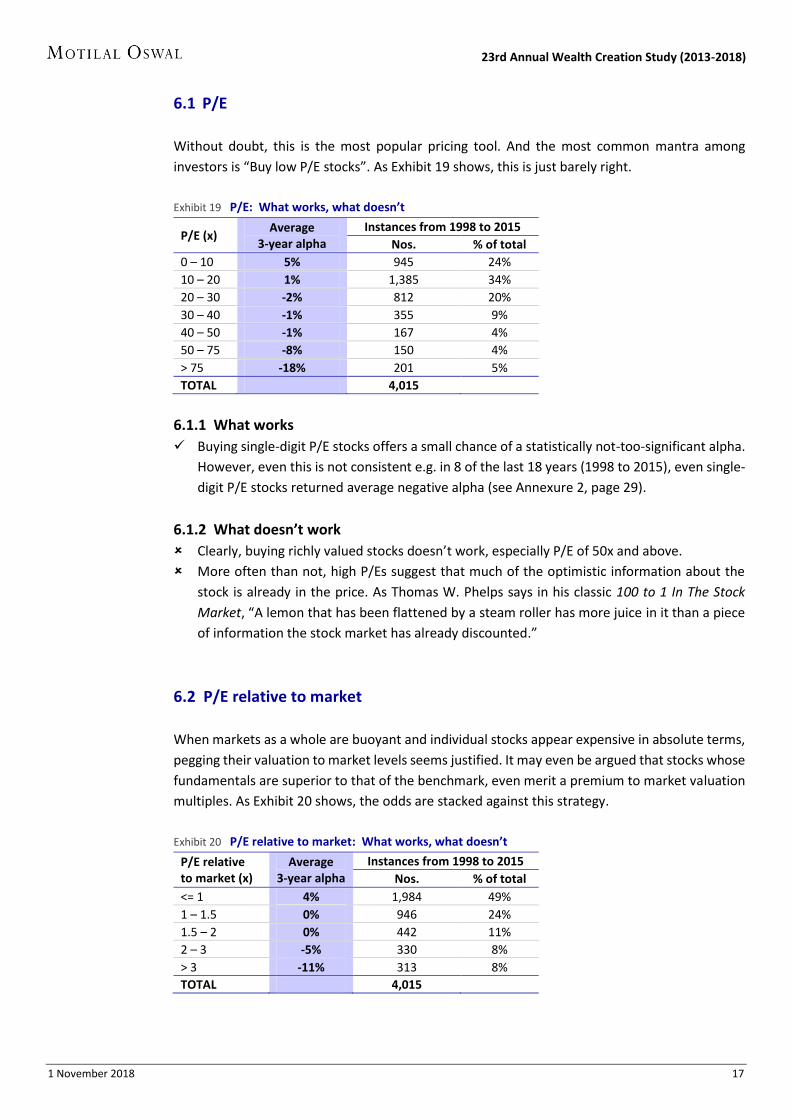
6.1 P/E
Without doubt, this is the most popular pricing tool. And the most common mantra among
investors is “Buy low P/E stocks”. As Exhibit 19 shows, this is just barely right.
Exhibit 19 P/E: What works, what doesn’t
P/E (x) Average
3-year alpha
Instances from 1998 to 2015
Nos. % of total
0 – 10 5% 945 24%
10 – 20 1% 1,385 34%
20 – 30 -2% 812 20%
30 – 40 -1% 355 9%
40 – 50 -1% 167 4%
50 – 75 -8% 150 4%
> 75 -18% 201 5%
TOTAL 4,015
6.1.1 What works
Buying single-digit P/E stocks offers a small chance of a statistically not-too-significant alpha.
However, even this is not consistent e.g. in 8 of the last 18 years (1998 to 2015), even single-
digit P/E stocks returned average negative alpha (see Annexure 2, page 29).
6.1.2 What doesn’t work
Clearly, buying richly valued stocks doesn’t work, especially P/E of 50x and above.
More often than not, high P/Es suggest that much of the optimistic information about the
stock is already in the price. As Thomas W. Phelps says in his classic 100 to 1 In The Stock
Market, “A lemon that has been flattened by a steam roller has more juice in it than a piece
of information the stock market has already discounted.”
6.2 P/E relative to market
When markets as a whole are buoyant and individual stocks appear expensive in absolute terms,
pegging their valuation to market levels seems justified. It may even be argued that stocks whose
fundamentals are superior to that of the benchmark, even merit a premium to market valuation
multiples. As Exhibit 20 shows, the odds are stacked against this strategy.
Exhibit 20 P/E relative to market: What works, what doesn’t
P/E relative to market (x)
Average 3-year alpha
Instances from 1998 to 2015
Nos. % of total
<= 1 4% 1,984 49%
1 – 1.5 0% 946 24%
1.5 – 2 0% 442 11%
2 – 3 -5% 330 8%
> 3 -11% 313 8%
TOTAL 4,015
1 November 2018 18
23rd Annual Wealth Creation Study (2013-2018)
6.2.1 What works
Buying stocks below market P/E offers some chance of a statistically not-too-significant
alpha. However, as was the case with low P/E, even this is not consistent – in 7 of the last 18
years, stocks bought below market P/E returned negative alpha (see Annexure 2, page 29).
6.2.2 What doesn’t work
Clearly, buying 2x and above market P/E levels is a sure recipe for underperformance.
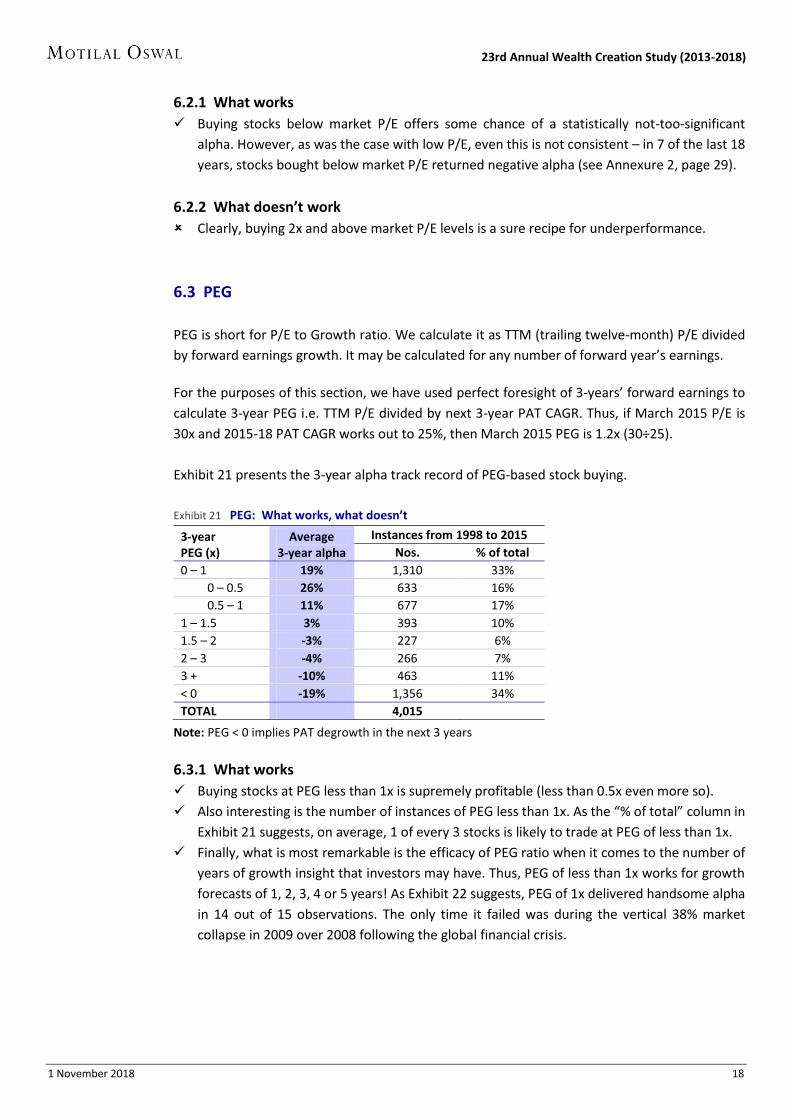
6.3 PEG
PEG is short for P/E to Growth ratio. We calculate it as TTM (trailing twelve-month) P/E divided
by forward earnings growth. It may be calculated for any number of forward year’s earnings.
For the purposes of this section, we have used perfect foresight of 3-years’ forward earnings to
calculate 3-year PEG i.e. TTM P/E divided by next 3-year PAT CAGR. Thus, if March 2015 P/E is
30x and 2015-18 PAT CAGR works out to 25%, then March 2015 PEG is 1.2x (30÷25).
Exhibit 21 presents the 3-year alpha track record of PEG-based stock buying.
Exhibit 21 PEG: What works, what doesn’t
3-year PEG (x)
Average 3-year alpha
Instances from 1998 to 2015
Nos. % of total
0 – 1 19% 1,310 33%
0 – 0.5 26% 633 16%
0.5 – 1 11% 677 17%
1 – 1.5 3% 393 10%
1.5 – 2 -3% 227 6%
2 – 3 -4% 266 7%
3 + -10% 463 11%
< 0 -19% 1,356 34%
TOTAL 4,015
Note: PEG < 0 implies PAT degrowth in the next 3 years
6.3.1 What works
Buying stocks at PEG less than 1x is supremely profitable (less than 0.5x even more so).
Also interesting is the number of instances of PEG less than 1x. As the “% of total” column in
Exhibit 21 suggests, on average, 1 of every 3 stocks is likely to trade at PEG of less than 1x.
Finally, what is most remarkable is the efficacy of PEG ratio when it comes to the number of
years of growth insight that investors may have. Thus, PEG of less than 1x works for growth
forecasts of 1, 2, 3, 4 or 5 years! As Exhibit 22 suggests, PEG of 1x delivered handsome alpha
in 14 out of 15 observations. The only time it failed was during the vertical 38% market
collapse in 2009 over 2008 following the global financial crisis.

1 November 2018 19
23rd Annual Wealth Creation Study (2013-2018)
Exhibit 22 PEG works, whatever be the forecast horizon over 1 to 5 years
1-year 2-year 3-year 4-year 5-year
2000-05
Sensex return -28% -17% -15% 3% 5%
PEG < 1x return -14% 22% 12% 37% 31%
Alpha 13% 38% 27% 34% 25%
2008-13
Sensex return -38% 6% 8% 3% 4%
PEG < 1x return -42% 27% 26% 18% 15%
Alpha -4% 21% 19% 15% 11%
2013-18
Sensex return 19% 22% 10% 12% 12%
PEG < 1x return 36% 61% 38% 45% 39%
Alpha 17% 39% 28% 33% 27%
6.3.2 What doesn’t work
Buying stocks at PEG > 1.5x is avoidable.
The high level of underperformance at PEG of 3x+ should be a warning signal especially in the
current market where stocks which are high on quality (read, high RoE) but low on growth
are trading at fancy P/E multiples.
6.4 Payback Ratio
Payback Ratio is a proprietary ratio of Motilal Oswal, and is calculated as –
Payback Ratio = Current Market Cap
Sum of next 5 years’ PAT
Clearly, lower the ratio, higher the stock returns.
For the purposes of this section, we have used next five years of PAT with perfect foresight e.g.
in 1998, we calculate Payback Ratio by dividing 1998 Market Cap by the sum of actual PAT of
1999, 2000, 2001, 2002 and 2003.
Exhibit 23 presents the 5-year alpha track record of Payback Ratio based stock buying.
Exhibit 23 Payback Ratio: What works, what doesn’t
Payback Ratio (x)
Average 5-year alpha
Instances from 1998 to 2013
Nos. % of total
0 – 1 17% 454 13%
1 – 1.5 5% 421 12%
1.5 – 2 4% 353 10%
2 – 3 0% 616 18%
3 + -12% 1,153 34%
< 0 -26% 375 11%
TOTAL 3,372
Note: Payback < 0 implies the cumulative PAT of next five years is negative
For detailed annual workings, see Annexure 2, page 30
1 November 2018 20
23rd Annual Wealth Creation Study (2013-2018)
6.4.1 What works
Buying stocks with Payback Ratio less than 1x is highly rewarding.
There is some chance of outperformance even up to Payback Ratio of 2x.
6.4.2 What doesn’t work
Payback Ratio of over 3x is a clear sign of overvaluation.
Loss-making companies are best avoided (Payback Ratio < 0 implies the cumulative PAT of
next five years is negative.)
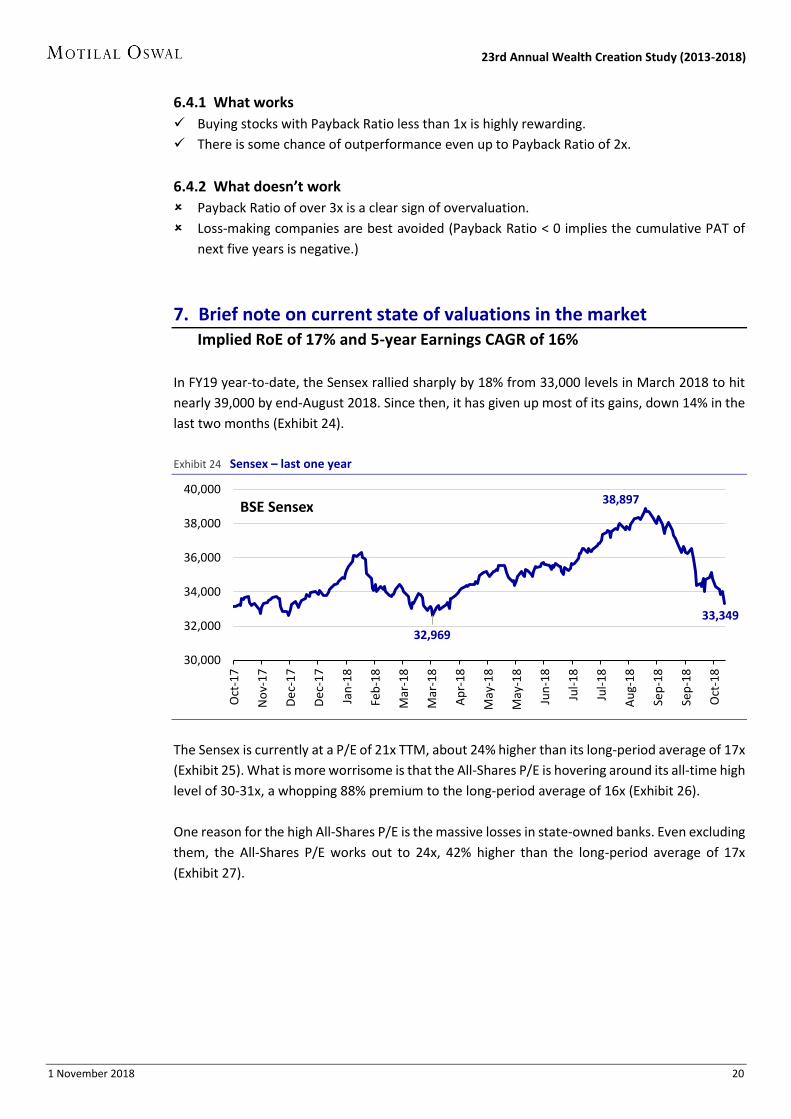
7. Brief note on current state of valuations in the market Implied RoE of 17% and 5-year Earnings CAGR of 16%
In FY19 year-to-date, the Sensex rallied sharply by 18% from 33,000 levels in March 2018 to hit
nearly 39,000 by end-August 2018. Since then, it has given up most of its gains, down 14% in the
last two months (Exhibit 24).
Exhibit 24 Sensex – last one year
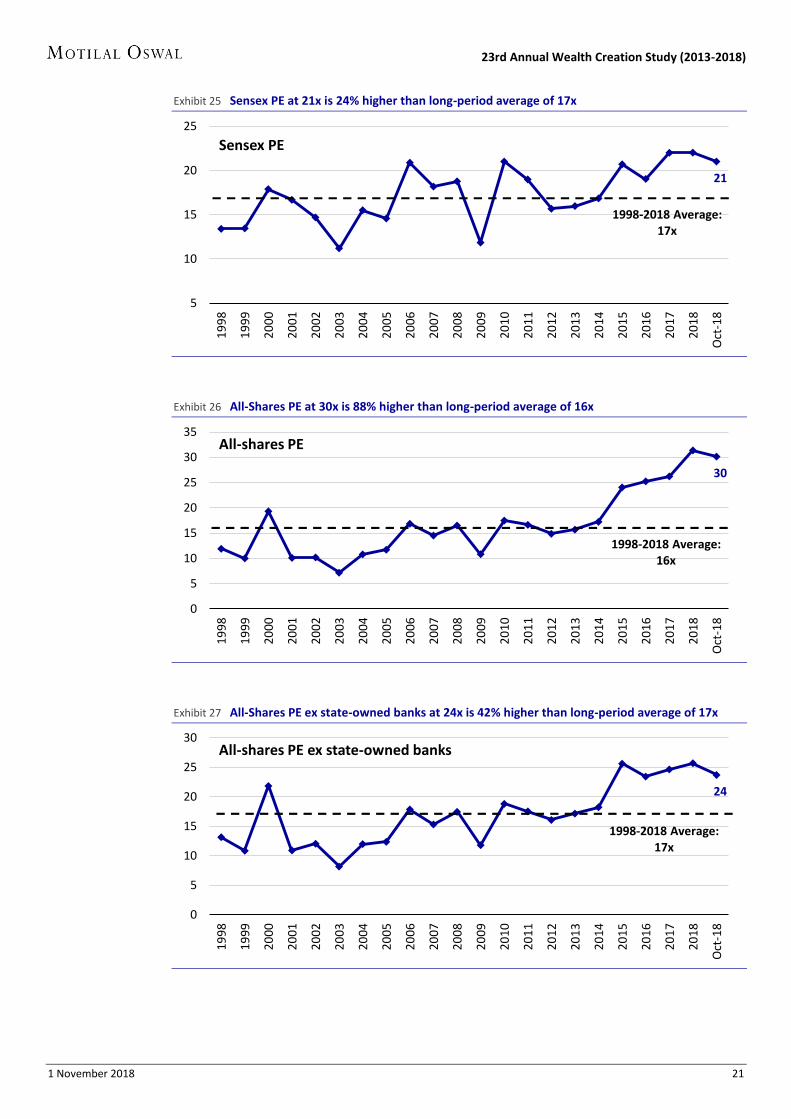
The Sensex is currently at a P/E of 21x TTM, about 24% higher than its long-period average of 17x
(Exhibit 25). What is more worrisome is that the All-Shares P/E is hovering around its all-time high
level of 30-31x, a whopping 88% premium to the long-period average of 16x (Exhibit 26).
One reason for the high All-Shares P/E is the massive losses in state-owned banks. Even excluding
them, the All-Shares P/E works out to 24x, 42% higher than the long-period average of 17x
(Exhibit 27).
32,969
38,897
33,349
30,000
32,000
34,000
36,000
38,000
40,000
Oct
-17
No
v-1
7
De
c-1
7
De
c-1
7
Jan
-18
Feb
-18
Mar
-18
Mar
-18
Ap
r-1
8
May
-18
May
-18
Jun
-18
Jul-
18
Jul-
18
Au
g-1
8
Sep
-18
Sep
-18
Oct
-18
BSE Sensex
1 November 2018 21
23rd Annual Wealth Creation Study (2013-2018)
Exhibit 25 Sensex PE at 21x is 24% higher than long-period average of 17x
Exhibit 26 All-Shares PE at 30x is 88% higher than long-period average of 16x
Exhibit 27 All-Shares PE ex state-owned banks at 24x is 42% higher than long-period average of 17x
21
5
10
15
20
25
19
98
19
99
20
00
20
01
20
02
20
03
20
04
20
05
20
06
20
07
20
08
20
09
20
10
20
11
20
12
20
13
20
14
20
15
20
16
20
17
20
18
Oct
-18
Sensex PE
1998-2018 Average:17x
30
0
5
10
15
20
25
30
35
19
98
19
99
20
00
20
01
20
02
20
03
20
04
20
05
20
06
20
07
20
08
20
09
20
10
20
11
20
12
20
13
20
14
20
15
20
16
20
17
20
18
Oct
-18
All-shares PE
1998-2018 Average:16x
24
0
5
10
15
20
25
30
19
98
19
99
20
00
20
01
20
02
20
03
20
04
20
05
20
06
20
07
20
08
20
09
20
10
20
11
20
12
20
13
20
14
20
15
20
16
20
17
20
18
Oct
-18
All-shares PE ex state-owned banks
1998-2018 Average:17x
1 November 2018 22
23rd Annual Wealth Creation Study (2013-2018)
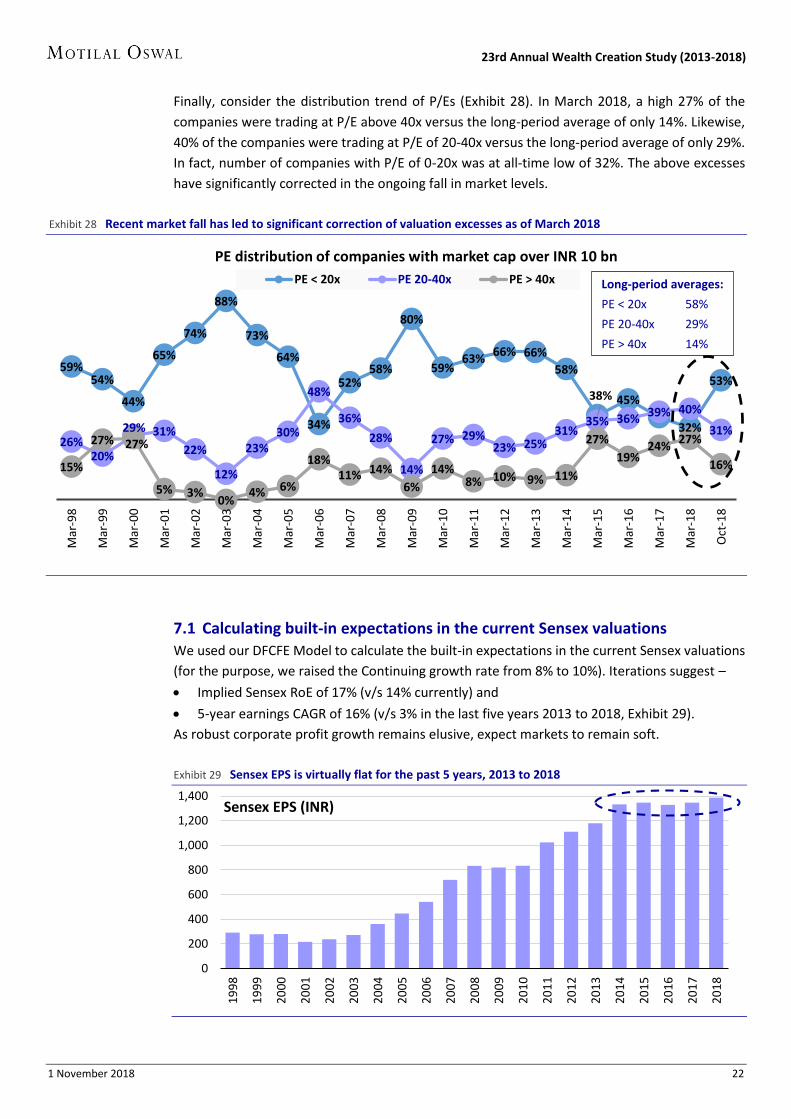
Finally, consider the distribution trend of P/Es (Exhibit 28). In March 2018, a high 27% of the
companies were trading at P/E above 40x versus the long-period average of only 14%. Likewise,
40% of the companies were trading at P/E of 20-40x versus the long-period average of only 29%.
In fact, number of companies with P/E of 0-20x was at all-time low of 32%. The above excesses
have significantly corrected in the ongoing fall in market levels.
Exhibit 28 Recent market fall has led to significant correction of valuation excesses as of March 2018
7.1 Calculating built-in expectations in the current Sensex valuations
We used our DFCFE Model to calculate the built-in expectations in the current Sensex valuations
(for the purpose, we raised the Continuing growth rate from 8% to 10%). Iterations suggest –
Implied Sensex RoE of 17% (v/s 14% currently) and
5-year earnings CAGR of 16% (v/s 3% in the last five years 2013 to 2018, Exhibit 29).
As robust corporate profit growth remains elusive, expect markets to remain soft.
Exhibit 29 Sensex EPS is virtually flat for the past 5 years, 2013 to 2018
59%54%
44%
65%
74%
88%
73%
64%
34%
52%58%
80%
59%63%
66% 66%
58%
38% 45%
32%
53%
26%20%
29% 31%
22%
12%
23%30%
48%
36%
28%
14%
27% 29%23% 25%
31%35% 36% 39% 40%
31%
15%
27% 27%
5% 3%0%
4% 6%
18%11% 14%
6%
14%8% 10% 9% 11%
27%
19%24%
27%
16%
Mar
-98
Mar
-99
Mar
-00
Mar
-01
Mar
-02
Mar
-03
Mar
-04
Mar
-05
Mar
-06
Mar
-07
Mar
-08
Mar
-09
Mar
-10
Mar
-11
Mar
-12
Mar
-13
Mar
-14
Mar
-15
Mar
-16
Mar
-17
Mar
-18
Oct
-18
PE distribution of companies with market cap over INR 10 bn
PE < 20x PE 20-40x PE > 40x
0
200
400
600
800
1,000
1,200
1,400
19
98
19
99
20
00
20
01
20
02
20
03
20
04
20
05
20
06
20
07
20
08
20
09
20
10
20
11
20
12
20
13
20
14
20
15
20
16
20
17
20
18
Sensex EPS (INR)
Long-period averages:
PE < 20x 58%
PE 20-40x 29%
PE > 40x 14%

1 November 2018 23
23rd Annual Wealth Creation Study (2013-2018)
8. Conclusions Buy QGLP – Quality, Growth, Longevity at reasonable Price
The two key drivers of value are RoE and Earnings growth.
Companies create Intrinsic Value only when they earn RoE higher than Cost of Equity.
If RoE is exactly equal to Cost of Equity, any level of growth creates no value.
Low RoE companies must focus on increasing RoE, high RoE companies on increasing growth.
Both high RoE and high Earnings growth are difficult to sustain, especially Earnings growth.
Hence, stocks whose rich valuations factor in such high growth rates to sustain will most likely
disappoint.
PEG less than 1x is a near-infallible formula for healthy outperformance.
Any growth insight is valuable, even if it means only for the next one year.
Valuations above 50x P/E have a very low probability of generating market outperformance.
Buy QGLP – stocks with high-Quality business run by high-Quality management, with healthy
earnings Growth to be sustained over a Long period (at least 5-6 years), at reasonable Price,
preferably PEG less than 1x.
And finally, investors must seriously consider selling stocks in their portfolio trading at 3x PEG
or 2x relative to market, whichever is higher.
Exhibit 30 Summary
Pricing heuristic WHAT WORKS … WHAT DOESN'T …
Metric Alpha Metric Alpha
PEG < 1x 19% > 3x -10%
Payback < 1x 17% > 3x -12%
P/E < 10x 5% > 50x -14%
P/E relative to market < 1x 4% > 2x -8%

1 November 2018 24
23rd Annual Wealth Creation Study (2013-2018)
ANNEXURE 1: RoE & Earnings growth drivers
Having determined that RoE and Earnings growth are the key drivers of value, it is relevant to
know what drives each of them. We briefly discuss this here.
A. What drives RoE Industry structure & Company strategy
Two major factors drive RoE of any company, one external to it and the other internal –
1. External: Attractiveness of industry structure, and
2. Internal: Effectiveness of a company’s own strategy.
A.1 Attractiveness of industry structure RoE varies across sectors depending on the competitive dynamics governing them. The Five
Forces framework of Michael Porter is ideal to assess the attractiveness of industry structure
(Exhibit A). The higher each force is, the lower is the industry attractiveness, and vice versa e.g.
higher the rivalry among existing competitors, lower is the industry attractiveness, and vice versa.
In Exhibit B, we present our Industry Structure Score for major industries in India. Companies in
sectors with score of 3.5 or higher are likely to enjoy higher RoE than those in low-scoring sectors.
Exhibit A Porter’s Five Forces framework
NOTE: In their book Playing to
Win, authors A G Lafley and
Roger Martin highlight that –
(1) The interplay of forces along
the vertical axis decides how
much value will get created
in the industry; and
(2) The interplay of forces along
the horizontal axis decides
how the industry value will
get distributed among the
players, the customers and
the suppliers.

1 November 2018 25
23rd Annual Wealth Creation Study (2013-2018)
Exhibit B Industry Structure Score for major industries in India based on Porter’s Five Forces
Inter-firm Bargaining Power of Threat of TOTAL
Sector Rivalry Customers Suppliers Entrants Substitutes SCORE
Agri & related 0 1 1 0 0.5 2.5
Alcoholic Beverages 0.5 0.5 1 1 1 4.0
Auto Ancillaries 0.5 0 0 1 1 2.5
Automobiles – 2-wheelers 0.5 1 1 0.5 1 4.0
Automobiles – Cars/UVs 0 0.5 1 0.5 1 3.0
Automobiles – LCVs/HCVs 0 0.5 1 0 1 2.5
Automobiles – Tractors 0 0.5 1 1 1 3.5
Aviation 0 1 0 0.5 1 2.5
Banks – Private Sector 0 0.5 1 0.5 1 3.0
Banks – Public Sector 0 0.5 1 0.5 1 3.0
Cables 0 0 0 0.5 0.5 1.0
Capital Goods 0 0 1 0 1 2.0
Cement 0 1 1 0 1 3.0
Ceramic Products 0 0.5 0.5 0.5 1 2.5
Chemicals 0 0 1 0 1 2.0
Cigarettes 1 1 1 1 1 5.0
Construction 0 0 0.5 0 1 1.5
Consumer – FMCG 0.5 1 1 1 1 4.5
Consumer Durables 0 0.5 1 0 1 2.5
Engineering 0 0 1 0 1 2.0
Fertilizers 0 1 0 1 1 3.0
Gas Distribution 1 1 0 1 0.5 3.5
Gems & Jewelry 0 0.5 0.5 0 1 2.0
Hospitals/Diagnostics 0.5 0.5 0.5 0 1 2.5
Hotels & Restaurants 0 0 1 0.5 1 2.5
IT – Software 1 0 1 1 0 3.0
Logistics 0 0 0.5 0 1 1.5
Media – Print/TV 0 0 1 0.5 0.5 2.0
Mining & Mineral products 0.5 0.5 0.5 0.5 1 3.0
NBFC 0 0.5 0.5 0 1 2.0
NBFC – Housing 0 1 0.5 0 1 2.5
NBFC – Insurance 0 0.5 1 0.5 1 3.0
Non Ferrous Metals 0.5 1 0.5 0 0.5 2.5
Oil & Gas – Downstream 1 1 0.5 1 0.5 4.0
Oil & Gas – Upstream 0.5 1 0 0.5 1 3.0
Packaging 0 0 0 0.5 0.5 1.0
Paints 1 1 1 1 1 5.0
Paper 0 0 0.5 1 1 2.5
Pharmaceuticals 0.5 1 1 0 0.5 3.0
Plastic Products 0 0.5 0 0.5 1 2.0
Ports & related 0.5 0.5 1 1 1 4.0
Power 0 1 0.5 0 0 1.5
Realty 0 0 1 0 1 2.0
Retail 0.5 0 0.5 0.5 0.5 2.0
Shipping 0 0 0.5 0.5 0.5 1.5
Steel 0 0.5 1 0 0.5 2.0
Sugar 0 0 0 0 1 1.0
Telecom 0 0.5 0.5 1 1 3.0
Textiles 0 0 0 0 1 1.0
Travel 0 0 0.5 0.5 1 2.0
Tyres 0.5 0 0 0.5 1 2.0
SCORING
METHODOLOGY:
Each of the Five
Forces is rated 0 or
1 with a middle
score of 0.5.
As an illustration,
for an industry, if
Bargaining Power of
Customers is high,
that industry gets 0
for that Force.
Conversely, if
Bargaining Power of
Customers is low,
the industry gets 1.
If Bargaining Power
is balanced, the
industry gets 0.5.
Every Force is rated
this way, and the
sum total of all Five
Forces is the
Industry Structure
Score.

1 November 2018 26
23rd Annual Wealth Creation Study (2013-2018)
A.2 Effectiveness of a company’s own strategy
Even within the same industry, RoEs vary widely among companies. This suggests that individual
company strategy also plays a key role in determining RoE. Strategy is all about creating,
maintaining, and ideally, improving competitive advantage over rivals. Companies with a sound
strategy are likely to enjoy and sustain high RoE and vice versa. According to Michael Porter, there
are 3 broad strategies – (1) Differentiation, (2) Low cost, and (3) Focus.
A.2.1 Differentiation
A differentiated strategy is all about offering customers a unique value proposition which is not
easy to replicate by competition. This leads to customer loyalty, ensuring healthy sales, profits
and RoE.
Example: Most consumer-facing companies follow a strategy of differentiation. Be it
products like toothpaste, cola and biscuits, or even services like restaurants, banks
and airlines, companies aspire to offer a unique product/service/experience to
customers to retain their loyalty.
A.2.2 Low cost
In sectors where customers are unable to differentiate between products/services offered by the
various players, having the lowest cost compared to peers is the only way to sustain competitive
advantage and RoE.
Example: Commodity products like steel, cement and paper are undifferentiated in the eyes
of the customer. Hence, companies in these sectors will need to aspire to be among
the lowest cost producers in order to maintain or gain market share.
A.2.3 Focus
This is a special case of companies focused on just one segment of product, customers or
geography i.e. a niche.
Example: Companies like Symphony, which is focused only on air-coolers or Jammu &
Kashmir Bank, which is focused only in the state of Jammu & Kashmir.
A.2.4 Stuck-in-the-middle
Porter uses “Stuck-in-the-middle” to describe companies which do not seem to have adopted any
of the above strategies.
Example: Many state-owned Indian companies fall into this category – neither differentiated
nor low-cost nor focused.
A.3 What hurts RoE A company’s prevailing RoE trend could be adversely affected by disruptive competition,
prolonged business downcycle, regulatory shocks (all three external factors), and capital
misallocation by the management (e.g. unrelated business diversification, mega acquisition, etc).

1 November 2018 27
23rd Annual Wealth Creation Study (2013-2018)
B. What drives Earnings growth Industry growth & Company Growth mindset
Two major factors drive Earnings growth for any company, one external to it and the other
internal –
1. External: Industry growth, and
2. Internal: Company Growth Mindset.
B.1 Industry growth
The major factors driving industry growth are:
1. Global and domestic economic growth
2. Value Migration
3. Low product penetration and
4. Emergence of a new industry or industry segment.
B.1.1 Global and domestic economic growth
This forms the base rate of growth for most industries. Domestically, rising per capita incomes
lead to exponentially higher spend on discretionary goods and services (Exhibit C). Further, a
healthy rate of savings and investment leads to higher derived demand for capital goods,
construction, engineering, etc.
Exhibit C Linear growth in per capita income leads to exponential growth for discretionaries
B.1.2 Value Migration
In his book Value Migration, author Adrian J Slywotzky says, “Value migrates from outmoded
business designs to new ones that are better able to satisfy customers’ most important
priorities.” Value Migration results in a gradual yet major shift in how the current and future
profit pool in an industry is shared. Value Migration is one of the most potent drivers of growth,
as it creates a sizable and sustained business opportunity for its beneficiaries.
GDP p.c. $1,000
GDP p.c. $2,000
9001,000
100
1,000
Basic spend
Discretionary spend
10x

1 November 2018 28
23rd Annual Wealth Creation Study (2013-2018)
Exhibit D Examples of Value Migration
Sector Value migration from Value migration to
IT Services Developed world Low labor-cost countries
Pharmaceuticals Developed world Low-cost chemistry countries
Banking State-owned banks Private banks
Telecom Fixed line networks Wireless networks
e-tailing Brick-and-mortar retailing Online retailing
Gems & Jewelry Unorganized jewelry market Organized jewelry retailing
Aviation Full service airlines and railways Low cost airlines
B.1.3 Low product penetration
Industries whose products have a low penetration enjoy high level of growth for a prolonged
period. For instance, penetration of products like cars and air-conditioners in India is very low
compared to peer countries like China. Companies in such industries will enjoy healthy growth
for long period.
B.1.4 Emergence of new industry or industry segment
Completely new industries or industry segments will have a long runway of growth till they reach
the maturity phase. Examples are electric cars globally, and compact air-coolers in India.
B.2 Company Growth Mindset External factors apart, a company’s Growth mindset has a significant influence on its GAP.
What is Growth mindset? Psychologists talk of two kinds of mindset: (1) Fixed mindset and (2)
Growth mindset. At the personal level, a “Fixed mindset” assumes that our character,
intelligence, and creative ability are static givens which we cannot change in any meaningful way.
Such a mindset views success as an affirmation of that inherent intelligence. Hence, all efforts are
towards avoiding failure at any cost. A “Growth mindset,” on the other hand, thrives on challenge
and sees failure not as evidence of unintelligence but as an opportunity for growth and for
stretching existing abilities. Hence, companies with Growth mindset are likely to be more
entrepreneurial and risk-taking than companies with Fixed mindset.
A company’s Growth mindset may take several forms, mainly, (1) Aggressive capacity expansion,
(2) Periodic new product launches and/or new business initiatives, (3) Active inorganic growth
strategy, and (4) Operating/financial leverage.
B.3 What hurts Earnings growth
A company’s prevailing Earnings growth trend may slow down due to one or more of the
following factors: industry maturity, weakening of the company’s competitive advantage, and
high-base effect.
1 November 2018 29
23rd Annual Wealth Creation Study (2013-2018)
AN
NE
XU
RE
2:
De
tail
ed
alp
ha
pe
rfo
rma
nce
of
PE,
PE
re
lati
ve t
o m
ark
et,
PEG
an
d P
ayb
ack
ra
tio
We
pre
sen
t h
ere
th
e d
eta
iled
alp
ha
pe
rfo
rman
ce o
f th
e v
ario
us
pri
cin
g te
chn
iqu
es
cove
red
in S
ect
ion
6 –
P/E
, P/E
re
lati
ve t
o m
arke
t, P
EG a
nd
Pay
bac
k R
atio
.
Alp
ha
imp
lies
ou
tpe
rfo
rman
ce o
ver
the
Se
nse
x fo
r th
e n
ext
3/5
ye
ars,
as
the
cas
e m
ay b
e.
For
eve
ry y
ear
, we
hav
e c
on
sid
ere
d o
nly
co
mp
anie
s w
ith
mar
ket
cap
gre
ate
r th
an IN
R 1
0 b
illio
n.
1.
P/E
– 3
-ye
ar
alp
ha
fo
r va
rio
us
cate
gori
es
acr
oss
ye
ars
PE
(x)
Ave
rage
1
99
8
19
99
2
00
0
20
01
2
00
2
20
03
2
00
4
20
05
2
00
6
20
07
2
00
8
20
09
2
01
0
20
11
2
01
2
20
13
2
01
4
20
15
0 -
10
5
%
-9%
2
3%
3
0%
2
8%
2
3%
9
%
-5%
-1
6%
-4
%
10
%
3%
1
0%
-4
%
-14
%
-6%
-2
%
17
%
1%
10
- 2
0
1%
0
%
-1%
1
%
1%
7
%
-1%
-7
%
-5%
-9
%
5%
-3
%
7%
-7
%
-6%
4
%
9%
1
3%
1
1%
20
- 3
0
-2%
-6
%
4%
-1
2%
-2
%
-3%
-3
2%
-7
%
-3%
-1
0%
-2
%
-4%
-4
%
0%
4
%
5%
7
%
15
%
7%
30
- 4
0
-1%
4
5%
-2
%
-4%
-1
7%
-1
5%
-1
5%
-2
2%
-9
%
-11
%
-11
%
-5%
1
0%
-3
%
-1%
7
%
15
%
18
%
5%
40
- 5
0
-1%
1
7%
-5
%
-3%
-1
1%
-1
7%
N
.A.
3%
1
6%
-6
%
-5%
-3
%
5%
-1
2%
-2
%
-5%
0
%
8%
0
%
50
- 7
5
-8%
-2
1%
3
%
-2%
N
.A.
-15
%
N.A
. 8
%
1%
-1
7%
0
%
-10
%
-35
%
-19
%
-18
%
-7%
0
%
0%
3
%
> 7
5
-18
%
N.A
. -8
%
-37
%
N.A
. N
.A.
N.A
. N
.A.
-24
%
-22
%
-20
%
-19
%
-23
%
-18
%
-25
%
-24
%
-19
%
-2%
3
%
No
. o
f co
mp
an
ies
54
5
6
73
6
2
58
6
9
11
2
16
2
25
5
28
5
32
4
21
9
35
2
37
5
36
2
34
7
37
5
47
5
2.
P/E
re
lati
ve t
o m
ark
et
– 3
-ye
ar
alp
ha
fo
r va
rio
us
cate
gori
es
acr
oss
ye
ars
PE
Re
lati
ve t
o
Ma
rke
t (x
) A
vera
ge
19
98
1
99
9
20
00
2
00
1
20
02
2
00
3
20
04
2
00
5
20
06
2
00
7
20
08
2
00
9
20
10
2
01
1
20
12
2
01
3
20
14
2
01
5
<=
1
4%
-2
%
16
%
21
%
17
%
17
%
8%
-5
%
-14
%
-8%
9
%
0%
1
0%
-5
%
-8%
-2
%
3%
1
5%
8
%
1 -
1.5
0
%
-6%
2
%
-4%
-5
%
3%
4
%
-10
%
0%
-9
%
-2%
-3
%
7%
-1
%
1%
4
%
6%
1
3%
9
%
1.5
- 2
0
%
-6%
1
2%
-9
%
3%
1
%
-6%
-1
%
-2%
-1
2%
-9
%
-6%
2
%
-4%
3
%
7%
1
1%
1
9%
2
%
2 -
3
-5%
2
5%
-6
%
-4%
-1
5%
-1
5%
-3
2%
-1
4%
-1
2%
-9
%
-10
%
-7%
0
%
-15
%
-14
%
2%
1
2%
1
4%
1
%
> 3
-1
1%
3
%
-1%
-3
2%
N
.A.
-16
%
-15
%
8%
2
%
-21
%
-8%
-1
6%
-2
0%
-2
0%
-1
9%
-1
9%
-1
1%
-1
%
4%
No
. o
f co
mp
an
ies
54
5
6
73
6
2
58
6
9
11
2
16
2
25
5
28
5
32
4
21
9
35
2
37
5
36
2
34
7
37
5
47
5

1 November 2018 30
23rd Annual Wealth Creation Study (2013-2018) A
NN
EXU
RE
2 (
con
tin
ue
d):
De
tail
ed
wo
rkin
gs o
f P
E, P
E re
lati
ve t
o m
arke
t, P
EG a
nd
Pa
ybac
k ra
tio
1.
PEG
– 3
-ye
ar
alp
ha
fo
r va
rio
us
cate
gori
es
acr
oss
ye
ars
PEG
(x)
A
vera
ge
19
98
1
99
9
20
00
2
00
1
20
02
2
00
3
20
04
2
00
5
20
06
2
00
7
20
08
2
00
9
20
10
2
01
1
20
12
2
01
3
20
14
2
01
5
0 -
1
19
%
19
%
31
%
25
%
26
%
16
%
12
%
7%
5
%
-1%
1
8%
1
7%
1
9%
1
5%
1
4%
2
2%
2
7%
3
7%
3
0%
0 -
0.5
2
6%
4
1%
3
5%
3
4%
3
5%
2
6%
1
6%
1
7%
8
%
5%
2
2%
2
6%
2
5%
2
3%
1
3%
2
6%
3
4%
4
8%
3
9%
0.5
- 1
1
1%
8
%
26
%
14
%
9%
3
%
-6%
-3
%
0%
-5
%
13
%
8%
9
%
10
%
14
%
19
%
22
%
30
%
25
%
1 -
1.5
3
%
8%
7
%
16
%
0%
-8
%
-4%
-2
1%
-1
7%
-3
%
-2%
5
%
10
%
6%
4
%
13
%
13
%
20
%
12
%
1.5
- 2
-3
%
0%
-9
%
12
%
-15
%
-3%
-2
3%
-5
%
-24
%
-9%
-7
%
-5%
-7
%
-4%
3
%
11
%
13
%
17
%
8%
2 -
3
-4%
-1
%
-8%
1
%
19
%
-14
%
N.A
. -3
2%
-3
3%
-1
%
-7%
-6
%
-2%
-1
%
-2%
-2
%
9%
1
1%
1
0%
3 +
-1
0%
-1
2%
-7
%
-10
%
-17
%
-14
%
-5%
-3
2%
-2
8%
-2
1%
-9
%
-13
%
0%
-1
0%
-2
%
-3%
2
%
5%
-1
%
< 0
-1
9%
-2
2%
-1
1%
-2
2%
-2
5%
-6
%
-31
%
-30
%
-33
%
-26
%
-15
%
-21
%
-15
%
-22
%
-19
%
-13
%
-13
%
-3%
-1
0%
No
. o
f co
mp
an
ies
54
5
6
73
6
2
58
6
9
11
2
16
2
25
5
28
5
32
4
21
9
35
2
37
5
36
2
34
7
37
5
47
5
No
te:
PE
G <
0 im
plie
s P
AT
de
gro
wth
in t
he
ne
xt 3
ye
ars
2.
Pay
ba
ck R
ati
o –
5-y
ea
r a
lph
a f
or
vari
ou
s ca
tego
rie
s a
cro
ss y
ea
rs
Pa
yba
ck
Ra
tio
(x)
A
vera
ge
19
98
1
99
9
20
00
2
00
1
20
02
2
00
3
20
04
2
00
5
20
06
2
00
7
20
08
2
00
9
20
10
2
01
1
20
12
2
01
3
0 -
1
17
%
15
%
29
%
31
%
19
%
14
%
11
%
8%
9
%
17
%
14
%
11
%
7%
1
6%
2
3%
2
3%
2
5%
1 -
1.5
5
%
15
%
11
%
13
%
-11
%
-6%
-1
1%
-1
%
2%
1
%
8%
1
2%
6
%
6%
1
0%
1
5%
1
5%
1.5
- 2
4
%
8%
1
0%
1
7%
1
0%
-3
%
-10
%
-3%
-3
%
1%
5
%
2%
-1
%
6%
4
%
7%
1
3%
2 -
3
0%
7
%
5%
1
1%
-2
%
-12
%
-17
%
-8%
-2
%
-1%
0
%
1%
-3
%
4%
4
%
5%
6
%
3 +
-1
2%
-6
%
-10
%
-11
%
-16
%
-19
%
-28
%
-14
%
-13
%
-11
%
-11
%
-15
%
-20
%
-11
%
-4%
-3
%
-2%
< 0
-2
6%
-1
9%
N
.A.
-58
%
-26
%
N.A
. -6
1%
-4
%
-22
%
-26
%
-26
%
-24
%
-28
%
-23
%
-19
%
-16
%
-17
%
No
. o
f co
mp
an
ies
55
5
7
78
6
6
61
7
3
11
6
16
7
26
0
29
9
34
1
23
7
37
7
40
4
38
8
39
3
No
te:
Pay
bac
k <
0 im
plie
s th
e c
um
ula
tive
PA
T o
f n
ext
fiv
e y
ear
s is
ne
gati
ve

1 November 2018 31
23rd Annual Wealth Creation Study (2013-2018)
NOTES

1 November 2018 32
23rd Annual Wealth Creation Study (2013-2018)
2013-18 Wealth Creation Study:
Detailed findings

1 November 2018 33
23rd Annual Wealth Creation Study (2013-2018)
Trend in Wealth Creation
INR 44.9 trillion Wealth Created during 2013-18
The top 100 Wealth Creators created INR 44.9 trillion of wealth during 2013-18.
This is the highest ever quantum of Wealth Created by far.
Pace of Wealth Creation is also robust at 23% CAGR whereas the benchmark Sensex CAGR is
only 12%.
Exhibit 1 2013-18 Wealth Created at INR 44.9 trillion is the highest ever
Exhibit 2 2013-18 pace of Wealth Creation is healthy at 23% CAGR vis-à-vis benchmark’s 12% CAGR
14.316.3
25.4
9.7
26.5
22.1
16.218.4
29.4
34.2
28.4
38.9
44.9
20
01
-06
20
02
-07
20
03
-08
20
04
-09
20
05
-10
20
06
-11
20
07
-12
20
08
-13
20
09
-14
20
10
-15
20
11
-16
20
12
-17
20
13
-18
Wealth Created (INR trillion)
36%40%
49%
19%
26%
17%19%
17%
33%
25%
18%22% 23%
20
01
-06
20
02
-07
20
03
-08
20
04
-09
20
05
-10
20
06
-11
20
07
-12
20
08
-13
20
09
-14
20
10
-15
20
11
-16
20
12
-17
20
13
-18
Wealth Created CAGR (%)
(26%)(30%)
(39%)
(12%)
(22%)
(12%)(6%)
(4%)
(18%)
(10%)
(5%)(11%)
(12%)
#1
Key Takeaway
Muted markets no deterrent for robust Wealth Creation
For the past four study periods, benchmark indices have delivered muted 5-year return CAGR
of 10-12%. Yet, Wealth Creation has been robust in all these periods, reinforcing our pet take
on market timing, “Forget markets, think stocks.”
Wealth Created Trend (INR trillion)
Pace of Wealth Creation
(Figures in brackets is Sensex CAGR)

1 November 2018 34
23rd Annual Wealth Creation Study (2013-2018)
The Biggest Wealth Creators
HDFC Bank is the Biggest Wealth Creator for the first time ever
After consistently hugging the second and third rank for the last 6 studies, HDFC Bank has
finally broken through to emerge the biggest Wealth Creator over 2013-18.
HDFC Bank has dethroned TCS, suggesting that it is difficult to sustain the top spot beyond
five 5-year periods. Reliance Industries had a 5-year run earlier (see Exhibit 4).
Bajaj Finance holds the unique distinction of featuring in the top 10 of both Biggest and
Fastest Wealth Creators.
Exhibit 3 Top 10 Biggest Wealth Creators (2013-18)
Rank Company Wealth Created CAGR (%) P/E (x) RoE (%)
INR b % share Price PAT 2018 2013 2018 2013
1 HDFC Bank 3,247 7.2 25 22 27 22 17 19
2 Reliance Inds 3,094 6.9 18 13 15 13 12 11
3 TCS 2,532 5.6 13 13 21 22 30 36
4 Maruti Suzuki 2,308 5.1 47 25 41 17 15 11
5 Hind. Unilever 1,883 4.2 23 10 55 31 72 113
6 HDFC 1,640 3.7 17 16 22 19 16 21
7 Kotak Mah. Bank 1,345 3.0 26 23 32 22 12 14
8 IOC 1,008 2.2 20 38 8 15 19 7
9 Larsen & Toubro 990 2.2 17 14 21 18 16 13
10 Bajaj Finance 902 2.0 73 35 38 10 16 18
Total of Top 10 18,948 42 21 18 21 18 17 15
Total of Top 100 44,883 100 24 19 22 18 16 14
Exhibit 4 Five-year successive run of Biggest Wealth Creator broken again
91
73
26
2
34
1 1,2
47
37
7
38
3
24
5
1,0
30
1,0
65 1
,67
8
1,8
56
3,0
77
1,5
14
2,5
56
1,7
42
1,1
87
2,2
84
3,6
38
3,4
58
2,6
37
2,4
99
3,2
47
19
96
19
97
19
98
19
99
20
00
20
01
20
02
20
03
20
04
20
05
20
06
20
07
20
08
20
09
20
10
20
11
20
12
20
13
20
14
20
15
20
16
20
17
20
18
Hindustan Unilever (HUL)
(4)
Wipro
HUL
Wipro (2)
ONGC (3)
Reliance Industries (5)
ITC
TCS (5)HDFCBank
#2
Key Takeaway
The Value Migration run continues
HDFC Bank has broken TCS’s 5-year run as the Biggest Wealth Creator, but the Value Migration
run continues. Simply stated, Value Migration means that value (i.e. profit and market cap)
moves from outmoded business models to superior ones. In IT, value migrated from “Boston to
Bangalore” (i.e. developed economies to emerging economies). In banking, value is relentlessly
migrating from state-owned banks to private banks. HDFC Bank is a key beneficiary.
Biggest Wealth Creators over the years
(Wealth Created in INR billion)

1 November 2018 35
23rd Annual Wealth Creation Study (2013-2018)
The Fastest Wealth Creators
Indiabulls Ventures is the Fastest Wealth Creator
Indiabulls Ventures has emerged as the Fastest Wealth Creator, with 2013-18 stock price
multiplier of 30x (97% CAGR).
Eicher Motors is among the top 10 Fastest Wealth Creators in the last 7 studies, and Bajaj
Finance in the last 5.
8 of the top 10 Fastest Wealth Creators had base 2013 market cap of less than INR 20 billion.
5 of the 10 stocks were trading at single-digit P/E in 2013.
INR 100,000 invested equally in 2013 in these 10 stocks would have grown to almost INR 1.7
million in 2018, delivering a return CAGR of 75%. Over the same period, INR 100,000 invested
in the Sensex would have grown to only INR 175,000 (12% return CAGR).
Exhibit 5 Top 10 Fastest Wealth Creators (2013-18)
Rank Company Price Appn. CAGR (%) Mkt Cap (INR b) P/E (x)
(x) Price PAT 2018 2013 2018 2013
1 Indiabulls Ventures 30 97 30 127 2 54 3
2 Dalmia Bharat 19 81 23 257 12 48 6
3 TVS Motor 19 80 40 293 15 44 12
4 HEG 19 79 48 127 7 12 4
5 Sterlite Technologies 17 75 67 125 9 37 35
6 Bajaj Finance 15 73 35 1,023 57 38 10
7 Motilal Oswal 13 67 42 146 11 26 11
8 IIFL Holdings 12 64 27 224 18 25 7
9 NBCC 12 64 11 171 15 48 7
10 Eicher Motors 11 62 45 772 69 39 23
Exhibit 6 History of Fastest Wealth Creators
Year Company 5-yr Price
Multiple (x) 5-yr Price CAGR %
Year Company
5-yr Price Multiple (x)
5-yr Price CAGR %
1996 Dr Reddy's Labs 30 97 2008 Unitech 837 284
1997 Cipla 7 48 2009 Unitech 54 122
1998 Satyam Computers 23 87 2010 Unitech 28 95
1999 Satyam Computers 75 137 2011 Sanwaria Agro 50 119
2000 SSI 223 195 2012 TTK Prestige 24 89
2001 Infosys 66 131 2013 TTK Prestige 28 95
2002 Wipro 69 133 2014 Eicher Motors 27 94
2003 e-Serve 50 119 2015 Ajanta Pharma 50 119
2004 Matrix Labs 75 137 2016 Ajanta Pharma 53 121
2005 Matrix Labs 136 167 2017 Ajanta Pharma 29 96
2006 Matrix Labs 182 183 2018 Indiabulls Ventures 30 97
2007 B F Utilities 665 267
#3
Key Takeaway
Beware of over-valuation and overstaying
Charlie Munger has said, “Anything that compounds for a long time must decompound at some
point of time.” Most of the Fastest Wealth Creators have seen massive valuation re-rating. In
some cases, their P/Es may have even reached unsustainable levels, leaving no margin of safety.
In such situations of over-valuation, selling the stock(s) is the best way to lock in the
supernormal returns. Overstaying in these winners runs the risk of eroding much of the gains.

1 November 2018 36
23rd Annual Wealth Creation Study (2013-2018)
The Most Consistent Wealth Creators
Titan Company is the Most Consistent Wealth Creator
Titan Company has emerged the Most Consistent Wealth Creator by virtue of –
1. Appearing among top 100 Wealth Creators in each of the last 10 studies; and
2. Recording the highest Price CAGR of 33% over the 10-year period 2008 to 2018,
fractionally ahead of Godrej Consumer.
All the top 10 Consistent Wealth Creators are consumer-facing companies.
A surprising finding is that except for HDFC Bank, 2018 RoE is lower than 2008 RoE. The main
reason is hoarding of surplus cash.
Exhibit 7 Top 10 Most Consistent Wealth Creators (2008-18)
Appeared in 10-yr Price 10-yr PAT P/E (x) RoE (%)
Rank Company WC Study (x) CAGR (%) CAGR (%) 2018 2008 2018 2008
1 Titan Company 10 33 22 73 30 22 35
2 Godrej Consumer 10 33 25 51 20 24 93
3 Shree Cement 10 31 17 42 13 15 42
4 Pidilite Inds. 10 30 19 49 20 27 28
5 Maruti Suzuki 10 27 14 41 14 15 20
6 Marico 10 26 17 54 26 31 51
7 Asian Paints 10 25 17 54 28 24 42
8 HDFC Bank 10 22 28 27 29 17 14
9 Kotak Mah. Bank 10 21 20 32 22 12 17
10 Dabur India 10 20 15 42 29 24 53
Exhibit 8 Consumer-facing companies more likely to be Consistent Wealth Creators
NOTE: Bracket indicates number of times appeared within top 10 in last 5 Wealth Creation Studies
Consistent Wealth Creators based on last 5 Studies
Consumer-facing Non Consumer-facing
#4
Key Takeaway
The re-rating bonus may not be that consistent
Most of the Consistent Wealth Creators have steady earnings growth. However, in the last
couple of years, valuation re-rating has significantly amplified returns. Expecting this re-rating
bonus to sustain is rather unrealistic.
Consumer & Healthcare
Asian Paints (5) Pidilite (1)
ITC (2) Marico (1)
Nestle (3) Godrej
Sun Pharma (4) Cons. (1)
Dabur (4)
Titan (4)
Auto
M & M (2)
Maruti Suzuki (1)
Financials
Kotak Mah. (5)
HDFC Bank (4)
Axis Bank (4)
Bosch (4)
Cummins (3)
Hind. Zinc (1)
Shree Cem. (1)

1 November 2018 37
23rd Annual Wealth Creation Study (2013-2018)
Wealth Creators Index (Wealthex) v/s BSE Sensex
Superior earnings and price performance over benchmark
We compare Wealthex (top 100 Wealth Creators Market Cap index) with the BSE Sensex on 3
parameters - (1) market performance, (2) earnings growth and (3) valuation.
Market performance: Over 2013-18, Wealth Creating companies have delivered return CAGR
of 24% v/s 12% for the BSE Sensex. March 2018 over March 2013, Wealthex is up 196%
whereas the Sensex is up 75% i.e. 121% outperformance over 5 years.
Earnings growth: Wealthex clocked 5-year earnings CAGR of 19% v/s 3% for BSE Sensex.
Further, YoY earnings growth for Wealthex is higher in all the 5 years 2013 through 2018.
Valuation: Valuation re-rating has contributed 8% to Sensex CAGR of 12%. In contrast, much
of Wealthex’s 24% CAGR is led by the 19% earnings CAGR.
Exhibit 9 Wealthex v/s Sensex: Superior market performance on the back of higher earnings growth
Mar-13 Mar-14 Mar-15 Mar-16 Mar-17 Mar-18 5 Year CAGR (%)
BSE Sensex 18,836 22,386 27,957 25,342 29,621 32,969 12
YoY (%) 19 22 10 12 12
Wealthex - based to Sensex 18,836 24,207 34,847 35,147 45,754 55,680 24
YoY (%) 29 44 1 30 22
Sensex EPS (INR) 1,179 1,334 1,348 1,330 1,347 1,387 3
YoY (%) 13 1 -1 1 3
Wealthex EPS (INR) 1,042 1,333 1,372 1,628 2,093 2,494 19
YoY (%) 28 3 19 29 19
Sensex PE (x) 16 17 21 19 22 24 8
Wealthex PE (x) 18 18 25 22 22 22 4
Exhibit 10 Wealthex invariably outperforms benchmark indices handsomely
50
100
150
200
250
300
350
Mar
-13
Jul-
13
No
v-1
3
Mar
-14
Jul-
14
No
v-1
4
Mar
-15
Jul-
15
No
v-1
5
Mar
-16
Jul-
16
No
v-1
6
Mar
-17
Jul-
17
No
v-1
7
Mar
-18
Wealth Creator Index Relative to Sensex (%)
121% Outperformance
#5
Key Takeaway
Sensex – a weak earnings machine; QGLP stocks invariably outperform
Ever since the Lehman crisis of 2008, Sensex has been a weak earnings machine with single digit
earnings growth in most years. As our theme study suggests, QGLP stocks – stocks with Quality,
Growth, Longevity, at reasonable Price – invariably outperform the Sensex.

1 November 2018 38
23rd Annual Wealth Creation Study (2013-2018)
Wealth Creation: Sector analysis
Financials is the biggest Wealth Creating sector for the second consecutive year
Financials has emerged as India’s biggest Wealth Creating sector over 2013-18 for the second
consecutive year. The surge in Wealth Creation in the sector has been led by private banks
and NBFCs.
In terms of share of Wealth Created, IT is the biggest loser over the last 5 years, and Auto is
the biggest gainer.
Wealth Creation was highly concentrated – top 5 sectors accounted for a high 79% of total
Wealth Created.
Exhibit 11 Financials is the top Wealth Creating sector
Sector WC Share of WC % CAGR 13-18 (%) P/E (x) RoE (%)
(No of companies) (INR b) 2018 2013 Price PAT 2018 2013 2018 2013
Financials (22) 11,905 27 20 28 15 27 16 13 17
Cons. & Retail (21) 6,994 16 24 25 13 54 34 30 38
Auto (13) 5,906 14 6 20 21 12 13 16 10
Oil & Gas (5) 5,684 13 9 39 23 34 19 18 16
Technology (4) 3,932 9 23 15 15 20 20 27 34
Healthcare (13) 2,392 6 1 22 17 25 20 17 13
Cement (5) 2,105 5 2 26 53 12 33 14 3
Capital Goods (5) 1,560 4 11 31 40 18 25 18 10
Metals / Mining (2) 1,536 4 4 23 4 36 16 7 14
Telecom & Media (3) 839 2 1 17 17 30 29 17 10
Utilities (1) 471 1 - 16 13 13 11 15 16
Others (6) 1,560 4 1 29 16 26 15 18 18
Total 44,883 100 100 24 19 22 18 16 14
Exhibit 12 Financials sector significantly beats its own previous high of Wealth Creation
1,8392,723
3,891
5,826
2,126
4,949 5,194
3,6724,456
7,103 7,5866,364
9,346
11,905
Oil& Gas
Oil& Gas
Oil& Gas
Oil& Gas
Oil& Gas
Metals/Mining
Finan-cials
Finan-cials
Cons-sumer/Retail
IT Cons-sumer/Retail
Cons-sumer/Retail
Finan-cials
Finan-cials
2005 2006 2007 2008 2009 2010 2011 2012 2013 2014 2015 2016 2017 2018
Top Wealth Creating Sectors (INR B)
#6
Key Takeaway
Financials should rule the roost for the next few years
India’s Financials sector offers a huge opportunity. In Banking, there’s massive Value Migration
on from state-owned to private banks. Further, insurance and asset management are emerging
as high-growth segments. Expect Financials to rule the roost in Wealth Creation for the next
few years at least.

1 November 2018 39
23rd Annual Wealth Creation Study (2013-2018)
Wealth Creation: Ownership – Private v/s PSU
PSUs remain insignificant in Wealth Creation, but there are signs of bottoming out
PSUs’ (public sector undertakings) Wealth Creation performance during 2013-18 continues
to be weak. However, there are some signs of the same bottoming out:
– The number of PSUs in the top 100 Wealth Creators is 11, up from 5 three years ago
– Wealth Created by these 11 PSUs is 9% of total, again higher than 2% a few studies earlier.
– Finally, unlike in the past, PSUs’ 2013-18 PAT CAGR at 24% is higher than private sector’s
18%. This has led to PSUs’ price CAGR at 22% almost matching that of the private sector.
The 11 Wealth Creating PSUs are IOC, BPCL, HPCL, GAIL, Power Grid Corporation, Concor,
Petronet LNG, Indraprastha Gas, LIC Housing, Bharat Electronics, and NBCC.
Exhibit 13 PSUs remain insignificant in Wealth Creation
Exhibit 14 Robust PAT CAGR of 24% is the key Exhibit 15 6 of the 11 PSU Wealth Creators are driver of Wealth Creation for the 11 PSUs in Oil & Gas (IOC, BPCL, HPCL, PLNG, GAIL, IGL)
2013-2018
PSU Private
No. of Wealth Creators in Top 100 11 89
Share of Wealth Created (%) 9 91
5-year Sales CAGR (%) 0 11
5-year PAT CAGR (%) 24 18
5-year Price CAGR (%) 22 24
P/E - 2013 (x) 12 19
P/E - 2018 (x) 11 25
RoE - 2013 (%) 11 14
RoE - 2018 (%) 19 16
Key Takeaway
Only monopolistic PSUs are Wealth Creators
Only those PSUs are creating wealth, which face minimal competition from the private sector.
The 3 oil marketing companies, GAIL, Power Grid, Concor, Indraprastha Gas, etc, are all
monopolistic. Bharat Electronics and NBCC also get nominated business from the government.
In general, PSUs find it challenging to successfully compete against the private sector.
#7
Oil & Gas69%
Utilities12%
Capital Goods
7%
Financials4%
Others8%

1 November 2018 40
23rd Annual Wealth Creation Study (2013-2018)
The rise and rise of the Indian entrepreneur
We observed India’s market cap distribution over the last 20 years into 3 categories – PSUs,
MNCs and private entrepreneurs.
As Exhibit 16 shows, there is a clear and continuous migration of value from PSUs and MNCs
to private entrepreneurs.
PSUs’ share of market cap is down from 36% in 1998 to 15% currently. Likewise, share of
MNCs is down from 23% to 12%. Both their losses have been the gain of the Indian private
entrepreneur, with market cap share rising from 41% in 1998 to 73% currently.
Expect the above trend to continue as –
1. MNCs increasingly prefer the unlisted route to expand their presence in India and
2. PSUs continue to see their competitive advantage eroding.
Exhibit 16 Indian private entrepreneurs are gaining significant share of India’s market cap
36
%
19
%
11
%
17
%
24
%
30
%
36
%
33
%
27
%
23
%
26
%
32
%
29
%
29
%
27
%
23
%
20
%
18
%
16
%
17
%
16
%
15
%
23
%
32
%
15
% 22
% 20
% 19
% 14
%
11
%
12
%
9% 7% 1
0%
8% 9%
11
%
12
%
13
%
13
%
13
%
12
%
12
%
12
%
41
%
49
%
75
% 60
%
56
%
51
%
50
%
56
%
62
%
68
%
66
% 59
%
63
%
62
%
62
%
64
%
68
%
69
%
71
%
71
%
72
%
73
%
Mar
-98
Mar
-99
Mar
-00
Mar
-01
Mar
-02
Mar
-03
Mar
-04
Mar
-05
Mar
-06
Mar
-07
Mar
-08
Mar
-09
Mar
-10
Mar
-11
Mar
-12
Mar
-13
Mar
-14
Mar
-15
Mar
-16
Mar
-17
Mar
-18
Oct
-18
India Inc's Market Cap Distribution PSU MNC Private
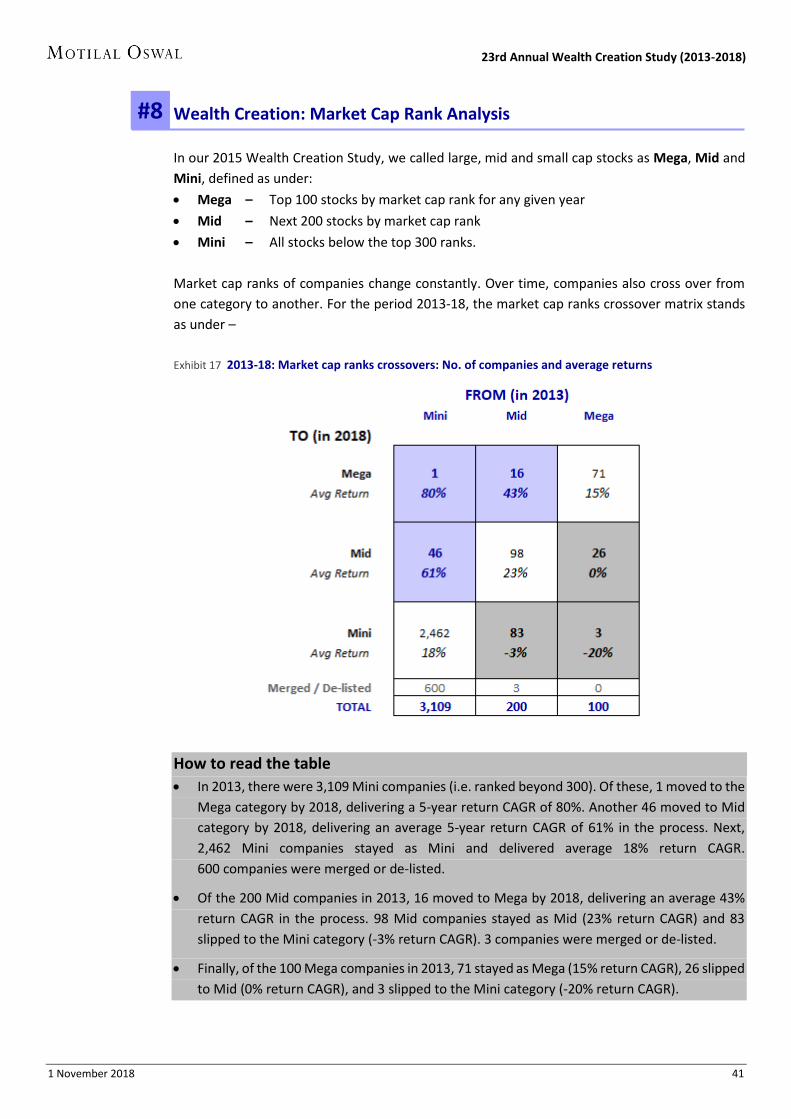
1 November 2018 41
23rd Annual Wealth Creation Study (2013-2018)
Wealth Creation: Market Cap Rank Analysis
In our 2015 Wealth Creation Study, we called large, mid and small cap stocks as Mega, Mid and
Mini, defined as under:
Mega – Top 100 stocks by market cap rank for any given year
Mid – Next 200 stocks by market cap rank
Mini – All stocks below the top 300 ranks.
Market cap ranks of companies change constantly. Over time, companies also cross over from
one category to another. For the period 2013-18, the market cap ranks crossover matrix stands
as under –
Exhibit 17 2013-18: Market cap ranks crossovers: No. of companies and average returns
How to read the table
In 2013, there were 3,109 Mini companies (i.e. ranked beyond 300). Of these, 1 moved to the
Mega category by 2018, delivering a 5-year return CAGR of 80%. Another 46 moved to Mid
category by 2018, delivering an average 5-year return CAGR of 61% in the process. Next,
2,462 Mini companies stayed as Mini and delivered average 18% return CAGR.
600 companies were merged or de-listed.
Of the 200 Mid companies in 2013, 16 moved to Mega by 2018, delivering an average 43%
return CAGR in the process. 98 Mid companies stayed as Mid (23% return CAGR) and 83
slipped to the Mini category (-3% return CAGR). 3 companies were merged or de-listed.
Finally, of the 100 Mega companies in 2013, 71 stayed as Mega (15% return CAGR), 26 slipped
to Mid (0% return CAGR), and 3 slipped to the Mini category (-20% return CAGR).
#8

1 November 2018 42
23rd Annual Wealth Creation Study (2013-2018)
We specifically analyzed the 3 positive crossovers –
1. Mini-to-Mega
2. Mini-to-Mid and
3. Mid-to-Mega.
8.1 Mini-to-Mega: 1 company
During 2013-18, there was one company, TVS Motor, which moved from Mini to Mega. It
ranks 47th in our list of top 100 Wealth Creators, and is the third fastest Wealth Creator.
Exhibit 18 Mini-to-Mega (2013-18): 1 stock, and it features among our top 100 Wealth Creators
Mkt Cap Rank WC Rank * Price PAT P/E (x)
2018 2013 Biggest Fastest CAGR % CAGR % 2018 2013
TVS Motor 97 342 47 3 80 40 44 12
* 2013-18 Wealth Creation Rank
8.2 Mini-to-Mid: 46 companies, 61% average Price CAGR During 2013-18, 46 companies crossed over from Mini to Mid category, generating an
average return CAGR of 61%, v/s 12% for the Sensex.
Of these 46 Mini-to-Mid stocks, 11 feature in our list of 100 Biggest Wealth Creators.
7 of the top 10 fastest Wealth Creators are featured in the list.
Exhibit 19 Mini-to-Mid (2013-18): 11 of 46 Mini-to-Mid stocks feature among top 100 Wealth Creators
Mkt Cap Rank WC Rank * Price PAT P/E (x)
2018 2013 Biggest Fastest CAGR % CAGR % 2018 2013
Indiabulls Ventures 199 899 97 1 97 30 54 3
Dalmia Bharat 110 388 51 2 81 23 48 6
HEG 200 497 93 4 79 48 12 4
Sterlite Tech. 205 443 94 5 75 67 37 35
Motilal Oswal 178 408 86 7 67 42 26 11
IIFL Holdings 123 310 58 8 64 27 25 7
NBCC 158 350 80 9 64 11 48 7
Symphony 206 380 95 11 58 26 67 21
Graphite India 182 341 90 13 56 52 14 12
Bharat Financial 168 372 89 14 55 L to P 34 –
Natco Pharma 184 366 96 15 54 54 20 17
AVERAGE 68 38 35 11
* 2013-18 Wealth Creation Rank
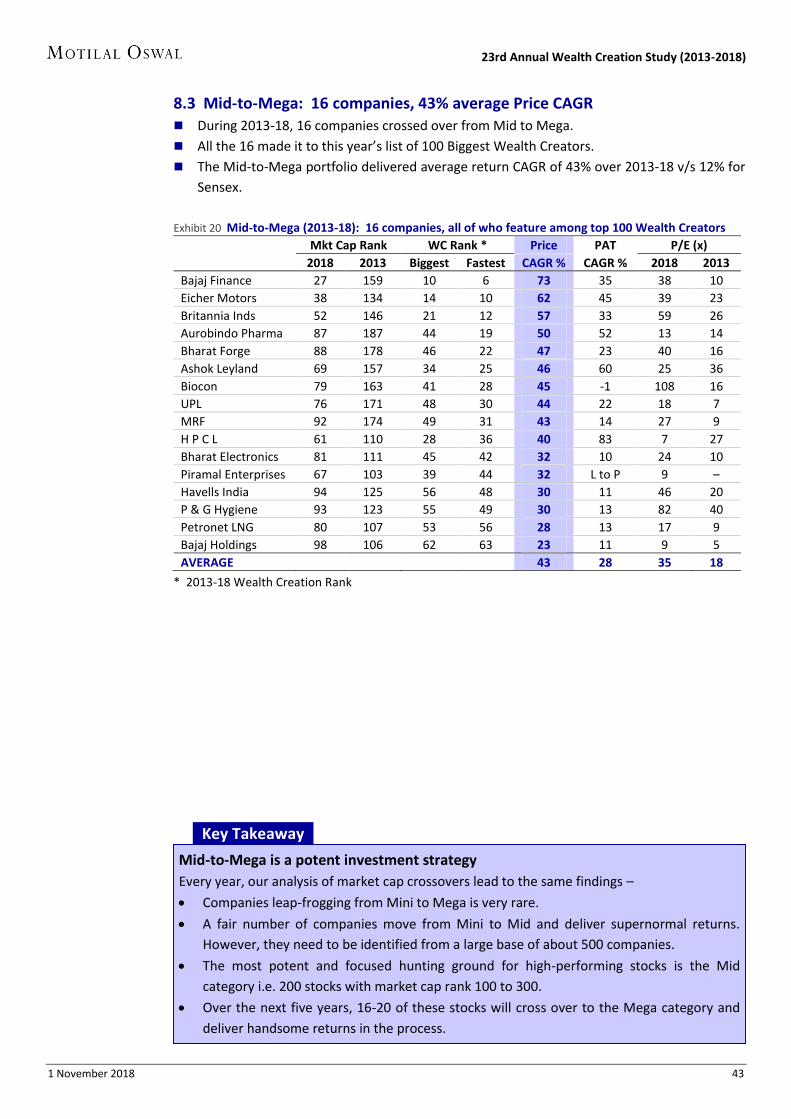
1 November 2018 43
23rd Annual Wealth Creation Study (2013-2018)
8.3 Mid-to-Mega: 16 companies, 43% average Price CAGR
During 2013-18, 16 companies crossed over from Mid to Mega.
All the 16 made it to this year’s list of 100 Biggest Wealth Creators.
The Mid-to-Mega portfolio delivered average return CAGR of 43% over 2013-18 v/s 12% for
Sensex.
Exhibit 20 Mid-to-Mega (2013-18): 16 companies, all of who feature among top 100 Wealth Creators
Mkt Cap Rank WC Rank * Price PAT P/E (x)
2018 2013 Biggest Fastest CAGR % CAGR % 2018 2013
Bajaj Finance 27 159 10 6 73 35 38 10
Eicher Motors 38 134 14 10 62 45 39 23
Britannia Inds 52 146 21 12 57 33 59 26
Aurobindo Pharma 87 187 44 19 50 52 13 14
Bharat Forge 88 178 46 22 47 23 40 16
Ashok Leyland 69 157 34 25 46 60 25 36
Biocon 79 163 41 28 45 -1 108 16
UPL 76 171 48 30 44 22 18 7
MRF 92 174 49 31 43 14 27 9
H P C L 61 110 28 36 40 83 7 27
Bharat Electronics 81 111 45 42 32 10 24 10
Piramal Enterprises 67 103 39 44 32 L to P 9 –
Havells India 94 125 56 48 30 11 46 20
P & G Hygiene 93 123 55 49 30 13 82 40
Petronet LNG 80 107 53 56 28 13 17 9
Bajaj Holdings 98 106 62 63 23 11 9 5
AVERAGE 43 28 35 18
* 2013-18 Wealth Creation Rank
Key Takeaway
Mid-to-Mega is a potent investment strategy
Every year, our analysis of market cap crossovers lead to the same findings –
Companies leap-frogging from Mini to Mega is very rare.
A fair number of companies move from Mini to Mid and deliver supernormal returns.
However, they need to be identified from a large base of about 500 companies.
The most potent and focused hunting ground for high-performing stocks is the Mid
category i.e. 200 stocks with market cap rank 100 to 300.
Over the next five years, 16-20 of these stocks will cross over to the Mega category and
deliver handsome returns in the process.
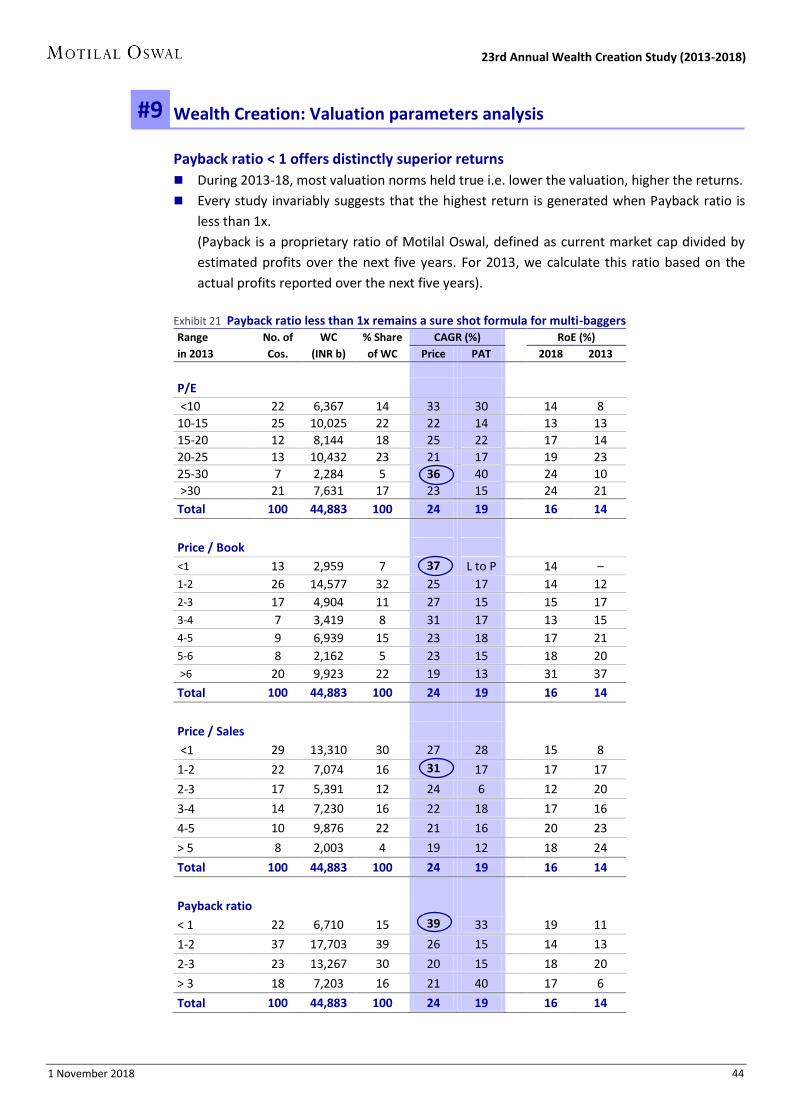
1 November 2018 44
23rd Annual Wealth Creation Study (2013-2018)
Wealth Creation: Valuation parameters analysis
Payback ratio < 1 offers distinctly superior returns
During 2013-18, most valuation norms held true i.e. lower the valuation, higher the returns.
Every study invariably suggests that the highest return is generated when Payback ratio is
less than 1x.
(Payback is a proprietary ratio of Motilal Oswal, defined as current market cap divided by
estimated profits over the next five years. For 2013, we calculate this ratio based on the
actual profits reported over the next five years).
Exhibit 21 Payback ratio less than 1x remains a sure shot formula for multi-baggers Range No. of WC % Share CAGR (%) RoE (%)
in 2013 Cos. (INR b) of WC Price PAT 2018 2013
P/E
<10 22 6,367 14 33 30 14 8
10-15 25 10,025 22 22 14 13 13
15-20 12 8,144 18 25 22 17 14
20-25 13 10,432 23 21 17 19 23
25-30 7 2,284 5 36 40 24 10
>30 21 7,631 17 23 15 24 21
Total 100 44,883 100 24 19 16 14
Price / Book
<1 13 2,959 7 37 L to P 14 –
1-2 26 14,577 32 25 17 14 12
2-3 17 4,904 11 27 15 15 17
3-4 7 3,419 8 31 17 13 15
4-5 9 6,939 15 23 18 17 21
5-6 8 2,162 5 23 15 18 20
>6 20 9,923 22 19 13 31 37
Total 100 44,883 100 24 19 16 14
Price / Sales
<1 29 13,310 30 27 28 15 8
1-2 22 7,074 16 31 17 17 17
2-3 17 5,391 12 24 6 12 20
3-4 14 7,230 16 22 18 17 16
4-5 10 9,876 22 21 16 20 23
> 5 8 2,003 4 19 12 18 24
Total 100 44,883 100 24 19 16 14
Payback ratio
< 1 22 6,710 15 39 33 19 11
1-2 37 17,703 39 26 15 14 13
2-3 23 13,267 30 20 15 18 20
> 3 18 7,203 16 21 40 17 6
Total 100 44,883 100 24 19 16 14
#9

1 November 2018 45
23rd Annual Wealth Creation Study (2013-2018)
PEG < 1x is also a solid formula for superior returns
For the purposes of this section, PEG (P/E to Growth ratio) is obtained by dividing trailing
12-month P/E by future 5-year earnings CAGR.
We have used perfect foresight of 5 years’ earnings to calculate PEG. Thus, if a stock’s P/E in
2013 was 20x, and its 2013-18 PAT CAGR is 25%, its 2013 PEG works out to 0.8x (20 ÷ 25).
Clearly, lower the PEG, higher the likely return.
Our theme study this year (see pages 4 to 31) has almost conclusively established that stocks
with PEG less than 1x tend to significantly outperform the market.
As tabled below, the story was no different for the 2018 Wealth Creators. Nearly half the
Wealth Creators were trading at PEG of less than 1x in 2013, and delivered the highest return.
Exhibit 22 PEG less than 1x is a solid formula for high returns PEG Range No. of WC % Share CAGR (%) RoE (%)
in 2013 (x) Cos. (INR b) of WC Price PAT 2018 2013
<0.5 23 7,427 17 38 34 19 10
0.5-1 26 17,803 40 28 17 15 14
1-1.5 11 5,093 11 20 13 18 18
1.5-2 11 4,952 11 16 13 25 26
2-3 9 2,091 5 22 10 11 16
>3 14 5,365 12 20 6 18 23
L to P 3 682 2 24 L to P 13 -20
PAT decline 3 1,470 3 19 -17 3 16
Total 100 44,883 100 24 19 16 14
Note: PEG here is calculated as P/E of March 2013 divided by 2013-18 PAT CAGR

1 November 2018 46
23rd Annual Wealth Creation Study (2013-2018)
Those who missed the Wealth Creators’ list
The big who didn’t beat the market
During 2013-18, the Sensex return CAGR was 11.8%.
11 companies (Exhibit 23) created enough wealth to qualify among the 100 biggest Wealth
Creators, but failed to make it to the final list as their stock return CAGR was lower than the
Sensex.
They made way for 11 others to join the list (Exhibit 24).
Exhibit 23 Those who missed the list … Exhibit 24 … and those who made it
2013-18 WC * Price Potential 2013-18 WC * Price Size
(INR b) CAGR (%) Size Rank ** (INR b) CAGR (%) Rank
Infosys 949 9.4 10 Graphite India 127 56 90
ITC 641 4.4 18 Honeywell Auto 126 46 91
ICICI Bank 571 7.9 23 WABCO India 124 42 92
Bharti Airtel 419 6.5 33 HEG 120 79 93
M & M 391 11.4 35 Sterlite Tech. 116 75 94
Wipro 332 5.2 43 Symphony 113 58 95
SBI 296 3.8 48 Natco Pharma 112 54 96
Bajaj Auto 276 8.9 55 Indiabulls Ventures 112 97 97
NTPC 228 3.6 63 Supreme Inds 111 31 98
United Spirits 185 10.5 72 Bayer Crop Science 111 28 99
Cipla 131 7.4 99 The Ramco Cement 111 24 100
* - Wealth Created; ** Size rank had the stock outperformed the benchmark
The fast who didn’t make it big
The 100th biggest Wealth Creator created Wealth of INR 111 billion. Over 1,500 more
companies beat the benchmark return CAGR of 11.8% but did not make it to the list as they
created absolute wealth less than INR 111 billion.
Exhibit 25 lists the top 20 fastest among them.
Exhibit 25 The fast who didn’t make it big
2013-18 Price Price WC 2013-18 Price Price WC
CAGR (%) Mult. (x) (INR b) CAGR (%) Mult. (x) (INR b)
Minda Inds 103 34.8 88 L T Foods 79 18.3 22
Eveready Inds 86 22.3 26 TVS Srichakra 79 18.2 23
Garware-Wall Ropes 85 21.6 19 Navin Fluorine 78 18.1 36
Aegis Logistics 83 20.4 82 Optiemus Infra 78 17.7 20
Maithan Alloys 82 20.1 21 Ahluwalia Contracts 77 17.3 24
KRBL 82 19.9 97 Tata Metaliks 77 17.2 18
Orient Paper 81 19.5 7 Phillips Carbon 76 16.8 35
Johnson Con. Hitachi 81 19.4 64 Escorts 75 16.5 94
Excel Crop Care 81 19.3 32 CEAT 74 16.0 53
Can Fin Homes 80 19.1 59 Balaji Amines 74 16.0 17
Note: In choosing these companies, the condition is that base 2013 market cap is at least INR 1 billion
#10
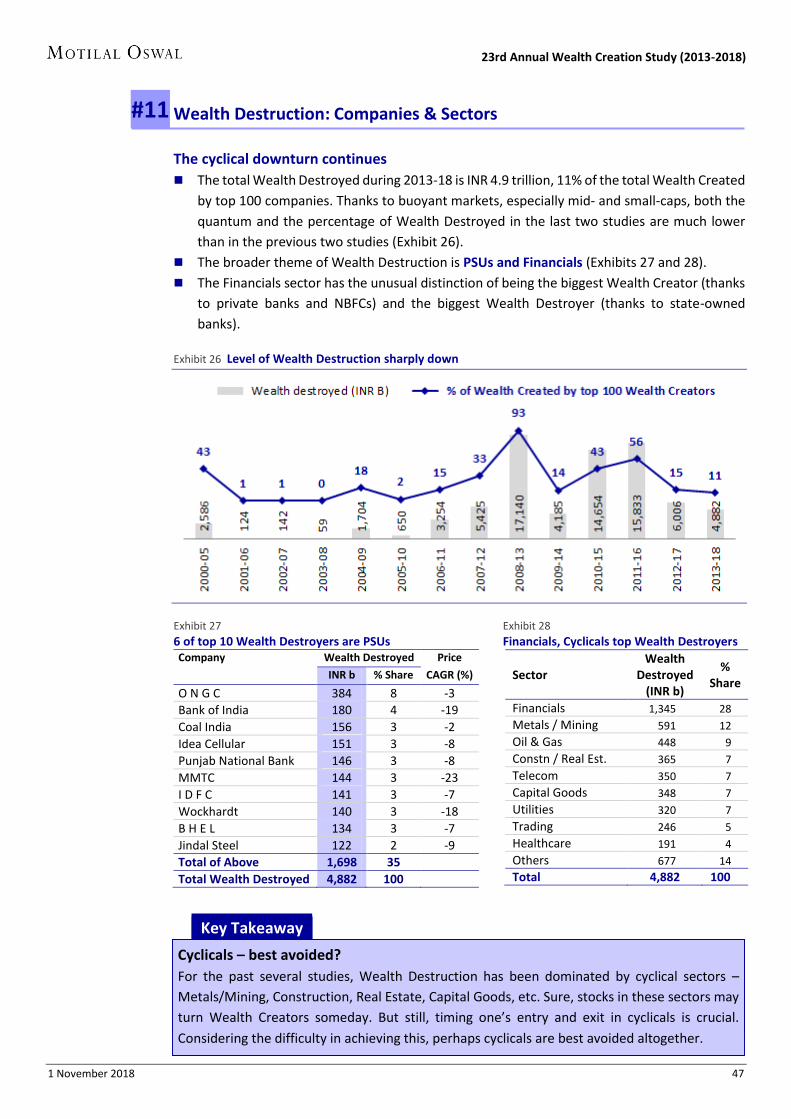
1 November 2018 47
23rd Annual Wealth Creation Study (2013-2018)
Wealth Destruction: Companies & Sectors
The cyclical downturn continues
The total Wealth Destroyed during 2013-18 is INR 4.9 trillion, 11% of the total Wealth Created
by top 100 companies. Thanks to buoyant markets, especially mid- and small-caps, both the
quantum and the percentage of Wealth Destroyed in the last two studies are much lower
than in the previous two studies (Exhibit 26).
The broader theme of Wealth Destruction is PSUs and Financials (Exhibits 27 and 28).
The Financials sector has the unusual distinction of being the biggest Wealth Creator (thanks
to private banks and NBFCs) and the biggest Wealth Destroyer (thanks to state-owned
banks).
Exhibit 26 Level of Wealth Destruction sharply down
Exhibit 27 Exhibit 28
6 of top 10 Wealth Destroyers are PSUs Financials, Cyclicals top Wealth Destroyers Company Wealth Destroyed Price
INR b % Share CAGR (%)
O N G C 384 8 -3
Bank of India 180 4 -19
Coal India 156 3 -2
Idea Cellular 151 3 -8
Punjab National Bank 146 3 -8
MMTC 144 3 -23
I D F C 141 3 -7
Wockhardt 140 3 -18
B H E L 134 3 -7
Jindal Steel 122 2 -9
Total of Above 1,698 35
Total Wealth Destroyed 4,882 100
#11
Sector Wealth
Destroyed (INR b)
% Share
Financials 1,345 28
Metals / Mining 591 12
Oil & Gas 448 9
Constn / Real Est. 365 7
Telecom 350 7
Capital Goods 348 7
Utilities 320 7
Trading 246 5
Healthcare 191 4
Others 677 14
Total 4,882 100
Key Takeaway
.
Key Takeaway
Cyclicals – best avoided?
For the past several studies, Wealth Destruction has been dominated by cyclical sectors –
Metals/Mining, Construction, Real Estate, Capital Goods, etc. Sure, stocks in these sectors may
turn Wealth Creators someday. But still, timing one’s entry and exit in cyclicals is crucial.
Considering the difficulty in achieving this, perhaps cyclicals are best avoided altogether.

1 November 2018 48
23rd Annual Wealth Creation Study (2013-2018)
Appendix 1: MOSL 100: Biggest Wealth Creators (2013-2018)
Rank Company Wealth Created CAGR (2013-18, %) RoE (%) P/E (x)
INR b Share (%) Price PAT Sales 2018 2013 2018 2013
1 HDFC Bank 3,247 7.2 25 22 19 17 19 27 22
2 Reliance Industries 3,094 6.9 18 13 0 12 11 15 13
3 TCS 2,532 5.6 13 13 14 30 36 21 22
4 Maruti Suzuki 2,308 5.1 47 25 12 15 11 41 17
5 Hindustan Unilever 1,883 4.2 23 10 6 72 113 55 31
6 HDFC 1,640 3.7 17 16 14 16 21 22 19
7 Kotak Mahindra Bank 1,345 3.0 26 23 18 12 14 32 22
8 IOC 1,008 2.2 20 38 -2 19 7 8 15
9 Larsen & Toubro 990 2.2 17 14 10 16 13 21 18
10 Bajaj Finance 902 2.0 73 35 34 16 18 38 10
11 HCL Technologies 831 1.9 19 16 15 24 31 16 14
12 IndusInd Bank 812 1.8 35 28 20 15 14 30 20
13 Hindustan Zinc 760 1.7 20 8 12 25 19 14 8
14 Eicher Motors 703 1.6 62 45 7 28 17 39 23
15 Bajaj Finserv 702 1.6 46 12 31 13 20 30 8
16 BPCL 650 1.4 28 35 -1 25 12 10 14
17 Titan Company 608 1.4 30 9 10 22 37 73 31
18 Asian Paints 604 1.3 18 13 11 24 32 54 43
19 Axis Bank 598 1.3 14 -40 11 1 16 315 12
20 UltraTech Cement 571 1.3 16 -1 8 9 16 46 20
21 Britannia Industries 534 1.2 57 33 10 29 44 59 26
22 JSW Steel 534 1.2 34 42 13 23 7 11 13
23 Motherson Sumi 519 1.2 40 31 17 17 19 38 26
24 Godrej Consumer 479 1.1 23 17 9 24 20 51 39
25 Power Grid Corpn 471 1.0 13 13 18 15 16 13 11
26 Yes Bank 466 1.0 29 27 20 16 22 17 12
27 Adani Ports 449 1.0 21 19 26 18 24 20 18
28 HPCL 428 1.0 40 83 0 29 3 7 27
29 Shree Cement 422 0.9 32 8 12 15 24 42 15
30 Hero Motocorp 400 0.9 18 14 6 30 38 20 16
31 Tech Mahindra 372 0.8 19 22 35 19 25 17 10
32 Zee Entertainment 352 0.8 22 15 13 19 18 39 28
33 Nestle India 348 0.8 12 3 4 36 59 65 41
34 Ashok Leyland 348 0.8 46 60 18 23 5 25 36
35 Pidilite Industries 337 0.7 28 19 11 27 25 49 33
36 Dabur India 335 0.7 19 13 5 24 36 42 32
37 GAIL (India) 332 0.7 13 2 1 12 15 15 9
38 Vedanta 322 0.7 12 27 102 12 13 14 6
39 Piramal Enterprises 316 0.7 32 L to P 25 19 -2 9 -48
40 Bharti Infratel 308 0.7 14 22 -8 15 5 24 36
41 Biocon 302 0.7 45 -1 11 6 13 108 16
42 Bosch 289 0.6 15 9 6 14 16 39 31
43 Marico 284 0.6 25 16 7 31 19 54 37
44 Aurobindo Pharma 284 0.6 50 52 23 21 11 13 14
45 Bharat Electronics 280 0.6 32 10 11 18 14 24 10
46 Bharat Forge 278 0.6 47 23 10 18 13 40 16
47 TVS Motor Company 278 0.6 80 40 17 25 14 44 12
48 UPL 273 0.6 44 22 14 23 17 18 7
49 MRF 256 0.6 43 14 5 12 20 27 9
50 Hindalco Industries 251 0.6 19 12 8 9 8 10 6
Rank Company Wealth Created CAGR (2013-18, %) RoE (%) P/E (x)
INR b Share (%) Price PAT Sales 2018 2013 2018 2013

1 November 2018 49
23rd Annual Wealth Creation Study (2013-2018)
Appendix 1: MOSL 100: Biggest Wealth Creators (2013-2018) … continued
Rank Company Wealth Created CAGR (2013-18, %) RoE (%) P/E (x)
INR b Share (%) Price PAT Sales 2018 2013 2018 2013
51 Dalmia Bharat 239 0.5 81 23 25 9 6 48 6
52 Tata Steel 239 0.5 14 L to P 0 9 -24 12 -4
53 Petronet LNG 238 0.5 28 13 -1 21 26 17 9
54 Cadila Healthcare 235 0.5 21 22 13 20 23 22 23
55 P & G Hygiene 224 0.5 30 13 8 47 26 82 40
56 Havells India 224 0.5 30 11 1 18 28 46 20
57 Page Industries 216 0.5 47 25 24 41 53 73 33
58 IIFL Holdings 205 0.5 64 27 8 18 14 25 7
59 Kansai Nerolac 205 0.5 32 19 11 16 16 55 32
60 Vakrangee 197 0.4 46 46 33 26 20 34 32
61 Grasim Industries 193 0.4 18 5 15 5 12 24 11
62 Bajaj Holdings 190 0.4 23 11 23 15 18 9 5
63 Cholamandalam Inv. 183 0.4 40 26 16 19 16 23 13
64 Berger Paints 181 0.4 30 16 9 20 23 55 31
65 Balkrishna Industries 181 0.4 51 15 6 17 24 30 8
66 Rajesh Exports 181 0.4 43 23 43 18 19 17 8
67 Voltas 180 0.4 52 24 3 15 12 36 13
68 Sun TV Network 179 0.4 17 10 9 24 25 30 22
69 Siemens 176 0.4 14 12 -3 10 11 51 45
70 3M India 176 0.4 39 43 10 20 8 70 81
71 Edelweiss Financial 175 0.4 50 38 32 13 7 25 13
72 GRUH Finance 173 0.4 41 20 21 26 30 58 26
73 Shriram Transport 169 0.4 16 0 12 12 20 22 11
74 ABB 169 0.4 21 25 4 12 5 64 74
75 Container Corporation 167 0.4 18 3 9 11 15 28 14
76 Whirlpool India 164 0.4 47 22 13 20 21 55 22
77 Divi's Labs 159 0.4 17 8 13 15 24 33 22
78 Indraprastha Gas 157 0.3 38 14 6 19 24 28 11
79 LIC Housing Finance 157 0.3 19 14 14 16 16 13 11
80 NBCC 156 0.3 64 11 17 18 22 48 7
81 M & M Financial 154 0.3 19 2 16 10 20 29 12
82 Torrent Pharma 152 0.3 29 7 13 14 32 33 13
83 Emami 152 0.3 22 4 8 18 40 66 29
84 L&T Fin. Holdings 149 0.3 16 20 21 12 11 21 21
85 Gillette India 148 0.3 27 21 3 33 14 93 75
86 Motillal Oswal 135 0.3 67 42 42 25 8 26 11
87 Sundaram Finance 133 0.3 32 5 10 15 22 26 9
88 Dewan Housing 133 0.3 44 21 21 14 14 14 5
89 Bharat Financial 127 0.3 55 L to P 43 15 -76 34 -4
90 Graphite India 127 0.3 56 52 11 38 7 14 12
91 Honeywell Auto 126 0.3 46 24 10 18 12 59 27
92 WABCO India 124 0.3 42 15 22 17 20 59 20
93 HEG 120 0.3 79 48 11 58 18 12 4
94 Sterlite Technologies 116 0.3 75 67 1 29 2 37 35
95 Symphony 113 0.3 58 26 16 31 30 67 21
96 Natco Pharma 112 0.2 54 54 26 22 15 20 17
97 Indiabulls Ventures 112 0.2 97 30 40 12 29 54 3
98 Supreme Industries 111 0.2 31 8 8 23 33 35 14
99 Bayer Crop Science 111 0.2 28 1 0 17 15 48 16
100 The Ramco Cement 111 0.2 24 7 3 14 17 31 15
TOTAL / AVG 44,883 100.0 34 21 14 20 19 38 19
Rank Company Wealth Created CAGR (2013-18, %) RoE (%) P/E (x)
INR b Share (%) Price PAT Sales 2018 2013 2018 2013
Note: L to P stands for Loss to Profit

1 November 2018 50
23rd Annual Wealth Creation Study (2013-2018)
Appendix 2: MOSL 100: Fastest Wealth Creators (2013-2018)
Rank Company 2013-18 Price CAGR 13-18 (%) Wealth Created RoE (%) P/E (x)
CAGR (%) Times (x) PAT Sales INR b Share (%) 2018 2013 2018 2013
1 Indiabulls Ventures 97.0 29.6 30 40 112 0.2 12 29 54 3
2 Dalmia Bharat 81.0 19.4 23 25 239 0.5 9 6 48 6
3 TVS Motor Company 80.2 19.0 40 17 278 0.6 25 14 44 12
4 HEG 79.5 18.6 48 11 120 0.3 58 18 12 4
5 Sterlite Technologies 75.3 16.5 67 1 116 0.3 29 2 37 35
6 Bajaj Finance 72.6 15.3 35 34 902 2.0 16 18 38 10
7 Motilal Oswal 67.3 13.1 42 42 135 0.3 25 8 26 11
8 IIFL Holdings 64.1 11.9 27 8 205 0.5 18 14 25 7
9 NBCC 63.5 11.7 11 17 156 0.3 18 22 48 7
10 Eicher Motors 61.9 11.1 45 7 703 1.6 28 17 39 23
11 Symphony 58.2 9.9 26 16 113 0.3 31 30 67 21
12 Britannia Industries 56.8 9.5 33 10 534 1.2 29 44 59 26
13 Graphite India 55.8 9.2 52 11 127 0.3 38 7 14 12
14 Bharat Financial 55.3 9.0 L to P 43 127 0.3 15 -76 34 -4
15 Natco Pharma 54.5 8.8 54 26 112 0.2 22 15 20 17
16 Voltas 52.4 8.2 24 3 180 0.4 15 12 36 13
17 Balkrishna Industries 51.1 7.9 15 6 181 0.4 17 24 30 8
18 Edelweiss Financial 50.4 7.7 38 32 175 0.4 13 7 25 13
19 Aurobindo Pharma 50.2 7.6 52 23 284 0.6 21 11 13 14
20 Maruti Suzuki 47.3 6.9 25 12 2,308 5.1 15 11 41 17
21 Whirlpool India 47.0 6.9 22 13 164 0.4 20 21 55 22
22 Bharat Forge 46.9 6.8 23 10 278 0.6 18 13 40 16
23 Page Industries 46.8 6.8 25 24 216 0.5 41 53 73 33
24 Bajaj Finserv 46.4 6.7 12 31 702 1.6 13 20 30 8
25 Ashok Leyland 45.9 6.6 60 18 348 0.8 23 5 25 36
26 Vakrangee 45.8 6.6 46 33 197 0.4 26 20 34 32
27 Honeywell Auto 45.7 6.6 24 10 126 0.3 18 12 59 27
28 Biocon 45.4 6.5 -1 11 302 0.7 6 13 108 16
29 Dewan Housing 44.4 6.3 21 21 133 0.3 14 14 14 5
30 UPL 44.1 6.2 22 14 273 0.6 23 17 18 7
31 MRF 43.2 6.0 14 5 256 0.6 12 20 27 9
32 Rajesh Exports 43.0 6.0 23 43 181 0.4 18 19 17 8
33 WABCO India 42.4 5.9 15 22 124 0.3 17 20 59 20
34 GRUH Finance 40.6 5.5 20 21 173 0.4 26 30 58 26
35 Motherson Sumi 40.4 5.4 31 17 519 1.2 17 19 38 26
36 H P C L 40.3 5.4 83 0 428 1.0 29 3 7 27
37 Cholamdalam Inv. 39.8 5.3 26 16 183 0.4 19 16 23 13
38 3M India 38.8 5.2 43 10 176 0.4 20 8 70 81
39 Indraprastha Gas 38.3 5.1 14 6 157 0.3 19 24 28 11
40 IndusInd Bank 34.7 4.4 28 20 812 1.8 15 14 30 20
41 JSW Steel 33.8 4.3 42 13 534 1.2 23 7 11 13
42 Bharat Electronics 32.5 4.1 10 11 280 0.6 18 14 24 10
43 Kansai Nerolac 32.4 4.1 19 11 205 0.5 16 16 55 32
44 Piramal Enterprises 32.1 4.0 L to P 25 316 0.7 19 -2 9 -48
45 Shree Cement 31.9 4.0 8 12 422 0.9 15 24 42 15
46 Sundaram Finance 31.5 3.9 5 10 133 0.3 15 22 26 9
47 Supreme Industries 30.5 3.8 8 8 111 0.2 23 33 35 14
48 Havells India 30.4 3.8 11 1 224 0.5 18 28 46 20
49 P & G Hygiene 30.2 3.7 13 8 224 0.5 47 26 82 40
50 Berger Paints 29.7 3.7 16 9 181 0.4 20 23 55 31
Rank Company 2013-18 Price CAGR 13-18 (%) Wealth Created RoE (%) P/E (x)
CAGR (%) Times (x) PAT Sales INR b Share (%) 2018 2013 2018 2013

1 November 2018 51
23rd Annual Wealth Creation Study (2013-2018)
Appendix 2: MOSL 100: Fastest Wealth Creators (2013-2018) … continued
Rank Company 2013-18 Price CAGR (13-18, %) Wealth Created RoE (%) P/E (x)
CAGR (%) Times (x) PAT Sales INR b Share (%) 2018 2013 2018 2013
51 Titan Company 29.7 3.7 9 10 608 1.4 22 37 73 31
52 Torrent Pharma 29.1 3.6 7 13 152 0.3 14 32 33 13
53 Yes Bank 28.9 3.6 27 20 466 1.0 16 22 17 12
54 Pidilite Industries 28.4 3.5 19 11 337 0.7 27 25 49 33
55 Bayer Crop Science 28.4 3.5 1 0 111 0.2 17 15 48 16
56 Petronet LNG 27.9 3.4 13 -1 238 0.5 21 26 17 9
57 BPCL 27.7 3.4 35 -1 650 1.4 25 12 10 14
58 Gillette India 26.6 3.3 21 3 148 0.3 33 14 93 75
59 Kotak Mahindra Bank 26.3 3.2 23 18 1,345 3.0 12 14 32 22
60 Marico 25.2 3.1 16 7 284 0.6 31 19 54 37
61 HDFC Bank 24.8 3.0 22 19 3,247 7.2 17 19 27 22
62 The Ramco Cement 23.8 2.9 7 3 111 0.2 14 17 31 15
63 Bajaj Holdings 23.5 2.9 11 23 190 0.4 15 18 9 5
64 Hindustan Unilever 23.4 2.9 10 6 1,883 4.2 72 113 55 31
65 Godrej Consumer 22.9 2.8 17 9 479 1.1 24 20 51 39
66 Zee Entertainment 22.3 2.7 15 13 352 0.8 19 18 39 28
67 Emami 21.7 2.7 4 8 152 0.3 18 40 66 29
68 ABB 21.3 2.6 25 4 169 0.4 12 5 64 74
69 Adani Ports 20.6 2.6 19 26 449 1.0 18 24 20 18
70 Cadila Healthcare 20.6 2.6 22 13 235 0.5 20 23 22 23
71 IOC 20.2 2.5 38 -2 1,008 2.2 19 7 8 15
72 Hindustan Zinc 20.0 2.5 8 12 760 1.7 25 19 14 8
73 HCL Technologies 19.5 2.4 16 15 831 1.9 24 31 16 14
74 Tech Mahindra 19.2 2.4 22 35 372 0.8 19 25 17 10
75 Dabur India 19.0 2.4 13 5 335 0.7 24 36 42 32
76 LIC Housing Finance 18.9 2.4 14 14 157 0.3 16 16 13 11
77 M & M Financial 18.9 2.4 2 16 154 0.3 10 20 29 12
78 Hindalco Industries 18.5 2.3 12 8 251 0.6 9 8 10 6
79 Hero Motocorp 18.1 2.3 14 6 400 0.9 30 38 20 16
80 Grasim Industries 18.0 2.3 5 15 193 0.4 5 12 24 11
81 Reliance Industries 17.9 2.3 13 0 3,094 6.9 12 11 15 13
82 Asian Paints 17.9 2.3 13 11 604 1.3 24 32 54 43
83 Container Corpn 17.7 2.3 3 9 167 0.4 11 15 28 14
84 Divi's Labs 17.2 2.2 8 13 159 0.4 15 24 33 22
85 HDFC 17.2 2.2 16 14 1,640 3.7 16 21 22 19
86 Larsen & Toubro 16.7 2.2 14 10 990 2.2 16 13 21 18
87 Sun TV Network 16.7 2.2 10 9 179 0.4 24 25 30 22
88 L&T Fin. Holdings 16.3 2.1 20 21 149 0.3 12 11 21 21
89 UltraTech Cement 16.1 2.1 -1 8 571 1.3 9 16 46 20
90 Shriram Transport 15.7 2.1 0 12 169 0.4 12 20 22 11
91 Bosch 14.9 2.0 9 6 289 0.6 14 16 39 31
92 Axis Bank 14.4 2.0 -40 11 598 1.3 1 16 315 12
93 Siemens 14.3 2.0 12 -3 176 0.4 10 11 51 45
94 Tata Steel 13.9 1.9 L to P 0 239 0.5 9 -24 12 -4
95 Bharti Infratel 13.7 1.9 22 -8 308 0.7 15 5 24 36
96 GAIL (India) 12.9 1.8 2 1 332 0.7 12 15 15 9
97 Power Grid Corpn 12.8 1.8 13 18 471 1.0 15 16 13 11
98 TCS 12.6 1.8 13 14 2,532 5.6 30 36 21 22
99 Vedanta 12.3 1.8 27 102 322 0.7 12 13 14 6
100 Nestle India 12.3 1.8 3 4 348 0.8 36 59 65 41
TOTAL / AVG 34.5 5.4 21 14 44,883 100.0 20 19 38 19
Rank Company 2013-18 Price CAGR (13-18, %) Wealth Created RoE (%) P/E (x)
CAGR (%) Times (x) PAT Sales INR b Share (%) 2018 2013 2018 2013
Note: L to P stands for Loss to Profit

1 November 2018 52
23rd Annual Wealth Creation Study (2013-2018)
Appendix 3: MOSL 100 – Alphabetical order
WC Rank 2013-18 Wealth Created WC Rank 2013-18 Wealth Created
Company Biggest Fastest INR b Price
CAGR %
Price
Mult. (x) Company Biggest Fastest INR b
Price
CAGR %
Price
Mult. (x)
3M India 70 38 176 38.8 5.2 Indiabulls Ventures 97 1 112 97.0 29.6
ABB 74 68 169 21.3 2.6 Indraprastha Gas 78 39 157 38.3 5.1
Adani Ports 27 69 449 20.6 2.6 IndusInd Bank 12 40 812 34.7 4.4
Ashok Leyland 34 25 348 45.9 6.6 JSW Steel 22 41 534 33.8 4.3
Asian Paints 18 82 604 17.9 2.3 Kansai Nerolac 59 43 205 32.4 4.1
Aurobindo Pharma 44 19 284 50.2 7.6 Kotak Mahindra 7 59 1,345 26.3 3.2
Axis Bank 19 92 598 14.4 2.0 L&T Fin. Holdings 84 88 149 16.3 2.1
BPCL 16 57 650 27.7 3.4 Larsen & Toubro 9 86 990 16.7 2.2
Bajaj Finance 10 6 902 72.6 15.3 LIC Housing Finance 79 76 157 18.9 2.4
Bajaj Finserv 15 24 702 46.4 6.7 M & M Financial 81 77 154 18.9 2.4
Bajaj Holdings 62 63 190 23.5 2.9 Marico 43 60 284 25.2 3.1
Balkrishna Industries 65 17 181 51.1 7.9 Maruti Suzuki 4 20 2,308 47.3 6.9
Bayer Crop Science 99 55 111 28.4 3.5 Motherson Sumi 23 35 519 40.4 5.4
Berger Paints 64 50 181 29.7 3.7 Motilal Oswal 86 7 135 67.3 13.1
Bharat Electronics 45 42 280 32.5 4.1 MRF 49 31 256 43.2 6.0
Bharat Financial 89 14 127 55.3 9.0 Natco Pharma 96 15 112 54.5 8.8
Bharat Forge 46 22 278 46.9 6.8 NBCC 80 9 156 63.5 11.7
Bharti Infratel 40 95 308 13.7 1.9 Nestle India 33 100 348 12.3 1.8
Biocon 41 28 302 45.4 6.5 P & G Hygiene 55 49 224 30.2 3.7
Bosch 42 91 289 14.9 2.0 Page Industries 57 23 216 46.8 6.8
Britannia Industries 21 12 534 56.8 9.5 Petronet LNG 53 56 238 27.9 3.4
Cadila Healthcare 54 70 235 20.6 2.6 Pidilite Industries 35 54 337 28.4 3.5
Cholamandalam Inv. 63 37 183 39.8 5.3 Piramal Enterprises 39 44 316 32.1 4.0
Container Corpn. 75 83 167 17.7 2.3 Power Grid Corpn 25 97 471 12.8 1.8
Dabur India 36 75 335 19.0 2.4 Rajesh Exports 66 32 181 43.0 6.0
Dalmia Bharat 51 2 239 81.0 19.4 Reliance Industries 2 81 3,094 17.9 2.3
Dewan Housing 88 29 133 44.4 6.3 Shree Cement 29 45 422 31.9 4.0
Divi's Labs 77 84 159 17.2 2.2 Shriram Transport 73 90 169 15.7 2.1
Edelweiss Financial 71 18 175 50.4 7.7 Siemens 69 93 176 14.3 2.0
Eicher Motors 14 10 703 61.9 11.1 Sterlite Technologies 94 5 116 75.3 16.5
Emami 83 67 152 21.7 2.7 Sun TV Network 68 87 179 16.7 2.2
GAIL (India) 37 96 332 12.9 1.8 Sundaram Finance 87 46 133 31.5 3.9
Gillette India 85 58 148 26.6 3.3 Supreme Industries 98 47 111 30.5 3.8
Godrej Consumer 24 65 479 22.9 2.8 Symphony 95 11 113 58.2 9.9
Graphite India 90 13 127 55.8 9.2 Tata Steel 52 94 239 13.9 1.9
Grasim Industries 61 80 193 18.0 2.3 TCS 3 98 2,532 12.6 1.8
GRUH Finance 72 34 173 40.6 5.5 Tech Mahindra 31 74 372 19.2 2.4
HDFC 6 85 1,640 17.2 2.2 The Ramco Cement 100 62 111 23.8 2.9
HPCL 28 36 428 40.3 5.4 Titan Company 17 51 608 29.7 3.7
Havells India 56 48 224 30.4 3.8 Torrent Pharma 82 52 152 29.1 3.6
HCL Technologies 11 73 831 19.5 2.4 TVS Motor Company 47 3 278 80.2 19.0
HDFC Bank 1 61 3,247 24.8 3.0 UltraTech Cement 20 89 571 16.1 2.1
HEG 93 4 120 79.5 18.6 UPL 48 30 273 44.1 6.2
Hero Motocorp 30 79 400 18.1 2.3 Vakrangee 60 26 197 45.8 6.6
Hindustan Unilever 5 64 1,883 23.4 2.9 Vedanta 38 99 322 12.3 1.8
Hindustan Zinc 13 72 760 20.0 2.5 Voltas 67 16 180 52.4 8.2
Hindalco Industries 50 78 251 18.5 2.3 WABCO India 92 33 124 42.4 5.9
Honeywell Auto 91 27 126 45.7 6.6 Whirlpool India 76 21 164 47.0 6.9
IOC 8 71 1,008 20.2 2.5 Yes Bank 26 53 466 28.9 3.6
IIFL Holdings 58 8 205 64.1 11.9 Zee Entertainment 32 66 352 22.3 2.7

Explanation of Investment Rating Investment Rating Expected return (over 12-month) BUY >=15% SELL < - 10% NEUTRAL > - 10 % to 15% UNDER REVIEW Rating may undergo a change NOT RATED We have forward looking estimates for the stock but we refrain from assigning recommendation *In case the recommendation given by the Research Analyst becomes inconsistent with the investment rating legend, the Research Analyst shall within 28 days of the inconsistency, take appropriate measures to make the recommendation consistent with the investment rating legend.
Disclosures: The following Disclosures are being made in compliance with the SEBI Research Analyst Regulations 2014 (herein after referred to as the Regulations).
Motilal Oswal Securities Ltd. (MOSL*) is a SEBI Registered Research Analyst having registration no. INH000000412. MOSL, the Research Entity (RE) as defined in the Regulations, is engaged in the business of providing Stock broking services, Investment Advisory Services, Depository participant services & distribution of various financial products. MOSL is a subsidiary company of Motilal Oswal Financial Service Ltd. (MOFSL). MOFSL is a listed public company, the details in respect of which are available on www.motilaloswal.com. MOSL is registered with the Securities & Exchange Board of India (SEBI) and is a registered Trading Member with National Stock Exchange of India Ltd. (NSE) and BSE Limited (BSE), Multi Commodity Exchange of India (MCX) & National Commodity & Derivatives Exchange Ltd. (NCDEX) for its stock broking activities & is Depository participant with Central Depository Services Limited (CDSL) & National Securities Depository Limited (NSDL) and is member of Association of Mutual Funds of India (AMFI) for distribution of financial products. Details of associate entities of Motilal Oswal Securities Limited are available on the website at http://onlinereports.motilaloswal.com/Dormant/documents/Associate%20Details.pdf
MOSL, it’s associates, Research Analyst or their relative may have any financial interest in the subject company. MOSL and/or its associates and/or Research Analyst may have actual/beneficial ownership of 1% or more securities in the subject company at the end of the month immediately preceding the date of publication of the Research Report. MOSL and its associate company(ies), their directors and Research Analyst and their relatives may; (a) from time to time, have a long or short position in, act as principal in, and buy or sell the securities or derivatives thereof of companies mentioned herein. (b) be engaged in any other transaction involving such securities and earn brokerage or other compensation or act as a market maker in the financial instruments of the company(ies) discussed herein or act as an advisor or lender/borrower to such company(ies) or may have any other potential conflict of interests with respect to any recommendation and other related information and opinions.; however the same shall have no bearing whatsoever on the specific recommendations made by the analyst(s), as the recommendations made by the analyst(s) are completely independent of the views of the associates of MOSL even though there might exist an inherent conflict of interest in some of the stocks mentioned in the research report. Research Analyst may have served as director/officer, etc. in the subject company in the last 12 month period. MOSL and/or its associates may have received any compensation from the subject company in the past 12 months.
In the last 12 months period ending on the last day of the month immediately preceding the date of publication of this research report, MOSL or any of its associates may have: a) managed or co-managed public offering of securities from subject company of this research report, b) received compensation for investment banking or merchant banking or brokerage services from subject company of this research report, c) received compensation for products or services other than investment banking or merchant banking or brokerage services from the subject company of this research report. d) Subject Company may have been a client of MOSL or its associates during twelve months preceding the date of distribution of the research report.
MOSL and it’s associates have not received any compensation or other benefits from the subject company or third party in connection with the research report. To enhance transparency, MOSL has incorporated a Disclosure of Interest Statement in this document. This should, however, not be treated as endorsement of the views expressed in the report. MOSL and / or its affiliates do and seek to do business including investment banking with companies covered in its research reports. As a result, the recipients of this report should be aware that MOSL may have a potential conflict of interest that may affect the objectivity of this report. Compensation of Research Analysts is not based on any specific merchant banking, investment banking or brokerage service transactions.
Terms & Conditions: This report has been prepared by MOSL and is meant for sole use by the recipient and not for circulation. The report and information contained herein is strictly confidential and may not be altered in any way, transmitted to, copied or distributed, in part or in whole, to any other person or to the media or reproduced in any form, without prior written consent of MOSL. The report is based on the facts, figures and information that are considered true, correct, reliable and accurate. The intent of this report is not recommendatory in nature. The information is obtained from publicly available media or other sources believed to be reliable. Such information has not been independently verified and no guaranty, representation of warranty, express or implied, is made as to its accuracy, completeness or correctness. All such information and opinions are subject to change without notice. The report is prepared solely for informational purpose and does not constitute an offer document or solicitation of offer to buy or sell or subscribe for securities or other financial instruments for the clients. Though disseminated to all the customers simultaneously, not all customers may receive this report at the same time. MOSL will not treat recipients as customers by virtue of their receiving this report. Analyst Certification The views expressed in this research report accurately reflect the personal views of the analyst(s) about the subject securities or issues, and no part of the compensation of the research analyst(s) was, is, or will be directly or indirectly related to the specific recommendations and views expressed by research analyst(s) in this report.
Disclosure of Interest Statement Companies where there is interest Analyst ownership of the stock No A graph of daily closing prices of securities is available at www.nseindia.com, www.bseindia.com. Research Analyst views on Subject Company may vary based on Fundamental research and Technical Research. Proprietary trading desk of MOSL or its associates maintains arm’s length distance with Research Team as all the activities are segregated from MOSL research activity and therefore it can have an independent view with regards to subject company for which Research Team have expressed their views.
Regional Disclosures (outside India) This report is not directed or intended for distribution to or use by any person or entity resident in a state, country or any jurisdiction, where such distribution, publication, availability or use would be contrary to law, regulation or which would subject MOSL & its group companies to registration or licensing requirements within such jurisdictions.
For Hong Kong: This report is distributed in Hong Kong by Motilal Oswal capital Markets (Hong Kong) Private Limited, a licensed corporation (CE AYY-301) licensed and regulated by the Hong Kong Securities and Futures Commission (SFC) pursuant to the Securities and Futures Ordinance (Chapter 571 of the Laws of Hong Kong) “SFO”. As per SEBI (Research Analyst Regulations) 2014 Motilal Oswal Securities (SEBI Reg No. INH000000412) has an agreement with Motilal Oswal capital Markets (Hong Kong) Private Limited for distribution of research report in Hong Kong. This report is intended for distribution only to “Professional Investors” as defined in Part I of Schedule 1 to SFO. Any investment or investment activity to which this document relates is only available to professional investor and will be engaged only with professional investors.” Nothing here is an offer or solicitation of these securities, products and services in any jurisdiction where their offer or sale is not qualified or exempt from registration. The Indian Analyst(s) who compile this report is/are not located in Hong Kong & are not conducting Research Analysis in Hong Kong.
For U.S. Motilal Oswal Securities Limited (MOSL) is not a registered broker - dealer under the U.S. Securities Exchange Act of 1934, as amended (the"1934 act") and under applicable state laws in the United States. In addition MOSL is not a registered investment adviser under the U.S. Investment Advisers Act of 1940, as amended (the "Advisers Act" and together with the 1934 Act, the "Acts), and under applicable state laws in the United States. Accordingly, in the absence of specific exemption under the Acts, any brokerage and investment services provided by MOSL, including the products and services described herein are not available to or intended for U.S. persons. This report is intended for distribution only to "Major Institutional Investors" as defined by Rule 15a-6(b)(4) of the Exchange Act and interpretations thereof by SEC (henceforth referred to as "major institutional investors"). This document must not be acted on or relied on by persons who are not major institutional investors. Any investment or investment activity to which this document relates is only available to major institutional investors and will be engaged in only with major institutional investors. In reliance on the exemption from registration provided by Rule 15a-6 of the U.S. Securities Exchange Act of 1934, as amended (the "Exchange Act") and interpretations thereof by the U.S. Securities and Exchange Commission ("SEC") in order to conduct business with Institutional Investors based in the U.S., MOSL has entered into a chaperoning agreement with a U.S. registered broker-dealer, Motilal Oswal Securities International Private Limited. ("MOSIPL"). Any business interaction pursuant to this report will have to be executed within the provisions of this chaperoning agreement.
The Research Analysts contributing to the report may not be registered /qualified as research analyst with FINRA. Such research analyst may not be associated persons of the U.S. registered broker-dealer, MOSIPL, and therefore, may not be subject to NASD rule 2711 and NYSE Rule 472 restrictions on communication with a subject company, public appearances and trading securities held by a research analyst account.
For Singapore In Singapore, this report is being distributed by Motilal Oswal Capital Markets Singapore Pte Ltd (“MOCMSPL”) (Co.Reg. NO. 201129401Z) which is a holder of a capital markets services license and an exempt financial adviser in Singapore, as per the approved agreement under Paragraph 9 of Third Schedule of Securities and Futures Act (CAP 289) and Paragraph 11 of First Schedule of Financial Advisors Act (CAP 110) provided to MOCMSPL by Monetary Authority of Singapore. Persons in Singapore should contact MOCMSPL in respect of any matter arising from, or in connection with this report/publication/communication. This report is distributed solely to persons who qualify as “Institutional Investors”, of which some of whom may consist of "accredited" institutional investors as defined in section 4A(1) of the Securities and Futures Act, Chapter 289 of Singapore (“the SFA”). Accordingly, if a Singapore person is not or ceases to be such an institutional investor, such Singapore Person must immediately discontinue any use of this Report and inform MOCMSPL.
Disclaimer: The report and information contained herein is strictly confidential and meant solely for the selected recipient and may not be altered in any way, transmitted to, copied or distributed, in part or in whole, to any other person or to the media or reproduced in any form, without prior written consent. This report and information herein is solely for informational purpose and may not be used or considered as an offer document or solicitation of offer to buy or sell or subscribe for securities or other financial instruments. Nothing in this report constitutes investment, legal, accounting and tax advice or a representation that any investment or strategy is suitable or appropriate to your specific circumstances. The securities discussed and opinions expressed in this report may not be suitable for all investors, who must make their own investment decisions, based on their own investment objectives, financial positions and needs of specific recipient. This may not be taken in substitution for the exercise of independent judgment by any recipient. Each recipient of this document should make such investigations as it deems necessary to arrive at an independent evaluation of an investment in the securities of companies referred to in this document (including the merits and risks involved), and should consult its own advisors to determine the merits and risks of such an investment. The investment discussed or views expressed may not be suitable for all investors. Certain transactions -including those involving futures, options, another derivative products as well as non-investment grade securities - involve substantial risk and are not suitable for all investors. No representation or warranty, express or implied, is made as to the accuracy, completeness or fairness of the information and opinions contained in this document. The Disclosures of Interest Statement incorporated in this document is provided solely to enhance the transparency and should not be treated as endorsement of the views expressed in the report. This information is subject to change without any prior notice. The Company reserves the right to make modifications and alternations to this statement as may be required from time to time without any prior approval. MOSL, its associates, their directors and the employees may from time to time, effect or have effected an own account transaction in, or deal as principal or agent in or for the securities mentioned in this document. They may perform or seek to perform investment banking or other services for, or solicit investment banking or other business from, any company referred to in this report. Each of these entities functions as a separate, distinct and independent of each other. The recipient should take this into account before interpreting the document. This report has been prepared on the basis of information that is already available in publicly accessible media or developed through analysis of MOSL. The views expressed are those of the analyst, and the Company may or may not subscribe to all the views expressed therein. This document is being supplied to you solely for your information and may not be reproduced, redistributed or passed on, directly or indirectly, to any other person or published, copied, in whole or in part, for any purpose. This report is not directed or intended for distribution to, or use by, any person or entity who is a citizen or resident of or located in any locality, state, country or other jurisdiction, where such distribution, publication, availability or use would be contrary to law, regulation or which would subject MOSL to any registration or licensing requirement within such jurisdiction. The securities described herein may or may not be eligible for sale in all jurisdictions or to certain category of investors. Persons in whose possession this document may come are required to inform themselves of and to observe such restriction. Neither the Firm, not its directors, employees, agents or representatives shall be liable for any damages whether direct or indirect, incidental, special or consequential including lost revenue or lost profits that may arise from or in connection with the use of the information. The person accessing this information specifically agrees to exempt MOSL or any of its affiliates or employees from, any and all responsibility/liability arising from such misuse and agrees not to hold MOSL or any of its affiliates or employees responsible for any such misuse and further agrees to hold MOSL or any of its affiliates or employees free and harmless from all losses, costs, damages, expenses that may be suffered by the person accessing this information due to any errors and delays.
Registered Office Address: Motilal Oswal Tower, Rahimtullah Sayani Road, Opposite Parel ST Depot, Prabhadevi, Mumbai-400025; Tel No.: 022-3980 4263; www.motilaloswal.com. Correspondence Address: Palm Spring Centre, 2nd Floor, Palm Court Complex, New Link Road, Malad (West), Mumbai- 400 064. Tel No: 022 3080 1000. Compliance Officer: Neeraj Agarwal, Email Id: [email protected], Contact No.:022-30801085.
Registration details of group entities: MOSL: SEBI Registration: INZ000158836 (BSE/NSE/MCX/NCDEX); CDSL: IN-DP-16-2015; NSDL: IN-DP-NSDL-152-2000; Research Analyst: INH000000412. AMFI: ARN 17397. Investment Adviser: INA000007100.Motilal Oswal Asset Management Company Ltd. (MOAMC): PMS (Registration No.: INP000000670) offers PMS and Mutual Funds products. Motilal Oswal Wealth Management Ltd. (MOWML): PMS (Registration No.: INP000004409) offers wealth management solutions. *Motilal Oswal Securities Ltd. is a distributor of Mutual Funds, PMS, Fixed Deposit, Bond, NCDs, Insurance and IPO products. * Motilal Oswal Real Estate Investment Advisors II Pvt. Ltd. offers Real Estate products. * Motilal Oswal Private Equity Investment Advisors Pvt. Ltd. offers Private Equity products *MOSL has been amalgamated with Motilal Oswal Financial Services Limited (MOFSL) w.e.f August 21, 2018 pursuant to order dated July 30, 2018 issued by Hon'ble National Company Law Tribunal, Mumbai Bench. The existing registration no(s) of MOSL would be used until receipt of new MOFSL registration numbers.
Motilal Oswal Wealth Creation Study Gallery