Hindustan Unilever - Motilal Oswal
26
31 May 2021 Annual Report Update | Sector: Consumer Hindustan Unilever Investors are advised to refer through important disclosures made at the last page of the Research Report. Motilal Oswal research is available on www.motilaloswal.com/Institutional-Equities, Bloomberg, Thomson Reuters, Factset and S&P Capital. Krishnan Sambamoorthy – Research Analyst ([email protected]) Research Analyst: Dhairya Dhruv ([email protected]) / Kaiwan Jal Olia ([email protected]) BSE SENSEX S&P CNX CMP: INR2,341 TP: INR2,780 (+19%) Buy 51,937 15,583 Stock Info Bloomberg HUVR IN Equity Shares (m) 2,350 M.Cap.(INRb)/(USDb) 5501.2 / 75.8 52-Week Range (INR) 2504 / 2001 1, 6, 12 Rel. Per (%) -7/-8/-46 12M Avg Val (INR M) 5618 Free float (%) 38.1 Financials Snapshot (INR b) Y/E Mar 2021 2022E 2023E Sales 460 504 577 Sales Gr. (%) 18.6 9.5 14.6 EBITDA 113 131 154 Margins (%) 24.6 26.0 26.7 Adj. PAT 82 93 114 Adj. EPS (INR) 34.8 39.5 48.4 EPS Gr. (%) 11.5 13.6 22.5 BV/Sh.(INR) 201.8 202.4 203.3 Ratios RoE (%) 29.5 19.6 23.9 RoCE (%) 39.0 26.6 32.1 Payout (%) 116.3 98.6 98.1 Valuations P/E (x) 67.3 59.2 48.3 P/BV (x) 11.6 11.6 11.5 EV/EBITDA (x) 48.2 41.6 35.3 Div. Yield (%) 1.7 1.7 2.0 Shareholding pattern (%) As On Mar-21 Dec-20 Mar-20 Promoter 61.9 61.9 67.2 DII 10.7 10.7 6.7 FII 15.0 14.9 12.1 Others 12.5 12.5 14.1 FII Includes depository receipts Treading on the path to sustainable growth We present some key points from Hindustan Unilever (HUVR)’s FY21 Annual Report: Gaining market share: HUVR now has 14 brands with over INR10b in annual sales (v/s 12 brands last year). In FY21, it gained market share in 84% of its portfolio and launched more than 150 SKUs. Rapid technology adoption: A significant leap has been observed in technology adoption among small retailers, which are convinced that this is, indeed, the need of the hour. HUVR’s eB2B app, ‘Shikhar’, has enabled its retailer partners to place contactless orders conveniently, with over 500k retailers ordering through the app. We reckon that while this accounts for ~20% of HUVR’s direct reach and ~6% of the total reach, the proportion of sales would be higher. HUVR is looking to scale up the app, while continuing to work at the backend to build next-day delivery systems. The company has partnered with the State Bank of India to resolve the liquidity issues of small retailers, thus helping build stronger channel relationships. HUVR continues to empower Shakti entrepreneurs and now has a network of nearly 136k spanning 18 states/territories in India ensuring strong growth in a volatile supply chain environment. Strengthening e-commerce presence: Online sales have emerged as a key growth channel, and this growth is likely to sustain post the pandemic as well. As a result, the company is focusing on replicating the concept of the ‘perfect store’, successfully applied to its brick-and-mortar stores, in its e-commerce sales as well. The move to build the perfect online store and drive everyday great execution has ensured the best-in-class online availability and discoverability of its products. E-Commerce-focused innovations include smart packaging solutions and the right pack price architecture to suit last-mile logistics. Boosting GSKCH sales: FY21 marked the first year of its merger with the GlaxoSmithKline Consumer Healthcare Limited (GSKCH) business in India. With low penetration levels, the Health Food Drinks (HFD) category offers huge headroom for growth. The Annual Report highlights HUVR has clear strategies in place to drive growth, such as (a) improving accessibility and reach, (b) landing impactful innovations, (c) increasing profitability through synergies, and (d) investing in brands. To make Horlicks and Boost more accessible to consumers, HUVR introduced new pouch packs and INR2 sachets in FY21. Significant expansion was also seen in Boost’s distribution across India. Extending premiumization to segments beyond detergents: Notably, from a premiumization perspective, rapidly increasing sales of dishwashers in India (as indicated in the Annual Report) could be a game-changer, driving the shift from a) powder to liquid dishwashing products, and b) beyond that to Vim’s premium ‘Matic’ range of products. This, we note, is in addition to the ongoing spurt and premiumization in the even larger Personal Wash category. HUVR has seen significant premiumization in Detergents in the last 6–7 years, which may potentially be observed in the Dishwashing and Personal Wash segments as well.
-
Upload
khangminh22 -
Category
Documents
-
view
2 -
download
0
Transcript of Hindustan Unilever - Motilal Oswal

31 May 2021
Annual Report Update | Sector: Consumer
Hindustan Unilever
Investors are advised to refer through important disclosures made at the last page of the Research Report. Motilal Oswal research is available on www.motilaloswal.com/Institutional-Equities, Bloomberg, Thomson Reuters, Factset and S&P Capital.
Krishnan Sambamoorthy – Research Analyst ([email protected]) Research Analyst: Dhairya Dhruv ([email protected]) / Kaiwan Jal Olia ([email protected])
BSE SENSEX S&P CNX CMP: INR2,341 TP: INR2,780 (+19%) Buy 51,937 15,583
Stock Info Bloomberg HUVR IN
Equity Shares (m) 2,350
M.Cap.(INRb)/(USDb) 5501.2 / 75.8
52-Week Range (INR) 2504 / 2001
1, 6, 12 Rel. Per (%) -7/-8/-46
12M Avg Val (INR M) 5618
Free float (%) 38.1 Financials Snapshot (INR b) Y/E Mar 2021 2022E 2023E
Sales 460 504 577
Sales Gr. (%) 18.6 9.5 14.6
EBITDA 113 131 154
Margins (%) 24.6 26.0 26.7
Adj. PAT 82 93 114
Adj. EPS (INR) 34.8 39.5 48.4
EPS Gr. (%) 11.5 13.6 22.5
BV/Sh.(INR) 201.8 202.4 203.3
Ratios
RoE (%) 29.5 19.6 23.9
RoCE (%) 39.0 26.6 32.1
Payout (%) 116.3 98.6 98.1
Valuations
P/E (x) 67.3 59.2 48.3
P/BV (x) 11.6 11.6 11.5
EV/EBITDA (x) 48.2 41.6 35.3
Div. Yield (%) 1.7 1.7 2.0 Shareholding pattern (%)
As On Mar-21 Dec-20 Mar-20
Promoter 61.9 61.9 67.2
DII 10.7 10.7 6.7
FII 15.0 14.9 12.1
Others 12.5 12.5 14.1
FII Includes depository receipts
Treading on the path to sustainable growth
We present some key points from Hindustan Unilever (HUVR)’s FY21 Annual Report: Gaining market share: HUVR now has 14 brands with over INR10b in annual
sales (v/s 12 brands last year). In FY21, it gained market share in 84% of its portfolio and launched more than 150 SKUs.
Rapid technology adoption: A significant leap has been observed in technology adoption among small retailers, which are convinced that this is, indeed, the need of the hour. HUVR’s eB2B app, ‘Shikhar’, has enabled its retailer partners to place contactless orders conveniently, with over 500k retailers ordering through the app. We reckon that while this accounts for ~20% of HUVR’s direct reach and ~6% of the total reach, the proportion of sales would be higher. HUVR is looking to scale up the app, while continuing to work at the backend to build next-day delivery systems. The company has partnered with the State Bank of India to resolve the liquidity issues of small retailers, thus helping build stronger channel relationships. HUVR continues to empower Shakti entrepreneurs and now has a network of nearly 136k spanning 18 states/territories in India ensuring strong growth in a volatile supply chain environment.
Strengthening e-commerce presence: Online sales have emerged as a key growth channel, and this growth is likely to sustain post the pandemic as well. As a result, the company is focusing on replicating the concept of the ‘perfect store’, successfully applied to its brick-and-mortar stores, in its e-commerce sales as well. The move to build the perfect online store and drive everyday great execution has ensured the best-in-class online availability and discoverability of its products. E-Commerce-focused innovations include smart packaging solutions and the right pack price architecture to suit last-mile logistics.
Boosting GSKCH sales: FY21 marked the first year of its merger with the GlaxoSmithKline Consumer Healthcare Limited (GSKCH) business in India. With low penetration levels, the Health Food Drinks (HFD) category offers huge headroom for growth. The Annual Report highlights HUVR has clear strategies in place to drive growth, such as (a) improving accessibility and reach, (b) landing impactful innovations, (c) increasing profitability through synergies, and (d) investing in brands. To make Horlicks and Boost more accessible to consumers, HUVR introduced new pouch packs and INR2 sachets in FY21. Significant expansion was also seen in Boost’s distribution across India.
Extending premiumization to segments beyond detergents: Notably, from a premiumization perspective, rapidly increasing sales of dishwashers in India (as indicated in the Annual Report) could be a game-changer, driving the shift from a) powder to liquid dishwashing products, and b) beyond that to Vim’s premium ‘Matic’ range of products. This, we note, is in addition to the ongoing spurt and premiumization in the even larger Personal Wash category. HUVR has seen significant premiumization in Detergents in the last 6–7 years, which may potentially be observed in the Dishwashing and Personal Wash segments as well.

Hindustan Unilever
31 May 2021 2
Valuation and view The company continues to place building blocks for future growth and has been
able to do so ahead of peers. It continues to display the dexterity shown over the last decade despite its larger size, even as it continues to grow v/s peers.
HUVR continues to strengthen the key drivers of its success in India over the last decade, including (a) pioneering the use of technology to generate data and facilitate decision making, (b) the Winning in Many Indias (WiMI) strategy, focused on decentralization and localized strategies, (c) recognizing trends and investing in them early on, (d) funneling cost savings back into the business, and (e) its strong execution ability, which has led to a positive earnings momentum. The company’s earnings growth has gained further impetus in recent years (before COVID-19 affected FY21) – it reported a ~18% EPS CAGR in the four years ended FY20 v/s a ~12% CAGR over FY10–20. This is particularly impressive given the weak mid-single-digit earnings growth posted by (much smaller) peers in recent years.
After premiumization in Detergents led to strong growth in detergent sales and margins in the last decade, the Personal Wash and Dishwashing segments show considerable promise going forward. The high-margin Discretionary portfolio was under pressure in FY21 – resulting in lower than the usual 12% adjusted EPS growth) – and is expected to face significant pressure in FY22 as well (albeit less than in the previous year). Nevertheless, the trajectory of premiumization over the medium term is evident. Additionally, synergies from the GSKCH business would play a big role in the resumption of strong earnings growth going forward.
There is no material change in our forecasts. We maintain a Buy rating, with unchanged TP of INR2,780 (55x Jun’23E EPS).
Stock Performance (1-year)
Hindustan Unilever
31 May 2021 3
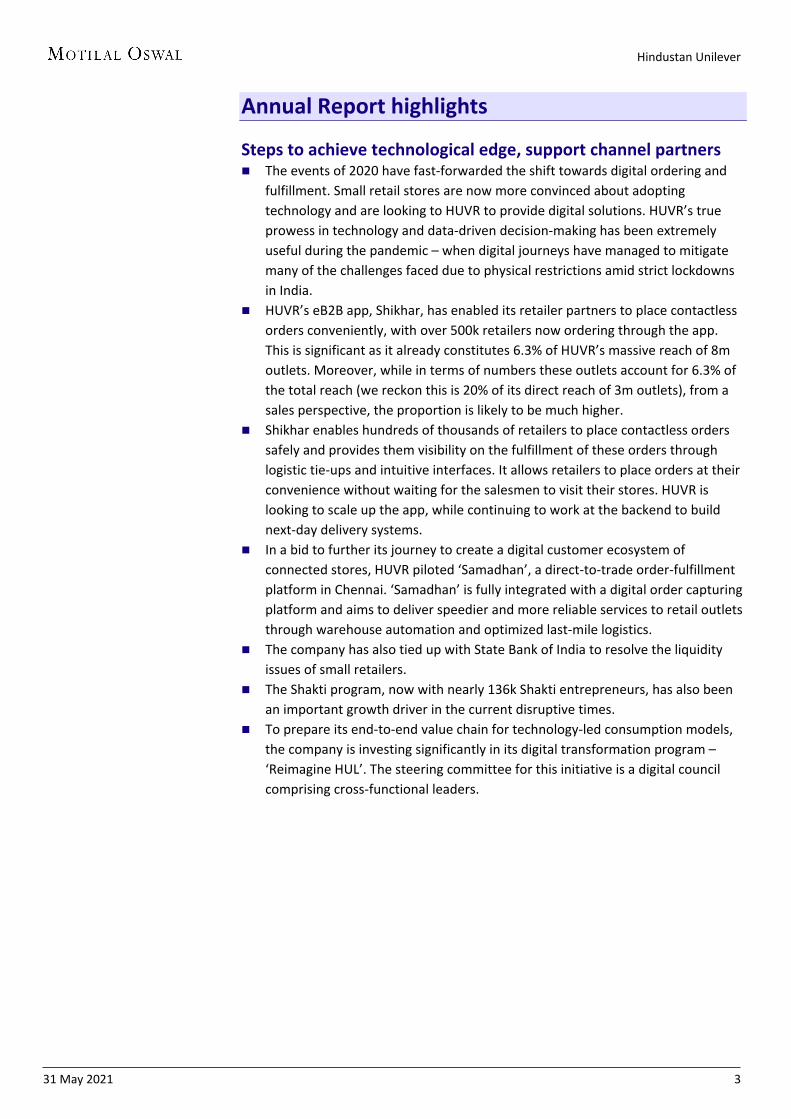
Annual Report highlights Steps to achieve technological edge, support channel partners The events of 2020 have fast-forwarded the shift towards digital ordering and
fulfillment. Small retail stores are now more convinced about adopting technology and are looking to HUVR to provide digital solutions. HUVR’s true prowess in technology and data-driven decision-making has been extremely useful during the pandemic – when digital journeys have managed to mitigate many of the challenges faced due to physical restrictions amid strict lockdowns in India.
HUVR’s eB2B app, Shikhar, has enabled its retailer partners to place contactless orders conveniently, with over 500k retailers now ordering through the app. This is significant as it already constitutes 6.3% of HUVR’s massive reach of 8m outlets. Moreover, while in terms of numbers these outlets account for 6.3% of the total reach (we reckon this is 20% of its direct reach of 3m outlets), from a sales perspective, the proportion is likely to be much higher.
Shikhar enables hundreds of thousands of retailers to place contactless orders safely and provides them visibility on the fulfillment of these orders through logistic tie-ups and intuitive interfaces. It allows retailers to place orders at their convenience without waiting for the salesmen to visit their stores. HUVR is looking to scale up the app, while continuing to work at the backend to build next-day delivery systems.
In a bid to further its journey to create a digital customer ecosystem of connected stores, HUVR piloted ‘Samadhan’, a direct-to-trade order-fulfillment platform in Chennai. ‘Samadhan’ is fully integrated with a digital order capturing platform and aims to deliver speedier and more reliable services to retail outlets through warehouse automation and optimized last-mile logistics.
The company has also tied up with State Bank of India to resolve the liquidity issues of small retailers.
The Shakti program, now with nearly 136k Shakti entrepreneurs, has also been an important growth driver in the current disruptive times.
To prepare its end-to-end value chain for technology-led consumption models, the company is investing significantly in its digital transformation program – ‘Reimagine HUL’. The steering committee for this initiative is a digital council comprising cross-functional leaders.

Hindustan Unilever
31 May 2021 4
Exhibit 1: Enhanced agility and responsiveness with the aid of technology
Source: Company, MOFSL
Adapting to a changing shopping world Channeling the robust WiMI strategy, HUVR has pinpointed the demand shift
induced by reverse migration, the revival of neighborhood stores, and the expansion of e-commerce.
HUVR has maximized growth by prioritizing these focus areas and ramped up the availability of products and brand presence across categories and population strata.
The rural economy has been a growth driver. HUVR is empowering Shakti entrepreneurs and now has a network of nearly 136k entrepreneurs spanning 18 states/territories in India.
Exhibit 2: Adaptability to consumer trends
Big brands are those with an annual turnover > INR10b * Excludes the impact of merger of GSKCH and acquisition of VWash Source: Company, MOFSL
Hindustan Unilever
31 May 2021 5
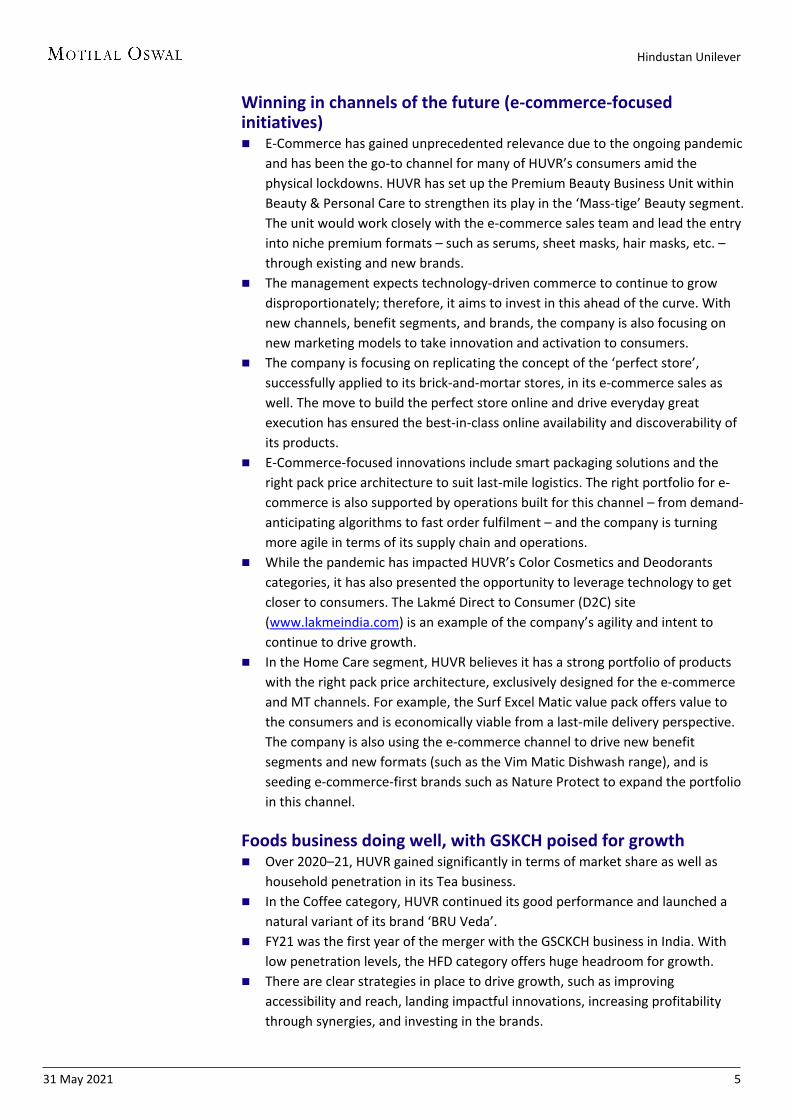
Winning in channels of the future (e-commerce-focused initiatives) E-Commerce has gained unprecedented relevance due to the ongoing pandemic
and has been the go-to channel for many of HUVR’s consumers amid the physical lockdowns. HUVR has set up the Premium Beauty Business Unit within Beauty & Personal Care to strengthen its play in the ‘Mass-tige’ Beauty segment. The unit would work closely with the e-commerce sales team and lead the entry into niche premium formats – such as serums, sheet masks, hair masks, etc. – through existing and new brands.
The management expects technology-driven commerce to continue to grow disproportionately; therefore, it aims to invest in this ahead of the curve. With new channels, benefit segments, and brands, the company is also focusing on new marketing models to take innovation and activation to consumers.
The company is focusing on replicating the concept of the ‘perfect store’, successfully applied to its brick-and-mortar stores, in its e-commerce sales as well. The move to build the perfect store online and drive everyday great execution has ensured the best-in-class online availability and discoverability of its products.
E-Commerce-focused innovations include smart packaging solutions and the right pack price architecture to suit last-mile logistics. The right portfolio for e-commerce is also supported by operations built for this channel – from demand-anticipating algorithms to fast order fulfilment – and the company is turning more agile in terms of its supply chain and operations.
While the pandemic has impacted HUVR’s Color Cosmetics and Deodorants categories, it has also presented the opportunity to leverage technology to get closer to consumers. The Lakmé Direct to Consumer (D2C) site (www.lakmeindia.com) is an example of the company’s agility and intent to continue to drive growth.
In the Home Care segment, HUVR believes it has a strong portfolio of products with the right pack price architecture, exclusively designed for the e-commerce and MT channels. For example, the Surf Excel Matic value pack offers value to the consumers and is economically viable from a last-mile delivery perspective. The company is also using the e-commerce channel to drive new benefit segments and new formats (such as the Vim Matic Dishwash range), and is seeding e-commerce-first brands such as Nature Protect to expand the portfolio in this channel.
Foods business doing well, with GSKCH poised for growth Over 2020–21, HUVR gained significantly in terms of market share as well as
household penetration in its Tea business. In the Coffee category, HUVR continued its good performance and launched a
natural variant of its brand ‘BRU Veda’. FY21 was the first year of the merger with the GSCKCH business in India. With
low penetration levels, the HFD category offers huge headroom for growth. There are clear strategies in place to drive growth, such as improving
accessibility and reach, landing impactful innovations, increasing profitability through synergies, and investing in the brands.

Hindustan Unilever
31 May 2021 6
To make Horlicks and Boost more accessible to consumers, HUVR introduced new pouch packs and INR2 sachets for both these brands in FY21.
Significant expansion was also seen in Boost’s distribution across India. Horlicks was relaunched with added zinc, which is known to boost immunity.
The Horlicks Plus range was also relaunched, marking HUVR’s entry into the High Sciences space of Nutrition.
HUVR seamlessly executed one of the largest FMCG acquisitions in India virtually, amid lockdowns in the country. Through the merger, the company successfully integrated a large base of vendors and on-boarded distributors. Its go-to-market plan has been designed to ensure the combined strength of the erstwhile GSKCH and HUVR is leveraged in the marketplace.
During the year, the company also completed the integration of the acquired business into the ‘HUL SAP-ERP’ platform.
Exhibit 3: Smooth integration driving strong performance
Source: Company, MOFSL
Key segmental highlights A) Beauty & Personal Care (BPC): COVID boosts Skin Care, but impacts other categories Leveraging the WIMI strategy, HUVR was able to offer an extensive portfolio, with products tailored to specific regional preferences. COVID-19 had a varied impact on the segment, with some categories such as Skin Cleansing (especially Hand Hygiene) getting a boost, while others (including Skin Care, Color Cosmetics, and Deodorants) seeing sharp decline YoY – due to people being homebound.
Exhibit 4: Beauty & Personal Care performance Particulars (INR b) FY17 FY18 FY19 FY20 FY21 Beauty & Personal Care revenue 163.0 164.6 176.6 173.5 179.6 YoY growth (%) 1.8 1.0 7.2 (1.8) 3.6 Contribution to total turnover (%) 47.3 46.8 46.2 44.7 39.1 Beauty & Personal Care EBIT 38.5 41.6 46.9 48.7 51.3 YoY growth (%) 1.2 8.1 12.6 3.9 5.3 Margins (%) 23.6 25.3 26.5 28.1 28.5 Beauty & Personal Care contribution to total EBIT (%) 64.9 60.9 58.0 56.2 49.7
Source: Company, MOFSL

Hindustan Unilever
31 May 2021 7
HUVR swiftly pivoted to service consumers’ needs by expanding its range of hygiene products, focused on supplying essential products, drove relevant innovation designed for channels such as e-commerce, and communicated with contextually relevant messaging. 1) Hair Care: HUVR continued to focus on core brands, driving salience with
impactful communication. At the same time, it kept innovating to meet evolving consumer needs. TRESemmé launched its “Salon at Home” campaign, addressing the beauty-at-home trend. HUVR introduced a sulfate-free range and new offerings in serums and masks. Dove launched a new campaign highlighting its proposition on hair damage repair.
2) Oral Care: Closeup delivered highly relevant in-home contextual messaging during the lockdown, in line with the brand’s message to uphold good oral hygiene.
3) Progress on the Naturals play: While Lever Ayush, the master brand, maintained focus on its key market in
southern India, HUVR continued to build specialist brands such as Indulekha and Hamam.
It expanded the Indulekha franchise with the launch of a new variant – Indulekha Neemraj Oil and Shampoo.
It also introduced one of Unilever’s global Naturals segment brands ‘Love Beauty and Planet’ in India.
The third leg of the company’s strategy in this segment involved natural variants of existing brands, such as TRESemmé Botanique, Glow & Lovely Ayurvedic Care, Lifebuoy Neem and Turmeric, Pears Naturale, etc.
4) New launches: (1) Lifebuoy launched 15 new SKUs in the Hand Hygiene portfolio to ensure the accessibility and availability of products. (2) LUX was re-launched with a superior product formulation. (3) Indulekha Neemraj Oil and Shampoo, a new variant, was also launched.
B) Home Care: Increased relevance due to consumers being homebound The Home Care business’ relevance increased in the wake of COVID-19 with people spending more time in their homes. The categories within this segment were also a mixed bag – categories such as Dishwashing and Surface Cleaning did well, while Laundry, the largest segment in the category, was impacted due to reduced usage.
Exhibit 5: Home Care performance Particulars (INR b) FY17 FY18 FY19 FY20 FY21 Home care revenue 113.5 116.3 128.8 136.4 139.6 YoY growth (%) 4.9 2.5 10.7 5.9 2.3 Contribution to total turnover (%) 32.9 33.0 33.7 35.2 30.3 Home care EBIT 12.6 17.0 21.6 25.6 27.7 YoY growth (%) 19.6 34.7 27.6 18.3 8.3 Margins (%) 11.1 14.6 16.8 18.8 19.9 Home care contribution to total EBIT (%) 21.2 24.8 26.8 26.6 26.9
Source: Company, MOFSL
1) Fabric Wash: Fabric cleaning became less frequent during the year due to
reduced mobility. Reverse migration and a drop in income levels resulted in downtrading. Surf launched ‘Surf Excel Active Hygiene’ to provide consumers a germ-free wash for their clothes. HUVR also launched its first Home Care
Hindustan Unilever
31 May 2021 8
product under the Lifebuoy brand, ‘Lifebuoy Laundry Sanitiser’, and stepped up its focus on anti-bacterial variants of Rin and Comfort. Surf Excel introduced a smart spray with stain lifting technology. The premium portfolios of Liquid Detergents and Fabric Conditioners proved to be more resilient, delivering strong performance and driving premiumization.
2) Dishwashing: The Dishwashing portfolio benefitted from the in-home cooking trend. The premiumization opportunity continues to be strong and HUVR is well-placed to lead this trend. Vim Liquid pioneered the format upgrade in the country through its large-scale direct contact program. Vim launched anti-bacterial variants of dishwash bars and liquids. It also launched the Vim Matic range targeting dishwasher users.
3) Floor cleaners: A new Domex variant was launched with a formulation containing sodium hypochlorite, proven to destroy the Coronavirus in 60 seconds. Domex also rolled out a surface cleaner spray and wipes to extend the brand usage.
4) Nature Protect – HUVR launched Nature Protect targeting soft hygiene needs with its neem-based portfolio comprising surface cleaners, laundry, fruit-and-veggie cleaners, and an on-the-go cleaner.
5) Life Essentials: This category faced severe disruption in the first half of the year as a result of the lockdown. However, in the second half of the year, the Water Purifier business gained momentum to win consumers through value-added innovations and channel-differentiating products in e-commerce.
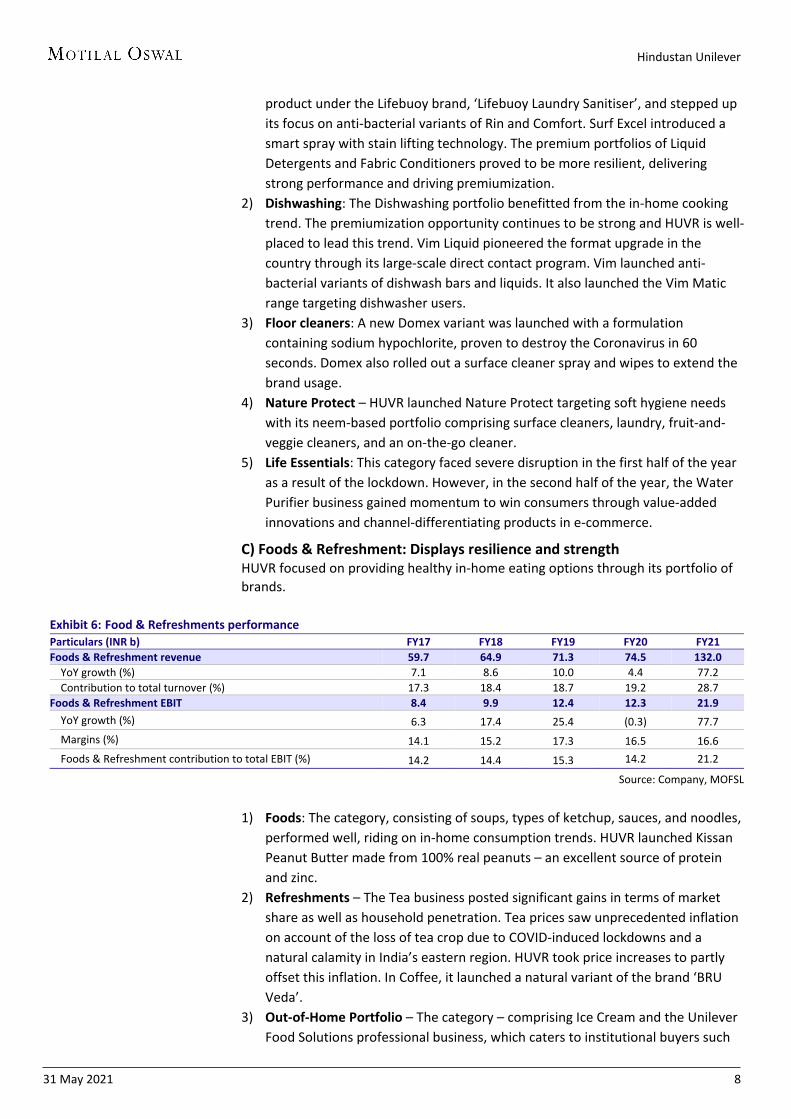
C) Foods & Refreshment: Displays resilience and strength HUVR focused on providing healthy in-home eating options through its portfolio of brands.
Exhibit 6: Food & Refreshments performance Particulars (INR b) FY17 FY18 FY19 FY20 FY21 Foods & Refreshment revenue 59.7 64.9 71.3 74.5 132.0 YoY growth (%) 7.1 8.6 10.0 4.4 77.2 Contribution to total turnover (%) 17.3 18.4 18.7 19.2 28.7 Foods & Refreshment EBIT 8.4 9.9 12.4 12.3 21.9 YoY growth (%) 6.3 17.4 25.4 (0.3) 77.7 Margins (%) 14.1 15.2 17.3 16.5 16.6 Foods & Refreshment contribution to total EBIT (%) 14.2 14.4 15.3 14.2 21.2
Source: Company, MOFSL
1) Foods: The category, consisting of soups, types of ketchup, sauces, and noodles,
performed well, riding on in-home consumption trends. HUVR launched Kissan Peanut Butter made from 100% real peanuts – an excellent source of protein and zinc.
2) Refreshments – The Tea business posted significant gains in terms of market share as well as household penetration. Tea prices saw unprecedented inflation on account of the loss of tea crop due to COVID-induced lockdowns and a natural calamity in India’s eastern region. HUVR took price increases to partly offset this inflation. In Coffee, it launched a natural variant of the brand ‘BRU Veda’.
3) Out-of-Home Portfolio – The category – comprising Ice Cream and the Unilever Food Solutions professional business, which caters to institutional buyers such
Hindustan Unilever
31 May 2021 9
as hotels and offices – saw a challenging year on account of lockdowns. HUVR collaborated with last-mile delivery partners such as Swiggy and Zomato to provide home-delivery solutions for ice creams. Sequential recovery was seen as more people stepped out of their homes in the second half of the year.
4) Nutrition and the GSKCH acquisition – HUVR integrated its Nutrition business with the acquisition of GSKCH. Low category penetration levels offer huge headroom for growth. The company’s strategies to drive growth in this category include a) improving accessibility and reach, b) landing impactful innovations, c) increasing profitability through synergies, and d) investing in the brands. HUVR introduced new pouch packs and INR2 sachets for Horlicks and Boost to improve accessibility, while expanding Boost across India. It launched Horlicks with added zinc, which is known to boost immunity. It relaunched the “Plus” range under the Horlicks brand, marking its entry into the High Sciences space in the Nutrition category.
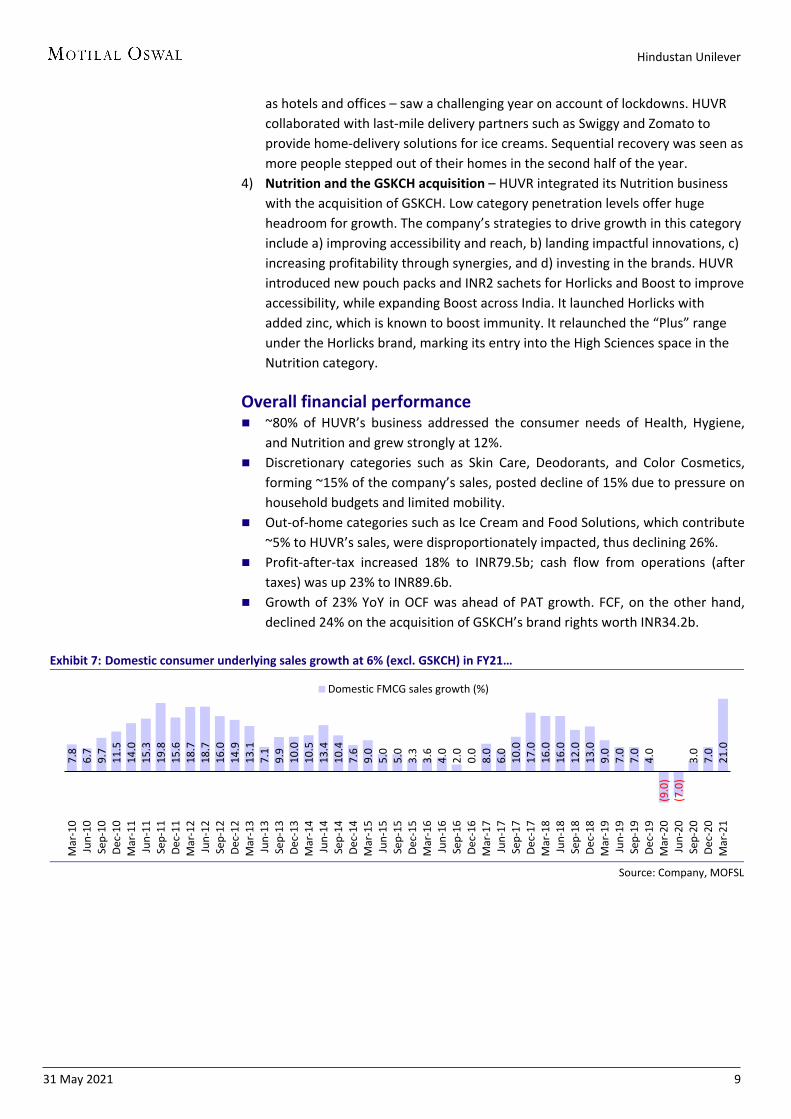
Overall financial performance ~80% of HUVR’s business addressed the consumer needs of Health, Hygiene,
and Nutrition and grew strongly at 12%. Discretionary categories such as Skin Care, Deodorants, and Color Cosmetics,
forming ~15% of the company’s sales, posted decline of 15% due to pressure on household budgets and limited mobility.
Out-of-home categories such as Ice Cream and Food Solutions, which contribute ~5% to HUVR’s sales, were disproportionately impacted, thus declining 26%.
Profit-after-tax increased 18% to INR79.5b; cash flow from operations (after taxes) was up 23% to INR89.6b.
Growth of 23% YoY in OCF was ahead of PAT growth. FCF, on the other hand, declined 24% on the acquisition of GSKCH’s brand rights worth INR34.2b.
Exhibit 7: Domestic consumer underlying sales growth at 6% (excl. GSKCH) in FY21…
Source: Company, MOFSL
7.8
6.
7
9.7
11
.5
14.0
15
.3
19.8
15
.6
18.7
18
.7
16.0
14
.9
13.1
7.
1
9.9
10
.0
10.5
13
.4
10.4
7.
6
9.0
5.
0
5.0
3.
3
3.6
4.
0
2.0
0.
0
8.0
6.
0
10.0
17
.0
16.0
16
.0
12.0
13
.0
9.0
7.
0
7.0
4.
0
(9.0
) (7
.0)
3.0
7.
0
21.0
Mar
-10
Jun-
10Se
p-10
Dec-
10M
ar-1
1Ju
n-11
Sep-
11De
c-11
Mar
-12
Jun-
12Se
p-12
Dec-
12M
ar-1
3Ju
n-13
Sep-
13De
c-13
Mar
-14
Jun-
14Se
p-14
Dec-
14M
ar-1
5Ju
n-15
Sep-
15De
c-15
Mar
-16
Jun-
16Se
p-16
Dec-
16M
ar-1
7Ju
n-17
Sep-
17De
c-17
Mar
-18
Jun-
18Se
p-18
Dec-
18M
ar-1
9Ju
n-19
Sep-
19De
c-19
Mar
-20
Jun-
20Se
p-20
Dec-
20M
ar-2
1
Domestic FMCG sales growth (%)

Hindustan Unilever
31 May 2021 10
Exhibit 8: …and underlying volumes at 3% YoY (excl. GSKCH)
Source: Company, MOFSL
Exhibit 9: Volume growth (incl. GSKCH) at 16.5% in FY21…
Source: Company, MOFSL
Exhibit 10: …leading to double-digit topline growth
Source: Company, MOFSL
Exhibit 11: HUVR’s – significantly superior reach v/s peers; total reach of 8m outlets
Source: Company, MOFSL
Despite a 120bp contraction in HUVR’s gross margin, EBITDA margin contraction
was just 20bp YoY at 24.6%. The margin performance was a result of the strong savings agenda, scale efficiencies (achieved on the back of healthy volume growth in some categories), the mix impact given merger of the relatively higher margin GSKCH business as well as a strong portfolio of premium brands, and market development efforts. PAT (bei) was up 21.3% to INR81.8b while adjusted EPS was up 11.5% on account of dilution led by the GSKCH merger.
10.9
10
.3
14.0
13
.0
14.0
8.
3
9.8
9.
1
10.0
9.
0
9.0
5.
0
6.3
4.
0
5.0
4.
0
3.0
6.
0
5.0
3.
0
6.0
6.
0
7.0
6.
0
4.0
4.
0
(1.0
) (4
.0)
4.0
0.
0
4.0
11
.0
11.0
12
.0
10.0
10
.0
7.0
5.
0
5.0
5.
0
(7.0
) 4.
0
14.0
17
.0
31.0
Mar
-10
Jun-
10Se
p-10
Dec-
10M
ar-1
1Ju
n-11
Sep-
11De
c-11
Mar
-12
Jun-
12Se
p-12
Dec-
12M
ar-1
3Ju
n-13
Sep-
13De
c-13
Mar
-14
Jun-
14Se
p-14
Dec-
14M
ar-1
5Ju
n-15
Sep-
15De
c-15
Mar
-16
Jun-
16Se
p-16
Dec-
16M
ar-1
7Ju
n-17
Sep-
17De
c-17
Mar
-18
Jun-
18Se
p-18
Dec-
18M
ar-1
9Ju
n-19
Sep-
19De
c-19
Mar
-20
Jun-
20Se
p-20
Dec-
20M
ar-2
1
Underlying volume growth (%)
6.8 4.0 4.8 5.8
0.8
6.5
9.8
2.0
16.5
FY13
FY14
FY15
FY16
FY17
FY18
FY19
FY20
FY21
Domestic volume growth (%)
258 280 308 311 319 345 382 388 460 504 577
16.7
8.6 9.9
0.8 2.7
8.3 10.7
1.5
18.6
9.5
14.6 FY
13
FY14
FY15
FY16
FY17
FY18
FY19
FY20
FY21
FY22
E
FY23
E
Total Revenue (INR b) Revenue growth (%)
43% 39%
35% 33% 30% 29%
22% 21% 18% 16%
HUL BRIT TGBL CLGT NEST JYOTHY GCPL HMN MRCO DABUR
Direct reach as a % of total reach

Hindustan Unilever
31 May 2021 11
Exhibit 12: FY21 gross margin lower on steep RM inflation in 2HFY21
Source: Company, MOFSL
Exhibit 13: Efficient cost management helps maintain robust operating margins
Source: Company, MOFSL
Exhibit 14: Margin expansion trajectory to continue after FY21 blip Y/E March (INR b) FY16 FY17 FY18 FY19 FY20 FY21 FY22E FY23E Gross Profit 157.6 162.1 182.9 202.6 209.9 243.2 271.6 314.7 Gross Margin (%) 50.7 50.8 53.0 53.0 54.1 52.9 53.9 54.5 Gross margin change – YoY (bps) 140 10 220 0 110 -120 100 60 EBIDTA 57.5 60.5 72.8 86.4 96.0 113.2 131.1 153.9 EBITDA Margin (%) 18.5 19.0 21.1 22.6 24.8 24.6 26.0 26.7 EBITDA margin change – YoY (bps) 160 50 210 150 220 -20 140 70
Source: Company, MOFSL
Exhibit 15: Other expenses (incl. A&P) to sales trend over past five years Companies FY17 FY18 FY19 FY20 FY21 HUL 26.8 26.9 25.8 25.0 23.4 Britannia 20.3 19.2 21.0 20.2 18.8 Colgate 32.0 30.6 30.7 31.3 29.3 Dabur 20.5 19.3 18.2 18.4 18.2 Emami 28.3 29.5 28.4 28.0 26.4 GCPL 24.3 24.9 24.7 25.1 23.5 ITC* 15.6 14.7 15.0 15.7 16.7 Marico 25.5 22.0 21.1 22.2 20.1 Nestle 25.0 24.0 24.8 23.9 22.1 P&G Hygiene and Healthcare 27.0 31.1 32.9 37.0 39.4
Source: Company, MOFSL, *Estimates for FY21
Exhibit 16: HUVR derives maximum benefit through savings in other expenses (incl. A&P expense) as percentage of sales post GST (FY18–21)
Source: Company, MOFSL, *Estimates
47.7 48.8 49.3
50.7 50.8
53.0 53.0 54.1
52.9 53.9 54.5
FY13
FY14
FY15
FY16
FY17
FY18
FY19
FY20
FY21
FY22
E
FY23
E
Gross margin (%)
15.5 16.0 16.9 18.5 19.0
21.1 22.6
24.8 24.6 26.0 26.7
FY13
FY14
FY15
FY16
FY17
FY18
FY19
FY20
FY21
FY22
E
FY23
E
EBITDA Margin (%)
3.4 3.2 1.9 1.9 1.4 1.3 1.2 0.4
-2.0
-8.3
HUVR
HMN
NES
T
MRC
O
GCP
L
CLG
T
DABU
R
BRIT
ITC*
PGHH
Savings in other expenses (incl. A&P) as a % of sales (FY18-21)
Hindustan Unilever
31 May 2021 12
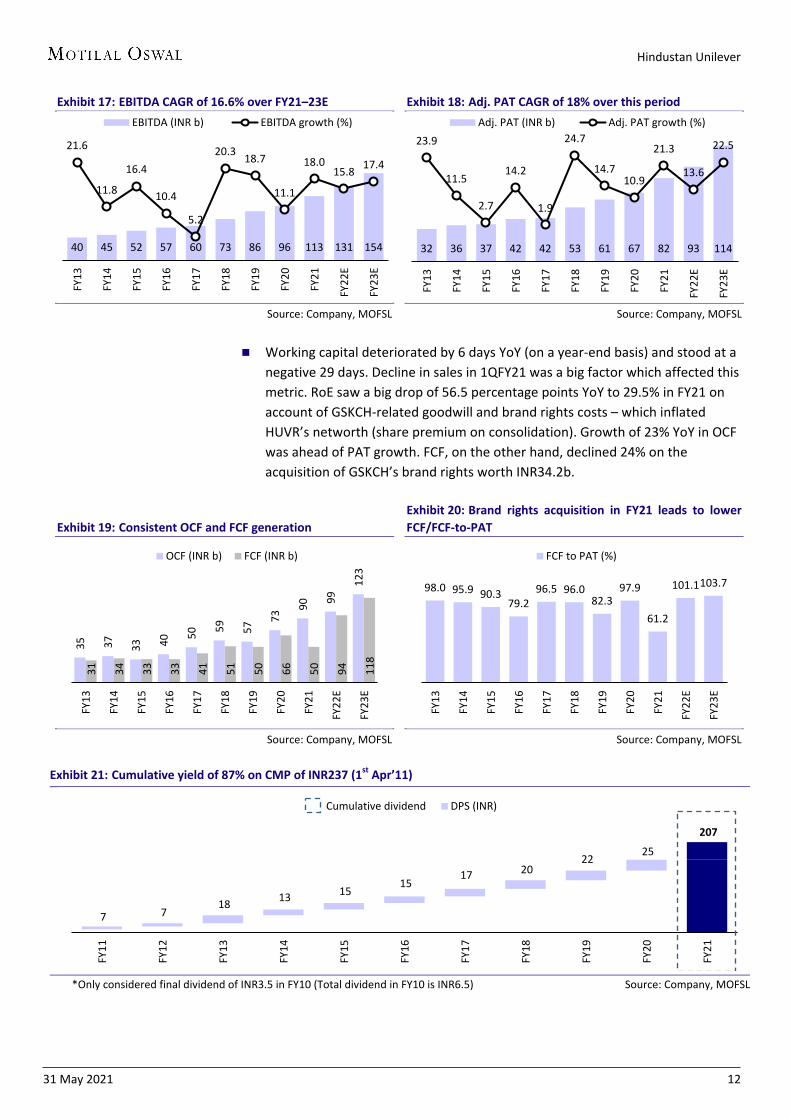
Exhibit 17: EBITDA CAGR of 16.6% over FY21–23E
Source: Company, MOFSL
Exhibit 18: Adj. PAT CAGR of 18% over this period
Source: Company, MOFSL
Working capital deteriorated by 6 days YoY (on a year-end basis) and stood at a
negative 29 days. Decline in sales in 1QFY21 was a big factor which affected this metric. RoE saw a big drop of 56.5 percentage points YoY to 29.5% in FY21 on account of GSKCH-related goodwill and brand rights costs – which inflated HUVR’s networth (share premium on consolidation). Growth of 23% YoY in OCF was ahead of PAT growth. FCF, on the other hand, declined 24% on the acquisition of GSKCH’s brand rights worth INR34.2b.
Exhibit 19: Consistent OCF and FCF generation
Source: Company, MOFSL
Exhibit 20: Brand rights acquisition in FY21 leads to lower FCF/FCF-to-PAT
Source: Company, MOFSL
Exhibit 21: Cumulative yield of 87% on CMP of INR237 (1st Apr’11)
*Only considered final dividend of INR3.5 in FY10 (Total dividend in FY10 is INR6.5) Source: Company, MOFSL
40 45 52 57 60 73 86 96 113 131 154
21.6
11.8
16.4
10.4
5.2
20.3 18.7
11.1
18.0 15.8 17.4
FY13
FY14
FY15
FY16
FY17
FY18
FY19
FY20
FY21
FY22
E
FY23
E
EBITDA (INR b) EBITDA growth (%)
32 36 37 42 42 53 61 67 82 93 114
23.9
11.5
2.7
14.2
1.9
24.7
14.7 10.9
21.3
13.6
22.5
FY13
FY14
FY15
FY16
FY17
FY18
FY19
FY20
FY21
FY22
E
FY23
E
Adj. PAT (INR b) Adj. PAT growth (%)
35
37
33 40 50
59
57 73
90 99
123
31
34
33
33
41
51
50
66
50
94
118
FY13
FY14
FY15
FY16
FY17
FY18
FY19
FY20
FY21
FY22
E
FY23
E
OCF (INR b) FCF (INR b)
98.0 95.9 90.3 79.2
96.5 96.0 82.3
97.9
61.2
101.1 103.7
FY13
FY14
FY15
FY16
FY17
FY18
FY19
FY20
FY21
FY22
E
FY23
E
FCF to PAT (%)
7 7 18 13 15
15 17 20
22 25
207
FY11
FY12
FY13
FY14
FY15
FY16
FY17
FY18
FY19
FY20
FY21
Cumulative dividend DPS (INR)

Hindustan Unilever
31 May 2021 13
Exhibit 22: HUVR has consistently delivered superior returns to shareholders v/s benchmark indices despite FY21 being an aberration
Date of purchase
HUL Share Performance* (%)
Sensex Performance* (%)
HUL v/s Sensex (%)
Nifty Performance* (%)
HUL v/s Nifty (%)
30-Mar-2012 493 184 309 177 316 28-Mar-2013 422 163 259 159 263 31-Mar-2014 303 121 182 119 184 31-Mar-2015 178 77 101 73 105 31-Mar-2016 180 95 85 90 90 31-Mar-2017 167 67 100 60 107 28-Mar-2018 82 50 32 45 37 29-Mar-2019 42 28 14 26 16 31-Mar-2020 6 68 -62 71 -65
* Performance v/s 31-Mar-2021Source: Company, MOFSL

Hindustan Unilever
31 May 2021 14
Sustainability HUVR’s parent Unilever plans to globally invest EUR1b over 10 years in R&D for
new technologies to reduce its carbon footprint, plastic waste, and water use; it would increase the number of biodegradable and sustainable ingredients associated with its products.
For instance, it would replace crude oil and other fossil fuels used to make some of its chemicals with renewable and recycled carbon.
Unilever aims to achieve this through partnerships and cutting-edge innovation – applying the latest science and biotechnology at scale to create cleaner, more sustainable products that clean, remove stains, and disinfect at least as well as conventional products. It aims to continue to deliver superior products that are better for the planet at affordable costs.
Exhibit 23: Focus on improving consumers’ health as well as the planet
Source: Company, MOFSL
Exhibit 24: HUVR’s delivery on its sustainability plan Particulars 2018 2021 Reduction in CO2 emissions (kg/tonne of production) in manufacturing operations compared with 2008 baseline 59% 91% Reduction in water consumption (m3/tonne of production) in manufacturing ops. compared with 2008 baseline 55% 54% Reduction in total waste (kg/tonne of production) generated from factories compared with 2008 baseline 58% 59% Better livelihoods – Shakti entrepreneurs empowered (in m)* 0.11 0.14 Sustainable sourcing – Tea sourced from sustainable sources for Unilever brands 65% 67% Health and well-being – Reach through water, sanitation, and hygiene (wash) initiatives >150m >154m
Source: Company, MOFSL

Hindustan Unilever
31 May 2021 15
Highlights of sustainability efforts in India HUVR successfully reduced CO2 emissions per tonne of production by 91% (85%
in the previous year) compared with the 2008 baseline. It has committed to making 100% of its plastic packaging reusable, recyclable, or
compostable by 2025. It is working on reducing plastic pollution through (a) targeting absolute reduction using more recycled and less virgin plastic, (b) improving the recyclability of plastic used, and (c) collecting more plastic than it sells. The company has done significant work in this area – it has collected and safely disposed of more than 100,000 tonnes of post-consumer-use plastic waste (in aggregate) since 2018 through collection and disposal partners.
It successfully reduced water consumption by 54% (m3/tonne of production) in manufacturing operations v/s the 2008 baseline. Notably, this is lower than the 58% levels in the previous year, possibly led by the GSKCH manufacturing integration. Similarly, the total waste (kg/tonne of production) generated from factories was lower v/s the 2008 baseline – it stood at 59% in the year under review vis-à-vis 63% in the previous year.
From 2021, HUVR has committed to collecting more plastic than is used in its packaging.
Along with collection and processing, HUVR is also progressing on making plastic packaging circular by eliminating unwanted plastics, using post-consumer recycled plastics (PCR), and recycle-ready structures. It is working alongside partners such as Banyan Nation for this purpose. The company’s purpose-driven brands (such as Surf Excel Laundry Liquid, Sunsilk, and TRESemmé) use 25% r-HDPE (High Density Polyethylene). Vim uses 50% r-PET in its liquid bottles. The company has eliminated ~1 kilo tonne of plastic by eliminating plastic coatings from soap cartons (Dove, Lux, and Liril) and Lifebuoy’s soap stiffeners; it has also moved shampoo sachets, soap wrappers, and Vim bar flow-wraps to the recycle-ready structure.
Through intervention at the grass-root level, the Hindustan Unilever Foundation has created water potential of more than 1.3t liters.
67% of the tea sourced for Unilever’s brands in India is from sustainable sources. 93% of the tomatoes used in Kissan Ketchup are from sustainable sources. 100% of the chicory used is sourced sustainably as all of Unilever’s chicory
farmers in India are covered under the Unilever Sustainable Agriculture Code, which provides farmers with knowledge and expertise about sustainable agricultural practices.
HUVR has maintained its long-held commitment to send zero non-hazardous waste to landfills from its factories. The total waste generated from its factories declined 59% against the 2008 baseline. 100% of the non-hazardous waste generated at its factories was recycled, reused, or sent for energy recovery in environment-friendly ways.
Aim to be beacon of diversity HUVR reiterated its commitment to being gender-balanced in its managerial
team over the next few years. An important milestone in its diversity journey has been the recent induction of
female shop-floor employees at the Haldia and Kidderpore factories.

Hindustan Unilever
31 May 2021 16
The company aims to ensure that the Unilever experience is fair for everyone and fully includes members of the LGBTQI+ community, persons with disability, and other minority groups.
Change in CFO Mr Ritesh Tiwari was appointed Executive Director, Finance and Chief Financial
Officer of the company. He joined the Board of Directors with effect from 1st May’21.
Mr Srinivas Phatak, his predecessor, was elevated to the position of Executive Vice President, Global Financial Control and Risk Management, Unilever. He would cease to be a member of the Management Committee of HUVR.

Hindustan Unilever
31 May 2021 17
Key tables and charts
Exhibit 25: Mr Sanjiv Mehta’s gross salary – INR154m Particulars of Remuneration (INR m) Sanjiv Mehta (Chairman and MD) FY18 FY19 FY20 FY21 Gross salary (a) Salary as per provisions contained in section 17(1) of the Income-tax Act, 1961 70 88 125 112 (b) Value of perquisites u/s 17(2) Income-tax Act, 1961 10 11 0 17 (c) Profits in lieu of salary under Section 17(3) Income-Tax Act, 1961 56 27 33 20 Stock Option 54 58 32 0 Sweat Equity 0 0 0 0 Commission 0 0 0 0 Others (Contribution to PF, Superannuation and Consultancy fees) 4 4 5 4 Total 194 189 194 154 Remuneration as % of staff cost 1.1 1.1 1.1 0.7 Remuneration as % of EBITDA 0.3 0.2 0.2 0.1 Remuneration as % of PAT 0.4 0.3 0.3 0.2
Source: Company, MOFSL
Exhibit 26: CFO’s total remuneration – INR71m Particulars of Remuneration (INR m) Srinivas Phatak/ P. B. Balaji (ED, Finance and IT & CFO) FY18* FY19 FY20 FY21 Gross salary (a) Salary as per provisions contained in section 17(1) of the IT Act, 1961 37 22 24 32 (b) Value of perquisites u/s 17(2) Income-tax Act, 1961 0 0 0 0 (c) Profits in lieu of salary under Section 17(3) Income-Tax Act, 1961 2 19 14 11 Stock Option 0 4 8 0 Sweat Equity 0 0 0 0 Commission 0 0 0 0 Others (Contribution to PF, Superannuation and Consultancy fees) 3 4 5 6 Total 42 49 51 71 Remuneration as % of staff cost 0.2 0.3 0.3 0.3 Remuneration as % of EBITDA 0.1 0.1 0.1 0.1 Remuneration as % of PAT 0.1 0.1 0.1 0.1
*incl. remuneration paid to Mr. P. B. Balaji Source: Company, MOFSL
Exhibit 27: Mr Wilhelmus Uijen’s total remuneration in FY21 – INR81m Particulars of Remuneration (INR m) Wilhelmus Uijen / Pradeep Banerjee (ED, Supply Chain) FY18 FY19 FY20* FY21 Gross salary (a) Salary as per provisions contained in section 17(1) of the Income-tax Act, 1961 20 24 13 53 (b) Value of perquisites u/s 17(2) Income-tax Act, 1961 0 0 2 20 (c) Profits in lieu of salary under Section 17(3) Income-Tax Act, 1961 20 3 2 6 Stock Option 10 17 0 0 Sweat Equity 0 0 0 0 Commission 0 0 0 0 Others (Contribution to PF, Superannuation and Consultancy fees) 4 15 58 3 Total 55 59 75 81 Remuneration as % of Staff Cost 0.3 0.3 0.4 0.4 Remuneration as % of EBITDA 0.1 0.1 0.1 0.1 Remuneration as % of PAT 0.1 0.1 0.1 0.1
*incl. remuneration paid to Mr. Banerjee Source: Company, MOFSL
Hindustan Unilever
31 May 2021 18
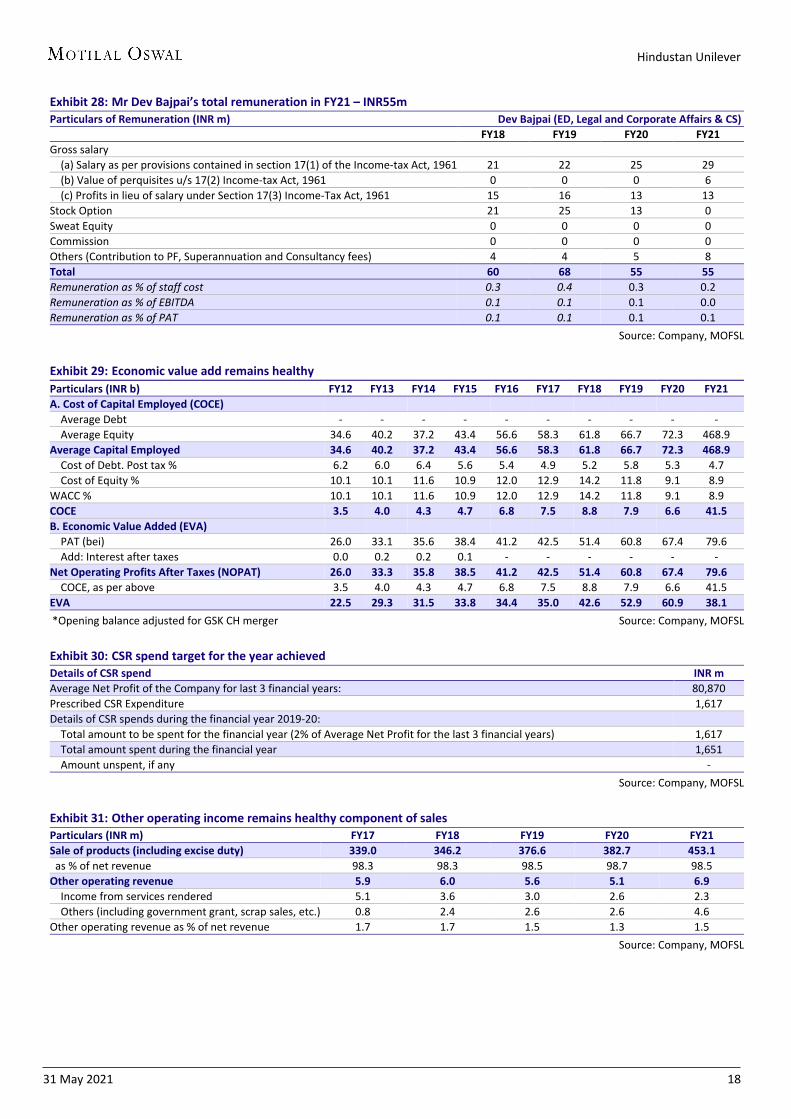
Exhibit 28: Mr Dev Bajpai’s total remuneration in FY21 – INR55m Particulars of Remuneration (INR m) Dev Bajpai (ED, Legal and Corporate Affairs & CS) FY18 FY19 FY20 FY21 Gross salary (a) Salary as per provisions contained in section 17(1) of the Income-tax Act, 1961 21 22 25 29 (b) Value of perquisites u/s 17(2) Income-tax Act, 1961 0 0 0 6 (c) Profits in lieu of salary under Section 17(3) Income-Tax Act, 1961 15 16 13 13 Stock Option 21 25 13 0 Sweat Equity 0 0 0 0 Commission 0 0 0 0 Others (Contribution to PF, Superannuation and Consultancy fees) 4 4 5 8 Total 60 68 55 55 Remuneration as % of staff cost 0.3 0.4 0.3 0.2 Remuneration as % of EBITDA 0.1 0.1 0.1 0.0 Remuneration as % of PAT 0.1 0.1 0.1 0.1
Source: Company, MOFSL
Exhibit 29: Economic value add remains healthy Particulars (INR b) FY12 FY13 FY14 FY15 FY16 FY17 FY18 FY19 FY20 FY21 A. Cost of Capital Employed (COCE) Average Debt - - - - - - - - - - Average Equity 34.6 40.2 37.2 43.4 56.6 58.3 61.8 66.7 72.3 468.9 Average Capital Employed 34.6 40.2 37.2 43.4 56.6 58.3 61.8 66.7 72.3 468.9 Cost of Debt. Post tax % 6.2 6.0 6.4 5.6 5.4 4.9 5.2 5.8 5.3 4.7 Cost of Equity % 10.1 10.1 11.6 10.9 12.0 12.9 14.2 11.8 9.1 8.9 WACC % 10.1 10.1 11.6 10.9 12.0 12.9 14.2 11.8 9.1 8.9 COCE 3.5 4.0 4.3 4.7 6.8 7.5 8.8 7.9 6.6 41.5 B. Economic Value Added (EVA) PAT (bei) 26.0 33.1 35.6 38.4 41.2 42.5 51.4 60.8 67.4 79.6 Add: Interest after taxes 0.0 0.2 0.2 0.1 - - - - - - Net Operating Profits After Taxes (NOPAT) 26.0 33.3 35.8 38.5 41.2 42.5 51.4 60.8 67.4 79.6 COCE, as per above 3.5 4.0 4.3 4.7 6.8 7.5 8.8 7.9 6.6 41.5 EVA 22.5 29.3 31.5 33.8 34.4 35.0 42.6 52.9 60.9 38.1
*Opening balance adjusted for GSK CH merger Source: Company, MOFSL
Exhibit 30: CSR spend target for the year achieved Details of CSR spend INR m Average Net Profit of the Company for last 3 financial years: 80,870 Prescribed CSR Expenditure 1,617 Details of CSR spends during the financial year 2019-20: Total amount to be spent for the financial year (2% of Average Net Profit for the last 3 financial years) 1,617 Total amount spent during the financial year 1,651 Amount unspent, if any -
Source: Company, MOFSL
Exhibit 31: Other operating income remains healthy component of sales Particulars (INR m) FY17 FY18 FY19 FY20 FY21 Sale of products (including excise duty) 339.0 346.2 376.6 382.7 453.1 as % of net revenue 98.3 98.3 98.5 98.7 98.5 Other operating revenue 5.9 6.0 5.6 5.1 6.9 Income from services rendered 5.1 3.6 3.0 2.6 2.3 Others (including government grant, scrap sales, etc.) 0.8 2.4 2.6 2.6 4.6 Other operating revenue as % of net revenue 1.7 1.7 1.5 1.3 1.5
Source: Company, MOFSL
Hindustan Unilever
31 May 2021 19
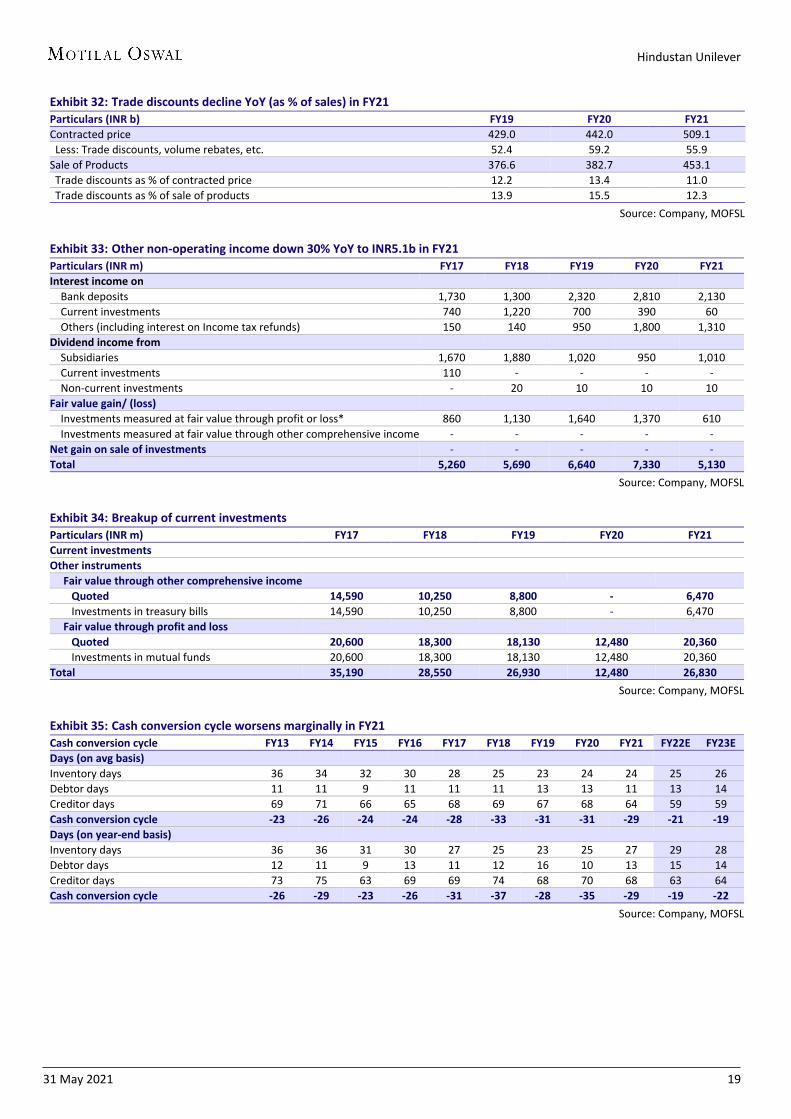
Exhibit 32: Trade discounts decline YoY (as % of sales) in FY21 Particulars (INR b) FY19 FY20 FY21 Contracted price 429.0 442.0 509.1 Less: Trade discounts, volume rebates, etc. 52.4 59.2 55.9 Sale of Products 376.6 382.7 453.1 Trade discounts as % of contracted price 12.2 13.4 11.0 Trade discounts as % of sale of products 13.9 15.5 12.3
Source: Company, MOFSL
Exhibit 33: Other non-operating income down 30% YoY to INR5.1b in FY21 Particulars (INR m) FY17 FY18 FY19 FY20 FY21 Interest income on Bank deposits 1,730 1,300 2,320 2,810 2,130 Current investments 740 1,220 700 390 60 Others (including interest on Income tax refunds) 150 140 950 1,800 1,310 Dividend income from Subsidiaries 1,670 1,880 1,020 950 1,010 Current investments 110 - - - - Non-current investments - 20 10 10 10 Fair value gain/ (loss) Investments measured at fair value through profit or loss* 860 1,130 1,640 1,370 610 Investments measured at fair value through other comprehensive income - - - - - Net gain on sale of investments - - - - - Total 5,260 5,690 6,640 7,330 5,130
Source: Company, MOFSL
Exhibit 34: Breakup of current investments Particulars (INR m) FY17 FY18 FY19 FY20 FY21 Current investments Other instruments Fair value through other comprehensive income Quoted 14,590 10,250 8,800 - 6,470 Investments in treasury bills 14,590 10,250 8,800 - 6,470 Fair value through profit and loss Quoted 20,600 18,300 18,130 12,480 20,360 Investments in mutual funds 20,600 18,300 18,130 12,480 20,360 Total 35,190 28,550 26,930 12,480 26,830
Source: Company, MOFSL
Exhibit 35: Cash conversion cycle worsens marginally in FY21 Cash conversion cycle FY13 FY14 FY15 FY16 FY17 FY18 FY19 FY20 FY21 FY22E FY23E Days (on avg basis) Inventory days 36 34 32 30 28 25 23 24 24 25 26 Debtor days 11 11 9 11 11 11 13 13 11 13 14 Creditor days 69 71 66 65 68 69 67 68 64 59 59 Cash conversion cycle -23 -26 -24 -24 -28 -33 -31 -31 -29 -21 -19 Days (on year-end basis) Inventory days 36 36 31 30 27 25 23 25 27 29 28 Debtor days 12 11 9 13 11 12 16 10 13 15 14 Creditor days 73 75 63 69 69 74 68 70 68 63 64 Cash conversion cycle -26 -29 -23 -26 -31 -37 -28 -35 -29 -19 -22
Source: Company, MOFSL

Hindustan Unilever
31 May 2021 20
Exhibit 36: Inventory days flat YoY (on average), but up by 2 days on year-end basis in FY21 Particulars (Days) FY17 FY18 FY19 FY20 FY21 On average basis Raw material 9 8 8 8 8 Packing material 1 1 0 1 1 Work-in-progress 3 2 2 2 3 Finished goods 14 13 12 12 11 Stores and spares 1 1 1 1 1 Inventory 28 25 23 24 24 On year-end basis Raw material 9 8 8 9 10 Packing material 1 1 0 1 1 Work-in-progress 2 3 2 2 3 Finished goods 14 13 12 12 12 Stores and spares 1 1 1 1 1 Inventory 27 25 23 25 27
Source: Company, MOFSL
Valuation and view The company continues to place building blocks for future growth and has been
able to do so ahead of peers. It continues to display the dexterity shown over the last decade despite its larger size, even as it continues to grow v/s peers.
HUVR continues to strengthen the key drivers of its success in India over the last decade, including (a) pioneering the use of technology to generate data and facilitate decision making, (b) the WiMI strategy, focused on decentralization and localized strategies, (c) recognizing trends and investing in them early on, (d) funneling cost savings back into the business, and (e) its strong execution ability, which has led to a positive earnings momentum. The company’s earnings growth has gained further impetus in recent years (before COVID-19 affected FY21) – it reported a ~18% EPS CAGR in the four years ended FY20 v/s a ~12% CAGR over FY10–20. This is particularly impressive given the weak mid-single-digit earnings growth posted by (much smaller) peers in recent years.
After premiumization in Detergents led to strong growth in detergent sales and margins in the last decade, the Personal Wash and Dishwashing segments show considerable promise going forward. The high-margin Discretionary portfolio was under pressure in FY21 – resulting in lower than the usual 12% adjusted EPS growth) – and is expected to face significant pressure in FY22 as well (albeit less than in the previous year). Nevertheless, the trajectory of premiumization over the medium term is evident. Additionally, synergies from the GSKCH business would play a big role in the resumption of strong earnings growth going forward.
There is no material change in our forecasts. We maintain a Buy rating, with unchanged TP of INR2,780 (55x Jun’23E EPS).

Hindustan Unilever
31 May 2021 21
Exhibit 37: HUVR P/E (x)
Source: Bloomberg, Company, MOFSL
Exhibit 38: Consumer sector P/E (x)
Source: Bloomberg, Company, MOFSL
56.5
43.8
65.7
24.1
55.2
32.5
15.0
35.0
55.0
75.0
May
-11
Aug-
12
Nov
-13
Feb-
15
May
-16
Aug-
17
Nov
-18
Feb-
20
May
-21
P/E (x) Avg (x) Max (x)Min (x) +1SD -1SD
42.3 36.5
46.8
24.7
41.8
31.2
21.0
31.0
41.0
51.0
May
-11
Aug-
12
Nov
-13
Feb-
15
May
-16
Aug-
17
Nov
-18
Feb-
20
May
-21
P/E (x) Avg (x) Max (x)Min (x) +1SD -1SD
Hindustan Unilever
31 May 2021 22
Financials and valuations
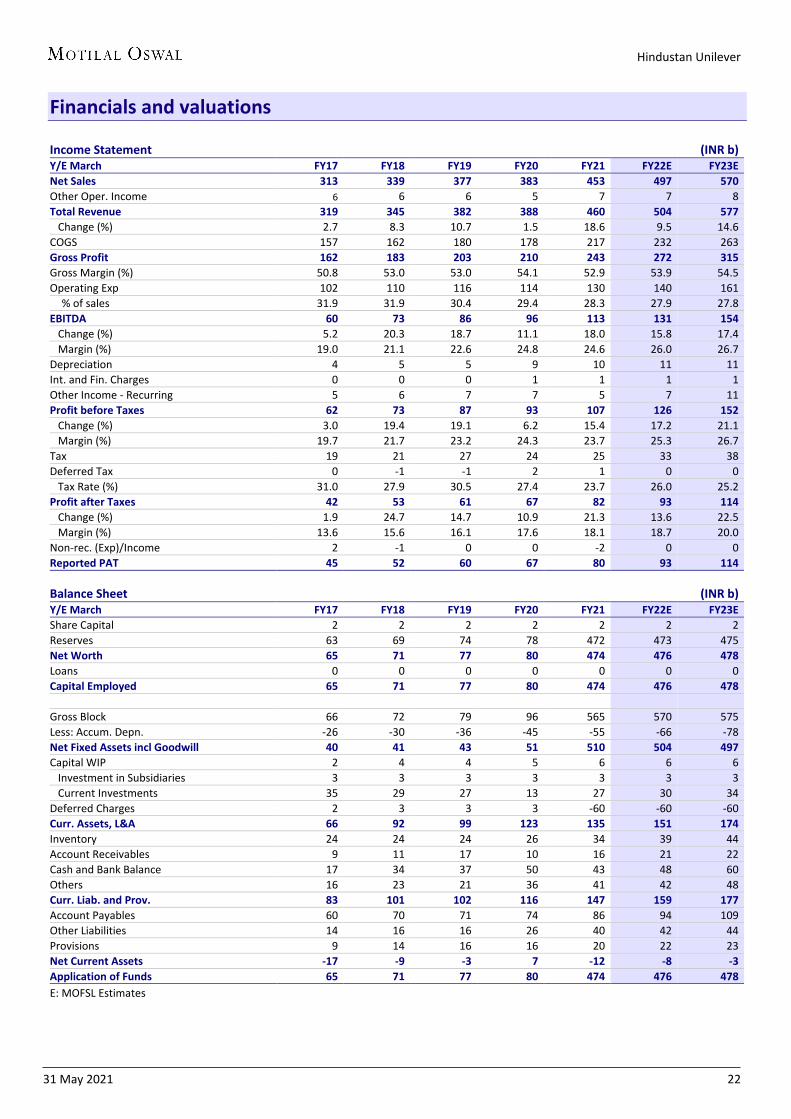
Income Statement (INR b) Y/E March FY17 FY18 FY19 FY20 FY21 FY22E FY23E Net Sales 313 339 377 383 453 497 570 Other Oper. Income 6 6 6 5 7 7 8 Total Revenue 319 345 382 388 460 504 577 Change (%) 2.7 8.3 10.7 1.5 18.6 9.5 14.6 COGS 157 162 180 178 217 232 263 Gross Profit 162 183 203 210 243 272 315 Gross Margin (%) 50.8 53.0 53.0 54.1 52.9 53.9 54.5 Operating Exp 102 110 116 114 130 140 161
% of sales 31.9 31.9 30.4 29.4 28.3 27.9 27.8 EBITDA 60 73 86 96 113 131 154 Change (%) 5.2 20.3 18.7 11.1 18.0 15.8 17.4 Margin (%) 19.0 21.1 22.6 24.8 24.6 26.0 26.7 Depreciation 4 5 5 9 10 11 11 Int. and Fin. Charges 0 0 0 1 1 1 1 Other Income - Recurring 5 6 7 7 5 7 11 Profit before Taxes 62 73 87 93 107 126 152 Change (%) 3.0 19.4 19.1 6.2 15.4 17.2 21.1 Margin (%) 19.7 21.7 23.2 24.3 23.7 25.3 26.7 Tax 19 21 27 24 25 33 38 Deferred Tax 0 -1 -1 2 1 0 0 Tax Rate (%) 31.0 27.9 30.5 27.4 23.7 26.0 25.2 Profit after Taxes 42 53 61 67 82 93 114 Change (%) 1.9 24.7 14.7 10.9 21.3 13.6 22.5 Margin (%) 13.6 15.6 16.1 17.6 18.1 18.7 20.0 Non-rec. (Exp)/Income 2 -1 0 0 -2 0 0 Reported PAT 45 52 60 67 80 93 114 Balance Sheet (INR b) Y/E March FY17 FY18 FY19 FY20 FY21 FY22E FY23E Share Capital 2 2 2 2 2 2 2 Reserves 63 69 74 78 472 473 475 Net Worth 65 71 77 80 474 476 478 Loans 0 0 0 0 0 0 0 Capital Employed 65 71 77 80 474 476 478
Gross Block 66 72 79 96 565 570 575 Less: Accum. Depn. -26 -30 -36 -45 -55 -66 -78 Net Fixed Assets incl Goodwill 40 41 43 51 510 504 497 Capital WIP 2 4 4 5 6 6 6 Investment in Subsidiaries 3 3 3 3 3 3 3 Current Investments 35 29 27 13 27 30 34 Deferred Charges 2 3 3 3 -60 -60 -60 Curr. Assets, L&A 66 92 99 123 135 151 174 Inventory 24 24 24 26 34 39 44 Account Receivables 9 11 17 10 16 21 22 Cash and Bank Balance 17 34 37 50 43 48 60 Others 16 23 21 36 41 42 48 Curr. Liab. and Prov. 83 101 102 116 147 159 177 Account Payables 60 70 71 74 86 94 109 Other Liabilities 14 16 16 26 40 42 44 Provisions 9 14 16 16 20 22 23 Net Current Assets -17 -9 -3 7 -12 -8 -3 Application of Funds 65 71 77 80 474 476 478 E: MOFSL Estimates 0

Hindustan Unilever
31 May 2021 23
Financials and valuations
Ratios Y/E March FY17 FY18 FY19 FY20 FY21 FY22E FY23E Basic (INR) EPS 19.6 24.5 28.1 31.2 34.8 39.5 48.4 Cash EPS 21.5 26.7 30.5 35.6 39.1 44.4 53.3 BV/Share 30.0 32.7 35.4 37.2 201.8 202.4 203.3 DPS 17.0 20.0 22.0 25.0 40.5 39.0 47.5 Payout % 98 99 95 96 116 99 98 Valuation (x) P/E 119.2 95.6 83.4 75.0 67.3 59.2 48.3 Cash P/E 109.1 87.7 76.7 65.8 59.9 52.8 43.9 EV/Sales 16.1 14.8 13.4 13.1 12.0 11.0 9.5 EV/EBITDA 83.5 69.1 58.2 52.1 48.2 41.6 35.3 P/BV 78.1 71.6 66.2 63.0 11.6 11.6 11.5 Dividend Yield (%) 0.7 0.9 0.9 1.1 1.7 1.7 2.0 Return Ratios (%) RoE incl. Goodwill 66.5 78.1 82.5 86.0 29.5 19.6 23.9 RoCE incl. Goodwill 96.7 108.6 119.1 119.8 39.0 26.6 32.1 Working Capital Ratios Debtor (Days) 11 12 16 10 13 16 14 Asset Turnover (x) 4.8 4.8 4.9 4.8 1.0 1.0 1.2 Leverage Ratio Debt/Equity (x) 0.0 0.0 0.0 0.0 0.0 0.0 0.0 Cash Flow Statement (INR b) Y/E March FY17 FY18 FY19 FY20 FY21 FY22E FY23E OP/(loss) before Tax 62 73 85 91 105 126 152 Financial other income -1 -3 -1 -2 1 -7 -11 Depreciation 4 5 5 9 11 11 11 Net Interest Paid -2 -2 -3 -4 -2 1 1 Direct Taxes Paid -18 -22 -27 -25 -24 -33 -38 (Incr)/Decr in WC 5 9 -3 3 -1 0 7 CF from Operations 50 59 57 73 90 99 123 Other Items 0 5 4 -8 12 10 13 (Incr)/Decr in FA -9 -8 -7 -7 -40 -5 -5 Free Cash Flow 41 51 50 66 50 94 118 (Pur)/Sale of Investments -10 8 3 22 24 -3 -4 CF from Invest. -18 4 0 7 -4 2 4 Dividend Paid -36 -39 -45 -62 -88 -92 -112 Others -7 -8 -9 -4 -5 -4 -4 CF from Fin. Activity -43 -47 -55 -67 -93 -95 -115 Incr/Decr of Cash -11 17 3 13 -7 5 12 Add: Opening Balance 28 17 34 37 50 43 48 Closing Balance 17 34 37 50 43 48 60 E: MOFSL Estimates
Hindustan Unilever
31 May 2021 24
N O T E S
Hindustan Unilever
31 May 2021 25
Explanation of Investment Rating Investment Rating Expected return (over 12-month) BUY >=15% SELL < - 10% NEUTRAL < - 10 % to 15% UNDER REVIEW Rating may undergo a change NOT RATED We have forward looking estimates for the stock but we refrain from assigning recommendation *In case the recommendation given by the Research Analyst is inconsistent with the investment rating legend for a continuous period of 30 days, the Research Analyst shall within following 30 days take appropriate measures to make the recommendation consistent with the investment rating legend. Disclosures The following Disclosures are being made in compliance with the SEBI Research Analyst Regulations 2014 (herein after referred to as the Regulations). Motilal Oswal Financial Services Ltd. (MOFSL) is a SEBI Registered Research Analyst having registration no. INH000000412. MOFSL, the Research Entity (RE) as defined in the Regulations, is engaged in the business of providing Stock broking services, Investment Advisory Services, Depository participant services & distribution of various financial products. MOFSL is a subsidiary company of Passionate Investment Management Pvt. Ltd.. (PIMPL). MOFSL is a listed public company, the details in respect of which are available on www.motilaloswal.com. MOFSL (erstwhile Motilal Oswal Securities Limited - MOSL) is registered with the Securities & Exchange Board of India (SEBI) and is a registered Trading Member with National Stock Exchange of India Ltd. (NSE) and Bombay Stock Exchange Limited (BSE), Multi Commodity Exchange of India Limited (MCX) and National Commodity & Derivatives Exchange Limited (NCDEX) for its stock broking activities & is Depository participant with Central Depository Services Limited (CDSL) National Securities Depository Limited (NSDL),NERL, COMRIS and CCRL and is member of Association of Mutual Funds of India (AMFI) for distribution of financial products and Insurance Regulatory & Development Authority of India (IRDA) as Corporate Agent for insurance products. Details of associate entities of Motilal Oswal Financial Services Limited are available on the website at http://onlinereports.motilaloswal.com/Dormant/documents/List%20of%20Associate%20companies.pdf MOFSL and its associate company(ies), their directors and Research Analyst and their relatives may; (a) from time to time, have a long or short position in, act as principal in, and buy or sell the securities or derivatives thereof of companies mentioned herein. (b) be engaged in any other transaction involving such securities and earn brokerage or other compensation or act as a market maker in the financial instruments of the company(ies) discussed herein or act as an advisor or lender/borrower to such company(ies) or may have any other potential conflict of interests with respect to any recommendation and other related information and opinions.; however the same shall have no bearing whatsoever on the specific recommendations made by the analyst(s), as the recommendations made by the analyst(s) are completely independent of the views of the associates of MOFSL even though there might exist an inherent conflict of interest in some of the stocks mentioned in the research report MOFSL and / or its affiliates do and seek to do business including investment banking with companies covered in its research reports. As a result, the recipients of this report should be aware that MOFSL may have a potential conflict of interest that may affect the objectivity of this report. Compensation of Research Analysts is not based on any specific merchant banking, investment banking or brokerage service transactions. Details of pending Enquiry Proceedings of Motilal Oswal Financial Services Limited are available on the website at https://galaxy.motilaloswal.com/ResearchAnalyst/PublishViewLitigation.aspx A graph of daily closing prices of securities is available at www.nseindia.com, www.bseindia.com. Research Analyst views on Subject Company may vary based on Fundamental research and Technical Research. Proprietary trading desk of MOFSL or its associates maintains arm’s length distance with Research Team as all the activities are segregated from MOFSL research activity and therefore it can have an independent view with regards to Subject Company for which Research Team have expressed their views. Regional Disclosures (outside India) This report is not directed or intended for distribution to or use by any person or entity resident in a state, country or any jurisdiction, where such distribution, publication, availability or use would be contrary to law, regulation or which would subject MOFSL & its group companies to registration or licensing requirements within such jurisdictions. For Hong Kong: This report is distributed in Hong Kong by Motilal Oswal capital Markets (Hong Kong) Private Limited, a licensed corporation (CE AYY-301) licensed and regulated by the Hong Kong Securities and Futures Commission (SFC) pursuant to the Securities and Futures Ordinance (Chapter 571 of the Laws of Hong Kong) “SFO”. As per SEBI (Research Analyst Regulations) 2014 Motilal Oswal Securities (SEBI Reg No. INH000000412) has an agreement with Motilal Oswal capital Markets (Hong Kong) Private Limited for distribution of research report in Hong Kong. This report is intended for distribution only to “Professional Investors” as defined in Part I of Schedule 1 to SFO. Any investment or investment activity to which this document relates is only available to professional investor and will be engaged only with professional investors.” Nothing here is an offer or solicitation of these securities, products and services in any jurisdiction where their offer or sale is not qualified or exempt from registration. The Indian Analyst(s) who compile this report is/are not located in Hong Kong & are not conducting Research Analysis in Hong Kong. For U.S. Motilal Oswal Financial Services Limited (MOFSL) is not a registered broker - dealer under the U.S. Securities Exchange Act of 1934, as amended (the"1934 act") and under applicable state laws in the United States. In addition MOFSL is not a registered investment adviser under the U.S. Investment Advisers Act of 1940, as amended (the "Advisers Act" and together with the 1934 Act, the "Acts), and under applicable state laws in the United States. Accordingly, in the absence of specific exemption under the Acts, any brokerage and investment services provided by MOFSL , including the products and services described herein are not available to or intended for U.S. persons. This report is intended for distribution only to "Major Institutional Investors" as defined by Rule 15a-6(b)(4) of the Exchange Act and interpretations thereof by SEC (henceforth referred to as "major institutional investors"). This document must not be acted on or relied on by persons who are not major institutional investors. Any investment or investment activity to which this document relates is only available to major institutional investors and will be engaged in only with major institutional investors. In reliance on the exemption from registration provided by Rule 15a-6 of the U.S. Securities Exchange Act of 1934, as amended (the "Exchange Act") and interpretations thereof by the U.S. Securities and Exchange Commission ("SEC") in order to conduct business with Institutional Investors based in the U.S., MOFSL has entered into a chaperoning agreement with a U.S. registered broker-dealer, Motilal Oswal Securities International Private Limited. ("MOSIPL"). Any business interaction pursuant to this report will have to be executed within the provisions of this chaperoning agreement. The Research Analysts contributing to the report may not be registered /qualified as research analyst with FINRA. Such research analyst may not be associated persons of the U.S. registered broker-dealer, MOSIPL, and therefore, may not be subject to NASD rule 2711 and NYSE Rule 472 restrictions on communication with a subject company, public appearances and trading securities held by a research analyst account. For Singapore In Singapore, this report is being distributed by Motilal Oswal Capital Markets Singapore Pte Ltd (“MOCMSPL”) (Co.Reg. NO. 201129401Z) which is a holder of a capital markets services license and an exempt financial adviser in Singapore.As per the approved agreement under Paragraph 9 of Third Schedule of Securities and Futures Act (CAP 289) and Paragraph 11 of First Schedule of Financial Advisors Act (CAP 110) provided to MOCMSPL by Monetary Authority of Singapore. Persons in Singapore should contact MOCMSPL in respect of any matter arising from, or in connection with this report/publication/communication. This report is distributed solely to persons who qualify as “Institutional Investors”, of which some of whom may consist of "accredited" institutional investors as defined in section 4A(1) of the Securities and Futures Act, Chapter 289 of Singapore (“the SFA”). Accordingly, if a Singapore person is not or ceases to be such an institutional investor, such Singapore Person must immediately discontinue any use of this Report and inform MOCMSPL. Specific Disclosures 1 MOFSL, Research Analyst and/or his relatives does not have financial interest in the subject company, as they do not have equity holdings in the subject company. 2 MOFSL, Research Analyst and/or his relatives do not have actual/beneficial ownership of 1% or more securities in the subject company 3 MOFSL, Research Analyst and/or his relatives have not received compensation/other benefits from the subject company in the past 12 months 4 MOFSL, Research Analyst and/or his relatives do not have material conflict of interest in the subject company at the time of publication of research report 5 Research Analyst has not served as director/officer/employee in the subject company 6 MOFSL has not acted as a manager or co-manager of public offering of securities of the subject company in past 12 months 7 MOFSL has not received compensation for investment banking/ merchant banking/brokerage services from the subject company in the past 12 months 8 MOFSL has not received compensation for other than investment banking/merchant banking/brokerage services from the subject company in the past 12 months 9 MOFSL has not received any compensation or other benefits from third party in connection with the research report 10 MOFSL has not engaged in market making activity for the subject company
Hindustan Unilever
31 May 2021 26
******************************************************************************************************************************** The associates of MOFSL may have: - financial interest in the subject company - actual/beneficial ownership of 1% or more securities in the subject company - received compensation/other benefits from the subject company in the past 12 months - other potential conflict of interests with respect to any recommendation and other related information and opinions.; however the same shall have no bearing whatsoever on the
specific recommendations made by the analyst(s), as the recommendations made by the analyst(s) are completely independent of the views of the associates of MOFSL even though there might exist an inherent conflict of interest in some of the stocks mentioned in the research report.
- acted as a manager or co-manager of public offering of securities of the subject company in past 12 months - be engaged in any other transaction involving such securities and earn brokerage or other compensation or act as a market maker in the financial instruments of the
company(ies) discussed herein or act as an advisor or lender/borrower to such company(ies) - received compensation from the subject company in the past 12 months for investment banking / merchant banking / brokerage services or from other than said services.
The associates of MOFSL has not received any compensation or other benefits from third party in connection with the research report Above disclosures include beneficial holdings lying in demat account of MOFSL which are opened for proprietary investments only. While calculating beneficial holdings, It does not consider demat accounts which are opened in name of MOFSL for other purposes (i.e holding client securities, collaterals, error trades etc.). MOFSL also earns DP income from clients which are not considered in above disclosures. Analyst Certification The views expressed in this research report accurately reflect the personal views of the analyst(s) about the subject securities or issues, and no part of the compensation of the research analyst(s) was, is, or will be directly or indirectly related to the specific recommendations and views expressed by research analyst(s) in this report. Terms & Conditions: This report has been prepared by MOFSL and is meant for sole use by the recipient and not for circulation. The report and information contained herein is strictly confidential and may not be altered in any way, transmitted to, copied or distributed, in part or in whole, to any other person or to the media or reproduced in any form, without prior written consent of MOFSL. The report is based on the facts, figures and information that are considered true, correct, reliable and accurate. The intent of this report is not recommendatory in nature. The information is obtained from publicly available media or other sources believed to be reliable. Such information has not been independently verified and no guaranty, representation of warranty, express or implied, is made as to its accuracy, completeness or correctness. All such information and opinions are subject to change without notice. The report is prepared solely for informational purpose and does not constitute an offer document or solicitation of offer to buy or sell or subscribe for securities or other financial instruments for the clients. Though disseminated to all the customers simultaneously, not all customers may receive this report at the same time. MOFSL will not treat recipients as customers by virtue of their receiving this report. Disclaimer: The report and information contained herein is strictly confidential and meant solely for the selected recipient and may not be altered in any way, transmitted to, copied or distributed, in part or in whole, to any other person or to the media or reproduced in any form, without prior written consent. This report and information herein is solely for informational purpose and may not be used or considered as an offer document or solicitation of offer to buy or sell or subscribe for securities or other financial instruments. Nothing in this report constitutes investment, legal, accounting and tax advice or a representation that any investment or strategy is suitable or appropriate to your specific circumstances. The securities discussed and opinions expressed in this report may not be suitable for all investors, who must make their own investment decisions, based on their own investment objectives, financial positions and needs of specific recipient. This may not be taken in substitution for the exercise of independent judgment by any recipient. Each recipient of this document should make such investigations as it deems necessary to arrive at an independent evaluation of an investment in the securities of companies referred to in this document (including the merits and risks involved), and should consult its own advisors to determine the merits and risks of such an investment. The investment discussed or views expressed may not be suitable for all investors. Certain transactions -including those involving futures, options, another derivative products as well as non-investment grade securities - involve substantial risk and are not suitable for all investors. No representation or warranty, express or implied, is made as to the accuracy, completeness or fairness of the information and opinions contained in this document. The Disclosures of Interest Statement incorporated in this document is provided solely to enhance the transparency and should not be treated as endorsement of the views expressed in the report. This information is subject to change without any prior notice. The Company reserves the right to make modifications and alternations to this statement as may be required from time to time without any prior approval. MOFSL, its associates, their directors and the employees may from time to time, effect or have effected an own account transaction in, or deal as principal or agent in or for the securities mentioned in this document. They may perform or seek to perform investment banking or other services for, or solicit investment banking or other business from, any company referred to in this report. Each of these entities functions as a separate, distinct and independent of each other. The recipient should take this into account before interpreting the document. This report has been prepared on the basis of information that is already available in publicly accessible media or developed through analysis of MOFSL. The views expressed are those of the analyst, and the Company may or may not subscribe to all the views expressed therein. This document is being supplied to you solely for your information and may not be reproduced, redistributed or passed on, directly or indirectly, to any other person or published, copied, in whole or in part, for any purpose. This report is not directed or intended for distribution to, or use by, any person or entity who is a citizen or resident of or located in any locality, state, country or other jurisdiction, where such distribution, publication, availability or use would be contrary to law, regulation or which would subject MOFSL to any registration or licensing requirement within such jurisdiction. The securities described herein may or may not be eligible for sale in all jurisdictions or to certain category of investors. Persons in whose possession this document may come are required to inform themselves of and to observe such restriction. Neither the Firm, not its directors, employees, agents or representatives shall be liable for any damages whether direct or indirect, incidental, special or consequential including lost revenue or lost profits that may arise from or in connection with the use of the information. The person accessing this information specifically agrees to exempt MOFSL or any of its affiliates or employees from, any and all responsibility/liability arising from such misuse and agrees not to hold MOFSL or any of its affiliates or employees responsible for any such misuse and further agrees to hold MOFSL or any of its affiliates or employees free and harmless from all losses, costs, damages, expenses that may be suffered by the person accessing this information due to any errors and delays. Registered Office Address: Motilal Oswal Tower, Rahimtullah Sayani Road, Opposite Parel ST Depot, Prabhadevi, Mumbai-400025; Tel No.: 022 71934200/ 022-71934263; Website www.motilaloswal.com.CIN no.: L67190MH2005PLC153397.Correspondence Office Address: Palm Spring Centre, 2nd Floor, Palm Court Complex, New Link Road, Malad(West), Mumbai- 400 064. Tel No: 022 7188 1000. Registration Nos.: Motilal Oswal Financial Services Limited (MOFSL)*: INZ000158836(BSE/NSE/MCX/NCDEX); CDSL and NSDL: IN-DP-16-2015; Research Analyst: INH000000412. AMFI: ARN - 146822; Investment Adviser: INA000007100; Insurance Corporate Agent: CA0579;PMS:INP000006712. Motilal Oswal Asset Management Company Ltd. (MOAMC): PMS (Registration No.: INP000000670); PMS and Mutual Funds are offered through MOAMC which is group company of MOFSL. Motilal Oswal Wealth Management Ltd. (MOWML): PMS (Registration No.: INP000004409) is offered through MOWML, which is a group company of MOFSL. Motilal Oswal Financial Services Limited is a distributor of Mutual Funds, PMS, Fixed Deposit, Bond, NCDs,Insurance Products and IPOs.Real Estate is offered through Motilal Oswal Real Estate Investment Advisors II Pvt. Ltd. which is a group company of MOFSL. Private Equity is offered through Motilal Oswal Private Equity Investment Advisors Pvt. Ltd which is a group company of MOFSL. Research & Advisory services is backed by proper research. Please read the Risk Disclosure Document prescribed by the Stock Exchanges carefully before investing. There is no assurance or guarantee of the returns. Investment in securities market is subject to market risk, read all the related documents carefully before investing. Details of Compliance Officer: Name: Neeraj Agarwal, Email ID: [email protected], Contact No.:022-71881085. * MOSL has been amalgamated with Motilal Oswal Financial Services Limited (MOFSL) w.e.f August 21, 2018 pursuant to order dated July 30, 2018 issued by Hon'ble National Company Law Tribunal, Mumbai Bench.