Just Dial - Motilal Oswal
12
25 February 2016 Update | Sector: Technology Just Dial BSE SENSEX S&P CNX CMP: INR537 TP: INR830 (+55%) Buy 22,976 6,971 Bloomberg JUST IN Equity Shares (m) 70.5 M.Cap.(INRb)/(USDb) 37.9/ 0.6 52-Week Range (INR) 1,455/378 1, 6, 12 Rel. Per (%) -26/-22/-39 Avg Val, (INR m) 699 Free float (%) 67.4 Financials & Valuation (INR b) Y/E Mar 2016E 2017E 2018E Sales 7.0 8.5 10.5 EBITDA 1.7 1.5 2.4 NP 1.3 1.2 1.8 EPS (INR) 19.3 16.7 25.9 EPS Gr. (%) -1.8 -13.9 55.2 BV/Sh (INR) 90.3 104.7 127.6 RoE (%) 20.7 17.1 22.3 RoCE (%) 28.3 24.4 31.8 P/E (x) 27.8 32.2 20.8 P/BV (x) 5.9 5.1 4.2 Estimate change TP change Rating change JD Omni and improved Search Plus launched; sets stage for next leg of growth We attended the launch of JD Omni and improved Search Plus, key highlights of which were as follows: JD Omni takes hyper local to the next level, makes every SME an e-tailer JUST unveiled the new JD Omni app, which is a digital business manager by providing vendors with their own ecommerce portal, app, dashboard with financial parameters (along with a monthly comparison), inventory management system along with payment integration, making it the complete enterprise solutions. In a nutshell, it helps traders come online with their businesses and sell directly to consumers, apart from assisting in supply chain management. Pricing of the first version is INR20,000 as setup cost and a monthly fee of INR2,000. Close to 1,500 SMEs have already signed for the same, including 500 opting for the upfront fee model. Upfront fee is ~INR120,000, however the introductory fees for the 500 opting for it was INR65,000. The ones opting for upfront free model get access to only the first version and AMC for five years. JD Omni will cater to both segments – retail and services, as well as B2B and not just B2C. At the vendor end, the app interface is similar to Search Plus version. JD Omni to be high margin business Management commented that costs for JD Omni and Search Plus has been frontloaded (~INR120-150m incurred in 9mFY16), hence gross margins are expected to be high. Subsequently, JUST will incur sales related cost like cost of hosting website, app, marketing and employee cost. As per management, EBITDA margins are expected to be 70-75%. It is also planning to hire 500 dedicated feet on street sales personnel and 500 tele marketing personnel by March 2016, especially for JD Omni. JD Omni and Search Plus will be synergistic with the existing Search business by transacting and managing vendors’ inventory and logistics, and providing them with a domain. Search Plus upgrade launched JUST also upgraded the version of Search Plus which saw addition of key features in the form of search through voice commands, cab bookings through Uber, Ola, and Easy Cabs integrated into Just Dial, IRCTC feature for booking of train tickets, and added scheduling for repairs services. While booking for Ola is back ended into JD app itself, Uber interface is integrated to the Uber app. It has also enhanced hyper local search features with price comparison of local and leading ecommerce portals, apart from UI/UX improvement. It will be launching voice commands for Indian languages also soon. The app also now has its own inbuilt maps in one single app. Management highlighted that it is generating revenue from unique product categories that don’t have vertical apps. It will be soon introducing one tap pay option through PayUMoney soon, without a need of wallet, through connected cards and introducing JD hyper local logistics, in top cities of India. Management highlighted that evangelists campaign with 1000 personnel pan India will begin soon. Niket Shah ([email protected]); +91 22 3982 5426 Chintan Modi ([email protected]); +912239825422/Kaustubh Kale ([email protected]); +912230102498 Investors are advised to refer through important disclosures made at the last page of the Research Report. Motilal Oswal research is available on www.motilaloswal.com/Institutional-Equities, Bloomberg, Thomson Reuters, Factset and S&P Capital.
-
Upload
khangminh22 -
Category
Documents
-
view
0 -
download
0
Transcript of Just Dial - Motilal Oswal
25 February 2016 Update | Sector: Technology
Just Dial BSE SENSEX S&P CNX CMP: INR537 TP: INR830 (+55%) Buy 22,976 6,971
Bloomberg JUST IN Equity Shares (m) 70.5 M.Cap.(INRb)/(USDb) 37.9/ 0.6
52-Week Range (INR) 1,455/378 1, 6, 12 Rel. Per (%) -26/-22/-39 Avg Val, (INR m) 699 Free float (%) 67.4
Financials & Valuation (INR b) Y/E Mar 2016E 2017E 2018E Sales 7.0 8.5 10.5 EBITDA 1.7 1.5 2.4 NP 1.3 1.2 1.8 EPS (INR) 19.3 16.7 25.9 EPS Gr. (%) -1.8 -13.9 55.2 BV/Sh (INR) 90.3 104.7 127.6 RoE (%) 20.7 17.1 22.3 RoCE (%) 28.3 24.4 31.8 P/E (x) 27.8 32.2 20.8 P/BV (x) 5.9 5.1 4.2
Estimate change TP change Rating change
JD Omni and improved Search Plus launched; sets stage for next leg of growth
We attended the launch of JD Omni and improved Search Plus, key highlights of which were as follows: JD Omni takes hyper local to the next level, makes every SME an e-tailer JUST unveiled the new JD Omni app, which is a digital business manager by providing vendors with their own ecommerce portal, app, dashboard with financial parameters (along with a monthly comparison), inventory management system along with payment integration, making it the complete enterprise solutions. In a nutshell, it helps traders come online with their businesses and sell directly to consumers, apart from assisting in supply chain management. Pricing of the first version is INR20,000 as setup cost and a monthly fee of INR2,000. Close to 1,500 SMEs have already signed for the same, including 500 opting for the upfront fee model. Upfront fee is ~INR120,000, however the introductory fees for the 500 opting for it was INR65,000. The ones opting for upfront free model get access to only the first version and AMC for five years. JD Omni will cater to both segments – retail and services, as well as B2B and not just B2C. At the vendor end, the app interface is similar to Search Plus version.
JD Omni to be high margin businessManagement commented that costs for JD Omni and Search Plus has been frontloaded (~INR120-150m incurred in 9mFY16), hence gross margins are expected to be high. Subsequently, JUST will incur sales related cost like cost of hosting website, app, marketing and employee cost. As per management, EBITDA margins are expected to be 70-75%. It is also planning to hire 500 dedicated feet on street sales personnel and 500 tele marketing personnel by March 2016, especially for JD Omni. JD Omni and Search Plus will be synergistic with the existing Search business by transacting and managing vendors’ inventory and logistics, and providing them with a domain.
Search Plus upgrade launchedJUST also upgraded the version of Search Plus which saw addition of key features in the form of search through voice commands, cab bookings through Uber, Ola, and Easy Cabs integrated into Just Dial, IRCTC feature for booking of train tickets, and added scheduling for repairs services. While booking for Ola is back ended into JD app itself, Uber interface is integrated to the Uber app. It has also enhanced hyper local search features with price comparison of local and leading ecommerce portals, apart from UI/UX improvement. It will be launching voice commands for Indian languages also soon. The app also now has its own inbuilt maps in one single app. Management highlighted that it is generating revenue from unique product categories that don’t have vertical apps. It will be soon introducing one tap pay option through PayUMoney soon, without a need of wallet, through connected cards and introducing JD hyper local logistics, in top cities of India. Management highlighted that evangelists campaign with 1000 personnel pan India will begin soon.
Niket Shah ([email protected]); +91 22 3982 5426 Chintan Modi ([email protected]); +912239825422/Kaustubh Kale ([email protected]); +912230102498 Investors are advised to refer through important disclosures made at the last page of the Research Report.
Motilal Oswal research is available on www.motilaloswal.com/Institutional-Equities, Bloomberg, Thomson Reuters, Factset and S&P Capital.
Just Dial
25 February 2016 2
JD Social – a social network with commercial intent to be launched soon JUST plans to launch a 'JD social' feature which will have the feel of a social networking website but help commercially. It will enable the user to interact with his friends, use function of checking in, upload photos, like and comment on his friends activities through Just Dial apart from their reviews and ratings.
Valuation and viewWe expect 21% revenue CAGR and 9% profit CAGR over FY15-18. We believe, its recent launch of JD Omni and Search Plus will provide new avenues of growth for coming years. However, the evangelists and ad campaigns shall prove to be the key to success of both JD Omni and Search Plus. Maintain Buy with a TP of INR830, 32x FY18E EPS.
Just Dial
25 February 2016 3
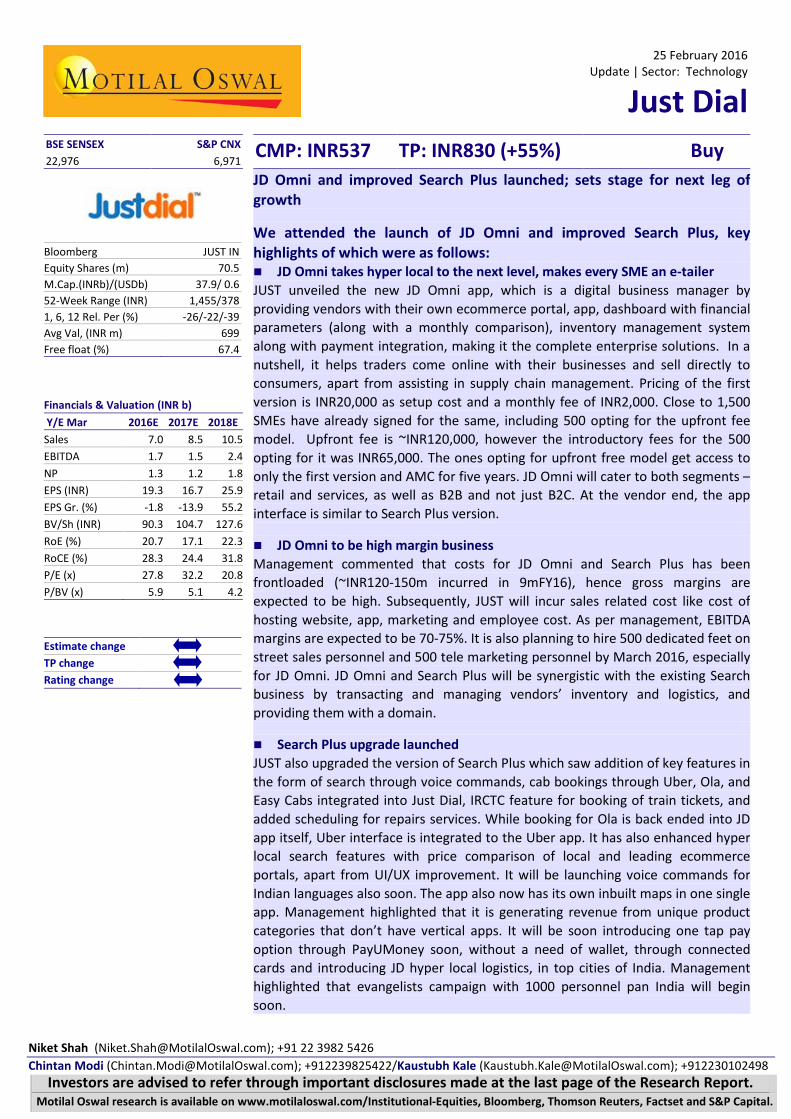
Exhibit 1: Signing up on JD Omni takes five minutes in a three step process
Source: MOSL, Company
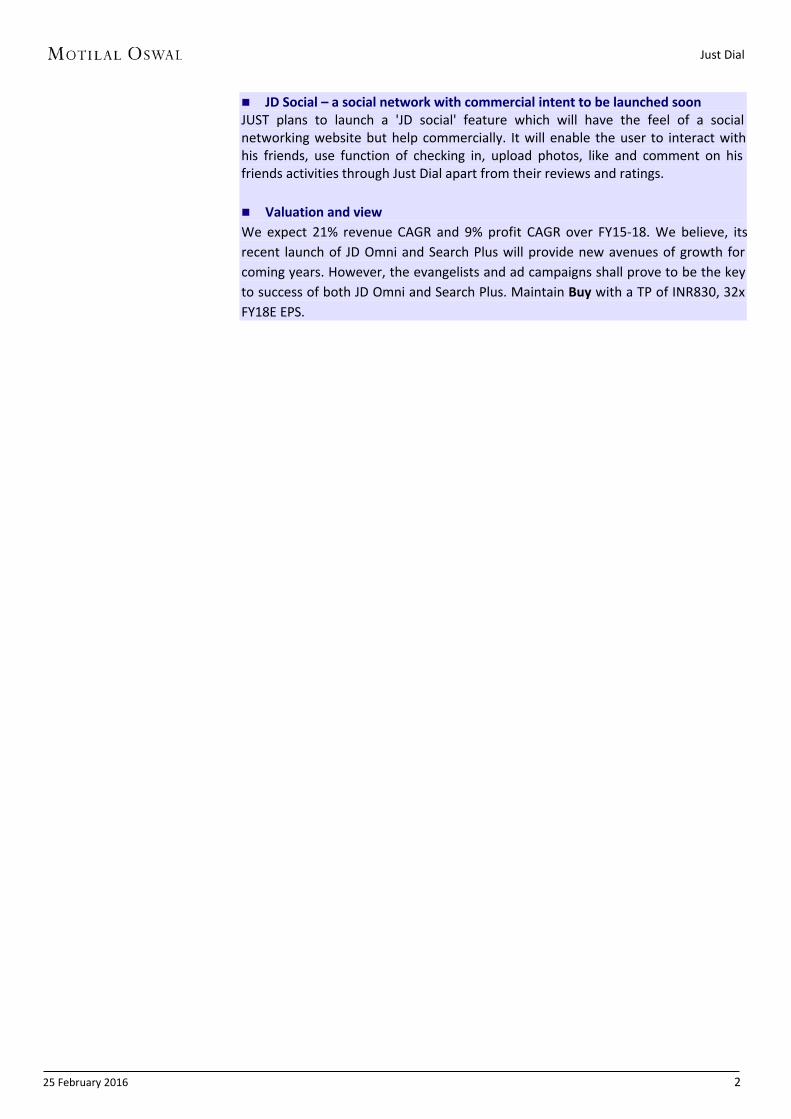
Exhibit 2: Signing up on JD Omni takes five minutes in a three step process
Source: MOSL, Company
Just Dial
25 February 2016 4
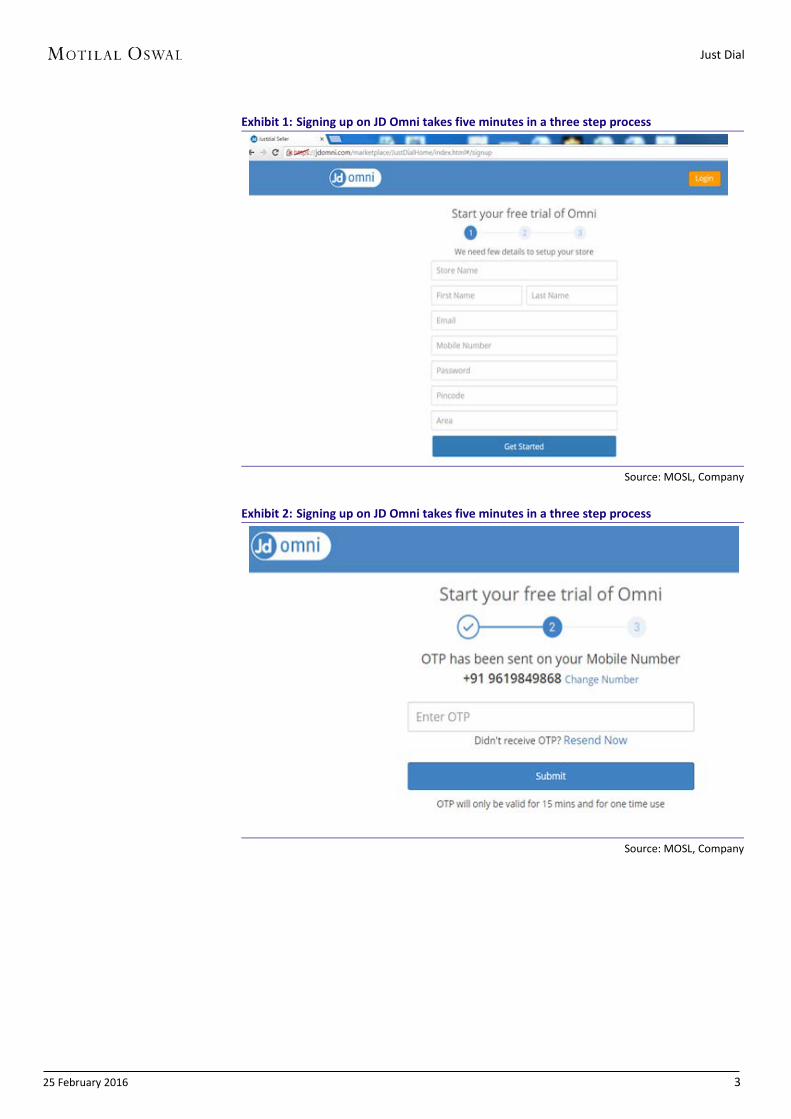
Exhibit 3: Pre-populated retailer types which allows ease of registering
Source: MOSL, Company
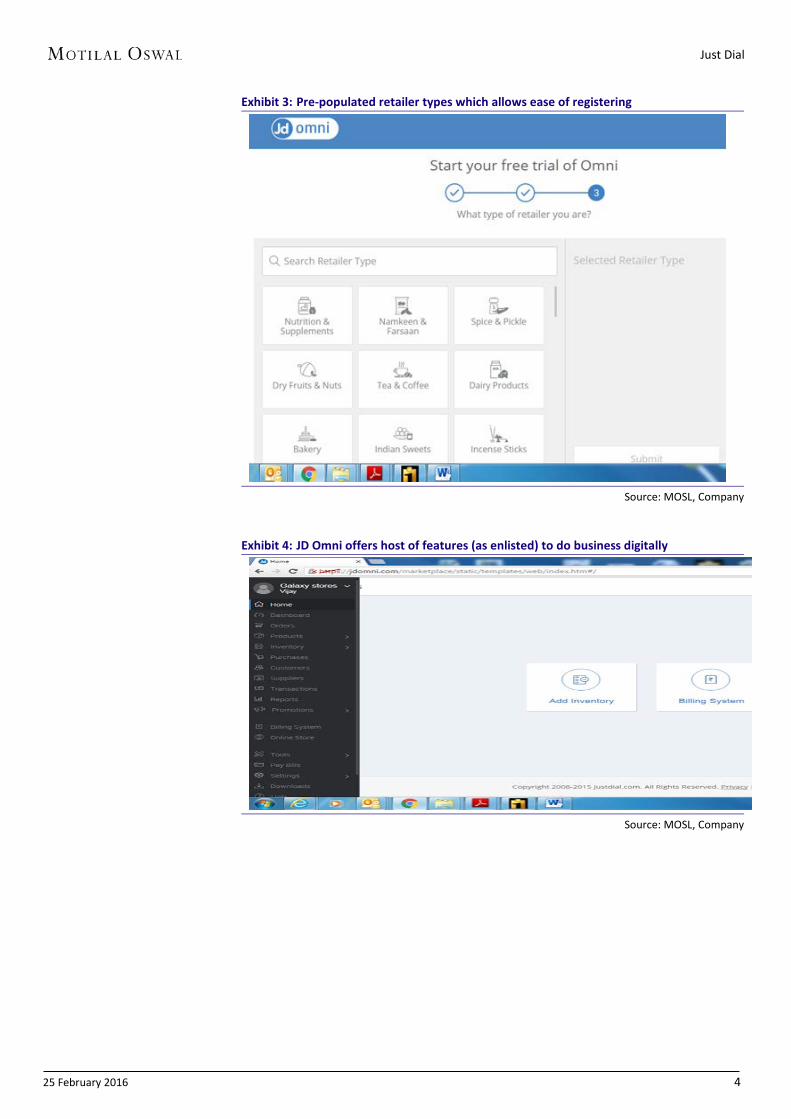
Exhibit 4: JD Omni offers host of features (as enlisted) to do business digitally
Source: MOSL, Company
Just Dial
25 February 2016 5
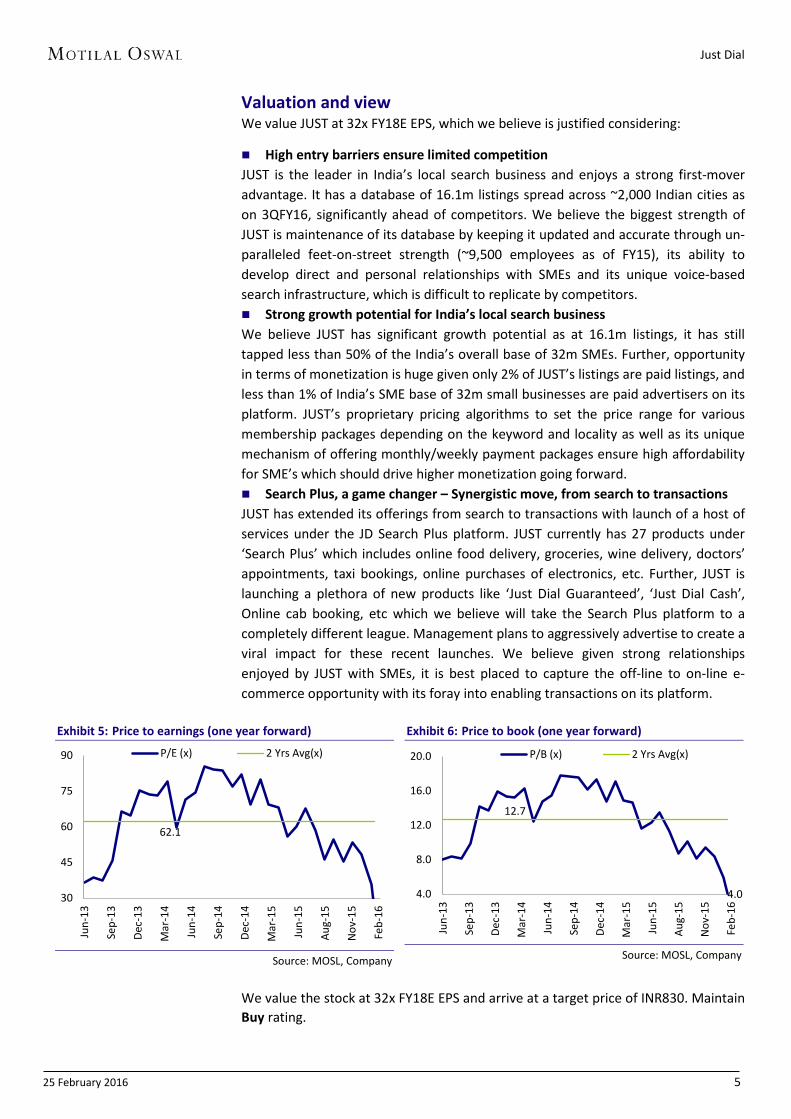
Valuation and view We value JUST at 32x FY18E EPS, which we believe is justified considering:
High entry barriers ensure limited competitionJUST is the leader in India’s local search business and enjoys a strong first-moveradvantage. It has a database of 16.1m listings spread across ~2,000 Indian cities ason 3QFY16, significantly ahead of competitors. We believe the biggest strength ofJUST is maintenance of its database by keeping it updated and accurate through un-paralleled feet-on-street strength (~9,500 employees as of FY15), its ability todevelop direct and personal relationships with SMEs and its unique voice-basedsearch infrastructure, which is difficult to replicate by competitors. Strong growth potential for India’s local search businessWe believe JUST has significant growth potential as at 16.1m listings, it has stilltapped less than 50% of the India’s overall base of 32m SMEs. Further, opportunityin terms of monetization is huge given only 2% of JUST’s listings are paid listings, andless than 1% of India’s SME base of 32m small businesses are paid advertisers on itsplatform. JUST’s proprietary pricing algorithms to set the price range for variousmembership packages depending on the keyword and locality as well as its uniquemechanism of offering monthly/weekly payment packages ensure high affordabilityfor SME’s which should drive higher monetization going forward. Search Plus, a game changer – Synergistic move, from search to transactionsJUST has extended its offerings from search to transactions with launch of a host ofservices under the JD Search Plus platform. JUST currently has 27 products under‘Search Plus’ which includes online food delivery, groceries, wine delivery, doctors’appointments, taxi bookings, online purchases of electronics, etc. Further, JUST islaunching a plethora of new products like ‘Just Dial Guaranteed’, ‘Just Dial Cash’,Online cab booking, etc which we believe will take the Search Plus platform to acompletely different league. Management plans to aggressively advertise to create aviral impact for these recent launches. We believe given strong relationshipsenjoyed by JUST with SMEs, it is best placed to capture the off-line to on-line e-commerce opportunity with its foray into enabling transactions on its platform.
Exhibit 5: Price to earnings (one year forward)
Source: MOSL, Company
Exhibit 6: Price to book (one year forward)
Source: MOSL, Company
We value the stock at 32x FY18E EPS and arrive at a target price of INR830. Maintain Buy rating.
62.1
30
45
60
75
90
Jun-
13
Sep-
13
Dec-
13
Mar
-14
Jun-
14
Sep-
14
Dec-
14
Mar
-15
Jun-
15
Aug-
15
Nov
-15
Feb-
16
P/E (x) 2 Yrs Avg(x)
4.0
12.7
4.0
8.0
12.0
16.0
20.0
Jun-
13
Sep-
13
Dec-
13
Mar
-14
Jun-
14
Sep-
14
Dec-
14
Mar
-15
Jun-
15
Aug-
15
Nov
-15
Feb-
16
P/B (x) 2 Yrs Avg(x)
Just Dial
25 February 2016 6
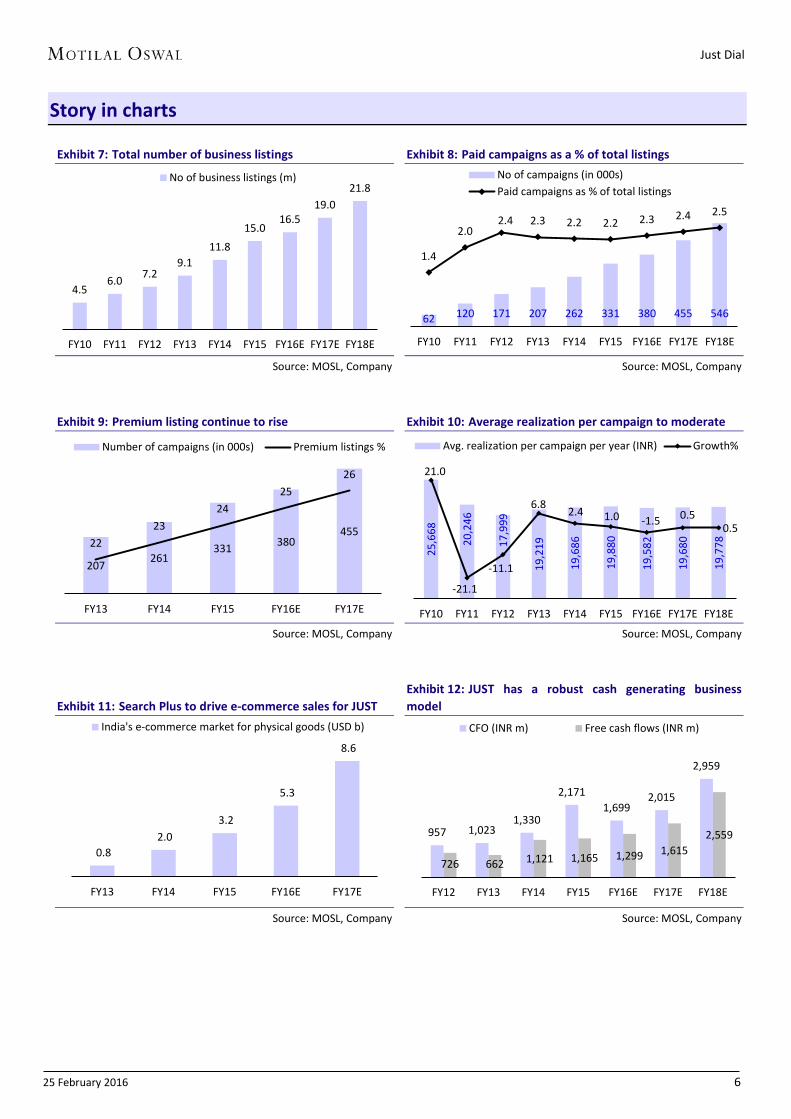
Story in charts
Exhibit 7: Total number of business listings
Source: MOSL, Company
Exhibit 8: Paid campaigns as a % of total listings
Source: MOSL, Company
Exhibit 9: Premium listing continue to rise
Source: MOSL, Company
Exhibit 10: Average realization per campaign to moderate
Source: MOSL, Company
Exhibit 11: Search Plus to drive e-commerce sales for JUST
Source: MOSL, Company
Exhibit 12: JUST has a robust cash generating business model
Source: MOSL, Company
4.5 6.0 7.2
9.1 11.8
15.0 16.5
19.0 21.8
FY10 FY11 FY12 FY13 FY14 FY15 FY16E FY17E FY18E
No of business listings (m)
62 120 171 207 262 331 380 455 546
1.4
2.0 2.4 2.3 2.2 2.2 2.3 2.4 2.5
FY10 FY11 FY12 FY13 FY14 FY15 FY16E FY17E FY18E
No of campaigns (in 000s)Paid campaigns as % of total listings
207 261 331 380
455 22
23 24
25 26
FY13 FY14 FY15 FY16E FY17E
Number of campaigns (in 000s) Premium listings %25
,668
20,2
46
17,9
99
19,2
19
19,6
86
19,8
80
19,5
82
19,6
80
19,7
78
21.0
-21.1
-11.1
6.8 2.4 1.0 -1.5 0.50.5
FY10 FY11 FY12 FY13 FY14 FY15 FY16E FY17E FY18E
Avg. realization per campaign per year (INR) Growth%
0.8 2.0
3.2
5.3
8.6
FY13 FY14 FY15 FY16E FY17E
India's e-commerce market for physical goods (USD b)
957 1,023 1,330
2,171 1,699
2,015
2,959
726 662 1,121 1,165 1,299 1,615 2,559
FY12 FY13 FY14 FY15 FY16E FY17E FY18E
CFO (INR m) Free cash flows (INR m)
Just Dial
25 February 2016 7
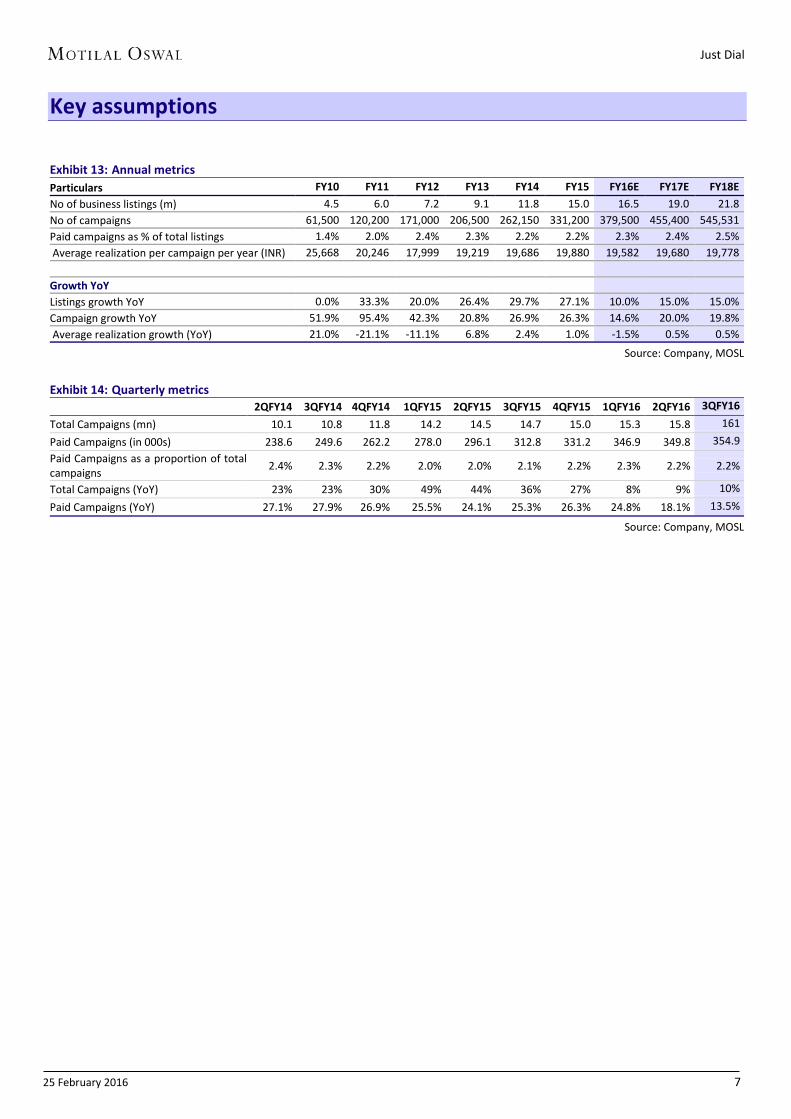
Key assumptions
Exhibit 13: Annual metrics Particulars FY10 FY11 FY12 FY13 FY14 FY15 FY16E FY17E FY18E No of business listings (m) 4.5 6.0 7.2 9.1 11.8 15.0 16.5 19.0 21.8 No of campaigns 61,500 120,200 171,000 206,500 262,150 331,200 379,500 455,400 545,531 Paid campaigns as % of total listings 1.4% 2.0% 2.4% 2.3% 2.2% 2.2% 2.3% 2.4% 2.5% Average realization per campaign per year (INR) 25,668 20,246 17,999 19,219 19,686 19,880 19,582 19,680 19,778
Growth YoY
Listings growth YoY 0.0% 33.3% 20.0% 26.4% 29.7% 27.1% 10.0% 15.0% 15.0% Campaign growth YoY 51.9% 95.4% 42.3% 20.8% 26.9% 26.3% 14.6% 20.0% 19.8% Average realization growth (YoY) 21.0% -21.1% -11.1% 6.8% 2.4% 1.0% -1.5% 0.5% 0.5%
Source: Company, MOSL
Exhibit 14: Quarterly metrics 2QFY14 3QFY14 4QFY14 1QFY15 2QFY15 3QFY15 4QFY15 1QFY16 2QFY16 3QFY16 Total Campaigns (mn) 10.1 10.8 11.8 14.2 14.5 14.7 15.0 15.3 15.8 161 Paid Campaigns (in 000s) 238.6 249.6 262.2 278.0 296.1 312.8 331.2 346.9 349.8 354.9 Paid Campaigns as a proportion of total campaigns 2.4% 2.3% 2.2% 2.0% 2.0% 2.1% 2.2% 2.3% 2.2% 2.2%
Total Campaigns (YoY) 23% 23% 30% 49% 44% 36% 27% 8% 9% 10% Paid Campaigns (YoY) 27.1% 27.9% 26.9% 25.5% 24.1% 25.3% 26.3% 24.8% 18.1% 13.5%
Source: Company, MOSL
Just Dial
25 February 2016 8
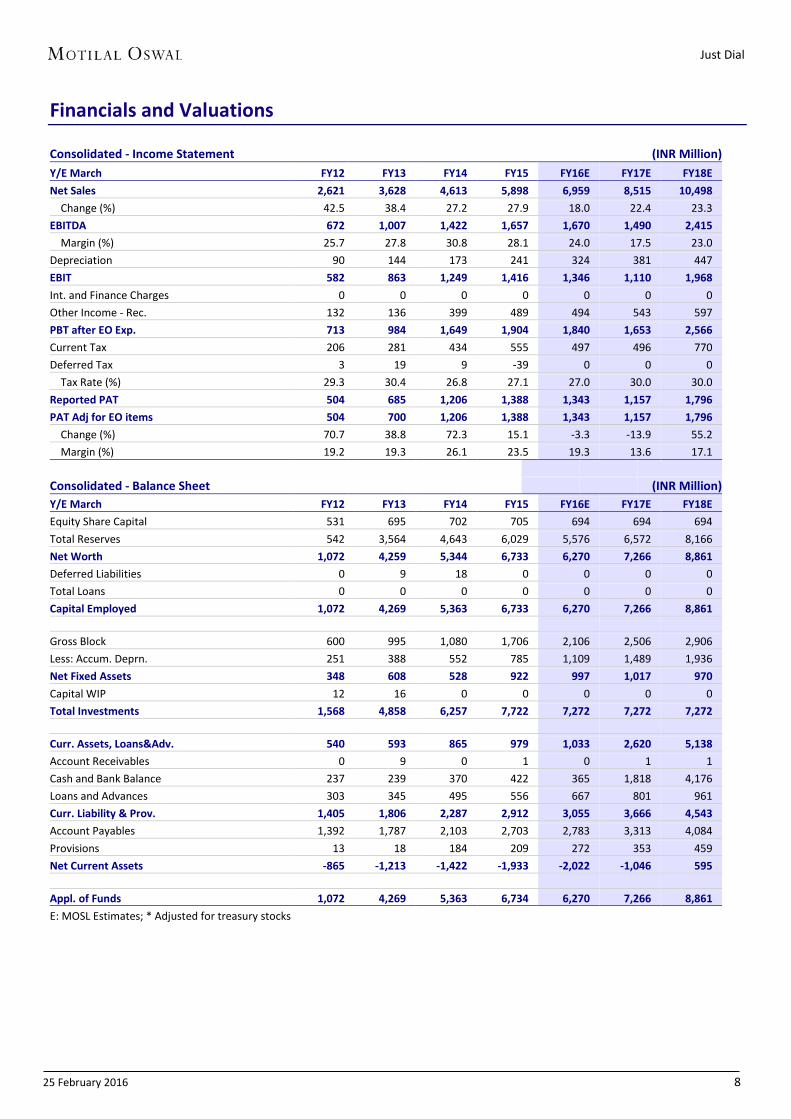
Financials and Valuations
Consolidated - Income Statement (INR Million) Y/E March FY12 FY13 FY14 FY15 FY16E FY17E FY18E Net Sales 2,621 3,628 4,613 5,898 6,959 8,515 10,498 Change (%) 42.5 38.4 27.2 27.9 18.0 22.4 23.3 EBITDA 672 1,007 1,422 1,657 1,670 1,490 2,415 Margin (%) 25.7 27.8 30.8 28.1 24.0 17.5 23.0 Depreciation 90 144 173 241 324 381 447 EBIT 582 863 1,249 1,416 1,346 1,110 1,968 Int. and Finance Charges 0 0 0 0 0 0 0 Other Income - Rec. 132 136 399 489 494 543 597 PBT after EO Exp. 713 984 1,649 1,904 1,840 1,653 2,566 Current Tax 206 281 434 555 497 496 770 Deferred Tax 3 19 9 -39 0 0 0 Tax Rate (%) 29.3 30.4 26.8 27.1 27.0 30.0 30.0 Reported PAT 504 685 1,206 1,388 1,343 1,157 1,796 PAT Adj for EO items 504 700 1,206 1,388 1,343 1,157 1,796 Change (%) 70.7 38.8 72.3 15.1 -3.3 -13.9 55.2 Margin (%) 19.2 19.3 26.1 23.5 19.3 13.6 17.1
Consolidated - Balance Sheet (INR Million) Y/E March FY12 FY13 FY14 FY15 FY16E FY17E FY18E Equity Share Capital 531 695 702 705 694 694 694 Total Reserves 542 3,564 4,643 6,029 5,576 6,572 8,166 Net Worth 1,072 4,259 5,344 6,733 6,270 7,266 8,861 Deferred Liabilities 0 9 18 0 0 0 0 Total Loans 0 0 0 0 0 0 0 Capital Employed 1,072 4,269 5,363 6,733 6,270 7,266 8,861
Gross Block 600 995 1,080 1,706 2,106 2,506 2,906 Less: Accum. Deprn. 251 388 552 785 1,109 1,489 1,936 Net Fixed Assets 348 608 528 922 997 1,017 970 Capital WIP 12 16 0 0 0 0 0 Total Investments 1,568 4,858 6,257 7,722 7,272 7,272 7,272
Curr. Assets, Loans&Adv. 540 593 865 979 1,033 2,620 5,138 Account Receivables 0 9 0 1 0 1 1 Cash and Bank Balance 237 239 370 422 365 1,818 4,176 Loans and Advances 303 345 495 556 667 801 961 Curr. Liability & Prov. 1,405 1,806 2,287 2,912 3,055 3,666 4,543 Account Payables 1,392 1,787 2,103 2,703 2,783 3,313 4,084 Provisions 13 18 184 209 272 353 459 Net Current Assets -865 -1,213 -1,422 -1,933 -2,022 -1,046 595
Appl. of Funds 1,072 4,269 5,363 6,734 6,270 7,266 8,861 E: MOSL Estimates; * Adjusted for treasury stocks
Just Dial
25 February 2016 9
Financials and Valuations
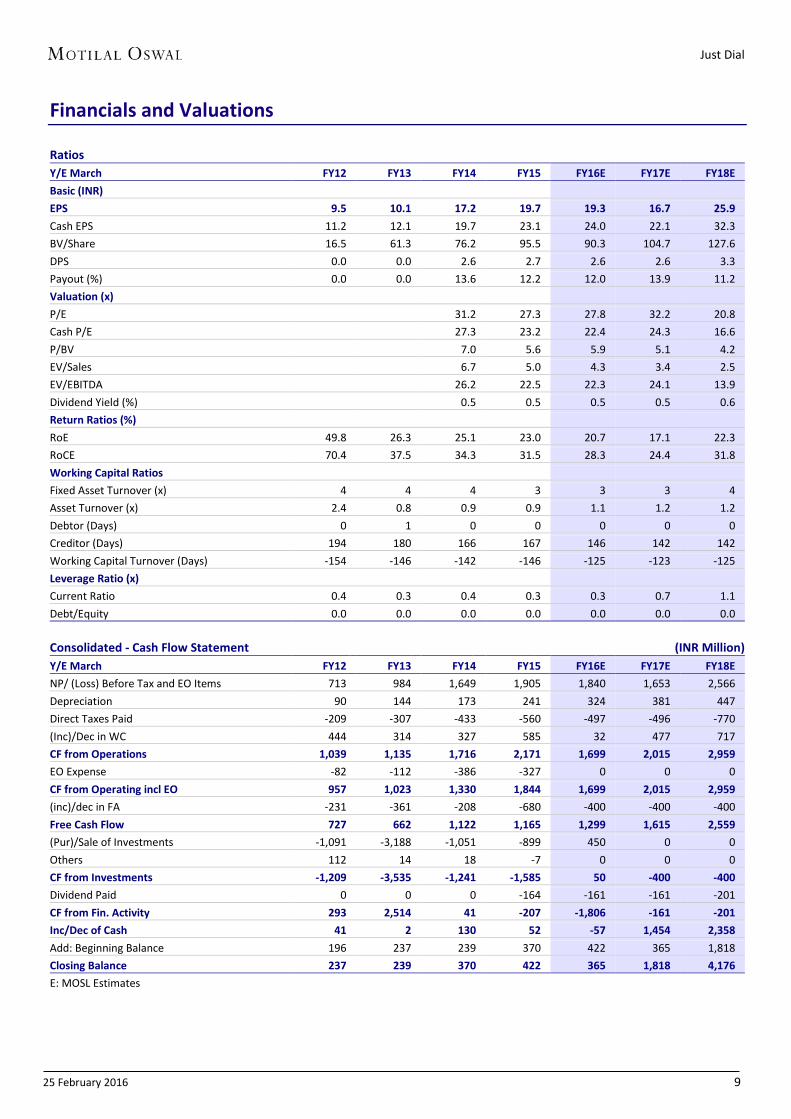
Ratios Y/E March FY12 FY13 FY14 FY15 FY16E FY17E FY18E Basic (INR)
EPS 9.5 10.1 17.2 19.7 19.3 16.7 25.9 Cash EPS 11.2 12.1 19.7 23.1 24.0 22.1 32.3 BV/Share 16.5 61.3 76.2 95.5 90.3 104.7 127.6 DPS 0.0 0.0 2.6 2.7 2.6 2.6 3.3 Payout (%) 0.0 0.0 13.6 12.2 12.0 13.9 11.2 Valuation (x)
P/E 31.2 27.3 27.8 32.2 20.8 Cash P/E 27.3 23.2 22.4 24.3 16.6 P/BV 7.0 5.6 5.9 5.1 4.2 EV/Sales 6.7 5.0 4.3 3.4 2.5 EV/EBITDA 26.2 22.5 22.3 24.1 13.9 Dividend Yield (%) 0.5 0.5 0.5 0.5 0.6 Return Ratios (%)
RoE 49.8 26.3 25.1 23.0 20.7 17.1 22.3 RoCE 70.4 37.5 34.3 31.5 28.3 24.4 31.8 Working Capital Ratios
Fixed Asset Turnover (x) 4 4 4 3 3 3 4 Asset Turnover (x) 2.4 0.8 0.9 0.9 1.1 1.2 1.2 Debtor (Days) 0 1 0 0 0 0 0 Creditor (Days) 194 180 166 167 146 142 142 Working Capital Turnover (Days) -154 -146 -142 -146 -125 -123 -125 Leverage Ratio (x)
Current Ratio 0.4 0.3 0.4 0.3 0.3 0.7 1.1 Debt/Equity 0.0 0.0 0.0 0.0 0.0 0.0 0.0
Consolidated - Cash Flow Statement (INR Million) Y/E March FY12 FY13 FY14 FY15 FY16E FY17E FY18E NP/ (Loss) Before Tax and EO Items 713 984 1,649 1,905 1,840 1,653 2,566 Depreciation 90 144 173 241 324 381 447 Direct Taxes Paid -209 -307 -433 -560 -497 -496 -770 (Inc)/Dec in WC 444 314 327 585 32 477 717 CF from Operations 1,039 1,135 1,716 2,171 1,699 2,015 2,959 EO Expense -82 -112 -386 -327 0 0 0 CF from Operating incl EO 957 1,023 1,330 1,844 1,699 2,015 2,959 (inc)/dec in FA -231 -361 -208 -680 -400 -400 -400 Free Cash Flow 727 662 1,122 1,165 1,299 1,615 2,559 (Pur)/Sale of Investments -1,091 -3,188 -1,051 -899 450 0 0 Others 112 14 18 -7 0 0 0 CF from Investments -1,209 -3,535 -1,241 -1,585 50 -400 -400 Dividend Paid 0 0 0 -164 -161 -161 -201 CF from Fin. Activity 293 2,514 41 -207 -1,806 -161 -201 Inc/Dec of Cash 41 2 130 52 -57 1,454 2,358 Add: Beginning Balance 196 237 239 370 422 365 1,818 Closing Balance 237 239 370 422 365 1,818 4,176 E: MOSL Estimates
Just Dial
25 February 2016 10
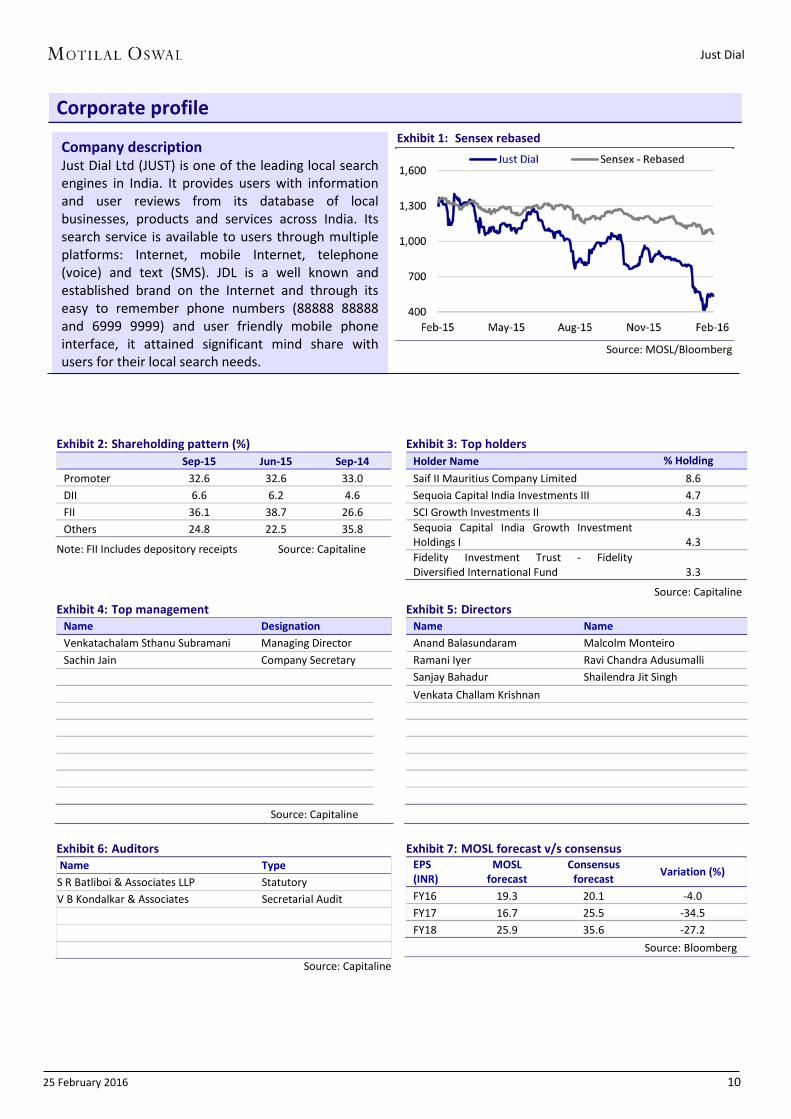
Corporate profile Exhibit 1: Sensex rebased
Source: MOSL/Bloomberg
Exhibit 2: Shareholding pattern (%)
Sep-15 Jun-15 Sep-14 Promoter 32.6 32.6 33.0 DII 6.6 6.2 4.6 FII 36.1 38.7 26.6 Others 24.8 22.5 35.8
Note: FII Includes depository receipts Source: Capitaline
Exhibit 3: Top holders Holder Name % Holding Saif II Mauritius Company Limited 8.6 Sequoia Capital India Investments III 4.7 SCI Growth Investments II 4.3 Sequoia Capital India Growth Investment Holdings I 4.3 Fidelity Investment Trust - Fidelity Diversified International Fund 3.3
Source: Capitaline Exhibit 4: Top management
Name Designation Venkatachalam Sthanu Subramani Managing Director Sachin Jain Company Secretary
Source: Capitaline
Exhibit 5: Directors Name Name Anand Balasundaram Malcolm Monteiro Ramani Iyer Ravi Chandra Adusumalli Sanjay Bahadur Shailendra Jit Singh Venkata Challam Krishnan
Exhibit 6: Auditors Name Type S R Batliboi & Associates LLP Statutory V B Kondalkar & Associates Secretarial Audit
Source: Capitaline
Exhibit 7: MOSL forecast v/s consensus EPS (INR)
MOSL forecast
Consensus forecast Variation (%)
FY16 19.3 20.1 -4.0 FY17 16.7 25.5 -34.5 FY18 25.9 35.6 -27.2
Source: Bloomberg
Company description Just Dial Ltd (JUST) is one of the leading local search engines in India. It provides users with information and user reviews from its database of local businesses, products and services across India. Its search service is available to users through multiple platforms: Internet, mobile Internet, telephone (voice) and text (SMS). JDL is a well known and established brand on the Internet and through its easy to remember phone numbers (88888 88888 and 6999 9999) and user friendly mobile phone interface, it attained significant mind share with users for their local search needs.

Just Dial
25 February 2016 11
N O T E S
Just Dial
25 February 2016 12
Disclosures This document has been prepared by Motilal Oswal Securities Limited (hereinafter referred to as Most) to provide information about the company(ies) and/sector(s), if any, covered in the report and may be distributed by it and/or its affiliated company(ies). This report is for personal information of the selected recipient/s and does not construe to be any investment, legal or taxation advice to you. This research report does not constitute an offer, invitation or inducement to invest in securities or other investments and Motilal Oswal Securities Limited (hereinafter referred as MOSt) is not soliciting any action based upon it. This report is not for public distribution and has been furnished to you solely for your general information and should not be reproduced or redistributed to any other person in any form. This report does not constitute a personal recommendation or take into account the particular investment objectives, financial situations, or needs of individual clients. Before acting on any advice or recommendation in this material, investors should consider whether it is suitable for their particular circumstances and, if necessary, seek professional advice. The price and value of the investments referred to in this material and the income from them may go down as well as up, and investors may realize losses on any investments. Past performance is not a guide for future performance, future returns are not guaranteed and a loss of original capital may occur.
MOSt and its affiliates are a full-service, integrated investment banking, investment management, brokerage and financing group. We and our affiliates have investment banking and other business relationships with a some companies covered by our Research Department. Our research professionals may provide input into our investment banking and other business selection processes. Investors should assume that MOSt and/or its affiliates are seeking or will seek investment banking or other business from the company or companies that are the subject of this material and that the research professionals who were involved in preparing this material may educate investors on investments in such business. The research professionals responsible for the preparation of this document may interact with trading desk personnel, sales personnel and other parties for the purpose of gathering, applying and interpreting information. Our research professionals are paid on the profitability of MOSt which may include earnings from investment banking and other business.
MOSt generally prohibits its analysts, persons reporting to analysts, and members of their households from maintaining a financial interest in the securities or derivatives of any companies that the analysts cover. Additionally, MOSt generally prohibits its analysts and persons reporting to analysts from serving as an officer, director, or advisory board member of any companies that the analysts cover. Our salespeople, traders, and other professionals or affiliates may provide oral or written market commentary or trading strategies to our clients that reflect opinions that are contrary to the opinions expressed herein, and our proprietary trading and investing businesses may make investment decisions that are inconsistent with the recommendations expressed herein. In reviewing these materials, you should be aware that any or all of the foregoing among other things, may give rise to real or potential conflicts of interest. MOSt and its affiliated company(ies), their directors and employees and their relatives may; (a) from time to time, have a long or short position in, act as principal in, and buy or sell the securities or derivatives thereof of companies mentioned herein. (b) be engaged in any other transaction involving such securities and earn brokerage or other compensation or act as a market maker in the financial instruments of the company(ies) discussed herein or act as an advisor or lender/borrower to such company(ies) or may have any other potential conflict of interests with respect to any recommendation and other related information and opinions.; however the same shall have no bearing whatsoever on the specific recommendations made by the analyst(s), as the recommendations made by the analyst(s) are completely independent of the views of the affiliates of MOSt even though there might exist an inherent conflict of interest in some of the stocks mentioned in the research report Reports based on technical and derivative analysis center on studying charts company's price movement, outstanding positions and trading volume, as opposed to focusing on a company's fundamentals and, as such, may not match with a report on a company's fundamental analysis. In addition MOST has different business segments / Divisions with independent research separated by Chinese walls catering to different set of customers having various objectives, risk profiles, investment horizon, etc, and therefore may at times have different contrary views on stocks sectors and markets.
Unauthorized disclosure, use, dissemination or copying (either whole or partial) of this information, is prohibited. The person accessing this information specifically agrees to exempt MOSt or any of its affiliates or employees from, any and all responsibility/liability arising from such misuse and agrees not to hold MOSt or any of its affiliates or employees responsible for any such misuse and further agrees to hold MOSt or any of its affiliates or employees free and harmless from all losses, costs, damages, expenses that may be suffered by the person accessing this information due to any errors and delays. The information contained herein is based on publicly available data or other sources believed to be reliable. Any statements contained in this report attributed to a third party represent MOSt’s interpretation of the data, information and/or opinions provided by that third party either publicly or through a subscription service, and such use and interpretation have not been reviewed by the third party. This Report is not intended to be a complete statement or summary of the securities, markets or developments referred to in the document. While we would endeavor to update the information herein on reasonable basis, MOSt and/or its affiliates are under no obligation to update the information. Also there may be regulatory, compliance, or other reasons that may prevent MOSt and/or its affiliates from doing so. MOSt or any of its affiliates or employees shall not be in any way responsible and liable for any loss or damage that may arise to any person from any inadvertent error in the information contained in this report. MOSt or any of its affiliates or employees do not provide, at any time, any express or implied warranty of any kind, regarding any matter pertaining to this report, including without limitation the implied warranties of merchantability, fitness for a particular purpose, and non-infringement. The recipients of this report should rely on their own investigations.
This report is intended for distribution to institutional investors. Recipients who are not institutional investors should seek advice of their independent financial advisor prior to taking any investment decision based on this report or for any necessary explanation of its contents.
Most and it’s associates may have managed or co-managed public offering of securities, may have received compensation for investment banking or merchant banking or brokerage services, may have received any compensation for products or services other than investment banking or merchant banking or brokerage services from the subject company in the past 12 months. Most and it’s associates have not received any compensation or other benefits from the subject company or third party in connection with the research report. Subject Company may have been a client of Most or its associates during twelve months preceding the date of distribution of the research report
MOSt and/or its affiliates and/or employees may have interests/positions, financial or otherwise of over 1 % at the end of the month immediately preceding the date of publication of the research in the securities mentioned in this report. To enhance transparency, MOSt has incorporated a Disclosure of Interest Statement in this document. This should, however, not be treated as endorsement of the views expressed in the report.
Motilal Oswal Securities Limited is registered as a Research Analyst under SEBI (Research Analyst) Regulations, 2014. SEBI Reg. No. INH000000412
There are no material disciplinary action that been taken by any regulatory authority impacting equity research analysis activities
Analyst Certification The views expressed in this research report accurately reflect the personal views of the analyst(s) about the subject securities or issues, and no part of the compensation of the research analyst(s) was, is, or will be directly or indirectly related to the specific recommendations and views expressed by research analyst(s) in this report. The research analysts, strategists, or research associates principally responsible for preparation of MOSt research receive compensation based upon various factors, including quality of research, investor client feedback, stock picking, competitive factors and firm revenues
Disclosure of Interest Statement JUST DIAL Analyst ownership of the stock No Served as an officer, director or employee No A graph of daily closing prices of securities is available at www.nseindia.com and http://economictimes.indiatimes.com/markets/stocks/stock-quotes
Regional Disclosures (outside India) This report is not directed or intended for distribution to or use by any person or entity resident in a state, country or any jurisdiction, where such distribution, publication, availability or use would be contrary to law, regulation or which would subject MOSt & its group companies to registration or licensing requirements within such jurisdictions.
For U.S. Motilal Oswal Securities Limited (MOSL) is not a registered broker - dealer under the U.S. Securities Exchange Act of 1934, as amended (the"1934 act") and under applicable state laws in the United States. In addition MOSL is not a registered investment adviser under the U.S. Investment Advisers Act of 1940, as amended (the "Advisers Act" and together with the 1934 Act, the "Acts), and under applicable state laws in the United States. Accordingly, in the absence of specific exemption under the Acts, any brokerage and investment services provided by MOSL, including the products and services described herein are not available to or intended for U.S. persons.
This report is intended for distribution only to "Major Institutional Investors" as defined by Rule 15a-6(b)(4) of the Exchange Act and interpretations thereof by SEC (henceforth referred to as "major institutional investors"). This document must not be acted on or relied on by persons who are not major institutional investors. Any investment or investment activity to which this document relates is only available to major institutional investors and will be engaged in only with major institutional investors. In reliance on the exemption from registration provided by Rule 15a-6 of the U.S. Securities Exchange Act of 1934, as amended (the "Exchange Act") and interpretations thereof by the U.S. Securities and Exchange Commission ("SEC") in order to conduct business with Institutional Investors based in the U.S., MOSL has entered into a chaperoning agreement with a U.S. registered broker-dealer, Motilal Oswal Securities International Private Limited. ("MOSIPL"). Any business interaction pursuant to this report will have to be executed within the provisions of this chaperoning agreement.
The Research Analysts contributing to the report may not be registered /qualified as research analyst with FINRA. Such research analyst may not be associated persons of the U.S. registered broker-dealer, MOSIPL, and therefore, may not be subject to NASD rule 2711 and NYSE Rule 472 restrictions on communication with a subject company, public appearances and trading securities held by a research analyst account.
For Hong Kong: This report is distributed in Hong Kong by Motilal Oswal capital Markets (Hong Kong) Private Limited, a licensed corporation (CE AYY-301) licensed and regulated by the Hong Kong Securities and Futures Commission (SFC) pursuant to the Securities and Futures Ordinance (Chapter 571 of the Laws of Hong Kong) “SFO”. As per SEBI (Research Analyst Regulations) 2014 Motilal Oswal Securities (SEBI Reg No. INH000000412) has an agreement with Motilal Oswal capital Markets (Hong Kong) Private Limited for distribution of research report in Kong Kong. This report is intended for distribution only to “Professional Investors” as defined in Part I of Schedule 1 to SFO. Any investment or investment activity to which this document relates is only available to professional investor and will be engaged only with professional investors.”
Nothing here is an offer or solicitation of these securities, products and services in any jurisdiction where their offer or sale is not qualified or exempt from registration. The Indian Analyst(s) who compile this report is/are not located in Hong Kong & are not conducting Research Analysis in Hong Kong. For Singapore Motilal Oswal Capital Markets Singapore Pte Limited is acting as an exempt financial advisor under section 23(1)(f) of the Financial Advisers Act(FAA) read with regulation 17(1)(d) of the Financial Advisors Regulations and is a subsidiary of Motilal Oswal Securities Limited in India. This research is distributed in Singapore by Motilal Oswal Capital Markets Singapore Pte Limited and it is only directed in Singapore to accredited investors, as defined in the Financial Advisers Regulations and the Securities and Futures Act (Chapter 289), as amended from time to time. In respect of any matter arising from or in connection with the research you could contact the following representatives of Motilal Oswal Capital Markets Singapore Pte Limited:
Kadambari Balachandran Email : [email protected] Contact : (+65) 68189233 / 65249115 Office Address : 21 (Suite 31),16 Collyer Quay,Singapore 04931
Motilal Oswal Securities Ltd
Motilal Oswal Tower, Level 9, Sayani Road, Prabhadevi, Mumbai 400 025 Phone: +91 22 3982 5500 E-mail: [email protected]