Scientific communities in the developing world - Horizon IRD
Upload
khangminh22Category
view
1download
0
DOCUMENT DE TRAVAIL DT/2003/05
Colonization, Institutions, and Inequality A Note on Some Suggestive Evidence
Denis COGNEAU Charlotte GUENARD

2
COLONIZATION, INSTITUTIONS, AND INEQUALITY A Note on Some Suggestive Evidence
Denis Cogneau DIAL – UR CIPRÉ de l’IRD
Charlotte Guénard IEP-Paris, DIAL – UR CIPRÉ de l’IRD
Document de travail DIAL / Unité de Recherche CIPRÉ Juin 2003
RESUME
Quels sont les types d’institutions qui influencent les inégalités économiques ? En utilisant une base de données sur les inégalités nationales de revenu sur un échantillon de 73 pays non européens, nous montrons que la « bonne gouvernance » contribue non seulement au niveau de revenu moyen des pays mais aussi à une distribution plus égalitaire à travers l’accroissement de la part de revenu reçue par la classe moyenne. A côté de cet effet de la qualité des institutions capitalistes, nous trouvons une relation en U inversé entre les inégalités et l’importance de la population de descendance européenne. Nous trouvons enfin une corrélation large et robuste entre la densité de population précoloniale et l’égalité de la distribution actuelle du revenu. Nous argumentons que cette dernière corrélation reflète des dimensions institutionnelles qui ne sont pas captées par les mesures usuelles de qualité des institutions dans les bases de données disponibles. Les pays qui étaient les plus densément peuplés au seizième siècle ont en effet une moins bonne gouvernance mais accordent une plus large part du revenu aux plus pauvres. Ils avaient des Etats précoloniaux plus structurés, ont résisté plus souvent à la colonisation, et ont adopté plus souvent un système d’économie mixte. Beaucoup d’entre eux présentent une répartition des terres plus égalitaire. L’égalité de la distribution des terres apparaît comme un déterminant important de l’égalité globale des revenus et de la pauvreté, indépendamment des standards de « gouvernance » usuels.
Mots clefs : Colonisation, Inégalités, Institutions, Développement.
ABSTRACT What is the kind of institutions that affect economic inequalities? Using a database on national income inequality for 73 non-European countries, we show that 'good governance' not only contributes to the level of income but also to a more equal distribution by increasing the income share of the middle class. Beside this effect of the quality of capitalist institutions, we also find an inverted U relationship between inequalities and the extent of European settlement. We finally find a large and robust correlation between the pre-colonial population density and the present equality of income distribution. We argue that this latter correlation may have to do with institutional dimensions that are not captured by usual measures of institutional quality in available databases. Countries which were more densely populated in 1500 have indeed worse 'governance' but give larger income shares to the poor. They had more structured pre-colonial States, more often resisted to colonisation, and more often adopted a mixed economic system. Many of them in fact ended with a more equal land distribution. The equality in the distribution of landholdings does appear as an important determinant of the overall equality of income and of poverty which is independent from 'usual' governance issues.
Key Words: Colonization, Inequalities, Institutions, Development. JEL Classification: N37, O40, P51.

3
Table of Contents
1. INTRODUCTION ................................................................................................................................... 4
2. COLONIZATION PATTERNS AND INEQUALITY: A DISCUSSION .......................................... 7 2.1 Settlement colonization.............................................................................................................................. 8 2.2 ‘Divide and rule’ colonization ................................................................................................................... 9 2.3 Pre-colonial development, resistance to colonization and inequalities.................................................... 10
3. ECONOMETRIC RESULTS ............................................................................................................... 12
4. CONCLUSION ...................................................................................................................................... 22
APPENDICES................................................................................................................................................ 23 A. Variables definitions and sources ....................................................................................................... 23 B. Details on some variables constructions............................................................................................. 25
REFERENCES............................................................................................................................................... 27
List of tables Table 1 A typology of colonization............................................................................................................................. 31
Table 2 First results on the relation colonization-inequality..................................................................................... 32
Table 3.1 Basic results – Dependent variable: Gini index............................................................................................ 33
Table 3.2 A little more sophisticated specification ....................................................................................................... 33
Table 4 Robustness checks for the basic result on the Gini index (dependent variable) ........................................... 34
Table 5.1 European Settlement as an additional variable ............................................................................................ 35
Table 5.2 Additional instruments for the quality of institutions and the population of European descent ................... 36
Table 6 Robustness checks with ‘commodity endowments’ (Dependent variable: Gini index) ................................. 37
Table 7 Pre-colonial variables and Lorenz Curve..................................................................................................... 38
Table 8 Present institutions and pre-colonial variables ............................................................................................ 39
Table 9 A Land Distribution story (1)........................................................................................................................ 40
Table 10 A Land Distribution Story (2) ....................................................................................................................... 41
List of figures Figure 1 The weight of European Descent population in 1975 and the Gini index..................................................... 42
Figure 2.1 The log-Density of population in 1500 and the Gini index ........................................................................... 43
Figure 2.2 Gini index as a function of log-Density of population in 1500 ..................................................................... 43
Figure 2.3 Gini index as a function of log-Density of population in 1500 Lower tercile of settlers mortality ............... 44
Figure 2.4 Gini index as a function of log-Density of population in 1500 Middle tercile of settlers mortality .............. 44
Figure 2.5 Gini index as a function of log-Density of population in 1500 Highest tercile of settlers mortality............. 45

1. Introduction
In two recent papers, Acemoglu, Johnson and Robinson provide convincing evi-dence about the influence of European colonialism on the growth paths experi-enced by non-European regions. Colonies where Europeans settled, or expectedto settle, in large numbers because mortality rates for early settlers were rela-tively low ended with better capitalist institutions and therefore a higher level ofGDP per capita (Acemoglu et al. 2001). Colonies which were the most denselypopulated and urbanized at the beginning of the colonial period (around 1500)performed worse under colonial rule and after, because of an ’institutional reversalof fortune’ (Acemoglu et al. 2002). A causal link thus seems to be rather estab-lished going from some pre-colonial characteristics such as health conditions andpopulation density to long-run growth performance, passing through some long-lasting institutional features such as the protection of individual property rightsor the constraints put on political executives. However there is room for studyand debate about the exact channels through which pre-colonial conditions andcolonial intervention interacted in institution building. For instance, the effectof pre-colonial density of population on post-colonial institutions is decomposedby Acemoglu, Johnson and Robinson into two channels. First population densitywould have made extractive institutions more profitable through forced labor andhigh taxes systems. Second it would have both directly and indirectly1 limitedthe settlement of a large European population, and therefore the development ofinstitutions encouraging local economic performance.2
Are the relative numbers of indigenous and settlers the very causal deter-minants of the quality of institutions, or else are endowments in some naturalresources which were particularly profitable during the pre-colonial and/or thecolonial periods the ultimate explanation? This is the now famous hypothesisraised recently by Engerman and Sokoloff (1994, 2000, 2002). In Caribbean is-lands where the indigenous population died because of the diseases brought byEuropeans, the latter did not reverse their institutional choice and imported slaves
1Through the disease environment which was worse, because of contagion, in densely settledareas.
2"In prosperous and densely settled areas, Europeans introduced or maintained already-existing extractive institutions to force the local population to work in mines and plantations,and took over existing tax and tribute systems. In constrast, in previously sparsely settled areas,Europeans settled in large numbers and created institutions of private property, providing secureproperty rights to a broad section of the society and encouraging commerce and industry". Cf.Acemoglu et al., 2002, pp. 1265-66 and p.1279 (for this quotation).
4
from dense regions of Africa in order to carry on running large scale sugar pro-duction. In the New World, tropical regions might indeed have suffered from akind of ’natural resource curse’ determining at the same time bad extractive insti-tutions, a higher use of forced indigenous or slave labor and high persistent levelsof inequality. Easterly (2002) has recently provided an empirical test in favor ofthis latter thesis on a worldwide sample of former colonies. In our paper, we alsotry to explore the multidimensional consequences of colonization by looking atthe levels of economic inequality attained in former European colonies. Economicequality has often been raised as a potential determinant of growth, through avariety of channels among which the workings of credit markets and the politicaldetermination of economic policies.3 However, the 1990s empirical literature hasnot produced any robust evidence on the inequality-growth relationship at thecountry level, perhaps because of the superposition of a number of contradictoryelementary relationships and because of nonlinearities.4 The difficulty with thisinequality-growth relationship, as well as for its older ’Kuznets curve’ counter-part, has always been that the level and the distribution of income are potentiallycodetermined by the same factors. In particular, growth and inequality are con-strained by long-lasting institutions. For instance, historical institutions shapethe workings of credit markets and the political equilibrium, which may in turninfluence policies, growth and inequality.5
Both in Engerman and Sokoloff historical perspective and in Easterly econo-metric work, the basic theoretical argument rests upon the unequalitarian insti-tutions induced by the weight of large plantation crops or of minerals extractionin the total product. In the case of agricultural commodities, economies of scale6
or even more simply the profitability of large plantations using forced, indenturedor slave labor would have resulted in a skewed size distribution of farms. Moregenerally, in countries where such profit opportunities prevailed during the colo-nial period, unequalitarian institutions were designed to protect the interests of
3See e.g. Aghion, Caroli, García-Peñalosa, 1999.4See Banerjee and Duflo (2000) or Cogneau and Guénard (2002).5For macroeconomic policies and macroeconomic volatility, Acemoglu et al. (2003) again
produce evidence of an institutional determination.6Decreasing returns prevail at the stage of production for most agricultural commodities. It
is not true at the processing stage for a small set of them including sugarcane, bananas, oilpalm and tea, and coffee or rubber to a lesser degree. See e.g., Bingswanger H.P., K. Deininger,G. Feder (1995), who argue p. 2695 that "the superiority of the plantation depends on acombination of economies of scale in processing and a coordination problem". [underlined bythe authors]
5

the small class of European owners. Then, long after the colonial period andthe industrial revolution, persisting unequalitarian institutions still hamper capi-tal accumulation and development. In what follows we shall raise serious doubtsabout the pieces of evidence produced by Easterly, and shall conclude with Nu-gent and Robinson (2001) that ’endowments are not fate’. Note that within theEngerman and Sokoloff framework, pre-colonial population density has an am-biguous status. On the one hand, if economies of scale prevail, high populationdensity regions with abundant indigenous labor should more often end up withlarge plantations. Moreover, labor shortages in low density regions might have pre-cluded plantation agriculture. Then, the interaction variable crossing the kind ofresource endowments (and thus the intensity of scale economies or diseconomies)with the population density should have a significant impact on land distributionand overall inequality of income. On the other hand, low density regions offeredvast areas of land ready for European settlers appropriation and favored landintensive technologies.7
Our estimates indicate that institutions determined by pre-colonial and colo-nial history account for a very important share of income inequality differentialsamong former colonies and even among the larger set of non-European countries.Like in Acemoglu et al. (2001), we first find that countries where the settlers’mortality was low ended with better capitalist institutions, as measured by thevarious indicators gathered by Kaufman, Kraay and Zoido-Lobatón (1999a andb, 2002). Like in Acemoglu et al. (2002), we also confirm that the most denselypopulated countries in 1500 which were colonized by Europeans ended with worsecapitalist institutions and lower GDP per capita. In contrast we find that theyturn out to have a more equal distribution of income. The rare non-Europeancountries which were never colonized by Europeans also associate a higher popu-lation density in 1500 and a low level of income inequality at the end of the 20thcentury. The institutions of old densely populated countries do better at increas-ing the income share of the poorest. It seems that ’good’ capitalist institutionsalso reduce income inequality by increasing the income share of the middle class.Those two factors are sufficient to explain the continental ’dummies’ on inequal-
7Nugent and Robinson (2001) do not find any kind of variation whatsoever with populationdensity among Latin American coffee economies (Costa Rica, Colombia, El Salvador, Guatemala,Nicaragua). First, in the case of coffee, decreasing returns clearly prevail at the productionstage, making smallholder production more efficient; second, low population density countrieslike Costa Rica and Nicaragua exhibit very different size distribution of farms, with Nicaraguabeing closer to the populated Mayan highlands countries like El Salvador or Guatemala. Seealso previous footnote.
6

ity, contrasting the high levels attained in Latin America and Africa with the lowlevels of Asia.The remainder of this paper is organized as follows. Section 2 makes a dis-
cussion of the potential impact of colonization patterns on economic inequality,from the institutional standpoint. Section 3 presents the suggestive evidence wehave obtained regarding the impact of pre-colonial and colonial institutions oninequality. Section 4 concludes.
2. Colonization patterns and inequality: a discussion
The colonization of Asia, Africa, America, and Oceania by Europeans took placeat different times in world history. It also took different paths because Europeansencountered in each case different levels of organization and of resistance. In Asia,Europeans had to deal with cultural, political and economic settings whose com-plexity was at least comparable to theirs, even if it may be that they were alreadymore advanced in terms of wealth and technology at the end of the 18th cen-tury.8 The spread of writing, of great religions and of sophisticated agriculturaltechniques came with differentiated societies and organized States extending theirauthority over vast and densely populated lands. There Europeans could not af-ford to settle in great numbers, even in places were health and climate conditionswere enjoyable. Only a few countries have never been colonized by Europeanpowers (see table 1); excepting Liberia and Ethiopia, all are located in the Asiancontinent: China, Japan, Korea, Taiwan, Thailand, Iran, Turkey. In the NewWorlds of America and Oceania, European settlers were confronted with youngemerging empires only in two cases (Aztecs and Incas) while the rest of the timeencountering tribal often nomadic societies. Even confronted with harsh resis-tance, Europeans succeeded after a lot of massacres in getting the land from the’Indians’ and settled down in large numbers. In Southern regions and especiallyin the Caribbean islands where coffee, cotton, sugar, tobacco and other tropicalproducts were very profitable, they also brought six millions of African slaves asa supplementary and more docile labor force. Slave trade was the first main in-trusion of Europeans in Africa, starting about the end of the 17th century. Thepower of Arab and Turk Empires had for a long time prevented them from step-ping down on the Southern coast of the Mediterranean Sea. Given its proximity toEurope, Northern Africa remained a special case. Europeans settled down during
8See, .e.g., Maddison, 2001; this point is mitigated by Goody, 1996.
7

the 19th century, mainly the French in Algeria, but had to leave in the 1960s. InSub-Saharan Africa, bad health conditions, a higher density of population than inAmerica, and the profit already derived from Americas through triangular trade,probably explain why Europeans did not attempt to extend their rule into thedepths of the continent before the end of the 19th century. At this time, the riseof the competition between imperialist European nations which would end up inWWI led first to the ’Scramble for Africa’, a rapid and late invasion of the con-tinent between 1880 and the early 1900s. Finally, it is only in South-Africa andZimbabwe (ex-South Rhodesia) that Europeans chose to settle down in numbersand remained, even if they never came in as large numbers than in America9.[ Insert Table 1 here ]
2.1. Settlement colonization
It is only in Canada, USA, Australia and New-Zealand, and also in Argentina andUruguay, that the white descendants of European settlers happened to representthe majority of the population. Still today, the first four ’Neo-Europe’ countriesattract the bulk of migration flows running out of Europe. The weight of thepopulation of European descent quickly reached more than 80% of the wholepopulation in these countries, except in some Southern States of USA where blackpeople still outnumber white people. Between the Neo-Europe countries and LatinAmerican countries other than Argentina and Uruguay, there is a large gap in thedistribution of the weight of European descent population (see figure 1). Braziland Chile are the next countries with the largest proportion of Whites where theyhardly weight more than 50% of the population. In other Latin American and inCaribbean Islands, the Whites weight between 10 and 30% of the population.10
Elsewhere in the world, the population of European descent has a significantweight only in South-Africa, Zimbabwe andMauritius. In Latin America and someof the Caribbean Islands, some European people, mostly of Spanish or Portugueseorigins, mixed up with the indigenous population and more rarely with blacks andgave birth to a Metis population. It almost never happened in Zimbabwe or South-Africa. In contrast, most of political leaders in Latin America countries come fromthe white population, whereas in Zimbabwe only since 1980 and in South-Africa
9French settlers left Algeria in 1962, and Portuguese settlers left Angola and Mozambique in1975.10Except in Guyana where they represent a very small minority (2%) and Haiti where they
are absent
8

only since 1994 the political executive is held by Blacks. It remains that in everycountries where Whites represent a significant proportion of the population, theyown a disproportionate share of land and capital assets, they are more educatedand earn higher wages; finally white elites hold most of the levies of economicpower, and in most cases of political power. Historically, institutions have beenbuilt up in order to defend and preserve the interests of white owners and settlers.[ Insert figure 1 here]
2.2. ’Divide and rule’ colonization
In countries where they did not settle in numbers, that is in Asia and in mostregions of Africa, Europeans had to invent how to rule vast regions with limitedadministrative bureaucracies and military forces. Although some variations ex-isted between the colonial powers which have already been commented at large(see, e.g., Cogneau, 2003a, for a recent contribution on this issue), all Europeancolonial administrators implemented a kind of ’Indirect Rule’ system, relying onsome indigenous intermediaries. European rulers had to enter a repeated gamewith the different local powers in order to maintain their supremacy. The firststrategy was to get rid of previous kings or most dangerous leaders and to se-lect allies among the less reluctant customary chiefs and landlords. The secondstrategy was to promote a middle class of indigenous civil servants through formaleducation. In any case, they had to refrain newly promoted elites from acquiringtoo much authority from their strategic positions. Indirect rule always implied a’divide and rule’ strategy. The colonial ruler thoroughly enumerated and classifiedethnic and linguistic divisions, and often transformed moving and transient dividesinto hard and permanent enmities. Ethnic groups were rated on various scales:advanced / retarded, hard working / lazy, peaceful / belligerent, etc. (see, e.g.Horowitz, 2000).11 Besides, not any form of autonomy was ever granted. Evenwhen customary chiefs or landlords were allowed to collect taxes, to own anddistribute land, the threat of a direct fiscal intervention and expropriation wasmaintained. Educated indigenous were generally not given any job security. Themost talented of them became lawyers, journalists or doctors because they werekept out of the most important functions in the colonial administration. Forcedlabor institutions implied large labor displacement towards regions of plantation,
11In some countries where a new colonial power happened to take the place of another, suspi-cion was maintained a long time against the allies of the former. See the cases of former GermanCameroon, Togo and Tanganyika.
9
mines or extractive industries. After having mixed up populations in those regionsor in urban areas, white employers often stimulated job competition between au-tochthons and allochthons. Most often, where the European descent populationdid not make the majority, the colonial power had refrained and delayed the ed-ucation and industrialization processes for fear of loosing its authority, and haddesigned institutions able to ensure the extraction of large rents for the benefitof a small number. Then, after independence, most colonized countries endedwith larger ethnic, racial and social divides, a highly dualistic economic structure,small and weak State redistribution systems and a scarce supply of public goods.The colonial institutions were most of the time taken over unchanged by a localelite drawn out from one ethnic group and/or the dominant cast of the indigenoussociety.
2.3. Pre-colonial development, resistance to colonization and inequali-ties
Each of those characteristics of colonization may be thought of as contributingindependently to the generation of economic inequalities. Large inequalities ofincome between racial or ethnic groups or casts directly lead to a large inter-groupcomponent in income inequality indexes, while dualistic factor markets and weakredistribution systems generate inequalities inside each group, thus raising theintra-group component. However, from an analytical and not purely descriptivestandpoint, the two factors are not independent. Indeed, dualistic economic andState structures tend to stimulate cast or ethnic conflict for the capture of rents,generating clientelism in public employment, public investment choices (’whiteelephants’; see e.g. Robinson and Torvik, 2002), etc. Conversely, ethnic and castdivisions tend to lower the demand for universal redistribution and public goods,even in a democratic setting, because equalitarian political programs clash withhierarchical or racial preferences (see, e.g. Alesina, Glaeser, Sacerdote, 2001 andLee and Roemer, 2002 for models and applications to the US case).Hence we have good reasons to think that colonization often induced institu-
tions that tend to generate and to maintain large inequalities. For instance, Iyer(2002) finds that Indian districts which were ruled by the British exhibit nowa-days a lower level of public goods delivery than districts which were never annexedto the British Empire, even once controlled for the highly selective colonial an-nexation policy. In the sample we have gathered of non-European countries, the
10

7 countries12 which were never directly ruled by the Europeans have an averageGini index that is around 9 points lower than the mean of the other countries.At the other end of the spectrum of colonization, the 4 European colonies whichended in 1900 with more than 80% percent of their population being of Europeandescent, the Neo-Europe countries13, have also an average Gini index that is morethan 15 points lower. The institutions of these countries are closer to those ofEuropean countries than to those of other former colonies. Between these twogroups of countries, we need indicators for the depth of the colonial institutionalmark or for the degree of resistance to the colonial intrusion. We can look at theimpact of the time length of the colonial period on present inequalities. Againit turns out to be positively correlated with the Gini index with a correlationcoefficient of +0.18 on our sample of 62 former colonies excluding Neo-Europecountries. We can also look for measures of the pre-colonial level of economic andinstitutional development, assuming that regions that were initially wealthier andhad more solid State structures could resist more to the unequalitarian impact ofcolonization. In this paper, we consider three possible indicators of pre-colonialdevelopment: the age of the first city founded before 1500 (from Parker,1997), theantiquity of the State (from Bockstette et al., 2002)14 and the logarithm of thedensity of population in 1500 (from Acemoglu et al., 2002)15. The first variableis indeed negatively correlated with the Gini index with a correlation coefficientof -0.33, the second also with -0.29, and the third again more with -0.53. Table 2shows that the effect of the population density in 1500 absorbs the effects of boththe length of the colonial period and of the age of the first city, as well as theeffect of State antiquity. The Neo-Europe dummy and the density of populationin 1500 taken together explain more than 40% of the variance of Gini indexes inour sample. The next section tries to corroborate a little further this first resultand to discuss its institutional implications.[ Insert Table 2 here ]
12China, Iran, Japan, Korea, Taiwan, Thailand, Turkey.13Australia, Canada, New-Zealand and United States.14For each period of 50 years between 1 and 1950 C.E., they asked 3 questions: (i) Is there
a government over the tribal level? (ii) Is this government foreign or locally based ? (iii) Howmuch of the territory was ruled by this government? The scores on the three questions weremultiplied by one another and by 50. The scores on each of the 39 half centuries were then"discounted" to reduce the weight of the most remote periods.15Number of people per unit of arable land, drawn from Mc Evedy and Jones (1975).
11

3. Econometric results
Table 3.1 shows the basic result of this paper. We transpose the Acemoglu etal. (2002) basic specification for explaining the present differentials of GDP percapita to the explanation of present inequality differentials. Whatever the out-come variable, this specification introduces a measure of the present quality ofcapitalist institutions and instruments it by (the logarithm of) the European set-tlers’ mortality in the 19th century.16 Here we make use of the recent Kaufmanet al. (2002) database on governance; for our basic specification, we have selectedthe ’rule of law’ dimension among the six institutional dimensions distinguishedby Kaufman et al. Given the overall correlation of those six dimensions, our re-sults are not affected by the choice of another dimension than ’rule of law’ or of anarithmetic mean of the six. The Acemoglu et al. paper also tests for the impactof the density of population in 1500 on present GDP per capita. They show thatdensity in 1500 is negatively correlated with present GDP per capita and that itseffect goes entirely through the quality of institution variable (the ’institutionalreversal of fortune’ story).From the WIDER database on inequality, we have extracted a sample of 73
non-European countries for which a recent Gini index was available for the 1980-98period.17 For the year of observation of the Gini index, we have then gathered suchvariables as GDP per capita in PPP terms, life expectancy at birth, populationdensity, urbanization rate, etc. (see Appendix for variables definition and sources).Quality of institution variables from Kaufman are for the year 2000. In table 3.1,we find again the basic result of Acemoglu et al, i.e. a strong impact of the qualityof institutions on the level of GDP per capita and a purely mediated impact ofthe pre-colonial level of development as measured by the density of populationin 1500. The same result holds if we take the life expectancy at birth instead ofthe GDP per capita, or else the average number of years of education in 1990.We find conversely that the Gini inequality index is negatively influenced by the’rule of law’ variable but that the direct effect of population density in 1500remains significant. As the population density in 1500 is negatively correlatedwith the present quality of institutions, its direct effect is in fact raised whenthis latter variable is taken into account. We find also that the present densityof population is not correlated either with the quality of institutions or with thedensity of population about five centuries ago; besides, the Gini index shows no
16We had to extrapolate a settler mortality for some countries. See Appendix B.3 for details.17See Appendix B.1 for details.
12

correlation whatsoever with present density of population, so that we can notgive a mere demographic or factoral interpretation to the equalizing effect of thedensity of population in 1500.18 As shown in the bottom line of table 3.1, thedensity of population in 1500 is both directly and indirectly negatively relatedto the present urbanization rate, whereas the latter is positively correlated withthe present population density. Old densely settled countries have remained morerural on the whole, while countries populated during the colonial period haveurbanized at a higher pace.19 Anyway, like for the present population density, weobserve no correlation at all between the urbanization rate and the Gini index.[ Insert Tables 3.1 and 3.2 here ]Turning back to the explanation of present inequality, we may have a look to
figure 2.1 which plots the Gini index against the (log.) density of population in1500. In the right part of the cloud of points, we clearly discern the downwardrelationship revealed by the linear regression estimator. Figure 2.2 presents theresult of a gaussian kernel regression (with 0.5 bandwidth) for the same sample; aKuznets-like inverted-U curve relationship comes out, with the Gini index beinglow at both low and high levels of population density in 1500.20 The range ofvariation of the Gini index is fairly large, as between the lower points of thecurve fit and its maximum there is a more than 20 points difference. Figures 2.3to 2.5 show the results of separate gaussian kernel regressions on a partition ofthe sample by terciles of settlers’ early mortality. We observe that as settlers’mortality increases, the inverted U-curve relationship becomes a downward linearrelationship, or in other words that the upward part of the inverted-U curve mainlycomes from lower mortality countries.[ Insert Figures 2.1 to 2.5 here]In table 3.2, we try to give account of the non-linear relationship revealed
by the gaussian kernel regressions, by setting down a little more sophisticatedspecification introducing an interaction effect between the quality of institutionsand the pre-colonial population density. This interaction effect comes out asfairly significant. It may be interpreted as a varying coefficient model where the
18Within the frameworks of a dual economy model or an imperfectly opened economy, Bour-guignon and Morrisson (1998) and Spilimbergo, Londoño and Székely (1999) examine the impactof population density on the distribution income.19This observation could be due to a spurious effect of definition. In densely settled countries,
the population threshold which define an urban area might be higher than in sparsely settledcountries.20Anecdotally, a specification relating the Gini index to the squared logarithm of the density
of population in 1500, ln(d1500)2, gives a good linear fit, with a correlation coefficient of +0.6.
13

equalizing effect of the colonially-induced quality of institutions (as instrumentedby settlers’ mortality) is mitigated by the level of pre-colonial development. Inthis interpretation, when early development is low the equalizing effect of good(colonially-induced) capitalist institutions is higher.In Table 4, we make some robustness checks for the simple two variables spec-
ification explaining the Gini index. In the top panel of the table, we test for theeffects of additional variables. Geographical variables like distance from Equator,temperature or country size do not come out as significant. Alternative measuresof pre-colonial development like the age of the first city founded before 1500 or theantiquity of the State variable do not come out either. The same is true for colo-nial origin dummies, which do not come out either.21 Only continental dummiesdo come out as slightly significant at the 10 percent level, because of the Oceaniadummy which isolates two Neo-Europe countries, Australia and New-Zealand. Inthis regression with continental dummies, the ’governance’ effect both decreasesin magnitude and significance. In the bottom panel of table 4, we deal with theimpact of sample variations. While the effect of pre-colonial population densityis maintained in all sub-sample regressions22, the quality of institution effect doesnot loose its significance but decreases in magnitude when Neo-Europe countriesare withdrawn from the analysis. Likewise, we have just seen that the introduc-tion of continental dummies cancels out the quality of institutions effect. Thesetwo variations do not come as a surprise, as gaussian kernel regressions (figures2.3 to 2.5) and the non-linear specification estimated in table 3.2 have alreadyshown that the quality of institutions effect is mainly relevant in countries of lowpre-colonial density. Neo-Europe countries have both the highest quality of in-stitutions and the lowest pre-colonial density. Likewise, geographical continentsshow large variation in pre-colonial density, with America and Oceania being themost sparsely populated regions in 1500, and Asia the most densely populated(Africa standing in between).[ Insert Table 4 here]In fact, as pointed out in section 2.1, America and Oceania also make the
exception (with South-Africa and Zimbabwe) in that Europeans settled down in
21The selection of colonies by the different European powers is here considered as exogenous,as in Acemoglu et al. (2001) or La Porta et al. (1999). See Cogneau (2003) for a discussion ofthe selection issue in the case of the partition of Africa.22In particular, notice that dropping never colonized countries whose ’potential set-
tlers’mortality’ has been extrapolated does not change the results. The same is true for otherTable 3.1 regressions on development indicators. This robusteness check has been systematicallyrepeated for all results in the remainder of this paper.
14

numbers in this continent. In table 5 we have tried to identify an additional directeffect on inequality of the proportion of population of European descent, takingthe estimations collected by Acemoglu et al. (2001) for the years 1900 and 1975.We then need to use additional instruments in order to correct for measurementerrors and the potential endogeneity of the European settlement variable. As pre-vious regressions in table 4 have shown that distance from Equator, temperatureand age of the first city play no role in inequality once pre-colonial density andquality of institutions are taken into account, we treat them as valid exogenousinstruments for both the quality of institutions and the proportion of Europeandescent population. Table 5.2 gives the instrumenting first-step regressions andSargan overidentification test in Table 5.1 confirm the consistency between thechosen instruments. Table 5.1 shows again a non-linear inverted-U curve causal-ity running from the weight of European presence, whether in 1900 or in 1975, topresent inequalities of income. The maximum of the inverted-U curve is reachedaround 40 percent of population being of European descent. Up to this level, Eu-ropean settlement has an unequalizing effect, either directly through pure racialdiscrimination in schooling or labor markets (see e.g. Lam, 1999 on the cases ofBrazil and South Africa) or through more diffuse institutional externalities. As thefour Neo-Europe countries are the only countries where this weight was over 0.6 in1900, this non-linear relationship becomes upwardly linear when these countriesare withdrawn from the sample. The right part of the table shows the estimationof this linear relationship. Interestingly enough, when the weight of Europeandescent population is taken into account, the quality of institutions maintains itsmagnitude and significance even when Neo-Europe countries are withdrawn fromthe analysis. As before, the effect of pre-colonial density of population is notaffected by the addition of this new variable.[ Insert Tables 5.1 and 5.2 here ]In sum, the direct effect of the quality of institutions on the Gini index is better
identified when Neo-Europe countries are included. First, there is a strong causalrelation running from settlers’ mortality, through the weight of European descentpopulation, to the quality of capitalist institutions. Second, up to a certain level,the weight of European descent has by itself an unequalizing effect with coun-terbalances the equalizing effect of the quality of institutions. In North Americaand Oceania where both the settlers’ mortality and the pre-colonial populationdensity were at their lowest levels, European settlers quickly made the majorityof the population and built up capitalist institutions of the highest quality. Insome countries where settlers’ mortality and/or indigenous density were a little
15
higher, Europeans also settled down but in lesser numbers (when they did notbring African slave population with them). In those regions, they constructedcapitalist institutions of only average quality and more unequal social systems.In Table 6, we turn to another and last robustness check for our basic rela-
tion. We draw from the recent econometric contribution of Easterly (2002) whichtests for the resource endowment thesis from Engerman and Sokoloff (1994, 2000,2002; see introduction of this paper). Easterly extracts production data23 for aset of 8 agricultural commodities (Bananas, Coffee, Maize, Millet, Rice, Rubber,Sugar Cane, Wheat) and 3 mineral commodities (Copper, Oil, Silver) and trans-forms it in a vector of 11 dummies indicating whether the country produces eachcommodity. He argues that these dummies of production do not change throughtime and are therefore exogenous; alternatively to the crop dummies, he also usessoil suitability estimations24 which are meant to be independent from (potentiallyendogenous) production decisions. He uses this vector of resource endowments toexplain (and instrument for) the share of the three middle quintiles of the dis-tribution of income, aside to the settlers’ mortality variable. We collected thesame variables for agricultural commodities from the FAO databases and simi-lar variables for mineral production from Parker (1997). We also computed, foreach agricultural commodity, the proportion of total arable land area harvestedin 1961.25 We then tested for the influence of these three sets of resource endow-ments indicators on our basic specification. Given the small size of the sample, theintroduction of 11 dummies strongly reduces the number of degrees of freedom;this may make estimation problematic, for the effect of some dummies may in factstand for some countries’ idiosyncrasies.26 We therefore made three preliminaryprincipal component analyses of each of the three sets of 11 resource endowmentsand retained the four first (orthogonal to each other) principal components. Wethen computed the GMM estimators results either with the raw set of commodityvariables (11 variables) or with the principal components (4 variables).[ Insert Table 6 here ]
23From FAOSTAT agriculture data: http://apps.fao.org/page/collections?subset=agriculture24From FAOGlobal Agro-Ecological zones: http://www.fao.org/ag/AGL/agll/gaez/index.htm25Our sample is different from Easterly’s, as we only use ’high quality’ (known methodology,
national coverage) inequality indexes. Its size is nevertheless larger because we do not introducelike him other variables like schooling or openness into the analysis. We present results forthe Gini index, in order to deal with the largest sample, but taking the middle class share likeEasterly changes nothing.26For instance there are only five silver producers in our sample: Mexico, Peru, USA, Australia,
and Canada, which are all also copper producers.
16

As far as our basic specification is concerned, the robustness check is unam-biguous. The effects of the ’governance’ variable and of the pre-colonial populationdensity are left unchanged when resource endowments variables are introduced.Moreover, the resource endowments variables are jointly significant only whenthe raw set of 11 variables are considered, whatever their definition: productiondummies, soil suitability, or proportion of area harvested. Principal componentsnever come out as significant. This means that it is only the residual part ofinformation brought about by the seven (11-4=7) last principal components ofthe ’resource endowments space’ which makes resource endowments have an ef-fect on inequality. This could be a matter of concern for the test of the resourceendowment thesis, in which we shall not delve too much here. Let us just raisetwo additional doubts about Easterly’s test. First, production dummies are notcompletely time-invariant: within the 1961-98 period for which FAO data is avail-able, some countries begin or stop producing some commodities. The exogeneityof these resource endowments indicators is therefore questionable. In the caseof minerals for instance, settlement colonization more often induced prospectingefforts together with railway building (see, e.g., Cogneau, 2003a, in the case ofAfrica). Second, the point estimates obtained are hard to interpret, in particularwith regard to the ’scale economies’ story. For instance, in Easterly’s paper, oilproduction, aside to maize and millet, has a strong equalizing effect which mayseem surprising, whereas rice has a strong unequalizing effect, aside to sugar caneand silver. Our estimates turn out to be completely different to Easterly’s, but noteasier to interpret. As Easterly himself acknowledges, the list of 11 commoditieshe has selected is rather arbitrary. Lastly, we tried to add some other commoditieswhere scale economies may also hold, at least at the processing stage: cotton, teaand tobacco; this did not change our conclusions.Table 7 puts another light on the effect of colonially-induced capitalist institu-
tions on present inequalities. For many countries, the WIDER database not onlyprovides Gini indexes but also quintiles’ shares of income.27 We may then estimateour basic model at some points of the Lorenz curve of the income distribution.These estimations reveal that, even on the whole sample including Neo-Europecountries, the equalizing effect of the quality of capitalist institutions is not sig-nificant in the bottom of the distribution. Good capitalist institutions help toincrease the income share of a large middle class ranging from the second quintileto the fourth quintile, but not the income share of the 20% poorest, and in facthardly the income share of the second quintile. In contrast, the equalizing effect
27See Appendix B.1 for details.
17
of pre-colonial density reaches more than half of its potency on the 40% poorest,and three quarters of it on the 60% poorest. The fact that colonization-inducedinstitutions are not pro-poor is of course reinforced in settlers colonies where thepoorest are all of indigenous origin.[ Insert Table 7 here ]Lastly, we turn to the interpretation of the pre-colonial population density
effect. Throughout this paper, we have already given hints about the fact thatthe effect of this variable on inequalities may stand for pre-colonial institutionsunrelated to the capitalist institutions whose quality is measured by available’governance’ databases. As we have seen, pre-colonial density does not play anydirect role in GDP per capita or in life expectancy differentials that is not medi-ated by capitalist institutions quality. Besides, there is no significant link betweenthe present density of population and the pre-colonial one. As table 8 shows, thepre-colonial density of population is, beside the settlers’ mortality, correlated witha lot of post-colonial institutional dimensions. The first two lines of table 8 recallus that densely populated countries were less often colonized and when they wereit was for a shorter period. As the third line also shows, European could not settlein large numbers in these countries, even when settlers’ mortality was low. Thefourth line recalls that a large population density in 1500 is correlated with an earlystart of State institutions; on the other hand, European settlers immediately builtstructured States but also most often obtained their formal independence earlierin history, this explaining the negative impact of the early mortality of settlers onthe antiquity of the State. Then the fifth line shows that ethnic fractionalization ispositively correlated to settlers’ mortality and negatively to pre-colonial density.28
The strong positive association of ethnic fractionalization with settlers’ mortalityprobably reflects the ’divide and rule’ strategy that Europeans colonial powershad to adopt in places where they did not settle in numbers, as outlined in section2.2. The association with pre-colonial density conversely reflects the pre-colonialcohesiveness of densely populated and early developed regions where cultural andlinguistic differentiation was limited by frequent social interactions.29 The fol-lowing line shows that densely populated countries in 1500 more often adopteda mixed economic system (as coded by Barro, 1991) during the post-War period
28This observation allows us to raise some doubts about the exogeneity of ethnic fractional-ization to long-run economic and institutional development indicators, in contrast with what isasserted by Alesina et al. (2002) and more in line with Miguel (2003).29The two coefficients are left unchanged even when we introduce latitude, arable land size,
continental or colonial origin dummies.
18

than others. Here we might again see a sign of resistance to Western or colonialinfluence; they however did not choose more often a socialist system. In the sixbottom lines of the table come the six quality of institutions dimensions in thetypology of Kaufman and coauthors. Here again we see that densely populatedregions in 1500 ended with worse capitalist institutions, or worse political institu-tions at least from the European standpoint, in all dimensions. From the resultsof this table, a lot of institutional variables are potential candidates to stand forthe institutional medium through which pre-colonial density has an equalizing im-pact on the distribution of income. It could be the short duration of the colonialintrusion, the antiquity of the State, the ethnic homogeneity, the mixed economicsystem, or one of the five Kaufman’s dimension that we have up to now omittedin our regressions.[ Insert Table 8 here ]However, none of these variables pass the test when we introduce them aside to
the density of population in our basic specification (see Table 4 for the antiquity ofthe State variable). A proper test however calls for instrumenting each of them byanother variable than population density. In the two cases of the length of colonialrule and of the antiquity of the State, we use the age of the first pre-colonial city.When instrumented that way and confronted with the population density effect,the effects of the two variables are again cancelled out, like in the Table 2 OLSresults. In the case of the weight of the population from European descent, wehave already shown that this variable has an unequalizing effect that is indepen-dent enough from pre-colonial population density and that is more linked to thequality of institutions effect (see above, Tables 5.1 and 5.2). For ethnic fractional-ization, distance from Equator and arable land size are valid instruments. Wheninstrumented, it does not comes out either as a significant determinant of presentinequality. As for the mixed economic we did not find any acceptable instrument,but its OLS correlation with the Gini index is small (-0.09) and completely in-significant. Finally, the five remaining dimensions of the Kaufman et al. databaseare so closely correlated one with each other, with correlation coefficients rangingfrom +0.57 to +0.89, that it seems difficult to disentangle their respective effect.Most importantly, like the ’rule of law’ dimension, they are all correlated nega-tively with the Gini index and with the pre-colonial population density. Taken atface value, this latter fact does not make them ideal candidates for explaining theequalizing impact of the pre-colonial population density.The same is not true for the last variable whose colonial and pre-colonial
determination are examined in Table 9, the Gini index of the distribution of land
19

holdings during the 1960-70 period. Although on a much smaller sample of 51countries30, the correlation between the income Gini and the land Gini reaches+0.34. The correlation of land Gini with pre-colonial population density is -0.53.31 These two facts make the land Gini a good candidate for the mediation ofthe pre-colonial population density equalizing effect. The importance of the sizedistribution of landholdings for growth and for poverty reduction has already beenstressed by many authors.32 Bourguignon and Morrisson (1998) also show thatinequality in the size distribution of land assets has a strong influence on incomeinequality in LDCs, even once controlled for a traditional quadratic Kuznets curveeffect.33 As Table 9 shows, the longer the colonial rule was the more unequal thepresent land distribution is. Interestingly enough, the land Gini is not significantlyhigher in Neo-Europe countries and is not correlated with the settlers’ mortalitywhereas it is strongly correlated with the pre-colonial population density. Besides,countries which were never colonized have a more equal land distribution, with aland Gini index that is about 20 points lower on average.[ Insert Table 9 here ]Sparsely populated countries had vast areas of arable land which could be ap-
propriated by European permanent settlers or, when settlers’ mortality was toohigh, which the colonial ’divide and rule’ strategy concentrated in the hands ofdocile chiefs or landlords. Furthermore, the Hecksher-Ohlin/Stolper-Samuelsonstory tells that the growth of trade, at least since the mid-19th century, madeland returns raise in relatively land abundant countries and labor returns raise inrelatively labor abundant countries (see e.g. O’Rourke and Williamson 1999 and2002). This evolution should have reinforced the correlation between populationdensity and inequalities.34 In sparsely populated countries with an unequal dis-tribution of land, large landowners got higher prices for their land in comparison
30See Appendix B.2 for details.31While it comes out as only weakly linked with present population density with a correlation
coefficient of -0.23.32See, e.g., Deininger and Olinto, 2000.33In contrast with them, we did not find any correlation whatsoever between the level of income
inequality and the level of income dualism against agriculture, as measured by the relative laborproductivity of agriculture vs. other sectors. Measurement errors may explain this surprisingresult.34Spilimbergo, Londoño and Székely (1999) find a positive impact of (present) relative land
endowments on the inequality of income. The effect they find is however more pronounced inclosed economies. We looked at the correlation of two indicators of openness (share of trade inGDP in PPP terms, Frankel-Romer potential trade) with both the inequality of income and thepre-colonial population density but found no significant link whatsoever.
20

with indigenous smallholders, not forgetting underpaid forced indigenous laborand slave labor. In densely populated countries with a more equal distribution ofland, smallholders using their own labor got higher prices.35 In the absence of largeland reforms in the post-colonial period, a rather stable intergenerational trans-mission of land assets should have contributed to the persistence of landholdingsinequalities. These inequalities also translated intergenerationally in inequalitiesin physical and human capital.[ Insert Table 10 here ]In Table 10, we examine the substitution of land inequality for pre-colonial
population density in our basic specification for inequality of income. When pop-ulation density in 1500 is treated as an instrument for present land inequality(GMM1 estimations of the table), we observe that the effect of land inequalityis re-estimated upward with a coefficient which is more than doubled (comparingGMM1 and OLS). This is revealing that the naive correlation between the incomeGini and the land Gini understates the causal relationship running from the latterto the former. We may see in this result the redistrbution efforts that countrieswith an unequal land distribution were compelled to undertake in order to reducepoverty. The coefficient of ’rule of law’ is left unchanged: low and insignificant forthe share of the 40% poorest, important for the middle class share and the Giniindex. We finally made an attempt to split the effect of pre-colonial populationdensity on inequalities into an indirect effect mediated by land inequality and a di-rect effect potentially mediated by another institution, by instrumenting the landGini by the same geographical instruments as for weight of the European descentpopulation (see Table 5.2, distance from Equator, distance from Equator squared,average temperature, age of the first city founded before 1500). We obtain half-satisfactory results (GMM2 estimates). While Sargan tests for overidentificationconfirm the coherency of instruments, the coefficients of the two variables in com-petition are difficult to identify precisely. At the 5 percent level, they both mostoften loose in magnitude and in significance. However, the land inequality coef-ficient seems to resist a little more. First, it remains significant at the 5 percentlevel in the explanation of the 40% poorest share of income. Second, in the expla-nation of the middle class share or of the Gini index, it is significant respectivelyat the 12 and 10 percent levels. We are thus left with a half-empty and half-full
35Even inside a densely populated country like India, Banerjee and Iyer (2002) give indicationsthat Indian districts which were placed under a landlord indirect rule rather than a direct Britishrule had (i) a more unequal ditribution of land during the colonial period, (ii) ended today withhigher inequalities, lower agricultural productivity, and a lower supply of public goods.
21
glass. Although this land inequality story may seem intellectually satisfying andtheoretically parsimonious, it is nevertheless far from being granted empirically.First, it is based on a small sample of countries. Second, the identification problemstill stands.However, the idea that the effect of the pre-colonial population density or early
development on present inequality of income is purely indirect and mediated bypresent (and past) land distribution is not rejected by the data. Moreover, asfar as the overall distribution of income is concerned, our estimates give similarmagnitudes to the ’good governance’ effect and to the land distribution effect.With the GMM1 estimates of Table 9, a one standard deviation variation in bothvariables (0.8 for the rule of law index, 15 points for the land Gini index) leadto close variations in the Gini index of income (5 or 6 points). At the bottomof the distribution (40% poorest), the land inequality effect however stronglypredominates.
4. Conclusion
In keeping with the emerging "institutional paradigm" in development economics,this paper has examined whether it can be said that income inequality shares thesame institutional determinants as ’level of development’ variables (like GDP percapita, life expectancy, schooling). Like relative average development, national in-equality levels have been shown to be rather stable over time (see, e.g., Deiningerand Squire 1996 and 1998). This stability might be attributed to the persistanceof historical institutions. Even if we focus here on the causality running from in-stitutions to inequality, our approach does not preclude the existence of an inverserelationship running from inequality shocks to institutional change. The histori-cal work of Engerman and Sokoloff (op. cit.) and the recent econometric paperfrom Easterly (op. cit.) put more stress on this latter causality.36 The questionwe asked is whether an improvement of ’governance standards’ like legal systemswould bring a decrease in inequality as a secondary benefit. On this point, our
36Djankov et al. paper (2003) also view changes in inequality of wealth as determining changesin institutions through shifts in their ’Institutional Possibility Frontier’. Accodring to them,institutions result from a trade-off between ’disorder’ and ’dictatorship’ (which substitutes forthe old ’efficiency/equity’ trade-off of public economics). An exogenous rise of inequality, ledfor instance by technological change, may call for an increase in State control in order to restorethe balance between ’social losses due to private expropriation’ and ’social losses due to Stateexpropriation’ that minimize total losses. Conversely, one can think that States are compelledto make redistributive efforts in order to build and to preserve their ’legitimacy’.
22

results suggest with insistence that ’good governance’ standards miss an impor-tant determinant of income inequality which has something to do with agrarianissues and with asset inequality. Like ’bad governance’, asset inequality has a longhistory that can be traced back to the features of European colonialism. Colonieswhere Europeans could not settle in numbers because of a high level of mortalityrates inherited extractive institutions and bad governance (cf. Acemoglu et al. op.cit.). And also, colonies which were sparsely populated and underdeveloped atthe beginning of the colonial period inherited unfair institutions and an unequaldistribution of assets. Well-functioning capitalist institutions play undeniably agreat role in the promotion of growth, of health improvements and of educationaladvances. It is shown here that they indeed also contribute to the reduction ofincome inequalities. However they may not be able to solve all the problems raisedby a highly unequal initial distribution of endowments. In regions of the worldwhich were sparsely settled and underdeveloped at the beginning of European col-onization, the institutional shock brought about by European settlers printed adurable mark on the distribution of assets. In these regions, the progress towardsthe equality of opportunities for income, health or education37 may stay out ofreach if policies focus exclusively on ’good governance’ issues.38 Much researchis warranted to progress on these questions. As international comparisons withmacro-data quickly reveal their limits, further research should go down at thelocal/regional level and combine historical and micro-data.
37Equality opportunities always imply a kind of redistribution of assets, and redistributionof assets frequently although not always involves a redistribution of income. For instance, asfar as parental income determines the health and the schooling of children, parental incomeredistribution may be needed to equalize opportunities for future income, health or education.See, e.g., Cogneau, 2003b.38As might be the case if the ’law and finance’ movement fails in dealing with the large
inequalities which prevail in Latin America. See Dezalay and Garth (2002) for a sociologicalanalysis of the exportation of this school of thinking.
23
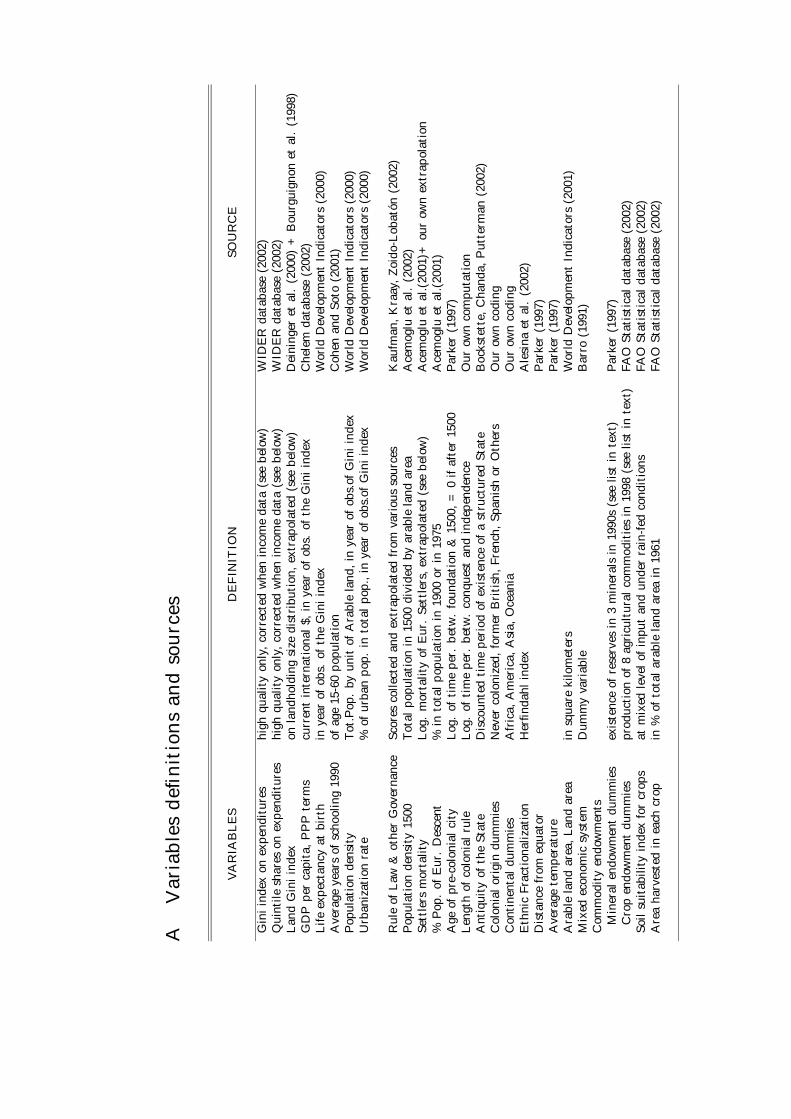
AV
aria
ble
sd
efin
itio
ns
and
sou
rces
VA
RIA
BL
ES
DE
FIN
ITIO
NSO
UR
CE
Gin
iin
dex
onex
pen
ditu
res
high
qual
ity
only
,co
rrec
ted
whe
nin
com
eda
ta(s
eeb
elow
)W
IDE
Rda
taba
se(2
002)
Qui
ntil
esh
ares
onex
pen
ditu
res
high
qual
ity
only
,co
rrec
ted
whe
nin
com
eda
ta(s
eeb
elow
)W
IDE
Rda
taba
se(2
002)
Lan
dG
ini
inde
xon
land
hold
ing
size
dist
ribu
tion
,ex
trap
olat
ed(s
eeb
elow
)D
eini
nger
etal
.(2
000)
+B
ourg
uign
onet
al.
(199
8)G
DP
per
capi
ta,
PP
Pte
rms
curr
ent
inte
rnat
iona
l$,
inye
arof
obs.
ofth
eG
ini
inde
xC
hele
mda
taba
se(2
002)
Lif
eex
pec
tanc
yat
birt
hin
year
ofob
s.of
the
Gin
iin
dex
Wor
ldD
evel
opm
ent
Indi
cato
rs(2
000)
Ave
rage
year
sof
scho
olin
g19
90of
age
15-6
0p
opul
atio
nC
ohen
and
Soto
(200
1)P
opul
atio
nde
nsit
yT
ot.P
op.
byun
itof
Ara
ble
land
,in
year
ofob
s.of
Gin
iin
dex
Wor
ldD
evel
opm
ent
Indi
cato
rs(2
000)
Urb
aniz
atio
nra
te%
ofur
ban
pop
.in
tota
lp
op.,
inye
arof
obs.
ofG
ini
inde
xW
orld
Dev
elop
men
tIn
dica
tors
(200
0)
Rul
eof
Law
&ot
her
Gov
erna
nce
Scor
esco
llect
edan
dex
trap
olat
edfr
omva
riou
sso
urce
sK
aufm
an,
Kra
ay,
Zoi
do-L
obat
ón(2
002)
Pop
ulat
ion
dens
ity
1500
Tot
alp
opul
atio
nin
1500
divi
ded
byar
able
land
area
Ace
mog
luet
al.
(200
2)Se
ttle
rsm
orta
lity
Log
.m
orta
lity
ofE
ur.
Sett
lers
,ex
trap
olat
ed(s
eeb
elow
)A
cem
oglu
etal
.(20
01)+
our
own
extr
apol
atio
n%
Pop
.of
Eur
.D
esce
nt%
into
tal
pop
ulat
ion
in19
00or
in19
75A
cem
oglu
etal
.(20
01)
Age
ofpr
e-co
loni
alci
tyL
og.
ofti
me
per
.b
etw
.fo
unda
tion
&15
00,
=0
ifaf
ter
1500
Par
ker
(199
7)L
engt
hof
colo
nial
rule
Log
.of
tim
ep
er.
bet
w.
conq
uest
and
inde
pen
denc
eO
urow
nco
mpu
tati
onA
ntiq
uity
ofth
eSt
ate
Dis
coun
ted
tim
ep
erio
dof
exis
tenc
eof
ast
ruct
ured
Stat
eB
ocks
tett
e,C
hand
a,P
utte
rman
(200
2)C
olon
ial
orig
indu
mm
ies
Nev
erco
loni
zed,
form
erB
riti
sh,
Fre
nch,
Span
ish
orO
ther
sO
urow
nco
ding
Con
tine
ntal
dum
mie
sA
fric
a,A
mer
ica,
Asi
a,O
cean
iaO
urow
nco
ding
Eth
nic
Fra
ctio
naliz
atio
nH
erfin
dahl
inde
xA
lesi
naet
al.
(200
2)D
ista
nce
from
equa
tor
Par
ker
(199
7)A
vera
gete
mp
erat
ure
Par
ker
(199
7)A
rabl
ela
ndar
ea,
Lan
dar
eain
squa
reki
lom
eter
sW
orld
Dev
elop
men
tIn
dica
tors
(200
1)M
ixed
econ
omic
syst
emD
umm
yva
riab
leB
arro
(199
1)C
omm
odit
yen
dow
men
tsM
iner
alen
dow
men
tdu
mm
ies
exis
tenc
eof
rese
rves
in3
min
eral
sin
1990
s(s
eelis
tin
text
)P
arke
r(1
997)
Cro
pen
dow
men
tdu
mm
ies
prod
ucti
onof
8ag
ricu
ltur
alco
mm
odit
ies
in19
98(s
eelis
tin
text
)FA
OSt
atis
tica
lda
taba
se(2
002)
Soil
suit
abili
tyin
dex
for
crop
sat
mix
edle
vel
ofin
put
and
unde
rra
in-f
edco
ndit
ions
FAO
Stat
isti
cal
data
base
(200
2)A
rea
harv
este
din
each
crop
in%
ofto
tal
arab
lela
ndar
eain
1961
FAO
Stat
isti
cal
data
base
(200
2)

B. Details on some variables construction
B.1. Gini index and quintile shares of expenditures
Inside the WIDER database, we selected only data from large sample surveys withknown methodology and national coverage (’high quality data’ in the terminologyof Deininger and Squire, 1996) For each country we kept the latest data availablefor the Gini index within the 1980-98 period. For only 4 countries the latest highquality Gini index available is before 1988. Data for GDP per capita in PPPterms, life expectancy at birth, urbanization rate and contemporary populationdensity were collected for the year of observation of the Gini index. For countriesfor which a Gini index was available, we then extracted the quintile shares of theincome distribution. Years of observation are not always the same for quintileshares than for Gini indexes. When the indexes were computed from income datarather than from expenditures, we substracted 6 percentage points from the Giniindex as Deininger and Squire (1996) recommend, and substracted 2, 1.5 and 1.5percentage points respectively from the 1st, 2nd and 3rd quintiles.
B.2. Gini index of landholding size distribution
The Deininger and Olinto (2002) dataset of land Gini indexes for the period 1960-70 intersects with only 39 countries of our original sample of 73 countries. TheBourguignon and Morrisson (2000) dataset for the 1970-80 period gives us a ’smalland medium farmers share’ for an additional set of 12 countries. Its intersectionwith the 39 countries sample makes possible to estimate a simple linear regressionon 27 countries relating the land Gini index to Bourguignon and Morrisson’s ’smalland medium farmers share’:
LGINI = −0.39(0.08)
SMFARM + 95.7 (B.1)
R2 for this linear relationship reaches 0.47. For the 12 additional countries wethen extrapolated the land Gini using the predictor given by this simple regression.
B.3. Settlers’ mortality extrapolation
We had to extrapolate mortality of early settlers for former colonies which are notcovered by the Acemoglu et al. (2001, 2002) sample. We also had to extrapolatea potential settlers’ mortality for the seven countries which were never directlycolonized.
25

Burundi was given the same settlers’ mortality as Rwanda.Guinea-Bissau was given the same settlers’ mortality as Guinea (Conakry).Lesotho was given the same settlers’ mortality as South Africa.Malawi and Zambia were given the same settler’s mortality as Kenya.Zimbabwe was given the average of South Africa as Kenya.Cambodia and Lao were given the same settlers’ mortality as Vietnam.Philippines was given the same settlers’ mortality as Indonesia.Thailand was given the average of Malaysia and Vietnam.China, Iran, Japan, Korea, Taiwan and Turkey were given the same settlers’
mortality as Malaysia.
26

References
[1] Acemoglu D., S. Johnson, J.A. Robinson, 2001, The Colonial Origins of Com-parative Development: An Empirical Investigation, American Economic Re-view, 91(5), 1369-1401
[2] Acemoglu D., S. Johnson, J.A. Robinson, 2002, Reversal of Fortune: Geogra-phy and Institutions in the Making of the ModernWorld Income Distribution,Quarterly Journal of Economics, 117(4), 1231-1294.
[3] Acemoglu D., S. Johnson, J.A. Robinson, Y. Tchaicharoen, 2003, Institu-tional causes, macroeconomic symptoms: volatility, crises and growth, Jour-nal of Monetary Economics, 50(1), 49-123.
[4] Aghion P., E. Caroli, C. García-Peñalosa, 1999, Inequality and EconomicGrowth: The Perspective of New Growth Theories, Journal of EconomicLiterature, 47(4), 1615-1660.
[5] Alesina A., E. Glaeser, B. Sacerdote, 2001, Why Doesn’t the US Have aEuropean Style Welfare State, Brookings Papers on Economic Research, Fall.
[6] Alesina A., A. Devleeeschauwer, W. Easterly, S. Kurlat, R. Wacziarg, 2002,Fractionalization, NBER WP 9411.
[7] Banerjee A.V. and Duflo E., 2000, Inequality and Growth: What Can theData Say? NBER WP 7793.
[8] Banerjee A., L. Iyer, 2002, History, Institutions and Economic Performance:The Legacy of Colonial Land Tenure Systems in India, MIT, Working Paper02-27.
[9] Barro R J., 1991, Economic Growth in a Cross-Section of Countries, Quar-terly Journal of Economics, 106(2), 407-444.
[10] Bingswanger H.P., K. Deininger, G. Feder, 1995, Power, Distortions, Re-volt and Reform in Agricultural Land Relations, in Behrman J. and T.N.Srinivasan (eds), Handbook of Development Economics, Volume III, North-Holland.
[11] Bockstette V., A. Chanda, L. Putterman, 2002, States and Markets: TheAdvantage of an Early Start, Journal of Economic Growth, 7(4), 347-369.
27

[12] Bourguignon F., C. Morrisson, 1990, Income distribution, development andforeign trade, European Economic Review, 34(6), 1113-1132.
[13] Bourguignon F., C. Morrisson, 1998, Inequality and Development: The Roleof Dualism, Journal of Development Economics, 57(2), 233-258.
[14] Cogneau D., Ch. Guénard, 2002, Can a Relation Be Found Between Inequalityand Growth? DT DIAL 2002/03, 39 pp.
[15] Cogneau D., 2003a, Colonisation, School and Development in Africa - AnEmpirical Analysis, DIAL WP 03/01.
[16] Cogneau D., 2003b, Poverty, Inequality of conditions and inequality of op-portunities — Chances and risks of new poverty reduction strategies, in ClingJ.-P., M. Razafindrakoto, F. Roubaud (eds), New International Povery Re-duction Strategies, Routledge.
[17] Cohen D., M. Soto, 2001, Growth and Human Capital: Good Data, GoodResults, Technical Paper 179, OECD Development Centre.
[18] Deininger K., P. Olinto, 2000, Asset distribution, inequality and growth, RuralDevelopment Research Group Working Paper, World Bank.
[19] Deininger K., L. Squire, 1996, A New Data Set Measuring Income Inequality,The World Bank Economic Review, 10(3), 565-591.
[20] Deininger K. and Squire L., 1998, New Ways of Looking at Old Issues: In-equality and Growth, Journal of Development Economics, 57, 259-287.
[21] Dezalay Y. , B. G. Garth, 2002, The Internationalization of Palace Wars:Lawyers, Economists, and the Contest to Transform Latin American States,Chicago Series in Law and Society, University of Chicago Press.
[22] Djankov S., E. Glaeser, R. La Porta, F. Lopez-de-Silanes, A. Shleifer, 2003,The New Comparative Economics, World Bank Policy Research Working Pa-per 3054, May.
[23] Easterly W., 2002, Inequality does Cause Underdevelopment: New evidence,Center for Global Development Working Paper n◦1.
28

[24] Engerman S. L., Sokoloff K. L., 1994, Factor Endowments, Institutions andDifferential Paths of Growth Among New World Economies: A View FromEconomic Historians of the United States, NBER Historical Papers #66.
[25] Engerman S. L., Sokoloff K. L., 2002, Factor Endowments, Inequality andPaths of Development Among New World Economies, NBER WP 9259.
[26] Goody J., 1996, The East in the West, Cambridge University Press.
[27] Horowitz D. L., 2000, Ethnic Groups in Conflict, University of CaliforniaPress (1st edition 1985).
[28] Iyer L., 2002, The Long-term Impact of Colonial Rule: Evidence from India,Department of Economics MIT, unpublished paper.
[29] Kaufman D., A. Kraay, P. Zoido-Lobatón, 1999a, Aggregating Governance In-dicators, World Bank Policy Research Department Working Paper No. 2195.
[30] Kaufman D., A. Kraay, P. Zoido-Lobatón, 1999b, Governance Matters, WorldBank Policy Research Department Working Paper No. 2196.
[31] Kaufman D., A. Kraay, P. Zoido-Lobatón, 2002, Governance Matters II:Updated Indicators for 2000/01, mimeo, World Bank.
[32] La Porta R., F. Lopez-de-Silanes, A. Shleifer, R. Vishny, 1999, The Quality ofGovernment, Journal of Law, Economics and Organization, 15(1), 222-279.
[33] Lam D., 1999, Generating Extreme Inequality: Schooling, Earnings and In-tergenerational Transmission of Human Capital in South Africa and Brazil,Population Studies Center, Report No. 99-439, University of Michigan.
[34] Lee W., J. Roemer, 2002, Electoral Consequences of Racialism for Redistri-bution in the United States, 1972-1992, mimeo, Northern Illinois Universityand Yale University.
[35] Mc Evedy C., R. Jones, 1978, Atlas of World Population History, Facts onFile.
[36] Maddison A., 2001, The World Economy, A Millenial Perspective, OECD.
[37] Miguel E.,2003, Tribe or Nation? Nation-Building and Public Goods in Kenyaversus Tanzania, University of Berkeley, unpublished paper.
29

[38] Nugent J.B., J.A. Robinson, 2001, Are Endowments Fate? unpublished pa-per.
[39] O’Rourke K., J G. Willliamson, 1999, The Hecksher-Ohlin Model Between1400 and 2000: When it Explained Factor Price Convergence, when It DidNot, and Why, NBER Working Paper No. 7411.
[40] O’Rourke K., J. G.Williamson, 2002, From Malthus to Ohlin: Trade, Growthand Distribution since 1500, mimeo; Trinity College and Harvard University.
[41] Parker P., 1997, National Cultures of the World: A Statistical Reference,Cross-Cultural Statistical Encyclopedia of the World, vol.4, Greenwood Press.
[42] Robinson J.A., R. Torvik, 2002, White Elephants, CEPR Discussion PaperNo. 3459.
[43] Sokoloff K.L., S.L. Engerman, 2000, Institutions, Factor Endowments, andPaths of Development in the New World, Journal of Economic Perspectives,14(3).
[44] Spilimbergo A., J. L. Londoño, M. Székely, 1999, Income Distribution, FactorEndowments and Trade Openness, Journal of Development Economics, 59,77-101.
30

Tab
le1:
Aty
pol
ogy
ofco
loni
zati
on
Nev
erun
der
Eur
opea
nad
min
istr
atio
nU
nder
Eur
opea
nA
dmin
istr
atio
nso
met
ime
bet
wee
n15
00an
d19
00’R
ussi
anE
mpi
re’
&ot
hers
Pur
ese
ttle
men
tco
loni
esSe
ttle
men
t/
extr
acti
onco
loni
esP
ure
extr
acti
onco
loni
esM
ongo
liaU
SAL
atin
Am
eric
aA
fric
aC
entr
alA
sia
Chi
naan
dT
aiw
anC
anad
aC
arib
bea
nIs
land
sSo
uthe
rnA
sia
Cau
casu
sJa
pan
Aus
tral
iaSo
uth-
Eas
tern
Asi
aN
orth
and
Sout
hK
orea
New
-Zea
land
Sout
hA
fric
aSi
ngap
ore
(&H
ong-
Kon
g)(A
rgen
tina
&U
rugu
ay)
Zim
babw
eIs
rael
Tha
iland
For
mer
Sett
lem
ent
colo
nies
(in
1900
)A
lban
iaA
fgha
nist
anA
lger
ia,
(Mor
occo
&T
unis
ia)
Ara
bic
coun
trie
sA
ngol
a,(M
ozam
biqu
e)Ir
an(E
gypt
,K
enya
,M
alaw
i,Z
ambi
a)Ir
aq,
exce
pt19
20-3
2(C
ongo
Dem
.R
ep.)
Syri
a&
Leb
anon
,ex
cept
1919
-44
Jord
an&
Pal
esti
ne,
exce
pt19
19-4
6T
urke
y

Table 2: First results on the relation colonization-inequality
Dependent variable: Gini index (1) (2) (3) (4) (5)
Never colonized -8.78*(3.29)
Neo-Europe -14.56* -16.27* -24.54* -16.34* -25.32*(4.26) (4.18) (4.35) (4.14) (1.71)
Length of colonial rule (log.)(a) +1.31* +0.19(0.63) (0.64)
Age of pre-colonial city (log.)(b) -0.61* -0.34(0.30) (0.28)
Antiquity of the State(c) -13.17* -4.41(4.23) (3.91)
Pop. Density in 1500 (log.) -2.63* -2.91*(0.68) (0.56)
R2 0.18 0.27 0.40 0.25 0.48N 73 65
Method : Ordinary least squares. All regressions have a constant term. *: significant atthe 5% confidence level. (a): logarithm of the time period between date of conquest byEuropeans and date of independence, equals zero if never colonized; (b): if a city wasfounded before 1500, equals the logarithm of the period between the date of foundationand the year 1500, or else equals 0; (c): statehist5, discounted periods of existence of astructured state, see Bockstette, Chanda, Putterman (2002).
32

Table 3.1: Basic results - Dependent variable: Gini index
Independent variables: Rule of Law(i) Density in 1500(log.)
Dependent variables:
Gini Index (%) -7.05* -2.48*(1.71) (0.53)
GDP per capita(a) (log.) +1.44* +0.01(0.20) (0.05)
Life Expectancy(a) (log.) +0.26* +0.01(0.04) (0.01)
Density of pop.(a) (log.) +0.47 +0.19(0.31) (0.10)
Urbanisation rate(a) (%) +16.65* -3.71*(4.85) (1.65)
N 73Average years of schooling(b) +3.61* -0.24
(0.58) (0.16)59
Method : GMM estimators. All regressions have a constant term. *: significantat the 5% confidence level. (i): instrumented by settlers’ mortality. (a): in the year ofobservation of the Gini index; (b): estimate for the year 1990.
Table 3.2: A little more sophisticated specification
Rule of Law(i) Density in 1500 Rule of law ×(log.) Density in 1500 (log.)(i)
Gini index (%) -7.37* -3.40* +1.94*(1.54) (0.43) (0.58)
73Method : GMM estimators. All regressions have a constant term. *: significant at the5% confidence level; (i): instumented by the settlers’ mortality and the cross-productof the settlers’ mortality and the (log.) population density in 1500.
33

Table 4: Robustness checks for the basic result on the Gini index (dependentvariable)
Independent variables: Rule of Law(i) Density in 1500 Other variables(log.) [p-value]
Additional variables:Continental dummies(a) -3.12 -2.14* -
(2.61) (0.66) [0.09]Colonial origin dummies(b) -10.00* -3.04* -
(2.84) (0.86) [0.22]D. from Equat. & av. temperat. -7.04* -2.46* -
(2.35) (0.67) [0.94]Age of pre-colonial city(c) -7.00* -2.45* -
(1.80) (0.63) [0.95]Arable land (log.) -6.89* -2.42* -
(1.61) (0.53) [0.48]N 73
Antiquity of the State(d) -7.98* -3.04*(2.02) (0.66) [0.15]
N 65Sample variations: NWithout non-colonies -8.51* -3.05* 66
(2.30) (0.82)Without Neo-Europes -4.64* -3.20* 69
(2.20) (0.48)Without America -5.98* -3.02* 50
(1.86) (0.54)Without Africa -7.01* -1.96* 44
(1.65) (0.53)Without Asia -8.21* -2.52* 54
(2.61) (0.96)
Method : GMM estimators. All regressions have a constant term. *: significant atthe 5% confidence level. The basic specification is the one of the first line of table3.1 which relates the Gini index to an indicator of the rule of law (instrumented)and to the density of populaiton in 1500. Coverage: Non-European countries. (a):Africa, America, Asia, Oceania; (b): Never a colony, English colony, French colony,Spanish colony, Other former colony ; (c): if a city was founded before 1500, equalsthe logarithm of the period between the date of foundation and the year 1500, or elseequals 0; (d): statehist5, discounted periods of existence of a structured state, seeBockstette, Chanda, Putterman (2002). 34

Table 5.1: European Settlement as an additional variable
All non-European Without Neo-EuropePED 1900 PED 1975 PED 1900 PED 1975
Rule of Law(ii) -7.03* -7.62* -7.82* -7.49*(2.40) (2.14) (2.08) (2.00)
Density in 1500 (log.) -1.72* -1.86* -1.60* -1.59*(0.70) (0.67) (0.71) (0.70)
Pop. Eur. Descent (PED)(ii) +65.16* +48.95* +33.94* +29.61*(28.09) (24.15) (15.58) (14.62)
PED squared(ii) -75.51* -53.86* - -(31.59) (27.25)
Inverted U-curve maximum 0.43* 0.45* - -(0.05) (0.07)
Sargan test 1.20 2.72 0.79 1.09[ p-value ] [0.55] [0.26] [0.85] [0.78]
N 73 69
Method : GMM estimators. All regressions have a constant term. *: significant at the5% confidence level; (ii): instumented by the settlers’ mortality century, the distancefrom equator and the distance from equator squared, the average temperature, and theage of the first pre-colonial city founded before 1500.
35

Table 5.2: Additional instruments for the quality of institutions and the popula-tion of european descent
All non-EuropeanRule of Law PED1975
Settlers mortality (log.) -0.36* -0.34* -0.05* -0.02(0.06) (0.07) (0.02) (0.02)
Density in 1500 (log.) -0.09* -0.07 -0.08* -0.07*(0.04) (0.05) (0.01) (0.01)
Distance from Equator -0.03 -0.00(0.02) (0.01)
D. from Eq. squared (×100) +0.14* +0.03*(0.05) (0.01)
Average Temperature +0.05* -0.00(0.02) (0.00)
Age of pre-colonial city(a) -0.01 -0.02*(0.02) (0.01)
R2 0.41 0.55 0.49 0.67N 73
Method : GMM estimators. All regressions have a constant term. *: significantat the 5% confidence level. (a): see table 2.
36

Table 6: Robustness checks with ’commodity endowments’ (Dependent variable:Gini index)
Independent variables: Rule of Law(i) Density in 1500 Other variables N(log.) [p-value]
Additional variables:Commodity endowments (a) 73
Set of 11 dummies -4.55* -2.48*(2.14) (0.45) [0.00]
4 principal components -6.50* -2.66*(1.87) (0.51) [0.22]
Soil suitability(b) 66Set of 11 variables -6.72* -2.23*
(2.76) (0.55) [0.04]4 principal components -6.81* -2.42*
(2.87) (0.57) [0.69]% Area harvested (c)
Set of 11 variables -5.25* -1.89* 73(1.18) (0.56) [0.00]
4 principal components -6.40* -2.19*(2.30) (0.54) [0.06]
Method : GMM estimators. All regressions have a constant term. *: significant at the5% confidence level. (a): like in Easterly’s specification (2002), dummies indicatingwhether the country produces (in 1998) a commodity among the following list:Bananas, Coffee, Copper, Maize, Millet, Oil, Rice, Rubber, Silver, Sugar Cane, Wheat;(b): substituting sol suitability estimations for crop dummies (for bananas, maize,millet, rice, sugarcane and wheat); (c): proportion of arable land area dedicated toeach crop in the year 1961 instead of crop dummies.
37

Table 7: Pre-colonial variables and Lorenz Curve
Independent variables: Rule of Law(i) Density in 1500Dependent variables: (log.)
Share 20% poorest +0.78 +0.38*(0.48) (0.14)
Share 40% poorest +2.12* +0.86*(0.97) (0.27)
Share 60% poorest +3.62* +1.26*(1.35) (0.38)
Share 20% richest -4.69* -1.45*(1.48) (0.43)
Share Middle Class (20-80%) +3.90* +1.07*(1.09) (0.33)
Ratio Top 20% / Bottom 60% -0.41* -0.13*(0.17) (0.04)
Gini index -6.99* -2.51*(1.76) (0.56)
N 67
Method : GMM estimators. All regressions have a constant term. *: significantat the 5% confidence level; (i): see table 3.1. Coverage: Non-European countries.
38

Table 8: Present institutions and pre-colonial variables
Independent variables: Settlers Mortality Density in 1500 R2 NDependent variables: (log.)
Ever colonised (probit) -0.56* 0.30(a) 73(0.18)
Length of colonial rule(b) -0.07 -0.15* 0.14 66(0.08) (0.06)
Pop. of Eur. Descent(c) 1975 -0.05* -0.08* 0.49 73(0.02) (0.01)
Antiquity of the State(d) -0.08* +0.07* 0.42 63(0.02) (0.01)
Ethnic Fractionalization(e) +0.11* -0.03* 0.31 73(0.02) (0.01)
Mixed econ. syst.(f) (probit) -0.22 +0.28* 0.11(a) 73(0.14) (0.10)
Voice and Accountability(g) -0.22* -0.16* 0.30 73(0.06) (0.05)
Political Stability(g) -0.29* -0.11* 0.32 72(0.06) (0.05)
Government Effectiveness(g) -0.35* -0.09 0.38 68(0.06) (0.04)
Regulatory quality(g) -0.17* -0.12* 0.24 73(0.06) (0.04)
Rule of Law(g) -0.36* -0.09* 0.41 73(0.06) (0.04)
Control of Corruption(g) -0.31* -0.12* 0.33 72(0.07) (0.05)
Method : GMM estimators. All regressions have a constant term. *: significant atthe 5% confidence level. Coverage: Non-European countries. (a): Pseudo-R2; (b):logarithm of the time period between date of conquest by Europeans and date ofindependence; the regression for this variable is estimated on colonised countries only;(c): Estimated share of Population of European Descent in 1975, see Acemoglu etal. (2000); (d): statehist5, discounted periods of existence of a structured state, seeBockstette, Chanda, Putterman (2002); (e): from Alesina et al. (2002); (f): from Barro(1991) (g): in 2000, from Kaufman et al. (2002).
39

Table 9: A Land Distribution Story (1)
Dep.var.: Land Gini index (%) (1) (2) (3) (4)
Never colonized -20.23*(6.20)
Neo-Europe +2.56 -0.16 -1.90(7.42) (7.03) (7.58)
Length of colonial rule (log.)(a) +3.79*(1.12)
Age of pre-colonial city (log.)(b) -1.03(0.57)
Antiquity of the State(c) -33.32*(9.36)
Settlers’ Mortality -0.72(1.62)
Pop. Density in 1500 (log.) -4.37*(1.03)
R2 0.19 0.32 0.22 0.28N 51 49 51
Method : Ordinary least squares. All regressions have a constant term. *: sig-nificant at the 5% confidence level. (a): logarithm of the time period between date ofconquest by Europeans and date of independence, equals zero if never colonized; (b):if a city was founded before 1500, equals the logarithm of the period between the dateof foundation and the year 1500, or else equals 0; (c): statehist5, discounted periods ofexistence of a structured state, see Bockstette, Chanda, Putterman (2002).
40

Table 10: A Land Distribution Story (2)
Indep. variables: Rule of Law(i)(ii) Land Gini(i)(ii) Density in 1500 R2 or N(log.) [ Sargan
Dep. variables: p-value]
40% poorestOLS +0.46 (0.68) -0.13* (0.04) 0.24GMM 1 +0.12 (0.49) -0.27* (0.06) 46GMM 2 +0.70 (0.85) -0.16* (0.07) +0.56 (0.44) [0.45]
Middle Class(a)
OLS +2.81* (0.46) -0.12* (0.04) 0.32GMM 1 +2.45* (0.71) -0.27* (0.07) 46GMM 2 +3.28* (1.29) -0.16 (0.11) +0.41 (0.62) [0.11]
Gini indexOLS -6.22* (1.39) +0.18* (0.07) 0.38GMM 1 -5.65* (1.36) +0.43* (0.10) 51GMM 2 -8.98* (2.14) +0.31 (0.18) -0.71 (1.03) [0.62]
Method : GMM estimators. All regressions have a constant term. *: significant at the5% confidence level; (a): cumulated share of the second, third and fourth quintiles;(i): GMM1 = instrumented by settlers’ mortality; (ii): GMM2 = instumented by thesettlers’ mortality century, the distance from equator and the distance from equatorsquared, the average temperature, and the age of the first pre-colonial city foundedbefore 1500.
41
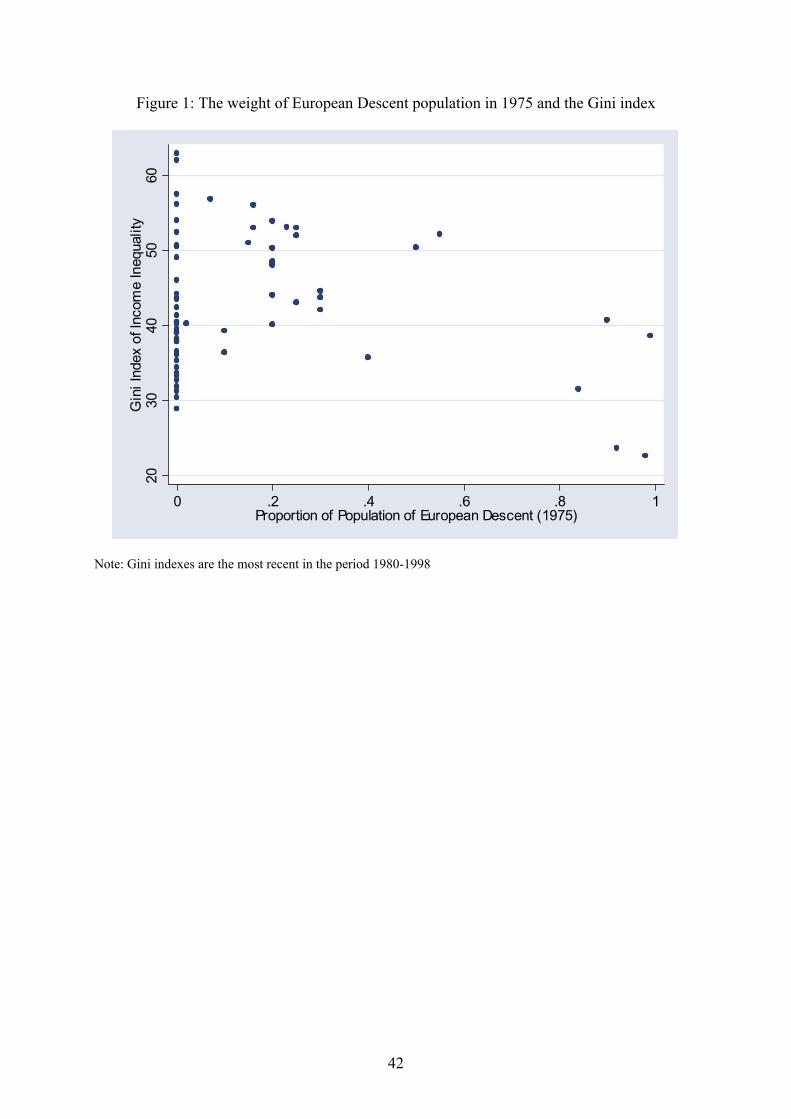
42
Figure 1: The weight of European Descent population in 1975 and the Gini index
2030
4050
60G
ini I
ndex
of I
ncom
e In
equa
lity
0 .2 .4 .6 .8 1Proportion of Population of European Descent (1975)
Note: Gini indexes are the most recent in the period 1980-1998
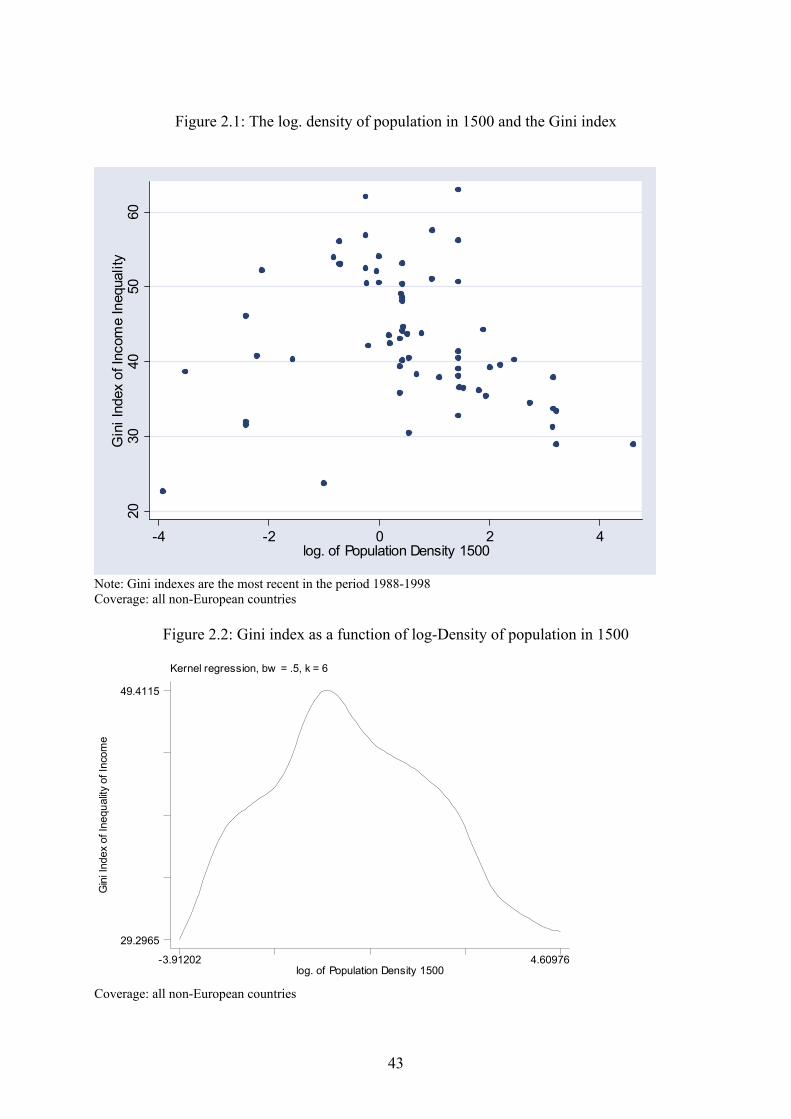
43
Figure 2.1: The log. density of population in 1500 and the Gini index
2030
4050
60G
ini I
ndex
of I
ncom
e In
equa
lity
-4 -2 0 2 4log. of Population Density 1500
Note: Gini indexes are the most recent in the period 1988-1998 Coverage: all non-European countries
Figure 2.2: Gini index as a function of log-Density of population in 1500
Kernel regression, bw = .5, k = 6
Gin
i Ind
ex o
f Ine
qual
ity o
f Inc
ome
log. of Population Density 1500-3.91202 4.60976
29.2965
49.4115
Coverage: all non-European countries

44
Figure 2.3: Gini index as a function of log-Density of population in 1500 Lowest tercile of settlers mortality
Kernel regression, bw = .5, k = 6
Gin
i Ind
ex o
f Ine
qual
ity o
f Inc
ome
log. of Population Density 1500-3.91202 4.60976
29.2965
49.4115
Coverage: all non-European countries
Figure 2.4: Gini index as a function of log-Density of population in 1500 Middle tercile of settlers mortality
Kernel regression, bw = .5, k = 6
Gin
i Ind
ex o
f Ine
qual
ity o
f Inc
ome
log. of Population Density 1500-2.12026 3.16548
33.1071
49.4178
Coverage: all non-European countries

45
Figure 2.5: Gini index as a function of log-Density of population in 1500 Highest tercile of settlers mortality
Kernel regression, bw = .5, k = 6
Gin
i Ind
ex o
f Ine
qual
ity o
f Inc
ome
log. of Population Density 15000 3.21888
32.8745
47.0513
Coverage: all non-European countries
Copyright © 2022 FDOKUMEN