Banded vegetation patterns - Horizon IRD
95
ACTA INTERNATIONAL JOURNAL OF ECOLOGY ELSEVIER
-
Upload
khangminh22 -
Category
Documents
-
view
1 -
download
0
Transcript of Banded vegetation patterns - Horizon IRD

ACTAINTERNATIONAL JOURNAL OF ECOLOGY
ELSEVIER
ACTAOECOLOGlCAINTERNATIONAL JOURNAL OF ECOLOGY
Aims and ScopeActa Üecologica is a venue for the publication of original
research articles and reviews in ecology. We encourage
studies in behavioural ecology, community ecology,
conservation biology, evolutionary ecology, physiological
ecology and population ecology. There is no bias wirh
respect to taxon, biome or geographic area. Both
theoretical and empirical papers are welcorne,
but combinations are particularly sought. Priority is given
to papers based on explicitly stated hypotheses. Papers
explaining variation are preferred over those concentrating
on average values. The forum section is reserved for short
papers with crirical discussion of current issues in eco1ogy,
as weil as comments and viewpoints on previously
published papers. Acta Oecologica does not publish book
reviews, but comments on new books are welcome in the
forum section.
Acta Oecofogica is indexed in:
Currem Conrcnrs (AR & ES, Ecological Abstracrs. Currem Advancesin Ecological and Environmemal Sciences, the INISî' pascalDarabasc, IBZ Darabase and Chcmic»] Abstrncts, Science CitationIndex, Sci Senrch. ReSCHch Alert.
Editor-in-Chief
III ARIF VAN NOOR1)WIIK
Behauioml and euolution.trv ecoloc'?JI
Executive Editors:
SIII'IIA:\ HXIIT:\\( :11\VIIiR
Plantpopulation all(/ph)'si%gmi/ l'(ology, ('((}jystems ecology, global change
iii M:\RIL'\I HO\\AFRT-McKFY
Euoiutionnry bi%gy, plant-insect interactions
~ joxo CARlΠMARQn.S
Marine ec%gy/mode//ing
'1[$ HA:\\ PrTER KOELEWII~
Pftlrltpopulation
MARCEL KIA~SSr.:\
Animal Ecop!Jpi%g..l!
Managing Editor
\II CHIARA MARUJITII
NIOO-eTOPO. Rox 40N L 6666 ZG Hcrcren - The NcrhcrlandsFax: (31) 2647 23 227.e-mail: acraoecCi.Dcro.nioo.knaw.nl
ÉDITIONSELSEVIER
23. rue Lillois75724 Paris cedex 15. l'rance
hllp:/ /www.clscvicr.Ir
LIFE SCIENCES DEPARTMENTTel.: (33) 1 45589067 - Fax: (33) 1 45589424.Desk editor - Béatrice Fournier: (33) 1 45589033; [email protected] - Marc Essodaigui : (33) 1 45 58 9048; [email protected]
SUBSCRIPTIONS Tel.: (33) 1 45589067 - Fax: (33) 01 45589424; [email protected] (Vol 20) annual subscription; 6 issues.• France: FF 1 480.• EU (with 2.1 % VAT*): FF 1 787.• Rest of the world: FF 1 884.• North. Central and South America: US$ 318.lncluding air delivery.'" For tax exemption, VAT registrution numbcr must he indicated.
'''''''''''''''''''"' ",",,' "!') " "''' "'.• " Address order and payrnent to: Éditions scientifiques et médicales Elsevier:23. rue Linois, 75724 Paris cedex 15• by check or credit card (CB. EuroCard, MasterCard or Visa) indicatc No. and expiry date• by transfcr: CCP Paris n" 30041 00001 1904540 H 020/70.
Subscriptions hegin 4 wccks upon rcccipt of payrncnt and sturt with the lïrsl issue of the calcndar ycar. Bad issues and volumes arc availablc l'romthe publishcr. Claims l'or missing issues should he made within (0 months or puhlication.
<D (1)1)1) Éditions scientifiques cl médicales Elsevier. Paris
En application de la loi du 1er juillet 11)1)2. il est interdit de reproduire. même partiellement. la présente publication sans l'autorisation de l'éditeurou du Centre français d'exploitation du droit de copiè C~O. rue des Grands-Augustins. 7500(0 Paris).Ail rights rescrved. No partojtltis publication /JIOY he trausluted, /'{'fJrodu ('('(1. storc«! in ({ rctricval svstetu (Ir transmittcd in anvjorni (Ir hv OHl'
otlter II/{'O/IS. clectronic, mcrhanical, IJIIO/oCOIJYi/lg. rccording. or otltcrwisc. without /IIÙIl' penuission or the publishet:
Imprimé en Frunce par STEDJ1. hL! Ney. 7501XParisDépôt légal: 571Y- À parution
Prcvidcnr-directcurgénl'ral et directeur de la puhlic.uion : Catherine l.ucctCommivvion paritaire: 010,' T n049
Périodicité: (, n'" / an

Acta Oecologica 20 (3) 133/ © Elsevier, Paris
Foreword
In many arid and serni-arid environments in the world, the landscape is spectacularly patterned with alternating stripes of dense vegetation and almost bare soil. These banded landscapes are found in biomes as diverseas grasslands, shrublands, woodlands and forests. Land use and the socio-political systems that utilise bandedlandscapes are aImost as diverse. Their typical spatial structure, mainly related to noteworthy hydrological processes, invites the development of eIegant modeis ro describe their function and to conjecture about their origins. Studies of banded landscapes have developed from purely descriptive to causal processes summarised inmathematical modeis.This special issue of Acta Oecologica treats ecological and biological aspects (plants, mesofauna, organic matter)ofbanded landscapes. Except for one 'Forum' contribution, the papers result from an international Symposiumheid in Paris in April 1996 under the auspices of the Orstom institute (now IRD) and the SALT research project (SAvana on the Long Term, one of the core projects of the IGBP programme). Papers presented at the symposium on physical and geochemical aspects have been assembled in a special issue of Carena, ta be publishedin 1999. Most of the work on banded landscapes was originally carried out as isolated individual studies, Theconvergence of results is pleasing and a good reason ta publish these papers together. Already the concepts offunction/dysfunction in landscapes and the associated field methodologies developed in studying banded landscapes have been applied to other less overtly patterned landscapes with success. This issue should heip in stimulating this extension.
DAVID TONGWAY
'Gungahlin Hornestead'CSIRü Wildlife and EcologyGPO Box 284, Canberra 2601 ACT, Australia
JOSIANE SEGHIERI
IRDB.P. 504534032 Montpellier, France

Acta Oecologica 20 (3) (1999) 135-146 / © Elsevier, Paris
Banded vegetation patterning in a subantarctic forestof Tierra dei Fuego, as an outcome of the interaction between wind
and tree growth
Juan Puigdefabregas "", Francesc Gallart b, Oscar Biaciotto c, Mario Allogia d, Gabriel del Barrio a
a Fstaciôn Experimemmuü de Zonas Aridas (CS/G), General Segura L, 04001 Almeria, Spain." Instituto de Ciencias de la Tierra '[aume Alml'la '(CS/G), Marti i Franqués sin, 08028 Barcelona, Spain.
r ' Centro A ustral de Inuestigacion Cientifica (CON/CJ""n Ushuaia, Argentina.d tnstiiuto Forestal Nacional Ushuaia, A rgentina.
* Corresponding author (fax: +3450277100; e-mail: puigdefatieeera.csic.es}
Received March 17, 1997; revised Octoher 23, 199R; accepted Novernber 12, 199R
Abstract - Banded patterns have been investigated in a Nothofagus betuloides primeval forest from Bahia deI Buen Suceso, on the easternedge of Tierra dei Fuego island (Argentina). These forests grow on spodosols developed upon silicic shales, in a cold oceanic climate, with 5 ocmean annual temperature and 600 mm mean annual rainfall. Bands are oriented perpendicular to the prevailing wind direction, with older anddying trees in the windward edge and a seedling regrowth in the lee side of each band. Forest structure, species composition and relevant soilproperties were sampled in a wind-affected forest and in an undisturbed stand. In the former, samples were obtained in transects across thebanding and along a hill-slope gradient. Results show that wind causes about 50 % reduction of stand basal area and of size of overstorey trees.Stand growth processes, such as self-thinning, basal area and height growth, and specifie composition of the understorey, occur in a windwarddirection, as well as changes in soil properties such as C/N ratio and redox potential increase. Based on field observations, we have developedan hypothesis of how wind is able to generate this pattern. ILs core is that bands develop when vulnerability of trees to wind damage increaseswith age and with lack of protection from older windward trees. In such conditions, bands are the outcome of a tuning between tree growthrates and wind killing capacity. On the basis of this hypothesis, a simulation model, based on the cellular auto mata approach, was constructed.Simulated patterns that arise from heterogeneous forests with random age distributions match successfully with those observed in nature.Increasing tree growth rates lead to longer wavelengths and higher wave propagation rates, whi le increasing wind killing potential leads toshorter wavelengths and lower propagation rates. This interpretation of banded patterning involves a resonance between a directionaldisturbance and an oscillatory process, such as stand regeneration, growth and decay. © Elsevier, Paris
Banded spatial pattern / wind waves / subantarctic forest / Nothofagus / Patagonia / cell automata modelling / directional dlsturbancesin ecosystems
1. INTRODUCTION
Wave regenerating forests, with stripes perpendicular to the direction of the prevailing wind, have beendescribed in north-eastern United States [14, 16, 18]and in central Japan [II, 15]. Parallel dieback stripestravel slowly downwind giving place to a successionof regeneration phases that occur between them. Several factors have been cited as possible causes of suchstriped dieback, ail related to wind effects such aswinter desiccation, summer cooling, rime depositionand branch breakage [15].
The reported cases of wind wave regeneratingforests are restricted to subalpine conifers [17], i.e.Abies balsamea in the United States and A. veitchii inJapan. Here, a case of striped forest is described for anew geographie region, the eastern part of Tierra deIFuego in South America, involving a broad-Ieaved treespecies, Nothofagus betuloides (Fagaceae).
The maintenance of this striped pattern, onceformed, has been explained in terms of a sharpincrease of mortality once trees exceed a criticalage [16, 18]. Nevertheless, the question of how suchpatterns are generated is still a topic of active research.

136
Are stripes initiated by linear discontinuities caused bydisturbance s or topographie features in the forest? Canthey be generated by the effect of wind on an initialrandom patterned forest? One of us [7] showed thatstriped patterns couId dynamically evolve from random patterns, using a very simple mode] in whichwind-exposed trees had an increased probability ofdeath as age increased. That model was a crudeover-simpli fication of reality, because cells were supposed to be occupied by a single tree representin g acohort. Subsequently Sato and Iwasa [15] publishedanother model to explain the central Japan case. It wasbased on a ce llular-automata approach, which assumedthat tree height grows at a constant rate, and that treesdie if they are taller than their windward neighbours bya difference larger than a certain threshold. A series ofadditional rules were incorporated to make the modelmore robust and stable in producing two-dimensionalpatterns. This second model was also able to successfully generate stripes from initial random patterns, butit was still far from reality because its rigid deterrninistic structure and its assumption that trees, eachrepresenting a cohort, grow on sites arranged in atwo-dimensional lattice.
In this work, a further step towards a more realisticmodel of wave regeneration systems is proposed byusing ad hoc field information, and by managing thedemographie evolution of cohorts across space. Forestresponses to a range of parameter values are exp loredand simulation outputs are qualitatively compared toobserved patterns in the field.
2. FIELD SITES AND METHÛDS
The study site is located in Bahia dei Buen Suceso,in the eastern edge of the Isla Grande de Tierra deiFuego, Argentina (54°5 1'50" S, 65°13'36" W) (figure 1) . The littoral eastern sector of the island ischaracterised by a cold, oceanic and windy climate [2,5, 10, 13] with meari temperatures of 10 "C in February, 2 "C in August, and 5 "C round the year. Meanannual rainfall is around 600 mm, precipitation exceeds the atmospheric evaporative demand throughoutthe year and prevailing winds flow from the northwestern sector.
Bedrock is made mostly by silicic shales which, inconjunction with the cold and wet climate, facilitatethe formation of stagnopodzols and peat soils in thevalley bottoms and fl at summit areas [3]. On hillslopes and weil drained areas, podzolic soils areformed which support extensive evergreen forests,with a nearly mono-specifi e overstorey of Nothofag us
J. Pui gdefâbregas et al.
~1
,........ ."
100 km
Figure 1. Locat ion of the study area.
betuloides . Some small tree species, e.g. Drymi s winteri , and in much smaller proportion, Maytenus magellanica and Berberis ilicifolia, are the main understorey components. Small deciduous patches ofNothofagus antarctica colonise the more extreme environments such as the fringes of peatbogs or areasexposed to strong winds.
Owing to inaccess ibility by road. the landscape ofthe area is largely primeval and forest dynamics aremostly controlled by peat soil fl ows and wind. Theformer cause large strips where forest is peeled awaydownslope and new regeneration phases stanagain [8]. The latter causes a pattern of paraIle! stripesof regeneration waves perpendicular to the dominantwind direction. Regenerat ion waves often occur onnorthern exposed hill-slopes where prevailing northwestern winds can fl ow freely along.
Available aerial photographs from the CartographieService of Argentina , and an ad hoc helicopter surveyallowed us to find suitable sites for field observationand provided images for contrasting simulation outputs (figure 2). A study site was selected on a hill-slopewith altitude ranging between 20 and 340 m, a meangradient of 40 % and a mostly north aspect. Thesampling desig n consisted of three circular plots alonga mature forest band adjacent to and downwind from adieback stripe, and a transect across a whole regeneration wave. An additional circular plot was located onan east-facing hill-slope, protected from western wind,as a reference for undisturbed forest.
The three circular plots in the wind exposed hillslope were established at the low slope (LS), midslope
Acta Oecologica

Banded patlerning in su banlarcl ic foresls 137
3. THE SPATIAL PATTERN OF FORESTSTRUCTURE
Figure 3. Plot of maximum tree height s, observ ed in 50-m 2 quadrats, ver sus elapsed tirne from the dieback front (PLOTAG E) along aregenera tion wave in rnidslope position,
150
••• •
••••
••
50 100
PLOTAGE (years)
••••••••••••
o
Ê 30
)( 25CtI
~ 20-J:.!2l 15CIl
J: 10CIl
E1- 5
O+-------..-----r------,
3.1. Field description of the regeneration wavesystem
Th e reg enera tion wave system displays a con spi cuous pattern of par allel band s perpendi cul ar to thed irectio n of the prevailing wind. lmmed iately windward from a fro nt of dead and se nesce nt trees, there isan open field with youn g sa plings that progre ssiv elyc hange s windward to matu re forest up to the nextdieback front. T he midslope transect that was sampledac ross this pattern provides quantitati ve informa tionabo ut fores t struc ture and soil cha nges .
3.1.1. Spatial variation in th e forest structure
Stand age shows a Iinear windward increase at a rateo f 1.17 yea r-rn" ! ( r = 0.806, P < 0.001). Th e maturefo res t stand ing immediately lee ward from the deadfront has an age of 209 years at the stem base. Theordina te interce pt (62 years), ind icates that forest recruitme nt occurs in the floor of the previ ous maturephase and grows upw ard when the canopy becomesopen fo llowi ng the dea th of large tree s. This lag ofcirca 62 years between stand age and plot age countedfrom the dieback front , means that the pe riod, or thetime elapsed betwee n two co nsecutiv e dead stripes inthe sampled transect is of 147 years. As wavelen gth is125 rn, the dieback front is travell ing downwind at arate of 0.85 m-year" :
Canopy height sho ws a sig mo ida l trend with time(figure 3). Once trees have reach ed the measurement
Figu re 2. Low altitude phot ograph of wind regenerati on waves in aNothofa gus betuloides fores t of Bah ia dei Buen Suceso (Tierra deiFuego, Arge ntina) . Preva iling wind blows from the righ t side of theimage.
(MS) and upslope (US ) sectors . Altitu des and gradients were 50 , 120 and 235 m, and 21, 30 and 25 %,respecti vel y. Th e undisturbed forest plot (UDF) was atan altitude of 75 m, with a slop e gradie nt of 52 %.
Ali plots had a d iame ter o f 20 m, except US, whic hwas composed of four circu lar subplots with a 10-01diam eter. ln eac h plot , a il stems larger than 5 cm indiameter at bre ast height (D BH ) were tallied, theirDBH me asured and con dition (do minant, codominantor suppres sed ; alive, se nescent or dead) recorded. Asm all sample of three to five overstorey trees wasse lected fo r measuring total height and for extractin g acore of wood for age es timation. Total length s of thethree regeneration wav es downwind from each cir cular plot were measured at the three hill- slope sec to rs.
A tran sect was se t up downwind from the midslopecir cul ar plot , stretc hing 125 01 across the who le regeneration wave, from one dead fro nt to the next. Alo ngthis tran sect, 25 co ntiguous rectangular plots of5 x 10 01 were establ ished, Th e dat a record ed in eachplot were equivalent to those ob tained in the circularplot s, with some additio nal information co ncerninglifter, orga nic and top minerai layers o f soi l. Depth ,pH, redox potential (rH ) and temperature were measured in eac h layer, in a 0.5 x 2 01 su bqu adr at at thecent re o f each plot, us ing por table e lec trodes and atemperature sen sor, Samples were taken from theorga nic layer for laborato ry C and N determination ,usin g the Walkl ey and Black and Kjelldall me thods,respectiv ely.
Vol. 20 (3) 1999

~ ~ Il .• .111 1.....'" ~ ~ v 0
~ :; ~ :ri. en '" ;::: r-, M œ V 0~
N co V 0 '" v "N M '" '" r-, cc ec en~ ~ :: :: ~ ~ ~
v
PLOTAGE (y" ",,)
138
threshold of 5 cm DBH , at so rne 20 yea rs elapsed fromthe dead front, max imum heights grow slowly from 8to 10 m during the next 60 years. During the following40 years, trees grow faster to reach heights between 20and 25 m at 120 years after the dieback front. Th ereafter, maximum height s become more variable. but onaverage, they maintain height or even decline.
Stem basal area of N. betu/oides (figure 4) growswindward from the dieback zone up to maximumvalues of around 90 m<ha" at a plot age of100-120 years and thereafter, it declines stead ily to thenext dead front while the proportion of senesce nt anddead trees increases. During the initial phases of standgrowth, up to 60-70 years after the dead front, largescattered dead trees of the previous wave share a largeproportion of the total stem basal area .
D. winteri shows a pattern of stem basal area out ofphase with that of N. betu/oides and sornewhat advanced to it (figure 4). Maximum values of around40 m2 ·ha- 1 occur at 70-80 years after the diebackzone. Thereafter, stem basal area of D. winteri declin esand virtually disappears at the peak phase of N.betu/oides. In mature s tands, when the overstoreybegins to open, recruitment of D. wint eri starts again.
-; 140
s: 120 •
i'. 100 '
~ ao60
0;~ 40-"c; 20
~ 0
J. Puigdefâbregas el al.
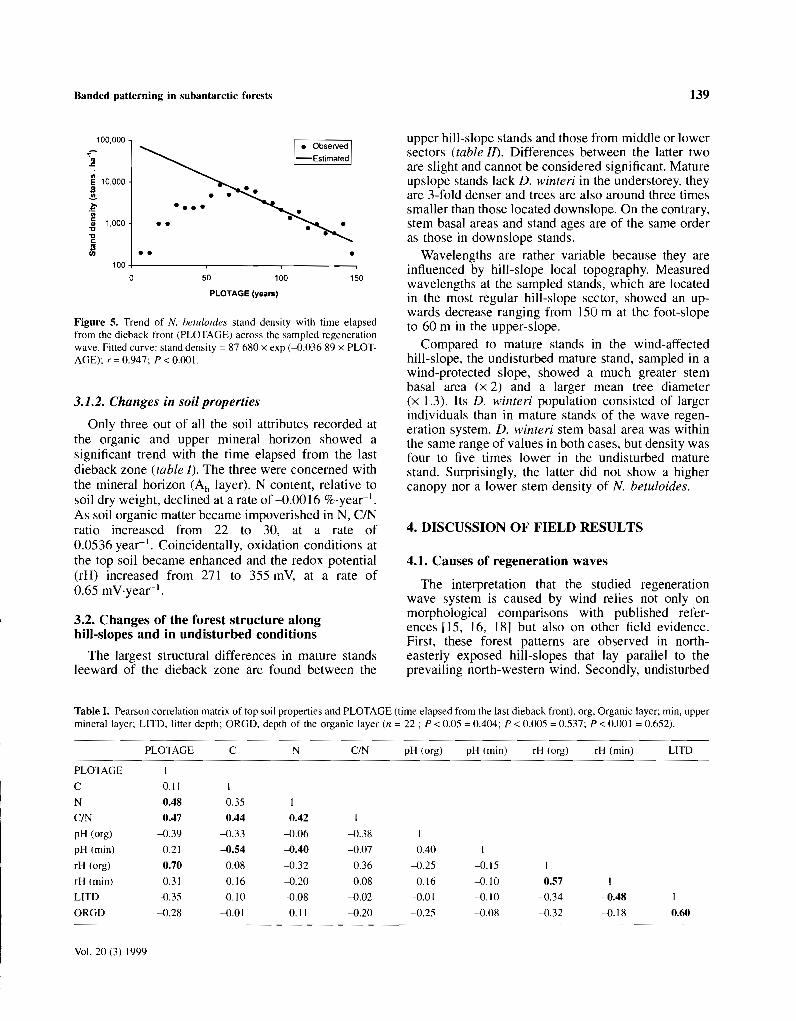
In the case of N. betuloides, the den sity of stemslarger than 5 cm DBH reaches a maximum at 60 yearswindward from the dead front (figure 5) . Before thistime, the regrowth has not yet reached the measurement threshold of 5 cm DBH. This maximum densityat 60 year plot age and around 120 year stand age isvery high (around 9000 stems-ha:" ), and it declinesexponentially with a coeffi cient of -0.03689 to387 sternsha" in mature stands leeward of the dieback zone.
The increase in stem bas al are a together with theparallel decline in stand den sity are the outcomes of abiomass redistribution process. A larger proportion ofthe latter is progressively shared by fewer and biggerindividuals. This trend is described by the ratio of stembasal area to stand den sit y, the basal area of theaverage tree, thar may also be ex pressed as a DBH(D BH m). DBHm grows expo nentially with time,reaching values of 30 cm in mature stands 1eeward ofthe dieback zone, at 147 years plot age and 209 yearss tand age. The equation which de scribes this trend is:
DBHm =5.1418 x exp(0.01 28 x PLOTAGE)
r =0.878, P < 0.001
Nothofagus betu/oid es
I_ OOild
D Scn~ eut
' . Allv e
Drymis winleri
D Senescent
__ l ,l,Ilo coM M
PLOTA GE (years)
Figure 4. Trends of stem basal area with lime elapsed l'rom the dieb ack front (PLOTAGE) along the sampled regeneration wa ve, Waves aretravelling l'rom the right la the left. dead , Dead stem s; sen, senesce nt stems; alive , live stems.
Acta Oecologica
Banded patterning in subantarctic forests 139
PLOTAGE (ysars)
Figure 5. Trend of N. betuloides stand density with time clapsedfrom the dieback front (PLOTAGE) across the sampled regenerationwave. Fitted curve: stand density =87 680 x exp (-0.036 89 x PLOTAGE); r'OO.947; P<O.OOI.
3.2. Changes of the forest structure alonghill-slopes and in undisturbed conditions
The largest structural differences in mature standsleeward of the dieback zone are found between the
4. DISCUSSION OF FIELD RESULTS
4.1. Causes of regeneration waves
The interpretation that the studied regenerationwave system is caused by wind relies not only onmorphological comparisons with published references [15, 16, 18] but also on other field evidence.First, these forest patterns are observed in northeasterly exposed hill-sIopes that lay parallel to theprevailing north-western wind. Secondly, undisturbed
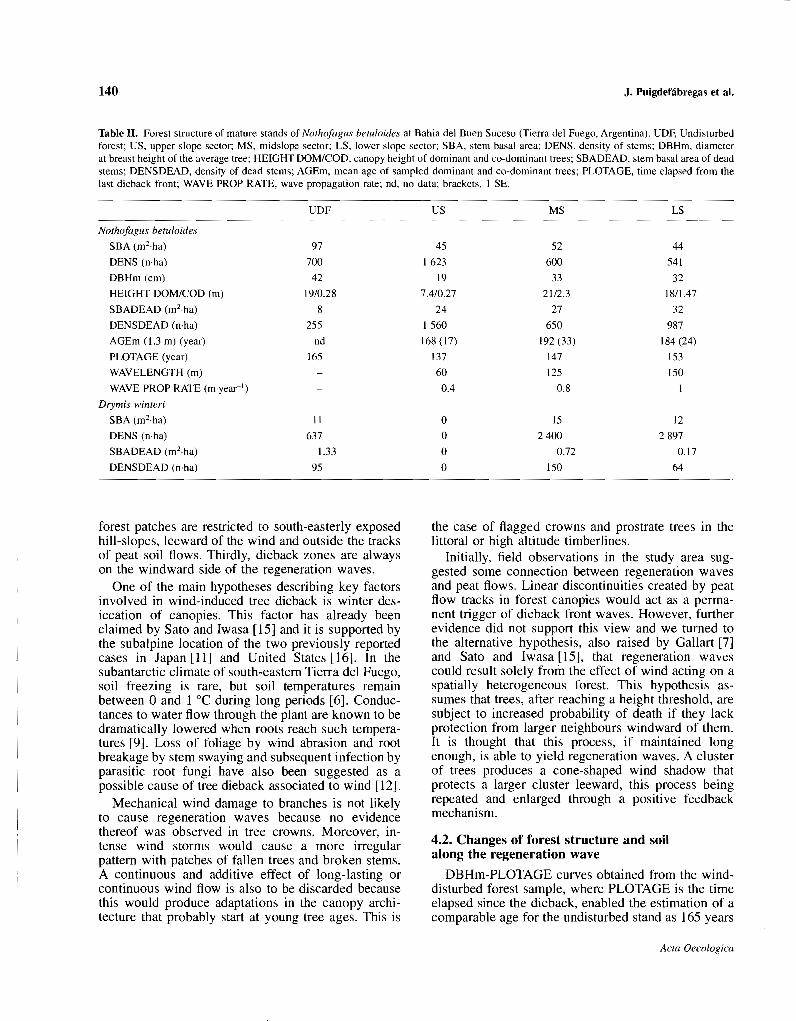
upper hill-slope stands and those from middle or lowersectors (table Il). Differences between the latter twoare slight and cannot be considered significant. Matureupslope stands lack D. winteri in the understorey, theyare 3-fold denser and trees are also around three timessmaller than those located downslope. On the contrary,stem basal areas and stand ages are of the same orderas those in downslope stands.
Wavelengths are rather variable because they areinftuenced by hill-slope local topography. Measuredwavelengths at the sampled stands, which are locatedin the most regular hill-slope sector, showed an upwards decrease ranging from 150 m at the foot-slopeto 60 m in the upper-slope.
Compared to mature stands in the wind-affectedhill-slope, the undisturbed mature stand, sampled in awind-protected slope, showed a much greater stembasal area (x 2) and a larger mean tree diameter(x 1.3). Its D. winteri population consisted of largerindividuals than in mature stands of the wave regeneration system. D. winteri stem basal area was withinthe same range of values in both cases, but density wasfour to five times lower in the undisturbed maturestand. Surprisingly, the latter did not show a highercanopy nor a lower stem density of N. betuloides.
150
•10050
~ 10,000S.!!-~"in~ 1,000
"cJ!fil ••
100 +-------,---------,--------,a
100,000
3.1.2. Changes in soil properties
Only three out of ail the soil attributes recorded atthe organic and upper mineraI horizon showed asignificant trend with the time elapsed from the lastdieback zone (table l). The three were concerned withthe mineraI horizon (Ah layer). N content, relative tosoil dry weight, declined at a rate of -0.0016 %·yeac1
•
As soil organic matter became impoverished in N, C/Nratio increased from 22 to 30, at a rate of0.0536 year". Coincidentally, oxidation conditions atthe top soil became enhanced and the redox potential(rH) increased from 271 to 355 mY, at a rate of0.65 mv-year".
Table J. Pearson correlation matrix of top soil properties and PLOTAGE (time clapsed from the last dieback front). org, Organic layer; min, upperminerai layer; LITD, litter depth; ORGD, depth of the organic layer (n =22 ; P < 0.05 =0.404; P < 0.005 =0.537; P < 0.001 =0.652).
PLOTAGE C N C/N pH (org) pH (min) rH (org) rH (min) LITD
PLOTAGE 1
C 0.11 1
N -0.48 0.35 1
C/N 0.47 0.44 --0.42 1
pH (org) -0.39 -0.33 -0.06 -D.38 1
pH (min) 0.21 -0.54 --0.40 -0.07 0.40 1
rH (org) 0.70 0.08 -0.32 0.36 -0.25 -0.15 1
rH (min) 0.31 0.16 -D.20 0.08 0.16 -0.10 0.57 1
LITD -0.35 -0.10 -0.08 -D.02 -0.01 -0.10 -0.34 -0.48 1
ORGD -0.28 -0.01 0.11 -0.20 -0.25 -0.08 -0.32 -0.18 0.60
Vol. 20 (3) 1999
140 J. Puigdefâbregas et al.
Table II. Forest structure of mature stands of Nothofagus betu/oides at Bahia dei Buen Suceso (Tierra deI Fuego, Argentina). UDF, Undisturbedforest; US, upper slope sector; MS, midslope sector; LS, lower slope sector; SBA. stem basal area; DENS, density of stems; DBHm, diameterat breast height of the average tree; HEIGHT DOM/COD, canopy height of dominant and co-dominanttrees; SBADEAD, stem basal area of deadstems; DENSDEAD, density of dead stems; AGEm, mean age of sampled dominant and co-dominant trees; PLOTAGE, time elapsed from thelast dieback front; WAVE PROP RATE, wave propagation rate; nd, no data; brackets, 1 SE.
Nothofagus beru/aides
SBA (mc·ha)
DENS (n-ha)
DBHm (cm)
HEIGHT DOM/COD (m)
SBADEAD (rrr'-ha)
DENSDEAD (n-ha)
AGEm (1.3 m) (year)
PLOTAGE (year)
WAVELENGTH (m)
WAVE PROP RATE (myear ')
Drymis winteri
SBA (rn <ha)
DENS (n-ha)
SBADEAD (rrr-ha)
DENSDEAD (n-ha)
UDF
97
700
42
19/0.28
8
255
nd
165
II
637
1.33
95
US MS LS
45 52 44
1623 600 541
19 33 32
7.4/0.27 21/2.3 18/1.47
24 27 32
1560 650 987
168 (17) 192 (33) 184 (24)
137 147 153
60 125 150
0.4 0.8 1
0 15 12
0 2400 2897
0 0.72 0.17
0 150 64
forest patches are restricted to south-easterly exposedhill-slopes, leeward of the wind and outside the tracksof peat soil flows. Thirdly, dieback zones are alwayson the windward side of the regeneration waves.
One of the main hypotheses describing key factorsinvolved in wind-induced tree dieback is winter desiccation of canopies. This factor has already beenclaimed by Sato and Iwasa [15] and it is supported bythe subalpine location of the two previously reportedcases in Japan [Il] and United States [16]. In thesubantarctic climate of south-eastern Tierra del Fuego,soil freezing is rare, but soil temperatures remainbetween 0 and 1 oc during long periods [6]. Conductances to water flow through the plant are known to bedramatically lowered when roots reach such temperatures [9]. Loss of foliage by wind abrasion and rootbreakage by stem swaying and subsequent infection byparasitic root fungi have also been suggested as apossible cause of tree dieback associated to wind [12],
Mechanical wind damage to branches is not likelyto cause regeneration waves because no evidencethereof was observed in tree crowns. Moreover, intense wind storms would cause a more irregularpattern with patches of fallen trees and broken stems.A continuous and additive effect of long-lasting orcontinuous wind flow is also to be discarded becausethis would produce adaptations in the canopy architecture that probably start at young tree ages. This is
the case of flagged crowns and prostrate trees in thelittoral or high altitude timberlines.
Initially, field observations in the study area suggested sorne connection between regeneration wavesand peat ftows. Linear discontinuities created by peatflow tracks in forest canopies would act as a permanent trigger of dieback front waves. However, furtherevidence did not support this view and we turned tothe alternative hypothesis, also raised by Gallart [7]and Sato and Iwasa [15], that regeneration wavescould result solely from the effect of wind acting on aspatially heterogeneous forest. This hypothesis assumes that trees, after reaching a height threshold, aresubject to increased probability of death if they lackprotection from larger neighbours windward of them.It is thought that this process, if maintained longenough, is able to yield regeneration waves. A clusterof trees produces a cone-shaped wind shadow thatprotects a larger cluster leeward, this process beingrepeated and enlarged through a positive feedbackmechanism.
4.2. Changes of forest structure and soilalong the regeneration wave
DBHm-PLOTAGE curves obtained from the winddisturbed forest sample, where PLOTAGE is the timeelapsed since the dieback, enabled the estimation of acomparable age for the undisturbed stand as 165 years
Acta Oecologica

Banded patterning in subantarctic forests
(table lI). The corresponding estimate of the forestband just leeward of the dieback front in the sam piedwave transect was 147 years, which is 89 % of theundisturbed stand estimate. Wind does not appear toaffect mature stand ages significantly. However, meanstem density just leeward of the dead front in thesampled wave (387 stems-ha:") was only 55 % of thedensity found in undisturbed forest (table If).
Such differences in age-density proportions allowan estimate to be made of the change in the mortalityor exponential decay coefficient, by assuming the sameequation and ordinate intercept value for both disturbed and undisturbed conditions. This is not unrealistic because the initial density of saplings is not likelyto be affected by wind. In this way, it is estimated thatmortality coefficients in undisturbed and winddisturbed conditions are 0.02935 and 0.036 89, respectively. This means a 25 % increase in mortality inwind-affected fore st.
Observed values of stem density and basal area injuvenile stands (around 100 years plot age) are extremely high (9000 and 90 m2·ha-!, respectively).Similar values were found elsewhere in N. pumilio [1Jand they are interpreted as a forest adaptation to therisk of paludification or soil swamping and blanketbog development. By building up as quickly as possible an efficient transpiring system that ensures soildrainage, paludification is avoided. Maturation offorest stands leads to a redistribution of basal area in asmaller number of big trees.
Understorey changes along the regeneration waveare controlled by the strong competition that occursduring the intermediate stage of the overstorey regeneration. High tree densities and stem basal areasexclude understorey shrubs and force D. winteri toadvance its seedling phase as soon as the N. betuloidescanopy starts to break down. In this way, maxima ofthe stem basal area in the understorey occur beforethose of the overstorey.
Topsoil changes along the regeneration wave concern redox potential values and C/N ratios. The formermay be interpreted as an effect of the progressivedrainage of the upper soil layers by the growing stand.The second is the result of leaf litter input from thegrowing N. betuloides canopy, whose leaves are sclerophyllous, slowly decomposing and have large C/Nratio [6]. Herbs and grasses (Gunnera sp., Luzuriagasp., Senecio sp. and Carex sp.), which could supplYlitter with lower C/N ratio, are progressively excludedand, once the high density stage has been established,only lichens and bryophytes remain in the groundlayer.
Vol. 20 (3) 1999
141
4.3. Changes of the wave regeneration systemaIong hiII-sIopes
The lower travelling velocity of regeneration wavesin the upper slope sectors may be explained by densermature stands with smaller trees than in downhillstands and therefore also requiring more time to die.
The decrease in tree height along the altitudinalgradient in hill-slopes has also been reported in otherFueguian forests [1J. One of the main factors that maycause stunted trees in the upper slope sectors is thetemperature decrease with altitude. As mean summertemperatures are already low (8 "C at sea level), agradient of -0.005 °Cm- i means a temperature of6.5 "C at 300 m altitude in the upper hill-slope sector.This is already a critical summer temperature for treegrowth, not far from the 5-6 "C which have beenestimated for the timberline in the area [4J.
5. MODELLING THE WAVE REGENERATIONSYSTEM
Based on these field observations, we propose a setof simple hypotheses to explain the generation anddynamic persistence of striped patterns in forests. Themain assumption is that trees thar have grown protected from wind by taller windward neighbours, afterbeing suddenly exposed by dieback of the latter, sufferincreased probability of death, and are finally killed bywind. Field observations also suggest that bandedpatterns are not triggered by linear discontinuities inthe forest, but rather result from an initially randomdistribution of ages, and a subsequent spatial synchronisation of the regeneration, maturation and senescence phases of the forest.
This hypothesis is formalised in a system structureand a model which describes its behaviour. Simulationoutputs using this model allow the above-mentionedhypothesis to be tested. A qualitative contrast withfield observed patterns will help to strengthen theconsistency of the proposed structure.
The model assumes that a forest grows in a twodimensional space, divided in square cells or plots.Each cell supports a cohort of trees which declines byself-thinning according to the exponential decaycurve: DENS t = DENSo exp(-k x n, where DENSoand DENS t are densities at time 0 and t, while k is amortality coefficient which is converted to a yearlyintrinsic death probability IDP, as IDP = 1 - exp(-k),and added with a random factor. Once self-thinninghas been applied, a wind dieback factor (WDF) cornesinto operation. This factor depends on a protectionfactor (PF) from windward neighbours, on the age of

142
the cohort and on the number of trees that can be killedin one iteration.
The protection factor is calculated as a sum of fourscores produced by the three adjacent windward cells,one straight forward, the two side diagonals, and afourth one straight forward in the second row windward. If one of these cells is occupied by at least onetree, and its cohort is older that the target cell cohort,its score is 1, except the two rows windward cell,which scores 0.5. If cohorts in windward cells areyounger than those in the target one, their score is O. Ineach case, the total score is brought to the range 0-1,by expressing it as a ratio to the maximum possiblevalue which is 3.5. The age factor (AF) is introducedas a linear function that varies between 0 and 1, whenthe cohort is I-year-old or has reached the age(AMAX) at which wind will kill the trees if they areexposed. AMAX is therefore a parameter that expresses the inverse of wind killing capacity.
NTREE is the maximum number of trees that can bekilled by wind in a single iteration. It is a scaling andtuning factor to adjust wind killing capacity to the celldimension and self-thinning coefficient chosen in eachrun.
The global wind dieback factor (WOF) is thencalculated as a product:
WOF =PF x AF x NTREE
WOF score, rounded to the nearest integer value,yields the number of trees killed in each cell, at eachiteration, in addition to the self-thinning ageing mortality. WOF may therefore take integer values rangingbetween 0 and NTREE.
Each run is initialised by distributing cohorts in thesimulation field in which age varies at random between 0 and 50 years. This upper limit for age isadopted in order to provide cohorts with some initialresistance to wind. Otherwise, the presence of oldstands from the start easily produces artefacts. Thisassumption is realistic because wind action is notexpected to start suddenly on an already developedforest, but rather to precede the forest occupation of agiven area.
ln order to simulate variations of wind effect alonghill-slopes, an option is provided in which parameterscan change in a linear way between extreme valuesthat are set at the left and right sides of the simulationfield.
J. Puigdefabregas et al.
6. RESPONSES OF THE REGENERATIONWAVE SYSTEM TO PARAMETER CHANGES
The above-described model has four parameters:OENSo' tree density in terms of number of trees percell at starting regeneration; IOP, yearly intrinsic deathprobability in undisturbed conditions; AMAX, age atwhich a tree may be killed if exposed to wind; andNTREE, maximum number of trees that can be killedby wind in each cell at each iteration.
Field information provides a basis for setting realistic values to these parameters. Starting density is setat 87 680 individuals-ha", as obtained from the empirical density-age curve (figure 5). It has to be notedthat this initial density is considered at the so-calledPLOTAGE =O. That means that time starts to becounted for ageing and height increments when overstorey trees have died out. OENSo acts as a scale factorbecause it sets the cell dimension. For this simulationsurvey, a cell size of 30 m2 has been adopted, resultingin 263 saplings per cell in starting regeneration cells.
IOP was set at 0.03, a value close to the fieldestimate for undisturbed stand which was 0.029.AMAX was set at 150, also close to the field record ofwave period or time elapsed between two consecutivedead fronts. NTREE was set at a value of 2 periteration, which is the approximate number of trees percell in mature stands leeward of dead stripes inmidslope and foot-slope positions.
6.1. Exploring responses to parameter changes
A survey was made on the system responses tochanging values of the two parameters IOP andAMAX. In both cases, parameter values were allowedto vary in a range of ± 50 % around the baseline valuesindicated above. In each run, a total of 3 000 iterationswere performed. Images of the resulting outputs areshown in figures 6 and 7.
Results show that bands perpendicular to winddirection are formed, in patterns similar to regeneration waves observed in the field. Output images showalso that there is a fetch or criticallength that is neededto start the formation of bands.
Simulation outputs show that decreasing IOP valueslead to shorter wavelengths and older trees in the windexposed mature stripes (figure 6). IOP changes arelinked to site productivity changes, because in fertilesites, trees develop faster, intra-cohort competition forlight is stronger and therefore, self-thinning and IOPare also larger. This means that stands in less productive sites attain maturity with higher densities than
Acta Oecologica

Banded patterning in subantarctic fore sts 143
IOP:AMAX:OENSO:NTREE:iters.:
0.015·0.015150 -150
2632
3000
0.045 - 0.045150 -150
2632
3000
0 oyears0000D
•••••••• 160 years
Figure 6. Simulation output showing the effect of changing intrinsicdeath probability (lDP) on wave Iengths and age distribution of waveregeneration systems. The grey tonescale represents the ages of the cohort s in each pixel. Waves propag atedo wnwind, from the top to the bortorn of the figures. IDP may beconsideree as a surrogate of the siteproductivity. Values of the parameter s are shown at the bertem ofeach image. AMAX, Age al whichtrees may be killed by wind;DEN So, number of trees per pixel atstarti ng regeneration; NTREE,maximu m number of trees that canbe killed by wind in each pixel aleach iteration ; iters., number of iterat ion s, For JDP and AMAX, thevalues sel at the right and left handof the images are supplied .
Eoo...
oooooo
••••••
o years
160 years
Figure 7. Simulation output showing the effect of changing wind killing capaci ty on waveleng ths and agedistribut ion of the wave regeneration system. The grey tone scalerepresents the ages of the cohorts ineach pixel. Wind killing capacity isexpressed by rhe inverse of AMA X,the age at which trees may be affec ted by wind , and il is higher allower AMAX values. Waves prop agate downwind, l'rom the top la thebouorn of figures. Abbrev iations asin fig ure 6.
IOP:AMAX:OENSO:NTREE:iters.:
0.03 - 0.0390 - 90
2632
3000
0.03·0.03210 - 210
2632
3000
those of more productive ones. Consequently. evenwith the sa me wind dieback factor (WOF), kill ing thetrees of an exposed cell tak es more lime in Jess
Vol. 20 (3) 1999
producti ve site s, where wave sys tems are expected totravel more slowly, as shown by their shorter wav elengths and old er ages of mature stands.

144 J. Puigdefâbregas et al.
Eoo..,
IOP:AMAX:OENSO:NTREE:iters. :
0.02 - 0.03140 -150
2632
3000
o 0 yearsoooo
•••••••• 160 years
Figure 8. Field (left) and sim ulation (right) cornparison of the hillsJope effect on wave regenerationpatterns. The system propagatesdownwind from the top to the bottom. ln both cases. upper hill-slopeis on the left and lower hill -slope onthe right. Values of the pararnetersare shown al the bottorn of thesimulation image. !DP (int rinsicdea th probabi lity) and AMA X (ageat which trees may be killed bywind) change from !eft 10 right , andthey can be taken as surro gates ofsite producti vity and wind killingcapacity, respectively, The grey tonescale represent s the ages of the cohon s in each pixel. The image on theleft is an aerial photograph of thestudied north -exposed hill-slope atBahia dei Buen Suceso (Tierra deiFuego, Argentin a). Abbrevi ations asin figure 6.
Decreasing AMAX is a wa y to incre ase wind killin gpotential by increasing WDF. The resulting pattern(figure 7) shows younger Forest stripes exposed towind, shorter wavelengths and, therefore, slower motion of the wave system. A larger WDF means thatForest stands are exposed to wind at younger stages butstill keeping high den sities, becau se self-thinning didnot operate during long periods. Therefore, killing thetrees of an exposed cell takes more time than withlarge AMAX values, and resulting wavelength s areshorter.
6.2. Qualitative contrast with field observations
The wind dieback factor (W DF) has not been fullyparametrised with field data and therefore, at thisstage, the model doe s not provide simulation outputsthat can be quantitatively compared with reality, particularly for band dim ensions. However, relativechanges of WDF acro ss the land ca n be reproducedreasonably weil , allowing qualitative comparison s between field and simulated patterns, as shown in figure 8.
The field pattern ima ge was obtained From an aerialphotograph of the stud ied hill-slope, where altitudesrange From 20 to 340 m. ln the western sector of thehill -slope (upper part of the image), the forest has beencompletely stripped off by peat soil flows. The simulated pattern was obtained by usin g parameter valuessirnilar to those observed in the real hill- slope. For this
purpose , IDP and AMAX values were ch anged laterally across the simulatio n field. ln both images, windflow cornes from the west (top).
Upper hill- sJope IDP value was estimated at 0 .02 ,ass uming that it c hanges with altitude at the same rateas observed tot al mortalities in the sa mpied stands .Field information shows thar ages of stands next todieback front are slightly lower in the upper than inlower hill-slope sectors, a lthoug h differences arehardl y significa nt. Therefore, upper hill-slope AMAXwas rated onl y 10 years younger than the lower hill slope one.
Simulated and real images show that regenerationwave s are wider and tra vel faster in the downslopesector. For thi s reason , the overall pattern appea rsdown-curved in the right side of both images. Theexistence of a fetch can also be appreciated in the topof the images, where the most windward sector of theForest is located. The fetch feature demonstrates thatdieback fronts cau sed by wind acting from line ardisturbances or acc idents ca nnot start a wave system.Dead fronts so initiated are quickly absorbed by theexisting heterog eneity of the downwind Forest structure , and the y ca n onl y progre ss if an existing wavepattern cat ch es and transm its them forward.
ln the image of the real situation, band s do not reachthe uppermost hill-slope. Instead, sm all tree island sand irregular features are observed. Near to the waterd ivide , w ind veloc ity increases and becomes more
Acta Oecologica

Banded patterning in subantarctic forests
persistent. In such conditions, trees are exposed towind since their youth, and their crowns adopt avariety of adaptive architectures that increase theirsurvival probability. Wind protection is dependent onthe local existence of wind-adapted individuals and,therefore, spatial patterns are less regular and bandsare no longer formed. The proposed model is not ableto reproduce such local features because individualadaptive processes are not included in it.
7. CONCLUSIONS
Field observations on wave regeneration patternsfrom a subantarctic forest of Nothofagus betuloides ineastern Tierra dei Fuego show that wind action is themain controlling factor. Compared to undisturbedforest stands, the most mature stages of wind-affectedforests show a significant reduction of stem basal area.Across the regeneration waves, growth and decayphases occur, together with self-thinning, biomassredistribution, and temporary exclusion of the understorey, which is mainly composed of Drymis winteri.Sorne topsoil properties, such as C/N ratio and redoxpotential, increase across the regeneration wave, during the growth of the stand. Field evidence suggeststhat banded patterns arise dynamically as a consequence of the formation of a circular sector, leeward ofeach tree, where younger trees can grow protectedfrom wind.
A model has been proposed to explore the consistency of this hypothesis by comparing the variation ofsimulated patterns, as a response to changes of keyfactors and parameters, with those observed in nature.The model incorporates sorne demographie processesand is therefore able to simulate real situations observed on hill-slopes.
Sorne assumptions of the model are as follows. Therelationship between tree height and age is supposed tobe linear, while field results show a logistic trend. Anyyounger stand windward means unprotection, and nothreshold is considered for such age differential. Treeresistance of a tree suddenly exposed to wind damagedecreases linearly with age. Wind protection is independent of tree density of windward stands. Despitethese over-simplifications, simulation outputs qualitatively match field observations.
The model predicts that larger tree growth rates leadto longer wavelengths and higher propagation rates,while an increase of wind killing capacity leads toshorter wavelengths and lower propagation rates. Thisis supported by field observations according to whichin upper slope sectors with lower growth rates and
Vol. 20 (3) 1999
145
higher wind intensity, wavelengths are shorter than infoot-slope situations.
Therefore, wave regeneration patterns would be theoutcome of a resonance between tree growth-decaycycles and wind killing capacity, and might arise bywind action on an initial forest with random agedistribution. This case suggests a more formaI researchon how anisotropy may result from the interactionbetween a vectorial process and an initially isotropiesystem.
Acknowledgments
This work was funded by the CONICET (Argentina) / CSIC(Spain) Convention and the SUBANTARCTIS Project (CONICET).The support from both programmes is gratefully acknowledged.
REFERENCES
[II Allogia M.. dei Barrio G., Bianciotto O., Ferrés L., Gallart F.,Puigdefabregas J., Efectos de los aludes sobre la dinamica deIbosque de Nothofagus betuloides, in: Puigdcfabrcgas J.,Garcia-Novo F., Frangi J., Vila A. (Eds.). Los SistemasNaturales Subantarticos y su Ocupaci6n Humana, CSIC,Madrid, 1999, in press.
[21 Burgos U., Clima dei extremo sur de Suramérica, in: BoelckeO., Moore D.M., Roig F.A. (Eds.), Transecta Botanica de laPatagonia Austral 2, CONICET-Royal Society-lnstituto de laPatagonia, Chile, 1985, pp. 10-40.
13] Cabaneiro A., Solé A .. Bianciolto O., Puigdefabregas J.,Formaci6n y evoluci6n de suelos en los principales sistemasforestales deI sector oriental de Tierra deI Fuego, in: Puigdefabregas 1.. Garcïa-Novo F., Frangi J., Vila A. (Eds.), LaTierra deI Fuego: Los Sistemas Naturales y su Ocupaci6nHumana, CSIe, Madrid, 1999. in press.
14] deI Barrio G., Puigdefabregas J., lturraspe R., Régimentérmico estacional en un ambiente montaüoso de Tierra deIFuego, con especial atencion al limite superior dei bosque,Pirineos 132 (1988) 137-148.
[5] Etchevere P.H., Maczynski C.R.O.. Los Suelos de Tierra deIFuego. INTA, Buenos Aires, 1963, 25 p.
161 Frangi .I.L., Richter L.L .. Estructura y funcion de ecosistemasforestales fueguinos, in: Puigdefabregas J., Garcfa-Novo F.,Frangi J., Vila A. (Eds.), La Tierra dei Fuego: Los SistemasNaturales y su Ocupaci6n Humana, CSIC, Madrid, 1999, inpress.
[71 Gallart F., Algunos ejemplos de utilizaci6n de técnicas desimulacion en geomorfologfa, in: Gutierrez M., Peiia J.L.,Lozano M.V. (Eds.), Actas de la 1 Reuni6n Nacional deGeomorfologfa, vol. 2. lnstituto de Estudios Turolenses,Teruel, Spain, 1990, pp. 773-787.
[81 Gallart F., Clotet-Perarnau N., Bianciotto 0 .. Puigdefâbregas1., Peat soil flows in Bahia dei Buen Suceso, Tierra dei Fuego(Argentina). Geornorphology 9 (\ 994) 235-241.

146
[9] Hinckley T.M., Goldstein G.H., Meinzer E, Teskey R.O.,Environmental constraints at arctic, temperate-maritime andtropical treelines, in: Turner H., Tranquillini W. (Eds.), Establishment and Tending of Subalpine Forest: Research andManagement, Rapports Institut Fédéral de RecherchesForestières n° 270, Birmensdorf, Switzerland, 1985, pp.21-30.
[10] lturraspe R., Sottini R., Schroeder c.. Escobar J., Generaci6nde informaci6n hidroclimâtica en Tierra deI Fuego. Hidrologfay Variables Climâticas deI Territorio de Tierra dei Fuego,Informaci6n basica, CONICET-CADIC. Contribuci6n Cientffica n° 7, Ushuaia, Argentina, 1989, pp. 4-170.
[II] Kohyama T., Etiology of 'Shigamare' dieback and regeneration in subalpine Abies forests of Japan, GeoJournal 17 (1988)201-209.
[12] Marchand P.J., Goulet EL., Wave mortality in subalpine forestecosystems with particular reference to foliage and rootattrition in Abies balsamea, White Mountains, New Hampshire (USA), in: Turner H., Tranquillini W. (Eds.), Establishment and Tending of Subalpine Forest: Research and Management, Rapports Institut Fédéral de Recherches Forestièresn° 270, Birmensdorf, Switzerland, 1985, pp. 173-177.
J. Puigdefâbregas et al.
[131 Prohaska F., The climate of Argentina, Paraguay and Uruguay,in: Schwerdtfeger W. (Ed.), Clirnates of Central and SouthAmerica. World Survey of Climatology, vol. 2, ElsevierScientific Publishers, 1976, pp. 13- 112.
[14] Reiners W.H., Lang G.E., Vegetational patterns and processesin the balsam fir zone, White Mountains. New Hampshire,Ecology 60 (1979) 403--417.
[15] Sato K., lwasa Y.,Modeling of wave regeneration in subalpineAbies forests: Population dynamics with spatial structure,Ecology 74 (1993) 1538-1550.
[16] Sprugel D.G., Dynamic structure of wave regenerated Ablesbalsamea forests in the north-eastern United States, J. Ecol.64 (1976) 889-911.
[17] Sprugel D.C., Characteristics, causes and consequences ofwave regeneration in high-altitude forests. in: Turner H..Tranquillini W. (Eds.), Establishment and Tending of Subalpine Forest: Research and Management, Rapports InstitutFédéral de Recherches Forestières n° 270, Birmensdorf,Switzerland, 1985, pp. 179-188.
[18] Sprugel D.G., Bormann F.H., Natural disturbance and thesteady state in high altitude balsam fir forests, Science 211(1981) 390-393.
Acta Oecologica

Acta Oecologica 20 (3) (1999) 147-158 / © Elsevier, Paris
The influence of vegetation pattern on the productivity,diversity and stability of vegetation:
The case of 'brousse tigrée' in the Sahel
Pierre Hiernaux a*, Bruno Gérard b
" international liuestock ResearcnInstitute (Il Rl), [CRiSA7; B.P i2404 Niamey, Niger." lntrrruuional Croj: Research lnsntutejor the Semi-Arid Tropics ([CRI.~AT), [CRl,~Ki; B.P 12404 Niamey, Niger.
* Corresponding author (fax: +227752208; e-mail: [email protected])
Received March 17, 1997; revised Novcmber 10, 1998; accepted Novernber 12, 1998
Abstract - Sample sites of 'brousse tigrée' and related vegetation types are described for Mali and Niger. Species composition and physicalstructure of the herbaceous layer as weil as woody plant population were recorded at ail sites together with data on soils and natural resourcemanagement. Herbage yield was measured whereas foliage yield and wood mass were calculated using allometry equation calibrated for eachspecies. 'Brousse tigrée' is characterizcd by the rcgularly alternating bare-soil stripes with dense linear thickets arranged perpendicularly to theslope. There was no c1ear superiority in total plant production of 'brousse tigrée' when compared to neighbouring site with diffuse vegetation.However, the pattern of 'brousse tigrée' tended to favour woody plant yield to the detriment of herbage yield. The number of herbaceous speciesrecorded per site (22-26) was slightly above Sahelian vegetation average despite low number of species per l-m? quadrat (6-9), bare soilexcluded, This species richness reflects the diversity in edaphic niches resulting from the redistribution and local concentration of waterresources and shade. The high spatial heterogeneity and species richness of the herbaceous layer in 'brousse tigrée' did not attenuate theinterannual variation in herbage yield despite low yields. Except for the herb layer, little evidence was found of grazing influence on thevegetation structure and yield a few hundred metres away from livestock concentration points. On the other hand, the clearing of thickets forcropping led to severe soil erosion which threaten the resilience of 'brousse tigrée'. These observations and the well-defined climatic, soil
and topographie situations under which the 'brousse tigrée' occurs invalidate the hypothesis of an anthropic origin of that vegetationpattern. © Elsevier. Paris
Vegetation pattern i patchiness i diversity / herbage yield / wood mass / vegetation dynamics / Sahel
1. INTRODUCTION
'Brousse tigrée' differs from other Sahelian vegetation types by the dominance of woody plants and apattern characterized by the regularly alternating baresoil stripes with Iinear and dense thickets (figure 1).The bare stripes act as impluvium for the thicketswhich are linear shaped following the contours.'Brousse tigrée' develops naturally in the Sahel between the isohyets 400 and 600 mm on poorly permeable soils, often composed of a very thin silty horizonthat caps the bedrock or an indurated pan, located onuniform and very gentle slopes [10], Variants of'brousse tigrée' have been distinguished based onpattern characteristics such as width and shape of the
thickets and bare stripes [2] and on the dominantwoody species [17]. Locally, the vegetation patterncan range from uniform 'diffuse scrub' to weil patterned 'brousse tigrée' of variable impluvium andthickets width, all with similar woody species composition. Neighbouring sites with diffuse serub and'brousse tigrée' sampled in Mali and Niger wereanalysed to test the following hypotheses: higherspatial heterogeneity of the vegetation pattern increases: 1) vegetation diversity; 2) vegetation productivity [21]; 3) higher spatial heterogeneity and speciesdiversity of the herbaceous layer attenuate interannualfluctuations in herbage yields [1, 26]; 4) 'broussetigrée' has an anthropic origin; 5) clearing, woodcutting and grazing by Iivestock cause the 'broussetigrée' pattern to degrade [4].

148 P. Hiernaux, 8. Gérard
lm
L
Diffuse scrub
0.30
~0 E
Soilhorizons S L C S L C S L C S L C S L C
0 - 6 cm 63 35 02 73 23 04 69 29 02 76 23 01 74 :l5 016 ·12 cm 62 33 06 60 30 10 67 31 02 60 31 09 71 26 03
12 ·25 cm 63 41 06 37 36 27 28 54 18 50 32 18 63 29 0825 -50 cm 56 34 10 37 36 27 33 37 30 42 32 26 55 33 12
DOWlHilope Core Upslopeedge edge
.. ~ .. ~ ..Thicket Impluvium Thicket
O.lm
0.15
Figure 1. Scheme of the vegetation pattern , terrain topography and soil texture profiles (Ioose soil onl y) for neighbouring ' brousse tigrée ' anddiffuse scrub sites in Nampala (Mali).
2. METHÛDS
Data from three different studies by the International Livestock Centre for Africa (lLCA , now (LR[)in collaboration with the Malian Institute of RuralEconomy ([ER) and the National Institute of Agriculture Research in Niger (lNRAN) have been used inthis paper. 'Brousse tigrée' and related vegetation siteswere characterized in the regional assessment andmapping of pastoral resources conducted in a region ofMali centred on the flood plain of the Niger River,known as Macina, and extending to adjacent uplandsto the west and north (figure 2). Other sites werecharacterized in the Gourma study which extended tothe south of the Niger river between Timbuktu andGao down to the border with Burkina Faso. Theobjective of that study was to monitor changes invegetation ( 1984- 1993) following the major drought
in 1983-84 [II]. The third group of ' brousse tigrée 'sites were described and monitored ( 1994- 1998) inwestern Niger (Fakar a) in a study on the role oflivestock in nutrient cycling within Sahelian agroecosystems.
2.1. Field rneasures
Herbage yields, pattern and species composition, asweil as woody plant population density and speciescomposition were recorded at all sites together withdata on soils and resource management. However,because of differences in scale and aims, the samplingdesigns differed between studies. ln the Macina study,the classification of the vegetation types was based ona correspondence analysis of descriptors including thelist of herbaceous species, recorded in 400 plots,10 x 10 m in size, distributed over the area stratifi edby cIimatic zones subdivided by edaphic units based
Acta Oecologica

The influence of vegetation patterns
[J Flood plains
Il Alluvial plains
+ 'Brousse tigrée' sites
o Other scrub sites
'"
a
.. .. .. . .. .....
KM
50 100 150 200
149
Figure 2. Situation map of the 'brousse tigrée' and related vegetation sites studied within the Sahel of Mali and Niger.
on soil texture and flood regime, in tum subdivided bythe type of land use [31] . Herbaceous standing mass atthe end of the g rowing season was destructivel ymeasured in 1 x 1 m plot s placed in each facies whosearea with in the 10 x 10 m plot was visually assessed .To better c harac terize the woody plant populationcomplementary observations were made in 100 ofthese sites. They consisted of exhaustive counting ofthe woody plants encountered in each of sixteenadjacent 10 x 10 m plots arranged in a 160-m Jongtransect band [15] . Les s frequent species were alsorecorded in bands adj acent to one side of the transectband and of increasing width (10, 20, 40, 80 m) so thatthe total area investigated was 160 x 160 m. Eachplant recorded was ch aracterized by its species name,canopy dimensions, number and trunk circumference.
The same wood y plant descriptors were observed inthe Gourma and Fakara stud ies but in a differentsampling design . The plot s were c irc ular and centredon four points located randomly along a linear tran sectof 1 000 m (Gour ma) or 200 m (Fakara) lon g, se t
Vol. 20 (3) 1999
perpendicul ar to the major ecological gradi ent in thesite. Th e radius of the circular plot was chosendepend ing on the density of the spec ies in the stand. Asa result the s ize of the individual plot s ranged between1/64 and 1 ha. In patterned vege tation, th ickets andimpluvium were sampled separately. At all s ites,foli age yield and wood mas s were estimated usingallometric relations established, for eac h species, between yield or mass and the basal circumference of thestems [6, 18, 28].
ln the Gourma and Fakara studies, herbage coyer,standing mass and species composition were recordedusing a two-Ievel stratified random sampling design:major differences in vegetation induced by terrainfeatures (such as impluvium and thicket oft en subdivided into upstream, core and downstream bands)were identified as facies sampled ind ividually. Fourstrata were systematically di stin gui shed within eachfacies on the base of the apparent density of thevegetatio n: bare soil , low, medium and high density.The areas covered by each strata within facies were

150
measured along linear transects of 1 000 m (Gourma)or 200 m (Fakara), which were used to weigh thevegetation parameters. Weighed averages and variances were calculated for each site following Cookand Stubbendieck [7]. In the Gourma study, a virtualsample of fifty plots was created using a randomgenerator for normal distribution applied to each stratain proportion of the area it covered, each strata beingcharacterized by the mean and variance of the herbagemass measured in quadrats. The mean and variance ofthe virtual random sample were calculated and thecoefficient of variation of that mean used to estimatespatial heterogeneity. Interannual variability was estimated by the coefficient of variation of the interannualmeans calculated over 10 years [16].
2.2. Remote sensing
To better characterize the vegetation pattern of'brousse tigrée', aerial photographs were scanned at aresolution of 300 dpi for panchromatic prints whereascolour slides were processed and transferred to CDROM at a Kodak laboratory. After correction forcontrasts, pixel brightness was used to classify vegetation and soils using Adobe Photoshop software. In thecase of colour slides, the analysis was done on the redband reflectance data in order to enhance the contrastbetween vegetation and soils [14]. Neighbouring'brousse tigrée' and 'diffuse scrub' sites located lessthan 5 km from large water points and across a majorand historical transhumance track were studied toassess the effect of high intensity of trampling andgrazing by livestock on the vegetation pattern. Anaerial photograph (IGN mission 75 MAL 32/500,photo 875) was scanned over an area of 3 x 3 kmcentred on the transhumance track. Isolated trees andthicket were identified by a classification of pixelbrightness. The image was then vectorized and imported in Atlas GIS. The mean and total areas occupiedby tree crowns or thickets were derived for 100-mwide corridors drawn parallel to the central axis of thetranshumance path and at distances ranging from 0 to600 m on either side of the track.
3. RESULTS
3.1. Woody species composition
From the results of the correspondence analysis ofthe Macina data [17] and observations in Gourma andNiger, species composition of 'brousse tigrée' wasrelated to average rainfall and to the texture of the topsoil (figure 3). A few species including Combretum
P. Hiernaux, B. Gérard
micranthum'; Pterocarpus lucens (although absent ineastern Burkina Faso, Niger and northern Nigeria),Boscia senegalensis, B. angustifolia, Grewia fiavescens, G. bieolor, Acacia ataxacantha and Guierasenegalensis constituted the core of what cou Id beconsidered as the archetype 'brousse tigrée'(figure 3A). This archetype was found between theisohyets 400 and 600 mm-yr", on poorly permeablesoils with a thin silty horizon overlaid on ferralitichardpans (figure 1). Variants were found when top soilwas more loamy (figure 3B) or more sandy (figure 3C).Below 400 mm mean annual rainfall, 'brousse tigrée'was gradually replaced by open scrubs whose speciescomposition depended on top soil texture (figure 3D,E, F), while above 600 mm there was gradual transition towards the 'Iow trees and shrub savannah' foundon the shallow soils of the northern sub-humid zone(figure 3H). Whatever the variant considered, thewoody species composition of 'brousse tigrée' was notdistinctive of that particular vegetation pattern. Diffusescrubs with similar woody species composition werefound in environment very similar to those of 'broussetigrée' except for the terrain slope (figure 1). Moreover, vegetation with similar species composition alsooccurred on deep alluvial soils of the fossil flood plainof the Niger river in Mali (figure 2). The f1atness of theterrain and the low permeability of the alluvial soilsresulted in ecological niches equivalent to the nichesfound on the shallow soils of 'brousse tigrée' [17].
3.2. Vegetation pattern
Patchy patterns are common in arid and semi-aridvegetation [8, 12, 30] among them the 'brousse tigrée'pattern is characterized by regularly alternating baresoil stripes with linear and dense thickets set perpendicular to the direction of the gentle slope. In thestudied sites, the impluvium to thicket area ratioincreased when annual rainfall decreased (table f). Theaverage width of the pattern period (impluvium +thicket) varied with slope and top soil texture. In thedryer situations, sand may deposit across the barestrips and, depending on the orientation of the thicketrelative to the dominant winds, sand may accumulateon the windward side of the thicket [20].
Two of the range sites monitored in northernGourma between the isohyet 300 and 200 mm (indicated as 'very open scrub' in figure 5) were patternedand functioned as 'brousse tigrée' although theirthickets were few and far apart at the onset of
1 Taxa are named ufter the second edition of the Flora of WestTropical Africa, 1954-1972. by J. Hutchinson and J.M. Dalziel,re-edited by R.W.J. Keay and EN. Hepper, Crowns Agents forOverseas Governments and Administrations, London, vol. \-3.
Acta Oecologica

The influence of vegetation patterns 151
Openscrub
Densescrub
Law treeand
shrubsavanna
'Broussetigrée'
&diffusescrub
Chart of woody species composition
getation
he Sahel
r·piëïëopslsSubë;.ësa························JBombax costatum
i Pterocarpus erinaceus Saba senegalensis
U~~~r.~9.~p..~r!!.'.~~..~~~!~.~?~.':1.~ ~~~g.i.~.p.~.~~~.~? .
r lnof 'brousse tigrée' ve
F 6.4 (2.1)Mean (s.d.)of the number in tofwoodyspecies per site Maerua crassifolia-, Acacia erhenbergiana
E 11.5 (2.5)Balanites aegyptiacaGrewia villosa D 6.4 (2.6)
Euphorbia balsamifera Acacia laetaCalotropis procera
A 10.4 (4.1) Commiphora africanaCombretum aculeatumAcacia senegal Combr. micranthum Maerua crassifoliaAcacia raddiana Pterocarpus lucens Cadaba glandulosaBalanites aegyptiaca
Boscia senegalensis Grewia tenaxBoscia angustifolia
C 13.0 (4.8)Acacia ataxacantha B 11.5 (3.7)
Guiera senegalensisGrewia flavescens
Grewia bicolorCombretum glutinosum
Guiera senegalensisAnogeissus leiocarpus
Dichrostachys glomerata Feretia apodantheraCombretum nigricans Grewia bicolor Dalbergia melanoxylonSclerocarya birrea
G 13.5 (0.5)Ziziphus mauritiana
Ziziphus mauritiana Piliostigma reticulata
Combretum passargeiAcacia seyal
:................................................Gardenia sokotensis iH 17.0 (8.0)Acacia macrostachya !
Lannea microcarpa i Lannea acidai Sterculia setigera
Annual a fa Il(mm)
400
600
80 60 Top soil sand content (%)
Figure 3. Species composition of 'brousse tigrée' and related vegetation in relation to c1imatic and soil texture conditions.
observations in 1984. Ten years later, the spatialpattern and composition of the vegetation were totallymodified and the vegetation could not be consideredpart of 'brousse tigrée' any longer. The herbaceouslayer has been the first to suffer from a succession ofdry years. Herbaceous cover and yield declined andthe herbaceous layer fragmented into scatteredpatches. However, herbaceous species diversity wasmaintained in a few refuge niches. Then, as the drycondition persisted, most of the woody plants diedwith the exception of Boscia senegalensis and Maerua
crassifolia shrubs. A few species such as Acaciaerhenbergiana and Commiphora africana for thewoody plants, Microchloa indica, Tragus berteronianus and Schoenefeldia gracilis for the grasses startedto establish with better rains in 1988 and 1990.However, these new corners spread in linear patternsalong the new network of gullies that resulted from thechange from sheet run-off to concentrated run-off.
'Brousse tigrée' and related diffuse scrub are distributed on shallow soils irrespective to rural popula-
Vol. 20 (3) 1999


The influence of vegetation patterns 153
Table II. Changes from 1950 to 1995 of the area covered by thickets and bare soil impluviums in two 'brousse tigrée' sites from the Fakararegion (Kodey, Niger) subjected to intense forestry and pastoral use and partially cleared for shifting millet and sorghum crops.
Site
Peyrel
Raneo
Year Period width (m) Thicket relative area (%) Impluvium relative area (%)
mean s.d. Dense Open Total Gravels or Bare silty or Totalstand stand thicket herbs sandy soils impluvium
1950 55 10 10.7 45.9 56.6 27.1 16.3 43.4
1995 10.9 10.0 20.9 21.6 57.5 79.1
1950 95 21 19.0 30.7 49.7 15.0 35.3 50.3
1995 3.6 6.3 9.9 4.8 85.3 90.1
rarily flooded sites. The direction of differences between neighbouring diffuse and patterned vegetationwas not constant. The average numbers of herbaceousspecies recorded per site (flora richness) in 'broussetigrée' and diffuse scrub were comparable and rangedbetween 22 and 26 (table Ill), while average numbersof species recorded per quadrat, excluding barepatches, ranged between 6.7 to 9.0. In contrast towoody plants, the flora richness of the herbaceouslayer of 'brousse tigrée' and related diffuse scrub wasslightly superior to Sahelian vegetation average, whilethe average number of species per quadrat was inferior.
3.4. Herbaceous plant production
In the Macina study, the herbaceous yield of'brousse tigrée' was 489 kg DM·ha- i compared to1 194 kg DM·ha- ' for neighbouring diffuse scrub (table IV). In the Gourma, from 1984 to 1993, the annualherbage yields of the 'brousse tigrée' site averaged177 (SE 42) kg·ha- I compared to 927 (SE 203) kg-ha"!
for the neighbouring diffuse scrub and the average ofthe coefficient of variation of the mean herbage mass(virtua1 random sampling of fi ft Y quadrats) were441 % (SE 63) and 131 % (SE II) respectively. Theinterannual variability of the herbage production wasassessed by the coefficient of variation of the interannuai production mean which was 76 % in 'broussetigrée' and 69 % in the diffuse scrub. In the Fakara,from 1994 to 1996, the average herbage yield of theheavily grazed 'brousse tigrée' site was 363 (SE 137)kg DM·ha-1 compared to 507.3 (SE 134.7) kg·ha- I inthe heavily grazed diffuse scrub site, and the averagesof the coefficient of variation of the mean herbagemass were 124 and 90 %, respectively. There was thusa large superiority of the herbage yield in diffuse scrubcompared to 'brousse tigrée' in aIl sites and years.There also was a difference of magnitude in the spatialheterogeneity of the herbaceous layer as indicated bythe coefficient of variation of the herbage mass whichwas much larger in 'brousse tigrée' than in diffusescrub, at least when the site was not too heavilygrazed.
Table III. Woody and herbaceous species richness per site, and average number of herbaceous species recorded per l-rrr' quadrat in 'broussetigrée' (BT) and diffuse scrubs (OS) sites from three study zones in the Sahel.
Study Vegetation Woody plants Herbaceous plants
zone pattern Area sampled Sites Species Area Sites Species Speciesx x recorded sampled x recorded recorded
replicates years per site x years 1m2 Isite
replicates------- -_._--_.
(rn ') mean s.d. (rn ') mean s.d. mean s.d.
Macina BT 1600 x 4 1 9
OS 1600x4 4 8.5 2.5
Gourrna BT 312.5/2 500 x 4 3 7.7 0.5 1 x 12 9 7.7 0.9 22.5 3
OS 2500 x 4 3 15 2.2 1 x 12 10 9 1.1 23.2 1.4
Fakara BT 312.511 250 x 4 2 8.5 0.5 1 x 12 2 6.7 2.5 22.5 1.5
OS 625 x 4 2 5.5 0.5 1 x 12 4 7.8 1.3 26.5 5.8
Vol. 20 (3) 1999

154 P. Hiernaux, B. Gérard
Table IV. Contribution of herbaceous species grouped by Iife-type and palatability classes to the herbage mass of the structural units of 'broussetigrée' compared to the diffuse scrub (Macina sites, Mali).
Grasses 'Brousse tigrée'and forbs
Thicketpalatibility
Upstream edge Core Downstream Total thicketedge
Area (%) 17 17 16 50
Good 3.3 1.8 4.4 2.8
Mediocre 3.6 5.2 8.8 5.2
Poor 10.7 1.8 1.1 3.9
Total grasses 17.6 7.8 14.3 11.9
Good 0.4 0 l.l 0.4
Mediocre 77.9 80.4 70.3 77.6
Poor 4.1 10.8 14.3 10.1
Total forbs 82.4 91.2 86.7 88.1
Herbage yield 2618 430 332 952(kg DM·ha")
Impluvium
50
10.4
5.2
26.8
42.4
35.3
10.5
11.8
57.6
25
Total'broussetigrée'
100
6.6
5.2
15.4
27.1
17.9
44
10.9
72.8
489
Diffusescrub
100
2.3
3.7
6
12
59.7
16.5
11.8
88
1 194
As illustrated by the Macina site data (table IV), thespecies composition of the herbaceous layer of'brousse tigrée' was generally dominated by dicotyledons, especially in the thicket where they were betteradapted to dense shade. Among the grasses, most ofthe species were found at the upstream edge of thethicket and were adapted to temporary soil waterlogging. The feed quality and palatability of theherbage was usually low with the exception of a fewplants that colonize the sandy deposits such as Zorniaglochidiata, an annual legume promoted by heavygrazing, Schoenejeldia gracilis and Brachiaria xan-
tholeuca, annual grasses, or Andropogon gayanus, aperennial grass.
3.5. Woody plant productionThe patterned structure of 'brousse tigrée' translated
into contrasting densities and composition of woodyplants between impluvium and thicket, and also between the upstream edge, core and downstream edgeof the thicket (table V). Compared to neighbouringdiffuse scrub, the high density of the woody plants inthe thicket approximately compensated for the verylow density in the impluvium. With the exception of
Table V. Density of woody plant species per structural units of the 'brousse tigrée' compared to diffuse scrub (Macina sites, Mali).
Woody species Density of woody plants in 'brousse tigrée' (ha') Density
Thicket Impluvium Totalin diffuse
scrub (ha')Upstream Core Dowstream Total thicket
'brousse
edge edgetigrée'
area (%) 17 17 16 50 50 100 100
Pterocarpus lucens 206 439 150 308 38 173 250
Combretum micranthum 219 811 925 691 8 350 281
Boscia senegalensis 156 321 325 281 39 160 200
Dichrostachys glome rata 31 8 4 12
Grewia fiavescens 25 6 3 50
Acacia ataxacantha 6 50 14 7 19
Guiera senegalensis 656 473 25 407 15 211
Grewia tenax 25 6 3
Ali species 1300 2044 1500 1721 81 901 812
Acta Oecologica

The influence of vegetation patterns 155
Table VI. Woody plant density, foliage and wood masses of &Isquo;brousse tigrée' (BT) and diffuse scrub (OS) sites in three regions of theSahel.
Study Vegetation Component Area Woody plant density Wood mass Leal' masszone type facies (%) (ha:') (kg OM ha') (kg OM·ha- l )
Macina BT thicket 50 1721 11095 1402
impluvium 50 81 68 8
ail 100 901 5030 705
OS 100 812 11621 1263
Gourma BT thicket 13 2091 47366 4213
impluvium 87 210 143 II
ail 100 207 4388 389
OS 100 220 1938 123
Fakara BT thicket 30 4519 53820 4109
impluvium 70 151 572 79
ail 100 2335 27196 2094
OS 100 2243 6037 2221
the Macina site, foliage and wood masses were higherin the 'brousse tigrée' than in diffuse scrub even atlower density of woody plants (table VI). The largersize of individual plants and longer span of thegrowing season allowed by the spatial concentration ofresources in the thicket, could explain the superiorityof 'brousse tigrée' foliage production and wood massdespite inferior plant density. Indeed, the partition ofthe wood mass per size of logs: large logs from thetrunks and main branches, and small wood frombranches, showed a higher proportion of large logs in'brousse tigrée' than in associated diffuse scrubs.'Brousse tigrée' and related diffuse scrub rank amongthe more productive vegetation types in the Sahel interm of woody plant products. In the studied 'broussetigrée' sites, woody plant production spanned widelyfrom 689 to 2094 kg DM·ha-l·yc l for foliage whilethe standing wood mass varied from 4 388 to27 196 kg DM-ha- I (table VI). Production in 'broussetigrée' was not systematically superior to the production in diffuse scrub despite the close density of woodyplant observed within each pair of neighbour sites. Thepalatable fraction of the foliage production of 'broussetigrée' varied largely depending on species composition from 44.5 and 46.8 % palatable foliage in theMacina and Gourma, respectively, to only 1.3 % in theFakara. The use of these browse resources was furtherlimited by the difficulty of access for the animais, dueto the height of sorne trees and the high density of thethickets. Standing wood in 'brousse tigrée' was composed of about 70 % of trunks and large branches and30 % of minor branches, and number of species suchas Pterocarpus lucens and Combretum ssp. providedgood quality fuel wood.
Vol. 20 (3) 1999
4. DISCUSSION
4.1. Flora richness and diversity
The wide array of ecological niches created by thespatial concentration of water, nutrients and shadecouId explain the relatively rich herbaceous florarecorded in the 'brousse tigrée' and diffuse scrub sites(hyp. 1 validated). However, the larger contrasts between niches in 'brousse tigrée' compared to diffusescrub did not result in a richer flora (hyp. 1 invalidated), perhaps because of the high fragmentation ofthe herbaceous layer in 'brousse tigrée'. The lowermean number of species per quadrat in 'brousse tigrée'supports this argumentation but the edaphic specialization of each niche (xeric in the bare soil impluvium;hydromorphic at the upstream edge of the thicket;sciaphyllous within thicket) cou Id also contribute toexplain the limited number of species recorded perquadrat. The same principles should apply to thewoody plants. However, the woody flora was relatively poor whatever the pattern of the vegetation (hyp.1 invalidated). This couId indicate that niche diversification is less effective for woody plants, perhapsbecause competition is more severe as plant sizeincreases [1].
4.2. Herbage and woody plant yields
Large extent of bare soils in the impluvium is themain reason for low herbage yields in 'brousse tigrée'compared to neighbouring diffuse scrubs (hyp. 2invalidated). The impluvium is very hostile to plantdevelopment because of the shallowness of the topsoil, associated to surface crusting. This causes sheet

very open scrubr--* j;;;~)'OU'" tigrée'
-/""' .
diffuse scrub -----tr .//•... // f). • f).
~//:f(}••
.4..J / li • Log(CVS) =0.088 + 1.469Iog{CVT)
r2 = 0.55
156
"""' 1,000?F-U)
> 500U'--'
>< 3004)"0
200.8
:Ê100
~'Co:l> 503- 30o:l0..
U) 205 10 20 30 50
Temporal variability index (CVT %)100
P. Hiernaux, B. Gérard
Figure 5. Relationship betweenspatial heterogeneity and temporal variability in herbage massfor 24 Sahelian sites (Gourma.Mali). The regression is estabIished between the logarithm ofaverage coefficient of variationof annual mean herbage mass(CYS) and the logarithm of thecoefficient of variation of the10 years interannual mean of theherbage mass (CYT).
--_._-- -----,soil texture: Sand Sand Sand Silt Clay
1
grazing intensity: low medium high high high
• • f). * ()------- ---------
run-off to redistribute most rainfall downstream to thedetriment of the impluvium soil moisture [25]. Inaddition, the herbaceous layer is very sparse in thecore of the thicket because of the dense shade. Thespatial redistribution of water and nutrients benefitsperennial plants, especially woody plants, allowing forthe development of dense and multi-layered forestislands instead of a diffuse scrub, Annual wood production has not been measured, however; only annualfoliage production compensated for inferior herbageyields in 'brousse tigrée' (hyp. 2 validated). Thestanding wood mass was superior in 'brousse tigrée'than in the neighbouring diffuse scrub in the Gourmaand Fakara sites as observed in another site in westernNiger [19], but not in the Macina site (hyp. 2 partiallyvalidated). The concentration of resources on a portionof the area extends the duration of the growing seasonin that spot to the benefit of the productivity oflong-cycle plants and reduces the risk of plant mortality in that niche [21]. On the other hand, redistributionof resources may also increase losses through run-offspill over out of the patterned vegetation unit duringlarge rain events or through deep percolation andleaching under the thickets [13]. The effect of patterning on the overall vegetation productivity will dependon trade-offs between productivity benefits for thewoody plants in the thicket and resource losses byrun-off and deep percolation.
4.3. Vegetation stability
Contrary to expectations, the high spatial heterogeneity and species diversity of the herbaceous layer of
'brousse tigrée' did not attenuate the interannualvariation in herbage yield despite much lower averageyields (hyp. 3 invalidated). The coefficient of variationof the 10-year mean herbage yield was consistentlyhigher for 'brousse tigrée' than diffuse scrub found inthe same climatic zone. Moreover, considering the24 range sites monitored for 10 years in the Gourrna,there was a positive linear regression between thiscoefficient of variation which is an indicator of theinterannual variability and the average coefficient ofvariation of annual mean herbage mass which is anindicator of spatial heterogeneity (figure 5). Therefore,it appears that the higher the spatial heterogeneity ofthe vegetation pattern, the larger the susceptibility ofthe herbaceous layer production to vary from year toyear [16].
4.4. The origin of 'brousse tigrée'
The transformation of two 'brousse tigrée' sites intovery open scrubs following two decades of poor rainsin a region that receives between 300 and 200 mm ofrain annually on average confirms the climatic limit of'brousse tigrée'. The very open scrub that resultedfrom these changes cannot be considered part of'brousse tigrée' any longer because of the mutation inspecies composition, vegetation pattern and, above aIl,the change in the mode of water redistribution fromsheet run-off to concentrated run-off [9]. The weIldefined climatic, and also soil and topographie situations under which the 'brousse tigrée' occurs irrespective of population density [2, 10] does not support theanthropic origin of that vegetation pattern although it
Acla Oecologica

The influence of vegetation patterns
does totally exclude influences of grazing, selectivewood cutting or burning practices on the onset of thepattern and its dynamics.
4.5. The degradation of 'brousse tigrée'
Grazing by livestock and wood cutting or clearingfor cropping are often implicated in the set-up of thepatchy pattern of 'brousse tigrée' as weil as in itsdegradation [4]. Indeed, selective and intensive grazing of annual herbs during the growing season help thedominance of woody plants (hyp. 5 validated). Inaddition, the patchiness of the vegetation coyer reduces the risk of fire which could have balanced theinfluence of grazing in the competition between herbsand woody plants. However, except for species composition of the herb layer [29], no evidence was foundof an influence of a long history of grazing bytranshumant livestock on the structure of vegetationacross grazing pressure gradients established fromlivestock concentration points such as water points,cattle paths or resting sites (hyp. 5 invalidated). Thiswas confirmed by the narrow limits of the influence oflivestock along major transhumance tracks such as theDiafarabé track that connect the Macina flood plains tothe upland rangelands 600 km away in southern Mauritania [5]. Centuries of seasonal heavy grazing andtrampling along the path only affected the pattern ofthe 'brousse tigrée' and that of neighbouring diffusescrubs within 200 m from the central axis of the track(figure 4). On the contrary, the thicket clearing andsubsequent cropping, because wood cutting, tillageand weeding maintain the soil 100se and denudatedduring the wet season, affects the spatial redistributionof water which drives the pattern and functioning of'brousse tigrée' [22]. The concentration of run-off,gully formation and mobilization of the sand depositsrapidly led to severe soil erosion which threatens theresilience of the 'brousse tigrée' (hyp. 5 validated) asobserved in two sites in Niger (table Il).
5. CONCLUSION: IMPLICATIONS FORNATURAL RESOURCE MANAGEMENT
The pastoral value of 'brousse tigrée' is limited bylow herbage yields and feed quality with the exceptionof the patches found on the thin sandy deposits whichexist in sorne of the dryer or degraded 'broussetigrée' [20]. However, depending on the species composition of the woody vegetation, browse could provide an important animal feed resources [24]. Selective cutting that would favour the growth of selectedbest-value browse species, such as Pterocarpus lucensand Ziziphus mauritiana is one option for improvedmanagement. Planting best-value species could evenbe envisaged in the poorest stands.
Vol. 20 (3) 1999
157
The main production of 'brousse tigrée' is forestry [23]. Because of the spatial concentration ofwater and nutrients, the ecological conditions in thethicket are appropriate for a forest system to developdespite limited rainfall and long lasting dry season.Based on the annual foliage production, the productivity of this discontinuous fore st at least equals theproductivity of neighbouring diffuse scrubs, and ityields a larger proportion of higher value timbers [19].Forestry management should aim at maintaining thisproductivity in organizing selective cutting of livewood, chiefly as building material and fuel, althoughfuel wood harvest in the Sahel consist mainly incollecting dead wood [3] which has limited impact onthe ecosystem.
The increasing practice of thicket clearing for shifting crop of sorghum, in southern Sahel, and millet, innorthern Sahel, puts the 'brousse tigrée' at risk as itaffects the spatial redistribution of water which drivesthe pattern and functioning of that biome. The concentration of run-off that result from clearing for croppingrapidly aggravates erosion on poorly permeable soilsand increases water flows outside the 'brousse tigrée'.This causes sudden floods that threaten downstreamcropping lands and may further justify costly reclamation operation on degraded 'brousse tigrée' [27].
Acknowledgments
This study was supported by the International Livestock Research Institute ([LRI) and carried out at the Sahelian Center ofICRISAT, Sadoré (Niger). The data From Mali emanate Fromcollaborative research projects between the Malian 'Institutd'économie rurale' (1ER) and the International Livestock Center forAfrica ([LCA). The authors are grateful to A. Kali lou, A. Haïdara, Y.Maïga who contributed to field data collection and thank A.Buerkert, B. Hiernaux, S. Fernândez-Rivera and T.O. Williams fortheir contributions. Critical comments From two anonymous refereeswere also appreciated.
REFERENCES
[Il Abrams P.A., Monotonie or uni modal diversity productivitygradients: what does competition theory predict?, Ecology 76(1995) 2019-2027.
[2] Ambouta K., Contribution à l'édaphologie de la brousse tigréede l'Ouest nigérien, thèse, Nancy, France, 1984, 116 p.
[3] Benjaminsen T.A., Fuelwood and desertification: Sahel orthodoxies discussed on the basis of field data From the Gourrnaregion of Mali, Geoforum 24 (1993) 397--409.
[4] Boudet G., Désertification de l'Afrique tropicale sèche,Adansonia ser. 2 12 (1972) 505-524.
[5] Breman H., Diallo A., Traoré G., Djiteye M.M., The ecologyof the annual migrations of cattle in the Sahel, in: Proc. FirstInt. Rangeland Congress, American Soc. Range Manag.,Denver, USA, 1978, pp. 592-595.

158
[6] Cissé M.I., Production fourragère de quelques arbressahéliens : relations entre la biomasse foliaire maximale etdivers paramètres physiques, in: Le Houerou H.N. (Ed.),Browse in Africa, the Current Stage of Knowledge, International Livestock Centre in Africa (ILCA), Addis Ababa,Ethiopia, 1980, pp. 203-208.
[7] Cook C.W., Stubbendieck J., Range research: basic problemsand techniques, Society for Range Management, Denver,USA, 1986, pp. 215-250.
[8] Coughenour M.B., Coppock DL, Ellis J.E., Herbaceousforage variability in an arid pastoral region of Kenya: importance of topographie and rainfall gradients, J. Arid Environ.19 (1990) 147-159.
[9] d'Herbès J.M., Valentin C; Surface condition in the Niameyregion (Niger): spatial distribution, ecological and hydrological implications, J. Hydro!. 188 (1997) 18-42.
[10] d'Herbès J.M., Valentin C,, Thiéry J., La brousse tigrée auNiger: synthèse des connaissances acquises. Hypothèses surla génèse et les facteurs déterminant les différentes structurescontractées, in: d'Herbès J.M., Ambouta J.M.K., Peltier R.(Eds.), Fonctionnement et gestion des écosystèmes forestierscontractés sahéliens, John Libbey Eurotext, Paris, 1997, pp.131-152.
[11] de Leeuw P.N., Diarra L., Hiernaux P., An analysis of feeddemand and supply for pastoral livestock: the Gourma regionof Mali, in: Behnke Jr R.H., Scoones L, Kerven C. (Eds.),Range Ecology at Disequilibrium, ODJ, London, 1993, pp.136-152.
[12] Forman R.T.T., Godron M., Patches and structural cornponents for a landscape ecology, Bioscience 31 (1981) 733-740.
[13] Galle S., Seghieri J., Mounkaila H., Fonctionnement hydrologique et biologique à l'échelle locale. Cas d'une broussetigrée au Niger, in: d'Herbès J.M., Ambouta J.M.K., Peltier R.(Eds.), Fonctionnement et gestion des écosystèmes forestierscontractés sahéliens, John Libbey Eurotext, Paris, 1997, pp.105-108.
[14] Gérard B., Utilisation des systèmes d'informationgéographiques et des photographies aériennes prises à bassealtitude pour une meilleure gestion des stations de rechercheagronomique, in: Nutall C. (Ed.), Travaux d'Africagis'95,UNITAR, Genève, 1995, pp. 357-362.
[15] Hiernaux P., L'inventaire du potentiel fourrager des arbres etarbustes d'une région du Sahel malien. Méthodes et premiersrésultats, in: Le Houerou H.N. (Ed.), Browse in Africa, theCurrent Stage of Knowledge, International Livestock Centrein Africa (lLCA), Addis Ababa, Ethiopia, 1980, pp. 195-202.
[16] Hiernaux P., Spatial heterogeneity in Sahelian range lands andresilience to drought and grazing, in: West N.E. (Ed.),Rangelands in a Sustainable Biosphere, Proc. Fifth lnt.Rangeland Congress, vo!. 2, American Soc. of Range Manag.,Denver, USA, 1996, pp. 232-233.
[17] Hiernaux P., Coulibaly M., Diarra L., Recherche d'unesolution aux problèmes de l'élevage dans le delta intérieur duNiger au Mali. vo!. l, Les pâturages de la zone d'étude,ODEMICIPEA, Bamako, Mali, 1983, 133 p.
[18]
[19]
[20]
[21]
[22]
[23]
[24]
[25]
[26]
[27]
[28]
[29]
[30]
[31]
P. Hiernaux, B. Gérard
Hiernaux P., Cissé M.L, Diarra L., de Leeuw P.N., Fluctuations saisonnières de la feuillaison des arbres et des buissonssahéliens. Conséquences pour la quantification des resourcesfourragères, Rev. Elev. Méd. Vét. Pays Trop. 47 (1994)117-125.lchaou A., d'Herbes J.M., Productivité comparée des formations structurées et non structurées dans le Sahel nigérien.Conséquences pour la gestion forestière, in: d'Herbès J.M.,Arnbouta J.M.K., Peltier R. (Eds.), Fonctionnement et gestiondes écosystèmes forestiers contractés sahéliens, John LibbeyEurotext, Paris, 1997, pp. 119-130.Leprun J.C., Étude de quelques brousses tigrées sahéliennes:structure, dynamique, écologie, in: Le Floc'h E., Grouzis M..Cornet A., Bille J.C. (Eds.), L'aridité une contrainte audéveloppement, Éditions de l'Orstom, Paris, 1992, pp.221-244.Ludwig J.A., Tongway D.1., Spatial organisation of landscapeand its function semi-arid wood lands, Australia, Landsc. Eco!.10 (1995) 51-63.Mauchamp A., Rambal S., Lepart J., Simulating the dynamicsof a vegetation mosaic: a spatialized functional model, Eco!.Model. 71 (1994) 107-130.Montagne P., Les marchés ruraux de bois-énergie au Niger.Outils de développement rural local, in: d'Herbès J.M.,Ambouta J.M.K., Peltier R. (Eds.), Fonctionnement et gestiondes écosystèmes forestiers contractés sahéliens, John LibbeyEurotext, Paris, 1997, pp. 185-202.Piot J., Nebout J.P., Nanot R., Toutain B., Utilisation desligneux sahéliens par les herbiv~res domestiques. Étudequantitative dans la zone sud de la mare d'Oursi, GERDAT,Paris, 1980, 213 p.Seghieri J., Floret C., Pontanier R., Plant phenology inrelation to water availability. Herbaceous and woody speciesin the savannas of Northern Cameroon, J. Trop. Eco!. Il(1995) 237-254.Tilman D., Downing J.A., Biodiversity and stability in grasslands, Nature 367 (1994) 363-365.Torrekens P., Brouwer J., Hiernaux P., Évolution de lavégétation spontanée sur plateaux latéritiques aménagés pardes ouvrages anti-érosifs dans le département de Dosso(Niger), in: d'Herbès J.M., Ambouta J.M.K., Peltier R. (Eds.),Fonctionnement et gestion des écosystèmes forestiers contractés sahéliens, John Libbey Eurotext, Paris, 1997, pp.235-246.Touré A.S., Grandtner M.M., Hiernaux P., Équations deprédiction et dynamique saisonnière de la masse foliaire dequatre ligneux du Moyen-Bani-Niger (Mali), Ann. ACFAS 59(1991) 265-291.Turner M., Life on the rnargin: Fulbé herding practices and therelationship between economy and ecology in the inland deltaof Mali, Ph.D. thesis, University of California, Berkeley,1992,469 p.Vetaas O.R., Effect of spatial arrangement of environmentalvariables on ordination results from a disturbed humiditygradient in northeastern Sudan, Coenose 8 (1993) 27-37.Wilson R.T., de Leeuw P.N., de Haan C. (Eds.), Recherchessur les systèmes des zones arides du Mali: résultats préliminaires, International Livestock Centre in African ILCA, Research Report S, Addis Ababa, Ethiopia, 1983, 177 p.
Acta Oecologica

Acta Oecologica 20 (3) (1999) 159-170 / © Elsevier, Paris
Distribution and floristics of moss- and lichen-dominated soil crustsin a patterned Callitris glaucophylla woodland in eastern Australia
David J. Eldridge
Centrefor Natural Resources,Department ofLand and Water Conservation, c/- School of Geography,University ofNew South Wales, Sydney NSW, 2052, Australia.
(fax: +61293137878; e-mail: [email protected])
Received April 1, 1997; revised November 19, 1998; accepted November 27, 1998
Abstract - The distribution and abundance of soil crust lichens and bryophytes was examined in a patterned Callitris glaucophylla woodlandin eastem Australia. Twenty-one lichen species and 26 bryophyte species were collected within thirty quadrats along a sequence of runoff,interception and runoff zones. Crust coYerwas significantly greatest in the interception zones (79.0 %), followed by the runoff zones (24.0 %),
and lowest in the groved, runon zones (6.6 %). Lichens and bryophytes were distributed across ail geomorphic zones, and, although there weresignificantly more moss species in the interception zones (mean =9.1) compared with either the runoff (4.2) or runon (3.2) zones, the numberof lichen species did not vary between zones. Ordination of a reduced data set of 32 species revealed a separation of taxa into distinct groupscorresponding to the three geomorphic zones. Canonical correspondence analysis (CCA) of the 32 species and thirteen environmental variablesrevealed that the most important factors associated with the distribution of species were sheet and scarp erosion, soil stability and coherence,litter coyer and crust coyer. Surface cracking, microtopography and plant coyer were of interrnediate importance. The CCA biplot revealed thatthe timbered runon zones (groves) were dominated by 'shade-tolerant' mosses Fissidens vittatus and Barbula hornschuchiana, whilst theheavily eroded runoffzones supported sparse populations of 'erosion tolerant' lichens (Endocarpon rogersii) and mosses (Bryum argenteum andDidymodon torquatus). Interception zones supported a rich suite of 'crust forming' mosses and lichens capable of tolerating moderate inundationby overland flow. Two other groups of taxa were identified by this analysis: the 'pioneer' group, comprising mainly nitrogen-fixing lichenswhich occupy the zone of active erosion at the lower edge of the groves, and the 'opportunists' dominated by liverworts, occupying the shallowdepressions or bays at the margins of the groves and the interception zones. This study confirrns that the non-vascular lichens and bryophytesin these arid soil crusts, are, like the vascular plants, strongly paltemed according to geomorphic zone, being most strongly associated with soilsurface and erosional features. © Elsevier, Paris
Lichens / bryophytes / soil crusts / correspondence analysis / patterned landscapes
1. INTRODUCTION
Pattemed landscapes, where the dominant vegetation has a regular banded appearance with altematingzones of bare soil and vegetation, have been describedas 'brousse tigrée', tiger bush, banded vegetation,gilgaid desert pavements or grove-intergrove in Africa,Mexico and Australia [1,7, 10,28,36,37,40,46,54,58]. These landscapes are characterised by dense,usually perennial vascular vegetation aligned on thecontour, separated from more or less unvegetated soil.This vegetated section acts as a sink area, sequesteringsoil sediments, water and nutrients shed from the baresource area immediately above it in the landscape.Runoff generated on the source zones is trapped on theupslope areas of the sink zones where infiltration
proceeds. At the same time, erosion and decay of thelower surface of the vegetated zone occurs so that thevegetated band gradually moves upslope [52].
Water availability is the driving force in pattemedlandscapes, controlling the structure and the dynamicsof the vegetation. Surface biota such as mosses,lichens, liverworts, fungi and cyanobacleria arestrongly influenced by water availability, and themselves influence critical soil and ecological processesthrough their effect on infiltration, soil physical andchemical properties, nutrient cycling, decompositionand germination, and establishment [2, 8, 17, 22, 35].Thus soil biota are likely to play a major role in thedynamics of pattemed systems.

160
Despite the importance of the se organisms to ecosystem function and stability, there has been littleattempt to examine how they are distributed throughout patterned landscapes and their roles in the genesisand persistence of patterning. This is not surprising,given their small size, the difficulties involved in theiridentification, and problems of nomenclature, even tothe level of genus. The more conspicuous componentsof soil crusts, i.e. lichens and bryophytes (mosses andliverworts), have largely been neglected from studiesof vegetation dynamics in serni-arid regions in general,and patterned landscapes in particular [22]. Most studies have been conducted at a provincial [15, 23, 44,45] or regional [14, 20] level, or have concentrated onsites of special interest such as National Parks andNature Reserves [9,43,59]. One study, conducted in apatterned woodland in eastern Australia [11] demonstrated that soil crust biota were important componentsof bare microterraces formed on low slopes afterwildfire. On these microterraces, the lichens Heterodea muelleri and Cladia aggregata, and variousmosses and algae played a significant role in stabilising bare slopes and therefore contributing to slopestability.
Anecdotal evidence suggests that soil crusts inpatterned landscapes are generally species poor andoften occupy a small proportion of the soil surface. Forexample, crusts in 'brousse tigrée' landscapes areusually dominated by only a few cyanobacteria [56].Similarly in patterned shrub-steppe in eastern Australia [10], crusts support only isolated lichens andmosses which are typically found on hummocks beneath perennial shrubs such as Atriplex vesicaria [22].At Lake Mere, although crusts supported a moderatediversity of lichen and bryophyte species (Eldridgeand Tozer unpubl. data), coyer levels of lichens andbryophytes are typically less than 10 % [4, 55] thoughcyanobacterial coyer may be substantially greater.
Extensive areas of soil crust supporting a floristically rich suit of lichens, bryophytes, cyanobacteriaand algae are common in wooded ecosystems on themargins of the agricultural and pastoral regions ineastern Australia in areas of 350-500 mm averageannual rainfall. Within this zone, a large area ofcypress pine (Callitris glaucophylla) wood land exhibiting a strongly patterned sequence of runoff and runonzones, and a well-developed soil crust, provided anideal opportunity to study the distribution and floristicsof soil crust lichens and bryophytes in relation topatterning.
This paper reports an investigation of the distribution and floristics of lichens and bryophytes in soil
D.J. Eldridge
crusts in relation to patterning in a Callitris glaucophylla woodland using correspondence analysis (CA)and canonical correspondence analyses (CCA). Noattempt was made to study cyanobacteria or algae.Correspondence analysis was used to examine thedistribution of lichen and bryophyte (moss and liverwort) species across the three geomorphic zones.Similarly, CCA was used to examine how species weredistributed within the three zones in relation to a rangeof environmental variables.
2. METHOOS
2.1. Site description
The study was conducted at 'Coan Downs', approximately 140 km south-west of Cobar, in centralwestern NSW Australia (145°35' E, 32°56' S). Theclimate is semi-arid with a low and unreliable rainfallaveraging 350 mm per annum. Rainfall is evenlydistributed throughout the year, and average diurnaltemperatures range from a maximum of 35 "C inJanuary to 3 "C in July. Annual evaporation at Cobar isapproximately 2575 mm [5].
The site was located on the plains unit of Yackerboon Land System [33]. 'Coan Downs' is a grazingproperty running Merino ewes principally for woolproduction. It is typical of properties in the generalarea which have been operating as grazing propertiesfor over a century.
2.2. Soils and vegetation of the zones
The landscape comprised a strongly patterned openwoodland on a plain with slopes up to 3 %. It ischaracterised by zones of water-deposited sedimentssupporting dense bands of cypress pine (Callitrisglaucophylla) with band width to 16 m (table J). Thesegroved, runon zones were separated by unvegetated,stony runoff zones up to 20 m across. A narrowinterception zone to 3 m wide commonly occurred onthe upslope edge of the groves (figure 1).
The Callitris glaucophylla groves represent zonesof resource accumulation, receiving water-bome sediments from upslope by water erosion and overlandflow. Consequently, ponded infiltration rates weresignificantly higher in the groves compared with therunoff zones [13]. The soil type at the site is a redearth [49] or Typic Haplargid [48]. A description ofsorne physical properties of the surface soils from twodepths, 0-20 and 20--40 mm from the runoff and runon(grove) zones is given in table J. Analyses of soilphysical properties indicates higher levels of organiccarbon in these zones compared with runoff zones(table J). Electrical conductivity was significantly
Acta Oecologica

Soil crust floristlcs in a patterned woodland
Table I. Description of the soils and vegetation of the three geomorphic zones at 'Coan Downs'. 1 Data represent the means of eight soilsamples; 2 no significant differences in particle size analyses betweenthe runoff and runon zones. Different letters within a row aresignificant at P < 0.05. n.d., Not determined.
Runoff Interception Runon
Zone width (m)
Mean (+ SEM) 10.6 (1.72) 2.50 (0.22) 813 (1.31)
Range 6-12 1-3 4-12
No. of zones examined 16 16 15
Soil physical properties 1
Organic carbon (%)
0--20 mm 0.55" (0.03) n.d. 0.90h (0.05)
20-40 mm 0.50" (0.04) n.d. 0.62h (0.04)
Elect. conductivity (dSm")
0--20 mm 0.17" (0.06) n.d. 0.29h (0.03)
20-40 mm 0.20' (0.07) n.d. 0.35h (0.02)
pH (water 1:5)
0--20 mm 6.18 " (0.14) n.d. 6.36" (0.08)
20-40 mm 5.78' (0.11) n.d. 6.38" (0.08)
Particle size analysis (%)2
0.2-2.0 mm
0--20 mm 19 (1.1) n.d. 18 (0.08)
20-40 mm 17 (0.7) n.d. 19(1.2)
0.02--D.2 mm
0--20 mm 43 (0.7) n.d. 42 (0.9)
20-40 mm 42 (1.1) n.d. 42 (0.2)
0.002-0.2 mm
0-20 mm 14 (0.5) n.d. 14 (1.4)
20-40 mm 14 (0.8) n.d. 12 (1.1)
< 0.002 mm
0--20 mm 24 (0.8) n.d. 26 (1.7)
20-40 mm 27 (0.5) n.d. 27 (0.5)
higher in the runon zones compared with the runoffzones (table Tï.
The vascular plant community at the site is characterised by a patterned open woodland dominated bywhite cypress pine (Callitris glaucophyllaï, Understorey pastures were dominated by a sparse cover ofspeargrasses (Stipa spp.), wiregrasses (Aristida spp.)and various annual forbs.
2.3. Field measurements
A 400-m transect was positioned from a Callitrisglaucophylla grove at the bottom of the slope to arunoff zone at the top of a ridge consistent with thegradsect approach of Gillison and Brewer [25]. Along
Vol. 20 (3) 1999
161
this transect, thirty 0.5-m2 quadrats were positioned atirregular intervals so that one quadrat was placed ineach of the runoff, interception and runon zones of tendifferent sequences from the bottom to the top of theslope. At the time of the survey (June 1995), the areahad received approximately 15 mm of rainfall, so thatthe three zones were easily distinguished by thegrowth of vascular plants and by water ponding on thesurface in the case of the interception zones. Enlargedblack-and-white aerial photography at a scale of approximately 1:12 000 assisted the placement of thetransect and quadrats within the zones. Data on soitsurface characteristics, vascular and non-vascularplant cover and composition, litter cover and type anddegree of erosion were collected from each of thethirty quadrats according to the methods describedbelow and are summarised in table Il.
2.3.1. Soil surface characteristics
Landscape position on a quadrat basis was classifiedas either midslope or lowerslope. Surface microtopography was defined as the vertical distance between thelowest and highest points of the soil surface within thequadrat, i.e. < 5, 5-8, 8-15,15-25 and> 25 mm. Crustcoherence gives a measure of the force required todisrupt the soil surface with an object equivalent to thediameter of a bali-point pen. This measurement assesses the degree to which the surface has the capacityto resist stress or reform after wetting [53]. Classeswere ranked as sandy (single grained), self-mulching(clay aggregates), break on touch, slight pressure,significant pressure, high pressure and unbreakable.The degree of surface cracking measures the percentage of the surface covered with cracks and relates tothe capacity of the surface to disintegrate and erode: 0,< 10, 10-25, 25-50 and> 50 %. Surface stability ofthe soil surface to raindrop impact was ranked asstable, moderately stable, unstable or very unstable.This was determined using local experience and insorne cases the Emerson drop test [53]. The degree ofsheet erosion caused by wind and/or water was rankedas 0, < 10, 10-25, 25-50 or > 50 %. The degree oferoded scarp erosion was ranked as 0, < 10, 10-25,25-50 or > 50 %.
2.3.2. Vascular and non-vascular plants
Within each quadrat, vascular plant cover and littercover were recorded as 0, < 10, 10-25, 25-50 or> 50 %. Total cover of lichens and bryophytes in themicrophytic crust was estimated (crust), along with therelative contribution of lichen (lich%) and bryophytes(bryo%) to total cover.

162
runon
erosionto/erators
/
runoff interception runon
D.J. Eldridge
-4-12m--1~"--6-20m------"r1-3m +4-12m-
Figure 1. Diagrammatic representation of the runoff-interception-runon complex in a semi-arid Callitris glaucophylla woodland in semi-arideastern Australia. The vertical distance is not to scale.
2.3.3. Crust floristics
Samples of soil crust were collected from each ofthe thirty quadrats, transported to the laboratory andpassed through a 2-mm sieve. AlI bryophytes andlichens were identified, mostly to species level, usingstandard taxonomie keys. Nomenclature follows Streimann and Curnow [50] for mosses, Scott [44] for
liverworts, McCarthy [38] for lichens, and where appropriate, more recent taxonomie revisions.
2.4. Analyses
One-way ANOVA [39] using arcsine transformeddata was used to examine differences in cru st coyer
Table II. Environmental variables used in the canonical correspondence analysis.
Variable Code Range of values Description
Microtopography micro 1-50 < 5 mm (1) to > 25 mm (5)
Lowslope Islo 0-1 lowslope (1) or not (0)
Midslope mslo 0-1 midslope (1) or not (0)
Crust coherence coher 1-7 sand (1) to unbreakable (7)
Surface cracking crack 1-5 nil (1) to > 50 % (5) cracking
Surface stability stab 1--4 stable (1) to very unstable (4)
Eroded sand sand 1-5 nil (1) to > 50 % (5) eroded sand
Scarp erosion scar 1-5 nil (1) to > 50 % (5) erosion
Plant cover plant 1-5 nil (1) to > 50 % (5) cover
Litter cover litt 1-5 nil (1) to > 50 % (5) litter cover
Bryophyte composition bry% 0-100 composition (%)
Lichen composition lic% 0-100 composition (%)
Crust cover crust 0-100 projected foliage cover (%)
Acta Oecologica

Soil crust ftorlstics in a patterned woodland
and species richness (number of species) of bothlichens and bryophytes between the three geomorphiczones.
Lichen and bryophyte data were pooled to producea data matrix of presence/absence of species withineach of the ten quadrats by three geomorphic zones. Ofthe initial total of twenty lichens and 26 bryophytes,'rare' species « three total occurrences) were excluded from the matrix as their scarcity may haveresulted from insufficient sampling rather than any realrelationship between occurrence and geomorphiczone. It was considered that their inclusion in the dataanalyses may dominate and confuse the interpretationsand conclusions drawn. After exclusion of these 'rare'species, the combined data matrix of sixteen lichensand sixteen bryophytes was analysed using correspondenee analysis. Correspondence analysis (CA) is agraphical display ordination technique which simultaneously displays the rows (sites) and columns (species) of a data matrix in low dimensional space [27].Row identifiers (species) plotted close together aresimilar in their relative profiles, and column identifiersplotted close together are correlated, enabling one tointerpret not only which of the taxa are clustered, butalso why they are clustered.
Canonical correspondence analysis (CCA [51]) wasused to examine the relationships between the measured environmental variables and the distribution oflichens and bryophytes. Canonical correspondenceanalysis expresses species relationships as a linearcombination of environmental variables, and combinesthe features of correspondence analysis ordinationwith canonical correlation analysis [26]. Canonicalcorrespondence analysis ordinates species data usingaxes that are constrained to be linear combinations ofthe environmental variables. This provides a graphicalrepresentation of the relationships between species andenvironmental variables.
A matrix of thirty rows (quadrats) by 32 columns(species) emanated after pooling the lichen and bryophyte data across the thirty quadrats (ten per geomorphic zone). The dataset contained a large number(70 %) of zero values. The number of taxa per sampleranged from 0 to 17, and the number of samplescontaining any one taxa ranged from 3 to 25. Analyseswere performed on the same subset matrix of 32species by thirteen environmental variables.
3. RESULTS
163
(mean ± SEM = 79.0 ±4.1 %), intermediate in therunoff zones (24.0 ± 4.1 %) and least in the groves(6.6 ± 3.4 %).
3.2. Crust floristics
Sixteen lichens and sixteen bryophytes were foundat the study site (table /ll). Of the bryophytes, threewere liverworts from the farnilies Aytoniaceae (Asterella drummondii) , Ricciaceae (Riccia spp.) andCodoniaceae (Fossombronia spp.). Sixty-two percent(eight) of the remaining thirteen bryophytes comprised
Table III. Bryophyte and lichen species included in the analyses.
Code Bryophyte-------------------
Asdm Asterella drummondii (Hook. f. & Tay!.) R.M. Schuster
Baho Barbula hornschuchiana Schultz
Baca B. ca/ycina Schw.
Brar Brvum argenteum Hedw.
Brdi B. dichotomum (Hedw.)
Brpa B. pachytheca C. Muel!.
Deco Desmatodon convolutus (Brid.) Grout
Dito Didymodon torquatus (Tayl.) Catches.
Ecpu Eccremidium pulchellum (Hook. & Wils.) C. Muel!.
Ecar E. arcuatum (Hook. & Wils.) C. Muell.
Fivi Fissidens vit/a/us Hook.f & Wils.
Fozz Fossombronia spp. Raddi.
Fuzz Funaria spp.
Gire Gigaspermum repens (Hook.) Lindb.
Phro Phascum robustum (Broth. ex Roth Stone) var. robustum
Rizz Riccia spp,
Code Lichen
Busu Bue/lia subcoronata (Muel!. Arg.) MaIme
Cazz Catapvrenium spp.
Clzz C/adonia sp.
Cocz Collema coccophorum Tuck.
Enpa Endocarpon pallidum Ach.
Enpu E. pusillum Hedwig
Enrg E. rogersii McCarthy
Enro E. robustum McCarthy
Ensb E. simplicatum (Nyl.) Nyl, var. hisporum McCarthy
Ercr Eremastrella crvstallifera (Taylor) G. Schneider
Hebe Heterodea beaugelholei R. Filson
Hede Heppia despreauxii (Mont.) Tuck.
Leoc Lecidea ochroleuca Pers.
3.1. Lichen and bryophyte cover
Cover of lichens and bryophytes was significantlydifferent between ail three zones (F2 .2 7 = 106.57,P < 0.00 1), being greatest in the interception zones
Vo!. 20 (3) 1999
Pen
Psde
Xabe
Peltu/a spp.
Psora decipiens (Hedw.) Hoffm.
Xanthoparmelia bellatula (Kurokawa & Filson) Elix &Johnston

164 D.J. Eldridge
mosses from two families, Pottiaceae and Bryaceae.Apart from the foliose lichens Heterodea beaugelholeiand Xanthoparmelia bellatula, most of the sixteenlichens were crustose or squamulose types. This isconsistent with results from other semi-arid regions [42]. The genus Endocarpon comprised 38 %(six) of the total lichen species. The interception zonesalways had a greater numbers of species, genera orfamilies compared with either the runon or runoffzones.
Only two of the thirty quadrats contained no lichensor bryophytes. Pooled across thirty quadrats, therewere significantly more bryophyte species in theinterception zones (mean = 7.9) compared with eitherthe runoff (3.7) or runon (2.9) zones (F2 27 = 21.35,P < 0.001). There was no significant difference however in the number of lichen taxa between the threezones (P = 0.118). Within the intercept zone, therewere significantly more bryophyte taxa (mean =7.9)than lichen taxa (mean = 6.1; P = 0.002).
Ordination of the species data produced a separationof taxa (figure 2) which corresponded to the runoff,interception and runon zones (figure 3). Axis 1 offigure 3 separated quadrats in the interception zonesfrom those in the other zones, and axis II separatedquadrats in the runon zones from those in the runoffand interception zones. Overlap of sorne quadrats nearthe origin indicates that these quadrats were dominatedby taxa with preference profiles common to aIl threezones.
Lichens and bryophytes were found in aIl threegeomorphic zones (figures 2, 3). Sorne groups of taxahowever were strongly associated with a particularzone, and six distinctive groups are identified intable IV. Group 1 containing four lichens and fourbryophytes is found almost exclusively in the interception zones. A second group (Group II) comprising fivelichens and one bryophyte is generally associated withthe interception and runon zones. Two groups (GroupsIII and IV, table IV) are generally found in aIl zones.The fifth group comprises those species which arefound exclusively in, or have high abundances mainlyin the runoff zones. The sixth group containing the twomosses Fissidens vittatus and Barbula hornschuchiana, occurs exclusively in the groved runon zones(table IV).
3.3. Distribution of environmental variables
The major differences in the environmental variables between the three zones are shown in table V.GeneraIly, there was greater microtopography andcover of lichens and bryophytes in the interceptionzones, which were dominated by bryophytes. Runoffzones were characterised by smooth, eroded surfacesof sparse lichen-dominated crusts whilst the groveswere uneroded, very stable and protected by an extensive and deep cover of litter.
3~--------~-----------,
3~-------------------,
{:, Lichens• Bryophytes 2
runoff zone
2
2
. runon zone (grove)
o
interception zone
NUl 0'>(«
-1
-2
-3
-2 -12
•
o-1
•
. .~. {:,
............ ..~6m •.. ~!'1:è, 6e:,
{:, .-2
-1
-3 +-----,---------T-----,------i
-2
';: 0'>(«
Axis 1Axis 1
Figure 2. Correspondence analysis based on presence/absence ofthe 32 bryophyte and lichen species from the thirty quadrats.
Figure 3. Correspondence analysis indicating the placement of thethirty quadrats within the runoff (circle), runon (triangle) andinterception (square) zones.
Acta Oecologica

~No
Table IV. Distribution of the 32 lichen (L) and 32 bryophyte (B) species occurring in the thirty quadrats according to geomorphic zone. R, Runoff zone; I, interception zone; G. runonzone (grove), See table III for explanation of lichen and bryophyte codes.
Crust Forrners Opportunists Generalists Pioneers Erosion tolerators Shade(Group 1) (Group II) (Groups III) (Group IV) (Group V) tolerators
(GroupVI)
L B B L B L B L B B B B L L L L L L L B B L L L L L B B L B B BABE ECPC BROt HEBE ECAR PSDE PHRO BUSU ['SDR FOZZ BACA FUZZ PEZZ RIZZ CLZZ EReR ENRû CAZZ LEDe GIRE BRPA ENSB Gez HEDE ENPA ENPU DECO orro ENRG BRAR FIYI BAHO
RI
1
R2 + + + + +R3
1+ + + + + + + + + +
R4 + + + + +R5 + + + +R6 + + + + + + + +R7 + + + + + + + + + +R8 + + + + + + + + + + +R9 + + + + + + +RIO + + + + + + + + + + +
Il + + + + + + + + + + + + + + +12 + + + + + + + + + + + +I3 + + + + + + + + + + + + +14 + + + + + + + + + + + + +15 + + + + + + + + + + + + + +16 + + + + + + + + + + + + + +17 + + + + + + + + + + + + + +18 + + + + + + + + + + + +19 + + + + + + + + + + + + + + + +110 + + + + + + + + + + + + + + +
GI + + + + + + + +G2 + + + + + +G3 + + + + + + + + + + + + + +G4 + + + + + + +G5 + + + + + + + + + + + + +G6 + + +G7 + + + + + + + +G8
G9
GIO + + + + + + +

166 D.J. Eldridge
Table V. Biophysical features of the three geomorphic zones.
Runoff Intercept Runon
Midslope location lowslope lowslope
5-8 mm microtopography 8-15 mm 5-8 mm
Very hard surface very hard surface crumbly surface
Moderately stable surface moderately stable surface very stable surface
< la % scarp erosion < 10 % scarp erosion no scarp erosion
< la % sheet erosion < 10 % sheet erosion no sheet erosion
< la % plant cover < la % plant cover < la % plant cover
< la % litter cover < 10 % Iitter > 50 % litrer
Lichen dominant bryophyte dominant lichen and bryophyte co-dominant
Sparse crust cover extensive crust cover very sparse crust cover
Coher
erosion tolerators
Callitris litter, stability and coherence of the soilsurface, and the degree of sheeting and scarp erosionon the soil surface. Although sorne species clusteredinto neatly defined groups (figure 4), others showed nostrong association with particular environmental variables. This is not surprising, as few of the environ-
Scerp
shadetolerators
Deco
Sra,
pioneers
Flvl
Leoc CuzEnta
LItt
opportunists
crust îormers
Crus!
3.4. Relationships between crust taxa andenvironmental variables
The species-environment biplot (figure 4) demonstrates the relationships between the 32 lichen andbryophyte species to the thirteen measured environmental variables. The length of the vectors indicatesthe relative importance of the variable in deterrniningthe axes, and the angle between an arrow and an axisis an inverse measure of their correlation r51]. The firstthree unconstrained ordination axes for the 32 lichensand bryophytes accounted for 33, 40 and 60 % respectively of the variation in species distributions.
The biplot indicates that the most important determinants of lichen and bryophyte distribution are sheeting and scarp erosion, litter cover, coherence andstability of the soil surface, and crust cover. Theanalysis was markedly influenced by the occurrence ofthe moss Fissidens vittatus which was strongly associated with sites of high litter cover, i.e. the Callitrisglaucophylla groves. Examination of table IV revealsthat it is the only one of the 32 species restrictedexclusively to the runon zones (groves). The runonzones were characterised by an extensive litter cover,were uneroded, and supported Fissidens vitattus andBarbula homschuchiana. Species restricted to therunoff zones were separated from those restricted tothe intercept and runon zones by the 'scarp erosionsheeting-% lichen cover' and 'microtopography-%plant cover' axes (figure 4).
4. DISCUSSION
The CCA indicates the complex organisation ofenvironmental factors influencing the distribution ofterricolous lichens and bryophytes in this patternedsemi-arid woodland. The distribution of individualspecies was most strongly associated with cover of
Figure 4. Species-environment biplots for axes 1 and 2 for the CCAfor the combined bryophyte and lichen dataset. Vectors show thedirection of maximum variation in the measured environmentalvariables. Closed triangles represent the centroids of the nominalvariables midslope (Mslo) and lowerslope (Lslo). Species codes aregiven in table III. Explanation of environmental variables are givenin table II.
Acta Oecologica

Soil crust ftoristics in a patterned woodland
mental variables represent simple gradients [32]. Forexample, although microsites under the Callitris treesare characterised by a dense litter layer, they also havelow levels of incoming radiation, high levels of biological activity [57] and high infiltration rates [13].Various groupings of species, responding in similarways to the measured environmental variables, areshown in table IV and can be identified in figure 4.
4.1. Group 1. The crust formers
In the upper left corner of figure 4 are sites supporting an extensive coyer of both microphytic crusts andvascular plants, and corresponding to the interceptionzones. Microtopography on these moderately hardsetting surfaces is up to 10 mm, and the majority of thesoil surface comprises cracks up to 1 mm wide. Themoderate infiltration rates in these soils [13], due tothe presence of perennial grasses and their associatedmacropores [29], are intermediate between the runoffzones and the timbered groves. The dominant speciesin this zone include the mosses Eccremidium arcuatum, E. pulchellum and Phascum robustum var. robustum, and the foliose lichen Heterodea beaugleholia.Less abundant species are indicated in table IV.
As the interception zone is an area of sedimentaccretion, species growing in this zone must be capable of surviving frequent blanketing by depositedsediments originating upslope from the runoff zones.Consequently, taxa in the interception zone are dominated by mosses which have relatively higher growthrates compared to the slow-growing lichens. Sorneubiquitous mosses are able to survive episodic burialbeneath fine sediments by rapidly producing newgrowth from terminal shoots. Using thin section analysis, this phenomenon has been observed for Grimmiamesopotamica, a common moss in arid areas ofIsrael [8]. Soil aggregates examined by the authorduring laboratory identification of mosses and lichenshave revealed long pieces of dead stem and attachedleaves buried up to 30 mm below the soit surface [16].Clearly then, sorne mosses are able to survive in thiszone of accretion by growing up through successivelayers of sediments using the twisting and turningmovements of their leaves.
In contrast to bryophytes, lichens have extremelyslow growth rates [31]. Annual growth rates of folioselichens. measured as increases in thallus diameter, areof the order of 1-10 mm per year in more mesicareas [30]. Although there are few empirical data fromsemi-arid and arid regions, and none from Australia'sarid zone, anecdotal evidence suggests annual growthrates of less than one millimetre per annum (J. Elixpers. comm.). Measurements of individual Xanthoparmelia spp. thalli at the sites indicated that sornewere up to 100 mm across, indicating an age of up to
Vol. 20 (3) 1999
167
100 years old. Xanthoparmelia spp. typically formrosettes with irregular to irregular-dichotornous lobeson the soit surface. These lichens are sensitive tofragmentation by human and animal trampling, orvehicular traffic [21]. Low levels of trampling mayincrease fragmentation and thus assist dispersal, butinundation is devastating. Even coverage by waterduring summer storms is likely to lead to the demise ofthese lichens as they are unable to photosynthesisewhen hydrated during high summer temperatures [47].Thus individual thalli are likely to be found along theuphill edge of the interception zones where the probability of deposition is least. Furthermore, because ofthe risk of inundation by eroded soil, Xanthoparmeliaspp. probably spread upslope within the interceptionzone as accretion proceeds from downslope, and thebanded system moves upslope. This hypothesiseddispersal of Xanthoparmelia spp. propagules upslopeis yet to be tested in these patterned landscapes.
4.2. Group II. The opportunists
In the centre left of the CCA biplot (figure 4) is agroup of six taxa associated with locally depressedbryophyte-dominated sites characterised by moderately rough surfaces with high plant coyer. These sitesdisplay characteristics of both the interception zonesand runon zones, and occur as an intergrade betweenthe downslope edge of the interception zone, and theupslope edge of the vegetated groves, where thechange of slope produces a series of long discontinuous depressions or bays. In pattemed 'brousse tigrée'landscapes in Niger these bays have been shown to becrucially important for the establishment of annualgrasses [12]. In the present study, these sites weredominated by liverworts, in particular the thalloseRiccia group which includes Riccia limbata, R. lamellosa and R. nigrella, and the large Asterella drummondii. The Fossombronia group of leafy liverworts, themosses Barbula calycina and Funaria spp., and thePeltula spp. group of lichens were also found in thisinterzone.
4.3. Group III. The generalists
In the centre of figure 4 are the ubiquitous generalists such as Bryum pachytheca, Endocarpon simplicatum var. bisporum and Gigaspermum repens which donot appear to be strongly influenced by the measuredenvironmental variables. Survey data from westernNSW demonstrate that these three species are amongstthe most common taxa associated with soil crusts [14,20].
4.4. Group IV. The pioneers
Between the runoff and runon zones is a group ofspecies associated with sites of sparse crust coyer,

168
moderate levels of erosion, low levels of plant coyerand relatively smooth surfaces. These sites, whichhave features of both the runon and runoff zones, arecharacterised by 'pioneer' species including filamentous cyanobacteria and the lichens Endocarpon pallidum, E. pusillum, Collema coccophorum and Heppiadespreauxii. Apart from Endocarpon pallidum, theother species are ubiquitous throughout the world'ssemi-arid rangelands on a range of soil types andvegetation communities [14]. Collema coccophorumand Heppia despreauxii are cyanolichens, possessingas their photobionts cyanobacteria (blue-green algae)which are capable of nitrogen fixation. Their positionas outliers on the 'crust' vector of figure 4 suggeststhat they often occur as individual squamae in landscapes where crusts are poorly developed. Rogers [41]referred to these taxa as pioneers as they tended tooccur early in the successional development on soilsurfaces, and did not appear to be adversely affectedby grazing [42]. In eastern Australia, Eldridge [14]found that the lichen Collema coccophorum whichoccurred at 65 % of 282 sites surveyed, was oftenfound partially buried in the soil surface, suggestingthat it is capable of occupying unstable microsites. Inthe western United States however, Collema spp. areknown to be susceptible to animal impact [2]. As agroup however, the gelatinous lichens, of which Collema is a member, are less susceptible to disturbancethan other groups of lichens [19].
The location of this 'pioneer' group midway between the groves and runoff zones is consistent withwhat is known about landscape evolution in thesepatterned landscapes. The generally accepted view isthat the vegetated bands migrate upslope by erosiondownslope of the groves, sometimes referred to as thezone of senescence [52]. Erosion proceeds within thissmall zone of increasing sIope, which is up to30-50 cm across, gradually cutting back into the zoneof senescing Callitris trees at the lower edge of thegroves. This intermediate region would be expected tohave low levels of soil nutrients, as weil as high soilinsolation, high runoff and high erosion. Consequently,vascular plant coyer is sparse. Given the higher slopesin these bands and the relatively smooth surfaces, thereis little opportunity for infiltration to occur. Cyanolichens are better suited to extreme conditions by theirunique structure which makes them more efficient atwater absorption and therefore extends the period overwhich they can photosynthesise [3, 24]. Thus pioneering cyanolichens such as Collema coccophorum areable to photosynthesise at higher temperatures thanother green algal lichens [34]. These lichens pave theway for the 'generalist' mosses Bryum pachytheca andGigaspennum repens as the systems' stabilisers.
D.J. Eldridge
4.5. Group V. The erosion tolerators
Sites characterised by relatively smooth surfaceswith extensi ve scarp erosion, sheet erosion and loosesurface sand are found in the top right corner offigure 4. These actively eroding runoff sites werecharacterised by crusts dominated by lichens, particularly Endocarpon rogersii, at relatively low coyerlevels (24 %), but also supported the mosses Bryumargenteum, Didymodon torquatus and Desmatodonconvolutus. Although experiencing episodes of erosionin the past, active erosion only occurs in those patcheswhere lichens are absent. Where the lichens occur,they protect the soil surface from water erosion,reducing sediment detachment and helping to traperoding sand particles. The intimate relationship between the lichen thallus and the soil surface results insmalllevels of surface microtopography, generally lessthan 3-5 mm. These erosion tolerant mosses are ubiquitous in the arid zone of eastern Australia [20].Furthermore, these mosses do not have strong preferences for sites of a particular condition, but are foundin degraded as weil as well-managed sites [18]. Inparticular, the cosmopolitan moss Bryum argenteumthrives in disturbed or inhospitable environments suchas on pavements and roads [6]. Its position at the apexof the 'sheeting' vector suggests that it is able to growin areas of active erosion. Being short and relativelystout, Bryum argenteum may not be able to withstandinundation in lower-lying areas or sites with greatercompetition from vascular plants.
4.6. Group VI. The shade tolerators
As weil as the dense litter coyer, the mossesFissidens vitattus and Barbula hornschuchiana wereassociated with weakly coherent (non-hardsetting),non-cracking soil surfaces characteristic of surfacesbeneath the Callitris glaucophylla canopies in therunon zones or groves. Their position away from the'crust' coyer vector suggests that these mosses do notoccur as part of a well-developed soil crust, but ratheras individuals. Furthermore, given the high projectedfoliage coyer provided by the Callitris trees, these siteswould be expected to have low levels of incomingradiation. These species could therefore be termed the'shade tolerators'.
5. CONCLUSIONS
The measured environmental variables explained60 % of the variation in lichen and bryophyte distribution at this patterned Callitris glaucophylla woodland in eastem Australia. Of the variables, litter coyer,sheet and scarp erosion, soil coherence and stabilitywere the most important. Despite this, other unmea-
Acta Oecologica

Soil crust ftoristics in a patterned woodland
sured biotic and abiotic factors may have been influential. For example, small changes in unmeasuredmicrohabitat variables such as light intensity, soilmoisture, soil fertility and micro-infiltration may haveaccounted for sorne of the unexplained variation inspecies distribution. Equaily important might havebeen ecological processes such as competition, dispersaI and recruitment. factors which are poorly understood in non-vascular plants.
In this patterned Callitris glaucophylla woodland,bryophytes and lichens were strongly patterned according to complex interactions between soil surfacecondition, erosion and vascular plants. Clearly definedgroups of species were strongly associated with thethree geomorphic zones, and looser species assemblages tended to occur at the intergrades between thesezones. These results increase our understanding of therelationships between individual soil crust componentsand geomorphic processes such as erosion and deposition. Their predominance in terms of cover andbiodiversity on sorne of these landscapes is c1earlycentral to the functioning of these important patternedenvironments.
Acknowledgments
Merrin Tozer assisted with field data collection and identificationof lichens and bryophytes. Terry Koen and Bob Gittins providedadvice on analysis of the data using correspondence and canonicalcorrespondence analyses, and Jayne Belnap provided useful cornments on an earl y draft. This work was financed by the Land andWater Resources Research and Development Corporation and ispublication No. CNR98.034 of the Centre for Natural Resources.
REFERENCES
[1 J Ambouta K., Contribution à l'édaphologie de la Broussetigrée de l'Ouest nigerien. thèse de Docteur-Ingenieur. université Nancy-I, 1984, 116 p.
[2] Belnap J., Surface disturbances: their role in acceleratingdesertification, Environ. Monitor. Assess. 37 (1995) 39-57.
[3] Blum O.B., Water relations, in: Ahmadjian Y., Hale M.E.(Eds.), The Lichens, Academie Press, New York, London,1973, pp. 381-400.
[4] Bryannah M.. The use of ants as bioindicators of ecosystemhealth under grazing use in a patterned semi-arid mulga(Acacia aneura) wood land in eastern Australia, B.Sc (Hons.)thesis. Australian National University, Canberra, 1995.
[51 Bureau Of Meteorology, Selected tables of Australian rainfalland related data, Bureau of Meteorology, Melbourne, Victoria,Australia, 1961.
[6] Catcheside D.G., Mosses of South Australia, D.1. Woolman,Governrnent Primer, South Australia, 1980, 364 p.
Vol. 20 (3) 1999
169
[71 Cornet A.F., Montana c., Delhoume J.P., Lopez-Portillo J.,Water flows and the dynarnics of de sert vegetation stripes, in:Hansen A.1.. di Castri F. (Eds.), Landscape BoundariesConsequences for Biotic Diversity and Ecological Flows,Ecological Studies, Springer Verlag, New York, 1992, pp.327-345.
[8J Danin A., Gaynor E., Trapping of airborne dust by mosses inthe Negev Desert, Israel, Earth Surf. Process, Landf. 16(/991) 153-162.
[9] Downing A.1., Selkirk PM., Bryophytes on the calcareoussoils of Mungo National Park, and arid area of southerncentral Australia. Great Basin Nat. 53 (1993) 13-23.
[101 Dunkcrlcy D.L., Brown K.1., Runoff and runon areas in apatterned chenopod shrubland, arid western New SouthWales, Australia: characteristics and origin, J. Arid Environ.30 (1995) 41~55.
[II] Eddy J., Humphreys G.S., Hart D.M., Mitchell P.B., Fanningpc., Vegetation arcs and litter dams: similarities and differences, Abstract, Banded Vegetation Patterning in Arid andSerni-Arid Environments: Ecological Processes and Consequences for Management, April 1996, Paris, France, 1996, pp.95.
[12J Ehrmann M.. Galle S., Seghieri J., Valentin C; Patterning andpioneer processes of a herbaceous front in a tiger bush,Abstract, Banded Vegetation Patterning in Arid and SerniArid Environments: Ecological Processes and Consequencesfor Management, April 1996, Paris, France, 1996, pp. 27-28.
l 131 Eldridge D.1.. Cryptogam co ver and soil surface condition:effects on hydrology on a semi-arid woodIand soil, Arid SoilRes. Rehab. 7 (1993) 203-217.
[14] Eldridge D.1., Distribution and floristics of terricolous lichensin soil crusts in arid and serni-arid New South Wales,Australia, Aust. 1. Bot. 44 (1996) 581-599.
[15] Eldridge D.1., Soil crust lichens and mosses on calcretedominant soils at Maralinga in arid South Australia, J.Adelaide Bot. Gardens 18 (1998) 9-24.
[16] Eldridge D.1., Trampling of microphytic crusts on calcareoussoils and its impact on erosion under rain-irnpacted flow,Catena 33 (1998) 221-239.
[17] Eldridge D.1., Greene R.S.B., Assessment of sediment yieldl'rom a serni-arid red earth with varying coyer of cryptogams,J. Arid Environ. 26 (1994) 221-232.
[18] Eldridge D.1., Koen T.B., Coyer and floristics of microphyticsoil crusts in relation to indices of landscape health, PlantEco!. 137 (1998) 101-114.
[191 Eldridge D.1., Rosentreter R., Morphological groups: a framework for monitoring microphytic crusts in arid landscapes, J.Arid Environ. 41 (1999) 11-25.
[201 Eldridge D.1., Tozer M.E., Distribution and floristics ofbryophytes in soil crusts in semi-arid and arid eastern Australia, Aust. J. Bot. 44 (1996) 223-247.
[21 J Eldridge D.1., Tozer M.E., Soil crust Xanthoparmeliae: keyindicators of rangeland health in serni-arid New South Wales,Aust. LichenoL Newslett. 38 (1996) 19-20.
[221 Eldridge D.1., Lepage M.. Bryannah M.A., Ouedraogo P., Soilbiota in pattemed landscapes, in: Valentin c., Tongway D.1.,d'Herbes J.M., Seghieri J. (Eds.), Banded Vegetation Patterning in Arid and Serni-Arid Environments: Ecological Processes and Consequences for Management, Springer-Verlag,1999, in press.
[23] Filson R.B .. Rogers R,W., Lichens of South Australia, Government Printer, South Australia, 1979.

170
[24] Galun M., Bubrick P., Garty J., Structural and metabolicdiversity of two desert-lichen populations, J. Hattori Bot. Lab.53 (1982) 321-324.
[25] Gillison A.N., Brewer K.R.W., The use of gradient directedtransects or gradsects in natural resource surveys, J. Environ.Manag. 20 (1985) 103-127.
[26] Gittins R., Canonical Analysis. A Review with Applications inEcology, Springer- Verlag, Berlin, 1985.
[27] Greenacre M.1., Theory and Applications of CorrespondenceAnalysis, Academie Press, London, 1984.
[28] Greene R.S.B., Soil physical properties of three geomorphiczones in a semi-arid mulga woodland, Aust. J. Soil Res. 30(1992) 55-69.
[29] Greene RS.B., Kinnell P.LA., Wood J.T.. Role of plant coyerand stock trampling on runoff and soil erosion from semi-aridwooded rangelands, Aust. J. Soil Res. 32 (1994) 953-973.
[30] Hale M.E., The Biology of Lichens, 2nd ed., Edward Arnold,London, 1974.
[31] Hawksworth D.L., Hill D.1., The Lichen-Forrning Fungi,Blackie, Glasgow, 1984.
[32] John E., Dale M.R.T., Environmental correlates of speciesdistribution in a saxicolous lichen community, J. Veg. Sei, 1(1990) 385-392.
[33] Johnston D., Milthorpe PL., Land Systems Series SheetSI55-2 Nymagee, Soil Conservation Service of NSW, Australia, 1984.
[34] Lange O.L., Kidron G.I., Budel B.. Meyer A., Kilian E.,Abeliovitch A., Taxonomie composition and photosyntheticcharacteristics of the biological soil crusts covering sanddunes in the western Negev Desert, Funct. Ecol, 6 (1992)519-527.
[35] Longton R.E.. The role of bryophytes and lichens in terrestrialecosystems, in: Bates J.W., Farrner A.M. (Eds.), Bryophytesand Lichens in a Changing Environment, Cambridge Press,Oxford, 1992, pp. 32-76.
[36] Ludwig J.A., Tongway D.1., Monitoring the condition ofAustralian arid lands: Iinked plant-soil indicators, in:McKenzie D.R, Hyatt D.E., McDonald V.1. (Eds.), Ecological Indicators, Elsevier Applied Science No. 1, 1993, pp.765-772.
[37] Mabbutt J.A., Fanning P.c., Vegetation banding in aridWestern Australia, J. Arid Environ. 12 (1987) 243-250.
[38] McCarthy P.M., Checklist of Australian Lichens, 4th ed.,National Herbarium of Victoria, Melbourne, 1991.
[39] Minitab, MINITAB Reference Manual, Release 8,Minitab Inc.. State College, Pennsylvania, 1991.
[40] Montana c., The colonisation of bare areas in two-phasemosaics of an arid ecosystem, J. Ecol. 80 (1992) 315-327.
[41] Rogers R.W., Lichens from the T.G.B. Osborn vegetationreserve at Koonamore in arid South Australia, Trans. R Soc.Sth. Aust. 98 (1974) 113-124.
[42] Rogers RW., Lange R.T., Soil surface lichens in arid andsub-arid south-eastern Australia, 1., Introduction and f1oristics,Aust. J. Bot. 20 (1972) 197-230.
D.J. Eldridge
[431 Scott G.A.M., Desert bryophytes, in: Smith A.J.E. (Ed.),Bryophyte Ecology, Chapman and Hall, London, 1982, pp.105-122.
[44] Scott G.A.M., Southern Australian Liverworts, Aust. Govt.Publ. House, Canberra, ACT, 1985.
[45] Scott G.A.M., Stone LG., The Mosses of South Australia,Academie Press, London. 1976.
[46] Serpantie G., Tezenus du Montcel L., Valentin c., La dynamique des états de surface d'un territoire agropastoralsoudano-sahélien sous aridification climatique: conséquenceset propositions, in: Le Floc'h E., Grouzis M., Bille J.c. (Eds.),L'aridité, une contrainte au développement, Orstom édition,Collection didactiques, Paris, 1991, pp. 419-448.
[47] Shirazi A.M., Muir P.S., McCune B.. Environmental factorsinflucncing the distribution of Lobaria oregana and L. Pulmonaria, Bryologist 99 (1996) 12-18.
[48] Soil Survey Staff. Soil taxonomy: a basic system of soiltaxonomy for making and interpreting soil survey, USDAAgric. Handbook No. 436, Govt. Printer, Washington DC.1975.
[49] Stace H.C.T., Hubble G.D., Brewer R., Northcote K.H.,Sleeman J.R.. Mulcahy M.1., Hallsworth E.G., A Handbook ofAustralian Soils, Rellim Technical Publications, South Australia, 1968.
[50] Streimann H., Curnow J., Catalogue of Mosses of Australiaand its External Territories, Australian Government Publishing Service, Canberra, 1989.
[51] ter Braak C.1.F., Canonical correspondence analysis: a neweigenvector technique for multivariate direct gradient analysis, Ecology 67 (1986) 1167-1179.
[52] Thiery J.M., d'Herbes J.M., Valentin C, A model simulatingthe genesis of banded vegetation patterns in Niger, J. Ecol, 83(1995) 497-507.
[53] Tongway D.1., Rangeland Soil Condition Assessment ManuaI.CSIRO, Melbourne, 1993.
[54] Tongway D.1., Ludwig J.A., Vegetation and soil patterning insemi-arid mulga lands of eastern Australia, Aust. J. Ecol. 15(1990) 23-34.
[55] Tongway D.1., Ludwig J.A., Small-scale resource heterogeneity in semi-arid landscapes, Pac. Conserv. Biol. 1 (1994)201-208.
[56] Valentin c., Sealing, crusting and hardsetting soils in Sahelianagriculture, in: So RB., Smith G.D., Raine S.R., SchaferB.M., Loch RJ. (Eds.), Sealing, Crusting and HardsettingSoils: Productivity and Conservation, Aust. Soc. Soil Sei. Inc.(Qld. Branch), Brisbane, 1995, pp. 53-76.
[57] Whitford W.G.. The importance of the biodiversity of soilbiota in arid ecosystems, Biol. Conserv. 5 (1996) 185-195.
[58] Wickens G.E., Collier F.W., Sorne vegetation patterns in theRepublic of the Sudan, Geoderma 6 (1971) 43-59.
[59J Willis J.H., The vegetation of Hattah Lakes National Park,National Parks Authority, Victoria, 1970.
Acta Oecoiogica

Acta Oecologica 20 (3) (1999) 171-183 / © Elsevier, Paris
Short range co-operativity competing with long range inhibition explainsvegetation patterns
Olivier Lejeune a, Pierre Couteron b, René Lefever a-
" Faculté des Sciences, CP 231, Uniuersué Libre de Bruxelles, B-]f)50 Bruxelles, Belgium.h École national" du ginie rural des eaux etforêts (ENCRJ,l'), ll.l~ 5093, 34033 Montneilier cedex01, France.
* Corresponding author (fax: +3226505767; e-mail: riefeversioulh.ac.be )
Received March 17,1997; rcviscd Fcbruarv 10, 1999; acccptcd Marrh 15, 1999
Abstract - We model the non-local dynamics of vegetation communities and interpret the formation of vegetation patterns as a spatialinstability of intrinsic origin: the wavelength of the patterns predicted within the framework of this approach is determined by the parametersgoverning the dynamics rather than by boundary conditions and/or geometrical constraints. The spatial periodicity results from an interplaybetween short-range co-operative interactions and long-range self-inhibitory interactions inside the vegetation community. The influence ofenvironmental anisotropies on pattern symmetry and orientation is discussed. As a case study, the approach is applied to a system of vegetationbands situated in the north-west of Burkina Faso. The parameters describing the co-operative and inhibitory interactions at the origin of thepatterns are evaluated. © Elsevier, Paris
Tiger bush / vegetation dynamics / non- local interactions / intrinsic symmetry breaking / instability / etTects of anisotropy
1. INTRODUCTION
In many uninhabited arid regions of the African,American and Australian continents, one finds vastterritories where the vegetation is distributed nonuniformly with a spatial periodicity in the order of lOto 500 m (see table 1). Generically, these large botanical and ecological structures are called 'vegetationpatterns'. They have also been given more specifienames, such as vegetation arcs, bands, stripes, lanes,groves, tiger bush, spotted bush and pearled bush,which describe different modes of patterning. Thedifferences in aspect, syrnmetry, or orientation existingbetween these modes are phenotypical rather thanfundamental. They represent various manifestations ofa general botanical phenomenon. The following observations have been made concerning its occurrence:
- Influence of aridity: Vegetation patterns are acharacteristic landscape in arid regions where rainfallsare intense, rare and of short duration. Such climaticconditions prevail over one third of the earth's surface [34, 43]. These patterns are not specifie to particular plants or soils. They may consist of herbs andgrasses as weil as shrubs and trees; they have been
observed on soils which range from sandy and silty toclayey [2, 15, 22, 23, 33, 38, 41, 44, 45, 46, 47].Comparing patterns consisting of the same vegetationshows that, on average, vegetation density diminishesas aridity increases. Simultaneously, the size of thespatial periodicities increases. Typically, the vegetatedbands of tiger bush (also often called vegetationstripes), become less densely populated while, at thesame time, the sum of the vegetated band width and ofthe bare inter-band width, i.e. the pattern wavelength,increases [Il, 16, 42].
- Influence of environmental anisotropy: As mostecological systems, vegetation patterns are subjectedto environmental factors, such as the direction ofdominant winds, the sun's course in the sky, the slopeof the ground surface, etc., which break the isotropy ofspace. But none of these 'extrinsic anisotropies' displays a spatial periodicity which per se can impose theemergence of a well-defined wavelength in the organisation of vegetal communities. They can howeverdetermine the symmetry properties and/or patternorientation. In this respect, numerous evidences indicate that the existence of a small siope, on which waterflows without forming drainage channels, orients veg-

172 O. Lejeune et al.
Table I. General characteristics of vegetation patterns in different geographic regions. h. Height; w, width; s, spacing; 1, length.
Region Type of vegetation Patterns Slope, orientation Authors
British acacias, bushes and trees (h: 6-10 m) arcs 1:400, perpendicular [23]
Somali land w: 30---40 m
s: 120-130 m
1: 0.5-1 km
lanes parallel
w: 80-100 m
s: 80--400 m
1: 3--4 km
Sudan grass stripes 1:160 to 1:300, perpendicular [45]
w: 8-12 m
s: 20-30 m
trees (h: 4-5 rn) arcs 1:200 to 1:50 [44]
w: 40-50 m
s: 50--60 m
1: 150-300 m
Western tall shrubland, low woodland dominated bands 1:50 to 1:500, perpendicular [21]Australia by Acacia aneura (h: 2-7.5 m) w: 10--40 m
s: 15-120m1: 1-3 km
South Africa thorny wooded shrub, grassland (h: 3-5 ) stripes less than 1:100 [38]
w: 20-50 ms: 20-50m
Mexico grassland (h: 15-60 cm) stripes 1:100 to 1:400, perpendicular [6]
w: 20-70 m
shrub (h: 1-2.5 m) s: 60-280 m
1: 100-300 m
Jordan shrub arcs and lines almost flat parallel and perpendicular [41]
w: 5 m
s: 25-100 m
1: 300-800 m
1
Southem Combretum woodland (h: 4 m) stripes less than 1:100, perpendicular [42]Niger w: 20---40 m-l s: 35-150 m
etation stripes [4, 13,21,28]. The orientation adoptedby the stripes can be either orthogonal to the groundslope, i.e. parallel to the contour lines, or parallel to theground slope [3, 13, 23, 41]. In the former case, anup-slope migration of the stripes has been observed forgrass patterns [45]. This invalidates the hypothesis thatan underlying soil pattern causes the formation ofvegetation stripes: it is unrealistic to think that a soil'sproperty moves upward and drives the stripe migration. Up-slope motion has also been advocated withtrees and bushes, but on a much slower time scale [6,13, 27, 36], whilst several other authors remainedsceptical [42, 44].
In this paper, we discuss how vegetation patternscan occur as a consequence of processes which aretotally 'intrinsic' to the vegetation dynamics andwhich are at work even in an isotropie environmentimposing no oriented constraint or boundary conditionupon the vegetation. We show that the pattern'swavelength is determined by the kinetic parametersassociated with the plant's life cycle and by theparameters controlling inter-plant interactions. Theprincipal ingredients explaining the patterning phenomenon are the aridity of the environment and theexistence of co-operative and inhibitory interactionsoperating over different ranges. Remarkably, this ex-
Acta Oecologica

lt-Model of vegetation patterns 173
2. A GENERALISED VERHULST EQUATION:THE jt-MODEL
2.1. Formulation of the model
As a starting point for studying the mechanisms ofpattern formation of vegetal communities, we considera logistic equation of the form [18]:
(2)= d p( r, t)
Regarding F3 and the kinetics governing vegetationdeath, we suppose that plants do not kill each other ata distance or, at least, do not do so over distancescomparable to LI and L 2 . Vegetation death is modelledas a local process the rate of which is proportional tothe vegetation density at the point r:
genotypic differences and age classes can be neglected. When several species are present, it amountsto assuming that the dominant species imposes itsspatial distribution [14]. We do not describe explicitlythe inter-species dynamics. A less global treatment ofthe space-time behaviour of vegetal communities,based on a discrete cellular automata model, has beenproposed recently by Mauchamp et al. [24] and Thiéryet al. [35].
The term FI x F2 models vegetation propagationand maturation; the term F 3 models vegetation death.Writing the former term as a product of two functionsaccounts for the fact that vegetation developmentinvolves processes fulfilling different biological functions, depending upon different plant structures andinfluenced by different systemic agents. The majordistinction we make here is between processes theactivation of which increases the phytomass density,which we associate with the 'propagation distributionfunction' FI (units: kg·m-2.ç l ) , and processes which,on the contrary, limit the phytomass density, which weassociate with the (dimensionless) 'inhibition distribution function' F2 . The first processes mostly involveplant aerial structures, such as the canopy. Theycorrespond to reproduction, seed dissemination, germination and the maturation of new plants. The secondprocesses mostly involve the root system and theuptake of nutrients. They rely on the availability offree soil, which new vegetation may colonise, and onsoil resources which are in limited supply. The timeevolution of p at point r depends at least in part on theplants living within the neighbourhood of the point rconsidered, e.g. at r + r'. Adopting a mean fieldapproach, continuous in time and in space, we associate to each point of the vector field r' + r the propagation and inhibition densities, w1(r', L,)I, (p(r + r, t)) (units: kg-rrrt-s") and w2(r', L 2 )
f2(p(r + r, t)) (units: rrr') which introduce the weighting functions w, (r', LI) and w2(r', L 2 ) (units: m").The parameters LI and L 2 control the steepness withwhich the weighting functions vary. They have thedimension of a length and determine the range overwhich propagative and inhibitory interactions operate.
(1)
= [I dr' w, ( r', L, ) I, (p( r + r', t)) ] X
[I dr' w2( r' , L2 ) fi p( r + r', t)) ]
f,(p(r,t))
where p(r, t), p(r + r', t) represent the epigeneousphytomass density (units: kg·m-2 ) at time t, at spacepoints rand r + r'. This density is defined as the planttotal phytomass (including the necromass) per unitarea. Considering a global variable, p, including aIlvegetal species present, is justified for patterns formedby a one-species pure strand and in aIl cases where
planation works without requiring the involvement ofa ground slope. It contrasts with the point of view,often expressed [10, 13, 14, 20, 45], that a slope is ofprimary importance for the formation of patterns. Wealso bring sorne clarification concerning the role ofenvironmental anisotropy as a 'rnechanism of patternselection'; the switching between organisations exhibiting different symmetry properties, e.g. hexagonalsymmetry versus stripes, is exemplified. We find thatthe orientation of the patterns with respect to adirection of anisotropy depends on whether this anisotropy influences co-operative or inhibitory interactions.
We base our discussion on an extension to botanicalecosystems of the logistic equation initially introducedby Verhulst in 1848 and used since then in variousbiologieal and non biological contexts (for reviews,see e.g. [9, 17,25,30]). In the next section, we brieflyrecall the assumptions underlying our approach. Subsequently, we discuss its properties under isotropie andanisotropie environmental conditions. As a case studyin section 4, the approach is applied to a system ofvegetation bands situated in the north-west of BurkinaFaso.
Vol. 20 (3) 1999

174 O. Lejeune et al.
K=!!!:.a
As a measure of (anti- )co-operative feedbacks andof the range of interactions, we introduce the dimensionless parameters
The product fl'(O) f2(0), the units of which are theinverse of a time, determines the vegetationreproduction-maturation time scale. Setting
In practice, .the quantities introduced in equations(4-6) can be estimated as follows. Knowing theaverage mass m and average area a occupied by anisolated adult plant one has that
(8)
(7)f~ ( 0 ) fzC 0 ) =ln 2tl/2
{ d} {tl/2 - L - K ln 2 }t, r, p, = -12 r, r 2' p ,- Iln t l/2
where tY2 is the phytomass density doubling time,provides an estimate of it. Alternatively, t lh could beidentified with the time it takes for the vegetationdensity to recover its usual level after having beenhalved by sorne external cause, such as e.g. the actionof man, grazing, fire, unusual drought, etc.
Taking equation (7) as unit of time, the inhibitionrange L2 as unit of length and the carrying capacity Kas unit of vegetation density, we redefine time, space,vegetation density and vegetation inverse life time bysetting
fj(p) =fl(O) +f~(O) p + ~~'(O) /
=p [~ ( 0 ) + ~J;'( 0 ) p ] (4)
<Pi><d> = L diS' where S =L <Pi> (3)
1
By definition, the propagation distribution function FIvanishes in the absence of vegetation which impliesthatfl(O) = 0 in equation (4);//(0) determines the rateat which phytomass increases when its density issmall. The term quadratic in the density, Y2f((0) pZ,amounts to a feedback effect of the vegetation on itspropagation rate. Clearly, this feedback is co-operative(anti-co-operative) if f((O) is positive (negative). Thedominant terms in the Taylor expansion of f2(P) read
To specify the propagation and inhibition functions fI'andf2, we consider their Taylor expansion in terms ofthe vegetation density P (it is superfluous to explainthe space and time dependency of P here). Thedominant terms of fJ(p) read (prime' denotes derivation with respect to p):
From a biological point of view, this simplification isplausible. It is noteworthy that its validity also conditions the use of a mean field treatment [18]. The rateconstant d (units: s") represents the inverse of thevegetation lifetime. When the vegetation consists ofseveral species, having different lifetimes, an effective< d> can be defined by weighting the lifetime of eachspecies according to its average phytomass density<Pi >:
(5) Â= r((O) K
2f~(0)(9)
By definition, the inhibion distribution function F2 ispositive and decreases with p. The inequalitiesfz(O) > 0 and f2'(0) < 0 must hold, so that vegetationdevelopment is turned off as the phytomass densitygets high and approaches the ratio
K= _ f 2( 0 )
f;( 0)(6)
At this stage, one can already guess that within theframework of equation (1), the emergence of periodicpatterns characterised by a well-defined wavelengtharises from the competition between propagative andinhibitory interactions operating over different ranges.We shall therefore calI equation (1) the 'propagatorinhibitor model ', or in brief, the n-model.
which has the dimensions of a vegetation density, andrepresents the territory's carrying capacity. The notionof carrying capacity expresses that environmentalresources put an upper bound on the phytomassdensity. The very fact that mature plants have a sizeand thus need a minimum of physical space puts anupper bound to their density. K is the 'close packeddensity' of a fully occupied territory.
2.2. Isotropie version of the n:-model
For the model to be operational, the propagation andinhibition densities as weIl as their weighting functions must be specified. This requires that environmental conditions and vegetation kinetics be further specified. To begin with, we consider the ideal situation ofan environment having no structure of its own. Spaceis then isotropie, meaning that aIl space points and
Acta Oecologica

lt-Model of vegetation patterns 175
directions are equivalent. Consequently, the weightingfunctions are invariant under rotation. In first approximation, it is reasonable to assume that they areGaussian normalised decreasing functions of the distance 1r] separating the points r' + rand r:
ingly arid environment. Hence, the most favourableenvironmental conditions is obviously Il = 0, meaningthat phytomass losses are negligible. The right handside of equation (11) models a 'pure birth' process therate of which vanishes only if no vegetation is present(the territory is a complete desert), i.e. if
or if the vegetation density has reached its maximumvalue, i.e. if
w.( r', L) = _1_1 exp( - I r /1 2 /2 L 2) ,
1 1 2 nl.: 11
i=I,2 (10)
Placing equations (2-10) in equation (1) yields theisotropie version of the rr-model:
p( r ) = Po = 0
p( r ) = {- ~ for A < -11 for -1 ~ A
(12)
(13)
[ l Ir'I' ]1-21n dr' e - - 2 p(r+r/,r) -
pp(r,r) (l')
2.3. Uniform stationary distributions
When the phyto-density is uniform, i.e. when p is afunction of the normalised time r only, equation (1 ') isreduced to the ordinary differential equation:
which for A = 0, is the classical Verhulst logisticequation. By definition, Il is non-negative (f1 E [0,00D.Its increase amounts to a decrease of the plants lifespan relative to the time they need to reproduce andmature, which clearly models the effect of an increas-
[l'l'ap( r, r ) 1 1 __r_ 1
a = --2ldr e 2 L 2 p( r + r , r ).r 2 nl.
( 1 + Ap( r + r, r ) ) ] x
(15)* A - 1P =21\
( 1 + A )2P = 4A
1 i.e. corresponds to real, non-negative values.
Thus, when Il = 0, any p(r), initially close to zero,monotonously increases in the course of time untilasymptoticaIly, for r --7 00, it reaches the most denselypopulated state, i.e. either -liA or 1 depending onwhether Ais less or greater than -1. The trivial state Pois then unstable while the most densely populatedstates are stable. For Il > 0 and r --7 00, a vegetalpopulation can only survive, if the non-trivial roots,
A - 1 ± V(A - 1 )2 + 4A( 1 - p)P± = 2A (14)
of equation (11) are real and positive. They represent ahomogeneous stationary state situation such that, ateach point of the territory, the vegetation reproductionand death are exactly balanced. Depending on A andIl, two cases are possible.
2.3.1. Case 1: feedback effects are co-operative(A. > 0)
When co-operativity is weak (0 < A ~ 1), only theuniform branch of stationary solutions p; (curvesdrawn in full line in figure 1) is rneaningful' in so faras 0 ~ Il ~ l. When aridity CIl) increases, the vegetalpopulation becomes sparser: p; monotonously decreases till zero which is reached for Il = 1. At thispoint, p+ intersects the trivial branch Po. Subsequently,for Il > 1, the trivial state Po is stable and remains theonly stationary solution possible of equation (Il).Vegetation survival is then impossible; the vegetationdensity can only tend to zero for r --7 00. Whenco-operative interactions are strong (A > 1), thebranch of solutions p+ extends beyond Il = 1, up to theturning point (u", p*) given by(Il)
which allows us to study the mechanism governingpattern formation in botanical ecological systems interms of only three, basic parameters: Il which isrelated to the aridity of the environment, A whichdetermines the intrinsic co-operativity of the vegetation and L which controls the range of spatial interactions. To simplify notations, we have dropped thetildes over r and fi in equation (1 '),
We shall discuss later how the values of L" L2 andA can be deduced from experimental observations.Before that, it is appropriate to examine the propertiesof the uniform stationary distributions predicted byequation (1 ').
dp( r )-----cF[ = p( r ) [1 + Ap( r )] x
[1 - p( r )] - pp( r )
Vol. 20 (3) 1999

176 O. Lejeune et al.
Consequently, for 1 :s; f.l :s; u", an hysteresis loop and abistability phenomenon appear: both Po and p; arestable while p.: which takes values in between thesestates (dashed curve in figure 1), is unstable. Whenf.l> f.l*, only the trivial state Po is possible.
Figure 1. Uniform stationary distributions of vegetation P, as afunction of environmental aridity measured by fi, for different valuesof the vegetation feedback constant A (indicated on the curves). ForA =0, the stationary solution is sim ply the straight line Ps=1 - fi.The trivial uniform distribution, Po= 0, is always a solution ofequation (II); it is unstable (dashed Iine) for 0 <:;'fI < 1 and stableotherwise (full line). Strong inter-plant co-operative interactions(A> 1) give rise to a hysteresis loop allowing the survival of a stablevegetal population under environmental conditions harsher than thosecorresponding to fi = 1.
(17)<d> t 1l2
f.1 = ln 2
The switching point f.l = 1 then corresponds simply tothe situation where the vegetation average lifetime andaverage maturation time are equal.
The second parameter upon which the uniformstationary distributions depend, A, controls the rangeof zz-values for which a vegetation population cansurvive at densities given by P+. A crude estimation ofA can be made by reasoning as follows (we shallindicate later a more reliable method of deterrninationbased on the spatial characteristics of the patternsthemselves). First, we note that patterning can beviewed as a phenomenon of redistribution of thevegetation over space. In other words, the value of P+,uniform stationary solution of equation (II), is likelyto approximate the average density obtained by redistributing the pattern's vegetation over the entire territory, i.e.
ment: it controls the switching of the trivial statePo = 0 from instability (for 0 :s; f.l < 1) to stability (forf.l 2 1). In agreement with our assumption that nonlocal effects can be neglected in the kinetics governingvegetation death (cf. section 2.1) and its definitiongiven by equation (8), f.l can be estimated by using therelationship
Jl*10.80.6
Jl
...... . .
0.4
............
-,
....... - 1
0.2
.~... .......... -2
oo
0.2
0.8
1
0.6
Ps0.4
where A is the territory's surface. Next, we rememberthat vegetation patterns are typical of arid climates. Wethus expect that their existence generally correspondsto values of f.l close to 1, which suggests consideringthe Taylor expansion of p+ in the neighbourhood of theswitching point f.l = 1. Taking equation (18) into account, and limiting the expansion to the dominantterm, this yields
2.3.2. Case 2: feedback effects are anti-co-operative(A <0)
For
- 00 < A < 0 and O:S; f.1:S; 1 (16)
only the uniform stationary distributions given by p;are stable and meaningful. They correspond in generalto a decrease of the average uniform vegetationdensity (dotted curves infigure J). No hysteresis loopis possible; the stationary branch of solutions p: (notdrawn because unphysical) is unstable.
{~1 - A'
<p> = A - 1A '
if 0 :s; A < 1
if 1 < A(19)
which predicts, in the strongly co-operative case whereA is greater than 1, the existence of a quite simplerelationship between A and < p >:
2.3.3. In conclusion
Within the framework of this model, the parametersf.l and A suffice for complete1y unfolding the properties of uniforrn stationary vegetation distributions. Thefirst one measures the degree of aridity of the environ-
A= 11 - <p>
(20)
Acta Oecologica

lt-Model of vegetation patterns
In the weakly co-operative case where Ais less than 1,equation (19) predicts that < p > should decrease like-1I(l-A) as the aridity of the environment (u) increases. When data on the behaviour of a given kind ofvegetation under different aridity conditions are available, this relationship may serve for an approximatedetermination of A.
We demonstrate in section 3 that in the absence ofco-operative feedback, vegetation patterns cannotform. Therefore, we are not interested here in investigating further the properties of uniform stationary statedistributions corresponding to A :s: O.
3. VEGETATION PATTERN FORMATION VIAA SYMMETRY BREAKING INSTABILITY
3.1. Isotropie environments
We now come back to equation (1 ') and the problemof pattern formation in isotropie environments towhich this equation applies. The phenomena of symmetry breaking taking place under those conditionscan only be of 'intrinsic origin', i.e. independent fromthe geometrical factors or boundary conditions imposed by the environments.
We study the stability of the uniform stationarydistribution p == {p+,p_}with respect to arbitrary, nonuniform perturbations r3p(r;r). In terms of twodimensional Fourier modes one has
r5p(r, r ) = 21n Jdkr5p(k, r ) e
ik r(21)
where r5p( k, r ) = ew,r r5p( k, 0) is the amplitude ofthe Fourier mode of wave vector k, or equivalently, ofwavelength À =2n/k, k = 1k 1 being the modulus of k.By placing equation (21) in equation (1 ') and linearising this equation. furnishes the dispersion relation
L'k'w
k= ( 1 - Ps) ( 1 + 2Aps) e- -2- -
k'-p,(I+Ap,)e-"2-1l (22)
The mode k is (un)stable if the sign of W k is (positive)negative. We look for conditions under which equation(22) admits a finite band of unstable wavenumbers kfrom which are excluded both the large modes, corresponding to spatial periodicities of the size of the
Vol. 20 (3) 1999
177
plants themselves (k ~ 00), and the mode corresponding to spatially uniform perturbations (k = 0). Thispattern formation mechanism, via a symmetry breaking instability, is the botanical analogue of the Turinginstability which has been extensively studied in thefield of chemical morphogenesis and reactiondiffusion systems [26, 30, 32, 37]. As is well-known,the so-called Turing cri tical point at which the instability appears is met when simultaneously:
(23)
Il is easy to show that these conditions can never befulfilled in the anti-co-operative case where A isnegative. Indeed: using the stationary state conditionIl = (l - pJ(l + ApJ, we may rewrite equation (22) as
L 2 k'
W k = - ( 1 - Ps) ( 1 + Aps) ( 1 - e- -2-) +L 2 k!. k?
Aps(1 - Ps) e -2- - pJ 1 + Ap,,) e-"2 (24)
Noting then that for A < 0, the non-trivial uniformstationary distributions are given by Ps= p+ and thatthe inequality °< 1 + p; holds (cf. figure 1), oneimmediately finds that each term in equation (24) isnegative. Thus, W k can never be equal to zero. Similady, in the absence of feedback (A = 0), one immediately sees that a symmetry breaking instability isimpossible.
For A> 0, the branch of stationary states p+ is theextension for Il > °of the stable state Ps = 1. Let usshow that vegetation patterns may appear via a Turinginstability of this branch when: (i) the co-operativityparameter A is strictly positive, and (ii) the propagation distribution function FI operates effectively over ashorter range than the inhibition distribution functionF20 i.e. the inequality L = L/L2 < 1 holds. Since we areinterested in periodicities corresponding to large wavelengths (small wave numbers), compared to the size ofplants, it is appropriate to study the critical conditions(equation (23» within the framework of the weakgradient limit- obtained by expanding equation (24) up
, For a more general treatment and a discussion of the consistency ofthis approximation see Lefever and Lejeune [18].

178 O. Lej eune et al.
to O(k4) . Thi s tran sforrns the dispersion relation W k
into the polynomial expression 0.5
1 4 1 [ )wk = -Sp+( I + AP+) k +2 p/ I+ AP+
- ( 1 - P+) ( 1 + 2 Ap+) L2
] e-p+(I-A+ 2AP+) (25)
from which we straightforwardly deri ve, usin g the firsttwo co nditio ns of equation (23), that a t the Turi ngcri tica l point , the wave nurnber ke of the first mod ebecorning unstabl e and the co rres ponding value Le ofL read:
L 0.25
oo
1111111
k 1 -+ _111111
k c 5
k10
Figure 2. Ba nd of unstab le modes k as a function of L for I l = 1.1and A = 2. For L > Le. a il modes are stab le; L = Le. is the criticalvalue at wh ich w, = 0 for k = k,; when L < L" the modes betw een k,and «; are unsta ble, Vanish ingly small mod es and arbitrar ily largemodes are a lway s stable for L "" O. When the ra tio of repro duc tio nand inh ibition range s. L te nds to zero . k, decreases to a finite va luedifferent fro m zero but k" diverges. The ca se L = 0 needs a spec ifietreatm ent and wi ll not be cons idered here .
(26)
(27)
( 1 + Ap + - y2( J + Ap+) ( 1 - A + 2Ap+) ) P+
( 1 + p+) ( 1 + 2Ap+)L =c
k = r 1 - A + 2AP+](l/4J
e 8 1+ AP+
The analysis of equ ations (25-27) dernon stratesthat:
(i) Le is less than one for all physically acce ptablevalues of A and P+.
(ii) The valu es of o, c lose to one , as weIl as thevalues close to zero, are exc luded from the do rna in ofex istence of the instability.
(i ii) In ag ree me nt with ex perimenta l observatio ns ,the waveleng th of the pattern s (pred icted as firstapproxim ation by the critical wavelength ,(. =2:rr/kJincreases as the aridity of the environment increases,i.e. for P+ decreasing (p increasing) and A co nstant.(iv) As figure 2 exemplifies, decreasing L, fo r fixedvalues of fA and A , in general destabilises the sys temand broadens the band of unstable modes.
(v) Different syrnmetries are possible for the pattern s es tablishing them selv es in the course of rime (forT ---7 00) when p+ becom es unstable. Figure 3 reports atypi cal example showi ng that for a s rnall variatio n inthe parameter va lues , the patterns may sw itch fromstripes to hexagon al symmetry.
The predicti on that fl at terri tories ca n suppo rt vegetation stripes steps aside from the tradit ional theorythat a ground slope is a necessary factor fo r theformation of tiger bush [13 , 14, 45]. Th e second ki ndof pattern, co nsis ting of densely veget ated spots arranged on an hexagonal lattice, couId be re late d tospotted [5] or pearl y bush [3]. More recently, th is kindof sy mmetry has been unambiguously identified by
Couteron [7] in Burkina-Faso . We shall illustrate further the pred ict ions of the model in the next sec tionwhere we shall use it to analyse the tiger bus h patternsstudied by one of us (P. Couteron) in Bu rkina Faso.Before, we will very briefly indi cate sorne resultswhich clari fy the ' pa ttern selection role ' of environmental anisotropies .
Figure 3. Patte rns obiai ned by integ ratin g the iso tropi e n -mode l ( 1')for ~ =0.95 , L =0. 1 and two va lues of A T he in tegration domai n isa square-sh aped territory subjec ted to peri od ic bound ary conditions.The initi al co ndi tion is a slig htly perturbed uniform sta tionary statedistribution P. (Ga uss ian perturbations of zero mean and 1 %variance ). The mode l predi ct s a pattern of stripes if t\ = 1 and apattern of hexagonal symmetry if A = 0 .8. As a co nse quence of theiso tro py of sp ace . the o rie nta tion finall y adopt ed by the stripes andhexagons is de te rmi ned by the randorn initia l con di tion. Blackco rrespo nds 10 the highesl phy to- densi ty.
Acta Oecologica

n -Model of vegetation patterns 179
Figure 4. Influence of an anisotropie environ mental factor oriented in the y-directio n. The values of ft. 1\ and L are the same as in the isotropiecase described in.figure 3; the pattern s obtained for an isotropie environment are repre sented again on the left hand side of the figure (randornlyoriented stripes and hexagon s). The patterns in the middle and on the right hand side report the effect of anisotropy respectively on the propagatorfunction (' , = 1" 2 = 0) and on the inhibitor function (', = O." = 1). In the first case, both the randornly oriented stripes and the hexagons transforminto vegetation stripes parallel to the anisotropy direction y; in the second case, the patterns transform into more or Jess wavy strip es orthogona lto the anisotropy direction y. Stripes parallel to the direct ion of anisot ropy are globa lly sta tic whereas orthogonal stripes migrat e upward (in thepositive y-direction).
(28)
3.2. Anisotropie environments
The influence of ani sotropy on the symmetry breaking instability of the isotropie rt -rnodel is best seen byinvestig ating the two situa tions where an env ironmental source of spatial ani sotropy affects either only thepropagation distribution function Fior the inhibitiondistribution funetion F2 . We have proposed a simpletreatment permitting to deal with these situ ations [18].It con sists in introducing a bias in the wei ghtingfunctions W I , W 2 whieh fixes their mean to a non-zerovalue, respeeti vely li and l 2 for one of the planedirections, say the y-d irec tio n; in the x-d irec tio n, asbefore , no bias is introduced . The evolution equationfor the epigeneous phytomass then beeomes:
Vol. 20 (3) 1999
ar
p( r, r) = [_1_2ldr' e- >. 2 + ~~ 2- l, ) ' p( r + r' , r).
2 til.
( 1 + I\p( r + r ' , r) )
x [1-2
InIdrl e - x' 2 + ( ; ' - 1
2)2 p(r+r
/,r)]_
IlP( r , r)
Integrating this equation for the sa me valu es of u,1\ , L as in the isotropie case eon sidered above, but fortwo eho ice s of values of l i and l2' we obr ain the resultsreported infigure 4. Rem arkably, they demonstrate not

180
o nly thar the presence of an isotrop ie factors determines the orientation of the patterns and the ir sy rnme try properties (str ipes replace hex agon s) but also thatthe o rie ntation selected is either par allel or orthogonalto the direction of anisotropy depending on whetherthe latter affec ts prop agation or inh ibition .
On the other hand, the model also predi cts that whenthe anisotropy affec ting inhibition increases fur ther ,arc -s haped pattern s perpendicuJar to the d irection ofaniso tropy appear [18] . Vegetation arcs, the main axi sof whi ch is orthogon al to a ground slope, have beendescribed by Greenwood [13] and Boaler andHod ge [3, 4]. A curvature of the gro und surface isusuall y invo ked in orde r to ex pla in the origin of thesestructures . In co ntras t with widespread opinio n, themod el predicts that arc uate vegetation patterns ca nap pea r even if the gro und gradient is co nstant. Finally,we may still menti on that vegetation stripes paralle! tothe anisotropy directi on are static whereas bands andarcs oriented at rig ht angle to that directi on moveupward (a t Jeast fo r the se ts of par am eters co nside redin the simulations made so far (u npu bl. resultsj) .
4. A CASE STUDY: TIGER BUSH IN BURKINAFASO
O. Lejeune et a l.
Figure 5. Banded system under investigation. The picture is or iented according to the main slope, wit h vegetalion bands roug hlyfollowing the co ntour. Note that herb aceous vegetation (inte rrnediategrey tone s), is mainly observed up-slope the woody thickets (da rkgrey ) .
7.5 X 5 cm printed outl ooks, which have been nurnerised (grey-scale values in the range 0-255) at aresolution of 300 dots per inch (DPI) through a HPScanjet scanner (pixel side eq uivalent to 0.8 m in thefield ). A sq uare window of 400 x 400 pixels (i.e.320 x 320 m in the field) was ex trac ted for analys is(figure 5) . O n the pictu re, br ight pixels co rres po nd tobare soils, whereas dar k ones are dom inated by woo dyvegetation ; intermediate grey -scale values ca n mai nlybe interpreted as being dense grass cover. Sincecontinuo us grass and woody vegetation have res pective epige neous phytomass averaging 1 500 kg-ha"and 2. 104 kg-ha:" ( [19] ; Co uteron unpubl. data), greyscale valu es ca n be see n as a monotonou s func tion o fthe phytorn ass.
Fourier coe fficients have been computed from themean-cor rected values Zjk co ntained in the digitalimage as :
T he vegetation pattern represented in fig ure 5 islocated at and aro und [4°[0' N and 2°28' W in thenorth- west part of Bu rkina Faso . Climate is trop icalse rni-a rid ; mean rainfall amounts to 490 mm-year'"and potential evapot ranspiration (Penman) is slightlyunder 2 000 mmyear" [8]. The vegetation under inves tigation grows on a gentle s lo pe (around 1 %)located on Paleozoi c sa nds tones . Soi ls are shallow(betwe en [0 and 20 cm), and poorl y deve loped onferrug inised sandsto ne debri s, overtopping the unweath ered sand stone (encountered around 60-80 cmdepth). Vegetation belongs to the Sahel transition zon ewith most specie s rel ated to the Suda nian centre ofendemism [40] ; it co nsists mainly of multi stemmedshrubs/trees and of annuaI grasses. Dominant woo dyspecies are Combretum micranthum G. Don , andPterocarpus lucen s Lepr., which acc ount respecti vel yfor 50 and 30 % of the total basal area . Average heightof wo ody individu als is around 3 m [7] . The siteex perie nces a low grazing pre ssure (mainly goats) butneithe r woo d-cutti ng nor cultiva tion .
Th e aeri al photograph was obtained on Oc tober [0 ,1995 around 10h30 (U .T.), i.e. with a zenithal so larang le of about 38°. Pictures were taken from anelevatio n of 750 m with a Pentax ILX ca mera (50 mmfoc us and 35 mm len s). The film (Kodak Gold 100AS A) was mac hine-processed into co loured
tI
apq = ~2 fr Zjk cos [ 2 n(~ +~ ) J
J ~ . [ (l!.i. gA) Jbr = 2 .L.J Z k S IO 2 tt +q n t. k J n n wit h n = 400
Acta Oecologica

n-Model of vegetation patterns 181
A. Periodogram B. Radical spectrum800
700 1600,
500·
4001
200
100
a 0- 2--4-6--81012 14 16 18
C. Angular spectrum45
1
- - -
4
3.5 r3
251
2
1.5
0
15
[
.i
.-~0'--
a 60 120 180 240 300 360
Figure 6. Spectral analysis of the tiger bush represented in figure 5.
(30)
(31 )
( 1 + AP+ - y2( 1 + AP+) (1 - A + 2AP+) ) P+
( 1 - P+) ( 1 + 2Ap+)
-' Passing l'rom the isotropie situation to the cases where thepropagation and inhibition densities are markedly anisotropie produces no significant variation of the pattern wavelength.
analysis of figure 5 allows us to conclude that thevegetation pattern corresponds to
Je = 70 m and p+ "" <p> "" 0.3 (29)
L2 _1 [1 1 - A + 2AP+] 1/4
Ac-n 2 I+i\p+
Using these values we may now evaluate the propagator and inhibitor ranges LI and L2 of the vegetation,as weil as its co-operativity A. Transforming equations(26) and (27) to real space, we rewrite them as
where Ac is now expressed in physical space units.Since the value of p; is fixed by the spectral analysis,cf. equation (29), the right hand sides of these expressions is a function of A only. Furthermore, in equation(30), we may equate Ac to the measured wavelength Agiven by equation (29). This procedure is exact at theTuring critical point. Below this point, when a finiteband of uns table modes (for L < LJ exists, the value ofAc is generally close to that of the fastest growingmode and the relationship A= Ac remains, even then, agood fit. On the other hand, the existence on the terrainof a small ground slope means that in reality theenvironment is anisotropie. The influence on the pattern wavelength of this anisotropy, as figure 4 suggests', can be neglected in a first approach such as the
The periodogram values (sample spectrum) were calculated as /"q = n2(a2"q + b2"q)' In figure 6A, we display the /"q-values as a n x n grey-tone image (withrescaling in the range 0-255), for which the centrecorresponds to p = q = o. (/()() is set to zero by priorsubtraction of the mean). Such a picture displays asymmetry with respect to the centre since /"._q = /_",q./ ' ,/n2 represents the portion of the variance of the".qimage accounted for by the eosine wave Cj k withfrequency (p', q'), i.e. Cj k = cos[2n(p'j/n + q'k/n)]. Aperiodogram with a spike at the point p = +/-p' andq =+/-q' (/"q =0 for ail other values of p and q) isassociated to a digital image consisting solely of sucha wave (i.e. a pattern constituted of bands), who setravel direction is e= tan-I(p'/q'), while the associated
wavenumber is r = Vp2+ q2. Hence /1'4 can also beexpressed as GrI}' For a simple banded pattern, thedominant entry of the periodogram should indicate adirection e perpendicular to the bands (i.e. accountingfor the heterogeneity of the image) and a periodicity rcorresponding to the number of bands within thewindow. To enhance the interpretability of the results,polar spectra [29] have also been computed by binningGrl} values into polar segments, as _5° < () ~ 5°, ...,345° < () ~ 355° and 0 < r ~ 1, 1 < r ~ 2, etc.
The banded pattern under consideration yielded aperiodogram dominated by two groups of entries(figure 6A). A spike in the radial spectrum (figure 68)for wave numbers 4 and 5 revealed a dominantwavelength ranging between 64 (i.e. 320/5) and 70 m.A main orientation between 90° and 100° was deducedl'rom the angular spectra (figure 6C; dotted line corresponds to the isotropie situation). The average phytomass density < p > evaluated by redistributing thevegetation uniforrnly over the territory gives for p+ anapproximate value of 0.3. In surnmary, the spectral
Vol. 20 (3) 1999

Figure 7. Range of interactions LI and L2 as a function of A for< p > =0.3 and À =70 m. The inset is a blow-up showing thebehaviour near A =2.5.
O. Lejeune et al.
aridity [1], a recording that may explain why periodicvegetation patterns are so frequent in arid and semiarid zones.
On our field site, we found an average value of1.2 m for the radius of the crown of mature C.micranthum (the dominant species), and 1.3 m for ailmature individuals, irrespective of species [7]. Sincefavourable influences are supposed to extend significantly up to 2L, due to the properties of the Gaussiandistribution, it is reasonable to consider L
J< 1 m. Such
a range of values yields two contrasting sets ofsolutions for A and L 2 , which correspond either to low(A < 1) or to high (A", 2.5) co-operativity. Low cooperativit y determines high values for Llo around15 m, whilst high co-operativity imply L2 < 4 m. In thefirst case, the range of significant inhibition, 2Llo andhence of lateral root extension, should extend up to30 m. So a large extension, though not impossible, isnot reported in the literature, even for more aridconditions [12], wh ilst a lateral root extension between2 m and 8 m is fully consistent with most publishedresults. As a consequence, the high co-operativitysituation appears more realistic in the light of theavailable data.
3.02.51.5 2.0
A1.00.5
o0.0
182
20 -------
~
El 16<;»
~ L2Ol)t:: 12ro 6....t:: 40.- 8.....(.)
LJro....2 2.45 250
t:: 4 A-
one presented here. This point will be discussed in aforthcoming publication. Hence, by setting in equations (30) and (31), o; =0.3, ..te =70 m, we solve theseequations for LI and L2 in terms of A. Figure 7 reportsthe values of LI and L 2 obtained in this manner. Onefinds that the values of A and LI for which the modelpredicts the existence of patterns are given by theinequalities
Acknowledgments
The support of the 'Instituts Internationaux de Physique et deChimie'. Solvay, and of the Centre for Nonlinear Phenomena andComplex Systems (U.L.B.) is gratefully acknowledged.
10TI < A < 2.5 and 0 m < LI < 4 m (32)
In agreement with the general discussion presentedabove, in this domain L 2 ranges between 0 and 18 mand the inequality L 2 > LI always holds. One also seesthat for a fixed value of LI' figure 7 predicts thepossible existence of two distinct values for A, andhence for L2 •
The value of LI and L2 can be further discussed inIight of the field data. In serni-arid and arid situations,short-range co-operativity is likely to result from thefavourable influence exerted by the crown of a maturewoody individual on the surrounding vegetation. Suchinfluences have been extensively studied with respectto herbaceous vegetation (see [39] for a review), butthe results are Iikely to also hold for woody seedlings.On the other hand, long-range inhibition may resultfrom adverse influences exerted by the root system ofa pre-existing mature individual. Data regarding rootsystems are scarce, but it is weil established that lateralroots do extend far beyond the limit of the crown [12,31]. Furthermore, having lateral roots extending outside the crown (i.e. L2 > LI) may be an outcome of
REFERENCES
[1] Belsky A.J., Influence of trees on savanna productivity: testsof shade, nutrients, and tree-grass competition, Ecology 75(1994) 922-932.
[2] Bernd J., The problem of vegetation stripes in semi-aridAfrica, Plant Res. Dev. 8 (1978) 37-50.
[3] Boaler S.B., Hodge C.A.H., Vegetation stripes in Somaliland,J. Eco!. 50 (1962) 465-474.
[4] Boaler S.B., Hodge C.A.H., Observations on vegetation arcsin the northern region. Somali Republic, J. Eco!. 52 (1964)511-544.
[5] C1os-Arceduc M., Étude sur photographies aériennes d'uneformation végétale sahélienne: La brousse tigrée, Bul!. Inst.Afr. noire Sér. A 18 (1956) 677--684.
[61 Cornet A.P., Delhoume J.P., Montana c.,Dynamics of stripedvegetation patterns and water balance in the Chihuahuandesert, in: During H.J., Werger M.J.A., Willems J.H. (Eds.),Diversity and Pattern in Plant Communities, SPB AcademiePublishing, The Hague, 1988, pp. 221-231.
[7] Couteron P., Relations spatiales entre individus et structured'ensemble dans des peuplements ligneux soudano-sahéliensau nord-ouest du Burkina Faso, Ph.D. thesis, University ofToulouse. France, 1998, 223 p.
[8J Couteron P., Kokou K., Woody vegetation spatial patterns ina semi-arid savanna of Burkina Faso, West Africa, Plant Eco!.132 (1997) 211-227.
Acta Oecologica

n-Model of vegetation patterns
[9] Fife P.c., Mathematical Aspects of Reacting and DiffusingSystems. Lecture Notes in Biomathematics 28, SpringerVerlag, Berlin, 1979.
[10] Galle S., Seghieri J., Dynamics of soil water content inrelation to annual vegetation: the tiger bush in the SahelianNiger, Ann. Geophys. 12 (suppl. Il) (1994) C443.
[II] Gavaud M.. Étude pédologique du Niger Occidental. Éditionsde l'Orstom, Dakkar-Hann, 1966.
[12] Glover PE., The root systems of sorne British-Somalilandplants-IV, East Afr. Agr. J. 17 (1951) 38-50.
113] Greenwood 1.E.G.W., The development of vegetation inSomali land Protectorate. Geogr. J. 123 (1957) 465-473.
[14] Greig-Smith P.. Pattern in vegetation, J. EcoJ. 67 (1979)755-779.
[15] Hemming C.F. Vegetation arcs in Somaliland, J. Ecol. 53(1965) 57-67.
[16] d'Herbès J.M., Valentin c., Thiéry J.M., La brousse tigrée auNiger: synthèse des connaissances acquises. Hypothèse sur lagenèse et les facteurs déterminant les différentes structurescontractées. in: d'Herbès J.M., Ambouta J.M.K., Peltier R.(Eds.), Fonctionnement et gestion des écosystèmes contractéssahéliens, John Libbey Eurotext, Paris, 1997, pp. 131-152.
[17] Hoppensteadt FC., Peskin C.S .. Mathematics in Medicine andthe Life Sciences. Texts in Applied Mathernatics 10, SpringerVerlag, Berlin, 1992.
[18] Lefever R., Lejeune O., On the origin of tiger bush, Bull.Math. Biol. 59 (1997) 263-294.
[19] Le Houerou RN., The Grazing Land Ecosystems of theAfrican Sahel, Springer-Verlag, Berlin, 1989, 282 p.
[20] Litchfield WH., Mabbutt J.A., Hardpan in soils of semi-aridWestern Australia, J. Soil Sci. 13 (1962) 148-159.
[21] Mabbutt J.A., Fanning P.c., Vegetation banding in aridWestern Australia, J. Arid Environ. 12 (1987) 41-59.
[22J Macfadyen WA., Soil and vegetation in British Somali land,Nature 165 (1950) 121.
[23] Macfadyen W.A .. Vegetation patterns in the semi-desert plainsof British Somaliland, Geogr. J. 116 (1950) 199-211.
[24] Mauchamp A., Rambal S., Lepart J., Simulating the dynamicsof a vegetation mosaic: a spatialized functional model, Ecol.Model. 71 (1994) 107-130.
[25J May R.M.. Stability and Cornplexity in Model Ecosystems,Princeton University Press, New Jersey, 1973.
[26] Meinhardt H., Models of Biological Pattern Formation, Academie Press, New York, 1982.
[27J Montana C; The colonization of bare areas in two-phasemosaics of an arid ecosystem, 1. Ecol. 80 (1992) 315-327.
[28J Montana C; Lopez-Portillo J., Mauchamp A., The response oftwo woody species to the conditions created by a shiftingecotone in an arid ecosystem, J. Ecol. 78 (1990) 789-798.
Vol. 20 (3) 1999
183
[29] Mugglestone M.A., Renshaw E., Detection of geologicallineations on aerial photographs using two-dimensional spectral analysis, Comput. Geosc. 24 (1998) 771-784.
[30] Murray J.O., Mathematical Biology. Biomathematics Texts19, Springer-Verlag, BerlinlNew York. 1989.
[31] Poupon H., Structure et dynamique de la strate ligneuse d'unesteppe sahélienne au nord du Sénégal, Ors tom, Paris, 1980,351 p.
[32] Prigogine 1., Structure, dissipation and life, in: Marois M.(Ed.), Theoretical Physics and Biology, North-Holland, Amsterdam, 1969.
[33J Ruxton B.P. Berry L., The Butana grass patterns, J. Soil Sci.II (1960) 61-62.
[34] Schlesinger WH .. Reynolds J.F, Cunningham G.L., Huenneke L.F, Jarrell WM., Virginia R.A., Whitford W.G., Biological feedbacks in global desertification, Science 247 (1990)1043-1048.
[351 Thiéry J.M.. d'Herbès J.M., Valentin C; A model sirnulatingthe genesis of banded vegetation patterns in Niger. J. Ecol. 83(1995) 497-507.
[36] Tongway DJ.. Ludwig J.A., Vegetation and soil patterning insemi-arid mulga lands of Eastern Australia, Aust. J. Ecol. 15(1990) 23-34.
[37] Turing A.M., The chemical basis of morphogenesis, Philos.Trans. R. Soc. Lond. Ser. B 237 (1952) 37-72.
[38] Van Der Meulen F. Morris 1.W., Striped vegetation patterns ina Transvaal savanna, Geo. Eco. Trop. 3 (1979) 253-266.
[391 Vetaas O.R.. Micro-site effects of trees and shrubs in drysavannas, J. Veg. Sci. 3 (1992) 337-344.
[40J White F, The Vegetation of Africa. A Descriptive Memoir toAccompany the Unesco/AEFTAT/UNSO Vegetation Map,Unesco/AEFTATIUNSO, Paris, 1983, 356 p.
[411 White L.P., Vegetation arcs in Jordan, J. Ecol. 57 (1969)461-464.
[42J White L.P., Brousses tigrées patterns in southern Niger. J.Ecol. 58 (1970) 549-553.
[43] White L.P., Vegetation stripes on sheet wash surfaces, J. Ecol.59 (1971) 615-622.
[44] Wickens G.E., Collier EW., Sorne vegetation patterns in theRepublic of the Sudan, Geoderma 6 (1971) 43-59.
[45] Worrall G.A.. The Butana grass patterns, J. Soil Sci. 10 (1959)34-53.
[46] Worrall G.A., Patchiness in vegetation in the northern Sudan,J. Ecol. 48 (1960) 107-115.
[47] Worrall G.A., Tree patterns in the Sudan, J. Soil Sei. II (1960)63-67.


Acta Oecologica 20 (3) (1999) 185-195 / © Elsevier, Paris
Soil organic matter dynamics in tiger bush (Niamey, Niger).Preliminary results
Karine Guillaume u*, Luc Abbadie '', André Mariotti b, Hassan Nacra U
" Laboratoire d'écologie, CNRS UMR 7625, l\'cofenormale supérieure, 46, rue d'Ulm, 75230 Paris cedex 05, France.h Laboratoire de !Jùil!;éochimie isotopique, INRA-CNRS, URA 196, université Pierre-et-Marie-Curie, 4, placeJussieu, 75252 Paris cedex 05, France,
* Corresponding author (fax: +33 1 4432 38 85; e-mail: kguillauccbiologie.ens.fr}
Receivcd April l, 1997; revised Dcccmber l, 1998; accepted December 16, 1998
Abstract~ Sorne typical features of soil organic matter dynamics and soil texture were studied to discuss the particular spatial pattern of tigerbush in Niger and its dynarnics, The soil texture through silt and clay contents showed a high variability in the vegetation arc as weil as in thebare area. These variations were c1early linked to water/wind erosion and termite activity. Tiger bush soils showed a high capacity to store soilorganic matter despite a moderate primary production, even in the bare area where the input of plant debris has been nil for many decades, Thecarbon content was higher within the vegetation arc (0,93 %) than within the bare area (0,45 %), Additionally, potential carbon mineralisationsignificantly varied in relation to the total carbon content and thus to primary production, Then, the vegetation arcs can be viewed as 'fertilityislands' as in many arid ecosysterns. The measurements of Ô"C showed a dominant contribution of C, plants to the soil organic matter pooLNevertheless, the contribution of C4 plants was not ncgligible. Two hypotheses could be proposed: a different mineralisation rate between C,and C4 plants; or (ii) a better physical protection of C4 compounds against biodegradation, The soil variables depending totally or partly onbiological factors, such as carbon and nitrogen contents, carbon isotopie composition, carbon potential mineralisation, did not show anysymmetry in their variations along the studied transects. Il was expected in the vegetation arc because the vegetation cover does not showsymmetry in its specifie composition and spatial structure. In the bare area, a c1ear asymmetry was observed on sorne of the variables: carboncontent, fine material content and natural abundance of "c. This supports the hypothesis that the vegetation arcs move upslope, and weakensthe hypothesis of the alternance of contraction and spreading periods of the vegetation cover. © Elsevier, Paris
Total organic carbon / organic matter dynamics / mineralisation / tiger bush / Niger / Sahel
1. INTRODUCTION
The term 'brousse tigrée' or 'tiger bush' was usedfor the first time in 1956 [II] in relation to aerialphotographs of sorne areas in Niger. Inside these areas,vegetation was described as alternating bands of vegetation and bare soil, strongly suggesting tiger (orzebra) skin. This vegetation pattern is not restricted toNiger. Similar structures have also been described inother arid and semi-arid regions such as Mauritania,Mali and Burkina-Faso [28], Somaliland [9, 20, 31],Sudan [46], Australia [30], USA [23], Mexico [34]and Jordan [44].
In Niger, the tiger bush vegetation occurs in theSahelian zone extending from 13° N to 15° N [2].Vegetation is concentrated in bands of ca. 25 m wide,perpendicular to the slope, separated by ca. 50 m wide
zone of bare soil. The ongin of such a vegetationpattern is still in discussion. Sorne authors hypothesised previously that the vegetation was continuallydistributed but contracted into patches after an increase in aridity [11]. Others hypothesised a continuous upward movement of the vegetation arcs due to aparticular pattern of water infiltration in the soil [2, 4,28, 46]. Sorne authors proposed the fol1owing mechanism: the water running on the bare area would bestopped by grasses at the upslope boundary of thevegetation arc, enter the soil, and then be supplied tograsses and trees, allowing an upward extension ofplant cover [2, 4, 28, 46]. At the downslope boundaryof the vegetation arc, plants would lack water and die,leading to woody vegetation regression. Sorne simulation models have been recently proposed, linking theobserved vegetation pattern to the primary succession

186 K. Guillaume et al.
Table I. Review of available data on soil organic matter and carbon contents (expressed in %) in sorne banded vegetation around the world.
Site Latitude Annual Average Number of Depths % Organic Referencesrainfall annual dry (cm) matter(mm) temperature months
N'Daki (Mali) 15°34' N 300 Bare Herbaceous Livingground zone woody
0-20 1.0 0.7 2.0 [28]
Upper Centre ofedge of arc
arc
Baran 08°15' N 150 0-5 2.6 [20](Somaliland) to
47°12' E 0-23 1.0
% Carbon
Vegetatedarea
Chihuahan 26°29' to 264 20.8 -c ~7 0-3 0.55 1.96 [13]desert 26°52' N 6-14 0.45 0.53
(Mexico) 25-33 0.30 0.3148-58 0.23
Settling Annual Living Deadzone herbaceous woody woody
Goguezé 13°37' N 600 30 -c >7 Crust 0.41 0.42
Koara AI 0.71 0.51 [2]
(Niger) AIl 0.19 0.17 0.47
A 12 0.29 0.30 0.42
BC 0.34 0.29 0.30 0.39 0.43
process [35, 36] or to the competitive interactionsbetween neighbours for water uptake [41].
Little attention has been paid to organic matter andnutrient cycling in tiger bush. Only few data, listed intables 1 and II, are available on soil organic matterpools [2, 13, 20, 28] and chemical characteristics ofsoil [2]. However, soil organic matter cycling andnutrient availability act as strong constraints on plantfunctioning [19]. In many arid ecosystems, nitrogen,after water, is the major factor controlling the rate andlevel of primary production [39]. More generally, nutrient availability influences many vegetation characteristics such as growth rate, plant distribution andspatial occupation. Nutrient distribution and availability partly regulate plant competition intensity, and thusplant colonisation ability.
Tiger bush provides an attractive opportunity tostudy how plant communities control soil organicmatter storage, quality, distribution and mineralisation.Indeed, several vegetation types are concentrated onsmall areas, on soils with similar physical characteristics (texture), and under the same macroclimatic con-
ditions. Vegetation types follow each other, in time andspace, and differ by plant functional types (perennialsvs. annuals; trees vs. grasses; C3 vs. C4 ) , architecture(root distribution) and chemical composition. Tigerbush also provides a good opportunity to study soilorganic matter turnover since the effects of the plantsuccession on soil organic matter dynarnics can beunderstood through the simultaneous study of aIlstages. In addition, sorne large areas are completelydevoid of vegetation where the input of organic matterinto soil is stopped for many years and soil organicmatter is only driven by the mineralisation process.
The purpose of this paper is to give sorne generalinformation on soil organic matter dynamics in thetiger bush system. We have measured the quantitiesand spatial distribution of soil organic matter in thedifferent zones of the vegetation arc and the bare area.Potential soil respiration was determined in order toevaluate the ability of soil to produce mineral nutrients. We also assessed its origins (grass/tree) throughthe measurements of l3C natural abundance in the soilof the vegetation arc and the bare area. A comparison
Acta Oecologica

Soi! organic matter dynamics 187
Table II. Review of available data on nitrogen content (expressed in %), in sorne banded vegetation around the world.
Site Latitude Annual Average Number of Depths % Nitrogen Referencesrainfall annual dry months (cm)(mm) tempe rature
Bare Vegetatedground area
Chihuahan 26029' ta 264 20.8 -c ~7 0--3 0.052 [13]
desert 26°52' N 6-14 0.053
(Mexico) 25-33 0.056
48-58 0.033
Herbaceous Livingzone woody
N'Daki 15034' N 300 0--20 0.082 0.056 0.188 [28]
(Mali)
Settling Annual Living Deadzone herbaeeous woody woody
Goguezé 13037' N 600 30 -c >7 Cru st 0.06 0.07
Koara AI 0.07 0.03 [2]
(Niger) Ali 0.02 0.01 0.04
A I2 0.03 0.02 0.02
BC 0.02 0.02 0.02 0.03 0.03
between the soil organic matter contents, intensity ofthe mineralisation process and isotopie composition ofcarbon, between the vegetation arc and the bare area,will be used to discuss the spatial pattern of tiger bush:contraction and decontraction of vegetation cover inresponse to long-term rainfall regime, or upwardmovement of vegetation arcs under the influence ofsoil water dynamics.
2. MATERIALS AND METHODS
2.1. Study site
The study site is located 60 km NE of Niamey(Niger, West Africa) in the vicinity of Banizoumbou(13°40' N; 2°48' E). The climate belongs to theSahelo-Sudanian type [3]. Mean annual rainfall is560 mm (1905-1989 [26]), with a short rainfall season« 5 months, May to September) and a long dry season(> 7 months). Monthly average temperature is 26 oc.Tiger bush occurs exclusively on shallow gravely soilsdeveloped on plateaux formed by a thick lateriticcuirasse of Tertiary age [17] with gentle slopes(0-0.2 %). Soils are classified as tropical ferrugineoussoils (FAO-Unesco: Acrisols).
As in man y tropical areas, the main types of crusts,at the top soil, have been distinguished and classifiedusing porosity (abundance and type) and arrangementof coarse and fine particles (related distribution pat-
Vol. 20 (3) 1999
tern, orientation and distribution) [10, 43]. Thesecrusts are colonised by blue algae, and act on run-offand water infiltration [32].
Each bare area-vegetation arc can be divided intofour zones according to plant cover, crust type andrun-off ability [10]: (1) the bare area characterised bya high run-off; (2) the herbaceous zone, characterisedonly by annuaI grasses with Michrochloa indica andCyanotis lanata as the main annuaI dominant species;(3) the woody zone with Combretum micranthum andC. nigricans as the dominant trees; and (4) the senescent zone with dead trees (figure 1). Sorne livingtermite mounds occur in the herbaceous and woodyzones whereas those in the senescent zone are abandoned [II].
2.2. Samples collection
Sampling was carried out in April 1995 during thedry season. Soil sampIes were collected along threetransects through the vegetation arc in the middle ofeach zone defined above and, up to the 24-m transectin the upward bare area (4 m each). For each pointalong the transects, two depths were distinguished:0-10 and 10-20 cm. Soils samples were immediatelyair-dried, sieved to 2 mm and stored for analysis.
In order to determine the plant photosynthetic pathway (C), C 4 ) , !itter and leaves of the two commonwoody species (Guiera senegalensis and Combretum

Combrerum nigricansCulera senegalensis Combretum micron/hum
Herbaceous Woody Senescent
188
Barc area
RunolT
Siope < 1%
Michrochloo indicaSpcrmacoce ruellioCassio mimosotdes
zone
Vegetation arc
Cyanotis lana/a
zone
Bare urea
Scarse grasses
Dead trces
K. Guillaume et al.
Series 2, Fisons). The results were expressed aspercentage of 'dry soil.
2.3.3. ~13C natural abundance
Natural abundance of 13C was measured on sievedand crumbled soil samples with an elemental analyser(NA 1500, Fisons) cou pIed with a mass spectrometer(Sira 10, Fisons), according to Girardin and Mariotti [18]. The results were expressed as Ol3C units:
Figure 1. Schematic representation of an elementary unit (bare area- vegetation arc) of tiger bush. The vegetation arc is classicallydivided into three zones and characterised by the vegetation cover:herbaceous, woody and senescent zones.
micranthum) were sampled inside the vegetation arc.Litter was collected at random in five points on the soilsurface and pooled in a larger sample. Leaves werecollected at random in five trees of each species, andalso pooled in two larger samples. Sorne leaves of thethree main grass species (Michrochloa indica, Cyanolis lanata, Spermacoce ruellia) were also collectedlater, during the wet season, following the sameprotocol.
2.3. Laboratory measurements
2.3.1. Soil texture determination
Organic matter was destroyed by adding 100 mLhydrogen peroxide to 20 g soil, heId at 20 "C for 6 hand then 60 "C for 16 h. Distilled water (300 mL) and25 mL sodium hexametaphosphate (40 g-L- 1
) werethen added to disperse the aggregates and the sampleswere shaken for 16 h at 175 rpm. The water suspension was sieved at 50 um. The 0-50 um fraction wassonicated at 100 J·mL- ' (Branson Sonifier 450) andpassed through a 20-flm sieve in water in order to splitmicroaggregates. The 0-20 um fraction was centrifuged (Sorvall RC 3B Plus, Du Pont De Nemours) toseparate the 2-20 and 0.05-2 um fractions. Centrifugation speed and time were calculated according toJackson and Tanner [24, 40]. The resulting six fractions were dried at 40 "C and weighed: 50-2 000(sands), 20-50 (coarse silt), 2-20 (fine silt) and0.05-2 um (clay).
2.3.2. Total organic C and N
Aliquots of sieved samples « 2 mm) were thoroughly crumbled. Total organic carbon and nitrogenwere determined with an elemental analyser (NA 1500
o13C = [(R samplelR standard) - 1] x 1 000
where R = l3C/l2C
The standard used was calibrated against NBS 19,and Ol3C was expressed against PDB [12].
2.3.4. Soit respiration
Aliquots of 20 g air dry soil were incubated in thedark in glass bottles with rubber stoppers at 28 "C(± 1 "C) and 80 % of the water holding capacity. After3 d, a 250-flL aliquot of the accumulated atmospherewas removed from each ftask with a gas-tight syringeand analysed by gas chromatography (DI 200 Analyserapparatus, Delsi-Nermag). Results were expressed asug C-C02 produced by 20 g dry soil.
2.4. Statistical analysis
Data were tested using SAS® (Statistical AnalysisSystem, SAS Institute Inc. 1990). Because of variablesnot normally distributed, we used two different procedures: PROC RANK and PROC GLM. We testedresponses of texture (silt and clay), soil total organiccarbon and nitrogen contents, Ol3C and C-C02 measurements along the element unit (bare area - vegetation arc), sampling point (0, 4, 8 m, etc. senescentzone) and depth (0-10, 10-20 cm). Additionally, weused PROC REG, within the bare area, because of alack of soil sample replicates. A simple linear regression was performed to identify a relationship betweentotal carbon, nitrogen, silt and clay contents along thebare area. The LSMEANS procedure was used tocompare the least square means of variables. AlI testswere performed at the 0.05 significance level.
3. RESULTS AND DISCUSSION
3.1. Soil texture
Inside the whole soil (0-20 cm), silt and claycontents differed significantly between the bare areaand vegetation arc (P < 0.05). There was no significantinteraction between zone and depth (P> 0.5). The silt
Acta Oecologica
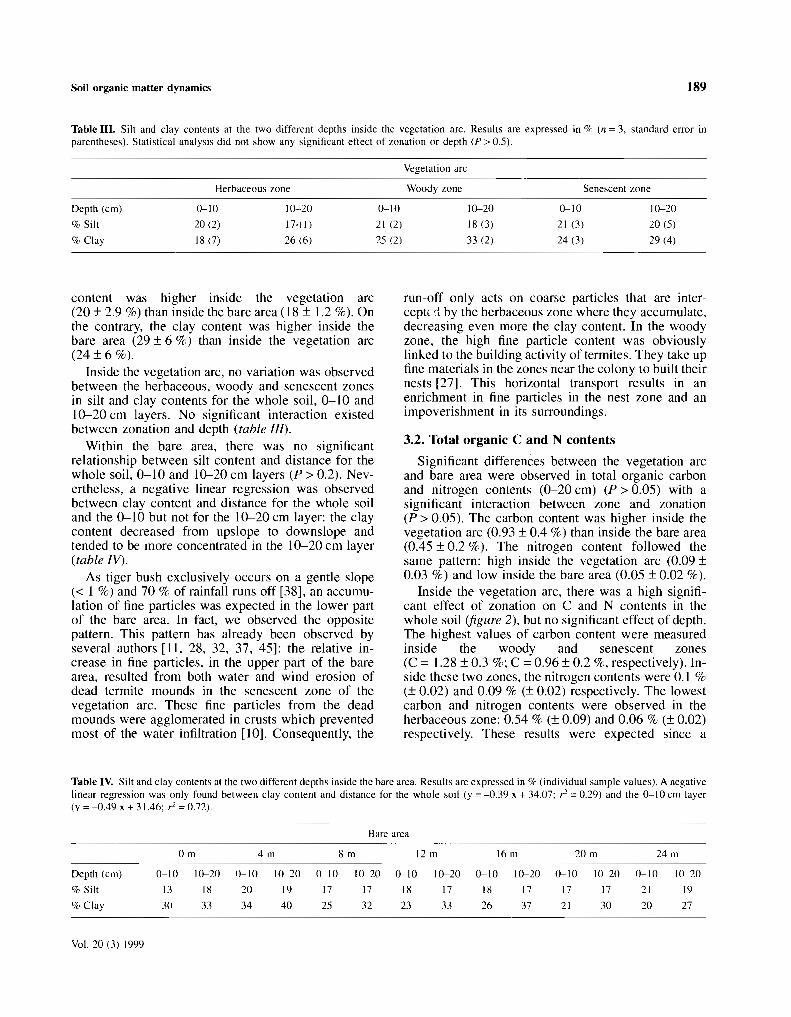
Soil organic matter dynamics 189
Table III. Silt and clay contents at the two different depths inside the vegetation arc. ResuIts are expressed in % (n = 3, standard error inparentheses). Statistical analysis did not show any significant effect of zonation or depth (P> 0.5).
Vegetation arc
Herbaceous zone Woody zone Senescent zone
Depth (cm)
% Silt
% Clay
0-10
20 (2)
18 (7)
10-20
17·(1 )
26 (6)
0-10
21 (2)
25 (2)
10-20
18 (3)
33 (2)
0-10
21 (3)
24 (3)
10-20
20 (5)
29 (4)
content was higher inside the vegetation arc(20 ± 2.9 %) than inside the bare area (18 ± 1.2 %). Onthe contrary, the clay content was higher inside thebare area (29 ± 6 %) than inside the vegetation arc(24 ± 6 %).
Inside the vegetation arc, no variation was observedbetween the herbaceous, woody and senescent zonesin silt and clay contents for the whole soil, 0-10 and10-20 cm layers. No significant interaction existedbetween zonation and depth (table lIT).
Within the bare area, there was no significantrelationship between silt content and distance for thewhole soil, 0-10 and 10-20 cm layers (P > 0.2). Nevertheless, a negative linear regression was observedbetween clay content and distance for the whole soiland the 0-10 but not for the 10-20 cm layer: the claycontent decreased from upslope to downslope andtended to be more concentrated in the 10-20 cm layer(table IV).
As tiger bush exclusively occurs on a gentle slope« 1 %) and 70 % of rainfall runs off [38], an accumulation of fine particles was expected in the lower partof the bare area. In fact, we observed the oppositepattern. This pattern has already been observed byseveral authors [II, 28, 32, 37, 45]: the relative increase in fine particles. in the upper part of the barearea, resulted from both water and wind erosion ofdead termite mounds in the senescent zone of thevegetation arc. These fine particles from the deadmounds were agglomerated in crusts which preventedmost of the water infiltration [10]. Consequently, the
run-off only acts on coarse particles that are interceptes by the herbaceous zone where they accumulate,decreasing even more the clay content. In the woodyzone, the high fine particle content was obviouslylinked to the building activity of termites. They take upfine materials in the zones near the colony to built theirnests [27]. This horizontal transport results in anenrichment in fine particles in the nest zone and animpoverishment in its surroundings.
3.2. Total organic C and N contents
Significant differences between the vegetation arcand bare area were observed in total organic carbonand nitrogen contents (0-20 cm) (P > 0.05) with asignificant interaction between zone and zonation(P> 0.05). The carbon content was higher inside thevegetation arc (0.93 ± 0.4 %) than inside the bare area(0.45 ± 0.2 %). The nitrogen content followed thesame pattern: high inside the vegetation arc (0.09 ±0.03 %) and low inside the bare area (0.05 ± 0.02 %).
Inside the vegetation arc, there was a high significant effect of zonation on C and N contents in thewhole soil (figure 2), but no significant effect of depth.The highest values of carbon content were measuredinside the woody and senescent zones(C = 1.28 ± 0.3 %; C = 0.96 ± 0.2 %, respectively). Inside these two zones, the nitrogen contents were 0.1 %(± 0.02) and 0.09 % (± 0.02) respectively. The lowestcarbon and nitrogen contents were observed in theherbaceous zone: 0.54 % (± 0.09) and 0.06 % (± 0.02)respectively. These results werc expected since a
Table IV. Silt and clay contents at the two different depths inside the bare arca. Results are expressed in % (individual sample values). A negativelinear regression was only found between clay content and distance for the whole soil (y =-0.39 x + 34.07: r =0.29) and the 0-10 cm layer(y = -0.49 x + 31.46: il = 0.72).
Bare arca_._--
001 401 801 1201 1601 2001 2401
Depth (cm) 0-10 10-20 0-10 10-20 0-10 10-20 0-10 10-20 0-10 10-20 0-10 10-20 0-10 10-20
% Silt 13 18 20 19 17 17 18 17 18 17 17 17 21 19
% Clay 30 33 34 40 25 32 23 33 26 37 21 30 20 27
Vol. 20 (3) 1999

190 K. Guillaume et al.
Figure 2. Total carbon and nitrogen contents inside the vegetationarc (a) at the 0-10 cm layer and (b) at the 10-20 cm layer. Resultswere expressed in % (n =3, with standard error). Statistical analysisshowed a highly significant effect of zonation for the total carbon andnitrogen contents in the 0-20 cm layer (P < 0.001).
positive linear relationship is often observed betweennet primary production and soil organic matter contentin the superficial layers. Obviously, primary production is highly variable among zones in the vegetationarc. It is maximum in the woody zone, medium in theherbaceous zone, and insignificant in the senescentzone. No quantitative data about primary productionare available, but the woody biomass was estimated to27 t.ha ' in the woody zone of the Banizoumbousite [22]. The herbaceous production was estimated at952 kg dry matter-ha':' in the Macina tiger bush inMali [21]. Moreover, C and N contents were high inthe senescent zone even though the primary production is insignificant which can be interpreted in twoways: (i) the organic matter stock is not yet affected byerosion; or (ii) the decomposition of soil organicmatter has not yet begun [48].
Along the bare area, high variations of total carbonand nitrogen contents were observed (figure 3). Thisvariability could be related to the variability of the soiltexture within the bare areas [10, 43]. The highest
Ll
3.3. l3C natural abundance
Carbon isotope fractionation associated with photosynthesis is less intensi ve in C4 than in C3 plants: Ôl3Cvalues of C3 plants lie between -23 and -34 %0(average of -26 %0) whereas for C4 plants, they rangefrom -9 to -17 %0 (average of -12 %0) [33]. In tigerbush, plants belong to the two photosynthetic groups:the leaves of the two major tree species, Guierasenegalensis (ô l3C = -27.1 %0) and Combretum micranthum (Ô 13C = -27.6 %0) had a natural abundanceof l3C typical of C3 plants, like the two grass speciesCyanotis lanata (Ôl3C = -29.3 %0) and Spermacoceruellia (Ôi 3C = -28.5 %0). Only the grass Michrochloaindica (Ôl3C = -13.8 %0) is a C4 plant. In the tree leaflitter, the ô l3C was -27.5 %0.
For the whole soil, there was a significant effect ofzone on Ôi 3C values (P < 0.0001). Under the barearea, we observed an enrichment of soil organic matter(SOM) in l3C (Ôl3C = -22.4 ± 0.9 %0) whereas, underthe vegetation arc, SOM is impoverished in l3C(Ô13C = -23.6 ± 1.6 %0).
In the vegetation arc, there was a significant effectof zonation, but not of depth (table V). This meetsprevious observations by Balesdent et al. [6, 7]: the
carbon and nitrogen contents were measured upwardsfrom the bare area: 0.75 % (± 0.04) and 0.08 %(± 0.01), respectively. Moreover, a negative linearcorrelation was observed between the organic carboncontent and the distance only at 0-20 and 0-10 cmdepth. In the majority of tropical soils, and particularlyin West Africa, soil organic matter content is largelydependent on soil texture: there is a strong positivecorrelation between soil organic matter, clay and siltcontents [15]. However, we did not observe a positivecorrelation between carbon and clay contents but anegative linear correlation was found between the totalcarbon and silt contents, in the whole soil(y = -0.06 x + 1.58; r =0.44). Obviously, soil textureonly explained a part of the carbon content variation.Generally, the size of the soil carbon pool dependsboth on decomposition and plant debris incorporation.In the bare area, the input of plant debris into the soildoes not occur which implies that the carbon contentvariation can only be driven by the mineralisationprocess. As the carbon content is higher upslope thandownslope, two hypotheses could be proposed: (i) themineralisation rate is higher downslope than upslope;or (ii) the time elapsed since the beginning of decomposition is larger downslope than upslope, i.e. a higherproportion of carbon has been mineralised downslopethan upslope. If the second hypothesis is validated, theage of the organic matter pool is higher downslopethan upslope and it thus supports the hypothesis of anunidirectional movement of vegetation.
.%C
O%N
.%C
O%N
Senescentzone
Senescentzone
a. 0-10 cm
Livingmne
Living zone
Ll
b. 10-20 cm
zone
Herbaceous
Herbaceouszone
L
%
1.5
1.0
%2.0
0.5
0.0
1.5
1.0
2.0
0.5
0.0
Acta Oecologica
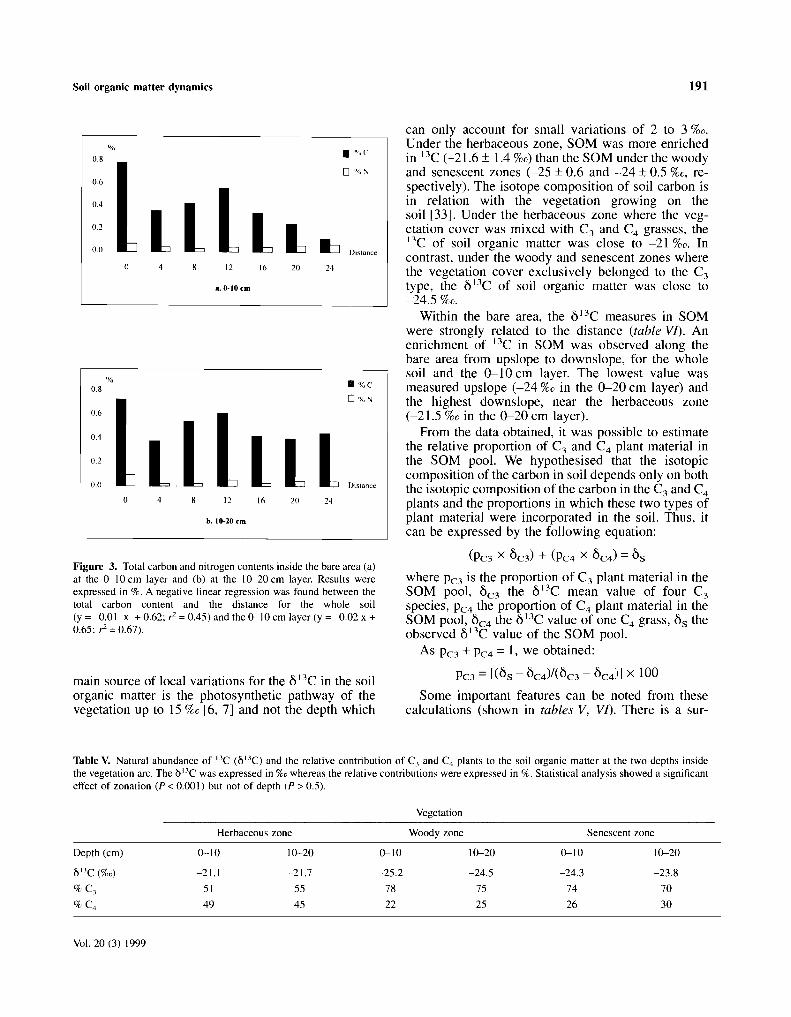
Soi! organic matter dynamics 191
main source of local variations for the Ôl3C in the soilorganic matter is the photosynthetic pathway of thevegetation up to 15 %0 [6, 7] and not the depth which
Figure 3. Total carbon and nitrogen contents inside the bare area (a)at the 0-10 cm layer and (b) at the 10-20 cm layer. Results wereexpressed in %. A negative linear regression was found between thetotal carbon content and the distance for the whole soil(y =-0.01 x + 0.62; ? =0.45) and the 0-10 cm layer (y =-0.02 x +0.65; ? =0.67).
LllLLL
LLlLl
can only account for small vanations of 2 to 3 %0.Under the herbaceous zone, SOM was more enrichedin l3C (-21.6 ± 1.4 %0) than the SOM under the woodyand senescent zones (-25 ± 0.6 and -24 ± 0.5 %0, respectively). The isotope composition of soil carbon isin relation with the vegetation growing on thesoil [33]. Under the herbaceous zone where the vegetation cover was mixed with C~ and C4 grasses, thel3C of soil organic matter was close to -21 %0. Incontrast, under the woody and senescent zones wherethe vegetation cover exclusively belonged to the C3type, the Ô13C of soil organic matter was close to-24.5 %0.
Within the bare area, the Ôl3C measures in SOMwere strongly related to the distance (table VI). Anenrichment of 13C in SOM was observed along thebare area from upslope to downslope, for the wholesoil and the 0-10 cm layer. The lowest value wasmeasured upslope (-24 %0 in the 0-20 cm layer) andthe highest downslope, near the herbaceous zone(-21.5 %0 in the 0-20 cm layer).
From the data obtained, it was possible to estimatethe relative proportion of C3 and C4 plant material inthe SOM poo1. We hypothesised that the isotopiecomposition of the carbon in soil depends only on boththe isotopie composition of the carbon in the C3 and C4plants and the proportions in which these two types ofplant material were incorporated in the soil. Thus, itcan be expressed by the following equation:
(PC3 x ÔC 3) + (PC4 x ÔC 4 ) =s,where PC3 is the proportion of C3 plant material in theSOM pool, ÔC 3 the Ôl3C mean value of four C3species, PC4 the proportion of C4 plant material in theSOM pool, ÔC 4 the Ô13C value of one C4 grass, s, theobserved Ô13C value of the SOM pool.
As PC3 + PC4 = 1, we obtained:
PC3 = [(Ôs - Ôc 4)/(ÔC 3 - ÔC 4 ) ] x 100
Sorne important features can be noted from thesecalculations (shown in tables V, VI). There is a sur-
Distance
Distance
• %t'
o %N
• %l"
D %N
24
24
20
20
16
16
12
12
8.0-10 cm
b. 10-10 cm
4
%0.8
0.6
004
0.2
0.0
0
%0.8
0.6
0.4
0.2
0.0
0
Table V. Natural abundance of "c (Ô"C) and the relative contribution of C, and C4 plants to the soil organic matter at the two depths insidethe vegetation arc. The Ô"C was expressed in %0 whereas the relative contributions were expressed in %. Statistical analysis showed a significanteffect of zonation (P < 0.001) but not of depth (P> 0.5).
Vegetation
Herbaceous zone Woody zone Senescent zone
Depth (cm)
Ô"C (%0)
% C,
% C4
0-10
-21.1
51
49
10-20
-21.7
55
45
0-10
-25.2
7822
10-20
-24.5
75
25
0-10
-24.3
74
26
10-20
-23.8
70
30
Vol. 20 (3) 1999

192 K. Guillaume et al.
Table VI. Natural abundance of I.1C (/)I.1C) and the relative contribution of C, and C4 plants to the soil organic matter at the two depths insidethe bare area. The /) I.1C was expressed in %0 whereas the relative contributions were expressed in %. A negative linear regression was foundbetween the ÔI.1C and the distance for the whole soil (y =0.09 x - 23.49; ,-2 =0.66), and the 0-10 cm layer (y =0.10 x - 23.56; r =0.80).
Bare area
Om 4m 8m 12 m 16 m 20m 24 m
Depth (cm) 0-10 10-20 0-10 10-20 0-10 10-20 0-10 10-20 0-10 10-20 0-10 10-20 0-10 10-20
Ôl.1C (%0) -24.1 -23.9 -22.2 -22.1 -23.1 -23.5 -22.3 -22.5 -21.8 -21.7 -21.3 -21.4 -21.0 -22.1
% C, 72 71 59 58 65 68 59 61 56 55 52 53 51 58
% C. 28 29 41 42 35 32 41 39 44 45 48 47 49 42
prisingly high contribution of C4 plants to SOMstorage inside the vegetation arc, which was neverbelow 20---25 % and can amount up to 50 %. C4 plants,mainly represented by Michrochloa indica, only contribute less than 5 % of the above grass biomass(Guillaume, unpubl. data). It seems that the C4 signalin the soil is too high when compared to the real inputof C4 plant material in the organic matter pool. Theproportion of stabilised C4 organic matter will behigher than the proportion of C4 compounds in theincoming vegetal debris. Two hypotheses could beproposed: (i) different rate decomposition between theC3 and C4 plants; or (ii) a better physical protection ofthe C4 plants against biodegradation. Indeed, withinthe bare area, the input of fresh organic matter is nil.Mineralisation is the only process controlling theoutput of carbon. The natural abundance of 13C shouldnot change during decomposition [5, 25, 42], except ifthe Ô13Csignatures of the chemical fractions differ anddecay at different rates [8]. As we observed a 2 %0variation of Ôl3C natural abundance, we can hypothesise that the decomposition rates differ between theC3 and C4 compounds, leading to a progressive relative enrichment of the compounds of C4 origin withtime, i.e. with distance. The better physical protectionof the C4 organic matter could be the mechanism ofthis enrichment. The physical fractionation of soilorgano-mineral particles should help to clarify thesepoints.
Inside the vegetation arc (figure 4), there was nosignificant effect of depth but a significant one ofzones in the whole soil. The C-COz value was lowerunder the herbaceous zone (65.4 ± 15 ug C-COZ·g- l
soil) than those of the woody zone (165.9 ± 18 ugC-COZ·g-1 soil). Furtherrnore, a positive linear correlation was observed between the carbon dioxide production and the total organic carbon content in thewhole soil, 0-10 and 10-20 cm layers (table VII). Theintensity of potential soil respiration was mostly dependent on the quantity of organic carbon, like in othertropical ecosystems [1, 14]. Nevertheless, the accessibility of the organic matter partly controls potentialsoil respiration as shown by the carbon mineralisationrate (ratio C-COz/C, figure 4) which is much higherunder the herbaceous and woody zones than under thesenescent zone.
In the bare area, although SOM was low, potentialrespiration was not negligible (figure 5) in relationwith the presence of cryptogamic crusts [32, 39]. COzproduction did not vary significantly with depth ordistance. Nevertheless, the highest value was measured upslope (29.1 ± 10 ug C-COZ·g-1 soil, 0-20 cm);whereas the lowest was measured downslope(15.6 ± 0.3 ug C-COZ·g- l soil, 0-20 cm). A positivelinear relationship between carbon dioxide total production and the organic carbon content was observedin the whole soil, 0-10 cm, and in 10-20 cm layers(table VIII) clearly indicating that the potential respi-
Table VII. Resulls of the linear regression between the C-C02
measurements (as dependent variable) and the total organic carboncontent (as regressor) inside the vegetation arc in the 0-10, 10-20 and0-20 cm layers.
Pararneter estimate F-value
a b
P> FR-square
0.48
0.62
0.52
0.03
0.01
0.0007
6.61
11.83
17.72
3.59
2.45
3.18
0.99
2.16
1.34
0-IOcm
10-20 cm
0-20 cm
3.4. Soi! respiration
The quantities of COz involved were significantlyhigher under the vegetation arc (104 ±54 ugC-COZ·g-1 soil) than under the bare area (19.8 ± 6 ugC-COZ·g-1 soil). This is obviously due to the pattern oforganic carbon distribution and quality in the landscape. The organic compounds are more abundant andmore degradable (regular and fresh organic matterinputs) in the vegetation arc than in the bare soil (nomaterial input and humified compounds): carbon mineralisation is high and thus nutrient availability moreimportant in the vegetation arc than in the bare area.
Acta Oecologica

Soit organic matter dynamics 193
ug C-C02 . g-I sailug C·CO z . il soil
1.2 40 0.44
250
10.5
200 1.38 Il30
10.4 0.46
1501.08 0.33 0.5 0.52
20
100 -- • 1 1 1 Il5010
0 0
Herbaceous Woody zone Senescent 12 16 20 24zone zone
a. 0-10 cm 8.0-10 cm
/lg C-C02 · g-1
soilug c-co, . g"] soil
1.3840
250
Il30 0.29
0.37200 0.39
0.33 0.28
10.41
150 20
10.4
0.89 0.61
1 1100 • • 1 1 11050
0
Herbaceous Woody Senescent 12 16 20 24
zone zone zoneb. 10-20 cm
b. ]0-20 cm
Figure 4. Potential of carbon mineralisation and mineralisation rateinside the vegetation arc (a) at the 0-10 cm layer and (b) at the10-20 cm layer. The potential of carbon mineralisation was expressed in fig C-C02·g- 1 (n = 3). The mineralisation rate (number)was expressed in %. Statistical analysis showed a significant effect ofzonation (P < 0.02) but not of depth (P> 0.4).
Figure 5. Potential of carbon mineralisation and mineralisation rateinside the bare area (a) at the 0-10 cm layer and (b) at the 10-20 cmlayer. The potential of carbon mineralisation was expressed in figC-C02 ·g- l
• The mineralisation rate (number) was expressed in %. Nolinear regression existed between the total carbon content and thedistance for the whole soil, 0-10 and 10-20 cm layers (P > 0.1).
4. CONCLUSIONS
Table VllI. Results of the linear regression between the C-C02
measurements (as dependent variable) and the total organic carboncontent (as regressor) inside the bare area in the 0-10. 10-20 and0-20 cm layers.
ration was driven more by the quantity of organiccarbon than its quality. Moreover, the carbon mineralisation rate does not significantly vary with distance.This allows us to reject our hypothesis which explained the higher carbon content upslope than downslope by a difference in the mineralisation rate.
a b
0-10 cm 1.42 2.4 15.04 0.01 0.75
10-20 cm LOI 2.40 7.29 0.04 0.59
0-20 cm 1.15 2.41 16.70 0.001 0.58
Vol. 20 (3) 1999
Parameter estirnate F-value P>F R-square
The present study has revealed sorne typical features of soil organic matter and dynamics in the tigerbush ecosystem.
(1) A high variability in clay content was observedin the vegetation arc as weil as in the bare area. Inrelation with water mn-off and termite activity, there isa c1ear tendency in fine particle variations. Thesevariations cou Id be due to the removal of coarsermaterial from the bare area (relative increase in finematerial) which is deposited in the herbaceous zonewhere the fine materials relatively decrease, inducedby the building activity of termites in the woody zone(absolute increase of fine material).
(2) Soil total carbon and nitrogen contents werehigh. Even in the bare area, organic matter content wasnot negligible despite the lack of plant material inputfor many decades. Tiger bush system showed a surprisingly high capacity of the soils to store organic

194
matter despite a moderate primary production level.This is likely to be related to the high soil fine particlescontent partly due to termite activity. An importantfraction of the organic matter is probably stabilised onmineraI colloids. In other words, a significant part ofthe organic matter stored in the soil, measured either inthe vegetation arc or in the bare area, could have beenproduced during a previous primary production cycleby a previous vegetation arc.
(3) Measurements of Ô13C showed a dominantcontribution of C3 plants to the soil organic matterpool. Nevertheless, the contribution of C4 plants,mainly the annual grass Michrochloa indica, was notnegligible. In the bare area, the Ô13C values variedwith distance, i.e. the relative contributions of C3 andC4 plants to the SOM pool varied with time, that of C3
becoming lower and lower (lower in the downslopethan in the upslope). The two types of organic matterlikely differed in their relative enrichment in l3Cduring mineralisation, i.e in their mineralisation rate.This point could be elucidated with a study of thedistribution and the isotopie composition of organiccarbon in different size classes of soil organo-rnineralparticles, obtained after a physical soil fractionation.
(4) Potential carbon mineralisation significantly varied between the vegetation arc and the bare area. It washigh in the vegetation arc, but remained significant inthe bare area. Nutrient availability was likely highduring the wet season, as previously observed incomparable formations in Australia [29]. Vegetationarcs can be viewed as 'fertility islands' as in many aridecosystems [16, 39, 47].
(5) The soil variables depending totally or partly onbiological factors, such as carbon and nitrogen contents, isotopie composition of carbon, carbon potentialmineralisation, did not show any symmetry in theirvariations along the studied transects. It was expectedin the vegetation arc because the vegetation cover donot show symmetry in its specifie composition and itsspatial structure. In the bare area, a clear asymmetrywas observed on sorne of the variables, carbon content, fine mate rial content and natural abundance ofl3e. This supports the hypothesis that vegetation arcsmove upslope, and weakens the hypothesis of thealternance of contraction and spreading periods of thevegetation cover.
Acknowledgments
We express our gratitude to A. Casenave, Director of OrstomNiamey for the facilities he offered us in the field. V. Parra, J.c. Lataand the two anonymous reviewers provided helpful comments on an
K. Guillaume et al.
earlier version of the manuscript. We thank Id and Hamza for theirassistance in the field. and G. Guillaume, D. Benest, C. Girardin,M. Grably for their technical assistance in the laboratory. The workwas supported by grants from SALT programme (CNRS andOrstom).
REFERENCES
[1] Abbadie L., Lensi R., Carbon and nitrogen rnineralization anddenitrification in a humid savanna of West Africa (Larnto,Côte d'Ivoire), Acta Oecol. II (1990) 717-728.
[2] Ambouta K., Contribution à l'édaphologie de la brousse tigréede l'Ouest nigérien, Ph.D. thesis, université Nancy-I, 1984,121 p.
[31 Aubréville A.. Climats, forêts, et désertification de l'Afriquetropicale, Soc. Edit. Géogr. Marit. Colon., Paris, 1949. 351 p.
[4] Audry P., Rossetti C, Observations sur les sols et la végétation en Mauritanie du sud-est et sur la bordure adjacente duMali (1959-1961), Food and Agricultural Organisation, Rome24067/F/l,1962.
[5] Balesdent J., Girardin c., Mariotti A., Site-related o13C of treeleaves and soil organic matter in a temperate forest, Ecology74 (1993) 1713-1721.
[6] Balesdent J., Mariotti A., Guillet B., Natural "c abundance asa tracer for studies of soit organic matter dynamics, Soil Biol.Biochem. 19 (1987) 25-30.
[7] Balesdent J., Wagner G.H., Mariotti A., Soil organic matterturnover in long-tenu field experiments as revealed byCarbon-13 natural abundance, Soil Sci. Soc. Am. J. 52 (1988)118-124.
[8] Berg B., Mc Claugherty C; Johansson M.B., Litter mass-Iossrates in late stages of decomposition at sorne climatically andnutrionally different pines sites. Long term decomposition ina Scots pine forest, Cano J. Bot. 71 (1993) 680-692.
[9] Boaler B., Hodge C.A.H., Observations on vegetation arcs inthe northem region, Somali Republic, J. Ecol. (1964)511-544.
[10] Casenave A., Valentin c., A runoff capability classificationsystem based on surface features criteria in serni-arid areas ofWest Africa, J. Hydrol. 130 (1992) 231-249.
[II] Clos-Arceduc M., Études sur photographies aériennes d'uneformation végétale sahélienne: la brousse tigrée, Bull. IFANsér. A 7 (1956) 677-684.
[12] Craig H., Isotopie standards for carbon and oxygen correctionfactors for mass spectrometrie analysis of carbon dioxide,Geochim. Cosmochim. Acta 12 (1957) 133-149.
[13] Delhoume J.P., Distribution spatiale des sols le long d'unetoposéquence représentative de la Réserve de la Biosphère deMapimi, Estudio integrado de los recursos vegetacion, suelosy agua en la Reserva de la Biosfera de Mapimi l, Ambiente yhumano Instituto de Ecologia, Mexico, 1987, 30 p.
[14] Djellali N., Billes G., Bounaga N., Lossaint P., Étude del'activité biologique des sols de la steppe d'Alfa d'Algérie.Minéralisation du carbone et de l'azote, Oecol. Plant. 6 (1985)289-307.
[15] Feller C; Fritsch E., Poss R., Valentin c., Effet de la texturesur le stockage et la dynamique des matières organiques dansquelques sols ferrugineux et ferralitiques (Afrique de l'Ouest,en particulier), Cah. Orstom sér. Pédol. XXVI (1991) 25-36.
Acta Oecologica

Soil organic matter dynamics
[16] Garner W., Steinberger Y., A proposed mechanism for theformation of 'Fertile Islands' in the desert ecosystem, J. AridEnviron. 16 (1989) 257-262.
[17] Gavaud M., Étude pédologique du Niger occidental, 3 vol.,Orstom, Paris, 1965.
[18] Girardin C; Mariotti A., Analyse isotopique du nC enabondance naturelle dans le carbone organique: un systèmeautomatique avec robot préparateur, Cah. Orstom Sér. Pédol.XXVI (1991) 371-380.
[19] Harper J.L., Population Biology of Plants, Academie Press,1977,892 p.
[20] Hemming CP, Vegetation arcs in Somaliland, J. Eco\. 53(1965) 57-67.
[21] Hiernaux P., Gérard B., The influence of vegetation pattern onthe productivity, diversity and stability of the vegetation: thecase of 'brousse tigrée' in the Sahel, Acta Oeco\. 20 (1999)147-158.
[22] Itchaou A., Étude de la productivité des formations forestièresde brousse tigrée et de brousse diffuse: Conséquences pour lagestion et la régénération de ces formations, Mémoired'Ingénieur spécialité eaux et forêts, 1995, 161 p.
[23] Ives R., Desert ripples, Am. J. Sci. 244 (1946) 492-501.[24] Jackson ML., Soil Chemical Analysis Advanced Course, 5th
ed., University of Madison Press, Wisconsin, 1969,894 p.[251 Kingston J.O., Marino B.D., Hill A., Isotopie evidence for
neogene hominid paleoenvironments in the Kenya Rift Valley,Science 264 (1994) 955-959.
[26] Lebel T, Le Barbé L., Rainfall climatology of the centralSahel during the years 1950-1990, J, Hydrol. 188-189 (HapexSahel Spec. Issue) (1997) 97-122.
[27] Lepage M., Abbadie L., Mariotti A., Food habits of sympatrictermite species (Isoptera, Macrotermitinae) as determined bystable carbon isotope analysis in a Guinean savanna (Lamto,Côte d'Ivoire), J. Trop. Eco\. 9 (1993) 303-311.
[28] Leprun J.c., Étude de quelques brousses tigrées sahéliennes:structure, dynamique, écologie, in: Le Floc'h E., Grouzis M.,Cornet A., Bille J.c. (Eds.), L'aridité, une contrainte audéveloppement, Orstom, Paris, 1992, pp. 221-244.
[29] Ludwig J.A., Tongway 0.1., Spatial organisation of landscapes and its function in semi-arid woodlands, Australia,Landsc. Ecol. 10 (1995) 51-63.
[30] Mabbut J.A., Fanning P.c., Vegetation banding in arid westernAustralia, J. Arid Environ. 12 (1987) 41-59.
[31] Macfayden WA., Soil and vegetation in British Somali land,Nature 165 (1950) 121.
[321 Malam Issa O., Premières données sur les biofilms microbiensà la surface du Niger. Résultats micropétrographiques etgéochimiques, DEA, université d'Orléans, 1995, 50 p.
Vol. 20 (3) 1999
195
[33] Mariotti A., Le carbone 13 en abondance naturelle, traceur dela dynamique de la matière organique des sols et del'évolution des paléoenvironnements continentaux, Cah. Orstom Sér. Pédo\. XXVI (1991) 299-313.
[34] Mauchamp A., L'hétérogénéité spatiale, sa dynamique et sesimplications dans une mosaïque de végétation en zone aride,Ph.D. thesis, université Montpellier-II, 1992, 169 p.
[35] Mauchamp A., Rambal S., Lepart J., Simulating the dynamicsof a vegetation mosaic: a spatialized functional model, Eco\.Mode\. 71 (1994) 107-130.
[36] Montana C; The colonization of bare area in two-phase of anarid ecosystem, J. Ecol. 80 (1992) 315-327.
[37] Ouedraogo P., Rôle des termitières dans la structure et ladynamique d'une brousse tigrée soudano-sahélienne, Ph.D.thesis, université Paris-VI, 1997,232 p.
[38] Peugeot c., Influence de l'encroûtement superficiel du sol surle fonctionnement hydrologique d'un versant sahélien (Niger). Expérimentation in situ et modélisation, Ph.D. thesis,université Grenoble-l, 1995, 317 p.
[391 Skujins J., Nitrogen cycling in arid ecosystems, in: Clark F.E.,Rosswall T (Eds.), Terrestrial Nitrogen Cycles, Stockholm,1981, pp. 477-491.
[40] Tanner C.B., Jackson M.L., Nomographs of sedimentationtimes for soil particles under gravity or centrifugai acceleration, Soil Sci. Soc. Am. J. 12 (1948) 60-65.
[41] Thiéry lM., d'Herbès lM., Valentin c., A model simulatingthe genesis of banded vegetation patterns in Niger, J. Ecol, 83(1995) 497-507.
[42] Tieszen L.L., Bouttom TW., Stable carbon isotopes in terrestrial ecological research, Ecol. Stud. 68 (1989) 167-195.
[43] Valentin c., Bresson L.M., Morphology, genesis and classification of surface crust in loamy and sandy soils, Geodenna 55(1992) 225-245.
[44] White L.P., Vegetation arcs in Jordan, J. Eco\. 57 (1969)461-464.
[45] White L.P., Vegetation stripes on sheet wash surfaces, J. Eco\.59 (1971) 615-622.
[46] Worral G.A., The Buttana grass patterns, J. Soil Sci. JO(1959)34-53.
[47] Zaady E., Groffman P.M., Shachak M., Litter as a regulator ofN and C dynamics in Macrophytic patches in Negev desertsoils, Soil Biol. Biochem. 28 (1996) 39-46.
[48] Zanguina \., Thurow TL., Juo A.S.R., Manu A., Soil andhydrology of a banded vegetation site in Niger and their effecton tree establishment, in: Banded Vegetation Patterning inArid and Semi-arid Environment, Orstom, Paris, France,1996, pp. 53-55.


Acta Oecologica 20 (3) (1999) 197-208 1 © Elsevier, Paris
Spatial distribution of Prosopis glandulosa var. torreyana in vegetationstripes of the southern Chihuahuan Desert
Jorge Lôpez-Portillo*, Carlos Montana
Instituto de Ecologie, Apartado Postal 63, Xalapa 91000 Veracruz, Mexico.* Corresponding author (fax: +5228187809; e-mail: [email protected])
Receivecl March 17. 1997; revisecl December 8, 1998; accepted December 16, 1998
Abstract - Mosaics consisting of vegetation stripes surrounded by bare areas have been described in several arid and semiarid ecosystems.The dynamics of the system depends on the redistribution of rainwater which is preferentially stored and evapotranspired in the vegetatedstripes. A process of plant 'colonization' in the upslope fringe of the stripes has been described in sorne cases and a consequent upslopemigration of the stripes has been inferred, but not confirmed in ail cases quoted in the literature. ln this paper, we studied the spatial distributionof mesquite iProsopis glandulosa var. torreyana) and the soil parameters in three vegetation stripes and their associated bare areas in thesouthern Chihuahuan Desert. The spatial distribution of mesquites of different sizes do not coincide with that expected under the hypothesis ofan uniform upslope stripc migration, but soil data suggest that current bare areas had been vegetated sorne tirne ago. Dispersion andestablishment abilities enhanced by overgrazing may explain the observed mesquite distribution, but the presence of trees with high basaldiameters in any part of the stripes suggests stripe permanence at the sa me site and no upslope migration. These results point to the contlictingevidence on stripe migration that has been already found in other areas. The most probable scenario in our study area is that of a generallong-terrn change of form of the stripes taking place at very variable speeds in different stripes, including the possibility that sorne of themremain stationary for prolonged periods, and showing different histories of colonization according to the life-history of the different speciesconcerned. The speed and regularity of the process would show a very high temporal and spatial variability due to the interaction of climatic,geomorphologie and biotic interactions. © Elsevier, Paris
'Brousse tigrée' 1 Mexico 1stripe migration 1 size distribution of woody plants
1. INTRODUCTION
Vegetation patches with long axes parallel to theslope and surrounded by bare areas have been reportedin many arid and semiarid ecosystems. Such patternhas been called 'brousse tigrée' (tiger-spotted scrub)by Clos-Arceduc [13]. Other related plant associationsare vegetation arcs [5, 25] and vegetation stripes [4,45]. We will use 'vegetation stripes' as the genericterm.
It has been proposed that vegetation stripes can beformed in either of two alternative ways (i.e. [22]): bythe lateral extension of embryonic vegetation patchesin a generally bare area; or, in a vegetated area, by theformation of gaps and the reorganization of the remaining vegetation in stripes. Once stripes are forrned,there are two possibilities: stripes migrate upslope; orthey remain at the same location, Researchers whoinfer vegetation stripe migration from their data indi-
cate that the upslope front of the stripe can expandbetween 15 and 30 cm annually (e.g. [5]). Montana [3 1] reported an expansion of 4 m in 5 humidyears (210--412 mm annuai rainfall) at the front of avegetation stripe in Mapimf, Mexico (i.e, 80 cm perannum), but that expansion was nill in the two following dry years (168 and 199 mm annual rainfall) indicating a high temporal variability of the process.
Water arriving to the stripes may come from twosources: direct rainfall which may infiltrate; or sheetflow which results from brief and intense showers. Aproportion of sheet flow gets stranded at the front andin the depressions of the stripes, while the rest runsvarying distances across the stripe, depending on theamount of flow. Since in Mapimï, the probability ofrains generating intense sheet flow (i.e. higher than5 mm) is low [14], it can be suggested that sheet flowwill irrigate the upslope sections of the stripes more

198 J. Lôpez-Portlûo, C. Montana
Table I. Hypotheses related to the logic of distribution of long-livedwoody plants in vegetation stripes. If stripes migrate and there is aresource (i.e. water availability) gradient decreasing slopewise, casescontained in hypothesis 1 are found; with no stripe migration and aresource gradient. hypothesis 2 would explain our data; finally, nostripe migration and no resource gradient would result in a logic ofdistribution of plant attributes best explained by hypothesis 3. It is notpossible for stripes to migrate if there is no water availabilitygradient.
trees. For this reason, if the stripes are stationary inspite of a water availability gradient we can hypothesize that:
(c) Coyer, height and basal diameter of long-livedshrubs or trees will tend to diminish from the upslopeto the downslope part of the stripes.
A recapitulation of the three hypotheses is shown intable 1and is graphically represented infigure l, where
Figure 1. Expected distribution of basal diarneters, height and coverof mesquite plants in vegetation stripes if the stripes migrate (a) andif the stripes remain stationary (b), under the hypotheses described intable 1. Curve la shows the expected distribution of the basaldiameter and curve lb the distribution of the height and cover of theplants if the stripes migrate. Curve 2 shows the distribution of basaldiameter, height and cover of mesquites if the stripes are stationary inthe presence of a soil moisture gradient, while curve 3 shows thedistribution of the same variables if the stripes are stationary in theabsence of such gradient.
b
a
1b
1a
Hypothesis 2
Hypothesis 3
Hypothesis 1
Impossible
Yes No
Stripe migration
cover and height
Slopewise distance
...(1)
>oo...o.:s:Cl
ëi>.s:::.~(1)-(1)
E.!!!"C
niUlC'llal
Yes
No
Water availabilitygradient
frequently. This suggestion agrees with the proposedassociation between stripe movement and a gradient ofwater availability decreasing downslope within thestripe [22].
A long-lived plant (e.g. a shrub or a tree) establishedat the upslope front of a stripe with a slopewise widthof, say, 30 m, will be 50-year-old when found in themiddle of the stripe and 100-year-old when in thedownslope margin of this stripe (considering a 30 cmadvance per year). As the stripe advances, wateravailability will change from (relatively) very high inthe upper and middle sections of the stripe to low andvery low at the downslope part and its associated barearea. As a consequence, the plant will lose part of itsbiomass through the death of sorne of its branches anddecrease its growth rate. Nevertheless, basal stemdiameter will remain as a record of the growth reachedunder optimal humidity conditions. If this dynamics istrue and vegetation stripes advance in rates measurablein years, then, for long-living plants such as trees andsorne shrubs we can hypothesize that:
(a) There will be younger plants (smaller basaldiameters) at the upslope front of the stripes, and theoldest (greater basal diameters) will be found in thedownslope part and its associated bare area.
(a') Coyer and height will be higher in the middleposition of the stripe (where plants have reached anoptimal size due to their age and to water availability)and will tend to decrease downslope.
However, the literature also contains examples ofapparently stable (i.e. non-migrating) stripes. Authorssuggesting this have based their conclusions on theconstancy of shape and location of stripes in aerialphotographs taken with a difference of 15-20years [21, 43], or on the existence, below the stripes,of a concave layer cemented by siliceous compoundswhich requires a long time of stripe permanence at thesame position [28, 29]. Additionally, Boaler andHodge [5] and Mabbutt and Fanning [29] suggestedthat stripe migration would diminish the impluviumarea which wouId in turn modify water availability inthe stripe. If stripes are stationary in absence of a wateravailability gradient, we can hypothesize that:
(b) There will be no consistent trend in the distribution of long-living plants, and their age (basaldiameter), height and coyer distribution will not berelated to their position in the stripe.
Even if stripes are stationary, a water gradient belowthem is possible, for reasons stated before. Such along-term gradient would be reflected in changes inthe coyer, height and basal diameter of the individual
Acta Oecologica

Spatial distribution of mesquite in vegetation stripes
basal diameter, height and cover of shrubs or trees arerelated to distance along the stripe.
There are no explicit hypothesis on the relationshipbetween plant density and stripe dynamics. However,Bush and Van Auken [12] suggested that in the savannas of Texas, the mortality of Prosopis glandulosa washighest in the transition from seedlings to saplings, andthat once these were established, survival probabilitywas high. For this reason, we would expect, under thestripe migration hypothesis, similar densities of theolder plants in the middle and downslope (older) partsof the stripes, and a higher density of younger plants atthe front of the stripes (since space has not yet beenpreempted), especially if there is a moi sture gradient.
Soil characteristics may change in a different way ifvegetation stripes migrate or remain stable as shownby Mabbutt and Fanning [29]. If plants can modify soilstructure, promote lixiviation and illuviation, differences in soils beneath stable stripes and the adjacentbare areas could be expected to be due to the long-termpresence of vegetation in the same site, while nodifferences in soil parameters will be found if thestripes migrate in the long term.
The objective of this paper was to analyze thespatial distribution of the basal diameter, height, coverand density of individuals of the honey mesquite,Prosopis glandulosa var. torreyana (Fabaceae) to testthe three hypotheses stated above. We made explicitassumptions about the conditions under each of thehypotheses, and compared them with field data resulting from the census of this species in three vegetationstripes. Additionally, we measured soil properties inthe same three stripes to test the hypothesis of stripemigration.
2. MATERIALS AND METHüDS
2.1. Study site
The study site (26°41' N, 103°44' W, 1 170 m altitude) is located in a lower Bajada (an alluvial fan fromarid environments) at the Bolson de Mapimi, a closedbasin within the Chihuahuan Desert [32]. Averageannual rainfall is 264 mm, 71 % distributed mainly insummer showers of short duration. Mean annual temperature is 20.8 "C with a seasonal variation of 16.2 "Cand a mean daily range of 20 oc. There is a meannumber of 37 d (range: II-58) with freezing temperatures, which occur mainly in December and January [14]. Vegetation is a xerophytic scrub [35] orChihuahuan Desert scrub [8], but vegetation stripes(our community of interest) can be described aspatches of dense grassed-scrub (i.e. an association of
Vol. 20 (3) 1999
199
Hilaria mutica grasses and of mainly Prosopis glandulosa var. torreyana trees) surrounded by bare areaswith vegetation cover lower than 10 %. Vegetationstripes, as weil as other vegetation types within thestudy area are used for extensive cattle ranching.Cattle managers do not use fire to promote resprouting,since they fear that this kind of management wouldresult in extensive grass killing. Only dead parts ofplants are used as fuel wood, and this is collected byhand. Also, we found no evidence of natural fires dueto lighting strikes in our field surveys. Soils are haplicyermosols with a clay loam texture developed on lutitefacies covered by fine textured alluvial fans of variable(10-50 cm) depth [7, 16]. For the purpose of thiswork, we selected three vegetation stripes and theirassociated bare areas.
2.2. Species
The honey mesquite, P glandulosa var. torreyana isa long-Iived woody species (tree or shrub) distributedin the Chihuahuan and Sonoran deserts. This and otherspecies of Prosopis can be considered as facultativephreatophytes, since their roots can take water fromshallow and deep soil horizons [2, 24, 38].
2.3. Census of individuals
In each of the three vegetation stripes and theirassociated bare areas, we traced 50 x 150 m bands,with the longer axis perpendicular to contour lines.Each band was subdivided in a mesh of JO x 10 m. Weregistered the location of each mesquite individualregardless of its size in a Cartesian coordinate system,so that its exact location could be known and graphically represented. The height, basal diameter of thewidest (live or dead) branch, and the longest andshortest diameters of the canopy of every individualwere annotated. The census areas inside vegetationstripes were 91 x 50 m for stripe l , and 50 x 50 m forstripes 2 and 3, the remaining areas corresponded tothe upslope and downslope bare zones.
2.4. Relief
Relief was determined with a topographer's transit,at 5-m intervals along four parallel lines equidistantfrom each other in each band (i.e. every 12.5 m). Wecalculated linear regressions between relief and distance, one for each line. Ali linear regressions indicated a significant association between distance andrelief (P < 0.001). We proceeded to calculate theregression lines and their residuals. Regression coefficients indicated the mean slope (0.3-1 %), while theresiduals showed variations in microtopography exc1uding the distance-related trend. We merged theresiduals data for each stripe in arder to have athree-dimensional map that could suggest lateral ftow.
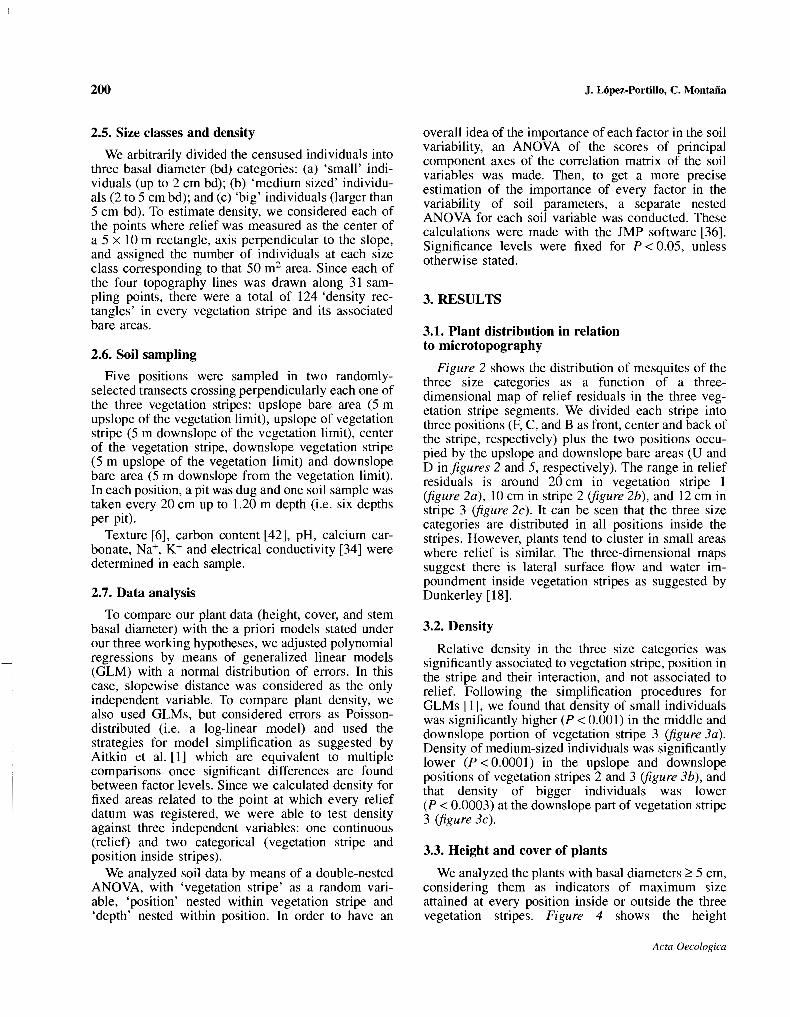
200
2.5. Size classes and density
We arbitrarily divided the censused individuals intothree basal diameter (bd) categories: (a) 'small' individuals (up to 2 cm bd); (b) 'medium sized' individuais (2 to 5 cm bd); and (c) 'big' individuals (larger than5 cm bd). To estimate density, we considered each ofthe points where relief was measured as the center ofa 5 x la m rectangle, axis perpendicular to the slope,and assigned the number of individuals at each sizeclass corresponding to that 50 m2 area. Since each ofthe four topography lines was drawn along ~ 1 sampling points, there were.a tota~ of 124.'denslty. rectangles' in every vegetation stnpe and ItS associatedbare areas.
2.6. Soi! sampling
Five positions were sampled in two randomlyselected transects crossing perpendicularly each one ofthe three vegetation stripes: upslope bare area (~ mupslope of the vegetation limit), upsl?pe ~f ~egetatIon
stripe (5 m downslope of the vegetation hm~t), cen.terof the vegetation stripe, downslope vegetation stnpe(5 m upslope of the vegetation limit) and ~own.sl~pe
bare area (5 m downslope from the vegetation limit).In each position, a pit was dug and one soit sample wastaken every 20 cm up to 1.20 m depth (i.e. six depthsper pit).
Texture [6], carbon content [42], pH, calcium carbonate, Na", K+ and electrical conductivity [34] weredetermined in each sample.
2.7. Data analysis
To compare our plant data (height, cover, and stembasal diameter) with the a priori models stated underour three working hypotheses, we adjusted polynomialregressions by means of generalized linear mode~s
(GLM) with a normal distribution of errors. In thlscase, slopewise distance was considered as t~e onlyindependent variable. To compare plant density, wealso used GLMs, but considered errors as Poissondistributed (i.e. a log-linear model) and used thestrategies for model. simplificati~n as suggested. byAitkin et al. [1] which are equivalent to multiplecomparisons once significant differences are .foundbetween factor levels. Since we calculated density forfixed areas related to the point at which every reliefdatum was registered, we were able to test densityagainst three independent variables: one continuous(relief) and two categorical (vegetation stripe andposition inside stripes).
We analyzed soil data by means of a double-nestedANOVA, with 'vegetation stripe' as a random variable, 'position' nested within vegetation stripe and'depth' nested within position. In order to have an
J. Lôpez-Pornllo, C. Montana
overal1 idea of the importance of each factor in the soilvariability, an ANOVA of the scores of principalcomponent axes of the correlation matrix of the s?ilvariables was made. Then, to get a more preciseestimation of the importance of every factor in thevariability of soit parameters, a separate nestedANOVA for each soil variable was conducted. Thesecalculations were made with the JMP software [36].Significance levels were fixed for P < 0.05, unlessotherwise stated.
3. RESULTS
3.1. Plant distribution in relationto microtopography
Figure 2 shows the distribution of mesquites of thethree size categories as a function of a threedimensional map of relief residuals in the three vegetation stripe segments. We divided each stripe intothree positions (F, C, and B as front, center.a.nd back ofthe stripe, respectively) plus the two posmons occupied by the upslope and downslope bare areas. (U a~d
D in figures 2 and 5, respectively). The range III reliefresiduals is around 20 cm in vegetation stripe 1(figure 2a), 10 cm in stripe 2 (figure 2b), and 12 cm. instripe 3 (figure 2e). It can be seen that the three sizecategories are distributed in al! positions inside thestripes. However, plants tend to cluster in small areaswhere relief is similar. The three-dimensional mapssuggest there is lateral surface flow and water irnpoundment inside vegetation stripes as suggested byDunkerley [18].
3.2. Density
Relative density in the three size categories wassignificantly associated to vegetation stripe, po~ition inthe stripe and their interaction, and not associated torelief. Following the simplification procedures forGLMs [1], we found that density of small individualswas significantly higher (P < 0.001) in the middle anddownslope portion of vegetation stripe 3 (figure 3a).Density of medium-sized individuals was significantlylower (P < 0.000 1) in the upslope and downslopepositions of vegetation stripes 2 and 3 (figure 3b), andthat density of bigger individuals was lower(P < 0.0003) at the downslope part of vegetation stripe3 (figure 3e).
3.3. Height and coyer of plants
We analyzed the plants with basal diameters ~ 5 cm,considering them as indicators of maximum sizeattained at every position inside or outside the t~ree
vegetation stripes. Figure 4 shows the height
Acta Oecologica

Spatial distribution of mesquite in vegetation stripes
/
li: /\/
1 ~1
j/ /-Q
l '
:w -~
L;1
0
201
Figure 2. Spatial distribution of mesquites ofdifferent size categories in three vegetationstripes as a function of the slopewise distanceand of the residuals of four linear regressionsbetween relief and slopewise distance, Sizecategories are: (1) less than 2 cm of basaldiameter (bd), (2) between 2 and 5 cm bd, and(3) more than 5 cm bd, Numbers 8 and 9 in thestripes indicate dead individuals correspondingto size categories 2 and 3, respectively. Positions are indicated as: (U) upslope bare area, (F,C, B) front, center and back of the stripe, and(0) downslope bare area.
54
3
2
N 1E 0
010 1.0...G.lCo- 0.5~CIlC 0.0G.l 2.0C
1.5
1.0
0.5
0.0
a
b
c
Figure 3. Density of mesquites of three size categories in threepositions within three vegetation stripes. Data from each sizecategory are shown in a separate histogram: (a) less than 2 cm ofbasal diameter (bd), (b) between 2 and 5 cm bd, and (c) more than5 cm bd. Figures along the abscissa axes identify the differentstripes. Each bar represents the density of plants in each position:front (white bars), medium (diagonally-hatched bars), and back(horizontally-hatched bars) of the stripes. Discontinuous linesparallel to the abscissas split density groups that are significantlydifferent (P < 0.05).
2 3
Vegetation stripe
Vol. 20 (3) 1999

':';:. '. : .....'!- ........;. '..
.. ~., :(.,i.rt ..'':.. .. .,.. -":' ...' ..: ..
. .. ..
.. ~
'.-. " ..-. . ..'1 ' ••,,..:..." 1••.:
.. ".~u-"~~.~.. ... ....
f
c
150
J. Lépez-Portillo, C. Montana
100
.. ." .. ...... ..• ~.... .. '1
50
.M ••
::.;1.
·f ,;:•.:,:•• :
" ... ....
: :~'C." .. ".
h
e
150 0100
,
... ..'
......b
.~ ...~~ ...~.,J. : ...~
.. .. .."'", ........ '. .. " ..
.......
.-=. :.-. . '",-,. ~ .'.' ..
:t-::..•
50
d
9
a
150 010050
202
3
l 2
~Cl'iiiJ:
015
N~
S 10..CIl>0 5U
Ê0
.!:!...15
~Eco
10ï5;;;li)coal 5
0
Slopewise distance (m)
Figure 4. Plant height (a-c), cover (d-t) and basal diameter (g-i) of mesquites with basal diameters ~ 5 cm growing in three vegetation stripesas a function of the slopewise distance. Each triad (a. d, g), (b. e, h) and (c, f, i) of scatter diagrams and their adjusted lines corresponds to oneof the three sampled vegetation stripes. Stripe 1 showed a cubic (a, r = 0, 16, P < 0.00 1) and a quadratic (g, r = 0.04, P = 0.02) regression, whilestripe 2 showed significant linear regressions in b (r = 0.16. P = 0.02) and h (r = 0.10, P = 0.01). There were no significant regressions in stripe3 for any plant attribu te.
(figure 4a-c) and cover (figure 4d-j) in the three vegetation stripes as a function of the slopewise distance.There was a significant correlation between slopewisedistance and height in two vegetation stripes(figure 4a, b). The slopes of the regression lines werenegative, indicating that height tends to decreasedownslope. We did not find significant relationshipsbetween plant cover and slopewise distance in anystripe (i.e. cover was similar along stripes).
3.4. Basal diameter
Figure 4g-i shows the basal diameter (bd) of 'older'individuals (~ 5 cm) in the three vegetation stripes as afunction of the slopewise distance. The trend in stripe1 (figure 4c) was for bd to be higher at the center. Asignificant linear regression between bd and slopewisedistance was found for stripe 2 (figure 4h); the siope ofthe regression line indicated that basal diameter tendsto decrease downslope.
3.5. Soil
Soil profiles were very similar to those described byDelhoume [16] and Breimer [7]. They had a 10- to15-cm thick A horizon extending to a more or lessclayey B horizon 40- to 50-cm thick. Then a weathered
lutite C horizon with a blocky structure overlaid amassive lutite bedrock. The first three principal components of the correlation matrix of soil variables(clay, silt, sand, carbonate, organic carbon, sodium andpotassium content, pH and electrical conductivity)accounted for 39.4, 18.0 and 15.3 % of the totalvariability. The nested ANOVA of the first axis scoresrevealed that most of its variability (81.6 %) wasaccounted for by depth and that positions and stripesexplained 3.7 and 4.4 %, respectively, the three effectsbeing significant. The variability of the second axiswas significantly associated to the stripe (7.1 % of thetotal variability explained) whereas its relationshipwith depth and position (37.8 and 6.9 %, respectively)was not significant. In the third axis, the most important factors were depth and stripe (35.5 and 30.4 % ofvariability explained) and the effect of position wasnon-significant (4.6 %).
Clay content varied between stripes (15.7 % of thevariance explained by this factor) and between depths(51.7 % of the variance explained) but not betweenpositions. Variation between stripes ranged from 31.3in stripe 2 up to 41.0 % in stripe 3 (stripe 1 had anintermediate value of 37.4 %). Variation betweendepths ranged from 24.3 % at 20 cm depth up to nearly40.0 % at the remaining depths (figure 5a). Silt and
Acta Oecologica

Spatial distribution of mesquite in vegetation stripes
sand content also varied between stripes (6.7 and6.1 % of the variances explained for each respectiveANOVA) but varied neither between positions nordepths. In these cases, ranges of variation were from15.0 (stripe 3) up to 19.5 % (stripe 1) in silt contentand from 43.2 (stripe 1) up to 49.6 % (stripe 2) in sandcontent.
pH varied between stripes (11.7 % of the varianceexplained by this factor) but varied neither betweenpositions nor depths. It varied from 8.7 in stripe 3 upto 9.0 in stripe 2 (stripe 1 had an intermediate value of8.8).
Calcium carbonate content varied between stripes(4.4 % of the variance explained by this factor) andbetween depths (76.4 % of the variance explained).Stripe 3 had the highest content (21.9 %) whereasstripes 1 and 2 had 19.1 and 19.4%. respectively. Ilwas lower at 20 cm and increased with depth(figure 5b).
Carbon content varied between stripes (4.5 % of thevariance explained by this factor), between positions(4.7 % of the variance explained) and between depths(75.2 % of the variance explained). It was higher instripe 3 (0.42 %) than in stripes 1 and 2 (0.31 and0.28 %, respectively). Il was also higher (0.71 %) at20 cm than at any other depths (figure 5c). Final!y, itwas higher inside the stripes (0.38 %) than in the bareareas (around 0.27 %) (figure 5d). Separate analysesfor each depth showed that differences between positions were only significant at the upper layer(0-20 cm, figure 5e).
Potassium content varied between stripes (2.7 % ofvariance explained) and between depths (69.9 %). Itranged from 0.55 meq·IOO g-l in stripe 1 up to0.74meq·IOOg-1 in stripe 3, with an intermediatevalue of 0.70 meql Oûs ' in stripe 2. In depth, itdecreased from 1.4 meqIOû s' in the surface up to0.4 meq·l 00 g-I below 80 cm (figure 5.f).
Sodium content varied significantly between stripes(13.7 % of the variance explained), between positions(7.7 %) and between depths (57.2 %). It ranged from6.6 in stripe l , to 13.9 meql Oûs' in stripe 3, with anintermediate value of 9.5 rneql Oûs' in stripe 2. Ilincreased with depth from 2.6 at the surface up tonearly 15 meq·IOO g-I below 80 cm (figure 5g). Regarding positions, it ranged from 8.2 meqI 00 g-I inthe downslope part of the vegetation stripe up to11.2 meq·IOO g-l in the upslope bare area (figure 5h).Aiming to elucidate whether the vertical distributionof the Na" content varied with positions, we calculatedthe interaction of position and depth (although itsvalidity for purposes of generalization can be criticized because of the nested nature of our experimentaldesign). This interaction was non-significant (P = 0.9)indicating that the eventual leaching of Na" did not
Vol. 20 (3) 1999
203
differ between soils from stripes and bare areas.Contrariwise, the stripes by depth interaction washighly significant (P = 0.003). Sodium content waslower than 5 meql Oû g-I up to 40 cm depth in al!stripes. Between 40 and 60 cm depth, it amounted to5.5, 8.8 and 11.9 meql 00 s ' in stripes r, 2 and 3,respectively, and below 80 cm, it increased to 9.4, 13.8and 21.3 meq·IOO s' suggesting an important difference in the sodium contained in the bedrock. Separatednested ANOVAs for each depth revealed that differences between stripes were significant below 60 cmwhereas there was no differences between positions atany depth, except between 60 and 80 cm. These resultssuggest a high variability in the sodium contained inthe bedrock and a lower variability in the al!ochtonousmaterial deposited over it.
Electrical conductivity had a pattern of variabilitysimilar to that of sodium content. It varied significantlybetween stripes (11.4 % of the variance explained).between positions (11.9 % of the variance) and depth(59.9 % of the variance). It ranged from 2.2 in stripe 1up to 4.4 mx-crrr' in stripe 3, with an intermediatevalue of 2.5 rnâcm"! in stripe 2. Il increased withdepth from 0.3 near the surface to nearly 4.6 mâcrrr 'below 80 cm (figure 5i). Regarding positions, it rangedfrom 2.3 in the downslope vegetation-stripe to3.5 mô-crrr ' in the upslope bare area (figure 5j). Thecalculations of the interactions and of separate nestedANOVAs for each depth showed a pattern similar tosodium content.
4. DISCUSSION
4.1. Mesquite distribution
Mesquite density was not related to position insidethe stripes in any of the size classes we distinguished.This suggests different histories of colonization of thevegetation stripes by this species of Prosopis. There isalso no trend as to where younger plants were established, or where they survive and grow. It has beenreported that mesquites occupy pasture lands whereco ver has been sensibly affected by grazing [9. II], avery likely situation at our study site, which has beenexposed to caule grazing since the last century [20,26]. It could then be argued that, under these conditions, seedlings may establish at any position withinthe stripe, and that this trend would be similar whetherstripes migrated or not. Thus, the distribution of plantswithin stripes could be thought of as a mosaic ofdifferent patch sizes not arranged in a slopewisedirection as expected if vegetation stripes migratedupslope.
We did not establish the statistical relationshipbetween basal stem diameter and age, and are aware of

204 J. Lépez-Portlllo, C. Montana
DBCPosition
40 60 80 100 120Oepth (cm)
u
20
;ë'0'4tEU 0.3
0.2
1.5 [ f~ 1.0+:Il:
0.5
~-~-~-~~~~-
40 60 80 100 120Oepth (cm)
40 60 80 100 120Oepth (cm)
20
20
0.81C0.6
il.U 004
0.2~-~-~-~-~----''---
1.0 1e;ë'!LU
0.5
-----'--~-~-~-~-
40 60 80 100 120Oepth (cm)
U C B D 20Position
i:r~ ';::I~h~20 40 60 80 100 120 U C B D
";" Oepth (cm) ":' Position
E
r~ iluUl§.~>~:>..."0 0U 20 40 60 80 100 120 U U C B D
Oepth (cm) Position
Figure 5. Soil data from three vegetation stripes merged by position along the stripes and their bare areas or by soil sampling depth. Twotransects perpendicular to contour lines were sampled at five positions and six depths in three vegetation stripes. Relationship between: (a) claycontent and depth; (b) calcium carbonate and depth; (c) C and depth; (d) C and position; (e) C in the 0-20 cm layer and position; (f) K+and depth;(g) Na" and depth; (h) Na" and position; (i) electrical conductivity and depth; and G) electrical conductivity and position. Soils were sampled at20-cm depth intervals; the top value of each interval is shown in the corresponding abscissas. Positions are indicated as: (U) upslope bare area,(F, C, B) front, center and back of the stripe, and (0) downslope bare area. Vertical lines represent standard errors.
this limitation [23], considering that plants are genetically different and that different growth rates could bepossible even under similar water availability conditions. In addition, older stems would have died andtheir stumps would go unregistered; if so, we wouldunderestimate in favor of greater basal diameters. Firesare not used as a management tool by land users, sothis factor can be ruled out as a cause of mortality.Wildfires due to lighting strikes would have restrictedeffects due to the existence of bare areas betweenstripes; we found no evidence of massive mortality inthe stripes we studied. Another cause of death wouldbe wood-borers mainly in Coleoptera, but this wouldaffect an ample range of basal diameters.
We used stems with the highest basal diameters forour analyses on plant attributes. Although an interaction between these individuals could be expected, thiswould be less intense than that between plants ofcontrasting sizes [10]. Therefore, a supposition wedepend on for the validity of these analyses (in order toavoid violation of the statistical principle of independenee between observations) is that such 'big' treesare relatively independent of each other.
If we were to detect a pattern in the spatial distribution of basal diameters, this should be very slightdue to intraspecific and substrate variation (i.e. statistical models of slopewise distance against plant at-
Acta Oecologica

Spatial distribution of mesquite in vegetation stripes
tributes should explain a low proportion of theirvariability). No model parameters derived from ourdata explained more that 16 % of total variability ofplant attributes. To suggest a relationship betweenbasal diameter (bd) and age, we relied on the work ofArcher [3] in a subtropical savanna of Texas concerning the growth of Prosopis glandulosa var. glandulosatrees in vegetation islands 'founded' by the tree itself.Archer [3] estimated that tree stem bd near 5 cm werearound 50 years of age, and from 172 to 217 years oldif bd was around 27 cm. Since there is a high densityof trees with 2 5 cm bd at the front of the three stripeswe studied, we consider this as evidence against themoving stripe hypothesis. Furthermore, aIl modelsbetween slopewise distance and plant height, coyer orbasal diameter are more akin to the stable stripehypotheses, i.e. basal diameter tended to be greater atthe middle of vegetation stripe 1, but it diminishedtowards the downslope part, and basal diarneter (in theother stripes) and height either tended to diminishslopewise, or were similar along the stripes as wasfound for plant coyer.
An argument that has been used to suggest stripemigration is that there are more dead trees or shrubs inthe downslope limits of the stripe and its associatedbare area [5, 15,25,27,33,41,44], a result we alsofound in vegetation stripes 2 and 3. However, takinginto consideration that we found no evidence supporting the migration of stripes, an alternative would bethat sorne sections of the downslope part of the stripeshave contracted, the rest of the area remaining stable(see last paragraph). A similar conclusion with additional elements was found and described as an 'enduring feature' by Dunkerley and Brown [19].
In conclusion, the distribution of mesquite densitiessuggests that colonization events were different in thethree stripes under study and the results do not supportthe stripe migration hypothesis since (a) rnesquites ofthe higher basal diameters tend to be distributed at thefront of the stripes, or at any position within; and (b)there are no unequivocal trends between the positioninside the stripes and mesquite physiognomy, and theobserved trend would seem to be opposite to thatexpected under the stripe migration hypothesis (i.e.height tended to be higher in the upslope part of twostripes and was similar along the third stripe, and therewere no differences in coyer within the stripes).Finally, the presence of dead individuals downslope ofthe stripes (Iabeled as 8 and 9 in figure 2) cou Id be aconsequence of a partial downslope contraction of thestripes.
4.2. Soil variability
The variability between stripe vs. bare area soilsseems to support the hypothesis thar stripes change
Vol. 20 (3) 1999
20S
their positions in the long term. The results of the PCAof soil variables indicate that a very low variabilitycould be assigned to the position of the soil samples.These results show that the most important effect onsoil variability is due to depth, It explains most of thevariability of the three axes analyzed (although itseffect on the second axis is not significant). Betweenstripe differences has a fair importance for explainingthe variability of the third axis, whereas position has avery low importance significantly explaining only3.7 % of the first axis variability. Separate ANOVAsfor each soil variable showed that there were nodifferences between soils beneath stripes and bareareas, with the exceptions of carbon and sodiumcontent, and electrical conductivity. Differences incarbon content were restricted to the surface horizon(the first 20 cm) and it could be argued that this is aconsequence of the long-terrn change in the position ofvegetated areas. Sodium content and electrical conductivity were lower at the center and downslope of thestripe when compared to the upslope of the stripe andthe bare areas. There was no evidence of a long-termdifferent leaching between positions as revealed by anon-significantinteraction between positions anddepths, but there was evidence of a strong variation inthe bedrock and the original soil material. In summary,contrasting with mesquite distribution, soil data wouldsuggest that vegetation stripes do not remain stationaryin the long term. Soil profiles did not indicate anymineralogical, structural pre-existent differences orother than those produced by the presence of vegetation in the stripes, Moreover, carbon content in bareareas suggests that they were vegetated sorne time ago.Other studies conducted in the same area point in thesame direction. Delhoume ([ 16, 17]; see also [15])found that soils of stripes and bare areas were developed over fine-textured aIluvial-colluvial transportedmaterial, overlying on in situ claystone (lutite), exceptin very small and localized pockets where they aredeveloped over a bit coarser colluvial deposits. Soilsof stripes and bare areas only differed in the surfacehorizons and these differences were interpreted by theauthors as the consequence of differences in vegetationCoyer. Soils of both types presented the same succession of horizons with the same morphology. The maindifferences were in the carbon content of the 0-25 cmlayer: bare areas had less carbon content (0.55 %; C/Nratio of 7.1) than vegetated areas (1.96 %; C/N ratio of37.7).
4.3. Consequences for the dynamics of vegetationstripes
Regarding vegetation, Montana et al. [33] foundthat most of P. glandulosa and F. cernua seedlingsoccurred in the upslope part of the stripes they studied,20 km apart and under a less grazed condition than the

206 J. Lépez-Portillo, C. Montaiia
A
B
---~----------------~~ ..
.:[...u....
.:[...u.
c
.:rIOO[
(or the surface of their associated water-collecting bareareas) are changed bysudden erosional events due tounusual rainstorms or periods of overgrazing. ln addition to rainfall unpredictability, the variability in thespeed of this rearrangement process could be attributed both to the development of the microgeomorphological processes, which ultimately determine the redistribution of sheet-flowing water, and to thepopulation biology (seed dispersal, establishment requirements, growth rate) of the species concerned andthe resulting biotic interactions (competition and facilitation between plants, granivory, secondary dispersion, and herbivory).
Figure 6. Four successive steps involved in the formation or reconstruction of degraded stripes. (A) Small patches of grasses and woodyplants coalesce. (B) As the vegetation develops, roots explore deeperlayers so the soil is modified by their activity, increasing soilwater-holding capacity. Additionally. other plants are established insmall bare areas within the stripes or where the grass has been grazed.(C) The full development and function of root systems furtherincrease water infiltration. (D) Evapotranspiration demand outgrowssoil water-stocking capacity. Sorne plants of the downslope margin ofthe stripes, recei ving less water from sheet f1ow, die from waterdeficit. The result is a contraction of the downslope part of stripe.Vertical scales show soil depth in cm. The upslope part of the stripeis on the left.
ones studied in the present work. Coyer variation ofadult plants also agreed with the hypothesis that thestripes do not remain stationary. Mauchamp et al. [30]found that the establishment of F. cernua seedlings ishighly dependent on the conditions provided by thecolonization front of the arcs. As a consequence, theyproposed that F. cernua populations function as ametapopulation with successive establishment and local extinctions according to the development andspatial change of the grass coyer as the upslope frontof the stripe expands.
However, the detailed distribution of Prosopis saplings reported in this paper suggests that changes in theposition of vegetated patches do not follow the regularand predictable pattern underlying the migration hypotheses outlined in this paper. In addition, the presence of mesquites with high basal diameter values inthe upslope boundary of the stripes suggests that thoseboundaries have changed little since these trees wereestablished. On one hand, it may be that differences inrelief within the stripes determine differences in soilwater stocking where pockets of high (or low) waterstorage do not follow a regular pattern across thestripes, an argument that has been considered atgreater length by Dunkerley [18]. But the dispersionand establishment characteristics of P glandulosa mayalso explain the observed patterns of distribution ofsaplings and juveniles. Mesquite seeds are endozoochorously dispersed by large herbivores and can beclumped in places where anirnals graze or rest, as wewas found at the back of one of our vegetation stripes.Brown and Archer [10] concluded that rapid deve1opment of roots enhanced P glandulosa var. glandulosaseedling survival in a Texas savanna by enabling themto access soil moisture below the layers explored bygrasses. Also, their ability to develop extensive lateralroot systems allow water uptake from large volumes ofsoil [24]. Results reported for the same species byBush and Van Auken [Il] indicate that reduced grasscompetition enhances seedling establishment. Thesecharacteristics of mesquite biology suggest that theirpopulations can explosively grow in stripes undergrazing conditions, different situation to that of nonendozoochorously dispersed species (e.g. Flourensiacernua, [30]).
In summary, our data points to the conflictingevidence on stripe migration that has been alreadyexposed (e.g. [45, 46]). If we merge the informationalready discussed, we could argue that the most likelyscenario for our study area is that of a generallong-term (hundreds of years) change of form takingplace at variable speeds in different stripes, includingthe possibility that they might remain stationary. Thisscenario could include a rearrangement of the spatialdistribution of vegetation patches when their structure
Acta Oecologica

Spatial distribution of mesquite in vegetation strlpes
We propose, for the formation or spatial reorganization of stripes, a dynamics compatible with our dataand synthesized in four stages (figure 6). In the firststage, a vegetation stripe would be formed through thecoalescence of smaller patches of grasses and woodyplants; roots would be mostly superficial and thus thedepth of the soil modified by their activity [40]. In thesecond stage, the aerial and subterranean parts ofwoody plants develop. As roots increase in depth, thesoil is modified by their activity, increasing its capacityof water storage. Additionally, other plants are established in the bare areas within the stripes or where thegrass has been grazed. In the third stage, developmentand function of roots further increase water infiltration,which may cause ion lixiviation and clay illuviation [5, 29, 41, 43, 44], until water storage capacitybelow the stripes is in equilibrium with the amount ofwater received both by direct rainfall and sheet flow,which can be up to 2.5 times the annual precipitation [15, 25]. In the fourth stage, growth and development of plants further modify soil conditions, but thewater that is evapotranspired is higher than the onethat can be stocked, and the plants in sorne sections ofthe downslope margin of the stripes, receiving lesswater from sheet flow, die as a consequence of a waterdeficit. This model would imply that available water isrelatively homogeneous and that the main contrast isbetween vegetation stripes and their bare areas. Onlyafter these four steps have been completed, do theconditions become suitable for the process of upslopecolonization and migration to be set in motion, butfield evidence of such process remains controversial [37, 39]. Even after that, a very high temporal andspatial variability in the speed of the process should beexpected due to the interaction of climatic, geomorphologic and biotic factors. However, stripe migrationdoes not seems to be a necessary condition for theexistence of the striped vegetation pattern.
Acknowledgments
The staff of the 'Laboratorio dei Desierto' gave logistic supportduring field work. Lourdes Cruz and Ninfa Portilla conducted thesoil analyses. Financial support was granted by the 'ConsejoNacional de Ciencia y Tecnologfa'. We thank two anonymousreferees for the critical revision of this manuscript.
REFERENCES
[1] Aitkin M., Anderson D., Francis B., Hinde J., StatisticalModelling in GLIM. Oxford Statistical Science Series, Clarendon Press. Oxford, 1990, 374 p.
[2] Ansley RJ., Jacoby P.W., Cuomo GJ., Water relations ofhoney mesquite following severing of lateral roots: influenceof location of subsurface water, J. Range Manag. 43 (1990)436--442.
Vol. 20 (3) 1999
207
[3] Archer S., Development and stability of grass/woody mosaicsin a subtropical savanna parkland, Texas, USA, J. Biogeogr.17 (1990) 453--462.
[4] Boaler S.B., Hodge c.A., Vegetation stripes in Somaliland, J.Ecol. 50 (1962) 465--474.
[5] Boaler S.B., Hodge C.A., Observations on vegetation arcs inthe Northern region, Somali Republic, J. Ecol. 52 (1964)511-544.
[6] Bouyoucos GJ., Hydrometer method improved for makingparticle size analysis of soil, Agron. J. 54 (1962) 464--465.
[7] Breimer R.F., Physiographic soil survey, in: Montana C. (Ed.),Estudio Integrado de los Recursos Vegetacién, Suelo y Aguaen la Reserva de la Bi6sfera de Mapimf, Instituto de Ecologfa,México, 1988, pp. 115-134.
[8] Brown D.E., Chihuahuan Desert-scrub, Desert Plants 4 (1982)169-179.
[9] Brown J.R., Archer 5., Woody plant invasion of grasslands:establishment of honey mesquite (Prosopis glandulosa var.glandulosaï on sites differing in herbaceous biomass andgrazing history, Oecologia 80 (1989) 19-26.
[10] Brown J.R., Archer S.. Water relations of perennial grass andseedling vs. adult woody plants in a subtropical savanna,Texas, Oikos 57 (1990) 366-374.
[II] Bush J.K., Van Auken O.W., Growth and survival of Prosopisglandulosa seedlings associated with shade and herbaceouscompetition, Bot. Gaz. 151 (1990) 234-239.
[12] Bush J.K., Van Auken O.W.. Importance of time of germination and soil depth on growth of Prosopis glanda/osa (Leguminosae) seedlings in the presence of a C4 grass, Am. J. Bot.78 (1991) 1732-1739.
[13] Clos-Arceduc M., Étude sur photographies aériennes d'uneformation végétale sahélienne: La brousse tigrée, Bull. Inst.Fr. Afr. Noire Sér. A 18 (1956) 677-684.
[14] Cornet A., Principales caractéristiques climatiques, in: Montana C. (Ed.), Estudio Integrado de los Recursos Vegetaci6n,Suelo y Agua en la Reserva de la Biésfera de Mapimf,Instituto de Ecologfa, México, 1988, pp. 45-76.
[15J Cornet A.F., Montana c., Delhoume J.P., L6pez-Portillo J.,Water flows and the dynamics of desert vegetation stripes, in:Hansen AJ., Di Castri F. (Eds.), Landscape Boundaries.Consequences for Biotic Diversity and Ecological Flows,Ecological Studies No. 92, Springer Verlag, Gennany, 1992,pp. 327-345.
[161 Delhoume J.P., Distribution spatiale des sols le long d'unetopo séquence représentative, in: Montana C. (Ed.), EstudioIntegrado de los Recursos Vegetaci6n, Suelo y Agua en laReserva de la Biésfera de Mapimf, Instituto de Ecologfa,México, 1988, pp. 135-166.
[17] Delhoume J.P., Fonctionnement hydro-pédologique d'une toposéquence de sols en milieu aride (Réserve de la Biosphèrede Mapimf, nord-Mexique), thèse, université de Poitiers,France, 1996, 295 p.
[18] Dunkerley D.L., Banded vegetation: development under uniform rainfall from a simple cellular automaton model, PlantEcol. 129 (1997) 103-111.
[191 Dunkerley D.L., Brown KJ., Runoff and runon areas in apatlerned chenopod shrubland, arid western New SouthWales, Australia: characteristics and origin, J. Arid Environ.30 (1995) 41-55.

208
[20] Ezcurra E., Montana c., Los recursos naturales renovables enel norte arido de México, in: Leff E. (Ed.), Medio ambiente ydesarrollo en México, Centro de Investigaciones Interdisciplinarias en Humanidades, UNAM-Grupo Editorial Miguel Angel Pornia, Mexico, 1990, pp. 297-327.
[21] Greenwood J.E.G.W., The development of vegetation patternsin Somali land Protectorate, Geogr. J. 123 (1957) 465-473.
[22] Greig-Smith P.. Pattern in vegetation, J. Ecol. 67 (1979)755-779.
[23] Harper J.L.. Population Biology of Plants, Academie Press,London, 1977, 892 p.
[24] Heitschmidt R.K., Ansley R.1., Dowhower S.L., Jacoby P.W.,Priee D.L., Sorne observations from the excavation of honeymesquite root systems, J. Range Manag. 41 (1988) 227-231.
[25] Hemming c.E., Vegetation arcs in Somaliland, 1. Ecol, 53(1965) 57-68.
[26] Hernandez L., Ganado bovino asilvestrado en el Bolson deMapirni: sus antecedentes historicos y su papel ecol6gico ysocio-econémico en la Reserva de la Biosfera de Mapimï,Ph.D. thesis, Instituto PoIitécnico Nacional, México, 1995,247 p.
[27] Janke B., Zum problem der vegetationsstreifen (BrousseTigrée) in semiariden Afrika, Die Erde 1 (1976) 31-46.
[28] Litchfield W.H., Mabbutt J.A., Hardpan in soils of semi-aridWestern Australia, J. Soil Sci. 13 (1962) 148-159.
[29] Mabbutt J.A., Fanning P.c., Vegetation banding in aridWestern Australia, J. Arid Environ. 12 (1987) 41-59.
[30] Mauchamp A., Montana c.. Lepart J., Rambal S.. Ecotonedependent recruitment of a desert shrub, Flourensia cernua, invegetation stripes, Oikos 68 (1993) 107-116.
[31] Montana C., The colonization of bare areas in two-phascmosaics of an arid ecosystern, J. Ecol. 80 (1992) 315-327.
[32] Montana C.; Breimer R.F., Major vegetation and environrnental units, in: Montana C. (Ed.), Estudio integrado de losrecursos vegetaciôn, suelo y agua en la Reserva de la Biésferade Mapimi, Instituto de Ecologfa, México, 1988, pp. 99-114.
[33] Montana c., Lopez-Portillo J., Mauchamp A, The response oftwo woody species to the conditions created by a shiftingecotone in an arid ecosystem, J. Ecol, 78 (1990) 789-798.
J. Lôpez-Portillo, C. Montana
[341 Richards L.A Diagnosis and Improvement of Saline andAlkali Soils, (Ed.), US Department of Agriculture HandbookNo. 60, Washington OC, 1954, 160 p.
[35] Rzedowski 1.. Vegetaci6n de México, Limusa, México, 1978,432 p.
[36] SAS Institute, JMP User's Guide, Version 3.1, SAS InstituteInc.• North Carolina, USA, 1995, 239 p.
[37] Seghieri J., Galle S., Rajot JL, Ehrmann M., Relationshipsbetween soil moisture and growth of herbaceous plants in anatural mosaic in Niger, J. Arid Environ. 36 (1997) 87-102.
[38] Simpson 8.B., Solbrig O.T., Introduction, in: Simpson B.B.(Ed.), Mesquite. Its Biology in Two Desert Scrub Ecosystems,Dowden, Hutchinson, Ross, Stroudsburg, Pennsylvania, 1977,pp. 1-25.
[39] Thiéry J.M., d'Herbes J.M., Valentin C; A model simulatingthe genesis of banded vegetation patterns in Niger, J. Ecol, 83(1995) 497-507.
[40] Tiedemann AR., Klemendson J.O., Effect of mesquite onphysical and chemical properties of the soil, J. Range Manag.26 (1973) 27-29.
[41] Tongway D.1., Ludwig J.A., Vegetation and soil patterning insemi-arid mulga lands of Eastern Australia, Aust. J. Ecol, 15(1990) 23-34.
[42] Walkley A., Black T.A., An, examination of the Degtjareffmethod for determining soil organic matter and a proposedmodification of the chromic acid tritation method, Soil Sei, 37(1934) 29-38.
[43] White L.P., Vegetation arcs in Jordan, J. Ecol. 57 (1969)461-464.
[44] White L.P., Brousse tigrée patterns in southern Niger, J. Ecol.58 (1970) 549-553.
[45] White L.P., Vegetation stripes on sheet wash surfaces, J. Ecol.59 (1971) 615-622.
[46] Wickens G.E., Collier F.W., Sorne vegetation patterns in theRepublic of Sudan, Geoderma 6 (1971) 43-59.
Acta Oecologica

Acta Oecologica 20 (3) (1999) 209-217 / ©EIsevier, Paris
Forum
Run-on contribution to a Sahelian two-phase mosaic system:Soil water regime and vegetation life cycles
Josiane Seghieri a*, Sylvie Galle b
a [RD, B.P. 5045, 34032 Montpellier, France.
h LTHE, B.P. 53, 3804[ Grenoble cedex 9, France.
* Corresponding author (fax: +33467416294; e-mail: [email protected])
Received April l , 1997; revised February 12, 1999; accepted March 16, 1999
Abstract - An experiment was carried out from 1992 to 1995, in south-western Niger on a banded vegetation pattern which dominates on alaterite-capped plateau in the region. We quantified the changes in infiltration and vegetation in a thicket from which run-on from the upslopebare soil zone was artificially divested. A concrete wall (40 m long, 60 cm high, 20 cm thick, with a foundation 25 cm deep) was constructedat its upslope boundary. Infiltration was measured to a depth of 5A m by a neutron probe, and densities of annuai plants were monitored alongtransects crossing perpendicularly a control thicket and the thicket deprived of run-on, Phenological phases and leaf water potential of the twodominant shrub species were recorded from stratified sampling according to their preferred location along the water resource gradient. Resultsindicated that run-on contributed the most to infiltration in the central zone. but the water content available to the annuaI plants (layer 0-10 cm)was not affected by run-on deprivation. Significant differences were found in the water content available to the shrubs (layer 0-100 cm) bothbetween zones (upslope and central), and between thickets after the wall was built. However, in the thicket deprived of run-on, life cycle andphysiology of the shrubs were severely disturbed upslope, while much smaller effects were observed in the centre. Surprisingly, within thestudy interval, run-on contribution was not found to be as essential to shrubs' life cycle at the location where it contributed the most to theinfiltration. © Elsevier, Paris
Banded vegetation pattern / leaf water potential / phenology / Iife history strategy / water resource / water flow / gradient
1. INTRODUCTION
Several hypotheses have been proposed to explainthe functioning of banded vegetation pattern and mostrefer to the influence of overland water flow [3, 15, 16,17]. In Niger, 4 years of monitoring soil water contentand run-off demonstrated that about 70 % of heavyrain (54 % of annual rainfall) falling on bare surfacesproduces sheet run-off [20]. It moved downslope to beintercepted and to pond over the thicket where theaverage infiltration was equal to four times the incident rainfall [8]. Seghieri et al. [21] showed that thedistribution of the vegetation changed characteristically along this soil water gradient. In this study, wesought to quantify the changes in infiltration and
vegetation response when no water flow reaches thethicket.
We prevented water flow into a thicket by buildinga concrete wall on its upslope border. We compared thesoil moisture regime, the density of plants in herbaceous layer, and the phenology and leaf water potentialof the two dominant species in the woody coverbetween a control thicket, and the thicket deprived ofrun-on. The leaf water potential indicated the physiological responses of the shrubs to drought periodsinduced by seasonal variations in water availability. Itallowed us to quantify the level of shrub waterstress [10, 24]. Leaf water potential represents theintegration of both atmospheric stress and soil water


Run-on contribution to banded vegetation survival 211
Figure 2. Rainfall distribution in Banizoumbou during the 1992,1993, 1994 and 1995 rainy seasons.
2.2.1. Infiltration and available moisturefor vegetation
Soil moisture profiles (min. 1 m and max. 5.40 mdeep) were monitored over 4 years, using Solo-25sneutron probes (Nardeux, Saint-Avertin, France). Access tubes were installed in each of the two thickets asfollows: 1) one in the upslope bare zone; 2) one in theupslope zone of the thicket; 3) one in the central zone;and 4) one in the senescence zone. Soil moisture wasmonitored according to a rain-dependent time series,i.e. 1,2 and 4 d after rainfall. Frequency progressivelydecreased to once a month during the dry season. Forcalibration, two soil samples, 500 g each, were usedfrom the 0-250 and 250-550 cm layers. They wereanalysed using the nuclear absorption-desorption technique described in Couchat et al. [4]. The calibrationequation was a function of the dry bulk density. It wasmeasured with a gamma-ray probe (Nardeux Sol040),with values ranging from 1.65 g-crrr' in the 0-20 cmtop layer, to 1.8 g-cm-' in deeper layers. Furtherdetails on the calibration specifie to banded vegetationare available in Cuenca et al. [5].
During the dry season, deep drainage and evapotranspiration exhausted the moisture in the profile tothe depth measured [8]. Whatever the previous rainyseason, the driest profile observed remained the sameevery year. Tightly bound to the soil, this remainingwater was unavailable for plants and for redistribution.The retention curve indicated that a volumetrie soilwater content of 12 % corresponds to a 10-MPa soilwater pressure head. Unlike the minimum water profile, the maximum water profile observed depended onthe rainy season. The annual range of variation of soilwater content characterised the infiltration processesduring each year in each zone.
In a given soil layer, the available water for theplants at any time was calculated as the differencebetween the measured stored soil water at this timeand the minimum stored soil water (in mm). At the endof the experiment, extractions of plants from the threeherbaceous groups considered below indicated thattheir roots were never deeper than 10 cm and generallyabove 5 cm. Uprooted shrubs of Guiera senegalensisin the upslope zone and of Combretum micranthum inthe central zone had 90 % of their major roots above60 and 100 cm deep, respectively. Means of storedwater available for the plants were calculated over aperiod from July to September for each year, inupslope and in central zones of the thickets. The twosoil layers considered corresponded to two rootingdepths: one for annuaI plants (0-10 cm) and the otherfor woody plants (0-100 cm).
1995537 mm
1994672 mm
1993512mm
1992425 mm
August September OctoberJulyJuneMay
O+-----,h."...I"T'".&...,-,.......lI""""'mTTT'll'TTT""1.........,rrr--r-..L...---
10 t20
30
40
50
60
70 ~ Rainfall (mm)
Ot---n-rT-.l..rr-rnT"'""1rn-rnIT"T',...,"T"T"""T".......-10
20
30
40
50
60
70
o t--...,-,....----r+"T'TT"T"T"T'f-"'ITTï""1llr-r"TT""-......10
20
30
40
50
60 f-
70
01-.........--...........,.,.,,..,.......................-1
10
20
30
40
50
60
70
Guiera senegalensis and annuaI coyer, the 'centralzone' dominated by Combretum micranthum and the'senescence zone' of the thicket were divested ofmn-on. We collected data on infiltration and annualplant density before and after the wall was built, whichallowed comparisons using a time control as weil as aspatial control.
Vol. 20 (3) 1999


Run-on contribution to banded vegetation survival
Table I. Classification of the phenological stages observed on each individual shrub sampIed.
213
Stage aStage 1
Stage 2
Stage 3
Stage 4
Stage 5
Foliation
Absent
Swelling buds, no leaf development
Leaf buds and open buds (over 1a andless than 50 % of these organs in eachindividual)
Leaves mostly open
Leaves and dry leaves, or leaves whichhave changed colour (over 10 but lessthan 50 %)
Over 50 % in each individual with dryleaves and falling leaves"
Flowering
Absent
Floral buds only
Floral buds and open ftowers (over 10but less than 50 %)
Over 50 % of organs carrying openflowers
Open flowers and dry ftowers (over 10and less than 50 %)
A majority of dry ftowers and sheddingof flower elements
Fruiting
Absent
Early setting stage
Development of fruits to normal size
Maturity
Ripe fruits and onset of dissemination (fallof fruits)
Fruits dried and fallen
* This is a difficult stage to monitor since it may extend over several rnonths according to the species (e.g. Guiera senegalensis).
thicket, ten Guiera senegalensis located in the upslopezone and twenty Combretum micranthum located inthe central zone were selected. Data on phenologywere collected according to the method of Grouzis andSicot [9]. Each shrub was classified as shown in table 1after Le Floc'h [14]. Data were collected weeklyduring the rainy season, and monthly during the dryseason.
Among the individuals for which phenology wasmonitored, three Guiera senegalensis and five Combretum micranthum per thicket were sampled for theleaf water potential recordings. We used a hydraulicpress (HP, Objectif K model, France) rather thanconventional methods, because it was more convenientto implement in the field. Good correlations have beenfound between HP and conventional methods such aspsychrometric and pressure chamber techniques [2,10, 12, 23]. We measured the pressure when water wasfirst exuded from a piece of leaf. Diurnal variation inleaf water potential of each shrub was recorded everyweek or every two weeks. It was measured on twoIeaves per shrub, every hour from predawn to the timethe minimum value was overtaken. The mean waterpotentials were calculated from six sampled leaves perthicket for Guiera senegalensis and ten sampled leavesper thicket for Combretum micranthum at each time ofmeasurement. For each species, seasonal courses ofpredawn and daily minimum means were plotted forthe two thickets. Predawn Ieaf water potential was anindicator of the soil water availability in the rootingzone. Daily minimum potential was related to the dailymaximum of both atmospheric stress and soil waterstress from which the shrubs suffered.
Vol. 20 (3) 1999
3. RESULTS
3.1. Similarities remaining betweenthe two thickets after construction of the wall
The increasing infiltration gradient from the baresoil zone to the centre of the thicket, and the decreasing one from the centre of the thicket to the senescencezone remained in the thicket deprived of run-on(figure 4). Indeed, there was a statistically significantdifference in available water for the shrubs betweenupslope and central zone in layer 0-100 cm within thetwo thickets (P < 0.05), with a mean of 2.4 times morewater in the central zone. In the two thickets and thefour zones, abundant rainfalls during 1994 producedthe highest amount of infiltration (figure 4). For thesuperficial layer 0-10 cm, the same difference occurred in available water for the plants betweenthickets before and after the wall was built (P> 0.05).Consequently, the difference observed could not bedue to the erection of the wall but only to a naturalspatial heterogeneity. There was no statistical difference in available water of this layer between upslopeand central zone within the two thickets.
Densities of Microchloa indica in the upslope andthe central zones were the same (P> 0.05) within thetwo thickets over the study time in the six transects.There was a difference between the two thickets(P < 0.001) in the mean densities of Cyanotis lanata.However, it was of the same order before and after thewall was built (103 plantsmê in the control and409 plants-m" in the other thicket). Consequently, itwas not due to run-on deprivation. Unlike Microchloaindica, there was a difference (P < 0.001) in densitiesof Cyanotis lanata between upslope and the centre ofthe thickets (twelve times more plants-m? in the


Run-on contribution to banded vegetation survival 215
4. DISCUSSIONIn the study site, at the scale of the bare zone and the
thicket just downslope, obviously the run-on flow fromthe bare zone contributed mainly to the total infiltration in the central zone of the thicket. Its contributionwas much less in the upslope vegetated zone. It wasnegligible downslope of the thicket except when along and abundant wet season, with regular distribution of rains, occurred as was the case in 1994. Thecentral zone benefited from the highest infiltrationcapacity that could reach 500 mm during a single rainyevent [8]. Cracks in the rooting zone as weil as activityof foraging termites mainly contribute to this highinfiltration rate [6, 19]. The infiltration capacity in thecentral zone was so high that even a considerablereduction of water input by run-on did not induce agreat deficit of water content available to the shrub, i.e.in layer 0-1 m. In this zone, the rainfall and thenegligible run-off taking place in the upslope vegetation zone (about 2 % of total rain [8]) provided enoughwater to Combretum micranthum for it to complete itslife cycle, especially as it overlapped with the rainyseason ('arido-passive' species, i.e. metabolically inactive during the dry season [7]). If Combretum micranthum was affected, the consequences were not
were significantly lower in the control thicket than inthe other, but significantly higher after (P = 0.002).The density dropped almost to 50 % behind the wallwhile it increased in the control thicket. Constructionof the wall could be the main cause since the difference between thickets remained statistically stableduring the 2 years following construction (1993,1994).
Figure 5a indicated that population of Guiera senegalensis suffered from a strong reduction in the number of shrubs flowering and fruiting in the thicketdeprived of run-on compared to the population in thecontrol thicket. The maximum percentage of reproducing shrubs and the duration of the two sexual reproduction phases, that took place at the beginning of thedry season, strongly decreased behind the wall. AIthough the Jeafing phase was Jess disturbed, it suffereda reduction in amplitude and duration of the periodwhen maximum percentage of the population wasleafing. For the same species, the two leaf waterpotential (daily minimum and predawn) decreasedquickly after the break of the rains in the thicketbehind the wall compared to control (figure 6a, b).This indicated plant stress linked to a reduction inavailability of water in the rooting zone of the thicketdeprived of run-on. Although reduced, a similar effectwas recorded in Combretum micranthum physiology(figure 6c).
1995
Il ..,
...".............--...----~-
(a) Guiera senegalensis
(b) Combretum micranthum
1 1--+-
1994
--Leafing • - - Flowering --Fruiting
Wall
Control
0% .-
25%
0%
25%
i0% .;
75%
00/0 .__ ---+----+-~----+---------: r-------t_ ,
75% .
50% .
50%
25%
50% ~
75% -1 Control
25% +
100% T
75% 1
50% -r
100%
100%
% of population sampied
100% 1
The difference in mean densities of Microchloaindica between thickets were significantly reversedbefore and after the wall was built (P < 0.001). Indeed,the means were 195 plants-rn"? in the control thicketand 862 plants-rn"? in the other one before the wallwas built, and they shifted to 430 and 361 plants-rn'?respectively over the two following years. Consequently, the wall appeared as the probable cause of thedrop in the thicket deprived of run-on since thedifference between thickets remained the same everyyear after construction (P > 0.05). Before the wall wasbuilt, mean densities of the group 'remaining species'
Figure 5. Phenological spectra over 2 years in the control thicket(Control) and the thicket deprived of mn-on (Wall) of (a) Guierasenegalensis and (b) Combretum micranthum.
mjjasondJfmamJjasond
Vol. 20 (3) 1999

216 J. Seghieri, S. Galle
April May June Julv Auaust Sept Oct Nov011;- ~--~-,-,- -,- ~ -----0.5 co (a) ~
1t ~~1~r-- ~~251 1"'1"3 '
3 5 RalnY season
4
was supplied only with precipitation providing lessthan 20 % of overaIl rnoisture, and corresponding to adrop of 45 % in soil moisture as compared to thecontrol thicket, shrubs were strongly affected. Response of shrubs to mn-on deprivation depended bothon the life cycle and the location of the species alongthe water resource gradient.
Contrary to the shrub rooting zone, there wasneither a 'wall effect' nor a 'zone effect' in the rootinglayer of annual plants. There, water resource wasmainly controlled by direct rainfall and evaporation.Consequently, decreases in mean densities of Microchloa indica and 'remaining species' in the dammedthicket could not be caused by a decrease in soil watercontent available to the plants. The wall has probablystopped the possible input of plant seeds carried by therunoff flows from the upslope zone in natural conditions [21]. The presence of annual plants located alongthe upslope border of the wall where an irregular andthin covering of sand and dust had gradually accumulated supports this interpretation.
Microchloa indica was as abundant in the centralzone than upslope (no zone effect), That means itsdomination upslope [21] was due to the significantlower densities of the other species compared to thecentral zone (significant zone effect).
5. CONCLUSIONRainy season
~l""ii. Rainy season ....
-----1 '~
0
0.5 (c)
1
1.5
2
2.5
3
3.5
4
o.~r(b)
1
15 '----------+'---------------',-:-=~---
2 t2.5 f
3 '
3.~1
Leal water potential (MPa)
Figure 6. Seasonal changes in the predawn and daily minimum leafwater potentials over 2 years in the control thicket and the thicketdeprived of mn-on: (a) Guiera senegalensis during 1994, (b) Guierasenegalensis during 1995, (c) Combretum micranthum during 1995.The rainy period is indicated. Solid line and syrnbols, control thicket;dashed line and open syrnbols, thicket deprived of run-on; circles,predawn potential; diamonds, daily minimum potential; error bars,confidence intervals (P = 5 %).
visible (within 3 years) in the whole plant functioning,despite sorne disturbance observed at the organ scale.Unlike Combretum micranthum, Guiera senegalensissuffered seriously from a lack of water in the upslopezone of the thicket deprived of mn-on. That led to adelay and a concentration of the leafing-out stage andto a drastic decrease in the reproductive rate. Acornbination of two probable causes can be suggested:its reproduction started at the end of the rainy season,when the soil was drying ('arido-active' species [7])and the species was located in an area (upslope) wherethere was 2.4 times less available water for the plantsthan in the central zone of the thicket. When this zone
Run-on did not contribute to water storage in layer0-10 cm, and thus did not supply the annual herbaceous coyer which probably depends mainly on microheterogeneity of the bumpy soil surface.
The central zone of the study thickets benefited themost from mn-on. Even so, most of the supply frommn-on to this zone was lost for the woody vegetationthrough deep drainage; despite this, the zone was afavourable habitat for vegetation as it supported thegreater number of species. For instance, sorne Sudanian woody species were observed there (Gardeniasokotensis Hutch., Combretum nigricans Lepr.). It hadsuch a high infiltration capacity that rainfall input,without mn-on contribution, was sufficient to rnaintaindominant shrubs in quite good conditions at least for along while (several years). This suggested that therun-off/run-on pattern was not as essential to vegetation performance in the central zone than in theupslope one. Although the mn-on contribution wasmuch less to the upslope zone than to the central one,it seemed of prirnary importance for the survival ofshrubs which are located upslope (Guiera senegalensis). The result on the upslope zone fully supports the
Acta Oecologica

Run-on contribution to banded vegetation survival
conventional opinion that a banded pattern IS necessary for optimal vegetation function [18].
Acknowledgments
We are very grateful to D. Freudenberger (CSIRO, Div. Wildlifeand Ecology, Canberra, Australia) for his help in statistics, andJ. Aronson (CEFE-CNRS Montpellier, France) for the improvementin the English. This research was partially supported by SAvanna onthe Long Term (SALT), centre-project of the Global ChangeTerrestrial Ecosystems project, and the programme Hydrological andAtmosphcric Pilot Expcrimcnt in Sahel (HAPEX-Sahel).
REFERENCES
[1] Ambouta K., Contribution à l' édaphologie de la brousse tigréede l'ouest Nigérien, Docteur-ingénieur thesis, Université deNancy, 1984, 125 p.
[2] Bristow K.L., Van Zyl WH., De Jager J.M., Measurement ofleaf water potential using the J 14 press, J. Exp. Bot. 32 (1981 )851-854.
[3] Cornet A, Delhoume lP., Montana C, Dynamics of stripedvegetation patterns and water balance in the Chihuahuandesert, in: During H.J., Werger M.J.A, Willems J.H. (Eds.),Diversity and Pattern in Plant Communities, Academie Publishers, The Hague, 1988, pp. 221-231.
[4] Couchat P., Carre C, Marcesse r., Ho r., The measurement ofthermal neutron constants of the soil: application to thecalibration of neutron moisture gauges and to the pedologicalstudy of the soil, in: Schrack R.A., Bowman CD. (Eds.),Nuclear Cross-Sections and Technology, US Department ofCongress, 1975, pp. 516-579.
[5] Cuenca R.H., Brouwer J., Chanzy A., Droogers P., Galle S.,Gaze S.R., Sicot M., Stricker H., Angulo-Jaramillo R., BoyleS.A, Bromley J., Chebhouni A.G., Cooper lD., Dixon A.J.,Fies r.c., Gandah M., Gaudu J.C, Laguerre L., Lecocq J.,Soet M., Steward H.J., Vandervaere J.P., Vaudin M., Soilmeasurements during HAPEX-Sahel intensive observationperiod, J. Hydrol. 188-189 (1997) 224-266
[6] Eldridge D.1., Nest of ants and termites influence infiltrationin a semi -arid wood land, Pedobiologia 38 (1994) 481-492.
[7] Evenari M., Adaptations of plants and animais to the desertenvironment, in: Evenari M., Noy-Meir 1., Goodall D.W.(Eds.), Hot Deserts and Arid Shrublands. Ecosystems of theWorld, Elsevier, Amsterdam, 1985, pp. 79-92.
[8] Galle S., Ehrmann M., Peugeot C, Water balance on a bandedvegetation pattern. A case study of tiger bush in westernNiger, Catena 00 (1999) (in press).
[9] Grouzis M., Sicot M., Une méthode d'étude phénologique depopulations d'espèces ligneuses sahéliennes: influence dequelques facteurs écologiques, in: Le Houérou H.N. (Ed.), Lesfourrages ligneux en Afrique. État actuel des connaissances.Colloque sur les fourrages ligneux en Afrique, CIPEA,Addis-Ababa, 1980, pp. 231-237.
Vol. 20 (3) 1999
217
[10] Hicks S.K., Lascano R.J., Wendt CW, Onken A.B., Use of ahydraulic press for estimation of leaf water potential in grainsorghum, Agron. J. 78 (1986) 749-751.
[11] Hutchinson 1.. Dalziel J.M., Flora of West Tropical Africa,Crown Publishers, London, UK, 1954-1972.
[12] Jones CA., Carabaly A., Estimation of leaf water potential intropical grasses with the Campbell-Brewster hydraulic press,Trop. Agric. 57 (1980) 305-307.
[13] Le Barbe L., Lebel T., Rainfall climatology of the centralSahel during the years 1950-1990, J. Hydro!. 188-189 (1997)43-73.
[14] Le Floc'h E., Caractérisation morphologique des stades etphases phénologiques dans les communautés végétales, Ph.D.thesis, U.ST.L. Montpellier-II Univ., CNRS-CEPE doc No.45,1969,132p.
[151 Ludwig J.A., Tongway D.1., Spatial organisation of landscapes and its function in semi-arid woodlands, Australia,Landsc. Ecol. 10 (1995) 51--63.
[16] Mauchamp A, Rambal S., Lepart L, Simulating the dynamicsof a vegetation mosaic: a spatialized functional model, Ecol.Model. 71 (1994) 107-130
[17] Montana C, The colonization of bare areas in two phasemosaics of an arid ecosystem, J. Ecol. 80 (1992) 315-327.
[18] Noy-Meir 1., Desert ecosystem structure and function, in:Evenari M., Noy-Meir 1., Goodall D.W (Eds.), Hot Desertsand Arid Shrublands. Ecosystems of the World, Elsevier,Amsterdam, 1985. pp. 93-103.
[19] Ouedraogo P., Rôle des termites dans la structure et ladynamique d'une brousse tigrée soudano-sahélienne, Ph.D.thesis, Univ. P.-et-M.-Curie Paris-VI, Paris, 1997,282 p.
[20] Peugeot C, Esteves M., Galle S., Rajot lL., Vandervaere J.P.,Runoff generation processes: results and analysis of field datacollected at the East Central Supersite of the HAPEX-Sahelexperiment, J. Hydrol. 188-189 (1997) 179-202.
[21] Seghieri J., Galle S., Rajot J.L., Ehrmann M., Relationshipsbetween the soil moisture regime and the growth of theherbaceous plants in a natural vegetation mosaic in Niger, J.Arid Environ. 36 (1997) 87-102.
[22] Slatyer R.O., Methodology of a water balance study conducted on a desert wood land (Acacia anuera E Muell.)community in central Australia, Unesco Arid Zone Res. 16(1961) 15-26.
[23] Sojka R.E., Sadler E.J., Camp CR., Arnold EB., A comparison of pressure chamber, leaf-press and canopy temperaturefor four species under humid conditions, Environ. Exp. Bot.30 (1990) 75-83.
[24] Winkel T., Rambal S.. Influence of water stress on grapevinesgrowing in the field: from leaf to whole-plant response, Aust.J. Plant Physiol. 20 (1993) 143-157.


Acta Oecologica 20 (3) (1999) 219-224 / © Elsevier, Paris
Forum
Seedling occurrence in alpine treeline conifers:A case study from the central Rocky Mountains, USA
Stephan Hâttenschwiler a*, William K. Smith b
a lnstitute of Botany. University of Basel, Schônbeinstrasse 6. CH-4056 Basel, Switzerland.
b Department of Botany, University of "'Yoming. Laramie "'Yoming 8207/, USA.* Corresponding author (fax: +41 61 26735 04; e-mail: [email protected])
ReceivedJanuary 20. 1999; revised February 10. 1999; accepted February 12. 1999
Abstract - Information conceming the occurrence of very young (1- to 10-year-old) tree seedlings in the alpine treeline ecotone is rare.Seedling occurrence of the dominant conifers Picea engelmannii and Ables lasiocarpa was measured in the treeline ecotone of the MedicineBow Mountains. Wyoming (central Rocky Mountains, USA), an area composed of elongated tree islands separated by open meadows (ribbonforest) that grade into the closed forest. No seedlings were found on the windward sides of tree islands. while a mean of 0.6 seedlings-rrr?occurred on the leeward (downward) sides. These values compared to the 4.2 seedlings.m? in the closed forest. In addition, a strongcorrespondence was found between snowpack depth and seedling abundance, with depths that were either too shallow « 0.5 m) or too deep(> 1.5 m) associated with fewer or no seedlings. A. lasiocarpa seedlings made up much less of the overall seedling population in the ribbonforest (6 %) than in the closed forest (22 %). Seedling establishment in this portion of the alpine treeline ecotone appears to be occurring at alow rate that differs bctwecn the two dominant species and may be strongly infiuenced by wind-driven snow accumulation patterns. © Elsevier,Paris
Abies lasiocarpa / Picea engelmannii / ribbon forest / snow effects / treeline ecotone
1. INTRODUCTION
Seedling establishment is a key component in theprocess of succession and ultimate plant distributionpatterns [3, 12]. Seedling life stage is especially crucial at distributional boundaries, or within ecotonessuch as those found at the alpine treeline, and seedlingestablishment may be an important factor in evaluatingthe stability of these treelines. The observed elevational and latitudinal occurrence of the alpine andarctic treelines have been discussed extensively [1, 9,15, 23, 24]. In addition, a considerable number ofstudies dealing with the success of tree regeneration attreeline suggest that global climate change may bemonitored using treeline dynamics (see review [22]).Despite this continuing interest in the origin andpersistence of treelines, there are almost no quantitative analyses of the natural occurrence of very young
(1- to lO-year-old) seedlings within alpine treelineecotones, except sorne studies documenting establishment and survi val of planted seedlings and sown seeds(e.g. [2, 13]), and sorne observational remarks onseedling occurrence (e.g. [1, 4]).
The purpose of the present study was to quantify thenatural occurrence of young (1- to lO-year-old) treeseedlings of the two dominant species Picea engelmannii Perry ex Engelm. and Abies lasiocarpa(Hook.) Nutt. within the upper treeline ecotone of theMedicine Bow Mountains of the south-central RockyMountains, USA, in comparison to the adjacent closedforest. This transitional ecotone between closed, subalpine forest and open, alpine meadow is composed ofelongated islands of trees which are usually separatedby tens of metres of open meadow, forming a ribbonlike pattern (ribbon forest). This ribbon forest ecotoneis common in the central Rocky Mountains from

220
Colorado to Montana [l, 4] and similar patterns ofbanded vegetation have been observed in Nothofagusforests in Argentina [21]. We also evaluated the relationship between seedling occurrence in this portion ofthe treeline ecotone and the strong pattern of wintersnow deposition that occurs, a potentially importantfactor for seedling survival in winter and summer.
2. MATERIALS AND METHOnS
2.1. Study sites
Study sites were located in the Medicine BowMountains of south-eastern Wyoming approximately65 km west of Laramie, Wyoming (41°21' N,106°14' W) at an elevation of near 3360 m. Theclimate is characterized by very cold winters (minimum air temperature below -40 "C), and cool summers (daytime maximum < 25 "C). Precipitation in thesubalpine zone varies from about 650 to 750 mm peryear, coming predominantly in the form of winter andspring snows [5, 16] which is redistributed considerably by wind. West and south-west winds duringwinter and spring can be very strong, often averagingover 10 m-s" [10, 16]. The closed subalpine forest atour study site was > 500 years old (estimated using thediameter-age relationship described in Oosting andReed [18]) and composed of P engelmannii and A.lasiocarpa. Above an elevation of about 3 300 m,elongated tree islands composed of these two speciesare found in more wind-exposed sites, with their longaxes perpendicular to the prevailing WSW winterwinds. Billings [4] defined the term 'ribbon forest' forthis special forest type. Smaller tree islands with'flagged trees' blend into low-lying krummholz matsat higher elevation in the ecotone, or at more windexposed sites even at lower elevations. Both P engelmannii and A. lasiocarpa can reproduce asexually bylayering which extends the width of both tree islandsand krummholz mats [6]. The area of our study siteshas a typical gradient of krummholz mats (about l min height), followed by small tree islands at lowerelevation (tree heights of 1.5 to 3 m), and then longerribbon-like tree islands (tree heights of 3 to 10 m) thatgrade into the closed forest (tree heights of lOto20 m). For more detailed descriptions of the characteristic ribbon forest-type treeline ecotone see Arnoand Hammerly [1] and Billings [4].
2.2. Experimental design
In September 1992, sample transects were established parallel to the direction of the prevailing winterwinds on the south-west and north-east sides of tenrandomly selected tree islands (composed of about
S. Hlittenschwiler, W.K. Smith
twenty to thirty trees with a maximum height of near10 m) within an area of about 5 ha. This enabled anevaluation of the association between wind exposureand winter snow deposition on seedling occurrence,i.e. windward and leeward sides of each tree island.Ten transects in the same cardinal orientation to treeislands were also placed randomly in the adjacentclosed forest within an area of about 3 ha. A set ofthree I-m2 quadrats were established at a distance of l ,5 and 10 m from both the leeward and windward edgesof the tree islands. Three I-m 2 quadrats were established along transects in the closed forest at the samedistance and cardinal direction as for the leewardtransects established in the ribbon forest. Seedlingcounts of P engelmannii and A. lasiocarpa were takenfor four age classes (current 1, 2, 3-5 and 6-10 yearsold). The height of these seedlings were found to rangebetween 2 and 7 cm. Seedling age was estimated basedon the presence of cotyledons (1 year), or the numberof bud scars and leaf whorls. Seedlings with bothcotyledons and primary leaves were considered2 years old. Based on our experience with these andalso with other treeline conifer seedlings of knownage, these age estimates are considered to be fairlyaccurate.
Snow depths were measured during March 10 to 21,1990 and March 16 to 18, 1991 at 2-m intervals on thewindward and leeward sides of five different treeislands that were chosen as representative.
Three-way analysis of variance (ANOVA) was usedto test for the effects of forest type (ribbon forest vs.closed forest), species (P engelmannii vs. A. lasiocarpa) and quadrat position along the transect (1, 5and 10 m) on the variable seedling density. Seedlingage structure was compared between forest types andspecies using separate one-way ANOVAs (forest typeor species as factor). Percentage data (seedling agestructure) were first arcsine transformed prior toANOVAs to meet the requirement of normal distribution.
3. RESULTS
In the ribbon forest, no seedlings of either specieswere found on the windward, SW side of any treeisland, and thus data from these transects were notincluded in the statistical analyses. Therefore, comparisons between the ribbon and the closed forest arebased on seedling abundance measured on the leeward, NE sides of tree islands. Mean seedling occurrence (both species) was significantly greater in theclosed forest (4.2 seedlings-rrr", n = 30 quadrats) thanin the ribbon forest (0.6 seedlings-m", n = 30 quadrats) (figure l , table l), and the total number of seed-
Acta Oecologica

Seedting occurrence in treeline conifers 221
Table I. Three-way ANOVA for the dependent variable seedlingdensity and the independent factors forest type (ribbon and closed),
100 n = 10 transects P. engelmanniitree species (P engelmannii and A. lasiocarpa) and quadrat position(three quadrats along each transect), n = la transects.
Factors df Sum of Mean F-value P-value~ 80
squares square ~ A. lasiocarpa>.
Forest type (F) 1 99.0 99.0 32.65 < 0.001 uc
Tree species (Sp) 1 57.4 57.4 18.93 < 0.001 a> 60::::l
Quadrat (Q) 2 4.9 2.4 0.80 0.451 0-a>
F x Sp 1 23.4 23.4 7.72 0.006 ~
FxQ 2 3.3 1.6 0.54 0.5850> 40c
Sp x Q 2 1.1 0.5 0.18 0.839 =0a>
F x Sp x Q 2 2.1 1.0 0.34 0.712 a>U) 20Error 108 327.5 3.0
n = 10 transects
4. DISCUSSION
of--t--'---,--
1m 5m10m
Closed forest
P. engelmannii
A. lasiocarpa
1 m 5 m 10 m
Ribbon forest
OL.--+....L..-....,......--I-'--_
NE 4'0C
a> 3uceu'0c::::l 2.0eu0>c=0a>a>
U)
A mean maximum seedling abundance of0.9 seedlingsrn? (figures 1, 3) in the ribbon fore st at
Figure 1. Frequency (above) and abundance (below) of P engelmannii and A. lasiocarpa seedlings within ten l-m? quadrats at threedifferent positions (l , 5 and 10 m) on the NE side of the tree islands(Ieft) in the ribbon forest and within the adjacent closcd forest (right).Seedling frequency is the number of quadrats with at least oneseedling present and is expressed in per cent of the total number ofquadrats (n = 10). Seedling abundance is the average number ofseedlings per quadrat (means of ten transects ± standard errors).
lings was more than seven times greater in the closedforest. There were more seedlings of P. engelmanniithan of A. lasiocarpa in both the ribbon and the closedforest (figure 1). AIso, seedling species compositiondiffered between the two forest types (table 1) withonly 6 % of aIl seedlings in the ribbon forest being A.lasiocarpa, compared to 22 % in the closed forest. Incontrast, the corresponding overstory canopies werecomposed of about 60 and 35 % of A. lasiocarpa (treedensity) in the ribbon forest and the closed forest,respectively.
Over 90 % of aIl seedlings found for both speciesand within both forest types were either 1- or 2-yearold (figure 2). Sixty-nine percent of aIl P. engelmanniiseedlings were older than 1 year in the ribbon forestcompared to only 26 % in the closed forest (figure 2,P < 0.05, n = 10 transects). The age structure of A.lasiocarpa seedlings cannot be compared between thetwo forest types, because only one A. lasiocarpaseedling was found in the ribbon forest. However,compared to P. engelmannii, there were relativelymore A. lasiocarpa seedlings older than 1 year in theclosed forest (64 % of aIl A. lasiocarpa seedlingsfound, P < 0.05, n = 10 transects).
Seedling abundance for both species was similaralong the transects in both forest types (no overall andno interactive quadrat effects, table 1). Accordingly,the frequency of seedling occurrence was rather homogeneous, except in the ribbon forest in quadrats 5 maway from the tree island edge (figure 1). At thisquadrat position, no single seedling of either specieswas found (quadrat position effect for the ribbon forestalone: P < 0.09) which also corresponded to high snowdepths (figure 3). Low snow depth (0.1-0.2 m) onwindward sides of islands was also associated with theabsence of seedlings (figure 3).
Vol. 20 (3) 1999

222 S. Hatt enschwiler, W.K. Smith
Figure 2. Age distr ibution of P engelmanni i and A. lasiocarpaseedlings along ten transects in the ri bbon forest and the adjacentclosed forest. Total seedli ng numbers of ten transects x three quadratsare indicated above the bars: age classes are as indicated.
Ribbon forest Closed fores!
the end of the growing season, suggests a relativelylow seed ling establish ment over the last 10 yea rs, atleast. These findings are in contrast to previous report sof no seedling recruitment in the same area [4], or insimilar areas [9, 20] of the Roc ky Mountains. AJthough there were subs tantially more seedlings in theadjacent close d forest , the proport ion of P. enge lmannii seed lings was smaller, and were much younge r onaverage than seedlings found in the ribbon forest.
These differences in abundance and age structurebetween the two forest types did not co rrespond to thecurre nt species dominance observed in the corresponding overstory canopies, where P. enge lmannii dorni nates in the closed fores t, but A. lasiocarpa is moreabundant in the ribbon forest (see also [1, 4]). Seedlingabundance, therefore, may be ex plai ned by speciesspeci fie seedJing es tablis hment success rather than bythe occ urrence of seed trees. P. enge lmannii has beenshown to germinate more rapidly at lo wer tem pera tures than A. lasiocarpa [14], and this difference wasenh anced at high light inten siti es [19]. A more ra pidgermination at lower temperature has been recogn izedas a potential adaptation for drought avoi dance , enabling a bett er correspondence with available soi lmoisture from snow rnelt-out in the spring. The highertem perature requirements for A. lasiocarpa germina-
97
P.e.
28
A. ,.
2 yrs
6-10yrs<
3·5 yrs {
16
P.e.A.t.
80
100
20
Cf)
Clc
'g 60Q)Cf)
coëf- 40cfl.
l 8'0C:J 6ealal>0 4.0III
zal
CD 2I
N
E 1.5li)
al 1.0.S'Ual
0 .5alCf)
1-
-<F= ribbon=C>1-
- W- and SW-winds
• -..~
-SW ~
Q) Q) al ~ alC C C C0 0 0 0c c c
~c
10 8 6 4 2 a o 2 4 6 8 10
Distance (m) Distance (m)
Figu re 3. Above: Schernatic representation of the snow depths on the wi ndward and leeward sides of a typical tree island in the ribbon forest(based on mcasurements in March 1990 and 1991). Snow accumulation depths and spatial distri bution vary according to the width of the treeisland and height of the island trees (the snowbank forms al a distance equal to approxirnately half the height of the tal lest island trees). Below :Mean seedling abundance (± standard errer) rneasured on the upwind and leeward sides of the tree islands in the ribbon forest for a total of tentransecrs on each side. Seedl ing ages and nurnbers were counted at l , 5 and 10 m from both the upwind and dow nwind sides of the tree islands.
Acta Oecologica

Seedling occurrence in treeline conifers
tion may shorten the already brief period when optimaltemperature and soil moisture availability overlap inthe ribbon forest. Consequently, seedlings of P. engelmannii in the ribbon forest appear to show greatersurvival compared to A. lasiocarpa seedlings.
On the other hand, young seedlings of A. lasiocarpahave been shown to establish better on a litter layercompared to P. engelmannii, possibly because of alonger tap root [8, 14], and they are also considered tobe more shade tolerant than P. engelmannii [14].Consequently, seedlings of A. lasiocarpa in the closedforest survive better relative to those of P. engelmannii, as indicated here by the greater abundance of olderage classes of A. lasiocarpa.
In contrast to the adjacent closed forest, we observed a spatial pattern of seedling occurrence thatcould be associated with the existence of tree islandsand their observed influence on snow deposition patterns in the ribbon forest. No seedlings were found onthe windward sides of individual tree islands wheresnow depths were minimal, while seedlings on theleeward sides of tree islands were found only atmicrosites where accumulative snow depths werebetween 0.5 and 1.5 m. Thus, an optimal snow depthmay be necessary for maximum seedling establishment, with depths that are too shallow or too deepresulting in less successful establishment. Too muchsnow accumulation could inhibit seedling establishment because of the shortened growth season andinadequate carbon balance [4, 18]. An additional negative factor of too much snow may be snow creep andits sheering effect on seedlings under the snowpack. Incontras t, microsites with relatively shallow snowdepths, such as those on the windward sides of treeislands, may not provide enough water for the growthand survival of conifer seedlings during summer. It hasbeen reported previously that summer soil water availability in the ribbon forest is determined mainly bysnow accumulation patterns during winter [17]. Also,in the same closed forest of the Medicine BowMountains, Cui and Smith [7] concluded that a greaterseedling mortality in the understory at more sunexposed microsites appeared to be the result of waterstress. The potentially lethal effects of blowing snow,leaf cuticle abrasion, and extreme desiccation reportedfor upper treeline conifers [10, 11] could also contribute to, or could even be the primary cause of, seedlingmortality on the windward sides of tree islands. Weconclude that wind-driven snow impacts in this typicalribbon-forest treeline ecotone may be a dominantinfluence on the observed occurrence of these veryyoung conifer seedlings. Snow distribution patterns in
Vol. 20 (3) 1999
223
turn are affected by adult tree islands which codetermine seedling occurrence and, thus, may beimportant to the stability and maintenance of thisupper treeline.
Acknowledgments
Field assistance by Monique Allen is gratefully acknowledged.Comments and discussions by Jay Arnone, Christian Kôrner andthree anonymous referees on earlier drafts of the manuscript areappreciated.
REFERENCES
[Il Arno S.E, Hammerly R.P., Timberline: Mountain and ArcticForest Frontiers, The Mountaineers, Seattle, Washington,1984.
[2] Barbour M.G., Pavlik B.M., Antos J.A., Seedling growth andsurvival of red and white tir in a Sierra Nevada ecotone, Am.J. Bot. 77 (1990) 927-938.
[3] Bazzaz EA., The physiological ecology of plant succession,Annu. Rev. Ecol. Syst. 10 (1979) 351-371.
[4] Billings w'D., Vegetational pattern near alpine timberline asaffected by tire-snowdrift interactions, Vegetatio 19 (1969)192-207.
[5] Bliss L.e., A comparison of plant development in microenvironments of arctic and alpine tundras, Ecol. Monogr. 26(1956) 303-337.
[6] Cooper W.S., Reproduction by layering among conifers, Bot.Gaz. 52 (1911) 369-379.
[7] Cui M., Smith W.K., Photosynthesis, water relations andmortality in Abies lasiocarpa seedlings during natural establishment, Tree Physiol. 8 (1990) 37--46.
[8] Day RJ., The microenvironments occupied by spruce and tirregeneration in the Rocky Mountains, Canadian ForestBranch Publication 1037, 1964.
[9] Griggs R.E, The timberlines of northern America and theirinterpretation, Ecology 27 (1946) 275-289.
[10] Hadley J.L., Smith w'K., Wind effects on needles of timberline conifers; seasonal influence on mortality, Ecology 67(1986) 12-19.
[II] Hadley J.L., Smith W.K., Influence of leaf surface wax andleaf area-to-mass ratio on cuticular transpiration in conifers,Cano J. For. Res. 20 (1990) 1306-1311.
[12] Harper J.L., The Population Biology of Plants, AcademiePress, New York, 1977.
[13] Hâttenschwiler S., Kôrner e., Responses to recent c1imatewarming of Pinus sylvestris and Pinus cembra within theirmontane transition zone in the Swiss Alps, J. Veg. Sei. 6(1995) 357-368.
[14] Knapp A.K., Smith WK, Factors influencing understoryseedling establishment of engelmann spruce (Picea engelmannii) and subalpine tir (Abies lasiocarpaï in southeast Wyoming, Cano J. Bot. 60 (1982) 2753-2761.
[15] Kôrner C, A re-assessment of high elevation treeline positionsand their explanation, Oecologia 115 (1998) 445--459.
[16] Linsday J.H., The effect of environ mental factors on the leafwater balance of conifers, M.Sc. thesis, University of Wyoming, Laramie, 1967.
224
[17] Oberbauer S.F., Billings W.D., Drought tolerance and wateruse by plants along an alpine topographie gradient, Oeeologia50 (1981) 325-331.
[18] Oosting H.J., Reed J.F., Virgin spruce-fir forest in the Medicine Bow Mountains, Wyoming, Eco!. Monogr. 22 (1952)69-91.
[19] Patten D.T., Light and temperature influence on engelmannspruce seed germination and subalpine forest advance, Ecology 44 (1963) 817-818.
[20] Pearson G.A., Forest types in the Southwest as determined byclimate and soil, US Department of Agriculture TechnicalBulletin 247, 1931.
S. Hattenschwiler, W.K. Smith
[21] Puigdefàbregas J., Gallart F., Biaeiotto O., Allogia M., deIBarrio G., Banded vegetation patterning in a subantarcticforestof Tierra dei Fuego, as an outcome of the interactionbetween wind and tree growth, Acta Oecol. 20 (1999)135-146.
[22] Rochefort R.M., Little R.L., Woodward A., Peterson D.L.,Changes in sub-alpine tree distribution in western NorthAmerica: a review of climatic and other causal factors,Holocene 4 (1994) 89-100.
[231 Tranquillini w., Physiological Ecology of the Alpine Timberline, Springer-Verlag, Berlin, Heidelberg, New York, 1979.
[24] Wardle P., An explanation for alpine timberlines, N. Z. J. Bot.9 (1971) 371-402.
Acta Oecologica

ACTAOECOLOGlCAINTERNATIONAL JOURNAL OF ECOLOGY
The aims and scope of Acta Oecologica are presentedat the front of this issue.The text should be written in English.There are no page charges.Manuscripts should be sent to: Chiara Marchetti,NIOO-CTO, P.O. Box 40, NL 6666 ZG Heteren, TheNetherlands. The original and two copies are required,each accompagnied by figures and tables. Authors areinvited to suggest the names of potential referees.
Manuscript preparation
Manuscripts should be typed, double spaced, on oneside only, with a 5 cm margin.The title page should contain the full title, a short running title, author's name(s), affiliation address(es),address for correspondence, Fax number, e-mail.
Full pa pers
Articles should be divided into the following sequencesections: title page, abstract, keywords, introduction,material and methods, results, discussion, conclusion,acknowledgements, references, tables, legends offigures and figures.An abstract not exceeding 250 words is required forarticles. The abstract should indicate the main resultsand conclusions.Methods should be explained in sufficient detail topermit replication.
Forum
The Forum section is reserved for short papers containing critical discussion of current issues in ecology, andwelcomes comments and viewpoints on previouslypublished papers
Units
Use the form: IJL·h-1·mg-1.
Use standard international units (SI).
References
Journal titles should be abbreviated according to the Listof seriai title word abbreviations (standard ISO) publishedby the ISSN International Centre, 20, rue Bachaumont,75002 Paris, France.References cited should be listed in alphabetical order,and this reference list is numbered in ascending order.The numbering shall be used when citing references in thetext. List numbers in numerical order in square brackets.The following models for the reference list cover ailsituations. The punctuation must be followed exactly.
INSTRUCTIONS TO AUTHORS
[1] Begon M., Harper J., Towsend C., Ecology. Individuals, populations and communities, BlackwellScientific Publications, London, 1990, 945 p.
[2] Grant B., Dunham A., Thermally imposed timeconstraints on the activity of the desert lizardSce/oporus meriami, Ecology 69 (1988) 167-176.
[3] Petai J., The role of ants in ecosystems, in: BrianM.v. (Ed.), Production ecology of ants and termites,IBP 13, Cambridge University Press, Cambridge,1978, pp. 293-325.
Tables and figures
ln the text, write: figure 1, table IV, etc.Tables should be numbered with roman numerals,each on a separate sheet, and contain only horizontalrules. Ail tables should have complete but brief headings.Figure legends should be typed on a separate sheet.Ali illustrations are to be considered as figures andnumbered consecutively throughout the text. Adoptpreferably a width to allow 1/2 or 1/4 reduction (finalsize 8 or 16 cm wide).If photographs are included, 3 sets of oriqinals are required with high contrast on glossy paper. Colour illustrations carry an extra charge.
Acceptance of pa pers
After revision and final acceptance, the manuscriptshould preferably be provided on a high density (HO)disk labelled with: the type of computer used in MS-DOSor format Mac Intosh, the type of software and versionnumber, ail file names and author's name(s). The corresponding printed version should be supplied. Once yourtext is typed, save as an RTF (Rich Text Format) file.
Page proofs
Page proofs will be sent to the first author and shouldbe returned to the Editor within 48 hours of receipt.Alterations in the text, other than corrections, mayhave to be charged to the author and could seriouslydelay publication.
Offprints
Twenty-five offprints of each paper and one copy ofthe journal issue will be provided free of charge.Additional offprints may be purchased. Send an orderform with the proofs.For permission to reproduce material from ActaOecologica, please apply to the Editor-in-Chief.On acceptance, papers become the copyright of thejournal.

INTERNATIONAL JOURNAL OF ECOLOGY
ACTAECOt GICA
1999Vol. 20 . No 3
MayJune
c o N T E N T sBanded Vegetation Patterns - Special Issue
133 Foreword
135 Banded vegetation patterning in a subantarctic forest of Tierra dei Fuego, as an outcome ofthe interaction between wind and tree growth
Puigdeftbregas J, GaLlart P, Biaciotto O; Allogza M, del Barrie G.
147 The influence of vegetation pattern on the productivity, diversity and stability of thevegetation: The case of 'brousse tigrée' in the Sahel
Hiernaux P., Gérard B.
159 Distribution and floristics of moss- and lichen-dominated soil crusts in a patterned Callitrisglaucophylla woodland in eastern Australia
Eldridge DI
171 Short range co-operativity competing with long range inhibition explains vegetation patternsLejeune O: Couteron P, Lefèver R.
185 Soil organlc matter dynamics in tiger bush (Niamey. Niger). Preliminary resultsGuilLaume K, Abbadie L Marioui A., Nacra H
197 Spatial distribution of Prosopis glandulosa var. torreyana in vegetation stripes of the southernChihuahuan Desert
Lâpez-Portillo J, Montana C.
Forum
209 Run-on contribution to a Sahelian two-phase mosaic system: Soil water regime and vegetationlife cycles
Seghieri J, Galle 5.
219 Seedling occurrence in alpine treeline conifers: A case study from the central RockyMountains, USA
Hauenschu/iler 5., Smith WK