010079522.pdf - Horizon IRD
26
International Journal of Environmental Research and Public Health Article Determination of the Microbial and Chemical Loads in Rivers from the Quito Capital Province of Ecuador (Pichincha)—A Preliminary Analysis of Microbial and Chemical Quality of the Main Rivers Pamela Borja-Serrano 1 , Valeria Ochoa-Herrera 1,2,3 , Laurence Maurice 4,5 , Gabriela Morales 2 , Cristian Quilumbaqui 2 , Eduardo Tejera 6 and António Machado 1, * 1 Instituto de Microbiología, Colegio de Ciencias Biológicas y Ambientales (COCIBA), Universidad San Francisco de Quito (USFQ), Diego de Robles y Vía Interoceánica, Campus Cumbayá, Casilla Postal 17-1200-841, Quito 170901, Ecuador; [email protected] (P.B.-S.); [email protected] (V.O.-H.) 2 Colegio de Ciencias e Ingeniería, El Politécnico, Instituto Biósfera, Universidad San Francisco de Quito, Quito 170901, Ecuador; [email protected] (G.M.); [email protected] (C.Q.) 3 Department of Environmental Sciences and Engineering, Gillings School of Global Public Health, University of North Carolina at Chapel Hill, Chapel Hill, NC 27599, USA 4 Geosciences Environnement Toulouse, CNRS/IRD/CNES/Université Paul Sabatier, 14 avenue Edouard Belin, 31400 Toulouse, France; [email protected] 5 Área de Salud de la Universidad Andina Simón Bolívar, Toledo N22-80, P.O. Box 17-12-569, Quito 170143, Ecuador 6 Facultad de Ingeniería y Ciencias Aplicadas, Grupo de Bioquimioinformática, Universidad de Las Américas, Quito 170125, Ecuador; [email protected] * Correspondence: [email protected]; Tel.: +593-2-297-1700 Received: 19 May 2020; Accepted: 15 June 2020; Published: 14 July 2020 Abstract: Contamination of natural water sources is one of the main health problems worldwide, which could be caused by chemicals, metals, or microbial agents. This study aimed to analyze the quality of 18 rivers located in Quito, the capital province of Pichincha, Ecuador, through physico-chemical and microbial parameters. The E. coli and total coliforms assessments were performed by a counting procedure in growth media. Polymerase chain reaction (PCR) was realized to detect several microbial genera, as well as Candida albicans, two parasites (Cryptosporidium and Giardia spp.) and E. coli pathotypes: enterohemorrhagic E. coli (EHEC), enteroaggregative E. coli (EAEC), enteroinvasive E. coli (EIEC) and enteropathogenic E. coli (EPEC). Additionally, physico-chemical parameters and major and trace metals were analyzed in each surface water sample. Our results demonstrated that most of the rivers analyzed do not comply with the microbial, physico-chemical, and metal requirements established by the Ecuadorian legislation. In terms of microbial pollution, the most polluted rivers were Monjas, Machángara, Pisque, and Pita Rivers. Furthermore, three out of four analyzed E. coli pathotypes (EIEC, EHEC, and EAEC) were detected in certain rivers, specifically: Monjas River showed the presence of EIEC and EHEC; in the Machángara River, EAEC and EIEC were detected; and finally, EIEC was present in the Guayllabamba River. Several physico-chemical parameters, such as pH, COD total , and TSS values, were higher than the Ecuadorian guidelines in 11, 28, and 28% of the rivers, respectively. Regarding heavy metals, Zn, Cu, Ni, Pb, Cd, and Mn surpassed the established values in 94, 89, 61, 22, 22, and 17% of the rivers, respectively. Machangara River was the only one that registered higher Cr concentrations than the national guidelines. The values of Al and Fe were above the recommended values in 83 and 72% of the rivers. Overall, based on the physical-chemical and microbiological parameters the most contaminated rivers were Machángara and Monjas. This study revealed severe contaminations in Ecuadorean Rivers; further studies should evaluate the sources of contamination and their impact on public health. Int. J. Environ. Res. Public Health 2020, 17, 5048; doi:10.3390/ijerph17145048 www.mdpi.com/journal/ijerph
-
Upload
khangminh22 -
Category
Documents
-
view
0 -
download
0
Transcript of 010079522.pdf - Horizon IRD
International Journal of
Environmental Research
and Public Health
Article
Determination of the Microbial and Chemical Loadsin Rivers from the Quito Capital Province of Ecuador(Pichincha)—A Preliminary Analysis of Microbialand Chemical Quality of the Main Rivers
Pamela Borja-Serrano 1, Valeria Ochoa-Herrera 1,2,3 , Laurence Maurice 4,5 , Gabriela Morales 2,Cristian Quilumbaqui 2, Eduardo Tejera 6 and António Machado 1,*
1 Instituto de Microbiología, Colegio de Ciencias Biológicas y Ambientales (COCIBA),Universidad San Francisco de Quito (USFQ), Diego de Robles y Vía Interoceánica, Campus Cumbayá,Casilla Postal 17-1200-841, Quito 170901, Ecuador; [email protected] (P.B.-S.);[email protected] (V.O.-H.)
2 Colegio de Ciencias e Ingeniería, El Politécnico, Instituto Biósfera, Universidad San Francisco de Quito,Quito 170901, Ecuador; [email protected] (G.M.); [email protected] (C.Q.)
3 Department of Environmental Sciences and Engineering, Gillings School of Global Public Health,University of North Carolina at Chapel Hill, Chapel Hill, NC 27599, USA
4 Geosciences Environnement Toulouse, CNRS/IRD/CNES/Université Paul Sabatier, 14 avenue Edouard Belin,31400 Toulouse, France; [email protected]
5 Área de Salud de la Universidad Andina Simón Bolívar, Toledo N22-80, P.O. Box 17-12-569,Quito 170143, Ecuador
6 Facultad de Ingeniería y Ciencias Aplicadas, Grupo de Bioquimioinformática, Universidad de Las Américas,Quito 170125, Ecuador; [email protected]
* Correspondence: [email protected]; Tel.: +593-2-297-1700
Received: 19 May 2020; Accepted: 15 June 2020; Published: 14 July 2020�����������������
Abstract: Contamination of natural water sources is one of the main health problems worldwide, whichcould be caused by chemicals, metals, or microbial agents. This study aimed to analyze the qualityof 18 rivers located in Quito, the capital province of Pichincha, Ecuador, through physico-chemicaland microbial parameters. The E. coli and total coliforms assessments were performed by a countingprocedure in growth media. Polymerase chain reaction (PCR) was realized to detect several microbialgenera, as well as Candida albicans, two parasites (Cryptosporidium and Giardia spp.) and E. colipathotypes: enterohemorrhagic E. coli (EHEC), enteroaggregative E. coli (EAEC), enteroinvasive E. coli(EIEC) and enteropathogenic E. coli (EPEC). Additionally, physico-chemical parameters and majorand trace metals were analyzed in each surface water sample. Our results demonstrated that most ofthe rivers analyzed do not comply with the microbial, physico-chemical, and metal requirementsestablished by the Ecuadorian legislation. In terms of microbial pollution, the most polluted riverswere Monjas, Machángara, Pisque, and Pita Rivers. Furthermore, three out of four analyzed E. colipathotypes (EIEC, EHEC, and EAEC) were detected in certain rivers, specifically: Monjas Rivershowed the presence of EIEC and EHEC; in the Machángara River, EAEC and EIEC were detected;and finally, EIEC was present in the Guayllabamba River. Several physico-chemical parameters,such as pH, CODtotal, and TSS values, were higher than the Ecuadorian guidelines in 11, 28, and 28%of the rivers, respectively. Regarding heavy metals, Zn, Cu, Ni, Pb, Cd, and Mn surpassed theestablished values in 94, 89, 61, 22, 22, and 17% of the rivers, respectively. Machangara River wasthe only one that registered higher Cr concentrations than the national guidelines. The values ofAl and Fe were above the recommended values in 83 and 72% of the rivers. Overall, based on thephysical-chemical and microbiological parameters the most contaminated rivers were Machángaraand Monjas. This study revealed severe contaminations in Ecuadorean Rivers; further studies shouldevaluate the sources of contamination and their impact on public health.
Int. J. Environ. Res. Public Health 2020, 17, 5048; doi:10.3390/ijerph17145048 www.mdpi.com/journal/ijerph
Int. J. Environ. Res. Public Health 2020, 17, 5048 2 of 26
Keywords: river quality; total coliforms; Escherichia coli pathotypes; parasites; physico-chemicalparameters; major and trace elements
1. Introduction
The discharge of wastes and chemical compounds into rivers is one of the biggest sourcesof environmental contamination, mainly in developing countries, due to a lack of domestic andindustrial wastewater treatment [1–3]. The absence of water treatment generates an accumulationof environmental pollutants which could lead to severe public health issues [4]. Pollution in riverscan affect different economical sections, such as agriculture, cattle raising, industrial production,and recreational activities [5–7]. The increase in microorganisms and anthropogenic contaminantsenhances the risk of pathogen outbreaks, bacterial antibiotic resistance, and public health costs [8,9].
Globally, more than 80% of residual waters are released into the environment without any adequatetreatment [10]. It has been reported that, worldwide, around two million people die annually due towater-related diseases [11]. In 2000, Ecuador evidenced more than two thousand cases of diseasesassociated with water microbial pollution, where most of those cases consisted of diarrhea or dysenteryassociated with pathogens, such as Escherichia coli and others [12,13]. The rates of morbidity andmortality by water contamination are increasing in Ecuador [12].
Of Ecuador’s twenty-four provinces, Pichincha holds significant importance because it is whereQuito, the capital city of Ecuador, is located. Pichincha contains a population of approximately 2,576,287,and 86.9% of its inhabitants reside in Quito [14,15]. The domestic and industrial wastes producedin Quito are discharged in four main rivers [16], specifically, in Machángara, Monjas, San Pedro,and Guayllabamba. Around 81% of this contamination is due to domestic wastewater discharge,and the remaining 19% of pollution is attributed to industrial waste [16], such as chemicals andoils. Quito currently has a pilot wastewater treatment plant that is treating less than 3% of the totaleffluent discharges of Quito city [17]. However, in August 2019, the newly elected mayor, Jorge Yunda,inaugurated the project “Vindobona”, in which they expect to treat almost 99% of the wastewaters thatend in the rivers from the capital city [18].
Although the contamination of Pichincha’s rivers is visible nowadays, few studies have beenpublished regarding their microbial and chemical quality [19–21]. The last study conducted bythe municipal water service of Quito (EPMAPS) revealed that most of the rivers in the south partof the capital exceeded the authorized microbial limits of potable water by 3000% [22]. In 2014,Voloshenko and colleagues found emerging organic pollutants along the San Pedro, Guayllabambaand Esmeraldas Rivers, such as carbamazepine and acesulfame. This study also revealed an increase inpollutant concentrations in the surroundings of Quito [21]. Most water quality studies utilize biologicalindicators such as Escherichia coli and total coliform counts [23,24]. However, other potentiallypathogenic microorganisms can be identified in the recollected samples and used as biologicalindicators, such as Salmonella, Pseudomonas, Shigella, and Legionella spp., as well as parasites, Giardiaand Cryptosporidium spp. [25–28]. Water quality can also be evaluated in terms of physico-chemicalproperties and parameters [19,29], such as metals, which can reach the hydrosystem through naturalor anthropogenic sources. The natural causes for the presence of metals in rivers can be attributed torock erosion or soil weathering, while the ones for anthropogenic sources include industrial, mining,and agricultural discharges or untreated sewage [5,19,29].
The identification of potentially pathogenic microorganisms and the microbial load evaluation areusually done by microbiological classical methods [30] and even by biological molecular techniques [28].Escherichia coli is known to be a commensal bacterium; nevertheless, some strains can be pathogenicfor humans or animals [8] and can be considered as a potential public health risk [1]. Therefore,several studies evaluated specific E. coli pathotypes [8,30], such as enterohemorrhagic E. coli (EHEC),enteroaggregative E. coli (EAEC), enteroinvasive E. coli (EIEC), and enteropathogenic E. coli (EPEC).
Int. J. Environ. Res. Public Health 2020, 17, 5048 3 of 26
E. coli pathotype identification is usually done by molecular microbiology methods, such as polymerasechain reaction (PCR) [26,28,31]. On the other hand, the counting of commensal E. coli and total coliformsis traditionally done by a classical methodology through a specific culture medium [28,30].
The main goal of the present study was to evaluate the microbial load of 18 different rivers fromthe capital province of Quito (Pichincha), through E. coli and total coliform counting and molecularidentification of other potential opportunistic and pathogenic microorganisms (genera or species)using PCR detection. A physico-chemical evaluation was also conducted that included an analysisof major elements and trace metals in the river samples to identify the most polluted rivers and toestablish if their microbial load is related to the urban and industrial discharges.
2. Methods
2.1. Sample Site and Collection
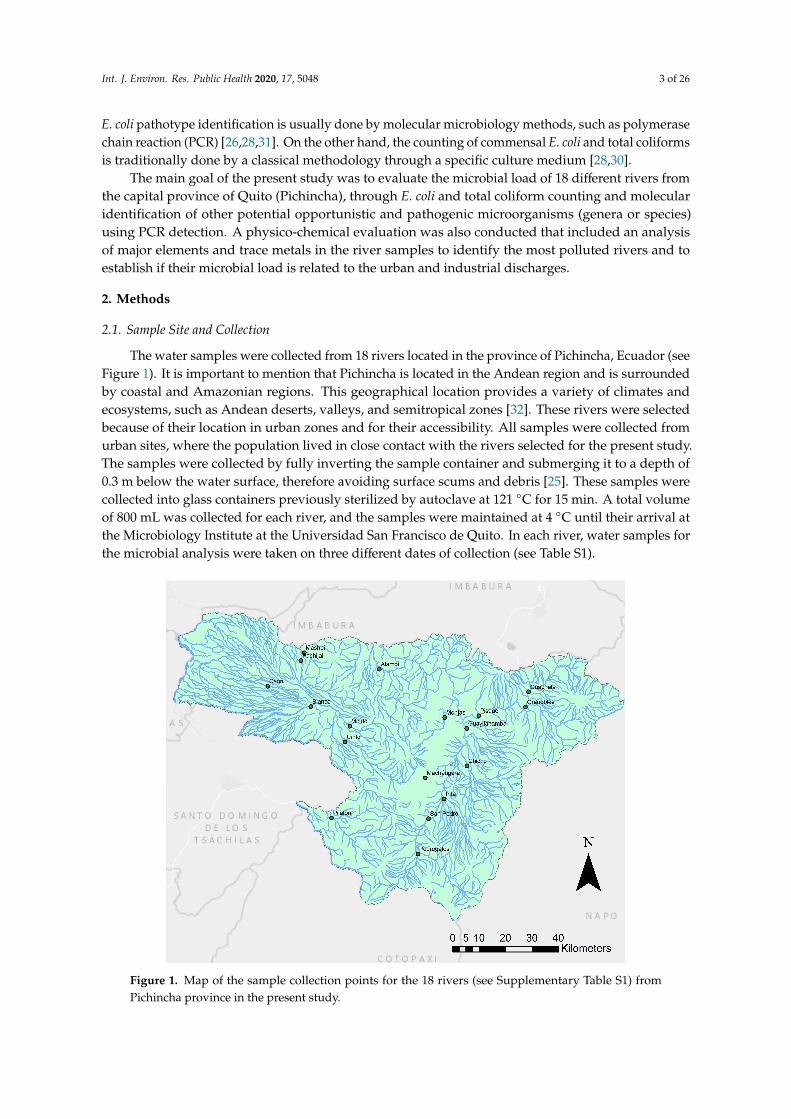
The water samples were collected from 18 rivers located in the province of Pichincha, Ecuador (seeFigure 1). It is important to mention that Pichincha is located in the Andean region and is surroundedby coastal and Amazonian regions. This geographical location provides a variety of climates andecosystems, such as Andean deserts, valleys, and semitropical zones [32]. These rivers were selectedbecause of their location in urban zones and for their accessibility. All samples were collected fromurban sites, where the population lived in close contact with the rivers selected for the present study.The samples were collected by fully inverting the sample container and submerging it to a depth of0.3 m below the water surface, therefore avoiding surface scums and debris [25]. These samples werecollected into glass containers previously sterilized by autoclave at 121 ◦C for 15 min. A total volumeof 800 mL was collected for each river, and the samples were maintained at 4 ◦C until their arrival atthe Microbiology Institute at the Universidad San Francisco de Quito. In each river, water samples forthe microbial analysis were taken on three different dates of collection (see Table S1).
Int. J. Environ. Res. Public Health 2020, 17, x 3 of 31
coli (EHEC), enteroaggregative E. coli (EAEC), enteroinvasive E. coli (EIEC), and enteropathogenic E. coli (EPEC). E. coli pathotype identification is usually done by molecular microbiology methods, such as polymerase chain reaction (PCR) [26,28,31]. On the other hand, the counting of commensal E. coli and total coliforms is traditionally done by a classical methodology through a specific culture medium [28,30].
The main goal of the present study was to evaluate the microbial load of 18 different rivers from the capital province of Quito (Pichincha), through E. coli and total coliform counting and molecular identification of other potential opportunistic and pathogenic microorganisms (genera or species) using PCR detection. A physico-chemical evaluation was also conducted that included an analysis of major elements and trace metals in the river samples to identify the most polluted rivers and to establish if their microbial load is related to the urban and industrial discharges.
2. Methods
2.1. Sample Site and Collection
The water samples were collected from 18 rivers located in the province of Pichincha, Ecuador (see Figure 1). It is important to mention that Pichincha is located in the Andean region and is surrounded by coastal and Amazonian regions. This geographical location provides a variety of climates and ecosystems, such as Andean deserts, valleys, and semitropical zones [32]. These rivers were selected because of their location in urban zones and for their accessibility. All samples were collected from urban sites, where the population lived in close contact with the rivers selected for the present study. The samples were collected by fully inverting the sample container and submerging it to a depth of 0.3 m below the water surface, therefore avoiding surface scums and debris [25]. These samples were collected into glass containers previously sterilized by autoclave at 121 °C for 15 min. A total volume of 800 mL was collected for each river, and the samples were maintained at 4 °C until their arrival at the Microbiology Institute at the Universidad San Francisco de Quito. In each river, water samples for the microbial analysis were taken on three different dates of collection (see Table S1).
Figure 1. Map of the sample collection points for the 18 rivers (see Supplementary Table S1) from Pichincha province in the present study. Figure 1. Map of the sample collection points for the 18 rivers (see Supplementary Table S1) fromPichincha province in the present study.
Int. J. Environ. Res. Public Health 2020, 17, 5048 4 of 26
Additionally, for the physical-chemical analysis, water samples were taken once in each riverthrough: (i) a dark amber glass bottle cleaned in a muffle oven at 550 ◦C in order to eliminate traces ofcontaminants and (ii) an acid-clean 1-L Teflon bottle previously washed with 10% HCl at 120 ◦C andthen rinsed with distilled water according to standardized protocols [33]. The samples were conservedat 4 ◦C until their arrival at the Laboratory of Environmental Engineering at Universidad San Franciscode Quito (LIA-USFQ). The samples were then immediately filtered using a vacuum pump with 0.45-µmpre-cleaned cellulose filters. For metal analysis, the filtrate was transferred to polyethylene bottles andthen preserved with high-purity concentrated nitric acid (HNO3) (LobaChemie, Mumbai, India) toobtain a final concentration of 2% v/v at the Laboratory of Environmental Engineering at UniversidadSan Francisco de Quito (LIA—USFQ), Ecuador.
2.2. Sample Preparation for Microbiological Analysis
Surface water samples were filtered using a 0.45-µm nitrocellulose membrane (Millipore, Merck,Burlington, MA, USA) with a vacuum pump under aseptic conditions (Chemical Duty Pump, Milipore,Merck, Burlington, MA, USA). The following procedure was adapted from the study conducted byDobrowsky and colleagues (2014) with minor modifications. The membrane was removed and placedin a sterile falcon tube with 20 mL of distilled sterile water. The tube was vortexed during 15 min tosuspend the soil particles and the microorganisms. Then, the membrane was removed, and the tubeswere centrifuged at 5000 rpm for 15 min to precipitate the sediments. Once the pellet was obtained,it was suspended in 2 mL of distilled sterile water. This sample was divided into 2 aliquots of 1 mL,one for bacterial DNA extraction using the Power Soil Extraction Kit (MO BIO Laboratories, QIAGEN,Venlo, The Netherlands) and the other 1 mL for bacterial growth cultures.
2.3. Cultivation of Microorganisms from River Samples
Different media cultures were used to isolate or count the microorganisms found in the samples.More accurately, 20 µL of samples were incubated on MacConkey agar (Difco, Becton, Dickinson andCompany, Franklin Lakes, NJ, USA) at 37 ◦C for 18 to 24 h for the recovery of the gener a Escherichia,Salmonella, Shigella, and Pseudomonas. Another 20 µL were incubated on Legionella CYE Agar Base(Difco, Becton, Dickinson and Company, Franklin Lakes, NJ, USA) at 35 ◦C for 48 h for the isolation ofLegionella spp., and on Biggy agar (Difco, Becton, Dickinson and Company, Franklin Lakes, NJ, USA)to isolate Candida spp. Finally, for the quantification of Escherichia coli and total coliforms, successivedilutions of the initial aliquot were cultured in Chromocult Agar medium (Merck; Biolab, Wadeville,Gauteng, South Africa) at 35 ◦C for 24 to 48 h.
2.4. DNA Extraction
DNA from the collected water samples was extracted using the instructions for the commercialPowerSoil DNA Isolation Kit (MO BIO Laboratories, Inc., QIAGEN, Venlo, The Netherlands).This commercial kit used PowerBead Tubes, which contained a buffer that dispersed the soil particlesand dissolved humic acids and also protected nucleic acids from degradation. The DNA solution fromeach tube was stored at −20 ◦C for further PCR analysis.
2.5. Molecular Identification of the Microbial Load
2.5.1. Bacterial Genera and Candida Albicans
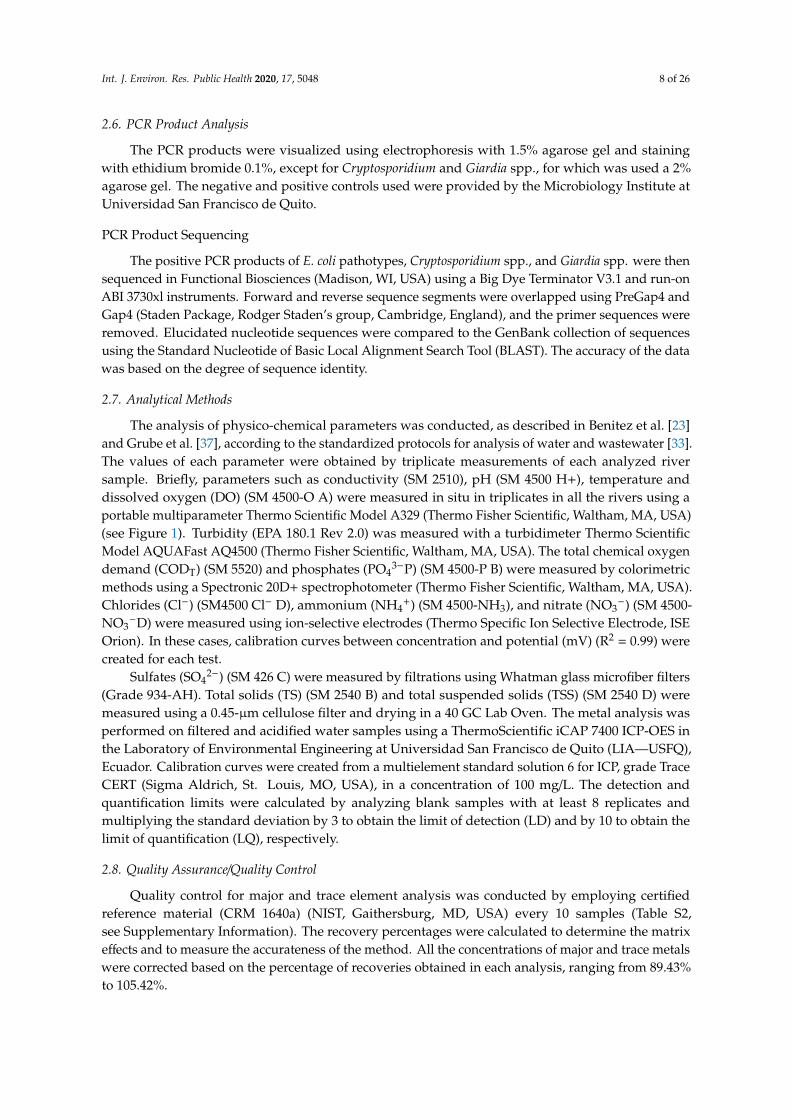
Once the microbial DNA was extracted from the different samples, 16S conserved rRNA geneswere amplified. The PCR mixtures consisted of a final volume of 20 µL and contained 4.0 µL of 1×Green GoTaq Flexi buffer (Promega, Madison, WI, USA), 1.6 µL of 2.0 mM MgCl2 (Promega, Madison,WI, USA), 0.4 µL of 0.2 mM dNTPs mix (Promega, Madison, WI, USA), 1.0 µL of each PCR primer(Table 1), 0.2 µL of 0.5 U GoTaq Fexi DNA polymerase (Promega, Madison, WI, USA), 2 µL templateDNA and the remaining volume of DNA-free water. For Shigella spp., Salmonella spp., Legionella spp.
Int. J. Environ. Res. Public Health 2020, 17, 5048 5 of 26
and Pseudomonas spp., the same reaction mixture was used with the exception that 0.09 µL of 0.5 UGoTaq Flexi DNA polymerase were added. Additionally, for the identification of Candida albicans,the same reaction mixture was used, with the exception that 2 µL of 2.0 mM MgCl2 and 0.18 µL of 0.5 UGoTaq Flexi DNA polymerase were added. The PCR methodology was performed in a thermocycler(Bio-Rad Laboratories, Inc., Hercules, CA, USA) with the procedure illustrated in Table 1.
2.5.2. Cryptosporidium and Giardia spp.
For the molecular identification of certain well-known parasites, specifically, Cryptosporidium andGiardia spp., nested PCR was performed using 2 sets of primers for each parasite. The PCR mixturesconsisted of a final volume of 25 µL and contained 5 µL of 1× Green GoTaq Flexi buffer (Promega,Madison, WI, USA), 3 µL of 3.0 mM MgCl2 (Promega, Madison, WI, USA), 1.0 µL of 0.4 mM dNTPsmix (Promega, Madison, WI, USA), 0.75 µL of each PCR primer (Table 2), 0.07 µL of 0.35U GoTaqFexi DNA polymerase (Promega, Madison, WI, USA), 1 µL template DNA and the remaining volumeof DNA-free water. The nested PCR used the same reaction, with the only difference being that theproduct of PCR from the pre-nested one was used as template DNA. The PCR methodology wasperformed in a thermocycler (Bio-Rad Laboratories, Inc., Hercules, CA, USA) with the procedureillustrated in Table 2.
2.5.3. Escherichia coli Pathotypes
For the molecular identification of E. coli pathotypes, the PCR mixtures consisted of a final volumeof 20 µL. The volume contained 4 µL of 1× Green GoTaq Flexi buffer (Promega, Madison, WI, USA),1.6 µL of 2.0 mM MgCl2 (Promega, Madison, WI, USA), 0.4 µL of 0.2 mM dNTPs mix (Promega,Madison, WI, USA), 0.5 µL of each PCR primer (Table 1), 0.18 µL of 0.5 FU GoTaq Fexi DNA polymerase(Promega, Madison, WI, USA), 2 µL template DNA and the remaining volume of DNA-free water.The PCR methodology was performed in a thermocycler (Bio-Rad Laboratories, Inc., Hercules, CA,USA) with the procedure illustrated in Table 3.
Int. J. Environ. Res. Public Health 2020, 17, 5048 6 of 26
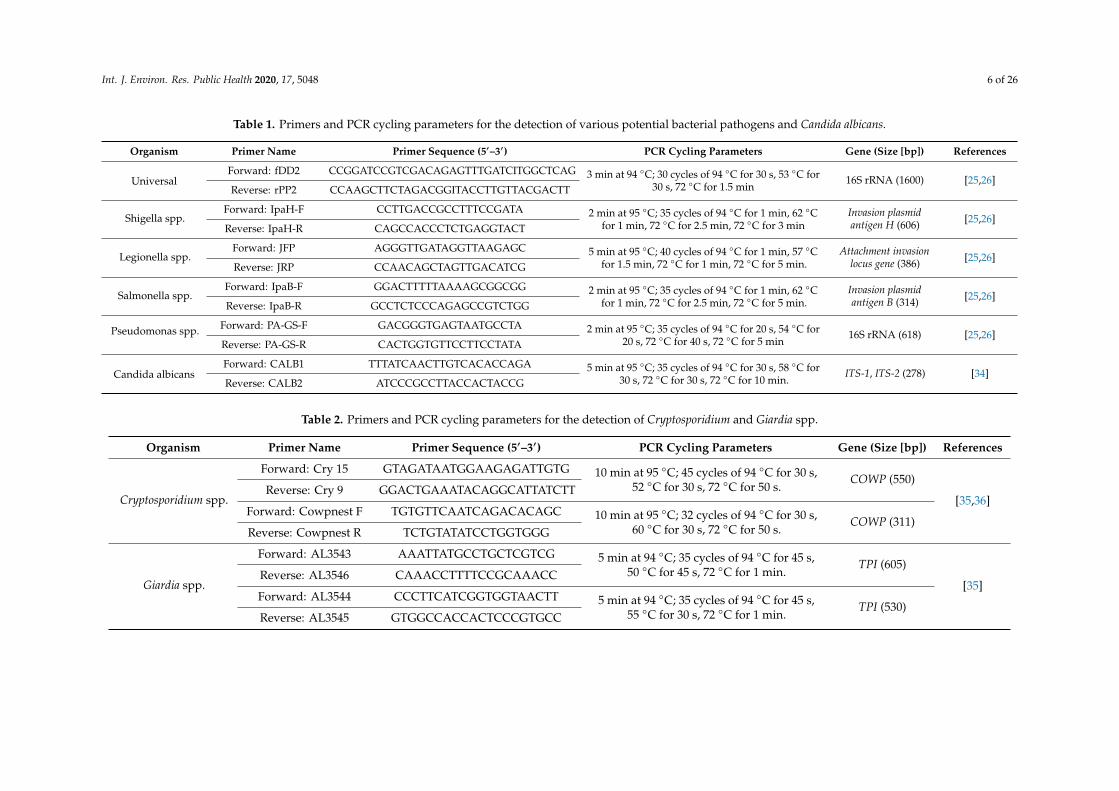
Table 1. Primers and PCR cycling parameters for the detection of various potential bacterial pathogens and Candida albicans.
Organism Primer Name Primer Sequence (5′–3′) PCR Cycling Parameters Gene (Size [bp]) References
UniversalForward: fDD2 CCGGATCCGTCGACAGAGTTTGATCITGGCTCAG 3 min at 94 ◦C; 30 cycles of 94 ◦C for 30 s, 53 ◦C for
30 s, 72 ◦C for 1.5 min16S rRNA (1600) [25,26]
Reverse: rPP2 CCAAGCTTCTAGACGGITACCTTGTTACGACTT
Shigella spp.Forward: IpaH-F CCTTGACCGCCTTTCCGATA 2 min at 95 ◦C; 35 cycles of 94 ◦C for 1 min, 62 ◦C
for 1 min, 72 ◦C for 2.5 min, 72 ◦C for 3 minInvasion plasmidantigen H (606) [25,26]
Reverse: IpaH-R CAGCCACCCTCTGAGGTACT
Legionella spp.Forward: JFP AGGGTTGATAGGTTAAGAGC 5 min at 95 ◦C; 40 cycles of 94 ◦C for 1 min, 57 ◦C
for 1.5 min, 72 ◦C for 1 min, 72 ◦C for 5 min.Attachment invasion
locus gene (386) [25,26]Reverse: JRP CCAACAGCTAGTTGACATCG
Salmonella spp.Forward: IpaB-F GGACTTTTTAAAAGCGGCGG 2 min at 95 ◦C; 35 cycles of 94 ◦C for 1 min, 62 ◦C
for 1 min, 72 ◦C for 2.5 min, 72 ◦C for 5 min.Invasion plasmidantigen B (314) [25,26]
Reverse: IpaB-R GCCTCTCCCAGAGCCGTCTGG
Pseudomonas spp. Forward: PA-GS-F GACGGGTGAGTAATGCCTA 2 min at 95 ◦C; 35 cycles of 94 ◦C for 20 s, 54 ◦C for20 s, 72 ◦C for 40 s, 72 ◦C for 5 min
16S rRNA (618) [25,26]Reverse: PA-GS-R CACTGGTGTTCCTTCCTATA
Candida albicansForward: CALB1 TTTATCAACTTGTCACACCAGA 5 min at 95 ◦C; 35 cycles of 94 ◦C for 30 s, 58 ◦C for
30 s, 72 ◦C for 30 s, 72 ◦C for 10 min.ITS-1, ITS-2 (278) [34]
Reverse: CALB2 ATCCCGCCTTACCACTACCG
Table 2. Primers and PCR cycling parameters for the detection of Cryptosporidium and Giardia spp.
Organism Primer Name Primer Sequence (5′–3′) PCR Cycling Parameters Gene (Size [bp]) References
Cryptosporidium spp.
Forward: Cry 15 GTAGATAATGGAAGAGATTGTG 10 min at 95 ◦C; 45 cycles of 94 ◦C for 30 s,52 ◦C for 30 s, 72 ◦C for 50 s.
COWP (550)
[35,36]Reverse: Cry 9 GGACTGAAATACAGGCATTATCTT
Forward: Cowpnest F TGTGTTCAATCAGACACAGC 10 min at 95 ◦C; 32 cycles of 94 ◦C for 30 s,60 ◦C for 30 s, 72 ◦C for 50 s.
COWP (311)Reverse: Cowpnest R TCTGTATATCCTGGTGGG
Giardia spp.
Forward: AL3543 AAATTATGCCTGCTCGTCG 5 min at 94 ◦C; 35 cycles of 94 ◦C for 45 s,50 ◦C for 45 s, 72 ◦C for 1 min.
TPI (605)
[35]Reverse: AL3546 CAAACCTTTTCCGCAAACC
Forward: AL3544 CCCTTCATCGGTGGTAACTT 5 min at 94 ◦C; 35 cycles of 94 ◦C for 45 s,55 ◦C for 30 s, 72 ◦C for 1 min.
TPI (530)Reverse: AL3545 GTGGCCACCACTCCCGTGCC

Int. J. Environ. Res. Public Health 2020, 17, 5048 7 of 26
Table 3. Primers and PCR cycling parameters for the detection of E. coli pathotypes according to Ramírez Castillo and colleagues [8].
Organism. Primer Name Primer Sequence (5′–3′) PCR Cycling Parameters Gene (Size [bp])
EAECForward: AggRKs1 GTATACACAAAAGAAGGAAGC
Stage 1, initial denaturing at 95 ◦C for 2 min; stage 2, denaturing at95 ◦C for 1 min, primer annealing at 54 ◦C for 1 min, and elongationat 72 ◦C for 1 min; for 30 cycles, and stage 3, final elongation step at
72 ◦C for 10 min.
aggR (254)Reverse: AggRkas2 ACAGAATCGTCAGCATCAGC
EHECForward: VTcomU GAGCGAAATAATTTATATGTG
stx (518)Reverse: VTcomd TGATGATGGCAATTCAGTAT
EPECForward: SK1 CCCGAATTCGGCACAAGCATAAGC
eae (881)Reverse: SK2 CCCGGATCCGTCTCGCCAGTATTCG
EIECForward: IpaIII GTTCCTTGACCGCCTTTCCGATACCGTC
ipaH (619)Reverse: IpaIV GCCGGTCAGCCACCCTCTGAGAGTAC
Int. J. Environ. Res. Public Health 2020, 17, 5048 8 of 26
2.6. PCR Product Analysis
The PCR products were visualized using electrophoresis with 1.5% agarose gel and stainingwith ethidium bromide 0.1%, except for Cryptosporidium and Giardia spp., for which was used a 2%agarose gel. The negative and positive controls used were provided by the Microbiology Institute atUniversidad San Francisco de Quito.
PCR Product Sequencing
The positive PCR products of E. coli pathotypes, Cryptosporidium spp., and Giardia spp. were thensequenced in Functional Biosciences (Madison, WI, USA) using a Big Dye Terminator V3.1 and run-onABI 3730xl instruments. Forward and reverse sequence segments were overlapped using PreGap4 andGap4 (Staden Package, Rodger Staden’s group, Cambridge, England), and the primer sequences wereremoved. Elucidated nucleotide sequences were compared to the GenBank collection of sequencesusing the Standard Nucleotide of Basic Local Alignment Search Tool (BLAST). The accuracy of the datawas based on the degree of sequence identity.
2.7. Analytical Methods
The analysis of physico-chemical parameters was conducted, as described in Benitez et al. [23]and Grube et al. [37], according to the standardized protocols for analysis of water and wastewater [33].The values of each parameter were obtained by triplicate measurements of each analyzed riversample. Briefly, parameters such as conductivity (SM 2510), pH (SM 4500 H+), temperature anddissolved oxygen (DO) (SM 4500-O A) were measured in situ in triplicates in all the rivers using aportable multiparameter Thermo Scientific Model A329 (Thermo Fisher Scientific, Waltham, MA, USA)(see Figure 1). Turbidity (EPA 180.1 Rev 2.0) was measured with a turbidimeter Thermo ScientificModel AQUAFast AQ4500 (Thermo Fisher Scientific, Waltham, MA, USA). The total chemical oxygendemand (CODT) (SM 5520) and phosphates (PO4
3−P) (SM 4500-P B) were measured by colorimetricmethods using a Spectronic 20D+ spectrophotometer (Thermo Fisher Scientific, Waltham, MA, USA).Chlorides (Cl−) (SM4500 Cl− D), ammonium (NH4
+) (SM 4500-NH3), and nitrate (NO3−) (SM 4500-
NO3−D) were measured using ion-selective electrodes (Thermo Specific Ion Selective Electrode, ISE
Orion). In these cases, calibration curves between concentration and potential (mV) (R2 = 0.99) werecreated for each test.
Sulfates (SO42−) (SM 426 C) were measured by filtrations using Whatman glass microfiber filters
(Grade 934-AH). Total solids (TS) (SM 2540 B) and total suspended solids (TSS) (SM 2540 D) weremeasured using a 0.45-µm cellulose filter and drying in a 40 GC Lab Oven. The metal analysis wasperformed on filtered and acidified water samples using a ThermoScientific iCAP 7400 ICP-OES inthe Laboratory of Environmental Engineering at Universidad San Francisco de Quito (LIA—USFQ),Ecuador. Calibration curves were created from a multielement standard solution 6 for ICP, grade TraceCERT (Sigma Aldrich, St. Louis, MO, USA), in a concentration of 100 mg/L. The detection andquantification limits were calculated by analyzing blank samples with at least 8 replicates andmultiplying the standard deviation by 3 to obtain the limit of detection (LD) and by 10 to obtain thelimit of quantification (LQ), respectively.
2.8. Quality Assurance/Quality Control
Quality control for major and trace element analysis was conducted by employing certifiedreference material (CRM 1640a) (NIST, Gaithersburg, MD, USA) every 10 samples (Table S2,see Supplementary Information). The recovery percentages were calculated to determine the matrixeffects and to measure the accurateness of the method. All the concentrations of major and trace metalswere corrected based on the percentage of recoveries obtained in each analysis, ranging from 89.43%to 105.42%.
Int. J. Environ. Res. Public Health 2020, 17, 5048 9 of 26
2.9. Statistical Analysis
The information obtained from the microbial, physico-chemical, and metal analysis of the collectedsamples was evaluated by using the statistical software package SPSS version 23.0 (IBM Corp, 2013;Armonk, NY, USA). Several linear and multiple regressions were performed between the concentrationof E. coli and total coliforms, physical-chemical parameters, and major and trace element concentrations.In all the hypothesis tests, a significance level of 5% was used as the standard. In all tests, a p-value < 0.05was considered to be statistically significant.
3. Results
3.1. Growth of Microbial Genera and Escherichia coli/Total Coliforms Counts
Different media cultures were used to isolate bacteria present in the rivers from this study.In MacConkey agar, all water samples demonstrated growth of enteric bacteria, which includedmicroorganisms form the genera Escherichia, Salmonella, Shigella, and Pseudomonas. As excepted,all rivers showed the presence of enteric bacteria and their further analysis was carried out throughPCR (see Section 3.2). During the culture on Legionella CYE Agar Base, 14 out of the 18 rivers presentedgrowth of this genus. Alambí, Blanco, Caoní, and Mindo Rivers did not show any Legionella spp.growth on the three water samples recollected. In the Biggy agar, 12 of 18 rivers showed thepresence of Candida spp. None of the triplicated water samples demonstrated Candida growth inthe Alambí, Granobles, Guachalá, Monjas, Pisque, or Pita Rivers. These initial results were furtherevaluated through molecular analysis by PCR, confirming their presence or absence on water samples(see Section 3.2).
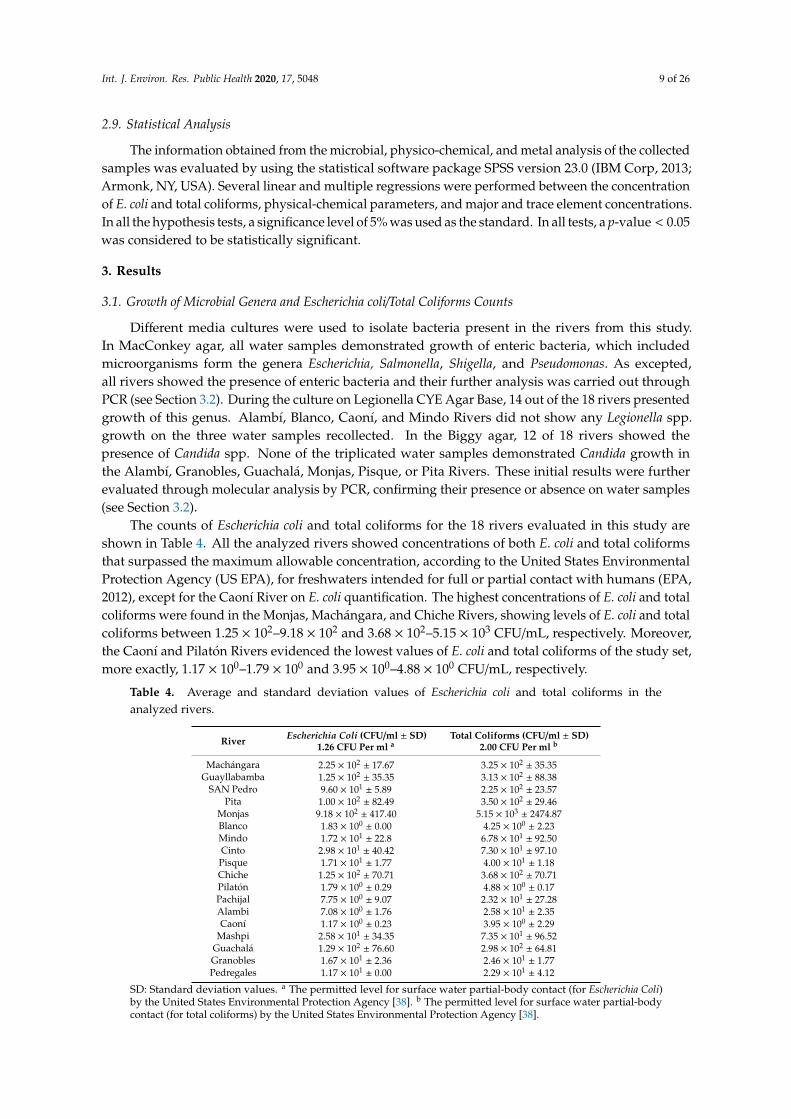
The counts of Escherichia coli and total coliforms for the 18 rivers evaluated in this study areshown in Table 4. All the analyzed rivers showed concentrations of both E. coli and total coliformsthat surpassed the maximum allowable concentration, according to the United States EnvironmentalProtection Agency (US EPA), for freshwaters intended for full or partial contact with humans (EPA,2012), except for the Caoní River on E. coli quantification. The highest concentrations of E. coli and totalcoliforms were found in the Monjas, Machángara, and Chiche Rivers, showing levels of E. coli and totalcoliforms between 1.25 × 10²–9.18 × 10² and 3.68 × 10²–5.15 × 10³ CFU/mL, respectively. Moreover,the Caoní and Pilatón Rivers evidenced the lowest values of E. coli and total coliforms of the study set,more exactly, 1.17 × 100–1.79 × 100 and 3.95 × 100–4.88 × 100 CFU/mL, respectively.
Table 4. Average and standard deviation values of Escherichia coli and total coliforms in theanalyzed rivers.
River Escherichia Coli (CFU/ml ± SD)1.26 CFU Per ml a
Total Coliforms (CFU/ml ± SD)2.00 CFU Per ml b
Machángara 2.25 × 10²± 17.67 3.25 × 10²
± 35.35Guayllabamba 1.25 × 10²
± 35.35 3.13 × 10²± 88.38
SAN Pedro 9.60 × 101± 5.89 2.25 × 10²
± 23.57Pita 1.00 × 10²
± 82.49 3.50 × 10²± 29.46
Monjas 9.18 × 10²± 417.40 5.15 × 10³
± 2474.87Blanco 1.83 × 100
± 0.00 4.25 × 100± 2.23
Mindo 1.72 × 101± 22.8 6.78 × 101
± 92.50Cinto 2.98 × 101
± 40.42 7.30 × 101± 97.10
Pisque 1.71 × 101± 1.77 4.00 × 101
± 1.18Chiche 1.25 × 10²
± 70.71 3.68 × 10²± 70.71
Pilatón 1.79 × 100± 0.29 4.88 × 100
± 0.17Pachijal 7.75 × 100
± 9.07 2.32 × 101± 27.28
Alambi 7.08 × 100± 1.76 2.58 × 101
± 2.35Caoní 1.17 × 100
± 0.23 3.95 × 100± 2.29
Mashpi 2.58 × 101± 34.35 7.35 × 101
± 96.52Guachalá 1.29 × 10²
± 76.60 2.98 × 10²± 64.81
Granobles 1.67 × 101± 2.36 2.46 × 101
± 1.77Pedregales 1.17 × 101
± 0.00 2.29 × 101± 4.12
SD: Standard deviation values. a The permitted level for surface water partial-body contact (for Escherichia Coli)by the United States Environmental Protection Agency [38]. b The permitted level for surface water partial-bodycontact (for total coliforms) by the United States Environmental Protection Agency [38].
Int. J. Environ. Res. Public Health 2020, 17, 5048 10 of 26
Using the Ecuadorian legislation [39], comparing our results against the standard valuesof E. coli and total coliforms for quality of water intended for recreational use, it is possible toconclude that only Pilatón and Caoní showed E. coli and total coliforms values below the Ecuadorianguidelines, respectively.
3.2. Detection of Microbial Genera, Candida Albicans, and Escherichia coli Pathotypes
Molecular analysis was conducted by PCR to confirm the presence or absence of the followingmicrobial genera: Legionella, Pseudomonas, Salmonella, Shigella, Cryptosporidium, and Giardia. Concerningparasites genera, three rivers showed the presence of Cryptosporidium spp., which were the following,Mindo, Pisque, and Alambi Rivers. Meanwhile, eight rivers showed the presence of Giardia spp.,more precisely, the Machángara, San Pedro, Monjas, Blanco, Mindo, Pisque, Pilatón, and GuachaláRivers. Sequencing and comparison of these products to the GenBank nucleotide collection usingBLASTN did not produce any significant alignments for Cryptosporidium spp.; however, the positiveproducts for Giardia spp. showed 100% homology to Giardia intestinalis (syn. G. duodenalis or G. lamblia).The presence and absence of different bacterial genera, such as Pseudomonas, Salmonella, Legionella,and Shigella, were also analyzed in the study set. None of the rivers showed the presence of Salmonellaspp., while almost all rivers displayed the presence of Pseudomonas spp., except the Blanco and CaoníRivers. The second-most prevalent bacteria genus detected in our study was Legionella spp., showingits presence in 11 of the 18 analyzed rivers. Although Legionella spp. was detected by growth culture in14 rivers, Legionella species could not be detected in 3 of the 14 rivers through PCR: the Pilatón, Pachijal,and Mashpi Rivers. Finally, three rivers showed the presence of Shigella spp., more exactly, the Pita,Monjas and Cinto Rivers.
The presence of Candida species was previously shown in 12 of the 18 rivers through growth culture.However, Candida albicans was only detected in three rivers by PCR: the Pita, Monjas, and BlancoRivers. Furthermore, the detection of four E. coli pathotypes was done for all the analyzed rivers:enteroaggregative E. coli (EHEC), enteropathogenic E. coli (EPEC), enteroinvasive E. coli (EIEC) andenteroaggregative E. coli (EAEC). Our analysis showed the EIEC pathotype as the most prevalentpathogen in the study set, illustrating positive results in the Machángara, Guayllabamba, and MonjasRivers. Meanwhile, EHEC and EAEC were each only detected in one river individually, more precisely,the Monjas and Machángara Rivers, respectively. Sequencing and comparing these products to theGenBank nucleotide collection using BLASTN did not produce any significant alignments for thesepathotypes due to the low size of the consensus sequences and a great number of gaps. However,positive results were obtained by PCR, as in previous published studies [8,40,41]. Finally, the EPECpathotype was not detected in any of the 18 rivers evaluated during this study.
3.3. Analysis of Physical Parameters and Chemical Elements
Furthermore, we also analyzed the physico-chemical parameters presented in Table 5. The reportedvalues were obtained by triplicate measurements of each analyzed river. These parameters werecompared to the maximum contaminant levels (MCL) for the preservation of flora and fauna in freshwater established by Ecuadorean legislation [39]. pH, conductivity, dissolved oxygen (DO), turbidity,redox potential (ORP) and temperature were measured in situ. The remaining physico-chemicalparameters were measured at the Laboratory of Environmental Engineering at Universidad SanFrancisco de Quito (LIA-USFQ). Concerning pH, the Pisque and Machángara Rivers showed the highestpH values above the Ecuadorian threshold, specifically, 9.55 and 9.11, respectively. The minimum pHvalue registered was 7.15 in both the Chiche and Pachijal Rivers. Conductivity values ranged from19.87 µS/cm in the Caoní River to 616.00 µS/cm in the Monjas River. According to the US EnvironmentProtection Agency (EPA), the suggested range of conductivity for surface waters is 150–500 µS/cm,meaning that the obtained values in this study are lower and higher than the suggested ones [19].Half of the analyzed rivers evidenced conductivity values lower than the minimum value (150 µS/cm),more exactly, the Caoní, Mashpi, Pachijal, Chiche, Blanco, Alambi, Pilatón, Mindo and Guachalá Rivers.
Int. J. Environ. Res. Public Health 2020, 17, 5048 11 of 26
Additionally, the San Pedro and Monjas Rivers showed higher conductivity values than the maximumlimit (500 µS/cm). Turbidity measurements also varied tremendously, between 1.23 NTU in the BlancoRiver and 881.33 NTU in the Machángara River. Nonetheless, ORP values ranged slightly between297.13 mV in the San Pedro River to 489.53 mV in the Alambi River. The Monjas River was the onlyriver with a low DO value (5.36 mg/L) and the highest value of DO (10.32 mg/L) was obtained in boththe Pachijal and Chiche Rivers. Similarly, regarding the temperature variability, the values rangedfrom a minimum of 12.40 ◦C in the Mashpi River to a maximum of 22.30 ◦C in the Caoní River. Five ofthe eighteen rivers (28%) presented values of CODTotal superior to the Ecuadorian guideline for thepreservation of flora and fauna in fresh waters (40 mg/L), more exactly, the Machángara (692 mg/L),Monjas (318 mg/L), Chiche (206 mg/L), Pisque (180 mg/L) and Alambi (65 mg/L). Although all theanalyzed rivers showed TS values within the permitted limits for discharges to bodies of waterestablished in the Ecuadorian legislation, five rivers showed TSS values superior to the MCL (130 mg/L),more precisely, the Machángara, Alambi, Chiche, Pisque, and Monjas Rivers, by factors of 4, 2.8,2.3, 1.8 and 1.2, respectively. Next, the major anion concentrations, such as of chloride, phosphate,sulfate, and nitrate, were within the allowed MCL values for discharges to bodies of water in Ecuador.According to the World Health Organization, the natural level of ammonium in surface waters isusually less than 0.2 mg/L [42]. In our study, ammonium values ranged between 0.13 and 27.48 mg/L,in the Pedregales and Monjas Rivers, respectively. Additionally, the obtained concentration valuefor fluoride varied from 0.03 to 0.17 mg/L. Hem (1985) reported that, generally, the concentration offluoride in natural water sources is less than 1.0 mg/L.
3.4. Analysis of Metallic Trace Elements
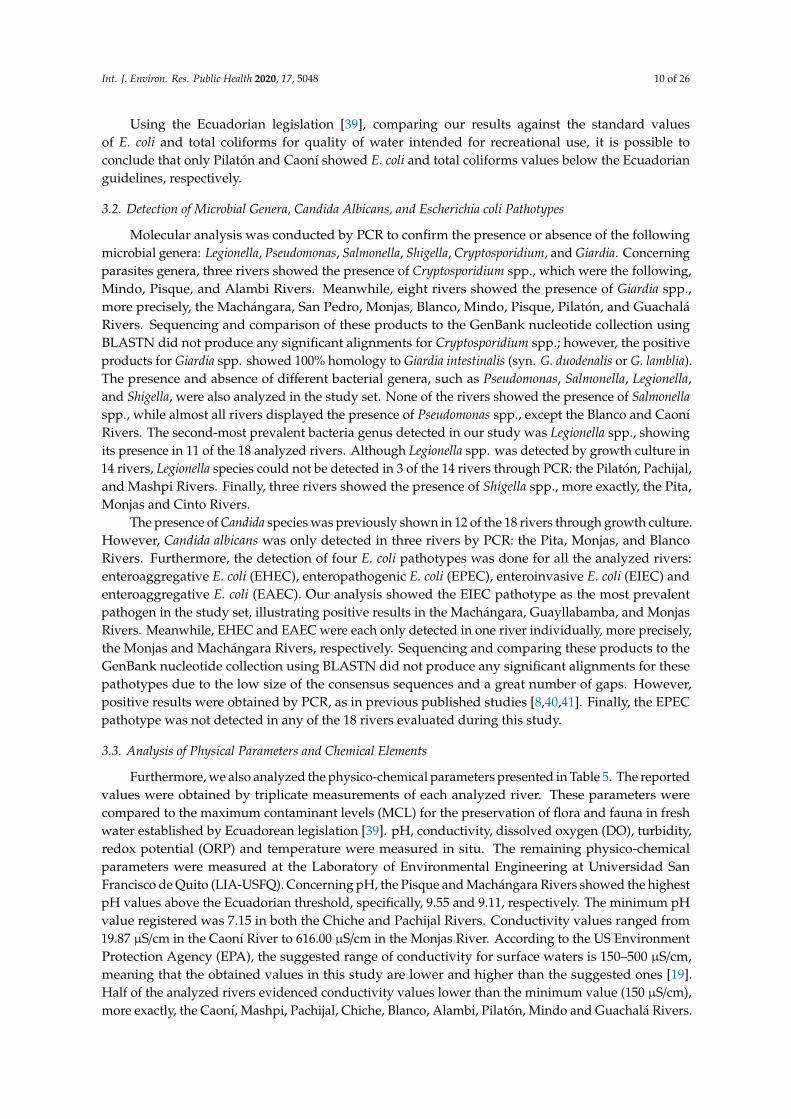
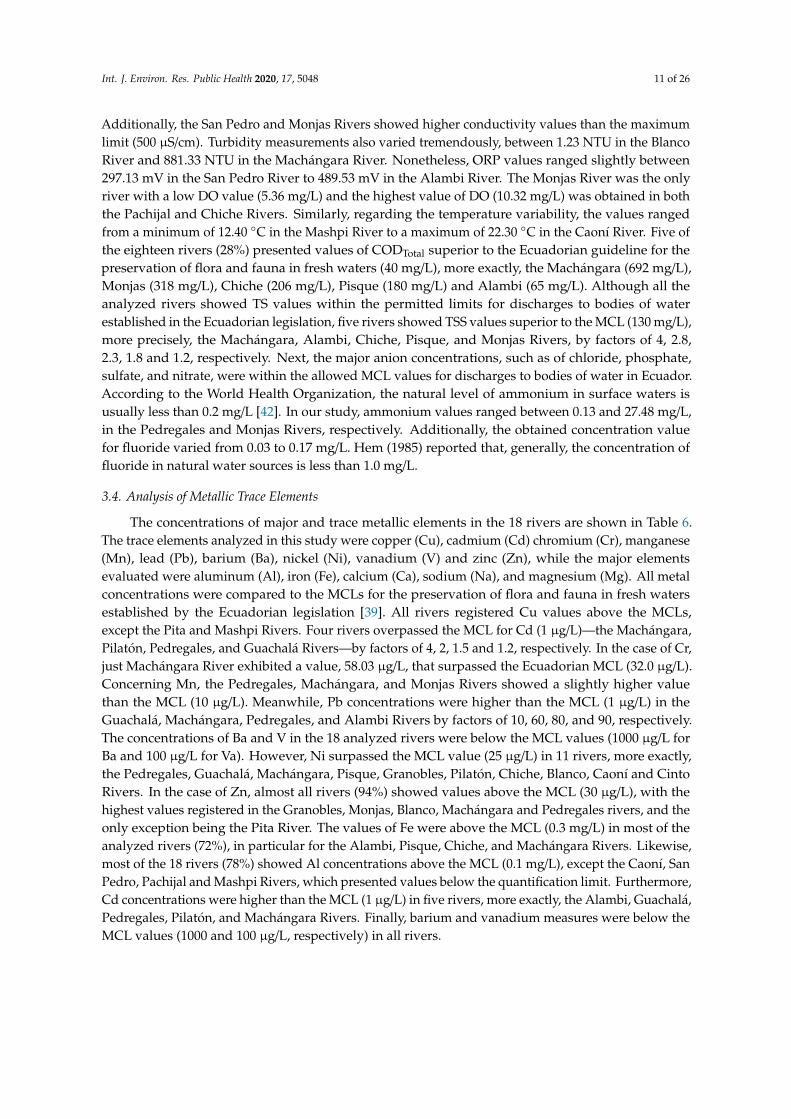
The concentrations of major and trace metallic elements in the 18 rivers are shown in Table 6.The trace elements analyzed in this study were copper (Cu), cadmium (Cd) chromium (Cr), manganese(Mn), lead (Pb), barium (Ba), nickel (Ni), vanadium (V) and zinc (Zn), while the major elementsevaluated were aluminum (Al), iron (Fe), calcium (Ca), sodium (Na), and magnesium (Mg). All metalconcentrations were compared to the MCLs for the preservation of flora and fauna in fresh watersestablished by the Ecuadorian legislation [39]. All rivers registered Cu values above the MCLs,except the Pita and Mashpi Rivers. Four rivers overpassed the MCL for Cd (1 µg/L)—the Machángara,Pilatón, Pedregales, and Guachalá Rivers—by factors of 4, 2, 1.5 and 1.2, respectively. In the case of Cr,just Machángara River exhibited a value, 58.03 µg/L, that surpassed the Ecuadorian MCL (32.0 µg/L).Concerning Mn, the Pedregales, Machángara, and Monjas Rivers showed a slightly higher valuethan the MCL (10 µg/L). Meanwhile, Pb concentrations were higher than the MCL (1 µg/L) in theGuachalá, Machángara, Pedregales, and Alambi Rivers by factors of 10, 60, 80, and 90, respectively.The concentrations of Ba and V in the 18 analyzed rivers were below the MCL values (1000 µg/L forBa and 100 µg/L for Va). However, Ni surpassed the MCL value (25 µg/L) in 11 rivers, more exactly,the Pedregales, Guachalá, Machángara, Pisque, Granobles, Pilatón, Chiche, Blanco, Caoní and CintoRivers. In the case of Zn, almost all rivers (94%) showed values above the MCL (30 µg/L), with thehighest values registered in the Granobles, Monjas, Blanco, Machángara and Pedregales rivers, and theonly exception being the Pita River. The values of Fe were above the MCL (0.3 mg/L) in most of theanalyzed rivers (72%), in particular for the Alambi, Pisque, Chiche, and Machángara Rivers. Likewise,most of the 18 rivers (78%) showed Al concentrations above the MCL (0.1 mg/L), except the Caoní, SanPedro, Pachijal and Mashpi Rivers, which presented values below the quantification limit. Furthermore,Cd concentrations were higher than the MCL (1 µg/L) in five rivers, more exactly, the Alambi, Guachalá,Pedregales, Pilatón, and Machángara Rivers. Finally, barium and vanadium measures were below theMCL values (1000 and 100 µg/L, respectively) in all rivers.

Int. J. Environ. Res. Public Health 2020, 17, 5048 12 of 26
Table 5. Average and standard deviation values of physico-chemical parameters and major anions in 18 rivers of the Pichincha Province (Ecuador).
RiverMCL
pH6.5–9 a
Conductivity(µS/cm)
N/A
DO(mg/L)
N/A
Turbidity(NTU)N/A
ORP(mV)N/A
T(◦C)N/A
CODTotal(mg/L)
40 a
TS(mg/L)1600 b
TSS(mg/L)130 b
Cl−(mg/L)1000 b
NH4+N
(mg/L)N/A
NO3−N(mg/L) 13 a
PO43−P(mg/L) 10 b
SO4−
(mg/L)1000 b
Fluoride(mg/L)1.0 b
Machángara 9.11 *± 0.03
297.97± 1.38
6.77± 0.24
881.33± 12.66
362.70± 3.61
15.20± 0.30
692.00 *± 6.13
1359.00± 4.24
520.00 *± 18.86
37.27± 1.04
20.36± 0.87
6.40± 0.07
0.17± 0.01
29.00± 0.00
0.14± 0.00
Guayllabamba 7.90± 0.03
365.00± 5.81
7.42± 0.23
56.50± 0.66
402.23± 0.15
18.20± 0.00
33.002.27
397.00± 7.07
90.00± 9.43
26.51± 2.01
2.54± 0.29
5.13± 0.03
1.17± 0.01
11.50± 0.50
0.03± 0.00
San Pedro 8.00± 0.01
529.77± 0.06
8.23± 0.20
22.17± 3.30
297.13± 3.45
13.43± 0.06
20.00± 2.36
470.00± 14.14
52.008.49
23.78± 0.54
7.16± 0.18
6.95± 0.00
1.19± 0.14
65.85± 6.59
0.17± 0.00
Pita 8.41± 0.01
221.80± 0.00
8.10± 0.05
10.73± 0.76
346.70± 1.55
13.80± 0.10
8.00± 4.71
280.00± 14.14
45.00± 28.28
4.45± 0.51
0.23± 0.05
1.93± 0.00
0.50± 0.19
71.62± 4.12
0.13± 0.00
Monjas 8.04± 0.05
616.00± 0.10
5.36± 0.03
136.00± 15.10
323.17± 0.55
19.60± 0.10
318.00 *± 0.00
632.50± 10.61
153.50 *± 4.95
40.32± 1.44
27.48± 1.47
3.43± 0.00
3.93± 0.56
103.72± 9.88
0.15± 0.00
Blanco 7.32± 0.09
53.53± 0.08
8.76± 0.22
1.23± 0.03
310.00± 10.41
20.97± 0.06
20.00± 2.12
470.00± 14.14
6.67± 4.71
1.11± 0.23
4.19± 1.54
0.63± 0.03
0.05± 0.01
3.50± 0.50
0.04± 0.00
Mindo 8.37± 0.16
139.67± 0.15
8.27± 0.26
1.76± 0.11
323.70± 0.53
17.87± 0.15
2.00± 2.12
280.00± 14.14
8.33± 2.36
9.31± 0.04
0.19± 0.01
0.70± 0.00
0.11± 0.01
6.00± 0.00
0.04± 0.00
Cinto 7.20± 0.01
232.93± 0.64
8.06± 0.18
5.34± 0.15
306.00± 0.95
20.37± 0.29
2.00± 2.12
632.00± 10.61
6.67± 0.00
21.39± 0.07
0.39± 0.01
0.57± 0.00
0.05± 0.01
29.00± 0.00
0.05± 0.01
Pisque 9.55 *± 0.17
273.43± 0.40
8.02± 0.08
306.67± 4.62
408.20± 2.18
16.63± 0.12
180.00 *± 1.53
806.00± 28.28
236.67 *± 33.00
14.04± 0.73
0.27± 0.02
10.98± 0.09
0.11± 0.00
6.00± 0.00
0.14± 0.01
Chiche 7.15± 0.01
44.80± 0.02
10.32± 0.31
5.89± 0.21
412.23± 11.52
21.40± 0.00
206.00 *± 4.59
597.00± 24.04
300.00 *± 0.00
28.17± 1.37
1.01± 0.01
6.31± 0.09
0.18± 0.01
3.50± 0.50
0.15± 0.00
Pilatón 8.15± 0.01
101.67± 0.12
8.77± 0.20
56.10± 3.12
372.23± 1.31
17.23± 0.06
2.16± 2.12
182.00± 14.14
54.00± 14.14
3.93± 0.00
0.22± 0.01
0.95± 0.03
0.12± 0.01
11.00± 0.00
0.05± 0.00
Pachijal 7.15± 0.01
44.80± 0.02
10.32± 0.31
5.89± 0.21
412.23± 11.52
21.40± 0.00
2.00± 0.00
61.00± 9.90
3.33± 0.00
1.24± 0.03
0.22± 0.02
0.86± 0.03
0.11± 0.01
2.00± 0.00
0.03± 0.00
Alambi 8.15± 0.14
72.07± 0.12
8.92± 0.17
251.33± 11.50
489.53± 1.12
18.50± 0.00
65.00 *± 2.27
521.00± 1.41
366.67 *± 0.00
3.42± 0.15
0.24± 0.05
1.25± 0.03
0.21± 0.02
3.00± 0.00
0.04± 0.00
Caoní 7.33± 0.15
19.87± 0.04
9.35± 0.33
25.93± 1.99
397.07± 9.02
22.30± 0.00
7.00± 2.27
45.00± 7.07
20.00± 7.07
2.31± 0.00
0.21± 0.04
11.66± 0.06
0.09± 0.02
3.50± 0.50
0.05± 0.00
Mashpi 8.15± 0.01
33.72± 0.12
9.87± 0.50
11.07± 1.01
435.40± 3.65 N/A 9.00
± 0.0036.00± 11.31
8.33± 7.07
1.06± 0.04
0.22± 0.03
1.19± 0.00
0.06± 0.00
4.00± 0.00
0.03± 0.00
Guachalá 8.11± 0.02
147.00± 0.69
7.78± 0.62
7.60± 0.27
381.40± 0.00
12.40± 0.00
2.00± 0.00
407.50± 10.61
21.67± 2.36
2.53± 0.03
0.29± 0.02
2.60± 0.00
0.27± 0.01
14.00± 0.00
0.07± 0.00
Granobles 7.78± 0.00
159.00± 0.15
6.91± 0.07
16.70± 0.46
424.23± 0.93
13.80± 0.00
13.00± 2.27
182.50± 10.61
28.33± 2.36
4.69± 0.37
0.29± 0.01
4.97± 0.06
0.59± 0.01
6.50± 0.50
0.04± 0.00
Pedregales 7.67± 0.26
194.00± 0.61
6.72± 0.08
11.60± 0.26
328.83± 0.64
13.53± 0.23
2.00± 0.00
222.00± 5.66
18.33± 2.36
13.26± 0.64
0.13± 0.00
1.56± 0.09
0.30± 0.01
6.00± 0.00
0.06± 0.00
a Table 2: Quality criteria acceptable for the preservation of flora and fauna in fresh waters, cold or warm, and marine waters and estuaries. Texto Unificado Legislación Secundaria delMedio Ambiente (TULSMA), Book VI, Annex I [39]. b Table 9: Discharge limits to a fresh water body. TULSMA, Book VI, Annex I [39]. * Values that exceed the quality criteria. N/A:not available. The reported values were obtained by triplicate measurements of each analyzed river sample.
Int. J. Environ. Res. Public Health 2020, 17, 5048 13 of 26
Table 6. Average and standard deviation values of major and trace metallic elements in 18 rivers of the Pichincha Province (Quito, Ecuador).
River Trace Elements Major Elements
MCLCopper(µg/L)
5 a
Lead(µg/L)
1 a
Chromium(µg/L)
32 a
Manganese(µg/L)100 a
Barium(µg/L)1000 a
Cadmium(µg/L)
1 ª
Nickel(µg/L)
25 a
Vanadium(µg/L)100 b
Zinc(µg/L)
30 a
Aluminium(mg/L)
0.1 a
Iron(mg/L)
0.3 a
Calcium(mg/L)
N/A
Sodium(mg/L)
N/A
Magnesium(mg/L)
N/A
Machángara 38.95 *± 0.00
59.7± 0.00
58.03± 0.00
165.52± 0.00
541.88± 0.00
4.17 *± 0.22
54.92 *± 0.00
50.76± 0.00
437.37 *± 0.00
18.05 *± 0.00
5.39 *± 0.00
21.2± 1.65
31.76± 1.03
6.05± 0.07
Guayllabamba 10.17 *± 0.00 <LQ 2.86
± 0.0075.50± 0.00
340.90± 0.00 <LQ 17.92
± 0.0028.49± 0.00
104.84 *± 0.00
0.49 *± 0.00
0.46 *± 0.00
17.86± 2.13
30.71± 1.43
13.33± 0.43
San Pedro 8.57 *± 0.00 <LQ 1.64
± 0.0048.95± 0.00
773.21± 0.00 <LQ <LQ 56.89
± 0.0053.44 *± 0.00
0.03± 0.00
0.28± 0.00
29.32± 2.79
73.15± 1.26
34.21± 2.87
Pita <LQ <LQ <LQ 44.02± 0.00
38.45± 0.00 <LQ <LQ 21.80
± 0.005.22± 0.00
0.16 *± 0.00
0.31 *± 0.00
16.07± 1.52
17.73± 0.55
10.73± 0.43
Monjas 10.65 *± 0.00 <LQ 2.27
± 0.00208.13± 0.00
256.91± 0.00 <LQ 3.77
± 0.0017.80± 0.00
149.67 *± 0.00
0.18 *± 0.00
0.26± 0.00
24.09± 2.97
58.19± 1.90
9.28± 0.63
Blanco 15.23 *± 0.00 <LQ 35.18
± 0.0010.13± 0.00
477.14± 0.00 <LQ 36.86 *
± 0.0018.51± 0.00
181.80 *± 0.00
5.07 *± 0.00
0.84 *± 0.00
7.92± 0.34
8.46± 0.99
2.72± 0.27
Mindo 15.68 *± 0.00 <LQ 36.26
± 0.0013.86± 0.00
440.11± 0.00 <LQ 37.31 *
± 0.0026.23± 0.00
76.77 *± 0.00
17.66 *± 0.00
0.43 *± 0.00
15.96± 0.94
12.01± 0.40
4.91± 0.09
Cinto 10.76 *± 0.00 <LQ 36.25
± 0.0069.92± 0.00
427.05± 0.00 <LQ 35.33 *
± 0.0027.15± 0.00
68.75 *± 0.00
17.30 *± 0.00
0.57 *± 0.00
17.74± 1.75
16.76± 0.78
9.00± 0.53
Pisque 23.11 *± 0.00 <LQ 41.58
± 0.0027.89± 0.00
389.50± 0.00 <LQ 42.78 *
± 0.0047.23± 0.00
83.62 *± 0.00
17.53 *± 0.00
2.37 *± 0.00
46.16± 3.71
28.62± 1.92
12.39± 0.78
Chiche 18.07 *± 0.00 <LQ 41.78
± 0.0030.13± 0.00
388.95± 0.00 <LQ 37.09 *
± 0.0046.02± 0.00
87.70 *± 0.00
18.08 *± 0.00
3.95 *± 0.00
12.71± 1.94
20.15± 0.74
7.08± 0.84
Pilatón 14.88 *± 0.00 <LQ 42.83
± 0.0023.31± 0.00
308.75± 0.00
2.31 *± 0.01
39.96 *± 0.00
26.02± 0.00
101.74 *± 0.00
13.12 *± 0.00
0.59 *± 0.00
11.67± 1.73
8.78± 0.76
4.42± 0.49
Pachijal 7.89 *± 0.00 <LQ 2.03
± 0.001.72± 0.00
229.62± 0.00 <LQ <LQ 2.43
± 0.0076.32 *± 0.00 <LOQ 0.04
± 0.005.82± 0.01
4.82± 0.06
3.28± 0.22
Alambi 8.82 *± 0.00
88.9± 0.00
3.01± 0.00
41.32± 0.00
348.04± 0.00
1.02± 0.00
3.15± 0.00
9.16± 0.00
103.90 *± 0.00
2.06 *± 0.00
1.15 *± 0.00
10.98± 0.00
8.90± 1.32
4.40± 0.19
Caoní 5.39 *± 0.00 <LQ 2.07
± 0.001.13± 0.00
253.81± 0.00 <LQ 35.33 *
± 0.00 <LQ 58.55 *± 0.00
0.08± 0.00
0.11± 0.00
3.70± 0.08
4.59± 0.21
2.37± 0.08
Mashpi <LQ <LQ 1.84± 0.00
4.11± 0.00
82.75± 0.00 <LQ <LQ <LQ 75.86 *
± 0.00 <LQ 0.02± 0.00
5.82± 0.08
4.99± 0.16
3.22± 0.01
Guachalá 12.28 *± 0.00
12.4± 0.00
42.63± 0.00
22.26± 0.00
248.71± 0.00
1.16 *± 0.03
89.94 *± 0.00
28.48± 0.00
98.91 *± 0.00
18.25 *± 0.00
0.88 *± 0.00
15.23± 2.03
14.57± 0.94
6.66± 0.86
Granobles 17.61 *± 0.00 <LQ 44.60
± 0.0054.99± 0.00
389.02± 0.00 <LQ 41.37 *
± 0.0033.65± 0.00
146.93 *± 0.00
18.12 *± 0.00
0.93 *± 0.00
13.77± 0.81
14.61± 0.42
6.63± 0.54
Pedregales 11.53 *± 0.00
86.0± 0.00
4.49± 0.00
140 *± 0.00
333.81± 0.00
1.49 *± 0.17
100.11 *± 0.00
24.50± 0.00
3711.6 *± 168.48
0.39 *± 0.00
0.87 *± 0.00
170.26± 2.51
17.81± 1.02
10.62± 0.35
a Table 2: Quality criteria acceptable for the preservation of flora and fauna in fresh waters, cold or warm, and marine waters and estuaries. Texto Unificado Legislación Secundaria delMedio Ambiente (TULSMA), Book VI, Annex I [39]. b Table 3: Quality criteria for water for agricultural irrigation. TULSMA, Book VI, Annex I [39]. * Values that exceed the quality criteria.<LQ: below the limit of quantification. N/A: not available. The reported values were obtained by triplicate measurements of each analyzed river sample.
Int. J. Environ. Res. Public Health 2020, 17, 5048 14 of 26
Unfortunately, some elements, such as Ca, Na, and Mg, are not regulated by Ecuadorian legislation.However, Ecuadorian legislation generally follows US EPA guidelines. The analysis and importanceof these major elements are well-known in several studies worldwide. In this study, the Ca levelsvaried from 3.70 to 170.26 mg/L, in the Caoní and Pedregales Rivers, respectively. Meanwhile, Naconcentrations ranged between 4.59 and 73.15 mg/L, in the Caoní and San Pedro Rivers, respectively.Finally, Mg values varied from 2.37 to 32.21 mg/L in the Caoní and San Pedro Rivers, respectively.
3.5. Statistical Analysis
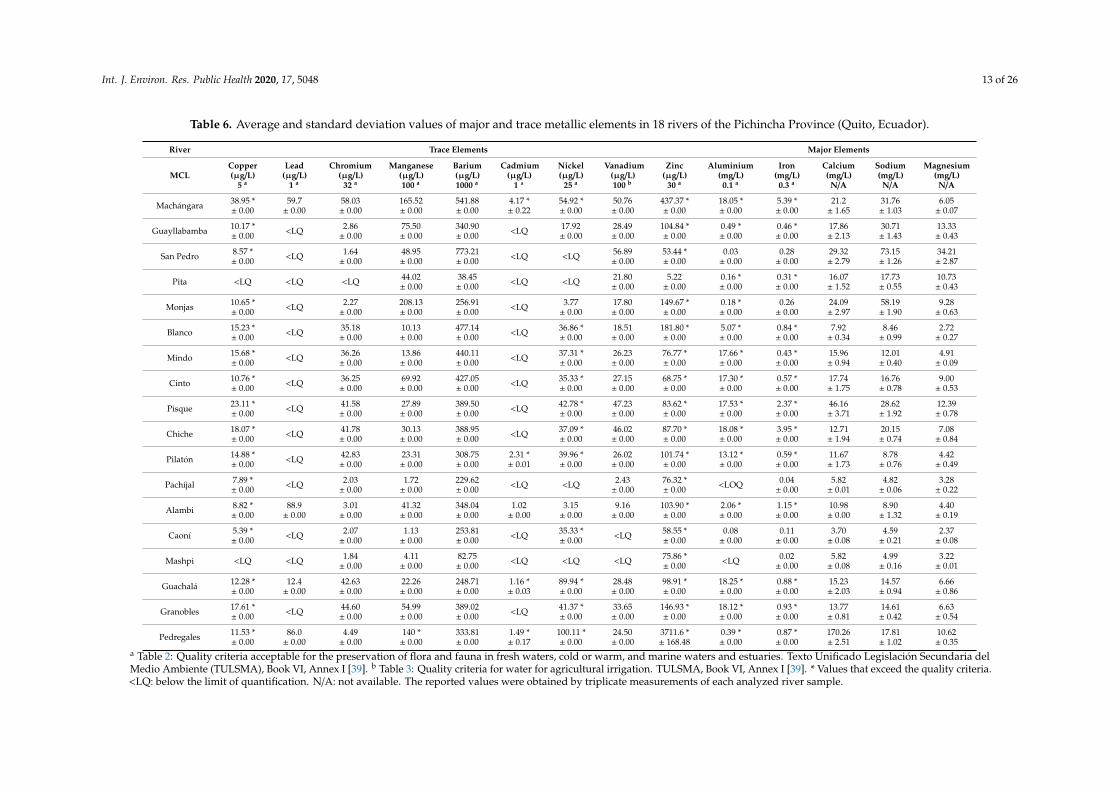
The correlation values between some physico-chemical parameters and the microbial load (E. coliand total coliform count) are shown in Table 7. All these physico-chemical parameters showedp values below 0.05 against microbial load, meaning that they were statistically significant. Accordingto Mukaka [43], correlation values could be classified into five categories: very high correlations(0.90–1.00), high correlations (0.70–0.90), moderate correlations (0.50–0.70), low correlations (0.30–0.50)and negligible correlations (0.00–0.30). Therefore, the phosphate parameter showed a very high positivecorrelation within the microbial load. Next, ammonium and sulfate showed a high positive correlationwith the microbial load. However, Mn and conductivity only demonstrated a high positive correlationwith E. coli count, supporting only a moderate positive correlation with total coliform count. Next,Cl− and Na demonstrated a moderate positive correlation with microbial load, while DO revealed amoderate negative correlation with microbial load. Similarly, CODTotal showed a moderate positivecorrelation with E. coli count but a low positive correlation against total coliform count. Finally, F−
evidenced a low positive correlation with microbial load.
Table 7. Correlation values between physico-chemical parameters and microbial load and theircorrelation categories according to Mukaka [40].
Parameters E. coli (CFU/mL) Total Coliforms (CFU/mL) Correlation Category(for E. coli/Total Coliforms)
Conductivity (µS/cm) 0.702 0.649 High/ModerateDO (mg/L) −0.599 −0.555 Negligible/Negligible
CODTotal (mg/L) 0.506 0.376 Moderate/LowCl− (mg/L) 0.674 0.578 Moderate/Moderate
NH4+N (mg/L) 0.870 0.801 High/High
PO43−P (mg/L) 0.924 0.938 Very high/Very high
SO42− (mg/L) 0.770 0.726 High/High
Manganese (mg/L) 0.742 0.675 High/ModerateFluoride (mg/L) 0.499 0.402 Low/LowSodium (mg/L) 0.607 0.547 Moderate/Moderate
Legend: All of these correlations showed a previously significant p-value equal or below 0.05.
4. Discussion
4.1. Fecal Coliform Bacteria in River Water Resources
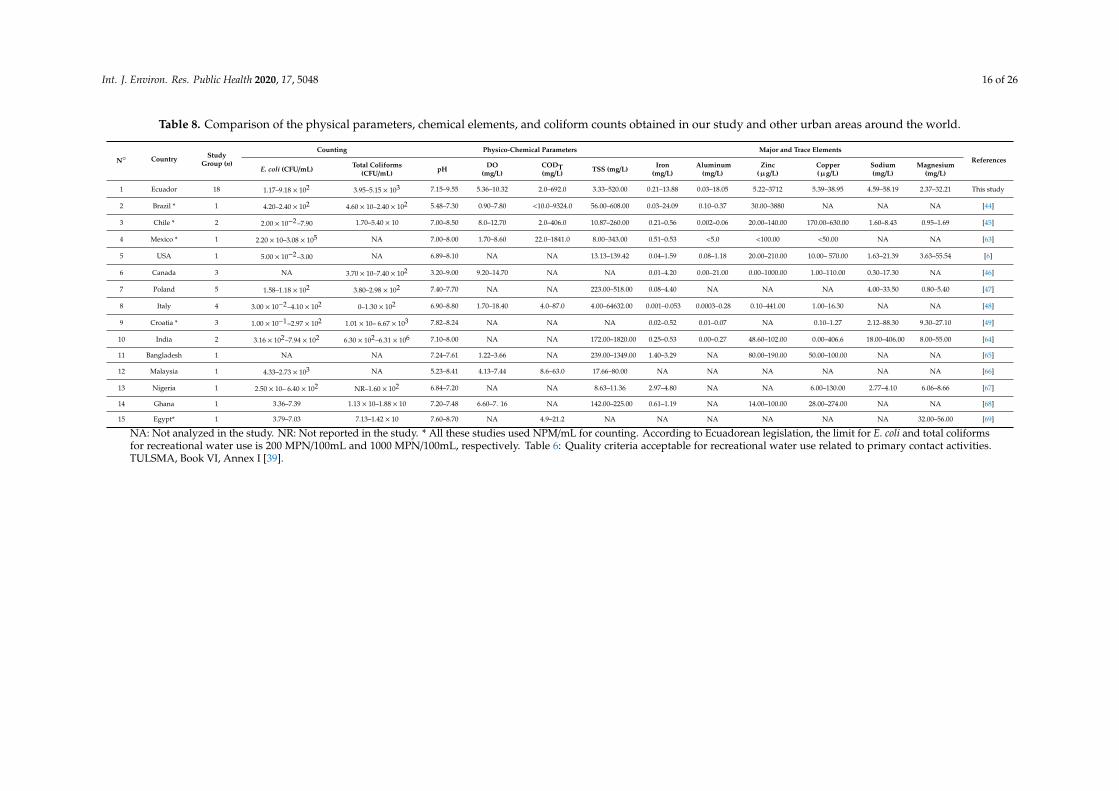
In the current study, most of the rivers showed E. coli and total coliform levels above the permittedlimits established by the United States Protection Agency [38], except for the Caoní River regardingE. coli values. However, according to Texto Unificado Legislación Secundaria del Medio Ambiente(TULSMA) [39], only the Pilatón and Caoní Rivers showed E. coli and total coliform values belowEcuadorian regulations. Our results were in agreement with previous studies performed in other LatinAmerican countries. The minimum and maximum values of E. coli and total coliform count obtainedin our river set and in other previous studies are shown in Table 8. All these studies were conducted inseveral natural water resources, mainly rivers near or in urban areas.
Furthermore, the E. coli levels obtained in the rivers of this study (1.17–9.18 × 10² CFU/mL)were similar to the results reported in Ubá Creek from Brazil [44] and in the Cautín and Imperial

Int. J. Environ. Res. Public Health 2020, 17, 5048 15 of 26
Rivers from Chile [45]. However, Carvalho et al. [44] and Rivera et al. [45] reported lower resultsfor total coliforms when compared to the present study. These studies were conducted in similarwater resources on the outskirts of the cities Minas Gerais [44] and Nueva Imperial [45]. On the otherhand, studies in the Upper Mississippi River in Minnesota from the United States [6] and in threewatersheds of the Atlantic region in Canada [46], also located near urban zones, reported lower levelsof E. coli and total coliforms, respectively, when compared to our study or even to other Latin Americancountries. As the rivers in our study set, these rivers are also used as drinking water sources andfor other activities, such as swimming, bathing, kayaking, and others [6,46]. Studies performed insome countries in Europe, such as Croatia, Italy, and Poland, reported similar levels of E. coli [47–49],showing much lower contamination levels when compared to the results obtained in the present study(see Table 4). However, countries in Asia (such as India and Malaysia) and Africa (such as Nigeria,Ghana, and Egypt) showed similar levels of E. coli when compared to studies in Latin Americancountries, including this study. A possible explanation for the slight difference in the microbial valuesmeasured in Latin America as compared to those in the USA, Canada, and Italy could be the lack ofwastewater treatment plants, while the unique climate and biodiversity of Ecuador could also explainhigher microbial load in relation to other developing countries such as Ghana and Egypt [50]. It iswell known that the proximity of volcanoes surrounding Pichincha province plays an important rolein sediments and soil fertility, leading to a richness of microbial load and diversity, as reported inseveral studies [51–53]. Additionally, the precipitation climate of Pichincha province could lead to anincrement in microbial load. Previous studies demonstrated that rain events may lead to an inflowof high nutrient concentrations as well as high loads of microbes [54,55]. Fresh water is seasonallyplentiful, generally from October through June, with runoff diminishing or fluctuating drastically therest of the year [15]. Thus, these reasons could explain our results in the present study. However,most countries in Asia and Africa also possessed wastewater treatment plants, which lead to lesspolluted water sources [56,57]. On the contrary, in Ecuador, most industrial and domestic effluentsare directly discharged into rivers, without any previous microbial or physical-chemical treatment.Several industries related to textiles, treated wood and food processing are in the Pichincha area,releasing their effluents with little or no treatment into water resources [15,58,59]. Pichincha provinceis between two ridges with a series of upland valleys with elevations ranging from 2000 to 3000 m.These upland valleys descend in elevation from north to south, with Quito (Ecuador’s capital) being inthe northern Sierra [15]. In 2013, a pilot wastewater treatment plant opened in the Pichincha Province,in the district of Quito, but it could not supply the treatment required for all the rivers analyzed in thisstudy [17] since the wastewater treatment plant located in the Southern area of Quito only treats <3%of the city’s effluent. Nowadays, Quito’s municipal government is working on a project to treat almost99% of the city’s effluent to reduce the contamination from the wastewaters [18].
The values obtained in the correlation analysis showed that, in this study, there is a strongrelationship between the microbial load and certain ions, more exactly, phosphorus, ammonium,and sulfate (see Table 7). Even though these values do not surpass the limits established by Ecuadorianlegislation, they could be taken into account to estimate the microbial load in rivers. It is well knownthat most of the bacterial microorganisms usually conduct fermentation of biological compoundsto proliferate and thus produce phosphorus, ammonium, and sulfate as metabolism derivates [60].Therefore, it could be possible to use these chemical parameters (phosphorus, ammonium, and sulfate)as potential indicators of persistent and elevated microbial loads in river water analysis. Vadde et al. [61]and Vrzel et al. [62] conducted long-term observations of persistent fecal contamination (E. coli andtotal coliforms) in several seasons and spatial locations of the Sava Basin (Slovenia) and Tiaoxi(China) Rivers, respectively, using microbial source tracking (MST) methods through phosphorus (TP),nitrite-N (NO2-N), and ammonium-N (NH4-N) measurements. Therefore, additional studies shouldbe performed in order to conduct further analysis in several seasons and different spatial locations inthe Ecuadorian rivers evaluated in this study.
Int. J. Environ. Res. Public Health 2020, 17, 5048 16 of 26
Table 8. Comparison of the physical parameters, chemical elements, and coliform counts obtained in our study and other urban areas around the world.
N◦ Country StudyGroup (n)
Counting Physico-Chemical Parameters Major and Trace ElementsReferences
E. coli (CFU/mL) Total Coliforms(CFU/mL) pH DO
(mg/L)CODT(mg/L) TSS (mg/L) Iron
(mg/L)Aluminum
(mg/L)Zinc
(µg/L)Copper(µg/L)
Sodium(mg/L)
Magnesium(mg/L)
1 Ecuador 18 1.17–9.18 × 10² 3.95–5.15 × 10³ 7.15–9.55 5.36–10.32 2.0–692.0 3.33–520.00 0.21–13.88 0.03–18.05 5.22–3712 5.39–38.95 4.59–58.19 2.37–32.21 This study
2 Brazil * 1 4.20–2.40 × 10² 4.60 × 10–2.40 × 102 5.48–7.30 0.90–7.80 <10.0–9324.0 56.00–608.00 0.03–24.09 0.10–0.37 30.00–3880 NA NA NA [44]
3 Chile * 2 2.00 × 10⁻²–7.90 1.70–5.40 × 10 7.00–8.50 8.0–12.70 2.0–406.0 10.87–260.00 0.21–0.56 0.002–0.06 20.00–140.00 170.00–630.00 1.60–8.43 0.95–1.69 [45]
4 Mexico * 1 2.20 × 10–3.08 × 105 NA 7.00–8.00 1.70–8.60 22.0–1841.0 8.00–343.00 0.51–0.53 <5.0 <100.00 <50.00 NA NA [63]
5 USA 1 5.00 × 10⁻²–3.00 NA 6.89–8.10 NA NA 13.13–139.42 0.04–1.59 0.08–1.18 20.00–210.00 10.00– 570.00 1.63–21.39 3.63–55.54 [6]
6 Canada 3 NA 3.70 × 10–7.40 × 102 3.20–9.00 9.20–14.70 NA NA 0.01–4.20 0.00–21.00 0.00–1000.00 1.00–110.00 0.30–17.30 NA [46]
7 Poland 5 1.58–1.18 × 10² 3.80–2.98 × 10² 7.40–7.70 NA NA 223.00–518.00 0.08–4.40 NA NA NA 4.00–33.50 0.80–5.40 [47]
8 Italy 4 3.00 × 10⁻²–4.10 × 10² 0–1.30 × 10² 6.90–8.80 1.70–18.40 4.0–87.0 4.00–64632.00 0.001–0.053 0.0003–0.28 0.10–441.00 1.00–16.30 NA NA [48]
9 Croatia * 3 1.00 × 10⁻¹–2.97 × 10² 1.01 × 10– 6.67 × 10³ 7.82–8.24 NA NA NA 0.02–0.52 0.01–0.07 NA 0.10–1.27 2.12–88.30 9.30–27.10 [49]
10 India 2 3.16 × 10²–7.94 × 10² 6.30 × 10²–6.31 × 10⁶ 7.10–8.00 NA NA 172.00–1820.00 0.25–0.53 0.00–0.27 48.60–102.00 0.00–406.6 18.00–406.00 8.00–55.00 [64]
11 Bangladesh 1 NA NA 7.24–7.61 1.22–3.66 NA 239.00–1349.00 1.40–3.29 NA 80.00–190.00 50.00–100.00 NA NA [65]
12 Malaysia 1 4.33–2.73 × 10³ NA 5.23–8.41 4.13–7.44 8.6–63.0 17.66–80.00 NA NA NA NA NA NA [66]
13 Nigeria 1 2.50 × 10– 6.40 × 10² NR–1.60 × 10² 6.84–7.20 NA NA 8.63–11.36 2.97–4.80 NA NA 6.00–130.00 2.77–4.10 6.06–8.66 [67]
14 Ghana 1 3.36–7.39 1.13 × 10–1.88 × 10 7.20–7.48 6.60–7. 16 NA 142.00–225.00 0.61–1.19 NA 14.00–100.00 28.00–274.00 NA NA [68]
15 Egypt* 1 3.79–7.03 7.13–1.42 × 10 7.60–8.70 NA 4.9–21.2 NA NA NA NA NA NA 32.00–56.00 [69]
NA: Not analyzed in the study. NR: Not reported in the study. * All these studies used NPM/mL for counting. According to Ecuadorean legislation, the limit for E. coli and total coliformsfor recreational water use is 200 MPN/100mL and 1000 MPN/100mL, respectively. Table 6: Quality criteria acceptable for recreational water use related to primary contact activities.TULSMA, Book VI, Annex I [39].
Int. J. Environ. Res. Public Health 2020, 17, 5048 17 of 26
4.2. E. coli Pathotypes Detection
The present study showed the presence of three E. coli pathotypes in some rivers of the Pichinchaprovince, more specifically, EAEC, EHEC, and EIEC. The most prevalent pathogen was EIEC. showingpositive results in 3 out of the 18 rivers, more exactly, the Machángara, Guayllabamba, and MonjasRivers. EHEC and EAEC were only detected in the Monjas and Machángara Rivers, respectively.When compared to the present study, other countries, such as Australia, South Africa, and Nigeria,reported the presence of four E. coli pathotypes [70–72]. This diversity in pathotypes could be due toseveral sanitation issues and zoonotic transmission by wild and livestock animals [73–75]. RamírezCastillo and colleagues [8] identified EAEC as the most prevalent E. coli pathotype in the water set ofSan Pedro River (Aguascalientes State, Mexico), in contrast to our results. EAEC is the second-mostcommon cause of travelers’ diarrhea after ETEC, in both developed and developing countries [76].EAEC are commonly recognized as a cause of endemic and epidemic diarrhea worldwide and,recently, have been shown to cause acute diarrheal illness in newborns and children in industrializedcountries [77]. In the same way, a study performed in Japan reported the presence of EPEC and EAECin the Yamato River [78], while another study in Germany reported the presence of EIEC and EPECin low percentages in the Rhine River [79]. EPEC is one of the most important pathogens infectingchildren less than 2 years of age in the developing world [80], but its prevalence may vary due todifferences in study populations, age groups and types of samples or diagnostic methodologies [81].Lastly, EIEC is a pathotype of E. coli that uses the same invasive mechanisms as Shigella spp. [82],being one of the leading causes for diarrheal mortality and morbidity [83]. Some studies have describedthe infectious potential of EIEC to cause food-related public health outbreaks [82,84,85], but limitedresearch has been performed on this subject [82]. Public health regulations apply only to Shigella spp.infections, but they usually lack simple methods to distinguish them from EIEC [82].
It is important to mention that the higher amount of E. coli pathotypes usually found in tropical orsub-tropical countries can be attributed to warmer water conditions that facilitate the survival rateof E. coli pathotypes [86]. Thus, the presence of different E. coli pathotypes in developed countriesas compared to developing ones could be attributed to climate variations and environment context,as previously discussed in Section 4.1. This situation could be a threat to public health since thelocal legislation only focuses on microbial and physical-chemical parameters, while the presence ofpathogenic bacteria should also be considered [87]. In addition, most of the rivers receive dischargesfrom several sources, such as agricultural farms, livestock or breeding farms, and also wastewatersfrom urban and industrial areas. Therefore, it is challenging to establish the main point sources ofpollution in the rivers of our study set without further seasonal and spatial analysis of each river.Nonpoint sources of pollution must also be considered in the evaluation of the microbial load in eachriver. It is important to mention that heavy rain or similar events in tropical countries may increase thenumber of pathogens in river sediments as well as the presence of contaminants of nonpoint sources(such as fecal material from domestic and wild animals) in the rivers [71,87]. In Quito, the capitalcity of Ecuador, several rivers are located near agricultural or livestock farms, and they also receivedischarge from industrial wastewaters and municipal sewage without previous treatment [16]. Finally,rivers are commonly used for recreational activities, agriculture, livestock feeding, or even domesticactivities (such as bathing, washing clothes, and drinking water) [2], leading to severe public healthissues, mainly diarrheal-associated diseases [13], with Ecuador not being the exception.
4.3. Analysis of Commensal and Parasitic Microorganisms
Furthermore, other bacterial genera were also detected in this study, such as Pseudomonas andLegionella. These results were not surprising because both genera are known to be abundant andcommensal in water resources [25,31]. However, some species of both Pseudomonas and Legionellagenera have been associated with diseases, more exactly, P. aeruginosa and L. pneumophila [31,87],respectively. Nonetheless, other non-bacterial species have been reported in water sources [87–89],such as Candida albicans and parasites (Giardia and Cryptosporidium spp.). Candida albicans was detected
Int. J. Environ. Res. Public Health 2020, 17, 5048 18 of 26
in a low percentage in our study set, in 3 of the 18 analyzed rivers. Even though Candida sp. hasbeen associated with freshwater, this result was expected because this yeast is commonly foundin mucocutaneous areas and alimentary tracts of mammals or birds [90]. Cook and Schlitzer [90]revealed that the presence of Candida albicans in rivers commonly came from a recent source ofcontamination by human or animal feces. Other species of Candida, such as C. parapsilosis, C. krusei,C. glabrata, and C. tropicalis, have also been associated with fresh water [91] and opportunisticinfections [34]. Cryptosporidium and Giardia spp. parasites were also detected in 3 and 8 of the18 rivers, respectively, evidencing greater parasite contamination in the Pichincha River than withCandida albicans. In Germany, a study on the Rhine River showed similar results, isolating a biggerpercentage of Giardia than Cryptosporidium species [27]. Most studies lack parasite detection in wateranalysis or show low levels of biologic contamination [6,26]. However, it has been shown by severalauthors that inhibitory compounds (such as humic acids) in river samples can inhibit nested PCR,leading to false results in parasite detection [25,27]. To avoid this, it is recommended to treat thesamples with sodium or hypochlorite to reduce the possible effects of inhibition [27]. Another possiblemethodical troubleshooting issue, mainly in Cryptosporidium oocytes, could be the loss of parasitesample by absorption into the recollection recipients or laboratory material and filtration steps [92].Thus, further studies should be conducted to isolate pathogenic species from these rivers and fullycharacterize their virulence properties against public health.
4.4. Evaluation of Physico-Chemical Parameters in Water Samples
As previously referred to in Table 5, most of the physico-chemical parameters analyzed in thisstudy were below the maximum allowable levels established by the Ecuadorean legislation for thepreservation of flora and fauna in fresh waters, cold or warm, marine waters and estuaries or dischargelimits to a fresh water body [39]. Nevertheless, certain parameters were outside of the authorized range,more precisely, pH in 11% of the rivers and CODT, and TSS in 28% of the rivers. When compared to otherstudies, some rivers in other countries of Latin America, such as Chile [45] and Mexico [63], showed pHvalues within the range of this study (7.00 to 8.50). Meanwhile, in Brazil, Carvalho and Stapelfeldt [44]reported lower pH levels ranging from 5.48 to 7.30 in creek Ubá. However, studies from rivers in NorthAmerica (the Mississippi, Mersey, Point Wolfe, and Dunk Rivers) showed pH values in a higher rangevarying from 3.20 to 9.00 [6,46]. The present study showed the highest pH value (9.55) reported inthe Pisque River when compared to several studies worldwide, shown in Table 8. Usually, higher pHvalues in surface waters are associated with carbonate rocks of the geographical region and also withwastewaters from residual municipal or industrial discharge effluents [63,93]. DO values obtainedin this study were similar to the ranges analyzed in rivers from other countries. However, severalrivers from countries worldwide, such as Italy [48], Bangladesh [65], and Malaysia [66], registeredextremely low DO values (see Table 8). These low DO values could be explained by the discharge ofuntreated wastewaters with high concentrations of organic matter [94]. In Ecuador, when studyingwater quality parameters in the Machángara River in a longitudinal analysis (DO, biodegradabilityindex (BOD/COD) and total nitrogen), Vizcaíno et al. [20] observed that high temperatures had anegative effect on DO by decreasing its value. Thus, longitudinal studies should be conducted toclarify variables associated with the inconsistency of these physico-chemical parameters.
Five rivers (Alambi, Pisque, Chiche, Monjas, and Machángara Rivers) showed high levels of totalchemical oxygen demand (CODT). Rivera and colleagues [45] detected similar CODTotal levels in Chile’sCautin and Imperial Rivers. However, in the Atoyac (Mexico) and Ubá (Brazil) Rivers, studies reportedgreater differences in CODT range, reaching contamination levels of 1841 and 9324 mg/L [44,63],respectively. Regarding other countries worldwide, such as Italy [48], Malaysia [66] and Egypt [69],the obtained values for COD were lower than the ones from this study. Some authors have suggestedthat these high COD values can be related to the discharge of wastewater and agricultural activities,which normally increase the concentration of organic matter in the river [4].
Int. J. Environ. Res. Public Health 2020, 17, 5048 19 of 26
Finally, the values of total suspended solids (TSS) in our study showed that 28% of riversregistered values above the MCL (Monjas, Pisque, Chiche, Alambi, and Machángara Rivers). Most riversworldwide registered high levels of TSS, surpassing the maximum permitted limit. Concerning thepresent study, high levels of TSS (3.33–520.00 mg/L) were reported in the Machángara, Alambi,Chiche, Pisque, and Monjas Rivers. Likewise, rivers from Brazil [44] and Poland [47] showed similarhigh measures of TSS. It is important to mention that high values of TSS could be associated withseveral climate and geographical conditions [66], such as recent rainfall, organic or inorganic particlessuspended in surface water, and even higher rates of soil erosion produced by human activities.Several examples of these conditions in Pichincha province are given in Sections 4.1 and 4.2.
4.5. Determination of Minor and Major Elements in Water Samples
Minor and major elements were also measured in the water samples of the 18 rivers, as previouslyshown in Table 6. In the case of the trace metals, the concentrations were higher than those establishedby Ecuadorian legislation [39] for Zn, Cu, Ni, Pb, Cd, and Mn in 94, 89, 61, 22, 22, and 17% of therivers analyzed in this study, respectively. Finally, Cr was higher than the recommended value in theMachangara River. In the case of major elements, Al and Fe values were higher than the recommendedguidelines in 83 and 72% of rivers analyzed, respectively. As previously mentioned, 89% of the riverssurpassed the MCL values for Cu; this could be explained by the possible presence of organic or inorganiccompounds from agricultural pesticides used near those rivers or also by the mineral composition of thesoil [95]. A single value of Cr surpassed the guidelines by a factor of 1.6. This peak value was registeredin the Machángara River, which could be attributed to discharges from industries that are located nearthe river [95]. The presence of Cr in water bodies can be related to discharges from the cement, dye,construction, metallurgy, paint (with anticorrosive compounds), and leather industries [96,97]. It isimportant to mention that several of these industries are located in the Pichincha area. Four riversin our study set also showed higher values of Cd when compared to MCL: the Machángara, Pilatón,Pedregales, and Guachalá Rivers. According to the WHO [42], high Cd concentrations are related tothe presence of steel or plastic industries, which can also be found in the Pichincha area. Additionally,Cd is commonly used in agricultural fertilizers, and, during agricultural runoff, it could reach watersources [98]. High Fe values found in this study are comparable to values reported in other countries.A possible explanation for these high values of Fe could be the discharge of untreated effluentsfrom metallurgical industries located near these rivers, probably similar to the Fe and Al companiespreviously described next to the Nworie River in Nigeria [67] and metal contaminations alreadydescribed in other rivers or regions in Ecuador [51,99–101]. Alternatively, they could reflect naturalsources due to the soil composition [95]. On the other hand, the Pedregales, Machángara, and MonjasRivers showed higher concentrations of Mn than the allowed value in Ecuadorian legislation [39].Comparing this result with other countries, Gowrisankar and colleagues [64] reported a low range ofMn levels in the Adyar River and Chembarambakkam Lake in India. Gowrisankar and colleagues alsosuggested that high concentrations of metals, such as Al, Fe, and Mn, could be attributed to domesticsewage contaminants, for instance, metal scraps, batteries, paints, or oils from service stations [64].Moreover, this study also showed higher concentrations of Al in comparison with other Americancountries, such as Mexico [63], Brazil [44], Chile [45], and the USA [6]. However, in Canada, Khanand colleagues [46] showed similar contamination levels of Al in the Mersey, Point Wolfe and DunkRivers. Additionally, 22% of the rivers showed high levels of Pb, more exactly, the Machángara, Alambi,Guachalá, and Pedregales Rivers. In 1985, a study demonstrated that rivers located near volcanic zonesusually contain higher concentrations of metals, such as Al, Pb, and Fe [95]. In another study performedin Mexico, they found high concentrations of metals such as Fe, Al, and Mn, which they also attributedto the location of the river near a volcanic zone [53]. Since the majority of the rivers located in Pichinchaoriginate on the highlands and are located near volcanoes [32], this could be a plausible explanationfor the guideline-surpassing values of Al and Fe metals. Nonetheless, the high concentrations ofAl could also be associated with discharge of industrial wastewaters, as already postulated in a
Int. J. Environ. Res. Public Health 2020, 17, 5048 20 of 26
previous study [102]. Furthermore, only the Pita River showed a value of Zn within legal limits.Other studies also obtained similar values, more precisely, for the Ubá Creek in Brazil (3.88 mg/L) [44].While several studies in other Latin American countries (Mexico and Chile), North American countries(USA and Canada), a European country (Italy), Asian countries (India and Bangladesh) and an Africancountry (Ghana) reported lower Zn values in their river analyses, not one was within the MCLestablished by Ecuadorean legislation. The high Zn concentrations in rivers could be associated withindustrial discharges in Ecuador [29] and Brazil [103]. In this study, sixteen of the eighteen riversshowed higher values of copper than the maximum legal value established by Ecuadorian legislation.Some sources mention that Cu can be dispersed to the environment from water pipes from householdsor industries [95]. Comparing our values of Cu with other studies worldwide, only Mexico evidencedsimilar concentrations [63]. However, several studies from other countries, such as Chile, the USA,Canada, India, Bangladesh, Nigeria and Ghana, reported higher values of Cu in their rivers analysis.High concentrations of copper could be explained by mining industries or activities near the watersources [103]. They could also be explained due to the geological characteristics of the river [45],while lower concentrations of copper could be explained by adsorption on mineral surfaces [95].Major elements were also analyzed in this study, revealing a high range of concentrations for Ca,Na and Mg. Although no maximum legal value of these major elements is described in Ecuadorianlegislation, this study showed the highest values of Ca when compared to other studies worldwide.Regarding Na, only the Sutla River in Croatia [49] and the Adyar River in India [64] evidenced valueshigher than in the present study. However, some studies of rivers in India (Adyar River) [64], USA(Mississippi River) [6], and Egypt (Nile River) [69] reported concentrations of Mg almost twice as highas the values reported in this study. These high concentrations of major elements have been describedin rivers located near volcanos according to Meybeck and Helmer [93]. It is also important to note thatthe Pedregales River showed the highest concentration of Ca, and it is also located in an industrial areafor dairy products, which are often enriched with this metal [104]. Consequently, industrial dischargescould also pollute the river with high levels of Ca through their untreated effluent discharges into thePedregales River. Additional studies should be conducted to compare control and impacted areasacross the river. A longitudinal analysis should be carried out to establish if the presence of metals insurface water samples is attributable to natural or anthropogenic sources.
5. Conclusions
In summary, this study revealed diverse and severe contamination in most of the 18 riverslocated in the province of the capital city, Quito (Pichincha), in Ecuador. The level of contaminationwas characterized by different types of parameters, microbial load and several microbial genera,physico-chemical parameters, and metal levels. These 18 rivers are commonly used in rural areasfor drinking purposes and recreational, agricultural, and industrial activities. The initial analysisof the microbial parameters in 18 rivers from Pichincha showed high levels of fecal contamination(E. coli and total coliforms), the presence of several microbial species (Pseudomonas and Legionella spp.,Candida albicans, Cryptosporidium and Giardia spp.) and also E. coli pathotypes (EAEC, EHEC, and EIEC).Cryptosporidium and Giardia spp. were detected in three and eight rivers, respectively, evidencinggreater parasite contamination in the rivers of Pichincha. Sequencing analysis confirmed the positiveresults for Giardia spp., identifying with 100% homology to Giardia intestinalis. The Monjas andMachángara Rivers showed the highest number of E. coli pathotypes. In both cases, two pathotypeswere identified by PCR, more precisely, EHEC and EIEC in the Monjas River and EAEC and EIECin the Machángara River. The physico-chemical results were higher than the Ecuadorean guidelinesfor CODTotal and TSS in 28% of the rivers evaluated. In the case of the heavy metals, Zn, Cu, Ni,Pb, Cd, and Mn exceeded the guidelines in 94, 89, 61, 22, 22 and 17% of the rivers analyzed in thisstudy. Al and Fe exceeded the guidelines in 83% and 72% of the rivers. Furthermore, both microbialand physico-chemical analysis revealed that the most contaminated rivers were the Machángara andMonjas. It is highly recommended to conduct a spatial analysis in different seasons to evaluate the
Int. J. Environ. Res. Public Health 2020, 17, 5048 21 of 26
effects of climate conditions on the microbial and physico-chemical parameters. Finally, different pointand non-point sources of pollution in each river, as well as their impact on public health, should alsobe analyzed.
Supplementary Materials: The following are available online at http://www.mdpi.com/1660-4601/17/14/5048/s1,Table S1: Name of the rivers and location on the map of Pichincha, with its coordinates and water samplescollection date. Table S2: Recovery percentage, reproducibility percentage, accuracy percentage, detection,and quantification limits obtained from metal analysis employing the ICP-OES.
Author Contributions: Molecular analysis: P.B.-S. and C.Q. DNA extraction: P.B.-S. Physical-chemical analysis:G.M., C.Q., L.M. and V.O.-H. Study design, project coordination, and help with the manuscript draft: A.M. andV.O.-H. Data analysis: P.B.-S., E.T., L.M., A.M. and V.O.-H. Original draft preparation: P.B.-S. and A.M. Reviewand editing: A.M., L.M. and V.O.-H. All authors have read and agreed to the published version of the manuscript.
Funding: This work was supported by Chancellor Grant 2015 and COCIBA research budget from UniversidadSan Francisco de Quito, under the Project ID: 1106 entitled “Characterization and quantification of microbialpathogens in the natural water resources of Ecuador”. This work was realized under jurisdiction of the ContratoMarco de Acceso a los Recursos Genéticos No. MAE-DNB-CM-2018-0085. The funders had no role in studydesign, data collection and analysis, decision to publish, or preparation of the manuscript.
Acknowledgments: We thank the volunteers that made this study possible, and also the people who work in theInstitute of Microbiology of USFQ, in particular Christina Álvarez who helped in the development of the analysisin the laboratory. We also thank Izan Chalen for creating the map for this study. Finally, we would like to thankthe Laboratory of Environmental Engineering at USFQ (LIA-USFQ) for metal analysis (ThermoScientific iCAP7400 ICP-OES) and Universidad San Francisco de Quito for financial support.
Conflicts of Interest: The authors declare no conflict of interest.
References
1. Kora, A.J.; Rastogi, L.; Kumar, S.J.; Jagatap, B.N. Physico-chemical and bacteriological screening of HussainSagar lake: An urban wetland. Water Sci. 2017, 31, 24–33. [CrossRef]
2. Noorhosseini, S.A.; Allahyari, M.S.; Damalas, C.A.; Moghaddam, S.S. Public environmental awareness ofwater pollution from urban growth: The case of Zarjub and Goharrud rivers in Rasht, Iran. Sci. Total Environ.2017, 599–600, 2019–2025. [CrossRef] [PubMed]
3. Olguín, E.J.; González-portela, R.E.; Sánchez-galván, G.; Zamora-, J.E. Contaminación de ríos urbanos:El caso de la subcuenca del río Sordo en Xalapa, Veracruz, México. Rev. Lat. Biotecnol. Amb. Algal 2010, 1,178–190.
4. Zhang, X.; Wu, Y.; Gu, B. Urban rivers as hotspots of regional nitrogen pollution. Environ. Pollut. 2015, 205,139–144. [CrossRef]
5. Paul, D. Research on heavy metal pollution of river Ganga: A review. Ann. Agrar. Sci. 2017, 15, 278–286.[CrossRef]
6. Staley, C.; Gould, T.J.; Wang, P.; Phillips, J.; Cotner, J.B.; Sadowsky, M.J. Bacterial community structure isindicative of chemical inputs in the Upper Mississippi River. Front. Microbiol. 2014, 5, 1–13. [CrossRef]
7. WHO. Water Quality Monitoring: A Practical Guide to the Design and Implementation of Freshwater Quality Studiesand Monitoring Programmes; WHO: Geneva, Switzerland, 1996; ISBN 9781107671812.
8. Ramírez Castillo, F.Y.; Avelar González, F.J.; Garneau, P.; Díaz, F.M.; Guerrero Barrera, A.L.; Harel, J.Presence of multi-drug resistant pathogenic Escherichia coli in the San Pedro River located in the State ofAguascalientes, Mexico. Front. Microbiol. 2013, 4, 1–16. [CrossRef]
9. Valencia, R.; Ortiz, E.; Gomez, J.L. La contaminación de los ríos, otro punto de vista. Cienc. Front. 2014, 7.10. UNESCO. Informe Mundial de las Naciones Unidas sobre el Desarrollo de los Recursos Hídricos 2017. Aguas
residuales: El recurso Desaprovechado; UNESCO: Paris, France, 2017; ISBN 978-92-3-300058-2.11. WHO. Waterborne Disease Related to Unsafe Water and Sanitation; WHO: Geneva, Switzerland, 2018; pp. 9–10.12. Fretes, V.; Giugale, M.; López, J. Ecuador: An Economic and Social Agenda in the New Millenium; The World
Bank: Washington, DC, USA, 2003; ISBN 0821355457.13. Vasco, G.; Trueba, G.; Atherton, R.; Calvopiña, M.; Cevallos, W.; Andrade, T.; Eguiguren, M.; Eisenberg, J.N.S.
Identifying etiological agents causing diarrhea in low income Ecuadorian communities. Am. J. Trop. Med. Hyg.2014, 91, 563–569. [CrossRef]
Int. J. Environ. Res. Public Health 2020, 17, 5048 22 of 26
14. INEC. Resultados del Censo 2010 de Población y Vivienda en el Ecuador. Fascículo Provincial Pichincha; INEC:Quito, Republic of Ecuador, 2010.
15. Sistema Nacional de Información Quito, Pichincha. 2010. Republic of Ecuador, National Information.Available online: https://sni.gob.ec/inicio (accessed on 22 June 2020).
16. Gomez, L.; Torres, M.; Landazuri, A.; Mayorga, L. Programa para la descontaminación de los ríos de Quito,PDRQ. In Proceedings of the VI International Conference of Una Perspectiva Internacional sobre RecursosHídricos y Medio Ambiente, Quito, Ecuador, 7–9 January 2014; p. 9.
17. EPMAPS. Estudio De Impacto Ambiental: Construcción y Operación-Mantenimiento de la Planta deRecuperación de agua en el sector Quitumbe. Calid. Ambient. 2013, 2–26.
18. Unidad de Noticias. El proyecto Vindobona arranca para la descontaminación de los ríos de Quito. El Comercio2019, 1–3.
19. Perez Naranjo, C.; Maurice, L.; Ochoa-Herrera, V.; Lopez, F.; Egas, D.; Lagane, C.; Besson, P. Determinaciónde elementos mayores en sedimentos provenientes de zonas afectadas por actividades petroleras en Ecuador.ACI Av. Cienc. Ing. 2015, 7, C95–C115. [CrossRef]
20. Vizcaíno, P.; Carrera, E.V.; Sanroman, M.; Rojo-Alvarez, J.L. Spatio-Temporal Analysis of Water QualityParameters in Machángara River with Nonuniform Interpolation Methods Spatio-Temporal Analysis ofWater Quality Parameters in Machángara River with Nonuniform Interpolation Methods. Water 2016, 8, 507.[CrossRef]
21. Voloshenko, A.; Cumbal, L.; Lev, O. Emerging pollutants in the Esmeraldas watershed in Ecuador: Dischargeand attenuation of emerging organic pollutants along. Environmental Science Processes & Impacts Emergingpollutants in the Esmeraldas watershed in Ecuador: Discharge and attenuati. Environ. Sci. Process. Impacts2014, 1–13. [CrossRef]
22. Campaña, A.; Gualoto, E.; Chiluisa-Utreras, V. Evaluación físico-química y microbiológica de la calidad delagua de los ríos Machángara y Monjas de la red hídrica del distrito metropolitano de Quito. Bionatura 2017,2, 305–310. [CrossRef]
23. Benítez, M.B.; Champagne, P.; Ramos, A.; Torres, A.F.; Ochoa-Herrera, V. Wastewater treatment for nutrientremoval with Ecuadorian native microalgae. Environ. Technol. (United Kingdom) 2018, 3330, 1–9. [CrossRef]
24. Liang, X.; Liao, C.; Thompson, M.L.; Soupir, M.L.; Jarboe, L.R.; Dixon, P.M.E. coli surface properties differbetween stream water and sediment environments. Front. Microbiol. 2016, 7, 1–10. [CrossRef]
25. Dobrowsky, P.H.; De Kwaadsteniet, M.; Cloete, T.E.; Khan, W. Distribution of indigenous bacterial pathogensand potential pathogens associated with roof-harvested rainwater. Appl. Environ. Microbiol. 2014, 80,2307–2316. [CrossRef]
26. Dobrowsky, P.H.; van Deventer, A.; De Kwaadsteniet, M.; Ndlovu, T.; Khan, S.; Cloete, T.E.; Khan, W.Prevalence of virulence genes associated with pathogenic Escherichia coli strains isolated from domesticallyharvested rainwater during low- and high-rainfall periods. Appl. Environ. Microbiol. 2014, 80, 1633–1638.[CrossRef]
27. Gallas-Lindemann, C.; Sotiriadou, I.; Plutzer, J.; Noack, M.J.; Mahmoudi, M.R.; Karanis, P. Giardiaand Cryptosporidium spp. dissemination during wastewater treatment and comparative detection viaimmunofluorescence assay (IFA), nested polymerase chain reaction (nested PCR) and loop mediatedisothermal amplification (LAMP). Acta Trop. 2016, 158, 43–51. [CrossRef]
28. Law, J.W.-F.; Ab Mutalib, N.-S.; Chan, K.-G.; Lee, L.-H. Rapid methods for the detection of foodborne bacterialpathogens: Principles, applications, advantages and limitations. Front. Microbiol. 2014, 5, 770. [CrossRef][PubMed]
29. Reyes, J.; Vergara, I.; Torres, O.; Díaz, M.; González, E. Contaminación por metales pesados: Implicacionesen salud, ambiente y seguridad alimentaria. Rev. Ing. Investig. Desarro. 2016, 16, 66–77. [CrossRef]
30. Ahmed, W.; Sidhu, J.P.S.; Toze, S. An Attempt to Identify the Likely Sources of Escherichia coli HarboringToxin Genes in Rainwater Tanks. Environ. Sci. Technol. 2012, 46, 5193–5197. [CrossRef] [PubMed]
31. Stanwell-Smith, R.; Zinnser, H.; Brundtland, G.H.; Satcher, D.; Wilson, M.E. Emerging Issues in Water andInfectious Disease; WHO: Geneva, Switzerland, 2003; Volume 1, pp. 1–24.
32. Museo Ecuatoriano de Ciencias Naturales (MECN). Ecosistemas del Distrito Metropolitano de Quito DMQ;Editorial Fondo Ambiental del Municipio del Distrito Metropolitano de Quito: Quito, Ecuador, 2009;ISBN 9789978996713.
Int. J. Environ. Res. Public Health 2020, 17, 5048 23 of 26
33. APHA. Standard Methods for the Examination of Water and Wastewater; APHA: Washington, DC, USA, 2012;Volume 22, ISBN 9780875530130.
34. Luo, G.; Mitchell, T.G. Rapid Identification of Pathogenic Fungi Directly from Cultures by Using MultiplexPCR Rapid Identification of Pathogenic Fungi Directly from Cultures by Using Multiplex PCR. J. Bacteriol.2002, 40, 2860. [CrossRef]
35. Salza, S. Ricerca e Caratterizzazione di Protozoi Zoonosici in Mitili Allevati e Commercializzati Nella RegioneSardegna; Università degli Studi di Sassari: Sassari, Italy, 2014.
36. Yu, J.R.; Lee, S.U.; Park, W.Y. Comparative sensitivity of PCR primer sets for detection of Cryptosporidiumparvum. Korean J. Parasitol. 2009, 47, 293–297. [CrossRef]
37. Grube, A.M.; Stewart, J.R.; Ochoa-Herrera, V. The challenge of achieving safely managed drinking watersupply on San Cristobal island, Galápagos. Int. J. Hyg. Environ. Health 2020, 228, 113547. [CrossRef]
38. Recreational Water Quality Criteria. 2012. Available online: http://www.adeq.state.ar.us/regs/drafts/reg02/
13-003-R/comments/reg_2_comments_bwd_attachment_8.pdf (accessed on 22 June 2020).39. FAO. TULSMA Norma De Calidad Ambiental Y De Descarga De Efluentes: Recurso Agua; FAO: Rome, Italy, 2015.40. Costa, C.F.M.; Monteiro Neto, V.; de Santos, B.R.C.; Costa, B.R.R.; Azevedo, A.; Serra, J.L.; Mendes, H.B.R.;
Nascimento, A.R.; Mendes, M.B.P.; Kuppinger, O. Enterobacteria identification and detection of diarrheagenicEscherichia coli in a Port Complex. Braz. J. Microbiol. 2014, 45, 945–952. [CrossRef]
41. Ndlovu, T.; Le Roux, M.; Khan, W.; Khan, S. Co-detection of virulent escherichia coli genes in surface watersources. PLoS ONE 2015, 10, 1–12. [CrossRef]
42. Gorchev, H.G.; Ozolins, G. WHO guidelines for drinking-water quality. WHO Chron. 2011, 38, 104–108.[CrossRef]
43. Mukaka, M.M. Statistics corner: A guide to appropriate use of correlation coefficient in medical research.Malawi Med. J. 2012, 24, 69–71.
44. Carvalho, C.D.F.; Stapelfeldt, F. Qualidade das águas do ribeirão Ubá-MG. Geociencias 2004, 57, 165–172.[CrossRef]
45. Rivera, N.R.; Encina, F.; Mejias, A.M.P. La Calidad de las Aguas en los Ríos Cautín e Imperial, IX Región-Chile Water Quality in the Cautín and Imperial Rivers, IX Region-Chile. Inf. Tecnológica 2004, 15, 89–101.
46. Khan, F.; Husain, T.; Lumb, A. Water quality evaluation and trend analysis in selected watersheds of theAtlantic region of Canada. Environ. Monit. Assess. 2003, 88, 221–242. [CrossRef] [PubMed]
47. Lenart-Boron, A.; Wolanin, A.; Jelonkiewicz, E.; Zelazny, M. The effect of anthropogenic pressure shownby microbiological and chemical water quality indicators on the main rivers of Podhale, southern Poland.Environ. Sci. Pollut. Res. 2017, 24, 12938–12948. [CrossRef]
48. Ferronato, C.; Modesto, M.; Stefanini, I.; Vianello, G.; Biavati, B.; Antisari, L.V. Chemical and MicrobiologicalParameters in Fresh Water and Sediments to Evaluate the Pollution Risk in the Reno River Watershed (NorthItaly). J. Water Resour. Prot. 2013, 5, 458–468. [CrossRef]
49. Dragun, Z.; Kapetanovic, D.; Raspor, B.; Teskeredžic, E. Water quality of medium size watercourse underbaseflow conditions: The case study of river Sutla in Croatia. Ambio 2011, 40, 391–407. [CrossRef]
50. Doherty, M.; Yager, P.L.; Moran, M.A.; Coles, V.J.; Fortunato, C.S.; Krusche, A.V.; Medeiros, P.M.; Payet, J.P.;Richey, J.E.; Satinsky, B.M.; et al. Bacterial biogeography across the Amazon River-ocean continuum.Front. Microbiol. 2017, 8, 1–17. [CrossRef]
51. Mainville, N.; Webb, J.; Lucotte, M.; Davidson, R.; Betancourt, O.; Cueva, E.; Mergler, D. Decrease of soilfertility and release of mercury following deforestation in the Andean Amazon, Napo River Valley, Ecuador.Sci. Total Environ. 2006, 368, 88–98. [CrossRef]
52. Barraza, F.; Maurice, L.; Uzu, G.; Becerra, S.; López, F.; Ochoa-Herrera, V.; Ruales, J.; Schreck, E. Distribution,contents and health risk assessment of metal(loid)s in small-scale farms in the Ecuadorian Amazon: An insightinto impacts of oil activities. Sci. Total Environ. 2018, 622–623, 106–120. [CrossRef]
53. Vargas-solano, S.V.; Rodríguez-gonzález, F.; Arenas-ocampo, M.L.; Martínez-velarde, R.; Sujitha, S.B.;Jonathan, M.P. Heavy metals in the volcanic and peri-urban terrain watershed of the River Yautepec, Mexico.Environ. Monit. Assess. 2019, 191. [CrossRef]
54. Kaushik, R.; Balasubramanian, R.; Dunstan, H. Microbial quality and phylogenetic diversity of fresh rainwaterand tropical freshwater reservoir. PLoS ONE 2014, 9. [CrossRef] [PubMed]
55. Merz, J.; Dangol, P.M.; Dhakal, M.P.; Dongol, B.S.; Nakarmi, G.; Weingartner, R. Rainfall-runoff events in amiddle mountain catchment of Nepal. J. Hydrol. 2006, 331, 446–458. [CrossRef]
Int. J. Environ. Res. Public Health 2020, 17, 5048 24 of 26
56. Nikiema, J.; Figoli, A.; Weissenbacher, N.; Langergraber, G.; Marrot, B.; Moulin, P. Wastewater treatmentpractices in Africa-experiences from seven countries. Sustain. Sanit. Pr. 2013, 14, 16–24.
57. Panswad, T.; Polprasert, C.; Yamamoto, K. Water Pollution Control in Asia. In Proceedings of the InternationalAssociation of Water Pollution Research and Control, Bangkok, Thailand, 9–11 November 1988; Elsevier:Amsterdam, The Netherlands, 1988.
58. Proaño, R.G.S.; Gualoto, K.J.G. Wastewater treatment of industrial loads with advanced oxidation inconventional systems. La Granja J. Life Sci. 2018, 27, 103–111. [CrossRef]
59. Montero, C.; Castañeda, K.; Oña, M.; Flores, D.; De La Rosa, A. Catalyst based on sludge derived fromwastewater treatment of textile industry. Chem. Eng. Trans. 2018, 70, 931–936. [CrossRef]
60. Jacoby, R.; Peukert, M.; Succurro, A.; Koprivova, A. The Role of Soil Microorganisms in Plant MineralNutrition—Current Knowledge and Future Directions. Front. Plant Sci. 2017, 8, 1–19. [CrossRef]
61. Vadde, K.; Wang, J.; Cao, L.; Yuan, T.; McCarthy, A.J.; Sekar, R. Assessment of Water Quality and Identificationof Pollution Risk Locations in Tiaoxi River. Water 2018, 10, 183. [CrossRef]
62. Vrzel, J.; Vukovi, B.; Kolarevi, S.; Ga, Z.; Kra, M.; Kosti, J.; Aborgiba, M.; Farnleitner, A.; Reischer, G.;Linke, R.; et al. Science of the Total Environment Determination of the sources of nitrate and the microbiologicalsources of pollution in the Sava River Basin. Sci. Total Environ. 2016, 573, 1460–1471. [CrossRef]
63. Sandoval Villasana, A.M.; Pulido-Flores, G.; Monks, S.; Gordillo Martinez, A.J.; Villegas Villareal, E.C.Physicochemical, microbiological and toxicological evaluation of the environmental degradation of theAtoyac river, Mexico. Interciencia 2009, 34, 880–887.
64. Gowrisankar, G.; Chelliah, R.; Ramakrishnan, S.R.; Elumalai, V.; Dhanamadhavan, S.; Brindha, K.; Antony, U.;Elango, L. Data Descriptor: Chemical, microbial and antibiotic susceptibility analyses of groundwater after amajor flood event in Chennai. Sci. Data 2017, 4, 1–13. [CrossRef]
65. Islam, M.S.; Tusher, T.R.; Mustafa, M.; Mahmud, S. Effects of Solid Waste and Industrial Effluents on WaterQuality of Turag River at Konabari Industrial Area, Gazipur, Bangladesh. J. Environ. Sci. Nat. Resour. 2013, 5,213–218. [CrossRef]
66. Al-Badaii, F.; Shuhaimi-Othman, M.; Barzan, M. Water Quality Assessment of the Semenyih River, Selangor,Malaysia. J. Chem. 2013, 2013, 31–34. [CrossRef]
67. Onyekuru, S.O.; Okereke, C.N.; Ibeneme, S.I.; Nnaji, A.O. An Evaluation of the Spatial Distributions of thePhysico-Chemical and Microbial Contents of Nworie River in Owerri, Southeastern Nigeria. Br. J. Appl.Sci. Technol. 2014, 4, 3687–3700. [CrossRef]
68. Karikari, A.Y.; Ansa-Asare, O.D. Physico-Chemical and Microbial Water Quality Assessment of Densu Riverof Ghana. West Afr. J. Appl. Ecol. 2006, 10, 1–12. [CrossRef]
69. Rawway, M.; Kamel, M.S.; Abdul-raouf, U.M. Microbial and Physico-Chemical Assessment of Water Qualityof the River Nile at Assiut Governorate (Upper Egypt) Microbial and Physico-Chemical Assessment of WaterQuality of the River Nile at Assiut Governorate (Upper Egypt). J. Heal. Ecol. 2016, 1, 7–14. [CrossRef]
70. Nontongana, N.; Sibanda, T.; Ngwenya, E.; Okoh, A.I. Prevalence and antibiogram profiling of Escherichiacoli pathotypes isolated from the kat river and the fort beaufort abstraction water. Int. J. Environ. Res.Public Health 2014, 11, 8213–8227. [CrossRef]
71. Sidhu, J.P.S.; Ahmed, W.; Hodgers, L.; Toze, S. Occurrence of virulence genes associated with diarrheagenicpathotypes in Escherichia coli isolates from surface water. Appl. Environ. Microbiol. 2013, 79, 328–335.[CrossRef]
72. Titilawo, Y.; Obi, L.; Okoh, A. Occurrence of virulence gene signatures associated with diarrhoeagenic andnon-diarrhoeagenic pathovars of Escherichia coli isolates from some selected rivers in South-Western Nigeria.BMC Microbiol. 2015, 15, 1–14. [CrossRef]
73. Islam, M.Z.; Musekiwa, A.; Islam, K.; Ahmed, S.; Chowdhury, S.; Ahad, A.; Biswas, P.K. Regional variation inthe prevalence of E. coli O157 in cattle: A meta-analysis and meta-regression. PLoS ONE 2014, 9. [CrossRef]
74. Okeke, I.N.; Lamikanra, A.; Steinrück, H.; Kaper, J.B. Characterization of Escherichia coli strains from casesof childhood diarrhea in provincial southwestern Nigeria. J. Clin. Microbiol. 2000, 38, 7–12.
75. Ebomah, K.E.; Adefisoye, M.A.; Okoh, A.I. Pathogenic Escherichia coli strains recovered from selectedaquatic resources in the eastern cape, South Africa, and its significance to public health. Int. J. Environ. Res.Public Health 2018, 15. [CrossRef] [PubMed]
76. Opinion, S. Public health risks associated with Enteroaggregative Escherichia coli (EAEC) as a food-bornepathogen. EFSA J. 2015, 13, 1–88. [CrossRef]
Int. J. Environ. Res. Public Health 2020, 17, 5048 25 of 26
77. Weintraub, A. Enteroaggregative Escherichia coli: Epidemiology, virulence and detection. J. Med. Microbiol.2007, 56, 4–8. [CrossRef] [PubMed]
78. Gomi, R.; Matsuda, T.; Fujimori, Y.; Harada, H.; Matsui, Y.; Yoneda, M. Characterization of pathogenicEscherichia coli in river water by simultaneous detection and sequencing of 14 virulence genes.Environ. Sci. Technol. 2015, 49, 6800–6817. [CrossRef] [PubMed]
79. Stange, C.; Sidhu, J.P.S.; Tiehm, A.; Toze, S. Antibiotic resistance and virulence genes in coliform waterisolates. Int. J. Hyg. Environ. Health 2016, 219, 823–831. [CrossRef] [PubMed]
80. Bouzari, S.; Jafari, A.; Aslani, M.M. Escherichia coli: A brief review of diarrheagenic pathotypes and theirrole in diarrheal diseases in Iran. Iran. J. Microbiol. 2012, 4, 102–117.
81. Ochoa, T.J.; Barletta, F.; Contreras, C.; Mercado, E. New insights into the epidemiology of enteropathogenicEscherichia coli infection. Trans Soc. Trop. Med. Hyg. 2008, 102, 852–856. [CrossRef]
82. Van Den Beld, M.J.C.; Warmelink, E.; Friedrich, A.W.; Reubsaet, F.A.G.; Schipper, M.; De Boer, R.F.;Notermans, D.W.; Petrignani, M.W.F.; Van Zanten, E.; Rossen, J.W.A.; et al. Incidence, clinical implicationsand impact on public health of infections with Shigella spp. and entero-invasive Escherichia coli (EIEC):Results of a multicenter cross-sectional study in the Netherlands during 2016–2017. BMC Infect. Dis. 2019,19, 1–12. [CrossRef]
83. Troeger, C.; Forouzanfar, M.; Rao, P.C.; Khalil, I.; Brown, A.; Reiner, R.C.; Fullman, N.; Thompson, R.L.;Abajobir, A.; Ahmed, M.; et al. Estimates of global, regional, and national morbidity, mortality, and aetiologiesof diarrhoeal diseases: A systematic analysis for the Global Burden of Disease Study 2015. Lancet Infect. Dis.2017, 17, 909–948. [CrossRef]
84. Newitt, S.; MacGregor, V.; Robbins, V.; Bayliss, L.; Anne Chattaway, M.; Dallman, T.; Ready, D.; Aird, H.;Puleston, R.; Hawker, J. Two linked enteroinvasive Escherichia coli outbreaks, Nottingham, UK, June 2014.Emerg. Infect. Dis. 2016, 22, 1178–1184. [CrossRef]
85. Escher, M.; Scavia, G.; Morabito, S.; Tozzoli, R.; Maugliani, A.; Cantoni, S.; Fracchia, S.; Bettati, A.; Casa, R.;Gesu, G.P.; et al. A severe foodborne outbreak of diarrhoea linked to a canteen in Italy caused by enteroinvasiveEscherichia coli, an uncommon agent. Epidemiol. Infect. 2014, 142, 2559–2566. [CrossRef] [PubMed]
86. Barcina, I.; Arana, I.; Iriberri, J.; Egea, L. Factors affecting the survival of E. coli in a river. Hydrobiologia 1986,141, 249–253. [CrossRef]
87. Pandey, P.K.; Kass, P.H.; Soupir, M.L.; Biswas, S.; Singh, V.P. Contamination of water resources by pathogenicbacteria. AMB Express 2014, 4, 51. [CrossRef] [PubMed]
88. Bakhiet, S.; Ahmed, W.; Mohammed, W. Significance of Fungal Species Isolated from Blue Nile River andTuti Island on Drinking Water Quality Significance of Fungal Species Isolated from Blue Nile River and TutiIsland on Drinking Water Quality. J. Appl. Life Sci. Int. 2016. [CrossRef] [PubMed]
89. Olorode, O.A.; Bamigbola, E.A.; Ogba, O.M. Comparative Studies of some River Waters in Port Harcourtbased on Their Physico-Chemical and Microbiological analysis, Niger Delta Region of Nigeria. Int. J. BasicAppl. Sci. 2015, 3, 29–37.
90. Cook, W.L.; Schlitzer, R.L. Isolation of Candida albicans from freshwater and sewage. Appl. Environ. Microbiol.1981, 41, 840–842. [CrossRef]
91. Medeiros, A.O.; Missagia, B.S.; Brandão, L.R.; Callisto, M.; Barbosa, F.A.R.; Rosa, C.A. Water qualityand diversity of yeasts from tropical lakes and rivers from the Rio Doce basin in Southeastern Brazil.Braz. J. Microbiol. 2012, 43, 1582–1594. [CrossRef]
92. Huck, P.; Emelko, M.; Coffe, B.; Maurizio, D.; Omelia, C. Filter Operation Effects on Pathogen Passage; FAO:Rome, Italy, 2001.
93. Meybeck, M.; Helmer, R. The quality of rivers: From pristine stage to global pollution. Palaeogeogr. Palaeoclim.Palaeoecol. 1989, 75, 283–309. [CrossRef]
94. Minnesota Pollution Control Agency. Low Dissolved Oxygen in Water—Causes, Impact on Aquatic Life—AnOverview; Minnesota Pollution Control Agency: Duluth, MN, USA, 2009.
95. Hem, I.D. Study and Interpretation the Chemical of Natural of Characteristics Water; USGS: Reston, VA, USA,1985.
96. Quishpe Ballagán, Á.M. Tratamiento de Efluentes Líquidos de la Industria de Curtido, Mediante PrecipitaciónQuímica, Adsorción con Carbón Activado y Rizofiltración. Esc. Politécnica Nac. 2010, 145. [CrossRef]
Int. J. Environ. Res. Public Health 2020, 17, 5048 26 of 26
97. Medina, M.; Pozo, P. Determinación de Cromo Hexavalente en Descargas de Aguas Residuales De UnaCurtiembre, Ubicada En El Sector De Izamba, Ambato En La Provincia De Tungurahua. InfoAnálitica 2016, 1,83–101.
98. Roberts, T.L. Cadmium and phosphorous fertilizers: The issues and the science. Procedia Eng. 2014, 83, 52–59.[CrossRef]
99. Tarras-Walhberg, N.H.; Flachier, A.; Lane, S.; Sangfors, O. Environmental impacts and metal exposure ofaquatic ecosystems in rivers contaminated by small scale gold mining: The Puyango River basin, southernEcuador. Sci. Total Environ. 2001, 278, 239–261. [CrossRef]
100. Betancourt, Ó.; Tapia, M.; Méndez, I. Decline of General Intelligence in Children Exposed to Manganese fromMining Contamination in Puyango River Basin, Southern Ecuador. Ecohealth 2015, 12, 453–460. [CrossRef]
101. González-Merizalde, M.V.; Menezes-Filho, J.A.; Cruz-Erazo, C.T.; Bermeo-Flores, S.A.; Sánchez-Castillo, M.O.;Hernández-Bonilla, D.; Mora, A. Manganese and Mercury Levels in Water, Sediments, and Children LivingNear Gold-Mining Areas of the Nangaritza River Basin, Ecuadorian Amazon. Arch. Environ. Contam. Toxicol.2016, 71, 171–182. [CrossRef] [PubMed]
102. Guibaud, G.; Gauthier, C. Study of aluminium concentration and speciation of surface water in fourcatchments in the Limousin region (France). J. Inorg. Biochem. 2003, 97, 16–25. [CrossRef]
103. Gurmendi, A.; Szczesniak, P.; Torres, I.; Velasco, P.; Wilburn, D. The Mineral Industries of Latin America andCanada. U.S. Geol. Surv. Min. Yearb. 2003, 85, 1140–1146.
104. Cisneros, E.; Machuca, R. Estructuración De Un Modelo De Encadenamiento Productivo Para La ProducciónY Comercialización De Los Productos Derivados De La Leche En La Provincia De Pichincha, Cantón Mejía.Bachelor’s Thesis, Salesian Polytechnic University, Quito, Ecuador, 2014.
© 2020 by the authors. Licensee MDPI, Basel, Switzerland. This article is an open accessarticle distributed under the terms and conditions of the Creative Commons Attribution(CC BY) license (http://creativecommons.org/licenses/by/4.0/).