Le lait, patrimoine des Peuls pasteurs du Niger - Horizon IRD
Upload
khangminh22Category
view
1download
0
gg
EditorsRichard Escadafal and Maria Luisa Paracchini

Editors
Richard Escadafal and Maria Luisa Paracchini
EUROPEAN COMMISSION
Joint Research CentreDIRECTORATE-GENERAL
Geomatics for Land and Water management:Achievements and Challenges
in Euromed context
2005 EUR 21647 EN
International Workshop
Joint Research Centre, Italy23-25 June, 2004

European CommissionDG Joint Research CentreInstitute for Environment and Sustainability (IES)I-21020 Ispra (VA), Italy
Editors: Richard Escadafal, directeur de recherche IRD, CESBIO, Toulouse (France)and Maria Luisa Paracchini, Soil and Waste Unit,�JRC-IES, Ispra (Italy)
Cover: José-Joaquín BlascoLayout: O. Piau (Agropolis Productions, Montpellier, France – [email protected])Photo cover: Colour composite of a synthesis of images acquired by the VEGETATION
instrument onboard SPOT 4 during the year 2000�for the VEGA2000 initiative of the VEGETATION programme. Data processed at JRC in theframework of the GLC2000 project. Colour coding: red=MIR, green=B3,blue=B2
Legal NoticeNeither the European Commission nor any person acting on behalf of the Commission isresponsible for the use that might be made of the following information.
A great deal of additional information on the European Union is available on the Internet.It can be accessed through the Europa server: http://europa.eu.int
EUR 21647 EN
Luxembourg: Office for Official Publications of the European Communities, 2004
ISBN 92-894-9425-5
© European Communities, 2005
Reproduction is authorized provided the source is acknowledged
Printed in Italy
MISSION STATEMENT
The mission of the Joint Research Centre is to provide customer-driven scientificand technical support for the conception, development, implementation and monitoringof European Union policies. As a service of the European Commission, the JRCfunctions as a reference centre of science and technology for the Union. Close tothe policy-making process, it serves the common interest of the Member States,while being independent of special interests, whether private or national.


Table of contentsIntroduction............................................................................................................................................................................................................................ 1
SOILS AND LAND USE IN WATERSHEDS
Latest developments of the European Soil Information System ............................................................................................................... 5
Remote Sensing and Geomatics Applications for Desertifi cation
and Land Degradation Monitoring and Assessment ....................................................................................................................................15
The use of ASTER imagery in GIS-based Watershed Analysis at Mediterranean Islands ........................................................23
Remote Sensing of Land Surface for Monitoring Arid Mediterranean Environment ..................................................................35
Erosion Mapping of the Dalaman Watershed (Turkey) by Satellite Images ....................................................................................43
Agro-Ecological Zoning by Use of Satellite Remote Sensing and GIS ..............................................................................................51
Typologic, hydrologic and major land use characteristics of coastal Lebanese watersheds ................................................57
Utilizing Remote Sensing Techniques in Combating Desertifi cation in Shobak Area-Jordan ..............................................65
Erosion Measurement in Çayboðazý Catchment
A South-Western Mediterranean Coastal Region in Turkey .....................................................................................................................77
Gestion des bassins versants en milieu semi aride tunisien ....................................................................................................................85
Watershed typology and national infrastructures for monitoring land and water ......................................................................95
Typologie et infrastructure pour la gestion des ressources en eau et sol .........................................................................................95
Dead Sea Recession and Its Impacts on the Surrounding Area ..........................................................................................................123
Monitoring Urban DynamicChange in the Palestinian Territories (1989 –2004) .....................................................................137
Strategies and Tools for Stakeholders and Endusers: A Learning Curve in Progress ................................................................155
WATER AND WATERSHED MANAGEMENT
Development of a pan-European database of rivers and catchments
in support to the needs of the EU environmental policies ....................................................................................................................165
The SAF for Land Surface Analysis ......................................................................................................................................................................173
Spatial sampling design for land cover characterization
using very high spatial resolution satellite imagery ..................................................................................................................................181
Building evapotranspiration scenarios by satellites images ..................................................................................................................189
Implementation of GIS for runoff simulation and forecasting in the Central Asia condition ............................................205
The Israeli-Palestinian Water Situation .............................................................................................................................................................211
Integrated hydrological modelling concepts for a peripheral
mountainous semi-arid basin in southern Morocco .................................................................................................................................219
Water Master Planning in Jordan: The Use of Interactive Digital Planning Tools
for Integrated Water Resources Management ...............................................................................................................................................229
Use of remote sensing and G.I.S. for the study of water resources in the Tensift region (Morocco) .............................241
Use of geomatics in survey and management of Egyptian soil and water resources .............................................................247


Introduction
LandWaterMED thematic network
Land and water resources are under severe pressure in the Mediterranean region, and a large number of initiatives have been taken to address environmental issues at the level of the region, particularly through international agreements.
Among these efforts, numerous research projects have been launched and supported by the European Commission, particularly in the Mediterranean countries of the E.U. Encompassing the wider region, the INCO-MED programme is fostering euro-Mediterranean collaborative research projects, among them land and water issues have attracted a lot of attention. In this context, the “LandWaterMED” thematic network* has been focusing specifi cally on gathering regional expertise in monitoring land and water resources and condition, with the help of new sets of techniques labeled “geomatics” (integrating remote sensing and geographic information system).
Indeed, among the prominent environmental threats, vegetation cover decrease -particularly strong in this region- is leading to land degradation, whereas climate change and population growth endanger the water resources and availability. A better management of land and water is clearly benefi ting from highly improved information collection and processing provided by the methods of geomatics.
Despite a diffi cult geopolitical context in the Middle East during the period of the network activities, several meetings have allowed to exchange experience, information and knowledge gathered by the network members and to identify gaps and areas where further common research is needed.
Content and structure of these proceedings
The present proceedings compile some of the most signifi cant contributions to this network, at the occasion of the international workshop held in the Joint Research Center of the European Commission in June 2004.
Whereas this panorama is far from exhaustive of the work done in this area, we hope this series of examples from a large number of Countries of the region will not only illustrate the diversity of situations but also stir interest and discussions leading to further collaborations and research of euro-Mediterranean dimension.
A fi rst series of paper shows examples of remote sensing and geographic information systems applied to soil management issues, whereas the second part focuses more on water issues. Emphasis is put on case studies in the Mediterranean partner countries, and European projects illustrate the regional dimension.
Through these papers two main points are evidenced: soil conservation and conscious approaches to water management are more and more obviously linked, and geomatics facilitate the combination of information useful to assess and handle both resources. This is clearly indicating an ongoing trend towards integrated management of soil and water, at the watershed level, and we hope this will be the philosophy underlying future research project following this network activities.
Richard Escadafal and Maria Luisa Paracchini
* the LandwaterMED network has been supported by the European Commission, under the contract number ICA3-CT-2000 30008
Introduction 1


Soils and Land Use in watersheds


Montanarella L., Jones R. 5
Latest developments of the European Soil Information System
Luca MONTANARELLA and Robert JONES
European Commission, Joint Research Centre, Institute for Environment and SustainabilityT.P. 280, 21020 Ispra (VA) ITALY
Abstract: The European Soil Information System (EUSIS) has been developed over the past years in the framework of the activities of the European Soil Bureau. It is a large collaborative project covering the entire European Union and bordering countries and involving National soil surveys and soil science institutions in more then 45 countries. The current coverage of the system includes continental Europe, Siberia and part of North Africa and the Middle East.Such a system should allow to derive the data needed for the regular reporting about the state of European soils by the European Environment Agency and the European Commission.
Keywords: Soil, GIS, data, Europe.
Introduction
In the past two decades there has been increasing acceptance of the need to organise the soil resource information of a country into a Soil/Land Information System so that it can be more readily available. Such type of digital soil inventories is needed for most of the current computerized models in order to derive environmentally relevant information from basic soil data. Most countries have accepted this need but, as with soil maps, there is a large contrast in terms of development of such systems across Europe.
As can be observed from the available survey (doc. EUR 18991 EN, Soil Resources of Europe), soil and land information systems vary across the countries of Europe. They range from essentially simple databases containing soil profi le and analytical data to well developed integrated computerised systems containing climatic, land use and cadastral information as well as soil data. The capabilities of these systems range from purely storage and retrieval of data to integrated dynamic modelling using GIS technology for evaluating current and future policy requirements at national and regional scale.
The most advanced systems within European countries seem to be those of Austria, France, Germany, Netherlands and the UK. The Austrian system is a good example of one built from the outset to take in a large variety of data from many different sources. The Dutch system, having the benefi t of a digitised set of detailed soil maps for the whole country and associated descriptive and analytical data, is strongly linked with GIS technology and a range of simulation models so as to be able to respond readily to a whole range of topical issues. The England and Wales system (Landis) is a good example of one that from its inception had a very fl exible design based on relational database technology and at an early stage in its development combined climatic, land use and topographic data.
Computerised information systems are now capable of producing sophisticated graphical output but it is important to appreciate that the outputs are only as good as the input data, and for at least half of the European countries this is inadequate for decision making because less than 50 per cent of the area has suffi ciently detailed soil maps.

LandWaterMed network6
The European Soil Information System (EUSIS)
This system is based on the 1:1,000,000 scale “Soil Geographical Database of Europe “ (Jamagne M. et al., 2001) that is currently covering Europe.
The database has been recently extended to cover also the Mediterranean basin countries and the former Soviet Union (Montanarella L., 2001; Stolbovoi V. et al., 2001).
This new coverage is part of the joint Circumpolar Soil Database under development together with Canada and the United States. This extension will serve as a tool for the more accurate estimation of soil organic carbon pools in the boreal areas and for estimates of potential changes in GHG emission in relation to changes of soil temperature regimes in these areas. A fi rst version of this common Euro-Asian Soil database is available (fi g. 1).
EUSIS is a multi-scale system integrating data of different level of detail into one single Geographic Information System (GIS) (King, D. et al., 1998; Montanarella L., 1999). It links to global scale systems with the 1:5,000,000 scale World Soil and Terrain database (SOTER) (UNEP/ISSS/ISRIC/FAO, 1995) at one end, while assuring compatibility with the European 1:1,000,000 scale soil database. On more detailed scales (1:250,000 to 1:5,000) it links to National, Regional and local soil information systems within the European Union, assuring a coherent approach from the local to the global scale (fi g. 2).
The system incorporates also a number of pedotransfer rules (Van Ranst, E., L. Vanmechelen, A.J. Thomasson, J. Daroussin, J.M. Hollis, R.J.A. Jones, M. Jamagne and D. King, 1995) that allow the preparation of derived products, like soil erosion risk maps, soil organic carbon estimates, and many others. More complex models use the EUSIS for the early forecast of crop production, desertifi cation risk assessments, groundwater vulnerability to agrochemicals, etc… Still the system is far away from being ideal for all applications required; nevertheless it forms currently the only soil information system covering the entire European continent.
The main elements of the European Soil Information System are described in the next paragraph:
Figure 1: Provisional soil map extracted from the Euroasian Geographical Soil Databases.

Montanarella L., Jones R. 7
Figure 2: The European Soil Information System, responding to users (in blue) needs at different scales (in red).
Soil Geographical Data Base of Europe at scale 1:1.000.000
This database forms the core of EUSIS. Its history dates back to the mid 80’.
In 1985, the Commission of the European Communities published a soil map of the EC at 1:1,000,000 scale (see above). In 1986, this map was digitised to build a soil database to be included in the CORINE project (Co-ordination of Information on the Environment). This database was called the Soil Geographical Data Base of the EC, version 1. To answer the needs of the DG VI MARS project (Directorate General for Agriculture, Monitoring Agriculture by Remote Sensing), the database was enriched in 1990-1991 from the archive documents of the original EC Soil Map and became version 2. The MARS project then formed the Soil and GIS Support Group with experts to give some advice concerning this database. These experts recommended that new information should be added and each participating country should make updates, leading to the current version 3 of the database.
The aim of the Soil Geographical Database at scale 1:1,000,000 is to provide a harmonised set of soil parameters covering Europe and the Mediterranean countries to be used in agro-meteorological and environmental modelling at regional, state, or continental levels. Its elaboration focuses on these objectives.
Originally covering countries of the European Union, the database has recently been extended to Central European and Scandinavian countries. It currently covers Albania, Austria, Belgium, Bosnia and Herzegovina, Bulgaria, Croatia, Czech Republic, Denmark, Estonia, Finland, France, FYROM (Former Yugoslav Republic of Macedonia), Germany, Greece, Hungary, Ireland, Italy, Latvia, Lithuania, Netherlands, Norway, Poland, Portugal, Romania, Slovakia, Slovenia, Spain, Sweden, Switzerland, United Kingdom and Yugoslavia. The extension is completed for Iceland and the New Independent States (NIS) covering Belarus, Moldova, Russia and Ukraine. Finally, work is on going to further extend it to other Mediterranean countries: Algeria, Cyprus, Egypt, Jordan, Lebanon, Malta, Morocco, Palestine, Syria, Tunisia and Turkey.
Beside these geographical extensions, the database has also experienced important changes during its lifetime. The latest major changes concern the introduction of a new extended list for parent materials, and, for coding soil types, the use of the new World Reference Base (WRB) for Soil Resources in association with the 1990 FAO-UNESCO revised legend.
The database is currently managed using the ArcInfo® Geographical Information System (GIS) software package.
The database contains a list of Soil Typological Units (STU), characterizing distinct soil types that have been identifi ed and described. The STU are described by attributes (variables) specifying the nature and properties of the soils, for example the texture, the moisture regime, the stoniness, etc. The scale selected for the geographical representation

LandWaterMed network8
is the 1:1,000,000. At that scale, it is not technically feasible to delineate each STU. Therefore STUs are grouped into Soil Mapping Units (SMU) to form soil associations. The criteria for soil groupings and SMU delineation have taken into account the functioning of pedological systems within the landscape.
The detailed instruction guide of this inventory is available (doc. EUR 20422 EN).
Georeferenced Soil Database for Europe at scale 1:250,000
The scale and the precision of the 1:1,000,000 database do no longer suffi ce to ensure the harmonisation in methodology between the various soil survey organisations and to meet the needs for specifi c soil information. The Task Force of the European Environment Agency and DG XI of the European Commission initiated a study on the feasibility of the creation of a soil inventory of Europe at scale 1:250,000 (Dudal et al., 1993). The study concluded that the preparation of such a map was feasible and desirable. Meetings of the heads of soil surveys of the European Union, which took place at Silsoe in 1989 (Hodgson, 1991) and at Orléans in 1994 (Le Bas and Jamagne, 1996), respectively recommended and endorsed the preparation of a georeferenced soil database for Europe at scale 1:250,000. The implementation of these recommendations was ensured by a Soil Information System Development Working Group (SISD) and subsequently entrusted to the European Soils Bureau which was created within the JRC in 1996 (Montanarella, 1996).
A specifi c working group elaborated the basic concepts underlying the creation of this new database. A Manual of Procedures was therefore published (Doc. EUR 18092 EN), outlining the basic structure and procedures of this new soil inventory. In fi ve selected areas of Europe (fi g. 3) detailed pilot studies were implemented, leading to the creation of the fi rst elements of the future complete coverage of Europe with this information layer.
During 2003 a new pilot area covering the complete Danube river basin has been initiated. First results are available for Austria, Slovakia and Czech Republic.
Soil Profile Analytical Database of Europe
In order to enhance information about soils, the 1:1 Million scale Soil Geographical Database has been improved with the addition of a Soil Profi le Database. This database contains soil profi le characterisations with physical and chemical analyses. For each dominant Soil Typological Unit (STU), and if possible, for all of them, a representative soil profi le with its analytical data is selected by the contributing experts in their own country. Diffi culties were encountered during the attempt to harmonise those data across countries. Thus, the decision was made to have two different kinds of profi les, characterised to a depth of 2 metres, for each STU being recorded: estimated soil profi les and measured soil profi les.
The estimated soil profi le description corresponds to a non-georeferenced profi le, based on the average of various observations and expert knowledge. The measured soil profi le corresponds to a set of data taken directly from georeferenced soil profi les, described in the fi eld, sampled, and analysed in the laboratory.
For estimated profi les the analytical methods are selected to allow comparisons of their properties across countries, and all properties must be fully described, using expert estimates if needed.
For measured profi les a code indicates which analytical methods were used, and missing values are permitted.
Figure 3: Pilot areas at 1:250.000 scale completed by 2002

Montanarella L., Jones R. 9
Ideally, estimated soil profi le data should provide the data that illustrates best each STU. For each attribute, the data can be an average of the observations made on several measured profi les corresponding to the STU. The data can also correspond to a specifi c soil profi le that has been defi ned as the one fi tting the best to the central concept for that STU. Or, for some attributes, the data can be the result of expert knowledge when the data is missing or information is incomplete. All STUs that have been listed should have a corresponding estimated profi le fully characterised. This requirement may be waived only if neither the data nor the expert knowledge is available in a given area. In this case, the co-ordinator should at least provide the characteristics of the dominant STU. In other cases also, a STU may represent only a tiny part of the surface area in a SMU and its description may be omitted.
The fi rst version of this database (SPADE I) includes only soil profi le data for the dominant STU in each SMU. There is an on-going project aiming to complete the data for all STU in all SMU (SPADE II). This project is expected to be completed by end of 2004.
Pedotransfer rules
The fourth component of the European Soil Information System is the database of pedotransfer rules (PTR) allowing to derive a number of additional properties for practical purposes. These are based on expert judgement, mainly qualitative, and assume that a due weight is given to the confi dence level of individual inferred attributes.
A set of tools was conceived within Arc/Info to manage and use a rules database for the inference of new information from that available within an Info database. These tools may be considered as a prototype of an expert system shell and were used in the above context. Several hundreds occurrences of rules were established by a European working group in the form of IF <condition> AND <condition> ... THEN <inferred value>. At this stage, although rules are applied to spatial objects (soil units), the system does not take spatial relationships between objects into consideration.
Output attributes were selected on the basis of the environmental parameters needed for the problems faced, e.g., hydrology of soil types for predicting catchment response to rainfall and standard percentage of run-off; location and sensitivity of wetlands; soil buffering capacity for predicting soil susceptibility; ecosystem and surface water deposition; vulnerability of ground -and surface- water to pollution by agrochemicals and farm waste; soil erosion potential, etc.
The output attributes selected for this work are listed in table 1. They are grouped into four classes that respectively correspond to attributes of biological, chemical, mechanical and hydrological nature. Some of them can be derived directly from the Soil Database via pedotransfer rules, others need previously derived attributes as input.
For each output attribute, we have indicated the necessary input attributes for making the estimates. We also indicate the values of the classes adopted at the output. They were fi xed in a rather broad manner, in view of the low level of precision in the input attributes. The thresholds selected for class intervals are resulting from a compromise between currently established values in the Soil Science, and the possible level of precision at this scale. The adopted values may not correspond to the thresholds necessary for environmental problems. However, multiplication of the number of classes certainly would have reduced the reliability of the pedotransfer rules and thus the system would become unusable.
The pedotransfer rules DB remains one of the fundamental tools for deriving useful information out of existing soil databases. Recent implementation of complex pedotransfer rule based evaluations of soil erosion and topsoil organic carbon content have demonstrated the high potential of such “expert based” approaches compared to more deterministic modelling exercises. The lack of reliable, comparable and compatible input data for sophisticated deterministic models leaves the pedotransfer rule based estimates as the only possible mean to derive policy relevant information out of very general data sets, like the SGDBE.

LandWaterMed network10
Table 1: List of selected output attributes from pedotransfer rules with their required inputs.
OUTPUT ATTRIBUTES INPUT ATTRIBUTES OUTPUT CLASSES
BIOLOGICAL ATTRIBUTES
Topsoil organic carbon content (OC_TOP) (0 - 25 cm)
SNTEXTUSEATC
- FAO soil name- Topsoil textural class- Regrouped land use class- Accumulated mean temp.
H(igh): > 6.0%M(edium): 2.1-6.0%L(ow): 1.1-2.0%V(ery) L(ow): < 1.0%
Presence of a raw peaty topsoil horizon (PEAT)
SN - FAO soil name Y(es)N(o)
CHEMICAL ATTRIBUTES
Soil profile differentiation (DIFF) SN - FAO soil name H(igh) differentiationL(ow) differentiationO: No differentiation
Profile Mineralogy (MIN) SN - FAO soil name (C)hemical or Geochemical(M)echanical or PhysicalMC: Chemical and MechanicalND: No Differentiation
Topsoil Mineralogy (MIN_TOP) PMMIN
- Parental material- Profile Mineralogy
KQ: 1/1 minerals + quartzKX: 1/1 minerals + oxides & Hy.MK: 2/1 and 1/1 mineralsM: 2/1 and 2/1/1 non swelling m.
Subsoil Mineralogy (MIN_SUB) PMMIN
- Parental material- Profile Mineralogy
MS: Swelling and non s. 2/1 m.S: Swelling 2/1 mineralsTV: Vitric materialsTO: Andic materials
Topsoil Cation Exchange Capacity (CEC_TOP)
DIFFMINOC_TOPTEXT
- Soil profile differentiation- Profile Mineralogy- Topsoil organic carbon content- Topsoil textural class
L(ow): < 15 cmol(+)kg-1 soilM(edium): 15-40H(igh): > 40
Subsoil Cation Exchange Capacity (CEC_SUB)
MIN_SUBTD
- Subsoil mineralogy- Subsoil textural class
Topsoil Base saturation (BS_TOP) SNUSE
- FAO soil name- Regrouped land use class
L(ow): < 50%M(edium): 50-75%H(igh): > 75%
Subsoil Base saturation (BS_SUB) SNMIN_SUB
- FAO soil name- Subsoil mineralogy
L(ow): < 50%H(igh): > 50%
MECHANICAL ATTRIBUTES
Depth to rock (DR) SNPMPHASE
- FAO soil name- Parent material- Phase
S(hallow): 0-40 cmM(oderate): 40-80 cmD(eep): 80-120 cmV(ery) D(eep): > 120 cm
Volume of stones (VS) PHASEPM
- Phase- Parent material
0% stones - 10% stones15% stones – 20% stones
Subsoil textural class (TD) SNTEXTDR
- FAO soil name- Topsoil textural class- Depth to rock
1 Coarse2 Medium3 Medium fine4 Fine5 Very Fine
Topsoil structure (STR_TOP) USESN
- Regrouped land use class- FAO soil name
G(ood)N(ormal)P(oor)
Subsoil structure (STR_SUB) SN - FAO soil name H(umic) or Peaty soilO : Peaty subsoil
Topsoil Packing Density (PD_TOP) STR_TOPTEXTUSE
- Topsoil structure class- Topsoil textural class- Regrouped land use class
L(ow): < 1.4 g/cm3
M(edium): 1.4 – 1.75 g/cm3
Subsoil Packing Density (PD_SUB) STR_SUBTDSN
- Subsoil structure class- Subsoil textural class- FAO soil name
H(igh): > 1.75 g/cm3
Montanarella L., Jones R. 11
HYDROLOGICAL ATTRIBUTES
Parent material hydrogeological type (PMH) PM - Parent material R, C, S, L, H, M (INRA et al., 1993)
Depth to a gleyed horizon (DGH) SN - FAO soil name S(hallow): 0-40 cmM(oderate): 40-80 cmD(eep): 80-120 cmV(ery deep): > 120 cm
Depth to impermeable layer (DIMP) TEXTPD_SUBSN
- Topsoil textural class- Subsoil packing density- FAO soil name
S(hallow): < 80 cmD(eep): > 80 cm
Hydrological class (HG) ATCPMH
SNALTDIMP
- Accumulated mean temp.- Parent material hydrogeological type- FAO soil name- Elevation- Depth to impermeable layer
HG1: soil with permeable substratum, remote from groundwater: seldom wetHG2: lowland soil affected by groundwater, seasonally or permanently wet, or artificially drainedHG3: soil with impermeable layers within 80 cm depth, seasonally or permanently wetHG4: soils of the uplands and mountains
Topsoil Available Water Capacity (AWC_TOP) TEXTPD_TOP
- Topsoil textural class- Topsoil packing density
Topsoil Easily Available Water Capacity (EAWC_TOP)
TEXTPD_TOP
- Topsoil textural class- Topsoil packing density V(ery) H(igh): > 190 mm
H(igh) : 140-189 mm
Subsoil Available Water Capacity (AWC_SUB) TDPD_SUBDR
- Subsoil textural class- Subsoil packing density- Depth to rock
M(edium) : 100-139 mmL(ow): < 99 mm
Subsoil Easily Available Water Capacity (EAWC_SUB)
TDPD_SUBDR
- Subsoil textural class- Subsoil packing density- Depth to rock
Future perspective
The European Commission has established within its sixth environmental action programme the objective of protecting soils against a number of major threats, like erosion, pollution, decline of organic matter content, loss of biodiversity, sealing by infrastructure, salinization and desertifi cation. In order to achieve this objective it has proposed to introduce a specifi c thematic strategy for soil protection. The way forward towards such a new strategy has been presented in the Communication COM 179 (2002) “Towards a EU Thematic Strategy for Soil Protection”.
The communication recognizes several distinctive features of soils that make the development of a soil protection policy somewhat different from the protection of air and water. One of these features is the very high variability of soils across Europe
The very high diversity of European soils refl ects the differences in climate, geological origin, vegetation, land use and historical development that are one of the main characteristics of European landscapes.
Recognizing soil diversity implies to take into account the strong local connotation of any soil protection policy. Different soils require different management and protection measures.
It seems therefore a mandatory pre-condition to the development of any future soil protection strategy the compilation of a detailed and up-dated inventory of the current status of European soils.
The future development of an European Spatial Data Infrastructure (ESDI) within the INSPIRE (http://www.ec-gis.org/inspire/) initiative of the European Commission will generate a fully streamlined fl ow of soil data and information from the local scale up to the European scale. Such a nested soil information system (D. King et al., 1998) will allow to access to soil information at the appropriate scale for each of the required applications (global, European, national, regional, local) by the different stakeholders.
The development of a coherent approach to soil protection within the EU will take time. On the long term, a soil framework directive may be the appropriate instrument to achieve fully the goals outlined in the soil protection strategy.

LandWaterMed network12
Nevertheless fi rst steps are already possible within the existing legislative framework:
One of the major existing instruments for improving soil protection in the EU is the Common Agricultural Policy (CAP). The mid-term review of this policy and the resulting new Council Regulation No. 1782/2003 of 29th of September 2003 explicitly specifi es under article 5 obligations for member states to ensure good agricultural practices and environmental condition of land. Annex IV of the regulation specifi es in detail (table 2) what practices should be implemented and according to which minimum standards. Among these practices there are measures to reduce soil erosion, increase soil organic matter content and improve soil structure. Already implementing this new measures will result in a substantial step forward towards soil protection in Europe.
Table 2: Good agricultural and environmental condition referred to in article 5 of Council Regulation No. 1782/2003 (annex IV).
Issue StandardsSoil erosion: Protect soil through appropriate measures
��Minimum soil cover��Minimum land management reflecting site-specific conditions��Retain terraces
Soil organic matter: Maintain soil organic matter levels through appropriate practices
��Standards for crop rotation where applicable��Arable stubble management
Soil structure:Maintain soil structure through appropriate measures
��Appropriate machinery use
Minimum level of maintenance:Ensure minimum level of maintenance and avoid the deterioration of habitats
��Minimum livestock stocking rates or/and appropriate regimes��Protection of permanent pasture��Retention of landscape features��Avoiding the encroachment of unwanted vegetation on agricultural land
Other important policy areas where immediate action could be implemented are the Nitrates Directive, the Water Framework Directive, the Air Quality Directives, the Landfi ll Directive, the Habitats Directive and other, more general environmental legislation, making a signifi cant contribution to the prevention of contamination and the protection of biodiversity.
Pre-condition to the successful implementation of any of such measures will be the development of a coherent European Soil Information System involving stakeholders at all levels: from the local to the global scale.
References
Adler, G., Eckelmann, W., Hartwich, R., Hennings, V., Krone, F., Stolz, W., and Utermann, J. (1998). The FISBo BGR Soil Information System: State of the art. In: Land Information Systems – Developments for planning the sustainable use of land resources. H.J. Heineke et al. (eds.) European Soil Bureau Research Report No. 4. EUR 17729 EN. Offi ce of the Offi cial Publications of the European Communities, Luxembourg. p.133-139.
Arzl, N., Dvorak, A., Riss, A., Schreier, I. and Schwarz, S. (1998). Development of the Soil information system BORIS in Austria. In: Land Information Systems – Developments for planning the sustainable use of land resources. H.J. Heineke et al. (eds.). European Soil Bureau Research Report No. 4. EUR 17729 EN. Offi ce of the Offi cial Publications of the European Communities, Luxembourg. p.77-90.
Avery, B.W. (1987). Soil Survey Methods: A Review. Soil Survey Technical Monograph No. 18. Cranfi eld University, Silsoe, UK.
Bølviken, B., Demitriades, A., Hindel, R., Locutura, J. O’Connor, P., Ottesen, R.T:, Plant, J., Ridgway, J. Salminen, R., Salpeteur, I., Schermann, O. and Volden, T. (eds.), 1990. Geochemical mapping of western Europe towards the year 2000. Project Proposal. Geological Survey of Norway (NGU) Report 90-106. 10 p. and 10 appendices.
Bølviken, B., Bogen, J., Demitriades, A., De Vos, W., Ebbing, J., Hindel, R., Ottesen, R.T., Salminen, R., Schermann, O. and Swennen, R., 1993. Final Report of the working group on regional geochemical mapping 1986 – 1993. Forum of European Geological Surveys (FOREGS), Geological Survey of Norway (NGU) Open File Report 93-092, 18 p. and 6 appendices.
Bregt, A.K. and Bulens, J. (1998). Integrating GIS and process models for land resource planning. In: Land Information Systems – Developments for planning the sustainable use of land resources. H.J. Heineke et al. (eds.). European Soil Bureau Research Report No. 4. EUR 17729 EN. Offi ce of the Offi cial Publications of the European Communities, Luxembourg. p.293-304.
Bruand A., O. Duval, H.Wösten and A. Lilly (eds). The use of pedotransfer in soil hydrology research in Europe. EUR 17307 EN 211pp. (1997). Offi ce for Offi cial Publications of the European Communities, Luxembourg.
Bullock P., R.J.A. Jones and L. Montanarella (eds). Soil Resources of Europe. EUR 18991 EN 202pp. (1999). Offi ce for Offi cial Publications of the European Communities, Luxembourg.
De la Rosa, D., Almorza, J. and Puertas, J.M. (1983). Estructura de una basa de datos de suelos. Pub.no. 2. Dirección General de Medio Ambiente. Junta de Andalucía. Sevilla, Spain.
Darnley, A., Björklund, A., Bølviken, B., Gustavson, N., Koval, P.V., Plant, J.A., Steenfelt, A., Tauchid, M., and Xuejing, X., 1995. A global geochemical database for environmental and resource management. Recommendations for international geochemical mapping. Final report of IGCP-project 259, UNESCO Publishing, Paris, France, 122p.
Dent, D and Young, A. (1981). Soil Survey and Land Evaluation. Goerge Allen and Unwin, London.
Dudal, R., Bregt, A.K. and Finke, P.A., 1993. Feasibility study of the creation of a soil map of Europe at scale 1:250,000. DG XI, Task Force European Environment Agency. Commission of the European Communities. Leuven - Wageningen. 69 p.

Montanarella L., Jones R. 13
EEA. 1995. Europe’s Environment. The Dobris Assessment. D. Stanners and P. Bourdeau (Eds.). European Environment Agency, Copenhagen.
EEA. (1998). Europe’s Environment. The Second Assessment. European Environment Agency, Copenhagen.
European Soil Bureau, Scientifi c Committee. Georeferenced Soil Database for Europe: Manual of Procedures Version 1.0. EUR 18092 EN 184pp. (1998). Offi ce for Offi cial Publications of the European Communities, Luxembourg.
FAO-UNESCO (1990). Soil Map of the World. Revised Legend. FAO, Rome, Italy.Heineke H.J., W. Eckelmann, A.J. Thomasson, R.J.A. Jones, L. Montanarella and B. Buckley (eds).Land Information Systems: Developments for planning the sustainable use of land resources. EUR 17729 EN 546pp. (1998). Offi ce for Offi cial Publications of the European Communities, Luxembourg.
Hodgson, J.M. (Ed.), 1991. Soil Survey - A basis for European Soil Protection. Soil and Groundwater Research Report. Commission of the European Communities, Luxemburg. 214 p.
Hollis, J.M. and Avery, B.W. (1997). History of Soil Survey and development of the soil series concept in the U.K. Advances in GeoEcology 29, 109-144.
Hubrechts, L., Vander Poorten, K. and Vanclooster, M. (1988). From soil survey to quantitative land evaluation in Belgium. In: Land Information Systems – Developments for planning the sustainable use of land resources. H.J. Heineke et al. (eds.) European Soil Bureau Research Report No. 4. EUR 17729 EN. Offi ce of the Offi cial Publications of the European Communities, Luxembourg. pp 91-100.
IUSS/FAO/ISRIC,1998 : World Reference Base for soil resources. World Soil Resources Report 84. FAO, Rome.
Jamagne M., Montanarella L., Daroussin J., Eimberck M., King D., Lambert J.J., Le Bas C., Zdruli P., 2001 – Methodology and experience from the soil geographical database of Europe at 1:1,000,000 scale. In: Soil resources of Southern and Eastern Mediterranean countries. Zdruli P., Steduto P., Lacirignola C., Montanarella L. (Eds). Options méditerranéennes. CIHEAM, Bari. 27-47.
King D., R.J.A. Jones and A.J. Thomasson (eds). European Land Information Systems for Agro-environmental Monitoring. EUR 16232 EN, 284pp. (1995). Offi ce for the Offi cial Publications of the European Communities, Luxembourg.
King D., Meyer-Roux J., Thomasson A.J., Vossen P., 1998 – A proposed European soil information policy. In: Land Information Systems. Development for planning the sustainable use of land resources. Heineke H.J., Eckelmann W., Thomasson A.J., Jones R.J.A., Montanarella L., Buckley B. (Eds). European Soil Bureau Research report n°4, EUR 17729 EN. Offi ce for publications of the European Communities. Luxembourg. 11-18.
Klingebiel, A.A. and Montgomery, P.H. (1961). Land Capability Classifi cation. USDA Soil Conservation Service, Agricultural Handbook No. 210, 21pp.
Le Bas, C. and M. Jamagne (eds), 1996. Soil databases to support sustainable development. INRA-SESCPF, Joint Research Centre-IRSA. 149 pp.
Lelentjis, T., Alatas, J., Toulios, L., Floras, S. and Kapetanak, G. (1998). In: Land Information Systems – Developments for planning the sustainable use of land resources. H.J. Heineke et al. (eds.) European Soil Bureau Research Report No. 4. EUR 17729 EN. Offi ce of the Offi cial Publications of the European Communities, Luxembourg. p.141-149.
Montanarella, L., 1996. The European Soil Bureau, European Society for Soil Conservation. Newsletter N° 2, 1996, Trier: 2-5.
Montanarella L. et Jones R.J.A., 1999 – The European soil bureau. In: Soil resources of Europe. Bullock P., Jones R.J.A., Montanarella L. (Eds). European Soil Bureau, Research Report n°6. EUR 18991 EN. JRC Ispra. 3-14.
Montanarella L., “The European Soil Information System (EUSIS)”; in “Desertifi cation Convention: data and Information Requirements for Interdisciplinary Research”, G. Enne, D. Peter, D. Pottier (eds.), EUR 19496 EN, 2001.
Niemi J. and P. Heinonen, Environmental monitoring in Finland 2003-2005, Suomen ympäristö 616, 2003
Nyborg, A.A. and Klakegg, O. (1998). Using a soil information system to combat soil erosion from agricultural lands. In: H.J. Heineke et al. (eds.) Land Information Systems – Developments for planning the sustainable use of land resources. European Soil Bureau Research Report No. 4. EUR 17729 EN. Offi ce of the Offi cial Publications of the European Communities, Luxembourg. p.177-180.
Proctor, M.E., Siddons, P.A., Jones, R.J.A., Bellamy, P.H. and Keay, C.A. (1998). LandIS - a Land Information System for the UK. In: Land Information Systems – Developments for planning the sustain use of land resources. H. J. Heineke et al. (eds.). European Soil Bureau Research Report No. 4. EUR 17729 EN. Offi ce for the Offi cial Publications of the European Commission, Luxembourg. p.219-234.
Soil Survey Staff. (1975). Soil Taxonomy. USDA Soil Conservation Service. Agriculture Handbook No. 436.
Soil Survey Staff. (1994). Keys to Soil Taxonomy. Soil Conservation Service. 6th Edition.
Starr M., H. Lehtinen, J. Sippola and T. Tarvainen, Soil Monitoring programmes is Finland, Pro Terra No 4/2000, 13-152.
Stolbovoi V., L. Montanarella, V. Medvedev, N. Smeyan, L. Shishov, V. Unguryan, G. Dobrovol’skii, M. Jamagne, D. king, V. Rozhkov, I. Savin, “Integration of Data on the Soils of Russia, Belarus, Moldova and Ukraine into the Soil Geographic Database of the European Community”; Eurasian Soil science, Vol. 34, No. 7, 2001, pp. 687-703.
Van Ranst, E., L. Vanmechelen, A.J. Thomasson, J. Daroussin, J.M. Hollis, R.J.A. Jones, M. Jamagne and D. King. 1995. Elaboration of an extended knowledge database to interpret the 1:1,000,000 EU soil map for environmental purposes. In: King, D., R.J.A. Jones and A.J. Thomasson (eds.). European landinformation systems for agro-environmental monitoring, pp. 71-84. Offi ce for offi cial publications of the European Communities, Luxembourg.
Van Ranst, E., Vanmechelen, L. and Groenemans, R. (1998). Elaboration of a European forest soil database to monitor atmospheric pollution. In: Land Information Systems – Developments for planning the sustainable use of land resources. H.J. Heineke et al. (eds.) European Soil Bureau Research Report No. 4. EUR 17729 EN. Offi ce of the Offi cial Publications of the European Communities, Luxembourg. p.51-67.
UNEP/ISSS/ISRIC/FAO., 1995: Global and National Soils and Terrain Digital Databases (SOTER) Procedures Manual. World Soil Resources Report No. 74. FAO, Rome.

LandWaterMed network14

Hill J. et al 15
Remote Sensing and Geomatics Applications for Desertification and Land Degradation
Monitoring and Assessment
J. HILL, Th. JARMER, Th. UDELHOVEN, and M. STELLMES
Remote Sensing DepartmentFaculty of Geography/Geosciences
University of TrierD-54286 Trier (Germany)
Abstract: The combined output of LADAMER should be a comprehensive as well as spatially explicit image of land degradation effects and associated processes for the relevant European Mediterranean countries, in particular for the prototype region of the Iberian Peninsula. It will hence serve as a kind of integrating project between former research approaches and ongoing monitoring and assessment efforts. Consequently, the innovative aspect of LADAMER lies in the novel combination of optical remote sensing methods with advanced physical, ecological and socio-economic modelling components. Combining these in a surveillance system is expected to substantially improve the quality of land degradation assessment and monitoring at the regional Mediterranean scale. The compiled data base is expected to build a basis for further GMES developments in the domain of land degradation research and other closely connected issues. These aspects will also be further pursued in the Integrated Project DeSurvey which also includes application sites in Northern Africa, Senegal, China and Chile.
Introduction
Desertifi cation, as a specifi c expression of land degradation processes, is a concept applied by scientists and policy makers after droughts threatened the Sahel in the last quarter of the 20th century, defi ned by the United Nations Convention to Combat Desertifi cation (UNCCD) as “the degradation of the land in arid, semi-arid and dry-sub-humid areas, as a result of several factors, including climatic change and human activities”. The dominant symptomatic character of this defi nition does not account for the underlying processes of the phenomenon. The consequence is that the popular meaning of desertifi cation is often associated with a catalogue of environmental calamities rather than specifi c distress in the human population-renewable resources system. In such conditions both prospects and mitigation become extremely uncertain.
Purely climate climatic factors were rarely responsible for desertifi cation processes in the Mediterranean region. This is primarily because dry spells are and have been relatively short-lived, and natural ecosystems and agricultural systems have the potential to recover easily. Present land degradation in Northern Mediterranean countries is primarily due to dramatic land use changes that occurred during the second half of this century and which in many cases lead to an unstable state of ecosystems (Brandt & Thornes, 1996). It is widely agreed that socio-economic disturbances, particularly when they occur combined with climatic fl uctuations, become the main drivers of desertifi cation (i.e., Reynolds & Stafford-Smith, 2002). They affect water balances and land degradation through changes in land-use patterns. In particular, large areas of Mediterranean rangelands are affected from transitional processes that cause confl icts between past and present land uses or economic and ecological priorities, i.e. between optimised productivity and ecosystem conservation.
LandWaterMed network16
Substantial research efforts have been launched and carried out to investigate various aspects of the desertifi cation problem, but it is quite recent that projects have adopted a more holistic concept. Among these we fi nd the LADAMER project that has been launched under the umbrella of the GMES initiative, as well as the Integrated Project DeSurvey to be started in 2005 (both supported by the European Union, DG Research). Both projects are to a considerable extent focussed on remote sensing and geomatics applications in the desertifi cation context (e.g., Hill & Peter, 1996; Hill, 2000), an approach which quite recently has also been adopted by the European Space Agency (ESA) in launching their DesertWatch project.
The Conceptual Framework
A major diffi culty of assessing land degradation is inherently related to the very concept, as ‘the loss of the land’s capacity to produce goods and services’. This is a rather unspecifi c symptom which may involve a large array of processes, each with its own boundary conditions for its detection or monitoring. Land degradation assessment methods have evolved from classic fi eld survey methods for soil and vegetation mapping and land suitability evaluations to the more recent ecological approaches (e.g., Ludwig & Tongway, 1992; Mouat et al., 1992). These ground-based methods score low for most of the practical requirements, but when based on broad fi eld experience, they may yield very accurate results in relatively small areas.
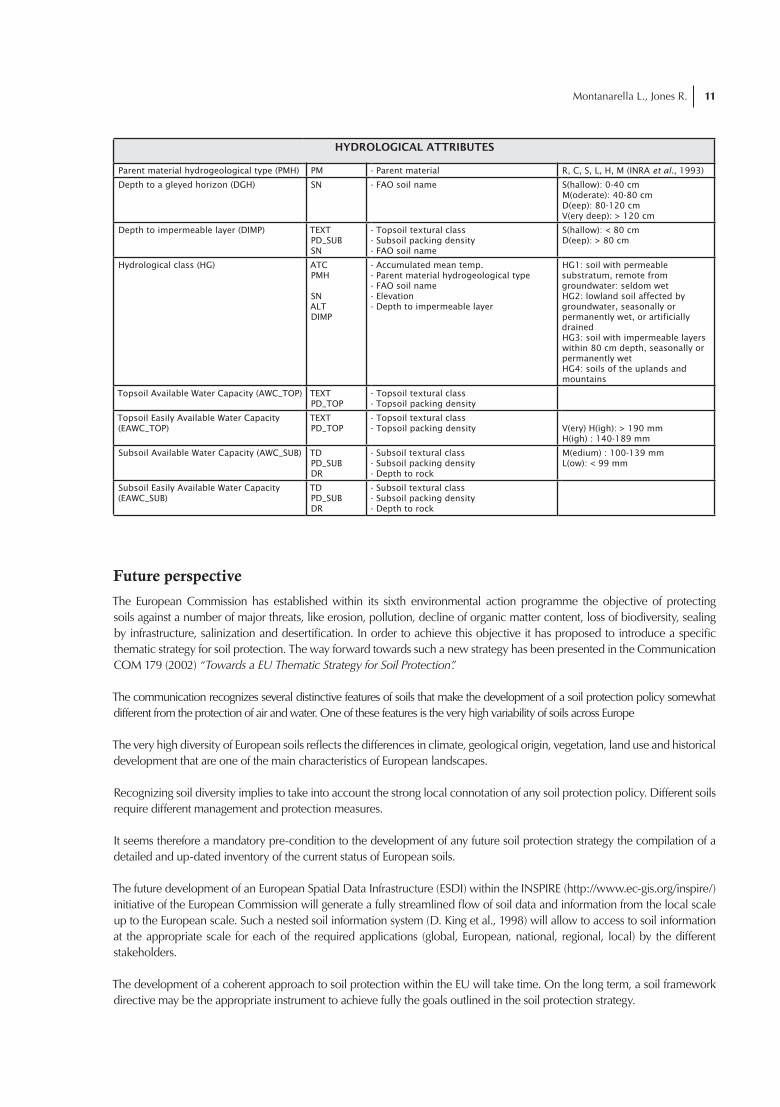
Initially, although it was already recognized in principle that land degradation involved complex interactions between physical and socio-economic process domains (e.g., Perez-Trejo, 1994), a large part of research activities focussed on soil erosion assessments as a core indicator for degradation processes. The European Commission, for example, launched a fi rst attempt to produce exhaustive maps on natural resources and soil erosion risks in Mediterranean Europe (CORINE, 1992; see also fi gure 1). These initial mapping experiments on one hand suffered from methodological shortcomings but also revealed major defi cits due to the limited availability of base data layers on European scale. The data availability has meanwhile largely improved (i.e. European Soil Map at 1:1 million scale, CORINE Land Cover, etc.) such that recent research activities like the “Pan-European Soil Erosion Risk Assessment”-Project (PESERA) can build on more solid grounds and are achieving substantially improved results (e.g., Grimm et al., 2001).
Besides, the insight that land degradation assessments must go far beyond the soil erosion issue has grown considerably. Human population and natural renewable resources may be considered two linked elements in a single system, which is affected by climatic or socio-economic disturbances. The former include droughts, rain spells, etc. The latter involve demographic, political, market and technological changes that enable or disenable access to those resources. Under steady-state conditions, intensity and duration of disturbances remain within the range of those that have appeared throughout the history of the system. They have been incorporated in its own evolution, in such a way that it recovers quickly after they have ceased. However, a new or very extreme disturbance or combination of disturbances may happen that takes the system beyond its threshold of sustainability (Puigdefabregas & Mendizabal, in press). This may occur as an increased availability of resources (i.e. a humid period, the introduction of a new technology) an increased demand for products (i.e., higher prices, local increase in agricultural population) or the contrary, as a reduction of available resources (i.e., extreme drought).
Figure 1. Actual Soil Erosion Risk Map of the European Mediterranean Countries (CORINE, 1992)

Hill J. et al 17
In both cases, resources become over-exploited. If the system is endowed with feedback mechanisms to reverse this condition, it can recover and return to the steady state. Otherwise it falls into an over-exploitation loop that leads to its own extinction. This process, when it happens in drylands, may be considered the core of desertifi cation.
Such disturbances or desertifi cation drivers may continue working to date or not. In the fi rst case we are dealing with ‘current’ desertifi cation. In the second, the forces that drove desertifi cation in the past are no longer at work today. If resilience thresholds of natural resources have not been exceeded, natural recovery is possible, if they have (i.e., extreme soil erosion), we are dealing with ‘relict’ desertifi cation. In the latter case, the imprints of past desertifi cation are observable today, even after disappearance of the underlying factors. Distinguishing between current and relict desertifi cation is crucial for designing treatment programs. The former require either relieving driving forces or providing the affected systems with capacity for adaptation. The latter need only ecological and economically sound restoration.
The LADAMER and DeSurvey Approaches
During the past 10 years, the European Commission has funded numerous dedicated research projects in the fi eld of land degradation and desertifi cation which focussed on data collection in specifi c fi eld sites, detailed methodological studies, assessment and monitoring experiments, and the development of specifi c modelling concepts. Although substantial scientifi c progress has been achieved and some projects succeeded to link a considerable number of fi eld sites and case studies across the Mediterranean basin, the scientifi c community has, apart from few initiatives not been able to provide unifying concepts for assessing land degradation processes on Mediterranean scale as required by political decision makers.
LADAMER (EVK2-2002-0599) builds on an integrated approach which combines specifi c fi elds of expertise in landscape ecology and soil science, remote sensing, spatial analysis and knowledge system management. The major concern of the project is to identify hot spot areas subject to a high desertifi cation/degradation risk, and to provide an assessment of the present degradation status of Mediterranean lands on small scales. With regard to the substantial progress in data availability and methodological concepts achieved during the past decade it is a major objective of this proposal to provide such an exhaustive assessment.
Following this rationale, it is believed that the LADAMER approach might supply products relevant to institutional end-users on national and international level, by integrating different models and techniques that have already proven their validity on local to regional scale. The major challenge for this integration is that the resulting methodological packages, in order to ensuring their applicability, are required to be objective, reproducible and transferable; include error estimates of the category assignation; be applicable at the regional scale over large areas; and have low data requirements, be cost-effective and easy to apply. Although complemented by additional important topics such as the analysis of climate change impacts, ground-based land condition assessments (model-based approaches), agricultural risk assessments, socio-economic issues, the Integrated Project DeSurvey is the platform to further develop and expand the remote sensing and geomatics approaches initiated within LADAMER.
This work basically involves three major components - remote sensing based time series analyses, land degradation modelling and land use / land cover change modelling - that will allow for adequate monitoring, assessment and modelling of land degradation at a European Mediterranean scale.
Figure 2. Design of a Dynamic Systems Approach for Land Degradation Assessment followed under LADAMER and DeSurvey

LandWaterMed network18
The Land Degradation Assessment Component
A major diffi culty of assessing land degradation is inherently related to the very concept, as ‘the loss of the land’s capacity to produce goods and services’. This is a rather unspecifi c symptom which may involve a large array of processes, each with its own boundary conditions for detection or monitoring. Land degradation assessment methods have evolved from classic fi eld survey methods for soil and vegetation mapping and land suitability evaluation to the more recent ecological approaches. These ground-based methods score low for most of the practical requirements, but when based on broad fi eld experience, they may yield very accurate results in relatively small areas.
Current knowledge of land degradation processes, particularly concerning runoff and soil erosion, has already been incorporated in a range of distributed physically-based models, such as ANSWERS, SHE, KINEROS, LISEM and MEDRUSH. These models can provide theoretical insight in complex cause and effect relationships and may be suitable to catchment scale case-studies on land degradation. Besides the fact that they are only addressing a facet of the land degradation problem they are also too demanding, in terms of input data, model implementation and calibration, to be an option for national and trans-national assessment studies. The characterisation of terrain form and topographic position has been an almost intrinsic part of land surveys for a long time. More recently, the use of digital elevation data and derived terrain attributes for the modelling and prediction of runoff and sediment transport patterns has been advocated. These approaches score better on many of the practical requirements and are especially suitable for the identifi cation of potential hazard zones, but cannot be used for the monitoring of change.
The vegetation cover interferes more or less directly with all water loss processes at a site in order to optimise to a certain extent the local water availability for their own benefi t, an optimisation process which involves several sub-processes and feedback mechanisms. Recently, in the frame of the MEDALUS project, a theoretical framework for land degradation assessments has been developed (Boer, 1999) which relies on these vegetation functions to estimate the local water balance, in terms of rainfall to evapotranspiration ratios. Experience with the application and qualitative evaluation of this method was obtained in a medium sized area (1000 km2). The approach is innovative in the sense that it provides a process-oriented, rather than descriptive, procedure for assessing land degradation on the basis of an established ecological theory while meeting most of the mentioned requirements for small scale applications. Its adaptation to LADAMER/DeSurvey, requires the method to be upgraded in a number of aspects. The conceptual basis will be adapted to a wider range of climates, vegetation types, and land use settings. The temporal resolution will be increased from mean annual to annual and, possibly, seasonal to better capture the cover changes of deciduous and annual vegetation types or crops. Moreover, the conceptual basis and cartographic modelling procedures will be modifi ed to allow application at a range of spatial resolutions (e.g. 30 m – 1 km). Multivariate regionalisation of the target area, in terms of soil-lithology, terrain and land cover types, is used to reduce uncertainty of the assessment.
Figure 3. Data products from the NOAA-AVHRR satellite series (pathfinder) and the MERIS-System on the ENVISAT satellite.

Hill J. et al 19
The Remote Sensing Component
It is widely accepted that satellite remote sensing offers considerable advantages for land degradation assessments. With a comprehensive spatial coverage it is intrinsically synoptic, and provides objective, repetitive data which contribute to resource assessments and monitoring concepts of environmental conditions in drylands (e.g., Hill et al., 1995; Lacaze et al., 1996). However, only if these observations can be coupled with GIS-based ecological modelling concepts, they may develop their full capacity to be used for modifying and adapting environmental management principles and mitigation strategies.
It has long been known that surface properties (i.e., vegetation cover and composition, specifi c properties of parent material and soils) control water availability or the spontaneous emergence and development of new plants in arid and semi-arid regions. Consequently, one of the objectives of remote sensing approaches is to focus on this particular interface. Particularly the application of the ecological assessment framework sketched before requires spatially distributed estimates of the actual vegetation density (i.e. proportional cover), and preferably a set of geo-referenced sample sites were the deviation between actual and potential vegetation density) can be assumed to be minimal. So far, the primary remote sensing input into the model has been limited to spatially distributed estimates of actual vegetation density (either as fractional cover or Leaf Area Index derived in relation to a satellite-based vegetation estimate) which can be derived with reasonable accuracy (e.g. Hostert, 2001). In order to meet the prerequisites of LADAMER, this interface, which so far has been based on limited data series obtained from earth observation satellites (e.g. Landsat TM/ETM, ASTER) must now be extended to accommodate small scale multi-year observations from global monitoring satellites (SPOT VEGETATION, NOAA-AVHRR, MODIS, MERIS, see fi gure 3).
Therefore, the objective is not only to classify each pixel into land cover based on predefi ned classifi cation schemes but rather to derive continuous fi elds of vegetation characteristics at a resolution of 1 km where also sub-pixel heterogeneities of land cover can be considered (e.g., DeFries et al., 1995; Moody & Johnson, 2001; Shababov et al., 2002). A number of techniques have been proposed which also appear suited for a dedicated analysis of multi-year time series of SPOT VEGETATION data that cover the Mediterranean member states of the European Communities. Among these, the most interesting approaches include linear mixture modelling to deconvolve proportional land cover based on spectral or spectro-temporal endmembers, and artifi cial neural networks which make no assumptions about the linearity of the spectral response to mixtures (e.g., Atkinson et al., 1997). In several Mediterranean ecosystem studies, spectral unmixing techniques have already been successfully used at local scales using high resolution Landsat time series which may facilitate a local validation of the continuous vegetation assessment derived global monitoring satellites (Hostert et al., 2004; Röder et al., 2005).
Changes of the vegetation density over time also bear important information on land degradation dynamics which are induced by natural or man-made processes. In this respect, the production of suitable small-scale map representations of existing degradation trends requires the decoupling of long-term trends and cyclic components of vegetation dynamics (e.g., Moody & Johnson, 2001). Due to the complexity of such approaches, mostly automatic classifi cation or principal-component-related techniques have been employed to global coverage and high temporal resolution imagery for mapping either phenology types or seasonality effects.
While these approaches allow identifying pixel clusters with similar temporal and radiometric behaviour, they fail to unveil long-term degradation trends as expressed by associated vegetation changes. In comparison, it has been shown for regions similar to Mediterranean Europe that the fi rst and second harmonics of the discrete Fourier transform concisely summarised the amplitude and phase of annual and biannual signals embedded in time-series of AVHRR-NDVI-data. While this is not yet providing a trend analysis in the classical way, it does constitute information that is of high signifi cance for detecting hot spots of land use changes. The description of regional degradation trends will be further based on a classical trend analysis (parametric and non-parametric) of 20 years of pre-processed 8-km AVHRR Pathfi nder data. Major emphasis will be given to novel approaches such as wavelet transforms, singular spectrum
Figure 4. Conceptual aspects of cellular automata
LandWaterMed network20
analysis, or temporal mixture analysis. Applied to a regional Mediterranean scale the remote sensing component should additionally provide a regional map on which areas of gradual (i.e. long-term) changes can be identifi ed as well as so-called ‘hot spots’ of abrupt land use change. By coupling trend analysis of vegetation density with the local water balance approach described in the previous objective, we expect to be able to introduce the time dimension in the land degradation assessment. It is important to state that the methodology will be applied at the regional Mediterranean scale, and its performance for monitoring and early warning purposes will be evaluated.
The Land Use / Land Cover Change Modelling Component
The development of integrated assessment models is currently a rapidly expanding activity. This trend is propelled by the growing understanding that policy-making should be based on integrated approaches. System theory clearly has shown that systems and problems do not exist in isolation, rather that they have dimensions that extent into other domains, other disciplines, other levels of detail, and other temporal and spatial scales. Complexity and Computation Theory has shown that even seemingly weak linkages may have major repercussions on the behaviour of the system as a whole. Policy makers, responsible for the management of regions, watersheds, or coastal zones are confronted with this reality on a daily basis. They are to manage fragile systems that exhibit an extremely rich behaviour not in the least because of the many intelligent actors, the human inhabitants or users that steer the development in a direction of their own interest.
Confronted with this complexity on the one hand and with better informed, agile recipients of the policies on the other, policy makers have to be able to rely on adequate instruments enabling them to better understand and anticipate the effects of their interventions in the system as fully as possible (e.g., Engelen et al., 1993; 1996). As a result, today’s research and development agendas strongly promote the development of tools enabling an integrated approach, which is propelled by the revolution in the computing hardware and software since the beginning of the eighties. Most relevant in the fi eld of spatial planning and policy making has been the rapid growth of high resolution remote sensing and Geographical Information Systems in the past two decades. As a result new dynamic modelling techniques have been added to the toolbox of the spatial scientists. Agent based approaches, and in particular Cellular Automata, are rapidly gaining interest (e.g., Couclelis, 1997).
Cellular Automata (CA) models can be thought of as simple dynamic systems in which the state of each cell in an n-dimensional array depends on its previous state and on the state of the cells within its neighbourhood, according to a set of stated transition rules. While the early applications of CA models in the spatial sciences remained rather conceptual and theoretical, most recent applications are developed with an aim to realistically represent geographical systems, both in terms of the processes modelled and the geographical detail represented. This trend has come with an increase in the complication of the models developed. One of the very essential relaxations to the standard CA defi nition is the introduction of the fi nite non-homogeneous cell space: a bounded cell space consisting of cells having different attribute values representing physical, environmental, social, economic, infrastructural or institutional characteristics of the cell. This has allowed to conceptually and practically link Cellular Automata models with GIS. As a result, most recently, a number of authors have suggested ways to build Cellular Automata functionality into GIS and/or GIS functionality into CA. In this context, remote sensing plays a more than viable role in repeatedly injecting land use information into CA-based land cover change models on various scale levels (e.g. Liverman et al, 1998).
Just as important in the context of integrated modelling are the possibilities for linking CA models to other cellular models representing changes in the cellular space -in which the CA dynamics unfold- or to dynamic models operating at a more macroscopic scale. In the latter case, the macro-models will constrain the overall dynamics of the CA. The models developed, or under development, as part of EU-projects like MODULUS, Medaction, MURBANDY, and MOLAND have taken full advantage of the possibilities to link CA and other dynamic models. In MODULUS this has resulted in an integrated model representing the non-homogeneous character of the cellular space by means of models calculating among other: the soil quality and water balance, the quality and quantity of the aquifer, the characteristics of the natural vegetation. On top of these physical layers (partially also to be derived from remote sensing data), the human dynamics unfold changing the land use and land cover. These dynamics are governed by CA decision rules, representing human (spatial) behaviour, socio-economic preferences and decision-making, crop choices, etc. This is the basis from which LADAMER will start in its effort to integrate physical, ecological and land use models and apply them to the full Western Mediterranean in an effort to defi ne the ‘hot spots’ areas prone to desertifi cation. The Integrated Project DeSurvey will follow this line of research and further develop these approaches.

Hill J. et al 21
Validation and Methodological Refinements
LADAMER is intended to provide a framework for generating at regional scale information on land degradation status and trends, which allows international and national planners and decision makers to identify those areas where efforts and eventually resources should be concentrated to prevent or mitigate desertifi cation and related land degradation processes. To fulfi l this function the information must be reliable and unambiguous, respectively the limitations and uncertainty levels of the methodology must be known. Consequently elements of product validation and uncertainty analyses of the various model parameters and remotely sensed variables are needed. An at least partial validation for the western Mediterranean appears feasible with regard to existing case studies produced in former EU-funded projects. Among these we fi nd the southern Alentejo (DesertLinks, MedAction), the Guadalentin region in SE-Spain (MEDALUS, ERMES, DeMon), Languedoc in S-France (DeMon), Sardinia (GeoRange) and Crete (DeMon).
GMES Aspects
In fact, the LADAMER project encompasses two separate phases. The fi rst phase will start with the procurement and processing of considerable volumes of geo-scientifi c, socio-economic and remotely sensed data covering the Mediterranean basin. The establishment of this unifi ed data base will provide the basis for spatio-temporal analyses and the production of a regional land degradation map for the Mediterranean member states of the European Union. Together with the processed geo-data layers and spatialised socio-economic variables, this information will fl ow into a concept model to produce a land degradation assessment. Phase II will be devoted to a more in-depth validation, the integration of additional or improved data layers, and the evaluation of advanced methodological options to upgrade the quality and information content of models and products.
Given the improved availability of homogeneous geo-data layers on European land-use, soils and terrain elevation, the availability of climatic recordings used for agro-climatic modelling on European scale, the recent progress in remote sensing data collection and regionalised socio-economic data it One core element of the approach is to use existing datasets and concentrate on the integration of these, rather than procuring and processing completely new datasets. Although the required base data sets largely exist, it is a major objective of the proposal to assemble these in a unifi ed project data base, where the spatial and thematic consistency of physical and socio-economic information will be ensured. Since much of this information is scattered across various European (e.g. EEA, JRC) and international institutions (e.g. the United States) it is a mandatory prerequisite for using all information in the assessment strategies developed in LADAMER. An additional key element is the provision of an appropriate metadata documentation to support the use of the database by users of subsequent actions, such as for example DeSurvey. Needless to say that an important aspect in this GMES project is to understand whether “publicly available” data can also in practice be accessed within acceptable delays and transparent licensing procedures.
Acknowledgements
The LADAMER project (EVK2-2002-0599) is funded by the European Commission, DG Research, as a contribution to the GMES action. This support is gratefully acknowledged. The project consortium involves partners from four additional institutes who contributed to this paper. I’m particularly grateful to Maria Roxo (Universidade Nova de Lisboa, Portugal), Juan Puigdefabregas (Estacion Experimental de Zonas Aridas, CSIC, Almeria, Spain), Stefan Sommer (European Commission, Joint Research Centre, Ispra, Italy), and Guy Engelen (Research Institute for Knowledge Systems, Maastricht, The Netherlands).

LandWaterMed network22
Atkinson, P.M., M.E.J. Cutler, & H. Lewis, 1997, Mapping sub-pixel proportional cover with AVHRR imagery, Int. J. Remote Sensing, 18, 917-935.
Boer, M.M., 1999, Assessment of dryland degradation. Linking theory and practice through site water balance modelling, PhD Dissertation, (Netherlands Geogr. Studies: Utrecht).
Brandt, J., & J.B. Thornes, 1996, eds., Mediterranean desertifi cation and land use, (John Wiley & Sons: Chichester).
CORINE, 1992, Soil erosion risk and important land resources in the southern regions of the European Community, EUR 13233 EN, (Offi ce for Offi cial Publications of the European Communities: Luxembourg).
Couclelis H., 1997, From cellular automata to urban models: new principles for model development and implementation, Environment and Planning B, 24, pp.165-174.
Grimm, M., R. Jones & L. Montanarella, 2001, Soil erosion risk in Europe, EUR 19939 EN, (Offi ce for Offi cial Publications of the European Communities: Luxembourg).
DeFries, R.S., M. Hansen, & J.R.G Townshend, 1995, Global discrimination of land cover types from metrics derived from AVHRR pathfi nder data, Remote Sens. Env., 54, 209-222.
Eastman, J.R., & M. Fulk, 1993, Long sequence time series evaluation using standardized principal components, Photogrammetric Eng. Remote Sensing, 59 (6), June, 991-996.
Engelen G., White R. and Uljee I., 1993, Exploratory modelling of socio-economic impacts of climatic change, in: Maul G.A., ed., Climate Change in the Intra-Americas Sea, (Edward Arnold: London), 306-324.
Engelen G., White R., Uljee I., and Wargnies S., 1996, Numerical modelling of small island socio-economics to achieve sustainable development, in: Maul G.A., ed., Small Islands. Marine Science and Sustainable Development, American Geophysical Union, Washington DC, Coastal and Estuarine Studies, 51, 437-463.
Hill, J., J. Mégier and W. Mehl, 1995, Land degradation, soil erosion and desertifi cation monitoring in Mediterranean ecosystems, Remote Sensing Reviews, vol. 12, 107-130.
Hill, J. and D. Peter, (eds.), 1996, The Use of Remote Sensing for Land Degradation and Desertifi cation Monitoring in the Mediterranean Basin. State of the Art and Future Research, Proc. of a Workshop, jointly organized by JRC/IRSA and DGXII/D-2/D-4, Valencia, 13-15 June 1994, Valencia, EUR 16732 EN, (Offi ce for Offi cial Publications of the European Communities: Luxembourg).
Hill, J., P. Hostert, G. Tsiourlis, P. Kasapidis, and Th. Udelhoven, 1998, Monitoring 20 years of intense grazing impact on the Greek island of Crete with earth observation satellites, Journal of Arid Environments, 39, 165-178.
Hill, J, 2000, Assessment of semi-arid lands: monitoring dryland ecosystems through remote sensing, in R.A. Meyers, ed., Encyclopedia of analytical chemistry – instrumentation and applications, (John Wiley & Sons: Chichester), 8769-8794.
Hostert, P., 2001, Monitoring von Degradationserscheinungen im europäisch-mediterranen Raum mit Methoden der Fernerkundung und GIS: Untersuchungen am Beispiel der Weidegebiete Zentralkretas, PhD Dissertation, University of Trier, Germany. [online available at http://ub-dok.unitrier.de/diss/diss45/20010423/20010423.htm]
Hostert, P., A. Röder & J. Hill, 2004, Coupling spectral unmixing and trend analysis for monitoring of long-term vegetation dynamics in Mediterranean rangelands, Remote Sensing of Environment, 87, 183-197.
Lacaze, B., V. Caselles, C. Coll, J. Hill, C. Hoff, S. de Jong, W. Mehl, J.F.W. Negendank, H. Riezebos, E. Rubio, S. Sommer, J. Teixeira Filho, and E. Valor, 1996, Integrated Approaches to Desertifi cation Mapping and Monitoring in the Mediterranean Basin. Final Report of the DeMon-1 Project, edited by J. Hill, EUR 16448 EN, (Offi ce for Offi cial Publications of the European Communities: Luxembourg).
Liverman, D., E.F. Moran, R.R. Rindfuss and P.C. Stern, eds, 1998, People and pixels, linking remote sensing and social science, (National Academy Press, Washington D.C.)
Ludwig, J.A., & D. Tongway, 1992, Monitoring the condition of Australian arid lands: linked plant-soil indicators, in: McKencie, D.H., D.E. Hyatt, & V.J. McDonald, eds., Ecological Indicators. Proceedings of an International Symposium, Fort Lauderdale, Florida, USA, October 16-19, 1990, (Chapman & Hall: London), 765-772.
Mouat, D.A., C.A. Fox, & M.R. Rose, 1992, Ecological indicator strategy for monitoring arid ecosystems, in: McKencie, D.H., D.E. Hyatt, & V.J. McDonald, eds., Ecological Indicators. Proceedings of an International Symposium, Fort Lauderdale, Florida, USA, October 16-19, 1990, (Chapman & Hall: London), 717-737.
Moody, A. & D.M. Johnson, 2001, Land-surface phenologies from AVHRR using the discrete Fourier transform, Remote Sens. Env., 75, 305-323.
Perez-Trejo, F., 1994, Desertifi cation and land degradation in the European Mediterranean, EUR 14850 EN, (Offi ce for Offi cial Publications of the European Communities: Luxembourg).
Pickup, G., G.N. Bastin, & V.H. Chewings, 1994, Remote-sensing-based condition assessment for non-equilibrium rangelands under large scale commercial grazing, Ecological Applications, 4, 497-517.
Puigdefabregas, J., 1998, Ecological impacts of global change on drylands and their implications on desertifi cation, Land Degradation and Rehabilitation 9, 393
Puigdefabregas, J., Mendizábal, T. (1998), Perspectives on desertifi cation: western Mediterranean, Journal of Arid Environment 39, 209-224.
Puigdefabregas, J. and del Barrio, G., 2000, eds., A Surveillance System for Assessing and Monitoring of Desertifi cation (SURMODES). Project nº 902, Expo 2000 Hannover - Projects around the World. CDROM, EEZA (CSIC), Almeria, Spain (www.eeza.csic.es/surmodes).
Puigdefabregas, J., & T. Mendizabal, 2003, Prospects for desertifi cation impacts in Southern Europe, in press.
Reynolds, J.F., and D.M. Stafford Smith. 2002. An Integrated Assessment of the Ecological, Meteorological and Human Dimensions of Global Desertifi cation. Dahlem Workshop Report 88. Berlin: Dahlem University Press.
Röder, A., T. Kuemmerle, & J. Hill, 2005, Extension of retrospective datasets using multiple sensors. An approach to radiometric intercalibration of Landsat TM and MSS data,, Remote Sensing of Environment, 95, 195-210.
Shababov, N.V., L. Zhou, Y. Knyazikhin, R.B. Myneni, & C.J. Tucker, 2002, Analysis of interannual changes in northern vegetation activity observed in AVHRR data from 1981 to 1994, IEEE Transactions on Geoscience and Remote Sensing, 40(1), 115-130.
References
Chrysoulakis N., Abrams M. 23
The use of ASTER imagery in GIS-based Watershed Analysis at Mediterranean Islands
Nektarios CHRYSOULAKIS1 and Michael ABRAMS2
1Foundation for Research and Technology -Hellas, Inst. of Applied and Computational MathematicsVassilika Vouton, P.O. Box 1527, GR-71110, Heraklion, Crete, Greece
Telephone +30 2810 391762Fax +302810391761
e-mail: [email protected] Propulsion Laboratory/California Institute of Technology
MS 183-501, 4800 Oak Grove Drive Pasadena ,CA 91109-8099 USA Telephone +1 818 3540937
Fax +18183540966e-mail: [email protected]
Abstract: In this study, high spatial resolution stereo imagery from ASTER (Advanced Spaceborne Thermal Emission and Refl ection Radiometer), onboard Terra satellite, was analysed in combination with Global Positioning System (GPS) data and fi eld observations, using GIS techniques to examine the potential of high spatial resolution multi-spectral remote sensing to support watershed management. Terrain elevation data were derived by applying photogrammetric processes to overlapping ASTER stereo pairs for the region of Heraklion, Crete, whereas land cover/use data were derived by applying supervised classifi cation techniques on ASTER multispectral imagery. ASTER method gives a strong advantage in terms of radiometric variations versus the multi-date stereo-data acquisition with across-track stereo, which can then compensate for the weaker stereo geometry. GIS methods were applied to estimate watershed characterization parameters for the study area offering the advantages of spatial data handling capabilities and automatic extraction of thematic information. The drainage pattern, which was derived, provided a generally representative depiction of the watershed. The output pixel spacing of 15 m of the produced DEM as well as the high spatial resolution of ASTER imagery found to be quite satisfactory for the watershed characterization of the study area, indicating the high potential of ASTER multispectral imagery to support watershed management. It is therefore expected, the proposed method to provide valuable information to hydrological research and modelling in Mediterranean. Keywords: Digital Elevation Model, Global Positioning System, Multispectral Classifi cation, GIS-based Watershed Characterization
Introduction
Watersheds have been identifi ed as planning units for administrative purposes to conserve these precious resources. The concept of watershed management recognises the inter-relationships between land cover/use, soil and water and the link between uplands and downstream areas. Watershed management addresses the various elements related to reservoir identifi cation given the watershed characteristics in an integrated manner that consider socio-economic issues, as well as, environmental aspects related to fl ood and drought risks. The objectives of many watershed studies include watershed segmentation, identifi cation of drainage divides and the network of channels, characterization of terrain slope and aspect, catchment confi guration and routing of the fl ow of the water. Obtaining these variables has been diffi cult to do from paper maps and aerial photographs. These traditional methods are time consuming and subject to errors related to manual operations. The automated watershed segmentation and extraction of channel network and sub-watershed properties from raster elevation data represents a convenient and rapid way to parameterise a watershed. Additional analysis steps are required to derive physical characteristics of the watershed including area, elevation parameters, perimeter of the watershed and drainage density, which is the length of streams per unit area.
LandWaterMed network24
Hydrologic models attempt to incorporate the spatial variation of hydrologically signifi cant environmental characteristics within watersheds. These models are classifi ed spatially as either lumped or distributed. The more spatially complex distributed models attempt to describe more fully the spatial variation in topography, soils, surface characteristics and meteorology to explicitly include these in the model. When using this method, the watershed surface is discretized in to a spatial grid and the characteristics of the watershed are described within each grid cell. It is not feasible to construct databases at optimal resolutions for hydrologic modelling on anything but the smaller basin or sub-basin scale due to the lack of suitable data and computational resources for the model [1]. The grid resolution of 10 m has been suggested as appropriate for hydrologic modelling [2]. However, at this resolution the data are not available over large areas. Hydrologic studies are normally conducted using raster datasets at spatial resolutions of 30 m or less if possible. Hydrologic models require different types of data depending on the process modelled and the relevant time and space scales of these processes. These data include surface representation (slope, aspect, plain geometry), soil characterization (permeability, conductivity, storativity), antecedent moisture conditions, land cover/use condition, vegetation characteristics and biomass, as well as a number of watershed topological properties such as the structure of the channel network and its contributing sub-catchments.
The integration of spatial data handling capabilities of a Geographic Information System (GIS) with hydrologic or hydraulic models, offers the advantage of having information content of the spatially distributed data to analyse the involved process. Digital Elevation Models (DEMs) and land cover/use products are primary inputs for hydrologic models for surface runoff that affects infi ltration, erosion, and evapotranspiration, playing important role in determining the runoff characteristics of a specifi c catchment area. Therefore, remote sensing and GIS have been found useful tools in identifi cation and categorisation of watersheds on the basis of natural resources and their limitations. The quantitative assessment of the processes depends on the topographic confi guration of the land surface, which is one of the several controlling boundary conditions. Many topographic parameters can be computed directly from DEM [3], [4], [5], [6], allowing the automatic watershed segmentation and parameterisation for water resources, hydraulic and hydrologic applications.
Remotely sensed data make it possible to extract hydrologic parameters and to update these parameters at relevant temporal scales (monthly, seasonally, annually) over very large spatial domains. Following acquisition, the satellite data must be processed to correct for the infl uence of the intervening atmosphere, remapped to a geographic or spatial grid and analysed to derive information required specifi cally for watershed characterization or for hydrologic modelling. Image classifi cation is usually part of this analysis in order to produce thematic maps capable of being used in GIS analysis. The utility of classifi ed satellite images in hydrologic research depends on the accuracy of the classifi cation scheme employed. Classifi cation accuracy is related to the variability in the refl ectance spectra for each derived class, band position and width, radiomentric sensitivity, noise of the instrument and numerical precision of the classifi cation algorithm.
Previous research has demonstrated the variability of techniques for automatically deriving a wide variety of topographic and topologic information, that are meaningful to watershed runoff process, directly from DEM [5], [7]. It is therefore obvious that watershed characterization requires at the fi rst step, the construction of a DEM to be completed by thematic maps for land use and cover, in addition to other terrain information. For the production of DEMs from optical satellite data, the respective satellite sensors should have stereo coverage capabilities. To obtain stereoscopy with images from satellite scanners, two solutions are possible [8]: a) the along-track stereoscopy with images from the same orbit using fore and aft images; and b) the across-track stereoscopy from two different orbits. The fi rst solution is used in ASTER (Advanced Spaceborne Thermal Emission and Refl ection Radiometer) imagery. The ASTER method gives a strong advantage in terms of radiometric variations versus the multi-date stereo-data acquisition with across-track stereo, which can then compensate for the weaker stereo geometry. The viability of stereo correlation for parallax difference from digital stereoscopic data has been described and evaluated in previous studies [9], [10], [11], [12], [13]. Moreover, the production of geocoded, orthorectifi ed raster images, a necessity for incorpo rating image data in a GIS database, requires DEM data [14], [15], because raw satellite images usually contain such signifi cant geometric distortions that they can not be use directly with map base products in a GIS [16].
Recently, at the local level, a number of data sources have been used to derive land cover products for high resolution studies [17]. One of the main problems when generating land cover maps from digital images is the confusion of spectral responses from different features. Sometimes two or more different features with similar spectral behaviour are grouped into the same class, which leads to errors in the fi nal map. The accuracy of the map depends on the spatial and spectral resolution and the seasonal variability in vegetation cover types and soil moisture conditions [18].

Chrysoulakis N., Abrams M. 25
Attempts have been made to improve the accuracy of image classifi cation. One approach is the use of multi-temporal imagery to distinguish classes [19], [20]; another is the piecewise linear classifi er with simple post-processing [21]. The integration of GIS with ancillary information has also been tested, to improve image classifi cation [22], [23], [24], [25].
In this study, ASTER imagery was analysed in combination with Global Positioning System (GPS) data and fi eld observations to provide accurate DEM and land cover/use thematic maps for the area of NW Heraklion, Crete and to examine the potential of high spatial resolution ASTER imagery to support watershed analysis at Mediterranean islands. GIS techniques were also used to extract watershed physical parameters, capable of supporting watershed characterization and hydrologic modelling.
Data and Methodology
The data used in this study was an ASTER image, acquired on August 10, 2000 (09.25 LST), over the region of Heraklion, Crete, Greece and GCPs (Ground Control Points) derived from differential GPS measurements using the GPS base station of the Regional Analysis Division of FORTH/IACM (Foundation for Research and Technology – Hellas, Institute of Applied and Computational Mathematics). Field observations have been also used for training site selection for the supervised classifi cation of ASTER multipsectral imagery. A Transverse Mercator projection was applied (Projection System: Hellenic Geodetic Reference System 87 - HGRS87) in order to have all data in the same cartographic projection system. The study area located around Giofyros river watershed and includes 12 Municipalities of the Prefecture of Heraklion, as shown in Figure 1.
ASTER is an advanced multispectral imager that was launched on board NASA’s Terra spacecraft in December, 1999. ASTER covers a wide spectral region with 14 bands from the visible to the thermal infrared with high spatial, spectral and radiometric resolution. ASTER consists of three separate instruments subsystems, each operating in a different spectral region, using separate optical system. These subsystems are the visible - near infrared (VNIR), the short-wave infrared (SWIR) and the thermal infrared (TIR). The spatial resolution varies with wavelength: 15 m in the VNIR, 30 m in the SWIR and 90 m in the TIR. The VNIR subsystem consists of two telescopes – one nadir looking with a there band detector (Channels 1, 2 and 3N) and the other backward looking (27.7° off-nadir) with a single band detector (Channel 3B). The city of Heraklion is clearly depicted in bluish tones in the upper part of Figure 1, which is a pseudocolor combosition of the ASTER channels 1, 2, and 3N (RGB: 3N-2-1). The most important specifi cations of the ASTER stereo subsystem that govern the DEM generation capabilities, include: stereo geometry; platform altitude of 705 km and ground speed of 6.7 km/sec; base to height ratio (B/H) of 0.6; IFOV of 15 m; bandpass of 0.76-0.86 micrometers in channel 3N and 3B; 9 seconds required to acquire a 60 x 60 km scene; 64 seconds required to acquire a stereo pair [9].
The work carried out in this study is part of the project REALDEMS (REmote sensing Application for Land cover and Digital Elevation Model Service). This project is a joint effort of the FORTH , the Jet Propulsion Laboratory, the University of the Aegean and the PLANO S.A., aiming at providing accurate DEMs and land cover maps for Crete and Mytiline islands (Greece), capable of being used in local studies. REALDEMS is a 2-years project (2004 – 2006) and the Greek part is funded by the General Secretariat for Research and Technology. Three main research stages have been planned: In the fi rst stage, all available ASTER images will be selected and pre-processed and the fi eld measurements and observations will be performed. The second stage includes all remote sensing analysis tasks, whereas the third stage is related to GIS analysis and validation of results, in terms of application of produced DEM and land cover for watershed characterization and mapping. This type of application has been selected because of the great importance
Figure 1. The study area: 12 Municipalities covering the broader Giogyros river watershed area are included.

LandWaterMed network26
of water resources for Mediterranean islands. Thus, REALDEMS also aiming at introducing satellite remote sensing data and methodologies in support of local level watershed management providing also valuable information to hydrological modelling. The REALDEMS methodology is presented in Figure 2.
Thus, in this study, ASTER 3N and 3B images of August 10, 2000, were used for DEM production, whereas VNIR imagery were used for land cover/use classifi cation and mapping. Field measurements with the use of GPS were also performed to provide GCPs for DEM correction and geo-location, as well as to support fi eld observations and training site selection for the supervised classifi cation process. DEM extraction from ASTER stereo imagery is based on the principle of automatic stereo correlation.
The accuracy to which absolute elevations can be derived by photogrammetric techniques is governed by: a) B/H ratio i.e. geometric stereo disposition, b) reliability of the correlation procedure and c) accuracy and density of GCPs. A digital stereo correlation approach used to calculate parallax differen ces from ASTER stereo pair [9]. Relative ground elevations were determined by measuring the parallax differences in the registered images. The parallax differences were converted to absolute elevations with the use of GCPs. The image coordinates of the GCPs in conjunction with their HGRS87 map coordinates allowed the development of transformation equations needed to register the stereo images and eventually geodetically rectify them to the Earth’s surface. The used geometric model was a rigorous parametric model developed at the Canada Centre for Remote Sensing [26]. The Root Mean Square Error (RMSE) in XY (planimetry) and Z (elevation) were used for the DEM accuracy assessment. Assuming parallax difference correlation errors in the range of 0.5 to 1.0 pixels (7-15 m), elevation errors (RMSEz) would expected to be in the ±12 m to ±26 m range.
The produced DEM was used for a GIS-based watershed characterization to determine: a) the hydrographic network and outlets; b) the maps of slopes and aspects and c) the limits, the boundaries and the area of the watershed and sub-watersheds. Four steps were carried out to delineate the drainage network: a) removing depressions and fl at areas in the DEM to eliminate indefi nite downslope drainages, b) assigning fl ow direction per cell, c) assigning fl ow accumulation values per cell, and d) determining the threshold fl ow accumulation value that best represented the drainage pattern [5]. Additional analysis steps were carried out to derive physical characteristics of the watershed. Depressions are groups of raster cells completely surrounded by other cells of higher elevation. They are usually artifacts that arise from data inaccuracies or limited horizontal and vertical resolution of the DEM. The depressions are removed by raising the elevations within each depression to the elevation of its lowest outlet. Areas of limited relief can translate into perfectly fl at surfaces in DEMs due to the following reasons: a) too low a vertical and/or horizontal DEM resolution to represent tha landscape, b) fi lling the depressions and c) lanscape that is truly fl at, which seldomly occurs. Whatever teir origin, fl at surfaces are problematic because fl ow direction on a perfectly fl at surface is indetermionate [6]. Elevation and fl ow direction were the essential data from which all of the other drainage computations were made.
The slope was determined from the change in elevation divided by the distance between cells, determined between the centres of the cells in question. The D8 method is used to determine the direction of overland fl ow at each cell of the DEM. The D8 method compares the elevation of each grid cell against the elevation of its eight adjacent neighbours and a single fl ow direction is assigned along the steepest downslope path. The surface drainage pattern defi ned by
Figure 2. Flowchart of the REALDEMS methodology.

Chrysoulakis N., Abrams M. 27
these overland fl ow directions allows for the derivation of the upstream drainage area or fl ow accumulation for each cell. In-house software tools [27] developed in ESRI ArcView script language were used to query the fl ow direction grid to identify those cells deemed to be upslope of the cell in question and create a grid of accumulated fl ow to each cell by summing the weight for all cells that fl ow into each down-slope cell. Once the fl ow direction and fl ow accumulation were determined, stream networks were identifi ed by setting a threshold for the fl ow accumulation to defi ne the beginning of a stream. Watersheds for any point were determined by identifying all cells that fl ow into a particular cell of interest. With the aid of the fl ow accumulation, the location of the watershed outlet was determined and an outlet feature point was created. A minimum threshold was defi ned and all of the DEM points upstream from the defi ned outlet were connected together to form a stream network of feature lines.
Using the outlets on the stream network and the fl ow directions, the contributing DEM points for each outlet were assigned the proper basin id. The boundaries between DEM points with different basin ids were converted to feature polygons. Once the boundaries of the sub-basins were determined, geometric properties important for hydrologic modelling (area, slopes, aspects, etc.) were computed from the DEM data. Overland areas are defi ned as undissected hillslopes of irregular shape that drain directly into a channel link. For hydrologic modelling these overland areas are often approximated by rectangular planes of given width, length and slope. The geometric dimensions of these planes are essential for the determination of the magnitude, shape and timing of the overland runoff hydrograph and are used in hydrologic models. The identifi cation of channel network and sub-catchment topology from raster images provides an important linkage between DEM-derived drainage features and automated watershed management and hydrologic modelling. Surface features may be represented within the GIS by using vector or raster format, or by refi nements such as the Triangulated Irregular Network (TIN). In this method, an area is represented by irregular triangles with the elevation specifi ed at each triangle vertex. The elevation is assumed to vary linearly over the triangle. This formulation allows for the specifi cation of irregular features which might not be possible with gridded data and is commonly employed in hydrologic modelling [1], [28], [29]. ESRI ArcView 3D Analyst was used to produce a TIN layer from the ASTER derived DEM.
Land cover/use mapping is one of the most important and typical applications of remote sensing data. Land cover corresponds to the physical condition of the ground surface, for example, forest, grassland, concrete pavement etc., while land use refl ects human activities such as the use of the land, for example, industrial zones, residential zones, agricultural fi elds etc. Generally land cover does not coincide with land use. A land use class is composed of several land covers. Remote sensing data can provide land cover information rather than land use information. Land cover/use is a primary input of hydrologic models determining the runoff characteristics of a specifi c catchment area.
A supervised land cover classifi cation system is being developed in REALDEMS project, however, in this study, a hybrid classifi cation method was applied for land use mapping using ASTER VNIR imagery and fi eld observations. Initially the raw imagery was orthorectifi ed using the produced DEM and the GCPs. Afterwards, a supervised classifi cation was performed to derive land cover types as explained above. Following, a semi-automatic extraction of land use classes took place based on the produced land cover types in combination with ASTER imagery photointerpretation, very high spatial resolution satellite data and 1:5000 topographic maps. Points of interest (i.e. airport, port, industrial zones, etc.) were located and polygons covering these areas were digitised in ArcView.
In practice, these polygons were used to create a digital mask for VNIR imagery in order to mask pixels corresponding to the following land use types: a) main commercial zones; b) industrial zones; c) public buildings and areas; d) airport; e) port; f) coast; g) major hotel installations; h) sporting installations and i) archaeological sites. Once pixels corresponded to the aforementioned areas had been masked, the remaining VNIR pixels corresponded to residential developed land or to undeveloped. Therefore, the supervised classifi cation scheme was applied again to these pixels, resulted in seven more classes: a) residential developed areas; b) sea and wetlands; c) vineyards; d) olive groves; e) other cultivated land; f) areas with natural vegetation and g) mixed areas.
Results and Discussion
ASTER VNIR stereo imagery was used for DEM production. A digital stereo correlation approach was used to calculate parallax differences from ASTER stereo pair. In the stereo pair, any positional differences parallel to the direction of satellite travel (parallax differences) were attributed to displacements caused by relief. Relative ground elevations were determined by measuring the parallax differences in the registered images. The parallax differences were converted to absolute elevations values with the use of GCPs. The image coordinates of the GCPs in conjunction with their map coordinates permitted the

LandWaterMed network28
development of transformation equations needed to register the stereo images and eventually geodetically rectify them to the Earth’s surface. PCI photogrammetric software (Orthoengine) was employed for DEM production. DEM was directly produced by digital cross-correlation between ASTER 3N and 3B channels, read from the distribution fi le (HDF format) by the software. It was possible to automatically create a relative DEM from 3N and 3B input fi les, using just tie points to adjust the images together.
However the addition of GCPs permitted more precise geocoding and scaling of the fi nal product (absolute DEM: elevation referenced to mean sea level). Once tie points and GCPs had been collected, then a Bundle Adjustment operation was performed. This operation computes a photogrametric model using the orbital and sensor ephemeris information plus the GCPs and tie points, so that images were located relative to each other and to the ground.
Afterwards, epipolar images were created for both input fi les. These versions of the original 3N and 3B fi les removed any offsets between them in the y-direction. Therefore, the autocorrelation pixel matching algorithm was run more quickly on the epipolar images, because it should not have to search so many pixels to fi nd a match. Following the DEM extraction, stereo editing was performed to edit-out failures resulting in a smooth complete DEM.
Figure 3 shows the produced DEM for the study area. Catchments and mountainous areas are clearly depicted. The planimetric accuracy of the produced DEM was at ± 15 m (1 ASTER pixel), whereas its vertical accuracy was checked by using 100 survey monuments (TPoints), available from 1:5000 topographic maps of the Prefecture of Heraklion. TPoints are shown with the red crosses in Figure 3. The elevation of each TPoint was compared with the elevation of the respective DEM pixel. A very good correlation (R2 = 0.9971) was observed as shown in Figure 4, where a scatter-plot between TPoints derived (ZTPoints) and ASTER DEM derived (ZASTER) elevation values is presented. The absolute value (|�Z|) of elevation difference between ZTPoints and ZASTER for all TPoints is shown in Table 1. The mean |�Z| value is equal to 10.36, whereas the standard deviation is 6.86. That means that the mean vertical accuracy of the produced DEM is ± 10.36 m. The RMSE was used for a more quantitative evaluation of DEM’s vertical accuracy. RMSE encompasses both systematic and random errors and is defi ned as:
where, �zi is the Z
Tpoint(i) - Z
ASTER differences and n is the number of T
Points (n = 100).
Therefore, based on Table 1, it was founded that RMSE was 12.41 m, whereas the the majority (88%) of the |�Z| values were less than 20 m; 73% were less than 15 m; 50% were less than 10 m and 30% were less than 5 m. Moreover, the maximum error was less than 30 m, an acceptable value yielding that the distribution of errors is within the normal extent.
Figure 3: The produced DEM for the NW Heraklion.

Chrysoulakis N., Abrams M. 29
Table 1: Elevation difference between ASTER DEM and survey monuments.
Coordinates are in Hellenic Geodetic Reference System 87 (HGRS87).
Once the DEM was produced, GIS techniques were used for slope and aspect spatial distributions extraction. Figure 5 (left) shows the slope image of the area. Slope images are usually color-coded according to the steepness of the terrain at each pixel. In Figure 5, the calculated slopes have been grouped in four main categories. Using the elevation and the slope information, aspect values for each pixel were calculated and classifi ed in four main categories as shown in Figure 5 (right).
Figure 4: Scatter-plot between ZTPoints
and ZASTER
. An excellent correlation was observed

LandWaterMed network30
Figure 5: Slope (left) and aspect (right) spatial distributions as derived from ASTER DEM.
DEM, slope and aspect products were also used as inputs in GIS analysis for the watershed characterization process as shown in Figure 2. Elevation and fl ow direction were the essential data from which all of the other drainage computations were made. Using the developed GIS tools, the location of the watershed outlets was determined and outlet feature points were created. The watershed was subdivided into sub-basins by converting the nodes along the stream feature arcs to outlet nodes. Figure 6 shows the watershed hydrographic network and outlets.
Figure 6: Watershed hydrographic network and outlets.

Chrysoulakis N., Abrams M. 31
The watershed segmentation result is shown in Figure 7. An ID number has been assigned to each sub-basin. Once sub-basins have been identifi ed, spatial calculations can been performed using GIS capabilities. The result of the sub-basin area calculation are shown in Table 2.
Figure 7: Sub-basin identification.
As it has been already mentioned, surface features may be represented within the GIS by using the TIN confi guration, because it allows for the specifi cation of irregular features which might not be possible with gridded data and is commonly employed in hydrologic modelling. Using the ArcView 3D Analyst a TIN elevation representation was produced from ASTER DEM. This product is capable of being used in application of hydrologic models in the area of concern. It is also capable of performing quantitative 3D spatial calculations, as for example the calculation of the area between different elevation levels as shown in Figure 8.
Figure 8: Area between different elevation levels.
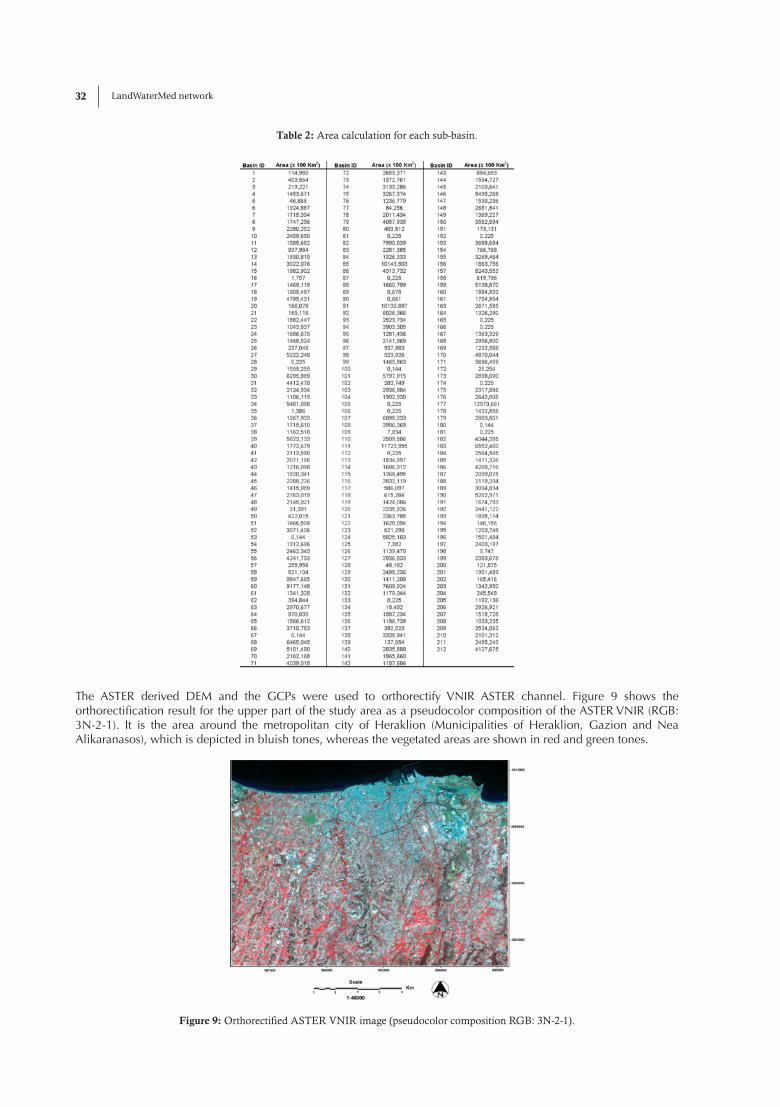
LandWaterMed network32
Table 2: Area calculation for each sub-basin.
The ASTER derived DEM and the GCPs were used to orthorectify VNIR ASTER channel. Figure 9 shows the orthorectifi cation result for the upper part of the study area as a pseudocolor composition of the ASTER VNIR (RGB: 3N-2-1). It is the area around the metropolitan city of Heraklion (Municipalities of Heraklion, Gazion and Nea Alikaranasos), which is depicted in bluish tones, whereas the vegetated areas are shown in red and green tones.
Figure 9: Orthorectified ASTER VNIR image (pseudocolor composition RGB: 3N-2-1).

Chrysoulakis N., Abrams M. 33
Figure 10: Land use classification for the study area around the city of Heraklion.
Since fi eld observations were available for the study area the production of land cover/land use was straightforward through the application of a supervised classifi cation method on ASTER VNIR imagery. However, for the upper part of the area of concern, which is a mixed (urban, industrial, agricultural and natural) area as shown in Figure 9, the supervised classifi cation algorithms were not appropriate for the land cover/use production. For this reason the hybrid classifi cation scheme described in Section 2 was applied. Figure 10 shows the land use classes as derived by combining the land cover classifi cation product with available vector data and in-situ observations. Eighteen land use types have been derived in total. Eight of them represent undeveloped land (cultivations, natural vegetation, wetlands and coastal zone), one type is referred to residential developed areas and the remaining nine types represent other developed areas (industrial and commercial zones, airport, road network etc.). This detailed mapping provides valuable information for land parameterization by models dealing with surface processes.
Conclusions
The work carried out in this study was a part of REALDEMS project aiming to provide accurate DEMs and land cover maps for Greek islands, capable of being used in local studies. REALDEMS is also aiming to introduce satellite remote sensing data and methodologies in support of local level watershed management. In this framework, high spatial resolution ASTER imagery was analyzed in combination with GPS data and fi eld observations to provide DEM, land cover/ land use thematic maps and watershed characterization products for NW Heraklion, Crete. The ASTER method was used because it gives a strong advantage in terms of radiometric variations versus the multi-date stereo-data acquisition with across-track stereo, which can then compensate for the weaker stereo geometry. Near infrared stereo imagery was used for DEM production, whereas VNIR imagery was used for land use classifi cation and mapping.
GPS measurements were performed to provide GCPs for DEM correction and geo-location, as well as to support fi eld observations and training site selection for the supervised classifi cation. A hybrid GIS-based classifi cation scheme was applied for urban areas, combining the supervised classifi cation results with ancillary spatial data. GIS methods were used for the watershed analysis. GIS tools were employed to estimate watershed characterization parameters offering the advantages of spatial data handling capabilities and automatic extraction of thematic information. The sub-basins were located and the drainage pattern was extracted providing a generally representative depiction of the watershed.
The planimetric and elevation accuracy of the produced DEM (± 15 and ± 12.41 m, respectively) are considered quite satisfactory for large catchment hydrological parameterization, indicating the high potential of ASTER imagery to support watershed management. The resultant DEM can be used as a data product in its own right and/or as the DEM needed to orthorectify other satellite images acquired over the same area. Following the orthorectifi cation, these images (original or classifi ed) are ready to be used alongside other spatial data sets.

LandWaterMed network34
[1] Cruise, J. F. and Miller, R. L., 2003. Hydrologic Modelling Using Remotely Sensed Databases. In: J. G. Lyon (editor): GIS for Water Resources and Watershed Management, pp. 189 - 205. Taylor & Francis, New York, USA (ISBN 0-415-28607-7).
[2] Zhang, W. and Montgomery, D. R., 1994. Digital elevation model grid size, landscape representation, and hydrologic simulation. Water Resources Research, 30, 1019 - 1028.
[3] Martz, L. W. and Garbrecht, J., 1997. The assignment of drainage direction over fl at surfaces in raster digital elevation models. Journal of Hydrology, 193, 204 - 213.
[4] Martz, L. W. and Garbrecht, J., 1999. An outlet breaching algorithms for the treatment of closed depressions in a raster DEM. Computers & Geosciences, 25, 835 - 844.
[5] Jenson, S. K. and Domingue, J. O., 1998. Extracting topographic structure from digital elevation data for geographical information system analysis. Photogrammetric Engineering and Remote Sensing, 54, 1593 - 1600.
[6] Garbrecht, J., Martz, L. W. and Starks, P. J., 2003. Technological Advances in Automated land Surface Parameterisation from Digital Elevation Models. In: J. G. Lyon (editor): GIS for Water Resources and Watershed Management, pp. 207- 217. Taylor & Francis, New York, USA (ISBN 0-415-28607-7).
[7] Larcoix, M. P., Martz, L. W., Geoff, W. K. and Garbrecht, J., 2002. Using digital terrain analysis modelling techniques for the parameterisation of hydrologic model. Environmental Modelling & Software, 17, 127 - 136.
[8] Toutin Th., 2001. Elevation Modelling from Satellite VIR Data: A Review. International Journal of Remote Sensing, 22, 1097 - 1125.
[9] Lang, H., and Welch, R., 1999. ATBD-AST-08 Algorithm Theoretical Basis Document for ASTER Digital Elevation Models. Standard Product AST14 Report, The Jet Propulsion Laboratory, California Institute of Technology, Los Angeles, USA.
[10] Ackermann, F., 1994. Digital elevation models - techniques and application, quality standards, development. International Archives of Photogrammetry and Remote Sensing, 30, 4, 421-432.
[11] Bolstad, P.V. and Stowe, T., 1994. An evaluation of DEM accuracy: Elevation, slope, and aspect. Photogrammetric Engineering and Remote Sensing, 60, 1327 - 1332.
[12] AI-Rousan, N. and Petrie, G., 1998. System calibration, geometric accuracy testing and validation of DEM and orthoimage data extracted from SPOT stereopairs using com mercially available image processing systems. International Archives of Photogrammetry and Remote Sensing, 32, 4, 8 - 15.
[13] Cheng Ph., Toutin Th. and Stohr C., 1999. Automated DEM Extraction from Aerial Photos or Optical Satellite Images. In: Proceedings of the 13th International Conference on Applied Geologic Remote Sensing, March 1-3, 1999, Vancouver, Vol. 1, pp. 56-63.
[14] Hohle, J., 1996. Experience with the production of digital orthophotos. Photogrammetric Engineering and Remote Sensing, 62, 1189 - 1194.
[15] Thorpe, J., 1996. Aerial photography and satellite imagery: Competing or comple mentary? Earth Observation Magazine, 5, 35 - 39.
[16] Toutin Th., 2004. Geometric processing of remote sensing images: models, algorithms and method. International Journal of Remote Sensing, 25, 1893 - 1924.
[17] Steininger, M. K., 2000. Satellite estimation of tropical secondary forest above-ground biomass: data from Brazil and Bolivia. International Journal of Remote Sensing, 21, 1139 - 1175.
[18] Congalton, R. G., 1988. Using spatial autocorrelation analysis to explore the errors in maps generated from remotely sensed data. Photogrammetric Engineering and Remote Sensing, 54, 587 - 592.
[19] Conese, C. and Maselli, F., 1991. Use of multi-temporal information to improve classifi cation performance of TM scenes in complex terrain. ISPRS Journal of Photogrammetry and Remote Sensing, 46, 187 - 197.
[20] Barbosa, P. M., Casterad, M. A. and Herrero, J., 1996. Performance of several Landsat 5 Thematic Mapper (TM) image classifi cation methods for crop extent estimates in an irrigation district. International Journal of Remote Sensing, 17, 3665-3674.
[21] K-Y. Huang and Mausel, P., 1993. Spatial post-processing of spectrally classifi ed video images by a piece wise liner classifi er. International Journal of Remote Sensing, 14, 2563 - 2573.
[22] Gastellu-Etchegorry, J.P., Estreguil, C. and Mougin, E., 1993. A GIS based methodology for small-scale monitoring of tropical forests - A case study in Sumatra. International Journal of Remote Sensing, 14, 2349 - 2368.
[23] Ortiz, M.J., Formaggio, R. and Epiphanio, J. C.N., 1997. Classifi cation of croplands through integration of remote sensing, GIS and historical database. International Journal of Remote Sensing, 18, 95-105.
[24] Palacio-Prieto, J.L. and Luna-González, L., 1996. Improving spectral results in a GIS context. International Journal of Remote Sensing, 17, 2201 - 2209.
[25] Chrysoulakis, N., Kamarianakis, Y., Farsari, Y., Diamandakis M. and Prastacos, P., 2004. GIS-based estimation of Urban Growth Models and Defi nition of Sustainable Urban Indicators with the use of satellite and socio-economic data. In: CD-ROM of Proceedings of 3rd Pan-Hellenic Conference of GIS Applications. HellasGIS, Athens, Greece.
[26] Toutin Th., 1995. Multi-source Data Fusion with an integrated and Unifi ed Geometric Modelling. Advances in Remote Sensing EARSeL Journal, 4, 118 - 129.
[27] Diamandakis, M. and Prastacos, P., 2002. GIS and Water resources. WADI Project Tutorial/Workshop, Ecole Superieure d’Ingénieurs de Beyrouth, Beirut, Lebanon.
[28] Goodrich, D. G., Woolhiser, D. A. and Keeper, T. O., 1991. Kinematic routing using fi nite elements on a triangular irregular network. Water Resources Research, 27, 995 – 1003.
[29] Greene, R. G. and Cruise, J. F., 1996. Development of a geographic information system for urban watershed analysis. Photogrammetric Engineering and Remote Sensing, 62, 863 - 870.
References

Escadafal R. 35
Remote Sensing of Land Surface forMonitoring Arid Mediterranean Environment
Richard ESCADAFAL
CESBIO, 18, avenue Edouard Belin,31401 Toulouse cedex 9 – FRANCE
Abstract: Desertifi cation is the major environmental threat in arid lands and remote sensing a major source of information to assess and monitor this phenomenon. Green vegetation cover change as estimated by vegetation indices is a good desertifi cation indicator under humid and subhumid climates, however it generally fails at depicting the condition of arid steppic ecosystems. An approach taking into account all components of the land surfaces has been developped and results evidence the importance of soils features both for interpreting remote sensing data and for documenting desertifi cation in the dryer parts of the Mediterrranean. Consequences for the implementation of environmental monitoring with current and future satellites are discussed.
Keywords: Soils, desertifi cation, spectrometry, fi eld data, Northern Africa
Satellites Watching Arid Lands
Arid lands are prone to land degradation phenomena regrouped under the term desertifi cation a very serious threat considered as such since the fi rst international conference on the topic in 1977. Among the measures designed to tackle it, the need to assess the extension and rate of propagation has been clearly identifi ed and is still a priority (see UNCCD). The task is immense as most desertifi cation endangered regions are large areas of rather low agricultural activity with modest infrastructures, they are usually not routinely subjected to detailed environmental monitoring. In the Mediterranean region the southern rim with its dryer climate is clearly the most affected area (fi g 1a).
Since the launch of the fi rst civilian satellites, remote sensing images have been made available and a great hope has been placed in this technology as a source of environmental information, particularly for desertifi cation assessment as their images cover very large areas compared to traditional survey methods.
After the fi rst attempts, it has been established that most of the satellites with optical sensors (the more resembling to aerial photography cameras) are very effi cient at mapping green vegetation extension. This is not a big surprise as they have been designed for that, all of them record images at least in the red and near infrared spectral bands. Vegetation indices, based on the contrast between values in these two bands, express the ‘greenness’ of the landsurface (fi g.1b), such as the widely used and long established NDVI (Price, 1987).
As a matter of fact, satellites are now routinely used to map green vegetation density and extension. This approach is effective from humid (with the limitation of less usable images because of the denser cloud cover) to semi-arid regions, where the vegetation is shorter but still green, such as in the northern Mediterranean countries. Several recent research programmes have demonstrated how the motoring of green vegetation cover with optical remote sensing helps to assessing its fl uctuations and the corresponding desertifi cation patterns. This has been successfully used to assess desertifi cation in the sahelian countries where most of the vegetation is made of annual herbaceous easily detected with the NDVI, and thus its fl uctuation and depletion (Tucker et al., 1991).

LandWaterMed network36
In northern Mediterranean regions detailed rangeland condition has been obtained through advanced processing of series of Landsat TM images for monitoring green vegetation cover changes (Hill et al., 2005 [these proceedings])
However in the arid regions of the south Mediterranean countries where desertifi cation monitoring is so needed, there is not much green vegetation to monitor, apart from small patches of irrigated fi elds and oasis. Natural vegetation is a steppe dominantly composed of shrubs, cover is sparse. Greening occurs only sporadically following the rain, then shrubs grow new leaves and some annual plants develop in between the shrubs. These vast areas are usually used as rangelands, but many parts have been recently turned into rain fed agriculture. Still, only in rainy years the crops will have a signifi cant cover, remotely sensed by satellites.
Thus, to use satellite imagery for desertifi cation assessment in the context of the dry Mediterranean countries the question is what can be actually remotely sensed with the existing satellites and is it helpful for desertifi cation monitoring.
Figure 1 : a) extract of the desertification map of the world (UNCCD) compared to b) global green vegetation image
(Spot-VGT : www.vito.be)
Remotely Sensing Mediterranean Arid Lands
As expected, whereas the classical approach using vegetation indices for green cover assessment has been successfully applied to sub-humid and semi arid parts of northern Africa (Maselli et al., 1998), it has failed in detecting the vegetation of the vast arid steppes spreading between the rather humid coastal regions and the extreme desert conditions of the central Sahara (Kennedy, 1989)
Figure 2. Extract of the Global Land Cover map of Africa (Mayaux et al. 2003)Legend: pink:rain-fed agriculture, beige: open shrubland, red: salt hardpans,
light yellow: sparse grassland (‘pseudo-steppe) and in grey: bare soil (highly dominant in North African countries)

Escadafal R. 37
The dryer the climate, the sparser the vegetation, and in typical arid steppe ecosystems the vegetation cover is often less then 30% , a value which is also considered as a threshold for remote sensing as lower cover are diffi cultly detected with vegetation indices. The fact that the plants from the steppe are short woody shrubs with short leaves, make them even more diffi cult to detect with these indices, moreover certain types of arid soils are responsible for ‘noise’ in the vegetation indices (see fi g.3)
Figure 3. Evidence of soil artefacts in Spot-VGT imagery over dry Mediterranean areas ( 10 days composited image, early Oct.2003, project POSTEL/CYCLOPES )
Image above: (Band 2,3,4 “false colour” composite) showing the green vegetation areas in redImage below : NDVI computed for the same image,
values above 0.1 for bare soils and bare rocks in desert areas in the lower part are artefacts
Reconsidering the overall issue of environmental remote sensing of these arid biomes, a new approach as then been developed, trying to circumvent these limitations of the approach generally used over other biomes. It is based on considering both the global features of arid land surfaces and the sensors characteristics of the satellite to be used.
Integrated Land surface Condition Assessment
In the new approach we have developed to use remote sensing in desertifi cation monitoring, instead of trying to monitor only the “green” component of the landsurface, we have taken into account the fact that the whole land surface is affected by the degradation (and recovery) phenomena involved. Thus, when characterising the land surface condition we are looking at all its diverse components : the mineral ones, soil but also stones, pebbles, outcropping rocks, surfi cial sand, and the vegetal components made of the different plants, including dry parts and litter.
Several techniques have been tested for assessing the relative abundance of each of these components in terms of percentage of the surface cover, among them the line intercept method based on the measurement of fraction cover intercepted by 20m lines randomly distributed on the studied land surface sample, as well as nadir viewing photographs from a pole or from other devices such as kites and balloons (fi g.4).
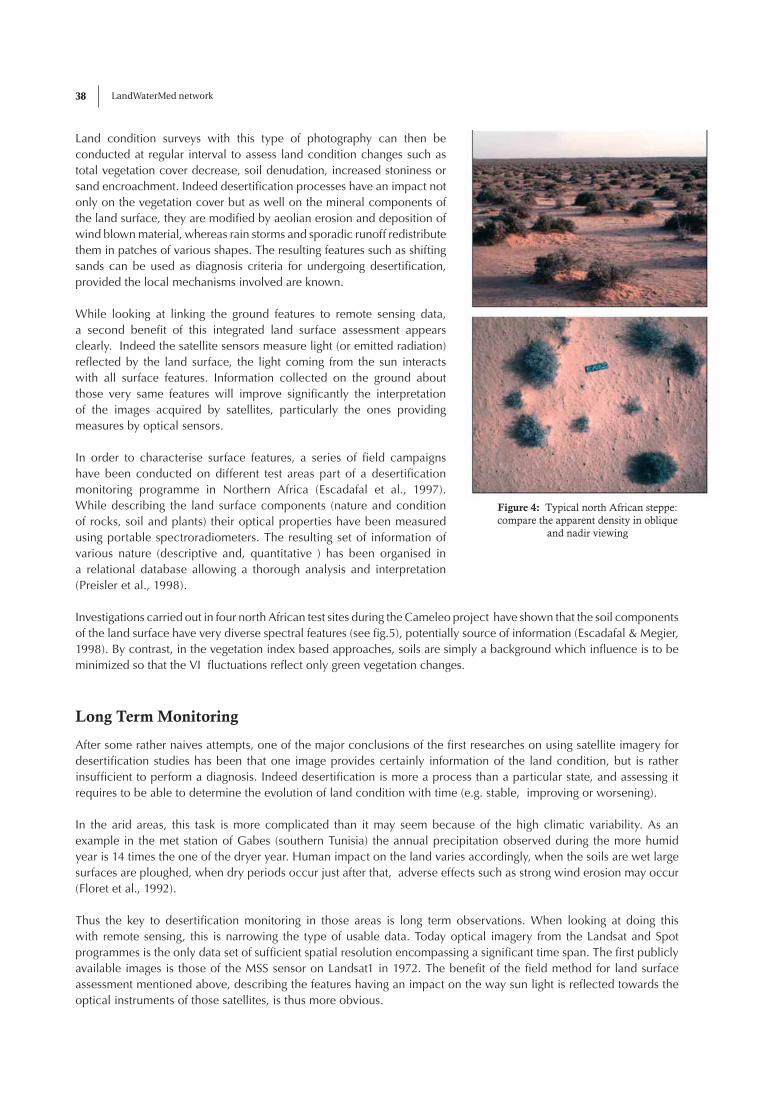
LandWaterMed network38
Land condition surveys with this type of photography can then be conducted at regular interval to assess land condition changes such as total vegetation cover decrease, soil denudation, increased stoniness or sand encroachment. Indeed desertifi cation processes have an impact not only on the vegetation cover but as well on the mineral components of the land surface, they are modifi ed by aeolian erosion and deposition of wind blown material, whereas rain storms and sporadic runoff redistribute them in patches of various shapes. The resulting features such as shifting sands can be used as diagnosis criteria for undergoing desertifi cation, provided the local mechanisms involved are known.
While looking at linking the ground features to remote sensing data, a second benefi t of this integrated land surface assessment appears clearly. Indeed the satellite sensors measure light (or emitted radiation) refl ected by the land surface, the light coming from the sun interacts with all surface features. Information collected on the ground about those very same features will improve signifi cantly the interpretation of the images acquired by satellites, particularly the ones providing measures by optical sensors.
In order to characterise surface features, a series of fi eld campaigns have been conducted on different test areas part of a desertifi cation monitoring programme in Northern Africa (Escadafal et al., 1997). While describing the land surface components (nature and condition of rocks, soil and plants) their optical properties have been measured using portable spectroradiometers. The resulting set of information of various nature (descriptive and, quantitative ) has been organised in a relational database allowing a thorough analysis and interpretation (Preisler et al., 1998).
Investigations carried out in four north African test sites during the Cameleo project have shown that the soil components of the land surface have very diverse spectral features (see fi g.5), potentially source of information (Escadafal & Megier, 1998). By contrast, in the vegetation index based approaches, soils are simply a background which infl uence is to be minimized so that the VI fl uctuations refl ect only green vegetation changes.
Long Term Monitoring
After some rather naives attempts, one of the major conclusions of the fi rst researches on using satellite imagery for desertifi cation studies has been that one image provides certainly information of the land condition, but is rather insuffi cient to perform a diagnosis. Indeed desertifi cation is more a process than a particular state, and assessing it requires to be able to determine the evolution of land condition with time (e.g. stable, improving or worsening).
In the arid areas, this task is more complicated than it may seem because of the high climatic variability. As an example in the met station of Gabes (southern Tunisia) the annual precipitation observed during the more humid year is 14 times the one of the dryer year. Human impact on the land varies accordingly, when the soils are wet large surfaces are ploughed, when dry periods occur just after that, adverse effects such as strong wind erosion may occur (Floret et al., 1992).
Thus the key to desertifi cation monitoring in those areas is long term observations. When looking at doing this with remote sensing, this is narrowing the type of usable data. Today optical imagery from the Landsat and Spot programmes is the only data set of suffi cient spatial resolution encompassing a signifi cant time span. The fi rst publicly available images is those of the MSS sensor on Landsat1 in 1972. The benefi t of the fi eld method for land surface assessment mentioned above, describing the features having an impact on the way sun light is refl ected towards the optical instruments of those satellites, is thus more obvious.
Figure 4: Typical north African steppe: compare the apparent density in oblique
and nadir viewing
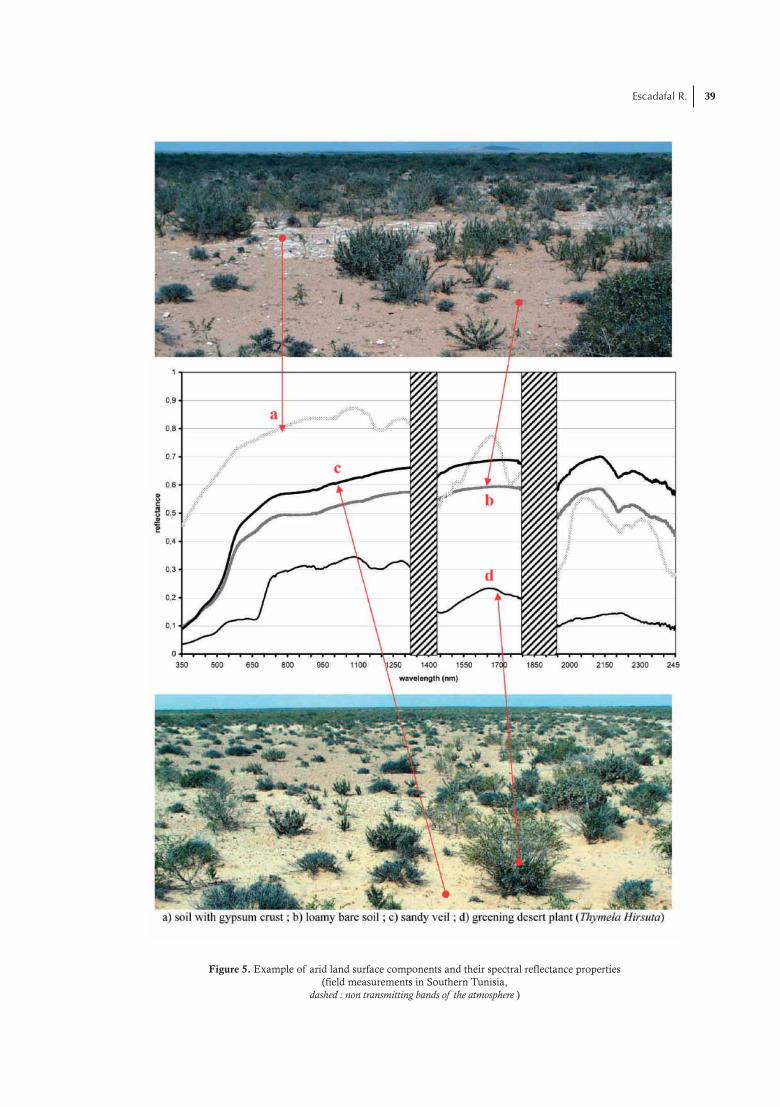
Escadafal R. 39
Figure 5. Example of arid land surface components and their spectral reflectance properties(field measurements in Southern Tunisia,
dashed : non transmitting bands of the atmosphere )

LandWaterMed network40
In principle a series of Landsat images would allow us to monitor land surface changes during a time span of more than 30 years. However experience has proven there are big limitations that have to be taken into account when building such a series:
��ancient Landsat images covering areas outside the USA have been only partially archived, and conservation has been poor, very few of the images acquired by these satellite in the 70’s and 80’s are still in image providers catalogues and available for purchase. Spot programme has a more consistent archive, but it starts only in 1986 (Spot1) and is still rather costly to use.
��encompassing more than 30 years involves the combination of a minimum of two types of images from the MSS and the TM sensors, a task requiring diverse techniques of resampling as their resolution and spectral bands are different
��calibration factors and furthermore the atmospheric parameters of these ancient satellite images are usually not available. Thus alternative intercalibration methods have to be deployed, based on pseudo-invariant features, despite their limitations.
• comparing long series of images of different sensors requires meticulous geometric correction schemes, avoiding error propagation.
��fi nally, even if Landsat images are acquired with a constant nadir viewing angle, the illumination angle varies. At the time of the Landsat and Spot satellite overpasses, under Mediterranean latitudes the sun elevation is much lower in winter than in summer, thus the bidirectional refl ectance properties of the land surface should be taken into account. Sun elevation has even a stronger effect on areas with relief such as hills or mountains, because of the strong variation on shadow size.
Despite these constraints , the long term monitoring efforts for land degradation assessment have been tempted in different areas, good examples in the Med region are the Georange and Cameleo projects, both supported by the European Commission. Considering the Tunisian test site of this last one, fi gure 6 displays examples out of a series of images obtained after geometric correction and intercalibrations described above (Albinet, 2004).
Figure 6. Series of five georeferenced and intercalibrated Landsat TM imagesover the Tunisian test site of Menzel Habib (standard false colour composite, area 30x40km)
In light yellow bare sand, in red, denser green vegetation, in greenish grey denser shrub vegetation. See the changes throughout seasons and years

Escadafal R. 41
Prospective: Geomatics for Regional Desertification Monitoring in the Mediterranean Partner Countries
The discussion above demonstrate the need for a more intensive use of existing data (the use rate of the image providers is rather low so far). Simultaneously the increasing number of sensors in orbit on various platforms, with a variety of spatial resolution and of spectral bands is allowing to get rich and richer information on the land surface condition. In addition to optical sensors, active microwave sensors (such as SARs) provide data on the land surface roughness, whereas passive microwave sensors will estimate soil water content (SMOS satellite, e.g.).
Combining larger and more diverse sets of data is a current trend in environmental assessment programmes under implementation at various scales in Europe and surrounding countries. Whereas numerical methods have been applied fi rst to remote sensing imagery, now they can be expanded to less regularly gridded data such as ground collected information, and data previously established in ‘analog’ format, such as paper maps, point samples, ... (so called ‘ancillary’ data). Tools to combine all these different types of geo-spatial information, are regrouped in software programmes called geographic information systems. These systems allow not only to project data with different original geocoding onto only one reference system, but also to combine them in various ways appropriate to retrieve information relevant to specifi c environmental issues such as soil susceptibility to erosion, environmental threat on rivers and water bodies, etc.
However the “data crunching” power of these tools should not blind us, and the hope for various “push button” indices on environmental assessment is a rather naive high-tech approach of already well known concerns about the land and water quality and its changes with time. A sound understanding of the ecological phenomena actually occurring on the ground is not to be substituted by fancy computer programming, but to be seconded by those techniques. Interpreting the results of the various data processing algorithms and combinations still requires human expertise.
In the case of desertifi cation monitoring over arid Mediterranean regions discussed here, so far no ‘global desertifi cation index’ could be computed by automated processing of series of satellite images. Detected changes have to be analysed and interpreted in the context of recent climate oscillations (dry and humid years) as well of the local soil condition. Land surface changes will be quite different in a sandy steppic plain and in rocky hilly areas, e.g. and desertifi cation diagnosis can vary from one region to another.
Sometimes a vegetation increase will indicate worsening condition, when it is involving the development of plants of lower quality. Conversely, sand movement often appear as a desertifi cation signal, however degraded soils will recover after being invaded by shifting sands allowing a better water balance and psammophytic plants to grow.
As a conclusion, having these remarks in mind, the efforts undertaken at regional level to exchange methods and data and to make them compatible are not an attempt to get automated land and water condition indices from the desktop, but a step towards a regional vision and comparison, taking into consideration existing differences and accumulated knowledge.

LandWaterMed network42
References
Albinet F, 2004. Surveillance des changements écologiques en zone aride : télédétection des modifi cations de surface à long terme. Mémoire de DESS-SIGMA, INP-Toulouse, 54 p.
Escadafal R., Mehl W., Bernard S., Bacha S., 1997. Potentialités de l’instrument VEGETATION pour le suivi de la désertifi cation: simulation de la détection des mouvements de sable en Afrique du Nord. In ‘Physical Measurements and Signatures in Remote Sensing’, Guyot et Phulpin (eds.), Balkema, Rotterdam, pp. 719-725
Escadafal R. & Mégier J. 1998 – CAMELEO : a concerted research effort to develop validated desertifi cation monitoring techniques in Northern Africa. Actes du symposium international« Satellite-based observation : a tool for the study of the Mediterranean basin», CNES,Toulouse, France.
Floret C., le Floc’h E. & Pontanier R. 1992 – Perturbations anthropiques et aridifi cation en zone présaharienne. L’aridité, une contrainte au développement. Editions ORSTOM, Paris : 449-463.
Hill J, Jarmer Th., Udelhoven Th. and Stellmes M. 2005. Remote Sensing and Geomatics Applications for Desertifi cation and Land Degradation Monitoring and Assessment (these proccedings).
Kennedy P.J. 1989 – Monitoring the phenology of Tunisian grazing lands. Int. J. Remote Sensing, 10 (4-5) : 835-845
Maselli F., Gilabert M.A; Conese C, 1998. Integration of high and low resolution NDVI data for monitoring vegetation in mediterranean environments. Remote Sensing of the Environment, 63:208-218.
Mayaux P., Bartholomé E., Massart M., Van Cutsem C., Cabral A., Nonguierma A., et al. 2003, A Land-cover Map of Africa. Offi ce for Offi cial Publications of the European Communities, Luxembourg , EUR 20665 EN -38 pp.
Preissler H., Bohbot H., Mehl W., Sommer S., 1998. “MedSpec - A spectral database as a tool to support the use of imaging spectrometry data for environmental monitoring” , Proc. of the 1st EARSeL Workshop on Imaging Spectroscopy, Zurich, Switzerland, 6-8 October 1998, pp. 455-462.
Price, John C., 1987, Calibration of satellite radiometers and the comparison of vegetation indices: Remote Sensing of the Environment, 21, 15-27.
Schmidt, H. and A. Karnieli. 2000. Remote sensing of the seasonal variability of vegetation in a semi-arid environment. Journal of Arid Environments 45(1): 43-60.
Tucker, C.J., W.W. Newcomb, S.O. Los, and S.D. Prince, 1991. Mean and inter-year variation of growing-season normalized difference vegetation index for the Sahel 1981-1989. International Journal of Remote Sensing 12:1113-1115.
UNCCD (1977) United Nation Convention to Combat Desertifi cation, http://www.unccd.int/
Yldirim H. et al 43
Erosion Mapping of the Dalaman Watershed (Turkey)by Satellite Images
Hülya YILDIRIM1, Mehmet E. Özel1 , Bora UGURLU1, Orhan DOÐAN2
1ÇOMÜ Çanakkale Turkey,Tel.:+90 286 218 00 18,Fax: +90 286 218 05 26
[email protected], [email protected] Kahramanmara Turkey
Tel:+90 344 223 76 [email protected]
Abstract: Dalaman River Watershed (approx. 4500 km2 in area) in South-western Turkey was studied for mapping erosion by techniques of Satellite Remote Sensing (SRS) and Geographic Information Systems (GIS) in a project carried out at Marmara Research Center (Space Technologies Dept.) of TUBITAK funded by the Turkish Non-Govermental Organization, TEMA (Turkish Foundation for Combatting Soil Erosion Prevention, Reforestration and The Protection of the Natural Habitats). The project aimed at (1) creation of potential erosion maps of the Watershed by standart erosion methodologies such as CORINE, ICONA and USLE, (2) Investigation of applicability of these methodologies under various conditiobs for the future reference, and (3) dissemination of information on status of erosion and erosion protection measures.The results of this pilot study are analized for the applicability of these methodologies in nation-wide applications.
Keywords: Remote Sensing, Satellite Image Processing, GIS, GPS, Soil Erosion
Introduction
One of the pilot projects, aiming the use of Satellite Remote Sensing (SRS), related image processing and Geographic Information Techniques (GIS) at a representative watershed in the Mediterrenian Region of Turkey has been the erosion mapping of the watershed area of Dalaman River. The soil erosion in Turkey is drastically consuming one of nation’s natural resources, the soil. It is very important problem of the country. Annual loss of soil carried away by rivers to the lakes and the seas is increasing every year. Process is particularly acute in the Mediterranean watersheds of the country. The “Dalaman Erosion Mapping Project” was conducted by the fi nancial resources provided by a non-governmental organization TEMA.
The increasing coastal population and pollution in Mediterranean ecosystems, as well as the practices of Mediterranean agriculture require a comprehensive assessment and evaluation of the erosion. The erosion process is particularly signifi cant in the Mediterranean watersheds which is shared by a number of countries. A land-use planning and watershed management based on sustainable use of natural resources and preservation of existing ecological balance depends heavily on the availability of detailed information on soil resources and their current state.
Soil erosion research is a capital-intensive and time-consuming exercise. For the preparation of the fi rst erosion map of Turkey, data were collected for 5 years beginning from 1966, by the public offi ce called “Organization for Land and Water Surveys (TOPRAKSU/LANDWATER)” from the aerial photographs and land surveys. When the map published in 1981, it was out of date due to fast economic growth in 1970’s combined with the pressure of a high population growth and connected environmental degradation and deforestation. Preparing an up-to-date erosion map of Turkey has been an urgent task. At present, the quality of available data is extremely uneven. Remote sensing provides convenient solution for this problem. Further, voluminous data gathered with the help of remote sensing techniques are better handled and utilized with the help of GIS.

LandWaterMed network44
Terrain observations and remote sensing (including aerial photography) are commonly used to characterize land units when drawing up inventories or monitoring of erosion. In practice, stratifi cation or delimitation of “fundemental units of erosion” on remotely sensed images is generally of an empirical nature (see Dubucq, 1986; Pickup et al., 1988); it combines the approaches of geographers, agronomists or pedologists for delimiting landforms. Pedologists and geologists are able to determine break points and actions such as runoff erosion. Use of GIS techniques can introduce these into the delineations of spaces.
Basic research into the processes of land degradation has provided progressive refi nement in the concept of soil erodibility and has led to the development of deterministic models for runoff and erosion. Such models deal with different processes at different scales and are now fairly well developed (see Dickinson et al., 1990); among the more commonly used is that of Wischmeier ans Smith (1978) for soil loss mechanisms on slopes. An assessment of the spatial and temporal variability of certain factors that condition the susceptibility of soils to erosion, i.e. surface state of bare ground, vegetation and morphology is possible trough SRS. This approach is greatly helped by the precise management and fl exibility by the use of GIS systems.
The signs of erosion that are most commonly interpreted and used for calculating soil losses, are gullies and rills, commonly a meter or less in size. Such features cannot be identifi ed on satellite images currently avaiable until they have reached present day dimensions (i.e. Evans, 1990). This explains the initial disinterest in these techniques, which are considered too distant from the normal working scales of erosion studies (1:10,000 and 1:25,000)
Although the gully itself cannot generally be identifi ed from lower resolution (SPOT, LANDSAT TM, IRS...) satellite imagery, it is possible to obtaion information that helps explain some of the environmental features that favor runoff and gullying (King et al., 1989). These essentially are signs of land degradation, due to natural or anthropic causes, that are directly visible on bare ground or indirectly determined from land use, vegetation, terrain morphology, density of the hydrographic network, etc. These signs must be checked in fi eld in order to establish relationships with nature of the degradation, e.g. effective erosion.
The identifi cation and assessment of areas occupied by different categories of agricultural land or vegetation is a technique that has also been well mastered by remote sensing, and the accuracy that can be obtained is well known. The vegetation/land use layer is the most common input parameter to erosion modelling that was obtained through remote sensing and digital image processing techniques.
Project Objectives
Main objective of Dalaman Erosion Mapping Project (DEMP) was to obtain erosion maps of the Dalaman River watershed of south – western Turkey, using SRS and GIS techniques. In more technical terms, the project objectives were:
Figure 1: LANDSAT TM (5 4 3) May 1993 Satellite Image of DALAMAN Watershed

Yldirim H. et al 45
• Creation of erosion maps of Dalaman River watershed in Mediterranean Climate Zone of Turkey by using SRS and GIS technologies.
• Detection of erosion levels and types by using the well-known CORINE, ICONA and USLE methodologies.
• To investigate the use SRS and GIS technologies and their potential to detect soil erosion and applicability of these methodologies under various conditions for the future use.
• Dissemination of information on status of erosion and erosion protection measures.
As the erosion problem needs to be solved urgently in Turkey (Ozel et al., 1999), this project has focused on the development of methods that will allow rapid assessment of those areas that are most endangared by erosion. High level of accuracy required for the design of practical erosion, control works at local scale was not required at this stage.
Study Area
The Dalaman River is situated in the south-western Mediterranean Region of Turkey (Fig. 1) and has a drainage area of 4480 km2 . According to long term data from Turkish State Hydrological Surveys (DSI) data, the average water fl ow of the Dalaman river is about 55 m3 per second. According to observations of the past 15 years, 780,000 tons of sediment are carried annually, corresponding to a sediment yield of 174 tons/year /km2 (DEMP, 1994). The Terra Rossa (Mediterranean Red Soil) group occupies large portions of the Dalaman River watershed. Calcareous layers on main rock and soil slippery slots are subject to severe erosion. The brown soils situated especially in the western watershed has “podzol” character, representing a quite rare phenomenon in the area.
In (Turkish) Mediterranean region, brown forest soil and non calcareous brown forest soil take the second and third ranks in aerial size respectively. Alluvial soils are found in the vicinity of Karaburun, where Dalaman River fl ows into the sea and in upper regions of the watershed. In general, according to the old erosion map of Turkey the greatest part of the watershed is classifi ed as severely and very severely eroded (DEMP, 1994).
Figure 2: Dalaman watershed erosion mapping pilot project main steps in diagram of erosion mapping

LandWaterMed network46
Material and Data
Main data resources of the project are fi eld surveys, laboratory analysis, digital elevation data, soil type maps, meteorological data and the remote sensing satellite data. As analogue data, soil maps prepared by the Village Affairs General Directorate (VAGD). 1:25 000 scale, 55 soil maps have been digitized. During the fi eld survey stage, total of 702 soil samples had been collected. They were analyzed in the laboratory, using standart techniques to obtain the (so-called) texture K-values, soil depth and stoniness required during the GIS analysis stage. In order to relate these data to the soil data layer aimed. Besides, data on land use, vegetation composition and vegetation density have been collected for the interpretation of the satellite images.
In order to get the most recent information about land use and the state of vegetation cover, images from LANDSAT TM satellites at two different seasons were considered. LANDSAT images, are particularly essential for determination of the land-cover, biomass and state of vegetation. During this study, 1993 satellite images were used besides archived old LANDSTAT images. 1:25 000 scale Digital Terrain Model (DTM) data prepared by the General Mapping Authority (GMP) were used to extract the required terrain related data layers. As analogue data, soil maps prepared by the Village Affairs General Directorate (VAGD) have been digitized and related to the fi eld survey.
Methodology
The study was conducted to achieve to generate the geospatial database applying the principles of GIS and SRS. And watershed analysis for the erosion estimation studies by using CORINE, ICONA and USLE methodologies. RS technology offers to create very basic digital data derived from the satellite imagery, GIS technology offers combining existing knowledge stemming from very different data (Yýldýrým et al., 1999). GIS system were used for data input and data storage and analysis. Main steps in Dalaman erosion mapping execise are given as fl ow diagram in Fig. 2. As an example, details of one method (CORINE) is given in Fig.3.
Figure 3: CORINE Methodology

Yldirim H. et al 47
• Satellite Remote Sensing Works
The main digital data coverages needed for evaluation and measurement of the erosion state have been obtained from the satellite imagery and have been input as data layers into the GIS for further analysis.A supervised classifi cation was employed to prepare the land use/ cover map of the study area. Best results were obtained from the maximum likelihood classifi er. Using this classifi er, land use/ land cover and vegetation parameters were obtained. For vegetation density estimates, a standar Normalised Density Vegetation Index (NDVI) parameter form satellite images and ground density values of vegetation classes collected by fi eld works were
used for regression analyses to get vegetation density of the canopy for each point (pixel) in the watershed. In order to get the most recent information about the state of vegetation cover, two different seasons were considered. Digital images are particularly essential for determination biomass and state of vegetation.
• Erosion Mapping Methodologies
The following three different methodologies were used for the preparation of the region’s erosion map:
• CORINE Methodology: It has been applied in all European Community countries to determine the state of erosion and to monitor land fertility.
• ICONA Methodology: It had previously been applied to Esen watershed in the same region as Dalaman River (Dogan and Küçükçakar,1994) and also to pilot studies in Tunis and Spain to determine the state of erosion, under the sponsorship of Priority Mediterranean Action Program (PAP/CAR). In these studies, erosion data were collected from aerial photographs and land surveys.
• USLE Methodology: It has been widely used in orginal and some revised forms all over he world, but especially in the USA, in order to determine the quantitative amount of soil loss in units such as tons/ha/yr.
Figure 4: Dalaman Wateshed Erosion Risk Assesment of CORINE
Figure 5: Dalaman Wateshed Erosion Risk Assesment of ICONA
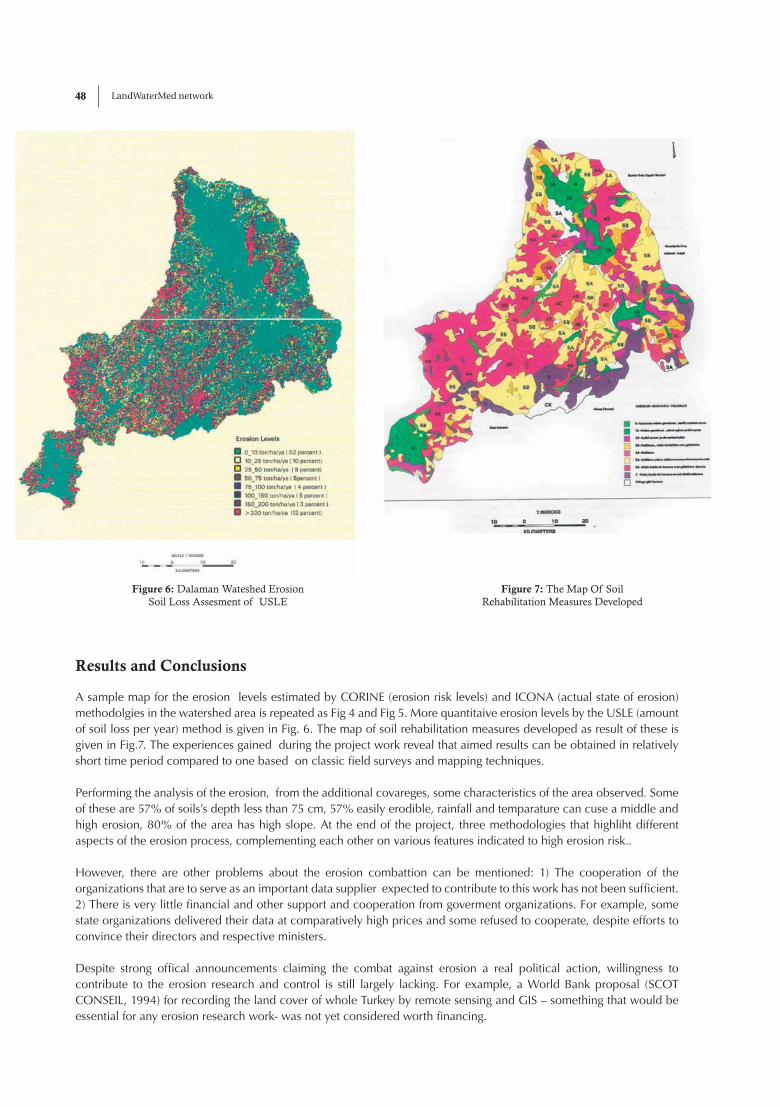
LandWaterMed network48
Results and Conclusions
A sample map for the erosion levels estimated by CORINE (erosion risk levels) and ICONA (actual state of erosion) methodolgies in the watershed area is repeated as Fig 4 and Fig 5. More quantitaive erosion levels by the USLE (amount of soil loss per year) method is given in Fig. 6. The map of soil rehabilitation measures developed as result of these is given in Fig.7. The experiences gained during the project work reveal that aimed results can be obtained in relatively short time period compared to one based on classic fi eld surveys and mapping techniques.
Performing the analysis of the erosion, from the additional covareges, some characteristics of the area observed. Some of these are 57% of soils’s depth less than 75 cm, 57% easily erodible, rainfall and temparature can cuse a middle and high erosion, 80% of the area has high slope. At the end of the project, three methodologies that highliht different aspects of the erosion process, complementing each other on various features indicated to high erosion risk..
However, there are other problems about the erosion combattion can be mentioned: 1) The cooperation of the organizations that are to serve as an important data supplier expected to contribute to this work has not been suffi cient. 2) There is very little fi nancial and other support and cooperation from goverment organizations. For example, some state organizations delivered their data at comparatively high prices and some refused to cooperate, despite efforts to convince their directors and respective ministers.
Despite strong offi cal announcements claiming the combat against erosion a real political action, willingness to contribute to the erosion research and control is still largely lacking. For example, a World Bank proposal (SCOT CONSEIL, 1994) for recording the land cover of whole Turkey by remote sensing and GIS – something that would be essential for any erosion research work- was not yet considered worth fi nancing.
Figure 6: Dalaman Wateshed Erosion Soil Loss Assesment of USLE
Figure 7: The Map Of Soil Rehabilitation Measures Developed

Yldirim H. et al 49
“Soil Inventorys Reports and Maps of Muðla, Burdur, Denizli”, TOPRAKSU, 1972, 1972, 1973 dated Forestry Minisrty Publications, Rep. No.:243, 265, 244, Vol. No.:31, 52, 31.
Dubucq, M., (1986), “Teledetection Spatiale et Erosion des Sols”, Etude bibliographique, Cahier ORSTOM, Serie Pedologie Vol. XXI, No. 2.
“Munsell Soil Color and Soil Refl ectance Data (MSS and TM)”Escafadal, R., et al., Remote Sensing Environment , 27:37 – 46.
King, C., Maacorps, J., Aumonier, F., Renaux , B., and Lenote, N., (1989), “Detection D’indices D’erosion par SPOT Dans les Sols Limomeux du Nord-Pas de Calas, Une Etude Multi-Date”, de la SFPT 114(1989-2), 10-13.
Dickinson, W. T., Wall, G. J. And Rudra, R. P., (1990), “Model Building for Producing and Managing soils Erosion and Transport”, John Wiley & Sons, Ltd., 415-428.
Evans, R., Steven, M.D., and Clark, J.A.(eds), (1990) “Discirimation and Monitoring of Soils, in Application of Remote Sensing in Agriculture”, Butterworths, 75-95.
“Development of GIS in Turkey” , Scot Conseil 1994, World Bank Technical Evaluation Report.
“DEMP: Dalaman River Erosion Mapping Project”, 1994, Project Proposal to TEMA by Space Technologies Dept., Marmara Research Center, TUBITAK, Gebze, Kocaeli
Doðan, O, Küçükçakar, N., (1994), “Erozyon Haritalanmasýnda Bazý Metodolojiler (“Some Basic Methodologies in Erosion Mapping”, text in Turkish), Köy Hizmetleri Ankara Araþtýrma Merkezi Yayýný (Village Affairs Ankara Research Institute Publications).
Ozel, M. E., Dogan, O., Yýldýrým, H., Küçükçakar, N., (1999), “Dalaman Havzasý Erozyon Haritalama Pilot Projesi (“A Pilot Project of Erosion Mapping of Dalaman Basin”, text in Turkish), Project Final Report, Gebze, Turkey.
H.Yýldýrým et al., 1999, ”Verifi cation of Watershed Rehabilitation Efforts in Eastern Anatolia by Satellite Remote Sensing”. Third Turkish-German Joint Geodetic Days, 1-4 June 1999, Ýstanbul.
References

LandWaterMed network50

Özel M.E. et al 51
Agro-Ecological Zoning byUse of Satellite Remote Sensing and GIS
Mehmet E.ÖZEL1, HülyaYILDIRIM1, M. Ilter AÐDAÐ3, Erhan ALPARSLAN2, M.TORUN3,Cihangir AYDÖNER2 Samuray ELÝTAÞ2, Mehmet DAÐCI2 , Bora ERKAN2,
M.DOK3, H.DURAN3
1ÇOMÜ (Çanakkale 18 Mart Üniversitesi), Remote Sensing Center, Çanakkale, Turkey[Tel:+90(286)2180525; Fax: :+90(286)2180526; [email protected]]
2TUBITAK-MRC Space Technologies Group, Gebze, Kocaeli, Turkey3MA-KTAE (Ministry of Agriculture, Black Sea Agricultural Research Inst.), Samsun, Turkey
Abstract: This contribution aims to introduce the previous work done for a pilot agro-ecological zoning exercise for the area of Samsun Province of Turkey, using satellite remote sensing and geographic information system (GIS) technologies. The vegetation cover information was obtained from satellite images (LANDSAT TM and Indian IRS-1C) and they were jointly analyzed with the soil type information to create an agro-ecological zoning layer, which is essential in large scale land-use planning of agricultural land for optimum vegetation growth and production. The results obtained are presented as a thematic map far practical use.
IntroductionAn agro-ecological zone (AEZ) is a crop production area which is homogeneous within itself with respect to its climate, soil and environmental conditions (Özel et al., 1998a). In this paper, a method is introduced to defi ne agro-ecological zones for Samsun province using satellite remote sensing images (Sabins, 1987) and geographical information systems (GIS) analysis (Aronoff, 1991).
A number of layers of information or data affecting the growth of vegetation has been created and then weighted by the educated guesses of experts in this topic. By some trial and error a fi nal weighting factors list is obtained and used for present exercise. Information layers needed for this analysis were mostly imported from an already existing GIS database for the province, i.e., Yeþilýrmak River Basin Development Project GIS Infrastructure (YDPG) (Özel et al., 1998b). The YDPG aims to build a GIS database for fi ve provinces in the Yesilirmak River’s watershed with several information layers such as the 3D-topography, the soil, road maps, political information (urban centers, county boundaries, etc.) meteorological data (e.g. temperature, precipitation) land cover-land use information as well as the vegetation cover derived from recent satellite images (Yýldýrým et al., 1995; Özel et al., 1997). The information layers extracted from the existing GIS for AEZ purposes were the following:
1. Topography and 3D Digital Terrain Model (DTM) of the Province
2. Soil Information Layer based on Land and Water Works (TOPRAKSU, 1984) maps
3. Climatic Information Layer (based on Turkiye Klima Atlasý. (TKA, 1989) (Climate Atlas of Turkey) )
4. Vegetation Cover Map of the Province (derived from recent satellite images)
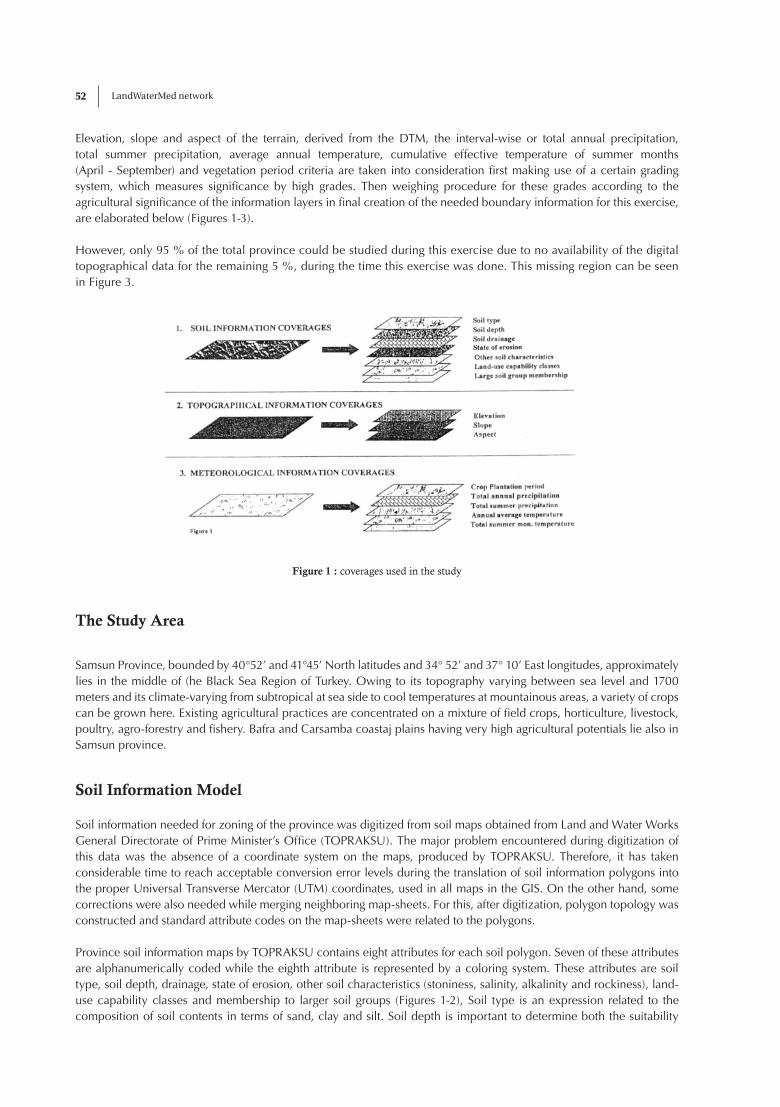
LandWaterMed network52
Elevation, slope and aspect of the terrain, derived from the DTM, the interval-wise or total annual precipitation, total summer precipitation, average annual temperature, cumulative effective temperature of summer months (April - September) and vegetation period criteria are taken into consideration fi rst making use of a certain grading system, which measures signifi cance by high grades. Then weighing procedure for these grades according to the agricultural signifi cance of the information layers in fi nal creation of the needed boundary information for this exercise, are elaborated below (Figures 1-3).
However, only 95 % of the total province could be studied during this exercise due to no availability of the digital topographical data for the remaining 5 %, during the time this exercise was done. This missing region can be seen in Figure 3.
Figure 1 : coverages used in the study
The Study Area
Samsun Province, bounded by 40°52’ and 41°45’ North latitudes and 34° 52’ and 37° 10’ East longitudes, approximately lies in the middle of (he Black Sea Region of Turkey. Owing to its topography varying between sea level and 1700 meters and its climate-varying from subtropical at sea side to cool temperatures at mountainous areas, a variety of crops can be grown here. Existing agricultural practices are concentrated on a mixture of fi eld crops, horticulture, livestock, poultry, agro-forestry and fi shery. Bafra and Carsamba coastaj plains having very high agricultural potentials lie also in Samsun province.
Soil Information Model
Soil information needed for zoning of the province was digitized from soil maps obtained from Land and Water Works General Directorate of Prime Minister’s Offi ce (TOPRAKSU). The major problem encountered during digitization of this data was the absence of a coordinate system on the maps, produced by TOPRAKSU. Therefore, it has taken considerable time to reach acceptable conversion error levels during the translation of soil information polygons into the proper Universal Transverse Mercator (UTM) coordinates, used in all maps in the GIS. On the other hand, some corrections were also needed while merging neighboring map-sheets. For this, after digitization, polygon topology was constructed and standard attribute codes on the map-sheets were related to the polygons.
Province soil information maps by TOPRAKSU contains eight attributes for each soil polygon. Seven of these attributes are alphanumerically coded while the eighth attribute is represented by a coloring system. These attributes are soil type, soil depth, drainage, state of erosion, other soil characteristics (stoniness, salinity, alkalinity and rockiness), land-use capability classes and membership to larger soil groups (Figures 1-2), Soil type is an expression related to the composition of soil contents in terms of sand, clay and silt. Soil depth is important to determine both the suitability

Özel M.E. et al 53
of soil for plantation and the amount of water needed by the plants remaining in soil in non-irrigated land. Each soil attribute was divided into several sub-groups according to that attribute characteristics and each group received certain grades. These grades were then weighted by weights varying between 2 to 4 according to the agricultural signifi cance of this soil characteristic as outlined in Figure 2. Joint analysis of these soil attributes has resulted in the fi nal Soil Information Model for Samsun Province (Figure 3). This model shows that % 15 of Samsun province (126,300 ha) is very good in soil quality. This top quality soil covers the whole Çarsamba plain, and partially Bafra, Vezirkopru and Havza plains. On the other hand, 22% of the land in the Province is not suitable for vegetation growth. Both land types need to be studied by fi eld surveys and by satellite images in order to avoid incorrect land-usage.
Figure 2 : weighting procedure
Topographical Model
1:50.000 scaled elevation data for Samsun Province was obtained in digital form from Turkish General Commander of Mapping (GCM) in 28 map-sheets, each covering an area of 15’ x 15” A triangulated irregular network (TIN) was constructed from each map-sheet containing iso-elevation data at every 20 meters. Neighboring TIN’s were merged to create the digital elevation model of the terrain in the Province. The so formed Digital Elevation Mode (DEM was further analyzed and corrected at the map-sheet intersections. Elevation, slope and aspect parameters used in this analysis were then derived from the resultant DEM with proper weighting factors (see fi gure 2).
• Elevation
Elevation of agricultural fi elds from sea level, air temperature, vegetation growth period illumination and other ecological factors are directly related with terrain elevation. The elevation grades were given a weight factor of 3 in AEZ calculations by experts in this fi el< Suitability for vegetation growth decreases as the elevation of the land from the sea level increases. In order to refl ect this property into agro-ecological zoning computations, a grading system is developed, which assigns lower grades as the elevation from sea level increases. In this system, there are elevation slices of 200 m, from sea level until the highest point of 1700 m and each slice is assigned a grade in descending fashion from sea level to the highest point varying between 100 to 40. The higher the grade, the more suitable is the land for vegetation growth. One exception to this rule is when the land is too close to the sea level, say between 20 m. In this case, there exists drainage problems affecting vegetation growth. This is taken into account by assigning a lower grade to 0-20 m sub-interval than 20-200m sub-interval. However, this grade is still higher than 201-400 m interval, not violating the descending grad rule as elevation increases (Figure 2). These grades are then weighted by a factor of 3 in the fi nal agro-ecological computations.

LandWaterMed network54
• Slope (%)
Slope is derived from digital elevation model of the terrain and it is expressed in terms of %. It is an important parameter affecting the micro-climate of the terrain, directly infl uencing the suitability of the land for crop production. When the slope of a land is greater than 8 %, it is considered ‘technically unsuitable’ for tillage and seed bed preparation. Samsun Province has heterogeneous slope distribution due to her coastal plains and mountainous regions. The land slopes in Samsun province are grouped into 7 intervals, from 0 to 50% and each interval receives a certain grade, decreasing as the slope increases. Grades are between 1 and 100, sharply decreasing after slope of 15 % (Figure 2). These grades are then weighted by a factor of 2 in agro-zoning computations.
• Aspect
Aspect is derived from digital elevation model of the terrain and gives the angle from north in clockwise direction of pixels. Aspect affects the agricultural land in temperature, illumination and humidity and is defi ned to be in one of the 8 compass directions; north, northwest, northeast, west, east, southwest, southeast and south. Because of the geographical location of Turkey, the hillsides having view to the south receives higher grades than the cliffs looking to the north. Thus, list of given directions receive grades in increasing fashion from north to south, fl at areas receiving the highest grade. In this system, the lowest grade is 40, the highest one is 100 (Figure 2). These grades are then weighted by a factor of 0.5 in the fi nal agro-ecological zoning computations.
• Composite Topographic Model
Elevation, slope and aspect information layers were jointly analyzed to create the fi nal topographic composite model (TCM) showing crop plantation suitability from topographical point of view. This shows that 8 % of the province is topographically the most suitable for crop production and happens to be in the interior and rear parts of the coastal plains. The next suitable land lies in Carsamba, Bafra and Vezirköprü plains and covers 23 % of the province. Although the mountainous region (51 %) receive high grades from aspect point of view, their fi nal grade is low because they lose from elevation and slope point of vjew (See fi gures lc. 2c and 3 c).
Figure 3 : Agro-ecological zoning - Province of Samsun-Turkey - Degrees of suitability for crop production (scale 1:1.000.000)
Meteorological Information Model
As far as the climatic factors directly affecting crop production in a particular area is concerned, the temperature, precipitation and their term averages are the top priorities. These climatic factors do not change considerably within short distances and they are related to the topography. Besides temperature and precipitation, there are micro-climatic factors infl uencing crop production such as soil temperature, illumination, crop plantation period, seasonal precipitation, (i.e. summer precipitation), potential evapo-transpiration, etc. (Figures lc,2c,3c).
less than 1000 points (3.79 ha)1000-1250 points (238180 ha)1250-1500 points (321387 ha)1500-1750 points (134913 ha)1750-2000 points ( 46218 ha)2000-2250 points ( 68049 ha)more than 2250 points ( 82139 ha)
TOTAL AREA : 908 798 ha

Özel M.E. et al 55
• Crop Plantation Period
This period starts at spring with the Jast freezing date and expires on the date of fi rst freezing of autumn, The information on freezing dates was obtained as the average of a long time period of many years and published in TKA, Türkiye Klima Atlasi (Climate Atlas of Turkey) in 1989. Because the data in TKA is for periods of 15 days, the interval between two iso-curves were divided into 15 equal intervals to obtain 1 day polygons. The day values for these polygons were entered for each day of the year in ascending order. Last freezing date of the spring was subtracted from the fi rst freezing date of the autumn to obtain the needed crop plantation period. According to the length of these periods, four groups are determined to be <240 240-270, 270-300, >300, and these periods arc given grades in ascending order from 50 to 100 as in Figure 2c, These grades are then weighted by a factor of 3.
• Total Annual Precipitation
Total annual precipitation is especially important, infl uencing crop plantation in interior regions where ‘rainfed agriculture’ is practiced with or without fellow practice. This plays a signifi cant role for agricultural production because of lessening of soil humidity during summer season-refi lling of underground water resources pumped for irrigation purposes and continuity in stream resources all depend on availability of suffi cient precipitation Total annual precipitation information layer was generated in a similar fashion as that of above division, 5.1. Annual precipitation is considered in fi ve different groups according to the amount of precipitation in mm and these groups were <35O, 350-500, 500-650, 650-800 and > 800. Each group received grades starting at 50 points in increasing fashion until the highest point of 100 as given in Figure 2c. These grades were then weighted by a factor of 2 in agro-ecological zoning computations.
• Total Summer Precipitation (April-September)
Since the precipitation during the months from April to September play a signifi cant role in summer crops in the province, the total precipitation during these months are summed up to give the total summer precipitation. This factor is important for rain-fed plantations in the summer months. Monthly precipitation values were obtained from TKA. Amount of summer precipitation in mm were categorized in six groups, namely < 100, 100-200, 200-300, 300-400, 400-500 and > 500 and each group were assigned grades from 20 to 100 in ascending fashion as given in Figure 2c. These grades were then weighted by a factor of 3 for fi nal computations.
• Average Annual Temperature
Earth temperature values change linearly by elevation according to the following formula:
x = (y – a) / b
where x is the measured temperature,
y is the elevation value in m,
a and b are constant values for each climate region, as given in TKA.
Temperature for each pixel was corrected according to this formula. Average annual temperatures were then graded according to 4 different temperature groups; <9°, 12°-9°, 15°-12°, and >15°, The warmer the group, the higher the grade it receives as in Figure 2. These grades were then weighted by a factor of 2 for fi nal computations.
• Total Temperature during Summer Months (April-September)
For this, fi rst the average monthly temperatures are calculated. The results are then multiplied by the number of days in the month. The sums are added up from April to September. At the end, the results are graded in 4 groups, (< 1500, 2000-1500, 2250-2000,>2250), between 20 to 100, where the higher the temperature the higher the grade, as in Figure 2c. These grades were then weighted by a factor of 3 for fi nal computations.

LandWaterMed network56
• Composite Meteorological Model
Composite meteorological model for Samsun province was obtained by registration of total annual precipitation, annual average temperature, total summer months temperature and crop plantation period coverages, as-given in Figures 1c, 2c and 3c. As a general trend, the crop vegetation potential decreases as one moves from coastal plains into interior regions. East coast of the province is the most suitable area for crop plantation according to this model. Southwest regions are rather weak in crop production due to decreases in temperature, precipitation and crop vegetation period.
Satellite Images Layers
A LANDS AT TM image for the Samsun province (acquired in August 1997) was combined with an Indian IRS-1C Panchromatic image (acquired in October 1997). These two images were merged by ‘data fusion’ techniques to create a high resolution color image, which was visually interpreted for possible land use types as a ‘ground truthing’ for the zones obtained. “Grassland’, ‘forest’ and ‘dense forest’ were the main classes which were painted using three different tones of green on the color composite LANDSAT TM image created from bands 5,4,3, resulting in a most recent vegetation cover image of the province.
Results and Conclusions
By joint analysis of these four main GIS layers (i.e., topography, soil information and meteorological information obtained through YDPG and vegetation cover by contemporary satellite data), agro-ecological zoning for the vegetation growth is obtained for the Samsun province as shown in Figure 3d. By the properly weighted combination of these four composite layers, a fi nal layer of Crop Production Suitability Degrees in Samsun Province was created as the end product of Agro-Ecological Zoning exercise. Final map is illustrated in Figure 3d. This map indicates that the most fertile land for optimum crop production lies in Carsamba plain. Bafra and Vezirköprü plains follow the Carsamba plain.
The present agricultural practices in these areas mostly are not at their optimum, as closer inspection at satellite vegetation data show reveals. Large areas in these optimal regions are mostly covered by hazelnut and noundary-defi ning trees such as poplar. Replacement and change of this practice in favor of agriculturally and economically more valuable crops need to be planned and implemented by Ministry of Agriculture. Initiatives of local agricultural offi ces on this line should be supported and implemented by government authorities.
References
Aronoff S., 1991, “GIS: A Management Perspective”, WDL Publications, Ottawa, Canada
Ozel M.E. et al., “Samsun Ilinde Agro-ekolojik Zonlama” (Agro-ecological Zoning in Samsun Province), MAM-KTAE Proje Sonuc Dokümaný (Project Final Document),] December 1998.
Ozel M.E., et al., “Yesilýrmak Watershed Development Project (YWDP) Geographical Information Systems Infrastructure and Landcover/Land Use Mapping via Recent Satellite Imagery”, YISARS, International Symposium On Arid Soils, Sept. 1998, Izmir
Ozel M.E. et al., “Erosion Mapping of the Dalaman Watershed (Turkey):A Pilot Study for the Creation of a Nationwide database on Erosion”, Proc. of 2”d Turkish-German Geodetic Days. pp. 447-456, May 97: Berlin, Germany
Sabins F.F. Jr., 1987. “Remote Sensing: Principles & Interpretation”. Freeman &. Co., NewYork
Türkiye Klima Atlasi, ( Climate Atlas of Turkey), Devlet Meteoroloji Isleri Genel Md., (State Meteorological Works General Directorate) Ankara, 1989
TOPRAKSU G.M.Yayinlarý. 1984, “Samsun Ýli Arazi Varligi, Rapor No. 748. Ankara.
Yildirim H. et al., “Vegetation density mapping in a test site in southwestern Turkey by RS and GIS techniques”. 2” German-Turkish Geodetic Days, May 1997, Berlin

Mazri T. et al 57
Typologic, hydrologic and major land use characteristics of coastal Lebanese watersheds
Talih MASRI, Amin SHABAN, Mohammad KHAWLIE and Ghaleb FAOUR
National Council for Scientifi c research/National Center for Remote sensingPO Box 11-8281 Code 1107 2260 Beirut, Lebanon
Tel.: 961.4.409845 or 6Fax: 961.4.409847
E-mail: [email protected]
Abstract: This study targets to set out a detailed classifi cation of Lebanese coastal watersheds taking into accounts the whole physical parameters, as well as the water resources assessment.Depending on their physical confi guration, size and discharged water, watersheds in coastal Lebanon are divided into 19 major, 35 intermediate and 40 minor watersheds. The areal extents of the three types of watersheds are precisely calculated. Values were obtained using ESRI’s Arcview Software. Obtained results were discussed and interpreted.In order to study the actual status of land cover and land use of the coastal watersheds, a Geographic Information System GIS is used for map intersection of coastal watersheds with the newly issued land use map (CNRS-MoA-MoE 2002). This superposition exhibits several fi ndings on the watershed level concerning the areal extent of the agricultural lands via the forest area, the plantations distribution according to the water availability, the characteristics of the peri-urban agriculture in relation to the water quality and the anthropic pressure.
Introduction
The average annual precipitation rate in Lebanon is about 825 mm. This means that, for a country of about 10400km2, around 8600 million m3/year can be considered as a realistic volume of precipitated water (Dar Al-Handasa and IAURIF, 2002). The coastal (occidental) Lebanon, which has the largest population rate and with an area of about 5000 Km2, receives a volume of about 4900 Mm3/year from precipitation. However, around 2780 Mm3/year is evapotranspirated, whilst the rest 2120 Mm3/year is fl owing within different watersheds. Thus, a portion is percolates into subsurface aquifers, while the rest is discharged into the sea. It is essential to assess these coastal watersheds of in order to end up with a comprehensive management plan, thereby to conserve the located water resources.
A watershed, as a major surface water territory, is the whole area that contributes water to a particular river, lake or basin; also the divide or height of land form which the natural drainage fl ows in opposite directions (Way, 1978). Watersheds have a signifi cant role in controlling the hydrologic orientation of water at the surface. Their characterization is to be based on a set of fundamental multipurpose parameters, capable of representing both the diversity and the key features of the basin.
Coastal Lebanon as a whole is considered as a regional watershed. Because it catches waters from the heights in the east, then fl ows them seaward to the west. Among this regional hydrologic province, a number of fragmental watersheds are situated to represent topographic or geologic-controlled hydrologic systems The peaks-line of Mount Lebanon is a watershed divide between occidental and oriental parts of the Lebanese territory. The fl owing water in the coastal watersheds are relatively simple and have short rivers with relatively low discharges (Sanlaville, 1977). This can be attributed to the relative short distances between the highest and lowest (discharge) points, which are normally in the range of about 30-50 km.
Typological and the related hydrologic properties of the watersheds in this area have not studied yet in a comprehensive and prefect approach. This study targets to set out a detailed classifi cation of watersheds taking into accounts the whole physical parameters, as well as the water resources assessment. This, in turn, serves to monitor the land use characteristic in each watershed, thus allows determining a time-series behavior.

LandWaterMed network58
Measuring Station
• Gauging stations on rivers
The water fl ow of Litani River, the biggest Lebanese river, have been continuously measured since 1930, while Ibrahim River since the 40s. After that time gauging stations were established on most Lebanese rivers and on some major issuing springs. About 70 stations were functional till 1974. During the civil war 1975-1991, the majority of these stations deteriorated. Nowadays only about 20 stations are functioning (Jaber, 1995).
Recently, the Litani River Authority (LRA, 2002) has plotted a map showing hydrological observation gauging stations on different river tributaries. There are 38 existing stations, while a 3-times number is proposed to be established on several river courses, taking into account the infl uencing hydrological characterizations. Accordingly, most of the old stations have been reactivated as they damaged during the civil war, thus totally neglected.
Basing on the new data from the operating stations, and due to the dramatic increase on water demands, thinking of water dams construction on these rivers has become an important governmental issue. Till quite recent, there are 11 and 14 water dams with water restriction capacity of <1Mm3 and � 1Mm3; respectively. Most of these dams are situated on the Litani River tributaries. Moreover, new dams are proposed to be established. 13, 4 and 2 water dams are suggested to restrict 30, 30-100and >100 Mm3; respectively (Dar Al-Handasa and IAURIF, 2002). In selecting the old and new site of the above-mentioned dams, the role of hydrological and physical watershed properties have been taken into consideration. This is in addition to the human settlement distribution, as lead by watershed typology.
• Climatic stations
A total number of 70 major meteorological stations are distributed on the Lebanese territory, 51 are in the coastal region (the study area). The oldest station in Lebanon was established at the American University of Beirut (coastal area - Beirut) at the end of the 19th century. The second was established in the Beqaa valley by the St.Joseph University at the beginning of this century. Till 1974, Lebanon had 136 to 143 climatic stations of different functions (Kheir et al., 1992; and Jaber, 1995), that mean every station is covering about 73 Km2 of Lebanese territory. After the civil war only 10 stations kept on working. These stations are divided into Synoptic with time series of precipitation and temperature, and Pluviometric with precipitation values only.
Based on previously available data received from all those stations 4 climatological maps were achieved at scale 1/200000. They were achieved successively by Copiere, Ray, Dubertret and Plassard (Jaber, 1995).
Watersheds
Physically, watersheds in coastal Lebanon can be divided into three principal types, depending mainly on their confi guration, size and discharged water (Shaban, 2003). They named as major, intermediate and minor watersheds (Fig.1). Only one common factor characterizes all of them, namely their predominant westward catching direction into the sea, while they share different properties (Table 1). There are 19 major, 35 intermediate and 40 minor watersheds in the coastal region. Three of them are shared basins with Syria and Israel, i.e. no. 1 and 19, while for no. 16, a presumed limit was plotted, depending on the surrounding topography. According to fi gure 1, watershed no. 1, in the north, shares with Syria and constitutes El-Kabir river water basin, the other one is no. 19, which shares with Israel and catches water to Wadi Ain Azba in South Lebanon.
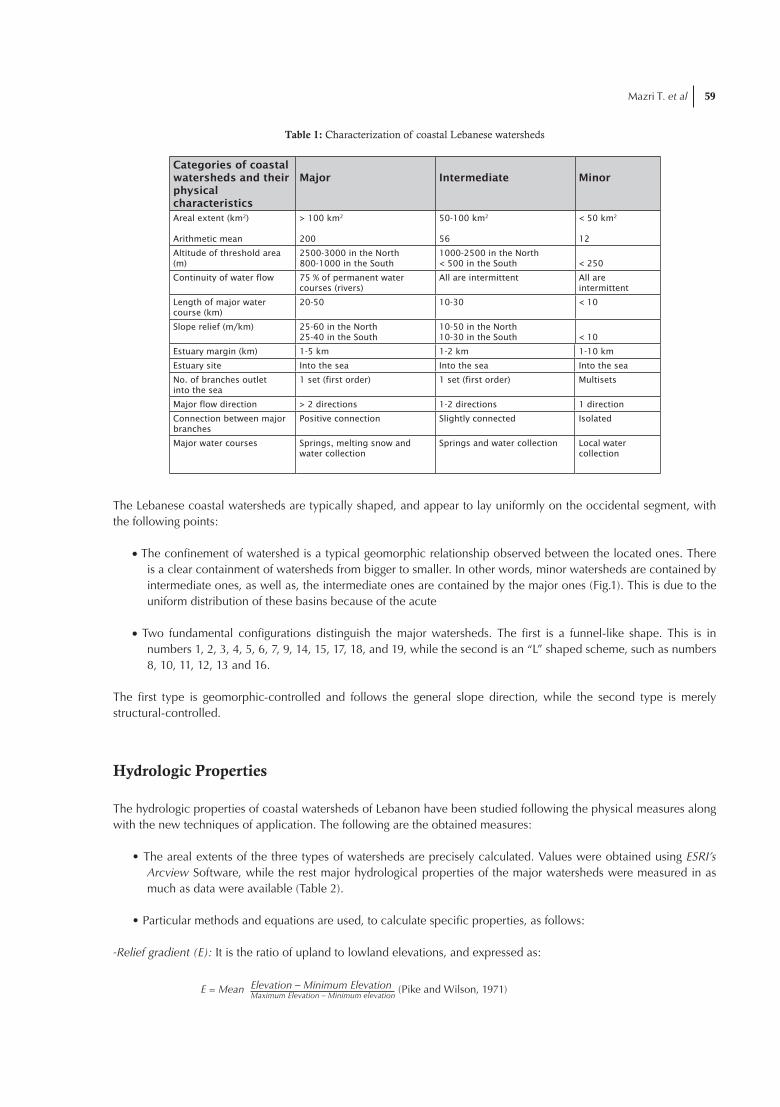
Mazri T. et al 59
Table 1: Characterization of coastal Lebanese watersheds
Categories of coastal watersheds and their physicalcharacteristics
Major Intermediate Minor
Areal extent (km2)
Arithmetic mean
> 100 km2
200
50-100 km2
56
< 50 km2
12
Altitude of threshold area (m)
2500-3000 in the North800-1000 in the South
1000-2500 in the North < 500 in the South < 250
Continuity of water flow 75 % of permanent water courses (rivers)
All are intermittent All are intermittent
Length of major water course (km)
20-50 10-30 < 10
Slope relief (m/km) 25-60 in the North25-40 in the South
10-50 in the North10-30 in the South < 10
Estuary margin (km) 1-5 km 1-2 km 1-10 km
Estuary site Into the sea Into the sea Into the sea
No. of branches outlet into the sea
1 set (first order) 1 set (first order) Multisets
Major flow direction > 2 directions 1-2 directions 1 direction
Connection between major branches
Positive connection Slightly connected Isolated
Major water courses Springs, melting snow and water collection
Springs and water collection Local water collection
The Lebanese coastal watersheds are typically shaped, and appear to lay uniformly on the occidental segment, with the following points:
��The confi nement of watershed is a typical geomorphic relationship observed between the located ones. There is a clear containment of watersheds from bigger to smaller. In other words, minor watersheds are contained by intermediate ones, as well as, the intermediate ones are contained by the major ones (Fig.1). This is due to the uniform distribution of these basins because of the acute
��Two fundamental confi gurations distinguish the major watersheds. The fi rst is a funnel-like shape. This is in numbers 1, 2, 3, 4, 5, 6, 7, 9, 14, 15, 17, 18, and 19, while the second is an “L” shaped scheme, such as numbers 8, 10, 11, 12, 13 and 16.
The fi rst type is geomorphic-controlled and follows the general slope direction, while the second type is merely structural-controlled.
Hydrologic Properties
The hydrologic properties of coastal watersheds of Lebanon have been studied following the physical measures along with the new techniques of application. The following are the obtained measures:
• The areal extents of the three types of watersheds are precisely calculated. Values were obtained using ESRI’s Arcview Software, while the rest major hydrological properties of the major watersheds were measured in as much as data were available (Table 2).
• Particular methods and equations are used, to calculate specifi c properties, as follows:
-Relief gradient (E): It is the ratio of upland to lowland elevations, and expressed as:
E = Mean (Pike and Wilson, 1971)Elevation – Minimum ElevationMaximum Elevation – Minimum elevation

LandWaterMed network60
-Mean Catchment Slope (Sb):
(Elevation at 0.85 L) – (Elevation at 0.10L)
Elevation at 0.75 L
Where L is the maximum length of the basin, and measurements are taken along this line
(0.10 L near the lower part of the catchment, 0.85 L towards the upper end).
The slope (in degree) = tan-1 (slope in decimal form)
Drainage density (D):
� L (total of all stream lengths)
A (area of the basin)
Table 2: Major hydrological properties of major watersheds in coastal Lebanon
No. Major water course Area (km2)
Length (curved) (km)
Volume of precipitated water (Mm3)
Average annual discharge (Mm3/year)
Relief gradient (E)
Mean catchment slope (Sb)
Drainage density (D) (km/km2)
Average width: length ratio (%)
1 El-Kabir River 195 (within Lebanon)
46 113 213 0.34 45 0.71 22
2 Estwan River 146 40 146 65 0.38 46 0.93 15
3 Akra River 121 36 105 64 0.33 45 0.85 16.5
4 Al-Bared River 284 37 224 168 0.25 44 1.05 22
5 Abou-Ali River 482 42 504 369 0.46 46 1.20 38
6 Ouadi El-Koura 100 27 64 N.D. 0.23 44 0.84 18.5
7 Ej-Jouz River 196 33 122 82 0.42 44 0.92 24
8 Ibrahim River 326 44 381 498 0.47 45 1.25 20
9 El-Kaleb River 237 35 327 251 0.57 45 1.60 23
10 Beirut River 216 48 262 101 0.53 50 1.55 12.5
11 Ed-Damour River 333 45 336 256 0.51 46 0.95 21
12 El-Awali River 291 50 321 284 0.33 44 1.14 16
13 Siniq River 102 18 102 11 0.26 44 1.40 33
14 Ez-Zahrani River 140 36 144 202 0.28 46 0.94 19
15 Abou-Alaswad River
179 33 173 8 0.31 43 0.84 23
16 El-Kasmieh River 210 32 115 387 0.41 47 0.91 17
17 Ouadi Abou Zeble 116 26 82 N.D. 0.32 46.4 0.72 27
18 Ouadi Ain Baal 89 27 74 N.D. 0.35 46 0.61 15
19 Ouadi Ain Azba 143 (within Lebanon)
31 115 N.D. 0.31 46 0.67 19
N.D.=No Data
• Following Thiessen and Isohyets methods, the volume of precipitated and evapotranspirated water in each watershed has been carried out. The average precipitated water is 195, 22 and 10.6Mm3 and the evapotranspirated is 113, 12 and 5.5Mm3 respectively for the major, intermediate and minor watersheds.
For the major watersheds, the relationship between the precipitated water and their discharges is established. It is proved that no coincidence between the precipitation and discharge. This can be attributed, in addition to climatic conditions, mainly to geology and human exploitation.
Results obtained in Table 2 highlight the following interpretations:
1) The average discharge from each river basin of the coastal area is about 198 Mm3/year. Some basins have no data on discharge, i.e. 6, 17, 18, 19. If the discharge from each one of these basins is estimated as about 10 millions m3/year, the total yield from coastal basins will approach about 3010 Mm3/year.
Sb = (Morisawa,1976)
D =

Mazri T. et al 61
2) The average actual lengths (curved) of the major watercourses in the area is about 33 km. This indicates the relatively short distance between source and discharge points, which would be, averaged less than 35 km.
3) The average area of the major coastal watershed is around 200 km2 which can be described as small catchments if compared to the Nested scales applied on MEDRUSH model. Although the average areas of the minor and intermediate basins are 12 km2 and 56 km2, respectively, this describes them as sub-catchments to very small catchment’s basin.
4) The relief gradients are variable from 23-m/1 km up to 57-m/1 km. The average is about 37-m/1 km. This means that the relief is moderate to slightly high. In the study area, the higher relief gradients exist usually within the intermediate water basins that located in the middle part of the area. This is in turn, refl ects that the water discharges faster from the Middle Jurassic rocks are exposed normally and with high altitudes.
5) The relationship between the discharged water from these basins and the catchment areas were plotted. It is clear that there is a remarkable coincidence between both variables; although this is not totally exist in all basins due to a number of controls, mainly the geologic ones.
6) According to the catchment slope angle (Sb), there is a minor difference between the maximum and minimum calculated values (i.e. 43-50°), while the average is about 46°. This is considered as a high angle, therefore infl uences the surface runoff rates within these basins.
7) Drainage density within each catchment is 1.01, 0.76 and 0.24 km/km2 for major, intermediate and minor watersheds; respectively. This is for a map with scale: 100000. It indicates that higher drainage density exists on the major ones and descending with small catchments. Mainly, slope gradient affecting this behavior, then the geology of the rock included in each type.
8) The ratio of width (W) to length (L) in a drainage basin is a refl ection of the time runoff effectively reaches the major watercourse duration. The higher the W/L ratio, the higher the runoff duration, i.e. more infi ltration time interval. Therefore, in the case of the study area, the less W/L means the more losses into the sea and vise-versa (Shaban, 2003)
• Watershed Typology
Typological presentation of watersheds is necessary for extrapolating the results of sophisticated models of landscape and hydrologic processes, usually run at the watershed or sub-watershed land (E.C, 2002). Watershed typologies have a spectrum of analysis. Some relies on water basin boundary, others on areal extents, etc. Usually, it depends on data available for this purpose. Mainly of these types is that done by El Nino Technical Group (1998). They depend on the areal extent, administrative coverage and institutional coordinating agencies.
In this study, the followed typological classifi cation aims to take into consideration the exploitation of the water resources as it actually exists. Nevertheless, human settlements are distributed on more than a watershed boundary for different categories, i.e. major, intermediate or minor watersheds (Fig.1). These settlements may locate on two or more watersheds where water use would affect its availability. For this reason, the typology of the study area is done by Neighborhood Effective Watershed “NEWS”, dividing the area into 14 zones (Fig. 2). The zone merges the natural watershed boundary with human settlements and administrative zoning. A comprehensive analysis of water resources management is done for each zone taking into account the following variables:
1. Volume of precipitated and evapotranspirated water,
2. Volume of water losses, either to the sea or to the neighboring countries (or zones),
3. Volume of surface water, including rivers, springs, lakes and ponds,
4. Volume of groundwater,
5. Population size and water consumption by different sectors.
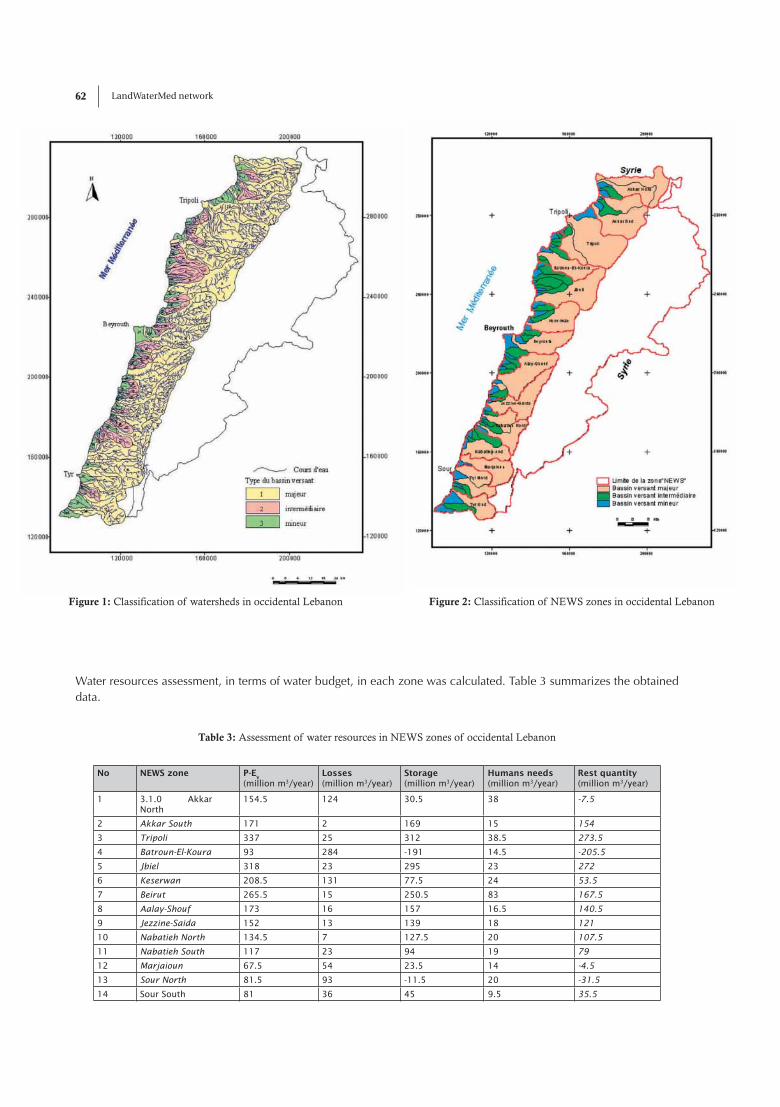
LandWaterMed network62
Water resources assessment, in terms of water budget, in each zone was calculated. Table 3 summarizes the obtained data.
Table 3: Assessment of water resources in NEWS zones of occidental Lebanon
No NEWS zone P-Ev
(million m3/year)Losses(million m3/year)
Storage(million m3/year)
Humans needs(million m3/year)
Rest quantity(million m3/year)
1 3.1.0 Akkar North
154.5 124 30.5 38 -7.5
2 Akkar South 171 2 169 15 154
3 Tripoli 337 25 312 38.5 273.5
4 Batroun-El-Koura 93 284 -191 14.5 -205.5
5 Jbiel 318 23 295 23 272
6 Keserwan 208.5 131 77.5 24 53.5
7 Beirut 265.5 15 250.5 83 167.5
8 Aalay-Shouf 173 16 157 16.5 140.5
9 Jezzine-Saida 152 13 139 18 121
10 Nabatieh North 134.5 7 127.5 20 107.5
11 Nabatieh South 117 23 94 19 79
12 Marjaioun 67.5 54 23.5 14 -4.5
13 Sour North 81.5 93 -11.5 20 -31.5
14 Sour South 81 36 45 9.5 35.5
Figure 1: Classification of watersheds in occidental Lebanon Figure 2: Classification of NEWS zones in occidental Lebanon

Mazri T. et al 63
Major land characteristics
The coastal watersheds are located within the Mediterranean bio-climatic zones ascending from the Thermo to Oro Mediterranean. This leads to a rich biological diversity of these water basins related to their altitude and lithologies. Nevertheless, the sequential anthropic pressure infl uences the actual vegetation cover of these water basins. So far, Jenuperus excelsa and Cedrus libani, which must be located mainly on altitudes exceeding 1200m, are not found as dense forests except in some few localities. The Pinus pinea and Quercus infectoria, representing the principal vegetation cover of the sandy rock formation in moderate altitudes, are decreased due to frequent fi re events. The Ceratonia siliqua and Pistacia palestina, are substituted in the middle regions by olive tree plantations.
In order to study the actual status of land cover and land use of the coastal watersheds, a Geographic Information System GIS is used for map intersection of coastal watersheds with the newly issued land use map (CNRS-MoA-MoE 2002). This superposition exhibits the following results (Table 4):
Table 4: Land use characteristics of major watersheds in coastal Lebanon
Watershed No.
Major water course Area(km2)
ForestKm2
UrbanKm2
Mitage urbainKm2
AgricultureKm2
Water bodyKm2
1 El-Kabir River 110 (within Lebanon)
54.8 3.8 1.5 12.0 0.03
2 Estwan River 146 28.2 5.5 3.8 16.7 0.16
3 Akra River 121 23.0 5.6 4.5 28. 0.0
4 Al-Bared River 284 113.4 4.9 3.5 43.7 0.2
5 Abou-Ali River 482 84.2 22.8 10.4 115.5 0.1
6 Ouadi El-Koura 100 16.9 7.1 3.7 42.3 0.0
7 Ej-Jouz River 196 62.0 12.0 1.4 29.1 0.3
8 Ibrahim River 326 62.0 12.5 1.0 18.4 0.3
9 El-Kaleb River 237 51.3 26.3 6.7 19.7 0.04
10 Beirut River 216 94.0 29.7 3.3 19.2 0.2
11 Ed-Damour River 333 67.7 43.9 10.8 74.0 0.06
12 El-Awali River 291 70.5 21.7 11.3 46.2 0.07
13 Siniq River 102 24.8 13.7 4.46 18.7 0.04
14 Ez-Zahrani River 140 25.2 8.22 6.8 24.1 0.0
15 Abou-Al aswad River 179 2.0 23.5 14.7 47.7 0.0
16 El-Kasmieh River 210 10.7 12.1 12.7 47.6 0.0
17 Ouadi Abou Zeble 116 0.2 8.4 17.2 39.0 0.0
18 Ouadi Ain Baal 89 5.5 7.6 .7.7 26.9 o.o
19 Ouadi Ain Azba 143 (within Lebanon)
18.0 6.3 4.8 22.6 0.0
Total 3714 814.4 275.6 130.3 691.4 1.47
From the above table the following points were concluded:
1. In all watersheds, the area of lakes and ponds does not exceed 1.5km2. However, water dams are almost absent on river tributaries, thus water run-off directly towards the sea.
2. Due to the lack of dams and the steep slopes, the cultivated lands are restricted via the forest area. The agricultural mechanization cannot be used on the traditionally man-made terraces. So the old orchards and terraced areas are neglected and subjected to the forest trees and shrubs invasion. Nevertheless, this is not the case for all coastal water basins. In the southern ones (watersheds no.14-19) there is an obvious increase of the areal extent of the agricultural lands due to the continuous care to the rainfed agriculture on the relatively low slopes plateau.
3. From the above GIS intersection, it was obvious that the major Lebanese cities are located nearby the river outlets on the minor and moderate watersheds. In these water basins, the urban expansion is the prevailing land use characteristic. While the case is different for the major watersheds that extend from the water divide to the coast. Nevertheless, the areas of urban settlement are well refl ected by the major watersheds surrounding the capital Beirut (watersheds no. 9-12) and Tripoli (watershed no.5) and Nabatieh (watershed no. 15).

LandWaterMed network64
4. Most of the agricultural lands of the minor watershed have changed to urban settlements and cities infrastructures. The rest small lands, within and around the urban texture, are applying peri-urban agricultures characterized by a typical dense plantation of tropical trees and greenhouses.
5. The dense population and the intensive agriculture have led to a water defi cit. To fulfi ll the urban and agriculture needs, water is derived from the less populated neighboring basins. This is the case of Beirut city, where water is derived from El-Kaleb and Ed-Damour basins.
6. The exploitation of groundwater from some minor and moderate coastal watersheds is much greater than the recharged water into their aquifers. This lead to a clear draw down in water table and followed by saltwater intrusion. The increase of water salinity have obliged the farmers to relied upon plantation of some salt tolerant vegetables such as spinach and tomato. Thus, the planted tomato in green houses are increased into 51% while the areas with sensitive plants, such as cucumber, are decreased to 16% only (Masri and Faour, 2004).
7. The Lebanese farmers have distributed geographically their plantations according to the water availability in their farm. In south Lebanon, the subtropical trees such as citrus, bananas, avocado etc. were planted under the level of the Litani and Kasmieh water courses. While, the olive trees, grapes, almond etc. and other rainfed plantations are located on the higher level of these courses.
8. The interference of olive trees with other plants indicates the availability of water. In the land cover map of 1990, olive plantations were classifi ed into three categories: pure olive plantations, mixed olive with subtropical trees and mixed olive with forests. The pure olive plantations are merely rainfed. The mixed olive with subtropical trees indicates the water availability. While the olive trees mixed with forests indicate a high degree of neglect (Masri and Faour, 2002)
References
CNRS-MoA-MoE (2002). Land Cover/Land use map of Lebanon scale 1/20000.
Dar Al-Handasa and IAURIF. 2002. Schéma d’Adménagement du Territoire Libanais. Phase I, Diagnostic et Problématiques. Rapport Provisoire.154p.
El-Nino Technical Group. 1998. Watershed management typology. PCARRD/PCAMRD. http://www.pcarrd.dost.gov.ph/enso.
European Commission. 2002. Catchment characterization and management. http://eurolandscape.jrc.it/watershed/ccm.html.
Jaber, B., 1995. Water problems of Lebanon. National Congress on Water Strategic Studies Center, Beirut (in Arabic), 67p.
Khair, K., Aker, N., Zahrudine, K., 1992. Hydrogeological units of Lebanon. Hydrogeology Jour.. Springer-Verlag, 1(2): 34-49.
Masri T; Moussa, Z.; Routier, J; Awad, M. (1999) A Methodological Approach for Georeferenced Phytosociological Description of Pinus pinea Forest. Proceeding of “The 5th Annual Middle East GIS ESRI User Conference”. May 17-20,1999.Beirut- Lebanon.6 P.
Masri Talih and Ghaleb Faour (2002). Driving forces of olive plantation changes in Lebanon during the second half of the 20 th. Century. Arabic Journal of Remote sensing. No 14. p-p 77-88. Damascus, Syria.
Masri Talih, Mohammad Khawlie et Ghaleb Faour (2002). « Les facteurs de changement d’utilisation et de couvert des sols et les ressources en eau au Liban.- Etude sur 40 ans ». RICAMARE Workshops in I.R.D. Medenine, Tunisie 20-21 avril 2001. Published in: MEDIAS Newsletter. Mars 2002- No13 bis P.p.9.
Masri T., Khawlie M., Faour G., and Awad M. (2003) Mapping forest fi re prone areas in Lebanon P.p 109-112 in the “proceedings of the 4th International Workshop on Remote Sensing and GIS applications to Forest Fire Management: Innovative concepts and methods in fi re danger estimation. Ghent University-EARSeL, 233pages, ISBN: 2-908885-25-5
Masri Talih et Ghaleb Faour (2004). L’interface serriculture - urbanisation sur le littoral Sud Libanais. Publication IFPO (sous presse).
Morisawa, M., 1976. Geomorphology Laboratory Manual. John Wiley & Sons Inc. N.Y., 253p.
Pike, R., Wilson, S., 1971. Elevation-relief ratio. Hypsometric Integral and Geomorphic Area-Altitude Analysis. GSA Buul., 82: 1079-1084.
Sanlaville, P., 1977. Etude géomorphologique de la région littorale du Liban. Publications de l’Université Libanaise. Section des études géographiques, Beyrouth, tome I, 405 p.
Shaban, A. 2003. Studying the hydrogeology of occidental Lebanon: utilization of remote sensing. Ph.D. dissertation. Bourdeaux 1 University. 202p. (Under study).
Way, D., 1978. Terrain analysis. Mc-Graw-Hill Inc. N.Y., 438 p.

AL-ASSAF M. et al 65
Utilizing Remote Sensing Techniques in Combating Desertification in Shobak Area-Jordan
Majeda AL-ASSAF1, Omar ABBADI2, Ibrahim ZUKROTI2 and Izzeddin WAYNAKH2
1The Higher Council for Science and TechnologyP.O.Box 36 Jubeiha 11941 Amman-Jordan
Phone: 962-6-5340401Fax: 962-6-5340589
e-mail: [email protected]
2Royal Jordanian Geographic CenterRemote Sensing Section
P.O.Box 414 Jubeiha 11941 Amman-JordanPhone: 962-6-5349199
Fax: 962-6-5347694e-mail: [email protected]
e-mail: [email protected]
Abstract: One of the most important global phenomena that are currently threatening the ecosystem is desertifi cation. Desertifi cation is mainly caused by the climatic changes and human infl uence. Climate constitutes one of the most important natural resources that strongly infl uence any sustainable development action. Indeed, the climate changes and variability, expressed essentially in rainfall regime fl uctuations and temperature increase, led to a continuous degradation of the other natural resources.Eventually, this study came to highlight the main problems and conducting baseline studies on main desertifi cation aspects, identifying the environmental indicators and clarifying the causes and solutions to land degradation, to better planning and implementation of anti-desertifi cation strategies towards sustainable development.The study area is situated within the semi-arid area. Shobak is considered an important town for agricultural activities and tourism. Consequently, it was necessary to conduct further comprehensive studies on the effect of climatic changes during the past decades on the social and environmental aspects. In this study, two satellite images from Landsat 5-TM (1984) and Landsat 7-ETM (2000) were employed to detect the changes in the land use.
Keywords: Desertifi cation, RS, GIS, Shobak, soil erosion, vegetation cover.
Introduction
Desertifi cation is considered as a global phenomenon caused by the climatic changes and human infl uence, manifested by the misuse of land which in turn caused environmental degradation. Desertifi cation occurs mainly in arid and semi-arid areas and in order to combat desertifi cation, all the relevant institutions whether governmental or non-governmental should participate to conduct the studies and researches needed to highlight its causes and effects in order to set up plans and programs to reduce its impact.
From this concept the (RJGC) and the Higher Council of Science and Technology in cooperation with the Ministry of Water and Irrigation, conducted this project to combat desertifi cation in Shobak area, and to shed the light on the environmental indicators that resulted in desertifi cation.

LandWaterMed network66
Due to the climatic changes during the past two decades which negatively affected the ecosystem in the arid and semi-arid regions, especially environments prone to be affected easily by desertifi cation, awareness and concern has aroused within the local and international fi rms regarding this issue.
Consequently, Jordan has been affected also by these global negative changes due to its location in the arid to semi-arid areas which also led the local organizations to conduct all the researches and employ all the academic and technical efforts to identify the desertifi cation parameters and indicators.
This project aims to identify and monitor the environmental indicators, aspects of desertifi cation and its geographical properties. To identify the human and natural factors causing desertifi cation in Shobak area. Furthermore, to set up the plans to combat desertifi cation in order to conserve the natural resources and to maintain its sustainability.
Methodology
The methodology of the study is shown in the schematic chart (Fig.1) Mainly based on identifying the desertifi cation indicators using remote sensing techniques and monitoring the changes using the change detection method by making a comparison between two satellite images of Landsat 7-ETM radiometrically and geometrically corrected acquired on 28/10/2000 (Fig.2) and the Landsat 5-TM acquired in August 1984 (Fig.3).
Aerial photo acquired on 1993 and 2000 were also used to detect the changes in the forest area.
Topographic map scale 1/50000, 1/100000 and geologic maps scale 1/50000, 1/250000 were also used in this study.
Figure 1: Schematic Chart

AL-ASSAF M. et al 67
The Study Area
The study area is situated south-west Jordan, about 250km from Amman city. Bounded by the following coordinates (30˚15’-30 4̊5’) N and (35˚30’-36˚) E with an area about 3000km² as shown in Figure 4.
Figure 4: Location of the Study Area.
Figure 2: Landsat 7-ETM of the Study Area. Figure 3: Landsat 5-TM of the Study Area.

LandWaterMed network68
• Geomorphology of the Area
The geomorphology refl ects the combined actions of geological factors of rock types and the effect of tectonic movements manifested by the Jordan Rift Valley, and the other natural factors like the climate, wind and water erosion. The area can be divided into two parts:
a. The Western Escarpment:
It is characterized by very steep slopes that prevented urban expansion and left the area to be used simply as range land. The height difference between the mountainous range and the escarpment is about 600m.
b.The Eastern Slopes:
These slopes are directed towards the east. The height difference between the western crest and the eastern edges is about 700-800m.
Most of the study area is composed of rugged mountainous and hilly regions which obliged the simple farmer to harvest the yield in a primitive way which caused later on soil erosion.
• Climate
The study area is affected by the western cold atmospheric depression coming from the Mediterranean Sea in the winter season. During the summer season the area is affected by the Indian hot front. Meanwhile, during the spring time, the area is dominated by the sandy, hot Khamasin wind coming from North Africa.
The climate in the area is affected by the following factors:
a. The Shara Mountain Range (the highest mountain in Jordan).
b. Shobak area is situated along the marginal Mediterranean Sea climatic zone.
c. The area is bounded from the east by the desert and is situated relatively far from water bodies.
Table 1: Climatic data of the study area
Country : Jordan Station : EL SHOUBAKAltitude: 1365 meter(s) above M.S.L.Latitude: 30.30 Deg. (North) Longitude: 35.32 Deg. (East)
Month Max. Temp(deg.C)
Min. Temp(deg .C)
Humidity(%)
Wind Spd.(Km/d)
Sunshine(Hours)
Solar Rad.(MJ/m2/d)
ETo(mm/d)
January 8.4 -0.9 77 130 5.5 10.9 1.22
February 10.9 -0.6 76 112 6.7 14.2 1.7
March 14.2 1.8 66 130 7.6 17.9 2.6
April 18.8 4.9 60 121 9 22.2 3.66
May 22.6 7.1 56 104 10.9 26.1 4.56
June 25.8 10.5 51 112 12.3 28.5 5.36
July 26.9 12.6 49 104 12.4 28.4 5.43
August 27.2 12.8 53 112 12 26.9 5.15
September 25.5 9.9 61 104 10.7 22.9 4.09
October 22.6 6.8 65 86 9.3 18.2 2.85
November 16.1 3.3 77 95 7.3 13.2 1.68
December 11.4 0.2 75 112 5.6 10.3 1.26
Average 19.2 5.7 63.8 110.2 9.1 20 3.3

AL-ASSAF M. et al 69
• Sun Radiation
The study area is characterized by a total high sun radiation, mainly because the area is generally free of clouds during the entire year and the rate of humidity is low (Table 1). This table refl ects the amount of total radiation in the study area that is needed for the plant and grass growth. In the mean time, this is considered as a negative factor because it increases the rate of evapotranspiration in plants and the soil, accompanied with low precipitation especially in the eastern parts. This fact limits the rainfed agriculture and the growth of trees except for the seasonal crops and herbs.
• Precipitation
The area is characterized by low precipitation and with unfavorable changes in the rainfall trend during the entire year. Also, most of the time, the area is characterized by heavy rainfall after a along time of drought periods which causes soil erosion especially in poor soil status, as it is shown on the satellite image of the area. In order to make comparison between the stations, graphs were drawn showing the amount of annual precipitation for the effective station that has long-term records (Figure 7 and 8).
• Relative Humidity
Relative humidity is considered as one of the most important meteorological indicator because it is strongly related to evaporation as evaporation increases whenever the relative humidity decreases.
The rate of evaporation that was recorded in two stations is 63.8% and 44.7% respectively. These values refl ect the arid climate that prevails in the area especially in the eastern parts. Also, the rate of RH decreases to 34% during the summer season whereas increases during the winter.
Figure 5: Histogram of long-term annual rainfall at Shaubak Agro Station.
Figure 6: Histogram of long-term annual rainfall at Ma`an rain gauging station.

LandWaterMed network70
Figure 7: Histogram of long-term annual rainfall
Figure 8: Histogram of long-term annual rainfall in the study area.
The Role of Remote Sensing in Monitoring Desertification
Remote sensing can play a major role in monitoring desertifi cation or any changes that can occur on earth. The digital satellite data with its multi-spectral and multi-temporal characteristics can help in detecting any changes during certain period. Also, the spatial properties give more accurate geographical positions with deferent resolutions.
Change detection technique can be useful in detecting desertifi cation. It involves the ability to quantify temporal effects using multi-temporal data set because of repetitive coverage at short intervals and consistent image quality.
As mentioned above, the study area is situated within the semi-arid area. Shobak is considered an important town for agricultural activities and tourism. Therefore, it was necessary to conduct further comprehensive study on the effect of climatic changes during the past decades on the social and environmental aspects. In this study, two satellite images from Landsat 5-TM (1984) and Landsat 7-ETM (2000) were employed to detect the changes in the land use.
Vegetation cover can be detected through the spectral bands that are composed of the visible range (b1, b2, b3) and the near infrared (b4) since the sensors record in these ranges high refl ectance for the plants. This refl ectance differs with types of vegetation, its distribution and densities. In addition, the different approachable techniques like vegetation indices, color composite, normalization and fi ltering can facilitate the study and explain more the natural characteristics of the vegetation cover.
• Current Changes Resulted from Crop Cultivation
a. Vegetables Plantation:
The local farmers are using the land for one year only and the next year it is abandoned. This method is devastating the natural vegetation cover and causing soil degradation. It is also causing environmental hazard and agricultural land deterioration hence desertifi cation. This feature has been observed through the satellite data by using the change detection method between the two satellite data (1984 and 2000, Fig.9).

AL-ASSAF M. et al 71
Figure 9: Areas cultivated with vegetables and
watermelon before 1984, and in 2000.
b. Wheat and Barley Plantation:
In this image it is evident that grain plantation is spread irregularly along the wadi like wheat and barley. It is also noticed that by comparing the two images (1984 and 2000), the agricultural plots are shifted from one year to another as illustrated in Figure 10. This agricultural method also leads to eliminate the natural vegetation cover and the disintegration of the surface soil which will cause soil erosion.
Figure 10: Areas cultivated with wheat and barley in 1984, and in 2000.

LandWaterMed network72
c. Tree Crops Plantation:
Tree Crops plantation are spread in the center of the area especially apple trees (Fig.11). The land was found suitable for this type of plantation regarding the climate, soil type and the abundance of ground water. Figure 12 shows the satellite image using the change detection technique, the distribution of apple trees cultivation during the years from 1984 to 2000. The pink color shows the tree crops cultivated in 2000 while the yellow color shows the tree crops cultivated in 1984. The blue color indicates lands suitable for cultivation while the green color represents old cultivated lands during the year 1984.
Recently, the government has implemented the project of Nomad settlement which was accompanied by constructing residential units and cultivating the land with cereals, orchards and olive trees.
Figure 11: Tree Crops Cultivation, mainly Apple Trees.
Figure 12: Satellite image of, the distribution of apple trees cultivation during the years from 1984 to 2000. The pink color shows the tree crops cultivated
in 2000 yellow color shows the tree crops cultivated in 1984, blue color indicates lands suitable for cultivation,
and green color represents old cultivated lands during the year 1984.

AL-ASSAF M. et al 73
d. Highland Project:
This project was carried out on the north-western hilly areas. This project aims to protect soil erosion by constructing retaining walls of 1m high in order to combat desertifi cation.
• Forests
Forests are mainly concentrated along the north western edge of the study area. They are mainly composed of oak trees and used to be dense and widely spread in the past.
Nowadays, the area is covered with scattered groups of trees due to wood collection mainly for the construction of the Hijaz railway for providing the needed fuel in the 1940s (Fig.13).
Figure 13: Scattered groups of trees in the study area
• Soil Erosion
The soil can easily be exposed to erosion hazards and looses its agricultural potentialities and the soil become less fertile. This procedure undergoes different stages from chemical decomposition and mechanical disintegration to fi nal transportation by wind action and fl oods.
a. Wind Erosion
Wind erosion can have strong effect on lands without vegetation cover. As well as, on disintegrated surface soil due to plowing, random vehicle mobilization and herd movement especially in the recent harvested lands. Wind erosion prevails all over the study area and is considered as a normal feature that can only be prevented by constructing wind barriers.
b. Water Erosion
The effect of water erosion is mainly caused by heavy fl oods in the south-eastern part of the area where large wadis are spread and activated by these strong fl oods that eroded large amounts of the surface soil leaving white gravels. These gravels are evident on the satellite image due to the high refl ectance in the visible bands (Fig.14).

LandWaterMed network74
Figure 14: Satellite image showing the high reflectance of gravels due to flooding
• Limestone Quarries
These quarries are extended in the south-eastern part of the study area. Intense exploitation and excavation is considered as an environmental catastrophe that will lead to strong desertifi cation in short period. Figure 15 shows the satellite image; the yellow color indicates the area that was excavated during 1984 while the white color indicates excavation during 2000.
Figure 15: Satellite image of the limestone quarries in the study area.

AL-ASSAF M. et al 75
• Recommendations and Proposed Solutions
It is obvious from what has been mentioned above regarding the main indicators of desertifi cation in Shobak area, the present practiced farming system do not consider the production sustainability and environmental protection. In order to limit such practices it is preferable to study each aspect of desertifi cation individually and to set the appropriate solutions.
��Vegetables Plantation : Vegetable plantation is considered one of the productive activities that should be practiced in the area. In Al-Husseinya area, where cultivation is one of the most important economical resources, it should follow more friendly environmental ways by employing crop rotation system, limiting the plow in the adjacent lands in order to prevent soil erosion and protect the vegetation cover.
��Cereals Plantation : The amount of rainfall and soil properties are regarded as two of the main factors to be taken into consideration in order to save effort and money, not to mention also the good economic revenue, preserving the soil components and the vegetation cover. So it is not suitable to cultivate cereals where the rate of precipitation is less than the amount needed to its growth, which will result in weak and less profi table yield. Instead, it should be left as pastures for animal grazing.
��Apple Trees Plantation : Shobak area was considered a suitable zone for apple plantation, which was realized after conducting many studies in the early 1980’s to evaluate the climatic conditions, soil components and water adequacy. Since that time, apple cultivation expanded in that zone. However, and due to the scarcity of rainfall and the over pumping of groundwater, led to large amount of groundwater exploitation for irrigation purposes, which in turn resulted in drying up most of the springs in the area. So it is recommended to better manage the groundwater, to limit tree crops plantation and try to cultivate more competitive economical crops.
��Forestation : Good management and conservation of forests and expanding in forestation process are regarded the most important factors to combat desertifi cation. Dana Natural Reserve plays a major role in forest preservation and biodiversity conservation. It is recommended to expand the area of forestation especially along the eastern slopes of Shera’ Mountains.
��Soil Erosion : In order to prevent soil erosion caused by wind and water action in sloping areas, it is recommended to construct retaining walls and make terraces. Also, forest plantation and the use of suitable agricultural techniques and tools can preserve the natural vegetation cover and prevent soil disintegration. In the gentle sloping areas, it is recommended to conduct water harvesting projects and to construct small dams to prevent soil erosion by fl ooding.
�� Limestone Quarries : Limestone excavation and exploitation should be under the supervision of the concerned corporations so as to manage the excavation process by using the well-known scientifi c ways in mines management. Also, the site needs restoration and fi xing the removed soil to prevent wind erosion.
��Livestock Grazing : The necessity for managing and arranging the natural pastures is considered also one of the essential factors to combat desertifi cation. Therefore, it is recommended to apply the law of land use, defi ning the pastures zones, establishing grazing reserves and organizing the grazing itself in order to give the time for herbaceous regeneration. As the case in Dana Natural Reserve where we can notice the dense vegetation cover.
References
Abanda, Ali; The Role of Satellite Images in Control of Desertifi cation.
Al Budeiri, A.; Natural Reserves Effect in Combating Desertifi cation. The Leading Seminar on Eco-systems Desertifi cation in Jordan. Ministry of Education, UNESCO, Amman-Jordan, 1993.
Dwivedi, R.S.; Remote Sensing in Desertifi cation, Studies on How to Monitor and Assess Desertifi cation.
Ptichnikov, A.V.; The Study of Desertifi cation Processes in the Aral Sea Region from Space Imagery. Institute of Geography, Mapping Science and Remote Sensing, Moscow.
Tadrus, Kamal; Desertifi cation in Jordan; Its Causes, Aspects and Relevant activities to Combat Desertifi cation. The Leading Seminar on Eco-systems Desertifi cation in Jordan. Ministry of Education, UNESCO, Amman-Jordan, 1993.

LandWaterMed network76

Dodan O. 77
Erosion Measurement in Çayboðazý Catchment South-Western Mediterranean Coastal Region in Turkey
Orhan DOÐAN
University of KahramanmarasTel: +90 344 225 14 44Fax: +90 344 223 74 09
e-mail: [email protected]
Abstract: This project has been conducted by the support of PAP/RAC/UNEP, FAO and DGCONA (Direccion General de Conservation de la Naturaleza, Madrid). Primary goal of the study is to determine the common methodologies for measuring and mapping of erosion in Mediterranean Countries. The study was applied both in Spain, Tunisia and Turkey.In this study, the erodibility of soil and the amounts of soil carried out in Çayboðazý Catchment were measured and the erosion risk mapping were generated.As a result of four years practical fi eldwork, the average annual soil loss was found to be 111,2 t/km2. The results indicated that medium and severe erosion effects occurred in 51% and 33.7% of studied catchment area, respectively.
Keywords: Erosion measurement, erosion mapping, mediterranean catchment in Turkey.
Introduction
Turkey has a total area of about 78 million hectares. The erosion affected area reaches to 57.6 million hectares, 0.5 million hectares of which is effected by wind erosion.
About 63 % of total erosion affected area has severe and very severe erosion, 20 % has moderate and 14 % slight or negligible erosion caused by these problems and natural reasons. Apart from natural reasons, some technical and socio-economic problems are the main causative factors for having high amount of soil losses.
These are:
��misuse of agricultural land in terms of soil suitabilities,
��defi ciency in determination of optimum farm sizes according to agro-ecological conditions,
��legal problems in land ownership,
��insuffi cient soil conservation measures,
��desagregation of farm plots by inheritance and absence of plant production planning.
According to the measurements made in 26 river catchments of Turkey, about 500 million tons of sediment and 9 million tons of nutrient materials are transported to rivers, lakes, reservoirs and seas.

LandWaterMed network78
The amount of sediment transportation is about 626 t/km2/yr and sediment delivery ratio at national level is around 18 %. Measures to control erosion like afforestation, terracing, rangeland and riverbed improvement have been taken in only 3.5 million hectares of land since the 1960’s.
Erosion measurement studies at a research level have been carried out by especially the Research Institutes of the General Directorate of Rural Services since 1967. The parameters of the Universal Soil Loss Equation are being researched for the general country. In addition, rainfall-fl ow and sediment researches are being carried out in a number of small catchments that are suitable for small dam construction.
This research has been carried out by the General Directorate of Rural Affairs-TURKEY under the PAP/RAC/UNEP Erosion Mapping and Measurement Program. This program is being performed under technical guidance of ICONA (Instituto para la Conservation de la Naturaleza, Madrid) with the collaboration of FAO.
The general objectives of this program can be listed as,
��to develop and apply a common methodology for measuring water erosion and mapping the erosion status of all the Mediterranean countries,
��to develop new integrated and consolidated methodologies for Mediterranean countries in order to classify the areas subject to highly effective water erosion in the Mediterranean catchment,
��to determine the amount of transported soil under various land uses.
The special objectives of this research can be defi ned as follows;
��to develop a predictive erosion map,
��to measure rainfall-induced erosion processes in a catchment and its sub-catchments,
�to compare erosion mapping and measurement studies’ outputs.
• Catchment Characteristics
Çayboðazý catchment and Nif, Cenger sub-catchments are located in separate catchments at the southwest the Mediterranean part of Turkey. Çayboðazý catchment shows typical characteristics of Mediterranean climate. Winters are generally warm and rainy, and summers are hot and dry. According to climatological data from Fethiye Meterological Station (closest settlement to the catchment), the long-term average of annual rainfall is 923.3 mm and the long-term average of temperature is about 18.4 °C. The majority of the annual rainfall is recorded in November, December, January and February (670 mm). Some characteristics of studied catchments in this study are presented in table 1.
Table 1: Topographic and hydrographic characteristics of Çayboðazý, Nif, Cenger catchments (From the topographic map at 1/25.000 scale).
Name of The Catchment Çayboðazý Nif Cenger
Area (km2) 190.410 64.970 10.940
Maximum height (m) 1980 1980 1270
Minimum height (m) 22 175 505
Relief (m) 1958 1805 765
Average height (m) 787.2 989.8 870.0
Average slope (%) 31.13 36.99 34.78
Main waterway length (km) 30.00 16.80 5.70
Total length of waterway (km) 447.90 113.80 14.55
Drainage density (m/km2) 2352.29 1751.58 1329.98
The length of overland flow (km2/m) 0.00213 0.000285 0.00028
Waterway frequency 3.939 2.216 1.554
Bifurcation ratio 7.079 3.157 3.508
Slope of the main waterway profile (%) 3.24 6.74 10.67

Dodan O. 79
Çayboðazý catchment has a rough topography (Figure 2). About 80% of the soil of the catchment has slopes exceeding 35 %. The area of soils, which is almost fl at or moderate slope, covers only 10% of the catchment. The dominant parent material of the soils in the Çayboðazý catchment is gravey hard limestone formations. Peridodites and serpantines cover about 40% of the catchment. In addition, it is possible to see eocene fl ysch series on about 5 % of the catchment.
About 70 % of Nif sub-catchment is covered by hard limestone formations and about 33 % by peridodites and serpentines. The geological structure of Cenger sub-catchment consists of completely hard limestone formations.
About 80 % of the total area of the catchment is covered by forests and bushes. This is an important factor in decreasing the amount of erosion. The forests are especially widespread on the seventh land capability class areas, which are on the soils formed generally on the cracks of calcerous parent material.
As plant cover, cluster pine, cedar belts and alpine rangelands are found in the Çayboðazý catchment. The Cluster pine belt extends from coastline up to 1200 m a s l. The cedar belt takes place at 1200-1500 m a s l. Cereals are widely grown in dry conditions. Peanuts, vegetables, corn, cotton and beans are grown on irrigated areas. Olives and citrus fruits are the main crops of orchard areas. General plantation types and cover densities on studied total catchment areas are shown in table 2 belove.
Table 2: Plant types and cover densities on the catchment areas studied.
Land Use Plant Cover Density (%) Area (ha) Are (%)Forest 50-75 445.7 2.34
Forest 75+ 14631.1 76.84
Orchard 50-75 246.8 1.30
Orchard 75+ 1546.5 8.12
Irrigated farming 25-50 536.0 2.82
Irrigated farming 50-75 761.2 4.00
Irrigated farming 75-100 160.4 0.84
Dry farming 50-75 610.6 3.21
Dry farming 75+ 23.5 0.12
Bushes 75+ 78.2 0.41
About 83 % of the catchment, which is under forest regime, is 7th class in terms of land use capability. 4 major soil groups are determined in the catchment. The erodibility degrees were calculated according to USLE. According to USLE, erodibility degrees are very slight and moderate in general. Details are shown in table 3.
Figure 1: Turkey (Location of Research)

LandWaterMed network80
Figure 2: General picture of Çaybogazi Catchment
Table 3: Soil of Çayboðazý catchment and their erodibility degrees.
Major Soil GroupArea Erodibility Degree K Factor
(According to USLE)Ha %Red Mediterranean Soils 10765 56.54 0.02-0.17 Very slight-Moderate
Non-Calcerous Brown Forest Soils 5903 31.00 0.02-0.24 Very slight-Severe
Reddish Brown Mediterranean Soils 1223 6.42 0.01-0.05 Very slight-Slight
Colluvial-Alluvial Soils 1150 6.04 0.04-0.15 Very slight-Slight
Erosion Measurement Network in the Catchment
The placement of stations for measuring rainfall, discharge, sediment and water temperature parameters in the selected Çayboðazý catchment and Nif, Cenger sub-catchments (Figures 3, 4 and 5) can be seen in the table 4.
Table 4: The placements of stations and equipments used in measurements.
Measurement Station
Far Rainfall For Water Level For SedimentFor Temperature
Çayboðazý Pluviograf-Limnigraph (with buoy)-Staff gauge
DH-48 (Depth-integration method)
Thermometer
Nif Tiping bucket-Hydrostatic probe-Staff gauge
DH-48 (Depth-integration method)
Hydrostatic probe
Cenger Tiping bucket-Cap-depth probe-Staff gauge
DH-48 (Suspended sediment sampler)
Thermometer
Rainfall, water level and temperature data at Nif and Cenger station has been measured in every fi ve minutes, compiled in data-loggers and recorded in a portable computer. Suspended sediment has been measured in each of the three stations every 15 days during rainy periods by means of a DH-48 using depth-integration method.
Evaluation of Measured Data
After taking the suspended sediment samples according to the depth integration method and analysing them, suspended sediment amounts (t/d), corresponding to discharges of the streams during sampling were calculated. Then, sediment discharge curves were derived and formulated for each station by using suspended sediment amounts and the corresponding discharges.

Dodan O. 81
For Cenger Station:
Qs = 10 1.3499 Qw 1.6408 ; r = 0.8677**
For Nif Station:
Qs = 10 0.4318 Qw 1.6214 ; r = 0.942**
For Yanýklar Station:
Qs = 10 -0.6627 Qw 2.4360 ; r = 0.905**
Where: Qs: Quality of sediment transported (ton/day), Qw: Flow rate.
Figure 3: Data collection
Figure 4: Data collection

LandWaterMed network82
Figure 5: Data collection
The discharges and the amounts of sediment onto the Çayboðazý catchment and the Nif, the Cenger sub-catchments were calculated daily. The bedloads of the catchments have been calculated by increasing the suspended amounts by 15 %.
Erosion Status of the Çayboðazý Catchment
Predictive erosion mapping of Çayboðazý catchment has been realized using a topographic map at 1/25.000 scale and 1/15.000 to 1/35.000 scale air photographs. Two maps showing the erosion status and the erodibility degrees of Çayboðazý catchment are presented in fi gure 6 and 7. The program activities consisted of photo-interpretation, land survey and fi eld controls as well as offi ce work. Brief work layout is illustrated in fi gure 8.
Figure 6: Erosion status of Çaybogazi catchment Figure 7: Erosion status of Çaybogazi catchment

Dodan O. 83
Figure 8: Work layout for generating the erosion status map.
Proportionally, the Çenger catchment has more area under the effect very severe and severe erosion status than the other two catchments. According to the basic predictive erosion framework, about 42 % of the area of Çaybogazi catchment is under the effect of moderate, severe and very severe erosion status. The rest 58 % of the area of the catchment is subject to very slight or slight erosion. Annual suspended sediment amounts of each sub-catchment for the other water years could not be calculated due to the lack of measurements. Flow and sediments amounts measured in Çaybogazi catchments are shown in table 5.
Table 5: Flow and sediment amounts of Çayboðazý catchment
MonthsMean Flow (m3/s) Suspended Sediment (t) Mean
Bedload (t)
Mean Total1993 1994 1995 Mean** 1993 1994 1995
Mn/km2 Mn/Hav
X 1.459 2.468 2.852 2.260 17.533 61.033 105.115 0.322 61.227 9.184 70.411
XI 1.820 2.403 8.515 4.246 79.507 70.006 2465.763 4.578 871.759 130.764 1002.523
XII 3.527 3.193 13.055 6.592 233.706 230.256 4727.788 9.089 1730.583 259.587 1990.170
I 5.136 6.949 17.085 9.723 1235.127 1035.451 10178.73 21.794 4149.771 622.466 4772.237
II 7.656 7.684 6.323 7.221 1578.256 916.448 575.469 5.375 1023.391 153.509 1176.900
III 10.962 4.795 8.335 8.031 2808.909 322.143 1489.346 8.089 1540.133 231.020 1771.153
IV 6.769 3.608 7.197 5.858 723.632 153.916 826.173 2.983 567.927 85.189 653.116
V 5.011 2.612 4.974 6.299 348.482 74.895 339.321 1.335 254.233 38.135 292.368
VI 3.568 3.396 4.181 3.715 149.547 140.634 215.124 0.885 168.435 25.265 193.700
VII 2.675 3.422 3.141 3.086 74.553 137.669 113.514 0.570 108.579 16.287 124.866
VIII 2.500 3.034 2.660 2.731 62.806 101.363 73.286 0.416 79.152 11.873 91.025
IX 2.500 2.820 2.400 2.573 60.780 81.510 55.020 0.346 65.860 9.879 75.739
Annual 4.465 3.867 6.727 5.020 7372.838 3325.384 21164.65 55.779 10620.96 1593.144 12214.10
Conclusion and Recommendations
• This research was carried out in the Çayboðazý catchment for erosion measurement during the 1993-1996 water years.
• About 92 % of the annual erosive rainfall at Nif Station and about 93 % of the annual erosive rainfall at the Çenger Station were recorded during the November-March period. According to the long-term data from Fethiye Station, 78 % of annual erosive rainfall has been recorded at the same period.
• The three-year average of suspended sediment in the Çayboðazý catchment was calculated as 55.779 t/km2/yr. Total sediment amount from unit are as 64.146 t/km2/yr. This amount is extremely low when compared with that of Turkey’s general average (626 t/km2/yr) In the Dalaman catchment, however, the 26-year average of suspended sediment was calculated as 53.200 t/km2/yr and the 18-year average of suspended sediment amounts 71.7 t/km2/yr for the Eþen catchment. These are adjacent to the research catchment. This comparison shows that Çayboðazý and their neighboring catchments are nearly same in terms of sediment yield.

LandWaterMed network84
• Sediment amounts of the Çayboðazý catchment and its sub-catchments could not be compared with each other for the whole research period because of the lack of some measurements at Nif and Cenger station. Suspended sediment amount from Nif sub-catchment was found as 8.838 t/km2/yr for 1994 water year, where the measurements were complete. This amount for the Çayboðazý catchment was 17.464 t/km2/yr for the same year. In the same way, suspended sediment amount for the Cenger sub-catchment was calculated as 130.804 t/km2/yr for 1995 water year. This amount for Çayboðazý catchment was 111.158 t/km2/yr for the same year.
• These comparisons show that the Cenger catchment has more intensive erosion than the Çayboðazý and the Nif catchments. This result confi rms the Çayboðazý catchment’s predictive erosion map.
• In the Dalaman catchment, however, the 26-year average of suspended sediment was calculated as 53.200 t/km2/yr and the 18-year average of suspended sediment amounts 71.7 t/km2/yr for the Esen catchment. These are adjacent to the research catchment.
• This comparison shows that Çayboðazý and their neighboring catchments are nearly same in terms of sediment yield.
��The natural drainage areas of the catchments must take into consideration as a whole and the countries benefi ting from these catchments must produce joint methodologies ant techniques for their effi cient conservation.
References:
[1] Beyazit, M.: Hydraulic of Flow on Mobile Riverbeds, Istanbul Technical University Library, No:835, Istanbul (Turkish), 1971.
[2] Doðan, O. and Güçer, C.: Factors Leading to water Erosion and Determining the Soil Losses by Use of Universal Equation, Directorate of TOPRAKSU, Central TOPRAKSU Research Institute Publication, General Publication No:41, Technical Publication No:24, Ankara (Turkish), 1976.
[3] Doðan, O.: Erosive Potentials of Rainfalls in Turkey, A Publication of General Directorate of Rural Services, Ankara (Turkish), 1987.
[4] Doðan, O. and Küçükçakar, N.: Rapport national turc sur la cartographie de l’erosion dans le bassin-versant d’ESEN (Project pilote de la PAP/CAR), Ankara, 1994.
[5] Doðan, O.: Rapport national turc sur les politiques en matieres de gestion durable des ressources en sol, Darft pour la reunion du Groupe sur la gestion des ressources naturelles de I’OCDE, Paris, Mars, 1992.
[6] Doðan, O.: Cartographie de I’erosion et les recherches sur la conservation des sols en Turquie, Cahiers OPTION Mediterraneennes Volum 1. CIHEAM/CCE-DGI ISSN : 1022-1379, Zaragoza, Espana, 1993.
�7 State Water Works: Frequency Atlas of Maximum Rainfalls in Turkey, General Directorate of State Water Works, Ankara (Turkish), 1990.
�8 General Directorate of Electrical Power Resources: Sediment Observations and the Amounts of Sediment Transported in the Rivers of Turkey, General Directorate of Electrical Power Resources, Publication: 93- 59, Ankara (Turkish), 1993.
[9] Kantarcý, D.: Regional Classifi cation of Growing Environment in Mediterranean Region, General Directorate of Forestry, Publication: 668-64, Ankara (Turkish), 1991.
[10] Sevinç, A.N.: Sediment Yield of Yagri Small Dam in Eskisehir-Sivrihisar-Mercan Köyü, General Directorate of Rural Services, Eskisehir Research Institute Publications, General Publication No:214, Report Series No:164, Eskisehir (Turkish), 1990.
[11] Williams, IR. and Gerndt, H.: Sediment Yield Computed with Universal Equation, Journal of Hydraulics Division, Vol:98, Paper 9426, 1972.

Boussema M.R. 85
Gestion des bassins versants en milieu semi aride tunisien
Mohamed Rached BOUSSEMA
Laboratoire de Télédétection et Systèmes d’Information à Référence Spatiale (LTSIRS)Ecole nationale d’ingénieurs de Tunis, B.P. 37, 1002 Tunis-Belvédère, Tunisie
Tél. : 216 71 874 700Fax. : 216 71 872 729
e-mail : [email protected]
Résumé: L’érosion hydrique est un phénomène complexe qui touche particulièrement la Tunisie et menace gravement ses potentialités en eau et en sols.Plusieurs travaux de recherche ont été effectués au Laboratoire de Télédétection et Systèmes d’Information à Référence Spatiale (LTSIRS) s’inscrivant dans la problématique de gestion et de conservation des ressources naturelles à l’échelle du bassin versant. Ces travaux ont largement mis à contribution les moyens modernes de télédétection et des systèmes d’information géographique (SIG) qui ont permis de modéliser et de cartographier l’érosion hydrique au niveau des bassins versants de la Tunisie septentrionale et centrale.Les travaux de recherche menés avaient ainsi pour objectifs l’étude des paramètres contrôlant le développement du réseau hydrographique, la quantifi cation de l’érosion par ravinement, l’élaboration des cartes de sensibilité à l’érosion qui serviront d’aide à la décision pour l’aménagement du territoire et la mise en œuvre de scénarios et des étapes d’aménagements effi caces pour lutter contre l’érosion.
Mots clés : Erosion hydrique, Télédétection, SIG, modélisation hydrologique, bassin versant.
Introduction
L’érosion hydrique est un phénomène complexe qui touche particulièrement la Tunisie et menace gravement ses potentialités en eau et en sols. Ce phénomène est géré par plusieurs facteurs souvent interdépendants. On cite en particulier les facteurs topographiques, pédologiques, lithologiques, hydro-climatologiques, mais aussi ceux liés aux aménagements de conservation des eaux et du sol, à l’occupation du sol et aux états de surface. Ils présentent une grande variabilité spatio-temporelle, ce qui limite les possibilités de les surveiller et de les contrôler.
Dans le but de développer des méthodologies et des scénarios d’aménagements de conservation des eaux et du sol, les différents paramètres qui contrôlent les facteurs de l’érosion hydrique ont été analysés et traités (fi gure 1). Pour ce faire, des données issues des images aérospatiales multi-dates et multi-sources et d’autres recueillies sur le terrain ont été utilisées. Ces données ont permis de tester plusieurs modèles hydrologiques et d’érosion et de les adapter aux conditions climatiques et physiques des régions semi arides tunisiennes.
Les travaux de recherche menés avaient ainsi pour objectifs l’étude des paramètres contrôlant le développement du réseau hydrographique, la quantifi cation de l’érosion par ravinement, l’élaboration des cartes de sensibilité à l’érosion qui serviront d’aide à la décision pour l’aménagement du territoire et la mise en œuvre de scénarios et des étapes d’aménagements effi caces pour lutter contre l’érosion.
Figure 1 : Méthodologie suivie pour l’étude des bassins versants

LandWaterMed network86
Les travaux de recherche effectués
Plusieurs travaux de recherche ont été effectués au Laboratoire de Télédétection st Systèmes d’Information à Référence Spatiale (LTSIRS) s’inscrivant dans la problématique de gestion et de conservation des ressources naturelles à l’échelle du bassin versant. Ces travaux ont largement mis à contribution les moyens modernes de télédétection et des systèmes d’information géographique (SIG) qui ont permis de modéliser et de cartographier l’érosion hydrique au niveau des bassins versants de la Tunisie septentrionale et centrale.
Durant la période du projet Landwatermed (1999-2004), les travaux suivants ont été effectués :
• étude de l’évolution du ravinement par unité lithologique dans les bassins versants des oueds El Hammam et Rmel de sebkha El Kelbia (Bouchnak, 2000) ;
• cartographie de la sensibilité à l’érosion ravinante par unité lithologique dans les sous-bassins versants des oueds Hjar et Ettiour (Razzeg, 2000) ;
• étude du fonctionnement hydrologique d’un bassin versant par intégration de paramètres hydrologiques et de transport solide dans un SIG (Ezzina, 2000) ;
• intégration de données à référence spatiale dans un modèle hydrologique (Zoghlami, 2000) ;
• méthodologie d’inventaire d’aménagements de bassins versants se basant sur les images aérospatiales (Baccari, 2001) ;
• apport de la télédétection et du SIG à l’évaluation de la dégradation des sols par érosion hydrique : les abords de Aïn Jelloula en Tunisie centrale (El Abed, 2002) ;
• simulation à l’aide d’un SIG des apports en sédiments et en eau des lacs collinaires dans le bassin versant du Merguellil (Boughattas, 2003).
D’autres travaux de recherche sont en cours de fi nalisation. En particulier, deux études retiennent l’attention par leur originalité. Il s’agit de :
• « la cartographie et les statistiques des variations temporelles des paramètres pluviométriques, topographiques et lithologiques, liés aux processus d’érosion des terres, et étude de leur interrelation », recherche effectuée par H. Bouchnak dans le cadre d’une thèse de doctorat en cours d’achèvement.
• « l’apport des images aérospatiales pour l’évaluation des effets des paramètres biophysiques sur l’effi cience hydrologique des aménagements de conservation des eaux et du sol », recherche effectuée par N. Baccari dans le cadre d’une thèse de doctorat en cours.
Les thèmes traités
L’ensemble de ces travaux de recherche a concerné les catégories des thèmes suivants :
• L’érosion hydrique
• La cartographie de l’érosion à l’aide d’un SIG et détermination des zones sensibles à l’érosion, les zones à risque d’érosion et les zones d’urgence ;
• L’étude de l’évolution du ravinement en fonction de la lithologie ;
• L’inventaire des aménagements réalisés sur les bassins versants pour lutter contre l’érosion par les départements techniques du Ministère de l’agriculture, en utilisant essentiellement sur les images aérospatiales ;
• L’évaluation de la dégradation des sols par érosion hydrique ;

Boussema M.R. 87
• L’évaluation des effets des paramètres biophysiques sur l’infl uence hydrologique des aménagements de conservation des eaux et du sol ;
• L’étude de l’interrelation des paramètres pluviométriques, topographiques et lithologiques liés aux processus d’érosion des terres ;
• La quantifi cation de l’érosion ravinante.
• L’hydrologie
• La modélisation de l’écoulement à l’aide d’un modèle numérique de terrain ;
• L’étude du fonctionnement hydrologique d’un bassin versant non jaugé en milieu semi-aride ;
• La modélisation hydrologique à l’aide d’un SIG.
• Les caractéristiques naturelles et physiques
• L’extraction des caractéristiques morphologiques de terrain dans un bassin versant ;
• La cartographie de l’occupation du sol et des états de surface à l’aide des images satellitaires ;
• La restitution de la topographie par interférométrie radar et par stéréovision ;
• L’évaluation du paramètre topographique par décomposition parcellaire des bassins versants ;
• La détection et la caractérisation des zones humides en milieu semi-aride sur des images radar.
• Les aspects informatiques
• le développement de logiciel d’interface et d’aide à la décision ;
• l’adaptation de modèles hydrologiques informatisés.
La localisation des bassins versants étudiés
Les principaux bassins versants étudiés se situent en Tunisie septentrionale et centrale particulièrement sur les fl ancs de l’Atlas tellien (fi gure 2) :
• le bassin versant du lac Ichkeul : drainé par les oueds suivants : O. Joumine, O. Ghézala, O. Melah, O. Sejnane et le Lac de Bizerte ;
• le bassin versant du Medjerda : drainé par les oueds suivants : O. El Hnach ;
• le bassin versant de sebkha El Kelbia : drainé par les oueds suivants : O. El Alem, O. El Hammem et O. Rmel ;
• le bassin versant du Merguellil : drainé par les oueds suivants : O. Redjel, O. Hajar, O. O. Ettiour, O. Rajjala, O. Fidh Ali et O. Fidh Ben Naceur ;
• le bassin versant de Sharshara : drainé par les oueds suivants : O. El Mahjourya ;
• le bassin versant de Nebhana : drainé par les oueds suivants : O. El Guazine et O. Mrichet el Anze.
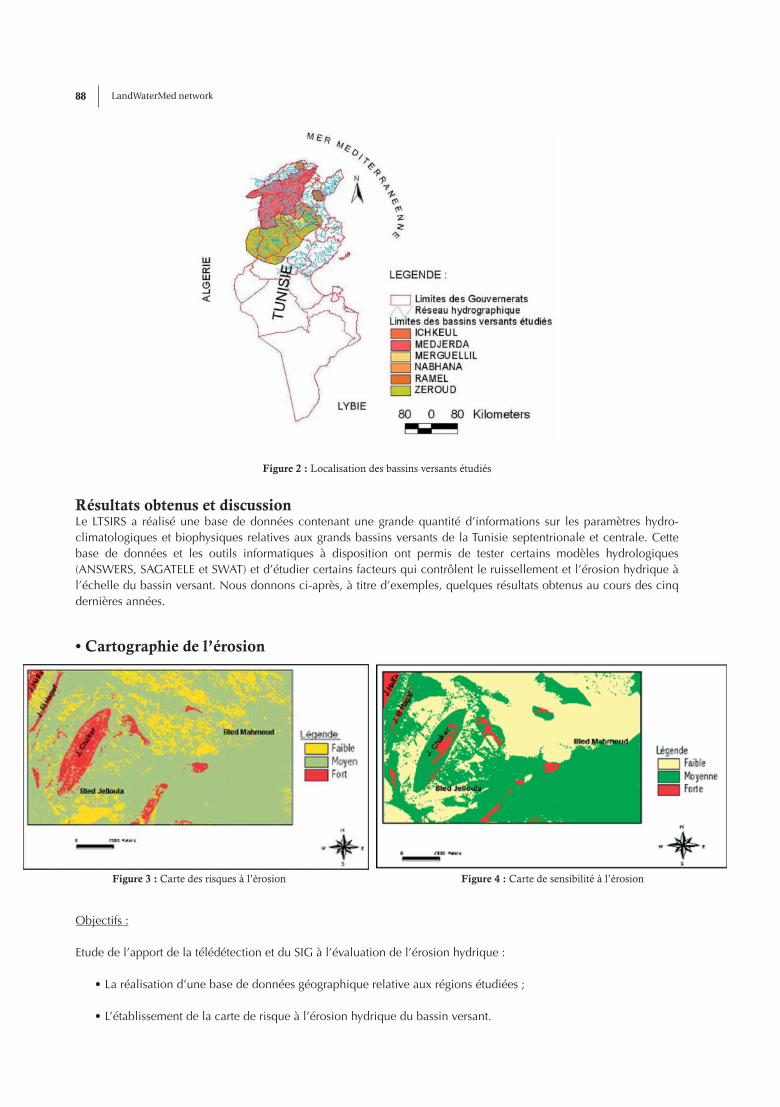
LandWaterMed network88
Figure 2 : Localisation des bassins versants étudiés
Résultats obtenus et discussionLe LTSIRS a réalisé une base de données contenant une grande quantité d’informations sur les paramètres hydro-climatologiques et biophysiques relatives aux grands bassins versants de la Tunisie septentrionale et centrale. Cette base de données et les outils informatiques à disposition ont permis de tester certains modèles hydrologiques (ANSWERS, SAGATELE et SWAT) et d’étudier certains facteurs qui contrôlent le ruissellement et l’érosion hydrique à l’échelle du bassin versant. Nous donnons ci-après, à titre d’exemples, quelques résultats obtenus au cours des cinq dernières années.
• Cartographie de l’érosion
Objectifs :
Etude de l’apport de la télédétection et du SIG à l’évaluation de l’érosion hydrique :
• La réalisation d’une base de données géographique relative aux régions étudiées ;
• L’établissement de la carte de risque à l’érosion hydrique du bassin versant.
Figure 3 : Carte des risques à l’érosion Figure 4 : Carte de sensibilité à l’érosion

Boussema M.R. 89
Résultats obtenus :
Plus de 70 % des sols présentent un risque moyen d’érosion (fi gures 3 et 4) (El Abed, 2002).
• Modélisation de l’érosion hydrique
Figure 5 : Carte d’érosion du bassin versant Fidh Ali pendant l’averse du 17/10/95 en grid de 70 m
Figure 6 : Carte de l’érosion du bassin versant Fidh Ali pendant la période du 10/06/93 au 23/05/96 en grid
Objectifs :
• La simulation des apports en eau et sédiments des lacs collinaires ;
• L’intégration des données issues du SIG Arcview dans le modèle hydrologique ANSWERS ;
• Le traitement de la sensibilité du modèle hydrologique utilisé ANSWERS à travers ses paramètres ;
• La cartographie instantanée des bassins versants étudiés.
Résultats obtenus :
Une meilleure estimation du ruissellement et des concentrations en sédiments (fi gures 5 et 6) (Boughattas, 2003).

LandWaterMed network90
• Aménagements anti-érosifs
Figure 7 : Répartition spatiale des aménagements de CES dans le bassin versant Ettiour
Figure 8 : Répartition spatiale des aménagements de CES par unité lithologique du bassin versant Ettiour
Objectifs :
• L’inventaire des aménagements de conservation des eaux et du sol de petites hydrauliques à partir des orthophotographies aériennes ;
• L’étude de l’effi cacité de certains aménagements par rapport à leur substratum sol.
Résultats obtenus :
• Les travaux de conservation des eaux et du sol de la zone d’étude ont été réalisés à l’aveuglette sans connaissance opérationnelle de la distribution des sols à l’échelle du bassin versant (fi gures 7 et 8) (Baccari, 2001) ;
• Le développement d’une méthodologie d’inventaire d’aménagements de conservation des eaux et du sol.
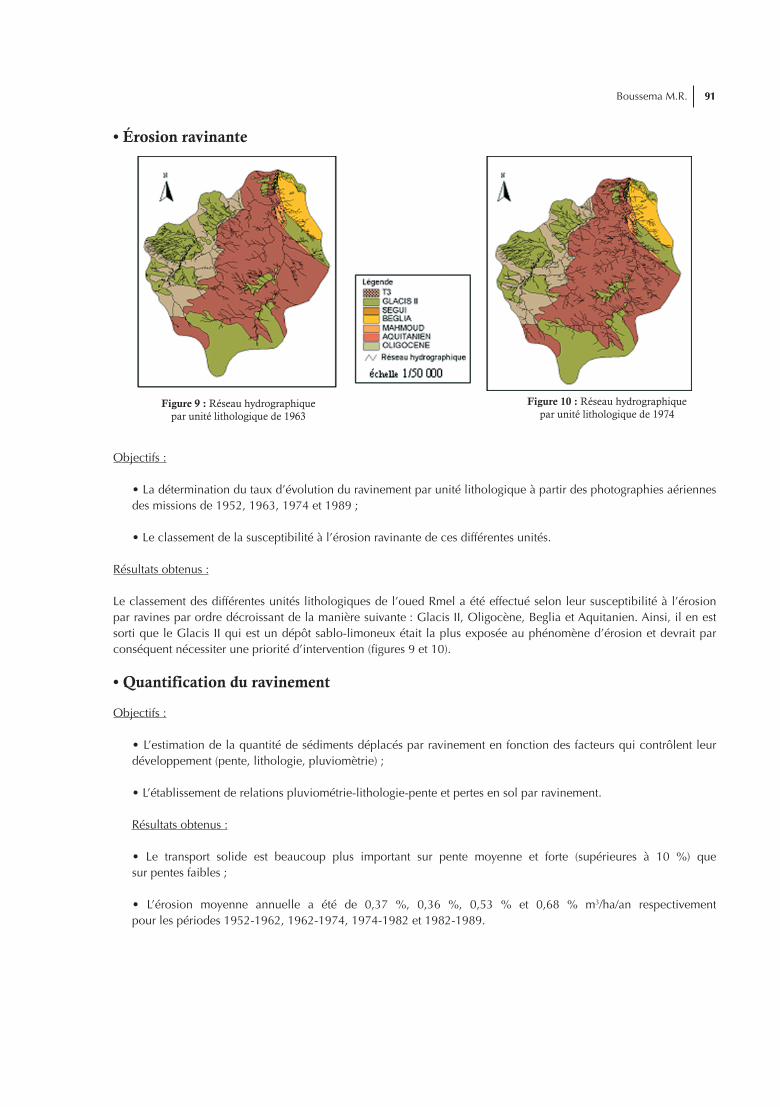
Boussema M.R. 91
• Érosion ravinante
Figure 9 : Réseau hydrographique par unité lithologique de 1963
Figure 10 : Réseau hydrographique par unité lithologique de 1974
Objectifs :
• La détermination du taux d’évolution du ravinement par unité lithologique à partir des photographies aériennes des missions de 1952, 1963, 1974 et 1989 ;
• Le classement de la susceptibilité à l’érosion ravinante de ces différentes unités.
Résultats obtenus :
Le classement des différentes unités lithologiques de l’oued Rmel a été effectué selon leur susceptibilité à l’érosion par ravines par ordre décroissant de la manière suivante : Glacis II, Oligocène, Beglia et Aquitanien. Ainsi, il en est sorti que le Glacis II qui est un dépôt sablo-limoneux était la plus exposée au phénomène d’érosion et devrait par conséquent nécessiter une priorité d’intervention (fi gures 9 et 10).
• Quantification du ravinement
Objectifs :
• L’estimation de la quantité de sédiments déplacés par ravinement en fonction des facteurs qui contrôlent leur développement (pente, lithologie, pluviomètrie) ;
• L’établissement de relations pluviométrie-lithologie-pente et pertes en sol par ravinement.
Résultats obtenus :
• Le transport solide est beaucoup plus important sur pente moyenne et forte (supérieures à 10 %) que sur pentes faibles ;
• L’érosion moyenne annuelle a été de 0,37 %, 0,36 %, 0,53 % et 0,68 % m3/ha/an respectivement pour les périodes 1952-1962, 1962-1974, 1974-1982 et 1982-1989.

LandWaterMed network92
• Sensibilité des modèles hydrologiques
Objectifs :
• L’adaptation des modèles hydrologiques ANSWERS et SWAT aux conditions hydrologiques semi-arides tunisiennes ;
• L’étude de l’infi ltrabilité de certains types de sols sur le bassin versant de l’oued Rmel ;
• L’étude des paramètres physico-chimiques des sols.
Résultats obtenus :
Le modèle ANSWERS est sensible à l’humidité, la profondeur de la zone de contrôle et au coeffi cient de Manning (Mosbahi, 2004).
• Description des surfaces des sols à l’aide d’images satellitaires
Figure 11 : Images SPOT4
Figure 12 : Carte des types des surfaces des sols
Objectifs :
• L’étude de l’apport de la télédétection et la caractérisation des états des surfaces des sols ;
• La cartographie des types des surfaces des sols.
Résultats obtenus :
La réalisation des cartes d’occupation des sols et des types des surfaces des sols (fi gures 11 et 12) (Lounissi, 2004).

Boussema M.R. 93
Apport de la télédétection à l’étude des bassins versants
La télédétection satellitaire permet l’accès à de nouvelles données spatialisées dont les caractéristiques essentielles sont les résolutions spatiale, spectrale et temporelle.
L’apport de l’imagerie satellitaire consiste ainsi en la possibilité de suivre la variabilité spatiale des caractéristiques physiques d’un bassin versant. L’accès direct et récent aux sources de données provenant des images satellitaires et ses plans dérivés, permet l’obtention d’informations plus ou moins précises sur la répartition spatiale des caractéristiques physiques des bassins versants, ce qui autorise une extrapolation spatiale des informations à partir de la connaissance de quelques données ponctuelles. La répétitivité temporelle des images offre la possibilité de suivre les changements dynamiques de ces caractéristiques.
Ainsi, on confi rme, à travers les travaux de recherche effectués au LTSIRS, que la télédétection spatiale est un outil privilégie pour le suivi hydrologique des bassins versants, pour la connaissance des zones où les données de base sont peu nombreuses, pour la cartographie fi ne de l’occupation du sol, et pour la comparaison entre les bassins. Cela permet d’aider à la caractérisation des bassins, l’extrapolation à des bassins non jaugés, et l’étude de zones diffi ciles d’accès. Les mesures au sol ont réconforté les informations extraites des images. En ce sens, la télédétection a joué plutôt un rôle de relais entre les informations locales, quantitatives ou qualitatives, et une connaissance spatiale ou temporelle sur les zones de grande ampleur, qu’un rôle de substitution.
Le couplage télédétection –modélisation hydrologique apparaît ainsi comme très prometteur. Dans les modélisations hydrologiques classiques, le couplage des paramètres se fait à l’aide des données d’observation sur le terrain, nécessitant d’avoir un grand nombre d’observations, pour assurer le calage et la validation des paramètres.
Conclusion
L’objectif principal des travaux effectués au LTSIRS est la détermination des différents paramètres intervenant dans l’érosion des sols dans les bassins versants en milieu semi-aride.
Grâce aux méthodes modernes fournies par l’informatique à l’interprétation des images satellitaires et les techniques des SIG, on découvre progressivement l’intérêt offert par la cartographie pour caractériser le degré d’évolution des paysages. Ainsi, il a été possible au cours des études effectuées d’élaborer des cartes des manifestations actuelles et ponctuelles de l’érosion (zones à risque), qui peuvent servir d’outils d’aide à la décision dans le cadre d’une politique d’aménagement des bassins versants visant à réduire le phénomène d’érosion.
Références bibliographiques
Bouchnak H., 2000. Etude de l’évolution du ravinement par unité lithologique dans le bassin versant des Oueds El Hammam et Rmel. Mémoire de DEA., FST, 78p.
Bouchnak H., Sfar Felfoul M., Boussema M. R., et SNANE M. H., 2004. Etude de l’évolution du ravinnement en fonction de la lithologie dans les bassins versants des oueds EL Hamm et Rmel en Tunisie centrale. Revue de Télédétection. Vol. 4. n°1, p. 75-93.
Baccari N., 2001. Méthodologie d’inventaire d’aménagements de bassins versants se basant sur les images aérospatiales. Mémoire de DEA., FST, 75 p.
Baccari N., Boussema M. R., et SNANE M. H., 2004. Nécessité de développement d’une méthodologie d’inventaire basée sur des photographies aériennes numérisées, la réalité de terrain et un SIG : le cas des aménagements de conservation des eaux et du sol en Tunisie. Revue de Télédétection. Vol.4. n°1,16 p.
Zoghlami M, 2000. Intégration de données à référence spatiale dans un modèle hydrologique. Mémoire de DEA, ENIT,. 75 p.
El Abed I, 2002. Apport de la télédétection et du SIG à l’évaluation de la dégradation des sols par érosion hydrique : les abords de Aïn Jelloula en Tunisie centrale. Mémoire de DEA., FST, 95 p.
Boughattas N. H., 2003. Simulation à l’aide d’un SIG des apports en sédiments et en eau des lacs collinaires dans le bassin versant Merguellil. Mémoire de DEA., FST, 115p.
Mosbahi M., 2004. Sensibilité du modèle ANSWERS aux paramètres hydrodynamiques du sol. Mémoire de Mastère., FST, 76 p.
Lounissi N., 2004. Description des surfaces des sols à l’aide d’images Satellitaires. Mémoire de Mastère., FST, 92 p.

LandWaterMed network94

Amri M. 95
Watershed typology and national infrastructures for monitoring land and water
Typologie et infrastructure pour la gestion des ressources en eau et sol
Moncer AMRI
Centre National de TélédétectionP.O. Box 200, Km 9, Route de la Marsa, 1080 TUNIS
Telephone: (216) 71 761 333Fax: (216) 71 760 890
e-mail:[email protected]
Abstract: Representatives of CNT participated in all meetings of the network : Since the ISPRA(Italy) kick-off meeting on April 15 2002, followed by the second meeting held in Valencia (Spain) on 15 September 2002, the third meeting which took place in Amasya (Turkey) on June15 2003, and the forth meeting which took place in ISPRA on June 23 2004. CNT has set as a priority to conduct studies related to activities dealing with water and land resources management and has been involved in projects in the multilateral Mediterranean framework.
This paper presents the contribution of CNT to the network activities and it covers the Watershed typology and national infrastructures for monitoring land and water (in french language). It also presents some projects focusing on the use of remote sensing and GIS as an appropriate tool for land and water resource management allowing for the performance of all of the work packages dealing with the watersheds dynamics by modeling their evolution, and with geo-information systems for land and water management.
Keywords: CNT, network, water and land resources, Watershed remote sensing, GIS, management, modeling
Résumé: Les représentants du CNT ayant participé à toutes les rencontres dans le cadre des activités du réseau Landwatermed : depuis la réunion de démarrage tenue à ISPRA (Italie) le 15 avril 2002, suivie par celle ayant eu lieu à Valence (Espagne) le 15 septembre 2002, à celles abritée par la Turquie à Amasya le 15 juin 2003 et par l’Italie le 23 juin 2004 à ISPRA. Le CNT s’est fi xé comme priorité de conduire des projets relatifs à la gestion des ressources en eau et sol et a été actif dans le cadre multilatéral Euro Méditerranéen.
Cette contribution aux actes du réseau Landwatermed, présente les activités du CNT dans le réseau et présente un article sur « la typologie et infrastructure pour la gestion des ressources en eau et sol ». Elle présente également quelques projets réalisés ou en cours de réalisation mettant en œuvre la télédétection et les systèmes d’information géographique comme outil approprié pour la gestion des ressources en eau et sol. Il est ainsi permis de dire que toutes les tâches prévues dans les activités du réseau Landwatermed telles que la modélisation de l’évolution de la dynamique des bassins versants et leur gestion, ont été accomplies.
Mots clés : CNT, réseau, ressources en eau et sol, bassin versant, télédétection, SIG, Gestion, modélisation
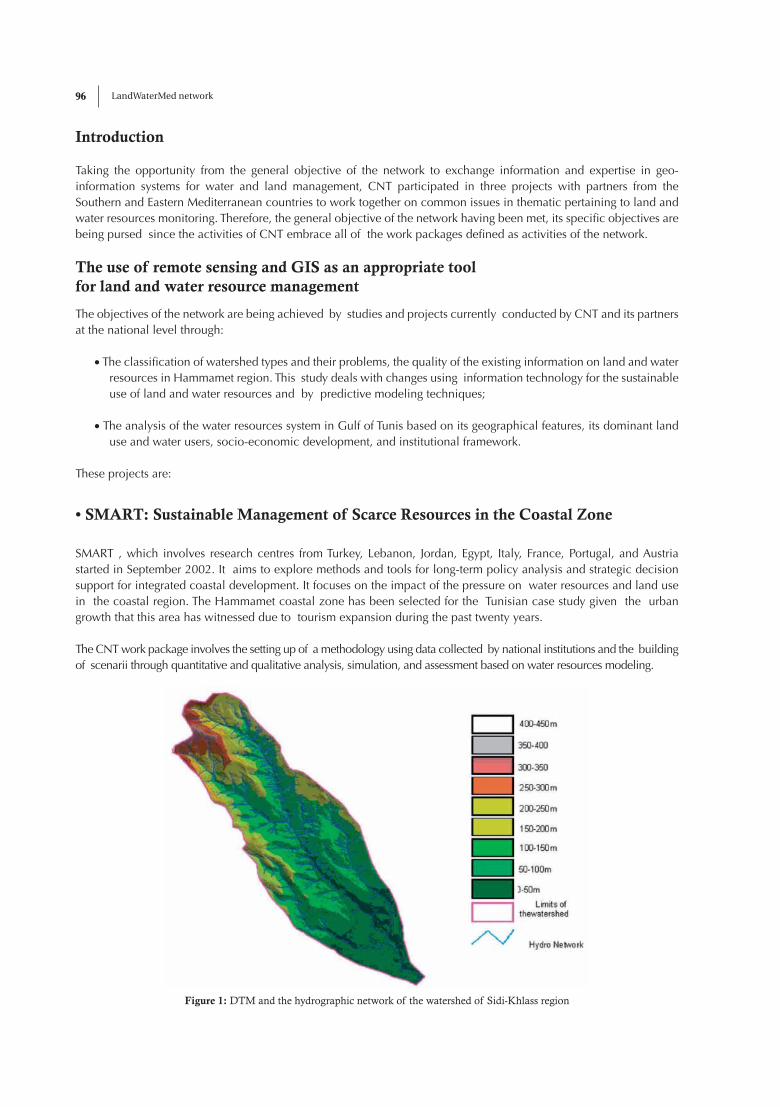
LandWaterMed network96
Introduction
Taking the opportunity from the general objective of the network to exchange information and expertise in geo-information systems for water and land management, CNT participated in three projects with partners from the Southern and Eastern Mediterranean countries to work together on common issues in thematic pertaining to land and water resources monitoring. Therefore, the general objective of the network having been met, its specifi c objectives are being pursed since the activities of CNT embrace all of the work packages defi ned as activities of the network.
The use of remote sensing and GIS as an appropriate tool for land and water resource management
The objectives of the network are being achieved by studies and projects currently conducted by CNT and its partners at the national level through:
��The classifi cation of watershed types and their problems, the quality of the existing information on land and water resources in Hammamet region. This study deals with changes using information technology for the sustainable use of land and water resources and by predictive modeling techniques;
��The analysis of the water resources system in Gulf of Tunis based on its geographical features, its dominant land use and water users, socio-economic development, and institutional framework.
These projects are:
• SMART: Sustainable Management of Scarce Resources in the Coastal Zone
SMART , which involves research centres from Turkey, Lebanon, Jordan, Egypt, Italy, France, Portugal, and Austria started in September 2002. It aims to explore methods and tools for long-term policy analysis and strategic decision support for integrated coastal development. It focuses on the impact of the pressure on water resources and land use in the coastal region. The Hammamet coastal zone has been selected for the Tunisian case study given the urban growth that this area has witnessed due to tourism expansion during the past twenty years.
The CNT work package involves the setting up of a methodology using data collected by national institutions and the building of scenarii through quantitative and qualitative analysis, simulation, and assessment based on water resources modeling.
Figure 1: DTM and the hydrographic network of the watershed of Sidi-Khlass region

Amri M. 97
SMART relies on a number of tools for natural resources analysis including:
• An hybrid expert system with GIS functionality and spatial data analysis;
• A river basin scale water resources modeling system: Water Ware;
• A detailed 3D dynamic fl ow and transport modeling system: TELEMAC.
As illustration for this project, see below the DTM and the hydrographic network of the watershed of sidi-khlass region.
This will provide decisions-makers with policy scenarios to explore development strategies, based on their consequences and their socio-economic and technological implications towards long-term sustainability.
• OPTIMA: Optimisation for Sustainable Water Resources Management.
CNT is building an hydro-geological data base for the geological, hydro-geological and hydro-dynamical characterization of Nabeul-Hammamet Region. In addition, an environmental database is being set up . Data to be derived from this data base will serve as an input for WaterWare. Upon completion of the data base, the methodology thus set will be used to identify and to characterize other watersheds in Tunisia.
OPTIMA which brings together partners from Lebanon, Jordan, Palestine, Tunisia, Morocco, Italy, Turkey, Greece, Cyprus, Malta, and Austria aims to develop and implement an innovative approach to water resources management through the use of GIS combined with remote sensing capabilities. OPTIMA will use as input results some of the deliverables anticipated from data from the SMART project.
The project which is based on the European Water Framework Directive (2000/60/EC) also seeks to build a wide dissemination network of expertise and knowledge exchange. OPTIMA will use optimisation and mathematical programming methodology, simulation model, to increase effi ciencies towards solving confl icting demands on water resources.
CNT is currently participating in this proposal in the framework of INCO-MPC Specifi c Support Actions related also to the rational use of natural resources.
The project seeks to capitalize results from previous and ongoing projects funded by the European Community (INCO, MEDA, …) around the Mediterranean region by gathering these data and making it publicly available on the Internet for on-line display and analysis in local processing .
The data to be set up include GIS data, DEM and bathymetry, land use and land-cover data;
hydro-meteorological data (water resources management, precipitation, storage, demand, supply) with emphasis on groundwater resources and water quality; oceanographic data: (coastal water and fi sheries, biodiversity); and regional development data (demographic, socio-economic, and infra-structural data for the coastal zone).
In this project , the tasks of CNT and CEDARE (Egypt) include the design and modeling of a GIS web. CNT partners in the network will provide data to feed the system.
LandWaterMed network98
Watershed typology and national infrastructures for monitoring land and water(This article is in French language)
Introduction
L’eau et le sol sont des ressources vitales, elles se font de plus en plus rares du fait de la diffi culté de leur renouvellement et de la pression sans cesse croissante des besoins des populations, de l’agriculture et de l’industrie. L’action humaine dans la quête du bien-être induit une altération des facteurs environnementaux se traduisant par la perturbation du milieu et le dérèglement du climat provoquant des sécheresses dévastatrices par ci et des inondations destructrices par là.
Les contraintes sur le milieu telles que l’accroissement démographique occasionnent une dégradation le plus souvent irréversible. Désertifi cation, rareté des précipitations, dégradation des sols et des nappes (salinisation des sols irrigués et des nappes phréatiques) ainsi que la perturbation des systèmes écologiques sont aujourd’hui, autant de préoccupations à la fois pour les scientifi ques et pour les décideurs. Pour un développement durable souhaité par tout le monde, il est nécessaire, de réserver un meilleur traitement à notre environnement terrestre et d’assurer une gestion plus rationnelle de ces ressources aussi bien pour la mobilisation que pour l’exploitation.
L’échange d’information entre les pays méditerranéens sur les diffi cultés rencontrées dans ces domaines et sur les solutions adoptées est nécessaire car ces problèmes sont communs à tous. Ce projet de rapport, rédigé dans le cadre des activités du premier groupe de travail du réseau LandWaterMed, tentera après une présentation générale de données sur le pays de brosser un aperçu de la typologie et des caractéristiques des principaux bassins versants, des ressources naturelles (eau et sol) disponibles) ainsi que des moyens de leur gestion par leur mobilisation, leur aménagement et leur exploitation et ce à la fois pour les milieux sous haute et basse pression anthropique.
L’utilisation des nouvelles technologies de télédétection et des systèmes d’information géographique pour assurer une meilleure gestion de ces ressources est également abordée par la présentation des principaux projets réalisés ou en cours de réalisation dans ce domaine. Ce rapport a été rédigé en s’appuyant sur les revues spécialisées traitant du sujet et notamment les Cahiers Sécheresse ainsi que le document Résultats du premier inventaire forestier national en Tunisie édité en 1995 par la Direction Générale des Forêts du Ministère de l’agriculture.
L’eau et le sol sont des ressources vitales, elles se font de plus en plus rares du fait de la diffi culté de leur renouvellement et de la pression sans cesse croissante des besoins des populations, de l’agriculture et de l’industrie. L’action humaine dans la quête du bien-être induit une altération des facteurs environnementaux se traduisant par la perturbation du milieu et le dérèglement du climat provoquant des sécheresses dévastatrices par ci et des inondations destructrices par là.
Les contraintes sur le milieu telles que l’accroissement démographique occasionnent une dégradation le plus souvent irréversible. Désertifi cation, rareté des précipitations, dégradation des sols et des nappes (salinisation des sols irrigués et des nappes phréatiques) ainsi que la perturbation des systèmes écologiques sont aujourd’hui, autant de préoccupations à la fois pour les scientifi ques et pour les décideurs.
Données physiques
• Situation géographique
La Tunisie, située au nord de l’Afrique, en bordure de la mer Méditerranée, a une superfi cie totale de 163.610 km2 dont 11.160 km2 de lacs et chotts. La superfi cie cultivable s’élève à 8,7 millions d’hectares, soit environ la moitié de la superfi cie totale. La superfi cie cultivée était de près de 4 millions d’hectares en 1991, soit 46% de la superfi cie cultivable et 24% de la superfi cie totale.
Superfi cie du pays 1994 16361 000 haSuperfi cie cultivable 1991 8 700 000 haSuperfi cie cultivée 1991 3 961 000 ha
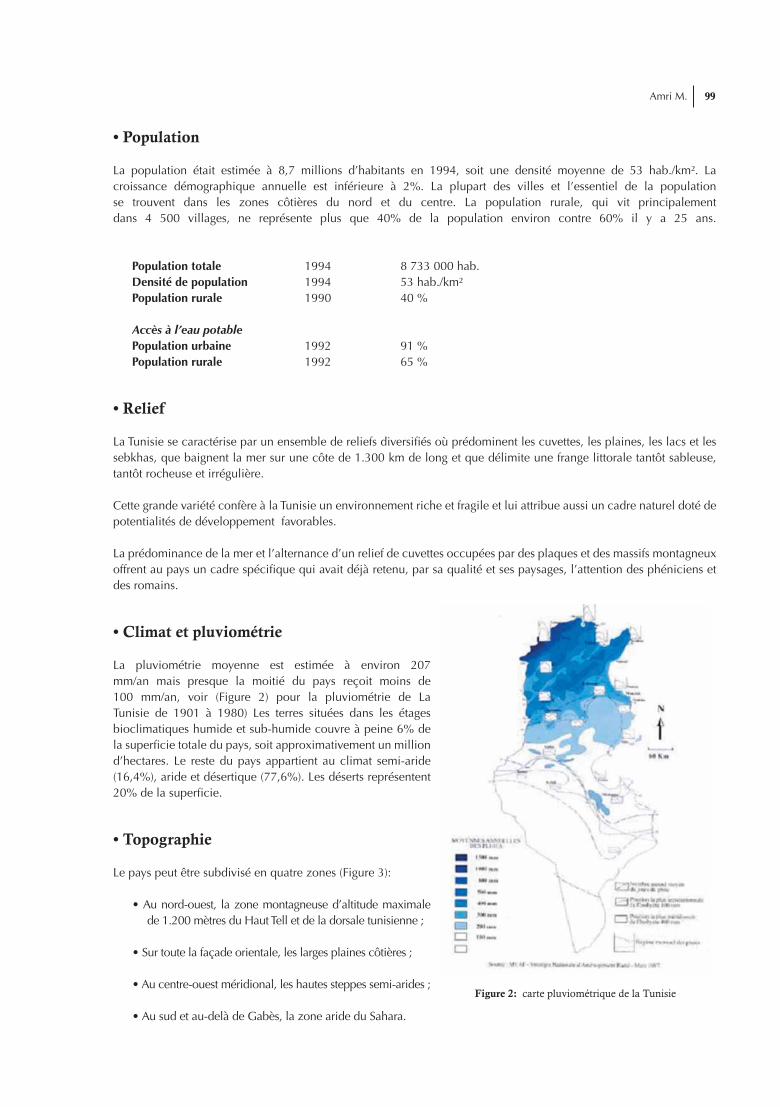
Amri M. 99
• Population
La population était estimée à 8,7 millions d’habitants en 1994, soit une densité moyenne de 53 hab./km². La croissance démographique annuelle est inférieure à 2%. La plupart des villes et l’essentiel de la population se trouvent dans les zones côtières du nord et du centre. La population rurale, qui vit principalement dans 4 500 villages, ne représente plus que 40% de la population environ contre 60% il y a 25 ans.
Population totale 1994 8 733 000 hab.Densité de population 1994 53 hab./km²Population rurale 1990 40 %
Accès à l’eau potablePopulation urbaine 1992 91 %Population rurale 1992 65 %
• Relief
La Tunisie se caractérise par un ensemble de reliefs diversifi és où prédominent les cuvettes, les plaines, les lacs et les sebkhas, que baignent la mer sur une côte de 1.300 km de long et que délimite une frange littorale tantôt sableuse, tantôt rocheuse et irrégulière.
Cette grande variété confère à la Tunisie un environnement riche et fragile et lui attribue aussi un cadre naturel doté de potentialités de développement favorables.
La prédominance de la mer et l’alternance d’un relief de cuvettes occupées par des plaques et des massifs montagneux offrent au pays un cadre spécifi que qui avait déjà retenu, par sa qualité et ses paysages, l’attention des phéniciens et des romains.
• Climat et pluviométrie
La pluviométrie moyenne est estimée à environ 207 mm/an mais presque la moitié du pays reçoit moins de 100 mm/an, voir (Figure 2) pour la pluviométrie de La Tunisie de 1901 à 1980) Les terres situées dans les étages bioclimatiques humide et sub-humide couvre à peine 6% de la superfi cie totale du pays, soit approximativement un million d’hectares. Le reste du pays appartient au climat semi-aride (16,4%), aride et désertique (77,6%). Les déserts représentent 20% de la superfi cie.
• Topographie
Le pays peut être subdivisé en quatre zones (Figure 3):
• Au nord-ouest, la zone montagneuse d’altitude maximale de 1.200 mètres du Haut Tell et de la dorsale tunisienne ;
• Sur toute la façade orientale, les larges plaines côtières ;
• Au centre-ouest méridional, les hautes steppes semi-arides ;
• Au sud et au-delà de Gabès, la zone aride du Sahara.
Figure 2: carte pluviométrique de la Tunisie

LandWaterMed network100
Caractéristiques des bassins versants
• Typologie
La typologie hydrologique peut être perçue à partir du modèle numérique du terrain (Figure 4) qui met en relief le paysage et permet de représenter l’ossature du terrain.
Figure 3 : Modèle numérique du terrain de la Tunisie
Figure 4 : Hydrologie de la Tunisie
Figure 5 : Réseau hydrographique
• Données climatologiques et hydrologiques des bassins versants
Seul l’extrême nord, qui couvre les étages bioclimatiques humide, sub-humide et semi-aride supérieur et moyen, jouit d’une pluviométrie moyenne favorable comprise entre 400 et 1.500 mm/an environ, avec un climat de type méditerranéen. Les quatre cinquièmes de la pluviométrie tombent entre octobre et mars. Le centre, qui s’étend sur le semi-aride inférieur et l’aride supérieur et moyen dispose d’une pluviométrie moyenne à faible, située entre 200 et 400 mm.
Le sud, beaucoup moins arrosé (pluviométrie inférieure à 200mm), englobe l’aride inférieur et le sahara. L’aridité climatique est caractérisée par la rareté et l’irrégularité des pluies d’une part, l’agressivité et la violence des vents d’autre part. Initialement mal drainés, ils ont bénéfi cié d’un aménagement hydro-agricole adéquat et sont devenus les fl euves des terres des grandes cultures pluviales et des périmètres d’irrigation.
• Caractéristiques des systèmes hydrographiques
Les principaux systèmes hydrographiques sont:
• la Mejerda au nord-ouest ;
• Zroud au centre-est ;
• les ravins et chotts au sud.
Amri M. 101
a. Le Bassin de la Mejerda :
Avec un bassin versant de 18.250 km2 , la Mejerda et ses affl uents représentent le plus important système hydrographique de la Tunisie. Ce bassin est contrôlé par le barrage Sidi Salem construit à 70 km en amont de la ville de Tunis, il a pour capacité 550 hm3 ,pour superfi cie 4300 ha et pour longueur de retenue 42 km. Ce barrage assure la fonction de réservoir d’eau potable pour alimenter 60 % de la population (la capitale et les principales villes côtières du pays) et il permet d’irriguer 14.000 ha de terrain au niveau de la basse vallée de la Mejerda et au Cap Bon. Son réservoir s’étend sur la Mejerde et sur les deux affl uents situés sur la rive gauche soit, d’amont en aval, l’oued Béja et l’oued Ez Zerga. La retenue se subdivise en trois grands bassins : le bassin principak de la Mejerda et les deux bassins affl uents de l’oued Béja et de l’oued Ez Zerga.
La région se trouve dans un climat méditerranéen sub-humide caractérisé par une pluviométrie moyenne de 400 à 600 mm et de température moyenne annuelle de 23°C. les pluies sont en général réparties inégalement sur trois saisons : l’automne, l’hiver et le printemps. L’été est relativement sec.
Les pluies de début de l’année hydrologique sont orageuses, torrentielles et arrivent à la suite d’une longue période de sécheresse provoquant un charriage important des sols dénués.
Dans la basse vallée de la Medjerda, la nappe phréatique est très proche de la surface du sol et affl eure en plusieurs zones sous forme de garas et de marécages. Dans cette région, le drainage, l’irrigation et l’assainissement sont les techniques utilisées par les agriculteurs afi n de pallier l’excès, le défi cit ou la mauvaise qualité de l’eau. (Cahiers Sécheresse 1999 ; 10 : 117-122.)
b. Le bassin de Sidi Bouzid :
La région de Sidi Bouzid, située au centre de la Tunisie, a une température moyenne annuelle de 14°C alors que les températures moyennes de l’été et de l’hiver sont respectivement de 26°C et de 7°C. Tandis qu’en été la température peut atteindre des pointes de 50°C et en hiver elle peut descendre jusqu’à un minimum de –5°C.
Les vents dominants sont le vent Marguellil sec et froid, de direction nord-sud et le Sirocco chaud et chargé de sable de direction sud-nord.
Le réseau hydrologique de la plaine de Sidi Bouzid est constituée essentiellement par l’oued El Hachim, l’oued Serg Edhiba et l’oued El Fekka qui rejoint l’oued Zeroud au niveau du barrage.
Les eaux pérennes de l’oued El Fekka ont un débit d’étiage évalué à environ 280 l/s en moyenne au niveau de la station hydrologique de Khanguet.
Les cours d’eau de la région sont à régime torrentiel en sortie de la dorsale et provoquent des inondations dans les zones d’épandage (oued El Fekka).
Les sols sont plutôt sablonneux et favorisent l’infi ltration d’où la présence des nappes profondes et des nappes phréatiques. Les sols sont à vocation arboricole et la culture maraîchère est de plus en plus pratiquée dans la région.
c. Les bassins du sud-ouest :
Ils comprennent :
• Le bassin versant de Redayef-Moularès situé à l’ouest de Gafsa, couvre une superfi cie de l’ordre de 250 km2 et a pour principales limites : Jebels de Bliji, Stah, Moularès, Bouramli et Ben Younès.
• Les bassins de Gafsa drainés par les trois principaux oueds Baiech et El Melah à l’est et El Melah (Magroun) à l’ouest.

LandWaterMed network102
L’oued Baiech constitue le principal réseau hydrographique qui draine les versants de la plaine de Majen Ben Abbès. Ses affl uents sont l’oued Sidi Aich et l’oued Sefi oune.
La surface du bassin drainée par cet oued est de l’ordre de 5.700 km2.
L’oued Baiech se prolonge vers le sud-ouest par l’oued Gouifl a qui se jette dans Chott El Gharsa.
L’oued El Maleh a un bassin versant qui s’étend sur 1250 km2 couvrant les versants de Jebel Orbata et les reliefs au nord. C’est le seul oued pérenne avec un débit d’étiage de 80 l/s en moyenne. Ses eaux proviennent des sources et suintement de ses rives.
L’oued El Maleh (Magroun)n affl uent de l’oued Baiech, collecte les eaux des versants des chaînes de Ben Younès, Kef Dekouane et Jebel Stah ainsi que de Sebkhat El Maleh. Son bassin versant est de 320 km2.
Les volumes d’eau ruisselés par an sont en moyenne estimées à 49 millions de m3 pour oued Baiech, 14,8 millions de m3 pour oued El Maleh et 3,1 millions de m3 pour oued El Maleh (Magroun) soit un volume global de 67millions de m3.
Bilan hydrique
• Ressources en eau
Les ressources en eau potentielles renouvelables sont estimées globalement à 4,6 milliards de m³ par an dont 41% en eaux souterraines. Sur le potentiel annuel de 2,7 milliards de m3 d’eau de surface seuls 78% sont mobilisables par les barrages et les barrages collinaires, le reste, c’est à dire 0 ;6 milliard de m3 par an, ne pouvant être retenus que par les lacs collinaires et les ouvrages de CES.
Afi n de mobiliser la totalité des eaux de surface (les 18 barrages existants permettent la mobilisation de 1,334 milliards de m3 par an), la stratégie nationale de développement des ressources en eaux (1991-2000) a prévu la réalisation de 21 barrages,203 barrages collinaires, 1000 lacs collinaires et 4290 ouvrages de recharge de nappe et d’épandage des eaux de crues.
La moitié seulement des ressources en eaux a une salinité intérieure à 1,5 g/l et peut donc être utilisée sans réstriction.
Précipitations moyennes 207 mm/anRessources en eau renouvelables internes - totales 3,5 km³/anRessources en eau renouvelables internes - par habitant 1994 401 m³/anRessources en eau renouvelables globales 3,9 km³/anCapacité totale des barrages 1991 1,5 km³Eau désalinisée 1990 8 310 6 m³/an
a) Eau de surface :
Les ressources potentielles en eau de surface sont estimées globalement à 2,6 milliards de m³/an dont 1,5 sont actuellement exploitables grâce à des réservoirs d’où la possibilité de mobiliser d’autres ressources des travaux de conservation des eaux et par des systèmes de recharge des nappes souterraines.
Le réseau hydrographique est particulièrement dense au nord où l’oued Medjerda est le fl euve le plus important. C’est dans cette zone que les principaux aménagements pour l’irrigation et pour la lutte contre les inondations ont été réalisés.

Amri M. 103
b) Eau souterraine :
Les ressources potentielles en eaux souterraines internes sont estimées à 1,2 à 1,8 milliards de m³/an On distingue deux catégories en fonction de la profondeur de la nappe:
• jusqu’à 50 m, les eaux sont défi nies comme «phréatiques» et peuvent être utilisées pour l’exploitation privée (avec quelques restrictions). Le potentiel est estimé à 669 millions de mètres cubes par an;
• au-delà de 50 m, les eaux souterraines sont réservées à l’exploitation publique. Le potentiel est estimé à 1 170 millions de mètres cubes par an dont 630 provenant des nappes fossiles.
c) Eaux usées :
L’emploi des eaux usées traitées a été pris en considération depuis les 20 dernières années. Le potentiel actuellement estimé à 0,096 km³ pourrait atteindre 0,2 km³ l’an.
Traitement 1993 96 106 m³/anRéutilisation des eaux usées traitées 1993 18 106 m³/an
• Prélèvements en eau
Les prélèvements totaux en eau sont estimés à 3,1 km³/an. Ces prélèvements dépendent fortement de l’ampleur et de la distribution des précipitations, en particulier les prélèvements pour l’irrigation varient en fonction des pluies et en de l’étendue des terres réellement irriguées dans les réseaux publics d’irrigation. En défi nitive, si environ 3,1 km³ sont annuellement mobilisés, seuls 1,9 km³ sont effectivement utilisés.
Agriculture 1990 2 727,5 106 m³/anCollectivités 1990 261,4 106 m³/anIndustrie 1990 86,1 106 m³/anTotal 3 075,0 106 m³/an
par habitant 1990 382 m³/anen % des ressources renouvelables internes 87,8 %Autres prélèvements -106 m³/an
En 1992, la population rurale ayant accès à une source d’eau potable saine à une distance inférieure à 3 km était de 65%, tandis que 91% de la population urbaine bénéfi ciait d’un branchement individuel au réseau de distribution d’eau potable.
• Développement de l’irrigation
Le potentiel d’irrigation des ressources en eau est estimé à 563 000 ha dont 402 000 ha pour des périmètres en maîtrise totale et partielle et 161 000 ha pour l’irrigation de complément et les épandages de crue.
La superfi cie totale avec contrôle de l’eau était estimée à 385 000 ha en 1991 dont 355 000 ha équipés pour une maîtrise partielle et totale et 30 000 ha d’irrigation par épandage de crue.
Le taux de croissance moyen annuel des superfi cies aménagées pour l’irrigation est de 2%: et à ce rythme, le potentiel d’irrigation serait complètement valorisé en 2010.
La superfi cie équipée pour l’irrigation en maîtrise totale et partielle (consacrée à l’arboriculture fruitière : dattiers, orangers, vignes et aux cultures maraîchères : tomates, melons, pastèques, pommes de terre pour 70% de la superfi cie réellement irriguée) peut être divisée en 52 000 ha d’irrigation de complément et 303 000 ha d’irrigation intensive. L’irrigation de complément est en majorité l’irrigation de surface, éventuellement par aspersion, sur les céréales en cas de défi cit pluviométrique sévère, et sur les arbres fruitiers pendant les premières années de leur développement.

LandWaterMed network104
L’irrigation intensive, 303 000 ha, peut elle-même être divisée en:
•140 000 ha équipés sur des petits périmètres constitués à titre individuel par les agriculteurs (70 000 ménages concernés) grâce à des investissements privés, à partir de puits de surface ou par pompage dans les oueds ;
• 163 000 ha équipés sur des périmètres à réseau d’irrigation collectif, à partir de forages profonds pour des périmètres moyens (60 000 ha; 47 000 ménages concernés) et à partir des retenues de barrages pour les grands périmètres (103 000 ha; 24 000 ménages concernés). Ces périmètres ont été réalisés au moyen d’investissements publics.
Les réseaux collectifs sont généralement modernes et étanches: réseaux en canaux préfabriqués ou en conduites basse pression pour l’irrigation de surface, et réseaux en conduites sous pression pour l’irrigation par aspersion. L’irrigation de surface reste prédominante.
L’utilisation des eaux usées traitées pour l’irrigation concerne actuellement près de 6 000 ha, les autres sources d’eau étant les barrages, les oueds ou les eaux souterraines.
La superfi cie réellement irriguée est de 270 000 ha, soit un taux d’utilisation de ces périmètres de 89%.
(Cahiers Sécheresse, Volume 9, Numéro 2, pages 111 à 115, Juin 1998)
Irrigation et drainage
Potentiel d’irrigation 1991 563 000 ha
Irrigation 1991
Irrigation, maîtrise totale/partielle: superfi cie équipée 355 000 ha
irrigation de surface 294 000 ha
irrigation par aspersion 55 000 ha
micro-irrigation 6 000 ha
Partie irriguée à partir des eaux souterraines 61 %
Partie irriguée à partir des eaux de surface 39 %
Partie de la superfi cie équipée réellement irriguée 91 %
Superfi cie irriguée par épandage de crues 30 000 ha
Superfi cie totale avec contrôle de l’eau 385 000 ha
- En pourcentage de la superfi cie cultivée 1991 9,7 %
- Partie irriguées par pompage 1991 85,8 %
Cultures irriguées
Production totale de céréales irriguées 1991 8 250 t
en % de la production totale de céréales 1991 3,5 %
Cultures irriguées 1992 308 000 ha
- fruitiers et vignes 1992 112 000 ha
- légumes 1992 108 000 ha
- blé 1992 33 000 ha
- oléagineux 1992 18 000 ha
- autres 37 000 ha
Drainage - Environnement
Superfi cie drainée 1991 162 000 ha
en % de la superfi cie cultivée 1991 4,1 %

Amri M. 105
• Les ressources en sol
La Tunisie se caractérise par la rareté des ressources en sol puisque environ 40 % de son territoire représente des terres incultes telles que : erg saharien, chotts, affl eurements rocheux et terrain en très forte pente. Parmi les 60 % de terres utiles, seuls 31 % sont des terres fertiles alors que 69 % sont des sols assez médiocres ou pauvres.
L’occupation actuelle des sols telle qu’elle a été prise en considération dans le schéma directeur de l’aménagement du territoire de juin 1996, se présente comme suit: (Source:MEAT)
les terres agricoles ont une superfi cie de 5,4 millions d’hectares répartie comme suit :
Céréaliculture : 2,1 millions d’hectares ;Arboriculture : 1,9 millions d’hectares ;Maraîchages : 1,4 millions d’hectares .
Les terres sylvo-pastorales ont une superfi cie de 4 millions d’hectares répartie comme suit :
Forêts : 0,635 millions d’hectares ;Parcours forestiers : 0,294 millions d’hectares ;Parcours alfatiers : 0,434 millions d’hectares ;Parcours ordinaires : 2,637 millions d’hectares .
Les terres incultes représentent une superfi cie de 7 millions d’hectares répartie comme suit :
Accumulations sableuses : 3,1 millions d’hectares ;Sebkhas et zones humides : 2,0 millions d’hectares ;Affl eurements rocheux nus : 1,9 millions d’hectares.
L’inventaire forestier et pastoral réalisé par la Direction Générale des Forêts du Ministère de l’Agriculture, (entamé en 1989 et achevé fi n 1994), s’était fi xé pour objectifs :
• L’inventaire des ressources forestières et pastorales du pays sur un domaine d’étude de 120.000 km2 environ;
• La cartographie thématique des formations forestières et pastorales ;
• La réalisation d’une base de données ;
• L’établissement d’un plan directeur national de développement forestier et pastoral.
Les résultats de l’inventaire, réalisé par interprétation de photographies aériennes et d’images satellites, a permis de défi nir et de délimiter les régions forestières et de dresser les cartes d’occupation du sol pour différents gouvernorats.
Il ressort de l’inventaire que le taux de boisement du territoire national inventorié est de 7,6%. Le taux régional varie de moins de 1 % dans les régions désertiques représentant la moitié de la surface du territoire inventorié, à 10 % dans la région du centre représentant le quart de la superfi cie et à plus de 15 % dans la région nord représentant le quart de la superfi cie du pays. Ce taux atteint 33,6% à Jendouba. La répartition selon l’occupation des sols des superfi cies inventoriées ainsi que les proportions des espèces en Tunisie est donnée par les graphiques suivants (Figure 6)

LandWaterMed network106
Figure 6: Répartition de l’occupation des sols et des espèces
Les cartes d’occupation du sol pour quelques gouvernorats sont reproduites par les cartes 1 à 12.
Carte 1 : Régions forestières de la Tunisie Carte 2 : Occupation du sol de la Tunisie

Amri M. 107
Carte 3 : Occupation du sol de l’Ariana
Carte 4 : Occupation du sol de Tunis
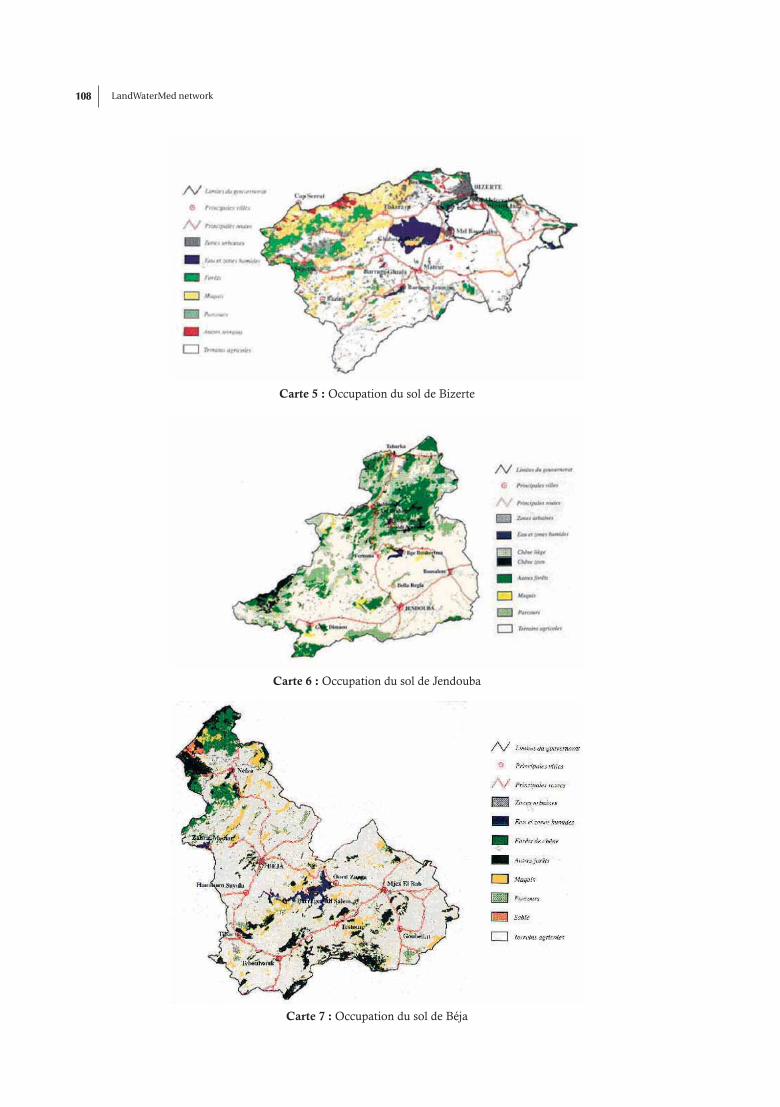
LandWaterMed network108
Carte 5 : Occupation du sol de Bizerte
Carte 6 : Occupation du sol de Jendouba
Carte 7 : Occupation du sol de Béja

Amri M. 109
Carte 8 : Occupation du sol du Kef
Carte 9 : Occupation du sol de Zaghouan

LandWaterMed network110
Carte 10 : Occupation du sol de Nabeul
Carte 11 : Occupation du sol de Siliana

Amri M. 111
Carte 12 : Occupation du sol de Kasserine
Gestion des ressources naturelles
• Historique
Les civilisations qui se sont succédées en Tunisie ont toujours cherché à maîtriser et à gérer l’eau et à lutter contre la dégradation du milieu naturel. Les méthodes différaient selon l’époque, la région, les données naturelles et les besoins. Mais d’une façon générale ces méthodes consistaient à arrêter à chaque instant l’eau dans son écoulement et son élan soit par une rigole, soit par une banquette, soit par une terrasse ou par un bassin et autres moyens pour faire perdre à l’eau sa force érosive et réduire son écoulement à sa plus simple expression.
En période pré-romaine, c’était aux berbères et aux phéniciens que revenait les premières pratiques de conservation des eaux et des sols adaptées aux conditions du milieu.
A l’époque romaine, les réalisations dans ce domaine avaient concerné surtout la mobilisation des eaux (citernes, barrages) et l’aménagement des versants en terrasses.
En période arabe (Aghlabites et Hafsides), les techniques d’irrigation se sont développées, notamment les techniques d’épandage des eaux de cuves.
Ce n’est qu’après l’accession du pays à l’indépendance que des actions de travaux de conservation des eaux et des sols se sont multipliées (reboisement, fi xation des dunes de sable,…).
Ces actions d’aménagement, de protection et de conservation s’intègrent dans des plans quinquennaux de développement du pays et sont réalisés par différents programmes menés à cet effet pour assure :
��la protection de l’environnement ;
��le développement des zones les moins favorisées;
��le développement de l’agriculture.
L’approche méthodologique d’élaboration du Programme d’Action Nationale de Lutte Contre la Désertifi cation (PAN/LCD) par exemple s’appuie sur les résultats des expériences antérieures avec les ajustements nécessaires prenant en considération les principes de la convention internationale de conservation des eaux et des sols.

LandWaterMed network112
• Techniques d’aménagement traditionnelles:
Parmi les techniques traditionnelles de conservation des eaux et des sols pratiquées on peut citer:
a) Le système hydrographique Meskat:
pratiqué en région semi-aride au Sahel et qui consiste à utiliser les parties en amont des parcelles agricoles comme impluvium dont les eaux de ruissellement vont alimenter des cuvettes plantées en oliviers et aménagées dans les parties situées en aval de ces parcelles;
b) Le système hydrographique Jessours:
Ce système est pratiqué en région aride et désertique du sud. Ils sont construits en travers de petits ravins en vue de retenir les eaux de ruissellement, permettant ainsi de satisfaire les besoins en eau des cultures installées, généralement oliviers et arbres fruitiers. Les composantes du jessour sont la diguette ou barrage, la retenue ou champ et l’impluvium. Au sud tunisien, on peut dénombrer plus de 400.000 hectares de territoire montagneux aménagés en jessours.
Exploitation
• Gestion
En Tunisie aride et semi-aride, la nécessité de gérer au mieux la rareté naturelle des ressources en eau avait incité à créer un système associatif de gestion et d’exploitation de l’eau. En témoigne le modèle d’Ibn Chabbat (savant mathématicien de la région de Tozeur ) pratiqué dès le XIIème siècle pour l’organisation de la distribution de l’eau dans les oasis du Djérid.
Pour la gestion de l’eau dans le pays, le rôle de l’État consiste à mobiliser les ressources et à fournir au départ une grande partie des investissements nécessaires à la réalisation des ouvrages et équipements hydrauliques. Les utilisateurs sont encouragés à prendre en charge la gestion quotidienne des ressources mobilisées et des infrastructures mises en place.
C’est ainsi que pour participer au développement des zones rurales et encourager la décentralisation administrative, l’État tunisien, engagé depuis 1986 dans la politique d’ajustement structurel, implique progressivement les collectivités et les organisations locales dans la gestion des activités économiques et notamment dans celles relatives aux ressources en eau.
Les maîtres d’œuvre sont la Direction générale du Génie rural du ministère de l’Agriculture, pour l’habitat dispersé, et la SOciété Nationale d’Exploitation et de Distribution des Eaux, pour les agglomérations. Le taux de la population rurale bénéfi ciant de l’adduction d’eau potable passera alors de 60 à 75%.
Le développement général du pays, nécessite la création de points d’eau potable et de moyens d’irrigation, ce qui a impliqué la création et la multiplication du nombre des associations de gestion et d’exploitation de l’eau appelées associations d’intérêts collectifs (AIC).
• Les Associations d’intérêts collectifs
Cahiers Sécheresse, Volume 9, Numéro 2, pages 111 à 115, Juin 1998
Il existe en fonction de l’usages de l’eau, deux types d’associations: les AIC d’eau potable, les plus nombreuses, et les associations d’irrigation à partir des forages ou des lacs collinaires. Dans plusieurs gouvernorats notamment de Kasserine, Gafsa et Kairouan, certaines AIC sont dites mixtes (70 AIC en 1996).

Amri M. 113
• Associations d’intérêts collectifs pour l’eau potable
La stratégie nationale durant le VIIIe Plan (1992-1996) visait l’alimentation en eau potable pour environ 500.000 ruraux supplémentaires, et la création d’environ 900 AIC. Ainsi, entre 1986 et 1996, le nombre d’associations d’eau potable a été multiplié par quatorze passant d’une centaine à 1399 en décembre 1996.
• Associations d’intérêts collectifs pour l’irrigationAutour des lacs collinaires le développement des AIC est faible à l’exception du gouvernorat de Siliana où on comptait 22 AIC en août 1997.
• Les AIC des oasis L’irrigation des palmeraies était pratiquée à partir des cours d’eau et des grandes sources sur lesquels s’exerçait le droit d’usage des riverains. Le tarissement de ces sources et la forte croissance de la demande en eau suite à l’augmentation de la superfi cie irriguée passant de 20.000 ha en 1986 à 25.000 ha en 1994, ont amené l’État a prendre en charge la création des ressources en eau par la généralisation des forages profonds et des équipements hydrauliques.
L’AIC est à la fois une entité spatiale en tant qu’unité de gestion de l’eau et une entité sociale - en tant qu’association. Elle devient de plus en plus nécessaire pour l’allocation optimale des ressources rares et l’amélioration des revenus agricoles. Pour chaque AIC, les choix, les capacités techniques et fi nancières et les stratégies varient en fonction des différents héritages économiques et socioculturels.
Dégache est une oasis réputée pour l’effi cacité du travail d’une majorité de producteurs ayant une bonne capacité fi nancière, et par une production de dattes de qualité. Le système de production est très diversifi é et riche en deglet nour. L’oasis est donc très ouverte sur le marché extérieur et représente l’activité motrice de l’économie locale.
Tozeur est une oasis moyenne en matière de qualité de la production, qui bénéfi cie de conditions pédo-climatiques et sociales favorables.
El Hamma est la plus petite et la plus jeune des oasis anciennes, ses caractéristiques pédo-climatiques et hydriques (salinité et pénurie de l’eau en particulier) sont très défavorables à la production des dattes de bonne qualité. Historiquement, El Hamma est une oasis pauvre, productrice de dattes de variétés communes (Alig, Besr-hélou).
Projet de développement des ressources naturelles
• Objectifs
Les projets de développement et de gestion des ressources naturelles visent à :
��Améliorer le niveau et la qualité de vie des populations rurales, par :
��L’amélioration des parcours naturels et leur consolidation biologique pour assurer la durabilité des ouvrages et réduire la pression sur les forêts et parcours ;
��La construction d’ouvrages de CES dans les exploitations privées ;
��L’augmentation de la productivité de l’élevage ;
��Le développement d’actions génératrices de revenu pour les femmes ;
��Le désenclavement des établissements humains et le renforcement de l’approvisionnement en eau potable ;
�� Le renforcement des institutions publiques et non gouvernementales et l’introduction de mécanismes de participation des populations ;

LandWaterMed network114
��Limiter, et si possible stopper les processus actuels de dégradation des ressources naturelles : sol, végétation, eau ;
��Freiner la détérioration des infrastructures et notamment lutter contre l’envasement des barrages.
On peut classer les projets et actions prévus en dehors de ceux préconisés dans le cadre des stratégies sectorielles, en 3 catégories :
�� les projets de développement agricoles intégrés (PDAI), fi nancés sur le budget de l’Etat avec l’assistance de bailleurs de fonds et mis en œuvre par les Commissariats régionaux au développement agricole (CRDA) ;
�� les projets de Développement Rural Intégrés (PDRI), fi nancés sur le budget de l’Etat et mis en œuvre par les Gouverneurs avec l’assistance des CRDA ;
��les projets de développement des zones d’ombre, fi nancés sur le fonds national de solidarité et mis en œuvre par les Gouverneurs avec l’assistance technique des CRDA.
• Principales composantes
a. La lutte contre l’érosion hydrique
Elle comprend les travaux d’aménagement intégré des bassins versants et de conservation des eaux et du sol. Les actions prévues à cet effet sont : la construction de banquettes, l’édifi cation de cordons en pierres sèches, la confection des ados de parcours, le traitement et la correction des ravins et des berges d’oueds, la construction des lacs collinaires, etc.
b. La lutte contre l’ensablement
Elle comprend la stabilisation mécanique des dunes de sable par la création de dunes artifi cielles (tabias), le rehaussement périodique des dunes artifi cielles, et la fi xation des dunes par la plantation d’arbres et arbustes forestiers.
c. L’aménagement hydraulique des périmètres irrigués
Il comprend la création, l’aménagement ou l’équipement de puits de surface, puits profonds, forages, sources, etc.
d. La réhabilitation des périmètres irrigués
Elle consiste à réaliser des travaux d’assainissement des eaux ou de drainage.
e. Le développement agricole
Il comprend principalement le défrichement du jujubier et du chiendent, l’arboriculture (extension, entretien et rajeunissement) ;
f. L’amélioration pastorale par resemis et plantation d’arbustes fourragers.
Utilisation des nouvelles technologies
• Principaux projets
Les principaux projets utilisant les nouvelles technologies telles que la télédétection et les systèmes d’information géographique ont été fi nancés par le Secrétariat d’Etat à la Recherche Scientifi que et à la Technologie: Certains projets ont été fi nancés dans le cadre de la coopération avec la communauté européenne. Les principaux projets réalisés ou en cours de réalisation sont les suivants.

Amri M. 115
• Projets réalisés
Les principaux projets réalisés sont des projets d’étude de l’environnement littoral et marin, d’étude se rapportant à l’infrastructure ; d’étude statistique agricole et d’évaluation de dégâts de phénomènes naturels.
On peut citer parmi ces projets :
��Etude de la pollution de l’environnement marin (Golfe de Gabès)
��Etude dynamique de la désertifi cation dans la région de Menzel Habib
��Veille satellitaire de la désertifi cation en Tunisie Méridionale
��Etude de la pression urbaine sur les terres agricoles dans le Grand Tunis
��Sélection de sites pour l’aquaculture
��Recherche de sites favorables à l’implantation de retenues collinaires
��Evaluation des dégâts causés par une catastrophe naturelle
��Suivi des ressources en eau dans le bassin méditerranéen
Ces projets, menés en majorité dans le cadre de la coopération tuniso- européenne et particulièrement avec la France, ont permis aux techniciens tunisiens d’acquérir et de maîtriser les techniques de télédétection et des systèmes d’information géographique et ce par la variété des thèmes abordés.
A titre d’exemple le projet Suivi des ressources en eau dans le bassin méditerranéen a été mené par le CNT en coopération avec INFOCARTO (Espagne), INFOGRAPH (Portugal) et l’Université de Extremadura (Espagne) pour développer une méthodologie basée sur les observations des satellites NOAA pour le contrôle et le suivi des ressources en eau dans le bassin méditerranéen.
L’objectif est de trouver une corrélation entre l’indice de végétation à différentes périodes de 1990 à 1994) et les paramètres géophysiques tels que précipitations, température de surface et humidité relative.
L’étude s’est basée sur les précipitations enregistrées par 23 stations météorologiques sur une période de 5 ans allant de 1990 à 1994 par cumul mensuel pluviométrique pour chaque station.
La répartition spatiale de la pluviométrie subdivise la Tunisie en trois étages bioclimatiques (fi gure 2):
• Région extrême Nord-Ouest : plus fort cumul pluviométrique (500 à 900 mm). C’est une région de forêts.
• Région du centre du pays où culmine Jebel Chaambi à 1450 m: cumul pluviométrique assez moyen (200 à 500 mm)
• Région du Sud et du Chott Jérid : faible cumul pluviométrique (50 à 200 mm).
L’utilisation des images NOAA a aussi permis de déterminer l’indice de végétation normalisé (NDVI):
NDVI = k*(C2 – C1) / (C1+ C2) + A
Avec C1 et C2 : luminances dans les canaux 1 et 2 (visible et infrarouge)
K = 192 et A = 48.2 :paramètres de rectifi cation pour les pays semi-arides

LandWaterMed network116
Les images (Figure 7) présentent pour les années 1990 à 1994, les indices de végétation normalisés mensuels alors que (Figure 8) représente une moyenne.
Figure 7 : indice de végétation normalisé (de 1990 à 1994)
Figure 8 : moyenne de l’indice de végétation normalisé
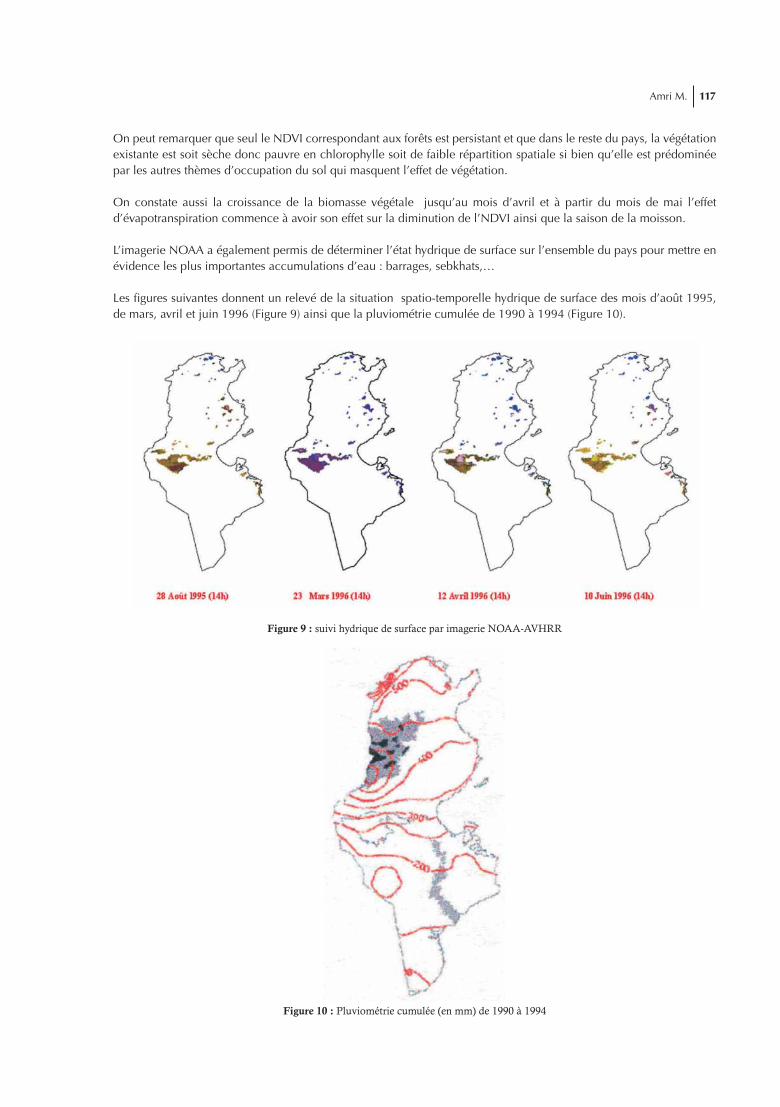
Amri M. 117
On peut remarquer que seul le NDVI correspondant aux forêts est persistant et que dans le reste du pays, la végétation existante est soit sèche donc pauvre en chlorophylle soit de faible répartition spatiale si bien qu’elle est prédominée par les autres thèmes d’occupation du sol qui masquent l’effet de végétation.
On constate aussi la croissance de la biomasse végétale jusqu’au mois d’avril et à partir du mois de mai l’effet d’évapotranspiration commence à avoir son effet sur la diminution de l’NDVI ainsi que la saison de la moisson.
L’imagerie NOAA a également permis de déterminer l’état hydrique de surface sur l’ensemble du pays pour mettre en évidence les plus importantes accumulations d’eau : barrages, sebkhats,…
Les fi gures suivantes donnent un relevé de la situation spatio-temporelle hydrique de surface des mois d’août 1995, de mars, avril et juin 1996 (Figure 9) ainsi que la pluviométrie cumulée de 1990 à 1994 (Figure 10).
Figure 9 : suivi hydrique de surface par imagerie NOAA-AVHRR
Figure 10 : Pluviométrie cumulée (en mm) de 1990 à 1994
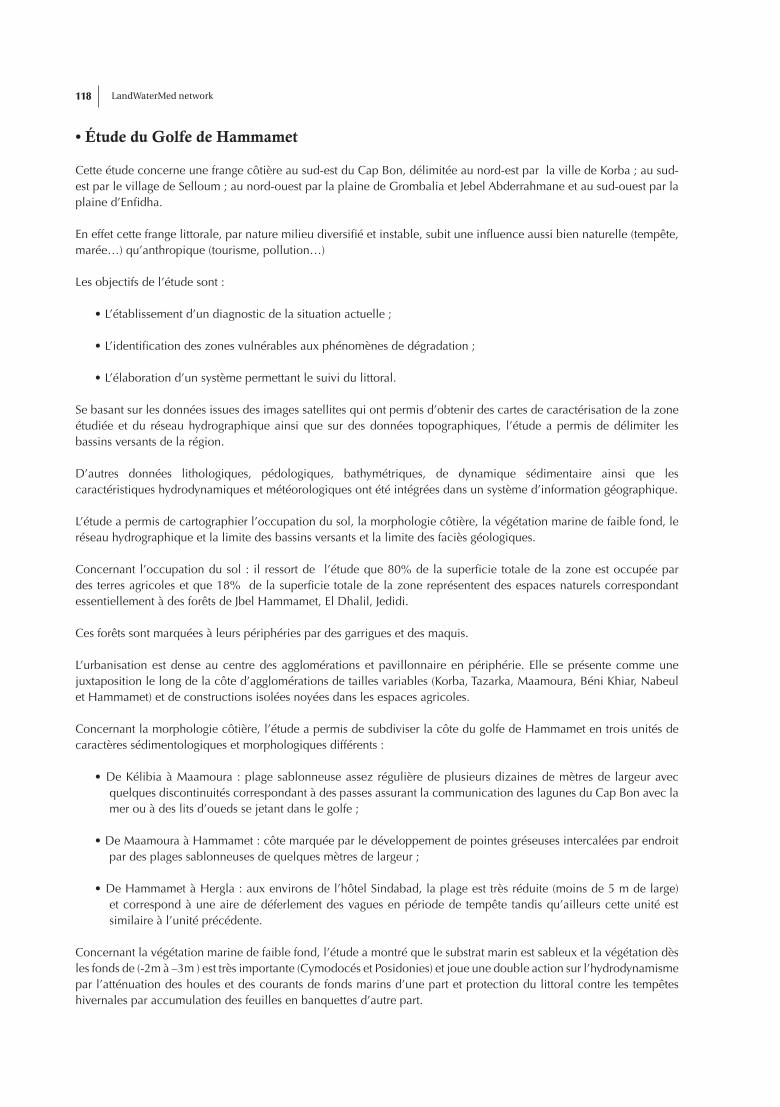
LandWaterMed network118
• Étude du Golfe de Hammamet
Cette étude concerne une frange côtière au sud-est du Cap Bon, délimitée au nord-est par la ville de Korba ; au sud-est par le village de Selloum ; au nord-ouest par la plaine de Grombalia et Jebel Abderrahmane et au sud-ouest par la plaine d’Enfi dha.
En effet cette frange littorale, par nature milieu diversifi é et instable, subit une infl uence aussi bien naturelle (tempête, marée…) qu’anthropique (tourisme, pollution…)
Les objectifs de l’étude sont :
• L’établissement d’un diagnostic de la situation actuelle ;
• L’identifi cation des zones vulnérables aux phénomènes de dégradation ;
• L’élaboration d’un système permettant le suivi du littoral.
Se basant sur les données issues des images satellites qui ont permis d’obtenir des cartes de caractérisation de la zone étudiée et du réseau hydrographique ainsi que sur des données topographiques, l’étude a permis de délimiter les bassins versants de la région.
D’autres données lithologiques, pédologiques, bathymétriques, de dynamique sédimentaire ainsi que les caractéristiques hydrodynamiques et météorologiques ont été intégrées dans un système d’information géographique.
L’étude a permis de cartographier l’occupation du sol, la morphologie côtière, la végétation marine de faible fond, le réseau hydrographique et la limite des bassins versants et la limite des faciès géologiques.
Concernant l’occupation du sol : il ressort de l’étude que 80% de la superfi cie totale de la zone est occupée par des terres agricoles et que 18% de la superfi cie totale de la zone représentent des espaces naturels correspondant essentiellement à des forêts de Jbel Hammamet, El Dhalil, Jedidi.
Ces forêts sont marquées à leurs périphéries par des garrigues et des maquis.
L’urbanisation est dense au centre des agglomérations et pavillonnaire en périphérie. Elle se présente comme une juxtaposition le long de la côte d’agglomérations de tailles variables (Korba, Tazarka, Maamoura, Béni Khiar, Nabeul et Hammamet) et de constructions isolées noyées dans les espaces agricoles.
Concernant la morphologie côtière, l’étude a permis de subdiviser la côte du golfe de Hammamet en trois unités de caractères sédimentologiques et morphologiques différents :
• De Kélibia à Maamoura : plage sablonneuse assez régulière de plusieurs dizaines de mètres de largeur avec quelques discontinuités correspondant à des passes assurant la communication des lagunes du Cap Bon avec la mer ou à des lits d’oueds se jetant dans le golfe ;
• De Maamoura à Hammamet : côte marquée par le développement de pointes gréseuses intercalées par endroit par des plages sablonneuses de quelques mètres de largeur ;
• De Hammamet à Hergla : aux environs de l’hôtel Sindabad, la plage est très réduite (moins de 5 m de large) et correspond à une aire de déferlement des vagues en période de tempête tandis qu’ailleurs cette unité est similaire à l’unité précédente.
Concernant la végétation marine de faible fond, l’étude a montré que le substrat marin est sableux et la végétation dès les fonds de (-2m à –3m ) est très importante (Cymodocés et Posidonies) et joue une double action sur l’hydrodynamisme par l’atténuation des houles et des courants de fonds marins d’une part et protection du littoral contre les tempêtes hivernales par accumulation des feuilles en banquettes d’autre part.

Amri M. 119
Le réseau hydrographique, extrait par photo-interprétation d’une image SPOT (1994), a été classé en cours d’eau permanent, primaire et secondaire.
Les bassins versants du golfe de Hammamet sont parcourus par des oueds qui les drainent à la saison des pluies.
Les oueds les plus importants sont oued Lebna, oued Chiba et oued Rmel.
Les différentes formations géologiques drainées par les multiples oueds se jetant dans la mer, les lagunes et les sebkhats montrent une lithologie dominée par les faciès argilo-gréseux.
• Autres projets
Télédétection Appliquée aux Statistiques Agricoles Tunisiennes (TASAT) :
Le projet Télédétection Appliquée aux Statistique Agricoles Tunisiennes est un projet de recherche d’une durée de trois ans (2000-2002), mené par le Centre National de Télédétection en collaboration avec le Ministère de l’agriculture (INAT, DGPDIA, CRDA).
Ce projet fait suite à deux projets de recherche :
• le premier projet : Sécurité alimentaire (1995) avait permis d’établir une méthodologie de stratifi cation et de calcul de superfi cies des cultures ;
• le second projet Statistiques Agricoles (1997).avait permis de développer une méthodologie pour la prévision précoce des cultures céréalières sur un gouvernorat test (Béja).
L’objectif du projet TASAT est d’estimer le potentiel céréalier (blé dur, blé tendre, orge) à l’échelle de la Tunisie dès le mois d’Avril. La méthodologie appliquée pour atteindre cet objectif est axée sur deux volets:
• L’estimation des surfaces emblavées à l’échelle nationale grâce aux cartes d’occupation du sol réalisées à partir des images SPOT et des enquêtes de terrain.
• La prévision des potentiels de rendement par le modèle FLOUE (FLYM) basé sur un système expert développé dans le cadre d’une thèse doctorale.
Télédétection pour la prévention et lutte contre les risques des incendies de forêts :
Il s’agit d’un projet de recherche mené sur une durée de trois ans (2001-2004) par le Centre National de Télédétection en partenariat avec la Direction Générale des forets (DGF), l’Institut National de Recherche en Génie Rural Eaux et Forêts (INRGREF), l’Offi ce National de la Protection Civile (ONPC) et l’Institut National de la Météorologie (INM).
Le projet a pour objectifs l’analyse des phénomènes liés aux feux de forêts et à leur propagation en vue de mettre au point un système de prévention et de lutte contre les incendies de forêts en utilisant les données issues de satellites d’observation de la terre. Il permettra de :
• Connaître les causes à l’origine des incendies de forêts
• Cartographier une zone à risque à l’échelle d’un massif test
• Cartographier des zones à risques à l’échelle nationale
• Modéliser la propagation des feux sur le massif test
• Aider à la prise de décision pour les actions de prévention et d’intervention.

LandWaterMed network120
Télédétection pour le suivi du milieu littoral:
Ce projet mené également par le CNT en partenariat avec l’Institut National des Sciences et Technologies de la Mer (INSTM), la Faculté des Sciences de Tunis (FST), la Faculté des Sciences de Monastir (FSM), l’Agence de Protection et d’Aménagement du Littoral (APAL), la Direction Générale de l’Aménagement du Territoire (DGAT) et l’Institut National de la Météorologie ( INM) vise à mettre en place un système de suivi du milieu littoral permettant de :
• Connaître les différentes composantes du milieu littoral par l’établissement d’un bilan exhaustif ;
• Valoriser la frange côtière par simulation de scénarios d’aménagement harmonieux ;
• Contribuer à un aménagement du littoral et à une exploitation rationnelle des ressources en intégrant des schémas fi ables ;
• Suivre les milieux fragiles et de trouver un compromis entre développement harmonieux et protection en établissant des études diachroniques sur les milieux fragiles
SIG pour la Gestion et la Programmation des Services Publics (en particulier de l’électrifi cation par l’énergie solaire ) pour l’Habitat Dispersé »( ANER)
Dans le cadre du projet national mobilisateur « Gestion et programmation des services publics (en particulier de l’électrifi cation par l’énergie solaire) pour l’habitat dispersé », mené en collaboration avec l’Agence Nationale des Energies Renouvelables, le CNT a entrepris la réalisation d’un projet pour :
• Réaliser des cartes d’occupation du sol au 1 / 50 000 sur la zone d’intérêt comprenant les thèmes tels que ( zones urbaines (habitat isolé, habitat dense, cultures annuelles, arboriculture, forêts, végétation naturelle, parcours et diffi culté du terrain, plans d’eau…)
• Fournir des couches d’informations sur les courbes de niveau, le réseau routier et ferroviaire, le réseau hydrographie, le réseau électrique (MT et HT) et le modèle numérique de terrain.
• Former les ingénieurs et les techniciens de l’ANER en Systèmes d’Information Géographiques.
La télédétection et les SIG pour l’Inventaire des ressources forestières et pastorales (INFORTEL) :
Ce projet mené en partenariat avec le Ministère de l’Agriculture (Direction Générale des Forêts,Institut Sylvo-Pastoral de Tabarka, Direction de la Conservation de la Nature et du Milieu Rural) a pour objectif l’élaboration de cartes au 1/25 000 pour le suivi du programme national de boisement.
Le projet est basé sur l’utilisation de photographies aériennes et sur les images satellites. Il s’appuie sur le premier inventaire forestier et pastoral au 1/50000 ainsi que sur les cartes topographiques. En plus de la photo-interprétation des orthophotos, des travaux de mesures et de relevés sur le terrain sont indispensables et concernent la topographie, la pédologie, l’humidité, la description des strates arbustive, herbacée et ligneuse.
Le projet a été mené dans la région du nord-ouest couvrant les trois gouvernorats de Bizerte, Béja et Jendouba. Et étant donné son importance et son intérêt, le projet est en cours d’extension sur le reste du pays.
Les principaux résultats ont permis de réaliser un système de classifi cation permettant d’obtenir des cartes d’occupation forestière et pastorale à l’échelle 1/25 000. Les résultats du projet seront intégrés dans une Bases de Données Cartographiques et Statistiques.

Amri M. 121
• Projets en cours de realisation
Deux projets sont en cours de réalisation et s’insèrent dans le cadre des activités duréseau. Ces projets sont SMART et OPTIMA. Le projet SMART a pour objectif la réalisation d’une base de données hydrogéologiques de la région de Nabeul-Hammamet permettant la détermination des caractéristiques hydrologiques et hydrodynamiques. Cette base de données servira en «input» à l’application WaterWare et permettra la simulation des débits dans chaque cours d’eau du bassin versant. Après collecte et inventaire des données géologiques, hydrogéologiques et climatologiques, leur interprétation et leur traitement, il sera attendu d’avoir un SIG permettant d’obtenir les résultats sur l’hydrologie et l’hydrodynamique des bassins versants. (Caractéristiques hydrographiques de la zone d’étude (géométrie, relief , réseau hydrographique, estimation des apports en eau).
L’hydrogéologie de la nappe phréatique et de la nappe profonde permettra la détermination du réservoir aquifère ( son étendu, sa lithologie, son état en fonction des réserves régulatrices, de l’exploitation et du nombre de puits ainsi que les cadres géologique et structural). Un inventaire des points d’eau permettra d’avoir une carte de salinité, de suivre l’évolution du niveau pièzométrique et de déterminer l’interface entre l’eau douce et l’eau salée. L’hydrodynamique est basée sur des données climatologiques (température, vents, pluviométrie, évaporation, humidité), océanographiques (marée, houle, bathymétrie, modélisation hydrodynamique à l’aide du logiciel TELEMAC).
Conclusion
Les pays méditerranéens de la rive sud connaissent des diffi cultés similaires dans la gestion des ressources ‘’eau et sol’’. D’une part, l’eau est de plus en plus rare alors que les besoins et la consommation sont en augmentation croissante. D’autre part, les méthodes d’irrigation sont consommatrices d’eau et ont des répercussions négatives sur les sols. Les scientifi ques observent une modifi cation des paramètres hydrodynamiques et hydro-chimiques des nappes profondes ainsi que l’apparition de problèmes d’hydromorphie et de salinisation des eaux et des sols.
Il est nécessaire de déployer en amont les techniques de mobilisation de la ressource eau et de résoudre en aval les problèmes de la gestion des eaux après utilisation pour assurer une durabilité du développement. Ces diffi cultés communes imposent aux pays méditerranéens d’échanger les informations et les expériences et l’accent devra être mis autant sur les techniques d’économie d’eau que sur les techniques de mobilisation. La production d’eau est devenue inéluctable, aussi les pays méditerranéens ont-ils intérêt à maîtriser les technologies de dessalement de l’eau de mer et de traitement des eaux usées. L’utilisation des images satellites et des Systèmes d’Information Géographique a permis d’obtenir des cartes thématiques d’occupation du sol ainsi que des cartes des réseaux hydriques (plans d’eaux, chenaux d’écoulement de surface et de drainage). Ces techniques ont aussi permis d’extraire et d’intégrer différentes données. Le traitement de ces informations aideront les scientifi ques et les décideurs à identifi er les zones à potentiel agronomique du point de vue hydrique et à déterminer l’infl uence des activités humaines sur le sol.
Conclusion (English version)
The completion of the tasks assigned to the CNT in the aforementioned projects meet those set by Land Water-Med pertaining to monitoring changes in land and water use and to problems caused by water scarcity and to the role of advanced technologies in this respect CNT is willing to go further after the end of Landwatermed network meetings to work with its partners on projects aiming to have a better understanding of the environmental degradation of the Mediterranean basin that we are concerned of over last decades. The degradation is worsening in the coastal zone because it is often an attractive area for urban development, industry, and tourism, and because it is also an area of great sensitivity and fragile ecosystems. Therefore these zones need more studies that can be done on the framework of Euro Mediterranean partnerships.
Références bibliographiques
Stratégie Nationale d’Aménagement Rurale 1997
Cahiers Sécheresse 1999 ; Volume 10 : 117-122
Cahiers Sécheresse , 1998 Volume 9, 111-115

LandWaterMed network122

Abbadi O. et al 123
Dead Sea Recession and Its Impacts on the Surrounding Area
Omar ABBADI1, Maria KHIRFAN1 and Majeda AL-ASSAF2
1Royal Jordanian Geographic CenterRemote Sensing Section
P.O.Box 414 Jubeiha 11941 Amman-JordanPhone : 962-6-5349199
Fax : 962-6-5347694e-mail : [email protected]
e-mail : [email protected]@hotmail.com
2The Higher Council for Science and TechnologyP.O.Box 36 Jubeiha 11941 Amman-Jordan
Phone : 962-6-5340401Fax : 962-6-5340589
e-mail : [email protected]
Abstract: The Dead Sea area is a (world-wide) unique natural site. Lying at the lowest spot on earth, the waters of the Dead Sea are prized for their therapeutic value and for their minerals. Also, the wide interest in the Dead Sea has meant a broad range of often competing uses for the basin and its resources, from industry to agriculture to tourism to habitat and nature conservation. So, conservation of the Dead Sea environment should be of the top priorities of all countries surrounding it.The Dead Sea and its surrounding environment have been extremely compromised. Sea level has been dropping by nearly one meter per year due to water diversions upstream and due to mineral extraction industries. Consequences thus far include loss of one-third of the sea’s natural surface area and much coastline, the drying up of nearby natural springs that support wildlife, and the development of hundreds of sinkhole which have damaged infrastructure, limited economic development opportunities, and destroyed natural habitat. Remote sensing provides a straightforward means to map the extent of water bodies, to record an area occupied by open water, and to monitor changes in water bodies over time. Four available Landsat satellite images with different acquisition date at 30 m spatial resolution were used to monitor the changes in the surface area of the Dead Sea through the years from 1964 to 2001.This study aims to shed some light on the different aspects that lead to the degradation of the Dead Sea basin and its effect on the surrounding environment and on the present condition of the water resources within the Dead Sea area, in addition to the major industrial activities that are taking place in this area.
Keywords: Dead Sea, Recession, Remote sensing, Jordan rift Valley, water resources, drainage, manual digitizing method, surface area, mineral extraction industries, ecosystem, sinkholes.
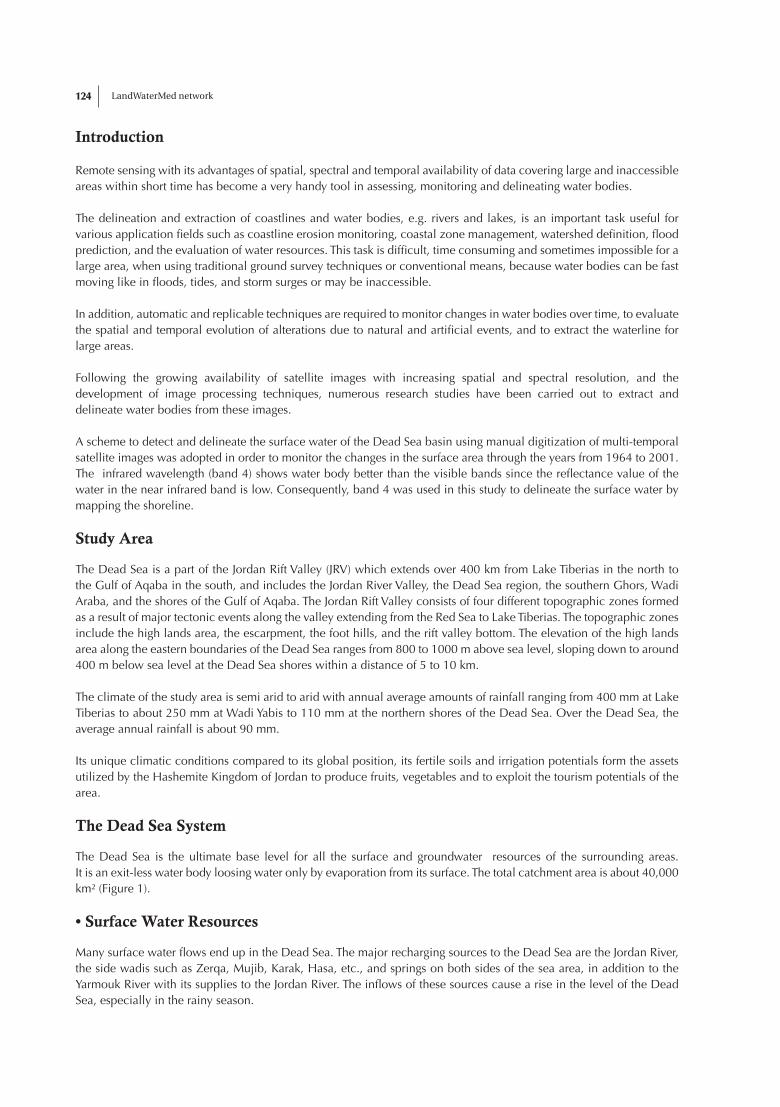
LandWaterMed network124
Introduction
Remote sensing with its advantages of spatial, spectral and temporal availability of data covering large and inaccessible areas within short time has become a very handy tool in assessing, monitoring and delineating water bodies.
The delineation and extraction of coastlines and water bodies, e.g. rivers and lakes, is an important task useful for various application fi elds such as coastline erosion monitoring, coastal zone management, watershed defi nition, fl ood prediction, and the evaluation of water resources. This task is diffi cult, time consuming and sometimes impossible for a large area, when using traditional ground survey techniques or conventional means, because water bodies can be fast moving like in fl oods, tides, and storm surges or may be inaccessible.
In addition, automatic and replicable techniques are required to monitor changes in water bodies over time, to evaluate the spatial and temporal evolution of alterations due to natural and artifi cial events, and to extract the waterline for large areas.
Following the growing availability of satellite images with increasing spatial and spectral resolution, and the development of image processing techniques, numerous research studies have been carried out to extract and delineate water bodies from these images.
A scheme to detect and delineate the surface water of the Dead Sea basin using manual digitization of multi-temporal satellite images was adopted in order to monitor the changes in the surface area through the years from 1964 to 2001. The infrared wavelength (band 4) shows water body better than the visible bands since the refl ectance value of the water in the near infrared band is low. Consequently, band 4 was used in this study to delineate the surface water by mapping the shoreline.
Study Area
The Dead Sea is a part of the Jordan Rift Valley (JRV) which extends over 400 km from Lake Tiberias in the north to the Gulf of Aqaba in the south, and includes the Jordan River Valley, the Dead Sea region, the southern Ghors, Wadi Araba, and the shores of the Gulf of Aqaba. The Jordan Rift Valley consists of four different topographic zones formed as a result of major tectonic events along the valley extending from the Red Sea to Lake Tiberias. The topographic zones include the high lands area, the escarpment, the foot hills, and the rift valley bottom. The elevation of the high lands area along the eastern boundaries of the Dead Sea ranges from 800 to 1000 m above sea level, sloping down to around 400 m below sea level at the Dead Sea shores within a distance of 5 to 10 km.
The climate of the study area is semi arid to arid with annual average amounts of rainfall ranging from 400 mm at Lake Tiberias to about 250 mm at Wadi Yabis to 110 mm at the northern shores of the Dead Sea. Over the Dead Sea, the average annual rainfall is about 90 mm.
Its unique climatic conditions compared to its global position, its fertile soils and irrigation potentials form the assets utilized by the Hashemite Kingdom of Jordan to produce fruits, vegetables and to exploit the tourism potentials of the area.
The Dead Sea System
The Dead Sea is the ultimate base level for all the surface and groundwater resources of the surrounding areas.It is an exit-less water body loosing water only by evaporation from its surface. The total catchment area is about 40,000 km² (Figure 1).
• Surface Water Resources
Many surface water fl ows end up in the Dead Sea. The major recharging sources to the Dead Sea are the Jordan River, the side wadis such as Zerqa, Mujib, Karak, Hasa, etc., and springs on both sides of the sea area, in addition to the Yarmouk River with its supplies to the Jordan River. The infl ows of these sources cause a rise in the level of the Dead Sea, especially in the rainy season.

Abbadi O. et al 125
In the predevelopment stage, the total surface infl ows averaged (30 years) 1670 Mm³.y-1 and the total fl ow of the Jordan River was measured and estimated to be around 1370 Mm³.y-1, prior to the implementation of the different water projects in Jordan, Syria and Israel. By time this quantity was reduced dramatically especially since 1964 when Israel began to drain approximately 500 Mm³.y-1 from Tiberias Lake to the Israeli territories. This amount raised in recent years to about 700 Mm³.y-1. Nowadays the total discharge of the Jordan river to the Dead Sea range between 250-300 Mm³.y-1.
In recent years, the estimated discharge from the side wadis and springs to the Dead Sea were about 407 Mm³.y-1. This quantity was reduced sharply due to the construction of the dams on the wadis on both sides of the sea, as well as the dryness of several major springs.
Figure 1: Dead Sea catchment area (modified after Salameh 2000).

LandWaterMed network126
• Groundwater Resources
Along the entire shore of the Dead Sea, the groundwater of the surrounding areas discharges directly or via surface courses into the Dead Sea. The groundwater levels lie at a few hundred meters above sea level compared to 418 m below sea level (bsl) for the Dead Sea. The groundwater gradients are directed radially to the Dead Sea. Under the conditions of constant Dead Sea level the surface and groundwater infl ows feeding the Dead Sea are lost by evaporation.The groundwater infl ows into the Dead Sea in the predevelopment stage averaged (30 years) 220 Mm³.y-1. In recent years, the groundwater discharges decreased to an average of 140 Mm³.y-1, evenly distributed over the year.
• Dead Sea Outflows
The Dead Sea is exit-less. Losses of its water are a result of evaporation or extraction for the uses by the Potash Works on both sides; east and west. The average evaporation rate equals 202 mm per month.
The Dead Sea works both in Jordan and Israel extract around 450 Mm³.y-1 from the Dead Sea water body and return back around 160 Mm³.y-1. An average of 290 Mm³.y-1 is actually consumed.
• Dams within The Dead Sea Area
Several dams were constructed on the major and minor wadis within the Dead Sea catchment area and the adjacent catchment areas as shown in Table 1.
Table 1: Source: JVA data base
Name LocationYear of Completion
Storage CapacityMCM
Sultan Wadi Mujib 1962 1.20
Qatraneh Wadi Mujib 1963 2.00
Wadi Shueib Wadi Shueib 1964 2.30
Al-Kafrein Wadi Al-KafreinPhase I. 1967Phase II.1996
11.00
Ziglab Wadi Ziglab 1967 4.3
King Talal Zerqa RiverPhase I. 1977Phase II. 1983
86.00
Al-Arab Wadi Al-Arab 1986 20.00
Karama Mallaha Basin 1997 55.00
Tanur Wadi Hasa 2001 16.80
Al-Wehda Yarmouk River 225.00
During the last four decades, the water resources within the Dead Sea drainage basin were notoriously developed. The development of the surface and groundwater resources feeding the Dead Sea was driven by two factors, namely:
• Increasing demand for water within the drainage basin.
• Anxiety of the different riparian states of the Dead Sea that the other riparian states will develop the water resources faster and hence deprive them from that water.
The fast development of the water resources deprived the Dead Sea of the major portions of water infl ows. The level of the Dead Sea has been continuously dropping since the late fi fties, from about 392 m below sea level in 1958 to about 411 m below sea level in 1998 and reached approximately 418 m below sea level at present. The reason for this drop is the extensive exploitation of water resources which formerly used to fl ow into the Dead Sea. The water balance of the Dead Sea has since the late 1950s been disturbed, and evaporation losses have been partly compensated by reducing the stored amounts of groundwater (Tables 2 and 3).

Abbadi O. et al 127
Table 2: Summary of water amounts which used to flow into the Dead Sea prior to the water resources development within its catchment area (modified after Salameh 2000)
SourceAmountMm³.y-1
Surface waterLake Tiberias (outflows)East side WadisWest side WadisDead Sea Eastern catchmentDead Sea Western catchmentWadi Araba basinSubtotal Surface Water
54260758219163811670
GroundwaterEastern sideWestern sideNorthern and Southern basinsSubtotal Groundwater
9010030220
PrecipitationSubtotal ppt over the Dead Sea 90
Total 1980
Table 3: Present days water balance (modified after Salameh)
SourceAmountMm3.y-1
The average outflow from Lake TiberiasThe Average surface runoff of the Western Jordan River catchmentsAverage discharge of the Yarmouk RiverEastern side of the Jordan RiverEastern side of the Dead Sea (surface)Eastern side of the Dead Sea (ground)Western side of the Dead Sea (surface)Western side of the Dead Sea (ground)Western Wadi ArabaEastern Wadi ArabaIrrigation return flows, subsurface flows, and saltwater diversions into the Jordan River
40105042147901350
101085
Precipitation over the Dead Sea 70
2.0.2.1.0 Total Inflows 617
Since about 40 years, large projects to utilize the surface and groundwater which formerly discharged into the Dead Sea have been implemented. These diverted and dammed water sources caused during the last 40 years a continuous drop in the level of the Dead Sea. The total quantity of surface and groundwater infl ows into the Dead Sea at present sum up to 617 Mm³.y-1. Therefore, the infl ows into the Dead Sea declined from 1980 Mm³.y-1 in the fi fties and early sixties to something in between 547 and 678 Mm³.y-1 at present.
Methodology and Analysis
The development of satellite images with increasing spatial and spectral resolution has facilitated water bodies extraction and delineation from these images. The extraction of features, such as coastlines and water bodies directly from satellite images can be done mainly either by classifi cation or manual digitizing method.
In this study, manual digitizing method has been used as the main tool to estimate the water surface area of the Dead Sea basin. The infrared band of Landsat TM (b4) was used to delineate the Dead Sea surface area as it is known to delineate water bodies because water is a strong absorber of near IR and emphasize water-land contrast.
Four available Landsat satellite images with different acquisition date at 30 m spatial resolution were used to monitor the changes in the surface area of the Dead Sea through the years from 1973 to 2001.

LandWaterMed network128
The available satellite image acquired on 1973 was in the form of a hard copy and the other images were available as digital forms.
The following are the types of satellite images that were mainly used in this study:
• Landsat MSS acquired in 1973
• Landsat 5 TM acquired in 1983
• Landsat 5 TM acquired in 1994
• Landsat 7 ETM+ acquired in 2001
A topographic map scale 1/100 000 produced in 1964 was scanned to be used in this study. The satellite image of 1973 was also scanned in order to be used in the digital form.
Geometric correction and registration has been applied to all the images in addition to the scanned map. Subset was also done for all the images to obtain the specifi ed area i.e. the Dead Sea basin.
By using the manual digitizing method, approximate values are obtained due to the coarse resolution of the available images and the physical error while digitizing.
After delineating all the satellite images the following results were obtained:
• In 1964, the Dead Sea basin was composed of two basins; the northern and southern basins. The estimated surface area was around 983 km². In this period the Dead Sea did not seem to suffer yet from water infl ow defi ciency (Figure 2).
• In 1973, the surface area decreased to about 938 km². The Dead Sea was still composed of two basins. It was evident from the satellite image below that the basin was slightly affected by water recession (Figure 3). Mainly because of the construction of the salt pans by the two potash companies on both sides and water diversions upstream.
• However in 1983, it was evident that the Dead Sea suffered major water shortage due to water diversions upstream and mineral extraction industry. This led the Dead Sea to decrease to 1/3 of its natural surface area and reached about 697 km². Consequently two separate basins were formed (Figure 4).
• Moreover, in 1994 the surface area had decreased to around 668 km². Which is evident from the satellite image below showing the Dead Sea with its northern basin only after its detachment from the southern basin due to the exploitation of water resources (Figure 5).
• In 2001, the surface area reached to about 648 km². In the satellite image below it is also obvious that the receding is continuous due to water diversions upstream and due to mineral extraction industries (Figure 6).
• It is evident that the basin is receding gradually during the past 30 years as shown in Figure 7 and table 4 below.
Table 4: Showing the estimated surface area.
Years Estimated Area (km²)Blue color: 1964 983
Red color: 1973 938
Cyan color: 1983 697
Green color: 1994 668
Violet color: 2001 648

Abbadi O. et al 129
Figures :
2: Showing the scanned topographic map (1964).
3: Showing the color composite image 4,5,7 (R,G,B,) of Landsat MSS (1973)
4: Showing the color composite image 4,3,2 (R,G,B) of Landsat 5 TM of the northern basin (1983)
2 34

LandWaterMed network130
Figures :
5: Showing the color composite image 4,3,2 (R,G,B) of Landsat 5 TM (1994)
6: Showing the color composite image 4,3,2 (R,G,B) of Landsat 7 ETM+ (2001)
7: Showing the delineation map of the Dead Sea basin through the years from 1964 to 2001.
5 67
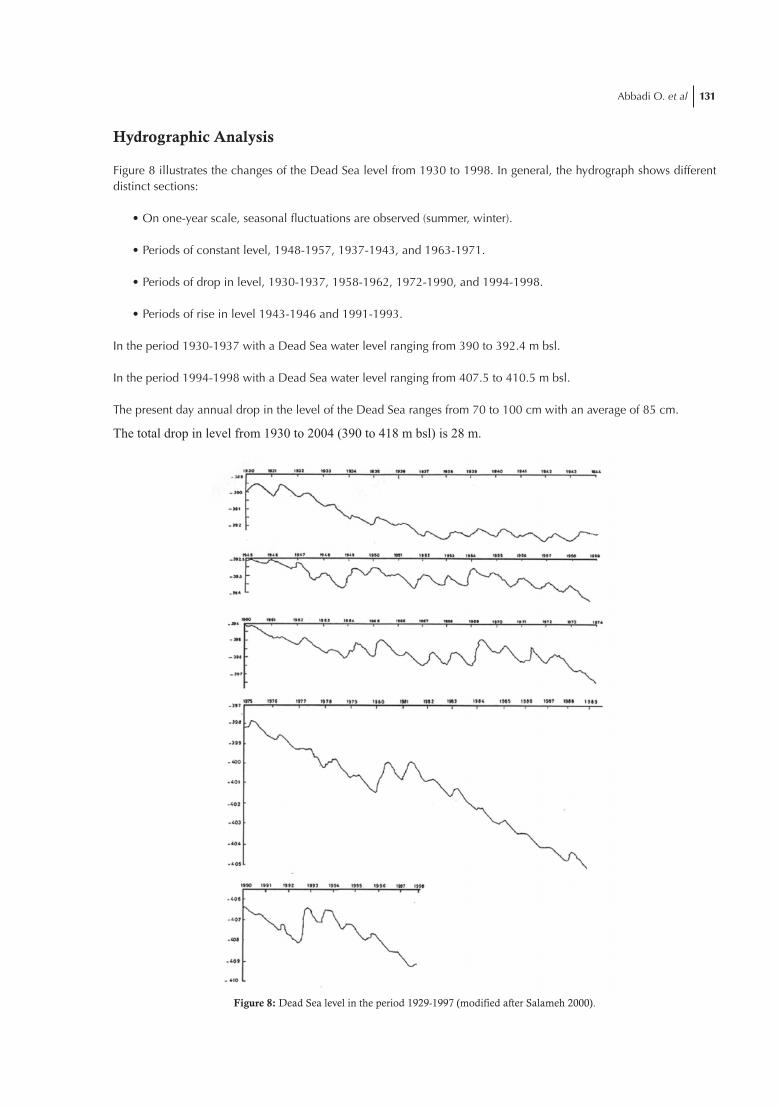
Abbadi O. et al 131
Hydrographic Analysis
Figure 8 illustrates the changes of the Dead Sea level from 1930 to 1998. In general, the hydrograph shows different distinct sections:
• On one-year scale, seasonal fl uctuations are observed (summer, winter).
• Periods of constant level, 1948-1957, 1937-1943, and 1963-1971.
• Periods of drop in level, 1930-1937, 1958-1962, 1972-1990, and 1994-1998.
• Periods of rise in level 1943-1946 and 1991-1993.
In the period 1930-1937 with a Dead Sea water level ranging from 390 to 392.4 m bsl.
In the period 1994-1998 with a Dead Sea water level ranging from 407.5 to 410.5 m bsl.
The present day annual drop in the level of the Dead Sea ranges from 70 to 100 cm with an average of 85 cm.
The total drop in level from 1930 to 2004 (390 to 418 m bsl) is 28 m.
Figure 8: Dead Sea level in the period 1929-1997 (modified after Salameh 2000).
LandWaterMed network132
Benefits Provided by the Dead Sea
The Dead Sea waters, the saltiest of any large body of water in the world, are valued for their medicinal value. Many visitors come to fl oat in its waters and receive cosmetic and medicinal treatments in local spas and clinics. Some of the many historical and cultural attractions of the Dead Sea include the baptism site of Jesus and Lot’s cave and many others.
Natural benefi ts provide by the Dead Sea basin include serving as home and habitat to diverse desert wildlife. Many of these species are rare or endangered and where also the Dead Sea represents an important resting and feeding stop. It is also home to several nature reserves such as Wadi Mujib as well as other areas prized for their natural beauty.
The chemicals in the Dead Sea support both large mineral extraction industries, which supply fertilizer, agricultural and industrial process, and a cosmetic and healthy aids industry. The Arab Potash Company and the Dead Sea Works, both located in the southern basin, are each the single largest factories in their host countries of Jordan and Israel respectively.
Threats Facing the Dead Sea
• Drop in Sea Level and Loss of Sea Due to Water Abstraction
The primary threat is to the Dead Sea results from upstream diversions of waters that feed the Dead Sea. The national water carriers of Israel and Jordan divert 90% of the natural fl ow of the Jordan River, leaving only 10% of the natural fl ow to reach the Dead Sea. The primary user of these waters is agriculture, however, domestic and industrial use are also served. Also, diversions of water from coastal springs such as Wadi Mujib, which fl ow directly into the Dead Sea has also reduced its contribution to the Dead Sea to a fraction of natural fl ow.
Enhanced evaporation of the Dead Sea’s waters by mineral extraction industries along the southern shores of the Dead Sea has also undermined the sustainability of the Sea as a stable ecosystem. As a result of the diversions and evaporation ponds, the water level of the Dead Sea has declined over 28 meters since 1930, and continues to drop at a rate of nearly a meter per year. One third of the original surface area of the Dead Sea has already disappeared. Water now needs to be pumped from the northern basin to the southern in order to supply the mineral factories with water.
• Loss of Ecosystem Habitat Due to Drop in Sea Level
The drop in the Sea’s level has caused drop in the water table along the coasts. This has resulted in the drying up of springs and associated habitats, threatening rare species. Also, as the shore of the Dead Sea recedes, estuarine ecosystems have also begun to disappear and change in composition. While it was long believed that the Dead Sea contained no life at in its waters, it was discovered to support endemic species of hypersaline-tolerant bacteria. However, with the loss of volume, the Dead Sea’s salinity concentration has increased to such a point that even these salt-tolerant species are at risk.
• Loss of Infrastructure and Productive Land due to Drop in Sea Level Sinkholes Formation
The coastal rocks saturated with Dead Sea water are some how cemented by salts deposited from the over saturated Dead Sea water. By lowering the Dead Sea level allows these rocks to be percolated by fresh-or brackish water, which causes the dissolution of the salts in the groundwater of the coastal areas (especially the salty Lisan Formation), creating herewith underground cavities. This in turn results in ground collapses. This is what happened in the Lisan Peninsula during the last few years, where ten of sinkholes up to 50 m in diameter and 25 m in depth were formed within a few hours. At the beginning of September 1999 a huge sinkhole developed at the northern shore at the Dead Sea by the same dissolution-cavity formation-collapse mechanism. Over 1000 such sinkholes have developed on the western shore of the Dead Sea.

Abbadi O. et al 133
Environmental Damage from Overuse of Dead Sea Resources
In addition to the value of the loss of natural and cultural features due to the drop in the Dead Sea level and misuse of surrounding lands, there is direct economic impact on residents, transportation, investment and industry in the region. A complete assessment of future damages would be highly speculative, since we are only now learning of the scale of damages.
Agricultural land and road infrastructure has been lost in Jordan. Also, the hotels along the Dead Sea have already spent hundreds of thousand of dollars for shore stabilization embankments to counteract possible damage from the receding shoreline.
The Jordanian mineral industry has also incurred damage to at least one of its evaporation ponds and certain areas are now unavailable for use as ponds, costing it tens of thousands of dollars. Furthermore, the need for the mineral companies to periodically relocate pumping station locations as the sea level drops could cost several million dollars per readjustment.
An Estimate of the Impact of the Drop In the Water Level on Agriculture, Tourism, and Mineral Industry
a. Agricultural Sector
Agriculture has suffered directly from the sinkholes phenomenon in Ghor Haditha. Agricultural plots impacted by the sinkholes are left empty. Some of these plots included date-palm plantations, while others included different kinds of fi eld crops. The average area that was impacted exceeds 50 dunums. The Jordan Valley Authority (JVA) has tried to fi ll the sinkholes, however most sinkholes sizes increased and general subsidence is happening on a large scale.
b. Tourist Sector
The hotel industry in Jordan is located at the northern shore of the Dead Sea. The impacts of the deterioration of the Dead Sea can only be seen as an increase in expenditure in order to maintain the beaches in a healthy shape.
The primary economic impacts related to the deterioration of the Dead Sea water level is as follows:
• Beach erosion, which results in the change of the northern beach morphology where all the hotels are located, especially in the form of beach erosion due to exposed shores.
• Sinkholes have not appeared in the northern beach area and therefore are not assumed to have an impact on the hotel industry.
c. Mineral Extraction
The Arab Potash Company was designed on the bases that the Dead Sea surface area is shrinking. The company planned to change the location of the pumping station from the upper basin of the Dead Sea every 10 years to cope with the decline in the sea level. This negative impact of changing the location of the pumping station will cost around JD 15 million.
On the other hand, the positive impact is that by lowering the sea level and the reduction in the total fresh water input from the River Jordan and the other sources has lead to an increase in the Dead Sea water density which has meant an increase of the mineral content of the pumped water which resulted in reducing the duration required to precipitate the mineral in the evaporation ponds.
Benefits of Dead Sea Basin Conservation
a. Conservation of unique ecosystems
b. Conservation of rare and endangered fl ora and fauna
c. Preservation of historical and cultural sites

LandWaterMed network134
d. Preservation of undeveloped area for hiking and aesthetic enjoyment
e. Avoided damages to industry, transportation, agriculture and public safety due to sinkholes
f. Avoided expenditures to accommodate receding shoreline, especially by tourism industry
g. Considerations of social equity may be merited when evaluating conservation of the Dead Sea as a policy option, given that it may serve as a tourist destination for local tourists of below average income who lack other travel destination possibilities.
Dead Sea Canal
As has been mentioned previously, the Dead Sea is drying up with severe negative consequences on the ecosystem, industry and wildlife in the area.
There have been several proposals for a canal to transport Mediterranean Sea or Red Sea water to the Dead Sea. Such a water project would reserve the negative impacts on the environment; that is, the erosion of the shoreline and disruption of the water column caused by declining water levels. The canal would reverse negative impacts on trade by revitalizing the potash works industry and tourism in the area. The canal would also create new trade and development opportunities by using the 400-meter differential between the bodies of water to generate hydropower, a much needed source of water for domestic, agricultural and industrial purposes.
The canal plan also calls for refi lling the lake to its historic level (393 m bsl during the 1930s) over a period of 10-20 years. The canal would also eliminate sinkhole collapse due to the declining of level of the Dead Sea.
Conclusions
• Remote sensing provides a straightforward means to map the extent of water bodies, to record an area occupied by open water, and to monitor changes in water bodies over time. With its advantages of spatial, spectral and temporal availability of data covering large and inaccessible areas within short time, remote sensing has become a very handy tool in monitoring and delineating water bodies.
• Remote sensing technique with the continuous development of satellite images has also facilitated water body extraction and delineation of surface water from these images. This task is diffi cult, time consuming and sometimes impossible for a large area, when using traditional ground survey techniques or conventional means.
• In this study, manual digitizing method was used and approximate values were obtained due to the coarse resolution of the available images and the physical error while digitizing.
• Agriculture is a major consumer of water diverted upstream and sent out of the basin, while mineral extraction accelerates natural rates of evaporation from the Dead Sea itself.
• All the riparian states should work jointly to develop and implement a sustainable development plan with designated areas for conservation.
• Implementation of a sustainable regional management plan in order to obtain economic benefi ts from its conservation, so that the future generations will be able to experience the beauty of the Dead Sea and its natural surroundings, the tourist industry and the local wild life.
• Establishing the ‘red-lines’ of minimum resources necessary to maintain ecologically rich spring-fed ecosystems, such as Wadi Mujib and other core areas of natural and social value, and to identify least cost methods of securing these resources.
• Limiting the upstream abstraction of water which naturally fl owed to the Dead Sea. Also limiting the mineral extraction activities of industry in the basin.

Abbadi O. et al 135
Friends of the Earth Middle East. Advancing Conservation and Sustainable Development of the Dead Sea Basin- Broadening the Debate on Economic and Management Issues, March 2004.
E. Salameh and H. El-Naser. Does the Actual Drop in the Dead Sea Level Refl ect the Development of Water Sources Within its Drainage Basin?, Acta hydrochim. hydrobiol 27 (1999).
E. Salameh and H. El-Naser. Changes in the Dead Sea Level and their Impacts on the Surrounding Groundwater Bodies, Acta hydrochim. hydrobiol 28 (2000).
E. Salameh, H. Bannayan. Water Resources of Jordan Present Status and Future Potentials. Friedrich Ebert Stiftung Amman, 1993.
S. Bagli, P. Soille. Morphological Automatic Extraction of Pan-European Coastline from Landsat ETM+ images. Institute for Environment and Sustainability, Land Management Unit, IT, 2003.
L.C. Chen and J.Y. Rau. Detection of Shoreline Changes for Tideland Areas Using Multi-temporal Satellite Images. Int. J. Remote Sensing, 19 (17): 3383-3397, 1998.
P.S. Frazier and K.J. Page. Water Body Detection and Delineation with Landsat TM Data. Photogrammetric Engineering and Remote Sensing, 66 (12):1467-1467, December 2000.
K. Whithe and H.M. El Asmar. Monitoring Changing Position of Coastline Using Thematic Mapper Imagery, an example from the Nile Delta. Geomorphology, 29 (29): 93-105, 1999.
References

LandWaterMed network136

Isaac J, Saad S. 137
Monitoring Urban DynamicChange in the Palestinian Territories (1989 –2004)
Jad ISAAC and Sophia SAAD
Applied Research Institute – Jerusalemwww.arij.org
P.O. Box 860, Caritas Street, Bethlehem - PalestineTel: +972 – 2 – 2741889Fax: +972 – 2 – 2776966e-mail: [email protected]
e-mail: [email protected]
Abstract: This paper examines Palestinian land use development using qualitative and quantitative methods of analysis of urban trends in the West Bank between the years 1989 and 2002. The scale and direction of Palestinian and Israeli urbanization is assessed using Geographical Information Systems (GIS) and remote sensing technology. The location and extent of property destruction and home demolitions is also mapped and analyzed using GIS and an analysis of home demolitions in the Gaza Strip during the year 2004 is presented as a case study. The paper also considers the impact of Israeli settlements and activities on Palestinian urbanization trends and the socioeconomic condition of Palestinian localities. Qalqilya city is presented as a case study, showing the impact of the separation wall on a Palestinian urban population.
Keywords: West Bank, Land use change, Urbanization, Colonization, Israeli settlements, Urban trend, Spatial structure.
Introduction
The last century witnessed momentous changes in the spatial structure of cities all over the world due to globalization, changes in the global economy and technological advances. Societies in developed countries have become predominantly urban, while developing countries are rapidly urbanizing. As the likelihood of a reversal process in this trend is not expected, the future of humanity is expected to evolve in urban centers. The evolution in the structure and formation of urban centers remains highly speculative especially in developing countries where population growth is increasing rapidly.
At the beginning of the new millennium, Palestinians are faced with the problem of a rapid urbanization process matched with scarcity of land and a lack of urban planning.
Using GIS and remote sensing technology, this paper investigates the location, scale and direction of urbanization trends in the West Bank. Time series LANDSAT TM data for the years 1989, 1996, 1997 and 2000 are used as the cornerstone of the analysis as well as IKONOS satellite images for the year 2002 for data verifi cation. The direction of the urbanization trends are determined by observing the spatial formation of the urban area to identify locations that experienced development in land use. In this context, distinction between Palestinian and Israeli land use developments is emphasized in order to assess the impact of these trends on the loss of agricultural land. IKONOS satellite images from different years are also used to detect dynamic changes in the urban fabric and landscape.
The remainder of this paper comprises four parts. The fi rst part highlights the methodology adopted to accomplish the objective of the research. The second part provides a description of the study area chosen for the analysis. The third part gives the results drawn from the analysis. And the last part presents two case studies of dynamic changes due to Israeli activities in the Gaza Strip (the Rafah Refugee Camp) and the West Bank (Qalqiliya city).

LandWaterMed network138
Methodology
Changes in the spatial structure of an urban area can be determined by an analysis of time series aerial photos or satellite images. Using state of the art Geographic Information System (GIS) and remote sensing technologies, it is possible to extract and plot land use patterns from these two sources of imagery. Although aerial photos are the most powerful imaginary source that can determine the spatial structure and dynamical change of the city structure, the cost of retaining time series aerial photos is high and inaccessible in most cases in the Palestinian context. Fortunately, the existence of archive satellite images can make the task of studying the dynamic change in the structure of a city possible.
To date, there is a large number of satellite image sources worldwide. Among those are the famous French SPOT, American LANDSAT (MSS, TM and ETM), Indian IRS and the recent American IKONOS satellite images. Each of the above has its own standards and specifi cations that allow research in different geo-fi elds. LANDSAT is the core of multi-spectral digital imaginary, and the cost of LANDSAT images is by far the lowest among the mentioned satellite imaginary (UNIDIR, 1999).
In this paper, the analysis involves classifying LANDSAT TM images for the West Bank area for the years 1989, 1996, 1997 and 2000 to extract the developed land in the region. The classifi cation is carried out on the ERDAS imagine 8.5 platform through the usage of a developed model and automatic classifi cation. Additionally, another methodology is adopted to identify urban development in the study area and apply accuracy assessment using high-resolution satellite data (IKONOS images) for the year 2002. The classifi cation of these images depends on visual interpretation and screen digitizing. This approach will provide accurate, up-to-date information about the latest urban developments within the study area. To achieve the goal of this research several technical steps in the remote sensing and GIS framework were completed. These involved data organization, processing, interpretation and analysis. The resultant output was used to synthesize the observed trend on urbanization of the region.
Image pre-processing
The digital images for the years 1989, 1996, 1997 and 2000 were radiometrically corrected, georeferenced, scene cropped and processed in ERDAS imagine. Georeferencing the LANDSAT images was based on the 1997 SPOT image acquired for the West Bank. The SPOT image is projected to the UTM WGS84 projection system and is considered the base map for all the GIS Arc coverage databases. Scene cropping involves sub-setting the study area from the West Bank full LANDSAT scene. The result of this process is four images with root mean-square errors of less than one half of the pixel size of the images and with compatible projecting system that can further be integrated in GIS. All four images were re-sampled to have a spatial resolution of 28.5 meters.
• Image Analysis
Different functionalities in ERDAS imagine remote sensing platform was used to analyze the four LANDSAT images for both the Palestinian and Israeli land development. In the Palestinian context, the analysis involves applying automatic image classifi cation to extract the Palestinian urban land use. The process entails delineating the boundary of the Palestinian urban areas on the 2002 IKONOS images to create GIS Arc coverage of these areas. The boundary is then used as the area of interest of the urban areas in classifying the four LANDSAT images. The signifi cance of this procedure is in two folds. On the one hand, the spatial resolution of 2002 IKONOS images is 4 meter, which allows more appropriate visualization of the urban area. On the other hand, constraining the analysis of the past LANDSAT images to the 2002 area of interest will reduce the bias in classifi cation and will bound it to only Palestinian urban land use.
Logistic regression algorithm was used in an attempt to map the built-up areas using LANDSAT TM data. The algorithm created was modifi ed and adopted to map only the built-up areas while supervised classifi cation, was applied to identify the vegetation cover of the target area. Therefore, the spectral properties of the built-up areas and their comparison to other major classes of land cover existing on the image were studied. The spectral properties of the built-up areas on the LANDSAT TM images were compared with the spectral properties of bare rocks, bare\low vegetated soil, other vegetation classes and shaded areas. The LANDSAT images pixels were categorized to urban and non-urban areas. The method followed to map the built-up areas using binary logistic regression is shown in fi gure 1 (Rishmawi, 2001).
The analysis entails an examination of both Palestinian and Israeli land development in the study area. Palestinian development is different from Israeli development in that the Palestinian development is a natural process occurring as population increases and urban centers grow. In this context, the spatial analysis offered distinguishes between the two development models and treats them as two separate processes.

Isaac J, Saad S. 139
Figure 1: Flowchart of the method adopted to extract the Palestinian built-up area using logistic regression modeling
With the aim of ensuring the successful development of the logistic regression models, the sampling size regarding the number of both cases was about the same to avoid bias in the sampling process. Moreover, a satisfactory absolute sampling size ranging between 4500-6000 pixels was obtained to represent all the spectral variability occurring on the satellite image for the built-up (urban) areas and the same for the non-urban areas.
Non-urban samples were assigned the value zero, whereas urban areas were assigned the value one to create the dependent variable in the modeling process. The logistic regression equations were structured in SPSS statistical package using the radiometrically corrected six bands of the LANDSAT TM images used in this research as independent explanatory variables. Table 1 shows the classifi cation results of the developed model for year 2000 based on the comparisons of observed versus predicted readings models with better performance were applied to the entire satellite data.
The mathematical formulation of the better performing logistic regression model was built into the ERDAS Imagine graphical model maker and applied to the LANDSAT images. This resulted in a new continuous data layer with a minimum of 0 and a maximum of 1. A simple thresholding was applied to map the urban areas. All pixels with a value greater than 0.5 were classifi ed as built-up, and those with a value less than 0.5 were classifi ed as non-urban.
Table 1: Classi� cation results of the binary model (the cut value is 0.5)
Observed
Predicted
CODE Percentage
0 1 Correct
Step 1 Code 0 4342 276 94
1 325 4242 92.9
Overall Percentage 93.5
However, land cover classifi cation in ERDAS involves employing the maximum likelihood function to estimate the probability that a pixel belongs to a particular class. The basic equation assumes that these probabilities are equal for all classes and that the input bands have normal distributions. In the analysis, the supervised classifi cation was used to estimate the general vegetation cover from the different LANDSATs within the area of interest defi ned for the analysis.
The supervised classifi cation (automatic classifi cation) entailed two main steps. First, the training of different land classes in the LANDSAT images were defi ned using our recognition skills and knowledge of the spectral properties of land cover types in the study area. The classes defi ned include the built up area, vegetation and bare soil, bare rocks and other land features. Second, the supervised classifi cation was carried out using the ERDAS imagine platform to result a new image with different classes for a specifi c year. The different classes resulted from the different training areas were then grouped to produce four main classes which includes: dryland fi eld crops and vegetables, dryland fruit trees, irrigated agricultural land and forest trees.
LandWaterMed network140
The analysis of the Israeli urban land use development did not involve automatic land classifi cation as in the case of the Palestinian urban land use development. The boundary of the Israeli settlements is usually apparent on the satellite images since either major roads or fencing always surround these settlements. Therefore, delineating the Israeli settlement boundaries in the four time periods was suffi cient for the purpose of the analysis. The delineation of boundaries was carried out by on-screen digitizing and creating four GIS Arc coverages for the different four time periods.
• Implementing the GIS DatabaseThe classifi ed images presenting the Palestinian areas and coverages presenting the Israeli settlements were imported into GIS as ArcInfo grids and vectors, respectively. The grids were used to extract the Palestinian urban land use class as separate grids in GIS. The imported vectors were built in GIS to calculate their geometry. These two types of data are compatible with other GIS data and can be presented in GIS as layers for further analysis.
• Data Calculation and ExtractionDifferent fi gures were extracted from the GIS database using the computational functionalities available in GIS. These include total amount of Palestinian urban land use (sq. Km) in the study area in the four time periods as well as the total land occupied by Israeli settlements in the study area in the four time periods.
• Data ValidationThe validation of the digital data resulting from processing in remote sensing platform was carried out as an auxiliary step to check the reliability of the extracted fi gures. The validation involved comparing the resultant urban land use from the grid in the year 2000 to the 2002 IKONOS images. This step was carried out by over-laying the grid on top of the IKONOS cover and swipe between the two layers to notice differences and by applying accuracy assessment that was 90% for the classifi ed built-up area and 78 to 80% for the land cover classes.
Study AreaGeopolitical Formation: In recent years, the political confl ict over the West Bank and Gaza Strip has become the major factor impacting the modem development of urban land use in the region. Land use has thus been radically altered in a relatively short period. A period of transition began in 1993, when the Palestinian-Israeli peace process commenced in Oslo. The Oslo agreements split the Palestinian territories into three main administrative and geopolitical categories;
these are area A, area B and area C. Area A is under full Palestinian control and includes the main Palestinian urban centers in the West Bank. Area B is under Palestinian civil administration but subject to Israeli security control, and comprises the larger part of the Palestinian villages and towns. Israel retains full control over the rest of the Palestinian land, which is categorized area C. In this context, land use development is a function of the political situation in which development can only occur in specifi c parts of the West Bank. Map 1 shows the geopolitical situation of the West Bank. The break down of the three geopolitical areas in the West Bank is given in table 2. However, the fi nal geopolitical status is still ambiguous and governed by future agreements between the two parties.
Table 2: Distribution of the geopolitical areas in the West Bank (ARIJ database, 2000)
Geopolitical Area Area in Km² % Of the West Bank
Area A 1004.8 18%
Area B & nature reserves 1035.4 21%
Area C 3460.7 61%
Area C entails Israeli settlements, military bases, closed military areas and a sophisticated network of bypass roads. There is a total of 177.8 km² of Israeli Settlements in the West Bank (ARIJ database, 2003). These are marked by low population densities and function primarily as suburban satellites of existing Israeli cities. Also, it is important to note that the master plan for Israeli settlements in the West Bank includes an area of 497.5 km², which is 8.5% of the West Bank. These settlements are distributed all over the West Bank, primarily condensed in East Jerusalem and in the Jordan Valley.

Isaac J, Saad S. 141
Map 1: Geopolitical conditions in the West Bank

LandWaterMed network142
In its current status, the West Bank has two different urban land use infrastructures: Palestinian urban areas and Israeli Settlements. The West Bank hosts about 2,408,795 Palestinians and 450,000 Israeli Settlers, including East Jerusalem (PCBS, 2003; ARIJ database 2003). The total land of Palestinian built-up areas is 354.9 km2 (ARlJ GIS database, 2002). That translates to a population density of approximately 2531 Israelis per km² of built space in the Israeli settlements as compared to approximately 6787.2 Palestinians per km2 of built space. Consequently there are two different and parallel planning schemes: one Israeli, to serve the Israeli settlers living in the West Bank and Gaza Strip, and the other Palestinian, to serve the Palestinian people. This has created a geographical discontinuity in the lands under Palestinian control.
Trends of Urbanization and Magnitude of developmentThe resulted land use / land cover classes from the automatic classifi cation are presented in the time series maps, see map 2. The analysis shows that the Palestinian built-up areas in the West Bank Governorates continued to increase from 1989 to 2000. Furthermore, it illustrates that Israeli settlements established on the West Bank lands have continued to expand on the account of different land uses especially valuable agricultural land.
In order to obtain up-to-date land use / land cover inventories, IKONOS satellite images acquired in year 2002 were analyzed and current land use data was generated. A map that shows the land use / land cover classes in the West Bank with the urban growth patterns was produced, where the different types were classifi ed based on the CORINE level two classifi cation system, see map 3.
Map 2: Land cover changes in the West Bank from 1989 to 2000
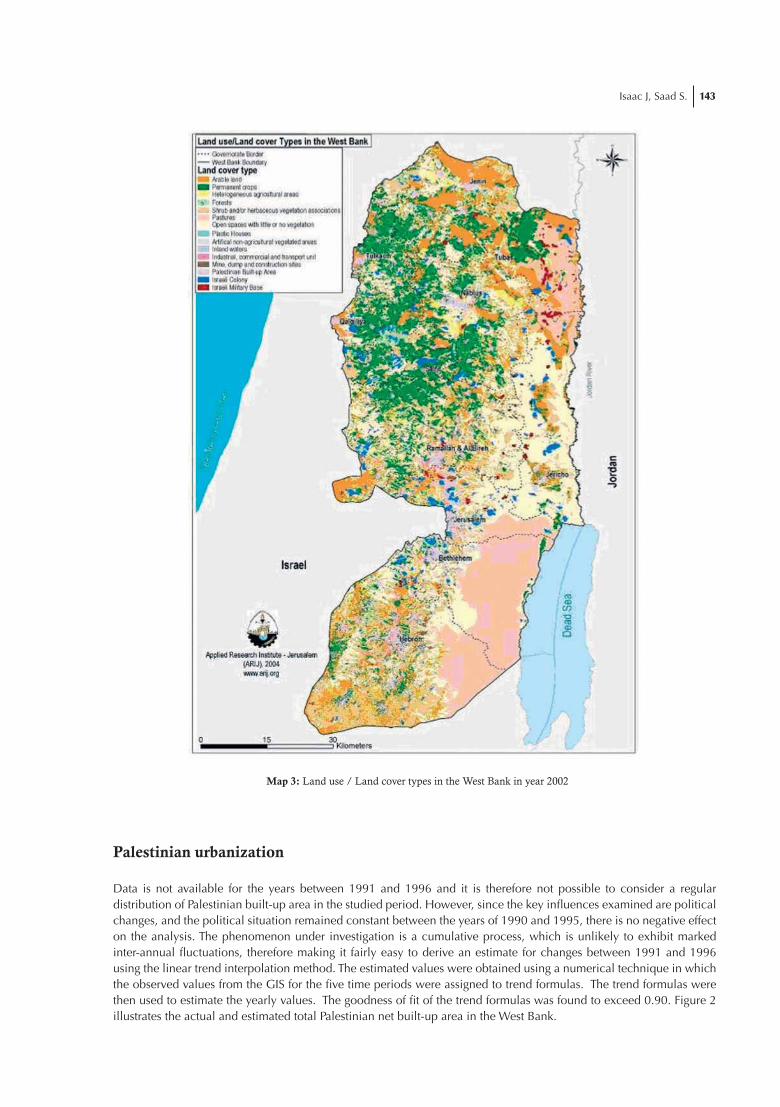
Isaac J, Saad S. 143
Map 3: Land use / Land cover types in the West Bank in year 2002
Palestinian urbanization
Data is not available for the years between 1991 and 1996 and it is therefore not possible to consider a regular distribution of Palestinian built-up area in the studied period. However, since the key infl uences examined are political changes, and the political situation remained constant between the years of 1990 and 1995, there is no negative effect on the analysis. The phenomenon under investigation is a cumulative process, which is unlikely to exhibit marked inter-annual fl uctuations, therefore making it fairly easy to derive an estimate for changes between 1991 and 1996 using the linear trend interpolation method. The estimated values were obtained using a numerical technique in which the observed values from the GIS for the fi ve time periods were assigned to trend formulas. The trend formulas were then used to estimate the yearly values. The goodness of fi t of the trend formulas was found to exceed 0.90. Figure 2 illustrates the actual and estimated total Palestinian net built-up area in the West Bank.

LandWaterMed network144
The analysis showed that the Palestinian built-up area continued to increase during the period of 1989 – 2000. The trend chart indicates that the urban development in the 1990s has gone through two main phases of change. These two phases comprise the two time periods, 1990 – 1995 and 1995 – 2000. It should be noted that it was not until 1995 that the Palestinian National Authority (PNA) started controlling major parts of the Palestinian urban areas.
The linear trend line indicates that total urban development grew at approximately 5632 dunums/year between years 1990 and 1995 and then accelerated after 1995 with 8888 dunums/year until the year 2000. This trend observed between the years 1995 and 2000 for the West Bank was expected, due to the fact that the PNA has allowed development in the territories under its jurisdiction, and the economic situation was conducive to urban growth. The trend observed indicates that urban development is directly affected by the political situation which infl uences economic growth and the land development process. By making Palestinian development in areas B and C diffi cult, if not impossible, the political situation has played a great role in forcing the Palestinian built-up area expansion in areas (A) where Palestinians have relative control over the land. Figure 3 shows the impact of geopolitical divisions (e.g. Areas A, B and C) on the development of Palestinian communities. Historical change in urban fabric in the West Bank is shown in map 4.
Figure 2: Urban trend of total actual and estimated Palestinian built-up area in the West Bank
Figure 3: Built-up area development in Areas A, B and C

Isaac J, Saad S. 145
• Israeli Settlements
Settlements were delineated from year 1989 to 2000 and year 2003. The analysis showed that the Israeli settlements established on the West Bank lands have continued to expand throughout the period. This expansion occurred in a form of clusters on the account of the available fertile and valuable agricultural areas of the West Bank. Figure 4 shows the total area of Israeli settlements in dunums by Governorate as derived from the satellite images.
Map 4: Historical change in urban fabric in the West Bank

LandWaterMed network146
Figure 4: Estimated total area of Israeli settlements in dunums as derived from the time series analysis
Figure 5 illustrates the estimated annual increase in the Israeli settlement area in the West Bank Governorates from 1989 to 2003. The continuously accelerating rate of expansion after the establishment of the PNA is clearly evident. For example, an annual expansion of 885, 291, 603, 879, 742, 857, 409 and 186 dunums/year occurred in the Bethlehem, Jenin, Jericho, Nablus, Qalqiliya, Salfi t, Tubas and Tulkarm Governorates respectively during the period of 1997-2003. Thus, the total average annual increase in the Israeli settlements area was about 7090 dunums/year in the period before the Palestinian Authority, while it increased to approximately 7239 dunums/year after the establishment of the PNA.
Figure 5: Annual increase of the Israeli settlements in the West Bank Governorates in dunums
• Impact of the Israeli activities in the West Bank
The construction of Israeli settlements in the different parts of the West Bank affected most Palestinian communities and their surrounding agricultural lands and open spaces. Settlement expansion also affected the Palestinian environment as well as the ecological resources. Palestinian lands were confi scated for building or expanding Israeli settlements, outposts and bypass roads. Therefore, urban expansion associated with the encroachment on agricultural and grazing land created additional pressure on the environment and natural resources and limited the possibilities for sustainable development.
The percentages of change (increase rate) for the Palestinian urban growth trend and for the Israeli settlements expansion trend in the West Bank Governorates between 1989 and 2000 as derived from the LANDSAT time series images are shown in Figure 6. The data showed that the change in Palestinian built-up area and the expansion of Israeli settlements in the Jerusalem Governorate from 1989 to 2000 occurred at the same pace of approximately 110%. However, the Governorates of Bethlehem, Jenin, Nablus, Tubas and Tulkarm experienced an accelerating percentage of change through the expansion of Israeli settlements between years 1989 and 2000 with 191%, 226%, 228%, 197% and 192%, respectively. On the other hand, the data reveals that Ramallah and Salfi t experienced the highest percentage of change of Palestinian built-up area with 212% and 217% respectively.

Isaac J, Saad S. 147
Figure 6: Percentage of change for Palestinian net built-up area and Israeli settlements
total area urban trends from year 1989 to 2000 by Governorate
The analysis of LANDSAT images for the years 1989, 1997 and 2000 in addition to the IKONOS Satellite image for the year 2002 showed variation in the total cultivated areas, on both the level of the individual Governorates and the entire West Bank. It was found that the variation in the total cultivated lands from 1989 until 2000 was mainly for fi eld crop cultivation while for the period from 2000 until 2002, the main variation was for fruit trees. The differences in the total cultivated areas for the years 1989 (2032.8 km2), 1997 (2200.6 km2) and 2000 (2147.4 km2) ranged from 2.5 – 8% due to the cropping rotations, especially for the dryland fi eld crops and vegetables (land cultivation for the fi rst year with fi eld crops, the second year with summer crops and third year as fallow land); changes in the cultivated areas of non-permanent crops and the accuracy of the analysis reached only up to 80%.
However, the decrease in total cultivated areas from year 2000 to 2002 reached up to 3.4%, which is considered to be within the normal rate of change. The reduction, however, was mainly a result of Israeli activities affecting the Palestinian agricultural lands, as 1.44 million trees were uprooted from the West Bank (between 2000 and 2002) with total area of 138 thousand dunums. It is worth mentioning that the analysis revealed that the West Bank has also lost 5% (almost 3281 dunums) of its forest area between 1989 and 2000. This loss occurred mainly in the Bethlehem, Jerusalem, Nablus, Ramallah and Tubas Governorates, see fi gure 7. Most of this loss is due to the Israeli Government’s policy of land confi scation, the clearing of agricultural land and the deforestation of forested areas in order to establish new settlements or expand existing ones. The Jerusalem and Bethlehem Governorates have lost about a quarter of their forested area (e.g. 25% and 28% respectively) in the period of 1989 to 2000. Of particular signifi cance is the case of the Har Homa settlement, established in 1997 on Abu Ghunaim Mountain in the north of Bethlehem Governorate. The mountain had previously been designated as a forested nature reserve by the Israeli authorities, but was deforested to build the settlement (see photo 1).
Figure 7: Percentage of lost forest as derived from the land cover analysis

LandWaterMed network148
Photo 1: Abu Ghunaim mountain – Har Huma settlement
Case studies
IKONOS and SPOT 5 satellite images from different years were also used to detect dynamic changes in the urban fabric and landscape as a result of Israeli activities in Gaza Strip and in Qalqiliya city.
• Gaza
Since the beginning of the occupation in 1967, Israel has either confi scated or declared as closed, areas comprising over 25% of the Gaza Strip, thereby placing those areas out of Palestinian reach. Presently, there are 26 Israeli settlements in the Gaza Strip housing an estimated 8000 Israeli settlers, (ARIJ database, 2003). Most of these settlements are found in the southwestern and northern part of the Gaza Strip adjacent to the Mediterranean coast, see map 5.
According to land use classifi cations of the settlements in the Gaza Strip, it is possible to detect patterns of settlement expansion in Gaza. These land use classifi cations include new settlement outposts as well as residential, agricultural, industrial and security areas. The total area controlled by Israel in Gaza Strip is 116.7 km² which comprises about 32.2 % of Gaza’s total area. The area controlled consists of Israeli settlement area including built up areas, security zones, military installations and bases, buffer zones and yellow areas. Such areas often overlap; therefore, the total area controlled (116.7 km²) is not the sum of the areas detailed in table 3. Map 5 illustrates the overlap between Israeli areas in the Gaza Strip.
About 8000 Israeli settlers occupy 116.7 square kilometers (overlapped) of the total area of 362.7 km², whereas 1,389,789 Palestinians (http://www.pcbs.org/populati/demd4.aspx) reside in the remaining 246 km² with a built-up area of only 76.5 km² (ARIJ database, 2004) The Palestinian population density of 5650 capita/km² of the area controlled by the Palestinians is therefore 82 times greater than that of Israeli population density of 68.6 capita/km² of the area controlled by Israel. The Palestinian density gets even higher when computing population density as the total population over only the built up area. When this computation is made the population density reaches 18167.2 capita/km2. Hence, Palestinians in the Gaza Strip live in scattered, separated and overcrowded areas with limited access to natural resources. There is also very little open space to absorb future growth of the Palestinian population.
The dynamic change in the spatial structure of the urban area in Gaza was studied using time series of 2001 IKONOS and 2003, 2004 SPOT 5 satellite images. In particular, the size and location of shaved areas were analyzed. It is noticed that the area shaved had increased dramatically after the beginning of the second Intifada where massive devastation of agricultural lands, uprooting of trees and home demolition are committed by Israeli forces. Map 6 compares the area of shaved lands in the northern part of Gaza in 1999, 2001, 2003 and 2004. Table 4 shows land areas shaved in each Palestinian Governorate in Gaza between 2003 and 2004 (ARIJ database, 2004).
Table 3: Areas controlled by Israel in Gaza Strip in km2
Source: ARIJ database, 2000
Israeli Settlement area 53.7
Israeli Settlement , year 2004 28.4
Israeli Military Base, year 2004 2.14
Israeli security zone 58.04
Israeli Military Installation Areas 2.418
Yellow Areas 15.8

Isaac J, Saad S. 149
Table 4: land areas shaved in Gaza between 2003 and 2004 by Governorate in dunums
Governorate 2003 Shaving 2004 Shaving Increase Increase %
Rafah 2217 3458 1241 56%
Khan Yunis 3115 5473 2358 76%
Dier Al-Balah 2496 4070 1574 63%
Gaza 3836 12138 8302 216%
Jabalyia 7483 17475 9992 134%
Total 19147 42614 23467 123%
A large number of houses were demolished in the southern Gaza city of Rafah during the month of May 2004 (see map 7 for the location of demolitions). A report issued by the United Nations Relief and Works Agency for Palestinian Refugees (UNRWA) listed 45 buildings, housing a 360 families (575 individuals) that were demolished between 18 and 24 May, 2004.
Israel also constructed a concrete Separation Wall along the Israeli controlled border between Rafah and Egypt. The wall stretches for a length of 7 Km and reaches a height of 8 meters. It is similar to the wall that Israel is building in the West Bank, see map 8. The construction of the wall in Rafah entailed the expropriation and destruction of Palestinian land and private properties , including the uprooting of thousands of fruitful trees (mainly citrus and banana) and the destruction of a number of plastic houses.
Map 5: Geopolitical map of Gaza Strip 2003

LandWaterMed network150
Map 6: Time series satellite images for years 1999, 2001, 2003 and 2004 showing the shaving of land in the northern part of Gaza Strip
Map 7: Locations of house demolitions southern Gaza Strip

Isaac J, Saad S. 151
• Qalqiliya City
Qalqiliya is located in the northwest West Bank. It is the smallest Palestinian Governorate. Following the seizure of the West bank in 1967, Israel began to construct settlements around Qalqilya, eventually encircling the city with 17 Israeli colonies. The settlements form a buffer between the city and the surrounding villages on one hand, and between the Governorate and the rest of the West Bank on the other. The closest settlements to the city center are Alfeh Menashe, Tsofi m, Tsuregal, Yirhav and Ariel (the biggest settlement in the West Bank).
The separation wall around the city of Qalqiliya takes the form of a concrete wall with a height of 6 to 8 meters and is punctuated by armored sniper towers every 200 meters. The wall completely surrounds the city, leaving only one entrance/exit east of the city. Large areas of agricultural lands around Qalqiliya have been isolated by the wall making it increasingly diffi cult for villagers to access their agricultural lands, market their agricultural products or to reach their work in the main city. The dynamic change in Qalqiliya’s landscape due to the construction of the separation wall can be noticed from the two IKONOS satellite images for 2002 and 2004, see map 9.
Map 8: Concrete Separation Wall along the border with Egypt

LandWaterMed network152
Map 9: Qalqiliya city in 2002 and in 2004
Conclusion
Over the past 14 years, there has been signifi cant urban expansion in the West Bank Governorates. Within the defi ned target area of the West Bank, the area of urban land use has more than doubled, increasing from 1.1% of the total land coverage to 2.6% (an expansion of 133%). Such an observed phenomenon indicates that the demand for new urban development is high in the Palestinian territories. Nevertheless, given the upgrading of urban infrastructure needed to accommodate the new development if not well managed, this growth is likely to cause many problems in the future. Therefore, more focus on urban planning and management is needed to accommodate the expected future development.
The fi ndings, as analyzed from satellite LANDSAT and IKONOS images, indicate that there have been two phases of urban development in the West Bank, from 1990 to 1995 and from 1995 to 2000. The second phase was characterized by a boost in the rate of urban growth. The reason for this transition is believed to be the limited autonomy which the Palestinians have exercised since 1995. This is the fi rst time Palestinians have been able to control part of their own land in more than 30 years. This would suggest that the major factor affecting the recent urban development in Palestine is the political situation.
The political situation has had, and continues to have, a major infl uence on urban development in the West Bank and Gaza Strip. Israeli actions have been highly signifi cant. Furthermore, Israeli control over large parts of the Occupied Territories (Area C, and in certain matters, Area B) has limited integrated planning throughout the region, and the formulation and implementation of comprehensive developmental plans. The instability of political conditions and intermittent political crises has aggravated the situation resulting from this lack of planning.
This paper has depicted the trends of Israeli activities in the West Bank and Gaza Strip. Utilising very signifi cant parts of the Palestinian open space and natural resources, this actions have of course an effect on the Palestinian communities and the integrity of the Palestinian land. Moreover, the fi ndings indicate that the growth rate in expanding Israeli settlements has increased since the year 1995. In the year 2003, Israeli settlements covered about 4% of the total West Bank area where the total area controlled by Israel in Gaza Strip comprises about 45 % of Gaza’s total area.

Isaac J, Saad S. 153
References
Applied Research Institute – Jerusalem (ARIJ) “Database, 2000”
Applied Research Institute – Jerusalem (ARIJ) “Database, 2002”
Applied Research Institute – Jerusalem (ARIJ). “Database, 2003”
Applied Research Institute – Jerusalem (ARIJ). “Database, 2004”
Palestinian Central Bureau of Statistics (PCBS) (2003), “Statistical Abstract of Palestine No. (4)”, November, Ramallah.
Rishmawi, K., (2001), “Burned Area and Fire Severity Mapping on the Mediterranean Island of Thasos Using Landsat TM and IKONOS Images”. Chania: Greece.
UNIDIR (1999), “The Potential Uses of Commercial Satellite Imagery in the Middle Easf’, Workshop Report

LandWaterMed network154

Spiteri A., De Ketelaere D. 155
Strategies and Tools for Stakeholders and Endusers: A Learning Curve in Progress
Anna SPITERI and Dirk DE KETELAERE
Integrated Resources Management (IRM) Co. Ltd.21, Victory Street, Senglea CSP 06, Malta
Tel 00356.21891340 Fax 00356.21676152 e-mail [email protected]
Abstract: The paper examines how to shift the emphasis in research projects, from ‘academic’ on the shelf results, to useful ‘hands on’ results that could be immediately taken up by stakeholders and endusers alike. A detailed outline is presented on how the SAGE (1992) methodology, which is focused on water resources, can be extended to cater for the planning and management of all environmental resources. Crucial to the topic of this paper, the approach shows how to effectively take into consideration the role and attitude among different stakeholders, their respective interests, actions and also their perceptions towards the environment. The paper describes how the initial experience gained in a previously completed INCO research project, RESMANMED is used to guide direct contacts – through individual meetings and joint workshops - with stakeholders and endusers from the very start of two further INCO research projects, COLASU and OPTIMA.
Introduction
The issue of making the results of research projects effective and useful is at the present time rightly reaching critical awareness especially with the great emphasis put on stakeholder and enduser involvement in EU sponsored research projects. IRMCo has for several years been attempting to develop methodologies and tools that would shift the emphasis from ‘academic’ on the shelf results, to useful ‘hands on’ results that could be taken up immediately by stakeholders and endusers alike.
This paper describes IRMCo’s ongoing learning curve, a process which started from its fi rst INCO project in 1997, and is continuing with two other INCO projects, one which started in 2002, and the most recent starting in 2004. What the three projects have in common is that they are developed (or projected to be developed) in a GIS environment and they each address the stakeholder issue, be it at varying and increasing degrees of their involvement. Moreover, a thorough understanding of existing policies and environmental laws in the countries of study is also a common denominator. The latter with the objective to better allow the drawing up of effective guidelines and recommendations. In the fi rst INCO project, RESMANMED(1), IRMCo explored and adapted the SAGE methodology.
The SAGE Methodology
The ‘Schéma d’Aménagement et de Gestion des Eaux’ (SAGE) developed in France in 1992, offered a new planning and management approach to water resources and their use, based on the concept of decentralisation. Its innovative character, when fi rst published, lay with the emphasis on a process of extensive dialogue among legislators, planners and endusers.
This methodology was fi rst applied by IRMCo in RESMANMED (1997-200), and focused on the special fragility associated with coastal karst environments. In this project, a logical step-by-step application of the SAGE philosophy was introduced towards the end of the project in relation to the special vulnerability of the karst island of Gozo.

LandWaterMed network156
In this project, the initial diagnosis of the state and use of the Island’s resources was coupled with the outcome of a role and attitude survey among the different actors, aiming to analyse their respective interests, actions and also their perceptions towards the environment. Since the RESMANMED project is completed, it is here more thoroughly described.
Objectives of the RESMANMED research: Gozo Case Study
Gozo, the second largest island in the Maltese archipelago with a surface area of just over 65 square kilometers, was selected as one of three study areas for the EU sponsored INCO-DC research project on ‘Resource Management in Karstic Areas of the Coastal Regions of the Mediterranean’.
The main objectives of the research were:
• to produce an inventory of environmental resources for selected coastal karst regions in Malta, Turkey and Lebanon;
• to identify the institutional structures in these countries and to evaluate existing policies for resources management;
• to devise and validate integrative methodologies using information management tools such as GIS and remote sensing ;
• and fi nally to formulate sustainable resource management strategies that can be used to respond effectively to identifi ed development needs.
Each of these objectives must be seen in relation to the specifi c conditions and requirements posed by a karst environment, whereby the term karst refers to the landscape associated with Mediterranean karst terrains, the guarigue and maquis habitats, the unique solution subsidence features such as caves, sinkholes and dolines as well as to the ability of karst aquifers to store vast quantities of freshwater. It is generally accepted that karst environments are very fragile and therefore merit special attention in relation to any form of human activities.
Application of the SAGE philosophy
It is worthwhile to start with a review of the various requirements necessary for a correct implementation of the SAGE philosophy to meet the targets that were set for the Gozo Case Study. The philosophy was developed in relation to a single resource only: water and its use. Clearly, this needed to be extended in the RESMANMED project to cater for the whole range of environmental resources, i.e. water, soils, forestry, biodiversity, karst heritage and their respective uses.
Secondly, as can be expected, SAGE defi nes the hydrological basin as the basic territorial reference unit. The precise perimeter of the so-called Local Water Commissions is then further refi ned through the identifi cation for example of smaller catchment areas with specifi c, common characteristics, diffi culties and needs. Although an in-depth discussion on the selection criteria for the “optimum” size and boundaries of these local commissions is beyond the scope of the present paper, it follows that a similar, “suitable” territorial reference unit was needed for the Gozo Case Study. Here, the term “suitable” translates into the requirement for these territorial reference units to be truly representative of a coastal karst environment.
The innovative character of SAGE lies with the incorporation of a process of extensive dialogue among decision-makers, planners and end-user groups. Each of these so-called “actors” is represented in the local commissions, which are then responsible for the elaboration and implementation of a local water planning and management scheme. Until these commissions are actually formed and operational, SAGE recommends the preparation of a preliminary planning and management scheme by an informal steering group, whose additional task is to create favourable conditions for the eventual introduction of the methodology. The latter observation provided a most interesting starting point for the adaptation and extension of the step-by-step approach described below.
A step-by-step approach
The logical sequence provided by SAGE, shown in Table 1, has been maintained with a single adaptation: water is replaced by all environmental resources.

Spiteri A., De Ketelaere D. 157
Table 1: Logical sequence provided by SAGE (1992)
Step 1 State and use of environmental resources
Step 2 Global diagnostic
Step 3 Trends and scenarios
Step 4 Selection of strategy
Step 5 Outputs
Step 6 Final validation
Step 1 State and use of environmental resources
The fi rst step essentially translates into a data collection exercise and was started with the drawing up of a comprehensive list of parameters that can be used to describe both the state and use of the environmental resources. As an example, information on the geology includes an appraisal of the quality of the different limestone formations as a construction material such as gravel or building stone. Existing limestone quarries are identifi ed, together with their depth of excavation / elevation above the groundwater table. Socio-economic data such as the volume and rate of production and the number of employees are also needed. It proved most useful to also keep track of the source of the data collected (e.g. map, fi eld survey, aerial photograph); the scale; as well as to store an indicator for the quality of the data (based on age, completeness and reliability). This fi rst step permitted the production of an atlas of environmental resource state and use maps.
Step 2 Global diagnostic
This step involves a two-fold diagnosis. The maps originating from the previous step facilitated a detailed compatibility analysis, i.e. a comparison of the adequacy of the present use of the various resources with their capacity to sustain such use. In many cases, it was possible to establish a direct link between past human activities and the ‘condition’ of the resources today. Centuries’ old rubble walls, delineating fi eld boundaries but more importantly providing adequate terracing, have been ill-maintained in the recent past, which could be easily demonstrated by superimposing the present day soil erosion map.
In parallel to the above diagnosis, another type of diagnosis is carried out, the so-called diagnosis of the axis “actors”. The objective is to identify the role and attitude of the different stakeholders, facilitated through the use of two different matrices or spreadsheets. In the fi rst matrix, shown in Table 2, eleven actors (public entities, local residents, farmers, developers, environmental researchers etc.) which are relevant to the Gozo Case Study have been listed in the same order in both horizontal and vertical direction. For each combination of two actors, i.e. for each cell in the matrix except the diagonal, it is marked whether their respective actions present either synergy, marked “+” or confl ict “-” of interest. A neutral position is marked “0”. Not surprisingly, it proved extremely diffi cult to assign such marks without referring to a particular type of development and its associated impacts. For this reason, as described further below, the actual use of this fi rst matrix was found to be more relevant at a later stage.
In a second matrix, shown in Table 3, the actors are again listed in the same order in the vertical direction. The horizontal direction however, is now reserved to indicate whether their respective actions or interests represent an attitude of conservation or one of aggression towards the environmental resources. This was achieved by repeating this question in relation to actions that concern the protection of the resource through protective measures, the use of the resource for recreation, overexploitation of the resource, the generation of pollution and (as the most aggressive type of action) the alteration of the environmental resources.
Several classes were introduced for the fi lling of this matrix, ranging from very weak to very strong. For this second type of matrix, it can be easily understood that it proved necessary to build a matrix for each of type of resource as well as in relation to a particular development.

LandWaterMed network158T
able
2 :
The
mat
rix
acto
rs -
acto
rs
Past
/Pre
sent
Situ
atio
n o
f En
viro
nm
enta
l R
esourc
es
A
cto
rs
Act
ors
Pla
nn
ing
A
uth
ori
tyO
ther
Pu
bli
c En
titi
es
Lo
cal
cou
nci
lsM
TA
1H
CEB
2Lo
cal
resi
den
tsT
ou
rist
sFarm
ers
Develo
pers
Leis
ure
In
du
stry
En
vir
on
mR
ese
arc
hN
GO
s
Plan
nin
g A
uth
ori
ty
Oth
er P
ublic
Enti
ties
Loca
l C
ounci
ls
MT
A1
HC
EB2
Loca
l re
siden
ts
Touri
sts
Farm
ers
Dev
eloper
s
Leis
ure
Indust
ry
Envi
ronm
enta
l R
esea
rcher
s
NG
Os
Stro
ngly
Conve
rgen
t =
+ +
St
rongly
Confl
icti
ng =
-
-C
onve
rgen
t =
+
C
onfl
icti
ng =
-
Neu
tral
=
0
N
ot
Consu
lted
=
?
MT
A1 =
Mal
ta T
ouri
sm A
uth
ori
tyH
CEB
2 =
Hote
ls a
nd C
ater
ing E
stab
lishm
ent
Boar
d

Spiteri A., De Ketelaere D. 159
Ressource :
PROTECTIVE AGRESSIVE
Actions
Actors
Resource protection measures
Use of resource for recreation
Over exploitation of resource
Pollution generation
Alteration of environmental resource
Planning Authority
Other Public Entities
Local councils
MTA1
HCEB2
Local residents
Tourists
Farmers
Developers
Leisure Industry
Environmental Researchers
NGO’s
MTA1 = Malta Tourism Authority HCEB2 = Hotels and Catering Establishment Board
Table 3: The matrix actors - actions
Step 3 Trends and scenarios
The analysis of trends and the drawing up of, intentionally chosen, very contrasting scenarios provides the next logical step. In the SAGE philosophy, this particular step is designed to provide essential information for the next two steps, i.e. the selection of strategy and the formulation of guidelines. In the strict sense, the application of this step depends on the availability of historical records, i.e. it requires the availability of time series of the data collected during the fi rst step. Obvious scenarios would then make use of an extrapolation of any trends that are noticed. The collection of all data related to the present already amounted to a mammoth task, since very few of the data information requirements proved readily available. Hence, both time and fi nancial constraints did not permit to cater for an analysis of trends. To overcome this diffi culty, it was decided to adopt the following alternative approach.
By selecting a few, major developments carried out in the recent past, it was possible to assess the impact of these specifi c developments on the different resources. Even more importantly, it became possible to fi ll in the matrices described above.
The very rapid urbanization witnessed during the past 15 years of Xlendi village has been driven by a demand for tourist accommodation during the summer period. The village is equally popular with Maltese holidaymakers and hence the village has been growing at an exponential rate. There are virtually no local residents, giving the out-of-season visitor the impression of entering a ghost town. The urban extension has occurred to a large extent along the roads leading into the village, providing a linear development pattern. Due to the local topography, fi rst roads and today also houses have been built along one of the island’s most scenic valleys. Another development, Fort Chambray, one the island’s unique historical monuments, is the object of a controversial conversion into a major hotel resort.

LandWaterMed network160
In both instances, the impact on the environmental resources can be visually assessed, and these developments therefore present a strong case for current development application procedures to be reviewed. Naturally, this is easier said than done, but this is precisely where the SAGE philosophy offers an innovative approach, which can be tested in the following manner. A different type of scenario is created, in which one group of actors, and their interests, is given priority over other group of actors. In this type of scenario, it is evident how existing trends could even be reversed, at least hypothetically. However, the approach does offer an immediate insight in novel ways how to reach an acceptable equilibrium between the need for development and the need for conservation. To demonstrate this, two future development scenarios were analysed from the diagnosis of the ‘actors’ point of view. The fi rst concerned the continued expansion of Xlendi village for the next 10 years, while a second scenario dealt with the much debated idea to construct an airport on the island of Gozo.
Step 4 Selection of strategy
The selection of an appropriate strategy concerns foremost the reaching of a consensus among the representatives of the various stakeholders on so-called “collective objectives”. These are formulated and illustrated through the use of several “indicators”, which can be quantitative or qualitative. Generally, these indicators are defi ned around three inter-related themes: 1) resource conservation, 2) resource use optimization and 3) land use planning. Further research on the Gozo Case Study has been focused on the identifi cation of such indicators. Using the present situation as a reference basis, the potential future development scenarios could be assessed both quantitatively and qualitatively. A set of resource impact maps that would result from these future development scenarios provide a visual aid, a most useful means to explain the overall methodology and hence a signifi cant contribution towards gaining the acceptance and eventual implementation of the new approach.
Step 5 Outputs
The most important output is to arrive at the formulation of guidelines concerning land use planning, agricultural practices, heritage conservation, etc. that are compatible with the collective objectives defi ned in the previous step. The application of the SAGE philosophy in this respect led to the formulation of “optimum response strategies”, based on the lessons learned from previous ‘mistakes’ and also on the basis of what can be envisaged to result from the scenarios that were selected earlier.
Step 6 Final validation
As for any good project management, outputs need to be thoroughly tested, hence the essential inclusion of a “fi nal validation” step. In the context of the present research, the study has led to the production of an operational, GIS based tool for the planning and management of the environmental resources for the Island of Gozo. Its use is designed to cater for these needs at a regional scale, it is not intended to replace the requirements of a site-specifi c Environmental Impact Assessment. Most importantly, the production of an atlas of maps depicting the state and use of the various resources as well as the production of resource impact maps associated with carefully selected development scenarios, provide an essential visual aid to assist in the creation of a favourable “atmosphere” that is needed to gain the understanding and acceptance of the methodology by all stakeholders.
Conclusions for the RESMANMED project
The adaptation and application of the SAGE philosophy as a novel approach for a better planning and management of the environmental resources for the Island of Gozo, has already resulted in tangible progress. The compilation of data on the state and use of all environmental resources, including socio-economic data, into one single coherent GIS has led to new insights about environmental resource relationships and resource interdependencies. Moreover, the additional consideration of the perception of the local actors towards their environment, their soils, their valleys and their heritage, has offered a novel form to assess whether our actions today are compatible with the needs of tomorrow’s generations.

Spiteri A., De Ketelaere D. 161
The ongoing COLASU research project
The second INCO research project, COLASU(2), is focused on studying the pollution and sustainable development of two lagoons, El Meleh in Tunisia and Nador in Morocco.
El Meleh lagoon is located on the Tunis gulf at about 4 km to the north of Soliman town. It is 3 km long and 1 km wide with a surface area of 200 ha. The natural hydraulic feed of the lagoon is derived from precipitation (457 mm/year), streams (oued El Bey), seawater and groundwater (Oued El Bey and Said phreatic waters). There is also an artifi cial input by direct discharge of treated waters of the Soliman wastewater treatment station (the discharge reaches 3000 m3/day). The lagoon system presents three geomorphological landscapes, a bar of coastal dunes, a coastal plain and a consolidated bar near Soliman.
Nador lagoon is located on the Moroccan eastern coast. It is a restricted lagoon of 115 km2 (25 by 7.5 km) and with a depth not exceeding 8m.The island barrier is 25 km large with an average width of 300-400m (it can come up to 2 km in some parts) and is cut by an artifi cial inlet. The lagoon is nourished by several tributaries which are used today for the sewer discharge of the upstream built-up areas. There are 3 urban clusters in the surroundings and 2 saline workings on the banks of the lagoon. There is also an important fi sh farm.
In this project, IRMCo, who are the scientifi c coordinators, have from the very start, in July 2002, made it an area of priority and concern to have direct contact with the relevant stakeholders and potential end-users. Indeed the aspect of stakeholder involvement is always put foremost on the agenda of every coordination meeting. This is done with a longer-term view to defi ne the issues relevant to the sustainable management of the lagoons in active, direct consultation with them.
One of the fi rst tasks of the relevant partners was to draw up an inventory of the institutions and organizations that have a direct or indirect involvement in the management of the respective lagoons. The partners also obtained letters of interest which augured well for the project from the very beginning. A year into the project, IRMCo succeeded to have individual meetings with 10 of the stakeholders in Tunisia through the active assistance of the Tunisian partner. These meetings served to discuss the progress of the project and to invite the stakeholders to a joint, interactive workshop in December 2004. These visits were followed up with an invitation letter a month later.
The aim of the workshop is to give an opportunity to all the relevant stakeholders to come together to review the progress of the project, to give their feedback and to enable IRMCo to tackle the task of formulating ‘optimum response guidelines’ for the sustainable management of the lagoons, which in themselves are a Deliverable in the COLASU project.
IRMCo are presently working on developing a specifi c design of the workshop layout that will channel feedback from the stakeholders that can be directly translated into the guidelines.
Guiding a Workshop for Stakeholders and Endusers
At this preliminary phase of the workshop preparation some fundamental questions are being explored.
How to draw up the workshop format? Are presentations alternating with round table discussions the right approach? How to establish what resources are available to the stakeholders to solve the problem? Do the stakeholders consider existing policies and legislation to be adequate?
Do we use the type of matrices that we used in RESMANMED to ascertain the confl icts of interests that relate to the growing tourist village of Soliman Plage and its seasonal wastewater overload. (By the time of the Workshop the fi nal report of the Life Cycle Assessment (LCA) of the wastewater treatement station near El Meleh should be completed).
What must be done to ensure that after the workshop the stakeholders will use the results of the study? What must be done to encourage stakeholders to consult the tools (LCA) available with the Tunisian partner of the project after the project?

OPTIMA
The lessons learned so far from RESMANMED and from Colasu will be further explored in our third INCO project, titled OPTIMA(3), which deals with the optimization of sustainable water resources. In this project IRMCo contributes for the fi rst time with a specifi c workpackage on stakeholder involvement, placing emphasis on a Participatory Strategic Approach, that targets the creation of tools which the stakeholders can relate to and are therefore willing to adopt through demonstration of the various geomantic technologies.
To this effect, IRMCo has been assigned with a lead-role towards the development of a Guidebook for local stakeholder participation and dissemination, as well as the organization of a regional end-user conference towards the end of the projects, to be held in Malta.
The fi rst task of IRMCo is to make a detailed study of the many physical, social, political, and economical conditions that can limit or hinder the success of the project.
In OPTIMA, the intention is to go a few steps further than in the previous two projects and explore the meaning of developing a Strategic Participatory Approach. It is understood from literature that Participatory Approaches or so-called Learner-Centered Approaches in adult training developed in parallel to the evolution towards a knowledge system perspective. ‘”While traditional teaching methods, e.g. didactic teaching, emphasized the transfer of knowledge, messages or content-pre-selected by outside specialists, participatory training focuses more on the development of the human capacities, the stakeholders or endusers themselves to assess, choose, plan, create, organize and take initiative (SRINIVASAN, 1993).
A new related task in OPTIMA is the implementation of a Marketing Plan of how to reach the stakeholders and endusers effectively. A new area of research will have to be explored and adapted and a new discipline, that of cognitive science would have to be brought in the project. Thus the language and the colours used for example for specifi c products, like maps, would also be given due importance.
Conclusion
IRMCo envisages that by documenting this learning curve in progress, the step-by-step guidelines that may emerge would be of valuable use also to other research projects in the Mediterranean.
Acknowledgements
The fi nancial support received from the European Commission to the INCO projects listed below is gratefully acknowledged.
References
(1) RESMANMED: Resource management in karstic areas of the coastal regions of the Mediterranean, INCO-DC Project (1997-2000) Contract no. ERBIC18CT970151
(2) COLASU: Sustainability of Mediterranean coastal lagoon ecosystems under semi-arid climate, INCO-Med Project (2002-2005) Contract no. ICA3-CT-2002-10012
(3) OPTIMA: Optimisation of sustainable water resources in the Mediterranean, FP6 INCO-Med Project (2004-2007) Contract no. INCO-CT-2004-509091
ResManMed (1997-2000) - Interim and Final Reports on the INCO-DC project ERBIC18CT970151, Resource Management in Karstic Areas of Coastal Regions of the Mediterranean, unpublished.
SAGE (1992) - Schema d’Amenagement et de Gestion des Eaux, Guide Methodologique, Ministere de l’Environnement, Direction de l’Eau, Agences de l’Eau, Conseil Superieur de la Peche, Octobre 1992, pp. 91 + annexes
Srinivasan, R., (1993) - A spatial decision support system for assessing agricultural nonpoint source pollution. Water Resources Bulletin. AWRA, Vol.30, NO. 3: June 1994. pp 441-452.
LandWaterMed network162

Water and Watershed Management


Paracchini M.L., Vogt J. 165
Development of a pan-European database of rivers and catchments in support to the needs
of the EU environmental policies
Maria Luisa PARACCHINI and Juergen VOGT
EC Joint Research Centre, Institute for Environment and SustainabilitySoil and Waste Unit – TP 262, 21020 Ispra – ITALY
Abstract: the paper describes the methodology for deriving a pan-European river network and catchment database from a digital elevation model of 250 m resolution.In order to model channel initiation refl ecting the natural variability of drainage density over Europe a method for deriving a landscape stratifi cation has been defi ned, based on relief, climate, geology, soil and land cover.Different critical contributing areas have been calculated based on the relation between local slope and contributing area for the identifi ed landscape types.The river network was then derived from the DEM applying methods of morphological image analysis; in such a way spurious pits and anomalies in the original data interrupting the fl ow were removed, and river stretches from additional datasources were imposed on the DEM in cases where the automatically derived network was deviating substantially from reference datasets.Basins and sub-basins were delineated according to Strahler ordering and a pilot study was launched in order to apply the Pfafstetter coding to the whole database.
Keywords: digital elevation model, GIS, drainage network, landscape stratifi cation
Introduction
One of the main goals of the environmental policies of the European Union is to assess and monitor the state of the environment at the continental level. In order to fulfi l this goal European-wide spatial datasets with relevant information for assessing the state of the environment have been collected by the Services of the European Commission for over a decade. Among these a digital database on river networks, lakes and associated catchments and their characteristics has been developed by the Catchment Characterisation and Modelling project at the EC Joint Research Centre, Institute for Environment and Sustainability. This is provided in support of the environmental monitoring activities of the European Environment Agency and DG Environment, and more in general when the analysis of environmental pressures and their impact on water resources is needed.
Furthermore, with the adoption of the Water Framework Directive (2000/60/EC) the request to use GIS for handling environmental data has assumed a formal role. For the fi rst time, in fact, Member States are explicitly asked to provide data in a GIS compatible format.

LandWaterMed network166
Study Area and Data
The area covered in this study extends from Scandinavia to the Mediterranean and from Portugal to 38 degrees Longitude East (fi g.1). Given its extension (11.2 million square kilometres) automatic mapping tools had to be derived and readily available input data covering the entire area had to be sought.
The following data layers were used in the frame of this study:
��Digital Elevation Models (DEMs), at spatial resolutions varying from 100 to 250 metres and mosaicked in order to cover the EU and Accession Countries; in areas where a medium resolution DEM could not be collected (e.g., Iceland, Russia) data from the HYDRO1K at 1000 m resolution were used (see fi g.1).
��The land use/land cover database for Europe, CORINE Land Cover data (Eurostat-GISCO), in grid format with a resolution of 250 meters. In areas where CORINE LC data were not available, they were complemented by IGBP land cover data (1km resolution) and PELCOM data (1 km resolution).
��Daily meteorological data from the European database of the MARS project (Monitoring Agriculture from Remote Sensing), which are available on a 50 km grid for the period 1975-1999 (Van der Voet et al. 1994, Terres 2000).
��Soil data, including information on the geology, from the European Soil Database (ESBSC 1998).
Figure 1: CCM study area and DEM coverage
Data from the Eurowaternet station network of the European Environmental Agency (Nixon et al. 1998, Boschet et al. 2000), the Bartholomew river network at 1:1,000,000 scale and detailed river networks for a few sample catchments have been used for validation purposes (Colombo et al. 2001, Vogt et al. 2002a).

Paracchini M.L., Vogt J. 167
Drainage Network Extraction at a Continental Scale
• Landscape stratification
Studies that deal with the extraction of rivers from DEMs must fi rstly address the question of the location of the channel heads. At the fi eld scale related processes are very complex, in general terms they can be synthesized by the assumption that a channel head is located where linear fl uvial processes start to dominate over diffuse slope processes. This condition is met at different scales, depending on the prevailing geomorphic process, that means the drainage area necessary to start a channel varies according to local conditions (e.g., Dietrich and Dunne, 1993; Montgomery and Foufoula-Georgiou, 1993).
In the CCM project the challenge was to establish a methodology that refl ects the natural variability of drainage density within different environmental conditions throughout Europe. A way to address the problem is to prepare a landscape stratifi cation that refl ects the landscape aptitude to develop different drainage densities and assign a different critical contributing area to each one of the identifi ed landscape types.
Based on a literature survey, a set of fi ve variables describing climate, relief type, vegetation cover, soil transmissivity, and rock erodibility were selected as the most important factors determining drainage density (see Vogt et al. 2002a and Vogt et al. 2002b for more detailed discussions):
��Mean annual precipitation (1975 – 1999) was used as the climate indicator according to Moglen et al. (1998).
��The infl uence of the terrain morphology has been considered through the relative relief, defi ned as the maximum altitude difference in a moving window of 3 by 3 grid cells (Oguchi 1997, Roth et al. 1996).
��The percentage of surface covered by vegetation was used in the analysis due to its effect on critical shear stress and thus its control on channel initiation (Tucker et al. 1997, Foster et al. 1995). CORINE Land Cover data with a grid-cell size of 250 m were reclassifi ed into 14 classes and monthly cover percentages were assigned to each class according to the scheme derived for Europe by Kirkby (1999).
��As a proxy indicator of saturated soil hydraulic conductivity, soil texture has been chosen as the main soil factor affecting drainage density (e.g., Dietrich et al. 1992, Tucker and Bras 1998). Soil texture was derived from the European soil map (ESBSC 1998).
��From the European soil map the parent material corresponding to each soil mapping unit was extracted by deriving the dominant lithology. The rock erodibility was then calculated according to the scale proposed by Gisotti (1983).
Each variable has been classifi ed into three to seven classes and a Landscape Drainage Density Index (LDDI) has been derived from a weighted combination of these variables, using a multi-criteria evaluation technique (Fig.2).
Figure 2: Landscape stratification into six landscape drainage density index (LDDI) classes

LandWaterMed network168
• Definition of the critical contributing area
For each of the LDDI classes the critical contributing area could then be defi ned on the basis of the relationship between local slope and contributing area.
This is a possibility of addressing the problem, given the fact that at coarse grid resolution detailed geomorphic processes and channel initiation cannot be modelled. If values of local slope versus contributing area for each grid cell are plotted, a graph of the so-called scaling response can be determined (fi g.3), that correspond to changes in the dominance of the prevalent processes. Of particular importance at this regards is the point where dS/dA becomes stable, identifying the value of critical contributing area above which all points are channelised. Fig.3 shows the position of such a point in two graphs corresponding to two different landscape types.
Figure 3: Example plot of local slope versus contributing area. Note the logarithmic scale.
• Extraction of the river network
Once the thresholds for the critical contributing area are defi ned per landscape type, the drainage network can be extracted from the DEM by calculating the fl ow direction and fl ow accumulation matrices. This poses the problem of spurious pits interrupting the fl ow path. This problem has been solved by developing a new algorithm based on the concepts of morphological image analysis (Soille 1999). More precisely, each pit is suppressed by creating a descending path from it to the nearest point having a lower elevation value. This is achieved by carving, i.e. lowering down, the terrain elevations along the detected path (see Figure 4).
Figure 4: DEM processing by carving

Paracchini M.L., Vogt J. 169
Also the problem of fl at areas is handled within the same procedure. The developed al-gorithm is in fact suitable to an adaptive drainage enforcement; it consists in imposing on the DEM river networks coming from other sources only in places where the automatic river network extraction de-viates substantially from the reference datasets (Soille, 2002). In addition, priority queue data structures allow for an effi cient implementation of the algorithm, which in turn enables the processing of fi les such as the complete pan-European DEM. Details about the algorithm can be found in Soille (2002).
Lakes and lagoons are taken into account through a specifi c layer, which is based on CORINE Land Cover (CLC) data as well as other land cover data in areas where CLC data are not available. It is ensured that rivers fl ow along the centre line of the lakes. The derived drainage network is fully connected and hierarchically structured from the smallest tributary to the largest river fl owing into the sea. Basins and sub-basins are then delineated according to the surface morphology. A view on a subset of the resulting drainage network is shown in Figure 5.
The river and catchment database have been coded according to Strahler, but a way to assign a more “intelligent” type of coding has also been sought. The chosen coding procedure is the one proposed by Pfafstetter (Verdin and Verdin 1999). It was proposed as a means to obtain a unique numeric code at the level of each entity (e.g., river segment). The advantage of this coding is that it can be derived automatically from a consistent river network. Consequently, a user reading the Pfafstetter code of any segment can immediately understand the position of this segment in relation to other segments of the river network. Pfafstetter codes are based both on the area drained by a segment, and on the position of the segment within the network (Fig.6).
Figure 6: Example of coding according to Pfafstetter
Figure 5: European Drainage Network as derived by the CCM project

LandWaterMed network170
• Data Validation
A fi rst validation of the dataset is carried out through checking data topology and coherency, and against independent data sets.
With respect to the fi rst approach the most important data requirements are that the river network is fully connected, that connectivity is maintained through lakes, that lakes are represented by closed polygons, and that consistency exists between the different layers (i.e., rivers, lakes, coast and catchment boundaries and – in some cases – political boundaries).
Data validation against independent data sets is performed using existing European and national datasets, as well as a few large-scale datasets for selected drainage basins. The validation is implemented in two ways: through the assessment of the position of the river reaches by overlaying them to the reference datasets and evaluating their correspondence through buffers of varying size; and through the comparison of the calculated size of a sample of river basins with the offi cially reported size in the EC Eurowaternet database (more than 3000 basins). The results of this validation have shown that with reference to Eurowaternet data, 80% of the sub-catchments are mapped with an error (in the estimate of the drained area) smaller than 15% and that the river network is of high quality and corresponds to a mapping scale of roughly 1:500,000.
Conclusions
The methodology presented in this paper allows for the derivation of high quality pan-European datasets on river networks, lakes and associated catchments. By including a landscape stratifi cation, the developed algorithm allows to retrieve drainage networks reproducing the natural variation in drainage density. It has further been implemented with a fast and reliable algorithm based on the concepts of morphological image analysis. The speed of this algorithm allows for repeated calculations even for large areas such as the entire European continent. This is a major asset for implementing corrections after further validation steps.
In the current version, the LDDI is subdivided in only a few classes for practical reasons of deriving the critical contributing area. Further improvements of the methodology are, therefore, expected through the use of more drainage density classes or the implementation of a continuous LDDI.
Based on the underlying data on climate, vegetation cover, terrain, soils and geology, a fi rst set of characteristics will be calculated for each catchment in the hierarchical system. These can serve for further analysis and as proxy pressure indicators for the monitoring activities of the European Environment Agency (EEA) and the calculation of agri-environmental indicators.
The version 1.0 of the database is available through the website http://agrienv.jrc.it. A new version based on the recently available NASA SRTM DEM is under development and should be fi nished by the end of 2005.
References
BOSCHET, A.F., V. DE PAEPE, T.J. LACK (2000): Inland waters. Annual topic update.- European Environment Agency, Topic Report 1/2000, Luxembourg (Offi ce for Offi cial Publications of the European Communities) 30p.
COLOMBO, R., J.V. VOGT, F. BERTOLO (2001): Deriving drainage networks and catchment boundaries at the European scale. A new approach combining Digital Elevation Data and environmental characteristics.- Offi ce for Offi cial Publications of the European Communities, Luxembourg, EUR 19805 EN,. 58 p.
Dietrich, W. E., T. Dunne, 1993. The channel head, in: Channel network hydrology, ed. by K. Beven and M.J., Kirkby, pp. 175-219, Wiley Chichester.
DIETRICH, W.E., C.J. WILSON, D.R. MONTGOMERY, J. McKEAN, R. BAUER (1992): Erosion thresholds and land surface morphology.- Geology 20: 675-679.
ESBSC European Soil Bureau Scientifi c Committee (1998): Georeferenced soil data-base for Europe, Manual of Procedures.- EUR 16393 EN, CEC-JRC, Ispra, 184 p.
FOSTER, G.R., D.C. FLANAGAN, M.A. NEARING, L.J. LANE, L.M. RISSE, S.C. FINKNER (1995): Hillslope erosion component.- In: FLANAGAN, D. C., M. NEARING (Eds.): WEPP: USDA-Water Erosion Prediction Project: 11.1-11.12; NSERL Report No. 10, USDA ARS, Lafayette, IN.
GISOTTI, G. (1983): Geologia e Pedologia nell’assetto del territorio.- Bologna (Ed. Edagricole).
KIRKBY, M.J. (1999): Defi nition and practical demonstration of a pre-operational system for desertifi cation monitoring in the Mediterranean Basin based on remote sensing methods.- 1st Annual Report, MODEM Project, JRC-Space Applications Institute, Ispra (Va), Italy.

Paracchini M.L., Vogt J. 171
COLOMBO, R., J.V. VOGT, F. BERTOLO (2001): Deriving drainage networks and catchment boundaries at the European scale. A new approach combining Digital Elevation Data and environmental characteristics.- Offi ce for Offi cial Publications of the European Communities, Luxembourg, EUR 19805 EN,. 58 p.
Dietrich, W. E., T. Dunne, 1993. The channel head, in: Channel network hydrology, ed. by K. Beven and M.J., Kirkby, pp. 175-219, Wiley Chichester.
DIETRICH, W.E., C.J. WILSON, D.R. MONTGOMERY, J. McKEAN, R. BAUER (1992): Erosion thresholds and land surface morphology.- Geology 20: 675-679.
ESBSC European Soil Bureau Scientifi c Committee (1998): Georeferenced soil data-base for Europe, Manual of Procedures.- EUR 16393 EN, CEC-JRC, Ispra, 184 p.
FOSTER, G.R., D.C. FLANAGAN, M.A. NEARING, L.J. LANE, L.M. RISSE, S.C. FINKNER (1995): Hillslope erosion component.- In: FLANAGAN, D. C., M. NEARING (Eds.): WEPP: USDA-Water Erosion Prediction Project: 11.1-11.12; NSERL Report No. 10, USDA ARS, Lafayette, IN.
GISOTTI, G. (1983): Geologia e Pedologia nell’assetto del territorio.- Bologna (Ed. Edagricole).
MOGLEN, G.E., E.A.B. ELTAHIR, R.L BRAS (1998): On the sensitivity of drainage density to climate change.- Water Res. Research. 34 (4), 855-862.
Montgomery, D.R., E. Foufoula-Georgiou, 1993. Channel network source representa-tion using Digital Elevation Models, Water Resour. Res., 29(12), 3925-3934.
NIXON, S., J. GRATH, J. BØGESTRAND (1998): Eurowaternet. The European Environment Agency’s monitoring and information network for inland water resources.- European Environment Agency, Technical Report No. 7, Copenhagen (EEA) 47p.
OGUCHI, T. (1997): Drainage density and relative relief in humid steep mountains with frequent slope failure.- Earth Surf. Processes and Landforms 22: 107-120.
ROTH, G., P. LA BARBERA, M. GRECO (1996): On the description of the basin effective drainage structure.- J. Hydrol. 187, 119-135.
SOILLE, P. (1999): Morphological Image Analysis.- Springer-Verlag, Berlin, Heidelberg, New York.
SOILLE, P. (2002): Advances in the analysis of topographic features on discrete images.- Lecture Notes in Computer Science 2301: 175-186.
TERRES, J.M. (2000): The Crop Growth Monitoring System implemented by the JRC/ARIS unit for the information needs of the EC DG VI – Agriculture.- In: CONESE, C., M.A. FALCHI (Eds.): Proceedings of the 7th International Congress for Computer Technology in Agricultural Management and Risk Prevention, 15th – 18th November 1998, Florence, Italy (= Supplemento agli Atti degli Georgofi li, 2000), 225 – 230.
TUCKER, G.E., N.M. GASPARINI, S.T. LANCASTER, R.L. BRAS (1997): An integrated hillslope and channel evolution model as an investigation and prediction tool.- Technical Report prepared for the U.S. Army Corps of Engineers Construction Engineering Research Laboratories.
TUCKER, G.E., R.L. BRAS (1998): Hillslope processes, drainage density, and landscape morphology.- Water Res. Research 34: 2751-2764.
VAN DER VOET, P., C.A. VAN DIEPEN, J. OUDE VOSHAAR J. (1994): Spatial interpolation of daily meteorological data. A knowledge-based procedure for the region of the European Communities.- Report 53.3, Winand Staring Centre for Integrated Land, Soil and Water Research, Wageningen, 105p.
VERDIN, K.L. and VERDIN, J.P., 1999. A topological system for delineation and codifi cation of the Earth’s river basins. Journal of Hydrology, 218, 1-12.
VOGT, J.V., R. COLOMBO, F. BERTOLO (2002a): Deriving drainage networks and catchment boundaries. A new methodology combining digital elevation data and environmental characteristics.- Geomorphology (accepted).
VOGT J.V., R. COLOMBO, M. L. PARACCHINI, P. SOILLE, A. de JAGER, S. FOLVING (2002b): A European landscape stratifi cation refl ecting drainage density In: K. Helming, H. Wiggering (Eds.) (2002): Sustainable Development of Multifunctional Landscapes.-, Springer Verlag, Berlin, Heidelberg, New York (in press).

LandWaterMed network172
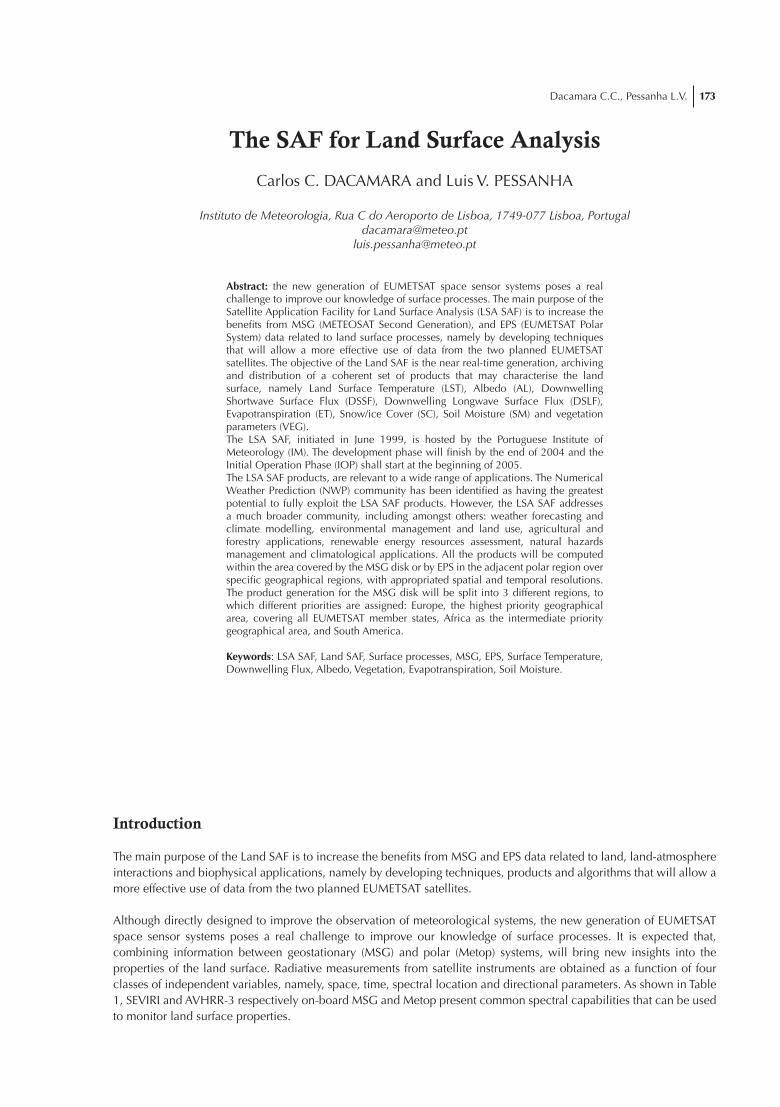
Dacamara C.C., Pessanha L.V. 173
The SAF for Land Surface Analysis
Carlos C. DACAMARA and Luis V. PESSANHA
Instituto de Meteorologia, Rua C do Aeroporto de Lisboa, 1749-077 Lisboa, [email protected]
Abstract: the new generation of EUMETSAT space sensor systems poses a real challenge to improve our knowledge of surface processes. The main purpose of the Satellite Application Facility for Land Surface Analysis (LSA SAF) is to increase the benefi ts from MSG (METEOSAT Second Generation), and EPS (EUMETSAT Polar System) data related to land surface processes, namely by developing techniques that will allow a more effective use of data from the two planned EUMETSAT satellites. The objective of the Land SAF is the near real-time generation, archiving and distribu tion of a coherent set of products that may characterise the land surface, namely Land Surface Temperature (LST), Albedo (AL), Downwelling Shortwave Surface Flux (DSSF), Downwelling Longwave Surface Flux (DSLF), Evapotranspiration (ET), Snow/ice Cover (SC), Soil Moisture (SM) and vegetation parameters (VEG).The LSA SAF, initiated in June 1999, is hosted by the Portuguese Institute of Meteorology (IM). The development phase will fi nish by the end of 2004 and the Initial Operation Phase (IOP) shall start at the beginning of 2005.The LSA SAF products, are relevant to a wide range of applications. The Numerical Weather Prediction (NWP) community has been identifi ed as having the greatest potential to fully exploit the LSA SAF products. However, the LSA SAF addresses a much broader community, including amongst others: weather forecasting and climate modelling, environmental management and land use, agricultural and forestry applications, renewable energy resources assessment, natural hazards management and climatological applications. All the products will be computed within the area covered by the MSG disk or by EPS in the adjacent polar region over specifi c geographical regions, with appropriated spatial and temporal resolutions. The product generation for the MSG disk will be split into 3 different regions, to which different priorities are assigned: Europe, the highest priority geographical area, covering all EUMETSAT member states, Africa as the intermediate priority geographical area, and South America.
Keywords: LSA SAF, Land SAF, Surface processes, MSG, EPS, Surface Temperature, Downwelling Flux, Albedo, Vegetation, Evapotranspiration, Soil Moisture.
Introduction
The main purpose of the Land SAF is to increase the benefi ts from MSG and EPS data related to land, land-atmosphere interactions and biophysical applications, namely by de veloping techniques, products and algorithms that will allow a more effective use of data from the two planned EUMETSAT satellites.
Although directly designed to improve the observation of meteorological systems, the new generation of EUMETSAT space sensor systems poses a real challenge to improve our knowledge of surface processes. It is expected that, combining information between geostationary (MSG) and polar (Metop) systems, will bring new insights into the properties of the land surface. Radiative measurements from satellite instruments are obtained as a function of four classes of independent variables, namely, space, time, spectral location and directional parameters. As shown in Table 1, SEVIRI and AVHRR-3 respectively on-board MSG and Metop present common spectral capabilities that can be used to monitor land surface properties.

LandWaterMed network174
MSG and Metop systems will provide access to directional information on a daily composite basis, allowing a proper sampling of effects of surface anisotropy on the observed radiances. In fact, the SEVIRI instrument will provide multiple illumination angles of the surface whereas AVHRR-3, will allow multi-angular viewing of a given ground target. A better determination of anisotropic properties of the land surface is, therefore, to be expected, thanks to the synergy between sun-synchronous and geostationary sensor systems. MSG will also provide an image repeat cycle of 15 minutes offering new opportunities to detect short-term evolution of land resources. On the other hand, the diurnal and sub-diurnal sampling of thermal signatures by MSG, together with the access to imagery and soundings from Metop, will also afford solving the land surface temperature cycles. Retrieval of the diurnal cycle of temperature may prove useful in characterizing soil moisture since some studies have shown that during the mid-morning LST changes, are more sensitive to soil moisture, than to other components in the surface energy budget. Availability of high temporal resolution from MSG, together with global coverage imagery from Metop, are optimally suited to the measurement of environmental parameters that change rapidly in time.
Table 1: SEVIRI and AVHRR-3 spectral characteristics
SEVIRI/MSGRemarks
AVHRR-3/Metop
Channel Band (μm) Channel Band (μm)HRV 0.50 – 1.00 Solar
VIS 0.6 0.56 - 0.71 Solar (Red) 1 0.58 - 0.68
VIS 0.8 0.74 - 0.88 Solar (NIR) 2 0.727 - 1.00
IR 1.6 1.50 - 1.78 Solar 3A 1.58 - 1.64
IR 3.9 3.48 - 4.36 Window 3B 3.55 - 3.93
IR 6.2 5.35 - 7.15 Water vapour
IR 7.3 6.85 - 7.85 Water vapour
IR 8.7 8.30 - 9.10 Window
IR 9.7 9.38 - 9.94 Ozone
IR 10.8 9.80 - 11.80 Window 4 10.30 - 11.30
IR 12.0 11.00 - 13.00 Window 5 11.50 - 12.50
IR 13.4 12.40 - 14.40 CO2
The LSA SAF Concept
The Satellite Application Facility on Land Surface Analysis (LSA SAF) has been initiated in June 1999, with the purpose of developing techniques to retrieve products related with land, land-atmosphere interactions, and biospheric applications, using data from new EUMETSAT satellites, namely, Meteosat Second Generation (MSG, launched in August 2002), and the fi rst Meteorological Operational Polar satellite of EUMETSAT (Metop-1, scheduled to December 2005).
The Portuguese Institute of Meteorology (IM), hosts the LSA SAF, which, during the development phase, has been organized as a Consortium involving thirteen institutions from eight EUMETSAT member states (Table 2).
The objective of the Land SAF shall be the near real-time generation, archiving and distribution of a coherent set of products that may characterise the land surface.
Table 2: The LSA SAF Consortium
SATELLITE APPLICATION FACILITY FOR LAND SURFACE ANALYSIS
1. Royal Meteorological Institute (RMI), BELGIUM
2. Météo-France (MF), FRANCE
3. Institute of Meteorology and Climate Research (IMK), GERMANY
4. Meteorological Institute of the University of Bonn (MIUB), GERMANY
5. Federal Institute of Hydrology (BfG), GERMANY
6. University of the Aegean (UA), GREECE
7. Italian Institute of Biometeorolog (Ibimet), ITALY
8. Applied Meteorology Foundation (FMA), ITALY
9. Instituto de Meteorologia (IM), PORTUGAL
10. Institute for Applied Science and Technology (ICAT), PORTUGAL
11. University of Évora (UE), PORTUGAL
12. University of Valencia (UV), SPAIN
13. Swedish Meteorological and Hydrological Institute (SMHI), SWEDEN
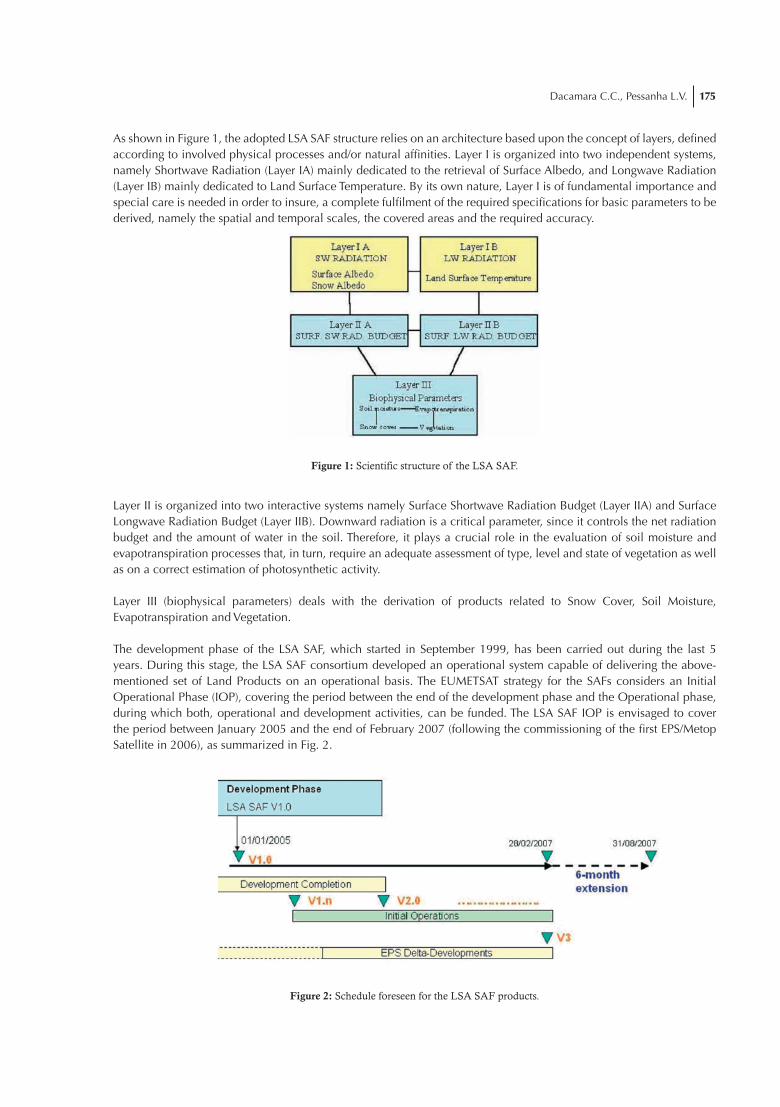
Dacamara C.C., Pessanha L.V. 175
As shown in Figure 1, the adopted LSA SAF structure relies on an architecture based upon the concept of layers, defi ned according to involved physical processes and/or natural affi nities. Layer I is organized into two independent systems, namely Shortwave Radiation (Layer IA) mainly dedicated to the retrieval of Surface Albedo, and Longwave Radiation (Layer IB) mainly dedicated to Land Surface Temperature. By its own nature, Layer I is of fundamental importance and special care is needed in order to insure, a complete fulfi lment of the required specifi cations for basic parameters to be derived, namely the spatial and temporal scales, the covered areas and the required accuracy.
Figure 1: Scientific structure of the LSA SAF.
Layer II is organized into two interactive systems namely Surface Shortwave Radiation Budget (Layer IIA) and Surface Longwave Radiation Budget (Layer IIB). Downward radiation is a critical parameter, since it controls the net radiation budget and the amount of water in the soil. Therefore, it plays a crucial role in the evaluation of soil moisture and evapotranspiration processes that, in turn, require an adequate assessment of type, level and state of vegetation as well as on a correct estimation of photosynthetic activity.
Layer III (biophysical parameters) deals with the derivation of products related to Snow Cover, Soil Moisture, Evapotranspiration and Vegetation.
The development phase of the LSA SAF, which started in September 1999, has been carried out during the last 5 years. During this stage, the LSA SAF consortium developed an operational system capable of delivering the above-mentioned set of Land Products on an operational basis. The EUMETSAT strategy for the SAFs considers an Initial Operational Phase (IOP), covering the period between the end of the development phase and the Operational phase, during which both, operational and development activities, can be funded. The LSA SAF IOP is envisaged to cover the period between January 2005 and the end of February 2007 (following the commissioning of the fi rst EPS/Metop Satellite in 2006), as summarized in Fig. 2.
Figure 2: Schedule foreseen for the LSA SAF products.

LandWaterMed network176
The LSA SAF Products
The LSA SAF products (Figure 3) are classifi ed as operational, internal operational, internal potential operational candidates, demonstration, and fi nally, experimental. This classifi cation (Table 3) was proposed by the end of the initial 5-year period of the development phase and took into account the maturity and the potential of the LSA products. The main characteristics of the products proposed to be operational (including internal products) during IOP are summarised in Table 4.
Figure 3: The LSA SAF products.
Table 3: Classification of LSA SAF products proposed for the IOP
Classification Type Acronym Definition
Operational Products OPTo be included in the LSA SAF System by the end of the development phase, and externally distributed during the IOP.
Internal Operational Products OP-IntTo be included in the LSA SAF System but not externally distributed
Internal Products Potential Operational Candidates
POC-IntMay be included in the LSA SAF System after validation and/or further scientific justification.
Demonstration Products DEMRequire validation and comparison with other satellite-derived products before being classified as operational.
Experimental Products EXPRequire scientific justification, validation and comparison with similar products from other sources to argue their added value.
Table 4: LSA SAF products, respective classification
Product Acronym TypeSurface Albedo AL OP
Snow Albedo SA OP-Int
Bi-directional Reflectance Distribution Function BRDF OP-Int
Aerosol AE POC-Int
Land Surface Temperature LST OP
Emissivity EM OP-Int
Thermal Surface Parameters TSP POC-Int
Downwelling Surface Short-wave Fluxes DSSF OP
Downwelling Surface Long-wave Fluxes DSLF OP
Snow Cover SC OP
Soil Moisture SM EXP
Evapotranspiration ET EXP
Fractional Vegetation Cover FVC OP-Int
Leaf Area Index LAI DEM
Fraction of Absorbed Photosynthetic Active Radiation fAPAR DEM

Dacamara C.C., Pessanha L.V. 177
• Surface Albedo, Snow Albedo and Bi-directional Reflectance Distribution Function
The snow-free albedo (AL) is based on the Bi-directional Refl ectance Distribution Function (BRDF). Two BRDF models are currently being applied by the LSA SAF on atmospherically corrected directional refl ectance data, for snow-free and snow covered pixels. The snow information is obtained from the LSA SAF Snow Cover (SC) product. The inversion of the kernel-driven BRDF models, is successively carried out for each pixel of the three SEVIRI channels (VIS 0.6, VIS 0.8, and IR 1.6), if at least three observations at different times and hence different angular conditions are available during the compositing period.
• Aerosol
The MSG tropospheric aerosol product algorithm is based on the pseudo-inversion of the SEVIRI 0.6 μm measurements, with fi ve aerosol type models being considered for the retrievals: continental, urban, desertic, biomass burning, and marine types. The global mapping of aerosol types relies on a climatologic database and will be updated with the MODIS programme.
• Land Surface Temperature and Emissivity
Generation of Land Surface Temperature (LST) relies on a Generalized Split-Window (GSW) algorithm, where the correction of atmospheric effects is based on different absorption in the IR10.8 and IR12.0 SEVIRI channels. The GSW algorithm is applied to cloud free pixels, identifi ed using the cloud mask from the NWC SAF. Emissivity (EM) is derived for each pixel using the Vegetation Cover Method (VCM) that relies on a geometrical model to compute an effective emissivity, based on information of fractional vegetation cover. An EM Look-Up Table (EM LUT) for IR10.8 and IR12.0 SEVIRI channels was built up using the spectral response function of the two channels and laboratory refl ectance spectra of different types of surface objects such as vegetation, water, soil, rocks and manmade materials. The values of the EM LUT were assigned to surface types based on land cover classifi cation. Dynamical information on the proportion of vegetation and exposed surfaces within a pixel is computed based on LSA SAF FVC information.
The possibility of simultaneous calculation of LST and EM making operational use of another method the Two Temperature Method (TTM) will be assessed.
• Thermal Surface Parameters
Thermal Surface Parameters (TSPs) are obtained from a parametric model that adequately describes the LST diurnal cycle. The thermal behaviour of the land surface is then described by the TSPs and the 96 (possible) MSG LSTs per pixel per day are reduced to 5 TSPs (determined by fi tting) plus 2 (calculated) TSPs per pixel per day. Characteristic TSPs for each pixel may be evaluated and then aggregated for a given area (e.g. grid of a model) and for a given time window (e.g. 10 days or one month).
• Downwelling Surface Fluxes
The DSSF algorithm uses a parameterisation requiring the knowledge of the atmospheric transmittance for both clear and cloudy sky conditions. Information about the surface albedo (AL and SA) is also required. The LSA SAF DSSF method follows a similar approach to the one used in the Ocean & Sea Ice (O&SI) SAF, which is mandatory to ensure the spatial coherence of the product on coastal zones.
• Snow Cover
The SC algorithm determines whether a satellite ground pixel is snow covered or not using thresholding tests on top of the atmosphere radiance for visible (0.6 micro-meter) and near-infrared (1.6 micro-meter) channels. Infrared channels and forecasted 2m-temperature (obtained from ECMWF) are also used to ensure that clouds are not mistaken for snow.

LandWaterMed network178
• Soil Moisture and EvapotranspirationThe SM product algorithm is based on the complete version of the Surface-Vegetation-Atmosphere-Transfer (SVAT) scheme of ECMWF, the so called Tiled ECMWF Surface Scheme of Exchange processes at the Land surface (TESSEL).
• Fractional Vegetation Cover and Leaf Area Index
The LSA SAF algorithms for retrieving the vegetation (VEG) products FVC and LAI are divided into two successively applied units, both using SEVIRI and AVHRR data. Unit 1 consists of an optimised spectral mixture analysis method (VMESMA), whereas unit 2 performs the inversion of a physically-based canopy refl ectance model (DISMA). VMESMA may be regarded as a fast and robust algorithm to compute FVC and LAI products corrected from the directional effects. The DISMA algorithm is applied subsequently as a refi nement step taking into account as much as possible directional information.
• Fraction of Absorbed Photosynthetic Active Radiation
The photo-synthetically active radiation absorbed by vegetation (fSAPAR) is estimated using the SEVIRI Vegetation Index (SVI) based on the VIS0.6 and VIS0.8 spectral albedos (available from LSA SAF AL). The best estimate for the fSAPAR value at noon of the acquisition day, is determined by means of error LUTs, and by linear interpolation of the values for equinox and solstice between which the acquisition day falls. Finally the fAPAR, again at noon of the acquisition day, is calculated as a linear combination of fSAPAR and VIS0.6 albedo.
The LSA SAF Services
• Operational product distribution
The baseline architecture proposed for operational production during IOP is in line with that developed and demonstrated during the development phase. The system will be fully centralized at IM (Fig. 4). And the functional requirements of the LSA SAF are detailed in the System/Software Requirements Document.
Figure 4: LSA SAF relations with other systems.

Dacamara C.C., Pessanha L.V. 179
During the IOP, the LSA SAF will be able to operationally generate, archive, and disseminate the operational products detailed in Table 4. The primary or beta-users of the LSA SAF during IOP will be provided a subset, or all of those products, according to each specifi c request.
The sensitivity studies performed for the operational products suggest that these are compliant with the User Requirements Document. However, further scientifi c validation will be carried out during the IOP. The monitoring and quality control of the operational products, centralized at IM, is performed automatically by the LSA SAF software, which provides quality information to be distributed with the products.
In addition to the near real-time automatic quality control of the products, the assessment and monitoring of their accuracy against independent data, will be of the responsibility of the development entity. The algorithm software maintenance will also be responsibility of the entity in charge of each product development. However, the system and overall confi guration of the LSA SAF will be managed by IM.
During the IOP, the LSA SAF products may be accessed in near real time (NRT) only via FTP. The NWP Centres, which will take part of the LSA SAF beta-users group (section 4.3), will investigate the potential use of LSA SAF products for assimilation and/or updating of NWP model parameters. The operational products will be generated and ready to be disseminated in NRT using EUMETCast or RMDCN, which is not envisaged during the IOP, since the LSA SAF strategy is to analyse the data fl ow and timeliness requirements for this services.
The off-line distribution will be possible for all the LSA SAF products. The primary interface to the users will be provided via the WebPages (U-MARF, or IM), where the users are able to browse the catalogue and place their orders. The off-line distribution of LSA SAF products will be essentially via Internet. Other alternatives are standard mailing of data on CD-ROM or equivalent.
• Targeted users
The LSA SAF products, related with land properties, land-atmosphere interaction, and biophysical parameters (Tables 2 and 4), are relevant to a wide range of applications. The Numerical Weather Prediction (NWP) community has been identifi ed as having the greatest potential to fully exploit the LSA SAF products. The meteorological users have, thus, been assigned the highest priority during the phases of product design and development. However, the LSA SAF addresses a much broader community, including amongst others:
��Weather forecasting and climate modelling, which require detailed information on the nature and properties of land;
��Environmental management and land use, which require information on land cover type and land cover changes (e.g. provided by biophysical parameters or thermal characteristics);
��Agricultural and Forestry applications, which require information on soil and vegetation properties;
��Renewable energy resources assessment, particularly biomass, which depends on biophysical parameters, and solar energy, which highly depends on downwelling shortwave radiation at the surface;
��Natural hazards management, which requires frequent observations of terrestrial surfaces in both the solar and thermal bands;
��Climatological applications and climate change detection.
All the products will be computed within the area covered by the MSG disk or by EPS in the adjacent polar region over specifi c geographical regions, with the corresponding spatial and temporal resolution. The product generation for the MSG disk, will be split into 3 different regions, to which different priorities are assigned:
��Europe will be the highest priority geographical area, covering all EUMETSAT member states;
��Africa will be considered the intermediate priority geographical area;
��South America will be the lowest priority geographical area.

LandWaterMed network180
Identified user groups
Several users or user groups among the targeted areas listed above have already been identifi ed and approached through direct contact. These will be part of the LSA SAF beta-users group, who will be provided with the whole set or a subset of LSA SAF products during the IOP.
The dialogue initiated with the end-users community during the IOP, will be crucial to provide an indirect mean of LSA SAF products validation. This will be extremely valuable in helping the users scientifi c community to appraise the reliability of the products as well as their limitations, which in turn will serve the developers to review their prototyping algorithms. In particular, the close interaction with NWP (e.g, INM, M-F, and ECMWF) will be a critical step towards acceptance of LSA SAF products by the NWP community, previously identifi ed as having the greatest potential to fully exploit those products.
Concluding Remarks
The new generation of EUMETSAT space sensor systems poses a real challenge to improve our knowledge of land surface processes. In fact, the SEVIRI instrument on-board MSG will provide multiple illumination angles of the surface, whereas AVHRR-3, on-board Metop, will allow observing a given ground target under different viewing angles. Combining information between geostationary (MSG) and polar systems (Metop) appears, therefore, as especially attractive, since it will bring new insights into the anisotropic properties of the land surface.
The scientifi c structure and defi nition of activities within the scope of the LSA SAF Project was defi ned in such a way that an appropriate overall vision is ensured, namely in keeping an appropriate balance between products that are innovative enough to interest a broad range of users and products that possess a robustness and exploring synergies amongst products to be delivered in order to process each product in the most effi cient way.
It is expected that integration of LSA SAF products with state-of-the-art land surface schemes will help the NWP Community to increase and improve its usage of satellite data over land. On the other hand such integration will also pave the way to a future delivery of LSA SAF products offering further added value, in comparison to others already existing or expected in the near future.

Caetano M., Schoenmakers B.J. 181
Spatial sampling design for land cover characterization using very high spatial resolution satellite imagery
Mário CAETANO1 and Bart-Jan SCHOENMAKERS2
1 Portuguese Geographic Institute (IGP),Rua Artilharia Um, 107
1099-052 Lisbon, Portugal,[email protected]
2 National Statistics Institute (INE),Avenida António José Almeida 2,
100-043 Lisbon, [email protected]
Abstract: High spatial resolution (HSR) images (e.g., Landsat, SPOT) have been used in many operational programs (e.g., CORINE Land Cover (CLC) program) to produce land cover maps of large regions. However, it is widely recognised that the spatial resolution of HSR images (e.g., 30 m) do not allow: (1) an effi cient and reliable identifi cation of some land cover classes, (2) an adequate land cover characterisation in fragmented landscapes, since small landscape units cannot be mapped.To overcome the limitations of HSR images, we are developing a methodology to characterise land cover in large regions, based on very high spatial resolution satellite (VHSR) images (e.g. QUICKBIRD and IKONOS). Because of the high cost of VHSR images, and the consequent time consuming processing, we propose to use these images to produce land cover maps just for a small set of spatial samples. Then, land cover statistics (derived from land cover maps for the samples) are extrapolated to the whole area under study (i.e., region or country).In this paper we present a study to select the most adequate sampling rate in order to minimize the number of spatial samples and to maximize the accuracy of land cover statistics. The study is carried out by using a reference land cover map (i.e., COS’90), already existent, for the whole inland Portuguese territory. The best sampling rate is selected based on the comparison of the results produced by spatial sampling followed by extrapolation, and the statistics derived from the COS’90 to the whole territory (i.e., the truth). Results show that a sampling rate of 0.06 allows a reliable identifi cation of many land cover classes of the 2nd level of the CLC nomenclature. However, other land cover classes require a larger sampling rate.
Keywords: remote sensing, land cover, very high spatial resolution satellite images, spatial sampling, sampling rate
Introduction
Land cover characterization has been recognised as an important tool for territory management and environmental monitoring. Satellite images have been the most common data source for land cover characterisation in many operational programs.
High spatial resolution (HSR) satellite images (e.g., Landsat TM) have been widely tested for land cover mapping at regional scales (e.g., 1:100 000) with various degrees of success. Several research groups have been developing methodologies for automatic land cover mapping using this type of images. It is widely recognised that most automatic classifi cation methods fails on the identifi cation of spectral and spatial patterns of some land cover classes. As a result of this limitation, there are many land cover classes that are identifi ed with rather low accuracies, and the map products cannot be used in operational environmental monitoring or territory management. For this reason, operational programs for land cover mapping, such as the CORINE Land Cover (CLC) 2000, are still based on visual analysis and require a comprehensive auxiliary dataset. Land cover mapping with satellite images of regional areas is very expensive and time consuming, and for this reason most countries does not carry out periodical programs for land cover mapping production and/or updating of existing ones. As a consequence, most countries does not have updated information on land cover. For example, in Portugal, the last land cover map is from 1990.

LandWaterMed network182
Furthermore, land cover maps produced at regional scales (e.g., 1:100 000) do not completely fulfi l the requirements of decision makes that work at national level. Usually land cover maps at national and regional levels are produced using satellite images with relatively large pixels (30 m, 10 m), and as a consequence the scale of the maps is relatively coarse and the minimum mapping unit (MMU) is quite large. For example in the CLC program, the maps are produced at 1:100 000 scale and the MMU is 25 ha. In most countries, maps with such small scales and large MMUs cannot be used for an adequate characterisation of land cover at national level. One of the problems is the under estimation of land cover classes existing in small patches, because these are generalised in order to have maps with MMUs larger than 25 ha (1). For example, in Portugal, many residential areas are “lost” in the CLC cartography because they are smaller then 25 ha. On the other hand, one can expect many errors introduced by diffi culties on the interpretation of the satellite images that are usually used in this type of programs, e.g. Landsat.
In summary, one may state that land cover maps of national territories produced with HSR images do not satisfy the user requirements, mainly because of its scale and MMU (imposed by the spatial resolution of HSR images). Furthermore, map production with HSR images is time consuming since many times one has to use an exhaustive set of ancillary data and methodologies based on visual interpretation are needed. Therefore, alternative data sources and methodologies have to be used and developed for land cover map production of large areas such as national territories.
More recently, very high spatial resolution (VHSR) images (e.g., IKONOS, QUICKBIRD) started to be used for land cover/use mapping at local scales. Results are very encouraging, since this type of images circumvents many of the problems found in Landsat type imagery. Technically, VHSR images allow land cover characterisation with higher thematic and spatial detail, which is more adequate for decision making at national level. The main problem, and that makes impossible the usage of VHSR images in land cover mapping of large areas such as national territories, is the high cost of these images and the associated high cost of interpretation of a large number of images necessary to cover the whole territory.
To reduce the cost of this approach and to make it feasible at national level, we are developing a methodology where VHSR images are only used to characterise the land cover of small sample areas. Then, we propose to use simple procedures to extrapolate the characterisation at the sample level for the whole national territory, to produce land cover statistics.
There are already some land cover characterisation programs based on the extrapolation to the whole territory of results obtained to spatial samples. One of the oldest projects for the production of land cover statistics is the TERUTI, a French project that exists since the 70’s (2). The TERUTI project consists on the regular observation of a group of points, situated within a selection of rectangular segments. Both the points and the segments are selected in a systematic way, forming a representative sample. In other European countries similar projects (surveys) exist (3).
The European project LUCAS (Land Use/Cover Area Frame Statistical Survey) is a more recent development, intended to provide statistical information about the land cover and use, and some agro-environmental indicators. The objective of the project is to obtain harmonized data for the 25 countries of the European Union (EU), to offer a common sampling base (frame, nomenclature, data processing) for all the member states, and to evaluate the possibility to use a point area frame as one of the pillars of the future Agriculture Statistical System. The methodology of this project is based on the methodology used for similar projects in some European countries (4).
Spatial sampling is also used in the United States since the 60’s for the production of environmental and agricultural statistics. The “National Resources Inventory” is a area frame survey, which is effectuated by intervals of a minimum of 5 years, and land cover is one of the main elements of this survey (5).
More recently, some authors started to use satellite images to characterize land cover in a set of spatial samples, extrapolating then the results to the whole territory. Wang et al. (6) describe a study realized in China, with the objective to monitor the cultivated area in some provinces. In this study the land cover within the spatial samples is characterised by using aerial photographs and Landsat TM images. Another study from Loveland et al. (7) and Griffi th et al. (8) tried to determine the level of land cover change for a period of 30 years in the United States using Landsat TM and MSS images for the observation years. The classifi cation consists out of 11 general land cover classes, based on the classifi cation system of the United States Geological Survey (USGS). These classes were identifi ed through a visual interpretation of the Landsat TM images with the support of aerial photographs. Smiatek (9) presents another study on the use of Landsat TM images and spatial samples in order to estimate the proportions of different land cover classes in a given regional area.

Caetano M., Schoenmakers B.J. 183
In this paper, we report the fi rst results of the methodology we are developing for land cover characterisation at national level based on spatial sampling and VHSR images. By using VHSR images (e.g., QUICKBIRD, IKONOS) to characterise land cover within spatial samples, we can perform a better land cover characterization than with satellite images with lower spatial resolution (e.g., Landsat, SPOT). This is particular true for fragmented landscapes, i.e. characterised by small patches of different land covers. In fact, VHSR images can be used to map land cover with a rather low MMU, e.g., 1 ha, which allows the identifi cation of very small landscape units.
The fi rst step of the methodology consists on the defi nition of an adequate sampling scheme to characterise land cover at national level. Then, VHSR images are used to characterise land cover on the established spatial samples. In the last step, land cover statistics obtained for the spatial samples are extrapolated to the whole territory. To the best of our knowledge this is the fi rst study that attempts to use VHSR imagery to characterise land cover at national level. Furthermore, this is also the fi rst study on land cover characterisation through spatial sampling, and where land cover within spatial samples is characterised using VHSR images.
This paper is focussed on the fi rst step of the methodology, i.e. spatial sampling. The main goal of the study here reported is to identify the best sampling method that allows a reliable land cover characterisation at national level, and that uses the minimum possible number of VHSR images (in order to reduce the cost of the image acquisition and interpretation). In summary, we want to fi nd the sampling rate that maximizes the accuracy of land cover area estimates and that minimizes the number of samples. The selection of the minimum number of spatial samples that allows an adequate characterisation of land cover at national level is extremely important in studies where the cost of land cover characterisation at the sample level is relatively high, such as the one we are conducting with VHSR images.
Methods
The methodology to defi ne the best scheme of spatial sampling, and to evaluate its adequacy to characterize land cover at national level, makes use of an existent land cover map for the whole inland Portuguese territory. This reference map, here designated by COS’90, was produced at 1:25 000 scale with a minimum mapping unit (MMU) of 1 ha, and is based on visual interpretation of aerial photography of 1990.
The reference map, i.e. COS’90, is used within this study in two different ways. First, it is used to derive the land cover characteristics of the sample areas. Then, it is used to derive the truth, i.e. the real land cover characteristics at national level, by producing land cover statistics to the whole territory. The results obtained for the several spatial samples are then extrapolated to the whole territory, and we compare these estimates with the statistics derived from the cartography to the whole territory, i.e. the truth.
By using an existent map to derive the land cover statistics for the spatial samples, we do not need to acquire the large number of VHSR images that would be required to test different sampling schemes. Furthermore, we also save time since we do not need to analyse the VHSR images to generate land cover maps for the spatial samples (which is always time consuming). We are assuming that VHSR images can be used to produce, for each spatial sample, a map similar to COS’90. On the other hand, because COS’90 provide us the truth (which in most studies is not known), we can perform a real evaluation of all sampling schemes. This means that we can compare the estimates of land cover abundances resulting from the extrapolation of the statistics derived from all samples, to the real abundance of land cover classes derived from the COS’90, to the whole national territory.
The reference map, i.e. COS’90, had to be processed in order to allow, or in some cases to simplify, the study we want to do. The fi rst step was to convert the COS’90 nomenclature (which is quite complex and not hierarchical) to the one of CORINE Land Cover (3rd level). Then, we merged all the sheets in one seamless database, free of topological errors. The last step was to generate statistics (area in ha and in % of the whole territory) for each class of the three levels of the CLC nomenclature for the whole territory.
Regarding sampling issues, we need to defi ne the sampling scheme, sampling units and sample size (i.e. sampling rate). The procedure we are following has been designated in the literature by area frame survey, which is a probabilistic survey where the sampling units are small geographical areas whose selection probability is proportional to the area of the unit (10, 11). The sampling units can be points, lines or areas (segments). In our study, we use segments because we want to capitalise the investment on the acquisition of VHSR images. There are three main types of segments (x): (1) with

LandWaterMed network184
limits that can be distinguished in the terrain, (2) rectangular segments, and (3) landscape units (i.e. areas with same land cover). In our study we decided to use rectangular segments, since this is the most common shape of VHSR images. We established the size of each sampling unit as 10 Km by 10 Km, since it is close to the minimum area that can be covered by a single VHSR image, such as IKONOS and QUICKBIRD.
The main sampling schemes are: simple random sampling, systematic sampling, stratifi ed sampling and cluster sampling (12). In simple random sampling, all the sampling units have an equal selection probability and they all can be selected from the whole area frame. Systematic sampling is similar to the previous, but with the difference that there is a fi xed distance between all the units, which results in a better geographical distribution of the sample. For this kind of sampling it is possible to decide not to align the sampling units, and in this case a sampling unit is selected within a group of units but not always in the same position. In stratifi ed sampling, the population is divided into sub-populations, which represent the strata. Within every stratum is carried out a simple random sampling or systematic sampling. Cluster sampling consists out of two kinds of sampling units: the primary sampling units (PSU) and the secondary sampling units (SSU). Different types of elements can represent the PSUs and SSUs. The PSUs can be segments and the SSUs can be points. In order to have an effective sampling the SSUs, contained within the PSUs, should be heterogeneous.
Several authors sustain that, despite the existence of a large amount of literature on this topic, there is no clear indication about the best sampling strategy to be adopted from a practical point of view, due to the existence of a great deal of heterogeneity within spatial data (13). In our study, and at this stage of our research, we decided to use a systematic sampling since it guarantees a better geographical distribution of samples. At this stage, we are more interested on the effect of the sampling rate (i.e., sample size) than on the type of sampling scheme, since a crucial issue on our methodology is the minimum number of samples that allows an adequate land cover characterisation at national level.
In this study, we test three sampling rates, which systematic sampling schemes differ on the distance between samples: 20 Km, 30 Km and 40 Km. For each distance between samples, we made different runs by changing the location of the samples. For the 20 Km distance between samples, we tested 4 different spatial distribution of samples, for the 30 Km distance we tested 9, and for the 40 Km between samples we tested 16. By testing all the possible sample spatial distributions for the same sampling rate, we can test the effect of sample spatial arrangement on the ability to characterize land cover at national level. In Table 1, we characterise the different sampling procedures tested in this study.
Table 1: Characterisation (sampling rate and number of segments) of the systematic sampling procedures tested in this study. Sampling procedures are identified by the distance between segments (20, 30 and 40 Km). For each sampling rate,
we also present the number of spatial arrangements of samples that were used in the study.
Distance between samples (Km)
20 30 40Number of sample spatial arrangements 4 9 16
Sampling rate (average) 0.25 0.11 0.06
Number of segments (average) 247,3 109,89 61,81
For the selection of the samples, we created an area frame consisting out of rectangular segments (i.e., sampling units) with a dimension of 10x10 Km2. To facilitate the selection of samples, we created groups of 4, 9 and 16 segments for the, and respectively, sampling schemes with 20Km, 30 Km and 40 Km distance between samples. Not all of the groups have exactly these numbers of segments, because some segments are outside Portugal borders. The number of segments located within Portuguese borders depends on the spatial distribution of samples. This explains why in Table 1, for each distance between samples, we present the average of the sampling rate and the average of the number of segments. By changing the spatial distribution of samples, for the same distance between samples, we also change the number of samples located within Portugal borders.
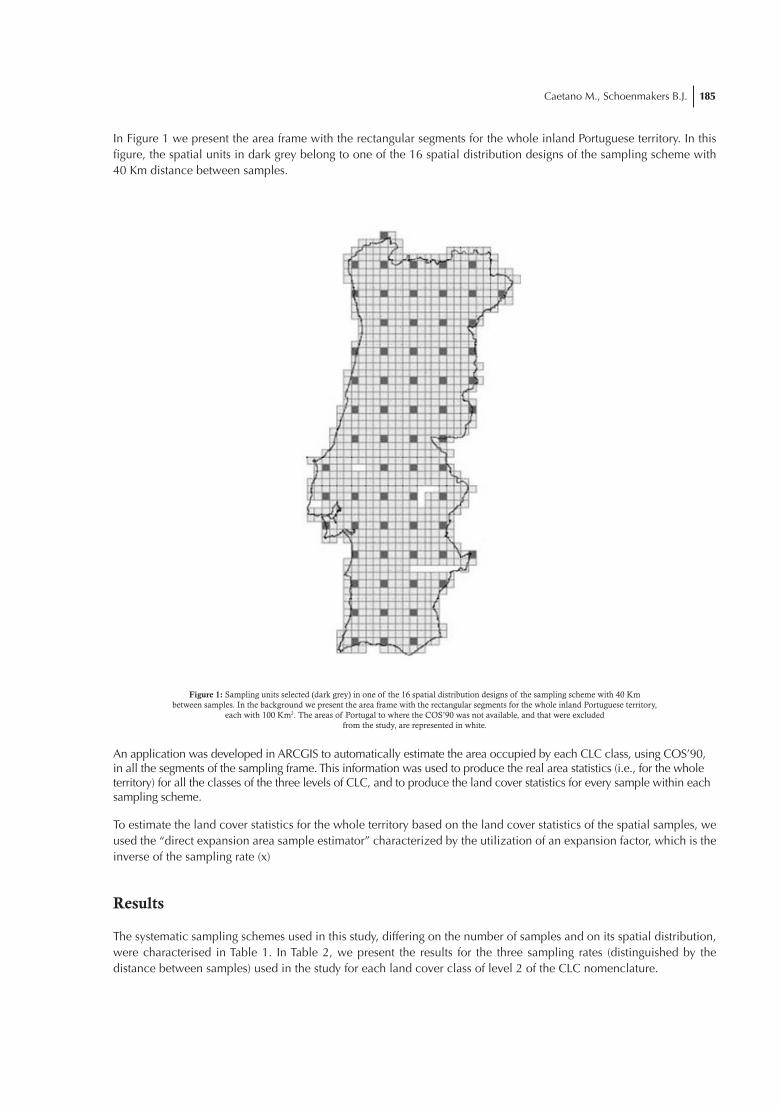
Caetano M., Schoenmakers B.J. 185
In Figure 1 we present the area frame with the rectangular segments for the whole inland Portuguese territory. In this fi gure, the spatial units in dark grey belong to one of the 16 spatial distribution designs of the sampling scheme with 40 Km distance between samples.
Figure 1: Sampling units selected (dark grey) in one of the 16 spatial distribution designs of the sampling scheme with 40 Km between samples. In the background we present the area frame with the rectangular segments for the whole inland Portuguese territory,
each with 100 Km2. The areas of Portugal to where the COS’90 was not available, and that were excluded from the study, are represented in white.
An application was developed in ARCGIS to automatically estimate the area occupied by each CLC class, using COS’90, in all the segments of the sampling frame. This information was used to produce the real area statistics (i.e., for the whole territory) for all the classes of the three levels of CLC, and to produce the land cover statistics for every sample within each sampling scheme.
To estimate the land cover statistics for the whole territory based on the land cover statistics of the spatial samples, we used the “direct expansion area sample estimator” characterized by the utilization of an expansion factor, which is the inverse of the sampling rate (x)
Results
The systematic sampling schemes used in this study, differing on the number of samples and on its spatial distribution, were characterised in Table 1. In Table 2, we present the results for the three sampling rates (distinguished by the distance between samples) used in the study for each land cover class of level 2 of the CLC nomenclature.

LandWaterMed network186
Table 2: Comparison of land cover class abundances estimated by using data from the whole territory and by using statistics derived from sample extrapolation. The land cover classes are from the 2nd level of the CORINE land Cover nomenclature. Results for three sampling rates, with different distance between samples (20, 30 and Km) are presented. For each sampling rate, we indicate the average of the differences (Average of dif) to the real
statistics and the standard deviation of the differences (Std of the dif) for each spatial distribution design.
Land cover class Real class abundance in the whole territory (%)
20 Km between samples
30 Km between samples
40 Km between samples
CLC Code
CLC class description
Std of thedif
Average of dif
Average of dif
Average of differences
Std of thedif
Average of dif
11 Urban fabric 2.4 5.4 4.0 9.4 7.3 12.7 10.4
12Industrial, commercial and transport units
0.5 15.4 12.1 24.1 18.5 27.8 20.9
13Mine, dump and construction sites
0.1 24.3 16.2 34.7 26.6 61.9 47.8
14Artificial non-agricultural vegetated areas
0.1 48.4 36.3 76.3 44.8 101.0 49.6
21 Arable land 18.2 2.2 1.6 2.2 1.7 5.5 4.5
22 Permanent crops 8.7 1.3 1.1 6.4 3.8 15.4 12.8
23 Pastures 0.1 16.7 10.9 14.8 10.4 46.6 35.1
24Heterogeneous agricultural areas
10.6 3.2 2.4 1.1 0.9 7.6 6.3
31 Forests 36.2 0.8 0.5 2.9 2.0 3.6 2.4
32
Shrubs and/or herbaceous vegetation associations
17.4 1.2 0.9 3.3 2.8 7.3 5.3
33Open spaces with little or no vegetation
3.9 5.4 4.1 10.2 7.5 17.3 14.8
41 Inland wetlands 0.1 109.9 82.1 167.5 100.9 252.0 131.3
42 Coastal wetland 0.3 27.5 20.2 62.1 44.8 82.8 71.6
51 Inland waters 1.0 18.4 13.1 19.0 14.9 29.9 22.7
52 Marine waters 0.1 62.5 53.6 81.9 71.2 161.9 105.0
The results of each sampling rate were calculated by using all the possible sample spatial arrangements. The column “Class abundance in the whole territory” presents the percentage of the whole territory occupied by each land cover class, calculated with the land cover map for the whole territory (i.e., COS’90). This column represents the “reality” that we would like to reproduce with an adequate sampling scheme and sampling rate. The results on land cover characterization by spatial sampling are presented using the difference between (1) the estimated percentage (i.e., the percentage of the whole territory occupied by each class estimated using the sampling and extrapolations procedures), and (2) the real percentage (i.e., the one calculated using data from the whole territory). Because for each sampling scheme we tested all the different spatial distribution of samples, we present the average of the differences (to the reality) of the percentages for each land cover class obtained for all spatial distributions. To evaluate the effect of the spatial distribution, we present the standard deviation of the differences between the real percentage and the estimated one calculated with all possible spatial distribution of samples for each sampling rate.
An analysis of Table 2 reveals that:
��The difference between the real area of each land cover class and the one estimated by sampling (independently of sampling rate) followed by extrapolation, is strongly affected by the abundance of the land cover class in the whole territory. As the abundance of land cover classes in the whole territory increases, the difference between the real area and the estimated one decreases.
��For all land cover classes, as the sampling rate decreases (i.e., as distance between samples decreases) the difference between the real area and the estimated one increases.

Caetano M., Schoenmakers B.J. 187
��For land cover classes characterised by small abundances (i.e., smaller that 5% of the whole territory), the difference between the real percentage and the estimated one is very large, even for high sampling rates (i.e. small distance between samples). For example, for the inland wetlands class (41) the lowest difference is 82%. This means, that classes with small abundance cannot be adequately characterised by sampling.
��For land cover classes characterised by large abundances (i.e., larger than 15% of the whole territory), the difference between the real percentage and the estimated one is very small, even for low sampling rates (i.e., large distance between samples). For example, for the class forests (31) the largest difference is 2.4%. This means, that classes covering a large area in the territory can be adequately characterised by low sampling rates.
��For land cover classes characterised by medium abundances (i.e., between 5 and 15% of the whole territory), the difference between the real percentage and the estimated one is still acceptable, even for low sampling rates. For example, for the class Shrubs and/or herbaceous vegetation associations (32), the largest difference is 5.3%, and for the class Arable land (21) the largest difference is 4.5%. Therefore, one may state that low sampling rates still allow an acceptable estimation of the area occupied by classes characterised by medium abundance.
��For the same sampling rate, the spatial distribution of samples affects the ability to land cover characterisation through sampling followed by extrapolation.
��The way how spatial distribution of samples affects the difference between the real area and the estimated ones depends on the area occupied by land cover classes in the whole territory.
��For land cover classes with small spatial abundance, the standard deviations of the differences between the real area and the estimated ones are extremely large. For example, for the class Coastal wetland, the lowest standard deviation is 27.5%. These results indicate that the ability to quantify the abundance of classes depends largely on the spatial distribution of samples.
��For land cover classes with large abundance, the standard deviation of the differences between the real area and the estimated ones is rather small. For example, for the class Forests the largest standard deviation is 3.6 %.
These results suggest that the area covered by land cover classes with large abundance can be estimated through spatial sampling followed by extrapolation using a reasonable sampling rate. Of course that the word reasonable is, in this case, very subjective and depends on the fi nancial resources available to acquire and process VHSR images. Nevertheless, it is our opinion that a sampling rate of 0.06 or even 0.11 is very reasonable, since it would imply the acquisition of just 62 or 110 VHSR images, respectively (Table1). Results also show that a sampling strategy cannot be used to estimate the area covered by land cover classes with extremely low spatial representativeness (e.g., inland waters). On the other hand, an adequate area estimation of land cover classes with intermediate spatial representativeness may require a decrease of thematic detail by merging some land cover classes.
Conclusions
We are developing a methodology to characterise land cover through spatial sampling followed by extrapolation to the whole territory. Land cover for each spatial sample is characterised through the interpretation of VHSR images. The study presented in this paper refers to the fi rst step of our methodology, and that consists on the estimation of the lowest sampling rate that allows an adequate estimation of the area occupied by leach and cover class.
This study showed that the ability to adequately quantify the abundance of land cover classes in large areas (such as national territories), through spatial sampling followed by extrapolation, depends on the expected abundance of the land cover. The area occupied by land cover classes characterised by large abundances (i.e., larger than 15%), can be adequately estimated by rather low sampling rates (i.e., 0.06). On the other hand, for this type of classes and for the same sampling rate, the spatial distribution of samples does not signifi cantly affect the area estimates. Land cover classes characterised by small abundances (i.e., smaller than 5%), requires a very high sampling rate to allow adequate estimates, which would reduce the effi ciency of the methodology. Regarding land cover classes with average spatial abundance (i.e., between 5 and 15%), the ability of our methodology to quantify the area occupied by each class is quite diverse. In fact, there are classes where the methodology seems to work and others where the estimates are quite

LandWaterMed network188
different from the reality. For these classes, a solution can be to merge them into a single class, which would increase its abundance, allowing the use of a lower sampling rate to produce reliable estimates. In this case, it is expected that the difference between the real area and the estimated one of these merged classes would decrease signifi cantly.
In this study we evaluated our methodology through a qualitative analysis of the results. The results are quite promising and we are now developing reliable statistical procedures to quantitatively evaluate the differences between the real land cover area and the ones derived by sampling followed by extrapolation. This study will allow us to establish thresholds on the expected abundances of land cover classes, to identify the ones that can be characterised by sampling and the ones that cannot. Further results will be published in a forthcoming paper.
References
[1] Gallego F J, E Carfagna & S Peedell, 1999. The use of Corine land cover to improve area frame survey estimates in Spain. Research in Offi cial Statistics (ROS), EUROSTAT 2 (2), 99-122
[2] Gay C E & J C Porchier, 1998. Land Cover and Land Use Classifi cation Using TER-UTI. In: Proceedings of Agricultural Statistics 2000, an International Conference on Agricultural Statistics, edited by T.E. Holland e M.P.R. van den Broecke, 193-201
[3] Vidal C & P Marquer, 2002. Changes in Land cover and Land use. Methods and tools (Eurostat)
[4] Joint Research Centre, 2002. Building agro environmental indicators – Focusing on the European area frame survey LUCAS. In: Report EUR 20521 EN, edited by J Gallego
[5] Goebel J J, 1998. The National Resources Inventory and its Role in U.S. Agriculture. In: Proceedings of Agricultural Statistics 2000, An International Conference on Agricultural Statistics, edited by T E Holland & M P R van den Broecke
[6] Wang J, J Liu, D Zhuan, L Li & Y Ge, 2002. Spatial sampling design for monitoring the area of cultivated land. International Journal of Remote Sensing, 23 (2), 263-284
[7] Loveland, T R, T L Sohl, S V Stehman, A L Gallant, K L Sayler, & D E Napton, 2002. A strategy for estimating the rates of recent United States land-cover changes. Photogrammetric Engineering & Remote Sensing, 68 (10), 1091-1099
[8] Griffi th J A, S V Stehman, T L Sohl & T R Loveland, 2003. Detecting trends in landscape pattern metrics over a 20-year period using a sampling-based monitoring programme. International Journal of Remote Sensing, 24 (1), 175-181
[9] Smiatek G, 1995. Sampling Thematic Mapper Imagery for Land Use Data. Remote Sensing of Environment, 52, 116-121
[10] FAO, 1996, Multiple frame agricultural surveys. In: Current surveys based on area and list sampling methods, FAO Statistical Development Series
[11] Tsiligirides T A, 1998. Remote sensing as a tool for agricultural statistics: a case study of area frame sampling methodology. Computers and electronics in agriculture, 20 (1), 45-77
[12] Cochran W G, 1977. Sampling Techniques, 3rd Ed, (John Wiley & Sons)
[13] Arbia, G & G Espa, 2001. Optimal spatial sampling strategies for agricultural and environmental data. Proceedings of the 2nd Conference on Agricultural and Environmental Statistical Applications (CAESAR)

Meliá J. et al 189
Building evapotranspiration scenarios by satellites images
Joaquín MELIÁ, Demetrio SEGARRA and Beatriz MARTÍNEZ
Unidad de Teledetaccion. Departament de Termodinámica. Universitat de Valencia.C/Dr.Moliner 50, 46100 Burjassot (VALENCIA)
+34 96 3543122+34 96 3543385
e-mail:Joaquín.Meliá@uv.es
Abstract: In this work several evapotranspiration scenarios are proposed under different climatological conditions. Evapotranspiration calculation for an extensive area (347.530 ha) of Castilla La Mancha are performed by using a multitemporal inventory, for the period 1982-2000, of irrigated areas with Landsat images. The FAO-56 Penman-Monteith and the Thornwaite methods are discussed for mapping potential evapotrasnpiration. Constructed scenarios let us to evaluate the intensive irrigation impact on evapotranspiration for the studied period, and to simulate different approaches concerning an extension of irrigated areas and climatological conditions.
Keywords: Regional evapotranspiration, Remote sensing, Central Spain
Introduction
Since 1949 when the French ecologist Aubreville employed for fi rst time the term “desertifi cation a number of defi nitions has been done [1]. Desertifi cation may be defi ned as irreversible changes resulting in land degradation, through processes of erosion with the eventual loss of productive capacity The possibility of global climatic change, resulting in many regions in southern and eastern Spain being subjected to higher temperatures with less precipitation, has alerted to the criticality consumption of water resources in the Castilla-la-Mancha region. In 1977 this region was defi ned by the FAO as being at high to very high risk of desertifi cation.
Over the last 20 to 30 years there has been a large increase of irrigated crops in the region. Conversion to irrigated farming practices is necessary and fundamental for the development of modern, competitive agriculture [2]. However, so that this development is sustainable, it must be adequately controlled to prevent environmental degradation through over-use of local water resources that may result in the eventual desertifi cation of the land. However, in this respect, short-term gain confl icts with the long-term interests of the region. It is therefore essential that threats of desertifi cation are recognized, understood and quantifi ed, where possible, so that counteractive measures may be implemented before land-degradation reaches an irretrievable state. Research is the fi rst step in creating the socio-political awareness, both in the local community and wider world that is necessary to actively combat these threats. Many countries throughout the world are faced with the possibility of land-degradation and desertifi cation, including California and large swaths of North Africa. Indeed, the Sahara desert is gradually encroaching further into agricultural areas in this region; a stark reminder of the reality of the desertifi cation process.

LandWaterMed network190
This contribution was intended as an illustration of the work currently being undertaken by researchers at the Universitat de València in Spain. The group is involved in several international and national projects, whose aim is to better defi ne the hydrology of the Albacete region, in Central Spain, aiding the assessment of desertifi cation risks in the area. These projects include CICYT “Evaluación por teledetección de la incidencia de los cambios de la cubierta vegetal del suelo y los fl ujos de agua y energía” (CLI99-0793), LSA SAF [3], LandWater MED (Geo-information for sustainable management of Land and Water resources in the MEDiterranean region) (ICA3-CT-1999-00015) (http://landwatermed.net/) and EFEDA (European Field Experiment in a Desertifi cation Threatened Area) [4].
The research group has been analyzing the changes in land-use during the last 20 years, particularly with respect to the increasing surface area of irrigated crops. Using the Penman-Monteith method recommended by the FAO, we are calculating the evapotranspiration in the region over this time period, making interannual comparisons. Using a simplifi ed hydrological model, we then compare the water lost from the local hydrological cycle through evapotranspiration to the precipitation totals in the region. It has been shown that the precipitation received by the region is not enough to sustain the rates of evapotranspiration observed. This necessitates the use of subterranean water resources, which could have serious consequences for the region in terms of land degradation. It is usually the case that standard agricultural practices, employed in such arid and semi-arid areas, exacerbate the problem of soil degradation and erosion. An increase in irrigated areas is leading to water defi cit in the local hydrological cycle, which results in a lower water table with increased risk for soil erosion. These dangers have been recognized by the European-Union and the Spanish central and regional administrations. Many have stressed that environmental protection considerations must preside permanently over the allocation of land-use in such regions. However, due to the economic benefi ts of increased irrigated cultivation in these regions this advice is not yet being incorporated into local farming policy in the region.
Study area description
The study area involves three provinces of the Castilla-La Mancha region, Albacete, Cuenca and Ciudad Real. It is delimitated by the following UTM coordinates, X (m): 493000, 630000 and Y (m): 4280000, 4380000 and covers 13.700 km2. This area was originally selected due to its fl at morphology. It is a plateau with 67% of the land lying at an elevation of between 600 and 1000 m above sea level, thus minimising the complication introduced by topography, and the presence of large, uniform man-made vegetated units, suitable for validation of remote sensing instruments and derived products. Figure 1 shows the location of the study area in Castilla-La Mancha and Spain over AVHRR/NOAA image.
The area was employed as a test site for the EFEDA experiment in 1991 [5]. Since then, additional activities have been performed in the framework of different projects, such as EFEDAII, RESRAPS, and RESMEDED funded by ESA. This area was also selected by ESA as a test site for the preparation activities for the Land Surface Processes and Interactions Mission (LSPIM) Earth Explored candidate Core Mission as part of these activities, the DAISEX (Digital Airborne Spectrometer EXperiment) campaign were carried out during 1998, 1999 and 2000 [6]. More recently, this area has been object of different validation activities such as SEVIRI/MSG vegetation products validation, CHRIS/PROBA validation, MERIS/ENVISAT products and algorithm validation, DEMETER project (Demonstration of Earth Observation technologies in routine irrigation advisory services), coordinated by EUMETSAT, ESA, EU, CNES and CYCIT (Comisión Interministerial de Ciencia y Tecnología)
Figure 1: Location of the study area in Castilla-La Mancha and Spain over AVHRR/NOAA image.

Meliá J. et al 191
The climate is of Mediterranean type, with heaviest rainfalls in spring and autumn and lowest in summer. It presents a high grade of continentality, with quite sudden changes from cold months to warm months and high thermic oscillations in all season between the maximum and minimum daily temperatures. The area experiences elevated evapotranspiration. Discounting mountainous areas, the mean annual temperature is between 12 and 16 C, [5], which allows for a varied range of crops to become established. The region shows a fairly high grade of continentiality with quite sudden changes from cold months to warm months and high thermic oscillations in all seasons between the maximum and minimum daily temperatures.
The rainfall statistics from 1931-1960 [7] show that the mean annual rainfall is little more than 400 mm in most of the area, making La Mancha one of the driest regions in Europe. Precipitation is seasonal, with a minimum in summer (June-August) and a high year-to-year variability. Highest rainfall in the region is broadly correlated to areas of mountainous relief. Correspondingly, lower altitude areas with predominantly fl at morphology experience as little as 300 mm.
Figure 2: Mean annual precipitation (mm) for the period 1961-2000. Data provided by the Instituto Nacional de Meteorología [8].
In the region, of about 347.530 ha, where we evaluate the evapotranspiration, the mean annual precipitation is of 1.220 hm3/year. Figure 2 represents the mean annual precipitation for the period 1961-2000 [8].
Agriculture is of signifi cant economic importance to the region. The area is characterised by its high concentration of vineyard crops. According to MAPA (Ministerio de Agricultura, Pesca y Alimentación), in the year 1990 there were about 21% of the national total. However, despite around 25% of the population being employed in the sector, in 1988 the total agricultural production in the region reached just 9% of the total national production.
Until recent decades La Mancha was predominantly a dryland farming area. However, exploitation of groundwater resources for irrigation has increased largely and some 20% of the area of the main aquifers system, which cuts through the area from north to south, is nowadays subjected to intensive, irrigated agriculture. The resultant long-term depletion in groundwater levels highlights the criticality of water resources in much of the study area [4].

LandWaterMed network192
Focal areas
The area involves three different focal areas. Barrax is a small area (55 km2) considered for ground measurements campaigns, which includes concomitant fi eld and tower measurements, fi ne-resolution, and medium-resolution imagery from airborne and satellite sensors. Nevertheless, comparisons are generally diffi cult since in-situ observations and the generated products usually result from different processes. Hence a larger area has been selected to take into account the upscaling between local measurements and space-derived products. For this purpose, the Villarobledo-Tomelloso vineyard area was selected (aprox 6060 km2) to take advantage of the high-resolution sensor airborne data available and cadastral data in a region, which experiment frequent changes. Figure 3 shows the location of the two focal areas.
Figure 3: Mosaic of two Landsat-7 images corresponding to 199-33 and 200-33 images with the two focal areas: Tomelloso and Barrax. The Tomelloso image belongs to a RGB composition (ETM4, ETM3, ETM2) obtained by the satellite Landsat-7
on 25 April 2000. The Barrax image shows a RGB POLDERcomposition (5, 3, 19).
On the other hand, it is under development the DEMETER project, which is designed to assess and demonstrate in an operational perspective how the performance and cost effectiveness of irrigated advisory services is substantially improved by the incorporation of Earth observation techniques and Information Society Technology into their day-to-day operations. The project is implemented in three pilot zones in Spain, Italy, and Portugal of approximately 3030 km2, respectively. Main products of the project include measurements of evapotranspiration and biophysical parameters, as well as an intensive temporal monitoring evolution of the area by means of high spatial resolution imagery analysis (Landsat/ETM+, SPOT, IRS/LISS) during the period April-September [9].
Barrax test site. The Barrax site is situated in the west of the province of Albacete, 28 km from the capital town (39º 3’ N, 2º 6’ W). The study zone is defi ned by the following UTM coordinates X (m): 576000, 581000 and Y (m): 4321000, 4326000 (see fi gures 3 and 4).
Activities in Barrax were extended as part of ESA, EU and CYCIT projects. More recently, this area was selected by ESA as a test site for SPECTRA related activities. As a part of these activities DAISEX campaigns were carried out during 1998, 1999 and 2000 (http://io.uv.es/projects/daisex) [6] and also SPARC during July 2003 (http://io.uv.es/projects/sparc). The SPARC campaign was coincident with other different initiatives from ESA, CNES and EU in order to take full advantage of European initiatives towards better effi ciency or scientifi c resources. This fi eld campaign will continue on 2004.
The landscape in this area is fl at with no change of elevation higher than 2 m over the whole area. Under the Barrax area several aquifers geological formations exist. These formations (Holocene, Miocene, Cretaceous and Jurassic) seem to be connected and form a regional groundwater body. The regional water table is about 20-30 m below land surface. Nevertheless, there is some evidence that, at least locally, several perched aquifers exist with their water table between 4 and 7 m deep.

Meliá J. et al 193
The soils of the area have been poorly developed. They are very fi nely textured and have a high degree of compactness under drying conditions. All soils show a calcic hard-pan layer at approximately 40 cm below the surface. The main limitation offered by the soils regarding their productive capacity is the small real depth, due to the presence of the petrocalcic horizon with large amounts of total and/or active limestone. The stoniness is excessive in many cases due to the presence of remains of the petrocalcic horizon on the surface.
Figure 4: RGB (5, 3, 1) POLDER composition of the Barrax study area. The two images have been acquired with different observation conditions. A Land Use Classification is also presented.
The dominant cultivation in the area is approximately 65% dry land (of which 67% are winter cereals and 33% fallow land) and 35% irrigated land (corn 75%; barley/sunfl ower 15%; alfalfa 5%; onions 2.9%; vegetables 2.1%) with several extensive irrigated circular man-made agricultural crops up to 1km of diameter. The senescent biomass and vigorous vegetation are distributed in different proportions (see fi gures 3 and 5) according to date and crop phenology.
Figure 5: Fraction of green and died vegetation coverage.
The University of Castilla-La Mancha operates three agro-meteorological stations through the study area:
• Las Tiesas-Anchor Station (39º 02’ 31’’ N; 2º 04’ 55’’ W)
• Las Tiesas-Lysimeter Station (39º 03’ 30’’ N; 2º 05’ 24’’ W)
• Blancares Station (39º 06’ 45’’ N; 2º 06’ 40’’ W)
These stations belong to the Permanent Station Network of the University of Castilla-La Mancha and are connected by modem with the central computer at the Institute for Regional Development (IDR) in Albacete. The data are compiled and stored automatically for later treatment, although they are also accessible in real time.
Tomelloso test site. The study zone is defi ned by the following UTM coordinates X (m): 495096, 557110 and Y (m): 4321694, 4379098 (see fi gures 3 and 6) and involves several councils (Villarobledo, Tomelloso, and Mota del Cuervo, among others). The vineyard crop in a proportion of about 50% cultivates the area. There are other cover types that

LandWaterMed network194
alternate with the vineyard, such as dry crops, irrigated crops, olives, fallow and forest. The landscape area presents different types of soils: brown soils and calcic brown soils dedicated especially for cereals and forest respectively, and calcic soils. The vineyard is well adapted to calcic soil (i.e. dry, little developed soils), which allows the crop to maintain excellent green vegetation throughout the summer period.
The vineyard has been considered as a good indicator of the desertifi cation process in the EFEDA, RESMEDES/RESYSMED projects and also in the project “Evaluation por Teledetección de la incidencia de los cambios de la cubierta vegetal del suelo en los fl ujos de agua y energía” funded by the CYCIT. Castilla-La Mancha is an especially rapidly changing region regarding the vineyard. In 1983, this crop covered 752.081 ha, being one of the highest vineyard concentrations in the world, while it covered 620.609 ha in 1993 [10].
Figure 6: Land use map of the Tomelloso area corresponding to the year 2000 as obtained using the multitemporal masking classification method (Lanjeri et al. 2001). An ETM+/Landsat 7 RGB composition (4,3,2) of the study area,
taken on 25 April 2000, is underimposed.
DEMETER test site. The project is coordinated by the IDR (Instituto de Desarrollo Regional- Castilla-La Mancha) and funded by the EU (http://www.demeter-ec.net/). size. It is driven by the users within the project consortium (the local Irrigation Advisory Services, IAS or Irrigation Users Associations and the national Ministries of Agriculture of the three countries). The consortium is completed with members from academic institutions and industry. A high-level Advisory Board, composed of leading experts and policy makers, assists the co-ordinator (University of Castilla-La Mancha, Spain).
Present IAS methodology is based on standards recommended by the Food and Agriculture Organisation (FAO). In a fi rst step, therefore, DEMETER will mimic the FAO approach by providing EO-derived crop coeffi cients, which is based on mature EO technology and is directly usable by the IAS. Maps of crop water requirements are obtained from applying the FAO methodology in a Geographical Information System (GIS) framework. From these maps, spatial information (general and personalized) can be provided to the end-users using IT tools.
DEMETER will overcome the space-time resolution problem so far associated with the use of EO data in irrigation management by synthesizing data from all existing high-resolution satellites (Landsat, IRS, Spot, ASTER), using a new inter-satellite cross-calibration procedure. In a second step, advanced EO-derived products on more detailed crop vigor, water stress, and irrigation performance monitoring will be developed and proposed for next-generation IAS.
Finally, DEMETER will provide a modular prototype technology for creating new Space-and-IT-assisted IAS (e-SAIAS) in “high-tech” as well as “low-tech” environments for further Member states and worldwide use (see fi gure7).

Meliá J. et al 195
Figure 7: One of the three pilot DEMETER zones located at Albacete province, in Spain. The figure shows a Landsat-TM image belonging to 15th July 2003 along with classification information of the 2000.
Vegetation cover evolution during 1982-2000 period
Vegetation cover maps for 1982 to 1986 period and for 1996 and 2000 have been obtained using Landsat TM and ETM+ imagery. For 1982-1986 period, only irrigated winter and summer crops are considered (see fi gure 8).
Figure 8: Vegetation cover maps for 1982,1986, 1996 and 2000 years, obtained by Landsat TM and ETM+ imagery. For the two first years only irrigated winter and summer crops are considered
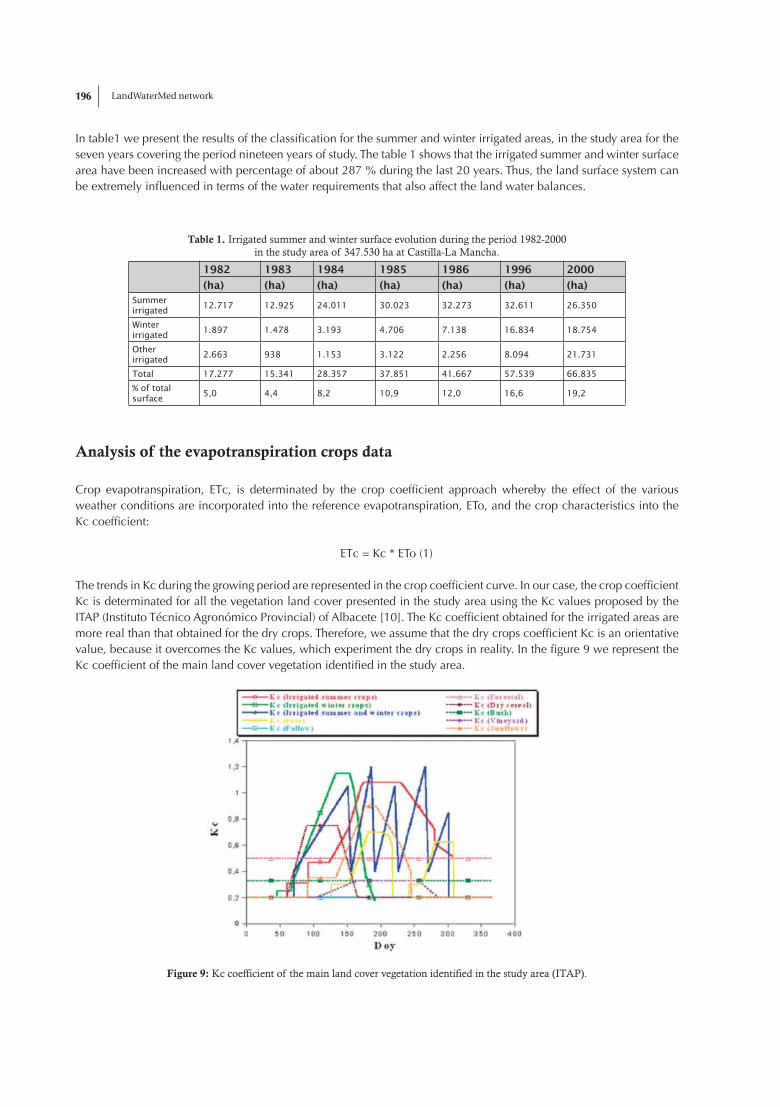
LandWaterMed network196
In table1 we present the results of the classifi cation for the summer and winter irrigated areas, in the study area for the seven years covering the period nineteen years of study. The table 1 shows that the irrigated summer and winter surface area have been increased with percentage of about 287 % during the last 20 years. Thus, the land surface system can be extremely infl uenced in terms of the water requirements that also affect the land water balances.
Table 1. Irrigated summer and winter surface evolution during the period 1982-2000 in the study area of 347.530 ha at Castilla-La Mancha.
1982 1983 1984 1985 1986 1996 2000
(ha) (ha) (ha) (ha) (ha) (ha) (ha)Summer irrigated
12.717 12.925 24.011 30.023 32.273 32.611 26.350
Winter irrigated
1.897 1.478 3.193 4.706 7.138 16.834 18.754
Other irrigated
2.663 938 1.153 3.122 2.256 8.094 21.731
Total 17.277 15.341 28.357 37.851 41.667 57.539 66.835
% of total surface
5,0 4,4 8,2 10,9 12,0 16,6 19,2
Analysis of the evapotranspiration crops data
Crop evapotranspiration, ETc, is determinated by the crop coeffi cient approach whereby the effect of the various weather conditions are incorporated into the reference evapotranspiration, ETo, and the crop characteristics into the Kc coeffi cient:
ETc = Kc * ETo (1)
The trends in Kc during the growing period are represented in the crop coeffi cient curve. In our case, the crop coeffi cient Kc is determinated for all the vegetation land cover presented in the study area using the Kc values proposed by the ITAP (Instituto Técnico Agronómico Provincial) of Albacete [10]. The Kc coeffi cient obtained for the irrigated areas are more real than that obtained for the dry crops. Therefore, we assume that the dry crops coeffi cient Kc is an orientative value, because it overcomes the Kc values, which experiment the dry crops in reality. In the fi gure 9 we represent the Kc coeffi cient of the main land cover vegetation identifi ed in the study area.
Figure 9: Kc coefficient of the main land cover vegetation identified in the study area (ITAP).

Meliá J. et al 197
A large number of quasi-empirical methods have been developed over the last twenty years by numerous scientists to estimate the reference evapotranspiration from different climatic variables. Further studies have been undertaken by the FAO working group [11] [12]) to evaluate the utility of FAO Penman-Monteith method in determinating the evapotranspiration when limited meteorological data are available recommended the FAO Penman-Monteith equation as the standard method for estimating reference and crop evapotranspiration, ETo and ETc [13]. This is a method with strong likelihood of correctly predicting ETo in a wide range of locations and climates and has provision for application in data-short situations.
The reference evapotranspiration, ETo, has been calculated using the FAO Penman-Monteith equation [14]
(2)
= reference evapotranspiration (mm day-1)
= net radiation at the crop surface (MJ m-2 day-1)
= soil heat fl ux density (MJ m-2 day-1)
= mean daily air temperature at 2 m height (oC)
= wind speed at 2 m height (ms-1)
= saturation vapour pressure defi cit (KPa)
= slope vapour pressure curve (Kpa oC -1 )
= psychometric constant (Kpa oC -1 )
The ETo values have been obtained using the equation indicated above, where all the parameters are measured at the Barrax site in Las Tiesas anchor station (situated in the west of the province of Albacete). In addition, the daily ETo calculated at the Las Tiesas (Barrax) agrometeorological station is applied uniformly across the whole study area. According to the ITAP the Las Tiesas station is the most representative and useful for agrometeorological studies in the Albacete region [15]. This approach ignores the spatial variations in the various meteorological variables involved in the determination of the evapotranspiration. Therefore, it is assumed that the spatial distribution of the evapotranspiration on any particular day is dependent only upon the spatial distribution of the various crop classes.
Figure 10 represents the annual ETo, for the period 1961-90, obtained from the data of the 43 meteorological stations ruled by the Instituto Nacional de Meteorología in the area and appling the Thornwaite method. An error of � 20 mm the values obtained for Las Tiesas using FAO Penman-Monteith equation con be extrapolated to all the study area.

LandWaterMed network198
Figure 10. Annual reference evapotranspiration, ETo, for the period 1961-90, obtained, by the Thornwaite method, from the data of the 43 meteorological stations
ruled by the Instituto Nacional de Meteorología in the area.
Then, we have established climatic curves using the reference evapotranspiration data for four years (1997 to 2000). In fi gure 11 we represent the accumulated reference crop evapotranspiration ETo for the years 1997 (very wet) and 2000 (very dry) and for a climatic curve type. The accumulated ETo for 1997 was 1193 l/m2, and 1322 l/m2, for 2000. The ETo variation was about 10 %.
Figure 11: Accumulated ET0 for the years 1997 (very humid) y 2000 (very dry) and for the climatic year type.

Meliá J. et al 199
In the fi gure 12 we present the accumulated crop evapotranspiration curves for the climatic year type for the main vegetation cover types. To obtain these curves; we considerer the climatic type year and the temporal evolution of the crop coeffi cient Kc.
Figure 12. Accumulated crop evapotranspiration curves, ETc, for the climatic year type and for the main vegetation cover types.
Anual evapotranspiration. Monitoring spatial distribution of evapotranspiration for the 2000 year.
To carry out this study, we have used the land vegetation cover map obtained for 2000, and the evapotranspiration data also corresponding to the same year, which is classifi ed as a very dry one
The accumulated regional evapotranspiration for a selected land cover type, ETci, can be calculated:
(3)
And for the all identifi ed cover types:
(4)
Assuming that the reference evapotranspiration measured in Las Tiesas (Barrax) is representative for the whole area the expression 4 can be simplifi ed:
(5)
The results are presented in the fi gure 13.
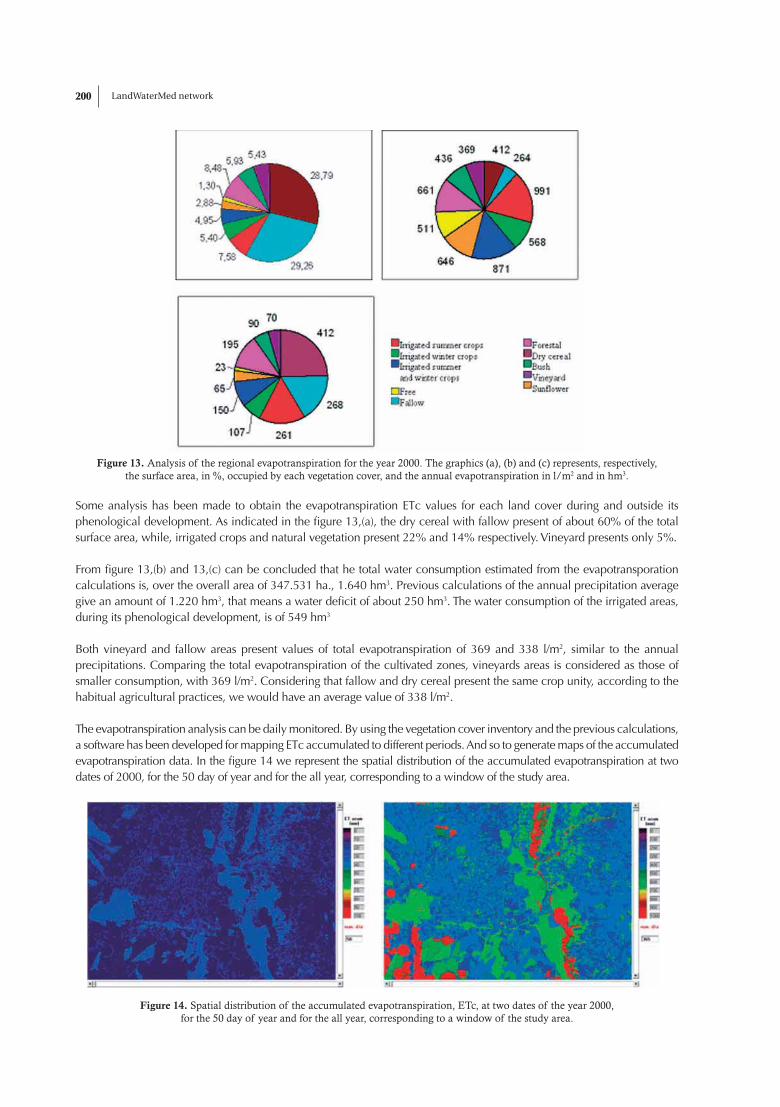
LandWaterMed network200
Figure 13. Analysis of the regional evapotranspiration for the year 2000. The graphics (a), (b) and (c) represents, respectively, the surface area, in %, occupied by each vegetation cover, and the annual evapotranspiration in l/m2 and in hm3.
Some analysis has been made to obtain the evapotranspiration ETc values for each land cover during and outside its phenological development. As indicated in the fi gure 13,(a), the dry cereal with fallow present of about 60% of the total surface area, while, irrigated crops and natural vegetation present 22% and 14% respectively. Vineyard presents only 5%.
From fi gure 13,(b) and 13,(c) can be concluded that he total water consumption estimated from the evapotransporation calculations is, over the overall area of 347.531 ha., 1.640 hm3. Previous calculations of the annual precipitation average give an amount of 1.220 hm3, that means a water defi cit of about 250 hm3. The water consumption of the irrigated areas, during its phenological development, is of 549 hm3
Both vineyard and fallow areas present values of total evapotranspiration of 369 and 338 l/m2, similar to the annual precipitations. Comparing the total evapotranspiration of the cultivated zones, vineyards areas is considered as those of smaller consumption, with 369 l/m2. Considering that fallow and dry cereal present the same crop unity, according to the habitual agricultural practices, we would have an average value of 338 l/m2.
The evapotranspiration analysis can be daily monitored. By using the vegetation cover inventory and the previous calculations, a software has been developed for mapping ETc accumulated to different periods. And so to generate maps of the accumulated evapotranspiration data. In the fi gure 14 we represent the spatial distribution of the accumulated evapotranspiration at two dates of 2000, for the 50 day of year and for the all year, corresponding to a window of the study area.
Figure 14. Spatial distribution of the accumulated evapotranspiration, ETc, at two dates of the year 2000, for the 50 day of year and for the all year, corresponding to a window of the study area.

Meliá J. et al 201
Interannual evapotranspiration monitoring. Climatic and land use scenarios.
Figure 15: Annual evapotranspiration,ETc (expressed in hm3), for the seven years when vegetation inventory is available. For comparison the climatic value of rainfall in the period (1961-2000) is represented.
Interanual evapotranspiration monitoring can be easily calculated by applying the equation 5 to the data of each year, i.e. vegetation inventory and daily reference evapotranspiration. Figure 15 shows the results for the ETc (expressed in hm3) for those years when vegetation inventory is available. For comparison the climatic value of rainfall in the period (1961-2000) is represented.
Cereal/bare soil to irrigated areas ratio shows a very important change, from 5,7 in 1982 to 1,1 in 2000. Annual ETc for the 1982 year is 1.302 hm3 and 1640 hm3 for the 2000 year. Concerning climatic value of rainfall for the year 1982 the P/ETc is about 0,94 and 0,74 for 2000. Figures for 2000 show that about the 37 % of the total ETc is due to irrigated areas that cover the 22,1 % of the cultivated surface.
We developed software in order to constructing scenarios in which ones several climatic conditions and different inventories of the vegetation cover can be considered. Figure 16 is an example of the impact on evapotranspiración of a 10.000 ha shifted from cereal/bare soil to irrigated areas under typical climatic conditions, 44,26 hm3.
In fi gure 17 it is considered the climatic conditions referred to a very dry year with a normal year to year variability of cereal. The effect over regional evapotranspiration is negligible.
Figure 16: The impact on evapotranspiración of a 10.000 ha shifted from cereal/bare soil
to irrigated areas under typical climatic conditions, 44,26 hm3.

LandWaterMed network202
Figure 17: The scenario considerer the climatic conditions referred to a very dry year.
Same scenarios are intercompared in fi gure 18. Three climatic conditions are considered: very dry, very wet and typical rainfall. For the 1982 and 2000 years measured vegetation cover inventories are considered. For the 1982/Cereal a scenario with no irrigation area is considered and the 2000x1,5 scenario means an increased of irrigated areas of 50 %. Figure 18 show same interesting results. For the fi rst scenario,1982 cereal, and with the value of typical precipitation the total ET is 1.280 hm3, quite close to the 1.220 hm3 of precipitation. With this vegetation cover scenario the variability of ET between different precipitation regime is very low: 1,08.
Figure 18: Constructed scenarios for several climatic conditions and extrapolations of vegetation cover.
Acknowledgments
We thank the University of Castilla-La Mancha for their active collaboration. This work was supported by the CYCYT projects
“Evaluación por Teledetección de la incidencia de los cambios de la cubierta vegetal del suelo en los fl ujos de agua y energia” (CLI99-
0793) and “Indices direccionales y espectrales para el análisis de la vegetación en zonas semiáridas. Aplicación a sensores de nueva
generación” (REN2002-01495).

Meliá J. et al 203
References
[1] Cañete, R.B. et al. 2002. Los grandes cultivos herbáceos de regadio en Castilla-La Mancha. Libro Blanco de la Agricultura y el Desarrollo Rural. Jornada Autonómica de la Comunidad de Castilla-La Mancha. Toledo, september 2002.
[2] Camacho de Coca, F., García-Haro, F. J and Martínez, B. 2002. An operational strategy for retrieval of vegetation products from SEVIRI & AVHRR-3 data. Proceedings of the LSA SAF Training Workshop, (Ed. EUMETSAT: Darmstadt), Lisboa, 8-10 July, 111-119.
[3] Bolle, H.J., et al. 1993. EFEDA: European fi eld experiment in a desertifi cation-threatened area. Annales Geophysical, 173-189.
[4] Martin de Santa Olalla, F. 1994. Desertifi cación en Castilla- La Mancha: El proyecto EFEDA, chapter VI. (UCLM).
[5] Moreno, J., Calera, A., Caselles, V., Cisneros, N, J.M., Martínez-Lozano, J.A., Meliá, J. Montero, F. and Sobrino, J. 2001. The measurements programme at Barrax. ESA-DAISEX proceedings, ESA SP-499, 43-52.
[6] MATA, C. A. 1984. Fichas hídricas normalizadas y otros parámetros hidrometeorológicos. Instituto Nacional de Meteorología, Madrid.
[7] Tamayo, J., 1994- Relación entre las precipitaciones y el índice de vegetación. Diferencia normalizada (NDVI) en áreas de riesgo de desertifi cación. Aplicación a la zona de estudio del Proyecto EFEDA. PhD.Universitat de Valencia
[8] Calera, A. 2000 Seguimiento mediante teledetección de la cubierta vegetal de los cultivos de secano y su relación con variables climáticas en Castilla La Mancha. Tesis Doctoral. Universitat de Valencia
[9] JCCLM. 1998. Datos de superfi cie de vid en secano en Castilla-La Mancha. Junta de Comunidades de Castilla-La Mancha (internal report).

LandWaterMed network204

Yakovlev A. 205
Implementation of GIS for runoff simulation and forecasting in the Central Asia condition
Andrey YAKOVLEV
Central Research Hydrometeorological Institute (SANIGMI)72, K.Makhsumov str., 700052, Tashkent, Uzbekistan
(998-71)1354072(998-71)1331150
e-mail:[email protected]
Abstract: This paper discusses using of GIS for runoff simulation and forecast that have been implemented in the Central Asian condition. A reduction of meteorological and snow survey observation network in runoff formation zone an opportunity to apply methods of forecast of river runoff, which was created earlier, not exists. Using of new types of information together with GIS technology allows solving traditional tasks with a satisfactory precision and in a new way. Some aspects for further investigations are shown in this paper.
Keywords: Snowmelt runoff simulation and forecasting, GIS, Remote sensing
Introduction
Due to a precipitation of the winter season surface water resources of the Central Asia are formed mainly in a mountain part. The basic consumer of water resources is irrigated agriculture and waterpower industry which use more than 90% of all water resources available in the region. Basis of effi cient water management are simulations and forecasts of river runoff with various lead-time (short and long–time). Nowadays, because of reduction of meteorological and snow survey observation network in runoff formation zone an opportunity to apply methods of forecast of river runoff, which was created earlier, not exists. Besides, it is necessary to note that all large rivers of the Central Asia are transboundaries rivers. In addition, the forecasted runoff data of these rivers still serve for purposes intergovernmental (transboundary) water resource assessment.
One of solutions of a way out is development of new methods of the runoff simulation and forecast by application of newest computer and information achievements of world community such as remote sensing and geographical information systems (GIS).
Perhaps, with exception of regression models of river runoff simulation, conceptual models demand to some information as initial information of cartographical watershed characteristics. For the territory of the Central Asia there is no digital elevation model (DEM) with the high spatial resolution. The DEM GTOPO30 has the spatial resolution as 0.00830 (latitude–longitude) that equals about 1 km for average latitude of the Central Asia. Often it is not suffi cient for the runoff simulation. Therefore, the principal task for cartographical support with information of runoff computation is creation of DEM of watersheds. GIS allows calculating various hypsographic values such as distribution of the area by elevation zones, values of the mean altitude of each elevation zone and for whole watershed. GIS also allows giving a more precise defi nition obtained hypsographic curves of river watersheds which were designed by manually. Nowadays, available hypsographic information is not complete because of it was obtained from maps of different scales and by various methods.

LandWaterMed network206
Snowmelt Runoff Model (SRM)
In framework of common project of Hydrometeorological survey of Uzbekistan and Swiss Aral Sea Mission it performs the work of a short-term runoff forecasting of some Central Asian Rivers based on the Snowmelt Runoff Model (SRM) [2]. In this model, the grand attention is given to creation of a GIS of watersheds. Nowadays, the GIS are created for basins of the following rivers – Naryn (the right tributary of the Syr–Darya river), Karadarya (the left tributary of the Syr–Darya river), Vakhsh (the right tributary of the Amu–Darya river), Pyandzh (the right tributary of the Amu–Darya river), Zeravshan, the rivers of northern slopes of Fergana valley and the rivers of Charvak water reservoir basin.
Figure 1: Basins of the Central Asian Rivers for which were created GIS for SRM.
The GIS for these river basins was made from topographic maps with a scale of 1:200,000 and 1:500,000. The GIS includes the following layers: elevation lines, elevation peaks (summits), rivers and lakes. After digitizing elevation lines and peaks, the DEM was made for these basins with spatial resolution 200 m. For the creation of a high quality DEM, additional elevation points were computed along the river fl ow.
Figure 2: The GIS of Pyandzh River basin.

Yakovlev A. 207
Figure 3: DEM of Pyandzh River basin. The watershed area is about 119 000 km2.
This created GIS allows calculating various hypsographic values such as distribution of the area by elevation zones, values of the mean altitude of each elevation zone and for whole watershed. The GIS also allows giving a more precise defi nition obtained hypsographic curves of river watersheds, which were designed by manually. Nowadays, available hypsographic information is not complete because of it was obtained from topographic maps of different scales and by various methods.
Remote Sensing and GIS is actively used in the framework of SRM as the space information technology to provide satellite images and to create additional information for SRM (e.g. snow–covered maps and its temporal and spatial variations) [4]. Based on NOAA-AVHHR images, within the framework of the above–named project the work on creation of snow–covered maps (GRID layers) of the main rivers of the Central Asia during of fl ood season is performing. GIS of the river basins are used for precise geometrical correction of satellite images. In addition, a snow cover area (SCA) both whole basin and for each of elevation zone is computed with use of the GIS. It is possible by overlapping the DEM and the classifi ed satellite image. For computation of a seasonal snow line altitude the method with use hypsographic curve has been chosen. Thus is accepted that all snow cover in a basin is lay above of the seasonal snow line altitude. The SCA of whole basin is computed as the sum of the SCA of each elevation zone. Then hypsographic curve of a basin is applied to computation of seasonal snow line altitude.
Figure 4: Schema of creation of a snow–covered map and computation of a seasonal snow line altitude.

LandWaterMed network208
Spatially distributed model of short–term forecast of inflow into Charvak water reservoir
GIS have allowed passing from simple conceptual models of runoff simulation to more complex models with spatially distributed parameters. For such spatially distributed models are computed GRID layers with such information as a fl ow length alongside the fl ow direction, an exposition and a slope of watershed. Joint using of digital satellite images and Joint use of digital satellite images and GIS will allow constructing maps of various types of landscapes and vegetative cover in the future. Such cartographical information will be necessary for the advanced spatially distributed model of runoff simulation.
In the developed model of computation of infl ow into Charvak water reservoir based on the satellite data about SCA are used the GRID layers of the DEM and the fl ow length alongside the fl ow direction up to closing gauge [5].
a b
Figure 5. Maps of elevation (a) and flow length (b) in a watershed of Charvak reservoir.
As one size of target production of this model has been obtained a GRID layer of a lag time and corresponding pattern of the watershed area of Charvak reservoir. An average speed of water trickling is turned out equal to 23.8 km per day.
Figure 6: Pattern of the area of Charvak reservoir vs. lag time.

Yakovlev A. 209
GIS of modern glaciation
Some of the Central Asia Rivers, it is especial in their headwaters, have snow–ice melt type. The role of glaciers in formation of a runoff is very great: within with a plenty of precipitation and in the cold summer, glaciers increase the mass, withdrawing a part of precipitation from a runoff. In dry and hot years, the rivers have additional runoff as result of a glacier melting.
The last time, the data of glaciation for this region were obtained by A. Shetinnikov as per 1980 [6]. For obtaining these data, the analogue satellite images from the Soviet orbital platform were utilized. Under publication of a number of authors [3], in the end of 20 century there was noticeable climate warming of the planet, and in particular, this process has affected also the territory of the Central Asia. Glaciers, being by a product of climate, as should undergo essential change [7].
Figure 7: Gissar-Alay mountain system and ASTER images coverage.
Based on ASTER (The Advance Space borne Thermal Emission and Refl ection Radiometer) images work on creation GIS of a modern glaciation of some river basins are started [1]. Thematic processing of the images was implemented for the range of the images on the date of the survey – second half of August 2001–2002 years. The images were received in the framework of Aster Research Opportunity Scheme (ARO) of Japanese space agency ERSDAC (“Monitoring of mountain glaciers and glacial lakes using ASTER space images”, contract AP-0290). The creation of GIS of glaciers of some river basins of Alay, Turkestan and Zeravshan ranges of Gissar–Alay mountain system, which in turn is a part of Pamir–Alay mountain system, was fulfi lled.
The vector layer is created where each of glaciers is represented as a polygon with the precise geographical position and the true form. The data on a modern glaciation will allow more precisely computing icemelt runoff. Moreover, these data are necessary for an estimation of water resources of the Central Asian region.

LandWaterMed network210
Figure 8: Digitized glaciers (vector polygonal layer) with attributes (as example Sokh River basin)
Conclusion
Hydrological simulation and forecasting are the important element of water management of the Central Asian region. Use of some existing methods of the runoff forecast is complicated or it is not possible for the lack of the necessary initial data. As one can see the use of new types of information together with GIS technology allows solving traditional tasks with a satisfactory precision and in a new way.
References
[1] Batirov R., Yakovlev A. Monitoring of Mountain Glaciers and Glacial Lakes using ASTER Space Images. Proc. of the First International Conference on Hydrology and Water Resources in Asia Pacifi c Region (APHW2003), Kyoto, Japan, 2003, Vol. 2.
[2] Baumgartner M., Spreafi co M., Weiss H. Operational snowmelt runoff forecasting in the Central Asian region. Remote Sensing and Hydrology 2000. Proc. of Symposium held at Santa Fe, New Mexico, USA. IAHS Publ. No. 267. 2001.
[3] Chub, V.E. Climate change and its impact on the natural resources potential of the Republic of Uzbekistan. SANIGMI, Tashkent, 2000.
[4] Kobilov T., Baumgartner F., Pertziger F., Vasilina L. Operational technology for snow cover mapping in the mountains of Central Asia by means of NOAA AVHRR data. Remote Sensing and Hydrology 2000. Proc. of Symposium held at Santa Fe, New Mexico, USA. IAHS Publ. No. 267. 2001.
[5] Pertziger F.and Yakovlev A. Use of satellite information and GIS for simulation of infl ow to Charvak reservoir. Bulletin of SCST of the Republic of Uzbekistan, No 3–4, Tashkent, 2001.
[6] Schetinnikov, A.S., and Yakovlev A.V. Structure and functional capabilities of the data bank “Glaciers” for PC. Proc. of SANIGMI, edition 153 (234), 2000.
[7] Tronov, M.V. Glaciers and climate. Leningrad. Gidrometeoizdat, 1966.

Tal A. 211
The Israeli-Palestinian Water Situation
Abraham TAL
ICTAFTel Aviv University
Tel: 972-3-6412882Fax:[email protected]
Abstract: The increasing populations and rapid development in the region, have made water and land resources insuffi cient and diminishing due to over-exploitation, erosion and contamination. The water exist in the north and centre whereas most of the land and population are in the centre and south. Furthermore, the water resources are at low elevations (between –200 to +30) whereas most of the land to be irrigated and most of the urban areas are at much higher elevations. The solution to these discrepancies was the construction of the National Water Carrier during the 1950s, bringing the waters from the north and central parts of the country, to the central and southern parts.The use of fresh water was in the year 2000 to the order of 55% to agriculture, 33% to household use and 12% to industrial and other uses. The planned use for 2020 is for some 42% to agriculture, 40% for household use and the remaining 18% going to to industrial and other uses. This is based on an expected increase in resources by some 30% coming from desalination and reuse.
The basic principles in the water sector are:��Central administration;��equal access to all and��equal pricing for all parts of the country,
all governed by the water law, health standards and control, environmental protection and specifi c municipal regulations.The recent severe shortage created the necessary political atmosphere for decisions on increasing reuse, desalination and import of water from Turkey.
Keywords: water, shortage, policy, national carrier

LandWaterMed network212
Introduction
The populations of the Middle East are one of the most rapidly increasing populations in the world, with the Palestinian populations of the West Bank and the Gaza Strip holding the world record for natural growth. However the water and land resources of at the disposal of the Israeli and Palestinian peoples are diminishing due to over-exploitation, erosion and contamination.
• Facts and Figures - Israel
��Population 5,760,000 (96) Forecast 2010 - 7,000,000��Total area 22,145 Sq Km = 2,214,500 Hectares ~ 5,500,000 Acres.��Agriculture ~ 1,050,000 Acres��Forest ~ 305,000 Acres��Desert ~ 1,750,000 Acres
Figure 1: Israel and the Middle East
Tab.1: Selected Economic Indicators for Israel
Unit 1985 1986 1987 1988 1989 1990 1991 1992 1993 1994 1995 1996 1997
Population & Employment
Population (annual average) Thousands 4,233 4,299 4,369 4,442 4,518 4,660 4,946 5,124 5,262 5,399 5,545 5,689 5,718
Employment ( « « ) « 1,345 1,360 1,404 1,453 1,461 1,492 1,583 1,650 1,751 1,871 1,968 2,013 2,210
Resources & Uses
Gross National Product $ billion 23.2 28.9 34.5 42.8 43.6 50.9 58.5 64.3 64.1 73.6 84.8 93.1 95.5
Gross Domestic Product « 24.2 29.9 35.7 43.9 44.7 52.2 59.5 65.6 65.0 74.7 86.6 95.2 98.1
Private Consumption « 14.0 17.6 22.2 26.5 27.0 32.1 36.2 40.1 41.1 50.0 53.5 53.1 51.0
Investment (Gross fixed capital formation) « 4.0 5.4 6.9 7.7 7.2 9.5 14.4 16.2 16.5 18.7 20.4 22.3 21.2
Civilian Government Exp. « 11.5 11.5 11.9 12.5 12.9 13.6 14.3 15.3 15.7 16.8 17.5 18.2 18.6
Defence Expenditure « 10.5 8.6 11.5 10.5 8.5 9.4 9.6 9.0 9.7 8.6 8.2 8.9 8.9
Foreign Trade: «
Exports of goods & services « 10.1 11.5 13.7 15.1 16.3 17.9 18.0 20.4 21.9 25.0 27.7 29.2 31.2
Imports of goods & services « 11.8 15.8 20.3 21.3 20.2 23.8 27.3 29.4 32.3 38.6 41.5 45.2 46.4
Import surplus (trade deficit) « 1.7 4.3 6.6 6.2 3.9 5.9 9.3 9.0 10.4 13.6 13.8 16.0 15.2

Tal A. 213
Principles and Situation
The Basic Principles ruling the water sector in Israel are as follows:
��Water in Israel is centrally administered. ��Access to water is equal to all ��Pricing is equal in all parts of the country for each sector.
The situation in the water sector may be illustrated by the following statements:
��Israel is badly short of water. ��Most of its resources are situated in the north, and centre whereas most of its land and population arre in the
centre and the south.��The water resources are at low elevations (between –200 to +30) whereas most the land to be irrigated and most
of the urban areas are much higher.��Furthermore, the currently available resources are insuffi cient to satisfy the demand.
Water resources
The generalized situation is as follows:
��Total available resources (1997) – 2224 Mm3 (million cubic meters)��Total use - 2008 Mm3
The balance is in the national carrier pipelines and canals and in recharging ground water.
The resources are more or less equally divided between surface water and groundwater .
New resources must be found for continuing development by :
��Reuse��Desalination��Water saving technologies
Policies as of the years 2002-2003 include the objectives:
��To reduce the allocations to agriculture by 25-50% ;��To maximize reuse by constructing wastewater treatment plants for all collectable water in urban and industrial use; ��To construct large-scale desalination plants – the fi rst 100,000m3/year is under construction and additional
50,000 m3 plants are planned to be constructed and to come on-line every 3 years.
Surface Water Resources
The average long-term annual yield of surface waters, including recycled water, is some 1.3 billion cubic meters
The Lake Kinneret (Sea of Galilee) reservoir has total potential capacity of 700 million cubic meters (Mm3) when full at (-) 208.9 m and down to the “red line”[1] the depth at which withdrawal from the Lake is permitted.
Consequently only 386 Mm3 were pumped from the Lake in 1997; withdrawals from other surface sources in 1997 amounted to 488 Mm3. Since, low rainfall has caused withdrawals beneath the “ red line”.
The surface water resources are shown in the following map (fi g.2).

LandWaterMed network214
Figure 2: Israel’s Surface Water Resources
• Groundwater resources
The main aquifers are situated in the central parts of Israel and the Palestinian Authority, including the Coastal, the Western Mountain and the Eastern Mountain, aquifers. These are illustrated in the following map (fi g.3).
The National Carrier System
The solution to the discrepancy between the relatively water-abundant areas and the agricultural and heavily populated areas, was the National Carrier System – a conveyer consisting of open canals, pipelines and buffer reservoirs. Built during the 1950s, the conveyer moves water from the Sea of Galilee and from the Coastal and Western Mountain aquifers to th central and southern parts of the country. The map below illustrates the layout of the Carrier. The cross section shown in fi g.5 illustrates the complex topographical obstacles and the different sections of the carrier system.
Figure 3: The Aquifers

Tal A. 215
Figure 4: The National Water Carrier
Figure 5: Carrier Cross section

LandWaterMed network216
Water Use
The following table shows the development of the water use from the mid-60s to 1997, the distribution among the different resources and the use per sector.
Tab.2: Water Production by Source and Water Consumption by Sector for Years 1990 and 1997 and for Budget Years 1984/85 and 1964/65
Item Calendar years Budget years
1997 1990 1984/85 1964/65Total production, by producer and source 2,224 2,035 1.989 1,393
Mekorot - Total 1,524 1,328 1,258 696
- Wells 737 815 n.a n.a
-Lake Kinneret - National Water Carrier 386 153 397 273
- Other surface water 225 247 397 n.a
- Recycled water 176 113 n.a. n.a
Other Producers - Total 700 707 731 697
- Wells 356 393
- Surface water 263 254
- Recycled water 81 60
Consumption - Total1) 2,008 1,804 1,920 1,329
Supplier
- Mekorot 1,307 1,127 1,213 620
- Other suppliers including self- supply 701 677 707 709
Domestic Consumption 2) 621 482 422 199
- Mekorot 487 344 298
- Other suppliers 134 138 124
Industrial water use 123 106 109 55
- Mekorot 74 79 75
- Other suppliers 49 27 34
Agricultural use 1,264 1,216 1,389 1,075
- Mekorot 746 704 841 470
- Other suppliers 518 512 548 605
Source: Based on Water Commission data1) Difference between production and consumption due to the quantities
of water used for operating the national water system including recharge2) Includes water for gardens and public landscaping
Tab.3 shows again the distribution by main sector for the years 2000 (actual) and 2020 (planned). This table shows Israel’s obligations to supply 50 MMC per year to the Kingdom of Jordan and to supply the needs of the Palestinian Authority.
Tab 3: Water use by sector 2000 - 2020
Year Population of Israel (106)1
Water Usage in Israel (106m3)PalestinianAuthority4
Kingdom of Jordan
Grand totalAgriculture3 Industry HouseholdUse2
Sweet Treated Total Sweet Other Total
2000 6.2 880 270 1150 100 35 135 705 56 55 2101
2020 8.6 530 830 1150 150 60 210 1120 210 55 2745
1 According to the Central Bureau of Statistics and the Israel 2020 programme2 2020 household use assumes an average 130m3 per person per year3 Based on the use during the years 1996-19984 1.6 million inhabitants in 2000 with an average use of 35m3 per capita 3.0 million inhabitants in 2020 with average use of 70m3 per capita
Water Sector Organization and Legislation
The water law of 1954 delegates the responsibility for the water sector to the Water Commissioner – an organization within the Ministry of National Infrastructures. The following organogram shows the complexity of the administration of this vital secto with 7 government Ministries involved in their different areas of responsibility.

Tal A. 217
Figure 6: Organizational Structure of the Israeli Water Sector
The following laws govern the management of the water: The water law of 1954 and its amendments, Health standards and control, Environmental protection and�Specifi c municipal regulations based on the above laws.
Necessary Actions for Sustainability
Due to the unfavourable climatic conditions and rainfall distribution a great volume of storage is needed; such storage capacity can be found in Israel in the Sea of Galilee and in addition, only in the aquifers. This situation requires a complicated central management in order to achieve overall effi ciency, desalination of sea-water has been practiced in Israel for many years but only in the extreme southern desert region of Eilat and the Arava valley.
It is now planned to supplement the dwindling resources for the whole of the country. This will be achieved :
��By increasing wastewater reuse from the present level of some 10% of the total to around 50% to be used in agriculture and industry, thus shifting most of the fresh water to urban and household consumption. The environmental and health aspects have been monitored and studied for over 25 years of reuse of the waters produced “Shafdan” treatment plant (south of Tel-Aviv) .
��By constructing desalination plants. The fi rst 100 million m3 per year plant is under construction and the Water Commissioners plan calls for constructing additional 50 million m3 plants every 3 years.
��By import of water by sea from Turkey to the extent of 50 Mm3 per year.
References[1] Case Study of the City of Tel-Aviv-Yaffo, Abraham Tal, Shmuel Kantor, Sustainable Use of Water in Metropolitan Cities (METRON Project) Commission
of the European Communities, Environment and Climate RTD Programme , November 2000

LandWaterMed network218

De Jong C. et al 219
Integrated hydrological modelling concepts for a peripheral mountainous semi-arid basin
in southern Morocco
Carmen DE JONG1, Rebecca MACHAUER1, George LEAVESLEY2, Sebastien CAPPY3, Peter POETE1, Oliver SCHULZ1
1 Geographical Institute, University of Bonn, Postfach 1147, 53001 Bonn, Germany++ 49 228 739095++ 49 228 737506
2 Water Resources Division, USGS, Denver, USA3 Geological Institute, University of Bonn, Germany
e-mail:[email protected]
Abstract: The aims of this study are to apply the Modular Modelling System (MMS) as a hydrological modelling tool for the mountainous Ameskar basin located in the peripheral, semi-arid Drâa basin of Morocco. The Drâa drains from the High Atlas Mountains to Lac Iriki and feeds a large dam for irrigation purposes. Precipitation inputs include rain and snow. Evapotranspiration and snow sublimation play a signifi cant role. Vegetation consists mainly of shrubs and is scarce beyond the intensively irrigated oases. Surface and subsurface run-off and springs are controlled by complex geomorphology and geology including limestone and basalt. Wadi river beds are highly porous and discharge is sporadic and highly variable depending on precipitation inputs and river bed characteristics.
Keywords: mountain, fl oods, geomorphology, MMS, HRUs
Introduction
Peripheral, semi-arid regions such as the Drâa in southern Morocco are subject to a wide variety of socio-economic and environmental pressures. One of the most severe problems effecting the Drâa in terms of the natural physiography is its water shortage and drought over the last 5 years. This type of arid watershed faces pressure in water resources that may constrain economical development in the near future through losses in income from the agricultural sector. According to the world water poverty index, Morocco has an index of below 45 and the Drâa belongs to the world’s ten most driest catchments (Ravenga et al 1998). The latter has an average population density of 11 people / km2. With more than 80% of original forest lost in the last century and 95 % of the basin being arid, its population, settlements, infrastructure and agriculture has to be concentrated around the rivers and oases. Apart from its complex hydrogeology and geomorphology, in particular in the mountain regions, the Drâa catchment is also subject to highly variable rain- and snowfall regimes and extremely sporadic and variable discharge.
The downstream reservoir Mansour Eddahbi situated near Ouarzazate, the regional capital, is strongly dependant on water input from the mountain catchments. Over the past few years, there have been large fl uctuations in water input into the reservoir and its minimum capacity is often no longer reached (Fig. 1). Apart from being negatively effected by several years of water shortage, the Mansour Eddahbi dam has been also subject to substancial infi ll by sediments and consequently rapid capacity loss. If this trend continues, the reservoir will have lost half of its capacity by the year 2030 and will require intensive study of sediment delivery to predict its entire lifetime and economical function.

LandWaterMed network220
Since there is a need to apply an integrated, watershed-wide approach to watershed management (Ravenga et al 1998), appropriate measuring and modelling systems are necessary. It is also important to develop user-friendly models that are applicable for stakeholders e.g water managers and non-university agencies, such as the Agence du Bassin Sous Massa, (ABSM) Agadir. In terms of integrated watershed management it is important to consider that large watersheds are often managed hydrologically in a piecemeal fashion e.g. for irrigation but not as interactive, catchment-wide units. Cross-sectoral and cross-regional approaches (Sassari Declaration 2003) are essential if the ability of watersheds to provide ecological, hydrological and economical services are to be sustained.
On the geographical side this should include, apart from climatological, hydrological, vegetation and soil aspects, in particular sediment dynamics related to reservoir sedimentation. According to the UN World Water Development Report (2003) an increased emphasis should be put on the building of national capacities to make effective reporting of progress of such management programmes. The translation of scientifi c approaches to the practioneers level requires not only a two-way thinking according to the HELP philosophy (UNESCO 2005) but also the early planning of sophisticated integrated models together with future stakeholders in order to facilitate acceptance and implementation over the long-term.
Therefore it is important to analyse, understand and model the hydrological regime of all important surface and subsurface reservoirs and river systems using an integrated approach that takes into account those aspects that are pertinent to semi-arid catchments. Since standard hydrological models are limited with respect to integration of non-standard aspects, the MMS modelling system was chosen as a fl exible and extendable system to characterize the full hydrological cycle in mountain and lowland catchments.
The aims of this paper are to apply the MMS hydro-meteorological modelling system to the mountainous Ameskar valley based on detailed physical parameterisation of the basin, and to develop an integrated modelling approach which will be validated from AMSM discharge stations. This will provide the basis for an extensive basin-wide approach that is in development for the whole Drâa catchment.
Physical characteritics of the study area
The Drâa basin forms a large transboundary catchment (115 000 km2) stretching across Algeria, Mauretania and Western Sahara but the Drâa river itself is restricted to the upper parts of the catchment (34,609 km2) located in Morocco and does not reach the Atlantic ocean any longer (Fig. 2). In the Drâa catchment there are four distinct geological units: the southern slopes of the intracontinental High Atlas range, an intensively eroded high alpine
Figure 1: Annual infill of Mansour Eddahbi reservoir (pictured on the right) from total contributing river discharge over the last 60 years until 2000.
Red stripes mark periods of major drought.
Figure 2: Transboundary limits of Drâa catchment and location of Ameskar valley

De Jong C. et al 221
mountain chain composed of a Variscan basement and Mesozoic carbonated cover, the asymmetrical synclinorium basin of Ouarzazate with Cenozoic continental formations, the low Anti-Atlas range (Jebel Saghro), a Precambrian basement with Paleozoic cover and the Saharan forelands down to the former terminal lake Lac Iriki. The study site, the remote, semi-arid Ameskar basin (140 km2) was selected as one of the most typical and highest valleys in the High Atlas Mountains. It ranges between 1850 – 3950 m and is located in the northern Drâa basin within the M’Goun Range (Fig. 2). This region is particularily interesting for the study of hydrological dynamics since in winter it has southerly oriented snow-covered slopes and a particularly complex geology.
Here, the High Atlas forms a Mesozoic calcareous massif. The catchment consists of a complex anticlinal structure with highly folded and thrusted geological units, mainly limestone, basalt, syenite, silt, sandstone, gypsum and clays including evaporitic minerals. Geomorphologically, the basin has rockfaces, extensive scree slopes, debris fl ow channels, debris fans, ancient and active landslides on the lower valley fl anks and coarse, gravelly river beds. As is typical for the mountains and forelands, the Assif-n-Ait-Ahmed fl ows over a highly porous bed. Average surface discharge is only 0.5 m3s-1, remains sporadic and fl ows down to the village of Lower Ameskar. Flow becomes totally subsurface in the lower reaches of the valley but remerges in the gorge below the Ameskar valley. The Assif-n-Ait-Ahmed joins the M’Goun which in turn forms the Drâa below its confl uence with the Dades [Youbi 1990].
At Ifre (1500 m) average discharge of the M’Goun is 4 m/s. Vegetation in the valley is scarce and dominated by scattered juniperus trees between 1800-2400 m, cushion shrubs above 2400 m and accacia wadi communities in the rivers and dry wadi beds. The valley oases are partially irrigated with Mediterranean fruit oases and legumes. In the Upper Drâa, the average annual available groundwater resource is approximately 80 Mm3 per annum. At Ifre, the Oued M’Goun has a catchment size of 1240 km2 and although it covers only 8% of the total surface area of the Upper Drâa it provides the main freshwater resource for the region. It is estimated that approximately 40% of the rivers feeding the reservoir originate from the M’Goun range.
The High Atlas mountains play a distinct role in producing orographic precipitation and cloud formation. Average annual precipitation in the Ameskar catchment varies around 600 mm and is infl uenced by a strong vertical temperature and rainfall gradient. The semi-arid climate can be subdivided into two dominant seasons: a wetter winter season with both rain and snow at the beginning and towards the end and a very dry summer season with at least 2 months without precipitation. At the highest peak station (3850 m) minimum temperatures can reach –25°C during the winter while average summer temperatures only reach 15°C and wind speeds can attain 25 m/s and precipitation can reach 700 mm per annum. On average there are more than 140 frost days per year. Snowfall events are erratic throughout the winter and at the higher stations, fi rst modeling results and fi eld experiments indicate a high percentage of snow lost directly through sublimation [Schulz et al 2003]. Sporadic fl oods occur as a result of snowmelt and / or catchment wide precipitation in spring and autumn. The fl ood characteristics are a refl ection of extreme rainfall or snowmelt patterns as well as geomorphologic and geologic setting. Flood peaks are high with steep ascending and descending (“shark-tooth”) fl ood limbs. The periods between extreme events are marked by low or absent discharge.
In the Drâa there are several important infl uences on the water storages, as indicated in the table below.
Main Influence
Physical Socio-economic
snow climate / vegetation afforestation /deforestation
soil / slope / geomorphological units
Precipitation, landslides, debris flows, soil erosion
infrastructure / land use / animal density
groundwater Precipitation, discharge, percolation, infiltration, ET
pumping and wells for household and irrigation
surface runoff climate, geomorphology, vegetation
pumping / irrigation
reservoirs Precipitation, discharge, ET
lachés, farmers small reservoirs

LandWaterMed network222
Snow is particularly unique for this semi-arid region and functions as a principal water store as well as augmenting and delaying discharge into the late spring [Schulz and de Jong in press]. Since soils are poorly developed or absent in most areas, the different geomorphological units play an important role in the amount and period over which they can store water. The coarse-grained river beds tend to infi ltrate water very rapidly but on the other hand the interfl ow areas can fi ll up quickly during intensive rainfall events. Impermeable surfaces such as rocks and silty areas convey water immediately at the surface and do not act as potential reservoirs. Conversely, areas mobilised by mass movements tend to be regions of higher infi ltration and storage capacity. The mountain oasis farmers are most directly infl uenced by these conditions and have most experience in traditional land use in particular water usage. The greatest diffi culty confronting the mountain farmers is not water shortage but infrastructure i.e. limitations of accessibility. In the forelands, the role of groundwater, reservoirs and surface runoff plays a dominant role in determining land use, settlement and economical survival. In those areas with the highest water shortage, pumping is becoming an increasingly essential means of maintaining household water supply and irrigation.
Methods
This study combines four main approaches: fi rstly, fi eld experimental, secondly remote sensing, thirdly GIS and model parameterization and fourthly modelling.
• Field experimental techniques
Experimental techniques include climate stations, snow pillows and lysimeters, water sampling of spring and stream gauges. These are very important for obtaining a picture of hitherto undocumented processes as well as for validating model results under the given extreme hydrologic and climatologic conditions.
Climate stations
Campbell climate stations were installed at the beginning of the project in 2001 at three sites in the Ameskar catchment and at one site in the neighbouring Ouzighimt catchment (Figure 1). For simplicity only the stations in the Ameskar catchment will be discussed here: Ameskar (2250 m), Tichki (3260 m) and M’Goun (3850 m) (Fig. 3a). Meteorological data including soil and air temperature, humidity, radiation, precipitation, wind direction and wind speed is collected at one level in 15 minute intervals. The two upper stations include snow height sensors and snow pack thermometers. Precipitation was corrected for the three stations according to Sevruk and Zahlavova [1994].
Snow Pillows
Snow pillows were installed at the 3260 m site of Tichki (Ameskar) and at the 2960 m site at Tounza (Ouzighimt) in cooperation with the USDA (Salt Lake City) in October 2003. They enable accurate measurements of snow water equivalent of daily snowfall and snow ablation over a surface area of approximately 4 m2 via a pressure transducer that is connected to the Campbell station data logger.
Lysimeter
In the spring of 2004, a self-developed lysimeter consisting of cushion hedgehog shrub was installed at the Tichki site near the snow pillow. The lysimeter, which has a surface area of 0.3 m2 and weight of approximately 50 kg was placed on automatically weighing scales and connected to a notebook for data collection. The fi rst data will be available after the summer of 2004.
Surface and subsurface discharge measurements
Three fl oating gauge stations are operational in the catchment (Fig. 2), one since April 2002 in Taria (2752 m) with a catchment area of 5.5 km2, one since October 2003 at Cascade (2195 m) with a catchment area of 53 km2 and one since November 2003 at Tichki village with a catchment area of 15 km2. Discharge measurements were problematic due to very long periods of low fl ow alternating with extreme fl ood fl ow. Since no calibrations are possible during fl ood fl ow, discharge is underestimated for fl oods especially at Cascade where the fl ow cross-section is diffi cult to

De Jong C. et al 223
defi ne and changes frequently during high fl ow. During the period of 2002, the Taria stage recorder periodically stopped working over the summer of 2002 and after the fl ood in April 2003. This is possibly due to high suspended sediment concentrations deposited in the stilling well during fl oods and causing the fl oat to jam. The observed stage was corrected manually for this second period according to the pre-fl ood reference level.
Approximately 50 springs were sampled to determine discharge and water quality. Hydrogeological measurements distinguished the discharge of different springs, the age and origin of water. The methods include �2H, �18O and Tritium measurements, discharge and water quality measurements of springs.
Figure 3 a) Climate station with rain gauge and snow height measurements (M’Goun 3850 m), b) snow pillow at Tounza (2960 m), c) stage gauge based on automatic floater (Tichki 2400 m) and
d) automatically weighing lysimeter with hedgehog cushion shrub at Tichki (2300).
• Remote sensing
Remote sensing is essential in remote and mountainous regions for deriving a variety of spatial and temporal parameters from the earth’s surface. The most important background for this study was a DEM with a 30 m resolution derived from ASTER images and ground control points supported by an intensive GPS fi eld campaign. The interpretation from these images also supported the creation of geological and geomorphological maps. LANDSAT images were important for deriving vegetation and land use classifi cation including the delineation of important areas such as the oases. MODIS images form the basis of temporal snow distribution maps that will be used in modelling areal snow depletion.
• GIS and model parameterization
Ameskar catchment
The pre-processor of the Modular Modelling System (MMS) consists of the GIS Weasel. This is a GIS-based tool for classifying Hydrological Response Units (HRUs) based on a Digital Elevation Model (DEM) with a grid size of 100 m which are combined with vegetation, geomorphological / soil properties and geological maps. Vegetation is delineated from topographical maps and remote sensing images and classifi ed according to bare ground, shrub and grass units.

LandWaterMed network224
Soil characteristics are derived from simple assumptions on maximum water holding capacity derived from the geomorphological maps since well-developed soils are largely absent (Fig. 4). The GIS layers are created by digitizing polygon-shaped units of geomorphology, hydrogeology and vegetation and these layers are converted into grids and processed as an input to the GIS Weasel. A detailed geological map was produced from a combination of fi eld work and image interpretations derived from remote sensing. Once the parameter fi le has been established it is introduced into the PRMS (Precipitation Runoff Modelling System) of MMS (Modular Modelling System) together with a simple data fi le. The data fi le is derived from radiation, minimum and maximum temperature and wind speed from all three climate stations. The most diffi cult layer to establish was the geomorphology which was derived from a variety of interpretations based mainly on fi eld work, topographic maps (1: 100 000) and high resolution remote sensing images such as IKONOS and ASTER.
The fi rst stage of the GIS Weasel pre-processor programme delimits the catchment and produces various hydrological parameters such as stream network, fl ow planes and radiation surfaces to defi ne Hydrological Response Units. The catchment was subdivided into two main zones: the Taria subcatchment at the Taria gauging outlet and the Cascade subcatchment at the Cascade outlet. No surface discharge is present at the fi nal basin outlet therefore the model was not run for that part. Once the HRUs have been classifi ed the very small ones are disaggregated to larger units to improve the effi ciency of discharge modelling [Carlile 2002]. In a second stage the HRUs are then intersected with the vegetation, geological and geomorphological layer and parameterized.
Figure 4 GIS layers with a) simplified stream network in the two subcatchments Taria and Cascade, b) vegetation, c) geomorphology, d) geology and e) HRUs with hydrogeological reservoirs.
Drâa catchment
For the remaining Drâa catchment, a 30 m DEM recently established from ASTER images was used as basis for calculating the HRUs. This has improved the representation of mountain terrain and the narrow oasis areas. The minimum HRU size is 4 km2 for the whole catchment. Apart from the HRUs the extent of mountain and palm oases was derived from the LANDSAT images and integrated into the parameter fi le. The purpose of these areas is to establish individual evapotranspiration characteristics and to be able to model water removal by pumping and irrigation. Since

De Jong C. et al 225
the highly porous river beds with their very high infi ltration capacity are important components of the hydrological system in semi-arid environments, the extent of the river beds have been digitized and will also provide an input into the model in terms of channel loss functions. Seperate vegetation and hydrogeological layers have been established. The model is still under development but provides a promising tool for modelling the hydro-meteorological and socio-economic situation of the whole Drâa catchment, based on the concept developed in the Ameskar catchment. It will aim to provide links with hydrogeological models and meteorological outputs from high resolution climate models.
Figure 5: Subdividion of upper Drâa basin into subcatchments with gauge outlets (DRH Agadir) in the drainage area of the Mansour Eddahbi reservoir. An example of delineation into
HRUs is shown for the Ifre catchment.
• Modelling
The PRMS (Precipitation Runoff Modelling System) developed by Leavesley [2002] was applied to the Ameskar subcatchment and is in development for the entire Drâa above the Mansour Eddahbi reservoir. A special subroutine extrapolates precipitation from point to space for each HRU. The modelling platform has several useful functions e.g. the groundwater model MODFLOW has been coupled to PRMS and the UEB (Utah Energy Balance) snow model is in the process of being integrated. This is particularly important for mountain basins with high sublimation rates. The water balance components for Taria are listed in Table 2.
Results and Discussion
Experiences from the Taria subcatchment show that nearly 50% of the water is transmitted into storage and base fl ow and only half that amount fl ows at the surface [de Jong et al 2004]. This can be explained by the dominance of limestone in the whole sub-catchment. In addition, a very high percentage of precipitation is lost by evapotranspiration and by snow sublimation(nearly 50%). Interfl ow exceeds surface fl ow for most events at Taria. This is caused by the geomorphological setting of the basin. The highly porous channels of Taria rapidly fi ll with water during heavy and

LandWaterMed network226
intensive precipitation events. Surface fl ow peaks within short time spans as soon as interfl ow storage zones have been saturated and fl ood recession is equally rapid, producing a characteristic “shark-tooth” fl ood hydrograph (Fig. 6). Precipitation inputs cease nearly instantaneously causing fl ows to quickly return into the interfl ow areas and the deeper groundwater reservoirs. High fl ow and fl ood fl ow events are dominated by near surface and surface fl ow. Little water can be buffered in the vegetation zone since the vegetation cover is sparse and loamy soils are rare.
For the Taria subcatchment, good correlations were obtained between the modelled and observed discharge (Fig. 6) i.e. the Pearson correlation coeffi cient is 0.74 and the Index of Agreement is 0.70. The differences between the observed and simulated runoff are the result of differences in the timing and magnitude of precipitation versus snowmelt and runoff. Low fl ow on the 4th of April 2003 at Taria is the result of snowmelt initiated 4 days after the precipitation event. The fl ood event is overpredicted which may be both the effect of inaccurate discharge measurements as well as lack of consideration of channel loss.
Table 2: Modelled components of water cycle for the Taria subcatchment [after Machauer 2003].
N ETA Q QO QI QB S
mm 446 220 125 6 9 110 101
% 100 49 28 1 2 25 23
N= total precipitation, ETA = actual evapotranspiration, Q = discharge, QO = surface flow, QI = interflow, QB = base flow, S = storage
The experiences from the Ameskar valley show that a channel loss function enabling water loss through extremely high infi ltration into porous river beds would be required to compensate for the seemingly high discharge losses modelled for fl ood fl ows in the larger subcatchment. A channel loss function has been recently developed within PRMS and will be applied for the Drâa catchment. The river beds cause an “oasis” effect since large quantities of water are pumped out of the river bed onto the terraces for irrigation and this in turn causes a partial backfl ow into the channel. In future, such man-induced systems changes must be incoorporated into hydrological modelling. The oases areas shall be integrated into the model as regions with surplus water, extensive pumping, irrigation and return fl ow and high evapotranspiration. In terms of geomorphology, the extensively broad wadi river beds have also been descretized in order to model these as areas with very high infi ltration, fl uvial accumulation and negligible evapotranspiration.
Figure 6: Modelled and observed discharge for the high altitude, snow fed Taria catchment in the Ameskar valley from 1st April 2002 to 30th July 2003. Problems of stage recorder malfunctioning are obvious for the summer season.

De Jong C. et al 227
Conclusion
This study underlines the importance of an interdisciplinary modelling platform for water balance studies in semi-arid mountain catchments. The modelling procedure has given insight into the complexity of discharge patterns infl uenced by snowmelt in peripheral basins. It has been demonstrated that it is important to put major focus on the identifi cation and parameterization of Hydrological Response Units based specifi cally on hydrological, geomorphological, hydrogeological, vegetation and human-induced aspects such as irrigation descretizated for oases areas. Since water usage in the Drâa catchment is confi ned to the river beds, it is crucial for the success of an integrated modelling study to consider the interrelations between physical and socio-economic aspects, in particular pumping, surface and groundwater abstraction, irrigation and return fl ow.
Acknowledgements
This project was funded by the BMBF (Federal Ministry for Education and Research) in the frame of the GLOWA-IMPETUS Morocco
project. We are thankful to the immense help and data exchange made possible by the Agence du Bassin de Sous Massa, Agadir,
especially Khalid Makroum. We are grateful for the support given by numerous Moroccan and German Diploma and PhD students,
especially Anna Zeyen. We are also very grateful to the help we received from numerous inhabitants of the Ameskar valley and to our
colleagues from the USDA Salt Lake City, Bob Nault and Tim Bardsley in setting up the snow pillows.
References
[1] Carlile, P. W., A.J. Jakeman, B.F.W. Croke und B.G. Lees, 2002 Use of Catchment Attributes to Identify the Scale and Values of Distributed Parameters in Surface and Sub-surface Conceptual Hydrology Models. In: Integrated Assessment and Decision Support, Proceedings of the First Biennial Meeting of the International Environmental Modelling and Software Society, Volume 1: 346-351.
[2] de Jong, C. Machauer, R. Reichert, B, Cappy, S. Viger, R. and Leavesley, G. 2004 An integrated geomorphological and hydrogeological MMS modeling framework for a semi-arid mountain basin in the High Atlas, southern Morocco Pahl, C., Schmidt, S. and Jakeman, T. (eds) iEMSs 2004 International Congress: „Complexity and Integrated Resources Management“. International Environmental Modelling and Software Societey, Osnabrueck, Germany.
[3] FAO 2003 Sassari Declaration: Integrated Watershed Management: Water Resources for the Future Sassari Province, Italy, 22- October 200324.
[4] Leavesley, G.H., Markstrom, S.L., Restrepo, P. J. and R. J. Viger, 2002 A modular approach to adressing model design, scale, and parameter estimation issues in distributed hydrological modelling. In: Hydrological Processes 16, 173-187.
[5] Machauer, R., Hydrological investigations in the Assif-n-Ait-Ahmed catchment in the High Atlas Morocco, Unpublished Diploma Thesis, University of Bonn, 96, 2003.
[6] Ravenga, C. et al., 1998. Watersheds of the world. Ecological value and vulnerability. A joint publication of the World Resources Institute and the Worldwatch Institute, Washington, USA.
[7] Sevruk, B. and L. Zahlavova, 1994 Classifi cation system of precipitation gauge site exposure and application. International Journal of Climatology, 14, 681-689.
[8] Schulz, O. and de Jong, C. in press. Snowmelt and sublimation – Field experiments and modelling in the High Atlas Mountains of Morocco, Hydrology and Earth System Sciences.
[9] The United Nations World Water Development Report 2003. World Water Assessment Programme
[10] UNESCO HELP Programme 2005, http://www.unesco.org/water/ihp/help
[11] Yair, A. and Lavee, H. 1985 Runoff generation in arid and semi-arid zones. Hydrological Forecasting. (eds.) M.G. Anderson and T.P. Burt, Wiley.
[12] Youbi, L., 1990 Hydrologie du Bassin du Dades. Offi ce Regional de mise en valeur agricole de Ouarzazate, pp. 40, Ouarzazate.

LandWaterMed network228
Taha S. 229
Water Master Planning in Jordan: The Use of Interactive Digital Planning
Tools for Integrated Water Resources Management
Suzan TAHANational Water Master Plan Project Director
Ministry of Water & IrrigationP.O. Box 2412Amman-Jordan
E-Mail: [email protected]
Abstract: The Government of Jordan recognizes the need for a more integrated approach to national water resources planning and management in order to meet new challenges in the water sector and the increasing gap between demand and supply. Hence, with the assistance of the GTZ, the Ministry of Water and Irrigation (MWI) started the Water Sector Planning Support Project (WSPSP). The key objective of this project is to establish a Digital National Water Master Plan (NWMP) based on an extensive Water Information System (WIS) including a Geographic Information System (GIS). The Digital Water Master Planning tools, currently deployed at the MWI can be used to continuously monitor and analyze the current water management situation and assess water resources and demand projections. These tools assist in evaluating reasonable options and strategies to reverse water imbalances, and in managing and developing Jordan’s water resources. Other uses for the tools include the performance and evaluation of daily water management tasks.
Introduction
Jordan is one of the most water scarce countries in the world. Water supply defi ciency is limiting the achievement of higher standards of living and constraining economic development associated with industry, tourism and agriculture. Shortages are more of a permanent nature. Demands for freshwater have been therefore met by developing renewable supplies, over-drafting renewable groundwater basins, and using irreplaceable fossil groundwater. But as the country faces rapidly increasing costs of supply expansion, it is becoming harder to manage the balance between the limited renewable supply and the increasing demand for water. The current gap is currently met by measures that threaten the sustainability of water resources. The government is hence concerned that a more integrated approach to national water resources planning and management will be necessary to guarantee an adequate water supply to all users in the future.
Background
Since the completion of the fi rst National Water Master Plan for Jordan, in 1977, dramatic changes have taken place with respect to water availability and water demand. Increased urbanization has had a strong impact on water use patterns. Deviations from the recommendations expressed in the fi rst Master Plan have resulted in partial deterioration of groundwater quality in many parts of the Kingdom. The infl ux of more than 350,000 people from the Gulf States in 1991 increased the demand on the already over-stretched water resources.
While the fi rst Master Plan is still in use as an offi cial reference document, serious consideration have been made to set up a “digital water master plan” that can be updated easily as new information becomes available, and which permits a fl exible response to new questions and challenges.
Consequently, in 1994, the Jordanian Ministry of Water and Irrigation (MWI) started the Water Sector Planning Support Project (WSPSP) in cooperation with the Deutsche Gesellschaft Fur Technische Zusammenarbeit (GTZ) GmbH. One of the key objectives of this project is to build up a National Water Master Plan which is based on a water information system (WIS) for providing a ranking of alternative strategies and action plans to improve water resources management and secure long-term water supply.

LandWaterMed network230
Objectives
In order to guarantee the required water supply to all users and safeguard the resources for future generations a common planning framework is needed. This framework is given by the Water Master Plan.
According to the United Nations, the primary objective of a Water Master Plan is to establish a basic framework for:
• Orderly and integrated planning and implementation of water resources programs and projects; and
• A rational water resources management consistent with overall national socio-economic development objectives.
By using the interactive tools, the new Masterplan will not be a static printed document but a Digital Water Master Plan based on an extensive Water Information System (WIS). In close cooperation with the Ministry of Water and Irrigation and GTZ, the German consulting company AHT International has developed the Digital Planning Tools. These software tools are database applications with a GIS (digital mapping) interface that are applied to:
• Assess the present availability, withdrawals, losses and uses of the water resources;
• Formulate alternative development scenarios for water resources and demand/use at various planning horizons;
• Perform the balancing of resources versus demands for the recent past as well as for the alternative development options and
• Identify technical and operational options in order to bridge the gap between resources and demands.
Components of the Digital National Water Master Plan
• Water Information System (WIS)
The Digital Water Master Plan receives its data from the Water Information System (WIS). This is the central information system at the Ministry of Water and Irrigation, serving the Ministry as well as WAJ (Water Authority of Jordan) and JVA (Jordan Valley Authority). In addition, it is the authorized source for data on water monitoring, management, and planning for external users like research institutions or international donors.
The WIS is a complex system of hard and software, data and tools as well as people for its operation and maintenance. It can be accessed from all computer workplaces within the Ministry’s network. The majority of data is either stored in ORACLE data base tables or in GIS fi les. These two data systems are linked, thus permitting both the data selection by inter-active maps and cartographic representation of results.
The WIS contains monitoring data collected in the fi eld either by operators of the water supply and wastewater disposal systems (namely WAJ and JVA), the hydrological service of the Ministry and/or external institutions like the Department of Statistics and the Ministry of Agriculture. In addition to the monitoring data the WIS holds the results of water demand and resources projections.
The two primary user interfaces of the WIS are the Data Entry and Visualization Application (DEVA) and the Digital Visualization System (DVS). The DEVA (written under Oracle developer) is both used for data entry and the production of reports in a fi xed format.
The DVS is specially made for the master plan allowing producing standard information products in an automated way. It is an MS-Access application with integrated MapObjects GIS modules for spatial selection and cartographic outputs. The DVS is applied to monitoring and forecasted data to produce standardized tables, charts and maps under Excel. Thus, its results can be easily post-processed with MS Offi ce software.
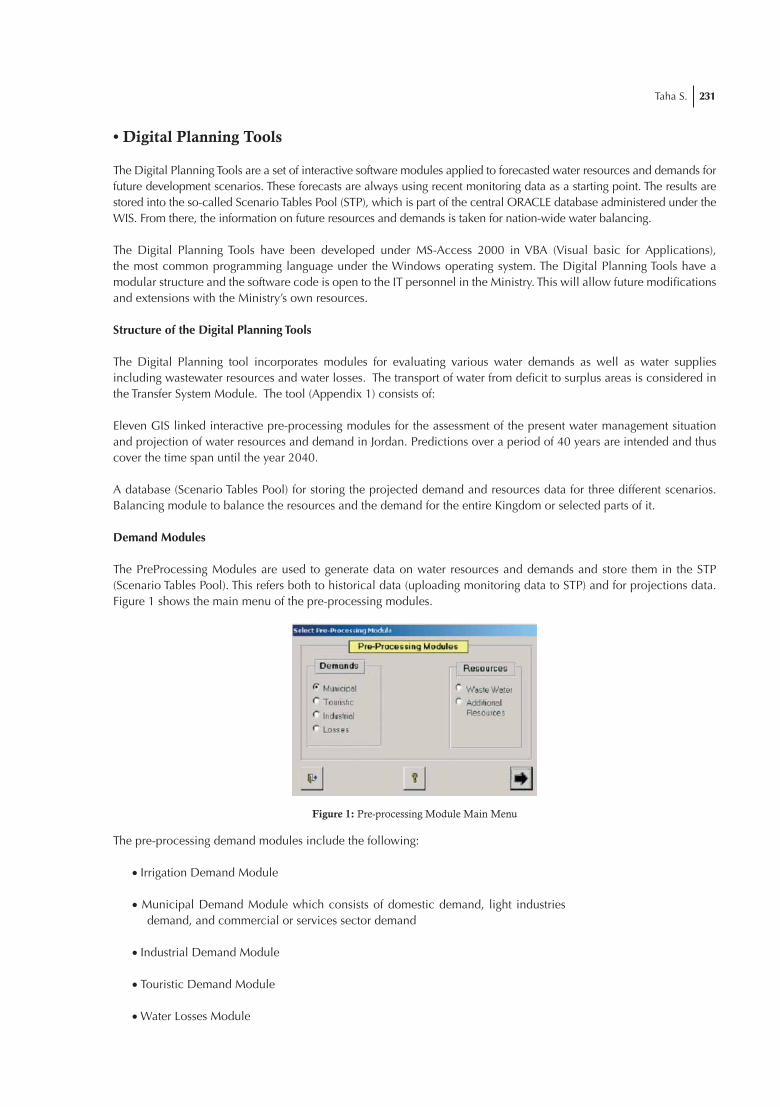
Taha S. 231
• Digital Planning Tools
The Digital Planning Tools are a set of interactive software modules applied to forecasted water resources and demands for future development scenarios. These forecasts are always using recent monitoring data as a starting point. The results are stored into the so-called Scenario Tables Pool (STP), which is part of the central ORACLE database administered under the WIS. From there, the information on future resources and demands is taken for nation-wide water balancing.
The Digital Planning Tools have been developed under MS-Access 2000 in VBA (Visual basic for Applications), the most common programming language under the Windows operating system. The Digital Planning Tools have a modular structure and the software code is open to the IT personnel in the Ministry. This will allow future modifi cations and extensions with the Ministry’s own resources.
Structure of the Digital Planning Tools
The Digital Planning tool incorporates modules for evaluating various water demands as well as water supplies including wastewater resources and water losses. The transport of water from defi cit to surplus areas is considered in the Transfer System Module. The tool (Appendix 1) consists of:
Eleven GIS linked interactive pre-processing modules for the assessment of the present water management situation and projection of water resources and demand in Jordan. Predictions over a period of 40 years are intended and thus cover the time span until the year 2040.
A database (Scenario Tables Pool) for storing the projected demand and resources data for three different scenarios. Balancing module to balance the resources and the demand for the entire Kingdom or selected parts of it.
Demand Modules
The PreProcessing Modules are used to generate data on water resources and demands and store them in the STP (Scenario Tables Pool). This refers both to historical data (uploading monitoring data to STP) and for projections data. Figure 1 shows the main menu of the pre-processing modules.
Figure 1: Pre-processing Module Main Menu
The pre-processing demand modules include the following:
��Irrigation Demand Module
��Municipal Demand Module which consists of domestic demand, light industries demand, and commercial or services sector demand
��Industrial Demand Module
��Touristic Demand Module
��Water Losses Module

LandWaterMed network232
Each demand pre-processing module requires data input from various databases; production and/or water use data. Water use and demand data are aggregated to demand centres such as towns and villages, developed irrigated areas and project areas, which are geographically represented via point information in GIS.
Except for the Irrigation Demand pre-processing module, all the modules are similar in structure and the underlying algorithms are rather simple General features of the modules include:
��Selection based on spatial units
��Selection based on criteria
��Demand projection with pre-defi ned parameters for 3 development scenarios
Spatial Selection and Selection Criteria: each time a demand pre-processing module is started; selection of a set of individual water demand centers or balancing unit is done using MapObjects LT. The spatial selection window offers several powerful options for spatial selection (Figure 2).
Figure 2: Municipal Demand Module Interface
Figure 3: Spatial Selection Interface

Taha S. 233
The selection of demand centers also is possible according to the selection criteria of the balancing module under consideration, such as selection based on the agroclimatic zone or governorate. Typical selection criteria for all modules include demand centers, balancing unit, year of reference (the year based on which demand projections are started and for which data are available), and amounts of water used or demanded.
Other selection criteria distinguish between historical assessment of water use and future demand development or projections. For the analysis of the present water use/demand situation only one year needs to be selected. The module, which is linked to WIS then will display monthly use values for the required sector and the selected spatial unit. Results can be exported to external tables for further analysis and processing. It is believed that this feature of the demand modules will facilitate daily water management tasks. Spatial analysis of water use data also allows for regular data processing and analysis and provides such information as per capita water use, irrigation water use/demand and the total amounts of water used by each demand sector, etc. Total water demand then can be compared later with existing resources and hence allow for the examination of the current water management situation.
Demand Projection Parameters and Development Scenarios
For the projection of demands, the interval or the balancing years for which demand development is calculated should be selected. The parameters relevant to the sector demand projection also should be selected. Three scenarios are considered for demand projections (high, medium and low) and one value for each parameter has to be assumed for each scenario. Taking the municipal demand as an example, the projection parameters are:
��Reference Year Data: Population and Water Use Data (Litres/Capita/Day)
��Population Growth rate
��Migration (in or out)
��Sudden Increase or Decrease in Water Demand (Litres/Capita/Day)
It should be noted that the values to be attached to the projection parameters should be realistic and based on national and sector policies. Review of these parameters can be made in the future to account for changes in factors affecting the sector demand. These include socio-economic development, changes in standards of living and degree of urbanization, actual progress in birth planning schemes, demographic distribution, as well as the progress in the introduction of water saving methods.
Irrigation Demand Module
The irrigation demand module predicts irrigation water demand in the future based on information provided for a given reference year. Hence, proceeding with assumptions regarding the future is only possible after the reference year demand computations is completed and evaluated.
The module requires entry of various parameters for the year of reference and data input from several database tables. These include crops areas tables, distribution of irrigation methods, leaching requirements for every crop group and water salinity class, application effi ciency, and year type2 Net Crops Irrigation Requirements (NIR) tables. Other Parameters required for input by the module include the salinity class of the water currently used for irrigation, the reference year and the type of hydrological conditions prevailing during that year, in addition to the delivery system effi ciency. Irrigation demand related data and results are aggregated to irrigation centers which are geographically represented via point information in ArcView GIS .
The monthly NIR tables are fi lled following some pre-processing of rainfall and climatic data, calculation of Eto using FAO Penman, and subsequent computation of monthly net irrigation requirements, using three different MS access based applications (Figure 4). The NIR_calculator developed for the computation of monthly net irrigation demand, considers the different hydrological conditions (wet, dry or median) for the agroclimatic zone in which the crops are grown, as well as knowledge on individual crop factors3 in the various growing stages and reported cropping calendars. Innovation in this system includes the computation of crop evapotranspiration under different application and cultivation methods (surface or drip, in addition to greenhouse crops and crops having plastic mulches).

LandWaterMed network234
Figure 4: General Layout of the Irrigation Module
The input parameters required for the assessment of future demand are 1) Changes in irrigated areas with respect to the reference year. 2) Changes in the distribution of irrigation methods. 3) Projected gains in conveyance and application effi ciency and 4) Projected irrigation water salinity class. Formulation of future scenarios can be carried out in an iterative manner to examine the impact of changing the above parameters on total demand, or using information on planned development and sector strategies. Up to three developments scenarios can be considered covering the time span until the year 2040 and in fi ve-year interval.
• Resources Modules
Surface Water Module
The Surface Water Resources Module includes a rainfall/runoff model, and is used to assess fl ood fl ow volumes and deep infi ltration, as well as the regionalization of base-fl ow volumes to river or wadi sections. It is based on the parameters and functions involved in the “Curve-Number (CN) Method”. These include the soil type (depth, porosity, vegetation cover), terrain slopes, and antecedent moisture condition [2 & 3].
Inputs for the surface water resources model include time independent data (hydrological soil classifi cation) and time dependent data available in the ORACLE databases at the Ministry of Water and Irrigation. These include daily monitoring data from rainfall, meteorological and base fl ow gauge stations. Regionalization of the rainfall/runoff model is performed on a regular 1 km2 raster cell, thus permitting a realistic reference of the calculated resources to any form of spatial unit (administrative, hydrological, etc.).
Regionalization of input data such as rainfall, temperature and evapotranspiration is executed in daily intervals. Where needed, the regionalization is linked with a digital terrain model. Regionalization of evapotranspiration data (which play an important role in the rainfall/runoff model and in the determination of water stored in the upper soil) is linked with such a model. This linkage is needed in the absence of abundant evaporation stations in the country in order to account for the effect of dramatic changes in altitude (such as that witnessed between the Jordan Valley and the bordering mountain ranges) on the spatial variation of evapotranspiration.
Using the Surface Water Resources Module, water resources can be calculated for any given year, and for a certain hydrological year (e.g., dry, wet or median). Because the module is linked to the ORACLE databases, modeling the effect of actual changes in meteorological conditions and rainfall patterns on runoff is possible and hence, subsequent refi nement of the module is practicable.
Taha S. 235
Ground Water Module
A numerical fl ow model was developed for the simulation of groundwater both by the Ministry of Water and Irrigation and the Federal Institute for Geosciences and Natural Resources (Germany). The model makes it possible to simulate the groundwater fl ow and calculate the groundwater budget for the whole or parts of the country. Furthermore the model can be used for the prediction of future demands.
The transient 3D – multi-layered fl ow model is based on a fi nite volume approach; it covers the whole area of Jordan and includes all of the major aquifers. Thus this model is unique all over the world.
Dams Safe Yield Module
The model simulates, on a monthly time scale, the performance of a reservoir given a certain scenario with respect to resources and demands under wet, dry and median conditions. Resources include net wastewater and base fl ow reaching the dam, fl ood fl ow, additional infl ows generated from non-utilized releases from upstream reservoirs, if any.
The model simulation results show how the reservoir would behave under a future development scenario given historical (observed or estimated) data with respect to the resources. An additional estimate of the simulation results are the long term annual and monthly expected yields with their respective reliabilities. The results are used to determine monthly safe yield fi gures, which is the principal purpose and outcome of the model.
Other Modules
Other water resources modules include the Wastewater Module, and the Non-conventional Water Resources Module. The Non-conventional Water Resources Module considers groundwater resources that are of marginal quality, including brackish water with total dissolved solids greater than 10,000 parts per million (ppm).
The Wastewater Module builds on the municipal, touristic and industrial demand projections generated from the respective demands modules and assesses the amounts of wastewater produced based on scenarios for the percentage of population served.
Scenario Tables Pool
Projected demand and resources data are stored in the Scenario Tables Pool (STP) using an ORACLE database format. The demand projections are performed for three different demand scenarios (high, medium and low) and those for the resources for three hydrological conditions (dry, median, and wet years).
Balancing
The balancing integrates the spatially distributed resources with the demand values, which are attributed to point demand centers. In order to compare between the projected water demand and the resources, a balancing run is required and the following steps are needed [7]:
• Selection of balancing parameters (e.g., balancing unit, scenario, time step)
• Selection of units (e.g., governorates to be balanced)
• Running the balance
• Saving the results (optional)
• Generation of maps from results (optional)

LandWaterMed network236
• Balancing Results
Balancing results can be viewed in a variety of histograms as well as in tabular form. Generation of map layouts and printout on any Windows printer/plotter is supported.
The results can be stored externally on any storage media. The display of results from earlier balancing runs can be reloaded to the application, for example, to effi ciently compare different assumptions. The number of balancing results loaded into the result viewer is limited by MS Windows system capability [7].
Planning
The results of the modeling may be used as one of several elements to determine the necessary political and socio-economic decisions for further water planning and development. A Transfer Module is used in this regard as a planning tool and considers all reservoirs or surface water storage facilities and the main pipelines existing in the country. The module simulates inter-regional transfer and investigates its effect on water balance after transfer from surplus to defi cit areas is considered.
Suitable measures then can be formulated and development alternatives can be considered. Such measures include:
a. Enhancement of water use effi ciency
• Reduction of losses from the supply networks
• Introduction of water saving technologies
• Public awareness campaigns on water consumption
• Adaptation of different cropping patterns
b. Mobilization of additional water resources
• Artifi cial groundwater recharge
• Surface water reservoirs
• Increased re-use of treated waste water
• Use of non-conventional water resources
• Desalination
• Transfer of water
The effects of the proposed measures can be further investigated using the model. Ranking of alternative management scenarios using multi-criteria analysis (Financial, socio-economic, environmental, political, etc.) can hence be carried out.
Years of Balancing & Temporal Discretion
Water balancing for the Master Plan is performed for different spatial layers:
• Natural regions (surface water basins)
• Administrative regions (Governorates) and

Taha S. 237
• Water-use related regions (socio-economic zones). These units divide the nation into 15 regions as follows: 2 Urban regions (Amman/Zarqa and Irbid, with together almost 70% of the total population in Jordan), 1 Industrial region (particularly mining industries), 1 “Aqaba Special Economic Zone” (ASEZ / Aqaba), 3 Irrigation zones Jordan Valley, Southern Ghors, 2 Irrigation zones Jordan Highlands, 4 Irrigation zones in Desert areas (including Wadi Araba), 1 Western Desert, 1 Desert.
• The temporal discretion of the water management balancing extends to the month, season, and hydrological or calendar year. Balancing can be performed for a current year in order to analyze the present water resources management situation in terms of water availability (resources and supply), water quality, and water demand, and/or use. Balancing also can be made for historical years to depict historical trends and to obtain information about changes in water demand/use patterns and water supply and resources. Balancing for future years will cover the time span until the year 2040 and will be performed in fi ve-year intervals for the period 2005 to 2040.
• Digital NWMP
A Water Master Plan as a document is consisting of the following principal parts:
• The description of the water resources (surface and ground water plus alternative resources) in quantity and quality
• The description of the present and likely future development of water demands by different user sectors;
• The presentation of the technical (physical) and operational water management measures to fulfi l the demands in their temporal and spatial distribution under consideration of social, environmental and economic aspects.
Due to the complexity of the task, a master plan is structured in several layers like executive summary, main report (in several volumes) and various technical annexes and appendices.
Figure 5: Layout of the Digital National Water Master Plan

LandWaterMed network238
Advantages of the Digital Version of the NWMP
A digital version of the National Water Master Plan has the following advantages:
• A digital version of the master plan is portable; the whole document fi ts to a CD-ROM, which allows easy navigation within and between the various parts and layers of the document.
• The NWMP can be easily updated, whenever new data become available or new boundary conditions necessitate. The printed version of the NWMP may be outdated shortly after being published.
• The integration of spatial and relational databases enhances analysis and presentation capabilities of the NWMP.
• A digital version allows the effi cient know-how transfer. The methodologies and techniques used to establish the Master Plan are encoded in the software procedures and the database structures. Additionally, the NWMP contains a separate volume giving detailed explanations on the methodologies used for the plan.
• Users are enabled to modify the assumptions of the NWMP according to the changes in the environment (technical, socio-economical, climatological, and demographic). This is a pre-requisite to planning and implementation of water resources development schemes.
• All data used for the NWMP are available to the users and can be directly processed in digital environment. These databases provide the framework for permanent updating activities of the NWMP.
Summary and Conclusions
This time the “National Water Master Plan” is more than a traditional master-planning document, since it is mainly developed as a tool that can be used to continuously monitor and analyze the current water management situation and to assess Jordan’s water supply and demand projections. Being digital (database dependent) and GIS based, the tool can be easily updated whenever new data become available or new boundary conditions necessitate, thus allowing for a regular update of the NWMP. These conditions permit more fl exible responses to new water sector challenges and to spatial variation in development. In addition, the use of GIS as a basis for the NWMP permits easy display, visualization and analysis of the spatially related data.
The implementation of a Digital Planning tools as a planning instrument allows testing of development scenarios and hence the optimization of water resources and demand management strategies. Other uses for the tool include the performance of daily water management tasks. The tool reporting fl exibility also helps in this regard as it allows digital output of various types of data for additional processing.
The interactive and modular features of the Digital Water Balancing System enable the development and refi nement of the modules by the user, thus ensuring sustainable use of the planning tool. Other advantages include:
• Transparency in water balancing through separate data tables linked to each module.
• Improved acceptance for the digital water master-planning tool, because the conceptual design of the modules and the underlying algorithms have been developed and implemented locally.
• The possibility for permanent enhancement of the digital planning tools, because new modules and algorithms can be incorporated/integrated into the tool.
• Defi nition of responsibilities in data acquisition and processing.
• Provision of know-how to process demand and resources data
Finally, the modular structure of the tool allows for the adaptation of the modules to the specifi c situations of other countries, since the users can be familiarized with the internal procedures of the system.

Taha S. 239
Appendix 1: Structure of the Digital Planning tools
References1. AHT International GMBH (1998). Strengthening of the National
capacity in Water Resources Planning Project, UNDP Project No. JOR/92/007. Support for the Development of the Conceptual Design of Oracle Database. Mission Report, November 1998.
2. AHT International GMBH (1997). Water Sector Planning Support at the Ministry of Water and Irrigation, Digital Balancing Model for Water Resources Management, 2nd Phase. First Progress Report, March 1997.
3. AHT International GMBH (1997). Water Sector Planning Support at the Ministry of Water and Irrigation, Digital Balancing Model for Water Resources Management, 2nd Phase. Second Progress Report, June 1997.
4. AHT International GMBH (1998). Water Sector Planning Support at the Ministry of Water and Irrigation, Digital Balancing Model for Water Resources Management, 2nd Phase. First Quarterly Report, June 1998.
5. AHT International GMBH (1998). Water Sector Planning Support at the Ministry of Water and Irrigation, Digital Balancing Model for Water Resources Management, 2nd Phase. Second Quarterly Report, Sep. 1998.
6. AHT International GMBH (1998). Water Sector Planning Support at the Ministry of Water and Irrigation, Digital Balancing Model for Water Resources Management, 2nd Phase. Third Quarterly Report, Dec. 1998.
7. AHT International GMBH (1999). Water Sector Planning Support at the Ministry of Water and Irrigation, Digital Balancing Model for Water Resources Management, 2nd Phase. Fourth Quarterly Report, March 1999.
8. Hazim El-Naser (1999). Water Resources Management Policy Reforms for the Hashemite Kingdom of Jordan. Country Case Study: Presented to the Second Regional Seminar on Policy Reform in Water Resources Management, Middle East/North Africa/Mediterranean (MENA/MED) Water Initiative, the World Bank, May 1999, Amman, Jordan.
9. Ministry of Water & Irrigation and Deutsche Gesellschaft Fur Technische Zusammenarbeit (GTZ) GmbH (1996). The Jordanian-German „Water Sector Support Project“ at the Ministry of Water and Irrigation, September 1996, Unpublished Report.
10. Suzan Taha & Hazim El-Naser; Irrigation Demand and Use in Jordan: Prospects for research Paper presented to the International Symposium on Arid Regions Monitored by Satellites, Nov. 2001, Marrakech, Morocco.
11. Suzan Taha and Hazim El-Naser; Projection of Irrigation Demand in Jordan: Introduction to GIS-based Model for the projection and Management of Irrigation Demand. Paper presented to MEDAQUA Conference, June 2001, Amman, Jordan.
12. Suzan Taha and Hazim El-Naser: Water Resources Management in Jordan: The Use of Interactive Digital Planning Tools based on GIS applications. Paper presented to the EURO-MED Workshop on IT Applied to Natural Resources Management, May 1999. Petra, Jordan
13. Suzan Taha, Richard G. Allen, Klaus Jacobi & Edward Qunqar; Evapotranspiration and Irrigation Water Requirements for Jordan’s National Water Master Plan: GIS-based ET Calculations. Paper presented to the International USCID Conference, July 2002, Luis Obispo, California, USA
14. Water Quality Improvement and Conservation Project (1998). Water Information System (WIS) Databases Design Update Document, Ministry of water and Irrigation, July 1998.
15. Work Group Industrial Demand (1998). National Water Master Plan Project, Ministry of Water and Irrigation, Conceptual Design of the Industrial Demand Pre-processing Module, 1998.
16. Work Group Irrigation Demand (1998). National Water Master Plan Project, Ministry of Water and Irrigation, Conceptual Design of the Irrigation Demand Pre-processing Module, 1998.
17. Work Group Municipal Demand (1998). National Water Master Plan Project, Ministry of Water and Irrigation, Conceptual Design of the Municipal Demand Pre-processing Module, 1998
18. Work Group Non-conventional Water Resources (1998). National Water Master Plan Project, Ministry of Water and Irrigation, Conceptual Design of the Non-conventional Water Pre-processing Module, 1998.
19. Work Group Touristic Demand (1998). National Water Master Plan Project, Ministry of Water and Irrigation, Conceptual Design of the Touristic Demand Pre-processing Module, 1998.
20. Work Group Wastewater (1998). National Water Master Plan Project, Ministry of Water and Irrigation, Conceptual Design of the Wastewater Pre-processing Module, 1998.

LandWaterMed network240

Bourida A. et al 241
Use of remote sensing and G.I.S. for the study of water resources in the Tensift region (Morocco)
A. ABOURIDA, S. ER-ROUANE et G. CHEHBOUNI
University Cadi AyyadDepartment of Geology, Facuty of Sciences Semlalia, Marrakech
Tél : 00 212 44 43 46 49Fax : 00 212 44 43 74 11
e-mail:[email protected]
Abstract : The area of Tensift was selected like zone of study for the LandWaterMed project. It covers a surface of approximately 20000 km². It is characterized by an arid climate with a weak pluviometry and a strong evapotranspiration. Agriculture and the breeding constitute the principal activity of 60% of the population. The development of this sector requires an important mobilization of the water resources. This would lead to an overexploitation of groundwater considering the shortfall in the supply. This alarming situation requires the development of an exploitation plan of water in the region, thus some studies based on the use of remote sensing and GIS were realized in order to set up a water management model.
Keywords: Remote sensing, GIS, model, water resources, Tensift, Morocco.
Introduction
The thematic network LandWaterMed entitled “Geo-Information for sustainable management of Land and Water resources in the MEDiterranean area” was created in 2000 and gathers researchers of various Mediterranean countries of whom Morocco. Thus, the Faculty of Science Semlalia Marrakech suggested like application the study of the water resources in the Tensift basin and particularly in the Haouz plain taking account its importance for the regional socio-economic development and also because of the availability of Spot and Landsat images, acquired by the scientifi c franco-Morrocan program “SudMed” where multiple studies are in progress aiming a better comprehension of the hydroecologic systems under various anthropic and climatic impacts.
The network LWM aims to promote the use of remote sensing and Geographical Information systems in the studies of characterization and management of water and soil. Thus, one of major expectation of this project is to generalize the use of these new technics of investigation and to promote the introduction of networks of experts between Mediterranean countries in order to multiply experience sharing.

LandWaterMed network242
General context of the study area
The Tensift zone is limited by the High Atlas in the South, the Jbilet hills in the North, by the catchments of Wadi Ksob near Essaouira in the West and wadi Oum er Rbia in the East (fi g.1). The total area of the site is around 20000km².This region has a semi- arid climate which is characterized by a hot and dry summer and a cold winter with rainfall varying between 100 mm on the plain to more than 700 mm in altitudes of the high Atlas (fi g.2).
Figure 1: Study area location (Landsat TM)
Figure 2: Annual average rains [3]
In 1997 The population was estimated at 2.832.000 inhabitants with only 36,8 % urban ones. The region’s economy is mostly based on agricultural and breeding activities. It is especially the rain agriculture which is practiced in the majority of the region. Modern irrigated agriculture currently extends on a surface about 140000Ha including 22000 Ha [1] of small and middling Hydraulic. The climate constitutes a limiting factor to the development of this activity and explains also the absence of vegetation on the ¾ of the area surface. It is only in the relief of the atlasic chain that the natural vegetation is developed enough (oak, thuja, ...).
From the geological and hydrogeologic point of view, the atlasic chain is constituted by volcanic and metamorphic rocks of primary and permo-triassic age witch are not very permeable. In the same way, the primary rocks of Jbilet is made by schistous and metamorphic compact rocks [2] generally impermeable except in altered surface where the permeability of fracture generate perched groundwater of very limited extensions.
The Haouz and Mejjate plain belong to the Tensift basin. They contain plio-quaternary alluvial formations and limestone of the Eocene and Cretaceous, characterized by good permeability with high possibilities of supply by the whole wadis which drain the Atlas before joining Tensift (fi g.1).

Bourida A. et al 243
Figure 3: Stratigraphic log of the studied zone[12]
Water problematic in Tensift
The water resources of the area are very irregular and unequally distributed. The mountains constitute a water reservoir whereas the plain is a zone of transition and use of this water. Even though the relative abundance of water in the Atlas, most of the area is characterized by the scarcity of the resource worsened by the insuffi ciency of the infrastructures of mobilization, transport and use. Concerning surface water, the principal affl uents at the northern slope of the High Atlas generate about 705Mm3/year nearly 85% of the water resources of the Tensift basin, whereas those of right bank generate only very weak fl ows and do not infl uence the fl ow of the wadi [3].
Under these conditions and in order to ensure the demands of irrigation water, increasingly signifi cant, considering the important soil potentialities of the area, several actions were taken by decision-makers :
• Transfer of water from the Oum er-rbiaa basin
• Rationalization of the use of water and integrated management of needs and supply.
In the same time, the users carried out an intensifi cation of the exploitation of the Haouz groundwater. This led to an unbalance of the aquiferous system which appears by a regular drop of piezometric surface. We assist to a drawing up in the nonrenewable reserves of the Haouz aquifer with an annual defi cit about 170Mm3 [3].
Characterization of the aquifers:
The underground water of the Haouz plain is the most important aquifer in this area considering the importance of its extent and its potentialities. It is a generalized phreatic water table enclosed in the plioquaternary alluvial deposit. The thickness of this reservoir varies generally between 50 and 80 m and can reach 120m. The water depth is about 25m (0 to 5 m while approaching Tensift river and 70m in edge of the Atlas) and reached 45 m in the more exploited zones. The structural complexity of these deposits, vertically and horizontally, appears by the extreme variability of the hydraulic gradient and the hydrodynamic parameters [4].

LandWaterMed network244
Several piezometric campaigns were carried out on the plain, they allowed the development of piezometric map showing a generally direction of fl ow to the North with an important hydraulic gradient in the South, middle in the North and small in the Eastern part of the Haouz (fi g.4).
The analysis of the piezometric, physico-chemical and climatological data on wells located in the irrigated perimeters enabled us to show the impact of re-infi ltration of irrigation water on the hydrodynamic of the groundwater [5] [6]. Thus we observe a continuous drop in the irrigated zone because of pumping and a important increase in the perimeter irrigated by surface water coming from dams (sector N’fi s, Z1, Tessaout upstream..).
The resources of the Haouz aquifer are estimated at more 300Mm3 [1]. These potentialities are currently overexploited with drawing from its own reserves. This involved a general drop of the water table level from 0.5 to 1.5 m/year and more by place. This very alarming situation requires installation of an exploitation plan of the water resources in the area. Thus several studies and research tasks, using new techniques, were carried out. They aim to a better comprehension of some parameters infl uencing the fl ows of the water table in order to control its hydrodynamic functioning.
Figure 4: piezometric map of Haouz Aquifer [13]
Investigation tools:
In order to optimize the exploitation of water of the Haouz phreatic groundwater without exhausting their reserves and to provide a global response to the water problematic, the recourse to the mathematical models becomes essential. Since 2001 and within the scientifi c program SUDMED, a modeling work of the Haouz groundwater is undertaken [7] by using new techniques of study such as the remote sensing, isotope and the geographical information systems.
A data base including various informations available at the Hydraulic Agency of Tensift Basin (ABHT) was elaborated [8]. It contains piezometric measurements, hydrodynamic parameters, the drillings geological data and historic of pumping.
It was updated in 2002 by introducing the data of a piezometric investigation carried by the ABHT. The whole of these data added to satellitale images, geological and pedological maps were used for developing of a hydrogeological GIS of the Tensift region. The exploitation of the contents of this GIS tool by some treatments allows us to make a cartographic support and data fi les necessary to modeling.
Thus specifi c treatments were carried in order to specify inputs relating to the groundwater supply and exploitation. Therefore the treatment of the isotopic analysis permitted us to determinate the aquifer areas of supply and its hydrodynamic behavior [9]. Also, to apprehend pumped volumes of underground water, not easily quantifi able by measurement in situ, and to determine the water needs for the various cultures we used satellitale images. First of all it was necessary to have an idea of the land use of the area. For this, we use multi temporal supervised classifi cation. The Landsat TM acquired at three dates allows us to differentiate irrigated and non irrigated crops. These results are used to calculate the volumes of water used by crops and then to determinate the quantity of water pumped used for the irrigation [10] [11].

Bourida A. et al 245
Conclusion:
Besides the synthesis work undertaken, this project allows us to have knowledge on three issues:
• Conception of a data base and a GIS of the Tensift water resources: The whole of the data relating to the water resources of the area were stored in a GIS tool. Its exploitation by some specifi c treatments permits us to have a cartographic support and data fi les used for the model.
• Use of the techniques of remote sensing for the establishment of a land use map for the evaluation of plausible exchanges fl ows: The use of the space imagery allows us to approach the quantities of water taken by pumping through multi date supervised classifi cation. This factor, which is not easily quantifi able, is capital for the modeling and the management of the aquifer.
• Synthesis by groundwater model: This step, in progress, will permit us to elaborate a model which can reproduce the functioning process of the aquifer. This fi rst step of modeling in steady state will be useful as basis for future work in transient state for the development of estimated scenarios refl ecting the evolution of the Haouz groundwater under various human and climatic impacts.
References
[1] Debbarh A. Badraoui M. Vers une maîtrise des impacts environnementaux de l’irrigation. Actes de l’atelier du PCSI, 28-29 mai 2002, Montpellier, France, 14p. (2002).
[2]� Huvelin P., Mouvements pré-atlasiques et récents dans les Jbilets et sur leurs pourtours. Notes Ser. géol. Maroc, t. 33, N°249, pp. 83-123, 7 fi g., 4 photos, 1973.
[3]� CSEC, Conseil Supérieur de l’Eau et du Climat Plan directeur pour le développement des ressources en eau du bassin du Tensift, 9ème session., (2001).
[4]� Sinan, M. Paramètres hydrogéologique et géoélectriques en milieu alluvial fortement hétérogène. Thèse 3ème cycle, Univ. Sci., tech., Montpellier, France (1986).
[5]� Abourida A., Razoki, B., Errouane, S., Leduc, C. & Prost, J.P., Impact de l’irrigation sur la piézométrie du secteur N’fi s au Haouz Central de Marrakech (Maroc). In «Hydrology of Mediterranean and semiarid regions», publ. AISH n°278, 389-395 (2003).
[6]� Abourida A. , Errouane S., Leduc C., Chehbouni G. « Impact de la modernisation agricole sur l’évolution piézométrique de la nappe phréatique du Haouz (Maroc central) » colloque Modernisation de l’agriculture irriguée dans les pays du Maghreb 19-21 Avril 2004 Rabat, Maroc.
[7]� Abourida A., Errouane S., Chehbouni G. et Prost, J.P. «Modélisation et gestion des ressources en eau souterraines de la plaine du Haouz Marrakech (Maroc) » colloque WATMED (Monastir Tunisie octobre (2002).
[8]� Razoki, B. Mise en place d’un système de gestion de base de données pour la gestion des ressources en eaux souterraines de la plaine du Haouz (Meseta occidentale, Maroc). Thèse Univ. Cadi Ayyad, Marrakech, Morocco (2001).
[9]� Abourida A., Er-rouane S., Bahir M., DA Silva M.O., Elhamdaoui A., Ibn Majah M., Cheggour A. : Contribution de l’isotopie pour la compréhension du fonctionnement. Hydrodynamique de la nappe du Haouz de Marrakech (Maroc). Séminaire « Premières Journées de l’Hydrologie Isotopique Marocaine », Faculté des Sciences Semlalia, 12-13 décembre 2002
[10] Abourida A., Errouane S., Simonneaux V., Chehbouni G., Cheggour A « Determination of the water volumes used for irrigation in the Haouz plain by remote sensing » IGARSS -Toulouse (2003).
[11] Abourida A., Errouane S., Chehbouni G., De Solan B. « Use of satellite images to estimate the discharge by pumping of the Haouz aquifer of Marrakech (Morocco) » symposium de Valence 2002.
[12]� Ambroggi R.et Thuille, G. (1952) - Les plaines et les plateaux des domaines marginal de l’Atlas, Haouz de Marrakech. In : Hydrogéologie du Maroc. Notes mém. Serv. Géol., Maroc.
[13]� DRPE, Direction Régionale de Planifi cation des Eaux (1988) Etude du plan intégré d’aménagement des eaux des bassins Sebou, Bouregreg, Oum-Er-Rbia et Tensift. Sous-mission III B. 147 p.

LandWaterMed network246

Gad A., Ali R. 247
Use of geomatics in survey and management of Egyptian soil and water resources
A. GAD and R. ALI
National Authority for Remote Sensing and Space Sciences,23, Josef Brows Tito, El-Nozha El-Gededa, Cairo, Egypt P. Box 1564-Alf Maskan
Phone: +/2012/3568182 & +/202/5613909 & Off. +/2026225817Fax: +/202/[email protected]
Abstract: Geomatics refers to acquiring and managing information, with inclusion of measuring, mapping, geodesy, satellite positioning, photogrammetry, computer systems, remote sensing, information systems, environmental visualization and computer graphics. Land information management also includes various stages of data acquisition, manipulation, display and management.This article reviews different attempts of surveying soil and water resources. Photogrametry and remote sensing techniques, including measurement component, are employed. Three major projects were performed to survey and manage soil resources, in addition to a running one. Satellite images, GIS and ground positioning system are used in input, retrieving and manipulating data of land resources.Egypt managed the river Nile resource by installing some barrages and dams on the river to control water fl owage. Other projects are planed to develop and increase the water input for the sake of Nile basin countries, including Egypt.
Keywords: Geomatics, survey, soil, water, Egypt
Introduction
Geomatics can be defi ned as the science and technology of acquiring and managing information about the world and its environment (http:// Surveying.mentapolism.org, 2005). The term represents the rapidly changing and expanding world of land information management, which consists of measuring, mapping, geodesy, satellite positioning, photogrammetry, computer systems, remote sensing, information systems, environmental visualization and computer graphics. Land information management also includes the various stages of data acquisition, manipulation, display and management. The bit of geomatics that this plane surveying subject is particularly concerned with is the measurement component, also known as surveying. ‘Land surveying’ has been defi ned as the art and science of determining the position of natural and artifi cial features on, above or below the earth’s surface; and representing this information on paper plans, as fi gures in report tables or on computer based maps (Wattles, 1992).
Surveying science has a very long and distinguished history, dating at least back to the ‘rope stretchers’ of Babylonia and the Egyptian dynasties. The development of the principles of geometry, astronomy and time still forms the foundation on which current surveying knowledge is built. Today ‘surveyors’ use satellites to image the earth’s environment, use different satellites for navigation and precise position fi xing, use computer visualization techniques for mapping, micro-computer controlled equipment for measuring the earth’s surface and information systems to present and analyze data about land and land usage. But, the underlying core of knowledge for all of this sophistication is the mathematics of geometry
Egypt covers an area of almost one million square kilometers in North Africa. Almost 4% of this area is now occupied by more than 70 million inhabitants, who are mainly concentrated in the Nile Valley and the Delta as well as in the coastal zone along the Mediterranean Sea. Thus the population density is one of the highest in the world amounting to almost 1,750 inhabitants per km2 (Hamdi and Abdelhafez, 2000). Agriculture represents a milestone in the Egyptian national economy as it has its special historical background. The major challenge Egypt is facing at the present time is the need for better development and management of the natural resources to meet the demand of a nation growing at a rate of 2.2% annually (Hamdy, 1996).

LandWaterMed network248
Remote Sensing and Geomatics
Remote sensing data is considered as an important tool for the sustainable development activity. It can be regarded as a classic source of data on natural resources for a region and provides a record of the continuum of resource status. It can also be regarded as a recent developed technique in monitoring and assessment of resources, due to its repetitive nature and dependence on spectral signature of objects. Multi-resolution sensors are used to study and monitor land features, natural resources and dynamic aspects of human activities towards preparation of thematic maps depicting various resource status (Ress, 1990). During the last three decades, developments in remote sensing technology has made great gait and has made signifi cant contributions to the management of natural resources, disaster management, environmental monitoring etc.
Ursula et. al. (2003) indicated that the term Geomatics connects to the know-how dealing with the nature and structure of spatial and non-spatial information, its methods of attainment, analog and digital capture, organization, classifi cation and qualifi cation, analysis, management, display and spreading, as well as the infrastructure needed for the optimal use of the information. Geomatics is a synergism of various disciplines -Geographical Information System (GIS), computerized databases and applications, computer science, graphical processing, cartography, photogrammetry, statistics, remote sensing etc. The applications of Geomatics are appropriate to real-world problems of management of natural and man-made environment and of the objects related to it. This would include the fi elds of natural resources management, resources planning and decision-making.
Geomatics has to be at the core of sustainable development efforts with specifi c utilities for:
1. Organizing integrated spatial and non-spatial databases using the GIS tools in a systematic manner. The spatial data consist of maps driven from remotely sensed data and conventional sources, on a standard cartographic reference. The non-spatial data, consisting of numeric information concerning the spectral characteristics of ground features.
2. Integration or the synthesis of the spatial and non-spatial information within the framework of a coherent data model and linkages between the different datasets.
3. Generation of spatial outputs, supported by tables/charts, to help the developmental planning and decision-making.
The Geographical Information system (GIS) package will have to be the momentum, as both spatial and non-spatial databases have to be handled. The GIS package offers effi cient utilities for handling both spatial and non-spatial datasets and allows for their organization, integration, analysis and transformation.
National Institutions applying geomatics in soil science or related fields
There are different institutes practicing the Geomatics concept in surveying and management of soil resources. These Institutes belong to either Ministry of Agriculture of Ministry of Scientifi c research. They are equipped suitable fi eld vehicles, sampling tools, laboratory analysis instruments and computer facilities. The can be surveyed in the following:
1. Soils and Water Science Departments of the Egyptian Universities: Cairo, Ain Shams, Alexandria, Assiut, Zagazig, Menoufi ya, Tanta, Mansoura, Suez Canal, Minya, El Wadi El Gadid and Al Az-har.
2. Soil, Water and Environment Research Institute, Agriculture Research Centre, Ministry of Agriculture and Land Reclamation, Giza.
3. National Research Centre, Soil and Water Use Laboratory, Dokki.
4. General Authority for Rehabilitation Projects and Agricultural Development (GARPAD), Dokki.
5. Atomic Energy Authority, Agricultural Section, Inshas.
6. Salinity Laboratory, Ministry of Agricultural and Land Reclamation, Alexandria, Bacus.

Gad A., Ali R. 249
7. The Desert Research Center (DRC), Ministry of Agricultural and Land Reclamation, Matariya.
8. Executive Authority for Land Improvement Projects (EALIP), Dokki.
9. National Authority for Remote Sensing and Space Sciences (NARSS), Heliopolis.
10. The Egyptian Survey Authority, Ministry of Public Work and Water Resources, Giza.
11. Egyptian Geologic Survey and Mineral Exploration Authority (EGSMA), Cairo.
Application of geomatics in survey and management of Egyptian soil resources
• General
High Dam soil survey (FAO, 1962), Soil Map of Egypt (ASRT, 1985) and Land Master Plane (ARE and Kingdom of the Netherlands, 1986) are the main references for Egyptian soil survey activities. At present time, a new project (Gad, 2003) is sponsored by the ASRT and housed in NARSS on the title “Preparation of land resources data base for agricultural usage” Moreover, many of M. Sc. and Ph.D. thesis and research papers dealing with mapping soil resources are available in the academic libraries. Gromatics is applied in different soil survey activities, as photogrametry, space data, GPS, computer programs and plan-metric tools are used. However, in spite of availability of such huge amounts of data, there is no digital database including soil resources exist.
• Early activities of soils and water research institute, Ministry of Agriculture
Soil survey in Egypt has been established since 1958 within the Ministry of Agriculture, particularly in the Soil and Water Research Institute. The continual need for the pedogenic classifi cation of alluvial soils of the country was repeatedly emphasized by a number of recommendations and resolutions at different local symposia and conferences. An association map for the soils of Egypt has been published by Ghaith and Tanios (1965). The map has been initiated through the compilation of a number of studies carried out by the staff members of the Soil Survey Department of the Institute. The map was prepared using the reconnaissance survey carried out by the FAO in association with the Soils and Water Research Institute as well as with the Egyptian General Desert Development Organization. The delineated soil associations are divided as follows:
1. Soils on fl at or level land;
2. Soils on undulating and rolling land;
3. Soils on dissected and mountainous land.
Hamdy (1996) stated that in the eighties, a Centre for remote sensing was established at the Soil and Water Research Institute, fi nanced by the Ministry of Agriculture and UNDP, which enabled the staff members to get acquainted with the theory and application of remote sensing techniques. Hence, a number of areas in the dessert, having high priorities, have been surveyed and Soil and Land Use maps were prepared. The selected areas are Bourg El Arab, West Nubariya, Nubariya Extension and North Sinai.
• High Dam soil survey (FAO, 1962)
Prior to the construction of the High Dam, FAO has sponsored the project “High Dam Soil Survey” (FAO, 1962). The survey activities were executed by the soils department of the ministry of Agriculture with the assistance of the United Nations special fund and the FAO as Executing Agency. A reconnaissance soil survey was carried out on both sides of the cultivated land of the Nile valley and delta to establish soil conditions and the soil potentiality for irrigated agriculture in the adjoining desert lands in view of the possibilities of extending irrigated agriculture in the U.A.R. (Egypt) after the construction of the high Dam on the Nile south of Aswan. It was realized that large parts would have to

LandWaterMed network250
be developed by sprinkler irrigation which can be more economical in water use; a total of about 1.3 million acres of suitable land was required. The survey area extends on both sides of the Nile valley and Delta from Aswan in the south to Mediterranean Coast on the west side of the delta, including the coastal area between Alexandria and El-Alamine, and to the Suez Canal between Suez and El kantara on the east side of the Delta.
The whole survey is represented in 9 map Sheets, covering an area of 13,618,308 acres, at a scale of approximately 1: 200,000. Aerial photographs of fairly good quality (available for Upper and Middle Egypt on a scale of 1: 40,000 and for Lower Egypt at 1: 20,000), and in particular the photo-mosaics at 1: 50,000 of the entire area, have proved indispensable for such an extensive survey.
The Arial photographs were examined stereoscopically for systematic photo analysis of the terrain before fi eldwork started, the result being copied with differently colored china marks on the photo-mosaic. The pattern of mapping units thus obtained was studied to improve the analysis and the classifi cation of the analysis units, and also to select sample areas for detailed fi eldwork and for checking the photo-analysis. After suffi cient knowledge between photo images and soil conditions had thus been obtained, gradually less sample area work was done and more real photo-interpretation was applied (i.e., direct prediction as to what the soils would actually be).
Semi-detailed soil surveys were carried out in fi ve selected areas of the Nile valley and delta with a view to the extension of irrigation beyond the areas then under surveys.
The areas surveyed were as follows:
1. Kom ombo east 365,025 acre2. Northern Delta 409,806 acre3. Amiriya 141,852 acre4. Port said – Salhiya – Ismaeliya 535.089 acre5. Ismaeliya – suez 395,855 acre
It has already been noted that it was originally intended that the selection of areas for semi-detailed survey should be based on the reconnaissance of the whole project area, but that delays in the production of the necessary photo-mosaics made it necessary to start at once with the semi – detailed survey of certain areas.
Previous to the fi eld work, a preliminary photo interpretation map was compiled by the stereoscopic examination and analysis of air photographs (scale 1:20,000) of good quality. A preliminary soil classifi cation was made at the same time and the tentative boundaries of the photo-analysis were transferred to available photo mosaics (scale 1:50,000). A provisional photo interpretation map was drawn up from these mosaics to serve as a base for the fi eld work.
Sample areas and sample lines were carefully selected and studied in rather great detail; profi le pits were dug at short intervals in order to obtain the fullest possible information about the differences in soil characteristics on which the mapping units were based. It was possible to produce a soil map with a high standard of accuracy, in regard to the topographic position of the plotted soil boundaries as well as the nature of the soil unit described. For each project areas the following maps, on scale 1:50,000) have been compiled:
1. A semi-detailed soil map
2. A semi-detailed soil potentiality map for irrigated agriculture
3. A soil sample index map
The sample index map indicates, by different symbols, whether samples were analyzed mechanically or chemically, whether available water has been determined, whether an infi ltration rate determination was made, or the salt composition of the groundwater determined. With respect to the acreages on the soil potentiality maps, it may be remarked that areas are given in acres, but actually measured in feddan. Generally, the feddan in indicated as 4200 m2, while the acre is 4047 m2.

Gad A., Ali R. 251
Soil classifi cation was adopted to express the potentiality of soils for irrigated agriculture. The classifi cation is based on the assumption that within the framework of the High Dam reclamation scheme, an adequate irrigation and drainage system can be provided to those areas which were recommended for irrigation.
• Soil Map of Egypt (ASRT, 1985)
The Academy of Scientifi c Research and Technology has fi nanced a project for the preparation of the “Soil Map of Egypt” at scale 1:100,000 for the cultivated areas. Therefore, a group of soil experts from the Universities, Ministry of Agriculture, National Research Centre and the Desert Research Centre was set up to perform this task. Hence, colored soil classifi cation maps for the cultivated areas in Egypt have been published, at scale of 1:100,000. The accompanying soil report of the map contains:
1. Description of soil profi les;
2. Geology and geomorphology;
3. Different soil analyses and methods;
4. Morphology and soil formation; and
5. Classifi cation of soils according the US-Soil Taxonomy at the Family Level (Soil Survey Staff, 1975).
The fi nal report of the project includes a brief description for the different soil associations, indicating their distribution, formation, morphology and other characteristics. According to US Soil Taxonomy (Soil Survey Staff, 1975), three soil orders have been found for the soils of Egypt: Entisols, Aridosols and Vertisols. Table 1 gives detailed information at suborder and great group level for the three soil orders.
Table 1. Classification of the soils of Egypt at order, sub-order and great group level according to the US Soil Taxonomy
Great Group Suborder Order Torrifluvents Fluvents Entisols
Ustifluvents
Orthents Torriorthents
Psamments Torripsaments
Quartzipsamments
Aquents, Psammaquents
Natrargids Argid Aridisols
Durargids
Salorthids Orthids
Salids
Calcids
Gypsids
Calciorthids
Camborthids
Gypsiorthids
Torrerts Torrerts Vertisols
• Land Master Plane (ARE and Kingdom of the Netherlands, 1986)
The objective of the LMP is to provide the concerned authorities in the Egyptian government with the necessary technical information for the selection of the best land resources for future agricultural expansion, both at regional and national level. The data collected include those from the checks of previous surveys and from additional surveys for the LMP. For storage and retrieval of the collected data a HP 9816 computer and a disk memory HP 9133 disk memory have been introduced as database. The database contains an Index of Data and Information (IDI) and an Integrated

LandWaterMed network252
Soil Information Systems (ISIS). The results of the land resource evaluations at national level and subsequent priority ranking are discussed at a main-Annex, and presented in an atlas of 8 volumes containing soil/land capability and land management maps, each volume dealing with one of the eight region in which the survey areas have been subdivided: East of Delta and central Delta, North West Coast, Middle Egypt, Upper Egypt, Sinai, New Valley and South New Valley, and High Dam lake shores.
• Preparation of land resources data base for agricultural usage (Gad, 2003)
This research proposal was submitted recently to the academy of scientifi c research and technology to be performed by the National Authority for Remote Sensing and Space Sciences (NARSS). It aims to employ the geographic information systems in designing and establishing a comprehensive geographical land resources database for Nile Valley and Delta (Scale 1: 100,000). Data available for soil resources will be geometrically corrected and updated, by using space images. Also, recent satellite images will be used in producing recent soil maps (Scale 1: 100,000) for El-Fayoum and Qalubia Governorates. These two cases are selected to represent the soils in the Nile Valley and Delta, and will be considered as an example to be followed to update the soil map for all Egyptian territory using the Soil Survey basis to soil Taxonomy (Soil Survey Staff, 2003). The suggested schedule has been followed successfully in a number of previous projects (i.e. Sinai Peninsula, Halyeb-Shaltein and North western coast).
Application of geomatics in survey and management of Egyptian water resources
The problem of water resources availability is as important for Egypt as other countries in the arid and semi arid areas. The Nile River is the essential irrigation water resource, on which old agricultural civilization was based. The Egyptian annual share from the Nile reaches 55.5 * 109 m3 according to the year 1959 agreement between Egypt and the Sudan. The contribution of other unconventional ones (i.e. rain, ground water and desalinized water) in the national income is still limited. Rainfall ranges between 20 mm/year, in the south, to 200 mm/year, at extreme north of the coastal areas.
In the past, Egypt could develop the river Nile resource by installing some barrages and dams on the river to control water fl owage. The fi rst barrage (i.e. Delta barrage) was established in the period 1843 to 1863 as one of great water projects. Aswan Dam was also established in 1902 and enlarged twice to bring its capacity to 5*109 m3 in 1933. Moreover, other great barrages were erected on the Nile as Isna, Nagea Hammady, Asiout, Zeftah, Edfi na and Demietta. The greatest water project is the High dam, which was established during the period 1964 to 1970, has a storage capacity of 164 * 109 m3. Other great Dams were constructed on the Nile branches outside the Egyptian boundaries, as Gebel El-Awliaa on the White Nile, Roseiry and Sennar Dams at the Sudan. Ouien Dam was also constructed on the exit of Victoria Lake in Uganda.
There are other projects were planed to develop and increase the water input for the sake of Nile basin countries, including Egypt. These projects are based on the idea of harvesting water lost in swamp areas. The canal Gongely project, at south of the Sudan, is aimed to store the lost waters from Mashar swamps. Construction of the canal started in 1979 and stopped in 1983 due to internal corruption. Other projects include Albert Dam, on the tropical plateau at the exit of Albert Lake, River Barrow Dam and Lake Tana Dam in Ethiopia. When these projects are completed, an annual water volume of 19*109 m3will be saved at Aswan. This amount will be equally divided between Egypt and the Sudan, thus Egyptian share from Nile River water will be 65*109 m3.
In order to face the agricultural and urban expansion in Egypt, a lot of efforts are oriented towards controlling water resources through rationalizing water consumption, developing irrigation techniques and searching for unconventional water resources. Thus, there is a progress in the reuse of waste and drainage water after applying treatment and mixing techniques.
Desalination of seawater is aimed to benefi t from the long shores on both the Mediterranean and Red Seas. The costs of producing one cubic meter of desalinated water can be reduced to be LE 0.70 and then may be used in producing high ranked crops. Also, there are efforts to use the deep and shallow ground water aquifers and intensify well’s network in the Nile Valley and Delta and western desert. National planes are working towards the rainfall ands fl ash foods water harvesting. Table (2) shows the current and expected water requirements by the year 2025 (El-Kady, 1994).

Gad A., Ali R. 253
Table 2: Water Requirements by year 2025, as compared by the actual requirements in year 1997.
Usage sector Year 1997 Year 2025Irrigation 48.0 64.0
House use 4.0 7.3
Industry 4.0 7.3
Others* 3.0 2.4
Total requirements 59.0 81
Available 60.0 60.0
Difference +1.0 -21.0
* Winter closure and evaporation from irrigation networks.
It is clear that the water requirements by year 2025 will reach 81*109 m3 with defi ciency of 21 109 m3. A volume of 9.5 109 m3 can be replaced from upper Nile projects, as explained. It is possible to replenish the water defi cit through the following means;
1. Reducing the water wasted by evaporation and leakage
2. Developing low coast techniques of desalination
3. Improving usage effi ciency
4. Renewing and replacing water distribution networks
5. Using recent irrigation techniques
6. Following effi cient management system
7. Reuse of drainage and waste water after treatment
8. Planting the crops, which last in land for short periods
9. Devising crop varieties tolerant to low water quality
10. Protecting the water system from pollution by improving wastewater treatment techniques and using a separate network for low water quality.
Usage of recent generation remotly sensed data
Different authors have recently used geomatics in surveying land and water resources in Egypt. Most of researchers are using the recent generation of remote sensing images, characterized by high spectral and spatial resolution. GIS system is rather used in the recent survey attempts aiming to build up comprehensive databases. Kusky et al (1999) in their study of structural and tectonic evolution of the Sinai Peninsula found that the analysis of Landsat images reveals three main structural provinces characterized by different styles of deformation. The authors suggested that the major fracture zones will serve as transmitters of water from the highlands in the south to the lowlands of the north. It was recommended that such concept could be considered in future groundwater exploration in the Sinai Peninsula. Yehia et. al. (1999) defi ned and traced on Landsat-TM images the drainage networks, affecting Ras Gharib and Hurghada towns, on the Red coast of Egypt. Basin boundaries and their morphometric parameters were used to assess fl ash fl ood probability and groundwater potentiality.
EI-Baz (1999) use remote sensing data in his study on the western desert and found that the Sand accumulations in the Western Desert of Egypt are located within topographic depressions. The source of the sand appears to be the “Nubian Sandstone,” which is exposed throughout the southern part of the desert. Satellite images, particularly radar data, reveal that sand- covered northward-trending courses of dry rivers end at the depressions. The depressions must

LandWaterMed network254
have hosted great volumes of surface water during the wet climates. Much of that water would have seeped into the underlying rock through primary and/or secondary porosity to be stored as groundwater, which should be considered in economic development projects.
El-Baz et.al. (2000) illustrated that El-Faiyum Depression in the Western Desert of Egypt is a structurally controlled tectonic basin, marked by northeast-striking faults along its northern margin. These faults are parallel to similar faults of the Syrian arc fold belt, which includes a group of related faults, folds, push-up structures, and basins. Lake Qarun is located in the northern part of El-Faiyum depression, at a right-step between two strands of the NE striking fault system. It was suggested that Lake Qarun, resting at 45 meters below sea level, is a pull apart basin formed along dextral strike slip faults related to the Syrian arc. Eocene-Pliocene deposits of the Faiyum depression may be thermal subsidence phase deposits related to extension in the Lake Qarun pull-apart. The Syrian arc belt has been active intermittently from the Cretaceous through the present, consistent with the record of recent seismicity in the Faiyum depression. A detailed mapping program was recommend, satellite image interpretation, topographic modeling, and seismic monitoring to better understand and help reduce the hazards associated with active faulting in the area.
Major soil constraints
Analyzing the soils characteristics, driven from different resources, makes it possible to point out the major soil constrains in Egypt include urbanization, salinization, surface soil scraping for brickyards, pollution, wind erosion, water erosion (Abdel-Rahman et.al.2000). Urbanization can be categorized as the head of economical problems, facing Egypt’s development. It represents the nature of Egypt’s environment, which shows the demographic distribution, since people are concentrated near fresh water in the Delta and Nile Valley. The loss of fertile land annually amounted to almost 60,750 hectares. Examples are demonstrated in different cities and villages throughout the country as in Greater Cairo, Giza, Banha, Tanta, Minoufi a, El-Menia, and Qualiubiya (Abdel-Samie et.al. (1993). Aboel Ghar (2002) found that the urban settlements increased by 45% from 1988 to 1994 and by 363% from 1994 to 2001. This phenomenon needs decisive solutions as it affects tremendously agriculture production.
Salinity is the second soil constraint especially in northern Nile delta and oases. It may be monitored through remote sensing technique, using cloud free multi-spectral scanner sensors MSS and Thematic Mapper taken during the summer season. Hamdi et. al (1992) applied the maximum likelihood classifi cation technique to discriminate between the different stages of salinity. Pax-Lenney Mary et al.(1996) used 10 multi-spectral Landsat Thematic Mapper images change detection has been outlined, for a 10 years period from 1984-1993. The scene covers the western two-thirds of the Nile Delta and a portion of the adjacent Western Desert. The result output includes an image showing the status of agricultural land in the Western Desert (i.e. reduced productivity, urbanization, reclaimed lands in the desert and coastal zones).
References
Abdel-Rahman, S.I.; Gad, A. and Abdel-Rahman, M.A. (2000). Soils and agriculture potentialities of Mersa Shaa’b area, southeastern desert of Egypt: An integrated RS and LIS approach. Egypt. J. Soil Sci. 40, 3, pp. 305-316
Abdel-Samie, A.G.; Younes, H.A. and Gad, A. (1993). Application of remote sensing technology in the study of desertifi cation of Arable lands in Egypt I-Urbanization. Egypt. J. Remote Sensing, 1, 1-15.
Aboel Ghar, M. and Tateishi, R. (2002). Monitoring of agricultural area trend in eastern Nile Delta in Egypt using, J. Remote sensing & Space Sci., V. 3.
Academy of Scientifi c Research and Technology –ASRT-(1985). The Soil Map of Egypt. Final Report of the Academy of Scientifi c Research and Technology.
ARE and Kingdom of the Netherlands (1986). Land Master Plane, Project reports and soil maps, Ministry of Agriculture, Egypt.
El-Baz, F. (1999). Ground water construction beneath sand fi elds in the western desert of Egypt: Indications by RADAR images from space., Egypt .J. Remote Sensing & Space Sci., V. 1, (1999).
El-Baz, F.; Yehia, A.; Ramadan, T. and Kusky, T. (2000). Notes on the structural and neotectonic evolution of El-Faiyum depression, Egypt: relationship to earthquake hazards., Egypt. J. Remote Sensing & Space Sci., V. 3, pp. 1-12 (2000)
El-Kady, M (1994), Crop Inventory in Egypt Using Remote Sensing, copyright ASPRS/ACSM
FAO (1962). High Dam Soil Survey. p. 467 – Cairo: FAO.
Gad, A. (2003). Preparation of land resources data base for agricultural usage, a research project proposal submitted by NARSS to the Academy of Scientifi c Research and Technology, Egypt.
Ghaith, A and Tanios, M. (1965). Preliminary soil association map of the United Arab Republic, General Organization for Government Printing Offi ce, Cairo, Egypt.
Hamdi, H. (1996). The status of agricultural lands in Egypt. The use of multispectral NDVI-features derived from Landsat TM. Remote Sensing and Environment, 56, 8.
Hamdi, H. and Abdelhafez, S. (2000). Agriculture and Soil Survey in Egypt, Options Méditerranéennes, Série B, n. 34

Gad A., Ali R. 255
14. Hamdi, H. et al., 1992. Monitoring salinity problem areas in Egypt using remote sensing. Report 2 submitted to FAO,
15. http://Surveying.mentapolism.org (2005). Online resources for land surveying and geomatics.
16. Kusky, T. M. and EI-Baz, F.(1999). Structural and tectonic evolution of the Sinai Peninsula, using LANDSAT data: Implication for ground water exploration, Egypt .J. Remote Sensing &Space Sci., V. 1, (1999)
17. Pax-Lenney, M.; Woodcock, J.; Collins., and Hamdi, H. (1996). The status of agricultural lands in Egypt. The use of multispectral NDVI-features derived from Landsat TM. Remote Sensing and Environment, 56, 8.
18. Rees, W.G. (1990). Physical principles of remote sensing – Topics in remote sensing, Cambridge University press, ISBN 0521359945.
19. Soil Survey Staff (2003). A Basic System of Soil Classifi cation for Making and Interpreting Soil Surveys. Second Edition. Agricultural Handbook 436.
20. Soil Survey Staff. 1975. Keys to Soil Taxonomy. Seventh Edition. 644 pp. USDA Natural Resource Conservation Service, Washington DC.
21. Ursula, C.; Peter Hofmann, B, , Willhauck, G.; Lingenfelder, I and Heynen, M. (2003). Multi-resolution, object-oriented fuzzy analysis of remote sensing data for GIS-ready information, ISPRS Journal of Photogrammetry and Remote Sensing Volume 58, Issues 3-4.
22. Wattles, C.W. (1992). A guide to understanding land surveys. 2ed edition, USA-IABN 0-471-57717-0
23. Yehia, M.A., Ashmawy, M. H., and El.ETR, H. A. (1999). Quantitative study of the fracture pattern of the area around the western part of Wadi El-Kharit, South eastern desert, Egypt, Egypt .J. Remote Sensing &Space Sci., V. 1


14LB
-NA
-21647-EN-C
The mission of the Joint Research Centre is to provide customer-driven scientific and technical support for the con-ception, development, implementation and monitoring of European Union policies. As a service of the EuropeanCommission, the JRC functions as a reference centre of science and technology for the Community. Close to thepolicy-making process, it serves the common interest of the Member States, while being independent of commer-cial or national interests.
EUROPEAN COMMISSION
Joint Research CentreDIRECTORATE-GENERAL
Copyright © 2022 FDOKUMEN