In-situ variability of DOM in relation with ... - Horizon IRD
22
J. Mar. Sci. Eng. 2021, 9, 241. https://doi.org/10.3390/jmse9030241 www.mdpi.com/journal/jmse Article In-Situ Variability of DOM in Relation with Biogeochemical and Physical Parameters in December 2017 in Laucala Bay (Fiji Islands) after a Strong Rain Event Timoci Koliyavu 1, *, Chloe Martias 2 , Awnesh Singh 1 , Stéphane Mounier 2 , Philippe Gérard 2,3 and Cecile Dupouy 1,2, * 1 Pacific Center for Environment and Sustainable Development, The University of the South Pacific (USP), Private Mail Bag, Suva, Fiji; [email protected] 2 Aix-Marseille Universite, Universite de Toulon, IRD, CNRS/INSU, Mediterranean Institute of Oceanography (MIO), UM 110, 13288 Marseille, France; [email protected] (C.M.); [email protected] (C.D.), [email protected] (S.M.); [email protected] (P.G.) 3 Centre IRD of Noumea, BP A5, CEDEX, 98848 Noumea, New Caledonia * Correspondence: [email protected] (T.K.); [email protected] (C.D.); Tel.: +679-500-4434 (T.K.); +687-260-729 (C.D.) Abstract: Heavy rain events alter the biogeochemical outflows, affects water quality and ecosystem health within the coastal waters of small Pacific Islands. We characterized snapshots of the optical fingerprints of dissolved organic matter (DOM) sources together with the select nutrients, biogeo- chemical and physical variables for 10 stations in December 2017 in Laucala Bay, Fiji Islands. DOM absorption coefficients and fluorescence components were determined via spectrofluorometry and Parallel Factor Analysis identifying four components: Type M, two terrestrial (humic, fulvic) com- ponents, and a protein component linked to marine biological activity. Associations of DOM to- gether with climate variables and the other tested variables were determined via principal compo- nent, hierarchical cluster, and cross-correlation (Pearson) analysis. All component s (together with most tested variables) displayed higher values (plumes) at the southwest coast consistent with sur- face currents outflow during the wet season. Type M component associated with two allochthonous fluorescent components signaling anthropogenic forcings via riverine outflows. Terrigenous inputs association with autochthonous chromophoric dissolved organic matter (CDOM) is indicative of tidal mixing, dilution, and bottom resuspension processes. Positive correlations of dissolved or- ganic carbon (DOC) with nutrients (NOx, PO4) elucidates DOM being utilized as energy sources. The positive correlation of DON with nutrients (NOx, PO4, Si(OH)4) reflects the role of DON as a nutrient source consistent with chlorophyll plume formation. Keywords: DOM absorption; fluorescence; biogeochemistry; PARAFAC; EEM spectra; autochtho- nous; allochthonous; chlorophyll; CDOM; FDOM 1. Introduction Like many developing countries, Fiji is a natural resource-dependent state experienc- ing intense competing pressures for agriculture, tourism, transport, mining, and many more land-use practices, which in total affects the health and quality of the surrounding water bodies [1–4]. Consequently, water clarity is affected by anthropogenic forces on ter- restrial runoffs and riverine discharges, such as DOM (dissolved organic matter) sourced outflows from sewage, mining, sugarcane farming, land clearing, dredging, and natural processes, such as shoreline erosion, sediment resuspension from tidal action, coastal Citation: Koliyavu, T.; Martias, C.; Singh, A.; Mounier, S.; Gérard, P.; Dupouy, C. In-Situ Variability of DOM in Relation with Biogeochemical and Physical Parameters in December 2017 in Laucala Bay (Fiji Islands) after a Strong Rain Event. J. Mar. Sci. Eng. 2021, 9, 241. https://doi.org/ 10.3390/jmse9030241 Academic Editors: Emanuele Organelli and Chiara Santinelli Received: 31 December 2020 Accepted: 5 February 2021 Published: 24 February 2021 Publisher’s Note: MDPI stays neu- tral with regard to jurisdictional claims in published maps and insti- tutional affiliations. Copyright: © 2021 by the authors. Licensee MDPI, Basel, Switzerland. This article is an open access article distributed under the terms and con- ditions of the Creative Commons At- tribution (CC BY) license (http://cre- ativecommons.org/licenses/by/4.0/).
-
Upload
khangminh22 -
Category
Documents
-
view
3 -
download
0
Transcript of In-situ variability of DOM in relation with ... - Horizon IRD

J. Mar. Sci. Eng. 2021, 9, 241. https://doi.org/10.3390/jmse9030241 www.mdpi.com/journal/jmse
Article
In-Situ Variability of DOM in Relation with Biogeochemical and Physical Parameters in December 2017 in Laucala Bay (Fiji Islands) after a Strong Rain Event Timoci Koliyavu 1,*, Chloe Martias 2, Awnesh Singh 1, Stéphane Mounier 2, Philippe Gérard 2,3 and Cecile Dupouy 1,2,*
1 Pacific Center for Environment and Sustainable Development, The University of the South Pacific (USP), Private Mail Bag, Suva, Fiji; [email protected]
2 Aix-Marseille Universite, Universite de Toulon, IRD, CNRS/INSU, Mediterranean Institute of Oceanography (MIO), UM 110, 13288 Marseille, France; [email protected] (C.M.); [email protected] (C.D.), [email protected] (S.M.); [email protected] (P.G.)
3 Centre IRD of Noumea, BP A5, CEDEX, 98848 Noumea, New Caledonia * Correspondence: [email protected] (T.K.); [email protected] (C.D.); Tel.: +679-500-4434 (T.K.);
+687-260-729 (C.D.)
Abstract: Heavy rain events alter the biogeochemical outflows, affects water quality and ecosystem health within the coastal waters of small Pacific Islands. We characterized snapshots of the optical fingerprints of dissolved organic matter (DOM) sources together with the select nutrients, biogeo-chemical and physical variables for 10 stations in December 2017 in Laucala Bay, Fiji Islands. DOM absorption coefficients and fluorescence components were determined via spectrofluorometry and Parallel Factor Analysis identifying four components: Type M, two terrestrial (humic, fulvic) com-ponents, and a protein component linked to marine biological activity. Associations of DOM to-gether with climate variables and the other tested variables were determined via principal compo-nent, hierarchical cluster, and cross-correlation (Pearson) analysis. All component s (together with most tested variables) displayed higher values (plumes) at the southwest coast consistent with sur-face currents outflow during the wet season. Type M component associated with two allochthonous fluorescent components signaling anthropogenic forcings via riverine outflows. Terrigenous inputs association with autochthonous chromophoric dissolved organic matter (CDOM) is indicative of tidal mixing, dilution, and bottom resuspension processes. Positive correlations of dissolved or-ganic carbon (DOC) with nutrients (NOx, PO4) elucidates DOM being utilized as energy sources. The positive correlation of DON with nutrients (NOx, PO4, Si(OH)4) reflects the role of DON as a nutrient source consistent with chlorophyll plume formation.
Keywords: DOM absorption; fluorescence; biogeochemistry; PARAFAC; EEM spectra; autochtho-nous; allochthonous; chlorophyll; CDOM; FDOM
1. Introduction Like many developing countries, Fiji is a natural resource-dependent state experienc-
ing intense competing pressures for agriculture, tourism, transport, mining, and many more land-use practices, which in total affects the health and quality of the surrounding water bodies [1–4]. Consequently, water clarity is affected by anthropogenic forces on ter-restrial runoffs and riverine discharges, such as DOM (dissolved organic matter) sourced outflows from sewage, mining, sugarcane farming, land clearing, dredging, and natural processes, such as shoreline erosion, sediment resuspension from tidal action, coastal
Citation: Koliyavu, T.; Martias, C.;
Singh, A.; Mounier, S.; Gérard, P.;
Dupouy, C. In-Situ Variability of
DOM in Relation with
Biogeochemical and Physical
Parameters in December 2017 in
Laucala Bay (Fiji Islands) after a
Strong Rain Event. J. Mar. Sci. Eng.
2021, 9, 241. https://doi.org/
10.3390/jmse9030241
Academic Editors: Emanuele
Organelli and Chiara Santinelli
Received: 31 December 2020
Accepted: 5 February 2021
Published: 24 February 2021
Publisher’s Note: MDPI stays neu-
tral with regard to jurisdictional
claims in published maps and insti-
tutional affiliations.
Copyright: © 2021 by the authors.
Licensee MDPI, Basel, Switzerland.
This article is an open access article
distributed under the terms and con-
ditions of the Creative Commons At-
tribution (CC BY) license (http://cre-
ativecommons.org/licenses/by/4.0/).

J. Mar. Sci. Eng. 2021, 9, 241 2 of 22
surges and wave action [4–7]. DOM is ubiquitous in aquatic systems and serves as the largest reservoir of dissolved organic carbon (DOC) in the oceans [8–10].
DOM contains a highly diverse mixture of molecules [10,11], which provide the larg-est source of energy and nutrients for the aquatic biomes. The large quantities of carbon (C), nitrogen (N), and phosphorous (P) that DOM carries sometimes exhibit colloidal structures that are suitable for adsorption of both inorganic and organic materials altering its availability to the aquatic biodiversity [11–13]. Owing to the diverse and complex na-ture of the molecular structure of DOM, it is highly reactive triggering numerous aquatic reactions producing products that could be either beneficial or lethal to the coastal biomes [12].
Brownish-colored water is likely to have a high carbon load from the humic sub-stances found in plants and soil. The organic carbon load from soil sediment runoff ex-plains the acidic properties of the waters and the resulting yellow-brown coloration [14,15]. DOM occurs naturally in many forms such as fatty acids, carbohydrates, amino acids, hydrocarbons, fulvic acids, humic acids, viruses, and clay-humic metal complexes [10] and has both allochthonous and autochthonous origins [15,16].
Allochthonous DOM is linked to degraded organic materials of terrestrial origin while autochthonous DOM arises from in-situ biological activities [13,14] such as phyto-plankton exudation and lysis, animal excretion, and fragments or cadavers derived from biogenic sources [10,17–20]. A fraction of DOM contains chromophores that strongly ab-sorb short-wavelength light ranging from ultraviolet (UV) to blue of the electromagnetic spectrum [14–16], hence the term chromophoric dissolved organic matter (CDOM). CDOM can be characterized by its absorbance in the UV-visible domain. The absorption of light by CDOM far exceeds the absorption by particles [20] reaffirming its role in regu-lating primary productivity in estuarine and coastal environments. Owing to its spectral attenuation properties, CDOM becomes a good indicator of water clarity and has been the focus of numerous tropical ocean optics studies in the past decades [21–25].
CDOM plays a significant role not only in the transport of DOC from the terrestrial to coastal and oceanic environments but also by the provision of numerous ecosystem services. CDOM provides sources of energy to heterotrophs [26,27], protection of micro-organisms from harmful UV radiation [15,16,28], regulation of photosynthetically availa-ble radiation (PAR), for marine algae and benthic organisms [13,14], and affects the avail-ability of complex metal or organic pollutants [16,29,30].
The proposed research will complete this measurement with absorbance and fluores-cence to characterize DOC’s reactivity in aqueous ecosystems. Fluorescent properties of DOM have been documented in various studies [15–18,25–27,31] and can be characterized by the differences in fluorescence spectra upon sample excitation in the UV-visible do-main. The variability is normally associated with the different sources of DOC in aquatic systems. It is possible to distinguish humic acids from other fluorescing components like tyrosine and tryptophan because microbially-derived acids normally emit higher intensi-ties compared to terrestrially derived acids [32–39].
Examining DOC and DON interactions with nutrients across the environmental gra-dients, including dissolved oxygen and temperature, could help elucidate the role of physio-chemical parameters in driving the coupled biogeochemistry of DOM and nitrates. A few studies have assessed the nutrient availability and variability levels within the Suva Lagoon and Laucala Bay revealing catalytic impacts of the episodic rainfall events [40–43]. Nutrient levels were ten folds higher during severe rain events within the bay com-pared to areas of pristine waters [41–44]. In this study, in-situ sampling to characterize the absorption and fluorescent properties of DOM sourced waters by spectrofluorometry and its associations with select environment variables were classified for the first time in the Fiji waters. The major goals of this study were to assess the land-lagoon transfers of DOM and add new information on CDOM fluorescence into the ongoing monitoring of the physical, meteorological, and biogeochemical parameters in the Suva Lagoon and the Fiji waters.

J. Mar. Sci. Eng. 2021, 9, 241 3 of 22
2. Materials and Methods 2.1. Study Area
Climatic conditions in Fiji are predominately governed by the South Pacific Conver-gence Zone (SPCZ), seeing a wet-warm season from November to April and the cool-dry season from May to October [1,2]. Rainfall is highly variable within the regions and is mainly influenced by the island topography and the southeast trade winds [3,43]. Since the establishment of Suva to be the capital city of Fiji in 1882, the Suva Lagoon (Figure 1) has been the center of numerous activities including international shipping (mainly Suva Harbor waters (SHW), the western portion of Suva Lagoon), national shipping transport, dives, and coastal fisheries, naval expeditions, land reclamation, and ocean researches and monitoring. The Laucala Bay coastal waters (LBW), located to the east of Suva Lagoon (18.10–18.17° S, 178.36–178.62° E (Figure 1); has been the focus of numerous research (e.g., [1–4,41–45]. The average depth within the LBW is 9 m deepening to more than 30 m in the Nukulau and Nukubuco Passages, while SHW has an average depth of 15 m and deepens to more than 100 m in the Suva Passage [44]. LBW is sourced from Uluituni Creek, Vatu-waqa, and the Samabula rivers in the west and the Nasinu, Vunidawa, Vunivadra chan-nel, and Rewa Delta waters (RDW) from the east (Figure 1).

J. Mar. Sci. Eng. 2021, 9, 241 4 of 22
Figure 1. Site maps of the Suva Lagoon showing the study area Laucala Bay in the island of Viti Levu, Fiji Islands. Study Scheme 22. transects (T1–T4 in black solid line and red labels).KWTP refers to the Kinoya Wastewater Treatment Plant.

J. Mar. Sci. Eng. 2021, 9, 241 5 of 22
Rewa Delta is the delta of the Rewa River, the largest river catchment (2920 km2) with the Vunidawa River and Vunivadra channels as its main distributaries into the LBW [1,3,44] SHW is connected to LBW via the Nasese passage while the Pacific Ocean waters (POW) flushes through the Nukubuco and Nukulau passages into the bay. LBW and SHW are surrounded by the Suva Barrier Reefs which in turn limits the dispersal of sediments and particle discharge out into the POW [43]. Twice daily during high tide, a shallow layer of oceanic waters enters the submerged reefs from the POW into the LBW which has an estimated surface area of 45 km2 and 39 km2 of mudflats exposed at low waters [43]. The entire bay is surrounded by mangroves along the coasts. Terraces run along the south-eastern side of the Suva Peninsula at 45 m, 17 m, and 10 m elevations which are very erosional and depositional [43]. From the north of the bay, KWTP (Kinoya Wastewater Treatment Plant), which is the main sewerage treatment plant for the Suva and Nasinu municipalities, discharges most of its effluents into LBW, at about 200 m from the coast [1,43].
2.2. In-Situ Sampling and Sea Measurements Out of the 55 stations surveyed in Laucala Bay during the 5 BULA IRD cruises [41–
45] surface sampling sites at the Suva Lagoon, a total of 10 stations were selected into 4 transects, to cover the Laucala Bay monitoring sites and organized along 4 transects T1–T4 (north to the south except for T4) (Figure 1, Table 1).
Table 1. Station locations, transects, zones, water depth, and tide.
Station Longitude Latitude Transect Zones Depth(m) Tide 22 178.4578 18.1585 T1 CO 5.93 Ebb 23 178.458 18.165 T1 OB 20.35 Decreasing 30 178.4800 18.1291 T2 CO 6.79 Decreasing 31 178.4778 18.1485 T2 IB 5.87 Decreasing 33 178.4778 18.1685 T2 CO 30.53 Decreasing 41 178.4978 18.1285 T3 IB 15.78 Low 42 178.4978 18.1485 T3 IB 15.53 Flood 44 178.4978 18.1685 T3 OB 15.21 Increasing 47 178.5175 18.1798 T4 OB 22.79 Increasing 49 178.5269 18.1635 T4 OB 12.54 Increasing
Stations were organized along 4 transects T1–T4 (north to the south except for T4). T1 (St 22-23) covered the Nasese passage from the coastal vicinity of the Vatuwaqa river mouth into the near reef vicinity while T2 (St 30-31-33) surveys the mouth of the Samabula River to the reef edge. T3 (St 41-42-43) covers the coastal vicinity of the Nasinu and Vuni-dawa rivers to the reef edge while T4 (St 47–49) tries to cover the Nukulau and the Laucala passages.
All transects cogitate river mouths and passages (including KWTP outfall) with sta-tions positioned on a roughly regular grid from the coast to the barrier reefs into POW. Stations were grouped into three zones (coastal, CO; inner bay, IB; and outer bay, OB) as illustrated by black dashed lines in Figure 1 and defined by an imaginary line running at about a kilometer (km) from the coastline; IB running 2 km along the coastline while OB refers to an imaginary line running at about a km from the inner reef edges of the barrier reefs. The Rewa River could not be sampled at low tide.
The survey cruise was conducted onboard the MV Halimeda on 1 December 2017 from 09:00 h–17:00 h. The mean depth of the waters recorded at all stations was 15.13 m and the mean rainfall received during the past three months before the survey was 12.42 mm. Wind intensities fluctuated in 2017 recording monthly means of 3.90 ms−1, 2.12 ms−1, and 3.91 ms−1 for October, November, and December, respectively. Strong rains of about 74.4 mm were observed on 1 December 2017 compared to the monthly mean of 13.65 mm
J. Mar. Sci. Eng. 2021, 9, 241 6 of 22
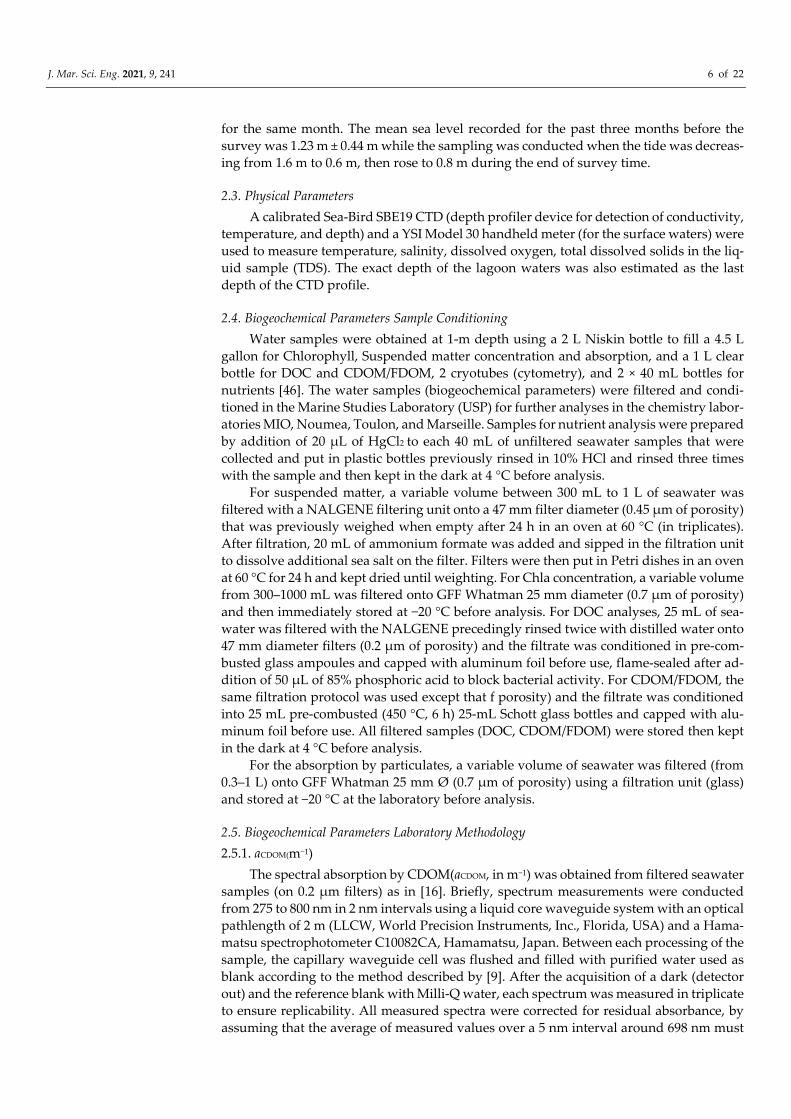
for the same month. The mean sea level recorded for the past three months before the survey was 1.23 m ± 0.44 m while the sampling was conducted when the tide was decreas-ing from 1.6 m to 0.6 m, then rose to 0.8 m during the end of survey time.
2.3. Physical Parameters A calibrated Sea-Bird SBE19 CTD (depth profiler device for detection of conductivity,
temperature, and depth) and a YSI Model 30 handheld meter (for the surface waters) were used to measure temperature, salinity, dissolved oxygen, total dissolved solids in the liq-uid sample (TDS). The exact depth of the lagoon waters was also estimated as the last depth of the CTD profile.
2.4. Biogeochemical Parameters Sample Conditioning Water samples were obtained at 1-m depth using a 2 L Niskin bottle to fill a 4.5 L
gallon for Chlorophyll, Suspended matter concentration and absorption, and a 1 L clear bottle for DOC and CDOM/FDOM, 2 cryotubes (cytometry), and 2 × 40 mL bottles for nutrients [46]. The water samples (biogeochemical parameters) were filtered and condi-tioned in the Marine Studies Laboratory (USP) for further analyses in the chemistry labor-atories MIO, Noumea, Toulon, and Marseille. Samples for nutrient analysis were prepared by addition of 20 µL of HgCl2 to each 40 mL of unfiltered seawater samples that were collected and put in plastic bottles previously rinsed in 10% HCl and rinsed three times with the sample and then kept in the dark at 4 °C before analysis.
For suspended matter, a variable volume between 300 mL to 1 L of seawater was filtered with a NALGENE filtering unit onto a 47 mm filter diameter (0.45 µm of porosity) that was previously weighed when empty after 24 h in an oven at 60 °C (in triplicates). After filtration, 20 mL of ammonium formate was added and sipped in the filtration unit to dissolve additional sea salt on the filter. Filters were then put in Petri dishes in an oven at 60 °C for 24 h and kept dried until weighting. For Chla concentration, a variable volume from 300–1000 mL was filtered onto GFF Whatman 25 mm diameter (0.7 µm of porosity) and then immediately stored at −20 °C before analysis. For DOC analyses, 25 mL of sea-water was filtered with the NALGENE precedingly rinsed twice with distilled water onto 47 mm diameter filters (0.2 µm of porosity) and the filtrate was conditioned in pre-com-busted glass ampoules and capped with aluminum foil before use, flame-sealed after ad-dition of 50 µL of 85% phosphoric acid to block bacterial activity. For CDOM/FDOM, the same filtration protocol was used except that f porosity) and the filtrate was conditioned into 25 mL pre-combusted (450 °C, 6 h) 25-mL Schott glass bottles and capped with alu-minum foil before use. All filtered samples (DOC, CDOM/FDOM) were stored then kept in the dark at 4 °C before analysis.
For the absorption by particulates, a variable volume of seawater was filtered (from 0.3–1 L) onto GFF Whatman 25 mm Ø (0.7 µm of porosity) using a filtration unit (glass) and stored at −20 °C at the laboratory before analysis.
2.5. Biogeochemical Parameters Laboratory Methodology 2.5.1. aCDOM(m−1)
The spectral absorption by CDOM(aCDOM, in m−1) was obtained from filtered seawater samples (on 0.2 µm filters) as in [16]. Briefly, spectrum measurements were conducted from 275 to 800 nm in 2 nm intervals using a liquid core waveguide system with an optical pathlength of 2 m (LLCW, World Precision Instruments, Inc., Florida, USA) and a Hama-matsu spectrophotometer C10082CA, Hamamatsu, Japan. Between each processing of the sample, the capillary waveguide cell was flushed and filled with purified water used as blank according to the method described by [9]. After the acquisition of a dark (detector out) and the reference blank with Milli-Q water, each spectrum was measured in triplicate to ensure replicability. All measured spectra were corrected for residual absorbance, by assuming that the average of measured values over a 5 nm interval around 698 nm must
J. Mar. Sci. Eng. 2021, 9, 241 7 of 22
be zero and shifting the spectra as proposed by [47]. CDOM absorption spectrum values extracted at different wavelengths include: aCDOM(254), aCDOM(350), aCDOM(412) and aC-
DOM(442) nm.
2.5.2. DOC (µM) The DOC concentration was measured using a SHIMADZU TOC 5000 equipped with
an autosampler. To eliminate dissolved organic carbonate, 50 mL of HCl was added fol-lowed by oxygen bubbling for ten minutes. The sample was analyzed by high-tempera-ture catalytic combustion (650 °C). The obtained detection limit for this procedure was 0.15 µM (Mediterranean Institute of Oceanography, Campus de Toulon). Instrumental uncertainty on DOC values is 2–3 µM.
2.5.3. Nutrients (µM L−1) Nitrate + nitrite (reported as NOx) concentrations were determined at nanomolar con-
centrations [48], phosphate (PO43) concentrations were determined according to [49] and silicates (Si(OH)4) according to [50,51] with all analyses being conducted on a BranLuebbe III continuous flow autoanalyzer. Total dissolved nitrogen (TON) and phosphorus con-centrations were determined as nitrate and phosphate (PO4) concentrations after wet oxi-dation of water samples.
2.5.4. SPM-Dry Weight (mg L−1) Suspended particulate matter (SPM), a proxy for turbidity, was calculated as the dif-
ference between the weight of the dried filter and the empty dried filter and divided by the filtered volume (dry weight (mg L−1). Weighting was done on a microbalance with the precision of 0.02 mg L−1 [16].
2.5.5. Chla and Pheophytin, Pheo (µg L−1) After grinding on the GF/F filter, phytoplankton chlorophyll-a, Chla; was extracted
in 90% methanol and analyzed with a fluorometer Trilogy Turner 7200-000 as in [16].
2.5.6. FDOM (Fluorescent Dissolved Organic Matter) This technique allows the obtaining of excitation-emission spectra as a function of
the fluorescence intensity in a mixture of compounds. The Fluorescence Excitation-Emis-sion Matrices of Fluorescence (EEMs: 3D) of the natural water samples were obtained us-ing the Perkin Elmer LS 55 spectrofluorometer.
The acquisition method of the 3D fluorescence data was as follows: λEx 200–500 nm; λEm 280–550 nm with a 5 nm step for excitation and emission. A scanning rate of 1200 nm/min and a response time of 0.5 s [15,16]. The cell used was a quartz cell with a 1 cm optical path, previously washed with 10% HCl, rinsed three times with MQ water and calcined (500 °C, 4 h). Before starting the spectral data acquisition, the temperature of the sample had to be close to 20 °C. A thermostat bath set at 20 °C kept the tank and its con-tainer at this temperature throughout the acquisition. The acquisition of EEMs was carried out in triplicate. At the beginning of each series, a blank (MQ water) was also passed. The EEMs were normalized by measuring the intensity of the Raman peak from the 3D matrix to obtain Raman Unit (R.U.), using the excitation at 350 nm and dividing the EEMs by the area under the Raman peak. In this way, variations in the sensitivity of the instrument if any were corrected.
The Parallel Factor Analysis was performed using the Progmeef program (Progmeef, https://woms18.univ-tln.fr/progmeef/, M.I.O. Toulon University, accessed on 9 February 2021) on the 10 EEMs spectra corresponding to the stations including 4 series of EEMs obtained at other cruises at the same stations (June and October 2015, October 2016 [31]); with the same instrument (53 EEMs × 3) whereby 4 components (Figure 2) were identified and recorded with a CORCONDIA >60%. The four fluorescent (C) components were: a

J. Mar. Sci. Eng. 2021, 9, 241 8 of 22
C1-type M peak (Ex = 300/Em = 420 nm) which is derived from microbial/photorespiration from phytoplankton, two terrestrial-like humic components (C2 fulvic like (Ex = 250/Em = 420), a C4 humic-like (Ex = 280/Em = 510 nm) and a C3 (Ex = 250/Em = 340 nm) protein-like component.
Figure 2. C1-type M peak, two terrestrial-like components (C2 fulvic-like and C4 humic-like) and C3 protein-like 2017.
2.6. Statistical Analysis, Standardization, and Visualization A total of 22 (N = 193) variables were compiled for the study. Maps of the spatial
variability of select parameters from both the tested variables were visualized using Surfer 11 mapping software. Understanding the linkages of DOM sources with biogeochemical and meteorological parameters requires the standardization of data for further compila-tion methods. All variables from the dataset were standardized (mean of 0 and standard deviation of 1) using select statistical cluster classifier methods. The missing data were imputed by a chained equations algorithm [52] while the correlation and covariance ma-trices were compiled using cross-correlation, principal component analysis (PCA), and hierarchical cluster analysis (HCA). Results were presented as correlogram, dendrogram, boxplots, and PCA correlation circle. All numerical computations were analyzed using R program language software version 4.0.
3. Results and Discussion 3.1. Physical Conditions in Laucala Bay in December 2017
Salinity distributions (Table 2, Figure 3a,b) displayed higher values at the OB (mean values of 25.6 ± 0.4) and lower values on the IB (mean values of 22 ± 2.8). The lowest values were observed for the CO region (21.7 ± 8.9). Low salinity patterns (Figure 3a) were rec-orded in Laucala Passage (18.8) and near the vicinity of the mouth of the Vatuwaqa River. Generally, salinity is a measure of the total dissolved salts (TDS, see Table 2 for measured values) within the waters which means that for Laucala Bay, the TDS (Figure 3d) is very much affected by the freshwater inputs from riverine discharges. This situation corre-sponds to an IRD cruise after rain in March 1999, when significant freshwater was ex-ported from the Rewa River and produced a well-defined salinity gradient over the whole lagoon with salinity ranging from as low as 25.5 in the eastern part of Laucala Bay to a maximum of 35.5 in the western part of Suva Harbour [44].
C1 C2
C3 C4

J. Mar. Sci. Eng. 2021, 9, 241 9 of 22
Figure 3. Color maps of (a) surface salinity (b) surface temperature (c) DO and (d) total dissolved solids (TDS).
Table 2. Mean values and standard deviation of the physical Variables Dissolved Oxygen (DO), Salinity, Temperature and Total Dissolved Solids in CO (Coastal), IB (Inner Bay), and OB (Outer Bay).
Physical Variables CO (N = 3)
IB (N = 3)
OB (N = 4)
YSI DO (mg L−1) 7.23 ± 0.25 6.94 ± 0.96 7.04 ± 0.18 CTD Sal. 17.96 ± 5.79 24.17 ± 3.0 26.8 ± 2.19
YSI Temp. (°C) 27.26 ± 0.35 27.43 ± 0.25 27.40 ± 0.36 YSI TDS (mg L−1) 18,778 ± 5726 24,429 ± 2308 27,146 ± 2462
Observations from both the surface and bottom temperature obtained from the CTD(depth profiler) and YSI (Yellow Springer Institute) Model 30 handheld water quality meter were similar (not shown). Surface temperature readings from the YSI meter rec-orded a minimum, maximum, mean of 26.9, 28, 27.5, and a standard deviation of 0.35 °C respectively (Table 2) which parallels previous [3] findings where the temperature was expected to be higher in the wet-warm season.
Dilution effects through the mixing of the surface and bottom layers could be at-tributed to causing these patterns as the surveyed stations were not so deep (5–30 m, Table 1). A mass of freshwater is thus observed via temperature distributions from the east to the west direction within the LBW (Figure 3b) which is consistent with the strong surface currents inflows (≈2 ms−1 and exacerbated by severe rain events [44]) from the RDW and Vunidawa river into the LBW through the Laucala passage. Dissolved oxygen, DO (Table 2, Figure 3c) which is essential to all marine life; exhibited a negative gradient offshore, that is, varies with salinity and TDS (Figure 3ad), and is consistent with previous findings [15,16].
The variability and distribution of the measured parameters (biogeochemical, ab-sorption, and fluorescence) are summarized (Table 3) and compiled displayed as color maps (Figures 4 and 5). Slightly dissimilar patterns for Chla and SPM (Figure 4c,d) were observed. Chla had a maximum concentration in the CO (mean value of 3.3 ± 2 µg L−1)

J. Mar. Sci. Eng. 2021, 9, 241 10 of 22
and IB (3.17 ± 2.33 µg L−1) and decreases in the OB (Table 3). SPM showed non significantly different concentrations in CO, IB, and OB (2 ± 0.4 mg L−1, 1.70 ± 1.13 µg L−1 and 1.83 ± 1.13, Table 3). Chla and SPM had higher variability in the IB (Figure 6d,f). SPM sources are more diverse in the CO (Figure 4a,b). This has been noted previously [2,3], as, during the rainy season, significant freshwater flow rates from the Rewa River plus the small rivers from the western coast of Laucala Bay strongly affected the distribution of SPM [44].
Table 3. Range, mean values, and standard deviations of the Biogeochemical and Nutrient variables for the CO, IB, and OB (for 10 stations).
Variables All Stations Mean Values and STD Mean All Stations
[Range] CO (N = 3) IB (N = 3) OB (N = 4) N = 10 Chl (µg L−1) 0.79–5.60 3.29 ± 1.99 3.17 ± 2.33 1.42 ± 0.41 2.62 ± 1.05
Pheo (µg L−1) 0.46–1.5 1.06 ± 0.51 0.46 ± 0.32 0.72 ± 0.08 0.78 ± 0.33 DOC (µM) 73.56–92.73 84 ± 5.4 83 ± 9.5 81 ± 6 81.45 ± 3.95 DON (µM) 10–326 119 ± 7.0 33 ± 36 20 ± 19 72.8 ± 84.6
SPM (mg L−1) 0.67–3.37 2.03 ± 0.41 1.70 ± 1.13 1.83 ± 0.42 1.90 ± 0.52 aCDOM(254) (m−1) 1.57–1.73 1.65 ± 0.05 1.63 ± 0.09 1.62 ± 0.04 1.63 ± 0.036 aCDOM(350) (m−1) 0.48–1.83 1.26 ± 0.50 0.68 ± 0.26 0.94 ± 0.29 1.01 ± 0.33 aCDOM(412) (m−1) 0.18–0.8 0.51 ± 0.25 0.25 ± 0.09 0.35 ± 0.02 0.398 ± 0.14 aCDOM(442) (m−1) 0.12–0.53 0.33 ± 1.74 0.16 ± 0.05 0.22 ± 0.01 0.26 ± 0.09
C1 (R.U) 0.3–0.20 0.13 ± 0.08 0.12 ± 0.05 0.08 ± 0.03 0.11 ± 0.03 C2 (R.U) 0.04–0.25 0.15 ± 0.1 0.14 ± 0.06 0.06 ± 0.01 12.25 ± 0.05 C3 (R.U) 0.03–0.32 0.11 ± 0.01 0.16 ± 0.14 0.07 ± 0.01 0.123 ± 0.05 C4 (R.U) 0.04–0.25 0.15 ± 0.09 0.14 ± 0.01 0.06 ± 0.02 0.123 ± 0.05
Si(OH)4 (µM L−1) 31.07–109.4 84.83 ± 22.75 65.3 ± 31.16 57.36 ± 12.33 69.17 ± 14.14 PO4 (µM L−1) 0.08–0.94 0.55 ± 0.36 0.29 ± 0.24 0.14 ± 0.02 0.325 ± 0.24 NOx (µM L−1) 0.11–4.49 1.75 ± 2.38 0.56 ± 0.65 0.8 ± 0.40 0.813 ± 0.834 Wind (ms−1) 0.3–1.8
Rainfall (mm) 0–98.10 SL(m) 0.581–4.45
J. Mar. Sci. Eng. 2021, 9, 241 11 of 22
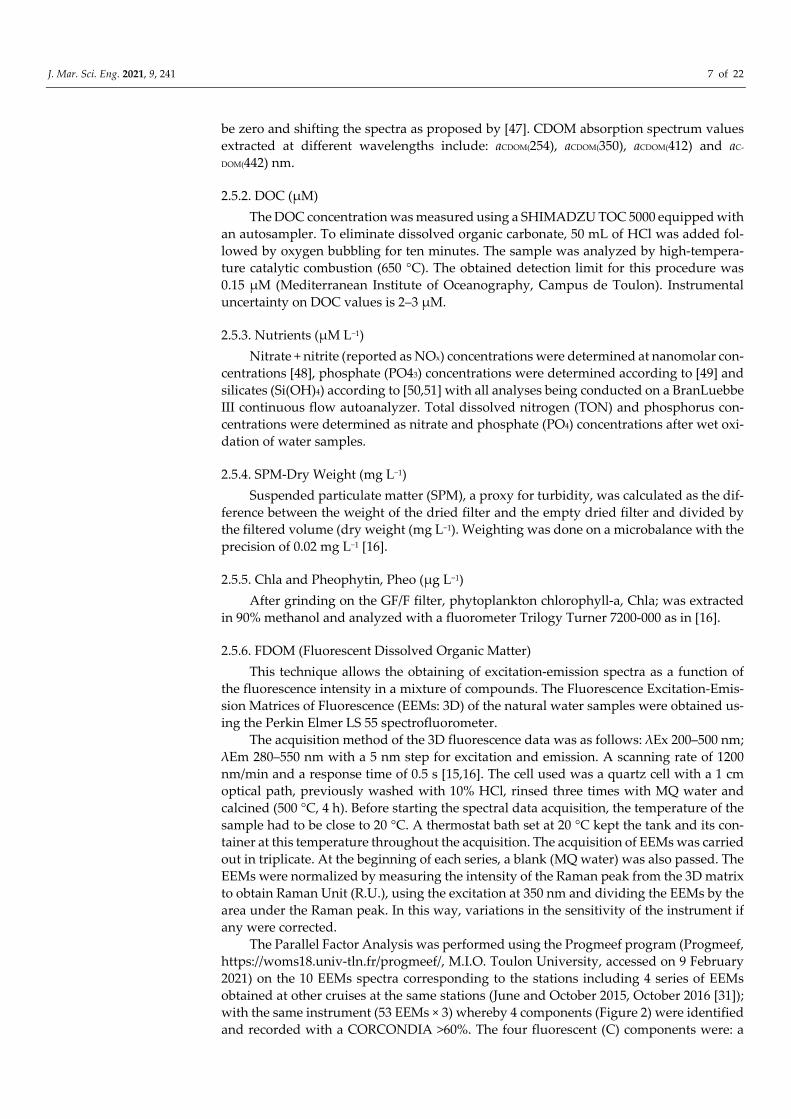
Figure 4. Color maps for biogeochemical variables (a) dissolved organic nitrogen (DON); (b) dissolved organic carbon (DOC); (c) Chla and (d) suspended particulate matter (SPM).
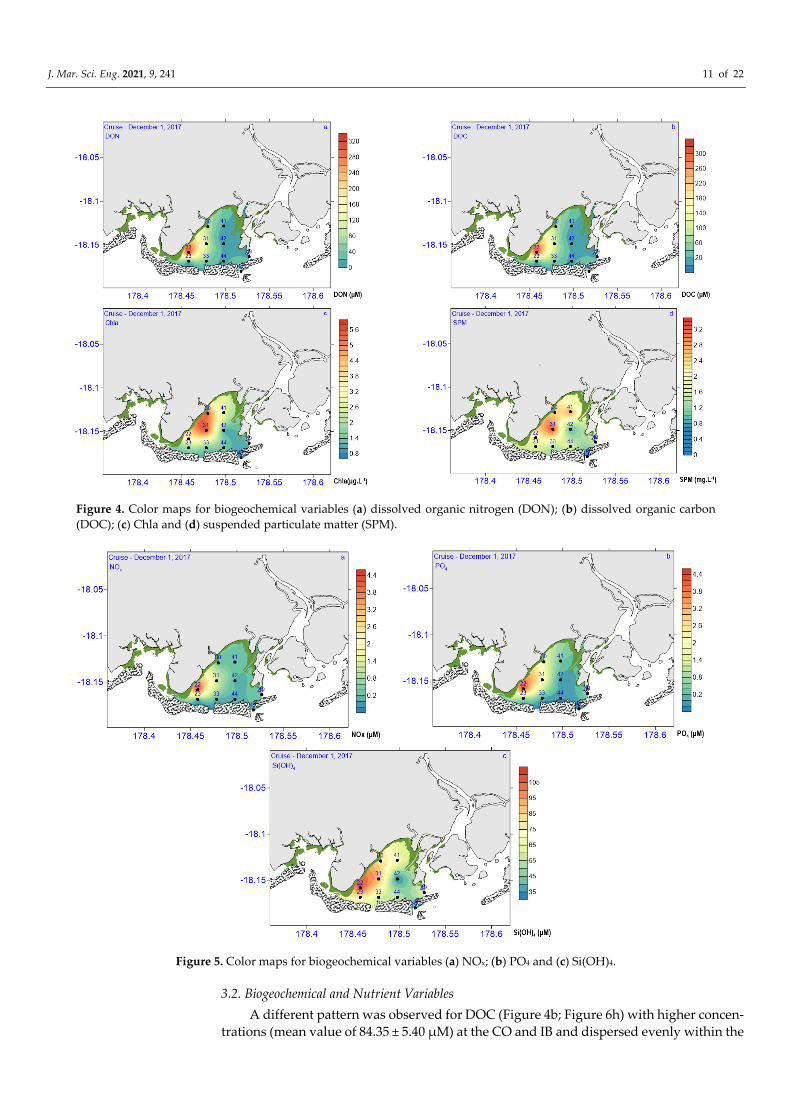
Figure 5. Color maps for biogeochemical variables (a) NOx; (b) PO4 and (c) Si(OH)4.
3.2. Biogeochemical and Nutrient Variables A different pattern was observed for DOC (Figure 4b; Figure 6h) with higher concen-
trations (mean value of 84.35 ± 5.40 µM) at the CO and IB and dispersed evenly within the

J. Mar. Sci. Eng. 2021, 9, 241 12 of 22
LBW into the OB (mean value of 82.47 ± 9.50 µM) though not statistically different. Lower concentrations (mean value of 81.21 ± 2.97 µM) were found at the eastern part of the IB. DON presented a sharp maximum in the eastern part of the Bay (Figure 4a, Figure 6d). NOx and PO4 (Figure 5a–c) mean values showed similar spatial distributions with a large maximum in the west portion of CO (Figure 6r–t). Si(OH)4 showed a patchier distribution. The minimum and maximum values of nutrient concentrations correspond to values ob-served during the rainy period at the BULA cruises [44,45].
Figure 6. Boxplots showing the distribution of environment parameters along with the CO (red), IB (green), and OB (blue). It visualizes five summary statistics: the median (horizontal line in the middle of Table 3.
The biogeochemical and nutrient parameters (Chla, DOC, Pheo, DON, PO4, Si(OH)4, NOx) on the other hand showcased a negative gradient in the offshore direction from CO to OB (Figures 4 and 5). The sequential mean values for all stations were: 2.51 µg L−1, 82 µM, 0.74 µg L−1, 53 µM, 0.31 µM L−1, 67 µM L−1, and 0.75 µM L−1 respectively.
Higher variability in concentrations was observed within the CO and IB stations and low variability in OB was observed (Figure 6a,c,g) for salinity, DO, chla and DON. SPM and DOC (Figure 6f,h) displayed low variability in the CO contrasting higher variabilities for IB and OB stations. While temperature (Figure 6b) displayed uniformity from the CO, IB, and OB; pheophytin (Figure 6e) displayed higher variabilities in the CO and OB sta-tions. It is striking that the highest percentage of pheophytin (Table 3) is observed in OB (30%, 14%, and 50% at CO, IB, and OB, respectively). This can be explained by the fact that waters flushed by fresh waters to the outside of the bay during decreasing tide are char-acterized by a high proportion of degraded phytoplankton.
3.3. CDOM Absorption and Fluorescence CDOM absorption coefficients displayed large ranges in LBW for aCDOM (254) and aC-
DOM(442) recording values from 1.57 to 1.73 and 0.48 to 0.12m-1 respectively (Table 3). High variability in the coastal stations (CO) and low variability in the IB and OB (Figure 6 l,m) were evident for spectral absorptions aCDOM(412) and aCDOM(442). Coversely aCDOM(254) and aCDOM(350) displayed high variability for IB and OB stations. While aCDOM(350) displayed similar distribution patterns with aCDOM(412)/aCDOM(442) (Figure 6j–m), the distribution

J. Mar. Sci. Eng. 2021, 9, 241 13 of 22
pattern is patchier for aCDOM(254) (Figure 7a) with equal values in CO, IB and OB (Figure 6i).
Figure 7. Color maps for absorption coefficients: (a) 254 nm ; (b) 350 nm; (c) 412 nm and (d) 442 nm.
Distinctively, C1, C2, and C4 fluorescent components presented similar maps (Figure 8a,b,d), and recorded higher values at the west coast of the LBW near the vicinity of the mouths of Uluituni Creek and Samabula River. C3 presented a slightly different distribu-tion in the South West of Laucala Bay with a lower value in front of Uluituni Creek. Lower values were recorded at the OB region within the reef edges and into the POW. Several identical distribution patterns were identified, one for the fluorescent components C2 and C4 (Figure 8b,d; Figure 6 o,q) displaying a higher concentration within the CO (mean val-ues 0.15 ± 0.1 and 0.15 ± 0.09 01 R.U.) and IB (mean values 0.14 ± 0.06 and 0.14 ± 0.01 R.U.) region. Spatially distinguishable plumes at the western coast within the mouths of Ului-tuni Creek (in front of station 22) and Vatuwaqa River and a lower concentration at the OB (mean values 0.06 ± 0.01 and 0.06 ± 0.0201 R.U. respectively) were also observed.

J. Mar. Sci. Eng. 2021, 9, 241 14 of 22
Figure 8. Color maps for components: (a) C1—Type M; (b) C2—Fulvic Terrestrial; (c) C3—Protein–like and (d) C4—Humic Terrestrial.
The other two fluorescent components C1 and C3 (Figure 6n,p) recorded less similar distributions displaying higher plumes at the west coast of LBW but slightly lower con-tributions (mean values 0.08 ± 0.03 and 0.07 ± 0.0101 R.U.) at the OB region. A notable feature observed here was the similarity (mean values of 0.11 R.U. for all contributions, Table 3) in distribution patterns for all fluorescent components (Figure 6n–q) with lower values in the OB and higher plumes observed in the CO and IB at the west coast of the bay. Another identical pair was observed for aCDOM(412) and aCDOM(442) with higher values within CO (mean values 0.51 ± 0.25 and 0.33 ± 1.74 m−1) and IB (mean values 0.25 ± 0.09 and 0.16 ± 0.05 m−1) vicinity contrasting lower concentrations (mean values 0.35 ± 0.02 and 0.22 ± 0.01 m−1) at the OB for both parameters.
The third identical distribution pattern was observed for the pair DON and NOx (Figure 6g,t) with very high concentrations in the CO (mean values of 119 ± 7.8 µM and 1.7 ± 2.4 µM), lower concentrations at the IB(mean values of 33 ± 35.8 µM and 0.56 ± 0.65 µM) and lower levels in the OB(mean values of 20 ± 19.5 µM and 0.35 ± 0.40 µM) for both parameters. Very similar distribution patterns were observed for Si(OH)4 and PO4 (Figure 6r,s) with higher concentrations were observed at the CO and dispersed evenly into the IB which contrasts the low concentrations at the OB region for both variables.
3.3.1. Association and Dependence of Environment Variables Cross-correlation coefficients for all the test variables (N = 22) are presented in the
correlogram (Figure 9). Positively correlated variables are displayed in green pies (highly correlated are darker with smaller pie cuts) and negative in red pies. The correlation coef-ficient(r) is labeled inside the pie and the sizes of the circles are equivalent to the value of the coefficient. Distinctive correlation patterns displayed by the physical parameters, tem-perature recording negative correlations with all the other variables (biogeochemical, bio-optics, fluorescence, and nutrients) with notable significant correlation with DON, aC-
DOM(412)/aCDOM(442), and aCDOM(350). Salinity on the other hand also displayed a negative correlation with all variables. Significant correlations were observed with DO and

J. Mar. Sci. Eng. 2021, 9, 241 15 of 22
Si(OH)4. For the biogeochemical variables, DOC was moderately correlated with DON while Chla recorded high correlations with aCDOM(254), all fluorescent components; and nutrients but moderate for NOx. Pheo was highly correlated with SPM, aCDOM(350), aC-
DOM(412), and aCDOM(442) while SPM was highly correlated with aCDOM(412), Si(OH)4, and Pheo.
Figure 9. Pearson correlation matrices (method = pie) at the significance level of 0.05 calculated for Table 3.
For the nutrients results, NOX was highly correlated with all CDOM spectral absorp-tion components and three fluorescent components, namely; C1, C2, and C3. Si(OH)4 and PO4 had a very high correlation with DON. Si(OH)4 and PO4 both displayed high correla-tions with NOx, Chla, aCDOM(350), aCDOM(254), DO, and fluorescent components C1, C2, and C4.
As for the CDOM spectral absorption parameters, aCDOM(254) displayed high correla-tions with all fluorescent components, all nutrients, and Chla; while aCDOM(350) showed high correlations with pheophytin, aCDOM(412), aCDOM(442), and all nutrients. All absorption coefficients were highly correlated to all nutrients and Chla.
For the fluorescent components, C1 was strongly correlated to C2, C4, PO4, Chla/aC-
DOM(254), aCDOM(442)/Si(OH)4, aCDOM(412), NOX and moderately correlated with DON and aCDOM254.The second component C2 was very strongly correlated to C4, C1, PO4 and strongly correlated to C3, NOx, aCDOM(254)/Si(OH)4, C4, DON, and aCDOM(442). C2 had moderate correlation with aCDOM(412) and sea level (r = −0.56). The third component, C3 displayed very strong correlations with aCDOM(254)/C4, C2, Chla/C3, PO4, Si(OH)4 and moderate negative correlation with SL. The fourth component displayed very strong cor-relations with C2, PO4, C1, NOx, C3, aCDOM(254), Si(OH)4, Chla, and moderate correlations with DON, aCDOM(412), and aCDOM(442).
3.3.2. Association with the Climate Variables—PCA Results PCA was performed for the standardized dataset (N = 193) and imputed together
with the climate variables: Sea level (SL), rainfall, and wind datasets (standardized) for the past three months before the survey and presented (Figure 10a) in a correlation circle. Quality representation (cos2) of the tested variables via the principal components, Dim 1 and Dim2 has seen low representations for DO, wind, and salinity (<0.25, arrows midway in the circle) contrasting higher values (>0.65, arrows reaching near the circle) for PO4, DON, Si(OH)4 and Chla. Dim1 and Dim2 accounts for 60% variability of the tested param-

J. Mar. Sci. Eng. 2021, 9, 241 16 of 22
eters which sees strong positive correlations for all CDOM absorption parameters (aC-
DOM(254), aCDOM(350), aCDOM(412), aCDOM(442)), all fluorescent components(C1–C4) and all nutrients (Si(OH)4, PO4, NOx) with Dim1 (0.54 ≤ r < 0.98, p < 0.05, n = 193). Dim2 however, was moderately correlated with Chla and DON recording r values of 0.40 and 0.48 respec-tively.
Figure 10. (a) Principal component analysis (PCA) with Pearson correlation and quality representation on the correlation circle, cos2 square cosine, squared coordinates and (b) Hierarchical (K-means) Cluster Analysis, HCA (k = 4) for “complete (furthest distance)” agglomeration method.
Associations with the climate variables have seen strong positive correlations of rain-fall with the nutrients parameters PO4 and NOx; absorptions aCDOM(350), aCDOM(412), aC-
DOM(442), and moderate correlations with TOC and DO. Wind on the other hand had a moderate correlation with all component components (C1–C4), SPM, Chla, Pheo, and Si(OH)4. Sea level and temperature, however, displayed negative correlations with all the biogeochemical and nutrient parameters tested for PCA.
3.3.3. Association with DOM Sources—HCA Results HCA was performed (k = 5, method = complete/furthest distance) with the most cor-
related (pies in Figure 9a) variables to trace linkages of tested variables with the sources of DOM obtained from the laboratory analytical results and presented (Figure 10b) as a hierarchical dendrogram. Two main clusters were identified, one enclosed in the light blue rectangle, the other is divided into 3 clusters: red, green, and dark blue. The light blue (single fork/branch) cluster comprises pheophytin while the red (double fork) cluster consists of TOC and DOC. The red, green, and dark blue are branched as a single big cluster.
The green cluster consists of SPM as a single fork/cluster and branches into another cluster which consists of aCDOM(254) as a single cluster which in turn branches into Chla and C3-protein-like as a separate (2 fork) cluster. The green and the dark blue cluster are branched as a single big cluster. On the other hand, the dark blue cluster consists of two separates clusters both cluster again branching out into two clusters.
One links fluorescent components together in a single cluster: C1-type M (maybe linked to pollution) as a single cluster which then branches (2 forks) into C2-fulvic terres-trial(origin) and C4-humic terrestrial(origin) as a separate cluster. The component cluster link with the nutrients (2 forks): Si (OH)4 and PO4 as the other cluster. Both the nutrients and component clusters make a big single cluster which branches with another big cluster

J. Mar. Sci. Eng. 2021, 9, 241 17 of 22
branching in two clusters. One branch contains CDOM parameters as a single cluster: aC-
DOM(350) (single cluster), aCDOM(412), and aCDOM(442) (double fork cluster) linked to DON and NOx as another single cluster.
The measurement and distribution of various environment variables are needed to assess environmental constraints and to identify naturally or potentially disturbed major sources of terrigenous and anthropogenic inputs. Sources of CDOM could therefore be inferred from the absorption coefficients and their relation with the environment. This cruise could not sample the Rewa River at low tide. Therefore, spatial distributions ob-tained in December 2017 during this particular cruise do not include the inputs of the Rewa River after a strong rain [42] which allows estimating other sources in Laucala Bay.
3.4. CDOM Inputs Enhancement and Conservative Dilution by Heavy Rain Rainfall impacts on riverine terrigenous outflows in tropical coastal lagoons in the
Pacific have been documented in various studies [15,16]. Observation of high positive cor-relations of rainfall with DON (r = 0.74, p < 0.05), nutrients (PO4, Si(OH)4, NOx; 0.74 ≤ r ≤ 0.62, p < 0.05) and moderate positive correlations with C2-humic terrestrial, C4-fulvic ter-restrial fluorescent components were recorded. Terrigenous CDOM enhanced by heavy rain is consistent with the results of previous studies [15,16]. The dilution effects of mixing of the oceanic waters masses from SHW and POW together with freshwater discharges from RDW, Uluituni Cr., Vatuwaqa, Samabula, Nasinu, Vunivadra channel, and Vuni-dawa (hereby termed riverine outflows) was evident from the surface salinity and tem-perature signals (positive gradients coast-offshore, Figure 3a,b) across the bay.
Periods of high rainfall events exacerbate the mixing effect [15], with a lower mean surface salinity (23.2 ± 0.33) recorded for LBW comparable to previous records of 24.8 during wet conditions [3]. The current study recorded even lower salinity (19.7 ± 2.82) values for CO and IB stations again highlighting the influence of freshwater riverine dis-charges into the LBW. Observations of significant negative correlations (Figure 3a) of sa-linity with most tested variables (e.g., C2-fulvic terrestrial and C4-fulvic terrestrial) indi-cate the terrestrial origins of CDOM [15]. Similarly, the type M component which may be linked to pollution also recorded a significant negative correlation with salinity which may also correspond to anthropogenic (terrestrial) sources. Thus, the negative correlations between salinity and the absorption coefficients of CDOM indicate that the conservative dilution of LBW through the riverine discharges plays a vital role in controlling the dis-tribution of CDOM absorption and fluorescence [15,16].
3.5. In-Situ CDOM from Biogenic Sources Very weak negative correlations (Figure 9) were observed between salinity and
Chla(r = −0.33, p < 0.05); also with C3-(protein-like) component indicating possible links with the in-situ production within the bay or from oceanic origins [16] and through bot-tom re-suspensions [15]. Conspicuously, very high concentrations were observed for Chla concentrations in the CO (5.24 µg L−1) and IB (5.69 µg L−1) stations(Figure 6d) contrasting lower values observed in other tropical lagoons (e.g., the eastern lagoon of New Caledo-nia, 1.44 µg L−1 [16]). Owing to the high Chla biomass observations and its high correlation (Figure 9, r = 0.76, p < 0.05) with C-3 protein-like component, an interpretation of in-situ CDOM production from phytoplankton biodegradation [15,16] was diagnosed. Confir-mations of CDOM inputs from biogenic sources were visualized in the HCA results (Fig-ure 10b green clusters) where Chla and C3protein-like-component were clustered as a sin-gle cluster. Chla also recorded high correlations with absorption coefficient aCDOM(254) (r = 0.72, p < 0.05) and SPM (r = 0.6, p < 0.05) which is indicative of possible linkages through re-suspension within the LBW. The high Chla biomass observed correlated very well with nutrients observations (Si(OH)4:PO4:NOx) indicating phytoplankton plumes induced from nutrient runoffs into the LBW[43]. Nutrients concentrations reported earlier [4] were com-parable to the findings of the current study (e.g., Mean NOx values recording 1.31 and 1.75

J. Mar. Sci. Eng. 2021, 9, 241 18 of 22
µM respectively) which is indicative of high terrestrial runoffs. Nevertheless concentra-tions of Si(OH)4 were relatively high (mean = 78.98 µM). The nutrient levels recorded were 10 folds higher than those recorded in unpolluted waters in Fiji [3,4] which may also in-dicate (apart from riverine discharges) possible links to effluents discharge from KWTP [4,43].
3.6. South-West Plume Formation during Heavy Rain via the LBW Distributions (Figures 4–7) for most tested variables (includes all biogeochemical,
CDOM absorptions, fluorescent components, and nutrients) displayed a peculiar pattern during heavy rain events. Plume formation observed at the west to northwest of the LBW along the Nasese passage is evident and is consistent with the surface current outflows through the Nasese passage to SHW during the wet season [44]. Strong surface currents (≥2 ms−1) inflows from the RDW into LBW from the north-west direction into the bay then west to south-west (SW) outflows via the Nasese passage into SHW. The moderate SW outflows (≤0.9–1.2 ms−1) through (combined with the geomorphological aspect of the bay and riverine outflows from the western coast) the narrow Nasese passage may partially explain the surface accumulation of most particulates (plume formation) at the west coast along T1. Particulate distributive patterns that display the plume formation outflows in the west coast of LBW include TOC, DON, Chla, all nutrients (PO4, NOx, Si(OH)4), all CDOM absorptions coefficients, and all fluorescent components (C1-type M, C2-humic terrestrial, C3protein-like, C4-fulvic terrestrial). Sea level observations displayed signifi-cant negative correlations with almost all the biogeochemical and bio-optical variables (Figure 9a) indicating high oceanic influx during high water levels and high freshwater influx during low water levels.
3.7. Association of Terrigenous and Oceanic Inputs PCA assessments (Figure 10a) reveal the various associations of the physical, bioge-
ochemical, DOM absorption/fluorescence, and nutrient parameters to select climatic pa-rameters (seal level winds and rainfall). Higher correlated variables were then demarcated through HCA (Figure 10b) to further detect their linkages. Oceanic inputs were easily identifiable via the association of Chla and C3protein-like components which were clus-tered together as once cluster (green rectangle in Figure 10b) together with SPM and ab-sorption coefficient aCDOM(254). Association with sea level derived from PCA (Figure 10a) ropes in the mixing of oceanic inputs and terrestrial inputs via bottom re-suspension and tidal influx within the bay thus displayed by the significant correlation with SPM (a proxy for water clarity). SPM associations in the oceanic cluster might be an indication that ori-gins of CDOM may differ (due to OM and microbial decomposition as in [15,16]) within the water column which exacerbates by rain events. Significant positive correlations of DO with rainfall and also with autochthonous/allochthonous CDOM (Figure 9a) settles the argument well [48]. Associations with optical properties of allochthonous CDOM were reproduced and visualized via HCA (Figure 10b) classifier method indicated by the blue cluster.
Fluorescent components of C2-fulvic like and C4-humic-like are clustered together with C1-type M indicative of their terrestrial (Figure 10b, blue rectangle) origins. Other clusters that may have linkages to the same sources include Si(OH)4 and PO4. Absorption coefficients aCDOM(412), aCDOM(442), and aCDOM(350) branch out into another single cluster which also derives their terrestrial origins. NOx and DON branch out from the absorption cluster (Figure 10b) indicative of the similarities of their sources. Finally, the sources of the 4 different clusters (Figure 10b) within the terrestrial (blue) cluster may differ or the same warranting further studies for verification. Notably, so, the marine (green rectangle, Figure 10b) and terrestrial clusters (blue rectangle, Figure 10a) are again clustered together as one big cluster which may be indicative of mixing via tidal influx and bottom re-sus-pension combined with rain and wind derived riverine discharges [48]. Another may de-pict the parachotonous origins of CDOM within the LBW. Nutrients and metal additives,

J. Mar. Sci. Eng. 2021, 9, 241 19 of 22
for example, in coastal waters through river outflows have also been reported to alter the in-situ ambient DOM pool [6]. Finally, the heterogeneity of CDOM origins in LBW arises from the interconnectivity through the transport of terrigenous inputs, decomposition of OM, and primary production activities within the interconnected biomes.
3.8. DOM Responses as Energy and Nutrient Sources Due to the inherent molecular complexity of DOM which contains functional groups
as well as essential nutrients such as nitrogen, N, and phosphorous, P [49–52]; it is not answering to quantify the portion of the DOM pool which contains organic nutrients N and P [53]. Instead, the concentration of organic nutrients must be calculated by difference as illustrated by [6,51] (e.g., [DON] = [TON] − [DIN]; where TON—total organic nitrogen; DIN—dissolved inorganic nitrogen). Nevertheless, since the biogeochemistry of DOM [16] is linked to the nutrients found in the coastal environment (e.g., NOx) we can assess the responses of DOM through CDOM and DOC with the tested nutrients variables [54]. Similarly, examining how DOC and CDOM respond to the other environment variables (e.g., physical and climatic parameters) will portray a better insight into how DOM re-sponds to the fluctuating environment and climate conditions [55]. The positive correla-tions of DOC with nutrients (NOx: r = 41, p < 0.05; PO4: r = 0.31, p < 0.05) elucidates DOM being utilized as energy sources while the negative correlation with Si(OH)4 (r = −0.08, p < 0.05) signals DOM being the sources of nutrients in the LBW [6,54]. Conversely, the highly positive correlation of DON with the nutrient variables NOx (r = 0.93, p < 0.05); PO4 (r = 0.74, p < 0.05) and moderate positive correlation with Si(OH)4 (r = 0.46, p < 0.05) reflects the role of DON as source of nutrients for the LBW [6]. DON, therefore, serves as a nutrient (N) source for microalgae which may partially explain the high recordings of Chla (max = 5.69 µg L−1) in the Laucala Bay waters.
4. Conclusions The instantaneous overview of the snapshots of optical fingerprints of CDOM varia-
bility during heavy rain events animating the superposition of daily disturbances within the LBW was investigated and presented for the first time. Four fluorescent intensities were identified, type M, linked to the degradation of organic matter; fulvic-like, protein-like, and humic-like. Type M, fulvic-like and humic-like were sourced from terrigenous origins while the protein-like component ties up with marine biogenic sources. The over-all dynamics and nature of the biogeochemistry and bio-optical characteristics of the LBW are heavily dictated by the frequency and intensities of the climate variables tested (rain-fall, wind, and SL). Notable findings include the formation of the south-west plume for-mation (heavy rain) for CDOM fluorescence and absorption parameters (and other bioge-ochemical parameters) characterized by strong inflows of riverine discharges into LBW and moderate outflows through the narrow Nasesese passage into SHW. The Suva Barrier Reefs system limits the dispersal of particulates into POW which complements their ac-cumulation in the west of the bay.
The recorded high Chla values coincided with the accumulation of nutrients in the bay which may be sourced by terrigenous (riverine discharges) and anthropogenic inputs. A significant correlation of Chla and DO reveals primary production and decomposition within the marine biomes. Negative gradients of the shore for salinity and temperature signifies the conservative dilution of freshwater from riverine discharges which in turn is proportional to rainfall intensities. The tidal influx and bottom re-suspension are indica-tive for mixing as denoted by negative correlations with the tested variables and wind have a moderate influence on the spatial distribution patterns of the optical fingerprints of CDOM. Thus the findings provided baseline information for the biogeochemical dy-namics and updates the physical and nutrients findings compiled for the Fiji waters data-base. DOM was being utilized as both energy and nutrients sources in the LBW as ob-served from the responses of DOC/CDOM to the nutrients variables NOx, PO4, and Si (OH)4. Also, DON was seen as a major source of organic nutrients in the LBW as observed

J. Mar. Sci. Eng. 2021, 9, 241 20 of 22
with its responses to the tested nutrient variables. The high nutrient loads (i.e., in the form of DON, etc.) transported by the rivers may partially explain the high phytoplankton (Chla) biomass within the Laucala bay coastal waters.
Author Contributions: Conceptualization, T.K. and C.D.; methodology, C.M., C.D., P.G., S.M. and TK.; surfer software, T.K. and A.S.; validation, T.K., A.S., S.M. and C.D.; formal analysis, T.K.; in-vestigation, T.K.; resources, C.D. and A.S.; data curation, T.K. and S.M.; writing—original draft preparation, T.K.; writing—review and editing, A.S., S.M. and C.D.; supervision, A.S. and C.D.; pro-ject administration, A.S. and C.D.; funding acquisition, T.K. and C.D. All authors have read and agreed to the published version of the manuscript.
Funding: This work benefits from the DROPS project (Dissolved oRganic carbOn around Pacific by Satellite, http://www.observatoire-gops.org/en/drops) and the French Ministry of Foreign affairs Fonds Pacifique COMETE project and from IRD M.I.O. ACTIONS SUD supports. Core funding was received from the University of the South Pacific Strategic Research Theme Grant Number: F5001–R1 001-71251-001].
Institutional Review Board Statement: Not applicable.
Informed Consent Statement: Not applicable.
Data Availability Statement: All data needed to evaluate the conclusions in the paper are presented in the paper.
Acknowledgments: All pre-laboratory preparations of the tested samples were carried out at the Marine Studies Laboratory, USP while further analytical tests were done in the chemistry laborato-ries of MIO in Noumea. We thank all technical support from USP and MIO laboratories and also the crew of the MV Halimeda, USP. Rainfall data was obtained from the Fiji Meteorological Department while the seal level and wind data from the Australian Meteorological Center. We thank Dr. Cathy Wong and Dr. Vincent Lal (Manager IAS Laboratory) for their helpful comments.
Conflicts of Interest: The authors declare no conflict of interest. The funders had no role in the design of the study, collection; analysis, interpretation, writing or in the decision to publish the re-sults.
References 1. Koliyavu, T.; Martias, C.; Singh, A.; Dupouy, C. Characterisation of chlorophyll plumes in the Fiji waters using ocean color
remote sensing. In Proceedings of the Pacific GIS & RS User Conference, Suva, Fiji, 27–30 November 2017. 2. Jenkins, A.P. Freshwater's fish survey methodology from streams & rivers in tropical oceanic islands: A Brief Guide Based on
the survey work conducted as part of the Fiji Ecosystem-Based Management Project, Wetlands International Oceania; Fiji Islands; 2009; 1–17.
3. Singh, A.; Aung, T. Salinity, Temperature and Turbidity Structure in the Suva Lagoon, Fiji. Am. J. Environ. Sci. 2008, 4, 266–275. 4. Singh, S.; Aalbersberg, W.G.L.; Morrison, R.J. Nutrient Pollution in Laucala Bay, Fiji Islands. Water, Air Soil Pollut. 2009, 363–372,
doi:10.1007/s11270-009-0050-8. 5. Fabricius, K.E.; Logan, M.; Weeks, S.J.; Brodie, J. The effects of river run-off on water clarity across the central Great Barrier
Reef. Mar. Pollut. Bull. 2014, 84, 191–200. 6. Wymore, A.S.; Rodríguez-Cardona, B.; McDowell, W.H. Understanding dissolved organic matter biogeochemistry through In-
Situ nutrients manipulations in stream ecosystems. J. Vis. Exp. 2016, 116, 54704, doi:10.3791/54704. 7. Angly, F.E.; Candice, H.; Thomas, C.M.; Hemerson, T.; Virginia, R.; Britta, S.; Bourne, D.; Tyson, G.W. Marine microbial com-
munities of the Great Barrier Reef lagoon are influenced by riverine floodwaters and seasonal weather events. PeerJ 2016, 4, 1511, doi:10.7717/peerj.1511.
8. Shilla, D.J.; Makoto, T.; Daniel.A. Terrigenous nutrient and organic matter in a subtropical river estuary Okinawa Japan: Origin, distribution and pattern across the estuarine salinity gradient. Chem. Ecol. 2011, 27, 532–542.
9. Kowalczuk, P.; Zabłocka, M.; Sagan, S.; Kuliński, K. Fluorescence measured in situ as a proxy of CDOM absorption and DOC concentration in the Baltic Sea. Oceanologia 2010, 52, 431–471.
10. Dupouy, C.; Frouin, R.; Tedetti, M.; Maillard, M.; Rodier, M.; Fabien, L.; Guidi, L.; Picheral, M.; Duhamel, S.; Charriere, B.; et al. Diazotrophic Trichodesmium influence on ocean color and pigment composition in the South West tropical Pacific. Biogeosci. Discuss. 2018, 1–43, doi:10.5194/bg-2017-570.
11. Kim. S.; Kaplan. L.A.; Hatche. P.G. Biodegradable dissolved organic matter in a temperate and tropical stream determined from ultra-high resolution mass spectroscopy, Limnol. Oceanogr. 2006, 51, 1054–1063.
12. Mostovaya, A.; Hawkes, J.A.; Dittmar, T.; Tranvik, J.L. Molecular Determinants of Dissolved Organic Matter Reactivity in Lake Water, Front. Earth Sci. 2017, 106, doi:10.3389/feart.2017.00106.

J. Mar. Sci. Eng. 2021, 9, 241 21 of 22
13. Downing, B.D.; Pellerin, B.A.; Bergamaschi, B.A.; Sarceno, J.F.; Koans, T.S. The effects of particles dissolved and temperature on in situ measurement of DOM fluorescence in rivers and streams. Limnol. Oceanogr. Methods 2012, 10, 767–785.
14. Mostofa, K.M.G.; Liu, C.-Q.; Yoshioka, T.; Vione, D.; Zhang, Y.; Sakugawa, H. Fluorescent dissolved organic matter in natural waters. In Photobiogeochemistry of Organic Matter; Mostofa, K.M.G., Yoshioka, T., Mottaleb, A., Vione, D., Eds.; Springer: Berlin, Germany, 2013; pp. 429–559.
15. Dupouy, C.; Röttgers, R.; Tedetti, M.; Frouin, R.; Lantoine, F.; Rodier, M.; Martias, C.; Goutx, M. Impact of Contrasted Weather Conditions on CDOM Absorption/Fluorescence and Biogeochemistry in the Eastern Lagoon of New Caledonia. Front. Earth Sci., 2020, 8, 54, doi:10.3389/feart.2020.00054.
16. Martias, C. , Tedetti, ,M.; Lantoine, F.;Jamet, L.; Dupouy, C. Characterization and sources of colored dissolved organic matter in a coral reef ecosystem subject to ultramafic erosion pressure (New Caledonia, Southwest Pacific). Sci. Total Environ. 2018, 616, 438–452.
17. Guillemette, F.; McCallister, S.L.; del Giorgio, P.A. Differentiating the degradation dynamics of algal and terrestrial carbon within complex natural dissolved organic carbon in temperate lakes. J. Geophys. Res. Biogeosci. 2013, 118, 963–973, doi:10.1002/jgrg.20077.
18. Thurman, E.M. Classification of dissolved organic carbon. In Organic Geochemistry of Natural Waters; Springer: Dordrecht, The Netherlands; Amsterdam, The Netherlands, 1985; pp. 103–110.
19. McKone, H.T. An Introduction to Marine Biogeochemistry (Libes, Susan M.). J. Chem. Educ. 1992, 69, 250–283, doi:10.1021/ed069pa251.2.
20. Luculano, F.; Álverez-Salgado, X.A.; Otero, J.; Catalá, T.S.; Sobrino, C.; Duarte, C.M.; Agustí, S. Patterns and Drivers of UV Absorbing Chromophoric Dissolved Organic Matter in the Euphotic Layer of the Open Ocean. Front. Mar. Sci. 2019, 6, 320, doi:10.3389/fmars.2019.00320
21. Vecchio, R.D.; Blough, N.V. Photobleaching of chromophoric dissolved organic matter in natural waters: kinetics and modeling. Mar. Chem. 2002, 78, 231–253, doi:10.1016/s0304-4203(02)00036-1.
22. Follett, C.L.; Repeta, J.D.; Rothman, H.D; Santineli, C. Hidden cycle of dissolved organic carbon in the deep ocean. Proc. Natl. Acad. Sci. USA 2014, 111, 16706–16711, doi:10.1073/pnas.1407445111.
23. Urban-Rich , J.; McCarty , J.T.; Fernandez , D.; Acun, J.L. Larvaceans and copepods excrete fluorescent dissolved organic matter (FDOM). J. Exp. Mar. Biol. Ecol. 2006, 332, 96–105.
24. Urban-Rich. J. Grazing impact of Chromophoric dissolved organic matter (CDOM) by the larvacean Oikopleura dioica. Mar. Ecol. 2006, 317, 101–110.
25. Dupouy, C.; Neveux, J.; Ouillon, S.; Frouin, R.; Murakami, H.; Hochard, S.; Dirberg, G. Inherent optical properties and satellite retrieval of chlorophyll concentration in the lagoon and open ocean waters of New Caledonia. Mar. Pollut. Bull. 2010, 61, 503–518, doi:10.1016/j.marpolbul.2010.06.039.
26. Dupouy, C.; Wattelez, G.; Fuchs, R.; Lefèvre, J.; Mangeas, M.; Murakami, H.; Frouin, R. The color of the Coral Sea. In Proceedings of the 12th International Coral Reef Symposium, 18E—The Future of the Coral Sea reefs and seamounts, Cairns, Australia, 9–13 July 2012; pp. 9–13, ICRS2012-18E_02.
27. Dupouy, C.; Röttgers, R.; Tedetti, M.; Martias, C.; Murakami, H.; Doxaran, D.; Lantoine, F.; Rodier, M.; Favareto, L.; Kampel, M.; et al. Influence of CDOM and Particle Composition on Ocean Color of the Eastern New Caledonia Lagoon during the CA-LIOPE Cruises. Proc. SPIE 2014, 9261, 932–1102.
28. Lee, E.-J.; Yoo, G.-Y.; Jeong, Y.; Kim, K.-U.; Park, J.-H.; Oh, N.-H. Comparison of UV–VIS and FDOM sensors for in situ moni-toring of stream DOC concentrations. Biogeosciences 2015, 12, 3109–3118.
29. Raymond, P.A.; Bauer, J.E. Riverine export of aged terrestrial organic matter to the North Atlantic Ocean. Nat. Cell Biol. 2001, 409, 497–500, doi:10.1038/35054034.
30. Di Toro, D.M.; Allen, H.E.; Bergman, H.L.; Meyer, J.S.; Paquin, P.R.; Santore, R.C. Biotic ligand model of the acute toxicity of metals, 1. Technical basis. Environ. Toxicol. Chem. 2001, 20, 2383–2396.
31. Mounier, S.; Zhao, H.; Garnier, C.; Redon, R. Copper complexing properties of dissolved organic matter: PARAFAC treatment of fluorescence quenching. Biogeochemistry 2010, 106, 107–116, doi:10.1007/s10533-010-9486-6.
32. Berggren, M.; Lapierre, J.F.; del Giorgio, P. Magnitude and regulation of bacterioplankton respiratory quotient across freshwater environmental gradients. ISME J. 2011, 6, 984–993, doi:10.1038/ismej.2011.157.
33. Stedmon, C.A.; Bro, R. Characterizing dissolved organic matter fluorescence with parallel factor analysis: A tutorial. Limnol. Oceanogr. Methods 2008, 6, 572–579, doi:10.4319/lom.2008.6.572.
34. Coble, P.G. Marine optical biogeochemistry—The chemistry of ocean color. Chem. Rev. 2007, 107, 402–418. 35. Campbell, J.W. The lognormal distribution as a model for bio-optical variability in the sea. J. Geophys. Res. Space Phys. 1995, 100,
13237–13254. 36. Carstea, M.E.; Bridgeman, J.; Baker, A.; Reynolds, M.D. Fluorescence spectroscopy for wastewater monitoring: Review. Water
Res. 2016, 95, 205–219. 37. Tedetti, M.; Cuet, P.; Guigue, C.; Goutx, M. Characterization of dissolved organic matter in a coral reef ecosystem subjected to
anthropogenic pressures (La Réunion Island, Indian Ocean) using multi-dimensional fluorescence spectroscopy. Sci. Total. En-viron. 2011, 409, 2198–2210, doi:10.1016/j.scitotenv.2011.01.058.

J. Mar. Sci. Eng. 2021, 9, 241 22 of 22
38. Tedetti, M.; Longhitano, R.; Garcia, N.; Guigue, C.; Ferretto, N.; Goutx, M. Fluorescence properties of dissolved organic matter in coastal Mediterranean waters influenced by municipal sewage effluent (Bay of Marseilles, France). Environ. Chem. 2012, 9, 438–449, doi:10.1071/en12081.
39. Tedetti, M.; Bigot, L.; Turquet, J.; Guigue, C.; Ferretto, N.; Goutx, M.; Cuet, P. Influence of Freshwater discharge on biogeochem-istry and benthic communities of a Coral Reef Ecosystem (La Reunion Island, Indian Ocean. Front. Mar. Sci. 2020, 1–18, doi:10.3389/fmars.2020.596165.
40. Newall, E.R.; Nguyen, T.M.H.; Le., T.P.Q.; Sengtaheuanghoung, O.; Ribolzi., O. A short review of fecal indicator bacteria in tropical aquatic ecosystems: knowledge gaps and future directions Front. Microbiol. 2015, 6, 308, doi:10.3389/fmicb.2015.00308.
41. Naidu, S.D.; Morison, R.J. Contamination of Suva Habour, Fiji. Mar. Pollut. Bull. 1994, 29, 126–130, doi:10.1016/0025-326x(94)90436-7.
42. Pratap, A.; Francis, S.M.; Prasad, S. Heavy metals contamination and risk assessment in sediments of Laucala Bay, Suva, Fiji. Mar. Pollut. Bull. 2020, 56, 1–10.
43. Morrison, R.J., Narayan, S.P.; Gangaiya, P. Trace Element Studies in Laucala Bay, Suva, Fiji. Mar. Pollut. Bull. 2001, 42, 397–404. 44. Fichez, R.D.P.; Chevillon, C.; Torreton, J.P.; Aung, T.H.; Chifflet, S.; Fernandez, J.M.; Gangaiya, P, Garimella, S, Gerard, P, Ouil-
lon, S.; et al. The Suva Lagoon Environment: An overview of a joint IRD Camelia Research Unit and USP Study. In At the Cross Roads: Science and Management of the Suva Lagoon; Morrison, R.J., Aalbersberg, W., Eds.; Institute of the Applied Sciences Press, Suva, Fiji: 2006; Volume 1, pp. 93–105.
45. Torréton, J.P.; Pringault, O.; Jacquet, S.; Chifflet, S.; Moreton, B.; Panché, J.-Y.; Rodier, M.; Gérard, P.; Blanchot, J. Rapport des missions BULA 3 (mars 2002) el BULA 4 (août 2003) dans le lagon de Suva (Fidji), Nouméa: IRD. septembre 2004. Rapports de mission Sciences de la Mer, Biologie Marine, n° 27, IRD Noumea, 2004; p. 45.
46. Fichez, R.; Chifflet, S.; Douillet, P.; Gérard, P.; Gutierrez, F.; Jouon, A.; Ouillon, S.; Grenz, C. Biogeochemical typology and temporal variability of lagoon waters in a coral reef ecosystem subject to terrigenous and anthropogenic inputs (New Caledo-nia). Mar. Poll. Bull. 2010, 61, 309–322.
47. Organelli, E.; Claustre, E. Small Phytoplankton Shapes Colored Dissolved Organic Matter Dynamics in the North Atlantic Sub-tropical Gyre. Geophys. Res. Lett. 2019, 46, 12183–12191, doi:10.1029/2019gl084699.
48. Cartisano, C.M.; Del Vecchio, R.; Bianca, M.R.; Blough, N.V. Investigating the sources and structure of chromophoric dissolved organic matter (CDOM) in the North Pacific Ocean (NPO) utilizing optical spectroscopy combined with solid-phase extraction and borohydride reduction, Mar. Chem. 2018, 204, 20–35, doi:10.1016/j.marchem.2018.05.005.
49. Raimbault, P.; Gentilhomme, V.; Slawyk, G. Short-term responses of 24-hour N-starved cultures of Phaeodactylum tricornutum to pulsed additions of nitrate at nanomolar levels. Mar. Ecol. Prog. Ser. 1990, 63, 47–52.
50. Murphy, J.; Riley, J.P. A modified single solution method for the determination of phosphate in natural waters. Anal. Chim. Acta 1962, 27, 31–36, doi:10.1016/s0003-2670(00)88444-5.
51. Fanning, K.A.; Pilson, M.E.Q. The diffusion of dissolved silica out of deep-sea sediments. J. Geophys. Res. Space Phys. 1974, 79, 1293–1297, doi:10.1029/jc079i009p01293.
52. Robards, K.; McKelvie, D.I.; Benson, L.R.; Bundle, N.J.W.; Casey, H. Determination of carbon, phosphorus, nitrogen and silicon species in waters. Anal. Chim. Acta Elsevier Sci. 1994, 287, 147–190.
53. Dommenget, D.; Latif, M. A cautionary note on the interpretation of EOFs. J. Clim. 2002, 15, 216–225. 54. Andrew, A.A.; Del Vecchio, R.; Subramaniam, A.; Blough, N.V.Chromophoric dissolved organic matter (CDOM) in the equa-
torial Atlantic ocean: Optical properties and their relation to CDOM structure and source. Mar. Chem. 2013, 148, 33–43, doi:10.1016/j.marchem.2012.11.001.
55. Brando, V.; Dekker, A.; Marks, A.; Qin, Y.; Oubelkheir, K. Chlorophyll and suspended sediment assessment in a macrotidal tropical estuary adjacent to the Great Barrier Reef: Spatial and temporal assessment using remote sensing. Cooperative Research Centre for Coastal Zone. Estuary Waterw. Manag. Technical Rep. 2006, 74, 70–92.