Scientists in the third world - Horizon IRD
207
T
-
Upload
khangminh22 -
Category
Documents
-
view
0 -
download
0
Transcript of Scientists in the third world - Horizon IRD

T
Scientists inthe Third WorldJACQUES GAILLARD
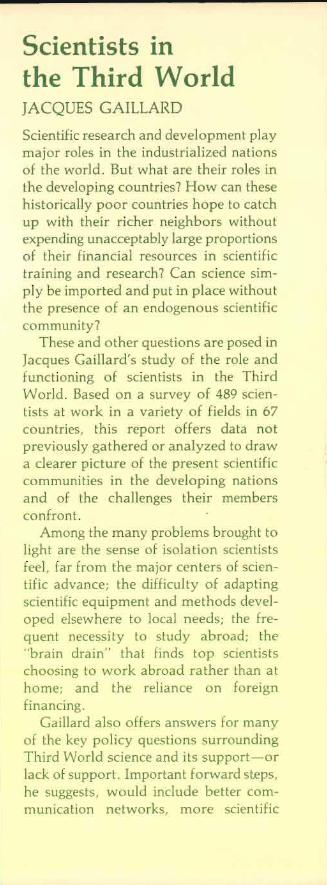
Sdentific research and deveJopm ni playmajor role in the industrialized nationsof the world. But what are their roles inthe developing countries? How can theshi torically poor countries hope t catchup with their richer neighbors withouLexpending unacceptably large proporLionsof their financial resources in scientifictraining and research? Can science simply b imported and put in place WiÙ'lOUtthe presence of an endogenous scienLificcommunity7
Th se and ther que tion are posed inJacqu s Gaillard's study of the role andfuncti ning f cientists in the ThirdWorld. Bascd on a survey of 489 scientisLs aL work in a variety f fi Id in 67eountries, Lhis reporL offer data notpreviously gathered or analyz d to drawa clearer pictur of the pr ent dentifiecommuniti s in the developing nationsand of the challenges lheir membersconfront.
Among the many problems broughL taIight ar the c;ense of isolati n sei nli tfe L far from the major cent rs of sei ntiflc advance; the duHculLy of adapLingci nlil ie equipment and methods devel
op cl elsewhere ta local needs; the trequent n ces lty to ludy abroad; lhe'brain Jrain" that finds top cientists
choosing to work abroad rather [hall athome: and the reliance on forelgnfinancin .
Gaillard al 0 Hers an wer for many01 the key policy questions urr undingThird World science and ]ts support-orlack of upport. Important forward tep ,he !>uggests, would include bett r c mmUnJcatton networks, more scientific

AGRARIAN QUESTIONSLawrence Busch, General Editor

SCIENTI5TSIN THE
THIRDWORLD
Jacques Gaillard
THE UNIVERSITY PRESS OF KENTUCKY

This book is a revised and expanded edition of Les Chercheurs des Pays enDéveloppement. Paris: Institut Français de Recherche Scientifique pour le Développement en Coopération (OR5TOM). 220 pages.
Copyright © 1991 by The University Press of Kentucky
Scholarly publisher for the Commonwealth,serving Bellarmine College, Berea College, CentreCollege of Kentucky, Eastern Kentucky University,
The Filson Club, Georgetown College, KentuckyHistorical Society, Kentucky State University, Morehead
State University, Murray State University, NorthernKentucky University, Transylvania University,
University of Kentucky, University of Louisville,and Western Kentucky University
Editorial and Sales Offices: Lexington, Kentucky 40508-4008
Library of Congress Cataloging-in-Publication Data
Gaillard, Jacques, 1951-[Chercheurs des pays en développement. English]Scientists in the Third World / Jacques Gaillard.
p. cm. - (Agrarian questions)Rev. translation of: Les chercheurs des pays en développement.Includes bibliographical references and index.ISBN 0-8131-1731-3 :1. Scientists-Developing countries. 2. Research-Developing
countries. I. Titre. Il. Series.Q127.2.G35 1991509.172'4-dc20 90-47574
This book is printed on acid-free paper meetingthe requirements of the American National Standard
for Permanence of Paper for Printed Library Materials. @

Contents
List of Tables and Figures vii
Acknowledgments xi
Preface xii
1 Introduction 1
2 Origins and Education 17
3 Research as a Profession 35
4 Practicing Research 56
5 Scientific Production 82
6 National Scientific Communities 107
7 Conclusion 137
Appendixes
A. Questionnaire for IFS Grantees 153
B. Countries in Which Respondents Work 165
C. Tables 166
References 173
Index 184
About the Author 191

Tables and Figures
Tables
Pl. Distribution of Scientists and Engineers, and Funds for Rand D asPercentages of World Totals, 1970, 1975, and 1980 xv
1.1. Types of Scientific and Technological Research in DCs andSources of Funding 7
1.2. Responses to Questionnaire by Geographical Area 111.3. Responses to Questionnaire by Scientific Field 111.4. Responses to Questionnaire by Status of IFS Support 131.5. Responses to Questionnaire by Number of Grants Obtained 131.6. Responses to Questionnaire by Year of Approval of First
Grant 142.1. Father's Profession as Related to Milieu and Degree of Urbaniza-
tion 182.2. Geographical Breakdown of Researchers by Sex 202.3. Gender of IFS Grantees by Research Area 212.4. Profession of Spouse by Gender 232.5. Doctoral Studies: Continent of Origin and Continent of Stud-
ies 282.6. Place of Doctoral Degree by Date of Studies 282.7. Number of Ph.D.s by Number of Years of Study Abroad 292.8. Study for Master's Degrees: Continent of Origin by Continent of
Education 302.9. Industrialized Country of Study by Home Continent 313.1. Choosing Research Science as a Profession: Importance of Crite
ria 383.2. Wages Paid to Research Scientists: Comparison with Minimum
Wages in DCs and Relative Satisfaction 413.3. Salaries Paid to Research Scientists 413.4. Nature of Second Job and Number of Hours Spent 423.5. Research Problem Choice: Relative Importance of Various Crite
ria 463.6. Relation of Thesis Subject to IFS-Funded Project as a Function of
Country of Doctoral Studies 483.7. Reasons for Changing Research Subjects 49

viii Tables and Figures
3.8. Relation of Thesis Subject to IFS-Funded Research as a Function ofYear Doctorate Obtained 50
3.9. Relation of Thesis Subject to IFS-Funded Research as a Function ofDiscipline 50
3.10. Institutions Where Research Scientists Work 523.11. Percentage of Time Spent Teaching According ta Host Institu
tion 533.12. Present Employment as Related ta Years Spent Abroad 544.1. Percentage of Time Spent on Research in Terms of Present Em
ployment 574.2. Time Spent on Administration by Number of Years Spent Study
ing Abroad 584.3. Apportionment of Time between Teaching, Basic Research, Ap
plied Research, and Development 594.4. Breakdown of Time Devoted ta Basic Research, Applied Re
search, and Development: Comparison of IFS and AmericanResearch Scientists 60
4.5. Expenses for Rand D Expressed as a Percentage of GNP 614.6. Obtaining Funds ta Complement IFS Grant 644.7. Choice of Research Subject: Relative Importance of Financing
from Budget ofScientist's Home Institution Compared ta Financing from Outside Institution 66
4.8. PossibiIity ofCarrying Out Research Activities without IFS Funding 67
4.9. Number of Joumals Researchers Subscribe ta or Can ConsultRegularly 74
4.10. Importance of Types of Publications ta Research Work 744.11. Number of Scientists with No Subscriptions ta Scientific Joumals
by Number of Years of Study Abroad 754.12. Frequency of Communication of IFS Grantees with Other Scïen
tists 774.13. Frequency of Communication with Foreign Scientists as Related
ta Place of Education (Abroad or Home Country) 784.14. Frequency of Participation in Conferences since Obtaining IFS
Grant 794.15. Sabbatical Leave: Continent Where Leave Is Taken Related ta
Home Continent 805.1. Fifteen Leading DCs, Ranked by Number of Mainstream Publica
tions Produced 865.2. Publication Production per Grantee per Year 895.3. Number of Journal Articles per Grantee per Year by Disci
pline 90

Tables and Figures ix
5.4. Place of Publication per Geographieal Area 90S.S. Number of Journal Articles per Grantee per Year by Sex 915.6. Number of Publications per Grantee per Year 915.7. Average Number of Authors and Coauthors (Local and Foreign)
per Publication 925.8. Language of Publication by Linguistic Area 935.9. Breakdown of Age of Reference Cited by Continent of Scientists'
Work 955.10. Breakdown of Age of Reference Cited by Scientific Discipline 955.11. Breakdown of Age of Reference between Publications Published
Abroad and Nationally 965.12. Breakdown of Age of Reference, Foreign vs. National 965.13. Receipt of Prizes or Awards by Number of Papers Published 985.14. Number of People Trained since Becorning IFS Grantee 1005.15. Percent of IFS Grantees Who Made Equipment Bought with
Grant Available to Others 1005.16. Implementation of Research Results by Geographieal Area 1015.17. Number of Projects Implemented per Research Area 1025.18. Beneficiaries of Implemented IFS-Supported Research 1025.19. Implementation of Research Results: Vectors and Actors 1036.1. Brief Comparison of Country Characteristics 1086.2. Estimated Number of Scientists 1186.3. Breakdown of Senegalese and Foreign Personnel in Main In
stitutes of Higher Education and Research in Senegal,1984-1988 123
6.4. Distribution of Teachers and Scientists at Chian Mai University bySex and Academie Level, 1986 125
6.5. Distribution of Teachers and Scientists at UCR by Sex 1266.6. Place of Education of Senior Senegalese Scientific and Technical
Staff Working at ISRA, 1985 1276.7. Place of Education and Educational Levels of Science and Tech-
nology Teachers at Chulalongkorn University 128Al. Marital Status by Age 166A2. Number of Children by Age 166A3. Number of Children by Years Spent Abroad 167A4. Number of Years Spent Abroad by Father's Profession 167AS. Choice of Research Subject and Importance Given to Criterion:
"Potential Contribution to Scientific Theory" by Number of YearsSpent Abroad 168
A6. Relative Influence of Various People in Choiee of ResearchTopie 168
A7. Number of Years Spent Abroad by Age 169

x Tables and Figures
A8. Percentage of Time Devoted to Research by Number of YearsSpent Studying Abroad 169
A9. Frequency of Communication with International Research Assistance Organizations (Other than IFS) by Number of YearsSpent Studying Abroad 170
A10. Tendency of Scientists to Work Alone or with Other Scientists byNumber of Years Spent Abroad 170
A11. Maintenance of Correspondence with Foreign Scientists outsideof International Scientific Meetings by Number of Years SpentAbroad 171
A12. Frequency of Sabbatical Leave by Number of Years Spent Studying Abroad 171
A13. Frequency of Job Offers Abroad by Number of Years Spent Studying Abroad 171
A14. Frequency of Accepting a Job Offer Abroad by Number of YearsSpent Studying Abroad 172
Figures
4.1. Total Annual Budget Available to Grantee (Including IFS Grant,Excluding Salary) 65
4.2. Sources of Funding 654.3. Percentage of Institutions That Do Not Have Technicians to In
stan, Maintain, and Repair Their Research Equipment 714.4. Time Required When a Foreign Technician Is Needed to Repair
Research Equipment 716.1. Students as a Percentage of Total Population, 1960-1985 1156.2. Distribution of FTE Scientists within Institutions 1196.3. Distribution of FTE Scientists in Major Fields of Science 1216.4. Changes in Numbers of National and Expatriate Scientists at
ISRA, 1983-1988 1246.5. Research Budget as a Percentage of GNP in Costa Rica, Senegal,
and Thailand, 1978-1986 133

Acknowledgments
The aim of this book is to contribute to the reader's understanding ofhow, by whom, and under which conditions research is actually conducted in the developing countries (DCs). Although the main focus ison OC scientists who received research subsidies from the International Foundation for Science (IFS), the results will be useful not only toIFS and other research aid and scientific development organizations,but also to researchers and science policymakers in general.
Although the major part of this study was written between 1986 and1988, the background work was started toward the end of 1984 when 1was still a scientific secretary at IFS in Stockholm. The original inspiration dates back to discussions 1had with my friends Geoff Oldham andFransisco Sagasti one evening in 1982. Afterward, at a seminar held atthe Research Policy Institute of Lund in September 1984, 1 starteddiscussing an early draft with the late Michael Moravcsik, and then, a
.bit later, with members of the ORSTOM (Institut Français de RechercheScientifique pour le Développement en Coopération) research team onscience, technology, and development in Paris.
Several people including Rigas Arvanitis, Jacques de Bandt, Lawrence Busch, Yves Goudineau, Said Ouattar, Michael Pollak, JeanJacques Salomon, Albert Sasson, Pierre Tripier, Roland Waast, and,most important, my wife, Anne Marie, read and suggested numerousimprovements to a draft version. Hervé Chevillotte, former head of theORSTOM Information Service at Bondy, gave me invaluable help inprocessing statistical data. Francine 5inègre, the ORSTOM librarian atBondy, was very efficient and helpful in digging out bibliographicalreferences. Tilly Gaillard did yeoman's work in translating it. Theintellectual and moral support 1received from Sven Brohult, foundingpresident of IFS, was decisive in bringing the study to fruition. Thebackbone of this book cornes from the IFS grantees themselves. Without their answers to my questionnaire, and the many very enlightening discussions we had, this book could not have been wrïtten. Mysincere gratitude goes to aIl these people.
1would like to express special appreciation to the Salén Foundation,ORSTOM, and IFS for their financial backing.

Preface
Developing Science and Training Scientistsin Third World Countries: A Must
The scientist's golden age of generous patrons is gone. Science isbecoming more and more costly. So costly, in fact, that sorne of thesmaller industrialized countries can no longer fund research teams,build and equip laboratories, and then keep them running. This beingthe picture, how can developing countries (DCs) justify investing inresearch? They are confronted with more pressing priorities, and in thepast, research and science have not generated the expected development.
The official discourse on "science for development," heard especially from the United Nations Educational, Scientific and CulturalOrganization (UNESCO) in the 1960s, insisted on the need to increaseresources for scientific research in the DCs. An international conference held in 1964 in Lagos led to the "Lagos Plan," which containeda series of recommendations designed to further scientific growth andindependence in the DCs. The two main recommendations stated that(1) each country should immediately devote 0.5% of its Gross NationalProduct (GNP) to research and development (R&D), and the figureshould be increased to 1% by 1980; and (2) each country should aim totrain 200 scientists for every million inhabitants by 1980.
In many countries, the latter objective has been reached or evenexceeded, especially in Asia and in Latin America; but, except for a fewcountries in Asia, we cannot say the same for the former (Gaillard1986). The principle of devoting greater resources to research wasreasserted at the United Nations Conference on Science and Technology for Development held in 1979 in Vienna. Emphasis was placedon the need to develop "endogenous" scientific and technologicalcapacities in harmony with the "social and cultural traditions" and the"particular conditions of each DC" The DCs were weIl aware of theneed to enhance their scientific and technological potential. Most ofthem established departments for scientific coordination and decisionmaking at the highest level of government, inspired as they were, witha bare 10 to 15 year lag, by the dominant models of the Westerncountries.

Preface xiii
Perrin (1983, p. 61) wrote, "Buying technology does not mean controlling it." Similarly, "science does not guarantee development" (Salomon 1984). In other words, it is not enough to invest in R&D, to set upresearch teams, and to build universities and laboratories with librariesand sophisticated equipment for miraculous scientific discoveries tohappen and development to bloom. A scientific policy is onlya component of a logical whole, one of the pawns in a national developmentstrategy. This being the case, isn't it obvious that the DCs do not havethe conditions required for autonomous development? Isn't science anintellectual consumer good available to an elite group, something thatwill never be able to contribute to national economic and social development? Isn't it easier and cheaper to import the scientific knowledgeneeded for development and thus save the price of a national researchsystem? Isn't it better to recognize that from now on research is aluxury, within the means of only the richest Western countries?
We think that this would be a wrong choice and that each countryshould feel that building up an endogenous scientific community mustbe a priority goal. Western science should not be considered as anexclusive model, and each country should adapt its research system toits socioeconomic conditions and development strategies. It also seemsimportant to emphasize that developing science is a lengthy undertaking. Even in much more favorable conditions, countries like the UnitedStates and Japan needed more than 50 years to develop a scientificpotential that could stand up to Europe. Western science started making inroads in Japan in 1869 (Price 1963), but it was not until the 1960sthat Japan's scientific power had emerged to a level that attracted worldattention.
On this subject, Moravcsik and Gibson (1979, p. 28) were right tostress that as time goes by there is a serious decrease in the predictedscientific potential, especially since many countries must start fromscratch and must create everything: "Of young students selected foreducation to become a scientist, many will never attain the advanceddegree; of those who do, many will never produce anything beyondtheir thesis; of those who do, many will produce only a fewadditionalpieces of work, after which they 'die scientifically'" It takes about 20years of training before a scientist can become productive. This is a longtime. A historical perspective composed merely of the last 20 to 25 yearsis not long enough to draw reliable conclusions on the emergence ornonemergence of endogenous scientific communities, of the right size,in the DCs. The UNESCO Statistical Yearbook (1985a, V-9) reports thatthe increase in scientists and engineers and the increase in R&D
xiv Preface
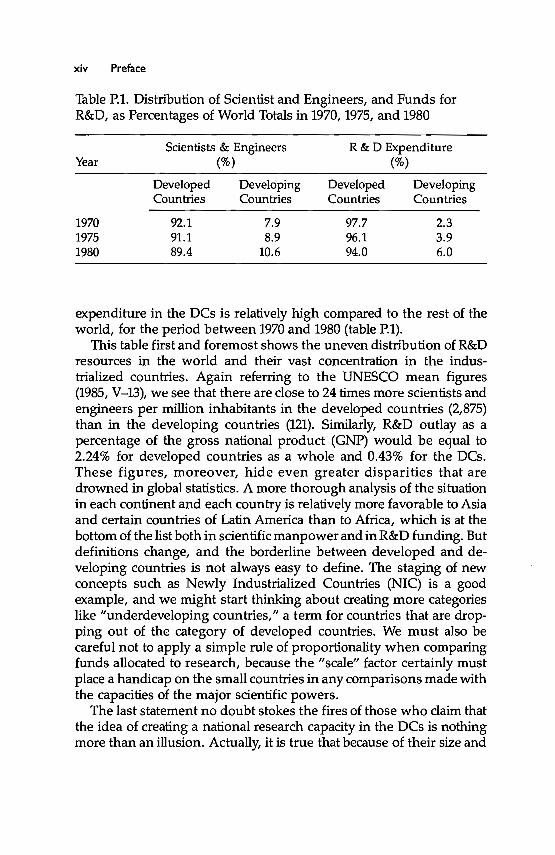
Table P.l. Distribution of Scientist and Engineers, and Funds forR&D, as Percentages of World Totals in 1970,1975, and 1980
Scientists & Engineers R & D ExpenditureYear (%) (%)
Developed Developing Developed DevelopingCountries Countries Countries Countries
1970 92.1 7.9 97.7 2.31975 91.1 8.9 96.1 3.91980 89.4 10.6 94.0 6.0
expenditure in the DCs is relatively high compared to the rest of theworld, for the period between 1970 and 1980 (table P.1).
This table first and foremost shows the uneven distribution of R&Dresources in the world and their vast concentration in the industrialized countries. Again referring to the UNESCO mean figures(1985, V-13), we see that there are close to 24 times more scientists andengineers per million inhabitants in the developed countries (2,875)than in the developing countries (121). Similarly, R&D outlay as apercentage of the gross national product (GNP) would be equal to2.24% for developed countries as a whole and 0.43% for the DCs.These figures, moreover, hide even greater disparities that aredrowned in global statistics. A more thorough analysis of the situationin each continent and each country is relatively more favorable to Asiaand certain countries of Latin America than to Africa, which is at thebottom of the list both in scientific manpower and in R&D funding. Butdefinitions change, and the borderline between developed and developing countries is not always easy to define. The staging of newconcepts such as Newly Industrialized Countries (NIC) is a goodexample, and we might start thinking about creating more categorieslike "underdeveloping countries," a term for countries that are dropping out of the category of developed countries. We must also becareful not to apply a simple rule of proportionality when comparingfunds allocated to research, because the "scale" factor certainly mustplace a handicap on the small countries in any comparisons made withthe capacities of the major scientific powers.
The last statement no doubt stokes the fires of those who daim thatthe idea of creating a national research capacity in the DCs is nothingmore than an illusion. Actually, it is true that because of their size and
Preface xv
available resources, very few DCs will be able to contribute to theproduction of scientific knowledge and, in particular, to new technologies. This inspired Salomon (1986) to make a distinction betweencontrolling production and controlling the use of scientific knowledgeand technological change. Even people who do not see the need foreach country to have its own scientific community recognize the vitalimportance for each country to have access to technology. But thequestion is whether technology can be successfully transferred without a minimum of scientific expertise at the receiving end. The answer,obviously, is no. Furthermore, much of the knowledge and technologyconceived in the developed countries cannot be applied directly in theDCs. There are always problems connected to knowledge appropriation and technology transfer that can only be solved through on-sitescience-in other words, on-site scientists.
Another justification that seems of prime importance is related to thefact that all modem nations need to have their own higher educationsystems to train their senior employees and that it is quite impossible toconceive of higher education without teachers who are actively involved in research. This is the only way to keep them in contact withscience on-the-move and thus keep them up to date on recent progressin their respective disciplines. AlI too many DC university professorsno longer practice science and merely recite scientific facts of the pastinstead of teaching their students that science is a method for statingand solving problems. This same attitude is still too often heard even inthe industrialized countries. We could find a whole series ofargumentsto justify promoting science and technology in the DCs, but that is notthe subject at hand. We feel that we are going far enough by concludingsimply that the nations that staunchly chose to embark on experimentalscience now number among the richest, and the DCs have every rightto seek their share; they do not want to be left in the wings of the scientific revolution that is now being acted on the stage before them.
Scope of the Study
Now that the stage has been set, there are still sorne problems of directsignificance to the role of science in the development of the DCs thatwe will not be able to deal with thoroughly in this study. My mindturns especially to the debate on priorities, which takes us straight tothe matter of training for scientific and technological personnel and tostrategies of development. What science is needed for what development? Answers to this question are both emotional and contradictory.Is the future of the DCs embedded in the new technologies that have
xvi Preface
mobilized only a very small number of them, such as Brazil and theRepublic of Korea, or is it in the agricultural R&D that involves morethan three-fourths of the populations of Africa and Asia? The twoapproaches are not mutually exclusive; new technologies are not incompatible with agriculture. Should we only encourage applied research in a finalized form that can answer urgent needs and providefast answers to the problems of underdevelopment, and consider basicresearch a useless luxury?
Because of the growing differences between Des, strategies cannotbe standardized; there is no universally applicable approach. We areconvinced that recourse to science, and thus to scientists, must formpart of these strategies.
This study talks about these scientists and the world in which theywork.

Chapter One
Introduction
Studies on Science and Scientists in Developing Countries:Abundant Documentation but Fragmentary Knowledge
There is a relatively large storehouse of documents and reports onscience and technology policies in the developing countries that havebeen prepared, more often than not, for international conferences suchas the 1979 United Nations Conference on Science and Technology forDevelopment held in Vienna (1980). This said, we have to recognizethat official speeches mainly contain statements of intent and that ourknowledge of science and scientists in the DCs is very incomplete.There is a relative abundance of literature on DC science scatteredthrough numerous journals, seminar reports, and proceedings; butthere are far too few empirical studies. Moravcsik (1976) has writtenone of the most complete bibliographies on this subject, coveringliterature up to the early 1970s. We share his feeling that research onDC science is an unexplored and fruitful area (Moravcsik 1985a).
Generally referring to national statistics compiled by organizationssuch as UNESCO and OECD (Organization for Economie Co-operationand Development), certain authors have emphasized the shortcomingsof the DC research systems and the shortage of available resources(Rossi 1973). Other authors compared socioeconomie conditions withthe level of scientific development in these countries (Eres 1982). Insorne of his writings, de Solla Price (de Solla Price and Gursay 1975)gives quantitative indicators for the DCs. Research by Garfield (1983)and his Institute for Scientific Information (ISI) in Philadelphia pointsto the low productivity of DC scientists, the difference in productivitylevels (half the work published by aU DC scientists cornes from India),and degrees of dependency (articles by DC scientists have greaterimpact when coauthored with scientists from developed countries).Using the ISI data base, quantitative analyses of mainstream scientificliterature, i.e., articles in intemationally read publications, were madeat the continentwide and nationallevels. One such bibliometric studyon mainstream science in Singapore recently showed that articleswritten by national scientists and published in international joumalswere very rarely cited (Arunachalam and Garg 1985). Care must be

2 Scientists in the Third World
taken not to overlook the value of this bibliometric approach that relieson the choices reflected in the data base. This method should only beused to examine international mainstream literature, since, when itwas used on the DCs, it gave the impression that approximately 5% ofthe world's scientific output was to be credited to these countries,while bibliometric work carried out at ORSTOM on soil sciences andagriculture suggests that over 20% of the scientific production concerning these disciplines in "the hot regions of the globe" cornes fromthe DCs (Chatelin and Arvanitis 1988a). Other authors such as Frame etal. (1977) provide interesting general information on the respectiveranking of various DCs and on the distribution and orientation ofscientific disciplines.
There has been little research on the scientists who make up the DCscientific communities or on how these communities are developing.The comparative study by T.O. Eisemon (1979) is among the exceptions. He interviewed teachers/scientists in the mathematics and zoology departments at the universities of Ibadan and Nairobi in 1978 andconcluded that "the achievements of Nigerian and Kenyan science areprimarily quantitative and in the sphere of construction of an institutional framework for scientific research. Science teaching programshave been developed, scientific societies established, publishing institutions formed. These are not trivial accomplishments in my view.Nevertheless, it is also true that scientific work-in a more substantialsense-has not been much advanced.... Nor have hopes for rapidscientific development been realized. A much longer time will berequired before a conclusive judgment can be passed on the effectiveimplementation of the scientific 'ethos' in Black Africa." Another studyon science in Mexico suggests that, as in the other DCs, there are fewerscientists than purported. The study concludes by saying that the"Mexican scientific community is like an army which has too manygenerals and too much equipment but which lacks soldiers, particularly well trained soldiers" (Schoijet 1979, p. 404).
In reality, most of these studies tend to show that none of the DCshas a genuine scientific community, not even India, which numericallyhas the world's third largest scientific community (Shiva and Bandyopadhyay 1980), or Brazil (Schwartzman 1978). What an Indian physicist had to say about research practices in his country was mostrevealing: "There is no scientific community in this country.... 1meetmy colleagues only abroad. 1 meet my colleagues even from Delhiabroad. . . . In a well-knit community, where you are exchangingpreprints, things are happening and there is excitement. There is noexcitement here. Our excitement cornes by mail from outside. It de-

Introduction 3
pends on the postal system. This is the worst part; the spirit is dead"(Shiva and Bandyopadhyay 1980, p. 587). This dependence on theoutside environment, in other words the West, is an often sung themesong for many OC scientists. Consequently, since the knowledgeformation process in the Des is largely influenced and deterrnined bythe Western world, a considerable part of their scientific output isforeign to where it is produced.
Problem Orientation
These recent studies confirrn what Stevan Dedijer (1963) feH in theearly 1960s when he wrote:
In the underdeveloped countries scientists are relatively few in number, andthey are often, as far as any particular field of research is concerned, dispersedover long distances. They suffer from isolation from each other, and thus theydo not have the benefits of the stimulation of the presence of persons workingin closely related fields. They are in danger, a danger to which they too oftensuccumb, of losing contacts with their colleagues in the international scientificcommunity. They feel peripheral and out of touch with the important developments in science unless they can visit and be visited by important scientistsfrom the more developed countries; they feel inferior and neglected becausetheir own joumals and organs ofpublication, where they exist at aH, are seldomread by foreign scientists, seldom quoted in the literature and are indeed oftenneglected by their own colleagues at home. They have little contactwith theircoHeagues in neighbouring underdeveloped countries. They are in brief notfuHy-fledged members of the scientific community and their work suffersaccordingly. [80-81]
More than twenty years have gone by since these words were written,but we have to admit that they somehow still ring true.
It is now generally recognized that an endogenous scientific community can only develop in a peripheral position if its members havesustained relations with the center. One of the best ways to establishsuch relationships is through interpersonal contacts between scientistswho come together because of their common interests and mutualrespect (Herzog 1983). The ways to establish such relations includestudying at foreign universities, often in a country in the center;attending conferences; taking sabbatical leaves to conduct researchabroad; and corresponding with foreign scientists and publishing articles in journals of international repute.
How often do OC scientists use these mechanisms? How effectiveare they, and what are their effects on science as it is practiced in the

4 Scientists in the Third World
DCs? What are the related problems? Is it necessary for De science andscientists to rely on the center for training, for their choice of researchsubjects, for funding research; and must DC scientists belong to theinternational scientific community. Are these preconditions to creatingnational scientific communities in the DCs? Are there other ways?
Our experience in practicing research in the DCs leads us to believethat the most productive scientists with the most promising results arethe ones who strive to form active groups of researchers focusingtogether on a high-impetus program and who participate in setting upeffective scientific institutions. These are the people who have had theopportunity to do most of their studies abroad and have establishedand maintained the strongest personal contacts with experienced scientists from the most advanced Western countries. As a result of theirmany years abroad, they are most affected by Western research methods, subjects, and models, even if these latter are not always applicablein their home country. These scientists are also the ones who have lostcontact with the everyday realities and problems of their countries andwho often feel closer to the Western scientists and values than to thepeople and traditional values of their home society. And as they arewhirled up the career path, they find themselves aU too rapidly in highranking posts, consumed by administrative and bureaucratic dutiesthat prevent them from practicing science at a time in their IHe whenthey should be at the height of their productive career. And finaUy,these scientists, as a result of their continued contacts with foreignsources, their qualifications, and their difficulty in readapting uponreturn home, will he solicited most often to accept better paid employment abroad in working conditions that they grew accustomed toduring their stay abroad.
We intend to provide partial answers to this situation and confirm orrefute the above through reference to a study carried out on 489research scientists working in 67 DCs. Our report will also discuss thesociocultural origin of the respondents and the formation of a DCinteUectual class. Attention will also dwell on their job motivations andtheir perception of their work and research methods in their homecountry in general.
These scientists have in common that they aU received at least onegrant from the International Foundation for Science (IFS) sorne timebetween 1974 and 1984. As an IFS scientific secretary, 1had the opportunity to meet most of these grantees during my travels to sorne 60 DCsor at seminars and conferences where they reported on their work. ThefoUowing brief description of IFS activities will facilitate understanding

Introduction 5
the specifie characteristics of the survey population and the system ofrecruitment.
The International Foundation for Science
International organizations and private foundations in the OECD andthe COMECON (Council for Mutua) Economie Assistance) countrieshave developed numerous programs to train scientists from the DCs(Gaillard 1979, 1984a, 1985a), but most programs nearly always offerthe first years of study in specialized universities and organizations inthe industrialized countries (ICs).
What is unique about IFS is that it helps young graduates from DCswork within their home institutions to set up research programs inbiological and agricultural sciences applied to the basie necessities oflife, and technology applied to rural problems.
IFS was created in the early 1970s, and by the end of 1988 close to1,500 young scientists in over 80 countries of Asia, Africa, Latin America, and Oceania had benefited from its grants.
The idea that inspired the creation of IFS was developed in the 1960sand was discussed by the Pugwash group (named for the Canadian citywhere the group first met) in 1965 and in 1969. The initial discussionsbrought together eminent specialists such as Robert Marshak, nuclearphysicist at the University of Rochester; Roger Revelle, director of theHarvard Center for Demographie Studies; Abdus Salam, director ofthe International Centre for Theoretical Physies in Trieste; and PaulAuger from UNESCO, The chief proponent was Sven Brohult, president of the Swedish Academy for Technieal Sciences (IVA). Thanks to asubsidy from UNESCO, two Swedish academies were able to organizea three-day meeting in July 1970 attended by 32 representatives fromscientifie academies and research organizations from 10 ICs and 6 DCsto discuss problems related to the development of science and theworking conditions of scientists in the DCs. At this meeting in Stockholm, a committee, presided over by Professor Paul Auger, was set upto prepare the creation of an organization to be called the InternationalFoundation for Science (IFS).
During ensuing discussions, the members of the committee expressed very serious differences of opinion concerning the size, structure, and functioning of the organization. There were two groupsrepresenting two lines of thought. One wanted IFS to be connected toUNESCO, The other, composed primarily of academicians, wanted IFSto be an independent, nongovemmental organization; and thus it was

6 Scientists in the Third World
decided. In January 1972 a letter was sent to sorne 50 research academies, institutions, and the like, inviting them to become foundingmembers of IFS. On March 25, 1972, with 14 founding members, theinterim committee announced the official establishment of IFS. Aninterim Board of Trustees was established with Prof. Sven Brohult aschairman. Contributions from the Salén Foundation (a private Swedishbusiness foundation) and the World Bank made it possible to set up asmall secretariat. Initial financing, in 1973 by Sweden and Canada, wasused in 1974 to pay for the first 45 research grants.
By the end of 1988, IFS had 85 member organizations in 71 countries.The aim and objectives of IFS have not changed since 1972 when theywere first defined in the IFS statutes: "promote and support highquality scientific and technological research in the OCs in the exact,natural and social sciences selected because of their importance tonational development ... support worthy young OC scientists andtechnicians by providing financial and other types of support. Grantees are selected on the basis of the quality of their projects, the value ofthese projects for the country and the region.... The research musttake place in a Oc. ... The grants must be applied for by individualscientists."
In 1981 the IFS Sponsors Committee charged an independent panelof experts to evaluate IFS activities (Sagasti et al. 1983). These expertsemphasized that IFS was unique in that it was the only institutionwhose sole aim was to offer direct support to individual scientists at thebeginning of their career. The maximum for an IFS grant was set at U.S.$10,000. One of the prerequisites for obtaining a grant was that theapplicant had to be employed by a OC university or research institutethat agreed, after the grant had been authorized, to provide the granteewith a laboratory or other basic facilities required to implement hisproject. Grants could be renewed three times. Applications for renewals were judged on the basis of the quality of the grantee's workduring the preceding research period. It has happened that IFS grantees, although usually young graduates, find employment as established research scientists or are rapidly promoted to senior positionssuch as dean of a faculty, vice-chancellor of a university, or director ofan institute, or are even put in charge of coordinating research at thenationallevel, after only one or two IFS grants. When this happens, IFSno longer provides support.
By helping young OC scientists mature, IFS is filling a large gap inthe network of international organizations working to support scientific and technical research activities in the DCs. IFS is singular in its
Introduction 7
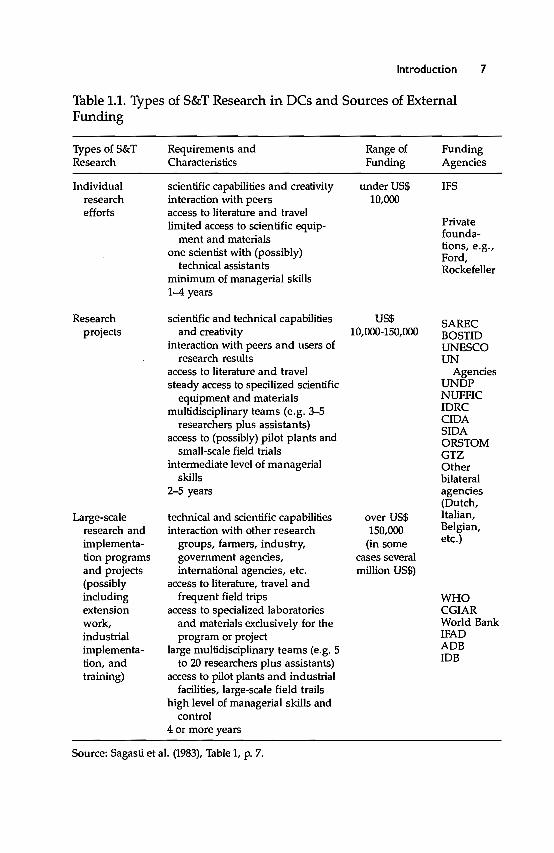
Table 1.1. Types of S&T Research in Des and Sources of ExternalFunding
Types ofS&TResearch
Individualresearchefforts
Researchprojects
Large-scaleresearch andimplementation programsand projecls(possiblyincludingextensionwork,industrialimplementation,andtraining)
Requirements andCharacteristics
scientific capabilities and creativilyinteraction wilh peersaccess to li terature and travellimiled access to scienlific equip-
ment and materialsone scientist with (possibly)
technical assistantsminimum of managerial skills1-4 years
scientific and technical capabilitiesand creativily
interaction with peers and users ofresearch results
access to literature and travelsteady access to specilized scienlific
equipment and materialsmultidisciplinary teams (e.g. 3-5
researchers plus assistants)access to (possibly) pilot plants and
small-scale field trialsintermediate level of managerial
skills2-5 years
technical and scientific capabilitiesinteraction with other research
groups, farmers, industry,govemment agencies,international agencies, etc.
access to literature, travel andfrequent field trips
access to specialized laboratoriesand materials exclusively for theprogram or project
large multidisciplinary teams (e.g. 5to 20 researchers plus assistants)
access to pilot plants and industrialfacilities, large-scale field trails
high level of managerial skills andcontrol
4 or more years
Range ofFunding
underUS$10,000
US$10,000-150,000
over US$150,000
(in sornecases severalmillion US$)
FundingAgencies
IFS
Privatefoundalions, e.g.,Ford,Rockefeller
SARECBOSTIDUNESCOUN
AgenciesUNDPNUFFICIDRCCIDASIDAORSTOMGTZOtherbilateralagencies(Dutch,Italian,Belgian,etc.)
WHOCGIARWorld BankIFADADBIDB
Source: Sagasti et al. (1983), Table 1, p. 7.

8 Scientists in the Third World
system of supporting individual scientists (see table 1.1); other organizations finance research and development programs. This division ofroles is especiaIly weIl accepted since the other organizations referredto above number among the main sponsors of IFS, viz., the SwedishAgency for Research Cooperation with Developing Countries (SAREC),Canada's International Development Research Centre (IDRC), and theUnited States Agency for International Development (U.S.AID).
During the last few years, the IFS budget has stayed at aboutU.S. $2million. In 1984 contributions were made, in descending order, bySweden, the United States, Canada, the Federal Republic of Germany,France, Australia, the Netherlands, Nigeria, Belgium, and Switzerland.
The typical grantee is between 28 and 40 years of age. About 60%have a Ph.D. and 25% an M.S. Approximately 16% are women. Theaverage IFS grant has been steadily increasing since 1974 and in 1984amounted toaboutU.S. $7,500. Grants are intended to cover the cost ofequipment, supplies, documentation, travel, and, if necessary, technical assistance and labor. IFS will not pay the grantee's salary and willnot support secret or military research. In over half the cases, thegrantees have received either higher amounts than the 1984 average orat least one grant renewal. The home institutions often provide thegrantee with resources weIl beyond what IFS gives.
An applicant must be a citizen of and carry out research in a De.During the first few years, the majority of the grantees came fromSoutheast Asia and India. After great effort, IFS has graduaIly achieveda better balance in favor of Africa and, to a lesser extent, Latin America.Since the beginning of the 1980s, grantee applications have gone upconsiderably. The IFS Secretariat received more than 400 applications in1984 and 1985, which means that grants are awarded to about one outof five applicants.
AlI applications are appraised by a panel of scientific advisers whosend in their evaluations by post or express them at semiannual meetings. The conclusions of the scientific advisers are submitted twice ayear to the Executive Committee, which takes decisions on the basis offunds available, geographical distribution, the state of research in thecountry concerned, and the number of grants to be distributed.
Another important part of IFS activities concerns supplementaryassistance for grantees. Additional sums may be granted for contingencies, e.g., to cover sudden price increases for scientific equipment, to purchase supplemental equipment, or to pay for attendanceat scientific meetings. The IFS Secretariat can also help grantees incontacting suppliers in order to improve the cost/quality ratio, settle
Introduction 9
invoices, obtain catalogs of scientific equipment, or obtain scientific publications or references not available in the grantee's home country.
Organizing workshops and conferences has become an importantpart of IFS activities since 1978, when it held its first four. Since that timemore than 30 seminars have been held in the four continents where IFSis working, bringing together hundreds of grantees.
ln the beginning, discussions on how to formulate the grant program and what research areas should be adopted were very impassioned. Suggestions ran from theoretical physics to biology to medicine and their applications. After study visits and consultations withnumerous scientists and organizations in both the DCs and the ICs, theinterim committee, in 1974, set out six priority research fields connected to biological and agricultural sciences. The six original, andpresent, fields of priority are aquaculture, animal production, foodcrops, afforestation and mycorrhiza, fermentation and applied microbiology, and natural products. In 1978 rural technology became theseventh priority area. These fields were chosen with the expectationthat results could have a positive effect on socioeconomic developmentand improve the well-being of the resident populations.
The Methodological Approach
Our study, which is part of a study on the impact of IFS support on thework and career paths of the grantees, involves four complementaryactions.
1. A questionnaire survey sent to the 766 scientists in 78 countries whohad received IFS grants between 1974 and 1984.
2. Interviews and discussions with DC scientists.3. A quantitative and qualitative bibliornetric study of work published
by dose to 200 scientists in the group.4. A comparative study of three DC scientific communities represent
ing the three main continents and three different historical andpolitical backgrounds, viz., Senegal, Thailand, and Costa Rica.
This book presents the results of the questionnaire survey, sorne of theinterviews, and the bibliometric and comparative studies. It is alsolargely supported by personal observations and substantial documentation collected during field trips.
The first version of the questionnaire was drawn up in September1984. It was revised subsequent to discussions with the ORSTOM

10 Scientists in the Third World
research team on scientific policies and practices and comments received from Prof. Lawrence Busch of the University of Kentucky. It wastested in October 1984 on a small sample of IFS grantees during theFourth IFS General Assembly in Rabat, Morocco. The final version(Appendix A) was sent, for the first time, in March 1985 to all the IFSgrantees. The questionnaire was drafted in English and then translatedinto French and Spanish. The Portuguese-Ianguage grantees, viz.,seven Brazilians, received the Spanish version. Reminder copies weresent out in May and October 1985. We coded the questionnaire inDecember 1985 and January 1986 and commissioned a private company to computerize the data in February 1986. Data processing andstatistical analysis were started in March 1986 at the ORSTOM computer services in Bondy, France, with assistance from its director,Hervé Chevillotte, and from the CIRCE (interregional center for electronic computation), which is part of the French national center forscientific research (CNRS).
Responses to the Questionnaire
Out of an initial population of 766 scientists in 78 countries, 489 in 67countries, or 63.84%, answered (see Appendix B). The 11 countriesfrom which no answers were received have fewer than four granteeseach. The countries were Benin, Botswana, Liberia, Rwanda, Swaziland, Bolivia, Trinidad, Afghanistan, Turkey, Western Samoa, andTonga.
AIl the respondents are DC scientists, and aIl are working in theirhome country except for eight who are working in another DC; 71.4%work for university or other academic institutions, and 26.2% fornational research and development institutions. Coincident with theIFS population as a whole, 83.4% are men, and 16.6% are women; 80%are between 30 and 45 years of age. More than 60% of the respondentshave a Ph.D. or the equivalent, for which most of them (76%) studiedin a developed country, mainly in the United States (26%), Great Britain(20%), or France (15%). The other respondents have either an M.S. orthe equivalent (25%), a "license" or a degree from an engineering orveterinary medicine school. As concerns time spent abroad to obtainthese degrees, 50% of the respondents spent between one and fiveyears abroad, 25% spent more than five years abroad, 25% spent lessthan one year (or no time at aIl) abroad.
The geographical distribution of survey respondents per continentcorresponds almost perfectly with the distribution of the total population, as table 1.2 indicates. The small percentage of Latin American

Introduction Il
Table 1.2. Responses to Questionnaire by Geographical Area
Responses Totals
Africa 182 37.2% 291 38.0%Latin America 86 17.6% 135 17.6%Asia 213 43.6% 324 42.3%Pacific 8 1.6% 16 2.1%
Total 489 100.0% 766 100.0%
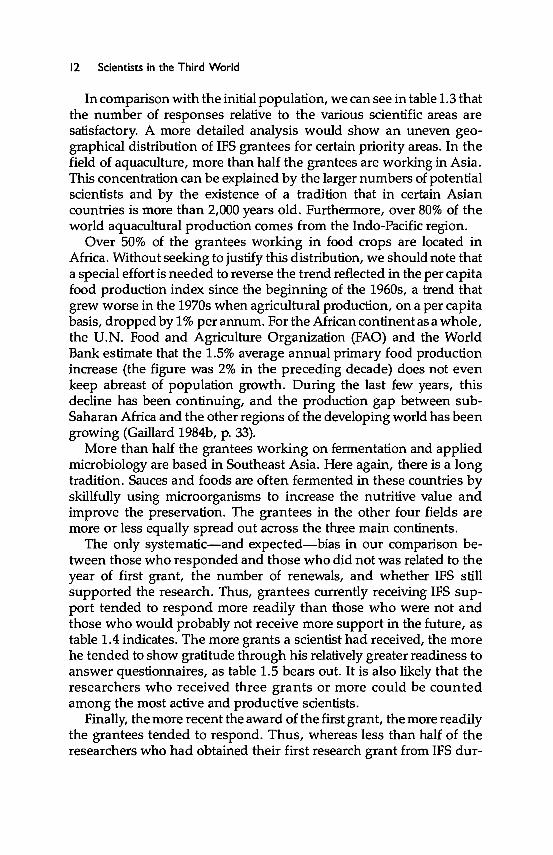
Table 1.3. Responses to Questionnaire by Scientific Field
Scientific Field Responses Totals
Aquaculture 98 20.0% 135 17.6%Animal production 75 15.3% 138 18.0%Food crops 113 23.1% 180 23.5%Afforestation & mycorrhiza 39 8.0% 56 7.3%Fermentation & applied 53 10.9% 85 11.1%
microbiologyNatural products 90 18.4% 137 17.9%Rural technology 21 4.3% 35 4.6%
Total 489 100.0% 766 100.0%
grantees can partIy be explained by the fact that IFS deliberately avoided publicizing its program in countries that were weIl on their scientificway, such as Argentina, Brazil, Venezuela, and Mexico, although it isan IFS principle not to exclude any DC from the list of potentiallybeneficiary countries. Further, up to now IFS has had only two officialworking languages, French and English, which is a handicap for theSpanish speakers.
The geographical distribution of the grantees reflects a deliberatepolicy that IFS adopted to extend assistance to scientists working incoun.tries and institutions that had special difficulty in carrying outresearch, a policy that favored Africa. This geographical distributionobviously does not coincide with the worldwide distribution of scientists and engineers working on research and development in DCs,which shows Asia to have 84%, Latin America 11%, and Africa 4%.These percentages are calculated using 1980 data from the 1985UNESCO Statistical Yearbook.
12 Scientists in the Third World
In comparison with the initial population, we can see in table 1.3 thatthe number of responses relative to the various scientific areas aresatisfactory. A more detailed analysis would show an uneven geographical distribution of IFS grantees for certain priority areas. In thefield of aquaculture, more than half the grantees are working in Asia.This concentration can be explained by the larger numbers of potentialscientists and by the existence of a tradition that in certain Asiancountries is more than 2,000 years old. Furthennore, over 80% of theworld aquacultural production cornes from the Indo-Pacific region.
Over 50% of the grantees working in food crops are located inAfrica. Without seeking to justify this distribution, we should note thata special effort is needed to reverse the trend reflected in the per capitafood production index since the beginning of the 1960s, a trend thatgrew worse in the 1970s when agricultural production, on a per capitabasis, dropped by 1% per annum. For the African continent as a whole,the V.N. Food and Agriculture Organization (FAO) and the WorldBank estimate that the 1.5% average annual primary food productionincrease (the figure was 2% in the preceding decade) does not evenkeep abreast of population growth. During the last few years, thisdedine has been continuing, and the production gap between subSaharan Africa and the other regions of the developing world has beengrowing (Gaillard 1984b, p. 33).
More than half the grantees working on fennentation and appliedmicrobiology are based in Southeast Asia. Here again, there is a longtradition. Sauces and foods are often fermented in these countries byskillfully using microorganisms to increase the nutritive value andimprove the preservation. The grantees in the other four fields aremore or less equally spread out across the three main continents.
The only systematic-and expected-bias in our comparison between those who responded and those who did not was related to theyear of first grant, the number of renewals, and whether IFS stillsupported the research. Thus, grantees currently receiving IFS support tended to respond more readily than those who were not andthose who would probably not receive more support in the future, astable 1.4 indicates. The more grants a scientist had received, the morehe tended to show gratitude through his relatively greater readiness toanswer questionnaires, as table 1.5 bears out. It is also likely that theresearchers who received three grants or more could be countedamong the most active and productive scientists.
Finally, the more recent the award of the first grant, the more readilythe grantees tended to respond. Thus, whereas less than half of theresearchers who had obtained their first research grant from IFS dur-

Introduction 13
Table 1.4. Responses to Questionnaire by Status of IFS Support:Active or Terminated
IFS Support
ActiveTerminated
Total
Responses
398 66.7%91 53.8%
489 63.8%
No Responses
199 33.3%78 46.2%
277 36.2%
Total
597169766
Table 1.5. Responses to Questionnaire by Number of GrantsObtained
No. of Grants Responses No Responses Total
1 249 58.6% 176 41.4% 4252 143 66.2% 73 33.8% 2163 65 74.7% 22 25.3% 874 31 83.8% 6 16.2% 375 1 100.0% 0% 1
Total 489 63.8% 277 36.2% 766
ing the years 1974 and 1975 responded, we recorded a response rate ofover 80% for the years 1982, 1983, and 1984 (table 1.6).
In any case, taking into account the size of the questionnaire and thepostal diffieulties in many DCs, we can consider the response ratesatisfactory.
Characteristics of the Survey Population
Before presenting and interpreting the results, it seems important topoint to the specifie characteristics of the study population in order toavoid overgeneralizing the conditions of OC scientists. In what way isour population representative of the OC scientists?
As we just saw, relative to the world distribution of scientists, theLatin American scientists, and even more so the African scientists, areoverrepresented; and the Asian scientists are underrepresented in oursample. The main effect of the African overrepresentation is that ourstudy lends greater importance to scientists working in the scientifieally least developed of the DCs.
The scientists in our sample work in fields of research given priority

14 Scientists in the Third World
Table 1.6. Responses to Questionnaire by Year of Approval of FirstGrant
Yr. of Approvalof First Grant Responses No Responses Total
1974 20 46.5% 23 53.5% 431975 18 35.3% 33 64.7% 511976 44 55.0% 36 45.0% 801977 32 56.1% 25 43.9% 571978 30 50.0% 30 50.0% 601979 43 55.8% 34 44.2% 771980 63 65.0% 34 35.0% 971981 49 63.6% 28 36.4% 771982 62 83.8% 12 16.2% 741983 82 87.2% 12 12.8% 941984 46 82.1% 10 17.9% 56
Total 489 63.8% 277 36.2% 766
in most DCs, but there are sorne fields of science and technology thatare not covered, in particular the social sciences, medicine, the exactsciences (mathematics and physics), as well as engineering and technology that are not specifically connected to rural development. Inother words, the sciences concerned by our study are agriculture,biology and microbiology applied to food and rural development,engineering and technology for rural environments, and, last, a multidisciplinary field that involves a variety of subjects such as chemistry,biology, taxonomy, pharmacy, and, on the periphery of medical sciences, natural products, in particular active substances in medicinalplants.
It is obvious that scientists working on physics would be moreinclined toward basic research and maintaining close contacts with theinternational scientific community than scientists working on agricultural research. But it is difficult to compare the relative importanceof IFS-supported fields with general statistics like the ones producedby UNESCO because the definitions of the latter's research areas areusually too broad. The most interesting estimates are probably theones put forth by CH. Davis (1983), although they apply only to subSaharan Africa. For the period from 1970 to 1979, the ISI records showthat publications included 22.3% for agriculture, 22.4% for biology, and38.2% for medicine. Despite the 22.3% figure for agriculture, thecitation record was 14.5%. This can be explained because of the site

Introduction 15
specificity of research carried out in the agricultural sciences, in thebroad sense of the term. According to Garfield (1983), the 14 ThirdWorld joumals that generate the largest number of citations for ThirdWorld authors are devoted to chemistry, biology, and medicine. Thisjustifies the hypothesis that the work carried out in the IFS-supportedresearch fields, except for the chemistry of natural products and microbiology, are underrated in the computations referred to above becausethey lie somewhat outside the mainstream.
Without being too presumptuous, we can say that the fields studiedby scientists in our survey group coyer over 50% of the fields that areunder study in the Des. The research our scientists conduct is sitespecific and applied rather than basic, although the dividing linebetween the two is not easy to plot. It would be of dubious value tomake comparisons with UNESCO statistics. As an example, it is interesting to see that conclusions from the 1985 Statistical Yearbook showthat in 1976 Niger devoted 100% of its research and developmentactivities to basic research!
The percentage of scientists in our sample who work in university orother academic institutions, i.e., over 70%, may at the outset seemexcessively high. Taking Davis's (1983) estimates, we see that, at leastfor sub-Saharan Africa, this figure is perfectly acceptable, since 65% ofthe total scientific output is produced in universities. Most of the DCs,indeed, do not have an industrial research capacity, except for countries like Brazil, Mexico, India, Argentina, and the Republic of Korea,which, when taken together, produce 60% of the manufactured goodscoming from Third World countries (Perrin 1983, p. 13).
What most clearly singles out the survey population may be that it iscomprised of internationally selected scientists, chosen according tocriteria that have become ever stricter over the years. Since the selection/application rate in recent times has been one out of five, they are nodoubt among the most highly qualified scientists of their countries.(Remember that 60% of them have a Ph.D. and that 76% of theirdegrees were received in the industrialized countries.) Further, thegroup is composed of scientists who have decided to work in theirhome country and who, when receiving the IFS grant, were employeesof research and/or training institutions where, under very varied conditions, they had the opportunity to conduct research.
What one of the scientists told me rather clearly refiects what manyof them feel: "The economic situation in my country makes researchvery difficult and frustrating, but I decided to stay anyway." Even theones who temporarily-often for financial reasons-Ieave their countries are determined to return home at the end of their contracts, even if

16 Scientists in the Third World
they have the opportunity to stay abroad. We will come back to this.Potential emigration is partIy unfulfilled because most of the scientistsare attached to their country and ther home environment.
Bernard Houssay, the Argentinian Nobel Prize recipient, said,"Science does not have a country, but a scientists does.... the countrywhere he was born, or raised and educated, the country that gave him aplace in his professional career, the country of his friends and family"(cited in CIMT 1970, p. 450).
A further characteristic of this sample population is that its membersare mainly at the beginning of their scientific career when they receivethe IFS grant. For many of them, this is their first opportunity toconduct independent research. IFS funds enable them to be moreflexible, enjoy more credibility in the eyes of their superiors, and gaingreater confidence in themselves. The following comment by a LatinAmerican grantee describes the situation weIl: "As an IFS grantee 1have funds available and, for the first time in my career, can use fundsas 1see fit. 1have also been able to have sorne influence on the choice ofresearch areas within my institution."
ChapterTwo
Origins a.nd Education
Social and Family Origin
1 come from a rural village in the eastern region of Ghana. My parents areilliterates but they had great interest to educate their children because they feltthat education went with good jobs in our society. 1am the second born out ofafamily of ten children. 1have four brothers and five sisters. 1was motivated toacquire a higher education through a prominent academician from my village.When 1was a small boy, any time this man came to our village1would visit him,and take inspiration from him. This man is now a professor of linguistics at auniversity in Ghana. 1 however developed love for science and scientificresearch when 1became aware of the numerous problems facing Ghanaianagriculture which needed to be solved.
This young Ghanaian, who now has a doctorate from a prestigiousBritish university, has come a very long way. After getting his degree,and before retuming to Ghana, with help from IFS he was able to workat the renowned Rothamsted Experimental Station under the supervision of scientists known the world over.
This career story illustrates haw fast a relatively large number ofscientists from DCs have been able ta advance from a small village to abig city. At the end of this sociointellectual adventure, they go on tobecome members of the intelligentsia, leaving behind them their homevillage where they seldom feel they still belong. The change is notalways radical. To determine the social and family origin of the scientists in our study population, we used the father's profession as anindicator to tally with the milieu of origin (capital, village, etc.) indeveloping our analysis. The resultsare reported in table 2.1. It isinteresting to observe that close to one-third of the researchers have afarming background, and one-fifth spent their childhood in a village.Before going any further, we should explain that the category "agriculture" embraces aIl the agricultural paid laborers and tenant farmers,regardless of the size of the farm, and cannot in any waybe said to forma homogeneous social group. The average size of the holdings and theproductivity levels differ from country to country. The average size forthe DCs as a whole was between 0.5 and 3 hectares per family (Todaro1977), which supports the thesis that many of them came from small

18 Scientists in the Third World
Table 2.1. Father's Profession as Related to Milieu and Degree ofUrbanization
Degree of urbanization
+50,000 Inhab. 2,500 toFather's Capital Other Than in 50,000 -2,500 Inhab.Profession City the Capital Inhab. and Villages Total
Agriculture 12 21 44 62 1392.6% 4.5% 9.4% 13.4% 29.9%
Liberal professions 40 38 26 7 111& senior 8.6% 8.2% 5.6% 1.5% 23.9%management
Crafts and 24 30 22 13 89commerce 5.2% 6.5% 4.7% 2.8% 19.2%
Middle 24 17 7 6 54management 5.2% 3.7% 1.5% 1.3% 11.6%
Office staff 17 15 4 0 363.6% 3.2% 0.9% 0% 7.8%
Laborers 5 7 4 1 171.1% 1.5% 0.9% 0.2% 3.7%
Service staff 1 3 0 1 5and caretakers 0.2% 0.6% 0% 0.2% 1.1%
Other 4 2 4 3 13categories 0.8% 0.4% 0.9% 0.7% 2.8%
Total 127 133 111 93 46427.3% 28.6% 23.9% 20.2% 100.0%
subsistence-Ievel fanns. Although the results did not separate the"paid laborers" from the "tenant fanners" category, we ascertainedthat many paid laborers were fannhands working on large plantationsgrowing export crops.
There are at least two reasons why these preliminary findings holdfew surprises. The first is that in Africa and Asia 78% of the populationeam their money (or their meals) from subsistence agriculture or as

Origins and Education 19
paid agricultural workers. In Latin America the figure is 47% (ILO1974). The second reason is related to the fact that most fields ofresearch somehow focus on agriculture and rural development. Asurvey conducted in the United States on 10,000 people who graduated from American universities between 1935 and 1960 showed that49% of the researchers working on agriculture had fathers who hadworked in agriculture, while only 15.6% of the researchers working inother fields of science and technology had this heritage (Harmon 1965).A more recent study carried out in the United States shows the effectsof having a family with an agricultural background on the agriculturerelated fields of research a scientist selects. "Although the U.5. farmpopulation is now less than 4% of the total population, 38% of allagricultural scientists come from farm backgrounds. In particular inagronomy, animal science . . . scientists typically have farm backgrounds" (Busch and Lacy 1983 p. 54).
The work by Bourdieu is most informative, notwithstanding the factthat it appIies to a French student population and research scientists.He reports that for the 1961-62 school year, 28% of the students innational agricultural schools of France came from farm backgrounds,while the average for all educational disciplines taken together was 6%(Bourdieu and Passeron 1964, pp. 20-21). This said, we still see thatmost of the OC scientists who come from farming families have a muchmore modest social background than their colleagues from the developed countries. For this category we can unhesitantly use the termsocial advancement.
For the other categories, we have to make allowances for the existence of unequal opportunities. Results unquestionably prove that thegrade school and then the university system have selection criteria thatare hardest on the least favored classes without, however, totallyexcluding them. The intermediate categories (especially crafts andcommerce) are in a rather good position (19.2%). Here again, theresults must be interpreted with great caution. The subcategory called"commerce" includes a heterogeneous range that stretches from theIittle stalls in the marketplace to large import-export firms. Our personal contacts with the grantees of our study population and theanswers to the questionnaire support the assertion that the scientistswhose parents are artisans or work in commerce come from relativelymodest famiIies. The percentage of grantees whose fathers were in thecategory of "office staff" was the same, i.e., ±8%, as Bourdieu foundfor students in French universities, all disciplines combined, for the1961-62 school year (Bourdieu and Passeron 1964, pp. 20-21). Thepercentage of sons and daughters of "laborers" (3.7%) was lower, but

20 Scientists in the Third World
Table 2.2. Geographieal Breakdown of Researchers by Sex
Asia and PacifieAfricaLatin America
Total
Men
170 77.0%165 91.0%73 85.0%
408 83.4%
Women
51 23.0%17 9.0%13 15.0%81 16.6%
Total
22118286
489
this can easily be explained by the lower rate of industrialization in theDCs.
The high percentage of researchers (23.9%) whose parents are inliberal professions or senior management positions, a social categorythat comprises a very small percentage of the population in most DCs,confirms the inequality of opportunity.
Eisemon provided further evidence for these results through interviews he made in Kenya and in Nigeria in 1978: "African scientists, likemost other Africans with higher education, are usually the first in theirfamilies to receive secondary and higher education. Many, particularlyin Kenya, come from rural backgrounds" (Eisemon 1979, p. 512).
Breakdown by Gender
Figures in table 2.2 show that only 16.6% of the IFS grantees arewomen, who thus, as a group, are underrepresented. However, aquièk comparison with the situation in the developed counmes of theworld mellows our initial reaction. For example, in 1982 only 13% of thescientists and engineers in the United States were women, and this wasa 200% increase over the 1972 figure. Women, however, make up 45%of the work force in that country (National Science Foundation 1984, p.1).
In a country like Sweden, whieh is well known for its efforts in favorof equality of the sexes (Gaillard 1983), in 1982 women accounted foronly 12% of the research scientists (SOU 1983). Furthermore, as theacademic level rises, the number of women at each level declines; overhalf the student body in the high schools is composed of girls, but only25% of the Ph.D. candidates and 3% of the university teachers arewomen (SOU 1983).
Using mean percentages of women and grouping the countries inour study obscures regional disparities and important differences between the counmes. Women researchers in our population figure asfollows: 9% for Africa, 15% for Latin America, and 23% for Asia. The

Origins and Education 21
Table 2.3. Gender of IFS Grantees by Research Area
Research Area Male Female Total
Food science 33 62.0% 20 38.0% 53Forestry 30 77.0% 9 23.0% 39Natural products 72 80.0% 18 20.0% 90Aquaculture 83 85.0% 15 15.0% 98Crop science 100 88.5% 13 11.5% 113Rural technology 19 90.5% 2 9.5% 21Animal production 71 95.0% 4 5.0% 75
Total 408 83.4% 81 16.6% 489
Philippines (36%) and Thailand (33%) had the highest percentages;there were no women researchers in the Republic of Korea and only10% in Sri Lanka. Sorne African countries such as Tunisia (27%) andTanzania (23%) have a laudably high percentage compared to thecontinent as a whole, while countries like Burkina Faso, Morocco, andSenegal rank far below the average.
Sample comparisons, excluding the countries with very few grantees, confirm that the percentage of women in the IFS populationcoincides rather closely with the national percentage in the countrieswe studied. Thus, according to a study carried out by the InternationalService for National Agricultural Research (ISNAR) in 1984 on 1,400researchers and technicians of the Department of Agriculture inThailand, 38% were women (Elliot 1984). This study also brought out astrong degree of disciplinary specialization; women tend to choosedisciplines that involve laboratory work and that oHer jobs in thecapital (Elliot 1984, p. 3). Women exceed their overall average in thefields of food science, forestry, and natural products. This is particularly true in Asia, where the percentage of women in research is thehighest.
As for Senegal, in 1984 we found that of the ±4Oü scientists andtechnicians working at the Institut Sénégalais de Recherche Agronomique (ISRA), only 4.5% were women. Statistics on the 1982-83 teaching staffat the University of Dakar showed a female component of 8.5%(over half were expatriate women). Sorne 7% worked in the faculty ofMedicine and Pharmacy and the Faculty of Arts and Humanities.Going back to 1980, in Sudan, out of 123 agricultural researchers only 4(i.e., 3%) were women. They worked in food sciences and in nutrition;there were no women in the other disciplines (Lacy et al. 1983, p. 19).
In food science, research by women in our sample bears directly on

22 Scientists in the Third World
nutrition and the production of foodstuffs: the improvement of traditional procedures to fennent foods, the production of microbial proteins, and studies linked to the contamination of foods by mycotoxinsand aflatoxins. In forestry women mainly research mycorrhizal associations, or the isolation, detennination, and culture of mycorrhizalstrains in the laboratory, or sorne field of taxonomy or ecology. Although sorne women run field experiments, forestry research demanding extended assignments away from home is left to the men.Natural products, mostly studied in the laboratory, and aquacultureconstitute disciplines at the crossroad; but here again it is interesting tonote that women researchers in this field concentrate on nutrition andthe development of foods for various aquatic organisms, on the development of vaccines, and on the parasitology of fish diseases. The threeremaining fields are typically the province of men and often requiretemporary or pennanent posting to isolated research units outside thecapital or a large town.
Women dedine to live outside urban areas not only because of theirdiscipline. Other factors such as the marital status, the number ofchildren to support, and the spouse's profession can also affect theresearcher's region of residence and, subsequently, his/her method ofresearch.
Marital Status and Spouse's Profession
Compared to the national trend, scientists in our study populationenter marriage late, since 70% in the 25 to 29 year age group are unwed,as are dose to one-third in the 30 to 34 year age group, and one-fifth inthe 35 to 39 year age group. One reason may be that many of them hadlong years of schooling and extended journeys abroad. Another reasonmay be that many students (85%) were in contact with the Westernmodel during their studies outside of their home countries. (For moredetails on the marital status, see table Al, Appendix c.)
The Western standard also seems to have been adopted for thenumber of children, since two-thirds of our scientists have at most twochiIdren. The maximum was eight children; the father was an Africanscientist over 50 years of age. Only 4% of the scientists have more thanfour children. Finally, considering the galloping population increasesin the countries of our study, it was interesting to note that dose to halfthe scientists in the 30 to 34 year age group and over one-fourth in the35 to 39 year age group had no children at ail. (For more details on thenumber of children per family, see table A2, Appendix c.)
Who do our scientists marry (table 2.4)? There is a strong endog-

Origins and Education 23
Table 2.4. Profession of Spouse, by Gender
Profession Male Femaleof Spouse Grantees Grantees Total
No profession 109 31% 1 2% 110 27%
Liberal professions& senior management
Scientists 55 16% 26 46% 81 20%Professors 67 19% 6 11% 73 18%Liberal professions 14 4% 5 9% 19 5%Senior administrative 11 3% 2 3% 13 3%Engineers 5 2% 7 12% 12 3%
Subtotal 152 44% 46 81% 198 49%
Middle managementMedical social prof. 14 4% 1 2% 15 4%Civil servant 13 4% 4 7% 17 4%Technical staff 9 2% 2 3% 11 3%
Subtotal 36 10% 7 12% 43 11%Office staff 33 10% 0 0% 33 8%Industry and commerce 6 2% 3 5% 9 2%Other 11 3% 0 0% 11 3%
Total 347 100% 57 100% 404 100%
amous trend since half of the spouses are scientists and teachers. Themarriage strategy (late marriage, strong endogamy, Malthusian behavior) seems to characterize a very rational approach to reproductionfor this emerging intel1ectual class. Under the influence of the Westernmodel, which purports that small families are more mobile and getalong better socially than large families, the scientists produce as manychildren as they think they can establish at a level they would besatisfied to occupy themselves. The investment required for researchquite clearly implies postponing marriage and the first child. Since inresearch the social status that accompanies the profession seems to takemore time to acquire than in other professions, scientists have to-andseem to be prepared to make-the relevant sacrifices.
This endogamous trend seems to be stronger among the womenresearchers than among the men, since close to half of them (45%)married research scientists. This provides us with an additional expla-

24 Scientists in the Third World
nation for the fact that women, more than men, prefer exercising theirprofession in the capital or in a large town.
We should also note that more than two-thirds of the wives ofresearchers have their own professional activity, which reflects a substantial social and mental break from their original social milieu. Finally, none of the scientists' spouses worked in farming, and very few(2%) worked in industry and commerce, while one-fifth of their fathersbelonged to this social category.
Our efforts to find a link between the length of residency in aWestern country and the adoption of the Western model as a system ofreference led us to the conclusion that there was no clear-cut causeand-effect relationship. The number of years spentabroad did not seemto have any influence on the profession of the spouse or the number ofchildren. Actually, we found that people who had spent the most yearsin Western countries (over 10) tended to have the most children (tableA3, Appendix C). But we have to remember that these are our oldestscientists and tended to have four or more children. Adopting theWestern model seemed to stem less often from acculturation caused byan extended stay in the West than from the scientist's profession.Constraints linked to aggregated effects of intel1ectual advancement(time) are probably the most decisive.
Similarly, there does not seem to be any very significant relationbetween the number of years spent abroad and the social origin of thescientists except, to a certain extent, for the"crafts and commerce" andthe "managerial staff" categories whose scientists tend more to studyabroad for extended periods of time (see table A4, Appendix C). Let uslook at the training component. Where, how, and for what degrees didour scientists study?
Training
"1 was born in Fiji and attended primary and secondary school there.The secondary school was the Marist Brothers High School in Suvawhere 1 obtained my Fiji Junior Certificate, Overseas CambridgeSchool Certificate, and New Zealand University Entrance Certificate.... 1wanted to get into a university to do further studies. At thattime there was no university in Fiji so 1 went to the University ofCanterbury in New Zealand in 1964. 1 was at this university for fiveyears obtaining my Bachelor of Science and Master of Science degrees." This Fiji scientist went on to study at the University ofQueensland in Australia, where he received his Ph.D. in rural economics in 1976. In the meantime, at the end of the 1960s the University of

Origins and Education 25
the South-Pacifie was created in Suva. In sum, he went abroad forstudies three times, and it took him over nine years abroad to obtain hisPh.D. (He interrupted his studies to work temporarily at the Ministryof Agriculture in Fiji.)
Until relatively recently, except for certain countries such as India,many DC students had to leave their home countries to attend auniversity and obtain the education needed to become scientists.Studying abroad is nothing new and is not specifie to young peoplefrom DCs, but it is noteworthy that the percentage of students fromDCs in the total foreign student bodies has increased considerably inmost Western countries since the 1960s. In the United States, forinstance, the figure rose from 34,232 in 1954--55 to 235,509 in 1977-78.During that same period, the Africans, as a percentage of the totalforeign student figures, rose from 3.4% to 12.6%, while the number ofEuropeans and Canadians fell from 28.9% to 13.7% (Maliyamkono andWells 1980, p. 1).
During the colonial era, most of the (very few) students who weresent abroad for their education studied in the colonizers' country.During the preindependence years, increasing numbers of DC students applied to study abroad, and the number of scholarships madeavailable by industrialized countries went up considerably. This evidenced increased awareness of the importance of education and therole of higher education in development-oriented science; it also reflected the donor countries' desire to maintain-or acquire-politicaland economic influence in newly independent states (Gaillard 1985a,p.94).
At the time of independence, there were sorne universities in theDCs, but they did not go as far as the doctorallevel and did not offer afull range of science and technology courses. In Latin America, forinstance, during the colonial era there were 23 universities but only 150alumni by the end of the eighteenth century (Botelho 1983, p. 16). In1857 the British colonizers created the frst universities in Asia, Calcutta, Madras, and Bombay. The University of Cairo was founded in 1908.The first universities of Black Africa are far more recent. The firstcourses to be given in University College, Ibadan, Nigeria, started in1948; and the first science majors graduated in 1950 (Kolinsky 1985, p.34). The University of Dakar, the oldest university in French-speakingBlack Africa, was started in 1957 and became Senegalese in 1960(Gaillard 1985b, p. 6).
In sorne countries, after the first university was created, change tookhold very quiekly, especially in the 196Os. In present-day Brazil thereare 60 universities plus 800 other institutions of higher learning, while

26 Scientists in the Third World
before 1965 a university education was available-to a very limitednumber of students-almost exclusively at the University of Sao Paulo.The number of students has made a sharp upward tum, going from200,000 in 1968 to over 1.1 million in 1977. Brazil now offers close to 600graduate programs in sorne 30 independent institutions and universities. Two-thirds lead to a master's degree, one-third to a doctorate.The University of Sao Paulo in 1977 offered 100 master's programs and66 doctoral programs in a great variety of disciplines.
Brazilian officiaIs query the quality of these programs and feel thatonly one-third of the doctoral programs are academically valid and thatmore than half of these are offered at the University of Sao Paulo(Schwartzman 1978, p. 545). This explains why the Brazilian NationalCouncil for Scientific and Technical Development (Conselho nacionalde desenvolvimento cientico e tecnologico, CNDCT) granted 1,000scholarships to Brazilian students in 1984 to receive doctoral orpostdoctoral training mainly in the United States, Great Britain,France, Belgium, Canada, Federal Republic of Gerroany, Australia,Sweden, and Spain (CNDCT, personal communication). This is onlythe tip of the iceberg because preparatory studies for a career inscientific research forro a subject that the DCs find difficult to hamess,and training abroad is more often than not the result of the student'spersonal initiative rather than a well-orchestrated govemment plan.Since the beginning of the 1960s, the spectrum of countries that receivethese students has grown considerably, although the DCs, regardlessof the postcolonial political vicissitudes, are still marked by their colonial heritages.
In 1974, pursuant to major political upheavals, nearly_ the wholeFrench scientific community of Madagascar packed up and left as thecountry went on to conclude numerous technical assistance agreements with COMECON countries (Gaillard 1984b, p. 2). An analysis ofMalagasy students studying abroad between 1975 and 1982 shows thatout of 2,000 students half studied in the USSR and (despite the above)20% in France; of the rest 14% studied in Romania, 6% in Aigeria, 3% inCuba, 1% in the United States, and 6% elsewhere. Further, in a summary survey we made in 1984, out of 69 scientists working atCENRADERU (the national center for research applied to rural development), we discovered that half of our respondents had studiedexclusively in Madagascar, and 37% had studiedinFrance. It should benoted, however, that only 20% of them had a doctorate or a Ph.D., that65% were between 30 and 39 years of age, and that only 10% wereunder 30 years old. At the University of Madagascar, the fact that arelatively large number of researchers, including many from the youn-

Origins and Education 27
gest age bracket, had obtained their SBA (diploma for advanced studiesin applied biological sciences) is a clear indication of the Malagasygovernment's determination to offer training in research within thecountry.
The Brazilian and Malagasy examples touched upon above show usthat training in research is undergoing rapid change with an expandinghost of countries offering study opportunities. We were also able to seethat speed is not always compatible with quality and that at the doctorallevel there is still strong reliance on the industrialized countries. Let usreturn to our study population.
As we saw in the introduction, over 60% of the scientists in ourpopulation have a state or third-cycle doctorate, Ph.D., or a doctor ofscience degree. This high percentage is the result of selection and is notthe norrn in the DCs. A study conducted on 20,000 scientists in 32countries, including 4 African countries, showed that in the 1960s only9% were in the highest educational group, i.e., had a doctorate, 27%had a master's, and 64% had a degree equivalent to the "licence" or abachelor's (Gram and Bindlish 1981, p. 5). Actually, in many DCsresearch is entrusted to scientific personnel of the "bachelor's" or"licence" level. The study also indicated that the 4 African countries(Kenya, Nigeria, Madagascar, and Sudan) on the average had a higherpercentage of scientists with a third-cycle (postgraduate) diploma thanin Asia or Latin America; the average for these African countries wasthat 27% of the scientists had a Ph.D. and 37% had a master's.
These statistics must be applied with great caution. Despite considerable efforts, there are still few DCs that have a very accurate picture oftheir scientific and technical potential. For Sudan, Lacy et al. (1983, p.23) purport percentages that are even higher than the ones that describe the researchers in the Sudanese Agricultural Research Corporation (ARC): out of 161 scientists working for ARC in 1981,50% had aPh.D. This percentage is even higher (65%) if we exclude the researchassistants. Further, 12 out of the 13 scientists who had been secondedelsewhere that year also had a Ph.D. Finally, 96% of the SudanesePh.D.s had received their diplomas, in equal proportions, from American and from British universities (Lacy et al. 1983, p. 24).
Table 2.5 shows that three-fourths (76%) of our study population didtheir doctoral studies in the industrialized countries. There is no significant difference on the basis of country of origin. A country analysis,however, shows that doctorates obtained in Asia and in Africa weredispensed in a very limited nurnber of countries. In Asia, 22 (60%) of the37students who obtained their doctoral degree studied in India. In Africa,11 (40%) out of 28 studied in Nigeria, mainly at the University of Ibadan.

28 Scientists in the Third World
Table 2.5. Doctoral Studies: Continent of Origin and Continent ofStudies
Continent of Origin
Place of Asia and LatinStudies Pacifie Africa America Total
Industrializedcountries 107 74.3% 91 76.5% 29 80.6% '227 75.9%
Asia 37 25.7% 0 0% 0 0% 37 12.4%Africa 0 0.0% 28 23.5% 0 0.0% 28 9.4%Latin
America 0 0.0% 0 0.0% 7 19.4% 7 2.3%Total 144 100.0% 119 100.0% 36 100.0% 299 100.0%
Table 2.6. Place of Doctoral Degree by Date of Studies
IndustrializedDates of Study DCs Countries Total
1980-85 30 31.3% 66 68.7% 96 32.4%1975-79 20 22.2% 70 77.8% 90 30.4%1970-74 7 10.0% 63 90.0% 70 23.7%1960-69 13 32.5% 27 67.5% 40 13.5%
Total 70 23.6% 226 76.4% 296 100%
The percentage of doctorates obtained in the DCs has been increasing steadily since the early 1960s and rose from 10% in the 1970-74period to over 30% in the 1980-85 period, as table 2.6 shows. For theperiod 1960-69, out of 13 doctoral degrees obtained in the DCs, 7 wereawarded in India, 2 in Nigeria, and the other 4 in Argentina, Brazil,Egypt, and Pakistan. hl percentage terros the number of doctoratesobtained in the DCs was rather high during this period partIy becausethe first wave of DC students who graduated in industrialized countries retumed home at the end of the 1960s and even more retumedduring the early 1970s. This is also an immediate result of the firstcontacts established by the IFS secretariat staffand scientific advisers inthe above mentioned countries (except Brazil). In January 1975 alone,there were three missions to India, and most of the Indian grantees

Origins and Education 29
Table 2.7. Number of Ph.D.s by Number of Years of Study Abroad
YearsAbroad
o1-23-45-910-20
Total
Researchers withDoctoral Degree
20 6.7%35 11.8%89 30.1%
126 42.6%26 8.8%
296 100.0%
TotalPopulation
73 15.2%113 23.5%118 24.3%151 31.4%27 5.6%
482 100.0%
% ofResearcherswith Doctorate/Total Population
27.4%31.0%75.4%83.4%96.3%61.4%
were selected in 1974-75 from among the young scientists who received their Ph.D. in the 196Os. Afterward IFS adopted a much morediscreet policy toward India in an attempt to stem the flow of applications from that country.
There is still strong reliance on studies abroad for research scientists.Table 2.7 shows that over 60% of our population studied abroad for overthree years in order to obtain a doctorate. It also shows a correlationbetween the (increasing) number of years abroad and the (growing)probability of obtaining a doctorate. In other words, the probabilitythat scientists who spend ten years or more abroad have a doctorate is3.5 times greater than for scientists who studied exclusively in theirhome country.
Oependence on other countries for education is also directly relatedto the level of diploma being sought; the more advanced the degree,the greater the dependence. Hence, for the doctorate 75% of ourpopulation studied abroad, for the master's degree 45%, and for thebachelor's degree 10%. Most students who went abroad for the bachelor's degree came from Africa and the Pacifie, but there were alsosorne from Asian countries such as Malaysia and Thailand that offertheir own bachelor's program.
Although we have no statistical proof, we have noticed that a studentwho has the choiee between studying at home or abroad will generallychoose the latter. Besides the economie benefits that accompany a stayin a foreign country, a diploma obtained in an industrialized country isusually rated higher than a diploma from a Oc. Moreover, in thediploma bargain market, there are hierarchies and clans! In Francealumni of certain universities are considered to control certain institu-

30 Scientists in the Third World
Table 2.8. Study for Master's Degree: Continent of Origin byContinent of Education
Continent of Origin
M.S. Asia and LatinPreparation Pacific Africa America Total
Industrializedcountries 58 35.6% 64 56.6% 23 50.0% 145 45.0%
Asia andPacific 105 64.4% 4 3.6% 3 6.5% 112 34.8%
Africa 0 0.0% 45 39.8% 0 0.0% 45 14.0%Latin America 0 0.0% 0 0.0% 20 43.5% 20 6.2%
Total 163 100.0% 113 100.0% 46 100.0% 322 100.0%
tions, just as the "Chicago Boys" might be known for their political andeconomic influence over the government of Chile.
We have seen that for the doctoral degree, reliance on foreignuniversities seems to be much the same regardless of continent oforigin. This does not hold for the master's and the bachelor's; Africa isthe least independent. Table 2.8 shows that for the master's degree,sorne 65% of the Asian researchers stayed in Asia, as against 40% of theAfrican students who stayed in Africa. All the Indian researchers, plusthree researchers working in Africa and three working in Latin America, obtained their master's degrees in India. Actually, four of the lattersix were of Indian origin and worked in Panama, Mauritius, Brazil, andMorocco. There was also a Pakistani who completed his master'sdegree in Pakistan and is now working in Uganda.
India is also the country with the highest percentage of Ph.D.s,since 25 out of 26 scientists in our population have reached thisqualification. It is the country that is the least dependent on foreignuniversities for this level of education: 21 of the 26 graduated in Indiaand 4 in the United States. This confirms our thesis that India is the DCthat is the least dependent on foreign universities at the diploma level.
Among the countries that train DC students to the doctoral level,there are three that stand out on the international scene since theyalone provided 80% of the doctorates obtained abroad by the IFSgrantees; viz., United States (34%), Great Britain (26%), and France(20%), followed rather far behind by Australia (6%) and Canada (4%).Table 2.9 shows the number of students per DC country and percountry of education.

Origins and Education 31
Table 2.9. Industrialized Country of Study by Home Continent
Home Continent
French- English-Country Asia and speaking speaking Latinof Ph.D. Pacific Africa Africa America Total
United States 40 51.3% 5 6.4% 21 26.9% 12 15.4% 78Great Britain 35 59.3% 4 6.8% 15 25.4% 5 8.5% 59France 2 4.4% 39 84.8% 0 5 10.8% 46Australia 12 85.7% 0 1 7.15% 1 7.15% 14Canada 7 70.0% 1 10.0% 1 10.0% 1 10.0% 10
Total 96 46.4% 49 23.7% 38 18.3% 24 11.6% 207
One-third of the students who sought education abroad obtainedtheir doctorate in the United States, a country chosen mainly bystudents from Asia and English-speaking Africa but also from LatinAmerica and, to a lesser extent, French-speaking Africa. In 197066% ofaIl foreign Ph.D. students in the United States came from the Des; by1980 the figure had risen to 77% while the percentage of students fromthe rich countries during that same period had dropped from 38% to23% (NSF 1981).
In Great Britain the foreign student component of the total studentbody was 19% in 1962; the figure rose to 35% by 1976, 43% of whomcame from commonwealth countries. The geographical distribution ofstudents in our population who obtained their doctorate in GreatBritain and in the United States is quite similar, except as concems thestudents from Latin America who more readily went to their northemneighbor for their studies.
Students from French-speaking Africa clearly prefer studying inFrance, since 85% of the doctorates completed in France were dispensed to students from this region. Nearly aH the foreign studentsstudying in Australia came from Southeast Asia and the Pacifie. Mostof the students who complete their doctorate in Canada come fromAsia.
Considering the smaH numbers involved, it would be unscientific togeneralize the results reported above, especially for doctorates obtained in the last two countries. Yet the students' home countries andthe countries they choose for their Ph.D. studies rather closely coincidewith international geopolitical zones of influence, even though ouranalyses are based on results derived from a small group. It is il-

32 Scientists in the Third World
lustrative that the four researchers in our population who completedtheir doctorate inJapan came from three Southeast Asian countries andfrom South Korea. The USSR constitutes a glaring gap on this educational map, having conferred only 2 doctoral degrees (to a Vietnameseand a Sri Lankan) out of the 226 obtained in foreign universities.
Although the present-day tendency is to diversify sources of education (as we will see later with Morocco), sorne DCs are still determinedto send their students to certain specifie countries, e.g., out of 14 Ph.D.students from the Philippines, 11 studied in the United States. Another example was Sri Lanka; out of 21 Ph.D. students, 17 studied inGreat Britain and 4 in the United States. On the other hand, a countrylike Thailand, whieh has never been colonized, tends to assign itsPh.D. students more evenly since 7 went to the United States and 9 toGreat Britain and also approaches other countries, since 2 studentswent to Australia, 2 to the Federal Republic of Germany, and 1 to thePhilippines.
The countries of study also have their preferred disciplines. Three ofthe four doctorates awarded in Japan were in the field of aquaculture, afield that was also favored in Canada. Although the United States offerscourses in all fields, it has special strength in the chemistry of naturalproducts and in crop sciences, especially in cropping methods andplant improvement. Over half the doctorates completed in Australiafocused on crop sciences with a bias toward plant physiology, mainlyfodder crops. Here again we must avoid overgeneralizing lest we err,but this is a pertinent line of research that requires more thoroughanalysis and probably a bigger population in order to produce moredefinitive conclusions.
In this phase of "construction," training abroad is important for theDC scientific communities but must be considered as supplementaryto education within the home country. Under no circumstances shouldit be used as a replacement for education within the DCs, whieh,during this transitional phase, must endeavor to meet their nationalrequirements for scientific and technical staff through an intelligentbalance between these national and foreign sources of education.
Furthermore, doctoral and postdoctoral studies in developed countries supported by the host countries are of considerable help to theDCs in strengthening their national research capability at relativelylittle expense: "Postdoctoral appointments in the United States havebecome less a means of enriching the research capacity of a few outstanding individuals in a few centres, and more a means of increasingthe size of the staff available to work as members of a research team inthe physical and biological services" (Kidd 1983, p. 409). We think that

Origins and Education 33
this remark could also be applied to doctoral courses and, in this case,applies to a far larger group of people.
The current tendency is toward a mixture, sometimes called a"sandwich," that alternates fieldwork and collecting data in the student's home country with lecture courses and thesis preparation (anddefense) in a foreign, industrialized country. This is a system that hasbeen adopted by many institutions of higher learning in the DCs, e.g.,the Institut Agronomique et Vétérinaire Hassan II (IAV) in Rabat,Morocco. The "sandwich" formula is included in a global educationpolicy designed to diversify sources of education that traditionallywere limited to France and to coordinate training dispensed by virtueof agreements concluded with various foreign countries and institutions.
For the third-cycle (postgraduate) doctorate in agronomy, most ofthe students are sent abroad to France, the United States, Belgium,Great Britain, Canada, etc., for their fifth year and then return to theirinstitute and spend most of their sixth year preparing a thesis. This is arather recent pattern, and many Moroccan students seem to preferapplying for a scholarship and doing all of their studies abroad. Quiteinterestingly, out of 19 Moroccans who applied for an IFS grant in 1982,12 had completed part or all of their higher education in France, 4 at IAVin Morocco, 2 in Great Britain, and 1 in Switzerland. A few hadattended advanced training courses in France, the United States, Germany, Great Britain, India, and Sweden (Gaillard 1982).
This academie diversity provides a well of ideas and inspiration forIAV to draw from in developing innovative methods for researchtraining. An eclectic approach such as this can also cause confusion andmake it difficult to evaluate foreign training schemes and diplomas,especially when a thesis has been written in a foreign language that isincomprehensible to nearly all the scientists and administrators in thestudent's home country. The problem is further aggravated when agroup of countries decides to organize a system of higher education atthe regionallevel, as is the case in the Pacifie: "The diversity of colonialexperiences throughout the Pacific has resulted in a pIethora of educational systems, with students studying in different languages, following different curricula" (Pernetta and Hill 1984, p. 164).
Postgraduate programs are gradually being offered in the DCs. Thishas manyadvantages, e.g., students do not have to be sent abroad forextended periods of time and at great cost and can be oriented to topiesof direct concern to their country's development. But there is the riskthat, at least during the start-up phases, the level of instruction may notbe up to the level offered in universities in developed countries. Very
34 Scientists in the Third World
often support is provided by scientists from these universities who givecourses that local scientists cannot give. This is the case for the diplomaof intensified studies (the DEA) in applied biological sciences at theUniversity of Madagascar. Close to 50 students were offered this curriculum during the first two school years; and according to sorne Frenchuniversity teachers who worked on the program, it is just about asgood as many French DEAs (Gaillard 1982, p. 2).
Not aIl the postdoctoral students in Des, whether they studiedabroad or in their home countries, are slated to become researchscientists-far from it. What persuaded the scientists in our studypopulation to make this choiee? How do they choose their first researchtopie? What are the most decisive criteria, and how do they differ fromtopies chosen by researchers in the developed countries? That will bethe subject of the next chapter.

Chapter Three
Research As a Profession
The Choice
Research scientists in DCs long to have a proper professional status;often draft texts have been prepared and then stored away in anticipation of better times to come. It is not up to us to discuss whetherresearch science is, or is not, a profession in the DCs. "Research is oftencarried out as part of sorne profession or system designed to upholdprofessional standards or value systems that are not specifie to research" (Barel and Malein 1973, p. 933). This was the case for a Moroccan scientist who had to bend his institution's rules in order to obtain aresearch budget. His problem was not at aH an uncooperative boss oreven fear of outside influence but merely that the statutes of hisinstitution had no provisions for research in its normal program ofactivities. We can also look into the ambiguous status of 70% of thescientists in our study who were teachers-cum-researchers but whoseprimary occupation, and in sorne cases, whose only recognized occupation, was teaching. What Jean Perrin said about the French universities in 1933 could also apply to certain OC universities now:"AHocating funds to scientifie research in a university is an irregularityto which the Administration agrees to close its eyes" (cited by Salomon1970, p. 61).
Whether it is irregular or not, more and more institutions are hiringscientists who have been trained in research and who devote varyingproportions of their time to research activities. How does one decide tobecome a researcher in a OC where the education system is often notdesigned to offer proper preparation for a scientific career and whereresearch, as we will see in chapter 4, is often very difficult to carry out?Obviously, there is no single answer to this question since the choicedepends on individual hopes and behaviors, on the social status oreven the degree of prestige, and on many other factors that accompanythe profession in many DCs.
Marcel Roche, who was part and party to the birth and growth ofmany scientific institutions in his home country, Venezuela, quiterightly pointed out in 1966 that "the past does not give us any exampleworth foHowing, and research scientists with the right experience to

36 Scientists in the Third World
show the way are few and far between" (Roche 1966, p. 59). It iscertainly not mere serendipity that explains the decision to award theNobel Prize to brilliant research scientists such as C. V. Raman in Indiaand Bernard Houssay in Argentina; and it seems reasonable to expectthem to serve as an example for attracting young people to research,even in disciplines other than their own.
ln most Des research scientists do not have a very high socialstanding or much prestige. Doctors and lawyers and other professionaIs of that level with the same amount of education as the researchscientists are not only better paid but also enjoy a much higher socialstatus. Speaking about Venezuela in the 1960s, Roche said, "1 knowmany examples of young people whose rich parents forbade them tomajor in sciences or to devote themselves to research often because ofthe low salaries or uncertain career opportunities. The bourgeois attitude to careers in science is much the same as the attitude to professions in the arts; success is reserved to very outstanding people alone,all the others being condemned to a Bohemian life of uncertainty. Thesituation has probably changed since the 'Sputnik' was invented, butresearch is still not seen as a fully acceptable profession" (Roche 1966, p.57).
The parents of one of our Moroccan friends, who graduated withdistinction as a veterinarian in France and recently got a doctorate inanimal physiology from the University of Upsala in Sweden, do notunderstand, or are having difficulty accepting, that their son decided tobecome a research scientist in Rabat rather than becoming a practicingveterinarian somewhere in Morocco or even in France. This scientistscornes from a comfortable family that is in business. The same reactionis also observed in the less favored social classes whose unclear understanding of scientific progress prevents them from seeing the use ofresearch in solving social and economic problems.
How attractive research as a profession can be depends on thecountry. According to Eisemon, in Kenya scientists have enjoyed aplace of special pride in society since the European colonization periodwhen close relationships were established between the scientific andthe politico-economic circles. "A scientific career brings an individualinto proximity with the commercial and political elite of that [Kenyan]society, [even] if it does not always convey full membership" (Eisemon1982, p. 137). Eisemon felt that research was appealing not only forprofessional reasons: "Academics are well remunerated [albeit increasingly less so in comparison to colleagues in the private sector].Professional conditions at the University of Nairobi are often superiorto those available in other kinds of institutions. Academic work is

Research as a Profession 37
largely unsupervised. Academics enjoy considerable independence inan atmosphere of professional and public trust. Equally important,selection of an academic career does not necessitate a sacrifice of othercareer opportunities" (Eisemon 1982, pp. 137-38).
In India, ever since the British colonizers brought Western science toBengal in the nineteenth century, the scientific community seems tohave been dominated by the upper Hindu castes, especially theBrahmans. KapiI Raj describes how the Brahmans in their own way"appropriated" occidental ideas and science to give credence to theirnew-dominant-status in the Indian society (Raj 1986). A glance atthe names of the IFS grantees in India and a recent study of scientificpersonnel in five institutes in Calcutta bears out the continued predominance of Brahmans and the upper Hindu castes in the Indianscientific community. According to this study (Surajit Sinka 1970), outof 386 scientists in the sample only one was Moslem, 83% belonged toupper Hindu castes, even Brahmans, and only 3.3% came from thelower castes. Paradoxically, there is not much prestige attached to theprofession of research scientist; and, like most intellectual positions inthe public sector in India, it is poorly paid. Eisemon (1982, p. 138)explained it as follows: "The primary attraction of academic work [inIndia] is not to be found in autonomy, possibilities for professionalfuIfillment, social prestige, or material reward, but in security of employment. "
In an effort to better understand the professional choice made by theresearch scientists in our population, we asked them to rate eightcriteria from 1 (essential) to 5 (not important at aIl). We first calculatedan overaIl mean for each criterion in an effort to rank the criteria byorder of choice for the population as a whole (table 3.1).
Regardless of field or country of research, intellectual stimulation isby far the prime criterion since over 90% of the scientists felt that it waseither essential or very important, as we see in greater detaiI from thefollowing percentages: essential, 65.44%; very important, 27.81%;moderately important, 2.86%; not very important, 1.22%; not important at all, 0.81%.
Social utility was rated second; 60% of the grantees felt that it wasessential or very important. Usefulness has always been a motive thatresearch scientists bring out, almost as if it were their justificationbefore society. Social utility is given paramount emphasis in the DCswhere research must serve development and all too often is consideredto be a remedy for every possible economic and social ill.
The other six criteria were considered moderately important or notvery important in making the professional choice. Job security was

38 Scientists in the Third World
Table 3.1. Choosing Research Science as a Profession: Importance ofCriteria, in Descending Order
Criteria Means Rating
Intellectual stimulation 1.41 1Social utility 2.18 2Job security 2.98 3Promotion prospects 2.99 4Influence of a professor 3.15 5Social status 3.25 6Remuneration 3.33 7Parental influence 3.89 8·Means are based on a five-step scale as foIlows: 1 = essential, 2 = very important, 3= moderately important, 4 = not very important, 5 = not important at aIl.SouTce: Questionnaire for IFS grantees.
considered moderately or very important for over half the respondents. In countries where researchers are civil servants, such as Indiaand Mali, job security tends to be rated "essential." Prospects for quickpromotions are good, but promotions are not always accompanied byhigher pay, which explains why these two criteria are rated "moderately important."
Social status is also ranked rather low. The replies do not seem tohave any correlation with the socioprofessional origin of the scientists'parents, which tends to confirm that the profession does not commandgreat social esteem.
FinaHy, parents seem to have very little influence, at least positiveinfluence, on their children's decision to enter research since over 60%feel that this criterion was not very important (20%) or not important ataH (41%).
The respondents were free to add other criteria, but very few did so.Actually, an a priori, weH-weighted choice seemed to explain a career inscientific research after higher education less than the fact that studentswere selected or had access to a scholarship at the right stage of theireducation, even when it meant studying subjects that initiaHy did notinterest them. This is at least what cornes out of the interviews we havemade.
Initially 1wanted to do medicine but did not get good marks in my qualifying exams in science subjects. This was because in school 1 did not take anyscience subjects, butthe college 1wentto agreed to give me a trial nm atphysicsand chemistry. 1just got pass marks in these two subjects and thus could not
Research as a Profession 39
get into medical school. 1decided to do botany and zoology for a B.S. 1then didan M.S. in plant pathology. While on the M.S. program 1 got the RotaryInternational for Postgraduate Study. 1 thus went to Hawaii University to dotropical plant pathology. 1 did courses in nematology, bacteriology, virology,advanced plant pathology, etc. On my retum to Zambia, 1 joined the plantprotection section where 1concentrated on plant diseases, a11 the while furtherspecializing in nematology. 1was, and still am, the only specialist in this field inmy country.
1could have done all my studies in Nigeria, but the year before 1entered theuniversity U.S.AID had set up a scholarship program for the best students.After having been selected, 1went to the United States and rather per chanceended up studying botany, zoology, and chemistry since that was what 1wasoffered. Since 1was the top student in my graduating class after obtaining myB.S., it was easy to get a scholarship to go on for a Ph.D. At that stage 1wasasked to choose between two majors. 1chose forestry without rea11y knowingwhat effect that would have on my future career when 1got back to Nigeria.Since at that time 1 was at the Davis Campus of the University of California,which specialized more in straight agriculture, 1was supposed to stay there fortwo years and then go back to Berkeley to pursue my major in forestry. Butfina11y 1ended up staying at the Davis Campus. 1had favorably impressed thestaff at the Department of Agronomy and was asked to stay. 1graduated with aPh.D., top student in the Department of Agronomy and ... was asked to stayin the U.S., but six months later 1 decided to return to Nigeria. Although mycountry was in the middle of a civil war, 1had the feeling that if 1stayed in theU.S. 1 would somehow be betraying my country and my family that 1 lovedverymuch.
The second interview, which 1 have shortened, could be summarized by one sentence that came out during our talk: "The opportunity was there." Upon his return from the United States, thisNigerian spent four hard months seeking employment and finallyfound a job at the University of Hé. Now he is dean of the Faculty ofAgriculture and Agricultural Technology at the newly created OwerriFederal University of Technology.
1want to conclude this series of interviews with a young man fromthe Philippines who climbed the career ladder very quickly since he isnow the president of a leading agricultural college in his country.
My eventual involvement in scientific agriculture had been largely dictatedby circumstances rather than personal choice. Despite my farming backgroundand my boyhood in a rural setting, my first choice was engineering because ofmy love for machines. However, my parents would have had to spend moremoney and the University of the Philippines at Los Banos was an attraction toagriculture because of its prestige. Graduate work was not in my plans at the

40 Scientists in the Third World
start, but there remained my interest to discover new ideas, new things, andresearch was a good medium to execute ideas. In short, research Ied to highereducation and higher education Ied to more research, better discoveries andcontacts with other scientists. Needless to say, recognition of my work byinstitutions, colleagues, and farmers drove me harder into research. However,1found out that 1could not stay forever in one place without a break. Foreignassignment Iured me as a way of discovering new things, Ieaming new ideas,making new contacts, and, of course, bringing satisfaction not only to me butalso to the members of my family. The economic reward cannot be ignored.
Thanks to contacts at Texas A&M University where he had specialized in soil and crop science, he easily found a job in a U.S.AIDprogram in Haiti for two years before returning to the Philippines.Many scientists from the DCs are haunted by the desire to spend sornetime working outside of their home country. During my missionsmany of them asked me whether IFS or sorne other internationalorganization might be able to use their services. One major reason isthat salaries paid to national research scientists in many DC countries,especially in Africa, are inordinately low.
Remuneration
It is very difficult to obtain a clear view of the problem of wages forresearch scientists and, for a multitude of reasons, even more difficultto make comparisons between countries: different standards of living,convertibility of local currency, the effects of a black market, etc. 1triedto avoid the problem by asking our respondents to compare theirwages with the minimum national wage. 1 then tried to match theanswers to this question with the question on whether the salary theyreceived was "adequate" or "inadequate." (These were the only twochoices.) Of course, there was no question ofmaking comparisons withsalaries paid in the developed countries.
Before trying to interpret the results of table 3.2, we had to look atthe DCs that do not have a minimum guaranteed salary, countries thatbase salaries on the supply and demand of the labor market. Since inthe DCs supply far exceeds demand, salaries are very low. In Frenchspeaking Africa, for instance, the minimum monthly salary is somewhere around the equivalent of U.S. $100. Most of the scientists in ourstudy population eamed between 1 and 5 times this amount, like mostof the other scientists in the country, since close to two-thirds of them(64.92%) received between 1 and 5 times the minimum wage. Table 3.3shows the breakdown of salaries.

Research as a Profession 41
Table 3.2. Wages Paid to Research Scientists: Comparison withMinimum Wages in DCs and Relative Satisfaction
Multiple of Adequate InadequateMinimum Wage Satisfaction Satisfaction Total
1-5 82 27.5% 216 72.5% 298 64.9%6-10 69 53.1% 61 46.9% 130 28.3%Il and more 18 62.5% 13 37.5% 31 6.8%
Total 169 36.8% 290 63.2% 459 100.0%
Table 3.3. Salaries Paid to Research Scientists
Multiple ofMinimum Wage
12345
No. of Scientists
1261807571
Percentage
2.4%13.2%17.5%16.3%15.5%
The minimum salary varies greatly within a broad spectrum. Thelowest salaries are paid in India and the highest in certain countries ofLatin America and in Nigeria where an oil boom led to such inflationthat salaries were increased every week or fortnight in an unsuccessfulattempt to keep up with increases in the cost of living.
At the top of the scale, we see that there are very few (6.76%)scientists who eam as much as 11 times the minimum wage. Thehighest wage was obtained by the dean of a faculty in Nigeria whoeamed 99 times the minimum wage, followed by a scientist in India (80times) and another in Malaysia (40 times). 1was not able to check thesefigures, and 1 quote them for their indicative value only, with duecaution and reservation. Most scientists in the "over 11 times" groupeam between 15 and 20 times the minimum wage and reside in 19countries located on the three continents, but we have not noticed asignificant concentration in any given country.
It is not surprising that the higher the number of times a scientist'ssalary was over the minimum wage the more adequate he felt it was.We noted that over two-thirds (72.48%) of the researchers who eamed

42 Scientists in the Third World
Table 3.4. Nature of Second Job and Number of Hours Spent
Hrs. Spent Weekly on Side Job
Type of 21 andSide Job 1-5 6-10 11-20 More Total
Consultancy 16 26.2% 22 36.1% 18 29.5% 5 8.2% 61 38.6%Teaching 20 40.0% 14 28.0% 11 22.0% 5 10.0% 50 31.6%Agriculture 2 10.5% 4 21.1% 8 42.1% 5 26.3% 19 12.0%Commerce 1 5.6% 8 44.4% 6 33.3% 3 16.7% 18 11.4%Research 0 0.0% 3 2 1 6 3.8%Translations 0 0.0% 2 0 0.0% 0 0.0% 2 1.3%Other 0 0.0% 2 0 0.0% 0 0.0% 2 1.3%
Total 39 24.7% 55 34.8% 45 28.5% 19 12% 158 100%
between 1 and 5 times the minimum wage felt that their salary wasinadequate, a feeling that was shared by close to two-thirds (63.18%) ofthe whole study population, without reference to the multiple of theminimum wage. This explains why many of them supplement theirincome by working overtime on side jobs that include anything fromconsultant in their specialty to teacher to taxi driver.
Close to one-third of the IFS grantees said they had side jobs. Thispercentage may seem high, but we think that the number is actuallyhigher because for most of them it was illegal to have a second job,especially those holding a civil service position. None of the scientistsin India confessed to having a side job, and many of them in India andin other countries such as Morocco actually insisted that it was quiteimpossible to have a side job since it was illegal.
Anyone who has spent time with OC scientists quickly realizes that asecond (or even third) job and income are vital. Sorne of the scientistswent so far as to take us to their second place of work so that they couldcontinue discussing their IFS-funded project with us.
The question on the nature of the work is still open, but the types ofwork easily fit into four main categories (see table 3.4) that account forover 90% of the total: consultancy (38.61%), teaching (31.65%), agriculture (12.02%), and commerce (11.39%). Consultancy work is nearlyalways related to the fields developed in the research activity. Inaquaculture it is quite normal for a scientist working on the optimalpostlarvae production conditions for king prawns (MacrobrachiumrosenbergiiJ to oHer his services to a local shrimp breeding enterprise inwhich he may eventually buy shares. Two- thirds of the scientists who

Research as a Profession 43
also work as consultants spend a notable 6 to 20 hours a week on theiroutside job.
Teaching is less time consuming since over two-thirds of the scientists who supplement their normal jobs by teaching spend only between 1 and 10 hours a week on it. Teaching can mean workingovertime at one's normal place of work or, as is more often the case, atan outside institution.
Agriculture can involve anything from working on a coffee plantation to raising layer hens. A Ghanaian scientist in Kumasi one dayshowed us the hens he farmed in his backyard. The eggs were sold atthe local market and permitted him to double his income. Scientistsworking on commerce usually were lending a hand in a family enterprise.
Because salaries are unacceptably low, the question of additionalincome was repeated as a leitmotiv in the comments the scientistsadded to the questionnaire, as we can see from the following examples:
"The economic situation in my country and in many other DCs overthe last ten years has made it very difficult to work as a researcher.Salaries are too low. At present [around 1985] the net monthly wage fora scientist in Ghana is 2,500 Cedis [about U.S. $50]. This wage is so lowthat the scientist spends much of his time looking for another source ofincome."
"The very poor salaries paid to university professors in Pero forcesthem to look for other sources of income to support their famiIies, andtherefore they cannot spend a proper amount of time on their research.An unskilled worker gets a quarter of the salary paid to a seniorprofessor with 17 years of service behind him."
"Salaries paid to research scientists in Indonesia are so low that mostof my colleagues have left the university to work for private firms."
"The main constraint is the ridiculously low salaries that are paid toscentists in Sri Lanka. A bank employee with only primary schoolingeams a higher salary, without even counting the other advantages hecan enjoy. We scientists spend our holidays, our evenings, and ourweekends working for private companies and teaching as visitinglecturers just to be able to buy enough food to feed ourselves."
Outside jobs were of equal concem to scientists who studied abroadand to scientists who studied exclusively in their home country, but itseemed clear that the longer a scientist had been abroad the lesssatisfied he was with his salary. We were able to confirm that the longera scientist studied abroad the greater his qualifications and the higherhis rank in the hierarchy, which also meant a relatively higher salary.We can also postulate that for scientists who spent many years abroad

44 Scientists in the Third World
where they enjoyed certain economic benefits and the wages paid inthe developed countries it was difficult to accept the lower standard ofliving that awaited them upon their return home.
Choosing the Research Tapic
We saw that the decision to enter research and the choiee of disciplinescan be influenced by the possibility of obtaining a scholarship at acertain time in one's schoollife. This factor seems to be so dedsive thatsorne authors go as far as to daim that "the fact that a scientist isengaged in a particular scientifie specialisation does not necessarilymean that he is very interested in it" (Eisemon 1979, p. 515). Ooes thisalso apply to research topics? Various criteria have been considereddecisive.
ln a recent study Zuckerman (1978) concluded that there were twomain criteria, namely, the evaluation and perception of the scientifieimportance of a problem and the feasibility of solving it. Medawar(1967, p. 7) also underscored the importance of only choosing researchtopics that had perceivable solutions when he said, "If politics is the artof the possible, research is surely the art of the soluble."
Scientific literature is often inspiring for the scientist who is trying toidentify a problem, as a Cuban IFS grantee explained. "When 1left theuniversity in January 1974," he said, "1 was hired at the Botany Institute. 1was put in charge of the Plant Eco-physiology Oepartment in1980. When 1first started working at the institute, 1was asked to workon mycorrhiza. First 1 said no, claiming that 1 didn't know anythingabout the subject. The Oirector of the Institute then gave me an articleby Barbara Mosse that was published in 1972 on the effects of variousstrains of mycorrhizal fungi on the growth of Paspalum notatum, afodder grass commonly found in Cuba."
A research topic might also be chosen because there is a fair chanceof having the results published in a specialized journal. This idea wasset out in an Indian research publication cited above in an interviewwith an Indian physicist who said, "We draw up projects by lookingthrough papers in the 'PhysicalReview,' the 'Journal ofPhysics,' etc. tofind out what types of things are being done, because if you don't dothat, you don't get a job here. You have to publish in those journals, soyou must do something which they are doing." (Shiva and Bandyopadhyay 1980, p. 583).
The choiee ofa topie may also depend on the equipment available forresearch. A grantee from Costa Rica who was in Belgium working onthe chemistry of synthetic products mainly applied to antibiotics had to
Research as a Profession 45
stop his research when he returned to his country because of lack ofproper infrastructure. He decided to switch to the chemistry of naturalproducts because someone else from the department of chemistry hadjust returned from a year's specialization in this field in the UnitedStates and the equipment required to begin the research was available.
Another factor that plays a considerable, even a vital, role in choosing a subject for research is funding; the researcher's need to acceptsorne concessions is discussed in chapter 4.
We have just seen that the choice of a research subject can beinfluenced by a series of factors, sorne of which are external to thescience involved. In fact, most often several factors intervene simultaneously in this choice: "Decisions made by scientists regarding problem choice emerge from a complex process of negotiation withinthemselves and with other scientists, administrators, and clients"(Busch and Lacy 1983, p. 44).
In an attempt to determine the relative importance of the differentfactors that may have played a part in the choice of research subject ofIFS grantees, we have adapted Busch's list of criteria that has beentested in the United States and in Sudan (Busch and Lacy 1983, p. 45) tothe requirements of our study by both eliminating and adding a fewfactors. Our basis was the mean figures obtained from a system basedon a scale offive numbers (running from l, w hich signified "essential,"to S, which signified "not important at aH"). We established a classification of the 20 choice criteria offered to the researchers, as can be seen intable 3.5.
The leading criterion, "importance to society," takes us back to thecriterion that was in second position in the list on choosing research asa profession, namely, "social utility." Here again we see the scientist'sneed to justify himself to society. When we asked the grantees whatthis concept meant to them, they indicated that social utility was moreor less the capacity of research to solve the economic and social problems facing their country. This criterion is rather close to other criteriain the list, e.g., likelihood of clear empirical results (rated ninth) and toa lesser extent, potential marketability of the final product (ratedtwelfth).
The fact that the top four criteria refer to a fairly heterogeneousassortment of concepts is probably significant and indeed tends toconfirm the hypothesis that the choice of a research subject dependsmore on a series of factors than on any one single factor.
It is also interesting to note that the position of the first six criteria onour list corresponds (although in a different order as concerns the firstthree and excepting the fifth criterion, which is different on the two

46 Scientists in the Third World
Table 3.5. Research Problem Choice: Relative Importance of VariousCriteria
BuschRank Mean class 'nDC Criterion Scorea USAb
1 Importance to society 1.76 22 Potential creation of new methods, useful materials,
and devices 1.88 53 Enjoy doing this kind of research 2.06 14 Scientific curiosity 2.23 45 IFS priority area 2.286 Publication probability 2.34 67 Availability of research facilities 2.40 38 Potential contribution to scientific theory 2.45 129 Likelihood of clear empirical results 2.65 8
10 Access to external funding 2.67 (9)c11 Currently a "hot topie" 2.71 1512 Potential marketability of final product 2.71 1713 Priorities of the research organization 2.71 1114 Length of time needed to complete project 2.82 1615 Credibility of other investigators doing similar
research 3.07 1416 Access to funding from your institution 3.21 (9)c17 Feedback from extension personnel 3.30 2018 Colleagues' approval 3.33 1819 Subject of your thesis 3.4920 Demands raised by clientele 3.59 13
aThe mean is based on a 5 number scale: 1 = essential, 2 = very important, 3 =moderately important, 4 = not very important, 5 = not important at ail.bBusch classification was based on a sample of 1,431 research scientists and used aseries of 21 criteria.«9) = Funding only.
lists) to what Busch and Lacy (1983) established in the United Stateswhen working on a sample of 1,431 American researchers employed inthe agricultural sciences. From a broader comparison that includes thelist as a whole, we see that, with but a few exceptions, the two lists arerelatively similar. This leads us to believe that the IFS grantees in ourpopulation have more or less adopted the same reference systems asconcerns criteria used for choosing research subjects as Americanresearchers working in comparable fields. Furthermore, when assessing whether studying abroad affected the relative importance assignedto the first ten criteria, we found that there was no really significant

Research as a Profession 47
difference in ratings by students, whether they had studied-for varying periods of time-abroad or even had not studied abroad at aIl. TableAS in Appendix C, for instance, shows that the number of years spentabroad does not have a signifieant effect on the importance assigned tothe criterion "potential contribution to scientifie theory" used in choosing a research subject.
The DC scientists in our population assign more importance thantheir American colleagues to criteria such as "potential creation of newmethods, useful materials and deviees," and "potential contribution toscientific theory," which are more characteristic of basie research. Onthe other hand, the fact that the criterion "demands raised by clientele"is at the bottom of our list no doubt reflects the marginal position ofscience in the DCs and supports the theory that research scientists andscientific institutions are kept out of the production lines because of theabsence of a "demand-pull" the economie system could have on thelocal know-how production system.
It is also probably signifieant that the importance of "the availabilityof research facilities" is underestimated by the scientists, who rate itseventh on the list of criteria used in choosing the research subject, andyet second on the list of constraints to progress in their research work.Perhaps there is an effort to mask reality when choosing a researchsubject so as to gloss over the objective impossibility of carrying out agiven piece of research even if there is a risk of having to face harshreality later. It also seems significant that the "IFS priority area" cornesfifth and "access to funding from your institution," sixteenth. Theproportion of external financial aid represents an ever larger percentage of research budgets in the DCs and, pari passu, influences thechoiee of research subjects. Chapter 4 looks at this subject in greaterdetail.
In an endeavor to determine the relative influence of various peopleon the choiee of the research subject, we used the same method as forchoosing the research subject. We prepared a series of 12 people orgroups of people on a list thatwe submitted to the grantees. The results(table A6, Appendix C) indicated that the people in the series had littleor no influence on the grantees and that there was little variation in theanswers from whch we calculated the means. The person who had thebiggest influence on the scientist's choice of research subject was hisimmediate superior whose mean score was 3.31, calculated on the basisof the following ratings: 1 = essential, 15%; 2 = very important, 20%; 3= moderately important, 17%; 4 = not very important, 15%; 5 = notimportant at aIl, 33%.
Actual1y, many respondents added their own names to the list,

48 Scientists in the Third World
Table 3.6. Relation of Thesis Subject to IFS-Funded Project as aFunction of Country of Doctoral Studies
Country of Direct Little or NoDoctoral Studies Relation Relation Total
IC 107 50.5% 105 49.5% 212Asia 29 87.9% 4 12.1% 33Africa 24 88.9% 3 11.1% 27Latin America 1 3 4
Total 161 58.3% 115 41.7% 276
indicating that they were the person who had had the greatest influence on the choice of research subjects. The thesis supervisor and thesubject of the thesis were not reported to have much effect on thechoice of the research subject since the mean scores were 3.72 and 3.49,respectively. Yet 1was able to confirm that in close to 60% of the casesthe subject of the thesis was directly related to the work that thescientist would be researching in his home country after completinghis thesis.
The percentage varies considerably as a function of place of study,i.e., in an industrialized country (IC) or De. For half the students whostudied for their doctorate in an IC, as table 3.6 shows, there was littleor no connection between the IFS-funded research and the subject ofthe thesis, while close to 9 out of 10 doctorates obtained in Asia(87.88%) and in Africa (88.89%) were directly related to the IFS-fundedresearch project.
There are too few doctorates from Latin America to be able tocalculate any significant percentages. These results seem very important to us since a large number of scientists who studied in ICs had tochange research subjects when retuming to their home countries.There were many reasons (table 3.7), but the main one was related tomatching research work with national needs.
A researcher who had worked on the problem of nutrition linked toobesity in the United States quite obviously had to change subjectsupon his retum to Thailand; he decided to work on controlling thethiamine (vitamin BI) deficiency caused by consuming too much teaand tannin.
The initial reflex of an African researcher who had studied in vitrocultivation of endives in France was to continue his work when heretumed to Congo, especiaily since he saw that endives grew weilthere. After further thought he decided to study the plant growth

Research as a Profession 49
Table 3.7. Reasons for Changing Research Subjects
C1assi- No. offication Reason Scientists Percentage
1 To work on problems of local importancerelated to my country's needs 46 38.3
2 To work in more applied research 17 14.23 Lack of equipment 17 14.24 To work in a new field 12 10.05 To expand my knowledge to other fields 7 5.86 To participate in a conference 6 5.07 Possibility of obtaining funding 5 4.28 Other 10 8.3
Total 120 100.0
physiology of Gnetum africanum, a localleafy vegetable that was disappearing. In 1985 he obtained his Doctorat d'Etat from the Universitéd'Orléans after defending a thesis on this subject.
Why scientists change subjects is an open question. 1 did not havemuch difficulty in grouping the answers, except as concemed thefourth reply, "to work in a new field." The scientists in this group, i.e.,10% of a11 those who changed research subjects, gave rather variedanswers that were not always easy to interpret. In sorne cases it merelymeant changing subjects; in other cases it meant initiating work in afield that was new to the country. Part of the answers probably couldhave been grouped with the answers at the top of the classifications list,but for reasons of precision 1 decided to isolate this group. If werecognize that the two reasons that tied for second position are closelycorrelated to the first reason, we can conclude that close to two-thirdsof the researchers changed subjects in order to adapt to local conditions, i.e., for reasons of relevance or lack of resources.
Retuming to the subject of the thesis, we see that the more recent thedate of the doctorate the more direct the relationship is between thesubject of the thesis and the current research work (table 3.8). Theseresults were as expected and could be explained by essentia11y threereasons.
First, the percentage of doctorates awarded in the DCs is increasing(chapter 2, table 2.6), and we have just seen that sorne 90% of thesubjects of doctoral theses completed in the DCs were directly relatedto the scientists' current research. Second, increasing attention is beinggiven in the developed countries to the relevance of the thesis topie;

50 Scientists in the Third World
Table 3.8. Relation of Thesis Subject to IFS-Funded Research as aFunction of Year Doctorate Obtained
Year ofDoctorate
1960-691970-741975-79198D-85
Total
DirectRelation
18 48.7%27 42.9%47 54.0%66 76.7%
158 57.9%
Little orNo Relation
19 51.3%36 57.1%40 46.0%20 23.3%
115 42.1%
Total
37638786
273
Table 3.9. Relation of Thesis Subject to IFS-Funded Research as aFunction of Discipline
Direct Little orDiscipline Relation No Relation Total
Aquaculture 24 55.8% 19 44.2% 43Animal production 28 71.8% 11 28.2% 39Crop science 59 71.1% 24 28.9% 83Forestry 12 60.0% 8 40.0% 20Food sciences 17 56.7% 13 43.3% 30Natural products 37 50.7% 36 49.3% 73Rural technology 4 40.0% 6 60.0% 10
Total 181 60.7% 117 39.3% 298
and even when the research for the thesis is done completely in adeveloped country, special efforts are made to allow the student!researcher to work in experimental conditions that are as similar aspossible to those prevailing in his home country. In crop science, forinstance, we closely monitored various research activities leading to athesis in whieh the student had imported plant material from his homecountry and used it in greenhouse or growth chamber conditionswhere he could control the temperature, light, and hygrometry. Third,a research scientist, as he progresses in his career, is justified in changing research subjects; it would be abnormal for him not to do so.
The relation of the thesis topie and the IFS-funded research variesaccording to subject, as we can see in table 3.9. The closest links arefound in fields like agronomie research in the broad sense of the term

Research as a Profession 51
and in rural development, i.e., animal production, crop science, andforestry.
Many scientists now working on aquaculture, a relatively recentresearch area requiring a multidisciplinary approach, were trained in arelated discipline such as oceanography, hydrology, marine biology, orfisheries. After completing their studies, not without difficulty, theyswitched to aquaculture. There are a few universities highly reputed inthe field of aquaculture, such as Auburn in the United States andStirling in Great Britain. Other efforts to create regional training centersto work with research centers on aquaculture in the DCs, e.g., thePhilippines, China, Nigeria, and Brazil, are very recent.
Rural technology is the field where we find the weakest link between the thesis topic and the IFS-funded research. We have theexample of the African researcher who used to work on theoreticalphysics applied to nuclear energy in France. Upon his return to Senegal, he had to start working on the solar energy requirements of aprogram to design solar dryers for fish and other foodstuffs. The lasttime we met was in 1985 in Dakar. Unfortunately, he had stopped aIlresearch activities because his teaching obligations did not leave himenough time. He wanted to obtain a Doctorat d'Etat from the Université de Nice in France in order to become a full-fledged professor butfelt that the results of research on solar energy would not generateenough data for a doctoral thesis. Thus, he went back to his originalspecialization, nuclear physics, and prepared a thesis on the radiationof uranium and radium.
The last example reveals the importance and the influence of theenvironment in which the researcher works on the research methodsand the choice of research subjects. Research scientists devote varyingamounts of time to research. Much depends on the objectives of theirhome institute as we will see by the following.
Institutional Contexts
The institutes where our grantees work can be grouped as shown intable 3.10. We made a distinction between agricultural colleges and"general" universities. The former usually have research programs thatare defined in close conjunction with development targets. They alsousually have experimental farms and test plots and, in certain cases,their own extension services. The main ones include the Tamil NaduAgricultural University at Coimbatore, India, the College of Agriculture of the University of the Philippines at Los Banos (UPLB),

52 Scientists in the Third World
Table 3.10. Institutions Where Research Scientists Work
Type of Institute
University (general)National research instituteAgricultural collegeResearch institute in a universityMinistryDevelopment agencyRegional research institutionPrivate institutionOther
Total
No. of Scientists
261109553312
7525
489
Percentage
53.4%22.3%11.2%6.7%2.5%1.5%1.0%0.4%1.0%
100.0%
Philippines, and the Hassan II Institute of Agronomy and VeterinarySciences at Rabat, Morocco.
We have established two subgroups for the research institutes:national research institutes and university research institutes. AIthough the latter generally have their own statutes that guarantee theirindependence from the host university, they usually maintain preferred relations with the university that entai! admitting postgraduatestudents to their research programs and teaching. One of the mostdynamic examples is the Institute of Chemistry at the University ofKarachi in Pakistan.
Research in small countries that do not have national research institutions can be conducted under the auspices of a ministry or adevelopment agency or service. But it must be kept in mind that themain function of the latter is development or extension, not research.Regional research institutions are new to the DCs. Quite a few alreadyexist in Southeast Asia, e.g., the Southeast Asian Fisheries Development Center (SEAFDEC), which has two main centers, one in thePhilippines and one in Thailand. Since they are generally properlyfunded, IFS has made no special effort to consider candidates fromamong the young researchers working there.
Nearly all the scientists in our study population (97.5%) work forgovernment institutions, and about two-thirds (71.37%) of this groupwork in a university establishment. Let us see what effects this canhave on the time devoted to teaching and thus, indirectly, on theirresearch (table 3.11).
The first conclusion that can be drawn from table 3.11 is that morethan half the researchers (55%) devote a hefty 20% to 60% of their time

Research as a Profession 53
Table 3.11. Percentage of Time Spent Teaching According to HostInstitution
Research% of Institute NationalTime Spent Agricultural within a ResearchTeaching University University University Institute Total
0 11 4.2% 1 1.8% 10 30.3% 57 52.8% 79 17.4%1-20 28 10.8% 8 14.8% 12 36.4% 45 41.7% 93 20.4%21-40 94 36.2% 27 50.0% 9 27.3% 4 3.7% 134 29.4%41--60 97 37.3% 15 27.8% 2 6.0% 1 0.9% 115 25.3%61--80 27 10.4% 3 5.6% 0 0% 1 0.9% 31 6.8%81-100 3 1.1% 0 0% 0 0% 0 0% 3 0.7%
Total 260 100.0% 54 100.0% 33 100.0% 108 100.0% 455 100.0%
to teaching activities. Obviously, the heaviest teaching load is shouldered by researchers working in universities where close to half theresearchers spend more than 40% of their time teaching. The timedevoted to teaching seems to be relatively less in agricultural universities than in other universities. Researchers in research instituteslocated on university grounds sometimes spend a nonnegligible part oftheir time teaching, although 30% of them do not teach at aIl. It isimportant to observe that there is no hard-and-fast barrier separatingthe universities and the research centers since more than 40% of theresearchers in the research centers devote between 1% and 20% of theirtime to teaching.
The percentage of time spent on teaching obviously also depends onthe researcher's functions within his home institution. This largelyexplains why 4% of the scientists in the universities do not teach at aIl,viz., most of them hold high-Ievel posts involving administrative duties that leave little or no time for teaching or research.
Table 3.12 shows the 10 main functions of IFS grantees in theiruniversities and research institutes. Classifications have been workedout using equivalences for titles and thus are based partIy on approximations.
The first observation that we can make is that most of the scientists(90%) still have functions that should allow them to conduct research.Percentagewise the most widespread function in the university issenior lecturer (27.1%); and in the research institutes, the main function is research officer (11.2%).
Checking the effects of years spent abroad on the functions of the

54 Scientists in the Third World
Table 3.12. Present Employment as Related to Years Spent Abroad
Years Abroad
Present Employment 0 1-2 3-4 5-9 10-20 Total
UniversityLecturer 21 12 24 21 4 82
35.6% 12.4% 21.3% 15.6% 16.6% 19.2%-Sr. lecturer 13 21 33 43 6 116
22.0% 21.6% 29.2% 31.9% 25.0% 27.1%
Professor 6 15 25 32 6 8410.2% 15.5% 22.1% 23.7% 25.0% 19.6%
Dean 0 0 1 2 2 5.9% 1.5% 8.3% 1.2%
Vice chancellor 0 0 1 3 1 5(Dep. vice chanc.) 0.9% 2.2% 4.2% 1.2%
Research Institute
Research assist. 4 7 1 0 0 126.8% 7.2% 0.9% 2.8%
Research officer 9 18 12 8 1 4815.2% 18.6% 10.6% 5.9% 4.2% 11.2%
Sr. research officer 1 10 6 4 1 221.7% 10.3% 5.3% 3.0%" '4.2% 5.1%
Lab. supervisor 5 11 5 11 0 328.5% 11.3% 4.4% 8.1% 7.1%
Director of 0 3 5 11 3 22institute 3.1% 4.4% 8.1% 12.5% 5.1%
Total 59 97 113 135 24 428100.0% 100.0% 100.0% 100.0% 100.0% 100.0%
scientists, we saw that in the university the effects were greatest onprofessors. Hence, the person who has spent between 10 and 20 yearsabroad has two and one-half times more chance of becoming a professor than the person who completed aIl of his studies in his homecountry. The influence is even clearer for the position of dean and vice-
Research as a Profession 55
chancellor. For the latter two functions, however, our results comefrom small samples; and we should avoid exaggerated generalizations.
For the research institutes, the post of director seems to be the onethat is most strongly affected by stays of varying duration abroad. AlI ofthe 22 IFS grantees who became research institute directors had spentsorne time studying abroad. A scientist who studied abroad for 10 to 20years had four times more chance of becoming the director of a research institute than the scientist who studied abroad for 1 or 2 years.
Here again we have to be careful in interpreting these results because a post assignment is the result of a whole gamut of interactingfactors. We saw previously that obtaining a doctoral degree could berelated to the number of years spent abroad (chapter 2, table 2.7). Andthe number of years spent abroad can also be correlated with age. It isin the 40 to 49 year age group that we find the highest number ofscientists who spent at least 10 years abroad (table A7, Appendix C).

Chapter Four
Practicing Research
Time Devoted to Research
ln the preceding chapter we saw that the time devoted to teachingdepended on the nature of the scientist's home institution. We can saythe same for the time devoted to research, which, moreover, is inversely proportionate to the time spent on other functions in the institutionsuch as teaching and administration. It also depends on the type of jobthe researcher or teacher/researcher has in the institution as table 4.1clearly shows.
As one might expect, it is the young scientists early in their careerswho devote the most time to research, e.g., research assistants, whospend more than 60% of their time on research activities. In the universities, professors forrn the category that devotes the most time toresearch, although only about 12% spend more than 60% of their timeon it. We can thus assume that professors turn over part of theirteaching obligations to senior lecturers and even more so to lecturers. Itis interesting that the vice-chancellors and their deputies reserve atleast a small amount of time for research. The directors of certainresearch institutes seem to participate very actively in research since30% of our respondents told us that it consumed 30% to 60% of theirtime, and 6% reported spending more than 60%. A partial explanationmay be that sorne research institutes in the Des are small and short ofscientists. The directors of such institutes devote considerable time toresearch partly because they are not bogged down by their administrative duties and partly to compensate for the shortage of scientists.Further, most of the scientists in our sample are working in countrieswhere research institutes are quickly developing and growing in numbers. The result has been that they rapidly climbed up the career ladderto reach posts of very great responsibility, in sorne cases withouthaving had enough time to confirrn their research capabilities.
We have often seen that the average career ofa De scientist is shorterthan that of a scientist in an le. Let us look at two examples. The firstone concerns a young West African research scientist who, afterlengthy studies in France, retumed to his home country and withinseven years became department head, dean of a university faculty, and
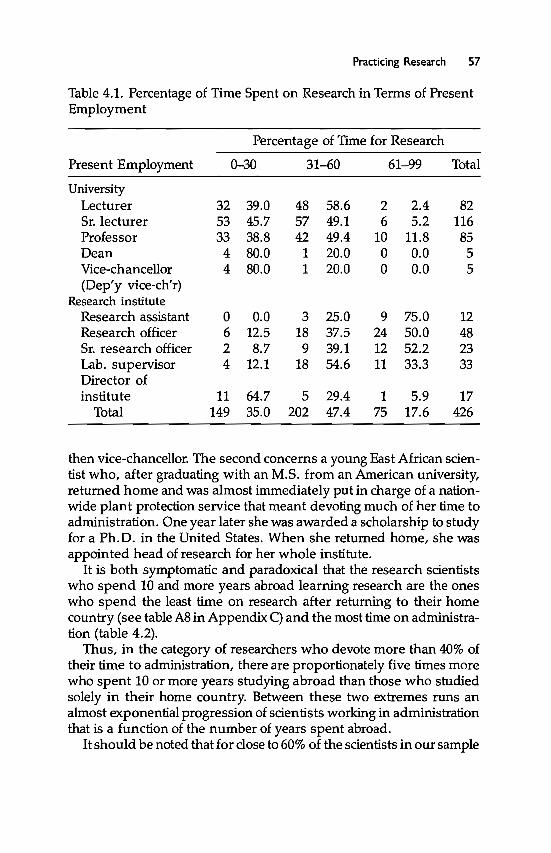
Practicing Research 57
Table 4.1. Percentage of Time Spent on Research in Terms of PresentEmployment
Percentage of Time for Research
Present Employment 0-30 31-60 61-99 Total
UniversityLecturer 32 39.0 48 58.6 2 2.4 82Sr. lecturer 53 45.7 57 49.1 6 5.2 116Professor 33 38.8 42 49.4 10 11.8 85Dean 4 80.0 1 20.0 0 0.0 5Vice-chancellor 4 80.0 1 20.0 0 0.0 5(Dep'y vice-ch'r)
Research inslituteResearch assistant 0 0.0 3 25.0 9 75.0 12Research officer 6 12.5 18 37.5 24 50.0 48Sr. research officer 2 8.7 9 39.1 12 52.2 23Lab. supervisor 4 12.1 18 54.6 11 33.3 33Director ofinstitute 11 64.7 5 29.4 1 5.9 17
Total 149 35.0 202 47.4 75 17.6 426
then vice-chancellor. The second concems a young East African scientist who, after graduating with an M.S. from an American university,returned home and was almost immediately put in charge of a nationwide plant protection service that meant devoting much of her time toadministration. One year later she was awarded a scholarship to studyfor a Ph.D. in the United States. When she returned home, she wasappointed head of research for her whole institute.
It is both symptomatic and paradoxical that the research scientistswho spend 10 and more years abroad learning research are the oneswho spend the least time on research after returning to their homecountry (see table A8 in Appendix C) and the most time on administration (table 4.2).
Thus, in the category of researchers who devote more than 40% oftheir time to administration, there are proportionately five times morewho spent 10 or more years studying abroad than those who studiedsolely in their home country. Between these two extremes runs analmost exponential progression of scientists working in administrationthat is a function of the number of years spent abroad.
Itshould be noted that for dose to 60% of the scientists in our sample

58 Scientists in the Third World
Table 4.2. Time Spent on Administration by Number of Years SpentStudying Abroad
No. ofPercentage of Time on Administration
Years Ahroad 0-10 11-40 41-99 Total
0 52 71.2% 18 24.7% 3 4.1% 731-2 69 61.1% 34 30.1% 10 8.8% 1133-4 64 54.7% 41 35.0% 12 10.3% 1175-9 82 54.3% 48 31.8% 21 13.9% 15110-20 11 40.8% 9 33.3% 7 25.9% 27
Total 278 57.8% 150 31.2% 53 11.0% 481
administrative duties consume less than 10% of their time; and forslightly over 10% of the scientists, administrative duties consume over40% of their time.
Here again, we realize that greater precision would require a multifactorial analysis. Yet it is interesting to observe that training abroadseems to confer eligibility for a position of responsibility for which thescientist has no exceptional qualification. Actually, the purpose ofgoing abroad is to leam research, not research administration; these aretwo very different activities that require very different capabilities.
We have seen previously that among the criteria used to chooseresearch topics the scientists in our population favored criteria thatwere more or less directly connected to, or seemed to be characteristicof, basic research. It is practically impossible to find functional definitions that rigorously distinguish "applied" from "basic" research. Pasteur was no doubt right in stressing that "there is no single category ofscience which we can caU 'applied science': there is science and thereare applications of science, the two being linked as a fruit is to the treethat bears it" (cited by Salomon 1970, p. 141). Furthermore, scienceconsidered as basic in one context may be considered as applied inanother. The IFS has a small number of detractors who say its researchprogram leans too heavily toward applied science, while others say its(over)emphasis on basic science is detrimental to a development foeus.The latter point of view is shared by a handful of Dutch and Belgianadministrators. Belgium, partly for this reason, decided to stop financing IFS activities, just a few months before the King Baudouin Foundation awarded IFS the King Baudouin Prize for development!
It seems significant that a not negligible number of researchersfound it difficult to distinguish between the time spent on "applied"

Praeticing Research 59
Table 4.3. Apportionment of Time among Teaching, Basic Research,Applied Research, and Development (average percentages)
In department orresearch group
Present Ideal
In IFS-supportedresearch program
Present Ideal
TeachingBasic researchApplied researchDevelopment
38.117.429.912.6
29.121.732.316.9
25.321.837.512.5
20.923.237.716.8
and on "basic" science. In an attempt to assess the overall orientation oftheir research and to help them with this breakdown, we suggestedthe following definitions, adapted from those used by the NationalScience Foundation (Kidd 1959):
Basic research stresses increases of knowledge in science, with "theprimary aim of the investigator being fuller knowledge or understanding of the subject under study, rather than a practical applicationthereof."
Applied research is directed toward practical application of knowledge. It covers "research projects that represent investigations directedto discovery of new scientific knowledge and that have specified commercial objectives with respect of either products or processes."
Development may be summarized as "the systematic use of scientificknowledge directed toward the production of useful materials, devices, systems, or methods, including design and development ofprototypes and processes. "
We asked the grantees to indicate the apportionment of their time(table 4.3) between teaching, basic research, applied research, anddevelopment activities, using the definitions set out above. Further, tofind out how satisfied they were, we asked them to characterize theideal time apportionment. In an effort to work out a comparison withcolleagues outside of IFS, we asked about the distribution of timewithin their department or research group. It was obviously not possible to check the results since they represented the personal assessmentof each scientist we consulted.
The first clear observation is that IFS grantees seem to devote moretime to research (an average of 60%) than their colleagues working inthe same department or research group and thus spend less timeteaching. On the whole they felt that they devoted more time to applied

60 Scientists in the Third World
Table 4.4. Breakdown of Time Devoted to Basic Research, AppliedResearch, and Development: Comparison of IFS and AmericanResearch Scientists (Average Percentages)
Basic researchApplied researchDevelopment
IFS
305217
American
305513
research (37.5%) than to basic research (21.8%) or to development(12.5%). Were they free to choose, they would spend less time onteaching, more time on basic research, and much more time on development. They seem generally satisfied with the amount of time theyhad for applied research. For purposes of comparison with the resultsobserved by Busch and Lacy (1983, p. 66) in the United States, wediscounted the time spent on teaching and recalculated the percentageof time spent on research and development on a basis of 100. Thecomparison is again quite instructive as table 4.4 shows us.
Thus, the scientists in our group and American scientists working incomparable fields spend exactly the same percentage of their time onbasic research. The time our group spends on applied research isslightly less and the time on development, slightly more, although thedifferences are not significant. Here again OC and American researchersseem to feel almost identically about the research they practice.
These results are means and thus conceal interdisciplinary differences. Chemistry and microbiology research scientists daim tospend at least 50% of their time on basic research. Conversely, scientistsresearching crop science and animal production devote 15% to 20% oftheir time to basic research. Busch found the same time distributionamong the American research scientists.
To condude, let us consider where the scientists worked during the12 months immediately before the survey:
in the laboratoryin the officein the fieldin the libraryin animal and plant
experimental areaselsewherein the computing facilities
30.3%22.8%20.0%14.9%
5.3%3.5%3.2%

Practicing Research 61
Table 4.5. Expenses for R&D Expressed as a Percentage of GNP
ICsaDCSbAfricaNorth AmericaLatin AmericaArab statesAsiaEuropeOceaniaUSSR
1970
2.360.300.332.470.320.311.021.701.104.04
1975.
2.250.360.352.130.510.231.081.781.044.79
1980
2.240.439.362.180.530.271.181.791.114.67
aAll the European countries, USSR, United States, Canada, }apan, Israel, Australia,and New Zealand.bAil the other countries in the worId.
This is the distribution of time, expressed as percentages, devoted taresearch for aU disciplines combined. A tiner analysis would undoubtedly bring out more details on differences between the disciplines,probably showing that differences could be related ta level of educationor position within the institute.
Funding Research
In chapter 3 we hastily observed that access ta funds was a criterion thataffected the choiee of research tapie and that its importance was greatest when funding was obtained from IFS, that it was less when it camefrom an institution other than the grantee's home institute, and that itwas least when it came from the budget of the grantee's institute.
After this abridged picture of R&D funding in DCs, let us look atthe size of the budgets available ta grantees before and after receiving the IFS grant, the relative importance of different sources of research funds, and the effects on the choice of research tapie andmethod.
The 1985 UNESCO statistics (table 4.5) show that R&D outlay in theDCs was estimated on the average ta be 0.30% of the GNP in 1970 androse ta 0.43% in 1980. During this same period of time, outlay for R&D
62 Scientists in the Third World
in DCs as compared to worldwide outlay rose from 2.3% to 6%.Globally, R&D has been allocated greater financing in the DCs, but thebenefits have not been the same everywhere. In Latin America andAsia, R&D funds doubled between 1970 and 1980, while in Africa theincrease was very slight. A more detailed study shows that a goodlypart ofR&D investments in the DCs was consumed in countries such asIndia and Brazil.
The last decade has been marked by considerable change. At thebeginning of the 1970s, efforts were made systematically at both thenational and the international levels to promote and support R&Dactivities in the DCs. The efforts were expressed through the creation ofnew organizations and an increase in the number of donors and theiroverall financial contributions.
External funding agencies have been paying for increasing parts ofresearch budgets in the DCs. In the field of agricultural research in theDCs as a whole, the figure has reached sorne 40% (Oram 1985). In sorneAfrican countries such as Mali, Mozambique, Senegal, Lesotho,Swaziland, and Zambia, the contribution has been as high as 70% andeven higher. Here again the difference is very great since foreign aidonly accounts for less than 15% of the national R&D budgets in Cameroon and Sudan. In sorne countries the number of donors involved inresearch financing is so great that it is practically impossible to determine the share that cornes from the national budget. In any case, thiswas the conclusion drawn in a recent report by ISNAR (1983) onresearch on agriculture and livestock in Burkina Faso. The report statedthat each year this little country received no less than 340 visits fromforeign governmental, multilateral, and international agencies for development-oriented research.
This erratic growth of foreign aid and the absence of coordinationcause serious problems, e.g., the capacity to absorb this aid, the excessivenumbers of task forces and individual visits for a variety of aid programsand sorne small projects, and the impossibility of integrating aid programs into national technieal and financial administration structures.
Moreover, when the level of foreign financing reaches the highpercentages referred to above, the consequences can be serious ifdonors decide to withdraw. These risks are unfortunately feH in manyDCs. The 1983 report by the committee of viee-chancellors of Australian universities on the situation in the University of Pacifie South(UPS), whose main campus is in Fiji, is very telling.
Besides its own budget of 10 million Fiji dollars, UPS receives an additiona15to 10 million for foreign-financed projects each year. These sums are difficult to
Praeticing Research 63
budget because of their unpredictability. Sorne of the donors by principlerefuse to fund administrative costs which usually amount to at least 15%. Thismeans that UPS has to draw this money from its own budget. Grants are alsooften tied to specifie activities on the donors-but not on UPS-list of toppriorities. The money is also very tightly controlled, in other words, cannot heallocated with any degree of flexibility. Furthermore, in many cases it has to heused to acquire inputs, he it personnel or materials, from the donor country.Donors are attracted mostly to projects that are easy to identify or see, such as abigbuilding or a large piece of equipment that can display a plaque showing thename of the donor. Furthermore this type of a project has the potential risk ofhaving to change size, objective, or duration. The donor even has the unilateralpower to bring it to a haIt, a decision that may he the result of a change ofgovemment, govemmental policy or economic conditions in the donor country.
The more diversified the financing, the greater the number of potential funders, the more time has to be devoted to receiving representatives of the various donor organizations, taking them through theresearch centers, filling in funding applications, organizing fund management along the lines set out in the specifie requirement forms andcriteria papers of each of the donors, drafting midterm or final progressreports, participating in evaluation groups/ etc. An African IFS granteewho became a research project administrator had the following to say:"1 have had my new position for a year and a half and could now devotepart of my time to research if we weren/t totally submerged by thedonors' requirements. At the moment1have 13 research projects goingon whieh are financed by extemal aid. Keeping the donors, with their.demands for reports, for meetings and their consultants satisfied, etc.takes up most of my time."
An Asian grantee who was asked about the impact of IFS financingon his research very openly said, "To the extent that 1 am simultaneously associated with a large number of research programs financed by diverse institutions, it is difficuIt for me to distinguish thecontribution of the IFS and to evaluate its impact on the whole of myachievements. "
A recent study conducted by the extemal financing service of theUniversity of Costa Rica included a list of 72 sources of foreign financing for research for the period from 1976 to 1984 (Costa Rica 1985).
ln order to study the size of the budget that the researchers in ourpopulation commanded, we asked them to evaluate their mean annualbudget (not including their salary) before and after receiving an IFSresearch grant. Apparently, many of them found it diffieult to evaluatetheir research budget since 118 researchers did not reply. The mean

64 Scientists in the Third World
Table 4.6. Obtaining Funds to Complement IFS Grant
Question: Has being an IFS grantee made it easier for you to obtainother funding from
Yes No
Your home institutionSorne other national institutionSorne international institutions (other than IFS)
42%24%20%
58%76%80%
obtained for all the researchers shows that they controlled an annualbudget of V.S. $5,682 before and V.S. $13,889 after receiving an IFSgrant. Since the difference, Le., V.S. $8,207, is slightIy above theaverage IFS grant, it may be assumed that the IFS grant has had acertain catalytic effect and facilitated the obtainment of supplementaryfunding. This hypothesis was confirmed by a large number of grantees, as table 4.6 indicates.
Before obtaining an IFS grant, close to 60% of the grantees controlled between nothing (19%) and V.S. $2,000; and close to 90% ofthem controHed less than V.S. $10,000.
Figure 4.1 shows the distribution of the size of the survey respondents' annual budgets after receiving an IFS grant. Thus, we learnedthat more than 30% of them controHed budgets of over $10,000 a year(excluding their own salary). There are 12 researchers who administered more than V.S. $60,000 a year. Paradoxically, almost aH areAfricans who are, for the most part, coordinating national programsthat are more development than research oriented. Between 40% and90% of their total budgets are financed by their home institutions.
Let us see how this works out for our survey population as a whole.Figure 4.2 shows that on the average more than half (53%) of thebudget available to IFS grantees cornes from IFS. The second mostimportant contribution cornes from the grantee's home institution(27%), foHowed by another research-funding national institution(10%). Only 8% of the mean budget came from international organizations (other than IFS). We know, however, that 80% of our populationdid not benefit from such contributions. In fact, for half of those whoreceived funding from an international organization other than IFS, thecontribution they received represented between 40% and 95% of theirresearch budget.
This distribution of sources of funding partIy explains the importance of funding from outside the home institution in the scientist's

Praeticing Research 65
Figure 4.1. Total Annual Budget Available ta Grantee (Including IFSGrant, Excluding Salary)
80
2J 60.~
-=.~ 40v'".....0
~ 20
oOta 9.9 10 ta19.9 20 ta 39.9 40 ta 59.9 60 ta 220
Annuai budget (x U.S.$ OOOs)
Figure 4.2. Sources of Funding
53%
l1ilil IFSIII SHIlm ONIEa onD Other

66 Scientists in the Third World
Table 4.7. Choice of Research Subject: Relative Importance ofFinancing from Budget of the Scientist's Home Institution Comparedto Financing from Outside Institution
Financing Essential Moderatelyby Home or Very to Not Very Not ImportantInstitution Important Important At An Total
Essential 118 48.1% 31 20.8% 11 15.7% 160 34.5%or veryimportant
Moderately to 82 33.5% 93 62.4% 24 34.3% 199 42.9%notveryimportant
Not important 45 18.4% 25 16.8% 35 50.0% 105 22.6%at an
Total 245 100.0% 149 100.0% 70 100.0% 464 100.0%(52.8%) (32.1 %) (15.1%)
choice of research subject. Table 4.7 shows that more than half (52.80%)of the scientists feel that access to funding outside of their institutes isessential or very important to their choice of research subject. On theother hand, there were only about one-third (34.48%) that felt thataccess to funding from their home institution was essential or veryimportant in the choice of their research subject.
We saw that the scientists' home institutions only provided slightlyover one-fourth (27%) of the funds available to the scientist and thatmore than one-fifth of the scientists questioned receive no financialsupport at aU from their institution. This makes it possible to measurethe influence and the responsibility of outside financial institutions, inour case that meant IFS, on the choice of research themes. The publicitygiven to certain themes and their appeal to funding agencies can,unfortunately, attract researchers to themes of lesser priority. This isespecially true in countries without nationally coordinated researchpolicies and with very limited research potential.
The winged bean (Psophocarpus tetragonolobus) is a good example. Itis a tropical legume with protein-rich seed and edible roots, leaves, andstems that certainly merits study. After an American organizationprepared a report to the glory of this "miracle" plant, that was broadIyread in the DCs, the local reaction, in many cases, was to delveheadlong into research of unprecedented scale, without consideringthe immediate ecological environment or the local eating habits. AU of asudden everyone wanted his research program keyed toward the

Praeticing Research 67
Table 4.8. Possibility of Carrying Out Research Activities without IFSFunding
No. of Researchers Percentage
Yes, other support would have been availableYes, even without other supportYes, but on a reduced scaleYes, but in a substantially different fonnNoOther
Total
7225
215807712
481
155
4S17162
100%
generous and quick transfer of the winged bean to the rural populations. In this field, as for forestry programs-trees should grow fast,and nitrogen should rain from heaven!-science, as is often the case, isexpected to produce wonders through solutions that are oblivious tothe socioeconomic situation.
We see that even DC research programs are subject to fashions andthat these fashions are often launched by certain research assistanceorganizations that have pet subjects. The DC scientists who have spentmany years abroad serve as a preferred relay for the transmission of thepriority themes that are proposed, inter alia, by these organizations, aswe see from table A9 in Appendix C. Apparently, the longer a scientisthas stayed abroad, the more frequently he is in contact with international research assistance organizations, besides IFS. Half of the scientists who never studied abroad were never in contact with theseorganizations.
In any case, the great majority of the scientists do not seem to betotally reliant on the availability of funding from IFS. Only 16% (table4.8) of them responded negatively to the question, "Would you havepursued your research if IFS funding had not been available?" whereasIFS funding represents on the average more than half of their budgets.
Table 4.8 also shows us that the vast majority of the grantees wouldhave been able to continue their research work in one way or anothereven without IFS financial support. Those who said that they wouldnot have been able to continue their research work without IFS supportwere largely those for whom IFS funding represented a very highpercentage of their budget. Thus, for 13% of the researchers, the IFSgrant accounted for at least 90% of their research budget. At the otherextreme, it is not surprising to learn that 5% of the researchers couldhave continued their research with no IFS support since for roughly

68 Scientists in the Third World
10% of the IFS grantees, IFS support represented less than 10% of thebudget at their disposaI.
ActuaIly, the answers to this question mainly indicate that the responding scientists were prepared to change and adapt their objectivesand methodologies depending on the financing but that they weredetermined to pursue their research, regardless of the funds availableto them. The cost of research depends on methodology, equipment,and analyses. We have seen over and over again the extraordinaryingenuity of researchers in using whatever was at hand to make theinstruments they needed for their analyses and measurements, assubstitutes for the instruments they were not able to import. This typeof an approach may not enable our responding researchers to be verycompetitive on the international scene; but it at least has the advantageof ensuring that they can maintain and repair their equipment, sincebuying sophisticated equipment is one thing, but installing and keeping it operational is quite another, as we will see in the followingsection.
Availability of Equipment, Vehicles,Technicians, and Scientific Documentation
It is difficult to generalize when speaking about laboratory equipmentand how it functions in the DCs, for situations from one country to thenext are extremely dissimilar. Within a country or even within aninstitution, in one place we see laboratories just as weIl equipped asthose in the Western countries; and then, shortly thereafter, we arefaced with the disheartening sight of laboratories with simple, oldequipment that often doesn't work. There are very few laboratories inthe DCs that have both modem, reliable equipment and the qualifiedpermanent personnel needed to operate and maintain it. There areendless tales on how sophisticated, expensive equipment in the DCs isleft idle. The electronic microscope seems to be a mythical symbol:"good research requires an electronic microscope." Unfortunately, as aresult of the shortage of qualified technicians, there are very few thatare in working condition.
Referring to the Universities of Ibadan and Nairobi, Eisemon told usthat "at both universities, sophisticated laboratory equipment-electron microscopes, for instance-stand idle for lack of replacement,proper maintenance or the failure of the manufacturers of scientificequipment to honour their service contracts promptly" (1979, p. 518).
During my last trip to Madagascar in 1984, 1 saw that a nuclearmagnetic resonance (NMR), that was delivered in 1981, had been out of
Practicing Research 69
commission for over a year. The supplier, who had been contactedimmediately to repair the machine in accordance with an after-salesservice warranty, had just replied that he would send a repairman inthe coming weeks, without however giving any indication of the date.Since the equipment broke down, the samples to be analyzed havebeen sent to France, which means that each analysis requires aboutthree months.
In his article on science in Arab countries and the Middle East,Zahlan (1970, p. 28) gives the following example. "There is muchunused equipment in the United Arab Republic. For example, there arefour electron microscopes which have not been used in scientific research, a magnificent mass spectrometer which lies idle, X-ray, andNMR units and numerous high resolution spectrographs which arecollecting dust." It is indeed often easier to obtain costly, prestigiousequipment from a donor country than glassware or reagents, or smallmaterials that are not only less eye-catching but may even be perishable. Furthermore, the sophisticated equipment is often negotiatedwithout the user even being consulted and without consideration forthe technical implications of using it or in sorne cases even the importrestrictions.
The example we heard about during our last trip to Costa Rica is agood illustration. I.:Universidad Nacional du Costa Rica had submitteda request to the Spanish govemment in 1978 for various types ofequipment, including an NMR for the department of chemistry. Sincethey received no news at aIl, the scientists there, after several years, lostaIl hope until the day early in 1985 when they received a notice from thecustoms office in San José stating that the NMR was theirs; aIl they hadto do was pay the customs duties of close to U.5. $5,000. Since theuniversity did not have that kind of money and the Spanish govemment did not seem to come up with a solution, the NMR, to this veryday, may weIl still be at the airport. This type of a situation quiteobviously is not compatible with the normal exercise of modem-dayscience.
Before even talking about delivery time for research equipment andlaboratory products, i.e., often between six months and a year, wehave to remember that close to one-third of the scientists in our population (and their institutions) did not have catalogs of scientific equipment suppliers; and the catalogs available to the others dated back tosomewhere between 1960 and 1985. Only 15% of the scientists hadrecent catalogs. We also noted that when DC scientists contacted thesuppliers directly, replies were few and far between. On the otherhand, when IFS negotiated an order on behalf of the scientists, the

70 Scientists in the Third World
suppliers telexed back a sales proposaI in a day or so and, moreover,agreed to worthwhile discounts and offered attractive conditions forspare parts and delivery.
When the equipment reaches the airport or seaport, the grantee'sproblem is not yet over, because even if he has a letter confirming thatthe delivery is a gift, which should ensure exemption from customsduties, it often takes several personal visits to convince the customsofficiaIs; and, in sorne cases, the grantee then still has to check for anydamage that may have occurred during transport. Then the equipmenthas to be hauled to the place where it will be used and installed. This ismade easier when the instruction manual is written in a language thescientist understands and when a qualified technician is available,which is not always the case, as we will see later. One scientist weinterviewed in a DC put it in these words: "In the DCs the scientists doeverything and they do it alone."
The problem of under- or nonutilization of certain costly researchequipment can often be traced back to the shortage of technical staff.UNESCO statistics (1985a, pp. V24-25) report the following ratio ofscientists to technicians: France approximately 1 to 2, Sweden 1 to .5,Germany 1 to l, and then, Indonesia 6 to l, Philippines 2.5 to l, Egypt 3to 1. In 1975 at the Universidad Autonoma de Mexico, there were 1,885scientists for 314 technicians, whieh means a ratio of 6 to 1 (Soberon andMendoza de Flores 1985). These statistics also hide problems of jobdefinition and evaluation. When scientists are asked to be more specifie, the problem seems even worse. We asked the responding scientists whether their institutions had technicians who were capable ofinstalling, maintaining, and repairing their research equipment.Figure 4.3 reports the results for the continents where these researchers are working.
Gose to half (44%) of the institutions do not have technicians toinstall, maintain, and repair the research equipment. Here again Africaseems to be in the worst position since over half (51%) of the institutions on this continent do not have the technieal staff required toensure that their scientific equipment will work weIl; the figure isslightly over one-third (37%) in Asia.
The percentage varies considerably and depends on whether thediscipline requires extensive laboratory work and research equipmentsuch as the chemistry of crop science and microbiology. These are thefields that have the highest number of technicians available: two-thirdsof the institutions working in these fields have a technician who issufficiently skilled to repair equipment or detect a problem and identifYthe part that needs to be replaced. On the other hand, 61% of the

Praeticing Research 71
Figure 4.3. Percentage of Institutions That Do Not Have Techniciansto Install, Maintain, and Repair Their Research Equipment
60
50
40
30
20Total Africa Latin Amer. Asia
Figure 4.4. Time Required When a Foreign Technician Is Needed toRepair Research Equipment
50
40
30
20
10
aa lto5 5 to la la to 15 15 and more
Time (no. of months)

72 Scientists in the Third World
institutions working on forestry or mycorrhiza do not have any qualified technicians.
One of the consequences of this situation is that many scientists areforced to turn to foreign technicians to repair their research equipment, either by sending out the defective piece or apparatus to thesupplier abroad or by having a foreign technician come to the laboratory. We asked the scientists how much time was needed for the repair.Figure 4.4 gives the answers from 214 scientists. The time varies from 0to 84 months. Scientists who reported that their equipment has still notbeen repaired are not included in the figure.
More than two-thirds of the scientists (68%) had to wait 5 months ormore to have their equipment repaired by a foreign technician, andmore than one-fourth of them had to wait 10 months or longer. Thisconsiderable delay, of course, is a handicap for the DC scientists whencompared with their colleagues in the ICs. Here again contacts madeduring extended stays abroad can be useful in solving the problem ofbroken research equipment or the shortage of equipment. Mutualassistance arrangements have been developed between sorne of ourDC scientists and foreign institutions that hosted them during theirstudies abroad; these institutions cooperate, for instance, in makingthe structural analyses of active compounds related to natural products. This type of solution, howeve~ does not have the makings of asatisfactory long-term system.
Another cause of delay for DC scientists is the shortage of usablevehicles. When visiting a DC research institution, it is always surprising to see that there is no shortage of vehicles, although most of themare out of order. Sometimes a relatively unimportant spare part ismissing; but if it is not available 10caIly, the vehicle cannot be used. Thevehicle is then used as a source of spare parts and soon becomes adoomed wreck. Furthermore, just because it is in working conditiondoes not mean that it will be used; there may be a fuel shortage, or theinstitution's travel budget may be overdrawn. With this in mind, wewere pleasantly surprised to hear that close to two-thirds (64%) of theIFS grantees said that in their research work they had no difficulty inobtaining a vehicle. We should add here that IFS, by principle, does notpay for the purchase ofa vehicle, so these were aIl vehicles bought withother funds. This is aU the more surprising since in most DCs vehicleoperating costs and taxes are so high that vehicles are sold for twice theprice they fetch in Western countries. There was only one slight variation among the disciplines as concerned access to vehicles. Scientistsworking in disciplines that required the most nonurban travel, e.g.,forestry, had easiest access to vehicles (72%) while scientists con-

Praeticing Research 73
centrating on laboratory research, e.g., the chemistry of natural products, had the most diffieulty (60%). Many researchers, however, saidthey used their private car for professional travel. 1 was not able tomeasure the relative importance of this group compared to the group asa whole.
Another backbone of research is access to information. A scientistneeds to stay up-to-date on scientifie progress accomplished in hisfield. His main source of information is recent articles in scientifiejournals. The next chapter shows that there are other, equally valid,methods. A scientifie institution, for instance, cannot be fully functional without a library or a documentation center where the scientistscan do their bibliographieal research. Having struggled with this problem for many years, we know that DC scientists have great difficulty inobtaining and using the scientifie and technieal information they need.According to B.K. Eres (1982), the weaknesses in the DC informationsystems can be traced directIy back to national socioeconomie conditions.
The situation can be worsened by political crises ofvarying duration.During our last trip to Madagascar, we saw that most of the subscriptions to scientifie journals stopped in 1974. That was the year thatnearlyall the French scientists left. We also know that exceptionally fewforeign scientifie journals entered Cuba in the 196Os. A journal orderedand paid for by IFS took more than one year to go from Florida to theBotanical Institute in Havana. Here again time and/or distance, combined with inadequate communieations and distribution circuits,handieap the DC scientists. If they are fortunate enough to be able tosubscribe to an international journal, they receive it several monthsafter their colleagues in the ICs. Furthermore, the information contained in international journals, which by far dominate the worldwidescientifie and technical information market, is not necessarily relevantnor directIy usable for the DC scientists.
Only half the scientists in our reference group have access to bibliographie catalogs such as "Current Contents," and less than one-thirdof them (27%) have access to bibliographie data banks. And even whenthese two sources ofbibliographie references are available the scientistscannot always locate and obtain articles or books that they have identified as perhaps being pertinent to their research.
In preparing a quantitative evaluation of the scientifie informationavailable to the IFS grantees, we asked for a list of the journals theysubscribed to or could consult regularly. We have not yet analyzed thelist; the numbers reported appear in table 4.9.
In more than half the cases, either the grantee or his institution only

74 Scientists in the Third World
Table 4.9. Number of Joumals Researchers Subscribe to or CanConsult Regularly
No. of Joumals
o123456789 or more
No. of Researchers
45555257523826261692
% of Researchers
10121112118664
20
Table 4.10. Importance of Types of Publications to Research Work
Rank
123456
Publications
Foreign publications in your fieldBooks and monographsResearch bulletinsForeign publications in related fieldsNational publications in your fieldNational publications in related fields
Mean*
1.31.92.02.32.43.0
-Mean score based on five-point scale: 1 = essential, 2 = very important,3 = moderately important, 4 = not very important, 5 = not important at aU.
subscribes to a maximum of four journals, and 10% of the researchersdo not have regular access to any journals. At the other extreme, 20% ofthe researchers subscribe to at least nine joumals. Without a qualityevaluation of the journals, we can equally assume that a good half of theresearchers in our cohort are relatively unfamiliar with informationproduced by the international scientific community.
This does not imply that foreign joumals are not important to theirresearch, quite the contrary. No less than 96% of the researchers ratedforeign publications in their field as either essential (72%) or veryimportant (24%) to their research. National scientific joumals wereconsidered far less important (see table 4.10).
Praeticing Research 75
One-quarter of the scientists felt that national publications in theirfield were not very important (15%) or not important at aIl (10%) toresearch. Countries like China, India, Brazil, and sorne of the smallerDCs like Philippines and Egypt have many national scientific journals;but this is not true in many other DCs, especially in Africa. Theproblem of quality is more important than the problem of quantity. Theconditions of acceptance for publication in national DC scientific journaIs do not always respect proper scientific standards. Perhaps the factthat many disciplines are not covered in DC journals further explainsthe greater importance the DC scientists assign to international journaIs. Many authors have discussed the role of national journals in DCscience. Basalla (1967, p. 618), for instance, in an article on the spread ofWestern science in non-Western societies, went as far as to say that thecreation of national journals was indispensable to the emergence of anindependent scientific tradition in the DCs.
The importance a DC scientist gives to national scientific journals isprobably dependent on the research and development fields theycover in his country. In a study on communications among 38 ricebreeders in 10 Asian countries, Hargrove (1979-1980, p. 130) demonstrated the greater importance and relevance of the national publications. Paradoxically, in answer to a question on their choice of journalsfor publishing their own works, more than haH answered that theypreferred "international journals published in the developed countries."
It is also probable, although we have not been able to bear this out,that the longer a scientist spent in training abroad, the more importance he assigns to work published in internationally read foreignpublications.
We found a close correlation between the number of subscriptions toforeign journals and the number of years a scientists spent in trainingabroad. This correlation is particularly visible for scientists who do notsubscribe to any journals at aIl, as we can see from table 4.11.
Scientific journals are a necessary and important channel of communication for scientific undertakings, but not the only one. Thefollowing section explores the main modes of communication and towhat extent the DC scientists use them.
Relations between Research Scientists
"Looking back on my own period of work in Lahore . . . 1felt terriblyisolated. If at that time someone had said to me, we shall give you theopportunity every year to travel to an active research centre in Europe

76 Scientists in the Third World
Table 4.11. Number of Scientists with No Subscriptions to ScientificJoumals by Number of Years of Study Abroad
No. of Years No. of Scientists TotalAbroad Not Subscribing At AlI Population Percentage
0 11 68 16.2%1-2 12 104 11.5%3-4 11 113 9.7%5-9 8 144 5.6%10--20 1 26 3.8%
Total 43 455 9.4%
or the United States for three months of your vacation to work withyour peers, would you then be happy to stay the remaining ninemonths at Lahore, 1 would have said yeso No one made the offer"(Salam 1966, p. 465). Abdus Salam shared this secret of the past withus, but it could just as weIl apply to many scientists in our sampletoday.
Many a DC scientist suffers from a feeling of isolation, especiaIlywhen he has just retumed from his studies in an IC and is trying to fitinto the scientific community at home. Moravcsik (1976, p. 80) describes how impossible it is for DC scientists to communicate with theirpeers and colleagues by drawing a comparison with birds whose wingshave been clipped. The feeling of isolation is probably heightened bythe fact that the newly retumed scientist has been trained in a largevariety of universities scattered throughout the ICs. Furthermore, during this early period when the young national scientific communitiesare just "taking off," the scientists often have to cope with being theonly specialists in their field within their institution, or even withintheir country.
AlI the authors, however, agree that science cannot exist withoutcommunications and that a coIleague's criticism is vital to progress inany scientific endeavor. Here again the DC scientists are enduring ahandicap little known to their coIleagues in the ICs.
There are different types of scientific relations and communications.We discussed the importance of access to scientific joumals. This is themost formaI written form and, perhaps, the most popular form ofscientific communication. Other modes of communication may be lessformaI but just as important and are based on interpersonal relationsbetween scientists. They include postal contacts, telephone caIls, conversations between colleagues within their institutions or during

Praeticing Research 77
Table 4.12. Frequency of Communication of IFS Grantees with OtherScientists (In Decreasing arder of Frequency)
Rank
123456789
1011
Actors
Scientists in your research group or departrnentScientists in another department in your institutionScientists outside your institution within your countryExtension staffScientists outside your countryA member of the IFS secretariatYour thesis adviserIFS grantees in your countryIFS scientific advisersRepresentatives from other funding agenciesIFS grantees from outside your country
Mean*
5.43.93.32.92.82.72.62.42.31.91.6
*Mean score based on a seven-point scale: 1 = never; 2 = rarely; 3 = annually;4 = monthly; 5 = biweekly; 6 = weekly; 7 = dai/y.
travels or conferences. These forms of communication are interdependent and complementary. Most of the authors agree that discussionswith colleagues are often a source of information.
To evaluate the degree of informaI communication between scientists in our group, we asked them how often they interacted with arange of people, from colleagues in their home institution to foreignscientists. Answers are given in table 4.12. The figures are means forthe population as a whole.
The DC scientists told us that they communicated a Utile less thanweekly with colleagues in their research group or department. This isthe same result that Busch and Lacy (1983, pp. 88--89) obtained in theirstudy of American agricultural scientists. On the other hand, theycommunicated much less frequently with other scientists in their owncountry than did the American researchers. Communications withscientists from other institutions in their country, for instance, tookplace only a little more than once a year. This result may be in partexplained by the fact that researchers in DCs are often the sole specialists in their field for the whole country, but this is not always thecase. Our travels in the DCs often took us to institutions where we sawthat scientists of the same country or even of the same institution withcommon Unes of interest did not even know each other. In fact, therewere very few who communicated more frequently with scientistsfrom other institutions in their own country than with scientists fromabroad; 35% of them only communicated once a year with scientists
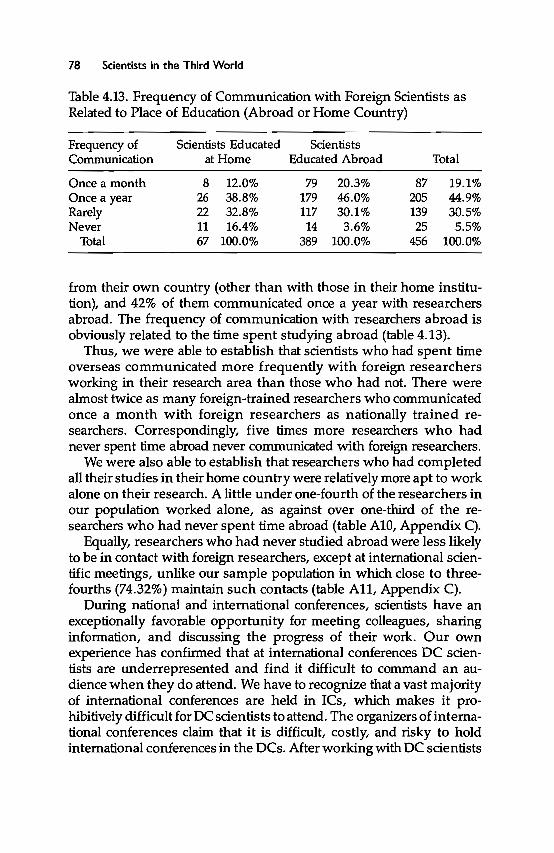
78 Scientists in the Third World
Table 4.13. Frequency of Communication with Foreign Scientists asRelated to Place of Education (Abroad or Home Country)
Frequency of Scientists Educated ScientistsCommunication at Home Educated Abroad Total
Once a month 8 12.0% 79 20.3% 87 19.1%Once a year 26 38.8% 179 46.0% 205 44.9%Rarely 22 32.8% 117 30.1% 139 30.5%Never 11 16.4% 14 3.6% 25 5.5%
Total 67 100.0% 389 100.0% 456 100.0%
from their own country (other than with those in their home institution), and 42% of them communicated once a year with researchersabroad. The frequency of communication with researchers abroad isobviously related to the time spent studying abroad (table 4.13).
Thus, we were able to establish that scientists who had spent timeoverseas communicated more frequently with foreign researchersworking in their research area than those who had not. There werealmost twice as many foreign-trained researchers who communicatedonce a month with foreign researchers as nationally trained researchers. Correspondingly, five times more researchers who hadnever spent time abroad never communicated with foreign researchers.
We were also able to establish that researchers who had completedaIl their studies in their home country were relatively more apt to workalone on their research. A little under one-fourth of the researchers inour population worked alone, as against over one-third of the researchers who had never spent time abroad (table A10, Appendix C).
EquaIly, researchers who had never studied abroad were less likelyto be in contact with foreign researchers, except at international scientific meetings, unlike our sample population in which dose to threefourths (74.32%) maintain such contacts (table All, Appendix C).
Ouring national and international conferences, scientists have anexceptionally favorable opportunity for meeting colleagues, sharinginformation, and discussing the progress of their work. Our ownexperience has confirmed that at international conferences OC sdentists are underrepresented and find it difficult to command an audience when they do attend. We have to recognize that a vast majorityof international conferences are held in ICs, which makes it prohibitively difficult for OC scientists to attend. The organizers of international conferences daim that it is difficult, costly, and risky to holdinternational conferences in the DCs. After working with OC scientists

Praeticing Research 79
Table 4.14. Frequency of Participation in Conferences since ObtainingIFS Grant
ln Scientist's Home Country Abroad
No. of No. of No. ofConferences Scientists Scientists
0 97 20.6% 160 33.9%1 68 14.4% 109 23.1%2 73 15.5% 70 14.8%3 61 13.0% 42 8.9%4 44 9.3% 30 6.4%S 32 6.8% 17 3.6%6-10 63 13.4% 3S 7.4%Over 10 33 7.0% 9 1.9%
Total 471 100.0% 472 100.0%
in organizing conferences in rnany of their countries, we feel that thesearguments are unfounded, especially when speaking about the Asiancountries where the hospitality and efficiency are often far better thanin the ICs. We have attended rnany poody organized conferences inICs we need not name.
This is a field IFS is trying to promote by backing OC scientists whoorganize conferences in their home country. IFS has also helped provide funds to enable grantees to participate in international conferences, but the prerequisite has always been that their work be farenough advanced to merit being presented and discussing sorne results. IFS has funded close to one-fourth of the participation costs forIFS grantees who have attended conferences abroad. Table 4.14 showsus how frequently the scientists in our population attended conferences since receiving an IFS grant. We see that they participated innearly twice as rnany conferences in their home country (1,969) asconferences abroad (1,007). On the average the participation frequencyper scientist per year was 0.84 conferences in the home country and0.43 abroad. It should be noted that a srnall number of scientistsparticipate in a large number of conferences abroad.
Thus, around 10% of the researchers participated in about haH theconferences abroad, each one totaling on average 10 conferencesabroad over a period of between six and ten years, in other wordsroughly 2 conferences per year, or four times the general average. The"champion" scored lS conferences abroad in three years. AlI but one of

80 Scientists in the Third World
Table 4.15. Sabbatical Leave: Continent Where Leave Is Taken Relatedto Home Continent
Continent ofContinent of Origin
Sabbatical Latin Asia andLeave Africa America Pacifie Total
Africa 3 0 1 4 3%Latin America 2 10 0 12 10%Asia 0 2 7 9 7%ICs 27 84% 29 71% 42 84% 98 80%
Total 32 26% 41 33% 50 41% 123 100%Total population 82 37% 86 18% 221 45% 489 100%
% sabbaticalleavelTotal population 18% 48% 22% 25%
the grantees who participated in more than 10 conferences held IFSgrants for at least nine years. They were also the most productive in thewriting field since they single-authored between 6 and 10 publishedarticles annually since receiving their first grant.
At the other end of the spectrum, we found researchers who wereneither very "mobile" nor very "visible," since one-third of them (34%)had never participated in a conference outside of their country andalmost one-fourth (23%) had attended only one. Allowances must bemade for the fact that most of them had only recently received their IFSgrant. To refine the analysis would require incorporating infonnationon the year of the first grant.
To make science more productive, scientists and scientific datashould be constantly "on the move" from country to country. Differentsystems, ranging from postdoctoral training to sabbaticalleave, havebeen tested in the !Cs for many years already. But there are very fewDCs that, like Malaysia, have officially adopted the system of regular,paid sabbaticalleave (Thong Saw Pak 1968).
Table 4.15 indicates that one-fourth (25%) of the scientists in ourpopulation have enjoyed at least one sabbatical leave. For over twothirds of them (68%), leave-which lasted between one month andfour years-was taken less than five years ago. For over three-fourths(77%), the leave lasted no more than one year. The table shows us thatthe Latin Americans benefited most from sabbaticalleave (48%) and theAfricans least (18%). The proportion of sabbaticals spent in ICs (80%) iseven higher than for Ph.D. studies (75%).
At the Ph.D. level, the United States is the country that attracts the

Praeticing Research 81
most scientists on sabbatical leave. Great Britain is second, althoughthe number is lower than the number of students who come fordoctoral studies. France, with only 9 scientists, is barely maintainingthird place, which it shares with Canada. Thereafter, we have FederalRepublic of Germany (6), Australia (6), Japan (4), and Spain (4).
In relating the number of years spent studying abroad to the frequency of sabbaticalleave, we see that the scientists who completed aIltheir studies in their home country are the last to take sabbaticalleave;those who most frequently take sabbaticalleave are 35 to 44 year oldPh.D.s who have spent between three and four years studying abroad(table A12, Appendix C).
Even if, as Charles Kidd wrote (1983, p. 409), a large proportion ofthe foreign scientists who are postdoctoral students or are on sabbaticalleave are nothing more than "paid employees working in an Americanresearch team," they do not have the same job contract as their American colleagues and continue to be part of the staff of their homeinstitutions that, moreover, in sorne cases, continue paying their salary.
The legal and employment status of scientists who accept an assignment abroad are very different. We talked to a certain number ofscientists who had made this choice; aIl of them expressed the firmintention to retum home when their contract expired. When checking,we found that indeed, except in a very few cases, they retumed to theirhome country as intended. One-fourth (25.93%) of the scientists in ourpopulation at sorne time in their career had received offers to workabroad. It was interesting to note that half of the offers came from DCs,although the United States was always in first place (21%), followed byNigeria (11%) and France (10%).
Offers were made more frequently to scientists who had spentlonger periods of time abroad. A scientist, for instance, who had spentmore than ten years studying outside his homeland had six times morechance to receive an offer to work abroad than his colleagues who hadaIl their training in their home country (table A13, Appendix C).Slightly over one-fourth (27.20%) of the scientists who received offersto work abroad honored them; here again there is a clear correlationbetween acceptance of the job offer and the number of years spentstudying abroad (table A14, Appendix C). In other words, the longerone has studied abroad, the greater the chance of receiving an offer towork abroad and the greater the tendency to accept the offer.

Chapter Five
Scientific Production
Whatever its quality, the true value of scientific research depends on itsavailability to the public, which is not only essential to the existence ofthe research scientist but also to ensuring that the results of researchreach their users. There are different ways of making research public.The most common is through publication in scientific journals. Publishing is at the heart of aIl scientific communities and is a measure ofproductivity. However, it is not the only one. This chapter indicatesways to measure the production of scientists from DCs and theircontribution to the reproduction of their national scientific communities. We will foeus on the results of a bibliometric study analyzing thelists of publications and works by 213 scientists who answered thequestionnaire sent to 489 grantees of the International Foundation forScience (IFS). As an introduction, let us look at the place of scientificproduction from the DCs in the world picture.
Can the DCs' Scientific Production Be Measured?
To measure the importance of scientific output from the DCs, mostauthors use international data bases, especially the one from the Institute for Scientific Information (ISI) in the United States (Garfield1983, Frame et al. 1977, Blickenstaff and Moravcsik 1982). Althoughthere is no data base that is anywhere near complete, the DCs wererecently credited with approximately 5% of the world's scientific production. Many data bases are highly specialized. This is not the case forISI, which covers sorne 4,500 journals from very diverse fields ofscience. But ISI is very selective and only screens the world's mostpopular scientific journals, the ones that puhlish the most frequentlycited articles. Its Science Citation Index (SCI), developed by the ISI mapmakers, mainly foeuses on what has become known as "mainstreamscience," the most internationally visible science carried in 3,100 scientific journals. Considering that there are not far from 70,000 scientificjournals in the world (Turner 1984), the ISI data base is highly selective.
Thus, ISI represents about 6.5% of the scientific journals publishedthroughout the world. Bibliometric work is often based on ISI data.Therefore, even if it covers the mainstream, it only bears on a smallproportion of the world's science. Further, the DC scientific reviews are

Scientific Production 83
rated as "backwood cousins" in the ISI data base, which includes barelyover 2% of them. French publications, together with all the otherpublications that are not in English, are at a disadvantage. The scantynumber of DC journals, per country and per discipline, to be found inthe ISI data base illustrates how severely DC science is underrepresented. The specialized review Chemical Abstracts, for instance, covers201 Brazilian chemical reviews, while the SeI only covers 6 (Cagnin1985). Out of sorne 200 scientifie journals that exist in Thailand, ISIonlycovers 2 (Yuthavong 1986). For the year 1980, Argentina was onlyrepresented by 4 reviews and Mexico by 3 (Roche and Freites 1982).Fate has been no kinder to the "newly industrialized countries." ISIonly covers 1 scientific publication from South Korea and 3 from Taiwan(Davis and Eisemon 1989). Out of the 76 veterinary reviews on the ISIlist, only 4 come from the DCs (Russel et al. 1987). And yet numerousstudies indicate that in given country-specifie fields, a goodly part ofthe research is produced in the DCs by DC scientists, who, for instance, produce 10% of the world's scientific literature on soil sciencesand agriculture (Chatelin and Arvanitis 1988a) and over 90% on cattlereproduction in the tropies (Galina and Russel 1987).
The question of adequately representing science produced in theDCs in international data bases was the main point at issue at a 1985conference organized at ISI in Philadelphia. The title of the final conference report, "Strengthening the Coverage of Third World Science,"pointed to a glaring gap (Moravcsik 1985c). It is diffieult to define theprecise amount of DC science omitted from the international databases, especially at ISI. The final conference report noted that "theworkshop participants estimated that only about half of the scientificoutput of the third world whieh meets international standards ofexcellence is included in the SCI" (Moravcsik 1985c, p. 3). ISI explainsthat DC scientifie production published in national journals is notincluded in the SeI for reasons of quality. The national scientifie journaIs are accused of not passing articles through a screening committeeand publishing poor and even dubious quality work (Packer andMurdoch 1974).1 This criticism is often addressed to India, the ThirdWorld's leading producer of science, by Indian scientists themselves(Arunachalam 1979a, 1979b, Arunachalam and Manorama 1988). Theexplanation often goes back to a cultural tradition that virtually banscriticism, especially in Asia. "No one wants to hurt the other. Politeness, a virtue of drawing room conversation, is extended to meanthat no one criticises the other. In such an atmosphere, genuine criticism of someone's work is taken as a personal insult and leads to

84 Scientists in the Third World
sentimental and emotional reactions, rather than rational defense"(Arunachalam 1979a, p. 8).
To achieve greater progress, a scientist must look critically at earlierwork and, in so doing, often must criticize his eIders, which is quiteinconceivable in most African and Asian societies. A colleague atORSTOM explained that he tried to work in a cooperative experimentin Indonesia but that "respect for the eIders and fear of losing face madeit very difficult to initiate truly scientific research. . . . since total respect for the culture was untenable, the problem amounted to findingthe dividing line between what could not, and should not be changed,and what could be" (Larue 1988, p. 2).
The work published in DC scientific journals is not excluded frominternational science and more specifically from the SCI for reasons ofquality alone. The citation criterion, which is the basis of the system,works against scientific communities at the periphery because, as wewill see in greater detail below, much of the work is published in localreviews only circulated within the country. The scientists of thesecommunities are caught in an especially vicious circle, because evenwhen their findings are published in highly influential, prestigiousscientific journals in the center, they are, aIl told, far less often citedthan writings by their colleagues from the center (Arunachalam andGarg 1985), which explains the very ambivalent feelings of scientificcommunities in the periphery concerning the significance of citation.Recent work on referencing within the Brazilian scientific communityshowed that "citation patterns are significantly influenced by factors'externa1' to the scientific realm and, thus, reflect neither simply thequality, influence, nor even the impact of the research work referredto" (Velho 1986, p. 71). Brazilian scientists feel that the place of publication strongly influences the number of times a publication is cited. Thiswas borne out by S.M. Lawani (1977) who showed that out of arepresentative sample of 100 entomology articles written by Nigerianauthors, articles published in foreign journals were cited 1.74 timesmore often than articles published in local scientific journals.2
ActuaIly, as J.D. Frame so correctly said, it aH depends on what youare trying to assess. "If the purpose of the bibliometric indicators is tohelp in the building of a national scientific inventory, telling us whatkind of research is being performed at different institutions, thencoverage of local as weIl as mainstream publications would seem important. On the other hand, if one is primarily interested in investigating Third World contributions to world science, then publicationcounts taken from a restrictive set would seem most appropriate"(1985, p. 121).

Scientific Production 85
Thus, when Eugene Garfield (1983) prepared "Mapping Science inthe Third World," he was actually measuring the impact of Third Worldscientific output on the international scientific community, using, ashis only criterion, the part of the Third World scientific output that wascited and used by the international scientific community. For thisreason it is not surprising to note that the impact was slight.
The Place of DC Science in Mainstream Science
Work by Frame et al. (1977) and more recent writings by Braun et al.(1988) reveal that mainstream scientific production is more tightlyconcentrated in a selected number of countries than national wealthexpressed as GNP; "the gap between the haves and the have-nots iseven greater in the domain of science than in the domain of economics"(Frame et al. 1977, p. 503). Ten countries produce more than 80% of theinternational scientific literature (84% in 1973,82% in 1981-85). Exceptfor India, which has maintained a steadfast eighth place since thebeginning of the 1970s, all the other countries are members of theindustrialized world (Frame et al. 1977). The DCs, between 1981 and1985, produced 5.8% of the world's scientific output, of which 3.75%came from Asia, 1.15% from Latin America, 0.38% from sub-SaharanAfrica, and 0.59% from the Middle East (Braun et al. 1988). Even if wechallenge the representative value of these estimates, especially considering the data base used, we still see that mainstream science fromthe DCs is marginal compared with the rest of the world.
Within the OC group, India leads by far, producing five times moremainstream scientific publications than its runner-up of the early1980s, the People's Republic of China.3 Table 5.1 lists the top 15 producers of scientific literature in the DCs for 1973 and for the 1981-85period.
This list changed considerably during the reference period. Production in certain 1973 leading countries like Brazil and Nigeria rosesharply. Sorne countries with small-even very small-scientific output in 1973 started climbing, e.g., Hong Kong, Saudi Arabia, SouthKorea. Other countries, like Iran and Lebanon, in the throes of politicaland military unrest, lost their standing.4 Most of the countries on thelist produced substantially more in the years following 19735 (Velho1985); but the per country mainstream scientific production remainedsmall, even in countries at the top of the list like Egypt, Mexico, andNigeria. A comparison with the production of scientific institutions inthe OECO countries shows that a country such as Egypt produces lessthan the Harvard University Medical School alone (Frame 1985, p. 118).

86 Scientists in the Third World
Table 5.1. Fifteen Leading DCs, Ranked by Number of MainstreamPublications Produced
1973 1981--85b
No. of PublicationsRank Country No. of Publications Country (Annual Averages)
1 India 6,880 India 10,9782 Argentina 764 People's Rep. 2,146
China3 Egypt 683 Brazil 1,4984 Brazil 573 Argentina 1,1245 Mexico 368 Egypt 1,0296 Chile 356 Nigeria 7907 Nigeria 280 Mexico 7098 Venezuela 200 Chile 5909 Taiwan 186 Taiwan 509
10 Iran 174 Hong Kong 36511 Malaysia 138 Saudi Arabia 31912 Kenya 125 South Korea 31213 Singapore 120 Venezuela 31114 Thailand 117 Kenya 24815 Lebanon 114 Singapore 214
Sources: Frame et al. 1977, table 4, pp. 507-8; bBraun et al. 1988.
The total production of the African continent, excluding South Africa,at present represents about one-sixth of the scientific production of aEuropean country such as France.
Other very recent studies provide information on mainstream science production in the various Third World countries. The work doneby Davis (1983) in 36 sub-Saharan African countries from 1970 to 1979 isinteresting because it concems a relatively homogeneous group ofcountries and shows the growing importance of universities, where65% of the scientific output originates. Mainstream scientific production cornes largely from medicine (38.2%), biology, and agronomy(approximately 22% each). Unfortunately, once again, the Frenchspeaking countries suffer from the fact that the ISI base covers a smallnumber of joumals in French. This explains why the top six mainstream-producing countries of Africa are English speaking, viz.,Nigeria, Kenya, Ghana, Uganda, Zambia, and Tanzania. Ivory Coastholds seventh place and Senegal, eighth. The leading position of thetop two countries leaves no room for doubt; the rest of the list is lesscertain.6

Scientific Production 87
The study of Krauskopf et al. (1986) on science in Latin America from1978 to 1982 puts Brazil in first place, where it logically belongs,althoughArgentina, whichis second, maintained a steady growth rateduring that period. In 1978 the five leading mainstream science producers of Latin America, i.e., Brazil, Argentina, Mexico, Chile, andVenezuela, produced 92% of Latin America's total output; life sciences(medicine and biology) were the leading disciplines.
The scientific output of groups of countries (Arunachalam andMarkanday 1981) and individual countries of Latin America (Krauskopf and Pessot 1983, Martinez-Palomo and Arechiga 1979, Morel andMorel 1978) has also been analyzed using ISI and other internationaldata bases. The studies provide interesting information on the positionof the various countries on the mainstream science supplier list andtheir impact on world science; but the description of how science isconstructed in these countries, the researchers' scientific strategy, andtheir participation in national and international science is incompleteand often inaccurate. These studies, moreover, tend, either implicitlyor explicitly, to assign research scientists of the peripheral scientificcommunities to two distinct categories: scientists who "really count,"in other words are known to the international scientific communitysince they publish overseas in influential international journals, andthe others, whose "local" science lacks originality and, at best, ispublished in low circulation local journals.
This thesis is clearly explained by Arunachalam (1988, p. 312) whospoke of scientists in India in the following terms:
Science in India appears to be divided into two distinct levels, one almost cutoff from the other. At one level, where much of the good work is done, thepractitioners are more at home with their counterparts elsewhere with whomthey share the same invisible colleges. Naturally, they continue to publish inoverseas journals, published mostly from the USA and the U.K. Rarely do theysubmit papers to national or local journals. Even if they submit papers to localjournals, they would rarely submit what they consider to be the better ones. Atthe other level, many people tackle problems of not much current relevance,scientific significance or originality in the strict sense of the terms. In spite ofthe occasional attempts of practitioners of science at this level to publish theirwork in high impact journals of the West, they often have to get their paperspublished within India or in foreign journals of low significance. What is more,there is not so much interaction between practitioners of science at the twolevels.
Several recent studies justify a revision of this exaggerated-butlargely held-caricature of science production in the periphery.

88 Scientists in the Third World
Chatelin and Arvanitis (1988a, 1988b) made a bibliometric study on sailsciences and agriculture that pointed to great differences in the nationaland individual publication strategies in the DCs and showed that localscience was not synonymous with poor science. It is not for reasons ofscientifie quality that the vast majority of studies on soils and agriculture are not /Imainstream./1 Many dynamie DC scientists actuallypartake of the international scientifie life but publish most of theirfindings in national journals. Studying a scientifie generation's originalwork in this field so vital to development brought out the importanceof the time needed to develop a scientifie thrust.
A close look at the history of scientifie production at a Mexicanbiomedieal research institute showed that research scientists hadchanged their publication strategies in the score of years between 1959and 1979 (Lomnitz et al. 1987). By 1979 half of their output was published in international journals. Yuthavong (1986), reporting on Thaiscientifie institutions, found a strong correlation between the numberof articles the scientists from these institutions published in international journals and in the Journal of the Science Society of Thailand. 7
Davis and Eisemon (1989) showed that a sizable proportion of themore dynamie scientists from four peripheral scientifie communities ofAsia (South Korea, Taiwan, Malaysia, and Singapore) published bathin local and in international journals. The decision to publish locally isoften the result of choiee rather than necessity. These four countrieshave developed important local scientifie literature that is not mainstream; and, according to these authors, the local science will probablynot be eliminated as the scientifie communities gain dout in the international scientifie community.
AlI these recent findings substantiate the thesis that the bibliometricindieators, especially the SCI, do not accurately assess the scientifieoutput from the periphery, especially from the DCs. It is impossible tomeasure and analyze the scientifie production from the DCs sincethere is no operational base, no proper index of local publications andscientifie work. It is, however, possible to select a series of locallypublished scientifie reviews and compare them with mainstream science as was done by Yuthavong, by Davis and Eisemon, and by others.This is a promising but time-consuming approach since these reviewsare not indexed in bibliographie bases. Furthermore, it does not account for the total scientific output, e.g., especially the unpublishedwork.
Our study uses a different approach. AlI the scientifie work done byIFS grantees is covered. Our questionnaire asks about the number ofarticles published in scientific joumals and bulletins, speeches given at

Scientific Production 89
Table 5.2. Publication Production per Crantee per Year
Articles in scientific journalsConference papersBooks or chapters in booksBulletins and reports
1.30.50.070.3
conferences, books, chapters of books, abstracts, coauthored reports,etc. We also conducted a more detailed bibliometric study on publications and work by 213 grantees selected from the reference populationand gave due consideration to balance between continents and between disciplines.
Total Scientific Output
Responses to the questionnaire indicate that the IFS grantees authorO.5publications per researcher per year and coauthor 1.7, in other words,slightly more than half that of American researchers in agriculturalsciences, according to Busch and Lacy (1983), who reported 0.9 and1.3, respectively.
Using lists of publications and working papers gives a slightlyhigher figure, i.e., 1.3 journal articles (sole author and coauthor) instead of 1.2 (0.5 + 0.7), as in the preceding case (table 5.2).8 Further, wehave been able to estimate that more than half (55%) of the totalscientific production of the grantees was published or available locally.The remaining 45% that was published abroad can be divided intoarticles published in scientific journals in ICs (37%) and in other DCs(8%). These global statistics camouflage significant variations betweengeographical and scientific areas, as table 5.3 shows.
The field in which the IFS grantees are publishing most (1.6 publications per grantee per year) is natural products. This is also the field inwhich they publish most abroad (1.1 publications per grantee peryear). Food sciences is almost the opposite. There are more local (1.0)publications than foreign (0.4) publications. These results can be tracedta the nature of the related research. The fields in which there are thefewest publications, Le., forestry (0.7) and rural technology (0.8), areprobably also the fields with the most practical applications, whoseresults do not always need to be published.
We have also observed that Asian grantees publish more than African or Latin American grantees (1.5 as against 1 journal article pergrantee per year, respectively). Further, Asian grantees publish more
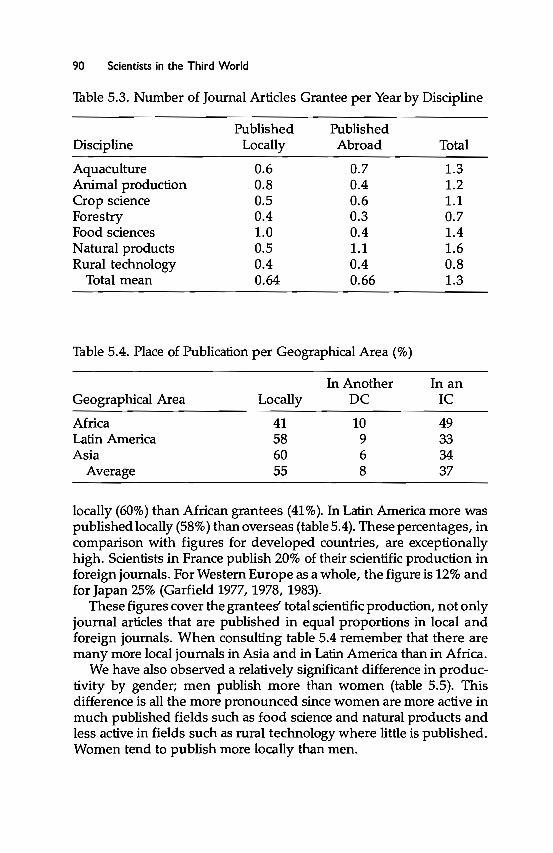
90 Scientists in the Third World
Table 5.3. Number of Journal Articles Grantee per Year by Discipline
Discipline
AquacultureAnimal productionCrop scienceForestryFood sciencesNatural productsRural technology
Total mean
PublishedLocally
0.60.80.50.41.00.50.40.64
PublishedAbroad
0.70.40.60.30.41.10.40.66
Total
1.31.21.10.71.41.60.81.3
Table 5.4. Place of Publication per Geographical Area (%)
Geographical Area
AfricaLatin AmericaAsia
Average
Locally
41586055
In AnotherDC
10968
In anIC
49333437
locally (60%) than African grantees (41 %). In Latin America more waspublished locally (58%) than overseas (table 5.4). These percentages, incomparison with figures for developed countries, are exceptionallyhigh. Scientists in France publish 20% of their scientific production inforeign journals. For Western Europe as a whole, the figure is 12% andfor Japan 25% (Garfield 1977, 1978, 1983).
These figures cover the grantees' total scientific production, not onlyjournal articles that are published in equal proportions in local andforeign journals. When consulting table 5.4 remember that there aremany more local journals in Asia and in Latin America than in Africa.
We have also observed a relatively significant difference in productivity by gender; men publish more than women (table 5.5). Thisdifference is all the more pronounced since women are more active inmuch published fields such as food science and natural products andless active in fields such as rural technology where little is published.Women tend to publish more locally than men.

Scientific Production 91
Table 5.5. Number of Journal Articles per Grantee per Year by Sex
Gender
MenWomen
PublishedLocally
0.650.53
PublishedAbroad
0.730.33
Total
1.380.86
Table 5.6. Number of Publications (Including Bulletins, Books,InternaI Reports, Conference Papers)
As Sole AsResearch Area Author Co-author Total
Aquaculture 0.9 1.3 2.2Animal production 0.4 1.6 2.1Forestry 0.7 1.2 1.9Food science 0.9 1.7 2.6Natural products 0.4 1.9 2.3Rural technology 0.7 0.9 1.6
Average 0.7 1.4 2.1
Research is becoming increasingly collective, and scientists worktogether not only to bring their research to a successful conclusion butalso to be able to publish their results under joint authorship. IFSgrantees, for instance, publish about two-thirds of their work withcoauthors, as is shown in table 5.6.
Table 5.6 illustrates the general rule that the fields in which scientistswork together most are the fields in which most is published. Thisconfirms earlier findings by de Solla Price and Beaver (1966) and byBeaver and Rosen (1978, 1979a, 1979b) who observed that collaborativeresearch enhanced productivity.9 Results also show that there is significant difference between disciplines. Fields that have the largestnumber of authors per publication, such as natural products, are fieldsthat require inputs from a variety of disciplines, e.g., taxonomy, botany, chemistry, and phannacology.1f the right specialists are not locallyavailable, foreign cooperation is required, which explains the highernumber of foreign coauthors per publication (0.53) for a field such asnatural products (table 5.7). Although the difference in average numbers of coauthors in tenns of geographical distribution is not signifi-

92 Scientists in the Third World
Table 5.7. Average Number of Authors and Coauthors (Local andForeign) per Publication
Research Area
AquacultureAnimal productionCrop scienceForestryFood scienceNatural productsRural technology
Average
No. ofAuthors
1.872.121.951.982.122.852.202.25
No. ofLocalAuthors
0.750.980.720.670.981.320.800.96
No. ofForeignCoauthors
0.120.140.230.310.140.530.400.29
Total No. ofPublicationsper Granteeper Year
2.22.62.11.92.62.31.62.1
cant, we have noted that Asia has the highest number (2.4), foHowed byLatin America (2.2) and then Africa (2.1).
The mean number of authors per publication gives an interestingindication of the degree of association among researchers who publish,and the origin (local or foreign coauthors) gives an indication of theopenness and/or dependence of the researchers. Table 5.7, for instance, confirms that natural products is the field for which the publication rate is the highest. It is also the field that brings IFS and foreignscientists together most. ActuaHy, the more the scientists publishabroad, the more they work with foreign scientists in their preparationwork.
Thus, we found that there were no researchers who had publishedmore than 12 articles abroad without a foreign coauthor. Garfield (1983)has shown that articles by researchers in DCs have a greater impact (onthe international scientific community, measured in terms of number ofcitations per article) when they are coauthored by researchers from ICs.Here we come up against the dilemma of the strategie scientific choicesthat researchers in DCs, in common with most researchers in peripheral scientific communities, have to make between participation inmainstream science (the most used, most visible, and most frequentlycited) and the resolution of local problems through "inward-Iooking"research, which sorne caH "domestic" or "inbred" science.
It is worth observing that coauthoring with foreign scientists is themost prevalent among scientists who studied or went on postdoctoralstudy tours abroad. In most cases, however, these publications are

Scientiflc Production 93
Table 5.8. Language of Publication by Linguistic Area
Spanish &Linguistic Area Local English French Portuguese
French-speaking countries 1 17 82English-speaking countries 8 92Spanish- & Port.- speaking
countries 36 1 63Average 6 76 8 10
produced in the years immediately following the stay abroad; sustained active collaboration is rare. Other associations develop when aforeign professor is on assignment in the scientist's home laboratory orwhen expertise, not locally available, is brought in as part of a programfinanced by a foreign institution or as follow-up to an internationalconference.
The choice of language of publication is aIso central to the scientificstrategy. A look at the lists of references consulted in preparing thisstudy confirms the hypothesis that the different linguistic worlds arealmost "language proof," especiaIly between the English and Frenchlanguages. Spanish and Portuguese speakers often cite literature inEnglish; this is rarely the case for French speakers. And references byEnglish-Ianguage scientists are drawn, for all intents and purposes,exclusively from literature written in English (table 5.8). To one degreeor another, these four languages dominate the world's scientific literature. In a few Asian countries, science is published in nationaIlocallanguages.
The percentages in table 5.8 refer to 5,000 publications produced by40 Latin American researchers (mainly Spanish speaking), 29 Frenchspeaking African researchers, and 138 English-speaking researchers.These results confirm the prime importance of English and the resulting subordination of the other languages. Out of 3,678 publications byEnglish-speaking grantees, 2 were in French, 1 in German, 4 in Russian, and none in either Spanish or Portuguese. On the other hand,more than one-third (36%) of the publications by Latin American andalmost one-fifth (17%) by French-speaking grantees were in English.Our case study in Senegal showed that English was increasingly usedin French-speaking countries. The percentage of articles published inEnglish by scientists working in Senegal, for instance, rose from 15% in1975 to sorne 30% in the early 1980s. 1O
The other conclusions that can be drawn concem the relatively

94 Scientists in the Third World
signifieant use of local languages in certain Asian countries, e.g.,Indonesia where more than half (52%) of the grantees' publishedworks appear in Indonesian languages, Thailand (28% in Thai), andSouth Korea (18% in Korean). These percentages would be considerably higher if our figures only applied to the language of publicationused in the national journals. Eisemon and Davis (1989) reported thatover half (57.1%) of the articles in six South Korean journals werepublished in Korean. ll Publication strategies differ greatly, dependingon both the country and the discipline. Unlike South Korea, in Singapore aIl the scientifie journals are in English.
As a general role, researchers will tend to write in local languagesfor national publications if their subject of research is for direct application. Except, perhaps, for a few Thai scientists, who find it difficult towrite in English, the decision to publish in a national language and in anational publication is usually a question of strategy, as can be seen ininterviews with scientists who say things like, "1 submitted this paperto a local journal because the contents essentially bear on a localproblem. This should make it easier for me to make the authoritiesaware of the problem and help them find the right solutions for ournational development." Or, as concerned Korean and Thai, "1 published in my national language so that 1 couId use it in teaching."
Another scientist said that he had decided to publish in a new localjournal to contribute to its development because "1 feel that it isessential for our countries to have good quality scientifie publications."
A few scientists adrnitted that it was "easier" and "faster" to publishin national journals. Using a national language also means reachingreaders who do not receive international journals and, furthermore,gaining repute among peers and students in the home institutions.Most published in both national and international journals. Onlyabout20% published exclusively in the national journals; these were mainlyyoung scientists working in agronomie research (animal production,crop science, forestry) and aquaculture. There were no scientists fromthe natural products group who published exclusively in the nationaljournals.
An analysis of the references used in articles provides preciousinformation on the scientific output and research practices. We saw, forinstance, that there was far more intralinguistic than interlinguistictransfer. We also obtained information on the relative use of local andinternational science and the relative age of the work cited in thescientists' publications. Sorne authors found that scientists from theperipheral countries tended to ignore-or did not have access toolder publications and thus concluded that the use of more recent

Scientific Production 95
Table 5.9. Breakdown of Age of Reference Cited by Continent ofScientists' Work
Total CenterYears Africa Asia Lat. Am. OC Countries
0-5 180 22% 195 22% 144 25% 519 23% 340 42%6--10 312 38% 240 27% 180 32% 732 32% 239 29%over 10 327 40% 456 51% 240 13% 1,023 45% 232 29%
Total 819 100% 891 100% 564 100% 2,274 100% 811 100%
Table 5.10. Breakdown of Age of Reference (in Years) Cited byScientific Discipline
Discipline 0-5 6--10 Over 10 Total
Aquaculture 132 23% 138 24% 303 52% 573Animal
production 42 17% 96 38% 114 45% 252Crop science 102 18% 171 31% 285 51% 558Forestry 51 26% 75 37% 75 37% 201Food sciences 48 21% 108 47% 75 32% 231Natural products 144 31% 144 31% 171 38% 459
Total 519 23% 732 32% 1,023 45% 2,274
references was characteristic of science in these countries (Rabkin andInhaber 1979). The opposite was also alleged, Le., that scientists in theperipheral countries cite references that are much older than thosecited in articles published in international joumals by colleagues fromICs (Arunachalam and Markanday 1981; Velho 1985, pp. 244-56).
Now let us look at our study population. For purposes of comparison with scientists from developed counmes working in similarfields, we referred to Lea Velho's thesis (1985, p. 247) tofind a sample ofarticles published by mainly American scientists in scientific journalsof center countries. The results (tables 5.9,5.10,5.11, and 5.12) showthat DC scientists generally refer to articles more than 10 years old.Close to half (45%) of the references date back to over 10 years, while forauthors from center countries the figure is under one-third (29%).
Scientists from center countries often (42%) use references under 5years old, while for DC scientists the figure drops to 23%. Table 5.9
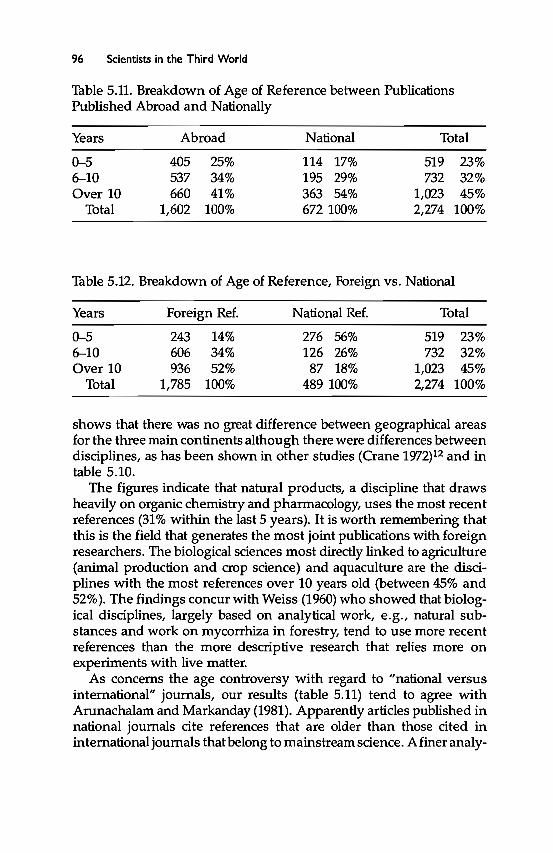
96 Scientists in the Third World
Table 5.11. Breakdown of Age of Reference between PublicationsPublished Abroad and Nationally
Years Abroad National Total
0-5 405 25% 114 17% 519 23%6-10 537 34% 195 29% 732 32%Over 10 660 41% 363 54% 1,023 45%
Total 1,602 100% 672 100% 2,274 100%
Table 5.12. Breakdown of Age of Reference, Foreign vs. National
Years
0-56-10Over 10
Total
Foreign Ref.
243 14%606 34%936 52%
1,785 100%
National Ref.
276 56%126 26%
87 18%489 100%
Total
519 23%732 32%
1,023 45%2,274 100%
shows that there was no great difference between geographical areasfor the three main continents although there were differences betweendisciplines, as has been shown in other studies (Crane 1972)12 and intable 5.10.
The figures indicate that natural products, a discipline that drawsheavily on organic chemistry and pharmacology, uses the most recentreferences (31% within the last 5 years). It is worth remembering thatthis is the field that generates the most joint publications with foreignresearchers. The biological sciences most directly linked to agriculture(animal production and crop science) and aquaculture are the disciplines with the most references over 10 years old (between 45% and52%). The findings concur with Weiss (1960) who showed that biological disciplines, largely based on analytical work, e.g., natural substances and work on mycorrhiza in forestry, tend to use more recentreferences than the more descriptive research that relies more onexperiments with live matter.
As concems the age controversy with regard to "national versusinternational" journals, our results (table 5.11) tend to agree withArunachalam and Markanday (1981). Apparently articles published innational joumals cite references that are older than those cited ininternational joumals that belong to mainstream science. A finer analy-

Scientific Production 97
sis would probably reveal signifieant differences between countries.Eisemon and Davis (1989) showed that one-fifth of the referencesin articles published in national journals of Malaysia, Thailand, andSouth Korea dated back to 5 years ago at most while in Singaporenearly one-third of the nonmainstream science references were of thatage.
It is quite clear that articles printed in national reviews are muchmore readily assimilated by DC scientists than anything found inforeign journals, as table 5.12 indieates.
Over half (56%) of the references drawn from national scientifieliterature date back at most 5 years, while only about one out of sevenreferences (24%) taken from foreign journals is thus dated. Yet thescientifie transfer within or between the DCs is not very great (only22%). In other words, references in publications by DC scientists aremainly (78%) taken from mainstream scientifie literaturebut with sornedelay since more than half the references date back to at least a decadeago.
Several reasons can be suggested for this situation, whieh is largelydue to dysfunctioning of scientific practices in the DCs. Since most ofthe DC scientists, unlike their colleagues in developed countries of thecenter, do not belong to what is generally called the "invisible college,"they do not become famiIiar with their colleagues' work before it ispublished. Actually, their only access to information is tedious bibliographie research, and even this does not always result in the identification of the most relevant reference work. In the preceding chapter,we saw that only half the scientists had bibliographie catalogs like"Current Contents" and that less than one-third of them had access tobibliographie data banks. The unavailability of bibliographie referenceswas felt with special acuteness in Africa.
This said, during our visits we saw that, except in a certain numberof African countries, the libraries in DC universities and institutionshad relatively recent scientifie journals from countries of the center thatinstitute scientists rarely consulted. Sorne of these journals looked as ifthey had never been opened. Many scientists try to subscribe individually to the most relevant international journals, but scanty, irregularfinancial means makes this diffieult.
The fact that DC scientists often cite articles in journals that are over10 years old can also be related to the time between their trainingperiod abroad and the publication of their work. Over 75% of ourcohort studied abroad, mainly in the United States, Great Britain, andFrance. Quite possibly their references are works they learned aboutduring their education abroad. This is an explanation Lea Velho enter-

98 Scientists in the Third World
Table 5.13. Receipt of Prizes or Awards by Number of PapersPublished
No. of 21 andPublications 0 1-9 10-20 Over Total
Grantees who 20 28 17 9 74obtained awards
% 8 15 49 60 16Total no. of grantees 238 183 35 15 471
tains in reference to Brazilian scientists: "The longer the time since theresearchers returned to Brazil from graduate training abroad, the olderthe foreign literature they tend to cite" (1985, p. 253).
Turning to total scientific production, we see that English-speakinggrantees, mainly in Asia, constitute the most published group (2.37publications per scientist per year), while French-speaking Africans(1.63) and Latin Americans (1.76) form the least published groups.These figures, of course, only provide a part of the picture and cannotbe used as a definitive measurement of the quality of a researchscientist. Other indicators have to be used. For reasons given above, wedecided not to use the citations method in measuring the impact andthe quality of articles published in international reviews. A full-fledgedqualitative evaluation would have required the participation of severalspecialists with a variety of linguistic capacities for each of the disciplines concerned, which was beyond the means of our study. Toconclude this chapter on scientific production, we looked at the scientific tribute bestowed on the grantees in recognition of their contribution to their respective fields.
Scientific Recognition
For the period between 1974 and 1984, in recognition of the quality oftheir scientific work since obtaining an IFS grant, 74 grantees, Le.,about 1 out of 6, received at least one scientific award. The frequency oftribute is clearly related to the year of first grant, since rewards (one ormore) were meted out to sorne 1 out of 4 grantees who obtained theirfirst grant in the 1974-79 period and 1 out of 3 for the 1974-75 period.
We also found links between scientific awards in Des and thenumber of publications credited to a scientist, although 20 of the 74recipients had not had anything published, as table 5.13 shows. Thus,we can see that more than haIf (60%) of the grantees who published at

Scientific Production 99
least 21 times received sorne credit. Over two-thirds of aIl forms oftribute were extended to Asian scientists; the rest were divided equallybetween African and Latin American scientists.
Most prizes were national expressions of merit, such as the ScienceAcademy Medal for Young Scientists (India), the Outstanding YoungScientist's Award (Philippines), the Gold Medal of the Pakistan Academy of Science, Best Woman Scientist of the Year (Sri Lanka), or theFirst National Prize for S&T Research (Congo), or awards from nationalscientific institutions, such as the Hooker Award (Indian AgriculturalResearch Institute, New Delhi) or the Best Scientist of the Year (Mahidol University, Thailand). Far less often, the prizes or recognitionwere international, such as the United Nations University Prize (biological sciences), the IBPGRlFAO Prize (genetic resources), FeIlow,Third World Academy of Science, or the Guinness Prize of ScientificMerit for Development.
Production of University Graduates
We know that more than two-thirds of the grantees (71%) work inuniversities or higher education establishments and devote much oftheir time to teaching. The teaching function is essential not only totrain senior civil servants and to reproduce the scientific communitybut also for research purposes proper. AIl too many university professors in DCs have lost contact with ongoing science and merely chantscientific facts of the past instead of teaching students that science is anactive method used to state and solve problems. The very concept ofhigher education demands that teachers participate in research andsimilarly that research scientists at sorne time in their career contributeto the teaching world.
This is the case for the majority of IFS grantees. We asked them howmany students they had trained since receiving an IFS grant. Theanswers appear in table 5.14.
The number of people trained is, quite understandably, inverselyproportionate to the level of the training. It is interesting to note thatduring the first 10 years of IFS there were practically as many Ph.D.strained by IFS grantees as there were grantees, although only onequarter (26%) were actively involved. More than half (54%) of thegrantees were involved in M.S. training. Many of the students, ofcourse, benefited from the financial support and equipment obtainedby the IFS grantees, as we can see from table 5.15.
Thus, a considerable majority (62%) ofiFS grantees make the equipment purchased with the IFS grant available for use in teaching ac-

100 Scientists in the Third World
Table 5.14. Number of People Trained since Becoming IFS Grantee
No. ofPeopleTrained
No. of grantees No. of PeopleInvolved in Trained perTraining Grantee
PostdoctoratePh.D.M.S.Technicians
138484
3,2423,194
30 (6%)130 (26%)262 (54%)305 (62%)
0.060.986.606.50
Table 5.15. Percent of IFS Grantees Who Made Equipment Boughtwith Grant Available to Others
Yes No
Teaching activities? 62% 38%Other research projects in their researchunit or department? 90% 10%Other research projects in otherdepartments of their institution? 56% 44%Other research projects in otherinstitutions? 25% 75%
tivities, and far more (90%) make it available to other projects in theirresearch unit or department. These percentages diminish as a functionof geographical distance, but it is interesting to see that one-fourth(25%) of the grantees share the equipment acquired with IFS supportwith research projects in other institutions. This must be taken intoaccount in any attempt to evaluate the impact of a research assistanceinstitution such as IFS in DCs. IFS, through its grantees, unquestionably helps a whole network of DC scientists, well beyond the grantee'snearest colleagues; but it is difficult to produce numbers.
Implementation of Research Results
Research is not an end in and of itself. A nation, like a business, thatonly works to produce research results would actually be working forits competitors. The video tape recorder, for instance, was invented inthe United States but was manufactured and sold by Japan. Two recent
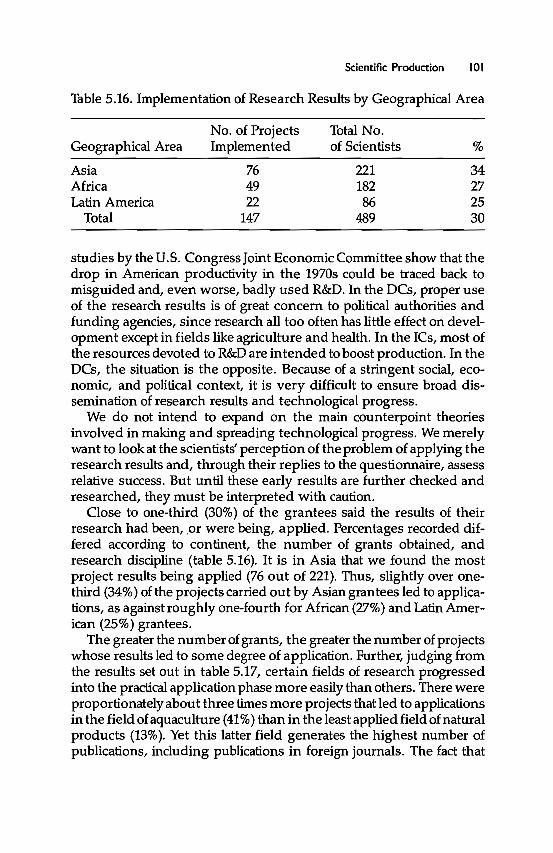
Scientific Production 101
Table 5.16. Implementation of Research Results by Geographieal Area
No. of Projects Total No.Geographieal Area Implemented of Scientists %
Asia 76 221 34Africa 49 182 27Latin America 22 86 25
Total 147 489 30
studies by the U.S. CongressJoint Economie Committee show that thedrop in American productivity in the 1970s could be traced back tomisguided and, even worse, badly used R&D. In the DCs, proper useof the research results is of great concem to political authorities andfunding agencies, since research aU too often has little effect on development except in fields like agriculture and health. In the ICs, most ofthe resources devoted to R&D are intended to boost production. In theDCs, the situation is the opposite. Because of a stringent social, economie, and political context, it is very difficult to ensure broad dissemination of research results and technological progress.
We do not intend to expand on the main counterpoint theoriesinvolved in making and spreading technological progress. We merelywant to look at the scientists' perception of the problem of applying theresearch results and, through their replies to the questionnaire, assessrelative success. But until these early results are further checked andresearched, they must be interpreted with caution.
Close to one-third (30%) of the grantees said the results of theirresearch had been, .or were being, applied. Percentages recorded differed according to continent, the number of grants obtained, andresearch discipline (table 5.16). It is in Asia that we found the mostproject results being applied (76 out of 221). Thus, slightly over onethird (34%) of the projects carried out by Asian grantees led to applications, as against roughly one-fourth for African (27%) and Latin Ameriean (25%) grantees.
The greater the number of grants, the greater the number of projectswhose results led to sorne degree of application. Further, judging fromthe results set out in table 5.17, certain fields of research progressedinto the practical application phase more easily than others. There wereproportionately about three times more projects that led to applicationsin the field ofaquaculture (41%) than in the least applied field of naturalproducts (13%). Yet this latter field generates the highest number ofpublications, including publications in foreign joumals. The fact that

102 Scientists in the Third World
Table 5.17. Number of Projects Implemented Per Research Area
Research Area
AquacultureAnimal productionCrop scienceForestryFood scienceNatural productsRural technology
No. of ProjectsImplemented
402241
918125
Total No.of Grantees
9875
11339539021
%
41293623341324
Table 5.18. Beneficiaries of Implemented IFS-Supported Research
RankScore
123456789
10
MeanScore"
3.523.293.252.932.732.642.632.492.421.87
Other scientific disciplinesSmall farmersRural residentsLocal or state govt. agenciesLarge farmersAgribusinessGeneral publicUrban residentsLocal industriesForeign or int'l industries
RankScore
123745968
10
MeanScore
4.263.923.823.343.563.463.203.413.252.61
"Mean score based on five-point scale: 1 = not at aIl; 5 = a great deaI.
aquaculture easily leads on the honor roll confirms certain resultsreported in a survey carried out in 1980 by Berlinguet (1980).
Out of 10 projects that seemed the most likely candidates for practical application, 5 were in aquaculture. Promise in this field seems tobe derived from the fact that experimental conditions are often similarto real production conditions or can be transferred at an investmentcost that soon translates into higher profits. Further, the grantees oftenserve as advisers to the producers.
We also wanted to know who benefited from the research resultsobtained by IFS grantees. To do so, a series of past, present, and

Scientific Production 103
Table 5.19. Implementation of Research Results: Vectors and Actors
No. of ProjectsImplemented %
Public sector (mainly extension services)FarmersUniversity research institutesPrivate sectorCooperativesPublicationsInternational OrganizationsOther
732315158761
50.015.910.010.05.44.74.0
potential beneficiaries was identified and ranked on the basis of answers provided by the grantees (table 5.18). It would be premature toanalyze the table; but it is interesting to note that the grantees felt thattheir colleagues from other disciplines were, and will continue to be,the primary users of the results of their research. Neither national orinternational industry seems to pay much heed to this research. Inbetween, the rural populations, especially the small fanners, seem tobenefit most and will continue to do 50.
Again, according to the grantees, application of the results of research depends, and will continue to depend, on the public sector,mainly the extension services. Table 5.19 further evidences this. Thegrantees themselves felt that international organizations played a veryminor role in this domain. We do not have complete infonnation oninteraction with other international organizations; but we have ascertained that in most cases their support was designed to provide IFSgrantees with the financial, material, and manpower backing neededto integrate the IFS project into a much broader multidisciplinaryresearch program by including a training component and externalpartners or to start up a new research program not connected to the IFSproject. This especially applies to organizations such as V.S.AlD,BOSTID (Board on Science and Technology for International Development), and IDRC. It may be profitable to think about creating aninternational body to work on the application of research results produced by scientists in DCs.
Several conclusions can be drawn from this chapter concerning thespecifie nature of science produced by DC researchers and the construction of science in their countries.

104 Scientists in the Third World
Quality is not the only reason why science produced in DCs is notadequately represented in international data bases. Sorne, like the oneat SCI, are not properly equipped to evaluate the scientific productionfrom science communities in peripheral regions, in particular in theDCs. They can be used as a source of information of the relativestrengths of various countries in mainstream science and their impacton world science but give an incomplete and often inaccurate picture oftotal scientific output and how science is constructed in nonmainstream countries.
A look at total scientific production shows that DC scientists oftenpublish (up to 60% in Asia) in national joumals, that the leadinglanguage is English, a language even used for publishing by close toone-fifth of the French-speaking scientists and over one-third of theLatin American scientists. We also saw that the English-speaking scientists only publish in English or, as is the case in Asia, (often) in locallanguages. Most of the scientists publish in both national and international journals. Although publication strategies differ according tocountry and to scientific discipline, scientists who decide to publish ina local language or journal do so by choice and not by necessity.
DC scientists cite references essentially (78%) from mainstreamscientific literature that they seem to receive later than their colleaguesin the center since nearly half the references are over 10 years old, asagainst 29% of the references cited by scientists from the center countries. An analysis of the citations indicates that DC scientists use morerecent articles from national journals than articles from internationaljournals. Actually, citation modes are affected significantly by factorsunrelated to science, factors that are social rather than cognitive innature. Scientists in the DCs have little or no informaI contact with theircolleagues in developed countries, and they need much more time toavail themselves of new scientific data that are pertinent to their research.
In sum, DC scientists often cite their colleagues from the developedcountries, but their own work being relatively "invisible" is seldomcited. They often feel caught in a dilemma: either adopt the habit ofscientists from developed countries and publish in international journaIs to become more "visible" and gain international standing or elseseek national recognition by publishing in local journals and sometimes in local languages, thus being condemned to nonexistence or, atbest, marginal existence in mainstream science. The general trend is toadopt the two strategies together.
Considering the dilemma, and since the circulation of scientificinformation is notoriously out of kilter, it is impossible to judge the

Scientific Production 105
quality of scientific work exclusively on the basis of citations. For thisreason, we must reject the abusive simplification that predicates on thecitation count criterion and seems to consider local science as a synonym of poor science and international science as a synonym for goodscience.
1. We know that most of the scientific journals published in the DCs areshort of articles and many seldom reject any, but we also know that the editorialpractice of certain mainstream joumals, including sorne of the leading ones, isnot always very selective. Packer and Murdoch (1974) asserted that during the1963-73 period, the Bulletin of the Entomological Society ofAmerica, by principle,and insofar as possible, printed ail the articles it received. During that decadeonly 4% of the articles submitted to the Journal of Economie Entomology, theAnnals of the Entomological Society of America, the Bulletin of the EntomologicalSociety of America, and Environmental Entomology were rejected.
2. In this publication Lawani also provides a per country rundown of the829 journals that have an above-average impact according to the SCI. TheUnited States is the leader (60% of the titles), followed by Great Britain and theNetherlands. There is only one DC journal (Revis ta Mexicana de Astronomia,published in Mexico) on the Iist.
3. The scientific output from the People's Republic of China was completely ignored in the 1973 SCI base (except for one publication). The powerfulemergence of this country at the end of the 1970s was due to three interdependent phenomena, viz., increased contact with Western science, a sharp rise inthe number of scientific journals published in the country, and ISI's stateddecision to correct the under- or nonrepresentation of that country in the !SIdata base.
4. Thailand and Malaysia, which had disappeared from the Iist of the top15, were sixteenth and seventeenth in the 1981-85 period, with annual averageproduction figures of 188 and 169 publications, respectively.
5. Brazil's progression has been especially remarkable considering thehighly internaI focus of its scientific output. In the fjeld of agricultural research,Brazilian scientists publish more than90% of their results in national journals inPortuguese. See the excellent Ph.D. thesis by Lea Velho entitled "Science on thePeriphery: A Study of the Agricultural Scientific Community in BrazilianUniversities" (University of Sussex 1985).
6. The PASCAL base (applied program for automatic compilation andselection of Iiterature) created by CNRS in France contains approximately fourtimes more references on Senegal that ISI does.
7. The Journal ofthe Science Society ofThailand is also indexed in the SeI of theISI. A weaker correlation was noted between the number of publicationsappearing in the latter's journal and the number of abstracts presented at the
106 Scientists in the Third World
annual symposium of the Science Society of Thailand by the various scientificinstitutes of Thailand.
8. In a more precise quantitative and qualitative evaluation, allowanceshave to be made for the relative value of the various types of publications. Whatvalue should be assigned to a book or a chapter in a book as compared to anarticle published in a scientific journal? Should the value ofa scientific article beconsidered inversely proportionate to the number of its coauthors?
9. Three reports by Beaver and Rosen published as a series in Scientometricsin 1978 and 1979 are based on a study of collaboration between scientiststhrough time since the seventeenth century. This study showed that collaboration in scientific research was a sign of professionalism within the scientificcommunity and made the scientists more mobile and "visible."
10. The case study on the history and the development of the scientificcommunity in Senegal, presented in the second part of my thesis, is alsorelevant here (Gaillard 1989).
11. The fields covered by these journals, viz., biology, biochemistry, computer sciences, electronics, and physics, are directly related to internationalscience.
12. Brown, cited in Crane (1972), found that the percentage of referencesunder 10 years old was the highest in publications on physics, lowest in biologyand that physiology and chemistry were in between.
Chapter Six
National Scientific Communities:Costa Rica, Senegal, Thailand
In the preceding five chapters, we repeatedly pointed out that globalstatistics blurred regional disparities and dissimulated very pronounced differences between DCs, even those within the same region.In any case, there is no single Third World; there are Third Worlds,with "levels of under-development no less unequaI than levels ofdevelopment" (Salomon 1984, p.46). We felt that a comparative study ofresearch scientists and the emergence of national scientific communities in several countries might better explain disparities and correlations of situations and problems and also consolidate results from oursurvey of the scientists. Chapter 6 abridges results from this comparative study; the complete results are reported in my Ph.D. thesis(Gaillard 1989).
Despite their incongruity, the countries called the Third World canbe seen as a set, broken down into subsets with sorne degree ofuniformity in size, industrialization, position in the world market,demography, wealth, dependence on natural resources, and the oftenprecarious balance between natural resources and population pressure. The most common typologies are linked to economic indicators,especially the per capita gross national product (GNP) and suggest aclassification based on thresholds, e.g., the World Bank typology thatrecognizes low-income countries (U.S. $0-400 per inhabitant per year),medium-income countries (U.S. $400--1,700), and oil exporting highincome countries (more than $1,700). In the United Nations systems,especially UNCTAD (United Nations Conference on Trade and Development) makes a distinction between several categories: newly industrialized countries (NICs), oil exporting countries, and the leastdeveloped countries (LDC). But the search for a more "explicative"typology must extend beyond quantifiable factors to include socialstructures, political systems, and national history.l
Several criteria guided our choice of countries for this study. First,we wanted to choose at least one country from each of the three majorcontinents of the Third World. For practical reasons (lack of time andresources), we decided to take small- or medium-sized countries that

lOS Scientists in the Third World
Table 6.1. Brief Comparison of Country Characteristics
No. of GNPinh~b. Area Density U.S.$/ Urbaniz.
Country OOOsa km2 inhablkm2 inhabb rate
Costa Rica 2,613 51,100 51.1 1,340 50.3%Senegal 6,793 196,722 34.5 370 25.4%Thailand 53,722 513,115 104.7 810 19.8%
France 55,623 543,964 102.3 9,545 73.4%United States 243,773 9,529,063 26.0 17,600 73.7%
Source: "Les Chiffres du Monde," Encyclopedia Universials, 1988.a1987b1988
showed signs of emerging national scientific communities. This explains why we automatically excluded countries as big as continentssuch as China, India, and Brazil, which, as we saw in the precedingchapter, are the three major scientific powers of the Third World. Inorder to avoid having to compare countries with levels of developmenttoo far apart, it seemed wise to avoid NICs such as the four Asian"dragons" (Taiwan, South Korea, Singapore, and Hong Kong) andcertain Latin American countries (Argentina and Mexico). Our choicewas also guided by ease of access to information and effective cooperation with national scientific leaders. The result was that we chose CostaRica to represent Latin America, Senegal for Africa, and Thailand forAsia. Table 6.1 briefly describes these countries in relation to Franceand the United States by indicating size (area and population), wealth(GNP/per inhabitant), and urbanization rate.
The three countries in the study are small (Costa Rica and Senegal)or medium (Thailand) in size. Their per capita income (expressed inU.S. dollars) places them high in the category of low-income countries(Senegal) or in the middle of the category of medium-income countries(Thailand and Costa Rica). AlI three countries are agricultural althoughthe economies of two of them (Costa Rica and Thailand) have beenstructurally changing as industry accounts for an increasing part of theGNP. None of them numbered among the top 15 producers of mainstream science from the DCs in the beginning of the 1980s. Thailandwas sixteenth, just after Singapore, and was seventh among the Asiancountries (excluding Japan). Despite its small size, Costa Rica waseighth among the Latin American countries, just after Columbia andCuba. Senegal and Ivory Coast shared seventh place among countries

National Scientific Communities 109
of sub-Saharan Africa (excluding South Africa), but this was largelythanks to input from expatriate French scientists working in Senegal(Gaillard and Waast 1988).
Industrializing Economies Still Heavily Dependent on Agriculture
With a population barely over 2.6 million in 1987 and a land area sorneten times smaller than France, Costa Rica is one of the smallest andsparsely populated countries of Latin America. The population is composed of white descendants of Spanish settlers, a small minority ofblacks (1.8%) who live mainly around the coast, and Indians (1%). Withan officialliteracy rate of over 90% and life expectancy of 74 years, CostaRica is one of the leaders of Latin America. Education and health havereeeived special attention, primary education has been free of chargeand compulsory for over a eentury, and the largest sector in thenational budget is education (Costa Rica 1981).
Although Costa Rica relies essentially on agriculture, industry isgenerating a growing part of the GNP. In 1974, for the first time,industry contributed more than agriculture. In the early 1980s, agriculture contributed close to 17% (as against 44% in 1950), accounted for70% of the national exports, and provided employment for close to 30%of the working population. Half of the agricultural output is exported;most export eamings come from coffee and bananas, then meat, sugar,and a certain number of lesser products (ISNAR 1981).
The main problems facing Costa Rica now are inflation, the energycrisis (the country spends 25% of its export eamings on importing oiland oil products), the sluggishness of the Central American CommonMarket, the drop in world priees for its exports, and its foreign publicdebt, whieh is close to V.S. $4 billion. This, proportionately, makesCosta Rica one of the most heavily indebted countries in the world.Again considering the size of the population, Costa Rica is one of thecountries that reeeives the most aid; a large part comes from the UnitedStates and from international organizations such as the World Bank andthe Inter-American Development Bank.
Senegal was populated in phases, whieh explains the ethnie mixtureof the territory. The main ethnic groups are the Wolofs (approximately40% of the population, mainly farmers and civil servants), the Serers(16%, farmers-herders), and the Peulhs (14%, herders-nomads). Thereare 40,000 Europeans (called toubabs) including 20,000 French (81% ofthem are in Dakar) and 10,000 Portuguese (mainly traders). Althoughthe most important sector in the national budget is education (28.3% ofthe 1985-86 budget), the illiteracy rate was estimated at 77.5%. At birth,

110 Scientists in the Third World
life expectancy is only 43 years. Most of the Senegalese are SunniteMuslims (91%), and 30% of the married men are polygamous (Encyclopredia Universalis 1988).
In 1981, 81% of the working population was employed in the primary sector, which meant that Senegal was, by nature, largely agricultural although this sector only contributed 17.6% of the GrossDomestic Product (GDP) (World Bank 1986). The agricultural sector hasundergone considerable change sinee 1960, with agriculture waning aslivestock and fish production rose. Groundnut is still by far the mostimportant industrial crop, but it too is on the decline. Senegal produeesinsufficient food crops, in particular cereal crops, and every year has toimport large quantities of riee and wheat. Since the early 1980s, especially after the agricultural program was stopped, the productionsystem deteriorated. The relation between the selling priee of agricultural products and the cost priee of factors of production is sounfavorable that agricultural inputs are being used ever less, andagricultural equipment is wasting away (Sène 1985).
The industrial sector only employed 6% of the working populationin 1980 and 5% in 1985 (World Bank 1986). Between 1980 and 1986, thesecondary sector generated annually between 29% and 33% of theGDP. In industry, the main sectors were textiles and proeessing plantoils, mainly (75%) in the Cap Vert Peninsula. Sourees of energy areinsufficient, and the main mining resource is phosphate, which is thefourth most important Senegalese export (Bonnefond 1987).
It is difficult to evaluate increases in the GDP. A fair estimate is asteady 1% per year (Bonnefond and Couty 1988). The economy hasbecome sluggish because of stagnation in the rural sector, paralysis inthe modem sector, and the drop in real government outlay sinee 1980.As the old-time factors of growth faded, compensation could havecome-but didn't-from the fish industry, phosphates, and tourism.Results are especially poor in agriculture sinee the annual GDP growthrate between 1973 and 1984 was - 0.2%. The per capita GNP droppedbyan average annual 0.5% between 1965 and 1984 (World Bank 1986).The economic and financial situations are alarming. The trade balaneeis bright red because of the increase in oil priees and the decrease ingroundnut and phosphate priees. Exports covered 81.5% of the imports in 1977 but only 55% in 1980 (World Bank 1986). The foreign debtis another burden for the Senegalese economy and is constantly growing. The outstanding debt was 901.2 billion CFA francs (US $1 = ± 250CFA in 1990) at the end of 1985, or 75.9% of the GDP. The service of thedebt, even after debt rescheduling, continues to rise; it reached 77.2

National Scientific Communities III
billion CFA francs in 1985, in other words, 31.7% of the value ofSenegalese exports (Bonnefond and Couty 1988).
Thailand has about the same number of inhabitants (54 million) asFrance and occupies a land area (514,000 kilometers2) that is also muchthe same. It ranks in the midway group of Southeast Asian countries.The majority of the people are Thai (79.5%, which includes 52.5%Siamese and 26.9% Laotians); there is a Chinese minority (12.1%) thatlives mainly in Bangkok and controls most of the trade and industry.The other ethnic groups include Malays (3.7%) who live mainly in thesouth and Khmers (2.7%). The principal religion is Buddhism. Themain expenditure in the national budget is servicing the debt (24.7%).Second place is shared by national defense and education, each receiving 18%.
Agriculture provides the livelihood for two-thirds of the population(four-fifths in 1960) and generates one-third of the GOP. After 1850, thesubstantial increase in the price of rice motivated the Thai farmers toconcentrate on this crop with the result being that rice exports rose tobecome 25 times greater in the century between 1850 and 1950. Theincrease in rice production is the result of cultivating more lands, nothigher yields; yields, on the contrary, have been going down (Muscat1966). Thailand is now the world's leading rice exporter (3 million tons)and has given over half its arable lands to rice. Cassava and maize arebeing farmed on newly opened lands.
Although four-fifths of the population lives in rural areas, the rapidurban growth, especiaUy in Bangkok, whose population rose from 1.7million in 1960 to over 5 million in 1988, has created the very seriousproblem for the govemment of providing jobs for the growing urbanpopulation and also creating new jobs in the rural zones to stem theexodus to the capital. Since 1960 a shrinking agricultural sector hasbeen contributing less to the GOP and offering less employment whilethe industrial and services sectors have been expanding. Industry hasregistered the highest production growth rate, while in terms of jobopportunities, construction has been faring best. It was mainly in the1960s and 1970s that the textile industry soared; it now represents 15%of the GOP and employs close to 300,000 people. The textile industry,along with American and Japanese automobile assembly plants, theSaraburi integrated steel plant, and the country's only cement factoriesare aU concentrated around Bangkok.
It was also in the 1960s that the private sector attracted large numbersof foreign investors. In 1974 foreign investments represented close to30% of the capital in this sector. Japan was the spearhead: it provided

1/2 Scientists in the Third World
42% of the foreign capital invested in this field in Thailand that year;the United States came second but had invested the equivalent of lessthan half the Japanese investment (Mingsarn 1981). The trade balanceis negative. Most trade is directed to industrialized Western countriesand Japan. International tourism offsets part of the deficit; but since the1960s, and more specifically since the United States withdrew fromVietnam, economic development has been dependent on Americanaid.
Regional Disparities
These three countries have more or less pronounced regional differences. In Senegal, the little bit of industrial development in progressis concentrated on the Cap Vert Peninsula, where Dakar, the capitalcity, is located. In Thailand, national industry is largely concentrated inthe highly productive central plain where most of the food crops,principally rice, are grown. This region, which includes Bangkok, thecapital city, contributes over half of the GNP. The least-favored area isthe densely populated mountainous north. The economic despair ofthe most underendowed regions is expressed through temporary andpermanent migration to the cities, mainly the capital. Of the threecountries, Costa Rica has the fewest internaI regional disparities.
These disparities are also seen through the development of schoolsof higher learning and the establishment of scientific communities.
Young Scientific Communities
The history and development of scientific research in Costa Rica,Senegal, and Thailand first and foremost evidence the youth of thesystems. AlI three have traversed serious growth pangs that were moreor less controlled in the 1960s. These pangs were accompanied andfollowed by ruptures and dysfunctioning as the states, in the early1980s, forsook their commitments, especially in Senegal and Thailand.
Modem science may have been born in Italy at the end of thesixteenth or the beginning of the seventeenth century, but it wasn'tuntil the middle of the nineteenth century in Costa Rica and Thailandand a little later in Senegal that durable, tangible signs of its arrivaIcould be seen. The first traces of research institutes and schools ofhigher learning started appearing at the end of the nineteenth centuryand became really visible during the first part of the twentieth century.And it wasn't until the 1960s and even more so the 1970s that national

National Scientific Communities 113
scientific communities started taking root and becoming bona fideinstitutions.
Penetration of Western Science and Colonial Heritage
There is no clear link between the inroads made by Western scienceand the colonial heritage during the 1960s and the countries' colonialpast or absence thereof. But it is interesting that Senegal, which becameindependent in 1960 (Costa Rica in 1821), was far behind at independence time, especially in the field of higher education. Until1967 mostof the student body at the University of Dakar was French; the university did not start accepting large numbers of Senegalese until 1969.Whatever the case, the choice and strategies of the French colonizers inSenegal, the withdrawal of the Spanish colonizers in Costa Rica, andthe determination to stay independent in Thailand had their effect onthe mainstreams of higher education and research and still affect thedevelopment of national scientific communities.
As concerns Costa Rica, Spain expected very little from this poorcolony, did next to nothing to contribute to its development, and, at thetime of independence in 1821, left very few Costa Ricans equipped tofashion the country's future. The University of Santo Tomas, CostaRica's first attempt to create a university, was opened in 1843, 22 yearsafter independence. Since there was no higher education available inCosta Rica, the future members of the national government were sentto the University of San Ramon de Leon in Nicaragua to study law andpublic administration. Nicaragua played an important role in CostaRican affairs and in educating a national elite on the morrow of independence. By the beginning of the twentieth century, the only branchof higher education that functioned normally in the country was theFaculty of Law, which explains why Costa Rica as a country and itsacademic world were long dominated by jurists. Starting in 1840, theUniversity of San Carlos in Guatemala gradually replaced San Ramonde Leon as the training ground for young Costa Ricans studying lawand medicine (Gonzalez 1976).
In Senegal, the French colonizers sought to organize technical services to make the lands of immediate benefit to France. Special attention was given from the outset to general agronomic research andespecially to export crops. An experimental groundnut station wascreated at Bambey in 1921, in the heart of the groundnut basin. Agronomie research did not include a training component; it wasn't until1979that a specialized school of agronomy was created in Senegal. Thislargely explains why agriculture, whieh now accounts for close to half
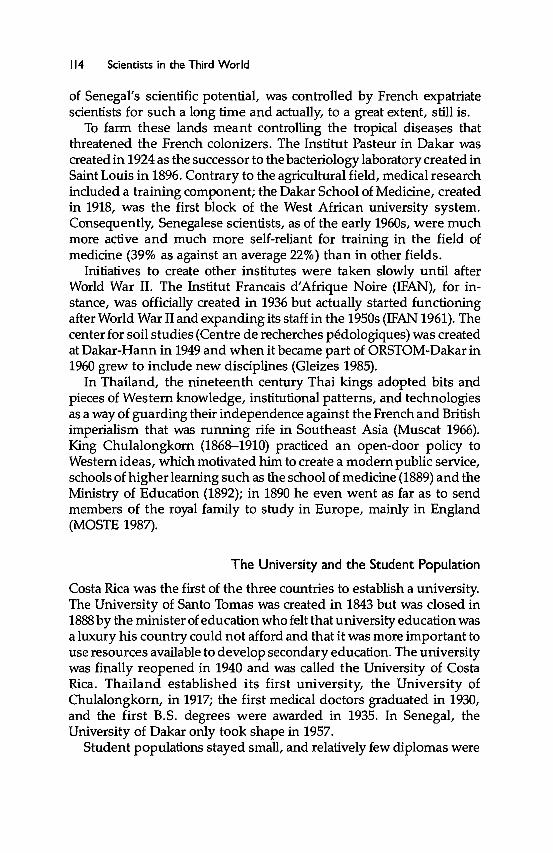
114 Scientists in the Third World
of Senegal's scientific potential, was controlled by French expatriatescientists for such a long time and actually, to a great extent, still is.
To farm these lands meant controlling the tropical diseases thatthreatened the French colonizers. The Institut Pasteur in Dakar wascreated in 1924 as the successor to the bacteriology laboratory created inSaint Louis in 1896. Contrary to the agricultural field, medical researchincluded a training component; the Dakar School of Medicine, createdin 1918, was the first block of the West African university system.Consequently, Senegalese scientists, as of the early 1960s, were muchmore active and much more self-reliant for training in the field ofmedicine (39% as against an average 22%) than in other fields.
Initiatives to create other institutes were taken slowly until afterWorld War II. The Institut Francais d'Afrique Noire (IFAN), for instance, was officially created in 1936 but actually started functioningafter World War II and expanding its staff in the 1950s (IFAN 1961). Thecenter for soil studies (Centre de recherches pédologiques) was createdat Dakar-Hann in 1949 and when it became part of ORSTOM-Dakar in1960 grew to include new disciplines (Gleizes 1985).
In Thailand, the nineteenth century Thai kings adopted bits andpieces of Western knowledge, institutional patterns, and technologiesas a way of guarding their independence against the French and Britishimperialism that was running rife in Southeast Asia (Muscat 1966).King Chulalongkorn (1868-1910) practiced an open-door policy toWestern ideas, which motivated him to create a modern public service,schools of higher leaming such as the school of medicine (1889) and theMinistry of Education (1892); in 1890 he even went as far as to sendmembers of the royal family to study in Europe, mainly in England(MOSTE 1987).
The University and the Student Population
Costa Rica was the first of the three countries to establish a university.The University of Santo Tomas was created in 1843 but was closed in1888 by the minister of education who feH that university education wasa luxury his country couId not afford and that it was more important touse resources available to develop secondary education. The universitywas finally reopened in 1940 and was called the University of CostaRica. Thailand established its first university, the University ofChulalongkorn, in 1917; the first medical doctors graduated in 1930,and the first B.S. degrees were awarded in 1935. In Senegal, theUniversity of Dakar only took shape in 1957.
Student populations stayed small, and relatively few diplomas were

National Scientific Communities 115
Figure 6.1. Students as a Percentage of Total Population, 1960-1985
82 84 86
-G- Senegal...... Costa Rica-a- Thailand
62 64 66 68 70 72 74 76 78 80
2.25 ,----------------------:::__==11----,
2.00
1.75
1.50
1.25
1,00
0.75
0.50
0,25
~ ...liI::::::;==:;:::::;::::::;=:::;:::::::;::::;::::;:::::;::;~~~:=~~~::::J0,00+60
co.....tG-='c:l.oc:l.-tG..o.......III..CQI
"='..III
\1o~
Yeors
awarded until the end of the 196Os. In the 1970s student enrollmentgrew substantially in aIl three countries but at very different rates; inCosta Rica and Thailand during this period more establishments ofhigher leaming were bom. To facilitate a comparative understanding,the graph in figure 6.1 shows the student enrollment figures as apercentage of the total population in the years between 1960 and 1985.
By the end of the 1960s, Costa Rica had the highest student body(0.58% of the total population in 1968). Senegal and ThaiIand hadpercentages that were rather similar to each other (0.12% in Senegal in1971 and 0.17% in Thailand in 1973). The student growth rate wasfastest in Thailand toward the end of the 1970s; by the beginning of the1980s, Thailand had caught up with Costa Rica. By 1983 the studentpopulation in these two countries amounted to 2.2% of the total population; this percentage figure is slightly higher than the equivalentFrench figure for that year.
On the other hand, in Senegal, notwithstanding the rise in enrollment from 2,500 to 10,000 in the 1970s, the student population still onlyamounted to 0.2% of the total population by the early 1980s, in otherwords ten times less than in Costa Rica and in Thailand. Part of theexplanation for this difference lies in the new higher level schools thatwere built in Costa Rica (4 new universities were established between1973 and 1978) and in Thailand (11 of the 14 public universities werecreated after 1960). In Thailand the proliferation and growth of privateuniversities, mainly specializing in business, also contributed to thisspectacular development, while in Senegal, the University of Dakar,

116 Scientists in the Third World
even now, is the only Senegalese university, since the plan to build auniversity at Saint Louis failed.
This rapid increase in both public and private universities in bothThailand and Costa Rica, of course, has had an effect on teachertraining and on research methods. In the beginning, the new universities had to draw on part of the teaching staff from the older universities and, to a small degree, on foreign staff. Thereafter, the teachingstaff was expanded from within by hiring new graduates. As a result,the teaching staff in the newly created universities was very young inboth age and educational experience. Nevertheless, the majority of thescientists and the best trained researchers work in the universities. Wewill corne back to this later.
The student boom and the large number of graduates, combinedwith the economic crisis and the budgetary cuts, gave rise to a newphenomenon, especially in Senegal and in Costa Rica, viz., unemployment among the intellectuals. In Costa Rica, the "production" of 4,000new graduates each year since 1980 has led to relative saturation of thelabor market in various professions, especially in law, medicine, andsenior positions in agriculture. This phenomenon has reached analarrning level in Senegal where nearly all branches suffer. An association of unemployed university graduates, organized per discipline,was born in 1981. This does not mean that all the employment needshave been fulfilled. The situation is quite the opposite. But the keyemployer, i.e., the state, is no longer able to keep up with the need tocreate new posts.
As universities grew, research activities went through an institutionalization process, and science policy-making bodies were created.This process started in Thailand at the end of the 19505, in Senegal inthe 19605, and in Costa Rica at the beginning of the 19705.
Creation of Science Policy-Making Bodies
With an eye on the European models, the three countries in our studybuilt up organizations to handle scientific policy. As institutional structures developed, 50 did these organizations; but in the end, all threecountries put science and technology under a ministry of its own: theMinistry of Science, Technology, and Energy (MOSTE) was created inThailand in 1979; the Ministry of Scientific and Technical Research(MRST) was created in Senegal in 1983; and the Ministry of Science andTechnology (MYCIT) was created in Costa Rica in 1986.
The MRST did not live very long. During a ministerial reorganization in 1986, it was replaced by the Department for Scientific and

National Scientific Communities 117
Technical Affairs (DAST), created as part of the Ministry of Planningand Cooperation. Unlike MRST, DAST has no financial or managerialresponsibility for national research activities. Although not of ministerial rank, DAST works much like MOSTE in Thailand and MYCIT inCosta Rica, which, because of the institutional organization of scienceand technology, do not have custody of or managerial responsibility forresearch organizations (except in one case in Thailand). ActualIy, theresearch institutes fall under various ministries, depending on theirfield of activity, i.e., agriculture, health, industry, education, etc.
Ministries for science and technology were grafted onto an institutional fabric without replacing any of the threads. The existing organizations were brought under their responsibility with varying degreesof success. The systems caused many problems especially because ofbureaucracy and power struggles. The first problem was the growth ofbureaucracy, especially painful in a country with a small scientificcommunity like Costa Rica. The creation of a ministry generated a bigneed for qualified staff without decreasing the staff requirements ofancillary institutions responsible for coordinating and promoting research activities, such as the national research councils (NRC inThailand and CONICIT in Costa Rica). AlI these institutions, especiallywithin the universities, called on outside consultants for various councils, commissions, and work groups, thereby depriving the best scientists of precious tirnes for research. The second major problem wasrelated to the jurisdiction of scientific research management organizations. Superimposition of these organizations led to power strugglesand the need for supracoordination, e.g., Thailand where there was aneed felt for an interrninisterial coordination body.
These bureaucratie organizations, especially in Latin America, arealso often accused of spending over half their budget on internaIoperating expenses (Moravcsik 1979). Furtherrnore, despite the political decision underlying their creation, institution budgets are too smallto run their programs, which, therefore, have to rely on outside loansand grants, e.g., CONICIT in Costa Rica. Further, there is generalagreement that investments in scientific activities need to be coordinated at the highest level, but interference by science policy-makingbodies can be dangerously excessive. University scientists are constantly being accused of running luxury research projects that thecountry cannot afford, even when the amounts involved are negligible. This situation is difficult to accept for scientists who are witness tothe creation of expensive, generally inefficient scientific bureaucracyand the imposition from above of often simplistically ranked priorities.Of course, a minimum of planning and perspective is essential. But

118 Scientists in the Third World
Table 6.2. Estimated Number of Scientists
CountryTotal No.of Scientists
No. of No. of ScientistsScientists PTE PTE Per 1,000 Inhab.
Costa Ricaa
Senegalb
Thailande
800-1,0001,000-1,1005,000-5,500
400-500500-600
3,000-3,500
0.170.080.06
a = 1981b = 1984-85c = 1982Fm = full-lime equivalents
thought has to be given to the size of the system to be run and the needto avoid establishing a management system that ends up by serving itsown interests rather than helping to structure a budding scientificcommunity.
,A Scientific Potential Difficult to Evaluate
Let us not forget that we are dealing with small scientific communitiesthat were estimated, in the early 1980s, at 800 to 1,000 people in CostaRica (CONICITIIDRC 1982) and in Senegal (Gaillard 1989) and just over5,000 in Thailand (MOSTE 1987). It is difficult to obtain confirrnedfigures on the numbers of participating scientists and their breakdownper institution and per major field of science. Most of the surveysavailable are incomplete or out of date. It is also difficult to makecomparisons between countries because of differences in data anddefinitions. The sources we consulted, however, provide general ideasof scope and trends (table 6.2).
Any evaluation of the national stock of research scientists in full-timeequivalents (PTE) is strongly affected by the concentration of largenumbers of scientists in the field of higher education. University scientists only devote part of their time (one-third, according to our estimates) to research. In an effort to assess the importance of researchwork relative to the national population, we calculated the number ofPTE scientists per 1,000 inhabitants. Costa Rica, the least populatedcountry, has the highest figure (0.17), with two to three times morethan Senegal or Thailand. Costa Rica places midway between Nigeria(0.06) and Brazil (0.37) in the league of DCs but far behind the mostadvanced ICs. There are approximately 20 times fewer FIE researchersper 1,000 inhabitants in Costa Rica than in France and 30 times fewer

National Scientific Communities 119
Figure 6.2. Distribution of FTE Scientists within Institutions
60
50.l!l.~ 40-s::.~ 30tJ
'"'+<0 20~
10
0Senegal Costa Rica
than in the United States. Further, simple proportionality cannot beused as the general role because in the event of problems of scale it isdisadvantageous for the small countries.
In sum, the number of FTE research scientists as a percentage of thepopulation as a whole is very small, compared to the ICs. It is interesting to see the breakdown between types of institutions and fields ofscience.
More than half of the FTE scientific potential is to be found in theuniversities (56% in Senegal, 58% in Costa Rica) (fig. 6.2). We do nothave global statistics on the assignment of Thai scientists per type ofinstitution; a variety of indices points toward the higher educationsector to find the vast majority of them. As an example, we see that80.7% of the abstracts from the 1984 annual symposium of the ScienceSociety of Thailand are signed by university scientists (Yuthavong1986).
University scientists are the best trained and have the most degrees.Their average level of education rose considerably during the 1970s. InSenegal, for instance, university scientists have more degrees and areolder than their colleagues in research institutes. Using the 1981AUPELF (Association des Universités Partiellement ou Entièrement deLangue Française) file (AUPELF 1984), we saw that over half (55%) hadfinished their doctorate (third-cycle) studies. In Thailand, sorne fourfifths of the teachers/scientists at least have their M.S. degree, and mostof them graduated from Thai universities. Gose to one-third have aPh.D., in most cases conferred by an English-Ianguage university

120 Scientists in the Third World
abroad (Gaillard 1989). It is difficult to make precise comparisonsbetween various avenues of education, but very probably the CostaRican teachers/researchers have the lowest level of training. A reportfrom the University of Costa Rica (UCR 1985c) indicated that only 20%of them had their doctorate and that the majority (60%) only had theirbachelor of science.
The teaching staff of the young universities is younger and less weIltrained, in particular in Costa Rica. Out of an academie staff of 1,229 atthe national university (UNA) in 1985, only 79, Le., 6.4%, had adoctorate. At the Costa Rica institute of technology (ITCR) in 1984,barely more than 1%of the teaching staff had a doctorate. But then, thestaff was very young: 48% was under 30 years of age, and 80% wasunder 35. These statistical figures reflect and imply problems inherentin the creation of several universities within a few years' time whenthere is a shortage of qualified teachers. By way of illustration, UNAand ITCR were only able to start their activities by drawing on theteaching potential from UCR and by bringing in-avowedly, in verysmall numbers-foreign staff. Afterward, the teaching staff was expanded from within by recruiting young graduates, whieh explains therelatively low level of education, especially at ITCR. To improve thesituation, sorne but not enough scholarships are awarded for staff tostudyabroad, in particular to reach the Ph.D. level.
University scientists in general are better trained, but they are oftenthe poor cousin of research in their home countries. This is especiallytrue in Senegal where, according to our calculations, university FTEscientists have budgets that are 5 to 10 times lower than those of theircolleagues in research institutes. A scan of the various institutes showsthat research at the Senegalese institute for agronomie research (ISRA)consumes a very large part of the Senegalese national research budget.Similarly, of the 13 ministries that participate in R&D activities inThailand, the Ministry of Agriculture stands out clearly since it consumed 54.5% of the national R&D budget in 1985 while the Ministry ofUniversities only consumed 7% that same year (MOSTE 1987). Thisexplains why the Thai universities often have to find their own resources or appeal for outside, national, or foreign resources to roundout their research budgets.
The situation is less clear-cut in Costa Rica where, at least in the early1980s, the universities consumed about half of the national researchbudget (CONICITIIDRC 1982). Whatever the case, many of the research programs conducted in the universities would not have beenpossible without foreign aid. University scientists, of a fairly good

National Scientific Communities 121
Figure 6.3. Distribution of FTE Scientists in Major Fields of Science
50
40III....III...~ 30GI...~ 20Ilo~ 10
oCosta Rico Sanaga!
AgricultureSocial sciences
Medical sciences
Thailand
level, constitute a potentially important source that is often underutilized.
The distribution within the different types of institutions also illustrates the weakness of private research in Costa Rica and in Thailandand its virtual nonexistence in Senegal (1%). The percentage figure isslightly higher in Thailand but, in numbers, only involves somewherebetween 100 and 200 scientists. A recent study has also shown that thedemand for highly qualified scientific personnel in the Thai privatesector is very limited. Costa Rica has a higher demand, but the privatesector seems exclusively interested in social science research and, to amuch lesser degree, agriculture. This is a situation found in many LatinAmerican countries where social science research is gradually movingout of the universities and into research centers or, even more so, intoprivate consultancy offices. In Costa Rica, thus, over one-third (36.5%)of social science research is conducted in private centers, although theuniversity still has the leading role. A clear understanding of the gapbetween Costa Rica, Thailand, and Senegal on the one hand and theICs on the other can be found in a figure for the OECD countries,where, on the whole, 50% of the research budget is used by the privatesector, mainly for industrial research (60% in sorne NICs of Asia).
A breakdown of scientists available in the main fields of research(fig. 6.3) shows concentration in three major fields: agriculture, socialsciences, and health. Agriculture is by far the leader in Thailand (33%of the scientists) and Senegal (40%). The social sciences are in second
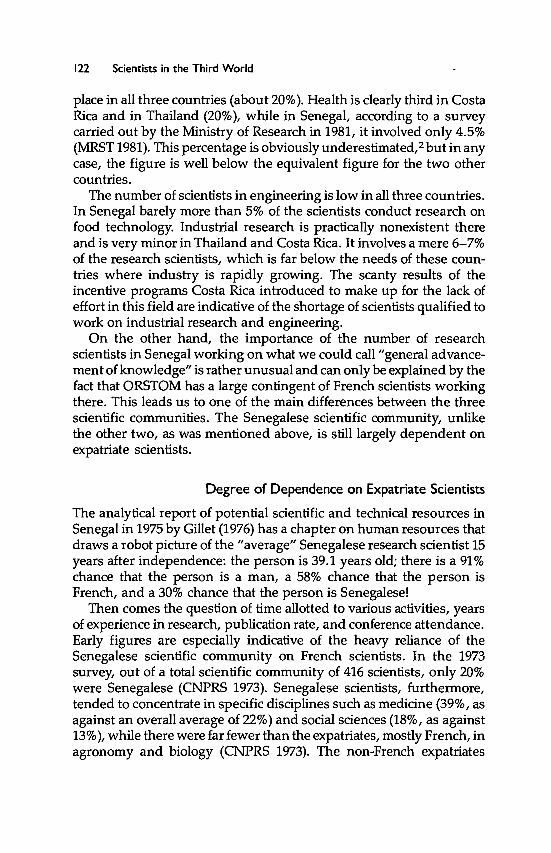
122 Scientists in the Third World
place in all three countries (about 20%). Health is dearly third in CostaRica and in Thailand (20%), while in Senegal, according to a surveycarried out by the Ministry of Research in 1981, it involved only 4.5%(MRST 1981). This percentage is obviously underestimated,2 but in anycase, the figure is well below the equivalent figure for the two othercountries.
The number of scientists in engineering is low in all three countries.In Senegal barely more than 5% of the scientists conduct research onfood technology. Industrial research is practically nonexistent thereand is very minor in Thailand and Costa Rica. It involves a mere 6-7%of the research scientists, whieh is far below the needs of these countries where industry is rapidly growing. The scanty results of theincentive programs Costa Rica introduced to make up for the lack ofeffort in this field are indieative of the shortage of scientists qualified towork on industrial research and engineering.
On the other hand, the importance of the number of researchscientists in Senegal working on what we could call"general advancement ofknowledge" is rather unusual and can only be explained by thefact that ORSTOM has a large contingent of French scientists workingthere. This leads us to one of the main differences between the threescientifie communities. The Senegalese scientific community, unlikethe other two, as was mentioned above, is stilliargely dependent onexpatriate scientists.
Degree of Dependence on Expatriate Scientists
The analytical report of potential scientific and technical resources inSenegal in 1975 by Gillet (1976) has a chapter on human resources thatdraws a robot pieture of the "average" Senegalese research scientist 15years after independence: the person is 39.1 years old; there is a 91 %chance that the person is a man, a 58% chance that the person isFrench, and a 30% chance that the person is Senegalese!
Then cornes the question of time allotted to various activities, yearsof experience in research, publication rate, and conference attendance.Early figures are especially indicative of the heavy reliance of theSenegalese scientific community on French scientists. In the 1973survey, out of a total scientific community of 416 scientists, only 20%were Senegalese (CNPRS 1973). Senegalese scientists, furthermore,tended to concentrate in specifie disciplines such as medicine (39%, asagainst an overall average of 22%) and social sciences (18%, as against13%), while there were far fewer than the expatriates, mostly French, inagronomy and biology (CNPRS 1973). The non-French expatriates

National Scientific Communities 123
Table 6.3. Breakdown of Senegalese and Foreign Personnel in MainInstitutes of Higher Education and Research in Senegal, 1984-1988
Expatriates 5enegalese
Institute No. % No. % Total
Universitya 191 40.0 287 60.0 478Institutes affiliated with
universitya 107 47.0 120 53.0 22715RAb 92 47.0 104 53.0 196ITAb 2 7.0 27 93.0 29OR5TOMc includ. senior
teehnicians and engineers 109 88.0 15 12.0 124Institut Pasteurc 17 71.0 7 29.0 24
5ubtotal 518 48.0 560 52.0 1,078
Agrie. eng. and sameeategory, rural dey.d 46 41.0 67 59.0 113
Average 564 47.0 627 53.0 1,191
a1984 staffb1985 staffC1988 staffd1980 staff
came mainly from neighboring French-speaking countries and workedessentially in the university. By 1973 there were a few Belgian andDutch scientists, and of late there have also been sorne Americans andAsians.
Senegalization of the scientific community gained such momentumin the 1970s that now the expatriate/Senegalese ratio has practicallybeen reversed. A survey started in 1981 on 828 scientists pointed to thisinversion; 75% of the scientists were Senegalese, 20% were French, theremaining 5% included mainly non-Senegalese Africans, but therewere also 9 Belgians, 3 Italians, 2 Englishmen, 2 Americans, and 1Indian. The 1983--85 figures we have on teachers/scientists working inthe university and the main research institutes, viz., ISRA (Senegaleseinstitute for agricultural research), !TA (Food and nutrition researchinstitute), ORSTOM (French institute of scientific research for development in cooperation), and Institut Pasteur, show 52% to be Senegalese(table 6.3). The total percentage of Senegalese is practically the samewith or without agricultural engineers and others in the same categoryworking on rural development.
With the exception of ORSTOM, ITA, and Institut Pasteur, the per-

124 Scientists in the Third World
Figure 6.4. Changes in Numbers of National and Expatriate Scientists at ISRA, 1983-1988
.........
............cQ,I...~en
\1e..Q,I
.a::le:::lIZ
120
100
80
60
40
20
o1983 1984
Source: 15RA, 1989.
1985 1986 1987 1988
centage of Senegalese was somewhere between 53% at ISRA in 1984and 60% at the university in 1983-84. In this example also the university has the highest number of non-Senegalese Africans. Including thisfigure, the Mricanization rate for teachers/researchers at the universityin 1983--84 was 66%. rrA is a Senegalese innovation created afterindependence. France participated very little, if at aIt which explainsthe low percentage of resident foreign scientists. ORSTOM and InstitutPasteur are exceptions, since they are the last French public serviceswith a non-Senegalized research center operating in Senegat hencethe heavy presence of French scientists. Efforts have been made,especially at ORSTOM, to include Senegalese staff in programs designed together with Senegalese research organizations.3
The percentage of Senegalese in the national scientific communityhas increased sharply since the beginning of the 1970s when they onlyaccounted for 14% of the scientists working in agriculture, for instance.It is encouraging to note that now the majority of the ISRA scientificstaff is Senegalese (fig. 6.4).4
Unlike Senegal, Costa Rica and Thailand hire very few foreignscientists; there were 156 (including 87 Japanese, 33 Americans, and 28Europeans) in Thailand in 1986, Le., about 3% of the national community (NRGMOSTE 1987), of which two-thirds worked on hurnansciences. Foreign scientists are proportionately more numerous outside the capital city than the Thai scientists, because they often workwith foreign aid prograrns that are increasingly being sited in the more

National Sdentific Communities 125
Table 6.4. Distribution of Teachers and Scientists at Chiang MaiUniversity, by Sex and Academic Level, 1986
Men Women
No. % No. % Total
Lecturer 346 45.5 414 54.5 760Assistant professor 260 50.0 260 50.0 520Associate professor 112 73.0 42 27.0 154Professor 15 88.0 2 12.0 17
Total 733 50.5 718 49.5 1,451
Source: Chiang Mai University Infonnation Book, 1986, table 4, p. 24.
remote areas. Furthennore, there are not many foreign teachers in theThai universities; out of a teaching staff of 2,401 at the ChulalongkomUniversity in 1985, 61 were not Thai and had come mainly to teachforeign languages (CUB 1988).
Participation of Women in Research and Higher Education
Disparities between the three countries are also very pronounced asconcems the participation of women in research and higher education.Thailand has the most and Senegal the least.
In Thai universities, there are almost as many women teachers asmen. In Chiang Mai University in 1986,49.5% of the teachers werewomen. There seems to be a clear dichotomy in discipline preferencesbetween men and women; women are more strongly attracted tomedical and paramedical professions and to the social and humansciences than men and seem to work at lower academic levels (table6.4).
In Thailand women are strongly represented not only in the universities but also in public research institutes such as the Thai Departrnentof Agriculture (DoA). A recent study indicated that out of the 1,419scientists at the DoA 38% were women (Elliot 1984). As far as we know,this is the world record, especially since agricultural research instituteshave traditionally had very few women on their research staff.5 Furthermore, most of the women are young; half of them are under 35years of age. There are, moreove~more women (269) than men (259) inthis age group. Considering recruitment trends and retirement figures,the percentage of women in the research services of the DoA is expected to exceed 50% by 1994. Although we do not have precise

126 Scientists in the Third World
Table 6.5. Distribution of Teachers and Scientists at UCR by Sex
Teachers Scientists Total
No. % No. % No. %
Women 518 26.7 134 31.0 652 27.4Men 1,429 73.3 298 69.0 1,727 72.6
Total 1,947 100.0 432 100.0 2,379 100.0
Source: ueR 1985.
statistics on the other research sectors, we have seen that the sametrend applies to other sectors, except engineering.
The medium- and long-term implications for research applicationsand orientations in Thailand are very important. There are verymarked differences between men and women in the choice of disciplines, mobility, power relations, etc. These implications show upclearly in the study on DoA personnel. A key issue is the place of work.Only 29% of the total research staff work in centers located outside ofBangkok, which, for an agricultural research institute, is very little.The breakdown is 20% women and 34% men. Since the percentage ofwomen working for DoA is predicted to continue rising, the department can expect to have more and more difficulty in assigning staff towork outside of Bangkok.
In Costa Rica (table 6.5) women account for between one-fourth andone-third of the teacherlscientist staff at the public universities, e.g.,27.4% at UCR. Paradoxically, percentagewise there are only half asmany women as men who have their Ph.D.s, and 31% of them work onresearch (UCR 1985b and c).
The choice of discipline is also strongly related to sex. Women ranktheir preferences as follows: arts (47%), social sciences (36%), health(21 %), basic science (20%), engineering and architecture (7.5%).
In Senegal women constitute a minority both in the university andin the public research institutes. At the University ofDakar, only 11.7%of the teachers are women (among the Senegalese teachers, only 9%are women). Women are best represented at the Faculty of Medicineand Pharmaceutical Studies (16%) and least represented at the Facultyof Law and Economies (4%). There are proportionately far fewer in thehigher academie echelons such as senior lecturer (3%) than at the lowerlevels such as assistants (26%).

National Scientific Communities 127
Table 6.6. Place of Education of Senior Senegalese Scientific andTechnical Staff Working at ISRA, 1985
Country
1. France2. United States3. Western Europe (excl. France)4. Eastern Europe (incl. USSR)5. Senegal6. Canada7. Other
Total
Source: Sène 1985, p. 31.
No.
562815121253
131
%
4321129942
100
Reliance on Research Training Abroad
Paradoxically, the countries with the youngest university systems suchas Senegal offer the most complete and elaborate doctorallevel curricwa. But the University of Dakar does not have enough qualifiedteachers and scientists to supervise Ph.D. (third-cycle) students. Thepossibility of studying at that level and then building up a career inresearch also depends on the discipline. This explains why a largenumber of doctors and veterinarians are trained in Senegal. In otherfields, such as agricultural sciences, training still often takes the stu-
. dent abroad. Out of a scientific and technical staff of 131 senior Senegalese who were working at ISRA in 1985, only 12 (9%) had completedtheir advanced studies in Senegal (table 6.6). This is relevant to understanding why it took until1979 for a specialized school of agriculture tobe bullt in Senegal. It maya priori seem paradoxical and abnorrnal for acountry that spends 50% of its research budget on agriculture and hasconsiderable research strength in this field not to have drawn earlier onits experienced scientists to train its research staff.
A look at the list of countries where the ISRA scientists were trainedshows that because of the diversification in fields of specialization thepreference was to study in the United States, or in Western (not onlyFrance) and Eastern Europe. France is still the main source of educationfor Senegalese scientists working in nearly aH fields, having trained43% of the ISRA staff. The United States has only been working inSenegal for a few years and seems to be specializing in a limitednumber of disciplines, in particular in rural sociology and economics. Itis expected to make greater efforts in the coming years.
In Thailand, despite the fact that the three main universities
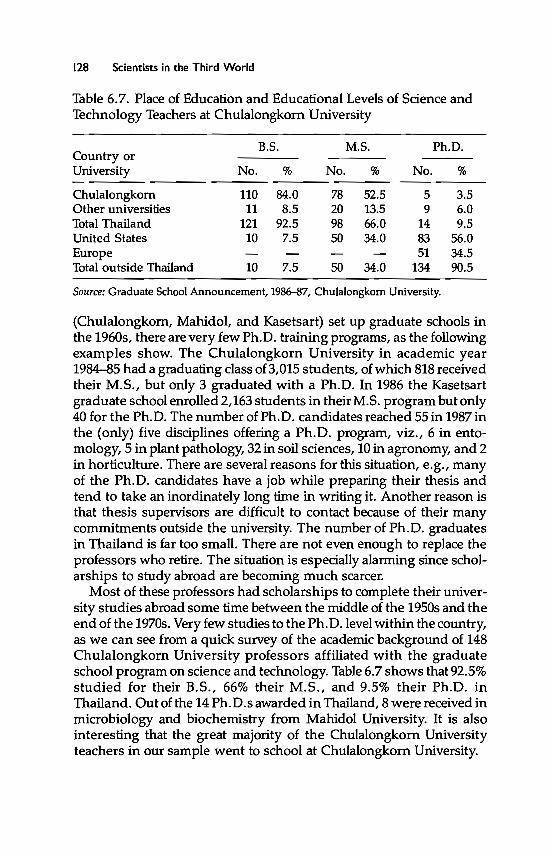
128 Scientists in the Third World
Table 6.7. Place of Education and Educational Levels of Science andTechnology Teachers at Chulalongkom University
B.S. M.S. Ph.D.Country orUniversity No. % No. % No. %
Chulalongkorn 110 84.0 78 52.5 5 3.5Other universities 11 8.5 20 13.5 9 6.0Total Thailand 121 92.5 98 66.0 14 9.5United States 10 7.5 50 34.0 83 56.0Europe 51 34.5Total outside Thailand 10 7.5 50 34.0 134 90.5
Source: Graduate School Announcement, 1986-87, Chulalongkom University.
(Chulalongkorn, Mahidol, and Kasetsart) set up graduate schools inthe 196Os, there are very few Ph.D. training programs, as the followingexamples show. The Chulalongkom University in academic year1984-85 had a graduating class of3,015 students, of which 818 receivedtheir M.S., but only 3 graduated with a Ph.D. In 1986 the Kasetsartgraduate school enrolled 2,163 students in their M.S. program but only40 for the Ph.D. The number of Ph.D. candidates reached 55 in 1987 inthe (only) five disciplines offering a Ph.D. program, viz., 6 in entomology, 5 in plant pathology, 32 in soil sciences, 10 in agronomy, and 2in horticulture. There are several reasons for this situation, e.g., manyof the Ph.D. candidates have a job while preparing their thesis andtend to take an inordinately long time in writing it. Another reason isthat thesis supervisors are difficult to contact because of their manycommitments outside the university. The number of Ph.D. graduatesin Thailand is far too small. There are not even enough to replace theprofessors who retire. The situation is especially alarming since scholarships to studyabroad are becoming much scarcer.
Most of these professors had scholarships to complete their university studies abroad sorne time between the middle of the 1950s and theend of the 1970s. Very few studies to the Ph.D.level within the country,as we can see from a quick survey of the academic background of 148Chulalongkom University professors affiliated with the graduateschool program on science and technology. Table 6.7 shows that 92.5%studied for their B.S., 66% their M.S., and 9.5% their Ph.D. inThailand. Out of the 14 Ph.D.s awarded in Thailand, 8 were received inmicrobiology and biochemistry from Mahidol University. It is alsointeresting that the great majority of the Chulalongkom Universityteachers in our sample went to school at Chulalongkom University.

National Scientific Communities 129
Now there are far fewer young Thais studying abroad. According toUNESCO, in the early 1980s there were close to 10,000 in foreignuniversities. Over half (58%) studied in the United States (UNESCO1985a), and 20% studied in two Asian countries, Philippines and India,which thus ranked second and third. In 1983 Japan ranked fourth byenrolIing 378 Thai students. Then came European countries, led byFrance and Federal Republic of Germany. .
In Costa Rica there is no Ph.D. program; the highest degree awardedby a Costa Rican university is the "maestria." There are 32 "maestria"programs; over half are offered at UCR. Furthermore, since the beginning of the 1980s, three-fourths of the "maestria" have been in publicadministration (21) and agricultural sciences and natural resources (22).Except in agricultural sciences, there are very few "maestria" programscreated since 1975 that lead to a career in research. Costa Rican students who want to study for a Ph.D. therefore are forced to go abroad.
According to UNESCO statistics, in 1981 there were 969 Costa RicanPh.D. candidates studying abroad; over half (57.68%) were in theUnited States, 20.5% in Europe, and interestingly enough 11.45% inLatin America (Argentina, Guatemala, and Cuba). Sorne students benefited from programs administered either by their universities or byCONICIT, usually sponsored through bilateral agreements; and sornestudents left on their own. Between 1973 and 1982, 127 Costa Ricanstudents were able to study for an M.S. or a Ph.D. in the United Statesunder aU.S.AID supported program administered by CONICIT. UCRruns the biggest Ph.D. scholarship program; between 1971 and 1984, itadministered 549 (Gonzalez and Calderon Alfaro 1986). The number ofscholarships fluctuates from year to year but tended to go down duringthe last few years of the reference period. Between 1971 and 1977,50scholarships were awarded every year, while between 1981 and 1984,the annual figure dropped to under 20. This drop was largely due tothe devaluation of the national currency, the colon, in relation to theU.S. dollar, as of the early 1980s.
Close to half (42.3%) of the UCR students who received scholarshipswent to study in the United States. The position of the other countrieswas much similar to data UNESCO reported for 1981. The spearheadposition of the United States is due to the prestige ofU.S. universities,the relative ease in leaming English, geographical proximity, the largenumber of scholarship programs available to UCR, and the sophistication and large number of scientific and technical courses. The lastreason explains the choice of many Costa Ricans to study agronomy,engineering, physics, biology, microbiology, computer sciences, andeconomics in the United States. The 13.8% of the students who use

130 Scientists in the Third World
their scholarships in France, the second country on the list, preferdisciplines such as sociology, law, joumalism, political sciences, inother words, the social sciences; but they are also interested in the artsand medicine. Third on the list is England where 36 UCR students gotscholarships; during the first few years of the reference period, England played an important role, but slowly but surely scholarshipsbecame scarcer. The possibility of getting a scholarship from a countryplays an important or even a decisive role. Gradually various countriesseem to specialize in selected disciplines. Itwas also interesting that thethree countries that offered the most scholarships required the CostaRican students to leam a foreign language, which apparently was not aproblem.
In sum, the United States was the first choice for the Thai and CostaRican students, and France was the first choice for the Senegalesestudents. As of the early 1980s, subject specialization started becomingso important that considerable numbers of Senegalese, especiallythose working on agricultural sciences, decided to study in the UnitedStates; and, similarly, in more recent years, 76 Costa Ricans (out of 549)from UCR decided to use their scholarships to study in France. Sorne ofthe DCs are facilitating enrollment for foreign students also, e.g., Thaistudents in India and Philippines; Costa Rican students in Argentina,Mexico, and Brazil; and, to a lesser extent, Senegalese students in IvoryCoast and Morocco.
We feel that research training is too heavily reliant on foreign facilities and that training abroad does not satisfy the quantitative orqualitative needs of the scientists from the three countries in thisreport. We feel that it would prove to be more realistic, efficient, and, intime, productive to allocate the considerable sums of money6 nowbeing used to train future scientists abroad to establish doctoral (thirdcycle) programs leading to a Ph.D. in priority fields within the nationaluniversities. University training within the home country would alsocontribute to structuring the scientific "fabric" and strengthening thenational scientific communities. This implies that the countries in thenorthem hemisphere would have to remodel their education aid policybut obviously does not mean eliminating the possibility for postdoctoral education abroad in certain very highly specialized or marginalfields.
Scientific Production Not Very Much, Not Very Visible
Even in relation to their home continents, the three countries in thisreport are small science producers; Senegal and Costa Rica produce
National Scientific Communities 131
between 50 and 100 mainstream publications a year, Thailand about300. Costa Rica's output, thus, accounted for about 1% of the aggregateLatin Arnerican production. Thailand hardly scored better: 2% of theAsian output (excluding Japan). Senegal produced about 4% of thesub-Saharan African scientific output. As a percentage of total production, these countries don't "weigh" much compared to Third Worldgiants such as India, Brazil, and Nigeria. The per scientist production,calculated in numbers of mainstream publications per scientist peryear, is srnall: about one-sixth in Costa Rica and one-tenth in Thailandand in Senegal. This varies according to discipline and institution.
Authors of mainstream publications often work in universities. Thisis the case for over half in Senegal and over two-thirds in Costa Ricaand in Thailand. In a11 three countries, the most "productive" and"visible" disciplines are health, biology (especia11y in Costa Rica), andenvironmental sciences (especially in Senegal). Social sciences are notvery "visible," except in Costa Rica where they account for close to onefifth of the total output. Agricultural sciences, which have the greatestpotential for the future in a11 three countries, are hardly "visible" evenwhen they are productive. An analysis of the total scientific productionof ISRA scientists in Senegal showed that the vast majority of thescientists did write but that their research data did not very often getpublished in specialized journals.
Actua11y, research findings and reports produced by research scientists in these three countries are often only stenciled and circulatedwithin the institute, if they are circulated at a11. The publication strategyfor scientists in these three countries depends on their institute'seditorial policy and the number of local journals in existence. Of thethree countries in this report, Thailand has the most local journals(around 2(0) and the most scientific output. There is also a closecorrelation between the number of articles the scientist produces forpublication in local and in international journals. In other words, themost productive scientists publish just as much in the local reviews asthey do in the international journals. Costa Rica and Senegal have amuch srna11er number of local joumals. In Costa Rica joumals appearrather regularly while in Senegal they do not. Consequently, the smallnumber of journals that are published rather regularly are so heavilysolicited that scientists are forced to submit their research for publication in joumals abroad.
This is exactly the case for scientists in the three countries, especia11yin Costa Rica and in Senegal. Actua11y, the percentage of articlespublished within Senegal has dropped from about 30% in 1975 to 23%in 1985, while during that same decade the percentage of Senegalese

132 Scientists in the Third World
scientists in the national scientific cornmunity increased substantiaIly.In Senegal, like in most French-speaking countries of Africa (but not inCosta Rica or in Thailand), over two-thirds (68.5%) of the authors wereforeigners, mainly French. The productivity rate of Senegalese andThaï, and to a certain extent Costa Rican, scientists is low because ofprofessional status, working conditions, lack of incentive, etc.
Research Scientists in Search of Statutes and Status
Of the three countries, Costa Rica offers its scientists, especially thoseworking at UCR, the best salaries and the most incentives to delve intoscientific activities and publish their findings. ProposaIs have recentlybeen made through the UCR internaI promotion system to encourageteachers/scientists to do more research. Obviously, there is still roomfor improvement, and different institutes offer different opportunities.The big devaluation of the colon early in the 1980s seriously affectedsalaries and lowered the purchasing power. But this situation was notunique to people working in science.
In Thailand, despite a political decision to support scientific workand an atmosphere propitious to its research development, there areinherent difficulties in the profession that are far from being solved. Inthe public sector, Thai research scientists and university teachers arebadly underpaid. Promotions and salary increases depend almostexclusively on seniority, with very little credit for educational level,work perfonnance, and services rendered, be it in research, education,or administration. This situation is, of course, deleterious to nonnalresearch schedules since far too many research scientists and teachersdoing research have to round out their salaries by accepting unrelatedside jobs.
The status of the research scientist in Senegal is precarious. Sincethere is no career stability, a future in this profession is fraught withuncertainty. Institute regulations make no allowances for the uniquecharacteristics of the profession. Career paths and positions are verydifferent from each other. The scientists who are assimilated to civilservants are probably worst off since the professional scale in thegovemment civil service does not provide for a Ph.D. level. This meansthat scientists with a doctorate, a master's, or a bachelor's degree are aIlin the same category and move up the seniority-driven scale at thesame pace. Attempts to provide the research scientists with commonprofessional statutes were nearing completion when the MRST wasdïssolved. Considering the present institutional structure, the eco-

National Scientific Communities 133
Figure 6.S. Research Budget as a Percentage of GNP in Costa Rica,Senegal, and Thailand, 1978-1986
0.5-Go Costa Rica.... Senegal
0.4 -a- Thailandll..Zl?..... 0.30
~
0.2
0.178 79 80 81 82 83 84 85 86
nomic crisis, and the budgetary restrictions in Senegal, there is littlechance that research will be given statutes of its own in the near future.
Insufficient Overail Financing
As concems research financing, the three countries are far from theirtargeted goals. Costa Rica is the only country that has made a noteworthy effort to increase the national research budget since the beginningof the 1980s and in 1986 devoted 0.41% of its GNP to research (fig.6.5).
Thailand, and even more so senegal, has invested less in researchsince the beginning of the 19805 and, expressed as a percentage of theGNP, now invests 10 to 20 times less on research than the OECOcountries. The aggregate value of this indicator hides large intersectoral differences. For the three countries, thus, we see that the biggesteffort is made in agriculture. The relatively smaller financial effort thathas been observed in senegal and Thailand will mean stronger relianceon foreign sources of funding and imbalances in research activities. Ofthe three countries, Senegal relies most heavily on foreign resourcesthat now fund two-thirds of its research budget. Foreign sources offunding have been diversified during the last decade although mostaid for Costa Rica and Thailand cornes essentially from the UnitedStates, while senegal turns to France. This said, French financing ofSenegalese research has gone down from 59.3% in 1972 to 35.5% in1986. By way of compensation senegal has been able to obtain support

134 Scientists in the Third World
from the United States (mainly through U.S.AID) and the World Bank.These two sources alone have met close to one-fourth of the Senegaleseresearch costs in 1986, while earlier, in 1975 for instance, they providedvery minimal support. Foreign financing of Thai research is less important, although in certain years it accounts for 30% of the total outlay. Wedo not have global statistics for Costa Rica but know that its reliance onforeign sources to fund research is much the same as in Thailand.
Foreign financing is especially important in agriculture and health.Incentives and new, well-tailored programs have recently been set upwith foreign aid to offset personnel shortages in engineering and inindustrial research, mainly in Costa Rica and in Thailand. Interest inthese new programs has been slow because of the shortage of qualifiedscientists. The private sector finances very little research, a mere 1% ofthe total budget. Here again, a comparison with the OECD countries,where the private sector supports at least half of the research costs,reveals extreme imbalances in research funding systems in the DCs.
The research budget in the universities, where more than haIf of theresearch expertise is to be found, is especially small. The University ofDakar in Senegal does not have its own research budget, and it isdifficult to calculate how much money is actually spent on research.According to a UNESCOIUNDP (United Nations Development Program) study, research costs represented 3.6% of the total universitybudget in 1981. The example of health-related research in Senegalenabled us to understand the difference in status between universityand nonuniversity research. In Costa Rica the UCR research budgethas increased substantially during the last few years. In 1984 it represented close to 12% of the total UCR budget. But it is still far too small;and aIl the universities have to look for outside, especially foreign,funding. This also applies to Thai universities. We have seen that theChulalongkom University had to count on foreign financing for morethan 50% of its research budget. The resources made available touniversity scientists are so pitifully small that foreign funding hasbecome decisive.
The Need to Regionalize Research
The data compiled on the amount of human and financial resourcesdevoted to research, in particular in Costa Rica and in Senegal, and onthe three countries' dependence on foreign sources for funding research and related training clearly indicate that these countries cannotdo everything themselves or work alone. The scientific machinery isbecoming too expensive to run, even for sorne of the ICs (the smaller-

National Scientific Communities 135
and medium-sized ones). This has convinced certain govemments, inparticular in Europe, to pool their resources in certain fields of researchthat require expensive equipment, e.g., nuclear physics and molecularbiology.
The question of regional and international cooperation is especiallyacute since resources are limited and the economidfinancial crisis isforcing certain countries to adopt policies of austerity and uninvolvement. Cooperation is of special importance in a continent such asAfrica where 31 out of 50 countries have fewer than 5 million inhabitants, and only 2 (Egypt and Nigeria) have over 30 million. We mightimagine Africa, or other continents, with minimal national structuresand intense regional cooperation that would include division of labor,networks, and interstate research centers. We might be somewhatdubious about this type of reorganization as we think back to themishaps of certain regional research institutes and the readily justifieddesire of countries to formulate their own research policies. Furthermore, this type of a strategy can only become genuinely productive ifsupported bywell-consolidated national systems. We will come back tothis question in our conclusions.
1. Referring to the "Interfuturs" scenario, Salomon and Lebeau (1988) suggest a typology with five Third Worlds and indicate that sorne countries wouldfit into more than one.
2. The fact that there is such a small number of scientists (66) working in thefield of health, i.e., 4.5%, may be explained partly by the limited scope of thesurvey conducted in 1981. Actually, the Faculty ofMedicine and Pharmacy had170 teachers in 1984. It is difficult to estimate the number of teachers who alsowork on research.
3. Many ORSTOM scientists also work for the Centre de RechercheOcéanographique at Dakar-Thiaroye (CRODT), which is a branch of ISRA.They provide scientific management and supervision and train young Senegalese for research work. This Franco-Senegalese cooperation is often cited asan example of success (Ruellan 1988).
4. Certain observers felt that the rapid Senegalization of the ISRA scientificstaff meant converting many Senegalese technicians into research scientists. 1was not able to check this.
5. By way of comparison, in chapter 2 we saw that in the United Stateswomen accounted for only 13% of the national scientific communityj and in thefield of agriculture, only 4% of the research scientists were women.
6. The cost ofliving for scholarship students abroad depends mainly on thecountry. The annual cost, in U.S. dollars, ranges from $3,000 in the USSR to$7,400 in the United States to $10,800 in Japan (Ramirez 1987). These figures do

136 Scientists in the Third World
not include registration and tuition fees nor travel expenses. With $4/500 as theaverage tuition fee for a semester in the United States and annual livingexpenses of $7/440 (actualized to cover inflation between 1985 and 1988)/ amaster's degree taken in the United States, in other words, two and one-halfyears of study, would cost about $44/000; a doctorate requiring 4 years of studywould "cost" $70/000. Just by way of comparison, a "maestria" at UCR in CostaRica would only cost 227/600 colons (and this includes living expenses), which,at the 1987exchange rate, comes to slightly less than $4/000/ in other words, tentimes less than in the United States (Ramirez 1987).
Chapter Seven
Conclusion
The results of the questionnaire sent to scientists in DCs, the analysis oftheir scientific output, and the comparative study of three nationalscientifie communities confirm dependence of both the DC communities and their scientists on countries in the center and on international scientific communities. Outside sources are also heavily reliedupon for training in research science, institution building, researchfinancing, and other such fields. To a large extent, DC scientists useinternational scientific literature as their reference, choose researchtopies on the basis of essentially the same criteria as their colleagues inthe center, and tend to select the same equipment that they grewaccustomed to using during their Ph.D. studies in laboratories in thelCs.
But importing equipment manufactured in the "north" into the DCsof the "south," even with dear instruction manuals, is not enough toensure equal quality service (Gaillard and Ouattar 1988). Similarly,scientists who studied in the "north" often discover that the subject oftheir thesis, their course curricula, knowledge, and experience are notdirectly applicable upon return to their home country. We have seenthe blanket transfer to the "south" of models from the "north." Thismay complete the first steps of institution building, but institutionalization should nat be synonymous with internationalization. It is becoming increasingly clear that applying major international criteria toscientifie communities of the periphery, especially in the DCs, will notguarantee the latters' integration into international scientific communities. It may, quite to the contrary, detract from the relevance ofresearch to local needs and problems.
The scientists of the national communities find themselves at theheart of a dilemma between their decision to participate in solving localproblems and their attraction to models and reference systems more orless imposed by the international scientifie communities. Sorne writersfeel that the OC scientifie communities are going through a transitionalphase between initial establishment and integration into the international scientific community (Roche and Freites 1982). But for DC scientists, the "open sesame" into the international scientific communitymeans adopting scientific standards and practices of the "north." This

138 Scientists in the Third World
may mean, for instance, using English as the language of scientificcommunication and eliminating the use of national languages, choosing research themes that may interest international scientific journals,and thus neglecting national realities and potential national users ofresearch results. What are the choices? We firmly believe that betweenthe two extremes made up of the national versus the internationalcourse there are feasible midway strategies.
In our conclusion we will go further than reiterating the manyresults and the questions arising from them by looking at the politicalimplications of these results, both as concerns the research assistancepolicies for the DCs and the national policies implemented by the DCsthemselves.
The Uphill Emergence of a Scientific Attitude and Profession
The strategies adopted by the scientists are the result of negotiationscarried out in a socioeconomic, cultural, and political environment thatis not always very conducive to a scientific outlook and societal recognition of research science as a profession. This is in part due to theeconomic and financial situation that exists in most of the DCs. Moreover, the results and answers science has to offer are often consideredunsatisfactory, because the DCs, hounded by growing marginalizationin the world economic system, anguish for development. There areother, deeper reasons related to the endogenous cultures of the DCsocieties that do not have their own scientists to serve as examples.
In most traditional societies, learning is based mainly on routine andrespect for knowledge heId by the eIders. Chapter 5 explains thatcritical views are not part of the tradition and cites the situation in Asiawhere tradition goes against the introduction of genuine scientificresearch and hinders normal scientific work. Respect, often blindrespect for the teachings of old, makes it difficult to acquire a capacityfor creative thought and learning through systematic observation. Onthe other hand, scientists trained abroad, in another cultural system,may easily be alienated from their original society. Another mostlegitimate question focuses on the effects the interaction between science and technology can have on the culture. Does the traditionalsociety risk losing its cultural identity? This is the thesis of a Thaibiochemist who felt that in certain cases preserving culture should begiven higher priority than developing science and technology. He said,"Who can tell whether mankind is served better by building a powerstation where an old temple now stands?" (Yuthavong 1979).
As part of our case study, we tried to bring out the special impor-

Conclusion 139
tance of finding scientists who can be seen as examples during this eraof newly emerging scientific communities. Three illustrious people,Clodomiro Picado in Costa Rica, Cheikh Anta Diop in Senegal, andKing Mongkut, considered as the father of science in Thailand, arevenerated by their scientific communities. Universities, research centers, and scientific awards have been named for them. Except forClodomiro Picado (who held astate doctorate from the Sorbonne), wemight ask what sort of scientists and scholars they actually were.Perhaps they were more like spiritual, or even religious and intellectuaI, leaders. This is a question worth exploring.
These scientific communities in quest of examples navigate in ascientifie field that should not be mixed up with the intellectual field,the word field being taken in the sense of a gradient of forces within aspecific environment. In 1987 in Ivory Coast, E. Fassin (personal communication) described the emergence of an intelligentsia, which, untilrecently, did not exist despite the considerable number of professionalsworking in education, joumalism, and other white-collar jobs. Theformation of this new group of "identity shapers," the intellectuals,was sparked by a combination of factors: a sudden economic hardship(with degree holders joining the ranks of the unemployed), new political classes, and a crisis in the model known as the Ivorian strategy.Certain scientists and university scholars, e.g., the economists, joinedthe group wearing the "halo" conferred by scientific work but often forreasons unrelated to their specific disciplines. This situation does notencourage the constitution of a scientifie field separate from the intelligentsia. Up to a certain point, the early scientific controversies in theDCs and the appearance of the first leading scientists, especially inAfrica, e.g., Cheikh Anta Diop in Senegal, can be traced back to anintellectual field with characteristics, such as autonomy from politicsand science as a reference, that support the ambiguity.
Identifying a specifie scientific "field" meant that society recognizeda specialized group, a category of "scholars" that stood out sociallyfrom the population in general and also from the intellectuals, theelites, and the executive cadres. This meant splitting away from thepractitioners, after taking distance from the state. Tripier (1984) hasillustrated how the emergence of a profession occurs at the cost of thestate and the market-at the cost of the market because it draws awaymembers from a professional category and reclassifies them accordingto a recognized need for a new function, and the cost of the statebecause a domain that was previously controlled and run by the statebecomes autonomous in defining its orientations and selling its resultson the public market (except for the part of the market that is astate

140 Scientists in the Third World
monopoly), thus reassigning former socioeconomic rules and regulations.
Up to the present, science in the DCs, especially in Africa, has beenessentially controlled by government. The first step for the newlyindependent countries was to build up the state and its institutions.Education was given top priority in order to train civil servants for thestate. This concept alone, without considering diploma qualifications,has often been used in assigning jobs; and careers have been constructed on successes or failures in the power struggle rather thanthrough professional specialization. Because of this situation, it hasbeen difficult for research science as a profession, or even as a vocation,to emerge in many DCs. We have seen that as a career it is not veryappealing and is in urgent need of statutes. But isn't the problem beingviewed backward? The absence of statutes is an indication that theprofession has not really distinguished itself in society and that professional standards and representations do not gel properly.
Care must, however, be taken to avoid overgeneralizing on the basisof the three countries cited as examples in this paper. We have notedconsiderable differences between the three countries that are indicativeof differences between their continents. In Africa, for instance, thesocial origin of the scientist is more indistinguishable than in the othercontinents. Conversely, in many countries in Asia, especially inThailand and in India, the scientist's history traces back to the conversion to science of groups traditionally characterized by eminentrelations to wisdom and/or power. In Thailand, for example, the royalfamily played, and is still playing, a very important role in the birth,growth, and dissemination of science. Princess Maha Chakri Sirindhorn, for instance, who recently received her Ph.D. in organicchemistry from the Mahidol University, is considered a symbol andoften participates in public scientific events. With reference to theintroduction of Western science in Bengal in the nineteenth century, K.Raj (1986) analyzes the historical vicissitudes that inspired members ofthe dominant Hindu cast, especially the Brahmans, to appropriateWestern knowledge in India and form-and maintain to the presentthe nucleus of a tightknit, socially esteemed scientific community.
Similarly, we were able to show that in Thailand and in Costa Ricathe scientific spirit is developed more easily than in Senegal. We thinkencouragement should be given to activities such as national sciencedays, science awards, science weeks for young people, annual conferences of national science associations, and also exhibits, sciencemuseums, and clubs that attract young people to science and scientificcareers. Further, research scientists should be provided with the re-

Conclusion 141
sources needed for their work. The recent example of two Jamaicanscientists who received a national award for developing a treatmentagainst glaucoma based on cannabis is very telling. After receiving theaward, one was immediately hired by an American firm, the other by aGerman firm. Jamaica conferred the award but did not offer sufficientlyattractive working conditions. In chapter 4 we saw that there was acorrelation between job offers abroad and the number of years spentstudying abroad. The place of education is almost decisive in shapingattitudes and scientific minds and in choosing research subjects andmethods.
Education: At Home or Abroad?
Our survey of scientists and our case studies confirm that researchtraining is heavily dependent on sources abroad. Notwithstandingincreasing opportunities in many DCs, most students still go abroad,mainly to Europe and the United States, for their doctorate and oftenfor their master's and sometimes even for their bachelor's degree. Theonly DC countries that have many doctoral candidates and enrollstudents from other DCs are India, Brazil, Mexico, Nigeria, Egypt, andthe Philippines.
This dependency is incompatible with the creation of an independent scientific tradition and the emergence of a truly autonomousscientific community. Tt is becoming increasingly urgent to shift the"center of gravity" of doctoral-Ievel educationfrom the countries of the"north" to the "south." This will require cooperation between thenorthem host countries (which often offer scholarships) and the DCsthemselves. The process will entail redefining aid policies (and the riskfor the "north" countries to lose sorne of their influence) and, in manycases, DC education policies. Substantial sums have been spent by thecountries that offered most of the scholarships, e.g., United States,France, United Kingdom, Canada, Australia. Thousands of potentialresearch scientists were trained without any concem for their futureroles in the national economic systems and more specifically in thenational research systems. Corresponding sums could be used in DCuniversities to establish or strengthen doctoral courses in disciplines ofnational priority.
This change cannot take place overnight. During a transitionalperiod, however long it may be, sorne compromise solutions will haveto be applied. The "sandwich" formula that altemates fieldwork anddata collection in the student's home country with courses and thesispreparation in the country of study seems most appropriate. When-

142 Scientists in the Third World
ever possible, the student should defend his thesis in his home country. Original, innovative training policies adopted by certain schools ofhigher leaming in DCs are worth looking at more closely and couldserve as an example or a source of inspiration for other countries. Oneexample is the Institut Agronomique et Vétérinaire Hassan II, in Rabat,Morocco, which applies the "sandwich" formula as part of its generaleducation scheme. Innovations, such as the training-employment contracts in France, should also be used to guarantee newly trainedscientists employment or integration into their national scientific communities. This type of a contract could provide a more satisfactory linkbetween newly acquired scientifidtechnical skiHs and the profitableprofessional performance. Regional cooperation is also part of theanswer and should be used to make up for shortcomings in the toplevel national education systems. This is particularly true for variousscientific and technical fields in many of the small DCs where trainingopportunities are still very limited.
Strengthening national academia wouId contribute to improving thestructuring of the scientific communities as a result of added inputfrom both the national scientific potential and the student body. This isessential if the actors on the scientific stage, from national leaders toPh.D. candidates to regular students, are to keep up with science-inthe-making and remain up-to-date on progress in their disciplines.Student participation in research is doubly important. On the onehand, it teaches students that science is a method that can be used tostate and solve problems. On the other, it contributes to making up forthe shortage of research scientists, especiaHy in field surveys, andproviding opportunities to coyer a large part, if not aH, of the nationalterritory.
AH these proposaIs and recommendations do not exclude the possibility of pursuing highly specialized postdoctoral studies in an le. Butthis usuaHy requires outside assistance, especiaHy financial backing,from countries of the "north."
Official Independence, Financial Dependence
AlI the DCs rely to sorne extent or another on research funding fromabroad. Our case studies showed that the figures could vary fromslightly under one-third (Thailand) to close to two-thirds (Senegal) ofthe research budget. Whatever the degree of dependency, the foreignfunds are often vital to defray the operating costs of research. The shareof foreign funding is especiaHy critical in agriculture and health sciences. In agricultural research, Oram (1985) estimated that foreign aid

Conclusion 143
paid for close to 40% of the R&D costs in the DCs. In certain countries,like Mali, Mozambique, Senegal, Lesotho, Swaziland, and Zambia, thefigure is 70% or more. It is not always easy to distinguish the exact shareof national and foreign funding. The fact that many universities do nothave a research budget and that there is a large number of donorsinvolved does not facilitate matters. Burkina Faso, for instance, whichis a small African country, each year receives at least 340 foreignmissions sent by governmental, multilateral, and international agencies to look at agricultural research problems (ISNAR 1983). The uncontrolled growth of foreign aid, especially in the 1970s, and the lack ofcoordination both among the aid dispensers and at the nationallevelscreated aIl sorts of problems, especially connected to the countries'capacity to absorb the aid.
Donor organizations providing research aid in DCs only startedworking on coordinating their efforts in the mid-1970s, probably as areaction to the economic crisis. The follow-through was that in 1982 agroup of donors (BOSTID, United States; GATE [German AppropriateTechnology Exchange], Federal Republic of Germany; IFS; NUFFIC(Netherlands Universities Foundation for International Cooperation),Netherlands; and SAREC, Sweden), upon the initiative of IDRC ofCanada, created IDRIS, the Interagency Development Research Information System, which serves as a data base for the group members bycompiling descriptions of their respective DC-related research activities. In the start-up phase, IDRIS wanted to bring together a smallnumber of organizations. However, it is open to new members, and itssystem is available to aIl outside users, especially the DCs. Similarinitiatives have been taken by the World Bank through the CGIAR(Consultative Group for International Agricultural Research), whichcreated a type of donors' club called SPAAR (Special Program forAfrican Agricultural Research).
Of the many advantages to having donors work together, we needonly mention greater transparency, better understanding of prioritiesand criteria for eligibility, and improved functioning. Working togetherfacilitates harmonization and cooperation. The mIes and standards foraid allocation by the donors are often ill known because they are notalways explicit, tend to be confidential, or are simply not weIl publicized. Lack of cooperation is detrimental for the donors and evenmore so for the DCs that would greatly benefit from meeting togetherto share their attitudes to and uses of the aid they are offered, to assessadvantages and drawbacks, and to discuss mechanisms that could beused nationally to obtain the most favorable aid conditions. In thatcontext, the DCs would do weIl to consult the study by UCR's foreign

144 Scientists in the Third World
financing section that has established a data base on research aidfunding institutions (UCR 1985b). The most original part of this studyis a confidential chapter that analyzes the difficulties with the varioustypes of aid, Le., delays, failures, lack of cooperation, problems oftransferring funds and purchasing equipment, etc. The study alsocontains a classification of the donor agencies, based on their usefulness and efficiency as seen by the "recipient," and a data bank on thevarious organizations that provide research assistance. Paradoxically,many DCs fear that if there is too much coordination in researchfinancing, the total amount of aid will be decreased. This is the attitudeadopted by national agricultural research leaders in India, according toa recent external evaluation, and is shared by many science policymakers (Busch 1988).
We do not share this last point of view. On the contrary, we believethat more coordination in research financing should help control foreign aid and minimize the risk of national scientists undertaking research on themes that the home country does not prioritize. When thepercentage of foreign financing is very high, the consequences suffered when funding agencies withdraw can be most serious. ManyDCs know this situation well. Foreign aid will have to continue providing a goodly part of research funding, but the DCs would do well toreduce their relative importance by appealing elsewhere, e.g., theprivate sector. There are several mechanisms that could be used, e.g., anew company excise tax, a research incentives fund. Private-nationalor foreign-foundations could be persuaded to play a bigger role. Thiswould be a further way of diversifying fields of operation and recipientinstitutions, since foreign public aid seems to be limited to the traditional fields such as agriculture and health, mainly treated withinpublic research institutes, and thus does not encourage the development of new fields.
The Context of Institutions and the Role of Universities
The largest pool of research scientists works in the universities. But inmost DCs, universities have little money for research, as we have seen,and are exceptionally reliant on foreign funding. A study conductedrecently in Brazil concluded that close to 40% of the university researchservices could not survive without foreign aid (Schwartzman 1986).The universities offer the most qualified scientists, or at least the oneswith the most diplomas, and produce the most mainstream science;the exact sciences are studied there and nowhere else. But the 1970sbrought about deep changes in the universities, as we have seen. The

Conclusion 145
quantum rise in enrollment, the increase in faculties and their graduaIestablishment outside the capital cities led to a type of Balkanization ofthe universities. Teaching conditions also changed. Often overloadedwith elementary courses to teach, deprived of normal experimentalfacilities, and forced to take on outside jobs to make ends meet, theuniversity research scientists find pitifully little time for research. Thesituation is critical. Is university research condemned to die out?
Many Des were faced with and forced to skirt the problem. This wasthe case in India, for instance, which had a rigid university systemunder pressure from aIl sorts of minority groups and was marred by anever-poorer level of recruitment and instruction. The reaction was tocreate a series of national university centers and technology institutesas "poles of excellence" based on other systems of recruitment andbetter links between teaching and research. Latin America favors another alternative solution by giving a leading role to private researchcenters for social science research. The expression of democracy thatled to the creation of universities for the masses is not always compatible with the ambition to create productive research centers withinthese universities. This probably explains why more public researchinstitutes were created or expanded.
These institutes, under tight govemment control, conduct researchon priority, usually technical fields, mainly agriculture and health.More and more increasingly qualified research scientists work in theseinstitutes, although their overall academic level is lower than that oftheir colleagues in the universities. They have fewer chances for refresher training and scientific communication. Because of their numerous assignments, little time is left for systematically recording researchfindings and even less for analyzing and preparing them for publication. Since these scientists are administratively assimilated to the civilservants and are in general more poorly paid than their universitycolleagues, they have to round out theirincome through outside jobs.This is a system that is more important for the institute scientists thanfor the university scientists because of their poor salaries and limitedcareer opportunities. Here again, it is difficult to generalize. In sorneLatin American countries, like Brazil, we found the opposite to be true,at least in agricultural research. Brazilian scientists want to leave theuniversity to work at EMBRAPA (National Agricultural Research Institute) where they have better wages and working conditions. And forreasons explained above, university scientists are authorized to toptheir income through part-time jobs outside the university.
The situation is worst in Africa where the turnover is especiallyhigh, the result being that much work is done sloppily, left incomplete,

146 Scientists in the Third World
and not recorded. In Nigerian institutes, 20% to 50% of the scientificposts are vacant. The proportion is the highest among the seniorscientists. The turnover rate is between 60% and 80% per five years,and the trend is growing worse (Idachaba 1980). ISNAR (1988, p. 55)has made a Pan-African study and concludes that "it still has not beenpossible to maintain a cadre of experienced agricultural researchers.The weakness of these experience profiles has had a profoundly negative impact on the institutional development and general productivityof NARS (National Agricultural Research System) in West Africa. Mostsignificantly it has not been possible to develop experience and stable'critical masses' of researchers in the key disciplines and commodities.Equally important, graduate recruits have frequently not received thekind of expert supervision and mentorship which is normally expectedfrom experienced col1eagues in scientific communities."
National systems are usual1y backed by private, often industrialreseach that, as we have seen, is practical1y nonexistent in Costa Rica(except for social science research), Senegal, and Thailand. There areonly a few countries in Southeast Asia that al10cate resources equal tothose earmarked for R&D in the OECD countries. In most DCs theprivate sector goes no further than importing technology, partly tomeet their immediate need for solutions and partly to compensate fortheir inadequate industrial R&D capacity. This does not mean that theprivate sector should conduct al1 industrial research. A certain capability exists within the universities, but there is not enough contactwith the private sector to make use of it. Furthermore, relations between research institutes and universities are barely more developedthan relations between universities and the private sector.
There are two major explanations for this dysfunctioning: first, theeffects of doctoral studies abroad; and second, the inability of theuniversities to play the central role they should play to stimulate andstructure the national scientific communities. Doctoral studies, if pursued in the DCs, would be designed to react more to the economicrealities and needs of both the private sector and the public researchcenters. Contacts students establish through the university duringtheir doctoral studies could more easily be maintained after they havegraduated and gone to work for public research centers or the privatesector. More incentives should be adopted to promote a better integration of research activities within the different research institutions(universities, private and public centers, etc.).
Incentive measures might include encouraging researchers fromvarious institutes to work together on joint projects, encouragingexchanges between staff members from various types of institutes for

Conclusion 147
varying periods of time, authorizing institute scientists to attend refresher training courses at the university, urging the national journals(which are often published by the universities) to adopt a more openeditorial policy, organizing research seminars regularly and invitingresearchers from various types of institutes, making national journalsmore visible, and making unpublished documents more readily available by creating a central index system for reference materials.
Problems of Communication
The last suggestion introduces the problem of scientific communications. Answers to the questionnaire indicated that communicationsbetween DC research scientists were infrequent and were often restricted to contacts with colleagues in the same institute or even, often,in the same department or research unit. Contacts with scientistsworking elsewhere within the country are as infrequent as with scientists working in countries of the "north." Scientists who spent thelongest time studying abroad had the most contact with foreign scientists. Similarly, they tended to depend more on work published in theICs and made little use of what their colleagues at home or in other DCspublished.
DC scientists often cite colleagues in ICs but not vice versa, evenwhen works by DC scientists are published in well-read internationaljournals. This behavior seems to be the result of a rather widespread,although difficult to prove, conviction among DC scientists that quoting works published by colleagues from ICs brings more credit to theirown work. However, scientists from the ICs seem to feel that the workpublished by their DC colleagues is insignificant. This attitude canhave unexpected consequences, as is shown in the example publishedby two colleagues from ORSTOM (Chatelin and Arvanitis 1988a) conceming two young Philippino researchers who published their findings on the sensitivity of maize hybrids to a fungus called Helmintosporium maydis. Four years later, an American scientist working on thesame question discounted the warning and claimed that in the Philippines hybrids were not resistant enough and local agricultural practiceswere bad. That was in 1965. In 1970 the United States suffered tremendous maize crop destruction due to Helmintosporium. This exampleshould make researchers in the ICs more circumspect, wary of presumptive judgments and undue simplifications that tend to considerDC science as "bad" and international science, dominated by thecountries of the "north," as "good."
Fortunately, blanket judgments are not systematic and are not the

148 Scientists in the Third World
only explanation for the widespread misunderstanding of researchwork conducted in the DCs. The lack of visibility and accessibility ofDC science aggravates the problem of unsatisfactory dissemination. Wementioned that DC scientists often publish their findings in nationaljournals. The data Léa Velho (1985) compiled in Brazil showed thatBrazilian scientists not only chose national journals but went furtherand often chose in-house publications. This happens in many DCs.Circulation becomes even more of a problem when the language ofpublication is a local tongue, unknown beyond national borders, e.g.,Thaï. These publications are very seldom listed in international databases. Furthermore, the number of copies printed is very limited, andthe radius of circulation is small. They are not published regularly andoften, because of financial difficulties, stop appearing after the first fewissues. What can be done? Again, there are solutions, but they requireresources.
In Senegal, as we have already mentioned, ISRA recently publishedan analytical bulletin of its scientists' work. This document, and thedata base it inspired, provide a new degree of visibility and are beingused as tools to structure scientific communications at the national leveland, hopefully, at a later date, will be expanded to the regional andinternational levels. This could be an example for other national institutions and serve in a nationwide common reference index system. Afterthe base has been established, it could be consulted via the telecommunications network. Procuring a terminal that can access data basesshould be a priority for unequipped scientific institutions. Sorne databases such as FAO's AGRIS (international information system for theagricultural sciences and technology) are intended for the DCs andcontain large quantities of nonconventional literature such as university theses, reports, and unpublished papers.
Modem microcomputer technology also has an important role toplay. Far be it from us to contribute to the mystifying utopia thatpretends that the information revolution will provide a formidableshortcut to solving aIl the ills of underdevelopment. Butwe do need torecognize the often accelerated availability of new tools in many DCresearch institutes. This was observed by the editors of a journalentitIed Tropical Animal Production that is computer printed and nowcalled Tropical Animal Production for Rural Development. The InstitutoMayor Campesino in Buga, Columbia, in 1988, wants it to become aresearch journal to promote communications among scientists anddecision makers concerned with rural development in the ThirdWorld. The journal is produced and distributed in diskette fonu andprinted 10caIly. DC institutions and scientists will have access to the

Conclusion 149
journal free of charge. To receive the journal merely requires sendingan unused diskette to the distribution centers in Columbia or England.Here again, the success of the project partly depends on assistancefrom the "north" in providing microcomputers to unequipped OCinstitutes.
National institutions in charge of science policies and donor organizations should also continue furthering the establishment of bathformaI and informaI netwarks by canvening national and regianalconferences and by publishing and widely distributing conferenceproceedings. Scientists in the lCs should also be given opportunities taparticipate in meetings arganized by the DCs. Cansidering how poorlyscientific information is circulated in the DCs, seminars and conferences are still probably the mast effective tool for establishing durable scientific contacts. National leaders and foreign aid organizatiansshauld realize this and pravide resaurces for OC scientists ta hanarinvitations ta conferences abroad. AlI too often they cannot fightthrough the obstacle course lined with problems of exit visas, lack offareign curreney, depleted travel budgets, and vague suspicions by theadministration that the trip is a joy ride or an exaggerated privilege for asenior civil servant.
Relations between research scientists and scientific communities inother DCs, especially at the regional level, need ta be revised. Especially for the small cauntries, training, funding pragrams, and organizing conferences are tao demanding ta shoulder at the nationallevel.
Critical Mass and Regional Cooperation
Thus, many DCs, because of their small size and/or lack of resources,cannat enjay scientific and technical autonamy and are tempted tafavar the solution of regional cooperation, either through networks orregional research centers. ProposaIs along these lines have been discussed at great length in regional and international conferences onscience and technology. This was the case at the First Conference ofMen of Science in Africa (Brazzaville, June 1987) and at the secondCASTAFRICA (Conference of Ministers Responsible for the Application of Science and Technalogy to Development in Africa) conference,which, in Tanzania, in July 1987, brought tagether ministers of scienceand technolagy in Africa. We have ta recagnize, unfortunately, thatparticipating states are often willing ta allacate funds ta create netwarks and regional scientific organizatians but then do not allocatefunds ta run them.

150 Scientists in the Third World
Furthermore, there are certain problems, especially related tohealth, that have to be solved at the regionallevel because of their scopeand nature, e.g., disease-bearing insects, while others, especially inagriculture, are more site-specifie and have to be researched as such.Results deemed s,atisfactory for one area may not be for another. This iswhy the network system, in a more or less institutional form, seems tooffer a less stringent answer that is better adapted to the requirementsof regional, continental, and international cooperation. This type ofcooperation is not new in the field of research. What is new is the recentproliferation of networks, especially in sub-Saharan Africa, and theattendant need for regional cooperation. SPAAR has inventoried over60 research networks in this region of the world devoted to subjectssuch as information exchange, scientifie consultation, and joint research.
There are new systems and fashions in multilateral partnershipsthat, in time, may cause national systems to split into two subsystems,one better endowed because of its support from the networks and theother left to fare for itself. The underlying risk will be that networksupported programs all take root in a small number of scientificallymore advanced countries. Actually, regional scientific cooperation canonly exist if the participating countries have adequate national scientificpolicies and capabilities. Otherwise, national scientific choices may besacrificed on the altar of regional or international cooperation. In otherwords, we cannot ignore the need to strengthen national researchsystems.
Redefining National and Donor Policies
We have seen that in many cases ample, although not always adequate,human and financial resources are made available to create institutions. The key problem is one of quality. Less attention is needed forsize and resources than for good functioning and effectiveness. Actions need to be sited on the scientifie field, e.g., detailed identificationof themes with a future, assistance in training teams, continued support for the more promising ones, assistance in communicationsthrough written media such as national joumals, and oral media suchas conferences. This will help consolidate the national scientific fabricand give it an international dimension.
On the DC side, the vital component is the national scientific policy,whose efiectiveness will depend on an improved professional statusfor the research scientists and increased autonomy for the institutions.This seems to be the most appropriate place to stress the need for

Conclusion 151
reliable, regularly updated statistics. Toois of analysis such as indicators or inventories of scientific and technical potential, a scientific planor budget, or even a definition of priorities aIl need an adequatestatistical base. There is no use speaking about a science policy orresearch management unless adequate support is provided.
For the aid policymaker, this means maintaining a general overviewbut relying less on aid packages and more on scientific operators. Thetype ofaction involved exceeds the capacity of the global administrativeoperators who are used to handling huge budgets. Innovations forinstitutionaI structures and new work parameters will be needed. Themost vital steps will be helping national scientific communities toemerge, developing internai standards and external capacities for project formulation, negotiation, and orientation. The awards system willhave to be better adapted to the needs of development and therequirements of research in cooperation.
Developing Science Takes Time
Sorne 25 years ago, most people thought that the technologies neededto develop the Third World were available. Sorne people even thoughtthat the DCs were starting the march to development at a favorablemoment in history and that aIl they needed to do to catch up was toshop in the supennarket of technologies for ready-made solutionsdesigned by the ICs. The general thought was that there was a direct,linear relation between basic research, applied research, technologicaldevelopment, and, downstream, economic growth. Knowledge wasexpected to flow through the system like water in a pipe. Quixotically, itwas thought that injecting proper investments and trained scientists atthe entrance of an R&D system guaranteed economic development atthe exit. True, science and technology brought World War II to an endin six years and put a man on the moon in eight; but the facts show thatthey have notbeen able to win the battle against the poverty rampant inmost DCs, even though the OC populations have been able to benefitfrom tangible progress, especially in certain fields such as health andnutrition.
We now know that the relations between science, technology, anddevelopment are much more complicated and that there is no shortcutto solving development-related problems. Developing science is alengthyenterprise. Even under conditions more favorable than thosefacing most DCs in the world of today, countries like the United Statesand Japan needed 50 years to be able to compete with Europeancountries. A study on the process of industrializing scientific research

152 Scient,ists in the Third World
in Western countries highlights the decisive factor as being time, thetime needed for science to find its legal niche in the social system.
Most DCs are still in the institutionalization and professionalizationstage. The initial institutional structure has been created, but its material expression, scientific research, has not yet been institutionalized,i.e., been recognized as a full-fledged component of society. Unlike theWestern countries, in the DCs the various steps in scientific development overlap each other.
The questionnaire and interviews have shown that scientists whohave studied abroad find it very difficult to fit into their nationalscientific communities and must accept numerous sacrifices. There arecertain prerequisites to making scientificinvestments "profitable." Hisnot enough just to lay down an institutional structure, train goodscientists, and give them proper supplies. The scientists need to be ableto find their place in a tightknit, lively scientific community that has itsown legitimate seat in society.

Appendix A
Questionnaire for IFS Grantees
1. This questionnaire is intended for aU IFS grantees, even those no longerreceiving IFS support for their research work.
2. Try to answer aIl the questions.
3. Definitions of words marked with an asterisk are given in the appendixto this questionnaire.
4. The squares to the right are not to be filled in.
Do not complete items 1 through 8.1. Answer to the questionnaire (yes/no).2. Agreement number (001 to 844).3. Country in which the grantee is working.4. Year of first grant (between '74 and '84).5. Research area (1 to 7).6. Number of grants (1 to 4).7. Total amount received from IFS by 31 Dec.
1984 in thousands of Swedish SEKs.8. IFS support active or completed.
I-Civil Status and Education
9. Family name _
10. First and middle names _
11. Names and addresses of your home institution _
o000000
DOoo
000
o
12. Citizenship _
13. Sex: Male 0 Female 0 0
14. Year of birth: 19 _ 0 0
15. What was your father's principal occupation when you were 016 years old? (If deceased or retired when you were 16, indicateprevious occupation.)
16. Where did you live when you were 16 years old? 0

154 Appendix A
o in your national capital?o in a town other than the capital with over 50,000 inhabitants?o in a town of between 2,500 and 50,000 inhabitants?o in a town of under 2,500 inhabitants?o in a village or rural area?
17. Are you married? Yes 0 No 0 0
18. How many children do you have?___ 019. If you are married, what is your wife's principal occupation? __ 00
20. Higher education.In chronological order list the diplomas you obtained, starting with theB.S. level. Indicate the scientific area of specialization and the name andcountry of the educational establishments you attended.
A. Diploma (or degree) 0Field of studies 0 []~M 00Establishment 0Country DOC!
B. Diploma (or degree) 0Field of studies 0 0~u 00Establishment 0Country 000
C. Diploma (or degree) 0Field of studies 0 0~M 00Establishment 0Country 000
D. Diploma (or degree) 0Field of studies 0 0~M 00Establishment 0Country 000
E. Diploma (or degree) 0Field of studies 0 0~u 00Establishment 0Country 000
21. If you wrote a Ph.D. thesis, give your supervisor's name and addressand the title of your thesis: _

Questionnaire for IFS Grantees 155
22. Languages.Mother tongue: 0Please complete the foIlowing table:
Languages
Read Speak Write
ENE ENE ENE
00000000000000000000
DODO
ooooooooo
E = Easily NE = Not Easily
23. How many years did you spend outside of your country forhigher education and training, including postdoctoralstudies, etc.? __ years
24. How many years did you spend abroad altogether? __ years
25. Why did you choose to become a scientist or a research worker?How important were the foIlowing considerations in your choice? Pleaserate each criteria by circling one number from Nessential" to "notimportant at aIl."
1 = Essential2 = Very important3 = Moderately important4 = Not very important5 = Not important at aIl
- Social status 12345- Job security 1 2 3 4 5- Remuneration 1 2 3 4 5- Career prospects 1 2 3 4 5- InteIlectual stimulation 1 2 3 4 5- Social utility 1 2 3 4 5- Parental influence 1 2 3 4 5- Influence of a professor 1 2 3 4 5- Other 1 2 3 4 5
II-Position
26. Job.1. Present position (title) _
Starting date (year) _oo

156 Appendix A
Amount of. time devoted toTeaching __% Administration __% 0 0 0 0Research __% Extension __% DO 0 0Other (specify) __% 0 0
2. Title of your position at the time you applied for your first IFS grant:o
Amount of time devoted toTeaching __% Administration __% DO 0 0Research __% Extension __% DO 0 0Other (specify) __% 0 0
3. Title of your first professional position: 0
27. What is at present your main field of science, e.g., agronomy,chemistry, zoology, etc.? 0 0
28. Since the beginning of your research caree!; have you substantiallychanged your scientific orientationlresearch subjects?
~D ~O 0
29. If Myes," what motivated this change? 0
30. Do you consider that the salary you receive as a scientist is adequate tosupport yourself and, if applicable, your family?
Adequate 0 Inadequate 0 0
31. Compare your salary as a scientist or teacher-cum-scientist with theminimum wage in your country by indicating how manytimes more you get.
__ times more 0 0
32. If you are obliged to have side jobs to support yourself and, ifapplicable, your family, indicate how many hours theyrequire per week.
__ hours DOSpecify the nature of your side jobs. _
oIII--Research Choice and Objectives, Working Relations
33. How would you say the activities in your departrnent or research unitare divided up? What do you think the time distribution should be?Indicate percentages of time.
Present-_%__%
TeachingBasic research
Ideal-_%-_%
DODO[]O[JO
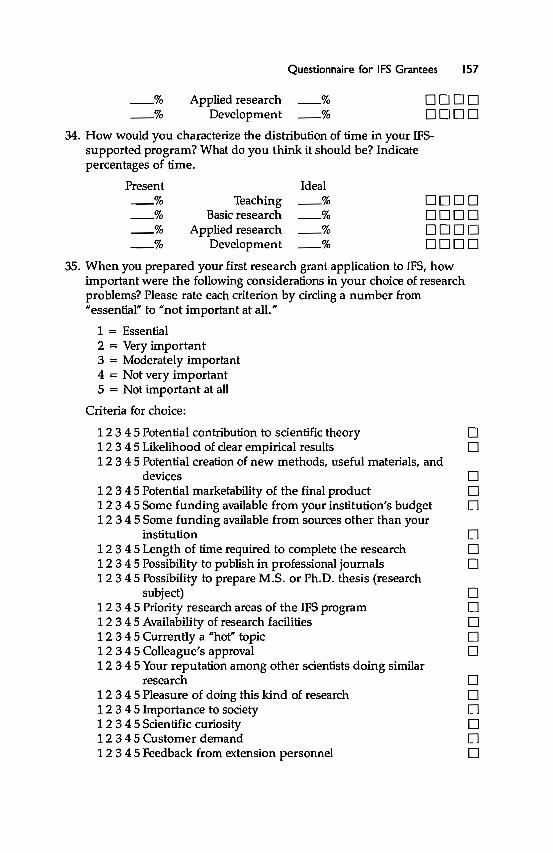
Questionnaire for IFS Grantees 157
__% Applied research __% CI CI CI 0__% Development __% [J CI 0 CI
34. How would you characterize the distribution of time in your IFSsupported program? What do you think it should be? Indicatepercentages of time.
Present Ideal__% Teaching __% CI 0 CI CI__% Basic research __% CI 0 0 CI__% Applied research __% CI CI CI CI__% Development __% CI CI 0 CI
35. When you prepared your first research grant application to IFS, howimportant were the following considerations in your choice of researchproblems? Please rate each criterion by circling a number from"essential" to "not important at all."
1 = Essential2 = Very important3 = Moderately important4 = Not very important5 = Not important at all
Criteria for choice:
123 45 Potential contribution to scientific theory CI1 2 3 45 Likelihood of clear empirical results 012345 Potential creation of new methods, useful materials, and
devices 01 2 3 45 Potential marketability of the final product 012345 Sorne funding available from your institution's budget 012 345 Sorne funding available from sources other than your
institution 01 2 3 4 5 Length of time required to complete the research 012345 Possibility to publish in professional journals CI12345 Possibility to prepare M.S. or Ph.D. thesis (research
~~ CI1 2 3 4 5 Priority research areas of the IFS program 01 2 3 4 5 Availability of research facilities 01 2 3 4 5 Currently a "hot" topic 012345 Colleague's approval CI1 2 3 4 5 Your reputation among other scientists doing similar
re~~ CI1 2 3 4 5 Pleasure of doing this kind of research CI1 2 3 4 5 Importance to society 01 2 3 4 5 Scientific curiosity 01 2 3 4 5 Customer demand 01 2 3 4 5 Feedback from extension personnel 0

158 Appendix A
123 45 Priorities of your research institution123450ther _
oo
36. In choosing your research subject, in what ways did the followingpeople influence you? Indicate the degree of influence by circling onenumber from "essential" to "not important at aIl."
1 = Essential2 = Very important3 = Moderately important4 = Not very important5 = Not important at aIl
12 3 4 5 Your immediate supervisor 01 2 3 4 5 A colleague in your department 012 3 4 5 A colleague in another department at your institution 01 2 3 4 5 A colleague at another institution 01 2 3 4 5 A research assistant/technician 012 3 4 5 A graduate student 012345 A professor other than your Ph.D. supervisor 012345 Your Ph.S.lPh.D. supervisor 012 3 4 5 The director of your research facility 01 2 3 4 5 A client or potential user 01234 5 An IFS scientific adviser 012 3 4 5 Another IFS grantee 01 2 3 4 5 A member of the IFS staff 01 2 3 4 5 The research review committee 01 2 3 4 5 Other (specify)
37. How often do you communicate with the following people regardingyour research? (Please circle one for each line: l=never, 2=rarely,3 = annuaIly, 4= monthly, 5 = biweekly, 6= weekly, and 7= daily.)
12 3 4 5 6 7 Scientists in your department 012 34 5 6 7 Scientists outside your department in your institution 0123 45 6 7 Scientists from other institutions in your country 012345 6 7 Scientists outside your country 01 2 3 4 5 6 7 IFS scientific advisers 01 2 3 4 5 6 7 IFS grantees in your country 01 2 3 4 5 6 7 IFS grantees outside your country 01234567 Your Ph.S.lPh.D. supervisor 01 2 3 4 5 6 7 IFS secretariat 01 2 3 4 5 6 7 Other funding agencies 012 3 4 5 6 7 Extension staff 0
38. To carry out your research project, do you work alone or with otherscientists?
Alone 0 With other scientists 0 0

00o I::J000000
Questionnaire for IFS Grantees 159
39. Do you correspond by mail on scientific problems with foreignscientists?
fuO ~O 0
IV-Research Funding
40. What was your annual research budget (excluding salaries) at the timeyou applied for an IFS grant, to the nearest V.s. $I,OOO?
V.S. $ 00
41. What was the annual research budget (excluding salaries) last year (orduring the last year you received IFS support, if your grant has beenterminated), to the nearest V.S. $I,OOO?
V.S.$ DO42. What were your sources of research funds in percentages (excluding
salaries) last year (or during the last year you received IFS support, ifyour grant has been terminated)?
Home institution __%IFS _%National funding organization (name) __%International funding organization (name) __%Other (specify) _%Total 100%
43. Would you have pursued your research if IFS funding had not beenmade available?(1) [] Yes, other support would have been available 0(2) 0 Yes, even without other support 0(3) 0 Yes, but on a reduced scale 0(4) 0 Yes, but in a substantially different form 0~O~ 0(6) 0 Other (specify) 0
44. Since becoming an IFS grantee, has it become easier for you to obtain:Yes No
- additional funding from your institution 0 0 0- additional funding from a national funding institution 0 0 0If yes, give name _
V-Scientific Literature. Publications. and Attendance to Conferences
45. After becoming an IFS grantee, how many of each of the following typesof publications have you authored or coauthored?Authored Coauthored
Articles in scientific joumalsArticles in conference proceedings
BooksChapters in books
Bulletins
DODOooo
00CIO
ooo

160 Appendix A
ReportsOther (specify)
oo
DD
46. Indieate in what scientifie joumals you have had arlicles published(as an author or coauthor). D
a f _b g _c h _d _e _
47. To what joumals do you subscribe or have easy and regular access? Da f _b g _c h _d _e _
48. Do you have easy and regular access to bibliographie catalogs such as"Current Contents"?
YesO NoDIf "Yes," whieh ones? _
49. How important is the following literature in your research? Circle onenumber from "essenlial" to "not important at aIl."
1 = Essenlial2 = Very important3 = Moderately important4 = Not very important5 = Not important at aIl
1 2 3 4 5 Nalional journals in your field1 2 3 4 5 National journals in related fields12 3 4 5 Foreign journals in your field1 2 3 4 5 Foreign journals in related fields1 2 3 4 5 Books and monographs1 2 3 4 5 Research bullelins
50. Since becoming an IFS grantee, how many scientific conferences haveyou attended?
Total With financialsupport from IFS
DDDDDD
Within Y0uf countryOutside your country
51. Do you have access to bibliographie data banks?Yes 0 No 0 If yes, whieh one(s)?
a c _b d _
DO 0DO D

Questionnaire for IFS Grantees 161
DO0000CID
00DO00
52. During the last 12 months, about what percent of your research time didyou spend:
- in the office __%- in the library __%- in the field __%- in the laboratory __%- in the computing facility __%- in animal and plant experimental areas __%- elsewhere (specify) __%
VI-Supporting Activities: Technical Assistance. Purchase and Maintenance ofEquipment, Evaluation
The year ofyour firstIFS grant Last year
53. Number of scientists you supervised: 0 00
54. Number of technicians you supervised: 0 0 0
55. Number of field-workers you supervised: 0 00
56. After becoming an IFS grantee, did it become easier for you to obtainscientific and technical assistance from your institution?~sO NoD 0
57. Do you or could you have easy access to a vehicle for your researchwork?~sO NoD 0
58. Do you or your institution receive catalogs of research equipment andsupplies regularly?~sO NoD 0
59. What is the publication date of the more recent catalogs on researchequipment and supplies currently available to you?19_ 0
60. Do you have technicians in your institution who can install, maintain,and/or repair research equipment?~sO NoD 0
61. The last time you had a piece of equipment that had to be repairedabroad or by traveling technician from abroad, how long did it take toget it repaired?
_ month(s) 00
62. Do you make the equipment purchased with IFS grant funds availablefor

162 Appendix A
- teaching activities- other research projects in your research units or
department- other research projects in other departments of your
institution- other research projects in other institutions
Yes Noo 0
o 0
o 0o 0
o
o
oo
63. Are research activities adequately encouraged in your country?Adequately 0 Inadequately 0 0
64. How do you perceive your government's attitude toward research?Indicate the attitude by circling one number between "negative" (1)and "very positive" (7).
negative 1 2 3 4 5 6 7 very positive 0
65. Is your research work evaluated regularly?fuO ~O 0
66. If yes, by whom?o
67. Which criteria are used to grant promotions to scientists in yourcountry?
o68. Have you had a sabbaticalleave:
Yes Noo 0o 0
- since the beginning of your career?- since you became an IFS grantee?
If yes, which year? 19__in which country? _for how long? __ months
69. Have you been offered employment abroad?Yes No
- since the beginning of your research career? 0 0- since you became an IFS grantee? 0 0
If yes, in which country? _- Did you accept the offer? 0 0
oo
DO000
DO
oo
000o
VII-Implementation. Use of Research Results. Recognition. Awards
70. Excluding your own discipline, do you believe that your IFS-supportedresearch and publication(s) have aIready or will directly or indirectlybenefit any of the foIlowing? (Grele the corresponding numbers on eachline from 1=not at aIl to 5 = a great deal.)

Questionnaire for IFS Grantees 163
DOWill benefit
12345
Has ordoes benefit12345 Other scientific disciplines
Specify: _1 2 3 4 5 Small farmers 1 2 3 4 5 0 01 2 3 4 5 Large farmers 1 2 3 4 5 0 01 2 3 4 5 Agri-business 1 2 3 4 5 0 012345 Rural area inhabitants 12345 DO1 2 3 45 City dwellers 1 2345 0 01 2 3 4 5 General public 1 2 3 4 5 0 01 2 3 4 5 Local or state agencies 1 2 3 4 5 0 01 2 3 4 5 Local industries 1 2 3 4 5 0 01 2 3 4 5 Other countries in the region 1 2 3 4 5 0 01 2 3 4 5 Foreign or international industries 1 23 4 5 0 01 2 3 4 5 Other 1 2 3 4 5 0 0
71. If your research results are being implemented or have already been 0implemented, briefly describe how and which national or internationalagency/agencies helped.
72. How many people have you trained?
Since thebeginning ofyour career
Since youbecame anIFS grantee
Technicians 0 0 0 0M. S. students 0 0 0 0Ph.D. students 00 [] DPost doctoral students [lOCI [J~~~~~ DO DO
73. Have you received any prizes/awards in recognition of your outstandingcontributions in the field ofyour scientific specialization?
Yes NoBefore you became an IFS grantee 0 0 0Since becoming an IFS grantee 0 0 0
74. What is, according to you, the main factor holding back your researchwork? 0

164 Appendix A
75. Are there any research interests or projects you would like to pursuethat you have not yet been able to?
YesO NoD D
76. If yes, specify and indicate constraints to their implementation. D
77. What is your future career goal?
o Continued scientific career Do Politics Do Private business Do Development programs Do Other (specify) 0
No questionnaire of this type can adequately cover aIl the pointsconsidered relevant by individuals with so wide a range of interests, soplease use the next page for any additional comments you may have.
Thank you for your cooperation. Please return the completedquestionnaire together with a complete list of anything you have hadpublished in the original language of publication (names of coauthors, titlesof scientific journals, number of pages, dates, etc.) to IFS by 31 M1lrch 1985.
Additional remarks:

Appendix B
Countries in WhichRespondents Are Working
Africa
Burkino FasoBurundiCameroonCongoEgyptEthiopiaGabonIvory CoastKenyaMadagascarMalawiMaliMauritiusMoroccoNigerNigeriaSenegalSeychellesSierra LeoneSomaliaSudanTanzaniaTogoTunisiaUgandaZaireZambiaZimbabwe
Latin America
ArgentinaBarbadosBrazilChileColombiaCosta RicaCubaDominican Rep.EcuadorGuatamalaHaitiJamaicaMexicoNicaraguaPanamaPeruUruguayVenezuela
Asia & Middle East
BangladeshChinaHongKongIndiaIndonesiaIranJordanKorea (Rep. of)LaosMalaysiaPakistanPhilippinesSingaporeSri LankaThailandTaiwanVietnam
Pacifie
FijiPapua New GuineaSolomon IslandsVanuatu
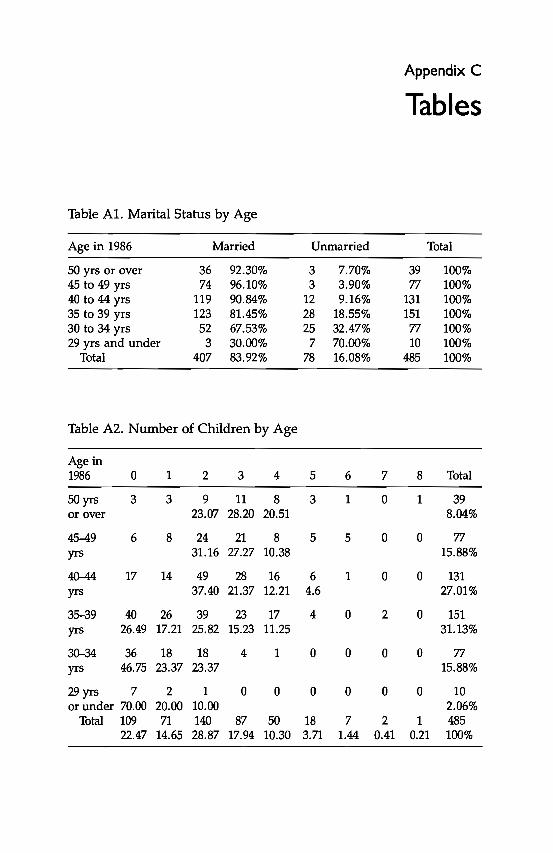
Appendix C
Tables
Table Al. Marital Status by Age
Age in 1986 Married Unmarried Total
50 yrs or over 36 92.30% 3 7.70% 39 100%45 ta 49 yrs 74 96.10% 3 3.90% 77 100%40 ta 44 yrs 119 90.84% 12 9.16% 131 100%35 ta 39 yrs 123 81.45% 28 18.55% 151 100%30 ta 34 yrs 52 67.53% 25 32.47% 77 100%29 yrs and under 3 30.00% 7 70.00% 10 100%
Total 407 83.92% 78 16.08% 485 100%
Table A2. Number of Children by Age
Age in1986 0 1 2 3 4 5 6 7 8 Total
50yrs 3 3 9 11 8 3 1 0 1 39or over 23.07 28.20 20.51 8.04%
45-49 6 8 24 21 8 5 5 0 0 77yrs 31.16 27.27 10.38 15.88%
40--44 17 14 49 28 16 6 1 0 0 131yrs 37.40 21.37 12.21 4.6 27.01%
35-39 40 26 39 23 17 4 0 2 0 151yrs 26.49 17.21 25.82 15.23 11.25 31.13%
30-34 36 18 18 4 1 0 0 0 0 77yrs 46.75 23.37 23.37 15.88%
29 yrs 7 2 1 0 0 0 0 0 0 10or under 70.00 20.00 10.00 2.06%
Total 109 71 140 87 50 18 7 2 1 48522.47 14.65 28.87 17.94 10.30 3.71 1.44 0.41 0.21 100%

Tables 167
Table A3. Number of Children by Years Spent Abroad
Years 0--3 4-8spent abroad children children Total
0 65 16.09% 8 10.53% 73 15.21%1-2 94 23.27% 18 23.68% 112 23.33%3-4 97 24.01% 20 26.32% 117 24.37%5--9 128 31.68% 23 30.26% 151 31.46%10--20 20 4.95% 7 9.21% 27 5.63%
Total 404 100% 76 100% 480 100%
Table A4. Number of Years Spent Abroad by Father's Profession
Father'sProfession 0 1-2 3-4 5--9 10--20 Total
Agriculture 22 35 36 41 8 14215.49% 24.65% 25.35% 28.87% 5.63% 100%
Self-employed 16 28 29 30 6 10914.68% 25.69% 26.60% 27.52% 5.50% 100%
Craftsman 10 19 21 33 4 87or trade 11.49% 21.84% 24.14% 37.93% 4.60% 100%
Executive 4 15 14 18 3 547.40% 27.78% 25.92% 33.33% 5.55% 100%
Employee 8 7 9 11 1 3622.22% 19.44% 25.00% 30.55% 2.78% 100%
Laborer 2 5 4 6 0 1711.76% 29.41% 23.53% 35.29% 0.00% 100%
Service staff 5 2 1 3 2 13or watchmen 38.46% 15.38% 7.69% 23.08% 15.38% 100%
Other 2 1 1 2 0 6categories 33.33% 16.66% 16.66% 33.33% 0.00% 100%
Total 69 112 115 144 24 46414.87% 24.14% 24.78% 31.03% 5.17% 100%

168 Appendix C
Table AS. Choice of Research Subject, Importance Given toCriterion: "Potential Contribution to Scientific Theory" by Numberof Years Spent Abroad
No.ofYears Moderately toSpent Essential or Relatively Not ImportantAbroad Very Important Unimportant at Ail Total
0 39 56.52% 25 36.23% 5 7.25% 69 100%1-2 57 52.29% 47 43.12% 5 4.59% 109 100%3-4 58 50.43% 49 42.61% 8 6.96% 115 100%5-9 83 56.08% 53 35.81% 12 8.11% 148 100%10-20 13 52.00% 11 44.00% 1 4.00% 25 100%1-20 211 53.15% 160 40.30% 26 6.55% 397 100%
Total 250 53.68% 185 39.70% 31 6.65% 466 100%
Table A6. Relative Influence of Various People in Choice of ResearchTopic
Rank Person Averagea Rating
1 Your immediate superior 3.312 The director of your research unit 3.523 A customer or potential user .. . . . . . . . . . . . . . . . . . .. 3.604 A colleague from another institute . . . . . . .. 3.675 A colleague in your department 3.696 Your thesis supervisor '" . . . . . . . . . . . . . . 3.727 Your IFS scientific adviser " 3.788 A professor other than your thesis supervisor 3.819 A research evaluation committee 3.94
10 A colleague from another department in yourinstitute 4.03
11 A research assistant " 4.1612 A member of the IFS Secretariat 4.26
"Average based on aS-figure scale (1 = essential, 2 = very important, 3 = relativelyimportant, 4 = relatively unimportant, 5 = not important at ail).
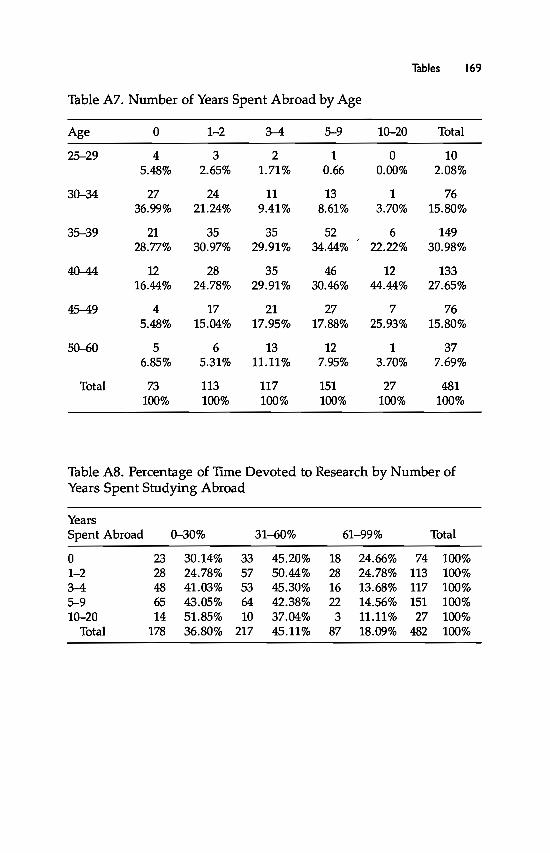
Tables 169
Table A7. Number of Years Spent Abroad by Age
Age 0 1-2 3-4 5-9 10-20 Total
25-29 4 3 2 1 0 105.48% 2.65% 1.71% 0.66 0.00% 2.08%
30-34 27 24 11 13 1 7636.99% 21.24% 9.41% 8.61% 3.70% 15.80%
35-39 21 35 35 52 6 14928.77% 30.97% 29.91% 34.44% 22.22% 30.98%
40-44 12 28 35 46 12 13316.44% 24.78% 29.91% 30.46% 44.44% 27.65%
45-49 4 17 21 27 7 765.48% 15.04% 17.95% 17.88% 25.93% 15.80%
50--60 5 6 13 12 1 376.85% 5.31% 11.11% 7.95% 3.70% 7.69%
Total 73 113 117 151 27 481100% 100% 100% 100% 100% 100%
Table A8. Percentage of Time Devoted to Research by Number ofYears Spent Studying Abroad
YearsSpent Abroad 0-30% 31-60% 61-99% Total
0 23 30.14% 33 45.20% 18 24.66% 74 100%1-2 28 24.78% 57 50.44% 28 24.78% 113 100%3-4 48 41.03% 53 45.30% 16 13.68% 117 100%5-9 65 43.05% 64 42.38% 22 14.56% 151 100%10-20 14 51.85% 10 37.04% 3 11.11% 27 100%
Total 178 36.80% 217 45.11% 87 18.09% 482 100%

170 Appendix C
Table A9. Frequency of Communication with International ResearchAssistance Organizations (Other than IFS) by Number of Years SpentStudying Abroad
Frequency of 0 1-2 3-4 '>-9 10-20Communication Years Years Years Years Years Total
Never 34 42 47 54 7 18450.00% 39.62% 41.59% 39.13% 28.00% 40.89%
Rarely 20 35 34 42 7 13829.41% 33.10% 30.09% 30.43% 28.00% 30.67%
Annual1y 12 23 24 38 7 10417.65% 21.70% 21.24% 27.54% 28.00% 23.11%
Monthly 2 6 8 4 4 242.94% 5.66% 7.08% 2.90% 16.00% 5.33%
Total 68 106 113 138 25 450100% 100% 100% 100% 100% 100%
Table AIO. Tendency of Scientists to Work Alone or with OtherScientists by Number of Years Spent Abroad
No. ofYears With OtherSpent Abroad Scientists Alone Total
0 48 65.75% 25 34.25% 73 100%1-2 95 84.07% 18 15.93% 113 100%3-4 93 80.17% 23 19.83% 116 100%'>-9 111 73.03% 41 26.97% 152 100%10-20 20 74.07% 7 25.93% 27 100%
Total 367 76.30% 114 23.70% 481 100%

Tables 171
Table AlI. Maintenance of Professional Correspondence withForeign Scientists outside of International Scïentific Meetings byNumber of Years Spent Abroad
No.ofYearsSpent Abroad Yes No Total
0 55 74.32% 19 25.68% 74 100%1-2 91 81.98% 20 18.02% 111 100%3-4 105 88.98% 13 11.02% 118 100%5--9 136 90.07% 15 9.93% 151 100%10--20 23 88.46% 3 11.54% 26 100%
Total 410 85.42% 70 14.58% 480 100%
Table A12. Frequency of Sabbatical Leave by Number of Years SpentStudying Abroad
No.ofYears Sabbatical No SabbaticalSpent Abroad Leave Leave Total
0 6 8.22% 67 91.78% 73 100%1-2 22 19.30% 92 80.70% 114 100%3-4 41 34.75% 77 65.25% 118 100%5--9 38 25.00% 114 75.00% 152 100%10--20 5 18.52% 22 81.48% 27 100%
Total 112 23.14% 372 76.86% 484 100%
Table A13. Frequency of Job Offers Abroad by Number of YearsSpent Studying Abroad
No.ofYears Job Offers No JobSpent Abroad Abroad Offers Abroad Total
0 6 8.22% 67 91.78% 73 100%1-2 15 13.27% 98 86.73% 113 100%3-4 37 31.36% 81 68.64% 118 100%5--9 54 35.76% 97 64.24% 151 100%10--20 13 48.15% 14 51.85% 27 100%
Total 125 25.93% 357 74.07% 482 100%

172 Appendix C
Table A14. Frequency of Accepting a Job Offer by Number of YearsSpent Studying Abroad
No. of Years Offer OfferSpent Abroad Accepted Refused Total
0 0 0 6 1DO.DO% 6 lDO%1-2 3 20.DO% 12 8O.DO% 15 lDO%3-4 9 24.32% 28 75.68% 37 lDO%5-9 17 38.48% 37 68.52% 54 lDO%10-20 5 38.46% 8 61.54% 13 lDO%
Total 34 27.20% 91 72.80% 125 lDO%

References
Aguilar, J., and A. Vicente. 1987. Papel deI Estado en el desarollo de las disciplinascientificas: el caso de Costa Rica. San José: CONICIT.
Alvarez, RD. 1984. Universidad: Investigacion y productividad. Caracas: Universidad Central de Venezuela.
Arunachalam, S.1979a. "Why Is Indian Science Mediocre?"Science Today (Feb.):8-9.
---. 1979b. "Scientific Journals in India: Their Relevance to InternationalScience." Science Today (Mar. 1979): 45--50.
---. 1988. "The Links betweeen Mainstream Science and Journals on thePeriphery." Journal of Scientific and Industrial Research 47 Gune): 307-14.
Arunachalam, S. and K.c. Garg.1985. "A Small Country in a World of BigScience: A Preliminary Bibliometric Study of Science in Singapore." Scientometrics 8, no. 5-6:301-13.
Arunachalam, S., and K. Manorama. 1988. "The Status of Scientific Journals ofIndia as Seen through Science Citation Index." Journal of Scientific and Industrial Research 47 Guly): 359-67.
Arunachalam, S., and S. Markanday. 1981. "Science in the Middle-Level Countries: A Bibliometric Analysis of Scientific Journals of Australia, Canada,India, and Israel." Journal of Information Science 3:13-26.
Arvanitis, R, and Y. Chatelin. 1988. "National Scientific Strategies in TropicalSoil Sciences." Social Studies of Science 18, no. 1:113-46.
AUPELF. 1984. Répertoire des enseignants et chercheurs Africains, universités d'Afrique membres de l'AUPELF. Montreal: Bibliotheque Nationale de Québec.
Baark, E. 1986. The Context ofNational Information Systems in Developing Countries:India and China in a Comparative Perspective. Lund, Sweden: Research PolicyInstitute, University of Lund.
Bailleuil, A. 1984. "L'Université de Dakar: Institutions et fonctionnement. Il
Thèse de Doctorat d'Etat en Droit, Université de Dakar, 1984.Barel, Y., and P. Malein. 1973. "Y a-t-il une profession de chercheur?" La
Recherche, no. 39 (Nov.): 933-38.Barrere, 1986. "La science en Inde." La Recherche, no. 180 (Sep.): 1136--48.Basalla, G. 1967. "The Spread of Western Science." Science 156:611-22.Beaver, D. de B., and R Rosen. "Studies in Scientific Collaboration." Part l,
"The Professional Origins of Scientific Coauthorship." Scientometrics l, no. 1(1978): 65--84; Part II, "Scientific Coauthorship, Research Productivity andVisibility in the French Scientific Elite." Scientometrics1, no. 2, (1979a): 133-49.Part III, "Professionalization and Natural History of Modem ScientificCoauthorship." Scientometrics l, no. 3 (1979b): 231-45.

174 References
Berlinguet, L. 1980. Report on an Exploratory Study on Practical Applications of IFSProjects. Ottawa, Canada.
Bhagavan, M.R1984. Technological Transformation of Developing Countries. Stockholm, Sweden: SAREC Report No. 4.
Black, RP., et al. 1972. "Data on Scientific and Technological Potential ofThailand," Vol. II. In Report on Activities of Task on Scientific and TechnologicalPotential of Thailand. Stanford, Cal.: Stanford Research Institute.
Blickenstaff, J. and M.J. Moravcsik. 1982. "Scientific Output in the ThirdWorld." Scientometrics 4, no. 2: 135-69.
Blutstein, H.I., et al. 1981. Costa Rica: A Country Study. Washington, D.C.:American University, Foreign Area Study.
Bonnefond, P. 1987. Notes Sénégalaises. Document de travail No. 1. Paris: Départment SDU, ORSTOM.
Bonnefond, P., and Ph. Couty. 1988. "Sénégal: Passé et avenir d'une criseagricole." Tiers Monde 29, no. 114 (Apr.-June): 319-40.
Botelho, A.J. 1983. Les Scientifiques et le pouvoir au Brésil: Le Cas de la SociétéBrésilienne pour le Progrès de la Science (SBPS), 1948-1980. Mémoire de DEA.Paris: STS/CNAM.
Bourdieu, P., and J.e. Passeron. 1964. Les Héritiers. Paris: Les Editions deMinuit.
Braibant, M. 1986. "Politiques macro-économiques et performances agricolesau Sénégal, 1960-1984." Thèse de Doctorat de 3ème cycle en économie dudéveloppement, Université de Paris 1.
Braun, T., W. Glënzel, and A. Schubert. 1988. "The Newest Version of the Factsand Figures on Publication Output and Relative Citation Impact of 100 Countries, 1981-1985." Scientometrics 13, no. 5-6:181--88.
Bruer, J.T. 1984. "Women in Science: Toward Equitable Participation." ScienceTechnology and Human Values 3--7 (Summer).
Busch, L. 1988. Universities for Development: Report of the Joint Indo-U.S. Impact Evaluation of the Indian Agricultural Universities. Lexington: Univ. of Kentucky.
Busch, L., and W.B. Lacy. 1983. Science, Agriculture, and the Politics of Research.Boulder, Colo.: Westview.
Cagnin, M.A., 1985. "Patterns of Research in Chemistry in BraziI." Interciencia10:64--77.
Centre National de la Planification de la Recherche Scientifique. 1973. Analysedu potential scientifique et technique au Sénégal. Dakar: CNPRS.
Chatelin, Y., and R Arvanitis. 1985. Pratiques et politiques scientifiques. Actes duForum des 6 et 7 Février 1984. Paris: ORSTOM.-- and --. 1988a. Stratégies scientifiques et développement: Sols et agri
cultures des régions chaudes. Paris: ORSTOM.-- and --. 1988b. "National Scientific Strategies in Tropical Soi! Sci
ences." Social Studies of Science 18: 113-46.Chulalongkorn University. 1986. Research in Chulalongkorn University. Bangkok:
Office of Research Affairs.

References 175
Clozel. 1916. Circulaire au sujet de la création d'un Comité d'Etudes Historiques etScientifiques de l'AOf. Dakar, Ann. Mém. Et. Hist. et Sc. AOE
Cole, J.R, and H. Zuckerman. 1983. "Marriage, Family, and Scientific Publication: Truth and Illusion in Science." Paper presented at the Macy FoundationResearch Symposium on Women in Science, New York, Nov. 17-19.
Committee on International Migration of Talent (CIMT). 1970. InternationalMigration of High-Level Manpower. New York: Praeger.
CONICIT. 1983. Primer seminario sobre la situacion cientifica y tecnologica en CostaRica. San José.
---. 1984. Diagnostico de la investigacion en Costa Rica.CONICITIIDRC 1982. Situacion actual y caracteristicas de las actividades de inves
tigacion en Costa Rica. San Jose.Cornevin, R, and Cornevin, M. 1964. Histoire de l'Afrique. Paris: Petite Bibli
othèque.Costa Rica: A Country Case Study. 1981. Washington, D.C: GPO.Costa Rica. 1985. "Dianostico deI financiamiento externo de la Universidad de
Costa Rica." Preparado por la Unidad de Financiamiento Extemo, ViceRectoria de Investigacion, Universidad de Costa Rica. Typed.
Costa Rica. 1986. Programa nacional de ciencia y tecnologia. San José: Ministry ofScience and Technology.
Crane, D. 1972. Invisible Colleges. Chicago: Univ. of Chicago Press.CUB. 1988. Chulalongkorn University Bulletin. Bangkok.Davis, C.H. 1983. "lnstitutional Sectors of "Mainstream" Science Production in
Sub-Saharan Africa, 1970-1979: A Quantitative Analysis." Scientometrics 5,no. 3:163-75.
Davis, C.H., and T.a. Eisemon. 1989. "Mainstream and Non MainstreamScientific Literature in Four Peripheral Asian Scientific Communities." Scientometrics 15, no. 3-4:215-39.
Dedijer, S. 1958. "Windowshopping for a Research Policy." Nature (June 7):367-71.
---.1963. "Underdeveloped Science in Underdeveloped Countries." Minerva 2, no. 1:61-81.
Eisemon, T.O. 1979. "The Implantation of Science in Nigeria and Kenya."Minerva 12, no. 4:504-26.
---.1982. The Science Profession in the Third World. New York: Praeger.Eisemon, T.O., et al. 1982. "Transplantation of Science to Anglophone and
Francophone Africa."Science and Public Policy 2, no. 4.Eisemon, T.O., and CH. Davis. 1989. "Publication Strategies of Scientists in
Four Peripheral Asian Scientific Communities: Sorne Issues in the Measurement and Interpretation of Non-mainstream Science." In P.G. Altbach, et al.,Scientific Development and Higher Education: The Case of Newly IndustrializingNations. New York: Praeger.
Elliot, H. 1984. The Use of Administrative Data for Policy Analysis: Lessons from theThai Department ofAgriculture. The Hague, Netherlands: ISNAR.
Encyclopaedia Universalis. 1988. "Les Chiffres du Monde."

176 References
Eres, B.K. 1982. "Socîoeconomic Conditions Relating to the Level of Information Activity in Less Developed Countries." Ph.D. diss., Drexel University,Israel.
Eriksen, J.H., et al. 1988. Kilsetsart University in TJuliland: An Analysis of Institutional Evolution and Development Impact. A.LD. Project Impact EvaluationReport. Washington, D.C.
Fondeville (de), A. 1986. "Communication sur le financement de la recherche:'Seminar on the management of Senegalese research systems, June 23-27,Dakar.
Frame, J.D. 1985. "Problems in the Use of Literature-Based S&T Indicators inDeveloping Countries:' In Science and Technology Indicators for Development,edited by H. Morita-Lou, 117-22. Boulder, Colo.: Westview.
Frame, J.D., F. Narin, and M.P. Carpenter, 1977. "The Distribution of WorldScience." Social Studies of Science 7:501-16.
Fuenzalida, E. 1971. Investigaci6n cienUfica yestratificaci6n internacional. Santiago:Editorial Andrés Bello.
Gaillard, A.M. 1983. Couples suédois vers un autre idéal sexuel. Paris: EditionsUniversitaires.
Gaillard, J. 1979. "La Fondation Internationale pour la Science: Naissance d'uneorganisation de soutien aux jeunes chercheurs des PED." Le Progrès Scientifique no. 199-200 (Mar.-June): 55-68.
---. 1982. "Rapport de mission au Maroc pour la Foundation Internationalepour la Science." Stockholm, Sweden.
---. 1984a. Réflexion sur une expérience concrète: La Fondation Internationale pourle Science. Proceedings of "Forum Pratiques et Politiques Scientifiques," Feb.6-7. Paris: Editions de l'ORSTOM, 139-42.
---. 1984b. "Rapport de mission à Madagascar pour la Foundation Internationale pour la Science:' Stockholm, Sweden.
--. 1984c. "Les Productions Végétales:' Paper presented at the Fourth IFSGeneral Assembly, Rabat, Morocco, Oct.
---. 1985a. "L'Aide à la recherche aux jeunes chercheurs des PED et le rôlede la Fondation Internationale pour la Science." Mondes en Développement 13,no. 49:91-104.
---. 1985b. "Rapport de mission au Sénégal pour la Foundation Internationale pour la Science." Stockholm, Sweden.
---.1986. "L'Aide étrangère et le financement de la recherche dans les paysen développement, Liaison Bulletin, no. 4, Dept H. June, 7-23. Paris:ORSTOM.
--.1987. "Les Chercheurs des pays en développement." La Recherche, no.189 aune): 860-70.
---, ed. 1988. Politique, programmation, gestion de la recherche pour le développement. Paris: IIAP.
Gaillard, J. and S. Ouattar. 1988. "Purchase, Use and Maintenance of ScientificEquipment in Developing Countries." Interciencia 13, no. 2:65-70.
Gaillard, J., and R. Waast. 1988. "La Recherche scientifique en Afrique." AfriqueContemporaine, La Documentation Francaise, no. 148:3-29.

References 177
--. 1989. "Les Chercheurs et l'émergence de communautés scientifiquesnationales dans les pays en développement. H Thèse de doctorat, CNAM,Paris.
Galina, C.S., and J.M. Russel. 1987. "Research and Publishing Trends in CattleProduction in the Tropics: Part 1. A Global Analysis. H CAB International 198755, no. 10 (Oct.): 743-49.
Garfield, E. 1977, 1978, 1983. Current Contents, no. 17 (Apr. 11, 1977); no. 18 (May29, 1978); no. 23 (Aug. 15, 22, 1983).
--. 1983. "Mapping Science in the Third World. Science and Public Policy 10,no. 3 (June): 112-27.
Gillet, J.E. 1976. Analyse du potential scientifique et technique au Sénégal (1975/1976).Dakar: OGRST.
Glaser, W.A. 1978. The Brain Drain, Emigration and Return. Oxford: PergamonPress.
Gleizes, M. 1985. Un Regard sur l'ORSTOM 1943-1983. Paris: ORSTOM.Goma, L.K.H. 1968. "Sorne Obstacles to the Effective Utilization of Trained
Scientific and Technical Personnel in Developing Countries." Paper presented at the eighteenth Pugwash Conference on Science and World Affairs,Nice, France.
Gomez, L.D., and J.M. Savage. 1983. "Searchers on That Rich Coast: CostaRican Field Biology1400-1980." In Costa Rican Natural History, edited by D.H.Janzen. Chicago: Univ. of Chicago Press.
Gomez, M. B., and V.V. Bermudez. 1979. Encuesta sobre cientificos activos en CostaRica (1978): Descripcion de la metodologia y presentacion de algunos resultados. SanJose: CONICIT.
Gonzalez, L.E 1976. Historia de la influencia extranjera en el desenvolvimientoeducacional y cientifico de Costa Rica. San José: Editorial Costa Rica.
Gonzalez, o.E, and o.M. Calderon Alfaro. 1986. Perfil occupacional de los profesores exbecarios de la Universidad de Costa Rica. Sistema de Estudios dePostgrado. San Jose: UCR.
Gonzalez de Wong, M.I., and G. Macaya Trejos. 1986. Diagnostico dei regimenacademico de la Universidad de Costa Rica." San José: UCR.
Hargrove, T.R.1979/80. "Communication amongAsianRice Breeders." Journalsof Research Communication Studies 2:119--32.
Harmon, L.R. 1965. Profiles ofPh. D.s in the Sciences. Washington, D.c.: NationalAcademy of Sciences.
Herzog, JA. 1983. Career Patterns ofScientists in Peripheral Communities. ResearchPolicy 12.341-49. Amsterdam: Elsevier Science Publisher.
Honntrakul, 1. 1953. The Historical Records of the Siamese-Chinese Relations.Bangkok: Mai Bithaya Press.
Idachaba, ES. 1980. Agricultural Research Policy in Nigeria. Washington, D.C.IFPRI Research Report No. 17.
IDRC. 1982. "Resource Allocation to Agricultural Research." Proceedings of aworkshop held in Singapore, June 8-10.
IFAN. 1961. "Historique de l'Institut Français d'Afrique Noire." Notes Africaines,no. 90 (Apr). Dakar.

178 References
ILO. 1974. 1974 World Population Year: Bulletin of Labor Statistics. Geneva,Switzerland: International Labor Organization.
Ingram, J.c. 1971. The Economie Change of Thailand, 1850-1970. Stanford: Stanford Univ. Press.
ISNAR, 1981. El sistema de investigaci6n agropecuaria y transferencia de tecnologia enCosta Rica. The Hague, Netherlands.
---. 1983. La Recherche agronomique et zootechnique en Haute Volta. Rapportd'une mission, Banque MondialelFAO/ISNAR/en Haute Volta, Mar.
---. 1988. Organizational, Financial, and Human Resource Issues Facing WestAfrican Agricultural Research Systems. Working Paper No. 9. The Hague,Netherlands.
ISRA, 1987. Stratégies et programmation des recherches 1989-1993. July. Dakar.---. 1988. Bulletin analytique documentaire-année 1986. Dakar: ISRA.ITCR. Informe estadistico de los recursos humanos. Cartago, Costa Rica: Departa
mento de Recursos Humanos, 1984.Jiminiga, S. 1986. "Forces et faiblesses d'un systéme" Afrique Nouvelle (Oct.).Kamchad, M. 1982. "The Beginning of a New Scientific Climate." Bangkok Post,
Aug.18.Kamchorn, Manunapichu. 1981. "Professions in Pure Science Are Losing Popu
larity." J. Sci. Soc. Thailand 7 (1981):37--40.Kidd, C.V. 1959. "Basic Research: Description versus Definition." Science 129:
368-71.---. 1983. "The Movement of Younger Scientists Into and Out of the United
States from 1967 to 1980: Sorne Aspects of the International Movement ofScientific Knowledge." Minerva 21, no. 4:387--409.
Kolinsky, M. 1985. "The Growth of Nigerian Universities, 1948-1980." Minerva23, no. 1:29-61.
Krauskopf, M., and R. Pessot. 1983. Actividad cientffica en Chile: Publicacionesregistradas durante el perfodo 1980-1982. Archives de Biologia y Medicina Experimentales no. 16, 17-27. Santiago, Chile.
Krauskopf, M., R. Pessot, and R. Vicuna. 1986. "Science in Latin America: HowMuch and Along What Unes?" Scientometrics 10, no. 3--4:199-206.
LaCoste, Y. 1959. Les Pays sous développés. Paris: PUF, Que sais-je? no. 853.Lacy, W.B., L. Busch, and P. Marcotte. 1983. "The Sudan Agricultural Research
Corporation: Organization, Practices, and Policy Recommendations." Lexington: Univ. of Kentucky. Mimeo.
Larue, B.M. 1988. "Quelques remarques concernant une expérience de coopération." Paris: ORSTOM. Typed.
Lawani, S.M. 1977. "Citation Analysis and the Quality of Scientific Productivity." BioScience 27, no. 1:26-31.
Legay, J.M. 1981. Qui a peur de la science? Paris: Editions Sociales.Le Pair; C. 1986. Sorne Comments on the Organization of Science and Technology in
Thailand. Utrecht, Netherlands: STW.Lomnitz, L.A., M.W. Rees, and L. Cameo. 1987. "Publication and Referencing
Patterns in a Mexican Institute." Social Studies of Science 17:115-33.Maliyamkono, T.L., and S. Wells. 1980. "Effects of Training on Economic

References 179
Development: Impact Surveys on Overseas Training." ln Policy Deuelopmentsin Ouerseas Training, edited by T.L. Maliyamkono. Dar es Salaam, Tanzania:Black Star Agencies.
Martinez-Palomo, A., and H. Arechiga. 1979. "La Investigaci6n biomédiea enMéxieo. 1: La investigaci6n basica." Gaceta Médiea de Méxieo, no. 115:65-70.
Medawar, P.B.1967. The Art of the Soluble. London: Methuen.Mingsarn, S. 1981. Technology Transfer. Singapore University Press.Monge, C 1975. La educaci6n superior en Costa Rica. San José, Costa Rica:
Consejo Nacional de Rectores, Oficina de Planificacion de la EducacionSuperior.
Moravcsik, M.J. 1976. Science Deuelopment-The Building of Science in Less Deueloped Countries, 2d ed. Bloomington, Ind.: PASITAM.
---. 1979. "Local Institutions for the Building of Science and Technology inDeveloping Countries." Paper prepared for a workshop organized by theAmerican Association for the Advancement of Science, Washington, D.C,Apr.
---. 1985a. "Science in the Developing Countries: An Unexplored andFruitful Area for Research in Science Studies." Journal of the Society for SocialStudies of Science 3, no. 3:2-13.
---. 1985b. "Relevance: An Analysis Illustrated on Science Education in theThird World." Interciencia 10, no. 1:9-14.
---. ed. 1985c. Strengthening the Couerage of Third World Science: The Bibliographie Indicators of the Third World's Contribution to Science." Deliberations, Conclusions, and Initiatives of an Ad Hoc International Task Force forAssessing the Scientific Output of the Third World. Philadelphia, Penn., JuI.
Moravcsik, M.J., and S.G. Gibson. 1979. "The Dynamics of Scientifie Manpower and Output." Research Policy 8:26-46. Amsterdam: Elsevier SciencePublishers.
Morel, C.M., and R. L.M. Morel. 1978. "Estudo sobre a producao cientificabrasileira segundo os datos do Institute for Scientifie Information (ISI): Umnovo instrumento para a analise de ciência brasileira." Ciência da Informaçao,no. 7 79--83, Rio de Janeiro.
MOSTE. 1981. Report on Scientific and Technical Manpower Survey. Bangkok. InThaL
---. 1983. Scientific and Technical Manpower and R&D in the Priuate Sector.Bangkok.
---. 1987. The White Book on Science and Technology in Thailand. Bangkok. InThaL
MRST. 1981. "Enquête-inventaire du potential scientifique et technique au Sénégal." Survey conducted by the Ministry of Technical and Scientific Research.
MRST. 1984. Le Centre National de Recherches Agronomiques de Bambey. Bambey,Senegal.
Muscat, R.J. 1%6. Deuelopment Strategy in Thailand. New York: Praeger.National Science Foundation. 1981. Science and Engineering Doctorates: 1960-1981.
NSF 83-309. Washington, D.C: GPo.---. 1984. Women and Minorities in Science and Engineering. Washington, D.C.

180 References
Nations Unies. 1980. Programme d'action de Vienne pour la science et pour latechnique au service du développement. New York.
Ndiaye, G.H. 1986. MLes Composantes extérieures des politiques de recherche:Articulation du niveau national, régional, international: l'Exemple du Sénégal." Paper presented at the seminar on "Les Choix Stratéguiques d'unePolitique de Recherche pour le Développement," IIAP, Paris, Sept. 22-26.
NESDB. 1981. Framwork for Future Science and Technology Development Plans.Bangkok: Technology and Environment Planning Division.
Niang, S.M. 1987. Africanisation totale du personnel dans trois ans." Le Soleil,Dakar, Senegal, Jan. 4.
NRC. 1979. Survey on University Graduate Manpower in Thailand. Bangkok.NRClMOSTE. 1987. Directory ofForeign Researchers' Research Projects in Thailand.
Bangkok.ONEC. 1973. Education Report, Institutions of Higher Education in Thailand.
Bangkok: Office of the National Education Commission.Oram, P. 1985. MDonor Assistance to Agricultural Research: A ProposaI for
Information Exchange." Unpublished.Oram, P., and V. Bindlish. 1981. Resource Allocations to National Agricuitural
Research: Trends in the 1970s. The Hague, Netherlands: ISNARlIFPRI, Nov.Packer, J.S., and w.P. Murdoch. 1974. "Publication of Scientific Papers in the
Journals of the Entomological Society of America: an Eleven Year Review."Bull. Entomol. Soc. Am., no. 20:249-53.
Pairor, Thipayasana. 1982. The Deve10pment of Science in Thailand. In ThaLPaye, L. 1959. Livret de l'Etudiant 1959...{j0. Senegal: Université de Dakar.Pernetta, J.c., and L. Hill. 1984. "The Role of Indigenous Professional and
Scientific Organisations in the Development of the Pacifie Region." In Proceedings of 1984 Waigani Seminar, University of Papua New Guinea.
Perrin, J. 1983. Les transferts de technologie. Paris: Editions la Découverte.Porges, L. Sources d'information sur l'Afrique Noire Francophone et Madagascar.
Paris: La Documentation Française.Price, D.J. de Solla.1963. Little Science, Big Science. New York: Columbia Univer
sity Press.Priee, D.J. de Solla, and D. de B. Beaver. 1966. "Collaboration in an Invisible
College." American Psychologist 21:1011-18.Priee, D.J. de Solla, and S. Gursay. 1975. "Sorne Statistical Results for the
Numbers of Authors in the States of the United States and the Nations of theWorld." Preface to Who Is Publishing in Science? Philadelphia: Institute ofScientific Information.
Rabkin, Y., and H. Inhaber.1979. "Science on the Periphery: A Citation Study ofThree Less Developed Counrnes." Scientometrics: 261-74.
Raj, K. 1986. "Hermeneutics and Cross-Cultural Communication in Science:The Reception of Western Scientifie Ideas in 19th Century India." CNRSRevue de Synthèse, Paris, 4, no. 1-2 Gan.-June):107-20.
Ramirez, M.A. 1987. Requerimientos de estudios de postgrado en Costa Rica, CONOC/T. San José.

References 181
RqJOrt by the Committee ofVice-Chancellors ofAustralian Universities on the Situationin the University of the Pacifie South (UPS). 1983. Canberra.
Richard, J. 1988. "Compte rendu de mission au Sénégal du 13 au 17 Mars 1988."Paris: Ministère de la Coopération. Typed.
Roche, M. 1966. "Aspects sociaux du progrès scientifique dans un pays en voiede développement." IMPACT, Science et Société 16, no. 1:53-63.
---.1976. "Early History of Science in Spanish America." Science194:806-1O.---. 1983. Interview with E. Mayz Vallenilla. "lAbolir la investigaci6n en la
universidad?" Interciencia 8.---. 1986. "lHa contribuido la ciencia al desarollo?" Interciencia 11, no. 5:
216-20.---. 1987. "The Establishment of a Scientific Community in Developing
Countries." Paper presented at the Second General Assembly of the ThirdWorld Academy of Science, Beijing, Sept. 1~18.
Roche, M., and Y. Freites. 1982. "Producci6n y flujo de informaci6n cientffica enun pais periférico Americano (Venezuela) "Interciencia 7, no. 5:279-90.
Rodriguez-Sala de Gomez Gil, M.L., et al. 1970. El cientifico en México. Cuader-nos de Investigaci6n Social, No. 2. Mexico City: Free University of Mexico.
Rossi, G. 1973. "La science des pauvres" La Recherche, no. 30:7-15.Rouille D'Orfeuîl, H. 1987. La Tiers Monde. Paris: Editions La Découverte.Ruellan, A. 1988. "La recherche scientifique: facteur de développement." Le
Monde Diplomatique, Aug., 24.Russel, J.M., et al. 1987. "Research and Publication Trends of a Latin American
University." Interciencia 12:243-44.---. 1981. "La universidad y el desarollo de la ciencia y tecnologia. In
Ciencia, Technologfa y Desarollo Latinoamericano, edited by E Sagasti, 195-208.México: El Trimestre Econ6micoIFondo de Cultura Economica.
Sagasti, E, G. Oldham, G. V. Pisit, and P. Thiongane. 1983. Evaluation of theInternational Foundation for Science (197~1981): Final Report. Stockholm: IFS.
Salam, A. 1966. "The Isolation of the Scientist in Developing Countries." Minerva 4, no. 4:461-65.
Salomon, J.J. 1970. Science et politique. Paris: Editions du Seuil.---.1984. "La science ne garantit pas le développement." Futuribles aune):
37-68.---. 1986. "Science technologie et développement: Le Problème des pri
orités." Tiers Monde 27, no. 105 aan.-Mar.): 213-22.Salomon, J.J., and A. Lebeau. 1988. I.:Ecrivain public et l'ordinateur: Mirages du
développement. Paris: Hachette.Sanga, S., and Y. Yongyuth. 1984. "The Status and Quantitative Policy Targets of
Science and Technology in Thailand." ASEAN Journal on Science and Technology for Development 1, no. 1:11~24. Singapore.
Santelices, B. Problemas para hacer investigacion en Chile: Una vision personal.Santiago: Revista Chilena de Historia Natural. In press.
Sasson, A. 1986. Quelles biotechnologies pour le Tiers-Monde? Paris: Biofutur/UNESCO.

182 References
Schoijet, M. 1979. "The Condition of Mexican Science." Minerva 12, no. 3:381-412.
Schwartzman, S. 1978. "Struggling to Be Born: The Scientific Community inBrazil." Minerva 16, no. 4:545--80.
---. 1986. "Coming Full Cirele: A Reappraisal of University Research inLatin America." Minerva 24, 4 (Winter): 456-75.
Sène, D. 1985. Etude de l'impact de la recherche agronomique sur le développementagricole au Sénégal. Paris: CIRAD.
Shenhav, Y.A., and D.H. Kamens. "The 'Cost' of Institutional Isomorphism."To be published in Education and the Modern World, edited by D.H. Kamens.London: Falmer Press.
Shiva, V., and J. Bandyopadhyay. 1980. "The Large and Fragile Community ofScientists in India." Minerva 18, no. 4:575-94.
Silo, 1983. Sénégal. Cahier d'Information No. 4. Paris: SILO, May.Sirilli, G. 1986. The Researcher in Italy: A Profession in Search of Recognition,
Research Policy No. 15:329-37. Amsterdam: Elsenier Science Publishers.Soberon, G., and R. Mendoza de Flores. 1985. La investigaci6n y la universidad.
Revista de la Universidad Aut6noma de México.SOU. 1973. Forskning for utveckling (Research for Development). Stockholm:
Statens Offentliga Utredningar 1973:41.--. 1983. Om hiilften vore kvinnor (If Half Were Women). Stockholm, Swe
den: Lieberfôrlag.Stepan, N. 1976. Beginnings of Brazilian Science. New York: Science History
Publications.Surajit Sinka. 1970. Indian Scientists: The Socio-Cultural and Organizational Context
of Their Profession in Science Technology and Culture. New Delhi, India: IndiaInternational Center.
Sylla, Y.1986. "La situation de la recherche au Sénégaletle statut du chercheur."Lecture given at the Teachers' Training School, Dakar, Senegal.
TDRI. 1986. A Computer Model for Resource Data Base. Second Progress Report.Bangkok, Thailand: TDRL
Thailand. National Statistics Office, Office of the Prime Minister. School andTeacher Census, 1967 and 1968. Final Report, Bangkok.
Thailand. Office of the Prime Minister. 1984. Thailand in the 80s. Thailand:National Identity Office.
Thai Life. 1985. "King Mongkut, the Father of Thai Science." Science and Technology in Transition 3, no. 2.
Thong, Saw Pak. 1968. "Malaysia: Problems of Science and Technology inMalaysia." Conference of Commonwealth Scientists, Royal Society, London.
Todaro, M.P.1977. Economie Development in the Third World. London: Longman.Tripier, P. 1984. "Approches sociologuiques du marché du travail: Essai de
sociologie de la sociologie (du travail). "Thèse de doctorat d'Etat, UniversitéParis VII.
"Tropical Animal Production for Rural Development." 1988. A proposai toestablish a computerized research journal to promote communication

References 183
among scientists and decision makers concerned with rural development inthe Third World. Buga, Columbia: Instituto Mayor Campesino.
Turner, W.A. 1984. "Quelques questions à propos des études bibliométriques."In Pratiques et Politiques Scientifiques, edited by Y. Chatelin and R. Arvanitis.Paris: ORSTOM.
UCR. 1985a. Recursos de infraestructura en la Universidad de Costa Rica.San José.---. 1985b. La producci6n de la investigaci6n en la Universidad de Costa Rica. San
José.---. 1985c. Las caracteristicas dei personal docente en la Universidad de Costa Rica.
San José.UNESCO, 1971a. Science Jar Development. Paris.---. 1971b. Scientists Abroad: A Study of the International Movement ofPersons in
Science and Technology. Paris.--. 1985a. Statistical Yearbook. Paris.---. 1985b. Science and Technology in Countries of Asia and the Pacifie, No. 52.
Paris.UNESCOlMinistry ofEducation/Science Society of Thailand. 1987. Five Years of
Thailand's Youth Science Week (1982-1986).UNESCO/PNUD. 1985. Inventaire du potentiel scientifique et technologique de la
communauté.United Nations Vienna Program ofAction Jar Science and Technology for Development.
1980. New York.Velho, L. 1985. "Science on the Periphery: A Study of the Agricultural Scientific
Community in Brazilian Universities." Ph.D. Thesis, SPRU, Univ. of Sussex.--. 1986. "The Meaning of Citation in the Context of a Scientifically Pe
ripheral Country." Scientometrics 9, no. 1-2:71--89.Vessuri, H. 1985. "The Search for a Scientific Community in Venezuela: From
Isolation to Applied Research." Minerva 22, no. 2:196-235.---.1986. "The Universities, Scientific Research and the National Interest in
Latin America." Minerva 24, no. 1:1-38.Weiss,P. 1960. "Knowledge: A Growth Process." Science 131:1716-19.World Bank: 1986. Report on World Development. Washington, D.C.Yuthavong, Y. 1979. "Cultural Factors in the Application of Science and Tech-
nology for Development." Journal of the Science Society of Thailand 5:55.---. 1986. "BibliometricIndicators ofScientific Activities in Thailand." Scien
tometrics 9, no. 3-4:139-43.Zahlan, A.B. 1970. "Science in the Arab Middle East." Minerva 8, no. 1:8--35.Zuckerman, H. 1978. "Theory Choice and Problem Choice in Science:' So
ciological Inquiry 48, no. 3-4:65-95.

Afghanistan, 10Africa: IFS grantees in, 8, 11, 12, 13;
women scientists in, 20; highereducation in, 25; education of scientistsin, 27, 29, 30, 145-46; salaries ofscientists in, 40; research topies in, 48;R&D as percentage of GNP in, 61, 62;technicians in, 70; sabbaticalleaves in,80; mainstream scientifie output of, 85,86; publications by IFS grantees in,89-90, 93; access to current publicationsin, 97; productivity of scientists in, 98,145-46; recognition of scientists from,99; implementation of research resultsin, 101; social status of scientists in, 1400See a/50 names of individua/ countries
Agricultural Research Corpo (ARC),Sudanese,27
Aigeria, 26applied research, 58-60, 100-103Arab states: R&D as percentage of GNP
in, 61; laboratory equipment in, 690 Seea/50 Middle East
Argentina: development of science in, 11;industrial research capacity of, 15;education of scientists in, 28; scientifiepublications in, 83; mainstreamscientifie output of, 87; as newlyindustrialized country, 108; foreignstudents in, 129, 130
Arunachalam, So, 87, %Arvanitis, R., 88Asia: IFS grantees in, 11, 12, 13; women
scientists in, 20, 21; higher educationin, 25; education of scientists in, 27, 29,30; research topies in, 48; R&D aspercentage of GNP in, 61, 62;technicians in, 70; internationalconferences in, 79; scientifie criticismin, 83-84, 138; mainstream scientifieoutput of, 85; publications by IFSgrantees in, 89-90, 92; local languageuse in, 94; productivity of scientists in,98, 104; recognition of scientists from,99; irnplementation of research resultsin, 101; newly industrialized countriesin, 121; R&D funding in, 121; socialstatus of scientists in, 1400 See a/50names of individua/ countries
Index
Association des Universités Partiellementou Entièrement de Langue Française(AUPELF), 119
Auger, Paul, 5Australia: funding for IFS from, 8;
foreign students in, 26, 30, 31, 32;sabbaticalleaves in, 81
awards, and scientifie recognition, 98-99
Basalla, Go, 75basie research, 58-60Beaver, Do de Bo, 91Belgium: funding for IFS from, 8, 58;
foreign students in , 26Benin, 10Berlinguet, L., 102Best Scientist of the Year, Mahidol
University, Thailand, 99Best Woman Scientist of the Year, Sri
Lanka, 99Board on Science and Technology for
International Development (BOSTID),103, 143
Bolivia, 10Botswana, 10Bourdieu, Po, 19Braun, To, 85Brazil: technological mobilization of,
xvii; development of science in, 2, 11,108; industrial research capacity of,15; higher education in, 25-26,141; education of scientists in, 28,145; aquaculture in, 51; researchand development in, 62; scientificpublications in, 75, 83; citation patternsin, 84, 98, 148; mainstream scientificoutput of, 85, 87, 105 n 5; number ofscientists in, 118; foreign studentsin, 130; productivity of scientists in,131; foreign aid for scientists in,144
Brazilian National Agricultural ResearchInstitute (EMBRAPA), 145
Brohult, Sven, 5, 6Burkina Faso: women scientists in, 21;
funding of R&D in, 62, 143Busch, Lawrence, 10, 27, 45, 46, 60, 77,
89

Cameroon, 62Canada: fun ding for IFS from, 6, 8;
foreign students in, 26, 30, 31;sabbaticalleaves in, 81
Carpenter, M.P., 2, 85CENRADERU (National Center for
Research Applied to RuralDevelopment), 26
Central American Common Market, 109Centre de recherches pédologiques,
Senegal, 114Chatelin, Y., 88Chevillotte, Hervé, 10Chiang Mai University, Thailand, 125Chile, 30, 87China, People's Republic of: aquaculture
in, 51; national scientific publicationsin, 75; mainstream scientific output of,85; national scientific community in,108
Chulalongkorn (king of Thailand), 114CIRCE (Interregional Center for
Electronic Computation), 10College of Agriculture, University of the
Philippines at Los Banos (UPLB), 51Colombia, 108, 149Conference of Ministers Responsible for
the Application of Science andTechnology to Development in Africa(CASTAFRICA), 149
conferences, national and international,78-80,149
Congo, 48-49CONlCrr (national research council),
Costa Rica, 117, 129consultancy work, 42-43Consultative Group for International
Agricultural Research (CGIAR), 143Costa Rica: research topies in, 44-45;
laboratory equipment in, 69;description of, 108, 109; mainstreamscientific output of, 108, 131; economyof, 109; as newly industrialized country,109, 112; regional disparities in, 112;national scientific community in, 112-13,140; higher education in, 113, 114-16,129-30; colonialism in andwestemization of, 113; unemploymentamong intellectuals in, 116; sciencepolicy-making bodies in, 116-18;number of scientists in, 118-22; fundingfor R&D in, 120-21, 133-34, 146; fields ofresearch favored in, 122; dependenceon expatriate scientists in, 124; wbmenin research and higher education in,126; reliance on research training
Index 185
abroad, 129-30; productivity ofscientists in, 130-32; scientificpublications in, 131; social status ofscientists in, 132
Council for Mutual Economic Assistance(COMECON), 5, 26
Cuba: foreign students in, 26, 129;research topies in, 44; availability ofscientific publications in, 73;mainstream scientific output of, 108
Dakar School of Medicine, Senegal, 114Davis, C.H., 14,15, 86, 88, 94Dedijer, Stevan, 3Department for Scientific and Technical
Affairs (DASl), Senegal, 116-17development, 58-60Diop, Cheikh Anta, 139
education, higher: in DCs, xvi, 24-34passim, 141-42, 144-47; andscholarships, 38-39, 44, 129-30, 141;opportunities for, 39-40; importanceof, in newly independent countries,140
Egypt: education of scientists in, 28;technicians in, 70; national scientifiepublications in, 75; mainstreamscientific output of, 85; highereducation in, 141
Eisemon, T.O., 2, 20, 36, 37, 68, 88, 94English-Ianguage publications, 93, 104Eres, B.K., 73Europe: R&D as percentage of GNP in,
61; publications by scientists in, 90;foreign students in, 127, 141. See a/50names of individua/ countries
FAO (United Nations Food andAgriculture Organization), 12
Fassin, E., 139Fiji, 62-63First National Prize for S&T Research,
Congo, 99Frame, J.O., 2, 84, 85France: funding for IFS from, 8; IFS
grantees studying in, 10; foreignstudents in, 26, 30, 31, 97, 127, 129, 130,142; higher education in, 29, 33;technicians in, 70; employment forforeign scientists in, 81; sabbaticalleaves in, 81; publications by scientistsin, 90; characteristies of, 108;investrnent in Senegal by, 133

186 Index
Garfield, Eugene, 1, 15, B5, 92German Appropriate Technology
Exchange (GATE), 143Germany, Federal Republic of: funding
for IFS from, B; foreign students in, 26,32,33,129; technicians in, 70; sabbaticalleaves in, BI; investment in foreignR&D by, 143
Ghana: salaries of scientists in, 43;second jobs held by scientists in, 43;mainstream scientific output of, B6
Gibson, S.G., xivGillet, J.E., 122Glënzel, W., B5Gold Medal of the Pakistan Academy of
Science, 99Great Britain: IFS grantees studying in,
10, 33; foreign students in, 26, 30, 31,32, 97, 130; aquaculture in, 51;sabbaticaI leaves in, BI; impact ofpublications in, 105 n 2
Guatemala, 113, 129Guinness Prize of Scientifie Merit for
Development, 99
Hargrove, T.R., 75Helmintosporium maydis (maize fungus),
147Hong Kong, 85, lOBHooker Award, Indian Agricultural
Research Institute, 99Houssay, Bernard, 16, 36
IBPGRlFAO Prize, 99IFS. See International Foundation for
ScienceIndia: productivity of scientists in, 1, 131;
number of scientists in, 2; IFS granteesin, B, 2B-29, 37; industrial researchcapacity of, 15; higher education in, 25,2B, 30, 141, 145; foreign students in, 33,129, 130; social status of researchscientists in, 37, 140; job security in, 38;salaries of scientists in, 41; second jobsheld by scientists in, 42; research topiesin, 44; research and development in,62; national scientifie publications in,75, B3, B7; mainstream scientific outputof, B5, B7; national scientifie communityin, lOB
Indonesia: salaries of scientists in, 43;technicians in, 70; scientifie criticism in,84; local language use in, 94
Institut Agronomique et VétérinaireHassan II (IAV), 33, 52, 142
institute for agricultural research (ITA),Senegal, 123-24
Institute for Scientific Information (ISI),1, 14, B2-B3
Institute of Chemistry, University ofKarachi, Pakistan, 52
Institut Français d'Afrique Noire (IFAN),114
Institut Français de RechercheScientifique pour le Développement enCoopération (ORSTOM), 2, 9, 84, 122,123-24
Instituto Mayor Campesino, Colombia,14B
Institut Pasteur, Senegal, 114, 123-24Institut Sénégalais de Recherche
Agronomique (ISRA), 21, 120, 123-24,127, 131
intellectual stimulation, of science, 37Interagency Development Research
Information System (IDRIS), 143Inter-American Development Bank, 109International Development Research
Centre (IDRC), Canada, B, 103, 143International Foundation for Science
(IFS): grants from, 4, 6-8; creation of, 5;membership of, 6; objectives of, 6;Sponsors Committee, 6; budget of, 8;impact of support on grantees, 9, 64,67-68, 99-100; research fields of, 9, 12,13-15,21-22,89; workshops andconferences sponsored by, 9, 79; andquestionnaire survey of grantees, 9-16,8B-B9, 153-64; General Assembly,Fourth (1984), 10; official languages of,11; and purchase of laboratoryequipment, 69-70
International Serviee for NationalAgricultural Research (ISNAR), 21, 62,125, 146
Interregional Center for ElectronicComputation (CIRCE), 10
Iran, 85Ivory Coast: mainstream scientific
output of, 86, lOB; foreign students in,130; intelligentsia in, 139
Jamaiea, 141Japan: development of science in, xiv,
151; foreign students in, 32, 129;sabbaticalleaves in, 81; publications byscientists in, 90; investment inThailand by, 111-12
job security, 37-38
Kenya: development of science in, 2;

background of scientists in, 20;education of scientists in, 27; socialstatus of research scientists in, 36-37;laboratory equipment in, 68;mainstream scientific output of, 86
Kidd, Charles, 81King Baudouin Foundation, 58Korea, Republic of: technological
mobilization of, xvii; industrial researchcapacity of, 15; women scientists in, 21
Krauskopf, M.R., 87
Lacy, W.B., 27, 46, 60, 77, 89Lagos Plan (1964), xiiiLatin America: IFS grantees in, 8, 10-11,
13; women scientists in, 20; highereducation in, 25; education of scientistsin, 27, 145; salaries of scientists in, 41;research tapies in, 48; R&O aspercentage of GNP in, 61, 62; sabbaticalleaves in, 80; mainstream scientificouput of, 85, 87; publications by IFSgrantees in, 89-90, 93; productivity ofscientists in, 98; recognition ofscientists from, 99; implementation ofresearch results in, 101; social scienceresearch in, 121. See a/so names ofindividua/ coun/ries
Lawani, S.M., 84least developed countries (LOC), 107Lebanon,85Lesotho, 62, 143Liberia, 10
Madagascar: education of scientists in,26-27; laboratory equipment in, 68-69;availability of scientific publications in,73
Maha Chakri Sirindhorn (princess ofThailand), 140
mainstream science, 82, 85-89, 104Malaysia: education of scientists in, 29;
salaries of scientists in, 41; sabbaticalleaves in, 80; mainstream scientifieoutput of, 88, 105 n 4; date ofreferences in publications in, 97
Mali: job security in, 38; funding of R&Oin, 62, 143
Marcotte, P., 27Markanday, S., 96Marshak, Robert, 5Medawar, P.B., 44Men of Science in Africa, First
Conference of (1987), 149Mexico: development of science in, 2, 11;
industrial research capacity of, 15;
Index 187
technicians in, 70; scientificpublications in, 83; mainstreamscientific output of, 85, 87,88; impact ofpublications in, 105 n 2; as newlyindustrialized country, 108; foreignstudents in, 130; higher education in,141
Middle East: laboratory equipment in,69; mainstream scientific output of, 85.See a/50 Arab states; names of individualcoun/ries
Ministry of Science and Technology(MYCIT), Costa Rica, 116-17
Ministry of Science, Technology, andEnergy (MOSTE), Thailand, 116-17
Ministry of Scientific and TechnicalResearch (MRST), Senegal, 116-17, 132
Mongkut (king of Thailand), 139Moravcsik, M.]., xiv, 1, 76Morocco: women scientists in, 21;
education of scientists in, 33; socialstatus of research scientists in, 36;second jobs held by scientists in, 42;foreign students in, 130
Masse, Barbara, 44Mozambique, 62, 143
Narin, F., 2, 85National Agricultural Research System
(NARS), West Africa, 146National Center for Research Applied ta
Rural Oevelopment (CENRAOERU), 26National Center for Scientific Research
(CNRS), France, 10, 105 n 6National Council for Scientific and
Technical Oevelopment (CNOCf),Brazil, 26
National research council (CONICIT),Costa Rica, 117, 129
National Research Council (NRC),Thailand, 117
National Science Foundation (NSF),United States, 59
national scientific communities: raIe ofnational journals in, 75, 94; integrationinto international scientific community,137-38; in opposition ta traditionalcultural identities, 138; emergence of,138-41, 151-52; need for at-home highereducation in, 141-42; funding of, 142-44;communication within, 147-49; regionalcooperation within, 149-50; andnational policies, 150-51
Netherlands: funding for IFS from, 8;impact of publications in, 105 n 2;investment in foreign R&O by, 143

188 Index
Netherlands Universities Foundation forInternational Cooperation (NUFFIC),143
newly industrialized countries (NICs),xiv, 107
Nicaragua, 113Niger, 15Nigeria: development of science in, 2;
funding for IFS from, 8; background ofscientists in, 20; education of scientistsin, 27, 28, 39; salaries of scientists in,41; aquaculture in, 51; laboratoryequipment in, 68; employment forforeign scientists in, 81; citationpatterns in, 84; mainstream scientificoutput of, 85, 86; number of scientistsin, 118, 146; productivity of scientists in,131; higher education in, 141
North America: R&D as percentage ofGNP in, 61. See a/50 Canada; UnitedStates
Dceania, R&D as percentage of GNP in,61
oil exporting countries, 107Dram, P., 142Drganization for Economic Co-operation
and Development (DECO), 1, 5, 85, 121,133, 134, 146
DRSTDM (Institut Français de RechercheScientifique pour le Développement enCoopération), 2, 9, 84, 122, 123-24
Dutstanding Young Scientist's Award,Philippines, 99
Pakistan, 28, 30Pasteur, Louis, 58Perrin, Jean, xiv, 35Peru, 43Pessot, R., 87Philippines: women scientists in, 21;
education of scientists in, 32, 39-40;foreign students in, 32, 129, 130;aquaculture in, 51; technicians in, 70;national scientific publications in, 75;higher education in, 141
Picado, Clodomiro, 139Priee, Dereck J. de Solla, 1, 91prizes, scientific, 98-99Psophocarpus tetraqon%bus (winged
bean), 66-67publications: available in Des, 73-75;
importance of, 74-75; as measure ofscientific productivity, 82; genderdifferences in, 90; joint authorship of,
91-93; languages of, 93-94, 104; analysisof references in, 94-98, 104
Pugwash group, 5
Raj, Kapil, 37, 140Raman, C.V., 36research and development (R&D),
percentage of GNP devoted to, xiii, xivxv, 61-62
Revelle, Roger, 5Roche, Marcel, 35-36Romania, 26Rosen, R., 91Rwanda, 10
Salam, Abdus, 5, 76Salén Foundation, 6Salomon, J.J., xviSaudi Arabia, 85Schubert, A., 85science: origins of, 112; recognition as a
field, 139-40Science Academy Medal for Young
Scientists, India, 99Science Citation Index (SCI), 82, 83, 84,
88, 104scientists, in DCs: need for, xiü-xvi;
productivity of, 1, 82-85, 89-98, 104;numbers of, 2-3, 118-22; isolation of, 3,75-76, 104, 170; as intellectual dass, 4,17; educational backgrounds of, 8, 10,24-34, 119-20; gender of, 8, 10, 20-22, 90,125-26; origins of, 17-20; social status of,19,36, 38, 132-33; number of childrenof, 22, 166, 167; marital status of, 22-24,166; as teachers, 35, 43, 52-53, 56,59-60,99-100; choosing research as aprofession, 35-40; parental influenceon, 38; salaries of, 40-44; second jobsheld by, 42-44, 145; equipment availablefor, 44-45, 68-73, 99-100,137; researchtopics selected by, 44-51, 121-22, 168;funding for, 45, 61-68, 133-34, 142-44;influence of superiors on, 47, 168; selfreliance of, 47-48; institutional contextsof, 51-55, 144-47; as administrators, 53,57-58; employment status of, 53-55,56-57; research time allotted to, 56-61,169; research publications available to,73-75, 76, 97; communication between,75-81, 134-35, 147-49, 170, 171; sabbaticalleaves for, 80-81, 171; foreign job offersfor, 81, 141, 170-71; relationship tomainstream science, 85-89; recognitionfor, 98-99; and implementation ofresearch results, 100-105; need for

regional cooperation between, 134-35;governmental control of, 140
Senegal: women scientists in 21 125126; research topies in 51 U1-:U' 'funding of R&D in, 62, 121, 133-34, 142,143, 146; mainstream scientifie outputof, 86,105 n 6,108-9,131; Englishlanguage use in, 93; description of, 108,109-11; as newly industrialized country,110, 112; economy of, 110-11; regionaldisparities in, 112; national scientifiecomm';1nity in, 112-13, 140; highereducation ID, 113, 114, 127; colonialismin and westemization of, 113-14;unemployment among intellectuals in116; science policy-making bodies in, '116-18; number of scientists in, 118-22;educational background of teachers in,120; dependence on expatriate scientistsin, 122-24; reliance on research trainingabroad, 127, 130; productivity ofscientists in, 130-32; scientificpublications in, 131, 148; social status ofscientists in, 132-33
Singapore: bibliometric study ofmainstream science in, 1, 97;mainstream scientifie output of 88 108'English language use in, 94; as'ne~ly ,industrialized country, 108
social advancement, 19social utility, of science, 37, 45Southeast Asia: IFS grantees in, 8, 12. See
a/50 names of individua/ countriesSoutheast Asian Fisheries Development
Center (SEAFDEC), 52South Korea: scientific publications in,
83; mainstream scientifie output of, 85,88; local language use in, 94; date ofreferences in publications in, 97; asn~wly i~dustrialized country, 108
Soviet Umon: foreign students in 26 32'R&D as percentage of GNP in, 61' ,
Spain, 26, 81Special Program for African Agricultural
Research (SPAAR), 143, 150Sri Lanka: women scientists in, 21;
education of scientists in, 32; salaries ofscientists in, 43
"Strengthening the Coverage of ThirdWorld Science," 83
Sudan: women scientists in 21'education of scientists in, 27; fundingofR&D in, 62
Swaziland, 10, 62, 143Sweden: funding for IFS from, 6, 8;
women scientists in, 20; foreign
Index 189
students in, 26, 33; technicians in 70'investment in foreign R&D by, 143 '
Swedish Agency for ResearchCooperation with DevelopingCountries (SAREC), 8, 143
Switz~rland: funding for IFS from, 8;forelgn students in, 33
Taiwan: scientific publications in, 83;mainstream scientific output of, 88; asnewly industrialized country, 108
Tamil Nadu Agricultural University atCoimbatore, India, 51
Tanzania: women scientists in, 21;mainstream scientific output of, 86
teachers, scientists as, 35, 43, 52-53, 56,59-60, 99-100
technicians, 70-72Thailand: women scientists in, 21, 125-26;
education of scientists in, 29, 32;research topies in, 48, 121-22; scientificpublications in, 83, 131; mainstreamscientifie output of, 88, 105 n 4, 108, 131;local language use in, 94; date ofreferences in publications in, 97;description of, 108, 111-12; as newlyindustrialized country, 111, 112;economyof, 111-12; regional disparities~n, 112; national scientific communityID, 112-13,140; colonialism in andwester.ni~tionof, 113,114; highereducation ID, 114-16, 127-29; sciencepolicy-making bodies in, 116-18;number of scientists in, 118-22; fundingof R&D in, 120, 121, 133-34, 142, 146;dependen~e on expatriate scientists in,124-25; reliance on research traininga~roa?, 1~7-29, 130; productivityofsaentists ID, 131-32; social status ofscientists in, 132, 140
Third World Academy of ScienceFellows,99
Tonga, 10Trinidad, 10Tripier, P., 139Tunisia,21Turkey,10
Uganda,86United Arab Republic, 69United Nations Conference on Science
and Technology for Development(1979), xiii, 1
United Nations Conference on Trade andDevelopment (UNCTAD), 107

1190 Index
United Nations Development Program,134
United Nations Educational, Scientificand Cultural Organization (UNESCO),xiii, 1, 5, 129, 134; Statistical Yearbook(1985), xiv, 11, 14-15, 61-62, 70
United Nations Food and AgricultureOrganization (FAO), 12
United Nations University Prize, 99United States: development of science
in, xiv, 151; funding for IFS from, 8; IFSgrantees studying in, 10; womenscientists in, 20; foreign students in,25,26, 30, 31, 32, 33, 39, 97, 127, 129,130, 141; selection of research topics in,46-47; aquaculture in, 51; research anddevelopment in, 60; contact betweenscientists in, 77; sabbaticalleaves in,80-81; employment for foreignscientists in, 81; publication rate ofscientists in, 89; productivity of, 101;impact of publications in, 105 n 2;characteristics of, 108; investment inforeign R&D by, 112, 133, 134, 143
United States Agency for InternationalDevelopment (U.S. Aid), 8, 39, 40, 103,129, 134
United States Congress Joint EconomicCommittee, 101
Universidad Autonama de Mexico, 70Universidad Nacional du Costa Rica,
funding of R&D at 63,69,134;established, 114; educational
background of teachers at, 120; womenin research at, 126; scholarships at,129-30; salaries at, 132
University of Chulalongkorn, Thailand,114, 125, 128, 134
University of Dakar, Senegal, 114, 115-16,126, 127, 134
University of Pacific South (UPS), Fiji,62-63
University of San Carlos, Guatemala, 113University of San Ramos de Leon,
Nicaragua, 113University of Santo Tomas, Costa Rica,
113, 114USSR. See Soviet Union
Velho, Lea, 95, 97, 148Venezuela: development of science in,
11, 35; status of research scientists in,36; mainstream scientific output of, 87
Vicuna, R., 87
Weiss, P., 96Western Samoa, 10World Bank, 6,12,107,109,134,143
Yuthavong, Y., 88
Zahlan, A.B., 69Zambia: employment of scientists in, 39
funding of R&D in, 62, 143;mainstream scientific output of, 86
Zuckerman, H., 44

Ja ques Gaillard i eni r research r withth French ln titute f r Sd ntific Re earch[or Development through C p rallon(ORSTOM).
journal, expanded opp rlumtie f rIra el ta mternational meeting thedevclopment of regionaJ partnerships. andgr al r c perallOn am ng spon TIngbodies.
As an in-depth look al an imporlanlsegment ai Lhe world of science, lhb b kwill be invaluable to scholar in the so laJsciences and l ail wh have an in! r 1
in agriculture, lht' deveJoping w r1ù, andthe history 01 science.
lSB 0- 13J·lnl-