Britannia - Motilal Oswal
20
19 June 2020 Annual Report Update | Sector: Consumer Britannia Investors are advised to refer through important disclosures made at the last page of the Research Report. Motilal Oswal research is available on www.motilaloswal.com/Institutional-Equities, Bloomberg, Thomson Reuters, Factset and S&P Capital. Krishnan Sambamoorthy – Research analyst ([email protected]); +91 22 6129 1545 Research analyst: Dhairya Dhruv ([email protected]); +91 22 6129 1547 | Pooja Doshi ([email protected]); +91 22 5036 2689 BSE SENSEX S&P CNX CMP: INR3,438 TP: INR3,470 (+1%) Neutral 34,732 10,244 Stock Info Bloomberg BRIT IN Equity Shares (m) 240 M.Cap.(INRb)/(USDb) 826.8 / 10.8 52-Week Range (INR) 3705 / 2101 1, 6, 12 Rel. Per (%) -5/27/31 12M Avg Val (INR M) 1874 Free float (%) 49.4 Financials Snapshot (INR b) Y/E Dec 2020 2021E 2022E Sales 116.0 132.3 147.0 Sales Gr. (%) 4.9 14.0 11.1 EBITDA 18.4 22.6 25.2 Margins (%) 15.9 17.1 17.1 Adj. PAT 14.1 16.7 18.5 Adj. EPS (INR) 58.6 69.5 77.1 EPS Gr. (%) 21.8 18.5 11.0 BV/Sh.(INR) 183.1 173.8 179.3 Ratios RoE (%) 32.6 38.9 43.7 RoCE (%) 24.1 26.2 29.9 Payout (%) 59.7 80.0 80.0 Valuations P/E (x) 58.6 49.5 44.6 P/BV (x) 18.8 19.8 19.2 EV/EBITDA (x) 44.1 35.9 32.2 Div. Yield (%) 1.0 1.6 1.8 Earnings growth trajectory likely to remain strong New category traction encouraging; ICD overhang remains Key highlights from Britannia’s (BRIT) FY20 annual report: Traction in new categories (now 2% of sales) is encouraging, which we believe is largely led by cream wafers and milk shakes. Control over other expenses (incl. A&P and conversion costs) has led to an all-time high EBITDA margin of 15.9% in FY20. Half of the 80bp savings on other expenses was led by cut in absolute ad-spends. Marginally lower conversion costs formed the second largest component of savings. Group inter-corporate deposits (ICDs) at INR6b are beyond the erstwhile self- imposed threshold of INR5b. Additionally, there were ICDs granted to other corporates in FY20 of INR1.25b. Of this, INR300m was outstanding at the year end. Efforts toward 100% reusable packaging materials are encouraging from a sustainability perspective. While both structural and near-term earnings visibility is superior to peers, we maintain Neutral rating on fair valuations of 44.6x FY22 EPS. Margin expansion drive continues in FY20 BRIT’s FY20 consolidated net sales grew 4.9% YoY to INR116b. Consol. EBITDA grew 6.3% YoY to INR18.4b. FY20 consol. gross margins declined ~30bp YoY to 40.3% on account of high raw material inflation. However, it did not deter BRIT to continue its EBITDA margin expansion spree. FY20 consol. EBITDA margins expanded 20bp YoY to 15.9%, driven by savings in ad-spends and conversion costs. Consol. PBT grew 5.2% YoY to INR18.6b while consol. adj. PAT increased 21.9% YoY to INR14.1b due to lower tax rate. BRIT’s cash conversion cycle remained flat YoY at zero days in FY20. In FY20, RoE improved 240bp to 32.6% while RoCE declined 140bp to 24.1%. BRIT’s gross debt increased significantly from INR1.6b in FY19 to INR15.4b in FY20, partially driven by the issue of bonus debentures of INR7.2b. However, it remains a net-cash company (net cash of INR27.7b). Cash Flow from Operations (CFO)/Free Cash Flow (FCF) grew 28.4%/21.9% YoY, reaching an all-time high level of INR14.8b/ INR12.4b. FCF/PAT conversion ratio improved from 65.4% in FY19 to 88% in FY20. Capex for FY20 was lower at INR2.4b as against INR4b in FY19. 2% sales from new categories encouraging While the potential gain in biscuits market share is an attractive proposition (a factor in which the company has delivered handsomely in recent years), the longer-term investment case for BRIT is partly based on growth of its brands outside of its core biscuits category. From this perspective, 2% of FY20 sales coming from new categories (likely from cream wafers/milkshakes since salty snacks/croissants are still in the test marketing phase), is an encouraging start. Motilal Oswal values your support in the Asiamoney Brokers Poll 2020 for India Research, Sales and Trading team. We request your ballot.
-
Upload
khangminh22 -
Category
Documents
-
view
6 -
download
0
Transcript of Britannia - Motilal Oswal

19 June 2020
Annual Report Update | Sector: Consumer
Britannia
Investors are advised to refer through important disclosures made at the last page of the Research Report. Motilal Oswal research is available on www.motilaloswal.com/Institutional-Equities, Bloomberg, Thomson Reuters, Factset and S&P Capital.
Krishnan Sambamoorthy – Research analyst ([email protected]); +91 22 6129 1545
Research analyst: Dhairya Dhruv ([email protected]); +91 22 6129 1547 | Pooja Doshi ([email protected]); +91 22 5036 2689
BSE SENSEX S&P CNX CMP: INR3,438 TP: INR3,470 (+1%) Neutral 34,732 10,244
Stock Info
Bloomberg BRIT IN
Equity Shares (m) 240
M.Cap.(INRb)/(USDb) 826.8 / 10.8
52-Week Range (INR) 3705 / 2101
1, 6, 12 Rel. Per (%) -5/27/31
12M Avg Val (INR M) 1874
Free float (%) 49.4
Financials Snapshot (INR b)
Y/E Dec 2020 2021E 2022E
Sales 116.0 132.3 147.0
Sales Gr. (%) 4.9 14.0 11.1
EBITDA 18.4 22.6 25.2
Margins (%) 15.9 17.1 17.1
Adj. PAT 14.1 16.7 18.5
Adj. EPS (INR) 58.6 69.5 77.1
EPS Gr. (%) 21.8 18.5 11.0
BV/Sh.(INR) 183.1 173.8 179.3
Ratios
RoE (%) 32.6 38.9 43.7
RoCE (%) 24.1 26.2 29.9
Payout (%) 59.7 80.0 80.0
Valuations
P/E (x) 58.6 49.5 44.6
P/BV (x) 18.8 19.8 19.2
EV/EBITDA (x) 44.1 35.9 32.2
Div. Yield (%) 1.0 1.6 1.8
Earnings growth trajectory likely to remain strong New category traction encouraging; ICD overhang remains
Key highlights from Britannia’s (BRIT) FY20 annual report:
Traction in new categories (now 2% of sales) is encouraging, which we believe is
largely led by cream wafers and milk shakes.
Control over other expenses (incl. A&P and conversion costs) has led to an all-time
high EBITDA margin of 15.9% in FY20. Half of the 80bp savings on other expenses was
led by cut in absolute ad-spends. Marginally lower conversion costs formed the
second largest component of savings.
Group inter-corporate deposits (ICDs) at INR6b are beyond the erstwhile self-
imposed threshold of INR5b. Additionally, there were ICDs granted to other
corporates in FY20 of INR1.25b. Of this, INR300m was outstanding at the year end.
Efforts toward 100% reusable packaging materials are encouraging from a
sustainability perspective.
While both structural and near-term earnings visibility is superior to peers, we
maintain Neutral rating on fair valuations of 44.6x FY22 EPS.
Margin expansion drive continues in FY20 BRIT’s FY20 consolidated net sales grew 4.9% YoY to INR116b. Consol. EBITDA
grew 6.3% YoY to INR18.4b.
FY20 consol. gross margins declined ~30bp YoY to 40.3% on account of high
raw material inflation. However, it did not deter BRIT to continue its EBITDA
margin expansion spree. FY20 consol. EBITDA margins expanded 20bp YoY to
15.9%, driven by savings in ad-spends and conversion costs.
Consol. PBT grew 5.2% YoY to INR18.6b while consol. adj. PAT increased 21.9%
YoY to INR14.1b due to lower tax rate.
BRIT’s cash conversion cycle remained flat YoY at zero days in FY20.
In FY20, RoE improved 240bp to 32.6% while RoCE declined 140bp to 24.1%.
BRIT’s gross debt increased significantly from INR1.6b in FY19 to INR15.4b in
FY20, partially driven by the issue of bonus debentures of INR7.2b. However, it
remains a net-cash company (net cash of INR27.7b).
Cash Flow from Operations (CFO)/Free Cash Flow (FCF) grew 28.4%/21.9% YoY,
reaching an all-time high level of INR14.8b/ INR12.4b.
FCF/PAT conversion ratio improved from 65.4% in FY19 to 88% in FY20.
Capex for FY20 was lower at INR2.4b as against INR4b in FY19.
2% sales from new categories encouraging While the potential gain in biscuits market share is an attractive proposition (a
factor in which the company has delivered handsomely in recent years), the
longer-term investment case for BRIT is partly based on growth of its brands
outside of its core biscuits category. From this perspective, 2% of FY20 sales
coming from new categories (likely from cream wafers/milkshakes since salty
snacks/croissants are still in the test marketing phase), is an encouraging start.
Motilal Oswal values your support in the Asiamoney Brokers Poll 2020 for
India Research, Sales and Trading team. We request your ballot.

Britannia
19 June 2020 2
BRIT has had the most impressive expansion in both total reach (now over 5.5m
outlets) and direct reach (now over 2.2m outlets) compared to other FMCG/
food peers in the past 5 years, which enables continued scale-up in biscuits
market share as well as growth in new categories.
Takeaways from Management Discussion and Analysis (MD&A) The company has created a strategy to win in ‘Many Indias’ in order to grow
the biscuits business. Large brands like Good Day, Milk Bikis and Marie Gold
have employed localized strategies to meet the unique needs of different
markets and fight local players. A focused and localized strategy has been
adopted for the Hindi Heartland states as well.
Dairy business: BRIT’s milk procurement in Maharashtra has been scaled up to
25,000 liters/day from 1,000 farmers in and around Ranjangaon.
Adjacencies business: ‘Cream wafers’ is INR70b category and is growing at a
healthy pace. BRIT is the first branded player with a large national presence to
enter this highly fragmented category.
COVID impact over medium term: BRIT was able to successfully manage the
immediate challenge of re-establishing normalcy in business operations and is in
the process of assessing the long-term implications and opportunities that may
emerge from this situation.
Control on other expenses BRIT has done well in restricting absolute other expenses (incl. A&P and
conversion cost) growth to only 1% YoY, thus, boosting margins by 80bp YoY.
Overall, EBITDA margins expanded by 20bp YoY to an all-time high level of
15.9% in a year when gross margins declined by 30bp and employee expenses to
sales increased 20bp YoY.
Half of the 80bp other expenses to sales contraction came from 5% YoY absolute
reduction in ad-spends, while another 20bp reduction was witnessed due to
marginally lower conversion charges. Ad spends are not shared separately in
quarterly numbers.
ICDs and debt on books As discussed in our 4QFY20 results note, the outstanding ICDs to group
companies stood at INR6b (INR3.5b to Bombay Dyeing and INR2.5b to Go-Air as
per the annual report) at end-FY20. While this is lower than the level at end-
FY19 of INR6.85b (INR3.5b to Bombay Dyeing and INR3.35b to Go-Air), it is
higher than the threshold of INR5b voluntarily set by the management a year
ago.
Unlike last year, the company also subscribed to ICDs to the tune of
INR1.25b belonging to other corporates outside of the usual financial services
companies issuing ICDs. Toward the year-end, the exposure to these was around
INR300m.
It is also notable that the company has both cash and cash equivalents
(including investments and ICDs) of INR43b (FY19 INR27.9b) as well as debt of
INR15.4b (FY19 INR1.6b) on books, which dilutes RoEs.
Shareholding pattern (%)
As On Mar-20 Dec-19 Mar-19
Promoter 50.6 50.6 50.7
DII 13.4 13.6 12.4
FII 14.7 15.8 15.8
Others 21.3 20.0 21.2
FII Includes depository receipts
Stock Performance (1-year)

Britannia
19 June 2020 3
Performance of key subsidiaries
The dairy business’ turnover/profitability declined 6%/59.3% YoY in FY20. The
two Middle Eastern businesses (Strategic Food International and Al Sallan)
combined, witnessed YoY growth of 2.6% in FY20 on turnover. PAT came in at
INR135m in FY20 (v/s net loss of INR76m in FY19).
It is also notable that the small BritChip JV (for Croissants) incurred net loss of
INR335m in FY20 because of the significant investments made so far; this net
loss is equal to 2.4% of consolidated PAT.
Sustainability efforts admirable Processes are being introduced to recycle, reduce and recover used plastic. The
company is in the process of developing 100% reusable packaging, although the
time frame has not been specified.
Valuation view Unlike most peers, BRIT’s structural as well as near-term earnings growth
appear attractive. Visibility on earnings growth for FY21 has been boosted by (a)
significantly stronger-than-expected top line growth in Apr-May’20, (b) recovery
in category growth after a long time even in the pre COVID-phase in Jan-Feb’20,
(c) expectation of in-home consumption being reasonably strong for the large
part of the year, and (d) benign outlook for all raw materials.
The increase in ICDs beyond the earlier-guided threshold levels and the fact that
the company seems to have chosen to keep both debt/cash on its books, leads
to consequent concerns over RoCE. This should keep target multiples in check.
Valuing the company at 45x FY22E EPS, we arrive at a target price of INR3,470,
which leads to an upside of 2% to CMP. Maintain Neutral.

Britannia
19 June 2020 4
New products and innovations Launches: FY20 remained yet another year of innovative launches across
categories. During the year, BRIT also focused on innovations that were
launched toward end-FY19 – Britannia Treat Burst, Britannia Treat Stars and
Britannia 50-50 Jeera. Additionally, two variants were launched in FY20 under
Treat-Tiramisu and Red Velvet as an ‘in and out’ during the year and these were
received very well by consumers. Little Hearts Strawberry was also launched,
which is currently under test marketing in Maharashtra.
Re-launches: FY20 saw the re-launch of Good Day biscuits, the most popular
brand of the company. BRIT also re-launched NutriChoice Cream Crackers and
NutriChoice Thin Arrowroot with an improved product mix, visual product
differentiation and distinguished packaging, which has helped these brands to
grow faster than industry.
New categories introduced over the past few years, now contribute 2% of sales,
which is encouraging. This is likely to be driven by mainly cream wafers and
milkshakes since salty snacks and croissants are still in the test marketing phase.
Nestle India Nestle India
New innovations
in FY20
New categories contributed 2% of revenues in
FY20
Britannia
19 June 2020 5
Takeaways from Management Discussion and Analysis (MD&A) Biscuits: Per capita consumption of biscuits in India is comparatively low at 2kgs
v/s 10kgs in certain developed countries. The low per capita consumption and
high levels of penetration provides a good base to increase consumption
through appropriate business strategies. Large brands like Good Day, Milk Bikis
and Marie Gold have employed localized strategies (Win in ‘Many Indias’) to
meet the unique needs of different markets and fight local players. A focused
and localized strategy has been adopted for the Hindi Heartland states as well.
Adjacencies: ‘Cream wafers’ is INR70b category and is growing at a healthy
pace. BRIT is the first branded player with a large national presence to enter this
highly fragmented category. ‘Salted snacks’ is another potential long-term
opportunity where the company’s product is in the test-marketing phase. Size of
the market is very large and the company is aiming to eventually bank on its
national distribution presence and conversion from unorganized/local to
organized/national players.
Dairy: BRIT’s strategy in the dairy business is to focus on strengthening its core
categories such as cheese and yoghurt and innovating in other categories such
as drinks. The company intends to make significant investments in the back-end
capabilities of the dairy business. As part of this effort, BRIT’s milk procurement
in Maharashtra has been scaled up to 25,000 liters/day from 1,000 farmers in
and around Ranjangaon.
COVID-19 impact: The changes forced on people and businesses by the COVID-
19 pandemic are likely to last for some time. The established ways of doing
business may also undergo changes leading to new ways of working. BRIT was
able to successfully manage immediate challenges of re-establishing normalcy in
business operations and is in the process of assessing the long-term implications
and opportunities that may emerge from this situation.
Key highlights from Mr. Varun Berry’s recent media interview
BRIT witnessed revenue growth of 20%/28% in April/May.
The pace of demand seen in April/May is unlikely to sustain post lockdown.
Focus was on supplying only four mega brands and large SKUs in April-May.
BRIT expects to get back to its normal product portfolio by end-June.
Difficult to predict domestic volume growth, but should certainly be 300bp
better than pre-COVID levels.
BRIT is expected to invest INR4.5b in manufacturing.
BRIT continued to gain market share in the last few months.
Within non-biscuits portfolio, rusks and dairy have done well.
Dairy will be the key focus area for the company to target the health and
wellness segment going forward.
Britannia
19 June 2020 6
Infrastructure Capex for FY20 stood at INR2.4b as against INR4b in FY19.
The company-owned plants are located at Kolkata (West Bengal), Rudrapur
(Uttarakhand), Hajipur (Bihar), Khurda (Orissa), Jhagadia (Gujarat), Perundurai
(Tamilnadu), Bidadi (Karnataka), Guwahati (Assam), Mundra (Gujarat) and
Ranjangaon (Maharashtra).
During the year, BRIT commissioned 3 biscuit lines and 1 snack line at the
Integrated Food Park, Ranjangaon. The plant now has 5 biscuit lines, 2 cake
lines, 1 croissant line and 1 snack line. BRIT also operationalized its green-field
unit in Nepal.
R&D In its quest to be a ‘Global Total Foods Company’, BRIT is leveraging its R&D
capabilities and expertise to innovate and renovate, provide high quality
products, improve packaging and reduce wastage.
It has successfully built capabilities to use alternate cereals, whole grains, super
seeds and protein isolates in an effort to provide more nutrients in its product
portfolio.
BRIT is in the process of developing 100% reusable packaging.
R&D costs stood at INR336m in FY20, of which INR20m was incurred on capital
R&D and INR316m on revenue R&D. Put together, R&D formed 0.29% of sales.
In FY19, total R&D spends stood at INR346m.
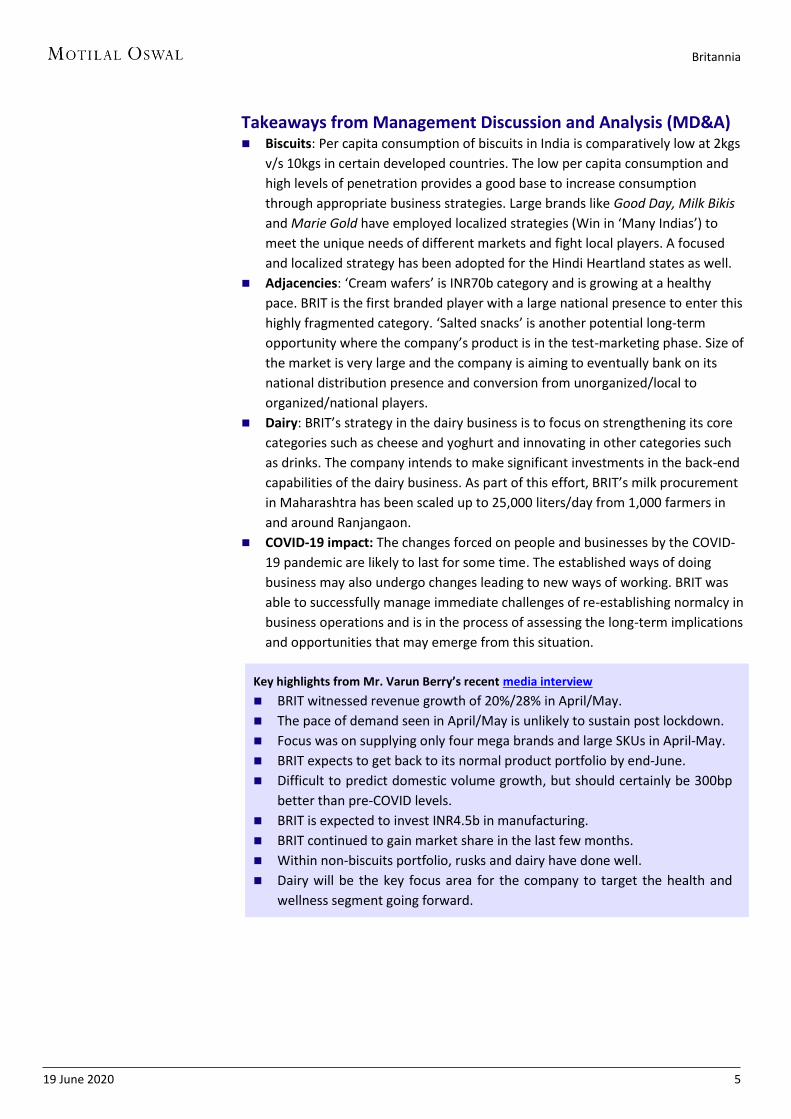
Exhibit 1: Expenditure on R&D in FY20 stood at INR336m
Particulars (INR m) FY17 FY18 FY19 FY20
Capital 261 19 8 20
Revenue 217 267 338 316
Total 478 285 346 336
YoY change (%) 9.2 -40.3 21.2 -3.0
Total R&D expenditure as a % of net sales 0.53 0.29 0.31 0.29
Source: Company, MOFSL
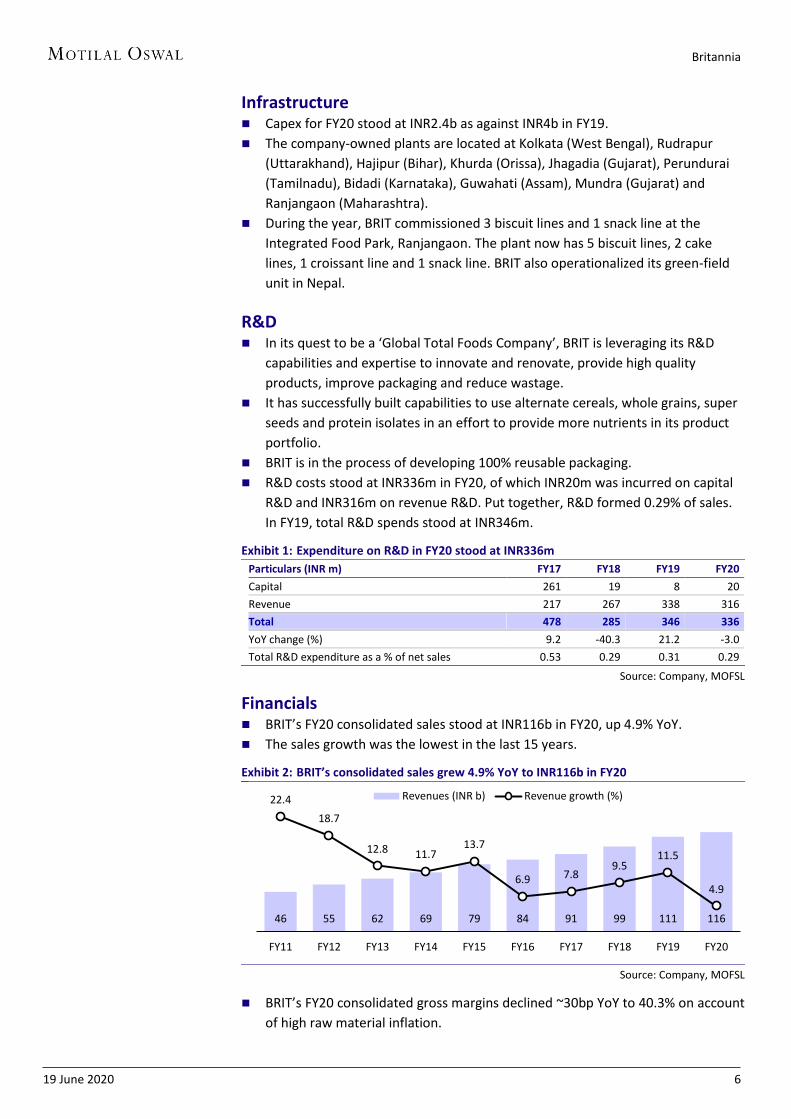
Financials BRIT’s FY20 consolidated sales stood at INR116b in FY20, up 4.9% YoY.
The sales growth was the lowest in the last 15 years.
Exhibit 2: BRIT’s consolidated sales grew 4.9% YoY to INR116b in FY20
Source: Company, MOFSL
BRIT’s FY20 consolidated gross margins declined ~30bp YoY to 40.3% on account
of high raw material inflation.
46 55 62 69 79 84 91 99 111 116
22.4
18.7
12.8 11.7 13.7
6.9 7.8 9.5
11.5
4.9
FY11 FY12 FY13 FY14 FY15 FY16 FY17 FY18 FY19 FY20
Revenues (INR b) Revenue growth (%)

Britannia
19 June 2020 7
Exhibit 3: Consolidated gross margins declined 30bp YoY in FY20
Source: MOFSL, Company
In FY20, consolidated employee expenses grew 10.2% YoY to INR4.9b. As % of
sales, employee expenses increased by 20bp YoY to 4.2%.
Consolidated ad spends (not disclosed on quarterly basis) declined 5.1% YoY to
INR4.8b in FY20. As % of sales, it declined 40bp YoY to 4.1%.
Exhibit 4: Employee cost up 20bp YoY to 4.2%
Source: Company, MOFSL
Exhibit 5: Ad spends down 40bp YoY to 4.1%
Source: Company, MOFSL
In FY20, conversion charges were marginally lower YoY to INR5.1b. However, it
was down 20bp YoY to 4.4% as % of sales.
Other expenses (excl. A&P and conversion costs) grew 4.2% YoY to INR13.6b in
FY20. As % of sales, it declined 10bp YoY to 11.7%.
Other expenses (incl. A&P and conversion costs) grew 1% YoY to INR23.4b in
FY20. As % of sales, it declined 80bp YoY to 20.2%.
Exhibit 6: Conversion charges down 20bp YoY to 4.4%
Source: Company, MOFSL
Exhibit 7: Other expenses down 10bp YoY to 11.7%
Source: Company, MOFSL
41.8 41.7
36.1
39.2 38.3
36.1
34.5 35.6
37.6
39.7 40.3 40.3
38.3 38.4
40.6 40.3
FY05 FY06 FY07 FY08 FY09 FY10 FY11 FY12 FY13 FY14 FY15 FY16 FY17 FY18 FY19 FY20
Gross Margin (%)
1.8 2.1 2.3 2.6 2.8 3.4 3.5 4.0 4.4 4.9
3.8 3.8
3.7
3.8
3.6
4.1
3.9
4.1 4.0
4.2
FY11 FY12 FY13 FY14 FY15 FY16 FY17 FY18 FY19 FY20
Employee cost (INR b) Employee cost (% of sales)
3.3 4.2 5.3 6.0 6.5 4.5 3.9 4.1 5.0 4.8
7.2 7.6
8.6 8.7 8.3
5.3
4.3 4.1 4.5 4.1
FY11 FY12 FY13 FY14 FY15 FY16 FY17 FY18 FY19 FY20
Ad spends (INR b) Ad spends (% of sales)
2.9 3.6 4.2 4.5 4.9 4.5 4.4 4.1 5.1 5.1
6.2 6.5 6.8 6.6 6.2
5.3 4.9
4.2 4.6 4.4
FY11 FY12 FY13 FY14 FY15 FY16 FY17 FY18 FY19 FY20
Conversion charge (INR b)
Conversion charge (% of sales)
5.5 6.6 7.2 7.9 8.8 9.3 10.1 10.8 13.0 13.6
11.8 12.0 11.7
11.5 11.2 11.1 11.1
10.9
11.8 11.7
FY11 FY12 FY13 FY14 FY15 FY16 FY17 FY18 FY19 FY20
Other op. exps (INR b) Other op. exps (% of sales)

Britannia
19 June 2020 8
BRIT’s FY20 consolidated EBITDA grew 6.3% YoY to INR18.4b.
BRIT continued its EBITDA margin expansion spree with FY20 consolidated
EBITDA margins expanding 20bp YoY to 15.9%.
Exhibit 8: BRIT’s consolidated EBITDA grew 6.3% YoY to INR18.4b in FY20
Source: Company, MOFSL
Exhibit 9: Consolidated EBITDA margins expanded 20bp YoY in FY20
Source: MOFSL, Company
In the last decade, BRIT expanded its EBITDA margins by a massive 1,150bp. The
expansion was largely driven by gross margin expansion (410bp), savings in ad-
spends (390bp) and conversion costs (220bp).
Exhibit 10: BRIT’s EBITDA margins have expanded by 1,150bp over FY10-20
Source: Company, MOFSL
BRIT’s FY20 consolidated PBT grew 5.2% YoY to INR18.6b.
BRIT’s FY20 consolidated Adj. PAT grew 21.9% YoY to INR14.1b. PAT was
boosted by lower tax rates. Effective tax rate in FY20 was 24.2% as against
34.6% in FY19.
2.5 3.1 4.2 6.3 8.6 12.1 12.8 15.0 17.3 18.4
49.3
25.4
35.3
48.8
37.7 40.6
5.2
17.5 15.4 6.3
FY11 FY12 FY13 FY14 FY15 FY16 FY17 FY18 FY19 FY20
EBITDA (INR b) EBITDA growth (%)
13.3 12.3
6.2
8.8 7.4
4.4 5.4 5.7
6.8 9.1
11.0
14.5 14.1 15.1 15.7 15.9
FY05 FY06 FY07 FY08 FY09 FY10 FY11 FY12 FY13 FY14 FY15 FY16 FY17 FY18 FY19 FY20
EBITDA Margin (%)
4.4
15.9 4.1
0.2 2.2
3.9
1.1
FY10 EBITDAmargin (%)
RM costs/Sales Staff costs/Sales Conversioncosts/Sales
Ad spends/Sales Othersexpenses/Sales
FY20 EBITDAmargin (%)

Britannia
19 June 2020 9
Exhibit 11: BRIT’s consolidated PBT grew 5.2% YoY to INR18.6b in FY20
Source: Company, MOFSL
Exhibit 12: BRIT’s consolidated Adj. PAT grew 21.9% YoY to INR14.1b in FY20
Source: Company, MOFSL
Exhibit 13: Performance – 3 years, 5 years and 10 years
Y/E March (INR m) FY10 FY15 FY17 FY20 10Y CAGR (%) 5Y CAGR (%) 3Y CAGR (%)
Total Revenue 37,765 78,584 90,541 115,996 11.9 8.1 8.6
Gross Profit 13,650 31,666 34,653 46,721 13.1 8.1 10.5
Gross Margin (%) 36.1 40.3 38.3 40.3 413 bps -2 bps 200 bps
EBIDTA 1,664 8,639 12,781 18,432 27.2 16.4 13.0
Margin (%) 4.4 11.0 14.1 15.9 1148 bps 490 bps 177 bps
Profit after Taxes 1,338 5,743 8,842 14,102 26.6 19.7 16.8
Margin (%) 3.5 7.3 9.8 12.2 861 bps 485 bps 239 bps
CFO 2,377 5,845 4,413 14,845 20.1 20.5 49.8
FCF 1,673 6,308 895 12,411 22.2 14.5 140.3
Source: Company, MOFSL
Exhibit 14: On an average basis, WC days stood flat YoY at 0 days in FY20
Cash conversion cycle (avg. basis) FY11 FY12 FY13 FY14 FY15 FY16 FY17 FY18 FY19 FY20
Days
Inventory days 26 26 24 21 19 18 22 24 24 24
Debtor days 6 6 7 6 6 7 7 9 12 11
Creditor days 17 22 23 25 29 32 31 32 35 36
Cash conversion cycle 15 11 8 2 -4 -7 -2 1 0 0
Source: Company, MOFSL
1.9 2.7 3.6 5.7 8.0 12.2 13.0 15.2 17.7 18.6
34.2 42.4
34.5
58.8
41.1 51.9
6.8 16.4 16.5
5.2
FY11 FY12 FY13 FY14 FY15 FY16 FY17 FY18 FY19 FY20
PBT (INR b) PBT growth (%)
1.3 2.0 2.6 4.0 5.7 8.2 8.8 10.0 11.6 14.1
0.3
48.8
30.1
52.3 45.1 43.6
7.3 13.6 15.2
21.9
FY11 FY12 FY13 FY14 FY15 FY16 FY17 FY18 FY19 FY20
Adj. PAT (INR b) Adj. PAT growth (%)

Britannia
19 June 2020 10
Exhibit 15: Average raw material days increased from 14.5
days in FY19 to 15.2 days in FY20
Source: Company, MOFSL
Exhibit 16: Average WIP days increased from 1.3 days in
FY19 to 1.4 days in FY20
Source: Company, MOFSL
Exhibit 17: Average finished goods days declined from 7.8
days in FY19 to 7.4 days in FY20
Source: Company, MOFSL
Exhibit 18: Thus, average inventory days increased from
23.7 days in FY19 to 24 days in FY20
Source: Company, MOFSL
Exhibit 19: On year-end basis, WC days decreased by 3 days to -2 days in FY20
Cash conversion cycle (year end basis) FY11 FY12 FY13 FY14 FY15 FY16 FY17 FY18 FY19 FY20
Days
Inventory days 27 29 22 22 19 19 27 24 26 23
Debtor days 6 8 7 6 6 7 7 11 13 10
Creditor days 21 26 23 29 33 33 31 37 38 35
Cash conversion cycle 13 10 6 -1 -8 -7 3 -1 1 -2
Source: Company, MOFSL
Gross fixed asset turnover declined from 5.4x in FY19 to 4.7x in FY20. Gross fixed
assets increased from INR26.8b in FY19 to INR29.3b in FY20. With capex nearing
completion, FATR is likely to go back up in the medium term. Sales slowdown
led by sluggishness in the biscuits category also had a part to play in the lower
FATR over the last 2 years. The outlook has improved and is much better for the
biscuits category since Jan’20.
15.7 16.4 14.6
12.3 10.4
9.3
12.5 14.7 14.5 15.2
FY11 FY12 FY13 FY14 FY15 FY16 FY17 FY18 FY19 FY20
Average Raw materials days
0.3
0.6
0.9 0.9 0.7
0.8 0.9
1.2 1.3 1.4
FY11 FY12 FY13 FY14 FY15 FY16 FY17 FY18 FY19 FY20
Average WIP days
9.7
8.9 8.3
7.9 8.0 8.2 8.7
8.3 7.8
7.4
FY11 FY12 FY13 FY14 FY15 FY16 FY17 FY18 FY19 FY20
Average Finished goods days
25.7 25.9
23.8
21.0 19.1 18.4
22.2 24.2 23.7 24.0
FY11 FY12 FY13 FY14 FY15 FY16 FY17 FY18 FY19 FY20
Average inventory days

Britannia
19 June 2020 11
Exhibit 20: Gross fixed asset turnover declined to 4.7x in FY20
Source: Company, MOFSL
Inter-corporate deposits (ICDs): ICDs increased from INR12b in FY19 to
INR12.9b in FY20, mainly on account of deposits to non-group companies.
ICDs to group companies reduced from INR6.9b in FY19 to INR6b in FY20.
While the company earns healthy rates on these ICDs, ideally investors would
not want to see lending to group entities.
Exhibit 21: ICD movement during FY20
(INR m) Name of borrower
Secured/ unsecured
Rate of Interest (%)
Term 1-Apr-19 Placed during FY20
Refunded during FY20
31-Mar-20
Group companies
Bombay Dyeing Unsecured 10.00 1 year 3,500 3,500 3,500 3,500
Go Airlines Unsecured 10.00 1 year 3,350 1,600 2,450 2,500
Finance companies
Bajaj Finance Unsecured 6.90 - 8.35 1 to 2 years 2,643 3,944 2,643 3,944
Kotak Mahindra Investments Unsecured 9.10 - 9.15 1 year 600 0 600 0
Shriram Transport Finance Unsecured 7.85 1 year 322 0 322 0
HDFC Limited Unsecured 6.90 - 7.20 1 year 1,578 1,250 1,578 1,250
LIC Housing Finance Unsecured 7.50 - 7.85 1 to 2 years 0 1,140 0 1,140
Standard Chartered Investments & Loans Unsecured 7.50 6 months 0 250 0 250
Other companies
Sterling & Wilson Solar Unsecured 12.50 6 months 0 500 500 0
Macrofil Investments Unsecured 10.00 1 year 0 750 450 300
Total
11,992 12,934 12,042 12,884
Source: MOFSL, Company
4.1 4.8 4.9 4.8 4.6 4.9 4.6
7.4
6.4
5.4 4.7
FY10 FY11 FY12 FY13 FY14 FY15 FY16 FY17 FY18 FY19 FY20
Gross Fixed Asset Turnover (x)

Britannia
19 June 2020 12
Exhibit 22: ICD movement over FY15-20 (INR m)
Name of borrower Mar-15 Mar-16 Mar-17 Mar-18 Mar-19 Mar-20
Group companies
Bombay Dyeing - 1,000 3,500 3,500 3,500 3,500
Bombay Burmah 400 400 400 - - -
Go Airlines - - - - 3,350 2,500
Group companies sub-total (a) 400 1,400 3,900 3,500 6,850 6,000
Group companies as % of total ICDs 12.3 22.0 45.7 36.4 57.1 46.6
Finance companies
Bajaj Finance 250 900 1,028 2,012 2,643 3,944
Kotak Mahindra Prime - 100 100 - - -
Kotak Mahindra Investments - 773 373 250 600 -
Shriram Transport Finance - 350 97 820 322 -
IL&FS - 635 688 - - -
Tata Housing Development - 100 - 250 - -
PNB Housing Finance - - 250 1,272 - -
HDFC Limited - - 1,500 750 1,578 1,250
Mahindra & Mahindra Financial Services - - - 250 - -
Tata Capital - - - 500 - -
LIC Housing Finance - - - - - 1,140
Standard Chartered Investments and Loans - - - - - 250
Finance companies sub-total (b) 250 2,858 4,035 6,103 5,142 6,584
Finance companies as % of total ICDs 7.7 44.9 47.3 63.6 42.9 51.1
Other companies
Scal Services 2,000 1,500 - - - -
Macrofil Investments 600 600 600 - - 300
Other companies sub-total (c) 2,600 2,100 600 - - 300
Other companies as % of total ICDs 80.0 33.0 7.0 - - 2.3
Total ICDs (a + b + c) 3,250 6,358 8,535 9,603 11,992 12,884
Source: MOFSL, Company
Exhibit 23: Investments, loans and advances, and other assets
Particulars FY15 FY16 FY17 FY18 FY19 FY20
Investments
Investments in debentures / bonds 250 1,141 1,141 856 5,300 14,549
Investments in mutual funds and equity instr. 4,859 6,623 3,588 8,918 9,197 14,109
Other investments 71 120 139 1,019 267 274
Investments sub-total (a) 5,179 7,884 4,869 10,793 14,763 28,932
Loans and advances
Inter-corporate deposits 3,250 6,358 8,535 9,603 11,992 12,884
Incentives recoverable 0 0 472 720 776 1,319
Interest accrued but not due 124 190 339 288 487 978
Advance Taxes 157 232 254 223 370 688
Deposits 398 528 312 169 516 558
Advances 1,771 600 1,634 879 1,019 427
Others 112 0 0 0 0 0
Loans and advances sub-total (b) 5,813 7,907 11,546 11,883 15,160 16,854
Total (a + b) 10,993 15,791 16,414 22,675 29,923 45,786
Source: MOFSL, Company
ICDs to group companies as % of total ICDs declined from 57.1% in FY19 to
46.6% in FY20.
ICDs to group companies as % of total loans, advances and investments declined
from 22.9% in FY19 to 13.1% in FY20.

Britannia
19 June 2020 13
Exhibit 24: ICDs to group companies declined from INR6.9b in FY19 to INR6b in FY20
Particulars FY15 FY16 FY17 FY18 FY19 FY20
ICDs to group companies (INR m) 400 1,400 3,900 3,500 6,850 6,000
ICDs to group companies as % of total ICDs 12.3 22.0 45.7 36.4 57.1 46.6
ICDs to group companies as % of total loans, advances and investments 3.6 8.9 23.8 15.4 22.9 13.1
Total ICDs as % of total loans, advances and investments 29.6 40.3 52.0 42.4 40.1 28.1
Source: MOFSL, Company
BRIT’s gross debt increased significantly from INR1.6b in FY19 to INR15.4b in
FY20. The increase was partially driven by issue of bonus debentures of INR7.2b
to equity investors. These debentures have an interest rate of 8% and a term of
3 years.
Accordingly, the company’s net cash (gross debt net of cash & cash equivalents,
investments and ICDs) stood at INR27.7b in FY20 as against INR26.3b in FY19.
Consequently, gross debt to equity (D/E) increased from 0.04x in FY19 to 0.35x
in FY20 whereas net D/E decreased from -0.62x in FY19 to -0.63x in FY20.
Exhibit 25: Gross debt increased significantly in FY20
Exhibit 26: Net debt declined further in FY20
Exhibit 27: Gross D/E increased significantly in FY20
Source: Company, MOFSL
Exhibit 28: Net D/E stood at -0.63x in FY20
Source: Company, MOFSL
BRIT paid a dividend of INR35 per share in FY20 as against INR15 per share in
FY19. This led to significant increase in the payout ratio, which increased from
31.2% in FY19 to 59.7% in FY20. This is the highest payout in the last decade.
The total dividend payout for FY20 stands at INR8.4b (FY19: INR4.3b).
With higher dividend payout, BRIT’s Return on Equity (RoE) improved from
30.2% in FY19 to 32.6% in FY20.
However, the Return on Capital Employed (RoCE) deteriorated from 25.5% in
FY19 to 24.1% in FY20 on account of higher loans taken in FY20.
6.2 6.0
3.8
1.5 1.5 1.3 1.2 2.0 1.6
15.4
FY11 FY12 FY13 FY14 FY15 FY16 FY17 FY18 FY19 FY20
Gross debt (INR b)0.9 2.3 1.7
-2.3
-9.2
-13.8 -13.4
-20.3
-26.3 -27.7
FY11 FY12 FY13 FY14 FY15 FY16 FY17 FY18 FY19 FY20
Net debt (INR b)
1.90
1.48
0.69
0.19 0.12 0.06 0.05 0.06 0.04
0.35
FY11 FY12 FY13 FY14 FY15 FY16 FY17 FY18 FY19 FY20
Gross D/E
0.29
0.57
0.31
-0.29
-0.74 -0.66 -0.50
-0.59 -0.62 -0.63
FY11 FY12 FY13 FY14 FY15 FY16 FY17 FY18 FY19 FY20
Net D/E

Britannia
19 June 2020 14
Exhibit 29: Payout ratio increased significantly in FY20
Source: Company, MOFSL
Exhibit 30: Return ratios remain impressive
Source: Company, MOFSL
BRIT’s Cash Flow from Operations (CFO) increased 28.4% YoY to an all-time high
of INR14.8b in FY20. The CFO growth is higher than its FY20 EBITDA and Adj. PAT
growth of 6.3% and 21.9%, respectively.
BRIT’s Free Cash Flow (FCF) increased 64.1% YoY to an all-time high of INR12.4b
in FY20.
FCF/PAT conversion ratio improved from 65.4% in FY19 to 88% in FY20.
Exhibit 31: Gross fixed asset turnover declined to 4.7x in FY20
Source: Company, MOFSL
Exhibit 32: FCF/PAT conversion ratio improved to 88% in FY20
Source: Company, MOFSL
Subsidiaries Revenue from key subsidiaries increased 24.8% YoY to INR15.2b in FY20.
On the other hand, there was a net loss of INR151m in FY20 as against net
profits of INR378m in FY19 from key subsidiaries.
In FY20, BRIT set up a wholly-owned subsidiary in Bangladesh under the name of
Britannia Bangladesh Private Limited.
57.9 50.8
39.1 36.4 33.4 29.1 29.9 29.9 31.2
59.7
FY11 FY12 FY13 FY14 FY15 FY16 FY17 FY18 FY19 FY20
Payout (%)
44.1
54.3 54.1 58.9 56.4
49.5
36.9 32.9 30.2 32.6
13.9 19.1
25.8
40.0 43.9 41.1
31.1 27.9 25.5 24.1
FY11 FY12 FY13 FY14 FY15 FY16 FY17 FY18 FY19 FY20
RoE (%) RoCE (%)
3.0 2.5 3.3
6.6 5.8
9.6
4.4
12.5 11.6
14.8
2.2 0.0 1.2 5.6 6.3 7.1 0.9
8.3 7.6
12.4
FY11 FY12 FY13 FY14 FY15 FY16 FY17 FY18 FY19 FY20
CFO (INR b) FCF (INR b)
166.5
1.1
44.5
142.4
109.9 86.1
10.1
82.4 65.4
88.0
FY11 FY12 FY13 FY14 FY15 FY16 FY17 FY18 FY19 FY20
FCF/PAT conversion (%)

Britannia
19 June 2020 15
Exhibit 33: Performance of key subsidiaries
INR m Stake
Sales Net Profit
Key Subsidiaries FY18 FY19 FY20 FY18 FY19 FY20
Britannia Dairy Products 100% 3,132 3,105 2,919 319 416 170
Daily Bread 0% 16 6 - 1 (1) -
Strategic Food International 100% 3,556 3,551 3,603 22 (63) 102
Al Sallan Food Industires 65% 1,836 1,576 1,659 94 (12) 33
International Bakery Products 100% 420 456 1,576 45 27 6
J B Mangharam Foods 100% 1,214 2,347 2,421 13 17 7
Manna Foods 100% 448 243 2,066 51 35 45
Sunrise Biscuit Company 99% 770 614 221 30 36 25
Ganges Vally Foods 99% 182 158 8 1 (6) (214)
Britannia and Associates (Mauritius) 100% 28 39 32 10 12 8
Britannia and Associates (Dubai) 100% 19 48 41 (12) 5 4
Britchip Foods 60% 1 36 271 (8) (84) (335)
Britannia Nepal 100% 0 2 383 (0) (3) (4)
Total
11,622 12,179 15,198 564 378 (151)
Growth (%)
2.3 4.8 24.8 41.1 (33.0) (139.9)
Source: MOFSL, Company
CSR spends stood at INR284m (v/s INR247m in FY19) and were up to the extent
(prescribed CSR for the year was INR284m) required under the provision, which
is 2% of average net profit in the past three years.
Foreign exchange earned was INR2.8b in FY20 (v/s INR3.2b in FY19), lower than
the foreign exchange used of INR2.9b (v/s INR1.9b in FY19).
Median remuneration for the year was 19.8% higher YoY in FY20. There were
4,535 permanent employees on the rolls and 8,440 temporary employees as of
31st Mar’20.
Remuneration of BRIT’s Managing Director, Mr. Varun Berry, grew 7.6% YoY in
FY20. Mr. Berry was granted 350,000 options on 1st May 2019 at an exercise
price of INR2,996.05. Loans were given to Mr. Varun Berry to fund the ESOP
consideration in both FY19 and FY20. These were duly repaid during the same
year. In FY19, the loan amount was INR297.9m while in FY20 it was INR239.6m.
Exhibit 34: Remuneration of Directors and Key Management Personnel
Name of Director / KMP FY20 remuneration
(INR m) YoY change
(%)
Ratio to median remuneration of
employees
Promoter and Non-Executive Directors
Mr. Nusli N Wadia, Chairman 58.2 8.6 171.7
Mr. A.K. Hirjee 11.6 24.7 34.2
Mr. Jeh N Wadia 4.4 91.3 13.0
Mr. Ness N Wadia 9.1 26.4 26.8
Independent Directors
Mr. Avijit Deb 5.3 32.5 15.6
Mr. Nimesh N Kampani 3.1 - -
Mr. Keki Dadiseth 6.1 -12.9 18.0
Dr. Ajai Puri 6.2 8.8 18.3
Mrs. Ranjana Kumar 0.4 - -
Dr. Ajay Shah 2.1 -16.0 6.2
Dr. Y.S.P Thorat 7.8 11.4 23.0
Mr. Keki Elavia 6.7 -5.6 19.8
Mrs. Tanya Dubash 3.3 - 9.7
Key Managerial Personnel
Mr. Varun Berry, MD 97.9 7.6 288.8
Mr. N Venkataraman, CFO 25.5 10.0 75.2
Mr. T.V. Thulsidass, Company Secretary 5.8 - 17.1
Source: Company, MOFSL

Britannia
19 June 2020 16
Exhibit 35: Contingent liabilities
Contingent liabilities and commitments (INR m) FY18 FY19 FY20
Contingent liabilities
Claims / demands against the Group not acknowledged as debts including excise duty, income tax, sales tax and trade and other demands
774 769 931
Bank guarantee and letter of credit 248.1 723.1 489.0
Commitments
Estimated amount of contracts remaining to be executed on capital account and not provided for
1,403 1,386 1,357
Total contingent liabilities and commitments 2,425 2,878 2,777
Source: Company, MOFSL

Britannia
19 June 2020 17
Financials and valuations
Income Statement (INR m)
Y/E March 2016 2017 2018 2019 2020 2021E 2022E
Net Revenues 83,972 90,541 99,140 110,547 115,996 132,269 147,000
Change (%) 6.9 7.8 9.5 11.5 4.9 14.0 11.1
Raw Material Cost 50,127 55,888 61,071 65,615 69,275 77,764 86,494
Gross Profit 33,845 34,653 38,069 44,932 46,721 54,505 60,506
Margin (%) 40.3 38.3 38.4 40.6 40.3 41.2 41.2
Advertising 4,461 3,850 4,113 5,008 4,754 6,424 7,689
% of Sales 5.3 4.3 4.1 4.5 4.1 4.9 5.2
Other Expenditure 17,240 18,022 18,940 22,590 23,535 25,486 27,653
EBITDA 12,144 12,781 15,017 17,334 18,432 22,595 25,164
Change (%) 40.6 5.2 17.5 15.4 6.3 22.6 11.4
Margin (%) 14.5 14.1 15.1 15.7 15.9 17.1 17.1
Depreciation 1,134 1,193 1,421 1,619 1,848 2,276 2,478
Int. and Fin. Charges 49 55 76 91 769 1,035 1,193
Financial Other Income 1,244 1,505 1,664 2,065 2,794 3,044 3,290
PBT 12,205 13,039 15,184 17,689 18,609 22,327 24,783
Tax 3,967 4,019 5,137 5,998 4,477 5,620 6,238
Deferred Tax -6 178 5 127 30 0 0
Tax Rate (%) 32.5 32.2 33.9 34.6 24.2 25.2 25.2
PAT 8,244 8,842 10,041 11,564 14,102 16,708 18,545
Change (%) 43.6 7.3 13.6 15.2 21.9 18.5 11.0
Margin (%) 9.8 9.8 10.1 10.5 12.2 12.6 12.6
Non-rec. (Exp.)/Income 0 0 0 0 -170 0 0
Reported PAT 8,246 8,845 10,040 11,555 13,936 16,708 18,545
Balance Sheet (INR m)
Y/E March 2016 2017 2018 2019 2020 2021E 2022E
Share Capital 240 240 240 240 241 241 241
Reserves 20,677 26,724 33,822 42,292 43,788 41,568 42,873
Networth 20,917 26,964 34,062 42,533 44,028 41,808 43,114
Minority Interest 25 26 131 327 357 0 0
Loans 1,311 1,246 2,007 1,560 15,376 14,628 13,955
Capital Employed 22,252 28,236 36,201 44,420 59,761 56,436 57,069
Gross Block 18,142 12,309 15,554 20,615 24,750 26,750 29,250
Less: Accum. Depn. -9,799 -1,988 -3,380 -5,035 -7,358 -9,635 -12,113
Net Fixed Assets 8,343 10,322 12,174 15,579 17,392 17,116 17,138
Goodwill on consolidation 1,159 1,278 1,282 1,304 1,390 1,390 1,390
Capital WIP 901 301 2,028 1,012 396 396 396
Investments 7,884 4,869 10,793 14,763 28,932 27,521 27,955
Current 6,623 3,588 8,918 9,197 14,109 12,698 13,132
Non-current 1,261 1,280 1,875 5,566 14,823 14,823 14,823
Deferred Liability -444 -231 -226 -99 -69 -69 -69
Currents Assets 16,208 24,088 25,377 29,623 30,117 31,213 33,512
Inventory 4,407 6,615 6,528 7,814 7,410 8,879 10,156
Account Receivables 1,706 1,792 3,046 3,942 3,204 4,039 4,470
Cash and Bank Balance 877 1,208 1,864 1,098 1,229 1,882 2,257
Others 9,219 14,474 13,938 16,768 18,275 16,413 16,629
Curr. Liab. & Prov. 12,687 12,852 15,679 17,960 18,535 21,267 23,391
Account Payables 7,691 7,573 9,941 11,405 11,163 13,244 14,650
Other Liabilities 4,996 5,279 5,738 6,555 7,372 8,024 8,741
Net Current Assets 3,521 11,236 9,698 11,663 11,582 9,946 10,122
Net Assets 22,252 28,236 36,201 44,420 59,761 56,437 57,068
E: MOFSL Estimates

Britannia
19 June 2020 18
Financials and valuations
Ratios
Y/E March 2016 2017 2018 2019 2020 2021E 2022E
Basic (INR)
EPS 34.3 36.8 41.8 48.1 58.6 69.5 77.1
BV/Share 87.2 112.4 141.9 177.0 183.1 173.8 179.3
DPS 10.0 11.0 12.5 15.0 35.0 55.6 61.7
Payout (%) 29.1 29.9 29.9 31.2 59.7 80.0 80.0
Valuation (x)
P/E 100.1 93.3 82.2 71.4 58.6 49.5 44.6
EV/Sales 9.7 9.1 8.2 7.3 7.0 6.1 5.5
EV/EBITDA 67.3 64.2 54.3 46.8 44.1 35.9 32.2
P/BV 39.5 30.6 24.2 19.4 18.8 19.8 19.2
Dividend Yield 0.3 0.3 0.4 0.4 1.0 1.6 1.8
Return Ratios (%)
RoE 49.5 36.9 32.9 30.2 32.6 38.9 43.7
RoCE 41.1 31.1 27.9 25.5 24.1 26.2 29.9
RoIC 80.0 45.6 41.5 41.9 44.3 54.5 63.9
Working Capital Ratios
Debtor (Days) 7 7 11 13 10 11 11
Asset Turnover (x) 3.8 3.2 2.7 2.5 1.9 2.3 2.6
Leverage Ratio
Debt/Equity (x) 0.1 0.0 0.1 0.0 0.3 0.3 0.3
Cash Flow Statement (INR m)
Y/E March 2016 2017 2018 2019 2020 2021E 2022E
OP Profit 12,205 13,040 15,184 17,689 18,439 22,327 24,783
Dep 1,134 1,193 1,421 1,619 1,848 2,276 2,478
Financial Other Income -368 -497 -470 -487 -684 -3,044 -3,290
Net Interest Paid 675 843 964 1,277 999 -1,035 -1,193
Direct Taxes Paid 4,032 3,966 4,965 5,961 5,033 5,620 6,238
Inc in WC -1,329 4,514 -2,283 25 -1,274 -2,290 -199
CF from Operations 9,592 4,413 12,488 11,558 14,845 19,265 19,125
(Inc)/Dec in FA -2,494 -3,518 -4,212 -3,994 -2,434 -2,000 -2,500
Free Cash Flow 7,098 895 8,276 7,564 12,411 17,265 16,625
(Pur.)/Sale of Investments -2,109 3,593 -5,374 -3,341 -13,266 1,411 -433
Other Non Rec Exp -3,914 -1,206 72 -1,462 406 -709 3,290
CF from Investments -8,517 -1,131 -9,514 -8,797 -15,294 -1,298 357
Issue of Shares 43 58 151 298 7,449 0 0
Inc in Debt 0 0 0 -419 -2,305 -748 -673
Dividend Paid 2,308 2,884 3,174 3,544 4,325 15,531 17,239
Other Item 197 125 -706 -138 240 1,035 1,193
CF from Fin. Activity -2,462 -2,951 -2,318 -3,527 579 -17,315 -19,106
Inc/Dec of Cash -1,387 331 657 -766 130 653 376
Add: Beginning Balance 2,263 877 1,208 1,864 1,098 1,229 1,881
Closing Balance 877 1,208 1,864 1,098 1,229 1,881 2,257
E: MOFSL Estimates

Britannia
19 June 2020 19
Explanation of Investment Rating
Investment Rating Expected return (over 12-month)
BUY >=15%
SELL < - 10%
NEUTRAL < - 10 % to 15%
UNDER REVIEW Rating may undergo a change
NOT RATED We have forward looking estimates for the stock but we refrain from assigning recommendation
*In case the recommendation given by the Research Analyst is inconsistent with the investment rating legend for a continuous period of 30 days, the Research Analyst shall within following 30 days take appropriate measures to make the recommendation consistent with the investment rating legend. Disclosures The following Disclosures are being made in compliance with the SEBI Research Analyst Regulations 2014 (herein after referred to as the Regulations). Motilal Oswal Financial Services Ltd. (MOFSL) is a SEBI Registered Research Analyst having registration no. INH000000412. MOFSL, the Research Entity (RE) as defined in the Regulations, is engaged in the business of providing Stock broking services, Investment Advisory Services, Depository participant services & distribution of various financial products. MOFSL is a subsidiary company of Passionate Investment Management Pvt. Ltd.. (PIMPL). MOFSL is a listed public company, the details in respect of which are available on www.motilaloswal.com. MOFSL (erstwhile Motilal Oswal Securities Limited - MOSL) is registered with the Securities & Exchange Board of India (SEBI) and is a registered Trading Member with National Stock Exchange of India Ltd. (NSE) and Bombay Stock Exchange Limited (BSE), Multi Commodity Exchange of India Limited (MCX) and National Commodity & Derivatives Exchange Limited (NCDEX) for its stock broking activities & is Depository participant with Central Depository Services Limited (CDSL) National Securities Depository Limited (NSDL),NERL, COMRIS and CCRL and is member of Association of Mutual Funds of India (AMFI) for distribution of financial products and Insurance Regulatory & Development Authority of India (IRDA) as Corporate Agent for insurance products. Details of associate entities of Motilal Oswal Financial Services Limited are available on the website at http://onlinereports.motilaloswal.com/Dormant/documents/List%20of%20Associate%20companies.pdf MOFSL and its associate company(ies), their directors and Research Analyst and their relatives may; (a) from time to time, have a long or short position in, act as principal in, and buy or sell the securities or derivatives thereof of companies mentioned herein. (b) be engaged in any other transaction involving such securities and earn brokerage or other compensation or act as a market maker in the financial instruments of the company(ies) discussed herein or act as an advisor or lender/borrower to such company(ies) or may have any other potential conflict of interests with respect to any recommendation and other related information and opinions.; however the same shall have no bearing whatsoever on the specific recommendations made by the analyst(s), as the recommendations made by the analyst(s) are completely independent of the views of the associates of MOFSL even though there might exist an inherent conflict of interest in some of the stocks mentioned in the research report MOFSL and / or its affiliates do and seek to do business including investment banking with companies covered in its research reports. As a result, the recipients of this report should be aware that MOFSL may have a potential conflict of interest that may affect the objectivity of this report. Compensation of Research Analysts is not based on any specific merchant banking, investment banking or brokerage service transactions. Details of pending Enquiry Proceedings of Motilal Oswal Financial Services Limited are available on the website at https://galaxy.motilaloswal.com/ResearchAnalyst/PublishViewLitigation.aspx A graph of daily closing prices of securities is available at www.nseindia.com, www.bseindia.com. Research Analyst views on Subject Company may vary based on Fundamental research and Technical Research. Proprietary trading desk of MOFSL or its associates maintains arm’s length distance with Research Team as all the activities are segregated from MOFSL research activity and therefore it can have an independent view with regards to Subject Company for which Research Team have expressed their views. Regional Disclosures (outside India) This report is not directed or intended for distribution to or use by any person or entity resident in a state, country or any jurisdiction, where such distribution, publication, availability or use would be contrary to law, regulation or which would subject MOFSL & its group companies to registration or licensing requirements within such jurisdictions. For Hong Kong: This report is distributed in Hong Kong by Motilal Oswal capital Markets (Hong Kong) Private Limited, a licensed corporation (CE AYY-301) licensed and regulated by the Hong Kong Securities and Futures Commission (SFC) pursuant to the Securities and Futures Ordinance (Chapter 571 of the Laws of Hong Kong) “SFO”. As per SEBI (Research Analyst Regulations) 2014 Motilal Oswal Securities (SEBI Reg No. INH000000412) has an agreement with Motilal Oswal capital Markets (Hong Kong) Private Limited for distribution of research report in Hong Kong. This report is intended for distribution only to “Professional Investors” as defined in Part I of Schedule 1 to SFO. Any investment or investment activity to which this document relates is only available to professional investor and will be engaged only with professional investors.” Nothing here is an offer or solicitation of these securities, products and services in any jurisdiction where their offer or sale is not qualified or exempt from registration. The Indian Analyst(s) who compile this report is/are not located in Hong Kong & are not conducting Research Analysis in Hong Kong. For U.S. Motilal Oswal Financial Services Limited (MOFSL) is not a registered broker - dealer under the U.S. Securities Exchange Act of 1934, as amended (the"1934 act") and under applicable state laws in the United States. In addition MOFSL is not a registered investment adviser under the U.S. Investment Advisers Act of 1940, as amended (the "Advisers Act" and together with the 1934 Act, the "Acts), and under applicable state laws in the United States. Accordingly, in the absence of specific exemption under the Acts, any brokerage and investment services provided by MOFSL , including the products and services described herein are not available to or intended for U.S. persons. This report is intended for distribution only to "Major Institutional Investors" as defined by Rule 15a-6(b)(4) of the Exchange Act and interpretations thereof by SEC (henceforth referred to as "major institutional investors"). This document must not be acted on or relied on by persons who are not major institutional investors. Any investment or investment activity to which this document relates is only available to major institutional investors and will be engaged in only with major institutional investors. In reliance on the exemption from registration provided by Rule 15a-6 of the U.S. Securities Exchange Act of 1934, as amended (the "Exchange Act") and interpretations thereof by the U.S. Securities and Exchange Commission ("SEC") in order to conduct business with Institutional Investors based in the U.S., MOFSL has entered into a chaperoning agreement with a U.S. registered broker-dealer, Motilal Oswal Securities International Private Limited. ("MOSIPL"). Any business interaction pursuant to this report will have to be executed within the provisions of this chaperoning agreement. The Research Analysts contributing to the report may not be registered /qualified as research analyst with FINRA. Such research analyst may not be associated persons of the U.S. registered broker-dealer, MOSIPL, and therefore, may not be subject to NASD rule 2711 and NYSE Rule 472 restrictions on communication with a subject company, public appearances and trading securities held by a research analyst account. For Singapore In Singapore, this report is being distributed by Motilal Oswal Capital Markets Singapore Pte Ltd (“MOCMSPL”) (Co.Reg. NO. 201129401Z) which is a holder of a capital markets services license and an exempt financial adviser in Singapore.As per the approved agreement under Paragraph 9 of Third Schedule of Securities and Futures Act (CAP 289) and Paragraph 11 of First Schedule of Financial Advisors Act (CAP 110) provided to MOCMSPL by Monetary Authority of Singapore. Persons in Singapore should contact MOCMSPL in respect of any matter arising from, or in connection with this report/publication/communication. This report is distributed solely to persons who qualify as “Institutional Investors”, of which some of whom may consist of "accredited" institutional investors as defined in section 4A(1) of the Securities and Futures Act, Chapter 289 of Singapore (“the SFA”). Accordingly, if a Singapore person is not or ceases to be such an institutional investor, such Singapore Person must immediately discontinue any use of this Report and inform MOCMSPL. Specific Disclosures 1 MOFSL, Research Analyst and/or his relatives does not have financial interest in the subject company, as they do not have equity holdings in the subject company. 2 MOFSL, Research Analyst and/or his relatives do not have actual/beneficial ownership of 1% or more securities in the subject company 3 MOFSL, Research Analyst and/or his relatives have not received compensation/other benefits from the subject company in the past 12 months 4 MOFSL, Research Analyst and/or his relatives do not have material conflict of interest in the subject company at the time of publication of research report 5 Research Analyst has not served as director/officer/employee in the subject company 6 MOFSL has not acted as a manager or co-manager of public offering of securities of the subject company in past 12 months 7 MOFSL has not received compensation for investment banking/ merchant banking/brokerage services from the subject company in the past 12 months 8 MOFSL has not received compensation for other than investment banking/merchant banking/brokerage services from the subject company in the past 12 months 9 MOFSL has not received any compensation or other benefits from third party in connection with the research report 10 MOFSL has not engaged in market making activity for the subject company

Britannia
19 June 2020 20
******************************************************************************************************************************** The associates of MOFSL may have: - financial interest in the subject company - actual/beneficial ownership of 1% or more securities in the subject company - received compensation/other benefits from the subject company in the past 12 months - other potential conflict of interests with respect to any recommendation and other related information and opinions.; however the same shall have no bearing whatsoever on the
specific recommendations made by the analyst(s), as the recommendations made by the analyst(s) are completely independent of the views of the associates of MOFSL even though there might exist an inherent conflict of interest in some of the stocks mentioned in the research report.
- acted as a manager or co-manager of public offering of securities of the subject company in past 12 months - be engaged in any other transaction involving such securities and earn brokerage or other compensation or act as a market maker in the financial instruments of the
company(ies) discussed herein or act as an advisor or lender/borrower to such company(ies) - received compensation from the subject company in the past 12 months for investment banking / merchant banking / brokerage services or from other than said services.
The associates of MOFSL has not received any compensation or other benefits from third party in connection with the research report Above disclosures include beneficial holdings lying in demat account of MOFSL which are opened for proprietary investments only. While calculating beneficial holdings, It does not consider demat accounts which are opened in name of MOFSL for other purposes (i.e holding client securities, collaterals, error trades etc.). MOFSL also earns DP income from clients which are not considered in above disclosures. Analyst Certification The views expressed in this research report accurately reflect the personal views of the analyst(s) about the subject securities or issues, and no part of the compensation of the research analyst(s) was, is, or will be directly or indirectly related to the specific recommendations and views expressed by research analyst(s) in this report. Terms & Conditions: This report has been prepared by MOFSL and is meant for sole use by the recipient and not for circulation. The report and information contained herein is strictly confidential and may not be altered in any way, transmitted to, copied or distributed, in part or in whole, to any other person or to the media or reproduced in any form, without prior written consent of MOFSL. The report is based on the facts, figures and information that are considered true, correct, reliable and accurate. The intent of this report is not recommendatory in nature. The information is obtained from publicly available media or other sources believed to be reliable. Such information has not been independently verified and no guaranty, representation of warranty, express or implied, is made as to its accuracy, completeness or correctness. All such information and opinions are subject to change without notice. The report is prepared solely for informational purpose and does not constitute an offer document or solicitation of offer to buy or sell or subscribe for securities or other financial instruments for the clients. Though disseminated to all the customers simultaneously, not all customers may receive this report at the same time. MOFSL will not treat recipients as customers by virtue of their receiving this report. Disclaimer: The report and information contained herein is strictly confidential and meant solely for the selected recipient and may not be altered in any way, transmitted to, copied or distributed, in part or in whole, to any other person or to the media or reproduced in any form, without prior written consent. This report and information herein is solely for informational purpose and may not be used or considered as an offer document or solicitation of offer to buy or sell or subscribe for securities or other financial instruments. Nothing in this report constitutes investment, legal, accounting and tax advice or a representation that any investment or strategy is suitable or appropriate to your specific circumstances. The securities discussed and opinions expressed in this report may not be suitable for all investors, who must make their own investment decisions, based on their own investment objectives, financial positions and needs of specific recipient. This may not be taken in substitution for the exercise of independent judgment by any recipient. Each recipient of this document should make such investigations as it deems necessary to arrive at an independent evaluation of an investment in the securities of companies referred to in this document (including the merits and risks involved), and should consult its own advisors to determine the merits and risks of such an investment. The investment discussed or views expressed may not be suitable for all investors. Certain transactions -including those involving futures, options, another derivative products as well as non-investment grade securities - involve substantial risk and are not suitable for all investors. No representation or warranty, express or implied, is made as to the accuracy, completeness or fairness of the information and opinions contained in this document. The Disclosures of Interest Statement incorporated in this document is provided solely to enhance the transparency and should not be treated as endorsement of the views expressed in the report. This information is subject to change without any prior notice. The Company reserves the right to make modifications and alternations to this statement as may be required from time to time without any prior approval. MOFSL, its associates, their directors and the employees may from time to time, effect or have effected an own account transaction in, or deal as principal or agent in or for the securities mentioned in this document. They may perform or seek to perform investment banking or other services for, or solicit investment banking or other business from, any company referred to in this report. Each of these entities functions as a separate, distinct and independent of each other. The recipient should take this into account before interpreting the document. This report has been prepared on the basis of information that is already available in publicly accessible media or developed through analysis of MOFSL. The views expressed are those of the analyst, and the Company may or may not subscribe to all the views expressed therein. This document is being supplied to you solely for your information and may not be reproduced, redistributed or passed on, directly or indirectly, to any other person or published, copied, in whole or in part, for any purpose. This report is not directed or intended for distribution to, or use by, any person or entity who is a citizen or resident of or located in any locality, state, country or other jurisdiction, where such distribution, publication, availability or use would be contrary to law, regulation or which would subject MOFSL to any registration or licensing requirement within such jurisdiction. The securities described herein may or may not be eligible for sale in all jurisdictions or to certain category of investors. Persons in whose possession this document may come are required to inform themselves of and to observe such restriction. Neither the Firm, not its directors, employees, agents or representatives shall be liable for any damages whether direct or indirect, incidental, special or consequential including lost revenue or lost profits that may arise from or in connection with the use of the information. The person accessing this information specifically agrees to exempt MOFSL or any of its affiliates or employees from, any and all responsibility/liability arising from such misuse and agrees not to hold MOFSL or any of its affiliates or employees responsible for any such misuse and further agrees to hold MOFSL or any of its affiliates or employees free and harmless from all losses, costs, damages, expenses that may be suffered by the person accessing this information due to any errors and delays. Registered Office Address: Motilal Oswal Tower, Rahimtullah Sayani Road, Opposite Parel ST Depot, Prabhadevi, Mumbai-400025; Tel No.: 022 71934200/ 022-71934263; Website www.motilaloswal.com.CIN no.: L67190MH2005PLC153397.Correspondence Office Address: Palm Spring Centre, 2nd Floor, Palm Court Complex, New Link Road,
Malad(West), Mumbai- 400 064. Tel No: 022 7188 1000. Registration Nos.: Motilal Oswal Financial Services Limited (MOFSL)*: INZ000158836(BSE/NSE/MCX/NCDEX); CDSL and NSDL: IN-DP-16-2015; Research Analyst: INH000000412. AMFI: ARN - 146822; Investment Adviser: INA000007100; Insurance Corporate Agent: CA0579;PMS:INP000006712. Motilal Oswal Asset Management Company Ltd. (MOAMC): PMS (Registration No.: INP000000670); PMS and Mutual Funds are offered through MOAMC which is group company of MOFSL. Motilal Oswal Wealth Management Ltd. (MOWML): PMS (Registration No.: INP000004409) is offered through MOWML, which is a group company of MOFSL. Motilal Oswal Financial Services Limited is a distributor of Mutual Funds, PMS, Fixed Deposit, Bond, NCDs,Insurance Products and IPOs.Real Estate is offered through Motilal Oswal Real Estate Investment Advisors II Pvt. Ltd. which is a group company of MOFSL. Private Equity is offered through Motilal Oswal Private Equity Investment Advisors Pvt. Ltd which is a group company of MOFSL. Research & Advisory services is backed by proper research. Please read the Risk Disclosure Document prescribed by the Stock Exchanges carefully before investing. There is no assurance or guarantee of the returns. Investment in securities market is subject to market risk, read all the related documents carefully before investing. Details of Compliance Officer: Name: Neeraj Agarwal, Email ID: [email protected], Contact No.:022-71881085. * MOSL has been amalgamated with Motilal Oswal Financial Services Limited (MOFSL) w.e.f August 21, 2018 pursuant to order dated July 30, 2018 issued by Hon'ble National Company Law Tribunal, Mumbai Bench.