Bull market, really? - Motilal Oswal
216
Company name January 2020 India Strategy Investors are advised to refer through important disclosures made at the last page of the Research Report. Motilal Oswal research is available on www.motilaloswal.com/Institutional-Equities, Bloomberg, Thomson Reuters, Factset and S&P Capital. Gautam Duggad – Research analyst ([email protected]); +91 22 6129 1522 Bull market, really?
-
Upload
khangminh22 -
Category
Documents
-
view
0 -
download
0
Transcript of Bull market, really? - Motilal Oswal

Company name
10 December 2010 1
January 2020
India Strategy
Investors are advised to refer through important disclosures made at the last page of the Research Report. Motilal Oswal research is available on www.motilaloswal.com/Institutional-Equities, Bloomberg, Thomson Reuters, Factset and S&P Capital.
Gautam Duggad – Research analyst ([email protected]); +91 22 6129 1522
Bull market, really?

Contents India Strategy – Bull market, really? ............................................................................................. 3-26
3QFY20 Highlights & Ready Reckoner ......................................................................................... 27-40
Sectors & Companies .................................................................................................................. 41-213 Automobiles .......................................... 42-54 Amara Raja Batt. ............................................. 46 Ashok Leyland ................................................. 46 Bajaj Auto ..................................................... 47 Bharat Forge ................................................... 47 Bosch .............................................................. 48 CEAT ................................................................ 48 Eicher Motors ................................................. 49 Endurance Tech. ............................................. 49 Escorts ............................................................ 50 Exide Inds. ....................................................... 50 Hero Motocorp ............................................... 51 Mahindra & Mahindra .................................. 51 Mahindra CIE .................................................. 52 Maruti Suzuki .................................................. 52 Motherson Sumi ............................................. 53 Tata Motors .................................................. 53 TVS Motor ....................................................... 54
Capital Goods.......................................... 55-63 ABB ............................................................... 58 Bharat Electronics ........................................... 58 BHEL ............................................................. 59 Blue Star .......................................................... 59 CG Consumer Elect.......................................... 60 Cummins India .............................................. 60 Engineers India................................................ 61 Havells India .................................................... 61 Larsen & Toubro ........................................... 62 Siemens........................................................... 62 Thermax ....................................................... 63 Voltas .............................................................. 63
Cement ................................................... 64-72 ACC ............................................................... 68 Ambuja Cements ............................................. 68 Birla Corporation ............................................. 69 Dalmia Bharat ................................................. 69 Grasim Industries ......................................... 70 India Cements ................................................. 70 J K Cements ..................................................... 71 Ramco Cements .............................................. 71 Shree Cement ................................................. 72 Ultratech Cement............................................ 72
Consumer ............................................... 73-85 Asian Paints ................................................. 77 Britannia ......................................................... 77 Colgate ............................................................ 78 Dabur .............................................................. 78 Emami ............................................................. 79 Godrej Consumer ............................................ 79 GSK Consumer ................................................ 80 Hind. Unilever ................................................. 80 ITC ................................................................... 81 Jyothy Labs ...................................................... 81 Marico ............................................................. 82 Nestle .............................................................. 82 P&G Hygiene ................................................... 83 Page Industries................................................ 83 Pidilite Inds. .................................................... 84 Tata Global ...................................................... 84 United Breweries ............................................ 85 United Spirits .................................................. 85
Financials ............................................... 86-101 AU Small Finance ............................................ 94 Axis Bank ......................................................... 94 Bank of Baroda ............................................. 95 DCB Bank......................................................... 95 Equitas Holdings.............................................. 96 Federal Bank ................................................... 96 HDFC Bank .................................................... 97 ICICI Bank ..................................................... 97 Indian Bank ..................................................... 98 IndusInd Bank ................................................. 98 Kotak Mahindra Bank ...................................... 99 Punjab National Bank ................................... 99 RBL Bank ....................................................... 100 State Bank of India ..................................... 100
HDFC Life Insur. ............................................. 101 ICICI Pru Life .................................................. 101 NBFC ................................................... 102-111 Bajaj Finance.................................................. 105 Chola. Inv & Fin. ............................................. 105 HDFC ........................................................... 106 IndoStar Capital ............................................. 107 L&T Fin.Holdings ............................................ 107 LIC Housing Fin .............................................. 108 M & M Financial ............................................ 108 MAS Financial ................................................ 109 Muthoot Finance ........................................... 109 PNB Housing .................................................. 110 Repco Home Fin ............................................ 110 Shriram City Union......................................... 111 Shriram Transport Fin. ................................... 111 Healthcare ........................................... 112-178 Ajanta Pharma ............................................... 115 Alembic Pharma ............................................ 115 Alkem Lab ...................................................... 116 Aurobindo Pharma ........................................ 116 Biocon ............................................................ 117 Cadila Health ................................................. 117 Cipla ........................................................... 118 Divis Labs ....................................................... 118 Dr Reddy’ s Labs ......................................... 119 Glenmark Pharma .......................................... 119 Granules India ............................................... 120 GSK Pharma ............................................... 120 IPCA Labs. ...................................................... 121 Jubilant Life ................................................... 121 Laurus Labs .................................................... 122 Lupin .............................................................. 122 Strides Pharma .............................................. 123 Sun Pharma ................................................... 123 Torrent Pharma ............................................. 124 Infrastructure ...................................... 125-128 Ashoka Buildcon ............................................ 127 IRB Infra ......................................................... 127 KNR Constructions ......................................... 128 Sadbhav Engineering ..................................... 128 Logistics .............................................. 129-133 Allcargo Logistics ........................................... 132 Concor ........................................................... 132 Gateway Distriparks ...................................... 133 Media .................................................. 134-142 D B Corp ......................................................... 139 Ent.Network .................................................. 139 Jagran Prakashan ........................................... 140 Music Broadcast ............................................ 140 PVR ................................................................ 141 Sun TV............................................................ 141 Zee Entertainment ......................................... 142 Metals ................................................. 143-215 Hindalco ...................................................... 147 Hindustan Zinc ............................................... 147 JSPL ................................................................ 148 JSW Steel ....................................................... 148 Nalco ............................................................. 149 NMDC ............................................................ 149 SAIL ................................................................ 150 Tata Steel ....................................................... 150 Vedanta ......................................................... 151 Oil & Gas ............................................. 152-165 Aegis Logistics ................................................ 158 BPCL ............................................................ 158 Castrol India................................................... 159 GAIL ............................................................ 159 Gujarat Gas .................................................... 160 Gujarat State Petronet .................................. 160 HPCL ........................................................... 161
Indraprastha Gas ........................................... 161 IOC ............................................................. 162 Mahanagar Gas ............................................. 162 MRPL ............................................................. 163 Oil India ......................................................... 163 ONGC ......................................................... 164 Petronet LNG ................................................ 164 Reliance Inds. ................................................ 165 Retail - A .............................................. 166-169 Jubilant Foodworks ....................................... 169 Titan Company .............................................. 169 Retail - B .............................................. 170-178 Aditya Birla Fashion ....................................... 175 Avenue Supermarts ....................................... 175 Future Lifestyle ............................................. 176 Future Retail.................................................. 176 Shoppers Stop ............................................... 177 Trent ............................................................. 177 V-Mart Retail ................................................. 178 Technology .......................................... 179-189 Cyient ............................................................ 183 HCL Technologies .......................................... 183 Hexaware Tech. ............................................. 184 Infosys ........................................................ 184 L&T Infotech .................................................. 185 Mindtree ....................................................... 185 MphasiS ........................................................ 186 NIIT Tech. ...................................................... 186 Persistent Systems ........................................ 187 TCS ................................................................ 187 Tech Mahindra .............................................. 188 Wipro .......................................................... 188 Zensar Tech ................................................... 189 Telecom ............................................... 190-196 Bharti Airtel ................................................... 195 Bharti Infratel ................................................ 195 Tata Comm .................................................... 196 Vodafone Idea ............................................... 196 Utilities ................................................ 197-202 CESC .............................................................. 199 Coal India ...................................................... 199 JSW Energy .................................................... 200 NHPC ............................................................. 200 NTPC ............................................................. 201 Power Grid Corp. ........................................... 201 Tata Power ................................................ 202 Torrent Power ............................................... 202 Others.................................................. 203-214 Brigade Enterpr. ............................................ 203 BSE ................................................................ 203 Coromandel International ............................. 204 Delta Corp ..................................................... 204 Godrej Agrovet .............................................. 205 Indian Hotels ................................................. 205 Info Edge ....................................................... 206 Interglobe Aviation........................................ 206 Kaveri Seed.................................................... 207 Lemon Tree Hotel .......................................... 207 MCX ............................................................... 208 Navneet Education ........................................ 208 Oberoi Realty ................................................ 209 P I Industries.................................................. 209 Phoenix Mills ................................................. 210 Quess Corp .................................................... 210 S H Kelkar ...................................................... 211 SRF ................................................................ 211 Tata Chemicals .............................................. 212 Team Lease Serv. ........................................... 212 Trident .......................................................... 213 UPL ................................................................ 213

January 2020 3
India Strategy | Bull market, really?
Earnings still tepid; Financials to drive aggregates
Another modest quarter of earnings ahead; tax cuts to provide some cheer With the Nifty near all-time highs and FII flows at a five-year high, one wouldn’t
be too amiss to conclude that India is in the midst of a major bull market. However, the reality is different. Economic growth momentum has decelerated, while corporate earnings have remained tepid for the last two years. CY19 turned out to be a year where the markets got further polarized in terms of both earnings and performance. While the Nifty delivered 12% returns, the Nifty Midcap-100 and Nifty Smallcap-100 were down 4% and 9%, respectively. Even within the Nifty, the divergence between the top 15 stocks by market cap and the rest has widened to 50%. Cumulatively over two years, the Nifty has now outperformed the Nifty Midcap-100 and Nifty Smallcap-100 by 35% and 51%, respectively. This to an extent is also a reflection of growth polarization and the heightened preference for quality in a slowing economy.
In our view, this polarization will reverse only if growth recovers and gets broad-based. From that perspective, CY20 holds some promise. The government and the RBI have taken some steps to revive growth, the effect of which will be visible with a lag. Some sectors are showing signs of stability/bottoming out with support from festive season demand and few macro indicators like Services PMI have also bounced. The forthcoming budget will be a crucial policy event with the market focus on: [a] potential near-term demand-booster from the government and [b] the contours of fiscal deficit arithmetic. Meanwhile, the recent geopolitical flare-up between the US and Iran has led to a spike in crude prices and intensified macro worries.
Corporate tax cuts have prevented a further slide in earnings estimates. Nonetheless, the FY20 corporate earnings story is all about Financials, with Nifty ex-BFSI earnings expected to decline 2% for the year. The upcoming earnings-report season will likely mark one more quarter of muted earnings.
We estimate MOFSL Universe’s 3QFY20 PBT/PAT to increase by 1%/9% YoY, led by BFSI (estimated to contribute 81% of incremental profit YoY), Automobile (low base effect) and Consumer (beneficiary of tax cuts). However, Metals/O&G are likely to drag the performance, given the underlying weak commodity prices. Telecom is expected to sharply reduce losses YoY, which will support earnings. Ex-BFSI, MOFSL Universe’s PBT is estimated to decline by 5% and PAT to increase by 2% YoY. We estimate Nifty PBT/PAT to increase 2%/8% YoY. Ex-BFSI, we expect Nifty PBT/PAT to decline 6%/2% YoY. Our FY20 Nifty EPS estimate has been stable at INR532. We now build in EPS growth of 10% for FY20.
Top Picks Large-Caps: ICICI Bank, SBI, Bharti Airtel, L&T, Infosys, Hindustan Unilever,
Eicher Motors, Ultratech. Mid-Caps: Indian Hotels, Ashok Leyland, ABFRL, L&T Infotech, Tata Global, JK
Cement, Alkem Labs, Crompton Consumer.
India Strategy BSE Sensex: 40,869 Nifty 50: 12,053

January 2020 4
India Strategy | Bull market, really?
Key sectoral trends/highlights Auto Universe’s PAT is expected to increase by 26% YoY in 3QFY20 off a weak
base (-23% YoY in 3QFY19) and entirely led by Tata Motors – first quarter of growth after six consecutive quarters of a profit decline. Ex-Tata Motors, Auto Universe’s PAT is expected to be down 7.5% YoY. We expect the EBITDA margin to expand by 180bp YoY/50bp QoQ to 12%. We expect Maruti and Bajaj Auto to report healthy double-digit profit growth, while Hero, M&M, TVS, Eicher and Ashok Leyland are expected to report a YoY profit decline.
Technology Universe's revenue/EBITDA/PAT are estimated to grow 8%/8%/5% YoY in 3QFY20. We expect single-digit profit growth across tier-1, barring Infosys (one-off in base). Tech Mahindra/Wipro are likely to report a YoY profit decline.
Private Banks are expected to report a healthy quarter (15% PPoP, 28% PBT and 40% PAT growth). ICICI Bank, Kotak Mahindra Bank, IndusInd, AU and HDFC Bank are expected to deliver strong YoY PAT growth.
NBFCs are likely to post PBT/PAT growth of 7%/20% YoY, led by Bajaj Finance (BAF). Ex-BAF, PBT/PAT growth is estimated at 1%/13%. BAF is expected to post another strong quarter with 55% profit growth. Chola (31%), Muthoot (31%) and MMFS (22%) are expected to deliver healthy profit growth, while LTFH, MAS, SHTF and SCUF are likely to deliver subdued growth in profitability.
PSU Banks are expected to post profit of INR66b, driven by SBI (PAT of INR72b), while Telecom is expected to report a loss for the 10th straight quarter.
Consumer Universe profits are expected to increase 17% YoY, led by tax cuts. PBT growth is expected to be modest at 4% YoY. Nestle (34%), Pidilite (20% YoY) and ITC (23%) are expected to exhibit a strong performance, while Godrej Consumer, Marico and UBBL are expected to post weak results.
Metals are expected to post a decline of 29%/59%/66% YoY in EBITDA/PBT/PAT. We do not expect profit growth YoY for any of our Metal coverage company.
Oil & Gas is expected to report a flattish PBT/PAT performance, dragged by 40% YoY decline in ONGC PAT. OMCs are expected to post strong YoY profit growth off a benign base (inventory losses in base). RIL is expected to deliver a 3% EBITDA decline and flattish 4% profit growth. Ex-OMCs, we expect a 14% decline in profits for O&G.
Cement is expected to post 18%/24%/21% EBITDA/PBT/PAT growth YoY off a low base (1% profit decline in base), led by higher YoY realization and lower costs. Ultratech is expected to post 87% profit growth YoY, ex of which Cement Universe profits are expected to be up 4% YoY. ACC, Ambuja and Shree are expected to post 44%, 37% and 16% profit growth YoY, respectively.
Capital Goods Universe is expected to report flat PBT and 13% YoY profit growth, led by L&T (27% profit growth). Ex-L&T, profit is expected to decline 2.7% YoY. ABB/Thermax/Voltas are expected to post 34%/30%/34% YoY profit growth, while BEL (-39%), Cummins (-4%), Siemens (0%) and Havells (0%) are expected to report a subdued performance.
Utilities sector’s PBT is expected to decline 11%, while PAT is expected to stay flat YoY, dragged by Coal India (-39%/-26% YoY PBT/PAT). Power Grid (PAT: +8%) and NTPC (+21%) are expected to lead the performance.
Healthcare is likely to deliver another muted quarter with 4% profit growth. Large-cap names like Lupin/Dr Reddy/Aurobindo are expected to post 1%/-7%/-2% profit growth, while Cipla/Sun’s profits are likely to grow by 22%/12% YoY.
Sources of exhibits in this report include Bloomberg, SEBI, NSE, Capitaline, Companies, and MOFSL database

January 2020 5
India Strategy | Bull market, really?
Model portfolio Our model portfolio construction is premised on earnings visibility, balance
sheet/cash flow comfort and market leadership position. Over the last two quarters, we have added/raised weights in a few high-quality Cyclicals in the portfolio, given their attractive valuations and improved business prospects. We maintain our positive stance on Financials, Consumption, IT and Telecom, and underweight stance on Commodities (Metals, Oil & Gas).
BFSI: We stay overweight on corporate banks. Our preferred picks are SBI, ICICI and Axis Bank. Large-ticket resolutions in IBC will boost the earnings of Corporate Banks in 3QFY20. In some Banks, value unlocking from subsidiaries is expected to provide further upside.
In NBFC, we maintain weights in HDFC, and replace MMFS with LTFH. Focused retailization strategy and reducing reliance on wholesale lending are likely to drive a re-rating of LTFH, in our view. It is one of the few NBFCs to maintain AAA credit rating across agencies, despite the higher share of wholesale loans. AMC business provides a strong option value.
Consumer: We retain HUL, ITC and Titan in the model portfolio. We continue liking HUL in staples, given the solid volume/margin outperformance versus industry. Integration with GSK Consumer will offer further margin synergies. ITC’s valuations at 18x FY21E EPS are attractive and discount most concerns. We are replacing Marico with Tata Global. TGB has shifted its focus back to the highly profitable India beverage business in order to build a dominant, natural beverages brand in the country.
Information Technology and Telecom: In IT, we are replacing Tech Mahindra with HCL Tech. As the trend of repatriation of workloads from public cloud to on-premise/hybrid cloud picks up, HCL will benefit the most given its stronghold in IMS. We expect up to ~5pp organic growth outperformance versus the top two over FY21-22. We are also introducing L&T Infotech in the portfolio. Over the past four years, LTI has continuously strengthened the moats around its business through a slew of measures. Client-specific issues – which had led to a muted performance over 9MCY18 – now appear to be largely behind. We further raise weights in Bharti Airtel, given the improving underlying business dynamics in the Telecom sector post the tariff hikes by key players.
In Oil & Gas, we are marginally cutting our weights in RIL after its recent sharp outperformance and the challenging context for the petrochemicals segment.
In Cement, we are raising the weight in Ultratech. Market mix has improved post-acquisition, with north/central India (both have better utilization outlook) contributing ~45% of volumes and the share of weaker regions (south/east) declining. We estimate a CAGR of 26% in EBITDA and 48% in EPS over FY19-21.
In Automobile, we are adding Eicher Motors. EIM is relatively well placed for BS6 transition due to the 5-7% price hike and more importantly the complete upgrade of the core portfolio post BS6 transition. We are raising the weight of Ashok Leyland. We believe worst is over for the CV industry, although volumes will remain volatile due to the upcoming BS6 transition. Unlike in the previous cycles, AL is on a very strong footing (lean cost structure/net cash balance sheet) and focused on adding new revenue/profit pools.

January 2020 6
India Strategy | Bull market, really?
Earnings still tepid; Financials to drive 3QFY20 Commodities continue to be a drag
Markets entered the new year after an eventful CY19 when the Nifty returned 12%, driven by USD14.2b FII inflows (highest in five years) even as GDP growth decelerated sharply and corporate earnings remained weak. Government announced several steps to revive growth, the impact of which is not yet visible.
After cutting repo rates by 135bp since Feb’19, the RBI maintained status quo in its latest meeting in Dec’19. It has also revised down the GDP growth estimate sharply to 5% for FY20 (~200bp revision since Aug’19). High frequency data remain weak yet. However, there are some silver linings to the dark clouds. Festive season in Oct-Nov’19 – although not blockbuster – was healthy. GST collections have moved up and came in at INR1t+ plus for Nov’19 and Dec’19. Better-than-expected monsoon and strong reservoir levels augur well for the Rabi season and rural India. Recent pick-up in inflation will also likely be positive for the rural pockets. We expect the government to unveil more steps to revive consumption demand in the forthcoming budget.
Overall, as far as the 3QFY20 earnings season is concerned, it will be more of the same with Financials driving the quarter and Commodities dragging it. Corporate commentary on the underlying demand scenario and any sequential improvement post government announcements will be the key monitorables. We believe that FY21 consensus estimates are factoring in a sharp recovery in earnings and have downside risks.
Financials to drive 3Q earnings; Ex-Financials, MOSL PBT to decline 5% YoY The reduction in the corporate tax rates will result in several adjustments in the
taxation charge in this quarter as well. Thus, we place more emphasis on analyzing PBT metrics for a more meaningful comparison.
MOFSL Universe's PBT is expected to grow by 1% and PAT by 9% YoY in 3QFY20, singularly led by Financials. Auto is also expected to rebound off a low base after six straight quarters of a profit decline. Consumers will benefit from tax cuts and post robust 17% profit growth. Reduction in losses in Telecom will also be accretive at the aggregate level. Metals will be a big drag with 59%/66% PBT/PAT decline YoY.
Ex-Financials, MOSL Universe PBT is expected to decline 5% YoY, while PAT is expected to increase 2% YoY. Ex-Metals, MOSL Universe PBT/PAT are expected to increase 7%/17% YoY.
Approximately 35% of MOFSL Universe are expected to post a YoY decline in PAT, while 41% are expected to deliver >15% growth.
Domestic Cyclicals are expected to contribute 42% of the profit pool, followed by Defensives (31%). The share of Global Cyclicals at 27% will be the lowest since Sep’16. Its share in the profit pool has been trending down after hitting a high of 53% in Mar'18.
3QFY20 PREVIEW

January 2020 7
India Strategy | Bull market, really?
We expect MOFSL Universe's revenue to decline 3% YoY (on the base of 21% growth in 3QFY19) – the worst in 14 quarters and the second consecutive YoY decline, largely due to (a) the correction in commodity prices, which is leading Metals to post the third consecutive quarter of a decline in YoY top-line performance (-14%) and Oil & Gas to post a 11% YoY decline and (b) the continued slowdown in Automobiles, where revenues are expected to be down 3% YoY – the third consecutive quarter of a decline.
MOFSL Universe EBITDA growth is estimated at 9% YoY – best in five quarters. The operating margin ex-Financials and OMCs is expected to expand by 40bp YoY to 19.3%.
Global Cyclicals are expected to post the fifth consecutive quarter of PAT decline (-16% YoY) after five straight quarters of strong double-digit growth, impacted by the correction in commodity prices.
Defensives are expected to post 21% YoY profit growth off a benign base (8% YoY decline in PAT in 3QFY19), as Telecom Universe is expected to post a sharp YoY reduction in its losses. Consumer Universe, however, is likely to post 17% growth in profit, aided by tax cuts.
For 3QFY20, Domestic Cyclicals' EBITDA and PAT are expected to grow by 16% and 22% YoY, respectively, off a high base, driven by Financials. Domestic Cyclicals have posted profit growth of 36%, 268%, 55% and 34% YoY in 3QFY19, 4QFY19, 1QFY20 and 2QFY20, respectively.
Earnings breadth weak; one third of universe to post PAT decline YoY Earnings breadth is likely to remain very weak, with 35% of the MOFSL Universe
expected to post a YoY decline in PAT. The number of companies reporting >30% growth is expected to decline from 31% to 22%, while that of companies reporting 0-15% growth will likely remain stable at ~23%.
Financials are expected to contribute 81% of incremental earnings of the MOSL Universe in 3QFY20. Metals Universe is expected to post a sharp 66% YoY decline in profits, while Oil & Gas is expected to have a flattish quarter. Among other sectors, Capital Goods/Cement are expected to post 13%/21% profit growth, while Consumer, Pharma and Tech Universe are expected to deliver 17%, 4% and 5% YoY earnings growth, respectively
Nifty sales are expected to decline 3% YoY, while EBITDA/PBT/PAT are estimated to grow by 7%/2%/8% YoY in 3QFY20. Ex-Financials, Nifty PBT and PAT are expected to decline by 6% and 2% YoY, respectively.
Nifty EPS marginally tweaked for FY20: Our FY20 Nifty EPS estimates have been marginally tweaked to INR532 (prior: INR538). We are now building in EPS growth of 10% for the Nifty for FY20. Financials are expected to account for 119% of incremental earnings. Excluding Financials, Nifty profits are likely to decline by 2% in FY20 – the worst in four years. Corporate Banks are likely to account for 82% of incremental profit growth for the Nifty in FY20. Excluding corporate banks, we are expecting 2% profit growth for the Nifty in FY20 – the worst in four years. For FY20, major earnings upgrades are in Tata Motors (L to P), Bharti (47%), Maruti (12%), SBI (9%) and Coal India (5%), while the major downgrades are in Grasim Inds (-43%), Axis Bank (21%), ONGC (18%), Vedanta (13%), Tata Steel (12%) and IOC (10%).

January 2020 8
India Strategy | Bull market, really?
Exhibit 1: Financials to account for 81% of incremental earnings of MOSL Universe in 3QFY20
SECTOR SALES EBITDA NET PROFIT PAT Delta EBITDA Margins
PAT Margins
(NO OF COMPANIES) Dec-19 Var % YoY
Var % QoQ Dec-19 Var %
YoY Var % QoQ Dec-19 Var %
YoY Var % QoQ
PAT Delta
Share %
Share %
Chg bp YoY
Chg bp YoY
High growth sectors 3,324 5 7 1,056 19 3 454 32 27 110 37 113 371 278 Others (22) 391 23 4 77 39 48 34 45 137 11 3 11 221 134 Private Banks (10) 386 17 4 324 15 2 167 40 55 48 13 49 -170 699 PSU Banks (4) 383 15 1 259 27 -9 66 36 42 17 5 18 656 268 Auto (17) 1,662 -3 11 199 15 15 82 26 10 17 7 17 184 112 Cement (10) 335 2 8 64 18 8 24 21 4 4 2 4 264 112 NBFC (13) 167 13 1 134 12 -1 81 20 -10 13 7 14 -68 287 Med/Low growth sectors 8,842 -4 3 1,415 8 3 781 5 -3 36 63 37 177 74 Consumer (18) 543 6 3 132 8 0 100 17 -7 14 8 15 41 175 Retail (9) 266 12 16 25 21 26 14 13 36 2 1 2 70 4 Capital Goods (12) 651 11 9 70 11 11 42 13 9 5 3 5 -1 10 Life Insurance (2) 171 19 10 6 19 -6 6 12 0 1 0 1 -1 -20 Technology (13) 1,191 8 3 281 8 6 204 5 3 10 16 10 -13 -54 Healthcare (19) 484 6 0 100 4 0 56 4 -3 2 4 2 -39 -22 Logistics (3) 40 9 2 6 26 0 3 3 0 0 0 0 213 -52 Media (7) 55 1 8 18 -6 15 11 2 -2 0 1 0 -245 10 Oil & Gas (15) 4,727 -11 2 517 12 2 245 1 -2 2 20 2 231 64 Utilities (8) 715 -3 0 257 1 0 101 0 -20 0 8 0 144 46 PAT de-growth sectors 1,791 -11 0 383 -8 6 6 -90 -92 -48 0 -50 48 -238 Infrastructure (4) 43 2 17 10 -9 -4 4 -16 6 -1 0 -1 -274 -176 Metals (9) 1,338 -14 -2 221 -29 6 40 -66 -69 -76 3 -78 -342 -443 Telecom (4) 411 3 3 153 57 6 -38 Loss Loss 28 -3 29 1,286 731 MOFSL (199) 13,958 -2.9 3.7 2,854 9.1 3.5 1,241 8.5 0.8 97 100 100 224 93 MOFSL Excl. OMCs (196) 11,545 0.8 4.0 2,735 5.3 2.8 1,193 5.7 -0.4 102 48 Sensex (30) 5,670 2.3 4.0 1,604 6.2 0.0 803 10.6 4.9 105 106 Nifty (50) 10,001 -3.3 4.1 2,242 7.3 2.4 1,005 7.7 2.5 221 102
Exhibit 2: MOFSL Universe: PBT is expected to grow by 1% and PAT by 9% YoY SECTOR PBT (INR b) Adjusted PAT (INR b)
(NO OF COMPANIES) Dec-18 Sep-19 Dec-19 Var % YoY
Var % QoQ Dec-18 Sep-19 Dec-19 Var %
YoY Var % QoQ
Auto (17) 94 98 112 19.9 14.0 65 75 82 25.9 10.0 Capital Goods (12) 61 55 61 0.4 10.3 37 39 42 12.5 8.8 Cement (10) 28 33 35 23.6 6.0 20 24 24 20.6 4.0 Consumer (18) 124 128 129 3.8 0.6 85 107 100 16.9 -6.9 Financials (29) 355 390 427 20.3 9.5 241 250 319 32.7 27.9 Private Banks (10) 173 208 222 28.2 6.7 120 108 167 39.8 54.7 PSU Banks (4) 79 74 95 20.2 28.6 48 46 66 35.8 42.0 Life Insurance (2) 6 6 6 14.9 0.5 5 6 6 12.4 -0.1 NBFC (13) 97 102 104 6.7 1.9 68 89 81 19.6 -9.7 Healthcare (19) 66 71 74 11.4 3.7 54 58 56 4.2 -3.2 Infrastructure (4) 6 5 5 -29.7 -7.9 4 3 4 -16.1 5.7 Logistics (3) 5 4 5 -8.8 1.0 3 3 3 2.8 0.2 Media (7) 17 13 15 -11.7 15.3 11 11 11 1.6 -1.7 Metals (9) 174 62 72 -58.6 16.5 115 127 40 -65.7 -68.8 Oil & Gas (15) 349 322 345 -1.1 7.3 242 250 245 1.0 -2.2 Excl. OMCs (12) 325 281 273 -15.9 -2.7 228 217 197 -13.7 -9.4 Retail (9) 17 13 18 5.1 35.7 12 10 14 13.2 35.7 Technology (13) 260 257 268 3.0 4.2 194 197 204 5.0 3.1 Telecom (4) -61 -57 -59 Loss Loss -66 -63 -38 Loss Loss Utilities (8) 142 152 126 -11.2 -17.4 101 126 101 0.1 -19.6 Others (22) 29 19 44 51.0 128.6 23 14 34 45.7 137.2 MOFSL (199) 1,667 1,568 1,676 0.6 6.9 1,143 1,231 1,241 8.5 0.8 Nifty (50) 1,358 1,268 1,379 1.5 8.8 934 981 1,005 7.7 2.5 Sensex (30) 1,035 1,024 1,082 4.6 5.6 726 766 803 10.6 4.9

January 2020 9
India Strategy | Bull market, really?
MOFSL Universe: Sales decline of 3%, PBT to grow 1%; PAT growth expected at 9% YoY
Exhibit 3: Commodities to drag top line
3
Exhibit 4: Earnings growth expected at 9% YoY despite flattish PBT
Exhibit 5: EBITDA margin to expand by 40bp YoY in 3QFY20
Source: MOFSL
Exhibit 6: PAT margin to stay flat YoY in 3QFY20
Source: MOFSL
Exhibit 7: Key assumptions Macro 1QFY20 2QFY20 3QFY20E 4QFY20E FY20E FY21E FY22E GDP Growth (%) 5.0 4.5 4.0 4.6 4.5 5.4 5.8 IIP Growth (%) 3.0 -0.3 -0.2 1.8 1.0 2.6 3.3 Inflation CPI-RU (%) 3.1 3.4 5.2 5.5 4.3 4.6 4.6 Currency: USD/INR 69.6 70.3 71.2 71.0 70.5 71.3 72.3 Repo Rate (%) 5.40 5.15 5.15 5.15 5.15 5.15 5.00 Interest Rate (%): 1Year CP Rate (Avg) 8.10 7.39 7.15 7.08 7.43 7.42 7.35 10Year G Sec (Avg) 7.21 6.56 6.55 6.51 6.71 6.50 6.42 Sectoral 1QFY20 2QFY20E 3QFY20E 4QFY20E FY20E FY21E FY22E Auto: CV Volume growth (%) -15.4 -42.8 -30.7 -39.8 -32.9 16.5 13.8 Car Volume growth (%) -14.4 -2.0 15.5 25.5 -20.8 16.6 11.1 Banking: Loan Growth (%) 12.0 10.5 8.6 9.0 9.0 12.5 14.2 Cement: Volume growth (%) -3.0 -2.0 3.0 5.0 1.0 6.0 6.0 Capital Goods: L&T order Intake (INRb) 387 483 450 618 1,938 2,146 2,404 Capital Goods: L&T order Intake (% YoY) 6.9 15.3 6.6 9.4 9.6 10.7 12.0 Metal: Steel (USD/Tonne) 656 619 605 613 627 629 632 Aluminum (USD/Tonne) 1,792 1,762 1,750 1,800 1,777 1,850 1,900 Zinc (USD/Tonne) 2,761 2,347 2,500 2,500 2,527 2,450 2,450 Oil: Brent (US$/bbl) 68.5 61.9 62.5 65.0 64.5 65.0 65.0 Oil & Gas: Under Recoveries (INRb) 91.4 50.7 52.2 53.8 248 253 256 Singapore GRM (USD/bbl) 3.5 6.5 1.7 4.0 3.9 6.0 6.0 Technology: $Revenue growth (%) 1.3 1.8 2.4 2.0 8.0 9.1 8.5
* CV volume for Tata Motors and Ashok Leyland; PV Volume for Maruti Suzuki (total volume growth)
14
5
0
-10 -4 -5 -4
4
-1
4 9
15 11 12 15 15
22 25 21
11 7
-2 -3
6
Jun-
14Se
p-14
Dec-
14M
ar-1
5Ju
n-15
Sep-
15De
c-15
Mar
-16
Jun-
16Se
p-16
Dec-
16M
ar-1
7Ju
ne-1
7Se
p-17
Dec-
17M
ar-1
8Ju
ne-1
8Se
p-18
Dec-
18M
ar-1
9Ju
ne-1
9Se
p-19
Dec-
19E
Mar
-20E
34
5
-6 -10
8 2 5
-8
2 7
16 16
-6
15 17
-8
13
3 1
27
3 12 9
18
Jun-
14Se
p-14
Dec-
14M
ar-1
5Ju
n-15
Sep-
15De
c-15
Mar
-16
Jun-
16Se
p-16
Dec-
16M
ar-1
7Ju
ne-1
7Se
p-17
Dec-
17M
ar-1
8Ju
ne-1
8Se
p-18
Dec-
18M
ar-1
9Ju
ne-1
9Se
p-19
Dec-
19E
Mar
-20E
18.9
18
.4
18.3
18
.9 20
.0
18.6
18
.9 20
.2 21
.1
19.8
20
.0
19.2
19
.3 20
.1
20.4
20
.0
20.1
19
.4
18.9
19
.0 19
.7
19.1
19.3
20.6
June
-14
Sep-
14De
c-14
Mar
-15
June
-15
Sep-
15De
c-15
Mar
-16
June
-16
Sep-
16De
c-16
Mar
-17
June
-17
Sep-
17De
c-17
Mar
-18
June
-18
Sep-
18De
c-18
Mar
-19
June
-19
Sep-
19De
c-19
EM
ar-2
0EMOFSL Universe EBITDA Margin LPA: 19.5%
9.9
9.6
9.0
9.7 10
.0
9.7
9.3
10.7
10
.3
9.8
9.4
10.3
9.
4 9.8 9.9 10.2
9.
1 9.
0 8.
5 9.
1 8.
0 9.
5 8.
4 9.
5
June
-14
Sep-
14De
c-14
Mar
-15
June
-15
Sep-
15De
c-15
Mar
-16
June
-16
Sep-
16De
c-16
Mar
-17
June
-17
Sep-
17De
c-17
Mar
-18
June
-18
Sep-
18De
c-18
Mar
-19
June
-19
Sep-
19De
c-19
EM
ar-2
0E
MOFSL Universe PAT Margin LPA: 9.5%

January 2020 10
India Strategy | Bull market, really?
Exhibit 8: 35% of the companies are likely to report PAT decline, while 41% are expected to post >15% PAT growth
41% of the companies would grow at >15% YoY, and 22% of the Universe would report >30% PAT growth. 35% of the Universe would report PAT de-growth.
Exhibit 9: Financials and loss reduction in Telecom to drive aggregate earnings; Metals to drag
Source: MOFSL
32 41 43 51
38 32 39 35 21 21 24 25 25 28 26 24 19 26 24 19 20 26 18 21 22 21 26 26 29 30 29 23 19 25 32 35 41
30 27 26 26 31 22
22 10 17
13 22
21 18 23
24 25 18 22 17 17 19 16 18 18 14 20 22
20 23 16 13
26 13 19 19 19 15
12 16 18
21 15 20
17 16 16 14
16 19
14 14 9 9 10 20 18 18
24 19 16 13 27 17 16 17 22
19 24 16 22
27 25 25
18 17
22 18 16 20 22 20 18
25 17 15
16
21 24 21 23 20 23
32 35 31 27 30 27
25 24 31 34
42 40 31 38 39 42 40 37 38 45
36 26 35 38 47
36 39 37 35 32 34 45 47
32 30 35 23
32 33 38 37 33 35
-15 -11
23
42
26
22
24
9
13
11
4
18
11
9
6
0
-3
8
12
9
17
7
-7
-9
-4
-3
-11
-13
-4
1
18
20
3
10 9
-21
7
5
11
23
8
14
6
June
09
Sep
09De
c 09
Mar
10
June
10
Sep
10De
c 10
Mar
11
June
11
Sep
11De
c 11
Mar
12
June
12
Sep
12De
c 12
Mar
13
June
13
Sep
13De
c 13
Mar
14
June
14
Sep
14De
c 14
Mar
15
June
15
Sep
15De
c 15
Mar
16
June
16
Sep
16De
c 16
Mar
17
June
17
Sep
17De
c 17
Mar
18
June
18
Sep
18De
c 18
Mar
19
June
19
Sep
19De
c 19
E
>30% >15-30% >0-15% <0% Ex OMCs (%)
% o
f MO
FSL
Uni
v. c
ompa
nies
Earnings Gr.
PAT Growth Ex OMCs (%)
1,24
1
1,14
3
48 28 17 17 14 13 11 10 5 4 2 2 2 1 0 0 0
-1 -76
MO
FSL
3QFY
19 P
AT (I
NRb
)
Priv
ate
Bank
s
Tele
com
PSU
Ban
ks
Auto
Cons
umer
NBF
C
Oth
ers
Tech
nolo
gy
Cap
Goo
ds
Cem
ent
Oil
& G
as
Heal
thca
re
Reta
il
Life
Insu
ranc
e
Med
ia
Util
ities
Logi
stic
s
Infr
a
Met
als
MO
FSL
3QFY
20 P
AT (I
NRb
)

January 2020 11
India Strategy | Bull market, really?
Share of Domestic Cyclicals in MOFSL Universe (excl. OMCs) earnings at 44%
Exhibit 10: PAT share of Global Cyclicals estimated at 24% (multi-qtr low) and of Domestic Cyclicals at 44% (multi-qtr high)
Defensives includes Consumer, Healthcare, Technology, Telecom and Utilities Global cyclicals includes Metals, Oil & Gas and JLR Domestic cyclicals includes Automobiles, Banks, Capital Goods, Infrastructure, Cement, Media, NBFCs, Real Estate and Retail
Nifty expected to post 2% PBT growth; PBT ex Financials to decline 6% Nifty PBT is expected to increase 2% YoY, while PAT is likely to grow by 8% YoY
off a similar base (+7% in the base quarter). Ex-Financials, Nifty PBT is likely to decline 6% YoY, while PAT is expected to be
down 2% YoY. Nifty sales are expected to decline 3% YoY off a strong base (+22% in 3QFY19) -
the second consecutive quarter of sales decline. Nifty EBITDA is expected to grow 7% YoY. 16 Nifty companies are expected to report a YoY decline in PAT, while 3 are
expected to post losses. Exhibit 11: Nifty sectoral 3QFY20 PAT change YoY (%)
Source: MOFSL
40
35
32
31
34
35 32
37
36
33
34
35
31
37
36
31
11 29
31
38
33 41
36
44
26
34
41
42
38
35 34
26
24
25
23 25
34
28
28
34
48
34
35 33
35
25
31 24
34 28
26
29
37
40
41
43
40
35 35
36
35
40
36
34 29
32
33
33
33
0%
25%
50%
75%
100%
Mar
-09
June
-09
Sep-
09De
c-09
Mar
-10
June
-10
Sep-
10De
c-10
Mar
-11
June
-11
Sep-
11De
c-11
Mar
-12
June
-12
Sep-
12De
c-12
Mar
-13
June
-13
Sep-
13De
c-13
Mar
-14
June
-14
Sep-
14De
c-14
Mar
-15
June
-15
Sep-
15De
c-15
Mar
-16
June
-16
Sep-
16De
c-16
Mar
-17
June
-17
Sep-
17De
c-17
Mar
-18
June
-18
Sep-
18De
c-18
Mar
-19
June
-19
Sep-
19De
c-19
E
Defensives
Global cyclicals
Domestic cyclicals
LP 82
52 36 31 27 20 14 9 8 8 5
-5 -5 -8 -17 -19
-75
Tele
com
Bank
s-PS
U
Auto
NBF
C
Bank
s-Pv
t
Cap
Goo
ds
Cons
umer
Reta
il
Cem
ent
Heal
thca
re
Nift
y
Tech
nolo
gy
Util
ities
Oil
& G
as
Agro
Che
m
Infr
a
Med
ia
Met
als
Metals, O&G to drag Nifty; BFSI, Auto,
Consumer and Capital Goods to support
Excl. OMCs

January 2020 12
India Strategy | Bull market, really?
Exhibit 12: Nifty Universe PBT and PAT change
PBT (INR M) PBT Adj. PAT (INR M) PAT
Company Sector Dec- 18 Sep-19 Dec- 19 YoY (%) QoQ (%) Dec- 18 Sep-19 Dec- 19 YoY (%) QoQ (%) Bajaj Auto Automobiles 15,591 16,089 16,549 6.1 2.9 11,019 14,024 12,411 12.6 -11.5 Eicher Motors Automobiles 7,479 5,922 6,515 -12.9 10.0 5,330 5,727 5,051 -5.2 -11.8 Hero MotoCorp Automobiles 11,384 10,979 9,309 -18.2 -15.2 7,691 9,196 7,121 -7.4 -22.6 Mahindra & Mahindra Automobiles 15,045 17,582 15,324 1.9 -12.8 14,578 13,548 11,148 -23.5 -17.7 Maruti Suzuki Automobiles 20,601 15,720 22,765 10.5 44.8 14,893 13,586 17,028 14.3 25.3 Tata Motors Automobiles -12,144 5,821 15,235 LP 161.7 -11,551 -1,949 11,144 LP LP Axis Bank Banks - Pvt 21,281 24,332 23,084 8.5 -5.1 16,809 -1,121 17,313 3.0 LP HDFC Bank Banks - Pvt 85,669 89,974 94,581 10.4 5.1 55,859 63,450 70,775 26.7 11.5 ICICI Bank Banks - Pvt 19,023 43,672 51,564 171.1 18.1 16,049 6,550 39,446 145.8 502.3 IndusInd Bank Banks - Pvt 15,103 18,857 20,170 33.6 7.0 9,850 14,010 15,087 53.2 7.7 Kotak Mahindra Bank Banks - Pvt 19,707 21,006 22,097 12.1 5.2 12,909 17,245 16,551 28.2 -4.0 State Bank Banks - PSU 66,187 50,598 105,083 58.8 107.7 39,548 30,117 71,981 82.0 139.0 Bajaj Finance NBFC 16,354 20,224 21,922 34.0 8.4 10,593 15,063 16,441 55.2 9.2 Bajaj Finserv NBFC 22,240 26,270 29,831 34.1 13.6 8,505 12,037 14,766 73.6 22.7 HDFC NBFC 27,502 26,451 28,157 2.4 6.4 20,422 29,805 22,638 10.8 -24.0 Larsen & Toubro Capital Goods 34,012 33,028 37,098 9.1 12.3 18,980 23,085 24,152 27.2 4.6 Grasim Industries Cement 8,770 6,510 4,813 -45.1 -26.1 6,082 5,265 3,465 -43.0 -34.2 Ultratech Cement Cement 5,912 8,962 11,369 92.3 26.9 4,076 5,790 7,617 86.9 31.6 Asian Paints Consumer 9,580 8,369 9,219 -3.8 10.2 6,472 8,450 6,989 8.0 -17.3 Britannia Consumer 4,664 4,994 4,622 -0.9 -7.4 3,007 4,038 3,467 15.3 -14.2 Hind. Unilever Consumer 20,120 23,550 21,983 9.3 -6.7 14,010 18,320 16,048 14.5 -12.4 ITC Consumer 48,212 48,077 48,675 1.0 1.2 32,091 40,231 39,427 22.9 -2.0 Nestle Consumer 5,854 7,080 7,222 23.4 2.0 4,049 6,035 5,408 33.5 -10.4 Cipla Healthcare 4,489 6,810 5,834 30.0 -14.3 3,322 4,714 4,037 21.5 -14.4 Dr Reddy’ s Labs Healthcare 5,805 2,835 5,798 -0.1 104.5 4,852 4,042 4,522 -6.8 11.9 Sun Pharma Healthcare 14,301 14,249 13,948 -2.5 -2.1 9,419 10,556 10,527 11.8 -0.3 Adani Ports Infrastructure 18,209 8,863 15,608 -14.3 76.1 14,086 10,541 11,761 -16.5 11.6 Zee Entertainment Media 8,109 6,760 5,676 -30.0 -16.0 5,247 5,604 4,246 -19.1 -24.2 Hindalco Metals 18,996 16,394 15,735 -17.2 -4.0 14,180 12,436 10,225 -27.9 -17.8 JSW Steel Metals 24,490 7,030 6,684 -72.7 -4.9 16,240 25,600 4,661 -71.3 -81.8 Tata Steel Metals 30,693 46 -80 PL PL 22,517 41,783 -3,722 PL PL Vedanta Metals 34,780 15,440 18,119 -47.9 17.3 15,740 25,240 6,243 -60.3 -75.3 BPCL Oil & Gas 5,895 16,551 16,656 182.5 0.6 4,951 17,084 11,110 124.4 -35.0 GAIL Oil & Gas 25,075 15,355 23,402 -6.7 52.4 16,496 10,643 15,691 -4.9 47.4 IOC Oil & Gas 13,446 8,145 29,870 122.1 266.7 7,168 5,634 19,924 177.9 253.6 ONGC Oil & Gas 120,630 90,383 74,728 -38.1 -17.3 82,627 62,631 49,844 -39.7 -20.4 Reliance Inds. Oil & Gas 144,210 150,010 142,899 -0.9 -4.7 103,760 113,520 107,517 3.6 -5.3 Titan Company Retail 5,997 4,270 6,013 0.3 40.8 4,111 3,143 4,690 14.1 49.2 HCL Technologies Technology 31,910 34,940 37,357 17.1 6.9 26,110 26,510 28,429 8.9 7.2 Infosys Technology 56,710 54,960 58,720 3.5 6.8 36,100 40,190 42,979 19.1 6.9 TCS Technology 107,270 105,290 108,771 1.4 3.3 81,210 80,420 83,050 2.3 3.3 Tech Mahindra Technology 14,838 13,374 13,455 -9.3 0.6 12,029 11,239 10,080 -16.2 -10.3 Wipro Technology 32,403 31,345 31,031 -4.2 -1.0 25,444 25,612 24,823 -2.4 -3.1 Bharti Airtel Telecom -12,135 -6,230 -11,628 Loss Loss -10,407 -11,229 -4,149 Loss Loss Bharti Infratel Telecom 10,375 9,802 10,466 0.9 6.8 6,484 9,662 7,832 20.8 -18.9 Coal India Utilities 70,281 42,785 43,168 -38.6 0.9 45,657 35,243 33,671 -26.3 -4.5 NTPC Utilities 33,467 45,746 40,664 21.5 -11.1 25,526 34,716 30,859 20.9 -11.1 Power Grid Corp. Utilities 29,758 32,827 30,974 4.1 -5.6 23,581 25,097 25,481 8.1 1.5 UPL Others 5,910 4,820 8,165 38.2 69.4 6,113 3,638 5,604 -8.3 54.1 Nifty (50) 1358,460 1268,088 1,379,076 1.5 8.8 933,850 980,761 1005303 7.7 2.5

January 2020 13
India Strategy | Bull market, really?
Exhibit 13: Nifty sales to decline 3% in 3QFY20, dragged by Commodities and Auto
Exhibit 14: 3QFY20 Nifty PAT to grow 8% YoY
Exhibit 15: Nifty EBITDA to post 7% YoY growth – highest in five quarters
15.5
4.5
-1.7
-11.8 -6.2 -8.2 -6.2
1.3
-2.3
3.8 8.3
15.8 10.9 12.3 14.4 15.2
23.6 25.1 22.2
10.3 6.5
-2.5 -3.3
6.1
June
-14
Sep-
14
Dec-
14
Mar
-15
June
-15
Sep-
15
Dec-
15
Mar
-16
June
-16
Sep-
16
Dec-
16
Mar
-17
June
-17
Sep-
17
Dec-
17
Mar
-18
June
-18
Sep-
18
Dec-
18
Mar
-19
June
-19
Sep-
19
Dec-
19E
Mar
-20E
36.4
4.7
-3.2 -9.9
7.3 2.9
10.5
1.9 2.4 5.0 8.4
4.1
-5.2
13.9 15.9
6.8 10.3 10.7 7.3
14.7
4.5 8.3 7.7
21.1
June
-14
Sep-
14
Dec-
14
Mar
-15
June
-15
Sep-
15
Dec-
15
Mar
-16
June
-16
Sep-
16
Dec-
16
Mar
-17
June
-17
Sep-
17
Dec-
17
Mar
-18
June
-18
Sep-
18
Dec-
18
Mar
-19
June
-19
Sep-
19
Dec-
19E
Mar
-20E
17.9
2.6 4.5
-3.8
13.6
3.1
12.1 14.3 11.7
17.9 16.8
5.0
-5.3
18.4 14.4
21.4
30.7
13.8
6.4 6.1 3.0 2.1
7.3 11.1
June
-14
Sep-
14
Dec-
14
Mar
-15
June
-15
Sep-
15
Dec-
15
Mar
-16
June
-16
Sep-
16
Dec-
16
Mar
-17
June
-17
Sep-
17
Dec-
17
Mar
-18
June
-18
Sep-
18
Dec-
18
Mar
-19
June
-19
Sep-
19
Dec-
19E
Mar
-20E
January 2020 14
India Strategy | Bull market, really?
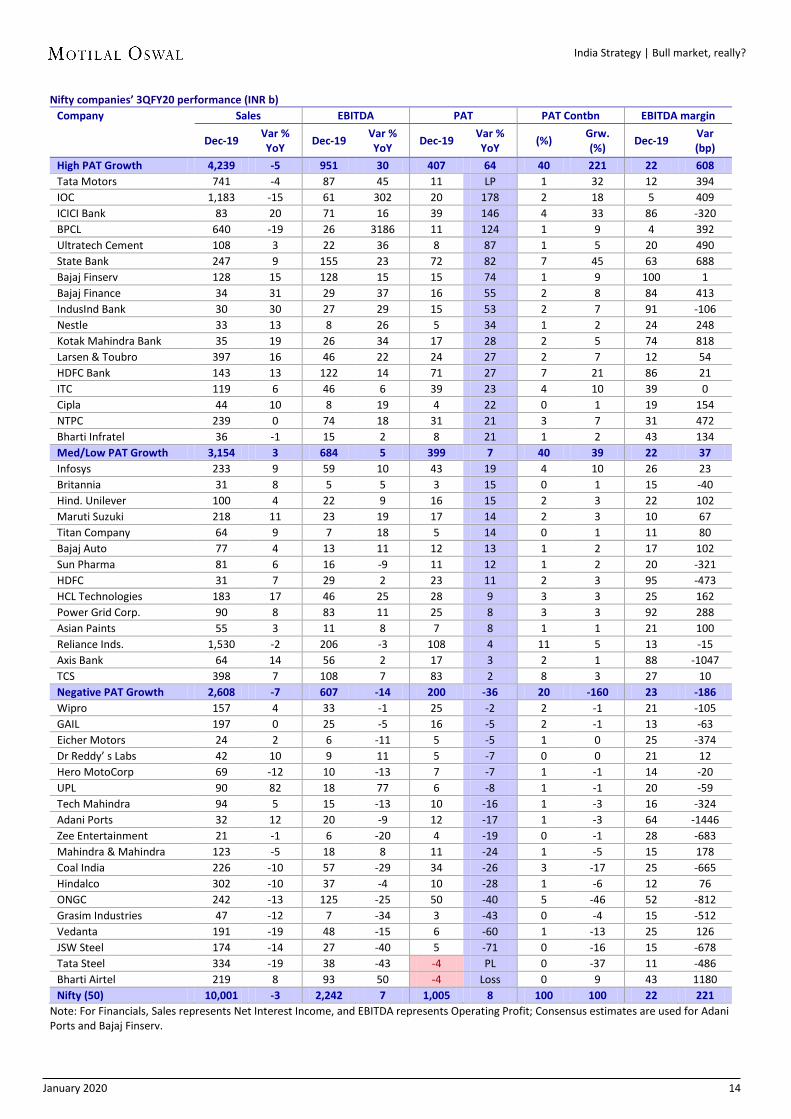
Nifty companies’ 3QFY20 performance (INR b) Company Sales EBITDA PAT PAT Contbn EBITDA margin
Dec-19 Var % YoY Dec-19 Var %
YoY Dec-19 Var % YoY (%) Grw.
(%) Dec-19 Var (bp)
High PAT Growth 4,239 -5 951 30 407 64 40 221 22 608 Tata Motors 741 -4 87 45 11 LP 1 32 12 394 IOC 1,183 -15 61 302 20 178 2 18 5 409 ICICI Bank 83 20 71 16 39 146 4 33 86 -320 BPCL 640 -19 26 3186 11 124 1 9 4 392 Ultratech Cement 108 3 22 36 8 87 1 5 20 490 State Bank 247 9 155 23 72 82 7 45 63 688 Bajaj Finserv 128 15 128 15 15 74 1 9 100 1 Bajaj Finance 34 31 29 37 16 55 2 8 84 413 IndusInd Bank 30 30 27 29 15 53 2 7 91 -106 Nestle 33 13 8 26 5 34 1 2 24 248 Kotak Mahindra Bank 35 19 26 34 17 28 2 5 74 818 Larsen & Toubro 397 16 46 22 24 27 2 7 12 54 HDFC Bank 143 13 122 14 71 27 7 21 86 21 ITC 119 6 46 6 39 23 4 10 39 0 Cipla 44 10 8 19 4 22 0 1 19 154 NTPC 239 0 74 18 31 21 3 7 31 472 Bharti Infratel 36 -1 15 2 8 21 1 2 43 134 Med/Low PAT Growth 3,154 3 684 5 399 7 40 39 22 37 Infosys 233 9 59 10 43 19 4 10 26 23 Britannia 31 8 5 5 3 15 0 1 15 -40 Hind. Unilever 100 4 22 9 16 15 2 3 22 102 Maruti Suzuki 218 11 23 19 17 14 2 3 10 67 Titan Company 64 9 7 18 5 14 0 1 11 80 Bajaj Auto 77 4 13 11 12 13 1 2 17 102 Sun Pharma 81 6 16 -9 11 12 1 2 20 -321 HDFC 31 7 29 2 23 11 2 3 95 -473 HCL Technologies 183 17 46 25 28 9 3 3 25 162 Power Grid Corp. 90 8 83 11 25 8 3 3 92 288 Asian Paints 55 3 11 8 7 8 1 1 21 100 Reliance Inds. 1,530 -2 206 -3 108 4 11 5 13 -15 Axis Bank 64 14 56 2 17 3 2 1 88 -1047 TCS 398 7 108 7 83 2 8 3 27 10 Negative PAT Growth 2,608 -7 607 -14 200 -36 20 -160 23 -186 Wipro 157 4 33 -1 25 -2 2 -1 21 -105 GAIL 197 0 25 -5 16 -5 2 -1 13 -63 Eicher Motors 24 2 6 -11 5 -5 1 0 25 -374 Dr Reddy’ s Labs 42 10 9 11 5 -7 0 0 21 12 Hero MotoCorp 69 -12 10 -13 7 -7 1 -1 14 -20 UPL 90 82 18 77 6 -8 1 -1 20 -59 Tech Mahindra 94 5 15 -13 10 -16 1 -3 16 -324 Adani Ports 32 12 20 -9 12 -17 1 -3 64 -1446 Zee Entertainment 21 -1 6 -20 4 -19 0 -1 28 -683 Mahindra & Mahindra 123 -5 18 8 11 -24 1 -5 15 178 Coal India 226 -10 57 -29 34 -26 3 -17 25 -665 Hindalco 302 -10 37 -4 10 -28 1 -6 12 76 ONGC 242 -13 125 -25 50 -40 5 -46 52 -812 Grasim Industries 47 -12 7 -34 3 -43 0 -4 15 -512 Vedanta 191 -19 48 -15 6 -60 1 -13 25 126 JSW Steel 174 -14 27 -40 5 -71 0 -16 15 -678 Tata Steel 334 -19 38 -43 -4 PL 0 -37 11 -486 Bharti Airtel 219 8 93 50 -4 Loss 0 9 43 1180 Nifty (50) 10,001 -3 2,242 7 1,005 8 100 100 22 221
Note: For Financials, Sales represents Net Interest Income, and EBITDA represents Operating Profit; Consensus estimates are used for Adani Ports and Bajaj Finserv.

January 2020 15
India Strategy | Bull market, really?
FY20 earnings recovery tepid Downside risks remain MOFSL earnings growth estimated at 11% for FY20, 32% for FY21: We estimate
FY20 revenue growth for our MOFSL Universe at 2% (v/s 14.4% CAGR over FY16-19) after three straight years of double-digit growth. Top-line performance will be impacted by Autos/Metals/O&G. We expect the EBITDA margin for our MOFSL Universe (ex-OMCs, Financials) to expand by 40bp to 18.5% in FY20. We expect profits to increase 11% YoY for the MOFSL Universe. Ex-PSU banks, the MOFSL Universe profits are estimated to increase 3% in FY20. Financials alone will likely account for 119% of incremental profits (72% contributed by PSU Banks, 35% by Private Banks), while Cement, Consumer and Capital Goods are expected to post 15%, 18% and 16% PAT growth, respectively. Ex-Financials, FY20 earnings growth for the MOFSL Universe is expected to be -2%. For FY21, we estimate MOFSL Universe sales/EBITDA/PAT growth of 12%/19%/32%.
Nifty profits to grow 9% in FY20, entirely led by Financials: Nifty sales growth is expected to be muted at 2% YoY in FY20. Nifty EBITDA/PAT are likely to grow 6%/9% in FY20. In FY20, 119% of incremental Nifty profits are likely to be contributed by BFSI. In fact, 82% of incremental FY20 profit in the Nifty is expected to accrue from three corporate lenders – Axis, ICICI and SBI. Ex-Corporate Banks, Nifty FY20 profits are likely to grow 2% – lowest in four years. Ex-BFSI, Nifty FY20 profits are expected to decline 2%, again worst in four years.
Exhibit 16: Expect Nifty PAT CAGR of 18% over FY19-21
Sales CAGR (%)
EBIDTA CAGR (%)
EBIDTA Margin
(%)
PAT (INR b)
PAT Gr. / CAGR (%)
PAT Delta Share (%)
Sector (FY19-21) (FY19-21) FY21E FY20E FY21E FY22E FY20E FY21E FY22E (FY19-21) (FY19-21) High PAT CAGR (>20%) 16 19 50.2 1,368 2,110 2,696 91 54 28 72 64 Financials (34) 16 19 67.9 1,200 1,899 2,432 105 58 28 80 60 Banks-PVT (11) 19 21 85.2 610 911 1,149 42 50 26 46 22 Banks-PSU (7) 13 18 72.1 219 553 780 LP 153 41 LP 32 Insurance (2) 19 11 3.8 27 31 36 10 15 18 13 0 NBFC (14) 14 16 84.9 345 405 466 22 17 15 20 6 Others (22) 16 25 19.9 122 149 186 32 22 25 27 3 Retail (9) 17 27 9.6 46 61 78 19 33 27 26 1 Medium PAT CAGR (10-20%) 6 10 13.5 2,364 3,032 3,419 -1 28 13 12 29 Cement (11) 6 16 21.1 135 164 200 15 22 22 19 2 Cap. Goods (13) 12 15 11.8 187 226 264 16 21 17 19 3 Healthcare (19) 11 15 21.9 223 274 309 13 23 13 18 3 Consumer (18) 10 12 24.9 396 445 509 18 12 14 15 5 Media (7) 8 7 33.5 44 50 56 17 12 12 15 1 Auto (17) 2 7 12.9 285 388 477 -9 36 23 11 3 Oil & Gas (15) 6 8 11.5 1,094 1,485 1,604 -11 36 8 10 12 Ex OMCs (12) 7 10 16.5 896 1,153 1,264 -1 29 10 13 11 Low PAT CAGR (up to 10%) 5 11 26.2 1,451 1,698 2,038 -7 17 20 5 7 Utilities (8) 6 14 36.7 481 519 585 7 8 13 7 3 Technology (13) 9 9 23.4 791 886 993 3 12 12 7 5 Logistics (3) 10 14 16.0 14 16 18 -10 11 14 0 0 Metals (9) 1 -2 18.8 313 397 540 -34 27 36 -8 -4 Infrastructure (4) 4 -2 23.5 14 11 10 -14 -20 -15 -17 0 Telecom (4) 12 41 41.1 -161 -130 -108 Loss Loss Loss Loss 2 MOFSL (206) 7 13 21.1 5,183 6,840 8,153 11 32 19 21 100 MOFSL Ex OMCs (203) 7 13 24.4 4,986 6,508 7,812 15 31 20 22 NA Nifty (50) 7 12 21.7 4,173 5,339 6,302 9 28 18 18 NA Sensex (30) 8 14 27.5 3,299 4,205 4,980 18 27 18 23 NA Note: For Banks: Sales = Net Interest Income, EBIDTA = Operating Profits; Note: Sensex & Nifty Numbers are Free Float.
EARNINGS FY20-21

January 2020 16
India Strategy | Bull market, really?
Exhibit 17: Expect Nifty ex corporate lenders PAT CAGR of 12% over FY19-21
Exhibit 18: Nifty profits expected to grow 9% in FY20, entirely led by Financials Profit (INR b) FY17 FY18 FY19 FY20E FY21E Nifty (50) 3,263 3,453 3,821 4,173 5,339 Growth YoY (%) 9 6 11 9 28 Financials 509 459 596 1,013 1,475 Growth YoY (%) -16 -10 30 70 46 Nifty - Ex Financials 2,754 2,994 3,226 3,160 3,864 Growth YoY (%) 15 9 8 -2 22 Corporate Banks 137 25 103 393 670 Growth YoY (%) -55 -82 314 280 71 Nifty - Ex Corporate Banks 3,126 3,428 3,718 3,780 4,669 Growth YoY (%) 16 10 8 2 24 Incremental Nifty PAT 273 190 369 352 1,166 Incremental Corp Banks PAT -165 -112 78 289 277 Incremental Financials PAT -96 -50 137 417 462 Incre. Financials PAT/ Incre. Nifty PAT (%) -35 -26 37 119 40 Incre. Corp Bank PAT/ Incre. Nifty PAT (%) -60 -59 21 82 24
MOFSL Universe earnings to grow 11% in FY20 aided by banks For the MOFSL Universe, we estimate PAT growth of 11% for FY20 (off a base of
12% in FY19), led by a continued recovery in Financials (profits expected to jump 2.1x YoY and contribute ~119% of incremental profits in FY20). Other sectors that are expected to do well are Capital Goods/Cement/Consumer/Retail (+16%/15%/18%/19%).
Auto, Metals, O&G, Technology and Utilities are expected to have a subdued year with earnings growth of (9%), (34%), (11%), 3%, and 7%, respectively.
Nifty EPS stable at INR532 for FY20 Our Nifty EPS estimates are stable at INR532 for FY20 (prior: INR538) but
upgraded by 1.5% to INR693 for FY21 (prior: INR683). We are now building in EPS growth of 10% for the Nifty in FY20. Corporate
Banks are likely to account for 82% of incremental profit growth for the Nifty in FY20, and Financials for 119%. We expect Nifty profit growth of 2% ex-corporate banks and a profit decline of 2% ex-BFSI in FY20.
For FY20, major earnings upgrades are in Tata Motors (L to P), Bharti (47%), Maruti (12%), SBI (9%) and Coal India (5%), while the major downgrades are in Grasim Inds (-43%), Axis Bank (21%), ONGC (18%), Vedanta (13%), Tata Steel (12%) and IOC (10%).
3
15
2
9
16
10 8
2
24
5
13
3 6
9
6
11 9
28
FY13 FY14 FY15 FY16 FY17 FY18 FY19 FY20E FY21E
Nifty Ex Corp. Banks PAT chg. YoY (%) Nifty-50 PAT chg. YoY (%)

January 2020 17
India Strategy | Bull market, really?
Exhibit 19: Top Nifty companies’ EPS upgrades/downgrades since 2QFY20 review (%)
Company FY20E Tata Motors LP Maruti Suzuki 11.6 State Bank 8.8 Coal India 5.3 GAIL -5.1 Bajaj Finserv -6.8 UPL -9.4 IOC -10.4 Tata Steel -12.0 Vedanta -13.3 ONGC -18.4 Axis Bank -21.2 Grasim Industries -43.5
Exhibit 20: Nifty stock absolute FY20E PAT change (INR b)
Exhibit 21: Nifty stock absolute FY21E PAT change (INR b)
4,17
3
3,82
1 21
2 73
62
54
29
26
22
22
20
18
18
18
17
15
15
9 9 9 8 8 6 6 6 4 4 4 3 3 3 3 3 2 1 1 1 2 4 8 9 11
11
15
16
18
22
26
44
62
85
Nift
y-50
FY1
9…SB
IIC
ICI B
kRe
lianc
e In
dHD
FC B
kIT
CIn
dusI
nd B
kBa
jaj F
inan
ceL&
TBh
arti
Airt
elBa
jaj F
inse
rvHD
FCTa
ta M
otor
sKo
tak
Mah
Bk
NTP
CU
ltrat
ech
TCS
Bhar
ti In
frat
elPo
wer
Grid HU
LSu
n Ph
arm
aW
ipro
Asia
n Pa
ints
Adan
i Por
tsAx
is Bk
Baja
j Aut
oZe
e En
tN
estle UPL
Info
sys
Cipl
aHC
L Te
chBr
itann
iaTi
tan
CoDr
Red
dy’s
Te
ch M
ahEi
cher
Mot
Hero
Mot
oCo
al In
dia
M&
MGA
ILHi
ndal
coM
arut
i Suz
uki
Gras
imJS
W S
teel
Veda
nta
BPCL
Tata
Ste
elO
NGC IO
CN
ifty-
50 F
Y20E
…
Nift
y50
FY19
PAT
Nift
y50
FY20
E PA
T 5,
339
4,17
3 17
1 116
86
83
79
76
57
41
32
31
26
24
24
21
20
19
19
18
17
16
14
13
13
11
10
10
10
9 8 7 7 6 6 6 6 5 5 4 4 3 3 3 3 3 3 2 1 1
Nift
y-50
FY2
0E…
Relia
nce
Ind
SBI
ICIC
I Bk
IOC
HDFC
Bk
Axis
BkO
NGC
Tata
Mot
ors
TCS
BPCL
Info
sys
Indu
sInd
Bk
L&T
NTP
CBa
jaj F
inan
ceM
arut
i Suz
uki
Kota
k M
ah B
kJS
W S
teel
HCL
Tech
Tata
Ste
elHU
LHD
FCU
ltrat
ech
Pow
er G
ridBh
arti
Airt
elBa
jaj F
inse
rvM
&M
Sun
Phar
ma
Gras
imAd
ani P
orts
GAIL
UPL ITC
Wip
roHi
ndal
coTe
ch M
ahTi
tan
CoEi
cher
Mot
Hero
Mot
oCo
al In
dia
Zee
Ent
Dr R
eddy
’s
Nes
tleCi
pla
Baja
j Aut
oBr
itann
iaVe
dant
aBh
arti
Infr
atel
Nift
y-50
FY2
1E…
Nift
y50
FY20
E PA
T
Nift
y50
FY21
E PA
T

January 2020 18
India Strategy | Bull market, really?
Exhibit 22: Nifty performance - expect FF PAT CAGR (FY19-21) of 21%
Sales (INR b) Sales EBIDTA Margin (%) EBITDA PAT (INR b) PAT YoY (%) PAT Contbn to
Company FY20E FY21E FY22E CAGR % 19-21 FY20 FY21 FY22 CAGR %
19-21 FY20E FY21E FY22E FY20 FY21 FY22 CAGR % 19-21 Delta %
High PAT Gr. (20%+) 14,487 16,474 18,393 11 26 28 29 21 1,612 2,307 2,800 53 43 21 48 83 Tata Motors 2,885 3,164 3,397 2 12 13 13 16 3 44 60 LP 1,255 35 LP 4 State Bank 977 1,118 1,288 12 69 70 71 19 235 351 463 924 49 32 291 22 ICICI Bank 326 385 456 19 85 85 86 18 106 192 234 216 81 22 139 10 Axis Bank 251 296 351 17 92 95 97 22 51 127 183 9 149 44 65 5 IndusInd Bank 118 143 175 27 91 95 97 30 59 83 107 79 40 29 58 3 Ultratech Cement 449 486 532 8 23 24 24 25 40 52 65 61 31 23 45 2 Bajaj Finance 132 170 210 32 83 84 84 37 62 82 100 55 33 21 43 3 Bajaj Finserv 164 206 249 30 80 74 68 25 51 60 65 57 19 9 37 2 HDFC Bank 560 662 787 17 85 86 87 20 265 344 416 26 30 21 28 9 Reliance Inds. 6,175 7,069 7,834 12 15 17 17 21 460 631 707 16 37 12 26 15 Larsen & Toubro 1,555 1,779 2,002 15 12 13 13 22 102 125 148 27 23 18 25 3 Kotak Mahindra Bank 136 160 191 19 75 77 78 21 90 108 132 24 21 22 23 2 Sun Pharma 325 359 397 12 20 22 22 18 44 53 59 21 21 10 21 1 Zee Entertainment 85 98 112 11 32 32 32 11 20 23 26 24 17 16 20 0 UPL 348 380 412 32 20 22 22 42 24 30 36 15 25 19 20 1
Med. PAT Gr. (10-20%) 3,285 3,661 4,084 10 32 32 33 18 653 730 832 19 12 14 15 12 Titan Company 219 261 314 15 11 12 12 23 15 20 25 9 30 29 19 0 Cipla 172 188 208 7 21 21 21 12 18 21 23 18 16 12 17 0 Asian Paints 214 244 279 12 20 20 20 17 28 30 35 26 9 16 17 1 Nestle 125 141 161 12 24 24 24 11 21 24 27 20 14 16 17 0 HDFC 125 139 156 10 98 98 98 11 105 118 133 21 12 12 16 2 Hind. Unilever 405 458 517 9 24 25 26 16 71 85 97 13 19 15 16 1 Britannia 118 133 151 10 15 16 16 11 14 16 18 18 14 16 16 0 Adani Ports 123 139 153 13 64 65 64 17 45 53 52 14 16 -1 15 1 NTPC 994 1,100 1,211 10 31 33 35 35 130 151 173 13 16 15 15 2 Bharti Infratel 144 150 157 1 42 43 44 4 34 33 49 35 -4 49 14 0 ITC 480 529 583 8 39 38 38 8 154 160 176 24 4 10 13 2 Dr Reddy’ s Labs 165 179 195 9 21 22 21 15 18 21 23 6 16 6 11 0
Low PAT Gr. (<10%) 26,363 29,522 31,697 4 16 17 17 4 1,908 2,302 2,670 -14 21 16 2 6 Power Grid Corp. 388 422 452 14 90 90 90 17 109 119 131 9 10 9 9 1 HCL Technologies 706 801 884 15 23 24 24 17 104 120 135 3 16 12 9 1 Infosys 913 982 1,069 9 25 26 26 10 165 191 213 2 16 12 9 2 Bajaj Auto 301 332 366 5 16 16 16 1 52 54 61 8 5 13 7 0 TCS 1,573 1,680 1,844 7 26 27 27 6 328 360 413 3 10 15 6 3 Wipro 614 652 685 5 20 20 20 6 97 103 108 6 6 5 6 1 Eicher Motors 92 109 128 6 25 27 28 0 20 24 31 -9 20 27 5 0 Tech Mahindra 370 404 428 8 16 17 17 3 42 47 51 -3 12 9 4 0 BPCL 2,765 3,015 3,105 1 5 6 6 5 59 91 94 -30 53 4 3 0 Maruti Suzuki 782 878 996 1 10 12 14 0 60 79 102 -20 32 29 3 0 Mahindra & Mahindra 1,015 1,109 1,197 3 14 14 15 2 42 52 62 -17 23 19 1 0 JSW Steel 752 849 1,087 0 18 23 22 1 58 77 110 -24 32 44 0 0 Hero MotoCorp 294 326 355 -2 14 14 14 -4 30 34 38 -11 12 12 0 0 IOC 5,134 6,227 6,739 9 5 6 6 3 88 171 178 -49 95 4 -1 0 ONGC 4,270 4,697 4,858 2 17 17 17 -2 286 343 364 -18 20 6 -1 0 Coal India 965 1,022 1,099 1 23 23 24 -4 166 170 195 -5 2 15 -1 0 GAIL 772 865 929 7 11 12 12 3 53 59 65 -17 13 10 -3 0 Hindalco 1,259 1,442 1,450 5 12 12 12 5 44 50 49 -20 13 0 -5 0 Grasim Industries 201 206 221 0 15 15 15 -13 27 35 44 -37 30 25 -10 -1 Tata Steel 1,415 1,543 1,803 -1 14 16 18 -7 58 74 122 -43 29 65 -15 -2 Vedanta 821 854 778 -4 20 22 22 -1 46 45 68 -32 -2 52 -18 -1 Bharti Airtel 867 1,004 1,100 11 42 45 46 33 -15 -5 9 Loss Loss LP Loss 2
Nifty (PAT free float) 44,134 49,658 54,175 7 21 22 22 12 2,199 2,865 3,421 13 30 19 21 100

January 2020 19
India Strategy | Bull market, really?
SECTOR WEIGHT / PORTFOLIO PICKS
BSE 100
MOST WEIGHT
WEIGHT RELATIVE TO BSE100
EFFECTIVE SECTOR STANCE
Financials 39.5 39.0 -0.5 Neutral Private 24.2 23.0 -1.2 Underweight HDFC Bank 9.5 8.0 -1.5 Buy ICICI Bank 6.0 8.0 2.0 Buy Axis Bank 3.0 5.0 2.0 Buy Federal Bank 0.3 2.0 1.7 Buy PSU 2.6 5.0 2.4 Overweight SBI 2.2 5.0 2.8 Buy NBFCs 12.7 11.0 -1.7 Underweight HDFC 7.3 6.0 -1.3 Buy L&T Finance Holdings 0.0 2.0 2.0 Buy ICICI Prudential Life 0.0 3.0 3.0 Buy Technology / Telecom / Media 13.1 15.0 1.9 Overweight Infosys 4.8 6.0 1.2 Buy Bharti Airtel 1.5 5.0 3.5 Buy HCL Tech 1.1 2.0 0.9 Buy L&T Infotech 0.0 2.0 2.0 Buy Consumption / Retail 12.4 10.0 -2.4 Underweight ITC 3.5 3.0 -0.5 Neutral HUL 2.4 3.0 0.6 Buy Titan 0.8 2.0 1.2 Neutral Tata Global Beverages 0.2 2.0 1.8 Buy Energy 11.4 7.0 -4.4 Underweight Reliance Inds 8.4 5.0 -3.4 Buy IOC 0.5 2.0 1.5 Buy Cap Goods, Infra & Cement 6.7 7.0 0.3 Neutral Larsen & Toubro 2.8 4.0 1.2 Buy Ultratech 0.8 3.0 2.2 Buy Auto 6.5 6.0 -0.5 Neutral Maruti 1.7 2.0 0.3 Buy Eicher Motors 0.5 2.0 1.5 Buy Ashok Leyland 0.2 2.0 1.8 Buy Healthcare 3.6 4.0 0.4 Neutral Lupin 0.3 2.0 1.7 Buy Alkem Labs 0.0 2.0 2.0 Buy Utilities / Metals 4.9 4.0 -0.9 Neutral NTPC 0.9 2.0 1.1 Buy Hindalco 0.6 2.0 1.4 Buy Midcaps 1.9 8.0 6.1 Overweight Indian Hotels 0.0 1.0 1.0 Buy ABFRL 0.0 1.0 1.0 Buy CG Consumer Electrical 0.2 1.0 0.8 Buy Voltas 0.3 1.0 0.7 Buy Colgate 0.3 1.0 0.7 Buy JK Cement 0.0 1.0 1.0 Buy Motherson Sumi 0.3 1.0 0.7 Buy Future Retail 0.0 1.0 1.0 Buy Cash 0.0 0.0 0.00 TOTAL 100.0 100.0
MOFSL model portfolio

January 2020 20
India Strategy | Bull market, really?
Nifty ends year near record high; Mid-caps underperform again FII flows highest since CY14
Buoyed by the strong rally after the corporate tax cuts in Sep’19, the Nifty ended 2019 with impressive 12% gains. Healthy FII inflows and a benign global backdrop too worked in favor of the markets.
CY19 was characterized by sharp polarization between the Nifty and the Nifty Midcap/Smallcap as well as within the benchmark. This trend is likely to continue until earnings recover and more importantly become broad-based.
In CY19, all the key global markets – Brazil (+32%), the US (+29%), Russia (+28%), Taiwan (+23%), Japan (+18%), the UK (+12%), India-Nifty (+12%), China-HSCEI (+10%) and Korea (+8%) – closed higher in local currency terms.
India’s share in the world market cap (2.5%) is at its historical average. In CY19, the world’s market cap was up by 24.9% (USD17.3t) and India’s market cap by 3.4% (USD0.1t).
Among sectors, Private Banks (+31%), Real Estate (+27%), PSU Banks (+19%), NBFCs (+15%), Technology (+10%) and Oil (7%) were the positive performers for CY19. Metals (-12%), Automobiles (-11%), Capital Goods (-10%), Utilities (-4%), Consumer (-4%), Healthcare (-4%), and Cement (-2%) were the key laggards.
Market breadth was balanced with 25 Nifty stocks closing higher in the year. Bajaj Finance (+60%), Bharti Airtel (+59%), ICICI Bank (+50%), Bajaj Finserv (+45%) and BPCL (+35%) were the top performers. Yes Bank (-74%), Zee Ent (-39%), M&M (-34%), GAIL (-33%) and Vedanta (-25%) were the top laggards.
FIIs got back in action, infusing USD14.2b in CY19 – the highest since CY14. However, DII inflows were weak at USD6b compared to USD15.9b in the previous year. Domestic MF inflows moderated to USD7.6b from USD17.5b in the previous year. Notably, CY19 marked the eighth straight year of DII ex-MF outflows (USD35.4b over CY12-19).
Nifty P/E is valued at 18.4x, above its historical average of 18.1x. At 2.7x, the Nifty P/B is marginally above the historical average of 2.6x. Market-cap-to-GDP at 75% (FY20E GDP) is near its long-term average.
Exhibit 23: CY19 returns impressive post a muted CY18
Exhibit 24: Nifty QoQ change (%) — gains strength toward year-end
5,20
1
6,13
5
4,62
4
5,90
5
6,30
4
8,28
3
7,94
6
8,18
6
10,5
31
10,8
63
12,1
68
76 18 -25 28 7 31 -4 3 29 3 12
84 23 -37 24 -5 29 -8 0 37 -5 10
CY09
CY10
CY11
CY12
CY13
CY14
CY15
CY16
CY17
CY18
CY19
Trend in Nifty
Annual Return in INR (%)
CAGR in INR: 8.9% CAGR in USD: 4.3%
Annual Return in USD (%)
4 3
-1
-5
0
-3
7
4
-5
12
4 3
8
-4
6
2
-1
7
1
-3
6
Dec-
14M
ar-1
5Ju
n-15
Sep-
15De
c-15
Mar
-16
Jun-
16Se
p-16
Dec-
16M
ar-1
7Ju
n-17
Sep-
17De
c-17
Mar
-18
June
-18
Sep-
18De
c-18
Mar
-19
Jun-
19Se
p-19
Dec-
19QoQ Return (%)
MARKETS & FLOWS
Refer our latest India Strategy report on The Decade That
Was

January 2020 21
India Strategy | Bull market, really?
All major economies end higher in CY19 In CY19, all the key global markets – Brazil (+32%), the US (+29%), Russia (+28%),
Taiwan (+23%), Japan (+18%), the UK (+12%), India-Nifty (+12%), China-HSCEI (+10%) and Korea (+8%) – closed higher in local currency terms.
Exhibit 25: World equity indices (CY19) – local currency (%)
Exhibit 26: World equity indices (CY19) – USD (%)
India’s share in world market cap at historical average India’s share in the world market cap (2.5%) is at its historical average. In CY19,
the world’s market cap was up by 24.9% (USD17.3t) and India’s market cap by 3.4% (USD0.1t).
Exhibit 27: Trend in India's contribution to world market cap
Exhibit 28: Market cap change in CY19 (%)
8
10
12
12
15
18
23
28
29
32
South Korea
China (HSCEI)
India - Nifty
UK
MSCI EM
Japan
Taiwan
Russia MICEX
S&P 500
Brazil
4
10
11
15
17
20
26
27
29
43
South Korea
India - Nifty
China (HSCEI)
MSCI EM
UK
Japan
Taiwan
Brazil
S&P 500
Russia MICEX
3.3
1.6
2.5
1.5
2.0
2.5
3.0
3.5
Dec-
09Ju
n-10
Nov
-10
Apr-
11Se
p-11
Feb-
12Au
g-12
Jan-
13Ju
n-13
Nov
-13
Apr-
14O
ct-1
4M
ar-1
5Au
g-15
Jan-
16Ju
n-16
Dec-
16M
ay-1
7O
ct-1
7M
ar-1
8Au
g-18
Jan-
19Ju
l-19
Dec-
19
India's Contribution to World Mcap (%)
Average of 2.5%
3 5 8
14 16
26 28 28
37 39
2.1 1.4 0.5 3.5 6.3 1.3 34.4 1.1 7.3 0.8
Indi
a
Kore
a
Indo
nesiaU
K
Japa
n
Taiw
anUS
Braz
il
Chin
a
Russ
ia
Mkt cap chg CY19 (%) Curr Mcap (USD Tr)

January 2020 22
India Strategy | Bull market, really?
Sector performance: Financials, Real Estate, Technology and Oil end higher In the sectoral space, Private Banks (+31%), Real Estate (+27%), PSU Banks
(+19%), NBFCs (+15%), Technology (+10%) and Oil (7%) were the positive performers for CY19.
Metals (-12%), Automobiles (-11%), Capital Goods (-10%), Utilities (-4%), Consumer (-4%), Healthcare (-4%), and Cement (-2%) were the key laggards.
Mid-caps continued underperforming the benchmark for the second year.
Exhibit 29: Trend in sector performance YoY (%) — Private Banks, Real Estate, PSU Banks and NBFCs top outperformers Return YoY (%) CAGR (%) Sector CY09 CY10 CY11 CY12 CY13 CY14 CY15 CY16 CY17 CY18 CY19 CY09-CY19 CY14-CY19 Pvt - Banks 98 36 -26 63 1 61 2 5 47 18 31 21 19 Real Estate 70 -26 -52 53 -32 8 -14 -6 106 -31 27 -5 8 PSU - Banks 73 33 -39 46 -26 79 -30 9 38 -6 19 7 4 NBFC 109 38 -27 48 -8 49 -8 4 33 10 15 13 10 Nifty 50 76 18 -25 28 7 31 -4 3 29 3 12 9 8 Technology 133 32 -16 -1 60 17 5 -8 11 25 10 12 8 Oil 73 1 -29 13 4 12 -3 27 34 -16 7 3 8 Cement 84 37 5 41 -14 37 1 17 46 -17 -2 13 7 Healthcare 69 34 -13 39 23 47 15 -13 0 -6 -4 10 -2 Consumer 40 32 10 47 11 18 1 3 32 11 -4 15 8 Utilities 74 -6 -40 11 -15 23 -6 2 20 -16 -4 -5 -2 Nifty Midcap100 99 19 -31 39 -5 56 6 7 47 -15 -4 9 6 Capital Goods 104 9 -48 35 -6 50 -9 -3 40 -2 -10 2 2 Auto 204 38 -20 40 7 52 -1 9 32 -22 -11 10 0 Metal 234 1 -47 19 -10 8 -31 37 48 -21 -12 -5 -1
Breadth balanced in CY19 – 25 Nifty stocks closed higher Market breadth was balanced with 25 Nifty stocks closing higher in the year.
Bajaj Finance (+60%), Bharti Airtel (+59%), ICICI Bank (+50%), Bajaj Finserv (+45%) and BPCL (+35%) were the top performers.
Yes Bank (-74%), Zee Ent (-39%), M&M (-34%), GAIL (-33%) and Vedanta (-25%) are the top laggards.
Exhibit 30: Best and worst Nifty performers for CY19 (%)—25 companies in the Nifty delivered positive returns
60 59 50 45 35 35 34 33 30 28 23 22 20 18 17 16 14 13 12 11 10 7 6 6 1 0
-1 -1 -3 -3 -3 -4 -4 -4 -6 -6 -8 -8 -10 -10 -10
-12 -12
-14 -16
-21 -25
-33 -34
-39
-74
Baja
j Fin
.Bh
arti
Airt
elIC
ICI B
ank
Baja
j Fin
serv
BPCL
Relia
nce
Ind.
Kota
k M
ah.B
kN
estle
Asia
n Pa
ints
Tita
n Co
HDFC
Axis
Bank
HDFC
Ban
kHC
L Te
chBa
jaj A
uto
UPL TC
SSB
IN
ifty
Info
sys
Dr R
eddy
'sTa
ta M
otor
sHU
LTe
ch M
ah.
Ultr
aTec
hSu
n Ph
arm
aW
ipro
Mar
uti
Bhar
ti In
frat
elEi
cher
Mot
ors
Brita
nnia
NTP
CPo
wer
Grid
Hind
alco
Adan
i Por
tsIn
dusI
nd B
kCi
pla
IOC
Tata
Ste
elL&
TGr
asim
Ind
JSW
Ste
elCo
al In
dia
ON
GC ITC
Hero
Mot
oVe
dant
aGA
ILM
&M
Zee
Ent
Yes B
ank

January 2020 23
India Strategy | Bull market, really?
Institutional flows: FIIs take centre stage FIIs came back in action, infusing USD14.2b in CY19 - the highest since CY14.
However, DII inflows were weak at USD6b compared to USD15.9b in the previous year. Domestic MF inflows moderated to USD7.6b from USD17.5b in the previous year. Notably, CY19 marked the eighth straight year of DIIs ex-MF outflows (USD35.4b over CY12-19).
Exhibit 31: Yearly FII flows in equities (USD b)
Exhibit 32: Quarterly FII flows in equities (USD b)
Exhibit 33: Yearly domestic MF flows in equities (USD b)
Exhibit 34: Quarterly domestic MF flows in equities (USD b)
Exhibit 35: Yearly DII ex-MF flows in equity (USD b)
Exhibit 36: Quarterly DII ex-MF flows in equity (USD b)
17.6
29.3
-0.5
24.5 20.0
16.2
3.3 2.9 7.7
-4.6
14.2
CY09
CY10
CY11
CY12
CY13
CY14
CY15
CY16
CY17
CY18
CY19
2.3
6.0
0.2
-2.6
-0.3
1.2 1.7
4.6
-4.6
6.6
1.8
-3.2
2.5 2.1
-2.7 -1.4
-2.6
6.8
4.5
-3.2
6.1
Dec-
14M
ar-1
5Ju
n-15
Sep-
15De
c-15
Mar
-16
June
-16
Sep-
16De
c-16
Mar
-17
June
-17
Sep-
17De
c-17
Mar
-18
Jun-
18Se
p-18
Dec-
18M
ar-1
9Ju
n-19
Sep-
19De
c-19
-1.2
-6.1
1.3
-3.9 -3.7
3.9
11.2
7.1
18.4 17.5
7.6
CY09
CY10
CY11
CY12
CY13
CY14
CY15
CY16
CY17
CY18
CY19
2.4 1.5
3.7 3.9
2.1
0.4 1.0 1.0
4.7
1.7
4.6
7.3
4.7 5.3 5.0
2.8
4.4
0.3 0.9
6.2
0.2
Dec-
14M
ar-1
5Ju
n-15
Sep-
15De
c-15
Mar
-16
June
-16
Sep-
16De
c-16
Mar
-17
June
-17
Sep-
17De
c-17
Mar
-18
Jun-
18Se
p-18
Dec-
18M
ar-1
9Ju
n-19
Sep-
19De
c-19
6.5
1.4
4.7
-7.0 -9.3 -8.8
-1.0 -1.9
-4.3
-1.6 -1.6
CY09
CY10
CY11
CY12
CY13
CY14
CY15
CY16
CY17
CY18
CY19
-2.0 -2.4
1.3
0.3
-0.1
0.5
-0.6
-2.2
0.5
-1.5 -1.5
-0.8 -0.5
-1.5
0.6
0.0 -0.7
-2.1
-0.2
1.5
-0.7
Dec-
14M
ar-1
5Ju
n-15
Sep-
15De
c-15
Mar
-16
June
-16
Sep-
16De
c-16
Mar
-17
June
-17
Sep-
17De
c-17
Mar
-18
Jun-
18Se
p-18
Dec-
18M
ar-1
9Ju
n-19
Sep-
19De
c-19

January 2020 24
India Strategy | Bull market, really?
Valuations marginally above long-period averages The Nifty P/E is valued at 18.4x, above its historical average of 18.1x. At 2.7x, the
Nifty P/B is marginally above the historical average of 2.6x. Market-cap-to-GDP at 75% (FY20E GDP) is near its long-term average.
Exhibit 37: 12-month forward Nifty P/E (x)
Exhibit 38: 12-month forward Nifty P/B (x)
Exhibit 39: 12-month forward Nifty RoE (%)
Exhibit 40: India’s market cap to GDP (%)
Mid-caps continue underperforming large-caps The Nifty Midcap100 (-4%) significantly underperformed the Nifty (+12%) in
CY19. Volatility was more pronounced among mid- and small-cap indices amidst the slowdown in the economy, the concerns around liquidity woes for NBFCs and the moderation in domestic consumption.
Exhibit 41: Mid-caps underperformed large-caps
18.4
12
15
18
21
24
Jan-
10
Jan-
11
Jan-
12
Jan-
13
Jan-
14
Jan-
15
Jan-
16
Jan-
17
Jan-
18
Jan-
19
Jan-
20
10 Year Avg: 18.1x
2.7
2.0
2.3
2.6
2.9
3.2
Jan-
10
Jan-
11
Jan-
12
Jan-
13
Jan-
14
Jan-
15
Jan-
16
Jan-
17
Jan-
18
Jan-
19
Jan-
20
10 Year Avg: 2.6x
14.7
12.0
13.4
14.8
16.2
17.6
Jan-
10
Jan-
11
Jan-
12
Jan-
13
Jan-
14
Jan-
15
Jan-
16
Jan-
17
Jan-
18
Jan-
19
Jan-
20
10 Year Avg: 14.5% 55
95 88
71 64 66
81 69 79
83 79 75
FY09
FY10
FY11
FY12
FY13
FY14
FY15
FY16
FY17
FY18
FY19
FY20
E
Average of 76% for the period
112
96
85
93
101
109
117
Dec-
18
Jan-
19
Mar
-19
Mar
-19
Apr-
19
May
-19
Jun-
19
Jul-1
9
Aug-
19
Sep-
19
Oct
-19
Nov
-19
Dec-
19
Nifty Rebased Nifty Midcap 100 Rebased

January 2020 25
India Strategy | Bull market, really?
THIS PAGE INTENTIONALLY LEFT BLANK

January 2020 26
India Strategy | Bull market, really?
MOFSL Universe: 3QFY20 Highlights
& Ready Reckoner
Note: In our quarterly performance tables, our four-quarter numbers may not always add up to the full-year numbers. This is because of differences in classification of account heads in the company’s quarterly and annual results or because of differences in the way we classify account heads as opposed to the company.
All stock prices and indices as on 2 January 2020, unless otherwise stated.
Sectors & Companies BSE Sensex: 41,627 Nifty 50: 12,282 January 2020

January 2020 27
India Strategy | Bull market, really?
MOFSL Universe: 3QFY20 aggregate performance highlights
Exhibit 42: Quarterly Performance - MOFSL Universe (INR b) Sector Sales EBITDA PAT
(Nos of Cos) Dec-19 Var % YoY
Var % QoQ Dec-19 Var
% YoY Var
% QoQ Dec-19 Var % YoY
Var % QoQ
Auto (17) 1,662 -2.6 11.1 199 15.0 15.2 82 25.9 10.0 Capital Goods (12) 651 10.8 8.8 70 10.7 11.3 42 12.5 8.8 Cement (10) 335 2.0 7.8 64 18.5 7.9 24 20.6 4.0 Consumer (18) 543 5.7 3.3 132 7.5 0.3 100 16.9 -6.9 Financials (29) 1,107 15.8 3.6 723 18.2 -2.8 319 32.7 27.9 Private Banks (10) 386 17.2 4.3 324 14.8 2.4 167 39.8 54.7 PSU Banks (4) 383 14.5 1.4 259 26.8 -9.5 66 35.8 42.0 Life Insurance (2) 171 18.8 10.1 6 18.6 -5.9 6 12.4 -0.1 NBFC (13) 167 12.5 1.2 134 11.6 -0.8 81 19.6 -9.7 Healthcare (19) 484 6.2 0.3 100 4.2 -0.5 56 4.2 -3.2 Infrastructure (4) 43 1.6 17.3 10 -9.0 -3.6 4 -16.1 5.7 Logistics (3) 40 9.0 1.7 6 26.0 0.5 3 2.8 0.2 Media (7) 55 1.0 8.2 18 -6.0 14.7 11 1.6 -1.7 Metals (9) 1,338 -14.3 -1.9 221 -29.0 6.0 40 -65.7 -68.8 Oil & Gas (15) 4,727 -11.4 2.3 517 12.3 1.9 245 1.0 -2.2 Excl. OMCs (12) 2,314 -4.6 2.8 398 -9.8 -2.7 197 -13.7 -9.4 Retail (9) 266 12.4 16.3 25 21.3 25.6 14 13.2 35.7 Technology (13) 1,191 8.3 3.0 281 7.8 6.0 204 5.0 3.1 Telecom (4) 411 2.9 3.1 153 57.3 5.6 -38 Loss Loss Utilities (8) 715 -3.1 0.0 257 0.9 0.3 101 0.1 -19.6 Others (22) 391 23.1 3.6 77 38.5 48.3 34 45.4 136.8 MOFSL (199) 13,958 -2.9 3.7 2,854 9.1 3.5 1,241 8.5 0.8 MOFSL Excl. OMCs (196) 11,545 0.8 4.0 2,735 5.3 2.8 1,193 5.7 -0.4 Sensex (30) 5,670 2.3 4.0 1,604 6.2 0.0 803 10.6 4.9 Nifty (50) 10,001 -3.3 4.1 2,242 7.3 2.4 1,005 7.7 2.5
Exhibit 43: Quarter-wise sales growth (% YoY)
Exhibit 44: Quarter-wise net profit growth (% YoY)
Exhibit 45: Sectoral sales growth-quarter ended Dec19 (%)
Exhibit 46: Sectoral PAT growth - quarter ended Dec19 (%)
For Banks: Sales = Net Interest Income, EBITDA = Operating Profits For Life Insurance: Sales = Net Premium, EBITDA = Operating Profits
10.8%
6.5%
-2.0% -2.9% Mar-19 June-19 Sep-19 Dec-19E
26.9%
3.5%
11.6% 8.5%
Mar-19 June-19 Sep-19 Dec-19E
16 12 11 9 8 6 6 3 2 2 1
-3 -3 -3
-11 -14
Fina
ncia
ls
Reta
il
Cap
Goo
ds
Logi
stic
s
Tech
nolo
gy
Heal
th C
are
Cons
umer
Tele
com
Cem
ent
Infr
a
Med
ia
Auto
MO
FSL
Uni
v
Util
ities
Oil
& G
as
Met
als
33 26 21 17 13 13 9 5 4 3 2 1 0
-16
-66 Loss
Fina
ncia
ls
Auto
Cem
ent
Cons
umer
Reta
il
Cap
Goo
ds
MO
FSL
Uni
v
Tech
nolo
gy
Heal
th C
are
Logi
stic
s
Med
ia
Oil
& G
as
Util
ities
Infr
a
Met
als
Tele
com
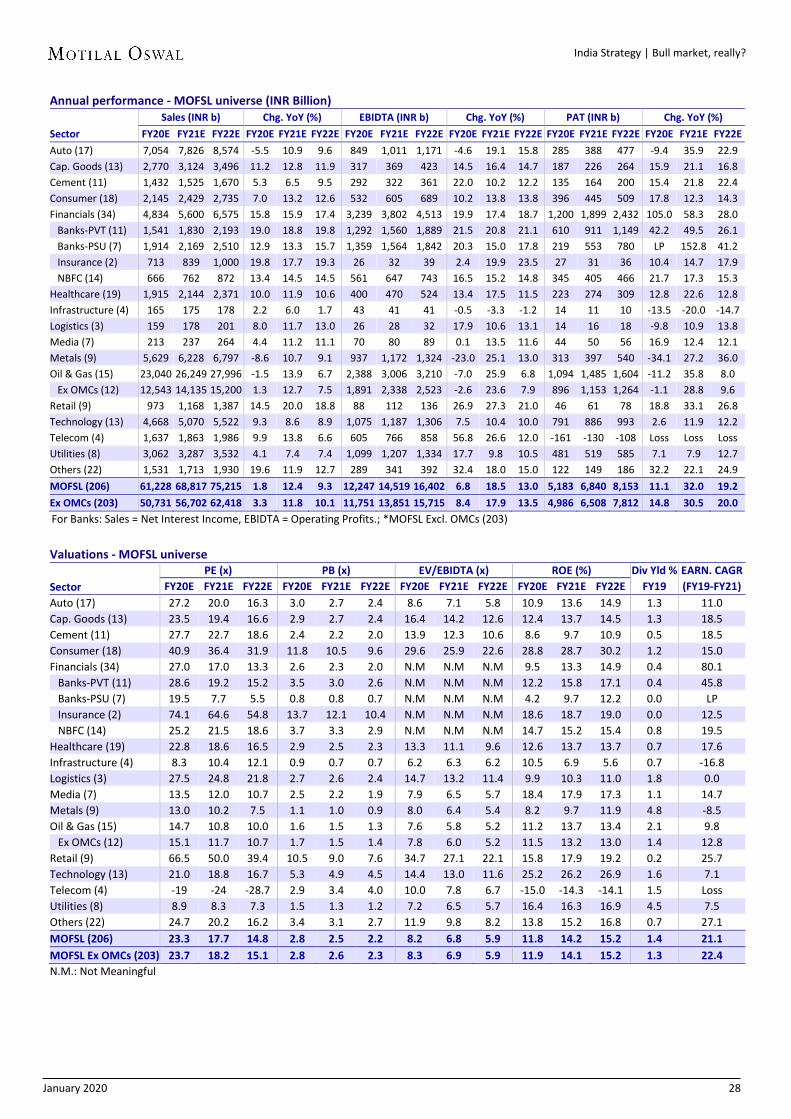
January 2020 28
India Strategy | Bull market, really?
Annual performance - MOFSL universe (INR Billion) Sales (INR b) Chg. YoY (%) EBIDTA (INR b) Chg. YoY (%) PAT (INR b) Chg. YoY (%) Sector FY20E FY21E FY22E FY20E FY21E FY22E FY20E FY21E FY22E FY20E FY21E FY22E FY20E FY21E FY22E FY20E FY21E FY22E Auto (17) 7,054 7,826 8,574 -5.5 10.9 9.6 849 1,011 1,171 -4.6 19.1 15.8 285 388 477 -9.4 35.9 22.9 Cap. Goods (13) 2,770 3,124 3,496 11.2 12.8 11.9 317 369 423 14.5 16.4 14.7 187 226 264 15.9 21.1 16.8 Cement (11) 1,432 1,525 1,670 5.3 6.5 9.5 292 322 361 22.0 10.2 12.2 135 164 200 15.4 21.8 22.4 Consumer (18) 2,145 2,429 2,735 7.0 13.2 12.6 532 605 689 10.2 13.8 13.8 396 445 509 17.8 12.3 14.3 Financials (34) 4,834 5,600 6,575 15.8 15.9 17.4 3,239 3,802 4,513 19.9 17.4 18.7 1,200 1,899 2,432 105.0 58.3 28.0 Banks-PVT (11) 1,541 1,830 2,193 19.0 18.8 19.8 1,292 1,560 1,889 21.5 20.8 21.1 610 911 1,149 42.2 49.5 26.1 Banks-PSU (7) 1,914 2,169 2,510 12.9 13.3 15.7 1,359 1,564 1,842 20.3 15.0 17.8 219 553 780 LP 152.8 41.2 Insurance (2) 713 839 1,000 19.8 17.7 19.3 26 32 39 2.4 19.9 23.5 27 31 36 10.4 14.7 17.9 NBFC (14) 666 762 872 13.4 14.5 14.5 561 647 743 16.5 15.2 14.8 345 405 466 21.7 17.3 15.3 Healthcare (19) 1,915 2,144 2,371 10.0 11.9 10.6 400 470 524 13.4 17.5 11.5 223 274 309 12.8 22.6 12.8 Infrastructure (4) 165 175 178 2.2 6.0 1.7 43 41 41 -0.5 -3.3 -1.2 14 11 10 -13.5 -20.0 -14.7 Logistics (3) 159 178 201 8.0 11.7 13.0 26 28 32 17.9 10.6 13.1 14 16 18 -9.8 10.9 13.8 Media (7) 213 237 264 4.4 11.2 11.1 70 80 89 0.1 13.5 11.6 44 50 56 16.9 12.4 12.1 Metals (9) 5,629 6,228 6,797 -8.6 10.7 9.1 937 1,172 1,324 -23.0 25.1 13.0 313 397 540 -34.1 27.2 36.0 Oil & Gas (15) 23,040 26,249 27,996 -1.5 13.9 6.7 2,388 3,006 3,210 -7.0 25.9 6.8 1,094 1,485 1,604 -11.2 35.8 8.0 Ex OMCs (12) 12,543 14,135 15,200 1.3 12.7 7.5 1,891 2,338 2,523 -2.6 23.6 7.9 896 1,153 1,264 -1.1 28.8 9.6 Retail (9) 973 1,168 1,387 14.5 20.0 18.8 88 112 136 26.9 27.3 21.0 46 61 78 18.8 33.1 26.8 Technology (13) 4,668 5,070 5,522 9.3 8.6 8.9 1,075 1,187 1,306 7.5 10.4 10.0 791 886 993 2.6 11.9 12.2 Telecom (4) 1,637 1,863 1,986 9.9 13.8 6.6 605 766 858 56.8 26.6 12.0 -161 -130 -108 Loss Loss Loss Utilities (8) 3,062 3,287 3,532 4.1 7.4 7.4 1,099 1,207 1,334 17.7 9.8 10.5 481 519 585 7.1 7.9 12.7 Others (22) 1,531 1,713 1,930 19.6 11.9 12.7 289 341 392 32.4 18.0 15.0 122 149 186 32.2 22.1 24.9 MOFSL (206) 61,228 68,817 75,215 1.8 12.4 9.3 12,247 14,519 16,402 6.8 18.5 13.0 5,183 6,840 8,153 11.1 32.0 19.2 Ex OMCs (203) 50,731 56,702 62,418 3.3 11.8 10.1 11,751 13,851 15,715 8.4 17.9 13.5 4,986 6,508 7,812 14.8 30.5 20.0 For Banks: Sales = Net Interest Income, EBIDTA = Operating Profits.; *MOFSL Excl. OMCs (203)
Valuations - MOFSL universe PE (x) PB (x) EV/EBIDTA (x) ROE (%) Div Yld % EARN. CAGR Sector FY20E FY21E FY22E FY20E FY21E FY22E FY20E FY21E FY22E FY20E FY21E FY22E FY19 (FY19-FY21) Auto (17) 27.2 20.0 16.3 3.0 2.7 2.4 8.6 7.1 5.8 10.9 13.6 14.9 1.3 11.0 Cap. Goods (13) 23.5 19.4 16.6 2.9 2.7 2.4 16.4 14.2 12.6 12.4 13.7 14.5 1.3 18.5 Cement (11) 27.7 22.7 18.6 2.4 2.2 2.0 13.9 12.3 10.6 8.6 9.7 10.9 0.5 18.5 Consumer (18) 40.9 36.4 31.9 11.8 10.5 9.6 29.6 25.9 22.6 28.8 28.7 30.2 1.2 15.0 Financials (34) 27.0 17.0 13.3 2.6 2.3 2.0 N.M N.M N.M 9.5 13.3 14.9 0.4 80.1 Banks-PVT (11) 28.6 19.2 15.2 3.5 3.0 2.6 N.M N.M N.M 12.2 15.8 17.1 0.4 45.8 Banks-PSU (7) 19.5 7.7 5.5 0.8 0.8 0.7 N.M N.M N.M 4.2 9.7 12.2 0.0 LP Insurance (2) 74.1 64.6 54.8 13.7 12.1 10.4 N.M N.M N.M 18.6 18.7 19.0 0.0 12.5 NBFC (14) 25.2 21.5 18.6 3.7 3.3 2.9 N.M N.M N.M 14.7 15.2 15.4 0.8 19.5 Healthcare (19) 22.8 18.6 16.5 2.9 2.5 2.3 13.3 11.1 9.6 12.6 13.7 13.7 0.7 17.6 Infrastructure (4) 8.3 10.4 12.1 0.9 0.7 0.7 6.2 6.3 6.2 10.5 6.9 5.6 0.7 -16.8 Logistics (3) 27.5 24.8 21.8 2.7 2.6 2.4 14.7 13.2 11.4 9.9 10.3 11.0 1.8 0.0 Media (7) 13.5 12.0 10.7 2.5 2.2 1.9 7.9 6.5 5.7 18.4 17.9 17.3 1.1 14.7 Metals (9) 13.0 10.2 7.5 1.1 1.0 0.9 8.0 6.4 5.4 8.2 9.7 11.9 4.8 -8.5 Oil & Gas (15) 14.7 10.8 10.0 1.6 1.5 1.3 7.6 5.8 5.2 11.2 13.7 13.4 2.1 9.8 Ex OMCs (12) 15.1 11.7 10.7 1.7 1.5 1.4 7.8 6.0 5.2 11.5 13.2 13.0 1.4 12.8 Retail (9) 66.5 50.0 39.4 10.5 9.0 7.6 34.7 27.1 22.1 15.8 17.9 19.2 0.2 25.7 Technology (13) 21.0 18.8 16.7 5.3 4.9 4.5 14.4 13.0 11.6 25.2 26.2 26.9 1.6 7.1 Telecom (4) -19 -24 -28.7 2.9 3.4 4.0 10.0 7.8 6.7 -15.0 -14.3 -14.1 1.5 Loss Utilities (8) 8.9 8.3 7.3 1.5 1.3 1.2 7.2 6.5 5.7 16.4 16.3 16.9 4.5 7.5 Others (22) 24.7 20.2 16.2 3.4 3.1 2.7 11.9 9.8 8.2 13.8 15.2 16.8 0.7 27.1 MOFSL (206) 23.3 17.7 14.8 2.8 2.5 2.2 8.2 6.8 5.9 11.8 14.2 15.2 1.4 21.1 MOFSL Ex OMCs (203) 23.7 18.2 15.1 2.8 2.6 2.3 8.3 6.9 5.9 11.9 14.1 15.2 1.3 22.4 N.M.: Not Meaningful

January 2020 29
India Strategy | Bull market, really?
Ready reckoner: Quarterly performance
Sector CMP SALES (INR M) EBDITA (INR M) NET PROFIT (INR M)
(INR) RECO Dec-19 Var % YoY
Var % QoQ Dec-19 Var
% YoY Var
% QoQ Dec-19 Var % YoY
Var % QoQ
Automobiles Amara Raja Batt. 727 Buy 17,624 4.0 4.0 2,843 12.5 -2.7 1,615 23.4 -26.2 Ashok Leyland 84 Buy 41,950 -33.7 6.8 2,627 -59.6 14.9 642 -83.4 -23.8 Bajaj Auto 3,119 Neutral 77,391 4.5 0.4 12,864 11.3 0.6 12,411 12.6 -11.5 Bharat Forge 491 Buy 12,769 -24.6 1.4 3,068 -37.0 2.1 1,765 -43.0 -27.9 Bosch 15,403 Neutral 29,098 -6.0 25.8 3,695 -12.6 9.7 2,800 -16.5 -6.1 CEAT 1,033 Buy 17,472 1.0 3.3 1,870 31.1 9.7 536 1.5 20.4 Eicher Motors 21,611 Buy 23,950 2.3 9.2 6,057 -10.9 11.9 5,051 -5.2 -11.8 Endurance Tech. 1,073 Buy 18,431 1.7 4.1 2,884 14.0 -0.9 1,379 24.4 -18.5 Escorts 619 Neutral 16,214 -2.0 22.5 1,840 -8.2 45.2 1,304 -1.9 14.9 Exide Inds. 189 Buy 25,468 2.0 -2.5 3,491 11.7 -4.9 2,032 31.1 -14.4 Hero Motocorp 2,429 Neutral 69,072 -12.2 -8.8 9,565 -13.4 -13.1 7,121 -7.4 -22.6 Mahindra CIE 169 Buy 20,067 1.6 7.4 2,451 -4.4 17.1 951 -32.7 62.3 Mahindra & Mahindra 540 Buy 122,720 -4.8 12.2 18,398 8.0 19.4 11,148 -23.5 -17.7 Maruti Suzuki 7,332 Buy 218,480 11.1 28.6 22,915 18.7 42.7 17,028 14.3 25.3 Motherson Sumi 150 Buy 169,249 2.7 6.3 14,173 1.7 7.5 3,743 -3.8 -2.7 Tata Motors 194 Buy 741,440 -3.6 13.3 86,590 45.4 20.9 11,144 LP LP TVS Motor 459 Neutral 40,523 -13.1 -6.8 3,400 -9.5 -11.0 1,415 -20.7 -28.1 Sector Aggregate 1661,919 -2.6 11.1 198,729 15.0 15.2 82,084 25.9 10.0 Capital Goods ABB 1,295 Buy 21,882 11.3 25.4 2,406 11.7 95.0 1,721 33.8 118.3 Bharat Electronics 103 Buy 23,250 -14.4 -15.2 4,729 -38.4 -13.2 3,075 -39.4 -9.4 BHEL 45 Neutral 77,588 5.8 24.6 3,491 59.6 30.8 1,790 -6.8 50.9 Blue Star 813 Neutral 12,375 12.6 -1.0 802 89.5 9.0 452 626.2 14.1 CG Consumer Elect. 241 Buy 10,973 6.5 2.0 1,317 4.4 1.8 1,000 25.5 -9.8 Cummins India 569 Buy 14,885 -1.0 13.8 1,935 -14.7 26.9 1,788 -4.4 -2.4 Engineers India 99 Buy 6,465 12.0 -10.7 949 0.0 -11.3 1,083 19.4 59.9 Havells India 654 Neutral 26,351 4.6 18.2 2,899 -1.6 23.8 1,963 0.3 8.2 Larsen & Toubro 1,345 Buy 396,500 15.8 12.2 45,598 21.5 13.4 24,152 27.2 4.6 Siemens 1,514 Buy 29,704 5.8 -28.1 3,405 -7.0 -16.1 2,877 0.0 -2.5 Thermax 1,098 Neutral 14,440 0.5 -10.1 1,144 6.5 -12.3 845 29.7 228.9 Voltas 659 Buy 16,165 8.4 13.7 1,364 18.0 28.9 1,240 33.8 12.0 Sector Aggregate 650,578 10.8 8.8 70,038 10.7 11.3 41,987 12.5 8.8 Cement ACC 1,493 Buy 40,516 4.0 14.9 5,957 22.3 7.1 3,302 43.6 10.1 Ambuja Cements 205 Neutral 31,120 8.7 18.5 5,687 40.8 29.3 3,550 36.8 51.3 Birla Corporation 629 Buy 16,643 6.9 2.3 3,157 52.4 1.2 903 230.0 2.2 Dalmia Bharat 819 Buy 22,633 4.6 1.2 4,463 17.5 -6.0 -249 PL PL Grasim Industries 767 Neutral 46,797 -11.6 -2.5 6,913 -34.3 4.8 3,465 -43.0 -34.2 India Cements 77 Neutral 12,585 -4.4 1.0 1,351 0.2 -8.2 -37 PL PL J K Cements 1,218 Buy 13,863 8.9 10.5 2,872 36.4 13.1 1,186 94.7 9.0 Ramco Cements 769 Neutral 13,194 9.3 0.5 2,536 20.2 -13.0 1,213 20.0 -27.9 Shree Cement 21,222 Neutral 29,589 6.4 5.6 8,991 30.3 6.5 3,497 16.1 13.1 Ultratech Cement 4,243 Buy 107,713 3.1 12.0 21,723 36.2 13.3 7,617 86.9 31.6 Sector Aggregate 334,652 2.0 7.8 63,649 18.5 7.9 24,445 20.6 4.0 Consumer Asian Paints 1,790 Sell 54,528 3.0 8.0 11,288 8.2 18.2 6,989 8.0 -17.3 Britannia 3,053 Neutral 30,698 8.0 0.7 4,757 5.3 -3.3 3,467 15.3 -14.2 Colgate 1,460 Buy 11,602 5.5 -5.0 2,997 -4.7 -7.2 1,920 -0.1 -21.4 Dabur 460 Neutral 22,762 3.5 2.9 4,701 5.5 -4.0 3,719 1.6 -14.5 Emami 312 Buy 8,312 2.5 25.9 2,737 2.6 41.8 2,205 5.7 36.0

January 2020 30
India Strategy | Bull market, really?
Ready reckoner: Quarterly performance
Sector CMP SALES (INR M) EBDITA (INR M) NET PROFIT (INR M)
(INR) RECO Dec-19 Var % YoY
Var % QoQ Dec-19 Var
% YoY Var
% QoQ Dec-19 Var % YoY
Var % QoQ
Godrej Consumer 684 Neutral 28,308 4.0 7.6 6,550 6.3 13.6 4,346 4.1 4.1 GSK Consumer 8,386 Neutral 12,732 14.0 -5.3 2,808 17.7 -29.0 2,887 38.4 -16.4 Hind. Unilever 1,938 Buy 99,704 4.3 1.2 22,364 9.3 -8.5 16,048 14.5 -12.4 ITC 240 Neutral 118,614 5.6 -0.1 45,703 5.7 0.2 39,427 22.9 -2.0 Jyothy Labs 151 Neutral 4,908 13.0 5.7 885 23.3 11.9 563 16.3 5.8 Marico 337 Neutral 18,424 -1.0 0.7 3,528 1.1 -0.1 2,364 -4.4 -6.6 Nestle 14,725 Neutral 32,651 12.7 1.5 7,725 25.9 1.7 5,408 33.5 -10.4 P&G Hygiene 11,321 Neutral 9,081 11.0 6.6 1,981 3.6 8.7 1,479 19.2 8.1 Page Industries 23,589 Neutral 7,679 4.0 -1.0 1,643 -0.6 10.2 1,128 10.7 -1.5 Pidilite Inds. 1,399 Neutral 19,037 3.0 5.4 3,754 11.5 1.9 2,613 19.8 -24.5 Tata Global 324 Buy 20,925 9.4 14.1 2,664 35.8 13.5 1,552 56.3 11.5 United Breweries 1,282 Neutral 15,818 9.0 0.2 2,230 -10.0 15.9 1,019 -6.6 -11.5 United Spirits 594 Buy 26,842 7.5 16.9 3,716 3.8 -10.6 2,405 13.1 7.1 Sector Aggregate 542,622 5.7 3.3 132,033 7.5 0.3 99,539 16.9 -6.9
Healthcare Alembic Pharma 561 Neutral 11,393 11.9 -8.2 2,848 17.6 -17.6 1,889 11.2 -24.5 Alkem Lab 2,084 Buy 20,828 8.2 -8.0 3,999 28.3 -15.8 2,862 31.5 -27.3 Ajanta Pharma 979 Buy 5,830 20.2 -9.3 1,568 36.0 -11.7 1,051 44.7 -10.2 Aurobindo Pharma 462 Buy 57,881 9.8 3.4 11,924 9.7 2.1 6,825 -1.5 2.0 Biocon 296 Neutral 17,449 13.2 11.0 4,624 13.1 14.7 2,396 5.9 37.9 Cadila Health 256 Buy 34,063 -4.8 1.2 6,676 -20.5 6.7 3,769 -26.2 13.2 Cipla 474 Neutral 43,929 9.6 -0.1 8,434 19.2 -7.3 4,037 21.5 -14.4 Divis Labs 1,825 Neutral 14,705 9.5 1.7 5,294 -6.2 3.7 3,894 -5.0 7.6 Dr Reddy’ s Labs 2,864 Neutral 42,403 10.1 3.9 9,032 10.7 6.5 4,522 -6.8 11.9 Glenmark Pharma 354 Neutral 26,418 5.3 -4.4 3,883 -0.3 -2.7 1,853 -13.6 -7.0 Granules India 122 Buy 6,896 9.2 -1.4 1,393 22.9 -3.0 876 45.3 -8.5 GSK Pharma 1,623 Neutral 8,336 1.0 -5.5 1,791 30.4 -7.7 1,389 46.4 -1.2 IPCA Labs. 1,141 Buy 10,858 14.6 -15.4 2,204 4.9 -17.1 1,479 6.7 -23.6 Jubilant Life 535 Buy 23,231 -2.3 2.5 4,879 -1.1 4.1 2,278 -13.6 -8.7 Laurus Labs 373 Buy 6,854 29.4 -3.8 1,302 48.5 -5.5 459 157.6 -18.9 Lupin 775 Buy 43,301 0.8 -0.7 7,361 6.3 0.7 2,651 0.7 -10.6 Strides Pharma 376 Buy 7,624 -3.2 6.6 1,540 21.2 5.1 564 136.1 7.8 Sun Pharma 435 Buy 81,297 6.2 2.3 16,178 -8.6 0.7 10,527 11.8 -0.3 Torrent Pharma 1,864 Neutral 20,604 3.6 2.8 5,542 5.4 2.4 2,436 13.2 -0.2 Sector Aggregate 483,899 6.2 0.3 100,473 4.2 -0.5 55,756 4.2 -3.2 Infrastructure Ashoka Buildcon 109 Buy 11,000 3.3 33.8 1,320 -11.3 7.4 789 -22.6 8.6 IRB Infra 75 Neutral 17,647 -1.3 0.7 6,629 -12.8 -11.3 1,817 -17.0 -9.2 KNR Constructions 264 Buy 5,800 29.2 10.9 1,131 25.5 4.9 553 6.2 31.4 Sadbhav Engineering 124 Buy 8,500 -8.2 50.4 1,020 -7.9 46.6 443 -21.3 71.2 Sector Aggregate 42,947 1.6 17.3 10,100 -9.0 -3.6 3,602 -16.1 5.7 Logistics Allcargo Logistics 104 Buy 19,502 8.1 4.1 1,377 22.1 5.9 672 41.1 5.0 Concor 572 Buy 17,292 10.0 -0.5 4,291 28.5 0.8 2,660 -3.2 0.7 Gateway Distriparks 122 Buy 3,229 9.5 -0.7 649 18.9 -11.3 139 -8.3 -23.6 Sector Aggregate 40,023 9.0 1.7 6,317 26.0 0.5 3,471 2.8 0.2 Media D B Corp 135 Buy 5,951 -9.8 12.0 1,456 4.2 48.0 843 11.5 11.5 Ent.Network 265 Buy 1,863 -7.3 63.5 353 -12.6 86.5 152 -5.0 308.9 Jagran Prakashan 63 Neutral 5,668 -7.7 10.2 1,291 -2.6 43.3 693 4.1 45.3

January 2020 31
India Strategy | Bull market, really?
Ready reckoner: Quarterly performance
Sector CMP SALES (INR M) EBDITA (INR M) NET PROFIT (INR M)
(INR) RECO Dec-19 Var % YoY
Var % QoQ Dec-19 Var
% YoY Var
% QoQ Dec-19 Var % YoY
Var % QoQ
Music Broadcast 29 Buy 754 -13.4 20.5 236 -17.4 41.7 133 -18.5 -29.5 PVR 1,879 Buy 9,964 18.2 2.4 2,083 26.8 7.1 792 53.0 19.9 Sun TV 434 Buy 9,647 6.7 21.3 6,686 0.2 42.6 4,336 23.4 18.3 Zee Entertainment 290 Neutral 21,485 -0.8 1.2 6,012 -20.3 -13.2 4,246 -19.1 -24.2 Sector Aggregate 55,331 1.0 8.2 18,117 -6.0 14.7 11,195 1.6 -1.7 Metals Hindalco 220 Buy 301,699 -10.2 0.4 36,913 -4.2 -0.6 10,225 -27.9 -17.8 Hindustan Zinc 214 Neutral 48,414 -12.6 7.3 22,851 -19.5 7.9 17,069 -22.8 -18.0 JSPL 173 Buy 97,033 1.4 8.5 17,342 -16.5 5.6 -3,397 Loss Loss JSW Steel 277 Buy 174,461 -14.1 -0.7 26,819 -40.4 -1.8 4,661 -71.3 -81.8 Nalco 46 Buy 21,579 -20.6 -8.7 1,140 -80.2 254.5 576 -83.1 LP NMDC 131 Buy 31,487 -13.7 40.5 17,725 -22.2 51.2 11,675 -22.5 52.5 SAIL 47 Neutral 137,647 -13.1 -2.6 11,464 -55.5 -1.2 -3,721 PL Loss Tata Steel 485 Neutral 334,395 -18.9 -3.3 38,293 -43.0 0.3 -3,722 PL PL Vedanta 159 Neutral 191,069 -19.3 -13.0 47,985 -15.0 8.5 6,243 -60.3 -75.3 Sector Aggregate 1337,785 -14.3 -1.9 220,531 -29.0 6.0 39,610 -65.7 -68.8 Oil & Gas Aegis Logistics 199 Buy 19,180 45.3 5.5 1,330 43.6 LP 828 40.0 LP BPCL 487 Neutral 640,308 -19.1 -0.5 25,735 3185.9 -6.8 11,110 124.4 -35.0 Castrol India 130 Buy 10,596 2.5 24.8 3,094 -2.5 26.6 2,308 8.9 22.5 GAIL 123 Buy 197,412 -0.2 9.4 25,417 -4.9 62.7 15,691 -4.9 47.4 Gujarat Gas 255 Buy 29,535 39.5 17.5 3,528 9.8 -4.8 1,879 24.9 -63.7 Gujarat State Petronet 232 Buy 4,860 7.1 -10.2 3,904 10.5 -10.7 2,242 29.2 -50.7 HPCL 270 Buy 589,126 -18.3 -3.2 32,559 789.8 33.4 16,985 586.1 61.4 IOC 127 Buy 1183,298 -15.5 5.9 61,276 301.6 30.2 19,924 177.9 253.6 Indraprastha Gas 422 Neutral 17,497 16.0 3.4 3,832 20.6 -2.4 2,716 37.2 -28.7 Mahanagar Gas 1,065 Neutral 7,558 0.4 -3.5 2,544 6.4 -7.0 1,739 17.2 -35.8 MRPL 44 Neutral 133,782 -25.1 1.3 390 LP LP -2,538 Loss Loss Oil India 153 Buy 30,205 -14.0 -6.0 11,643 -23.5 -6.3 7,960 -35.5 26.9 ONGC 128 Buy 241,837 -12.7 -1.3 125,058 -24.5 -5.9 49,844 -39.7 -20.4 Petronet LNG 269 Buy 92,146 -8.7 -1.6 10,598 25.0 -8.7 6,411 13.4 -46.3 Reliance Inds. 1,535 Buy 1529,577 -2.2 3.0 206,216 -3.3 -6.9 107,517 3.6 -5.3 Sector Aggregate 4726,918 -11.4 2.3 517,123 12.3 1.9 244,616 1.0 -2.2 Oil & Gas Excl. OMCs 2314,187 -4.6 2.8 397,553 -9.8 -2.7 196,598 -13.7 -9.4 Retail Aditya Birla Fashion 241 Buy 24,893 9.1 8.4 1,924 11.3 17.2 765 8.8 38.8 Avenue Supermarts 1,823 Sell 68,137 25.0 14.5 5,805 28.1 17.2 3,705 44.1 9.0 Future Lifestyle 399 Buy 18,950 12.0 20.3 1,743 5.0 39.1 619 -8.9 185.4 Future Retail 332 Buy 54,988 3.7 1.9 2,673 -3.8 -7.7 1,498 -25.6 -20.1 Jubilant Foodworks 1,682 Buy 10,444 12.4 5.7 2,596 52.2 10.5 1,108 14.8 25.3 Shoppers Stop 372 Neutral 10,279 2.9 21.6 1,053 8.4 125.1 475 1.2 LP Titan Company 1,155 Neutral 64,117 9.2 37.5 6,969 17.9 33.4 4,690 14.1 49.2 Trent 541 Buy 8,637 31.6 5.6 1,589 118.6 19.7 563 39.4 47.0 V-Mart Retail 1,664 Neutral 5,281 13.4 68.0 817 11.4 LP 541 29.7 LP Sector Aggregate 265,725 12.4 16.3 25,171 21.3 25.6 13,964 13.2 35.7
Technology Cyient 442 Buy 10,997 -7.4 -5.1 1,452 -17.0 -9.2 939 1.9 -4.8 HCL Technologies 573 Buy 183,249 16.7 4.5 45,538 24.9 11.0 28,429 8.9 7.2 Hexaware Tech. 337 Neutral 15,438 23.3 4.2 2,534 32.5 6.6 1,848 49.7 0.6 Infosys 735 Buy 232,922 8.8 2.9 59,417 9.8 5.4 42,979 19.1 6.9 L&T Infotech 1,822 Buy 27,079 9.5 5.3 5,004 -1.7 7.4 3,645 -2.9 1.2 Mindtree 813 Neutral 19,684 10.1 2.8 2,704 -4.6 8.9 1,667 -3.2 23.5

January 2020 32
India Strategy | Bull market, really?
Ready reckoner: Quarterly performance
Sector CMP SALES (INR M) EBDITA (INR M) NET PROFIT (INR M)
(INR) RECO Dec-19 Var % YoY
Var % QoQ Dec-19 Var
% YoY Var
% QoQ Dec-19 Var % YoY
Var % QoQ
MphasiS 894 Buy 22,233 12.8 3.0 4,301 30.1 6.1 3,076 10.7 12.6 NIIT Tech. 1,580 Neutral 10,909 12.3 5.0 2,010 11.3 5.9 1,223 22.1 2.4 Persistent Systems 714 Buy 9,233 6.8 4.4 1,297 -23.8 6.6 850 -7.3 -1.3 TCS 2,157 Neutral 397,885 6.6 2.1 107,826 6.9 5.4 83,050 2.3 3.3 Tech Mahindra 766 Buy 93,787 4.9 3.4 15,026 -12.8 0.1 10,080 -16.2 -10.3 Wipro 248 Neutral 156,933 4.2 3.8 32,663 -0.8 5.7 24,823 -2.4 -3.1 Zensar Tech 181 Buy 10,875 6.4 1.4 1,590 35.8 6.0 910 55.1 13.9 Sector Aggregate 1191,225 8.3 3.0 281,363 7.8 6.0 203,518 5.0 3.1
Telecom Bharti Airtel 455 Buy 219,157 8.3 3.7 93,209 49.9 5.2 -4,149 Loss Loss Bharti Infratel 254 Neutral 35,982 -1.2 1.0 15,349 2.0 3.7 7,832 20.8 -18.9 Tata Comm 405 Neutral 43,639 2.2 2.1 7,828 -7.1 2.2 407 76.0 -25.2 Vodafone Idea 6 Buy 111,846 -4.9 3.1 36,256 218.9 8.3 -41,715 Loss Loss Sector Aggregate 410,625 2.9 3.1 152,642 57.3 5.6 -37,625 Loss Loss
Utilities CESC 754 Buy 17,829 4.4 -20.6 3,978 97.9 -14.1 1,794 4.3 -34.8 Coal India 211 Buy 225,743 -9.9 10.8 56,780 -28.7 33.6 33,671 -26.3 -4.5 JSW Energy 70 Neutral 17,274 -28.7 -18.5 5,989 -18.9 -35.9 594 -59.3 -83.2 NHPC 24 Neutral 17,919 14.0 -31.2 9,284 55.8 -41.2 3,996 119.3 -70.2 NTPC 121 Buy 238,826 0.3 1.1 74,165 18.3 2.8 30,859 20.9 -11.1 Power Grid Corp. 195 Buy 89,671 7.9 -0.8 82,527 11.4 4.3 25,481 8.1 1.5 Tata Power 58 Neutral 74,656 -3.1 -2.8 16,992 6.1 -24.7 2,493 LP -28.9 Torrent Power 288 Buy 33,187 2.0 -13.6 7,764 5.4 -26.4 2,252 -5.0 -70.2 Sector Aggregate 715,104 -3.1 0.0 257,479 0.9 0.3 101,140 0.1 -19.6
Others Brigade Enterpr. 220 Buy 6,678 -2.9 -9.2 1,836 4.4 -3.5 337 -31.0 -9.7 BSE 523 Buy 1,150 13.2 5.7 -30 Loss Loss 206 -46.0 -27.1 Coromandel Int. 533 Buy 33,530 10.0 -31.0 3,777 24.3 -47.0 2,234 44.5 -55.7 Delta Corp 201 Buy 2,059 0.4 2.5 803 -6.1 -1.3 560 9.4 -4.3 Godrej Agrovet 520 Buy 17,734 22.0 -4.2 1,359 34.6 13.5 566 38.4 -45.5 Indian Hotels 147 Buy 13,896 5.0 37.9 4,224 25.9 163.3 1,546 28.0 116.1 Info Edge 2,532 Neutral 3,344 19.0 5.6 1,157 38.9 16.5 1,023 37.5 21.5 Interglobe Aviation 1,333 Neutral 90,698 14.6 11.9 23,598 47.9 2338.5 9,790 413.0 LP Kaveri Seed 501 Buy 752 11.9 -2.9 34 2755.3 -70.0 42 15.6 -39.1 Lemon Tree Hotel 63 Buy 2,362 64.8 54.6 829 69.2 71.2 112 -9.9 LP MCX 1,189 Buy 948 23.2 -5.4 403 92.5 -14.7 482 15.3 -33.1 Navneet Education 94 Buy 2,016 11.0 -18.3 181 15.6 -42.9 81 7.1 -81.0 Oberoi Realty 529 Buy 4,758 -10.0 -3.2 1,966 4.5 -7.6 2,162 56.8 56.6 P I Industries 1,440 Buy 8,323 17.6 -8.3 1,906 28.3 -0.7 1,306 21.7 6.3 Phoenix Mills 839 Buy 4,968 12.8 19.7 2,590 16.4 22.9 769 8.6 26.5 Quess Corp 504 Neutral 26,948 24.1 1.7 1,688 42.7 4.6 865 33.1 33.1 S H Kelkar 120 Buy 3,334 30.0 19.4 492 22.9 28.6 273 27.5 76.8 SRF 3,465 Buy 20,637 5.1 18.8 3,768 13.8 12.4 1,802 15.9 -12.1 Tata Chemicals 672 Buy 29,944 5.7 -2.9 5,570 18.2 -12.3 2,699 9.3 -23.9 Team Lease Serv. 2,510 Buy 13,950 19.0 10.0 304 24.0 24.1 245 -2.8 21.6 Trident 7 Buy 13,223 2.4 0.1 2,526 4.1 1.3 1,048 10.9 -22.2 UPL 596 Neutral 89,805 82.5 14.9 18,013 77.3 17.0 5,604 -8.3 54.1 Sector Aggregate 391,057 23.1 3.6 76,995 38.5 48.3 33,754 45.4 136.8 PL: Profit to Loss; LP: Loss to Profit; UR: Under Review

January 2020 33
India Strategy | Bull market, really?
Ready reckoner: Quarterly performance Sector CMP NII (INR M) OP. PROFITS (INR M) NET PROFIT (INR M)
(INR) Rating Dec-19 Var % YoY
Var % QoQ Dec-19 Var
% YoY Var
% QoQ Dec-19 Var % YoY
Var % QoQ
Financials Private Banks AU Small Finance 796 Buy 4,890 40.5 8.3 2,993 67.5 7.8 1,823 91.2 6.0 Axis Bank 757 Buy 63,895 14.0 4.7 56,306 1.9 -5.4 17,313 3.0 LP DCB Bank 183 Neutral 3,236 10.2 3.3 1,895 9.1 2.7 1,018 18.3 11.4 Equitas Holdings 108 Buy 3,640 13.6 3.8 1,362 11.2 6.2 642 2.8 35.0 Federal Bank 92 Buy 11,681 8.4 3.9 7,610 7.5 5.9 3,904 17.0 -6.3 HDFC Bank 1,287 Buy 142,539 13.3 5.5 122,457 13.6 4.7 70,775 26.7 11.5 ICICI Bank 541 Buy 82,749 20.4 2.7 71,330 16.1 3.8 39,446 145.8 502.3 IndusInd Bank 1,529 Buy 29,797 30.2 2.4 27,254 28.7 3.9 15,087 53.2 7.7 Kotak Mahindra Bank 1,671 Neutral 34,968 19.0 4.4 25,923 33.7 3.3 16,551 28.2 -4.0 RBL Bank 370 Buy 8,941 36.5 2.9 6,497 30.3 2.2 459 -79.6 -15.6 Pvt Banking Sector Aggregate 386,335 17.2 4.3 323,627 14.8 2.4 167,018 39.8 54.7 PSU Banks Bank of Baroda 104 Buy 71,247 50.2 1.4 53,884 52.3 1.0 -5,633 PL PL Indian Bank 103 Neutral 18,990 10.6 1.9 13,839 20.7 -7.8 -1,197 PL PL Punjab National Bank 67 Neutral 45,338 5.7 6.3 36,473 17.7 2.4 384 -84.4 -92.4 State Bank 339 Buy 247,434 9.0 0.6 154,686 22.5 -15.0 71,981 82.0 139.0 PSU Banking Sector Aggregate 383,009 14.5 1.4 258,883 26.8 -9.5 65,536 35.8 42.0 Life Insurance HDFC Life Insur. 634 Neutral 84,299 22.2 13.1 3,008 35.7 41.2 2,830 15.2 -8.3 ICICI Pru Life 487 Buy 86,562 15.7 7.3 3,481 7.0 -27.0 3,267 10.1 8.2 Life Insurance Sector Aggregate 170,861 18.8 10.1 6,489 18.6 -5.9 6,097 12.4 -0.1 NBFC Bajaj Finance 4,248 Neutral 34,060 30.7 8.5 28,672 37.4 9.6 16,441 55.2 9.2 Chola. Inv & Fin. 309 Buy 10,236 16.9 0.3 6,422 14.8 3.8 3,981 30.8 29.7 HDFC 2,466 Buy 30,867 7.2 4.6 29,257 2.1 0.9 22,638 10.8 -24.0 IndoStar Capital 196 Buy 1,450 2.8 -13.1 1,127 -1.3 -19.3 319 -55.2 -35.3 L&T Fin.Holdings 121 Buy 16,402 9.6 -4.3 12,243 17.4 -8.3 6,040 4.0 -6.8 LIC Housing Fin 456 Buy 12,142 16.5 0.5 11,288 13.8 -0.5 6,898 15.7 -10.7 M & M Financial 339 Buy 13,109 8.3 2.1 7,849 5.4 -4.2 3,901 22.4 54.9 MAS Financial 864 Buy 979 -4.8 3.4 764 -7.4 5.4 442 -2.8 -5.3 Muthoot Finance 768 Neutral 12,595 15.1 -12.3 8,665 10.5 -19.3 6,369 31.3 -25.8 PNB Housing 493 Buy 4,844 36.9 -2.1 5,636 10.1 -2.4 3,482 14.9 -5.1 Repco Home Fin 327 Buy 1,200 5.8 3.5 1,044 11.2 2.3 684 22.9 -32.0 Shriram City Union 1,388 Buy 8,970 -0.1 0.4 5,639 3.0 -1.8 2,729 5.5 -8.3 Shriram Transport Fin. 1,160 Buy 20,203 -0.5 1.2 15,837 -2.2 -0.2 6,906 8.7 -9.7 NBFC Banking Sector Aggregate 167,057 12.5 1.2 134,444 11.6 -0.8 80,831 19.6 -9.7 Financials Sector Aggregate 1,107,261 15.8 3.6 723,442 18.2 -2.8 319,482 32.7 27.9 PL: Profit to Loss; LP: Loss to Profit; UR: Under Review; For Banks: Sales = Net Interest Income, EBITDA = Operating Profits; For Life Insurance: Sales = Net Premium, EBITDA = Operating Profits

January 2020 34
India Strategy | Bull market, really?
THIS PAGE INTENTIONALLY LEFT BLANK

January 2020 35
India Strategy | Bull market, really?
Ready reckoner: Full year valuations CMP EPS (INR) PE (x) PB (x) RoE (%) Company Name INR Reco FY20E FY21E FY22E FY20E FY21E FY22E FY20E FY21E FY22E FY20E FY21E FY22E Automobiles 27.2 20.0 16.3 3.0 2.7 2.4 10.9 13.6 14.9 Amara Raja Batt. 727 Buy 38.0 38.4 42.2 19.1 18.9 17.2 3.3 2.9 2.6 18.2 16.3 16.0 Ashok Leyland 84 Buy 1.7 3.5 5.5 48.6 24.0 15.3 3.1 3.0 2.8 6.2 12.7 18.8 Bajaj Auto 3,119 Neutral 178.9 187.7 211.5 17.4 16.6 14.7 3.7 3.3 3.0 22.4 21.1 21.4 Bharat Forge 491 Buy 17.4 21.5 26.4 28.2 22.9 18.6 3.9 3.5 3.1 14.5 16.2 17.8 Bosch 15,403 Neutral 387.9 493.0 560.6 39.7 31.2 27.5 6.0 5.2 4.6 13.7 17.8 17.7 CEAT 1,033 Buy 56.8 71.9 93.7 18.2 14.4 11.0 1.4 1.3 1.2 8.0 9.5 11.3 Endurance Tech. 1,073 Buy 42.4 48.4 53.5 25.3 22.2 20.0 5.1 4.4 3.8 21.5 21.1 20.2 Eicher Motors 21,611 Buy 744.7 894.1 1,133.7 29.0 24.2 19.1 5.6 4.7 3.9 20.8 21.0 22.2 Escorts 619 Neutral 52.6 61.4 70.5 11.8 10.1 8.8 1.8 1.5 1.3 16.2 16.3 16.1 Exide Inds. 189 Buy 10.2 10.8 11.9 18.5 17.5 15.8 2.5 2.3 2.1 13.3 12.9 13.0 Hero Motocorp 2,429 Neutral 150.2 167.7 187.3 16.2 14.5 13.0 3.6 3.3 3.0 22.6 23.6 24.4 Mahindra & Mahindra 540 Buy 35.4 43.4 51.8 15.3 12.4 10.4 1.7 1.6 1.4 11.7 10.6 10.6 Mahindra CIE 169 Buy 11.4 14.6 16.5 14.8 11.6 10.3 1.4 1.2 1.1 9.6 11.0 11.2 Maruti Suzuki 7,332 Buy 198.5 261.6 338.4 36.9 28.0 21.7 4.5 4.1 3.7 11.8 14.4 16.8 Motherson Sumi 150 Buy 4.6 6.7 8.4 32.3 22.3 17.8 3.9 3.4 3.0 12.4 16.3 18.2 Tata Motors 194 Buy 0.9 12.3 15.6 213.9 15.8 12.5 1.1 1.0 1.0 0.5 6.6 8.2 TVS Motor 459 Neutral 13.1 17.7 23.3 35.1 25.9 19.7 5.7 4.9 4.1 17.4 20.4 22.7 Capital Goods 23.5 19.4 16.6 2.9 2.7 2.4 12.4 13.7 14.5 ABB 1,295 Buy 19.3 25.8 32.4 67.0 50.1 40.0 6.0 6.8 6.0 14.0 13.5 15.0 Bharat Electronics 103 Buy 6.4 7.5 8.3 16.2 13.7 12.4 2.5 2.3 2.1 15.7 16.8 17.0 BHEL 45 Neutral 3.4 3.0 3.4 13.5 14.9 13.5 0.5 0.5 0.5 3.7 3.3 3.6 Blue Star 813 Neutral 26.8 33.1 40.4 30.3 24.6 20.1 7.3 6.0 4.9 24.2 24.3 24.2 CG Consumer Elect. 241 Buy 7.6 9.6 11.6 31.7 25.1 20.8 11.0 8.8 7.0 38.5 38.7 37.5 Cummins India 569 Buy 24.4 26.6 29.4 23.4 21.4 19.3 3.6 3.4 3.1 15.8 16.2 16.8 Engineers India 99 Buy 6.5 8.7 9.6 15.3 11.5 10.3 2.8 2.7 2.5 17.6 22.5 23.8 Havells India 654 Neutral 12.8 16.1 19.4 51.2 40.7 33.7 8.6 7.6 6.6 16.8 18.6 19.7 K E C International 311 Buy 24.2 28.6 33.1 12.8 10.9 9.4 2.7 2.2 1.8 20.9 20.3 19.4 Larsen & Toubro 1,345 Buy 77.3 95.8 105.7 17.4 14.0 12.7 2.7 2.4 2.1 15.4 16.7 17.5 Siemens 1,514 Buy 30.5 40.0 44.9 49.6 37.8 33.7 6.0 5.3 4.8 12.0 14.1 14.1 Thermax 1,098 Neutral 29.8 39.0 44.8 36.9 28.2 24.5 3.8 3.4 3.1 10.7 12.8 13.3 Voltas 659 Buy 20.0 24.6 29.1 33.0 26.9 22.6 4.8 4.3 3.8 14.5 15.9 16.7 Cement 27.7 22.7 18.6 2.4 2.2 2.0 8.6 9.7 10.9 ACC 1,493 Buy 75.5 79.3 88.5 19.8 18.8 16.9 2.4 2.2 2.0 12.7 12.0 12.1 Ambuja Cements 205 Neutral 7.2 7.6 8.1 28.5 27.1 25.2 1.8 1.8 1.7 6.6 6.6 6.8 Birla Corporation 629 Buy 61.1 70.1 83.4 10.3 9.0 7.5 1.0 0.9 0.8 10.0 10.6 11.5 Dalmia Bharat 819 Buy 14.0 19.2 37.6 58.5 42.6 21.8 1.5 1.4 1.4 2.5 3.4 6.4 Grasim Industries 767 Neutral 41.3 53.8 67.1 18.5 14.3 11.4 1.2 1.1 1.1 4.3 4.0 3.8 India Cements 77 Neutral 3.8 4.1 5.8 20.2 18.9 13.3 0.4 0.4 0.4 2.2 2.3 3.3 J K Cements 1,218 Buy 64.2 69.1 86.5 19.0 17.6 14.1 3.0 2.6 2.2 17.0 15.9 17.2 JK Lakshmi Cem. 304 Buy 20.0 23.2 28.8 15.2 13.1 10.5 2.1 1.8 1.5 14.5 14.8 15.8 Ramco Cements 769 Neutral 28.1 29.8 34.1 27.4 25.8 22.6 3.6 3.2 2.8 13.9 13.1 13.3 Shree Cement 21,222 Neutral 453.7 569.5 695.5 46.8 37.3 30.5 5.7 5.1 4.5 14.3 14.5 15.6 Ultratech Cement 4,243 Buy 138.4 181.8 224.5 30.6 23.3 18.9 3.1 2.8 2.5 11.3 13.3 14.5 Consumer 40.9 36.4 31.9 11.8 10.5 9.6 28.8 28.7 30.2 Asian Paints 1,790 Sell 29.1 31.6 36.8 61.5 56.6 48.6 16.1 14.5 13.2 27.6 26.9 28.3 Britannia 3,053 Neutral 56.7 64.6 74.9 53.8 47.2 40.8 16.1 15.7 15.3 30.9 33.7 38.0 Colgate 1,460 Buy 29.9 36.0 43.1 48.8 40.6 33.9 28.7 31.3 40.2 57.5 73.8 103.9 Dabur 460 Neutral 9.0 10.0 11.4 51.2 45.8 40.3 12.7 11.8 10.5 26.4 26.7 27.5 Emami 312 Buy 13.0 14.7 16.8 24.1 21.2 18.6 6.1 5.9 5.5 26.7 28.2 30.7

January 2020 36
India Strategy | Bull market, really?
Ready reckoner: Full year valuations CMP EPS (INR) PE (x) PB (x) RoE (%) Company Name INR Reco FY20E FY21E FY22E FY20E FY21E FY22E FY20E FY21E FY22E FY20E FY21E FY22E Godrej Consumer 684 Neutral 15.5 17.6 20.0 44.1 38.9 34.1 9.1 8.9 8.6 21.2 23.2 25.7 GSK Consumer 8,386 Neutral 290.3 327.6 368.4 28.9 25.6 22.8 7.5 6.6 5.9 27.7 27.5 27.3 Hind. Unilever 1,938 Buy 32.8 39.1 45.0 59.2 49.6 43.1 53.3 52.4 44.4 91.3 106.5 111.7 ITC 240 Neutral 12.6 13.0 14.3 19.1 18.4 16.7 4.7 4.3 4.0 25.5 24.4 25.1 Jyothy Labs 151 Neutral 6.0 7.1 8.2 25.4 21.4 18.4 4.0 3.8 3.5 16.1 18.1 19.8 Marico 337 Neutral 7.5 8.0 9.3 45.2 41.9 36.4 12.0 10.5 9.7 29.0 26.7 27.7 Nestle 14,725 Neutral 214.4 244.7 283.4 68.7 60.2 52.0 65.9 59.8 59.4 70.9 104.2 114.7 P&G Hygiene 11,321 Neutral 151.0 200.3 238.0 75.0 56.5 47.6 34.6 29.1 24.5 49.8 56.0 55.9 Page Industries 23,589 Neutral 388.2 457.6 575.8 60.8 51.6 41.0 29.8 26.7 24.4 49.0 51.8 59.5 Pidilite Inds. 1,399 Neutral 22.1 26.5 30.7 63.4 52.8 45.6 14.4 12.3 10.3 24.7 25.1 24.6 Tata Global 324 Buy 8.9 9.7 11.0 36.3 33.4 29.4 2.7 2.2 2.1 7.5 8.3 7.2 United Breweries 1,282 Neutral 18.0 26.6 31.6 71.4 48.1 40.5 9.4 8.1 7.1 14.0 18.1 18.7 United Spirits 594 Buy 11.7 15.5 22.1 50.9 38.2 26.9 11.3 8.7 6.6 22.3 22.9 24.6 Financials Banks-Private 28.6 19.2 15.2 3.5 3.0 2.6 12.2 15.8 17.1 AU Small Finance 796 Buy 24.7 30.7 40.8 32.2 25.9 19.5 5.5 4.6 3.7 19.5 19.3 20.9 Axis Bank 757 Buy 18.9 45.2 64.9 40.0 16.8 11.7 2.5 2.2 1.9 6.7 13.9 17.2 DCB Bank 183 Neutral 12.4 17.9 22.5 14.7 10.2 8.1 1.7 1.5 1.2 12.6 15.8 16.9 Equitas Holdings 108 Buy 7.0 12.0 18.4 15.3 9.0 5.8 1.4 1.2 1.0 9.4 14.3 18.9 Federal Bank 92 Buy 8.3 10.3 12.7 11.1 9.0 7.2 1.3 1.1 1.0 11.9 13.3 14.8 HDFC Bank 1,287 Buy 48.7 63.2 76.3 26.4 20.4 16.9 4.1 3.5 3.0 16.7 18.7 19.2 ICICI Bank 541 Buy 16.5 29.7 36.2 32.8 18.2 14.9 3.1 2.7 2.4 9.8 16.0 17.1 IndusInd Bank 1,529 Buy 91.4 118.5 150.9 16.7 12.9 10.1 2.9 2.4 1.9 18.9 20.2 21.1 Kotak Mahindra Bank 1,671 Neutral 46.9 56.7 69.2 35.6 29.5 24.2 4.8 4.1 3.5 14.3 15.1 16.1 RBL Bank 370 Buy 11.7 25.6 40.3 31.6 14.4 9.2 1.7 1.6 1.4 6.4 11.4 16.1 South Indian Bank 10 Buy 1.8 2.8 4.1 5.7 3.7 2.5 0.3 0.3 0.3 6.0 8.8 12.6 Banks-PSU 19.5 7.7 5.5 0.8 0.8 0.7 4.2 9.7 12.2 Bank of Baroda 104 Buy 4.1 15.6 23.9 25.5 6.7 4.4 0.7 0.6 0.6 2.4 9.7 13.3 Bank of India 71 Neutral -10.3 5.7 9.0 -6.9 12.5 8.0 0.5 0.5 0.4 -6.3 3.6 5.3 Canara Bank 229 Neutral 15.1 28.0 46.8 15.2 8.2 4.9 0.6 0.6 0.5 3.4 6.5 10.1 Indian Bank 103 Neutral 15.1 28.5 45.0 6.8 3.6 2.3 0.3 0.3 0.3 4.8 9.3 13.2 Punjab National Bank 67 Neutral -4.5 7.6 11.3 -14.9 8.8 5.9 0.8 0.7 0.7 -4.9 8.4 11.3 State Bank 339 Buy 26.4 39.3 51.9 12.9 8.6 6.5 1.3 1.1 1.0 10.6 14.2 16.3 Union Bank 55 Neutral 0.0 4.5 8.4 1,421 12.4 6.6 0.5 0.5 0.5 0.0 4.3 7.9 Insurance 74.1 64.6 54.8 13.7 12.1 10.4 18.6 18.7 19.0 HDFC Life Insur. 634 Neutral 7.1 8.4 10.1 88.7 75.0 62.8 5.8 4.8 3.9 21.3 19.4 22.1 ICICI Pru Life 487 Buy 8.5 9.4 10.9 57.1 51.6 44.5 2.8 2.4 2.0 16.5 17.3 17.3 NBFC 25.2 21.5 18.6 3.7 3.3 2.9 14.7 15.2 15.4 Aditya Birla Cap 107 Buy 4.3 5.6 6.9 24.5 19.0 15.5 2.2 1.9 1.6 9.8 10.6 11.3 Bajaj Finance 4,248 Neutral 103.4 137.1 166.5 41.1 31.0 25.5 7.6 6.2 5.1 23.2 22.0 22.0 Chola. Inv & Fin. 309 Buy 18.3 21.2 23.3 16.9 14.6 13.3 3.2 2.7 2.3 20.9 20.2 18.6 HDFC 2,466 Buy 51.7 57.9 64.9 47.7 42.6 38.0 4.9 4.5 4.2 14.6 14.4 14.6 IndoStar Capital 196 Buy 20.6 26.8 31.8 9.5 7.3 6.2 0.6 0.5 0.5 6.1 7.4 8.1 L&T Fin.Holdings 121 Buy 12.2 14.4 16.1 9.9 8.4 7.5 1.5 1.3 1.1 16.6 16.9 16.3 LIC Housing Fin 456 Buy 56.6 61.6 72.4 8.1 7.4 6.3 1.2 1.1 1.0 16.5 15.8 16.3 M & M Financial 339 Buy 23.2 31.3 35.2 14.6 10.8 9.6 1.8 1.6 1.4 13.0 15.6 15.6 MAS Financial 864 Buy 32.3 39.4 47.3 26.8 21.9 18.3 4.6 4.0 3.4 19.4 20.2 20.6 Muthoot Finance 768 Neutral 66.3 76.3 86.6 11.6 10.1 8.9 2.8 2.3 2.0 26.2 25.2 24.1 PNB Housing 493 Buy 80.9 89.7 104.4 6.1 5.5 4.7 1.0 0.8 0.7 17.1 16.4 16.6 Repco Home Fin 327 Buy 48.6 52.5 60.6 6.7 6.2 5.4 1.1 1.0 0.8 18.2 16.7 16.5

January 2020 37
India Strategy | Bull market, really?
Ready reckoner: Full year valuations CMP EPS (INR) PE (x) PB (x) RoE (%) Company Name INR Reco FY20E FY21E FY22E FY20E FY21E FY22E FY20E FY21E FY22E FY20E FY21E FY22E Shriram City Union 1,388 Buy 167.9 181.6 202.4 8.3 7.6 6.9 1.2 1.1 1.0 16.1 15.1 14.8 Shriram Transport Fin. 1,160 Buy 122.8 129.9 146.3 9.4 8.9 7.9 1.5 1.3 1.1 16.5 15.2 15.0 Healthcare 22.8 18.6 16.5 2.9 2.5 2.3 12.6 13.7 13.7 Alembic Pharma 561 Neutral 38.4 33.1 38.3 14.6 17.0 14.6 3.2 2.8 2.4 23.8 17.3 17.4 Alkem Lab 2,084 Buy 89.2 108.9 128.2 23.4 19.1 16.3 4.0 3.4 3.0 18.2 19.3 19.5 Ajanta Pharma 979 Buy 49.1 57.5 65.8 20.0 17.0 14.9 3.3 2.9 2.5 17.9 18.1 18.0 Aurobindo Pharma 462 Buy 47.0 61.5 63.4 9.8 7.5 7.3 1.6 1.4 1.2 18.1 19.8 17.1 Biocon 296 Neutral 7.5 10.0 13.1 39.3 29.5 22.5 5.2 4.7 4.1 14.1 16.7 19.3 Cadila Health 256 Buy 14.5 17.0 19.1 17.7 15.0 13.4 2.4 2.1 1.9 11.3 14.8 14.9 Cipla 474 Neutral 22.1 25.7 28.9 21.4 18.4 16.4 2.3 2.0 1.8 10.5 11.0 11.2 Divis Labs 1,825 Neutral 53.6 67.2 78.4 34.0 27.2 23.3 6.0 5.1 4.3 18.9 20.3 20.2 Dr Reddy’ s Labs 2,864 Neutral 111.0 129.2 136.6 25.8 22.2 21.0 2.9 2.6 2.4 12.1 12.3 11.8 Glenmark Pharma 354 Neutral 24.5 28.6 32.5 14.5 12.4 10.9 1.6 1.4 1.3 11.7 12.3 12.5 Granules India 122 Buy 13.7 15.1 17.9 8.9 8.1 6.8 1.7 1.5 1.3 21.0 20.0 20.3 GSK Pharma 1,623 Neutral 32.4 34.8 40.0 50.1 46.6 40.6 10.4 9.6 8.7 20.7 20.7 21.5 IPCA Labs. 1,141 Buy 46.9 59.3 65.5 24.3 19.2 17.4 4.0 3.4 2.9 17.5 18.9 17.9 Jubilant Life 535 Buy 59.0 66.8 75.2 9.1 8.0 7.1 1.5 1.3 1.1 17.6 17.0 16.4 Laurus Labs 373 Buy 15.2 23.1 31.2 24.5 16.1 11.9 2.3 2.0 1.7 9.8 13.3 15.6 Lupin 775 Buy 24.4 37.8 43.4 31.8 20.5 17.8 2.4 2.2 2.0 7.7 11.1 11.7 Sun Pharma 435 Buy 18.3 22.1 24.4 23.8 19.7 17.9 2.3 2.1 1.9 10.2 11.3 11.3 Strides Pharma 376 Buy 22.0 34.0 42.3 17.1 11.1 8.9 1.2 1.1 1.0 7.1 10.3 11.8 Torrent Pharma 1,864 Neutral 56.8 72.9 90.9 32.8 25.6 20.5 5.9 5.1 4.4 19.1 21.4 23.2 Infrastructure 8.3 10.4 12.1 0.9 0.7 0.7 10.5 6.9 5.6 Ashoka Buildcon 109 Buy 11.6 12.5 12.4 9.4 8.7 8.8 1.2 1.1 1.0 13.8 13.1 11.7 IRB Infra 75 Neutral 18.0 4.9 -2.1 4.2 15.4 -36.2 0.4 0.4 0.4 9.6 2.5 -1.1 KNR Constructions 264 Buy 19.7 17.6 21.0 13.4 15.0 12.6 2.2 1.9 1.7 17.8 13.6 14.3 Sadbhav Engineering 124 Buy 9.2 16.6 18.3 13.6 7.5 6.8 1.0 0.6 0.5 7.5 10.5 8.3 Logistics 27.5 24.8 21.8 2.7 2.6 2.4 9.9 10.3 11.0 Allcargo Logistics 104 Buy 10.4 11.2 12.5 10.0 9.2 8.3 1.1 1.0 0.9 12.0 11.5 11.4 Concor 572 Buy 17.2 19.7 22.5 33.2 29.1 25.5 3.3 3.1 2.9 10.0 11.0 11.9 Gateway Distriparks 122 Buy 9.6 8.1 9.5 12.7 15.1 12.8 1.0 0.9 0.9 7.7 6.3 7.1 Media 13.5 12.0 10.7 2.5 2.2 1.9 18.4 17.9 17.3 D B Corp 135 Buy 17.8 21.1 22.7 7.6 6.4 5.9 1.3 1.2 1.1 16.6 18.4 18.2 Ent.Network 265 Buy 8.0 15.3 22.0 33.0 17.3 12.0 1.3 1.2 1.1 4.0 7.3 9.7 Jagran Prakashan 63 Neutral 11.5 11.4 11.3 5.4 5.5 5.5 0.9 0.8 0.7 17.2 15.4 13.6 Music Broadcast 29 Buy 2.1 2.4 3.2 13.5 11.8 8.9 1.2 1.1 1.0 9.2 9.7 11.5 PVR 1,879 Buy 47.4 57.4 68.6 39.6 32.7 27.4 5.4 4.7 4.0 15.7 15.4 15.8 Sun TV 434 Buy 38.5 40.4 43.1 11.3 10.7 10.1 2.7 2.3 2.0 25.6 23.1 21.3 Zee Entertainment 290 Neutral 19.6 23.8 27.5 14.8 12.2 10.5 2.7 2.2 1.9 20.2 20.0 19.5 Metals 13.0 10.2 7.5 1.1 1.0 0.9 8.2 9.7 11.9 Hindalco 220 Buy 19.7 22.3 22.2 11.2 9.9 9.9 1.1 1.0 0.9 10.7 11.0 10.0 Hindustan Zinc 214 Neutral 17.7 18.5 18.9 12.1 11.6 11.3 2.4 2.1 1.9 20.9 19.4 17.8 JSPL 173 Buy -7.1 5.5 10.6 -24.5 31.8 16.4 0.5 0.5 0.5 -2.1 1.7 3.1 JSW Steel 277 Buy 24.2 31.9 45.9 11.4 8.7 6.0 1.7 1.4 1.2 15.7 18.0 21.7 Nalco 46 Buy 1.4 3.5 3.4 33.4 13.1 13.5 0.8 0.8 0.8 2.5 6.3 6.0 NMDC 131 Buy 13.3 16.0 21.5 9.9 8.2 6.1 1.5 1.3 1.2 15.2 16.9 20.4 SAIL 47 Neutral -1.0 3.2 6.8 -49.6 14.8 7.0 0.5 0.5 0.5 -1.0 3.3 6.8 Tata Steel 485 Neutral 50.3 64.6 106.4 9.6 7.5 4.6 0.8 0.8 0.7 8.9 10.6 15.6 Vedanta 159 Neutral 12.3 12.1 18.3 13.0 13.2 8.7 0.9 0.9 0.8 7.2 6.9 9.9 Oil & Gas 14.7 10.8 10.0 1.6 1.5 1.3 11.2 13.7 13.4

January 2020 38
India Strategy | Bull market, really?
Ready reckoner: Full year valuations CMP EPS (INR) PE (x) PB (x) RoE (%) Company Name INR Reco FY20E FY21E FY22E FY20E FY21E FY22E FY20E FY21E FY22E FY20E FY21E FY22E Aegis Logistics 199 Buy 6.3 12.1 13.1 31.7 16.4 15.2 4.4 3.7 3.1 14.6 24.3 22.1 BPCL 487 Neutral 30.2 46.2 48.0 16.1 10.6 10.2 2.3 2.0 1.8 14.7 20.1 18.5 Castrol India 130 Buy 8.0 8.9 9.3 16.4 14.7 14.0 10.0 9.0 8.1 64.0 64.2 60.7 GAIL 123 Buy 11.7 13.2 14.5 10.6 9.4 8.5 1.2 1.1 1.0 11.5 12.0 12.2 Gujarat Gas 255 Buy 16.2 12.2 12.3 15.7 20.8 20.8 5.7 4.7 4.0 42.4 24.8 20.9 Gujarat State Petronet 232 Buy 19.9 18.0 18.6 11.7 12.9 12.5 1.9 1.7 1.5 17.9 14.1 12.9 HPCL 270 Buy 33.3 45.9 44.8 8.1 5.9 6.0 1.2 1.1 1.0 16.0 19.9 17.6 Indraprastha Gas 422 Neutral 16.5 17.2 18.6 25.5 24.6 22.7 5.9 4.9 4.2 25.2 21.8 20.0 IOC 127 Buy 9.6 18.6 19.4 13.3 6.8 6.6 1.0 0.9 0.9 7.6 14.1 13.6 Mahanagar Gas 1,065 Neutral 80.6 68.1 66.7 13.2 15.6 16.0 3.7 3.3 2.9 30.3 22.1 19.3 MRPL 44 Neutral -8.0 5.7 7.4 -5.5 7.7 5.9 0.8 0.8 0.7 -14.0 10.3 12.3 Oil India 153 Buy 25.1 25.4 25.8 6.1 6.0 5.9 0.6 0.6 0.5 10.0 9.5 9.2 ONGC 128 Buy 22.3 26.7 28.3 5.7 4.8 4.5 0.7 0.6 0.6 12.6 13.9 13.4 Petronet LNG 269 Buy 20.3 20.9 22.4 13.3 12.9 12.0 3.7 3.4 3.1 28.9 27.4 27.1 Reliance Inds. 1,535 Buy 77.7 106.5 119.3 19.8 14.4 12.9 2.1 1.9 1.7 11.3 13.8 13.7 Retail 66.5 50.0 39.4 10.5 9.0 7.6 15.8 17.9 19.2 Aditya Birla Fashion 241 Buy 3.1 4.8 5.9 77.1 49.7 40.7 11.3 9.2 7.5 15.7 20.4 20.3 Avenue Supermarts 1,823 Sell 21.0 28.9 36.2 86.9 63.1 50.3 16.5 13.1 10.4 21.0 23.1 23.0 Future Lifestyle 399 Buy 7.3 11.2 14.6 54.6 35.5 27.3 3.4 3.1 2.9 6.9 9.2 10.9 Future Retail 332 Buy 14.1 16.2 19.6 23.6 20.5 16.9 2.5 2.3 2.0 13.6 11.6 12.5 Jubilant Foodworks 1,682 Buy 27.6 35.6 45.6 60.9 47.2 36.9 15.0 12.5 10.4 24.6 26.4 28.2 Shoppers Stop 372 Neutral 9.0 11.1 10.3 41.2 33.5 36.1 3.1 2.9 2.7 7.9 8.9 7.6 Titan Company 1,155 Neutral 17.2 22.3 28.7 67.4 51.8 40.3 16.9 14.3 12.2 25.1 30.0 32.7 Trent 541 Buy 4.5 7.6 11.9 120.7 70.7 45.5 6.5 5.9 5.2 7.2 9.4 13.1 V-Mart Retail 1,664 Neutral 42.3 53.5 63.7 39.3 31.1 26.1 6.2 5.2 4.3 17.1 18.1 18.0 Technology 21.0 18.8 16.7 5.3 4.9 4.5 25.2 26.2 26.9 Cyient 442 Buy 36.0 41.8 44.6 12.3 10.6 9.9 1.8 1.6 1.5 14.4 15.3 15.1 HCL Technologies 573 Buy 38.3 44.6 50.0 15.0 12.9 11.5 3.2 2.8 2.5 22.9 23.4 23.3 Hexaware Tech. 337 Neutral 21.8 24.8 28.5 15.5 13.6 11.8 3.6 3.0 2.5 25.2 24.3 23.4 Infosys 735 Buy 38.6 44.7 49.9 19.1 16.4 14.7 5.1 4.7 4.4 26.0 29.7 30.9 L&T Infotech 1,822 Buy 84.9 101.0 116.3 21.5 18.0 15.7 5.3 4.3 3.6 27.2 26.4 25.0 Mindtree 813 Neutral 35.0 45.6 57.8 23.3 17.8 14.1 4.3 3.9 3.4 19.1 23.1 25.9 MphasiS 894 Buy 62.4 72.2 77.7 14.3 12.4 11.5 3.2 2.7 2.3 23.1 25.1 23.6 NIIT Tech. 1,580 Neutral 76.1 88.6 100.9 20.8 17.8 15.6 4.1 3.6 3.1 21.0 21.3 21.2 Persistent Systems 714 Buy 45.1 48.5 58.0 15.8 14.7 12.3 2.3 2.1 1.9 14.8 15.1 16.3 TCS 2,157 Neutral 87.4 95.8 110.0 24.7 22.5 19.6 7.6 7.3 6.8 33.0 33.0 35.8 Tech Mahindra 766 Buy 47.5 53.1 58.1 16.1 14.4 13.2 3.2 2.9 2.6 20.4 21.5 21.2 Zensar Tech 181 Buy 15.2 18.6 19.6 11.9 9.7 9.2 1.9 1.6 1.4 16.6 17.8 16.4 Wipro 248 Neutral 16.5 17.4 18.2 15.0 14.3 13.7 3.0 2.8 2.6 18.4 20.3 20.0 Telecom -19 -24 -28.7 2.9 3.4 4.0 -15.0 -14.3 -14.1 Bharti Airtel 455 Buy -2.9 -0.9 1.8 -156.7 -509.5 247.7 3.3 3.3 3.2 -2.1 -0.6 1.3 Bharti Infratel 254 Neutral 18.4 17.7 26.4 13.8 14.4 9.6 3.2 3.2 2.9 23.3 22.2 31.3 Tata Comm 405 Neutral 10.9 23.4 32.7 37.0 17.3 12.4 111.3 14.9 6.8 -798 152.6 75.2 Vodafone Idea 6 Buy -6.4 -5.7 -6.1 -1.0 -1.1 -1.0 0.8 4.0 -1.3 -45.6 -130.4 400.7 Utilities 8.9 8.3 7.3 1.5 1.3 1.2 16.4 16.3 16.9 CESC 754 Buy 91.9 99.5 120.8 8.2 7.6 6.2 1.0 0.9 0.8 13.0 12.8 14.1 Coal India 211 Buy 27.0 27.6 31.7 7.8 7.7 6.7 4.8 4.2 3.7 61.4 55.1 56.1 JSW Energy 70 Neutral 4.5 5.6 6.2 15.4 12.4 11.2 0.9 0.9 0.8 6.2 7.4 7.7 NHPC 24 Neutral 3.0 3.0 3.1 7.9 8.0 7.7 0.7 0.7 0.7 9.6 9.1 9.0 NTPC 121 Buy 13.1 15.2 17.5 9.2 8.0 6.9 1.0 0.9 0.9 11.4 12.3 13.0

January 2020 39
India Strategy | Bull market, really?
Ready reckoner: Full year valuations CMP EPS (INR) PE (x) PB (x) RoE (%) Company Name INR Reco FY20E FY21E FY22E FY20E FY21E FY22E FY20E FY21E FY22E FY20E FY21E FY22E Power Grid Corp. 195 Buy 20.8 22.8 25.0 9.4 8.5 7.8 1.6 1.4 1.3 17.4 17.2 16.9 Tata Power 58 Neutral 4.2 4.7 4.6 13.7 12.4 12.6 0.9 0.9 0.8 6.7 7.1 6.8 Torrent Power 288 Buy 28.9 27.8 30.6 10.0 10.4 9.4 1.4 1.2 1.1 14.6 12.6 12.6 Others 24.7 20.2 16.2 3.4 3.1 2.7 13.8 15.2 16.8 Brigade Enterpr. 220 Buy 8.2 8.3 12.5 26.9 26.3 17.6 1.9 1.8 1.7 7.5 7.2 10.0 BSE 523 Buy 26.0 30.5 36.4 20.1 17.1 14.3 1.1 1.2 1.2 5.7 6.9 8.5 Coromandel International 533 Buy 32.2 36.1 39.8 16.5 14.7 13.4 3.8 3.2 2.7 25.4 23.7 21.9 Delta Corp 201 Buy 8.2 9.4 10.5 24.5 21.4 19.2 2.5 2.3 2.0 10.9 11.2 11.2 Godrej Agrovet 520 Buy 14.2 20.1 22.2 36.5 25.8 23.5 5.5 4.8 4.2 15.8 19.8 19.1 Indian Hotels 147 Buy 3.0 4.3 5.7 48.8 33.8 25.8 3.8 3.5 3.1 8.0 10.7 12.7 Info Edge 2,532 Neutral 23.6 37.2 47.6 107.4 68.1 53.2 12.2 10.7 9.1 15.4 16.9 18.7 Interglobe Aviation 1,333 Neutral 53.4 61.1 90.2 25.0 21.8 14.8 7.0 6.7 6.2 28.8 31.4 43.5 Kaveri Seed 501 Buy 36.2 36.3 38.8 13.9 13.8 12.9 2.9 2.8 2.6 21.8 20.7 21.1 Lemon Tree Hotel 63 Buy 0.2 0.9 1.6 278.5 71.9 40.6 3.8 3.6 3.3 1.6 5.1 8.4 MCX 1,189 Buy 41.5 40.2 45.0 28.6 29.6 26.4 4.5 4.1 3.8 16.2 14.5 15.1 Navneet Education 94 Buy 8.8 9.9 11.4 10.7 9.4 8.3 2.3 1.9 1.6 23.0 21.8 21.0 Oberoi Realty 529 Buy 23.2 24.5 37.3 22.8 21.6 14.2 2.2 2.0 1.8 10.0 9.7 13.3 P I Industries 1,440 Buy 37.1 53.2 61.9 38.9 27.1 23.3 7.4 6.0 4.9 20.6 24.5 23.2 Phoenix Mills 839 Buy 23.2 29.7 39.3 36.2 28.3 21.3 3.4 3.1 2.7 9.8 11.5 13.5 Quess Corp 504 Neutral 21.9 34.5 43.2 23.0 14.6 11.7 1.9 1.6 1.4 11.1 15.3 16.4 S H Kelkar 120 Buy 6.5 8.4 10.0 18.4 14.3 12.1 2.0 1.8 1.6 10.7 13.0 14.0 SRF 3,465 Buy 134.8 186.2 218.5 25.7 18.6 15.9 4.1 3.5 2.9 17.5 20.2 19.9 Tata Chemicals 672 Buy 44.2 54.7 60.4 15.2 12.3 11.1 1.3 1.2 1.1 8.9 10.3 10.5 Team Lease Serv. 2,510 Buy 52.1 85.1 124.6 48.2 29.5 20.2 6.8 5.5 4.3 15.3 20.8 24.2 Trident 7 Buy 1.0 1.0 1.0 7.0 6.9 6.5 1.0 1.0 0.9 15.4 14.6 14.4 UPL 596 Neutral 31.5 39.4 46.9 18.9 15.1 12.7 2.9 2.6 1.5 15.9 18.0 18.8

January 2020 40
India Strategy | Bull market, really?
THIS PAGE INTENTIONALLY LEFT BLANK

January 2020 41
India Strategy | Bull market, really?
MOFSL Universe: 3QFY20 Highlights
& Ready Reckoner
Note: In our quarterly performance tables, our four-quarter numbers may not always add up to the full-year numbers. This is because of differences in classification of account heads in the company’s quarterly and annual results or because of differences in the way we classify account heads as opposed to the company.
All stock prices and indices as on 2 January 2020, unless otherwise stated.
Sectors & Companies BSE Sensex: 41,627 Nifty 50: 12,282 January 2020

January 2020 42
December 2019 Results Preview | Sector: Automobiles
Volume decay arrested, some green shoots visible Margins to improve from lows of 2QFY20
The December quarter would mark an arrest in the MoM volume downtrend across OEMs, partly driven by the emergence of green shoots and partly by the completion of inventory correction.
EBITDA margin for our OEM (ex-JLR) universe is likely to improve from the lows of 2QFY20 (after declining QoQ for five straight quarters). We estimate margins to improve ~110bp QoQ (-400bp YoY) to 11.3%, driven by favorable commodity prices and operating leverage due to a sequential improvement in volumes. Except mainstream 2W OEMs, all OEMs will likely deliver a sequential margin improvement.
We have lowered our FY21 EPS estimates for many companies under our coverage, with a 3-4% cut for HMCL, EIM, TVSL, BOS and BHFC. However, we have upgraded our EPS estimate for CEAT (+14% due to lower rubber prices), TTMT (+5%) and MM (+4%).
Volume stabilizes sequentially, inventories under control The December quarter would likely mark an arrest in the MoM volume downtrend across OEMs, partly driven by the emergence of green shoots and partly by the completion of inventory correction. Consumer sentiment has visibly improved in the post-festive period (v/s pre-festive period), catalyzed by higher marketing offers, good monsoon and an improvement in financing. As a result of demand stabilization and aggressive product cuts, OEMs were able to bring inventory under control in the run up to the upcoming BS6 transition.
Margins to recover from lows of 2QFY20 EBITDA margin for our OEM (ex-JLR) universe is likely to improve from the lows of 2QFY20 (after declining QoQ for five straight quarters). We estimate margins to improve ~110bp QoQ (-400bp YoY) to 11.3%, driven by favorable commodity prices and operating leverage due to a sequential improvement in volumes. Except mainstream 2W OEMs, all OEMs will likely deliver a sequential margin improvement. On a YoY basis, we estimate BJAUT (+1pp), TVSL (+30bp), MSIL (+70bp) and MM (+180bp) to deliver improved margins.
BS6 – the last hurdle After operating in a tough environment over the last 15 months, the auto industry now faces the last hurdle of BS6, post which we expect ‘business as usual’ from 2HFY21. With some stability in the demand environment and under-control inventory, BS6 transition will likely be less problematic (unlike BS4), in our view. BS6 transition would pose a bigger challenge for 2Ws, followed by CVs and PVs due to the magnitude of cost inflation, the possibility of change in competitive positioning and the scope of value migration. We expect some pre-buying in 2Ws and diesel PVs, but limited pre-buy in CVs due to 30-40% excess capacity with fleet operators.
Valuation and view We have lowered our FY21 EPS estimates for many companies under our coverage, with a 3-4% cut for HMCL, EIM, TVSL, BOS and BHFC. However, we have upgraded our EPS estimate for CEAT (+14% due to lower rubber prices), TTMT (+5%) and MM (+4%). MSIL, EIM and MSS are our top large-caps picks. Among mid-caps, we prefer AL and ENDU.
Automobiles
Company name Amara Raja Batteries
Ashok Leyland
Bajaj Auto
Bharat Forge
BOSCH
CEAT Eicher Motors Endurance technologies
Escorts
Exide Industries
Hero MotoCorp
Mahindra CIE
Mahindra & Mahindra
Maruti Suzuki
Motherson Sumi
Tata Motors
TVS Motor Company
Jinesh Gandhi - Research analyst ([email protected]); +91 22 6129 1524 Aanshul Agarawal - Research analyst ([email protected]); +91 22 7193 4337

January 2020 43
December 2019 Results Preview | Sector: Automobiles
Exhibit 1: Summary of expected quarterly performance (INR m) Sector CMP SALES (INR M) EBDITA (INR M) NET PROFIT (INR M)
(INR) RECO Dec-19 Var % YoY
Var % QoQ Dec-19 Var
% YoY Var
% QoQ Dec-19 Var % YoY
Var % QoQ
Automobiles Amara Raja Batt. 727 Buy 17,624 4.0 4.0 2,843 12.5 -2.7 1,615 23.4 -26.2 Ashok Leyland 84 Buy 41,950 -33.7 6.8 2,627 -59.6 14.9 642 -83.4 -23.8 Bajaj Auto 3,119 Neutral 77,391 4.5 0.4 12,864 11.3 0.6 12,411 12.6 -11.5 Bharat Forge 491 Buy 12,769 -24.6 1.4 3,068 -37.0 2.1 1,765 -43.0 -27.9 Bosch 15,403 Neutral 29,098 -6.0 25.8 3,695 -12.6 9.7 2,800 -16.5 -6.1 CEAT 1,033 Buy 17,472 1.0 3.3 1,870 31.1 9.7 536 1.5 20.4 Eicher Motors 21,611 Buy 23,950 2.3 9.2 6,057 -10.9 11.9 5,051 -5.2 -11.8 Endurance Tech. 1,073 Buy 18,431 1.7 4.1 2,884 14.0 -0.9 1,379 24.4 -18.5 Escorts 619 Neutral 16,214 -2.0 22.5 1,840 -8.2 45.2 1,304 -1.9 14.9 Exide Inds. 189 Buy 25,468 2.0 -2.5 3,491 11.7 -4.9 2,032 31.1 -14.4 Hero Motocorp 2,429 Neutral 69,072 -12.2 -8.8 9,565 -13.4 -13.1 7,121 -7.4 -22.6 Mahindra CIE 169 Buy 20,067 1.6 7.4 2,451 -4.4 17.1 951 -32.7 62.3 Mahindra & Mahindra 540 Buy 122,720 -4.8 12.2 18,398 8.0 19.4 11,148 -23.5 -17.7 Maruti Suzuki 7,332 Buy 218,480 11.1 28.6 22,915 18.7 42.7 17,028 14.3 25.3 Motherson Sumi 150 Buy 169,249 2.7 6.3 14,173 1.7 7.5 3,743 -3.8 -2.7 Tata Motors 194 Buy 741,440 -3.6 13.3 86,590 45.4 20.9 11,144 LP LP TVS Motor 459 Neutral 40,523 -13.1 -6.8 3,400 -9.5 -11.0 1,415 -20.7 -28.1 Sector Aggregate 1661,919 -2.6 11.1 198,729 15.0 15.2 82,084 25.9 10.0
Exhibit 2: Volume snapshot for 3QFY20 ('000 units) 3QFY20 3QFY19 YoY (%) 2QFY20 QoQ (%) FY20 FY19 YoY (%) Two wheelers 5,390 5,734 -6.0 5,565 -3.1 21,980 24,389 -9.9 Three wheelers 309 303 2.0 310 0.0 1,197 1,263 -5.2 Passenger cars 650 636 2.1 517 25.6 2,307 2,736 -15.7 UVs & MPVs 287 312 -8.0 293 -2.3 1,147 1,316 -12.9 Total PVs 937 948 -1.2 811 15.5 3,454 4,052 -14.7 M&HCV 61 100 -39.0 55 10.2 275 439 -37.3 LCV 138 153 -10.0 125 10.1 529 641 -17.5 Total CVs 198 253 -21.4 180 10.1 804 1,080 -25.6 Tractors 204 217 -6.0 173 17.8 736 775 -5.1 Total (ex Tractor) 6,834 7,238 -5.6 6,865 -0.5 27,436 30,784 -10.9
Exhibit 3: Trend in segment-wise EBITDA margins (%)
Exhibit 4: Commodity prices are benign
13.2
11.
2
9.2
13.2
11.
7
8.5
13.4
11.
8
7.3
14.1
11.
3
0.4
13.8
12.
1
4.4
2W Cars CVs
3QFY19 4QFY19 1QFY20 2QFY20 3QFY20
152
116
124
133
102
139
118
122
124
121
138
108
119
117
137
124
117
114
117
114
116
119
117
118
108
Steel Lead Copper Alu Rubber
3QFY19 4QFY19 1QFY20 2QFY20 3QFY20

January 2020 44
December 2019 Results Preview | Sector: Automobiles
Exhibit 5: Trend in key currencies v/s INR (Indexed)
Source: Bloomberg, MOFSL
Exhibit 6: Margins (ex-JLR) to contract YoY/QoQ
Source: Company, MOFSL
Exhibit 7: Revised estimates FY20E FY21E Rev Old Chg (%) Rev Old Chg (%) Bajaj Auto 178.9 179.5 -0.3 187.7 189.9 -1.2 Hero MotoCorp 150.2 153.6 -2.2 167.7 174.0 -3.6 TVS Motor 13.1 14.2 -8.0 17.7 18.3 -3.2 Eicher Motors * 744.7 729.8 2.0 894.1 926.8 -3.5 Maruti * 198.5 177.8 11.6 261.6 256.6 1.9 M&M (incl MVML) 35.5 34.2 3.8 38.6 37.1 3.9 Tata Motors * 0.9 -0.3 -380.0 12.3 11.7 5.2 Ashok Leyland 1.7 1.5 12.7 3.5 3.5 0.5 Escorts 52.6 52.7 -0.1 61.4 59.8 2.8 Amara Raja 38.0 39.1 -2.7 38.4 38.2 0.5 Bharat Forge * 17.4 17.7 -1.5 21.5 22.1 -2.9 BOSCH 387.9 419.0 -7.4 493.0 510.0 -3.3 Ceat 56.8 51.7 9.9 71.9 63.1 14.1 Endurance Tech* 42.4 43.0 -1.3 48.4 48.9 -1.2 Exide Industries 10.2 10.4 -1.8 10.8 11.1 -2.6 Mahindra CIE * 11.4 11.4 0.7 14.6 14.5 0.8 Motherson Sumi * 4.6 4.6 0.2 6.7 6.7 -0.2 * Consolidated
Exhibit 8: EBITDA margin to shrink by ~310bp YoY – fourth consecutive quarter of contraction Volumes ('000 units) EBITDA margins (%) Adj PAT (INR M) 3QFY20 YoY (%) QoQ (%) 3QFY20 YoY (bp) QoQ (bp) 3QFY20 YoY (%) QoQ (%) BJAUT 1,202 -4.6 2.5 16.6 100 0 12,411 12.6 -11.5 HMCL 1,541 -14.4 -8.9 13.8 -20 -70 7,121 -7.4 -22.6 TVS Motor 822 -17.0 -7.3 8.4 30 -40 1,415 -20.7 -28.1 MSIL 437 2.0 29.3 10.5 70 100 17,028 14.3 25.3 MM 217 -7.3 13.3 15.0 180 90 11,148 -23.5 -17.7 TTMT (S/A) 129 -24.6 23.2 3.8 -510 540 -4,378 -168.3 -67.4 TTMT (JLR) * 148 4.5 10.0 13.2 590 -60 190 -169.8 77.4 TTMT (Cons) 11.7 390 70 1,344 -100.5 -111 Ashok Leyland 31 -28.7 7.8 6.3 -400 40 642 -83.4 -23.8 Eicher (RE) 183 -6.0 9.7 25.8 -370 70 4,959 -1.1 -13.1 Eicher (VECV) 12 -26.8 9.0 6.0 -60 70 380 -50.0 153.4 Eicher (Consol) 25.8 -370 70 5,051 -5.2 -11.8 Agg. (ex JLR) 4,575 -11.0 -0.4 11.3 -40 100 50,438 -23.1 10.9
80
100
120
Dec-
17
Mar
-18
Jun-
18
Sep-
18
Dec-
18
Mar
-19
Jun-
19
Sep-
19
Dec-
19
USD GBP JPY
9.0
14.6
10.2
8
10
12
14
16
8
11
14
17
20
3QFY
14
1QFY
15
3QFY
15
1QFY
16
3QFY
16
1QFY
17
3QFY
17
1QFY
18
3QFY
18
1QFY
19
3QFY
19
1QFY
20
3QFY
20
Aggregate (incl JLR) Aggregate (excl JLR)

January 2020 45
December 2019 Results Preview | Sector: Automobiles
Exhibit 9: Relative performance – three-month (%)
Source: Bloomberg, MOFSL
Exhibit 10: Relative performance – one-year (%)
Source: Bloomberg, MOFSL
Exhibit 11: Comparative valuation CMP EPS (INR) PE (x) PB (x) RoE (%) Company Name INR Reco FY20E FY21E FY22E FY20E FY21E FY22E FY20E FY21E FY22E FY20E FY21E FY22E Automobiles 27.2 20.0 16.3 3.0 2.7 2.4 10.9 13.6 14.9 Amara Raja Batt. 727 Buy 38.0 38.4 42.2 19.1 18.9 17.2 3.3 2.9 2.6 18.2 16.3 16.0 Ashok Leyland 84 Buy 1.7 3.5 5.5 48.6 24.0 15.3 3.1 3.0 2.8 6.2 12.7 18.8 Bajaj Auto 3,119 Neutral 178.9 187.7 211.5 17.4 16.6 14.7 3.7 3.3 3.0 22.4 21.1 21.4 Bharat Forge 491 Buy 17.4 21.5 26.4 28.2 22.9 18.6 3.9 3.5 3.1 14.5 16.2 17.8 Bosch 15,403 Neutral 387.9 493.0 560.6 39.7 31.2 27.5 6.0 5.2 4.6 13.7 17.8 17.7 CEAT 1,033 Buy 56.8 71.9 93.7 18.2 14.4 11.0 1.4 1.3 1.2 8.0 9.5 11.3 Endurance Tech. 1,073 Buy 42.4 48.4 53.5 25.3 22.2 20.0 5.1 4.4 3.8 21.5 21.1 20.2 Eicher Motors 21,611 Buy 744.7 894.1 1,133.7 29.0 24.2 19.1 5.6 4.7 3.9 20.8 21.0 22.2 Escorts 619 Neutral 52.6 61.4 70.5 11.8 10.1 8.8 1.8 1.5 1.3 16.2 16.3 16.1 Exide Inds. 189 Buy 10.2 10.8 11.9 18.5 17.5 15.8 2.5 2.3 2.1 13.3 12.9 13.0 Hero Motocorp 2,429 Neutral 150.2 167.7 187.3 16.2 14.5 13.0 3.6 3.3 3.0 22.6 23.6 24.4 Mahindra & Mahindra 540 Buy 35.4 43.4 51.8 15.3 12.4 10.4 1.7 1.6 1.4 11.7 10.6 10.6 Mahindra CIE 169 Buy 11.4 14.6 16.5 14.8 11.6 10.3 1.4 1.2 1.1 9.6 11.0 11.2 Maruti Suzuki 7,332 Buy 198.5 261.6 338.4 36.9 28.0 21.7 4.5 4.1 3.7 11.8 14.4 16.8 Motherson Sumi 150 Buy 4.6 6.7 8.4 32.3 22.3 17.8 3.9 3.4 3.0 12.4 16.3 18.2 Tata Motors 194 Buy 0.9 12.3 15.6 213.9 15.8 12.5 1.1 1.0 1.0 0.5 6.6 8.2 TVS Motor 459 Neutral 13.1 17.7 23.3 35.1 25.9 19.7 5.7 4.9 4.1 17.4 20.4 22.7
99
103
107
111
115Se
p-19
Oct
-19
Nov
-19
Dec-
19
Nifty Index MOSL Automobiles Index
70
84
98
112
126
Dec-
18
Jan-
19
Feb-
19
Mar
-19
Apr-
19
May
-19
Jun-
19
Jul-1
9
Aug-
19
Sep-
19
Oct
-19
Nov
-19
Dec-
19
Nifty Index MOSL Automobiles Index

January 2020 46
December 2019 Results Preview | Sector: Automobiles
The tables below provide a snapshot of actual and estimated numbers for companies under the MOFSL coverage universe. Highlighted columns indicate the quarter/financial year under review.
Amara Raja Batteries Buy CMP INR727 | TP: INR823 (+13%) EPS CHANGE (%): FY20|21: -2.7|+0.5 Good replacement demand to offset weak OEM sales. Lead cost inflation (+9% QoQ in 2Q) to impact margins. Update on capacity addition in 2Ws/4Ws, e-rickshaw battery launch and li-ion battery status.
Quarterly Performance (INR Million) Y/E March FY19
FY20 FY19 FY20E
1Q 2Q 3Q 4Q 1Q 2Q 3QE 4QE Net Sales 17,787 17,531 16,947 15,667
18,150 16,953 17,624 16,196 67,931 68,923
YoY Change (%) 18.8 22.8 9.1 -0.9 2.0 -3.3 4.0 3.4 12.1 1.5 RM Cost (% of sales) 71.5 69.1 67.2 65.2
67.6 64.1 66.8 67.6 67.6 66.5
Staff Cost (% of sales) 4.7 5.3 5.1 5.2
5.4 5.8 5.6 5.8 4.9 5.7 Other Exp (% of sales) 11.4 12.1 12.7 14.1
11.6 12.8 11.5 11.4 13.0 11.9
EBITDA 2,203 2,366 2,528 2,421
2,792 2,923 2,843 2,459 9,518 11,017 Margins (%) 12.4 13.5 14.9 15.5 15.4 17.2 16.1 15.2 14.0 16.0 Depreciation 630 643 657 683
733 750 775 823 2,612 3,082
Interest 15 18 18 19
29 34 25 27 70 115 Other Income 137 142 125 63 102 180 110 108 468 500 PBT after EO 1,695 1,848 1,978 1,783
2,132 2,319 2,153 1,716 7,304 8,320
Tax 565 646 669 589
723 130 538 439 2,469 1,830 Tax Rate (%) 33.3 34.9 33.8 33.0
33.9 5.6 25.0 25.6 33.8 22.0
Adj PAT 1,130 1,202 1,309 1,193
1,409 2,189 1,615 1,277 4,835 6,490 YoY Change (%) 13.2 -5.5 -2.6 8.7 24.7 82.0 23.4 7.0 2.6 34.2 E: MOFSL Estimates
Ashok Leyland Buy CMP INR84 | TP: INR103 (+23%) EPS CHANGE (%): FY20|21: +12.7|+0.5 Higher discounts, lower M&HCV sales to hurt realizations. Benign RM prices/favorable mix/op. lev to drive margins. Update on trend in retail sales/views on pre-buy in 4Q. FY20 EPS upgrade driven by better-than-est. M&HCV vols.
Quarterly Performance (INR Million) Y/E March FY19 FY20E FY19 FY20E
1Q 2Q 3Q 4Q 1Q 2Q 3QE 4QE Total Volumes (nos) 42,127 51,958 43,755 59,526
39,608 28,938 31,205 35,183 197,366 134,934
Growth % 47.9 26.8 -6.2 1.3 -6.0 -44.3 -28.7 -40.9 12.9 -31.6 Realizations (INR '000) 1,487 1,467 1,446 1,486
1,435 1,358 1,344 1,400 1,472 1,388
% change -0.5 -1.1 -6.3 -0.5 -3.5 -7.4 -7.0 -5.8 -2.3 -5.7 Net operating revenues 62,627 76,211 63,252 88,459
56,839 39,295 41,950 49,253 290,550 187,337
Change (%) 47.1 25.4 -12.0 0.7 -9.2 -48.4 -33.7 -44.3 10.2 -35.5 RM/sales % 68.9 72.1 70.1 72.7
69.9 69.0 69.3 70.4 71.2 69.7
Staff/sales % 8.0 6.9 7.9 6.5
8.8 11.0 10.5 9.6 7.2 9.9 Other exp/sales % 12.4 10.1 11.7 9.7 11.8 14.1 14.0 13.1 10.8 13.1 EBITDA 6,716 8,290 6,496 9,854
5,370 2,286 2,627 3,417 31,357 13,699
EBITDA Margin (%) 10.7 10.9 10.3 11.1
9.4 5.8 6.3 6.9 10.8 7.3 Other Income 525 276 208 91
211 455 200 153 1,099 1,019
Interest 142 204 192 166
126 301 250 180 704 856 Depreciation 1,525 1,481 1,607 1,598 1,646 1,600 1,660 1,710 6,210 6,617 PBT after EO 5,360 6,708 4,836 8,065
3,607 191 917 1,680 24,968 6,395
Effective Tax Rate (%) 21.3 21.3 21.2 19.0 36.2 -103.5 30.0 31.9 20.6 30.0 Adj PAT 4,358 5,430 3,857 6,623
2,443 842 642 1,144 20,268 5,071
Change (%) 262.2 62.5 -20.8 -11.3 -43.9 -84.5 -83.4 -82.7 16.4 -75.0 E: MOFSL Estimates

January 2020 47
December 2019 Results Preview | Sector: Automobiles
Bajaj Auto Neutral CMP INR3,119 | TP: INR3,225 (+3%) EPS CHANGE (%): FY20|21: -0.3|-1.2 Dom. 2W vols decline but market share gains continue. Reasonable exports, benign RM to support margins. Update on pricing and specs for Chetak (e-scooter). Update on upcoming new product launches & BS6 pricing.
Quarterly Performance (INR Million) Y/E March FY19 FY20 FY19 FY20 1Q 2Q 3Q 4Q 1Q 2Q 3QE 4QE Volumes ('000 units) 1,227 1,339 1,260 1,194 1,247 1,174 1,202 1,096 5,020 4,719 Growth YoY (%) 38.1 25.0 25.8 14.2 1.7 -12.4 -4.6 -8.2 25.3 (6.0) Realization (INR/unit) 60,856 59,998 58,812 62,170 62,187 65,673 64,360 62,794 60,479 63,748 Growth YoY (%) -0.7 -2.3 -7.8 -4.3 2.2 9.5 9.4 1.0 (3.7) 5.4 Net Sales 74,649 80,363 74,094 74,205 77,558 77,073 77,391 68,794 3,03,576 3,00,816 Change (%) 37.2 22.1 16.0 9.3 3.9 -4.1 4.5 -7.3 20.6 (0.9) RM/Sales % 70.9 72.0 72.8 71.8 71.7 70.5 71.0 71.1 71.8 71.1 Staff cost/Sales % 4.2 3.9 4.3 4.2 4.6 4.4 4.5 5.0 4.1 4.6 Oth. Exp./Sales % 7.0 6.6 7.4 7.6 8.2 8.6 7.9 8.2 7.1 8.3 EBITDA 13,389 14,141 11,561 12,270 11,982 12,781 12,864 10,842 51,925 48,468
EBITDA Margins (%) 17.9 17.6 15.6 16.5 15.4 16.6 16.6 15.8 17.1 16.1 Other Income 3,469 3,104 4,700 3,680 4,413 3,934 4,300 4,494 14,389 17,141 Interest 3 3 36 3 5 12 5 -3 45 20 Depreciation 700 715 634 608 601 613 610 620 2,657 2,445 PBT after EO 16,156 16,527 15,591 18,759 15,788 16,089 16,549 14,718 67,032 63,144 Effective Tax Rate (%) 31.0 30.3 29.3 30.4 28.7 12.8 25.0 25.7 30.3 23.0 Adj. PAT 11,152 11,525 11,019 10,671 11,257 14,024 12,411 10,928 44,366 48,621 Change (%) 17.8 3.7 15.7 (1.2) 0.9 21.7 12.6 2.4 9.9 9.6 E: MOFSL Estimates
Bharat Forge Buy CMP INR491 | TP: INR567 (+16%) EPS CHANGE (%): FY20|21: -1.5|-2.9 Weak dom. CV, US Class 8 & Shale Oil reflect in sales drop. Adverse mix and op. deleverage to hurt margins. Update on CLWT plant at AP and new order wins. Guidance on dom. CV, US Class 8 & shale oil for FY21.
S/A Quarterly
(INR Million)
Y/E March FY19 FY20 FY19 FY20E 1Q 2Q 3Q 4Q
1Q 2Q 3QE 4Q
Tonnage 66,815 69,683 66,764 62,690
60,874 53,541 52,470 51,195 2,65,952 2,18,081 Change (%) 21.3 18.8 2.6 -3.6
-8.9 -23.2 -21.4 -18.3 9.9 -18.0
Realization (INR '000/ton) 221.5 241.0 253.5 266.2
221.2 235.2 243.4 253.0 245.2 237.4 Change (%) 1.6 12.4 18.6 18.1
-0.1 -2.4 -4.0 -5.0 11.7 -3.1
Net operating income 14,797 16,792 16,925 16,686
13,466 12,595 12,769 12,951 65,200 51,781 Change (%) 23.2 33.5 21.7 13.8
-9.0 -25.0 -24.6 -22.4 22.6 -20.6
RM/Sales (%) 36.1 39.1 36.8 37.3
37.0 40.1 38.0 37.9 37.4 38.3 Staff Cost (% of Sales) 8.3 7.3 7.2 7.1
9.2 9.7 9.5 9.6 7.5 9.5
Other Exp. (% of Sales) 26.6 25.4 27.2 26.5
27.7 26.3 28.5 28.4 26.4 27.7 EBITDA 4,288 4,754 4,869 4,849
3,519 3,004 3,068 3,108 18,761 12,699
EBITDA Margins (%) 29.0 28.3 28.8 29.1
26.1 23.9 24.0 24.0 28.8 24.5 Non-Operating Income 343 338 478 501
401 495 450 424 1,660 1,770
Interest 253 321 136 315
388 291 280 284 1,024 1,244 Depreciation 824 914 907 821
886 893 900 945 3,466 3,625
Fx loss/(gain) 2 410 -389 -323
24 -197 0 0 -300 -173 PBT after EO items 3,552 3,447 4,694 4,538
2,622 2,512 2,338 2,302 16,231 9,774
Eff. Tax Rate (%) 34.0 34.0 34.0 34.0
33.6 2.5 24.5 24.6 34.0 21.3 Adj. PAT 2,345 2,275 3,098 2,995
1,741 2,449 1,765 1,736 10,713 7,691
Change (%) 33.9 11.7 35.8 59.6
-25.7 7.6 -43.0 -42.0 19.7 -28.2 E: MOFSL Estimates

January 2020 48
December 2019 Results Preview | Sector: Automobiles
Bosch Neutral CMP INR15,403 | TP: INR15,803 (+3%) EPS CHANGE (%): FY20|21: -7.4|-3.3 Stability in PVs & tractors to dilute impact of weak CV vols. Seasonality in other exp., negative op. lev. to hurt margin. Update on BOS supplies to recent EV launches. FY21 EPS cut to factor in lower market share in 2W EFI.
Quarterly performance (S/A) (INR Million) Y/E March FY19
FY20 FY19 FY20
1Q 2Q 3Q 4Q 1Q 2Q 3QE 4QE
Net Sales 32,122 31,647 30,955 27,492
27,554 23,127 29,098 22,126 1,22,579 1,01,905 YoY Change (%) 21.3 12.5 0.8 -12.9 -14.2 -26.9 -6.0 -19.5 4.9 -16.9
RM Cost (% of sales) 54.4 56.7 55.5 54.3
54.4 55.4 54.5 54.8 55.3 54.8 Staff Cost (% of sales) 10.9 10.6 10.9 12.4
12.8 14.5 11.8 14.7 11.2 13.3
Other Expenses (% of sales) 15.1 13.9 19.9 14.5 15.2 15.5 21.0 16.1 15.9 17.1 EBITDA 6,282 5,972 4,226 5,165
4,848 3,369 3,695 3,174 21,635 15,087
Margins (%) 19.6 18.9 13.7 18.8 17.6 14.6 12.7 14.3 17.7 14.8 Depreciation 939 943 1,012 1,144
749 827 950 1,006 4,045 3,532
Interest 0 0 102 31
18 6 25 52 133 100 Other Income 1,147 1,395 1,786 1,625 988 1,675 1,000 881 5,953 4,543 PBT after EO Expense 6,489 6,413 4,899 5,615
4,231 1,418 3,720 2,998 23,364 12,367
Tax 2,179 2,213 1,545 1,498
1,432 434 921 739 7,430 3,525 Tax Rate (%) 33.6 34.5 31.5 26.7
33.8 30.6 24.8 24.6 31.8 28.5
Adj PAT 4,310 4,207 3,354 4,117
3,398 2,981 2,800 2,259 15,966 11,438 YoY Change (%) 42.4 19.1 19.3 -17.1 -21.2 -29.1 -16.5 -45.1 11.3 -28.4 E: MOFSL Estimates
Ceat Buy CMP INR1,033 | TP: INR1,235(+20%) EPS CHANGE (%): FY20|21: +9.9|+14.1 Ramp up at new TBR/PCR plant to offset weak demand. QoQ margin improvement due to favorable RM prices. Update on replacement demand and capex guidance. EPS upgrade to reflect weakness in rubber prices.
Consol. - Quarterly Earning Model
Y/E March FY19 FY20 FY19 FY20E 1Q 2Q 3Q 4Q 1Q 2Q 3QE 4QE Net Sales 17,063 17,723 17,299 17,605 17,521 16,916 17,472 17,720 69,845 69,629 YoY Change (%) 16.9 16.4 9.9 4.4 2.7 -4.6 1.0 0.7 11.9 -0.3 RM cost (%) 60.7 60.1 58.5 60.7 60.5 58.9 58.0 56.7 59.9 58.5 Employee cost (%) 7.0 8.0 8.2 7.3 7.7 7.2 7.8 8.1 7.6 7.7 Other expenses (%) 22.1 22.9 25.0 22.8 22.3 23.9 23.5 23.5 23.3 23.3 EBITDA 1,758 1,592 1,426 1,623 1,671 1,704 1,870 2,067 6,425 7,311 Margins (%) 10.3 9.0 8.2 9.2 9.5 10.1 10.7 11.7 9.2 10.5 Depreciation 460 477 482 508 644 671 750 752 1,927 2,817 Interest 204 186 222 269 349 374 385 400 880 1,508 Other Income 37 33 40 306 120 43 41 37 390 240 PBT before EO expense 1,131 962 762 1,153 798 702 776 951 4,008 3,226 Exceptional item 23 20 0 255 -298 8 0 0 297 -290 PBT 1,108 943 762 898 1,095 693 776 951 3,711 3,515 Tax Rate (%) 39.9 39.3 39.7 32.0 29.7 44.0 38.0 37.6 37.8 36.5 Minority Int. & Profit of Asso. Cos. -54 -59 -68 -32 -56 -52 -55 -87 -213 -250 Reported PAT 720 632 528 642 826 440 536 681 2,522 2,482 Adj PAT 735 644 528 801 637 445 536 681 2,707 2,298 YoY Change (%) 5,576 -17 -37 -14 -13 -31 2 -15 5 -15 E: MOFSL Estimates

January 2020 49
December 2019 Results Preview | Sector: Automobiles
Eicher Motors Buy CMP INR21,611 | TP: INR25,570 (+18%) EPS CHANGE (%): FY20|21: +2.0|-3.5 Strong exports, better mix to offset decline in dom. vols. QoQ margin improvement led by benign RM & op. lev. VECV QoQ margin improvement led by op. lev. Update on retail demand outlook/new product launches.
Quarterly performance (Consolidated) FY19 FY20 FY19 FY20E Y/E March 1Q 2Q 3Q 4Q
1Q 2Q 3QE 4QE
Net Operating income 25,478 24,082 23,411 25,001
23,819 21,925 23,950 23,626 97,971 93,219 Growth (%) 27.3 11.1 3.2 -1.1 -6.5 -9.0 2.3 -5.5 9.3 -4.7
EBITDA 8,095 7,293 6,795 6,847
6,144 5,414 6,057 5,819 29,031 23,434 EBITDA Margins (%) 31.8 30.3 29.0 27.4
25.8 24.7 25.3 24.5 29.6 25.1
Recurring PAT 5,761 5,663 5,330 5,448
4,517 5,727 5,051 5,020 22,203 20,315 Growth (%) 22.4 7.0 0.4 -16.0 -21.6 1.1 -5.2 -7.9 1.9 -8.5
Standalone (Royal Enfield) Royal Enfield ('000 units) 225 210 194 196
184 167 183 180 826 713
Growth (%) 22.5 3.6 -5.9 -13.6 -18.5 -20.7 -6.0 -8.2 0.7 -13.7 Net Realn (INR '000/unit) 113 114 121 127
128 131 131 133 119 131
Change - YoY (%) 3.9 7.3 10.1 14.4
13.5 14.5 8.6 4.7 8.6 10.4 EBITDA Margins (%) 32.3 30.6 29.5 27.8
25.9 25.0 25.8 25.7 30.1 25.6
Recurring PAT 5,912 4,927 5,014 4,804
4,982 5,705 4,959 4,936 20,659 20,544 Growth (%) 19.6 1.3 6.2 15.9 -15.7 15.8 -1.1 2.7 10.6 -0.6
VECV Total CV Volumes 16,327 18,696 16,936 21,010
13,331 11,370 12,391 17,864 72,969 54,956
Growth (%) 40.9 24.5 4.3 -9.0 -18.3 -39.2 -26.8 -15.0 10.7 -24.7 Net Realn (INR '000/unit) 1,598 1,586 1,664 1,527
1,692 1,763 1,771 1,473 1,590 1,653
Change - YoY (%) 2.7 1.9 4.3 6.4
5.9 11.1 6.5 -3.5 4.3 4.0 EBITDA Margins (%) 9.2 9.0 6.6 8.5
5.5 5.2 6.0 7.3 8.4 6.1
Recurring PAT 1,180 1,421 760 1,394
380 150 380 769 4,751 1,679 Growth (%) 76.1 49.6 -42.7 -21.8 -67.8 -89.4 -50.0 -44.8 0.4 -64.7
E: MOFSL Estimates
Endurance Technologies Buy CMP INR1,073 | TP: INR1,254(+17%) EPS CHANGE (%): FY20|21: -1.3|-1.2 Sales growth driven by new orders starting in 3Q. EU revenues to remain muted, in line with industry trends. Update on ramp-up of new business & new order wins. Update on any order wins for 2W ABS.
Consolidated - Quarterly
(INR Million)
Y/E March FY19
FY20 FY19 FY20
1Q 2Q 3Q 4Q
1Q 2Q 3QE 4QE
Net Sales 18,604 19,367 18,130 19,004
18,619 17,713 18,431 19,550 75,105 74,313 YoY Change (%) 23.6 23.2 17.8 9.5
0.1 -8.5 1.7 2.9 18.2 -1.1
RM Cost (% of sales) 58.6 59.7 58.4 54.9
55.6 54.0 55.7 55.5 57.9 55.2 Staff Cost (% of sales) 8.9 8.0 9.2 8.6
9.6 9.4 9.3 8.8 8.7 9.3
Other Exp. (% of sales) 17.9 17.8 18.4 19.4
19.0 20.2 18.4 19.0 18.4 19.4 EBITDA 2,714 2,798 2,530 3,246
2,941 2,911 2,884 3,255 11,288 11,991
Margins (%) 14.6 14.4 14.0 17.1
15.8 16.4 15.6 16.7 15.0 16.1 Depreciation 820 921 936 1,085
927 986 1,030 1,087 3,762 4,031
Interest 59 55 75 68
58 49 58 59 257 224 Other Income 41 80 93 56
68 114 75 65 270 322
PBT before EO expense 1,876 1,902 1,612 2,149
2,024 1,990 1,871 2,174 7,539 8,058 Exceptional Item 0 0 208 0
-472 0 0 0 208 -472
PBT after EO 1,876 1,902 1,404 2,149
2,496 1,990 1,871 2,174 7,331 8,531 Tax 630 650 439 662
840 300 492 583 2,381 2,215
Eff. Tax Rate (%) 33.6 34.2 31.2 30.8
33.7 15.1 26.3 26.8 32.5 26.0 Adj PAT 1,246 1,252 1,109 1,486
1,343 1,691 1,379 1,590 5,091 5,966
YoY Change (%) 29.1 25.6 15.8 27.7
7.8 35.0 24.4 7.0 24.5 17.2 E: MOFSL Estimates

January 2020 50
December 2019 Results Preview | Sector: Automobiles
Escorts Neutral CMP INR619 | TP: INR705 (+14%) EPS CHANGE (%): FY20|21: -|+2.8 Impact of weak tractor & CE sales diluted by rail business. YoY contraction in margins due to op. deleverage. Outlook for tractor demand in 4Q & FY21. Update on Kubota JV.
Standalone Quarterly Perf. (INR m)
Y/E March FY19 FY20 FY19 FY20E 1Q 2Q 3Q 4Q 1Q 2Q 3QE 4QE Net Sales 15,113 13,984 16,551 16,317 14,230 13,239 16,214 16,753 62,620 60,435 YoY Change (%) 29.9 15.4 37.3 13.6 -5.8 -5.3 -2.0 2.7 23.8 -3.5 Total Expenditure 13,257 12,409 14,546 14,419 12,805 11,972 14,373 14,803 55,375 53,953 EBITDA 1,855 1,575 2,005 1,898 1,424 1,267 1,840 1,950 7,245 6,482 Margins (%) 12.3 11.3 12.1 11.6 10.0 9.6 11.4 11.6 11.6 10.7 Depreciation 206 215 215 218 241 260 265 270 872 1,036 Interest 29 39 43 75 59 39 40 43 195 180 Other Income 170 221 244 173 167 211 210 244 924 832 PBT before EO expense 1,791 1,543 1,991 1,778 1,292 1,179 1,745 1,881 7,102 6,098 Extra-Ord expense 0 0 -109 0 0 92 0 0 -56 0 PBT 1,791 1,543 2,100 1,778 1,292 1,087 1,745 1,881 7,157 6,098 Tax 595 516 699 565 417 41 442 503 2,371 1,402 Rate (%) 33.2 33.5 33.3 31.8 32.2 3.8 25.3 26.7 33.1 23.0 Adj PAT 1,196 1,026 1,328 1,214 875 1,135 1,304 1,359 4,730 4,676 YoY Change (%) 90.9 24.9 44.6 7.8 -26.8 10.5 -1.9 12.0 34.7 -1.1 Margins (%) 7.9 7.3 8.0 7.4 6.2 8.6 8.0 8.1 7.6 7.7 E: MOFSL Estimates
Exide Industries Buy CMP INR189 | TP: INR224 (+19%) EPS CHANGE (%): FY20|21: -1.8|-2.6 Good replacement demand to offset weak OEM sales. Lead cost inflation (+9% QoQ in 2Q) to impact margins. Update on progress on li-ion technology. EPS estimate cut to reflect for lead price inflation.
S/A Quarterly Performance (INR Million) Y/E March FY19 FY20 FY19 FY20E
1Q 2Q 3Q 4Q 1Q 2Q 3QE 4QE Net Sales 27,725 27,204 24,968 25,987
27,793 26,109 25,468 25,953 1,05,883 1,05,322
Growth YoY (%) 31.8 15.3 9.6 5.7 0.2 -4.0 2.0 -0.1 15.3 -0.5 RM(%) 66.4 66.9 64.9 64.9
64.5 63.8 64.5 64.9 65.8 64.4
Employee cost (%) 5.8 6.1 6.5 5.7
6.0 6.7 6.8 6.7 6.0 6.5 Other Exp(%) 13.6 14.8 16.1 15.0 14.9 15.5 15.0 14.9 14.8 15.1 EBITDA 3,909 3,327 3,125 3,733
4,077 3,672 3,491 3,500 14,113 14,741
EBITDA Margin(%) 14.1 12.2 12.5 14.4
14.7 14.1 13.7 13.5 13.3 14.0 Change (%) 20.6 12.4 10.6 10.4 4.3 10.4 11.7 -6.2 13.7 4.4 Non-Operating Income 42 116 80 166
164 56 130 120 385 470
Interest 11 14 23 12
18 18 17 7 61 60 Depreciation 719 768 813 835 864 898 895 912 3,135 3,570 PBT after EO Exp 3,221 3,745 2,369 3,051
3,359 2,812 2,709 2,701 12,386 11,581
Effective Tax Rate (%) 34.8 28.3 34.5 31.0 33.2 15.6 25.0 25.1 31.9 25.1 Adj. PAT 2,099 1,908 1,550 2,107
2,243 2,373 2,032 2,024 7,703 8,671
Change (%) 11.1 17.0 0.5 11.1 6.8 24.4 31.1 -3.9 10.6 12.6 E: MOFSL Estimates
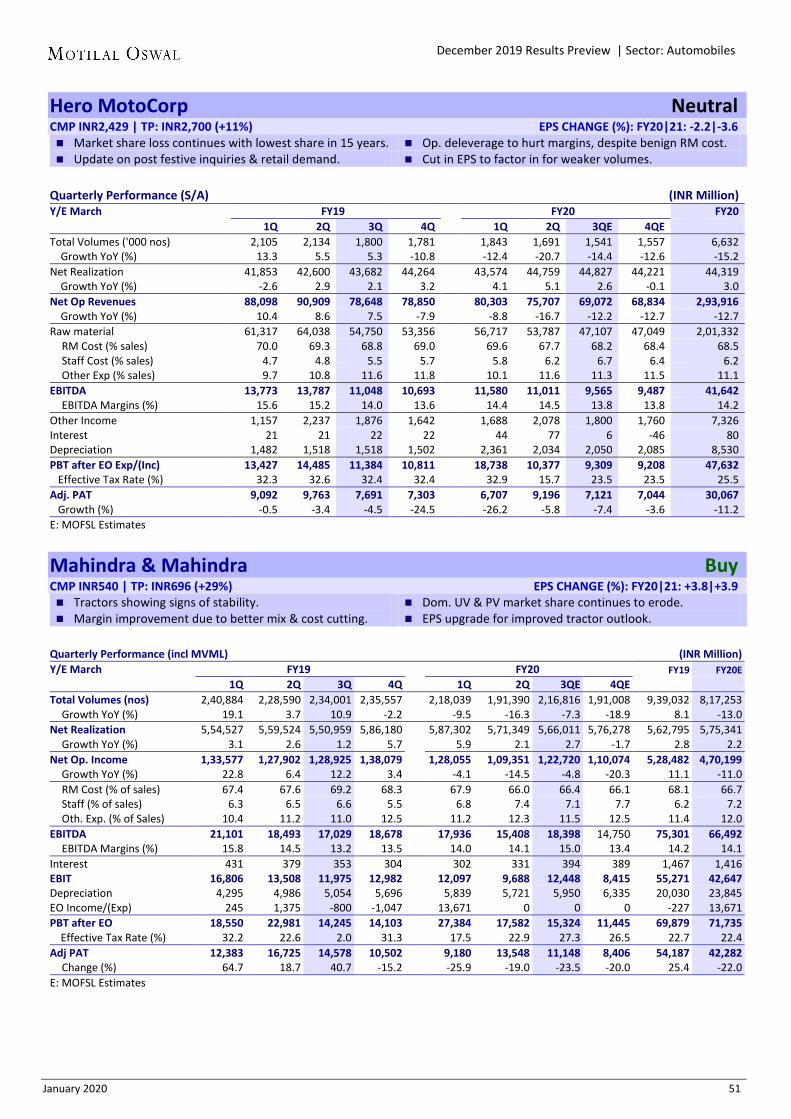
January 2020 51
December 2019 Results Preview | Sector: Automobiles
Hero MotoCorp Neutral CMP INR2,429 | TP: INR2,700 (+11%) EPS CHANGE (%): FY20|21: -2.2|-3.6 Market share loss continues with lowest share in 15 years. Op. deleverage to hurt margins, despite benign RM cost. Update on post festive inquiries & retail demand. Cut in EPS to factor in for weaker volumes.
Quarterly Performance (S/A)
(INR Million)
Y/E March FY19 FY20 FY20 1Q 2Q 3Q 4Q 1Q 2Q 3QE 4QE Total Volumes ('000 nos) 2,105 2,134 1,800 1,781 1,843 1,691 1,541 1,557 6,632 Growth YoY (%) 13.3 5.5 5.3 -10.8 -12.4 -20.7 -14.4 -12.6 -15.2 Net Realization 41,853 42,600 43,682 44,264
43,574 44,759 44,827 44,221 44,319
Growth YoY (%) -2.6 2.9 2.1 3.2 4.1 5.1 2.6 -0.1 3.0 Net Op Revenues 88,098 90,909 78,648 78,850
80,303 75,707 69,072 68,834 2,93,916
Growth YoY (%) 10.4 8.6 7.5 -7.9 -8.8 -16.7 -12.2 -12.7 -12.7 Raw material 61,317 64,038 54,750 53,356
56,717 53,787 47,107 47,049 2,01,332
RM Cost (% sales) 70.0 69.3 68.8 69.0
69.6 67.7 68.2 68.4 68.5 Staff Cost (% sales) 4.7 4.8 5.5 5.7
5.8 6.2 6.7 6.4 6.2
Other Exp (% sales) 9.7 10.8 11.6 11.8 10.1 11.6 11.3 11.5 11.1 EBITDA 13,773 13,787 11,048 10,693
11,580 11,011 9,565 9,487 41,642
EBITDA Margins (%) 15.6 15.2 14.0 13.6 14.4 14.5 13.8 13.8 14.2 Other Income 1,157 2,237 1,876 1,642
1,688 2,078 1,800 1,760 7,326
Interest 21 21 22 22
44 77 6 -46 80 Depreciation 1,482 1,518 1,518 1,502 2,361 2,034 2,050 2,085 8,530 PBT after EO Exp/(Inc) 13,427 14,485 11,384 10,811
18,738 10,377 9,309 9,208 47,632
Effective Tax Rate (%) 32.3 32.6 32.4 32.4 32.9 15.7 23.5 23.5 25.5 Adj. PAT 9,092 9,763 7,691 7,303
6,707 9,196 7,121 7,044 30,067
Growth (%) -0.5 -3.4 -4.5 -24.5 -26.2 -5.8 -7.4 -3.6 -11.2 E: MOFSL Estimates
Mahindra & Mahindra Buy CMP INR540 | TP: INR696 (+29%) EPS CHANGE (%): FY20|21: +3.8|+3.9 Tractors showing signs of stability. Dom. UV & PV market share continues to erode. Margin improvement due to better mix & cost cutting. EPS upgrade for improved tractor outlook.
Quarterly Performance (incl MVML) (INR Million) Y/E March FY19
FY20 FY19 FY20E
1Q 2Q 3Q 4Q
1Q 2Q 3QE 4QE Total Volumes (nos) 2,40,884 2,28,590 2,34,001 2,35,557
2,18,039 1,91,390 2,16,816 1,91,008 9,39,032 8,17,253
Growth YoY (%) 19.1 3.7 10.9 -2.2
-9.5 -16.3 -7.3 -18.9 8.1 -13.0 Net Realization 5,54,527 5,59,524 5,50,959 5,86,180
5,87,302 5,71,349 5,66,011 5,76,278 5,62,795 5,75,341
Growth YoY (%) 3.1 2.6 1.2 5.7
5.9 2.1 2.7 -1.7 2.8 2.2 Net Op. Income 1,33,577 1,27,902 1,28,925 1,38,079
1,28,055 1,09,351 1,22,720 1,10,074 5,28,482 4,70,199
Growth YoY (%) 22.8 6.4 12.2 3.4
-4.1 -14.5 -4.8 -20.3 11.1 -11.0 RM Cost (% of sales) 67.4 67.6 69.2 68.3
67.9 66.0 66.4 66.1 68.1 66.7
Staff (% of sales) 6.3 6.5 6.6 5.5
6.8 7.4 7.1 7.7 6.2 7.2 Oth. Exp. (% of Sales) 10.4 11.2 11.0 12.5
11.2 12.3 11.5 12.5 11.4 12.0
EBITDA 21,101 18,493 17,029 18,678
17,936 15,408 18,398 14,750 75,301 66,492 EBITDA Margins (%) 15.8 14.5 13.2 13.5
14.0 14.1 15.0 13.4 14.2 14.1
Interest 431 379 353 304
302 331 394 389 1,467 1,416 EBIT 16,806 13,508 11,975 12,982
12,097 9,688 12,448 8,415 55,271 42,647
Depreciation 4,295 4,986 5,054 5,696
5,839 5,721 5,950 6,335 20,030 23,845 EO Income/(Exp) 245 1,375 -800 -1,047
13,671 0 0 0 -227 13,671
PBT after EO 18,550 22,981 14,245 14,103
27,384 17,582 15,324 11,445 69,879 71,735 Effective Tax Rate (%) 32.2 22.6 2.0 31.3
17.5 22.9 27.3 26.5 22.7 22.4
Adj PAT 12,383 16,725 14,578 10,502
9,180 13,548 11,148 8,406 54,187 42,282 Change (%) 64.7 18.7 40.7 -15.2
-25.9 -19.0 -23.5 -20.0 25.4 -22.0
E: MOFSL Estimates

January 2020 52
December 2019 Results Preview | Sector: Automobiles
Mahindra CIE Buy CMP INR169 | TP: INR198 (17%) EPS CHANGE (%): FY20|21: +0.7|+0.8 Stability in volumes for key customers in India drives sales. EU business continues to be under pressure. QoQ margin improvement reflection of op. lev. Update on India/EU business outlook & cost saving efforts.
Quarterly performance (Consolidated)
(INR Million)
CY18
CY19 CY18 CY19E Y/E December 1Q 2Q 3Q 4Q 1Q 2Q 3Q 4QE Net Sales 19,965 20,789 19,811 19,750
21,744 21,420 18,685 20,067 80,315 81,916
YoY Change (%) 26.5 31.2 21.2 17.5 8.9 3.0 -5.7 1.6 24.9 2.0 EBITDA 2,587 2,822 2,536 2,565
2,825 2,616 2,092 2,451 10,511 9,985
Margins (%) 13.0 13.6 12.8 13.0 13.0 12.2 11.2 12.2 13.1 12.2 Depreciation 711 744 675 737
740 844 789 865 2,867 3,238
Interest 30 239 42 191
103 115 198 158 502 574 Other Income 52 87 67 182 148 78 42 100 387 368 PBT before EO expense 1,898 1,926 1,885 1,819
2,130 1,734 1,147 1,528 7,529 6,540
EO Exp/(Inc) 0 0 0 31
13 0 -51 0 504 -38 PBT before EO exp 1,898 1,926 1,885 1,788 2,117 1,734 1,198 1,528 7,025 6,578
Tax Rate (%) 30.6 27.9 27.9 22.3
28.0 27.2 48.9 37.8 29.1 33.9 Reported PAT 1,318 1,389 1,358 1,388
1,524 1,262 612 951 4,981 4,349
Adj PAT 1,318 1,389 1,358 1,413
1,534 1,262 586 951 5,339 4,324 YoY Change (%) 16.4 -9.1 -56.9 -32.7 44.7 -19.0 E: MOFSL Estimates
Maruti Suzuki Buy CMP INR7,332 | TP: INR8,000 (+9%) EPS CHANGE (%): FY20|21: +11.6|+1.9 Volume stability returns, driving inventory correction. Higher discount to dilute benefit of op. lev & lower RM. PAT to grow on low base, after five quarters of decline. Update on demand outlook/trends in post festive retails.
S/A Quarterly Performance (INR Million) Y/E March FY19 FY20 FY19 FY20E
1Q 2Q 3Q 4Q 1Q 2Q 3QE 4QE Volumes ('000 units) 490.5 484.8 428.6 458.5 402.6 338.3 437.4 377.5 1,862.4 1,555.7
Change (%) 24.3 -1.5 -0.6 -0.7 -17.9 -30.2 2.0 -17.7 4.7 -16.5 Realizations (INR/car) 4,57,907 4,58,560 4,58,850 4,68,057 4,89,819 5,02,053 4,99,543 4,97,577 4,61,867 4,97,095 Change (%) 3.0 3.7 2.6 2.1 7.0 9.5 8.9 6.3 3.0 7.6 Net operating revenues 2,24,594 2,22,332 1,96,683 2,14,594 1,97,198 1,69,853 2,18,480 1,87,821 8,60,203 7,73,352 Change (%) 28.0 2.1 2.0 1.4 -12.2 -23.6 11.1 -12.5 7.8 -10.1
RM Cost (% of sales) 69.0 68.7 71.4 71.9 71.5 71.2 71.7 71.5 70.0 71.5 Staff Cost (% of sales) 3.4 3.6 4.5 3.8 4.4 4.9 3.9 4.4 3.8 4.4 Other Cost (% of sales) 12.6 13.2 14.3 13.8 13.8 14.4 13.9 13.9 13.6 14.0
EBITDA 33,511 32,313 19,311 22,634 20,478 16,063 22,915 19,082 1,07,993 78,537 EBITDA Margins (%) 14.9 14.5 9.8 10.5 10.4 9.5 10.5 10.2 12.6 10.2
Depreciation 7,198 7,212 7,677 8,102 9,186 9,261 9,350 9,421 30,189 37,218 EBIT 26,313 25,101 11,634 14,532 11,292 6,802 13,565 9,661 77,804 41,319
EBIT Margins (%) 11.7 11.3 5.9 6.8 5.7 4.0 6.2 5.1 9.0 5.3 Non-Operating Income 2,718 5,266 9,173 8,677 8,364 9,200 9,500 8,162 25,610 35,226 PBT 28,824 32,110 20,601 23,121 19,109 15,720 22,765 17,552 1,04,656 75,145 Effective Tax Rate (%) 31.5 30.2 27.7 22.3 24.9 13.6 25.2 25.7 28.3 22.8 Adjusted PAT 19,753 21,009 14,893 17,956 14,355 13,586 17,028 13,040 73,573 58,009 Change (%) 26.9 -15.4 -17.2 -12.9 -27.3 -35.3 14.3 -27.4 -6.8 -21.2 E: MOFSL Estimates

January 2020 53
December 2019 Results Preview | Sector: Automobiles
Motherson Sumi Buy CMP INR150 | TP: INR176 (+18%) EPS CHANGE (%): FY20|21: -|- India business to benefit from PV vol. stability. Improvement at SMP to continue, but PKC to moderate. Margins to improve QoQ in both India and SMP. Update on SMP greenfield plants.
Quarterly performance (Consol.) (INR Million) Y/E March FY19 FY20 FY19 FY20E 1Q 2Q 3Q 4Q 1Q 2Q 3QE 4QE Net Sales 1,47,755 1,51,050 1,64,730 1,71,695
1,67,925 1,59,242 1,69,249 1,77,825 6,35,229 6,74,242
YoY Change (%) 13.0 12.6 14.5 11.4
13.7 5.4 2.7 3.6 12.8 6.1 RM Cost (% of sales) 57.6 57.9 57.7 58.1
57.5 57.3 56.7 51.0 57.8 55.5
Staff Cost (% of sales) 21.9 21.7 22.5 23.0
23.3 22.8 22.0 28.2 22.3 24.2 Other Exp (% of sales) 11.0 11.8 11.3 11.6
11.7 11.6 12.9 12.3 11.4 12.1
EBITDA 14,121 13,001 13,934 12,428
12,550 13,190 14,173 15,083 53,484 54,996 Margins (%) 9.6 8.6 8.5 7.2
7.5 8.3 8.4 8.5 8.4 8.2
Depreciation 4,471 4,879 5,714 5,518
6,365 6,551 6,625 6,733 20,582 26,274 Interest 1,005 1,315 882 1,030
1,559 1,254 1,250 1,204 4,232 5,267
Other income 447 463 610 682
547 825 500 428 2,202 2,300 PBT after EO Expense 9,093 7,269 7,948 6,562
5,173 6,211 6,798 7,573 30,872 25,755
Tax Rate (%) 36.0 35.4 33.9 37.8
34.3 30.1 30.5 29.9 35.7 31.0 Min. Int & Share of profit 1,389 982 1,365 -17
84 496 981 1,553 3,719 3,113
Adj PAT 4,431 3,711 3,891 4,100
3,315 3,846 3,743 3,753 16,132 14,658 YoY Change (%) 21.8 -15.6 6.3 -23.1
-25.2 3.6 -3.8 -8.5 -5.2 -9.1
E: MOFSL Estimates
Tata Motors Buy CMP INR194 | TP: INR220 (+13%) EPS CHANGE (%): FY20|21: LTP|+5.2 JLR product/market mix improvement to reflect from 3Q. India business to witness QoQ recovery in volumes. QoQ margin improvement due to India business. Upgrade FY21 EPS for improving mix at JLR.
Quarterly Performance [Consol]
(INR Million)
Y/E March FY19 FY20 FY19 FY20E 1Q 2Q 3Q 4Q
1Q 2Q 3QE 4QE
Net Op Income 6,67,011 7,19,811 7,69,159 8,64,220
6,14,670 6,54,320 7,41,440 8,74,923 30,19,384 28,85,352 Growth (%) 14.0 2.3 4.8 -3.9
-7.8 -9.1 -3.6 1.2 3.6 -4.4
EBITDA 50,504 66,266 59,557 80,193
29,955 71,605 86,590 1,15,372 2,55,702 3,03,522 EBITDA Margins (%) 7.6 9.2 7.7 9.3
4.9 10.9 11.7 13.2 8.5 10.5
JLR EBITDA Margins (%) 6.2 9.1 7.3 9.8
4.2 13.8 13.2 13.7 8.2 11.7 S/A EBITDA (%) 8.6 8.5 8.8 7.3
6.4 -1.7 3.8 6.8 8.3 4.2
Depreciation 58,571 59,412 64,393 53,531
51,117 52,996 57,380 59,882 2,35,906 2,21,375 Other Income 6,050 7,482 6,668 8,636
8,360 6,726 7,000 7,026 29,653 29,111
PBT before EO Exp -25,842 -2,932 -12,144 23,722
-31,294 5,821 15,235 36,392 -17,196 46,745 EO Exp/(Inc) 0 5,303 2,80,140 11,072
1,088 -391 0 0 2,96,516 697
PBT after EO Exp -25,842 -8,234 -2,92,284 12,649
-32,382 6,212 15,235 36,392 -3,13,712 46,047 Tax rate (%) 16.1 -33.0 8.2 8.8
-6.1 71.7 4.3 9.6 7.8 22.9
PAT -21,686 -10,953 -2,68,232 11,535
-34,343 1,758 14,583 32,901 -2,89,337 35,488 Minority Interest -398 -393 -317 88
-187 289 -200 -264 -1,020 -362
Share in profit of Associate 3,060 859 -1,376 -448
-2,454 -3,635 -3,239 -2,356 2,095 -11,684 Adj PAT -19,024 -5,597 -11,551 21,387
-35,980 -1,949 11,144 30,280 -54,297 -34,959
Growth (%) (295.9) (122.5) (196.1) (31.6)
NA NA LTP LTP NA NA

January 2020 54
December 2019 Results Preview | Sector: Automobiles
TVS Motor Company Neutral CMP INR459 | TP: IN442 (-4%) EPS CHANGE (%): FY20|21: -8.0|-3.2 Dom. market share moderating from FY19 levels. Exports growth continues to be good for both 2Ws & 3Ws. Op. deleverage to hurt margins on a QoQ basis. EPS cut to reflect continued weakness in dom. volumes.
S/A Quarterly Performance (INR Million) Y/E March (INR m) FY19 FY20 1Q 2Q 3Q 4Q 1Q 2Q 3QE 4QE FY19 FY20E Volumes ('000 units) 928.3 1,088.4 989.8 907.3 923.2 885.8 821.5 833.8 3,915.0 3,464.3
Growth (%) 15.7 14.7 19.8 2.0 (0.5) (18.6) (17.0) (8.1) 13.0 (11.5) Realization (INR '000/unit) 44.9 45.9 47.1 48.4 48.4 49.1 49.3 50.1 46.5 49.2
Growth (%) 6.0 7.1 5.3 7.3 7.7 7.0 4.7 3.6 6.2 5.8 Net Sales 41,710 49,935 46,640 43,876 44,686 43,478 40,523 41,763 1,82,099 1,70,451
Growth (%) 22.7 22.8 26.1 9.5 7.1 (12.9) (13.1) (4.8) 20.0 (6.4) EBITDA 3,238 4,282 3,757 3,117 3,558 3,820 3,400 3,456 14,333 14,233 EBITDA Margin(%) 7.8 8.6 8.1 7.1 8.0 8.8 8.4 8.3 7.9 8.4 Interest 180 212 167 247 291 285 290 289 806 1,155 Depreciation 933 1,016 1,012 1,031 1,194 1,241 1,245 1,287 3,993 4,966 Other Income 26 7 7 36 12 49 26 15 75 102 PBT before EO Exp 2,150 3,062 2,585 1,875 2,085 2,343 1,891 1,895 9,610 8,213 EO Exp 0 0 0 0 0 -760 0 0 -760
Tax rate (%) 30.6 31.0 31.0 26.7 31.8 17.8 25.2 25.5 30.3 24.2 Adjusted PAT 1,492 2,113 1,784 1,374 1,423 1,968 1,415 1,412 6,701 6,219
Growth (%) 15.2 (0.9) 15.6 (17.0) (4.6) (6.9) (20.7) 2.8 1.1 (7.2) E: MOFSL Estimates

January 2020 55
December 2019 Results Preview | Sector: Capital Goods
Commentary on ordering outlook a key monitorable Muted expectations on account of prolonged rains and economic slowdown While we expect overall 3QFY20 revenue growth in low double digits at 10.8%,
ex-L&T, the growth rate is estimated at just 4%. Operating profit margin at the aggregate level is estimated at 10.8% (flat YoY),
as companies are looking to rationalize their cost structure. We remain positive on L&T, ABB, and Siemens in the industrials space, while
Voltas remains our top pick in the consumer durables segment. Ex-L&T, revenue growth estimated at just 4% We expect companies under our coverage universe to deliver low double-digit revenue growth at the aggregate level. However, excluding L&T, the revenue growth is estimated at just 4%. The slowdown in the economy is likely to weigh on the revenue growth of capital goods companies. The similar trend was visible in 2QFY20 as well. L&T is likely to outperform the sectoral trend owing to strong growth in the Services, Infrastructure and Hydrocarbon segments. L&T’s revenue growth benefits from contribution from MindTree acquisition as well. Bharat Electronics is expected to underperform the sectoral revenue growth trend. We expect it to report revenue decline of 14.4% on account of large contribution from EVM/VVPAT in the base quarter. For companies in the Electrical Consumer Durables space, the UCP segment should grow in double digits as low base of last year and channel filling is expected to lead to healthy sales. However, for other segment categories like cables, switchgears and lighting, the growth is expected to be tepid due to slowdown in construction activity on account of economic slowdown as well as extended rains. Operating margins to remain stable led by cost rationalization Operating margins are expected to be flat YoY, despite multiple headwinds such as input price pressure and intense competition in industry. We believe that cost-rationalization measures undertaken by companies will largely lend support to margins. Operating profit margins at the aggregate level are estimated at 10.8%. While EBITDA at the aggregate level is expected to rise by 10.7%, aggregate net profit is expected to be higher at 12.5%, helped by benefits of lower corporate tax rates. PBT is expected to be flat. Positive FX impact likely on MNCs and Consumer Durable companies The INR appreciation of 1.2% YoY against the USD can potentially have a positive impact on earnings of companies like Voltas and Blue Star due to their reliance on imports of compressor and indoor units from China. Engineering companies like Siemens and ABB are net importers, but they largely hedge and thus the impact may be minimal.
Company name
ABB
Bharat Electronics
BHEL
Blue Star
CG Consumer Elect.
Cummins India
Engineers India
Havells India
Larsen & Toubro
Siemens
Thermax
Voltas
Capital Goods
Nilesh Bhaiya – Research Analyst ([email protected]); +91 22 6129 1556 Pratik Singh – Research Analyst (Pratik [email protected]); +91 22 7193 4140

January 2020 56
December 2019 Results Preview | Sector: Capital Goods
Commentary on new ordering a key monitorable Over the last few years, the capex cycle in India has been supported by government spending on infrastructure projects like roads, railways and power T&D sectors. Historically, private sector capex has remained subdued due to the under-utilization of assets created by companies. And with capacity utilization declining further in 2QFY20, the outlook on new ordering has weakened further. Thus, management commentary on new ordering outlook is a key monitorable, in our view.
Exhibit 12: Summary of expected quarterly performance Sector CMP SALES (INR M) EBDITA (INR M) NET PROFIT (INR M)
(INR) RECO Dec-19 Var % YoY
Var % QoQ Dec-19 Var
% YoY Var
% QoQ Dec-19 Var % YoY
Var % QoQ
Capital Goods ABB 1,295 Buy 21,882 11.3 25.4 2,406 11.7 95.0 1,721 33.8 118.3 Bharat Electronics 103 Buy 23,250 -14.4 -15.2 4,729 -38.4 -13.2 3,075 -39.4 -9.4 BHEL 45 Neutral 77,588 5.8 24.6 3,491 59.6 30.8 1,790 -6.8 50.9 Blue Star 813 Neutral 12,375 12.6 -1.0 802 89.5 9.0 452 626.2 14.1 CG Consumer Elect. 241 Buy 10,973 6.5 2.0 1,317 4.4 1.8 1,000 25.5 -9.8 Cummins India 569 Buy 14,885 -1.0 13.8 1,935 -14.7 26.9 1,788 -4.4 -2.4 Engineers India 99 Buy 6,465 12.0 -10.7 949 0.0 -11.3 1,083 19.4 59.9 Havells India 654 Neutral 26,351 4.6 18.2 2,899 -1.6 23.8 1,963 0.3 8.2 Larsen & Toubro 1,345 Buy 396,500 15.8 12.2 45,598 21.5 13.4 24,152 27.2 4.6 Siemens 1,514 Buy 29,704 5.8 -28.1 3,405 -7.0 -16.1 2,877 0.0 -2.5 Thermax 1,098 Neutral 14,440 0.5 -10.1 1,144 6.5 -12.3 845 29.7 228.9 Voltas 659 Buy 16,165 8.4 13.7 1,364 18.0 28.9 1,240 33.8 12.0 Sector Aggregate 650,578 10.8 8.8 70,038 10.7 11.3 41,987 12.5 8.8
Exhibit 13: Revenue growth pick-up driven by domestic execution
Source: MOFSL, Company
Exhibit 14: EBITDA margin improvement on cost rationalization by companies
Source: MOFSL, Company
26.3
11
.7
1.3
-1.0
-0
.8
-1.4
2.7
2.8
3.1
2.4 8.7
3.5
1.2 9.3 5.5
2.9
6.7 8.4
13.1
15
.1
18.9
10
.0
8.8
7.6
10.8
3QFY
144Q
FY14
1QFY
152Q
FY15
3QFY
154Q
FY15
1QFY
162Q
FY16
3QFY
164Q
FY16
1QFY
172Q
FY17
3QFY
174Q
FY17
1QFY
182Q
FY18
3QFY
184Q
FY18
1QFY
192Q
FY19
3QFY
194Q
FY19
1QFY
202Q
FY20
3QFY
20E
Engg Sector (revenue growth %)
11.0
14
.0
9.9
9.2 10.0
12.0
8.
3 7.
2 4.
3 11
.6
8.7
7.8 8.
5 10.2
7.
4 8.7 9.
7 11
.9
8.7 9.
9 10.9
12.8
10
.8
10.5
10
.8
3QFY
144Q
FY14
1QFY
152Q
FY15
3QFY
154Q
FY15
1QFY
162Q
FY16
3QFY
164Q
FY16
1QFY
172Q
FY17
3QFY
174Q
FY17
1QFY
182Q
FY18
3QFY
184Q
FY18
1QFY
192Q
FY19
3QFY
194Q
FY19
1QFY
202Q
FY20
3QFY
20E
EBITDA Margin (%)

January 2020 57
December 2019 Results Preview | Sector: Capital Goods
Exhibit 15: Book-to-bill stable at 2.1x
Source: MOFSL, Company
Exhibit 16: Order inflows to rise on adverse base
Source: MOFSL, Company
Exhibit 17: Summary of comparative full-year valuation
CMP EPS (INR) PE (x) PB (x) RoE (%) Company Name INR Reco FY20E FY21E FY22E FY20E FY21E FY22E FY20E FY21E FY22E FY20E FY21E FY22E Capital Goods 23.5 19.4 16.6 2.9 2.7 2.4 12.4 13.7 14.5 ABB 1,295 Buy 19.3 25.8 32.4 67.0 50.1 40.0 6.0 6.8 6.0 14.0 13.5 15.0 Bharat Electronics 103 Buy 6.4 7.5 8.3 16.2 13.7 12.4 2.5 2.3 2.1 15.7 16.8 17.0 BHEL 45 Neutral 3.4 3.0 3.4 13.5 14.9 13.5 0.5 0.5 0.5 3.7 3.3 3.6 Blue Star 813 Neutral 26.8 33.1 40.4 30.3 24.6 20.1 7.3 6.0 4.9 24.2 24.3 24.2 CG Consumer Elect. 241 Buy 7.6 9.6 11.6 31.7 25.1 20.8 11.0 8.8 7.0 38.5 38.7 37.5 Cummins India 569 Buy 24.4 26.6 29.4 23.4 21.4 19.3 3.6 3.4 3.1 15.8 16.2 16.8 Engineers India 99 Buy 6.5 8.7 9.6 15.3 11.5 10.3 2.8 2.7 2.5 17.6 22.5 23.8 Havells India 654 Neutral 12.8 16.1 19.4 51.2 40.7 33.7 8.6 7.6 6.6 16.8 18.6 19.7 K E C International 311 Buy 24.2 28.6 33.1 12.8 10.9 9.4 2.7 2.2 1.8 20.9 20.3 19.4 Larsen & Toubro 1,345 Buy 77.3 95.8 105.7 17.4 14.0 12.7 2.7 2.4 2.1 15.4 16.7 17.5 Siemens 1,514 Buy 30.5 40.0 44.9 49.6 37.8 33.7 6.0 5.3 4.8 12.0 14.1 14.1 Thermax 1,098 Neutral 29.8 39.0 44.8 36.9 28.2 24.5 3.8 3.4 3.1 10.7 12.8 13.3 Voltas 659 Buy 20.0 24.6 29.1 33.0 26.9 22.6 4.8 4.3 3.8 14.5 15.9 16.7
Exhibit 18: Relative performance – three months (%)
Source: Bloomberg, MOFSL
Exhibit 19: Relative performance – one year (%)
Source: Bloomberg, MOFSL
3,23
0 3,
482
3,59
4 3,
605
3,81
3 3,
717
2,70
7 3,
979 3,92
4 3,
917
3,97
6 3,
936
3,96
1 3,
940
4,13
9 3,
997
4,16
0 4,
246
4,30
2 4,
296
4,29
4 4,
379
2.6
2.9
3
.0
2.9
2
.8
2.5
1
.7
2.5
2
.4
2.4
2
.4
2.4
2
.3
2.3
2
.4
2.2
2
.3
2.3
2
.2
2.1
2
.1
2.2
1QFY
152Q
FY15
3QFY
154Q
FY15
1QFY
162Q
FY16
3QFY
164Q
FY16
1QFY
172Q
FY17
3QFY
174Q
FY17
1QFY
182Q
FY18
3QFY
184Q
FY18
1QFY
192Q
FY19
3QFY
194Q
FY19
1QFY
202Q
FY20
Order book (INR b) BTB (x)
-2
-1
31
14 22
-5
-2
2 27
15
3
-11
-15 -1
1 -9 -8
31
30
32
45
-14
-18
4 15
4QFY
141Q
FY15
2QFY
153Q
FY15
4QFY
151Q
FY16
2QFY
163Q
FY16
4QFY
161Q
FY17
2QFY
173Q
FY17
4QFY
171Q
FY18
2QFY
183Q
FY18
4QFY
181Q
FY19
2QFY
193Q
FY19
4QFY
191Q
FY20
2QFY
20
Order intake YoY %
89
94
99
104
109
Sep-
19
Oct
-19
Nov
-19
Dec-
19
Nifty Index MOSL Capital Goods Index
85
92
99
106
113
Dec-
18
Jan-
19
Feb-
19
Mar
-19
Apr-
19
May
-19
Jun-
19
Jul-1
9
Aug-
19
Sep-
19
Oct
-19
Nov
-19
Dec-
19Nifty Index MOSL Capital Goods Index

January 2020 58
December 2019 Results Preview | Sector: Capital Goods
The tables below provide a snapshot of actual and estimated numbers for companies under the MOFSL coverage universe. Highlighted columns indicate the quarter/financial year under review.
ABB Buy CMP INR1,294 | TP: INR1,460 (+13%) EPS CHANGE (%): CY19|20: -|- Automation and electrification products to drive growth. EBITDA margin flat YoY, EBITDA up 12% YoY. New corporate tax rate to aid profitability (PAT +34% YoY). Watch out for outlook on FMCG and Auto sector.
Quarterly Performance
(INR m)
Y/E December CY18 CY19E CY18 CY19E 1Q 2Q 3Q 4Q 1Q 2Q 3Q 4QE Sales 15,665 16,657 14,916 19,663 18,503 17,258 17,456 21,882 66,901 75,099 Change (%) NA NA NA 15.1 18.1 3.6 17.0 11.3 9.8 12.3 EBITDA 895 875 654 2,154 1,455 1,239 1,234 2,406 4,578 6,333 Change (%) NA NA NA 48.0 62.6 41.5 88.7 11.7 10.4 38.3 As % of Sales 5.7 5.3 4.4 11.0 7.9 7.2 7.1 11.0 6.8 8.4 Depreciation 225 228 236 239 233 220 227 250 928 930 Interest 199 150 137 53 26 96 44 34 539 200 Other Income 228 183 269 160 191 204 164 179 840 738 Extra-ordinary Income 569 582 723 693 272 607 565 810 2,567 2,253 PBT (Before Exceptional) 699 681 549 2,023 1,387 1,127 1,127 2,301 3,951 5,941 Tax 243 242 189 736 497 429 339 580 1,410 1,845 Effective Tax Rate (%) 34.8 35.5 34.4 36.4 35.8 38.1 30.1 25.2 35.7 31.1 Reported PAT 1,025 1,021 1,084 1,979 1,162 1,304 1,353 2,530 5,109 6,349 Adj. PAT 456 439 360 1,286 890 697 788 1,721 2,542 4,096 Change (%) NA NA NA 57.6 95.2 58.9 118.6 33.8 12.7 61.2
Bharat Electronics Buy CMP INR103 | TP: INR120 (+16%) EPS CHANGE (%): FY20|21: -13|-13 Base quarter had INR8.5b sales from EVM/VVPAT. Adjusted for EVM/VVPAT, sales growth to be 24.6% YoY.
Robust OB of INR562b, OB/revenue at 4.9x. Commentary on revenue growth and margins owing to a high base quarter.
Quarterly Performance (INR m) Y/E March FY19 FY20E FY19 FY20E 1Q 2Q 3Q 4Q 1Q 2Q 3QE 4QE
Sales 21,021 33,814 27,165 38,846 21,015 27,427 23,250 50,545 1,20,846 1,22,237 Change (%) 22.1 36.7 8.4 7.7 0.0 -18.9 -14.4 30.1 17.1 1.2 EBITDA 3,105 8,544 7,681 9,290 3,481 5,447 4,729 10,154 28,621 23,811 Change (%) 87.5 44.1 72.5 16.7 12.1 -36.2 -38.4 9.3 43.1 -16.8 As of % Sales 14.8 25.3 28.3 23.9 16.6 19.9 20.3 20.1 23.7 19.5 Depreciation 689 743 797 933 828 857 900 1048 3,162 3,632 Interest 3 0 0 119 3 12 20 87 122 122 Other Income 89 143 176 1,288 254 150 300 395 1,695 1,100 PBT 2,502 7,944 7,060 9,526 2,904 4,729 4,109 9,415 27,032 21,157 Tax 705 2,230 1,984 2,840 856 1,334 1,034 2,371 7759 5596 Effective Tax Rate (%) 28.2 28.1 28.1 29.8 29.5 28.2 25.2 25.2 28.7 26.5 Reported PAT 1,797 5,713 5,076 6,686 2,048 3,395 3,075 7,044 19,273 15,561 Change (%) 43.4 38.5 67.6 19.7 13.9 -40.6 -39.4 5.3 37.7 -19.3 Adj PAT 1,797 5,713 5,076 6,686 2,048 3,395 3,075 7,044 19,273 15,561 Change (%) 43.4 38.5 67.6 19.7 13.9 -40.6 -39.4 5.3 37.7 -19.3

January 2020 59
December 2019 Results Preview | Sector: Capital Goods
BHEL Neutral CMP INR45 | TP: INR46 EPS CHANGE (%): FY20|21: -|-13 Revenue growth led by execution of orders in hand. Expect stable gross margins at 39% (1HFY20: 39.4%). Operating profit to grow by 60% YoY, margin +150bp YoY. Watch out for any improvement in receivables position.
Quarterly Performance (INR m) Y/E March FY19 FY20E FY19 FY20E 1Q 2Q 3Q 4Q 1Q 2Q 3QE 4QE Sales (Net) 59,355 67,799 73,364 1,02,972 45,317 62,257 77,588 1,25,594 3,03,490 3,10,755 Change (%) 6.3 7.7 10.1 1.5 -23.7 -8.2 5.8 22.0 4.9 2.4 EBITDA 2,872 2,408 2,187 13,952 -2,667 2,669 3,491 16,007 21,420 19,500 Change (%) 41.6 NA -17.5 13.3 NA 10.8 59.6 14.7 10.8 -9.0 As a % Sales 4.8 3.6 3.0 13.5 -5.9 4.3 4.5 12.7 7.1 6.3 Interest 639 689 577 964 1,080 1,187 1,200 1,033 2,869 4,500 Depreciation 1,761 521 1,124 1,342 1,148 1,193 1,200 1,245 4,748 4,786 Other Income 1,786 1,517 2,265 1,209 1,455 1,356 1,300 1,331 6,776 5,443 Net Extra-ordinary Expenses
PBT 2,259 2,715 2,751 12,854 -3,440 1,645 2,391 15,060 20,579 15,656 Tax 703 863 831 6,027 -1,277 459 602 4,157 8,425 3,941 Effective Tax Rate (%) 31.1 31.8 30.2 46.9 37.1 27.9 25.2 27.6 40.9 25.2 Reported PAT 1,556 1,852 1,920 6,827 -2,162 1,186 1,790 10,903 12,154 11,716 Change (%) 92.5 60.4 25.3 49.3 NA -36.0 -6.8 59.7 50.7 -3.6 Adj. PAT 1,556 1,852 1,920 6,827 -2,162 1,186 1,790 10,903 12,154 11,716 Change (%) 92.5 60.4 25.3 49.3 NA -36.0 -6.8 59.7 50.7 -3.6
Blue Star Neutral CMP INR810 | TP: INR870 (+8%) EPS CHANGE (%): FY20|21: - |- UCP/MEP expected to grow at 14%/10% YoY. Op. margin led by UCP (+160bp) and MEP (+140bp) YoY. Adj. PAT to come in at INR452m on a favorable base year. Outlook for ACs in 2HFY20 and build up to summer.
Quarterly performance (INR m) FY19 FY20 FY19 FY20E Y/E March 1Q 2Q 3Q 4Q 1Q 2Q 3QE 4QE
Sales 15,078 10,322 10,990 15,958 15,755 12,495 12,375 18,365 52,348 58,989 Change (%) -0.2 21.5 17.9 18.5 4.5 21.0 12.6 15.1 12.8 12.7 EBITDA 1,367 581 423 1,094 1,149 736 802 1,449 3,465 4,136 Change (%) 23.6 18.7 -7.9 81.3 -16.0 26.7 89.5 32.4 30.3 19.4 As of % Sales 9.1 5.6 3.9 6.9 7.3 5.9 6.5 7.9 6.6 7.0 Depreciation 161 169 183 237 203 216 230 254 749 904 Interest 121 117 131 110 82 68 50 50 479 250 Other Income 33 49 104 61 217 106 50 47 247 420 Extra-ordinary Items 152 -27 -72 -26 0 -17 0 0 27 -17 PBT 1,118 344 214 808 1,080 558 572 1,193 2,484 3,402 Tax 325 78 10 7 325 169 130 245 420 869 Effective Tax Rate (%) 29 23 5 1 30 30 23 21 17 26 MI/Share of profit from JV (29) (43) (141) 23 14 8 10 15 (191) 47 Reported PAT 916 195 -9 798 768 379 452 963 1,900 2,563 Change (%) 20.3 -14.0 -107.0 151.9 -16.1 94.1 NM 20.6 32.0 34.9 Adj PAT 764 223 62 825 768 397 452 963 1,874 2,580 Change (%) 0.3 -2.0 -53.5 212.1 0.6 78.0 626.2 16.8 35.1 37.7

January 2020 60
December 2019 Results Preview | Sector: Capital Goods
CG Consumer Elect. Buy CMP INR241 | TP: INR296 (+23%) EPS CHANGE (%): FY20|21: -|- ECD to drive growth (+13% YoY), Lighting (-8% YoY). Price erosion in LED batons and panels to continue. Lower tax rate to aid PAT growth (+26% YoY). Watch out for price erosion in Lighting & drivers of ECD.
Quarterly Estimates (INR m) Y/E March FY19 FY20 FY19 FY20 1Q 2Q 3Q 4Q 1Q 2Q 3QE 4QE
Sales 12,039 10,378 10,303 12,069 13,468 10,758 10,973 13,309 44,789 48,509 Change (%) 20.2 8.1 9.8 7.2 11.9 3.7 6.5 10.3 9.8 8.3 EBITDA 1,673 1,239 1,261 1,685 1,919 1,293 1,317 1,838 5,858 6,366 Change (%) 29.3 2.7 8.2 2.5 14.7 4.3 4.4 9.0 10.3 8.7 As of % Sales 13.9 11.9 12.2 14.0 14.2 12.0 12.0 13.8 13.1 13.1 Depreciation 31 32 33 33 58 64 60 49 129 231 Interest 152 150 150 143 150 87 80 63 596 380 Other Income 88 98 124 172 173 123 120 185 483 600 Extra-ordinary Items
PBT 1,578 1,155 1,202 1,681 1,885 1,264 1,297 1,910 5,616 6,356 Tax 535 386 405 549 660 156 296 488 1,875 1,600 Effective Tax Rate (%) 33.9 33.4 33.7 32.7 35.0 12.3 22.9 25.5 33.4 25.2 Adjusted PAT 1,043 769 797 1,132 1,224 1,109 1,000 1,422 3,741 4,756 Change (%) 29.9 8.6 14.6 9.7 17.4 44.2 25.5 25.6 15.5 27.1 Extra-ordinary Income (net) - - - 285 - - - - 285 - Reported PAT 1,043 769 797 1,417 1,224 1,109 1,000 1,422 4,025 4,756 Change (%) 29.9 8.6 14.6 37.3 17.4 44.2 25.5 0.4 24.3 18.2
Cummins India Buy CMP INR569 | TP: INR640 (+12%) EPS CHANGE (%): FY20|21: -|- Revenue expectation: Domestic (+5%), Exports (-18%) YoY. Demand in ME and Europe to remain weak. Op. margins to contract (210bp YoY) due to adverse mix. Watch out for guidance and outlook on export segment.
Quarterly Performance
(INR m)
FY19 FY20E FY19 FY20E Y/E March 1Q 2Q 3Q 4Q 1Q 2Q 3QE 4QE Sales 13,280 14,869 15,038 13,404 13,430 13,084 14,885 14,587 56,590 55,986 Change (%) -1.0 28.9 11.0 8.7 1.1 -12.0 -1.0 8.8 11.3 -1.1 EBITDA 2,147 2,509 2,267 1,718 1,514 1,525 1,935 1,912 8,641 6,886 Change (%) 9.9 49.8 15.3 -0.7 -29.5 -39.2 -14.7 11.3 24.0 -6.3 As of % Sales 16.2 16.9 15.1 12.8 11.3 11.7 13.0 13.1 15.3 12.3 Depreciation 271 274 279 280 291 293 295 300 1,103 1,179 Interest 36 40 41 45 52 55 50 43 162 200 Other Income 696 785 755 692 769 926 800 726 2,928 3,221 PBT 2,536 2,980 2,702 2,085 1,940 2,102 2,390 2,295 10,304 8,728 Tax 706 865 831 676 525 269 602 576 3,078 1,972 Effective Tax Rate (%) 27.8 29.0 30.8 32.4 27.1 12.8 25.2 25.1 29.9 22.6 Adjusted PAT 1,830 2,116 1,871 1,409 1,415 1,833 1,788 1,719 7,226 6,755 Change (%) 10.2 38.4 8.7 (12.6) (22.7) (13.4) (4.4) 22.0 10.8 (6.5) Extra-ordinary Income (net) - - - - - - - - - - Reported PAT 1,830 2,116 1,871 1,409 1,415 1,833 1,788 1,719 7,226 6,755 Change (%) (17.6) 38.4 8.7 (12.6) (22.7) (13.4) (4.4) 22.0 2.0 (6.5)

January 2020 61
December 2019 Results Preview | Sector: Capital Goods
Engineers India Buy CMP INR99 | TP: INR146 (+47%) EPS CHANGE (%): FY20|21: -|- Turnkey segment expected to drive growth (+28% YoY). Stable margins in Consultancy (~+27%)/Turnkey (~7.5%). Adj. PAT to grow 19.4% owing to lower tax rates. Watch out for performance of turnkey segment.
Quarterly Performance (INR M) Y/E March FY19 FY20 FY19 FY20E 1Q 2Q 3Q 4Q 1Q 2Q 3QE 4QE Net Sales 5,733 6,814 5,770 6,126 7,349 7,237 6,465 7,057 24,443 28,108 YoY Change (%) 52.7 58.8 21.9 20.2 28.2 6.2 12.0 15.2 36.7 15.0 Total Expenditure 4,870 5,899 4,821 5,193 5,954 6,168 5,516 6,100 20,783 23,738 EBITDA 864 915 949 933 1,395 1,069 949 957 3,660 4,370 Margins (%) 15.1 13.4 16.4 15.2 19.0 14.8 14.7 13.6 15.0 15.5 Depreciation 55 57 53 58 57 58 57 62 224 234 Interest 2 4 3 4 3 4 4 1 12 12 Other Income 522 614 519 596 583 655 560 600 2,251 2,398 Extraordinary expense/income 0 0 0 0 0 0 0 0 0 0 PBT 1,328 1,468 1,411 1,467 1,917 1,663 1,448 1,493 5,675 6,522 Tax 462 491 504 517 676 986 364 406 1,974 2,433 Rate (%) 34.8 33.4 35.7 35.2 35.3 59.3 25.2 27.2 34.8 37.3 Reported PAT 866 978 908 950 1,241 678 1,083 1,087 3,701 4,089 Adj PAT 866 978 908 950 1,241 678 1,083 1,087 3,701 4,089 YoY Change (%) 6.3 -18.0 -16.3 0.1 43.3 -30.7 19.4 14.4 -8.4 10.5 Margins (%) 15.1 14.3 15.7 15.5 16.9 9.4 16.8 15.4 15.1 14.5
Havells India Neutral CMP INR 654 | TP: INR710 (+9%) EPS CHANGE (%): FY20|21: -4.0|-3.0 Revenue: ECD (+17%)/Cables (+7%)/Lighting (+5%) YoY. Lloyd’s expected to decline 15% YoY (owing to high base). Commentary on demand scenario for key segments. Lloyd’s strategy for 2HFY20 & upcoming summer season.
Quarterly Performance (INR m) FY19 FY20E FY19 FY20E Y/E March 1Q 2Q 3Q 4Q 1Q 2Q 3QE 4QE Sales 25,963 21,910 25,184 27,519 27,120 22,303 26,351 30,397 1,00,576 1,06,171 Change (%) 39.5 23.3 28.1 8.6 4.5 1.8 4.6 10.5 23.6 5.6 Adj EBITDA 3,123 2,625 2,946 3,229 2,757 2,341 2,899 3,582 11,922 11,578 Change (%) 81.1 2.2 12.3 -9.7 -11.7 -10.8 -1.6 11.0 13.6 -2.9 Adj EBITDA margin (%) 12.0 12.0 11.7 11.7 10.2 10.5 11.0 11.8 11.9 10.9 Depreciation 350 391 353 391 469 531 550 559 1,486 2,109 Interest 26 37 36 61 47 51 50 51 159 200 Other Income 292 343 331 310 397 292 325 335 1,276 1,349 PBT 3,039 2,540 2,888 3,086 2,637 2,051 2,624 3,307 11,553 10,618 Tax 935 754 931 1,018 898 237 660 833 3,637 2,628 Effective Tax Rate (%) 30.8 29.7 32.2 33.0 34.1 11.6 25.2 25.2 31.5 24.8 Reported PAT 2,104 1,786 1,957 2,068 1,739 1,814 1,963 2,474 7,915 7,990 Change (%) 73.3 4.4 0.7 -8.4 -17.3 1.5 0.3 19.6 11.1 0.9 Adj PAT 2,104 1,786 1,957 2,068 1,739 1,814 1,963 2,474 7,915 7,990 Change (%) 73.3 4.4 12.9 -11.9 -17.3 1.5 0.3 19.6 13.0 0.9

January 2020 62
December 2019 Results Preview | Sector: Capital Goods
Larsen & Toubro Buy CMP INR1,345 | TP: INR1,670 (+24%) EPS CHANGE (%): FY20|21: -1|-1 Expected order inflows: +7% YoY (INR450b), driven by
Infrastructure and Hydrocarbons. Consol. revenue driven by Services revenue, Core E&C:
+10% YoY (INR286b). Watch out for execution trend and outlook on some big
ticket size orders. Outlook and commentary on key orders in Maharashtra
and margins in Infrastructure segment.
Quarterly Performance (INR m) Y/E March FY19 FY20E FY19 FY20E
1Q 2Q 3Q 4Q 1Q 2Q 3QE 4QE Sales 2,70,048 3,06,781 3,42,340 4,33,034 2,96,360 3,53,285 3,96,500 5,09,273 13,52,203 15,55,417 Change (%) 13.4 16.0 19.1 6.5 9.7 15.2 15.8 17.6 13.0 15.0 EBITDA 27,577 35,415 37,514 52,791 33,189 40,219 45,598 73,558 1,53,296 1,92,563 Change (%) 32.9 19.6 19.4 -2.1 20.4 13.6 21.5 39.3 13.0 25.6 Margin (%) 10.2 11.5 11.0 12.2 11.2 11.4 11.5 14.4 11.3 12.4 Depreciation 6,047 4,776 4,053 4,354 4,615 6,297 5,000 4,399 19,230 20,310 Interest 3,637 3,984 5,340 5,065 5,867 6,859 7,500 7,849 18,026 28,074 Other Income 2,280 4,085 5,891 6,110 3,844 5,964 4,000 3,730 18,365 17,538 PBT 20,173 30,740 34,012 49,481 26,552 33,028 37,098 65,040 1,34,406 1,61,718 Tax 8,896 8,171 11,261 12,344 7,948 7,911 9,645 15,986 40,671 41,490 Effective Tax Rate (%) 44.1 26.6 33.1 24.9 29.9 24.0 26.0 24.6 30.3 25.7 Adjusted PAT (Before MI & AI) 11,277 22,569 22,751 37,137 18,604 25,116 27,452 49,055 93,735 1,20,228 Reported PAT 12,148 22,305 20,416 34,182 14,726 25,273 25,875 42,511 89,051 1,08,384 Change (%) 36.1 22.6 37.0 7.9 21.2 13.3 26.7 24.4 20.8 21.7 Extraordinary Inc/(Exp) 854 4,327 1,436 2,024 185 2,188 1,723 2,370 8,641 6,466 Adjusted PAT 11,294 17,978 18,980 32,158 14,541 23,085 24,152 40,141 80,410 1,01,919 Change (%) 26.5 6.8 26.2 1.5 28.7 28.4 27.2 24.8 11.0 26.7
Siemens Buy CMP INR1,514 | TP: INR1,705 (+13%) EPS CHANGE (%): FY20|21: -|-
Revenue growth to be muted in the quarter. Operating margin expected to contract 150bp YoY owing to adverse mix. Operating profit: +7% YoY (INR3.4b).
Net profit expected to remain flat YoY, as lower tax rates offset margin contraction.
Watch out for operating performance in Automation business.
Quarterly Performance (Standalone)
Y/E September FY19 FY20E
FY19 FY20E 1Q 2Q 3Q 4Q 1QE 2QE 3QE 4QE
Total Revenues 28,071 35,496 31,984 41,288 29,704 38,293 34,936 44,994 1,36,839 1,47,927 Change (%) 15.5 8.1 4.1 4.8 5.8 7.9 9.2 9.0 7.5 8.1 EBITDA 3,661 4,257 3,537 4,056 3,405 4,283 4,018 5,293 15,511 16,999 Change (%) 34.4 31.9 17.0 -3.1 -7.0 0.6 13.6 30.5 17.9 9.6 As % of Revenues 13.0 12.0 11.1 9.8 11.5 11.2 11.5 11.8 11.3 11.5 Depreciation 532 571 512 558 560 565 565 569 2,173 2,259 Interest 2 24 2 86 0 25 0 89 114 114 Other Income 877 830 825 941 1,000 1,075 1,150 1,177 3,473 4,402 Extra-ordinary Items -596 -157 0 354 0 0 0 0 -399 0 PBT 4,004 4,492 3,848 4,353 3,845 4,768 4,603 5,813 16,697 19,029 Tax 1,128 1,532 1,367 1,401 968 1,200 1,159 1,463 5,428 4,790 Effective Tax Rate (%) 28.2 34.1 35.5 32.2 25.2 25.2 25.2 25.2 32.5 25.2 Reported PAT 2,280 2,803 2,481 3,306 2,877 3,568 3,445 4,350 10,870 14,239 Adjusted PAT 2,876 2,960 2,481 2,952 2,877 3,568 3,445 4,350 11,269 14,239 Change (%) 51.0 34.7 21.4 5.7 0.0 20.5 38.8 47.4 26.1 26.4

January 2020 63
December 2019 Results Preview | Sector: Capital Goods
Thermax Neutral CMP INR 1,098 | TP: INR1,170 (+6%) EPS CHANGE (%): FY20|21: -|- Revenue: Flat growth in Energy and Environment
segment. High base effect of revenue in 3QFY19.
Energy/Environment/Chemicals (+30%/23%/23%) Adj. PAT expected to grow 30% YoY aided by lower tax
rate. Outlook on demand environment in domestic and
overseas markets.
Quarterly Performance (INR m)
Y/E March FY19 FY20 FY19 FY20 1Q 2Q 3Q 4Q 1Q 2Q 3QE 4QE
Sales 10,353 14,276 14,366 20,737 13,925 16,059 14,440 21,271 59,732 65,695 Change (%) 18.7 38.2 28.6 43.7 34.5 12.5 0.5 2.6 33.8 10.0 EBITDA 693 1,100 1,073 1,708 991 1,303 1,144 1,818 4,574 5,256 Change (%) -3.9 15.6 12.4 23.6 42.9 18.4 6.5 6.4 14.1 14.9 As of % Sales 6.7 7.7 7.5 8.2 7.1 8.1 7.9 8.5 7.7 8.0 Depreciation 210 235 230 247 262 281 270 276 920 1,089 Interest 33 39 36 35 44 38 45 38 143 165 Other Income 310 356 313 520 216 220 305 682 1,499 1,423 Extra-ordinary Items 6 64 99 26 0 0 0 0 195 0 PBT 761 1,183 1,121 1,946 901 1,204 1,134 2,186 5,010 5,424 Tax 274 498 463 699 273 947 285 556 1,940 2,061 Effective Tax Rate (%) 36.0 42.1 41.3 35.9 30.3 78.7 25.2 25.4 38.7 38.0 Share of Profit /Loss from JV/Minority 3 -3 -7 -4 0 0 -3 -8 (11) (11) Reported PAT 496 745 751 1,269 628 257 845 1,622 3,254 3,352 Change (%) 22.1 31.1 28.1 67.7 26.6 (65.5) 12.6 27.9 40.8 3.0 Adj PAT 490 682 652 1,243 628 257 845 1,622 3,059 3,352 Change (%) 20.6 19.9 11.2 64.2 28.2 (62.3) 29.7 30.5 32.4 9.6
Voltas Buy CMP INR660 | TP: INR785 (+19%) EPS CHANGE (%): FY20|21: -|- Revenue: UCP (+15% YoY) /EMP (+5% YoY on high base). Op profit (+18% YoY), Op Margins +60bp YoY. Lower losses from Beko JV and lower interest cost to lead
to adj. PAT growth of 34% YoY. Watch out for UCP segment outlook for 2HFY20, Inventory
level in channel, and sustainability of EMPS profits.
Quarterly Performance Y/E March FY19 FY20E FY19 FY20E 1Q 2Q 3Q 4Q 1Q 2Q 3QE 4QE
Sales 21,481 14,214 14,918 20,628 26,540 14,219 16,165 23,257 71,241 80,180 Change (%) 10.5 37.1 8.5 0.7 23.6 0.0 8.4 12.7 11.2 12.5 EBITDA 2,432 1,085 1,157 1,443 2,912 1,059 1,364 2,951 6,117 8,286 Change (%) 16.7 26.7 -2.5 -43.0 19.7 -2.5 18.0 104.5 -7.7 35.5 As of % Sales 11.3 7.6 7.8 7.0 11.0 7.4 8.4 12.7 8.6 10.3 Depreciation 59 60 62 59 77 80 80 79 240 317 Interest 27 64 132 106 44 49 50 57 330 200 Other Income 282 461 548 572 433 726 570 571 1,863 2,300 Extra-ordinary Items 0 0 -118 0 -301 -43
-118 -344
PBT 2,627 1,423 1,393 1,849 2,923 1,612 1,804 3,386 7,292 9,725 Tax 762 331 304 239 1,046 448 454 861 1,635 2,809 Effective Tax Rate (%) 29.0 23.2 20.1 12.9 32.4 27.1 25.2 25.4 22.1 27.9 Share of profit of associates/JV's (26) (58) (279) (215) (225) (100) (110) (225) (578) (660) Reported PAT 1,839 1,035 809 1,396 1,652 1,064 1,240 2,300 5,079 6,256 Change (%) -0.9 8.5 -19.4 -27.5 -10.2 2.9 53.3 64.7 -11.3 23.2 Adj PAT 1,839 1,035 927 1,396 1,953 1,107 1,240 2,300 5,197 6,600 Change (%) 0.2 8.5 -7.7 -28.1 6.2 7.0 33.8 64.7 -9.1 27.0

January 2020 64
December 2019 Results Preview | Sector: Cement
Prices down in south and east, but healthy in north/central-India Lower costs to cushion margins
No significant demand pick-up post festive season We expect companies under our coverage to report 1% YoY volume growth in 3QFY20 due to weak demand in October and November on account of weak construction activity (from unseasonal rains, low government spending and liquidity constraints). Demand has however improved in December supporting overall volume growth in the quarter. We expect volumes to increase by 2% YoY for ACC, 5% YoY for Ambuja, flat for UltraTech and 5% YoY for SRCM. South-based TRCL is estimated to deliver volume growth of 6% YoY, while ICEM’s volumes are expected to decline 5% YoY. We expect industry growth of 1-2% YoY in 3QFY20 and 1% YoY in FY20. Major price rollback in south/east/west, marginal in north/central All-India cement prices declined ~3% QoQ in 3QFY20, led by east and west regions (-5% QoQ each). Prices in south were down ~3% QoQ due to a decline of 9% in AP/Telangana and 1-2% in other southern states. Demand in AP/Telangana remains weak – both regions attempted hikes of INR50-70/bag in Sep and Nov’19, which failed to sustain.
Prices in west were down 5% QoQ in the quarter, led by Maharashtra (down ~6% QoQ due to weak demand amidst state election) and Gujarat (down 3% QoQ). North and central regions appear relatively well placed with prices down by only 1% QoQ (up ~10% YoY). Demand in north has been marginally better (up ~3-4% YoY), which along with strong production discipline, has helped sustain prices. Expect decline in fuel costs, operating leverage benefits Cost pressures subsided in 3QFY20 as domestic petcoke prices declined 18% YoY to INR7,569/t. Cost of imported coal (adjusted for exchange rate) was down 15% YoY in the quarter. However, cost of imported coal started rising from Oct’19 as a result of which it is higher by 14% QoQ. Companies typically hold fuel inventory for 2-3 months, and we expect them to report savings in power & fuel costs in subsequent quarters due to the recent correction in fuel prices. While diesel prices increased 1% QoQ, we expect a reduction in freight cost due to railway discounts and lower freight rates.
As highlighted in our previous report (Link), on a sequential basis, players in north/central-India (Ambuja, Shree Cement, JK Cement and UltraTech) are likely to report relatively low margin contraction than those in South/East (India Cement, Ramco, Dalmia Bharat and Orient Cement – expect margin contraction of INR70-100/t due to huge price erosion).
Cement Company name
ACC
Ambuja Cements
Birla Corporation
Dalmia Bharat
Grasim Industries
India Cements
J K Cement
Ramco Cement
Shree Cement
UltraTech Cement
Amit Murarka - Research analyst ([email protected]) +91 22 7199 2309 Pradnya Ganar – Research analyst ([email protected]); +91 22 6129 1537

January 2020 65
December 2019 Results Preview | Sector: Cement
Top picks: UTCEM, ACC and JKCE We prefer companies with higher exposure to the north as this region is likely to witness a maximum improvement in capacity utilization over the next two years. We are positive on UltraTech (UTCEM) as its market mix has improved (post acquisition), with the north/central-India contributing ~45% to volumes. We also like ACC, which is on capex growth mode and expected to deliver better profitability. In our view, JKCE is strategically well placed to benefit from the utilization improvement in the north due to limited supply addition. The company’s capacity expansion, which will likely be completed by FY20, will reduce the proportion of inefficient assets, in our view.
Exhibit 20: Summary of expected quarterly performance Sector CMP SALES (INR M) EBDITA (INR M) NET PROFIT (INR M)
(INR) RECO Dec-19 Var % YoY
Var % QoQ Dec-19 Var
% YoY Var
% QoQ Dec-19 Var % YoY
Var % QoQ
Cement ACC 1,493 Buy 40,516 4.0 14.9 5,957 22.3 7.1 3,302 43.6 10.1 Ambuja Cements 205 Neutral 31,120 8.7 18.5 5,687 40.8 29.3 3,550 36.8 51.3 Birla Corporation 629 Buy 16,643 6.9 2.3 3,157 52.4 1.2 903 230.0 2.2 Dalmia Bharat 819 Buy 22,633 4.6 1.2 4,463 17.5 -6.0 -249 PL PL Grasim Industries 767 Neutral 46,797 -11.6 -2.5 6,913 -34.3 4.8 3,465 -43.0 -34.2 India Cements 77 Neutral 12,585 -4.4 1.0 1,351 0.2 -8.2 -37 PL PL J K Cements 1,218 Buy 13,863 8.9 10.5 2,872 36.4 13.1 1,186 94.7 9.0 Ramco Cements 769 Neutral 13,194 9.3 0.5 2,536 20.2 -13.0 1,213 20.0 -27.9 Shree Cement 21,222 Neutral 29,589 6.4 5.6 8,991 30.3 6.5 3,497 16.1 13.1 Ultratech Cement 4,243 Buy 107,713 3.1 12.0 21,723 36.2 13.3 7,617 86.9 31.6 Sector Aggregate 334,652 2.0 7.8 63,649 18.5 7.9 24,445 20.6 4.0
Exhibit 21: Expect MOFSL Universe volumes to grow by 1% YoY to 64mt in 3QFY20
Source: Company, MOFSL
44 51 49 43 46 55 53 48 55 63 63 57 63 73 63 56 64
10.3
21.3
8.6 2.4 3.7
8.0 7.8 12.7
20.4 13.3
18.3 18.7 14.8 16.4
0.1 (1.1) 1.1
3QFY
16
4QFY
16
1QFY
17
2QFY
17
3QFY
17
4QFY
17
1QFY
18
2QFY
18
3QFY
18
4QFY
18
1QFY
19
2QFY
19
3QFY
19
4QFY
19
1QFY
20
2QFY
20
3QFY
20
Aggregate Vol (m ton) Volume growth (%)

January 2020 66
December 2019 Results Preview | Sector: Cement
Exhibit 22: Pan-India 3QFY20 average cement prices (INR/bag) down 3% QoQ
Source: Company, MOFSL
Exhibit 23: Diesel prices down 5% YoY in 3QFY20
Source: Company, MOFSL
Exhibit 24: Petcoke prices down 18% YoY in 3QFY20
Source: Company, MOFSL
Exhibit 25: MOFSL coverage realization to decrease 3% QoQ in 3QFY20
Source: Company, MOFSL
Exhibit 26: Profitability to decrease by ~INR44/ton QoQ in 3QFY20 led by lower realizations partially offset by better cost
Source: Company, MOFSL
345
329
325
323
313
329
331
325
321
323
321
324
352
328
329
324
319
331
365
363
357
375
363
367
345
340
346
364
363
351
335
324
329
359
360
341
South East West North Central All India
2QFY19 3QFY19 4QFY19 1QFY20 2QFY20 3QFY20
61.4 66.3 69.5 73.0 72.0 68.0 67.7 68.2 68.6
11% 13% 25% 24%
17%
3% -3% -7% -5%
3QFY
18
4QFY
18
1QFY
19
2QFY
19
3QFY
19
4QFY
19
1QFY
20
2QFY
20
3QFY
20
Diesel price (INR/ltr) YoY growth in Diesel prices
7,00
0
8,00
0
8,25
0
9,15
0
9,48
0
9,18
3
8,95
0
9,22
4
8,22
1
7,56
9
17% 25% 31%
40% 35%
15% 8% 1%
-13% -18%
2QFY
18
3QFY
18
4QFY
18
1QFY
19
2QFY
19
3QFY
19
4QFY
19
1QFY
20
2QFY
20
3QFY
20
Retail petcoke prices (INR/tonne)YoY growth in Retail petcoke prices
4,42
5
4,23
0
4,40
2
4,50
8
4,43
1
4,35
6
4,68
2
4,66
5
4,59
1
4,63
9
4,62
3
4,66
6
4,59
1
4,66
2
5,11
2
4,92
0
4,75
3
3QFY
16
4QFY
16
1QFY
17
2QFY
17
3QFY
17
4QFY
17
1QFY
18
2QFY
18
3QFY
18
4QFY
18
1QFY
19
2QFY
19
3QFY
19
4QFY
19
1QFY
20
2QFY
20
3QFY
20
Realization (Rs/ton)
743
850
978
894
795
789
1,01
3
892
850
895
850
725
717
905
1,24
1
978
934
3QFY
16
4QFY
16
1QFY
17
2QFY
17
3QFY
17
4QFY
17
1QFY
18
2QFY
18
3QFY
18
4QFY
18
1QFY
19
2QFY
19
3QFY
19
4QFY
19
1QFY
20
2QFY
20
3QFY
20
Aggregate EBITDA (Rs/ton)

January 2020 67
December 2019 Results Preview | Sector: Cement
Exhibit 27: Relative performance—3 months (%)
Exhibit 28: Relative performance—1 year (%)
Source: Bloomberg, MOFSL
Exhibit 29: Key operating parameters
Volume (m ton) Realization (INR/ton) EBITDA (INR/ton) 3QFY20 YoY (%) QoQ (%) 3QFY20 YoY (INR) QoQ (INR) 3QFY20 YoY (INR) QoQ (INR) ACC 7.7 2.1 18.9 4689 117 -170 778 129 -86 Ambuja 6.4 4.8 22.9 4724 214 -163 885 226 44 UltraTech Cement 21.8 -0.4 16.4 4951 171 -196 999 269 -28 Birla Corporation 3.3 4.0 4.3 4710 157 -100 946 300 -30 India Cements 2.8 -5.0 5.4 4478 28 -193 481 25 -71 Shree Cement 6.2 4.5 8.4 4514 200 -140 1418 352 -35 Dalmia Bharat 4.7 5.0 5.0 4822 -19 -180 951 101 -112 J K Cement 2.6 2.5 14.4 5413 315 -191 1121 278 -14 JK Lakshmi Cement 2.4 2.0 14.1 4381 325 -160 629 202 -93 The Ramco Cements 2.9 6.0 6.9 4528 136 -180 885 101 -92 Orient Cement 1.4 -10.0 9.4 3950 168 -200 311 60 -121 Prism Johnson 1.4 -5.0 12.0 4421 30 -80 634 -69 20 Sanghi Industries 0.5 -24.0 11.6 4383 376 -145 761 277 -58 Sector Agg. 64 1.1 13 4,753 161 (168) 934 216 (44)
Exhibit 30: Cement: Valuation summary CMP EPS (INR) PE (x) PB (x) RoE (%) Company Name INR Reco FY20E FY21E FY22E FY20E FY21E FY22E FY20E FY21E FY22E FY20E FY21E FY22E Cement 27.7 22.7 18.6 2.4 2.2 2.0 8.6 9.7 10.9 ACC 1,493 Buy 75.5 79.3 88.5 19.8 18.8 16.9 2.4 2.2 2.0 12.7 12.0 12.1 Ambuja Cements 205 Neutral 7.2 7.6 8.1 28.5 27.1 25.2 1.8 1.8 1.7 6.6 6.6 6.8 Birla Corporation 629 Buy 61.1 70.1 83.4 10.3 9.0 7.5 1.0 0.9 0.8 10.0 10.6 11.5 Dalmia Bharat 819 Buy 14.0 19.2 37.6 58.5 42.6 21.8 1.5 1.4 1.4 2.5 3.4 6.4 Grasim Industries 767 Neutral 41.3 53.8 67.1 18.5 14.3 11.4 1.2 1.1 1.1 4.3 4.0 3.8 India Cements 77 Neutral 3.8 4.1 5.8 20.2 18.9 13.3 0.4 0.4 0.4 2.2 2.3 3.3 J K Cements 1,218 Buy 64.2 69.1 86.5 19.0 17.6 14.1 3.0 2.6 2.2 17.0 15.9 17.2 JK Lakshmi Cem. 304 Buy 20.0 23.2 28.8 15.2 13.1 10.5 2.1 1.8 1.5 14.5 14.8 15.8 Ramco Cements 769 Neutral 28.1 29.8 34.1 27.4 25.8 22.6 3.6 3.2 2.8 13.9 13.1 13.3 Shree Cement 21,222 Neutral 453.7 569.5 695.5 46.8 37.3 30.5 5.7 5.1 4.5 14.3 14.5 15.6 Ultratech Cement 4,243 Buy 138.4 181.8 224.5 30.6 23.3 18.9 3.1 2.8 2.5 11.3 13.3 14.5
99
102
105
108
Sep-
19
Oct
-19
Nov
-19
Dec-
19
Nifty Index MOSL Cement Index
80
90
100
110
120
Dec-
18
Jan-
19
Feb-
19
Mar
-19
Apr-
19
May
-19
Jun-
19
Jul-1
9
Aug-
19
Sep-
19
Oct
-19
Nov
-19
Dec-
19
Nifty Index MOSL Cement Index

January 2020 68
December 2019 Results Preview | Sector: Cement
The tables below provide a snapshot of actual and estimated numbers for companies under the MOFSL coverage universe. Highlighted columns indicate the quarter/financial year under review.
ACC Buy CMP INR1493 | TP: INR1780 (+19%) EPS CHANGE (%): FY20|21: +1|-3 Dispatches to rise 2% YoY to 7.66mt in 4QCY19. Lower prices in south/east to impact realizations. EBITDA/t estimated at INR778 (-INR86 QoQ). Update on capacity expansion a key monitorable.
Quarterly Performance (Standalone)
(INR Million) Y/E December CY18 CY19 CY18 CY19E 1Q 2Q 3Q 4Q 1Q 2Q 3Q 4QE Cement Sales (m ton) 7.11 7.24 6.54 7.50 7.50 7.20 6.44 7.66 28.37 28.80 YoY Change (%) 7.7 7.4 9.7 8.4 5.5 -0.6 -1.5 2.1 8.2 1.5 Cement Realization 4,536 4,761 4,680 4,572 4,609 5,130 4,860 4,689 4,643 4,826 YoY Change (%) 6.4 5.6 0.7 2.1 1.6 7.7 3.8 2.6 3.3 4.0
QoQ Change (%) 1.3 5.0 -1.7 -2.3 0.8 11.3 -5.3 -3.5 Net Sales 36,246 38,483 34,332 38,954 39,191 41,497 35,276 40,516 148,014 156,480 YoY Change (%) 14.2 11.5 10.2 11.5 8.1 7.8 2.7 4.0 11.4 5.7 Total Expenditure 31,335 32,244 29,906 34,082 33,882 33,680 29,713 34,559 127,567 131,834 EBITDA 4,911 6,239 4,426 4,871 5,309 7,817 5,563 5,957 20,446 24,646 Margins (%) 13.5 16.2 12.9 12.5 13.5 18.8 15.8 14.7 13.8 15.8 Depreciation 1,474 1,481 1,499 1,543 1,467 1,460 1,504 1,501 5,996 5,931 Interest 193 275 201 223 209 199 163 180 892 750 Other Income 468 316 313 288 1,525 519 508 518 1,385 3,070 PBT before EO Item 3,712 4,798 3,040 3,394 5,159 6,677 4,405 4,794 14,943 21,035 EO Income/(Expense) 0 0 0 5,006 0 0 0 0 5,006 0 PBT after EO Item 3,712 4,798 3,040 8,400 5,159 6,677 4,405 4,794 19,949 21,035 Tax 1,261 1,543 984 1,095 1,774 2,164 1,406 1,492 4,883 6,836 Rate (%) 34.0 32.2 32.4 13.0 34.4 32.4 31.9 31.1 24.5 32.5 Reported PAT 2,451 3,255 2,056 7,305 3,384 4,513 3,000 3,302 15,066 14,199 Adjusted PAT 2,451 3,255 2,056 2,298 3,384 4,513 3,000 3,302 10,060 14,199 Margins (%) 6.8 8.5 6.0 5.9 8.6 10.9 8.5 8.1 6.8 9.1 YoY Change (%) 15.9 1.2 15.7 12.4 38.1 38.6 45.9 43.6 9.9 41.1
Ambuja Cements Neutral CMP INR205 | TP: INR220 (+7%) EPS CHANGE (%): FY20|21: 0|6 Dispatches to increase by 5% YoY to 6.43mt in 4QCY19. Weak pricing in east should impact realizations. Lower fuel costs and fixed cost absorption to aid margins Update on capacity expansion a key monitorable.
Quarterly Performance (S/A)
(INR Million) Y/E December CY18 CY19 CY18 CY19E 1Q 2Q 3Q 4Q 1Q 2Q 3Q 4QE Sales Volume (m ton) 6.25 6.39 5.49 6.13 6.37 5.82 5.23 6.43 24.26 23.85
YoY Change (%) 3.5 5.3 8.9 4.4 1.9 -8.9 -4.7 4.8 5.6 -1.7 Realization (INR/ton) 4,421 4,581 4,594 4,511 4,469 5,003 4,887 4,724 4,525 4,760
YoY Change (%) 5.4 -1.5 1.5 1.4 1.1 9.2 6.4 4.7 1.4 5.2 QoQ Change (%) -0.7 3.6 0.3 -1.8 -0.9 11.9 -2.3 -3.3
Net Sales 28,626 30,169 26,139 28,633 29,276 29,783 26,261 31,120 1,13,568 1,16,440 YoY Change (%) 11.7 5.4 12.7 5.6 2.3 -1.3 0.5 8.7 8.6 2.5
EBITDA 5,071 6,223 3,582 4,039 4,633 6,984 4,398 5,687 18,915 21,702 Margins (%) 17.7 20.6 13.7 14.1 15.8 23.4 16.7 18.3 16.7 18.6
Depreciation 1,393 1,364 1,360 1,365 1,314 1,309 1,329 1,351 5,481 5,303 Interest 257 192 192 182 175 208 216 202 823 800 Other Income 507 1,911 482 491 2,402 580 628 634 3,391 4,243 PBT before EO Item 3,928 6,578 2,512 2,983 5,546 6,047 3,481 4,768 16,002 19,842 Extraordinary Inc/(Exp) 0 0 0 2,779 0 0 0 0 2,779 0 PBT after EO Exp/(Inc) 3,928 6,578 2,512 5,762 5,546 6,047 3,481 4,768 18,781 19,842
Tax Rate (%) 30.8 24.1 28.9 6.7 23.0 31.9 32.6 25.6 20.8 28.0 Reported Profit 2,718 4,993 1,786 5,374 4,270 4,121 2,346 3,550 14,870 14,286 Adj PAT 2,718 4,993 1,786 2,594 4,270 4,121 2,346 3,550 12,091 14,286
YoY Change (%) 10.2 27.3 -34.4 -23.3 57.1 -17.5 31.4 36.8 -3.2 18.2 E: MOFSL Estimates

January 2020 69
December 2019 Results Preview | Sector: Cement
Birla Corporation Buy CMP INR629 | TP: INR825 (+31%) EPS CHANGE (%): FY20|21: +5|+3 Consolidated cement volumes to rise 4% YoY to 3.34mt. Better prices in north and central to be offset by weaker
prices in east. Expect blended EBITDA/t at INR946 (-INR30/t QoQ). Watch out for update on capacity expansion/timelines.
Consolidated Performance
(INR Million)
Y/E March FY19 FY20 FY19 FY20E 1Q 2Q 3Q 4Q 1Q 2Q 3QE 4QE Cement Sales (m ton) 3.52 3.07 3.21 3.85 3.64 3.20 3.34 4.02 13.65 14.20 YoY Change (%) 7.3 15.7 5.9 13.2 3.5 4.3 4.0 4.4 10.1 4.0 Cement Realization 4,499 4,538 4,553 4,625 4,954 4,810 4,710 4,743 4,554 4,804 YoY Change (%) -7.4 3.8 4.3 1.3 10.1 6.0 3.4 2.5 0.3 5.5
QoQ Change (%) -1.5 0.9 0.3 1.6 7.1 -2.9 -2.1 0.7 Net Sales 16,545 14,646 15,569 18,728 18,838 16,269 16,643 19,999 65,487 71,749 YoY Change (%) 13.4 18.5 12.1 13.4 13.9 11.1 6.9 6.8 14.2 9.6 Total Expenditure 14,081 12,790 13,498 15,632 14,992 13,148 13,486 15,872 56,001 57,497 EBITDA 2,464 1,856 2,071 3,095 3,847 3,121 3,157 4,127 9,486 14,251 Margins (%) 14.9 12.7 13.3 16.5 20.4 19.2 19.0 20.6 14.5 19.9 Depreciation 857 870 836 829 862 879 866 860 3,391 3,468 Interest 952 935 922 896 960 1,030 1,050 1,089 3,705 4,129 Other Income 232 203 106 244 169 199 170 163 785 700 Profit before Tax 887 253 419 1,615 2,192 1,411 1,411 2,341 3,174 7,354 EO Income/(Expense) 0 0 0 0 0 0 0 0 0 0 Profit before Tax after EO 887 253 419 1,615 2,192 1,411 1,411 2,341 3,174 7,354 Tax 49 91 146 333 786 527 508 826 617 2,648 Rate (%) 5.5 35.7 34.7 20.6 35.9 37.4 36.0 35.3 19.4 36.0 Reported PAT 838 163 274 1,282 1,406 883 903 1,514 2,557 4,707 Adj. PAT 838 163 274 1,282 1,406 883 903 1,514 2,557 4,707 YoY Change (%) 50.5 1,015.8 -225.3 -2.2 67.7 442.3 230.0 18.1 53.6 84.1 E: MOFSL Estimates
Dalmia Bharat Buy CMP INR819 | TP: INR1025 (+25%) EPS CHANGE (%): FY20|21: -15|-23 Estimate volumes at 4.69mt (+5% YoY). Pricing pressure in south/east. Expect EBITDA/t at INR950 (-INR112 QoQ). Watch out for south market update/capacity expansion.
Quarterly Performance (Consolidated)
(INR Million) Y/E March FY19 FY20 FY19 FY20E 1Q 2Q 3Q 4Q 1Q 2Q 3QE 4QE
Sales Dispatches (m ton) 4.51 4.13 4.47 5.57 4.55 4.47 4.69 5.95 18.68 19.66 YoY Change (%) 13.0 13.5 7.7 7.5 0.9 8.2 5.0 6.7 10.1 5.2 Realization (INR/ton) 5,251 5,082 4,841 5,102 5,576 5,002 4,822 4,864 5,077 5,050
YoY Change (%) 2.5 0.8 -2.9 0.6 6.2 -1.6 -0.4 -4.7 0.3 -0.5 QoQ Change (%) 3.5 -3.2 -4.7 5.4 9.3 -10.3 -3.6 0.9
Net Sales 23,680 20,990 21,640 28,420 25,370 22,360 22,633 28,918 94,840 99,282 YoY Change (%) 15.9 14.3 4.6 8.1 7.1 6.5 4.6 1.8 10.5 4.7 EBITDA 5,240 3,900 3,800 6,490 6,660 4,750 4,463 6,518 19,420 22,391 Margins (%) 22.1 18.6 17.6 22.8 26.3 21.2 19.7 22.5 20.5 22.6 Depreciation 3,050 3,030 3,320 3,560 3,420 4,060 4,100 4,372 12,960 15,952 Interest 1,620 2,250 720 920 1,160 1,030 1,000 1,075 5,510 4,265 Other Income 430 740 640 630 440 490 400 470 2,440 1,800 PBT after EO Expense 1,000 -640 400 2,640 2,520 150 -237 1,541 3,390 3,974 Tax Rate (%) 46.0 104.7 22.5 0.4 39.7 -140.0 20.0 6.0 -2.9 21.0 Reported PAT (pre minority) 540 30 310 2,630 1,520 360 -189 1,449 3,490 3,139 Minority + associate 0 40 30 350 50 90 60 210 410 410 PAT Adj for EO items 540 -10 280 2,280 1,470 270 -249 1,239 3,080 2,729 YoY Change (%) -25.0 -105.4 -47.2 78.1 172.1 -2,883.5 -189.1 -45.7 5.5 -11.4 E: MOFSL Estimates;

January 2020 70
December 2019 Results Preview | Sector: Cement
Grasim Industries Neutral CMP INR766 | TP: INR775 (+1%) EPS CHANGE (%): FY20|21: -16|-19 Estimate 6% YoY increase in VSF sales. Chemical biz to witness volume decline of 2% YoY. Expect EBITDA margin at 14.8% (-5pp YoY, +1pp QoQ). Watch out for outlook on VSF business/ future capacities.
Quarterly Perf. (S/A)
(INR Million)
Y/E March FY19 FY20 FY19 FY20E (Standalone) 1Q 2Q 3Q 4Q 1Q 2Q 3QE 4QE Net Sales 47,892 51,185 52,929 53,523 50,006 47,974 46,797 54,454 205,504 199,232 YoY Change (%) 74.8 26.8 20.9 16.2 4.4 -6.3 -11.6 1.7 30.2 -3.1 EBITDA 10,542 10,705 10,526 8,986 8,437 6,593 6,913 8,091 40,712 30,034 Margins (%) 22.0 20.9 19.9 16.8 16.9 13.7 14.8 14.9 19.8 15.1 Depreciation 1,827 1,874 1,928 1,974 2,032 2,085 2,100 2,148 7,604 8,365 Interest 588 522 413 468 780 861 900 1,067 1,991 3,608 Other Income 1,217 2,818 585 1,013 847 2,862 900 992 5,680 5,601 PBT before EO Items 9,343 11,127 8,770 7,557 6,471 6,510 4,813 5,869 36,797 23,663 Extraordinary Inc/(Exp) 0 -20,034 0 -847 -2,902 0 0 0 -23,680 -2,902 PBT after EO Items 9,343 -8,906 8,770 6,710 3,570 6,510 4,813 5,869 13,117 20,761 Tax 2,918 2,960 2,689 2,198 1,553 1,245 1,348 1,096 7,964 5,241 Rate (%) 31.2 -33.2 30.7 32.8 43.5 19.1 28.0 18.7 60.7 25.2 Reported PAT 6,426 -11,867 6,082 4,512 2,017 5,265 3,465 4,773 5,153 15,520 Adj. PAT 6,426 8,167 6,082 5,359 4,919 5,265 3,465 4,773 28,833 18,422 Margins (%) 13.4 16.0 11.5 10.0 9.8 11.0 7.4 8.8 14.0 9.2 YoY Change (%) 85.1 30.0 28.3 -9.4 -23.5 -35.5 -43.0 -10.9 41.9 -36.1 E: MOFSL Estimates
India Cement Neutral CMP INR77 | TP: INR80 (+4%) EPS CHANGE (%): FY20|21: -15|-28 Expect volumes to decline 5% YoY to 2.81mt. Pricing weakness witnessed in the south. Estimate blended EBITDA/t at INR481 (-INR71 QoQ). Demand visibility and pricing outlook in south India.
Quarterly Performance (Standalone)
(INR Million)
Y/E March FY19 FY20 FY19 FY20E 1Q 2Q 3Q 4Q 1Q 2Q 3QE 4QE
Sales Dispatches (m ton) 3.08 3.08 2.96 3.33 3.04 2.67 2.81 3.36 12.44 11.88 YoY Change (%) 16 14 9 8 -1 -13 -5 1 11.4 -4.5 Realization (INR/ton) 4,425 4,508 4,450 4,697 4,828 4,671 4,478 4,492 4,524 4,615
YoY Change (%) -8.9 -4.0 0.0 3.8 9.1 3.6 0.6 -4.4 -2.2 2.0 QoQ Change (%) -2.2 1.9 -1.3 5.5 2.8 -3.3 -4.1 0.3
Net Sales 13,607 13,871 13,163 15,640 14,688 12,457 12,585 15,097 56,280 54,826 YoY Change (%) 5.5 9.4 8.5 11.9 7.9 -10.2 -4.4 -3.5 8.9 -2.6 EBITDA 1,561 1,548 1,349 1,922 2,420 1,472 1,351 1,928 6,379 7,170 Margins (%) 11.5 11.2 10.2 12.3 16.5 11.8 10.7 12.8 11.3 13.1 Depreciation 616 617 632 648 599 613 620 641 2,513 2,473 Interest 733 954 728 827 799 816 820 858 3,242 3,294 Other Income 55 38 43 174 32 32 35 110 310 210 PBT before EO expense 267 14 31 622 1,054 75 -54 539 934 1,613 Extra-Ord expense 0 0 0 0 0 0 0 0 PBT 267 14 31 622 1,054 75 -54 539 934 1,613 Tax 57 0 0 183 331 -13 -17 134 240 435 Rate (%) 21.2 0.0 0.0 29.5 31.5 -16.7 32.0 24.8 25.7 27.0 Reported PAT 210 14 31 439 722 87 -37 405 694 1,177 Adj PAT 210 14 31 439 722 87 -37 405 694 1,177 YoY Change (%) -20.5 -94.0 -79.5 24.3 243.5 509.8 -218.3 -7.6 -31.0 69.5 Margins (%) 1.5 0.1 0.2 2.8 4.9 0.7 -0.3 2.7 1.2 2.1 E: MOFSL Estimates

January 2020 71
December 2019 Results Preview | Sector: Cement
JK Cement Buy CMP INR1,218 | TP: INR1,430 (+17%) EPS CHANGE (%): FY20|21: +7|+7 Estimate volumes (grey + white) to grow 2.5% YoY. Estimate decline in realizations at 3.4% QoQ. Expect EBITDA/t at INR1,121 (-INR14 QoQ). Watch out for update on capacity expansion.
Quarterly Performance (Standalone)
(INR M)
Y/E March FY19 FY20 FY19 FY20E
1Q 2Q 3Q 4Q 1Q 2Q 3QE 4QE
Sales Dispatches (m ton) 2.32 2.16 2.50 2.88 2.31 2.24 2.56 3.06 9.88 10.17 YoY Change (%) 8.9 -2.9 7.5 5.8 -0.3 3.6 2.5 6.5 5.1 3.0 Realization (INR/ton) 4,819 5,096 5,098 5,182 5,753 5,604 5,413 5,328 5,044 5,507
YoY Change (%) -1.7 2.3 5.2 7.1 19.4 10.0 6.2 2.8 3.2 9.2 QoQ Change (%) -0.4 5.8 0.0 1.7 11.0 -2.6 -3.4 -1.6
Net Sales 11,156 11,006 12,732 14,919 13,280 12,542 13,863 16,328 49,813 56,012 YoY Change (%) 7.1 -0.6 13.1 13.4 19.0 14.0 8.9 9.4 8.5 12.4 Total Expenditure 9,652 9,309 10,627 12,124 10,245 10,002 10,991 12,527 41,712 43,765 EBITDA 1,504 1,698 2,105 2,795 3,035 2,540 2,872 3,800 8,101 12,248 Margins (%) 13.5 15.4 16.5 18.7 22.9 20.3 20.7 23.3 16.3 21.9 Depreciation 474 487 486 497 494 518 648 770 1,944 2,429 Interest 547 583 564 533 534 561 700 819 2,221 2,614 Other Income 158 180 118 349 172 180 170 298 799 820 PBT before EO expense 640 808 1,173 2,114 2,179 1,641 1,694 2,510 4,736 8,025 PBT 640 808 1,173 2,114 2,179 1,641 1,694 2,510 4,736 8,025 Tax 147 161 564 614 641 553 508 786 1,487 2,488 Rate (%) 22.9 20.0 48.1 29.1 29.4 33.7 30.0 31.3 31.4 31.0 Reported PAT 493 647 609 1,500 1,538 1,088 1,186 1,725 3,249 5,537 Adj PAT 493 647 609 1,500 1,538 1,088 1,186 1,725 3,249 5,537 YoY Change (%) -37.8 -25.9 -16.6 42.5 211.8 68.2 94.7 15.0 -5.8 70.4 E: MOFSL Estimates
The Ramco Cements Neutral CMP INR769 | TP: INR800 (+4%) EPS CHANGE (%): FY20|21: -1|-8.5 Estimate volumes to increase 6% YoY to 2.91mt. Weaker pricing in south/east to impact margin. Expect EBITDA/t at INR885 (-INR92 QoQ). Watch out for cement pricing in south/expansion update.
Quarterly Performance
(INR Million)
Y/E March FY19 FY20 FY19 FY20E 1Q 2Q 3Q 4Q 1Q 2Q 3QE 4QE
Sales Dispatches (m ton) 2.61 2.47 2.75 3.29 2.70 2.72 2.91 3.43 11.12 11.77 YoY Change (%) 21.6 14.7 20.8 20.2 3.4 10.3 6.0 4.3 19.5 5.8 Realization (INR/ton) 4,537 4,622 4,392 4,640 4,989 4,708 4,528 4,609 4,549 4,699
YoY Change (%) -1.5 -3.4 -4.7 1.5 10.0 1.8 3.1 -0.7 -1.9 3.3 QoQ Change (%) -0.8 1.9 -5.0 5.6 7.5 -5.6 -3.8 1.8
Net Sales 12,046 11,806 12,074 15,293 13,698 13,129 13,194 15,848 51,220 55,869 YoY Change (%) 18.5 11.0 14.6 22.2 13.7 11.2 9.3 3.6 16.8 9.1 EBITDA 2,350 2,442 2,110 3,220 3,452 2,915 2,536 3,606 10,123 12,510 Margins (%) 19.5 20.7 17.5 21.1 25.2 22.2 19.2 22.8 19.8 22.4 Depreciation 735 728 756 767 758 765 825 850 2,985 3,199 Interest 114 131 135 128 135 147 160 359 509 802 Other Income 202 88 96 142 223 129 110 100 527 562 PBT before EO expense 1,703 1,671 1,315 2,467 2,782 2,132 1,661 2,497 7,156 9,071 Extra-Ord expense 0 0 0 30 0 0 0 0 30 0 PBT 1,703 1,671 1,315 2,437 2,782 2,132 1,661 2,497 7,126 9,071 Tax 453 527 304 783 862 450 448 689 2,004 2,449 Rate (%) 26.6 31.5 23.1 32.1 31.0 21.1 27.0 27.6 28.1 27.0 Reported PAT 1,250 1,145 1,011 1,654 1,920 1,682 1,213 1,808 5,122 6,622 Adj PAT 1,250 1,145 1,011 1,684 1,920 1,682 1,213 1,808 5,152 6,622 YoY Change (%) -19.8 -28.8 -8.4 22.5 53.6 46.9 20.0 7.4 -8.7 28.5 Margins (%) 10.4 9.7 8.4 11.0 14.0 12.8 9.2 11.4 10.1 11.9

January 2020 72
December 2019 Results Preview | Sector: Cement
Shree Cement Neutral CMP INR21,222 | TP: INR22,360 (+5%) EPS CHANGE (%): FY20|21: +6|-3 Estimate 3QFY20 cement volumes to increase 4.5% YoY. Better pricing in north offset by weaker prices in east. Expect power EBITDA at ~INR200m (-65%). Watch out for update on various project expansions.
Quarterly Performance (S/A)
(INR Million)
FY19 FY20 FY19 FY20E Y/E March 1Q 2Q 3Q 4Q 1Q 2Q 3QE 4QE
Sales Dispat. (m ton) 6.99 5.64 5.93 7.30 6.06 5.72 6.20 7.82 25.86 25.80 YoY Change (%) 18.7 15.6 11.4 13.3 -13.3 1.4 4.5 7.1 14.8 -0.2 Cement Realization (INR/Ton) 4,107 4,267 4,315 4,225 4,703 4,654 4,514 4,582 4,237 4,610
YoY Change (%) -0.9 2.3 4.7 1.6 14.5 9.1 4.6 8.4 1.0 8.8 QoQ Change (%) -1.2 3.9 1.1 -2.1 11.3 -1.0 -3.0 1.5
Net Sales 30,699 25,866 27,806 32,849 30,364 28,017 29,589 37,547 117,599 125,517 YoY Change (%) 21.0 21.0 21.1 16.9 -1.1 8.3 6.4 14.3 18.9 6.7 Total Expenditure 24,247 19,829 20,906 24,370 21,342 19,576 20,598 25,133 89,731 86,648 EBITDA 6,452 6,037 6,901 8,478 9,022 8,442 8,991 12,415 27,868 38,869 Margins (%) 21.0 23.3 24.8 25.8 29.7 30.1 30.4 33.1 23.7 31.0 Depreciation 3,055 3,295 3,361 4,206 4,027 4,283 4,350 4,381 13,917 17,041 Interest 1,262 1,458 393 697 680 717 680 643 3,810 2,721 Other Income 936 514 553 451 511 578 580 485 2,454 2,154 PBT before EO Exp 3,071 1,798 3,700 4,026 4,826 4,018 4,541 7,875 12,596 21,261 Extra-Ord Expense 0 1,781 0 0 0 0 0 0 1,781 0 PBT 3,071 17 3,700 4,026 4,826 4,018 4,541 7,875 10,814 21,261 Tax 276 -476 687 817 1,196 928 1,044 1,722 2,177 4,890
Rate (%) 9.0 -2,784.8 18.6 20.3 24.8 23.1 23.0 21.9 12.1 23.0 Reported PAT 2,795 493 3,013 3,210 3,630 3,091 3,497 6,154 9,510 16,371 Adj PAT 2,795 2,275 3,013 3,210 3,630 3,091 3,497 6,154 11,292 16,371 YoY Change (%) -36.5 7.5 -9.6 -19.6 29.9 35.9 16.1 91.7 -18.4 45.0 E:MOFSL Estimates
UltraTech Cement Buy CMP INR4,243 | TP: INR5,120 (+21%) EPS CHANGE (%): FY20|21: -4|-4 Estimate 3QFY20 grey cement volumes to remain flat YoY. Realizations expected to decline 3.8% QoQ. Better cost curve should limit margin decline to INR28/t. Watch out for update on acquisitions and expansion.
Quarterly Performance (Consol.) (INR million) FY19 FY20 FY19 FY20E 1Q 2Q 3Q 4Q 1Q 2Q 3QE 4QE Sales (m ton) 19.78 18.88 21.85 25.52 21.42 18.69 21.76 26.20 86.03 88.07 YoY Change (%) 39.0 34.6 29.4 31.2 8.3 -1.0 -0.4 2.7 33.2 2.4 Blended Realn.(INR/ton) * 4,826 4,899 4,780 4,848 5,324 5,147 4,951 5,007 4,837 5,100 YoY Change (%) -3.1 -1.7 -4.0 -2.7 10.3 5.1 3.6 3.3 0.9 5.4 QoQ Change (%) -3.1 1.5 -2.4 1.4 10.1 -3.3 -3.8 1.1 Net Sales 95,449 92,493 1,04,439 1,23,712 1,14,049 96,204 1,07,713 1,31,190 4,16,090 4,49,156 YoY Change (%) 32.6 33.3 30.2 33.2 19.5 4.0 3.1 6.0 34.3 7.9 EBITDA 17,887 14,212 15,945 25,395 29,499 19,180 21,723 30,946 73,437 1,01,348 Margins (%) 18.7 15.4 15.3 20.5 25.9 19.9 20.2 23.6 17.6 22.6 Depreciation 5,477 6,240 6,379 6,365 6,884 6,684 6,871 6,932 24,468 27,371 Interest 3,786 4,164 4,779 5,043 5,029 5,071 4,999 4,998 17,779 20,097 Other Income 793 1,428 1,125 1,331 1,342 1,537 1,517 1,496 4,678 5,891 PBT before EO expense 9,417 5,236 5,912 15,318 18,928 8,962 11,369 20,513 35,869 59,771 Extra-Ord expense 1,139 0 0 0 0 62 0 0 1,139 62 PBT after EO Expense 8,278 5,236 5,912 15,318 18,928 8,900 11,369 20,513 34,731 59,710 Tax 2,430 1,678 1,862 4,625 6,118 3,113 3,752 6,843 10,754 19,825 Rate (%) 29.4 32.0 31.5 30.2 32.3 35.0 33.0 33.4 31.0 33.2 Reported PAT 5,848 3,558 4,050 10,693 12,810 5,787 7,617 13,670 23,976 39,884 Minority Interest 10 11 26 -14 1 3 0 6 37 10 Adj PAT 5,859 3,569 4,076 10,679 12,811 5,790 7,617 13,676 24,013 39,894 YoY Change (%) -34.8 -15.8 -10.7 40.3 118.7 62.2 86.9 28.1 8.1 66.1 E: MOFSL Estimates

January 2020 73
December 2019 Results Preview | Sector: Consumer
Persistent volume woes lead to weak earnings outlook Rural growth continues to lag urban after earlier sustained outperformance
Weakest EBITDA growth since the quarter before GST implementation After eight quarters of continued outperformance, 2QFY20 witnessed rural growth slipping below urban growth, and the trend is likely to continue in 3QFY20 as well. Impact of floods persisted in the early part of 3QFY20 with liquidity concerns and weak rural demand. Also, the weak demand environment saw a rise in competitive intensity in the form of promotions and price-offs. This means that benefits of low material costs is now not expected to be as high as it would have been in a more favorable operating environment. On the other hand, ad-spends and new launches are expected to remain lower than usual as companies await signs of revival. Aggregate sales for 3QFY20 are likely to grow at 5.7% YoY while EBITDA growth is likely to come in at 7.5%, the lowest since 1QFY18, when demand fell off a cliff in the last month leading up to GST implementation. PAT growth is expected to be higher at 16.9%, mainly due to the assumption of lower rates post the corporate tax cuts announced in Sep’19. HUVR’s sales growth for 3QFY20 is expected at ~4.3% YoY (with 4% volume growth) while EBITDA growth is forecasted at 9.3% YoY. Boosted by low other income in the base quarter, HUVR’s PAT growth is expected to be up 14.5% YoY. We expect ITC to report 3% cigarette volume growth, driving sales growth of 5.6% YoY and EBITDA growth of 5.7% YoY; its PAT should grow 22.9%, aided by the corporate tax cuts. Tepid operating performance for the quarter is expected from most others, including Britannia, Colgate (expect decline in EBITDA due to higher adspends), Dabur, Emami, GCPL, MRCO, PGHH, Page, and UNSP. We expect UBBL to see a likely YoY decline in EBITDA and PAT. Nestle is expected to report double-digit sales growth and over 20% EBITDA and PAT growth. Tata Global is likely to have outstanding results with high single-digit sales growth, 35.8% EBITDA growth and 56.3% PAT growth.
Commodity costs are largely benign, agri inflation increasing moderately For 3QFY20, PFAD prices grew 33.8% YoY (29.2% sequential growth), while Mentha prices were down 23.4% YoY. Moderate YoY inflation is being witnessed in Wheat/Sugar at 8.6%/4.8%. Barley costs were up 10.9% YoY for the quarter. Tio2 costs declined 6% YoY and were down 3% sequentially. VAM YTD costs declined sharply YoY by 17.4%. After double-digit deflation in 1HFY20, Copra costs grew 3.5% YoY in Oct-Nov’19 while HDPE costs declined 29.3% YoY; Safflower was up 6.0% YoY and LLP costs were down 18.0% YoY.
Preference for quality and longevity of growth Our framework for earnings visibility, longevity of growth and quality management drives our choices in the consumer universe. However, relatively weak earnings growth outlook compared to the past and fair valuations have led to two stocks (BRIT and MRCO) getting downgraded from BUY to Neutral at the end of 2QFY20. We continue to prefer HUVR as our large-cap pick, particularly after taking into account the benefits of the GSKCH merger; it trades cheaper than peer multiples at 42.2xFY21 EPS. CLGT is our mid-cap pick due to its new and aggressive management at the helm, aiming to drive strong volume growth than what was witnessed in recent years.
Consumer
Asian Paints
Britannia Industries
Colgate
Dabur
Emami
Godrej Consumer
GSK Consumer
Hindustan Unilever
ITC
Jyothy Labs
Marico
Nestle India
Page Industries
Pidilite Industries
P&GHH
United Breweries
United Spirits
Research analyst: Krishnan Sambamoorthy ([email protected]); +91 22 6129 1545 Pooja Doshi ([email protected]); +91 22 5036 2689 | Dhairya Dhruv ([email protected]); +91 22 6129 1547

January 2020 74
December 2019 Results Preview | Sector: Consumer
Exhibit 31: Muted overall performance likely in 3QFY20 Sector CMP SALES (INR M) EBDITA (INR M) NET PROFIT (INR M)
(INR) RECO Dec-19 Var % YoY
Var % QoQ Dec-19 Var
% YoY Var
% QoQ Dec-19 Var % YoY
Var % QoQ
Consumer Asian Paints 1,790 Sell 54,528 3.0 8.0 11,288 8.2 18.2 6,989 8.0 -17.3 Britannia 3,053 Neutral 30,698 8.0 0.7 4,757 5.3 -3.3 3,467 15.3 -14.2 Colgate 1,460 Buy 11,602 5.5 -5.0 2,997 -4.7 -7.2 1,920 -0.1 -21.4 Dabur 460 Neutral 22,762 3.5 2.9 4,701 5.5 -4.0 3,719 1.6 -14.5 Emami 312 Buy 8,312 2.5 25.9 2,737 2.6 41.8 2,205 5.7 36.0 Godrej Consumer 684 Neutral 28,308 4.0 7.6 6,550 6.3 13.6 4,346 4.1 4.1 GSK Consumer 8,386 Neutral 12,732 14.0 -5.3 2,808 17.7 -29.0 2,887 38.4 -16.4 Hind. Unilever 1,938 Buy 99,704 4.3 1.2 22,364 9.3 -8.5 16,048 14.5 -12.4 ITC 240 Neutral 118,614 5.6 -0.1 45,703 5.7 0.2 39,427 22.9 -2.0 Jyothy Labs 151 Neutral 4,908 13.0 5.7 885 23.3 11.9 563 16.3 5.8 Marico 337 Neutral 18,424 -1.0 0.7 3,528 1.1 -0.1 2,364 -4.4 -6.6 Nestle 14,725 Neutral 32,651 12.7 1.5 7,725 25.9 1.7 5,408 33.5 -10.4 P&G Hygiene 11,321 Neutral 9,081 11.0 6.6 1,981 3.6 8.7 1,479 19.2 8.1 Page Industries 23,589 Neutral 7,679 4.0 -1.0 1,643 -0.6 10.2 1,128 10.7 -1.5 Pidilite Inds. 1,399 Neutral 19,037 3.0 5.4 3,754 11.5 1.9 2,613 19.8 -24.5 Tata Global 324 Buy 20,925 9.4 14.1 2,664 35.8 13.5 1,552 56.3 11.5 United Breweries 1,282 Neutral 15,818 9.0 0.2 2,230 -10.0 15.9 1,019 -6.6 -11.5 United Spirits 594 Buy 26,842 7.5 16.9 3,716 3.8 -10.6 2,405 13.1 7.1 Sector Aggregate 542,622 5.7 3.3 132,033 7.5 0.3 99,539 16.9 -6.9
Exhibit 32: Expect subdued 3QFY20 volume growth Quarter Ending 3QFY17 4QFY17 1QFY18 2QFY18 3QFY18 4QFY18 1QFY19 2QFY19 3QFY19 4QFY19 1QFY20 2QFY20 3QFY20E Asian Paints (Dom Deco) 2.0 10.0 4.0 9.0 6.0 10.0 10.0 11.0 21.0 10.0 16.0 14.0 3.0 Britannia (Biscuits) 2.0 2.0 2.0 5.0 11.0 11.0 11.0 11.0 7.0 7.0 3.0 3.0 4.0 Colgate (Toothpaste) (12.0) (3.0) (5.0) (0.9) 12.0 4.0 4.0 7.0 7.0 5.0 4.0 4.0 5.0 Dabur (5.0) 2.4 (4.4) 7.2 13.0 7.7 21.0 8.1 12.4 4.3 9.6 4.8 3.0 Emami 0.2 (1.5) (18.0) 10.0 6.0 8.0 18.0 (4.0) 3.5 0.0 0.0 1.0 (2.0) GSK Consumer (17.0) (1.0) 0.0 2.5 15.0 8.0 12.0 10.0 8.0 6.5 4.0 3.6 9.0 Hindustan Unilever (4.0) 4.0 0.0 4.0 11.0 11.0 12.0 10.0 10.0 7.0 5.0 5.0 4.0 ITC (cigarette) (1.0) 0.0 1.0 (6.0) (3.0) (2.0) 1.0 6.0 7.0 8.0 3.0 2.5 3.0 Marico Domestic (4.0) 10.0 (9.0) 8.0 9.4 1.0 12.4 6.0 5.0 8.0 6.0 1.0 (0.3) Pidilite (1.5) 7.0 0.0 15.0 23.0 13.0 20.2 11.0 13.0 4.0 6.0 (1.0) (3.0)
Source: Company, MOFSL
Exhibit 33: Relative performance – 3m (%)
Exhibit 34: Relative performance – 1Yr (%)
Source: Bloomberg, MOFSL
96
99
102
105
108
Sep-
19
Oct
-19
Nov
-19
Dec-
19
Nifty Index MOSL Consumer Index
90
97
104
111
118
Dec-
18
Jan-
19
Feb-
19
Mar
-19
Apr-
19
May
-19
Jun-
19
Jul-1
9
Aug-
19
Sep-
19
Oct
-19
Nov
-19
Dec-
19
Nifty Index MOSL Consumer Index

January 2020 75
December 2019 Results Preview | Sector: Consumer
Exhibit 35: Crude down 7.6% YoY in 3QFY20; up 1.1% QoQ
Exhibit 36: TiO2 down 6% YoY in 3QFY20; down 3% QoQ
Source: Bloomberg, MOFSL
Exhibit 37: VAM down 17.4% YoY YTD and 1.5% QoQ till Oct 2019
Exhibit 38: Copra (till Nov’19) up 3.5% YoY; up 1% QoQ
Source: Bloomberg, MOFSL
Exhibit 39: HDPE (till Nov 2019) down 29.3% YoY; 7% QoQ
Exhibit 40: LLP (till Nov 2019) down 18% YoY; 1.3% QoQ
Source: Bloomberg, MOFSL
Exhibit 41: PFAD up 33.8% YoY and 29.2% QoQ
Source: Bloomberg, MOFSL
Exhibit 42: Palm Oil up 28.8% YoY; up 22.6% QoQ
Source: Bloomberg, MOFSL
0.0
25.0
50.0
75.0
100.0
Dec-
14
May
-15
Oct
-15
Mar
-16
Aug-
16
Jan-
17
Jun-
17
Nov
-17
Apr-
18
Sep-
18
Feb-
19
Jul-1
9
Dec-
19
Brent Crude Index
250
150
190
230
270
310
Dec-
14
Apr-
15
Aug-
15
Dec-
15
Apr-
16
Aug-
16
Dec-
16
Apr-
17
Aug-
17
Dec-
17
Apr-
18
Aug-
18
Dec-
18
Apr-
19
Aug-
19
Dec-
19
TiO2 price (INR/kg)
1,163
923 700
900
1,100
1,300
1,500
Oct
-14
Feb-
15Ju
n-15
Oct
-15
Feb-
16Ju
n-16
Oct
-16
Feb-
17Ju
n-17
Oct
-17
Feb-
18Ju
n-18
Oct
-18
Feb-
19Ju
n-19
Oct
-19
VAM prices (USD/MT)
0
4,000
8,000
12,000
16,000
Nov
-14
Mar
-15
Jul-1
5N
ov-1
5M
ar-1
6Ju
l-16
Nov
-16
Mar
-17
Jul-1
7N
ov-1
7M
ar-1
8Ju
l-18
Nov
-18
Mar
-19
Jul-1
9N
ov-1
9
Copra Calicut/Kozhikode
80
95
110
125
140
Nov
-14
Mar
-15
Jul-1
5N
ov-1
5M
ar-1
6Ju
l-16
Nov
-16
Mar
-17
Jul-1
7N
ov-1
7M
ar-1
8Ju
l-18
Nov
-18
Mar
-19
Jul-1
9N
ov-1
9
HDPE (INR/Kg)
20
35
50
65
80
Nov
-14
Mar
-15
Jul-1
5
Nov
-15
Mar
-16
Jul-1
6
Nov
-16
Mar
-17
Jul-1
7
Nov
-17
Mar
-18
Jul-1
8
Nov
-18
Mar
-19
Jul-1
9
Nov
-19
Liquid Paraffin (INR/Lt)
15,000
24,000
33,000
42,000
51,000
Dec-
14Ap
r-15
Aug-
15De
c-15
Apr-
16Au
g-16
Dec-
16Ap
r-17
Aug-
17De
c-17
Apr-
18Au
g-18
Dec-
18Ap
r-19
Aug-
19De
c-19
Palm Fatty Acid price (INR/MT)
2,994
1,000
1,800
2,600
3,400
4,200
Dec-
14Ap
r-15
Aug-
15De
c-15
Apr-
16Au
g-16
Dec-
16Ap
r-17
Aug-
17De
c-17
Apr-
18Au
g-18
Dec-
18Ap
r-19
Aug-
19De
c-19
Palm Oil (Malaysian Ringgit Per Metric Tonne)

January 2020 76
December 2019 Results Preview | Sector: Consumer
Exhibit 43: Mentha down 23.4% YoY; flat QoQ
Source: Bloomberg, MOFSL
Exhibit 44: Molasses WPI remains up YoY
Source: Bloomberg, MOFSL
Exhibit 45: Wheat up 8.6% YoY; 6.3% QoQ
Source: Bloomberg, MOFSL
Exhibit 46: Sugar up 4.8% YoY and down 0.2% QoQ
Source: Bloomberg, MOFSL
Exhibit 47: Comparative valuation CMP EPS (INR) PE (x) PB (x) RoE (%) Company Name INR Reco FY20E FY21E FY22E FY20E FY21E FY22E FY20E FY21E FY22E FY20E FY21E FY22E Consumer 40.9 36.4 31.9 11.8 10.5 9.6 28.8 28.7 30.2 Asian Paints 1,790 Sell 29.1 31.6 36.8 61.5 56.6 48.6 16.1 14.5 13.2 27.6 26.9 28.3 Britannia 3,053 Neutral 56.7 64.6 74.9 53.8 47.2 40.8 16.1 15.7 15.3 30.9 33.7 38.0 Colgate 1,460 Buy 29.9 36.0 43.1 48.8 40.6 33.9 28.7 31.3 40.2 57.5 73.8 103.9 Dabur 460 Neutral 9.0 10.0 11.4 51.2 45.8 40.3 12.7 11.8 10.5 26.4 26.7 27.5 Emami 312 Buy 13.0 14.7 16.8 24.1 21.2 18.6 6.1 5.9 5.5 26.7 28.2 30.7 Godrej Consumer 684 Neutral 15.5 17.6 20.0 44.1 38.9 34.1 9.1 8.9 8.6 21.2 23.2 25.7 GSK Consumer 8,386 Neutral 290.3 327.6 368.4 28.9 25.6 22.8 7.5 6.6 5.9 27.7 27.5 27.3 Hind. Unilever 1,938 Buy 32.8 39.1 45.0 59.2 49.6 43.1 53.3 52.4 44.4 91.3 106.5 111.7 ITC 240 Neutral 12.6 13.0 14.3 19.1 18.4 16.7 4.7 4.3 4.0 25.5 24.4 25.1 Jyothy Labs 151 Neutral 6.0 7.1 8.2 25.4 21.4 18.4 4.0 3.8 3.5 16.1 18.1 19.8 Marico 337 Neutral 7.5 8.0 9.3 45.2 41.9 36.4 12.0 10.5 9.7 29.0 26.7 27.7 Nestle 14,725 Neutral 214.4 244.7 283.4 68.7 60.2 52.0 65.9 59.8 59.4 70.9 104.2 114.7 P&G Hygiene 11,321 Neutral 151.0 200.3 238.0 75.0 56.5 47.6 34.6 29.1 24.5 49.8 56.0 55.9 Page Industries 23,589 Neutral 388.2 457.6 575.8 60.8 51.6 41.0 29.8 26.7 24.4 49.0 51.8 59.5 Pidilite Inds. 1,399 Neutral 22.1 26.5 30.7 63.4 52.8 45.6 14.4 12.3 10.3 24.7 25.1 24.6 Tata Global 324 Buy 8.9 9.7 11.0 36.3 33.4 29.4 2.7 2.2 2.1 7.5 8.3 7.2 United Breweries 1,282 Neutral 18.0 26.6 31.6 71.4 48.1 40.5 9.4 8.1 7.1 14.0 18.1 18.7 United Spirits 594 Buy 11.7 15.5 22.1 50.9 38.2 26.9 11.3 8.7 6.6 22.3 22.9 24.6
500
1,000
1,500
2,000
2,500
Dec-
14Ap
r-15
Aug-
15
Dec-
15Ap
r-16
Aug-
16De
c-16
Apr-
17Au
g-17
Dec-
17Ap
r-18
Aug-
18De
c-18
Apr-
19
Aug-
19
Dec-
19
Mentha Oil prices INR / kg
1,460 109
0
50
100
150
200
Oct
-14
Feb-
15Ju
n-15
Oct
-15
Feb-
16Ju
n-16
Oct
-16
Feb-
17Ju
n-17
Oct
-17
Feb-
18Ju
n-18
Oct
-18
Feb-
19Ju
n-19
Oct
-19
India WPI Molasses
2,275
900
1,200
1,500
1,800
2,100
2,400
Dec-
14Ap
r-15
Aug-
15
Dec-
15
Apr-
16
Aug-
16
Dec-
16Ap
r-17
Aug-
17
Dec-
17Ap
r-18
Aug-
18
Dec-
18Ap
r-19
Aug-
19
Dec-
19Wheat Prices (INR/Quintal)
3,305
2,000
2,500
3,000
3,500
4,000
Dec-
14
May
-15
Oct
-15
Mar
-16
Aug-
16
Jan-
17
Jun-
17
Nov
-17
Apr-
18
Sep-
18
Feb-
19
Jul-1
9
Dec-
19
Sugar Prices

January 2020 77
December 2019 Results Preview | Sector: Consumer
The tables below provide a snapshot of actual and estimated numbers for companies under the MOFSL coverage universe. Highlighted columns indicate the quarter/financial year under review.
Asian Paints Sell CMP INR1,790 | TP: INR1,598 (-11%) EPS CHANGE (%): FY20|21: +0.8|+0.1 Expect 3% YoY volume growth off a high base. Tio2 prices down 6% YoY in 3QFY20. GM expansion on account of moderate crude inflation. Watch out for demand scenario across urban and rural.
Quarterly Performance (Consol.) (INR Million) Y/E March FY19 FY20 FY19 FY20E 1Q 2Q 3Q 4Q 1Q 2Q 3QE 4QE Est. Dom. Deco. Vol. growth (%) 10.0 11.0 21.0 10.0 16.0 14.0 3.0 14.0 13.0 11.8 Net Sales 43,903 46,155 52,940 50,182 51,047 50,507 54,528 58,110 193,415 214,192
Change (%) 15.1 8.2 24.3 11.9
16.3 9.4 3.0 15.8 15.0 10.7 Raw Material/PM 24,923 27,752 31,250 29,326 28,767 29,072 31,206 33,242 113,423 122,288 Gross Profit 18,980 18,403 21,690 20,856
22,280 21,435 23,322 24,868 79,992 91,904
Gross Margin (%) 43.2 39.9 41.0 41.6 43.6 42.4 42.8 42.8 41.4 42.9 Operating Expenses 9,683 9,956 11,260 12,626
10,701 11,886 12,034 14,865 44,747 49,486
% of Sales 22.1 21.6 21.3 25.2 21.0 23.5 22.1 25.6 23.1 23.1 EBITDA 9,297 8,447 10,430 8,230 11,579 9,548 11,288 10,003 35,245 42,418
Margin (%) 21.2 18.3 19.7 16.4
22.7 18.9 20.7 17.2 18.2 19.8 Change (%) 39.7 5.4 17.0 -2.0
24.5 13.0 8.2 21.5 10.2 20.4
Interest 210 257 148 153 267 259 272 208 510 1,006 Depreciation 1,358 1,436 1,154 1,301
1,918 1,972 2,307 2,893 4,307 9,089
Other Income 617 649 452 569 735 1,052 511 579 2,271 2,877 PBT 8,346 7,402 9,580 7,344 10,131 8,369 9,219 7,482 32,699 35,200 Tax 2,761 2,425 3,263 2,529
3,511 72 2,323 1,662 10,988 7,568
Effective Tax Rate (%) 33.1 32.8 34.1 34.4 34.7 0.9 25.2 22.2 33.6 21.5 Adjusted PAT 5,700 5,057 6,472 4,875 6,742 8,450 6,989 5,751 22,119 27,931
Change (%) 30.1 -3.9 14.1 -1.7 18.3 67.1 8.0 18.0 9.1 26.3 E: MOFSL Estimates; 2Q of both FY19 and FY20 adjusted for IND AS 116
Britannia Industries Neutral CMP INR3,053| TP: INR3,254 (+7%) EPS CHANGE (%): FY20|21: -0.3|-0.8 Expect 4% YoY volume growth in base business in 3Q. GM contraction due to agri. commodity inflation. Near-term vol. growth commentary, especially in rural. RM cost outlook and comment on NCD.
Consol. Quarterly Performance
(INR Million)
Y/E March FY19 FY20 FY19 FY20E 1Q 2Q 3Q 4Q 1Q 2Q 3QE 4QE Base business volume growth (%) 11.0 11.0 7.0 7.0 3.0 3.0 4.0 6.0 9.0 3.9 Net Sales 25,438 28,696 28,424 27,990 27,004 30,488 30,698 30,219 110,547 118,409 YoY change (%) 12.4 12.7 10.7 10.3 6.2 6.2 8.0 8.0 11.5 7.1 Gross Profit 10,175 11,491 11,737 11,531
10,912 12,247 12,444 12,209 44,932 47,812
Margins (%) 40.0 40.0 41.3 41.2
40.4 40.2 40.5 40.4 40.6 40.4 EBITDA 3,894 4,544 4,518 4,366 3,947 4,922 4,757 4,676 17,334 18,302 Margins (%) 15.3 15.8 15.9 15.6
14.6 16.1 15.5 15.5 15.7 15.5
YoY growth (%) 18.5 20.3 13.4 9.9 1.4 8.3 5.3 7.1 15.4 5.6 Depreciation 356 369 424 469
448 449 539 576 1,619 2,011
Interest 24 24 30 13
101 161 197 198 91 657 Other Income 420 440 600 618 675 682 600 622 2,065 2,578 PBT 3,933 4,590 4,664 4,502
4,072 4,994 4,622 4,524 17,689 18,211
Tax 1,352 1,559 1,658 1,557
1,430 955 1,156 1,043 6,125 4,584 Rate (%) 34.4 34.0 35.5 34.6 35.1 19.1 25.0 23.1 34.6 25.2 Adjusted PAT 2,581 3,031 3,007 2,946
2,642 4,038 3,467 3,480 11,564 13,628
YoY change (%) 19.5 16.2 14.1 11.7 2.4 33.2 15.3 18.2 15.2 17.8 E: MOFSL Estimates

January 2020 78
December 2019 Results Preview | Sector: Consumer
Colgate Buy CMP INR1,460 | TP: INR1,859 (+27%) EPS CHANGE (%): FY20|21: -0.6|-4.1 Expect 5% YoY volume growth in toothpaste segment. Modeled EBITDA decline due to high ad-spends in 3Q. Watch out for A&P intensity for toothpaste category. Market share movement to watch out, if disclosed.
Quarterly Performance (INR Million) Y/E March FY19 FY20 FY19 FY20E 1Q 2Q 3Q 4Q 1Q 2Q 3QE 4QE Toothpaste Volume Gr % 4.0 7.0 7.0 5.0 4.0 4.0 5.0 6.5 5.0 4.9 Net Sales (incldg. OOI) 10,413 11,680 10,994 11,538
10,849 12,218 11,602 12,374
44,624 47,042
YoY change (%) 6.5 7.7 6.4 5.7
4.2 4.6 5.5 7.2
6.6 5.4 Gross Profit 6,863 7,565 7,161 7,449 7,145 7,910 7,537 8,040 29,038 30,633
Gross margin (%) 65.9 64.8 65.1 64.6
65.9 64.7 65.0 65.0
65.1 65.1 EBITDA 2,815 3,296 3,145 3,104 2,998 3,230 2,997 3,155 12,360 12,380 Margins (%) 27.0 28.2 28.6 26.9
27.6 26.4 25.8 25.5
27.7 26.3
YoY growth (%) 26.7 9.5 11.2 0.9 6.5 -2.0 -4.7 1.6 11.0 0.2 Depreciation 394 398 406 394
499 504 447 299
1,592 1,748
Financial other Income 92 86 79 120 152 86 79 11 377 328 PBT 2,513 2,984 2,818 2,805
2,674 2,836 2,630 2,834
11,120 10,880
Tax 844 1,020 897 805
937 347 710 745
3,566 2,738 Rate (%) 33.6 34.2 31.8 28.7 35.0 12.2 27.0 26.3 32.1 25.2 Adj PAT 1,669 1,964 1,921 2,000
1,691 2,441 1,920 2,089
7,554 8,141
YoY change (%) 22.4 10.6 12.6 1.7 1.3 24.3 -0.1 4.5 10.9 7.8 E: MOFSL Estimates
Dabur Neutral CMP INR460 | TP: INR443 (-4%) EPS CHANGE (%): FY20|21: -1.2|-1.6 Expect 3% YoY volume growth off a high base Expect GM/EM expansion of 100bp/40bp YoY. Outlook on domestic volume growth and rural demand. Outlook on margin performance in international business.
Quarterly Performance (Consolidated) (INR Million) Y/E March FY19 FY20 FY19 FY20E 1Q 2Q 3Q 4Q 1Q 2Q 3QE 4QE Domestic FMCG vol. growth (%) 21.0 8.1 12.4 4.3 9.6 4.8 3.0 9.0 11.5 7.4 Net sales 20,807 21,250 21,992 21,282
22,733 22,120 22,762 23,903 85,150 91,517
YoY change (%) 16.2 8.5 11.8 4.7
9.3 4.1 3.5 12.3 9.9 7.5 Gross profit 10,321 10,491 10,839 10,589 11,256 11,235 11,446 12,087 42,240 46,024
Margin (%) 49.6 49.4 49.3 49.8 49.5 50.8 50.3 50.6 49.6 50.3 EBITDA 3,861 4,508 4,454 4,572 4,576 4,895 4,701 5,003 17,396 19,175 Margins (%) 18.6 21.2 20.3 21.5
20.1 22.1 20.7 20.9 20.4 21.0
YoY growth (%) 25.0 7.4 10.4 -5.8
18.5 8.6 5.5 9.4 7.6 10.2 Depreciation 427 431 449 462 528 545 538 457 1,769 2,067 Interest 149 156 167 124
153 152 151 117 596 573
Other income 737 812 753 661 733 818 828 849 2,962 3,228 PBT 4,022 4,734 4,591 4,647 4,629 5,016 4,840 5,278 17,993 19,763 Tax 724 961 924 328
834 662 1,113 1,245 2,937 3,854
Rate (%) 18.0 20.3 20.1 7.1 18.0 13.2 23.0 23.6 16.3 19.5 Adjusted PAT 3,292 3,766 3,661 4,307 3,791 4,350 3,719 4,013 15,026 15,873 YoY change (%) 18.1 4.1 10.2 8.7 15.2 15.5 1.6 -6.8 9.8 5.6 E: MOFSL Estimates

January 2020 79
December 2019 Results Preview | Sector: Consumer
Emami Buy CMP INR312 | TP: INR407 (+30%) EPS CHANGE (%): FY20|21: 0|0 Expect 2% decline in domestic volumes. High promotion despite low RM leads to GM contraction. Vol. growth and broad consumer demand outlook. Update on extent of pledge currently.
Consol. Quarterly performance (INR Million) Y/E MARCH FY19 FY20 FY19 FY20E 1Q 2Q 3Q 4Q
1Q 2Q 3QE 4QE
Domestic volume growth (%) 18.0 -4.0 3.5 0.0
0.0 1.0 -2.0 4.0 4.4 0.8 Net Sales 6,144 6,282 8,109 6,396 6,495 6,601 8,312 7,012 26,929 28,419 YoY change (%) 16.2 0.0 7.1 3.7
5.7 5.1 2.5 9.6 6.4 5.5
Gross Profit 4,071 4,310 5,432 3,889 4,171 4,602 5,695 4,383 17,699 18,850 Gross margin (%) 66.3 68.6 67.0 60.8
64.2 69.7 68.5 62.5 65.7 66.3
EBITDA 1,204 1,873 2,666 1,547 1,350 1,930 2,737 1,729 7,255 7,746 Margins (%) 19.6 29.8 32.9 24.2
20.8 29.2 32.9 24.7 26.9 27.3
YoY change 50.2 -7.0 0.7 -10.7
12.1 3.0 2.6 11.7 0.8 6.8 Depreciation 230 202 178 160 163 178 178 165 768 684 Interest 46 44 62 62
44 93 75 76 214 288
Other Income 50 52 55 173 106 164 105 136 366 512 PBT 980 1,680 2,482 1,498
1,250 1,822 2,590 1,624 6,639 7,286
Tax 103 240 401 280
177 211 388 608 1,060 1,384 Rate (%) 10.5 14.3 16.2 18.7 14.2 11.6 15.0 37.4 16.0 19.0 PAT before Amortization 879 1,440 2,086 1,225
1,080 1,621 2,205 1,010 5,517 5,917
YoY change (%) 45.3 -8.8 -0.9 1.3 22.8 12.6 5.7 -17.5 0.2 7.2 Reported PAT 267 827 1,378 562 393 960 1,597 537 3,032 3,487 E: MOFSL Estimates
Godrej Consumer Neutral CMP INR684 | TP: INR680 (-1%) EPS CHANGE (%): FY20|21: -1.3|-2.3 Mid-single-digit vol. growth in the domestic business. Expect GM/EM expansion of 20bp/50bp YoY in 3QFY20. Outlook on HI business recovery. Dmd outlook in Indonesia; margin improvement in Africa.
Quarterly Performance (Consolidated) (INR Million) Y/E March FY19 FY20 FY19 FY20E 1Q 2Q 3Q 4Q 1Q 2Q 3QE 4QE Net Sales (including OOI) 24,771 26,607 27,219 24,526 23,488 26,302 28,308 27,757 1,03,143 1,05,854 YoY change (%) 13.8 6.1 3.5 -3.1 -5.2 -1.1 4.0 13.2 4.7 2.6 Gross Profit 13,825 14,566 15,310 14,395
13,417 14,884 15,979 15,654 57,600 59,934
Margin (%) 55.8 54.7 56.2 58.7
57.1 56.6 56.4 56.4 55.8 56.6 EBITDA 4,491 5,382 6,162 5,796 4,589 5,765 6,550 6,487 21,176 23,392 Margins (%) 18.1 20.2 22.6 23.6
19.5 21.9 23.1 23.4 20.5 22.1
YoY growth (%) 28.4 -0.8 2.9 -4.2 2.2 7.1 6.3 11.9 2.4 10.5 Depreciation 421 426 427 426 473 477 473 465 1,700 1,889 Interest 477 612 578 575
551 531 642 680 2,243 2,404
Other Income 310 263 227 291
214 266 283 319 1,088 1,082 PBT 3,853 4,607 5,309 5,070 3,746 4,976 5,719 5,660 18,321 20,181 Tax 678 1,015 1,133 1,112
785 805 1,373 1,382 5,461 4,344
Rate (%) 17.6 22.0 21.3 21.9 21.0 16.2 24.0 24.4 29.8 21.5 Adj PAT 3,177 3,594 4,176 3,960 2,963 4,174 4,346 4,274 15,431 15,836 YoY change (%) 36.5 -1.9 -3.4 -6.5 -6.7 16.2 4.1 7.9 7.3 2.6 E: MOFSL Estimate

January 2020 80
December 2019 Results Preview | Sector: Consumer
GSK Consumer Neutral CMP INR8,386 | TP: INR8,509 (+1%) EPS CHANGE (%): FY20|21: 0|0 9% YoY vol. growth in domestic HFD business. Expect moderate GM/ EM expansion of 10bp/70bp YoY. Outlook on HFD vol. growth, market sh. and material cost. Watch out for performance of new brands/extensions.
Quarterly Performance
(INR Million)
Y/E Mar FY19 FY20 FY19 FY20E 1Q 2Q 3Q 4Q 1Q 2Q 3QE 4QE Dom. HFD volume growth (%) 12.8 10.8 8.0 6.5 5.4 3.6 9.0 11.0 8.4 8.0 Net Sales 11,071 12,720 11,168 12,861
11,943 13,451 12,732 15,039
47,820 53,165
YoY Change (%) 12.3 14.4 7.5 9.0
7.9 5.7 14.0 16.9
10.8 11.2 Gross profit 7,703 8,861 7,897 8,998
8,355 9,505 9,015 10,584
33,458 37,459
Margin (%) 69.6 69.7 70.7 70.0 70.0 70.7 70.8 70.4 70.0 70.5 EBITDA 2,303 3,537 2,385 3,185
2,804 3,958 2,808 3,867
11,410 13,438
Margins (%) 20.8 27.8 21.4 24.8
23.5 29.4 22.1 25.7
23.9 25.3 YoY Change (%) 38.0 36.6 14.9 27.4 21.8 11.9 17.7 21.4 29.2 17.8 Depreciation 147 151 158 149
196 203 198 191
605 788
Interest 2 2 2 2
17 18 18 15
8 68 Other Income 607 890 1,051 789 1,109 781 1,061 780 3,186 3,731 PBT 2,761 4,274 3,276 3,823
3,700 4,518 3,654 4,441
13,983 16,313
Tax 1,025 1,467 1,190 1,250
1,337 1,065 767 936
4,896 4,105 Rate (%) 37.1 34.3 36.3 32.7 36.1 23.6 21.0 21.1 35.0 25.2 Adj PAT 1,736 2,807 2,086 2,572
2,363 3,453 2,887 3,504
9,087 12,208
YoY Change (%) 31.3 45.9 27.4 21.4 36.1 23.0 38.4 36.3 29.8 34.3 E: MOFSL Estimates; full year volume growth includes export volumes
Hindustan Unilever Buy CMP INR1,938 | TP: INR2,195 (+13%) EPS CHANGE (%): FY20|21: -1.3|-3.5 Underlying dom. vol. growth of 4% YoY off a high base. Cost-saving initiatives and premiumization to support GM. Outlook on pace of rural growth and demand turnaround. Outlook on competitive intensity in soaps, RM cost.
Quarterly performance (Standalone) (INR Million) Y/E March FY19 FY20 1Q 2Q 3Q 4Q
1Q 2Q 3QE 4QE FY19 FY20E
Domestic volume growth (%) 12.0 10.0 10.0 7.0
5.0 5.0 4.0 7.0 10.0 5.3 Net sales 94,870 92,340 95,580 99,450
1,01,140 98,520 99,704 1,05,919 3,82,240 4,05,283
YoY change (%) 11.2 11.1 11.3 9.3
6.6 6.7 4.3 6.5 10.7 6.0 Gross Profit 51,230 47,990 51,400 52,020
54,660 53,670 54,660 56,438 2,02,640 2,19,429
Margin % 54.0 52.0 53.8 52.3
54.0 54.5 54.8 53.3 53.0 54.1 EBITDA 22,510 20,190 20,460 23,210
26,470 24,430 22,364 26,018 86,370 99,282
YoY change (%) 20.6 20.0 21.8 13.3
17.6 21.0 9.3 12.1 18.7 14.9 Margins (%) 23.7 21.9 21.4 23.3
26.2 24.8 22.4 24.6 22.6 24.5
Depreciation 1,270 1,300 1,330 1,340
2,140 2,370 2,155 1,938 5,240 8,602 Interest 70 70 70 70
240 310 240 170 280 960
Other income 1,350 3,050 1,060 1,180
1,470 1,800 2,014 2,120 6,640 7,404 PBT 22,520 21,870 20,120 22,980
25,560 23,550 21,983 26,031 87,490 97,124
Tax 6,640 6,270 5,060 6,890
8,080 4,600 5,936 7,608 24,860 26,224 Rate (%) 29.5 28.7 25.1 30.0
31.6 19.5 27.0 29.2 28.4 27.0
PAT bei 15,670 15,220 14,010 15,900
17,510 18,320 16,048 18,823 62,630 70,901 YoY change (%) 21.3 23.1 16.9 12.8
11.7 20.4 14.5 18.4 18.2 13.2
Reported Profit 15,290 15,250 14,440 15,380
17,550 18,480 16,048 18,823 60,360 70,901 E: MOFSL Estimates

January 2020 81
December 2019 Results Preview | Sector: Consumer
ITC Neutral CMP INR240 | TP: INR280 (+17%) EPS CHANGE (%): FY20|21: -0.2|+0.4 Expect cigarette volume growth of 3% YoY. Expect cigarette EBIT to grow 9% YoY. Update on any further share loss in capsule cigarettes. Demand outlook for ‘Other-FMCG’ business.
Quarterly Performance
(INR Million)
Y/E March FY19 FY20 FY19 FY20E 1Q 2Q 3Q 4Q 1Q 2Q 3QE 4QE Est. cigarette vol. gr. (%) 1.0 6.0 7.0 8.0 3.0 2.5 3.0 3.5 5.5 3.0 Net Sales 1,08,746 1,12,725 1,12,277 1,19,921
1,15,028 1,18,715 1,18,614 1,27,518 4,49,957 4,79,874
YoY change (%) 9.2 9.3 14.9 13.3
5.8 5.3 5.6 6.3 10.8 6.6 Gross Profit 67,652 69,928 69,272 73,765
73,630 73,898 72,631 77,862 2,68,260 2,90,027
Margin (%) 62.2 62.0 61.7 61.5 64.0 62.2 61.2 61.1 59.6 60.4 EBITDA 42,021 42,060 43,258 45,717 45,657 45,624 45,703 49,729 1,73,294 1,86,712 Growth (%) 12.2 11.8 11.2 10.3
8.7 8.5 5.7 8.8 11.3 7.7
Margins (%) 38.6 37.3 38.5 38.1 39.7 38.4 38.5 39.0 38.5 38.9 Depreciation 2,987 3,275 3,354 3,502
3,589 3,957 3,595 3,178 13,117 14,319
Interest 73 135 56 77
152 133 123 113 580 522 Other Income 4,039 5,041 8,364 7,402 6,202 6,543 6,691 6,298 24,845 25,734 PBT 42,999 43,691 48,212 49,539
48,117 48,077 48,675 52,735 1,84,442 1,97,604
Tax 14,813 14,145 16,121 14,720
16,378 7,846 9,248 10,001 59,798 43,473 Rate (%) 34.4 32.4 33.4 29.7 34.0 16.3 19.0 19.0 32.4 22.0 Adj PAT 28,187 29,547 32,091 34,819
31,739 40,231 39,427 42,734 1,24,643 1,54,131
YoY change (%) 10.1 11.9 14.4 18.7 12.6 36.2 22.9 22.7 15.3 23.7 E: MOFSL estimate; Full year COGS also includes contract processing charges (included in other op. exps. in quarterly)
Jyothy Labs Neutral CMP INR151 | TP: INR169 (+12%) EPS CHANGE (%): FY20|21: -3.8|-6.9 S/A net sales to grow 13% to ~INR4.9b. Soft RM prices to lead to GM expansion. Outlook on demand, especially in south India. Update on launches and performance of HI portfolio.
Standalone Quarterly Performance
(INR Million)
Y/E March FY19 FY20 1Q 2Q 3Q 4Q 1Q 2Q 3QE 4QE FY19 FY20E Net Sales 4,026 4,277 4,343 5,043 4,116 4,642 4,908 5,648 17,689 19,314 YoY change (%) 17.1 7.1 6.3 6.3
2.3 8.5 13.0 12.0 8.8 9.2
Gross Profit 1,892 1,965 1,971 2,243
1,965 2,119 2,301 2,653 8,071 9,037 Margins (%) 47.0 45.9 45.4 44.5
47.7 45.6 46.9 47.0 45.6 46.8
Total Exp 1,310 1,233 1,253 1,417 1,309 1,328 1,416 1,615 5,213 5,669 EBITDA 583 732 718 826 655 791 885 1,038 2,858 3,369
EBITDA growth % 34.2 13.3 5.2 -6.0
12.4 8.1 23.3 25.7 8.2 17.9 Margins (%) 14.5 17.1 16.5 16.4 15.9 17.0 18.0 18.4 16.2 17.4 Depreciation 138 139 140 167
185 188 190 192 583 755
Interest 77 71 67 64
61 59 63 61 278 244 Other Income 49 47 69 114 48 55 73 119 278 295 PBT 417 569 581 709
458 598 704 904 2,275 2,664
Tax 93 116 97 38
61 66 141 181 343 449 Rate (%) 22.3 20.3 16.7 5.4 13.4 11.0 20.0 20.0 15.1 16.8 Adjusted PAT 324 453 484 670
359 532 563 723 1,932 2,178
YoY change (%) 57.5 7.2 29.9 11.1 10.9 17.4 16.3 7.9 20.4 12.7 E: MOFSL Estimates

January 2020 82
December 2019 Results Preview | Sector: Consumer
Marico Neutral CMP INR337 | TP: INR358 (+6%) EPS CHANGE (%): FY20|21: -8.0|-17.1 Weak management commentary leads to low expectation. Benign RM cost with moderate Copra cost to support GM. Comments on vol. growth trends across key categories. Outlook on RM, margin guidance for international seg.
Quarterly Performance (INR Million) Y/E March FY19 FY20 FY19 FY20E 1Q 2Q 3Q 4Q 1Q 2Q 3QE 4QE Domestic volume growth (%) 12.4 6.0 5.0 8.0 6.0 1.0 -0.3 0.9 8.0 1.9 Net Sales 20,270 18,370 18,610 16,090 21,660 18,290 18,424 16,282 73,340 74,656 YoY Change (%) 20.5 19.6 14.6 8.7 6.9 -0.4 -1.0 1.2 16.0 1.8 Gross Profit 8,570 8,090 8,616 7,890 10,290 9,080 8,714 7,208 32,940 35,293
Gross margin (%) 42.3 44.0 46.3 49.0 47.5 49.6 47.3 44.3 44.9 47.3 EBITDA 3,660 3,050 3,489 2,830 4,610 3,530 3,528 2,043 12,810 13,711 Margins (%) 18.1 16.6 18.8 17.6 21.3 19.3 19.2 12.5 17.5 18.4
YoY Change (%) 12.6 17.7 15.8 12.2 26.0 15.7 1.1 -27.8 12.6 7.0 Depreciation 310 310 226 290 350 350 327 309 960 1,336 Interest 90 100 48 80 120 130 91 86 240 427 Other Income 240 290 216 280 280 350 235 278 1,030 1,143 PBT 3,500 2,930 3,431 2,740 4,420 3,400 3,345 1,926 12,640 13,091 Tax 910 780 914 560 1,080 880 937 398 3,160 3,295 Rate (%) 26.0 26.6 26.6 20.4 24.4 25.9 28.0 20.7 25.0 25.2 Adjusted PAT 2,550 2,160 2,473 2,130 3,270 2,530 2,364 1,452 9,300 9,616 YoY Change (%) 9.9 19.1 12.1 18.0 28.2 17.1 -4.4 -31.8 14.2 3.4 E: MOFSL Estimates
Nestle India Neutral CMP INR14,725 | TP: INR14,168 (-4%) EPS CHANGE (%): FY20|21: -0.1|-2.7 Expect robust net sales growth in line with the guidance. GM contraction of 150bp YoY due to RM cost inflation. Vol. gr. and comment on dmd environment to watch out. Response to NPD/variant launches, RM price outlook.
Quarterly performance (INR Million) Y/E December CY18 CY19 CY18 CY19E 1Q 2Q 3Q 4Q 1Q 2Q 3Q 4QE Net Sales 27,572 26,984 29,394 28,973 30,030 30,009 32,158 32,651 112,923 124,847 YoY Change (%) 10.6 12.3 16.9 11.4
8.9 11.2 9.4 12.7
12.8 10.6
Gross Profit 16,296 16,094 17,552 17,078
17,576 17,487 18,508 18,743
67,020 72,314 Margin (%) 59.1 59.6 59.7 58.9
58.5 58.3 57.6 57.4
59.4 57.9
EBITDA 7,119 6,648 7,420 6,137 7,495 7,073 7,595 7,725 27,324 29,887 Margins (%) 25.8 24.6 25.2 21.2
25.0 23.6 23.6 23.7
24.2 23.9
YoY Growth (%) 35.0 44.9 25.6 -4.8 5.3 6.4 2.4 25.9 23.0 9.4 Depreciation 825 817 930 784
780 808 780 967
3,357 3,334
Interest 311 283 275 252
316 299 299 317
1,120 1,231 Other income 564 602 670 752 732 726 564 781 2,589 2,802 PBT 6,547 6,150 6,886 5,854
7,131 6,691 7,080 7,222
25,437 28,124
Tax 2,157 2,003 2,257 1,804
2,381 2,213 1,045 1,814
8,220 7,453 Rate (%) 32.9 32.6 32.8 30.8
33.4 33.1 14.8 25.1
32.3 26.5
Adjusted PAT 4,391 4,147 4,629 4,049 4,750 4,478 6,035 5,408 17,217 20,671 YoY Change (%) 38.7 59.3 32.3 -4.3 8.2 8.0 30.4 33.5 27.5 20.1 E: MOFSL Estimates

January 2020 83
December 2019 Results Preview | Sector: Consumer
Page Industries Neutral CMP INR23,589 | TP: INR24,582 (+4%) EPS CHANGE (%): FY20|21: +0.2|-1.2 Expect flat YoY volume growth in 3Q due to high base. Expect EBITDA margin contraction off a high base. Competition mainly in men and women’s innerwear. Traction in kids wear and overall demand environment.
Quarterly Performance
(INR Million)
Y/E MARCH FY19 FY20 FY19 FY20E
1Q 2Q 3Q 4Q
1Q 2Q 3QE 4QE
Net Sales 8,153 6,908 7,383 6,079 8,350 7,754 7,679 6,594 28,522 30,376 YoY change (%) 17.0 10.4 18.9 -0.1 2.4 12.3 4.0 8.5 11.8 6.5 Gross Profit 4,481 3,994 4,215 3,866 4,598 4,344 4,377 4,194 16,555 17,512
Gross margin (%) 55.0 57.8 57.1 63.6
55.1 56.0 57.0 63.6
58.0 57.7 Other Expenditure 2,588 2,566 2,562 2,669
2,731 2,853 2,734 2,783
10,385 11,102
% to sales 31.7 37.1 34.7 43.9 32.7 36.8 35.6 42.2 36.4 36.5 EBITDA 1,893 1,428 1,653 1,197 1,866 1,490 1,643 1,410 6,170 6,410 Margins (%) 23.2 20.7 22.4 19.7
22.4 19.2 21.4 21.4
21.6 21.1
YoY change 38.0 11.4 28.3 -18.5 -1.4 4.4 -0.6 17.8 14.0 3.9 Depreciation 72 76 82 80 140 147 142 141 311 570 Interest 40 40 41 41
83 81 82 82
161 328
Other Income 72 108 95 87 55 57 85 76 362 273 PBT 1,852 1,420 1,625 1,163
1,699 1,321 1,504 1,263
6,060 5,786
Tax 608 494 606 413
592 175 376 313
2,121 1,456 Rate (%) 32.8 34.8 37.3 35.5
34.8 13.3 25.0 24.8
35.0 25.2
PAT 1,244 926 1,019 750 1,107 1,145 1,128 950 3,939 4,330 YoY change (%) 44.8 10.5 22.2 -20.4 -11.1 23.6 10.7 26.7 13.4 9.9 E: MOFSL Estimates
P&G Hygiene Neutral CMP INR11,321 | TP: INR11,397 (+1%) EPS CHANGE (%): FY20|21: 0|0 Expect net sales of 11% YoY off a high base. EBITDA margin to contract 160bp YoY. Sustenance of growth signs reported in preceding year. A&P spends – key monitorable.
Standalone - Quarterly Earning Model3% -15% -9% 7% -15% -9% (INR Million) Y/E June FY19 FY20 FY19 FY20E 1Q 2Q 3Q 4Q 1Q 2QE 3QE 4QE Net Sales 7,918 8,181 6,993 6,373 8,521 9,081 7,693 7,037 29,465 32,331 YoY Change (%) 20.4 16.2 22.9 21.5 7.6 11.0 10.0 10.4 20.0 9.7 Gross profit 4,766 4,542 4,032 3,776 5,146 5,114 4,494 4,224 17,116 18,979
Margin (%) 60.2 55.5 57.7 59.3 60.4 56.3 58.4 60.0 58.1 58.7 Total Expenditure 5,822 6,268 5,557 5,725 6,700 7,100 6,029 5,875 23,373 25,703 EBITDA 2,096 1,912 1,437 648 1,822 1,981 1,663 1,162 6,093 6,628 Growth 11.8 -9.0 -1.9 -22.8 -13.1 3.6 15.8 79.3 -3.0 8.8 Margins (%) 26.5 23.4 20.5 10.2 21.4 21.8 21.6 16.5 20.7 20.5 Depreciation 121 123 126 128 115 138 141 137 525 531 Interest 4 5 5 40 4 7 7 37 55 55 Other Income 96 117 84 97 110 142 144 118 402 514 PBT 2,066 1,901 1,390 577 1,814 1,977 1,660 1,106 5,830 6,556 Tax 716 660 489 -31 445 498 418 288 1,831 1,650 Rate (%) 34.7 34.7 35.2 -5.4 24.6 25.2 25.2 26.1 31.4 25.2 Adj PAT 1,350 1,241 901 608 1,368 1,479 1,241 817 4,214 4,906 YoY Change (%) 16.8 -5.4 8.3 36.5 1.4 19.2 37.8 34.4 12.5 16.4 Margins (%) 17.1 15.2 12.9 9.5 16.1 16.3 16.1 11.6 14.3 15.2 E: MOFSL Estimates

January 2020 84
December 2019 Results Preview | Sector: Consumer
Pidilite Industries Neutral CMP INR1,399 | TP: INR1,333 (-5%) EPS CHANGE (%): FY20|21: -3.7|-2.3 Expect 3% vol. decline in the dom. Consumer Bazaar seg. Expect GM expansion on the back of tepid VAM prices. Outlook on near-term vol. growth in dom. C&B & RM cost. Outlook for Industrial and Construction Chemical seg.
Consolidated - Quarterly Earning Model (INR Million) Y/E March FY19 FY20 FY19 FY20E 1Q 2Q 3Q 4Q 1Q 2Q 3QE 4QE Net Sales 18,341 17,572 18,483 16,389 20,166 18,066 19,037 17,689 70,785 74,958 YoY change (%) 20.0 14.9 19.8 10.3 10.0 2.8 3.0 7.9 16.5 5.9 Gross Profit 9,267 8,680 8,731 8,241 10,361 9,644 9,564 9,236 34,919 38,805
Margin (%) 50.5 49.4 47.2 50.3 51.4 53.4 50.2 52.2 49.3 51.8 EBITDA 3,817 3,666 3,368 2,788 4,437 3,682 3,754 3,263 13,638 15,137
YoY change (%) 18.9 -2.5 -9.0 1.8 16.3 0.5 11.5 17.1 1.7 11.0 Margins (%) 20.8 20.9 18.2 17.0 22.0 20.4 19.7 18.4 19.3 20.2
Depreciation 301 316 321 390 377 402 417 436 1,327 1,632 Interest 73 60 62 66 73 83 56 60 261 272 Other Income 321 276 307 562 399 558 399 386 1,466 1,741 PBT 3,764 3,566 3,291 2,895 4,385 3,755 3,680 3,154 13,336 14,974 Tax 1,361 1,230 1,110 431 1,444 293 1,067 965 4,132 3,769 Rate (%) 36.1 34.5 33.7 14.9 32.9 7.8 29.0 30.6 31.0 25.2 Adj PAT 2,404 2,336 2,181 2,464 2,941 3,462 2,613 2,189 9,384 11,205 YoY change (%) 6.4 -7.2 -8.0 -0.1
22.4 48.2 19.8 -11.1
-2.4 19.4
Margins (%) 13.1 13.3 11.8 15.0 14.6 19.2 13.7 12.4 13.3 14.9 E: MOFSL Estimates
Tata Global Beverages Buy CMP INR324 | TP: INR371 (+15%) EPS CHANGE (%): FY20|21: +27.3|+58.5 TGB standalone and Tata Coffee consol to drive revenue. Ramp of the newly commenced coffee processing plant. Expect EBITDA margins across businesses to improve.
Consolidated - Qtly Earning Model (INR Million) Y/E March FY19 FY20 FY19 FY20 1Q 2Q 3Q 4Q 1Q 2Q 3QE 4QE Gross Sales 18,026 17,609 19,126 17,755 18,971 18,341 20,925 19,454 72,515 77,691 YoY Change (%) 5.8 4.1 10.5 5.2 5.2 4.2 9.4 9.6 6.4 7.1 Total Expenditure 15,538 15,942 17,164 16,012 16,323 15,994 18,260 17,036 64,656 67,613 EBITDA 2,488 1,667 1,962 1,743 2,648 2,347 2,664 2,419 7,859 10,077 Margins (%) 13.8 9.5 10.3 9.8 14.0 12.8 12.7 12.4 10.8 13.0 Depreciation 295 305 296 329 460 468 460 472 1,225 1,860 Interest 126 115 130 155 182 201 130 130 525 643 Other Income 285 708 226 352 305 253 251 400 1,571 1,210 PBT before EO expense 2,352 1,955 1,762 1,611 2,311 1,931 2,326 2,217 7,681 8,784 Extra-Ord expense -182 -67 0 -84 -81 -15 0 0 -333 -96 PBT 2,534 2,022 1,762 1,695 2,392 1,946 2,326 2,217 8,014 8,880 Tax 835 637 549 588 739 483 581 548 2,609 2,352 Rate (%) 32.9 31.5 31.2 34.7 30.9 24.8 25.0 24.7 32.6 26.5 Minority Interest 119 142 96 131 163.5 147.3 80 109.2 488 500 Profit/Loss of Asso. Cos. -55 589 -124 -578 -74 92 -112 -217 -169 -311 Reported PAT 1,526 1,832 993 398 1,415 1,407 1,552 1,343 4,749 5,717 Adj PAT 1,344 1,765 993 314 1,334 1,392 1,552 1,343 4,416 5,622 YoY Change (%) NA NA -22.0 -48.7 -0.8 -21.1 56.3 328.1 -19.2 27.3 Margins (%) 7.5 10.0 5.2 1.8 7.0 7.6 7.4 6.9 6.1 7.2

January 2020 85
December 2019 Results Preview | Sector: Consumer
United Breweries Neutral CMP INR1,282 | TP: INR1,404 (+10%) EPS CHANGE (%): FY20|21: -0.2|+0.2 Expect 9% YoY revenue growth due to high base. Expect GM contraction due to high barley prices. Watch out for trend in volume and market share. Commentary on cost trend and outlook for RM.
Standalone - Quarterly Earning Model (INR Million) Y/E March
FY19 FY20
1Q 2Q 3Q 4Q 1Q 2Q 3QE 4QE FY19 FY20E Net Sales
18,659 15,260 14,512 16,294 20,485 15,786 15,818 18,170 64,754 70,258
YoY Change (%)
11.2 19.3 21.0 10.7 9.8 3.4 9.0 11.5 15.2 8.5 Gross Profit
10,095 8,485 7,739 8,230 10,314 8,225 8,162 9,267 34,678 35,968
Margin (%)
54.1 55.6 53.3 50.5 50.3 52.1 51.6 51.0 53.6 51.2 Total Expenditure
14,655 12,077 12,033 14,606 17,196 13,861 13,587 -44,316 53,371 60,703
EBITDA
4,004 3,182 2,479 1,712 3,289 1,925 2,230 2,111 11,384 9,555 YoY Change (%)
25.8 43.4 62.4 -17.8 -17.8 -39.5 -10.0 23.3 26 -16.1
Margins (%)
21.5 20.9 17.1 10.5 16.1 12.2 14.1 11.6 17.6 13.6 Depreciation
637 656 665 639 692 689 797 850 2,599 3,008
Interest
92 40 62 118 77 88 95 95 312 313 Other Income
153 37 21 106 32 19 30 30 320 111
PBT
3,428 2,523 1,772 1,062 2,552 1,167 1,368 1,196 8,793 6,345 Tax
1,208 885 681 383 907 16 349 305 3,160 1,593
Rate (%)
35.3 35.1 38.4 36.0 35.5 1.3 25.5 25.5 36 25.1 MI & P/L of Asso. Cos.
0 0 0 0 0 0 0 0 -4 -4
Adj PAT
2,219 1,638 1,092 679 1,645 1,151 1,019 891 5,629 4,748 YoY Change (%)
37.1 74.5 130.4 -25.3 -25.9 -29.7 -6.6 31.2 42.8 -15.7
Margins (%)
11.9 10.7 7.5 4.2 8.0 7.3 6.4 4.9 8.7 6.8 E: MOFSL Estimates
United Spirits Buy CMP INR594 | TP: INR703 (+18%) EPS CHANGE (%): FY20|21: -6.7|-7.1 Expect 5% YoY volume growth in 3QFY20. Expect GM contraction due to high RM cost. Trend in volume growth, premiumization and margins. Outlook for ENA/molasses, price inc. granted by states.
Quarterly Performance (INR Million) Y/E March FY19 FY20 FY19 FY20E (Standalone) 1Q 2Q 3Q 4Q 1Q 2Q 3QE 4QE Volume growth % 1.1 10.3 3.8 1.0 6.0 1.0 5.0 6.5 3.9 4.6 Total revenues 20,088 22,249 24,969 22,500
22,184 22,962 26,842 24,420 89,806 96,408
YoY change (%) 12.7 14.0 10.3 3.5
10.4 3.2 7.5 8.5 9.9 7.4 Gross Profit 10,090 11,175 12,130 10,462
10,497 10,325 12,503 11,408 43,857 44,733
Margin (%) 50.2 50.2 48.6 46.5
47.3 45.0 46.6 46.7 48.8 46.4 EBITDA 2,387 4,429 3,582 2,836 3,971 4,156 3,716 2,868 12,874 14,712 Margins (%) 11.9 19.9 14.3 12.6
17.9 18.1 13.8 11.7 14.3 15.3
EBITDA growth (%) 38.8 61.6 30.7 2.9 66.4 -6.2 3.8 1.1 25.2 14.3 Depreciation 339 350 355 401
500 573 505 517 1,445 2,095
Interest 582 438 575 605 520 452 420 412 2,200 1,804 PBT From operations 1,466 3,641 2,652 1,830
2,951 3,131 2,792 1,939 9,229 10,812
Other income 133 167 533 119 101 137 373 349 952 961 PBT 1,599 3,808 3,185 1,949
3,052 3,268 3,165 2,288 10,181 11,773
Tax 545 1,221 1,059 641
1,065 1,022 760 450 3,416 3,296 Rate (%) 34.1 32.1 33.2 32.9 34.9 31.3 24.0 19.7 33.6 28.0 Adj. PAT 1,054 2,587 2,126 1,308
1,987 2,246 2,405 1,838 6,765 8,477
YoY change (%) 45.6 89.8 43.5 -29.3 88.5 -13.2 13.1 40.5 38.1 25.3 E: MOFSL Estimates; quarterly numbers for FY19 are adjusted for re-grouping impact

January 2020 86
December 2019 Results Preview | Sector: Financials
Corporate Banks to report healthy profitability amidst weak macro NCLT recoveries to aid earnings; watchful of movement in stressed assets
Private Banks: NCLT recoveries bode well for corporate banks; expect PAT growth of 40% YoY: Core profitability continues improving and we estimate private banks to report operating profit growth of ~15% YoY. We thus estimate private banks to deliver PAT growth of 40% YoY, led by stable opex, moderation in credit cost, recoveries in select large NCLT cases (Essar Steel, Ruchi Soya, etc. – refer Exhibit 4) and lower tax outgo. ICICBC is likely to report a 146% YoY increase in net earnings and also healthy NII growth of 20% YoY. Loan growth in retail is expected to stay healthy, while wholesale lending
trends remain muted, reflecting tepid systemic trends. We estimate AXSB/ICICIBC to deliver 14%/13% YoY loan growth, while retail banks like HDFCB reported higher growth of ~20% YoY. IIB is estimated to exhibit loan growth of 19%, partly affected by the slowdown in the auto industry.
Margin trajectory is likely to remain stable/positive as the proportion of high-yielding book continues increasing and cost of fund has been trending down. We thus expect private banks to deliver NII growth of 17% YoY, led by ICICIBC (20% YoY), IIB (30% YoY) and KMB (19% YoY).
Asset quality trends are likely to remain mixed, with HDFCB, ICICIBC and KMB delivering a stable performance. We remain watchful of the progress in stressed accounts for banks like AXSB, IIB and RBL, given high rating downgrades in the system during the quarter.
PSBs’ earnings to reflect weak trends, barring SBIN: We estimate weakness in PSU banks’ earnings, as sluggish loan growth, higher slippages (mainly caused by stressed HFCs) and divergence in GNPLs are likely to keep credit costs elevated. However, lower opex run-rate and higher recoveries from NCLT resolutions are likely to cushion earnings. PSBs are expected to deliver NII growth of 15% YoY and PAT of INR65.5b (36% YoY), mainly led by the strong earnings recovery in SBIN. We expect PSBs’ PPoP growth to remain healthy at ~27% YoY.
Mid-sized private banks to report mixed trends: We expect mid-size private banks’ performance to remain mixed, with FB/DCB reporting 17%/18% YoY growth in net earnings. On the other hand, RBK’s earnings will be impacted by higher credit cost due to its exposure to a few stressed groups. The bank’s PAT is thus expected to decline sharply, though PPoP growth may remain healthy at 30% YoY.
Small finance banks – earnings to remain mixed: We expect AUBANK to report robust PPoP/PAT growth of 68%/91% YoY, led by strong loan growth of 32% YoY. However, Equitas is expected to report modest PPoP/PAT growth of 11%/3% YoY.
Financials – Banks and Insurance
3QFY20 earnings estimate (INR b)
PAT (INR b) 3Q FY20E
YoY (%)
QoQ (%)
Pvt Banks AUBANK 1.82 91.2 6.0
AXSB 17.31 3.0 NM
DCBB 1.02 18.3 11.4
EQUITAS 0.64 2.8 35.0
FB 3.90 17.0 -6.3
HDFCB 70.78 26.7 11.5
ICICIBC 39.45 145.8 502.3
IIB 15.09 53.2 7.7
KMB 16.55 28.2 -4.0
RBK 0.46 -79.6 -15.5
Pvt Total 167.02 39.8 54.7
PSU Banks BOB -5.63 NM NM
INBK -1.20 NM NM
PNB 0.38 -84.4 -92.4
SBIN 71.98 82.0 139.0
PSU Total 65.54 35.8 42.0
Banks Total 232.56 38.6 50.9
Life Insurance HDFCLIFE 2.83 15.2 -8.3
IPRU 3.27 10.1 8.2
Life Total 6.10 12.4 -0.1
Research Analyst: Nitin Aggarwal ([email protected]); +91 22 6129 1542 | Parth Gutka ([email protected]) Alpesh Mehta ([email protected]); Himanshu Taluja ([email protected]); Yash Agarwal ([email protected])

January 2020 87
December 2019 Results Preview | Sector: Financials
Life insurers to report modest earnings growth: HDFCLIFE and IPRU Life are
estimated to report net premium income growth of 22% and 16% YoY, respectively. With a continued focus on the protection business, the margins trajectory will likely remain stable. Overall, we expect PAT growth of 15% for HDFCLIFE and 10% YoY for IPRU.
Other monitorables: Margin trajectory – particularly as CASA growth remains under pressure.
Further, the trajectory of cost of funds will be important as many banks have lowered their interest rates.
Divergence impact – as many banks, especially PSUs, reported an NPL divergence for FY19 and will have to address the gap.
Treasury gains during the quarter and the outlook – as long bond-yields have moderated in recent weeks, helped by the RBI’s OMO operations.
Commentary on build-up of new stress along with the movement in existing stressed assets, rating downgrades and pace of resolution.
Management commentary on the MSME stress building in the system and any stress foreseen in the retail segment. Outlook on the investment cycle – particularly as GDP growth is at multi-year low.
Our top picks – HDFCB, ICICIBC, SBIN and IPRU HDFCB (BUY) Corporate loan growth is picking up and well compensating for the softness in
the retail portfolio (caused by muted growth in the vehicle segment). The bank has been able to maintain margins due to a large proportion of the
book being fixed rate in nature. Also, the robust fee income profile and strong cost control are likely to drive an improvement in the return ratios.
Asset quality remains stable and management has guided for healthy trends as per lead indicators across retail products. The bank has maintained a high coverage ratio on NPL and also built floating provisions.
We believe that strong capitalization and liquidity levels should help HDFCB to sustain growth momentum over the next few years.
HDFCB's operating performance remains strong in a tough environment. We estimate loan book/PAT CAGR of ~19%/25% over FY19-22, led by a continued improvement in operating leverage and a reduction in the tax rate. The stock trades at 3.7x FY21E ABV.
ICICIBC (BUY) ICICIBC’s net stressed loans (excluding NPA) declined to 3.0%, with bulk of the
corporate slippages occurring from the BB & below pool. It has substantially increased the PCR to 76% and also maintains healthy coverage on NCLT accounts, which will insulate earnings as these cases undergo resolution.
Healthy retail mix: (a) A robust liability franchise with an average CASA ratio of 42.2%. (b) Retail contribution to fees at ~74%. (c) Retail loans mix was up at ~62% with an increasing proportion of the high-yielding unsecured book.
ICICIBC is well placed in a challenging macro environment with limited exposure to the newly surfaced stressed names and one of the highest coverage in the banking sector. We estimate RoA/RoE of 1.7%/17.1% in FY22. Adjusted for subsidiaries, the standalone bank trades at 2.3x FY21E ABV.
HDFCB: Financial Snapshot (INR b) Y/E MARCH FY20E FY21E FY22E NII 559.7 662.4 787.0 OP 476.6 571.7 683.4 NP 265.1 344.1 415.5 NIM (%) 4.4 4.4 4.5 EPS (INR) 48.7 63.2 76.3 EPS Gr. (%) 22.8 29.8 20.8 BV/Sh. (INR) 310.6 364.1 430.2 ABV/Sh. (INR) 298.1 349.0 413.8 Ratios RoE (%) 16.7 18.7 19.2 RoA (%) 2.0 2.2 2.2 Payout (%) 24.7 15.2 13.4 Valuations P/E(X) 26.4 20.4 16.9 P/BV (X) 4.1 3.5 3.0 P/ABV (X) 4.3 3.7 3.1 Div. Yield (%) 0.9 0.7 0.8
ICICIBC: Financial Snapshot (INR b) Y/E March FY20E FY21E FY22E
NII 325.8 384.6 455.8
OP 277.0 326.5 390.6
NP 106.2 191.7 233.7
NIM (%) 3.6 3.6 3.7
EPS (INR) 16.5 29.7 36.2
EPS Gr (%) 215.3 80.5 21.9
ABV/Sh (INR) 151.2 174.8 204.8
Cons. BV/Sh (INR) 201.7 234.0 272.3
Ratios RoE (%) 9.8 16.0 17.1
RoA (%) 1.0 1.6 1.7
Valuations P/BV (x) (Cons) 2.7 2.3 2.0
P/ABV (x) 2.6 2.3 1.9
P/E (x) 24.0 13.3 10.9
Div. Yield (%) 1.0 1.2 1.2 *ADJ FOR INVT IN SUBSIDIARIES

January 2020 88
December 2019 Results Preview | Sector: Financials
SBIN (BUY) SBIN is well poised for an earnings recovery, led by its steady operating
performance at the PPoP level, recoveries from large NCLT resolutions, and normalization in credit cost to 1.3%/1.1% in FY21/22.
SBIN inarguably has one of the best liability franchise (CASA mix: 45.1%), which puts it in a better position to manage yield pressure.
Subsidiaries – SBI MF, SBI Life Insurance, SBI Cards and SBI Cap – have exhibited a robust performance over the last few years. The bank plans to monetize several of its subsidiaries, which would lead to further value unlocking.
SBIN is aiming for 0.9%-1% RoA by FY21, while we conservatively expect RoA/RoE to improve to ~1.0%/16.3% by FY22. Adjusted for subsidiaries, the standalone bank trades at 0.9x FY21E ABV.
IPRU (BUY) IPRU Life has taken a strategic call to move toward balanced product categories
and mass affluent customer segments which would help reduce volatility. The company is well positioned to capture a greater pie of the protection
business. This should drive incremental profitability with the share of protection in total APE improving to 14.9% in 2QFY20 from 7.7% in 2QFY19.
Management has guided for continued investments in the protection business which would be a drag on the near-term performance. However, we expect margins to improve on the back of improving operating leverage and persistency ratios.
We estimate VNB CAGR of ~23% over FY19-22 and operating RoEV to sustain at ~17%. We thus estimate the VNB margin to recover to ~24% by FY22 on the back of an improved protection mix. The stock trades at 2.4x FY21E EV.
SBIN: Financial Snapshot (INR b) Y/E March FY20E FY21E FY22E
NII 977.4 1,117.6 1,287.7 OP 672.1 781.8 912.9 NP 218.1 330.3 438.5 NIM (%) 3.0 3.2 3.3 EPS (INR) 24.4 37.0 49.1 EPS Gr. (%) 2,429.8 51.4 32.8 ABV (INR) 201.7 244.2 294 Cons. BV (INR) 271.0 307.3 356 Ratios RoE (%) 10.6 14.2 16.3 RoA (%) 0.6 0.8 1.0 Valuations P/BV (x) (Cons.) 1.3 1.1 1.0 P/ABV (x) 1.1 0.9 0.8 P/E (x) 9.2 6.1 4.6 *Adjusted for Investment in subs
IPRU: Financial Snapshot (INR b) Y/E MARCH FY20E FY21E FY22E Net Premiums 349.1 390.9 444.8 Surplus / Deficit 14.6 14.5 16.2 Sh. holder's PAT 12.2 13.5 15.7 NBP growth unwtd (%) 15.0 17.0 17.0
APE growth - (%) -0.9 20.6 17.0 Tot. Premium growth (%) 14.2 12.0 13.8
VNB margin (%) 21.6 23.2 24.0 RoE (%) 16.6 16.7 17.4 RoEV (%) 16.5 17.3 17.3 Total AUMs (INR b) 2,012 2,405 2,849
VNB (INR b) 15.7 20.3 24.6 EV per share 175 206 241 Valuations P/EV (x) 2.8 2.4 2.0 P/EPS (x) 56.4 51.0 44.0

January 2020 89
December 2019 Results Preview | Sector: Financials
Exhibit 48: 3QFY20 earnings estimates (INR m)
NII (INR m) PPoP (INR m) PAT (INR m)
Private Banks Dec-19 YoY (%) QoQ (%) Dec-19 YoY (%) QoQ (%) Dec-19 YoY (%) QoQ (%) AU Bank 4,890 40.5 8.3 2,993 67.5 7.8 1,823 91.2 6.0 Axis Bank 63,895 14.0 4.7 56,306 1.9 -5.4 17,313 3.0 NM DCB Bank 3,236 10.2 3.3 1,895 9.1 2.7 1,018 18.3 11.4 Equitas Holdings 3,640 13.6 3.8 1,362 11.2 6.2 642 2.8 35.0 Federal Bank 11,681 8.4 3.9 7,610 7.5 5.9 3,905 17.0 -6.3 HDFC Bank 142,539 13.3 5.5 122,457 13.6 4.7 70,775 26.7 11.5 ICICI Bank 82,749 20.4 2.7 71,330 16.1 3.8 39,446 145.8 502.3 IndusInd Bank 29,797 30.2 2.4 27,254 28.7 3.9 15,087 53.2 7.7 Kotak Mah. Bank 34,968 19.0 4.4 25,923 33.7 3.3 16,551 28.2 -4.0 RBL Bank 8,941 36.5 2.9 6,497 30.3 2.2 459 -79.6 -15.5 Pvt Banking Sector 386,335 17.2 4.3 323,627 14.8 2.4 167,019 39.8 54.7 PSU Banks Bank of Baroda 71,247 50.2 1.4 53,884 52.3 1.0 -5,633 NM NM Indian Bank 18,990 10.6 1.9 13,839 20.7 -7.8 -1,197 NM NM PNB 45,338 5.7 6.3 36,473 17.7 2.4 384 -84.4 -92.4 State Bank 247,434 9.0 0.6 154,686 22.5 -15.0 71,982 82.0 139.0 PSU Banking Sector 383,009 14.5 1.4 258,883 26.8 -9.5 65,537 35.8 42.0 Banking Sector 769,344 15.8 2.9 582,510 19.9 -3.2 232,556 38.6 50.9 Life Insurance HDFC Standard life 84,299 22.2 13.1 3,023 17.9 -7.5 2,830 15.2 -8.3 ICICI Prudential life 86,562 15.7 7.3 3,342 12.3 9.1 3,267 10.1 8.2 Life Insurance 170,861 18.8 10.1 6,365 14.9 0.5 6,097 12.4 -0.1 Note: For HDFC life and IPRU life NII represents net premium income, PPoP represents shareholder’s PBT and PAT represents shareholder's profits
Exhibit 49: Loan growth moderates to 7.1%
Exhibit 50: Deposit growth remains stable at ~10%
Exhibit 51: Top large lenders: Provisioning write-backs in these resolutions to drive FY20 earnings
Large Banks Essar steel Ruchi Soya Bhushan Power Prayagraj
(INR b) Exposure Amount
Write-backs (~90%)
Exposure Amount
Write-backs (~46%)
Exposure Amount
Write-backs (~41%)
Exposure Amount
Write-backs (~48%)
SBIN 132 119 18 8 98 40 40 19 PNB 29 26 7 3 44 18 9 4 ICICIBC 23 21 5 2 6 2 - - UNBK 21 19 3 1 18 7 5 3 BOI 20 18 4 2 - - 6 3 AXSB 1 1 3 1 9 4 - - BOB 0 0 5 2 26 11 4 2
66.
3
68.
1
69.
9
75.
3
72.
3
75.
7
73.
5
78.
8
76.
6
80.
1
80.
7
86.
3
86.
1
89.
8
93.
4
97.
7
97.
0
97.
7
99.
5
8.8
9
.1
10.
6
10.
7
9.0
11.
2
5.1
4.7
6
.0
5.7
9.8
9
.4
12.
4
12.
1
14.
5
13.
3
12.
0
8.7
7
.1
1QFY
162Q
FY16
3QFY
164Q
FY16
1QFY
172Q
FY17
3QFY
174Q
FY17
1QFY
182Q
FY18
3QFY
184Q
FY18
1QFY
192Q
FY19
3QFY
194Q
FY19
1QFY
202Q
FY20
3QFY
20
Loans (INR t) Chg YoY (%)
91.1
91
.3
97.2
95
.4
102.
1 10
5.2
108.
1 10
6.1
109.
7 10
8.2
114.
3 11
3.5
118.
0 12
0.3
125.
7 12
6.7
129.
1
130.
1
10.6
10
.2
9.7
9.1 12
.0
15.2
11
.2
11.1
7.
4 2.
9 5.
7 7.0 7.6 9.
9 10
.0
10.3
9.
4 10.1
2QFY
163Q
FY16
4QFY
161Q
FY17
2QFY
173Q
FY17
4QFY
171Q
FY18
2QFY
183Q
FY18
4QFY
181Q
FY19
2QFY
193Q
FY19
4QFY
191Q
FY20
2QFY
203Q
FY20
Deposits (INR t) Chg YoY (%)

January 2020 90
December 2019 Results Preview | Sector: Financials
Exhibit 52: Asset quality divergence (FY19) reported by banks and net impact in 3QFY20 INR b SBI BoB PNB Indian BK BOI GNPA as on FY19 - Reported by bank 1,728 699 785 134 607 GNPA as on FY19 - As assessed by RBI 1,847 752 811 135 618 Divergence in GNPA 119.3 52.5 26.2 1.8 11.2 - Already slipped during 1HFY20 87.9 NA NA NA NA Net impact during 3QFY20 31.4 NA NA NA NA
NNPA as on FY19 - Reported by bank 659 238 300 68 191 NNPA as on FY19 - As assessed by RBI 778 290 327 60 202 Divergence in NNPA 119.3 52.5 26.2 (8.2) 11.2 - Already slipped during 1HFY20 112.5 NA NA NA NA Net impact during 3QFY20 6.9 NA NA NA NA
Provision as on FY19 - Reported by bank 1,069 460 482 61 394 Provision as on FY19 - As assessed by RBI 1,189 501 502 71 408 Divergence in Provisioning 120.4 40.9 20.9 10.0 14.5 - Already provided during 1HFY20 73.8 14.8 NA NA NA Net impact during 3QFY20 46.5 26.2 NA NA NA
Exhibit 53: 10-year G-Sec yields trends…
Source: MOFSL, Company
Exhibit 54: Three-year G-Sec yields trends…
Source: MOFSL, Company
Exhibit 55: 91-day T bills yields moderated by ~40bp QoQ
Source: MOFSL, Company
Exhibit 56: 364 day T-bills yields moderated by 30bp QoQ
Source: MOFSL, Company
5.0
6.0
7.0
8.0
9.0
Dec-
16
Mar
-17
Jun-
17
Sep-
17
Dec-
17
Mar
-18
Jun-
18
Sep-
18
Dec-
18
Mar
-19
Jun-
19
Sep-
19
Dec-
19
Govt 10yr bond yield
5.0
6.0
7.0
8.0
9.0
Dec-
16
Mar
-17
Jun-
17
Sep-
17
Dec-
17
Mar
-18
Jun-
18
Sep-
18
Dec-
18
Mar
-19
Jun-
19
Sep-
19
Dec-
19
Govt 3yr bond yield
4.0
5.0
6.0
7.0
8.0
Mar
-16
Jun-
16Se
p-16
Dec-
16M
ar-1
7Ju
n-17
Sep-
17De
c-17
Mar
-18
Jun-
18Se
p-18
Dec-
18M
ar-1
9Ju
n-19
Sep-
19De
c-19
T-Bills 91 day
4.0
5.3
6.5
7.8
9.0
Apr-
15
Aug-
15
Dec-
15
Apr-
16
Aug-
16
Dec-
16
Apr-
17
Aug-
17
Dec-
17
Apr-
18
Aug-
18
Dec-
18
Apr-
19
Aug-
19
Dec-
19T-Bills 364 day

January 2020 91
December 2019 Results Preview | Sector: Financials
Exhibit 57: NIMs to remain largely stable or show improving trends
Exhibit 58: Relative performance—three months (%)
Exhibit 59: Relative performance—one year (%)
2.5 2.5 2.3 2.3 2.7 2.7 2.5 2.7 2.4 2.6 2.6 2.5 2.9 2.7 2.8 2.8 2.8 2.9 2.9
4.1 4.0 4.0 4.0 3.9 3.9 3.9 4.0 4.0 4.0 4.0 4.0 3.9 3.9 4.1 4.0 4.0 4.1 4.1
1QFY
16
2QFY
16
3QFY
16
4QFY
16
1QFY
17
2QFY
17
3QFY
17
4QFY
17
1QFY
18
2QFY
18
3QFY
18
4QFY
18
1QFY
19
2QFY
19
3QFY
19
4QFY
19
1QFY
20
2QFY
20
3QFY
20E
PSU Private
99
102
105
108
111
114
Sep-
19
Oct
-19
Nov
-19
Dec-
19Nifty Index MOSL Financials Index
95
102
109
116
123
130
Dec-
18
Jan-
19
Feb-
19
Mar
-19
Apr-
19
May
-19
Jun-
19
Jul-1
9
Aug-
19
Sep-
19
Oct
-19
Nov
-19
Dec-
19
Nifty Index MOSL Financials Index

January 2020 92
December 2019 Results Preview | Sector: Financials
Exhibit 60: Quarterly Performance Sector CMP NII (INR M) OP. PROFITS (INR M) NET PROFIT (INR M)
(INR) Rating Dec-19 Var % YoY
Var % QoQ Dec-19 Var
% YoY Var
% QoQ Dec-19 Var % YoY
Var % QoQ
Financials Private Banks AU Small Finance 796 Buy 4,890 40.5 8.3 2,993 67.5 7.8 1,823 91.2 6.0 Axis Bank 757 Buy 63,895 14.0 4.7 56,306 1.9 -5.4 17,313 3.0 LP DCB Bank 183 Neutral 3,236 10.2 3.3 1,895 9.1 2.7 1,018 18.3 11.4 Equitas Holdings 108 Buy 3,640 13.6 3.8 1,362 11.2 6.2 642 2.8 35.0 Federal Bank 92 Buy 11,681 8.4 3.9 7,610 7.5 5.9 3,904 17.0 -6.3 HDFC Bank 1,287 Buy 142,539 13.3 5.5 122,457 13.6 4.7 70,775 26.7 11.5 ICICI Bank 541 Buy 82,749 20.4 2.7 71,330 16.1 3.8 39,446 145.8 502.3 IndusInd Bank 1,529 Buy 29,797 30.2 2.4 27,254 28.7 3.9 15,087 53.2 7.7 Kotak Mahindra Bank 1,671 Neutral 34,968 19.0 4.4 25,923 33.7 3.3 16,551 28.2 -4.0 RBL Bank 370 Buy 8,941 36.5 2.9 6,497 30.3 2.2 459 -79.6 -15.6 Pvt Banking Sector Aggregate 386,335 17.2 4.3 323,627 14.8 2.4 167,018 39.8 54.7 PSU Banks Bank of Baroda 104 Buy 71,247 50.2 1.4 53,884 52.3 1.0 -5,633 PL PL Indian Bank 103 Neutral 18,990 10.6 1.9 13,839 20.7 -7.8 -1,197 PL PL Punjab National Bank 67 Neutral 45,338 5.7 6.3 36,473 17.7 2.4 384 -84.4 -92.4 State Bank 339 Buy 247,434 9.0 0.6 154,686 22.5 -15.0 71,981 82.0 139.0 PSU Banking Sector Aggregate 383,009 14.5 1.4 258,883 26.8 -9.5 65,536 35.8 42.0 Life Insurance HDFC Life Insur. 634 Neutral 84,299 22.2 13.1 3,008 35.7 41.2 2,830 15.2 -8.3 ICICI Pru Life 487 Buy 86,562 15.7 7.3 3,481 7.0 -27.0 3,267 10.1 8.2 Life Insurance Sector Aggregate 170,861 18.8 10.1 6,489 18.6 -5.9 6,097 12.4 -0.1 NBFC Bajaj Finance 4,248 Neutral 34,060 30.7 8.5 28,672 37.4 9.6 16,441 55.2 9.2 Chola. Inv & Fin. 309 Buy 10,236 16.9 0.3 6,422 14.8 3.8 3,981 30.8 29.7 HDFC 2,466 Buy 30,867 7.2 4.6 29,257 2.1 0.9 22,638 10.8 -24.0 IndoStar Capital 196 Buy 1,450 2.8 -13.1 1,127 -1.3 -19.3 319 -55.2 -35.3 L&T Fin.Holdings 121 Buy 16,402 9.6 -4.3 12,243 17.4 -8.3 6,040 4.0 -6.8 LIC Housing Fin 456 Buy 12,142 16.5 0.5 11,288 13.8 -0.5 6,898 15.7 -10.7 M & M Financial 339 Buy 13,109 8.3 2.1 7,849 5.4 -4.2 3,901 22.4 54.9 MAS Financial 864 Buy 979 -4.8 3.4 764 -7.4 5.4 442 -2.8 -5.3 Muthoot Finance 768 Neutral 12,595 15.1 -12.3 8,665 10.5 -19.3 6,369 31.3 -25.8 PNB Housing 493 Buy 4,844 36.9 -2.1 5,636 10.1 -2.4 3,482 14.9 -5.1 Repco Home Fin 327 Buy 1,200 5.8 3.5 1,044 11.2 2.3 684 22.9 -32.0 Shriram City Union 1,388 Buy 8,970 -0.1 0.4 5,639 3.0 -1.8 2,729 5.5 -8.3 Shriram Transport Fin. 1,160 Buy 20,203 -0.5 1.2 15,837 -2.2 -0.2 6,906 8.7 -9.7 NBFC Banking Sector Aggregate 167,057 12.5 1.2 134,444 11.6 -0.8 80,831 19.6 -9.7 Financials Sector Aggregate 1,107,261 15.8 3.6 723,442 18.2 -2.8 319,482 32.7 27.9 PL: Profit to Loss; LP: Loss to Profit; UR: Under Review; For Banks: Sales = Net Interest Income, EBITDA = Operating Profits; For Life Insurance: Sales = Net Premium, EBITDA = Operating Profits
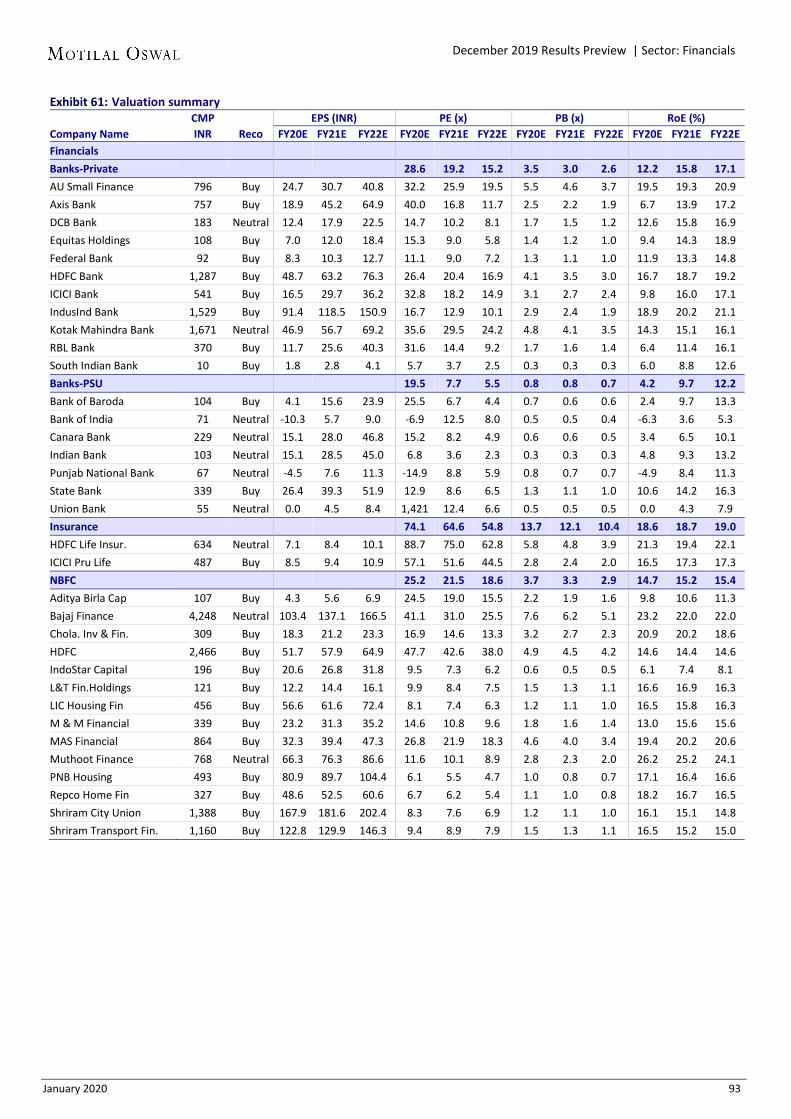
January 2020 93
December 2019 Results Preview | Sector: Financials
Exhibit 61: Valuation summary CMP EPS (INR) PE (x) PB (x) RoE (%) Company Name INR Reco FY20E FY21E FY22E FY20E FY21E FY22E FY20E FY21E FY22E FY20E FY21E FY22E Financials Banks-Private 28.6 19.2 15.2 3.5 3.0 2.6 12.2 15.8 17.1 AU Small Finance 796 Buy 24.7 30.7 40.8 32.2 25.9 19.5 5.5 4.6 3.7 19.5 19.3 20.9 Axis Bank 757 Buy 18.9 45.2 64.9 40.0 16.8 11.7 2.5 2.2 1.9 6.7 13.9 17.2 DCB Bank 183 Neutral 12.4 17.9 22.5 14.7 10.2 8.1 1.7 1.5 1.2 12.6 15.8 16.9 Equitas Holdings 108 Buy 7.0 12.0 18.4 15.3 9.0 5.8 1.4 1.2 1.0 9.4 14.3 18.9 Federal Bank 92 Buy 8.3 10.3 12.7 11.1 9.0 7.2 1.3 1.1 1.0 11.9 13.3 14.8 HDFC Bank 1,287 Buy 48.7 63.2 76.3 26.4 20.4 16.9 4.1 3.5 3.0 16.7 18.7 19.2 ICICI Bank 541 Buy 16.5 29.7 36.2 32.8 18.2 14.9 3.1 2.7 2.4 9.8 16.0 17.1 IndusInd Bank 1,529 Buy 91.4 118.5 150.9 16.7 12.9 10.1 2.9 2.4 1.9 18.9 20.2 21.1 Kotak Mahindra Bank 1,671 Neutral 46.9 56.7 69.2 35.6 29.5 24.2 4.8 4.1 3.5 14.3 15.1 16.1 RBL Bank 370 Buy 11.7 25.6 40.3 31.6 14.4 9.2 1.7 1.6 1.4 6.4 11.4 16.1 South Indian Bank 10 Buy 1.8 2.8 4.1 5.7 3.7 2.5 0.3 0.3 0.3 6.0 8.8 12.6 Banks-PSU 19.5 7.7 5.5 0.8 0.8 0.7 4.2 9.7 12.2 Bank of Baroda 104 Buy 4.1 15.6 23.9 25.5 6.7 4.4 0.7 0.6 0.6 2.4 9.7 13.3 Bank of India 71 Neutral -10.3 5.7 9.0 -6.9 12.5 8.0 0.5 0.5 0.4 -6.3 3.6 5.3 Canara Bank 229 Neutral 15.1 28.0 46.8 15.2 8.2 4.9 0.6 0.6 0.5 3.4 6.5 10.1 Indian Bank 103 Neutral 15.1 28.5 45.0 6.8 3.6 2.3 0.3 0.3 0.3 4.8 9.3 13.2 Punjab National Bank 67 Neutral -4.5 7.6 11.3 -14.9 8.8 5.9 0.8 0.7 0.7 -4.9 8.4 11.3 State Bank 339 Buy 26.4 39.3 51.9 12.9 8.6 6.5 1.3 1.1 1.0 10.6 14.2 16.3 Union Bank 55 Neutral 0.0 4.5 8.4 1,421 12.4 6.6 0.5 0.5 0.5 0.0 4.3 7.9 Insurance 74.1 64.6 54.8 13.7 12.1 10.4 18.6 18.7 19.0 HDFC Life Insur. 634 Neutral 7.1 8.4 10.1 88.7 75.0 62.8 5.8 4.8 3.9 21.3 19.4 22.1 ICICI Pru Life 487 Buy 8.5 9.4 10.9 57.1 51.6 44.5 2.8 2.4 2.0 16.5 17.3 17.3 NBFC 25.2 21.5 18.6 3.7 3.3 2.9 14.7 15.2 15.4 Aditya Birla Cap 107 Buy 4.3 5.6 6.9 24.5 19.0 15.5 2.2 1.9 1.6 9.8 10.6 11.3 Bajaj Finance 4,248 Neutral 103.4 137.1 166.5 41.1 31.0 25.5 7.6 6.2 5.1 23.2 22.0 22.0 Chola. Inv & Fin. 309 Buy 18.3 21.2 23.3 16.9 14.6 13.3 3.2 2.7 2.3 20.9 20.2 18.6 HDFC 2,466 Buy 51.7 57.9 64.9 47.7 42.6 38.0 4.9 4.5 4.2 14.6 14.4 14.6 IndoStar Capital 196 Buy 20.6 26.8 31.8 9.5 7.3 6.2 0.6 0.5 0.5 6.1 7.4 8.1 L&T Fin.Holdings 121 Buy 12.2 14.4 16.1 9.9 8.4 7.5 1.5 1.3 1.1 16.6 16.9 16.3 LIC Housing Fin 456 Buy 56.6 61.6 72.4 8.1 7.4 6.3 1.2 1.1 1.0 16.5 15.8 16.3 M & M Financial 339 Buy 23.2 31.3 35.2 14.6 10.8 9.6 1.8 1.6 1.4 13.0 15.6 15.6 MAS Financial 864 Buy 32.3 39.4 47.3 26.8 21.9 18.3 4.6 4.0 3.4 19.4 20.2 20.6 Muthoot Finance 768 Neutral 66.3 76.3 86.6 11.6 10.1 8.9 2.8 2.3 2.0 26.2 25.2 24.1 PNB Housing 493 Buy 80.9 89.7 104.4 6.1 5.5 4.7 1.0 0.8 0.7 17.1 16.4 16.6 Repco Home Fin 327 Buy 48.6 52.5 60.6 6.7 6.2 5.4 1.1 1.0 0.8 18.2 16.7 16.5 Shriram City Union 1,388 Buy 167.9 181.6 202.4 8.3 7.6 6.9 1.2 1.1 1.0 16.1 15.1 14.8 Shriram Transport Fin. 1,160 Buy 122.8 129.9 146.3 9.4 8.9 7.9 1.5 1.3 1.1 16.5 15.2 15.0

January 2020 94
December 2019 Results Preview | Sector: Financials
The tables below provide a snapshot of actual and estimated numbers for companies under the MOFSL coverage universe. Highlighted columns indicate the quarter/financial year under review.
AU Small Finance Bank Buy CMP INR796 | TP: INR900 (+14%) EPS CHANGE (%): FY20|21: +3.4|+0.2 Margins to expand 10bp QoQ. Expect GNPA to remain stable at 2.0%. Loan growth driven by used-car financing. C/I ratio remains a key monitorable.
Quarterly Performance (INR m) FY19 FY20E FY19 FY20E 1Q 2Q 3Q 4Q 1Q 2Q 3QE 4QE Net Interest Income 2,865 3,210 3,480 3,869 3,956 4,516 4,890 5,202 13,425 18,563 % Change (Y-o-Y) 56.2 46.1 39.0 34.9 38.1 40.7 40.5 34.4 42.7 38.3 Other Income 1,031 1,225 1,059 1,306 2,109 1,508 1,606 1,646 4,620 6,870 Total Income 3,896 4,435 4,539 5,174 6,065 6,024 6,496 6,848 18,045 25,433 Operating Expenses 2,370 2,683 2,752 3,018 3,157 3,247 3,503 3,649 10,826 13,555 Operating Profit 1,525 1,752 1,787 2,157 2,908 2,777 2,993 3,199 7,219 11,878 % Change (Y-o-Y) 22.5 22.2 16.8 39.6 90.7 58.5 67.5 48.3 25.3 64.5 Provisions 351 350 325 392 315 610 614 668 1,418 2,207 Profit before Tax 1,174 1,402 1,462 1,764 2,593 2,167 2,379 2,531 5,801 9,671 Tax Provisions 404 488 509 582 690 447 557 632 1,983 2,327 Net Profit 770 914 953 1,182 1,903 1,719 1,823 1,899 3,818 7,344 % Change (Y-o-Y) 24.5 34.0 20.8 42.4 147.3 88.1 91.2 60.6 30.7 73.8 Operating Parameters Deposit (INR b) 100.0 128.7 146.9 194.2 198.5 221.5 235.9 270.0 194.2 270.0 Loan (INR b) 152.7 181.2 200.0 228.2 231.0 248.1 264.9 294.9 228.2 294.9 Deposit Growth (%) 1,126.9 550.5 295.2 145.1 98.5 72.1 60.6 39.0 145.1 39.0 Loan Growth (%) 112.1 112.3 99.4 71.4 51.3 36.9 32.4 29.2 71.4 29.2 Asset Quality GNPA (%) 2.2 2.0 2.1 2.0 2.1 2.0 2.0 1.9 2.1 1.9 NNPA (%) 1.4 1.3 1.3 1.3 1.3 1.1 1.1 1.0 1.3 1.0 PCR (%) 36.8 37.6 37.6 37.4 40.5 43.9 46.0 47.7 37.4 47.7
Axis Bank Buy CMP INR757 | TP: INR825 (+9%) EPS CHANGE (%): FY20|21: -21.2|-2.8 Estimate slippages to remain elevated at ~4%. Expect stable margins at ~3.5% QoQ. Watch out for corporate slippages from BB & below pool. Loan growth driven by retail, unsecured and SMEs.
Quarterly Performance (INR m) FY19 FY20E FY19 FY20E 1Q 2Q 3Q 4Q 1Q 2Q 3QE 4QE Net Interest Income 51,668 52,321 56,037 57,056 58,437 61,018 63,895 67,305 217,082 250,654 % Change (Y-o-Y) 11.9 15.3 18.4 20.6 13.1 16.6 14.0 18.0 16.6 15.5 Other Income 29,250 26,784 40,007 35,263 38,688 38,958 35,550 36,490 131,303 149,686 Total Income 80,918 79,105 96,044 92,319 97,124 99,976 99,445 103,795 348,385 400,340 Operating Expenses 37,198 38,165 40,797 42,175 38,197 40,460 43,139 47,510 158,334 169,305 Operating Profit 43,720 40,940 55,247 50,144 58,928 59,516 56,306 56,285 190,051 231,035 % Change (Y-o-Y) 1.9 8.4 43.4 36.6 34.8 45.4 1.9 12.2 21.9 21.6 Provisions 33,377 29,274 30,545 27,114 38,146 35,184 33,222 27,677 120,310 134,228 Profit before Tax 10,343 11,666 24,701 23,030 20,782 24,332 23,084 28,608 69,741 96,806 Tax 3,333 3,770 7,893 7,979 7,081 25,453 5,771 7,470 22,975 45,775 Net Profit 7,011 7,896 16,809 15,051 13,701 -1,121 17,313 21,138 46,766 51,031 % Change (Y-o-Y) -46.3 82.6 131.4 -168.8 95.4 -114.2 3.0 40.4 1,596.4 9.1 Operating Parameters Deposit (INR b) 4,471 4,797 5,141 5,485 5,407 5,840 6,214 6,527 5,485 6,527 Loan (INR b) 4,411 4,561 4,751 4,948 4,973 5,216 5,430 5,690 4,948 5,690 Deposit Growth (%) 13.5 15.2 25.7 20.9 20.9 21.7 20.9 19.0 20.9 19.0 Loan Growth (%) 14.4 11.2 12.9 12.5 12.7 14.4 14.3 15.0 12.5 15.0 Asset Quality Gross NPA (INR b) 327 309 309 298 294 291 296 310 298 310 Gross NPA (%) 6.5 6.0 5.8 5.3 5.3 5.0 5.3 5.3 5.3 5.3 Net NPA (INR b) 149 127 122 113 110 111 111 109 113 109 Net NPA (%) 3.1 2.5 2.4 2.1 2.0 2.0 2.0 1.9 2.1 1.9 PCR (%) 54.4 58.9 60.4 62.1 62.5 61.7 62.5 64.9 62.1 64.9

January 2020 95
December 2019 Results Preview | Sector: Financials
Bank of Baroda Buy CMP INR104 | TP: INR120 (+15%) EPS CHANGE (%): FY20|21: -24.2|-20.6 Divergence in provisioning to keep credit costs elevated. Rundown in international book to continue. See elevated slippage trajectory on 1 large stressed HFC. Watch out for movement in the watchlist/stress addition.
Quarterly Performance (INRm) FY19 FY20E FY19 FY20E 1Q 2Q 3Q 4Q 1Q 2Q 3QE 4QE Net Interest Income 43,811 44,925 47,432 50,670 64,981 70,279 71,247 71,476 186,838 277,983 % Change (YoY) 28.7 20.7 7.9 26.6 48.3 56.4 50.2 41.1 20.4 48.8 Other Income 11,478 13,516 16,211 19,704 19,156 28,239 27,958 28,194 60,910 103,547 Total Income 55,289 58,441 63,644 70,374 84,137 98,519 99,204 99,670 247,748 381,530 Operating Expenses 25,233 27,622 28,258 31,766 41,375 45,160 45,320 45,871 112,880 177,725 Operating Profit 30,056 30,819 35,385 38,608 42,762 53,359 53,884 53,799 134,868 203,805 % Change (YoY) 13.5 1.3 -3.1 44.8 42.3 73.1 52.3 39.3 12.3 51.1 Provisions 21,656 24,295 27,942 53,993 32,849 42,092 62,550 18,885 127,887 156,376 Profit before Tax 8,400 6,524 7,443 -15,385 9,913 11,268 -8,666 34,914 6,982 47,429 Tax 3,120 2,270 2,731 -5,471 2,815 3,901 NM NM 2,646 32,573 Net Profit 5,280 4,254 4,712 -9,914 7,099 7,367 -5,633 6,024 4,335 14,856 % Change (YoY) 159.6 19.7 321.6 -68.0 34.5 73.2 NM NM -117.8 242.7 Operating Parameters Deposit (INR b) 5,815 6,070 6,106 6,387 8,955 8,941 9,220 9,426 6,387 9,426 Loan (INR b) 4,145 4,335 4,487 4,688 6,332 6,373 6,612 7,002 4,688 7,002 Deposit Growth (%) 1.9 4.1 6.5 8.0 54.0 47.3 51.0 47.6 8.0 47.6 Loan Growth (%) 9.8 11.9 12.3 9.7 52.8 47.0 47.4 49.4 9.7 49.4 Asset Quality Gross NPA (INR B) 559 551 532 482 697 700 690 672 482 672 Gross NPA (%) 12.5 11.8 11.0 9.6 10.3 10.3 9.8 9.0 9.6 9.0 Net NPA (INR B) 223.8 210.6 191.3 156.1 250.3 248.9 241.6 234.1 156.1 234.1 Net NPA (%) 5.4 4.9 4.3 3.3 4.0 3.9 3.7 3.3 3.3 3.3 PCR (%) 59.9 61.8 64.0 67.6 64.1 64.4 65.0 65.2 67.6 65.2
DCB Bank Neutral CMP INR183 | TP: INR200 (+9%) EPS CHANGE (%): FY20|21: 0.3|9.0 See higher credit costs on likely stress in SMEs/LAP. C/I ratio to moderate as pace of branch expansion slows. Expect slippage ratio at ~2.2% for 3QFY20E. Watch out for NIM compression QoQ.
Quarterly Performance (INR m) FY19 FY20E FY19 FY20E 1Q 2Q 3Q 4Q 1Q 2Q 3QE 4QE Net Interest Income 2,730 2,818 2,936 3,009 3,048 3,134 3,236 3,374 11,493 12,791 % Change (Y-o-Y) 17.1 13.6 17.2 14.1 11.6 11.2 10.2 12.1 15.5 11.3 Other Income 828 735 945 994 868 1,014 1,010 1,100 3,502 3,992 Total Income 3,558 3,553 3,881 4,002 3,915 4,148 4,246 4,474 14,994 16,783 Operating Expenses 2,144 2,092 2,143 2,150 2,250 2,302 2,351 2,352 8,529 9,254 Operating Profit 1,414 1,461 1,738 1,853 1,665 1,845 1,895 2,123 6,466 7,529 % Change (Y-o-Y) 3.7 17.4 41.8 30.9 17.8 26.3 9.1 14.6 23.2 16.4 Provisions 332 319 401 348 406 433 537 614 1,401 1,990 Profit before Tax 1,082 1,142 1,336 1,505 1,259 1,413 1,358 1,509 5,065 5,539 Tax 387 408 475 542 448 499 339 401 1,812 1,688 Net Profit 695 734 861 963 811 914 1,018 1,107 3,254 3,851 % Change (Y-o-Y) 6.6 24.7 51.0 50.0 16.6 24.5 18.3 15.0 32.7 18.3 Operating Parameters Deposit (INR b) 250.3 261.7 275.1 284.4 287.9 293.6 306.2 324.2 284.4 324.2 Loan (INR b) 212.4 220.7 228.9 235.7 240.4 248.0 253.8 268.7 235.7 268.7 Deposit Growth (%) 30.7 27.2 29.2 18.4 15.0 12.2 11.3 14.0 18.4 14.0 Loan Growth (%) 30.6 26.9 23.1 15.9 13.2 12.4 10.9 14.0 15.9 14.0 Asset Quality Gross NPA (INRb) 4.0 4.1 4.5 4.4 4.8 5.2 5.6 5.9 4.4 5.9 Gross NPA (%) 1.9 1.8 1.9 1.8 2.0 2.1 2.2 2.2 1.8 2.2 Net NPA (INRb) 1.5 1.6 1.6 1.5 2.0 2.4 2.5 2.6 1.5 2.6 Net NPA (%) 0.7 0.7 0.7 0.7 0.8 1.0 1.0 1.0 0.7 1.0 PCR (%) 61.6 62.1 63.3 65.0 58.9 54.5 55.5 56.9 65.0 56.9

January 2020 96
December 2019 Results Preview | Sector: Financials
Equitas Holdings Buy CMP INR108 | TP: INR125 (+16%) EPS CHANGE (%): FY20|21: -8.0|-8.2 Expect NIMs to remain stable at 8.8% QoQ. Expect PCR to improve. MSME book’s asset quality a key monitorable. Watch out for progress on the timeline of SFB listing.
Quarterly Performance (INR m) Y/E March FY19 FY20E
FY19 FY20E 1Q 2Q 3Q 4Q 1Q 2Q 3QE 4QE Net Interest Income 2,544 2,716 3,203 3,331 3,372 3,505 3,640 3,812 12,357 14,329 % Change (YoY) 17.8 11.0 37.0 34.0 32.6 29.1 13.6 14.5 31.1 16.0 Other Income 612 717 654 683 592 639 669 723 1,639 2,622 Total Income 3,156 3,433 3,857 4,014 3,964 4,145 4,308 4,535 13,996 16,951 Operating Expenses 2,395 2,372 2,632 2,751 2,738 2,862 2,946 3,098 10,270 11,645 Operating Profit 761 1,061 1,225 1,263 1,225 1,282 1,362 1,437 3,726 5,306 % Change (YoY) 6.1 1,392.3 197.9 87.3 61.1 20.8 11.2 13.8 105.9 42.4 Provisions 209 308 243 249 308 454 429 442 1,013 1,633 Profit before Tax 552 753 982 1,014 917 829 933 994 2,713 3,673 Tax 198 265 357 327 327 353 291 298 947 1,270 Net Profit 354 487 624 687 590 476 642 696 1,766 2,404 % Change (YoY) 96.2 -389.6 -304.1 97.3 66.7 -2.4 2.8 1.3 1,193.6 36.1 Operating Parameters AUM (INR b) 90 100 109 118 123 133 146 162 118 162 Deposits (INR b) 57 70 67 88 91 100 96 124 88 124 Loans (INR b) 84 94 107 116 120 130 144 159 116 159 AUM Growth (%) 27 36 41 44 38 33 35 37 44 37 Deposit Growth (%) 154 125 81 87 60 44 43 41 59 41 Asset Quality Gross NPA (%) 2.8 3.4 3.1 2.5 2.8 2.9 2.8 2.7 2.5 2.7 Net NPA (%) 1.5 2.0 1.8 1.4 1.6 1.6 1.6 1.5 1.4 1.5 PCR (%) 46.9 40.9 44.2 43.4 44.1 43.8 44.0 45.2 43.4 45.2
Federal Bank Buy CMP INR92 | TP: INR110 (+19%) EPS CHANGE (%): FY20|21: +0.1|+0.4 Expect continued strong traction in retail and SMEs. Other income led by strong traction in fee income. Estimate NIMs at ~3.0% QoQ. Slippages to remain elevated at ~2.0% annualized.
Quarterly Performance (INR m) FY19 FY20E FY19 FY20E 1Q 2Q 3Q 4Q 1Q 2Q 3QE 4QE Net Interest Income 9,801 10,225 10,773 10,965 11,542 11,238 11,681 12,078 41,763 46,539 % Change (YoY) 22.4 13.7 13.4 17.5 17.8 9.9 8.4 10.1 16.6 11.4 Other Income 2,709 3,229 3,456 4,117 3,915 4,209 4,324 4,575 13,510 17,023 Total Income 12,509 13,454 14,228 15,083 15,457 15,447 16,005 16,653 55,274 63,562 Operating Expenses 6,480 6,478 7,150 7,535 7,629 8,259 8,395 8,571 27,643 32,854 Operating Profit 6,029 6,976 7,078 7,548 7,828 7,188 7,610 8,082 27,631 30,708 % Change (YoY) 8.1 19.6 26.1 28.2 29.8 3.0 7.5 7.1 20.6 11.1 Provisions 1,992 2,888 1,901 1,778 1,920 2,518 2,489 2,124 8,559 9,051 Profit before Tax 4,038 4,088 5,177 5,770 5,907 4,670 5,121 5,959 19,073 21,657 Tax 1,411 1,427 1,841 1,955 2,065 503 1,216 1,387 6,634 5,172 Net Profit 2,627 2,660 3,336 3,815 3,842 4,167 3,905 4,571 12,439 16,485 % Change (YoY) 25.0 0.9 28.3 163.1 46.2 56.6 17.0 19.8 41.5 32.5 Operating Parameters Deposit (INR b) 1,112 1,182 1,235 1,350 1,325 1,395 1,453 1,579 1,350 1,579 Loan (INR b) 943 1,009 1,056 1,102 1,120 1,159 1,224 1,290 1,102 1,290 Deposit Growth (%) 16.1 21.6 22.8 20.5 19.1 18.1 17.7 17.0 20.5 17.0 Loan Growth (%) 23.6 25.2 24.2 19.9 18.8 14.8 16.0 17.0 19.9 17.0 Asset Quality Gross NPA (INR b) 28.7 31.8 33.6 32.6 33.9 36.1 39.6 39.9 32.6 39.9 Gross NPA (%) 3.0 3.1 3.1 2.9 3.0 3.1 3.2 3.0 2.9 3.0 Net NPA (INR b) 16.2 18.0 18.2 16.3 16.7 18.4 20.6 20.9 16.3 20.9 Net NPA (%) 1.7 1.8 1.7 1.5 1.5 1.6 1.7 1.6 1.5 1.6 PCR (%) 43.5 43.6 45.9 50.1 50.7 49.0 48.0 47.6 50.1 47.6

January 2020 97
December 2019 Results Preview | Sector: Financials
HDFC Bank Buy CMP INR1,287 | TP: INR1,410 (+10%) EPS CHANGE (%): FY20|21: -0.7|+2.0 Loan growth led by strong growth in corporate loans. Margins expected to remain stable at ~4.3%. Asset quality in agri portfolio a key monitorable. Watch out for any development on succession planning.
Quarterly Performance (INR b)
FY19 FY20E FY19 FY20E
1Q 2Q 3Q 4Q 1Q 2Q 3QE 4QE
Net Interest Income 108.1 117.6 125.8 130.9 132.9 135.2 142.5 149.0 482.4 559.7 % Change (Y-o-Y) 15.4 20.6 21.9 22.8 22.9 14.9 13.3 13.9 20.3 16.0 Other Income 38.2 40.2 49.2 48.7 49.7 55.9 56.7 56.2 176.3 218.6 Total Income 146.3 157.8 175.0 179.6 182.6 191.0 199.3 205.3 658.7 778.2 Operating Expenses 59.8 63.0 67.2 71.2 71.2 74.1 76.8 79.6 261.2 301.6 Operating Profit 86.5 94.8 107.8 108.4 111.5 117.0 122.5 125.7 397.5 476.6 % Change (Y-o-Y) 15.0 21.3 27.5 22.7 28.9 23.4 13.6 15.9 21.8 19.9 Provisions 16.3 18.2 22.1 18.9 26.1 27.0 27.9 25.3 75.5 106.3 Profit before Tax 70.2 76.6 85.7 89.5 85.3 90.0 94.6 100.4 322.0 370.3 Tax 24.2 26.5 29.8 30.7 29.7 26.5 23.8 25.2 111.2 105.2 Net Profit 46.0 50.1 55.9 58.9 55.7 63.4 70.8 75.2 210.8 265.1 % Change (Y-o-Y) 18.2 20.6 20.3 22.6 21.0 26.8 26.7 27.7 20.5 25.8 Operating Parameters Deposit Growth (%) 20.0 20.9 22.0 17.0 18.5 22.6 25.2 19.0 17.0 19.0 Loan Growth (%) 22.0 24.1 23.7 24.5 17.1 19.5 19.6 18.5 24.5 18.5 Deposit 8,058 8,334 8,525 9,231 9,546 10,216 10,675 10,985 9,231 10,985 Loan 7,086 7,508 7,810 8,194 8,297 8,970 9,340 9,710 8,194 9,710 Asset Quality Gross NPA 95.4 101.0 109.0 112.2 117.7 125.1 131.0 135.3 112.2 135.3 Gross NPA (%) 1.3 1.3 1.4 1.4 1.4 1.4 1.4 1.4 1.4 1.4 Net NPA 29.1 30.3 33.0 32.1 35.7 37.9 39.3 36.8 32.1 36.8 Net NPA (%) 0.4 0.4 0.4 0.4 0.4 0.4 0.4 0.4 0.4 0.4 PCR (%) 69.5 70.0 69.7 71.4 69.7 69.7 70.0 72.8 71.4 72.8
ICICI Bank Buy CMP INR541 | TP: INR625 (+16%) EPS CHANGE (%): FY20|21: -3.2|+1.5 Loan growth to be driven by retail and SME loans. Estimate gross slippages at 2.5% annualized. Expect margins to improve to ~3.4%. Net stressed loans (excl. NPAs) to decline from current 3%.
Quarterly Performance (INR b)
FY19 FY20E FY19 FY20E
1Q 2Q 3Q 4Q 1Q 2Q 3QE 4QE
Net Interest Income 61.0 64.2 68.8 76.2 77.4 80.6 82.7 85.1 270 326 % Change (YoY) 9.2 12.4 20.5 26.5 26.8 25.6 20.4 11.7 17.3 20.6 Other Income 38.5 31.6 38.8 36.2 34.3 41.9 43.5 45.7 145 165 Total Income 99.5 95.7 107.6 112.4 111.6 122.5 126.3 130.8 415 491 Operating Expenses 41.5 43.2 46.1 50.1 48.7 53.8 55.0 56.7 181 214 Operating Profit 58.1 52.5 61.5 62.3 62.9 68.7 71.3 74.0 234 277 % Change (YoY) 12.1 -24.9 21.5 -17.0 8.3 30.9 16.1 18.8 -5.3 18.2 Provisions 59.7 39.9 42.4 54.5 35.0 25.1 19.8 19.0 197 99 Profit before Tax -1.6 12.6 19.0 7.8 27.9 43.7 51.6 55.0 38 178 Tax -0.4 3.5 3.0 -1.9 8.8 37.1 12.1 13.9 4 72 Net Profit -1.2 9.1 16.0 9.7 19.1 6.5 39.4 41.1 34 106 % Change (YoY) -105.8 -55.8 -2.7 -5.0 NM -27.9 145.8 324.5 -50.4 215.8 Operating Parameters Deposit (INR b) 5,469 5,587 6,068 6,529 6,607 6,963 7,293 7,998 6,529 7,998 Loan (INR b) 5,163 5,445 5,643 5,866 5,924 6,134 6,387 6,746 5,866 6,746 Deposit Growth (%) 12.5 12.0 17.3 16.4 20.8 24.6 20.2 22.5 16.4 22.5 Loan Growth (%) 11.3 12.8 11.7 14.5 14.7 12.6 13.2 15.0 14.5 15.0 Asset Quality Gross NPA (INR b) 534.6 544.9 515.9 462.9 457.6 456.4 433.1 425.4 462.9 425.4 Gross NPA (%) 8.8 8.5 7.8 6.7 6.5 6.4 6.4 6.0 7.5 6.0 Net NPA (INR b) 241.7 220.9 162.5 135.8 118.6 109.2 103.9 100.0 135.8 100.0 Net NPA (%) 4.2 3.7 2.6 2.1 1.8 1.6 1.6 1.5 2.3 1.5 PCR (%) 54.8 59.5 68.5 70.7 74.1 76.1 76.0 76.5 70.7 76.5

January 2020 98
December 2019 Results Preview | Sector: Financials
Indian Bank Neutral CMP INR103 | TP: INR130 (+26%) EPS CHANGE (%): FY20|21: -16.8|+17.6 NIMs estimated to remain flat. Slippages to remain elevated led by divergence. Expect other income to be led by treasury gains.
Quarterly Performance (INR m) Y/E March FY19 FY20E FY19 FY20E 1Q 2Q 3Q 4Q 1Q 2Q 3QE 4QE Net Interest Income 18,070 17,309 17,167 17,635 17,854 18,630 18,990 19,178 70,181 74,653 % Change (YoY) 23.8 12.1 5.8 7.7 -1.2 7.6 10.6 8.7 12.0 6.4 Other Income 4,398 4,283 4,452 5,696 6,945 7,376 5,812 6,226 18,829 26,360 Total Income 22,468 21,593 21,619 23,330 24,800 26,007 24,803 25,404 89,010 101,013 Operating Expenses 9,492 9,682 10,153 10,876 11,058 10,989 10,963 11,383 40,204 44,394 Operating Profit 12,976 11,910 11,466 12,454 13,742 15,018 13,839 14,020 48,806 56,619 % Change (YoY) 3.6 -13.4 -5.2 7.0 5.9 26.1 20.7 12.6 -2.4 16.0 Other Provisions 10,296 10,043 9,237 16,388 7,948 9,094 15,414 10,721 45,964 43,177 Profit before Tax 2,680 1,867 2,229 -3,934 5,794 5,924 -1,575 3,299 2,842 13,443 Tax 587 366 707 -2,037 2,140 2,338 NM NM -377 4,811 Net Profit 2,093 1,501 1,523 -1,898 3,654 3,586 -1,197 2,589 3,220 8,632 % Change (YoY) -43.8 -66.7 -49.8 -243.8 74.6 138.8 NM NM -74.4 168.1 Operating Parameters Deposits (INR b) 2,102 2,195 2,258 2,421 2,415 2,532 2,578 2,735 2,421 2,735 Loans (INR b) 1,584 1,670 1,712 1,813 1,776 1,868 1,926 2,048 1,813 2,048 Deposit Growth (%) 9.8 10.5 9.4 16.2 14.9 15.3 14.2 13.0 16.2 13.0 Loan Growth (%) 22.5 19.9 15.4 15.8 12.1 11.9 12.5 13.0 15.8 13.0 Asset Quality Gross NPA (%) 7.2 7.2 7.5 7.1 7.3 7.2 7.1 6.8 7.1 6.8 Net NPA (%) 3.8 4.2 4.4 3.8 3.8 3.5 3.5 3.0 3.7 3.0 PCR (%) 49.3 42.8 42.6 49.1 49.5 52.7 53.5 58.5 49.1 58.5
IndusInd Bank Buy CMP INR1,529 | TP: INR1,600 (+5%) EPS CHANGE (%): FY20|21: +1.7|-4.5 Loan growth to moderate led by the auto slowdown. Credit costs to remain elevated. Margins to expand driven by high-yielding MFI portfolio. Watch out for progress on stressed asset resolution.
Quarterly Performance (INR m) FY19 FY20E FY20E 1Q 2Q 3Q 4Q 1Q 2Q 3QE 4QE Net Interest Income 21,224 22,033 22,881 22,324 28,440 29,094 29,797 30,276 117,606 % Change (YoY) 19.6 21.0 20.8 11.2 34.0 32.0 30.2 35.6 32.9 Other Income 13,016 13,173 14,689 15,590 16,633 17,272 18,297 20,077 72,278 Total Income 34,240 35,206 37,569 37,914 45,072 46,365 48,094 50,353 189,884 Operating Expenses 15,129 15,281 16,400 17,237 19,163 20,131 20,840 22,611 82,744 Operating Profit 19,111 19,924 21,170 20,677 25,910 26,234 27,254 27,742 107,140 % Change (YoY) 20.3 22.0 27.2 16.9 35.6 31.7 28.7 34.2 32.5 Provisions 3,500 5,903 6,067 15,607 4,306 7,377 7,084 6,290 25,057 Profit before Tax 15,611 14,022 15,103 5,070 21,603 18,857 20,170 21,452 82,083 Tax 5,254 4,819 5,253 1,469 7,278 4,848 5,083 5,738 22,947 Net Profit 10,357 9,203 9,850 3,601 14,325 14,010 15,087 15,714 59,136 % Change (YoY) 23.8 4.6 5.2 -62.2 38.3 52.2 53.2 336.4 79.1 Operating Parameters Deposit Growth (%) 18.8 18.9 20.3 28.5 26.3 23.2 22.4 22.0 22.0 Loan Growth (%) 29.4 32.4 34.7 28.6 28.4 20.8 19.2 18.9 18.9 Deposit (INR b) 1,589 1,682 1,757 1,949 2,006 2,072 2,150 2,377 2,377 Loan (INR b) 1,507 1,631 1,732 1,864 1,935 1,971 2,064 2,215 2,215 Asset Quality Gross NPA (INR b) 17.4 17.8 19.7 39.5 42.0 43.7 45.5 46.6 46.6 Gross NPA (%) 1.2 1.1 1.1 2.1 2.2 2.2 2.2 2.1 2.1 Net NPA (INR b) 7.6 7.9 10.3 22.5 23.8 22.0 21.8 22.2 22.2 Net NPA (%) 0.5 0.5 0.6 1.2 1.2 1.1 1.1 1.0 1.0 PCR (%) 56.2 55.8 47.7 43.0 43.3 49.6 52.0 52.4 52.4 *FY20 numbers incorporates merger with BHAFIN and hence not comparable with previous year

January 2020 99
December 2019 Results Preview | Sector: Financials
Kotak Mahindra Bank Neutral CMP INR1,671 | TP: INR1,600 (-4%) EPS CHANGE (%): FY20|21: +1.4|+1.3 Estimate modest loan growth at 14% YoY. CASA retention to be the key driver for NII and NIMs. Margins likely to remain flat at 4.6%. Asset quality to remain stable with GNPA at ~2.3%.
Quarterly Performance (INR m) Y/E March FY19 FY20E FY19 FY20E 1Q 2Q 3Q 4Q 1Q 2Q 3QE 4QE Net Interest Income 25,829 26,891 29,391 30,479 31,730 33,496 34,968 36,223 112,590 136,417 % Change (Y-o-Y) 15.0 16.3 22.8 18.1 22.8 24.6 19.0 18.8 18.1 21.2 Other Income 11,646 12,053 9,639 12,703 13,047 12,244 12,803 14,162 46,040 52,256 Total Income 37,475 38,944 39,030 43,182 44,778 45,740 47,770 50,384 158,630 188,673 Operating Expenses 17,150 17,994 19,646 20,359 20,789 20,654 21,848 22,387 75,148 85,678 Operating Profit 20,325 20,950 19,384 22,823 23,989 25,086 25,923 27,997 83,482 102,994 % Change (Y-o-Y) 27.4 21.5 6.5 13.1 18.0 19.7 33.7 22.7 16.6 23.4 Other Provisions 4,696 3,538 -323 1,713 3,168 4,079 3,826 3,641 9,624 14,714 Profit before Tax 15,629 17,412 19,707 21,110 20,822 21,006 22,097 24,356 73,858 88,281 Tax Provisions 5,380 5,995 6,798 7,032 7,220 3,762 5,546 6,621 25,205 23,149 Net Profit 10,249 11,417 12,909 14,078 13,602 17,245 16,551 17,734 48,653 65,132 % Change (Y-o-Y) 12.3 14.8 22.6 25.2 32.7 51.1 28.2 26.0 19.1 33.9 Deposits (INRb) 1,897 2,058 2,138 2,259 2,329 2,331 2,445 2,598 2,259 2,598 Loans (INRb) 1,769 1,849 1,964 2,057 2,080 2,133 2,242 2,365 2,057 2,365 Deposit growth (%) 16.0 24.2 18.2 17.3 22.8 13.2 14.4 15.0 17.3 15.0 Loan growth (%) 24.3 21.2 23.5 21.2 17.6 15.3 14.1 15.0 21.2 15.0 Asset Quality Gross NPA (INR b) 39.0 40.3 41.3 44.7 46.1 50.3 52.3 55.5 44.7 55.5 Gross NPA (%) 2.2 2.2 2.1 2.1 2.2 2.3 2.3 2.3 2.1 2.3 Net NPA (INR b) 15.3 15.0 14.0 15.4 15.2 18.1 18.3 18.7 15.4 18.7 Net NPA (%) 0.9 0.8 0.7 0.8 0.7 0.9 0.8 0.8 0.8 0.8 PCR (%) 60.8 62.8 66.2 65.4 67.0 64.0 65.0 66.3 65.4 66.3
Punjab National Bank Neutral CMP INR67 | TP: INR65 (-3%) EPS CHANGE (%): FY20|21: -8.9|-0.4 Expect business growth to remain muted. Slippages to remain elevated at ~6.4%. Expect strong recoveries on resolutions in large accounts. Margins to remain flat.
Quarterly Performance (INR b) Y/E March FY19 FY20E FY19 FY20E 1Q 2Q 3Q 4Q 1Q 2Q 3QE 4QE Net Interest Income 46.9 39.7 42.9 42.0 41.4 42.6 45.3 48.4 171.6 177.8 % Change (YoY) 21.7 -1.0 7.6 37.1 -11.7 7.3 5.7 15.2 15.0 3.6 Other Income 19.6 17.1 18.2 18.9 20.8 22.6 20.5 21.6 73.8 85.6 Total Income 66.5 56.8 61.1 60.9 62.2 65.3 65.9 70.0 245.3 263.4 Operating Expenses 24.6 28.4 30.1 32.3 27.4 29.7 29.4 31.1 115.4 117.6 Operating Profit 41.9 28.4 31.0 28.6 34.8 35.6 36.5 38.9 130.0 145.8 % Change (YoY) 30.4 -13.4 -27.0 -739.5 -17.0 25.4 17.7 36.0 26.2 12.2 Other Provisions 57.6 97.6 27.5 100.7 20.2 29.3 36.0 26.9 283.4 112.4 Profit before Tax -15.6 -69.2 3.5 -72.1 14.6 6.3 0.5 12.0 -153.5 33.4 Tax -6.2 -23.9 1.0 -24.6 4.4 1.3 0.1 53.0 -53.7 58.7 Net Profit -9.4 -45.3 2.5 -47.5 10.2 5.1 0.4 -41.0 -99.8 -25.4 % Change (YoY) -373.7 -908.5 7.1 -64.6 -208.4 -111.2 -84.4 -13.7 -18.8 -74.6 Operating Parameters Deposits (INR b) 6,303 6,497 6,504 6,760 6,725 6,958 6,980 7,200 6,760 7,200 Loans (INR b) 4,153 4,310 4,344 4,582 4,218 4,279 4,584 4,766 4,582 4,766 Deposit Growth (%) 0.8 2.1 0.4 5.3 6.7 7.1 7.3 6.5 5.3 6.5 Loan Growth (%) 3.9 5.0 -3.9 5.7 1.6 -0.7 5.5 4.0 5.7 4.0 Asset Quality Gross NPA (INR B) 829 813 777 785 773 795 789 774 785 774 Net NPA (INR B) 439 383 357 300 302 327 336 324 304 324 Gross NPA (%) 18.3 17.2 16.3 15.5 16.5 16.8 15.7 14.8 15.5 14.8 Net NPA (%) 10.6 8.9 8.2 6.6 7.2 7.7 7.3 6.8 6.6 6.8 PCR (%) 47.1 52.9 54.1 61.7 60.9 58.9 57.5 58.1 61.3 58.1

January 2020 100
December 2019 Results Preview | Sector: Financials
RBL Bank Buy CMP INR370 | TP: INR350 (-5%) EPS CHANGE (%): FY20|21: -15.2|+3.4 Loan growth driven by the cards/MFI business. Credit cost to remain elevated in the near term. Asset quality to decline on exposure to stressed accounts. Watch out for movement in the stressed watchlist.
Quarterly Performance (INRm) FY19 FY20E FY19 FY20E 1Q 2Q 3Q 4Q 1Q 2Q 3QE 4QE Net Interest Income 5,527 5,930 6,551 7,387 8,173 8,687 8,941 9,262 25,395 35,063 % Change (Y-o-Y) 46.1 41.1 40.2 47.6 47.9 46.5 36.5 25.4 43.8 38.1 Other Income 3,260 3,331 3,741 4,092 4,812 4,415 4,472 4,762 14,424 18,462 Total Income 8,787 9,261 10,291 11,480 12,985 13,102 13,414 14,025 39,818 53,526 Operating Expenses 4,464 4,770 5,307 5,880 6,797 6,744 6,916 7,139 20,420 27,597 Operating Profit 4,323 4,491 4,985 5,600 6,188 6,358 6,497 6,885 19,398 25,929 % Change (Y-o-Y) 38.8 48.1 49.5 46.2 43.1 41.6 30.3 23.0 45.7 33.7 Other Provisions 1,404 1,397 1,607 2,000 2,132 5,333 5,885 3,909 6,407 17,259 Profit before Tax 2,920 3,094 3,378 3,600 4,056 1,025 612 2,976 12,992 8,670 Tax Provisions 1,019 1,048 1,126 1,128 1,386 482 153 747 4,322 2,768 Net Profit 1,900 2,045 2,252 2,472 2,671 543 459 2,229 8,670 5,902 % Change (Y-o-Y) 34.8 35.8 36.2 38.8 40.5 -73.4 -79.6 -9.8 36.5 -31.9 Operating Parameters Deposit (INR b) 449.5 477.9 521.9 583.9 608.1 628.3 657.8 718.3 583.9 718.3 Loan (INR b) 422.0 458.7 498.9 543.1 568.4 584.8 617.2 657.1 543.1 657.1 Deposit Growth (%) 26.9 30.7 35.1 33.0 35.3 31.5 26.0 23.0 33.0 23.0 Loan Growth (%) 35.7 36.6 35.2 34.9 34.7 27.5 23.7 21.0 34.9 21.0 Asset Quality Gross NPA (INR b) 6.0 6.4 7.0 7.5 7.9 15.4 22.8 26.4 7.5 26.4 Gross NPA (%) 1.4 1.4 1.4 1.4 1.4 2.6 3.6 4.0 1.4 4.0 Net NPA (INR b) 3.2 3.4 3.6 3.7 3.7 9.1 13.5 14.7 3.7 14.7 Net NPA (%) 0.8 0.7 0.7 0.7 0.7 1.6 2.2 2.2 0.7 2.2 PCR (%) 47.0 47.5 48.5 50.6 52.9 41.0 44.3 50.6 44.3
State Bank of India Buy CMP INR339 | TP: INR425 (+25%) EPS CHANGE (%): FY20|21: -4.8|+0 Strong recoveries from resolution in few large accounts
(Essar steel, Ruchi Soya, etc.). Expect slippages to remain elevated at ~3.1%.
Loan growth driven by retail segment. Watch out for SMA1/2 numbers.
Quarterly Performance (INR b) Y/E March FY19 FY20E FY19 FY20E 1Q 2Q 3Q 4Q 1Q 2Q 3QE 4QE Net Interest Income 218.0 209.1 226.9 229.5 229.4 246.0 247.4 254.6 883.5 977.4 % Change (YoY) 23.8 12.5 21.4 14.9 5.2 17.7 9.0 10.9 18.0 10.6 Other Income 66.8 93.8 80.4 126.9 80.2 120.2 95.0 138.5 367.7 433.9 Total Income 284.8 302.8 307.3 356.4 309.5 366.2 342.5 393.1 1,251.2 1,411.4 Operating Expenses 165.0 163.8 181.0 187.1 177.1 184.2 187.8 190.2 696.9 739.3 Operating Profit 119.7 139.0 126.2 169.3 132.5 182.0 154.7 203.0 554.4 672.1 % Change (YoY) 0.8 -30.5 7.4 6.6 10.6 30.9 22.5 19.9 -6.8 21.2 Other Provisions 192.3 120.9 60.1 165.0 91.8 131.4 49.6 81.5 531.3 354.3 Profit before Tax -72.6 18.1 66.2 4.3 40.6 50.6 105.1 121.5 23.1 317.8 Tax Provisions -23.8 8.7 26.6 -4.1 17.5 20.5 33.1 28.6 14.5 99.7 Net Profit -48.8 9.4 39.5 8.4 23.1 30.1 72.0 92.9 8.6 218.1 % Change (YoY) -343.1 -40.3 -263.7 -110.9 -147.4 218.7 82.0 1,008.1 -113.2 2,429.8 Operating Parameters Deposits (INR t) 27.5 28.1 28.3 29.1 29.5 30.3 30.6 31.6 29.1 31.6 Loans (INR t) 18.8 19.6 20.5 21.9 21.3 21.5 22.6 24.0 21.9 24.0 Deposit Growth (%) 5.6 7.0 6.8 7.6 7.3 8.0 8.1 8.5 7.6 8.5 Loan Growth (%) 4.0 8.6 12.1 13.0 13.8 9.6 10.5 10.0 13.0 10.0 Asset Quality Gross NPA (%) 10.7 10.0 8.7 7.5 7.5 7.2 6.7 5.9 7.5 5.9 Net NPA (%) 5.3 4.8 4.0 3.0 3.1 2.8 2.7 2.3 3.0 2.3 PCR (%) 53.4 53.9 56.9 61.9 61.1 62.9 61.5 62.7 61.9 62.7

January 2020 101
December 2019 Results Preview | Sector: Financials
HDFC Standard Life Insurance Neutral CMP INR634 | TP: INR600 (-5%) EPS CHANGE (%): FY20|21: -2.1|-3.7 New business premium to remain healthy driven by first
year and single premiums. Protection mix to continue improving; RoEV to remain at
healthy levels. VNB margins likely to moderate, but will remain healthy. Opex to remain stable, resulting in stable expense ratio.
Policy holder's A/c (INR m)
FY19 FY20E
FY19 FY20E 1Q 2Q 3Q 4Q 1Q 2Q 3QE 4QE
Net premium income 49,947 67,776 68,977 102,475 64,512 74,537 84,299 140,344 289,240 363,691 Growth (%) 36.4% 25.8% 27.3% 15.1% 29.2% 10.0% 22.2% 37.0% 23.8% 25.7% Commission paid 1,982 2,637 2,623 3,935 3,222 3,655 3,825 5,574 11,177 16,277 Operating expense 7,246 9,458 9,243 12,189 8,808 10,955 10,708 12,924 38,136 43,395 Surplus/(Deficit) 3,388 1,946 2,217 5,956 3,765 2,130 3,008 2,932 13,507 11,834 Shareholder's A/c Total income 4,081 3,073 2,604 6,605 4,491 3,603 3,148 5,610 16,364 16,852 PBT 3,918 2,963 2,565 3,453 4,369 3,268 3,023 4,606 12,899 15,265 PAT 3,802 2,869 2,456 3,640 4,246 3,087 2,830 4,263 12,768 14,425 Growth (%) 20.2% 20.3% 18.5% 5.0% 11.7% 7.6% 15.2% 17.1% 15.1% 13.0% Key metrics VNB (INR b) 2.5 3.6 3.6 5.7 5.1 4.5 4.6 6.8 15.4 21.0 EV (INR b) 157 164 174 183 192 201 211 222 183 222 VNB Margins (%) 24.2 24.3 23.4 25.7 29.8 25.4 24.4 26.0 24.6 26.1 Solvency ratio (%) 197.0 193.0 191.0 188.0 193.0 192.0 187.4 178.9 188.0 178.9
ICICI Prudential Life Insurance Buy CMP INR487 | TP: INR520 (+7%) EPS CHANGE (%): FY20|21: +0|+0 New business premium to be driven by single premiums. Expense ratio to remain stable. VNB margins expected to remain healthy. Mix of protection business to continue improving.
Policy holder's A/c (INR m)
FY19 FY20E
FY19 FY20E 1Q 2Q 3Q 4Q 1Q 2Q 3QE 4QE
Net premium income 54,378 76,012 74,830 100,563 62,081 80,647 86,562 121,551 305,783 349,090 Growth (%) 12.8% 16.2% 10.1% 16.2% 14.2% 6.1% 15.7% 20.9% 14.1% 14.2% Commission paid 2,795 3,951 3,671 5,095 2,648 3,945 5,021 9,308 15,513 20,923 Operating expense 5,952 6,585 5,785 7,732 6,458 7,542 7,820 10,762 26,053 32,582 Surplus/(Deficit) 3,009 2,003 3,254 4,067 4,221 4,768 3,481 2,157 12,333 14,626 Shareholder A/c Total income 3,864 2,910 4,046 6,459 5,122 6,015 4,434 2,904 17,307 18,476 PBT 2,840 3,032 2,975 2,782 2,870 3,063 3,342 3,391 11,612 13,024 PAT 2,816 3,009 2,968 2,614 2,849 3,019 3,267 2,749 11,389 12,242 Growth (%) -30.6% -28.6% -34.4% -23.3% 1.2% 0.3% 10.1% 5.2% -29.7% 7.5% Key metrics VNB (INRb) 2.4 3.5 3.2 4.2 3.1 4.0 3.7 4.9 13.3 15.7 EV (INRb) - 192 - 216 - 227 239 252 216 252 VNB Margins (%) 17.5 17.5 17.0 17.0 21.0 21.0 20.8 21.7 17.0 21.6 Solvency ratio (%) 235 234 224 215 217 211 205 197 215 197

January 2020 102
December 2019 Results Preview | Sector: Financials - NBFCs
Mixed quarter – Good festive season but moderation thereafter Asset quality key monitorable
While the quarter started out on a positive note with respect to festive demand across categories, the post-festive season has been muted especially on vehicle financing.
All companies continued with higher liquidity on the balance sheet. While the supply of money from the capital markets to NBFCs remains tight, there is a clear trend of polarization – good companies with strong parentage are getting disproportionate money. In addition, cost of funds for these players is 50-100bp cheaper than that from banks.
Auto sales are exhibiting divergent trends. While volumes in certain segments like passenger cars have stabilized, those in M&HCV continue declining. Some players also offered lower yields in certain product segments during the festival season to boost sales.
HFCs with good parentage are likely to deliver healthy retail growth, driven by stable disbursement growth and lower prepayment rates due to a moderation in competitive intensity from smaller HFCs. However, the non-retail segment will continue witnessing moderation for all companies. Within our coverage universe, we expect stable growth from HDFC and LICHF, while other companies are likely to face a slowdown. Overall, we expect HFCs to lose market share to banks in the core home loan segment.
Asset quality remains a key monitorable. We note of increased delinquencies in LAP and M&HCV financing on an industry wide basis. Home loans and other products in vehicle financing are still maintaining largely stable asset quality. Lower resale rates may increase the ultimate losses and impact provisioning. Asset quality performance in corporate loans will be a key monitorable.
We remain selective in the NBFC space and prefer companies with good parentage. Our top picks in the sector are HDFC, LTFH and MMFS.
Housing finance – divergent performance across companies We expect HFCs to report divergent performances in 3QFY20. In our view, HDFC and LICHF are better off compared to other HFCs in the tight liquidity environment. AUM growth for both HDFC and LICHF should be 14-15%. There would be pressure on yields as both companies cut home loan rates by 10bp in the quarter. However, with the benefit of falling cost of funds, spreads are likely to remain sequentially stable. Asset quality performance of LICHF will be a key monitorable as it has been deteriorating over the past few quarters. PNBHF had a tough quarter - we expect it to report marginal decline in disbursements QoQ (on a lower base), resulting in early teens AUM growth. Spreads are likely to remain under pressure, while total income would get a boost from upfronting of gains on assignments.
Vehicle finance – credit costs a key monitorable Auto sales have exhibited divergent trends. While volumes in certain segments like passenger cars have stabilized, those in M&HCV continue declining. For CIFC we expect largely stable disbursements on a sequential basis. However MMFS may show sequential decline. We also see two key trends emerging from these NBFCs: (a) less focus on HCVs given intense pricing pressure from banks and (b) incremental migration toward financing of used vehicles. SHTF is likely to witness a subdued
Financials - NBFCs
Company name
Bajaj Finance
Chola. Inv & Fin.
HDFC
Indostar Capital
L&T Finance
LIC Housing Fin
M & M Financial
MAS Financial
Muthoot Finance
PNB Housing
Repco Home Fin
Shriram City Union
Shriram Transport Fin.
Research Analyst: Alpesh Mehta ([email protected]); +91 22 6129 1526 | Piran Engineer ([email protected]); +91 22 6129 1539 Nitin Aggarwal ([email protected]); +91 22 6129 1542 | Divya Maheshwari ([email protected]); +91 22 71934336

January 2020 103
December 2019 Results Preview | Sector: Financials - NBFCs
quarter on the growth front with low-to-mid single digit AUM growth, while MMFS would report high-teens AUM growth. On the margin front, we largely expect to see stability as incremental cost of funds has improved in the past three months. There has been an increase in delinquency levels for M&CV fleet operators across all financiers. Further, resale rates are lower leading to higher ultimate losses then provided for. As a result, there could be a rise in credit costs for vehicle financiers.
BAF to outperform; MUTH to be stable; SCUF/Indostar to have muted quarter BAF is likely to have a strong quarter with 35% AUM growth and 55%+ PAT growth (note that the superior PAT growth factors in the tax rate cuts and capital raise benefits). LTFH should continue its trend of balance sheet retailization – though growth is expected to remain modest on a consolidated basis. Having raised USD450m of foreign borrowings in Oct’19, MUTH resumed AUM growth in the quarter. While SCUF witnessed strong disbursements in 2Ws in the festive season, post-festive sales have been muted. Its MSME segment remains sluggish though. INDOSTAR is likely to have a muted quarter as the book continues to run down, while credit costs could inch up in the wholesale segment. We remain selective in the NBFC space and prefer companies with good parentage. Our top picks in the sector are HDFC, LTFH and MMFS.
Exhibit 62: Quarterly Performance Sector CMP NII (INR M) OP. PROFITS (INR M) NET PROFIT (INR M)
(INR) Rating Dec-19 Var % YoY
Var % QoQ Dec-19 Var
% YoY Var
% QoQ Dec-19 Var % YoY
Var % QoQ
NBFC Bajaj Finance 4,248 Neutral 34,060 30.7 8.5 28,672 37.4 9.6 16,441 55.2 9.2 Chola. Inv & Fin. 309 Buy 10,236 16.9 0.3 6,422 14.8 3.8 3,981 30.8 29.7 HDFC 2,466 Buy 30,867 7.2 4.6 29,257 2.1 0.9 22,638 10.8 -24.0 IndoStar Capital 196 Buy 1,450 2.8 -13.1 1,127 -1.3 -19.3 319 -55.2 -35.3 L&T Fin.Holdings 121 Buy 16,402 9.6 -4.3 12,243 17.4 -8.3 6,040 4.0 -6.8 LIC Housing Fin 456 Buy 12,142 16.5 0.5 11,288 13.8 -0.5 6,898 15.7 -10.7 M & M Financial 339 Buy 13,109 8.3 2.1 7,849 5.4 -4.2 3,901 22.4 54.9 MAS Financial 864 Buy 979 -4.8 3.4 764 -7.4 5.4 442 -2.8 -5.3 Muthoot Finance 768 Neutral 12,595 15.1 -12.3 8,665 10.5 -19.3 6,369 31.3 -25.8 PNB Housing 493 Buy 4,844 36.9 -2.1 5,636 10.1 -2.4 3,482 14.9 -5.1 Repco Home Fin 327 Buy 1,200 5.8 3.5 1,044 11.2 2.3 684 22.9 -32.0 Shriram City Union 1,388 Buy 8,970 -0.1 0.4 5,639 3.0 -1.8 2,729 5.5 -8.3 Shriram Transport Fin. 1,160 Buy 20,203 -0.5 1.2 15,837 -2.2 -0.2 6,906 8.7 -9.7 NBFC Banking Sector Aggregate 167,057 12.5 1.2 134,444 11.6 -0.8 80,831 19.6 -9.7 Financials Sector Aggregate 1,107,261 15.8 3.6 723,442 18.2 -2.8 319,482 32.7 27.9 E: MOFSL Estimates; Note: FY19 numbers as of Ind-AS; UR: Under Review; Source: MOFSL

January 2020 104
December 2019 Results Preview | Sector: Financials - NBFCs
Exhibit 63: Valuation summary CMP EPS (INR) PE (x) PB (x) RoE (%) Company Name INR Reco FY20E FY21E FY22E FY20E FY21E FY22E FY20E FY21E FY22E FY20E FY21E FY22E NBFC 25.2 21.5 18.6 3.7 3.3 2.9 14.7 15.2 15.4 Aditya Birla Cap 107 Buy 4.3 5.6 6.9 24.5 19.0 15.5 2.2 1.9 1.6 9.8 10.6 11.3 Bajaj Finance 4,248 Neutral 103.4 137.1 166.5 41.1 31.0 25.5 7.6 6.2 5.1 23.2 22.0 22.0 Chola. Inv & Fin. 309 Buy 18.3 21.2 23.3 16.9 14.6 13.3 3.2 2.7 2.3 20.9 20.2 18.6 HDFC 2,466 Buy 51.7 57.9 64.9 47.7 42.6 38.0 4.9 4.5 4.2 14.6 14.4 14.6 IndoStar Capital 196 Buy 20.6 26.8 31.8 9.5 7.3 6.2 0.6 0.5 0.5 6.1 7.4 8.1 L&T Fin.Holdings 121 Buy 12.2 14.4 16.1 9.9 8.4 7.5 1.5 1.3 1.1 16.6 16.9 16.3 LIC Housing Fin 456 Buy 56.6 61.6 72.4 8.1 7.4 6.3 1.2 1.1 1.0 16.5 15.8 16.3 M & M Financial 339 Buy 23.2 31.3 35.2 14.6 10.8 9.6 1.8 1.6 1.4 13.0 15.6 15.6 MAS Financial 864 Buy 32.3 39.4 47.3 26.8 21.9 18.3 4.6 4.0 3.4 19.4 20.2 20.6 Muthoot Finance 768 Neutral 66.3 76.3 86.6 11.6 10.1 8.9 2.8 2.3 2.0 26.2 25.2 24.1 PNB Housing 493 Buy 80.9 89.7 104.4 6.1 5.5 4.7 1.0 0.8 0.7 17.1 16.4 16.6 Repco Home Fin 327 Buy 48.6 52.5 60.6 6.7 6.2 5.4 1.1 1.0 0.8 18.2 16.7 16.5 Shriram City Union 1,388 Buy 167.9 181.6 202.4 8.3 7.6 6.9 1.2 1.1 1.0 16.1 15.1 14.8 Shriram Transport Fin. 1,160 Buy 122.8 129.9 146.3 9.4 8.9 7.9 1.5 1.3 1.1 16.5 15.2 15.0
Exhibit 64: Relative performance—3 months (%)
Source: Bloomberg, MOFSL
Exhibit 65: Relative performance—1 year (%)
Source: Bloomberg, MOFSL
95
100
105
110
115
Sep-
19
Oct
-19
Nov
-19
Dec-
19
Nifty Index MOSL Financials Index
90
100
110
120
130
Dec-
18
Jan-
19
Feb-
19
Mar
-19
Apr-
19
May
-19
Jun-
19
Jul-1
9
Aug-
19
Sep-
19
Oct
-19
Nov
-19
Dec-
19
Nifty Index MOSL Financials Index

January 2020 105
December 2019 Results Preview | Sector: Financials - NBFCs
The tables below provide a snapshot of actual and estimated numbers for companies under the MOFSL coverage universe. Highlighted columns indicate the quarter/financial year under review.
Bajaj Finance Neutral CMP INR4248 | TP: INR4500 (+6%) EPS CHANGE (%): FY20|21: -2.1|+2.3 Customer base growth moderate on higher base. Yet, AUM growth of 35% YoY healthy. Benefits of capital raise to help margins. Commentary on growth and Karvy issue key monitorables.
BAF: Quarterly Performance (INR m) Y/E March FY19 FY20
FY19 FY20E 1Q 2Q 3Q 4Q 1Q 2Q 3QE 4QE Interest Income 35,100 37,950 43,921 46,514 51,013 54,620 60,082 63,729 163,488 229,444 Interest expenses 13,591 15,654 17,861 19,132 21,134 23,234 26,022 27,278 66,236 97,668 Net Interest Income 21,509 22,296 26,059 27,382 29,879 31,386 34,060 36,451 97,252 131,776
YoY Growth (%) 22.2 16.8 18.8 21.1 38.9 40.8 30.7 33.1 19.6 35.5 Other Operating Income 4,278 4,783 5,929 6,571 7,070 8,605 10,012 10,739 21,530 36,426 Net Income 25,787 27,079 31,989 33,953 36,949 39,991 44,072 47,189 118,782 168,202
YoY Growth (%) 46.4 40.7 45.7 49.9 43.3 47.7 37.8 39.0 27.7 41.6 Operating Expenses 9,546 9,588 11,127 11,744 12,928 13,825 15,400 16,238 41,977 58,391 Operating Profit 16,241 17,491 20,861 22,209 24,022 26,167 28,672 30,951 76,805 109,811
YoY Growth (%) 59.6 53.0 55.5 61.9 47.9 49.6 37.4 39.4 27.3 43.0 Provisions and Cont. 3,268 3,146 4,508 4,093 5,507 5,942 6,750 6,338 15,014 24,537 Profit before Tax 12,973 14,345 16,354 18,116 18,514 20,224 21,922 24,613 61,792 85,274 Tax Provisions 4,615 5,110 5,761 6,356 6,562 5,161 5,480 6,185 21,842 23,389 Net Profit 8,359 9,235 10,593 11,761 11,953 15,063 16,441 18,428 39,950 61,885
YoY Growth (%) 81.3 54.5 53.5 57.3 43.0 63.1 55.2 56.7 60.0 54.9 AUM Growth (%) 32.4 34.9 37.8 40.6 41.2 38.3 35.1 35.0 42.1 35.0 Borrowings Growth (%) 25.9 54.7 60.4 64.4 66.4 46.1 39.8 34.5 52.6 34.5 Cost to Income Ratio (%) 37.0 35.4 34.8 34.6 35.0 34.6 34.9 34.4 35.3 34.7 Tax Rate (%) 35.6 35.6 35.2 35.1 35.4 25.5 25.0 25.1 35.3 27.4
Cholamandalam Inv & Fin Buy CMP INR309 | TP: INR360 (+17%) EPS CHANGE (%): FY20|21: -0.5|-1.2 Muted quarter - Disbursements up only 2% YoY. Cost of funds expected to be sequentially stable. Expect INR1.1b provisions v/s INR950m QoQ. Watch out for commentary on asset quality in VF.
CIFC: Quarterly Performance (INR m) Y/E March FY19 FY20
FY19 FY20E 1Q 2Q 3Q 4Q 1Q 2Q 3QE 4QE Income from Operations 16,057 16,751 18,261 18,851 20,295 21,970 22,299 22,654 69,920 87,218 Interest Expenses 7,950 8,565 9,508 9,864 10,870 11,769 12,064 12,342 35,887 47,045 Net Interest Income 8,107 8,185 8,753 8,987 9,425 10,200 10,236 10,312 34,032 40,173
YoY Growth (%) 22.2 17.9 22.2 20.9 16.3 24.6 16.9 14.8 9.2 18.0 Total Income 8,109 8,186 8,754 8,989 9,425 10,201 10,238 10,316 34,039 40,180
YoY Growth (%) 22.2 17.9 22.2 20.9 16.2 24.6 16.9 14.8 9.2 18.0 Operating Expenses 2,816 2,901 3,158 3,820 3,500 4,016 3,815 3,876 12,696 15,208 Operating Profit 5,293 5,285 5,596 5,169 5,925 6,185 6,422 6,440 21,344 24,972
YoY Growth (%) 22.5 24.8 28.8 20.5 11.9 17.0 14.8 24.6 16.7 17.0 Provisions & Loan Losses 905 690 961 556 1,095 952 1,100 954 3,112 4,101 Profit before Tax 4,388 4,595 4,635 4,614 4,830 5,233 5,322 5,486 18,232 20,871 Tax Provisions 1,535 1,549 1,591 1,695 1,688 2,163 1,341 1,402 6,370 6,594 Net Profit 2,852 3,047 3,044 2,919 3,142 3,070 3,981 4,084 11,862 14,277
YoY Growth (%) 36.0 49.4 38.7 2.3 10.2 0.8 30.8 39.9 21.8 20.4 AUM Growth (%) 29.5 30.9 29.3 26.5 26.8 24.2 22.2 20.8 26.5 20.8 NIM on AUM (%) 7.3 7.0 7.1 6.9 6.7 7.0 6.8 6.5 6.1 5.8 Cost to Income Ratio (%) 34.7 35.4 36.1 42.5 37.1 39.4 37.3 37.6 37.3 37.8 Tax Rate (%) 35.0 33.7 34.3 36.7 34.9 41.3 25.2 25.5 34.9 31.6

January 2020 106
December 2019 Results Preview | Sector: Financials - NBFCs
HDFC Buy CMP INR2466 | TP: INR2850 (+16%) EPS CHANGE (%): FY20|21: -0.8|-3.2 Key beneficiary of polarization of funding toward NBFCs. Selldown during the quarter declined ~40% QoQ.
INR90.2b MTM on GRUH merger with Bandhan Bank. INR30b one-time provision on stake sale gain.
Expect lower upfront assignment income. Adjusted PAT growth is factoring in core tax rate of 22%.
HDFC: Quarterly Performance (INR m) Y/E March FY19 FY20 FY19 FY20E 1Q 2Q 3Q 4Q 1Q 2Q 3QE 4QE Interest Income 90,957 96,627 1,01,389 1,03,430 1,07,811 1,07,809 1,09,388 1,14,288 3,92,402 4,39,296 Interest Expense 63,527 70,445 72,586 71,819 77,393 78,307 78,521 79,863 2,78,377 3,14,083 Net Interest Income 27,430 26,182 28,802 31,611 30,418 29,502 30,867 34,425 1,14,026 1,25,213
YoY Change (%) 20.8 16.0 17.3 19.3 10.9 12.7 7.2 8.9 18.3 9.8 Assignment Income 1,415 3,973 2,551 662 2,962 2,639 1,600 2,431 8,600 9,632 NII (including assignment income) 28,845 30,155 31,353 32,273 33,380 32,141 32,467 36,857 1,22,625 1,34,844
YoY Change (%) 19.7 21.4 22.5 18.7 15.7 6.6 3.6 14.2 20.6 10.0 Other Operating Income 624 745 699 1,459 628 641 825 1,054 3,527 3,148 Core Income 29,469 30,900 32,052 33,732 34,008 32,782 33,292 37,910 1,26,152 1,37,992
YoY Change (%) 20.3 22.0 23.0 20.2 15.4 6.1 3.9 12.4 21.4 9.4 Operating Expenses 5,096 3,221 3,391 3,158 3,817 3,789 4,035 4,263 14,866 15,905
YoY Change (%) 45.7 -36.8 -35.9 -38.9 -25.1 17.7 19.0 35.0 -22.0 7.0 Core Operating profits 24,373 27,679 28,662 30,573 30,191 28,992 29,257 33,647 1,11,287 1,22,087
YoY Change (%) 16.1 36.8 38.0 33.5 23.9 4.7 2.1 10.1 31.1 9.7 Provisions 197 1,313 1,160 2,515 3,200 2,541 1,100 1,082 5,185 7,923 Core PBT 24,176 26,366 27,502 28,058 26,991 26,451 28,157 32,566 1,06,102 1,14,165
YoY Change (%) 24.9 26.5 45.8 32.2 11.6 0.3 2.4 16.1 32.2 7.6 Profit on Sale of Inv./MTM on Inv. 619 11,054 1,090 4,882 18,492 13,048 91,300 2,161 17,645 1,25,000 Dividend income 5,859 58 21 5,369 11 10,738 40 6,171 11,306 16,960 One off expense/Prov -2,700 -1,465 -5,700 -5,000 -30,000 -4,165 -40,700 Other Income 46 114 75 65 58 67 100 120 300 345 PBT 30,700 34,891 28,688 36,909 39,851 45,304 89,597 41,017 1,31,187 2,15,769
YoY Change (%) 51.8 28.5 -51.0 41.8 29.8 29.8 212.3 11.1 -0.5 64.5 Provision for Tax 8,800 10,220 7,550 8,293 7,820 5,689 25,313 17 34,863 38,838 PAT 21,900 24,671 21,138 28,616 32,031 39,615 64,284 41,000 96,324 1,76,931
YoY Change (%) 53.7 24.7 -60.1 26.8 46.3 60.6 204.1 43.3 -12.1 83.7 PAT (Excl exceptional) 22,260 19,638 20,422 24,784 21,648 29,805 22,638 31,085 87,104 1,05,175
YoY Change (%) 56.3 -0.7 13.3 19.7 -2.8 51.8 10.8 25.4 19.7 20.7

January 2020 107
December 2019 Results Preview | Sector: Financials - NBFCs
IndoStar Capital Finance Buy CMP INR196 | TP: INR270 (+38%) EPS CHANGE (%): FY20|21: -17.0|-17.7 Expect rundown of corporate book; AUM to dip 6% QoQ. With moderating NIMs, expect NII growth at 3% YoY. Expect credit costs at INR700m v/s INR722m QoQ. Watch out for management commentary on asset quality.
INDOSTAR: Quarterly Performance (INR m) Y/E March FY19 FY20
FY19 FY20E 1Q 2Q 3Q 4Q 1Q 2Q 3QE 4QE Interest Income 2,234 2,786 2,886 2,907 3,817 3,718 3,458 3,365 10,813 14,359 Interest Expenses 1,119 1,404 1,474 1,639 2,260 2,049 2,008 1,928 5,636 8,245 Net Interest Income 1,115 1,382 1,411 1,268 1,557 1,670 1,450 1,437 5,177 6,114
YoY Growth (%) 6.5 12.4 36.8 18.8 39.7 20.8 2.8 13.3 18.3 18.1 Other Income 17 412 311 504 374 521 500 605 1,244 1,999 Total Income 1,132 1,794 1,722 1,772 1,931 2,190 1,950 2,041 6,420 8,113
YoY Growth (%) 5.9 43.0 65.5 51.0 70.5 22.1 13.2 15.2 38.6 26.4 Operating Expenses 541 692 580 654 738 793 823 821 2,466 3,175 Operating Profit 591 1,102 1,142 1,118 1,193 1,397 1,127 1,220 3,954 4,937
YoY Growth (%) -23.4 16.2 89.5 67.4 101.7 26.8 -1.3 9.1 28.1 24.9 Provisions & Loan Losses 77 111 48 -73 608 722 700 370 163 2,400 Profit before Tax 514 992 1,094 1,192 585 675 427 850 3,792 2,537 Tax Provisions 200 352 381 451 114 181 108 237 1,384 639 Net Profit 315 640 713 741 471 494 319 613 2,408 1,898
YoY Growth (%) -38.3 -7.9 80.7 83.4 49.6 -22.8 -55.2 -17.2 20.2 -21.2 AUM Growth (%) 50.4 76.0 53.6 93.7 55.0 38.0 30.6 (15.5) 89.1 (15.5) NIM (%) 6.6 7.3 7.3 5.2 5.3 6.0 5.6 5.7 6.4 6.6 Cost to Income Ratio (%) 47.8 38.6 33.7 36.9 38.2 36.2 42.2 40.2 38.4 39.1 Tax Rate (%) 38.8 35.5 34.9 37.8 19.4 26.8 25.2 27.9 36.5 25.2 E: MOFSL Estimates
L&T Finance Buy CMP INR121 | TP: INR140 (+16%) EPS CHANGE (%): FY20|21: -1.5|+2.4 Consolidated loan book to grow 9% YoY to INR1.03t. Credit costs at INR4.5b v/s INR5.9b QoQ.
One-off gains utilized to strengthen the balance sheet. PAT up 4% YoY to INR6.0b.
LTFH: Quarterly performance (INR m) Y/E March FY19 FY20
FY19 FY20E 1Q 2Q 3Q 4Q 1Q 2Q 3QE 4QE Interest Income 31,061 31,532 33,629 33,042 35,945 36,113 35,571 36,963 1,29,265 1,44,593 Interest Expenses 15,122 16,497 18,659 18,325 19,229 18,980 19,169 19,923 68,603 77,301 Net Interest Income 15,939 15,035 14,970 14,717 16,716 17,134 16,402 17,040 60,661 67,292
YoY Growth (%) 54.6 17.2 31.2 15.2 4.9 14.0 9.6 15.8 28.2 10.9 Other income 643 1,870 893 797 950 1,005 1,000 1,098 4,203 4,053 Total Income 16,582 16,905 15,863 15,514 17,666 18,139 17,402 18,139 64,865 71,345
YoY Growth (%) 43.3 30.4 33.0 19.4 6.5 7.3 9.7 16.9 31.2 10.0 Operating Expenses 5,048 5,256 5,430 4,324 4,435 4,791 5,159 5,486 20,058 19,870
YoY Growth (%) 41.6 21.9 50.9 -16.9 -12.1 -8.9 -5.0 26.9 20.3 -0.9 Operating Profits 11,535 11,649 10,433 11,190 13,231 13,349 12,243 12,653 44,806 51,475
YoY Growth (%) 44.1 34.7 25.3 43.6 14.7 14.6 17.4 13.1 36.7 14.9 Provisions 4,243 3,673 2,675 3,696 5,804 5,786 4,500 4,476 14,287 20,566 Profit before Tax 7,292 7,976 7,758 7,494 7,426 7,563 7,743 8,177 30,520 30,910 Tax Provisions 1,894 2,385 1,949 1,972 1,932 1,084 1,704 1,771 8,200 6,491 Profit after tax 5,398 5,591 5,810 5,521 5,494 6,479 6,040 6,406 22,320 24,419
YoY Growth (%) 71.8 62.2 77.8 104.5 1.8 15.9 4.0 16.0 71.8 9.4 Customer assets growth (%) 24.0 24.1 21.8 16.3 15.7 9.9 8.5 5.7 16.3 5.7 Cost to Income Ratio (%) 30.4 31.1 34.2 27.9 25.1 26.4 29.6 30.2 30.9 27.9 Tax Rate (%) 26.0 29.9 25.1 26.3 26.0 14.3 22.0 21.7 26.9 21.0

January 2020 108
December 2019 Results Preview | Sector: Financials - NBFCs
LIC Housing Finance Buy CMP INR456 | TP: INR530 (+16%) EPS CHANGE (%): FY20|21: 1.3|1.3 Expect loan growth at 14% YoY with largely stable mix. Spreads to remain stable at 1.4%; C/I ratio at 11.4%. Estimate provisions of INR2.5b v/s INR2.8b QoQ. Watch out for commentary on growth/asset quality.
LICHF: Quarterly Performance (INR m) Y/E March FY19 FY20 FY19 FY20E 1Q 2Q 3Q 4Q 1Q 2Q 3QE 4QE Interest Income 40,050 41,859 43,722 45,986 47,565 49,100 50,271 52,874 1,71,610 1,99,810 Interest Expenses 30,253 31,382 33,299 33,981 36,026 37,018 38,129 39,568 1,28,916 1,50,741 Net Interest Income 9,797 10,477 10,423 12,005 11,539 12,082 12,142 13,306 42,694 49,069
YoY Growth (%) 5.8 20.5 41.3 21.4 17.8 15.3 16.5 10.8 21.2 14.9 Fees and other income 543 220 670 593 507 691 600 710 2,008 2,507 Net Income 10,339 10,696 11,093 12,598 12,046 12,772 12,742 14,016 44,702 51,577
YoY Growth (%) 11.2 11.5 38.2 21.4 16.5 19.4 14.9 11.3 20.9 15.4 Operating Expenses 846 1,049 1,173 1,683 1,064 1,431 1,454 1,590 4,726 5,539 Operating Profit 9,494 9,647 9,921 10,915 10,982 11,341 11,288 12,427 39,976 46,037
YoY Growth (%) 14.1 11.5 39.7 23.7 15.7 17.6 13.8 13.9 22.7 15.2 Provisions and Cont. 1,610 2,194 1,325 1,052 2,573 2,780 2,500 2,439 6,181 10,292 Profit before Tax 7,884 7,453 8,596 9,862 8,409 8,561 8,788 9,988 33,796 35,745 Tax Provisions 2,205 1,722 2,633 2,927 2,302 837 1,889 2,121 9,486 7,149 Net Profit 5,679 5,732 5,963 6,936 6,107 7,724 6,898 7,867 24,310 28,596
YoY Growth (%) 25.7 11.5 25.5 16.7 7.5 34.8 15.7 13.4 21.4 17.6 Loan Growth (%) 14.7 16.2 17.2 16.2 17.3 15.4 13.7 12.4 16.2 17.3 Cost to Income Ratio (%) 8.2 9.8 10.6 13.4 8.8 11.2 11.4 11.3 10.6 10.7 Tax Rate (%) 28.0 23.1 30.6 29.7 27.4 9.8 21.5 21.2 28.1 20.0
Mahindra Financial Services Buy CMP INR339 | TP: INR400 (+18%) EPS CHANGE (%): FY20|21: -7.9|-5.8 Expect AUM growth at 18% YoY. INR2.8b provisions in 3QFY20 v/s INR3.6b QoQ.
Factoring in margin decline of 10-20bp QoQ. Watch out for commentary on growth/asset quality.
Quarterly Performance (INR m) Y/E March FY19 FY20 FY19 FY20 1Q 2Q 3Q 4Q 1Q 2Q 3QE 4QE Operating Income 19,285 21,097 22,304 24,552 23,940 24,864 25,612 26,683 87,229 1,01,099 Other Income 111 357 157 243 185 545 150 163 869 1,043 Total income 19,397 21,455 22,461 24,795 24,125 25,409 25,762 26,846 88,098 1,02,141
YoY Growth (%) 28.6 39.4 22.7 37.2 24.4 18.4 14.7 8.3 31.8 15.9 Interest Expenses 8,488 9,310 10,205 11,443 11,282 12,022 12,503 13,025 39,446 48,832 Net Income 10,909 12,145 12,256 13,352 12,843 13,387 13,259 13,821 48,653 53,309
YoY Growth (%) 44.8 50.8 20.7 29.7 17.7 10.2 8.2 3.5 35.0 9.6 Operating Expenses 3,849 4,276 4,812 5,549 5,600 5,196 5,410 5,733 18,476 21,939 Operating Profit 7,060 7,869 7,444 7,803 7,243 8,190 7,849 8,088 30,177 31,370
YoY Growth (%) 65.8 65.9 12.4 28.4 2.6 4.1 5.4 3.7 39.1 4.0 Provisions 2,938 2,311 2,247 -1,145 6,196 3,606 2,750 -1,287 6,352 11,265 Profit before Tax 4,122 5,558 5,197 8,947 1,047 4,584 5,099 9,375 23,824 20,105 Tax Provisions 1,432 1,744 2,010 3,068 363 2,066 1,198 2,203 8,254 5,830 Net Profit 2,691 3,814 3,187 5,880 684 2,518 3,901 7,172 15,571 14,274
YoY Growth (%) 33.6 132.5 -3.8 87.0 -74.6 -34.0 22.4 22.0 54.0 -8.3 Loan growth (%) 17.8 20.6 21.8 26.2 20.9 15.0 12.3 11.5 26.2 11.5 Cost to Income Ratio (%) 35.3 35.2 39.3 41.6 43.6 38.8 40.8 41.5 38.0 41.2 Tax Rate (%) 34.7 31.4 38.7 34.3 34.6 45.1 23.5 23.5 34.6 29.0

January 2020 109
December 2019 Results Preview | Sector: Financials - NBFCs
MAS Financial Buy CMP INR864 | TP: INR1000 (+16%) EPS CHANGE (%): FY20|21: 0.0|0.0 Expect 5% QoQ/25% YoY AUM growth. NII down 5% YoY due to higher funding cost. Asset quality stable – INR175m provisions in 3QFY20. Watch out for commentary on growth/margins.
Quarterly Performance (INR m) Y/E March FY19 FY20 FY19 FY20E
1Q 2Q 3Q 4Q 1Q 2Q 3QE 4QE Revenue from Operations 1,196 1,359 1,615 1,556 1,592 1,674 1,750 1,840 5,726 6,855 Interest expenses 410 501 587 569 644 727 771 833 2,067 2,974 Net Operating Income 786 858 1,028 987 949 947 979 1,007 3,659 3,882
Growth Y-o-Y (%) 49.5 23.1 33.6 20.1 20.7 10.4 -4.8 2.0 30.5 6.1 Operating Expenses 184 201 203 187 192 222 215 226 775 856 Operating Profits 602 657 825 800 756 725 764 780 2,885 3,026
Growth Y-o-Y (%) 64.2 26.6 51.3 20.6 25.5 10.3 -7.4 -2.4 38.7 4.9 Provisions 134 121 132 159 130 226 175 182 545 712 Profit before tax 468 537 694 641 627 499 589 599 2,339 2,314
Growth Y-o-Y (%) 60.7 33.9 50.3 28.7 33.8 -6.9 -15.1 -6.5 41.6 -1.1 Tax Provisions 164 191 239 224 219 33 147 150 818 550 Net Profit 305 346 455 416 407 467 442 449 1,521 1,764
Growth Y-o-Y (%) 81.6 42.2 50.9 29.1 33.7 35.0 -2.8 7.8 47.1 16.0 Int. Exp/Int. Income % 34.3 36.9 36.3 36.6 40.4 43.4 44.0 45.3 36.1 43.4 Cost to Income Ratio % 23.4 23.4 19.8 18.9 20.3 23.5 22.0 22.5 21.2 22.1 Prov to Operating Profits % 22.2 18.3 15.9 19.9 17.1 31.1 22.9 23.3 18.9 23.5 Tax Rate % 35.0 35.6 34.5 35.0 35.0 6.5 25.0 25.1 35.0 23.8
Muthoot Finance Neutral CMP INR768 | TP: INR750 (-2%) EPS CHANGE (%): FY20|21: 0.0|0.0 MUTH raised USD450m via ECBs in 3QFY20. Hence, it resumed lending. See loan growth at 15% YoY. Spreads to improve 60bp QoQ to 12.4%. Credit costs likely to remain subdued.
Quarterly Performance
(INR m)
Y/E March FY19 FY20 FY19 FY20E
1Q 2Q 3Q 4Q 1Q 2Q 3QE 4QE Income from operations 16,108 16,316 16,827 18,319 18,274 21,057 19,629 20,468 67,570 79,429 Other operating income 215 181 338 478 294 312 350 402 1,212 1,357 Total Operating income 16,323 16,496 17,165 18,797 18,568 21,369 19,979 20,870 68,782 80,786
YoY Growth (%) 18.5 -0.7 8.6 14.1 13.8 29.5 16.4 11.0 9.8 17.5 Total Income 16,330 16,501 17,171 18,804 18,587 21,405 19,999 20,885 68,806 80,876
YoY Growth (%) 18.6 -0.7 7.9 10.4 13.8 29.7 16.5 11.1 8.6 17.5 Interest Expenses 5,016 5,354 5,889 6,111 6,416 6,699 7,034 7,473 22,368 27,621 Net Income 11,314 11,148 11,282 12,694 12,171 14,707 12,965 13,412 46,438 53,255 Operating Expenses 3,738 3,669 3,440 4,547 3,972 3,969 4,300 4,881 15,394 17,121 Operating Profit 7,577 7,478 7,842 8,147 8,199 10,738 8,665 8,531 31,044 36,133
YoY Growth (%) 36.5 -12.7 -1.2 -7.3 8.2 43.6 10.5 4.7 0.6 16.4 Provisions 27 25 19 205 33 265 150 146 275 594 Profit before Tax 7,550 7,453 7,823 7,942 8,166 10,473 8,515 8,385 30,769 35,539 Tax Provisions 2,634 2,615 2,971 2,827 2,866 1,894 2,146 2,050 11,047 8,956 Net Profit 4,916 4,838 4,852 5,115 5,300 8,579 6,369 6,335 19,722 26,584
YoY Growth (%) 42.5 8.6 1.4 0.6 7.8 77.3 31.3 23.8 10.9 34.8 Cost to Income Ratio (%) 22.9 22.2 20.0 24.2 21.4 18.5 21.5 23.4 22.4 21.2 Provisions/Op. Profit (%) 0.4 0.3 0.2 2.5 0.4 2.5 1.7 1.7 0.9 1.6 Tax Rate (%) 34.9 35.1 38.0 35.6 35.1 18.1 25.2 24.5 35.9 25.2

January 2020 110
December 2019 Results Preview | Sector: Financials - NBFCs
PNB Housing Finance Buy CMP INR493 | TP: INR630 (+28%) EPS CHANGE (%): FY20|21: -1.8|0.0 3QFY20 remained subdued in terms of disbursements. However, spreads should remain largely stable. Expect provisions at INR1.2b v/s INR1.5b QoQ. Watch out for commentary on asset quality/capital raise.
PNBHF: Quarterly performance (INR m) FY19 FY20
FY19 FY20E 1Q 2Q 3Q 4Q 1Q 2Q 3QE 4QE Interest Income 15,238 16,121 17,641 18,929 19,794 20,159 20,209 20,524 67,929 80,686 Interest Expenses 10,998 12,289 14,103 14,275 15,127 15,213 15,365 15,720 51,664 61,424 Net Interest Income 4,241 3,832 3,538 4,654 4,667 4,946 4,844 4,804 16,265 19,262
YoY Growth (%) 25.0 5.8 -13.7 16.8 10.1 29.1 36.9 3.2 7.7 18.4 Other income 1,245 1,962 3,144 2,553 2,532 2,145 2,200 2,360 8,904 9,237 Total Income 5,486 5,794 6,682 7,207 7,199 7,091 7,044 7,165 25,169 28,499
YoY Growth (%) 33.9 31.8 36.2 17.6 31.2 22.4 5.4 -0.6 28.9 13.2 Operating Expenses 1,293 1,422 1,565 1,655 1,417 1,315 1,408 1,455 5,935 5,596
YoY Growth (%) 34.4 61.5 46.8 9.8 9.6 -7.5 -10.0 -12.1 34.4 -5.7 Operating Profits 4,193 4,372 5,117 5,552 5,782 5,776 5,636 5,710 19,233 22,903
YoY Growth (%) 33.7 24.4 33.3 20.1 37.9 32.1 10.1 2.8 27.3 19.1 Provisions 440 647 701 101 1,642 1,516 1,200 1,182 1,890 5,539 Profit before Tax 3,753 3,725 4,416 5,451 4,140 4,260 4,436 4,528 17,344 17,364 Tax Provisions 1,195 1,195 1,386 1,653 1,296 592 954 979 5,429 3,820 Profit after tax 2,558 2,530 3,030 3,798 2,845 3,668 3,482 3,549 11,915 13,544
YoY Growth (%) 50.4 33.1 32.0 51.0 11.2 45.0 14.9 -6.6 41.7 13.7 Loan growth (%) 45.2 37.0 27.9 29.8 18.8 11.3 4.1 -0.8 29.8 -0.8 Cost to Income Ratio (%) 23.6 24.5 23.4 23.0 19.7 18.5 20.0 20.3 23.6 19.6 Tax Rate (%) 31.8 32.1 31.4 30.3 31.3 13.9 21.5 21.6 31.3 22.0
Repco Home Finance Buy CMP INR327 | TP: INR390 (+19%) EPS CHANGE (%): FY20|21: 0.0|0.7 The condition in Tamil Nadu is still bleak. Expect loan growth at 11% YoY. Asset quality situation still remains dreary. Watch out for commentary on growth strategy.
Quarterly performance
(INR m)
Y/E March FY19 FY20 FY19 FY20E
1Q 2Q 3Q 4Q 1Q 2Q 3QE 4QE Interest Income 2,827 2,870 2,982 3,004 3,231 3,245 3,358 3,455 11,682 13,289 Interest Expenses 1,684 1,755 1,848 1,914 2,015 2,085 2,158 2,220 7,200 8,478 Net Income 1,143 1,115 1,134 1,090 1,216 1,160 1,200 1,235 4,482 4,811
YoY Growth (%) 8.2 -8.4 6.5 1.2 6.4 4.0 5.8 13.3 1.5 7.3 Other income 45 90 58 77 54 111 100 111 270 375 Total Income 1,188 1,205 1,192 1,167 1,270 1,270 1,300 1,347 4,752 5,186
YoY Growth (%) 6.9 -2.7 5.9 2.4 6.8 5.4 9.1 15.4 3.0 9.1 Operating Expenses 219 236 253 277 235 249 256 286 984 1,026
YoY Growth (%) 30.3 25.7 16.0 26.5 7.3 5.7 1.2 3.2 24.2 4.2 Operating Profits 969 970 939 890 1,035 1,021 1,044 1,061 3,768 4,161
YoY Growth (%) 2.8 -7.7 3.5 -3.4 6.7 5.3 11.2 19.2 -1.4 10.4 Provisions 47 -35 182 -24 75 1 130 86 170 292 Profit before Tax 923 1,004 757 915 960 1,020 914 975 3,598 3,868 Tax Provisions 314 338 201 399 336 14 230 244 1,252 825 Profit after tax 609 666 556 515 624 1,006 684 730 2,346 3,044
YoY Growth (%) 8.8 -4.9 31.2 58.1 2.4 51.1 22.9 41.7 16.7 29.7 Loan growth (%) 11.9 11.4 12.4 12.0 12.6 10.7 10.5 8.9 12.3 10.9 Cost to Income Ratio (%) 18.4 19.6 21.2 23.7 18.5 19.6 19.7 21.2 20.7 19.8 Tax Rate (%) 34.0 33.7 26.5 43.7 35.0 1.3 25.2 25.1 34.8 21.3

January 2020 111
December 2019 Results Preview | Sector: Financials - NBFCs
Shriram City Union Finance Buy CMP INR1388 | TP: INR1600 (+15%) EPS CHANGE (%): FY20|21: 2.3|2.4 3QFY20 was another subdued quarter for disbursements. Post-festive demand muted for 2Ws and MSMEs. SCUF offered lower rates for 2Ws during festival season. Expect asset quality to be largely stable.
Quarterly Performance (INR m) Y/E MARCH FY19 FY20
FY19 FY20E 1Q 2Q 3Q 4Q 1Q 2Q 3QE 4QE Interest Income 13,893 14,721 14,245 14,029 14,503 14,318 14,246 14,769 56,887 57,835 Interest expenses 4,640 4,952 5,269 4,993 5,316 5,384 5,276 5,342 19,854 21,318 Net Interest Income 9,253 9,769 8,976 9,035 9,187 8,934 8,970 9,426 37,033 36,516 Y-o-Y Growth (%) 12.4 13.1 -1.8 8.1 -0.7 -8.5 -0.1 4.3 10.0 -1.4 Fees and Other Income 109 437 147 351 441 585 550 564 1,044 2,140 Net Operating Income 9,362 10,206 9,122 9,386 9,628 9,519 9,520 9,990 38,077 38,656 Y-o-Y Growth (%) 13.5 16.6 -4.4 9.2 2.8 -6.7 4.4 6.4 10.9 1.5 Operating Expenses 3,677 3,963 3,648 3,647 3,853 3,775 3,881 4,108 14,935 15,617 Operating Profit 5,685 6,243 5,474 5,740 5,774 5,744 5,639 5,882 23,142 23,039 Y-o-Y Growth (%) 12.8 17.4 -3.3 8.3 1.6 -8.0 3.0 2.5 11.7 -0.4 Provisions 2,154 2,506 1,449 1,830 1,933 1,969 1,900 1,956 7,939 7,758 Profit before Tax 3,532 3,737 4,025 3,909 3,841 3,775 3,739 3,927 15,203 15,282 Tax Provisions 1,236 1,244 1,438 1,397 1,309 800 1,009 1,084 5,315 4,202 Net Profit 2,296 2,493 2,588 2,513 2,532 2,975 2,729 2,843 9,889 11,079 Y-o-Y Growth (%) 14.8 6.1 1.9 1,041.1 10.3 19.3 5.5 13.1 48.8 12.0 Int Exp/ Int Earned (%) 33.4 33.6 37.0 35.6 36.7 37.6 37.0 36.2 34.9 36.9 Cost to Income Ratio (%) 39.3 38.8 40.0 38.9 40.0 39.7 40.8 41.1 39.2 40.4 Tax Rate (%) 35.0 33.3 35.7 35.7 34.1 21.2 27.0 27.6 35.0 27.5
Shriram Transport Finance Buy CMP INR1160 | TP: INR1385 (+19%) EPS CHANGE (%): FY20|21: -4.4|-6.2 Expect moderate AUM growth in low single digits. Margins may witness some contraction. Asset quality to be largely stable. Watch out for commentary on liquidity and growth.
Quarterly Performance (INR m) Y/E March FY19 FY20 FY19 FY20E 1Q 2Q 3Q 4Q 1Q 2Q 3QE 4QE Interest Income 37,021 39,140 39,484 38,197 39,868 41,099 42,024 42,723 153,843 165,713 Interest expenses 18,537 18,504 19,187 18,885 20,431 21,134 21,821 22,636 75,113 86,022 Net Interest Income 18,484 20,636 20,297 19,313 19,436 19,965 20,203 20,087 78,730 79,691 Change YoY (%) 20.5 25.1 16.3 5.0 5.2 -3.3 -0.5 4.0 15.4 1.2 Other Operating Income 271 240 434 516 671 1,077 800 907 1,382 3,454 Other Income 21 98 23 91 78 23 70 108 233 279 Net Income 18,776 20,974 20,754 19,920 20,185 21,064 21,073 21,102 80,344 83,424 Change YoY (%) 21.2 25.1 17.8 2.9 7.5 0.4 1.5 5.9 12.6 3.8 Operating Expenses 4,719 4,748 4,553 4,799 4,758 5,189 5,235 5,284 18,739 20,466 Operating Profit 14,057 16,226 16,202 15,120 15,428 15,875 15,837 15,818 61,605 62,958 Change YoY (%) 15.7 22.7 17.3 3.2 9.8 -2.2 -2.2 4.6 11.5 2.2 Provisions 5,227 6,836 6,362 5,398 5,612 6,607 6,750 6,744 23,823 25,712 Profit before Tax 8,830 9,390 9,839 9,722 9,816 9,269 9,087 9,074 37,783 37,246 Tax Provisions 3,101 3,295 3,485 2,262 3,473 1,618 2,181 2,113 12,143 9,386 Net Profit 5,729 6,096 6,354 7,460 6,343 7,651 6,906 6,961 25,640 27,860 Change YoY (%) 24.6 22.6 17.3 -9.2 10.7 25.5 8.7 -6.7 4.2 8.7 AUM Growth (%) 21.7 20.9 14.1 8.5 5.8 3.6 6.1 7.5 8.5 7.5 Disbursement Growth (%) 24.1 11.5 -29.6 -21.7 -8.4 -3.7 43.3 20.3 -6.2 10.0 Cost to Income Ratio (%) 25.1 22.6 21.9 24.1 23.6 24.6 24.8 25.0 23.3 24.5 Tax Rate (%) 35.1 35.1 35.4 23.3 35.4 17.5 24.0 23.3 32.1 25.2

January 2020 112
December 2019 Results Preview | Sector: Healthcare
Muted quarter on US front to weigh on overall earnings growth ANDA approval pace moderate for second consecutive quarter
We expect aggregate earnings growth to be on a gradual downtrend for companies under our coverage in 3QFY20. We expect aggregate sales to grow 6.2% YoY in the quarter. EBITDA/PAT YoY growth should be lower than sales growth at 4.2%/4.3% due to lesser traction in niche products and lack of meaningful approvals in the US generics segment during the quarter.
Reduced approvals/share of niche products to moderate US sales growth We expect aggregate US sales growth to be on a downtrend in 3QFY20 at 2.7% YoY. Moderation in YoY growth can be attributed to lesser number of approvals (~46 for 3QFY20 v/s average of 73 quarterly approvals in FY19), coupled with reduced share of niche products in the portfolio. However, after two quarters of sequential decline, we expect 2.3% QoQ rise in US sales on aggregate basis. Sequential stability in US aggregate sales indicates minimal impact of price erosion. Specifically, we expect US sales of CDH/TRP to decline 23%/7% YoY in 3QFY20, thus impacting overall growth in the US segment. This should be on account of (i) the high base due to one-off opportunity in 3QFY19 for CDH, and (ii) lack of approvals due to regulatory concerns for TRP, which would be offset to some extent by 21%/49% YoY growth in US sales of ARBP/ALPM. Product acquisitions and better traction in existing products should drive growth for ARBP’s US sales and Valsartan-led opportunities are expected to benefit ALPM in 3QFY20 as well. While the ANDA pipeline pending for approval remains robust, regulatory headwinds continue to affect product approvals. We are yet to observe consistency in successful compliance, and thus, regulatory is a key risk for growth prospects in the US.
DF segment on steady growth path We expect the DF segment to provide the much needed cushion in terms of growth, which on an aggregate basis, is expected at 10.2% YoY for 3QFY20. Increased seasonal fluctuations are expected to positively benefit companies having higher exposure to anti-Infectives (Alkem/IPCA). Superior execution would drive healthy YoY growth for DRRD/LPC, while a changed strategy is expected to drive growth for CDH. We expect SUNP (at a high base) to grow in line with the industry at 9% YoY. Voluntary recall of Ranitidine led products by GSK should impact their YoY growth in 3QFY20. ALPM’s YoY growth is expected to remain under pressure owing to reduced discount to the trade channel.
ALKEM/GLXO/STR/LAURUS to deliver better-than-coverage average earnings growth ALKEM, GLXO, STR and LAURUS are expected to deliver strong YoY growth led by superior execution, while AJP and GRAN will likely benefit from a low base of the past year. We expect stable YoY earnings for LPC, while high base of the past year should result in earnings decline for DIVIs (on lower margins/ higher depreciation) and DRRD (on higher tax). Our top picks are IPCA and ALKEM.
Healthcare
Company name Alembic Pharma Ajanta Pharma Alkem Lab Aurobindo Pharma Biocon Cadila Health Cipla Divis Labs Dr Reddy’ s Labs Glenmark Pharma Granules India GSK Pharma IPCA Labs. Jubilant Life Laurus Labs. Lupin Strides Pharma Sun Pharma Torrent Pharma
Tushar Manudhane – Research analyst ([email protected]); +91 022 6129 1536 Hitakshi Chandrani – Research analyst ([email protected]); +91 22 6129 1557

January 2020 113
December 2019 Results Preview | Sector: Healthcare
Exhibit 66: Summary of quarterly performance (INR m) Sector CMP SALES (INR M) EBDITA (INR M) NET PROFIT (INR M)
(INR) RECO Dec-19 Var % YoY
Var % QoQ Dec-19 Var
% YoY Var
% QoQ Dec-19 Var % YoY
Var % QoQ
Healthcare Alembic Pharma 561 Neutral 11,393 11.9 -8.2 2,848 17.6 -17.6 1,889 11.2 -24.5 Alkem Lab 2,084 Buy 20,828 8.2 -8.0 3,999 28.3 -15.8 2,862 31.5 -27.3 Ajanta Pharma 979 Buy 5,830 20.2 -9.3 1,568 36.0 -11.7 1,051 44.7 -10.2 Aurobindo Pharma 462 Buy 57,881 9.8 3.4 11,924 9.7 2.1 6,825 -1.5 2.0 Biocon 296 Neutral 17,449 13.2 11.0 4,624 13.1 14.7 2,396 5.9 37.9 Cadila Health 256 Buy 34,063 -4.8 1.2 6,676 -20.5 6.7 3,769 -26.2 13.2 Cipla 474 Neutral 43,929 9.6 -0.1 8,434 19.2 -7.3 4,037 21.5 -14.4 Divis Labs 1,825 Neutral 14,705 9.5 1.7 5,294 -6.2 3.7 3,894 -5.0 7.6 Dr Reddy’ s Labs 2,864 Neutral 42,403 10.1 3.9 9,032 10.7 6.5 4,522 -6.8 11.9 Glenmark Pharma 354 Neutral 26,418 5.3 -4.4 3,883 -0.3 -2.7 1,853 -13.6 -7.0 Granules India 122 Buy 6,896 9.2 -1.4 1,393 22.9 -3.0 876 45.3 -8.5 GSK Pharma 1,623 Neutral 8,336 1.0 -5.5 1,791 30.4 -7.7 1,389 46.4 -1.2 IPCA Labs. 1,141 Buy 10,858 14.6 -15.4 2,204 4.9 -17.1 1,479 6.7 -23.6 Jubilant Life 535 Buy 23,231 -2.3 2.5 4,879 -1.1 4.1 2,278 -13.6 -8.7 Laurus Labs 373 Buy 6,854 29.4 -3.8 1,302 48.5 -5.5 459 157.6 -18.9 Lupin 775 Buy 43,301 0.8 -0.7 7,361 6.3 0.7 2,651 0.7 -10.6 Strides Pharma 376 Buy 7,624 -3.2 6.6 1,540 21.2 5.1 564 136.1 7.8 Sun Pharma 435 Buy 81,297 6.2 2.3 16,178 -8.6 0.7 10,527 11.8 -0.3 Torrent Pharma 1,864 Neutral 20,604 3.6 2.8 5,542 5.4 2.4 2,436 13.2 -0.2 Sector Aggregate 483,899 6.2 0.3 100,473 4.2 -0.5 55,756 4.2 -3.2
Source: Company, MOFSL
Exhibit 67: Healthcare Universe
YoY Growth (%) EBITDA Margin (%) PAT margin (%) Sales EBITDA Adj PAT Dec-19 Dec-18 CHG (BPS) Dec-19 Dec-18 CHG (BPS) MNC Pharma 1.0 30.4 46.4 21.5 16.6 485 16.7 11.5 515 Big 5 Generics 5.1 -1.7 -2.2 19.8 21.1 (135) 10.9 11.7 -80 CRAMS 12.3 0.9 2.5 33.4 37.2 (375) 24.1 26.4 (230) Second Tier generics 7.1 13.1 13.8 20.9 19.9 100 11.0 10.4 60 Sector Aggregate 6.2 4.2 4.3 20.8 21.2 (40) 11.5 11.7 (20)
Source: MOFSL, Company INR stable YoY/QoQ The INR depreciated against the USD (at INR71 on average in 3QFY20) as against INR70 in 2QFY20. On YoY basis, the USD/INR rate remained stable at INR71. As a result, we expect minimal currency-led benefits in 3QFY20. However, hedging policy of each company would lead to a varying impact across companies under our coverage universe.

January 2020 114
December 2019 Results Preview | Sector: Healthcare
Exhibit 68: 46 ANDAs approved on aggregate basis for 3QFY20
Exhibit 69: US sales growth to moderate further on YoY basis
Exhibit 70: Relative performance—3 months (%)
Exhibit 71: Relative performance—1 year (%)
Source: Bloomberg, MOFSL
Exhibit 72: Comparative valuation CMP EPS (INR) PE (x) PB (x) RoE (%) Company Name INR Reco FY20E FY21E FY22E FY20E FY21E FY22E FY20E FY21E FY22E FY20E FY21E FY22E Healthcare 22.8 18.6 16.5 2.9 2.5 2.3 12.6 13.7 13.7 Alembic Pharma 561 Neutral 38.4 33.1 38.3 14.6 17.0 14.6 3.2 2.8 2.4 23.8 17.3 17.4 Alkem Lab 2,084 Buy 89.2 108.9 128.2 23.4 19.1 16.3 4.0 3.4 3.0 18.2 19.3 19.5 Ajanta Pharma 979 Buy 49.1 57.5 65.8 20.0 17.0 14.9 3.3 2.9 2.5 17.9 18.1 18.0 Aurobindo Pharma 462 Buy 47.0 61.5 63.4 9.8 7.5 7.3 1.6 1.4 1.2 18.1 19.8 17.1 Biocon 296 Neutral 7.5 10.0 13.1 39.3 29.5 22.5 5.2 4.7 4.1 14.1 16.7 19.3 Cadila Health 256 Buy 14.5 17.0 19.1 17.7 15.0 13.4 2.4 2.1 1.9 11.3 14.8 14.9 Cipla 474 Neutral 22.1 25.7 28.9 21.4 18.4 16.4 2.3 2.0 1.8 10.5 11.0 11.2 Divis Labs 1,825 Neutral 53.6 67.2 78.4 34.0 27.2 23.3 6.0 5.1 4.3 18.9 20.3 20.2 Dr Reddy’ s Labs 2,864 Neutral 111.0 129.2 136.6 25.8 22.2 21.0 2.9 2.6 2.4 12.1 12.3 11.8 Glenmark Pharma 354 Neutral 24.5 28.6 32.5 14.5 12.4 10.9 1.6 1.4 1.3 11.7 12.3 12.5 Granules India 122 Buy 13.7 15.1 17.9 8.9 8.1 6.8 1.7 1.5 1.3 21.0 20.0 20.3 GSK Pharma 1,623 Neutral 32.4 34.8 40.0 50.1 46.6 40.6 10.4 9.6 8.7 20.7 20.7 21.5 IPCA Labs. 1,141 Buy 46.9 59.3 65.5 24.3 19.2 17.4 4.0 3.4 2.9 17.5 18.9 17.9 Jubilant Life 535 Buy 59.0 66.8 75.2 9.1 8.0 7.1 1.5 1.3 1.1 17.6 17.0 16.4 Laurus Labs 373 Buy 15.2 23.1 31.2 24.5 16.1 11.9 2.3 2.0 1.7 9.8 13.3 15.6 Lupin 775 Buy 24.4 37.8 43.4 31.8 20.5 17.8 2.4 2.2 2.0 7.7 11.1 11.7 Sun Pharma 435 Buy 18.3 22.1 24.4 23.8 19.7 17.9 2.3 2.1 1.9 10.2 11.3 11.3 Strides Pharma 376 Buy 22.0 34.0 42.3 17.1 11.1 8.9 1.2 1.1 1.0 7.1 10.3 11.8 Torrent Pharma 1,864 Neutral 56.8 72.9 90.9 32.8 25.6 20.5 5.9 5.1 4.4 19.1 21.4 23.2
9 9
4 4 4 3 3 3
2 2 1 1 1
0
SUN
P
CDH
ALPM
ARBP
GRAN
ALKE
M
GNP
LPC
AJP
TRP
CIPL
A
DRRD ST
R
LAU
RUS
Approved ANDAs in 3QFY20
1.6 1.6 1.5 1.6 1.7 1.9 1.8 1.7 1.8
(12)
2 (1) (0.2) 6.3
15.3 18.7 8.9
2.7
3QFY
18
4QFY
18
1QFY
19
2QFY
19
3QFY
19
4QFY
19
1QFY
20
2QFY
20
3QFY
20
US sales (USDb) YoY growth (%)
98
102
106
110
114
Sep-
19
Oct
-19
Nov
-19
Dec-
19
Nifty Index MOSL Health care Index
84
92
100
108
116
Dec-
18
Jan-
19
Feb-
19
Mar
-19
Apr-
19
May
-19
Jun-
19
Jul-1
9
Aug-
19
Sep-
19
Oct
-19
Nov
-19
Dec-
19
Nifty Index MOSL Health care Index

January 2020 115
December 2019 Results Preview | Sector: Healthcare
The tables below provide a snapshot of actual and estimated numbers for companies under the MOFSL coverage universe. Highlighted columns indicate the quarter/financial year under review.
Ajanta Pharma Buy CMP INR979 | TP: INR1124 (+15%) EPS CHANGE (%): FY20|21: - (0.4) |2.0 Expect robust growth in US/Asia business. Lower gross margin to be offset by better op. leverage Watch out for outlook on Insti. anti-malaria business. Watch out for outlook on growth in DF segment.
Consol. - Quarterly perf.
(INR M)
Y/E March FY19 FY20E FY19 FY20E 1Q 2Q 3Q 4Q 1Q 2Q 3QE 4QE Net Sales 5,110 5,441 4,851 5,152 6,119 6,428 5,830 5,713 20,554 24,090 YoY Change (%) 8.0 0.7 -17.4 -2.9 19.8 18.1 20.2 10.9 -3.5 17.2 Total Expenditure 3,535 3,779 3,698 3,881 4,436 4,651 4,262 4,322 14,809 17,670 EBITDA 1,575 1,662 1,153 1,271 1,684 1,776 1,568 1,392 5,744 6,420 YoY Change (%) 20.5 -9.5 -41.6 -8.9 6.9 6.9 36.0 9.5 -11.8 11.8 Depreciation 172 175 187 188 228 233 235 237 721 933 EBIT 1,403 1,487 966 1,083 1,456 1,543 1,333 1,154 5,024 5,487 YoY Change (%) 19.7 -12.1 -47.0 -11.8 3.8 3.8 38.0 6.5 -15.1 9.2 Interest 2 0 1 8 18 49 12 -26 12 53 Other Income 81 152 44 16 76 132 100 125 211 434 PBT before EO expense 1,483 1,640 1,010 1,092 1,515 1,626 1,421 1,306 5,223 5,868 Extra-Ord expense 0 0 80 0 0 11 0 0 80 11 PBT 1,483 1,640 930 1,092 1,515 1,616 1,421 1,306 5,143 5,857 Tax 425 385 261 203 368 452 370 333 1,273 1,523 Rate (%) 28.7 23.5 28.0 18.6 24.3 28.0 26.0 25.5 24.8 26.0 Reported PAT 1,058 1,255 669 889 1,146 1,164 1,051 973 3,870 4,334 Adj PAT 1,058 1,255 727 889 1,146 1,171 1,051 973 3,930 4,342 YoY Change (%) 11.6 -4.8 -50.7 -5.9 8.4 -6.7 44.7 9.5 -16.1 10.5 Margins (%) 20.7 23.1 15.0 17.3 18.7 18.2 18.0 17.0 19.1 18.0
Alembic Pharma Neutral CMP INR561 | TP: INR600 (+7%) EPS CHANGE (%): FY20|21: (0.6)|(0.4) Expect US sales to be strong on Valsartan opportunity. Expect DF to be muted on reduced discounts. Watch out ANDA filings in injectables/ophthalmic dosages. Commentary on recovery in DF business key monitorable.
Quarterly perf. (Consol.) (INR m) Y/E March FY19E FY20E FY19 FY20E
1Q 2Q 3Q 4Q 1Q 2Q 3QE 4QE
Net Sales 8,625 11,271 10,182 9,270 9,489 12,409 11,393 11,071 39,347 44,362 YoY Change (%) 33.1 42.8 21.2 8.6 10.0 10.1 11.9 19.4 25.7 12.7 Total Expenditure 7,115 8,247 7,759 7,489 7,240 8,954 8,545 8,622 30,611 33,360 EBITDA 1,510 3,023 2,422 1,780 2,249 3,455 2,848 2,449 8,736 11,002
YoY Change (%) 48.8 68.8 29.2 2.8 49.0 14.3 17.6 37.6 35.8 25.9 Depreciation 276 286 291 300 354 360 405 419 1,152 1,537 EBIT 1,786 3,310 2,713 2,080 2,603 3,815 3,253 2,868 9,888 12,539
YoY Change (%) 26.4 11.6 10.0 -5.1 28.3 25.6 39.4 39.8 32.1 26.8 Interest 16 58 60 51 50 71 90 113 184 323 Other Income 1 24 35 34 33 4 8 4 94 49 PBT before EO expense 1,219 2,703 2,108 1,464 1,878 3,029 2,361 1,922 7,494 9,190 Extra-Ord expense 0 0.0 0 0 328 0.0 0 0 0 328 PBT 1,219 2,703 2,108 1,464 1,550 3,029 2,361 1,922 7,494 8,862 Tax 315 703 400 149 360 525 472 416 1,568 1,772 Rate (%) 25.9 26.0 19.0 10.2 23.2 17.3 20.0 21.6 20.9 20.0 MI & P/L of Asso. Cos. -1 -1 9 75 -47 0 0 129 82 82 Reported PAT 905 2,001 1,698 1,240 1,237 2,504 1,889 1,378 5,845 7,008 Adj PAT 905 2,001 1,698 1,240 1,489 2,504 1,889 1,378 5,845 7,270 YoY Change (%) 35.7 64.6 30.0 32.2 64.6 25.1 11.2 11.1 41.6 24.4 Margins (%) 10.5 17.8 16.7 13.4 15.7 20.2 16.6 12.4 14.9 16.4

January 2020 116
December 2019 Results Preview | Sector: Healthcare
Alkem Labs Buy CMP INR2084 | TP: INR2470 (+18%) EPS CHANGE (%): FY20|21: 1.4|0.1 Expected to deliver robust growth in DF business. Expect moderate growth in int. business off a high base. Watch out for growth in chronic therapies in DF. Outlook on profitability in US business.
Quarterly Perf. (Consolidated)
(INR m)
Y/E March FY19 FY20E FY19 FY20E 1Q 2Q 3Q 4Q 1Q 2Q 3QE 4QE Net Revenues 16,695 19,189 19,250 18,542 18,495 22,640 20,828 19,427 73,572 81,390 YoY Change (%) 28.9 2.9 10.6 24.3 10.8 18.0 8.2 4.8 14.4 26.6 EBITDA 2,142 3,637 3,118 2,373 2,645 4,752 3,999 3,010 11,171 14,406
YoY Change (%) 127.0 -21.0 -13.3 80.7 23.5 30.7 28.3 26.9 5.7 36.3 Depreciation 425 458 477 573 558 564 570 577 1,932 2,270 EBIT 1,718 3,179 2,641 1,800 2,087 4,188 3,429 2,433 9,239 12,137
YoY Change (%) 169.5 -25.4 -18.1 97.9 21.5 31.7 29.8 35.2 1.1 32.8 Interest 163 164 154 66 161 178 180 131 546 650 Other Income 163 240 245 94 175 314 160 139 331 138 PBT before EO Exp 1,718 3,255 2,732 1,828 2,100 4,325 3,409 2,441 9,024 11,625 EO Exp/(Inc) 226 23 226 PBT 1,718 3,255 2,732 1,828 2,100 4,098 3,409 2,441 9,001 11,399 Tax 345 656 526 283 227 293 477 448 1,810 1,446 Rate (%) 20.1 20.2 19.3 15.5 10.8 6.8 14.0 18.3 20.1 12.4 PAT (pre Minority Interest) 1,373 2,599 2,206 1,544 1,873 3,805 2,932 1,993 7,191 9,953 Minority Interest 11 60 29 31 18 97 37 -3 131 148 Reported PAT 1,362 2,540 2,177 1,490 1,855 3,708 2,895 1,997 7,059 9,804 Adj Net Profit 1,362 2,540 2,177 1,513 1,855 3,935 2,895 1,997 7,082 10,664 YoY Change (%) 90.3 -20.8 0.6 58.7 36.2 54.9 33.0 32.0 12.2 50.6
Aurobindo Pharma Buy CMP INR462 | TP: INR533 (+15%) EPS CHANGE (%): FY20|21: 0.0| (0.3) Expect 21% YoY growth in CC for US business to USD410m. Expect ARV/Europe sales to grow moderately for 3QFY20. Update on CAPA from USFDA on recent inspections. Update on integration of Sandoz business.
Quarterly performance (Consolidated) (INR M) Y/E March FY19 FY20E FY19 FY20E
1Q 2Q 3Q 4Q 1Q 2Q 3QE 4QE
Net Sales 42,503 47,514 52,697 52,923 54,446 56,005 57,881 68,083 1,95,636 2,36,415 YoY Change (%) 15.5 7.1 21.5 30.7 28.1 17.9 9.8 28.6 18.6 20.8 EBITDA 7,792 10,260 10,864 11,304 11,464 11,675 11,924 14,585 40,219 49,647 YoY Change (%) -7.4 -8.2 5.9 40.6 47.1 13.8 9.7 29.0 6.2 23.4 Depreciation 1,545 1,637 1,631 1,866 2,409 2,433 2,500 3,592 6,680 10,934 EBIT 6,247 8,623 9,233 9,437 9,055 9,241 9,424 10,993 33,540 38,713 YoY Change (%) -12.1 -12.5 4.0 45.8 45.0 7.2 2.1 16.5 3.8 15.4 Interest 295 354 477 501 499 409 415 921 1,627 2,245 Other Income 437 263 134 323 110 206 190 194 1,157 700 PBT before EO expense 6,389 8,532 8,891 9,259 8,666 9,038 9,199 10,266 33,070 37,169 Forex loss/(gain) 682 397 -505 28 -48 272 0 0 603 224 Exceptional (expenses)/income -268 -250 -1,062 -127 -128 -1,581 -255 PBT 5,707 7,866 9,145 8,169 8,587 8,638 9,199 10,266 30,887 36,690 Tax 1,155 1,754 2,048 2,311 2,278 2,244 2,392 2,654 7,269 9,567 Rate (%) 20.2 22.3 22.4 28.3 26.5 26.0 26.0 25.9 23.5 26.1 Minority Interest -3 -2 -26 4 -47 -1 -18 12 -29 -54 Reported PAT 4,555 6,114 7,123 5,854 6,357 6,395 6,825 7,600 23,647 27,177 Adj PAT 5,095 6,632 6,925 6,636 6,415 6,691 6,825 7,599 25,288 27,530 YoY Change (%) -2.8 -15.1 5.5 22.6 25.9 0.9 -1.5 14.5 1.1 8.9 Margins (%) 12.0 14.0 13.1 12.5 11.8 11.9 11.8 11.2 12.9 11.6

January 2020 117
December 2019 Results Preview | Sector: Healthcare
Biocon Neutral CMP INR296 | TP: INR305 (+3%) EPS CHANGE (%): FY20|21: 0.0| (0.2) Traction in biologics/research services to drive revenue. Outlook on growth in small molecules segment. Growth prospects of recently launched Trastuzumab. Tactic to expand existing biosimilars share in key markets.
Quarterly performance (Consolidated)
(INR M)
Y/E March FY19 FY20E FY19 FY20E
1Q 2Q 3Q 4Q 1Q 2Q 3QE 4QE
Net Sales 11,238 13,210 15,410 15,288 14,659 15,720 17,449 18,496 55,144 66,324 YoY Change (%) 20.4 36.4 45.7 30.7 30.4 19.0 13.2 21.0 33.5 20.3 Total Expenditure 8,860 9,820 11,320 11,188 10,284 11,690 12,825 13,489 41,207 48,287 EBITDA 2,378 3,390 4,090 4,100 4,375 4,030 4,624 5,007 13,937 18,036 YoY Change (%) 23.8 86.1 84.5 76.0 84.0 18.9 13.1 22.1 68.1 29.4 Depreciation 991 1,120 1,170 1,198 1,242 1,320 1,300 1,320 4,478 5,182 EBIT 1,387 2,270 2,920 2,902 3,133 2,710 3,324 3,687 9,459 12,854 YoY Change (%) 48.7 156.2 134.9 110.3 125.9 19.4 13.8 27.1 113.0 35.9 Interest 176 190 190 159 166 140 150 99 709 555 Other Income 688 540 250 282 241 380 340 339 1,444 1,300 Extraordinary income 5 1,888 -220 -70 -79 590 0 0 1,946 511 PBT 1,904 4,508 2,760 2,955 3,129 3,540 3,514 3,927 12,140 14,110 Tax 521 730 460 409 852 1,000 808 867 2,123 3,528 Rate (%) 27.4 16.2 16.7 13.8 27.2 28.2 23.0 22.1 17.5 25.0 Minority Interest 186 240 130 409 214 380 310 264 964 1,168 PAT 1,197 3,538 2,170 2,137 2,063 2,160 2,396 2,796 9,053 9,415 Adj PAT 1,193 1,830 2,261 2,147 2,120 1,737 2,396 2,796 7,432 9,049 YoY Change (%) 46.5 157.1 121.4 88.1 77.7 -5.1 5.9 30.2 101.4 21.8 Margins (%) 10.7 26.8 14.1 14.0 14.1 13.7 13.7 15.1 16.4 14.2
Cadila Healthcare Buy CMP INR256 | TP: INR300 (+17%) EPS CHANGE (%): FY20|21: (1.5) |0.0 US/EU business to drag overall revenue growth. Low-margin consumer business to drag overall margins. Growth outlook in DF with change in strategy. Update on key transdermal filings/approvals for US.
Quarterly Performance (Consolidated) (INR Million) Y/E March FY19 FY20E FY19 FY20E
1Q 2Q 3Q 4Q 1Q 2Q 3QE 4QE Net Revenues 28,937 29,612 35,779 37,328 34,963 33,666 34,063 36,535 1,31,656 1,39,226 YoY Change (%) 31.7 -8.4 10.2 14.8 20.8 13.7 -4.8 -2.1 10.3 5.8 EBITDA 6,450 6,878 8,399 8,304 7,020 6,256 6,676 7,197 30,031 27,149 YoY Change (%) 132.6 -19.8 -0.4 -4.6 8.8 -9.0 -20.5 -13.3 5.5 -9.6 Depreciation 1,418 1,475 1,537 1,556 1,716 1,723 1,730 1,769 5,986 6,938 EBIT 5,032 5,403 6,862 6,748 5,304 4,533 4,946 5,427 24,045 20,211 YoY Change (%) 224.0 -26.0 -1.5 -7.1 5.4 -16.1 -27.9 -19.6 4.1 -15.9 Interest 350 357 455 773 891 897 810 733 1,935 3,331 Other Income 1,013 304 310 384 226 269 290 318 2,011 1,103 PBQ before EO Income 5,695 5,350 6,717 6,359 4,639 3,905 4,426 5,013 24,121 17,983 EO Exp/(Inc) 0 0 0 300 700 2,681 0 0 300 3,381 PBT after EO Income 5,695 5,350 6,717 6,059 3,939 1,224 4,426 5,013 23,821 14,602 Tax 1,203 1,247 1,586 1,267 791 395 907 973 5,303 3,066 Rate (%) 21.1 23.3 23.6 20.9 20.1 32.3 20.5 19.4 22.3 21.0 Min. Int/Adj on Consol 113 72 -24 -191 -112 243 250 75 -30 456 Reported PAT 4,605 4,175 5,107 4,601 3,036 1,072 3,769 4,115 18,488 11,992 Adj PAT 4,605 4,175 5,107 4,834 3,587 3,328 3,769 4,115 18,721 14,799 YoY Change (%) 232.7 -17.0 -6.4 -20.3 -22.1 -20.3 -26.2 -14.9 4.3 -21.0 Margins (%) 15.9 14.1 14.3 13.0 10.3 9.9 11.1 11.3 14.2 10.6
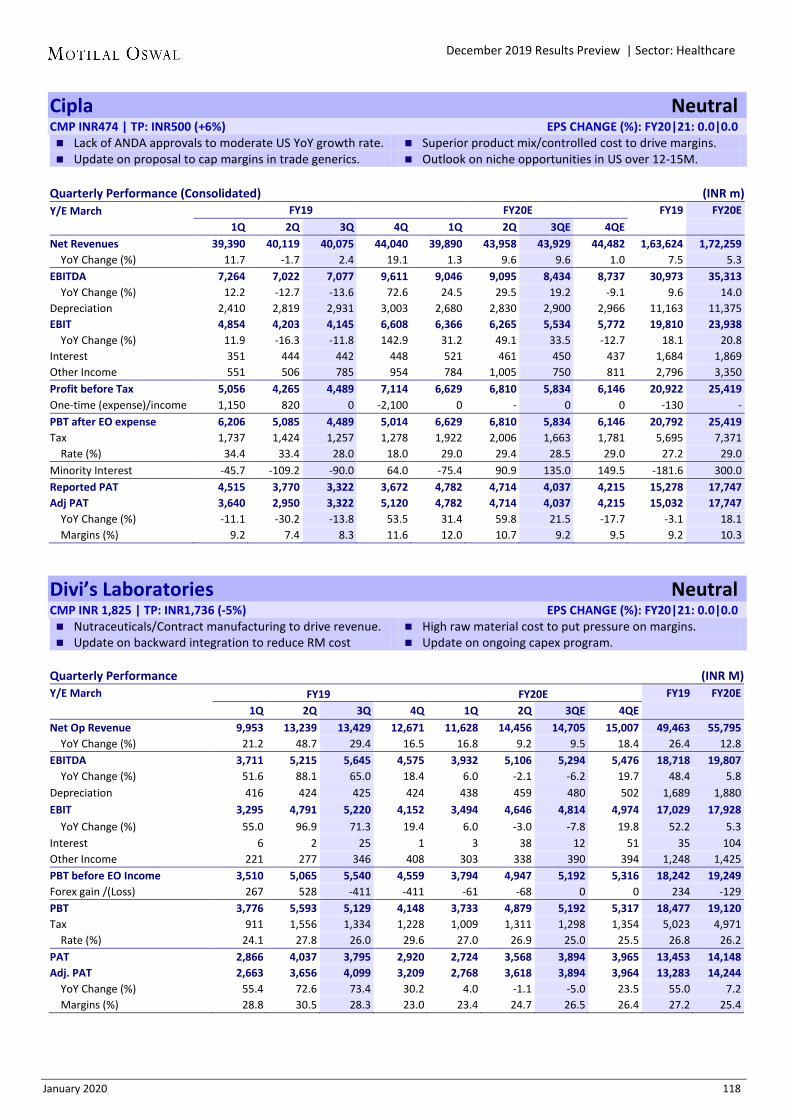
January 2020 118
December 2019 Results Preview | Sector: Healthcare
Cipla Neutral CMP INR474 | TP: INR500 (+6%) EPS CHANGE (%): FY20|21: 0.0|0.0 Lack of ANDA approvals to moderate US YoY growth rate. Superior product mix/controlled cost to drive margins. Update on proposal to cap margins in trade generics. Outlook on niche opportunities in US over 12-15M.
Quarterly Performance (Consolidated) (INR m) Y/E March FY19 FY20E FY19 FY20E
1Q 2Q 3Q 4Q 1Q 2Q 3QE 4QE
Net Revenues 39,390 40,119 40,075 44,040 39,890 43,958 43,929 44,482 1,63,624 1,72,259 YoY Change (%) 11.7 -1.7 2.4 19.1 1.3 9.6 9.6 1.0 7.5 5.3 EBITDA 7,264 7,022 7,077 9,611 9,046 9,095 8,434 8,737 30,973 35,313 YoY Change (%) 12.2 -12.7 -13.6 72.6 24.5 29.5 19.2 -9.1 9.6 14.0 Depreciation 2,410 2,819 2,931 3,003 2,680 2,830 2,900 2,966 11,163 11,375 EBIT 4,854 4,203 4,145 6,608 6,366 6,265 5,534 5,772 19,810 23,938 YoY Change (%) 11.9 -16.3 -11.8 142.9 31.2 49.1 33.5 -12.7 18.1 20.8 Interest 351 444 442 448 521 461 450 437 1,684 1,869 Other Income 551 506 785 954 784 1,005 750 811 2,796 3,350 Profit before Tax 5,056 4,265 4,489 7,114 6,629 6,810 5,834 6,146 20,922 25,419 One-time (expense)/income 1,150 820 0 -2,100 0 - 0 0 -130 - PBT after EO expense 6,206 5,085 4,489 5,014 6,629 6,810 5,834 6,146 20,792 25,419 Tax 1,737 1,424 1,257 1,278 1,922 2,006 1,663 1,781 5,695 7,371 Rate (%) 34.4 33.4 28.0 18.0 29.0 29.4 28.5 29.0 27.2 29.0 Minority Interest -45.7 -109.2 -90.0 64.0 -75.4 90.9 135.0 149.5 -181.6 300.0 Reported PAT 4,515 3,770 3,322 3,672 4,782 4,714 4,037 4,215 15,278 17,747 Adj PAT 3,640 2,950 3,322 5,120 4,782 4,714 4,037 4,215 15,032 17,747 YoY Change (%) -11.1 -30.2 -13.8 53.5 31.4 59.8 21.5 -17.7 -3.1 18.1 Margins (%) 9.2 7.4 8.3 11.6 12.0 10.7 9.2 9.5 9.2 10.3
Divi’s Laboratories Neutral CMP INR 1,825 | TP: INR1,736 (-5%) EPS CHANGE (%): FY20|21: 0.0|0.0 Nutraceuticals/Contract manufacturing to drive revenue. High raw material cost to put pressure on margins. Update on backward integration to reduce RM cost Update on ongoing capex program.
Quarterly Performance (INR M) Y/E March FY19 FY20E FY19 FY20E
1Q 2Q 3Q 4Q 1Q 2Q 3QE 4QE Net Op Revenue 9,953 13,239 13,429 12,671 11,628 14,456 14,705 15,007 49,463 55,795 YoY Change (%) 21.2 48.7 29.4 16.5 16.8 9.2 9.5 18.4 26.4 12.8 EBITDA 3,711 5,215 5,645 4,575 3,932 5,106 5,294 5,476 18,718 19,807 YoY Change (%) 51.6 88.1 65.0 18.4 6.0 -2.1 -6.2 19.7 48.4 5.8 Depreciation 416 424 425 424 438 459 480 502 1,689 1,880 EBIT 3,295 4,791 5,220 4,152 3,494 4,646 4,814 4,974 17,029 17,928 YoY Change (%) 55.0 96.9 71.3 19.4 6.0 -3.0 -7.8 19.8 52.2 5.3 Interest 6 2 25 1 3 38 12 51 35 104 Other Income 221 277 346 408 303 338 390 394 1,248 1,425 PBT before EO Income 3,510 5,065 5,540 4,559 3,794 4,947 5,192 5,316 18,242 19,249 Forex gain /(Loss) 267 528 -411 -411 -61 -68 0 0 234 -129 PBT 3,776 5,593 5,129 4,148 3,733 4,879 5,192 5,317 18,477 19,120 Tax 911 1,556 1,334 1,228 1,009 1,311 1,298 1,354 5,023 4,971 Rate (%) 24.1 27.8 26.0 29.6 27.0 26.9 25.0 25.5 26.8 26.2 PAT 2,866 4,037 3,795 2,920 2,724 3,568 3,894 3,965 13,453 14,148 Adj. PAT 2,663 3,656 4,099 3,209 2,768 3,618 3,894 3,964 13,283 14,244 YoY Change (%) 55.4 72.6 73.4 30.2 4.0 -1.1 -5.0 23.5 55.0 7.2 Margins (%) 28.8 30.5 28.3 23.0 23.4 24.7 26.5 26.4 27.2 25.4

January 2020 119
December 2019 Results Preview | Sector: Healthcare
Dr Reddy’s Labs Neutral CMP INR2,864 | TP: INR2,650 (-7%) EPS CHANGE (%): FY20|21: 3.5|2.3 Fewer approvals YTD expected to weigh on US growth. EU/India/Russia expected to show robust growth. Outlook on R&D spend for next 12-15 months. Update on ANDA filings/launches over next 12-15M.
Quarterly Performance - IFRS (INR M) Y/E March FY19 FY20E FY19 FY20E
1Q 2Q 3Q 4Q 1Q 2Q 3QE 4QE Sales 37,207 37,978 38,500 38,366 38,435 40,809 42,403 43,021 1,52,051 1,64,668 YoY Change (%) 12.2 7.1 1.2 8.5 3.3 7.5 10.1 12.1 7.1 8.3 Total Expenditure 29,632 30,575 30,344 31,968 31,168 32,328 33,371 33,879 1,22,518 1,30,747 EBITDA 7,575 7,403 8,156 6,398 7,267 8,481 9,032 9,142 29,533 33,922 YoY Change (%) 147.7 11.6 6.4 16.1 -4.1 14.6 10.7 42.9 29.0 14.9 Amortization 3,110 2,998 3,108 3,183 3,082 3,339 3,300 3,288 12,400 13,009 EBIT 4,465 4,405 5,048 3,215 4,185 5,142 5,732 5,854 17,133 20,913 YoY Change (%) 1,623.9 19.2 7.5 29.6 -6.3 16.7 13.5 82.1 53.9 22.1 Interest 0 0 0 0 0 1 2 3 1 2 Other Income 542 1,375 757 2,636 4,315 483 66 490 5,310 5,354 One-off income/(expense) 2,039 2,039 Profit before Tax 5,007 5,780 5,805 5,851 8,500 7,663 5,796 6,341 22,442 28,300 Tax 446 742 953 1,507 1,872 -3,261 1,276 963 3,648 849 Rate (%) 8.9 12.8 16.4 25.8 22.0 -42.6 22.0 15.2 16.3 3.0 Reported PAT 4,561 5,038 4,852 4,344 6,628 10,924 4,520 5,378 18,794 27,450 Minority Interest 0 0 0 0 0 0 0 0 0 0 Adjusted PAT 4,561 5,038 4,852 3,008 4,444 4,042 4,522 5,418 17,459 18,426 YoY Change (%) 671.7 76.8 13.5 -0.5 -2.6 -19.8 -6.8 80.2 62.6 5.5 Margins (%) 12.3 13.3 12.6 7.8 11.6 9.9 10.7 12.6 11.5 11.2
Glenmark Pharma Neutral CMP INR354 | TP: INR340 (-4%) EPS CHANGE (%): FY20|21: 0.5|0.5 Lack of meaningful approvals/high base of past year to
reduce US sales by 8% YoY to USD110m. Change in product mix and higher employee cost to hurt
margin YoY. Watch out for progress on NCE pipeline Update on free cash generation/debt repayment.
Quarterly performance (Consolidated) (INR Million) Y/E March FY19 FY20E FY19 FY20E 1Q 2Q 3Q 4Q 1Q 2Q 3QE 4QE Net Revenues (Core) 21,294 25,399 25,098 25,261 22,836 27,637 26,418 26,680 97,051 1,03,571 YoY Change (%) -8.6 14.2 15.6 12.4 7.2 8.8 5.3 5.6 8.2 6.7 EBITDA 3,106 3,986 3,894 3,517 3,276 3,991 3,883 4,091 14,504 15,241 YoY Change (%) -42.9 12.2 34.0 19.2 5.5 0.1 -0.3 16.3 -2.3 5.1 Depreciation 794 825 831 810 907 942 950 1,049 3,259 3,848 EBIT 2,312 3,162 3,063 2,707 2,369 3,049 2,933 3,042 11,245 11,394 YoY Change (%) -50.4 12.9 42.4 22.3 2.4 -3.6 -4.2 12.4 -4.9 1.3 Interest 790 851 885 819 930 898 910 960 3,346 3,698 Other Income 495 563 663 384 409 541 480 369 2,105 1,800 PBT before EO Expense 2,017 2,874 2,840 2,272 1,848 2,693 2,503 2,451 10,004 9,495 One-off loss/(gain) -1,250 -2,922 1,300 -130 250 -780 0 0 -3,002 -530 PBT after EO Expense 3,267 5,796 1,540 2,402 1,598 3,473 2,503 2,451 13,006 10,025 Tax 937 1,656 377 786 506 918 651 653 3,756 2,727 Rate (%) 28.7 28.6 24.5 32.7 31.6 26.4 26.0 26.6 28.9 27.2 Reported PAT 2,330 4,140 1,163 1,616 1,093 2,555 1,853 1,798 9,250 7,299 Adj PAT (excl one-offs) 1,442 2,065 2,145 1,659 1,264 1,993 1,853 1,798 7,312 6,907 YoY Change (%) -56.7 -3.5 104.8 9.4 -12.4 -3.5 -13.6 8.4 -9.0 -5.5 Margins (%) 6.8 8.1 8.5 6.6 5.5 7.2 7.0 6.7 7.5 6.7

January 2020 120
December 2019 Results Preview | Sector: Healthcare
Granules India Buy CMP INR122 | TP: INR145 (+19%) EPS CHANGE (%): FY20|21: 0.0|0.0 Traction in intermediates/formulation to drive revenue. Superior product mix to improve margins as well. Outlook on API segment given concerns in China. Update on supply demand dynamics in Metformin.
Quarterly Performance (INR M) Y/E March FY19 FY20E FY19 FY20E (Consolidated) 1Q 2Q 3Q 4Q 1Q 2Q 3QE 4QE Net Sales 4,532 5,809 6,318 6,133 5,953 6,995 6,896 6,763 22,792 26,607 YoY Change (%) 17.4 48.0 53.8 21.7 31.3 20.4 9.2 10.3 34.7 16.7 EBITDA 726 1,005 1,133 1,056 1,186 1,436 1,393 1,279 3,920 5,295 YoY Change (%) -13.8 30.7 53.0 142.0 63.4 42.9 22.9 21.2 40.8 35.1 Depreciation 245 265 270 274 287 303 315 313 1,055 1,217 EBIT 481 740 863 782 900 1,133 1,078 967 2,866 4,078 YoY Change (%) -27.8 26.9 58.5 236.7 87.1 53.1 24.9 23.7 41.7 42.3 Interest 65 76 75 68 69 69 67 64 285 268 Other Income 147 42 59 19 19 87 45 63 267 213 PBT before EO expense 563 706 847 652 849 1,151 1,056 966 2,768 4,022 Tax 191 234 265 202 272 193 180 160 891 804 Rate (%) 34.0 33.1 31.2 27.5 32.0 18.0 17.0 16.6 34.8 (Profit)/Loss of JV/Asso. Cos. -146 -130 -21 -190 -255 0 0 0 -487 -255 Reported PAT 518 603 603 569 832 958 876 806 2,292 3,473 Adjusted PAT 518 603 603 622 832 958 876 806 2,345 3,473 YoY Change (%) 40.7 49.4 72.3 204.3 60.7 59.0 45.3 29.5 76.9 48.1 Margins (%) 11.4 10.4 9.5 10.1 14.0 13.7 12.7 11.9 10.3 13.1
GSK Pharma Neutral CMP INR1,623 | TP: INR1,575 (-3%) EPS CHANGE (%): FY20|21: 0.0| (0.9) Voluntary recall of Ranitidine to weigh on YoY revenue. Superior product mix/cost rationalization to drive margin. Outlook on capacity utilization of recently added gross
block. Further cost rationalization prospects over 12-15M.
Quarterly Performance (Consolidated) Y/E March FY19 FY20E FY19 FY20E (Standalone) 1Q 2Q 3Q 4Q 1Q 2Q 3QE 4QE
Net Sales 7,357 8,163 8,254 7,511 7,880 8,820 8,336 8,230 31,281 33,266 YoY Change (%) 21.2 -2.4 17.3 0.3 7.1 8.0 1.0 9.6 8.0 6.3 Total Expenditure 6,000 6,512 6,880 5,881 6,169 6,880 6,545 6,427 25,273 26,021 EBITDA 1,356 1,652 1,373 1,631 1,711 1,940 1,791 1,803 6,008 7,245 YoY Change (%) 589.2 -14.0 -3.2 5.3 26.2 17.5 30.4 10.6 18.8 20.6 Depreciation 114 115 120 137 191 227 230 239 486 887 EBIT 1,243 1,537 1,253 1,494 1,520 1,713 1,561 1,564 5,522 6,358 YoY Change (%) 922.0 -16.7 -2.5 2.7 22.3 11.5 24.6 4.7 18.0 15.1 Interest 2 2 1 1 9 9 0 -10 6 9 Other Income 180 148 164 527 308 159 220 213 1,023 900 PBT before EO Expense 1,421 1,683 1,417 2,020 1,819 1,863 1,781 1,787 6,540 7,249 Tax 497 557 468 751 626 457 392 268 1,928 1,762 Rate (%) 35.0 33.1 33.0 37.2 34.4 24.5 22.0 15.0 36.3 24.3 Adjusted PAT 924 1,126 949 1,270 1,173 1,406 1,389 1,520 4,167 5,487 YoY Change (%) 570.2 -10.1 5.8 20.3 27.0 24.9 46.4 19.7 25.2 31.7 Margins (%) 12.6 13.8 11.5 16.9 14.9 15.9 16.7 18.5 13.3 16.5 One-off Expense/(Income) 83 118 -181 32 38 -3,622 0 0 52 -3,584 Reported PAT 841 1,008 1,130 1,238 1,135 5,028 1,389 1,519 4,454 9,071

January 2020 121
December 2019 Results Preview | Sector: Healthcare
Ipca Laboratories Buy CMP INR1,141 | TP: INR1,310 (+15%) EPS CHANGE (%): FY20|21: 0.0|0.0 Domestic/international segment to drive revenue growth. Higher share of API business to drag margins. Growth prospects in UK business. Growth outlook in API segment.
Quarterly Performance
(INR M)
Y/E March FY19 FY20E FY19 FY20E
1Q 2Q 3Q 4Q 1Q 2Q 3QE 4QE Net Revenues (Core) 8,754 10,120 9,476 8,796 10,782 12,839 10,858 9,477 37,732 43,955 YoY Change (%) 22.8 17.1 10.3 12.4 23.2 26.9 14.6 7.7 14.9 16.5 EBITDA 1,186 2,048 2,101 1,646 1,987 2,659 2,204 1,941 7,164 8,791 YoY Change (%) 589.6 33.3 22.7 40.4 67.6 29.8 4.9 17.9 57.5 22.7 Depreciation 466 454 426 448 461 496 500 415 1,824 1,872 EBIT 720 1,595 1,675 1,198 1,526 2,162 1,704 1,526 5,340 6,919 YoY Change (%) -375.3 45.4 31.5 61.8 112.0 35.6 1.7 27.4 92.8 29.6 Interest 49 24 49 64 46 42 46 42 189 176 Other Income 143 148 126 153 112 148 135 105 577 500 PBT before EO Expense 814 1,719 1,752 1,286 1,592 2,268 1,793 1,590 5,728 7,243 One-off (gain)/ Expense -3 312 -215 10 -91 0 0 0 245 -91 PBT after EO Expense 816 1,407 1,967 1,277 1,683 2,268 1,793 1,590 5,483 7,335 Tax 131 221 366 317 374 319 314 283 1,042 1,289 Rate (%) 16.1 12.9 20.9 24.6 23.5 14.1 17.5 17.8 18.2 17.8 Reported PAT 685 1,186 1,601 960 1,294 1,936 1,479 1,307 4,422 6,016 Adj PAT 683 1,498 1,386 970 1,203 1,936 1,479 1,307 4,685 5,924 YoY Change (%) N/A 47.9 19.9 65.5 76.1 29.2 6.7 34.7 95.7 26.4 Margins (%) 7.8 14.8 14.6 11.0 11.2 15.1 13.6 13.8 12.4 13.5
Jubilant Life Sciences Buy CMP INR535 | TP: INR627 (+17%) EPS CHANGE (%): FY20|21: 0.0|(1.6) Expect muted quarter on lower chemical prices and
ongoing measures to resolve regulatory issues. Update on traction in Rubyfill and other radiopharma
products. Supply demand scenario in life science chemicals. Update on remediation measures at site under WL.
Consoli. - Quarterly Earning Model (INR M) Y/E March FY19 FY20E FY19 FY20E
1Q 2Q 3Q 4Q 1Q 2Q 3QE 4QE Net Sales 20,787 22,695 23,771 23,856 21,819 22,659 23,231 23,281 91,108 90,990 YoY Change (%) 30.2 38.2 15.0 5.9 5.0 -0.2 -2.3 -2.4 20.5 -0.1 Total Expenditure 16,411 18,193 18,838 19,246 17,332 17,975 18,353 18,223 72,688 71,882 EBITDA 4,376 4,502 4,933 4,610 4,486 4,685 4,879 5,058 18,420 19,108 YoY Change (%) 29.6 47.1 18.3 0.7 2.5 4.1 -1.1 9.7 21.3 3.7 Depreciation 880 895 984 950 1,027 1,168 1,150 1,131 3,709 4,477 EBIT 3,496 3,607 3,949 3,660 3,460 3,516 3,729 3,927 14,711 14,631 YoY Change (%) 31.9 58.8 17.9 -0.3 -1.0 -2.5 -5.6 7.3 23.1 -0.5 Interest 727 627 683 616 726 716 690 607 2,198 2,739 Other Income 95 38 290 -66 97 123 125 110 357 455 PBT before EO expense 2,864 3,018 3,556 2,978 2,831 2,922 3,164 3,430 12,870 12,347 Extra-Ord expense 0 0 151 3,378 140 0 0 0 3,529 140 PBT 2,864 3,018 3,405 -400 2,691 2,922 3,164 3,430 9,341 12,207 Tax 860 920 881 607 841 428 886 958 3,268 3,113 Rate (%) 30.0 30.5 25.9 -151.8 31.2 14.7 28.0 27.9 35.0 25.5 Reported PAT 2,004 2,098 2,524 -1,007 1,850 2,494 2,278 2,472 6,073 9,094 Adj PAT 2,004 2,098 2,636 2,218 1,947 2,494 2,278 2,472 8,955 9,190 YoY Change (%) 36.2 63.6 24.0 -0.1 -2.9 18.9 -13.6 11.5 26.1 2.6 Margins (%) 9.6 9.2 11.1 9.3 8.9 11.0 9.8 10.6 9.8 10.1

January 2020 122
December 2019 Results Preview | Sector: Healthcare
Laurus Labs Buy CMP INR373 | TP: INR455 (+22%) EPS CHANGE (%): FY20|21: 5.3|(0.3) Strong quarter led by formulation segment. ARV API biz to be softer due to captive consumption. Watch out for outlook on ARV tenders Capex plans for next 2-3 years.
Consolidated - Quarterly Earning Model
(INR m)
Y/E March FY19 FY20E FY19 FY20E
1Q 2Q 3Q 4Q 1Q 2Q 3QE 4QE
Net Sales 5,390 5,883 5,295 6,352 5,506 7,124 6,854 6,596 22,919 26,080 YoY Change (%) 9.7 9.2 10.5 13.4 2.1 21.1 29.4 3.9 10.8 13.8 Total Expenditure 4,535 4,972 4,417 5,232 4,673 5,746 5,551 5,337 19,155 21,307 EBITDA 856 911 877 1,120 833 1,378 1,302 1,260 3,764 4,773 YoY Change (%) -11.4 -19.0 0.4 -4.2 -2.7 51.2 48.5 12.5 -8.9 26.8 Depreciation 382 398 427 435 458 478 480 479 1,642 1,896 EBIT 474 513 450 685 374 900 822 781 2,122 2,877 YoY Change (%) -29.0 -37.8 -20.2 -16.7 -21.0 75.4 82.7 14.0 -26.3 35.6 Interest 223 246 237 176 225 256 250 242 882 973 Other Income 26 105 14 16 45 14 20 52 162 130 PBT before EO expense 276 372 228 526 194 658 592 591 1,402 2,034 Extra-Ord expense 50 154 0 0 0 0 0 0 204 0 PBT 226 218 228 526 194 658 592 591 1,198 2,034 Tax 61 56 50 94 43 92 133 159 260 427 Rate (%) 27.0 25.6 21.7 17.9 22.1 14.0 22.5 26.9 21.7 21.0 Reported PAT 165 162 178 432 151 566 459 432 938 1,607 Adj PAT 202 277 178 432 151 566 459 432 1,097 1,607 YoY Change (%) -48.1 -38.8 -48.9 -4.2 -25.2 104.4 157.6 0.0 -33.1 46.5 Margins (%) 3.7 4.7 3.4 6.8 2.7 7.9 6.7 6.5 4.8 6.2
Lupin Buy CMP INR775 | TP: INR890 (+15%) EPS CHANGE (%): FY20|21: (7.4)| (1.7) DF/EU business to drive revenue growth. US sales to decline marginally YoY to USD190m. Update on niche approvals for US market. Update on prescription trends of Solosec for US market.
Quarterly Perf. (Consolidated) (INR m) Y/E March FY19 FY20E FY19 FY20E
1Q 2Q 3Q 4Q 1Q 2Q 3QE 4QE
Net Sales 38,559 39,511 42,946 44,063 44,184 43,597 43,301 39,026 1,65,079 1,70,107 YoY Change (%) -0.4 0.0 8.0 9.2 14.6 10.3 0.8 -11.4 4.5 3.0 Total Expenditure 31,481 34,014 36,023 34,760 35,582 36,286 35,940 32,191 1,36,279 1,39,998 EBITDA 7,079 5,496 6,922 9,303 8,602 7,310 7,361 6,835 28,800 30,109 YoY Change (%) -7.9 -35.6 0.6 31.3 21.5 33.0 6.3 -26.5 -8.5 4.5 Depreciation 2,590 2,655 2,798 2,808 3,171 3,215 3,225 2,482 10,850 12,093 EBIT 4,489 2,842 4,125 6,495 5,431 4,096 4,136 4,353 17,950 18,016 YoY Change (%) -11.6 -51.1 1.1 49.0 21.0 44.1 0.3 -33.0 -12.9 0.4 Interest 687 738 798 855 856 865 870 537 3,078 3,127 Other Income 34 2,307 434 865 722 1,333 750 495 3,640 3,300 EO Exp/(Inc) 0 0 2,819 558 0 5,465 0 -24,500 3,400 -19,035 PBT 3,836 4,410 942 5,947 5,297 -901 4,016 28,812 15,112 37,224 Tax 1,811 1,729 2,478 2,998 2,280 343 1,325 5,926 9,017 9,874 Rate (%) 47.2 39.2 263.0 50.4 43.0 -38.1 33.0 20.6 59.7 26.5 Minority Interest -4 21 -18 53 -13 27 40 12 52 66 Reported PAT 2,028 2,660 -1,517 2,896 3,031 -1,271 2,651 22,874 6,043 27,284 Adj PAT 2,028 2,660 2,633 3,225 3,031 2,966 2,651 2,376 10,546 11,024 YoY Change (%) -43.4 -41.5 2.2 -13.9 49.4 11.5 0.7 -26.3 -27.0 4.5 Margins (%) 5.3 6.7 6.1 7.3 6.9 6.8 6.1 6.1 6.4 6.5

January 2020 123
December 2019 Results Preview | Sector: Healthcare
Strides Pharma Buy CMP INR376 | TP: INR440 (+17%) EPS CHANGE (%): FY20|21: (3.7)| (0.9) Expect STR to maintain momentum in US business. Superior product mix to drive margins. Growth prospects in Ranitidine for US market. Update on upcoming ANDA approval pipeline.
Consol. - Quarterly Earning Model
(INR m)
Y/E March FY19 FY20E FY19 FY20E
1Q* 2Q 3Q 4Q* 1Q 2Q 3QE 4QE Net Sales 6,162 5,196 7,878 4,727 6,858 7,151 7,624 7,920 30,117 29,553 YoY Change (%) -6.3 -32.4 5.2 -29.4 3.4 37.6 -3.2 -5.7 6.1 -1.9 Total Expenditure 5,238 4,713 6,607 4,299 5,621 5,685 6,084 6,341 25,455 23,731 EBITDA 924 484 1,271 428 1,237 1,466 1,540 1,579 4,662 5,822 YoY Change (%) 46.8 -55.1 -2.9 -53.6 33.9 203.2 21.2 269.0 17.7 25.0 Depreciation 297 309 407 290 429 420 439 454 1,719 1,742 EBIT 627 175 864 138 808 1,046 1,101 1,125 2,944 4,080 YoY Change (%) 129.4 -75.2 -7.1 -71.2 28.8 498.0 27.4 715.8 21.5 38.7 Interest 234 173 501 168 353 404 415 455 2,053 1,628 Other Income 166 99 8 48 103 130 100 102 340 435 PBT before EO expense 559 57 372 18 557 772 786 772 1,230 2,887 Extra-Ord expense -164 50 -7 12 93 -834 0 0 26 -741 PBT 723 7 379 6 464 1,606 786 772 1,204 3,628 Tax -76 -55 63 -135 31 74 71 78 131 254 Rate (%) -10.4 -826.9 16.6 -2,416.1 6.7 4.6 9.0 10.1 10.9 7.0 MI & (P)/L of Asso. Cos. 203 115 71 70 178 213 151 159 483 700 Reported PAT from Continuing Ops. 595 -53 262 71 254 1,320 564 534 589 2,673 Adj. PAT from Continuing Ops. 302 -64 239 -38 341 524 564 534 613 1,964 YoY Change (%) 527.2 -120.6 -55.3 -136.3 13.2 NA 136.1 NA -39.0 220.3 Margins (%) 4.9 -1.2 3.0 -0.8 5.0 7.3 7.4 6.7 2.0 6.6
Sun Pharma Buy CMP INR435 | TP: INR515 (+18%) EPS CHANGE (%): FY20|21: (0.3) |0.0 DF/ROW/API to drive overall revenue growth. Competition to result in slightly lower US sales YoY to
USD360m. Watch out for prescription trends in specialty portfolio. Update on recent inspection at Halol.
Quarterly Perf (Consolidated) (INR m) Y/E March FY19 FY20E FY19 FY20E
1Q 2Q 3Q 4Q 1Q 2Q 3QE 4QE Net Revenues 71,388 68,465 76,567 70,443 82,593 79,492 81,297 82,010 2,86,863 3,25,392 YoY Change (%) 15.8 3.9 16.0 5.0 15.7 16.1 6.2 16.4 10.1 13.4 Total Expenditure 56,175 54,064 58,873 60,951 64,461 63,421 65,119 66,650 2,30,063 2,59,652 EBITDA 15,214 14,401 17,694 9,491 18,132 16,071 16,178 15,360 56,800 65,740
YoY Change (%) 44.4 9.5 26.5 -33.0 19.2 11.6 -8.6 61.8 9.6 15.7 Depreciation 4,016 4,265 4,711 4,541 4,571 4,733 4,750 4,766 17,533 18,820 EBIT 11,197 10,136 12,984 4,951 13,560 11,338 11,428 10,594 39,267 46,921
YoY Change (%) 58.4 5.9 22.6 -48.5 21.1 11.9 -12.0 114.0 6.6 19.5 Interest 1,309 1,295 1,448 1,500 1,041 839 880 943 5,553 3,703 Net Other Income 2,851 4,423 2,765 4,012 3,281 3,750 3,400 3,869 14,051 14,300 PBT before EO Exp 12,739 13,263 14,301 7,462 15,801 14,249 13,948 13,521 47,766 57,518 Less: EO Exp/(Inc) 0 12,144 -3,000 520 -674 -85 0 0 9,664 -759 PBT 12,739 1,119 17,301 6,942 16,474 14,334 13,948 13,521 38,102 58,277 Tax 1,639 2,189 2,709 -288 1,461 2,660 2,371 2,423 6,009 8,915 Rate (%) 12.9 16.5 18.9 -3.9 9.2 18.7 17.0 17.9 12.6 15.5 PAT (pre Minority Interest) 11,101 -1,070 14,832 7,231 15,014 11,674 11,577 11,097 32,093 49,362 Minority Interest 1,275 1,119 2,173 871 1,139 1,033 1,050 1,333 5,439 4,555 Reported PAT 9,825 -1,949 12,419 6,359 13,875 10,641 10,527 9,764 26,654 44,807 One-off upsides 0 0 0 0 0 0 0 0 0 0 Adj Net Profit* 9,825 10,196 9,419 6,879 13,208 10,556 10,527 9,764 36,318 44,048 YoY Change (%) 86.9 11.8 7.2 -25.2 34.4 3.5 11.8 41.9 12.2 21.3 Margins (%) 13.8 -2.8 16.2 9.0 16.8 13.4 12.9 11.9 9.3 13.8 *Note: PAT adjusted for forex loss

January 2020 124
December 2019 Results Preview | Sector: Healthcare
Torrent Pharmaceuticals Neutral CMP INR1,864 | TP: INR1,765 (-5%) EPS CHANGE (%): FY20|21: 2.1| (0.1) Lower US sales (USD54m) to drag overall revenue growth. Superior product mix to improve margins. Update on ongoing remediation measures at sites under
regulatory issues with respect to US market. Growth outlook for DF business.
Quarterly performance (Consolidated)
(INR M)
Y/E March FY19 FY20E FY19 FY20E
1Q 2Q 3Q 4Q 1Q 2Q 3QE 4QE
Net Revenues 18,720 18,940 19,880 18,560 20,220 20,050 20,604 20,736 76,100 81,610 YoY Change (%) 36.2 32.5 34.6 7.8 8.0 5.9 3.6 11.7 26.8 7.2 EBITDA 4,770 4,730 5,260 4,730 5,410 5,410 5,542 5,754 19,490 22,116 YoY Change (%) 60.6 43.8 46.5 14.3 13.4 14.4 5.4 21.6 39.3 13.5 Depreciation 1,500 1,520 1,560 1,600 1,600 1,630 1,650 1,709 6,180 6,589 EBIT 3,270 3,210 3,700 3,130 3,810 3,780 3,892 4,044 13,310 15,527 YoY Change (%) 50.7 31.0 39.6 19.0 16.5 17.8 5.2 29.2 34.4 16.7 Interest 1,220 1,260 1,330 1,230 1,220 1,160 1,110 1,040 5,040 4,530 Other Income 270 100 30 170 200 340 225 185 570 950 PBT before EO Expense 2,320 2,050 2,400 2,070 2,790 2,960 3,007 3,190 8,840 11,947 Extra-Ord Expense 0 0 -350 3,570 0 0 0 0 3,220 0 PBT after EO Expense 2,320 2,050 2,750 -1,500 2,790 2,960 3,007 3,190 5,620 11,947 Tax 690 260 290 20 630 520 571 608 1,260 2,330 Rate (%) 29.7 12.7 12.1 1.0 22.6 17.6 19.0 19.1 14.3 19.5 Reported PAT 1,630 1,790 2,460 -1,520 2,160 2,440 2,436 2,582 4,360 9,618 Adj PAT 1,630 1,790 2,152 1,656 2,160 2,440 2,436 2,582 7,228 9,618 YoY Change (%) -13.3 -12.3 -9.9 12.5 32.5 36.3 13.2 55.9 -7.1 33.1 Margins (%) 8.7 9.5 10.8 8.9 10.7 12.2 11.8 12.4 9.5 11.8

January 2020 125
December 2019 Results Preview | Sector: Infrastructure
Awarding activity to pick up in 4QFY20
Offshoots of ordering activity visible after lackluster 1HFY20 Road sector awarding peaked out in FY18 with NHAI awarding at 7,397km. Since, then, ordering activity has witnessed a slowdown (FY19: 2,222 km) owing to land acquisition delays faced by NHAI and cautiousness of banks toward lending to infrastructure projects. Moreover, the sector outlook has also been marred by concerns over NHAI debt – its borrowings grew 7.3x to INR1.8t in FY19 from ~INR250b in FY15 – thus, net gearing increased to 0.8x by FY19 from 0.2x in FY15. In Aug’19, the PMO asked NHAI to take a relook at the commercial viability of projects and to aggressively monetize road assets. According to our analysis based on NHAI’s balance sheet, its revenue potential and land acquisition rate, we expect NHAI to award 4,000km of orders in FY20. Ordering is expected to be skewed towards the year-end.
Execution of awarded projects – a key focus area HAM projects awarded in FY18 have seen delays in receiving the appointed date on land acquisition issues faced by NHAI and also due to banks adopting a stringent approach in lending to infrastructure projects. However, activities have started picking up now – most HAM projects awarded in FY18 have achieved financial closure and have got the appointed date from NHAI. We expect execution ramp-up of the previously awarded HAM projects. With very few HAM projects awarded in 1HFY20, we expect awarding to pick up pace now with NHAI smoothening out issues related to funding of these projects with banks.
Execution for coverage universe to be muted at 1.6% YoY We expect execution for our coverage universe to be muted at 1.6% YoY. Most companies have been demonstrating superior execution over the past few quarters owing to strong order book positions. This has led to sharp depletion of their order book, thereby increasing the dependency on new order inflows for sustenance of revenue growth. Also, we have factored in recent order cancellations for Sadbhav Engineering and IRB Infrastructure. In terms of revenue, KNR Construction is expected to outperform with 29.2% YoY growth, Ashoka Buildcon (+3.3%) while IRB Infrastructure and Sadbhav Engineering are expected to post revenue decline by 1.3%, 8.2%, respectively.
Operating margin to shrink due to adverse revenue mix We expect operating margins for our coverage universe to contract at the aggregate level, given the adverse revenue mix. Net profit is likely to decline 16.1% YoY for our coverage universe, with only KNR Construction reporting 6.2% YoY growth.
Look for strong balance sheets With financial closure becoming stringent and banks getting selective in extending credit to companies, the sector is likely to see consolidation, in our view. Companies with healthy balance sheets would benefit the most. Strict financial closure would also lead to moderation in competition, and thus, an improvement in pricing and margins of financially strong players. Our top picks are KNR and Ashoka Buildcon.
Infrastructure
Company name
Ashoka Buildcon
IRB Infra
KNR Constructions
Sadbhav Engineering
Nilesh Bhaiya – Research Analyst ([email protected]); +91 22 6129 1556 Pratik Singh – Research Analyst ([email protected]); +91 22 6129 1543

January 2020 126
December 2019 Results Preview | Sector: Infrastructure Exhibit 73: Summary of expected quarterly performance Sector CMP SALES (INR M) EBDITA (INR M) NET PROFIT (INR M)
(INR) RECO Dec-19 Var % YoY
Var % QoQ Dec-19 Var
% YoY Var
% QoQ Dec-19 Var % YoY
Var % QoQ
Infrastructure Ashoka Buildcon 109 Buy 11,000 3.3 33.8 1,320 -11.3 7.4 789 -22.6 8.6 IRB Infra 75 Neutral 17,647 -1.3 0.7 6,629 -12.8 -11.3 1,817 -17.0 -9.2 KNR Constructions 264 Buy 5,800 29.2 10.9 1,131 25.5 4.9 553 6.2 31.4 Sadbhav Engineering 124 Buy 8,500 -8.2 50.4 1,020 -7.9 46.6 443 -21.3 71.2 Sector Aggregate 42,947 1.6 17.3 10,100 -9.0 -3.6 3,602 -16.1 5.7
Exhibit 74: Softness witnessed in awarding activity for FY19, expect NHAI awarding activity to pick up in 4Q20
Source: NHAI, MOFSL
Exhibit 75: We expect road construction to remain on an uptrend
Source: NHAI, MOFSL
Exhibit 76: NHAI financials – Application of funds (INR b)
Source: NHAI, MOFSL estimates from FY19 onwards
Exhibit 77: NHAI Financials – Sources of funds (INR b)
Source: NHAI, MOFSL estimates from FY19 onwards
Exhibit 78: Comparative valuation CMP EPS (INR) PE (x) PB (x) RoE (%) Company Name INR Reco FY20E FY21E FY22E FY20E FY21E FY22E FY20E FY21E FY22E FY20E FY21E FY22E Infrastructure 8.3 10.4 12.1 0.9 0.7 0.7 10.5 6.9 5.6 Ashoka Buildcon 109 Buy 11.6 12.5 12.4 9.4 8.7 8.8 1.2 1.1 1.0 13.8 13.1 11.7 IRB Infra 75 Neutral 18.0 4.9 -2.1 4.2 15.4 -36.2 0.4 0.4 0.4 9.6 2.5 -1.1 KNR Constructions 264 Buy 19.7 17.6 21.0 13.4 15.0 12.6 2.2 1.9 1.7 17.8 13.6 14.3 Sadbhav Engineering 124 Buy 9.2 16.6 18.3 13.6 7.5 6.8 1.0 0.6 0.5 7.5 10.5 8.3
1,23
4
643
3,35
9 5,05
8 6,49
1
1,11
6
1,43
5 3,06
7 4,34
4
4,33
5
7,39
7
2,22
2 4,00
0 5,00
0
FY08
FY09
FY10
FY11
FY12
FY13
FY14
FY15
FY16
FY17
FY18
FY19
P
FY20
E
FY21
E
Km Awarding (km)
1,68
4
2,20
5
2,69
3
1,78
3
2,24
8
2,84
4
1,90
1
1,50
1
1,98
8
2,62
8
3,07
1
3,33
8
3,65
0
4,01
5
FY08
FY09
FY10
FY11
FY12
FY13
FY14
FY15
FY16
FY17
FY18
FY19
P
FY20
E
FY21
E
Km Completion (km)
22 25 29 29 33 30 40 50 60 78 91 219 178 321 310 400 440 484
92 79 126 208
306 497
451 474 410
3 7 13 24
46
87 133
182 235
FY14 FY15 FY16 FY17 FY18 FY19E FY20E FY21E FY22E
RedemptionLand AcquisitionProject ExpenditureInterest expense (net)
44 43 52 65 76 96 106 127 153 69 69 154 23 124 181 161 177 195 97 100 100 100
79 33 233 331
505
620 750 750 750
FY14 FY15 FY16 FY17 FY18 FY19E FY20E FY21E FY22E
Borrowings raisedAdditional Budgetary supportMonetization of NHCess receivedToll collection

January 2020 127
December 2019 Results Preview | Sector: Infrastructure The tables below provide a snapshot of actual and estimated numbers for companies under the MOFSL coverage universe. Highlighted columns indicate the quarter/financial year under review.
Ashoka Buildcon Buy CMP INR 109 | TP: INR150 (+39%) EPS CHANGE (%): FY20|21: -|- Revenue growth (+3.3% YoY) to come from execution of
existing projects. Adj. PAT to decline 23% YoY off a high base.
Watch for pending appointed date on 1 HAM project. New order wins as superior execution has led to depletion of existing OB (OB/rev 1.9x in 2QFY20 v/s 3.7x YoY).
Quarterly Performance (INR m) Y/E March FY19 FY20 FY19 FY20 1Q 2Q 3Q 4Q 1Q 2Q 3QE 4QE Net Sales 6,725 7,644 10,651 13,074 8,768 8,223 11,000 14,351 38,094 42,342 YoY Change (%) -4.8 101.9 61.6 86.2 30.4 7.6 3.3 9.8 55.7 11.2 EBITDA 701 1,037 1,487 1,815 1,095 1,229 1,320 1,722 5,040 5,366 Margins (%) 10.4 13.6 14.0 13.9 12.5 14.9 12.0 12.0 13.2 12.7 Depreciation 136 166 202 260 266 271 265 262 763 1,065 Interest 171 130 239 367 214 231 250 282 907 977 Other Income 366 157 254 380 342 392 250 286 1,157 1,270 Extra-Ord expense 112 0 -398 -73 0 0 0 0 -358 0 PBT 759 899 1,301 1,568 957 1,118 1,055 1,464 4,527 4,594 Tax 232 278 281 516 310 391 266 370 1,307 1,337 Rate (%) 30.6 30.9 21.6 32.9 32.4 35.0 25.2 25.3 28.9 29.1 Reported PAT 639 621 622 980 647 727 789 1,094 2,862 3,257 Adj PAT 527 621 1,019 1,053 647 727 789 1,094 3,220 3,257 YoY Change (%) -7.5 124.4 116.8 -0.1 22.8 17.1 -22.6 4.0 35.8 1.2 Margins (%) 7.8 8.1 9.6 8.1 7.4 8.8 7.2 7.6 8.5 7.7
IRB Neutral CMP INR 75 | TP: INR77 (+3%) EPS CHANGE (%): FY20|21: -10.0|-29.0 Revenue: Construction segment (+38% YoY) / BOT
segment (-35% YoY). We have factored in two project cancellations received
from NHAI for highway construction in Tamil Nadu. Op margin to contract 490bp YoY on adverse mix; op
profit to decline 13% YoY. Watch out for update on asset sale to the InvIT with GIC.
Quarterly performance (INR m) Y/E March FY19 FY20 FY19 FY20E 1Q 2Q 3Q 4Q 1Q 2Q 3QE 4QE Net Sales 15,380 14,323 17,885 19,483 17,730 17,521 17,647 12,297 67,070 65,195 YoY Change (%) -18.8 27.6 38.0 41.0 15.3 22.3 -1.3 -36.9 17.8 -2.8 EBITDA 7,467 6,701 7,604 7,601 8,554 7,474 6,629 5,631 29,373 28,288 Margins (%) 48.5 46.8 42.5 39.0 48.2 42.7 37.6 45.8 43.8 43.4 Depreciation 1,345 1,372 1,321 1,357 1,535 1,139 1,320 1,483 5,395 5,477 Interest 2,477 2,719 2,866 3,138 3,628 3,813 3,600 4,981 11,201 16,021 Other Income 453 532 465 506 481 490 550 595 1,956 2,116 Extra-Ord expense 0 0 0 0 0 0 0 0 0 0 PBT 4,098 3,141 3,882 3,612 3,872 3,012 2,259 -237 14,733 8,905 Tax 1,597 1,412 1,693 1,532 1,805 1,010 788 -327 6,234 3,277 Rate (%) 39.0 44.9 43.6 42.4 46.6 33.5 34.9 137.6 42.3 36.8 Min Int & P/Lof Asso. Cos. 0 0 0 -346 -346 0 -692 Reported PAT 2,501 1,729 2,189 2,080 2,066 2,002 1,817 435 8,500 6,321 Adj PAT 2,501 1,729 2,189 2,080 2,066 2,002 1,817 435 8,500 6,321 YoY Change (%) 26.2 15.0 -13.0 -13.2 -17.4 15.7 -17.0 -79.1 1.2 -25.6 Margins (%) 16.3 12.1 12.2 10.7 11.7 11.4 10.3 3.5 12.7 9.7
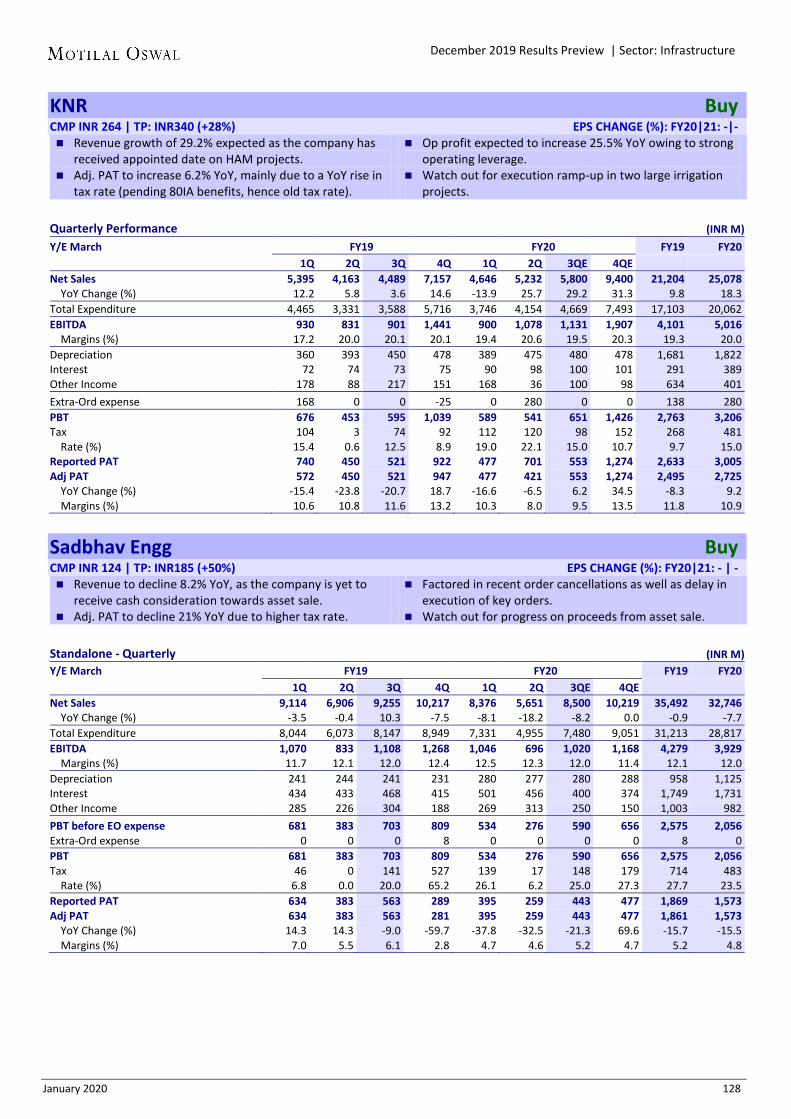
January 2020 128
December 2019 Results Preview | Sector: Infrastructure KNR Buy CMP INR 264 | TP: INR340 (+28%) EPS CHANGE (%): FY20|21: -|- Revenue growth of 29.2% expected as the company has
received appointed date on HAM projects. Op profit expected to increase 25.5% YoY owing to strong
operating leverage. Adj. PAT to increase 6.2% YoY, mainly due to a YoY rise in
tax rate (pending 80IA benefits, hence old tax rate). Watch out for execution ramp-up in two large irrigation
projects.
Quarterly Performance (INR M) Y/E March FY19 FY20 FY19 FY20 1Q 2Q 3Q 4Q 1Q 2Q 3QE 4QE Net Sales 5,395 4,163 4,489 7,157 4,646 5,232 5,800 9,400 21,204 25,078 YoY Change (%) 12.2 5.8 3.6 14.6 -13.9 25.7 29.2 31.3 9.8 18.3 Total Expenditure 4,465 3,331 3,588 5,716 3,746 4,154 4,669 7,493 17,103 20,062 EBITDA 930 831 901 1,441 900 1,078 1,131 1,907 4,101 5,016 Margins (%) 17.2 20.0 20.1 20.1 19.4 20.6 19.5 20.3 19.3 20.0 Depreciation 360 393 450 478 389 475 480 478 1,681 1,822 Interest 72 74 73 75 90 98 100 101 291 389 Other Income 178 88 217 151 168 36 100 98 634 401 Extra-Ord expense 168 0 0 -25 0 280 0 0 138 280 PBT 676 453 595 1,039 589 541 651 1,426 2,763 3,206 Tax 104 3 74 92 112 120 98 152 268 481 Rate (%) 15.4 0.6 12.5 8.9 19.0 22.1 15.0 10.7 9.7 15.0 Reported PAT 740 450 521 922 477 701 553 1,274 2,633 3,005 Adj PAT 572 450 521 947 477 421 553 1,274 2,495 2,725 YoY Change (%) -15.4 -23.8 -20.7 18.7 -16.6 -6.5 6.2 34.5 -8.3 9.2 Margins (%) 10.6 10.8 11.6 13.2 10.3 8.0 9.5 13.5 11.8 10.9
Sadbhav Engg Buy CMP INR 124 | TP: INR185 (+50%) EPS CHANGE (%): FY20|21: - | - Revenue to decline 8.2% YoY, as the company is yet to
receive cash consideration towards asset sale. Factored in recent order cancellations as well as delay in
execution of key orders. Adj. PAT to decline 21% YoY due to higher tax rate. Watch out for progress on proceeds from asset sale.
Standalone - Quarterly
(INR M)
Y/E March FY19 FY20 FY19 FY20 1Q 2Q 3Q 4Q 1Q 2Q 3QE 4QE Net Sales 9,114 6,906 9,255 10,217 8,376 5,651 8,500 10,219 35,492 32,746 YoY Change (%) -3.5 -0.4 10.3 -7.5 -8.1 -18.2 -8.2 0.0 -0.9 -7.7 Total Expenditure 8,044 6,073 8,147 8,949 7,331 4,955 7,480 9,051 31,213 28,817 EBITDA 1,070 833 1,108 1,268 1,046 696 1,020 1,168 4,279 3,929 Margins (%) 11.7 12.1 12.0 12.4 12.5 12.3 12.0 11.4 12.1 12.0 Depreciation 241 244 241 231 280 277 280 288 958 1,125 Interest 434 433 468 415 501 456 400 374 1,749 1,731 Other Income 285 226 304 188 269 313 250 150 1,003 982 PBT before EO expense 681 383 703 809 534 276 590 656 2,575 2,056 Extra-Ord expense 0 0 0 8 0 0 0 0 8 0 PBT 681 383 703 809 534 276 590 656 2,575 2,056 Tax 46 0 141 527 139 17 148 179 714 483 Rate (%) 6.8 0.0 20.0 65.2 26.1 6.2 25.0 27.3 27.7 23.5 Reported PAT 634 383 563 289 395 259 443 477 1,869 1,573 Adj PAT 634 383 563 281 395 259 443 477 1,861 1,573 YoY Change (%) 14.3 14.3 -9.0 -59.7 -37.8 -32.5 -21.3 69.6 -15.7 -15.5 Margins (%) 7.0 5.5 6.1 2.8 4.7 4.6 5.2 4.7 5.2 4.8
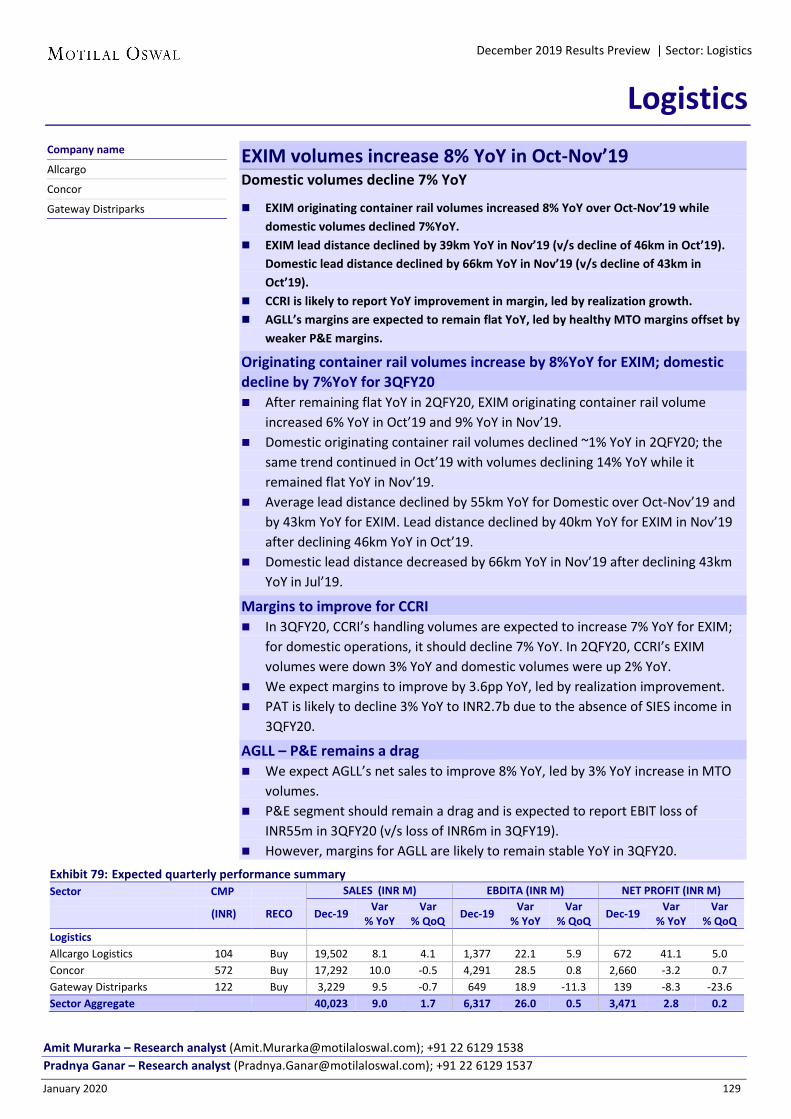
January 2020 129
December 2019 Results Preview | Sector: Logistics
EXIM volumes increase 8% YoY in Oct-Nov’19 Domestic volumes decline 7% YoY
EXIM originating container rail volumes increased 8% YoY over Oct-Nov’19 while domestic volumes declined 7%YoY.
EXIM lead distance declined by 39km YoY in Nov’19 (v/s decline of 46km in Oct’19). Domestic lead distance declined by 66km YoY in Nov’19 (v/s decline of 43km in Oct’19).
CCRI is likely to report YoY improvement in margin, led by realization growth. AGLL’s margins are expected to remain flat YoY, led by healthy MTO margins offset by
weaker P&E margins.
Originating container rail volumes increase by 8%YoY for EXIM; domestic decline by 7%YoY for 3QFY20 After remaining flat YoY in 2QFY20, EXIM originating container rail volume
increased 6% YoY in Oct’19 and 9% YoY in Nov’19. Domestic originating container rail volumes declined ~1% YoY in 2QFY20; the
same trend continued in Oct’19 with volumes declining 14% YoY while it remained flat YoY in Nov’19.
Average lead distance declined by 55km YoY for Domestic over Oct-Nov’19 and by 43km YoY for EXIM. Lead distance declined by 40km YoY for EXIM in Nov’19 after declining 46km YoY in Oct’19.
Domestic lead distance decreased by 66km YoY in Nov’19 after declining 43km YoY in Jul’19.
Margins to improve for CCRI In 3QFY20, CCRI’s handling volumes are expected to increase 7% YoY for EXIM;
for domestic operations, it should decline 7% YoY. In 2QFY20, CCRI’s EXIM volumes were down 3% YoY and domestic volumes were up 2% YoY.
We expect margins to improve by 3.6pp YoY, led by realization improvement. PAT is likely to decline 3% YoY to INR2.7b due to the absence of SIES income in
3QFY20.
AGLL – P&E remains a drag We expect AGLL’s net sales to improve 8% YoY, led by 3% YoY increase in MTO
volumes. P&E segment should remain a drag and is expected to report EBIT loss of
INR55m in 3QFY20 (v/s loss of INR6m in 3QFY19). However, margins for AGLL are likely to remain stable YoY in 3QFY20.
Exhibit 79: Expected quarterly performance summary Sector CMP SALES (INR M) EBDITA (INR M) NET PROFIT (INR M)
(INR) RECO Dec-19 Var % YoY
Var % QoQ Dec-19 Var
% YoY Var
% QoQ Dec-19 Var % YoY
Var % QoQ
Logistics Allcargo Logistics 104 Buy 19,502 8.1 4.1 1,377 22.1 5.9 672 41.1 5.0 Concor 572 Buy 17,292 10.0 -0.5 4,291 28.5 0.8 2,660 -3.2 0.7 Gateway Distriparks 122 Buy 3,229 9.5 -0.7 649 18.9 -11.3 139 -8.3 -23.6 Sector Aggregate 40,023 9.0 1.7 6,317 26.0 0.5 3,471 2.8 0.2
Logistics Company name
Allcargo
Concor
Gateway Distriparks
Amit Murarka – Research analyst ([email protected]); +91 22 6129 1538 Pradnya Ganar – Research analyst ([email protected]); +91 22 6129 1537

January 2020 130
December 2019 Results Preview | Sector: Logistics EXIM volumes increase 8% YoY in Oct-Nov’19
Exhibit 80: EXIM volumes increase 8% YoY in Oct-Nov’19
Source: Indian Rail, MOFSL
Exhibit 81: Domestic volumes decline 7% YoY in Oct-Nov’19
Source: Indian Rail, MOFSL
Exhibit 82: EXIM lead distance declined 40km YoY in Nov’19
Source: Indian Rail, MOFSL
Exhibit 83: Domestic lead distance declined 66km YoY in Nov’19
Source: Indian Rail, MOFSL
Exhibit 84: In Nov’19, India’s imports declined 13% YoY, while exports were flat YoY
Source: CEIC, MOFSL
Exhibit 85: IIP was down 4% YoY in Oct’19
Source: CEIC, MOFSL
3.56
4.04
4.05
3.74
4.38
3.94
4.40
4.13
4.29
4.37
4.04
4.07
3.89
3.8
10.7 8.3
3.6 5.3 5.6
10.3
5.1 1.9
(0.5) (1.2)
6.3 9.3
Nov
-18
Dec-
18
Jan-
19
Feb-
19
Mar
-19
Apr-
19
May
-19
Jun-
19
Jul-1
9
Aug-
19
Sep-
19
Oct
-19
Nov
-19
EXIM tonnes originating (mn) % Change (YoY)
0.91
0.96
1.01
0.93
1.14
0.89
0.93
1.00
1.08
0.89
0.91
0.88
0.91
1.1 (2.0)
7.4 3.3 5.6
1.1 (4.1) (2.9)
14.9
(13.6)
(4.2) (13.7)
0.0
Nov
-18
Dec-
18
Jan-
19
Feb-
19
Mar
-19
Apr-
19
May
-19
Jun-
19
Jul-1
9
Aug-
19
Sep-
19
Oct
-19
Nov
-19
Domestic tonnes originating (mn) % Change (YoY)
789
780 79
2
791
796
793
779
771 81
4
782
774
757
750
Nov
-18
Dec-
18
Jan-
19
Feb-
19
Mar
-19
Apr-
19
May
-19
Jun-
19
Jul-1
9
Aug-
19
Sep-
19
Oct
-19
Nov
-19
Average lead (kms) EXIM
1,26
4
1,26
4
1,24
1
1,26
7
1,27
7
1,20
4 1,27
5
1,16
6
1,05
0
1,28
7
1,16
9 1,23
2
1,19
8
Nov
-18
Dec-
18
Jan-
19
Feb-
19
Mar
-19
Apr-
19
May
-19
Jun-
19
Jul-1
9
Aug-
19
Sep-
19
Oct
-19
Nov
-19
Average lead (kms) Domestic
30
1
7
(2)
18
(0
) 3
8
3
1
2
1
3
(8)
2
(6)
(7)
(2)
(0)
29 28
11 18
8 1 1
(4)
1 4 3
(10) (9) (13) (12) (15) (13)
Jul-1
8Au
g-18
Sep-
18O
ct-1
8N
ov-1
8De
c-18
Jan-
19Fe
b-19
Mar
-19
Apr-
19M
ay-1
9Ju
n-19
Jul-1
9Au
g-19
Sep-
19O
ct-1
9N
ov-1
9
Export - YoY (%) Import - YoY (%)
4
8
0 3 2
0
3 3 4
1 4
-1 -4 -4
Sep-
18
Oct
-18
Nov
-18
Dec-
18
Jan-
19
Feb-
19
Mar
-19
Apr-
19
May
-19
Jun-
19
Jul-1
9
Aug-
19
Sep-
19
Oct
-19
IIP YoY growth (%)

January 2020 131
December 2019 Results Preview | Sector: Logistics Exhibit 86: Relative performance – three months (%)
Source: Bloomberg, MOFSL
Exhibit 87: Relative performance – one year (%)
Source: Bloomberg, MOFSL
Exhibit 88: Comparative valuation CMP EPS (INR) PE (x) PB (x) RoE (%) Company Name INR Reco FY20E FY21E FY22E FY20E FY21E FY22E FY20E FY21E FY22E FY20E FY21E FY22E Logistics 27.5 24.8 21.8 2.7 2.6 2.4 9.9 10.3 11.0 Allcargo Logistics 104 Buy 10.4 11.2 12.5 10.0 9.2 8.3 1.1 1.0 0.9 12.0 11.5 11.4 Concor 572 Buy 17.2 19.7 22.5 33.2 29.1 25.5 3.3 3.1 2.9 10.0 11.0 11.9 Gateway Distriparks 122 Buy 9.6 8.1 9.5 12.7 15.1 12.8 1.0 0.9 0.9 7.7 6.3 7.1
90
95
100
105
110
Sep-
19
Oct
-19
Nov
-19
Dec-
19
Nifty Index MOSL Logistics Index
80
90
100
110
120
Dec-
18
Jan-
19
Feb-
19
Mar
-19
Apr-
19
May
-19
Jun-
19
Jul-1
9
Aug-
19
Sep-
19
Oct
-19
Nov
-19
Dec-
19
Nifty Index MOSL Logistics Index

January 2020 132
December 2019 Results Preview | Sector: Logistics The tables below provide a snapshot of actual and estimated numbers for companies under the MOFSL coverage universe. Highlighted columns indicate the quarter/financial year under review.
Allcargo Buy CMP INR 104 | TP: INR120 (+15%) EPS CHANGE (%): FY20|21: -3|-15 Expect MTO volumes at 178k TEU (+6% YoY, -3.4% QoQ). CFS volumes at 85k TEU (+3%YoY, -4.9% QoQ). P&E segment to remain a drag and report EBIT loss. Update on logistics park to be a key monitorable.
Consolidated - Quarterly Earning Model (INR Million) Y/E March FY19 FY20 FY19 FY20E 1Q 2Q 3Q 4Q 1Q 2Q 3QE 4QE Net Sales 16,250 17,373 18,037 17,273 18,153 18,732 19,502 19,366 68,933 75,753 YoY Change (%) 9.5 12.3 21.9 12.4 11.7 7.8 8.1 12.1 14.0 9.9 EBITDA 1,021 1,249 1,128 1,072 1,406 1,300 1,377 1,361 4,470 5,444 Margins (%) 6.3 7.2 6.3 6.2 7.7 6.9 7.1 7.0 6.5 7.2 Depreciation 397 403 398 361 547 539 540 559 1,559 2,184 Interest 79 85 65 67 117 115 120 125 295 477 Other Income 51 54 141 108 63 108 80 52 353 303 PBT before EO expense 596 815 805 752 805 755 797 729 2,968 3,086 Extra-Ord expense 0 0 0 0 0 0 0 0 0 0 PBT 596 815 805 752 805 755 797 729 2,968 3,086 Tax 86 199 306 -48 175 109 144 128 542 555 Rate (%) 14.4 24.4 38.0 -6.4 21.8 14.5 18.0 17.5 18.3 18.0 Reported PAT 510 616 500 800 630 646 654 601 2,426 2,531 Min. Interest & P& L of Asso. Cos. 21 2 -23 -6 1 -6 19 16 -7 30 Adj PAT 531 618 477 793 630 640 672 618 2,419 2,561 YoY Change (%) -13.2 -3.1 37.1 328.5 18.7 3.6 41.1 -22.2 35.7 5.8 Margins (%) 3.3 3.6 2.6 4.6 3.5 3.4 3.4 3.2 3.5 3.4 E: MOFSL Estimates
Concor Buy CMP INR 572 | TP: INR685 (+20%) EPS CHANGE (%): FY20|21: 0|0 Expect EXIM volumes to increase 7% YoY. Domestic volumes expected to decline 7% YoY. Estimate EBITDA at INR4.3b (+28% YoY, +1% QoQ). Commentary on divestment a key monitorable.
Container Corp of India (INR Million) Y/E March FY19 FY20 FY19 FY20E 1Q 2Q 3Q 4Q 1Q 2Q 3QE 4QE Net Sales 14,983 17,223 15,726 17,499 16,389 17,387 17,292 18,774 65,427 69,842 YoY Change (%) 2.8 19.2 10.8 12.3 9.4 1.0 10.0 7.3 11.1 6.7 EBITDA 3,202 4,042 3,339 3,829 4,033 4,255 4,291 4,410 14,408 16,988 Margins (%) 21.4 23.5 21.2 21.9 24.6 24.5 24.8 23.5 22.0 24.3 YoY Change (%) -2.0 29.9 37.7 10.5 25.9 5.3 28.5 15.2 19.3 17.9 Depreciation 1,022 1,048 1,059 1,117 1,253 1,278 1,300 1,321 4,246 5,152 Interest 0 0 0 7 112 81 65 29 7 288 Other Income 1,321 1,692 1,586 2,132 583 637 630 630 6,735 2,479 PBT before EO expense 3,500 4,686 3,866 4,837 3,250 3,532 3,556 3,690 16,889 14,027 Extra-Ord expense 0 0 0 0 0 8,611 0 0 0 8,611 PBT 3,500 4,686 3,866 4,837 3,250 -5,078 3,556 3,690 16,889 5,417 Tax 977 1,326 1,119 1,313 971 -1,858 896 930 4,735 939 Rate (%) 27.9 28.3 28.9 27.2 29.9 36.6 25.2 25.2 28.0 17.3 Reported PAT 2,524 3,361 2,747 3,523 2,278 -3,220 2,660 2,760 12,154 4,478 Adj PAT 2,524 3,361 2,747 3,523 2,431 2,642 2,660 2,760 12,154 10,492 YoY Change (%) 3.7 46.8 -0.9 14.9 -3.7 -21.4 -3.2 -21.7 14.9 -13.7 Margins (%) 16.8 19.5 17.5 20.1 14.8 15.2 15.4 14.7 18.6 15.0 E: MOFSL Estimates

January 2020 133
December 2019 Results Preview | Sector: Logistics Gateway Distriparks Buy CMP INR 122 | TP: INR145 (+19%) EPS CHANGE (%): FY20|21: -3|+33 Expect 7% YoY growth in rail volumes. See YoY EBITDA at INR649m and EBITDA margin at 20.1%. Watch out for debt reduction. Update on DFCC a key monitorable.
Quarterly Performance (INR Million)
Y/E March FY19 FY20 FY19 FY20E (Consolidated) 1Q 2Q 3Q 4Q 1Q 2Q 3QE 4QE Net Sales 3,352 3,093 2,949 3,553 3,689 3,251 3,229 3,371 12,946 13,540 YoY Change (%) 26.0 2.3 1.5 21.2 10.0 5.1 9.5 -5.1 12.4 4.6 Total Expenditure 2,482 2,529 2,403 2,674 2,511 2,519 2,580 2,710 10,088 10,320 EBITDA 871 564 546 879 1,178 732 649 661 2,859 3,220 Margins (%) 26.0 18.2 18.5 24.7 31.9 22.5 20.1 19.6 22.1 23.8 YoY Change (%) 94 -4 -4 61 35 30 19 -25 33 13 PBT 643 327 276 642 637 178 158 145 1,888 1,119 Tax 146 60 53 229 12 -10 19 12 487 34 Rate (%) 22.7 18.2 19.2 35.6 1.9 -5.4 12.0 8.2 25.8 3.0 PAT before minority / profit of assoc. 497 268 223 413 625 188 139 134 1,401 1,085 YoY Change (%) 176.5 -7.7 -19.2 -19.8 25.6 -29.9 -37.6 -67.7 11.1 -22.6 Margins (%) 14.8 8.7 7.6 11.6 16.9 5.8 4.3 4.0 10.8 8.0 Less: Minority/Add: Profit of Asso. 189 93 71 -21 36 5 0 0 332 41 Reported PAT 308 174 152 434 589 182 139 134 1,069 1,044 Adj PAT 308 174 152 434 589 182 139 134 1,069 1,044 YoY Change (%) 132.0 -4.7 -19.9 32.9 91.1 4.6 -8.3 -69.3 28.4 -2.3 Margins (%) 9.2 5.6 5.1 12.2 16.0 5.6 4.3 4.0 8.3 7.7 E: MOFSL Estimates,

January 2020 134
December 2019 Results Preview | Sector: Media
Ad revenues to remain subdued Subscription revenue to support performance Broadcast: Pricing power to support overall revenue growth The Telecom Regulatory Authority of India’s (TRAI) new tariff order (NTO) and its slow pace of execution has led to reduced viewership over the past few quarters, thus impacting the broadcasting industry. Impact of the NTO now seems to be withering due to its low reach. However, slowdown in the economy has led to a drop in advertisement revenues post the festive season as advertisers are shying away from aggressive ad spends on traditional platforms. At the same time, we believe that broadcasters’ pricing power (charging better rates for their channels in the à-la-carte regime and via bouquet offerings) is likely to support overall revenue growth. ZEE has launched 4 new regional GEC channels in Punjabi, Bihari, Tamil and Kannada, which should provide Zee a foothold in the respective regions from next quarter. We expect ZEE/SUNTV to report total revenue growth of 6%/7% YoY. While ad growth is likely to remain flattish YoY, subscription should grow 13%/12% YoY. ZEE/SUNTV’s EBITDA margin is estimated to contract 100bp/450bp YoY, leading to flattish EBITDA in 3QFY20 YoY. Print: Decline in raw material prices to aid margins The Consumer and Financial sectors are the biggest advertisers for print media; as these two sectors are impacted by the economic slowdown, we expect muted revenues for the print media. Further, the government sector – another key contributor in terms of advertisement spending – has also curtailed its ad spends after the election season in 1HFY20. Newsprint prices have declined by ~INR2/kg, which should aid margins for print companies. However, increase in the page count for publications during the festive season is likely to offset the drop in print prices. We expect JAGRAN/DBCL’s revenue to decline 8%/10% YoY in 3QFY20. Ad revenue growth is likely to decline 6%/7% YoY for JAGRAN/DBCL while circulation growth is expected to remain flat YoY for both companies. Over 20% decline in newsprint prices from its peak should result in lower print costs to the tune of 20%/25% for JAGRAN/DBCL. We, thus, expect JAGRAN’s EBITDA to decline 3% YoY with margin expansion of 120bp. DBCL’s EBITDA should increase 4% YoY with margin improvement of 330bp YoY.
Company name
D B Corp
Entertainment Network
Jagran Prakashan
Music Broadcast
PVR
Sun TV
Zee Entertainment
Media
Aliasgar Shakir – Research Analyst ([email protected]); +91 22 6129 1565 Suhel Shaikh – Research Analyst ([email protected]); +91 22 5036 2611

January 2020 135
December 2019 Results Preview | Sector: Media Radio: Marred by low ad spends Revenues of radio companies are likely to decline owing to (a) lower ad spends by the Auto, Real Estate and NBFC sectors, and (b) the decline in government/political advertisements. We expect ENIL/MBL to report 7%/12% YoY decline in revenues on weak radio ad growth; EBITDA should also decline 4%/13% YoY, primarily due to weak revenue growth. PVR: Expect healthy revenue growth during festive season PVR is expected to post strong 18% YoY revenue growth, driven by (a) hit releases at the box office during the festive season, (b) healthy ticketing/food & beverages/ad revenue growth of 22%/19%/15% YoY, and (c) 24 screen additions in the quarter. EBITDA too is expected to increase 27% YoY with margin expansion of 140bp.
Exhibit 89: Media coverage — Quarterly snapshot FY17 FY18 FY19 FY20 YoY
(%) QoQ (%)
1Q 2Q 3Q 4Q 1Q 2Q 3Q 4Q 1Q 2Q 3Q 4Q 1Q 2Q 3QE Advertisement Revenue (INR b) Music Broadcast 0.6 0.7 0.7 0.7 0.7 0.8 0.8 0.8 0.8 0.8 0.9 0.8 0.7 0.6 0.8 -13 21 Entertainment Network (India) 1.1 1.3 1.5 1.7 1.0 1.3 1.5 1.6 1.2 1.2 2.0 1.8 1.3 1.1 1.9 -7 64 ZEE Entertainment 9.1 9.6 9.6 8.5 9.7 9.9 12.0 10.5 11.5 12.1 14.6 12.2 11.9 12.2 13.1 -11 7 SUN TV 3.2 3.1 2.8 2.7 3.0 3.3 3.4 3.4 3.6 3.4 3.8 3.4 3.7 3.4 3.9 1 14 Jagran Prakashan 3.5 3.4 3.7 3.3 3.6 3.4 3.6 3.1 3.6 3.1 3.6 3.4 3.5 3.0 3.4 -6 14 DB Corp 3.7 3.3 4.0 3.1 3.9 3.5 3.8 3.4 4.1 3.6 4.2 3.6 3.9 3.5 3.9 -7 11 PVR 0.5 0.6 0.8 0.5 0.7 0.7 0.9 0.7 0.7 0.8 1.1 0.9 0.9 0.9 1.3 14 36 Aggregate MOFSL universe 21.7 22.0 23.0 20.4 22.6 22.8 25.8 23.4 25.5 25.1 30.3 26.1 25.9 24.8 28.1 -7 13 Growth (YoY %) 15 11 2 1 4 4 12 15 13 10 17 11 2 -1 -7 Subs./Circulation Rev. (INR b) ZEE Entertainment 5.3 5.8 5.9 5.6 4.8 5.0 5.0 5.5 5.2 6.1 6.2 5.7 7.1 7.2 7.1 15 -1 SUN TV 2.7 2.7 2.8 2.8 3.1 3.2 3.2 3.5 3.5 3.9 4.0 3.6 4.4 4.4 4.4 12 1 Jagran Prakashan 1.1 1.1 1.1 1.1 1.1 1.1 1.1 1.1 1.1 1.1 1.1 1.1 1.1 1.1 1.0 -3 -2 DB Corp 1.2 1.2 1.2 1.2 1.2 1.2 1.3 1.3 1.3 1.3 1.3 1.3 1.3 1.3 1.3 -2 -1 Aggregate MOFSL universe 10.2 10.8 11.1 10.7 10.2 10.5 10.6 11.3 11.2 12.4 12.5 11.6 13.9 14.0 13.9 11 -1 Growth (YoY %) 14 17 13 0 0 -2 -4 6 9 18 18 3 15 13 11 Total Revenue (INR b) Music Broadcast 0.6 0.7 0.7 0.7 0.7 0.8 0.8 0.8 0.8 0.8 0.9 0.8 0.7 0.6 0.8 -13 21 Entertainment Network (India) 1.1 1.3 1.5 1.7 1.0 1.3 1.5 1.6 1.2 1.2 2.0 1.8 1.3 1.1 1.9 -7 64 ZEE Entertainment 15.7 17.0 16.4 15.3 15.4 15.8 18.4 17.3 17.7 19.8 21.7 20.2 20.1 21.2 21.5 -1 1 SUN TV 7.6 6.3 5.9 5.8 7.9 6.8 6.8 7.2 11.2 7.5 9.0 8.9 11.0 8.0 9.6 7 21 Jagran Prakashan 5.6 5.5 6.0 5.6 5.9 5.7 6.0 5.5 6.0 5.5 6.1 5.9 5.8 5.1 5.7 -8 10 DB Corp 5.7 5.4 6.3 5.2 5.9 5.7 6.0 5.6 6.3 5.8 6.6 5.9 6.1 5.3 6.0 -10 12 PVR 5.6 5.4 5.3 4.8 6.4 5.6 5.6 5.8 7.0 7.1 8.4 8.4 8.8 9.7 10.0 18 2 Aggregate MOFSL universe 42.1 41.6 42.1 39.0 43.2 41.5 45.0 43.7 50.2 47.7 54.8 51.8 53.8 51.1 55.3 1 8 Growth (YoY %) 17 16 4 4 3 0 7 12 16 15 22 19 8 7 1 EBITDA (INR b) Music Broadcast 0.2 0.3 0.3 0.2 0.2 0.2 0.2 0.3 0.3 0.3 0.3 0.3 0.2 0.2 0.2 -17 42 Entertainment Network (India) 0.3 0.2 0.4 0.4 0.2 0.3 0.4 0.4 0.3 0.3 0.4 0.4 0.2 0.2 0.4 -13 86 ZEE Entertainment 4.5 4.9 5.2 4.7 4.8 4.9 5.9 5.1 5.7 6.8 7.5 5.7 6.6 6.9 6.0 -20 -13 SUN TV 4.4 4.7 4.4 3.9 4.5 5.0 4.9 5.2 7.3 5.5 6.7 6.1 6.8 4.7 6.7 0 43 Jagran Prakashan 1.6 1.5 1.9 1.4 1.6 1.4 1.6 1.2 1.6 1.0 1.3 1.4 1.4 0.9 1.3 -3 43 DB Corp 1.8 1.5 2.0 1.1 1.9 1.4 1.4 1.0 1.7 0.9 1.4 1.0 1.7 1.0 1.5 4 48 PVR 1.1 0.8 0.8 0.5 1.1 0.9 1.0 0.9 1.4 1.2 1.6 1.6 1.6 1.9 2.1 27 7 Aggregate MOFSL universe 13.8 13.9 14.9 12.2 14.3 14.1 15.5 14.0 18.2 16.0 19.3 16.6 18.5 15.8 18.1 -6 15 Growth (YoY %) 22 17 7 3 4 1 4 15 27 14 24 18 4 -1 -6 EBITDA Margin (%) Music Broadcast 30.5 41.7 36.6 24.9 31.5 31.9 30.6 36.0 34.4 33.1 32.9 39.0 29.4 26.6 31.3 -150bp 470bp Entertainment Network (India) 26.6 17.8 25.3 21.3 16.4 22.7 24.1 22.2 23.3 22.3 20.1 24.9 18.6 16.6 18.9 -120bp 230bp ZEE Entertainment 28.8 28.9 31.5 30.7 31.4 31.0 32.3 29.3 31.9 34.2 34.8 28.1 32.9 32.7 28.0 -680bp -470bp SUN TV 57.4 74.6 74.6 67.6 57.0 73.4 72.0 72.9 65.6 73.9 73.8 68.4 62.0 58.9 69.3 -450bp 1040bp

January 2020 136
December 2019 Results Preview | Sector: Media FY17 FY18 FY19 FY20 YoY
(%) QoQ (%)
1Q 2Q 3Q 4Q 1Q 2Q 3Q 4Q 1Q 2Q 3Q 4Q 1Q 2Q 3QE Jagran Prakashan 27.6 27.6 31.0 25.6 27.3 24.5 27.2 22.0 27.1 18.0 21.6 23.3 24.2 17.5 22.8 120bp 530bp DB Corp 31.5 28.1 31.6 21.7 31.4 24.6 23.3 17.5 26.6 15.9 21.2 17.7 27.5 18.5 24.5 330bp 600bp PVR 19.0 14.8 15.1 9.7 17.6 16.3 18.2 16.1 19.7 17.5 19.5 19.2 18.0 20.0 20.9 140bp 90bp Margins MOFSL universe 32.8 33.5 35.3 31.2 33.1 34.0 34.4 32.1 36.3 33.5 35.2 31.9 34.5 30.9 32.7 -240bp 190bp Growth (YoY, bp) 131 46 97 -36 29 46 -83 95 319 -44 76 -20 -187 -261 -245 PAT (INR b) Music Broadcast 0.1 0.1 0.1 0.0 0.1 0.1 0.1 0.2 0.1 0.1 0.2 0.2 0.1 0.2 0.1 -19 -29 Entertainment Network (India) 0.2 0.1 0.2 0.1 0.0 0.1 0.1 0.1 0.1 0.1 0.2 0.2 0.1 0.0 0.2 -5 309 ZEE Entertainment 2.2 2.4 2.5 2.9 2.5 3.1 3.7 2.3 3.3 3.9 5.6 2.9 5.3 5.6 4.2 -19 -24 SUN TV 2.3 2.7 2.4 2.4 2.5 2.8 2.7 2.9 4.1 3.5 3.5 2.8 3.8 3.7 4.3 23 18 Jagran Prakashan 0.8 0.9 1.0 0.8 0.9 0.7 0.8 0.6 0.9 0.4 0.7 0.7 0.7 1.3 0.7 4 -45 DB Corp 1.0 0.9 1.2 0.6 1.1 0.8 0.8 0.6 1.0 0.5 0.8 0.5 0.9 0.8 0.8 11 12 PVR 0.4 0.3 0.2 0.0 0.4 0.3 0.3 0.3 0.5 0.3 0.5 0.5 0.4 0.7 0.8 53 20 Aggregate MOFSL universe 7.1 7.3 7.6 6.9 7.6 7.9 8.6 6.9 10.1 9.0 11.0 7.9 10.6 12.2 11.2 2 -8 Growth (YoY %) 1 17 3 9 7 7 13 0 34 15 28 14 5 35 2
Source: Company, MOFSL
Exhibit 90: 3QFY20E ad revenue growth (YoY, %)
Source: Company, MOFSL
Exhibit 91: 3QFY20E subscription/circulation revenue growth (YoY, %)
Source: Company, MOFSL
Exhibit 92: 3QFY20E total revenue growth (YoY, %)
Source: Company, MOFSL
-11
1
-6 -7 -13 -7
14
ZEE SUN TV Jagran DB Corp MBL ENIL PVR
15 12
-3 -2
ZEE SUN TV Jagran DB Corp
-1
7
-8 -10 -13 -7
18
ZEE SUN TV Jagran DB Corp MBL ENIL PVR

January 2020 137
December 2019 Results Preview | Sector: Media Exhibit 93: MOFSL Media universe quarterly aggregate revenue and EBITDA margin trend
Source: Company, MOFSL
Exhibit 94: MOFSL Media universe quarterly aggregate PAT growth trend
Source: Company, MOFSL
Exhibit 95: Expected quarterly performance summary (INR m) Sector CMP SALES (INR M) EBDITA (INR M) NET PROFIT (INR M)
(INR) RECO Dec-19 Var % YoY
Var % QoQ Dec-19 Var
% YoY Var
% QoQ Dec-19 Var % YoY
Var % QoQ
Media D B Corp 135 Buy 5,951 -9.8 12.0 1,456 4.2 48.0 843 11.5 11.5 Ent.Network 265 Buy 1,863 -7.3 63.5 353 -12.6 86.5 152 -5.0 308.9 Jagran Prakashan 63 Neutral 5,668 -7.7 10.2 1,291 -2.6 43.3 693 4.1 45.3 Music Broadcast 29 Buy 754 -13.4 20.5 236 -17.4 41.7 133 -18.5 -29.5 PVR 1,879 Buy 9,964 18.2 2.4 2,083 26.8 7.1 792 53.0 19.9 Sun TV 434 Buy 9,647 6.7 21.3 6,686 0.2 42.6 4,336 23.4 18.3 Zee Entertainment 290 Neutral 21,485 -0.8 1.2 6,012 -20.3 -13.2 4,246 -19.1 -24.2 Sector Aggregate 55,331 1.0 8.2 18,117 -6.0 14.7 11,195 1.6 -1.7
42.1 41.6 42.1 39.0 43.2 41.5 45.0 43.7 50.2 47.7 54.8 51.8 53.8 51.1 55.3
33 33
35
31
33 34 34
32
36
34
35
32
35
31
33
1QFY
17
2QFY
17
3QFY
17
4QFY
17
1QFY
18
2QFY
18
3QFY
18
4QFY
18
1QFY
19
2QFY
19
3QFY
19
4QFY
19
1QFY
20
2QFY
20
3QFY
20
Aggregate Revenue (INR b) Aggregate EBITDA margin (%)
7.1 7.3 7.6 6.9 7.6 7.9 8.6 6.9 10.1 9.0 11.0 7.9 10.6 12.2 11.2
1 17
3 9 7 7 13 0
34 15
28 14
5
35
2
1QFY
17
2QFY
17
3QFY
17
4QFY
17
1QFY
18
2QFY
18
3QFY
18
4QFY
18
1QFY
19
2QFY
19
3QFY
19
4QFY
19
1QFY
20
2QFY
20
3QFY
20
Aggregate PAT (INR b) YoY growth (%)

January 2020 138
December 2019 Results Preview | Sector: Media Exhibit 96: Relative performance-3m (%)
Source: Bloomberg, MOFSL
Exhibit 97: Relative performance-1 Yr (%)
Source: Bloomberg, MOFSL
Exhibit 98: Comparative valuation CMP EPS (INR) PE (x) PB (x) RoE (%) Company Name INR Reco FY20E FY21E FY22E FY20E FY21E FY22E FY20E FY21E FY22E FY20E FY21E FY22E Media 13.5 12.0 10.7 2.5 2.2 1.9 18.4 17.9 17.3 D B Corp 135 Buy 17.8 21.1 22.7 7.6 6.4 5.9 1.3 1.2 1.1 16.6 18.4 18.2 Ent.Network 265 Buy 8.0 15.3 22.0 33.0 17.3 12.0 1.3 1.2 1.1 4.0 7.3 9.7 Jagran Prakashan 63 Neutral 11.5 11.4 11.3 5.4 5.5 5.5 0.9 0.8 0.7 17.2 15.4 13.6 Music Broadcast 29 Buy 2.1 2.4 3.2 13.5 11.8 8.9 1.2 1.1 1.0 9.2 9.7 11.5 PVR 1,879 Buy 47.4 57.4 68.6 39.6 32.7 27.4 5.4 4.7 4.0 15.7 15.4 15.8 Sun TV 434 Buy 38.5 40.4 43.1 11.3 10.7 10.1 2.7 2.3 2.0 25.6 23.1 21.3 Zee Entertainment 290 Neutral 19.6 23.8 27.5 14.8 12.2 10.5 2.7 2.2 1.9 20.2 20.0 19.5
99
102
105
108
Sep-
19
Oct
-19
Nov
-19
Dec-
19
Nifty Index MOSL Media Index
65
80
95
110
125
Dec-
18
Jan-
19
Feb-
19
Mar
-19
Apr-
19
May
-19
Jun-
19
Jul-1
9
Aug-
19
Sep-
19
Oct
-19
Nov
-19
Dec-
19
Nifty Index MOSL Media Index

January 2020 139
December 2019 Results Preview | Sector: Media DB Corp Buy CMP INR135 | TP: INR180 (+35%) EPS CHANGE (%): FY20|21: -3.7|-3.3 Ad revenue to fall 7% on account of weak spends. Subscription revenue to be flat in festive season.
Newsprint prices have fell 13% YoY. EBITDA margins to be supported by falling opex.
Consol. - Quarterly Earning Model (INR m) Y/E March FY19 FY20 FY19 FY20E 1Q 2Q 3Q 4Q 1Q 2Q 3QE 4QE Net Sales 6,324 5,821 6,597 5,885 6,070 5,314 5,951 5,400 24,627 22,735 YoY Change (%) 6.7 2.4 10.2 5.0 -4.0 -8.7 -9.8 -8.2 6.2 -7.7 Total Expenditure 4,644 4,898 5,200 4,844 4,315 4,330 4,495 4,299 19,585 17,438 EBITDA 1,680 923 1,397 1,042 1,755 984 1,456 1,102 5,042 5,297 YoY Change (%) -9.9 -34.0 0.1 6.4 4.5 6.6 4.2 5.8 -10.6 5.1 Depreciation 243 251 249 243 304 303 307 314 986 1,227 Interest 18 30 19 18 53 64 60 62 85 238 Other Income 68 54 19 25 41 22 37 47 166 146 PBT 1,488 696 1,149 805 1,439 639 1,127 773 4,137 3,978 Tax 512 234 392 261 502 -117 284 195 1,399 863 Rate (%) 34.4 33.6 34.2 32.4 34.9 -18.3 25.2 25.2 33.8 21.7 Reported PAT 976 462 756 545 937 756 843 578 2,738 3,114 Adj PAT 976 462 756 545 937 756 843 578 2,738 3,114 YoY Change (%) -11.4 -41.3 -3.2 -4.6 -3.9 63.6 11.5 6.2 -15.5 13.7
ENIL Buy CMP INR265 | TP: INR311 (+17%) EPS CHANGE (%): FY20|21: 0|0 Expect weaker growth across radio channels. Falling listenership to affect old frequency channels.
Expect new frequency channels revenues to 12% fall. Solutions/FCT business to remain intact.
Standalone - Quarterly Earning Model
(INR m)
Y/E March FY19 FY20 FY19 FY20E 1Q 2Q 3Q 4Q 1Q 2Q 3QE 4QE Net Sales 1,216 1,225 2,009 1,755 1,316 1,139 1,863 1,624 6,205 5,941 YoY Change (%) 16.4 -2.2 35.9 10.1 8.2 -7.0 -7.3 -7.5 15.5 -4.2 Total Expenditure 932 952 1,605 1,317 1,071 950 1,510 1,336 4,807 4,861 EBITDA 284 273 404 437 244 189 353 287 1,398 1,080 YoY Change (%) 65.0 -3.9 13.5 23.5 -13.8 -30.8 -12.6 -34.3 19.9 -22.7 Depreciation 152 166 174 180 177 181 159 119 671 636 Net Interest cost -18 -22 -27 -43 0 0 0 0 -110 0 Other Income 0 0 0 0 31 32 29 25 0 117 PBT before EO expense 150 130 257 300 99 40 223 193 837 561 Extra-Ord expense 0 0 0 0 0 0 0 0 0 0 PBT 150 130 257 300 99 40 223 193 837 561 Tax 58 40 97 102 35 3 71 71 297 180 Rate (%) 38.5 31.1 37.8 34.0 35.1 6.5 32.0 36.8 32.0 35.1 Reported PAT 92 89 160 198 64 37 152 122 539 382 Adj PAT 72 89 160 198 64 37 152 122 519 382 YoY Change (%) 331.4 50.1 22.2 69.2 -10.6 -58.5 -5.0 -38.3 60.2 -26.4

January 2020 140
December 2019 Results Preview | Sector: Media Jagran Prakashan Neutral CMP INR63 | TP: INR70 (+12%) EPS CHANGE (%): FY20|21: -3.7|-3.3 Lower corporate ad spends will lead to 6% drop in sales. Circulation segment to be flat aided by festive season.
Fall in global newsprint prices to lower opex. Radio segment to fall due to lower listenership.
Consol. - Quarterly Earning Model (INR m) Y/E March FY19 FY20 FY19 FY20E 1Q 2Q 3Q 4Q 1Q 2Q 3QE 4QE Total Revenue from Operations 6,026 5,534 6,138 5,928 5,843 5,145 5,668 5,649 23,626 22,305 YoY Change (%) 1.9 -2.3 2.6 8.2 -3.0 -7.0 -7.7 -4.7 2.5 -5.6 Total Expenditure 4,390 4,538 4,813 4,548 4,432 4,244 4,377 4,196 18,289 17,248 EBITDA 1,636 996 1,326 1,380 1,411 901 1,291 1,454 5,337 5,057 YoY Change (%) 1.4 -28.1 -18.6 14.6 -13.7 -9.5 -2.6 5.3 -8.5 -5.2 Depreciation 307 311 331 331 355 361 360 363 1,279 1,439 Interest 31 53 91 83 92 79 86 86 258 344 Other Income 49 71 158 129 40 140 80 61 408 321 PBT 1,346 703 1,062 1,095 1,004 600 926 1,066 4,207 3,596 Tax 463 255 361 392 349 -659 233 268 1,470 192 Rate (%) 34.4 36.2 33.9 35.8 34.8 -109.7 25.2 25.2 34.9 5.3 MI & P/L of Asso. Cos. 29 27 36 39 -3 1 0 0 132 -2 Reported PAT 854 421 666 665 658 1,258 693 797 2,605 3,406 Adj PAT 854 421 666 665 658 477 693 797 2,605 3,406 YoY Change (%) -1.4 -39.4 -21.5 12.7 -23.0 13.3 4.1 19.9 -13.1 30.7
Music Broadcast Buy CMP INR29 | TP: INR42 (+44%) EPS CHANGE (%): FY20|21: -5.3|-5.1 Expect weaker growth across radio channels. Falling listenership to affect old frequency channels.
Expect new frequency channels revenues to 12% fall. Solutions/FCT business to remain intact.
Standalone - Quarterly Earning Model (INR m) Y/E March FY19 FY20 FY19 FY20 1Q 2Q 3Q 4Q 1Q 2Q 3QE 4QE Revenue 757 801 870 819 698 625 754 727 3,247 2,803 YoY Change (%) 7.6 5.7 14.2 7.8 -7.8 -22.0 -13.4 -11.3 8.9 -13.7 Total Expenditure 496 536 584 499 492 459 517 433 0 1,901 EBITDA 261 266 286 320 205 167 236 294 3,247 902 YoY Change (%) 17.5 9.7 22.6 16.8 -21.2 -37.3 -17.4 -8.1 234.5 -72.2 Depreciation 67 67 68 69 70 70 72 77 0 289 Interest 14 14 14 15 20 20 20 20 0 81 Other Income 24 36 45 46 33 50 45 51 0 178 PBT 204 221 249 282 149 126 188 247 3,247 710 Tax 69 87 86 98 62 -63 55 72 0 125 Rate (%) 33.7 39.4 34.3 34.8 41.9 -50.2 29.0 29.0 0.0 17.6 Reported PAT 135 134 164 184 87 189 133 175 3,247 585 Adj PAT 135 134 164 184 87 189 133 175 616 585 YoY Change (%) 24.5 5.1 37.9 12.9 -35.8 41.5 -18.5 -4.4 19.1 -5.1

January 2020 141
December 2019 Results Preview | Sector: Media PVR Buy CMP INR1879 | TP: INR2413 (+28%) EPS CHANGE (%): FY20|21: 0|0 Expect to add 24 new screens during the quarter Festive season and hit movies to drive growth
ATP to rise 8% to INR216. EBITDA margins to improve 90bp to 20.9%.
Quarterly Performance (INR m) Y/E March FY19 FY20 FY19 FY20E 1Q 2Q 3Q 4Q 1Q 2Q 3QE 4QE Net Sales 6,963 7,086 8,431 8,376 8,804 9,732 9,964 9,549 30,856 38,048 YoY Change (%) 9.4 27.6 51.3 43.2 26.4 37.3 18.2 14.0 32.2 23.3 Total Expenditure 5,591 5,845 6,788 6,768 7,217 7,788 7,881 7,873 24,992 30,758 EBITDA 1,372 1,240 1,643 1,608 1,587 1,944 2,083 1,676 5,863 7,290 YoY Change (%) 22.5 37.0 61.9 70.4 15.6 56.8 26.8 4.2 45.9 24.3 Depreciation 401 448 514 549 549 598 645 691 1,913 2,483 Interest 208 298 379 395 414 390 442 520 1,280 1,766 Other Income 43 61 143 85 68 62 62 62 331 254 PBT before EO expense 805 555 893 749 691 1,018 1,059 528 3,002 3,295 Extra-Ord expense 0 0 0 0 0 0 0 0 0 0 PBT 805 555 893 749 691 1,018 1,059 528 3,002 3,295 Tax 283 212 337 265 246 357 266 133 1096.6 1002.1 Rate (%) 35.2 38.1 37.8 35.3 35.7 35.0 25.2 25.2 36.5 30.4 MI & Profit/Loss of Asso. Cos. -1 13 38 17 -26 1 0 0 68 0 Reported PAT 523 330 518 467 470 661 792 395 1,838 2,293 Adj PAT 523 330 518 467 470 661 792 395 1,838 2,318 YoY Change (%) 17.6 29.3 79.3 78.6 -10.0 100.1 53.0 -15.4 47.0 26.2
Sun TV Buy CMP INR434 | TP: INR531 (+22%) EPS CHANGE (%): FY20|21: 0|0 Domestic subscription to remain strong. Ad revenue to remain weak due to slowdown in spending.
Digitization in Tamil Nadu to aid subscription growth. Foray into Bangla market to remain key monitorable.
Standalone - Quarterly Earning Model
(INR m)
Y/E March FY19 FY20 FY19 FY20 1Q 2Q 3Q 4Q 1Q 2QE 3QE 4QE Revenue 11,204 7,496 9,045 8,889 11,014 7,956 9,647 8,789 36,633 37,405 YoY Change (%) 42.5 10.9 32.4 24.0 -1.7 6.1 6.7 -1.1 28.0 2.1 Total Expenditure 3,857 1,956 2,373 2,805 4,185 3,268 2,961 2,952 10,990 13,366 EBITDA 7,347 5,540 6,672 6,084 6,829 4,687 6,686 5,837 25,643 24,039 YoY Change (%) 63.9 11.7 35.6 16.5 -7.1 -15.4 0.2 -4.1 30.9 -6.3 Depreciation 1,468 819 1,761 2,419 1,585 1,444 1,347 1,012 6,467 5,388 Interest 3 6 7 1 21 20 20 20 17 80 Other Income 390 621 516 673 567 721 621 575 2,200 2,485 PBT 6,267 5,336 5,420 4,336 5,791 3,945 5,940 5,380 21,359 21,056 Tax 2,175 1,823 1,907 1,506 1,972 280 1,604 1,452 7,411 5,308 Rate (%) 34.7 34.2 35.2 34.7 34.1 7.1 27.0 27.0 34.7 25.2 Reported PAT 4,091 3,513 3,513 2,831 3,819 3,665 4,336 3,927 13,949 15,747 YoY Change (%) 62.6 23.4 31.6 -2.3 -6.7 4.3 23.4 38.7 27.6 12.9

January 2020 142
December 2019 Results Preview | Sector: Media Zee Entertainment Neutral CMP INR290 | TP: INR320 (+10%) EPS CHANGE (%): FY20|21: 0|0 Ad revenue to remain weak, expect to fall at 12% YoY NTO to aid strong subscription revenue growth
Margins to drag due to lower revenue. Expect OTT platform to show strong subscription.
Consol. - Quarterly Earning Model
(INR m)
Y/E March FY19 FY20 FY19 FY20
1Q 2Q 3Q 4Q 1Q 2Q 3QE 4QE Revenue 17,720 19,759 21,668 20,193 20,081 21,220 21,485 22,036 79,339 84,823 YoY Change (%) 15.0 24.9 17.9 17.0 13.3 7.4 -0.8 9.1 23.3 6.9 Total Expenditure 12,064 13,001 14,125 14,510 13,484 14,291 15,473 14,511 53,700 57,759 EBITDA 5,657 6,757 7,543 5,683 6,598 6,929 6,012 7,526 25,640 27,064 YoY Change (%) 16.8 37.6 26.9 12.3 16.6 2.5 -20.3 32.4 23.5 5.6 Depreciation 576 588 615 568 690 583 649 674 2,347 2,597 Interest 53 55 55 1,142 205 180 180 238 1,304 803 Other Income 498 589 860 568 1,039 681 493 305 2,515 2,519 Fair Value through P&L gain/(loss) -213 -220 376 93 679 -88 0 0 36 591 PBT before EO expense 5,312 6,483 8,109 4,635 7,420 6,760 5,676 6,918 24,539 26,774 Extra-Ord expense 0 0 0 -218 0 1,706 0 0 -218 1,706 PBT 5,312 6,483 8,109 4,417 7,420 8,466 5,676 6,918 24,757 28,480 Tax 2,071 2,624 2,484 1,494 2,146 921 1,429 1,741 8,673 6,237 Rate (%) 39.0 40.5 30.6 33.8 28.9 10.9 25.2 25.2 35.0 21.9 MI & P/L of Asso. Cos. -23 -8 1 6 -31 12 1 -7 -23 -25 Reported PAT 3,264 3,867 5,624 2,917 5,306 7,533 4,246 5,184 16,107 22,269 Adj PAT 3,477 4,087 5,247 2,968 4,627 5,604 4,246 5,184 15,779 19,660 YoY Change (%) 15.3 31.3 26.1 132.2 33.1 37.1 -19.1 74.7 4.8 24.6

January 2020 143
December 2019 Results Preview | Sector: Metals
Lower steel realizations to seep in Our top picks: HNDL and JSP
Lower steel prices to seep in and impact profitability Revenue for steel companies under our coverage (TATA, JSTL, SAIL and JSP) is expected to decrease 1% QoQ on the back of lower realizations, partly offset by higher volumes (+4% QoQ). Steel prices have shown signs of recovery in recent weeks, on improving global prices and post a seasonally weak quarter (monsoons). However, with the low exit run-rate of 2QFY20 and expected renegotiation of auto contracts at lower prices, realizations are expected to dip in 3QFY20. While lower coking coal costs should provide some respite, operational profitability though would witness decline. We expect EBITDA for most steel companies (except JSP) to decline 1-5% sequentially. JSP, on the other hand, is expected to report 6% QoQ increase in EBITDA on the back of strong volume growth (+16% QoQ), led by ramp-up at Angul. Base metal prices broadly stable Aluminum LME was marginally lower QoQ at USD1,752/t in 3QFY20. Aluminum non-integrated spreads have improved due to decline in input product prices (alumina, coal). A recovery in aluminum prices, without demand support, is increasingly unlikely. Average Zinc LME was up 2% QoQ to USD2,392/t, which is positive for HZL and VEDL. Lead LME was higher 1% QoQ to USD2,050/t. Silver prices increased 5% QoQ to INR44,926/kg.
Zinc, iron ore leads to sequential improvement at aggregate level Aggregate revenue for metal companies under our coverage is expected to decline 2% QoQ/ 13% YoY on lower realizations. EBITDA would increase 5% QoQ to INR192.5b on account of higher volumes for Hindustan Zinc and NMDC and lower costs (potential improved coal availability for aluminum producers, lower coking coal costs for steel producers) On a YoY basis though, aggregate EBITDA/adj. PAT would decline 26% YoY/58% YoY on lower realizations. Vedanta’s EBITDA is likely to increase 8% QoQ to INR48b on higher volumes of zinc and steel and lower costs for its aluminum segment. NMDC’s EBITDA is expected to increase 51% QoQ to INR17.8b on higher volumes (post monsoons). HNDL’s (S/A+ Utkal) EBITDA is likely to decrease by 1% QoQ to INR36.9b on higher copper volumes and lower costs. Top picks –HNDL and JSP Commodity prices are showing signs of improvement on positive sentiment following the US-China trade deal. However, concerns over global growth and domestic liquidity issues remain. We continue to prefer structurally efficient companies with (a) low capital and operating costs, (b) access to cheap raw material, and (c) a strong balance sheet. Our top pick is HNDL. We also like JSP, which should benefit from capacity addition and revival of the Power sector (though the leverage is high).
Metals Company name
Hindalco
Hindustan Zinc
Jindal Steel & Power
JSW Steel
Nalco
NMDC
SAIL
Tata Steel
Vedanta
Aniket Mittal – Research analyst ([email protected]) +91 22 6129 1572
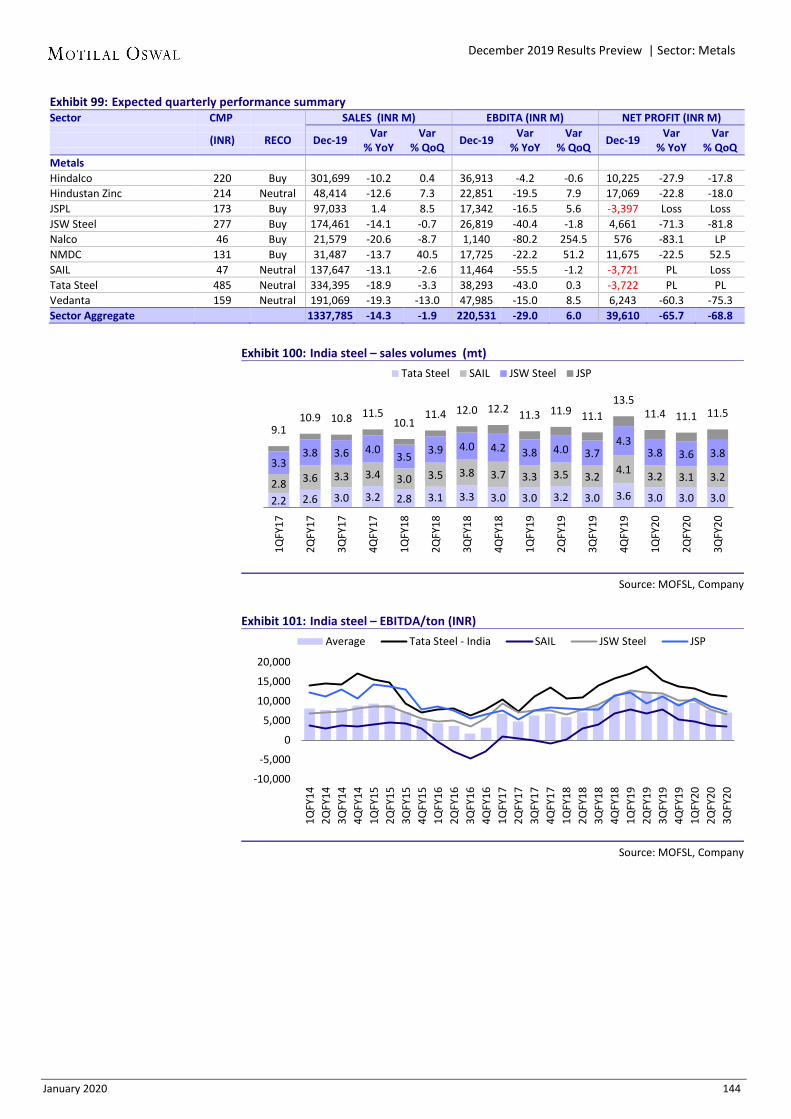
January 2020 144
December 2019 Results Preview | Sector: Metals Exhibit 99: Expected quarterly performance summary Sector CMP SALES (INR M) EBDITA (INR M) NET PROFIT (INR M)
(INR) RECO Dec-19 Var % YoY
Var % QoQ Dec-19 Var
% YoY Var
% QoQ Dec-19 Var % YoY
Var % QoQ
Metals Hindalco 220 Buy 301,699 -10.2 0.4 36,913 -4.2 -0.6 10,225 -27.9 -17.8 Hindustan Zinc 214 Neutral 48,414 -12.6 7.3 22,851 -19.5 7.9 17,069 -22.8 -18.0 JSPL 173 Buy 97,033 1.4 8.5 17,342 -16.5 5.6 -3,397 Loss Loss JSW Steel 277 Buy 174,461 -14.1 -0.7 26,819 -40.4 -1.8 4,661 -71.3 -81.8 Nalco 46 Buy 21,579 -20.6 -8.7 1,140 -80.2 254.5 576 -83.1 LP NMDC 131 Buy 31,487 -13.7 40.5 17,725 -22.2 51.2 11,675 -22.5 52.5 SAIL 47 Neutral 137,647 -13.1 -2.6 11,464 -55.5 -1.2 -3,721 PL Loss Tata Steel 485 Neutral 334,395 -18.9 -3.3 38,293 -43.0 0.3 -3,722 PL PL Vedanta 159 Neutral 191,069 -19.3 -13.0 47,985 -15.0 8.5 6,243 -60.3 -75.3 Sector Aggregate 1337,785 -14.3 -1.9 220,531 -29.0 6.0 39,610 -65.7 -68.8
Exhibit 100: India steel – sales volumes (mt)
Source: MOFSL, Company
Exhibit 101: India steel – EBITDA/ton (INR)
Source: MOFSL, Company
2.2 2.6 3.0 3.2 2.8 3.1 3.3 3.0 3.0 3.2 3.0 3.6 3.0 3.0 3.0 2.8 3.6 3.3 3.4 3.0 3.5 3.8 3.7 3.3 3.5 3.2 4.1 3.2 3.1 3.2 3.3
3.8 3.6 4.0 3.5 3.9 4.0 4.2 3.8 4.0 3.7 4.3
3.8 3.6 3.8
9.1 10.9 10.8 11.5
10.1 11.4 12.0 12.2 11.3 11.9 11.1
13.5 11.4 11.1 11.5
1QFY
17
2QFY
17
3QFY
17
4QFY
17
1QFY
18
2QFY
18
3QFY
18
4QFY
18
1QFY
19
2QFY
19
3QFY
19
4QFY
19
1QFY
20
2QFY
20
3QFY
20
Tata Steel SAIL JSW Steel JSP
-10,000
-5,000
0
5,000
10,000
15,000
20,000
1QFY
142Q
FY14
3QFY
144Q
FY14
1QFY
152Q
FY15
3QFY
154Q
FY15
1QFY
162Q
FY16
3QFY
164Q
FY16
1QFY
172Q
FY17
3QFY
174Q
FY17
1QFY
182Q
FY18
3QFY
184Q
FY18
1QFY
192Q
FY19
3QFY
194Q
FY19
1QFY
202Q
FY20
3QFY
20
Average Tata Steel - India SAIL JSW Steel JSP

January 2020 145
December 2019 Results Preview | Sector: Metals Exhibit 102: Revenue of coverage universe
Source: MOFSL, Company
Exhibit 103: EBITDA of coverage universe
Source: MOFSL, Company
Exhibit 104: Other base metals quarterly average prices – USD/ton
Quarter Zinc Copper Lead Silver (Rs/kg)
Avg. QoQ YoY
Avg. QoQ YoY
Avg. QoQ YoY
Avg. QoQ YoY 3QFY20 2,392 2% -9%
5,874 1% -5%
2,050 1% 4%
44,926 5% 20%
2QFY20 2,347 -15% -8% 5,803 -5% -5% 2,031 8% -3% 42,960 16% 14% 1QFY20 2,761 2% -11%
6,114 -2% -11%
1,882 -8% -21%
37,021 -5% -6%
4QFY19 2,709 3% -21%
6,215 1% -11%
2,038 4% -19%
39,018 4% 1% 3QFY19 2,627 3% -19%
6,164 1% -10%
1,967 -6% -21%
37,465 0% -3%
2QFY19 2,545 -18% -14%
6,106 -11% -4%
2,103 -12% -10%
37,529 -5% -3% 1QFY19 3,112 -9% 20%
6,868 -1% 21%
2,385 -5% 10%
39,423 2% -1%
4QFY18 3,410 5% 23%
6,959 2% 20%
2,521 1% 11%
38,509 0% -7% 3QFY18 3,235 9% 29%
6,819 7% 29%
2,491 7% 16%
38,571 0% -7%
2QFY18 2,955 14% 31%
6,345 12% 33%
2,332 8% 25%
38,659 -3% -16% 1QFY18 2,596 -6% 35%
5,662 0 20%
2,166 0 26%
39,766 -4% 0%
4QFY17 2,774 11% 65%
5,818 10% 24%
2,269 6% 30%
41,378 0% 16% 3QFY17 2,509 11% 55%
5,281 11% 8%
2,144 15% 27%
41,376 -10% 19%
2QFY17 2,251 17% 22%
4,769 1% -9%
1,870 9% 9%
45,793 15% 32% 1QFY17 1,918 14% -12%
4,735 0 -22%
1,720 0 -12%
39,661 11% 7%
4QFY16 1,682 4% -19%
4,680 -4% -20%
1,747 4% -3%
35,608 2% -4% 3QFY16 1,615 -13% -28%
4,893 -7% -26%
1,683 -2% -16%
34,778 0% -5%
2QFY16 1,847 -16% -20%
5,263 -13% -25%
1,715 -12% -21%
34,690 -7% -19% 1QFY16 2,187 5% 6%
6,052 0 -11%
1,944 0 -7%
37,177 0% -11%
Source: MOFSL, Company
748 834 915 1,072
946 1,050 1,154 1,275 1,214 1,272 1,265 1,341
1,179 1,121
1,095
0
500
1,000
1,500
1QFY
17
2QFY
17
3QFY
17
4QFY
17
1QFY
18
2QFY
18
3QFY
18
4QFY
18
1QFY
19
2QFY
19
3QFY
19
4QFY
19
1QFY
20
2QFY
20
3QFY
20
Reve
nue
(INR
b)
Tata Steel SAIL JSW Steel JSP NMDC VEDL Hindalco Nalco
142 146 182
213 171
197 237
286 276 270 261 258 225
184 193
0
75
150
225
300
375
1QFY
17
2QFY
17
3QFY
17
4QFY
17
1QFY
18
2QFY
18
3QFY
18
4QFY
18
1QFY
19
2QFY
19
3QFY
19
4QFY
19
1QFY
20
2QFY
20
3QFY
20
EBIT
DA (I
NR
b)
Tata Steel SAIL JSW Steel JSP NMDC VEDL Hindalco Nalco
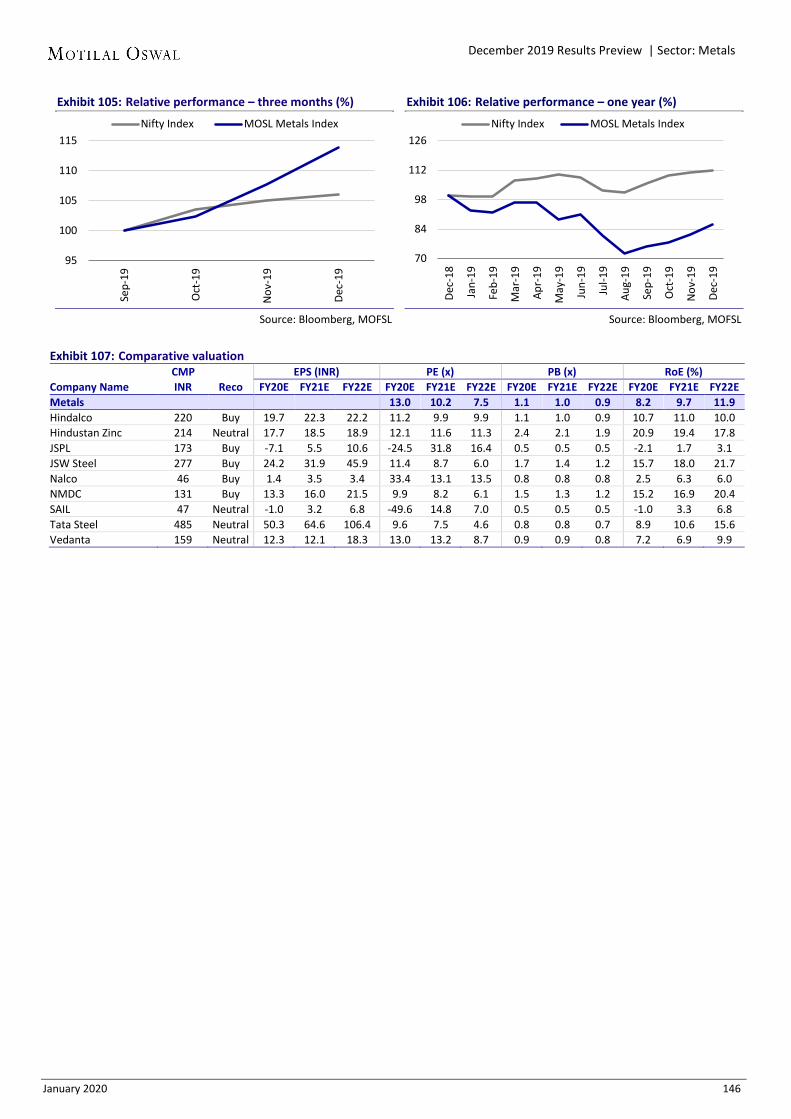
January 2020 146
December 2019 Results Preview | Sector: Metals Exhibit 105: Relative performance – three months (%)
Source: Bloomberg, MOFSL
Exhibit 106: Relative performance – one year (%)
Source: Bloomberg, MOFSL
Exhibit 107: Comparative valuation CMP EPS (INR) PE (x) PB (x) RoE (%) Company Name INR Reco FY20E FY21E FY22E FY20E FY21E FY22E FY20E FY21E FY22E FY20E FY21E FY22E Metals 13.0 10.2 7.5 1.1 1.0 0.9 8.2 9.7 11.9 Hindalco 220 Buy 19.7 22.3 22.2 11.2 9.9 9.9 1.1 1.0 0.9 10.7 11.0 10.0 Hindustan Zinc 214 Neutral 17.7 18.5 18.9 12.1 11.6 11.3 2.4 2.1 1.9 20.9 19.4 17.8 JSPL 173 Buy -7.1 5.5 10.6 -24.5 31.8 16.4 0.5 0.5 0.5 -2.1 1.7 3.1 JSW Steel 277 Buy 24.2 31.9 45.9 11.4 8.7 6.0 1.7 1.4 1.2 15.7 18.0 21.7 Nalco 46 Buy 1.4 3.5 3.4 33.4 13.1 13.5 0.8 0.8 0.8 2.5 6.3 6.0 NMDC 131 Buy 13.3 16.0 21.5 9.9 8.2 6.1 1.5 1.3 1.2 15.2 16.9 20.4 SAIL 47 Neutral -1.0 3.2 6.8 -49.6 14.8 7.0 0.5 0.5 0.5 -1.0 3.3 6.8 Tata Steel 485 Neutral 50.3 64.6 106.4 9.6 7.5 4.6 0.8 0.8 0.7 8.9 10.6 15.6 Vedanta 159 Neutral 12.3 12.1 18.3 13.0 13.2 8.7 0.9 0.9 0.8 7.2 6.9 9.9
95
100
105
110
115Se
p-19
Oct
-19
Nov
-19
Dec-
19
Nifty Index MOSL Metals Index
70
84
98
112
126
Dec-
18
Jan-
19
Feb-
19
Mar
-19
Apr-
19
May
-19
Jun-
19
Jul-1
9
Aug-
19
Sep-
19
Oct
-19
Nov
-19
Dec-
19
Nifty Index MOSL Metals Index

January 2020 147
December 2019 Results Preview | Sector: Metals The tables below provide a snapshot of actual and estimated numbers for companies under the MOFSL coverage universe. Highlighted columns indicate the quarter/financial year under review.
Hindalco Buy CMP INR220 | TP: INR256 (+16%) EPS CHANGE (%): FY20|21: -3.2|+1.4 EBITDA to go up on higher copper volumes and low costs. Aluminum LME to remain down. Watch out for production cost of aluminum segment. Novelis volumes expected to increase.
Quarterly Performance (Standalone + Utkal) (INR Million)
Y/E March FY19 FY20 FY19 FY20E 1Q 2Q 3Q 4Q 1Q 2Q 3QE 4QE Aluminum (sales, kt) 300 326 323 325 320 328 323 325 1,274 1,296 Copper (sales, kt) 82 79 99 100 82 82 85 90 360 339 Net Sales 106,700 108,330 119,380 124,550 100,550 99,660 102,070 107,184 457,592 409,649 EBITDA 18,590 17,370 17,170 13,580 11,420 10,950 11,138 12,335 66,710 45,843
Aluminum 15,240 13,490 12,860 10,430 8,890 8,490 8,360 9,214 52,020 34,954 USD/t 758 590 553 456 398 368 363 399 584 382
Copper 3,350 3,880 4,310 3,150 2,530 2,460 2,779 3,121 14,690 10,889 Interest 4,640 4,790 4,770 4,580 4,930 4,780 4,723 4,704 18,780 19,137 Depreciation 4,800 4,750 5,050 5,350 4,940 4,960 5,083 4,994 19,950 19,978 Other Income 920 1,850 2,090 3,750 1,320 1,560 1,579 1,595 8,610 6,054 PBT (before EO item) 10,070 9,680 9,440 7,400 2,870 2,770 2,911 4,231 36,590 12,782 EO item -220 -310 -530 PBT (after EO item) 10,070 9,680 9,440 7,400 2,650 2,460 2,911 4,231 36,590 12,252 Total Tax 2,730 2,430 2,310 2,340 980 790 935 1,359 9,810 4,064
% Tax 27.1 25.1 24.5 31.6 37.0 32.1 32.1 32.1 26.8 33.2 Reported PAT 7,340 7,250 7,130 5,060 1,670 1,670 1,976 2,872 26,780 8,189 Adjusted PAT 7,340 7,250 7,130 5,060 1,890 1,980 1,976 2,872 26,780 8,719
Hindustan Zinc Neutral CMP INR214 | TP: INR221 (+3%) EPS CHANGE (%): FY20|21: -10.6|-6.6 EBITDA expected to increase on higher sales volumes. Watch out for production guidance. Watch out for by-product yields. LME zinc has inched up.
Quarterly performance INR million Y/E March FY19 FY20 FY19 FY20E 1Q 2Q 3Q 4Q 1Q 2Q 3QE 4QE Mine prodn. (kt) 212 232 247 245 213 219 230 255 936 917 Sales
Zinc refined (kt) 170 160 187 177 168 168 174 192 694 701 Lead refined (kt) 42 49 54 52 48 44 49 54 197 194 Silver (tonnes) 141 161 178 199 155 135 153 170 679 612 Zinc LME (USD/t) 3,108 2,541 2,631 2,709 2,761 2,347 2,392 2,350 2,751 2,462 Net Sales 53,100 47,770 55,400 54,910 49,870 45,110 48,414 53,817 211,180 197,211 Change (YoY %) 16.0 -10.0 -6.5 -12.5 -6.1 -5.6 -12.6 -2.0 -4.4 -6.6 EBITDA 27,130 23,340 28,380 27,890 24,770 21,170 22,851 26,209 106,740 95,000 Change (YoY %) 13.8 -22.8 -12.5 -23.0 -8.7 -9.3 -19.5 -6.0 -13.0 -11.0
As % of Net Sales 51.1 48.9 51.2 50.8 49.7 46.9 47.2 48.7 50.5 48.2 Finance cost 150 0 510 510 290 250 0 0 1,170 540 DD&A 3,870 4,540 4,890 5,530 5,340 5,950 6,010 6,070 18,830 23,369 Other Income 2,990 3,940 5,500 5,390 4,290 5,900 4,025 3,433 17,820 17,649 PBT 26,100 22,740 28,480 27,240 23,430 20,870 20,867 23,572 104,560 88,739 Total Tax 6,920 4,590 6,370 7,120 5,780 60 3,798 4,290 25,000 13,928
% Tax 26.5 20.2 22.4 26.1 24.7 0.3 18.2 18.2 23.9 15.7 Reported PAT 19,180 18,150 22,110 20,120 17,650 20,810 17,069 19,282 79,560 74,811 Adjusted PAT 19,180 18,150 22,110 20,120 17,650 20,810 17,069 19,282 79,560 74,811 Change (YoY %) 2.2 -19.5 -0.9 -21.3 -8.0 14.7 -22.8 -4.2 -10.8 -6.0
Source: MOFSL, Company

January 2020 148
December 2019 Results Preview | Sector: Metals Jindal Steel & Power Buy CMP INR174 | TP: INR200 (+15%) EPS CHANGE (%): FY20|21: +0.4|+4.2 Standalone EBITDA expected to go up. Jindal Power’s EBITDA to go down QoQ. Watch out for ramp up of Angul plant and power demand. Consolidated EBITDA to increase.
Quarterly Performance (Consolidated) (INR Million) Y/E March FY19 FY20 FY19 FY20E 1Q 2Q 3Q 4Q 1Q 2Q 3QE 4QE Net Sales 96,654 99,823 95,656 101,590 99,456 89,395 97,033 102,582 393,721 388,466 Change (YoY %) 63.6 63.0 36.8 18.1 2.9 -10.4 1.4 1.0 42.5 -1.3 EBITDA 22,766 22,074 20,769 18,447 21,731 16,415 17,342 21,049 84,056 76,537 Change (YoY %) 68.3 60.7 29.3 -13.7 -4.5 -25.6 -16.5 14.1 29.9 -8.9 Interest 9,729 10,858 10,424 11,631 11,090 10,301 10,063 9,899 42,642 41,353 Depreciation 10,399 10,314 10,357 10,867 10,536 10,390 10,688 10,745 41,938 42,358 Other Income 0 9 148 0 8 8 8 8 157 32 PBT (before EO item) 2,637 911 136 -4,051 113 -4,266 -3,401 413 -367 -7,142 Extra-ordinary Income 0 2,555 0 -30,204 0 0 0 0 -27,650 0 PBT (after EO item) 2,637 3,466 136 -34,255 113 -4,266 -3,401 413 -28,017 -7,142 Total Tax 1,538 674 1,008 -7,122 987 -273 26 1,015 -3,902 1,755 Reported PAT 1,099 2,792 -872 -27,133 -874 -3,993 -3,427 -602 -24,115 -8,897 MI - Loss/(Profit) -709 -645 -614 -5,676 -968 -988 -30 -30 -7,644 -2,016 Adjusted PAT 1,808 882 -258 746 95 -3,005 -3,397 -572 3,178 -6,880
JSW Steel Buy CMP INR277 | TP: INR320 (+21%) EPS CHANGE (%): FY20|21: -1.3|+9.2 Consol. EBITDA expected to remain almost flat. Standalone steel sales to decline. Watch out for impact of lower steel prices and domestic
demand growth. Standalone EBITDA/t and consolidated adjusted PAT to
decline.
Quarterly Performance (Consolidated) (INR Million) Y/E March FY19 FY20 FY19 FY20E 1Q 2Q 3Q 4Q 1Q 2Q 3QE 4QE Net Sales 205,190 215,520 203,180 223,680 198,120 175,720 174,461 203,361 847,570 751,662 Change (YoY %) 38.4 27.2 13.8 9.4 -3.4 -18.5 -14.1 -9.1 20.9 -11.3 EBITDA 51,050 49,060 45,010 44,400 37,160 27,310 26,819 43,802 189,520 135,091 Change (YoY %) 85.9 55.0 16.9 -9.8 -27.2 -44.3 -40.4 -1.3 29.0 -28.7 EBITDA (INR per ton) 13,329 12,389 12,231 10,350 9,909 7,586 7,007 10,210 12,025 8,734 EBITDA (USD per ton) 199 177 170 147 142 108 100 145 172 124 Interest 8,870 9,630 10,210 10,460 10,420 11,270 10,920 11,095 39,170 43,705 Depreciation 9,050 9,740 10,780 10,840 10,260 10,570 10,330 10,450 40,410 41,610 Other Income 580 560 370 530 1,410 1,560 1,115 1,003 2,040 5,088 PBT (after EO Item) 33,710 30,250 24,390 23,630 17,890 7,030 6,684 23,260 111,980 54,864 Total Tax 10,530 9,360 8,200 8,350 7,620 -18,480 2,048 5,761 36,440 -3,051
% Tax 31.2 30.9 33.6 35.3 42.6 -262.9 30.6 24.8 32.5 -5.6 Reported PAT 23,180 20,890 16,190 15,280 10,270 25,510 4,636 17,499 75,540 57,915 MI (Profit)/Loss 270 390 210 280 200 240 233 238 1,150 911 Share of P/(L) of Ass. 210 -20 -160 -330 -190 -150 -208 -219 -300 -767 Adjusted PAT 23,660 21,260 16,240 15,230 10,280 25,600 4,661 17,518 76,390 58,059 Change (YoY %) 229.4 127.8 -16.5 -30.7 -56.6 20.4 -71.3 15.0 31.8 -24.0

January 2020 149
December 2019 Results Preview | Sector: Metals Nalco Buy CMP INR46 | TP: INR54 (+18%) EPS CHANGE (%): FY20|21: -44|-28 Rise in EBITDA is expected on lower costs. Aluminum LME has declined QoQ. Watch out for impact of alumina prices. Adjusted PAT to turn positive in Q3FY20.
Quarterly Performance (INR Million) Y/E March FY19 FY20 FY19 FY20E 1Q 2Q 3Q 4Q 1Q 2Q 3QE 4QE Alumina Prodn. (kt) 583 471 538 561 583 477 516 561 2,153 2,137
CoP (USD/t) 249 273 284 273 263 244 214 213 270 231 Aluminum Prodn. (kt) 110 111 108 111 111 110 110 112 440 442
CoP (USD/t) 2,030 1,949 2,059 1,842 2,017 2,190 2,004 1,998 1,966 2,052 Aluminum Sales (kt) 105 115 104 117 103 110 110 112 441 435 Alumina Sales (kt) 320 324 293 380 231 386 348 388 1,317 1,353 Avg LME Aluminum (USD/ton) 2,250 2,050 1,973 1,859 1,792 1,765 1,750 1,800 2,033 1,777 NSR premiums (USD/ton) 308 216 315 216 257 232 290 290 263 267 Alumina NSR (USD/ton) 547 535 476 394 369 302 282 300 488 313 Net Sales 29,733 30,409 27,189 27,662 20,841 23,636 21,579 23,554 114,993 89,609 Change (YoY %) 64.9 23.9 13.8 -3.4 -29.9 -22.3 -20.6 -14.9 20.9 -22.1 EBITDA 10,111 8,509 5,766 5,176 2,144 322 1,140 2,238 29,561 5,843 Alumina-EBITDA (USD/t) 299 263 192 122 106 57 36 56 214 60 Aluminum - EBITDA (USD/t) 527 316 229 233 62 -159 36 92 321 8
As % of Net Sales 34.0 28.0 21.2 18.7 10.3 1.4 5.3 9.5 25.7 6.5 Interest 6 6 6 6 16 16 0 0 33 Depreciation 1,217 1,160 1,181 1,203 1,264 1,343 1,248 1,264 4,761 5,118 Other Income 621 903 758 977 614 566 873 873 3,259 2,925 PBT (before EO Item) 9,509 8,246 5,337 4,943 1,477 -472 765 1,846 28,059 3,616 Extra-ordinary Income 910 0 -636 -910 0 0 0 0 PBT (after EO Item) 10,419 8,246 4,701 4,033 1,477 -472 765 1,846 28,059 3,616 Total Tax 3,549 3,146 1,683 1,697 499 -188 188 455 10,075 955
% Tax 34.1 38.2 35.8 42.1 33.8 39.9 24.6 24.6 35.9 26.4 Reported PAT 6,871 5,100 3,018 2,336 978 -284 576 1,391 17,984 2,662 Adjusted PAT 6,095 5,285 3,420 3,168 978 -284 576 1,391 17,984 2,662
NMDC Buy CMP INR131 | TP: INR152 (+16%) EPS CHANGE (%): FY20|21: -0.1|+27.2 Adj. EBITDA expected to increase on higher volumes. Iron ore sales volumes to increase QoQ. Watch out for iron ore production and iron ore demand. Adj. PAT expected to increase significantly in 3QFY20.
Quarterly Performance (INR Million) Y/E March FY19 FY20 FY19 FY20E 1Q 2Q 3Q 4Q 1Q 2Q 3QE 4QE Net Sales 24,220 24,379 36,494 36,433 32,637 22,418 31,487 27,929 121,527 114,472 EBITDA 14,788 13,824 22,788 20,015 19,265 11,723 17,725 12,769 71,416 61,481 Change (YoY %) -8.7 7.6 71.2 -3.9 30.3 -15.2 -22.2 -36.2 13.0 -13.9 Interest 108 97 96 102 117 97 0 0 403 215 Depreciation 616 675 694 804 648 976 835 856 2,789 3,314 Other Income 1,251 1,310 1,361 1,961 1,228 1,275 1,293 1,569 5,883 5,365 PBT (before EO Item) 15,316 14,362 23,360 21,070 19,728 11,925 18,183 13,482 74,107 63,319 Extra-ordinary item -550 -1,232 -1,245 906 -596 -1,121 -688 -688 -2,120 -3,092 PBT (after EO Item) 14,766 13,131 22,115 21,976 19,132 10,805 17,496 12,795 71,987 60,227 Total Tax 5,013 6,767 6,347 7,438 7,337 3,771 6,000 4,449 25,565 21,558
% Tax 34.0 51.5 28.7 33.8 38.4 34.9 34.3 34.8 35.5 35.8 Reported PAT 9,753 6,364 15,768 14,538 11,794 7,034 11,495 8,346 46,422 38,669 Adjusted PAT 9,877 9,262 15,064 13,587 12,666 7,657 11,675 8,657 47,789 40,654

January 2020 150
December 2019 Results Preview | Sector: Metals SAIL Neutral CMP INR47 | TP: INR43 (-9%) EPS CHANGE (%): FY20|21: 2|3 Expect flattish EBITDA in 3Q on lower realizations. Volumes to go up slightly. Watch out for impact of lower steel prices. Expect loss of INR3.7b.
Quarterly Performance (INR Million) Y/E March FY19 FY20 FY19 FY20E 1Q 2Q 3Q 4Q 1Q 2Q 3QE 4QE Sales (m tons) 3.3 3.5 3.2 4.1 3.2 3.1 3.2 3.8 14.1 13.4
Change (YoY %) 8.0 -1.8 -14.1 10.4 -0.7 -9.4 -1.1 -8.0 0.2 -5.1 Realization (INR per ton) 48,631 48,109 48,921 44,788 45,614 44,878 43,015 43,315 47,444 44,168
Change (YoY %) 27.2 25.1 20.4 -1.6 -6.2 -6.7 -12.1 -3.3 16.1 -6.9 Net Sales 159,072 167,180 158,358 185,063 148,200 141,274 137,647 164,596 669,673 591,718 Change (%) 37.4 22.8 3.3 8.6 -6.8 -15.5 -13.1 -11.1 16.3 -11.6 NSR to RM Spread (INR/t) 28,993 26,401 29,602 22,151 24,841 24,712 23,313 24,622 26,492 24,384 EBITDA 25,764 23,650 25,782 22,145 15,819 11,597 11,464 19,190 97,341 58,071 EBITDA per ton (INR) 7,877 6,806 7,965 5,359 4,869 3,684 3,582 5,050 6,896 4,335 Interest 7,554 7,711 8,251 8,034 7,884 9,404 8,264 8,459 31,549 34,011 Depreciation 8,136 8,261 8,547 8,903 8,725 9,011 9,211 9,409 33,847 36,356 Other Income 978 1,143 747 2,461 1,828 1,587 1,051 1,050 5,328 5,517 PBT (after EO Inc.) 8,278 8,480 9,498 7,123 1,039 -5,230 -4,961 2,373 33,379 -6,779 Total Tax 2,874 2,943 3,334 2,439 351 -1,802 -1,240 617 11,591 -2,074
% Tax 34.7 34.7 35.1 34.2 33.8 34.5 25.0 26.0 34.7 30.6 Reported PAT 5,404 5,537 6,163 4,684 688 -3,428 -3,721 1,756 21,789 -4,705 Adjusted PAT 7,215 5,760 6,314 5,043 688 -3,428 -3,721 1,756 24,330 -4,705
Change (YoY %) NA NA 322.4 -25.1 -90.5 -159.5 -158.9 -65.2 NA -119.3
Tata Steel Neutral CMP INR485 | TP: INR458 (-6%) EPS CHANGE (%): FY20|21: -3.5|+2.4 Standalone EBITDA to increase slightly on lower RM costs. Volumes would be broadly flat while EBITDA/t goes up. Watch out for margins of Tata Steel Europe and impact of
lower steel prices. Consolidated EBITDA expected to increase.
Quarterly Performance (Consolidated) (INR Million) Y/E March FY19 FY20 FY19 FY20E 1Q 2Q 3Q 4Q 1Q 2Q 3QE 4QE Net Sales 378,328 435,441 412,199 424,239 359,471 345,792 334,395 375,280 1,576,688 1,414,938
Change (YoY %) 28.0 34.1 23.2 17.4 -5.0 -20.6 -18.9 -11.5 19.8 -10.3 EBITDA 64,677 89,195 67,233 75,133 53,769 38,196 38,293 60,801 293,833 191,059
Change (YoY %) 30.0 88.9 18.0 15.6 -16.9 -57.2 -43.0 -19.1 34.2 -35.0 (% of Net Sales) 17.1 20.5 16.3 17.7 15.0 11.0 11.5 16.2 18.6 13.5
EBITDA(USD/tss) 147 171 134 142 121 83 81 121 148 102 Interest 16,701 21,531 19,400 19,378 18,064 18,714 18,716 18,508 76,601 74,002 Depreciation 18,056 19,079 19,255 18,805 20,828 21,272 21,690 21,697 73,418 85,487 Other Income 3,473 3,544 2,115 4,899 2,511 1,836 2,033 1,934 14,206 8,313 PBT (before EO Inc.) 33,392 52,130 30,693 41,849 17,387 46 -80 22,531 158,020 39,884 EO Income(exp) -3,465 1,583 324 115 160 -336 176 -1,210 PBT (after EO Inc.) 29,926 53,713 31,018 41,964 17,547 -290 -80 22,706 156,810 39,884 Total Tax 11,037 23,264 14,006 18,991 11,238 -40,500 4,554 7,929 67,184 -16,778
% Tax 33.1 44.6 45.6 45.4 64.6 -88,428 -5,684.4 35.2 42.5 -42.1 Reported PAT 18,890 30,449 17,012 22,973 6,309 40,210 -4,634 14,777 89,626 56,662 Adj. PAT (after MI & asso) 22,976 34,404 22,517 24,194 6,771 41,783 -3,722 15,414 101,390 57,589 Note: Quarterly nos. do not account for div. on pref shares
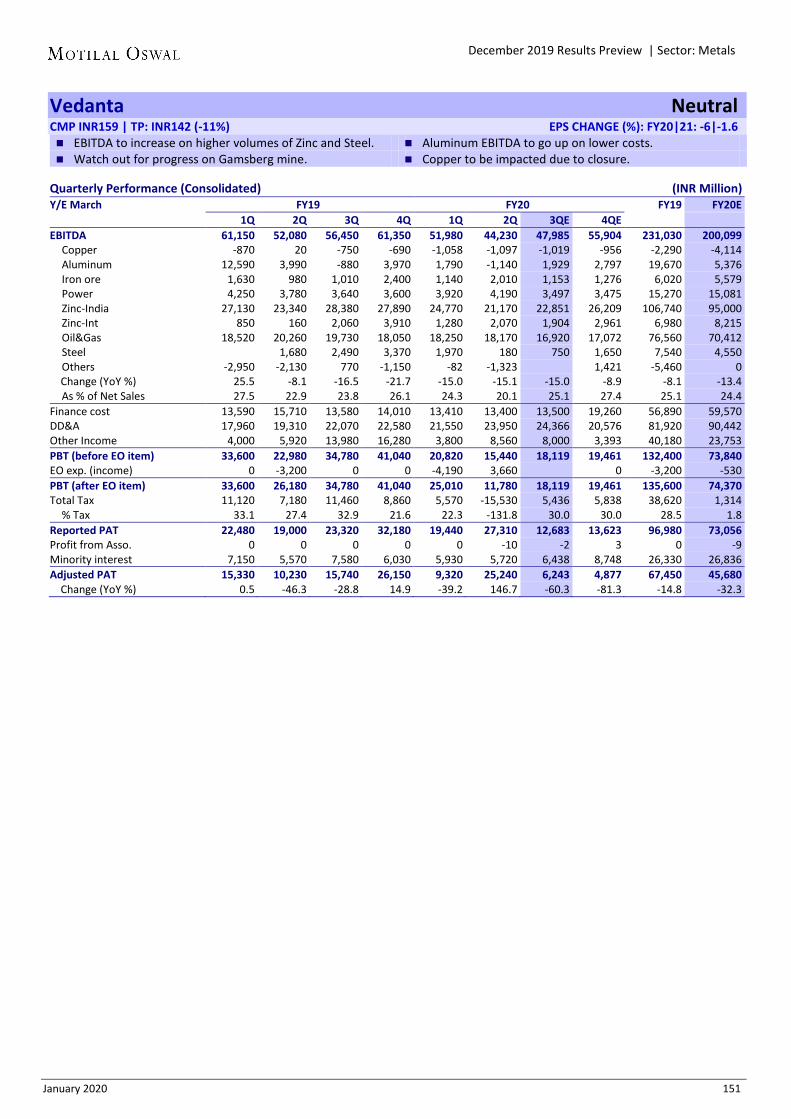
January 2020 151
December 2019 Results Preview | Sector: Metals Vedanta Neutral CMP INR159 | TP: INR142 (-11%) EPS CHANGE (%): FY20|21: -6|-1.6 EBITDA to increase on higher volumes of Zinc and Steel. Aluminum EBITDA to go up on lower costs. Watch out for progress on Gamsberg mine. Copper to be impacted due to closure.
Quarterly Performance (Consolidated) (INR Million) Y/E March FY19 FY20 FY19 FY20E 1Q 2Q 3Q 4Q 1Q 2Q 3QE 4QE EBITDA 61,150 52,080 56,450 61,350 51,980 44,230 47,985 55,904 231,030 200,099
Copper -870 20 -750 -690 -1,058 -1,097 -1,019 -956 -2,290 -4,114 Aluminum 12,590 3,990 -880 3,970 1,790 -1,140 1,929 2,797 19,670 5,376 Iron ore 1,630 980 1,010 2,400 1,140 2,010 1,153 1,276 6,020 5,579 Power 4,250 3,780 3,640 3,600 3,920 4,190 3,497 3,475 15,270 15,081 Zinc-India 27,130 23,340 28,380 27,890 24,770 21,170 22,851 26,209 106,740 95,000 Zinc-Int 850 160 2,060 3,910 1,280 2,070 1,904 2,961 6,980 8,215 Oil&Gas 18,520 20,260 19,730 18,050 18,250 18,170 16,920 17,072 76,560 70,412 Steel 1,680 2,490 3,370 1,970 180 750 1,650 7,540 4,550 Others -2,950 -2,130 770 -1,150 -82 -1,323 1,421 -5,460 0
Change (YoY %) 25.5 -8.1 -16.5 -21.7 -15.0 -15.1 -15.0 -8.9 -8.1 -13.4 As % of Net Sales 27.5 22.9 23.8 26.1 24.3 20.1 25.1 27.4 25.1 24.4
Finance cost 13,590 15,710 13,580 14,010 13,410 13,400 13,500 19,260 56,890 59,570 DD&A 17,960 19,310 22,070 22,580 21,550 23,950 24,366 20,576 81,920 90,442 Other Income 4,000 5,920 13,980 16,280 3,800 8,560 8,000 3,393 40,180 23,753 PBT (before EO item) 33,600 22,980 34,780 41,040 20,820 15,440 18,119 19,461 132,400 73,840 EO exp. (income) 0 -3,200 0 0 -4,190 3,660 0 -3,200 -530 PBT (after EO item) 33,600 26,180 34,780 41,040 25,010 11,780 18,119 19,461 135,600 74,370 Total Tax 11,120 7,180 11,460 8,860 5,570 -15,530 5,436 5,838 38,620 1,314
% Tax 33.1 27.4 32.9 21.6 22.3 -131.8 30.0 30.0 28.5 1.8 Reported PAT 22,480 19,000 23,320 32,180 19,440 27,310 12,683 13,623 96,980 73,056 Profit from Asso. 0 0 0 0 0 -10 -2 3 0 -9 Minority interest 7,150 5,570 7,580 6,030 5,930 5,720 6,438 8,748 26,330 26,836 Adjusted PAT 15,330 10,230 15,740 26,150 9,320 25,240 6,243 4,877 67,450 45,680 Change (YoY %) 0.5 -46.3 -28.8 14.9 -39.2 146.7 -60.3 -81.3 -14.8 -32.3

January 2020 152
December 2019 Results Preview | Sector: Oil & Gas
IMO 2020 fails to support GRMs Refining worsens, Petchem remains weak
SG GRM averaged USD0.2/bbl in Dec’19, averaging ~USD1.6/bbl for 3QFY19, primarily due to worsening of FO cracks and failure in revival of diesel cracks. This is the lowest quarterly GRM average in the last 15 years.
Petchem margins remain under pressure despite lower Naphtha prices; primary spreads of ethylene/propylene/butadiene declined 46%/20%/16% YoY in 3QFY20.
Additional OPEC+ cuts help revive Brent prices in Dec’19 In 3QFY20, average Brent prices stood at USD62.5/bbl, marginally higher than
the average price of USD61.9/bbl in 2QFY20, resulting in inventory gains for refiners based on their different inventory cycles.
In the absence of global recovery and rising domestic production from the US, we have revised down our Brent oil price forecast for FY21-22 to USD65/bbl from USD70/bbl despite higher production cuts by OPEC+.
We further expect no subsidy burden on the oil marketing companies (OMCs) or the upstream companies (ONGC/Oil India) in the quarter.
SG GRM at USD1.6/bbl (v/s USD4.2/bbl in 3QFY19; USD6.5/bbl in 2QFY20) Singapore GRM for the quarter declined to USD1.6/bbl, due to continued
weakness in diesel cracks and worsening of FO cracks. Gasoline cracks stood at USD8.1/bbl in 3QFY20 (v/s USD2.7/bbl in 3QFY19 and
USD7.9/bbl in 2QFY20), as gasoline demand rebounds. FO cracks worsened to -USD18.4/bbl (v/s +USD1.6/bbl in 3QFY19 and
+USD1.2/bbl in 2QFY20) with implementation of IMO2020 nearing. However, diesel cracks failed to get the expected traction in the final quarter
before IMO implementation and averaged USD11.9/bbl (v/s USD13.1/bbl in 3QFY19 and USD13.9/bbl in 2QFY20).
Indian refiners have a higher yield of ~36-48% for diesel in their slate (v/s 16% in SG GRM). FO yield is lower at ~2-13% for Indian refiners (v/s 23% in SG GRM).
PE delta declined ~33% YoY and PP delta declined ~21% YoY, despite weakness in feedstock prices, while PVC delta increased ~7% YoY.
Domestic oil and gas production growth declines Total domestic oil production in Oct-Nov’19 declined by ~5% YoY and ~3% QoQ.
Domestic gas production in Oct-Nov’19 decreased ~6% YoY and ~3% QoQ. (Dec’19 data not out yet).
LNG consumption was up ~13% YoY and flat QoQ in Oct-Nov’19, with strong consumption from the CGDs, while Power consumption moderated.
Oil & Gas
Oil & Gas
Swarnendu Bhushan – Research Analyst ([email protected]); +91 22 6129 1529 Sarfraz Bhimani – Research Analyst ([email protected]); +91 22 6129 1566
Company name Aegis Logistics
BPCL
GAIL
Gujarat Gas
Gujarat State Petronet
HPCL
Indraprastha Gas
IOC
Mahanagar Gas
MRPL
Oil India
ONGC
Petronet LNG
Reliance Industries

January 2020 153
December 2019 Results Preview | Sector: Oil & Gas
Exhibit 108: Expected quarterly performance summary Sector CMP SALES (INR M) EBDITA (INR M) NET PROFIT (INR M)
(INR) RECO Dec-19 Var % YoY
Var % QoQ Dec-19 Var
% YoY Var
% QoQ Dec-19 Var % YoY
Var % QoQ
Oil & Gas Aegis Logistics 199 Buy 19,180 45.3 5.5 1,330 43.6 LP 828 40.0 LP BPCL 487 Neutral 640,308 -19.1 -0.5 25,735 3185.9 -6.8 11,110 124.4 -35.0 Castrol India 130 Buy 10,596 2.5 24.8 3,094 -2.5 26.6 2,308 8.9 22.5 GAIL 123 Buy 197,412 -0.2 9.4 25,417 -4.9 62.7 15,691 -4.9 47.4 Gujarat Gas 255 Buy 29,535 39.5 17.5 3,528 9.8 -4.8 1,879 24.9 -63.7 Gujarat State Petronet 232 Buy 4,860 7.1 -10.2 3,904 10.5 -10.7 2,242 29.2 -50.7 HPCL 270 Buy 589,126 -18.3 -3.2 32,559 789.8 33.4 16,985 586.1 61.4 IOC 127 Buy 1183,298 -15.5 5.9 61,276 301.6 30.2 19,924 177.9 253.6 Indraprastha Gas 422 Neutral 17,497 16.0 3.4 3,832 20.6 -2.4 2,716 37.2 -28.7 Mahanagar Gas 1,065 Neutral 7,558 0.4 -3.5 2,544 6.4 -7.0 1,739 17.2 -35.8 MRPL 44 Neutral 133,782 -25.1 1.3 390 LP LP -2,538 Loss Loss Oil India 153 Buy 30,205 -14.0 -6.0 11,643 -23.5 -6.3 7,960 -35.5 26.9 ONGC 128 Buy 241,837 -12.7 -1.3 125,058 -24.5 -5.9 49,844 -39.7 -20.4 Petronet LNG 269 Buy 92,146 -8.7 -1.6 10,598 25.0 -8.7 6,411 13.4 -46.3 Reliance Inds. 1,535 Buy 1529,577 -2.2 3.0 206,216 -3.3 -6.9 107,517 3.6 -5.3 Sector Aggregate 4726,918 -11.4 2.3 517,123 12.3 1.9 244,616 1.0 -2.2 Oil & Gas Excl. OMCs 2314,187 -4.6 2.8 397,553 -9.8 -2.7 196,598 -13.7 -9.4
Source: MOFSL
Exhibit 109: Oil, Gas, Product Prices and Cracks & Margins (USD/bbl) (USD/bbl) 3QFY19 4QFY19 1QFY20 2QFY20 3QFY20 YoY (%) QoQ (%) Oil
WTI 58.8 54.9 59.8 56.4 56.8 (3.4) 0.7 Brent 67.4 63.3 68.9 61.9 63.3 (6.0) 2.3 Dubai 67.4 63.5 67.4 61.2 61.9 (8.3) 1.2 Arab Light-Heavy 2.2 1.4 1.8 1.5 2.3 4.5 51.1
Gas Henry Hub (USD/mmbtu) 3.8 2.9 2.6 2.4 2.4 (36.2) 1.2 Oil to Gas 18.2 21.8 27.0 26.0 26.3 44.8 1.3
Exchange Rate (INR/USD) 72.0 70.5 69.5 70.4 71.2 (1.1) 1.1 Product Cracks (v/s Dubai)
LPG (24.8) (22.0) (27.3) (27.5) (19.2) 22.6 30.4 Gasoline 2.7 1.9 5.7 7.9 8.1 204.0 3.2 Diesel 13.1 11.7 10.9 13.9 11.9 (9.4) (14.7) Jet/Kero 15.6 13.0 12.2 15.8 13.9 (10.8) (11.9) Naphtha (6.4) (7.6) (9.2) (7.9) (2.4) NM 69.4 Fuel Oil 1.6 0.9 (2.0) 1.2 (18.4) NM NM
SGRM 4.2 3.2 3.5 6.5 1.6 (61.6) (75.0) Source: MOFSL, Company

January 2020 154
December 2019 Results Preview | Sector: Oil & Gas
Top Ideas: Valuation and view PLNG – Accumulate for the long term: Visibility for PLNG’s medium-term/long-
term earnings is high, given (a) the huge gas demand-supply gap in India, (b) volume growth driven by gradual capacity addition, and (c) earnings growth boosted by annual re-gas charge escalation. Poor competition from existing and upcoming terminals and lower LNG prices are additional positives for PLNG.
GAIL – Concerns regarding US HH contracts to subside soon: The completion of three fertilizer plants along the Jagdishpur-Haldia-Bokaro-Dhamra pipeline (JHBDPL) – combined with contribution from Matix Fertilizer, Ramagundam start-ups and Mangalore Chemicals and Fertilizers’ (MCFL) conversion – is likely to de-risk ~60% of the total US Henry Hub (HH) contracts. The increase in domestic gas availability could boost gas transmission of GAIL by ~30% by FY23. Focus on industrial pollution (The National Green Tribunal’s order for the PCBs to file report on air polluted industrial clusters across India) bodes extremely well for transmission/sales volumes. We believe that gas would have a central role to play in reducing air pollution in such industrial clusters and that strict enforcement may result in a significant jump in gas volumes.
Expect post-reforms multiple to reflect in OMCs: The quarter has seen depressing benchmark GRMs for refiners, but marketing margins remain healthy. IOCL remains our preferred pick due to strong FCFF and high dividend yield.
Regulatory risk ahead for CGDs: City gas distribution (CGD) companies (IGL and MAHGL) took CNG and PNG price cuts in the quarter, in line with reduction in revised APM gas prices for 2HFY20. We expect decrease in EBITDA/scm margins for both the aforementioned companies.
The National Green Tribunal has mandated penalty against Pollution Control Boards (PCBs), if they do not comply with its Nov’19 order of curbing pollution in critically and severely polluted industrial clusters across India. Gujarat is already facilitated by better availability of gas/pipeline infrastructure and replacement of dirty industrial fuel could further support volume growth for the company.
Factoring in the regulatory concern and due to lack of support from Industrial pollution in both IGL and MAHGL, we maintain a Neutral rating on these two stocks. We maintain Buy on GUJGA with a TP of INR270, given the expected benefits from the focus on industrial production.
Mixed quarter for RIL: RIL is expected to clock in GRM of USD9.0/bbl, with a huge premium of USD7.3/bbl to SG GRM. Petchem segment is expected to suffer due to reduced margins.
ONGC appears attractive: ONGC currently has 13 field development projects and 3 IOR-EOR projects under implementation. These new additions will majorly help offset depletion from old fields and help maintain stable oil production for the company. But, we believe that once KG-DWN-98/2 comes into production, it would result in significant gas production growth for the company. We prefer ONGC over Oil India, as (a) gas production is likely to grow ~7% annually for the next 3-4 years, and (b) it has strong dividend yield.

January 2020 155
December 2019 Results Preview | Sector: Oil & Gas
Exhibit 110: Relative performance - 3m (%)
Exhibit 111: Relative performance - 1Yr (%)
Source: Bloomberg, MOFSL
Exhibit 112: Comparative valuations CMP EPS (INR) PE (x) PB (x) RoE (%) Company Name INR Reco FY20E FY21E FY22E FY20E FY21E FY22E FY20E FY21E FY22E FY20E FY21E FY22E Oil & Gas 14.7 10.8 10.0 1.6 1.5 1.3 11.2 13.7 13.4 Aegis Logistics 199 Buy 6.3 12.1 13.1 31.7 16.4 15.2 4.4 3.7 3.1 14.6 24.3 22.1 BPCL 487 Neutral 30.2 46.2 48.0 16.1 10.6 10.2 2.3 2.0 1.8 14.7 20.1 18.5 Castrol India 130 Buy 8.0 8.9 9.3 16.4 14.7 14.0 10.0 9.0 8.1 64.0 64.2 60.7 GAIL 123 Buy 11.7 13.2 14.5 10.6 9.4 8.5 1.2 1.1 1.0 11.5 12.0 12.2 Gujarat Gas 255 Buy 16.2 12.2 12.3 15.7 20.8 20.8 5.7 4.7 4.0 42.4 24.8 20.9 Gujarat State Petronet 232 Buy 19.9 18.0 18.6 11.7 12.9 12.5 1.9 1.7 1.5 17.9 14.1 12.9 HPCL 270 Buy 33.3 45.9 44.8 8.1 5.9 6.0 1.2 1.1 1.0 16.0 19.9 17.6 Indraprastha Gas 422 Neutral 16.5 17.2 18.6 25.5 24.6 22.7 5.9 4.9 4.2 25.2 21.8 20.0 IOC 127 Buy 9.6 18.6 19.4 13.3 6.8 6.6 1.0 0.9 0.9 7.6 14.1 13.6 Mahanagar Gas 1,065 Neutral 80.6 68.1 66.7 13.2 15.6 16.0 3.7 3.3 2.9 30.3 22.1 19.3 MRPL 44 Neutral -8.0 5.7 7.4 -5.5 7.7 5.9 0.8 0.8 0.7 -14.0 10.3 12.3 Oil India 153 Buy 25.1 25.4 25.8 6.1 6.0 5.9 0.6 0.6 0.5 10.0 9.5 9.2 ONGC 128 Buy 22.3 26.7 28.3 5.7 4.8 4.5 0.7 0.6 0.6 12.6 13.9 13.4 Petronet LNG 269 Buy 20.3 20.9 22.4 13.3 12.9 12.0 3.7 3.4 3.1 28.9 27.4 27.1 Reliance Inds. 1,535 Buy 77.7 106.5 119.3 19.8 14.4 12.9 2.1 1.9 1.7 11.3 13.8 13.7
Source: MOFSL Our key assumptions Our crude price assumptions are USD65/bbl for FY21-22. We expect the regional benchmark Singapore Reuters GRM to recover to
~USD6/bbl over the medium-to long-term.
99
102
105
108
111Se
p-19
Oct
-19
Nov
-19
Dec-
19
Nifty Index MOSL Oil & Gas Index
95
102
109
116
123
Dec-
18
Jan-
19
Feb-
19
Mar
-19
Apr-
19
May
-19
Jun-
19
Jul-1
9
Aug-
19
Sep-
19
Oct
-19
Nov
-19
Dec-
19
Nifty Index MOSL Oil & Gas Index

January 2020 156
December 2019 Results Preview | Sector: Oil & Gas
Brent down 6% YoY, up 2% QoQ
Exhibit 113: Brent down 6% YoY, up 2% QoQ
Source: Bloomberg, MOFSL
Exhibit 114: Brent Premium to WTI up QoQ to USD6.5/bbl
Source: Bloomberg, MOFSL
Exhibit 115: Reuters Singapore GRM lowest in last 15years at USD1.6/bbl, down from USD6.5/bbl in 2QFY20
Source: Bloomberg, MOFSL
Exhibit 116: Gasoline and Jet/kero cracks show some improvement, while FO cracks weaken (USD/bbl)
Source: Reuters, MOFSL
Exhibit 117: Crude differentials widened QoQ for both Arab L-H at USD2.3/bbl and Brent-Dubai at USD1.5/bbl
Source: Bloomberg, MOFSL
Exhibit 118: Spread over Naphtha for PE and PP declined QoQ, while PVC increased QoQ
Source: Bloomberg, MOFSL
63.3
0
30
60
90
120
150
1QFY
123Q
FY12
1QFY
133Q
FY13
1QFY
143Q
FY14
1QFY
153Q
FY15
1QFY
163Q
FY16
1QFY
173Q
FY17
1QFY
183Q
FY18
1QFY
193Q
FY19
1QFY
203Q
FY20
Brent Crude Price (USD/bbl)
6.5
0
5
10
15
20
25
1QFY
123Q
FY12
1QFY
133Q
FY13
1QFY
143Q
FY14
1QFY
153Q
FY15
1QFY
163Q
FY16
1QFY
173Q
FY17
1QFY
183Q
FY18
1QFY
193Q
FY19
1QFY
203Q
FY20
Brent less WTI (USD/bbl)
1.6
0
3
5
8
10
1QFY
123Q
FY12
1QFY
133Q
FY13
1QFY
143Q
FY14
1QFY
153Q
FY15
1QFY
163Q
FY16
1QFY
173Q
FY17
1QFY
183Q
FY18
1QFY
193Q
FY19
1QFY
203Q
FY20
Reuters Singapore GRM (USD/bbl)
8.7
(4.3
)
(22.
6)
13.2
15.2
(10.
5)
(40)
(25)
(10)
5
20
Gasoline Naphtha LPG Diesel Jet/Kero Fuel Oil
3QFY19 4QFY19 1QFY20 2QFY20 3QFY20
1.5
2.3
(2)
0
2
4
6
8
1QFY
123Q
FY12
1QFY
133Q
FY13
1QFY
143Q
FY14
1QFY
153Q
FY15
1QFY
163Q
FY16
1QFY
173Q
FY17
1QFY
183Q
FY18
1QFY
193Q
FY19
1QFY
203Q
FY20
Brent - Dubai Arab L-HIn USD/bbl
380
498
342
0
250
500
750
1000
1QFY
123Q
FY12
1QFY
133Q
FY13
1QFY
143Q
FY14
1QFY
153Q
FY15
1QFY
163Q
FY16
1QFY
173Q
FY17
1QFY
183Q
FY18
1QFY
193Q
FY19
1QFY
203Q
FY20
USD/MT PE PP PVC
December 2019 Results Preview | Sector: Oil & Gas
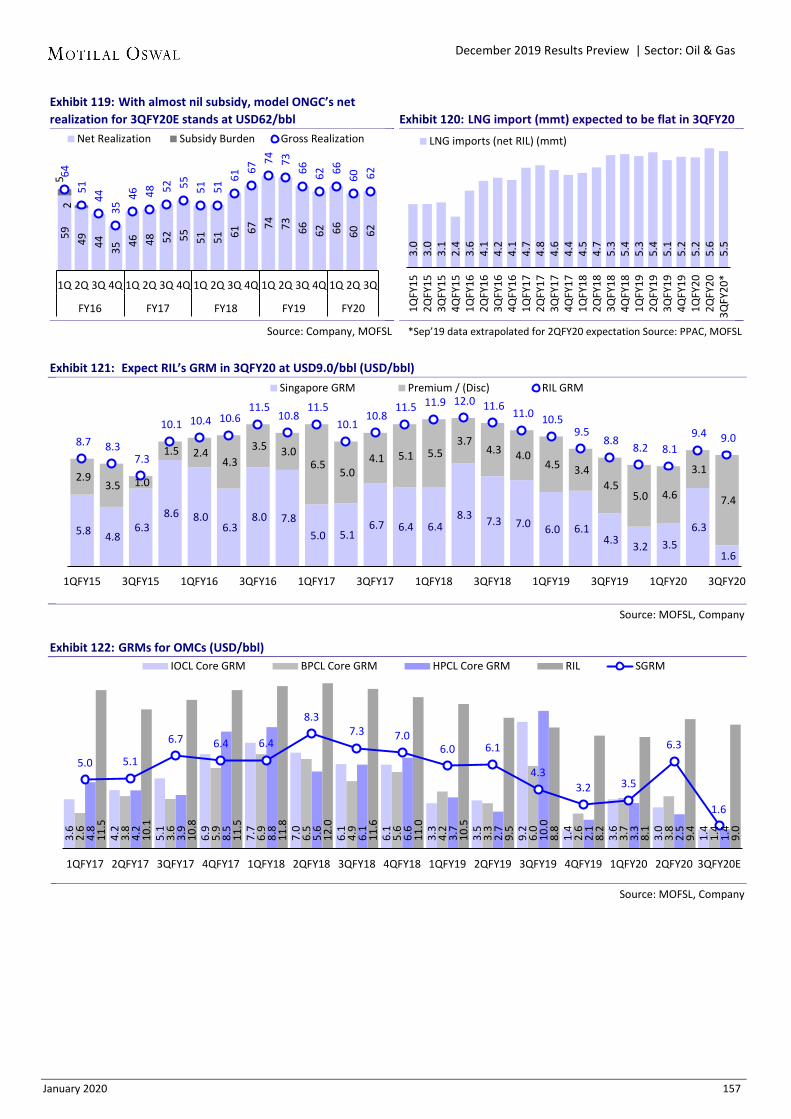
January 2020 157
December 2019 Results Preview | Sector: Oil & Gas
Exhibit 119: With almost nil subsidy, model ONGC’s net realization for 3QFY20E stands at USD62/bbl
Source: Company, MOFSL
Exhibit 120: LNG import (mmt) expected to be flat in 3QFY20
*Sep’19 data extrapolated for 2QFY20 expectation Source: PPAC, MOFSL
Exhibit 121: Expect RIL’s GRM in 3QFY20 at USD9.0/bbl (USD/bbl)
Source: MOFSL, Company
Exhibit 122: GRMs for OMCs (USD/bbl)
Source: MOFSL, Company
59
49
44
35 46
48
52
55
51
51
61
67 74
73
66
62
66
60
62
5 2
64
51
44
35 46
48
52
55
51
51 61
67 74
73
66
62
66
60
62
1Q 2Q 3Q 4Q 1Q 2Q 3Q 4Q 1Q 2Q 3Q 4Q 1Q 2Q 3Q 4Q 1Q 2Q 3Q
FY16 FY17 FY18 FY19 FY20
Net Realization Subsidy Burden Gross Realization
3.0
3
.0
3.1
2
.4
3.6
4
.1
4.2
4
.1
4.7
4
.8
4.6
4
.4
4.5
4
.7
5.3
5
.4
5.3
5
.4
5.1
5
.2
5.2
5
.6
5.5
1QFY
152Q
FY15
3QFY
154Q
FY15
1QFY
162Q
FY16
3QFY
164Q
FY16
1QFY
172Q
FY17
3QFY
174Q
FY17
1QFY
182Q
FY18
3QFY
184Q
FY18
1QFY
192Q
FY19
3QFY
194Q
FY19
1QFY
202Q
FY20
3QFY
20*
LNG imports (net RIL) (mmt)
5.8 4.8 6.3
8.6 8.0 6.3
8.0 7.8 5.0 5.1
6.7 6.4 6.4 8.3 7.3 7.0 6.0 6.1
4.3 3.2 3.5 6.3
1.6
2.9 3.5 1.0
1.5 2.4 4.3
3.5 3.0 6.5
5.0 4.1 5.1 5.5
3.7 4.3 4.0
4.5 3.4 4.5
5.0 4.6
3.1
7.4
8.7 8.3 7.3
10.1 10.4 10.6 11.5
10.8 11.5
10.1 10.8
11.5 11.9 12.0 11.6 11.0 10.5 9.5
8.8 8.2 8.1 9.4 9.0
1QFY15 3QFY15 1QFY16 3QFY16 1QFY17 3QFY17 1QFY18 3QFY18 1QFY19 3QFY19 1QFY20 3QFY20
Singapore GRM Premium / (Disc) RIL GRM
3.6
4.2
5.1
6.9
7.7
7.0
6.1
6.1
3.3
3.5
9.2
1.4
3.6
3.0
1.4
2.6
3.8
3.6
5.9
6.9
6.5
4.9
5.6
4.2
3.3
6.0
2.6
3.7
3.8
1.4
4.8
4.2
3.9
8.5
8.8
5.6
6.1
6.6
3.7
2.7
10.0
2.1
3.3
2.5
1.4
11.5
10.1
10.8
11.5
11.8
12.0
11.6
11.0
10.5
9.5
8.8
8.2
8.1
9.4
9.0
5.0 5.1
6.7 6.4 6.4
8.3 7.3 7.0
6.0 6.1
4.3 3.2 3.5
6.3
1.6
1QFY17 2QFY17 3QFY17 4QFY17 1QFY18 2QFY18 3QFY18 4QFY18 1QFY19 2QFY19 3QFY19 4QFY19 1QFY20 2QFY20 3QFY20E
IOCL Core GRM BPCL Core GRM HPCL Core GRM RIL SGRM

January 2020 158
December 2019 Results Preview | Sector: Oil & Gas
The tables below provide a snapshot of actual and estimated numbers for companies under the MOFSL coverage universe. Highlighted columns indicate the quarter/financial year under review.
Aegis Logistics Buy CMP INR199 | TP: INR247 (+24%) EPS CHANGE (%): FY20|21: 0|0 For Oct-Nov’19, India’s LPG consumption was strong at
+19% YoY; flat QoQ. LPG throughput from Mumbai and Haldia terminals is
expected to be strong. Watch out for utilization of Uran-Chakkan pipeline and
Pipavav railway gantry. Additional granting of shares in the current year under
three year ESOP plan remains a question.
Consolidated - Quarterly Earning Model (INR Million) Y/E March FY19 FY20 FY19 FY20E 1Q 2Q 3Q 4Q 1Q 2Q 3Q 4Q Net Sales 10,169 14,259 13,205 18,526 19,553 18,177 19,180 24,248 56,158 81,158 YoY Change (%) 18.8 14.9 -8.4 48.0 92.3 27.5 45.3 30.9 17.2 44.5 EBITDA 864 887 926 1,031 1,020 -281 1,330 1,711 3,709 3,780 Margins (%) 8.5 6.2 7.0 5.6 5.2 -1.5 6.9 7.1 6.6 4.7 Depreciation 121 125 129 131 159 170 175 173 505 676 Interest 65 73 51 72 85 74 75 113 262 347 Other Income 12 21 12 37 62 26 22 32 82 141 PBT 690 710 758 865 839 -499 1,102 1,458 3,023 2,899 Rate (%) 14.2 19.0 14.0 18.9 25.7 31.5 17.0 17.2 16.6 17.1 MI & P/L of Asso. Cos. 75 86 61 85 54 72 87 95 307 307 Reported PAT 516 489 591 617 570 -414 828 1,112 2,214 2,096 YoY Change (%) 17.5 -6.1 10.5 27.9 10.3 -184.6 40.0 80.3 11.9 -5.3 E: MOFSL Estimates
BPCL Neutral CMP INR487 | TP: INR549 (+13%) EPS CHANGE (%): FY20|21: -3.3|-7.6 Refinery throughput is estimated at 7.5mmt, lower QoQ
due to BS-VI upgradation shutdown at Mumbai refinery. Expect poor GRM (core at USD1.4/bbl), with inventory
gain (of 0.7/bbl). Despite poor GRMs, marketing margins were healthy
(estimated at INR5.0/litre). We model nil-subsidy sharing for OMCs.
Standalone - Quarterly Earning Model (INR Billion) Y/E March FY19 FY20 FY19 FY20E 1Q 2Q 3Q 4Q 1Q 2Q 3Q 4Q Net Sales 717.0 722.9 791.7 739.9 763.2 643.4 640.3 724.8 2,971.5 2,771.7 YoY Change (%) 25.5 35.6 30.6 13.4 6.4 -11.0 -19.1 -2.0 25.7 -6.7 EBITDA 45.8 33.5 0.8 45.3 21.5 27.6 25.7 27.5 125.4 102.3 Margins (%) 6.4 4.6 0.1 6.1 2.8 4.3 4.0 3.8 4.2 3.7 Depreciation 7.4 7.6 7.8 9.1 9.1 9.5 10.2 10.2 31.9 39.0 Interest 3.0 3.3 3.4 3.5 4.5 6.4 5.4 5.2 13.2 21.5 Other Income 5.5 5.4 9.7 10.6 5.4 8.7 7.3 7.8 31.1 29.2 PBT 33.8 18.7 5.9 46.0 13.5 16.6 16.7 19.9 104.4 66.6 Rate (%) 32.2 34.9 16.0 32.0 20.5 -3.2 33.3 33.3 31.7 21.6 Adj PAT 22.9 12.2 5.0 31.2 10.8 17.1 11.1 13.3 71.3 52.2 YoY Change (%) 208.0 -48.3 -76.9 16.9 -53.1 40.2 124.4 -57.6 -9.9 -26.8 Key Assumptions
Refining throughput (mmt) 7.7 7.6 7.5 8.2 7.5 7.7 7.5 7.5 31.1 30.1 Core GRM (USD/bbl) 4.2 3.3 6.0 2.6 3.7 3.8 1.4 4.2 4.0 3.3 Marketing sales volume excld exports (mmt) 11.0 10.1 10.7 11.4 11.1 10.3 10.8 11.8 43.1 44.0 Marketing GM incld inv (INR/litre) 4.9 4.9 2.9 6.5 4.4 5.0 5.0 4.1 4.8 4.5 E: MOFSL Estimates

January 2020 159
December 2019 Results Preview | Sector: Oil & Gas
Castrol (India) Buy CMP INR130 | TP: INR185 (+42%) EPS CHANGE (%): FY20|21: -1|0 Volumes forecast at 54.8m liters (+2% YoY, +24% QoQ). Expected realization at ~INR193/litre (+1% YoY, flat QoQ). EBITDA margin to be marginally lower led by volatility in
Brent oil prices during the quarter. Operating margin expansion and launch of new
products/tie-ups outlook by new CEO remain key.
Quarterly Performance (INR Million) Y/E December CY18 CY19 CY18 CY19E 1Q 2Q 3Q 4Q 1Q 2Q 3Q 4Q Volume (m litres) 51.2 57.0 51.2 54.0 50.4 55.4 44.2 54.8 213 205 Realization 181 178 181 191 194 188 192 193 183 192 Net Sales 9,271 10,172 9,269 10,334 9,762 10,396 8,492 10,596 39,046 39,246 YoY Change (%) 5.1 16.9 7.6 6.5 5.3 2.2 -8.4 2.5 8.9 0.5 EBITDA 2,743 2,517 2,274 3,174 2,830 2,843 2,445 3,094 10,708 11,212 YoY Change (%) 4.2 20.1 -10.3 3.5 3.2 13.0 7.5 -2.5 3.7 4.7 Margins (%) 29.6 24.7 24.5 30.7 29.0 27.3 28.8 29.2 27.4 28.6 Depreciation 143 132 135 146 162 166 186 191 556 705 Interest 7 3 -2 3 3 3 3 2 11 11 Other Income 228 173 186 256 211 159 116 183 843 669 PBT 2,821 2,555 2,327 3,281 2,876 2,833 2,372 3,085 10,984 11,166 Rate (%) 35.6 35.7 35.4 35.4 35.7 35.5 20.6 25.2 35.5 29.5 PAT 1,818 1,642 1,504 2,119 1,850 1,827 1,884 2,308 7,083 7,869 YoY Change (%) 1.6 19.1 -15.6 7.7 1.8 11.3 25.3 8.9 2.4 11.1 E: MOFSL Estimates
GAIL Buy CMP INR123 | TP: INR152 (+23%) EPS CHANGE (%): FY20|21: 0|0 Expect 4%/3% YoY/QoQ increase in transmission volumes
to 112mmscmd. Gas offtake at Zuari fertilizer and Nagarjuna fertilizer
plants after shutdown in 2QFY20 and commissioning of Ramagundam fertilizer plant are key for gas trading.
Selling US HH contracted volumes in the current higher Brent price should bring in some comfort.
Outlook on Kochi-Mangalore pipeline for improved volumes from 4QFY20.
Quarterly Performance (INR Million) Y/E March FY19 FY20 FY19 FY20E 1Q 2Q 3Q 4Q 1Q 2Q 3Q 4Q Net Sales 1,72,986 1,92,753 1,97,890 1,87,639 1,83,115 1,80,411 1,97,412 2,10,740 7,51,268 7,71,677 Change (%) 51.7 55.3 37.3 21.6 5.9 -6.4 -0.2 12.3 40.0 2.7 EBITDA 22,436 29,276 26,735 16,841 22,590 15,627 25,417 22,779 95,287 86,413 % of Net Sales 13.0 15.2 13.5 9.0 12.3 8.7 12.9 10.8 12.7 11.2 Depreciation 3,789 3,506 3,634 4,574 4,057 4,398 4,334 4,845 15,502 17,634 Interest 441 455 227 263 239 275 330 685 1,385 1,529 Other Income 1,196 3,656 2,201 8,659 1,512 4,401 2,648 4,009 15,712 12,569 Extraordinary item* 0 0 0 -3,263 0 0 0 0 -3,263 0 PBT 19,403 28,972 25,075 20,663 19,805 15,355 23,402 21,257 90,848 79,820 Rate (%) 35.1 32.2 33.0 29.9 35.0 30.7 32.9 36.5 33.7 34.0 PAT 12,593 19,630 16,812 14,486 12,875 10,643 15,691 13,507 60,256 52,717 Change (%) 22.8 49.9 33.2 41.9 2.2 -45.8 -6.7 -6.8 30.5 -12.5 Extraord.: Tax Prov. Write Back 0 0 317 -61 0 0 0 0 256 0 Adj PAT 12,593 19,630 16,496 14,546 12,875 10,643 15,691 13,507 63,264 52,717 Change (%) 22.8 49.9 30.7 44.6 2.2 -45.8 -4.9 -7.1 37.4 -16.7

January 2020 160
December 2019 Results Preview | Sector: Oil & Gas
Gujarat Gas Buy CMP INR255 | TP: INR270 (+6%) EPS CHANGE (%): FY20|21: 0|0 Expect volumes at 9.5mmscmd as demand has revived
post the monsoon/festival season at Morbi. We expect normalization of EBITDA margin to INR4.0/scm.
Cheaper alternative fuel competition like Propane at Morbi and FO (with decline in prices led by IMO) at other GAs will lead to volumes volatility for the company.
NGT order to curb industrial pollution will benefit GUJGA the most, facilitated by availability of gas and pipeline infrastructure in Gujarat.
Standalone - Quarterly Earning Model (INR Million) Y/E March FY19 FY20 FY19 FY20E 1Q 2Q 3Q 4Q 1Q 2Q 3Q 4Q Net Sales 17,651 19,643 21,174 19,076 26,146 25,129 29,535 29,244 77,544 1,10,054 YoY Change (%) 19.4 41.2 34.8 10.0 48.1 27.9 39.5 53.3 25.6 41.9 Total Expenditure 15,166 18,036 17,962 16,534 21,481 21,423 26,007 25,725 67,698 94,636 EBITDA 2,486 1,607 3,212 2,541 4,665 3,706 3,528 3,519 9,846 15,418 Margins (%) 14.1 8.2 15.2 13.3 17.8 14.7 11.9 12.0 12.7 14.0 Depreciation 707 724 728 722 779 802 806 966 2,880 3,353 Interest 486 494 485 497 510 528 518 481 1,962 2,036 Other Income 584 188 154 187 225 238 309 309 1,116 1,080 PBT 1,878 578 1,975 1,508 3,602 2,614 2,513 2,380 5,941 11,109 Rate (%) 35.3 28.9 30.1 22.7 35.1 -97.9 25.2 25.2 29.8 -0.6 Minority Interest & Profit/Loss of Asso. Cos. 0 0 0 0 -4 3 0 0 0 0 Reported PAT 1,214 411 1,380 1,165 2,341 5,170 1,879 1,780 4,170 11,171 Adj PAT 1,214 411 1,505 1,165 2,341 5,170 1,879 1,780 4,295 11,171 YoY Change (%) 16.3 -32.8 150.9 76.7 92.8 1,158.9 24.9 52.8 46.9 160.1 Total volume (mmscmd) 6.4 6.7 6.6 6.4 9.2 9.3 9.5 9.7 6.5 9.4 EBITDA (INR/scm) 4.2 2.6 5.3 4.3 5.6 4.3 4.0 4.0 4.1 4.5 E: MOFSL Estimates
Gujarat State Petronet Buy CMP INR232 | TP: INR285 (+23%) EPS CHANGE (%): FY20|21: 0|0 Transmission volumes are expected to be weak QoQ led
by poor power sector demand during the quarter. Development of three pipeline projects.
Vulnerability to any further volume loss to RIL’s petcoke gasifier as it gets commissioned in the coming quarter.
However, NGT order for curbing industrial pollution can lead to boost in volumes (like at Morbi).
Standalone - Quarterly Earning Model (INR Million) Y/E March FY19 FY20 FY19 FY20E 1Q 2Q 3Q 4Q 1Q 2Q 3Q 4Q Net Sales 3,912 5,983 4,538 4,339 5,126 5,411 4,860 4,767 18,773 20,163 YoY Change (%) 32.0 78.7 29.6 23.8 31.0 -9.6 7.1 9.9 41.0 7.4 EBITDA 3,438 5,163 3,532 3,293 4,020 4,371 3,904 4,128 15,426 16,423 YoY Change (%) 24.6 80.8 18.9 13.9 16.9 -15.3 10.5 25.4 34.4 6.5 Margins (%) 87.9 86.3 77.8 75.9 78.4 80.8 80.3 86.6 82.2 81.5 Depreciation 448 436 440 475 489 498 513 556 1,800 2,055 Interest 579 557 551 505 479 438 484 527 2,192 1,928 Other Income 54 384 76 79 77 454 90 103 594 724 PBT 2,466 4,553 2,618 2,392 3,129 3,890 2,996 3,148 12,028 13,163 Tax 1,021 1,319 882 859 1,068 -659 754 793 4,081 1,956 Rate (%) 41.4 29.0 33.7 35.9 34.1 -16.9 25.2 25.2 33.9 14.9 Reported PAT 1,444 3,233 1,736 1,533 2,061 4,549 2,242 2,355 7,947 11,207 YoY Change (%) -5.3 82.7 -4.4 -2.6 42.7 40.7 29.2 53.6 18.9 41.0 Margins (%) 36.9 54.0 38.2 35.3 40.2 84.1 46.1 49.4 42.3 55.6 Key Operating Parameters
Transmission Volume (mmscmd) 36.5 35.0 34.5 32.4 38.2 39.2 35.4 35.3 34.6 37.0 Implied Tariff (INR/mscm) 1,141 1,810 1,420 1,545 1,418 1,461 1,491 1,534 1,475 1,476 E: MOFSL Estimates

January 2020 161
December 2019 Results Preview | Sector: Oil & Gas
HPCL Buy CMP INR270 | TP: INR388 (+44%) EPS CHANGE (%): FY20|21: +4 |-1 We model poor core GRM YoY and QoQ at USD1.4/bbl
with inventory gain of 0.7/bbl However, marketing margin for the quarter was healthy
and it is expected at INR5.1/litre. We model nil-subsidy sharing for OMCs. Concerns about huge capex and execution risk at Vizag
prevail.
Standalone - Quarterly Earning Model (INR Billion) Y/E March FY19 FY20 FY19 FY20E 1Q 2Q 3Q 4Q 1Q 2Q 3Q 4Q Net Sales 676.3 675.2 721.1 679.4 709.9 608.6 589.1 688.5 2,752.0 2,596.2 YoY Change (%) 26.5 42.1 25.5 11.7 5.0 -9.9 -18.3 1.3 25.5 -5.7 EBITDA 37.3 30.1 3.7 46.6 14.5 24.4 32.6 26.2 117.6 97.7 Margins (%) 5.5 4.5 0.5 6.9 2.0 4.0 5.5 3.8 4.3 3.8 Depreciation 7.1 7.4 7.4 8.3 8.2 8.1 8.4 9.3 30.1 33.9 Forex loss 5.4 8.9 -6.0 -5.0 -1.9 1.2 0.3 0.0 3.2 -0.5 Interest 1.9 2.0 1.5 1.9 2.1 2.9 2.2 1.8 7.3 9.0 Other Income 3.1 4.1 3.9 5.2 6.2 4.0 3.8 3.4 16.4 17.3 PBT 26.0 16.0 4.7 46.7 12.4 16.2 25.5 18.5 93.4 72.5 Tax 8.8 5.0 2.2 17.0 4.3 5.6 8.5 6.2 33.1 24.6 Rate (%) 33.9 31.6 47.4 36.4 34.6 34.9 33.3 33.3 35.4 33.9 Adj PAT 17.2 10.9 2.5 29.7 8.1 10.5 17.0 12.3 60.3 47.9 YoY Change (%) 85.9 -37.1 -87.3 69.9 -52.8 -3.6 586.1 -58.5 -5.2 -20.5 Key Assumptions
Refining throughput (mmt) 4.5 4.8 4.6 4.6 3.9 4.6 4.4 4.4 18.4 17.3 Core GRM (USD/bbl) 3.2 2.7 10.0 2.1 3.3 2.5 1.4 4.2 4.5 2.9 Marketing sales volume incl exports (mmt) 9.7 9.1 9.7 10.1 10.1 9.4 9.8 10.0 38.7 39.3 Marketing GM incld inv (INR/litre) 4.6 4.4 2.0 6.4 3.8 4.5 5.1 4.5 4.3 4.5 E: MOFSL Estimates
Indraprastha Gas Neutral CMP INR422 | TP: INR405 (-4%) EPS CHANGE (%): FY20|21: 4.1|16.8 IGL has taken price cut of INR1.9-2.15/kg in CNG and
INR0.4-0.9/kg on PNG amid reduction in APM prices. Price revision and INR depreciation will lead to marginally
lower EBITDA/scm. We expect volumes growth at 12% YoY and 1% QoQ for
the quarter. CNG volumes growth from new GAs remains a key driver,
as IGL has limited role to play in terms of Industrials.
Quarterly performance (INR Million) Y/E MARCH FY19 FY20 FY19 FY20E 1Q 2Q 3Q 4Q 1Q 2Q 3Q 4Q Net Sales 12,874 14,215 15,084 15,426 15,761 16,925 17,497 18,938 57,600 69,121 Change (%) 22.7 26.2 27.4 25.1 22.4 19.1 16.0 22.8 25.4 20.0 EBITDA 2,951 3,080 3,179 3,312 3,585 3,926 3,832 4,041 12,521 15,384
EBITDA (Rs/scm) 5.8 5.7 5.9 5.9 6.3 6.5 6.3 6.4 5.8 6.4 % Change 6.4 9.4 20.8 20.3 21.5 27.5 20.6 22.0 14.1 22.9 Depreciation 473 503 513 522 605 621 632 670 2,011 2,528 Interest 6 6 9 0 16 18 0 0 21 34 Other Income 262 332 403 513 354 390 429 434 1,510.2 1,606.0 PBT before EO 2,735 2,903 3,060 3,303 3,318 3,677 3,629 3,805 12,000 14,428 PBT after EO 2,735 2,903 3,060 3,303 3,318 3,677 3,629 3,805 12,000 14,428 Rate (%) 35.7 35.5 35.3 31.7 34.2 -3.6 25.2 25.2 34.4 19.9 Adj. PAT 1,759 1,873 1,980 2,255 2,184 3,810 2,716 2,847 7,867 11,556
PAT (Rs/scm) 3.5 3.5 3.6 4.0 3.8 6.3 4.5 4.5 3.6 4.8 Change (%) 9.1 10.9 19.3 29.1 24.1 103.4 37.2 26.3 17.3 46.9 Gas Volumes (mmscmd)
CNG 4.13 4.41 4.40 4.61 4.66 4.92 4.92 5.09 4.39 4.90 PNG 1.42 1.48 1.50 1.66 1.59 1.65 1.70 1.92 1.51 1.72
Total 5.55 5.89 5.90 6.27 6.25 6.58 6.62 7.01 5.90 6.61

January 2020 162
December 2019 Results Preview | Sector: Oil & Gas
IOC Buy CMP INR127 | TP: INR192 (+51%) EPS CHANGE (%): FY20|21: -11|-4 IOC is going to report the highest inventory gains led by
crude price movement owing to its inventory cycle. Expect core GRM at USD1.4/bbl with an inventory gain of
USD1.2/bbl. Refinery throughput is estimated at 18.2mmt owing to
various precautionary shutdowns due to protest in Assam. We model in nil subsidy for the quarter and IOCL remains
our top pick among the pack.
Standalone - Quarterly Earning Model (INR Billion) Y/E March FY19 FY20 FY19 FY20E 1Q 2Q 3Q 4Q 1Q 2Q 3Q 4Q Net Sales 1,294.8 1,320.3 1,399.7 1,262.1 1,315.1 1,116.9 1,183.3 1,528.8 5,276.9 5,144.1 YoY Change (%) 22.8 45.8 26.5 7.5 1.6 -15.4 -15.5 21.1 24.4 -2.5 EBITDA 143.8 93.8 15.3 100.4 82.6 47.1 61.3 72.8 353.3 263.7 Margins (%) 11.1 7.1 1.1 8.0 6.3 4.2 5.2 4.8 6.7 5.1 Depreciation 17.9 18.1 18.6 20.6 20.9 21.0 22.0 23.6 75.1 87.6 Forex loss 18.1 26.2 -20.8 -8.4 -0.9 11.4 2.4 0.0 15.0 12.8 Interest 10.3 11.9 8.5 12.4 15.1 13.1 13.4 13.4 43.1 55.0 Other Income 5.9 10.4 4.4 10.6 6.3 6.5 6.5 6.6 31.3 25.8 PBT before EO expense 103.4 48.1 13.4 86.3 53.8 8.1 29.9 42.3 251.3 134.1 PBT 103.4 48.1 13.4 86.3 53.8 8.1 29.9 42.3 251.3 134.1 Rate (%) 33.9 32.4 46.7 29.4 33.2 30.8 33.3 33.3 32.8 33.1 Adj PAT 68.3 32.5 7.2 61.0 36.0 5.6 19.9 28.2 168.9 89.7 YoY Change (%) 155.2 -12.2 -90.9 16.9 -47.4 -82.6 177.9 -53.7 -13.4 -46.9 Margins (%) 5.3 2.5 0.5 4.8 2.7 0.5 1.7 1.8 3.2 1.7 Key Assumptions
Refining throughput (mmt) 17.7 17.8 19.0 17.4 17.3 17.5 18.2 18.0 71.8 71.0 Core GRM (USD/bbl) 3.4 3.5 9.2 1.4 3.6 3.0 1.4 4.2 4.4 3.0 Domestic sale of refined products (mmt) 20.5 18.6 20.3 20.5 20.5 19.0 20.7 21.3 80.0 81.5 Marketing GM incld inv per litre (INR/litre) 5.2 5.7 3.5 6.7 5.1 5.3 4.9 4.2 5.3 4.9 E: MOFSL Estimates
Mahanagar Gas Neutral CMP INR1,065 | TP: INR1,000 (-6%) EPS CHANGE (%): FY20|21: 0|0 MGL has taken price cut of INR2.04/kg on CNG and
INR1.19/kg on PNG in lieu of APM price cut. Price revision and INR depreciation are expected to lead
to lower EBITDA/scm for the quarter. We expect volumes growth of 2% YoY and flat QoQ. Volumes growth remains a key challenge for MGL.
Standalone - Quarterly Earning Model (INR Million) Y/E March FY19 FY20 FY19 FY20E 1Q 2Q 3Q 4Q 1Q 2Q 3Q 4Q Net Sales 6,193 6,965 7,527 7,225 7,575 7,836 7,558 8,323 27,911 31,292 YoY Change (%) 16.7 30.5 29.5 23.1 22.3 12.5 0.4 15.2 25.0 12.1 EBITDA 2,109 2,215 2,391 2,140 2,768 2,734 2,544 2,633 8,855 10,681 EBITDA/SCM 8.1 8.1 8.8 7.9 10.3 9.9 9.3 9.0 8.2 9.6 Margins (%) 34.1 31.8 31.8 29.6 36.5 34.9 33.7 31.6 31.7 34.1 Depreciation 295 308 328 329 372 391 407 417 1,259 1,586 Interest 1 1 1 1 14 15 14 14 3 56 Other Income 153 182 204 238 203 230 200 219 777 852 PBT 1,967 2,087 2,266 2,049 2,586 2,558 2,323 2,422 8,369 9,890 Rate (%) 34.8 34.7 34.6 34.9 34.2 -5.8 25.2 25.2 34.7 19.5 Reported PAT 1,283 1,363 1,483 1,335 1,702 2,706 1,739 1,811 5,464 7,960 Adj PAT 1,283 1,363 1,483 1,335 1,702 2,706 1,739 1,811 5,464 7,960 YoY Change (%) 3.2 9.2 19.6 27.4 32.7 98.6 17.2 35.7 14.3 45.7 Margins (%) 20.7 19.6 19.7 18.5 22.5 34.5 23.0 21.8 19.6 25.4 Sales Volumes (mmscmd)
CNG 2.1 2.2 2.2 2.2 2.2 2.2 2.2 2.3 2.2 2.2 PNG - Total 0.8 0.8 0.8 0.8 0.8 0.8 0.8 0.9 0.8 0.8 Total Volumes 2.9 3.0 3.0 3.0 3.0 3.0 3.0 3.2 2.9 3.0 E: MOFSL Estimates

January 2020 163
December 2019 Results Preview | Sector: Oil & Gas
MRPL Neutral CMP INR44 | TP: INR46 (+5%) EPS CHANGE (%): FY20|21: +18|-7 MRPL production during the quarter is expected to
normalize at 4.05mmt Expect core GRM at USD1.4/bbl with inventory gain of
USD0.6/bbl. Currently, the company lacks significant tailwinds in a
subdued refining margin environment. Progress on desalination plant, which is likely to reduce
dependence on Nethravathi River.
Standalone - Quarterly Earning Model (INR Million) Y/E March FY19 FY20 FY19 FY20 1Q 2Q 3Q 4Q 1Q 2Q 3Q 4Q Net Sales 1,35,578 1,54,913 1,78,606 1,51,525 92,805 1,32,027 1,33,782 1,41,036 6,20,621 4,99,650 YoY Change (%) 32.1 70.3 26.7 1.1 -31.5 -2.6 -13.6 -21.0 28.1 -19.5 EBITDA 11,987 5,460 -4,896 7,056 -4,748 -2,395 390 2,955 19,607 -3,798 Margins (%) 8.8 3.5 -2.7 4.7 -5.1 -1.8 0.3 2.1 3.2 -0.8 Depreciation 1,704 1,824 1,791 2,249 1,906 2,009 2,069 2,266 7,568 8,249 Forex loss 3,856 4,017 -3,849 -1,105 -262 2,240 475 0 2,919 2,454 Interest 1,106 1,173 999 1,440 1,441 2,287 1,947 2,135 4,718 7,810 Other Income 558 381 368 246 204 194 294 294 1,553 986 PBT before EO expense 5,879 -1,172 -3,469 4,718 -7,630 -8,737 -3,806 -1,151 5,956 -21,324 Extra-Ord expense 262 -251 103 34 0 0 0 0 148 0 PBT 5,617 -921 -3,572 4,684 -7,630 -8,737 -3,806 -1,151 5,808 -21,324 Rate (%) 35.6 11.9 25.0 31.9 34.5 34.2 33.3 33.3 42.8 34.1 Reported PAT 3,620 -812 -2,677 3,189 -5,001 -5,745 -2,538 -768 3,320 -14,051 Adj PAT 3,788 -1,033 -2,600 3,212 -5,001 -5,745 -2,538 -768 3,404 -14,051 YoY Change (%) 61.9 -120.8 -126.8 -40.7 -232.0 -251.6 145.8 -70.5 -84.8 -512.8 Margins (%) 2.8 -0.7 -1.5 2.1 -5.4 -4.4 -1.9 -0.5 0.5 -2.8 Key Assumptions
Refining throughput (mmt) 3.85 3.91 4.38 4.29 2.56 3.68 4.05 4.05 16.43 14.34 Reported GRM (USD/bbl) 7.78 4.41 -0.63 5.01 -0.42 0.68 2.00 3.19 8.40 8.31 E: MOFSL Estimates
Oil India Buy CMP INR153 | TP: INR181 (+19%) EPS CHANGE (%): FY20|21: -6|-8 Net realization to decrease by 8% YoY and flat QoQ, in line
with changes in crude prices. We assume no subsidy burden for the company in
3QFY20. Oil volumes growth is expected at 0.78mmt (-4% YoY, -1%
QoQ). Gas sales volumes are expected at 0.62bcm (-4% YoY, -6%
QoQ).
Quarterly Performance (INR Million) Y/E March FY19 FY20 FY19 FY20E
1Q 2Q 3Q 4Q 1Q 2Q 3Q 4Q Net Sales 33,905 37,436 35,140 30,869 33,734 32,136 30,205 31,404 1,37,350 1,27,478 Change (%) 45.4 51.3 23.2 2.9 -0.5 -14.2 -14.0 1.7 28.9 -7.2 EBITDA 14,084 14,746 15,215 10,793 13,532 12,429 11,643 11,916 54,838 49,519 % of Net Sales 41.5 39.4 43.3 35.0 40.1 38.7 38.5 37.9 39.9 38.8 Change (%) 61.1 45.7 24.3 34.8 -3.9 -15.7 -23.5 10.4 40.2 -9.7
D,D&A 3,372 3,656 3,694 4,241 3,994 4,154 4,154 4,116 14,963 16,417 Interest 1,124 1,257 1,216 1,198 1,235 1,208 1,204 1,101 4,795 4,748 OI (incl. Oper. other inc) 1,268 2,878 6,012 4,192 1,227 2,679 5,596 4,742 14,350 14,245
PBT before exceptionals 10,855 12,712 16,317 9,546 9,530 9,746 11,881 11,441 49,430 42,598 Exceptional item 0.0 0.0 0.0 10,267.9 0.0 0.0 0.0 0.0 10,268 0.0
PBT after exceptionals 10,855 12,712 16,317 -722 9,530 9,746 11,881 11,441 39,162 42,598 Rate (%) 35.2 32.2 24.4 14.3 34.4 35.6 33.0 30.8 26.8 33.3 PAT 7,032 8,620 12,335 -2,085 6,248 6,272 7,960 7,920 25,901 28,400 Change (%) 56.2 33.4 74.9 -124.1 -11.2 -27.2 -35.5 -479.8 -2.9 9.6 Adj. PAT 7,032 8,620 12,335 8,183 6,248 6,272 7,960 7,920 36,169 28,400 Key Assumptions (USD/bbl)
Exchange rate (INR/USD) 67.0 70.2 72.3 70.6 69.6 70.3 71.2 71.0 70.0 70.5 Net Oil Realization 72.0 73.4 66.7 61.8 66.3 61.3 61.3 63.8 68.5 63.2 E: MOFSL Estimates

January 2020 164
December 2019 Results Preview | Sector: Oil & Gas
ONGC Buy CMP INR128 | TP: INR150 (+17%) EPS CHANGE (%): FY20|21: -7|-5 Net realization is expected down 6% YoY/flat QoQ, similar
to movement in crude oil prices. Oil sales are expected to be lower by 3% YoY and 4% QoQ
and gas sales to decline 6% YoY and increase 2% QoQ. We expect no subsidy for the company during the quarter. Outlook on various field development and status remains
the key for volumes growth forward.
Standalone - Quarterly Earning Model (INR Billion) Y/E March FY19 FY20 FY19 FY20 1Q 2Q 3Q 4Q 1Q 2Q 3Q 4Q Net Sales 272.1 279.9 276.9 267.6 265.5 244.9 241.8 260.7 1,096.5 1,013.0 YoY Change (%) 42.7 47.6 20.4 11.6 -2.4 -12.5 -12.7 -2.6 29.0 -7.6 EBITDA 147.3 157.9 165.7 123.7 151.1 132.9 125.1 140.5 594.6 549.6 Margins (%) 54.1 56.4 59.8 46.2 56.9 54.3 51.7 53.9 54.2 54.3 Depreciation 50.3 48.5 61.5 85.1 61.6 62.6 65.9 65.7 245.4 255.6 Interest 7.5 6.3 5.8 5.3 6.5 6.8 5.8 5.2 24.9 24.3 Other Income 6.5 23.9 22.2 22.5 7.5 26.9 21.3 21.3 75.2 77.0 PBT 96.1 127.1 120.6 55.8 90.6 90.4 74.7 91.0 399.5 346.7 Rate (%) 36.0 35.0 31.5 27.5 34.8 30.7 33.3 33.3 33.1 33.0 Reported PAT 61.4 82.6 82.6 40.4 59.0 62.6 49.8 60.7 267.2 232.2 YoY Change (%) 58.2 61.1 64.8 -31.6 -3.9 -24.2 -39.7 50.0 33.9 -13.1 Margins (%) 22.6 29.5 29.8 15.1 22.2 25.6 20.6 23.3 24.4 22.9 Key Assumptions (USD/bbl)
Net Oil Realization 74.2 73.1 66.4 61.9 66.3 60.3 62.3 64.7 66.2 63.4 Crude oil sold (mmt) 5.8 5.4 5.4 5.9 5.3 5.4 5.2 5.4 22.4 21.3 Gas sold (bcm) 4.9 5.0 5.3 5.2 5.0 4.9 5.0 5.2 20.5 20.1 VAP sold (tmt) 856.0 914.0 920.0 884.0 952.0 850.0 873.0 858.1 3,574.0 3,533.1 E: MOFSL Estimates
Petronet LNG Buy CMP INR269 | TP: INR350 (+30%) EPS CHANGE (%): FY20|21: 0|0 India’s LNG consumption was up 13% YoY and down 1%
QoQ in Oct-Nov’19. Total volumes are expected to be up 19% YoY and down
4% QoQ, impacted by lower power sector gas off-take.
We model utilization for Dahej at 104% and Kochi at 16%. Outlook on Tellurian LNG as investment deadline
approaches and status on commissioning of Kochi-Mangalore pipeline remain key.
Standalone - Quarterly Earning Model (INR Million) Y/E March FY19 FY20 FY19 FY20E 1Q 2Q 3Q 4Q 1Q 2Q 3Q 4Q Net Sales 91,692 1,07,453 1,00,977 83,832 86,134 93,612 92,146 76,017 3,83,954 3,47,910 YoY Change (%) 42.5 38.3 30.2 -2.9 -6.1 -12.9 -8.7 -9.3 25.5 -9.4 EBITDA 9,344 8,837 8,481 6,272 10,239 11,605 10,598 10,666 32,935 43,108 Margins (%) 10.2 8.2 8.4 7.5 11.9 12.4 11.5 14.0 8.6 12.4 Depreciation 1,022 1,037 1,037 1,016 1,899 1,960 2,000 2,083 4,112 7,941 Interest 300 249 215 225 1,005 1,051 1,051 1,104 989 4,212 Other Income 990 1,115 884 1,514 1,044 975 1,024 1,493 4,503 4,537 PBT 9,012 8,666 8,113 6,545 8,379 8,848 8,571 8,973 32,336 34,771 Rate (%) 34.9 35.0 30.3 32.7 33.1 -24.7 25.2 24.9 33.3 14.4 Adj PAT 5,870 5,629 5,653 4,402 5,603 11,930 6,411 6,736 21,554 30,399 YoY Change (%) 34.1 -4.4 6.9 -15.8 -4.5 111.9 13.4 53.0 3.7 41.0 Margins (%) 6.4 5.2 5.6 5.3 6.5 12.7 7.0 8.9 5.6 8.7 Key Assumptions
Regas volume (Tbtu) 97 88 84 91 113 129 117 124 360 483 Sales volume (Tbtu) 123 129 118 114 113 121 123 122 484 479 Total Volumes (Tbtu) 220.2 217.0 202.0 205.1 226.0 250.0 240.1 245.6 844.3 961.7 E: MOFSL Estimates

January 2020 165
December 2019 Results Preview | Sector: Oil & Gas
Reliance Industries Buy CMP INR1,535 | TP: INR1,825 (+19%) EPS CHANGE (%): FY20|21: -6|-10 RIL to report better GRM premium aided by
commissioning of enhanced coker capacity. Petchem margins continue to suffer with PE delta -33%
YoY, PP delta -21% YoY, and PVC delta +7% YoY. However, company will better off its margins under its
flexible feedstock utilization. Outlook on full economic utilization of petcoke gasifier.
Consolidated - Quarterly Earning Model (INR Billion) Y/E March FY19 FY20 FY19 FY20E 1Q 2Q 3Q 4Q 1Q 2Q 3Q 4Q Net Sales 1,287.6 1,433.2 1,564.0 1,386.6 1,569.8 1,485.3 1,529.6 1,590.5 5,671.4 6,175.1 YoY Change (%) 54.3 56.7 56.7 18.6 21.9 3.6 -2.2 14.7 44.8 8.9 EBITDA 206.6 211.1 213.2 208.3 213.2 221.5 206.2 254.8 839.2 895.7 Margins (%) 16.0 14.7 13.6 15.0 13.6 14.9 13.5 16.0 14.8 14.5 Depreciation 51.7 52.3 52.4 53.0 50.1 53.2 52.9 53.9 209.3 210.0 Interest 35.5 39.3 41.2 48.9 51.1 54.5 50.8 53.8 165.0 210.1 Other Income 17.8 12.5 24.6 31.5 31.5 36.1 40.3 40.3 86.4 148.3 PBT before EO expense 137.2 132.0 144.2 137.9 143.4 150.0 142.9 187.5 551.2 623.8 PBT 137.2 132.0 144.2 137.9 143.4 150.0 142.9 187.5 551.2 623.8 Rate (%) 30.9 27.7 28.2 24.9 29.5 24.7 25.0 26.8 27.9 26.5 Minority Interest & Profit/Loss of Asso. Cos. -0.1 0.0 -0.2 -0.7 -0.3 -0.5 -0.4 -0.4 -1.0 -1.6 Reported PAT 94.8 95.5 103.8 104.3 101.4 113.5 107.5 137.7 398.4 460.2 YoY Change (%) 4.5 17.9 9.9 10.2 6.9 18.9 3.6 32.1 10.4 15.5 Margins (%) 7.4 6.7 6.6 7.5 6.5 7.6 7.0 8.7 7.0 7.5 Key assumptions Refining throughput (mmt) 16.6 17.7 18.0 16.0 17.5 16.7 17.8 17.5 68.3 69.5 GRM (USD/bbl) 10.5 9.5 8.8 8.2 8.1 9.4 9.0 10.0 9.3 9.1 Petchem sales (mmt) 3.1 3.3 3.5 3.1 2.9 4.0 3.5 3.5 13.0 13.9 Petchem (EBITDA/mt) 437 408 379 412 436 318 300 330 409 346 E: MOFSL Estimates

January 2020 166
December 2019 Results Preview | Sector: Retail (Consumer Discretionary)
Performance to be better than the past JUBI and TTAN’s PAT growth estimated at mid-teens We expect revenue growth of 9.6% YoY for the two retail companies (TTAN and JUBI) under our coverage in 3QFY20. EBITDA is expected to increase by 25.6% YoY (JUBI EBITDA boosted by Ind-AS 116 accounting) and adj. PAT by 14.2% YoY. Both TTAN and JUBI are benefiting from the corporate tax cut and we have factored this in our 3QFY20 estimates.
TTAN’s overall sales are expected to grow by 9.2% and PAT by 14.1% YoY. EBITDA margin is expected to expand by 80bp YoY to 10.9%. In the quarterly update, the company highlighted that the jewelry division’s revenue growth for quarter is 11% driven by a strong wedding season. The retail growth for the jewelry division was even higher at 15% on account of a large institutional order of INR2b in the base quarter. Watches & wearables and Eyewear segments saw muted growth due to poor consumer sentiment. Sales in all the divisions were also affected by the nationwide protests in the second half of December.
For Jubilant Foodworks (JUBI), we expect sales to increase by 12.4% YoY in the quarter, with same-store sales (SSS) growing 6% YoY. SSSG base (3QFY19) is still high at 14.6% though fairly below the 20%+ levels for the previous quarters. Adj. PAT is likely to rise by 14.8% YoY, while EBITDA is likely to appear optically high because of the Ind-AS 116 effect. Encouraging growth prospects for JUBI in an otherwise challenging consumption environment We had upgraded JUBI from Neutral to Buy post its 2QFY20 result. Domino’s delivered a 4.9% SSSG in 2QFY20 on a strong base of 20.5% in a moderating demand environment. In addition to this, a positive outlook for 2HFY20 despite worsening macros, were encouraging signs. Further, 4Q onwards the company faces a much softer base for SSSG. Finally, the corporate tax cut is expected to free up INR450-500m annually for JUBI. This additional cash, if invested to grow the business, will help JUBI to consolidate its position in the further in the QSR space. While the stock has run up ~18% since our upgrade, we continue to be bullish and maintain our Buy rating on JUBI. On the other hand, we maintain our Neutral rating on TTAN due to its uncertain near term outlook, recent increase in gold prices and fair valuation on FY21 forecasts.
Exhibit 123: Summary of expected quarterly performance Sector CMP SALES (INR M) EBDITA (INR M) NET PROFIT (INR M)
(INR) RECO Dec-19 Var % YoY
Var % QoQ Dec-19 Var
% YoY Var
% QoQ Dec-19 Var % YoY
Var % QoQ
Retail Jubilant Foodworks 1,682 Buy 10,444 12.4 5.7 2,596 52.2 10.5 1,108 14.8 25.3 Titan Company 1,155 Neutral 64,117 9.2 37.5 6,969 17.9 33.4 4,690 14.1 49.2
Source: Company, MOFSL
Retail (Consumer Discretionary) Company name
Jubilant Foodworks
Titan Company
Research analyst: Krishnan Sambamoorthy ([email protected]); +91 22 6129 1545 Pooja Doshi ([email protected]); +91 22 5036 2689 | Dhairya Dhruv ([email protected]); +91 22 6129 1547

January 2020 167
December 2019 Results Preview | Sector: Retail (Consumer Discretionary)
Exhibit 124: Tanishq’s LTL sales growth in 2QFY20 was low…
Source: Company, MOFSL
Exhibit 125: …largely due to lower volumes...
Source: Company, MOFSL
Exhibit 126: Average gold prices are however up 22.1% YoY (4.6% QoQ) in 3QFY20
Source: Company, MOFSL
Exhibit 127: JUBI’s SSSG is expected to be 6% in 3QFY20
Source: Company, MOFSL
Exhibit 128: Dominos is expected to add ~30 stores in 3QFY20
Source: Company, MOFSL
(40)
30
(5) 3
4
15 52
51
18
12
17 2
32 27 14 10 2
2QFY
163Q
FY16
4QFY
161Q
FY17
2QFY
173Q
FY17
4QFY
171Q
FY18
2QFY
183Q
FY18
4QFY
181Q
FY19
2QFY
193Q
FY19
4QFY
191Q
FY20
2QFY
20
Tanishq- LTL Growth (%)
(10)
28 15
6
(32)
4
37 49 49
6 6 (3)
24 20 15 6
(14)
2QFY
163Q
FY16
4QFY
161Q
FY17
2QFY
173Q
FY17
4QFY
171Q
FY18
2QFY
183Q
FY18
4QFY
181Q
FY19
2QFY
193Q
FY19
4QFY
191Q
FY20
2QFY
20
Jewelry volume Growth %
(10.2) (5.7) (6.8)
(2.9)
3.5 10.2
20.4 13.0
3.9
(2.7) (6.7)
0.4 4.5 7.5
3.7 6.8 7.6 4.0
21.3 22.1
4QFY
15
1QFY
16
2QFY
16
3QFY
16
4QFY
16
1QFY
17
2QFY
17
3QFY
17
4QFY
17
1QFY
18
2QFY
18
3QFY
18
4QFY
18
1QFY
19
2QFY
19
3QFY
19
4QFY
19
1QFY
20
2QFY
20
3QFY
20
Gold price change YoY (%)
1.9
6.
6
4.6
3.
2
2.0
2.
9
(3.2
) 4.
2
(3.3
) (7
.5)
6.5
5.
5
17.8
26
.5
25.9
20
.5
14.6
6.
0
4.1
4.
9
6.0
3QFY
154Q
FY15
1QFY
162Q
FY16
3QFY
164Q
FY16
1QFY
172Q
FY17
3QFY
174Q
FY17
1QFY
182Q
FY18
3QFY
184Q
FY18
1QFY
192Q
FY19
3QFY
194Q
FY19
1QFY
202Q
FY20
3QFY
20E
SSS growth (%)
838
876
911
950
990
1,02
6 1,
049
1,08
1 1,
107
1,11
7 1,
125
1,12
5 1,
127
1,13
4 1,
144
1,16
7 1,
200
1,22
7 1,
249
1,28
3 1,
313
3QFY
154Q
FY15
1QFY
162Q
FY16
3QFY
164Q
FY16
1QFY
172Q
FY17
3QFY
174Q
FY17
1QFY
182Q
FY18
3QFY
184Q
FY18
1QFY
192Q
FY19
3QFY
194Q
FY19
1QFY
202Q
FY20
3QFY
20E
Dominos stores

January 2020 168
December 2019 Results Preview | Sector: Retail (Consumer Discretionary)
Exhibit 129: Relative performance – three months (%)
Source: Bloomberg, MOFSL
Exhibit 130: Relative performance – one-year (%)
Source: Bloomberg, MOFSL
Exhibit 131: Comparative valuation CMP EPS (INR) PE (x) PB (x) RoE (%) Company Name INR Reco FY20E FY21E FY22E FY20E FY21E FY22E FY20E FY21E FY22E FY20E FY21E FY22E Retail 66.5 50.0 39.4 10.5 9.0 7.6 15.8 17.9 19.2 Jubilant Foodworks 1,682 Buy 27.6 35.6 45.6 60.9 47.2 36.9 15.0 12.5 10.4 24.6 26.4 28.2 Titan Company 1,155 Neutral 17.2 22.3 28.7 67.4 51.8 40.3 16.9 14.3 12.2 25.1 30.0 32.7
95
100
105
110
115Se
p-19
Oct
-19
Nov
-19
Dec-
19
Nifty Index MOSL Retail Index
90
100
110
120
130
Dec-
18
Jan-
19
Feb-
19
Mar
-19
Apr-
19
May
-19
Jun-
19
Jul-1
9
Aug-
19
Sep-
19
Oct
-19
Nov
-19
Dec-
19
Nifty Index MOSL Retail Index

January 2020 169
December 2019 Results Preview | Sector: Retail (Consumer Discretionary)
The tables below provide a snapshot of actual and estimated numbers for companies under the MOFSL coverage universe. Highlighted columns indicate the quarter/financial year under review.
Jubilant Foodworks Buy CMP INR1682 | TP: INR1984 (+18%) EPS CHANGE (%): FY20|21: 0|0 RM inflation could hurt margins. Expect addition of 30 Dominos’ stores in 3QFY20. Watch out for commentary on demand outlook for QSR. Launches/Hong’s Kitchen/promotions key monitorables.
Quarterly Standalone Perf. (INR Million) Y/E March FY19 FY20 Std. Consol. 1Q 2Q 3Q 4Q 1Q 2Q 3QE 4QE FY19 FY20E No of stores (Dominos) 1,144 1,167 1,200 1,227 1,249 1,283 1,313 1,343 1,227 1,343 SSG (%) 25.9 20.5 14.6 6.0 4.1 4.9 6.0 10.0 16.4 6.3 Net Sales 8,551 8,814 9,291 8,652 9,401 9,882 10,444 10,119 35,307 40,392 YoY change (%) 26.0 21.3 16.8 10.9 9.9 12.1 12.4 17.0 18.5 14.4 Gross Profit 6,373 6,575 7,019 6,581 7,093 7,439 7,839 7,595 26,548 30,363
Gross margin (%) 74.5 74.6 75.6 76.1 75.5 75.3 75.1 75.1 75.2 75.2 EBITDA 1,421 1,475 1,706 1,476 2,191 2,350 2,596 2,536 6,078 9,941 EBITDA growth % 78.5 44.4 24.6 15.5 54.2 59.3 52.2 71.8 36.2 63.6 Margins (%) 16.6 16.7 18.4 17.1 23.3 23.8 24.9 25.1 17.2 24.6 Depreciation 366 385 373 400 808 838 939 1,008 1,523 3,964 Interest 395 404 404 404 1,607 Other Income 71 108 138 151 153 172 228 242 469 761 PBT 1,126 1,199 1,471 1,227 1,141 1,281 1,481 1,366 5,024 5,131 Tax 380 422 506 436 393 396 373 344 1,744 1,488 Rate (%) 33.7 35.2 34.4 35.5 34.4 30.9 25.2 25.2 34.7 29.0 Adjusted PAT 747 777 965 792 748 884 1,108 1,022 3,280 3,643 YoY change (%) 213.2 60.2 46.2 16.3 0.1 13.9 14.8 29.0 58.9 11.0 E: MOFSL Estimates
Titan Company Neutral CMP INR1155 | TP: INR1242 (+8%) EPS CHANGE (%): FY20|21: 0|0 Expect lower store addition in FY20 on delays in roll out. Watches to see flat growth on tepid consumer sentiment. Watch out for commentary on inflating gold prices. Demand outlook/revision in guidance key monitorables.
Consolidated Quarterly Performance (INR Million) Y/E March FY19 FY20 FY19 FY20E 1Q 2Q 3Q 4Q 1Q 2Q 3QE 4QE Net Sales
44,510 45,672 58,715 48,888
51,511 46,616 64,117 56,811 197,785 219,055
YoY change (%)
9.4 27.5 34.6 19.0
15.7 2.1 9.2 16.2 22.7 10.8 Gross Profit
12,177 12,980 15,055 13,631
14,107 13,867 16,824 15,881 53,843 60,680
Margin (%) 27.4 28.4 25.6 27.9 27.4 29.7 26.2 28.0 27.2 27.7 EBITDA
4,829 4,689 5,912 4,485
5,734 5,223 6,969 5,445 19,915 23,371
EBITDA growth %
32.3 11.2 40.0 3.0
18.8 11.4 17.9 21.4 21.1 17.4 Margin (%) 10.8 10.3 10.1 9.2 11.1 11.2 10.9 9.6 10.1 10.7
Depreciation
407 428 385 408
760 822 842 751 1,628 3,175 Interest
109 135 157 125
339 449 459 88 525 1,333
Other Income 361 279 626 563 571 318 344 252 1,829 1,485 PBT
4,674 4,405 5,997 4,515
5,207 4,270 6,013 4,858 19,591 20,347
Tax
1,388 1,377 1,885 1,032
1,560 1,127 1,323 1,111 5,682 5,121 Rate (%) 29.7 31.3 31.4 22.9 30.0 26.4 22.0 22.9 29.0 25.2
Adjusted PAT
3,286 3,028 4,111 3,482
3,647 3,143 4,690 3,747 13,908 15,226 YoY change (%) 31.9 8.8 45.8 11.6 11.0 3.8 14.1 7.6 24.0 9.5
E: MOFSL Estimates

January 2020 170
December 2019 Results Preview | Sector: Departmental Retail
Economic slowdown takes a toll on shopping bags
Lackluster festive season; Store adds to remain healthy 3QFY20 was a subdued quarter for retailers due to a modest festive season owing to weak macro-economic factors. According to our channel checks, the economic slowdown has led to muted post-festive season demand. In fact, winter sales also fell short of retailer’s expectations. Consumption has been declining since the past few months and shopping behavior of customers has changed, which has led to a drop in the basket size of shoppers. Conversion rate has also suffered and is lower. Thus, same store sales growth (SSSG) in 3QFY20 is expected to moderate with most retailers’ SSSG coming in low to mid-single digits (v/s steady double-digit growth a couple of quarters back). Moreover, retailers had built up a huge inventory position in anticipation of strong festive sales. While this could have resulted in increased discounts to de-stock inventory in the EOSS period, it would have taken a toll on gross/EBITDA margins. However, we expect the EOSS that began in Dec’19 to result in higher sales due to the onset of the wedding season. This should provide some support to SSSG and sales. Pace of store addition is also expected to remain strong across retailers as the average annual footprint addition of 15-20% remains intact. Our channel checks suggest that Trent, Pantaloons and V-Mart are sticking with their plan of aggressive store addition. However, FLFL and FRL are expected to curb store additions, in view of the weak economic scenario. SSSGs to remain muted We expect retail companies to show YoY average revenue growth of 13%. Dmart/ Trent are likely to report the highest YoY revenue growth of 25%/32%; FLFL/V-Mart’s YoY revenue growth is expected in mid-teens. At industry level, average SSSG is expected in low single-digits; DMART/Westside should post healthy 18%/8% SSSG; while other retail companies are likely to report flat SSSG (up to 6%). We expect SSSG for ABFRL’s Madura and Pantaloons at 4% each and for Shoppers Stop at 2%. For V-Mart, we expect SSSG to be flat. Profitability to remain under pressure Average gross margin for the sector is likely to shrink 30bp YoY due to discounts, which are given to push sales/growth in a weak demand environment with competitive pressure. Trent’s 200bp gross margin decline is due to higher growth in its low-margin Zudio stores. Average EBITDA for our coverage universe is expected to grow 19% YoY, however, Dmart/Trent could be outliers with strong YoY growth of 28%/118%. ABFRL/ FLFL/FRL are expected to report modest 11%/5%/-4% YoY EBITDA growth due to moderation in gross margins. At the PAT level, retail companies are expected to report modest 13% YoY growth admist slowing sales and rising competitive pressure. ABFRL/Dmart/Trent are likely to report PAT growth of 9%/44%/40%.
Departmental Retail
Research Analyst: Aliasgar Shakir([email protected]); +91 22 6129 1565 Suhel Shaikh ([email protected]); +91 22 5036 2611; Anshul Aggarwal ([email protected]); +91 22 5036 2511

January 2020 171
December 2019 Results Preview | Sector: Departmental Retail
Exhibit 132: Retail Coverage Financial Snapshot
1QFY18 2QFY18 3QFY18 4QFY18 1QFY19 2QFY19 3QFY19 4QFY19 1QFY20 2QFY20 3QFY20E YoY gr. (%) QoQ (%) Total Revenue (INR b) ABFRL 17.6 18.0 18.5 17.5 19.1 20.1 22.8 19.2 20.7 23.0 24.9 9.1 8.4 DMART 36.0 35.1 40.9 38.1 45.6 48.7 54.5 50.3 57.8 59.5 68.1 25.0 14.5 FLFL 10.8 11.2 12.3 10.7 13.2 13.4 16.9 13.8 15.4 15.8 19.0 12.0 20.3 FRETAIL 47.0 45.1 46.9 45.7 45.4 49.3 53.0 54.0 51.5 53.9 55.0 3.7 1.9 SHOP 9.4 8.4 9.6 8.5 8.3 8.6 10.0 7.9 8.3 8.5 10.3 2.9 21.6 TRENT 4.9 5.2 5.2 5.3 5.9 6.2 6.6 6.7 7.7 8.2 8.6 31.6 5.6 VMART 3.2 2.4 3.7 3.0 3.6 2.6 4.7 3.4 4.5 3.1 5.3 13.4 68.0 Aggregate MOFSL universe 129.0 125.4 137.2 128.8 141.1 148.9 168.5 155.3 165.9 171.9 191.2 13.5 11.2 Growth (YoY) 26 9 12 9 9 19 23 21 18 15 13 Gross Profit (INR b) ABFRL 9.26 9.38 9.90 9.28 9.92 10.46 11.39 10.16 11.17 11.55 12.57 10.4 8.8 DMART 5.56 5.66 6.71 5.67 7.12 6.98 8.01 7.25 9.31 8.96 10.29 28.5 14.8 FLFL 3.97 4.06 4.40 4.08 4.62 4.84 5.74 5.18 5.76 5.44 6.37 10.9 17.1 FRETAIL 11.77 11.57 11.86 12.34 12.45 13.14 13.80 14.45 14.23 14.64 14.30 3.6 -2.3 SHOP 3.41 3.32 3.72 3.33 3.39 3.55 4.11 3.49 3.54 3.48 4.23 2.9 21.6 TRENT 2.75 2.72 2.95 2.66 3.21 3.13 3.48 3.17 4.07 3.91 4.41 26.5 12.6 VMART 0.99 0.71 1.33 0.89 1.21 0.77 1.66 1.00 1.39 0.98 1.90 14.8 93.8 Aggregate MOFSL universe 37.71 37.42 40.88 38.25 41.93 42.87 48.20 44.69 49.46 48.97 54.06 12.2 10.4 Growth (YoY) 21 8 13 11 11 15 18 17 18 14 12 Gross margin (%) ABFRL 52.7 52.0 53.4 52.9 51.9 52.1 49.9 53.0 54.1 50.3 50.5 60bps 20bps DMART 15.5 16.1 16.4 14.9 15.6 14.3 14.7 14.4 16.1 15.1 15.1 40bps 0bps FLFL 36.6 36.4 35.9 38.1 35.0 36.2 33.9 37.5 37.3 34.5 33.6 -30bps -90bps FRETAIL 25.0 25.7 25.3 27.0 27.4 26.7 26.0 26.8 27.6 27.1 26.0 0bps -110bps SHOP 36.2 39.6 38.6 39.2 41.0 41.1 41.2 44.1 42.5 41.2 41.2 0bps 0bps TRENT 55.6 52.0 56.6 50.3 54.4 50.8 53.0 47.4 53.0 47.8 51.0 -200bps 320bps VMART 31.5 29.2 36.1 30.0 33.6 29.2 35.6 29.0 30.7 31.2 36.0 40bps 480bps Aggregate gross margin (%) 29.2 29.8 29.8 29.7 29.7 28.8 28.6 28.8 29.8 28.5 28.3 -30bps -20bps EBITDA (INR b) ABFRL 0.75 0.93 1.38 1.63 1.14 1.43 1.73 1.25 1.42 1.64 1.92 11.3 17.2 DMART 3.03 3.18 4.22 2.94 4.23 3.90 4.53 3.77 5.77 4.96 5.81 28.1 17.2 FLFL 1.00 1.04 1.15 0.96 1.19 1.23 1.66 1.23 1.35 1.25 1.74 5.0 39.1 FRETAIL 2.10 2.11 2.15 2.01 2.21 2.48 2.78 2.91 2.65 2.90 2.67 -3.8 -7.7 SHOP 0.30 0.51 0.79 0.52 0.41 0.54 0.97 0.59 0.49 0.47 1.05 8.4 125.1 TRENT 0.58 0.49 0.69 0.25 0.71 0.59 0.73 0.34 0.98 1.33 1.59 118.6 19.7 VMART 0.37 0.09 0.64 0.23 0.43 -0.01 0.73 0.18 0.39 -0.08 0.82 11.4 NM Aggregate MOFSL universe 8.13 8.35 11.01 8.55 10.32 10.15 13.13 10.25 13.06 12.46 15.61 18.8 25.2 Growth (YoY) 42.0 21.0 37.9 26.1 27.0 21.6 19.3 20.0 26.5 22.8 18.8 EBITDA margin (%) ABFRL 4.3 5.2 7.4 9.3 5.9 7.1 7.6 6.5 6.9 7.1 7.7 20bps 60bps DMART 8.4 9.1 10.3 7.7 9.3 8.0 8.3 7.5 10.0 8.3 8.5 20bps 20bps FLFL 9.2 9.3 9.4 9.0 9.0 9.2 9.8 8.9 8.7 8.0 9.2 -60bps 120bps FRETAIL 4.5 4.7 4.6 4.4 4.9 5.0 5.2 5.4 5.1 5.4 4.9 -40bps -50bps SHOP 3.2 6.0 8.2 6.1 5.0 6.3 9.7 7.5 5.9 5.5 10.2 50bps 470bps TRENT 11.8 9.5 13.2 4.7 12.0 9.6 11.1 5.0 12.8 16.2 18.4 730bps 220bps VMART 11.8 3.5 17.4 7.8 12.0 -0.5 15.7 5.2 8.7 -2.5 15.5 -30bps 1800bps Margins MOFSL universe 6.3 6.7 8.0 6.6 7.3 6.8 7.8 6.6 7.9 7.2 8.2 40bps 90bps PAT (INR b) ABFRL -0.19 -0.10 0.34 1.13 0.06 0.43 0.70 2.03 0.14 0.30 0.77 8.8 151.2 DMART 1.75 1.91 2.52 1.67 2.51 2.26 2.57 2.03 3.38 3.40 3.70 44.1 8.9 FLFL 0.32 0.30 0.44 0.21 0.37 0.38 0.68 0.56 0.27 0.22 0.62 -8.9 188.0 FRETAIL 1.48 1.53 1.83 1.40 1.53 1.75 2.01 2.03 1.70 1.87 1.50 -25.6 -20.1 SHOP -0.04 -0.22 0.16 0.21 0.10 0.13 0.44 0.11 0.03 -0.06 0.48 7.2 -909.4 TRENT 0.38 0.29 0.38 0.12 0.38 0.33 0.40 0.16 0.63 0.38 0.56 39.4 47.0 VMART 0.22 0.03 0.37 0.16 0.25 -0.04 0.42 -0.01 0.23 -0.11 0.54 29.7 -608.9 Aggregate MOFSL universe 3.92 3.74 6.04 4.90 5.19 5.24 7.23 6.91 6.39 6.01 8.17 12.9 35.8 Growth (YoY) 91.5 19.3 67.8 90.7 32.4 39.8 19.6 41.1 23.0 14.8 12.9
Source: Company, MOFSL

January 2020 172
December 2019 Results Preview | Sector: Departmental Retail
Exhibit 133: Aggregate revenue growth (YoY, %)
Source: Company, MOFSL
Exhibit 134: Revenue growth (YoY, %)
Source: Company, MOFSL
Exhibit 135: Aggregate gross profit growth (YoY, %)
Source: Company, MOFSL
Exhibit 136: Change in gross margins (YoY, %)
Source: Company, MOFSL
Exhibit 137: Aggregate EBITDA growth (YoY, %)
Source: Company, MOFSL
Exhibit 138: 3QFY20E change in EBITDA margins (YoY, %)
Source: Company, MOFSL
Exhibit 139: Aggregate PAT growth (YoY, %)
Source: Company, MOFSL
Exhibit 140: PAT growth (YoY, %)
Source: Company, MOFSL
129.
0
125.
4
137.
2
128.
8
141.
1
148.
9
168.
5
155.
3
165.
9
171.
9
191.
2
26
9 12
9 9
19 23 21
18 15 13
1QFY
18
2QFY
18
3QFY
18
4QFY
18
1QFY
19
2QFY
19
3QFY
19
4QFY
19
1QFY
20
2QFY
20
3QFY
20E
Aggregate revenue (INR b) YoY growth (%)
9.1
25.0
12.0
3.7 2.9
31.6
13.4
ABFR
L
DMAR
T
FLFL
FRET
AIL
SHO
P
TREN
T
VMAR
T
37.7
37.4
40.9
38.2
41.9
42.9
48.2
44.7
49.5
49.0
54.1
29.2
29.8 29.8 29.7 29.7
28.8 28.6 28.8
29.8
28.5 28.3
1QFY
18
2QFY
18
3QFY
18
4QFY
18
1QFY
19
2QFY
19
3QFY
19
4QFY
19
1QFY
20
2QFY
20
3QFY
20E
Aggregate Gross Profit (INR b)60bps 40bps
-30bps
0bps 0bps
-200bps
40bps
50.5 15.1
33.6
26.0 41.2
51.0
36.0 AB
FRL
DMAR
T
FLFL
FRET
AIL
SHO
P
TREN
T
VMAR
T
Change in Gross Margin (bp) 3QFY20E Gross Margin (%)
8.1
8.3
11.0
8.5
10.3
10.1
13.1
10.3
13.7
12.5
15.6
6.3 6.7 8.0
6.6 7.3 6.8 7.8
6.6 8.3
7.2 8.2
1QFY
18
2QFY
18
3QFY
18
4QFY
18
1QFY
19
2QFY
19
3QFY
19
4QFY
19
1QFY
20
2QFY
20
3QFY
20E
Aggregate EBITDA (INR b) Aggregate EBITDA margin (%)
20bps 20bps
-60bps -40bps
50bps 730bps
-30bps
7.7 8.5 9.2 4.9 10.2 18.4 15.5
ABFR
L
DMAR
T
FLFL
FRET
AIL
SHO
P
TREN
T
VMAR
T
Change in EBITDA Margin (YoY, bp) 3QFY20E EBITDA margin (%)
3.9
3.7
6.0 4.9 5.2 5.2
7.2
6.9 6.7
6.0 8.2
91.5
19.3
67.8 90.7
32.4 39.8
19.6 41.1
28.3 14.8 12.9
1QFY
18
2QFY
18
3QFY
18
4QFY
18
1QFY
19
2QFY
19
3QFY
19
4QFY
19
1QFY
20
2QFY
20
3QFY
20E
Aggregate PAT (INR b) YoY growth (%)
8.8
44.1
-8.9 -25.6
7.2
39.4 29.7
ABFR
L
DMAR
T
FLFL
FRET
AIL
SHO
P
TREN
T
VMAR
T
PAT growth YoY (%)

January 2020 173
December 2019 Results Preview | Sector: Departmental Retail
Exhibit 141: Retail Coverage KPIs Snapshot
1QFY18 2QFY18 3QFY18 4QFY18 1QFY19 2QFY19 3QFY19 4QFY19 1QFY20 2QFY20 3QFY20E
Total Store count
Madura EBO's 2049 2103 2156 2190 2229 2288 2369 2406 2506 2579 2656 Pantaloons 213 243 256 275 282 288 302 308 314 331 343 DMART 132 136 141 155 157 160 164 176 184 189 195 Central 36 37 39 40 42 43 44 44 47 48 49 Brand Factory 54 57 60 63 69 76 89 93 97 100 103 Big Bazaar/FBB 307 314 318 327 352 358 375 386 389 388 392 Easyday 523 537 611 666 749 959 1050 1106 1150 1147 1197 Shoppers Stop 80 80 82 83 83 83 83 83 83 84 85 Westside 0 0 0 125 130 135 142 150 155 160 167 V-Mart 149 157 167 171 179 190 200 214 227 239 252 Store adds
Madura EBO's
54 53 34 39 59 81 37 100 73 77 Pantaloons
30 13 19 7 6 14 6 6 17 12
DMART
4 5 14 2 3 4 12 8 5 6 Central
1 2 1 2 1 1 0 3 1 1
Brand Factory
3 3 3 6 7 13 4 4 3 3 Big Bazaar/FBB
7 4 9 25 6 17 11 3 -1 4
Shoppers Stop
0 2 1 0 0 0 0 0 1 1 Westside
0 0 125 5 5 7 8 5 5 7
V-Mart
8 10 4 8 11 10 14 13 12 13 Total Store Adds
107 92 210 94 98 147 92 142 116 124
SSSG (%)
Pantaloons -6.0 0.0 -6.0 -2.5 -2.0 -2.0 17.0 -4.4 4.1 10.4 4.0 Madhura EBOs 21.0 1.0 4.0 7.7 0.0 8.0 8.0 6.0 3.2 7.0 4.0 Central 3.0 11.8 1.0 10.0 3.7 6.7 11.0 6.5 7.0 10.3 5.0 Brand Factory 17.3 6.6 13.7 15.8 15.4 12.3 21 13.1 2.5 6.1 0 Big Bazaar 13.8 13.1 11 13.4 10.1 9.4 10.1 13.6 8.1 5 2 Shoppers Stop -5.5 1.4 -4.1 2.1 -1.2 3.6 8.9 3.7 5.2 -2 2 Westside 12.0 10.0 9.0 9.0 8.0 9.0 12.0 12.0 12.0 13.0 8.0 V-Mart 8.0 10.0 7.0 9.0 1.2 0.0 11.0 3.5 5.2 1.0 0.0
Source: Company, MOFSL
Exhibit 142: Store adds across formats
Source: Bloomberg, MOFSL
Exhibit 143: SSSG to remain weak (%)
Source: Bloomberg, MOFSL
17
5 1
3
-1
1 5
12 12
6
1 3 4
1
7
13
Pant
aloo
ns
DMAR
T
Cent
ral
Bran
d Fa
ctor
y
Big
Baza
ar/F
BB
Shop
pers
Sto
p
Wes
tsid
e
V-M
art
2QFY20 3QFY20E
17.0
8.0
11.0
21.0
10.1
8.9
12.0
11.0
4 4 5
0
2 2
8
0
Pant
aloo
ns
Mad
hura
EBO
s
Cent
ral
Bran
d Fa
ctor
y
Big
Baza
ar
Shop
pers
Sto
p
Wes
tsid
e
V-M
art
3QFY19 SSSG (%) 3QFY20E SSSG (%)

January 2020 174
December 2019 Results Preview | Sector: Departmental Retail
Exhibit 144: Expected quarterly performance summary (INR m) Sector CMP SALES (INR M) EBDITA (INR M) NET PROFIT (INR M)
(INR) RECO Dec-19 Var % YoY
Var % QoQ Dec-19 Var
% YoY Var
% QoQ Dec-19 Var % YoY
Var % QoQ
Retail Aditya Birla Fashion 241 Buy 24,893 9.1 8.4 1,924 11.3 17.2 765 8.8 38.8 Avenue Supermarts 1,823 Sell 68,137 25.0 14.5 5,805 28.1 17.2 3,705 44.1 9.0 Future Lifestyle 399 Buy 18,950 12.0 20.3 1,743 5.0 39.1 619 -8.9 185.4 Future Retail 332 Buy 54,988 3.7 1.9 2,673 -3.8 -7.7 1,498 -25.6 -20.1 Jubilant Foodworks 1,682 Buy 10,444 12.4 5.7 2,596 52.2 10.5 1,108 14.8 25.3 Shoppers Stop 372 Neutral 10,279 2.9 21.6 1,053 8.4 125.1 475 1.2 LP Titan Company 1,155 Neutral 64,117 9.2 37.5 6,969 17.9 33.4 4,690 14.1 49.2 Trent 541 Buy 8,637 31.6 5.6 1,589 118.6 19.7 563 39.4 47.0 V-Mart Retail 1,664 Neutral 5,281 13.4 68.0 817 11.4 LP 541 29.7 LP Sector Aggregate 265,725 12.4 16.3 25,171 21.3 25.6 13,964 13.2 35.7
Exhibit 145: Relative performance – three months (%)
Source: Bloomberg, MOFSL
Exhibit 146: Relative performance – one-year (%)
Source: Bloomberg, MOFSL
Exhibit 147: Comparative valuation CMP EPS (INR) PE (x) PB (x) RoE (%) Company Name INR Reco FY20E FY21E FY22E FY20E FY21E FY22E FY20E FY21E FY22E FY20E FY21E FY22E Retail 66.5 50.0 39.4 10.5 9.0 7.6 15.8 17.9 19.2 Aditya Birla Fashion 241 Buy 3.1 4.8 5.9 77.1 49.7 40.7 11.3 9.2 7.5 15.7 20.4 20.3 Avenue Supermarts 1,823 Sell 21.0 28.9 36.2 86.9 63.1 50.3 16.5 13.1 10.4 21.0 23.1 23.0 Future Lifestyle 399 Buy 7.3 11.2 14.6 54.6 35.5 27.3 3.4 3.1 2.9 6.9 9.2 10.9 Future Retail 332 Buy 14.1 16.2 19.6 23.6 20.5 16.9 2.5 2.3 2.0 13.6 11.6 12.5 Jubilant Foodworks 1,682 Buy 27.6 35.6 45.6 60.9 47.2 36.9 15.0 12.5 10.4 24.6 26.4 28.2 Shoppers Stop 372 Neutral 9.0 11.1 10.3 41.2 33.5 36.1 3.1 2.9 2.7 7.9 8.9 7.6 Titan Company 1,155 Neutral 17.2 22.3 28.7 67.4 51.8 40.3 16.9 14.3 12.2 25.1 30.0 32.7 Trent 541 Buy 4.5 7.6 11.9 120.7 70.7 45.5 6.5 5.9 5.2 7.2 9.4 13.1 V-Mart Retail 1,664 Neutral 42.3 53.5 63.7 39.3 31.1 26.1 6.2 5.2 4.3 17.1 18.1 18.0
95
98
101
104
107
Sep-
19
Oct
-19
Nov
-19
Dec-
19
Nifty Index MOSL Retail Index
94
102
110
118
126
Dec-
18
Jan-
19
Feb-
19
Mar
-19
Apr-
19
May
-19
Jun-
19
Jul-1
9
Aug-
19
Sep-
19
Oct
-19
Nov
-19
Dec-
19
Nifty Index MOSL Retail Index

January 2020 175
December 2019 Results Preview | Sector: Departmental Retail
The tables below provide a snapshot of actual and estimated numbers for companies under the MOFSL coverage universe. Highlighted columns indicate the quarter/financial year under review.
Avenue Supermarts Sell CMP INR1,823 | TP: INR1,592 (-13%) EPS CHANGE (%): FY20|21: -3.3|0 Expect strong SSSG to drive revenue growth. Better gross margins to improve profitability.
Estimate addition of 6 new stores. Expect company to continue outperforming peers.
Standalone - Quarterly Earning (INR Million) Y/E March FY19 FY20E FY19 FY20 1Q 2Q 3Q 4Q 1Q 2Q 3QE 4QE Revenue 45,594 48,725 54,509 50,334 57,805 59,490 68,137 62,962 1,99,163 2,48,394 YoY Change (%) 26.7 38.9 33.1 32.1 26.8 22.1 25.0 25.1 32.7 24.7 Total Expenditure 41,367 44,829 49,976 46,568 52,037 54,535 62,331 58,079 1,82,741 2,26,982 EBITDA 4,227 3,896 4,533 3,765 5,768 4,955 5,805 4,883 16,422 21,412 Change YoY (%) 39.4 22.6 7.5 27.9 36.5 27.2 28.1 29.7 22.8 30.4 Depreciation 403 444 522 619 570 620 671 757 1,988 2,618 Interest 100 101 149 122 120 124 135 163 472 541 Other Income 143 139 86 147 119 89 89 89 514 385 PBT 3,866 3,491 3,949 3,171 5,198 4,300 5,087 4,052 14,476 18,638 Tax 1,360 1,233 1,378 1,142 1,821 900 1,382 1,101 5,113 5,204 Rate (%) 35.2 35.3 34.9 36.0 35.0 20.9 27.2 27.2 35.3 27.9 Reported PAT 2,506 2,257 2,571 2,029 3,377 3,401 3,705 2,951 9,363 13,434 Adj PAT 2,506 2,257 2,571 2,029 3,377 3,401 3,705 2,951 9,363 13,434 YoY Change (%) 43 18 2 21 35 51 44 45 19 43 E: MOFSL Estimates
ABFRL Buy CMP INR241 | TP: INR278 (+16%) EPS CHANGE (%): FY20|21: 26.6|0 Lifestyle brands driving revenue growth. Estimate Fast Fashion segment’s losses to reduce.
Lifestyle brands/Pantaloons to report modest SSSG of 4%. Expect Pantaloons to aggressively add stores.
Standalone - Quarterly Earning Model (INR m) Y/E March FY19 FY20 FY19 FY20 1Q 2Q 3Q 4Q 1Q 2Q 3QE 4QE Revenue 19,135 20,073 22,816 19,153 20,655 22,972 24,893 23,292 81,177 91,811 YoY Change (%) 8.8 11.2 23.0 9.2 7.9 14.4 9.1 21.6 13.2 13.1 Total Expenditure 17,997 18,645 21,086 17,908 19,231 21,329 22,968 21,457 75,637 84,985 EBITDA 1,138 1,428 1,729 1,245 1,424 1,642 1,924 1,836 5,541 6,826 Change, YoY (%) 52.3 53.4 25.6 -23.7 25.1 15.0 11.3 47.4 18.3 23.2 Depreciation 723 691 680 729 596 660 643 707 2,823 2,606 Interest 444 497 480 453 437 519 461 426 1,874 1,843 Other Income 85 187 134 242 315 131 101 101 648 648 PBT 56 427 703 305 705 594 922 804 1,492 3,024 Tax 0 0 0 -1,721 275 289 157 137 -1,721 858 Rate (%) 0.0 0.0 0.0 -564.0 39.0 48.7 17.0 17.0 -115.4 28.4 Reported PAT 56 427 703 2,026 430 305 765 667 3,213 2,167 Adj PAT 56 427 703 87 430 551 765 667 1,273 2,413 YoY Change (%) NM NM 105.3 -80.4 667.8 29.0 8.8 668.8 157.7 89.6 E: MOFSL Estimates

January 2020 176
December 2019 Results Preview | Sector: Departmental Retail
Future Lifestyle Fashions Buy CMP INR399 | TP: INR490 (+23%) EPS CHANGE (%): FY20|21: -12.6|-4.4 Full-price channel discounts to affect Brand Factory sales. Brand Factory to report flat SSSGs.
Brand Factory’s cost initiatives to cushion margins. Expect the company to curb store addition.
Consol. - Quarterly Earning Model (INR m) Y/E March FY19 FY20 FY19 FY20E 1Q 2Q 3Q 4Q 1Q 2Q 3QE 4QE Net Sales 13,190 13,360 16,920 13,810 15,438 15,753 18,950 15,470 57,281 65,612 YoY Change (%) 21.7 19.5 38.1 28.9 17.0 17.9 12.0 12.0 27.3 14.5 Total Expenditure 12,000 12,130 15,260 12,580 14,090 14,500 17,207 14,171 52,022 59,968 EBITDA 1,190 1,230 1,660 1,230 1,349 1,253 1,743 1,298 5,259 5,644 YoY Change (%) 19.5 18.3 44.5 28.1 13.3 1.9 5.0 5.5 27.1 7.3 Depreciation 450 470 510 640 627 688 702 722 2,071 2,739 Interest 270 280 280 340 338 367 278 267 1,168 1,249 Other Income 90 80 130 80 102 107 85 55 383 348 PBT 560 560 1,000 330 486 305 848 364 2,403 2,003 Tax 190 180 320 -230 157 90 229 98 465 574 Rate (%) 33.9 32.1 32.0 -69.7 32.2 29.6 27.0 27.0 19.4 28.7 MI & Profit/Loss of Asso. Cos. 0 0 0 0 39 -2 0 0 48 37 Reported PAT 370 380 680 560 290 217 619 266 1,890 1,392 Adj PAT 370 380 680 210 290 217 619 266 1,640 1,392 YoY Change (%) 15.6 25.5 53.0 0.0 -21.5 -42.9 -8.9 26.4 30.1 -15.1 E: MOFSL Estimates
Future Retail Buy CMP INR332 | TP: INR450 (+35%) EPS CHANGE (%): FY20|21: -7|-4.9 Expect company to curb store addition. FEL’s asset buyback to save INR6.5b/INR7b annually.
Estimate SSSG slowdown for Big Bazaar/FBB. Higher rents expected to drag company’s profitability.
Standalone - Quarterly Earning Model (INR m) Y/E March FY19 FY20 FY19 FY20 1Q 2Q 3Q 4Q 1Q 2Q 3QE 4QE Gross Sales 45,387 49,285 53,011 53,966 51,494 53,939 54,988 58,740 2,01,649 2,19,160 YoY Change (%) -3.5 9.4 12.9 18.0 13.5 9.4 3.7 8.8 9.1 8.7 Total Expenditure 43,179 46,809 50,232 51,059 48,844 51,042 52,314 55,493 1,91,280 2,07,692 EBITDA 2,208 2,476 2,778 2,907 2,650 2,897 2,673 3,247 10,369 11,467 Change YoY (%) 5.4 17.3 29.3 44.3 20.0 17.0 -3.8 11.7 24.6 10.6 Depreciation 199 230 253 324 355 385 397 410 1,006 1,547 Interest 511 554 562 612 683 843 854 1,284 2,240 3,663 Other Income 32 59 50 62 88 205 75 439 205 808 PBT before EO expense 1,531 1,751 2,013 2,032 1,700 1,875 1,498 1,992 7,328 7,065 PBT 1,531 1,751 2,013 2,032 1,700 1,875 1,498 1,992 7,328 7,065 Tax 0 0 0 0 0 0 0 0 0 0 Rate (%) 0.0 0.0 0.0 0.0 0.0 0.0 0.0 0.0 0.0 0.0 Reported PAT 1,531 1,751 2,013 2,032 1,700 1,875 1,498 1,992 7,328 7,065 Adj PAT 1,531 1,751 2,013 2,032 1,700 1,875 1,498 1,992 7,328 7,065 YoY Change (%) 3.6 14.3 9.9 44.9 11.0 7.1 -25.6 -1.9 19.1 -3.6 E: MOFSL Estimates

January 2020 177
December 2019 Results Preview | Sector: Departmental Retail
Shoppers Stop Neutral CMP INR372 | TP: INR415 (+12%) EPS CHANGE (%): FY20|21: -9.3|0 Economic slowdown to result in moderate sales growth. Shoppers Stop stores expected to see muted SSSG.
Gross margin should remain flat. Lower other operating expense to improve profitability.
Standalone - Quarterly Earning Model (INR Million) Y/E March FY19 FY20 FY19 FY20E 1Q 2Q 3Q 4Q 1Q 2Q 3QE 4QE Total Revenue from Operations 8,266 8,645 9,991 7,911 8,324 8,453 10,279 8,210 34,813 35,266 YoY Change (%) NA -8.1 19.3 -17.9 NA 2.3 2.9 -17.8 -3.1 1.3 Total Expenditure 7,851 8,105 9,020 7,320 7,833 7,986 9,225 7,546 32,280 32,590 EBITDA 415 540 972 591 491 468 1,053 664 2,533 2,676
YoY Change (%) 37.9 6.7 22.5 14.6 18.4 -13.5 8.4 12.4 19.7 5.7 Depreciation 306 311 278 455 448 433 440 439 1,351 1,761 Interest 28 27 30 25 20 20 20 20 124 80 Other Income 72 26 29 53 24 181 42 42 179 290 PBT before EO expense 152 229 692 164 47 196 635 247 1,237 1,125 PBT 152 229 692 164 47 196 635 247 1,237 1,125 Tax 54 96 249 50 14 255 160 62 449 490 Rate (%) 35.8 42.2 35.9 30.1 29.2 130.0 25.2 25.2 36.3 43.6 Reported PAT 98 132 443 115 33 -59 475 185 788 634 Adj PAT 98 132 469 302 33 -59 475 185 1,001 634 YoY Change (%) -363.0 -55.6 77.6 25.4 -66.2 -144.5 1.2 -38.7 30.8 -36.6 E: MOFSL Estimates
Trent Buy CMP INR541 | TP: INR615 (+14%) EPS CHANGE (%): FY20|21: 4.7|2.5 Westside to witness healthy SSSG. Low margin Zudio stores to drag company’s gross margin.
Expect TRENT to stick with aggressive store addition plan. Zudio’s revenue estimated to jump 3x.
Standalone - Quarterly Earning Model
(INR Million)
Y/E March FY19 FY20 FY19 FY20 1Q 2Q 3Q 4Q 1Q 2Q 3QE 4QE Revenue 5,906 6,159 6,565 6,687 7,672 8,180 8,637 9,064 25,317 33,554 YoY Change (%) 19.5 18.0 25.9 26.5 29.9 32.8 31.6 35.6 22.5 32.5 Total Expenditure 5,196 5,567 5,838 6,349 6,033 6,852 7,048 7,917 22,950 27,850 EBITDA 710 592 727 338 1,639 1,328 1,589 1,148 2,366 5,704 YoY Change (%) 21.4 19.9 6.0 35.6 130.9 124.3 118.6 239.9 17.5 141.0 Depreciation 105 108 116 135 536 585 630 676 465 2,427 Interest 75 102 88 103 597 598 606 622 368 2,424 Other Income 57 124 94 88 359 433 399 406 363 1,597 PBT 587 505 617 183 865 578 752 256 1,893 2,450 Tax 203 176 214 24 286 195 189 64 617 734 Rate (%) 34.6 34.8 34.6 13.0 33.0 33.7 25.2 25.2 32.6 30.0 Reported PAT 384 329 404 160 579 383 563 191 1,276 1,716 Adj PAT 384 329 404 138 579 383 563 191 1,254 1,716 YoY Change (%) 0.5 13.4 6.6 18.2 51.1 16.3 39.4 38.7 7.5 36.8 E: MOFSL Estimates

January 2020 178
December 2019 Results Preview | Sector: Departmental Retail
V-Mart Retail Neutral CMP INR1,664 | TP: INR1,750 (+5%) EPS CHANGE (%): FY20|21: -7.1|-8.7 New stores to drive fashion segment sales growth. Higher rent/employee cost to drag profitability.
Should continue spree of aggressive store adds. Expect modest SSSG.
Standalone - Quarterly Earning Model (INR Million) Y/E March FY19 FY20 FY19 FY20E
1Q 2Q 3Q 4Q 1Q 2Q 3QE 4QE
Revenue 3,612 2,622 4,658 3,445 4,534 3,144 5,281 3,885 14,337 16,844 YoY Change (%) 14.6 8.4 26.6 15.9 25.5 19.9 13.4 12.8 17.3 17.5 Total Expenditure 3,180 2,636 3,925 3,267 4,139 3,222 4,464 3,692 13,008 15,517 EBITDA 432 -14 734 178 395 -79 817 193 1,330 1,327 YoY Change (%) 16.5 -116.5 14.6 -22.9 -8.7 456.2 11.4 8.8 0.1 -0.2 Depreciation 65 67 72 72 80 78 85 96 276 338 Interest 2 2 9 3 2 9 9 9 16 29 Other Income 9 10 17 23 21 12 18 20 59 70 PBT 374 -97 670 51 334 -155 741 109 998 1,029 Tax 125 -57 253 60 83 -48 200 29 382 264 Rate (%) 33.5 58.5 37.8 117.3 24.8 31.3 27.0 27.0 38.2 25.6 Reported PAT 249 -40 417 -9 252 -106 541 79 617 765 Adj PAT 249 -16 417 65 252 -106 541 79 715 765 YoY Change (%) 11.2 -157.2 13.8 -59.4 1.2 576.0 29.7 22.7 -8.0 7.1 E: MOFSL Estimates

January 2020 179
December 2019 Results Preview | Sector: Technology
Modest expectations in a seasonally soft quarter Early budget trends for the new calendar year to be the focus
Growth to be tepid across Tier-I, some mid-caps to shine In a seasonally soft quarter, (i) higher-than-usual furloughs and (ii) caution in key
verticals (BFSI, Retail) will create further overhang on growth, in our view. Major currencies like GBP/EUR/AUD appreciated (~2%-7%) sequentially,
resulting in a cross-currency tailwind of 20-150bp across our coverage. Only NIIT Tech should face a cross-currency headwind of ~110bp.
We expect Tier-1 to deliver tepid organic growth of 0%-2% (CC), with Wipro/TCS leading/lagging the pack. Including inorganic contribution and cross-currency tailwind, tier-1 should report growth (USD) of 1.3%-3.5%.
Our mid-cap coverage should report growth of (6.4)%-4.3% (CC), with LTI/Cyient leading/lagging the group. Reported USD growth will likely be (5.1)%-4.5%.
Companies such as HCLT and Persistent should benefit from positive seasonality associated with their product revenue streams.
Expect slight margin improvement in most cases Utilization/mix improvement and INR depreciation will act as key margin
tailwinds. The impact of these will be offset to an extent by (i) fewer working days and (ii) large deal ramp-ups in some cases.
On an adjusted basis, we expect a sequential margin improvement of 0-90bp across Tier I, with TCS/HCLT leading/lagging the group. On reported 2QFY20 margins, TECHM is expected to witness 50bp contraction.
Within our mid-cap coverage, EBIT margin change should be (50)-80bp, with Mindtree/Cyient leading/lagging the pack.
Watch out for outlook on BFSI/Retail, deal wins and attrition Caution in spending within key verticals like capital markets/retail resulted in
growth moderation for IT companies over the last two quarters. In that context, the investor focus will be on commentary around early budget
trends in these verticals for the new calendar year. Deal wins and commentary around the pace of deal pipeline conversion will be
the other key monitorables on the demand side. From an operational standpoint, many companies have been struggling to tame
high attrition over the previous few quarters. This, along with commentary around onsite supply bottlenecks, will be the key areas of investor focus.
No material changes are likely in the current guidance of Infosys and HCLT.
Expect near-term softness in key verticals; prefer INFO, HCLT and LTI Discretionary IT spends in key verticals like BFSI and Retail will likely remain
subdued over the next year due to (i) the waning impact of US tax reforms and (ii) the policy uncertainty in the US in light of impending elections.
While verticals should remain tepid, we expect a tactical retreat in some horizontal trends (e.g. IMS) where public cloud repatriation should drive growth.
In that context, we prefer Infosys and HCLT among large caps and LTI among mid-caps. This is attributable to (i) decent visibility in growth, (ii) headroom for profitability improvement and (iii) reasonable valuations.
Cyient HCL Tech Hexaware Infosys L&T Infotech Mindtree Mphasis NIIT Tech Persistent TCS Tech Mahindra Wipro Zensar
Technology
Sudheer Guntupalli – Research analyst ([email protected]); +91 22 5036 2749 Research analyst: Anmol Garg ([email protected]); +912271934271 / Mohit Sharma ([email protected]); +912261291531

January 2020 180
December 2019 Results Preview | Sector: Technology
Exhibit 148: Tepid constant currency growth aided by cross currency tailwind Revenue (USD m) Revenue (INR b) Company 3QFY20E 2QFY20 QoQ (%) 3QFY19 YoY (%) 3QFY20E 2QFY20 QoQ (%) 3QFY19 YoY (%) TCS 5,588 5,517 1.3 5,250 6.4 397 390 2.1 373 6.6 Infosys 3,271 3,210 1.9 2,987 9.5 232 226 2.9 214 8.8 Wipro 2,112 2,049 3.1 2,047 3.2 151 147 3.4 146 3.4 HCLT 2,574 2,486 3.5 2,202 16.9 183 175 4.5 157 16.7 TECHM 1,317 1,287 2.3 1,261 4.5 93 91 3.4 89 4.9 Aggregate 14,862 14,549 2.2 13,746 8.1 1059 1,029 3.0 981 8.1
EBIT Margin (%) PAT (INR b) Company 3QFY20E 2QFY20 QoQ (%) 3QFY19 YoY (%) 3QFY20E 2QFY20 QoQ (%) 3QFY19 YoY (%) TCS 25 24.0 90.0 26 -70.0 83 80 3.3 81 2.3 Infosys 22 21.7 70.0 23 -60.0 43 40 6.9 36 19.6 Wipro 18 18.1 -30.0 20 -200.0 25 26 -3.1 25 -2.4 HCLT 20 20.0 10.0 20 40.0 28 27 7.2 26 8.9 TECHM 12 12.8 -50.0 16 -380.0 10 11 -10.3 12 -17.1 Aggregate 21 21.0 40.0 22 -100.0 190 184 2.9 181 4.7
Source: Company, MOFSL
Exhibit 149: Mid-caps should report better performance than Tier I Revenue (USD m) Revenue (INR b) Company 3QFY20E 2QFY20 QoQ (%) 3QFY19 YoY (%) 3QFY20E 2QFY20 QoQ (%) 3QFY19 YoY (%) LTI 380 364 4.5 347 9.6 27 26 3.6 25 4.0 MPHL 314 305 3.0 283 11.0 22 22 22.7 20 13.5 MTCL 276 271 2.0 252 9.9 20 19 8.7 18 4.0 HEXW 217 211 3.0 176 23.1 15 15 -5.4 13 3.1 CYL 156 164 -5.1 165 -5.6 11 12 15.8 12 9.5 ZENT 155 152 2.0 142 9.6 11 11 14.5 10 1.7 NITEC 152 149 2.5 135 13 11 10 8.5 10 2 Aggregate 1,651 1,615 2.2 1,499 10.1 117 114 2.9 107 9.9
EBIT margin (%) PAT (INR b) Company 3QFY20E 2QFY20 QoQ (%) 3QFY19 YoY (%) 3QFY20E 2QFY20 QoQ (%) 3QFY19 YoY (%) LTI 16 15.5 10 19 -350 4 4 1.2 4 -2.9 MPHL 17 16.1 70 16 100 3 3 12.6 3 10.7 MTCL 10 9.3 80 14 -350 2 1 23.5 2 -3.2 HEXW 14 13.9 50 14 30 2 2 0.6 1 49.7 CYL 9 9.6 -40 12 -320 1 1 -4.8 1 1.9 ZENT 11 10.4 60 9 190 1 1 13.9 1 55.1 NITEC 14 14.0 30 15 -110 1 1 2.4 1 22.1 Aggregate 14 13.1 50 15 -130 13 13 6.4 12 10.9
Source: Company, MOFSL
Exhibit 150: Cross-currency tailwinds largely driven by GBP appreciation
Source: Company, MOFSL
130 90 110 90
140
50 20
80 60
130 150
(130)
30
TCS
INFO
WPR
O
HCLT
TECH
M
MPH
L
LTI
MTC
L
HEXW CY
L
ZEN
T
NIT
EC
PSYS

January 2020 181
December 2019 Results Preview | Sector: Technology
Exhibit 151: 3QFY20 currency highlights (INR)
Rates (INR) Change (QoQ)
USD EUR GBP AUD USD EUR GBP AUD Average 71.24 78.9 91.7 48.7 1.3% 0.8% 5.7% 0.8% Closing 71.38 80.1 94.2 50.0 0.5% 2.6% 6.4% 3.7%
Source: Company, MOFSL Exhibit 152: 3QFY20 currency highlights (in USD)
Rates (USD) Change (QoQ)
EUR GBP AUD EUR GBP AUD Average 1.11 1.29 0.68 -0.5% 4.5% -0.3% Closing 1.12 1.33 0.70 1.8% 6.2% 3.2%
Source: Company, MOFSL
Exhibit 153: Relative performance—3m (%)
Source: Bloomberg, MOFSL
Exhibit 154: Relative performance—1Yr (%)
Source: Bloomberg, MOFSL
95
100
105
110
Sep-
19
Oct
-19
Nov
-19
Dec-
19
Nifty Index MOSL Technology Index
95
103
111
119
Dec-
18
Jan-
19
Feb-
19
Mar
-19
Apr-
19
May
-19
Jun-
19
Jul-1
9
Aug-
19
Sep-
19
Oct
-19
Nov
-19
Dec-
19
Nifty Index MOSL Technology Index

January 2020 182
December 2019 Results Preview | Sector: Technology
Exhibit 155: Expected quarterly performance summary Sector CMP SALES (INR M) EBDITA (INR M) Net Profit (INR M)
(INR) RECO Dec-19 Var % YoY
Var % QoQ Dec-19
Var % YoY
Var % QoQ Dec-19
Var % YoY
Var % QoQ
Cyient 442 Buy 10,997 -7.4 -5.1 1,452 -17.0 -9.2 939 1.9 -4.8 HCL Technologies 573 Buy 183,249 16.7 4.5 45,538 24.9 11.0 28,429 8.9 7.2 Hexaware Tech. 337 Neutral 15,438 23.3 4.2 2,534 32.5 6.6 1,848 49.7 0.6 Infosys 735 Buy 232,922 8.8 2.9 59,417 9.8 5.4 42,979 19.1 6.9 L&T Infotech 1,822 Buy 27,079 9.5 5.3 5,004 -1.7 7.4 3,645 -2.9 1.2 Mindtree 813 Neutral 19,684 10.1 2.8 2,704 -4.6 8.9 1,667 -3.2 23.5 MphasiS 894 Buy 22,233 12.8 3.0 4,301 30.1 6.1 3,076 10.7 12.6 NIIT Tech. 1,580 Neutral 10,909 12.3 5.0 2,010 11.3 5.9 1,223 22.1 2.4 Persistent Systems 714 Buy 9,233 6.8 4.4 1,297 -23.8 6.6 850 -7.3 -1.3 TCS 2,157 Neutral 397,885 6.6 2.1 107,826 6.9 5.4 83,050 2.3 3.3 Tech Mahindra 766 Buy 93,787 4.9 3.4 15,026 -12.8 0.1 10,080 -16.2 -10.3 Wipro 248 Neutral 156,933 4.2 3.8 32,663 -0.8 5.7 24,823 -2.4 -3.1 Zensar Tech 181 Buy 10,875 6.4 1.4 1,590 35.8 6.0 910 55.1 13.9 Sector Aggregate
1,191,225 8.3 3.0 281,363 7.8 6.0 203,518 5.0 3.1
Exhibit 156: Comparative valuation CMP EPS (INR) PE (x) PB (x) ROE (%) Company Name (INR) Reco FY20E FY21E FY22E FY20E FY21E FY22E FY20E FY21E FY22E FY20E FY21E FY22E Cyient 442 Buy 36.0 41.8 44.6 12.3 10.6 9.9 1.8 1.6 1.5 14.4 15.3 15.1
HCL Technologies 573 Buy 38.3 44.8 50.3 15.0 12.8 11.4 3.2 2.8 2.5 22.9 23.4 23.4
Hexaware Tech. 337 Neutral 21.8 24.8 28.5 15.5 13.6 11.8 3.6 3.0 2.5 25.2 24.3 23.4
Infosys 735 Buy 38.6 44.7 49.9 19.1 16.4 14.7 5.1 4.7 4.4 26.0 29.7 30.9
L&T Infotech 1,822 Buy 84.9 101.0 116.3 21.5 18.0 15.7 5.3 4.3 3.6 27.2 26.4 25.0
Mindtree 813 Neutral 35.0 45.6 57.8 23.3 17.8 14.1 4.3 3.9 3.4 19.1 23.1 25.9
MphasiS 894 Buy 62.4 72.2 77.7 14.3 12.4 11.5 3.2 2.7 2.3 23.1 25.1 23.6
NIIT Tech. 1,580 Neutral 76.1 88.6 100.9 20.8 17.8 15.6 4.1 3.6 3.1 21.0 21.3 21.2
Persistent Systems 714 Buy 45.1 48.5 58.0 15.8 14.7 12.3 2.3 2.1 1.9 14.8 15.1 16.3
TCS 2,157 Neutral 87.4 95.8 110.0 24.7 22.5 19.6 7.6 7.3 6.8 33.0 33.0 35.8
Tech Mahindra 766 Buy 47.5 53.1 58.1 16.1 14.4 13.2 3.2 2.9 2.6 20.4 21.5 21.2
Zensar Tech 181 Buy 15.2 18.6 19.6 11.9 9.7 9.2 1.9 1.6 1.4 16.6 17.8 16.4
Wipro 248 Neutral 16.5 17.4 18.2 15.0 14.3 13.7 3.0 2.8 2.6 18.4 20.3 20.0

January 2020 183
December 2019 Results Preview | Sector: Technology
The tables below provide a snapshot of actual and estimated numbers for companies under the MOFSL coverage universe. Highlighted columns indicate the quarter/financial year under review.
Cyient Buy CMP INR 442 | TP: INR520 (+18%) EPS CHANGE (%): FY20|21: -16.9|+16 Services revenue to be largely stagnant. DLM revenue to decline by USD9m QoQ. Watch out for outlook on A&D/Transportation. Fewer working days/higher SG&A in DLM to hurt margin.
Quarterly Perf. (INR m) Y/E March FY19 FY20E FY19E FY20E
1Q 2Q 3Q 4Q 1Q 2Q 3QE 4QE Revenue (USD m) 161 169 165 165 157 164 156 161 660 637 QoQ (%) -2.3 5.0 -2.2 0.1 -5.2 4.9 -5.1 3.1 8.6 -3.4 Revenue (INR m) 10,800 11,870 11,876 11,629 10,890 11,589 10,997 11,338 46,175 44,815 YoY (%) 19.1 23.0 20.8 9.5 0.8 -2.4 -7.4 -2.5 17.9 -2.9 GPM (%) 34.3 34.5 35.0 35.3 34.4 34.4 35.1 34.2 34.8 34.5 SGA (%) 22.1 20.8 20.3 20.2 21.2 20.6 21.9 19.7 20.8 20.8 EBITDA 1,316 1,627 1,749 1,752 1,445 1,599 1,452 1,641 6,444 6,138 EBITDA Margin (%) 12.2 13.7 14.7 15.1 13.3 13.8 13.2 14.5 14.0 13.7 EBIT Margin (%) 9.5 11.3 12.4 12.8 9.2 9.6 9.1 10.5 11.5 9.6 Other income 170 568 -187 789 283 264 332 430 1,340 1,309 ETR (%) 27.2 29.8 22.4 14.5 22.0 22.4 24.0 23.9 22.6 23.1 PAT 825 1,272 921 1,770 904 986 939 1,151 4,788 3,980 QoQ (%) -30.1 54.2 -27.6 92.2 -48.9 9.1 -4.8 22.6 YoY (%) -5.8 14.0 -15.2 49.9 9.6 -22.5 1.9 -35.0 11.6 -16.9 EPS (INR) 7.4 11.4 8.2 16.0 8.2 8.9 8.5 10.4 43.4 36.0 Headcount 13,851 13,845 14,002 13,916 13,912 13,800 14,040 14,220 13,916 14,220 Util incl. trainees (%) 75.0 78.0 78.1 77.8 78.0 78.0 76.0 77.0 Attrition (%) 16.9 16.9 18.4 19.9 17.4 18.0
Offshore rev. (%) 41.9 42.8 42.4 42.7 43.5 44.7 42.7 42.7 E: MOFSL Estimates
HCL Technologies Buy CMP INR 573 | TP: INR700 (+22%) EPS CHANGE (%): FY20|21: 4.1|16.8 Expect sequential growth of 2.6% (CC) in 3Q. Seasonality/incre. rev. (~USD50m) in Mode-3 bode well. Watch out for commentary around capital markets. Commentary around renewals key monitorable.
Quarterly Perf. (INR m)
Y/E March FY19 FY20E FY19 FY20
1Q 2Q 3Q 4Q 1Q 2Q 3QE 4QE Revenue (USD m) 2,055 2,099 2,202 2,278 2,364 2,486 2,574 2,612 8,633 10,035 QoQ (%) 0.8 2.1 4.9 3.5 3.8 5.2 3.5 1.5 10.1 16.3 Revenue (INR m) 1,38,780 1,48,610 1,56,990 1,59,900 1,64,250 1,75,280 1,83,249 1,82,820 6,04,280 7,05,599 YoY (%) 14.2 19.5 22.6 21.3 18.4 17.9 16.7 14.3 19.5 16.8 GPM (%) 34.4 35.5 35.3 34.8 33.5 35.0 36.6 35.3 35.0 35.1 SGA (%) 11.1 11.9 12.1 12.3 12.8 11.6 11.7 11.3 11.9 11.9 EBITDA (INRm) 32,260 34,990 36,470 35,970 34,000 41,030 45,538 43,819 1,39,690 1,64,387 EBITDA Margin (%) 23.2 23.5 23.2 22.5 20.7 23.4 24.9 24.0 23.1 23.3 EBIT Margin (%) 19.7 20.0 19.7 19.0 17.1 20.0 20.0 19.2 19.6 19.1 Other income 2,960 2,520 1,050 1,520 1,280 -30 661 -14 8,050 1,898 ETR (%) 20.6 21.1 17.7 19.3 24.0 23.9 23.9 23.9 19.6 23.9 Adjusted PAT 24,040 25,400 26,110 25,680 22,200 26,510 28,429 26,680 1,01,230 1,03,820 QoQ (%) 7.9 5.7 2.8 -1.6 -13.6 19.4 7.2 -6.2 YoY (%) 10.7 16.1 19.0 15.2 -7.7 4.4 8.9 3.9 15.3 2.6 EPS 8.6 9.1 9.6 9.5 8.2 9.8 10.5 9.9 36.8 38.3 Headcount 1,24,121 1,27,875 1,32,328 1,37,965 1,43,900 1,47,123 1,53,623 1,54,663 1,37,965 1,54,663 Util excl. trainees (%) 85.5 86.7 86.6 85.4
83.7 83.1
Attrition (%) 16.3 17.1 17.7 17.3 16.9
Fixed Price (%) 62.0 61.8 63.7 63.5 66.5 E: MOFSL Estimates

January 2020 184
December 2019 Results Preview | Sector: Technology
Hexaware Technologies Neutral CMP INR 337 | TP: INR380 (+13%) EPS CHANGE (%): FY20|21: 12.8|13.8 Softness in key client to drag growth (by 2.5% QoQ CC). Better mix/utilization/INR depreciation – margin tailwind. Watch out for outlook on integration of Mobiquity. Key client rev. run-rate to stabilize/at best recover post
4Q.
Quarterly Perf. (Indian GAAP)
(INR m) Y/E Dec CY18 CY19E CY18 CY19E
1Q 2Q 3Q 4Q 1Q 2Q 3Q 4QE Revenue (USD m) 162.2 168.3 171.1 176.1 180.0 188.5 210.5 216.8 678 796 QoQ (%) 3.9 3.8 1.7 2.9 2.2 4.7 11.7 3.0 11.6 17.4 Revenue (INR m) 10,490 11,367 12,096 12,524 12,640 13,083 14,814 15,438 46,477 55,975 YoY (%) 9.2 15.6 21.8 24.6 20.5 15.1 22.5 23.3 17.9 20.4 GPM (%) 32.9 31.8 32.8 31.6 30.2 32.4 33.8 33.8 32.2 32.6 SGA (%) 17.4 16.2 16.0 16.3 15.3 16.2 17.7 17.4 16.5 16.7 EBITDA 1,626 1,773 2,023 1,913 1,887 2,117 2,377 2,534 7,335 8,916 EBITDA Margin (%) 15.5 15.6 16.7 15.3 14.9 16.2 16.0 16.4 15.8 15.9 EBIT Margin (%) 14.1 14.0 15.4 14.0 13.8 14.6 13.9 14.3 14.4 14.1 Other income 204 327 264 -215 -42 99 171 40 580 268 ETR (%) 20.0 20.0 19.1 19.9 18.4 16.4 17.4 17.9 19.7 17.5 PAT 1,343 1,534 1,722 1,234 1,385 1,682 1,837 1,848 5,833 6,751 QoQ (%) 10.9 14.2 12.3 -28.3 12.2 21.4 9.2 0.6 YoY (%) 17.9 25.3 21.3 1.9 3.1 9.6 6.6 49.7 16.8 15.7 EPS (INR) 4.5 5.1 5.7 4.1 4.6 5.0 6.1 6.1 19.3 21.8 Headcount 14,619 15,357 16,050 16,205 16,492 18,294 19,062 19,494 16,205 19,494 Utilization (%) 81.3 78.2 79.0 78.7 79.0 80.7 79.0 81.5 80.9 81.9 Attrition (%) 13.4 14.4 15.7 17.0 18.2 18.2 17.3 0.0 Offshore rev. (%) 34.6 34.8 35.1 36.1 36.6 37.0 37.3 39.9 35.2 37.8 E: MOFSL Estimates
Infosys Buy CMP INR 735| TP: INR870 (+19%) EPS CHANGE (%): FY20|21: 8.9|15.8 Seasonality to be more pronounced given client mix. Recent strength from large wins to keep growth positive. Better productivity/INR depreciation to drive margins. Progress on investigation related to whistleblower.
Quarterly Performance (IFRS) (INR m) Y/E March FY19E FY20E FY19 FY20E
1Q 2Q 3Q 4Q 1Q 2Q 3QE 4QE Revenue (USD m) 2,831 2,921 2,987 3,060 3,131 3,210 3,271 3,333 11,799 12,946 QoQ (%) 0.9 3.2 2.3 2.4 2.3 2.5 1.9 1.9 7.9 9.7 Revenue (INR m) 1,91,280 2,06,090 2,14,000 2,15,390 2,18,030 2,26,290 2,32,922 2,35,818 8,26,760 9,13,061 YoY (%) 12.0 17.3 20.3 19.1 14.0 9.8 8.8 9.5 17.2 10.4 GPM (%) 38.0 37.8 37.2 36.2 35.3 36.6 37.3 37.6 37.3 36.7 SGA (%) 12.0 11.8 11.9 12.2 11.7 11.7 11.8 11.8 12.0 11.7 EBITDA 49,730 53,580 54,100 51,490 51,520 56,390 59,417 60,833 2,08,890 2,28,160 EBITDA Margin (%) 26.0 26.0 25.3 23.9 23.6 24.9 25.5 25.8 25.3 25.0 EBIT Margin (%) 23.7 23.7 23.0 21.4 20.5 21.7 22.4 22.8 22.9 21.9 Other income 7,260 7,390 7,530 6,650 6,960 5,840 6,487 6,107 28,830 25,393 ETR (%) 26.2 27.0 26.8 22.8 26.4 26.5 26.5 26.5 25.8 26.5 PAT 36,120 41,100 36,100 40,740 37,980 40,190 42,979 43,808 1,54,050 1,64,957 QoQ (%) -2.1 13.8 -12.2 12.9 -6.8 5.8 6.9 1.9 YoY (%) 3.6 10.3 -2.4 10.4 5.1 -2.2 19.1 7.5 -3.9 7.1 EPS (INR) 8.3 9.4 8.3 9.4 8.8 9.4 10.1 10.2 35.4 38.6 Headcount 2,09,905 2,17,739 2,25,501 2,28,123 2,29,029 2,36,486 2,36,625 2,37,557 2,28,123 2,37,557 Util excl. trainees (%) 86.1 86.0 84.2 82.7 83.5 84.9 85.5 87.0 85.4 85.8 Attrition (%) 23.0 22.2 19.9 20.4 23.4 21.7 21.5 E: MOFSL Estimates
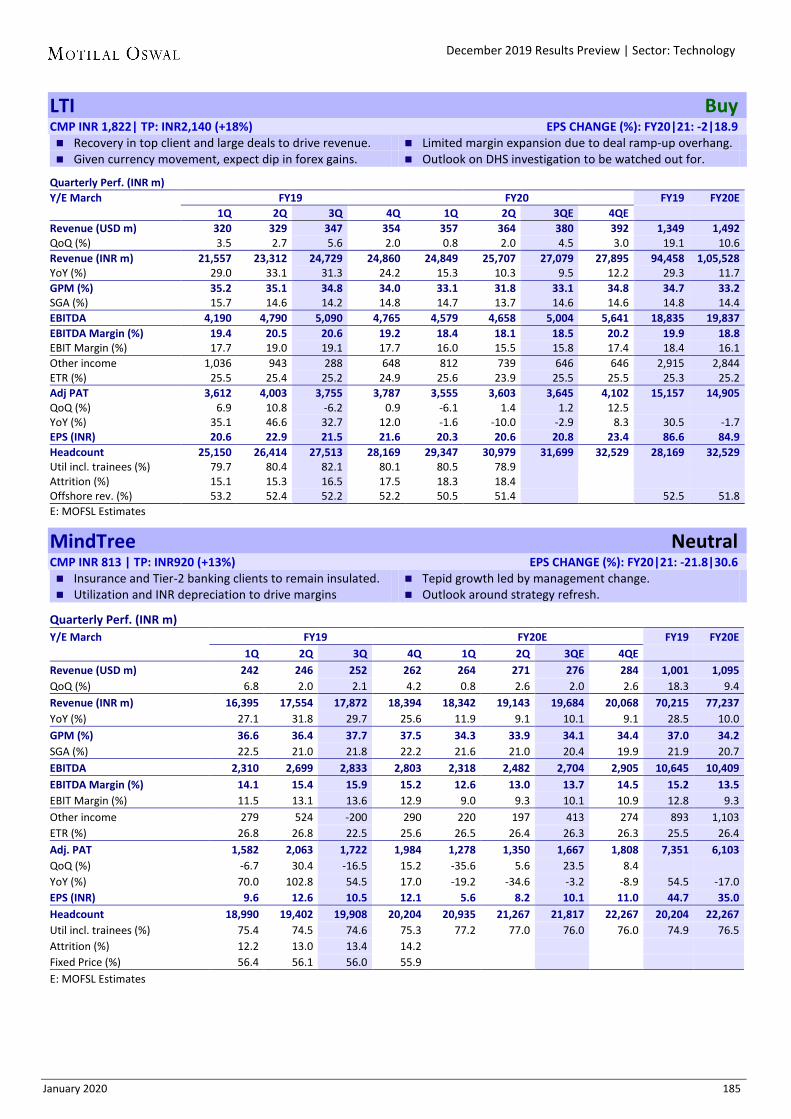
January 2020 185
December 2019 Results Preview | Sector: Technology
LTI Buy CMP INR 1,822| TP: INR2,140 (+18%) EPS CHANGE (%): FY20|21: -2|18.9 Recovery in top client and large deals to drive revenue. Limited margin expansion due to deal ramp-up overhang. Given currency movement, expect dip in forex gains. Outlook on DHS investigation to be watched out for.
Quarterly Perf. (INR m) Y/E March FY19 FY20 FY19 FY20E
1Q 2Q 3Q 4Q 1Q 2Q 3QE 4QE Revenue (USD m) 320 329 347 354 357 364 380 392 1,349 1,492 QoQ (%) 3.5 2.7 5.6 2.0 0.8 2.0 4.5 3.0 19.1 10.6 Revenue (INR m) 21,557 23,312 24,729 24,860 24,849 25,707 27,079 27,895 94,458 1,05,528 YoY (%) 29.0 33.1 31.3 24.2 15.3 10.3 9.5 12.2 29.3 11.7 GPM (%) 35.2 35.1 34.8 34.0 33.1 31.8 33.1 34.8 34.7 33.2 SGA (%) 15.7 14.6 14.2 14.8 14.7 13.7 14.6 14.6 14.8 14.4 EBITDA 4,190 4,790 5,090 4,765 4,579 4,658 5,004 5,641 18,835 19,837 EBITDA Margin (%) 19.4 20.5 20.6 19.2 18.4 18.1 18.5 20.2 19.9 18.8 EBIT Margin (%) 17.7 19.0 19.1 17.7 16.0 15.5 15.8 17.4 18.4 16.1 Other income 1,036 943 288 648 812 739 646 646 2,915 2,844 ETR (%) 25.5 25.4 25.2 24.9 25.6 23.9 25.5 25.5 25.3 25.2 Adj PAT 3,612 4,003 3,755 3,787 3,555 3,603 3,645 4,102 15,157 14,905 QoQ (%) 6.9 10.8 -6.2 0.9 -6.1 1.4 1.2 12.5 YoY (%) 35.1 46.6 32.7 12.0 -1.6 -10.0 -2.9 8.3 30.5 -1.7 EPS (INR) 20.6 22.9 21.5 21.6 20.3 20.6 20.8 23.4 86.6 84.9 Headcount 25,150 26,414 27,513 28,169 29,347 30,979 31,699 32,529 28,169 32,529 Util incl. trainees (%) 79.7 80.4 82.1 80.1 80.5 78.9
Attrition (%) 15.1 15.3 16.5 17.5 18.3 18.4 Offshore rev. (%) 53.2 52.4 52.2 52.2 50.5 51.4 52.5 51.8 E: MOFSL Estimates
MindTree Neutral CMP INR 813 | TP: INR920 (+13%) EPS CHANGE (%): FY20|21: -21.8|30.6 Insurance and Tier-2 banking clients to remain insulated. Tepid growth led by management change. Utilization and INR depreciation to drive margins Outlook around strategy refresh.
Quarterly Perf. (INR m)
Y/E March FY19 FY20E FY19 FY20E
1Q 2Q 3Q 4Q 1Q 2Q 3QE 4QE Revenue (USD m) 242 246 252 262 264 271 276 284 1,001 1,095 QoQ (%) 6.8 2.0 2.1 4.2 0.8 2.6 2.0 2.6 18.3 9.4 Revenue (INR m) 16,395 17,554 17,872 18,394 18,342 19,143 19,684 20,068 70,215 77,237 YoY (%) 27.1 31.8 29.7 25.6 11.9 9.1 10.1 9.1 28.5 10.0 GPM (%) 36.6 36.4 37.7 37.5 34.3 33.9 34.1 34.4 37.0 34.2 SGA (%) 22.5 21.0 21.8 22.2 21.6 21.0 20.4 19.9 21.9 20.7 EBITDA 2,310 2,699 2,833 2,803 2,318 2,482 2,704 2,905 10,645 10,409 EBITDA Margin (%) 14.1 15.4 15.9 15.2 12.6 13.0 13.7 14.5 15.2 13.5 EBIT Margin (%) 11.5 13.1 13.6 12.9 9.0 9.3 10.1 10.9 12.8 9.3 Other income 279 524 -200 290 220 197 413 274 893 1,103 ETR (%) 26.8 26.8 22.5 25.6 26.5 26.4 26.3 26.3 25.5 26.4 Adj. PAT 1,582 2,063 1,722 1,984 1,278 1,350 1,667 1,808 7,351 6,103 QoQ (%) -6.7 30.4 -16.5 15.2 -35.6 5.6 23.5 8.4 YoY (%) 70.0 102.8 54.5 17.0 -19.2 -34.6 -3.2 -8.9 54.5 -17.0 EPS (INR) 9.6 12.6 10.5 12.1 5.6 8.2 10.1 11.0 44.7 35.0 Headcount 18,990 19,402 19,908 20,204 20,935 21,267 21,817 22,267 20,204 22,267 Util incl. trainees (%) 75.4 74.5 74.6 75.3 77.2 77.0 76.0 76.0 74.9 76.5 Attrition (%) 12.2 13.0 13.4 14.2
Fixed Price (%) 56.4 56.1 56.0 55.9 E: MOFSL Estimates

January 2020 186
December 2019 Results Preview | Sector: Technology
Mphasis Buy CMP INR 894 | TP: INR1,050 (+18%) EPS CHANGE (%): FY20|21: 11.2|15.8 Recent strength in direct core deal wins to drive growth. DXC revenue should report market growth rate. Better utilization in application services to drive margins. Outlook for DXC channel.
Quarterly Perf. (INR m) Y/E March FY19 FY20E FY19 FY20E
Jun 18 Sep 18 Dec 18 Mar 19 Jun 19 Sep 19 Dec 19 Mar 20 Revenue (USD m) 269 276 283 292 297 305 314 325 1,119 1,240 QoQ (%) 1.7 2.6 2.6 3.2 1.8 2.6 3.0 3.6 13.1 10.9 Revenue (INR m) 18,202 19,149 19,710 20,250 20,626 21,581 22,233 23,091 77,310 87,532 YoY (%) 18.5 19.3 18.7 16.1 13.3 12.7 12.8 14.0 18.1 13.2 GPM (%) 28.9 28.1 27.9 26.8 28.4 28.8 30.0 30.8 27.9 29.5 SGA (%) 11.2 10.7 11.2 10.0 10.2 10.0 10.6 10.6 10.8 10.4 EBITDA 3,201 3,329 3,306 3,404 3,743 4,052 4,301 4,660 13,239 16,756 EBITDA Margin (%) 17.6 17.4 16.8 16.8 18.1 18.8 19.3 20.2 17.1 19.1 EBIT Margin (%) 16.6 16.4 15.8 15.8 15.5 16.1 16.8 17.7 16.1 16.5 Other income 449 467 499 332 541 351 357 657 1,747 1,906 ETR (%) 24.7 24.5 22.4 23.4 25.1 24.2 24.2 24.2 23.7 24.4 PAT 2,583 2,709 2,780 2,662 2,647 2,733 3,076 3,564 10,733 12,021 QoQ (%) 3.0 4.9 2.6 -4.2 -0.5 3.3 12.6 15.9 YoY (%) 38.0 37.0 29.3 6.2 2.5 0.9 10.7 33.9 26.2 12.0 EPS (INR) 13.4 14.0 14.4 14.3 14.2 14.2 16.0 18.5 56.1 62.8 Headcount 22,566 23,478 24,215 24,485 25,500 26,963 27,171 27,511 24,485 27,511 Net Additions 302 912 737 270 1015 1463 208 340 2221 3026 HP Channel rev. (%) 27.4 28.3 29.0 28.0 28.0 27.6 0.0
28.0
Fixed Price (%) 26.5 24.6 24.1 23.0 24.0 26.0 0.0 23.0 24.0 E: MOFSL Estimates
NIIT Technologies Neutral CMP INR 1,580 | TP: INR1,620 (+3%) EPS CHANGE (%): FY20|21: 14.9|+16.4 Recent deal wins to drive sequential growth. CC headwind due to difference in settlement dates. Quality revenue and INR depreciation to drive margins. Outlook on spending at key BFS accounts.
Quarterly Perf. (IND-AS, INR m) Y/E March FY19 FY20E FY19 FY20E
(Consolidated) 1Q 2Q 3Q 4Q 1Q 2Q 3QE 4QE Rev. (USD m) Ex. forex & bought outs 121 131 135 132 138 149 152 157 519 597 QoQ (%) -1.3 8.5 3.0 -1.9 4.4 7.7 2.5 3.3 11.9 15.0 Revenue (INR m) 8,005 9,074 9,717 9,319 9,597 10,385 10,909 11,238 36,115 42,129 YoY (%) 12.9 23.1 28.4 18.1 19.9 14.4 12.3 20.6 20.7 16.7 GPM (%) 33.8 35.0 35.4 34.7 33.9 34.6 34.9 35.4 34.8 34.7 SGA (%) 17.7 17.0 16.8 17.1 16.8 16.3 16.5 16.5 17.1 16.5 EBITDA (INRm) 1,287 1,634 1,805 1,641 1,641 1,898 2,010 2,122 6,367 7,670 EBITDA Margin (%) 16.1 18.0 18.6 17.6 17.1 18.3 18.4 18.9 17.6 18.2 EBIT Margin (%) 12.2 14.5 15.3 14.4 12.9 14.0 14.3 14.8 14.2 14.0 Other income 206 215 5 45 75 76 75 -12 471 214 ETR (%) 25.3 23.7 29.7 17.5 20.5 18.1 22.5 22.5 24.1 21.0 Minority Interest 45.0 49.0 49.0 34.0 24.0 56.0 40.8 38.7 177.0 159.4 PAT 841 1,118 1,002 1,111 1,022 1,195 1,223 1,240 4,072 4,680 QoQ (%) -2.3 32.9 -10.4 10.9 -8.0 16.9 2.4 1.4 45.3 14.9 YoY (%) 63.9 66.6 32.4 29.0 21.5 6.9 22.1 11.6 EPS (INR) 13.7 18.2 16.3 18.1 16.6 19.4 19.9 20.2 66.2 76.1 Headcount 9,764 10,025 10,144 10,263 10,297 10,800 11,050 11,450 10,263 11,450 Util excl. trainees (%) 80.1 80.4 79.0 79.3 80.5 79.0 79.0 82.0 79.7 81.3 Attrition (%) 10.1 10.8 11.7 11.7 12.9
Offshore rev. (%) 36.0 36.0 35.0 35.0 34.0
35.2 34.5 Fixed Price (%) 47.0 45.0 47.0 47.0 48.0 E: MOFSL Estimates

January 2020 187
December 2019 Results Preview | Sector: Technology
Persistent Systems Buy CMP INR 714 | TP: INR830 (+16%) EPS CHANGE (%): FY20|21: 2.6|7.5 Alliance segment to drive revenue growth. TSU to be supportive of growth, Accelerite to be overhang Lower costs/INR depreciation to drive margins. Outlook for hiring in senior roles.
Quarterly Perf. (IFRS, INR m)
Y/E March FY19 FY20E FY19 FY20E (Consolidated) 1Q 2Q 3Q 4Q 1Q 2Q 3QE 4QE Revenue (USD m) 123.6 118.2 120.8 118.3 119.6 125.5 129.7 133.3 481 508 QoQ (%) 5.7 -4.3 2.2 -2.1 1.1 4.9 3.3 2.8 2.2 5.6 Revenue (INR m) 8,343 8,356 8,642 8,318 8,321 8,846 9,233 9,492 33,659 35,891 QoQ (%) 10.9 0.2 3.4 -3.8 0.0 6.3 4.4 2.8 YoY (%) 14.6 9.8 9.1 10.5 -0.3 5.9 6.8 14.1 11.0 6.6 GPM (%) 35.6 35.3 38.2 36.8 34.7 34.7 34.9 35.6 36.5 35.0 SGA (%) 18.8 18.0 18.3 21.6 20.2 20.7 20.8 20.4 19.2 20.6 EBITDA 1,400 1,436 1,703 1,265 1,202 1,216 1,297 1,450 5,805 5,165 EBITDA Margin (%) 16.8 17.2 19.7 15.2 14.4 13.8 14.0 15.3 17.2 14.4 EBIT Margin (%) 12.0 12.4 15.1 10.7 9.8 8.9 9.1 10.7 12.6 9.7 Other income 187 231 -12 224 282 364 290 250 631 1,186 ETR (%) 26.4 30.5 29.2 24.1 24.9 25.5 25.1 25.1 27.7 25.1 PAT 873 881 917 844 825 861 850 948 3,516 3,483 QoQ (%) 18.5 0.9 4.1 -7.9 -2.3 4.4 -1.3 11.5 YoY (%) 16.3 6.7 0.1 14.6 -5.6 -2.3 -7.3 12.3 8.8 -0.9 EPS (INR) 10.9 11.0 11.5 10.6 10.7 11.2 11.0 12.3 44.0 45.1 Headcount 8,902 9,302 9,530 9,962 10,167 10,543 10,757 10,771 9,962 10,771 Util excl. trainees (%) 80.7 81.9 82.1 79.7 77.9 77.6 78.0 78.5 81.1 77.8 Attrition (%) 14.8 15.4 16.4 16.7 17.2 15.7
16.7
IP rev. proportion(%) 27.4 25.6 25.0 21.6 21.5 22.5 22.8 22.8 24.9 22.4 E: MOFSL Estimates
TCS Neutral CMP INR 2,157 | TP: INR2,340 (+8%) EPS CHANGE (%): FY20|21: 4.7|+9.7 Softness in BFSI and Retail. Better utilization and INR depreciation to drive margins. Updated outlook on order backlog. Cross currency tailwind of 130bp on high GBP exposure.
Quarterly Perf. (IFRS, INR m) Y/E March FY19 FY20E FY19 FY20E
1Q 2Q 3Q 4Q 1Q 2Q 3Q 4QE Revenue (USD m) 5,051 5,215 5,250 5,397 5,485 5,517 5,588 5,697 20,913 22,288 QoQ (%) 1.6 3.2 0.7 2.8 1.6 0.6 1.3 2.0 9.6 6.6 Revenue (INR m) 3,42,610 3,68,540 3,73,380 3,80,100 3,81,720 3,89,770 3,97,885 4,03,373 14,64,630 15,72,748 YoY (%) 15.8 20.7 20.8 18.5 11.4 5.8 6.6 6.1 19.0 7.4 GPM (%) 42.5 43.6 42.9 42.9 42.1 42.5 42.6 42.0 43.0 42.3 SGA (%) 16.1 15.7 15.9 15.8 15.8 16.3 15.5 15.6 15.9 15.8 EBITDA 90,710 1,02,780 1,00,830 1,03,011 1,00,370 1,02,260 1,07,826 1,06,309 3,97,331 4,16,765 EBITDA Margin (%) 26.5 27.9 27.0 27.1 26.3 26.2 27.1 26.4 27.1 26.5 EBIT Margin (%) 25.0 26.5 25.6 25.7 24.2 24.0 24.9 24.2 25.7 24.3 Other income 12,250 7,300 11,630 11,650 14,180 11,680 9,576 11,011 42,830 46,447 ETR (%) 24.7 23.2 24.1 23.3 23.4 23.5 23.5 23.5 23.8 23.5 PAT 73,570 80,380 81,210 83,541 81,310 80,420 83,050 83,050 3,18,701 3,27,830 QoQ (%) 6.6 9.3 1.0 2.9 -2.7 -1.1 3.3 0.0 YoY (%) 23.8 24.7 24.3 21.0 10.5 0.0 2.3 -0.6 23.4 2.9 EPS (INR) 19.2 21.0 21.6 21.7 21.7 21.4 22.1 22.1 83.5 87.4 Headcount 4,00,875 4,11,102 4,17,929 4,24,285 4,36,641 4,50,738 4,47,670 4,56,478 4,24,285 4,56,478 CC QoQ rev gr (%) 4.1 3.7 1.8 2.4 2.3 0.6 1.3 2.4 9.6 6.6 Attrition (%) 11.7 10.9 11.3 11.5 E: MOFSL Estimates

January 2020 188
December 2019 Results Preview | Sector: Technology
Tech Mahindra Buy CMP INR 766 | TP: INR880 (+15%) EPS CHANGE (%): FY20|21: -1.5|11.9 Tepid growth in both communication and enterprise. Partial AT&T deal impact on growth. Margin pressure from transition cost (A&T) constraint. Outlook for communications segment.
Quarterly Perf. (INR m)
Y/E March FY19 FY20E FY19 FY20E
1Q 2Q 3Q 4Q 1Q 2Q 3QE 4QE Revenue (USD m) 1,224 1,218 1,261 1,268 1,247 1,287 1,317 1,386 4,971 5,237 QoQ (%) -1.6 -0.5 3.5 0.5 -1.6 3.2 2.3 5.2 4.2 5.4 Revenue (INR m) 82,763 86,298 89,437 88,923 86,530 90,699 93,787 98,660 3,47,421 3,69,676 YoY (%) 12.8 13.5 15.0 10.4 4.6 5.1 4.9 11.0 12.9 6.4 GPM (%) 30.7 34.0 33.1 33.1 28.8 29.6 29.7 30.1 32.8 29.6 SGA (%) 14.3 15.3 13.8 14.7 13.6 13.0 13.7 13.8 14.5 13.5 EBITDA 13,569 16,186 17,226 16,387 13,141 15,009 15,026 16,058 63,368 59,234 EBITDA Margin (%) 16.4 18.8 19.3 18.4 15.2 16.5 16.0 16.3 18.2 16.0 EBIT Margin (%) 13.0 15.3 16.1 15.4 11.5 12.8 12.3 12.7 15.0 12.3 Other income 1,114 1,751 806 1,671 3,413 2,163 2,560 2,594 5,342 10,730 Interest expense 305 388 358 281 454 383 612 612 1,332 2,061 ETR (%) 21.2 26.8 17.8 23.5 25.7 16.9 25.5 25.5 22.4 23.4 PAT excl. BT amort & EOI 8,979 10,642 12,029 11,325 9,593 11,239 10,080 10,887 42,975 41,799 QoQ (%) -26.5 18.5 13.0 -5.9 -15.3 17.2 -10.3 8.0 YoY (%) 12.4 27.3 27.7 -7.3 6.8 5.6 -16.2 -3.9 13.1 -2.7 EPS (INR) 10.1 11.9 13.5 12.6 10.9 12.8 11.5 12.4 48.0 47.5 Headcount 1,13,552 1,18,391 1,21,842 1,21,082 1,25,773 1,31,522 1,32,371 1,37,555 1,21,082 1,37,555 Util excl. trainees (%) 81.0 81.0 82.0 82.0 80.0 82.0 83.0 86.5 81.5 82.9 Attrition (%) 19.0 20.0 21.0 21.0 21.0 21.0 0.0 0.0 Offshore rev. (%) 33.4 35.5 34.5 34.8 34.7 34.6 33.9 33.8 34.5 34.2 E: MOFSL Estimates
Wipro Neutral CMP INR 248 | TP: INR270 (+9%) EPS CHANGE (%): FY20|21: 11.7|5.1 Growth expected in the midpoint of the guidance range. Higher exposure to capital markets to be a overhang Margins to be effected by normalization of SGA. Outlook on capital markets and healthcare segment.
Quarterly Perf.(IFRS, INR m)
Y/E March FY19 FY20E FY19 FY20E
1Q 2Q 3Q 4Q 1Q 2Q 3QE 4QE IT Services Revenue (USD m) 1,989 2,010 2,047 2,076 2,039 2,049 2,112 2,155 8,120 8,355 QoQ (%) -1.5 1.0 1.8 1.4 -1.8 0.5 3.1 2.1 2.9 2.9 Overall Revenue (INR m) 1,39,777 1,45,410 1,50,595 1,50,063 1,47,161 1,51,256 1,56,933 1,58,921 5,85,845 6,14,270 QoQ (%) 1.5 4.0 3.6 -0.4 -1.9 2.8 3.8 1.3 YoY (%) 2.6 8.3 10.2 9.0 5.3 4.0 4.2 5.9 7.5 4.9 GPM (%) 28.2 30.0 31.0 28.7 29.1 28.6 30.6 30.5 29.5 29.7 SGA (%) 13.9 13.3 12.5 11.8 13.0 11.3 12.9 13.0 12.9 12.6 EBITDA 24,343 28,641 32,929 31,053 28,771 30,908 32,663 32,910 1,16,966 1,25,252 EBITDA Margin (%) 17.4 19.7 21.9 20.7 19.6 20.4 20.8 20.7 20.0 20.4 IT Serv. EBIT (%) 17.2 15.0 19.8 19.0 18.4 18.1 17.8 17.2 17.8 17.8 EBIT Margin (%) 14.3 16.7 18.4 17.0 16.2 17.3 17.7 17.6 16.6 17.2 Other income 4,319 5,053 4,646 6,560 6,221 5,251 3,323 1,731 20,578 16,526 ETR (%) 24.1 22.1 21.5 22.1 22.3 18.3 20.0 20.0 22.3 20.1 PAT 18,407 22,860 25,444 24,937 23,322 25,612 24,823 23,728 91,648 97,485 QoQ (%) -8.4 24.2 11.3 -2.0 -6.5 9.8 -3.1 -4.4 YoY (%) -11.6 4.4 12.9 24.2 26.7 12.0 -2.4 -4.8 7.4 6.4 EPS (INR) 3.5 2.9 4.2 4.1 4.0 4.3 4.2 4.0 14.8 16.5 Headcount 1,60,846 1,71,451 1,72,379 1,71,425 1,74,850 1,81,453 1,84,538 1,71,425 1,71,425 1,87,623 Util excl. trainees (%) 85.2 85.5 83.2 85.4 85.0 82.1 82.1 82.1 79.6 78.4 Attrition (%) 17.1 17.5 17.9 17.6 17.6 17.0
17.6
Offshore rev. (%) 47.1 47.2 47.8 48.5 47.7 46.7 47.3 47.3 47.7 47.3 Fixed Price (%) 58.9 58.9 59.8 60 61.6 61.9 59.4 E: MOFSL Estimates

January 2020 189
December 2019 Results Preview | Sector: Technology
Zensar Technologies Buy CMP INR 181| TP: INR210 (+17%) EPS CHANGE (%): FY20|21: 6.5|21.9 Completion of large transformation deal to be overhang. Utilization, onsite/offshore mix, INR dep to drive margins Outlook in MVS business. Progress on change in value proposition in Retail.
Quarterly Perf. (INR m) Y/E March FY19 FY20E FY19 FY20E
1Q 2Q 3Q 4Q 1Q 2Q 3QE 4QE Revenue (USD m) 132 135 142 149 153 152 155 159 557 620 QoQ (%) 4.1 2.4 5.1 4.9 3.1 -0.7 2.0 2.2 15.6 11.2 Revenue (INR m) 8,827 9,465 10,220 10,476 10,661 10,723 10,875 11,115 38,988 43,373 YoY (%) 19.8 24.1 28.8 28.6 20.8 13.3 6.4 6.1 29.7 11.2 GPM (%) 31.1 29.4 27.5 28.9 29.4 29.1 30.1 30.8 29.1 29.9 SGA (%) 16.5 16.5 16.0 15.7 15.2 15.1 15.5 15.8 16.1 15.4 EBITDA 1,252 1,275 1,171 1,381 1,515 1,500 1,590 1,665 5,079 6,270 EBITDA Margin (%) 14.2 13.5 11.5 13.2 14.2 14.0 14.6 15.0 13.0 14.5 EBIT Margin (%) 12.1 11.1 9.1 10.8 10.7 10.4 11.0 11.4 10.7 10.9 Other income 169 391 5 228 146 181 138 134 793 599 ETR (%) 27.8 28.1 28.0 29.9 28.4 28.5 28.0 28.0 28.5 28.2 PAT 836 951 587 870 787 799 910 960 3,244 3,455 QoQ (%) 15.1 13.8 -38.3 48.3 -9.6 1.5 13.9 5.5 YoY (%) 77.1 52.1 -0.7 19.9 -5.8 -16.0 55.1 10.3 40.6 6.5 EPS (INR) 3.7 4.2 2.6 3.9 3.5 3.5 4.0 4.2 14.4 15.2 Headcount 8,790 9,138 9,456 9,748 10,166 10,219 10,464 10,414 9,748 10,414 Utilization (%) 85.8 82.6 81.7 83.4 82.4 84.1 80.5 81.0 83.4 82.0 Offshore rev. (%) 35.4 33.6 32.6 32.6 31.9 33.3 32.0 31.9 33.5 32.3

January 2020 190
December 2019 Results Preview | Sector: Telecom
Price hike benefits to seep in
The stress in the telecom sector has called for combined efforts by both the government and telcos to clear the financial mess. The recent much-needed ~25% price hike, the passing of IUC to customers and the improving mix of MBB subscribers are all expected to drive a revival in earnings growth in 3QFY20. This apart, companies have continued emphasizing on subscriber growth. This is evident from healthy subscriber addition by RJio, according to the Oct’19 subscriber data. We expect only 20-25% of price increase benefits to accrue in 3QFY20 as most subscribers were using three-month validity bundles when the hike was announced. The remaining benefit is likely to be realized in subsequent quarters. We expect telcos to witness incremental EBITDA margin of 70% from the ARPU increase.
Bharti and VIL are likely to benefit on the ARPU front from better MBB subscriber addition because of RJio’s decision to pass on IUC to users in Oct’19. However, their gains will be limited given RJio’s improving market share.
The TRAI’s decision to continue the current IUC regime of INR0.06/minute until Dec’20 will benefit both Bharti and VIL, but the impact will reflect in 4QFY20. Although the recent SC judgment on AGR liabilities is a setback for the incumbents (and could dent their near-term leverage position), the government efforts instill some confidence in the sector. Overall, for 3QFY20, we estimate decent QoQ revenue/EBITDA growth for the industry.
Recent developments conducive for Bharti wireless business growth We expect Bharti India wireless segment revenue to increase 5% QoQ to INR115b in 3QFY20. Subscriber base is estimated to increase by 0.5% on the back of strong additions in Oct/Nov’19 due to RJio’s launch of IUC plans, which should be partially offset by TTSL subscriber churn. Additionally, we estimate ARPU increase of 4.5% to INR134 due to healthy MBB subscriber addition in Oct/Nov (favourable ARPU mix) and the price increase in Dec’19. Bharti’s India wireless EBITDA is estimated to increase 9.5% with a margin of 38% (+150bp) on the back of higher ARPU and stable network costs. For Telemedia/Enterprise business, 2QFY20 should be the new base and we expect revenue to remain flat at INR6b/INR34b. Africa business is likely to deliver healthy revenue/EBITDA growth of 3% each. At the consolidated level, revenue is expected to increase by 3.7% with EBITDA growth of 5.2% on the account of the healthy performance of the India wireless and Africa businesses.
VIL to see reversal on subscriber and ARPU trend VIL is expected to witness subscriber addition of 1.2% (due to RJio’s launch of IUC plans) and ARPU growth of 4% (on the account of price increase/better mix of high ARPU MBB subscribers). Thus, revenue is expected to increase 3.1% to INR112b in the quarter. Consequently, EBITDA is estimated to increase 8% on account of higher ARPU and expected synergy gains of INR1b, which should continue until 1QFY21.
RJio to continue witnessing healthy subscriber addition RJio’s launch of IUC plans has had a limited impact with Oct’19 subscriber addition remaining robust. We have factored in 24m (7% growth) subscriber addition in
Telecom
Company name Bharti Airtel
Bharti Infratel
Tata Communications
Vodafone Idea
Research Analyst: Aliasgar Shakir ([email protected]); +91 22 6129 1565 Suhel Shaikh ([email protected]); +91 22 5036 2611; Anshul Aggarwal ([email protected]); +91 22 5036 2511

January 2020 191
December 2019 Results Preview | Sector: Telecom
3QFY20, along with an ARPU increase of 4% due to price hikes. Subsequently, revenue/EBITDA are expected to increase 11%/15% to INR137b/INR59b with margin expansion of 160bp.
Bharti Infratel, TCOM to deliver muted performance Bharti Infratel is expected to deliver flat QoQ revenue growth as both tenancy addition and rental growth have remained flat QoQ. This indicates that the cut in VIL tenancies has stalled, but new industry addition is largely through selective tower adds. Thus, operating leverage benefits from tenancy growth have been restricted. EBITDA is expected to increase 4% QoQ to INR15b with some benefit from energy EBITDA, which is estimated to rise 3x off a low base. TCOM is expected to deliver 2.1% QoQ revenue growth on a consolidated basis – (data segment to grow at 3% QoQ, but voice segment revenue to decline by 1% QoQ). Consol. EBITDA is expected to increase by 2% on account of 3% growth in the data segment, which should be partially offset by a 5% decline in the voice segment.
Exhibit 157: Expected quarterly performance summary Sector CMP SALES (INR M) EBDITA (INR M) NET PROFIT (INR M)
(INR) RECO Dec-19 Var % YoY
Var % QoQ Dec-19 Var
% YoY Var
% QoQ Dec-19 Var % YoY
Var % QoQ
Telecom Bharti Airtel 455 Buy 219,157 8.3 3.7 93,209 49.9 5.2 -4,149 Loss Loss
Bharti Infratel 254 Neutral 35,982 -1.2 1.0 15,349 2.0 3.7 7,832 20.8 -18.9
Tata Comm 405 Neutral 43,639 2.2 2.1 7,828 -7.1 2.2 407 76.0 -25.2
Vodafone Idea 6 Buy 111,846 -4.9 3.1 36,256 218.9 8.3 -41,715 Loss Loss
Sector Aggregate 410,625 2.9 3.1 152,642 57.3 5.6 -37,625 Loss Loss
Exhibit 158: Industry’s wireless subscriber and net addition trend (m)
Source: TRAI, MOFSL
6 6 0 -1 -3 -5 -16
5
-15
5
27
-58
6 15 11 10
2 1 2 4 6 2
-22
0 0 4 3 3 3 10
1,080
1,110
1,140
1,170
1,200
May
-17
Jun-
17Ju
l-17
Aug-
17Se
p-17
Oct
-17
Nov
-17
Dec-
17Ja
n-18
Feb-
18M
ar-1
8Ap
r-18
May
-18
Jun-
18Ju
l-18
Aug-
18Se
p-18
Oct
-18
Nov
-18
Dec-
18Ja
n-19
Feb-
19M
ar-1
9Ap
r-19
May
-19
Jun-
19Ju
l-19
Aug-
19Se
p-19
Oct
-19
Wireless Subsriber (m) Wireless Subsriber net additions (m)

January 2020 192
December 2019 Results Preview | Sector: Telecom
Exhibit 159: Player-wise QoQ ARPU trend (INR)
*Represents Vodafone Idea merged co performance
Source: Company, MOFSL
Exhibit 160: Player-wise QoQ ARPU growth trend (%)
*Represents Vodafone Idea merged co performance
Source: Company, MOFSL
Exhibit 161: Player-wise QoQ wireless traffic trend (b min)
*Represents Vodafone Idea merged co performance
Source: Company, MOFSL
Exhibit 162: Player-wise QoQ wireless traffic growth trend (%)
*Represents Vodafone Idea merged co performance
Source: Company, MOFSL
Exhibit 163: Player-wise QoQ data traffic trend (b Mb)
*Represents Vodafone Idea merged co performance
Source: Company, MOFSL
Exhibit 164: Player-wise QoQ data traffic growth trend (%)
*Represents Vodafone Idea merged co performance
Source: Company, MOFSL
80
110
140
170
200
1Q 2Q 3Q 4Q 1Q 2Q*
3Q*
4Q*
1Q*
2Q*
3Q*
FY18 FY19 FY20
Bharti (India) Idea RJio
-20
-10
0
10
20
1QFY
17
2QFY
17
3QFY
17
4QFY
17
1QFY
18
2QFY
18
3QFY
18
4QFY
18
1QFY
19
2QFY
19*
3QFY
19*
4QFY
19*
1QFY
20*
2QFY
20*
3QFY
20E*
Bharti (India) Idea RJio
315
313
330
381
422
437
495
593
684
693
703
731
737
717
727
199
196
210
231
251
255
283 33
0
350
731
712
703
676
631
635
246
311
372
449
534
634
724
786
813
887
1Q 2Q 3Q 4Q 1Q 2Q 3Q 4Q 1Q 2Q*
3Q*
4Q*
1Q*
2Q*
3Q*
FY17 FY18 FY19 FY20
Bharti (India) Idea RJio
-4
4
12
20
28
1QFY
17
2QFY
17
3QFY
17
4QFY
17
1QFY
18
2QFY
18
3QFY
18
4QFY
18
1QFY
19
2QFY
19*
3QFY
19*
4QFY
19*
1QFY
20*
2QFY
20*
3QFY
20E*
Bharti (India) Idea RJio
0
4000
8000
12000
16000
1Q 2Q 3Q 4Q 1Q 2Q 3Q 4Q 1Q 2Q*
3Q*
4Q*
1Q*
2Q*
3Q*
FY17 FY18 FY19 FY20
Bharti (India) Idea RJio
0
50
100
150
200
1QFY
172Q
FY17
3QFY
174Q
FY17
1QFY
182Q
FY18
3QFY
184Q
FY18
1QFY
192Q
FY19
*3Q
FY19
*4Q
FY19
*1Q
FY20
*2Q
FY20
*3Q
FY20
E*
Bharti (India) Idea RJio
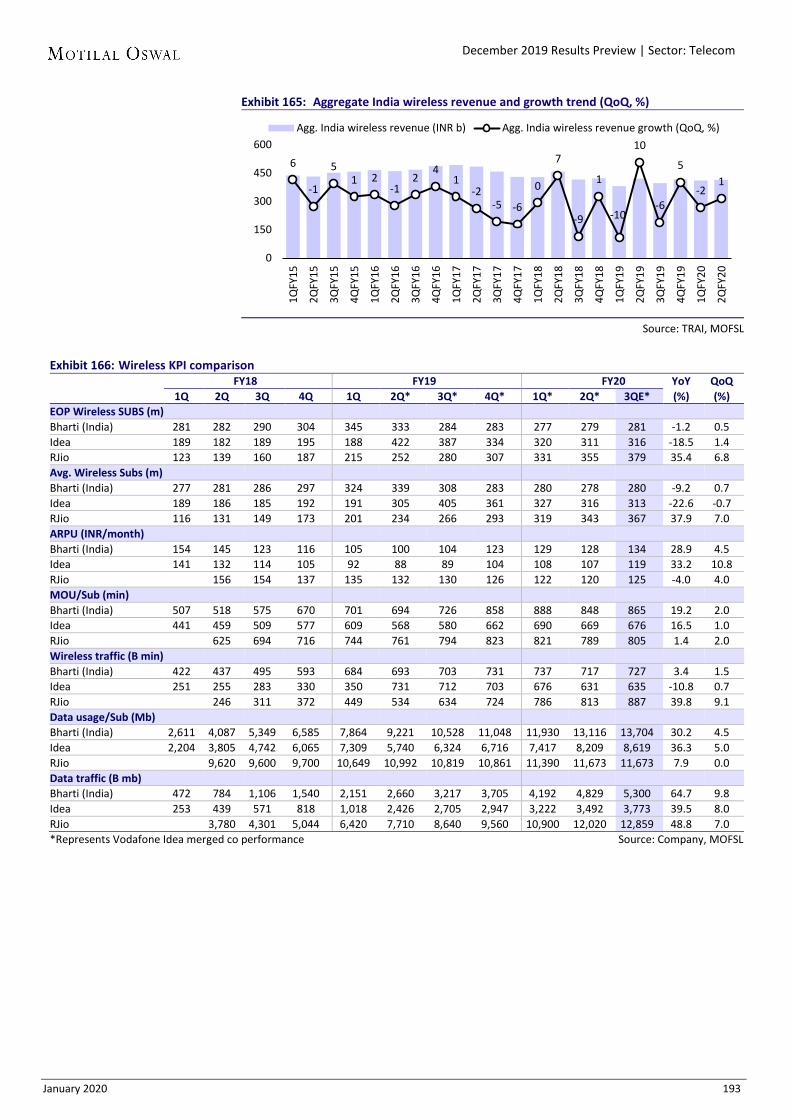
January 2020 193
December 2019 Results Preview | Sector: Telecom
Exhibit 165: Aggregate India wireless revenue and growth trend (QoQ, %)
Source: TRAI, MOFSL
Exhibit 166: Wireless KPI comparison
FY18 FY19 FY20 YoY QoQ 1Q 2Q 3Q 4Q 1Q 2Q* 3Q* 4Q* 1Q* 2Q* 3QE* (%) (%) EOP Wireless SUBS (m) Bharti (India) 281 282 290 304 345 333 284 283 277 279 281 -1.2 0.5 Idea 189 182 189 195 188 422 387 334 320 311 316 -18.5 1.4 RJio 123 139 160 187 215 252 280 307 331 355 379 35.4 6.8 Avg. Wireless Subs (m) Bharti (India) 277 281 286 297 324 339 308 283 280 278 280 -9.2 0.7 Idea 189 186 185 192 191 305 405 361 327 316 313 -22.6 -0.7 RJio 116 131 149 173 201 234 266 293 319 343 367 37.9 7.0 ARPU (INR/month) Bharti (India) 154 145 123 116 105 100 104 123 129 128 134 28.9 4.5 Idea 141 132 114 105 92 88 89 104 108 107 119 33.2 10.8 RJio 156 154 137 135 132 130 126 122 120 125 -4.0 4.0 MOU/Sub (min) Bharti (India) 507 518 575 670 701 694 726 858 888 848 865 19.2 2.0 Idea 441 459 509 577 609 568 580 662 690 669 676 16.5 1.0 RJio 625 694 716 744 761 794 823 821 789 805 1.4 2.0 Wireless traffic (B min) Bharti (India) 422 437 495 593 684 693 703 731 737 717 727 3.4 1.5 Idea 251 255 283 330 350 731 712 703 676 631 635 -10.8 0.7 RJio 246 311 372 449 534 634 724 786 813 887 39.8 9.1 Data usage/Sub (Mb) Bharti (India) 2,611 4,087 5,349 6,585 7,864 9,221 10,528 11,048 11,930 13,116 13,704 30.2 4.5 Idea 2,204 3,805 4,742 6,065 7,309 5,740 6,324 6,716 7,417 8,209 8,619 36.3 5.0 RJio 9,620 9,600 9,700 10,649 10,992 10,819 10,861 11,390 11,673 11,673 7.9 0.0 Data traffic (B mb) Bharti (India) 472 784 1,106 1,540 2,151 2,660 3,217 3,705 4,192 4,829 5,300 64.7 9.8 Idea 253 439 571 818 1,018 2,426 2,705 2,947 3,222 3,492 3,773 39.5 8.0 RJio 3,780 4,301 5,044 6,420 7,710 8,640 9,560 10,900 12,020 12,859 48.8 7.0
*Represents Vodafone Idea merged co performance Source: Company, MOFSL
6
-1
5 1 2
-1 2
4 1
-2 -5 -6
0
7
-9
1
-10
10
-6
5
-2 1
0
150
300
450
600
1QFY
15
2QFY
15
3QFY
15
4QFY
15
1QFY
16
2QFY
16
3QFY
16
4QFY
16
1QFY
17
2QFY
17
3QFY
17
4QFY
17
1QFY
18
2QFY
18
3QFY
18
4QFY
18
1QFY
19
2QFY
19
3QFY
19
4QFY
19
1QFY
20
2QFY
20
Agg. India wireless revenue (INR b) Agg. India wireless revenue growth (QoQ, %)

January 2020 194
December 2019 Results Preview | Sector: Telecom
Exhibit 167: Quarterly financials (pro forma) FY18 FY19 FY20 YoY QoQ 1Q 2Q 3Q 4Q 1Q 2Q* 3Q* 4Q* 1Q* 2Q* 3QE* (%) (%) Revenue (INR b) Bharti (India wireless) 129 122 108 104 105 103 102 106 109 110 115 13.3 5.1 Bharti (consolidated) 220 218 203 194 201 204 202 206 207 211 219 8.3 3.7 Idea 82 75 65 61 59 77 118 118 113 108 112 -4.9 3.1 RJio 61 69 71 81 92 104 111 117 124 137 32.4 11.3 EBITDA (INR b) Bharti (India wireless) 44 42 35 29 28 21 19 26 39 40 44 124.2 9.5 Bharti (consolidated) 78 79 75 69 67 62 62 66 83 89 93 49.9 5.2 Idea 19 15 12 14 7 5 11 18 37 33 36 218.9 8.3 RJio 14 26 27 31 36 41 43 47 51 59 46.4 15.4 EBITDA Margin (%) Bharti (India wireless) 34.3 34.4 32.6 28.4 26.3 20.9 19.1 24.1 35.7 36.3 37.9 1874bps 153bps Bharti (consolidated) 35.3 36.4 36.8 35.7 33.5 30.6 30.7 32.2 39.9 41.9 42.5 1180bps 60bps Idea 23.0 20.1 18.8 23.6 11.2 6.0 9.7 15.2 32.4 30.9 32.4 2275bps 155bps RJio 23.5 38.2 37.8 38.8 38.7 39.0 39.0 40.0 41.6 43.1 412bps 155bps PAT (INR b) Bharti (consolidated) 4 3 3 1 1 1 1 1 (28.7) (230.4) (4.1) NM NM Idea (8.1) (11.1) (12.8) (9.6) 3 (49.7) (50.0) (48.8) (48.7) (509.2) (41.7) NM NM RJio (2.7) 5 5 6 7 8 8 9 10 15 83.8 54.3 EPS (INR) Bharti 0.9 0.9 0.8 0.2 0.2 0.3 0.2 0.3 (5.6) (44.9) (0.8) NM NM Idea (2.3) (3.1) (3.6) (2.5) 0.6 (5.7) (5.7) (5.6) (5.6) (58.3) (4.8) NM NM RJio 0.0 (0.1) 0.1 0.1 0.1 0.2 0.2 0.2 0.2 0.2 0.3 83.8 54.3
*Represents Vodafone Idea merged co performance Source: Company, MOFSL
Exhibit 168: Relative performance – 3M (%)
Source: Bloomberg, MOFSL
Exhibit 169: Relative performance – 1Y (%)
Source: Bloomberg, MOFSL
Exhibit 170: Comparative valuation CMP EPS (INR) PE (x) PB (x) RoE (%) Company Name INR Reco FY20E FY21E FY22E FY20E FY21E FY22E FY20E FY21E FY22E FY20E FY21E FY22E Telecom -19 -24 -28.7 2.9 3.4 4.0 -15.0 -14.3 -14.1 Bharti Airtel 455 Buy -2.9 -0.9 1.8 -156.7 -509.5 247.7 3.3 3.3 3.2 -2.1 -0.6 1.3 Bharti Infratel 254 Neutral 18.4 17.7 26.4 13.8 14.4 9.6 3.2 3.2 2.9 23.3 22.2 31.3 Tata Comm 405 Neutral 10.9 23.4 32.7 37.0 17.3 12.4 111.3 14.9 6.8 -798 152.6 75.2 Vodafone Idea 6 Buy -6.4 -5.7 -6.1 -1.0 -1.1 -1.0 0.8 4.0 -1.3 -45.6 -130.4 400.7
Source: Company, MOFSL
90
98
106
114
122
Sep-
19
Oct
-19
Nov
-19
Dec-
19
Nifty Index MOSL Telecom Index
96
108
120
132
144
Dec-
18
Jan-
19
Feb-
19
Mar
-19
Apr-
19
May
-19
Jun-
19
Jul-1
9
Aug-
19
Sep-
19
Oct
-19
Nov
-19
Dec-
19
Nifty Index MOSL Telecom Index

January 2020 195
December 2019 Results Preview | Sector: Telecom
The tables below provide a snapshot of actual and estimated numbers for companies under the MOFSL coverage universe. Highlighted columns indicate the quarter/financial year under review.
Bharti Airtel Buy CMP INR 455 | TP: INR575 (+26%) EPS CHANGE (%): FY20|21: NM|NM 20-25% of price increase benefits to accrue in 3QFY20. Expect healthy subscriber addition in Oct-Nov’19. Estimate 70% EBITDA margin on incremental revenue. 2QFY20 is the new base for Enterprise/Telemedia.
Consol. - Quarterly Earning Model
(INR m)
Y/E March FY19 FY20 FY19 FY20E 1Q 2Q 3Q 4Q 1Q 2Q 3QE 4QE Revenue 2,00,800 2,04,225 2,02,311 2,06,022 2,07,379 2,11,313 2,19,157 2,29,247 8,07,802 8,67,180 YoY Change (%) -8.6 -6.2 -0.4 6.2 3.3 3.5 8.3 11.3 -2.2 7.4 Total Expenditure 1,33,542 1,41,790 1,40,131 1,39,706 1,24,577 1,22,710 1,25,948 1,29,040 5,49,613 5,02,275 EBITDA 67,258 62,435 62,180 66,316 82,802 88,603 93,209 1,00,207 2,58,189 3,64,905 YoY Change (%) -13.3 -21.2 -16.7 -4.3 23.1 41.9 49.9 51.1 -14.2 41.3 Depreciation 51,452 52,366 54,723 54,934 67,587 69,351 73,641 82,879 2,13,475 2,93,458 Net Finance cost 21,266 29,857 19,448 25,323 31,815 29,083 34,849 48,075 95,894 1,43,822 Other Income 2,610 1,253 -144 855 1,302 3,601 3,652 3,599 4,574 12,154 PBT before EO expense -2,850 -18,535 -12,135 -13,086 -15,298 -6,230 -11,628 -27,147 -46,606 -60,220 Extra-Ord expense 3,621 1,449 -14,137 -20,221 14,694 3,07,110 0 0 -29,288 3,21,804 PBT -6,471 -19,984 2,002 7,135 -29,992 -3,13,340 -11,628 -27,147 -17,318 -3,82,024 Tax -11,267 -22,476 -1,824 1,374 -6,070 -85,039 -4,651 -10,859 -34,193 -1,06,619 Rate (%) 174.1 112.5 -91.1 19.3 20.2 27.1 40.0 40.0 197.4 27.9 MI & P/L of Asso. Cos. 3,823 1,304 2,964 4,689 4,738 2,148 -2,828 -30,772 12,780 -26,714 Reported PAT 973 1,188 862 1,072 -28,660 -2,30,449 -4,149 14,484 4,095 -2,48,691 Adj PAT -3,004 -9,650 -10,407 -11,882 -14,001 -11,229 -4,149 14,484 -34,943 -14,895 YoY Change (%) -174.0 -304.3 -339.7 -1,524.1 366.1 16.4 -60.1 -221.9 -350.3 -57.4 E: MOFSL Estimates
Bharti Infratel Neutral CMP INR 254 | TP: INR279 (+10%) EPS CHANGE (%): FY20|21: -0.1|-0.4 Expect tenancy/rental rates to remain flat. Estimate Energy EBITDA to grow 3x on low base. Estimate tower addition to be in line with 1HFY20. Watch out for update on merger completion.
Quarterly Performance
(INR m)
Y/E March FY19 FY20 FY19 FY20E (Consolidated) 1Q 2Q 3Q 4Q 1Q 2Q 3QE 4QE Revenue from operations 36,735 36,683 36,402 36,003 36,297 35,612 35,982 36,379 1,45,823 1,44,268 YoY Change (%) 4.2 0.6 -0.4 -1.7 -1.2 -2.9 -1.2 1.0 8.6 -1.1 Total Expenditure 21,539 21,819 21,361 21,092 21,298 20,817 20,633 20,826 85,811 83,575 EBITDA 15,196 14,864 15,041 14,911 14,999 14,795 15,349 15,553 60,012 60,694 YoY Change (%) -3.5 -7.9 -5.9 -6.4 -1.3 -0.5 2.0 4.3 1.8 1.1 Depreciation 5,389 5,625 5,727 5,498 5,390 5,284 5,414 5,414 22,239 21,501 Interest -285 -442 -601 -243 -118 58 -116 -287 -1,571 -462 Other Income 609 557 460 408 651 349 415 415 2,034 1,831 PBT 10,701 9,881 10,375 10,064 10,378 9,802 10,466 10,841 41,021 41,485 Tax 4,321 3,883 3,891 3,988 1,946 140 2,634 2,729 16,083 7,449 Rate (%) 40.4 39.3 37.5 39.6 18.8 1.4 25.2 25.2 39.2 18.0 Reported PAT 6,380 5,998 6,484 6,076 8,432 9,662 7,832 8,112 24,938 34,036 Adj PAT 6,380 6,215 6,484 6,076 8,432 9,662 7,832 8,112 25,155 34,036 YoY Change (%) -3.9 -2.7 10.8 -4.3 32.2 55.5 20.8 33.5 -8.4 35.3
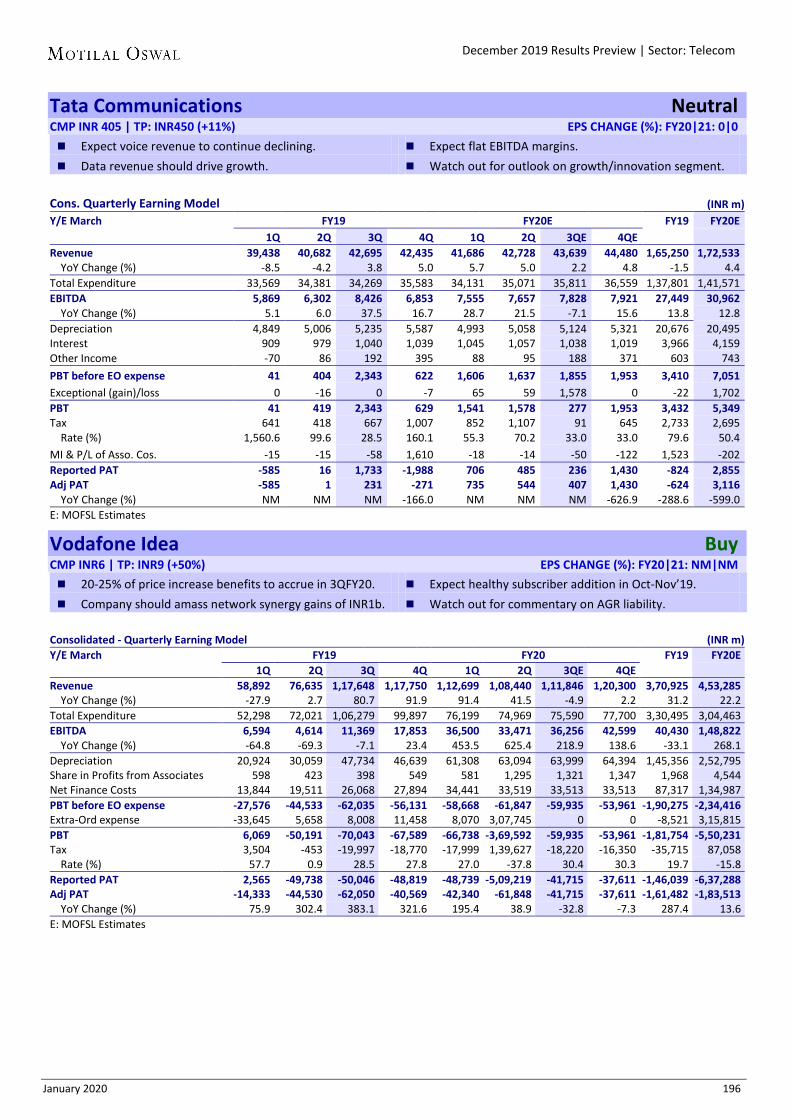
January 2020 196
December 2019 Results Preview | Sector: Telecom
Tata Communications Neutral CMP INR 405 | TP: INR450 (+11%) EPS CHANGE (%): FY20|21: 0|0 Expect voice revenue to continue declining. Expect flat EBITDA margins. Data revenue should drive growth. Watch out for outlook on growth/innovation segment.
Cons. Quarterly Earning Model
(INR m)
Y/E March FY19 FY20E FY19 FY20E 1Q 2Q 3Q 4Q 1Q 2Q 3QE 4QE Revenue 39,438 40,682 42,695 42,435 41,686 42,728 43,639 44,480 1,65,250 1,72,533 YoY Change (%) -8.5 -4.2 3.8 5.0 5.7 5.0 2.2 4.8 -1.5 4.4 Total Expenditure 33,569 34,381 34,269 35,583 34,131 35,071 35,811 36,559 1,37,801 1,41,571 EBITDA 5,869 6,302 8,426 6,853 7,555 7,657 7,828 7,921 27,449 30,962 YoY Change (%) 5.1 6.0 37.5 16.7 28.7 21.5 -7.1 15.6 13.8 12.8 Depreciation 4,849 5,006 5,235 5,587 4,993 5,058 5,124 5,321 20,676 20,495 Interest 909 979 1,040 1,039 1,045 1,057 1,038 1,019 3,966 4,159 Other Income -70 86 192 395 88 95 188 371 603 743 PBT before EO expense 41 404 2,343 622 1,606 1,637 1,855 1,953 3,410 7,051 Exceptional (gain)/loss 0 -16 0 -7 65 59 1,578 0 -22 1,702 PBT 41 419 2,343 629 1,541 1,578 277 1,953 3,432 5,349 Tax 641 418 667 1,007 852 1,107 91 645 2,733 2,695 Rate (%) 1,560.6 99.6 28.5 160.1 55.3 70.2 33.0 33.0 79.6 50.4 MI & P/L of Asso. Cos. -15 -15 -58 1,610 -18 -14 -50 -122 1,523 -202 Reported PAT -585 16 1,733 -1,988 706 485 236 1,430 -824 2,855 Adj PAT -585 1 231 -271 735 544 407 1,430 -624 3,116 YoY Change (%) NM NM NM -166.0 NM NM NM -626.9 -288.6 -599.0 E: MOFSL Estimates
Vodafone Idea Buy CMP INR6 | TP: INR9 (+50%) EPS CHANGE (%): FY20|21: NM|NM 20-25% of price increase benefits to accrue in 3QFY20. Expect healthy subscriber addition in Oct-Nov’19. Company should amass network synergy gains of INR1b. Watch out for commentary on AGR liability.
Consolidated - Quarterly Earning Model
(INR m)
Y/E March FY19 FY20 FY19 FY20E 1Q 2Q 3Q 4Q 1Q 2Q 3QE 4QE Revenue 58,892 76,635 1,17,648 1,17,750 1,12,699 1,08,440 1,11,846 1,20,300 3,70,925 4,53,285 YoY Change (%) -27.9 2.7 80.7 91.9 91.4 41.5 -4.9 2.2 31.2 22.2 Total Expenditure 52,298 72,021 1,06,279 99,897 76,199 74,969 75,590 77,700 3,30,495 3,04,463 EBITDA 6,594 4,614 11,369 17,853 36,500 33,471 36,256 42,599 40,430 1,48,822 YoY Change (%) -64.8 -69.3 -7.1 23.4 453.5 625.4 218.9 138.6 -33.1 268.1 Depreciation 20,924 30,059 47,734 46,639 61,308 63,094 63,999 64,394 1,45,356 2,52,795 Share in Profits from Associates 598 423 398 549 581 1,295 1,321 1,347 1,968 4,544 Net Finance Costs 13,844 19,511 26,068 27,894 34,441 33,519 33,513 33,513 87,317 1,34,987 PBT before EO expense -27,576 -44,533 -62,035 -56,131 -58,668 -61,847 -59,935 -53,961 -1,90,275 -2,34,416 Extra-Ord expense -33,645 5,658 8,008 11,458 8,070 3,07,745 0 0 -8,521 3,15,815 PBT 6,069 -50,191 -70,043 -67,589 -66,738 -3,69,592 -59,935 -53,961 -1,81,754 -5,50,231 Tax 3,504 -453 -19,997 -18,770 -17,999 1,39,627 -18,220 -16,350 -35,715 87,058 Rate (%) 57.7 0.9 28.5 27.8 27.0 -37.8 30.4 30.3 19.7 -15.8 Reported PAT 2,565 -49,738 -50,046 -48,819 -48,739 -5,09,219 -41,715 -37,611 -1,46,039 -6,37,288 Adj PAT -14,333 -44,530 -62,050 -40,569 -42,340 -61,848 -41,715 -37,611 -1,61,482 -1,83,513 YoY Change (%) 75.9 302.4 383.1 321.6 195.4 38.9 -32.8 -7.3 287.4 13.6 E: MOFSL Estimates

January 2020 197
December 2019 Results Preview | Sector: Utilities
Power demand declines but availability improves Valuations at lower end of historical average; prefer NTPC and COAL
Conventional electricity generation decreased 10% YoY in the first two months of 3QFY20. Coal-based generation declined ~14% YoY, nuclear generation again witnessed growth of ~13% YoY, while hydro generation increased ~24% YoY during the same period. Overall generation (including RE) decreased ~10% YoY. Renewable generation declined ~1% YoY. Solar generation improved ~15% YoY in the first two months of the quarter while wind generation dipped 6% YoY for the same period. For the first two months of 3QFY20, demand declined by 13% YoY for the Western region (MP: -20% YoY; Maharashtra: -15% YoY), while 9.5% YoY decline was seen in the Southern Region (Telangana and Karnataka: 16% each YoY). Coal India’s production was impacted due to heavy monsoons and flooding at some of its subsidiaries. However, lower offtake due to reduced demand from the Power sector has improved the situation of coal stocks. Coal availability for NTPC’s plants within the Korba coalfield (Sipat, Korba Stg.-III) has improved. With improving coal availability, we expect INR600m of fixed cost recoveries in this quarter for NTPC. We expect NTPC’s adj. PAT (excluding FC u/r) to increase ~21% YoY to ~INR30.9b on the back of higher regulated equity, higher other income post accrual of late payment surcharge and benefit of new CERC regulations. Reported PAT should rise 31% YoY to INR31b. Coal India’s EBITDA (ex-OBR) is expected to decrease ~29% YoY to INR56.8b due to lower sales volumes and FSA realization. PAT should decline ~26% YoY to INR33.7b. Power Grid’s PAT is expected to increase ~8% YoY to INR25.5b on account of continued capitalization and recovery of employee charges related to pay hike. NHPC’s PAT should see a sharp YoY rise to INR3.9b (v/s INR1.8b) on a low base as the previous year included the impact of pay revision hike. CESC’s standalone PAT growth will remain muted as the regulator has not approved the tariff hike for FY19. Tata Power’s adj. PAT is expected to come in at INR2.5b on better working of the Mundra-Coal JV hedge. Torrent Power’s adj. PAT is expected to decrease 5% YoY to INR2.3b. Top picks – NTPC and Coal India At current valuations, the utilities sector is trading at the lower end of its 10-year historical P/E and P/BV range. Valuations are heavily discounting the risk to growth potential. Our top picks are Coal India (to benefit from continued volume growth and operating leverage) and NTPC (capitalization-driven, double-digits regulated equity and earnings growth). Continued government divestment though would continue to be a risk.
Utilities
Company name
CESC
Coal India
JSW Energy
NHPC
NTPC
Power Grid Corp.
Tata Power
Aniket Mittal – Research analyst ([email protected]) +91 22 6129 1572

January 2020 198
December 2019 Results Preview | Sector: Utilities
Exhibit 171: Expected quarterly performance summary Sector CMP SALES (INR M) EBDITA (INR M) NET PROFIT (INR M)
(INR) RECO Dec-19 Var % YoY
Var % QoQ Dec-19 Var
% YoY Var
% QoQ Dec-19 Var % YoY
Var % QoQ
Utilities CESC 754 Buy 17,829 4.4 -20.6 3,978 97.9 -14.1 1,794 4.3 -34.8 Coal India 211 Buy 225,743 -9.9 10.8 56,780 -28.7 33.6 33,671 -26.3 -4.5 JSW Energy 70 Neutral 17,274 -28.7 -18.5 5,989 -18.9 -35.9 594 -59.3 -83.2 NHPC 24 Neutral 17,919 14.0 -31.2 9,284 55.8 -41.2 3,996 119.3 -70.2 NTPC 121 Buy 238,826 0.3 1.1 74,165 18.3 2.8 30,859 20.9 -11.1 Power Grid Corp. 195 Buy 89,671 7.9 -0.8 82,527 11.4 4.3 25,481 8.1 1.5 Tata Power 58 Neutral 74,656 -3.1 -2.8 16,992 6.1 -24.7 2,493 LP -28.9 Torrent Power 288 Buy 33,187 2.0 -13.6 7,764 5.4 -26.4 2,252 -5.0 -70.2 Sector Aggregate 715,104 -3.1 0.0 257,479 0.9 0.3 101,140 0.1 -19.6
Exhibit 172: Relative performance—3m (%)
Source: Bloomberg, MOFSL
Exhibit 173: Relative performance—1Yr (%)
Source: Bloomberg, MOFSL
Exhibit 174: Comparative valuation CMP EPS (INR) PE (x) PB (x) RoE (%) Company Name INR Reco FY20E FY21E FY22E FY20E FY21E FY22E FY20E FY21E FY22E FY20E FY21E FY22E Utilities 8.9 8.3 7.3 1.5 1.3 1.2 16.4 16.3 16.9 CESC 754 Buy 91.9 99.5 120.8 8.2 7.6 6.2 1.0 0.9 0.8 13.0 12.8 14.1 Coal India 211 Buy 27.0 27.6 31.7 7.8 7.7 6.7 4.8 4.2 3.7 61.4 55.1 56.1 JSW Energy 70 Neutral 4.5 5.6 6.2 15.4 12.4 11.2 0.9 0.9 0.8 6.2 7.4 7.7 NHPC 24 Neutral 3.0 3.0 3.1 7.9 8.0 7.7 0.7 0.7 0.7 9.6 9.1 9.0 NTPC 121 Buy 13.1 15.2 17.5 9.2 8.0 6.9 1.0 0.9 0.9 11.4 12.3 13.0 Power Grid Corp. 195 Buy 20.8 22.8 25.0 9.4 8.5 7.8 1.6 1.4 1.3 17.4 17.2 16.9 Tata Power 58 Neutral 4.2 4.7 4.6 13.7 12.4 12.6 0.9 0.9 0.8 6.7 7.1 6.8 Torrent Power 288 Buy 28.9 27.8 30.6 10.0 10.4 9.4 1.4 1.2 1.1 14.6 12.6 12.6
90
95
100
105
110
Sep-
19
Oct
-19
Nov
-19
Dec-
19
Nifty Index MOSL Utilities Index
80
90
100
110
120
Dec-
18
Jan-
19
Feb-
19
Mar
-19
Apr-
19
May
-19
Jun-
19
Jul-1
9
Aug-
19
Sep-
19
Oct
-19
Nov
-19
Dec-
19
Nifty Index MOSL Utilities Index

January 2020 199
December 2019 Results Preview | Sector: Utilities
The tables below provide a snapshot of actual and estimated numbers for companies under the MOFSL coverage universe. Highlighted columns indicate the quarter/financial year under review.
CESC Buy CMP INR751 | TP: INR957 (+27%) EPS CHANGE (%): FY20|21: No Change PAT growth to be muted on delay in tariff hike approval. Watch out for sales in distribution circle. Watch out for performance of DFs. Watch out for offtake from Dhariwal’s PPA.
Quarterly performance (INR Million) Y/E March FY19 FY20 FY19 FY20 1Q 2Q 3Q 4Q 1Q 2Q 3QE 4QE Sales 21,650 22,200 17,070 16,620 23,590 22,460 17,829 14,733 77,540 78,612 EBITDA 4,960 5,110 2,010 1,500 4,420 4,630 3,978 6,562 13,576 19,590 Change (%) -18.3 1.2 -36.0 -28.2 -10.9 -9.4 97.9 337.4 -17.5 44.3 As of % Sales 22.9 23.0 11.8 9.0 18.7 20.6 22.3 44.5 17.5 24.9 Depreciation 1,100 1,110 1,090 1,030 1,090 1,080 1,131 1,187 4,326 4,488 Interest 1,200 1,200 1,170 1,090 1,300 1,270 1,154 877 4,664 4,601 Other Income 200 280 450 720 230 450 477 611 1,649 1,769 Regulatory (inc)/exp 500 -370 -2,000 -3,830 -500 -480 0 980 -5,700 0 PBT 2,360 3,450 2,200 3,930 2,760 3,210 2,170 4,130 11,935 12,270 Tax 520 740 480 840 590 460 376 782 2,574 2,209 Effective Tax Rate (%) 22.0 21.4 21.8 21.4 21.4 14.3 17.3 18.9 21.6 18.0 Reported PAT 1,840 2,710 1,720 3,090 2,170 2,750 1,794 3,347 9,361 10,061 Adjusted PAT 1,840 2,710 1,720 3,090 2,170 2,750 1,794 3,347 9,361 10,061 Change (%) 3.4 9.7 11.7 9.2 17.9 1.5 4.3 8.3 6.5 7.5
Coal India Buy CMP INR211 | TP: INR271 (+28%) EPS CHANGE (%): FY20|21: +5.3|-3.3 Weak thermal demand to impact dispatches. Conservative on FSA realization. Watch out for e-auction volumes and realizations. Production showing signs of improvement.
Quarterly performance (INR Million) Y/E March FY19 FY20 FY19 FY20E 1Q 2Q 3Q 4Q 1Q 2Q 3QE 4QE Sales 240,708 218,840 250,458 285,463 249,390 203,826 225,743 285,904 995,469 964,863 Change (%) 25.6 20.6 15.7 6.1 3.6 -6.9 -9.9 0.2 15.9 -3.1 Adj. EBITDA 65,435 51,194 79,655 104,199 75,115 42,493 56,780 100,650 300,483 275,037 As of % Sales 27.2 23.4 31.8 36.5 30.1 20.8 25.2 35.2 30.2 28.5 Depreciation 7,452 8,069 8,611 10,372 7,343 7,930 9,210 12,421 34,504 36,904 OBR 8,835 8,023 11,777 22,077 8,991 6,381 12,110 27,407 50,712 54,889 Interest 1,103 8 620 1,019 166 1,700 626 287 2,750 2,778 Other Income 12,824 16,084 11,633 18,196 11,495 16,303 8,333 5,945 58,737 42,076 EO Inc/(Exp) 0 0 0 0 0 0 0 0 0 0 PBT 60,869 51,178 70,281 88,927 70,110 42,785 43,168 66,480 271,255 222,542 Tax 23,025 20,317 24,623 28,659 23,811 7,543 9,497 15,230 96,625 56,081 Tax Rate (%) 37.8 39.7 35.0 32.2 34.0 17.6 22.0 22.9 35.6 25.2 Reported PAT 37,843 30,861 45,657 60,268 46,299 35,243 33,671 51,250 174,630 166,462 Adjusted PAT 37,843 30,861 45,657 60,268 46,299 35,243 33,671 51,250 174,630 166,462 Change (%) 60.9 736.7 51.9 -2.3 22.3 14.2 -26.3 -15.0 46.8 -4.7

January 2020 200
December 2019 Results Preview | Sector: Utilities
JSW Energy Neutral CMP INR69 | TP: INR75 (+9%) EPS CHANGE (%): FY20|21: -4|+0.3 Expect lower merchant volumes. Expect higher hydro gen but CERC norms to offset benefit. Watch out for possible recovery of back-down charges. Watch out for update on acquisitions.
Quarterly Performance Y/E March FY19 FY20 FY19 FY20E 1Q 2Q 3Q 4Q 1Q 2Q 3QE 4QE Net Sales 23,606 24,308 24,217 19,246 24,122 21,186 17,274 25,037 91,376 87,618 YoY Change (%) 5.8 18.6 21.5 8.4 2.2 -12.8 -28.7 30.1 Total Expenditure 15,843 15,694 16,830 14,478 16,029 11,838 11,286 18,369 62,845 57,522 EBITDA 7,762 8,613 7,387 4,768 8,093 9,348 5,989 6,668 28,531 30,097 Margins (%) 32.9 35.4 30.5 24.8 33.5 44.1 34.7 26.6 31.2 34.3 Depreciation 2,899 2,933 2,933 2,872 2,913 2,943 2,951 2,902 11,637 11,709 Interest 3,130 3,083 2,948 2,764 2,698 2,722 2,700 2,684 11,924 10,804 Other Income 673 1,370 701 936 518 1,133 476 373 3,680 2,500 PBT before EO expense 2,407 3,967 2,208 68 3,000 4,816 814 1,454 8,650 10,084 Extra-Ord expense 0 0 0 0 0 0 0 0 0 0 PBT 2,407 3,967 2,208 68 3,000 4,816 814 1,454 8,650 10,084 Tax 236 1,125 638 126 883 1,338 194 207 2,124 2,622 Rate (%) 9.8 28.3 28.9 185.6 29.4 27.8 23.8 14.3 24.6 26.0 MI and Associates -121 -317 109 -97 -327 -51 26 418 -426 66 Reported PAT 2,292 3,160 1,461 39 2,444 3,530 594 829 6,951 7,397 Adj PAT 2,292 3,160 1,461 39 2,444 3,530 594 829 6,951 7,397 YoY Change (%) 5.5 6.4 211.8 -106.1 6.6 11.7 -59.3 2,041.9 40.2 6.4
NHPC Neutral CMP INR24 | TP: INR25 (+4%) EPS CHANGE (%): FY20|21: No Change Expect generation to increase 1.6% YoY. Update on Subansiri project. PAT to rise sharply off a low base of previous year. Watch out for progress on new projects.
Standalone performance Y/E March FY19 FY20 FY19 FY20E 1Q 2Q 3Q 4Q 1QE 2Q 3QE 4QE Net Sales 21,290 24,950 15,714 19,503
24,213 26,054 17,919 18,790 81,612 86,977
YoY Change (%) -8.5 26.5 4.9 71.5 13.7 4.4 14.0 -3.7 17.7 6.6 EBITDA 12,904 15,966 5,958 9,832
15,040 15,780 9,284 8,101 44,815 48,204
Depreciation 3,726 4,044 4,016 4,115
3,866 3,857 3,950 3,132 15,900 14,804 Interest 2,212 2,283 2,226 2,228
2,366 2,521 2,495 4,505 8,949 11,886
Other Income 1,129 4,716 1,199 2,359
872 4,992 1,079 1,382 9,248 8,324 Rate regulated activity 1,431 575 1,775 917 1,989 1,024 966 2,746 8,234 6,724 PBT before EO expense 9,527 14,930 2,690 6,765
11,668 15,418 4,884 4,592 37,448 36,562
Extra-Ord expense 0 0 0 0 0 0 0 0 0 0 PBT 9,527 14,930 2,690 6,765
11,668 15,418 4,884 4,592 37,448 36,562
Tax 2,151 2,745 868 1,842
2,857 2,023 888 996 11,142 6,764 Rate (%) 23 18 32 27
24 13 18 22 29.8 18.5
Reported PAT 7,376 12,185 1,822 4,923
8,811 13,395 3,996 3,596 26,306 29,798 Adj PAT 7,376 12,185 1,822 4,923
8,811 13,395 3,996 3,596 26,306 29,798
YoY Change (%) -14.5 19.6 -73.5 159.9 19.5 9.9 119.3 -4.6 13.3
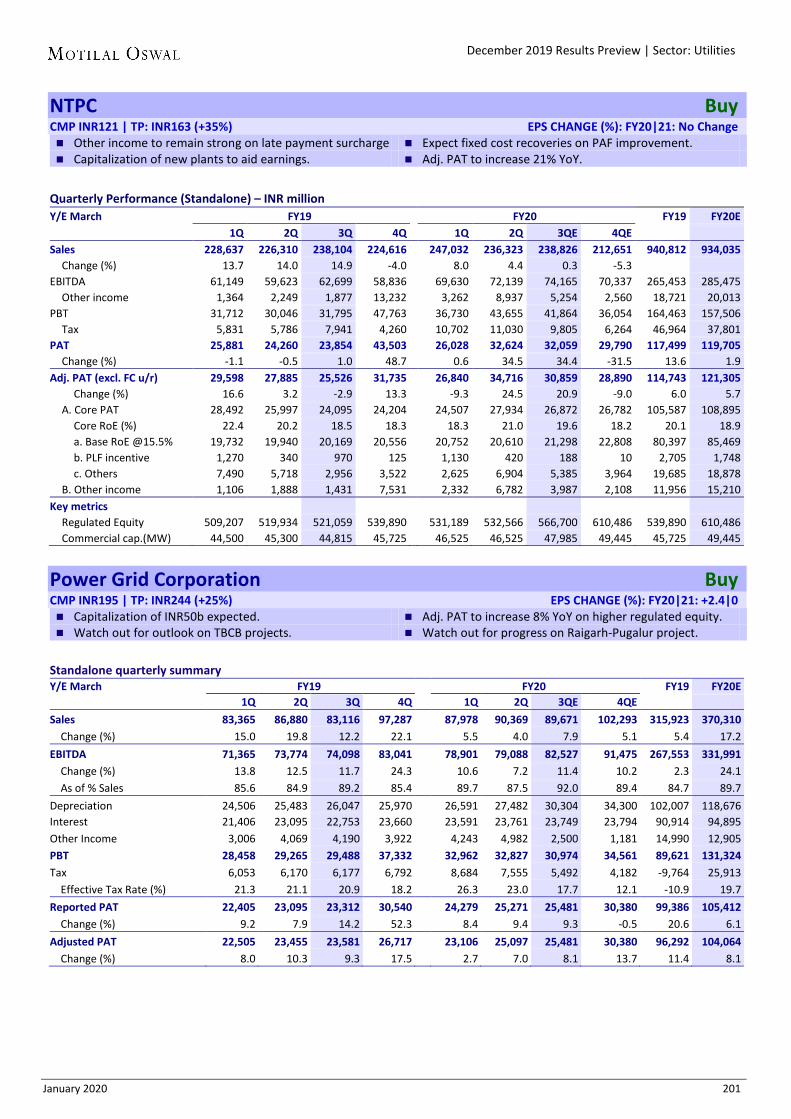
January 2020 201
December 2019 Results Preview | Sector: Utilities
NTPC Buy CMP INR121 | TP: INR163 (+35%) EPS CHANGE (%): FY20|21: No Change Other income to remain strong on late payment surcharge Expect fixed cost recoveries on PAF improvement. Capitalization of new plants to aid earnings. Adj. PAT to increase 21% YoY.
Quarterly Performance (Standalone) – INR million Y/E March FY19 FY20 FY19 FY20E 1Q 2Q 3Q 4Q 1Q 2Q 3QE 4QE Sales 228,637 226,310 238,104 224,616
247,032 236,323 238,826 212,651 940,812 934,035
Change (%) 13.7 14.0 14.9 -4.0
8.0 4.4 0.3 -5.3
EBITDA 61,149 59,623 62,699 58,836
69,630 72,139 74,165 70,337 265,453 285,475
Other income 1,364 2,249 1,877 13,232
3,262 8,937 5,254 2,560 18,721 20,013 PBT 31,712 30,046 31,795 47,763
36,730 43,655 41,864 36,054 164,463 157,506
Tax 5,831 5,786 7,941 4,260
10,702 11,030 9,805 6,264 46,964 37,801 PAT 25,881 24,260 23,854 43,503
26,028 32,624 32,059 29,790 117,499 119,705
Change (%) -1.1 -0.5 1.0 48.7 0.6 34.5 34.4 -31.5 13.6 1.9 Adj. PAT (excl. FC u/r) 29,598 27,885 25,526 31,735
26,840 34,716 30,859 28,890 114,743 121,305
Change (%) 16.6 3.2 -2.9 13.3
-9.3 24.5 20.9 -9.0 6.0 5.7 A. Core PAT 28,492 25,997 24,095 24,204
24,507 27,934 26,872 26,782 105,587 108,895
Core RoE (%) 22.4 20.2 18.5 18.3
18.3 21.0 19.6 18.2 20.1 18.9 a. Base RoE @15.5% 19,732 19,940 20,169 20,556
20,752 20,610 21,298 22,808 80,397 85,469
b. PLF incentive 1,270 340 970 125
1,130 420 188 10 2,705 1,748 c. Others 7,490 5,718 2,956 3,522
2,625 6,904 5,385 3,964 19,685 18,878
B. Other income 1,106 1,888 1,431 7,531 2,332 6,782 3,987 2,108 11,956 15,210 Key metrics
Regulated Equity 509,207 519,934 521,059 539,890
531,189 532,566 566,700 610,486 539,890 610,486 Commercial cap.(MW) 44,500 45,300 44,815 45,725
46,525 46,525 47,985 49,445 45,725 49,445
Power Grid Corporation Buy CMP INR195 | TP: INR244 (+25%) EPS CHANGE (%): FY20|21: +2.4|0 Capitalization of INR50b expected. Adj. PAT to increase 8% YoY on higher regulated equity. Watch out for outlook on TBCB projects. Watch out for progress on Raigarh-Pugalur project.
Standalone quarterly summary Y/E March FY19 FY20 FY19 FY20E 1Q 2Q 3Q 4Q
1Q 2Q 3QE 4QE
Sales 83,365 86,880 83,116 97,287 87,978 90,369 89,671 102,293 315,923 370,310 Change (%) 15.0 19.8 12.2 22.1 5.5 4.0 7.9 5.1 5.4 17.2 EBITDA 71,365 73,774 74,098 83,041
78,901 79,088 82,527 91,475 267,553 331,991
Change (%) 13.8 12.5 11.7 24.3
10.6 7.2 11.4 10.2 2.3 24.1 As of % Sales 85.6 84.9 89.2 85.4
89.7 87.5 92.0 89.4 84.7 89.7
Depreciation 24,506 25,483 26,047 25,970 26,591 27,482 30,304 34,300 102,007 118,676 Interest 21,406 23,095 22,753 23,660
23,591 23,761 23,749 23,794 90,914 94,895
Other Income 3,006 4,069 4,190 3,922
4,243 4,982 2,500 1,181 14,990 12,905 PBT 28,458 29,265 29,488 37,332 32,962 32,827 30,974 34,561 89,621 131,324 Tax 6,053 6,170 6,177 6,792
8,684 7,555 5,492 4,182 -9,764 25,913
Effective Tax Rate (%) 21.3 21.1 20.9 18.2
26.3 23.0 17.7 12.1 -10.9 19.7 Reported PAT 22,405 23,095 23,312 30,540 24,279 25,271 25,481 30,380 99,386 105,412 Change (%) 9.2 7.9 14.2 52.3 8.4 9.4 9.3 -0.5 20.6 6.1 Adjusted PAT 22,505 23,455 23,581 26,717
23,106 25,097 25,481 30,380 96,292 104,064
Change (%) 8.0 10.3 9.3 17.5 2.7 7.0 8.1 13.7 11.4 8.1

January 2020 202
December 2019 Results Preview | Sector: Utilities
Tata Power Neutral CMP INR58 | TP: INR65 (+13%) EPS CHANGE (%): FY20|21: +3.5|-3.7 Expect better working from Mundra-Coal JV hedge. Mundra losses to reduce on lower coal prices. Watch out for update on CESU project. Watch out for takeover of Praygraj.
Quarterly performance Y/E March FY19 FY20E FY19 FY20E 1Q 2Q 3Q 4Q 1Q 2Q 3QE 4QE Net Sales 73,134 75,146 77,067 72,302 77,667 76,778 74,656 61,168 295,586 290,269 YoY Change (%) 4.9 -1.9 10.9 -8.4 6.2 2.2 -3.1 -15.4 0.8 -1.8 Total Expenditure 55,426 56,067 61,050 58,816 54,647 54,218 57,664 51,999 231,359 218,527 EBITDA 17,708 19,079 16,017 13,487 23,021 22,560 16,992 9,169 64,227 71,742 Margins (%) 24.2 25.4 20.8 18.7 29.6 29.4 22.8 15.0 21.7 24.7 Depreciation 6,006 6,106 6,027 6,035 6,200 6,544 6,200 6,441 23,931 25,385 Interest 10,130 10,344 10,140 11,087 11,439 11,300 10,600 9,576 41,700 42,914 Other Income 898 1,046 148 1,867 1,079 1,072 122 977 3,958 3,250 Rate regulated activity -1,748 -3,727 -1,360 3,433 -2,000 -3,490 0 5,490 -659 0 PBT before EO expense 722 -53 -1,362 1,665 4,461 2,299 314 -381 1,895 6,693 Extra-Ord expense 14,496 593 2,380 -1,767 -1,131 -747 0 5,661 16,200 3,783 PBT 15,218 540 1,018 -102 3,330 1,552 314 5,280 18,095 10,476 Tax 1,556 935 1,498 1,152 3,429 520 68 -1,757 6,561 2,259 Rate (%) 10
147 -1,135 103 33 22 -33 36.3 21.6
MI & P/L of Asso. Cos. 3,047 3,752 1,747 1,830 1,612 1,725 2,247 1,410 10,376 6,993 Reported PAT 16,709 3,358 1,267 576 1,513 2,757 2,493 8,447 21,909 15,209 Adj PAT 2,213 2,764 -1,113 2,342 2,644 3,504 2,493 2,786 5,710 11,426 EBITDA+R.Reg.+JVs 19,649 19,679 17,183 19,247 23,428 21,602 19,838 16,634 73,696 81,502
Torrent Power Buy CMP INR288 | TP: INR345 (+20%) EPS CHANGE (%): FY20|21: +0.3|-2.4 EBITDA increase led by start of UnoSugen PPA. New CERC norms to have adverse impact on Sugen. Expect lower T&D losses at DFs. Watch out for update on progress of renewable projects.
Quarterly performance Y/E March FY19 FY20 FY19 FY20E 1Q 2Q 3Q 4Q 1Q 2Q 3QE 4QE Net Sales 35,281 34,445 32,535 29,248 37,361 38,420 33,187 26,146 131,510 135,114 YoY Change (%) 15.3 18.2 18.1 4.1 5.9 11.5 2.0 -10.6 Total Expenditure 27,617 24,577 25,171 22,150 29,025 27,870 25,423 18,193 99,515 100,510 EBITDA 7,664 9,869 7,364 7,098 8,337 10,550 7,764 7,953 31,995 34,604 Margins (%) 21.7 28.6 22.6 24.3 22.3 27.5 23.4 30.4 24.3 Depreciation 3,018 3,044 3,074 3,130 3,206 3,219 3,251 3,296 12,265 12,973 Interest 2,292 2,247 2,287 2,163 2,477 2,495 2,111 2,002 8,989 9,085 Other Income 523 441 533 399 545 493 526 305 1,896 1,868 PBT before EO expense 2,877 5,019 2,537 2,204 3,199 5,329 2,927 2,960 12,636 14,415 Extra-Ord expense 0 0 0 0 0 0 0 0 0 0 PBT 2,877 5,019 2,537 2,204 3,199 5,329 2,927 2,960 12,636 14,415 Tax 604 884 155 1,956 433 -2,227 673 1,635 3,598 514 Rate (%) 21.0 17.6 6.1 88.7 13.5 -41.8 23.0 55.2 28.5 3.6 MI and Associates 15 13 12 9 13 12 2 -19 49 8 Reported PAT 2,259 4,122 2,370 240 2,753 7,544 2,252 1,344 8,989 13,893 PAT 2,259 4,122 2,370 240 2,753 7,544 2,252 1,344 8,989 13,893 YoY Change (%) -17.2 27.7 15.6 -89.0 21.9 83.0 -5.0 461.1 -11.6 54.5

January 2020 203
December 2019 Results Preview | Sector: Others
The tables below provide a snapshot of actual and estimated numbers for companies under the MOFSL coverage universe. Highlighted columns indicate the quarter/financial year under review.
Brigade Enterprises Buy CMP INR220 | TP: INR252 (+15%) EPS CHANGE (%): FY20|21: No Change Strong pre-sales at 0.85msf driven by AFH projects. Revenue likely to decline 3% YoY off a high base. Watch out for new projects launch/stake sale in hotel biz. Incremental leasing rates for WTC & BTG key monitorable.
Consolidated - Quarterly Earning Model (INR Million)
Y/E March FY19 FY20E FY19 FY20E 1Q 2Q 3Q 4Q 1Q 2Q 3QE 4QE Gross Sales 6,991 8,259 6,877 7,600
7,087 7,353 6,678 7,423 29,728 28,540
YoY Change (%) 26.0 70.4 62.2 75.3 1.4 -11.0 -2.9 -2.3 56.7 -4.0 Total Expenditure 5,196 6,071 5,118 5,446 5,264 5,451 4,842 5,221 21,831 20,777 EBITDA 1,795 2,188 1,759 2,154
1,823 1,902 1,836 2,202 7,897 7,763
Margins (%) 25.7 26.5 25.6 28.3 25.7 25.9 27.5 29.7 26.6 27.2 Depreciation 317 339 320 425
383 473 500 574 1,400 1,930
Interest 628 697 697 763
796 940 996 1,020 2,785 3,751 Other Income 88 177 103 178 83 163 167 186 545 599 PBT before EO expense 938 1,329 845 1,144
727 653 507 794 4,257 2,680
Extra-Ord expense 0 0 0 0 0 0 0 0 0 0 PBT 938 1,329 845 1,144
727 653 507 794 4,257 2,680
Tax 313 464 251 428
269 281 70 110 1,455 730 Rate (%) 33.4 34.9 29.7 37.4 37.0 43.1 13.8 13.8 34.2 27.2 Reported PAT 631 683 489 597
412 374 337 542 2,399 1,665
Adj PAT 631 683 489 597
412 374 337 542 2,399 1,665 YoY Change (%) 100.6 67.1 0.1 138.8
-34.7 -45.3 -31.0 -9.1 63.2 -30.6
Margins (%) 9.0 8.3 7.1 7.8 5.8 5.1 5.1 7.3 8.1 5.8 E: MOFSL Estimates
BSE Buy CMP INR 523 | TP: INR710 (+36%) EPS CHANGE (%): FY20|21: -31.6|+17.2 Transaction volume from small cap. Look for revenues from Star MF platform. Commentary on margin recovery. Outlook on commodity derivatives.
Consolidated Quarterly performance
Y/E March FY19 FY20E FY19 FY20E 1Q 2Q 3Q 4Q 1Q 2Q 3QE 4QE Revenue from operations 1,185 1,121 1,016 1,126 1,095 1,088 1,150 1,246 4,448 4,580 YoY Change (%) 7.8 1.2 -21.9 -18.8 -7.6 -2.9 13.2 10.7 -9.1 3.0 Total Expenditure 992 1,028 1,110 1,132 1,066 1,146 1,180 1,222 4,262 4,614 EBITDA 193 93 -94 -6 29 -58 -30 25 186 -34 Margins (%) 16.3 8.3 -9.3 -0.5 2.6 -5.3 -2.6 2.0 4.2 -0.8 Depreciation 115 120 129 147 120 125 132 150 511 527 Interest 2 3 2 2 5 1 1 1 9 9 Investment income 479 497 756 695 565 507 408 409 2,427 1,889 PBT before EO expense 555 468 530 540 470 323 245 282 2,093 1,320 Extra-Ord expense 28 -15 133 64 38 68 7 7 210 120 PBT 527 483 397 476 432 255 238 275 1,883 1,200 Tax 70 101 18 44 88 -40 48 55 233 151 Rate (%) 13.3 20.9 4.6 9.2 20.4 -15.7 20.0 20.0 12.4 12.6 MI & P/L of Asso. Cos. 58 77 70 87 70 73 81 100 292 324 Reported PAT 515 459 449 519 414 368 271 320 1,942 1,372 YoY Change (%) 3.5 -31.3 -23.2 -16.6 -19.7 -19.9 -39.7 -38.3 -13.1 -24.7 Margins (%) 39.2 35.5 37.6 39.1 32.7 26.0 17.9 19.3 49.4 36.1 E: MOFSL Estimates

January 2020 204
December 2019 Results Preview | Sector: Others
Coromandel International Buy CMP INR533 | TP: INR637 (+20%) EPS CHANGE (%): FY20|21: +28.1|+12.2 Expect manufacturing fertilizer volumes to grow 36% YoY. Higher share of manufacturing volumes to drive margins. Ramp up in the recently commenced phos acid plant. Panning of Rabi acreage.
Quarterly Performance (INR M) Y/E March FY19 FY20 FY19 FY20E Consolidated 1Q 2Q 3Q 4Q 1Q 2Q 3QE 4QE Net Sales 25,285 50,083 30,495 26,383 21,307 48,580 33,530 27,239 132,246 130,657 YoY Change (%) 11.8 36.3 11.5 9.4 -15.7 -3.0 10.0 3.2 19.3 -1.2 Total Expenditure 23,146 43,420 27,456 23,794 19,354 41,450 29,753 24,362 117,815 114,920 EBITDA 2,139 6,663 3,039 2,590 1,953 7,130 3,777 2,877 14,431 15,737 Margins (%) 8.5 13.3 10.0 9.8 9.2 14.7 11.3 10.6 10.9 12.0 Depreciation 256 263 269 351 305 417 430 450 1,138 1,602 Interest 644 696 514 653 796 664 500 500 2,507 2,459 Other Income 88 98 98 86 100 95 102 93 371 389 PBT before EO expense 1,328 5,802 2,354 1,672 952 6,145 2,949 2,019 11,156 12,065 Extra-Ord expense 0 197 4 37 0 0 0 0 239 0 PBT 1,328 5,605 2,350 1,635 952 6,145 2,949 2,019 10,917 12,065 Tax 423 1,944 821 533 326 1,110 715 489 3,721 2,640 Rate (%) 31.8 34.7 34.9 32.6 34.3 18.1 24.3 24.2 34.1 21.9 Minority Interest & P/L of Asso. Cos. 3 5 -14 -2 2 -4 0 0 -8 -3 Reported PAT 902 3,656 1,543 1,104 624 5,039 2,234 1,530 7,205 9,428 Adj PAT 902 3,785 1,546 1,129 624 5,039 2,234 1,530 7,362 9,428 YoY Change (%) 24.2 8.6 -14.3 26.0 -30.8 33.1 44.5 35.6 6.5 28.1 Margins (%) 3.6 7.6 5.1 4.3 2.9 10.4 6.7 5.6 5.6 7.2
Delta Corp Buy CMP INR201 | TP: INR235 (+17%) EPS CHANGE (%): FY20|21: -4.7|-7.7 Expect rev to be flat; PAT growth at 9% YoY in 3Q. Expect EBITDA margin to shrink 270bp. Impact of rising competition in casino key monitorable. Watch out for management’s take on land-based policy
Consolidated - Quarterly Earning Model (INR Million) Y/E March FY19 FY20E FY19 FY20E 1Q 2Q 3Q 4Q 1Q 2Q 3QE 4QE Net Sales 1,873 2,011 2,052 2,043 1,865 2,008 2,059 2,302 7,978 8,235 YoY Change (%) 46% 38% 27% 19% 0% 0% 0% 13% 31.3 3.2 Total Expenditure 1,206 1,225 1,197 1,164 1,188 1,195 1,256 1,367 4,791 5,006 EBITDA 667 786 855 879 677 814 803 934 3,187 3,229 Margins (%) 35.6 39.1 41.7 43.0 36.3 40.5 39.0 40.6 39.9 39.2 Depreciation 94 94 95 95 110 120 122 122 377 474 Interest 2 7 6 3 10 11 10 9 18 40 Other Income 83 83 55 92 82 65 70 70 313 287 PBT before EO expense 654 768 810 875 640 748 741 873 3,105 3,002 Extra-Ord expense 0 0 11 -37 0 -7 0 0 -43 -7 PBT 654 768 799 911 640 755 741 873 3,148 3,009 Tax 228 274 296 344 217 166 185 218 1,141 785 Rate (%) 34.9 35.6 37.0 37.8 33.9 22.0 25.0 25.0 36.3 26.1 Reported PAT 423 481 505 567 425 590 560 658 1,968 2,234 Adj PAT 423 481 512 544 425 585 560 658 1,940 2,229 YoY Change (%) 100% 11% 14% 19% 0% 22% 9% 21% 25.3 14.9 Margins (%) 22.6 23.9 24.9 26.6 22.8 29.1 27.2 28.6 24.3 27.1 E: MOFSL Estimates

January 2020 205
December 2019 Results Preview | Sector: Others
Godrej Agrovet Buy CMP INR520 | TP: INR623 (+20%) EPS CHANGE (%): FY20|21: +13.6|+41.4 Animal feed (AF) biz drive revenue growth. AF and crop protection to witness margin expansion. Response to the price hike taken in animal feed.
Consolidated - Quarterly Earning Model (INR Million) Y/E March FY19 FY20 FY19 FY20 1Q 2Q 3Q 4Q 1Q 2Q 3QE 4QE Gross Sales 14,844 15,884 14,541 13,439 17,026 18,511 17,734 16,307 58,707 69,578 YoY Change (%) 8.8 11.4 19.1 12.5 14.7 16.5 22.0 21.3 12.8 18.5 Total Expenditure 13,451 14,477 13,531 12,691 15,607 17,314 16,374 15,332 54,149 64,627 EBITDA 1,393 1,407 1,010 749 1,419 1,197 1,359 975 4,558 4,951 Margins (%) 9.4 8.9 6.9 5.6 8.3 6.5 7.7 6.0 7.8 7.1 Depreciation 224 237 264 257 351 375 380 380 982 1,486 Interest 81 85 98 75 102 125 120 95 339 442 Other Income 39 338 49 107 102 113 105 143 531 464 PBT before EO expense 1,126 1,423 696 524 1,068 811 964 644 3,769 3,487 Extra-Ord expense 0 0 0 -883 0 0 0 0 -883 0 PBT 1,126 1,423 696 1,407 1,068 811 964 644 4,652 3,487 Tax 393 452 244 191 356 -213 328 193 1,280 664 Rate (%) 34.9 31.8 35.0 13.6 33.3 -26.2 34.0 30.0 27.5 19.0 Minority Interest & P/L of Asso. Cos. -69 29 43 79 -48 -16 70 83 82 89 Reported PAT 802 942 409 1,137 760 1,040 566 367 3,290 2,734 Adj PAT 802 942 409 254 760 1,040 566 367 2,407 2,734 YoY Change (%) 8.7 16.7 9.1 1.4 -5.3 10.4 38.4 44.7 10.9 13.6 Margins (%) 5.4 5.9 2.8 1.9 4.5 5.6 3.2 2.3 4.1 3.9
Indian Hotels Buy CMP INR147 | TP: INR191 (+30%) EPS CHANGE (%): FY20|21: 27.5|44.4 Standalone to drive revenue growth. Rate hike in the corporate segment. Improvement in the demand scenario post GST cut.
Consolidated - Quarterly Earning Model (INR Million) Y/E March FY19 FY20 FY19 FY20 1Q 2Q 3Q 4Q 1Q 2Q 3QE 4QE Gross Sales 9,797 9,645 13,235 12,443 10,200 10,074 13,896 13,314 45,120 47,485 YoY Change (%) 8.0 13.3 10.5 8.8 4.1 4.4 5.0 7.0 10.1 5.2 Total Expenditure 8,690 8,653 9,879 9,600 8,466 8,470 9,672 9,523 36,823 36,130 EBITDA 1,107 992 3,355 2,843 1,734 1,605 4,224 3,792 8,297 11,355 Margins (%) 11.3 10.3 25.4 22.8 17.0 15.9 30.4 28.5 18.4 23.9 Depreciation 785 812 833 849 1,004 999 1,080 1,066 3,279 4,149 Interest 469 467 491 474 847 868 860 837 1,901 3,412 Other Income 150 166 145 372 371 211 152 155 834 889 PBT before EO expense 3 -120 2,177 1,893 255 -52 2,437 2,044 3,951 4,684 Extra-Ord expense 39 453 -410 -148 -23 3 0 0 -66 -20 PBT -36 -573 2,587 2,040 277 -54 2,437 2,044 4,017 4,704 Tax -98 -193 990 871 176 -855 902 756 1,571 979 Rate (%) NA 33.6 38.3 42.7 63.5 NA 37.0 37.0 39.1 20.8 Minority Interest & P/L of Asso. Cos. -92 -328 -22 19 45 88 -11 10 -422 132 Reported PAT 153 -52 1,618 1,150 57 713 1,546 1,278 2,868 3,593 Adj PAT 192 401 1,208 1,002 34 716 1,546 1,278 2,802 3,573 YoY Change (%) NA NA 35.5 11.4 -82.4 78.6 28.0 27.5 318.9 27.5 Margins (%) 2.0 4.2 9.1 8.1 0.3 7.1 11.1 9.6 6.2 7.5

January 2020 206
December 2019 Results Preview | Sector: Others
Info Edge Neutral CMP INR 2532 | TP: INR2210 (-13%) EPS CHANGE (%): FY20|21: 2.7|57.6 Traction in recruitment sector from segments beyond IT. Outlook on advertisement expense. Commentary on Zomato’s operational efficiency plan. Real estate market outlook.
Quarterly Performance (Standalone) Y/E March FY19 FY20E FY19 FY20E 1Q 2Q 3Q 4Q 1Q 2Q 3QE 4QE Revenues 2,595 2,650 2,811 2,927 3,128 3,166 3,344 3,520 10,983 13,158 YoY (%) 16.7 17.7 23.7 21.6 20.5 19.5 19.0 20.3 20.0 19.8 Salary costs 1,106 1,118 1,151 1,212 1,298 1,349 1,295 1,323 4,586 5,266 Ad and Promotion costs 376 404 503 474 549 514 569 598 1,757 2,229 Other Expenses 270 304 324 328 272 310 323 334 1,226 1,239 Operating Profit 843 825 833 913 1,010 993 1,157 1,264 3,413 4,423 Margins (%) 32.5 31.1 29.6 31.2 32.3 31.4 34.6 35.9 31.1 33.6 Other Income 236 275 296 304 245 232 326 357 1,112 1,160 Depreciation 53 52 50 49 99 101 102 104 204 406 PBT bef. Extra-ordinary 1,026 1,048 1,079 1,168 1,139 1,107 1,363 1,499 4,320 5,109 Provision for Tax 236 267 335 331 390 266 341 375 1,169 1,371 ETR (%) 23.0 25.5 31.1 28.3 34.2 24.0 25.0 25.0 27.1 26.8 PAT bef. Minority 630 781 744 663 667 93 1,023 1,124 2,818 2,907 EOI -160 0 0 -174 -82 -749 0 0 -334 -831 Adjusted PAT 790 781 744 838 749 842 1,023 1,124 3,152 3,738 QoQ (%) 39.5 -1.1 -4.8 12.6 -10.6 12.4 21.5 10.0 YoY (%) 22.9 -5.5 5.8 48.0 -5.1 7.8 37.5 34.3 15.1 18.6 EPS (INR) 5.1 6.4 6.1 5.4 5.4 0.8 8.3 9.1 23.0 23.6 E: MOFSL Estimates
InterGlobe Aviation Neutral CMP INR1,333 | TP: INR1,533 (+15%) EPS CHANGE (%): FY20|21: -1|-32 Expect RPK growth of 12% YoY and 2% QoQ at INR20.6b. Expect flat YoY and ~10% QoQ growth in yield at INR3.85. Outlook on new aircraft deliveries from Airbus and
guidance on maintenance cost and employee (pilot) cost. DGCA A320neo aircraft engine replacement remains
headwind on net capacity additions.
Quarterly performance (INR Million) Y/E March FY19 FY20 FY19 FY20E 1Q 2Q 3Q 4Q 1Q 2Q 3Q 4Q Net Sales 65,120 61,853 79,162 78,833 94,201 81,052 90,698 79,172 2,84,968 3,45,123 YoY Change (%) 13.2 16.9 28.1 35.9 44.7 31.0 14.6 0.4 23.8 21.1 EBITDAR 10,313 1,111 15,953 20,563 26,564 968 23,598 23,441 47,940 74,571 Margins (%) 15.8 1.8 20.2 26.1 28.2 1.2 26.0 29.6 16.8 21.6 EBITDA -110 -10,050 2,192 5,914 25,276 -142 22,426 22,383 -2,055 69,943 Margins (%) -0.2 -16.2 2.8 7.5 26.8 -0.2 24.7 28.3 -0.7 20.3 Depreciation 1,553 1,820 2,038 2,185 9,009 10,287 10,346 10,519 7,596 40,161 Interest 1,087 1,300 1,377 1,326 4,842 4,235 4,235 4,170 5,090 17,481 Other Income 3,064 3,289 3,131 3,764 3,669 4,346 3,753 3,355 13,248 15,123 PBT 314 -9,881 1,908 6,167 15,094 -10,318 11,599 11,049 -1,492 27,424 Rate (%) 11.3 34.0 0.0 4.4 20.3 -2.9 15.6 15.6 204.5 25.2 Reported PAT 278 -6,521 1,908 5,895 12,031 -10,620 9,790 9,320 1,560 20,521 EPS 0.7 -17.0 5.0 15.3 31.3 -27.6 25.5 24.2 4.1 53.4 E: MOFSL Estimates

January 2020 207
December 2019 Results Preview | Sector: Others
Kaveri Seed Buy CMP INR 501| TP: INR583 (+16%) EPS CHANGE (%): FY20|21: +5|+0.5 Hybrid rice and maize to drive revenue. Market share movement in major markets of Gujarat and
Maharashtra. Expect EBITDA margins to expand off a low base.
Quarterly - Standalone
(INR M)
Y/E March FY19 FY20 1Q 2Q 3Q 4Q 1Q 2Q 3QE 4QE FY19 FY20E Net Sales 5,819 752 672 447 6,555 774 752 455 7,690 8,536 YoY Change (%) -1.5 8.0 -4.9 7.5 12.6 3.0 11.9 1.8 -0.4 11.0 Total Expenditure 3,784 673 671 507 4,222 661 718 512 5,634 6,113 EBITDA 2,035 79 1 -59 2,333 113 34 -57 2,056 2,423 Margins (%) 35.0 10.5 0.2 -13.3 35.6 14.6 4.5 -12.5 26.7 28.4 Depreciation 53 47 53 59 59 59 65 67 212 250 Interest 0 0 1 0 0 0 2 2 1 4 Other Income 168 131 106 24 43 30 95 27 429 196 PBT before EO expense 2,150 162 54 -95 2,317 84 62 -99 2,271 2,365 PBT 2,150 162 54 -95 2,317 84 62 -99 2,271 2,365 Tax 44 43 18 20 28 15 20 20 124 83 Rate (%) 2.0 26.4 32.5 -20.9 1.2 17.5 32.5 -20.0 5.5 3.5 Reported PAT 2,106 119 36 -114 2,289 69 42 -119 2,147 2,282 Adj PAT 2,106 119 36 -114 2,289 69 42 -119 2,147 2,282 YoY Change (%) 4.1 -42.9 -32.9 NA 8.7 -42.0 15.6 NA 2.1 6.3 Margins (%) 36.2 15.9 5.4 -25.6 34.9 8.9 5.6 -26.1 27.9 26.7
Lemon Tree Hotels Buy CMP INR63 | TP: INR72 (+15%) EPS CHANGE (%): FY20|21: -66.4|287.3 Mumbai, Udaipur and Kolkata hotels drive revenue. Impact of GST rate cut on demand. Traction at recently commenced hotel in Udaipur and
Kolkata. Expect EBITDA margin to expand 90bp as recently
commenced hotels are expected to stabilize.
Reported Cons. Quarterly Perf. (INR Million) Y/E March FY19 FY20 FY19 FY20E 1Q 2Q 3Q 4Q 1Q 2Q 3QE 4QE Gross Sales 1,269 1,287 1,434 1,505 1,409 1,528 2,362 2,375 5,495 7,674 YoY Change (%) 17.2 15.3 8.3 14.0 11.0 18.7 64.8 57.8 13.5 39.7 Total Expenditure 921 927 943 1,016 962 1,043 1,533 1,541 3,807 5,079 EBITDA 348 360 490 489 448 484 829 834 1,688 2,595 Margins (%) 27.4 28.0 34.2 32.5 31.8 31.7 35.1 35.1 30.7 33.8 Depreciation 131 132 135 143 172 196 300 310 541 977 Interest 197 198 214 238 309 325 400 410 847 1,444 Other Income 19 59 27 40 21 9 39 52 145 122 PBT before EO expense 40 89 168 148 -12 -27 168 166 445 295 Extra-Ord expense 0 0 0 0 0 0 0 0 0 0
PBT 40 89 168 148 -12 -27 168 166 445 295 Tax 20 28 34 -194 7 1 38 34 -111 80 Rate (%) 51.4 31.8 20.5 -131.0 -59.7 -2.2 22.5 20.8 -25.0 27.1 MI & P/L of Asso. Cos. -4 4 9 18 -2 -6 18 28 27 38 Reported PAT 23 57 125 325 -17 -22 112 103 529 177 Adj PAT 23 57 125 325 -17 -22 112 103 529 177 YoY Change (%) -196.7 -228.3 38.1 185.5 NA NA -9.9 -68.3 272.6 -66.5 Margins (%) 1.8 4.4 8.7 21.6 -1.2 -1.4 4.8 4.3 9.6 2.3

January 2020 208
December 2019 Results Preview | Sector: Others
MCX Buy CMP INR1,189 | TP: INR1,400 (+18%) EPS CHANGE (%): FY20|21: +44.8|-3.1 In 3Q, Gold and crude volumes up by 69% and 51% YoY. Sequentially volumes have softened after spike in 2Q. Outlook on pick up in options. Outlook on distribution by banks, pricing yields.
MCX Quarterly Performance
FY19 FY20E FY19 FY20E
1Q 2Q 3Q 4Q 1Q 2Q 3QE 4QE
Sales 729 711 769 791 795 1,002 948 969 3,000 3,713 Q-o-Q Gr. (%) 3.2 -2.4 8.2 2.9 0.4 26.1 -5.4 2.2 16.3 23.7 Staff Costs 186 174 177 188 188 195 196 197 725 775 Other expenses 294 312 383 352 330 334 349 368 1,336 1,381 Depreciation 37 38 38 41 40 42 42 42 154 167 EBIT 213 187 171 211 237 430 361 361 785 1,390 Margins (%) 29.2 26.3 22.2 26.6 29.8 43.0 38.1 37.3 26.2 37.4 Interest Costs 0 0 0 0 1 1 1 1 0 4 Other Income 126 222 322 317 314 444 242 242 986 1,242 PBT bef. Exceptional items 338 408 493 527 550 873 602 603 1,771 2,628 Tax 27 53 75 -80 114 154 121 121 75 509 Rate (%) 7.9 13.1 15.3 -15.2 20.7 17.6 20.0 20.0 4.2 19.4 PAT 73 359 418 607 436 719 482 482 1,458 2,119 Q-o-Q Gr. (%) -78.4 390.2 16.3 45.4 -28.2 65.0 -33.1 0.1 34.8 44.9 EPS (INR) 1.4 7.0 8.2 12.0 8.6 14.1 9.4 9.5 28.6 41.5 Total volumes (INR t) 16.2 16.6 17.4 17.6 17.7 23.2 20.6 21.1 67.7 82.6 Q-o-Q Gr. (%) 7.6 2.2 5.1 1.2 0.7 31.0 -11.2 2.2 Y-o-Y Gr. (%) 34.7 17.7 35.7 17.0 9.4 40.2 18.5 19.7 25.6 21.9 E: MOFSL Estimates
Navneet Education Buy CMP INR94 | TP: INR139 (+48%) EPS CHANGE (%): FY20|21: 2.7|0.4 Expect rev/PAT growth of 11%/7% YoY in 3Q. EBITDA margin likely to remain stable at 9.0%. Watch out for competition in stationary business. Syllabus change for FY21 key monitorable.
Standalone - Quarterly Earning Model (INR Million) Y/E March FY19 FY20E FY19 FY20E 1Q 2Q 3Q 4Q 1Q 2Q 3QE 4QE Net Sales
6,700 2,635 1,816 2,455 7,950 2,468 2,016 2,750 13,605 15,183
YoY Change (%) 18.5 43.7 4.1 15.5 18.7 -6.3 11.0 12.0 19.8 11.6 Total Expenditure 4,726 2,171 1,659 2,173 5,636 2,150 1,834 2,434 10,729 12,053 EBITDA
1,974 463 157 282 2,314 318 181 316 2,877 3,130
Margins (%) 29.5 17.6 8.6 11.5 29.1 12.9 9.0 11.5 21.1 20.6 Depreciation
57 60 62 65 80 88 90 95 245 353
Interest
42 23 11 42 70 18 18 45 119 151 Other Income 71 72 30 22 98 66 35 40 194 240 PBT before EO expense
1,946 451 113 196 2,262 279 108 216 2,707 2,865
Extra-Ord expense 0 0 0 0 0 0 0 0 0 0 PBT
1,946 451 113 196 2,262 279 108 216 2,707 2,865
Tax
683 162 38 49 788 -147 28 55 932 724 Rate (%)
35.1 35.9 33.5 25.1 34.8 -52.6 25.5 25.5 34.4 25.3
Reported PAT
1,263 289 75 147 1,474 425 81 161 1,775 2,141 Adj PAT
1,263 289 75 147 1,474 425 81 161 1,775 2,141
YoY Change (%)
15.2 73.9 -36.5 -2.8 16.7 47.0 7.1 9.5 15.8 20.7 Margins (%) 18.9 11.0 4.2 6.0 18.5 17.2 4.0 5.9 13.0 14.1

January 2020 209
December 2019 Results Preview | Sector: Others
Oberoi Realty Buy CMP INR529 | TP: INR631 (+19%) EPS CHANGE (%): FY20|21: -4.8|-4.4 Expect revenue to decline 10% YoY in 3Q. Revenue recognition at 360 West likely to drive PAT. Watch out for ramp up in occupancy of Commerze II. Launch of Thane project and Exquisite III, Goregaon.
Consolidated - Quarterly Earning Model
(INR Million)
Y/E March FY19 FY20E FY19 FY20E 1Q 2Q 3Q 4Q 1Q 2Q 3QE 4QE Net Sales 8,883 5,921 5,286 5,735 6,033 4,915 4,758 4,970 25,825 20,674 YoY Change (%) 240.7 95.1 48.4 66.2 -32.1 -17.0 -10.0 -13.3 104.1 -19.9 Total Expenditure 4,266 2,963 3,405 3,638 3,680 2,786 2,792 2,952 14,271 12,210 EBITDA 4,617 2,958 1,881 2,097 2,352 2,129 1,966 2,018 11,554 8,464 Margins (%) 52.0 50.0 35.6 36.6 39.0 43.3 41.3 40.6 44.7 40.9 Depreciation 106 110 114 110 111 113 116 120 440 460 Interest 49 58 49 38 239 246 250 255 194 989 Other Income 71 277 202 238 149 136 125 128 788 538 PBT before EO expense 4,533 3,067 1,920 2,187 2,151 1,906 1,725 1,771 11,707 7,553 Extra-Ord expense 0 0 0 0 0 0 0 0 0 0 PBT 4,533 3,067 1,920 2,187 2,151 1,906 1,725 1,771 11,707 7,553 Tax 1,450 940 573 644 643 540 423 434 3,607 2,039 Rate (%) 32.0 30.7 29.8 29.4 29.9 28.3 24.5 24.5 30.8 27.0 Adj PAT 3,094 2,138 1,379 1,558 1,521 1,381 2,162 3,364 8,169 8,427 YoY Change (%) 238.6 105.0 14.8 9.0 -50.9 -35.4 56.8 116.0 78.1 3.2 Margins (%) 34.8 36.1 26.1 27.2 25.2 28.1 45.4 67.7 31.6 40.8
PI Industries Buy CMP INR1,440 | TP: INR1,670 (+16%) EPS CHANGE (%): FY20|21: 24.6|43.5 CSM biz. to drive revenue for another quarter. Growth in domestic biz on the back of strong rabi acreage. Watch out for progress under Isagro acquisition. Ramp up in CSM business.
Standalone - Quarterly Earning Model
(INR Million)
Y/E March FY19 FY20 FY19 FY20E 1Q 2Q 3Q 4Q 1Q 2Q 3QE 4QE Net Sales 6,056 7,230 7,075 8,048 7,541 9,074 8,323 9,305 28,409 34,243 YoY Change (%) 9.5 28.9 31.6 28.7 24.5 25.5 17.6 15.6 24.8 20.5 Total Expenditure 4,875 5,884 5,589 6,329 6,027 7,155 6,417 7,130 22,677 26,729 EBITDA 1,181 1,346 1,486 1,719 1,514 1,919 1,906 2,175 5,732 7,514 Margins (%) 19.5 18.6 21.0 21.4 20.1 21.1 22.9 23.4 20.2 21.9 Depreciation 220 228 234 244 294 315 315 315 926 1,239 Interest 17 14 15 13 26 22 25 25 59 98 Other Income 102 124 152 222 123 106 130 200 600 559 PBT before EO expense 1,046 1,228 1,389 1,684 1,317 1,688 1,696 2,035 5,347 6,736 Extra-Ord expense 0 0 0 0 0 0 0 0 0 0 PBT 1,046 1,228 1,389 1,684 1,317 1,688 1,696 2,035 5,347 6,736 Tax 229 284 316 440 309 460 390 467 1,269 1,626 Rate (%) 21.9 23.1 22.8 26.1 23.5 27.3 23.0 22.9 23.7 24.1 Reported PAT 817 944 1,073 1,244 1,008 1,228 1,306 1,568 4,078 5,110 Adj PAT 817 944 1,073 1,244 1,008 1,228 1,306 1,568 4,078 5,110 YoY Change (%) -18.4 17.7 33.1 18.0 23.4 30.1 21.7 26.1 11.3 25.3 Margins (%) 13.5 13.1 15.2 15.5 13.4 13.5 15.7 16.9 14.4 14.9

January 2020 210
December 2019 Results Preview | Sector: Others
Phoenix Mills Buy CMP INR839 | TP: INR932 (+11%) EPS CHANGE (%): FY20|21: -|+2.3% Revenue/PAT expected to grow 13%/9% YoY in 3Q. EBITDA margins to expand 160bp YoY to 52.1% in 3Q. Watch out for occupancy ramp up at Lucknow mall. Construction progress of new malls key monitorable.
Consolidated - Quarterly Earning Model (INR Million) Y/E March FY19 FY20E FY19 FY20E 1Q 2Q 3Q 4Q 1Q 2Q 3QE 4QE Gross Sales 4,132 4,047 4,404 7,232 6,150 4,151 4,968 5,601 19,816 20,869 YoY Change (%) 4.4 9.2 5.7 65.6 48.9 2.6 12.8 -22.6 22.3 5.3 Total Expenditure 2,178 2,065 2,180 3,461 3,223 2,043 2,378 2,632 9,884 10,276 EBITDA 1,953 1,982 2,225 3,771 2,927 2,108 2,590 2,968 9,931 10,593 Margins (%) 47.3 49.0 50.5 52.1 47.6 50.8 52.1 53.0 50.1 50.8 Depreciation 499 506 523 514 507 509 510 660 2,042 2,186 Interest 846 917 917 826 871 878 881 861 3,506 3,490 Other Income 170 183 170 329 154 195 190 196 851 734 PBT before EO expense 778 741 955 2,761 1,703 915 1,389 1,644 5,235 5,651 Extra-Ord expense 0 0 0 -481 0 -78 0 0 -481 -78 PBT 778 741 955 3,242 1,703 993 1,389 1,644 5,716 5,729 Tax 235 179 175 510 234 350 500 577 1,099 1,661 Rate (%) 30.2 24.1 18.3 15.7 13.8 35.3 36.0 35.1 19.2 29.0 Reported PAT 597 620 708 2,284 1,304 658 769 869 4,210 3,600 Adj PAT 597 620 708 1,879 1,304 608 769 869 3,821 3,545 YoY Change (%) 40.3 48.6 8.5 103.0 118.3 -2.1 8.6 -53.8 57.8 -7.2 Margins (%) 14.5 15.3 16.1 26.0 21.2 14.6 15.5 15.5 19.3 17.0 E: MOFSL Estimates
Quess Corp Neutral CMP INR504 | TP: INR530 (+5%) EPS CHANGE (%): FY20|21: 25.0|57.5 AllSec to contribute revenue for full quarter. Expect margin expansion due to seasonality. Outlook on reduction in related-party loans. Outlook on simplification of organization structure.
Consolidated - Quarterly Y/E March FY19 FY20 FY19 FY20E 1Q 2Q 3Q 4Q 1Q 2Q 3QE 4QE Net Sales 19,684 20,917 21,722 22,948 23,947 26,503 26,948 28,050 85,270 1,05,448 YoY Change (%) 51.7 49.9 37.1 21.4 21.7 26.7 24.1 22.2 38.3 23.7 Total Expenditure 18,659 19,797 20,538 21,630 22,474 24,889 25,260 26,261 80,624 98,884 EBITDA 1,025 1,120 1,183 1,318 1,473 1,614 1,688 1,789 4,646 6,565 Margins (%) 5.21 5.36 5.45 5.7 6.2 6.1 6.3 6.4 5.4 6.2 Depreciation 299 291 317 325 579 652 646 706 1,232 2,583 Interest 261 282 280 321 396 461 393 321 1,144 1,571 Other Income 156 143 123 290 169 159 237 384 712 949 PBT before EO expense 621 690 710 962 666 660 887 1,146 2,983 3,359 Extra-Ord expense 0 0 0 0 0 0 0 0 0 0 PBT 621 690 710 962 666 660 887 1,146 2,983 3,359 Tax 93 105 11 121 106 -29 -18 -23 329 35 Rate (%) 14.9 15.1 1.5 12.6 15.9 -4.5 -2.0 -2.0 11.0 1.1 MI & P/L of Asso. Cos. -16 -31 49 86 -2 39 39 39 88 116 Reported PAT 544 616 650 755 563 650 865 1,130 2,565 3,208 Adj PAT 544 616 650 755 563 650 865 1,130 2,565 3,208 YoY Change (%) 19.2 -51.6 6.5 -0.3 3.4 5.5 33.1 49.6 -17.2 25.0 Margins (%) 2.8 2.9 3.0 3.3 2.3 2.5 3.2 4.0 3.0 3.0 E: MOFSL Estimates

January 2020 211
December 2019 Results Preview | Sector: Others
SRF Buy CMP INR3,465 | TP: INR4,077 (+18%) EPS CHANGE (%): FY20|21: +18.5|+38.1 Chemical biz. to drive revenue growth. Outlook in the specialty chemicals business. Expect margin expansion in chemical & packaging film biz. Ramp up on the commencement of the new HFC plant.
Consolidated - Quarterly Earning Model (INR Million) Y/E March FY19 FY20 FY19 FY20E 1Q 2Q 3Q 4Q 1Q 2Q 3QE 4QE Net Sales 16,762 17,550 19,640 20,142 17,633 17,378 20,637 23,907 74,095 79,555 YoY Change (%) 29.6 36.4 40.6 24.9 5.2 -1.0 5.1 18.7 32.6 7.4 Total Expenditure 13,576 14,375 16,330 16,306 14,186 14,026 16,870 19,337 60,588 64,418 EBITDA 3,186 3,175 3,310 3,836 3,447 3,352 3,768 4,570 13,507 15,137 Margins (%) 19.0 18.1 16.9 19.0 19.5 19.3 18.3 19.1 18.2 19.0 Depreciation 879 877 932 964 925 929 1,010 1,020 3,651 3,884 Interest 442 491 544 527 515 550 525 500 2,004 2,090 Other Income 38 29 52 163 152 220 139 149 283 660 PBT before EO expense 1,904 1,836 1,886 2,509 2,159 2,093 2,371 3,199 8,135 9,822 Extra-Ord expense 103 -52 -102 -19 -289 -960 0 0 -70 -1,249 PBT 1,801 1,889 1,988 2,528 2,448 3,053 2,371 3,199 8,205 11,071 Tax 462 377 331 619 554 41 569 769 1,789 1,934 Rate (%) 24.3 20.5 17.6 24.7 25.7 2.0 24.0 24.0 22.0 19.7 Reported PAT 1,338 1,512 1,657 1,909 1,894 3,011 1,802 2,430 6,416 9,138 Adj PAT 1,441 1,460 1,555 1,890 1,605 2,051 1,802 2,430 6,346 7,888 YoY Change (%) 56.0 53.1 41.2 60.9 11.3 40.5 15.9 28.6 52.8 24.3 Margins (%) 8.6 8.3 7.9 9.4 9.1 11.8 8.7 10.2 8.6 9.9
S H Kelkar Buy CMP INR120 | TP: INR151 (+26%) EPS CHANGE (%): FY20|21: -5.8|-12.9 Revenue/PAT expected to grow 30%/28% YoY in 3Q. EBIDTA margin likely to contract 85bp YoY to 14.8%. Watch out for potential rebound in FMCG industry. CFF acquisition –synergies and cross-selling opportunities.
Consolidated - Quarterly Earning Model (INR Million) Y/E March FY19 FY20E FY19 FY20E 1Q 2Q 3Q 4Q 1Q 2Q 3QE 4QE Net Sales
2,374 2,845 2,565 2,697 2,744 2,793 3,334 3,609 10,481 12,480
YoY Change (%) 1.3 28.2 -9.4 -5.4 15.6 -1.8 30.0 33.8 2.3 19.1 Total Expenditure 2,035 2,468 2,165 2,448 2,280 2,410 2,842 3,069 9,115 10,602 EBITDA
340 377 400 249 464 383 492 540 1,366 1,878
Margins (%) 14.3 13.3 15.6 9.2 16.9 13.7 14.8 15.0 13.0 15.0 Depreciation
68 76 89 79 121 131 125 128 312 506
Interest
15 19 45 61 70 71 70 68 140 279 Other Income 23 50 50 111 14 6 65 68 234 153 PBT before EO expense
280 333 316 220 286 186 362 412 1,149 1,246
Extra-Ord expense 0 0 0 0 0 0 0 0 0 0 PBT
280 333 316 220 286 186 362 412 1,149 1,246
Tax
100 49 103 19 96 36 85 97 270 314 Rate (%)
35.8 14.7 32.5 8.5 33.7 19.5 23.5 23.5 23.5 100
Minority Interest & P/L of Asso. Cos. -1 -4 -1 6 5 -5 4 4 -6 9 Reported PAT
181 288 214 196 185 154 273 311 885 923
Adj PAT
181 288 214 196 185 154 273 311 885 923 YoY Change (%)
-32.6 52.8 -36.7 -15.2 2.3 -46.5 27.5 59.1 -13.7 4.3
Margins (%) 7.6 10.1 8.3 7.3 6.7 5.5 8.2 8.6 8.4 7.4 E: MOFSL Estimates
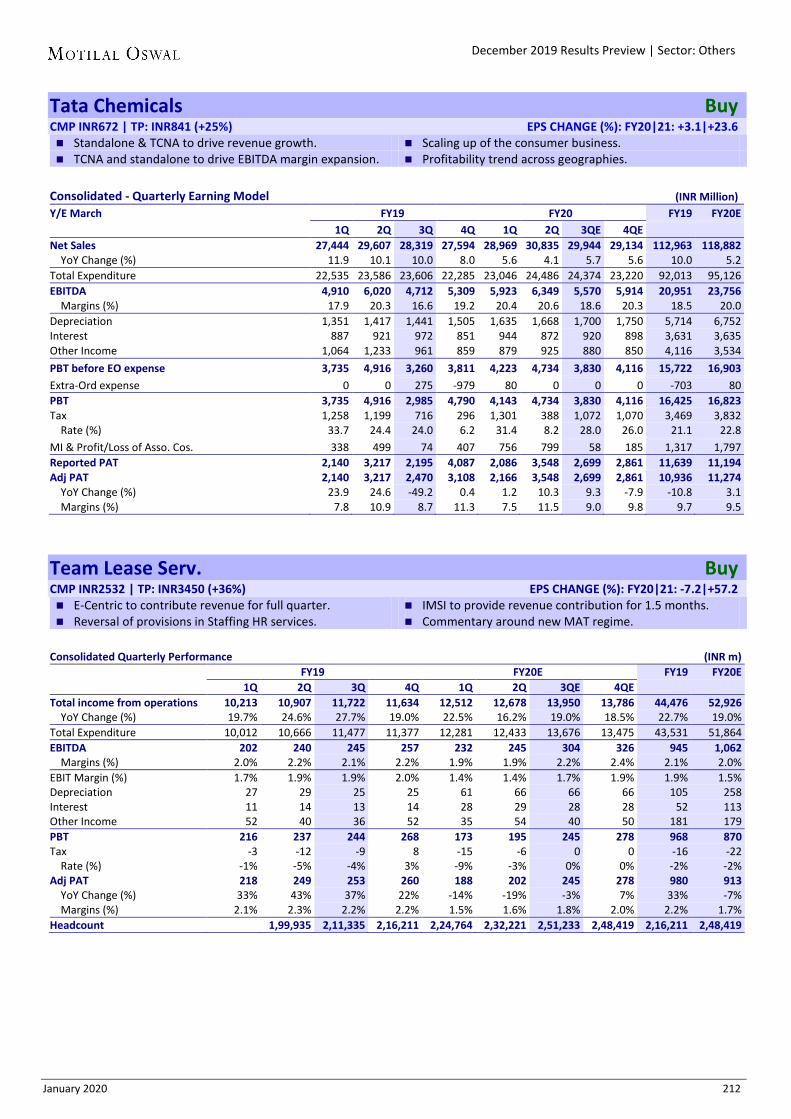
January 2020 212
December 2019 Results Preview | Sector: Others
Tata Chemicals Buy CMP INR672 | TP: INR841 (+25%) EPS CHANGE (%): FY20|21: +3.1|+23.6 Standalone & TCNA to drive revenue growth. Scaling up of the consumer business. TCNA and standalone to drive EBITDA margin expansion. Profitability trend across geographies.
Consolidated - Quarterly Earning Model (INR Million) Y/E March FY19 FY20 FY19 FY20E 1Q 2Q 3Q 4Q 1Q 2Q 3QE 4QE Net Sales 27,444 29,607 28,319 27,594 28,969 30,835 29,944 29,134 112,963 118,882 YoY Change (%) 11.9 10.1 10.0 8.0 5.6 4.1 5.7 5.6 10.0 5.2 Total Expenditure 22,535 23,586 23,606 22,285 23,046 24,486 24,374 23,220 92,013 95,126 EBITDA 4,910 6,020 4,712 5,309 5,923 6,349 5,570 5,914 20,951 23,756 Margins (%) 17.9 20.3 16.6 19.2 20.4 20.6 18.6 20.3 18.5 20.0 Depreciation 1,351 1,417 1,441 1,505 1,635 1,668 1,700 1,750 5,714 6,752 Interest 887 921 972 851 944 872 920 898 3,631 3,635 Other Income 1,064 1,233 961 859 879 925 880 850 4,116 3,534 PBT before EO expense 3,735 4,916 3,260 3,811 4,223 4,734 3,830 4,116 15,722 16,903 Extra-Ord expense 0 0 275 -979 80 0 0 0 -703 80 PBT 3,735 4,916 2,985 4,790 4,143 4,734 3,830 4,116 16,425 16,823 Tax 1,258 1,199 716 296 1,301 388 1,072 1,070 3,469 3,832 Rate (%) 33.7 24.4 24.0 6.2 31.4 8.2 28.0 26.0 21.1 22.8 MI & Profit/Loss of Asso. Cos. 338 499 74 407 756 799 58 185 1,317 1,797 Reported PAT 2,140 3,217 2,195 4,087 2,086 3,548 2,699 2,861 11,639 11,194 Adj PAT 2,140 3,217 2,470 3,108 2,166 3,548 2,699 2,861 10,936 11,274 YoY Change (%) 23.9 24.6 -49.2 0.4 1.2 10.3 9.3 -7.9 -10.8 3.1 Margins (%) 7.8 10.9 8.7 11.3 7.5 11.5 9.0 9.8 9.7 9.5
Team Lease Serv. Buy CMP INR2532 | TP: INR3450 (+36%) EPS CHANGE (%): FY20|21: -7.2|+57.2 E-Centric to contribute revenue for full quarter. IMSI to provide revenue contribution for 1.5 months. Reversal of provisions in Staffing HR services. Commentary around new MAT regime.
Consolidated Quarterly Performance (INR m) FY19 FY20E FY19 FY20E 1Q 2Q 3Q 4Q 1Q 2Q 3QE 4QE Total income from operations 10,213 10,907 11,722 11,634 12,512 12,678 13,950 13,786 44,476 52,926 YoY Change (%) 19.7% 24.6% 27.7% 19.0% 22.5% 16.2% 19.0% 18.5% 22.7% 19.0% Total Expenditure 10,012 10,666 11,477 11,377 12,281 12,433 13,676 13,475 43,531 51,864 EBITDA 202 240 245 257 232 245 304 326 945 1,062 Margins (%) 2.0% 2.2% 2.1% 2.2% 1.9% 1.9% 2.2% 2.4% 2.1% 2.0% EBIT Margin (%) 1.7% 1.9% 1.9% 2.0% 1.4% 1.4% 1.7% 1.9% 1.9% 1.5% Depreciation 27 29 25 25 61 66 66 66 105 258 Interest 11 14 13 14 28 29 28 28 52 113 Other Income 52 40 36 52 35 54 40 50 181 179 PBT 216 237 244 268 173 195 245 278 968 870 Tax -3 -12 -9 8 -15 -6 0 0 -16 -22 Rate (%) -1% -5% -4% 3% -9% -3% 0% 0% -2% -2% Adj PAT 218 249 253 260 188 202 245 278 980 913 YoY Change (%) 33% 43% 37% 22% -14% -19% -3% 7% 33% -7% Margins (%) 2.1% 2.3% 2.2% 2.2% 1.5% 1.6% 1.8% 2.0% 2.2% 1.7% Headcount 1,99,935 2,11,335 2,16,211 2,24,764 2,32,221 2,51,233 2,48,419 2,16,211 2,48,419

January 2020 213
December 2019 Results Preview | Sector: Others
Trident Buy CMP INR6.8 | TP: INR8.4 (+24%) EPS CHANGE (%): FY20|21: +14.7|+2.7 Textile segment revenue to grow 4% YoY whereas paper
segment to de-grow 4% YoY. Outlook on paper prices.
Utilization improvement of bed linen and towel segment. Update on capex plan.
Standalone - Quarterly Earning Model (INR Million) Y/E March FY19 FY20 FY19 FY20E 1Q 2Q 3Q 4Q 1Q 2Q 3QE 4QE Net Sales 11,312 13,915 12,914 14,054 13,053 13,208 13,223 14,397 52,195 53,881 YoY Change (%) -3.0 24.2 18.0 18.5 15.4 -5.1 2.4 2.4 14.3 3.2 Total Expenditure 8,954 10,768 10,487 11,514 10,143 10,714 10,698 11,647 41,723 43,201 EBITDA 2,358 3,147 2,427 2,541 2,911 2,494 2,526 2,750 10,472 10,680 Margins (%) 20.8 22.6 18.8 18.1 22.3 18.9 19.1 19.1 20.1 19.8 Depreciation 944 917 892 886 846 849 870 900 3,639 3,465 Interest 271 249 294 343 325 271 330 364 1,156 1,290 Other Income 88 108 150 111 78 70 75 73 457 297 PBT before EO expense 1,232 2,090 1,391 1,422 1,817 1,445 1,401 1,559 6,135 6,222 Extra-Ord expense 0 0 0 0 0 0 0 0 0 0 Forex (gain)/loss 416 558 -260 -48 -18 -26 0 0 666 -44 PBT 816 1,532 1,650 1,471 1,835 1,470 1,401 1,559 5,469 6,265 Tax 231 448 529 545 603 99 352 393 1,753 1,447 Rate (%) 28.3 29.2 32.1 37.1 32.8 6.8 25.2 25.2 32.1 23.1 MI & P/L of Asso. Cos. 0 0 0 0 0 0 0 0 0 0 Reported PAT 585 1,084 1,121 926 1,232 1,371 1,048 1,166 3,716 4,818 Adj PAT 883 1,479 945 895 1,221 1,347 1,048 1,166 4,202 4,784 YoY Change (%) 7.6 192.5 74.8 64.3 38.2 -8.9 10.9 30.3 74.2 13.9 Margins (%) 7.8 10.6 7.3 6.4 9.4 10.2 7.9 8.1 8.1 8.9
UPL Neutral CMP INR596 | TP: INR610 (+2%) EPS CHANGE (%): FY20|21: +15.4|+25 LatAm and India to drive revenue growth. Look out for new launches and share of branded products. Expect EBITDA margin to contract 50bp YoY. Playing out of synergies post Arysta acquisition.
Cons.: Quarterly Earning Model (Incl-Arysta) (INR Million) Y/E March FY19 FY20 FY19 FY20E 1Q 2Q 3Q 4Q 1Q 2Q 3QE 4QE Net Sales 41,340 42,570 49,210 85,250 79,060 78,170 89,805 100,831 218,370 347,866 YoY Change (%) 11.0 12.9 17.3 49.8 91.2 83.6 82.5 18.3 25.7 59.3 Total Expenditure 32,870 34,180 39,050 71,150 62,480 62,780 71,792 79,656 177,250 276,708 EBITDA 8,470 8,390 10,160 14,100 16,580 15,390 18,013 21,174 41,120 71,158 Margins (%) 20.5 19.7 20.6 16.5 21.0 19.7 20.1 21.0 18.8 20.5 Depreciation 1,750 1,810 1,820 4,310 5,770 6,080 6,200 6,600 9,690 24,650 Interest 1,750 1,810 2,020 4,050 3,980 3,810 4,000 4,000 9,630 15,790 Other Income 1,230 320 370 480 390 240 352 477 2,400 1,459 Exch. difference on trade rec./payable 500 520 780 1,190 60 920 0 0 2,990 980 PBT before EO expense 5,700 4,570 5,910 5,030 7,160 4,820 8,165 11,052 21,210 31,197 Extra-Ord expense 40 570 910 2,990 4,840 3,050 1,160 1,160 4,510 10,210 PBT 5,660 4,000 5,000 2,040 2,320 1,770 7,005 9,892 16,700 20,987 Tax 520 1,160 280 -310 120 660 1,269 1,781 1,650 3,830 Rate (%) 9.2 29.0 5.6 -15.2 5.2 37.3 18.1 18.0 9.9 18.2 MI & P/L of Asso. Cos. 40 140 110 290 420 220 1,001 1,911 580 3,552 Reported PAT 5,100 2,700 4,610 2,060 1,780 890 4,734 6,200 14,470 13,604 Adj PAT 5,580 3,438 6,113 5,763 7,790 3,638 5,604 7,070 20,893 24,102 YoY Change (%) 12.4 6.0 -3.0 -24.5 39.6 5.8 -8.3 22.7 -5.6 15.4 Margins (%) 13.5 8.1 12.4 6.8 9.9 4.7 6.2 7.0 9.6 6.9

January 2020 214
N O T E S

Motilal Oswal India Strategy Gallery

January 2020 216
Explanation of Investment Rating Investment Rating Expected return (over 12-month) BUY >=15% SELL < - 10%NEUTRAL > - 10 % to 15%UNDER REVIEW Rating may undergo a change NOT RATED We have forward looking estimates for the stock but we refrain from assigning recommendation
*In case the recommendation given by the Research Analyst is inconsistent with the investment rating legend for a continuous period of 30 days, the Research Analyst shall within following 30 days take appropriate measures to make the recommendation consistent with the investment rating legend.
Disclosures: The following Disclosures are being made in compliance with the SEBI Research Analyst Regulations 2014 (herein after referred to as the Regulations).
Motilal Oswal Financial Services Ltd. (MOFSL) is a SEBI Registered Research Analyst having registration no. INH000000412. MOFSL, the Research Entity (RE) as defined in the Regulations, is engaged in the business of providing Stock broking services, Investment Advisory Services, Depository participant services & distribution of various financial products. MOFSL is a subsidiary company of Passionate Investment Management Pvt. Ltd.. (PIMPL). MOFSL is a listed public company, the details in respect of which are available on www.motilaloswal.com. MOFSL (erstwhile Motilal Oswal Securities Limited - MOFSL) is registered with the Securities & Exchange Board of India (SEBI) and is a registered Trading Member with National Stock Exchange of India Ltd. (NSE) and Bombay Stock Exchange Limited (BSE), Multi Commodity Exchange of India Limited (MCX) and National Commodity & Derivatives Exchange Limited (NCDEX) for its stock broking activities & is Depository participant with Central Depository Services Limited (CDSL) National Securities Depository Limited (NSDL),NERL, COMRIS and CCRL and is member of Association of Mutual Funds of India (AMFI) for distribution of financial products and Insurance Regulatory & Development Authority of India (IRDA) as Corporate Agent for insurance products. Details of associate entities of Motilal Oswal Financial Services Limited are available on the website at http://onlinereports.motilaloswal.com/Dormant/documents/Associate%20Details.pdf
Details of pending Enquiry Proceedings of Motilal Oswal Financial Services Limited are available on the website at https://galaxy.motilaloswal.com/ResearchAnalyst/PublishViewLitigation.aspx
MOFSL, it’s associates, Research Analyst or their relative may have any financial interest in the subject company. MOFSL and/or its associates and/or Research Analyst may have actual/beneficial ownership of 1% or more securities in the subject company in the past 12 months. MOFSL and its associate company(ies), their directors and Research Analyst and their relatives may; (a) from time to time, have a long or short position in, act as principal in, and buy or sell the securities or derivatives thereof of companies mentioned herein. (b) be engaged in any other transaction involving such securities and earn brokerage or other compensation or act as a market maker in the financial instruments of the company(ies) discussed herein or act as an advisor or lender/borrower to such company(ies) or may have any other potential conflict of interests with respect to any recommendation and other related information and opinions.; however the same shall have no bearing whatsoever on the specific recommendations made by the analyst(s), as the recommendations made by the analyst(s) are completely independent of the views of the associates of MOFSL even though there might exist an inherent conflict of interest in some of the stocks mentioned in the research report. Research Analyst may have served as director/officer, etc. in the subject company in the past 12 months. MOFSL and/or its associates may have received any compensation from the subject company in the past 12 months.
In the past 12 months , MOFSL or any of its associates may have: a) managed or co-managed public offering of securities from subject company of this research report, b) received compensation for investment banking or merchant banking or brokerage services from subject company of this research report, c) received compensation for products or services other than investment banking or merchant banking or brokerage services from the subject company of this research report. d) Subject Company may have been a client of MOFSL or its associates in the past 12 months.
MOFSL and it’s associates have not received any compensation or other benefits from the subject company or third party in connection with the research report. To enhance transparency, MOFSL has incorporated a Disclosure of Interest Statement in this document. This should, however, not be treated as endorsement of the views expressed in the report. MOFSL and / or its affiliates do and seek to do business including investment banking with companies covered in its research reports. As a result, the recipients of this report should be aware that MOFSL may have a potential conflict of interest that may affect the objectivity of this report. Compensation of Research Analysts is not based on any specific merchant banking, investment banking or brokerage service transactions. Above disclosures include beneficial holdings lying in demat account of MOFSL which are opened for proprietary investments only. While calculating beneficial holdings, It does not consider demat accounts which are opened in name of MOFSL for other purposes (i.e holding client securities, collaterals, error trades etc.). MOFSL also earns DP income from clients which are not considered in above disclosures. Above disclosures include beneficial holdings lying in demat account of MOFSL which are opened for proprietary investments only. While calculating beneficial holdings, It does not consider demat accounts which are opened in name of MOFSL for other purposes (i.e holding client securities, collaterals, error trades etc.). MOFSL also earns DP income from clients which are not considered in above disclosures.
Terms & Conditions: This report has been prepared by MOFSL and is meant for sole use by the recipient and not for circulation. The report and information contained herein is strictly confidential and may not be altered in any way, transmitted to, copied or distributed, in part or in whole, to any other person or to the media or reproduced in any form, without prior written consent of MOFSL. The report is based on the facts, figures and information that are considered true, correct, reliable and accurate. The intent of this report is not recommendatory in nature. The information is obtained from publicly available media or other sources believed to be reliable. Such information has not been independently verified and no guaranty, representation of warranty, express or implied, is made as to its accuracy, completeness or correctness. All such information and opinions are subject to change without notice. The report is prepared solely for informational purpose and does not constitute an offer document or solicitation of offer to buy or sell or subscribe for securities or other financial instruments for the clients. Though disseminated to all the customers simultaneously, not all customers may receive this report at the same time. MOFSL will not treat recipients as customers by virtue of their receiving this report. Analyst Certification The views expressed in this research report accurately reflect the personal views of the analyst(s) about the subject securities or issues, and no part of the compensation of the research analyst(s) was, is, or will be directly or indirectly related to the specific recommendations and views expressed by research analyst(s) in this report.
Disclosure of Interest Statement Companies where there is interest Analyst ownership of the stock No A graph of daily closing prices of securities is available at www.nseindia.com, www.bseindia.com. Research Analyst views on Subject Company may vary based on Fundamental research and Technical Research. Proprietary trading desk of MOFSL or its associates maintains arm’s length distance with Research Team as all the activities are segregated from MOFSL research activity and therefore it can have an independent view with regards to subject company for which Research Team have expressed their views.
Regional Disclosures (outside India) This report is not directed or intended for distribution to or use by any person or entity resident in a state, country or any jurisdiction, where such distribution, publication, availability or use would be contrary to law, regulation or which would subject MOFSL & its group companies to registration or licensing requirements within such jurisdictions.
For Hong Kong: This report is distributed in Hong Kong by Motilal Oswal capital Markets (Hong Kong) Private Limited, a licensed corporation (CE AYY-301) licensed and regulated by the Hong Kong Securities and Futures Commission (SFC) pursuant to the Securities and Futures Ordinance (Chapter 571 of the Laws of Hong Kong) “SFO”. As per SEBI (Research Analyst Regulations) 2014 Motilal Oswal Financial Services Limited(SEBI Reg No. INH000000412) has an agreement with Motilal Oswal capital Markets (Hong Kong) Private Limited for distribution of research report in Hong Kong. This report is intended for distribution only to “Professional Investors” as defined in Part I of Schedule 1 to SFO. Any investment or investment activity to which this document relates is only available to professional investor and will be engaged only with professional investors.” Nothing here is an offer or solicitation of these securities, products and services in any jurisdiction where their offer or sale is not qualified or exempt from registration. The Indian Analyst(s) who compile this report is/are not located in Hong Kong & are not conducting Research Analysis in Hong Kong.
For U.S: Motilal Oswal Financial Services Limited (MOFSL) is not a registered broker - dealer under the U.S. Securities Exchange Act of 1934, as amended (the"1934 act") and under applicable state laws in the United States. In addition MOFSL is not a registered investment adviser under the U.S. Investment Advisers Act of 1940, as amended (the "Advisers Act" and together with the 1934 Act, the "Acts), and under applicable state laws in the United States. Accordingly, in the absence of specific exemption under the Acts, any brokerage and investment services provided by MOFSL, including the products and services described herein are not available to or intended for U.S. persons. This report is intended for distribution only to "Major Institutional Investors" as defined by Rule 15a-6(b)(4) of the Exchange Act and interpretations thereof by SEC (henceforth referred to as "major institutional investors"). This document must not be acted on or relied on by persons who are not major institutional investors. Any investment or investment activity to which this document relates is only available to major institutional investors and will be engaged in only with major institutional investors. In reliance on the exemption from registration provided by Rule 15a-6 of the U.S. Securities Exchange Act of 1934, as amended (the "Exchange Act") and interpretations thereof by the U.S. Securities and Exchange Commission ("SEC") in order to conduct business with Institutional Investors based in the U.S., MOFSL has entered into a chaperoning agreement with a U.S. registered broker-dealer, Motilal Oswal Securities International Private Limited. ("MOSIPL"). Any business interaction pursuant to this report will have to be executed within the provisions of this chaperoning agreement.
The Research Analysts contributing to the report may not be registered /qualified as research analyst with FINRA. Such research analyst may not be associated persons of the U.S. registered broker-dealer, MOSIPL, and therefore, may not be subject to NASD rule 2711 and NYSE Rule 472 restrictions on communication with a subject company, public appearances and trading securities held by a research analyst account.
For Singapore: In Singapore, this report is being distributed by Motilal Oswal Capital Markets Singapore Pte Ltd (“MOCMSPL”) (Co.Reg. NO. 201129401Z) which is a holder of a capital markets services license and an exempt financial adviser in Singapore, as per the approved agreement under Paragraph 9 of Third Schedule of Securities and Futures Act (CAP 289) and Paragraph 11 of First Schedule of Financial Advisors Act (CAP 110) provided to MOCMSPL by Monetary Authority of Singapore. Persons in Singapore should contact MOCMSPL in respect of any matter arising from, or in connection with this report/publication/communication. This report is distributed solely to persons who qualify as “Institutional Investors”, of which some of whom may consist of "accredited" institutional investors as defined in section 4A(1) of the Securities and Futures Act, Chapter 289 of Singapore (“the SFA”). Accordingly, if a Singapore person is not or ceases to be such an institutional investor, such Singapore Person must immediately discontinue any use of this Report and inform MOCMSPL.
Disclaimer: The report and information contained herein is strictly confidential and meant solely for the selected recipient and may not be altered in any way, transmitted to, copied or distributed, in part or in whole, to any other person or to the media or reproduced in any form, without prior written consent. This report and information herein is solely for informational purpose and may not be used or considered as an offer document or solicitation of offer to buy or sell or subscribe for securities or other financial instruments. Nothing in this report constitutes investment, legal, accounting and tax advice or a representation that any investment or strategy is suitable or appropriate to your specific circumstances. The securities discussed and opinions expressed in this report may not be suitable for all investors, who must make their own investment decisions, based on their own investment objectives, financial positions and needs of specific recipient. This may not be taken in substitution for the exercise of independent judgment by any recipient. Each recipient of this document should make such investigations as it deems necessary to arrive at an independent evaluation of an investment in the securities of companies referred to in this document (including the merits and risks involved), and should consult its own advisors to determine the merits and risks of such an investment. The investment discussed or views expressed may not be suitable for all investors. Certain transactions -including those involving futures, options, another derivative products as well as non-investment grade securities - involve substantial risk and are not suitable for all investors. No representation or warranty, express or implied, is made as to the accuracy, completeness or fairness of the information and opinions contained in this document. The Disclosures of Interest Statement incorporated in this document is provided solely to enhance the transparency and should not be treated as endorsement of the views expressed in the report. This information is subject to change without any prior notice. The Company reserves the right to make modifications and alternations to this statement as may be required from time to time without any prior approval. MOFSL, its associates, their directors and the employees may from time to time, effect or have effected an own account transaction in, or deal as principal or agent in or for the securities mentioned in this document. They may perform or seek to perform investment banking or other services for, or solicit investment banking or other business from, any company referred to in this report. Each of these entities functions as a separate, distinct and independent of each other. The recipient should take this into account before interpreting the document. This report has been prepared on the basis of information that is already available in publicly accessible media or developed through analysis of MOFSL. The views expressed are those of the analyst, and the Company may or may not subscribe to all the views expressed therein. This document is being supplied to you solely for your information and may not be reproduced, redistributed or passed on, directly or indirectly, to any other person or published, copied, in whole or in part, for any purpose. This report is not directed or intended for distribution to, or use by, any person or entity who is a citizen or resident of or located in any locality, state, country or other jurisdiction, where such distribution, publication, availability or use would be contrary to law, regulation or which would subject MOFSL to any registration or licensing requirement within such jurisdiction. The securities described herein may or may not be eligible for sale in all jurisdictions or to certain category of investors. Persons in whose possession this document may come are required to inform themselves of and to observe such restriction. Neither the Firm, not its directors, employees, agents or representatives shall be liable for any damages whether direct or indirect, incidental, special or consequential including lost revenue or lost profits that may arise from or in connection with the use of the information. The person accessing this information specifically agrees to exempt MOFSL or any of its affiliates or employees from, any and all responsibility/liability arising from such misuse and agrees not to hold MOFSL or any of its affiliates or employees responsible for any such misuse and further agrees to hold MOFSL or any of its affiliates or employees free and harmless from all losses, costs, damages, expenses that may be suffered by the person accessing this information due to any errors and delays.
Registered Office Address: Motilal Oswal Tower, Rahimtullah Sayani Road, Opposite Parel ST Depot, Prabhadevi, Mumbai-400025; Tel No.: 022 71934200/ 022-71934263; Website www.motilaloswal.com. CIN No.: L67190MH2005PLC153397.Correspondence Office Address: Palm Spring Centre, 2nd Floor, Palm Court Complex, New Link Road, Malad(West), Mumbai- 400 064. Tel No: 022 7188 1000. Registration Nos.: Motilal Oswal Financial Services Limited (MOFSL)*: INZ000158836(BSE/NSE/MCX/NCDEX); CDSL and NSDL: IN-DP-16-2015; Research Analyst: INH000000412. AMFI: ARN - 146822; Investment Adviser: INA000007100; Insurance Corporate Agent: CA0579 ;PMS:INP000006712. Motilal Oswal Asset Management Company Ltd. (MOAMC): PMS (Registration No.: INP000000670); PMS and Mutual Funds are offered through MOAMC which is group company of MOFSL. Motilal Oswal Wealth Management Ltd. (MOWML): PMS (Registration No.: INP000004409) is offered through MOWML, which is a group company of MOFSL. Motilal Oswal Financial Services Limited is a distributor of Mutual Funds, PMS, Fixed Deposit, Bond, NCDs,Insurance Products and IPOs.Real Estate is offered through Motilal Oswal Real Estate Investment Advisors II Pvt. Ltd. which is a group company of MOFSL. Private Equity is offered through Motilal Oswal Private Equity Investment Advisors Pvt. Ltd which is a group company of MOFSL. Research & Advisory services is backed by proper research. Please read the Risk Disclosure Document prescribed by the Stock Exchanges carefully before investing. There is no assurance or guarantee of the returns. Investment in securities market is subject to market risk, read all the related documents carefully before investing. Details of Compliance Officer: Name: Neeraj Agarwal, Email ID: [email protected], Contact No.:022-71881085.
* MOFSL has been amalgamated with Motilal Oswal Financial Services Limited (MOFSL) w.e.f August 21, 2018 pursuant to order dated July 30, 2018 issued by Hon'ble National Company Law Tribunal, Mumbai Bench.


![[William Bull (Firm) materials] - Wikimedia Commons](https://static.fdokumen.com/doc/165x107/633233565696ca4473031c93/william-bull-firm-materials-wikimedia-commons.jpg)