
DISEASE. Adrian Richard Bull. MEDICAL RESEARCH COUNCIL ...
126
C)F ISCDIJTH/VMJFTTCHSI EJMtl/y I)irrT;ilAi]]SL\lSrrS: C)!? BILOCDD I^RE^gSUTRlE I^ill.A'ITEI) DISEASE. (SINGLE VOLUME) Adrian Richard Bull. MEDICAL RESEARCH COUNCIL ENVIRONMENTAL EPIDEMIOLOGY UNIT, SOUTHAMPTON. APRIL 1992.
-
Upload
khangminh22 -
Category
Documents
-
view
4 -
download
0
Transcript of DISEASE. Adrian Richard Bull. MEDICAL RESEARCH COUNCIL ...

C)F ISCDIJTH/VMJFTTCHSI
EJMtl/y I)irrT;ilAi]]SL\lSrrS: C)!? BILOCDD I^RE^gSUTRlE I^ill.A'ITEI)
DISEASE.
(SINGLE VOLUME)
Adrian Richard Bull.
MEDICAL RESEARCH COUNCIL ENVIRONMENTAL
EPIDEMIOLOGY UNIT, SOUTHAMPTON.
APRIL 1992.

This thesis was submitted for examination in April 1992 and does not necessarily
represent the final form of the thesis as deposited in the University after examination.

UNIVERSITY OF SOUTHAMPTON.ABSTRACTFACULTY OF MEDICINE Doctor of MedicineEy\RJ.lf r)iriTEI(}/n[]SLA]SrrS: C)F IBIJCX)!) P]RJESSIJIU3 /iNI) ILEiL^ATliD DISiEASIE.By Adrian Richard Bull.
Two studies were designed to examine the relations between early growth and cardiovascular disease in adult life.
The first study was a survey of pelvimetry in 1,615 men and women aged 50 yrs or more living in 8 English towns. The mean diameters at the pelvic inlet were smaller in towns with higher SMR’s for cardiovascular disease. In both sexes the pelvises of those aged 75 or more had a lower brim index than the pelvises of those who were younger.
The second study followed up 449 infants bom in Preston during 1935-1943 who were still living in Lancashire. In both sexes systolic and diastolic pressures were strongly related to placental weight and birth weight. Mean systolic pressure rose by 15 mmHg as placental weight increased from 11b or less to greater than 1.51b, and fell by 11 mmHg as birth weight increased from 5.51b or less to greater than 7.51b. These relations were independent of each other, and of the observed effects of higher body mass index and alcohol consumption.
Analysis of subjects bom after 38 weeks completed gestation showed that for those with placental weights of 1.25 lb or less, mean systolic pressure rose by 13 mmHg as ponderal index (w/P) at birth fell from greater than 14.75 to 12 or less, while for those with placental weights of greater than 1.25 lb , mean systolic pressure rose by 14 mmHg as head circumference/length increased from less than 0.65 to 0.7 or more.
Growth in early life, reflected in the size of the adult bony pelvis, is related to risk of cardiovascular disease. The intrauterine environment, through an effect on intrauterine growth, has an important effect on blood pressure in adult life. Two groups of babies, characterised by birth measurements, have been identified as being at increased risk of raised blood pressure in adult life.

CONTENTS
Abstract List of Tables PrefaceAcknowledgements Author’s contribution
INTRODUCTION:
I The Relationship of Cardiovascular Disease in Adulthood to Conditions Experienced in Early Life.
2.4.6.7.8.
9.
II Blood Pressure Cerebrovascular Disease and Ischaemic Heart Disease
III Tracking of Blood Pressure from Childhood and its Relationship to Birthweight.
IV Patterns and Influences in Intra Uterine Growth.
V Maternal Height and Pelvic Size & Shape.
VI Conclusions from the Above Review.
14.
20.
28.
36.
41.
METHODS:
1. Pelvimetry Survey.2. Preston Cohort Study.
RESULTS:
1. Pelvimetry Survey.2. Preston Cohort Study.
DISCUSSION:
1. Pelvimetry Survey.2. Preston Cohort.
CONCLUSION.TABLES.REFERENCES.
44.46.
50.52.
67.70.
90.91.114.

LIST OF TABLES
1. I)y\T/i SIETT (ZyMSf: :SELJEX:TI()I^ (I^CIR I^RJEjSTTCWMCOHORT).
T/VBIJE (:()IVIPV\.RISC)N C)F I3IRTTH IP/VIl/i^/IETEBlS ]:C)R S/MVCPILIiS /VrfI) TOTAL BIRTH POPULATION FROM WHICH COHORT SELECTED, NHE/iN (sd). IPIIE^STC)!^ (:()HOI^r.
TABLE 3. PELVIC MEASUREMENTS IN PELVIMETRY STUDY POPULATION BY SEX (SD).
rAI3LE/I. l)IyMVIET15RS (crn) /VNI) R/vTKD;; /iTT ITilB FMEULA/K: BRUVI FO)R ELAjCH SEX BY AGE GROUP.(PELVIMETRY SURVEY).
TABLES. PELVIC DIMENSIONS BY AGE GROUP ADJUSTED FOR SEX, PELVIMETRY SURVEY.
TABLE 6. MEAN CONJUGATE DIAMETER (sd), WIDEST TRANSVERSE DIAMETER (sd), BRIM INDEX (sd), AND SMR FOR CARDIOVASCULAR DISEASE (1980-1988) FOR EACH TOWN, (n =number of x-rays available for analysis, Pelvic measurements adjusted for age and sex).
TABLE 7. NON PARAMETRIC CORRELATION COEFFICIENTS (FOR RANK) BETWEEN THE MEAN PELVIC MEASUREMENTS AND STANDARDISED MORTALITY RATIO FOR EACH TOWN.PELVIMETRY SURVEY.
TABLE 8. MEAN SYSTOLIC BLOOD PRESSURE BY BODY MASS (PRESTON COHORT).
TABLE 9. MEAN SYSTOLIC PRESSURE FOR ALCOHOL INTAKE (N,SD). (PRESTON COHORT)
TABLE 10. MEAN SYSTOLIC PRESSURE ACCORDING TO PLACENTAL AND BIRTH WEIGHTS (n).(PRESTON COHORT).
TABLE 11. MEAN DIASTOLIC PRESSURE BY PLACENTAL AND BIRTH WEIGHTS (PRESTON COHORT).
TABLE 12. MEAN SYSTOLIC PRESSURE BY SEX, PLACENTAL WEIGHT, AND BIRTH WEIGHT (n).(PRESTON COHORT).
TABLE 13. RELATIVE RISK OF BEING TREATED FOR HYPERTENSION OR HAVING A SYSTOLIC BLOOD PRESSURE ABOVE 160 mmHg, ACCORDING TO PLACENTAL WEIGHT (95% CONFIDENCE LIMITS). (PRESTON COHORT).

TABLE 14.
TABLE 15.
TABLE 16.
TABLE 17.
TABLE 18.
TABLE 19.
TABLE 20.
A4E/ihl (ZH/VNCIE (95% (:()^^FTD]Ef4(:E ir4TEI^\//Vl^l IN STY^STTCILIC I'RJESSlJRIi ASS()(:I/nnEI) \\nnrH F^LA(:I:hrr/\JL \VTEI(jHT IBIIITTH WEIGHT, BODY MASS INDEX, ALCOHOL CONSUMPTION AND SEX. (PRESTON COHORT).
MEAN CHANGE (95% CL) IN SYSTOLIC PRESSURE ASSOCIATED WTTTH P]Ly\(:EhrrAI. VVTEICIHTT, IBIRTTH YVTEICIHT, ILIiNCITH (DIF (lE^STT/iTTPON /VND SEX (TPRE^ST()N (ZCDIIOI^HT).
MEAN SYSTOLIC PRESSURE (mmHg) BY PARITY (n). COHORT)
(PRESTON
TABLE 21.
SYSTOLIC PRESSURE (ADJUSTED FOR AGE AND SEX) BY LENGTH AND PLACENTAL WEIGHT (n). GESTATION 38 WEEKS OR MORE. (PRESTON COHORT).
SYSTOLIC PRESSURE (ADJUSTED FOR AGE AND SEX) IN THOSE BORN WITH MINIMUM PERIOD OF GESTATION 38 WEEKS (n). (PRESTON COHORT).
ADJUSTED SYSTOLIC PRESSURE IN THOSE BORN WITH A MINIMUM OF 38 WEEKS GESTATION ACCORDING TO PLACENTAL WEIGHT AND RATIO OF HEAD CIRCUMFERENCE TO BIRTH LENGTH (n). (PRESTON COHORT).
BIRTH PARAMETERS OF INFANTS BORN AFTER A MINIMUM 38 WEEKS GESTATION WITH PLACENTAL WEIGHT 1.25 lbs OR LESS, CLASSIFIED ACCORDING TO PONDERAL INDEX. (PRESTON COHORT).
BIRTH PARAMETERS OF INFANTS BORN AFTER A MINIMUM 38 WEEKS GESTATION WITH PLACENTAL WEIGHT GREATER THAN 1.25 lbs CLASSIFIED ACCORDING TO HEAD CIRCUMFERENCE/LENGTH. (PRESTON COHORT).
TABLE 22. RELATIONSHIP OF MATERNAL CONJUGATE EXTERNA TO BIRTH PARAMETERS (n). (PRESTON COHORT).
TABLE 23. SYSTOLIC BLOOD PRESSURE ACCORDING TO INFANT AND ADULT SIZE (n=449). (PRESTON COHORT).

PREFACE.
Ischaemic Heart Disease (IHD) and Cerebrovascular disease (CVD) cause a considerable burden of mortality in England and Wales. In 1986 IHD (ICD code 410-414) was the underlying cause of 157,995 deaths, and CVD (ICD code 430-438) the cause of 71,328 deaths in England and Wales (27.3% and 12.3% of all deaths respectively) (1). Against a world standard population, the age standardised mortality for IHD in England and Wales in 1987 was 156 per 100,000 (range for 52 countries observed 16.8 - 190.2) and for CVD was 60.7 per 100,000 (range 17.5 - 153.5) (2).
This thesis examines two propositions - that under nutrition in early life is an important factor in the genesis of cardiovascular disease, and that fetal growth is related to blood pressure in adult life.
A literature review is reported that considers;1. The relationship of cardiovascular disease in adulthood to conditions experienced in early life,2. Blood pressure as a risk factor for IHD and CVD,3. Blood pressure and its relationship to birth weight,4. Maternal influence on birthweight,5. Stature and pelvimetry.
Two epidemiological studies are reported. One is a comparison of pelvic anatomy in different parts of England. The other is a follow up after 50 years of 443 people born and still living in Preston, whose birth records have been preserved.

This thesis would not have been possible without
- the inspiration and guidance of Professor David Barker,
- the collaboration and support of colleagues at the MRC Environmental Epidemiology unit, in particular Dr CLive Osmond, Mrs Shirley Simmonds, Dr Keith Godfrey, Miss Karen Vines, and, at Southampton General Hospital, Dr Peter Guyer and Dr John Herbetko,
- Mrs Foden and medical records staff at Sharoe Green Hospital, who had preserved the records made over 50 years ago; the staff at the NHS central register, Southport; and research workers Marie Ward and Margaret Kelly,
- The radiographers and radiologists from the district hospitals who contributed X-Rays to the pelvimetry survey; general practitioners across Lancashire who helped trace subjects for the Preston cohort study.
AUTHOR'S CONTRIBUTION.
PELVIMETRY SURVEY. I designed the study, recruited the contributing hospitals, and supervised the collection of the data. Miss Vines (statistician) provided statistical assistance with the analysis of the data, supported by Dr Osmond (statistician). Professor Barker (my supervisor) assisted with the interpretation of the results and suggested certain refinements of the analysis. Drs Guyer and Herbetko read the X-ray films.
PRESTON COHORT STUDY. From the original clinical records I designed the study, taking advice on methods of tracing subjects. I led the collection of the data, management of the fieldwork, and tracking of elusive cases, supported by Mrs Simmonds (research assistant). First analysis and interpretation was shared between myself, Professor Barker and Dr Osmond. Dr K Godfrey (epidemiologist) contributed to subsequent analysis within different groups of intra uterine retardation.

INTRODUCTION.
I THE RELATIONSHIP OF CARDIOVASCULAR DISEASE IN ADULTHOOD TO(:()r^IDITT01snS EXnPERIIiNCZELP IN lE/VlH/y IJEFIE.
]H[IS r()IU(:/U. /usnc) (jIECICIIl/lI^HICZ/U. A.S5;()(:Iv\TI()]SnS IBIETWIEUEISf NI)\T1EIU4yUL,
Ilfl^/iNTT /INI) /UDUTLT III3/VI,TH.
In 1964, Rose made (as one of three alternatives) the suggestion that ’ischaemic heart
disease tends to occur in individuals who come from a constitutionally weaker stock,
more liable to submit to a variety of disease’ (3). This conclusion was drawn from a
case control study, which compared 75 patients admitted for ischaemic heart disease with
patients admitted for conditions not known to be associated with that condition. Controls
were matched for age, sex, and whether manual or clerical workers. It was observed that
amongst siblings of the index cases there had been a large excess mortality in infancy.
Index cases themselves were more likely to have been admitted to hospital in the past,
for conditions other than ischaemic heart disease. An excess of parental mortality from
ischaemic heart disease had occurred amongst index cases, but for males only. Rose
concluded that the evidence for familial aggregation of ischaemic heart disease did not
preclude mechanisms that were environmental rather than genetic.
This association of infant mortality with subsequent ischaemic heart disease in the same
generation was later demonstrated by a different epidemiological method (4).
Standardised mortality rates were calculated for each local authority area in England and
Wales, using all deaths in the period 1968-1978, and 1971 census data. A close
geographical relationship was observed between current mortality rates for ischaemic
heart disease and past infant mortality rates. The correlations were consistent for both
sexes and all age groups. Stroke (defined as cerebrovascular disease other than
subarachnoid haemorrhage) was similarly correlated with infant mortality. Among the
other common causes of death, only bronchitis, stomach cancer and chronic rheumatic
heart disease had a close relationship to infant mortality. Bronchitis and chronic
rheumatic heart disease mortality, however, were associated with post neonatal mortality,
unlike stroke and ischaemic heart disease which were associated more closely with
neonatal death. This suggests a different mechanism for the influence observed, since
post neonatal mortality was related to overcrowding and family size, and thus exposure
to respiratory infections, whereas stillbirth and neonatal mortality rates depended upon
variations in maternal health and nutrition and thus the nature of the intra uterine
environment (5,6).
As a consequence of the study described above, a detailed geographical comparison was
made of maternal mortality (deaths attributable to pregnancy or childbirth) before and
after the First World War, and standardised mortality ratios at ages 55-74 during 1968-
1978 (7). The results showed a strong and consistent relationship between mortality from
stroke and ischaemic heart disease in one generation and maternal mortality (from causes
excluding puerperal fever) of the preceding generation.
The relationship between ischaemic heart disease in middle and late life, and infant
mortality of the same generation cohort has been demonstrated in Norway, where it was
observed that current geographical variations in mortality in middle age were correlated
with the pattern of infant mortality that had existed for that generation (8). The
10

correlation was particularly evident for arteriosclerotic heart disease. The author
suggested that ’the more fit survive and carry with them a life long vulnerability because
of the poor living conditions in early years’. It was later suggested that the Norwegian
correlations were explained by an effect on serum cholesterol of deprivation during
childhood followed by later affluence (9). An association between poor socioeconomic
circumstances during childhood and ischaemic heart disease in adult life was also shown
in Finland by Kaplan and Salonen, who examined a population of 1513 men in the rural
and urban communities of Kuopio (10). Socio economic conditions experienced during
childhood were assessed by fathers’ education and occupational prestige, mothers’
occupational prestige, whether the family lived on a farm, and whether the family was
perceived as being ’wealthy’. Current lifestyle and past medical history were fully
assessed. Subjects who reported low socioeconomic status during childhood were
significantly more likely to have cardiac ischaemia on exercise than those reporting high
socioeconomic class during childhood. There was no effect on risk of ischaemic heart
disease of any interaction between adult socioeconomic status and that of childhood, as
had been proposed by Forsdahl (9).
Barker et al argued that the factor underlying these observations was maternal health and
early growth rather than socioeconomic conditions experienced in childhood and in later
life (4,5,7). A direct link between low birth weight, reduced infant growth and
cardiovascular risk in individuals was shown in a follow up study of 5654 men bom in
Hertfordshire, England, during 1911-1930 (11). In that county, from 1911, every baby
was weighed at birth, visited periodically through the first year, and weighed again at one
year. The records have been preserved allowing men now aged about sixty to be traced.
11

The early development of these individuals could thus be related to later illness and
death. Cause of death in this cohort was analyzed in relation to birthweight, weight at
one year, and method of feeding. The relative risk of death from ischaemic heart disease
was strongly related to both prenatal and postnatal growth. Standardised mortality ratios
for ischaemic heart disease fell with increasing birthweight at one year, a trend not
evident for deaths from non-circulatory causes. Mortality from Ischaemic heart disease
also fell with increasing birthweight, although the trend did not reach statistical
significance. When those who had been bottle fed were excluded (because of different
associations of bottle feeding with Ischaemic heart disease), a simultaneous effect of
birthweight and weight at one year was demonstrated, with men for whom both weights
were lowest having the greatest risk of mortality from ischaemic heart disease. Stroke
mortality showed similar trends. Among babies with above average birthweight the risk
of ischaemic heart disease was found to be below average, irrespective of infant growth
(12).
HEIGHT RELATED TO ISCHAEMIC HEART AND CEREBROVASCULAR
DISEASE.
Adult height is influenced by the combination of genetic potential and environmental
conditions during early growth, and reflects the conditions of early life (13-18). Adult
height decreases with socioeconomic status - an effect which is still apparent among
children in England and Wales (19-22).
An excess risk of mortality from ischaemic heart disease and cerebrovascular disease has
12

been demonstrated among people of low stature in Norway, Finland, Sweden, and Britain
(19,23-25). The common conclusion drawn from these observations was that factors
operative in early life that are associated with low adult stature are also associated with
risk of cerebrovascular or ischaemic heart disease. It was suggested that these factors
could be either hereditary or environmental. The regional variation in height of mothers
and children in a British study has also been shown to have a negative correlation with
standardised mortality ratios for cerebrovascular and ischaemic heart disease (26).
CONCLUDING REMARKS.
A number of authors have observed that ischaemic heart and cerebrovascular disease are
related to conditions experienced in early life (8,10,23-25,27). Examination of maternal
and early infant mortality point to fetal and infant growth as a major influence on
cardiovascular disease (4,5,11,12).
13

II BLOOD PRESSURE CEREBROVASCULAR DISEASE AND ISCHAEMIC HEART
DISEASE.
BLOOD PRESSURE AS A RISK FACTOR.
In 1959 Leishman suggested that, because of the profession’s preoccupation with
lowering blood pressure, it was already difficult to assess properly the natural history of
the hypertensive condition (28). Leishman was able to report, however, a comparison
of 211 untreated hypertensive patients (diastolic pressure > 100 mmHg) first identified
in 1946, with two further groups treated by sympathectomy and ganglion blocking drugs.
The study demonstrated the link between hypertension and cerebrovascular and renal
disease, and the advantage of hypotensive therapy.
In 1970 Kannel et al reported the findings of a prospective study which followed up more
than 5,000 men and women for a period of 14 years - the Framingham cohort (29). A
comprehensive programme meant that only 2% of the study population were completely
lost to the project, although initial recruitment was only 68% of those identified for
inclusion. A detailed examination of non-haemorrhagic stroke showed gradients of risk
with blood pressure level that were similar for both diastolic and systolic measurements,
after adjustment for age. The data showed that there was no threshold of risk - that the
risk was proportional to the level of blood pressure, from lowest recorded to highest.
The relationship of risk to blood pressure was apparent at all ages.
14

In 1978, the same cohort provided data for analysis which related to more than 2 decades
follow up (30). Systolic blood pressure was confirmed as the most powerful predictor
of risk for non-haemorrhagic stroke. The data also supported earlier findings that
elevated blood pressure remained a risk factor for stroke in the older age groups. The
authors stressed that the risks were related to blood pressure and not to arbitrarily
designated hypertension.
Further examination of data from this cohort demonstrated that blood pressure lability did
not lessen the association between blood pressure and risk of stroke - the mean, minimum
and maximum of three blood pressures taken during an examination were equally
predictive of cardiovascular disease (31).
These findings have been confirmed in other populations. A North American population
of mixed race was sampled in 1960-1962; 2,350 people were re-examined seven to nine
years later with careful analysis of medical history or death suggestive of stroke (32).
Transient ischaemic attacks were not included in the analysis. The risk of stroke showed
a clear gradient across three categories of blood pressure.
In Sweden, 789 men aged 54 at initial examination in 1967 were followed up until the
end of 1985, with all strokes being determined from a stroke register, hospital activity
data, mortality data, and clinical interview (33). Diastolic blood pressure predicted stroke
independently of other risk factors - maternal history of stroke, abdominal obesity,
plasma fibrinogen.
15
In 1972 over 9,000 men and women were examined in Eastern Finland, having been
selected by random sampling from the population register (34). Follow up for strokes
or transient ischaemic attacks was carried out through national hospital discharge and
mortality data. The age adjusted risk of any stroke or brain infarction was observed to
rise steadily with increasing baseline blood pressure. Other risk factors for stroke
identified for men in a multiple logistic model were daily number of cigarettes and
history of previous stroke. No threshold of blood pressure associated risk was observed.
The authors pointed out that only 27 per cent of cases occurred among men with diastolic
pressures of 95 mmHg or more and concluded that population measures to reduce blood
pressure should be sought, since active intervention would have to include groups with
only borderline hypertension.
A survey of 17,530 London civil servants aged 40 to 64 (the Whitehall study) showed
that blood pressure was a risk factor for coronary heart disease, and linked both blood
pressure and symptoms of disease to employment grade (19).
In 1986, results were reported from the Multiple Risk Factor Intervention Trial (MRFIT),
in which 361,662 men aged 35-57 were screened in the years 1972-74 (35). In 1982, the
mortality experience of this cohort was analyzed from death certificates obtained through
state health departments. There were 2626 deaths from coronary heart disease. Mortality
was analyzed against diastolic blood pressure and a gradual increase in risk was
demonstrated over most levels, with an accentuation of risk at diastolic blood pressure
greater than 94 mmHg (above the 85th centile), such that those in the top 15% of the
population for blood pressure had a relative risk of death from ischaemic heart disease
16

of 2.5 compared with the bottom 25%.
Data from the same study (MRFIT) were used in an analysis of 325,384 white men who
were originally screened, in which cohort 2,426 deaths occurred (36). The mortality rate
from coronary heart disease was seen to increase progressively across the five quintiles
of blood pressure. The risk associated with rising blood pressure was shown to be
independent of that observed with serum cholesterol or smoking.
The role of blood pressure as a population risk factor for cardiovascular disease has been
demonstrated by the British Regional Heart Study (37). The project examined the
cardiovascular mortality of a number of towns. A clinical survey of middle aged men
was then conducted in 25 of these towns (individuals being identified by general practice)
to examine the relationship between distribution of cardiovascular risk factors and
cardiovascular mortality rates. Cardiovascular mortality included cerebrovascular disease
and ischaemic heart disease. The rates were associated with mean systolic blood
pressure, prevalence of heavy cigarette smoking, and heavy alcohol consumption. The
cohort was followed up over 8 years at which point a relative risk of having had a stroke
was 12.1 in men who were smokers and had a systolic blood pressure of 160mmHg or
more, compared with normotensive non smoking men (38).
INTERVENTION STUDIES.
A number of studies have demonstrated that blood pressure is a remediable cause of
ischaemic heart and cerebrovascular disease. In 1967, results were published of a
17

randomised control trial of hypotensive therapy for people with diastolic pressures
averaging between 115 and 129 mmHg (39). A beneficial effect on both mortality and
morbidity was reported. A randomised controlled trial of people with mild hypertension
was conducted by a Medical Research Council working party. It demonstrated a reduced
risk of stroke and some effect on ischaemic heart disease with lowered blood pressure
(40). A similar effect has been shown in American and Australian populations (41,42).
In 1989 a working party reviewed the evidence of such trials and concluded that
pharmacological treatment of hypertension is indicated for diastolic blood pressures which
are consistently over 100 mmHg (43).
A CONTINUUM OF RISK.
In many of these prospective studies, the relative risk of cardiovascular disease is shown
to be related to blood pressure, even in what is considered to be the normal range.
Elevation of blood pressure across the full range in a population is as important to the
incidence of blood pressure related disease as the proportion of individuals within the
population who have the highest levels (44). This is discussed by Kannel et al (36), who
calculated that an average reduction in diastolic pressure of 8 mmHg in the North
American population would produce a 20.6% reduction in Coronary Heart Disease deaths
for men aged 35 - 57, which is similar to the calculated effect of eliminating diastolic
hypertension (>90 mmHg). By pooling the results of nine controlled trials of treatment
of hypertension, McMahon has calculated that an overall reduction of diastolic pressure
18

of 5.7 mniHg would result in a 38% reduction of non fatal stroke (45).
CONCLUDING REMARKS
Raised blood pressure is a risk factor for both cerebrovascular and ischaemic heart
disease, independent of other risk factors, whether one considers individuals within a
population or compares different populations. Nevertheless, coronary heart disease has
a different epidemiology from that of stroke (46). Low rates of coronary heart disease
may occur in countries with a high prevalence of stroke and hypertension (47).
Hypertension, unlike coronary heart disease, is not uncommon in third world countries
(48). These differences in epidemiology, however, may be explained by differences in
risk factors other than hypertension (49 -51).
19
in TRACKING OF BLOOD PRESSURE FROM CHILDHOOD AND ITS RELATION
TX) BIRlTi V^EBGPrr.
The level of blood pressure at one examination is the most powerful predictor of blood
pressure at follow up (51,53). Furthermore, a relatively high initial blood pressure is
associated with a relatively fast subsequent increase of blood pressure (54-56). The
question arises, at what age does an irreversible trend towards hypertension begin? In
1977 a National (American) Task Force on Hypertension accepted that hypertension could
be predicted from measurements of blood pressure in childhood, and even suggested that
active therapy should be considered at that stage (57), although in an extensive review
it was concluded that there was insufficient long term data to support such action (58).
Tracking is the term used to describe the persistence of rank order for the blood pressure
of an individual relative to others in a population of similar age.
TRACKING OF BLOOD PRESSURE IN ADULT LIFE.
In 1975 data from the Framingham study showed that over 20 years’ follow up of
subjects, a high correlation was maintained between blood pressures of individuals from
one medical examination to the next irrespective of the variability of three blood pressure
readings taken at one examination (31).
A cohort of 3983 men declared fit for pilot training prior to World War II, 90% of whom
20

were aged 20-39, was followed up over 30 years (59). Initial blood pressures of the
subjects were read from the medical records of World War survivors (and so were not
taken in a standardised manner). Subsequent examinations were made at 5 yearly
intervals. Analysis considered the relative position within the overall distribution on each
occasion. There was a significant correlation between the single casual measurement of
blood pressure at entry, and subsequent follow up levels, for all ages and all periods of
follow up. The relationship was seen for both diastolic and systolic readings. The
correlation between sequential measurements was observed to be greater as the cohort
grew older, and to decrease as the interval between measurements increased. Those
whose blood pressure was in the upper part of the distribution at early examinations
tended to retain that position at later examinations.
In another cohort of pilots, which was followed up over 24 years, the initial blood
pressure measurements were taken in a more standardised fashion and body weight (as
well as parental longevity) was taken into account in the analysis (60). Blood pressure
was not shown to increase with age in every individual, although it did so for the cohort
as a whole. One sub group was identified that experienced a steady rise in blood
pressure. This group was further characterised by greater increase in weight and by
reduced parental longevity. Throughout the study, those men in the top quintile for blood
pressure in 1940 (when the men were in their early twenties) retained their position in
the range of blood pressure.
In a study of college students, conducted retrospectively over 22-31 years, both systolic
and diastolic blood pressure at initial examination were associated with the incidence of
21
doctor-diagnosed high blood pressure (as reported by questionnaire response) at follow
up (61). The risk of hypertension for those in the top quartile of blood pressure at
College was over twice that of the remainder on univariate analysis. Ponderal Index
(weight/height^) at College was also associated with subsequent risk, although cross
tabulation showed that early systolic blood pressure levels were predictive of later
hypertension independent of obesity.
Taking yet another group of aviators, Froom et al calculated that the sensitivity of
elevated blood pressure at entry medical (obtained retrospectively) as a test for raised
blood pressure 12-15 years later was 32.4%, with a specificity of 86.7% and a positive
predictive value of 10.8% (62). No allowance was made for change in other factors that
affect blood pressure. The authors concluded that these figures were broadly in line with
those estimated from other studies of adults and that this would suggest there is limited
predictive value of casual blood pressure measurement in early adulthood. Szklo has
pointed out the important differences between regression and correlation (53) observing
that average associations, but not individual associations, are strong between initial and
subsequent blood pressures.
In Wales, a follow up study was conducted over 17 years, in which the subjects were
initially aged between 5 and 74 (63). Tracking correlations were found to occur for all
age groups, for both systolic and diastolic readings, but to increase with initial age and
to decrease with longer intervals between measurements. Most of the increase in
correlation occurred before an initial age of 20, at which point analysis of variance
suggested a discrete rise. Other factors (such as body mass) were not taken into account.
22

TRACKING OF BLOOD PRESSURE IN CHILDHOOD.
To examine the tracking phenomenon in children, a Dutch group followed up 386
individuals aged 5-19 over four to five years, measuring blood pressures annually (64).
Tracking coefficients (age-standardized regression coefficients of rank in blood pressure
distribution over time) were observed of 0.4-0.6 for systolic blood pressure, and 0.2-0.5
for diastolic. The coefficients were largest in older children. Using a different method
of analysis, 60% of those children whose systolic blood pressure was in the upper third
of the distribution at initial examination retained their position at four years. For
diastolic blood pressure the figure was 52%. Coefficients were similar in obese and non
obese children, and in children whose parents had high blood pressure compared with
those whose parents did not. There was no analysis which controlled for changes in
other factors (such as obesity) which are known to affect blood pressure.
The Bogalusa Heart Study examined 3524 children aged 2-14 yrs, using a particularly
strict and careful study protocol (65). Careful analysis of blood pressure at one year
showed a high consistency of ranking in the top decile of blood pressure. A multiple
regression test for determinants of blood pressure at one year showed that initial systolic
blood pressure had a partial regression coefficient of 0.61-0.66, and initial diastolic
pressure a coefficient of 0.36-0.52, independent of age, race and obesity. The authors
concluded that their observations contributed to the probability that primary hypertension
begins early in life. The cohort of children was followed up for a period of eight years,
at which time analysis was made of sensitivity and specificity of initial blood pressure
levels as a screening test (66). Positive predictive values were shown that were
23

equivalent to those of other studies in older children, and higher than those using
equivalent age groups. The authors concluded that the basal blood pressure
measurements which they had measured showed a greater tendency to track with age than
the casual blood pressure measurements made by other workers.
In New Zealand, a cohort of 361 Polynesian children aged 5-14 years was examined and
followed up over 1.5-3.7 years (67). Using a technique which adjusted for age, a strong
correlation was shown between initial and follow up systolic blood pressure. Partial
regression analysis, controlling for Quetelet (Body Mass) Index, and for length of follow
up showed that the predictive effect of initial blood pressure was independent of these
factors.
A much larger group of 4,313 children, again aged 5-14 at the start, was followed up
over ten years (68). Analysis of the rank order of blood pressure and other parameters
at interval examinations during the study showed that changes in the blood pressure rank
of individuals were associated with differences in the rate of growth of height and weight
of that child. The study clearly identified groups of children who remained at a
consistently high rank for blood pressure, or who showed a consistently increasing (or
decreasing) rank order. The authors suggested that final rank order of blood pressure
may not be established until growth ceases. This would accord with those studies
described above that demonstrate higher tracking coefficients in mature adults than in
younger individuals. That these observations made in study populations may be
extrapolated to the general US population was demonstrated by results of a large national
survey (69), which used a national probability sample chosen to be representative of the
24

US population. 2,618 children aged 6-11 years were followed up over 6 years. The
results confirmed the relationship between successive measurements of blood pressure and
the authors suggested that risk of adult hypertension could be estimated from childhood
blood pressure.
Tracking of blood pressure in childhood has been shown from earlier ages. A small
study of 28 children whose blood pressures were relatively elevated at 5 years showed
that the elevation was still present at 11-12 years (70). A study of 1,797 infants, whose
blood pressure was first measured at an age of four days, demonstrated weak (though
significant) correlations for systolic blood pressure under one year, with the strength of
the correlations increasing with age up to four years (71). Analysis corrected for weight
of infant and state of wakefulness. The authors suggested that tracking of blood pressure
starts at about 1 year. A study of 730 infants aged 5 days to 2 years, however, showed
that blood pressures taken earlier than 6 months after birth were not consistently
predictive of later levels, but that both systolic and diastolic pressures at 6 and 12 months
were significantly correlated with blood pressure at later ages (72). The same researchers
followed up an older cohort for eight years, when 484 children were finally examined
(73). Simple regression and Chi squared analysis showed a highly significant correlation
between blood pressure order at initial examination and eight years later. For both
systolic and diastolic pressures, the tracking coefficients increased with age group.
The evidence for lifelong tracking of blood pressure depends upon a number of follow
up studies covering different stages of life. Some of the adult studies depend upon
retrospective determination of blood pressure taken during routine examination and none
25

make sufficient allowance for change in other correlates of blood pressure such as body
mass and alcohol consumption. These inadequacies would however tend to diminish the
ability of the studies to detect the tracking phenomenon, so that an underlying
perseverance of blood pressure ranking may in fact be greater than has so far been
demonstrated.
BLOOD PRESSURE AND BIRTHWEIGHT.
In 1985, data from a national birth cohort which had reached 36 years of age were
analyzed (74). Birth weight was shown to be inversely associated with adult levels of
systolic pressure in men and women. Stepwise multiple regression analysis showed that
birth weight was significantly related to adult systolic blood pressure, independently of
adult body mass, smoking habit, social class, and family history of hypertensive or
ischaemic heart disease. A second national birth cohort was examined at the age of ten
years (75). Systolic blood pressure was again shown to be inversely related to birth
weight, independently of current weight, and this relationship persisted after adjustment
for mothers’ blood pressure. The observations were similar at all gestational periods,
suggesting that the effect of birth weight was not a result of shortened gestation. A
follow up study of 468 men with a mean age of 64 years showed that blood pressure in
adult life was inversely related to birth weight (12).
A case control study of low birth weight babies showed that at 10 years of age the cases
had higher systolic and diastolic blood pressures than the controls, who were matched for
maternal height, social class, smoking habit of mother, sex of child, and ordinal position
26

of birth (76). At seven years of age, systolic pressure in 692 children in New Zealand
was shown to be inversely related to birth weight (77). A study of 692 children at the
same age showed a similar inverse relationship between blood pressure and birthweight
(78) and this has been confirmed in other studies (79-81). A small, retrospective study
of Swedish conscripts showed that the risk of increased diastolic blood pressure in early
adult life was significantly higher in those whose birth weight was small for gestational
age (82).
Low birthweight is associated with raised blood pressure in later life, and this effect is
independent of duration of gestation. Further study is required to examine the relations
of duration of gestation, different measurements of the baby at birth, and level of blood
pressure in adult life.
27

IV PATTERNS AND INFLUENCES IN INTRA UTERINE GROWTH.
MATERNAL INFLUENCE ON BIRTH WEIGHT.
In 1965, Ounsted showed that the most significant difference between a group of growth
retarded infants and controls (who were similar in respect of maternal age, parity, ill
health and raised BP) was in sibling birth weights, the siblings of the growth retarded
infants being significantly smaller than the siblings of the controls. A deficiency of tall
mothers and social class I and II was observed in the low birth weight group, and an
excess of smokers, but these differences were small compared with the ’gross and
significant’ differences in birth weight of live-born siblings. In a development of the
study, a small group of infants delivered early was studied and no tendency to repeat
short gestation was detected in the mothers. The author concluded that growth
retardation was a result of some maternal factor which did not appear to be genetically
determined, and that within the amorphous group of ’premature’ infants were two distinct
entities - truly premature and growth retarded (83). Prematurity due to early onset of
labour showed no tendency to recur in an individual mother.
In the following year it was again observed that certain mothers have a ’predisposition
... to produce malnourished infants repeatedly ’ although analysis did not adequately
consider other factors such as habitual smoking (84). Bakketeig et al, in a study of
454,358 single births in Norway, supported the observation that intrinsic maternal factors,
the nature of which remains uncertain, give rise to a marked tendency to produce infants
28

of similar gestational age and weight (85). Calculations showed that the relative risk of
low birth weight for gestational age in a second delivery, given that the first birth was
also small for gestational age, is 3.4. If a mother had either one or two previous low
birth weight babies, then the relative risk of a low weight third birth was 5.8. The effect
persisted after controlling for medical complications, onset of labour and length of
interpregnancy interval, although not for habits such as smoking.
In a study of births used for the 1958 British Perinatal Mortality Survey, low birth weight
at term showed a striking association with a history of previous low birth weight live
births to that mother. Other associations also shown were with low social class,
smoking, previous stillbirth or neonatal death, maternal employment, primiparity, and
(negatively) maternal height and prepregnant weight. Again, analysis was univariate for
each factor (86).
In separate reviews. Snow and Roberts concluded that, with the limited knowledge of
intrauterine growth available, the contribution to birth size of a fetus’ genes is very small
in comparison with the (largely environmental) influence of the mother, and that this
environmental influence is exerted only in late gestation - from about 28 weeks (87,88).
Furthermore, it has been proposed that maternal influence over fetal growth is a function
of the constraint imposed upon a mother when she herself was a fetus (89).
Other observations support the predominance of the in utero environmental influence over
that of the fetal genotype. In 1956 follow up measurements were carried out on young
adults who had previously been measured at birth and in early childhood. The
29

observation that measurements of length at birth showed considerably less correlation
with later height than did length at one year led to the conclusion that the major
determinant of newborn size is the nature of the prenatal environment, and that the
inherent growth characteristics do not assert themselves until after birth (13). In a small
series of middle class suburban infants, the correlation between length at birth and length
at one and two years was poor, although there was good correlation between length at
1 and 2. Similarly, there was no correlation between birth length and parental size
(except some correlation between baby girls and maternal height), but demonstrable
correlation between height at one and two years and parental height. The authors took
these results as evidence that birth length is a function of the maternal environment, with
parental genetic influence manifesting itself subsequent to and not before birth (90).
In analysis of a smaller group of middle class infants. Little related infant birthweight to
that of both parents, controlling for a number of potentially confounding variables which
included cigarette smoking and alcohol consumption (91). In this population, genetic
factors were seen to influence birth weight. The authors acknowledged that their results
were consistent with a mechanism that allows genetic influences to operate at larger
birthweights, but that is overridden by phenotypic maternal constraints at lower
birthweights, a theory clearly expounded by the Ounsteds (92).
That the in utero environment is a growth restraining factor is further supported by the
observation that from thirty weeks’ gestation, twins experience a progressive deficit of
weight and, to a lesser extent, length which is not apparent in their singleton equivalents
30
(93,94). Tanner has observed (as have others) that ’babies having genes for large size
but born to small mothers move upwards through the (growth) centiles to catch up their
proper growth once the maternal restraint is removed’ (93,95,96), although any such
catch up growth may itself be constrained by the socio-economic conditions in which the
child might find itself (15,17,18).
The nature of the restraint imposed upon the fetus relates to what might be termed the
reproductive efficiency of the mother, which is considered to be a result of adequate
growth and development of the mother through her own formative years. The maternal
influence over the growth of her child in utero appears to be one of restraint (95) such
that, in ideal circumstances, circumstances in which the mother herself was properly
nurtured and nourished, such restraint may not occur and genetic determinants of
birth weight are allowed to express themselves (91,92). Intra uterine growth restraint
appears to be due to characteristics of the mother that are not genetically but
environmentally determined (87-89).
In a carefully cross tabulated analysis of age, social class, parity, and year of birth of
mothers, Baird showed that the incidence of low birth weight was associated with low
height and (subordinately to height) estimated level of health and physique of the
mothers. Low birth weight incidence was also associated with maternal social class
(independent of age and parity but not of height) and, across all social classes, showed
a fluctuating pattern that could be explained by variations in the socio-economic
circumstances in which the maternal generation was born and raised (97).
31

In a study of ’prematures’ (infants of low birth weight), all such infants were enrolled
from the 1946 national birth cohort, and controls were selected that were matched for
sex, ordinal position of birth, locality of residence, maternal age, and social class. It was
seen that the mothers of the cases were shorter and lighter than the mothers of the
controls (98). A different analysis of data from the same cohort showed an association
between social class and low birth weight, although it was observed that increasing
maternal age tended to reduce the association, which is to be expected since maternal age
itself has an influence on reproductive efficiency (99).
A more modern analysis was carried out on a series of 20,698 singleton births which
occurred in Greater Dublin in 1978/1979 (100). The author examined birthweight,
classified into ’low’ (<2,500g), ’suboptimal’ (2,55-3,000g) and ’optimal (3,000-4,499g)
groups, as related to birth order and social class. It was observed that social class had
a dominant effect, independent of birth order, that was calculated to explain 93% of the
variation of optimal birthweight and 76% of the variation of suboptimal birthweight.
There was a linear relationship between the birthweight classes and social group.
Smoking habit, maternal health, and other factors were not analyzed separately but were
assumed to be a part of the socio-economic influence.
The relationships between social class, maternal height, and perinatal mortality (stillbirths
plus neonatal mortality) were studied by Baird in the 1940’s (101). In a comparison of
women attending a public hospital (social classes III-IV) and women attending a private
nursing home (classes I & II), a clear association with low social class was shown for
reduced height, increased perinatal mortality (after allowing for age differences at
32

delivery) and increased ’prematurity’ rates. These effects were attributed to the poor
diet, poor physique, and contracted pelves of the working class women. Subsequent
work confirmed the relationship of low height to social class, and further suggested that
tall women were, on the whole, healthier than small women (102). An excess of
perinatal mortality in short women was observed, as was an excessive rate of Caesarian
section. Analysis of the Caesarian sections showed that contracted pelvis was a cause for
the operation only in small women. Later work by Baird continued to show the
relationship of low birth weight with low social class, from which the author concluded
that a social policy was required that would raise standards of health and physique (103).
THIi hf/VTTlRE (DIF IffTTBLAi iriDERllSlE (SlbOWTiHl RJE:r/lRD,\TI()N.
The retardation of growth in utero has more than one pattern or mechanism. In 1966,
charts of intrauterine growth were constructed from observations on 4,700 babies. An
increase in weight:length ratio between 30-38 weeks was noted (104). Thus retardation
of growth at different stages of gestation would have different effects on the neonate’s
physical proportions. In 1971, four patterns of abnormal intrauterine growth were
described from observations on another series of newborn babies: i)infants with
abnormally short body length for dates, ii) infants showing disproportionate growth
between body length and head circumference, iii) infants who were malnourished
according to variation of soft tissue mass (determined by Rohrer’s ponderal index w/P),
iv) infants who were overweight (105). The authors concluded that reduced skeletal
growth was determined by crown to heel length and reflected in an increased ratio of
head circumference to length at birth. Birth weight by itself was not a valid measure of
33

skeletal or soft tissue mass growth. In 1977, the distinction between symmetrically and
asymmetrically retarded intrauterine growth was examined using ultrasound measurement
of fetal head and abdomen circumference (106). The authors distinguished a ’low growth
profile’ group of prolonged, symmetrical retardation, from a group suffering a ’late
flattening growth retardation pattern’ which was associated with a normal serial
cephalometry curve. This was reflected by Meire who observed that the rate of head
growth was slowest after 32 weeks (107).
The different timing of various aspects of fetal growth was described in 1982 when it was
observed that peak velocity of length growth was in the 2nd trimester, and of weight gain
was in the third trimester (108). The authors described three clinical types of intra
uterine growth retardation. Type 1 was described as chronic or proportionate lUGR due
to malnutrition of the fetus from the first trimester. Type 2 was named subacute or
disproportionate lUGR and was said to be due to adverse effects from the start of the
third trimester, and Type 3 or acute lUGR was due to adverse effects in the last two or
three weeks of gestation. The distinction between the three groups was made by
anthropometry of the new born infant, in particular the Ponderal Index (PI) which is
calculated as weight/length^ xlOO. Type 1 lUGR was characterised by a normal PI but
reduced weight, length and biparietal head diameter. Type 2 lUGR showed low values
of Ponderal Index with moderate reduction in length and more severe reduction in
weight. Type 3 was characterised by a very low ponderal index, with normal length and
only slightly retarded biparietal diameter, classic examples of which are babies bom to
mothers with severe, acute preeclampsia.
34

Similar observations were made by other authors. Villar, Smeriglio and others
differentiated lUGR with a low Ponderal Index (insult late in pregnancy) from lUGR
affecting length and head growth (109). Kliegman and Kins described growth impairment
due to placental insufficiency or malnutrition occurring at an earlier point resulting in a
normal ponderal index but high head circumference to length ratio, and at a later time
resulting in low ponderal index (110). Much of this had been anticipated by Gruenwald
in 1963 who differentiated chronic fetal distress (which caused retardation in skeletal
growth) from subacute fetal distress (which caused wasting) (111). Chronic fetal distress
affected body length but not head size due to mechanisms which preserved brain growth,
so that affected babies had relatively large heads for their body size. Subacute fetal
distress caused no reduction in longitudinal growth so that the babies were thin for their
length.
35

V MATERNAL HEIGHT AND PELVIC SIZE & SHAPE.
The shape of the inlet to the bony pelvis varies from flat (a transverse oval) to heart
shaped (android). The pelvic shape is one aspect of maternal physique to be linked to
obstetric complications, with the anthropoid (long oval) and gynaecoid (round) pelvises
being obstetrically safest (112-115).
The relationship of a woman’s height to the physical characteristics of her pelvis was
examined in a series of 500 women attending a London antenatal clinic. X Rays were
taken using lateral and pelvic inlet views. Analysis demonstrated that height was
correlated with conjugate diameter (symphysis pubis to sacrum) at the brim and, to a
lesser extent, with transverse diameter at the brim. A correlation between height and
pelvic brim index (conjugate diameter/transverse diameter x 100) suggested a significant
tendency of short women to have flat (transverse oval) as opposed to round pelvic inlets.
There was no evidence that other characteristics of body type related to parameters of
pelvic shape and size (112).
In 1938, a comparison of pelvic proportions was made between 600 primigravid women
of lower social class, and 100 nulliparous nursing students who came from a more
privileged background. The study adopted a classification system which described four
types of pelvis: 1) Dolichopellic; conjugate diameter > transverse diameter (long oval),
2) Mesatipellic; transverse diameter equals conjugate or exceeds it by no more than 1cm
(round), 3) Brachypellic; transverse diameter exceeds conjugate by 1.1-2.9cm, 4)
36
Platypellic; transverse diameter exceeds conjugate by 3cm or more (flat). Despite the
common perception at the time that brachypellic and platypellic pelves were the normal
type, it was seen that there were no platypellic pelves among the nursing students and a
greater proportion of dolichopellic or mesatipellic types than among the primiparous
women. A series of young girls aged 5-15, of similar social class to the primiparous
women, also showed a higher proportion of dolichopellic pelves, although this proportion
decreased with age. The authors suggested that antero posterior flattening of the pelves
results from inadequate nutrition during growth (116). In subsequent analysis of the
results, the authors showed a correlation between greater height and the dolichopellic or
mesatipellic pelvic types (long oval or round), although other bodily dimensions showed
no such association (117).
In Aberdeen pelvic anatomy was further examined by comparing 100 short women (under
5 ft) with 100 tall women (over 5ft 5ins). All were primiparous and under 30 years of
age. Radiography showed a considerably greater proportion of flat pelves among the
shorter women, and the incidence of one in three observed in this group was confirmed
by X Rays of a further 200 women. There was a significant difference in both mean
brim area and mean conjugate diameter between the two groups. Examination of the
womens’ background showed that a greater proportion of small than of tall women had
grown up in families of lower income and larger size. A similar comparison was made
of radiographic pelvic dimensions in males from differing socio-economic backgrounds
and of differing heights, and a similar pattern was observed of pelvic flattening related
to reduced height and impoverished background. The author concluded that pelvic
37
flattening is caused by a poor environment during growth (118). Maclennan observed
that ’contracted pel vises existed chiefly in the industrial centres in Scotland where the
standard of living was low... whereas the incidence of contracted pelvis in agricultural
areas was so small as to pose no practical problem’, showing that the incidence of
contracted pelvis varied with the incidence of rickets (115). Maclennan concluded that
the problem of contracted pelves was ’...the problem of rachitic contraction’ which, he
argued, occurs in early childhood and has already affected bony growth by the time
children reach school age.
Another series was compiled of 350 women who presented to the maternity ward of
Moreton District Hospital in Gloucestershire. Radiography of the pelvic brim used a
stereometric technique which minimised errors of measurement. A lack of correlation
between transverse and conjugate diameters was shown, but an association between pelvic
index (Conjugate diameter/transverse diameter) and pubic angle was demonstrated and
attributed to a common mechanism of defective (rachitic) nutrition in childhood
(119,120). An extension of the series was studied in terms of the transverse and
conjugate diameters as they fluctuated from women presenting in one year to women
presenting in the next. The conjugate diameter showed significant variation while the
transverse diameter did not. The correlation of conjugate diameter to height and the
apparent association of flattened pelves with exposure at a sensitive age to the
malnutrition of World War I, were taken as evidence for the dependence of pelvic shape
on adequate nutrition in early life (121).
In 1981 radiological pelvimetry was carried out on 242 males and 314 females at the
38

Royal Victoria Hospital in Belfast. Height was found to be positively correlated with
year of birth, with conjugate and transverse diameters, and with brim index (among
women only; among men r=0.12 p=.059). By cross tabulation, the brim index was seen
to increase with year of birth for standardized height, while the conjugate diameter was
more clearly associated with height for standardized year of birth. The authors concluded
that changes in pelvic size and shape were observed which were most probably explained
by environmental factors such as nutrition. They went on to suggest that geographical
differences in pelvic size may explain the differences in perinatal mortality through
obstetric complications that occur from one area of the country to another (122).
Earlier this century the common perception was that a flattened pelvis was the norm
amongst Caucasian women - even that there was a biological advantage in such a shape;
’With the evolution of the races one finds a tendency in the development of the pelvis
from the long oval through the round to the transverse oval. Among European women
generally the pelvis is transverse oval in shape. ’ (123).
In a paper mixed of anecdote, review, and observation of highly selected samples,
Vaughan concluded that a round (or dolichopellic) pelvis is common among women who
live in open air surroundings and have adequate nutrition, but that the flattened pelvis is
more commonly seen among women who live in conditions of confinement or poverty.
Flattening of the pelvis, the author says, is caused by rickets and disuse of the sacroiliac
joints before 14 years of age (124).
39

In a more scientifically argued paper, Thoms considered the possibility of mild rickets
as a cause of pelvic flattening by studying the relative lengths of the sacral, iliac, and
pubic parts of the pelvis in the plane of the ileo-pectineal line, using radiographs of fifty
females. The author showed that the iliac portion was shortened in flattened pelves, a
sign that he accepted as strongly indicative that mild rachitis during childhood caused
flattening of the pelvis (125).
Thoms observed that the pelvis is normally dolichopellic throughout childhood for both
sexes (126). In general, the growth of the pelvis is thought to keep pace with growth of
the lower limbs, with the characteristic sexual differences in shape becoming manifest at
puberty, when females have rapid growth of their pel vises while males have rapid growth
of their shoulders (127). The size and shape of the pelvis is affected by nourishment
throughout childhood (128). The shape of the pelvis continues to be affected by nutrition
during adolescence when there are differential rates of transverse and conjugate growth,
especially in girls (120,126-128).
Because of the different effects of nutritional standards on pelvic size and shape during
different stages of growth, it was thought that an examination of pelvic size and shape
in relation to cardiovascular mortality may give some insight into the period during which
undernutrition has the greatest effect on later risk of cardiovascular disease.
40

VT nONCTJJSTONS FROM THE ABOVE REVIEW.
Blood pressure is an important risk factor for cardiovascular disease. Many factors
influence the level of blood pressure, including obesity and alcohol consumption (37,129-
131). These factors, which come to operate increasingly in later life, would tend to
distort the patterns established earlier on, and so it is not surprising that studies of the
tracking phenomenon should demonstrate a decreasing correlation with length of interval
between measurements. Rather it is remarkable that tracking is observed at all by
analyses which do not fully control for other, independent variables.
The influence on blood pressure of factors operating in early life is an important one.
Those factors may be responsible for the different patterns of blood pressure with age
seen in certain subgroups of the population (60,68). Conditions of early life may have
affected the blood pressure levels of generations on a wide scale. The impact of a small
change in risk affecting the whole population is considerable, and may be much greater
than the impact of a large change affecting a small proportion of the population (36,44).
The association of raised blood pressure with low birth weight has been demonstrated,
but this association requires further examination in order to identify which subgroups of
low birth weight are particularly affected. The relationship of low birth weight in general
to raised blood pressure will be weaker than the relationship that will be observed
between raised blood pressure and the relevant subgroups of low birth weight.
41
Low birth weight is associated with poor maternal condition. Maternal factors are seen
to influence the incidence of intra uterine growth retardation, but not of preterm delivery
(83). Differences in low birth weight incidence are determined by variation in the
intrauterine growth retardation rate rather than by the incidence of preterm delivery
(132). Since blood pressure varies with incidence of low birth weight, and since low
birth weight incidence variations are caused by changes in the rate of intrauterine growth
retardation, it is inferred that raised blood pressure is associated with restrained
intrauterine growth - and so with poor maternal condition.
This inference is supported by the close epidemiological relationship of cardiovascular
disease to maternal mortality of the previous generation (7) and to the socioeconomic
conditions of the family of origin (8).
Pelvic size and shape are determined by nutritional factors during growth periods in early
life (120,126-128). Populations suffering high levels of cardiovascular disease appear to
be characterised by poor standards of nutrition in early life (4,8,10,11).
Two studies are reported:
1) A survey of pelvic size and shape among men and women aged 50 years or more,
currently living in 6 towns across England. This study tests the relation between
nutrition in early life (as indicated by pelvic growth) and later experience of
cardiovascular disease.
42

2) A follow up study from birth records of men and women currently aged 46 - 54 to
test the relation between current levels of blood pressure and intra uterine growth.
43

METHODS.
1. PELVIMETRY SURVEY.
Eleven towns with a range of mortality rates from cerebrovascular and ischaemic heart
disease were selected across England. The Radiological department of the central
hospital in each of these towns was approached and invited to take part in the study.
Nine towns agreed to do so and ethical permission was obtained in each place.
Patients aged 50 and above presenting for non-urgent 1 umbo-sacral spine X-ray, Intra
venous pyelography, or other abdominal radiographs were invited to consent to a further
single antero posterior X-ray of the pelvis. The method of invitation varied from town
to town according to local ethical stipulations. In most towns, an oral explanation and
consent were accepted. The date of birth, name, sex, and town of birth was recorded for
each patient. In order to adjust for the effect of magnification, the distances from table
top to symphysis pubis and from table top to film were recorded. The distance from
source to film was standardised at 100cm.
A standard sitting AP pelvic inlet X-ray was taken, with the patient reclining to an angle
which brought the posterior superior iliac spines level with the symphysis pubis. This
allowed accurate measurement of both sagittal and coronal inlet diameters, in addition to
the interspinous distance. From these diameters, the brim index (conjugate
diameter/widest transverse diameter), sagittal index (posterior sagittal diameter/conjugate
44

diameter) and posterior sagittal transverse index (posterior sagittal diameter/widest
transverse diameter) could be calculated (figure 1).
On receipt the films were made anonymous and allocated a random number. The films
were read blind by two radiologists and measurements were taken of the true conjugate,
widest transverse, posterior sagittal and interspinous diameters from those films on which
the pelvic inlet rim could be clearly identified. A magnification factor was derived from
film to source and symphysis pubis to source distances and this was used to adjust for the
effect of magnification. A test for inter observer differences showed no significant
variation.
Mortality and census data were obtained for the towns for the years 1980-1988, the latest
period for which they were available. Standardised mortality ratios for cerebrovascular
and ischaemic heart disease (ICD codes 430-438, 410-414) were calculated using national
rates for England and Wales as the standard.
45

2.PRESTON COHORT STUDY.
An historian was employed to search out hospitals in which detailed obstetric records had
been preserved. At Sharoe Green Hospital in Preston, which is an industrial city in
Northern England, labour and post natal records had been preserved of all deliveries that
occurred during 1935-1943. Records had been made by completing standard forms so
that, except for incompleteness, the same information was available for every case. The
data included personal details and residential address, date of admission, birth and
discharge, date of last menstrual period, obstetric history, placental weight and nature,
mother’s pulse and pelvic measurements, neonate’s weight, length and head
measurements, daily weight of child until discharge, and method of feeding.
The data was extracted from the records and a sample taken on the basis of completeness:
a minimum data set was specified (table 1) and only those records which satisfied the
specification were selected.
Of those measurements which had been made of the mothers’ pelves, the interspina!,
intercristal, and external conjugate and true conjugate (estimated) diameters were used.
The prescribed methods by which these diameters should have been measured were;
"Interspinal; This measurement is taken by placing one point of the pelvimeter on the
outside of one anterior superior iliac spine, and the other point on the
outside of the opposite anterior superior iliac spine.
Intercristal; ... is taken by placing one point of the pelvimeter on the outer margin of
46

one crest of the ilium, and the other point on the outer margin of the
opposite crest of the ilium.
Ext Conjugate; ... one point of (the pelvimeter) is placed on the spine of the last
lumbar vertebra, and the other on the front of the pubes. The
measurement is taken either when the patient is sitting or is in the
left lateral position."
(These definitions taken from Berkely C. Pictorial midwifery. 4th ed. Bailliere Tindall
Cox. London 1941).
Weights were measured in pounds and pelvic diameters, infant lengths and head
circumferences in inches. Measurements had often been rounded and the original units
were thus preserved.
In all, 1298 cases were notified to the National Health Service Central Register at
Southport, ethical approval for the project having been obtained. The mothers’ names
and addresses and the sex and dates of birth of the babies were sufficient to allow
identification of the infant from 1939 census data. For those born subsequently Christian
names were obtained from birth registration certificates. From NHSCR records, it was
then ascertained whether or not the individual was currently registered with the
Lancashire Family Practitioner Committee.
Lists of those currently registered with the Lancashire FPC were submitted to the FPC
office which identified the address and General Practitioner of each case. Letters were
sent to the GP’s of each individual, asking that addresses be checked against practice
47

records, and seeking the GP’s agreement that their patients be included in the study.
Individuals were then invited by letter to participate in the project.
Of 1298 notified to the NHSCR, 1122 (86%) were traced. 503 were found to be living
in Lancashire at addresses known to the FPC or General Practitioner and were asked to
take part in the study. 449 (89%) agreed to do so. An initial study sample of 259 adults
was examined. A second sample of 190 subjects was taken to test observations made on
the first. The two samples were similar (table 2) and so were treated as one study
population for further analysis.
Each subject was visited in their home by one of four field workers. The field workers
had not seen the obstetric data recorded for the subjects. After initial introductions,
measurements were taken of height (using a standardised portable stadiometer), weight
(using standard Seca spring scales), abdominal girth (at the umbilicus) and hip girth (at
the Trochanteric prominence). The first blood pressure and pulse readings were then
taken using an automated Dinamap machine. A second reading of pulse and blood
pressure was taken after administration of the questionnaire during which the subject
remained seated. All readings were taken on the left arm using a cuff which covered at
least two thirds of the upper arm. The mean of the two readings was used in the
analysis. Room temperatures were measured.
A questionnaire was used to explore past medical history, parental history of ischaemic
heart disease, cerebrovascular disease or raised blood pressure. Obstetric history, current
medication, and smoking habit. Alcohol consumption was derived from the frequency
48

with which people were accustomed to drink, and the amount they would drink on a
typical occasion. Consumption was converted to the total number of grams consumed
per week and categorised as low (up to 168 g), moderate (up to 280 g) and high. The
corresponding figures for women were 112 g and 168 g. Father’s occupation was used
to define social class of the subject at birth (OPCS 1980). Current social class was
derived from the subject’s occupation or, in the case of housewives, that of the husband.
The fieldworkers were trained to record measurements and to apply the questionnaire in
a standard fashion. The techniques of the field workers were compared at intervals
throughout the survey on small groups of individuals who were not a part of the main
study, and the results showed no significant inter observer variation.
49

RESULTS
I PELVIMETRY SURVEY.
Nine towns submitted 1652 X-Rays. The twenty six x-rays from one town (Bath) could
not be used due to missing information necessary to calculate a magnification factor.
Eight x-rays were unusable due to distortions of the pelvis by disease, three because
subjects were under 50, which left 1615 x-rays from eight towns available for analysis.
The mean age of the men was 66 yrs and of the women 67 yrs. Women had pel vises that
were larger in all dimensions than those of the men (table 3). There was no regular
progression of pelvic size or shape across all age groups. There was, however, a
significant difference between those aged 75 years or more and those younger than 75,
the effect being apparent in each sex. In females, the conjugate diameter and brim index
were significantly larger in those aged less than 75 years than in those aged 75 years or
more (table 4). The mean transverse diameter was larger in the older age group, but not
significantly so. In men, the conjugate diameter was larger in those aged less than 75,
but this was not statistically significant. The brim index was larger in the younger group
by a degree that was marginally significant (p=.056). The mean transverse diameter was
larger in men aged 75 or more, but this failed to reach significance (p=.086). The
remaining measures of pelvic size and shape were all larger in the younger age group in
both sexes. Because the differences between the two age groups were similar for males
and females (although to a different degree), the two sexes were combined for further
analysis, with an allowance made for the effect of sex. In the combined group, it was
50

seen that those aged 75 or more had smaller conjugate and posterior sagittal diameters,
but a larger mean widest transverse diameter, so that the brim index was 2.8 less in the
older age group than in the younger (95%CL 1.79 - 3.81) (table 5). Further analysis
used pelvic measurements adjusted for the effects of both age and sex.
The mean values for conjugate diameter, widest transverse diameter, and brim index are
shown by town and SMR in table 6.
Mean pelvic size in all planes decreased as SMR for cardiovascular disease increased.
Correlation coefficients of rank were calculated. For the whole study population,
negative correlations were observed between SMR and conjugate diameter (p< .02) and
between SMR and posterior sagittal diameter (p<.01). Correlations for SMR and
diameters in the coronal plane (widest transverse and interspinous) were not significant
at the 5% level (table 7).
Pelvic shape also varied with SMR, the three pelvic indices showing negative correlations
that did not, however, reach statistical significance (tabe 7).
Separate analysis for the two sexes showed the correlations of SMR with pelvic size and
shape to be stronger in women than in men (table 7).
51

H PRESTON COHORT STUDY.
1. DESCRIPTION OF STUDY POPULATION
The study population of 449 subjects comprised 236 men and 213 women, aged between
46 and 54 years at interview, with a mean age of 50 years. The mean birthweight of the
cohort was 6.98 lbs, the mean placental weight 20.81 ozs, and the mean systolic blood
pressure 150 mmHg. Placental weight and birthweight were strongly correlated
(r=0.52). The total study population was collected as two samples, as described in the
method. The mean systolic pressure of the men was 154 mm Hg (SD = 20) and of the
women 146 mmHg (SD=23). Systolic pressure rose by 1.3 mmHg per year of age and
diastolic rose by 1.0 mmHg. For further analysis, all pressures were adjusted to age 50
yrs.
2.EFFECT OF ADULT PARAMETERS ON BLOOD PRESSURE
In the combined group of men and women, mean systolic pressure rose with increasing
body mass index (kg/m^) (table 8) from 145 mmHg in those in the lowest quartile (24
kg/m2 or less) to 156 mmHg in those in the highest quartile (>28 kg/m2) (p=0.0001).
The effect was the same in both sexes.
52

78 individuals fell into the category of moderate or high alcohol intake, and their mean
systolic pressure was 4 mmHg higher (95%CL -1 - 10) than that of the rest. For men,
the difference was 5.1 mmHg (95%CL -0.3 - 10.5) (table 8).
Blood pressure was not consistently related to smoking nor to room temperature.
For analysis of blood pressure associations with birth parameters, mean systolic and
diastolic pressure were adjusted for body mass index and alcohol intake.
3. BERTH PARAMETERS AND BLOOD PRESSURE IN ADULT LIFE
Placental and birth weights
Systolic and diastolic blood pressure were related to placental weight and birthweight.
Systolic pressure fell with increasing birth weight, from 154mmHg in babies weighing
up to 5.5 lbs, to 149 in babies weighing over 7.5 lbs. Systolic pressure rose, however,
with increasing placental weight, from 147 mmHg in those with a placenta 16 ozs or less
to 157 mmHg in those with a placenta over 24 ozs (table 10). The associations of blood
pressure with birthweight and placental weight were independent of the other. At each
birthweight systolic pressure was seen to rise across the range of rising placental weight.
At each placental weight systolic pressure was seen to fall consistently with increasing
birthweight. Multiple regression analysis showed a fall of 11 mmHg (95%CL 3 - 19)
from birthweights of 5.5 lb or less to birthweights above 7.5 lbs. The same analysis
showed a rise of 15 mmHg (95%CL 8 - 23) in individuals who had had placental weights
53
of one pound or less to those who had had weights above 1.5 lb. At each category of
birthweight, systolic pressure was considerably higher in those whose placenta had
weighed more than 1.5 lb (table 10). For the two sexes combined, the difference in
blood pressure between those whose placentas weighed 1.5 lbs or less, and those whose
placentas weighed more than 1.5 lbs was 9 mmHg (95%CL 4 - 14).
The variation of blood pressure with birth and placental weights was similar for diastolic
pressure and for men and women when analysed separately (tables 11,12). Multiple
regression analysis for diastolic pressure showed a fall of 2 mmHg (95%CL -2 - 7) from
subjects who had had birthweights of 5.5 lb or less to those who had weighed more than
7.5 lb, and a rise of 6 mmHg (95%CL 2 - 10) from subjects who had had placental
weights of 1 lb or less to those who had had placental weights greater than 1.5 lb.
The combined effect of birth and placental weights on blood pressure was such that the
highest blood pressures were to be found in those adults who had been small babies with
large placenta, and the lowest in those who had been large babies with small placenta.
The effect of a discordance between placental weight and birth weight was further
examined by considering the placental weight as a proportion of the total weight of the
feto placental unit. There was a progressive increase of average systolic blood pressure
with the size of this proportion independently of sex, such that those with a proportion
above the 80th centile (0.181) had an average systolic of 154.9 mmHg compared with
54

those for whom the proportion fell below the 20th centile of 147.2 mmHg, a difference
of 7 mmHg (%%CL 1.4-14).
36 of the subjects (21 men and 15 women) were being treated for hypertension. The
relative risk of falling into this group increased to 3.0 across rising placental weight
(p< .001). There was no trend of risk with birthweight. 124 subjects (75 men and 49
women) had a systolic pressure greater than 160 mmHg. The relative risk of falling into
this group showed a similar trend with placental weight up to 2.5 (p<0.01) (table 13).
The relative risk of hypertension declined with increasing birthweight (to 0.7 in those
weighing over 7.5 lb) but this was not significant at the 5% level.
The simultaneous trends in systolic pressure with placental weight, birth weight, body
mass index, intake of alcohol and sex were calculated by multiple regression. Table 14
shows that the size of the trends in systolic pressure with placental and birth weight are
only slightly changed by adjustment for the three other variables.
Duration of gestation.
Duration of gestation could be estimated for 370 subjects for whose mothers the date of
onset of the last menstrual period had been recorded. Placental and birth weight
increased with gestation such that those born after a gestation of less than 38 weeks had
a mean birthweight of 95.4 ozs and mean placental weight of 19.9 ozs compared with
113.6 ozs and 21.6 ozs respectively for gestation of more than 38 weeks. Length of
gestation showed no relationship to blood pressure. Including gestation as an independent
55

variable in multiple regression analysis had little effect on the trends in systolic pressure
with birth weight and placental weight (table 15). Findings for diastolic pressure were
similar.
Parity.
Parity had been recorded for all but nine mothers. The relationships of systolic and
diastolic pressure to birthweight were similar in children of primiparous and multiparous
women. The difference in systolic pressures associated with placental weight greater than
1.5 lb compared with placental weights 1.5 lb or less was, however, greater in children
of multiparous women (table 16).
5.SOCIAL CLASS AND BLOOD PRESSURE
The social class of 310 of the mothers could be classified from the father’s occupation.
The blood pressure of subjects in social classes I II and III(N-M) was 1.8 mmHg
(95%CL -2.6 - 6.3) lower than the rest when social class was defined at birth, and 4.8
mmHg (95%CL 0.9 - 8.7) lower when defined currently. The relationship of systolic
pressure to decreasing birthweight on the one hand, and rising placental weight on the
other was similar for each social class, whether defined currently or at birth.
When social class was defined currently, those in classes I II and III(N_M) had a birth
weight 3.8 ozs heavier than the remainder (95%CL 0.4 - 7.2). The distribution of
56

placental weight varied with social class. Fewer subjects in social classes I and 11 had
placental weights at extreme values, either low or high. Of 254 individuals whose
mothers were in social classes III IV and V, 62 (24%) had placentas weighing more than
1.5 lb, compared with only 4 (7%) of 56 individuals whose mothers were in social
classes I or II. The relative risk of a baby having a placenta weighing more than 1.5 lbs
was 4.2 (95%CL 1.5 - 12.1) in social classes III - V compared with 1.0 in social classes
I and II.
6. FAMILY HISTORY
A history of high blood pressure in the mother was given by 94 subjects whose mean
systolic pressure was 8 mmHg higher than that of the remainder (95%CL 3-13). The
mean placental weight for this group was the same as that of the rest at 1.3 lb. A history
of high blood pressure in the father was given by 58 subjects, whose mean blood pressure
was 1 mmHg lower than that of the remainder (95%CL -7 - 5).
7. BABIES’ BODY MEASUREMENTS AND PLACENTAL WEIGHTS
Further analysis was carried out to examine the separate relations of weight, length, and
head circumference of the babies at birth. Because the proportionate relations of head
circumference, length, and birth weight vary with length of gestation, this analysis was
restricted to 327 men and women known to have been born after 38 weeks completed
gestation, according to reported date of last menstrual period. The mean birth weight of
this group was 7.1 lb, mean placental weight 1.3 lb, mean length 20.5 ins, and mean
57

head circumference 13.7 ins. Birthweight, length, and head circumference were strongly
positively associated with placental weight. The subjects were accordingly divided into
approximately equal groups of placental weight, one group with placentas 1.25 lbs or
less, the other with placental weight greater than 1.25 lbs.
EFFI3(:T ()N BIjClC)D FMBLE^SSllRE' C)F ILJEhJCjTH yMSfD FIE/tD (ZIIICZIIIVCFTEIKENCE.
At placental wight of 1.25 lbs or less, systolic pressure fell with increasing head
circumference, from 149 mmHg at Head circumference of 13.25 ins or less to 144 at
head circumference of more than 14 ins, although the trend did not reach statistical
significance (p=0.2). At placental weight greater than 1.25 lbs, there was no
relationship of blood pressure to head circumference.
There were, however, significant trends of blood pressure with length at birth in both
placental weight groups (table 17). At placental weights of 1.25 lbs or less, systolic
blood pressure rose as length increased (p = .06). At placental weights above 1.25 lbs,
systolic pressure fell as length increased (p = .06).
EFFECTS ON BLOOD PRESSURE OF RATIO OF WEIGHT/LENGTH^ (PONDERAL
INDEX).
The ponderal index was used to examine the trends of systolic pressure with length in
relation to birthweight.
58

Placental weight 1.25 lbs or less.
At placental weights of 1.25 lbs or less, systolic pressure fell as ponderal index rose,
from 154 mmHg at an index of 12 or less to 141 mmHg at an index greater than 14.75
(p=.0001) (table 18). This reflects the combined effect of systolic blood pressure falling
with increasing birth weight and with decreasing birth length. Simultaneous regression
analysis showed an inverse association of systolic pressure with birth weight (p=.0006)
and a direct association with birth length (p = .0006).
Defining hypertension as a systolic pressure above 160 mmHg, the relative risk of
hypertension at placental weights 1.25 lbs or less fell from 2.1 (95%CL 0.6 - 7.1) at a
ponderal index of 12 or less, to 1.0 at a ponderal index greater than 14.75.
Placental weight over 1.25 lbs.
At placental weights greater than 1.25 lbs, just as the trend of blood pressure with birth
length in this group was in the opposite direction to that for lower placental weight,
systolic blood pressure increased with ponderal index as opposed to the decrease seen at
lower placental weights, although the trend did not reach statistical significance (p=.l I).
EFFECTS ON BLOOD PRESSURE OF RATIO OF HEAD CIRCUMFERENCE TO
LENGTH.
Placental weight 1.25 lbs or less.
59

At placental weights up to 1.25 lbs there was no statistically significant relationship
between systolic pressure and the ratio of head circumference to length.
Placental weight over 1.25 lbs.
At placental weights greater than 1.25 lbs, there was a significant association of adult
systolic pressure with ratio of head circumference to length at birth (p< .02), with
systolic pressure rising from 145 mmHg at head circumference/length (hc/1) less than
0.65, to 153 mmHg at hc/1 0.7 or more (table 19).
Defining hypertension as systolic blood pressure of 160 mmHg, the relative risk of
hypertension among people born with placental weight over 1.25 lbs rose from 1 at a
ratio of head circumference to length of less than 0.65 to 2.3 (95%CL 0.8-6.4) at a ratio
of 0.7 or more.
FURTHER ANALYSIS OF EFFECTS OF LOW PONDERAL INDEX AND HIGH
HEAD CIRCUMFERENCE/LENGTH RATIO.
The relationship of measurements at birth to adult blood pressure therefore differed with
placental weight. At placental weights of 1.25 lb or less a low ponderal index predicted
high adult blood pressure. At placental weights above 1.25 lbs, a high ratio of head
circumference to length predicted high blood pressure. These relations were similarly
strong in men and women, and in first born and later born children. They were also
independent of placental weight within each placental weight group. The trends in
60

diastolic pressure were similar to those of systolic pressure but smaller.
Birth length, head circumference, birth weight, and placental weight are all closely
related. In order further to explore the implications of low ponderal index and high hc/1,
an analysis considered the study population in the two groups of placental weight by all
four birth parameters.
Babies of low ponderal index at placental weight 1.25 lbs or less.
In order to characterise those babies with low ponderal index at low placental weight, the
subjects in this group were divided into four approximately equal groups according to
ponderal index (table 20). Simple regression analysis showed that the trends with
ponderal index demonstrated in the table were significant for each measurement except
placental weight. Babies in the lowest group for ponderal index (value 12 or less) had
a mean adjusted systolic pressure lOmmHg higher than the remainder of the group
(95%CL 4-16), a mean birth length 0.78 ins above the remainder (95%CL 0.51-1.05),
a mean head circumference 0.2 ins less that the rest (95%CL 0-0.4) and a mean birth
weight 11 ozs less (95%CL 6.7-15). In other words, the babies in the lowest ponderal
index group had the highest blood pressure and were of slightly above average length
with smaller heads but considerably reduced weight. There was no trend in placental
weight across divisions of ponderal index.
Effects of high head circumference/length at placental weight over 1.25 lbs.
61

At placental weights over 1.25 lbs, systolic blood pressure increased with ratio of head
circumference to birth length. In order to characterise those babies with high hc/1, the
subjects were divided into four approximately equal groups according to ratio of head
circumference to length (table 21). Those individuals whose ration of head circumference
to length at birth was above 0.7 had a higher mean birthweight than the remainder of the
group at 7.3 lbs, a higher mean head circumference of 14.5 compared with 13.8
(difference of 0.7, 95%CL .53-.87), and a birth length of 20.1 compared with 20.9
(difference of .8, 95%CL .53-1.1). Babies with the highest hc/1 ratio in this group had
the highest mean systolic pressure, were shorter and heavier with larger heads but had
a similar placental weight to the remainder of the group.
8. INFLUENCES ON SIZE AND SHAPE OF BABIES
In order to gain some insight into factors affecting the size and shape of the babies,
further analysis was carried out on the overall study population (n=447).
Placenta! Weight
Head circumference and crown heel length at birth both increased with birthweight. At
any birthweight, head circumference tended to increase with placental weight, while
length decreased. Thus, the ratio of head circumference to length at birth was related to
placental weight, such that at constant birth weight a half pound increase in placental
weight was associated with an increase in head circumference/length of 0.23 standard
62
deviations (p<.01).
External conjugate diameter of the mother’s pelvis.
Birthweight increased progressively with the external conjugate diameter of the mother’s
pelvis such that an increase in conjugate externa of 1" was associated with an increase
in birthweight of 9 ozs. Children bom to mothers with conjugates of 7.25 inches or less
had a mean birthweight of 6.6 lb, whereas those born to mothers with a conjugate of 8.25
inches or more weighed 7.5 lb, a difference of 0.9 lb (p< .0001) (table 22).
Head circumference also increased progressively with the conjugate external diameter
(p < .001) such that an increase in conjugate externa of 1" was associated with an increase
in head circumference of 0.25". Children born to mothers with a conjugate of 8.25" or
more had a mean head circumference of 13.76, compared with a mean head
circumference of 13.36 for those born to mothers with conjugate externas of 7.25 or less,
a difference of 0.5" (p< .001).
Length at birth increased with conjugate externa (p=.001) such that an increase in
conjugate externa of 1" was associated with an increase in length of 0.35". Children
born to mothers with a conjugate of 8.25" or more had a mean length of 20.6" compared
with a mean of 20.3" for those born to mothers with conjugate externa of less than 8.25"
(p< .05).
Although placental weight increased with conjugate externa on simple regression analysis.
63

multiple regression showed no relationship independent of birthweight.
Regression analysis showed that ponderal index increased with conjugate externa (p < .05)
with individuals born to mothers with a conjugate externa of 7.25" or less having a mean
ponderal index of 12.9, whereas those born to mothers with a conjugate externa greater
than 8" had a mean ponderal index of 13.7 (p< .007). Head circumference/length
showed no relationship to pelvic size.
g.ICFTFIDCnnS ()IF BlOR/TTa Ip/IR/LNUETTEIFU)
Adult height.
Adult height (allowing for the difference between the two sexes) increased with length
at birth and birth weight independently (p< .05, p< .0001 respectively) such that an
increase in birth length of 1 inch gave rise to an increase in adult height of 0.74 ins
(95%CL .05 - 1.43), and an increase in birth weight of 8 ozs led to a rise in adult height
of 0.73 ins (95%CL 0.33 - 1.14). Adult height was related neither to placental weight
nor to head circumference independently of other birth parameters.
A strong relationship was observed between maternal conjugate externa and adult height
of offspring (p< .0001) so that mean height for males and females of mothers with
conjugates greater than 8 ins was 173 cm and 162 cm respectively, compared with
heights from mothers with conjugates 7.25 ins or less of 170 cm and 156 cm
64

respectively. Simultaneous regression analysis showed that the relation of adult height
to maternal conjugate diameter was independent of its relation to birth weight.
Adult body mass index.
Body Mass Index in adult life showed a relationship of borderline significance to
placental weight, with a mean BMI of 26.2 in individuals with placental weights up to
1.25 lb, and a mean BMI of 27 for individuals with placental weights greater than 1.25
lb (difference 0.8, 95%CL -0.06 - 1.58). This effect was more pronounced for subjects
who weighed 7.5 lb or less at birth. For this group, mean body mass index was 26.1
when placental weight was 1.25 lb or less compared with a mean of 27.1 for placenta
heavier than 1.25 lb (a difference of 1, 95%CL .04 - 2.02). No significant relationship
was observed for body mass index with ponderal index or head circumference over
length.
COMPARISON OF ADULT AND BABY SIZES.
When comparing the ranked heights of subjects in adulthood with ranked length at birth,
it was observed that the highest blood pressure (155 mmHg) was to be found in those
who had been less than 20 ins at birth but were relatively tall as adults, and those who
had been more than 20 ins at birth but were relatively short as adults (table 23). The
mean systolic pressure for people falling into these categories was 153.5 mmHg
compared with 147.8 mmHg for other people, a difference of 5.7 mmHg (95%CL 1.61 -
65

9.73). A similar difference was noted for Body Mass Index, those 20 ins or less at birth
but in the tallest group as adults and those over 20 ins at birth but not in the tallest group
as adults having a BMI of 27.2, compared with 26.2 for the remainder, a difference of
1 (95%CL .13- 1.79).
66

DISCUSSION
The pelvis was larger at the brim in all dimensions in those towns with the lowest rates
of cardiovascular mortality. Since pelvic size is correlated with adult height
(112,116,118,121) this observation is consistent with the relation of adult height to
cardiovascular mortality reported by Barker et al (26,75). The diameter in the sagittal
plane showed the greatest difference so that the pelvis appeared to be less flat in shape
for the populations of those towns, although this correlation was not statistically
significant.
The method of selection of patients for the study was not consistent across all towns,
although all were working to the same protocol. The practicalities of busy departments
precluded the use of consecutive patients. Selection within each town was made by a
number of radiographers, all of whom were unaware of their town’s position in the study.
It seems unlikely that a systematic sampling bias could have produced the results. For
similar reasons, it is unlikely that any bias was introduced by different habits of referral
for X-ray examination in the different towns.
Because the study is not confined to people who have always lived in the town in which
they were X-rayed, the subjects cannot be taken as a sample of the adults who were
brought up and continued to live in the towns. The standardised adult mortality ratios
67

were based on data from the years 1980-1988. The mean age of the study population in
1989/90 was 67 yrs. Thus the study sample does represent the population which gave
rise to the recorded cardiovascular mortality rates for the towns, so that the association
of those mortality rates with growth during childhood as reflected by pelvic size is not
an artefact of migration.
Women aged 75 or more were found to have smaller pelvic diameters in the sagittal
plane, and men in this age group to have larger transverse diameters, compared with
those under 75. Both these relations were significant in analysis of the combined group
when adjustments had been made for sex. In each sex, the pel vises were flatter among
those aged 75 or more than among the younger age group. These observations are
similar to those of Holland et al who reported a negative correlation of transverse
diameter with year of birth (in women) and a positive correlation of conjugate diameter
with year of birth (in both sexes) for people born between 1909 and 1950 (122).
A number of studies have demonstrated that pelvic growth was impaired in shorter
women who suffered poor socioeconomic environments in childhood (116,118). Both the
size and shape of the pelvis is affected by nourishment during childhood (121,128). The
shape continues to be affected by nutrition during adolescence (especially in girls, for
whom this is a period of maximum growth) (120,126-128). Rickets has been associated
with flattening of the pelvis in both individuals and populations (115,117,120,133). It
is important to note that the prevalence of dietary deficiency earlier this century was such
that in the late 1920’s, a survey found that 88% of 5 year old children in London had
signs of rickets (134).
68
The relation of pelvic size to standardised mortality ratios is evidence of a link between
nutrition in early life and later risk of cardiovascular disease. Pelvic size was more
closely related to SMR’s for cardiovascular disease than was pelvic shape, which suggests
that growth during early childhood is of greater relevance to cardiovascular disease than
growth during adolescence. It may also indicate that the period of growth that is most
important to blood pressure related disease is that which occurs in babyhood, before
weight bearing, since the effects of nutritional deficiency on pelvic shape are said to
occur once weight bearing begins (115,120,121,125).
The predominant influence on intrauterine growth is the in utero environment provided
by the mother (87,88). Genetic factors do not make a major contribution to birthweight
(87-90,131). Low birthweight has been shown in the results from the preston cohort
study described in this thesis to be associated with high blood pressure in later life, an
association which has previously been reported (75). Low birth weight has been
specifically related to low social class, small stature and poor physical health of the
mother (103,97,98). Pelvic size and shape, indicating a poor maternal environment which
limits intra uterine growth and thus the health of the fetus, may be an important predictor
of the blood pressure and risk of blood pressure related disease in the succeeding
generation.
69

2. PRESTON COHORT
The results of this follow up study show that the blood pressure and risk of hypertension
in men and women aged 48-52 are strongly predicted by placental weight and
birthweight. Whilst placental weight and birthweight are themselves closely related, the
effects of each on blood pressure are independent and opposite; a fall of 11 mmHg
occurred with increasing birthweight and a rise of 15 mmHg occurred with increasing
placental weight. These relations were not dependent on length of gestation. Raised
blood pressure was also associated with increased body mass index and alcohol
consumption, in agreement with other studies (37,137-139). The relations of placental
and birth weight to blood pressure were independent of and stronger than these effects
(table 14).
BODY MASS INDEX AND ALCOHOL CONSUMPTION.
Factors operating in adult life were linked with increased blood pressure. For both sexes
combined, mean systolic pressure was 10 mmHg (95%CL 4-15) higher in those with a
body mass index over 28 kg/m2 than in those with a BMI of less than 24 kg/m2, an
effect independent of alcohol consumption, birthweight and placental weight. This is
consistent with other studies. The Caerphilly study of middle aged men showed a
difference of 11 mmHg between those with a BMI of less than 24 kg/m2 and those with
a BMI of >27 kg/m2 (129), and a similar difference was shown for middle aged men
in England (37). That this relationship is partly one of cause and effect has been
70

demonstrated both by long term follow up studies which have linked a change in weight
to a change in blood pressure (54,60), and by therapeutic trials which have demonstrated
the beneficial effects of reducing weight in patients with mild or moderate hypertension
(137-139).
In this study, 78 individuals reported a rate of alcohol consumption that was moderate
or high. Their mean systolic pressure was 5 mmHg higher than that of the others
(95%Cl -2 - 12). The effect of alcohol on blood pressure has been demonstrated
previously. In the British Regional Heart Study, men in the highest consumption group
(consuming more than 6 drinks daily) had a mean systolic pressure 6-7mmHg higher than
in the lowest consumption groups (37). In 1977 the results of a study based on the
Kaiser-Permanente Medical Care Programme showed a mean difference of 10.86 mmHg
for white men between non drinkers and those taking 6 or more drinks per day, and a
difference of 5.39 mmHg between similar groups of white women (131). Again, the
relationship was shown to be one of cause and effect by studies which followed the
course of blood pressure during periods of altered drinking habit (138,140).
SOCIAL CLASS.
The mean blood pressure of those in social classes I-IIInon manual when defined
currently was lower than that of the remainder. The different experience of the social
classes with respect to ischaemic heart and cerebrovascular disease has previously been
examined and trends demonstrated that are consistent with those observed in this study.
In the United States a follow up study of 239 000 Bell company employees showed that
71

the incidence of coronary heart disease was 30% lower for those from a ’white collar’
background than it was for those from ’blue collar’ backgrounds (141). The author,
expecting to see an adverse effect of promotion from blue to white collar circumstances
because of altered lifestyle, found no such adverse effect. A sub sample of the workers
showed that those from white collar origins were taller, slimmer, and more likely to have
low blood pressure that their counterparts. The author concluded that ’...the origins of
coronary heart disease and efforts to prevent it must begin in early life’.
In Sweden, a retrospective analysis of data from the Gothenburg primary prevention
study showed an independent association between occupational class and incidence of
coronary heart disease after 10-13 years follow up (20). In Finland, SMR’s were
calculated for all ischaemic heart disease deaths among 25-84 year olds during 1969-1971
(142). Among 25-54 year olds, the data showed that, for other than divorced people,
there was a greater risk of ischaemic heart disease mortality among the less educated of
either blue collar or white collar occupations. The differences were smaller but still
statistically significant for those aged 55-84. Analysis of risk factors associated with
social class was not a part of the study, although the authors quoted unpublished data to
the effect that there is a gradient from high to low occupational groups in the Finnish
population of increasing blood pressure.
In Britain, results from the British Regional Heart Study were published of six years
follow up of 7735 middle aged men (143). Major ischaemic heart disease events were
shown to be more frequent among men in the lower social classes. Similar differences
in blood pressure levels were also demonstrated.
72

POTENTIAL BIAS.
The results are not based on a random sample of the overall population. Sharoe Green
Hospital (chosen for the study because of the ready availability of comprehensive
individual records) was not the only hospital serving Preston. Of all those whose records
were complete and available (1298), 86% were traced, but only 38% were still living in
Lancashire at a valid address. During the period in which the subjects were bom,
hospitalisation for labour was not universal and most babies born in hospital were first
born children. Correspondence attached to the maternity records showed that many
hospital deliveries had been planned at an early stage, and that medical problems were
not an important reason for hospital delivery. It is unlikely that the reasons for
hospitalisation during labour would have introduced a bias which led to a difference in
the nature of the relationship of blood pressure to placental and birth weight among
people born inside hospital compared with those born outside. One feature of the study
population was a high proportion of first births (79%) among the study population.
Within the study, however, the relationships observed are similar for first and later-born
children which suggests that birth order would not have given rise to a difference between
those born inside and those born outside hospital.
Similarly, it is unlikely that these effects would have been artificially introduced by the
success or otherwise of tracing individuals and including only those still resident in
Lancashire. The birth measurements of those who were visited as adults are similar to
those who were not (table 2).
73
Migration according to socio economic class is another possible selective factor for this
study population. It has been argued that the apparently greater importance to blood
pressure level of current residential address than of residential address at birth for
migrants is evidence against an early influence on blood pressure (139). This argument
was based on observations made on a relatively small number of subjects in a study
which divided the country only into three areas. Selective migration according to
socioeconomic class may have contributed to the conclusions drawn from that study, since
the higher classes may be more mobile than others and would tend to move to areas of
greater prosperity. In this study, the relationship between blood pressure and placental
and birthweight is seen in each social class, whether defined currently or at birth, which
suggests that selective migration could not have produced the observed relationships as
artefacts.
No observer bias could have influenced the results since the fieldworkers were unaware
of the birth measurements when they visited the subjects. Measurements made routinely
at birth, especially of placental weight, are prone to error. The data available showed
the anticipated evidence of rounding of these figures. Such errors would tend to reduce
rather than exaggerate any relationship of those measurements with later blood pressure.
A small proportion of the subjects were on medication which would lower blood
pressure, whether for specific hypotensive therapy or for other reasons such as angina.
No adjustment was made for this, which would have tended to conceal rather than
enhance the effects observed.
74

The strength, nature, and gradation of the relationship between blood pressure, placental
weight and birthweight are such that the effect is unlikely to have been produced by an
unknown confounding variable. The fact that placental and birth weights are correlated
but that the effect on blood pressure is produced by disparity between these two
parameters makes a confounding factor even more improbable. The strength of the effect
of birth parameters, which remains unaffected when factors operative in adult life are
taken into account, is such that environmental factors operative in utero cannot be
discounted as a major influence on later blood pressure levels.
TH13 EJFFEtZTS (Df: 13IFn:HWlEI(jHT AbTC) PI./V(:E:hrT/\L VVTEICjHT C)N ISlJOC)!)
PRESSURE.
An inverse relationship of birthweight to blood pressure was not unexpected. Several
reports have been made of such a relationship in childhood (75,76,78-80). One small
retrospective study of 77 conscripts at 28 years of age, using a case control study design,
showed an increased odds ratio of diastolic (but not systolic) hypertension for low birth
weight (82).
Only one cohort has previously been examined for a relationship between birthweight and
blood pressure in adult life (74,75) but this provided no data on placental weight. This
comprised a sample of 5,362 births occurring in one week of March, 1946. At 36 years
of age, the blood pressure, height and weight of 3,259 men and women among that
cohort were measured. Systolic but not diastolic pressure was inversely related to
birthweight independently of adult body weight, so that among men mean systolic
75

pressure fell by 2.57 mmHg from the lowest to the highest birthweight group (95% CL
0.98-4.16) and among women by 1.83 mmHg (75). The results presented here, when
no account is taken of placental weight, show a fall in systolic blood pressure of 2 mmHg
for men and 4 mmHg for women from those who weighed over 7.5 lbs at birth to those
who weighed less than 6.5 lbs (table 12). Birthweight was more strongly related to adult
blood pressure in 785 men born and still resident in Hertfordshire, England, at an
average age of 64 (145). Records of their birthweight had been preserved. Systolic
blood pressure was inversely related to birthweight, falling from a mean of 169 mmHg
in those weighing 5.5 lb or less at birth, to 162 mmHg in those weighing more than 9.5
lbs. This relationship was independent of body mass index.
Only when the previously unreported effect of placental weight is taken into account are
the large, independent and opposing associations revealed in this study, of a fall of 11
mmHg with increasing birthweight, and a rise of 15 mmHg with increasing placental
weight. The close relationship of placental and birth weights has disguised these
important, independent effects in all previous studies. The effect of discordance between
placental and birth weight is demonstrated by a consideration of the placental weight as
a proportion of the feto placental unit. There is a strong relationship between that
proportion and average systolic blood pressure in later life, with a difference of 7.7
mmHg between those above the 80th centile and those below the 20th.
PLACENTAL SIZE
The size of the placenta was an important and unexpected factor in later blood pressure
76

levels. Factors which determine the size of the placenta have not been fully explored.
A study of 8,684 consecutive births in Oxford during 1987-1988 showed that higher
mothers’ blood pressure at first antenatal attendance was not associated with higher
placental weight, but that large placental weight was associated with low maternal
haemoglobin and falls in maternal mean cell volume during pregnancy (146). In that
study, the highest ratio of placental weight to birth weight was found in women with the
lowest haemoglobins and largest falls in mean cell volume. An association of large
placenta with low maternal haemoglobin was also described in 1970 (147). Gruenwald
found an association between both very large and very small placenta and infant
mortality, although he did not ascertain causes of placental hypertrophy, (111). He
questioned whether the inadequacy of large placenta was due to infarction or detachment
from the uterine wall. The data from the study reported here contained no information
on maternal smoking which has, however, been shown to have no association with
increased placental weight (148).
FAMILY HISTORY.
Mother’s blood pressures are related to those of their children and it could be argued that
placental weight is linked to adult blood pressure through a maternal mechanism which
determines both blood pressure and placental weight. However, although people who
reported that their mothers had high blood pressure had higher blood pressure themselves,
the placental weight was no greater for births to mothers reported to have hypertension
than it was for births to other mothers, which suggests that a direct influence of maternal
77

blood pressure is not operating through an effect on the intra uterine environment or on
the placenta. People who reported that their fathers had high blood pressure did not
themselves have raised blood pressure.
A number of studies have shown familial aggregation of blood pressure levels
(61,73,149-151) and have postulated a genetic mechanism. As Szklo points out,
however, it is difficult in such analyses to distinguish between shared genetic and shared
environmental influences, especially if those environmental influences are operative in
utero (53).
Studies which have reported family history of hypertension or hypertensive disease as
predictive of hypertension have not always disaggregated maternal and paternal history
(151). Those which have disaggregated these histories have shown a closer relationship
of raised blood pressure to maternal family history than to paternal family history. In
examining blood pressure of parents and offspring among the Framingham cohort,
Havlick et al (150) found that maternal systolic blood pressure was significantly related
to systolic blood pressure of the offspring after taking other blood pressure correlates into
account, but that the relationship of paternal systolic blood pressure to that of male
offspring was of borderline significance (p=0.05) and paternal to female offspring of no
significance. In a follow up study over 18.5 years of 789 men, a maternal history of
stoke correlated significantly with the incidence of stroke in the subjects, but there was
no such effect for paternal history of stroke (33). Similar differences between the
relationship of paternal and maternal blood pressure to that of their offspring have been
78

shown by other researchers (72,152,153).
The findings reported here are consistent with other studies and suggest that, since the
pattern of blood pressure levels among siblings is not consistent with an X-linked genetic
mechanism (150), familial aggregation of raised blood pressure is due to environmental
rather than genetic factors, a conclusion consistent with the observations of other
reviewers (3,53,58). Those environmental factors may operate in utero through an effect
on placental and birth weights. A further possibility is that higher blood pressure in a
mother reflects her own earlier growth, which influences the intrauterine environment she
provides for her children.
IlSTTIR^ IJTEiRjlShE (jFbOWTH.
The weight of an infant at birth is a crude guide to the growth experienced in utero. Low
birth weight can result from an unduly short gestational term, intrauterine growth
retardation (lUGR), or a combination of the two. Earlier this century, international
convention was to describe as ’immature’ or ’premature’ any baby weighing 5.5 lbs or
less (99,111), so that such distinctions were not made. It is likely, however, that changes
in birth prevalence of low birth weight in Britain are principally due to variations in
lUGR, with the birth prevalence of preterm babies varying to a lesser degree (132). In
this study, duration of gestation was not related to later blood pressure levels, which
suggests that the relationship of blood pressure in adult life to birth weight is due to
variations in intrauterine growth retardation rather than prematurity. No analysis was
made of maternal smoking, which has been shown to be associated with a proportionate
79

reduction in birthweight and length (154).
As described in the introduction, intrauterine growth retardation may occur a) throughout
pregnancy, causing proportionately small babies, b) later in pregnancy resulting in failure
of skeletal growth reflected in a high head circumference/length ratio, or c) in the very
late stages of pregnancy leading to wasting and a low ponderal index (w/P).
An analysis was made of the relation of blood pressure to weight, length, and head
circumference within two groups of placental weight, the analysis being restricted to
those 327 subjects born after 38 weeks completed gestation. In those whose placental
weights were 1.25 lb or less, mean systolic pressure and the risk of hypertension rose as
ponderal index fell (table 18). In those whose placental weight was more than 1.25 lb,
mean blood pr^sure and the risk of hypertension rose as the ratio of head circumference
to length increased (table 19). An inverse relationship of systolic pressure to ponderal
index has also been observed in 4 year old children studied in Salisbury (150). In that
study, the effect was observed at all placental weights.
Placental weight 1.25 lb or less.
In the group of babies born with placental weights less than 1.25 lbs, there was a clear
association of low ponderal index with increased blood pressure. The relationship was
such that for a given weight, blood pressure increased with birth length, and for a given
birth length, blood pressure decreased with birth weight. The babies with lowest
80

ponderal index were characterised by a small but significant reduction in head
circumference, a small but significant increase in birth length, and a considerable
decrease (by 10%) in birth weight compared with the others (table 20).
Placental weight over 1.25 lb.
In the group of babies born with placental weight 1.25 lbs or more, there was a clear
association of increase in head circumference to length ratio with an increase in adult
blood pressure. The vulnerable babies in this group were characterised by reduced length
and increased head circumference, but were not significantly lighter that the rest (table
2U.
MECHANISMS FOR THESE EFFECTS.
Two groups of babies can be described who developed higher mean blood pressure as
adults. The first group had placental weights of 1.25 lb or less, were thin (low ponderal
index) with below average birthweight and head circumference, but above average length.
The second group had placental weights over 1.25 lb, were short in relation to head size
(high head circumference/length), with above average birthweight and head circumference
but below average length.
Babies born at term with a low ponderal index have been described as suffering sub-acute
fetal malnutrition (111), or fetal malnutrition (105), occurring at a stage in pregnancy
too late to affect skeletal growth (and so birth length). Maternal influences known to be
81

associated with this form of growth retardation are calorie restriction and low weight gain
in pregnancy (156). Babies born after the Dutch Hunger Winter of 1944-45 had a
disproportionate reduction in birthweight in relation to length (157). A small placenta
in itself, if giving rise to inadequate functional reserve, may result in fetal distress in the
last weeks of pregnancy (107), and so to a low ponderal index.
In this study it was observed that the external conjugate diameter of the mother was
associated with both birth length and birth weight. Babies in the low placental weight
group vulnerable to later increased blood pressure were seen to be longer than the others.
It is possible that babies able to grow to a full length in large mothers were more
vulnerable to weight loss when exposed to inadequate nutrition in the latter stages of
pregnancy, whether through mother’s calorie restriction or the inadequate functioning
reserve of an undersized placenta.
Large placental weight was associated with a higher head circumference to length ratio,
and with raised systolic pressure. Maternal anaemia during pregnancy has been
associated with increased placental weight (136,146). A recent study of four year olds
in Salisbury showed that those whose mothers had been anaemic during pregnancy had
higher mean blood pressure than those whose mothers had not been anaemic (155). A
survey of children living in a rural community in the Gambia also found a relation
between maternal nutrition, weight gain in the third trimester of pregnancy, and
subsequent blood pressure in the offspring (158).
In the Preston cohort, placental weight tended to be higher in families with lower social
82

class (4 out of 56 (7%) of babies bom at term to mothers in social class I or II had
placentas heavier than 1.5 lb compared with 62 out of 254 (24%) for mothers in lower
social classes: mean placental weight for father’s social class being IV or V was 21.68
ozs compared with 20.57 ozs for social class I or II, p=0.16). The link between low
social class and large placental weight is probably the standard of maternal nutrition.
Thus two mechanisms may operate to cause intra uterine growth retardation:
i) Relative under perfusion of a disadvantaged fetus may occur due to the presence of a
large placenta,
ii) Inadequate nutrition of a fetus in the last stages of pregnancy may occur due to an
inadequate (small) placenta.
The timing of these different insults would result in the different characteristics of the two
groups of babies described as being at risk. Relative under perfusion because of a large
placenta would occur throughout the last trimester, resulting in impaired length growth.
Inadequate nutrition of a well grown (long) baby in the late stages of pregnancy would
result in failure to put on weight and thus a low ponderal index (110).
A possible mechanism linking intra uterine growth retardation with late raised blood
pressure is an effect of fetal hypoxia on the patterns of blood flow. In 1967, observations
were made on the circulations of mature fetal sheep in a study of the regional controls
of systemic vasomotor tone (159). Asphyxia, induced in the fetus by occlusion of the
umbilical cord prior to artificial pulmonary ventilation, resulted in a fourfold increase in
blood flow through the coronary and cerebral circulations, with a reduced flow through
the femoral and renal arteries. Observation of the artero venous pressure differences
83

across the brain provided evidence that the altered flow patterns were due to active
vasodilation in that area, with vasoconstriction occurring in the renal vascular beds. In
1983, results were reported of further studies on mature fetal sheep which replicated the
observation that a reduced umbilical blood flow led to a moderate increase in flow to the
myocardium and to the brain (160). Furthermore, an analysis of the flow patterns in the
fetal circulation showed that blood with the highest oxygen concentrations was directed
to the heart and brain, a phenomenon which was enhanced during episodes of fetal
hypoxia. These effects could have a long term influence on renal function, since factors
operating during fetal growth are known to program the physiology of adult life (161).
There is evidence from both animal and human studies that blood flow patterns in early
life can alter arterial structure. In rats made hypertensive 4 weeks after birth, the wall
of the aorta was shown to thicken rapidly, an effect that could be partly reversed by
relieving the hypertension (162). In young children born with a single umbilical artery
the common iliac on that side, through which blood flowed from the placenta, was seen
to be elastic as opposed to the common iliac on the other side which was thin walled and
muscular (163). The differences in structure of the arteries is reflected in differences in
their compliance, as measured by ultrasound techniques (164). An arterial structure of
thin, muscular vessel walls of poor compliance would predispose to raised blood pressure
levels in later life. These mechanisms may operate in any fetus which is suffering
subacute or chronic distress, even if that distress occurs too late in pregnancy to affect
skeletal growth but leads instead to wasting.
84

MATERNAL STATURE, PLACENTAL WEIGHT, FETAL GROWTH, AND BLOOD
PRESSURE.
This study shows that the external conjugate diameter of the mother’s pelvis is related to
birthweight and birth length of her offspring (table 22). A woman’s physique depends
partly upon her nutrition in childhood (as discussed earlier). Poor nutrition of the mother
both in younger life and during pregnancy would thus predispose her offspring to higher
blood pressure in adult life.
Maternal physique and intrauterine growth-
The results of this study provide some explanation of the links which have been observed
between maternal stature, low birth weight, adult height, and risk of cerebrovascular or
ischaemic heart disease (18,23,75,165). Birth size was strongly related to the external
conjugate diameter of the mother’s bony pelvis. Such an effect would be consistent with
the separate conclusions of Snow, Roberts, and Ounsted (83,87,88) that intrauterine
growth is predominantly a function of the intrauterine environment rather than of genetic
make-up. The external measurement used in this study is only an approximation of the
true conjugate diameter of the pelvis and was subject to the errors of all such routine
measurements, both of which factors would tend to reduce its importance in the
relationship observed with infant size.
Maternal height was not recorded at Sharoe Green hospital. A relationship between
85

maternal height and conjugate diameter has been observed (112,117,118,122) as has a
relationship between maternal height and birth weight (165). The results reported here
confirm the relationship of a woman’s physique to the birthweight of her offspring.
A woman’s physique depends upon the circumstances of her life during growth (18,101).
That physique, through its influence on birthweight, is indirectly shown here to be a
factor in the levels of blood pressure of her offspring. The high labour complication and
Caesarian section rates observed in short women (102), and the increased perinatal
mortality for that group (101), are consistent with the inference that an observed
geographical relationship between maternal mortality among one generation and perinatal
and cerebrovascular mortality among the next, is partly due to an influence of maternal
physique on intra uterine growth and thus on the blood pressure of the offspring.
EFFECT OF BIRTH PARAMETERS ON ADULT SHAPE.
The adult height of the subjects was predicted by birth length and birth weight
independently of each other, with birthweight having the greatest effect. Such a
relationship would be blurred by catch up growth which, if conditions allow, is known
to occur following intrauterine growth restriction (15,17,18,93,95,96). In view of the
strength of the relationship of maternal physique to birthweight, it is apparent that limited
growth during gestation due to an inadequate intra uterine environment does result in
reduced adult height. The importance of intrauterine growth to adult height is further
demonstrated by the inverse relationship of adult height to infant head
circumference/length ratio. The trend, albeit of borderline significance at p = .07, that
86

exists for this relationship independently of birth weight suggests that a limitation of intra
uterine trunk and limb growth leads to a reduction in adult height. Although no
relationship was observed in this study between adult height and blood pressure levels,
this effect of compromised fetal growth on adult height is consistent with the increased
risk shown in considerably larger populations of cerebrovascular and ischaemic heart
disease mortality among people of short stature (8,19,23,27).
Body Mass Index in adult life tended to increase with increased placental weight at birth,
especially in smaller babies. An important effect of familial environmental factors in
early life (as opposed to genetic factors) on adult body fatness has been shown in a study
of 4643 non-familial adoptees (166). Thus part of the association between body mass
index and blotxl pressure may be explained by common causation of the two by intra
uterine growth retardation.
It was also observed that both those who were short at birth but subsequently caught up
to be tall in adult life, and those who were fully grown at birth but who ended up being
short in adult life, had higher blood pressure than the remainder, as well as a greater
body mass index. This suggests that serious growth retardation both before and after
birth could lead to increased adult body fatness and raised blood pressure, a hypothesis
consistent with observations made of children up to 1 year born in Hertfordshire (11)
where it was shown that there was a strong and graded relationship between the weight
at one year and death from ischaemic heart disease in later life.
87

POPULATION EFFECT
The relations of placental and birth weight to blood pressure levels and risk of
hypertension were independent of the effects of adult body mass index and alcohol
consumption and were stronger than them (table 14). Routine measurements made at
birth would appear to be better predictors of blood pressure than current factors, so much
so that adjustment of the results to allow for alcohol consumption and obesity made
negligible difference to the effects of birth measurements.
This study did not attempt an analysis of salt consumption. Early suggestions of a link
between salt ingestion and blood pressure arose from observations of populations divided
by migration (167-169). Observation of mildly hypertensive patients on salt restricted
diets with subsequent reintroduction of slow sodium and placebo tablets in a double blind
trial, suggested that salt restriction could have an effect for patients with elevated blood
pressure levels (170), while others have concluded that altered sodium intake does not
affect blood pressure in normotensive subjects (171). A recent cross cultural study in 52
centres concluded that reducing daily sodium intake from 170 mmol per day to 70 mmol
would cause a reduction of 2mmHg in systolic blood pressure (172). A follow up study
of 233 children found no significant association between sodium excretion and change in
blood pressure over time, but an inverse relationship of systolic blood pressure with
potassium intake and a positive association of Systolic blood pressure with
sodiumipotassium ratio (173). An analysis of 45 trials of salt intake concluded that
reducing daily consumption by 50 mmol resulted in a fall in systolic blood pressure of
88

5 -7 mniHg depending on baseline blood pressure (174). At age 60-69, systolic blood
pressure was reduced by a mean of 10 mmHG with a reduction in salt consumption of
100 mmol/24 hours. The effect was such that the group with the highest potassium
intake had an annual change in systolic blood pressure 1 mmHg less than the group with
the lowest potassium intake. These effects are small when compared to those associated
with placental and birth weight, which range over 25 mmHg.
The combined effects of placental and birth weight on blood pressure in the adult
are as large as 25 mmHg (table 14). Applied to a population such an effect would lead
to a considerable excess of cerebrovascular and cardiovascular mortality. Various
estimates of population attributable risk have been made to assess the broad effect of
raised blood pressure. In calculations made from observations on an American
population it was estimated that a reduction in diastolic pressure of 8 mmHg across the
population would reduce coronary heart disease mortality by 20.6% and all cause
mortality by 14.1% (36). Estimates on a British population are that a reduction of 10
mmHg in the blood pressure distribution would reduce total attributable mortality by 30%
(44). More recently, Macmahon et al have estimated that a prolonged reduction of
diastolic blood pressure by 5, 7.5 and 10 mmHg were respectively associated with a
minimum of 34%,46% and 56% less stroke, and 21 %,29% and 37% less coronary heart
disease (175).
89
CONCLUSION.
Blood pressure in adult life, and risk of cardiovascular disease, are adversely affected by
impaired growth during early life. This includes growth in the womb, which depends on
the environment offered by the mother. The maternal environment and nature of any
impairment of intra uterine growth is reflected by placental weight and the size and shape
of the newborn baby. A sustained improvement in nutrition throughout growth and
during pregnancy will make an important contribution to improved levels of blood
pressure and associated morbidity in both the current and subsequent generations.
90

Figure 1: Inlet view of the pelvis indicating anatomical measurements
AB. true conjugate diameter; CD, widest transverse diameter; A^B. posterior sagittal diameter and EF. the interspinous diameter.Brim index = AB/CD x 100; Sagittal index = A^B/AB x 100; Posterior sagittal transverse index = A^B/CD x 100.

iBLEI,
NIMUM DATA SET FOR CASE SELECTION (FOR PRESTON COHORT).
For Tracing: Name of MotherAddress at time of birth Date of birth Sex of infant.
For Study; Mother’s pelvimetry: Interspinous, Intercrista]Placental Weight Length of baby BirthweightWeight when Baby > 3days old.Head circumference.
>0 having the following characteristics: Married MotherLive at discharge Singleton birth.
91

BLE 2.
»MPARISON OF BIRTH PARAMETERS FOR SAMPLES AND TOTAL BIRTH POPULATION FROM iI(:H (:<:)]H[C)RT ISIUJEXZriTED, IVIELAJM A/ZiIJlIIiS (swd). F'EIE^)^)O^I (:C)H(]1RT.
Sample 1 Sample 2 Combined(n=449)
height 110.2(18) 113.6(18) 111/7(18)
lac wt 21.2 (4.7) 21.5 (5.4) :21 (5)
lead circ 13/7 (0)>6) 13.6 (0.8) 13.6 (0.7)
«ngth 20.5 (1.1) 20.2 (1.1) 20.4 (1.1)
ConjugateIxterna
7.7 (0.5) 7.8 (0.5) 7.8 (0.5)
ystolic bp 150.2 (22.2) 149.8 (19.3)
.dult height 165.9 (9.7) 165.5 C) I)
.dult weight 74.2 (14.4) 71.9 (15)
92
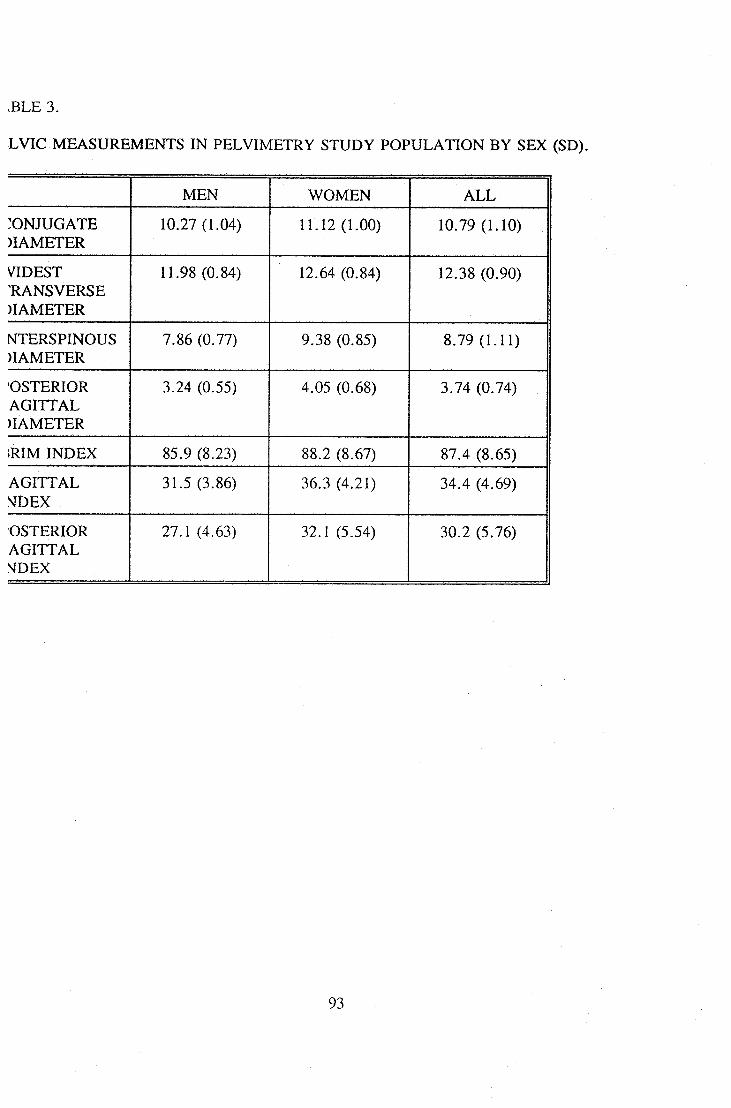
A4];/iSlUlRj5A4]=bTTrS PIEIJS/INilTITRl^ STUI)lf P'CMPUI./iTKDiNBTr S]E)( (SID).
.BLE 3.
MEN WOMEN ALL
CONJUGATE)IAMETER
10.27 (1.04) 11.12 (l.()0) 10.79 (1.10)
VIDEST'RANSVERSE)IAMETER
11.98 (0.84) 12.64 (0.84) 12.38 (0.90)
NTERSPINOUS)IAMETER
7.86 (0.77) 9.38 (0.85) 8.^(L11)
OSTERIORAGITTAL)IAMETER
3.24 (0.55) 4.()5 (0.6,8) 3.74 (0.74)
;RIM INDEX 85.9 (8.23) 88.2 (8.67) 87.4 (8.65)
AGITTALNDEX
31.5 (3.86) 36.3 (4.21) 34.4 (4.69)
OSTERIORAGITTAL^IDEX
27.1 (4.63) 32.1 (5.54) 30.2 (5.76)
93
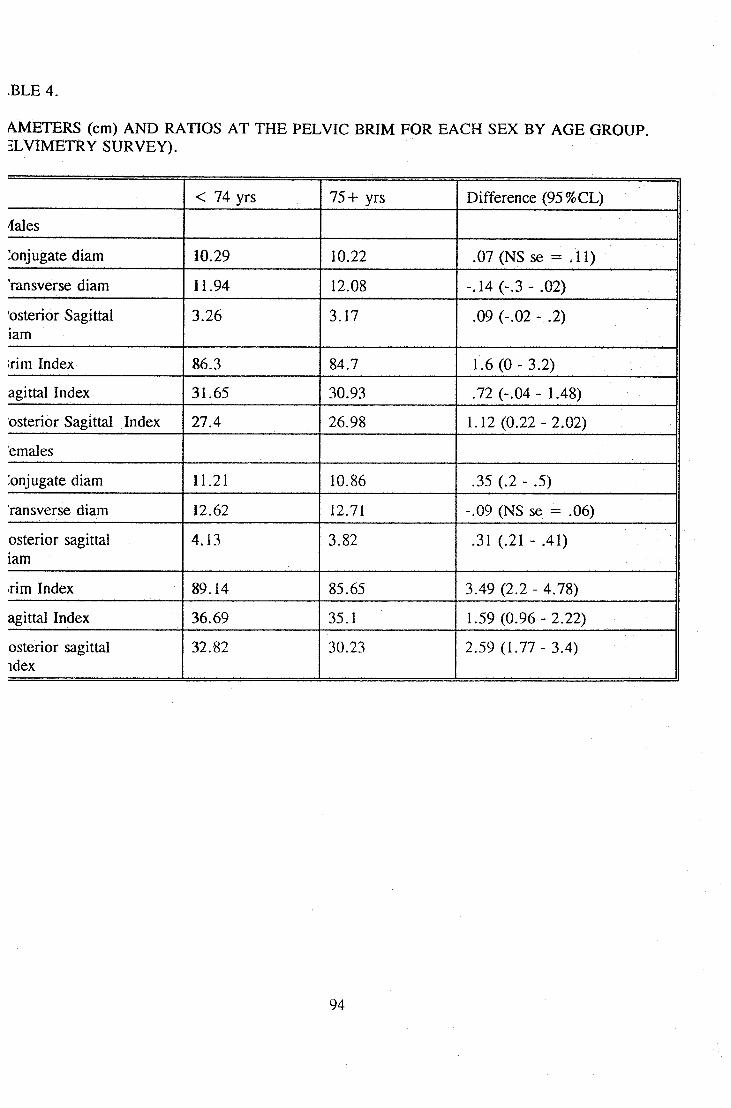
AMETERS (cm) AND RATIOS AT THE PELVIC BRIM FOR EACH SEX BY AGE GROUP.:suTR)/iEir).
.BLE 4.
< 74 yrs 75+ yrs Difference (95%CL)
dales
Conjugate diam 10.29 10.22 .cry (NS sx; == . 11)
ransverse diam 11.94 12.08 -.1.4 (-.3 - .(K2)
'osterior Sagittal iam
3^6 1+7 .09 (-.02 - .2)
:rim Index 86.3 84.7 1.6 (0 - 3/2)
agittal Index 31.65 30.93 .122 (-.Ckl - 1./18)
osterior Sagittal Index 27.4 26.98 1.1:2 (0.:22 - 2+)2)
emales
:onjugate diam 11.21 10.86 .35 (.2 - .5)
ransverse diam 1:2.6:2 12.71 -.CK) (^4S swe == .06)
osterior sagittal iam
4J3 3.82 (.:21 - .41)
rim Index 89H4 85.65 3.49 (2.2 - 4.78)
agittal Index 36.69 35+ 1.59 (0.S*6 - 2/22)
osterior sagittal idex
3Z82 30+3 2.59 (i.iry - 3/4)
94

iBLE 5.
iLVIC DIMENSIONS BY AGE GROUP ADJUSTED FOR SEX, PELVIMETRY SURVEY.
-74 YEARS 754- YEARS DIFFERENCE(95%CL)
ZONJUGATEJIAMETER
10.86 10.61 0.25(0.13,0.37)
VIDESTTRANSVERSE
12.35 12.46 4111(41.21,-0.01)
NTERSPINOUS)IAMETER
8.82 8.72 aio(0.005,0.20)
POSTERIORlAGITTAL
3.79 3.57 0.23(0.15,0.30)
(RIM INDEX 88J 85.3 2.80( 1.79,3.81)
lAGITTAL INDEX 34^ 33^ L27(0.79,1.75)
'OST SAGITTALNDEX
30^ 28^ 2.04( 1.43,2.66)
95

IBLE 6.
EAN CONJUGATE DIAMETER (sd), WIDEST TRANSVERSE DIAMETER (sd), BRIM INDEX (sd), m SMR FOR CARDIOVASCULAR DISEASE (1980-1988) FOR EACH TOWN, (n = number of x-/s available for analysis, Pelvic measurements adjusted for age and sex, diameters in cm).
TOWN n SMR CONJ DIAM TRANSDIAM
BRIM INDX
Hertford 138 93 1L21 12.65 88.78(0.89) (0.74) (7.71)
Shrewsbury 124 108 11.70 13.28 88.36(1.14) (0.78) (9.06)
?reston 23 117 10.86 1Z44 87.30(0.87) (0.66) (6.65)
Carlisle 254 117 10.80 12.38 87.51(0.95) (0.82) (8.05)
Jurnley 273 123 10.59 12.26 86.64(0.90) (0.77) (8.4)
Dewsbury 240 127 10.67 12.41 86.12(1.08) (0.75) (8.52)
Vigan 105 133 10^5 12.41 86.84(1.03) (0.73) CLOl)
riartlepool 293 133 10.49 1L96 88.06)0.82) (0.76) (8.(^
96

vBLE 7.
)N PARAMETRIC CORRELATION COEFFICIENTS (FOR RANK) BETWEEN THE MEAN PELVIC EASUREMENTS AND STANDARDISED MORTALITY RATIO FOR EACH TOWN.LLVIMETRY SURVEY.
Overall Men Women
Conjugate -0.843 -.530 41868Diameter (.02 > p > .01) (.2 > p > .1) (.02 > p > .01)
Videst Transverse -0.723 41470 -0.759Diam (.1 > p > .05) (p > .2) (.05 > p > .02)
nterspinous -0.687 41554 41783Diameter (H > p> TI5) (.2 > p > .1) (.05 > p > .02)
’ost Sagittal 4194 41494 4).904Diameter (.01 > p > .002) (p > .2) (.01 > p > :002)
Irim Index -1603 41289 41470(.2 > p > .1) (p > .2) (P > .2)
Sagittal Index -0.470 -^84 41687(p > .2) (p > .2) (.1 > p > .05)
’osterior Sag -1518 41319 41783ndex (p > .2) (p > .2) (.05 > p > .02)
97

.BLE 8.
3AN SYSTOLIC BLOOD PRESSURE BY BODY MASS (PRESTON COHORT).
(MI -24 145 mmHg
(MI -26 149 mmHg
(MI -28 149 mmHg
(MI -30 156 mmHg
98

\BLE9.
BAN SYSTOLIC PRESSURE FOR ALCOHOL INTAKE (N,SD). (PRESTON COHORT)
Men Women
Light drinkers 152.4 (171,18.7) 145.6 (200,22.8)
Moderate drinkers 158.2 (33,22.5) 141.8 (7,13.8)
Heavy drinkers 156.9 (32,14.6) 157.5 (6,16.1)
99

EAN SYSTOLIC PRESSURE ACCORDING TO PLACENTAL AND BIRTH WEIGHTS (n).HESTON COHORT).
.BLE 10.
Placental weight (lbs)
Jirth/eight
-l.() -1.25 -1.5 >1.5 All
5.5 152 (26) 154 (13) 153 (5) 206 (1) 154 (45)
6.5 147 (16) 151 (54) 150 (28) 166 (8) 151 (106)
7.5 144 (20) 148 (77) 145 (45) 160 (27) 149 (169)
>1\5 133 (6) 148 (27) 147 (42) 154 (54) 149 (29)
dl 147 (68) 149 (171) 147 (120) 157 (90) 150 (149)
100

^BLE 11.
BAN DIASTOLIC PRESSURE BY PLACENTAL AND BIRTH WEIGHTS (PRESTON COHORT).
Placental weight (lbs)
Birthveight
-1.0 -L25 -L5 >1.5 All
5.5 84 87 87 97 86
6.5 84 88 85 93 87
7.5 84 84 84 90 85
>7.5 78 85 85 88 86
Ml 84 86 85 89 86
101

BAN SYSTOLIC PRESSURE BY SEX, PLACENTAL WEIGHT, AND BIRTH WEIGHT (n). RESTON COHORT).
iBLE 12.
PLACENTAL WEIGHT (lbs)
JIRTHVEIGHT
^EN
-1.0 -L25 -1.5 >L5 ALL
-6.5 150 159 152 161 155 (79)
-7.5 152 154 147 164 154 (85)
>7.5 132 149 153 154 153 (72)
ALL 149 (26) 155 (88) 151 (66) 158 (56) 154 (236)
VOMEN
-6.5 150 143 149 191 149 (72)
-7.5 141 141 143 155 144 (84)
>7.5 133 148 139 152 145 (57)
ALL 146 (42) 143 (83) 143 (54) 157 (34) 146 (213)
102

■LATIVE RISK OF BEING TREATED FOR HYPERTENSION OR HAVING A SYSTOLIC BLOOD jiSISURI: y\JB(]rVTE 160 ninillg;, /i(:(:()Pir)IN<3 3)0 ])I,/VCI3NTAJL, (:()NI:r[)EN(:Ei\irT)S). (1)RE^ST()N (:()IR)I^T).
iBLE 13.
PLACENTAL WEIGHT (lbs)
-1.0 -1.25 -1.5 >L5
HEATEDlYPER-"ENSION
1.0 1.3(0.4,5.0)
2.4(0.7,8.9)
3.0(0.8,7.3)
lYSTOLlC> 160 mmHg
1.0 1.1(0.6,2.2)
1.2(0.6,2.5)
2.5(1.2,5.0)
103
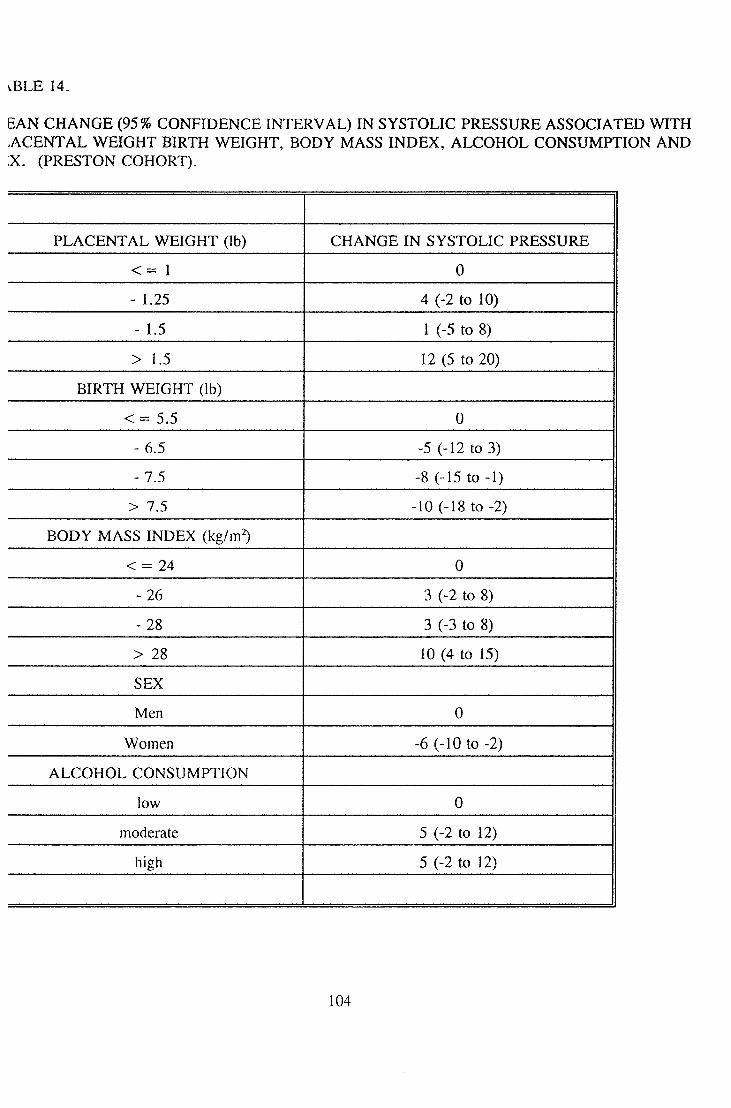
EAN CHANGE (95% CONFIDENCE INTERVAL) IN SYSTOLIC PRESSURE ASSOCIATED WITH WTSIGIiT BIRTH WTEICjITT, B()[)ir IVl/iSS: INDI5>[, /VIjC:()H()I. (:()NSUM]PTTC)N /iNI)
(TPRELSTCDN (:()H()icr).
iBLE 14.
]?I./V(:I3NT/U, WTEICjHT (lb) CHANGE IN SYSTOLIC PRESSURE
< = 1 0
- 1.25 4 (-2 to 10)
- 1.5 1 (-5 to 8)
> L5 12 (5 to 20)
IIIRTTT WIEICIIIT (lb)
< = 5.5 0
-6^ -5 (-12 to 3)
- 7.5 -8 (-15 to -1)
> T5 -10 (-18 to -2)
BODY MASS INDEX (kg/m^
<=24 0
- 26 3 (-2 to 8)
- 28 3 (-3 to 8)
> 28 10 (4 to 15)
SEX
Men 0
Women -6 (-10 to -2)
ALCOHOL CONSUMPTION
low 0
moderate 5 (-2 to 12)
high 5 (-2 to 12)
104

vBLE 15.
BAN CHANGE (95% CL) IN SYSTOLIC PRESSURE ASSOCIATED WITH PLACENTAL WEIGHT, l^TTH WTEI(3IiT, IJE^MCnH OIF (]I:STy\TI()N /llfl) SE:X (I)RE^ST()N (ZCDIjOItTT).
Placental weight (lbs) Systolic pressure (mmHg)
< =1. 0
-L25 4 (-2 to 10)
-1.5 3 ((-4 to 9))
>L5 13 (6 to :21)
Birth Weight (lbs)
= 5.5i 0
-6.5 ^6^1k)4)
-7.5 -7 (-If) to 0)
>7.5 -1() (-18 t() -2)
Length of gestation (weeks)
-37 0
38 -2 (^) k) 5)
39 -2 (-8 k) 3)
40 -3 (-9 k) 2i())
41 1 (-6 to -7)
>=42 -1 (-8 to 6)
Sex
Men 0
Women -7 (-11 to -3)
105

VBLE 16.
BAN SYSTOLIC PRESSURE (mmHg) BY PARITY (n). (PRESTON COHORT)
Placental Weight (lbs).
-1.5 >L5 All
vlultiparous 146 (65) 162 (22) 150 (87)
^rimiparous 149 (289) 156 (64) 150 (353)
106
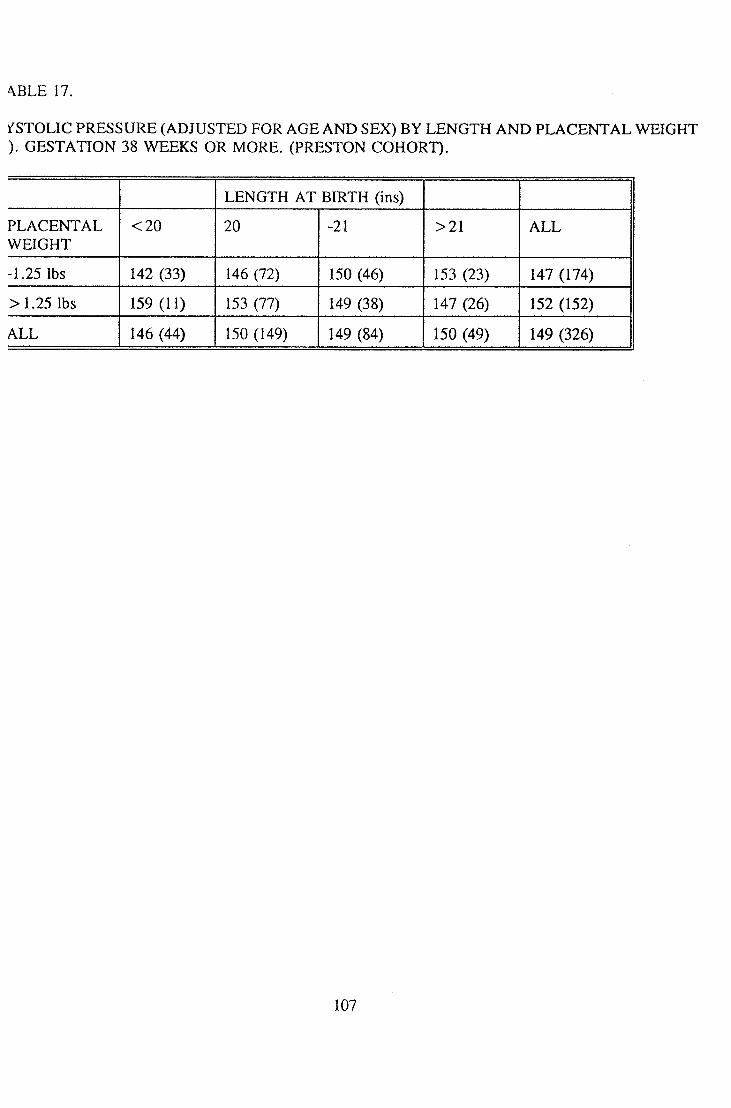
\BLE17.
irSTOLIC PRESSURE (ADJUSTED FOR AGE AND SEX) BY LENGTH AND PLACENTAL WEIGHT ). (iELSTV\TIC)N 218 WTEEHCS ()Il IVICXRE. (IPRE^STON (:()IiO]RT).
]LI=N(5TH /VT BIRTH (ins)
P]Ly\(:IENT/U,WEIGHT
<20 20 -21 >21 ALL
-1.25 lbs 142 (33) 146 (72) 150 (46) 153 (23) 14/7 (1-74)
:> 1.2!) »)s 159 (11) 153 (77) 14^9 (38) 1^17 (2i6) 152 (152)
ALL 146 (44) 1!)0 (]v$9) 1/19 (8/1) 150 (49) 149 (3:16)
107

STTCDIJIC: F^BJE^SSUELE (/II)JUSTED I:()R /SJSHD SEX:) IN ITHUCXSIi I3()IIN 'VVTiril NIIfQIIvrLrM [RIOD OF GESTATION 38 WEEKS (n). (PRESTON COHORT).
iBLE 18.
Ponderal Index
'lac wt. -12 -13.25 -14.75 > 14.75 All
1.25 lbs 154 (53) 147 (54) 142 (42) 141 (25) 14'7(1'74)
>1.25 lbs 148 (27) 149 (27) 152 (48) lf)4 (50) 152(152)
All 152 (80) 148 (81) 1/17 (90) 150 (75) 149(326)
108

.BLE 19.
XnjSinaD SYSTOLIC PRESSURE IN THOSE BORN V^TU A NnNIMIB4 OF 38 V^^^CS LST/vTI()f^ /l(:(:()FlDINO TC) PILAIZIZNT/U, VVTEICjHTT /iNI) FL/VTIC) ()!? HE/lD C:rR(:1UlVI]?E[RJE]SM:I: 113IE1TH IJEnSICiTH (n). (I^RE!;TC)N (:()H()ItT).
Ii(:/I.
"LACENTALVEIGHT
-0.65 -0.675 -0.7 0.124- ALL
1.25 lbs 150 (66) 154 (40) 14:2 (5:2) 139 (16) 14-7 (1-74)
>1.25 lbs 14/) (38) 150 (40) 157 (46) 153 (28) 15:2 (lf)2)
109

VBLE 20.
RTH PARAMETERS OF INFANTS BORN AFTER A MINIMUM 38 WEEKS GESTATION WITH,ACENTAL WEIGHT 1.25 lbs OR LESS, CLASSIFIED ACCORDING TO PONDERAL INDEX. RESTON COHORT).
PONDERAL INDEX.
-12 -13.25 -14.75 >14.75 SIGNIFICANCE OF TREND.
n = 53 54 42 25
LENGTH (ins) 20.9 20.3 20 19.9
WEIGHT (lbs) 6.3 6.6 7.0 7.8
H CIRC (ins) 13.4 13.5 13.5 14 p<.05
ADJ SYS 154 147 142 141 p< .05
PLAC WT (lbs) 1.11 1.12 L15 1.14 NS
no

IBLE2L
RITH I\ALfLALN(]3TrE:R:S ()]: irfE\AJSrTS B()R^^ /lI^nER iVOhTIAiUNi 38 \\rE:EK!; (jEST/VTIC)!^ WnTITH ,/VC:E^rr/\JL VVT3I(;HT (jflE/vTTEI^ TTIi/VlSf 1.2!) lbs (ZlL/iSlSIFriE:!) /\(:(:()RI)IN(3 -TO IHCE/SJD
CP-RJEsniobi
PK:/!.
-0.65 -0.675 -0.7 :> 0.7 SIGNIFICANCE OF TREND
n = 38 40 46 28
I.Ehl(3TH (ins) 2L2 20.6 20.2 19.9
li (ZlltC: (ins) 13.3 13.8 1/1.1 14.5
"VVIiICjHT (lbs) 7.5 7.6 7.4 7.3 NS
/iI)J siirs 145 150 157 153 p<.05
F1Lv\(: AATT (lbs) 1 X)1 L58 1 X)1 1X31 NS
Ill

\BLE 22.
ELyVTTOrqSHIP ()F CO^HUG/\TT3 lEXTHERffA TX) ]3I]RTH PAFLAA4EnnER^ (n).FLE^sinoN
Conjugate Externa.
-7.25 ins -7.75 ins -S.Oins > 8.0 ins
Birthweight (lbs) 6.6 (82) 62)(165) 7.1(127) 7.5 ((56)
Head Circ (ins) 13.36 13.66 13.72 13.76
Birth length 20H 20.23 2058 20.62
112

STOLIC BLOOD PRESSURE ACCORDING TO INFANT AND ADULT SIZE (n=449). (PRESTON )HORT).
iBLE 23.
Adult Height.
Jirth Length women -155cm men -169cm
women -162cm men -175 cm
women > 162 cm men >175 cm
< = 20 ins 148 149 155
>20 ins 154 151 146
113
FERENCES.
OPCS Mortality Statistics. Series DH12 No 13. HMSO 1986.
WHO Statistics. Annual report 1987. Geneva.
Rose G. Familial patterns in ischaemic heart disease. Brit J Prev Soc Med 1964;18:75-80.
Barker DIP. Osmond C. Infant mortality, childhood nutrition and Ischaemic heart disease in England and Wales. Lancet 1986(i); 1077-1081.
Barker DIP. Osmond C. Law C L. The intra uterine and early post natal origins of cardiovascular disease and chronic bronchitis. J Epid Comm Health. 1989;43:237-240.
Woolf B. Studies on infant mortality: Part 11, Social aetiology of stillbirths and infant deaths in county boroughs of England and Wales. Br J Soc Med 1947;2:73-125.
Barker DIP. Osmond C. Death rates from stroke in England and Wales predicted from past maternal mortality. BMJ 1987;295:83-86.
Forsdahl A. Are poor living conditions in childhood and adolescence an important risk factor for arterisclerotic heart disease? Br J PRev Soc Med. 1977;31:91-95.
Forsdahl A. Living conditions in childhood and subsequent development of risk factors for arteriosclerotic disease. J Epid Comm H. 1978;32:34-37.
Kaplan G. Salonen J. Socioeconomic conditions in childhood and ischaemic heart disease duringmiddle age. BMJ 1990;301:1121-1123.
Barker D J P. Winter P. Osmond C. Margetts B. Simmonds S. Weight in infancy and death from ischaemic heart disease. Lancet 1989 (ii):577-580.
Hales C N. Barker DIP. Clark P M S. Cox L J. Fall C. Osmond C. Winter P D. Fetal and infant growth and impaired glucose tolerance at age 64. BMJ 1991;303:1019-22.
Tanner J. Healy M. Lockhart R. Mackenzie J. Whitehouse R. Aberdeen Growth Study 1. The prediction of adult body measurements from measurements taken each year from birth to five years.Arch. Dis in Child. 1956;31:372-38L
Walker M. Shaper A. Wannamathee G. Height and Social Class in middle aged Briitish Men. J Epid Comm H. 1988;42:299-303.
Drillien C. A longtitudinal study of the growth and development of prematurely and maturely born children Part 2. Arch Dis Child. 1958;33:423-432.
Mantarell R. Habicht J. Growth in early childhood in developing countries. In: Human Growth. A Comprehensive Treatise (2nd ed). Eds Falkner F. Tanner J. Pp 241-262. Plenum Press N.York1986.
14

Johnston F. Newman B. Craviato J. Delicardi E. Schoill T. A factor analysis of correlates of nutritional status in Mexican children, birth to 3 yrs. In; Social and Biological predictors of nutritional status, physical growth and neurological develpment. L S Greene F Johnston eds. Pp 291-307. Academic Press New York.
Rona R. Genetic and environmental factors in the control of growth in childhood. Brit Med Bull1981;37:265-272.
Rose G. Marmot M. Social class and coronary disease. Br Heart J 1981;45:31-39.
Rosengren A. Wedel H Wilhelmsen L. Coronary heart disease and mortality in middle aged men from different occupational classes in Sweden. BMJ 1988;297; 1497-1500.
Whinchup P. Cook D. Shaper A. Social class and height. BMJ 1988;297:980-981.
MacIntyre S. A review of the social patterning and significance of measures of height weight blood pressure and respiratory function. Soc Sci Med 1988;27:327-337.
Waaler J. Height Weight and Mortality: The Norwegian Experience. Acta Med Scand. Supplementum 679. 1984.
Notkola V. Living conditions in childhood and coronary disease in adulthood. Commontationes Scientorum Social urn 1985;29.
NyStrom Peck A. Vagero D. Adult body height, self perceived health and mortality in the Swedish population. J Epid Comm H 1989;43:380-384.
Barker D J P. Osmond C. Golding J. Height and mortality in the countries of England and Wales. Ann Human Biol. 1990;17:1-6.
Marmot M. Shipley M. Rose G. Inequalities in death - specific explanations of a general pattern.Lancet 1984(i): 1003-1006.
Leishman A W. Hypertension - treated and untreated - a study of 400 cases. BMJ 1959;i: 1361-68.
Kannel W. Wolf P. Verter J. Mcnamara P. Epidemiologic assessment of the role of blood pressure in stroke. The Framingham study. JAMA 1970;214:301-310.
Kannel W. Wolf P. Verter J. Hypertension and cardiac impairments increase stroke risk. Geriatrics1978;33 (Sept):71-83.
Kannel W. Sorlie P. Gordon T. Labile Hypertension: A Faulty Concept? The Framingham Study.Circulation 1980;61:1183-1188.
Hey man A. Karp H. Heyden S. Bartel A. Cassel J. Tyroler H. Hames C. Cerebrovascular disease in the biracial population of Evans County, Georgia. Arch Int Med 1971;128:949-955.
115

Welin L. Svardsudd K. Wilhelmsen L. Larsson B. Tibblin G. Analysis of risk factors for stroke in a cohort of men bom in 1913. NEJM 1987;317:521-526.
Salonen J. Puska P. Tuomilehto J. Homan K. Relation of blood pressure, serum lipids and smoking to risk of cerebral stroke. Stroke 1982; 13:327-333.
Martin M. Hulley S. Browner W. Kuller L. Wentworth D. Serum cholesterol, blood pressure, and mortality: implications from a cohort of 361 662 men. Lancet 1986 (ii):933-936.
Kannel W. Neaton J. Wentworth D. Thomas H. Stamler J. Hulley S. Kjelsberg M. Overall and coronary heart disease mortality rates in relation to major risk factors in 325 348 men screened fortheMRFIT. Am Heart J. 1986;112:825-836.
Shaper A. Pocock S. Walker M. Cohen N. Wale C. Thomson A. British Regional Heart Study: Cardiovascular risk factors in middle aged men in 24 towns. BMJ 1981;283:179-186.
Shaper A. Phillips A. Pocock S. Walker M. Macfarlane N. Risk factors for stroke in middle agedBritish men. BMJ 1991;302:1111-5.
Veteran Administration Cooperative Study Group on Anti hypertensive Agents. Effects of treatment on morbidity in hypertension. JAMA 1967;202:116-122.
Medical Research Council Working Party. Stroke and coronary heart disease in mild hypertension: risk factors and the value of treatment. BMJ 1988;296:1565-1570.
Findings of the Hypertension Detection and Follow up Programme. JAMA 1982;247:633-638.
The Australian Therapeutic Trial in Mild Hypertension. Lancet 1980 (i): 1261-1267.
Treating mild hypertension. Report of the British Hypertension Society working party. BMJ 1989;298:694-698.
Rose G. Sick individuals and sick populations. Int J Epid 1985;14:32-38.
Macmahon S. Cutler J. Furberg C. Payne G. The effects of drug treatment for hypertension on morbidity and mortality from cardiovascular disease; a review of randomised controlled trials. Prog Cardiovasc Dis 1986;24 (suppl):99-l 18.
Haberman S. Capidleo R. Rose F. Eds. Progress in stroke research. Tunbridge Wells. Pp 3-14. Pitman Medical 1979.
Keys A. Seven Countries: a multivariate analysis of death and coronary heart disease. Cambridge MA: Harvard Univ. Press. 1980.
Hutt M. Burkitt D. The geography of non infectious disease. Oxford UK. Oxford University Press1986.
Uemara K. Pisa Z. WHO Statistics Quarterly Review 1985;38:142-162.
116

Rose C. Epidemiological aspects of stroke. In: Progress in Stroke Research, Eds. Rose, Greenalgh. Pitman 1983.
Haberman S. Capildeo R. Rose F. The diverging trends in cerebrovascular disease and ischaemic heart disease mortality. Stroke 1982; 13:582.
Stamler J. Berkson D. Dyer A. Relationship of multiple variables to blood pressure; findings from four Chicago Epidemiologic studies. In: Epidemiology and control of Hypertension. Ed. Paul O. Pp 307-356. New York and London, Strattan Intercontinental Book Corporation 1975.
Szklo M. Determination of blood pressure in children. Clin & Exper. Hypertension [A]1986;8:479-493.
Miall W. Bell R. Lovell H. Relation between change in blood pressure and weight. Br J Prev SocMed 1968;22:73-80.
Svardsudd K. Tiblin G. A longtitudinal blood pressure study. Change of blood pressure during 10 year follow up in relation to initial values. The study of men bom in 1913. J Chron Dis 1980;33:627-636.
Why does blood pressure rise with age? (Editorial) Lancet 1981 (ii):289-290.
National Heart Lung and Blood Institute’s Task Force on Hypertension: Report of the Task Force on Blood PRessure Control in Children. Pediatrics 1977;59 (Suppl):795-820.
Szklo M. Epidemiological patterns of blood pressure in children. Epid Reviews 1979;1:143-169. John Hopkins University School of Hygiene and Public Health.
Rabkin S. Mathewson F. Tate R. Relationship of Blood Pressure in 20-39 year old men to subsequent Blood Pressure and incidence of Hypertension over a 30 year observation period. Circulation 1982;65:291-299.
Obermann A. Lane N. Harlan W. Graybid A. Mitchell R. Trends in systolic blood pressure in the Thousand Aviator Cohort over a twenty four year period. Circulation 1967;36:812-822.
Paffenbarger R. Thorne M. Wing A. Chronic Disease in former College students VIII. Characteristics in youth predisposing to hypertension in later years. Am J Epid 1968;88:25-32.
Froom P. Bar David M. Ribak J. Van Dyk D. Kallner B. Benbassat J. Predictive value of systolic Blood Pressure in young men for elevated systolic pressure 12 to 15 years later. Circulation1983;68:467-469.
Rosner B. Henneken C. Kass E. Miall W. Age specific correlation of longtitudinal Blood Pressuredata. Am J Epid 1977;106:306-313.
Hofman A. Valkenburg H. Maas J. Groustra F. The natural history of blood pressure in children.Int J Epid 1985;14:91-96.
17

Voors A. Webber S. Berenson G. Time course studies of blood pressure in children. The Bogalusa Heart Study. Am J Epid 1979;109:320-334.
Shear C. Burke G. Freedman D. Webber L. Berenson G. Designation of children with high blood pressure - consideration on percentile cut points and subsequent high blood pressure: The BogalusaHeart Study. Am J Epid 1987;125:73-84.
Beaglehole R. Salmond C. Eyles E. A longtitudinal study of blood pressure in Polynesian children.Am J Epid 1977;105:87-89.
Lauer R. CcClarke W. Beaglehole R. Level, trend, and variability of blood pressure during childhood: The Muscatine Study. Circulation 1984;69:242-249.
Hait H. Lemeshow S. Rosen man K. A longtitudinal study of blood pressure in a national surveyof children. Am J Public Hlth 1982;72:1285-1287.
Buck C. The persistence of elevated blood pressure first observed at age five. J Chron DIs1973;26:101-104.
de Swiet M. Payers P. Shinebourne E. Value of repeated Blood Pressure Measurements in children -The Brompton Study. BMJ 1980 (i): 1567-1569.
Zinner S. Rosner B. Oh W. Kass E. Significance of blood pressure in infancy. Familial aggregation and predictive effect on later blood pressure. Hypertension 1985;7:411-416.
Zinner S. Margolius H. Rosner B. Kass E. Stability of blood pressure rank and urinary kallikrein concentration in childhood: an eight year follow up. Circulation 1978;58:908-915.
Wadsworth M. Cripps H. Midwinter R. Colley J. Blood pressure in a national birth cohort at the age of 36 related to social and familial factors, smoking, and body mass. BMJ 1985;291:1534-1538.
Barker DIP. Osmond C. Golding J. Kuh D. Wadsworth M. Growth in utero. Blood Pressure in childhood and adult life, and mortality from cardiovascular disease. BMJ 1989;298:564-567.
Cater J. Gill M. The follow up study: medical aspects. In: Illsey R. Mitchell R. eds. Low birth weight, a medical psychological and social study. Pp 191-205. Chichester: John Wiley, 1984.
Simpson A. Mortimer J. Silva P. Spears G. Williams S. In: Onesti G. Kim K. eds. Hypertension in the young and old. Pp 153-163. New York Grune and Stratton, 1981.
Simpson A. Mortimer J. Silva P. Spears G. Williams S. In: Hypertension in the young and old. Eds: Oneti G. Kim K. Grune and Stratton. New York 1981.
Whincup P. Cook D. Shaper A. Early influences on bloo pressure: a study of children aged 5-7 years. BMJ 1989;299:587-591.
Ellison R. Harper G. Lever T. Gestational and perinatal factors as determinants of choldhood blood pressure. CVD Epidemiology Newsletter 1979;26:69 (Abstr).
118

Ounsted M. Cockburn J. Moar V. Redman C. Factors associated with the Blood Pressure of children born to women who were hypertensive during pregnancy. Arch Dis Child 1985;60:631-635.
Gennser G. Rymark P. Isberg P. Low birth weight and risk of high blood pressure in adulthood.BMJ 1988;296:1498-1500.
Ounsted M. Maternal constraint of fetal growth in man. Develop Med Child Neurol. 1965;7:479.
Scott K. Usher R. Fetal malnutrition: its incidence casuses and effects. Am J Obst Gynaecol.1966;94:951-963.
Bakketeig L. Hoffman H. Harley E. The tendency to repeat gestational age and birth weight in successive births. Am J Obst Gynae. 1979;35:1086-1103.
Fed rick J. Adelstein P. Factors associated with low birth weight of infants delivered at term. BrJ Obst Gynaecol. 1978;85:1-7.
Snow M. Control of embryonic growth rate and fetal size in mammals. In: Human Growth A Comprehensive Treatise (2nd ed). Vol I. Falkner F. Tanner J. eds. Pp 67-79. Plenum Press New
1986.
Roberts D. The Genetics of Human Growth. In: Human Growth A Comprehensive Treatise (2nd ed). Vol III. Falkner F. Tanner J. eds. Pp 113-143. Plenum Press New York 1986.
Ounsted M. Ounsted C. Maternal regulation of intra uterine growth. Nature 1966;212:995-997.
Smith D. Truog W. Rogers J. Greitzer L. Skinner A. McCann J. Harvey M. Shifting linear growth during infancy: Illustration of genetic factors in growth from fetal life through infancy. J Peds1976;89:225-230.
Little R. Mother’s and Father’s birthweight as predictors of infant birthweight. Paed. and Perin. Epid. 1987; 1:19-31.
Ounsted M. Ounsted C. On Fetal Growth. Philadelphia. J. B. Lippincott. 1973.
Wilson R. Growth and development of human twins. In: Human Growth A Comprehensive Treatise (2nd ed). Vol III. Falkner F. Tanner J. eds. Pp 197-211. Plenum Press New York 1986.
McKeown T. Record R. Observations on fetal growth in multiple pregnancy in man. J Endocrin1952;8:386.
Tanner J. Growth as a target seeking function. In: Human Growth A Comprehensive Treatise (2nd ed). Vol 1. Falkner F. Tanner J. eds. Pp 167-179. Plenum Press New York 1986.
Keet M. Jarosczewicz A. Lombard C. Follow up study of physical growth of monozygous twins with discordant within-pair birthweights. Pediatrics 1986;77:336-343.
19

Baird D. The epidemiology of low birth weight: changes in incidence in Aberdeen 1948-1972. JBiosoc Sci 1974;6:323-341.
Douglas J. Mogford C. The results of a national inquiry into the growth of premature children from birth to four years. Arch Dis Child 1953;28:372-381.
Douglas J W B. Some factors associated with prematurity. The results of a National survey. J Obst Gynaecol Br Empire. 1950;57:143-170.
0. Dowding V. New assessment of the effects of birth order and socio-economic status on birth weight.BMJ 1981;282:683-686.
1. Baird D. Social class and fetal mortality. Lancet 1947 (ii):531-535.
2. Baird D. Social factors in Obstetrics. Lancet 1949 (i): 1079-1083.
3. Baird D. Environmental and Obstetric factors in prematurity. With special reference to experiencein Aberdeen. WHO Bull 1962;26:291-295.
4. Campbell S. Newman G. Growth of the fetal biparietal diameter during normal pregnancy. J Obst Gynaecol Br. Commonwealth 1971;78:513-519.
5. Miller H. Hassanein K. Diagnosis of impaired fetal growth in newborn infants. Pediatrics1971;48:511-522.
6. Campbell S. Thoms A. Ultrasound measurement of the fetal head to abdomen circumference ratio in the assessment of growth retardation. Br J Obstet Gynaecol. 1977;84:165-174.
7. Meire H. Ultrasound assessment of fetal growth patterns. Br Med Bull 1981;37:253-258.
8. Villar J. Belizan J. The timing factor in the pathophysiology of the intrauterine growth retardation syndrome. Obstet Gynaecol Survey 1982;37:499-506.
?. Villar J. Smeriglio V. Martorell R. Brown C. Klein R. Heterogeneous growth and mental development of intra uterine growth retarded infants during the first 3 years of life. Pediatrics1984;74:783-791.
3. Kliegman R. Kins K. Intrauterine growth and retardation: determinants of aberrant fetal growth. In: Neonatal perinatal medicine, eds; Famaroff A. Martins R. CV Mosby St Louis 1983.
1. Gruenwald P. Chronic fetal distress and placental insufficiency. Biol Neonat 1963;5:215-265.
2. Ince J. Young M. The bony pelvis and its influence on labour: a radiological and clinical study of 500 women. J Obst Gynae Br Empire. 1940;47:130-191.
3. Bourne A W. Williams L H. The obstetric pelvis. Recent advances in Obstetrics and Gynaecology. 10th Edition. J&A Churchill. London 1962.
120

4. Molomphy P. Kishore N. Thoms M. The obstetrical status of the dolicopellic-anthropoid pelvis. Obst & Gynae Survey. 1953;8:615-654.
5. Maclennan H. Contracted Pelvis in childhood: A study of its morbid effects on mother and child.J Obst Gynae. 1944;50:293-317.
6. Greulich W. Thoms H. The dimensions of the pelvic inlet in 789 white women. AnatomicalRecord 1938;72:45-51.
7. Greulich W. Thoms H. Twaddle R. A study of pelvic type and its relationship to body build in white women. JAMA 1939;112:485-493.
8. Bernard R. The Shape and Size of the Female Pelvis. Transactions of the Edinburgh Obstetric Society. Session CIV 1951-1952. 1-56.
9. Nicholson C. The interpretation of radiological pelvimetry. J Obsty Gynaecol. 1939;45:950-985.
0. Nicholson C. Allen H. Variation in the female pelvis. Lancet 1946 (ii): 192-195.
1. Nicholson C. The two main diameters at the brim of the female pelvis. J Anat 1945;79:131-135.
2. Holland E. Cran G. El wood J. Pinkerton J. Thompson W. Annals Human Biol. 1982;9:113-120.
3. Scheyer H. Anthropological and Roentgenological Observations on the pelves of Chinese women. Chinese Med J 1934;48:1228.
4. Vaughan K. The shape of the pelvic brim as the determining factor in childbirth. BMJ 1931;2:939-940.
5. Thoms H. Is the oval or female type of pelvis a rachitic manifestation? Am J Obst Gynae1936;31:111-115.
6. Thoms H. The role of nutrition in pelvic variation. Amer J Obst Gyn 1947;54:62-66.
7. Sinclair D. Human growth after birth. 4th ed. Oxford University Press 1985. New York.
8. Smout C. Jacoby F. Lillie E. Gynaecological and obstetrical anatomy. 4th ed. H K Lewis & Co. 1969. London.
9. Elliott P. Fehily A. Sweetnam P. Yarnell J. Diet alcohol body mass and social factors in relation to blood pressure : the Caerphilly heart study. J Epid Comm Hlth 1987;41:37-43.
0. Miall W. Bell R. Lovell H. Relation between change in blood pressure and weight. Br J Prev SocMed 1968;22:73-80.
1. Klatsky A. Friedman G. Siegelaub A. Gerard M. Alcohol consumption and blood pressure: Kaiser Permanente Multiphasic Health Examination Data. NEJM 1977;296:1194-1200.
121
2. Belizan J. Lech tig A. Villar J. Distribution of low birth weight babies in developing countries. AmJ Obst Gynaecol. 1978;132:704-705.
3. Maclennan H. Contracted pelvis in Scotland. Observations on its distribution, types, and severity. J Obst Gyn Brit Empire 1937;44:245-249.
4. McGonigle G. Kirby J. Poverty and Public Health. Victor Gollancz, 1936. London.
5. Campbell J. Cameron D. Jones D. MoH reports on public health and medical subjects No 68. High maternal mortality in certain areas. HMSO 1932 London.
6. Carr Hill R. Campbell D. Hall M. Meredith A. Is birthweight determined genetically? BMJ1967;295:687-689.
7. Reisin E. Abel R. Modan M. Silverberg D. Eliahou H. Modan B. Effect of weight loss without salt restriction on the reduction of Blood Pressure in the overweight hypertensive patient. NEJM1978;298:1-6.
8. Stamler R. Stamler J. Grimm R. Gosch F. Elmer P et al. Nutritional therapy for high blood pressure. JAMA 1987;257:1484-1491.
9. Langford H. Blaufox D. Oberman A. Hawkins M. Curb D. Dietary therapy slows the return of hypertension after stopping prolonged medication. JAMA 1985;253:657-664.
0. Saunders J. Beevers D. Baton A. Alcohol induced hypertension. Lancet 1981 (ii):653-656.
1. Hinkle L. Coronary Heart Disease and sudden death in actively employed American men. Bull NYAcad 1973;49:467-474.
2. Koskenvuo M. Kaprio J. Kesaniemi A. Sarna S. Differences in mortality from ischaemic heart disease by marital status and social class. J Chron Dis. 1980;33:95-106.
3. Pocock S. Shaper A. Cook D. Phillips A. Walker M. Social class differences in ischaemic heart disease in British men. Lancet 1987 (ii): 197-201.
4. Elford J. Philips A. Thomson H. Shaper A. Migration and geographical variation in ischaemic heart disease in Great Britain. Lancet 1989 (i):343-346.
5. Barker D J P. The intrauterine origins of cardiovascular and obstructive lung disease in adult life.J Royal Coll Physicians 1991;25:129-133.
6. Godfrey K. Redman C. Barker D J P. Osmond C. The effect of maternal anaemia and iron deficiency on the ratio of fetal weight to placental weight. Brit J Obst Gynaecol 1991;98:886-891.
7. Beischer N. Surasamboo R. Vohra S. Gilpisornkosal S. Reid S. Placental hypertrophy in severe pregnancy anaemia. J Obst Gynae Brit Comm 1970;77:398-409.
8. Spira A. Spira N. Goujard J. Smoking during pregnancy and placental weight: a multivariate
122

analysis of 3759 cases. J Perinatal Med 1975;3:237-241.
9. Julius S. Schork M. Predictors of Hypertension. Annals of NY Academy of Sciences 1978;304:38-52.
0. Havlick R. Garrison R. Feinleeb M. Kannel W. Castelli W. Mcnamara P. Blood Pressure Aggregation in Families. The Framingham Heart Study. Am J Epid 1979;110:304-312.
1. Stamler R. Stamler J. Riedlinger W. Algera G. Roberts R. Family (parental) history of prevalence of hypertension. Results of a nationwide screening programme. JAMA 1979;241:43-46.
2. Gerson L. Fodor J. Family aggregations of high blood pressure groups in two Newfoundland communities. Can J Public Health 1975;66:294-299.
3. Bengtsson B. Thulin T. Schesten B. Familial resemblance in casual blood pressure - a maternaleffect? Clin Science 1979;57:279-294.
4. Miller H. Hassanein K Maternal smoking and fetal growth of full term infants. Paediatric Res1974;8:960.
5. Law C. Barker D J P. Bull A R. Osmond C. Maternal and fetal influences on blood pressure.Arch Dis Child 1991;66:1291-1295.
6. Naeye R. Blane W. Paul C. Effects of maternal nutrition on the human fetus. Pediatrics1973;52:494-503.
7. Stein Z. Susso M Saenger G. Marolla F. Famine and human development. The Dutch hunger winter of 1944-1945. OUP New York 1975.
8. Margetts B. Rowland M. Foord F. Cruddas A. Cole T. Barker D J P. The relation of maternal weight to the blood pressure of Gambian children. Int J Epid (In press).
9. Campbell A. Dawes G. Fishman A. Hyman A. Regional redistribution of blood flow in the mature fetal lamb. Circulation Research 1967;21:229-235.
0. Rudolph A. The fetal circulation and its response to stress. J Dev Phys. 1984;6:11-19.
1. Dawes G. Zacutti A. Borrcitto F. Zacutti A Jr. Fetal autonomy and adaptation. John Wiley and sons. 1990. Chicester.
2. Berry C. Hypertension and arterial development: long-term considerations. Br Heart J1978;40:709-717.
4.
Meyer w. Lind J. Iliac arteris in children with a single umbilical artery: structre calcification and early atherosclerotic lesions. Arch Dis Child 1974;49:671-679.
Berry C. Goslin R. Laogun A. Bryan E. Anomalous iliac compliance in children with a single umbilical artery. Br Heart J. 1976;38:510-515.
123

i. Butler N. Alberman E. 2nd report of the 1958 British perinatal mortality survey. Churchill Livingstone 1969. Edinburgh.
). Teasdale T. Sorensen t. Stunkard A. Genetic and early environmental components in sociodemographic influences on body fatness. BMJ 1990;300:1615-1618.
1. Maddocks I. Blood pressure in Melanesians. Med J Austr 1967;1:1123-1126.
5. Prior I. Evans J. Harvey H. Davidson F. Lindsey M. Sodium intake and blood pressure in two Polynesian populations. NEJM 1968;279:515-520.
). Sever P. Peart W. Gordon D. Beighton P. Blood pressure and its correlates in urban and tribal Africa. Lancet 1980 (i):260-264.
). Macgregor G. Markandu N. Best F. Elder D. Cam J. Gagnella G. Squires M. Double blind randomised crossover trial of moderate sodium restriction in essential hypertension. Lancet 1982(i):351-355.
1. Burstyn P. Hornall D. Walshorn C. SOdium and potassium intake and blood pressure. BMJ1980;281:537-539.
1. Intersalt Cooperative Research Group. Intersalt: an international study of electrolyte excretion and blood pressure. Results for 24 hour urinary sodium and potassium excretion. BMJ 1988;297:319-328.
L Geleijnse J. Grobbee D. Hofman A. Sodium and potassium intake and blood pressure change inchildhood. BMJ 1990;300:899-902.
L Law M. Frost C. Said N. By how much does salt reduction lower blood pressure? I - Analysis of observational data among populations. BMJ 1991;302:811-815.
5. Macmahon S. Peto R. Cutler J. Collins R. Sorlie P. Neaton J. Abbott R. Godwin J. Dyer A. Stamler J. Blood pressure stroke and coronary heart disease. Lancet 1990;335:765-774.
124


![[William Bull (Firm) materials] - Wikimedia Commons](https://static.fdokumen.com/doc/165x107/633233565696ca4473031c93/william-bull-firm-materials-wikimedia-commons.jpg)