Adrian Kennelly RM Consulting Group - Final Report
156
Final Report Investigating the Costs Associated with the Production, Sale and Distribution of Vegetables Adrian Kennelly RM Consulting Group Project Number: VG12086
-
Upload
khangminh22 -
Category
Documents
-
view
4 -
download
0
Transcript of Adrian Kennelly RM Consulting Group - Final Report

Final Report
Investigating the Costs Associated with the Production, Sale and Distribution of Vegetables
Adrian Kennelly
RM Consulting Group
Project Number: VG12086
VG12086
This project has been funded by Horticulture Innovation Australia Limited using the vegetable industry levy and funds from the Australian Government.
Horticulture Innovation Australia Limited (HIA Ltd) makes no representations and expressly disclaims all warranties (to the extent permitted by law) about the accuracy, completeness, or currency of information in Investigating the Costs Associated with the Production, Sale and Distribution of Vegetables. Reliance on any information provided by HIA Ltd is entirely at your own risk. HIA Ltd is not responsible for, and will not be liable for, any loss, damage, claim, expense, cost (including legal costs) or other liability arising in any way (including from HIA Ltd or any other person’s negligence or otherwise) from your use or non-use of Investigating the Costs Associated with the Production, Sale and Distribution of Vegetables, or from reliance on information contained in the material or that HIA Ltd provides to you by any other means. ISBN 0 7341 3544 0 Published and distributed by: Horticulture Innovation Australia Limited Level 8, 1 Chifley Square Sydney NSW 2000 Tel: (02) 8295 2300 Fax: (02) 8295 2399 © Copyright 2015
Horticulture Australia Limited
Investigating the Costs Associated with the Production, Sale and Distribution of Vegetables
(VG12086)
Final Report
June 2014
ABN: 35 154 629 943 www.rmcg.com.au

Document Review & Authorisation Job Number: 33-H-02 Document Version
Final/ Draft Date Author Reviewed
By Checked by BUG
Release Approved By Issued to Copies Comments
1.0 Draft 12/02/14 P. McCann P. Mawson A Kennelly 1(e) Internal review
2.0 Final 27/02/14 P. McCann A. Kennelly P. Mawson A. Kennelly HAL 1(e) Final
3.0 Final 06/06/14 P. McCann A. Kennelly P. Mawson A. Kennelly HAL 1(e) Revised final
Note: (e) after number of copies indicates electronic distribution
Project Team: Adrian Kennelly, Principal, RMCG Peter McCann: Senior Consultant, RMCG Charles Thompson: Senior Fellow, RMCG Daryl Poole: Senior Consultant, RMCG Anna Renkin: Consultant, RMCG Dr Doris Blaesing: Senior Consultant, RMCG
HAL Project number and title: VG12086 Investigating the Costs Associated with the Production, Sale and Distribution of Vegetables
Purpose of the Project The purpose of this project was to investigate the costs associated with the production, sale and distribution of vegetables with the objective to develop a greater understanding of the priority cost of production issues for the vegetable industry and an improved strategic approach to managing these issues at both a national and regional level.
This project has been funded by HAL using the vegetable industry levy and matched funds from the Australian Government.
6 June 2014
Contact Details: Name: Adrian Kennelly Title: Principal Address: PO Box 620, Torquay Victoria 3228 P: (03) 5261 6105 F: (03) 5261 5515 M: 0427 679 042 E: [email protected]
International Standards Certification
QAC/R61//0611
RMCG Disclaimer: This report has been prepared in accordance with the scope of services described in the contract or agreement between RMCG and the Client. Any findings, conclusions or recommendations only apply to the aforementioned circumstances and no greater reliance should be assumed or drawn by the Client. Furthermore, the report has been prepared solely for use by the Client and RMCG accepts no responsibility for its use by other parties.
HAL Disclaimer: Any recommendations contained in this publication do not necessarily represent current HAL policy. No person should act on the basis of the contents of this publication, whether as to matters of fact or opinion or other content, without first obtaining specific, independent professional advice in respect of the matters set out in this publication.
Investigating the costs associated with the production, sale and distribution of vegetables Final Report
RMCG Consultants for Business, Communities & Environment
Table of Contents
Media Summary i
Technical Summary ii
1 Introduction 1 1.1 Background ............................................................................................................................. 1 1.2 Purpose ................................................................................................................................... 1 1.3 Approach ................................................................................................................................. 2 1.4 Report structure ...................................................................................................................... 2
2 Materials and methods 4 2.1 Introduction ............................................................................................................................. 4 2.2 Cost of production ................................................................................................................... 4
2.2.1 Why is CoP important? ................................................................................................ 4 2.2.2 What is included in CoP? ............................................................................................. 4 2.2.3 How do you calculate CoP? ......................................................................................... 5 2.2.4 Why count non-cash costs? ......................................................................................... 5 2.2.5 Why calculate per unit? ............................................................................................... 5
2.3 Analysis of existing data ......................................................................................................... 5 2.4 Consultation ............................................................................................................................ 6 2.5 Case studies ........................................................................................................................... 7 2.6 Strategy development ............................................................................................................. 7
3 Results of analysis 8 3.1 Introduction ............................................................................................................................. 8 3.2 CoP over time ......................................................................................................................... 8
3.2.1 Introduction .................................................................................................................. 8 3.2.2 Average total costs per farm ........................................................................................ 8 3.2.3 Average total costs per hectare ................................................................................. 10 3.2.4 Average total costs per tonne .................................................................................... 12 3.2.5 Conclusion ................................................................................................................. 14
3.3 CoP by performance ............................................................................................................. 14 3.3.1 Introduction ................................................................................................................ 14 3.3.2 Farm profile by performance ...................................................................................... 15 3.3.3 Cost per tonne relative to performance ..................................................................... 15 3.3.4 Differences in overhead costs ................................................................................... 16 3.3.5 Similarities with other industries ................................................................................ 17 3.3.6 Conclusion ................................................................................................................. 20
3.4 CoP by scale ......................................................................................................................... 20

Investigating the costs associated with the production, sale and distribution of vegetables Final Report
RMCG Consultants for Business, Communities & Environment
3.4.1 Introduction ................................................................................................................ 20 3.4.2 Income and costs per tonne by area sown to vegetables .......................................... 21 3.4.3 Overhead costs by area sown to vegetables ............................................................. 22 3.4.4 Conclusion ................................................................................................................. 22
3.5 CoP by commodity ................................................................................................................ 23 3.5.1 Introduction ................................................................................................................ 23 3.5.2 Costs per tonne by commodity .................................................................................. 23 3.5.3 Price and CoP ............................................................................................................ 24 3.5.4 Percentage of variable and overhead costs .............................................................. 24 3.5.5 Conclusion ................................................................................................................. 25
3.6 CoP by state ......................................................................................................................... 26 3.6.1 Introduction ................................................................................................................ 26 3.6.2 Area and production by state ..................................................................................... 26 3.6.3 Costs per tonne by state ............................................................................................ 27 3.6.4 Income and CoP ........................................................................................................ 27 3.6.5 Conclusion ................................................................................................................. 28
3.7 Conclusion ............................................................................................................................ 28
4 Results of consultation and case studies 30 4.1 Introduction ........................................................................................................................... 30 4.2 Project co-operators .............................................................................................................. 30 4.3 Characteristics of a successful business .............................................................................. 31 4.4 Relationship between case studies and characteristics ........................................................ 32
5 Recommended strategies 36 5.1 Introduction ........................................................................................................................... 36 5.2 Recommended strategies by characteristic .......................................................................... 36 5.3 Recommended strategies by priority .................................................................................... 38 5.4 Extension principles to facilitate strategy delivery ................................................................. 39 5.5 Resistance to change ........................................................................................................... 41 5.6 Strategy consultation ............................................................................................................ 42 5.7 Conclusion ............................................................................................................................ 43
6 Strategy implementation 44 6.1 Introduction ........................................................................................................................... 44
6.1.1 Approach ................................................................................................................... 44 6.1.2 Method ....................................................................................................................... 44
6.2 Consultation .......................................................................................................................... 45 6.3 Next steps ............................................................................................................................. 45
7 Acknowledgements 46

Investigating the costs associated with the production, sale and distribution of vegetables Final Report
RMCG Consultants for Business, Communities & Environment
8 Glossary of terms 47
9 References 48
Appendix 1: Cost of production data 49 Appendix 1.1: Average total costs per farm ................................................................................... 49 Appendix 1.2: Average total costs per hectare .............................................................................. 51 Appendix 1.3: Average total costs per tonne ................................................................................. 53 Appendix 1.4: Costs per tonne by farm financial performance ...................................................... 55 Appendix 1.5: Costs per tonne by area sown to vegetables .......................................................... 56 Appendix 1.6: CoP over time by state ............................................................................................ 57
Appendix 2: Case studies 63 Case Study 1: “The importance of succession planning” ............................................................... 63 Case Study 2: “Increasing value not area” ..................................................................................... 64 Case Study 3: “DIY controls costs and expert advice to increase yields” ...................................... 68 Case Study 4: “IPM results in better yield and quality” .................................................................. 75 Case Study 5: “Customer needs define scale, quality and costs” .................................................. 78 Case Study 6: “Creating value through product improvement” ...................................................... 82 Case Study 7: “Technology to increase scale” ............................................................................... 87 Case Study 8: “From little things big things grow” .......................................................................... 93 Case Study 9: “Power in numbers” .............................................................................................. 100 Case Study 10: “Change = Opportunity” ...................................................................................... 103 Case Study 11: “Only grow what you can comfortably sell at a margin” ...................................... 107 Case Study 12: “IPM focus has increased market share” ............................................................ 111 Case Study 13: “Focus on low volume high value products” ....................................................... 114 Case Study 14: “Successful business transition” ......................................................................... 117 Case Study 15: “Auto-transplanter to reduce labour” ................................................................... 120 Case Study 16: “Strategic expansion of land and water” ............................................................. 123 Case Study 17: “A Tasmanian survival story ” ............................................................................. 126 Case Study 18: “Reducing labour allowed more time for planning ” ............................................ 130 Case Study 19: “Building a future asset for our children ” ............................................................ 133
Appendix 3: Consultation database 136
Appendix 4: Feedback on draft strategy 138

Investigating the costs associated with the production, sale and distribution of vegetables Final Report
RMCG Consultants for Business, Communities & Environment
List of Figures Figure 1: Average total costs per farm by accounting category, 2005/06 – 2010/11 8 Figure 2: Average total costs per farm by management category, 2005/06 – 2010/11 9 Figure 3: Average total costs per hectare by accounting category, 2005-06 - 2010-11. 10 Figure 4: Average total costs per hectare by management category, 2005-06 – 2010-11 11 Figure 5: Average total costs per tonne by accounting category, 2005-06 – 2010-11. 12 Figure 6: Average total costs per tonne by management category, 2005-06 – 2010-11 13 Figure 7: Average total costs per tonne by accounting category relative to farm financial performance 2010-11 16 Figure 8: Income and costs per tonne by area sown to vegetables, 2010-11 21 Figure 9: Overhead costs by area sown to vegetables, 2010-11 22 Figure 10: Price and costs per tonne by commodity, 2010-11 24 Figure 11: Percentage of variable and overhead costs by commodity, 2010-11 25 Figure 12: Income and costs per tonne by State, 2010-11 28
List of Tables Table 1: Profile of vegetable growing farms by return on capital 15 Table 2: Overhead costs per tonne by return on capital 16 Table 3: Difference in profitability between the average and top 25% in the south west Victorian dairy industry in 2011/12 18 Table 4: Difference in overhead costs between the average and top 25% in the south west Victorian dairy industry in 2011/12 18 Table 5: Difference in profitability between the average and top producer in RMCG’s private network of pork producers between 2004/05 and 2009/10 19 Table 6: Costs per tonne by commodity, 2010-11 23 Table 7: Area and production of vegetable growing farms by State, 2010-11 26 Table 8: Costs per tonne by State, 2010-11 27 Table 9: Project co-operator summary table 30 Table 10: Case study summary table 33 Table 11: Recommended strategies for extension 37 Table 12: Extension principles to facilitate strategy delivery 39 Table 13: Possible approach after a business discussion 41
Investigating the costs associated with the production, sale and distribution of vegetables Final Report
RMCG Consultants for Business, Communities & Environment Page i
Media Summary
Reducing production costs can have an important influence on the market share of the Australian vegetable industry in both the domestic and international markets.
This project reinforces the critical relationship between scale, productivity and farm financial performance. The fact that the best performing vegetable growers farm more area, produce more product per area sown and achieve a higher price per tonne produced, whilst having the lowest CoP per tonne, indicates that increases in scale are offsetting the increases in farm costs and that scale has not come at the expense of productivity.
The best performing growers don’t appear to have a cost competitiveness issue. However, there are a large number of small growers, who do not have the benefits of economies of scale, suffer from high overhead costs, and do not attract higher prices by producing a premium product. These growers are struggling to remain competitive. Therefore, it is critical to learn from growers who have been successful in implementing practical strategies for lowering the cost of production.
The project identifies eleven characteristics common to growers who have successfully implemented practical strategies to improve cost competitiveness. Adoption of these characteristics by other growers will improve the profitability of the industry overall.
Three highly focussed, but integrated, strategic programs that encompass the nine high priority strategies developed are recommended. These programs are:
1. A regional benchmarking program
2. A business discussion group program
3. A business skill development program
Further, it is recommended that these three programs be implemented as a co-ordinated initiative, as each program will rely on the other programs to be successful. That is, the value of an integrated initiative is greater than the sum of its three parts.
Finally, it is critically important to the success of these programs that the industry recognise that adoption of the strategies is dependent on the extension approach used. The industry must incorporate the ten extension principles outlined into the recommended programs to ensure that the needs of all of the industry are met and the outcome of a more cost competitive industry is achieved.
These programs could be delivered with a mixture of on line self assessment tools, face to face discussion groups and on-going mentoring via links to a network of horticultural business consultants.

Investigating the costs associated with the production, sale and distribution of vegetables Final Report
RMCG Consultants for Business, Communities & Environment Page ii
Technical Summary
The Australian Vegetable Industry Strategic Investment Plan 2012 – 2017 identified increasing input costs as one of the key challenges facing the industry1. Input costs along the value chain impact the competitiveness of Australian produced vegetables in both domestic and export markets, and have direct impact on grower profitability.
This project investigates the costs associated with the production, sale and distribution of vegetables with the objective to develop a greater understanding of the priority cost of production issues for the vegetable industry and an improved strategic approach to managing these issues at both a national and regional level.
Analysis of existing data
There is limited publicly available data that specifically relates to the production, sale and distribution of vegetables beyond that already published by ABARES from their surveys of Australian vegetable growers conducted on behalf of HAL during the six-year period from 2005-06 to 2010-11. Further analysis of this data with a strong emphasis on gaining greater understanding by examining the data on a per unit basis and comparing the cost of production by business financial performance, scale of business, commodity and State was undertaken.
From this analysis it can be concluded that:
§ Average total costs of vegetable growing farms are increasing largely because of increased scale, productivity and overhead costs. Increased scale and productivity are a positive for the industry, as the analysis demonstrates that they have helped the industry maintain cost competitiveness, especially with regard to variable costs. However, the increase in overhead costs per hectare and per tonne is of concern, as many of these costs are beyond the control of vegetable growers and it would appear that increases in scale and productivity have not fully offset their increase.
§ Low profitability in the vegetable industry is mainly the result of high overhead costs, especially operator and family imputed labour, because of insufficient scale to cover this cost. This is not a problem that is unique to the vegetable industry, so there is an opportunity to learn from other agricultural industries with similar problems.
§ Larger scale growers and the better performing growers have lower costs per tonne. They appear to be able to offset the increasing trend in costs through their ability to capitalise on economies of scale from increased production. As a result, these growers are more likely to be cost competitive and profitable.
§ There is no direct relationship between what vegetable is grown and grower profitability, i.e. it is not what you grow, but how you grow it that determines profitability.
§ There is no direct relationship between location (State) and grower profitability, i.e. it is not where you grow it, but how you grow it that determines profitability.
This analysis reinforces the critical relationship between scale, productivity and farm financial performance. The fact that the best performing vegetable growers farm more area, produce more product per area sown and achieve a higher price per tonne produced, whilst having the lowest CoP
1 AusVeg and HAL (2012) Australian Vegetable Industry Strategic Investment Plan 2012 – 2017, page 12.
Investigating the costs associated with the production, sale and distribution of vegetables Final Report
RMCG Consultants for Business, Communities & Environment Page iii
per tonne, indicates that increases in scale are offsetting the increases in farm costs and that scale has not come at the expense of productivity.
Thus, our best performing vegetable growers do not have a cost competitiveness problem. It is the large number of small growers, who do not have the benefits of economies of scale and suffer from high overhead costs, who are struggling to remain competitive.
Therefore, we must seek to learn from those who have successfully increased the scale of their business to improve their cost competitiveness and identify strategies that will assist growers overcome the barriers to achieving this outcome.
Consultation
Consultation was undertaken at two key points in the project in order to validate the conclusions drawn from the analysis of data and to ensure the approach adopted for the development of cost reducing strategies was practical and catered for managing the issues identified at both a national and regional level. Feedback from this consultation has been used to refine the strategies recommended.
Case studies
Case studies were developed for 19 of the 27 vegetable businesses visited and identified eleven characteristics that were common to the majority of these businesses. Achieving the eleven characteristics led to improving cost competitiveness by improving scale, controlling costs and enhancing productivity.
The eleven characteristics identified are:
1. Learn from others
2. Customer / supply chain relationships
3. Continuous improvement
4. Monitor cost of production
5. Be prepared to change
6. Take considered risks
7. Succession plans in place
8. Know own strengths and weaknesses
9. Future focus
10. Have alternatives / insurance
11. Build a good team
These characteristics were used to develop strategies to assist industry to lower its cost of production.
Strategy Development
Strategies were developed to assist growers to adopt the eleven characteristics of business success identified and, as a result, improve cost competitiveness of the industry overall.

Investigating the costs associated with the production, sale and distribution of vegetables Final Report
RMCG Consultants for Business, Communities & Environment Page iv
Further consultation was undertaken involving the circulation of the strategies developed to industry. Feedback received was used to validate the final strategies recommended to ensure they were practical and met the needs of industry at both a national and regional level.
Three highly focussed, but integrated, strategic programs that encompass the nine high priority strategies developed are recommended. They are:
o A regional benchmarking program
o A business discussion group program
o A business skill development program
It is recommended that industry focus new investment on these programs and the strategies they encompass in order to improve the cost competitiveness of the industry overall.
Further, it is also recommended that these three programs be implemented as a co-ordinated initiative, as each program will rely on the other programs to be successful. The programs could be delivered in conjunction with on line self assessment tools, and on-going mentoring via links to a network of horticultural business consultants.
Finally, it is critically important to the success of these programs that the industry recognise that adoption of the recommended strategies is dependent on the extension approach used.

Investigating the costs associated with the production, sale and distribution of vegetables Final Report
RMCG Consultants for Business, Communities & Environment Page 1
1 Introduction
1.1 Background
The Australian Vegetable Industry Strategic Investment Plan 2012 – 2017 identified increasing input costs as one of the key challenges facing the industry2. Input costs along the value chain impact the competitiveness of Australian produced vegetables in both domestic and export markets, and have direct impact on grower profitability.
Previous survey work conducted by ABARES on behalf of HAL reported that total costs increased by 11% in 2010/11, with hired labour accounting for the largest share of on-farm costs3. A recent discussion paper published by AUSVEG4 reinforces these findings and provides some recommendations to assist vegetable growers. Other significant cash costs include fertilizer, contractors, seed, fuel and oil and interest paid on finance. Importantly, the ABARES survey data shows that the relative significance of each of these costs varies between regions.
Similarly, recent work completed for the potato processing industry by McKinna et al5 examined the financial statements of a small number of growers in each of the main international growing regions and was able to identify the specific drivers of differences in cost competitiveness in each region. This type of approach is necessary to ensure that solutions and priorities are tailored to different circumstances.
1.2 Purpose
RMCG were engaged by Horticulture Australia Limited (HAL) to investigate the costs associated with the production, sale and distribution of vegetables with the objective to develop a greater understanding of the priority cost of production issues for the vegetable industry and an improved strategic approach to managing these issues at both a national and regional level.
The approach adopted by RMCG involved four stages. They were:
1. Analysis of existing data
2. Consultation
3. Case studies
4. Strategy development
The rationale for this approach was to first identify the priority cost of production issues, then assist the industry develop improved strategies for managing cost of production by learning from growers who have been successful in implementing practical strategies for lowering the cost of production.
2 AusVeg and HAL (2012) Australian Vegetable Industry Strategic Investment Plan 2012 – 2017, page 12. 3 ABARES (2012) Australian vegetable growing farms: an economic survey, 2010-11 and 2011-12. 4 AUSVEG and HAL (2014) Costs of production for Australian vegetable growers 5 McKinna et al (2010) Processing potatoes global benchmarking study.

Investigating the costs associated with the production, sale and distribution of vegetables Final Report
RMCG Consultants for Business, Communities & Environment Page 2
The purpose of this final report is to:
§ Detail the approach taken
§ Present the results of the analysis, consultation and case studies
§ Recommend strategies to assist cost competitiveness
§ Identify what needs to be done at an industry level to assist other growers overcome the barriers for lowering cost of production.
1.3 Approach
There is limited publicly available data that specifically relates to the production, sale and distribution of vegetables beyond that already published by ABARES from their surveys of Australian vegetable growers conducted on behalf of HAL during the six-year period from 2005-06 to 2010-11. Thus, the first section of this report presents the results of further analysis of this data with a strong emphasis on gaining greater understanding by examining the data on a per unit basis and comparing the cost of production by business financial performance, scale of business, commodity and State.
We have deliberately focussed on the costs of production, sale and distribution to the point of sale by the vegetable grower, because we believe the industry must focus on those costs that are within its control and can be directly influenced by HAL through the implementation of specific management strategies and research projects. This is the basis from which the industry can take a more strategic approach.
Furthermore, data on the costs further along the supply chain, from the point of sale by the vegetable grower to the consumer (if they are different points), are usually commercial-in-confidence and unavailable.
As part of this investigation, RMCG conducted visits to a number of vegetable growing regions across Australia and met with key industry contacts to discuss and validate the findings of our analysis, as well as identify regionally specific cost of production issues for consideration. We also met with growers, who had been identified as successful at implementing practical strategies to lower their cost of production, to discuss the strategies implemented and the process of their implementation.
A clear outline of the issues faced by each business, how they responded, as well as the outcomes of having implemented the change, enabled RMCG to identify key characteristics for successful vegetable businesses. These characteristics were used as the basis for formulating and recommending strategies for industry to lower the cost of production.
The recommended strategies have been prioritised, considering the current information and programs available, so that if no current industry program or information exists, a higher priority for new industry investment results.
1.4 Report structure
The structure of this report reflects its purpose and includes the following sections:
1. Introduction – Provides background and an outline of purpose, approach and structure.
2. Materials and methods – outlines the activities undertaken.

Investigating the costs associated with the production, sale and distribution of vegetables Final Report
RMCG Consultants for Business, Communities & Environment Page 3
3. Results of analysis – outlines and discusses the results of further analysis of the ABARES Vegetable Industry financial survey data.
4. Results of consultation & case studies – outlines and discusses the analysis of consultation visits and the case studies developed.
5. Recommended strategies – identifies the recommended strategies to lower the cost of production for the vegetable industry and the priority order for investment, as well as guiding principles for their delivery and an approach to deal with resistance to change.
6. Acknowledgements – recognition of project funding and support.
7. Glossary – a useful guide to the terminology used in the report.
8. References – outline of documents referred to in this investigation.
9. Appendices – the data and analysis behind the figures, as well as the individual case studies and database of those consulted during the project.

Investigating the costs associated with the production, sale and distribution of vegetables Final Report
RMCG Consultants for Business, Communities & Environment Page 4
2 Materials and methods
2.1 Introduction
This section outlines the activities undertaken by RMCG to investigate the cost of production, sale and distribution of vegetables, and to formulate and recommend strategies to industry.
In this section, we discuss the importance of cost of production, the items that should be included and how it should be calculated. We also outline the importance of including non-cash costs in the calculation and, finally, why we explored these costs on a per unit basis.
Next we outline the review and further analysis of available data undertaken, including our strong emphasis on gaining greater understanding by examining the data on a per unit basis and comparing the cost of production by business financial performance, scale of business, commodity and State.
The final sections outline the consultation phase of the investigation, including the on-site visits and the development of case studies of growers who have successfully improved cost competitiveness and how the identification of key characteristics for successful vegetable businesses has been used as the basis for formulating and recommending strategies for industry to implement to better manage cost of production.
2.2 Cost of production
2.2.1 Why is CoP important?
The cost of production (CoP) of any product and its price determine the profitability of a business, i.e. if the price exceeds the cost of production, then the business will make a profit on the sale of that product, at that price. Thus, managing your cost of production in a highly competitive market is essential to business success.
2.2.2 What is included in CoP?
In a vegetable business it is easy to recognise and identify the direct costs of growing, marketing, distributing and selling your produce. These costs include such items as fertilizer, hired labour, packaging and transport. However, your full cost of production includes much more than just your direct costs.
Non-direct costs, such as overheads, finance and capital costs make a significant contribution to your cost of production. These costs are often harder to recognise and identify, particularly in industry-wide studies. As a result, a number of industry studies of cost of production only focus on the direct costs of production.
Whilst this is helpful, it can be misleading, as cost of production studies in other agricultural industries have shown that it is usually the non-direct costs that differ greatest between producers, because of scale, location, market and/or business structure. Thus, the greatest opportunity for learning and business improvement may be overlooked.

Investigating the costs associated with the production, sale and distribution of vegetables Final Report
RMCG Consultants for Business, Communities & Environment Page 5
2.2.3 How do you calculate CoP?
HAL published a useful case study as part of the InnoVeg program that outlined how to calculate the cost of production, what to include and how to use it for decision-making6.
Calculation of the full cost of production should include:
§ Direct costs, including, growing costs and post harvest costs
§ Overhead costs, including non-cash costs, such as depreciation and owners’ labour
§ Capital costs, including the opportunity cost of capital invested in machinery and land
§ Profit, which, although not a cost, is explicitly counted to ensure you do not forget it!
2.2.4 Why count non-cash costs?
Overhead and capital costs include a number of non-cash costs, such as depreciation, owners’ labour and opportunity cost. These must be included in a calculation of cost of production otherwise the business will be selling itself short and not covering all of its costs. As a result, it might make a cash surplus, but not make a profit.
A cash surplus is positive, but it might not be enough for the family to live off comfortably or to replace machinery, and maintain and improve their land base. The business needs to make a “profit” for these to occur. Thus, a full cost of production calculation must include them.
2.2.5 Why calculate per unit?
Industry level studies often report the total costs of production for the average producer. These provide important information on which costs are the most significant to the industry and how costs have changed over time.
Of course, individual producers need to understand their cost of production per unit (tonne, truckload, pallet, carton, box, etc.) so as they may use it when marketing their produce (refer to previously mentioned HAL case study).
Knowledge of the cost of production per unit at the industry level is also important, particularly if it can be further disaggregated by business performance, scale, commodity or location. This knowledge can help the industry identify which types of businesses are experiencing the most difficulty with maintaining their cost competitiveness and thus, help the industry better design and target a strategic response.
2.3 Analysis of existing data
RMCG’s brief was to investigate the costs associated with the production, sale and distribution of vegetables and develop a strategy to guide the industry’s response to managing these costs with the aim of improving the profitability of vegetable growers. Thus, we have attempted to calculate the full cost of production for vegetable growers based on the information available.
6 http://ausveg.businesscatalyst.com/rnd/businesscases/CS_Using%20Cost%20of%20Production%20for%20Decision%20Making.pdf

Investigating the costs associated with the production, sale and distribution of vegetables Final Report
RMCG Consultants for Business, Communities & Environment Page 6
Data on the amount of capital invested in machinery and land is not readily available in a form, which matches the operating cost data that is available, and the profit margin aim of a producer is a personal decision. Thus, these two items are not included in our analysis. However, we have included the non-cash overhead costs of depreciation and owners’ labour. Thus, our analysis includes all operating and finance costs, which is consistent with ABARES’ calculation of farm business profit7, or the generic accounting term “EBT”, i.e. Earnings Before Tax.
The data presented has been analysed by business performance (based on return on capital, excluding capital appreciation), as the industry needs to understand how its most profitable producers are maintaining cost competitiveness so others may learn from them.
The data has also been analysed by scale (per hectare & per tonne) because studies in other agricultural industries have demonstrated that scale has a significant impact on cost of production because of the opportunity it provides to spread the business’ overhead costs. This analysis will also help us better understand the differences between the most profitable growers and the average grower.
Furthermore, the data is also presented by commodity and State to enable us to determine the impact of what crop you grow and where you grow it on your cost of production. This will increase the industry’s understanding of CoP across the board and thus, aid it take a more strategic approach in its response to cost pressures.
The majority of the data used in the analysis has been sourced directly from ABARES’ vegetable industry financial survey. Thus, we have used the cost categories used by ABARES for ease and consistency. However, we have further aggregated the data to better understand the types of costs that are impacting vegetable growers the most, how they have changed over time and how they differ between growers.
The two approaches used are:
4. Costs have been aggregated into variable, overhead and finance costs, which are standard accounting or business management categories.
5. Costs have also been aggregated into the more readily identifiable categories of growing, labour, post harvest, plant & equipment, administrative overheads, and finance costs.
Definitions of each of these cost categories and other technical terms used in this report are provided in the glossary (refer to section 8).
2.4 Consultation
RMCG conducted visits to a number of vegetable growing regions across Australia and met with key industry contacts to discuss and validate the findings of the discussion paper, as well as identify regionally specific cost of production issues for consideration. RMCG also met with growers, who had been identified as successful at implementing practical strategies to lower their cost of production, to discuss the strategies implemented and the process of their implementation.
7 Farm business profit: farm cash income + changes in trading stocks – depreciation – imputed labour costs

Investigating the costs associated with the production, sale and distribution of vegetables Final Report
RMCG Consultants for Business, Communities & Environment Page 7
A detailed list of those consulted and the role they played in this project is presented in Appendix 3.
2.5 Case studies
The resultant discussions from the consultation stage were used to develop case studies of available strategies for lowering the cost of vegetable production. Each of the case studies developed (refer to Appendix 2) is based on the following format:
1. The Business – A background of the business to provide context and perspective. What is the business? Who owns/operates the business? Where is it located? What do they produce? How long have they been in business?
2. The Situation – A brief description of the situation prior to any change being implemented. What were they doing and how?
3. The Challenges – Identify what change was required and why. What was the impact? What were the implications of not overcoming it?
4. The Strategy/Execution – Describe what was done and how it was done. Outline any barriers that needed to be overcome or additional resources required.
5. Key Outcomes – What has been the result of the change?
6. Lessons learnt/Key Messages – What are the key messages or conclusions that can be drawn from this example?
RMCG believes that adopting a case study approach will assist the industry to learn from those who have successfully improved cost competitiveness.
2.6 Strategy development
RMCG have identified eleven key characteristics for successful vegetable businesses by analysing the case studies. These characteristics were used as the basis for formulating and recommending strategies for industry to lower the cost of production.
The recommended strategies have been prioritised, considering the current information and programs available, so that if no current industry program or information exists, a higher priority for new industry investment has been allocated to the strategy.

Investigating the costs associated with the production, sale and distribution of vegetables Final Report
RMCG Consultants for Business, Communities & Environment Page 8
3 Results of analysis
3.1 Introduction
This section examines the cost of production (CoP) of vegetable producing farms across the industry and how they have changed over time. The data used in the analysis has been sourced directly from ABARES’ vegetable industry financial survey.
The data presented has also been analysed by business performance (based on return on capital, excluding capital appreciation) and by scale (per hectare & per tonne). Furthermore, the data is also presented by commodity and State to enable us to determine the impact of what crop you grow and where you grow it on your cost of production.
3.2 CoP over time
3.2.1 Introduction
Average costs are presented as total per farm, per hectare and per tonne for the six-year period from 2005-06 to 2010-11.The data for each of these three pieces of analysis (total, per hectare & per tonne) is presented using two different methods of categorising costs. These methods are “cost by accounting category” and “cost by management category” (refer to section 2.3) The two different methods of categorising the costs use the same original data, but simply present them in two different ways to aid our understanding of CoP within the industry.
3.2.2 Average total costs per farm
Average total costs per farm by accounting category
Figure 1 shows the average total costs of vegetable growing farms in Australia, over the six-year period from 2005-06 through to 2010-11. Costs have been categorised into variable, overhead and financial costs for the purpose of the analysis.
Figure 1: Average total costs per farm by accounting category, 2005/06 – 2010/11
$0#
$100,000#
$200,000#
$300,000#
$400,000#
$500,000#
$600,000#
$700,000#
$800,000#
2005-06# 2006-07# 2007-08# 2008-09# 2009-10# 2010-11#
Average'total'farm'costs'
Variable#Costs# Overhead#Costs# Finance#Costs#

Investigating the costs associated with the production, sale and distribution of vegetables Final Report
RMCG Consultants for Business, Communities & Environment Page 9
This figure illustrates the following features:
§ There is an increasing trend in all three cost categories over time, but particularly in the four years from 2007-08 to 2010-11.
§ Variable costs are the largest component of total costs in all years and are the largest contributor to the increase in total costs over time.
§ The greatest volatility occurs in variable costs, particularly in the first three years, followed by a steady increasing trend from 2007-08 to 2010/11.
§ Overhead costs exhibit a decreasing trend in the three years to 2007-08, followed by an increasing trend thereafter.
§ Finance costs exhibit a slower and more stable increase over time.
Therefore, total average costs per farm and the three accounting categories of costs have increased over time, with the largest contribution to this increase coming from an increase in variable costs. An increase in costs needs to result in either a corresponding increase in productivity or the ability to attract a price premium. Thus, it is important to better understand the nature of these increases so as to better be able to manage them.
Average total costs per farm by management category
Figure 2 shows the same information as Figure 1 above, but the costs have been categorised in terms of what they specifically relate to at a management level.
Figure 2: Average total costs per farm by management category, 2005/06 – 2010/11
The important points to note in in Figure 2 above are:
§ Labour costs, followed by growing costs, are the biggest individual cost category in all years.
§ The greatest volatility is exhibited in post-harvest costs.
§ All costs have increased on average over the six-year period.
§ There has been a steady increase in total costs from 2007-08.
$0#
$100,000#
$200,000#
$300,000#
$400,000#
$500,000#
$600,000#
$700,000#
$800,000#
2005-06# 2006-07# 2007-08# 2008-09# 2009-10# 2010-11#
Average'total'farm'costs'
Labour#Costs# Growing#Costs# Plant#&#Equipment# AdministraGve#Costs# Post#Harvest#Costs# Finance#Costs#

Investigating the costs associated with the production, sale and distribution of vegetables Final Report
RMCG Consultants for Business, Communities & Environment Page 10
§ Growing costs exhibit the biggest increase by category over the six-year period, followed by plant and equipment costs and then labour costs.
§ Administrative costs have also increased significantly, although they remain a small proportion of total costs.
Therefore, as labour and growing costs are the largest cost categories and have increased over time, the focus for vegetable growers should be on understanding what these increases specifically relate to and whether they relate to increased farm size or increased production.
Conclusion
In examining the total average cost of vegetable growing farms it can be concluded that total costs for vegetable growing farms have increased over time. The increases in costs have been predominantly in variable expenses led by growing costs, plant & equipment and labour.
It is important that we understand what these increases specifically relate to, as increased costs could simply reflect increased scale or production. Therefore, we will now examine these costs on a per unit basis to better understand their impact on vegetable growers.
3.2.3 Average total costs per hectare
Average total costs per hectare by accounting category
Figure 3 shows the average total farm costs divided by the average area operated by vegetable growers for the six-year period from 2005-06 to 2010-11.
Figure 3: Average total costs per hectare by accounting category, 2005-06 - 2010-11.
$0#
$500#
$1,000#
$1,500#
$2,000#
$2,500#
$3,000#
$3,500#
$4,000#
2005*06# 2006*07# 2007*08# 2008*09# 2009*10# 2010*11#
Average'total'farm'costs'per'area'operated'
Variable#Costs# Overhead#Costs# Finance#Costs#

Investigating the costs associated with the production, sale and distribution of vegetables Final Report
RMCG Consultants for Business, Communities & Environment Page 11
From examining Figure 3 it should be noted that:
§ Variable costs are the largest contributor to total costs per hectare across all years, as reported in the previous section.
§ Whilst there is an increasing trend in variable costs over time, there is volatility across the years, which may be related to season and/or market conditions.
§ There is a steady increase in overhead costs in all years, except for 2009-10 and the increase is steady over the period.
§ Finance costs increased in 2006-07 then remained relatively stable for the four years to 2009-10, before increasing again in 2010-11.
Therefore, as average total costs per hectare are more variable and the increase over time is not as pronounced as reported in section 3.2.2, it suggests that increases in scale are, at least, partially responsible for the increase in total costs over time.
Average total costs per hectare by management category
Figure 4 shows average total costs per hectare by management category over the six-year period 2005-06 to 2010-11.
Figure 4: Average total costs per hectare by management category, 2005-06 – 2010-11
In examining Figure 4 it is important to note that:
§ Total costs remained relatively stable for the three years between 2007-08 and 2009-10.
§ All cost categories have had a large increase in the last twelve-month period (2010-11).
§ Labour costs per hectare have fluctuated over the period, but are not trending up and have remained at or below $1,000/ha.
§ Growing costs, plant & equipment, administrative costs and finance costs have increased over time.
$0#
$500#
$1,000#
$1,500#
$2,000#
$2,500#
$3,000#
$3,500#
$4,000#
2005*06# 2006*07# 2007*08# 2008*09# 2009*10# 2010*11#
Average'total'farm'costs'per'area'operated'
Labour#Costs# Growing#Costs# Plant#&#Equipment# AdministraGve#Costs# Post#Harvest#Costs# Finance#Costs#

Investigating the costs associated with the production, sale and distribution of vegetables Final Report
RMCG Consultants for Business, Communities & Environment Page 12
§ Whilst post harvest costs fluctuate significantly between years, which is most likely dependent on season and market conditions and thus, the end sale point of the vegetables grown.
Therefore, the stability of the key cost categories of labour and growing costs for the three-year period 2007-08 to 2009-10 indicates that increases in costs were offset by scale during that period. The recent increases may be seasonally related or may indicate that scale is no longer offsetting these further increases in costs. Importantly, increasing scale and/or other productivity improvements have managed to stabilise labour costs per hectare.
Conclusion
The analysis of average total costs per hectare demonstrates that at least some of the increase in total costs per farm over time (refer to section 3.2.2) is due to increases in scale.
Furthermore, the large fluctuation in average total costs per hectare between years would appear to be dependent on season and market conditions, as growing costs and labour costs are highest in the years when post harvest costs are the highest (2006-07 and 2010-11). This could indicate a higher than average yield was achieved in those years, thus incurring higher growing costs, labour costs and post harvest costs, as growers looked to manage and sell the greater volume produced. Thus, we will now examine average total costs on a per tonne basis to determine the impact of yield on CoP.
3.2.4 Average total costs per tonne
Average total costs per tonne by accounting category
Figure 5 shows the change in average total costs per tonne over the six-year period from 2005-06 to 2010-11. Costs have been categorised into variable, overhead and finance costs for the respective years.
Figure 5: Average total costs per tonne by accounting category, 2005-06 – 2010-11.
$0#
$100#
$200#
$300#
$400#
$500#
$600#
$700#
$800#
$900#
2005-06# 2006-07# 2007-08# 2008-09# 2009-10# 2010-11#
Average'total'farm'costs'per'tonne'
Variable#Costs# Overhead#Costs# Finance#Costs#
Investigating the costs associated with the production, sale and distribution of vegetables Final Report
RMCG Consultants for Business, Communities & Environment Page 13
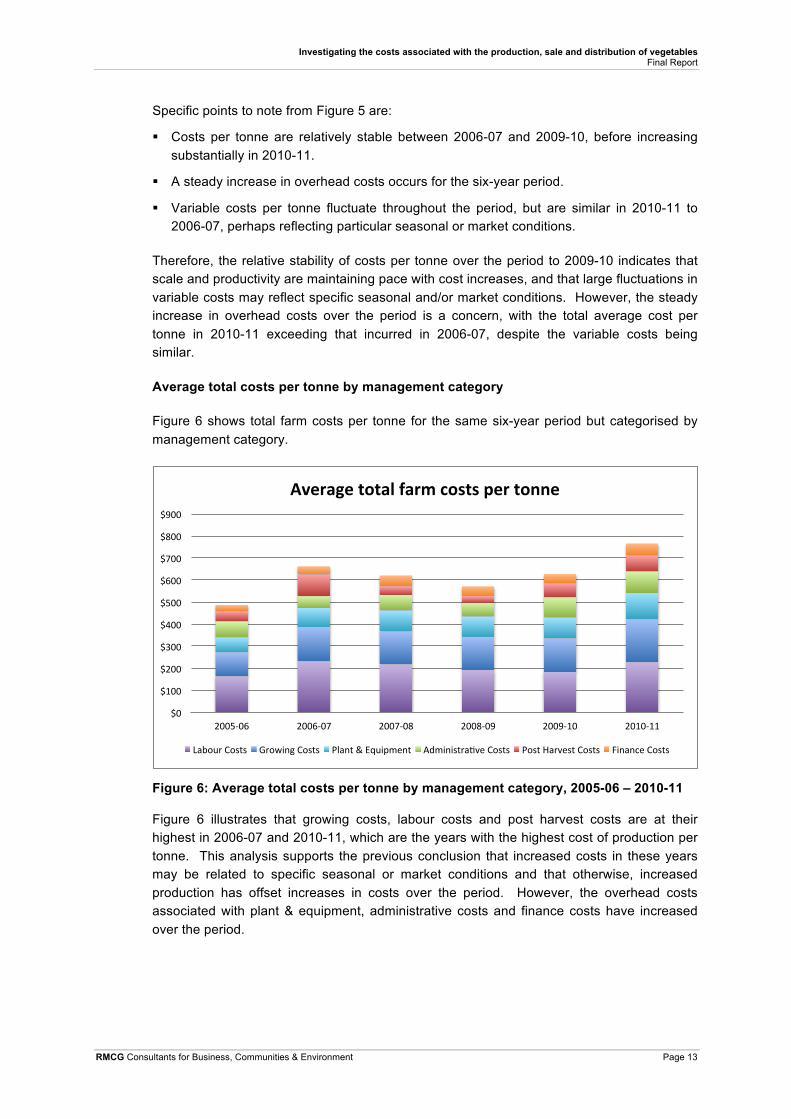
Specific points to note from Figure 5 are:
§ Costs per tonne are relatively stable between 2006-07 and 2009-10, before increasing substantially in 2010-11.
§ A steady increase in overhead costs occurs for the six-year period.
§ Variable costs per tonne fluctuate throughout the period, but are similar in 2010-11 to 2006-07, perhaps reflecting particular seasonal or market conditions.
Therefore, the relative stability of costs per tonne over the period to 2009-10 indicates that scale and productivity are maintaining pace with cost increases, and that large fluctuations in variable costs may reflect specific seasonal and/or market conditions. However, the steady increase in overhead costs over the period is a concern, with the total average cost per tonne in 2010-11 exceeding that incurred in 2006-07, despite the variable costs being similar.
Average total costs per tonne by management category
Figure 6 shows total farm costs per tonne for the same six-year period but categorised by management category.
Figure 6: Average total costs per tonne by management category, 2005-06 – 2010-11
Figure 6 illustrates that growing costs, labour costs and post harvest costs are at their highest in 2006-07 and 2010-11, which are the years with the highest cost of production per tonne. This analysis supports the previous conclusion that increased costs in these years may be related to specific seasonal or market conditions and that otherwise, increased production has offset increases in costs over the period. However, the overhead costs associated with plant & equipment, administrative costs and finance costs have increased over the period.
$0#
$100#
$200#
$300#
$400#
$500#
$600#
$700#
$800#
$900#
2005-06# 2006-07# 2007-08# 2008-09# 2009-10# 2010-11#
Average'total'farm'costs'per'tonne'
Labour#Costs# Growing#Costs# Plant#&#Equipment# AdministraFve#Costs# Post#Harvest#Costs# Finance#Costs#

Investigating the costs associated with the production, sale and distribution of vegetables Final Report
RMCG Consultants for Business, Communities & Environment Page 14
Conclusion
The analysis of average total costs per tonne demonstrates that scale and productivity are maintaining pace with cost increases, and that large fluctuations in variable costs reflect specific seasonal and/or market conditions. However, the steady increase in overhead costs over the period is a concern, with the total average cost per tonne in 2010-11 exceeding that incurred in 2006-07, despite the variable costs being similar.
3.2.5 Conclusion
It can be concluded from the analysis of average total costs of vegetable growing farms over the six period of 2005-06 to 2010-11 that:
§ Average total costs per farm have increased, especially growing costs, plant & equipment and labour.
§ However, the analysis of average total costs per hectare and per tonne demonstrates that increased scale and productivity are maintaining pace with cost increases, and that large fluctuations in variable costs between years reflect specific seasonal and/or market conditions.
§ The steady increase in overhead costs over the period is a concern, with the total average cost per tonne in 2010-11 exceeding that incurred in 2006-07, despite the variable costs being similar.
Therefore, average total costs of vegetable growing farms are increasing largely because of increased scale, productivity and overhead costs. Increased scale and productivity are a positive for the industry, as the analysis demonstrates that they have helped the industry maintain cost competitiveness, especially with regard to variable costs. However, the increase in overhead costs per hectare and per tonne is of concern, as many of these costs are beyond the control of vegetable growers and it would appear that increases in scale and productivity have not fully offset their increase. Thus, we will now examine the impact of financial performance and scale on these costs to better understand how the industry may address this challenge.
3.3 CoP by performance
3.3.1 Introduction
An examination of average total costs is helpful in determining what costs are the most significant costs to the industry and how these costs have changed over time. However, average total costs explain little about the relative cost efficiency of different vegetable growers and how actual costs relate to profitability. Thus, RMCG has utilised ABARES data to examine the impact of financial performance on the cost of production, i.e. do more profitable growers have greater or less costs than the average grower and, if so, why?
ABARES investigated differences in farm characteristics based on financial performance and ranked vegetable growing farms by rate of return in their 2010-11 economic survey of Australian vegetable growing farms. A three-year moving average rate of return was calculated for each farm to reduce the impact of annual seasonal and/or market conditions on farm financial performance.

Investigating the costs associated with the production, sale and distribution of vegetables Final Report
RMCG Consultants for Business, Communities & Environment Page 15
3.3.2 Farm profile by performance
Table 1: Profile of vegetable growing farms by return on capital
Profile per farm Bottom 25% Middle 50% Top 25%
Return on capital, excluding capital appreciation -6.0% 0.6% 10.1%
Area: § Total area operated (ha) § Area sown to vegetables (ha) § % of total area sown to vegetables
86 19 22%
189 26 14%
389 79 20%
Production:
§ Quantity of vegetables produced (t) § Average yield of vegetables (t/ha)
308 16.2
631 24.3
2,269 28.7
Price:
§ Total cash receipts § Proportion of receipts from vegetables § Cash receipts from vegetables § Average price received ($/t)
$230,300 76% $175,028 $568
$542,600 79% $428,654 $679
$1,840,000 88% $1,619,200 $714
The profile of vegetable growing farms by return on capital is presented in Table 1. It shows that:
§ The total area operated and area sown to vegetables increases substantially from the bottom 25% to the top 25%.
§ The proportion of the area sown to vegetables is very similar for the top 25% and the bottom 25%, but significantly less for the middle 50%
§ The average yield and the average price of vegetables increases from the bottom 25% to the top 25%.
Thus, the top 25%, on average, farm more area, produce more product per area sown and achieve a higher price per tonne produced.
3.3.3 Cost per tonne relative to performance
RMCG chose to examine the impact of performance on CoP by examining the costs per tonne of each of the three categories described in Table 1 because the scale of vegetable growing farms and their yield increases from the bottom 25% to the top 25%. Thus, costs per tonne were the only basis on which a fair comparison could be made. It is also the most relevant basis on which to make judgements about profitability and performance.
RMCG aggregated ABARES data into the categories described in the earlier sections to determine what types of costs differed between the performance categories. Figure 7 demonstrates the relationship that exists between average total farm costs per tonne of vegetables produced and farm financial performance.

Investigating the costs associated with the production, sale and distribution of vegetables Final Report
RMCG Consultants for Business, Communities & Environment Page 16
Figure 7: Average total costs per tonne by accounting category relative to farm financial performance 2010-11
The data presented in Figure 7 demonstrates that:
§ Total farm costs per tonne reduce dramatically as farm financial performance increases (or vice versa!)
§ Overhead costs reduce the most with increasing farm performance
§ Variable costs are similar for the middle 50% and top 25%, but slightly higher for the bottom 25%
§ Finance costs are lowest for the top 25% and are similar for the bottom 25% and middle 50%
Therefore, as discussed in section 2.2.1, farm business profitability is directly linked to CoP with total farm costs per tonne decreasing as financial performance increases and that this decrease in CoP is achieved by reducing overhead costs with increases in the scale of production (i.e. area sown and yield).
3.3.4 Differences in overhead costs
The specific cost categories that contribute to the difference in overhead costs by financial performance are identified in Table 2.
Table 2: Overhead costs per tonne by return on capital
Overhead Costs Bottom 25% Middle 50% Top 25%
Administration $42 $27 $15
Depreciation $75 $62 $38
Electricity $17 $20 $11
Insurance $17 $13 $9
$0#
$200#
$400#
$600#
$800#
$1,000#
$1,200#
bo,om#25%# middle#50%# top#25%#
Average'total'farm'costs'per'tonne'
Variable#Costs# Overhead#Costs# Finance#Costs#

Investigating the costs associated with the production, sale and distribution of vegetables Final Report
RMCG Consultants for Business, Communities & Environment Page 17
Overhead Costs Bottom 25% Middle 50% Top 25%
Motor vehicle expenses $12 $7 $4
Operator and family imputed labour $190 $88 $31
Other costs $27 $40 $24
Plant hire $6 $16 $8
Rates $20 $12 $5
Repairs – building and structures $23 $30 $15
Repairs – motor vehicle and plant $48 $44 $25
Total overhead costs per tonne $476 $360 $186
The data presented in Table 2 shows that:
§ Overhead costs vary from $476/t for the bottom 25% to $360/t for the middle 50% and $186/t for the top 25%
§ Operator and family imputed labour is the single largest overhead cost category for the bottom 25% and middle 50%
§ Whilst all overhead cost categories differ by performance, operator and family imputed labour accounts for $102/t of the $116/t difference (or 88%) between the bottom 25% and the middle 50%
§ Operator and family imputed labour accounts for $58/t of the $174/t difference (33%) between the middle 50% and the top 25%, whilst repairs ($34/t) depreciation ($25/t), other costs ($16/t) and administration ($12/t) combined account for 50% of the difference.
Thus, operator and family imputed labour is the single largest contributor to the difference in overhead costs between the most and least profitable vegetable growing farms. Other major costs that contribute to this difference are repairs, depreciation, other costs and administration.
3.3.5 Similarities with other industries
RMCG has recently been involved in similar cost of production studies in the dairy and pork industries. The dairy and pork industries are structured similarly to the vegetable industry, that is, they are predominantly small family owned and operated intensive agricultural industries with a strong focus on producing fresh produce for the domestic market, but with significant international competition in the processed food sector.
Similar data to that reported in Figure 7 and Table 2 for these industries is presented in this section to aid our understanding of the reasons for these differences.
Dairy – DPI Dairy Farm Monitor for south west Victoria in 2011/12
The Victorian Department of Environment and Primary Industries (formerly the Department of Primary Industries) undertakes an annual survey of dairy farm financial performance in each of the three major dairying regions of the State each year. RMCG is contracted to assist DEPI undertake and analyse this survey. The data from this survey is publicly available on the DEPI website.

Investigating the costs associated with the production, sale and distribution of vegetables Final Report
RMCG Consultants for Business, Communities & Environment Page 18
The difference in profitability between the average and the top 25% in the south west Victorian dairy industry in 2011/12 are presented in Table 3. The income and costs are presented as dollars per kilogram of milk solids ($/kg MS), which is the basis for payment in the dairy industry.
Table 3: Difference in profitability between the average and top 25% in the south west Victorian dairy industry in 2011/12
$/kg MS Average Top 25% Difference
Milk income 5.56 5.71 +0.15
Other income 0.42 0.46 +0.04
Total income 5.97 6.16 +0.19
Variable Costs 2.79 2.84 +0.05
Overhead Costs 2.40 1.72 -0.68
Finance Costs 0.90 0.92 +0.02
Total Costs 6.09 5.48 -0.61
Net Farm Income -0.12 0.69 +0.81
Return to equity -0.2% 8.3% +8.5%
The data presented in Table 3 shows that:
§ The difference in profitability between the average dairy farmers and the top 25% in south west Victoria in 2011/12 was $0.81/kg MS or 8.5% in terms of return to equity.
§ The major contributor to this difference was overhead costs, which were $0.68/kg MS lower for the top 25% of dairy farmers.
Thus, the difference in profitability between the average dairy farmer in south west Victoria and the top 25% is due to overhead costs, which is the same as the vegetable industry (refer to Figure 7).
The difference in overhead costs between the average and the top 25% in the south west Victorian dairy industry in 2011/12 are presented in Table 4. Each cost is reported as $/kg MS, as per Table 3 above.
Table 4: Difference in overhead costs between the average and top 25% in the south west Victorian dairy industry in 2011/12
$/kg MS Average Top 25% Difference
Bank charges 0.02 0.01 -0.01
Depreciation 0.21 0.16 -0.05
Farm insurance 0.06 0.04 -0.02
Labour – employed 0.43 0.56 +0.13
Labour – family 1.08 0.48 -0.60
Rates 0.05 0.04 -0.01
Registration & insurance 0.02 0.01 -0.01
Repairs & maintenance 0.40 0.30 -0.10
Other 0.13 0.12 -0.01
Total 2.40 1.72 -0.68

Investigating the costs associated with the production, sale and distribution of vegetables Final Report
RMCG Consultants for Business, Communities & Environment Page 19
The data presented in Table 4 shows that total labour costs account for $0.47/kg MS of the $0.68/kg MS difference in overhead costs, with the top 25% spending more on employed labour (+$0.13/kg MS), but less on family labour (-$0.60/kg MS).
Thus, the difference in overhead costs between the average dairy farmer in south west Victoria and the top 25% is largely due to the cost of family labour, which is the same as the vegetable industry (refer to Table 2).
Pork – RMCG private client network 2004/05 – 2009/10
RMCG conducted an annual survey of financial performance in a private network of pork producers between 2004/05 and 2009/10. The data is not publicly available, but has been presented here with the permission of the network.
The difference in profitability between the average and the top producer in the network over the period of 2004/05 to 2009/10 is presented in Table 5. The income and costs are presented as dollars per kilogram carcass weight ($/kg cwt).
Table 5: Difference in profitability between the average and top producer in RMCG’s private network of pork producers between 2004/05 and 2009/10
$/kg cwt Average Top Difference
Pork income 2.90 2.89 -0.01
Feed 1.44 1.53 +0.09
Overheads 0.42 0.38 -0.04
Labour 0.68 0.12 -0.56
Depreciation / R&M 0.24 0.15 -0.09
Total Costs 1.78 2.18 -0.60
Operating Profit 0.12 0.71 +0.59
Return to equity 3% 15% +12%
The data presented in Table 5 shows that:
§ The difference in profitability between the average producer and the top producer in RMCG’s private client network of pork producers between 2004/05 and 2009/10 was $0.59/kg cwt or 12% in terms of return to equity.
§ The major contributor to this difference was labour costs, which were $0.56/kg cwt lower for the top producer.
Whilst RMCG is unable to present the full data set for privacy reasons, RMCG is aware that the largest proportion of the difference in labour costs between the average and the top producer is unpaid family labour. Thus, the difference in profitability between the average producer and the top producer in RMCG’s private client network is due to the cost of family labour, which is, once again, the same as the vegetable industry (refer to Figure 7).
Conclusion
The data presented for the south west Victorian dairy industry and RMCG’s private network of pork producers shows that overhead costs, especially the cost of family labour is the major cause of the difference in profitability between the average and top producers. This is

Investigating the costs associated with the production, sale and distribution of vegetables Final Report
RMCG Consultants for Business, Communities & Environment Page 20
the same conclusion that was drawn from the analysis of the vegetable industry (refer to sections 3.3.3 and 3.3.4) above. Thus, the vegetable industry is not alone, as the causes of low profitability in the industry are similar to those in other similar industries, notably dairy and pork, thus there is an opportunity to learn from them.
3.3.6 Conclusion
It can be included from the examination of the impact of financial performance on the cost of production that:
§ The top 25% of vegetable growers by financial performance, on average, farm more area, produce more product per area sown and achieve a higher price per tonne produced.
§ Vegetable farm business profitability is directly linked to CoP with total farm costs per tonne decreasing as financial performance increases and that this decrease in CoP is achieved by reducing overhead costs with increases in the scale of production (i.e. area sown and yield).
§ Operator and family imputed labour is the single largest contributor to the difference in overhead costs between the most and least profitable vegetable growing farms. Other major costs that contribute to this difference are repairs, depreciation, other costs and administration.
§ The vegetable industry is not alone, as the causes of low profitability in the industry are similar to those in other similar industries, notably dairy and pork, thus there is an opportunity to learn from them.
Therefore, low profitability in the vegetable industry is mainly the result of high overhead costs, especially operator and family imputed labour, because of insufficient scale to cover this cost. This is not a problem that is unique to the vegetable industry, so there is an opportunity to learn from other agricultural industries with similar problems. Thus, the impact of scale on CoP will be examined in the next section.
3.4 CoP by scale
3.4.1 Introduction
The impact of scale on CoP is examined in this section, as the previous section concluded that low profitability in the vegetable industry is mainly the result of high overhead costs because of insufficient scale to cover these costs.
ABARES investigated differences in farm characteristics based on the area sown to vegetables in their 2010-11 economic survey of Australian vegetable growing farms. They aggregated their data into four categories of farm size. They were:
1. Less than 5 hectares
2. 5 – 20 hectares
3. 20 – 70 hectares
4. More than 70 hectares
Investigating the costs associated with the production, sale and distribution of vegetables Final Report
RMCG Consultants for Business, Communities & Environment Page 21
It is important to note that ABARES’ sample included vegetable farms that undertake protected agriculture. Vegetable farms that undertake protected agriculture are usually small in area, but have high costs per area due to the highly intensive nature of their operation and their focus on high value markets. Thus, RMCG, with the assistance of ABARES, split the “less than 5 hectare” category into two categories. Those that undertake protected agriculture and those that do not. Furthermore, the data is presented as cost per tonne to provide a valid comparison between different size farms.
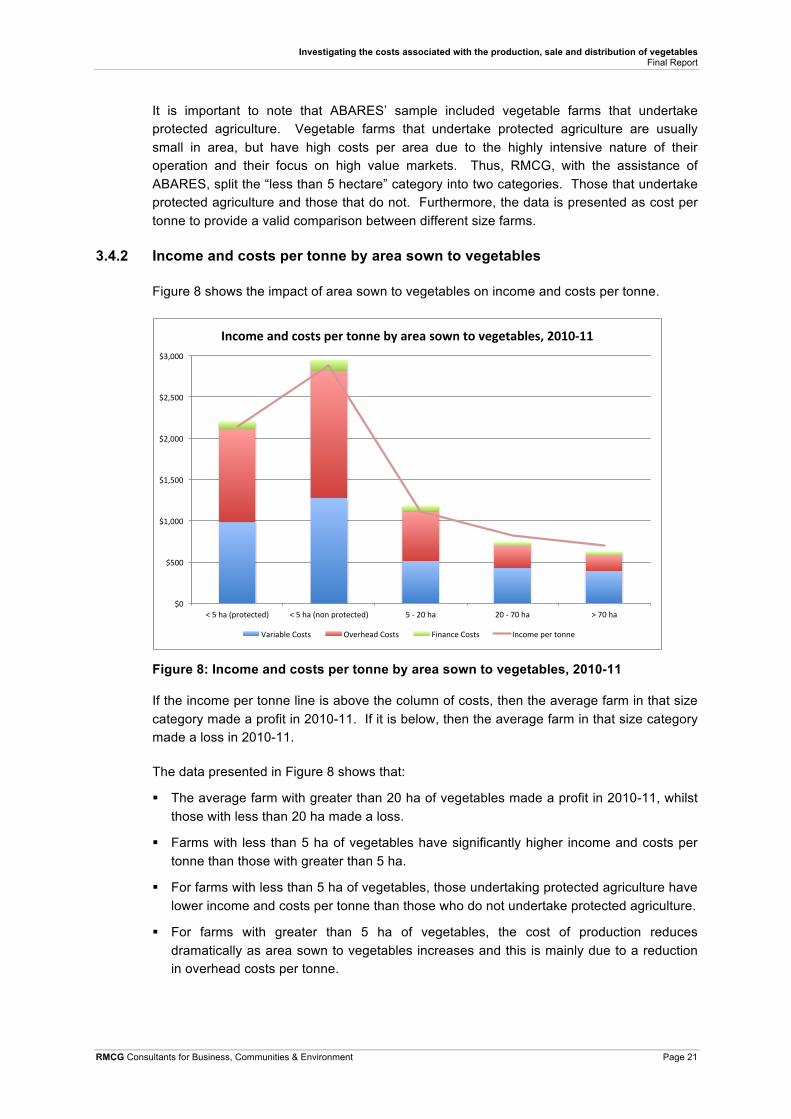
3.4.2 Income and costs per tonne by area sown to vegetables
Figure 8 shows the impact of area sown to vegetables on income and costs per tonne.
Figure 8: Income and costs per tonne by area sown to vegetables, 2010-11
If the income per tonne line is above the column of costs, then the average farm in that size category made a profit in 2010-11. If it is below, then the average farm in that size category made a loss in 2010-11.
The data presented in Figure 8 shows that:
§ The average farm with greater than 20 ha of vegetables made a profit in 2010-11, whilst those with less than 20 ha made a loss.
§ Farms with less than 5 ha of vegetables have significantly higher income and costs per tonne than those with greater than 5 ha.
§ For farms with less than 5 ha of vegetables, those undertaking protected agriculture have lower income and costs per tonne than those who do not undertake protected agriculture.
§ For farms with greater than 5 ha of vegetables, the cost of production reduces dramatically as area sown to vegetables increases and this is mainly due to a reduction in overhead costs per tonne.
$0#
$500#
$1,000#
$1,500#
$2,000#
$2,500#
$3,000#
<#5#ha#(protected)# <#5#ha#(non#protected)# 5#6#20#ha# 20#6#70#ha# >#70#ha#
Income'and'costs'per'tonne'by'area'sown'to'vegetables,'2010811'
Variable#Costs# Overhead#Costs# Finance#Costs# Income#per#tonne#

Investigating the costs associated with the production, sale and distribution of vegetables Final Report
RMCG Consultants for Business, Communities & Environment Page 22
Therefore, both income per tonne and total farm costs per tonne, especially overhead costs, decrease as the area sown to vegetables increases. However, the gap between income per tonne and total costs per tonne (profit) increases as area sown to vegetables increases. Thus, larger scale growers, on average, are receiving less income per tonne, but are more profitable than smaller scale growers (on average) because they are able to achieve greater economies of scale.
3.4.3 Overhead costs by area sown to vegetables
The differences in each overhead cost category for each size vegetable farm is presented in Figure 9.
Figure 9: Overhead costs by area sown to vegetables, 2010-11
The data shows that the overhead costs that differ most by area sown to vegetables (scale) are operator & family imputed labour, other cash costs, depreciation, the two categories of repairs and administration. This is exactly as was reported in section 3.3.4.
3.4.4 Conclusion
It can be included from the examination of the impact of scale on the cost of production that:
§ Larger scale growers, on average, are receiving less income per tonne, but are more profitable than smaller scale growers (on average) because they are able to achieve greater economies of scale.
§ Operator and family imputed labour is the single largest contributor to the difference in overhead costs between small and large scale vegetable growing farms. Other major costs that contribute to this difference are repairs, depreciation, other costs and administration.
$0#
$200#
$400#
$600#
$800#
$1,000#
$1,200#
$1,400#
$1,600#
<#5#ha#(protected)# <#5#ha#(non#protected)# 5#8#20#ha# 20#8#70#ha# >#70#ha#
Overhead(costs(per(tonne(by(area(sown(to(vegetables,(2010811(
Administra?on# Deprecia?on# Electricity#
Insurance# Motor#vehicle#expense# Operator#&#family#imputed#labour#
Other#cash#costs# Plant#hire#expense# Rates#
Repairs#8#buildings#and#structures# Repairs#8#motor#vehicles#and#plant#
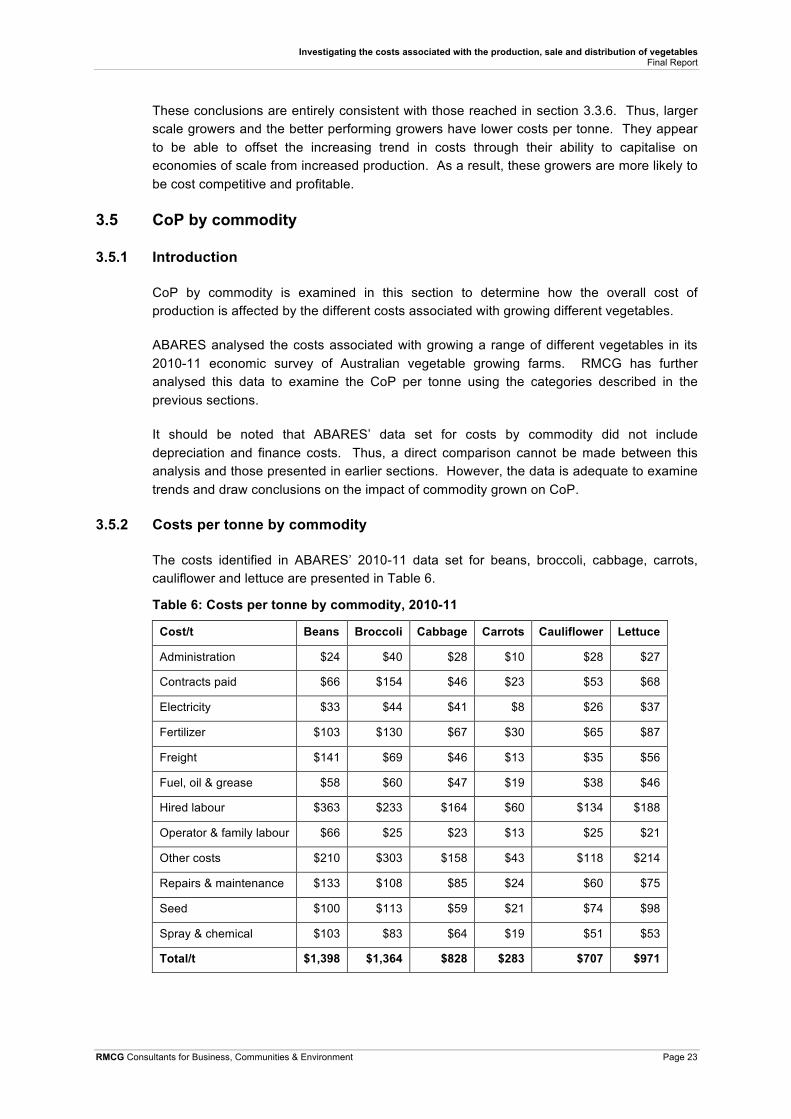
Investigating the costs associated with the production, sale and distribution of vegetables Final Report
RMCG Consultants for Business, Communities & Environment Page 23
These conclusions are entirely consistent with those reached in section 3.3.6. Thus, larger scale growers and the better performing growers have lower costs per tonne. They appear to be able to offset the increasing trend in costs through their ability to capitalise on economies of scale from increased production. As a result, these growers are more likely to be cost competitive and profitable.
3.5 CoP by commodity
3.5.1 Introduction
CoP by commodity is examined in this section to determine how the overall cost of production is affected by the different costs associated with growing different vegetables.
ABARES analysed the costs associated with growing a range of different vegetables in its 2010-11 economic survey of Australian vegetable growing farms. RMCG has further analysed this data to examine the CoP per tonne using the categories described in the previous sections.
It should be noted that ABARES’ data set for costs by commodity did not include depreciation and finance costs. Thus, a direct comparison cannot be made between this analysis and those presented in earlier sections. However, the data is adequate to examine trends and draw conclusions on the impact of commodity grown on CoP.
3.5.2 Costs per tonne by commodity
The costs identified in ABARES’ 2010-11 data set for beans, broccoli, cabbage, carrots, cauliflower and lettuce are presented in Table 6.
Table 6: Costs per tonne by commodity, 2010-11
Cost/t Beans Broccoli Cabbage Carrots Cauliflower Lettuce
Administration $24 $40 $28 $10 $28 $27
Contracts paid $66 $154 $46 $23 $53 $68
Electricity $33 $44 $41 $8 $26 $37
Fertilizer $103 $130 $67 $30 $65 $87
Freight $141 $69 $46 $13 $35 $56
Fuel, oil & grease $58 $60 $47 $19 $38 $46
Hired labour $363 $233 $164 $60 $134 $188
Operator & family labour $66 $25 $23 $13 $25 $21
Other costs $210 $303 $158 $43 $118 $214
Repairs & maintenance $133 $108 $85 $24 $60 $75
Seed $100 $113 $59 $21 $74 $98
Spray & chemical $103 $83 $64 $19 $51 $53
Total/t $1,398 $1,364 $828 $283 $707 $971

Investigating the costs associated with the production, sale and distribution of vegetables Final Report
RMCG Consultants for Business, Communities & Environment Page 24
The data shows that:
§ Beans ($1,398/t) and broccoli ($1,364) had the highest CoP per tonne in 2010-11, whilst carrots ($283/t) had the lowest CoP per tonne.
§ The costs that differ the most between vegetables are hired labour, other costs, freight, repairs & maintenance, spray & chemical, fertilizer and seed.
Thus, the cost of production varies significantly between different vegetables due to differences in growing costs (hired labour, spray & chemical, fertilizer and seed), post harvest costs (hired labour, freight) and overhead costs (other costs, repairs & maintenance).
3.5.3 Price and CoP
The costs presented in Table 6 are graphed in Figure 10 against the average price received for that commodity in 2010-11. As was discussed previously, this data set does not include depreciation or finance costs, thus this graph does not show the total cost of production (as defined in section 2.2.2) for each commodity. As a result, the fact that the price received line is above the column of costs for all commodities, except cabbage, does not mean that a profit was made on these commodities in 2010-11.
Figure 10: Price and costs per tonne by commodity, 2010-11
The figure shows that there is a direct relationship between price received and cost of production, i.e. those vegetables with higher CoP receive a higher price and those with lower CoP receive a lower price. Whilst the higher prices for higher CoP vegetables may not be sufficient to ensure a profit for all growers all of the time, it would appear that there is no direct relationship between what vegetable is grown and grower profitability.
3.5.4 Percentage of variable and overhead costs
RMCG examined the proportion of total costs spent on variable costs and overhead costs for each vegetable because of the link between CoP and the scale of production due to overhead costs established in the previous sections (refer to Figure 11). That is, if type of
$0#
$200#
$400#
$600#
$800#
$1,000#
$1,200#
$1,400#
$1,600#
$1,800#
Beans# Broccoli# Cabbage# Carrots# Cauliflowers# Le<uce#
Price&and&costs&per&tonne&by&commodity,&2010511&
Administra@on# Contracts#paid# Electricity# Fer@liser# Freight#
Fuel,#oil#&#grease# Hired#labour# Operator#&#family#labour# Other#costs# Repairs#&#Maintenance#
Seed# Spray#&#chemicals# Price#Received#

Investigating the costs associated with the production, sale and distribution of vegetables Final Report
RMCG Consultants for Business, Communities & Environment Page 25
vegetable grown has an impact on profitability then we would expect to see that the most profitable vegetables incurred significantly less overhead costs.
Figure 11: Percentage of variable and overhead costs by commodity, 2010-11
The data presented in the figure shows the proportion of the total costs spent on variable (60% - 67%) and overhead costs (33% - 40%) for different vegetables varies little. This reinforces the conclusion drawn from Figure 10, that there is no direct relationship between what vegetable is grown and grower profitability.
3.5.5 Conclusion
It can be included from the examination of the impact of commodity grown on the cost of production and vegetable grower profitability that:
§ The cost of production varies significantly between different vegetables due to differences in growing costs (hired labour, spray & chemical, fertilizer and seed), post harvest costs (hired labour, freight) and overhead costs (other costs, repairs & maintenance).
§ However, there is a direct relationship between price received and cost of production, i.e. those vegetables with higher CoP receive a higher price and those with lower CoP receive a lower price.
§ Furthermore, the proportion of the total costs spent on variable and overhead costs for different vegetables varies little.
Therefore, there is no direct relationship between what vegetable is grown and grower profitability, i.e. it is not what you grow, but how you grow it that determines profitability.
0%#
10%#
20%#
30%#
40%#
50%#
60%#
70%#
80%#
90%#
100%#
Beans# Broccoli# Cabbage# Carrots# Cauliflowers# Le?uce#
Percentage)of)variable)and)overhead)costs)by)commodity,)2010911)
Variable#Costs# Overhead#Costs#

Investigating the costs associated with the production, sale and distribution of vegetables Final Report
RMCG Consultants for Business, Communities & Environment Page 26
3.6 CoP by state
3.6.1 Introduction
CoP by State is examined in this section to determine how the overall cost of production is affected by the different costs associated with growing vegetables in different locations and for different markets.
ABARES collected data on a State basis in each of its economic surveys of Australian vegetable growers from 2005-06 to 2010-11. Trend data for each State, similar to that presented in section 0, is presented in Appendix 1.6.
RMCG has chosen to focus on the State based data for 2010-11 only, as the purpose of this section is to examine the impact of location on CoP, rather than trends in CoP over time within each State8. This approach is also consistent with our analysis of the impact of financial performance, scale and commodity on CoP in the previous sections.
3.6.2 Area and production by state
The vegetable industry is subtly different in each State because of different histories, markets and growing conditions. The average area farmed and the amount produced in each State in 2010-11 is presented in Table 7 to provide some context to the analysis in this section. It should be noted that the data is only broadly representative of the industry in each State, as the production data is the result of the specific seasonal and market conditions in 2010-11 and these vary significantly between years.
Table 7: Area and production of vegetable growing farms by State, 2010-11
NSW QLD SA TAS VIC WA
Total area operated (ha) 178 216 375 249 165 172
Area sown to vegetables (ha) 24 42 38 32 52 33
Percentage area sown to vegetables 13% 19% 10% 13% 32% 19%
Tonnes of vegetables produced (t) 512 816 1,517 1,211 1,101 1,162
Average yield of vegetables (t/ha) 21 19 40 38 21 35
The data presented in Table 7 shows that:
§ Farm area is largest in SA, TAS and QLD, but area sown to vegetables is largest in VIC due to a higher than average area sown to vegetables per farm.
§ Average yields are lowest in QLD, VIC and NSW, with almost double the yield achieved in SA, TAS & WA.
Thus, despite specific seasonal impacts in 2010-11, the data is broadly representative of the nature of the industry with a greater focus on fresh vegetable production in the larger States on the eastern seaboard and a greater focus on processed vegetable production in the smaller States, although WA is an exception because of its geographic isolation.
8 The trends in CoP exhibited in each State are very similar to that reported in section 0, with only subtle differences in magnitude. Thus, RMCG has provided this data in the appendices.

Investigating the costs associated with the production, sale and distribution of vegetables Final Report
RMCG Consultants for Business, Communities & Environment Page 27
3.6.3 Costs per tonne by state
The costs per tonne, categorised by management category (refer to section 2.3), for each State in 2010-11 are presented in Table 8.
Table 8: Costs per tonne by State, 2010-11
NSW QLD SA TAS VIC WA
Labour costs $197 $318 $148 $114 $227 $302
Growing costs $185 $191 $168 $136 $169 $340
Plant & equipment costs $114 $131 $75 $77 $123 $188
Administrative costs $81 $75 $74 $71 $128 $155
Post harvest costs $48 $139 $57 $11 $54 $79
Finance costs $41 $60 $35 $45 $74 $61
Total costs $667 $914 $557 $453 $775 $1,126
The data shows that:
§ Total costs per tonne vary significantly between States, from a high of $1,126/t in WA to a low of $453/t in TAS, which is a variation of 250%.
§ WA ($1,126/t) and QLD ($914/t) have the highest costs per tonne and TAS ($453/t) and SA ($557/t) the lowest, whilst VIC ($775/t) and NSW ($667/t) fit in the middle, reflecting the balance between a strong processing and fresh vegetable production industry.
§ Labour costs (TAS = $114/t to QLD = $318/t) and post harvest costs (TAS = $11/t and QLD = $139/t) vary the most between the States due to the nature of the industry in each State.
Thus, the cost of production varies significantly between each State due to the differences in the nature of their industries (processing vs fresh) and different growing conditions.
3.6.4 Income and CoP
The costs presented in Table 8 are graphed in Figure 12 against the average income per tonne for each State in 2010-11. If the income per tonne line is above the column of costs, then the average farm in that State made a profit in 2010-11. If it is below, then the average farm in that State made a loss in 2010-11.
The figure shows that there is a direct relationship between price received and cost of production, i.e. those States with a higher CoP receive a higher price and those with a lower CoP receive a lower price.
This is the same relationship that was observed between CoP and commodity in Figure 10, thus a similar conclusion can be drawn. That is, just as the differences in CoP observed in Table 8 reflect the nature of the industry in each State (processing vs fresh) and growing conditions, so does the average income per tonne.

Investigating the costs associated with the production, sale and distribution of vegetables Final Report
RMCG Consultants for Business, Communities & Environment Page 28
Figure 12: Income and costs per tonne by State, 2010-11
This does not mean that the average income per tonne will always be higher than the costs per tonne to generate a profit, but it does demonstrate that there is no direct relationship.
3.6.5 Conclusion
It can be included from the examination of the impact of location (State) on the cost of production and vegetable grower profitability that:
§ The cost of production varies significantly between each State due to the differences in the nature of their industries (processing vs fresh) and different growing conditions.
§ However, there is a direct relationship between price received and cost of production, i.e. those States with a higher CoP receive a higher price and those with a lower CoP receive a lower price.
Therefore, there is no direct relationship between location (State) and grower profitability, i.e. it is not where you grow it, but how you grow it that determines profitability.
3.7 Conclusion
It can be concluded from the review and further analysis of the available data and previous cost of production studies that:
§ Average total costs of vegetable growing farms are increasing largely because of increased scale, productivity and overhead costs. Increased scale and productivity are a positive for the industry, as the analysis demonstrates that they have helped the industry maintain cost competitiveness, especially with regard to variable costs. However, the increase in overhead costs per hectare and per tonne is of concern, as many of these costs are beyond the control of vegetable growers and it would appear that increases in scale and productivity have not fully offset their increase.
$0#
$200#
$400#
$600#
$800#
$1,000#
$1,200#
$1,400#
NSW# QLD# SA# TAS# VIC# WA#
Income'and'costs'per'tonne'by'State,'2010511'
Labour#Costs# Growing#Costs# Plant#&#Equipment#Costs# AdministraJve#Costs#
Post#Harvest#Costs# Finance#Costs# Income#per#tonne#

Investigating the costs associated with the production, sale and distribution of vegetables Final Report
RMCG Consultants for Business, Communities & Environment Page 29
§ Low profitability in the vegetable industry is mainly the result of high overhead costs, especially operator and family imputed labour, because of insufficient scale to cover this cost. This is not a problem that is unique to the vegetable industry, so there is an opportunity to learn from other agricultural industries with similar problems.
§ Larger scale growers and the better performing growers have lower costs per tonne. They appear to be able to offset the increasing trend in costs through their ability to capitalise on economies of scale from increased production. As a result, these growers are more likely to be cost competitive and profitable.
§ There is no direct relationship between what vegetable is grown and grower profitability, i.e. it is not what you grow, but how you grow it that determines profitability.
§ There is no direct relationship between location (State) and grower profitability, i.e. it is not where you grow it, but how you grow it that determines profitability.
This analysis reinforces the critical relationship between scale, productivity and farm financial performance. The fact that the best performing vegetable growers farm more area, produce more product per area sown and achieve a higher price per tonne produced, whilst having the lowest CoP per tonne, indicates that increases in scale are offsetting the increases in farm costs and that scale has not come at the expense of productivity.
Thus, our best performing vegetable growers do not have a cost competitiveness problem. It is the large number of small growers, who do not have the benefits of economies of scale and suffer from high overhead costs, who are struggling to remain competitive.
Therefore, we must seek to learn from those who have successfully increased the scale of their business to improve their cost competitiveness and identify strategies that will assist growers overcome the barriers to achieving this outcome.

Investigating the costs associated with the production, sale and distribution of vegetables Final Report
RMCG Consultants for Business, Communities & Environment Page 30
4 Results of consultation and case studies
4.1 Introduction
RMCG conducted extensive consultation visits as part of the second phase of the project. The visits involved face-to-face discussions with vegetable growers in five states. The purpose of these discussions was to better understand each business with regards to the issues they faced, how these impacted on profitability, what strategies they implemented to address the issues and finally, the resultant business outcomes. The information gathered from these discussions was used to develop case studies to demonstrate examples of strategies implemented for lowering vegetable cost of production.
4.2 Project co-operators
Twenty-seven vegetable businesses were visited during the consultation phase. These businesses exhibited a cross section of vegetable products and production processes, including in-field and protected cropping, as well as production, processing and full integration. (Refer to Appendix 2 for detailed outline of these businesses)
Table 9 below, summarises the locations and types of businesses visited as part of this investigation.
Table 9: Project co-operator summary table
State Main vegetable products
SA silverbeet, spinach, spring onions, radish, parsley, beetroot, coriander & endive
SA fancy lettuce varieties, baby spinach, cabbage, cauliflower, eggplant, lettuce, peeled vegetables, pumpkin, swede, tomatoes, turnip & salad mix
SA capsicums, eggplant & cucumbers
SA capsicums & cucumbers
SA anonymous
SA broccoli, cauliflowers & iceburg lettuce
Vic beans, sweet corn, broccoli, carrots, cauliflower & cabbage
Vic baby leaf salad
Vic salad lettuce, spinach & broccoli
Vic cos lettuce, iceburg lettuce, decorative lettuce, broccoli, cauliflower & mini cabbage
Vic celery, celeriac, cos lettuce, leeks, pak choy, salad onions, silverbeet, Tuscan cabbage & kale
Vic celery, leeks, baby leaf salad mix
QLD leafy vegetables including Chinese cabbage, celery and cos lettuce, carrots & beans
QLD iceburg lettuce & cauliflower
QLD sweet corn, pumpkins, broccoli & onions
QLD eggplant

Investigating the costs associated with the production, sale and distribution of vegetables Final Report
RMCG Consultants for Business, Communities & Environment Page 31
QLD baby leaf salad
QLD broccoli, lettuce, watermelon, pumpkins, parsnips & potatoes
QLD capsicums & fresh tomatoes
WA cabbage, cauliflowers & fresh tomatoes
WA coloured lettuce varieties
WA mixed farm, beef cattle, blue gums and vegetables – Chinese cabbage
WA lettuce
TAS mix of vegetable crops including brassicas, fresh beans, swedes, onions & potatoes, livestock and other crops
TAS carrots, onions, shallots and specialty vegetable lines
TAS poppies, peas, lucerne & livestock
TAS poppies, peas, beans & livestock
4.3 Characteristics of a successful business
Case studies were produced for nineteen of the twenty-seven businesses visited.
Eleven characteristics, which help achieve scale and lower the cost of production, were identified from an analysis of these case studies (refer to Table 10).
These characteristics were then used to develop strategies to enable industry to lower its cost of production (refer to section 5). The eleven characteristics identified are:
1. Learn from others – international and other study tours – go and look and copy from the best. At least read about new technologies, take part in industry events and study tours.
2. Customer / supply chain relationships – trust, mutually beneficial, win-wins (also extends to relationships with suppliers, labour and financiers).
3. Continuous improvement, trialling, open to new ideas and innovation.
4. Monitor cost of production and know margins. Costs optimised with scale, labour and mechanisation and are in proportion to income and value of crop. Overhead costs are also in proportion to income (as identified in section 3).
5. Be prepared to change, for example, grow the business through vertical integration, increased scale, change of enterprise, production system.
6. Take considered risks to grow the business (have a go within a good risk management framework, quality systems in place, business risk assessment), for example, integrate with value adding operations to achieve higher turnover and scale.
7. Succession plans in place – internal relationships are worked on and everyone has a clear expectation about their future.
8. Know own strengths (and these are made effective) and weaknesses (and these are made irrelevant by processes/and with explicit strategies such as bringing in outside expertise to offset any internal weaknesses).
Investigating the costs associated with the production, sale and distribution of vegetables Final Report
RMCG Consultants for Business, Communities & Environment Page 32
9. Future focus on strategically important things (market opportunity, trends, costs, scale). Having a clear goal.
10. Have alternatives / insurance for when tough times occur.
11. Build a good team of people in the business, foster a supportive culture and professional development, and have clear job descriptions, reviews, and career paths for staff.
It should be noted that not all of the successful businesses visited exhibited all eleven characteristics, however, to attain improved scale, productivity, cost control and financial performance, it is necessary to exhibit a majority of them.
4.4 Relationship between case studies and characteristics
The relationship between the case study developed for the businesses visited and these eleven characteristics is displayed in Table 10 below. RMCG is aware of examples where the business may have the characteristic, but because it was not specifically discussed or demonstrated in the case study prepared, that particular characteristic has not been checked off.
Further detail about each case study business is included in Appendix 2.

Investigating the costs associated with the production, sale and distribution of vegetables Final Report
RMCG Consultants for Business, Communities & Environment Page 33
Table 10: Case study summary table
State Business Implemented Strategy Lessons 1) Learn from
others 2) Customer relationships
3) Continuous improvement
4) Monitoring and
controlling costs
5) Preparedness
to change
6) Take considered
risks
7) Succession plans
8) Evaluate strengths & weaknesses
9) Future Strategy
10) Have back up
alternatives
11) Team focus
SA Thorndon Park Produce
Cost monitoring Secure long term ownership Mechanisation to reduce labour
Expansion has the potential to lower costs, when the business is profitable Succession is ongoing, must be explicitly addressed, agreed & documented Focus on Strengths, particularly machinery skills
x x x x x
x x
x
SA Hi Tech Hydroponics
Small scale but intensive hydroponic greenhouse crop production focusing on quality Integration
Increases in yield, quality & intensity to grow income Systems that focus on quality create demand, higher profit & business growth More profit per unit a better strategy than producing more units at lower prices Value add with pre-packing & wholesale but requires new skills
x x x x x x x x x
x
SA Phuong Vo Practices focusing on soil health to increase quality through compost & irrigation
Engage leading experts Efficient use of family labour Increased yield & quality, longer seasonal production to increase return on capital of greenhouses
x
x x x
x
SA Vandy Yon IPM to lift yield and quality
Continuous improvement such as adoption of IPM Large capital investment may be required to maintain competitiveness into the future
x
x x x x
x
x
SA Anon
Producing consistent top quality product in reliable quantities Mechanisation and R&D to reduce labour
Necessity the mother of invention Quality sells itself and reduces CoP Open, transparent & trusted relationships Learn from those doing it well Seek best available advice
x x x x x x x x x
x
SA Swanport Harvest
Marketing & branding Long term pricing arrangements Value add
Sound business systems to enable delegation People management Understand the market & customers Value add to increase demand & ultimately price Seek best available advice
x x x x x x
x x
x
Vic Bonaccord
Relationships to build market share & delivering on commitments Land purchases and development Quality consistently Fully integrated
Each and every crop in rotation needs to make money Relationships built on trust Long term approach to marketing Only grow what you can comfortably sell at a margin Quality and consistency of supply is the key
x x x x x x x x x x x

Investigating the costs associated with the production, sale and distribution of vegetables Final Report
RMCG Consultants for Business, Communities & Environment Page 34
State Business Implemented Strategy Lessons 1) Learn from
others 2) Customer relationships
3) Continuous improvement
4) Monitoring and
controlling costs
5) Preparedness
to change
6) Take considered
risks
7) Succession plans
8) Evaluate strengths & weaknesses
9) Future Strategy
10) Have back up
alternatives
11) Team focus
Vic Fresh Select
IPM- social and economic sustainability R&D and learning from others Consumer centric & customer compliant Focus on margins (scheduling & quality)
Quality management systems and focus on quality and social and economic sustainability can increase market share Engage expert advice Power of data and IT systems- investment back into the business R&D and learning from others
x x x x x x
x x
x
Vic Corrigan Produce Low volume, high value products Value adding to maintain market share
Don't promise what you can't deliver Planning to produce quality consistently is the key Keep business new and interesting- remain front of mind Reinvest in business- technology & people Get the right people around you
x x
x x x x x x x
Vic Schreurs & Sons Professional and disciplined approach to business Succession/business transition
Power of understanding costs to enable better informed planning and decision making, clear pathway forward Learn from others Efficient and effective use of resources Invest in the right people
x x
x x x x x x
x
Qld Harslett Farms
Mechanisation to reduce labour costs Contract growing to lower overheads
Understanding costs allows better decisions Efficient use of resources to maximise profit
x
x x x x x x
WA Mitri Hydroponics
Use of technology to increase scale through intensification Focus on quality, volume & year round supply
Seek external advice Learn from others who have implemented the technology Don't cut corners, precision agriculture requires quality equipment Pay attention to detail
x
x
x x
x
WA Loose leaf Lettuce
Meeting customer needs Communication Continuous improvement
Willingness to take a risk but aligned to overall strategy Service & meeting customer needs, the building blocks of business Importance of communication across the supply chain
x x x x x x
x x x
WA K&D Edwards Collective market power Production efficiencies
Working with others to get improved outcomes Collective marketing power for improved market access Outsourcing can allow you to focus on the critical areas
x x x
x

Investigating the costs associated with the production, sale and distribution of vegetables Final Report
RMCG Consultants for Business, Communities & Environment Page 35
State Business Implemented Strategy Lessons 1) Learn from
others 2) Customer relationships
3) Continuous improvement
4) Monitoring and
controlling costs
5) Preparedness
to change
6) Take considered
risks
7) Succession plans
8) Evaluate strengths & weaknesses
9) Future Strategy
10) Have back up
alternatives
11) Team focus
WA D&L East
Early adoption for market security Integration R&D Technology/innovation
Considered risks Seek advice and learn from others Regular communication Reduce risk by keeping more of what you do in-house Continual improvement Look for opportunities
x x x x x x x x x
TAS Thomas
Open, honest transparent relationships Technology to reduce labour costs Attention to detail Networking and learning
Resist blind loyalty, be more flexible Approach more business-like Confidence to make changes when needed
x x x x x x
x
TAS Premium Fresh
Open honest relationships, keep people informed Honor/respect role in the community Ask for help/bring in equity Never give up
Importance of monitoring expansion, expect the unexpected Be open to opportunities Be aware of risks, especially during the good times Improved business systems/procedures to increase accountability and manage risk Bring in equity partner to assist expansion (esp. at this scale)
x x x
x
x x x x
TAS Croftside Nominees
Secure market then grow Strategic expansion of land Upgrade irrigation to reduce labour and focus on planning Outsource to contractors but maintain critical oversight role Attention to detail on everything Build the right team
Don’t be scared to rely on and trust others- good relationships Good communication (ability to read people) is critical Keep good records to help with planning Good management makes good luck
x x x x x x x x x x x
TAS Stewart McGee Family Trust
Change crop to reduce workload / stress and open eyes to other opportunities Refinance to improve equity Focus on good relationships Attention to detail
Make changes only when ready (walk before you run) Match crops to land capability Listen to good advice Do things on time and get it right Be open to all opportunities
x x x x x x x x x
x

Investigating the costs associated with the production, sale and distribution of vegetables Final Report
RMCG Consultants for Business, Communities & Environment Page 36
5 Recommended strategies
5.1 Introduction
The consultation and case studies reinforced the critical relationship between scale, productivity and farm financial performance identified in our analysis. Successful vegetable growing businesses have demonstrated that increases in scale are offsetting the increases in farm costs and that scale has not come at the expense of productivity. RMCG also recognise that improved profitability can be achieved through a focus on improved quality and attention to detail and value adding that result in price premiums and may be better suited to smaller scale operations.
As outlined in the previous section, analysis of the case studies developed from visits and discussions with successful vegetable growing businesses across Australia identified eleven characteristics common to the majority of the businesses visited. Achieving the eleven characteristics led to improving cost competitiveness by improving scale, controlling costs and enhancing productivity.
Therefore, we have considered what industry strategies are necessary to encourage growers to adopt the eleven characteristics and, as a result, improve cost competitiveness of the industry overall. These strategies are presented by characteristic and priority in the next two sections, and then we outline the principles that should guide their delivery and an approach to overcome resistance to change so that implementation of these strategies achieves the outcomes sought.
5.2 Recommended strategies by characteristic
The recommended strategies have been developed considering the role and services that HAL, AUSVEG and other extension partners could provide.
Where we are aware of existing industry programs delivering these strategies, then we have classified the strategy as a medium priority. Where there is a gap in existing vegetable extension programs, then the strategy has been classified as a high priority.
Table 11 outlines the key characteristic, the recommended strategy to address the characteristic, an assessment of the current situation and its priority for new industry investment.

Investigating the costs associated with the production, sale and distribution of vegetables Final Report
RMCG Consultants for Business, Communities & Environment Page 37
Table 11: Recommended strategies for extension Characteristics of a successful business Strategy to address characteristic
Being addressed currently? Requirement for new industry investment
1 Learn from others - international and other study tours - go and look and copy from the best. Read at least about new technologies; take part in industry events and study tours.
1.1 Continue with AusVeg industry study tours and report on tour findings and/or new technologies in 'Vegetable Australia". Yes Medium
2 Customer / supply chain relationships - trust, mutually beneficial, win wins (also extends to relationships with suppliers, labour and financiers).
2.1 Develop relationships along the supply chain and build communication channels. Facilitate networking opportunities/conferences.
Partially - through newsletters/market updates needs to be more proactive and connect people.
Medium
2.2 Assist producers to understand customer needs, supply/demand relationships & opportunities for product development. Help to identify areas for efficiency improvement and contract review with suppliers
Partially- annual industry conference, no product focussed events.
Medium
3 Continuous improvement trialling, open to new ideas and innovation. 3.1 Ensure that R,D & E is focussed at Industry as well as the grower level and facilitate engagement across the supply chain Yes Medium
4 Monitor cost of production and know margins. Costs optimised with scale, labour and mechanisation and are in proportion to income and value of crop. Overhead costs are also in proportion to income.
4.1 Implement an independent, regionalised benchmarking program with a standard approach to data capture - build confidence in industry statistics and messages within.
No - ABARES survey industry wide
High
4.2 Facilitate localised focus/discussion groups to discuss, and analyse the relevant benchmark data - stories behind the numbers help to provide context.
No - ABARES survey industry wide
High
5 Be prepared to change, for example grow the business through vertical integration, increased scale, change of enterprise, production system.
5.1 Facilitate robust business discussions necessary for overcoming resistance and creating positive change. (Resistance to change< Plan x Vision x Discontent x Energy/resources) Develop a process for identifying qualified trusted advisors to facilitate these discussions.
No High
6
Take considered risks to grow the business (have a go within a good risk management framework QA, quality systems in place, business risk assessment) For example, integrate with value adding operations to achieve higher turnover and scale.
6.1 Raise industry awareness of fact sheets and support tools developed as part of the InnoVeg- Talking Business program to assist growers to conduct Business Risk Assessments. Continue to build on these tools where necessary.
Partially - VIDP - Talking Business & case studies. DPI Fact Sheets
Medium
6.2 Develop a program to assist businesses to review systems and processes to ensure the appropriate checks & balances are in place. Assist businesses to identify a trusted business advisor to help ensure accountable decision making by asking the "right" questions.
Partially - VIDP - Talking Business Medium
7 Succession plans in place - internal relationships are worked on and everyone has a clear expectation about their future.
7.1 Raise awareness of available tools to assist growers with succession planning - highlight the key issues and processes for consideration. Develop a process for identifying qualified trusted advisors to facilitate succession planning where necessary.
Partially - Generic succession planning tools are currently available
Medium
7.2 Assist business to ensure that consideration is given to appropriate business structures as part of the planning process and that structures are in accordance with business objectives and succession plans.
Partially - Individuals/accountants/legal- Tax perspective
Medium
8
Know own strengths (and these are made effective) know own weaknesses (and these are made irrelevant by processes/ and with explicit strategies such as bringing in outside expertise to offset any internal weaknesses).
8.1 Develop a Vegetable business focus program to build business skills capacity utilising a network of accredited advisors with links with the above strategies.
No - this could be done at different levels for small, medium and large enterprises or staff of large enterprises (staff often could do with training when moving up the ranks)
High
8.2 Develop a program to assist business to conduct a Business Audit & Self Audit as a follow on from benchmarking. Enable a better understanding of strengths and weaknesses and clarity on who the real competitors are.
No - again, differentiate by enterprise size / capacity
High
9 Future focus on strategically important things (market opportunity, trends, costs, scale). Having a clear goal.
9.1 Develop Business Planning and decision making processes that incorporate the above strategies. Partially - uncommon High
9.2 Develop a program to assist producers to build skills for managing a larger business (systems, processes, relationship management) – Develop a process for identifying qualified trusted advisors to assist where necessary.
Partially High
10 Have alternatives / insurance for when tough times occur. 10.1 Incorporate scenario planning into business planning process to understand and quantify the "what if". Partially - uncommon High
10.2 Assist business to better understand and manage risk through, for example, exploring opportunities for diversity of products and/or customers, and/or supply chain integration.
Yes Medium
11 Build a good team of people in the business, foster a supportive culture and professional development; have clear job descriptions, reviews, career paths for staff.
11.1 Develop a program to assist businesses to build skills in employee management, team building and identifying the need for professional development among employees.
Partially- uncommon High
Investigating the costs associated with the production, sale and distribution of vegetables Final Report
RMCG Consultants for Business, Communities & Environment Page 38
5.3 Recommended strategies by priority
Table 11 outlines the recommended strategies for increasing cost competitiveness. In prioritising the strategies RMCG have assumed that existing programs will continue and therefore priority has been given to strategies where new industry investment is required. The priority order for new industry investment to improve cost competitiveness is as follows:
High priority (generally not covered by existing extension programs)
1. Implement an independent, regionalised benchmarking program with a standard approach to data capture - build confidence in industry statistics and messages within.
2. Facilitate localised focus/discussion groups to discuss, and analyse the relevant benchmark data - stories behind the numbers help to provide context.
3. Facilitate robust business discussions necessary for overcoming resistance and creating positive change. Develop a process for identifying qualified trusted advisors to facilitate these discussions.
4. Develop a Vegetable business focus program to build business skills capacity utilising a network of accredited advisors with links with the above strategies.
5. Develop a program to assist business to conduct a Business Audit & Self Audit as a follow on from benchmarking. Enable a better understanding of strengths and weaknesses and clarity on who the real competitors are.
6. Develop Business Planning and Decision Making processes that incorporate the above strategies.
7. Develop a program to assist producers to build skills for managing a larger business (systems, processes, relationship management) – Develop a process for identifying qualified trusted advisors to assist where necessary.
8. Incorporate scenario planning into business planning process to understand and quantify the "what if".
9. Develop a program to assist businesses to build skills in employee management, team building and identifying the need for professional development among employees.
Medium priority (generally is addressed or partially addressed, but becomes a high priority if existing programs cease)
1. Continue with AUSVEG industry study tours and report on tour findings and/or new technologies in 'Vegetable Australia’.
2. Develop relationships along the supply chain and build communication channels. Facilitate networking opportunities/conferences.
3. Assist producers to understand customer needs, supply/demand relationships & opportunities for product development. Help to identify areas for efficiency improvement and contract review with suppliers
4. Ensure that R,D & E is focussed at Industry as well as the grower level and facilitate engagement across the supply chain

Investigating the costs associated with the production, sale and distribution of vegetables Final Report
RMCG Consultants for Business, Communities & Environment Page 39
5. Raise industry awareness of fact sheets and support tools developed as part of the InnoVeg - Talking Business program to assist growers to conduct Business Risk Assessments. Continue to build on these tools where necessary.
6. Develop a program to assist businesses to review systems and processes to ensure the appropriate checks & balances are in place. Assist businesses to identify a trusted business advisor to help ensure accountable decision making by asking the "right" questions.
7. Raise awareness of available tools to assist growers with succession planning - highlight the key issues and processes for consideration. Develop a process for identifying qualified trusted advisors to facilitate succession planning where necessary.
8. Assist business to ensure that consideration is given to appropriate business structures as part of the planning process and that structures are in accordance with business objectives and succession plans
9. Assist business to better understand and manage risk through, for example, exploring opportunities for diversity of products and/or customers, and/or supply chain integration.
There is necessarily some overlap between these strategies for industry and the package must be tailored to the target audiences needs. The following section outlines important extension principles that should inform the implementation of the recommended strategies.
5.4 Extension principles to facilitate strategy delivery
Previous work conducted by RMCG has identified the need for recognition that there is no ‘average’ grower and that there is significant variation in the age, cultural background education and training level, as well as operation size, production system, business structure and business priorities. Location, crop type and supply chain arrangements contribute to the diversity. All of these factors will impact on how farmers seek, understand and better utilise information that relates to their business.
Developing strategies to lower cost of production, whilst critical, is only part of the required solution. To facilitate change, it is critical to develop an extension approach that meets the needs of all of an industry.
Table 12 below was developed by RMCG as part of the HAL Project – Plant Health Desktop Study. It outlines ten extension principles and provides a description each.
Table 12: Extension principles to facilitate strategy delivery
Principle Description of core principle
1. Understand and respect the target audience
Extension programs must be targeted to the appropriate audience and address their specific motivations. Understanding the audience includes an analysis of their different needs and circumstances, the decisions they find difficult, the assistance they require and how they use information. Extension programs should focus on groups of growers (market segments) where a specific need has been identified rather than using a ‘blanket’ approach for the whole grower group (one size does not fit all).

Investigating the costs associated with the production, sale and distribution of vegetables Final Report
RMCG Consultants for Business, Communities & Environment Page 40
Principle Description of core principle
2. Segment the target audience and identify expected outcomes
The needs of different market segments will vary enormously. For the vegetable industry smaller growers will have different requirements from the larger growers (i.e. 20% of industry) who are also likely to be responsible for the majority of production. The needs of these various segments, and the type of delivery program required to address these needs will be substantially different.
3. Understand motivations for adoption of innovation
Extension programs must primarily consider the grower respecting their individual situation, views and motivations. An in depth understanding of the many technical and social factors which lead to a decision and the background, needs and aspirations will ensure that growers perspective can be appreciated. Growers have good reasons for not adopting a specific innovation (practice and/or technology) and this is not necessarily limited by lack of knowledge. Adoption of an innovation may occur for a range of reasons relating to the individuals motivations – including social benefits such as labour saving, prestige, comfort and opportunities for recreation (not just finance).
4. Ensure clarity of objectives and alignment with growers
Success of an extension program will be facilitated by clearly identifying the end goal or objective. Project activities should be planned that build the capacity of participants and enable them to work towards the overarching goal. Extension programs need to ensure that their messages are consistent with the motivations of the target audience. Benefits for growers in participating need to be promoted with targeted messages for specific groups (messages that are relevant to their motivations and farming context).
5. Utilise a range of extension methods/models
Extension programs need to incorporate a mix of extension methods (i.e. linear ‘top down’ transfer of technology and participatory ‘bottom up’ approaches). Utilisation of the range of extension methods/models will cater to the needs of different groups. ‘Reach – in’ extension, where the focus is on the farmer and their experiences, rather than the information provided to the farmer will be preferred where the issues are identified as complex.
6. Consider range of different learning styles
Extension programs need to be developed incorporating a suite of activities suited to different learning styles. Storytelling and story listening, case studies and group discussions are effective means to learn.
7. Appreciate complexity of decision making
An appreciation of the complexity of farm decision-making will facilitate the development of successful extension programs. The focus of programs should be on striving for better decisions rather than best practice – given many decisions are complex and best practice implies there is only one way to achieve a desired outcome. Extension is important in facilitating the process for complex decision-making.
8. Focus on capacity building
As decisions become more complex, there is a need for increased people skills and human capacity. Extension programs can support better decision-making by helping to improve producers awareness and skills in the decision making process and developing intuition to improve decision making i.e. facilitating farmers ability by increasing the growers experience, discussion of and thinking about a particular area. There is a core need to build capacity of individuals to seek the relevant information and make the correct decisions for their individual situation.
9. Utilise trusted service providers with appropriate skills
Extension practitioners need to incorporate the adult learning principles into the activities of the programs to increase participation rates and establish a supportive learning environment. Service providers must be trusted by the grower and support, respect and really listen to the target audience.

Investigating the costs associated with the production, sale and distribution of vegetables Final Report
RMCG Consultants for Business, Communities & Environment Page 41
Principle Description of core principle
10. Adopt a flexible and responsive approach
Extension programs need to be flexible to respond to changing needs and circumstances. This should include evaluation for the on-going adaptation and continuous improvement including changing extension models or using a combination of extension models in parallel.
5.5 Resistance to change
For a business to improve the managers must want to change it. After a business discussion, the owners may decide upon the following approaches.
Table 13: Possible approach after a business discussion
Approach Typical business owners response
1) Do nothing “We are happy with how we are and our future outlook”
2) Hope it will get better on its own “Things could be better but prices/or our yields are improving and that will take care of everything”
3) Set out to improve something – but later “I’ve got other things I would rather be doing before I change”
4) Set out to improve something “What actions can I take that will lead to a better business?”
5) Exit the business “ What else can I do?”
Some will choose the top three options because of a strong resistance to change. This can be based on experience of what has been successful or comfortable in the past.
Unfortunately, this is not always what is needed for achieving future goals and remaining viable when market conditions change. For positive change to occur it is important that the natural resistance to change is overcome.
Change will generally occur when R < ( P x V x D x E )
Where:
R = Resistance to change
P = Plan
V = Vision
D = Level of discontent with current situation
E = Energy /resources
It is important when working with growers for extension providers to accurately identify which components of this conceptual formula are missing. For example, is it lack of a plan, vision, discontent or energy and resources that is holding up positive change? Once the critical component is identified, this can then enable the provider to deliver information and develop a process that will encourage and facilitate change.

Investigating the costs associated with the production, sale and distribution of vegetables Final Report
RMCG Consultants for Business, Communities & Environment Page 42
5.6 Strategy consultation
The strategies developed as outlined above in section 5 were widely circulated to industry as part of the consultation process. The purpose of this approach was to validate the recommended strategies and to ensure that they were tailored to regional needs as well as the industry overall. A detailed list of those consulted and the role they played in this project is presented in Appendix 3.
In addition to validating the conclusions and strategies proposed, growers also identified production systems, product quality, customer relationships and value adding as key components of profitability.
A complete list of the feedback received during the strategy consultation is presented in Appendix 4 however, some of the key feedback received included:
§ Some growers did not have the internal processes to track their own cost of production and that this meant that some individuals may be selling produce at prices that are below sustainable levels. There is a need for more financial skills so this reduces.
§ Participation in discussion groups and benchmarking may be limited because of industry concerns about sharing what is seen as confidential data and commercial competitive advantages.
§ High performing growers do not need industry support to achieve the eleven characteristics as that is part of their “business as usual” approach and therefore would receive no benefit. While growers who would benefit are also unlikely to participate, as this is a major change to their existing business approach. This means that participation may be small and that a limited targeted funding pilot may be best to proceed in any business development program.
§ HAL would be best to invest in research and development of vegetable agronomy, for example, in chemical use so that Australian vegetables can maintain and enhace its “clean and green” competitive advantage.
§ An electronic web based set of business development tools would be useful, especially for time poor growers who find it difficult to travel and attend meetings.
§ Extension needs to link in with regional expos that growers attend.
§ Improved profitability can be achieved through a focus on improved quality and attention to detail that result in price premiums and improved yield and may be better suited to smaller scale operations.
§ A focus on growing the best product and building long term trusted relationships with customers underpins profit.
§ Extension should recognise a range of learning styles exist and provide a range of ways to engage on business skills development.
Investigating the costs associated with the production, sale and distribution of vegetables Final Report
RMCG Consultants for Business, Communities & Environment Page 43
5.7 Conclusion
It can be concluded from our analysis that there are eleven characteristics common to growers who have successfully implemented practical strategies to improve cost competitiveness by improving scale, controlling costs and enhancing productivity. Adoption of these eleven characteristics by other growers will improve the profitability of the industry overall, thus we have recommended and prioritised a suite of strategies to achieve adoption. RMCG propose that the nine high priority strategies recommended should be encompassed into three highly focussed, but integrated, strategic programs. They are:
1. A regional benchmarking program
2. A business discussion group program
3. A business skill development program
The strategic programs outlined above align with the Horticulture Australia Limited Strategic Plan 2012-2015, in particular, increasing knowledge that enhances the production, productivity, competitiveness and sustainability of Australian horticulture.
It is recommended that industry focus new investment on these programs and the strategies they encompass in order to improve the cost competitiveness of the industry overall.
It is also recommended that these three programs be implemented as a co-ordinated initiative, as each program will rely on the other programs to be successful (i.e. a regional benchmarking program may be confined to providing data only, if it is not linked to the discussion group program where the stories behind the numbers will facilitate learning and initiate change, and the skill development program, which will provide the skills necessary to successfully make change). Thus, the value of an integrated initiative is greater than the sum of its three parts.
Feedback from industry (refer to Appendix 4) has identified some of the potential challenges needing to be overcome for the successful uptake of these strategies by the vegetable industry particularly in relation to discussion groups. RMCG recommends that the strategies be piloted in conjunction with an online business management resource portal to enable on-going learning and self-assessment.
There is also value in providing a linkage to a network of horticultural business advisers who can provide on going support and business advise to growers on a 1:1 basis. Consistent with the private benefits this component should be funded by growers on a user pays basis.
Finally, it is critically important to the success of these programs that the industry recognise that adoption of the recommended strategies is dependent on the extension approach used. The industry must incorporate the ten extension principles outlined into the recommended programs to ensure that the needs of all of the industry are met and the outcome of a more cost competitive industry is achieved.
Investigating the costs associated with the production, sale and distribution of vegetables Final Report
RMCG Consultants for Business, Communities & Environment Page 44
6 Strategy implementation
6.1 Introduction
The extensive consultation undertaken with industry throughout the project led to the recommendation of three highly focussed but integrated strategic programs for improving vegetable grower cost competitiveness. RMCG also recommended that the strategies be piloted in conjunction with an online business management resource portal to enable on-going learning and self-assessment to help overcome some of the potential challenges identified.
We are aware that a number of vegetable growers do not have the internal processes to calculate and monitor cost of production and as a result, these growers may be at risk of selling produce at prices that are below sustainable levels. Therefore, RMCG proposes to undertake a pilot program to develop of a Cost of Production (CoP) self-assessment tool for vegetable growers. This program will be implemented within the scope and budget of the current project to extend the key messages and lessons learnt.
The outcome of the program, the development of a CoP self assessment tool, is to inform decision making of levy paying vegetable growers leading to increased profitability through a better understanding of how to calculate cost of production and to assess business performance against industry benchmarks.
6.1.1 Approach
RMCG proposes an approach which:
§ Aligns strongly with the industry’s strategic plan
§ Clearly communicates the issues and recommendations to improve cost competitiveness
§ Extends the findings and strategies recommended in this project
§ Builds on previous work developed as part of the InnoVeg- Talking business program and VegTool Gross Margin Tool (VG08021)
6.1.2 Method
The tool (an excel based spread sheet) and associated “Fact Sheet” will assist growers to identify a total CoP for their individual business and provide the means to assess this against industry benchmarks. This assessment will provide context and feedback to growers on business performance and enable them to make better-informed decisions with regard to future expenditure and whole of business management.
Additionally, the tool will enable growers to calculate cost of production for individual vegetable enterprises within their business. The allocation of costs to individual enterprises has long been a barrier for growers in calculating CoP. Therefore, it is important this tool provides a simple and effective basis for doing this by considering all business costs on the basis of area or revenue and allocating each cost across each enterprise on a percentage of use or contribution. It will also allow the grower to allocate the actual cost to an enterprise if this is known.
Investigating the costs associated with the production, sale and distribution of vegetables Final Report
RMCG Consultants for Business, Communities & Environment Page 45
Identifying the CoP for an enterprise has several benefits for business profitability. For example, it can assist growers to:
§ Identify the enterprises that consistently have a commodity price above the CoP and are therefore profitable
§ Identify the enterprises that consistently have a commodity price below the CoP and are therefore un-profitable
An improved understanding the margins involved for individual enterprises will inform decision making around enterprise mix and marketing. The ability to calculate and to monitor CoP for specific enterprises operated will also provide growers with the foundations for developing a number of the characteristics of successful business outlined in section 4.3 of this report
6.2 Consultation
Support from the vegetable industry’s peak body will be important for the successful grower adoption of this tool. Preliminary consultation has been undertaken with AUSVEG to seek their support and co-operation for this initiative. Their initial response has been positive and they have provided in principle support. RMCG will continue to work in collaboration with AUSVEG to refine the CoP self-assessment tool, to test the usefulness of the tool with a sample of growers, and to ensure adequate access to the final product by hosting it on the AUSVEG website.
6.3 Next steps
The data used for providing the industry benchmarks for comparing vegetable business performance within this pilot program is based on the ABARES data analysed in section 3, it is not enterprise or region specific. Therefore, RMCG recommends that in order to improve the benchmarks and build confidence in industry statistics and the messages within, the logical next step is an independent and standardised approach to data capture at a regional and enterprise level and the adaptation of this self assessment tool to enable cost of production to be compared to regional and enterprise specific benchmarks. This will provide an improved basis for comparing business performance.
Investigating the costs associated with the production, sale and distribution of vegetables Final Report
RMCG Consultants for Business, Communities & Environment Page 46
7 Acknowledgements
The authors wish to acknowledge the support of Horticulture Australia Limited for supplying funding through the vegetable industry levy with matched funds from the Australian Government.
We would also like to acknowledge the support of the growers and peak industry body representatives consulted throughout this investigation (refer to Appendix 3). Their generous provision of time, feedback and information has been invaluable.

Investigating the costs associated with the production, sale and distribution of vegetables Final Report
RMCG Consultants for Business, Communities & Environment Page 47
8 Glossary of terms
Administrative costs are overhead costs associated with administrating the business and its utility costs. RMCG has aggregated the ABARES identified costs of electricity, insurance, rates, and general administration as well as other cash costs to create this category.
Finance costs are the costs of using other people’s assets, e.g. interest on borrowed money, lease of land, and hire purchase of equipment. They are grouped together to clearly identify your financial commitments to other people. They are also separated because different business may have similar operations and, thus costs, but may be financed differently. Thus, it enables an easier comparison of those operations.
Growing costs are the costs incurred in growing the crop to the point of harvest. RMCG have aggregated the ABARES identified costs of seed, fertilizer, chemicals, fuel and oil & grease to create this category.
Labour costs are all the costs associated with labour both external (contractors) and internal (staff), as well as unpaid family labour. If you are to have a true and accurate picture of how your business is going, then you need to account for the family labour that is employed within the business, but not directly paid by the business, i.e. living off drawings. The best measure of this is to think about how much you would need to pay to employ a farm manager to take on your responsibilities. RMCG have aggregated the ABARES identified costs of contracts paid, hired labour and operator & family imputed labour to create this category.
Overhead costs (or fixed costs) are those costs that you have to pay regardless of production (i.e. they hang over your head!), e.g. rates, insurance, accountant, permanent labour, repairs and maintenance. Grouping them together helps you calculate how much your crops need to make, net of variable costs, for your business to be profitable.
Plant and equipment costs are a mix of the variable and overhead costs associated with the use of plant and equipment in the business. They have been grouped together, because they often comprise a large component of the overhead costs in a mechanised vegetable operation. Also, they may change considerably if you change crop or operations. Motor vehicle and plant hire expenses as well as repair and maintenance costs for building and motor vehicles have been included in this category. Depreciation has also been included as a plant and machinery cost, as it is usually associated with plant and equipment.
Post harvest costs are he costs incurred from the point of harvest. These involve the ABARE identified costs associated with freight, packing, as well as any produce required to be purchased
Variable costs (or direct costs) are those costs that vary directly with production, e.g. fertilizer, packaging, casual harvest labour. Grouping these costs together helps to calculate how much it costs to grow and/or pack a crop.

Investigating the costs associated with the production, sale and distribution of vegetables Final Report
RMCG Consultants for Business, Communities & Environment Page 48
9 References
Ashton, D. 2007, Australian Vegetable Growing Industry: An Economic Survey 2005-06, ABARE Research Report 07.17 Prepared for the Australian Vegetable Industry Development Group, Canberra, October.
Crooks, S 2009, Australian vegetable growing farms: an economic survey, 2006-07, ABARE Report to Horticulture Australia Ltd, Canberra, January.
Crooks, S 2009, Australian vegetable growing farms: an economic survey, 2007-08, ABARE report to Horticulture Australia Ltd, Canberra, September.
Crooks, S 2010, Australian vegetable growing farms: an economic survey, 2008–09, ABARE–BRS research report 10.12, Canberra, November.
Thompson, T 2011, Australian vegetable growing farms: an economic survey, 2009–10, ABARES report to client prepared for Horticulture Australia Limited, Canberra, November.
Thompson, T & Zhang, K 2012, Australian vegetable growing farms: an economic survey 2010–11 and 2011–12, ABARES Research report 12.11 prepared for Horticulture Australia Limited, Canberra, December.

Investigating the costs associated with the production, sale and distribution of vegetables Final Report
RMCG Consultants for Business, Communities & Environment Page 49
Appendix 1: Cost of production data Appendix 1.1: Average total costs per farm
Average total costs per farm by accounting category
Average'costs'per'farm 2005206 2006207 2007208 2008209 2009210 2010211
Variable'Costscontracts(paid $38,390 $56,118 $40,005 $48,696 $47,200 $62,500crop(&(pasture(chemicals $26,390 $25,923 $21,203 $26,469 $33,500 $42,100fertiliser $39,180 $49,439 $42,899 $53,867 $53,000 $62,300freight $19,720 $4,501 $4,252 $31,800 $34,100fuel,(oil,(grease $30,530 $34,307 $26,784 $30,695 $32,900 $32,500hired(labour $102,270 $151,387 $76,251 $87,694 $90,300 $96,600packing(charges(&(materials $49,780 $85,054 $26,462 $25,902 $34,700 $35,100produce(purchased $5,340 $5,966 $593 $294 $600 $600seed $32,310 $64,134 $28,612 $39,796 $41,600 $50,500Total'Variable'Costs $324,190 $492,048 $267,310 $317,665 $365,600 $416,300
Overhead'Costsadministration $11,340 $12,641 $10,187 $12,439 $14,600 $20,500depreciation $36,950 $41,135 $33,666 $38,282 $44,800 $47,000electricity $8,990 $11,998 $9,573 $10,990 $12,900 $14,200insurance $5,990 $6,757 $5,439 $6,257 $10,600 $10,700MV(expense $4,600 $3,904 $3,553 $6,701 $4,000 $5,300operator(&(family(labour $51,620 $54,275 $56,152 $55,756 $57,500 $59,800other(cash(costs $52,680 $18,678 $23,819 $25,136 $49,300 $40,100plant(hire(expense $3,490 $6,397 $3,140 $5,754 $5,300 $10,300R&MG(buildings $12,310 $20,943 $13,267 $14,254 $15,700 $20,300rates $5,980 $9,631 $7,390 $7,602 $10,200 $8,200repairsG(motor(vehicles $23,050 $25,584 $21,903 $27,229 $30,700 $31,600Total'Overhead'Costs $217,000 $211,943 $188,089 $210,400 $255,600 $268,000
Finance'Costsinterest $19,640 $25,761 $27,736 $30,564 $37,100 $39,700land(rent(expense $7,080 $11,631 $8,330 $10,968 $8,200 $12,500lease(payments $5,870 $4,427 $2,343 $2,890 $1,400 $800Total'Finance'Costs $32,590 $41,819 $38,409 $44,422 $46,700 $53,000
Total'Costs $573,780 $745,810 $493,808 $572,487 $667,900 $737,300
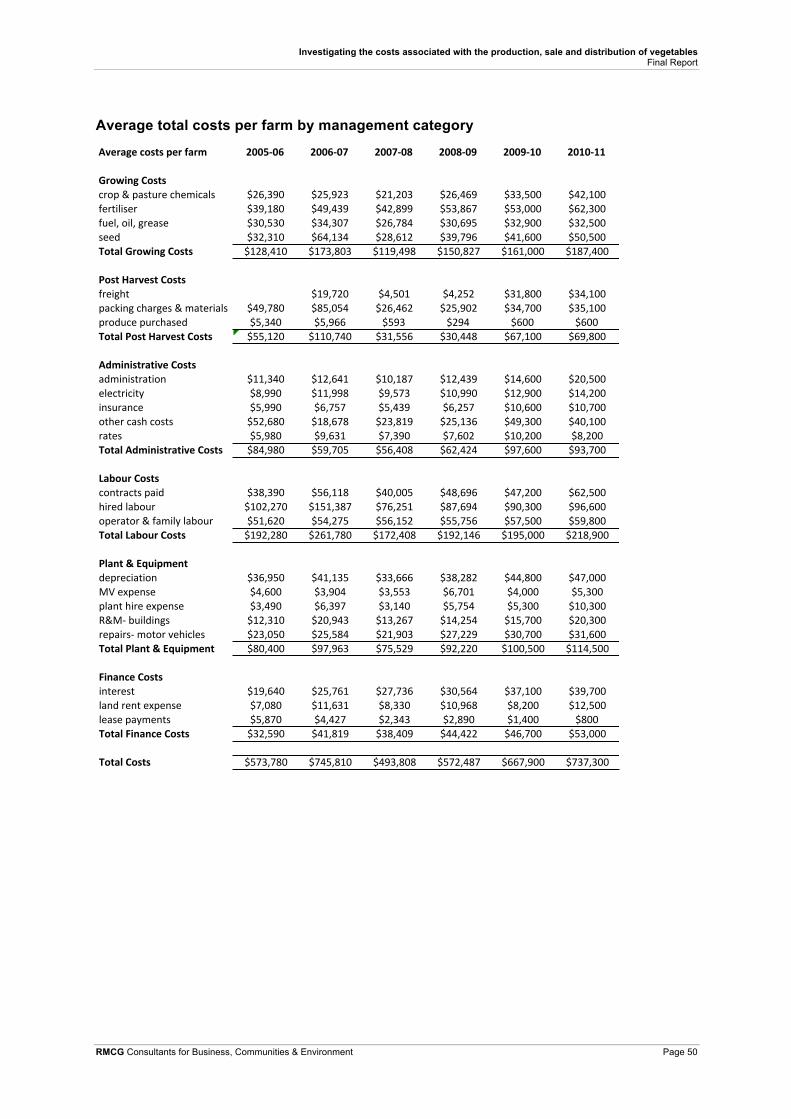
Investigating the costs associated with the production, sale and distribution of vegetables Final Report
RMCG Consultants for Business, Communities & Environment Page 50
Average total costs per farm by management category
Average'costs'per'farm 2005206 2006207 2007208 2008209 2009210 2010211
Growing'Costscrop%&%pasture%chemicals $26,390 $25,923 $21,203 $26,469 $33,500 $42,100fertiliser $39,180 $49,439 $42,899 $53,867 $53,000 $62,300fuel,%oil,%grease $30,530 $34,307 $26,784 $30,695 $32,900 $32,500seed $32,310 $64,134 $28,612 $39,796 $41,600 $50,500Total'Growing'Costs $128,410 $173,803 $119,498 $150,827 $161,000 $187,400
Post'Harvest'Costsfreight $19,720 $4,501 $4,252 $31,800 $34,100packing%charges%&%materials $49,780 $85,054 $26,462 $25,902 $34,700 $35,100produce%purchased $5,340 $5,966 $593 $294 $600 $600Total'Post'Harvest'Costs $55,120 $110,740 $31,556 $30,448 $67,100 $69,800
Administrative'Costsadministration $11,340 $12,641 $10,187 $12,439 $14,600 $20,500electricity $8,990 $11,998 $9,573 $10,990 $12,900 $14,200insurance $5,990 $6,757 $5,439 $6,257 $10,600 $10,700other%cash%costs $52,680 $18,678 $23,819 $25,136 $49,300 $40,100rates $5,980 $9,631 $7,390 $7,602 $10,200 $8,200Total'Administrative'Costs $84,980 $59,705 $56,408 $62,424 $97,600 $93,700
Labour'Costscontracts%paid $38,390 $56,118 $40,005 $48,696 $47,200 $62,500hired%labour $102,270 $151,387 $76,251 $87,694 $90,300 $96,600operator%&%family%labour $51,620 $54,275 $56,152 $55,756 $57,500 $59,800Total'Labour'Costs $192,280 $261,780 $172,408 $192,146 $195,000 $218,900
Plant'&'Equipmentdepreciation $36,950 $41,135 $33,666 $38,282 $44,800 $47,000MV%expense $4,600 $3,904 $3,553 $6,701 $4,000 $5,300plant%hire%expense $3,490 $6,397 $3,140 $5,754 $5,300 $10,300R&MG%buildings $12,310 $20,943 $13,267 $14,254 $15,700 $20,300repairsG%motor%vehicles $23,050 $25,584 $21,903 $27,229 $30,700 $31,600Total'Plant'&'Equipment $80,400 $97,963 $75,529 $92,220 $100,500 $114,500
Finance'Costsinterest $19,640 $25,761 $27,736 $30,564 $37,100 $39,700land%rent%expense $7,080 $11,631 $8,330 $10,968 $8,200 $12,500lease%payments $5,870 $4,427 $2,343 $2,890 $1,400 $800Total'Finance'Costs $32,590 $41,819 $38,409 $44,422 $46,700 $53,000
Total'Costs $573,780 $745,810 $493,808 $572,487 $667,900 $737,300

Investigating the costs associated with the production, sale and distribution of vegetables Final Report
RMCG Consultants for Business, Communities & Environment Page 51
Appendix 1.2: Average total costs per hectare
Average total costs per hectare by accounting category
Average'costs'per'farm 2005206 2006207 2007208 2008209 2009210 2010211304 231 189 205 256 214
Variable'Costscontracts1paid $126 $243 $212 $238 $184 $292crop1&1pasture1chemicals $87 $112 $112 $129 $131 $197fertiliser $129 $214 $227 $263 $207 $291freight $0 $85 $24 $21 $124 $159fuel,1oil,1grease $100 $149 $142 $150 $129 $152hired1labour $336 $655 $403 $428 $353 $451packing1charges1&1materials $164 $368 $140 $126 $136 $164produce1purchased $18 $26 $3 $1 $2 $3seed $106 $278 $151 $194 $163 $236Total'Variable'Costs $1,066 $2,130 $1,414 $1,550 $1,428 $1,945
Overhead'Costsadministration $37 $55 $54 $61 $57 $96depreciation $122 $178 $178 $187 $175 $220electricity $30 $52 $51 $54 $50 $66insurance $20 $29 $29 $31 $41 $50MV1expense $15 $17 $19 $33 $16 $25operator1&1family1labour $170 $235 $297 $272 $225 $279other1cash1costs $173 $81 $126 $123 $193 $187plant1hire1expense $11 $28 $17 $28 $21 $48R&MG1buildings $40 $91 $70 $70 $61 $95rates $20 $42 $39 $37 $40 $38repairsG1motor1vehicles $76 $111 $116 $133 $120 $148Total'Overhead'Costs $714 $918 $995 $1,026 $998 $1,252
Finance'Costsinterest $65 $112 $147 $149 $145 $186land1rent1expense $23 $50 $44 $54 $32 $58lease1payments $19 $19 $12 $14 $5 $4Total'Finance'Costs $107 $181 $203 $217 $182 $248
Total'Costs $1,887 $3,229 $2,613 $2,793 $2,609 $3,445
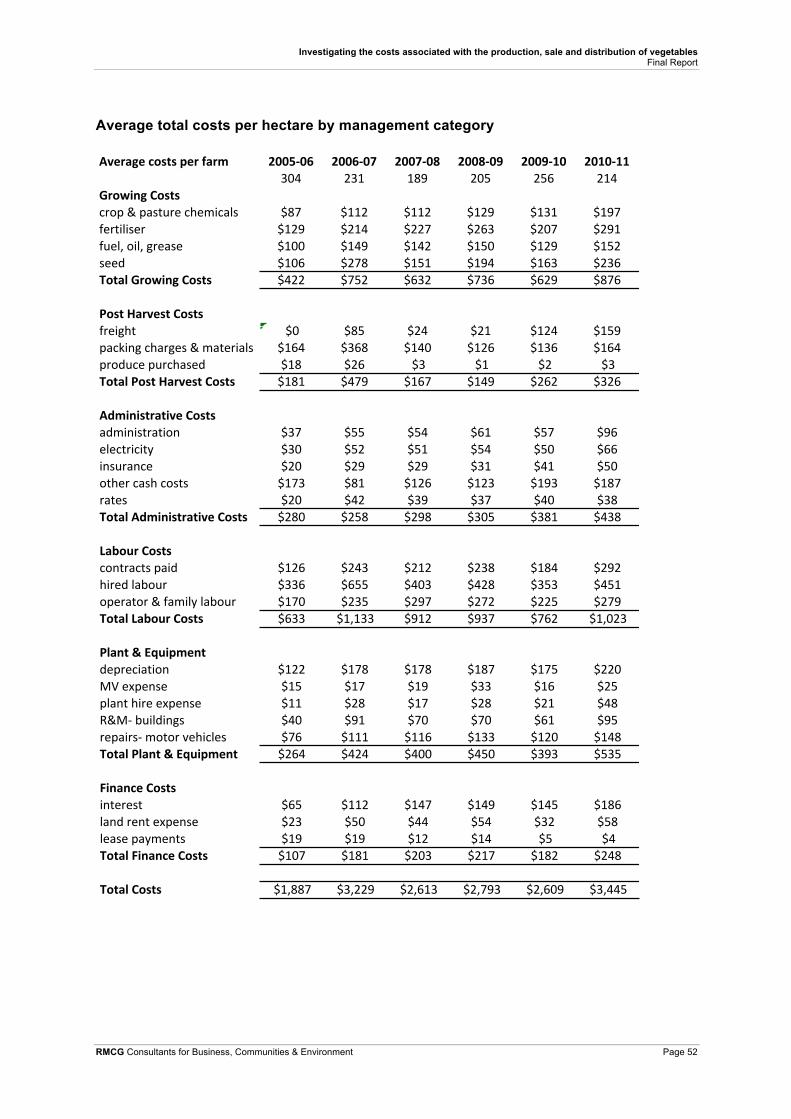
Investigating the costs associated with the production, sale and distribution of vegetables Final Report
RMCG Consultants for Business, Communities & Environment Page 52
Average total costs per hectare by management category
Average'costs'per'farm 2005206 2006207 2007208 2008209 2009210 2010211304 231 189 205 256 214
Growing'Costscrop.&.pasture.chemicals $87 $112 $112 $129 $131 $197fertiliser $129 $214 $227 $263 $207 $291fuel,.oil,.grease $100 $149 $142 $150 $129 $152seed $106 $278 $151 $194 $163 $236Total'Growing'Costs $422 $752 $632 $736 $629 $876
Post'Harvest'Costsfreight $0 $85 $24 $21 $124 $159packing.charges.&.materials $164 $368 $140 $126 $136 $164produce.purchased $18 $26 $3 $1 $2 $3Total'Post'Harvest'Costs $181 $479 $167 $149 $262 $326
Administrative'Costsadministration $37 $55 $54 $61 $57 $96electricity $30 $52 $51 $54 $50 $66insurance $20 $29 $29 $31 $41 $50other.cash.costs $173 $81 $126 $123 $193 $187rates $20 $42 $39 $37 $40 $38Total'Administrative'Costs $280 $258 $298 $305 $381 $438
Labour'Costscontracts.paid $126 $243 $212 $238 $184 $292hired.labour $336 $655 $403 $428 $353 $451operator.&.family.labour $170 $235 $297 $272 $225 $279Total'Labour'Costs $633 $1,133 $912 $937 $762 $1,023
Plant'&'Equipmentdepreciation $122 $178 $178 $187 $175 $220MV.expense $15 $17 $19 $33 $16 $25plant.hire.expense $11 $28 $17 $28 $21 $48R&MG.buildings $40 $91 $70 $70 $61 $95repairsG.motor.vehicles $76 $111 $116 $133 $120 $148Total'Plant'&'Equipment $264 $424 $400 $450 $393 $535
Finance'Costsinterest $65 $112 $147 $149 $145 $186land.rent.expense $23 $50 $44 $54 $32 $58lease.payments $19 $19 $12 $14 $5 $4Total'Finance'Costs $107 $181 $203 $217 $182 $248
Total'Costs $1,887 $3,229 $2,613 $2,793 $2,609 $3,445

Investigating the costs associated with the production, sale and distribution of vegetables Final Report
RMCG Consultants for Business, Communities & Environment Page 53
Appendix 1.3: Average total costs per tonne
Average total costs per tonne by accounting category
Average'costs'per'farm 2005206 2006207 2007208 2008209 2009210 20102111179 1127 796 1002 1063 963
Variable'Costscontracts/paid $33 $50 $50 $49 $44 $65crop/&/pasture/chemicals $22 $23 $27 $26 $32 $44fertiliser $33 $44 $54 $54 $50 $65freight $0 $17 $6 $4 $30 $35fuel,/oil,/grease $26 $30 $34 $31 $31 $34hired/labour $87 $134 $96 $88 $85 $100packing/charges/&/materials $42 $75 $33 $26 $33 $36produce/purchased $5 $5 $1 $0 $1 $1seed $27 $57 $36 $40 $39 $52Total'Variable'Costs $275 $437 $336 $317 $344 $432
Overhead'Costsadministration $10 $11 $13 $12 $14 $21depreciation $31 $36 $42 $38 $42 $49electricity $8 $11 $12 $11 $12 $15insurance $5 $6 $7 $6 $10 $11MV/expense $4 $3 $4 $7 $4 $6operator/&/family/labour $44 $48 $71 $56 $54 $62other/cash/costs $45 $17 $30 $25 $46 $42plant/hire/expense $3 $6 $4 $6 $5 $11R&MG/buildings $10 $19 $17 $14 $15 $21rates $5 $9 $9 $8 $10 $9repairsG/motor/vehicles $20 $23 $28 $27 $29 $33Total'Overhead'Costs $184 $188 $236 $210 $240 $278
Finance'Costsinterest $17 $23 $35 $31 $35 $41land/rent/expense $6 $10 $10 $11 $8 $13lease/payments $5 $4 $3 $3 $1 $1Total'Finance'Costs $28 $37 $48 $44 $44 $55
Total'Costs $487 $662 $620 $571 $628 $766

Investigating the costs associated with the production, sale and distribution of vegetables Final Report
RMCG Consultants for Business, Communities & Environment Page 54
Average total costs per tonne by management category
Average'costs'per'farm 2005206 2006207 2007208 2008209 2009210 20102111179 1127 796 1002 1063 963
Growing'Costscrop,&,pasture,chemicals $22 $23 $27 $26 $32 $44fertiliser $33 $44 $54 $54 $50 $65fuel,,oil,,grease $26 $30 $34 $31 $31 $34seed $27 $57 $36 $40 $39 $52Total'Growing'Costs $109 $154 $150 $151 $151 $195
Post'Harvest'Costsfreight $0 $17 $6 $4 $30 $35packing,charges,&,materials $42 $75 $33 $26 $33 $36produce,purchased $5 $5 $1 $0 $1 $1Total'Post'Harvest'Costs $47 $98 $40 $30 $63 $72
Administrative'Costsadministration $10 $11 $13 $12 $14 $21electricity $8 $11 $12 $11 $12 $15insurance $5 $6 $7 $6 $10 $11other,cash,costs $45 $17 $30 $25 $46 $42rates $5 $9 $9 $8 $10 $9Total'Administrative'Costs $72 $53 $71 $62 $92 $97
Labour'Costscontracts,paid $33 $50 $50 $49 $44 $65hired,labour $87 $134 $96 $88 $85 $100operator,&,family,labour $44 $48 $71 $56 $54 $62Total'Labour'Costs $163 $232 $217 $192 $183 $227
Plant'&'Equipmentdepreciation $31 $36 $42 $38 $42 $49MV,expense $4 $3 $4 $7 $4 $6plant,hire,expense $3 $6 $4 $6 $5 $11R&MG,buildings $10 $19 $17 $14 $15 $21repairsG,motor,vehicles $20 $23 $28 $27 $29 $33Total'Plant'&'Equipment $68 $87 $95 $92 $95 $119
Finance'Costsinterest $17 $23 $35 $31 $35 $41land,rent,expense $6 $10 $10 $11 $8 $13lease,payments $5 $4 $3 $3 $1 $1Total'Finance'Costs $28 $37 $48 $44 $44 $55
Total'Costs $487 $662 $620 $571 $628 $766

Investigating the costs associated with the production, sale and distribution of vegetables Final Report
RMCG Consultants for Business, Communities & Environment Page 55
Appendix 1.4: Costs per tonne by farm financial performance
bottom%25% middle%50% top%25%
Variable%Costs %%%%%%%%%%%%%%308% %%%%%%%%%%%%%%631% %%%%%%%%%%%2,269%Contracts)paid $85 $54 $69Crop)and)pasture)chemicals $45 $47 $42Fertiliser $78 $66 $62Freight $33 $31 $38Fuel,)oil)and)grease $50 $42 $27Hired)labour $109 $104 $97Packing)charges)and)materials $48 $32 $37Seed $86 $51 $49Total%Variable%Costs $535 $428 $420
Overhead%CostsAdministration $42 $27 $15Depreciation $75 $62 $38Electricity $17 $20 $11Insurance $17 $13 $9Motor)vehicle)expenses $12 $7 $4Operated)and)family)imputed)labour $190 $88 $31Other)costs $27 $40 $24Plant)hire $6 $16 $8Rates $20 $12 $5Repairs)P)buildings)and)structures $23 $30 $15Repairs)P)motor)vehicles)and)plant $48 $44 $25Total%Overhead%Costs $476 $360 $186
Finance%CostsInterest)paid $64 $67 $24Land)rent $8 $12 $14Lease)payments $2 $0 $1Total%Finance%Costs $74 $79 $39
Total%Costs $1,085 $867 $645
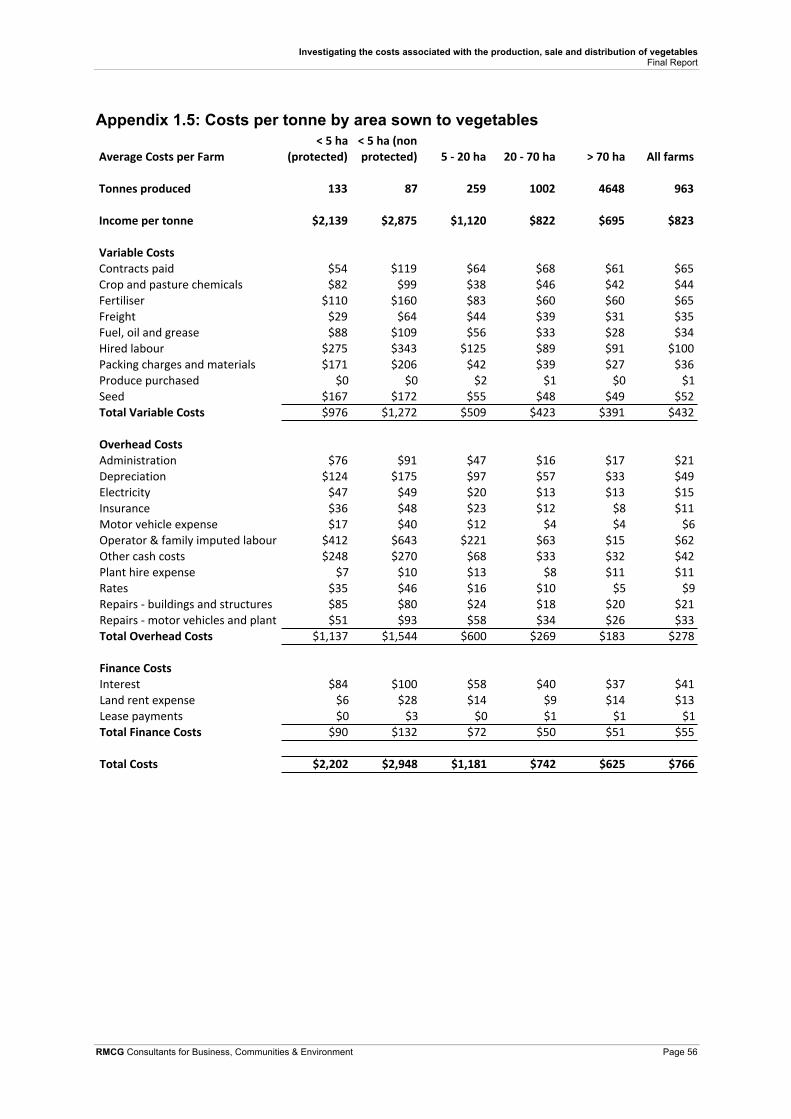
Investigating the costs associated with the production, sale and distribution of vegetables Final Report
RMCG Consultants for Business, Communities & Environment Page 56
Appendix 1.5: Costs per tonne by area sown to vegetables
Average'Costs'per'Farm<'5'ha'
(protected)<'5'ha'(non'protected) 5'7'20'ha 20'7'70'ha >'70'ha All'farms
Tonnes'produced 133 87 259 1002 4648 963
Income'per'tonne $2,139 $2,875 $1,120 $822 $695 $823
Variable'CostsContracts)paid $54 $119 $64 $68 $61 $65Crop)and)pasture)chemicals $82 $99 $38 $46 $42 $44Fertiliser $110 $160 $83 $60 $60 $65Freight $29 $64 $44 $39 $31 $35Fuel,)oil)and)grease $88 $109 $56 $33 $28 $34Hired)labour $275 $343 $125 $89 $91 $100Packing)charges)and)materials $171 $206 $42 $39 $27 $36Produce)purchased $0 $0 $2 $1 $0 $1Seed $167 $172 $55 $48 $49 $52Total'Variable'Costs $976 $1,272 $509 $423 $391 $432
Overhead'CostsAdministration $76 $91 $47 $16 $17 $21Depreciation $124 $175 $97 $57 $33 $49Electricity $47 $49 $20 $13 $13 $15Insurance $36 $48 $23 $12 $8 $11Motor)vehicle)expense $17 $40 $12 $4 $4 $6Operator)&)family)imputed)labour $412 $643 $221 $63 $15 $62Other)cash)costs $248 $270 $68 $33 $32 $42Plant)hire)expense $7 $10 $13 $8 $11 $11Rates $35 $46 $16 $10 $5 $9Repairs)Q)buildings)and)structures $85 $80 $24 $18 $20 $21Repairs)Q)motor)vehicles)and)plant $51 $93 $58 $34 $26 $33Total'Overhead'Costs $1,137 $1,544 $600 $269 $183 $278
Finance'CostsInterest) $84 $100 $58 $40 $37 $41Land)rent)expense $6 $28 $14 $9 $14 $13Lease)payments $0 $3 $0 $1 $1 $1Total'Finance'Costs $90 $132 $72 $50 $51 $55
Total'Costs $2,202 $2,948 $1,181 $742 $625 $766

Investigating the costs associated with the production, sale and distribution of vegetables Final Report
RMCG Consultants for Business, Communities & Environment Page 57
Appendix 1.6: CoP over time by state
New South Wales
$0#
$100,000#
$200,000#
$300,000#
$400,000#
$500,000#
$600,000#
2006/07# 2007/08# 2008/09# 2009/10# 2010/11#
Average'total'farm'costs'
Variable#Costs# Overhead#Costs# Finance#Costs#
$0#
$500#
$1,000#
$1,500#
$2,000#
$2,500#
2006/07# 2007/08# 2008/09# 2009/10# 2010/11#
Average'total'farm'costs'per'hectare'
Variable#Costs# Overhead#Costs# Finance#Costs#
$0#
$200#
$400#
$600#
$800#
$1,000#
2006/07# 2007/08# 2008/09# 2009/10# 2010/11#
Average'total'farm'costs'per'tonne'
Variable#Costs# Overhead#Costs# Finance#Costs#

Investigating the costs associated with the production, sale and distribution of vegetables Final Report
RMCG Consultants for Business, Communities & Environment Page 58
Queensland
$0#
$200,000#
$400,000#
$600,000#
$800,000#
$1,000,000#
$1,200,000#
$1,400,000#
2006/07# 2007/08# 2008/09# 2009/10# 2010/11#
Average'total'farm'costs'
Variable#Costs# Overhead#Costs# Finance#Costs#
$0#$1,000#$2,000#$3,000#$4,000#$5,000#$6,000#$7,000#$8,000#
2006/07# 2007/08# 2008/09# 2009/10# 2010/11#
Average'total'farm'costs'per'hectare'
Variable#Costs# Overhead#Costs# Finance#Costs#
$0#
$200#
$400#
$600#
$800#
$1,000#
$1,200#
2006/07# 2007/08# 2008/09# 2009/10# 2010/11#
Average'total'farm'costs'per'tonne'
Variable#Costs# Overhead#Costs# Finance#Costs#

Investigating the costs associated with the production, sale and distribution of vegetables Final Report
RMCG Consultants for Business, Communities & Environment Page 59
South Australia
$0#
$200,000#
$400,000#
$600,000#
$800,000#
$1,000,000#
2006/07# 2007/08# 2008/09# 2009/10# 2010/11#
Average'total'farm'costs'
Variable#Costs# Overhead#Costs# Finance#Costs#
$0#
$500#
$1,000#
$1,500#
$2,000#
$2,500#
2006/07# 2007/08# 2008/09# 2009/10# 2010/11#
Average'total'farm'costs'per'hectare'
Variable#Costs# Overhead#Costs# Finance#Costs#
$0#
$100#
$200#
$300#
$400#
$500#
$600#
2006/07# 2007/08# 2008/09# 2009/10# 2010/11#
Average'total'farm'costs'per'tonne'
Variable#Costs# Overhead#Costs# Finance#Costs#
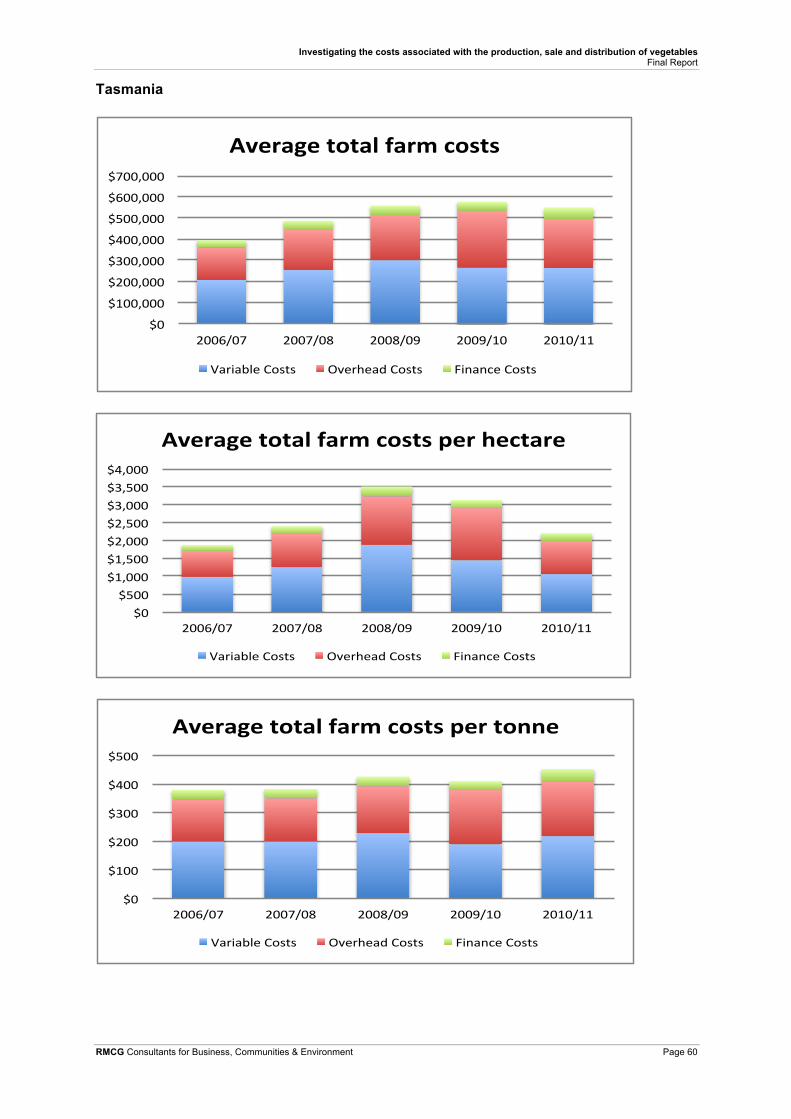
Investigating the costs associated with the production, sale and distribution of vegetables Final Report
RMCG Consultants for Business, Communities & Environment Page 60
Tasmania
$0#
$100,000#
$200,000#
$300,000#
$400,000#
$500,000#
$600,000#
$700,000#
2006/07# 2007/08# 2008/09# 2009/10# 2010/11#
Average'total'farm'costs'
Variable#Costs# Overhead#Costs# Finance#Costs#
$0#$500#
$1,000#$1,500#$2,000#$2,500#$3,000#$3,500#$4,000#
2006/07# 2007/08# 2008/09# 2009/10# 2010/11#
Average'total'farm'costs'per'hectare'
Variable#Costs# Overhead#Costs# Finance#Costs#
$0#
$100#
$200#
$300#
$400#
$500#
2006/07# 2007/08# 2008/09# 2009/10# 2010/11#
Average'total'farm'costs'per'tonne'
Variable#Costs# Overhead#Costs# Finance#Costs#

Investigating the costs associated with the production, sale and distribution of vegetables Final Report
RMCG Consultants for Business, Communities & Environment Page 61
Victoria
$0#
$200,000#
$400,000#
$600,000#
$800,000#
$1,000,000#
2006/07# 2007/08# 2008/09# 2009/10# 2010/11#
Average'total'farm'costs'
Variable#Costs# Overhead#Costs# Finance#Costs#
$0#
$1,000#
$2,000#
$3,000#
$4,000#
$5,000#
$6,000#
2006/07# 2007/08# 2008/09# 2009/10# 2010/11#
Average'total'farm'costs'per'hectare'
Variable#Costs# Overhead#Costs# Finance#Costs#
$0#
$200#
$400#
$600#
$800#
$1,000#
2006/07# 2007/08# 2008/09# 2009/10# 2010/11#
Average'total'farm'costs'per'tonne'
Variable#Costs# Overhead#Costs# Finance#Costs#

Investigating the costs associated with the production, sale and distribution of vegetables Final Report
RMCG Consultants for Business, Communities & Environment Page 62
Western Australia
$0#
$200,000#
$400,000#
$600,000#
$800,000#
$1,000,000#
$1,200,000#
$1,400,000#
2006/07# 2007/08# 2008/09# 2009/10# 2010/11#
Average'total'farm'costs'
Variable#Costs# Overhead#Costs# Finance#Costs#
$0#
$2,000#
$4,000#
$6,000#
$8,000#
$10,000#
2006/07# 2007/08# 2008/09# 2009/10# 2010/11#
Average'total'farm'costs'per'hectare'
Variable#Costs# Overhead#Costs# Finance#Costs#
$0#
$200#
$400#
$600#
$800#
$1,000#
$1,200#
2006/07# 2007/08# 2008/09# 2009/10# 2010/11#
Average'total'farm'costs'per'tonne'
Variable#Costs# Overhead#Costs# Finance#Costs#

Investigating the costs associated with the production, sale and distribution of vegetables Final Report
RMCG Consultants for Business, Communities & Environment Page 63
Appendix 2: Case studies Case Study 1: “The importance of succession planning”
1.1 The business
Thorndon Park Produce is a Pty Limited Company whose sole director is Danny De Ieso.
Its main office and packing shed is located at Waterloo Corner, North of Adelaide in South Australia. It also grows vegetables (bunch lines and sleeved product) on a second property 15 km further north at Gawler River.
Danny was brought up on his grandfathers vegetable farm at Newton and in 1993 he moved out to Waterloo Corner, he produces vegetables all year round with lines of:
§ Silverbeet
§ Spinach
§ Spring Onions
§ Radish
§ Parsley (curly)
§ Continental Parsley
§ Beetroot
§ Coriander
§ Endive
The business also owns a stand in the wholesale market, but this is no longer used as most produce is sold directly to wholesalers.
Appendix 2 - Figure 1: Growing and harvesting at Thorndon Park
1.2 The situation
Up until 2008 he owned the one farm at Waterloo corner with 6 ha (15 acres) of production plus leased land. Now the farm owns around 40 ha (100 acres).

Investigating the costs associated with the production, sale and distribution of vegetables Final Report
RMCG Consultants for Business, Communities & Environment Page 60
1.3 The challenges
1.3.1 Succession planning
Danny identified a number of important challenges, but his top one is succession planning and clarifying secure long-term ownership arrangements. Danny advises:
§ Family members should have very clear agreements or contracts, as verbal ones get misinterpreted or change over time
§ This should be sorted out at the time of asset purchase
§ Every farm needs to work on succession planning and you cannot start early enough
§ The implication of not managing succession is that the viability of the business is at risk
1.4 Costs
Danny believes that government red tape, labour costs and fuel/power costs are major challenges.
Labour costs are a very high component of total costs and Danny pays a lot of attention to the use of machinery that could reduce labour.
Appendix 2 - Figure 2: Danny's planting machine
Labour costs are also high because staff require continual training. Currently the farm employs about 30 labour units, of which four are full time permanents.
Most of the permanent staff work on highly skilled areas such as welding, machinery design and modification. The business has had a successful strategy of buying late model second hand machinery and rebuilding and modifying it to meet their needs.

Investigating the costs associated with the production, sale and distribution of vegetables Final Report
RMCG Consultants for Business, Communities & Environment Page 61
Danny is very concerned about food security and also the link between food security and fuel supply. He says the government is “insane” if they allow the closure of domestic oil refineries, as he sees this as a major threat to national security.
He believes that it would make Australia more dependent on overseas refiners who will be less responsive to the needs of their Australian customers and reduce the diversification of supply options and this threatens energy security.
He is also worried that other Government policies have decreased margins for growers through high energy costs, labour costs, free trade agreements, country of origin labelling, concentration of power in the market place, processed vegetable imports, water policy and local government policies.
1.5 Prices
Danny is concerned that many growers send produce on consignment or commission to wholesalers who can quote ”glut prices” and drive prices down. There are also production overruns from interstate that get quoted as “normal” prices.
Danny negotiates prices with his customers and will not send any produce off the farm unpriced.
He is continuing to modify mix of lines to meet new market trends.
1.6 The strategy / execution
1.6.1 What they did and how they did it
Cost monitoring
Danny is a strong advocate of financial tools such as the HAL funded Vegtool cost calculator9 and assisted in its development. He believes all growers should calculate their costs and their margin per unit, especially before deciding to purchase a property and or valuing property for its productive capacity.
This information is also very important for calculating prices to ensure profit margins are sustainable, when growers negotiate prices.
Costs
Danny uses 4 contracting firms to provide field and packing labour and also employs a team of mechanics and a serious workshop to modify and make their own machinery. He would love to move to fully mechanised robotics that would reduce the cost of production.
Danny feels that his business is forced into reducing labour, not because he want to, but because of the need to try and compete with cheap overseas imports. He is concerned about Government policy on free trade, which results in imports of cheap vegetables from
9 Available at http://ausveg.com.au/intranet/technical-insights/tools/grossmargin.htm
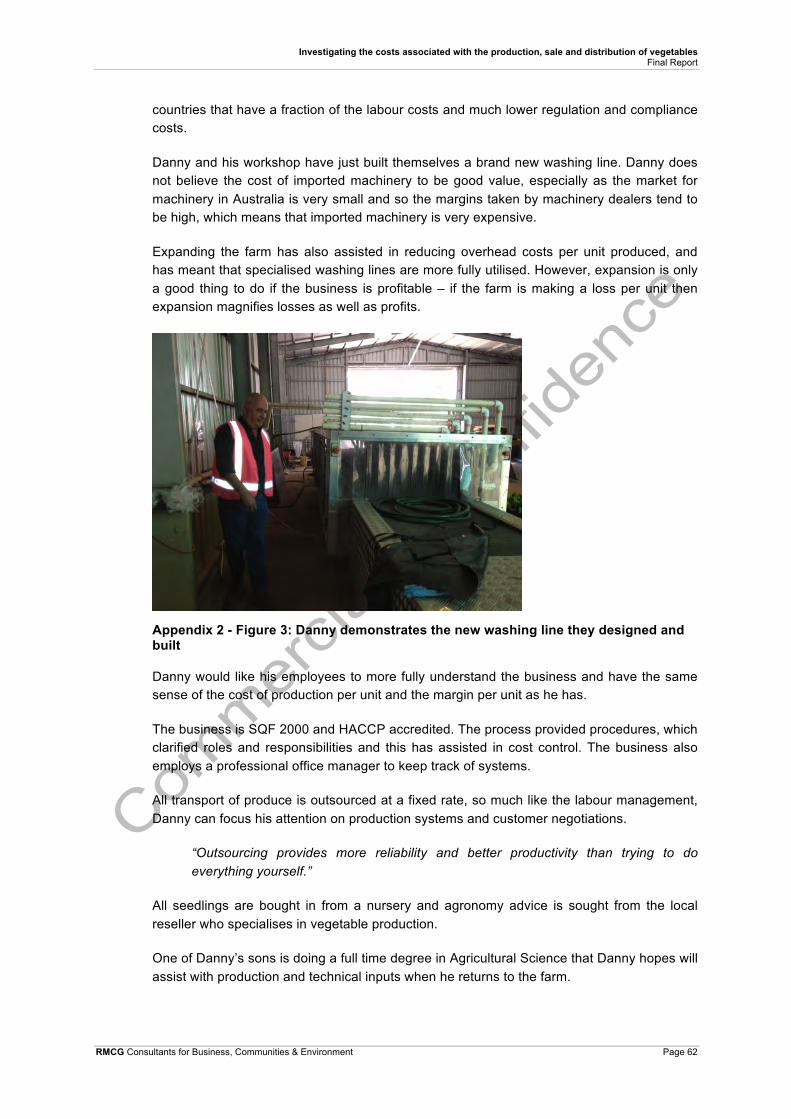
Investigating the costs associated with the production, sale and distribution of vegetables Final Report
RMCG Consultants for Business, Communities & Environment Page 62
countries that have a fraction of the labour costs and much lower regulation and compliance costs.
Danny and his workshop have just built themselves a brand new washing line. Danny does not believe the cost of imported machinery to be good value, especially as the market for machinery in Australia is very small and so the margins taken by machinery dealers tend to be high, which means that imported machinery is very expensive.
Expanding the farm has also assisted in reducing overhead costs per unit produced, and has meant that specialised washing lines are more fully utilised. However, expansion is only a good thing to do if the business is profitable – if the farm is making a loss per unit then expansion magnifies losses as well as profits.
Appendix 2 - Figure 3: Danny demonstrates the new washing line they designed and built
Danny would like his employees to more fully understand the business and have the same sense of the cost of production per unit and the margin per unit as he has.
The business is SQF 2000 and HACCP accredited. The process provided procedures, which clarified roles and responsibilities and this has assisted in cost control. The business also employs a professional office manager to keep track of systems.
All transport of produce is outsourced at a fixed rate, so much like the labour management, Danny can focus his attention on production systems and customer negotiations.
“Outsourcing provides more reliability and better productivity than trying to do everything yourself.”
All seedlings are bought in from a nursery and agronomy advice is sought from the local reseller who specialises in vegetable production.
One of Danny’s sons is doing a full time degree in Agricultural Science that Danny hopes will assist with production and technical inputs when he returns to the farm.

Investigating the costs associated with the production, sale and distribution of vegetables Final Report
RMCG Consultants for Business, Communities & Environment Page 63
1.7 Barriers that needed to be overcome or additional resources required
Danny identified that many potential workers were not sufficiently motivated and preferred an “easier life” than working in vegetables and that many were unreliable and or difficult to manage. He has transferred the human resources management to contract labour firms and employs four firms to provide him with workers as and when needed.
The cost of getting produce to market is a significant barrier, as is the need to better understand consumer needs and wants and how this is changing preferences for vegetables.
1.8 Key outcomes – what has been the result of having made the adaptation?
Expansion has enabled the business to share overhead costs associated with running the business, machinery and packing over a greater number of units of production, which has lowered the cost of production.
Outsourcing labour to an employment agency has reduced employment headaches and the workload associated with managing individuals. However, training is an ongoing need.
Designing and making the farm’s machinery has tailored the machinery to the product lines at a reasonable cost, but requires high skills in this area.
1.9 The future
Key needs are to:
§ Continue to expand the business
§ Meet with the next generation and set business goals and joint vision
§ Develop new retail market at this site
§ Develop and work on succession plans
1.10 Lessons learnt / key messages – what are the key messages or conclusions that can be drawn from this example?
The main messages are that:
§ Expansion has potential to lower costs, when the business is profitable
§ Recognise succession planning is an ongoing task, that must be explicitly addressed, agreed and documented every time assets or people change
§ Focus on strengths such as machinery skills, pays dividends

Investigating the costs associated with the production, sale and distribution of vegetables Final Report
RMCG Consultants for Business, Communities & Environment Page 64
Case Study 2: “Increasing value not area”
2.1 The business
Hi Tech Hydroponics is a business specialising in the production and marketing of fancy lettuce varieties. It is owned and managed by Mr Dino Musolino.
Dino has won a variety of awards, including the Premiers Food Award for Excellence, and the inaugural AUS Veg National Australian Bank Grower of the Year award. Dino has also been involved as a councilor in local government for 17 years and recently stood for the federal election.
The Musolino group also wholesale vegetables including: baby spinach, cabbage, cauliflower, eggplant, lettuce, peeled vegetables, pumpkin, salad mix, swede, tomatoes and turnip.
The business is located in Virginia and Dino has been in business since 1997 after leaving a 400 ha farm of field production family business.
Appendix 2 - Figure 4: The business produces hydroponic protected crop lettuce

Investigating the costs associated with the production, sale and distribution of vegetables Final Report
RMCG Consultants for Business, Communities & Environment Page 65
2.2 The situation – what were they doing and how?
After leaving the family business of field grown vegetable production Dino started with 0.4 ha (1 acre) of hydroponic lettuce. By 2000 this had expanded to 1 ha (2.5 acres) of lettuce with a significant turnover and a healthy profit. The workforce included three people plus casuals.
Dino believes that scale, in terms of area, is not the way to make money, he believes that producing quality produce through small sized family run blocks is the most profitable form of production. This is because having owners intimately involved and on the premises is important to get the attention to detail and commitment necessary for top quality production.
Dino believes that Council land use planning frequently fails to recognise the importance of needing to have small family run properties that are necessary to achieve “hands on” crop management, timing, land management, pest and disease control and clean well maintained properties.
Dino believes that 1 ha sized greenhouse properties producing top quality produce, with a dwelling can generate profits of approximately $100K and support a family. And that this is a sustainable option for the area and community.
2.3 The challenges
The challenge for Dino was to build a new business from a small area; he has achieved this with growing hydroponic lettuce under plastic and has now successfully expanded the business through vegetable wholesaling. The business now employ thirty people directly and has a greenhouse production area of around 2.8 ha (7 acres), a packing/washing plant, and a field production area of 80 ha for cauliflowers and cabbage.
Appendix 2 - Figure 5: The processing area

Investigating the costs associated with the production, sale and distribution of vegetables Final Report
RMCG Consultants for Business, Communities & Environment Page 66
The business has expanded from production of vegetables to value adding of vegetables.
One challenge has been getting permanent residency for his Indian crop production manager. Dino has had a fantastic manager for over four years, but the manager is unable to get permanent residency unless he has a PhD or BSc in horticulture. The manager has had four years of training and is a proven performer. Even though they produce lettuce all year round, the Department of Agriculture considers horticulture a seasonal activity. The situation is made even more ridiculous in that if his manager was employed as a nurseryman there would be no problem, because nursery is considered non-seasonal. Dino has spent around $20,000 in legal fees to try and keep his manager.
Labour is the biggest single cost for the business and Dino follows a rigorous process to make sure he employs the right people. He interviews them and then if suitable gives them a trial period of paid employment, he normally can tell whether they are suitable for the job after a few days. Many good employees go on to start their own business.
Dino does not believe in advertising for labour, as this tends to waste a lot of time. All employees are employed directly rather than through labour hire firms.
Power costs are significant for the pumping of bore water, cooling and are currently approximately $6,000 per month for the two sites. They have installed $150K worth of solar panels that are saving $40K/year in costs. Dino believes these should be compulsory systems for all new buildings.
Chemical and fertiliser costs are also significant. Overhead costs such as rates, insurances and machinery are not a large issue for the business.
2.4 The strategy / execution
The strategy was to focus on quality, through small-scale intensive hydroponic greenhouse crop production. The owner believes in making sure that produce is top quality and in achieving the best prices and not oversupplying the markets. Most money is made when things are in short supply.
Dino believes quality drives profit and that many businesses would be better off by producing less crop, but higher quality and higher value.
Dino’s strategy to build his business is outlined in the table below.
Appendix 2 - Table 1: Business growth
Year Business focus
1997 Started the business with 0.4 ha of hydroponic lettuce grown under plastic
2000 Expanded to 1 ha of lettuce
2005 Purchased an additional 1.4 ha across the road and developed hydroponic greenhouses in stages over the next two years
2013 2.8 ha hydroponic lettuce plus pre-packing, wholesaling and field crops

Investigating the costs associated with the production, sale and distribution of vegetables Final Report
RMCG Consultants for Business, Communities & Environment Page 67
Dino uses his own hydroponic system they developed themselves and believes it is the best system in Australia. A major feature of the system is that there is a very high crop rotation, planting to harvesting being only 3 weeks in summer. This means that they produce 8 crops per year from the same area and produce all year round.
There is very little waste in the system and quality is the prime focus.
2.5 Key outcomes – what has been the result of having made the adaptation?
Quality and high rotation through a controlled environment has meant that the market has demanded more of their produce and Dino and his family have used this to drive and expand their business growth.
Dino believes that plastic, especially high technology plastic can be more cost effective than glasshouses. But this needs to be demonstrated with some research to show the level of temperature, humidity and sunlight control that is possible under plastic as well as glass.
2.6 The future
Dino’s children are involved in the business and his future goals include possible political career or retirement. He does not intend to sell the business.
2.7 Lessons learnt / key messages – what are the key messages or conclusions that can be drawn from this example? § Income can be grown through increasing yield, quality and frequent crop rotations
through hydroponic protected crop systems
§ A focus on systems for quality and then achieving and delivering high quality creates demand for the produce, high profit and business growth
§ Growers can derive more profit per unit, rather than produce more units
§ Further value can be created by pre-packing and wholesaling, but these can require different skills to growing
§ A discussion with a local horticultural service provider highlighted that there is enormous growth in hydroponic protected crop systems in the Northern Adelaide Plains. This has grown from a low base over the last ten years. This has resulted in critical mass and expertise being developed, which is overcoming some of the earlier technical limitations and mistakes that were made with early systems.
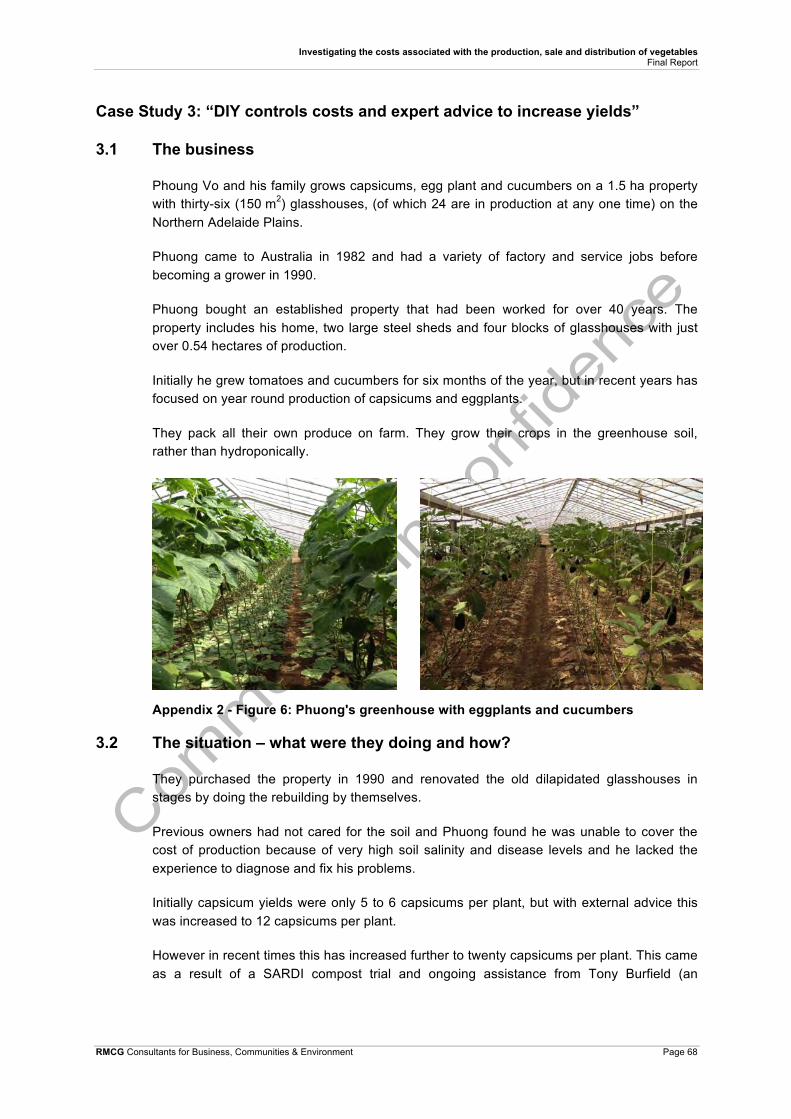
Investigating the costs associated with the production, sale and distribution of vegetables Final Report
RMCG Consultants for Business, Communities & Environment Page 68
Case Study 3: “DIY controls costs and expert advice to increase yields”
3.1 The business
Phoung Vo and his family grows capsicums, egg plant and cucumbers on a 1.5 ha property with thirty-six (150 m2) glasshouses, (of which 24 are in production at any one time) on the Northern Adelaide Plains.
Phuong came to Australia in 1982 and had a variety of factory and service jobs before becoming a grower in 1990.
Phuong bought an established property that had been worked for over 40 years. The property includes his home, two large steel sheds and four blocks of glasshouses with just over 0.54 hectares of production.
Initially he grew tomatoes and cucumbers for six months of the year, but in recent years has focused on year round production of capsicums and eggplants.
They pack all their own produce on farm. They grow their crops in the greenhouse soil, rather than hydroponically.
Appendix 2 - Figure 6: Phuong's greenhouse with eggplants and cucumbers
3.2 The situation – what were they doing and how?
They purchased the property in 1990 and renovated the old dilapidated glasshouses in stages by doing the rebuilding by themselves.
Previous owners had not cared for the soil and Phuong found he was unable to cover the cost of production because of very high soil salinity and disease levels and he lacked the experience to diagnose and fix his problems.
Initially capsicum yields were only 5 to 6 capsicums per plant, but with external advice this was increased to 12 capsicums per plant.
However in recent times this has increased further to twenty capsicums per plant. This came as a result of a SARDI compost trial and ongoing assistance from Tony Burfield (an

Investigating the costs associated with the production, sale and distribution of vegetables Final Report
RMCG Consultants for Business, Communities & Environment Page 70
integrated farming consultant). Phuong has now learned how to fix the soil and make his farm profitable. He has since assisted many other growers to follow in his footsteps.
3.3 The challenges
Apart from the soil challenges, Phuong's glasshouses are quite low, about 1.8 m to the gutter, and they have limited options for climate control, so they tend to be too warm on hot days and too cold at night and in cooler cloudy weather.
The low ceiling also makes it hard to ventilate excess heat and humidity, however, the sides and ends open to compensate for this.
The cost of electricity is also a challenge and his bill has doubled in the last few years. Phuong uses bore water, saving him from the expense of mains water. Many other growers now supplement their water by capturing and using of rainwater.
The cost of machinery is managed by purchasing second hand equipment. The cost of machinery is managed by purchasing second hand equipment and Phuong servicing everything himself. Phuong is a qualified mechanic and has the skills to fix almost anything.
Labour costs are managed by the use of family labour for all operations – growing and packing. Sometimes he uses a contractor to help with picking, for example, when he is overseas.
Fertiliser is also a big cost, but has been greatly reduced from $7,500/y to a total combined cost of $2,500/y by using compost.
Marketing is a challenge, and being a relatively small producer there is little negotiating power and the major supermarkets can control prices. Phuong's approach is to sell to merchant wholesalers with whom he has developed close relationships with over the last twenty years. His focus on consistent high quality produce has helped in the marketing.
Phuong believes it is important to live on the property to protect his livelihood, as there have been occasions when thieves enter greenhouses and steal crops, especially when prices are high.
Another challenge is that the number of new growers and area of production is expanding and increasing competition in the market.
3.4 The Strategy / Execution
The Strategy is best described by Tony Burfield in his report on the HAL funded capsicums project. This is available at http://www.growingcapsicums.com.au/PhuongsFarm.html
And also at: http://ausveg.com.au/intranet/technical-insights/docs/130055_VG09070.pdf

Investigating the costs associated with the production, sale and distribution of vegetables Final Report
RMCG Consultants for Business, Communities & Environment Page 71
An extract of this work is reproduced below:
Analyzing the impact Phuong’s changed farming practices on yields, particularly in soil health management, has shed some interesting light on very significant achievements that can benefit other growers. This section takes a closer look at his practices and how they are related to bottom line benefits in terms of costs vs yield benefits at an estimated selling price of $1.80/kg for his capsicums.
Phuong mostly plants his capsicum seedlings in July and the crops tend to be in the ground for about 10 months with 6-7 months of picking (a May planting takes about 4 months till picking and a late planting in October or November takes 3 months). A good crop now will produce 3 fruit sets for Phuong with 5-7 fruit per set. So most of the time Phuong averages 20+ good quality capsicums per plant. This level of productivity was not always the story. Ten years ago Phuong was more likely to get 6-7 fruit per plant and 1-2 sets only. Back then his first grade pick averaged around 75 % but is now about 91%. Things began changing significantly about seven years ago in the way Phuong managed his farm and they have returned very real benefits from his learning and application. He radically changed his approach to preparing for each planting after hosting compost trials conducted by SARDI, and irrigation and salinity trials conducted by the local Natural Resource Management team.
The benefit of these changes is highlighted in two videos (Soil pit workshop & Phuong and SARDI researcher review benefits under ‘Soil Health Management’ in the Resource Index). Lessons learned from these trials caused Phuong to abandon chicken manure in favour of organically certified recycled green organics/animal manure compost. He also learned to modify his irrigation program and closely target his watering to meet plant needs in response to weather and changing soil conditions and root profiles. As Phuong’s soil has improved he has reduced his plant density making it
easier to achieve good coverage with pesticide sprays. The local area has suffered from increasing pesticide resistance problems, but Phuong has been able to keep his losses in check compared to most other growers. Because resistance problems are becoming increasingly severe throughout the region Phuong is likely to adopt an effective bio-control program for next years capsicum crop. (see bio-control videos in Resource Index under ‘Managing an IPM program’).

Investigating the costs associated with the production, sale and distribution of vegetables Final Report
RMCG Consultants for Business, Communities & Environment Page 72
3.5 Key outcomes – what has been the result of having made the adaptation?
Below is a summary of Phuong’s planting and production output from a block of 8 small glasshouses.
Output before improving production practices (Crop value at $1.80/kg)
Glasshouse size 150m m2 x 8 glasshouses 1,200m2 Plants per block (600 per house) 4800 Plants per m2 4 Average number of fruit per plant 10 Total fruit per block 48,000 Average Kg of fruit per plant 3.75 Total Kg per block 18,000 $32,400
Current output at the same value
Glasshouse size 150m m2 x 8 glasshouses 1,200m2 Plants per block (600 per house) 3996 Plants per m2 3.33 Average number of fruit per plant 20 Total fruit per block 79,920 Average Kg of fruit per plant 7.5 Total Kg per block 29,970 $53,946
Summary of Key Indicators of Achievement: • The number of plants per square metre decreased from 4 to 3.33 (a reduction of 16.8%). • However the number of fruit per plant increased from 10 to 20 (an increase of 100%). • Clearly the increase in fruit per plant is a key benefit of this improved management system. • Kilograms per square metre were reasonably high (for a glasshouse operation) at 15 Kgs per
sq metre. However as a result of the changes this increased to 24.98 Kgs per square metre (an increase of 66.5%).
• Farm returns increased significantly from $32,400 to $53,946 an increase of 66.5%
Phuong’s Farm (Before Improvements)
Phuong’s Farm (After Improvements)
Number of plants per square metre
4.0 3.33
Fruit per plant 10 20.0 Kilograms per square metre 15 24.975 Farm Returns per square metre $27.00 $44.96 IMPROVEMENT IN TOTAL YIELD + 11,970 Kgs + $21,546 at 1.80/kg + %66.5
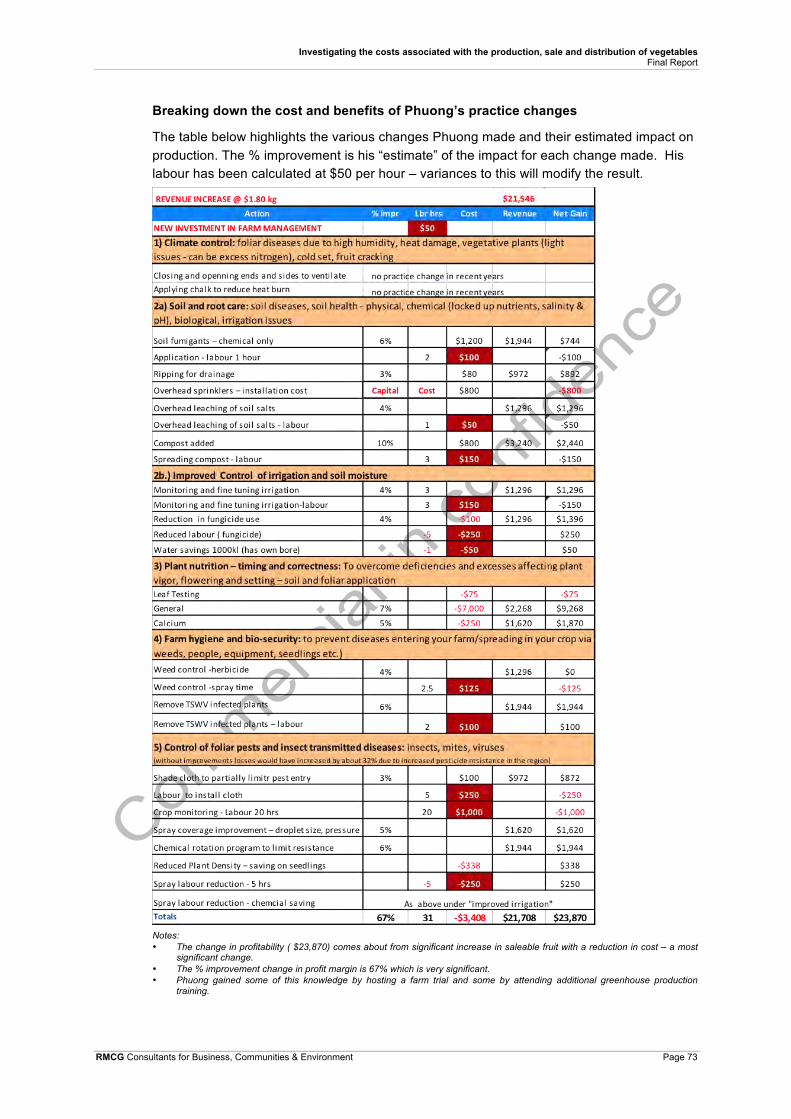
Investigating the costs associated with the production, sale and distribution of vegetables Final Report
RMCG Consultants for Business, Communities & Environment Page 73
Breaking down the cost and benefits of Phuong’s practice changes
The table below highlights the various changes Phuong made and their estimated impact on production. The % improvement is his “estimate” of the impact for each change made. His labour has been calculated at $50 per hour – variances to this will modify the result.
Notes: • The change in profitability ( $23,870) comes about from significant increase in saleable fruit with a reduction in cost – a most
significant change. • The % improvement change in profit margin is 67% which is very significant. • Phuong gained some of this knowledge by hosting a farm trial and some by attending additional greenhouse production
training.
Investigating the costs associated with the production, sale and distribution of vegetables Final Report
RMCG Consultants for Business, Communities & Environment Page 74
3.6 The future
When Phuong started to learn about growing crops he found that information from other growers was only “half right” whereas information from technical experts like Tony was much more reliable.
He believes he is always learning and is now developing skills in IPM, with assistance from James Altmann Biological Services.
Phuong believes there is still plenty of potential to lift production and also to value add, perhaps even look at a retail site in the local area.
He believes in sharing information so that growers can learn from each other and improving quality grows the whole market.
3.7 Lessons learnt / key messages – what are the key messages or conclusions that can be drawn from this example?
Phuong has demonstrated the benefits of engaging with leading experts and enjoys the challenge of continually learning to be a better and more profitable grower.
Phuong and his family have shown how providing most of the labour themselves can control costs on a small property. This includes rebuilding the greenhouses, machinery maintenance and modifications as well as the usual growing and packing.
Improving yields and quality and moving to all year round production have also increased the output and the return from the capital invested in the greenhouses.

Investigating the costs associated with the production, sale and distribution of vegetables Final Report
RMCG Consultants for Business, Communities & Environment Page 75
Case Study 4: “IPM results in better yield and quality”
4.1 The business
Vandy Yon and his family grow capsicums and cucumbers with 2.3 ha of plastic greenhouse production on the Northern Adelaide Plains.
They have been in business since 1998. They started with one greenhouse that they built themselves and later used contractors to assist with greenhouse construction.
On average they have two permanent casual staff (seasonal) and two extra workers when needed.
4.2 The situation – what were they doing and how?
The business was suffering from low yields. They were losing 50% to 80% of their crop due to virus and thrips when they were uncontrolled.
They could only pick for 2 months before the crop was finished, but now with the switch to a biological control system or integrated pest management (IPM) the plants are much more healthy and can be picked for 12 months or more, resulting in much higher yields and much better quality.
The IPM system has been applied by specialist IPM consultants and has been very successful.
4.3 The challenges
They found the switch to biological control more expensive than chemical control, but grew better quality and higher yielding crops.
Appendix 2 - Figure 7: Vandy is a producer of quality capsicums
They believe that they now control 99% of all pests, which they never need to spray, except for white fly. It took about 12 months to reduce the virus vectors (thrips) on capsicums by using break crops of cucumbers.
Labour costs remain the single biggest cost for the business. But water, fertilisers and chemicals are all significant. The farm is supplied with treated water from the Bolivar
Investigating the costs associated with the production, sale and distribution of vegetables Final Report
RMCG Consultants for Business, Communities & Environment Page 76
treatment plant, which has a relatively high salinity that needs careful management. Vandy is concerned about future water costs rising.
The biggest concern facing Vandy is the low margins as a result of low prices; he believes that he needs to get $25 to $30 per 10 kg carton of capsicums to make a decent living. But average prices have been closer to $16 to $18 per carton.
He commented that when soil is “new” then it is relatively easy to make money for the first five years, but after continuous cropping the soil becomes “tired” and requires expensive fumigation, nematode control, salinity management, composting etc. to maintain production.
Vandy uses a contractor to apply compost in the greenhouses to help improve the soil. Soil fumigation costs him around $2,500/year for a 36 m by 45 m greenhouse or $1.45/m2 and IPM costs around $3,000/year for the same area or $1.74/m2.
Electricity costs around $1,000/ quarter, which is mostly for water pumping and packing.
Another costs is plastic replacement on the greenhouses, spring 2013 has been particularly windy he finds, barring extreme storms, that it lasts around 4-5 years and it costs around $1,000 per greenhouse to replace.
4.4 The strategy / execution
The strategy to use external IPM consultants to help lift yield and quality has been very successful with a 30% improvement in cropping levels and quality. Vandy also enjoys not having to spray.
Vandy maintains quality by buying in seedlings from a reputable supplier to ensure greater consistency and health of seedlings.
4.5 Key outcomes – what has been the result of having made the adaptation
Higher yields and better quality have been a positive outcome for the move to biological control and also less chemicals in the system, which is a plus for the grower and the general public. The produce is now almost “organic”.
4.6 The future
Vandy believes that there are enormous pressures on growers with current low prices and he needs to keep improving the business to stay viable. Future options he is considering include the use of polycarbonates as an alternative to plastic greenhouses to save money on plastic replacement.
He is not considering hydroponics because of the high capital costs and the fact that his existing greenhouses are unsuitable (low height and the wrong span).
Vandy would like to see government support for IPM adoption and that this would reduce costs for all growers, as the risk of pest and disease spread would be lower and it would also provide public benefits, as there is less risk of chemical pollution and lower residues on
Investigating the costs associated with the production, sale and distribution of vegetables Final Report
RMCG Consultants for Business, Communities & Environment Page 77
crops. The risk of chemical residues on produce affects everyone in the industry, regardless of an individual’s standard of care and this would minimise this risk enormously.
It would take community action and coordination to achieve this across the Northern Adelaide Plains, but the community benefits would be significant. Once established, Vandy believes IPM would become standard practice for all growers.
Vandy also is concerned about future soil sustainability, and the difficulty in attracting future generations to the industry given the large labour requirement. He sees hydroponics as a potential solution to soil issues and providing the opportunity for additional mechanisation.
Other topics of interest to Vandy include:
§ Soil research so that less expensive remediation is available. This includes not losing production time by planting bio-fumigants, which take too long in the greenhouse and result in loss of a commercial crop.
§ New greenhouse designs with higher structures, ventilation and better climate control. These are also more comfortable work environments. But enormous capital investment is required to implement these.
4.7 Lessons learnt / key messages – what are the key messages or conclusions that can be drawn from this example?
The key messages are that continuous improvement is needed to maintain profit margins. Vandy has achieved this through the use of IPM and improving soil management.
However, he considers that this is not enough and in the future horticultural businesses will need to make large investments to maintain competitiveness with hydroponics and modern greenhouses.
This poses a risk and opportunity for many of the existing producers in the Northern Adelaide Plains.
There is an important question with regard to hydroponics versus soil production, considering all costs and benefits and level of risk. There are a variety of views, with some experts believing that with new soil management techniques soil can still be competitive and may offer other advantages.
Investigating the costs associated with the production, sale and distribution of vegetables Final Report
RMCG Consultants for Business, Communities & Environment Page 78
Case Study 5: “Customer needs define scale, quality and costs”
5.1 The business
This business is a major vegetable producer that has a large share of the market and because of the relatively small industry prefers its crop and its identity to remain anonymous.
It is a family business that has been in operation for four generations.
Pasture and cattle are grown as break crops between vegetable crops to help ensure a good rotation protects soil health.
The business sells vegetables to all capital cities in the major states and also exports to Asia. The marketing strategy is to aim to provide the best quality product to one wholesaler in each of the capital cities and to provide a pre-packed product in a number of different product lines.
5.2 The situation – what were they doing and how?
They produce vegetables at two locations, one of which depends on irrigation water from the Murray-Darling system. Up until the drought they produced two lines of vegetables, but the drought had a severe impact and now they specialise in one crop, but the two locations provides some geographic risk management and also a longer harvest spread.
The decision to drop the second crop was also heavily influenced by its much higher labour requirement and the fact that they were engaged in marketing and packing for 12 months of the year.
By focussing on one crop they now have a three-month window for maintenance and preparation with nine months of production, packing and marketing.
They used to employ an agricultural engineer to design, manufacture and modify machinery, but now find that they can buy in this expertise when needed on a project-by-project basis. The owners are very “hands on” and interested in the continual development and improvement of machinery to reduce labour.
The trend across the industry is that they have seen the product volumes increase, product quality improve and product consistency improve. This has occurred as the number of buyers and growers has reduced. They estimate the number of growers is now only around 5% of the number 30 years ago.
5.3 The challenges
They believe that the supermarket duopoly has a much too high market share and that the market control implemented by government in the USA (anti-trust laws that act against monopoly powers) would provide a much better and fairer market framework than the Australian situation, where the two major supermarkets control so much of the market.
The cost of production is a major challenge in Australia due to the harsh climatic conditions that are not suitable to many types of vegetables in Australia (for example, the need for

Investigating the costs associated with the production, sale and distribution of vegetables Final Report
RMCG Consultants for Business, Communities & Environment Page 79
irrigation) and also the high labour costs. They note that the cost of production is now more expensive than Holland, which traditionally had higher labour costs.
Previously the business exported to Europe in their offseason, but this has now has stopped due to competition from South Africa and northern Africa, which has the advantage of much lower labour costs.
They believe that they cannot grow much more in scale due to the domestic market limitations. They are already a large supplier and the market would not want to have less choice in grower suppliers as this poses an additional risk to them.
When they were producing two different types of crops the business employed forty workers. There are now approximately six permanents, as they have been able to mechanise much of the harvesting operation and focus on the one crop.
They have a practice of producing detailed cash flow forecasts for their bank and believe in keeping their financiers continually informed.
5.4 The strategy / execution
The business places a high value on evaluating and where appropriate importing the latest technology and ideas from larger producing countries such as Europe and USA. These regions have much larger industries, which means that there is more effort and more brainpower devoted to finding solutions and developing the next wave in technologies that can be applied in Australia.
“It is important to keep up to date with global research and development in your crops.”
The business has engaged top European agronomists to visit their farms and provide advice on growing and mechanisation. They have successfully mechanised the harvesting and packing of much of their production.
They believe that Australian research and development should focus on production issues rather than marketing or promotion10. They believe that research and development should look at the production issues facing Australian conditions such as the unique pest and disease pressures and climate challenges.
Their focus is to provide a consistent top quality product in reliable quantities to match customers’ needs. They have established long term trusted relationships with their nominated wholesalers and have a strong belief in telling the truth about their product. If its better or worse than the usual standard then the wholesaler will know this before it arrives. Long term trusted relationships result in better returns.
They believe that being a larger grower provides the advantage of producing a more consistent reliable product that lots of small farms could. Small producers struggle with consistency and also have a high transaction costs in selling their produce in small lots.
Their goal is to be as professional as the Dutch growers and their systems of production.
10 This is discussed further in the section below on key messages

Investigating the costs associated with the production, sale and distribution of vegetables Final Report
RMCG Consultants for Business, Communities & Environment Page 80
However, they have found that European equipment does need to be modified to meet Australian conditions, for example, the packing equipment has needed to incorporate more cooling and also shorter runs and a more diverse range of packaged product lines compared to European machines.
They do sometimes wonder if they pay the price for being early innovators and that they may be better off being more followers and let others do more of the expensive development work.
The cost of production is continually tracked and analysed.
Labour bills are increase by around 50% during harvesting periods due to overtime payments. Managing labour is easy if you get the right people. Spending time in getting the right people is the best investment.
Mechanisation has reduced the labour cost per kg of production by around 25% of previous levels, even though yields for mechanically harvested crops tend to be lower.
The farm has moved to centre pivot irrigation at one site to reduce labour costs in moving irrigation pipes.
Appendix 2 - Figure 8: Large spray unit provides high levels of efficiency
5.5 Key outcomes – what has been the result of having made the adaptation?
The key outcomes have been reduced labour due to the introduction of mechanical harvesting, and a focus on one type of vegetable.
Seeking and applying technology from international best practice have supported an approach of continuous improvement.

Investigating the costs associated with the production, sale and distribution of vegetables Final Report
RMCG Consultants for Business, Communities & Environment Page 81
The focus on quality has also meant that markets seek the product and the business works hard to develop and maintain mutually beneficial relationships with its customers.
5.6 The future
Succession planning is an ongoing task and there are clear arrangements in place for the next generation to join the business.
The business owners will continue to travel to Europe and the USA to get new ideas on how to lower the cost of production and improve quality.
There will be some expansion of around 20% over the next five years, but potential is limited due to the limited size of the Australian market.
There is also a focus on improving yields. The grower commented that the yields had doubled in the UK since the early 1990s and there was some potential for around a 15% gain.
Internationally the industry will find it hard to compete due to the high labour costs, low critical mass and the need to irrigate and apply pesticides more often in Australia.
5.7 Lessons learnt / key messages – what are the key messages or conclusions that can be drawn from this example?
The grower believes in the following key philosophies:
§ Ownership of the business means that when things are tough you have to find a way (necessity is the mother of invention)
§ Quality sells itself and reduces the cost of production
§ No surprises policy with the bank pays dividends
§ Same policy with customers. Tell the truth. Develop trusted relationships with wholesalers. Be valuable to them.
§ Find out who the best grower is by going to the market and talking to wholesalers, then go and learn from them
§ Get external advice (seek the best available in the world)
§ HAL investments should focus on production and quality, rather than market development. In particular, there is no other body placed to do the production research, while there are multiple sellers investing in focussed marketing.
§ Results from marketing expenditure are very hard to quantify and the market changes so rapidly that any findings are frequently out of date. For example, they could have spent a fortune in investigating exports to Europe, but at the end of the day it will only happen if the price is competitive. If our price is uncompetitive then that expenditure is wasted. If it is competitive then there will be a private marketer focussed on developing the market.

Investigating the costs associated with the production, sale and distribution of vegetables Final Report
RMCG Consultants for Business, Communities & Environment Page 82
Case Study 6: “Creating value through product improvement”
6.1 The Business
Swanport Harvest grows, packs and markets broccoli, cauliflowers and iceberg lettuce. They are located at Murray Bridge in SA. This is one of a few places in Australia where lettuce can be grown year-round.
Appendix 2 - Figure 9: Field harvesting lettuce
Appendix 2 - Figure 10: Irrigation system and paddock layout

Investigating the costs associated with the production, sale and distribution of vegetables Final Report
RMCG Consultants for Business, Communities & Environment Page 83
Don and Kathy Ruggiero manage the business. Don joined the family business thirty-eight years ago and took over sixteen years ago. Don’s parents started the farm with 16 ha at Murray Bridge, initially concentrating on onions and lettuce.
Fourteen years ago Don created the “STAY CRISP” brand of iceberg lettuce, which has becoming the dominant lettuce brand in South Australia and the NT.
See http://www.staycrisp.com.au/products.html
Today there are around 64 ha in production, which is triple cropped, plus supplies from other licensed growers.
The business employs around forty to fifty people.
6.2 The situation – what were they doing and how?
The tight margins of growing a commodity that was indistinguishable from others led to the idea to develop branded bagged lettuce.
There are rewards in creating consistent quality produce, as customers learn to trust the brand. Consistency of supply and reliable quantities are necessary to meet the needs of the supermarkets.
Continued brand presence must occur all year round and the drought in the Murray posed a major threat to the business. They made the decision to purchase temporary water at very high prices in order to maintain our position in the market place. But they did not expect the drought to continue for as long as it did.
6.3 The challenges
Drought
The drought on the Murray River resulted in low and zero water allocations and the business was forced to spend $800,000 on buying water. They decided to stop growing onions and focus on lettuce.
The key impact of the drought though was that other non affected regions planted more vegetables and overcompensated and oversupplied the market for several years, so the cost of the drought ended up being both the debt for water purchases and also lower margins due to lower prices.
Lower prices resulted in losses of $1.2 million and Don wonders, in hindsight, if he would have been better off getting out of the business at that time.
Cost of production
Don carefully tracks the cost of production of each of his product lines and is concerned that current merchant / provedore practices of demanding the lowest prices are driving prices down to below the cost of production. For example broccoli at $2/kg delivered is not profitable and they are considering stopping production.
Investigating the costs associated with the production, sale and distribution of vegetables Final Report
RMCG Consultants for Business, Communities & Environment Page 84
Marketing
Don believes that the wholesale market has become the dumping ground for inferior product. Another concern is that there is frequently over supply from Victoria that floods the much smaller SA market and lowers prices.
They avoid this by producing quality that commands better prices and is sought after by large scale customers, which helps to reduce transaction costs. Large supermarkets have been the best customers with clear arrangements, and fair prices. However, Don is concerned that if the supermarkets become more aggressive then the business could be exposed.
The initial switched to the bagged branded lettuce was not easy, as it was difficult to establish a premium product in a traditional commodity market. However, the additional costs in producing the premium product is now recognised as added value by customers and the product is well established and recognised, including the end consumers.
The number of buyers in the market continues to fall. Ten or twenty years ago there were around two hundred buyers; there are now around thirty and the trend continues. The major supermarkets have 80 to 90% of the volume.
Cost of Production
Don monitors costs and knows his cost of production intimately. He believes their cost of production is almost as low as it can go.
One area that it may be possible to reduce costs is by the use of direct seeding rather than buying in transplants. This could save 20-30c/Kg on broccoli, but does come at a higher risk of lower yields.
Some costs cannot be skimped upon because they compromise product quality or risk yield. Yields are already at best practice levels and the focus on quality means there is very little rejects in lines of production.
6.4 The strategy / execution
Recognising that growing and marketing are two very different skills is the key to the success of this business. Growing is now delegated almost entirely to the farm manager, who has autonomy in a lot of the decision making. In fact, Don is encouraging his manager to develop his own property.
The key focus of the business is ensuring that their position in the market is nurtured and grows through building brand loyalty and value. The business also develops long term pricing arrangements for its customers so that they can offer short term “specials”, while not compromising long-term average prices.
By creating the unique “STAY CRISP” brand and packaging for ice berg lettuce Don has been able to have more control over price and production levels with direct sales to the larger supermarkets. He is now buying in from other growers to continue to meet the demand for the product.

Investigating the costs associated with the production, sale and distribution of vegetables Final Report
RMCG Consultants for Business, Communities & Environment Page 85
Each lettuce is cut and packed into modified atmosphere packaging, which extends the shelf life. Each tray of lettuce is snap cooled within an hour of harvest using vacuum cooling. This rapid chilling helps increase the shelf life.
The company delivers their produce and uses professionally designed storage and display units to avoid product damage through handling. The product reduces in-store labour costs by eliminating trimming and minimising waste.
The business employs a sales manager and has implemented comprehensive QA systems on all its production.
Appendix 2 - Figure 11: STAYCRISP brand helps create customer loyalty
6.5 Key outcomes – what has been the result of having made the adaptation
Don has attempted to develop grower networks to develop market strategies, but found this difficult. He finds growers tend to love their independence and often lack the discipline to commit to one market and tight specifications.
His approach now is to look at contracting growers and developing an interstate network.
The investment in QA systems was expensive, but worthwhile, as it has provided procedures that make tasks much easier to delegate.
6.6 The future
Don sees the future of the business in consolidation and pushing the brand more nationally.
They are also looking at new vegetable lines, to create new lines of unique branded products.
“The future is about controlling and growing to specifications.”
Investigating the costs associated with the production, sale and distribution of vegetables Final Report
RMCG Consultants for Business, Communities & Environment Page 86
Don believes that the future will see medium sized growers struggle to survive unless they can create a niche product and market. Small businesses with little labour can survive by having low overheads.
He believes that large sized businesses will come and go; they are exposed to higher risk and higher rewards. Scale will magnify profits and losses. He believes that the attention to detail that is necessary to grow perishable fresh produce of the highest quality means that there are human limits to the scale that is possible.
Future grower networks could provide marketing strength. Ten good growers meeting specification will be able to deliver to the supermarket needs; and it is possible to provide guaranteed specification, all year round supply and a guaranteed price.
6.7 Lessons learnt / key messages – what are the key messages or conclusions that can be drawn from this example?
In this business the key area of focus is marketing, and all growing is now delegated or contracted out. This is because, an enormous effort has been spent in getting the systems right and developing the quality process so that growing can be delegated.
Don believes that the relative reward on effort of management time in his business is seen to be worth 10% of time for growing, 40% of time in people management and 50% of time in marketing.
People management is a high priority, because it delivers the quality and communication needed to link the production processes to market. However, individual people management can be a distraction, if higher management is too “hands on”. Therefore, contract labour firms are used to supply manual labour.
Being in touch with the market, its demands, and how best to meet them with your product is the key. Both quality and consistency of quantity (reliability) is necessary.
For this business the priority is adding value, not reducing costs at the grower end. Paradoxically, it is increased farm costs (by packaging) that are creating reduced total costs down the supply chain that adds to the value of the crop.
Don believes that it is important to be firm with negotiations and ensure that you are talking to the right people. But the bottom line is that you need to have something that they want.
Don believes in getting professional help, they have brought in an external facilitator to brainstorm future product lines and to help develop future business strategies.
Don believes that HAL should segregate commodities so that there is, for example, a group of iceberg lettuce growers. This would make R&D investment more tightly focussed to the needs of product lines. He also notes that most growers do not know their costs and this leads to people selling at below the cost of production and compromises in quality.
Don would like HAL to invest in more market understanding, networking and trends so that growers make more informed choices.

Investigating the costs associated with the production, sale and distribution of vegetables Final Report
RMCG Consultants for Business, Communities & Environment Page 87
Case Study 7: “Technology to increase scale”
7.1 Mitri Hydroponics
The current managers of the Dimitrovich family business are 3rd generation vegetable growers who have grown cabbage cauliflowers and fresh tomatoes on 60 acres north of Perth.
Two brothers Jim and Steve own the business with their sons Michael, Danny, Pete and Stephen now taking over management responsibilities in the business.
The farm consists of 60 acres (24 ha), 48 (19 ha) under irrigation. When the sons came back to the business in 1995 the farm experienced a period of rapid growth from 65,000 plants to 250,000 plants over a period of five years. The growth was required to support additional families that were dependant on the farm operation.
The younger generation had the drive, energy and inclination to incorporate new technology such as the introduction of tape irrigation, which supported a lot of the initial intensification achieved on the property.
7.2 The situation – what were they doing and how?
Prior to the decision to further intensify through hydroponics, the main crop grown was fresh tomatoes with cauliflowers and cabbages grown in the winter months. As the demands grew on the business with more family members being involved there was a need to grow.
In 2009 the sons had an epiphany moment when while working extremely hard, prices for the winter crops plummeted and they were losing money. They understood that in the cauliflower and cabbage markets they were too small a player and not in a position to develop key relationships with customers and where at the whim of the ups and downs in the market. They had the realisation that something had to change or they would not have a future in the business.
A decision was made to intensify the operation by moving into hydroponics and to focus their efforts on one crop. The aim to achieve improved economies of scale, provide a reliable high quality product all year, potential to establish stronger relationships with customers and to achieve a business that would support the needs of the families dependant upon it.
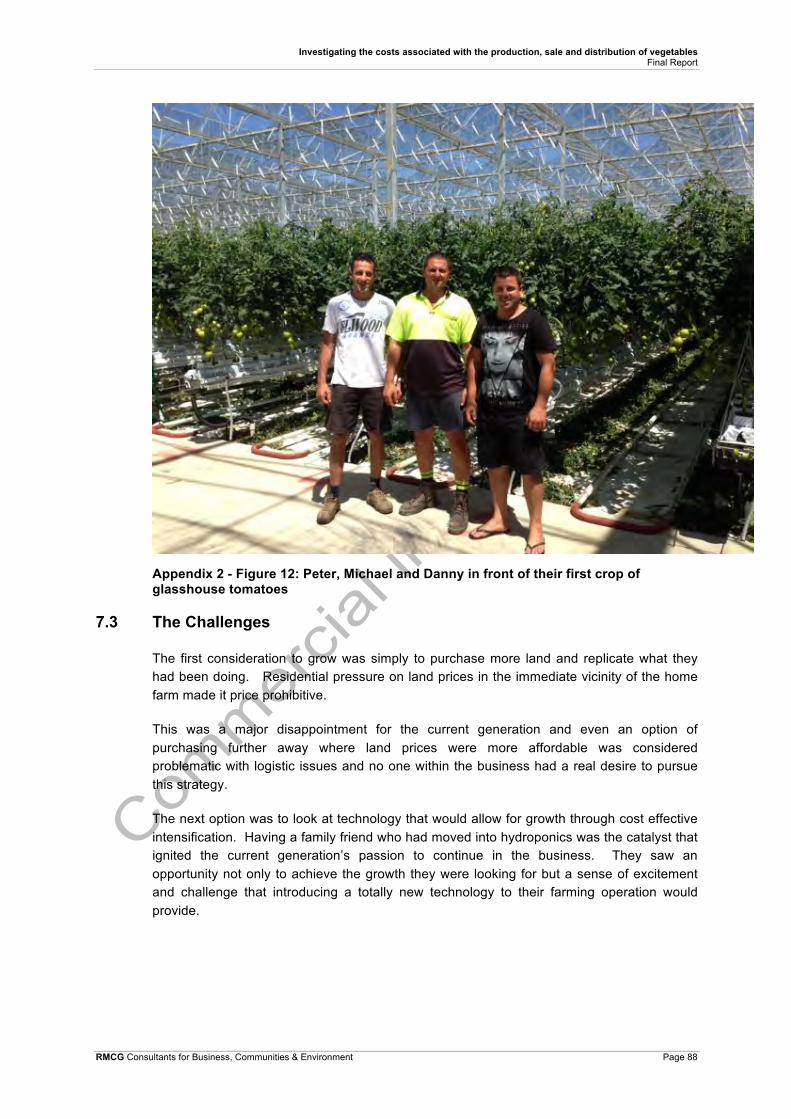
Investigating the costs associated with the production, sale and distribution of vegetables Final Report
RMCG Consultants for Business, Communities & Environment Page 88
Appendix 2 - Figure 12: Peter, Michael and Danny in front of their first crop of glasshouse tomatoes
7.3 The Challenges
The first consideration to grow was simply to purchase more land and replicate what they had been doing. Residential pressure on land prices in the immediate vicinity of the home farm made it price prohibitive.
This was a major disappointment for the current generation and even an option of purchasing further away where land prices were more affordable was considered problematic with logistic issues and no one within the business had a real desire to pursue this strategy.
The next option was to look at technology that would allow for growth through cost effective intensification. Having a family friend who had moved into hydroponics was the catalyst that ignited the current generation’s passion to continue in the business. They saw an opportunity not only to achieve the growth they were looking for but a sense of excitement and challenge that introducing a totally new technology to their farming operation would provide.

Investigating the costs associated with the production, sale and distribution of vegetables Final Report
RMCG Consultants for Business, Communities & Environment Page 89
The decision was not taken lightly as the glasshouse growing fresh tomatoes represented a considerable investment (once complete in the order of $250 to $300 per m2).
A common barrier for the new generation taking on more responsibility and wanting to do things differently is not having the support of the previous generation, which can be debilitating and often the barrier to achieve change. This was not an issue for the Dimitrovich family, with the older generation, even though still actively involved in the business, are fully supportive of investment and have handed over the decision making and responsibility to the next generation. This is a responsibility that the boys do not take lightly and are totally committed to making it successful.
“Failure is not an option!”
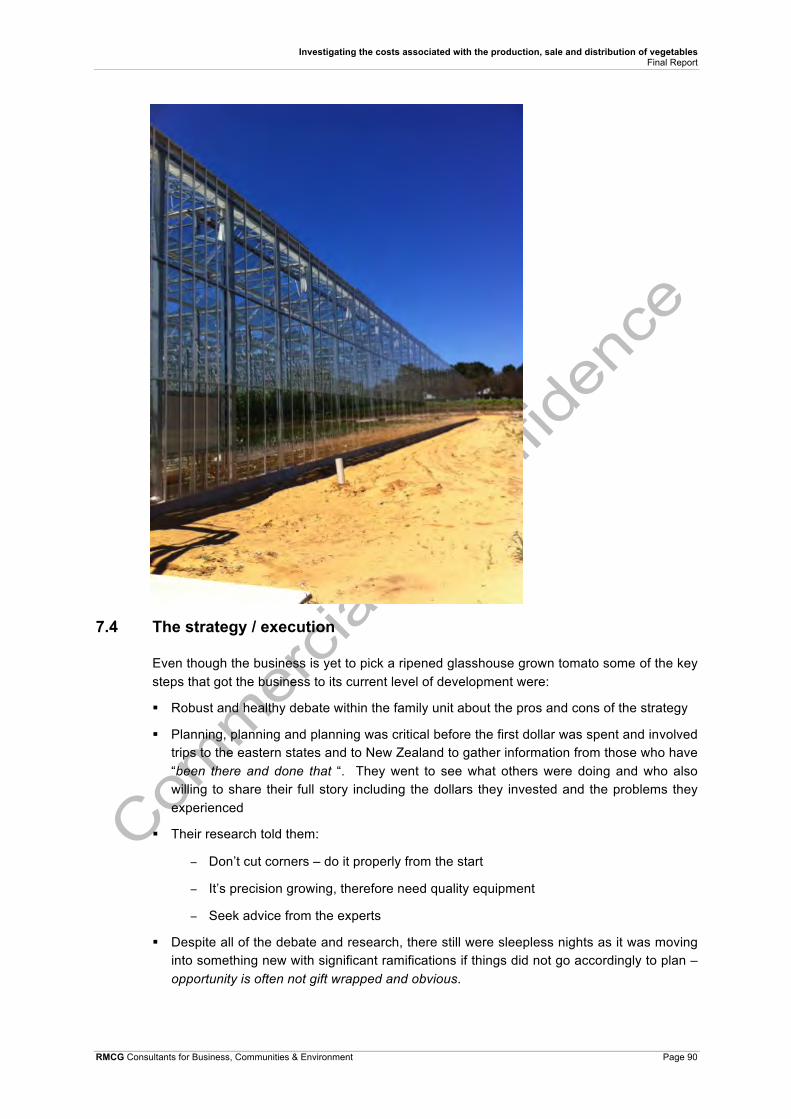
Investigating the costs associated with the production, sale and distribution of vegetables Final Report
RMCG Consultants for Business, Communities & Environment Page 90
7.4 The strategy / execution
Even though the business is yet to pick a ripened glasshouse grown tomato some of the key steps that got the business to its current level of development were:
§ Robust and healthy debate within the family unit about the pros and cons of the strategy
§ Planning, planning and planning was critical before the first dollar was spent and involved trips to the eastern states and to New Zealand to gather information from those who have “been there and done that “. They went to see what others were doing and who also willing to share their full story including the dollars they invested and the problems they experienced
§ Their research told them:
− Don’t cut corners – do it properly from the start
− It’s precision growing, therefore need quality equipment
− Seek advice from the experts
§ Despite all of the debate and research, there still were sleepless nights as it was moving into something new with significant ramifications if things did not go accordingly to plan – opportunity is often not gift wrapped and obvious.

Investigating the costs associated with the production, sale and distribution of vegetables Final Report
RMCG Consultants for Business, Communities & Environment Page 91
§ Development of a business case to present to the lenders to secure the investment dollars required
§ Had an opportunity to co invest with an equity partner, but the decision was made to retain full ownership and control. It meant more financial risk but was considered balanced with the improved risk management they achieved by keeping full control of the operation. “Those who own the business and run the business are more committed as they have most to lose”
§ Mentors with those who have experience in the field
§ Continuing to ask questions and seek the advice from the experts (both paid and unpaid advice)
§ An active decision to grow a crop that they have experience with (fresh tomatoes) as there was going to be a very steep learning curve moving to hydroponics and trying a new crop was considered an additional risk not worth taking at this early stage. Other crops will certainly be considered down the track after they have some hands on experience with the new technology.
7.5 Key outcomes – what has been the result of having made the adaptation?
The investment is still in its early stages with but some of the early success indicators include:
§ An obvious passion and commitment to make the investment work “I went on holidays and I couldn’t wait to get back to work”.
§ Attention to detail and careful monitoring of all the factors involved in the operation to ensure a successful crop is grown.
Investigating the costs associated with the production, sale and distribution of vegetables Final Report
RMCG Consultants for Business, Communities & Environment Page 92
§ Ongoing questioning and seeking the right advice – a consultant comes from Holland with world renowned expertise – hydroponics is not exposed to the local influences from soil type or climate as it is in a controlled environment. Expertise can therefore be sought worldwide.
§ Customers actually “knocking on the door” looking for the quality, volume and all year supply that the new operation can provide. This was not an expected outcome as initially the drive was to have more control over the growing environment leading to higher quality product and increased output.
7.6 The future
The current investment represents stage 1 of a longer-term goal to have 40,000 m2 (10 acres) area under hot houses. This will provide the growth the farm has been looking for and achieve economies of scale to improve the profitability of the business.
Although still exposed to the up and downs of the market, their future plans should allow for the development of stronger customer relationships and potential contracts that can help reduce some of the price volatility that they currently experience.
Over time they expect that they will become more confident with the use of the technology and see the potential to diversify the crops creating more market opportunities.
7.7 Lessons learnt / key messages – what are the key messages or conclusions that can be drawn from this example?
The key lessons from this example include:
§ Leverage expansion on your area of expertise and customer base, in this case the growing and sale of tomatoes
§ Do your homework and talk to others who have undertaken the change
§ Use world best advisors, such as the consultant from Holland
§ Be prepared to take the risk
§ Be passionate with what you do as it will help overcome the challenges will inevitably be faced
§ Don’t cut corners with the technology – precision growing requires precision equipment
§ Attention to detail and responding quickly when things change

Investigating the costs associated with the production, sale and distribution of vegetables Final Report
RMCG Consultants for Business, Communities & Environment Page 93
Case Study 8: “From little things big things grow”
8.1 The Loose Leaf Lettuce Company
Maureen and Barry Dobra were both from vegetable growing families and began their married life on 5 acres (2 ha) south of Fremantle. They grew to 17 acres (7 ha), but after two successive crop failures in 1981 and limited opportunities to further grow their land holdings, they could not see a future where they were and decided to relocate to Gingin – north of Perth which had both water and land availability.
Initially they bought a 60 acre property, which was farmed in partnership with Barry’s brother. Their farm relocation required bridging finance and coincided with record high interest rates and so in early days they “did the hard yards” worked extremely hard and lived in the shed.
A decision was made to diversify and establish themselves on 30 acres growing a range of crops including carrots, onions, broccoli, rockmelons, gourmet vegetables and coloured lettuces and then finally specialising in the coloured lettuces.
They raised a family of four children and in 1996 – the two eldest daughters started supplying loose lettuce leaves based on requests from customers as a bit of a hobby. Demand grew but the process was extremely labour intensive (using old washing machines to dry the product prior to hand packing). The two girls share farmed with their parents paying for access to the machinery and land.
The girls were still young and were eager to travel. This enabled their parents and eldest son Kevan to inherit what was a “hobby” – and turning it into a thriving enterprise.
8.2 The situation – what were they doing and how?
Prior to the loose leaf lettuce development, the farm operated like many others, focusing on growing a quality product on farm without much involvement post farm gate.
As the demand grew for the cut lettuce the Dobra’s could see the opportunity of having a direct line to the customer and having control from seed to the door of the customer. The demand was from the commercial vegetable markets and wholesalers who were primarily supplying the food industry. This was a relative niche market that became the Dobra’s focus.
However, the processing of the product was extremely labour intensive that not only impacted on the cost of production, but also was limiting their ability to meet the growing customer demand.
A decision was made to make a significant investment into a processing plant to reduce the manual labour required per unit and provide the ability to wash and pack a greater volume of product to meet the demand.

Investigating the costs associated with the production, sale and distribution of vegetables Final Report
RMCG Consultants for Business, Communities & Environment Page 94
The growth of the business has been gradual over time and now the Dobra’s have developed a vertically integrated business from seed through to the wholesaler’s door.
They continue to invest in the processing facility on site that allows them to package and deliver the product to their key customers adopting a philosophy of “we provide what our customers want and when they want it”.
It has provided them with some “control over our destiny” by being able to fill the majority of orders from their customers without relying on others and if they cannot provide the raw product from their farm then they actively source additional produce from other growers.
8.3 The challenges
As the business grew there have been a number of challenges along the way. The Dobra’s have had to change their roles within the business to managing rather than doing. Learning to let go of “hand on operations” has been difficult, but was critically important to enable expansion.
They recognise that when time managing the business is compromised so will the success of the business.
The Dobra’s primary drive to grow the business has been to improve its overall profitability. They identified that keeping up with the needs of their customers is vital for the ongoing relationship and securing their continued business. If the customers required more products then they would either look to grow it or source the product from elsewhere. This provided a stable market that has been an important success factor for the business.
They have grown the business on the processing side and on the area farmed. It was important to have continuity of supply and having a large proportion of that sourced from their own operation was an important strategy. Over time they have grown the land area, initially on the home area growing from 30 acres to 60 plus leasing an additional 9 acres.

Investigating the costs associated with the production, sale and distribution of vegetables Final Report
RMCG Consultants for Business, Communities & Environment Page 95
The opportunity to expand at the home property was limited so when an opportunity came up to purchase additional land with water, which was still within a reasonable distance to the processing plant, it was taken. The purchase came with its fair share of worry and concern with the signing of the contract was done with “a shaky hand”. Borrowings were increased to cover the cost of purchase and development and there was significant pressure on cash flow as they got the new farm up and running.
What got the Dobra’s over the line with additional land purchase and taking yet another risk as they grew their business was they had a high degree of belief in their strategy. They wanted continuity and control of supply that the new farm would provide and their previous track record gave them confidence in their ability to farm the new area.
As the business has grown they have needed to employ more people and now have a staff of 40 with about 50% backpackers and 50% permanent employees. This adds another layer of complexity in the business ensuring that all of the compliance issues are addressed (both Industrial relations and Occupational Health and Safety).
The growth of the business has meant they now have the scale to employ an Administration Manager. Their role is to manage the Human Relations within the business as well as oversee the quality control program.

Investigating the costs associated with the production, sale and distribution of vegetables Final Report
RMCG Consultants for Business, Communities & Environment Page 96
8.4 The strategy / execution
Customer Service = Reputation = Relationship = Growth
A corner stone to the success of the business is the importance they place on meeting their customer needs. They will talk often and always try to deliver on their customer needs. “We are in a service industry” and this builds the reputation of the business, which strengthens the relationships that secures the market and provides the confidence for the business to continue to invest in improving what they do.
For example their attention to service means that they attend to small things such as following up that one of their customers had not placed a regular order, which turned out that the customer had simply forgotten to place their order; resulted in product sales, the customer was happy and the relationship was strengthened.
They also adopt a philosophy of “building strong relationships” and focus on their existing customers by ensuring they continue to provide the service and quality product that is the foundation of the reputation of the business. In other words, they want their customers to be successful, which will lead to expansion for them.
This positive approach to other growers/processors has seen them even wash and pack their product, which improves their processing efficiencies even if it is giving another company a helping hand.
Communication
Meeting customer demand and keeping up the volume processed to reduce per unit costs is an important success factor for the business. When they cannot fill an order themselves they will actively seek out the supply from other growers. They therefore keep in constant communication with customers and other growers so that they can plan to meet the demand in not only what they grow but what they look to source from others.
Keeping informed about what is happening within the industry and in other growing regions is important as it helps identify opportunities that present from time to time. For example, regular contact with suppliers, agents and customers can lead to industry intelligence about a temporary supply issue in another market region which can provide an opportunity to off load surplus production or attract a higher price.
Maureen is constantly talking to people within the industry and keeping informed about what is happening within the industry and what support programs maybe available. They have accessed different government incentive schemes to introduce new technology to the business, which has helped improve productivity.
The Dobra’s are also constantly talking with their staff that enables them to ensure that everyone within the business is clear on daily tasks but also helps identify when things are not going accordingly to plan. They can address issues early before they become major problems that have the potential to impact on the business.
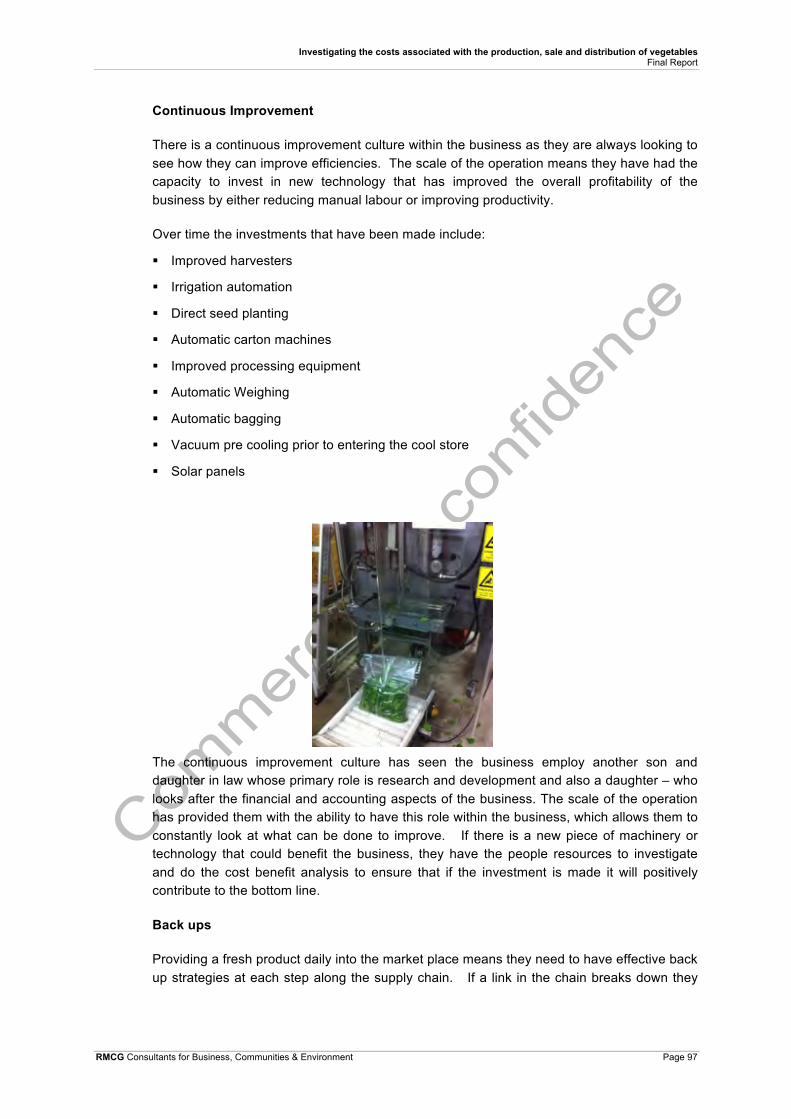
Investigating the costs associated with the production, sale and distribution of vegetables Final Report
RMCG Consultants for Business, Communities & Environment Page 97
Continuous Improvement
There is a continuous improvement culture within the business as they are always looking to see how they can improve efficiencies. The scale of the operation means they have had the capacity to invest in new technology that has improved the overall profitability of the business by either reducing manual labour or improving productivity.
Over time the investments that have been made include:
§ Improved harvesters
§ Irrigation automation
§ Direct seed planting
§ Automatic carton machines
§ Improved processing equipment
§ Automatic Weighing
§ Automatic bagging
§ Vacuum pre cooling prior to entering the cool store
§ Solar panels
The continuous improvement culture has seen the business employ another son and daughter in law whose primary role is research and development and also a daughter – who looks after the financial and accounting aspects of the business. The scale of the operation has provided them with the ability to have this role within the business, which allows them to constantly look at what can be done to improve. If there is a new piece of machinery or technology that could benefit the business, they have the people resources to investigate and do the cost benefit analysis to ensure that if the investment is made it will positively contribute to the bottom line.
Back ups
Providing a fresh product daily into the market place means they need to have effective back up strategies at each step along the supply chain. If a link in the chain breaks down they

Investigating the costs associated with the production, sale and distribution of vegetables Final Report
RMCG Consultants for Business, Communities & Environment Page 98
have strategies in place to respond. One critical area is that maintenance on equipment is always a priority so that the repairs are kept to minimum.
8.5 Key outcomes – what has been the result of having made the adaptation
Achieving a vertically integrated business has allowed the farm to have a secure and stable market for their product. They meet their customer demands; create a reputation of delivering a quality product when they want it and how they want it, which provides some certainty for their business. This builds confidence and improves their decision-making ability to grow and reinvest into the business.
This has been reflected in their success in turning a small sideline hobby into a thriving commercial business.
8.6 The future
The culture of continuous improvement will allow the business to continue to develop if the owners want to do so.
Succession and providing the opportunity for the businesses owners to step back and handover some of the responsibility to others will be one of the important challenges for the business in the future.

Investigating the costs associated with the production, sale and distribution of vegetables Final Report
RMCG Consultants for Business, Communities & Environment Page 99
8.7 Lessons learnt / key messages – what are the key messages or conclusions that can be drawn from this example?
The key messages from this example include:
§ Resilience through hard times and the development of a sideline hobby to a large business
§ Always have the needs of the customer as the number one priority as servicing those needs and relationships is the foundation of the success of the business
§ Constant communication with employees, suppliers, customers and the broader industry that allows the operation to keep in touch and be in a position to be proactive across all parts of the business
§ Keeping informed allows access to different support programs that become available from time to time
§ Be prepared to look at doing things differently to improve overall productivity and profitability
§ Willingness to take a calculated risk but ensure that it is aligned to the overall long term strategy of the business and is consistent with current markets and expertise
Investigating the costs associated with the production, sale and distribution of vegetables Final Report
RMCG Consultants for Business, Communities & Environment Page 100
Case Study 9: “Power in numbers”
9.1 K & D Edwards
Kim and Donnette Edwards operate a mixed farming operation in Manjimup south of Perth. Kim is the 4th generation on the farm and his father is semi retired but still contributes to the business.
The farm is 450 ha and is mixed farm growing beef, blue gums and vegetables. Vegetables represent 60% of the farm income and therefore is a critical component for the farms viability. The farm currently grows 5 ha of Chinese Cabbage for the domestic market. Kim supplies the majority of the labour and will employ backpackers during busy periods.
9.2 The situation – what were they doing and how?
Prior to 2006 most of the growers in the region including Kim grew export cauliflowers. The Manjimup area had over 70 growers at its peak with Singapore the key market. The export market at the time was providing good returns for the growers and allowed for individual businesses to grow, as there was an expanding market for the product.
In the early 2000’s China started to take market share due to a lower cost of production and over a relative short period the export market virtually disappeared.
This resulted in a major restructuring of the industry with many growers exiting. For those remaining, new markets and products needed to be found. There were limited opportunities on the export market and focus had to turn to the domestic market.
The domestic market is highly competitive and relatively small and therefore gaining access was always going to be a challenge.
Kim, as a relatively small grower had an additional challenge of not been of a size that would attract the interest of customers and therefore was more exposed to the ups and downs of the fresh market. As Perth represented the largest market, the region also had an added cost of transport compared to other regions closer to Perth.
9.3 The challenges
After the demise of the export market, initially Kim had no sense of direction and was growing different vegetables under trail and error basis. He could see that this approach had a limited future and there needed to be some change on how and what he grew on his property.
He was not alone in the challenges that he faced and he along with 5 other local growers decided to work collectively to market their produce. They formed an enterprise called UTR Produce and worked with a broker to help identify and secure markets for their combined output.
This has provided a more secure market for their product and also gives direction on what and how much they grow. Each grower will produce their product independently, but they use the collective of the group when it comes to selling the product.

Investigating the costs associated with the production, sale and distribution of vegetables Final Report
RMCG Consultants for Business, Communities & Environment Page 101
This provides economy of scale and professionalism in the marketing aspect of their vegetable production.
Kim has identified for the time being that Chinese Cabbage is a product that he can grow effectively with the resources he has available. Based on the orders the broker can secure, Kim is now more confident with his annual production plan and know that there is a market for his product. He is then able to concentrate his efforts on growing the product as efficiently as possible.
9.4 The strategy / execution
As small grower, Kim does not have the benefit of achieving large economies of scale for production and therefore needs to be as efficient as he can so that he can still derive a livelihood from his farming operation.
It doing so Kim actively seeks advice on how he can improve his productivity. He has focused on improving his efficiency by implementing the following:
§ Improving planting densities (25,000 plants/ha when growing export cauliflowers to now 40,000 plants per ha)
§ Purchase of double row planter to reduce labour and sowing times
§ Participating in an water efficiency program focusing on irrigation scheduling
§ Participating in an integrated pest management trial to reduce chemical usage
§ Applying fertiliser based on soil and tissue testing – more closely matching the needs of the crop rather than blanket based applications
Kim attempts to do the best he can at every stage of the growing cycle and each improvement builds on the previous achievement that is contributing to keeping ahead of the cost price squeeze.
9.5 Key outcomes – what has been the result of having made the adaptation?
Access to the collective marketing power that his group of growers provides improved market access and information. Crop planting decisions can be made with more confidence and energies can be focussed in growing quality product cost effectively.
9.6 The future Kim still has the challenge of keeping ahead of the cost price squeeze. The farm does not have the scale to support large capital investments into technology improve productivity. Continuing in keeping informed about incremental improvements that can be made on farm will be important for the farms future viability.
A future challenge will be to remain cost competitive against larger growers.

Investigating the costs associated with the production, sale and distribution of vegetables Final Report
RMCG Consultants for Business, Communities & Environment Page 102
9.7 Lessons learnt / key messages – what are the key messages or conclusions that can be drawn from this example? § Working with others to get professional marketing expertise and economies of scale in
marketing aspects
§ Using market intelligence to determine what to plant
§ Constantly applying and investigating ways to improve productivity to improve yield and quality

Investigating the costs associated with the production, sale and distribution of vegetables Final Report
RMCG Consultants for Business, Communities & Environment Page 103
Case Study 10: “Change = Opportunity”
10.1 D & L East
David and Lee East own and operate a vegetable growing business at Manjimup south of Perth.
They operated in partnership with David’s two brothers. Over time it was evident that the farm could not support three families, so other off farm businesses were purchased. David and Lee operate the farming business and the other two brothers run the off farm businesses. More recently two of David and Lee’s sons have joined the farming operation, so expansion may be needed as more families will need to be supported.
The farm was purchased in 1975 and was originally a cattle/sheep property. In 1984 they began growing export cauliflowers and got a lot of advice and assistance from a neighbour who was an established grower.
The farm is 400 acres and used to grow 100 acres of export cauliflowers at the peak in 1996 but now grow approximately 100 acres of lettuce (predominately for processing) after the decline of the export cauliflower market.
10.2 The situation – what were they doing and how?
The Easts started their vegetable growing career by producing cauliflowers for the export market. However, price pressures started to appear in the late 1990s as China started to enter the market.
The declining price for export cauliflowers was the catalyst for the change in operation for the Easts. They had reasonably sized operation growing 100 acres of cauliflowers and achieving a price competitive product in Australian terms but the lower cost of production from China severely restricted their options. Although they could provide a superior quality product, the price premium a buyer would pay above the base China price was still not enough for viable production in Australia.
David and Lee “could see the writing on the wall” and started to look for alternative crops.
Investigating the costs associated with the production, sale and distribution of vegetables Final Report
RMCG Consultants for Business, Communities & Environment Page 104
The alternatives were limited as the Western Australian domestic vegetable market is relatively small and highly competitive. It is also not a growing market so to achieve market share is usually at the expense of another grower.
The East’s had a reputation of being good operators which lead to an approach from a customer to grow lettuce as buyers were looking for a summer season supply option. Manjimup has the ability to provide a quality product during the summer months, as it is cooler than the winter supply regions close to Perth. Other potential growers in the region had been approached, but had declined so the East’s took on the challenge.
They knew there would be difficulties as they had trialled growing lettuce before without success, but they knew they had no real choice. Growing lettuce provided an opportunity for an alternative crop to replace the export cauliflower. By moving early they had the chance to stay ahead of the pack and secure a market.
10.3 The challenges
Moving to a different crop was always going to provide plenty of challenges. They went through a trialling period growing some smaller plots of lettuce while continuing with cauliflowers that provided some back up. Over a 2 to 3 year period of a “very steep learning curve” the cauliflowers were completely phased out and the lettuce growing enterprise became commercial.
It was fortunate that the equipment required was relatively similar to cauliflowers and therefore there was not a high extra cost in equipment when converting crops. The major adjustment was to develop the required knowledge and experience of lettuce agronomy. The East’s, as they did when they grew their first cauliflower, sought advice from other experienced growers as well as other industry advisors.
They travelled mainly to the eastern states and were able to get open and honest advice from other growers, as they were not considered to be a competitor by growing in the west. They continue to get advice, as they are always looking at improving what they do and taking any opportunities that might arise with alternative crops.
As the business has grown, more of the tasks have had to be handed over, but the critical and important tasks remain with the David and Lee. There is a handover of some of the responsibility to the boys, but there still remains some resistance to letting go of some critical areas in the business.
Supplying the multinational companies such as McDonalds and KFC provides opportunities but also some additional challenges. If there is a food scare on the other side of the world, it can have ramifications in Australia. An example is the potential introduction by McDonalds of some more stringent quality control measures to reduce the risk of salmonella contamination in food products. This may require them to introduce new buffers zones between crops and grazing animals, exclusion of stock from water sources, buffer zones under power lines (perceived problem with bird droppings), which may threaten the viability of the enterprise by forcing up the cost of production.

Investigating the costs associated with the production, sale and distribution of vegetables Final Report
RMCG Consultants for Business, Communities & Environment Page 105
10.4 The strategy / execution
Quality product
The Easts became increasingly aware of the importance of matching the quality and quantity of product to the needs of their customers. They control the production process from the production of seedlings through to the loading of trucks destined for the processing facilities and customers in Perth. Having control of the nursery growing the seedlings and the cool store prior to transport ensures the product is delivered to the required quality specifications.
It is often a misconception that with a processed product that quality may not have the same importance as in the fresh market. The Easts believe that irrespective of the end point destination, quality is always paramount and important for the ongoing success of the business.
Quality control includes selecting the right variety that is fit for purpose. “Don’t get fooled into multipurpose varieties”. Trying to grow multipurpose varieties results in sub standard results across the board, leading to customer dissatisfaction, which can have significant ramifications in a highly competitive market.
Management control through the supply chain
The nursery was an important addition to the process as the growing schedule to deliver the required product and volume is finely tunned and any hiccups along the way can impact on the supply to customer. Too many disruptions has ramifications on future price and contract negotiations. The Easts experienced some quality and supply issues with outsourced seedling supplies which impacted on their ability to meet customer requirements.
By home growing the seedlings they retain more control and the additional benefit is reduced transplanting shock improving the plant vigour and overall paddock yield. The nursery was a relatively low cost to set up and therefore they did not need scale to implement.
Scale to support technology investment
Other technology advances that have been introduced to the operation include cool storage, vacuum cooling, and fertigation, all with significant capital costs. Unlike the nursery, there needed to be a certain scale of operation to ensure the unit cost was kept under control. These enhancements have all been introduced to retain or improve margins when costs continue to rise.
Continuous improvement
The Easts are constantly trialling new varieties and exploring new opportunities. Nothing stays constant and they are looking to diversify what they grow can spread the risk and also provide other opportunities for business growth.
David and Lee are also continually looking for and to introduce innovation into their business. They do that by not only looking at what is happening locally but across Australia and internationally. The don’t take on all of the advice or ideas “willy nilly” but look at what is appropriate to their situation and business. They are also prepared to take a considered
Investigating the costs associated with the production, sale and distribution of vegetables Final Report
RMCG Consultants for Business, Communities & Environment Page 106
risk when introducing something new and potentially untested into the business. A recent example of this was the introduction of a mustard break crop that offered some biofumigation benefits.
10.5 Key outcomes – what has been the result of having made the adaptation?
The key outcome from the adaptation has been a continuing viable farm operation. If the move to growing processing lettuces for the domestic market was not taken then opportunities develop the business would have been limited. The change still involved a high degree of risk due to the inexperience in growing lettuces to the quality and volume required, but this risk was able to be mitigated by seeking good advice.
10.6 The future
With two sons coming home to the business and a third expressing interest, they know that they need to continually grow the business.
This means the will always be looking at improving what they do, looking for the next opportunity, and prepared to take a calculated risk.
10.7 Lessons learnt / key messages – what are the key messages or conclusions that can be drawn from the example?
The key messages include:
§ Seek advice and learn from others who have experience
§ Keeping in regular contact with customers to ensure their needs are being met
§ Recognise the market is always changing
§ Reduce risk by trialling new things
§ Control quality by keeping more of what you do in house and under your control
§ Don’t be fooled into multi purpose varieties as the market is too demanding
§ Be constantly on the look out for opportunities as sometimes an opportunity may not look like one at first glance as they often have too much uncertainty and perceived risk
§ Be prepared do the investigation, seek the advice and take a calculated risk
§ Continue to look at different ways to improve what you do to keep ahead of the pack

Investigating the costs associated with the production, sale and distribution of vegetables Final Report
RMCG Consultants for Business, Communities & Environment Page 107
Case Study 11: “Only grow what you can comfortably sell at a margin”
11.1 Bonaccord
Based at Lindenow in East Gippsland, Bonaccord is a large vegetable growing business owned and operated by the Ingram family.
Bonaccord currently farms around 2,300 acres (900 ha), producing a diverse mix of commodities, including beans, sweet corn, broccoli, carrots, cauliflower and cabbage as well as processing and packaging and transportation of fresh vegetables, processed and part-processed vegetables to market. All produce is sold domestically either direct to supermarkets or supplying local businesses/central markets.
The business began as a 54 acre (20 ha) dairy farm on the Mitchell River flats purchased by Max & Kath Ingram in 1960. The next generation of the Ingram family are the hands-on managers of the business. Ross runs the office and marketing, Keith the packing sheds and personnel, Gerald is in charge of harvesting and machinery maintenance and Murray manages the ground preparation and livestock. Good communication and an understanding of their own role as well as each other’s is vital. The families meet daily and continually discuss what’s going on in the business now as well as their plans for the future.
In addition to the production and packing/processing, Bonaccord operates their own nursery producing around 18 million seedlings annually for transplanting on farm. A transport/logistics business that consists of 40 refrigerated trucks ensures Bonaccord’s produce (as well as other local farmers) reaches its market on time and in the best possible condition.
11.2 The situation
With four out of the five brothers and their families involved in the business, it has been necessary for Bonaccord to continue to grow in order to accommodate the increased reliance on business profitability.
Growth has been the result of all involved in the business having a thorough understanding of the business profit drivers, their customers needs, as well as their own skills and area of expertise. This understanding has enabled the Ingram’s to recognise and take opportunities when they present.
This approach to business has resulted in Bonaccord becoming a fully integrated vegetable producing, processing and logistics company supplying markets nationally whilst making a major contribution to the local economy employing more than 250 people at peak time, a mix of full time permanent as well as contract labour.

Investigating the costs associated with the production, sale and distribution of vegetables Final Report
RMCG Consultants for Business, Communities & Environment Page 108
11.3 The strategy / execution
Bonaccord have implemented a number of different strategies over time that have enabled the business to reduce costs and maintain profitability. The cost reductions have largely come about through increases in scale allowing a more efficient use of their resources. “Increased scale and the growth of the business has been an evolutionary process”. According to Ross, the family believe it is important to “be in control of our own destiny”.
11.4 Scale
Ross believes that scale has been an important driver for business success. Scale has largely come as a result of the relationships with customers built over time and delivering on your commitments. Bonaccord now has the ability to produce a number of different commodities at a critical mass that is attractive to their customers. Being in a position to be able to guarantee supply whilst maintaining quality and consistency has enabled Bonaccord to continue to grow their market share. Increased scale has also increased risk and business complexity but sound business systems, a through understanding of the business and customers needs as well as attention to detail has helped to ensure that other aspects of the business have not been compromised by increased scale.
Scale increases at Bonaccord have been a combination of increasing area through the acquisition of nearby farms through time and has required infrastructure and land development. Increased area has assisted Bonaccord to achieve economies of scale by spreading fixed overhead costs, effectively lowering these costs per unit. It has also come about through increases in productivity with improved husbandry techniques, capital investment in water, mechanisation, processing capacity, as well as research and development and the adoption of new technology.
11.5 Crop rotations
The crop rotation employed at Bonaccord involves a minimum of five crops. Ross believes this has enabled them to produce high quality, high yielding produce sustainably. “You can’t have a monoculture”. The diversity in the crops grown minimises the build-up of pathogens, pests and disease and helps to reduce crop husbandry costs and improve soil health. One crop out of the five grown is a non-vegetable crop, grown to spell the soil. Up until recently, the non-vegetable crop had been a pasture or lucerne crop that would be used to fatten cattle. Ross’s belief that “every crop in the rotation needs to make money” has meant that they continually look at alternative crops. In the last couple of years, cereal crops of barley or wheat have been grown during the non-vegetable phase.
11.6 Value-add
The Ingrams saw the potential to integrate the business by processing product as a way to value add but also to reduce duplicated costs in freight into and out of an external processor. “Don’t let someone else take the cream”. The large majority of product sent from Bonaccord now is either processed or part processed and packed. Whilst this has required a large capital investment in processing sheds, cool rooms, labour and plant it has also provided the opportunity for Bonaccord to capture new markets as well as capturing on-farm, the value added to the product through processing. Ross believes that they have the ability to process the product more efficiently.

Investigating the costs associated with the production, sale and distribution of vegetables Final Report
RMCG Consultants for Business, Communities & Environment Page 109
11.7 Marketing
Ross takes a long-term view to the marketing of Bonaccord’s produce and emphasises the importance of the honest and open business relationships he has with his customers. He talks to customers daily providing updates and receiving feedback and market signals critical for forecasting and effective management. The building and development of these relationships as well as the ability to meet your commitments has been a key to business success and enabled Bonaccord to build market share. “Some growers can be too short sighted with respect to marketing”. In Ross’s opinion it is critical to “only grow what you can comfortably sell at a margin” and that way you will ensure that you are maximising profit. The risk of producing an over supply is that it results in product being sold at a lower value or in extreme cases dumped and this will reduce the average price per unit of product produced
11.8 Water security
Water is an important resource for the business, emphasised in the last decade with prolonged periods of drought and water restrictions. The recent completion of 2 dams holding 1,000MGL, that took five years to research and construct, has enabled the business to de-risk by pumping their allocation from the Mitchell river and securing water supply over the summer months when pumping restrictions are often in place. Whilst much of the dam construction was outsourced, the installation of pipes to feed the farm and packing sheds was all done internally at quieter periods on farm.
11.9 Mechanisation
Where possible, the farm operations of harvesting and planting have been mechanised to increase efficiency and to also reduce the dependence on labour. Crops such as broccoli and cauliflowers are still hand picked to ensure that quality is not compromised.
11.10 Barriers that needed to be overcome or additional resources required § Access to capital – hands on knowledge
11.11 Key outcomes – what has been the result of having made the adaptation? § Strong enduring relationships with key customers
§ Business has been de-risked
§ More secure water through the summer months
11.12 The future
The growth of Bonaccord has been substantial, particularly in the last 10 years and Ross firmly believes that it is now necessary for the business to consolidate and to focus on paying down debt. This is perhaps a dream.

Investigating the costs associated with the production, sale and distribution of vegetables Final Report
RMCG Consultants for Business, Communities & Environment Page 110
11.13 Lessons learnt / key messages – what are the key messages or conclusions that can be drawn from this example? § Each and every crop in the rotation needs to make money
§ Open, honest communication and relationships based on trust
§ Many in the vegetable game are too short sighted with respect to their marketing. It is important to only grow what you can comfortably sell at a margin.
§ Quality is the key – consistent supply of a quality product builds customer confidence
§ Personality – entrepreneurial skill, common sense, practical approach
§ Single operators need to get out, talk to other farmers or risk stagnating through lack of opportunity to share ideas

Investigating the costs associated with the production, sale and distribution of vegetables Final Report
RMCG Consultants for Business, Communities & Environment Page 111
Case Study 12: “IPM focus has increased market share”
12.1 Fresh Select
Based in Werribee South, approximately 35 kilometres from Melbourne’s CBD, Fresh Select is a vertically integrated horticultural company that produces and markets fresh vegetables to both domestic and overseas markets. The core crops grown by Fresh Select include:
§ cos lettuce (baby and midi varieties)
§ iceberg lettuce
§ decorative lettuce (red oak, green oak and symphony)
§ broccoli and baby broccoli
§ cauliflower (white, purple, orange and green)
§ mini cabbage (drumhead, savoy and red)
Approximately 90% of production is shipped direct to supermarket distribution channels right across Australia. The balance of produce is delivered into the central fruit and vegetable markets, as well as export markets.
With over 45 years of farming expertise, Fresh Select originated as a farm and export enterprise, selling broccoli and lettuce to South East Asia and the Middle East. With a rising Australian dollar, and export markets increasingly serviced by low cost producers such as China, Fresh Select changed its strategic focus to servicing the domestic market, in particular the fast growing supermarket chain – Coles.
Today Fresh Select’s biggest customer is Coles, which it views as a strategic business partner. Fresh Select and its supply partners employ over 350 people and operates across a number of stages of the horticultural supply chain including product development and innovation, seed procurement, farm production, agronomy, quality assurance and produce sales and marketing.
The company sources produce from its own farming enterprise, its glasshouse joint venture and also from a number of supply partners in Victoria and Queensland.
12.2 The situation – what were they doing and how?
Like the majority of growers, Fresh Select had previously relied on a conventional approach to pest management control that involved spraying insect pests with broad spectrum, synthetic chemicals often multiple times in any one season with little understanding of the life-cycle of the target pest or the chemical mode of action. In those early days there was no accurate identification of pest insects, further the distinction between beneficial and pest insects was overlooked.
As a result, crop growing costs were escalating, it appeared that chemicals were becoming less effective and the health of employees was being placed at unnecessary risk.
Investigating the costs associated with the production, sale and distribution of vegetables Final Report
RMCG Consultants for Business, Communities & Environment Page 112
12.3 The challenges
The industries nil tolerance to insect damage resulted in Fresh Select and other businesses across the industry adopting conventional practices to in-crop pest eradication. This approach to insect management was not only labour intensive, often requiring multiple in field spray operations, it was also costly due to the amount and type of chemicals applied and the machinery and increased machinery hours required to apply them. The practice also increased business risk as a result of the higher frequency of chemical usage and the potential for employee and consumer harm if the chemicals were not applied and managed correctly. Ongoing use also increased the risk of pests developing resistance to the chemicals.
From a customer perspective, market intelligence started to emerge that consumers were becoming increasingly conscious about food safety and environmental sustainability.
In the interests of economic, social and environmental sustainability, Fresh Select decided that their focus needed to be more in line with the principles of best management practices rather than the total eradication of in-crop pests. This change of focus would require a change of mind set not only with-in Fresh Select, but also its strategic supply partners and customers.
12.4 The strategy / execution
Fresh Select engaged the services of Dr Paul Horne and Jessica Paige from IPM Technologies to oversee the implementation of an Integrated Pest Management (IPM) strategy across their business. This decision followed a number of years of researching the principles of IPM and talking with other growers, both in Australia and overseas, who had implemented the practice in their businesses. Fresh Select identified a business opportunity, as an IPM program would provide a positive message to stakeholders across the supply chain including consumers regarding improvements to food safety.
IPM utilises a combination of chemical, cultural and biological pest control methods to keep pest numbers and other production problems at levels low enough to prevent significant economic loss. The ability to make sound decisions and forecasts requires that all involved have a good knowledge of pest life-cycle, biology and ecology and an ability to accurately identify pest and beneficial insect species. In addition, an understanding of the effects of pest damage on crop quality and how different control measures will impact both pest and beneficial insects is crucial.
The strategy required a cultural change within Fresh Select and its strategic supply partners. A more proactive approach by management was required with a focus on prevention rather than eradication. The IPM strategy also necessitated personnel with appropriate training and expertise, regular monitoring and recording of crop pest pressures with confidence in the approach built over time through education, observation and action.
A cultural change in the customer was also required in order to lift tolerance levels for pest damage from nil to low level thresholds. Strong relationships developed over time and a good understanding of each other’s business objectives and values assisted Fresh Select to convince their key customers of the benefits to consumers of an IPM approach, as well as improvements to environmental sustainability.
Investigating the costs associated with the production, sale and distribution of vegetables Final Report
RMCG Consultants for Business, Communities & Environment Page 113
12.5 Key outcomes – what has been the result of having made the adaptation? § Reduced chemical inputs through the use of a number of control methods
§ Increased requirement for crop monitoring by personnel with the appropriate expertise and training (e.g. an agronomist)
§ Improved business process through a proactive versus reactive approach – prevention versus eradication
§ Improved sustainability through decreased risk of resistance development
§ Improved wellbeing of employees and consumers through less reliance on synthetic chemicals
§ Increased market share as a result of customers having a better understanding of Fresh Select’s values and approach to economic and social sustainability in influencing business practices
12.6 The future
With IPM continuing to evolve as a practice, Fresh Select believes it is in the best interest of the broader industry to adopt the IPM model. With increasing pressure on cost, quality assurance and environmental sustainability, IPM will become a more important consideration for farms still following traditional pest management principles.
Farms that do not at the very least consider the benefits of IPM, run the risk of marginalising their businesses by reducing the number of distribution channels for their produce in the future.
Integrated crop management should also become a focus. Integrated crop management complements IPM and addresses the next phase of environmental sustainability. This includes crop rotation, alternative cropping, managed water usage, minimum tillage and controlled traffic.
12.7 Lessons learnt / key messages – what are the key messages or conclusions that can be drawn from this example?
It is important for the industry to be proactive when considering food safety and environmental sustainability. IPM is a proactive approach to pest management that aligns with the current market trend toward better food safety and environmental sustainability Utilising human resources with the appropriate expertise, is important when implementing IPM.
Benefits of IPM include:
§ Improved environmental sustainability
§ Improved food safety
§ Access to more distribution channels
§ Lower insecticide applications

Investigating the costs associated with the production, sale and distribution of vegetables Final Report
RMCG Consultants for Business, Communities & Environment Page 114
Case Study 13: “Focus on low volume high value products”
13.1 Corrigan’s Produce Farms
Based at Clyde, approximately 50 kilometres south east of Melbourne’s CBD, Corrigan’s Produce Farms, is a family owned and operated business, supplying high quality fresh vegetables to the Australian market. Deborah Corrigan and her brother Darren own and manage the business, proudly following in the footsteps of their father and grandfather. Together they have expanded the operations to approximately 600 acres with the purchase of an additional 200 acres in 2010. They now operate three vegetable producing blocks spread within fifteen minutes of each other.
Historically the business has grown celery, celeriac cos lettuce, leeks, pak choy and salad onions and silver beet as well as diversifying into a number of other vegetable lines including tuscan cabbage and kale. In addition to the focus on vegetable production, Corrigan Produce are also integrated into the supply chain, processing or part-processing many of their product lines, either through trimming, bunching and/or packaging product for direct supply to customers.
A mix of permanent and casual labour is used by the business. Approximately 70 people are employed on a permanent basis and are supported by around 40 casual employees. Labour represents the largest component of the overall business costs in both the production and processing areas.
13.2 The situation – what were they doing and how?
Prior to Deborah and Darren taking control of the family business it was firmly focussed on its traditional vegetable lines. With two members of the next generation keen to become involved, the business required growth.
The move to succession commenced over ten years ago, initiated by Deborah and her father. Deborah credits the earlier generations, particularly her father for “instilling a sense of doing and vision” in her and Darren. Deborah stated that “these days producing quality vegetables is a given, they key to business success is to be able to produce quality consistently throughout the year and at a critical volume in order to satisfy the customers needs”. “There is nothing worse for a business then not being in a position to supply the customer”. Meeting the customer needs is critical in order to maintain and to build market share.
13.3 The challenges
Deborah highlighted as a challenge, the trade-off between working in the business and working on the business. It can be very easy to get caught up in the day-to-day business operation and not take the necessary time to consider the bigger picture in terms of potential opportunities or longer-term strategies. Deborah and Darren have a good understanding of each other’s strengths (and weaknesses) and have implemented sound management systems and processes.
Corrigan’s location, whilst beneficial in terms of access to markets and labour also presents some challenges particularly with regard to limited opportunities for expansion. Development

Investigating the costs associated with the production, sale and distribution of vegetables Final Report
RMCG Consultants for Business, Communities & Environment Page 115
of surrounding land nearby for residential use has reduced the availability of land for horticultural purposes. It has also meant that capital values no longer reflect their productive capacity and as such, return on capital is not reflective of business performance.
13.4 The strategy / execution
Since taking over the management responsibility for Corrigan’s Produce Farms, there have been a number of different strategies that Deborah and Darren have initiated to grow the business, reduce cost of production and in turn, improve cost competitiveness.
Maintaining long-term relationships with customers has been instrumental in growing market share and building market knowledge. Maintaining regular contact has helped to identify customer needs as well as potential opportunities. Honesty and transparency is a key to building trust and “never promise anything you can’t deliver”.
More recently, based on their market knowledge, Corrigan’s have diversified into new product lines including Tuscan cabbage and kale as well as value adding marketing and packaging. Deborah believes that “it is important to keep the business fresh and new”. “There are opportunities in producing products that other growers find difficult”. The business now, in addition to growing their traditional product lines, has more of a focus on producing lower volumes of higher value products.
To enable a consistent supply of quality produce, a lot of planning is required as well as good record keeping for in-field operations. For the Corrigan’s, planning begins a minimum of twelve months in advance, identifying appropriate rotations and produce scheduling. It also involves monitoring what they do well and identifying inefficiencies. This supports their endeavours for continuous business improvement.
Deborah believes that reduced business risk can be achieved by not relying on one major customer. Doing so allows the business to operate in a competitive marketplace and provides greater options for placing their product lines at a margin. Increased market access helps to ensure the business can more effectively identify emerging trends or recognise opportunities.
Deborah also highlighted the importance of “getting the right people around you”. If you do not have the skills or interest in doing a particular task then outsource it to someone who has. Shortly after taking on the business Deborah engaged the services of an accountant to assist her to set up business systems that enabled her to take a more proactive approach to managing the business by regularly monitoring expenditure against budgets. She has also engaged a consultant to manage her Electricity and Chep accounts on an ongoing basis.
Investment of capital back into the business has also allowed maintenance and upgrading of important items of plant and equipment. It has also enabled the business to mechanise the Leek harvest operation with the recent purchase of a Leek harvester. This outlay of capital has helped to lower costs by eliminating a component of labour and by increasing harvest efficiency. According to Darren, “it now takes two people around two hours to harvest what seven people could harvest previously in a full day.”

Investigating the costs associated with the production, sale and distribution of vegetables Final Report
RMCG Consultants for Business, Communities & Environment Page 116
13.5 Key outcomes – what has been the result of having made the adaptation?
The strategies implemented at Corrigan Produce Farms have enabled Deborah and Darren to become more proactive in the management of their business. With the systems and processes they have implemented, they can now make effective business decisions with confidence.
Building long term relationships with their key customers and remaining in regular contact has allowed them to improve market knowledge, build market share and capitalise on opportunities for new product development or to value-add existing product lines.
Risk to the business has been reduced through the implementation of systems and processes, through engaging experts for specific tasks and through proactive management and regular monitoring.
Additionally, the adoption of mechanisation in the form of a Leek harvester has helped to lower costs and to increase operational efficiencies.
13.6 The future
Deborah outlined that it is important for the business to continue to explore opportunities for research and development. Focussing on marketing and ensuring that their business is front of their customers mind is critical for growing market share and developing new business opportunities.
Urbanisation and residential development also necessitates that consideration be given to the ongoing viability of vegetable production in the current location and the identification of alternatives going forward.
13.7 Lessons learnt / key messages – what are the key messages or conclusions that can be drawn from this example? § Good planning
§ Re-investment of capital back into the business is important – upgrades of plant and machinery – opportunities for efficiency.
§ Transparency, conservative estimates. “Don’t promise what you can’t deliver, There is nothing worse for a customer than not being able to get supply.”
§ Keep the business front of mind with customers, interesting and new.
§ Getting the right people around you. Character versus skill set.
Investigating the costs associated with the production, sale and distribution of vegetables Final Report
RMCG Consultants for Business, Communities & Environment Page 117
Case Study 14: “Successful business transition”
14.1 Schreurs & Sons
Schreurs and sons is a family owned and operated business consisting of approximately 600 acres based at Clyde, 50 kilometres south east of Melbourne’s CBD. The family owned and operated business, whilst historically specialising in celery, also produce leeks and baby leaf salad mix supplying fresh to supermarkets nationally as well as into the central markets.
The business relies on a core of permanent staff combined with casual labour as required. On average, labour represents approximately 35 – 40% of the total farm costs, with about two thirds of the workforce located in the processing and packing facilities and the balance in the field.
14.2 The situation – what were they doing and how?
Third generation vegetable growers, cousins Chris, Adam and Ben have recently taken ownership of the business from their parents following the finalisation of the family succession plan in July 2013. Whilst there is an obvious connection to the business, each of the cousins were pursuing quite different careers leading up to the transition and bring with them a combination of skill sets and business experience. Chris believes “it’s important having people who are good at different roles”
The transition was treated as a commercial transaction to ensure transparency and an equitable outcome for all involved. According to Chris, “the process they undertook in valuing the business for sale has been instrumental in giving the boys a thorough insight into the business and identifying the key business profit drivers”.
Essentially, this knowledge has enabled the new management to hit the ground running and focus on strategically important things. The aim is to combine the best aspects of a family run business with a corporate business focus with a culture of accountability. This involves a more disciplined approach to management decision making and the implementation of rigorous systems/processes.
14.3 The challenges
One of the biggest challenges for the Schreurs’ before the transition was not having an easily accessible holistic view on the financial processes that allowed them to take a detailed look at their business. When looking to transfer ownership of the business, there was no real way of applying a true business value under the old method for accounting. The system didn’t provide the necessary detail required.
Additionally, identifying and implementing an effective new operational structure was another challenge as there was a need to consolidate the reporting and departmental lines from five divisions to three.
Investigating the costs associated with the production, sale and distribution of vegetables Final Report
RMCG Consultants for Business, Communities & Environment Page 118
14.4 The strategy / execution
The strategy executed by the Schreurs family in transitioning business ownership from one generation to the next was focussed around sustainable success. By this, Chris believes “the first and most important step for a successful business transition is that the current owners of the business want the business to remain successful beyond the transition.” The active participation of all parties in the process appears to be an underlying reason for the successful business transition.
According to Chris, “It was important to have a clear exit date for all parties to work towards”. This allowed all involved to adequately prepare for the new roles that they would each assume. For Chris and his cousins this meant that they were clear on timeframes when negotiating finance commitments and they had a deadline for ensuring that they were adequately prepared to take on the responsibility of managing the business.
In the period leading up to the transition, Chris’s efforts were largely focussed around determining an appropriate business valuation. This involved building a cost model and getting a thorough understanding of business profitability. The diversity of crops grown and stages of crop growth made valuing the crop and potential income as well as the anticipated costs to generate that income complex. However, Chris firmly believes that undertaking the process was hugely beneficial in providing powerful business knowledge and insight and has laid solid foundations for the pathway forward.
In the months following the transition, Chris and his business partners’ attention turned to how best to use this insight for business success. “How do we grow and build the business with what we’ve got now?” An analysis was undertaken to determine:
§ What resources are currently being underutilised
§ Where are the business bottlenecks
§ What is the biggest limiting factor to business performance and profitability
14.5 Key Outcomes – what has been the result of having made the adaptation?
Through Chris’ undertaking and driving the business valuation process, they now have a financial management system in place that enables them to manage the business proactively through monitoring expenditure and performance against budgets.
Conducting an analysis of their business has assisted them to identify inefficiencies in business operations and develop an improved understanding of the key business profit drivers. Management is now well placed to identify where and how to go about making effective changes. According to Chris, “By identifying the easy wins, we are ensuring that we are creating the greatest reward for effort.” But second to that, we need to ensure we implement an effective and efficient company structure to deliver our targets, not only in the short term, but most importantly our long term goals.

Investigating the costs associated with the production, sale and distribution of vegetables Final Report
RMCG Consultants for Business, Communities & Environment Page 119
14.6 The future
Chris believes that before any radical changes to the business are made they will continue to assess what they are currently doing and where improvements can be made. It is also important to look outside the business, particularly with regards to identifying new opportunities or innovations. “Find out who’s doing it, who’s doing it well and learn what we can take away from that for our business.”
There is a lot to be said from “learning from others trials and tribulations and not necessarily from those within your own industry.”
According to Chris, they will continue to research and identify opportunities into the future. Whilst they are focussed on trying to build their equity and repay debt in the short term, they may still be potential new markets that could be pursued using existing resources or through better utilising their existing resources.
14.7 Lessons learnt / key messages – what are the key messages or conclusions that can be drawn from this example? § Active participation of all parties in the succession process. The existing business owners
must want the business to remain successful beyond the transition.
§ Having people in the business who are good at different roles
§ A good understanding of the business costs is empowering
§ Use existing resources efficiently and effectively
§ Industry and market research – who’s doing it, who’s doing it well, how can we implement it in our business?
§ Developing a culture of accountability

Investigating the costs associated with the production, sale and distribution of vegetables Final Report
RMCG Consultants for Business, Communities & Environment Page 120
Case Study 15: “Auto-transplanter to reduce labour”
15.1 Harslett Farms
Harslett Farms is a 4th generation vegetable growing business owned and operated by Alec & Denise Harslett, their son Tim and his wife Tracey.
The business, based in the Granite Belt of South East Queensland on the outskirts of Stanthorpe is a 200 ha operation growing leafy vegetables such as Chinese cabbage (wombok), celery and cos lettuce for the domestic market and under contract they grow carrots for Moffatt Fresh produce and beans for Mulgowie Farming Company.
Chinese cabbage is produced 12 months of the year whilst celery is produced December through to July and cos lettuce is grown October to April
Harslett Farms also have a nursery on farm to propagate their own seedlings for transplanting into the field. They are currently producing in excess of 6,000,000 seedlings per year. On average across the year, the farm employs 35 a mixture of 15 permanent staff supported by some contract crews, backpackers and causal locals.
15.2 The situation – what were they doing and how?
When Tim came home in 2002 changes focussed on business growth were necessary in order to minimise input costs, particularly labour.
Historically the Harslett’s have used a semi-auto transplanting machine for planting their leafy vegetables. A semi-auto planter will plant around 50,000 seedlings per day, equivalent to approximately 1 hectare per day. Planting occurs 4-5 days per week over a 30 week period.
A semi automatic transplanting machines is worth about $20k and a day of planting consisted of the following:
§ 6 staff per machine
§ 8.5 hour days
§ $30/hour including on costs
§ 50,000 plants transplanted per day
§ The tractor pulling the machine would cost around $20/hour in fuel and consumables
15.3 The challenges
The planting operation is labour intensive and inefficient, requiring six labour units to ride on the planter and drop seedlings into the planting cups.
As labour was one of the biggest costs in the business, the Harslett’s decided that they needed to explore alternatives to reduce this cost and to improve planting efficiency.
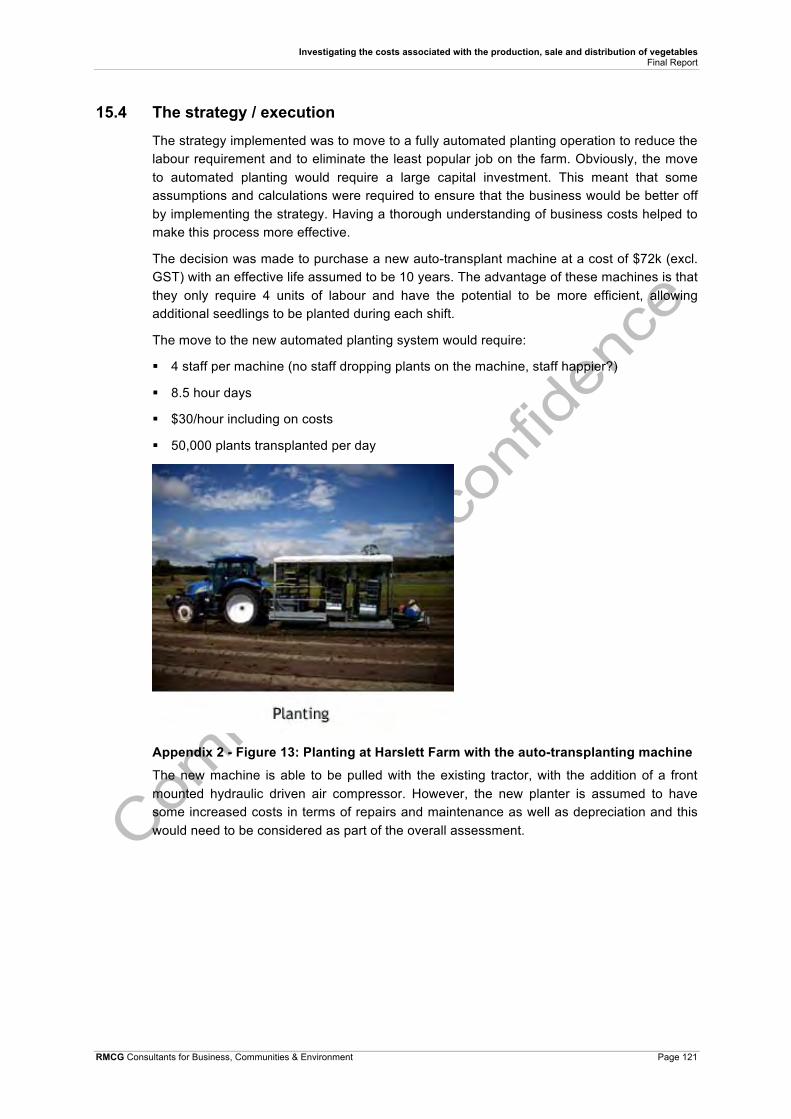
Investigating the costs associated with the production, sale and distribution of vegetables Final Report
RMCG Consultants for Business, Communities & Environment Page 121
15.4 The strategy / execution The strategy implemented was to move to a fully automated planting operation to reduce the labour requirement and to eliminate the least popular job on the farm. Obviously, the move to automated planting would require a large capital investment. This meant that some assumptions and calculations were required to ensure that the business would be better off by implementing the strategy. Having a thorough understanding of business costs helped to make this process more effective.
The decision was made to purchase a new auto-transplant machine at a cost of $72k (excl. GST) with an effective life assumed to be 10 years. The advantage of these machines is that they only require 4 units of labour and have the potential to be more efficient, allowing additional seedlings to be planted during each shift.
The move to the new automated planting system would require:
§ 4 staff per machine (no staff dropping plants on the machine, staff happier?)
§ 8.5 hour days
§ $30/hour including on costs
§ 50,000 plants transplanted per day
Appendix 2 - Figure 13: Planting at Harslett Farm with the auto-transplanting machine
The new machine is able to be pulled with the existing tractor, with the addition of a front mounted hydraulic driven air compressor. However, the new planter is assumed to have some increased costs in terms of repairs and maintenance as well as depreciation and this would need to be considered as part of the overall assessment.

Investigating the costs associated with the production, sale and distribution of vegetables Final Report
RMCG Consultants for Business, Communities & Environment Page 122
15.5 Key outcomes – what has been the result of having made the adaptation?
The strategy to move to a fully automated planter has resulted in cost savings to the business of approximately $45,000 per year as follows:
§ Labour savings equivalent to around $61,200/yr (2 units x $30/hr x 8.5 hrs/day x 4 days/wk x 30 wks)
§ Increased repairs and maintenance costs assumed to be $5,000/yr
§ Additional $3,500 opportunity cost of capital ($46,000 av cost @ 7.5%)
§ Additional depreciation costs of $5,200 ($52,000 over 10 years)
Subjectively Tim would say that there is now less undesirable jobs to do as there is less people required to transplant. From a management perspective, 2 less people are required to be employed.
Another point to consider is that unlike the cup planting operation with manual labour, the automatic transplanter is not selective in the plants that get planted. This means that to maximise establishment, Tim has to ensure that the seedlings selected from the nursery for planting are all healthy. A machine requires high average and low standard deviation in quality, therefore have been forced to pick up our game in the nursery. This has real, but difficult to quantify, flow on effects to overall quality of produce turned out.
In addition to producing their own vegetables, the Harsletts also grow carrots and beans under contract for two local wholesalers. This arrangement has enabled them to continue to grow their business without taking on additional risk. “We just need to do what we’re good at and what we enjoy doing”. It has also resulted in a lowering of costs by allowing them to spread their fixed costs of labour and machinery over a greater area of production.
15.6 Lessons learnt / key messages – what are the key messages or conclusions that can be drawn from this example? § A good understanding of business costs allows you to make informed decisions
§ Efficient use of resources to maximise profit
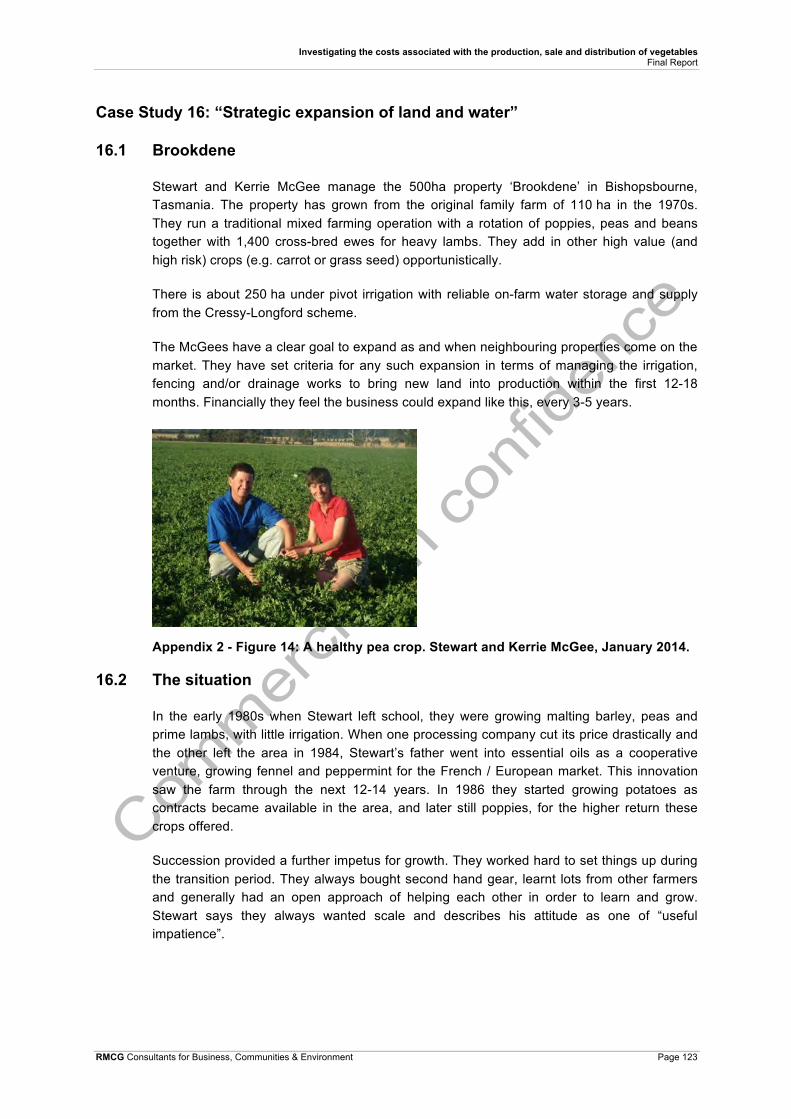
Investigating the costs associated with the production, sale and distribution of vegetables Final Report
RMCG Consultants for Business, Communities & Environment Page 123
Case Study 16: “Strategic expansion of land and water”
16.1 Brookdene
Stewart and Kerrie McGee manage the 500ha property ‘Brookdene’ in Bishopsbourne, Tasmania. The property has grown from the original family farm of 110 ha in the 1970s. They run a traditional mixed farming operation with a rotation of poppies, peas and beans together with 1,400 cross-bred ewes for heavy lambs. They add in other high value (and high risk) crops (e.g. carrot or grass seed) opportunistically.
There is about 250 ha under pivot irrigation with reliable on-farm water storage and supply from the Cressy-Longford scheme.
The McGees have a clear goal to expand as and when neighbouring properties come on the market. They have set criteria for any such expansion in terms of managing the irrigation, fencing and/or drainage works to bring new land into production within the first 12-18 months. Financially they feel the business could expand like this, every 3-5 years.
Appendix 2 - Figure 14: A healthy pea crop. Stewart and Kerrie McGee, January 2014.
16.2 The situation
In the early 1980s when Stewart left school, they were growing malting barley, peas and prime lambs, with little irrigation. When one processing company cut its price drastically and the other left the area in 1984, Stewart’s father went into essential oils as a cooperative venture, growing fennel and peppermint for the French / European market. This innovation saw the farm through the next 12-14 years. In 1986 they started growing potatoes as contracts became available in the area, and later still poppies, for the higher return these crops offered.
Succession provided a further impetus for growth. They worked hard to set things up during the transition period. They always bought second hand gear, learnt lots from other farmers and generally had an open approach of helping each other in order to learn and grow. Stewart says they always wanted scale and describes his attitude as one of “useful impatience”.
Investigating the costs associated with the production, sale and distribution of vegetables Final Report
RMCG Consultants for Business, Communities & Environment Page 124
16.3 The challenges
The predominantly clay loam over clay soils has meant significant investment (around $30-40,000 per year) in underground drainage works over the years, to remove the risk of crop failure from waterlogging.
Stewart reflects that getting into potatoes set a high expectation for ongoing good returns. This encouraged them to continue to expand the potato crop and yields were routinely well above the district average (approximately 4500 tonnes per year were grown). There was a lot of stress however and a feeling of increasing risk involved (e.g. disease pressure, lack of land availability, increased inputs required, and lack of productivity gains i.e. needing to increase inputs just to maintain yield). They made the decision in 2008 to stop growing potatoes and instead focus more on their other crops (i.e. peas, beans and poppies) and prime lamb production.
16.4 The strategy
The decision to stop growing potatoes was difficult. But the McGee’s embraced the change with their attitude of ‘getting on with it’ and quickly secured increased areas for more peas, beans and poppies. Today they reflect that while they agonised over this decision, it inevitably allowed them to move on. The reduced workload provided the opportunity to step back and see other opportunities. As Stewart says, “we wouldn’t be where we are now if we were still growing spuds”.
They say the ‘sweet spot’ was a combination of increased land values, reduced workload (having stopped potatoes), and some good advice from their accountant to refinance. They now keep cash in loans and redraw equity for operating as needed. This provides greater financial flexibility to cope with cash flow issues, should they have a late harvest situation (no equity to do this before). Stewart acknowledges they work hard to have good relationships with suppliers and this also allows them some flexibility for delayed payments, as needed.
16.5 Key outcomes
Since bedding down the current cropping rotation, the McGees have been able to gradually (strategically) expand while continuing to meet their increased commitments. They have improved their financial flexibility, completed the drainage program to reduced crop risks (e.g. waterlogging), and now have more time to pay attention to detail.
Timing is critical to their success; close attention to detail ensures consistently high yields, showing they are reliable and therefore attractive to processors (e.g. Simplot or Tasmanian Alkaloids).
Investment decisions on new plant and equipment are based on their potential to lift productivity. For example, the purchase of a new seed drill in 2009 was justified in part through anticipated pea yield increase of 10%

Investigating the costs associated with the production, sale and distribution of vegetables Final Report
RMCG Consultants for Business, Communities & Environment Page 125
16.6 The future
The McGees will strive to keep their overheads low through economies of scale. They will look at additional land as opportunities arise.
Their current rotation of peas, beans and poppies is a good fit for their property but they remain open to other avenues. As Kerrie says, they “never say never”. They are keen to look further into value-adding to move their vegetables further up the value chain, if and when they can, in conjunction with others in the supply chain.
They have an attitude that clearly demonstrates their capacity to ‘keep on evolving’.
16.7 Lessons learnt – key messages – what conclusions can be drawn from this example?
Stewart and Kerrie McGee have discovered that it pays to take considered risks. They put strategies in place to ensure the difficult decision to move away from potatoes (with the high return they gave) didn’t leave them with a gap. They took this step only when they felt ready: once investment in drainage was complete, extra cropping areas were secured, and once they had finalised their financial arrangements. There were direct savings in terms of reduced machinery costs (for potatoes), as they were able to sell some gear and cancel a new tractor on order.
They now have a rotation that fits their land capability well, and their farming approach rewards them with high yields and ongoing reliability for future contracts. This type of approach involves several key factors that have created success for the McGees, including:
§ Doing things on time and getting it right – “don’t just take it through its paces”
§ Taking advice from others
§ Watching R&D for fine tuning
§ Building good relationships with contractors, suppliers and processors

Investigating the costs associated with the production, sale and distribution of vegetables Final Report
RMCG Consultants for Business, Communities & Environment Page 126
Case Study 17: “A Tasmanian survival story ”
17.1 Premium Fresh Tasmania
Premium Fresh Tasmania (PFT) is a family-owned business that grows, packs and markets mainly carrots, onions and shallots plus a range of specialty vegetables (e.g. broccoli, brussel sprouts, leeks, beetroot, swedes, turnips and other bunching lines) based in Forth, Tasmania. Annual total production of around 35,000 tonnes maintains year-round supply to the major retailers and wholesale markets in all Australian states, and a growing number of export customers.
Brothers Mike, Rick and Jim Ertler manage the business, which operates on the same site as the family farm that was established over 55 years ago. There is a family tradition of ‘creating opportunities and making things happen’, dating back to grandfather Alex Ertler who was an entrepreneur with a cheese/yoghurt factory in Devonport in the 1950-60s.
Traditional family farming (contract growing for packers and processors) scaled up in 1985 when Mike and Rick developed a vegetable-processing factory in Devonport. Jim came home from college in 1990 to work on the farm with their father, and the business grew with new relationships to supply fresh market carrots directly to wholesalers supplying the major retailers, rather than other packers and processers in the region. In 2005 Premium Fresh began direct supply to the major retailers. As demand for product steadily increased, other growers throughout the region were contracted to supply Premium Fresh and this model remains in place today.
There are more than 80 individual growers who now supply PFT. With around 160 staff in the farming and factory operations, it is one of the region’s largest employers, providing additional flow-on business for local freight, fuel and machinery firms.
17.2 The situation
Market opportunities combined with the optimism and ‘can do’ attitude of the Ertler brothers (a family trait) saw significant expansion of the business and its facilities (e.g. automated grading, weighing and packing technologies) from about 2000 onwards, solely through reinvestment (about $15M over ten years) from profits and borrowings. Turnover grew from around $3M in 2000 to over $30M in 2011.
Striving to exceed customer expectations was the basis for growth, with loyalty and relationships a focus with the major retailers. The ten-year drought in other vegetable growing regions nationally created additional opportunities and fostered a general outlook of positivity and optimism at this time.
The largest costs to the business then were (and still are) in on-farm production, freight and labour. These were naturally climbing over time, but this was somewhat masked for the Ertler brothers through the expansion period via steady increases in volume to maintain supply contracts with the supermarkets.

Investigating the costs associated with the production, sale and distribution of vegetables Final Report
RMCG Consultants for Business, Communities & Environment Page 127
17.3 The challenges
In September 2012 PFT joined several other large Australian agricultural businesses facing serious financial trouble as a result of record low prices, rising costs and continued pressure from the high Australian dollar as well as the supermarket discounting war.
Earlier that year they had begun discussion with the Department of Economic Development (DED) regarding a loan. After two extensive applications (backed by reports from Deloitte), the brothers received the news in August 2012 that their final application had been rejected. They made the difficult decision to bring in voluntary administrators to save the family-owned business.
Mike and Jim reflect on the rising pressures. The first blow came when a major buyer dropped their weekly order without explanation (to the tune of $150,000 per week). When combined with higher shipping costs to Europe, seasonally low marketable yields in carrots (taking roughly $2M out of the books), onion prices at record low, and the high Australian dollar, this culminated in losses the company couldn’t absorb. Diversification into several niche crops (e.g. red beet, broccoli, sprouts, bunching lines and leeks) was already underway (to attempt to spread risk) but during the time of financial pressure this only added more costs and little income, with the additional time requirements on management staff and extra demands for labour and equipment.
Without notice, and with their charge over the business, the banks froze PFTs account and then removed vital funds, making it almost impossible for the business to trade on. The results of this action were neutralized by the support of Federal local member Sid Sidebottom who managed to secure Federal funding, with the State government providing support as well.
17.4 The strategy
The Ertlers maintain that good relationships all round certainly helped them survive 2012. They asked for – and received – guaranteed volumes from Coles, together with the financial and political support from both Governments. This was the vital injection of funds that stayed the bank and, importantly, gave recognition that the business was fundamentally sound. The company was able to keep trading (as was recommended by the administrator) and honour staff salaries and benefits. The support of nearly all creditors, to accept partial payment of debts owed, gave a further clear signal that the business was well respected, and worth saving.
17.5 Key outcomes
The Ertlers now recognise the need for outside investment and expertise and have, for the first time, brought in an equity partner. They say, with hindsight, that they should have looked earlier. By the time they really needed it, it was almost too late – people were either too wary or ‘waiting for a bargain’.
They have installed a new accounting system to give greater visibility over the business. Mike and Jim say their greatest change has been efficiencies gained by monitoring labour needs across the business, reducing numbers wherever possible and focusing more now on

Investigating the costs associated with the production, sale and distribution of vegetables Final Report
RMCG Consultants for Business, Communities & Environment Page 128
staff ‘intelligence’ than before. They feel they granted many areas of the business the ‘luxury’ of extra staff, without really testing the limits.
Jim says the experience has reinforced the importance of networking, in particular the lessons that might be learned from others in similar situations. Mike adds that the events of 2012 have increased their awareness of the risks and ensured they maintain valuable checks and balances within the naturally optimistic team.
17.6 The future
The Ertlers are quietly confident about the future. Their immediate goals are understandably focused on business survival (until their legal obligations are met in July 2014) and charting the unfamiliar territory with a new equity partner, but they are also keen to grow the export side of the business and are already well placed in rising Asian markets. They are aware of Tasmania’s natural advantages and will grow new specialty crops to fill seasonal gaps on the domestic market.
Mike and Jim see yet more opportunities to reduce the cost of production of their traditional vegetable lines by increasing marketable yield (pack-out). And, they will continue with gradual mechanisation to further reduce labour.
Future challenges include securing enough land, with growers and processor/packer companies alike competing for the famously productive soils of the region. The risk of oversupply in key commodity markets (e.g. carrots and onions) is an ever-present challenge as other growers inevitably increase scale, but may also present opportunities for PFT to be involved in new regional growing and/or marketing ‘clusters’.
17.7 Lessons learnt – key messages – what conclusions can be drawn from this example?
Premium Fresh Tasmania achieved significant growth and scale over the past decade through increasing volume (and spreading costs). They had a naturally optimistic attitude and took opportunities as they arose. The financial struggles of 2012 resulted from a somewhat unimaginable (for them) series of events, but they send a clear message for all businesses in expansion to adopt appropriate monitoring systems and to always ‘expect the unexpected.’
Mike and Jim Ertler are reflective about the lessons learnt. There was always a feeling of optimism during the good times. They funded their growth through reinvestment and borrowings but this left them with little headroom to weather a major downturn.
Having lived through the ‘mother of all years’ they remain confident about the future and are embracing the changes required to ensure survival and continued growth. With a new equity partner and direct insolvency experience in the management team, improved checks and balances are a key strategy to increase accountability and manage the significant risks involved in running a large-scale family business. Part of having checks and balances is to have sound planning and business procedures in place, such as:
§ Financial management and business reporting systems

Investigating the costs associated with the production, sale and distribution of vegetables Final Report
RMCG Consultants for Business, Communities & Environment Page 129
§ Human resource management – documentation and communication of policies and procedures, staff training and regular reviews
§ Quality assurance, traceability and documentation
§ Contract management and communications with growers and customers
§ Freight and logistics arrangements
§ Alignment of field production and packing processes with market needs
§ Careful planning and monitoring of diversification
§ Membership with relevant business groups e.g. Family Business Australia

Investigating the costs associated with the production, sale and distribution of vegetables Final Report
RMCG Consultants for Business, Communities & Environment Page 130
Case Study 18: “Reducing labour allowed more time for planning ”
18.1 The business
Owen Thomas manages the 800 hectare coastal property ‘North Down’ near Port Sorell east of Devonport, Tasmania. Owen grows a mix of vegetable and other crops and runs approximately 1400 adult Coopworth-Corriedale ewes (plus 500 joined ewe hoggets). A small cherry orchard was planted in 2001 to diversify farm income with 4ha now in production (plus 1.5ha of younger trees).
Appendix 2 - Figure 15: Views to Bass Straight from the homestead
Every class of land is represented on the property with crops and rotations tailored to suit land capability. Typically there is about 80ha intensively cropped, with 60-70ha occasionally cropped in rotation with poppies. Vegetables represent about 40% of farm turnover (25% livestock, 35% cherries/poppies) and can include brassicas, fresh beans, swedes, onions and potatoes.
Owen’s goals and farming decisions are based on sustainability (financial and physical) for the immediate future and that of his three children (aged 20, 18 and 13). The property has been in the family since settlement (1828) and Owen feels a strong connection and sense of stewardship to the land.
18.2 The situation
Owen’s father (and grandfather) were early adopters, growing some of the first crops of poppies and pyrethrum during the 1960s to 1980s. The 1980s also saw their first major dam built which allowed them to increase scale for vegetable cropping. Prior to this wool was the major enterprise. Two neighbouring parcels of land (5 hectares each) were bought at this time.
Vegetable production during this period was mainly for the local processing companies and commonly included beans, peas, onions and potatoes. The workload was high (e.g. using traveling irrigators) and Owen reflects that the cost/price squeeze became apparent then. The business weathered the wool price collapse of the early 1980s and high interest rates,
Investigating the costs associated with the production, sale and distribution of vegetables Final Report
RMCG Consultants for Business, Communities & Environment Page 131
and was later hit by losses in the main onion crop (from disease and closure of processor Vecon in the late 1980s).
The drought years in 2006-2008 prompted further rethinking and future planning. Owen was worried about declining yields and income and the extra work involved in ‘trying to grow more with less’. He reflects on this time where he felt that “labour would’ve defeated us”. He could see that he needed to focus on reducing stress from the heavy workload to not only improve the business, but his own health and future lifestyle. He came to the conclusion that intensification (and diversification) was a better route.
With the help of a financial advisor, Owen decided to reduce permanent farm labour (by about 0.75 FTE), and invested in linear irrigation. He also made the shift to using contractors as much as possible to reduce the costs and time spent on machinery. Cherries were planted at this time to diversify income. These changes meant Owen could focus more on agronomy and planning – the aspects of farming he enjoys most.
18.3 The challenges
The investment in new irrigation reduced labour but meant increased debt. It also required the clearing of shelterbelts previously planted to improve on-farm biodiversity. Owen would like to reinstate some of these in the future.
The business remained typically reliant on processing potatoes for regular income but was hit hard by the McCain closure in 2010 and a further 50% cut in other local contracts at that time. An attempt to ‘fill the gap’ with fresh market potatoes failed primarily due to oversupply (as growers responded to the McCain closure), and partly due to quality issues. Owen acknowledges there was risk in expanding into less reliable ground for the fresh market, but says there were limited options, given the sudden closure part-way into the season. Owen reduced wage overheads at the time, to help cope with this situation.
18.4 The strategy
Owen’s strategy for the recent business changes has been primarily to reduce permanent labour. This has included the shift to bring contractors in as much as possible and the investment in linear irrigation. This allowed paddock sizes to be increased, which then led to improved opportunities with local packing and processing companies. The extra scale provides better access for company staff to grow and monitor the crops through the season.
Importantly, Owen feels that building good relationships is key to his overall business strategy. He has worked hard to make it easy for companies to deal with them. Any changes to the system are easily managed or negotiated, as the relationship is already there. Owen has also used the same agronomist for 25-30 years and sees value in seeking out, and relying on, good people.
Owen also believes in ongoing learning and networking and keenly participates in courses (e.g. property management planning and Evergraze) when available.
Investigating the costs associated with the production, sale and distribution of vegetables Final Report
RMCG Consultants for Business, Communities & Environment Page 132
18.5 Key outcomes
Owen is happy they have modernised the farm. He is open in acknowledging there have been ups and downs, but he says they now have more reliable and higher yielding crops as a result of the changes.
He is pleased they are using their intensive land to its potential and avoiding the more sensitive areas of the farm (e.g. salt near the coastal flats). They now have a more targeted approach to fertiliser management.
Perhaps the key outcome is the improved labour productivity that has provided more time to think and tweak the system, where Owen’s natural skills and interests lie.
18.6 The future
There are still future challenges. Owen feels their ideal scale is still out there to achieve and says they haven’t got there due to land constraints (e.g. reduced capability of the sloping/salty lands). This may be also partly due to the confidence required to make changes. He says he feels a bit burnt by previous attempts / failures on some of this more risky land (e.g. fresh market potatoes). Future attempts to increase scale will come more from improved management of his crops and stock (i.e. fine tuning) rather than risky one-offs in less reliable ground.
18.7 Lessons learnt – key messages – what conclusions can be drawn from this example?
The Thomas Bros case provides some useful key messages or lessons learnt:
§ Avoid blind loyalties in business relationships
§ Look for good people always – be upfront and explain your decisions openly with people
§ Bring professional advice in if it’s not an area you have skills or interests in
§ Do the sums and invest in labour savings
§ Be flexible and open to change, keep learning and networking
§ Pay attention to detail – plan ahead, review your plans and make changes as needed
§ Consider intensification / diversification to increase scale (not just increase land area)

Investigating the costs associated with the production, sale and distribution of vegetables Final Report
RMCG Consultants for Business, Communities & Environment Page 133
Case Study 19: “Building a future asset for our children ”
19.1 The business
Tom and Inge Dowling manage Croftside Nominees Pty Ltd, a 1400ha (3500 acre) mixed farming operation at Cressy, northern Tasmania. They have a well-established rotation of poppies, peas and lucerne, in conjunction with a 10,000 DSE Merino based sheep operation. Tom currently grows 150ha peas, 260ha poppies and 270ha lucerne.
Appendix 2 - Figure 16: Peas one month from planting
The Dowlings have expanded their farming operation considerably over time – from 1200 acres in 1982 to 3500 acres today. They say they feel ‘lucky’ to have grown the business steadily through the purchase of ‘bite sized’ neighbouring farms each couple of years. This ‘luck’ is more the intersection of good planning and timely opportunity, as there has been a deliberate ‘project-based’ strategy to the investment in land and irrigation infrastructure.
Contracts (e.g. for extra volume and area for peas and poppies) were always secured first, to build a business case for the addition of land and irrigation. Peas (harvested early summer) are a mainstay of the operation as they are perfectly suited to the predominantly duplex soils, allowing quick follow-on of annual grass establishment prior to the wet winter.
19.2 The situation
The Dowlings began scaling up in the mid-late 1990s, following a successful period of share farming potatoes (1990-1993). Tom says the improved cash flow from potatoes gave them their first opportunity to increase spending on the business, which in itself was triggered by the confidence gained from an effective benchmarking group (which they stayed with for

Investigating the costs associated with the production, sale and distribution of vegetables Final Report
RMCG Consultants for Business, Communities & Environment Page 134
eight years). Through this, they were encouraged and mentored through a close examination of the business, which reinforced that high costs and lack of turnover were fundamental barriers. In 1995-96 Tom was typically growing 50 hectares poppies, 30 hectares peas, and 20 hectares lucerne, moving three travelling irrigators, and paying two labour units plus himself – he says he realised they needed to scale up, but had no time to do so.
The clear turning point came with the decision to bring contractors in and cease investment in plant and equipment. Looking closely at the books (and crop margins) helped identify that this was doable, which then provided security for getting contractors in and scaling up. Investment in pivot irrigation (and the associated reduction in labour) underpinned the expansion activities.
Tom and Inge married in 1997 and a smooth transition of management from Tom’s parents soon followed. Tom sees this as a ‘settling’ period, from a management perspective, and says succession planning has been a major part of their business success. He explains that he has progressive, inclusive and trusting parents, and so he had a long understanding of the ‘rules of the game’ well before he took control of the business. These strategies and values were reinforced during Tom’s formal agricultural college training.
19.3 The challenges
The changes around the engagement of contractors weren’t rushed and were not always easy. Inge reflects that letting go of control was a ‘massive hurdle’ for Tom, who acknowledges how hard it was to get his mind around the need to replace his own input. He first needed to appreciate the unsustainable human cost of his and Inge’s high workload.
Learning to trust others has been critical. They employed an assistant manager in 2000 and Tom says it took years to build the confidence to fully delegate and trust others after doing everything themselves. While they have enjoyed the assistance of two managers since then, they now have a balanced team and Tom can comfortably maintain his role of ‘overseer’ instead of having direct involvement in all farming operations.
19.4 The strategy
Tom believes there is a real need for someone in his situation to be good at ‘reading’ people. His changed role has created efficiencies through freeing up his time to focus on keeping staff (and contractors) happy, motivated, on time, and on task. He explains that before, he didn’t have time for that critical 10% oversight because he was so busy doing the work himself.
Another key to the Dowling’s strategy is to always look forward – Tom has focused on dual purpose crops (e.g. peas and lucerne) so they always have something coming on after. Being proactive with close attention to detail is absolutely critical and demonstrated by the farm routinely producing yields above the district average. Crop failures are rare.
Good relationships are an essential part of the strategy. They have had the same key advisors for many years and have developed strong relationships with their regular contractors. As Tom says, their businesses both rely on each other, and good communication along with business and personal trust is an important part of that.

Investigating the costs associated with the production, sale and distribution of vegetables Final Report
RMCG Consultants for Business, Communities & Environment Page 135
Tom is always seeking knowledge to inform his planning and relies on trusted advisors for assistance with maps and soils, for example, and he has a ‘management’ agronomist for holistic farm advice. He monitors and knows his figures over five years (the whole rotation).
19.5 Key outcomes
Tom says the major outcome has been the planned pace of his work and feels they now have a better work/family balance. Tom is happy that he still maintains a ‘finger on the pulse’, which is important in terms of his own personal goals.
The Dowlings are happy with the current scale of their farming operations and their business ‘health’ (e.g. costs are less than 60% of sales, down from nearly 90% in 1995-96).
They have improved their knowledge and confidence in their business to the point where they can say ‘no’ to an enterprise if the margin isn’t right. The vegetable companies and other customers respect them for this, as they now understand the triggers that govern the area and volumes the Dowlings will allocate to them. This has been proven consistently for many years.
19.6 The future
While Tom says he still needs a challenge and that he loves to take on a property and get it all ‘ship shape’, their plan for the future is to consolidate and to ‘keep it simple’ i.e. follow their established rotation and proven management approach. This will allow the Dowlings more freedom to enjoy the pleasures of family while maintaining a sound underlying business to give options or choices about future directions.
Tom is proud of his parents’ approach to business, in particular their focus on succession planning. He wants to foster the same for his family in the future, as well as promote the approach, and it’s benefits, to others.
19.7 Lessons learnt – key messages – what conclusions can be drawn from this example?
The Dowling’s case shows that taking considered risks pays off. As Tom says, “do your homework and secure volume first”. Their approach demonstrates that good management makes good luck. Key aspects include:
§ A focus on relationships and communication throughout the business (internal and external)
§ Unfailing attention to detail (to demonstrate potential)
§ Knowing your figures over the full rotation (and keeping good records to help with planning)
§ “Make that first crop count” – ensuring enough borrowing capacity to develop a new purchase ready for the next season (i.e. as soon after purchase as possible).
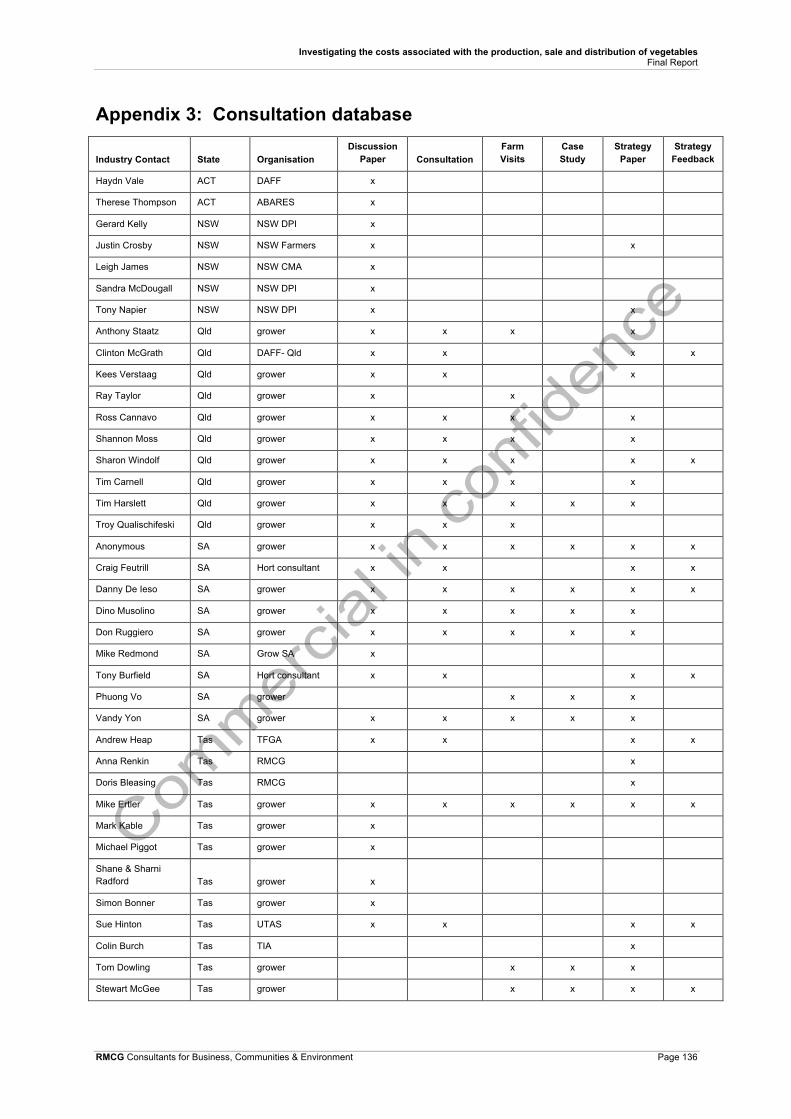
Investigating the costs associated with the production, sale and distribution of vegetables Final Report
RMCG Consultants for Business, Communities & Environment Page 136
Appendix 3: Consultation database
Industry Contact State Organisation Discussion
Paper Consultation Farm Visits
Case Study
Strategy Paper
Strategy Feedback
Haydn Vale ACT DAFF x
Therese Thompson ACT ABARES x
Gerard Kelly NSW NSW DPI x
Justin Crosby NSW NSW Farmers x
x
Leigh James NSW NSW CMA x
Sandra McDougall NSW NSW DPI x
Tony Napier NSW NSW DPI x
x
Anthony Staatz Qld grower x x x
x
Clinton McGrath Qld DAFF- Qld x x
x x
Kees Verstaag Qld grower x x
x
Ray Taylor Qld grower x
x
Ross Cannavo Qld grower x x x
x
Shannon Moss Qld grower x x x
x
Sharon Windolf Qld grower x x x
x x
Tim Carnell Qld grower x x x
x
Tim Harslett Qld grower x x x x x
Troy Qualischifeski Qld grower x x x
Anonymous SA grower x x x x x x
Craig Feutrill SA Hort consultant x x
x x
Danny De Ieso SA grower x x x x x x
Dino Musolino SA grower x x x x x
Don Ruggiero SA grower x x x x x
Mike Redmond SA Grow SA x
Tony Burfield SA Hort consultant x x
x x
Phuong Vo SA grower
x x x
Vandy Yon SA grower x x x x x
Andrew Heap Tas TFGA x x
x x
Anna Renkin Tas RMCG
x
Doris Bleasing Tas RMCG
x
Mike Ertler Tas grower x x x x x x
Mark Kable Tas grower x
Michael Piggot Tas grower x
Shane & Sharni Radford Tas grower x
Simon Bonner Tas grower x
Sue Hinton Tas UTAS x x
x x
Colin Burch Tas TIA
x
Tom Dowling Tas grower
x x x
Stewart McGee Tas grower
x x x x
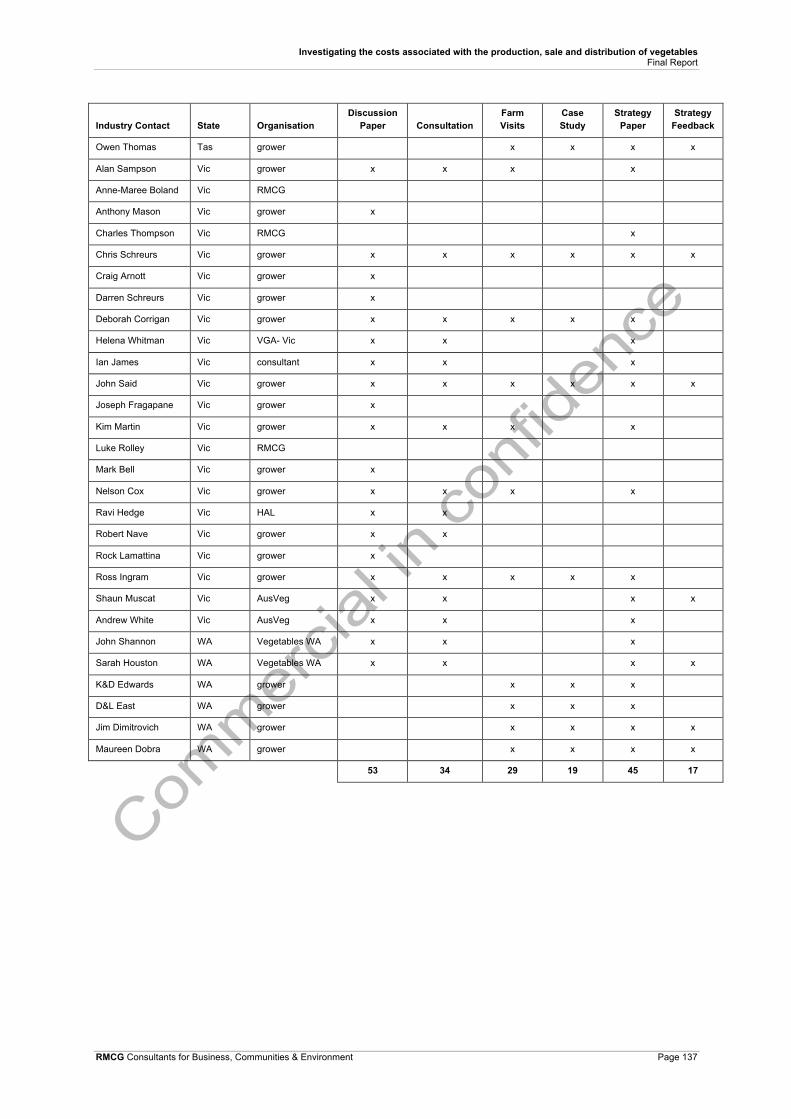
Investigating the costs associated with the production, sale and distribution of vegetables Final Report
RMCG Consultants for Business, Communities & Environment Page 137
Industry Contact State Organisation Discussion
Paper Consultation Farm Visits
Case Study
Strategy Paper
Strategy Feedback
Owen Thomas Tas grower
x x x x
Alan Sampson Vic grower x x x
x
Anne-Maree Boland Vic RMCG
Anthony Mason Vic grower x
Charles Thompson Vic RMCG
x
Chris Schreurs Vic grower x x x x x x
Craig Arnott Vic grower x
Darren Schreurs Vic grower x
Deborah Corrigan Vic grower x x x x x
Helena Whitman Vic VGA- Vic x x
x
Ian James Vic consultant x x
x
John Said Vic grower x x x x x x
Joseph Fragapane Vic grower x
Kim Martin Vic grower x x x
x
Luke Rolley Vic RMCG
Mark Bell Vic grower x
Nelson Cox Vic grower x x x
x
Ravi Hedge Vic HAL x x
Robert Nave Vic grower x x
Rock Lamattina Vic grower x
Ross Ingram Vic grower x x x x x
Shaun Muscat Vic AusVeg x x
x x
Andrew White Vic AusVeg x x
x
John Shannon WA Vegetables WA x x
x
Sarah Houston WA Vegetables WA x x
x x
K&D Edwards WA grower
x x x
D&L East WA grower
x x x
Jim Dimitrovich WA grower
x x x x
Maureen Dobra WA grower
x x x x
53 34 29 19 45 17
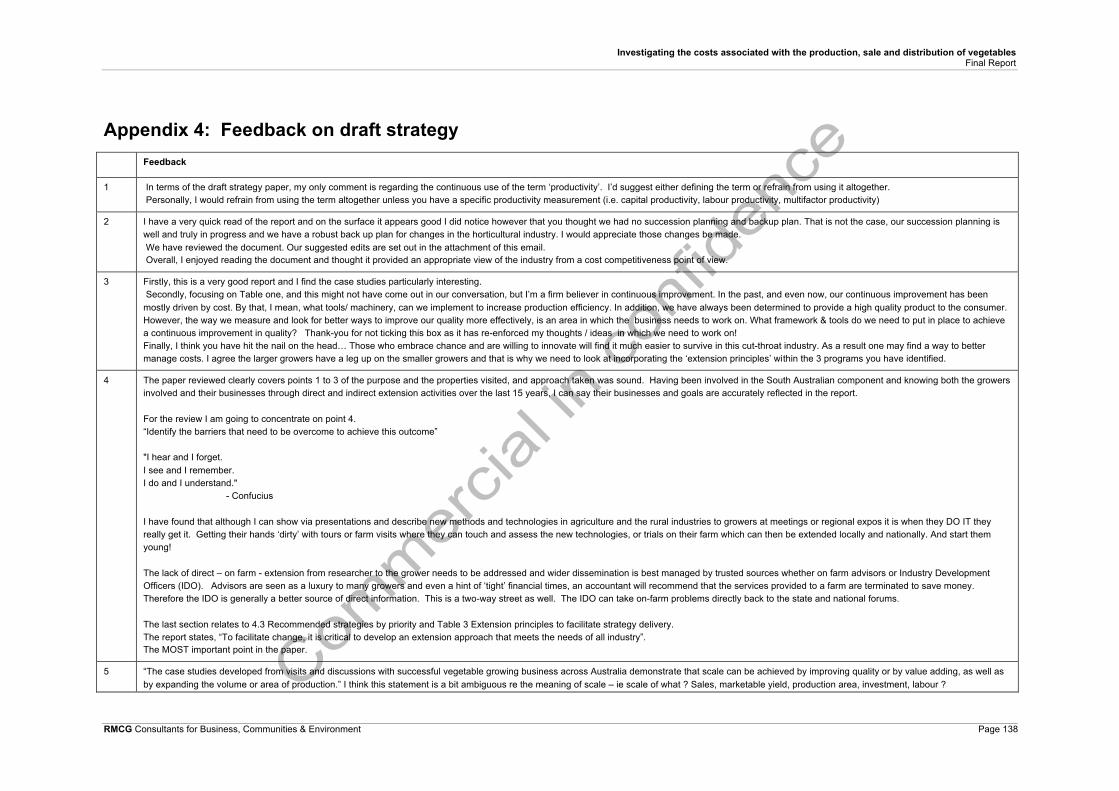
Investigating the costs associated with the production, sale and distribution of vegetables Final Report
RMCG Consultants for Business, Communities & Environment Page 138
Appendix 4: Feedback on draft strategy Feedback
1 In terms of the draft strategy paper, my only comment is regarding the continuous use of the term ‘productivity’. I’d suggest either defining the term or refrain from using it altogether. Personally, I would refrain from using the term altogether unless you have a specific productivity measurement (i.e. capital productivity, labour productivity, multifactor productivity)
2 I have a very quick read of the report and on the surface it appears good I did notice however that you thought we had no succession planning and backup plan. That is not the case, our succession planning is well and truly in progress and we have a robust back up plan for changes in the horticultural industry. I would appreciate those changes be made. We have reviewed the document. Our suggested edits are set out in the attachment of this email. Overall, I enjoyed reading the document and thought it provided an appropriate view of the industry from a cost competitiveness point of view.
3 Firstly, this is a very good report and I find the case studies particularly interesting. Secondly, focusing on Table one, and this might not have come out in our conversation, but I’m a firm believer in continuous improvement. In the past, and even now, our continuous improvement has been mostly driven by cost. By that, I mean, what tools/ machinery, can we implement to increase production efficiency. In addition, we have always been determined to provide a high quality product to the consumer. However, the way we measure and look for better ways to improve our quality more effectively, is an area in which the business needs to work on. What framework & tools do we need to put in place to achieve a continuous improvement in quality? Thank-you for not ticking this box as it has re-enforced my thoughts / ideas in which we need to work on! Finally, I think you have hit the nail on the head… Those who embrace chance and are willing to innovate will find it much easier to survive in this cut-throat industry. As a result one may find a way to better manage costs. I agree the larger growers have a leg up on the smaller growers and that is why we need to look at incorporating the ‘extension principles’ within the 3 programs you have identified.
4 The paper reviewed clearly covers points 1 to 3 of the purpose and the properties visited, and approach taken was sound. Having been involved in the South Australian component and knowing both the growers involved and their businesses through direct and indirect extension activities over the last 15 years, I can say their businesses and goals are accurately reflected in the report. For the review I am going to concentrate on point 4. “Identify the barriers that need to be overcome to achieve this outcome” "I hear and I forget. I see and I remember. I do and I understand." - Confucius I have found that although I can show via presentations and describe new methods and technologies in agriculture and the rural industries to growers at meetings or regional expos it is when they DO IT they really get it. Getting their hands ‘dirty’ with tours or farm visits where they can touch and assess the new technologies, or trials on their farm which can then be extended locally and nationally. And start them young! The lack of direct – on farm - extension from researcher to the grower needs to be addressed and wider dissemination is best managed by trusted sources whether on farm advisors or Industry Development Officers (IDO). Advisors are seen as a luxury to many growers and even a hint of ‘tight’ financial times, an accountant will recommend that the services provided to a farm are terminated to save money. Therefore the IDO is generally a better source of direct information. This is a two-way street as well. The IDO can take on-farm problems directly back to the state and national forums. The last section relates to 4.3 Recommended strategies by priority and Table 3 Extension principles to facilitate strategy delivery. The report states, “To facilitate change, it is critical to develop an extension approach that meets the needs of all industry”. The MOST important point in the paper.
5 “The case studies developed from visits and discussions with successful vegetable growing business across Australia demonstrate that scale can be achieved by improving quality or by value adding, as well as by expanding the volume or area of production.” I think this statement is a bit ambiguous re the meaning of scale – ie scale of what ? Sales, marketable yield, production area, investment, labour ?
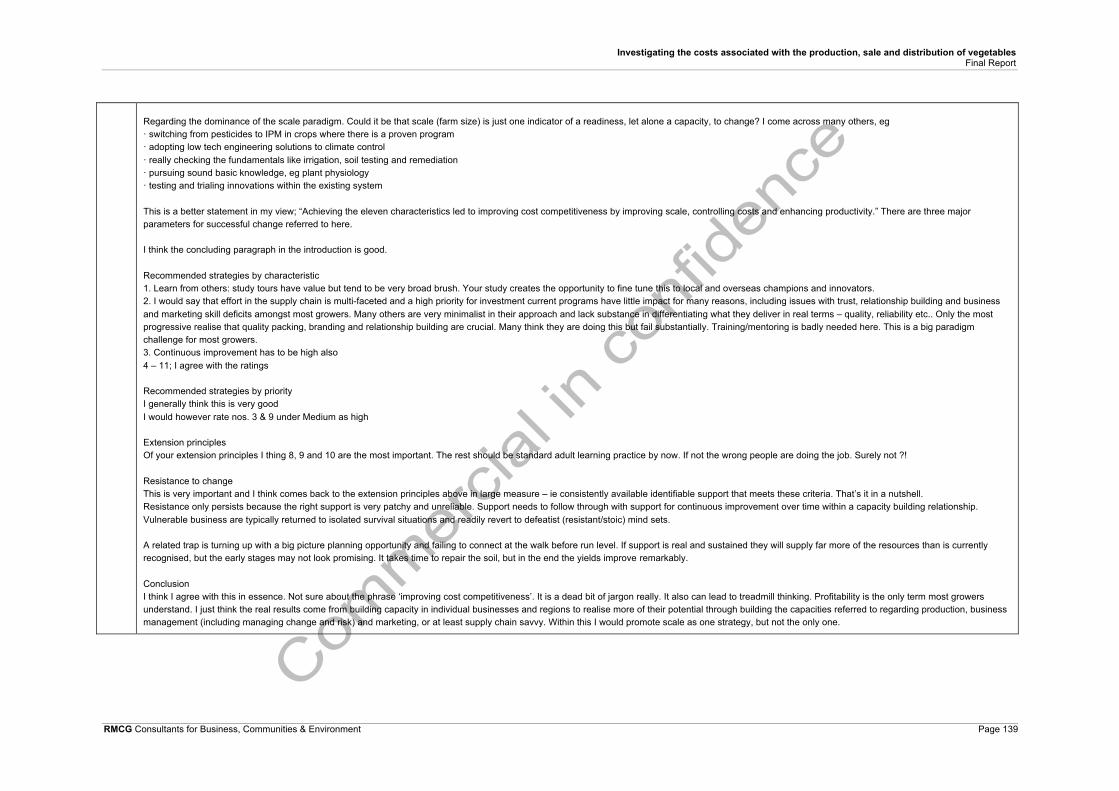
Investigating the costs associated with the production, sale and distribution of vegetables Final Report
RMCG Consultants for Business, Communities & Environment Page 139
Regarding the dominance of the scale paradigm. Could it be that scale (farm size) is just one indicator of a readiness, let alone a capacity, to change? I come across many others, eg · switching from pesticides to IPM in crops where there is a proven program · adopting low tech engineering solutions to climate control · really checking the fundamentals like irrigation, soil testing and remediation · pursuing sound basic knowledge, eg plant physiology · testing and trialing innovations within the existing system This is a better statement in my view; “Achieving the eleven characteristics led to improving cost competitiveness by improving scale, controlling costs and enhancing productivity.” There are three major parameters for successful change referred to here. I think the concluding paragraph in the introduction is good. Recommended strategies by characteristic 1. Learn from others: study tours have value but tend to be very broad brush. Your study creates the opportunity to fine tune this to local and overseas champions and innovators. 2. I would say that effort in the supply chain is multi-faceted and a high priority for investment current programs have little impact for many reasons, including issues with trust, relationship building and business and marketing skill deficits amongst most growers. Many others are very minimalist in their approach and lack substance in differentiating what they deliver in real terms – quality, reliability etc.. Only the most progressive realise that quality packing, branding and relationship building are crucial. Many think they are doing this but fail substantially. Training/mentoring is badly needed here. This is a big paradigm challenge for most growers. 3. Continuous improvement has to be high also 4 – 11; I agree with the ratings Recommended strategies by priority I generally think this is very good I would however rate nos. 3 & 9 under Medium as high Extension principles Of your extension principles I thing 8, 9 and 10 are the most important. The rest should be standard adult learning practice by now. If not the wrong people are doing the job. Surely not ?! Resistance to change This is very important and I think comes back to the extension principles above in large measure – ie consistently available identifiable support that meets these criteria. That’s it in a nutshell. Resistance only persists because the right support is very patchy and unreliable. Support needs to follow through with support for continuous improvement over time within a capacity building relationship. Vulnerable business are typically returned to isolated survival situations and readily revert to defeatist (resistant/stoic) mind sets. A related trap is turning up with a big picture planning opportunity and failing to connect at the walk before run level. If support is real and sustained they will supply far more of the resources than is currently recognised, but the early stages may not look promising. It takes time to repair the soil, but in the end the yields improve remarkably. Conclusion I think I agree with this in essence. Not sure about the phrase ‘improving cost competitiveness’. It is a dead bit of jargon really. It also can lead to treadmill thinking. Profitability is the only term most growers understand. I just think the real results come from building capacity in individual businesses and regions to realise more of their potential through building the capacities referred to regarding production, business management (including managing change and risk) and marketing, or at least supply chain savvy. Within this I would promote scale as one strategy, but not the only one.

Investigating the costs associated with the production, sale and distribution of vegetables Final Report
RMCG Consultants for Business, Communities & Environment Page 140
6 Learning from industry is more important than learning from other growers. Growers are time poor and are reluctant to share and generally will be reluctant to participate in discussion groups. Instead extension should be incorporated into existing local region events that growers attend, expos etc. IDOs are not the way to extend information either as they can tend to become unfocussed. It is very important that the common high costs of labour and power costs are explained so that Peak Bodies have this information. Access to labour is another common issue that is limiting industry. The gross margin tool for vegetable growers (VegTool) needs to be used by more growers. It is fustrating that most growers do not understand their costs and cost of production and do not properly price their produce. Growers should not allow produce to leave their properties without an agreed price. Knowing the cost of production of each crop for each month is critical for this. Education for the next generation of young growers is important. 1:1 extension is too expensive. As an industry we need to have a grower registration scheme to identify who our growers are by region and by commodity. We can then ask them how they want to be engaged with. This could also provide a mechanism to give feedback to HAL, and provide food security, safety traceability processes. In terms of extension of business management an on-line resource business portal would be useful. Growers can access this at times that are suitable for them and it could include a reference library so growers can refresh and update their previous training. The portal could include a number of tools to enable growers to calculate their cost of production of a range of vegetable crops.
7 Discussion groups will not work, because growers are unable to share their competitive advantages. The industry is too small. The main focus for HAL to reduce the cost of production should be to invest in agronomy research and development. For example, investing in clean and green production systems that reduce chemical use. This will provide a tangible market advantage compared to overseas competitors. HAL needs to concentrate on agronomy not the personal development of growers. The conclusions of the report are correct, but the Strategy is not. The Strategy will only get a small number of growers to participate and it be very difficult to achieve real change. You cannot help the growers who are doomed, as they will not participate in such programs. And the top performing growers do all these things by themselves anyway. That is they grow super quality, achieve excellent customer relationships and mix with smart people to keep developing. Successful growers already have their own informal way of achieving this and will see no advantage of a structured industry program that will be less tailored to their needs. In short the main priority should be agronomy and perhaps a small limited and targeted amount to a mentoring program. But do not spend a lot of $ on this component.
8 In review, it is great to see the WA growers in there as part of the final report and exciting that they are part of a process that aims to improve business viability for growers around Australia in the future. I am particularly pleased with the recommendations and very enthusiastic to see them implemented in the future. I really hope that they are taken on board and I would be excited to be involved in these sorts of business development programs for growers in the years ahead. Apart from that, it was an interesting read and seems like it was a really worthwhile project with lots of learnings to come from it. If you would like any further or more specific comments please let me know, but from going through the report today I would say great job!
9 Had a read of the draft report it is a great read got nothing to add I am very happy with the report.
10 Looking through the case studies would provide some very useful guidance to growers. The only thing that was probably missing was ensuring you get the right work life balance when growing your business.
11 We had some good discussion the other night. Basically everyone agreed that its not what or where you grow but how you grow that makes the difference. Have a few ideas re the case studies I will call you and discuss.
12 In regards to the CoP Draft – I have had a read through this and whilst I agree with some claims there are some that I don’t however this is consistent with fact this information is from a cross section of business size, geographical area etc. In my own summary vegetable productions costs are always increasing however these cannot be offset simply by increasing the sale price. There is continual focus on the strategies behind reducing costs however simple issues like the weather or increased sale price can change the bottom line dramatically. The simple solution to most costing issues could be to change the customers perception of the cost of vegetables - this to me is a high priority. If we can communicate to the general public that it is not ok to purchase for example Broccoli for $1/kg and the lowest price should in fact be more like $4/kg would be a step in the right direction. There are many many existing opportunities and training organisation and programs available to growers to continue to learn however time restraints and cost are generally the barrier.
13 We have read the draft report and the case studies and discussed. The case studies provide some very useful insights to assist with the setting of strategies for the future. It is interesting and noteworthy that the findings of this more formal investigation concur with the understanding that is emerging among growers and other industry participants, and that there is a consistency across States. It would have been desirable (perhaps the Terms of Reference or Tender) did not permit it, but an investigation of post farm gate costs (as part of the distribution) would also have been illuminating. Also, to assist those who will be charged with implementing strategies for change, perhaps some examples of future extension activity that might attract people to achieve the outcomes sought would be helpful (again, provided the TORs/Tender allowed this). The case studies provide some very useful insights to assist with the setting of strategies for the future. In terms of addressing the costs of production, there is a lot of research and evidence to suggest that collaboration between businesses (sharing of knowledge, skills, recourses and equipment etc.), may be one way of addressing some of the overhead costs and variable costs of production. This is a possible strategy that could fit within the three programs that have been suggested in the report. I have done some work in this area and would be happy to discuss with you.
Investigating the costs associated with the production, sale and distribution of vegetables Final Report
RMCG Consultants for Business, Communities & Environment Page 141
14 I like the summary of successful characteristics, but would make the point that scale can be illusory if not combined with sustainability. Anyone can go down the exploitative track and look successful for a couple of years before the chickens come home to roost.
15 [by phone]: Business skills are really important but it's hard to convey them (you either have an interest/skill in this or you don't) - I think it's more to do with a grower's attitude. It's a decision to 'have a go'. You decide, yes, you want to be a vegetable grower so you work out what you need to do, and have a go. We have (and need to have) a wide area of knowledge in everything, but we don't need to be an expert in everything - you need to know who to ask. Another thing that stood out in the case studies was that these successful ones have a focus on people skills - and that's not an area we traditionally [all growers] come from. You need to be able to manage people - maybe more relevant than the business skills actually. Maybe there could be more on that - e.g. like in the dairy industry where there's been a focus on how to manage dairy staff etc.
16 [by phone]: I think the strategies are all on the money. It all makes sense. But it's going to be a tall order to get it all together - agriculture would have to be one of the hardest industries to get people working together, we're all so competitive. For example, the idea of companies like Harvest Moon and Premium Fresh working together and marketing produce under Brand Tasmania all makes sense but it'll never happen - too competitive. It seems sometimes there are personalities to deal with too [ie the consultants or facilitators of groups etc] that mean things can start off well with good intentions but their different agendas or personalities can put some people off, or the same loud people all have their say, and then things tend to unravel [ie lose momentum]. We can't just throw our hands up though, we do have to try some of it. Just worried about the 'how' and 'when' re implementing some of the quite valid suggestions and strategies in the report. [NB - mentioned a couple of AusVeg and other industry forums etc that he'd been to, groups came up with ideas etc but nothing ever came of it. He rightly questions the follow up from things like that as being part of the problem.]
17 As one who has grappled with extension to this target market, I have no problem with your criteria or priorities. The issue for me is that the resources needed to complete extension along the lines indicated – are enormous and in my view would seriously fail an objective benefit/ cost. Farmers are competing for a share of resources and these (and they) are declining, especially in terms of government extension. Embedded in the Case Studies is the observation that good farmers can do all of this in their stride. That is probably why the best 20% produce and market more than 60% of the output – competitively. What also comes through this document is that if you address every socio-economic limitation faced, the extension task will be completed successfully.